UNITED STATES
SECURITIES AND EXCHANGE COMMISSION
Washington, D.C. 20549
FORM N-CSR
CERTIFIED SHAREHOLDER REPORT OF REGISTERED MANAGEMENT INVESTMENT COMPANIES
Investment Company Act file number 811-8416
| Touchstone Variable Series Trust |
| (Exact name of registrant as specified in charter) |
| |
| 303 Broadway, Suite 1100 |
| Cincinnati, Ohio 45202- 4203 |
| (Address of principal executive offices) (Zip code) |
| |
| Jill T. McGruder |
| 303 Broadway, Suite 1100 |
| Cincinnati, Ohio 45202- 4203 |
| (Name and address of agent for service) |
Registrant's telephone number, including area code: 800-638-8194
Date of fiscal year end: December 31
Date of reporting period: December 31, 2011
Form N-CSR is to be used by management investment companies to file reports with the Commission not later than 10 days after the transmission to stockholders of any report that is required to be transmitted to stockholders under Rule 30e-1 under the Investment Company Act of 1940 (17 CFR 270.30e-1). The Commission may use the information provided on Form N-CSR in its regulatory, disclosure review, inspection, and policymaking roles.
A registrant is required to disclose the information specified by Form N-CSR, and the Commission will make this information public. A registrant is not required to respond to the collection of information contained in Form N-CSR unless the Form displays a currently valid Office of Management and Budget ("OMB") control number. Please direct comments concerning the accuracy of the information collection burden estimate and any suggestions for reducing the burden to Secretary, Securities and Exchange Commission, 100 F Street, NE, Washington, DC 20549. The OMB has reviewed this collection of information under the clearance requirements of 44 U.S.C. § 3507.
Item 1. Reports to Stockholders.
The Report to Shareholders is attached herewith.
December 31, 2011
Annual Report
Touchstone Variable Series Trust
Touchstone Baron Small Cap Growth Fund
Touchstone Core Bond Fund
Touchstone High Yield Fund
Touchstone Large Cap Core Equity Fund
Touchstone Mid Cap Growth Fund
Touchstone Money Market Fund
Touchstone Third Avenue Value Fund
Touchstone Aggressive ETF Fund
Touchstone Conservative ETF Fund
Touchstone Enhanced ETF Fund
Touchstone Moderate ETF Fund

Table of Contents
| | Page |
| Letter from the President | 3 |
| Management's Discussion of Fund Performance (Unaudited) | 4 - 24 |
| Tabular Presentation of Portfolios of Investments (Unaudited) | 26 - 27 |
| Portfolio Investments: | |
| Touchstone Baron Small Cap Growth Fund | 28 |
| Touchstone Core Bond Fund | 30 |
| Touchstone High Yield Fund | 36 |
| Touchstone Large Cap Core Equity Fund | 40 |
| Touchstone Mid Cap Growth Fund | 42 |
| Touchstone Money Market Fund | 43 |
| Touchstone Third Avenue Value Fund | 46 |
| Touchstone Aggressive ETF Fund | 47 |
| Touchstone Conservative ETF Fund | 48 |
| Touchstone Enhanced ETF Fund | 49 |
| Touchstone Moderate ETF Fund | 50 |
| Statement of Assets and Liabilities | 52 - 53 |
| Statement of Operations | 54 - 55 |
| Statement of Changes in Net Assets | 56 - 59 |
| Financial Highlights | 60 - 65 |
| Notes to Financial Statements | 66 - 78 |
| Report of Independent Registered Public Accounting Firm | 79 |
| Other Items (Unaudited) | 80 - 88 |
| Management of the Trust (Unaudited) | 89 - 92 |
| Privacy Protection Policy | 93 |
Letter from the President
Dear Shareholder:
We are pleased to provide you with the Touchstone Variable Series Trust Annual Report. Inside you will find key financial information, as well as manager commentaries for the Funds, for the twelve months ended December 31, 2011.
2011 was a challenging environment for investors. From a market capitalization and style perspective, large cap outpaced both small and mid-cap stocks, while growth outperformed across most asset classes. The U.S. equity markets outperformed both the developed and emerging international markets for the year. Interest rates remain low, and are forecasted to stay low throughout the next two years.
In the third quarter, U.S. and world equity markets suffered their worst losses since the 2008-09 financial crisis, while treasury yields fell to their lowest levels since that period. For many investors, the key issues impacting markets were whether the U.S. economy is headed for a “double dip” recession, what can policymakers do to avert one, and whether the financial crisis in Europe can be contained.
It is thought that the U.S. economy is not on the brink of recession. The equity market is pricing in a mild recession already but certainly not a severe recession along the lines of 2008-2009. It is generally believed, however, that risks have increased and the outcome will be dictated by policy responses in the U.S. and Europe. The myriad of forces at play, which have been building throughout this year, could reach a climax soon depending on the outcome of U.S. budget deliberations and actions European policymakers take to halt financial contagion.
We continue to believe that diversification is essential to balancing risk and return. We recommend that you continue to work with your financial professional to employ a sound asset allocation strategy that invests in a combination of stock, bond and money market mutual funds to help keep your financial strategy on course. It is critical to maintain a long-term approach to gain the full potential benefits of investing.
Touchstone is committed to helping investors achieve their financial goals by providing access to a distinctive selection of institutional asset managers who are known and respected for proficiency in their specific areas of expertise. We hope that you will find the enclosed commentaries helpful.
We greatly appreciate your continued support. Thank you for including Touchstone as part of your investment plan.
Sincerely,

Jill T. McGruder
President
Touchstone Variable Series Trust
Management's Discussion of Fund Performance (Unaudited)
Touchstone Baron Small Cap Growth Fund
Sub-Advised by BAMCO, Inc.
Investment Philosophy and Process
The Touchstone Baron Small Cap Growth Fund primarily invests in common stocks of small-sized growth companies. The Fund’s sub-advisor, BAMCO, Inc. (“BAMCO”), seeks securities that it believes have (1) favorable price to value characteristics, are well managed, have significant long term growth prospects and have significant barriers to competition; and (2) the potential to increase in value at least 100% over the next four or five years. Securities are selected for their capital appreciation potential and investment income is not a consideration in BAMCO’s stock selection process.
Fund Performance and Market Review
The total return of the Touchstone Baron Small Cap Growth Fund was 4.84% for the year ended December 31, 2011. The total return of the Russell 2000 Growth Index was -2.91% for the same period.
The U.S. stock markets ended 2011 at almost the point at which they began.The U.S. stock markets rebounded in the fourth quarter following a sharp correction in the third quarter.The markets benefited from generally positive economic data and strong reported business results. We believe the primary reason for the rebound was that a number of economic indicators provided reassurance that a recession was not imminent, as had been feared in the fall.The markets, however, remain dominated by macro concerns. Daily headlines concerning developments in Europe have led to continued volatility.
Portfolio Review
During the year, the Fund’s favorable stock selection effect, and to a lesser extent, sector weightings, contributed to relative performance.
The Fund’s investments in Energy, Consumer Discretionary, and Industrials were the largest contributors to relative results for the year. Within Energy, strength in crude prices and opportunistic acquisition sled to outperformance of the majority of the Fund’s energy holdings, which contributed to positive stock selection effect. Among the largest contributors to relative performance within the sector were Southern Union Co. and Brigham Exploration. Within Consumer Discretionary, positive stock selection effect was largely the result of outperformance of Panera Bread Co. and Peet’s Coffee & Tea, Inc. Shares of Panera, a fast, casual restaurant concept, rose for the year on strong earnings and operating margin. Positive relative performance in apparel accessories, and luxury goods was the result of our focus on businesses with outstanding management and unique value-priced products with meaningful unit-growth potential, and that are benefiting from increasing global demand for luxury goods. Ralph Lauren Corp. and Under Armour, Inc. fared well during the year and significantly contributed to the Fund’s relative results. In Industrials, positive stock selection effect was mostly driven by outperformance of Generac Holdings, Inc. Genesee & Wyoming, Inc. was also a contributor to relative results. Genesee & Wyoming share prices increased during 2011 after the company reported double-digit growth and announced two large new acquisitions.
Industrial stocks rallied in the fourth quarter after pulling back sharply in the third quarter due to weak economic data. Industrial stock prices are highly sensitive to the macro outlook, yet not always indicative of the fundamentals of each company. We see pockets of strength in energy-oriented companies while industrial companies that are more geared towards government spending have a bit of a tougher outlook. We are invested in several high-quality companies that have been laying the groundwork so that they can capture growth by expanding marketing, sales, and product distribution. For example, Generac Holdings, Inc. a leading manufacturer of standby and portable generators for the residential, industrial, and commercial markets, performed well for the year as the company had strong second-half sales driven by severe power outages caused by seasonal storms. With 70%
Management's Discussion of Fund Performance (Continued)
market share in the residential standby generator market and only 2% market penetration, we believe that Generac has significant room to grow. Another absolute contributor was Colfax Corp., a supplier of industrial fluid-handling products. Its shares advanced as investors reacted favorably to its strong third-quarter earnings results and the potential earnings accretion from its pending acquisition of Charter International plc. Due to U.K. takeover rules, management has been unable to update yearly guidance for Colfax or comment on expectations for earnings accretion from the Charter deal. We continue to hold Colfax as we believe the stock remains undervalued relative to the substantial operational improvements expected at Charter. In addition, we are excited about and have confidence in management’s vision to create a multi-platform industrial company.
While the near-term macro backdrop is uncertain, over the long term we believe that global economic growth will generate higher demand in energy and that the industry will still be challenged to meet growing demand with new supply. We continue to see four trends in energy: 1) unconventional resource development, 2) increasing service intensity of finding, developing, and producing oil and gas, 3) deepwater and frontier exploration and development, and 4) global natural gas demand spurring additional development of gas resources around the world. The two largest absolute contributors within the Energy sector are Southern Union Co. and Brigham Exploration. Shares of Southern Union rose sharply on news of rival bids from Energy Transfer Equity L.P. and Williams Cos., and the company was ultimately sold to Energy Transfer Equity. Brigham Exploration, one of the largest operators in the Williston Basin, was also acquired this year by Statoil ASA, the Norwegian national oil company, driving the share prices higher.
The Fund’s investments in Health Care were the only meaningful detractors from relative performance during the year. Weakness in the sector was mainly attributable to underperformance of the Fund’s health care facilities holdings, led by hospital operator Community Health Systems, Inc. The company’s shares dropped in 2011 as a result of the company’s failed attempt to acquire Tenet Healthcare and the government’s investigation of its Medicare billing and hospital admissions practices.
Health Care performance for the year was weak due to continued high unemployment and low consumer confidence. For people with health insurance, employers are shifting more of the cost burden to employees, resulting in higher deductibles, co-payments and co-insurance. As a result, people are consuming less healthcare. We believe the winners will be healthcare companies that can reduce costs and enhance efficiency while improving patient outcomes and benefit from the aging of the population. For example, Edwards Lifesciences Corp. is a leading manufacturer of heart valves used in surgical and transcatheter heart-valve replacement. In early November, the company received regulatory approval for its transcatheter heart valve. The shares lost ground for the year, as it became clear that close government and medical association scrutiny, intended to ensure that physicians and medical centers are properly trained, will slow the introduction of these valves into surgical practice. We continue to have a positive view about the long-term global market potential for transcatheter valves and believe that Edwards will be a leader in the field for many years. The best performer in the sector was AMERIGROUP Corp., an HMO focused on people in government-sponsored programs. It increased significantly in 2011 as revenue is expected to grow more than 40% in 2012 on new business and an increased presence in New York, the result of a $1 billion Medicaid plan acquisition. We think AMERIGROUP has a significant growth opportunity in managed Medicaid as states seek ways to control their spending and budgets.
Strategy and Outlook
Although there are still U.S. fiscal issues and a somewhat dysfunctional government, we think the U.S. consumer has remained resilient and corporate America has remained strong. We think the balance sheets for the companies we own are solid, and businesses are equipped with ample capital to fund growth opportunities, make acquisitions, and/or return capital to shareholders. Though there is momentum at present, we think we are in for a period of modest general economic growth. Even in this environment, we believe the businesses in which we have
Management's Discussion of Fund Performance (Continued)
invested can grow earnings and accrete value. We do not believe this growth is reflected in the trading multiples, so we expect multiple expansions in the future when the focus of the markets returns to fundamentals.
We believe that current stock market valuations are compelling. U.S. interest rates remain near historically low levels, and the fixed income markets offer limited inflation-adjusted returns. There are important trends occurring in several industries that we believe offer growth opportunities over the next few years independent of normal business cycles. In our search for new companies, we seek businesses with visionary leaders that are separating themselves from competitors through efficient operations, strong balance sheets, unique assets or properties and, in many cases, innovative and game-changing technology.
Management's Discussion of Fund Performance (Continued)
Comparison of the Change in Value of a $10,000 Investment in the
Touchstone Baron Small Cap Growth Fund and the Russell 2000® Growth Index
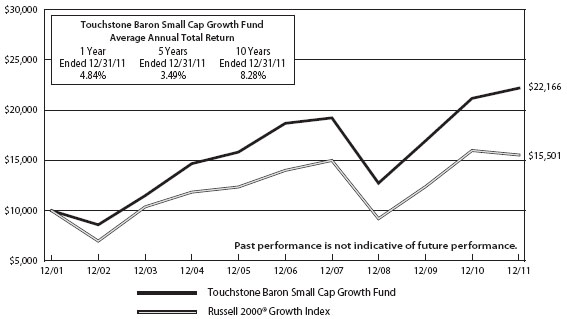
Past performance is not indicative of future performance.
Performance information does not reflect fees that are paid by the separate accounts through which shares of the Fund are sold. Inclusion of those fees would reduce figures for all periods.
The Fund commenced operations on December 14, 1992.
Management's Discussion of Fund Performance (Continued)
Touchstone Core Bond Fund
Sub-Advised by Fort Washington Investment Advisors, Inc.
Investment Philosophy and Process
The Touchstone Core Bond Fund seeks to provide as high a level of current income as is consistent with the preservation of capital. Capital appreciation is a secondary goal. In deciding what securities to buy and sell for the Fund, the overall investment opportunities and risks in different sectors of the debt securities market are analyzed by focusing on maximizing total return and reducing volatility of the Fund’s portfolio. A disciplined sector allocation process is followed in order to build a broadly diversified portfolio of bonds.
Fund Performance and Market Overview
The total return of the Touchstone Core Bond Fund was 8.45% for the year ended December 31, 2011. The total return of the Barclays Capital U.S. Aggregate Bond Index was 7.84% for the same period.
Performance was primarily driven by a lower and flatter yield curve and volatility in the non-Treasury markets. Interest rates fell and the yield curve flattened during the past year, with long-term rates falling more than short-term. Economic growth disappointed expectations in early 2011 as many temporary factors negatively impacted the U.S. and sovereign concerns in the eurozone intensified. The Federal Reserve (the Fed) contributed to this drop in rates as it refined guidance by indicating it would keep short-term interest rates low for the next two years. In addition, near the end of the third quarter, the Fed announced the sale of short-term Treasuries and the purchase of long-term Treasuries in an effort to reduce long-term rates (or keep long-term rates low). The change in interest rates was a positive for the Fund’s performance, with the largest impact coming from the holdings of long-term Treasuries during the third quarter, while the flattening of the yield curve had a negative impact on performance. Opportunistic use of Treasury inflation protected securities (TIPS) also made a positive contribution to performance over the year.
Portfolio Review
Residential mortgage-backed securities (RMBS) underperformed in 2011, and the Fund’s underweight position in this sector was a slight positive for performance. Commercial mortgage-backed securities (CMBS) fared better, outperforming for the year. The Fund was overweight this sector during the entire year, which was a positive factor for performance. In addition, the security selection within the CMBS sector had a positive impact on performance.
Corporate bonds underperformed significantly in 2011 as risk aversion increased as the eurozone crisis intensified and added significant uncertainty to the economic outlook. The Financial sector performed the worst as the market feared that further weakness in the eurozone could negatively impact access to markets for U.S. and European financial institutions. The Fund’s weighting to the sector was neutral for much of the year; however, it was underweight the banking industry, which positively impacted performance. The High Yield sector underperformed during 2011, but the Fund’s allocation to High Yield was a positive factor due to tactical shifts made throughout the year and a positive impact from security selection. The allocation was reduced in the first quarter of 2011, and was increased slightly in the fourth quarter. The Fund continues to hold a position in the High Yield sector given the high level of defaults built in to High Yield prices and our outlook for modest economic growth.
Strategy and Outlook
In positioning the Fund for the coming year, we are mindful that one year ago investors were optimistic about the U.S. and global economy, but have since turned cautious in the wake of all that has transpired. In our opinion, markets are now priced for subdued U.S. growth, a mild recession in Europe, and a soft landing in
Management's Discussion of Fund Performance (Continued)
China. We believe these are reasonable expectations and they constitute the base case of our economic outlook. We are also cognizant of events that could alter the outlook materially, including the possibility of a financial crisis in Europe, a more protracted slowdown in China, and the threat of oil-supply disruptions in the Middle East. These developments are not priced into markets, and undoubtedly would provoke a flight to quality. On the positive side, we see increased signs that the U.S. economy has made steady progress adjusting to the 2008-09 financial crisis. While we are uncertain when the U.S. economy will accelerate, we suspect a sustained upturn may be closer than market participants currently anticipate, in which case risk assets would likely rally and long-term bond yields would surge. Given this outlook, we anticipate that short- and long-term interest rates are unlikely to change materially from current levels over the next several months, economic growth will continue at a sub-par pace (+2 percent), core inflation will remain low (1-2 percent) and economic conditions will be supportive of an overall overweight to non-Treasury sectors. On our part, we plan to position the Fund with interest rate risk close to that of the benchmark and continue to opportunistically invest in TIPS. We continue to view the U.S. Treasury and government-related sectors (including Agencies) as relatively unattractive on a long-term basis. We intend to maintain a neutral position versus the benchmark in investment-grade corporate bonds and maintain a significant overweight to the CMBS and High Yield sectors to take advantage of the yield these sectors offer.
Comparison of the Change in Value of a $10,000 Investment in the
Touchstone Core Bond Fund and the Barclays Capital U.S. Aggregate Bond Index
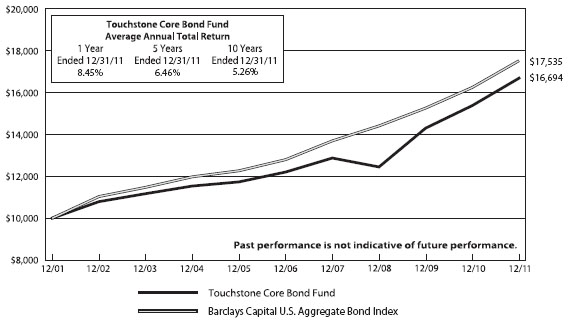
Past performance is not indicative of future performance.
Performance information does not reflect fees that are paid by the separate accounts through which shares of the Fund are sold. Inclusion of those fees would reduce figures for all periods.
The Fund commenced operations on January 1, 1999.
Management's Discussion of Fund Performance (Continued)
Touchstone High Yield Fund
Sub-Advised by Fort Washington Investment Advisors, Inc.
Investment Philosophy and Process
The Touchstone High Yield Fund seeks high current income and capital appreciation by primarily investing in non-investment grade securities. The Fund emphasizes the higher-quality segment of the high yield market. It utilizes a research process designed to maximize risk-adjusted returns by avoiding lower-rated securities.
Fund Performance and Market Overview
The total return of the Touchstone High Yield Fund was 6.08% for the year ended December 31, 2011. The total return of the BofA Merrill Lynch U.S. High Yield Cash Pay Index was 4.50% for the same period.
After a very volatile third calendar quarter with materially negative returns, the High Yield market rallied in the fourth calendar quarter.The difference in yield between Treasury securities and comparable high yield securities was 708 basis points at the end of the year, increasing over 170 basis points throughout the year. The Fund’s higher quality bias coupled with strong security selection allowed it to outperform the market.
Portfolio Review
Although the year began with a continuation of the two-year High Yield rally, significant volatility returned to the market mid-year. Concerns that the U.S. was going to fall back into a recession, the potential for higher default rates and considerable uncertainty surrounding developments in Europe all resulted in a significant increase in risk premiums in all risky asset classes. In this environment, higher quality BB-rated securities performed best while the lower quality CCC-rated securities had the worst performance. In fact, the total return of CCC-rated securities was actually negative, more than 580 basis points below the whole market. The Fund had significant contribution within the Energy sector, including considerable outperformance from Petrohawk Energy Corp., which was purchased by BHP Billiton Ltd. Additionally, Helix Energy Solutions Group Inc. was upgraded by the credit rating agencies and outperformed accordingly. Performance contributors also included Insight Communications Co. Inc., which announced its intent to be purchased by Time Warner Cable Inc. The Fund continues to benefit from the lack of exposure to Bank & Thrifts and Diversified Financials. Conversely, it was hurt by the lack of exposure to Ford Motor Company which began to attract interest from Investment Grade bond managers anticipating an upgrade by the rating agencies.
Strategy and Outlook
Looking back on the events of 2011, financial markets were dominated by two major developments: an end to the bull rally in global equities in spring that was followed by a period of market turbulence and a downward shift in the treasury yield curve that sent interest rates to new lows. These market moves, in turn, reflected a loss of confidence in economic and political leadership on both sides of the Atlantic. Problems in the U.S. were compounded by the spreading crisis in the eurozone, as yields on government debt surged not only for small countries in the periphery such as Greece and Portugal, but also for larger ones such as Italy and Spain. Just when it appeared the authorities had bought time by negotiating a 50 percent haircut on Greek debt, the European game-plan unraveled when the Greek government announced it would seek a political referendum. The upshot was that European officials for the first time acknowledged it was possible for a member of the eurozone to opt out, which raised new questions about the viability of the European Union (EU).
While some confidence in U.S. capital markets certainly returned in the fourth calendar quarter, considerable uncertainty remains. Market participants are now concerned with a variety of considerations including the ability of the U.S. to avoid a recession and the ability of political leaders on both sides of the Atlantic to avoid deadlock and resolve long-term fiscal problems. We feel that the United States can avoid a recession because
Management's Discussion of Fund Performance (Continued)
we do not see many of the typical excesses in the economy that tend to lead to a recession. Consumer spending is growing moderately and debt service burdens have been eased by record low interest rates. Spending on housing and autos – the most cyclically sensitive areas of the economy – continues to be abnormally low and do not appear to be near a bubble. While business investment spending has accelerated, it is far from excessive even though companies are enjoying record profits with very clean balance sheets. Finally, while unemployment does remain high, the trend in weekly jobless claims is decidedly lower. However, while the U.S. economy has regained momentum, conditions outside the U.S. (most notably in Europe and China) have deteriorated.
As for the ability of politicians to overcome deadlock and resolve long-term fiscal problems, we are less confident. With no prospect for growth on the horizon, it is difficult to be optimistic about Europe’s prospects, although we continue to believe European leaders will do what it takes to avoid a break-up of the eurozone. The most encouraging development is that the European Central Bank has stepped up its financing to the banking system, including initiating an unprecedented three-year refinancing operation at very low interest rates. As for the United States, there is no solution in sight due to gridlock between the two political parties. This already has resulted in a downgrade of U.S. Treasury debt by Standard and Poor’s, and the rating agencies could embark on a new round of downgrades if the impasse is not broken after the 2012 elections. In the meantime, failure to resolve the political dispute in the U.S. and the sovereign debt problems in the eurozone will continue to weigh on markets and contribute to unusually high volatility. In our opinion, markets are now priced for subdued U.S. growth, a mild recession in Europe, and a soft landing in China. We believe these are reasonable expectations, and they constitute the base case of our economic outlook.
While this outlook is hardly robust, it appears adequate to support the High Yield market. Even if economic growth turns negative, we expect any contraction to be shallow and short-lived. More importantly, default rates continue to decline and are expected to remain low, around 2 percent, throughout 2012. This level is down from 3.3 percent at year-end 2010 and significantly lower than 2009 peak of 13 percent. Strong corporate earnings, healthy balance sheets, considerable access to capital and reduced debt amortization all support this accommodative default forecast. Valuations are currently attractive in High Yield and the yields of comparable High Yield securities versus U.S. Treasury are comfortably above the long-term average. Additionally, current spreads are pricing in a default rate of 5 percent to 6 percent, a level that we do not think is in the cards.
The strength of Fort Washington’s High Yield strategy has historically been fundamental credit analysis with particular emphasis on avoiding problem credits. We believe this will continue to add value as negative credit events may have a material impact on returns in this challenging investment environment. We believe this core competency will provide considerable value to the Fund’s shareholders. We will continue to construct the Fund to be designed to exhibit less volatility than the broad market and seek to deliver attractive risk-adjusted returns. The Fund’s style is designed for performance over a full market cycle with focus on protecting principal in down markets, a style that we believe will outperform over the long-term.
Management's Discussion of Fund Performance (Continued)
Comparison of the Change in Value of a $10,000 Investment in the
Touchstone High Yield Fund and the BofA Merrill Lynch U.S. High Yield Cash Pay Index
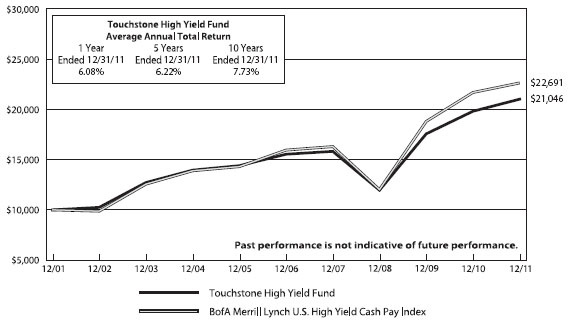
Past performance is not indicative of future performance.
Performance information does not reflect fees that are paid by the separate accounts through which shares of the Fund are sold. Inclusion of those fees would reduce figures for all periods.
The Fund commenced operations on May 1, 1999.
Management's Discussion of Fund Performance (Continued)
Touchstone Large Cap Core Equity Fund
Sub-Advised by Todd-Veredus Asset Management LLC.
Investment Philosophy and Process
TheTouchstone Large Cap Core Equity Fund primarily invests in common stocks of large capitalization companies. The Fund’s sub-advisor, Todd-Veredus Asset Management LLC (“Todd-Veredus”), selects stocks that it believes are attractively valued with active catalysts in place. Todd-Veredus uses a database of 4,000 stocks from which to choose the companies that will be selected for the Fund’s portfolio. As a result, the portfolio generally consists of 40-60 positions. Todd-Veredus’s selection process is expected to cause the Fund’s portfolio to have some of the following characteristics: attractive relative value, unrecognized earnings potential, above-average market capitalization, seasoned management and dominant industry position.
Fund Performance and Market Overview
The total return of the Touchstone Large Cap Core Equity Fund was 3.02% for the year ended December 31, 2011. The total return of the Russell 1000 Index was 1.50% for the same period.
For the full year, market return characteristics were very different than either the fourth quarter or almost any other quarter we have seen. The worst characteristics for the year were among the best for the fourth quarter. We believe this illustrates the volatile nature of 2011. Sentiment in the beginning of the year was that an economic recovery was at hand, and that feeling evaporated in the third quarter as uncertainty surrounding developments in Europe prompted a 20% decline during August. Late in the year, there was renewed optimism among investors that the economy was recovering, but unlike in the first part of the year, this optimism was more tempered, focusing on valuations instead of other economic indicators. For the full year, the higher quality, “show me” stocks with cash to distribute to shareholders, good profitability and visibility of earnings were the winners. Our style tends to emphasize stocks that possess these qualities.
Portfolio Review
The Fund’s emphasis on quality and valuation, as well as our economically sensitive emphasis during the August bear market, helped the Fund’s performance. Stock selection drove almost all of the Fund’s performance. Stock selection and an underweight in Financials as well as stock selection in Energy and Consumer Discretionary contributed to performance. The Fund’s stock selection in Information Technology, Industrials and Health Care detracted from performance.
The top five contributors to Fund performance during the year were Philip Morris International Inc., Ross Stores Inc., McDonalds Corp., United Health and Marathon Oil Corp. The Fund continues to hold all of these stocks. The five stocks detractors were AFLAC Inc., MetLife Inc.,Target Corp., Oracle Corp. and Broadcom Corp. The Fund’s leaders and laggards are from various sectors and are held by the Fund for many different reasons. It is difficult to pick one theme that caused either leadership or underperformance. We find this encouraging as it indicates to us we are in a stock-pickers market.
Economic statistics lead us to conclude that the recovery is likely to be durable and sustainable. To capitalize on this, the Fund is overweight the Consumer Discretionary and Industrials sectors. The Fund is underweight the Financials and Consumer Staples sectors. Regulations are likely to remain an issue for banks, although when investors become less concerned about European defaults, a strong rally could occur. We are looking within the Financials Sector for a potential increase in the sector’s weight. The Fund is not likely to increase the weight of Consumer Staples, as input costs remain an issue. We are examining Health Care for an increase it its weight, as the group consistently ranks among the best in our multi-factor ranking models.
Management's Discussion of Fund Performance (Continued)
Strategy and Outlook
We believe the U.S. equity market is setting the stage for better performance for the next two years. Other important trends that we see include a reinvigoration of the industrial base, a continuation in the growth of net exports, and a frugal consumer who is busy getting his or her fiscal house in order. All of these trends make a case for increased competition of U.S. businesses and consumers. On the negative side, there is still excess spending at the government level that will need to be addressed, though we suspect that some progress will be made on that front in the coming years. Investors are still somewhat cautious in their moves and only willing to buy where valuation looks good. We think that this will remain the case for the next few quarters as investors appear reluctant to fully embrace the idea that an economic recovery is sustainable. In summary, worldwide economies suffered headwinds last year. Markets have been volatile as a result of this, and that volatility may persist.
We believe that economies worldwide have decoupled. Emerging Markets should see renewed growth, especially as they focus on the consumption side of their economies. The U.S. should continue to see economic growth, but Europe is likely to suffer a self-imposed recession. We believe that markets worldwide will have a better year in 2012 than in 2011 if European problems do not migrate abroad and low rates force investors to consider income alternatives aside from traditional bonds.
Comparison of the Change in Value of a $10,000 Investment in the
Touchstone Large Cap Core Equity Fund and the Russell 1000® Index
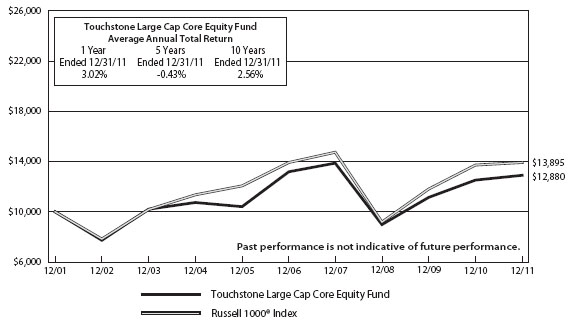
Past performance is not indicative of future performance.
Performance information does not reflect fees that are paid by the separate accounts through which shares of the Fund are sold. Inclusion of those fees would reduce figures for all periods.
The Fund commenced operations on May 1, 1999.
Management's Discussion of Fund Performance (Continued)
Touchstone Mid Cap Growth Fund
Sub-Advised by TCW Investment Management Company, LLC (through February 22, 2011) and Westfield Capital Management Company, L.P.
Investment Philosophy and Process
The Touchstone Mid Cap Growth Fund seeks capital appreciation by investing primarily in stocks of domestic mid-cap companies that are believed to have a demonstrated record of achievement with excellent prospects for earnings growth over a 1- to 3-year period. Securities are chosen that are believed to be reasonably priced with high forecasted earnings potential after in-depth fundamental analysis of a company’s financial statements, interviews with management, assessment of a company’s operations and product development as well as consideration of the company’s industry category.
Fund Performance and Market Overview
The total return of the Touchstone Mid Cap Growth Fund was -11.33% for the year ended December 31, 2011. The total return of the Russell Midcap® Growth Index was -1.65% for the same period.
We found that companies demonstrating relative certainty and predictability performed the best during 2011. We, as a firm, tend to gravitate toward companies with improving operating margins and misunderstood franchises where we project meaningful improvement in free cash flow growth. In general terms, the stocks that worked best in 2011 were either income or expensive. Investors were willing to pay high price-to-earnings multiples for visible, protected growth. We generally do not buy slow, predictable growers with the highest multiple of earnings. These stocks led in 2011 and made new highs, while less expensive companies with prospective growth potential were punished due to fears of collapse of the European Union and uncertainty about the pace of global economic growth. We had little to no exposure to the best performing parts of the market in 2011 –like Consumer Staples, Utilities and REITs – because in most cases the leadership stocks would not meet Westfield’s growth-at-a-reasonable-price style. Additionally, we underestimated the strength of the U.S. consumer. In the face of market and media fear that the 2008 stock market decline was repeating itself, we held the contrarian belief that growth was merely moderating and that the domestic economy would reaccelerate, albeit modestly. While this was an accurate view, we miscalculated the impact on investor psychology and the degree of aversion to any uncertainty or risk.
The Fund’s portfolio generated relative gains within the Industrials, Consumer Staples, and Financials sectors; however, these sectors’positive impact was offset by stock-specific weakness in the Health Care, Energy, Materials, and Information Technology sectors.
Portfolio Review
The Industrials sector contributed to relative results. Particular strength was evident in the aerospace and defense and industrial machinery sub-industries.The Fund’s portfolio is now equal weight Industrials, with investments in some early-cycle areas like trucking and construction-related stocks. J.B. Hunt Transport Services Inc. and Stanley Black & Decker Inc., for example, were purchased in the last quarter of the year. J.B. Hunt is the premier intermodal (truck and rail combination) freight carrier in the U.S. In our opinion, this is the secular growth segment of the trucking market and the company’s early entry into the intermodal freight market has allowed it to lock in favorable contracts with its railroad partners. Stanley manufactures industrial tools, and one of the reasons why we like the company is its significant leverage to improving U.S. construction. Stanley’s 2010 merger with Black & Decker was wildly accretive and the company’s future revenues should benefit from the merger synergies, a strong pipeline of new products, and pricing offsetting inflation.
The Consumer Staples sector contributed to relative results, helped by investments within packaged foods and meats. Ralcorp Holdings Inc., a leading player in the private label food industry, surged in April after packaged
Management's Discussion of Fund Performance (Continued)
foods manufacturer ConAgra Foods, Inc. made a bid to acquire the company. Green Mountain Coffee Roasters Inc., which manufactures Keurig coffee brewers and single-serve ‘K-Cups’ coffee pods, was one of the top contributors to the Fund portfolio’s return. We continue to think that the company represents a unique, open-ended growth story; however, we exited our position in December, as we were concerned that the heightened investor scrutiny of this high-expectations stock would put pressure on its near-term returns.
The Health Care sector detracted from active results. Dendreon Corp., which developed and markets the first cancer vaccine, Provenge, was one major detractor. Our investment thesis was based on the commercialization of Provenge, which has been approved by the FDA for the treatment of prostate cancer and is shown to significantly increase survival in patients who have failed existing therapies. While the summer selloff was harsh for many biotechnology stocks, Dendreon was hit particularly hard after releasing weak data around the time of the August “risk-off” trade. Investors were disappointed by evidence of lingering insurance reimbursement concerns, the company’s difficulty identifying suitable patients, and supply chain issues. While we still believe Provenge has potential, investor sentiment is likely to be a headwind, and we consequently sold our shares.
The Information Technology sector was a source of relative underperformance. While there were quite a few strong performers in the sector, including Alliance Data Systems Corp., Alcatel-Lucent ADS, Brocade Communications Systems Inc. and F5 Networks Inc., one investment in the application software sub-industry, Longtop Financial Technologies Ltd., contributed to the majority of the performance shortfall. Longtop is a provider of software and IT services in China. A position was established in the stock in September 2010 after meeting with the CEO and CFO, based on our belief that Longtop would play a critical role in the financial modernization of Chinese banks. The company had the leading market position in China, relationships with four top Chinese banks, and was rapidly growing in the smaller bank and insurance markets. In May of 2011, the company announced the resignation of its auditor and the CFO as the result of identified falsity of the company’s financial records and other associated transgressions. Trading of the stock was halted, and the stock was eventually sold out of the Fund’s portfolio in August, when trading in the shares resumed.
Stocks within the Energy sector had a negative impact on relative returns. In 2011, we witnessed extreme volatility in the Energy space. Unrest in the Middle East in the early part of the year was a key factor, as Libya’s civil war alone decreased world oil production by 1.3 million barrels a day in an already tight capacity market. Brent Crude oil prices shot up to $125 a barrel in April, making three-year highs. As oil prices rose, Energy stocks were hit with market trepidations about multiple macro risks including the effect of commodity inflation on the economy. Weatherford International Ltd., in particular, was a disappointing holding for the Fund’s portfolio over the past year. Weatherford provides oilfield-related services globally, and its growth is correlated with a rising global Gross Domestic Product (GDP), particularly in emerging economies. Middle East and North Africa dislocations and weather across several regions had a significant negative impact onWeatherford’s international revenues and margins. The Fund portfolio’s holdings within the coal and consumable fuels sub-industry, which drastically lagged the index sector overall, also negatively impacted relative performance. Alpha Natural Resources Inc. underperformed due in part to the perceived risk associated with Alpha finalizing its Massey Energy Co. acquisition. While we remain bullish on the prospects for secular demand growth for coal given its importance to power generation in emerging markets, we sold our shares in the stock.
The Materials sector detracted from comparative performance. In general, late 2011 was a difficult time for the Materials sector. Slowing global demand and sovereign debt risks drove investors out of this high beta sector. We continue to like the group, focusing on companies facing structural shifts and long-term growth opportunities. Importantly, many of the portfolio’s holdings in the sector have been trading below the replacement value of their assets, providing an attractive risk/reward combination. Rare earth mineral company Molycorp Inc. was the portfolio’s weakest holding in the sector. The company reported disappointing second quarter production and lowered forward guidance. Focusing on the company-specific competitive advantages, we also underestimated
Management's Discussion of Fund Performance (Continued)
the pace and severity of price declines for rare earth oxides due to global growth deceleration and customer inventory drawdowns. As a result, we sold our shares.
Strategy and Outlook
Looking forward, we are likely to be in a slow growth, de-leveraging environment for some time where the best stewards of capital will prove to be the biggest winners. The best performing stocks in 2011 were high dividend payers. However, we do not intend to buy stocks just because of a dividend yield. We will focus on identifying leadership companies that are growing organically, buying back stock, and raising their returns on invested capital, because we are convinced these kinds of companies will outperform for the foreseeable future. Sustainable growth comes with accelerating free cash flow and Return on Invested Capital (ROIC) – factors that have gained greater importance in our analysis and in the current market. We have also developed a major new growth theme related to domestically-oriented replacement cycles in transportation, repair and maintenance, and housing. While we agree that rising middle classes in emerging markets will continue to drive demand for energy and high value manufactured goods, we think that companies benefiting from the domestic economy will generate better returns in the near-term.
Beta is a measure of the volatility of a portfolio relative to its benchmark.
Comparison of the Change in Value of a $10,000 Investment in the
Touchstone Mid Cap Growth Fund and the Russell Midcap® Growth Index
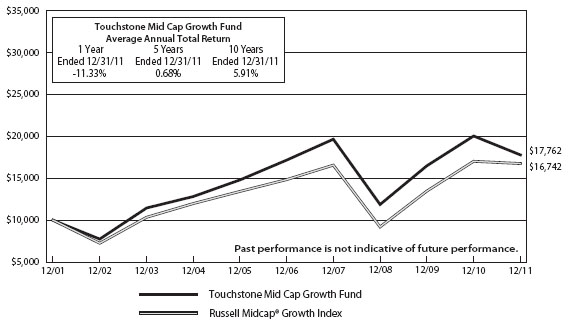
Past performance is not indicative of future performance.
Performance information does not reflect fees that are paid by the separate accounts through which shares of the Fund are sold. Inclusion of those fees would reduce figures for all periods.
The Fund commenced operations on November 21, 1994.
Management's Discussion of Fund Performance (Continued)
Touchstone Third Avenue Value Fund
Sub-Advised by Third Avenue Management, LLC
Investment Philosophy and Process
The Touchstone Third Avenue Value Fund primarily invests in common stocks of common stocks of well-financed companies (meaning companies believed to have high quality assets and a relative absence of liabilities) at a discount to what the Fund’s sub-advisor, Third Avenue Management LLC (“TAM”), believes is their intrinsic value. Third Avenue analyzes companies from the bottom up, focusing on business fundamentals such as competent management teams and strong long-term growth prospects.
Fund Performance and Market Overview
The total return of the Touchstone Third Avenue Value Fund was -15.31% for the year ended December 31, 2011. The total return of the Russell 3000 Value Index was -0.10% for same period.
In 2011, markets exhibited high instances of volatility and a high degree of correlation between stocks in various industries and geographies, as well as between asset classes. Both appear to have been the result of “fear trading” around several global and macroeconomic issues. At the start of the year, investors were confronted with the earthquake, tsunami and subsequent nuclear disaster in Japan. Concurrently, and picking up speed soon after, global markets were rocked by uncertainties resulting from the “Arab Spring” protests. At the start of August, Standard and Poor’s took the unprecedented step of downgrading U.S. Treasury debt. The Euro zone sovereign debt issues, which were years in the making, reached a series of pivotal, end of the year moments. Meanwhile, inflation-fighting tight monetary policies in India and China dampened some investor’s optimism about continued growing demand from the emerging markets.
Portfolio Review
2011 was marked by a massive divergence between the business performance and the stock performance of the companies in whose common stocks the Fund is invested. This has been most notable among its Hong Kong-based Real Estate and Investment Companies. 2011 would seem like a terrible year, if measured only by the common stock performance of these companies. However, the underlying businesses have actually performed well. Despite headwinds from government measures to curb residential housing prices in both Hong Kong and China, the companies have generated strong property development operating margins and continued net asset value (“NAV”) growth. These investments are Wheelock & Company Ltd., Henderson Land Development Ltd. and Cheung Kong Holdings Ltd. Each delivered strong business performance in 2011 and we believe that the stocks were victims of a macro trade away from China, which should reverse itself as the market takes notice of fundamentals.
The largest performance detractor was Wheelock & Co., a Hong Kong-based Real Estate and Investment Company. The stock price decline during the quarter appears to have been driven by tightening measures being imposed on the residential property markets in both Hong Kong and China. Nevertheless,Wheelock’s business fundamentals seem to remain healthy, particularly considering their larger exposure to the Hong Kong commercial real estate market, which remains strong.
Another significant detractor for the year was Henderson Land Development. Henderson delivered strong operating results this year and has a business that is quite diverse (it has a 40% ownership stake in Hong Kong & China Gas), although its market price did not reflect these strenghts.
The strongest performance contributors came from companies in the Energy sector, Bronco Drilling and Cimarex Energy Co. Bronco Drilling was sold to Chesapeake Energy Corp. for $315 million in June, at an attractive price. We sold Cimarex Energy as the stock had reached its full valuation. In all, we sold five positions during
Management's Discussion of Fund Performance (Continued)
the year, either on valuation or to allocate capital to higher conviction ideas. We added Consumer Discretionary clothing retailer American Eagle Outfitters Inc., Information Technology financial services firm Broadridge Financial Solutions, Inc. and Consumer Discretionary sports, media and entertainment company The Madison Square Garden Company.
Strategy and Outlook
The global economy appears to have entered another period of turbulence in late 2011 driven primarily by sovereign debt issues in Europe. Despite this challenging macro environment, the Fund’s holdings appear likely to continue generating attractive NAV growth over the next three to seven years, particularly if they can use their strong financial positions to make opportunistic investments as they have in the past. With discounts to NAV at historically wide levels, we believe that stock prices should, at a minimum, appreciate along with NAV growth over this period.
Comparison of the Change in Value of a $10,000 Investment in the
Touchstone Third Avenue Value Fund and the Russell 3000® Value Index
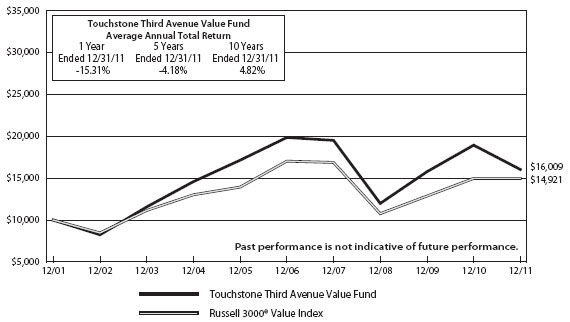
Past performance is not indicative of future performance.
Performance information does not reflect fees that are paid by the separate accounts through which shares of the Fund are sold. Inclusion of those fees would reduce figures for all periods.
The Fund commenced operations on December 14, 1992.
Management's Discussion of Fund Performance (Continued)
Touchstone ETF Funds
Sub-Advised by Todd-Veredus Asset Management LLC.
Touchstone Aggressive ETF Fund
Touchstone Conservative ETF Fund
Touchstone Enhanced ETF Fund
Touchstone Moderate ETF Fund
Investment Philosophy and Process
Four Exchanged Traded Funds (ETFs) are available for investors seeking “lifestyle” products for their annuity holdings. Strategic options include the Conservative, Moderate and Aggressive ETF Funds. These funds use asset allocations of up to nine ETFs that should not change dramatically over time, with higher bond weights for the more conservative funds, and lower bond weights for the more aggressive funds. The fourth option, the Enhanced ETF Fund, employs tactical asset allocation in an effort to generate better returns.
Performance and Market Overview
Each of the Touchstone ETF Funds underperformed their respective benchmarks during the trailing twelve month period ended December 31, 2011 against a difficult backdrop with volatile markets. The Touchstone Conservative ETF Fund’s total return was 3.44% for the year ended December 31, 2011. The total return of the Barclays Capital U.S. Aggregate Bond Index was 7.84% for the same period. The Touchstone Moderate ETF Fund’s total return was 1.84%, the Touchstone Aggressive ETF Fund -0.05%, and the Touchstone Enhanced ETF Fund’s total return was -4.01% for the year ended December 31, 2011. The total return of the S&P Composite 1500 Index was 1.75% for the same period. The specific blended benchmark returns were 6.00% for the Conservative ETF Fund, 4.49% for the Moderate ETF Fund, 3.17% for the Aggressive ETF Fund, and 2.47% for the Enhanced ETF Fund.
The fourth quarter news was highlighted by the politics of the sovereign debt crisis in Europe. Lack of leadership by politicians and European central bankers caused uncertainty creating volatility. Last year was economically sound for the U.S. and Emerging Markets, though somewhat less so for Europe. Annual equity returns were poor across all markets as the fear of European financial contagion kept a lid on stocks. We suspect that 2012 will be a better year as Emerging Markets are starting to stimulate their economies. Emerging Markets tend to be leading indicators for developed markets, and lower rates generally lead to better stock markets.
Portfolio Review
The strategically-oriented Conservative, Moderate and Aggressive Funds’ asset allocations have favored mid-and smaller-capitalization indexes versus the larger ones. The Funds also maintained exposure to international stocks, though it was lowered slightly when the Fund’s portfolio allocations were rebalanced last May. Within the U.S. styles, the Funds favored value slightly more than growth. International indexes underperformed domestic indexes by a wide margin. The growth indexes generally outperformed their value counterparts for the full year. International weakness was the primary reason for the underperformance of the strategically-oriented funds versus their benchmarks for the year.
The Enhanced ETF Fund uses a formula to determine which areas to overweight or underweight. We recently rebalanced this account, and the areas the model overweighted were the growth and fixed income sectors. For the year, we have found that the relative strength methodology that the Fund uses has fallen out of favor. We believe this is a short-term phenomenon and should return to a normal pattern in the future.
Management's Discussion of Fund Performance (Continued)
Strategy and Outlook
There are a number of themes to be aware of that should play out over the coming year. Worldwide economies suffered headwinds last year. Markets have been volatile as a result of this, and that volatility may persist. We believe that economies worldwide have decoupled. Emerging Markets should see renewed growth, especially as they focus on the consumption side of their economies. The U.S. should continue to see economic growth, but Europe is likely to suffer a self-imposed recession. European financial problems may only slowly improve, as politicians try to avoid relinquishing fiscal control to the European Union. Small progress will be grudgingly achieved. Politics remains at the forefront, as countries representing 45% of worldwide GDP are slated to have elections this year.
We believe that markets worldwide will probably have a better year in 2012 than in 2011 if European problems do not migrate abroad, and if low rates force investors to consider income alternatives aside from traditional bonds.
Comparison of the Change in Value of a $10,000 Investment in the
Touchstone Aggressive ETF Fund, the S&P Composite 1500 Index (Major Index)
and the Blend: 80% S&P Composite 1500 Index/20% Barclays Capital Aggregate Bond Index
(Minor Index)
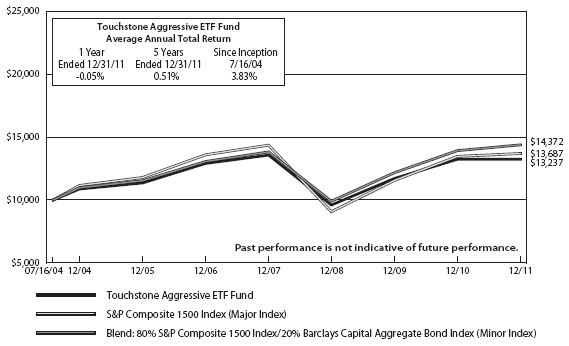
Past performance is not indicative of future performance.
Performance information does not reflect fees that are paid by the separate accounts through which shares of the Fund are sold. Inclusion of those fees would reduce figures for all periods.
The Fund commenced operations on July 16, 2004.
Management's Discussion of Fund Performance (Continued)
Comparison of the Change in Value of a $10,000 Investment in the
Touchstone Conservative ETF Fund, the Barclays Capital Aggregate Bond Index (Major Index)
and the Blend: 35% S&P Composite 1500 Index (Minor Index)/65% Barclays Capital Aggregate
Bond Index
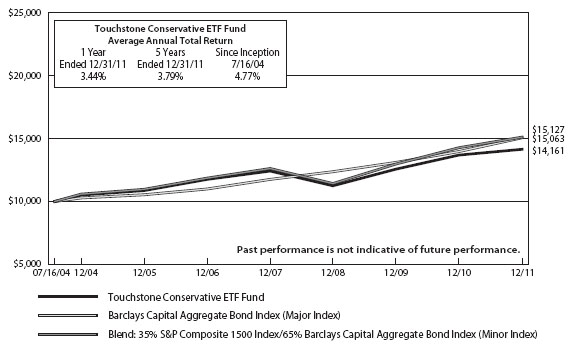
Past performance is not indicative of future performance.
Performance information does not reflect fees that are paid by the separate accounts through which shares of the Fund are sold. Inclusion of those fees would reduce figures for all periods.
The Fund commenced operations on July 16, 2004.
Management's Discussion of Fund Performance (Continued)
Comparison of the Change in Value of a $10,000 Investment in the
Touchstone Enhanced ETF Fund, the S&P Composite 1500 Index (Major Index)
and the Blend: 90% S&P Composite 1500 Index/10% Barclays Capital Aggregate Bond Index
(Minor Index)

Past performance is not indicative of future performance.
Performance information does not reflect fees that are paid by the separate accounts through which shares of the Fund are sold. Inclusion of those fees would reduce figures for all periods.
The Fund commenced operations on July 16, 2004.
Management's Discussion of Fund Performance (Continued)
Comparison of the Change in Value of a $10,000 Investment in the
Touchstone Moderate ETF Fund, the S&P Composite 1500 Index (Major Index)
and the Blend: 60% S&P Composite 1500 Index/40% Barclays Capital Aggregate Bond Index
(Minor Index)

Past performance is not indicative of future performance.
Performance information does not reflect fees that are paid by the separate accounts through which shares of the Fund are sold. Inclusion of those fees would reduce figures for all periods.
The Fund commenced operations on July 16, 2004.
This page intentionally left blank.
Tabular Presentation of Portfolios of Investments (Unaudited)
December 31, 2011
| Touchstone Baron Small Cap Growth Fund | | |
| Sector Allocation | (% of Net Assets) | |
| Consumer Discretionary | 32.9 | % |
| Industrials | 14.6 | |
| Financials | 14.6 | |
| Health Care | 7.8 | |
| Information Technology | 7.5 | |
| Energy | 7.1 | |
| Consumer Staples | 4.9 | |
| Utilities | 3.9 | |
| Telecommunication Services | 1.6 | |
| Materials | 0.5 | |
| Investment Funds | 11.9 | |
| Other Assets/Liabilities (Net) | (7.3 | ) |
| Total | 100.0 | % |
| Touchstone High Yield Fund | | |
| Credit Quality* | (% of Net Assets) | |
| BBB | 0.6 | % |
| BB | 28.4 | |
| B | 64.7 | |
| CCC | 5.0 | |
| NR | 0.3 | |
| Other Assets/Liabilities (Net) | 1.0 | |
| Total | 100.0 | % |
| Touchstone Core Bond Fund | | |
| Credit Quality* | (% of Total Investments) | |
| AAA | 61.3 | % |
| AA | 3.3 | |
| A | 6.9 | |
| BBB | 12.3 | |
| BB | 4.8 | |
| B | 8.5 | |
| CCC | 2.1 | |
| CC | 0.4 | |
| C or Lower | 0.4 | |
| Total | 100.0 | % |
| Touchstone Large Cap Core Equity Fund | | |
| Sector Allocation | (% of Net Assets) | |
| Information Technology | 19.2 | % |
| Industrials | 13.5 | |
| Consumer Discretionary | 12.9 | |
| Financials | 12.6 | |
| Health Care | 11.6 | |
| Energy | 11.6 | |
| Consumer Staples | 7.3 | |
| Materials | 4.6 | |
| Utilities | 2.7 | |
| Telecommunication Services | 2.6 | |
| Investment Funds | 2.9 | |
| Other Assets/Liabilities (Net) | (1.5 | ) |
| Total | 100.0 | % |
Tabular Presentation of Portfolios of Investments (Unaudited) (Continued)
| Touchstone Mid Cap Growth Fund | | |
| Sector Allocation | (% of Net Assets) | |
| Information Technology | 24.5 | % |
| Industrials | 15.3 | |
| Consumer Discretionary | 14.6 | |
| Energy | 13.6 | |
| Health Care | 11.0 | |
| Materials | 8.9 | |
| Financials | 7.0 | |
| Consumer Staples | 2.9 | |
| Telecommunication Services | 1.2 | |
| Other Assets/Liabilities (Net) | 1.0 | |
| Total | 100.0 | % |
| Touchstone Third Avenue Value Fund | | |
| Sector Allocation | (% of Net Assets) | |
| Financials | 43.3 | % |
| Energy | 14.7 | |
| Materials | 13.1 | |
| Consumer Discretionary | 11.7 | |
| Information Technology | 11.5 | |
| Health Care | 1.8 | |
| Investment Funds | 12.5 | |
| Other Assets/Liabilities (Net) | (8.6 | ) |
| Total | 100.0 | % |
| Touchstone Conservative ETF Fund | | |
| Sector Allocation | (% of Net Assets) | |
| Exchange Traded Funds | 98.6 | % |
| Investment Funds | 4.4 | |
| Other Assets/Liabilities (Net) | (3.0 | ) |
| Total | 100.0 | % |
| Touchstone Moderate ETF | | |
| Sector Allocation | (% of Net Assets) | |
| Exchange Traded Funds | 98.7 | % |
| Investment Funds | 6.0 | |
| Other Assets/Liabilities (Net) | (4.7 | ) |
| Total | 100.0 | % |
| Touchstone Money Market Fund | | |
| Credit Quality | (% of Total Investments) | |
| A-1/P-1/F-1 | 94.6 | % |
| FW1(NR) | 5.4 | |
| Total | 100.0 | % |
| Portfolio Allocation | (% of Net Assets) | |
| Variable Rate Demand Notes | 57.4 | % |
| Corporate Bonds | 12.7 | |
| Municipal Bonds | 11.8 | |
| U.S. Government Agency | | |
| Obligations | 11.6 | |
| Time Deposits | 2.2 | |
| Repurchase Agreement | 4.4 | |
| Other Assets/Liabiliaties (Net) | (0.1 | ) |
| Total | 100.0 | % |
| Touchstone Aggressive ETF Fund | | |
| Sector Allocation | (% of Net Assets) | |
| Exchange Traded Funds | 98.8 | % |
| Investment Funds | 12.8 | |
| Other Assets/Liabilities (Net) | (11.6 | ) |
| Total | 100.0 | % |
| Touchstone Enhanced ETF Fund | | |
| Sector Allocation | (% of Net Assets) | |
| Exchange Traded Funds | 98.9 | % |
| Investment Funds | 20.3 | |
| Other Assets/Liabilities (Net) | (19.2 | ) |
| Total | 100.0 | % |
* Source: Standard and Poors
Portfolio of Investments
Touchstone Baron Small Cap Growth Fund – December 31, 2011
| | | Shares | | | Market
Value | |
| | | | | | | | | |
| Common Stocks — 95.4% | | | | | | | | |
| | | | | | | | | |
| Consumer Discretionary — 32.9% | | | | | | | | |
| Ameristar Casinos, Inc. | | | 1,120 | | | $ | 19,365 | |
| Blue Nile, Inc.†* | | | 2,400 | | | | 98,112 | |
| Choice Hotels International, Inc. | | | 14,500 | | | | 551,725 | |
| DeVry, Inc. | | | 16,500 | | | | 634,590 | |
| Dick's Sporting Goods, Inc. | | | 23,000 | | | | 848,240 | |
| LKQ Corp.* | | | 16,000 | | | | 481,280 | |
| Lumber Liquidators Holdings, Inc.†* | | | 5,000 | | | | 88,300 | |
| Morningstar, Inc. | | | 6,500 | | | | 386,425 | |
| Panera Bread Co. - Class A* | | | 3,000 | | | | 424,350 | |
| Peet's Coffee & Tea, Inc.* | | | 9,000 | | | | 564,120 | |
| Penn National Gaming, Inc.* | | | 10,000 | | | | 380,700 | |
| Ralph Lauren Corp. | | | 4,500 | | | | 621,360 | |
| Strayer Education, Inc.† | | | 3,500 | | | | 340,165 | |
| Under Armour, Inc. - Class A* | | | 5,800 | | | | 416,382 | |
| Vail Resorts, Inc. | | | 11,500 | | | | 487,140 | |
| Wynn Resorts Ltd. | | | 1,359 | | | | 150,156 | |
| | | | | | | | 6,492,410 | |
| | | | | | | | | |
| Industrials — 14.6% | | | | | | | | |
| Aecom Technology Corp.* | | | 5,500 | | | | 113,135 | |
| Air Lease Corp.* | | | 2,922 | | | | 69,281 | |
| Colfax Corp.†* | | | 6,900 | | | | 196,512 | |
| Copart, Inc.* | | | 7,500 | | | | 359,175 | |
| CoStar Group, Inc.* | | | 5,700 | | | | 380,361 | |
| Generac Holdings, Inc.* | | | 15,000 | | | | 420,450 | |
| Genesee & Wyoming, Inc. - Class A* | | | 12,000 | | | | 726,960 | |
| Middleby Corp.* | | | 3,000 | | | | 282,120 | |
| Tetra Tech, Inc.* | | | 9,500 | | | | 205,105 | |
| Valmont Industries, Inc. | | | 1,500 | | | | 136,185 | |
| | | | | | | | 2,889,284 | |
| | | | | | | | | |
| Financials — 14.6% | | | | | | | | |
| Alexander's, Inc. REIT | | | 900 | | | | 333,027 | |
| Alexandria Real Estate Equities, Inc. REIT | | | 2,500 | | | | 172,425 | |
| Arch Capital Group Ltd. | | | 28,000 | | | | 1,042,440 | |
| Cohen & Steers, Inc.† | | | 7,423 | | | | 214,525 | |
| Douglas Emmett, Inc. REIT | | | 16,000 | | | | 291,840 | |
| Eaton Vance Corp. | | | 8,000 | | | | 189,120 | |
| Financial Engines, Inc.* | | | 1,490 | | | | 33,272 | |
| Green Dot Corp. - Class A†* | | | 990 | | | | 30,908 | |
| Jefferies Group, Inc.† | | | 5,500 | | | | 75,625 | |
| LaSalle Hotel Properties REIT | | | 3,500 | | | | 84,735 | |
| Manning & Napier, Inc.* | | | 8,120 | | | | 101,419 | |
| Primerica, Inc. | | | 13,000 | | | | 302,120 | |
| | | | | | | | 2,871,456 | |
| | | | | | | | | |
| Health Care — 7.8% | | | | | | | | |
| AMERIGROUP Corp.* | | | 10,500 | | | | 620,340 | |
| athenahealth, Inc.* | | | 1,200 | | | | 58,944 | |
| CFR Pharmaceuticals SA 144a ADR | | | 4,172 | | | | 98,065 | |
| Chemed Corp. | | | 1,477 | | | | 75,637 | |
| Community Health Systems, Inc.* | | | 12,205 | | | | 212,977 | |
| Edwards Lifesciences Corp* | | | 3,500 | | | | 247,450 | |
| Gen-Probe, Inc.* | | | 2,800 | | | | 165,536 | |
| IDEXX Laboratories, Inc.* | | | 800 | | | | 61,568 | |
| | | | | | | | 1,540,517 | |
| | | | | | | | | |
| Information Technology — 7.5% | | | | | | | | |
| Advent Software, Inc.* | | | 7,500 | | | | 182,700 | |
| Booz Allen-Hamilton Holding Corp.* | | | 8,649 | | | | 149,195 | |
| Cymer, Inc.* | | | 1,197 | | | | 59,563 | |
| MAXIMUS, Inc. | | | 6,000 | | | | 248,100 | |
| Pegasystems, Inc.† | | | 7,000 | | | | 205,800 | |
| RealPage, Inc.* | | | 8,500 | | | | 214,795 | |
| SS&C Technologies Holdings, Inc.* | | | 12,215 | | | | 220,603 | |
| Synchronoss Technologies, Inc.* | | | 2,500 | | | | 75,525 | |
| WebMD Health Corp.* | | | 3,500 | | | | 131,425 | |
| | | | | | | | 1,487,706 | |
| | | | | | | | | |
| Energy — 7.1% | | | | | | | | |
| CARBO Ceramics, Inc. | | | 3,800 | | | | 468,654 | |
| Denbury Resources, Inc.* | | | 5,700 | | | | 86,070 | |
| SEACOR Holdings, Inc.* | | | 2,500 | | | | 222,400 | |
| SM Energy Co. | | | 5,400 | | | | 394,740 | |
| Targa Resources Corp. | | | 5,500 | | | | 223,795 | |
| | | | | | | | 1,395,659 | |
| | | | | | | | | |
| Consumer Staples — 4.9% | | | | | | | | |
| Church & Dwight Co., Inc. | | | 8,000 | | | | 366,080 | |
| TreeHouse Foods, Inc.* | | | 6,000 | | | | 392,280 | |
| United Natural Foods, Inc.* | | | 5,000 | | | | 200,050 | |
| | | | | | | | 958,410 | |
| | | | | | | | | |
| Utilities — 3.9% | | | | | | | | |
| ITC Holdings Corp. | | | 10,000 | | | | 758,800 | |
| | | | | | | | | |
| Telecommunication Services — 1.6% | | | | | | | | |
| SBA Communications Corp. - Class A* | | | 7,513 | | | | 322,758 | |
| | | | | | | | | |
| Materials — 0.5% | | | | | | | | |
| Intrepid Potash, Inc.* | | | 4,500 | | | | 101,835 | |
| Total Common Stocks | | | | | | $ | 18,818,835 | |
| | | | | | | | | |
| Investment Funds — 11.9% | | | | | | | | |
| Invesco Liquid Assets Portfolio** | | | 1,353,441 | | | | 1,353,441 | |
| Touchstone Institutional Money Market | | | | | | | | |
| Fund^ | | | 995,365 | | | | 995,365 | |
| Total Investment Funds | | | | | | $ | 2,348,806 | |
| | | | | | | | | |
Total Investment Securities — 107.3% (Cost $13,078,815) | | | | | | $ | 21,167,641 | |
| | | | | | | | | |
| Liabilities in Excess of Other Assets — (7.3%) | | | | | | | (1,434,464 | ) |
| | | | | | | | | |
| Net Assets — 100.0% | | | | | | $ | 19,733,177 | |
| † | All or a portion of the security is on loan. The total value of the securites on loan as of December 31, 2011 was $1,326,521. |
| * | Non-income producing security. |
| ** | Represents collateral for securities loaned. |
Touchstone Baron Small Cap Growth Fund (Continued)
| ^ | Affiliated Fund, sub-advised by Fort Washington Investment Advisors, Inc. See Note 4 in Notes to Financial Statements. |
Portfolio Abbreviations:
ADR - American Depositary Receipt REIT - Real Estate Investment Trust
144a - This is a restricted security that was sold in a transaction exempt from Rule 144a of the Securities Act of 1933. This security may be sold in transactions exempt from registration, normally to qualified institutional buyers. At December 31, 2011, these securities were valued at $98,065 or 0.5% of net assets. These securities were deemed liquid pursuant to procedures approved by the Board of Trustees.
Other Information:
The inputs or methodology used for valuing securities may not be an indication of the risk associated with investing in those securities. For more information on valuation inputs, and their aggregation into the levels used in the table below, please refer to the security valuation section in the accompanying notes to financial statements.
Valuation inputs at Reporting Date:
| Description | | Level 1 | | | Level 2 | | | Level 3 | | | Total |
| Common Stocks | | $ | 18,818,835 | | | $ | — | | | $ | — | | | $ | 18,818,835 |
| Investment Funds | | | 2,348,806 | | | | — | | | | — | | | | 2,348,806 |
| | | | | | | | | | | | | | | $ | 21,167,641 |
See accompanying notes to financial statements.
Portfolio of Investments
Touchstone Core Bond Fund – December 31, 2011
Principal
Amount | | | | | Market
Value | |
| | | | | | | | | |
| | | | | Corporate Bonds — 31.8% | | | | |
| | | | | | | | | |
| | | | | Financials — 7.3% | | | | |
| $ | 250,000 | | | Bank of America Corp. MTN,
5.000%, 5/13/21 | | $ | 227,709 | |
| | 200,000 | | | Brandywine Operating Partnership LP,
5.400%, 11/1/14 | | | 206,361 | |
| | 290,000 | | | Caterpillar Financial Services Corp.
MTN, 5.450%, 4/15/18 | | | 339,005 | |
| | 120,000 | | | CIT Group, Inc., 144a, 7.000%, 5/2/16 | | | 119,850 | |
| | 10,000 | | | CIT Group, Inc., 144a, 7.000%, 5/2/17 | | | 9,988 | |
| | 170,000 | | | Citigroup, Inc., 5.500%, 4/11/13 | | | 173,557 | |
| | 250,000 | | | Credit Suisse New York MTN,
4.375%, 8/5/20 | | | 245,118 | |
| | 75,000 | | | EDP Finance BV, 144a, 6.000%, 2/2/18 | | | 63,089 | |
| | 100,000 | | | Ford Motor Credit Co. LLC,
5.875%, 8/2/21 | | | 104,221 | |
| | 350,000 | | | General Electric Capital Corp. MTN,
5.625%, 5/1/18 | | | 392,001 | |
| | 200,000 | | | Goldman Sachs Group, Inc.,
7.500%, 2/15/19 | | | 220,882 | |
| | 305,000 | | | Health Care REIT, Inc., 6.125%, 4/15/20 | | | 316,015 | |
| | 260,000 | | | HSBC Bank PLC, 144a, 3.100%, 5/24/16 | | | 260,015 | |
| | 300,000 | | | JPMorgan Chase & Co.,
4.250%, 10/15/20 | | | 302,107 | |
| | 16,000 | | | Liberty Mutual Group, Inc., 144a, 10.750%, 6/15/58(A) | | | 20,080 | |
| | 40,000 | | | MetLife, Inc., 10.750%, 8/1/39 | | | 52,800 | |
| | 250,000 | | | Morgan Stanley MTN, 4.100%, 1/26/15 | | | 237,302 | |
| | 26,000 | | | MPT Operating Partnership LP/MPT
Finance Corp., 6.875%, 5/1/21 | | | 25,772 | |
| | 43,000 | | | Omega Healthcare Investors, Inc.,
6.750%, 10/15/22 | | | 43,215 | |
| | 26,000 | | | PHH Corp., 9.250%, 3/1/16 | | | 24,700 | |
| | 245,000 | | | Teachers Insurance & Annuity
Association of America, 144a,
6.850%, 12/16/39 | | | 314,433 | |
| | 275,000 | | | WCI Finance LLC / WEA Finance LLC,
144a, 5.700%, 10/1/16 | | | 294,525 | |
| | | | | | | | 3,992,745 | |
| | | | | | | | | |
| | | | | Consumer Discretionary — 5.8% | | | | |
| | 40,000 | | | ACE Hardware Corp., 144a,
9.125%, 6/1/16 | | | 42,400 | |
| | 19,000 | | | AMC Networks, Inc., 144a,
7.750%, 7/15/21 | | | 20,662 | |
| | 37,000 | | | CCO Holdings LLC / CCO Holdings
Capital Corp., 7.000%, 1/15/19 | | | 38,572 | |
| | 15,000 | | | CCO Holdings LLC / CCO Holdings
Capital Corp., 7.875%, 4/30/18 | | | 15,994 | |
| | 60,000 | | | Cequel Communications Holdings I
LLC and Cequel Capital Corp., 144a,
8.625%, 11/15/17 | | | 63,600 | |
| | 32,000 | | | Chrysler Group LLC/CG Co-Issuer, Inc.,
144a, 8.250%, 6/15/21 | | | 29,120 | |
| | 5,000 | | | Clear Channel Worldwide Holdings,
Inc., 9.250%, 12/15/17 | | | 5,400 | |
| | 295,000 | | | Comcast Corp., 5.700%, 7/1/19 | | | 342,227 | |
| | 24,000 | | | Cooper-Standard Automotive, Inc.,
8.500%, 5/1/18 | | | 25,110 | |
| | 50,000 | | | CSC Holdings LLC, 8.625%, 2/15/19 | | | 57,625 | |
| | 18,000 | | | DISH DBS Corp., 7.875%, 9/1/19 | | | 20,340 | |
| | 40,000 | | | Entravision Communications Corp.,
8.750%, 8/1/17 | | | 39,200 | |
| | 100,000 | | | Equinox Holdings, Inc., 144a,
9.500%, 2/1/16 | | | 102,750 | |
| | 19,000 | | | Exide Technologies, 8.625%, 2/1/18 | | | 14,630 | |
| | 24,000 | | | Fisher Communications, Inc.,
8.625%, 9/15/14 | | | 24,420 | |
| | 23,000 | | | Goodyear Tire & Rubber Co.,
8.750%, 8/15/20 | | | 25,358 | |
| | 290,000 | | | Home Depot, Inc., 5.950%, 4/1/41 | | | 374,156 | |
| | 27,000 | | | Icon Health & Fitness, 144a,
11.875%, 10/15/16 | | | 21,938 | |
| | 30,000 | | | Insight Communications Co., Inc.,
144a, 9.375%, 7/15/18 | | | 34,275 | |
| | 28,000 | | | Intelsat Jackson Holdings SA, 144a,
7.250%, 4/1/19 | | | 28,420 | |
| | 18,000 | | | International Automotive
Components Group SL, 144a,
9.125%, 6/1/18 | | | 16,110 | |
| | 125,000 | | | Jarden Corp., 7.500%, 5/1/17 | | | 132,500 | |
| | 51,000 | | | JBS USA LLC / JBS USA Finance, Inc.,
144a, 7.250%, 6/1/21 | | | 47,558 | |
| | 57,000 | | | Libbey Glass, Inc., 10.000%, 2/15/15 | | | 60,990 | |
| | 140,000 | | | Macy's Retail Holdings, Inc.,
5.350%, 3/15/12 | | | 140,960 | |
| | 41,000 | | | Meritage Homes Corp.,
7.150%, 4/15/20 | | | 39,360 | |
| | 275,000 | | | News America, Inc., 6.900%, 3/1/19 | | | 323,206 | |
| | 6,000 | | | Pulte Group, Inc., 6.375%, 5/15/33 | | | 4,155 | |
| | 80,000 | | | Service Corp. International/US,
8.000%, 11/15/21 | | | 89,200 | |
| | 61,000 | | | Simmons Bedding Co., 144a,
11.250%, 7/15/15 | | | 62,982 | |
| | 40,000 | | | Stonemor Operating LLC /
Cornerstone Family Services of WV
/ Osiris Holding, 10.250%, 12/1/17 | | | 37,300 | |
| | 12,000 | | | Tenneco, Inc., 6.875%, 12/15/20 | | | 12,300 | |
| | 31,000 | | | Tenneco., Inc., 7.750%, 8/15/18 | | | 32,860 | |
| | 300,000 | | | Time Warner Cable, Inc.,
4.125%, 2/15/21 | | | 308,070 | |
| | 19,000 | | | Tomkins LLC / Tomkins, Inc.,
9.000%, 10/1/18 | | | 21,066 | |
| | 24,000 | | | Tower Automotive Holdings USA LLC
/ TA Holdings Finance, Inc., 144a,
10.625%, 9/1/17 | | | 24,120 | |
| | 225,000 | | | Viacom, Inc., 6.250%, 4/30/16 | | | 261,177 | |
| | 110,000 | | | Visteon Corp., 144a, 6.750%, 4/15/19 | | | 109,725 | |
| | 100,000 | | | Wyndham Worldwide Corp.,
7.375%, 3/1/20 | | | 114,137 | |
| | | | | | | | 3,163,973 | |
Touchstone Core Bond Fund (Continued)
Principal
Amount | | | | | Market
Value | |
| | | | | | | | | |
| | | | | Corporate Bonds — 31.8% (Continued) | | | | |
| | | | | | | | | |
| | | | | Energy — 4.8% | | | | |
$
| 50,000 | | | Atlas Pipeline Partners LP,
8.750%, 6/15/18 | | $ | 52,500 | |
| | 18,000 | | | Basic Energy Services, Inc.,
7.125%, 4/15/16 | | | 18,045 | |
| | 217,000 | | | Basic Energy Services, Inc.,
7.750%, 2/15/19 | | | 218,628 | |
| | 112,000 | | | Chesapeake Energy Corp.,
6.625%, 8/15/20 | | | 120,120 | |
| | 10,000 | | | Chesapeake Energy Corp.,
7.250%, 12/15/18 | | | 11,050 | |
| | 30,000 | | | Cloud Peak Energy Resources LLC /
Cloud Peak Energy Finance Corp.,
8.500%, 12/15/19 | | | 32,400 | |
| | 32,000 | | | Coffeyville Resources LLC / Coffeyville
Finance, Inc., 144a, 10.875%, 4/1/17 | | | 35,840 | |
| | 10,000 | | | Consol Energy, Inc., 8.000%, 4/1/17 | | | 10,950 | |
| | 10,000 | | | Consol Energy, Inc., 8.250%, 4/1/20 | | | 11,050 | |
| | 100,000 | | | Denbury Resources, Inc.,
8.250%, 2/15/20 | | | 111,750 | |
| | 300,000 | | | Enterprise Products Operating LLC,
3.200%, 2/1/16 | | | 310,584 | |
| | 100,000 | | | Enterprise Products Operating LLC, 7.000%, 6/1/67(A) | | | 98,125 | |
| | 37,000 | | | Expro Finance Luxembourg SCA, 144a,
8.500%, 12/15/16 | | | 32,560 | |
| | 53,000 | | | Genesis Energy LP/Genesis Energy
Finance Corp., 7.875%, 12/15/18 | | | 53,000 | |
| | 78,000 | | | Helix Energy Solutions Group, Inc.,
144a, 9.500%, 1/15/16 | | | 81,120 | |
| | 50,000 | | | Holly Energy Partners LP / Holly
Energy Finance Corp.,
6.250%, 3/1/15 | | | 50,375 | |
| | 22,000 | | | Inergy LP/Inergy Finance Corp.,
7.000%, 10/1/18 | | | 22,330 | |
| | 58,000 | | | Linn Energy LLC/Linn Energy Finance
Corp., 8.625%, 4/15/20 | | | 62,930 | |
| | 47,000 | | | Martin Midstream Partners LP / Martin
Midstream Finance Corp.,
8.875%, 4/1/18 | | | 48,410 | |
| | 116,000 | | | MEG Energy Corp., 144a,
6.500%, 3/15/21 | | | 118,610 | |
| | 14,000 | | | Newfield Exploration Co.,
6.875%, 2/1/20 | | | 14,980 | |
| | 195,000 | | | NuStar Logistics LP, 6.050%, 3/15/13 | | | 204,442 | |
| | 32,000 | | | OGX Petroleo e Gas Participacoes SA,
144a, 8.500%, 6/1/18 | | | 31,360 | |
| | 82,000 | | | Peabody Energy Corp., 144a,
6.000%, 11/15/18 | | | 83,640 | |
| | 38,000 | | | Penn Virginia Resource Partners LP /
Penn Virginia Resource Finance
Corp., 8.250%, 4/15/18 | | | 38,190 | |
| | 250,000 | | | Petrobras International Finance Co. -
Pifco, 5.375%, 1/27/21 | | | 262,650 | |
| | 44,000 | | | Pioneer Drilling Co., 9.875%, 3/15/18 | | | 45,980 | |
| 17,000 | | | Pioneer Drilling Co., 144a,
9.875%, 3/15/18 | | | 17,765 | |
| | 140,000 | | | Plains All American Pipeline LP / PAA
Finance Corp., 6.650%, 1/15/37 | | | 166,818 | |
| | 100,000 | | | Regency Energy Partners LP /
Regency Energy Finance Corp.,
6.875%, 12/1/18 | | | 106,250 | |
| | 35,000 | | | Sabine Pass LNG LP, 7.250%, 11/30/13 | | | 35,350 | |
| | 101,000 | | | Targa Resources Partners LP / Targa
Resources Partners Finance Corp.,
7.875%, 10/15/18 | | | 106,555 | |
| | | | | | | | 2,614,357 | |
| | | | | | | | | |
| | | | | Industrials — 3.2% | | | | |
| | 23,000 | | | Accuride Corp., 9.500%, 8/1/18 | | | 22,195 | |
| | 12,202 | | | American Airlines Pass Through Trust
2009-1A, 10.375%, 7/2/19 | | | 12,812 | |
| | 39,000 | | | Amsted Industries, Inc., 144a,
8.125%, 3/15/18 | | | 41,340 | |
| | 7,000 | | | Aviation Capital Group Corp., 144a,
6.750%, 4/6/21 | | | 6,595 | |
| | 265,000 | | | Burlington Northern Santa Fe LLC,
5.750%, 5/1/40 | | | 317,049 | |
| | 10,000 | | | BWAY Holding Co, 10.000%, 6/15/18 | | | 10,650 | |
| | 16,000 | | | Calcipar SA, 144a, 6.875%, 5/1/18 | | | 14,400 | |
| | 100,000 | | | Case New Holland, Inc.,
7.875%, 12/1/17 | | | 113,000 | |
| | 25,000 | | | Cenveo Corp., 8.875%, 2/1/18 | | | 21,812 | |
| | 9,034 | | | Continental Airlines 2003-ERJ1 Pass
Through Trust, Ser RJO3,
7.875%, 7/2/18 | | | 8,809 | |
| | 33,000 | | | Dynacast International LLC / Dynacast
Finance, Inc., 144a, 9.250%, 7/15/19 | | | 31,020 | |
| | 100,000 | | | Gibraltar Industries, Inc., Ser B,
8.000%, 12/1/15 | | | 100,000 | |
| | 23,000 | | | Griffon Corp., 7.125%, 4/1/18 | | | 22,770 | |
| | 25,000 | | | Iron Mountain, Inc., 8.000%, 6/15/20 | | | 26,031 | |
| | 25,000 | | | JM Huber Corp., 144a,
9.875%, 11/1/19 | | | 26,250 | |
| | 27,000 | | | Liberty Tire Recycling, 144a,
11.000%, 10/1/16 | | | 26,932 | |
| | 31,000 | | | Navios Maritime Holdings, Inc. /
Navios Maritime Finance II US, Inc.,
8.125%, 2/15/19 | | | 23,095 | |
| | 22,000 | | | Navios South American Logisitcs, Inc.
/ Navios Logistics Finance US, Inc.,
144a, 9.250%, 4/15/19 | | | 17,600 | |
| | 230,000 | | | Norfolk Southern Corp.,
5.750%, 4/1/18 | | | 271,150 | |
| | 190,000 | | | Republic Services, Inc.,
3.800%, 5/15/18 | | | 196,811 | |
| | 4,000 | | | RR Donnelley & Sons Co.,
7.250%, 5/15/18 | | | 3,880 | |
| | 10,000 | | | RR Donnelley & Sons Co.,
7.625%, 6/15/20 | | | 9,350 | |
| | 18,000 | | | Stena AB, 7.000%, 12/1/16 | | | 16,605 | |
Touchstone Core Bond Fund (Continued)
Principal
Amount | | | | | Market
Value | |
| | | | | | | | | |
| | | | | Corporate Bonds — 31.8% (Continued) | | | | |
| | | | | | | | | |
| | | | | Industrials — (Continued) | | | | |
$
| 62,000 | | | Tembec Industries, Inc.,
11.250%, 12/15/18 | | $ | 63,860 | |
| | 50,000 | | | TransDigm, Inc., 7.750%, 12/15/18 | | | 53,750 | |
| | 65,000 | | | Tutor Perini Corp., 7.625%, 11/1/18 | | | 61,425 | |
| | 225,000 | | | Xstrata Canada Financial Corp., 144a,
3.600%, 1/15/17 | | | 226,854 | |
| | | | | | | | 1,746,045 | |
| | | | | | | | | |
| | | | | Utilities — 2.7% | | | | |
| | 45,000 | | | AES Corp. (The), 8.000%, 10/15/17 | | | 49,500 | |
| | 30,000 | | | Calpine Corp., 144a, 7.500%, 2/15/21 | | | 32,100 | |
| | 25,000 | | | Calpine Corp., 144a, 7.875%, 7/31/20 | | | 26,938 | |
| | 215,000 | | | CenterPoint Energy, Inc.,
5.950%, 2/1/17 | | | 243,154 | |
| | 155,000 | | | CMS Energy Corp., 8.750%, 6/15/19 | | | 183,635 | |
| | 51,000 | | | Crestwood Midstream Partners LP /
Crestwood Midstream Finance
Corp., 144a, 7.750%, 4/1/19 | | | 49,598 | |
| | 12,000 | | | Crosstex Energy LP / Crosstex Energy
Finance Corp., 8.875%, 2/15/18 | | | 13,110 | |
| | 160,000 | | | Enel Finance International NV, 144a,
6.250%, 9/15/17 | | | 152,704 | |
| | 50,000 | | | Intergen NV, 144a, 9.000%, 6/30/17 | | | 52,625 | |
| | 145,000 | | | NextEra Energy Capital Holdings, Inc.,
6.350%, 10/1/66(A) | | | 145,072 | |
| | 265,000 | | | PPL Energy Supply LLC,
6.500%, 5/1/18 | | | 301,317 | |
| | 195,000 | | | Rockies Express Pipeline LLC, 144a,
6.250%, 7/15/13 | | | 205,788 | |
| | | | | | | | 1,455,541 | |
| | | | | | | | | |
| | | | | Materials — 2.4% | | | | |
| | 50,000 | | | AK Steel Corp., 7.625%, 5/15/20† | | | 47,000 | |
| | 36,000 | | | Aleris International, Inc.,
7.625%, 2/15/18 | | | 35,100 | |
| | 275,000 | | | ArcelorMittal, 5.500%, 3/1/21 | | | 252,425 | |
| | 225,000 | | | Barrick Gold Corp., 2.900%, 5/30/16 | | | 230,927 | |
| | 37,000 | | | Cascades, Inc., 7.750%, 12/15/17 | | | 36,630 | |
| | 15,000 | | | Cascades, Inc., 7.875%, 1/15/20 | | | 14,550 | |
| | 75,000 | | | JMC Steel Group, 144a,
8.250%, 3/15/18 | | | 73,125 | |
| | 30,000 | | | Koppers, Inc., 7.875%, 12/1/19 | | | 31,800 | |
| | 13,000 | | | Longview Fibre Paper & Packaging,
Inc., 144a, 8.000%, 6/1/16 | | | 13,000 | |
| | 16,000 | | | Lyondell Chemical Co.,
8.000%, 11/1/17 | | | 17,480 | |
| | 66,000 | | | LyondellBasell Industries N.V., 144a,
6.000%, 11/15/21 | | | 68,475 | |
| | 10,000 | | | Novelis, Inc./GA, 8.375%, 12/15/17 | | | 10,625 | |
| | 9,000 | | | PolyOne Corp., 7.375%, 9/15/20 | | | 9,292 | |
| | 100,000 | | | Steel Dynamics, Inc., 7.750%, 4/15/16 | | | 104,250 | |
| | 275,000 | | | Teck Resources Ltd., 10.750%, 5/15/19 | | | 335,500 | |
| | 21,000 | | | Texas Industries, Inc., 9.250%, 8/15/20 | | | 18,795 | |
| | 12,000 | | | Vulcan Materials Co., 7.500%, 6/15/21 | | | 12,960 | |
| | | | | | | | 1,311,934 | |
| | | | | | | | | |
| | | | | Telecommunication Services — 2.3% | | | | |
| 225,000 | | | AT&T, Inc., 6.550%, 2/15/39 | | | 286,209 | |
| | 49,000 | | | Cincinnati Bell, Inc., 8.375%, 10/15/20 | | | 48,878 | |
| | 50,000 | | | CommScope, Inc., 144a,
8.250%, 1/15/19 | | | 50,000 | |
| | 5,000 | | | EH Holding Corp., 144a,
6.500%, 6/15/19 | | | 5,212 | |
| | 1,000 | | | EH Holding Corp., 144a,
7.625%, 6/15/21 | | | 1,050 | |
| | 57,000 | | | Frontier Communications Corp.,
8.500%, 4/15/20 | | | 58,354 | |
| | 14,000 | | | MetroPCS Wireless, Inc.,
7.875%, 9/1/18 | | | 14,192 | |
| | 68,000 | | | NII Capital Corp., 7.625%, 4/1/21 | | | 67,490 | |
| | 19,000 | | | NII Capital Corp., 8.875%, 12/15/19 | | | 19,998 | |
| | 11,000 | | | PAETEC Holding Corp.,
8.875%, 6/30/17 | | | 11,880 | |
| | 12,000 | | | Sprint Capital Corp., 6.875%, 11/15/28 | | | 8,565 | |
| | 31,000 | | | Sprint Nextel Corp., 8.375%, 8/15/17 | | | 27,784 | |
| | 66,000 | | | Sprint Nextel Corp., 144a,
9.000%, 11/15/18 | | | 69,300 | |
| | 7,000 | | | TW Telecom Holdings, Inc.,
8.000%, 3/1/18 | | | 7,455 | |
| | 275,000 | | | Verizon Communications, Inc.,
6.250%, 4/1/37 | | | 339,284 | |
| | 50,000 | | | West Corp., 8.625%, 10/1/18 | | | 50,500 | |
| | 100,000 | | | Wind Acquisition Finance SA, 144a,
11.750%, 7/15/17 | | | 89,500 | |
| | 83,000 | | | Windstream Corp., 7.875%, 11/1/17 | | | 89,847 | |
| | | | | | | | 1,245,498 | |
| | | | | | | | | |
| | | | | Consumer Staples — 2.0% | | | | |
| | 190,000 | | | Anheuser-Busch InBev Worldwide,
Inc., 8.200%, 1/15/39 | | | 299,549 | |
| | 31,000 | | | BI-LO LLC / BI-LO Finance Corp., 144a,
9.250%, 2/15/19 | | | 31,930 | |
| | 28,000 | | | Central Garden and Pet Co.,
8.250%, 3/1/18 | | | 27,440 | |
| | 115,000 | | | Del Monte Corp., 7.625%, 2/15/19 | | | 110,400 | |
| | 55,000 | | | Ingles Markets, Inc., 8.875%, 5/15/17 | | | 59,538 | |
| | 290,000 | | | Kraft Foods, Inc., 4.125%, 2/9/16 | | | 314,861 | |
| | 30,000 | | | Reynolds Group Issuer, Inc. / Reynolds
Group Issuer LLC / Reynolds Group
Issuer LU, 144a, 8.250%, 2/15/21 | | | 26,550 | |
| | 15,000 | | | Reynolds Group Issuer, Inc. / Reynolds
Group Issuer LLC / Reynolds Group
Issuer LU, 144a, 8.750%, 10/15/16 | | | 15,788 | |
| | 195,000 | | | Safeway, Inc., 3.400%, 12/1/16 | | | 199,986 | |
| | | | | | | | 1,086,042 | |
| | | | | | | | | |
| | | | | Health Care — 0.8% | | | | |
| | 22,000 | | | Accellent, Inc., 8.375%, 2/1/17 | | | 21,560 | |
| | 55,000 | | | Apria Healthcare Group, Inc.,
11.250%, 11/1/14 | | | 56,788 | |
| | 25,000 | | | Aptalis Pharma, Inc., 12.750%, 3/1/16 | | �� | 26,375 | |
| | 57,000 | | | Capella Healthcare, Inc.,
9.250%, 7/1/17 | | | 57,855 | |
| | 145,000 | | | HCA, Inc., 6.500%, 2/15/20 | | | 150,438 | |
Touchstone Core Bond Fund (Continued)
Principal
Amount | | | | | Market
Value | |
| | | | | | | | | |
| | | | | Corporate Bonds — 31.8% (Continued) | | | | |
| | | | | | | | | |
| | | | | Health Care — (Continued) | | | | |
$
| 58,000 | | | Health Management Associates, Inc.,
144a, 7.375%, 1/15/20 | | $ | 60,320 | |
| | 30,000 | | | NBTY, Inc., 9.000%, 10/1/18 | | | 33,000 | |
| | 40,000 | | | Omnicare, Inc., 7.750%, 6/1/20 | | | 42,950 | |
| | | | | | | | 449,286 | |
| | | | | | | | | |
| | | | | Information Technology — 0.5% | | | | |
| | 24,000 | | | CoreLogic, Inc., 144a, 7.250%, 6/1/21 | | | 22,980 | |
| | 50,000 | | | Equinix, Inc., 8.125%, 3/1/18 | | | 54,500 | |
| | 19,000 | | | First Data Corp., 144a, 8.875%, 8/15/20 | | | 19,000 | |
| | 100,000 | | | Intel Corp., 3.300%, 10/1/21 | | | 105,343 | |
| | 39,000 | | | Kemet Corp., 10.500%, 5/1/18 | | | 41,242 | |
| | 39,000 | | | Viasat, Inc., 8.875%, 9/15/16 | | | 39,975 | |
| | | | | | | | 283,040 | |
| | | | | Total Corporate Bonds | | $ | 17,348,461 | |
| | | | | | | | | |
| | | | | U.S. Treasury Obligations — 26.7% | | | | |
| | 3,265,000 | | | U.S. Treasury Bond, 3.125%, 11/15/41 | | | 3,420,597 | |
| | 3,510,000 | | | U.S. Treasury Note, 0.875%, 11/30/16 | | | 3,520,695 | |
| | 5,045,000 | | | U.S. Treasury Note, 2.000%, 11/15/21 | | | 5,102,543 | |
| | 2,500,000 | | | U.S. Treasury Note, 0.250%, 11/30/13 | | | 2,500,292 | |
| | | | | Total U.S. Treasury Obligations | | $ | 14,544,127 | |
| | | | | | | | | |
| | | | | U.S. Government Mortgage-Backed Obligations — 16.9% | | | | |
| | 247,632 | | | FHLMC, Pool #A56988, 5.500%, 2/1/37 | | | 269,038 | |
| | 476,653 | | | FHLMC, Pool #A95946, 4.000%, 1/1/41 | | | 500,646 | |
| | 385,338 | | | FHLMC, Pool #A96485, 4.500%, 1/1/41 | | | 408,553 | |
| | 467,825 | | | FHLMC, Pool #G03217, 5.500%, 9/1/37 | | | 508,264 | |
| | 230,507 | | | FHLMC, Pool #G03781, 6.000%, 1/1/38 | | | 253,530 | |
| | 507,666 | | | FHLMC, Pool #G06031, 5.500%, 3/1/40 | | | 551,549 | |
| | 83,370 | | | FNMA, Pool #254759, 4.500%, 6/1/18 | | | 89,269 | |
| | 22,894 | | | FNMA, Pool #535290, 8.000%, 5/1/30 | | | 27,627 | |
| | 16,013 | | | FNMA, Pool #561741, 7.500%, 1/1/31 | | | 19,123 | |
| | 128,872 | | | FNMA, Pool #889734, 5.500%, 6/1/37 | | | 140,596 | |
| | 438,654 | | | FNMA, Pool #899079, 5.000%, 3/1/37 | | | 474,173 | |
| | 228,309 | | | FNMA, Pool #933806, 5.000%, 5/1/38 | | | 246,796 | |
| | 76,553 | | | FNMA, Pool #974401, 4.500%, 4/1/23 | | | 82,030 | |
| | 118,077 | | | FNMA, Pool #974403, 4.500%, 4/1/23 | | | 127,796 | |
| | 427,725 | | | FNMA, Pool #983610, 5.000%, 5/1/23 | | | 460,378 | |
| | 132,049 | | | FNMA, Pool #984256, 5.000%, 6/1/23 | | | 142,666 | |
| | 105,610 | | | FNMA, Pool #988107, 5.000%, 8/1/23 | | | 113,672 | |
| | 105,140 | | | FNMA, Pool #995220, 6.000%, 11/1/23 | | | 113,974 | |
| | 123,338 | | | FNMA, Pool #995472, 5.000%, 11/1/23 | | | 132,754 | |
| | 113,148 | | | FNMA, Pool #995529, 5.500%, 11/1/22 | | | 122,858 | |
| | 356,689 | | | FNMA, Pool #AB1149, 5.000%, 6/1/40 | | | 385,738 | |
| | 188,833 | | | FNMA, Pool #AB1800, 4.000%, 11/1/40 | | | 199,637 | |
| | 490,881 | | | FNMA, Pool #AD3795, 4.500%, 4/1/40 | | | 522,779 | |
| | 735,331 | | | FNMA, Pool #AD9150, 5.000%, 8/1/40 | | | 799,457 | |
| | 1,135,456 | | | FNMA, Pool #AE0548, 4.500%, 11/1/40 | | | 1,209,238 | |
| | 317,681 | | | FNMA, Pool #AE0831, 6.000%, 9/1/39 | | | 350,155 | |
| | 528,459 | | | FNMA, Pool #AE4429, 4.000%, 10/1/40 | | | 555,638 | |
| | 332,011 | | | FNMA, Pool #AI0805, 4.500%, 7/1/41 | | | 353,585 | |
| | 4,094 | | | GNMA, Pool #434792, 8.000%, 7/15/30 | | | 4,656 | |
| | 21,371 | | | GNMA, Pool #8503, 1.625%, 9/20/24 | | | 21,984 | |
| | | | | Total U.S. Government Mortgage-Backed Obligations | | $ | 9,188,159 | |
| | | | | | | | | |
| | | | | Commercial Mortgage-Backed Securities — 16.0% | | | | |
| | 230,000 | | | Banc of America Merrill Lynch
Commercial Mortgage, Inc., Ser
2005-4, Class A3, 4.891%, 7/10/45 | | | 233,795 | |
| | 280,000 | | | Banc of America Merrill Lynch Commercial Mortgage, Inc., Ser 2006-2, Class A3, 5.703%, 5/10/45(A) | | | 293,429 | |
| | 365,000 | | | Banc of America Merrill Lynch
Commercial Mortgage, Inc., Ser
2006-6, Class A3, 5.369%, 10/10/45 | | | 385,001 | |
| | 315,000 | | | Banc of America Merrill Lynch
Commercial Mortgage, Inc., Ser
2007-1, Class AAB, 5.422%, 1/15/49 | | | 335,132 | |
| | 450,000 | | | Banc of America Merrill Lynch Commercial Mortgage, Inc., Ser 2007-2, Class AAB, 5.582%, 4/10/49(A) | | | 483,408 | |
| | 575,000 | | | Bear Stearns Commercial Mortgage Securities, Ser 2005-PWR9, Class A4A, 4.871%, 9/11/42†† | | | 623,636 | |
| | 314,445 | | | Bear Stearns Commercial Mortgage Securities, Ser 2006-PW12, Class AAB, 5.695%, 9/11/38(A)†† | | | 334,261 | |
| | 230,000 | | | Bear Stearns Commercial Mortgage Securities, Ser 2006-PW13, Class A3, 5.518%, 9/11/41†† | | | 241,305 | |
| | 550,000 | | | Bear Stearns Commercial Mortgage Securities, Ser 2007-PW16, Class A4, 5.714%, 6/11/40(A)†† | | | 602,146 | |
| | 150,000 | | | Citigroup Commercial Mortgage Trust, Ser 2006-C4, Class A2, 5.728%, 3/15/49(A) | | | 157,812 | |
| | 135,000 | | | Commercial Mortgage Pass Through Certificates, Ser 2005-C6, Class A5A, 5.116%, 6/10/44(A) | | | 148,010 | |
| | 245,000 | | | First Union Commercial Mortgage
Trust, Ser 1999-C1, Class F, 144a,
5.350%, 10/15/35 | | | 242,891 | |
| | 288,868 | | | GE Capital Commercial Mortgage Corp., Ser 2005-C4, Class ASB, 5.277%, 11/10/45(A) | | | 308,256 | |
| | 470,000 | | | Greenwich Capital Commercial
Funding Corp., Ser 2005-GG3, Class
A3, 4.569%, 8/10/42 | | | 475,192 | |
| | 338,550 | | | GS Mortgage Securities Corp. II, Ser
2006-GG8, Class AAB,
5.535%, 11/10/39 | | | 354,588 | |
Touchstone Core Bond Fund (Continued)
Principal
Amount | | | | | Market
Value | |
| | | | | | | | | |
| | | | | Commercial Mortgage-Backed Securities — 16.0%
(Continued) | | | | |
| $ | 404,866 | | | JP Morgan Chase Commercial Mortgage Securities Corp., Ser 2006-CB14, Class A3B, 5.491%, 12/12/44(A) | | $ | 415,124 | |
| | 390,000 | | | LB-UBS Commercial Mortgage Trust, Ser 2006-C3, Class A3, 5.689%, 3/15/32(A)†† | | | 399,102 | |
| | 700,000 | | | Merrill Lynch/Countrywide
Commercial Mortgage Trust, Ser
2007-5, Class ASB, 5.362%, 8/12/48 | | | 743,392 | |
| | 465,000 | | | Morgan Stanley Capital I, Ser
2006-HQ9, Class A3,
5.712%, 7/12/44 | | | 475,214 | |
| | 584,835 | | | Morgan Stanley Capital I, Ser
2007-T25, Class AAB,
5.508%, 11/12/49 | | | 616,104 | |
| | 505,000 | | | Wachovia Bank Commercial Mortgage Trust, Ser 2006-C29, Class A3, 5.313%, 11/15/48†† | | | 528,676 | |
| | 330,000 | | | Wachovia Bank Commercial Mortgage Trust, Ser 2007-C34, Class APB, 5.617%, 5/15/46†† | | | 349,875 | |
| | | | | Total Commercial Mortgage-Backed Securities | | $ | 8,746,349 | |
| | | | | | | | | |
| | | | | Non-Agency Collateralized Mortgage Obligations — 3.1% | | | | |
| | 407,887 | | | Credit Suisse First Boston Mortgage
Securities Corp., Ser 2005-9, Class
2A1, 5.500%, 10/25/35 | | | 370,652 | |
| | 189,946 | | | Deutsche ALT-A Securities, Inc.
Alternate Loan Trust, Ser 2003-2XS,
Class A6, 4.970%, 9/25/33 | | | 188,260 | |
| | 570,515 | | | Deutsche ALT-A Securities, Inc.
Alternate Loan Trust, Ser 2005-3,
Class 4A4, 5.250%, 6/25/35 | | | 537,168 | |
| | 213,002 | | | Residential Asset Securitization Trust,
Ser 2005-A6CB, Class A8,
5.500%, 6/25/35 | | | 46,303 | |
| | 244,173 | | | Residential Asset Securitization Trust,
Ser 2006-A1, Class 1A3,
6.000%, 4/25/36 | | | 168,152 | |
| | 68,857 | | | Residential Funding Mortgage
Securities I, Ser 2006-S2, Class A2,
5.750%, 2/25/36 | | | 9,287 | |
| | 275,237 | | | Structured Asset Securities Corp., Ser
2005-17, Class 5A1,
5.500%, 10/25/35 | | | 224,469 | |
| | 187,179 | | | Washington Mutual Alternative Mortgage Pass-Through Certificates, Ser 2005-9, Class 2A4, 5.500%, 11/25/35†† | | | 152,419 | |
| | | | | Total Non-Agency Collateralized Mortgage Obligations | | $ | 1,696,710 | |
| | | | | | | | | |
| | | | | Asset-Backed Securities — 1.1% | | | | |
| 393,518 | | | Countrywide Asset-Backed Certificates, Ser 2007-S1, Class A5, 6.018%, 11/25/36(A) | | | 222,378 | |
| | 657,901 | | | Morgan Stanley Mortgage Loan Trust,
Ser 2007-3XS, Class 2A4S,
5.963%, 1/25/47 | | | 352,617 | |
| | | | | Total Asset-Backed Securities | | $ | 574,995 | |
| | | | | | | | | |
| | | | | Sovereign Bond — 0.9% | | | | |
| | 500,000 | | | Province of Quebec Canada, 2.750%,
8/25/21 | | $ | 499,444 | |
| | | | | | | | | |
| | | | | Agency Collateralized Mortgage Obligation — 0.1% | | | | |
| | 28,982 | | | GNMA, Ser 2003-11, Class GJ,
4.000%, 10/17/29 | | $ | 30,908 | |
| | | | | | | | | |
| | | | | Municipal Bonds — 0.7% | | | | |
| | | | | | | | | |
| | | | | California — 0.4% | | | | |
| | 180,000 | | | California St, UTGO, Ser 2009,
5.950%, 4/1/16 | | | 202,633 | |
| | | | | | | | | |
| | | | | Georgia — 0.3% | | | | |
| | 190,000 | | | Municipal Electric Auth. of Georgia
Rev, Ser 2010, 6.655%, 4/1/57 | | | 195,312 | |
| | | | | Total Municipal Bonds | | $ | 397,945 | |
| | | | | | | | | |
| | Shares | | | | | | | |
| | | | | | | | | |
| | | | | Preferred Stocks — 0.4% | | | | |
| | | | | | | | | |
| | | | | Financials — 0.4% | | | | |
| | 1,363 | | | Ally Financial, Inc., 0.05% | | | 27,614 | |
| | 7,900 | | | Citigroup Capital VIII, 0.04% | | | 184,386 | |
| | | | | Total Preferred Stocks | | $ | 212,000 | |
| | | | | | | | | |
| | | | | Investment Funds — 1.9% | | | | |
| | 47,266 | | | Invesco Liquid Assets Portfolio** | | | 47,266 | |
| | 1,017,462 | | | Touchstone Institutional Money
Market Fund^ | | | 1,017,462 | |
| | | | | Total Investment Funds | | $ | 1,064,728 | |
| | | | | | | | | |
| | | | | Total Investment Securities — 99.6% (Cost $53,955,247) | | $ | 54,303,826 | |
| | | | | | | | | |
| | | | | Other Assets in Excess of Liabilities — 0.4% | | | 205,032 | |
| | | | | | | | | |
| | | | | Net Assets — 100.0% | | $ | 54,508,858 | |
| (A) | Variable rate security - the rate reflected is the rate in effect as of December 31, 2011. |
| † | All or a portion of the security is on loan. The total value of the securites on loan as of December 31, 2011 was $46,041. |
Touchstone Core Bond Fund (Continued)
| ** | Represents collateral for securities loaned. |
| ^ | Affiliated Fund, sub-advised by Fort Washington Investment Advisiors, Inc. |
| †† | The issuers and/or sponsors of certain asset-backed securities may no longer exist; however, the securities held by the Fund are separate legal entities organized as trusts and publicly traded. The Fund receives principal and interest payments directly from these trusts. |
Portfolio Abbreviations:
FHLMC - Federal Home Loan Mortgage Association
FNMA - Federal National Mortgage Association
GNMA - Government National Mortgage Association
MTN - Medium Term Note
PLC - Public Limited Company
REIT - Real Estate Investment Trust
UTGO - Unlimited Tax General Obligation
144a - This is a restricted security that was sold in a transaction exempt from Rule 144a of the Securities Act of 1933. This security may be sold in transactions exempt from registration, normally to qualified institutional buyers. At December 31, 2011, these securities were valued at $3,786,400 or 6.9% of net assets. These securities were deemed liquid pursuant to procedures approved by the Board of Trustees.
Other Information:
The inputs or methodology used for valuing securities may not be an indication of the risk associated with investing in those securities. For more information on valuation inputs, and their aggregation into the levels used in the table below, please refer to the security valuation section in the accompanying notes to financial statements.
Valuation inputs at Reporting Date:
| Description | | Level 1 | | | Level 2 | | | Level 3 | | | Total | |
| Asset-Backed Securities | | $ | — | | | $ | 574,995 | | | $ | — | | | $ | 574,995 | |
| Commercial Mortgage-Backed Securities | | | — | | | | 8,746,349 | | | | — | | | | 8,746,349 | |
| Corporate Bonds | | | — | | | | 17,348,461 | | | | — | | | | 17,348,461 | |
| Investment Funds | | | 1,064,728 | | | | — | | | | — | | | | 1,064,728 | |
| Non-Agency Collateralized Mortgage Obligations | | | — | | | | 1,696,710 | | | | — | | | | 1,696,710 | |
| Municipal Bonds | | | — | | | | 397,945 | | | | — | | | | 397,945 | |
| Preferred Stocks | | | 212,000 | | | | — | | | | — | | | | 212,000 | |
| Sovereign Bond | | | — | | | | 499,444 | | | | — | | | | 499,444 | |
| U.S. Government Mortgage-Backed Obligations | | | — | | | | 9,188,159 | | | | — | | | | 9,188,159 | |
| U.S. Treasury Obligations | | | — | | | | 14,544,127 | | | | — | | | | 14,544,127 | |
| Agency Collateralized Mortgage Obligations | | | — | | | | 30,908 | | | | — | | | | 30,908 | |
| | | | | | | | | | | | | | | $ | 54,303,826 | |
See accompanying notes to financial statements.
Portfolio of Investments
Touchstone High Yield Fund – December 31, 2011
Principal
Amount | | | | | Market
Value | |
| | | | | | | | | |
| | | | | Corporate Bonds — 96.8% | | | | |
| | | | | | | | | |
| | | | | Consumer Discretionary — 21.5% | | | | |
$
| 189,000
| | | AMC Networks, Inc., 144a,
7.750%, 7/15/21 | | $ | 205,538 | |
| | 12,000
| | | Asbury Automotive Group, Inc.,
7.625%, 3/15/17 | | | 12,030 | |
| | 65,000
| | | CCO Holdings LLC / CCO Holdings
Capital Corp., 6.500%, 4/30/21 | | | 65,812 | |
| | 155,000
| | | CCO Holdings LLC / CCO Holdings
Capital Corp., 7.000%, 1/15/19 | | | 161,588 | |
| | 163,000
| | | CCO Holdings LLC / CCO Holdings
Capital Corp., 8.125%, 4/30/20 | | | 178,485 | |
| | 100,000
| | | Cequel Communications Holdings I
LLC and Cequel Capital Corp., 144a,
8.625%, 11/15/17 | | | 106,000 | |
| | 216,000
| | | Chrysler Group LLC/CG Co-Issuer, Inc.,
144a, 8.250%, 6/15/21 | | | 196,560 | |
| | 155,000
| | | Cooper-Standard Automotive, Inc.,
8.500%, 5/1/18 | | | 162,169 | |
| | 65,000 | | | CSC Holdings LLC, 8.625%, 2/15/19 | | | 74,912 | |
| | 140,000 | | | DISH DBS Corp., 7.875%, 9/1/19 | | | 158,200 | |
| | 250,000
| | | Entravision Communications Corp.,
8.750%, 8/1/17 | | | 245,000 | |
| | 196,000
| | | Equinox Holdings, Inc., 144a,
9.500%, 2/1/16 | | | 201,390 | |
| | 147,000 | | | Exide Technologies, 8.625%, 2/1/18 | | | 113,190 | |
| | 129,000
| | | Fisher Communications, Inc.,
8.625%, 9/15/14 | | | 131,257 | |
| | 126,000
| | | Goodyear Tire & Rubber Co. (The),
8.750%, 8/15/20 | | | 138,915 | |
| | 160,000
| | | Icon Health & Fitness, 144a,
11.875%, 10/15/16 | | | 130,000 | |
| | 169,000
| | | Intelsat Jackson Holdings SA, 144a,
7.250%, 4/1/19 | | | 171,535 | |
| | 127,000
| | | International Automotive
Components Group SL, 144a,
9.125%, 6/1/18 | | | 113,665 | |
| | 273,000 | | | Jarden Corp., 7.500%, 5/1/17 | | | 289,380 | |
| | 50,000 | | | Jarden Corp., 8.000%, 5/1/16 | | | 54,000 | |
| | 422,000
| | | JBS USA LLC/JBS USA Finance, Inc.,
144a, 7.250%, 6/1/21 | | | 393,515 | |
| | 139,000 | | | Lamar Media Corp., 6.625%, 8/15/15 | | | 141,432 | |
| | 256,000 | | | Libbey Glass, Inc., 10.000%, 2/15/15 | | | 273,920 | |
| | 250,000
| | | Meritage Homes Corp.,
6.250%, 3/15/15 | | | 246,250 | |
| | 105,000
| | | Meritage Homes Corp.,
7.150%, 4/15/20 | | | 100,800 | |
| | 335,000
| | | Penske Automotive Group, Inc.,
7.750%, 12/15/16 | | | 343,375 | |
| | 108,000 | | | Pulte Group, Inc., 6.375%, 5/15/33 | | | 74,790 | |
| | 28,000 | | | Pulte Group, Inc., 7.875%, 6/15/32 | | | 22,540 | |
| | 152,000 | | | Quebecor Media, Inc., 7.750%, 3/15/16 | | | 156,180 | |
| | 60,000 | | | Quebecor Media, Inc., 7.750%, 3/15/16 | | | 61,650 | |
| | 129,000 | | | Sealy Mattress Co., 8.250%, 6/15/14 | | | 127,710 | |
| | 290,000
| | | Stonemor Operating LLC /
Cornerstone Family Services of WV
/ Osiris Holding, 10.250%, 12/1/17 | | | 270,425 | |
| | 71,000 | | | Tenneco, Inc., 6.875%, 12/15/20 | | | 72,775 | |
| | 101,000 | | | Tenneco., Inc., 7.750%, 8/15/18 | | | 107,060 | |
| | 125,000
| | | Tomkins LLC / Tomkins, Inc.,
9.000%, 10/1/18 | | | 138,594 | |
| | 148,000
| | | Tower Automotive Holdings USA LLC
/ TA Holdings Finance, Inc., 144a,
10.625%, 9/1/17 | | | 148,740 | |
| | 250,000
| | | Visteon Corp./New, 144a,
6.750%, 4/15/19 | | | 249,375 | |
| | | | | | | | 5,838,757 | |
| | | | | | | | | |
| | | | | Energy — 19.4% | | | | |
| | 364,000
| | | Atlas Pipeline Partners LP,
8.750%, 6/15/18 | | | 382,200 | |
| | 19,000
| | | Basic Energy Services, Inc.,
7.125%, 4/15/16 | | | 19,048 | |
| | 70,000
| | | Basic Energy Services, Inc., 144a,
7.750%, 2/15/19 | | | 70,525 | |
| | 87,000
| | | Chesapeake Energy Corp.,
6.625%, 8/15/20 | | | 93,308 | |
| | 202,000
| | | Cloud Peak Energy Resources LLC /
Cloud Peak Energy Finance Corp.,
8.500%, 12/15/19 | | | 218,160 | |
| | 349,000
| | | Coffeyville Resources LLC / Coffeyville
Finance, Inc., 144a, 10.875%, 4/1/17 | | | 390,880 | |
| | 66,000 | | | Consol Energy, Inc., 8.000%, 4/1/17 | | | 72,270 | |
| | 66,000 | | | Consol Energy, Inc., 8.250%, 4/1/20 | | | 72,930 | |
| | 367,000
| | | Enterprise Products Operating LLC, 7.000%, 6/1/67(A) | | | 360,119 | |
| | 200,000
| | | Enterprise Products Operating LLC, 8.375%, 8/1/66(A) | | | 214,000 | |
| | 323,000
| | | Expro Finance Luxembourg SCA, 144a,
8.500%, 12/15/16 | | | 284,240 | |
| | 300,000
| | | Exterran Holdings, Inc.,
7.250%, 12/1/18 | | | 285,000 | |
| | 315,000
| | | Genesis Energy LP/Genesis Energy
Finance Corp., 7.875%, 12/15/18 | | | 315,000 | |
| | 244,000
| | | Helix Energy Solutions Group, Inc.,
144a, 9.500%, 1/15/16 | | | 253,760 | |
| | 88,000
| | | Hilcorp Energy I LP/Hilcorp Finance
Co., 144a, 7.625%, 4/15/21 | | | 92,180 | |
| | 50,000
| | | Hilcorp Energy I LP/Hilcorp Finance
Co., 144a, 8.000%, 2/15/20 | | | 53,500 | |
| | 95,000
| | | Holly Energy Partners LP/Holly Energy
Finance Corp., 8.250%, 3/15/18 | | | 99,750 | |
| | 132,000
| | | Inergy LP/Inergy Finance Corp.,
7.000%, 10/1/18 | | | 133,980 | |
| | 187,000
| | | Linn Energy LLC/Linn Energy Finance
Corp., 8.625%, 4/15/20 | | | 202,895 | |
| | 91,000
| | | MEG Energy Corp., 144a,
6.500%, 3/15/21 | | | 93,048 | |
| | 219,000
| | | OGX Petroleo e Gas Participacoes SA,
144a, 8.500%, 6/1/18 | | | 214,620 | |
| | 300,000
| | | Peabody Energy Corp., 144a,
6.000%, 11/15/18 | | | 306,000 | |
| | 145,000
| | | Penn Virginia Resource Partners LP /
Penn Virginia Resource Finance
Corp., 8.250%, 4/15/18 | | | 145,725 | |
Touchstone High Yield Fund (Continued)
Principal
Amount | | | | | Market
Value | |
| | | | | | | | | |
| | | | | Corporate Bonds — 96.8% (Continued) | | | | |
| | | | | | | | | |
| | | | | Energy — (Continued) | | | | |
| $ | 284,000 | | | Pioneer Drilling Co., 9.875%, 3/15/18 | | $ | 296,780 | |
| | 330,000
| | | Regency Energy Partners LP /
Regency Energy Finance Corp.,
6.500%, 7/15/21 | | | 343,200 | |
| | 250,000
| | | Targa Resources Partners LP / Targa
Resources Partners Finance Corp.,
7.875%, 10/15/18 | | | 263,750 | |
| | 9,000
| | | Targa Resources Partners LP / Targa
Resources Partners Finance Corp.,
8.250%, 7/1/16 | | | 9,428 | |
| | | | | | | | 5,286,296 | |
| | | | | | | | | |
| | | | | Industrials — 16.3% | | | | |
| | 91,984
| | | American Airlines Pass Through Trust
2009-1A, 10.375%, 7/2/19 | | | 96,584 | |
| | 264,000
| | | Amsted Industries, Inc., 144a,
8.125%, 3/15/18 | | | 279,840 | |
| | 75,000
| | | Ashtead Capital, Inc., 144a,
9.000%, 8/15/16 | | | 78,188 | |
| | 100,000 | | | BE Aerospace, Inc., 8.500%, 7/1/18 | | | 109,500 | |
| | 150,000 | | | Belden, Inc., 7.000%, 3/15/17 | | | 149,812 | |
| | 61,000 | | | BWAY Holding Co, 10.000%, 6/15/18 | | | 64,965 | |
| | 425,000
| | | Case New Holland, Inc.,
7.875%, 12/1/17 | | | 480,250 | |
| | 400,000 | | | Cenveo Corp., 8.875%, 2/1/18 | | | 349,000 | |
| | 138,905
| | | Continental Airlines 2003-ERJ1 Pass
Through Trust, Ser RJO3,
7.875%, 7/2/18 | | | 135,432 | |
| | 222,000
| | | Dynacast International LLC / Dynacast
Finance, Inc., 144a, 9.250%, 7/15/19 | | | 208,680 | |
| | 110,000 | | | Griffon Corp., 7.125%, 4/1/18 | | | 108,900 | |
| | 173,000
| | | JM Huber Corp., 144a,
9.875%, 11/1/19 | | | 181,650 | |
| | 231,000
| | | Liberty Tire Recycling, 144a,
11.000%, 10/1/16 | | | 230,422 | |
| | 318,000
| | | Martin Midstream Partners LP / Martin
Midstream Finance Corp.,
8.875%, 4/1/18 | | | 327,540 | |
| | 120,000 | | | Moog, Inc., 7.250%, 6/15/18 | | | 126,600 | |
| | 492,000
| | | Mueller Water Products, Inc.,
7.375%, 6/1/17 | | | 447,720 | |
| | 197,000
| | | Navios Maritime Holdings, Inc. /
Navios Maritime Finance II US, Inc.,
8.125%, 2/15/19 | | | 146,765 | |
| | 134,000
| | | Navios South American Logisitcs, Inc.
/ Navios Logistics Finance US, Inc.,
144a, 9.250%, 4/15/19 | | | 107,200 | |
| | 29,000
| | | RR Donnelley & Sons Co.,
7.250%, 5/15/18 | | | 28,130 | |
| | 76,000
| | | RR Donnelley & Sons Co.,
7.625%, 6/15/20 | | | 71,060 | |
| | 75,000 | | | Stena AB, 7.000%, 12/1/16 | | | 69,187 | |
| | 350,000 | | | TransDigm, Inc., 7.750%, 12/15/18 | | | 376,250 | |
| | 283,000 | | | Tutor Perini Corp., 7.625%, 11/1/18 | | | 267,435 | |
| | | | | | | | 4,441,110 | |
| | | | | | | | | |
| | | | | Telecommunication Services — 9.2% | | | | |
| | 72,000 | | | Cincinnati Bell, Inc., 8.250%, 10/15/17 | | | 72,360 | |
| | 248,000 | | | Cincinnati Bell, Inc., 8.375%, 10/15/20 | | | 247,380 | |
| | 31,000
| | | EH Holding Corp., 144a,
6.500%, 6/15/19 | | | 32,318 | |
| | 8,000
| | | EH Holding Corp., 144a,
7.625%, 6/15/21 | | | 8,400 | |
| | 364,000
| | | Frontier Communications Corp.,
8.500%, 4/15/20 | | | 372,645 | |
| | 114,000
| | | MetroPCS Wireless, Inc.,
7.875%, 9/1/18 | | | 115,567 | |
| | 260,000 | | | NII Capital Corp., 7.625%, 4/1/21 | | | 258,050 | |
| | 145,000 | | | NII Capital Corp., 8.875%, 12/15/19 | | | 152,612 | |
| | 384,000 | | | Sprint Capital Corp., 6.875%, 11/15/28 | | | 274,080 | |
| | 267,000
| | | Sprint Nextel Corp., 144a,
9.000%, 11/15/18 | | | 280,350 | |
| | 41,000
| | | TW Telecom Holdings, Inc.,
8.000%, 3/1/18 | | | 43,665 | |
| | 279,000 | | | West Corp., 8.625%, 10/1/18 | | | 281,790 | |
| | 231,000
| | | Wind Acquisition Finance SA, 144a,
11.750%, 7/15/17 | | | 206,745 | |
| | 114,000 | | | Windstream Corp., 7.500%, 4/1/23 | | | 112,575 | |
| | 29,000 | | | Windstream Corp., 7.875%, 11/1/17 | | | 31,392 | |
| | | | | | | | 2,489,929 | |
| | | | | | | | | |
| | | | | Materials — 8.6% | | | | |
| | 91,000 | | | AK Steel Corp., 7.625%, 5/15/20† | | | 85,540 | |
| | 312,000
| | | Aleris International, Inc., 144a,
7.625%, 2/15/18 | | | 304,200 | |
| | 228,000 | | | Cascades, Inc., 7.750%, 12/15/17 | | | 225,720 | |
| | 184,000 | | | Koppers, Inc., 7.875%, 12/1/19 | | | 195,040 | |
| | 424,000
| | | Longview Fibre Paper & Packaging,
Inc., 144a, 8.000%, 6/1/16 | | | 424,000 | |
| | 136,000
| | | Lyondell Chemical Co., 144a,
8.000%, 11/1/17 | | | 148,580 | |
| | 267,000
| | | LyondellBasell Industries N.V., 144a,
6.000%, 11/15/21 | | | 277,012 | |
| | 75,000 | | | Novelis, Inc./GA, 8.375%, 12/15/17 | | | 79,688 | |
| | 53,000 | | | PolyOne Corp., 7.375%, 9/15/20 | | | 54,722 | |
| | 300,000
| | | Tembec Industries, Inc.,
11.250%, 12/15/18 | | | 309,000 | |
| | 81,000
| | | US Concrete, Inc., 144a,
9.500%, 8/31/15 | | | 79,279 | |
| | 135,000 | | | Vulcan Materials Co., 7.500%, 6/15/21 | | | 145,800 | |
| | | | | | | | 2,328,581 | |
| | | | | | | | | |
| | | | | Information Technology — 6.3% | | | | |
| | 124,000
| | | CommScope, Inc., 144a,
8.250%, 1/15/19 | | | 124,000 | |
| | 156,000 | | | CoreLogic, Inc., 144a, 7.250%, 6/1/21 | | | 149,370 | |
| | 238,000 | | | Equinix, Inc., 8.125%, 3/1/18 | | | 259,420 | |
| | 15,000 | | | First Data Corp., 9.875%, 9/24/15 | | | 14,100 | |
| | 67,000 | | | First Data Corp., 144a, 8.250%, 1/15/21 | | | 59,965 | |
| | 153,000 | | | First Data Corp., 144a, 8.875%, 8/15/20 | | | 153,000 | |
| | 484,000 | | | Kemet Corp., 10.500%, 5/1/18 | | | 511,830 | |
| | 427,000 | | | Viasat, Inc., 8.875%, 9/15/16 | | | 437,675 | |
| | | | | | | | 1,709,360 | |
Touchstone High Yield Fund (Continued)
Principal
Amount | | | | | Market
Value | |
| | | | | | | | | |
| | | | | Corporate Bonds — 96.8% (Continued) | | | | |
| | | | | | | | | |
| | | | | Health Care — 5.4% | | | | |
| $ | 352,000 | | | Accellent, Inc., 8.375%, 2/1/17 | | $ | 344,960 | |
| | 200,000
| | | Apria Healthcare Group, Inc.,
11.250%, 11/1/14 | | | 206,500 | |
| | 232,000
| | | Health Management Associates, Inc.,
144a, 7.375%, 1/15/20 | | | 241,280 | |
| | 282,000 | | | Omnicare, Inc., 7.750%, 6/1/20 | | | 302,797 | |
| | 300,000 | | | Res-Care, Inc., 10.750%, 1/15/19 | | | 309,750 | |
| | 58,000
| | | Universal Hospital Services, Inc., 4.121%, 6/1/15(A) | | | 52,345 | |
| | | | | | | | 1,457,632 | |
| | | | | | | | | |
| | | | | Financials — 4.0% | | | | |
| | 148,000 | | | CIT Group, Inc., 144a, 7.000%, 5/2/16 | | | 147,815 | |
| | 74,000 | | | CIT Group, Inc., 144a, 7.000%, 5/2/17 | | | 73,908 | |
| | 107,000
| | | Credit Acceptance Corp.,
9.125%, 2/1/17 | | | 111,815 | |
| | 72,000 | | | EDP Finance BV, 144a, 6.000%, 2/2/18 | | | 60,565 | |
| | 113,000
| | | Liberty Mutual Group, Inc., 144a, 10.750%, 6/15/58(A) | | | 141,815 | |
| | 256,000
| | | MPT Operating Partnership LP/MPT
Finance Corp., 6.875%, 5/1/21 | | | 253,760 | |
| | 147,000
| | | Omega Healthcare Investors, Inc.,
6.750%, 10/15/22 | | | 147,735 | |
| | 104,000 | | | PHH Corp., 9.250%, 3/1/16 | | | 98,800 | |
| | 60,000
| | | Reynolds Group Issuer, Inc. / Reynolds
Group Issuer LLC, 144a,
8.750%, 10/15/16 | | | 63,150 | |
| | | | | | | | 1,099,363 | |
| | | | | | | | | |
| | | | | Utilities — 3.4% | | | | |
| | 150,000 | | | Calpine Corp., 144a, 7.875%, 1/15/23 | | | 161,250 | |
| | 94,000
| | | Crestwood Midstream Partners LP /
Crestwood Midstream Finance
Corp., 144a, 7.750%, 4/1/19 | | | 91,415 | |
| | 79,000
| | | Crosstex Energy LP / Crosstex Energy
Finance Corp., 8.875%, 2/15/18 | | | 86,308 | |
| | 51,000 | | | GenOn Energy, Inc., 7.625%, 6/15/14 | | | 51,000 | |
| | 350,000 | | | Intergen N.V., 144a, 9.000%, 6/30/17 | | | 368,375 | |
| | 85,000
| | | North American Energy Alliance LLC /
North American Energy Alliance
Finance Corp., 10.875%, 6/1/16 | | | 90,100 | |
| | 85,000
| | | NRG Energy, Inc., 144a,
7.875%, 5/15/21 | | | 82,875 | |
| | | | | | | | 931,323 | |
| | | | | | | | | |
| | | | | Consumer Staples — 2.7% | | | | |
| | 287,000
| | | BI-LO LLC / BI-LO Finance Corp., 144a,
9.250%, 2/15/19 | | | 295,610 | |
| | 169,000
| | | Central Garden and Pet Co.,
8.250%, 3/1/18 | | | 165,620 | |
| | 250,000 | | | Ingles Markets, Inc., 8.875%, 5/15/17 | | | 270,625 | |
| | | | | | | | 731,855 | |
| | | | | Total Corporate Bonds | | $ | 26,314,206 | |
| | | | | | | | | |
| | | | | Preferred Stock — 0.3% | | | | |
| | | | | | | | | |
| | | | | Financials — 0.3% | | | | |
| | 4,685 | | | Ally Financial, Inc., 0.05% | | $ | 94,918 | |
| | | | | | | | | |
| | | | | Investment Funds — 1.3% | | | | |
| | 86,937 | | | Invesco Liquid Assets Portfolio** | | | 86,937 | |
| | 263,209
| | | Touchstone Institutional Money
Market Fund^ | | | 263,209 | |
| | | | | Total Investment Funds | | $ | 350,146 | |
| | | | | | | | | |
| | | | | Total Investment Securities — 98.4% (Cost $26,788,933) | | $ | 26,759,270 | |
| | | | | | | | | |
| | | | | Other Assets in Excess of Liabilities — 1.6% | | | 431,726 | |
| | | | | | | | | |
| | | | | Net Assets — 100.0% | | $ | 27,190,996 | |
| (A) | Variable rate security - the rate reflected is the rate in effect as of December 31, 2011. |
| † | All or a portion of the security is on loan. The total value of the securites on loan as of December 31, 2011 was $84,685. |
| ** | Represents collateral for securities loaned. |
| ^ | Affiliated Fund, sub-advised by Fort Washington Investment Advisors, Inc. See Note 4 in Notes to Financial Statements. |
Portfolio Abbreviations:
144A - This is a restricted security that was sold in a transaction exempt from Rule 144A of the Securities Act of 1933. This security may be sold in transactions exempt from registration, normally to qualified institutional buyers. At December 31, 2011, these securities were valued at $8,736,328 or 32.1% of net assets. These securities were deemed liquid pursuant to procedures approved by the Board of Trustees.
Touchstone High Yield Fund (Continued)
Other Information:
The inputs or methodology used for valuing securities may not be an indication of the risk associated with investing in those securities. For more information on valuation inputs, and their aggregation into the levels used in the table below, please refer to the security valuation section in the accompanying notes to financial statements.
Valuation Inputs at Reporting Date:
| Description | | Level 1 | | | Level 2 | | | Level 3 | | | Total | |
| Corporate Bonds | | $ | — | | | $ | 26,314,206 | | | $ | — | | | $ | 26,314,206 | |
| Investment | | | | | | | | | | | | | | | | |
| Funds | | | 350,146 | | | | — | | | | — | | | | 350,146 | |
| Preferred | | | | | | | | | | | | | | | | |
| Stock | | | 94,918 | | | | — | | | | — | | | | 94,918 | |
| | | | | | | | | | | | | | | $ | 26,759,270 | |
See accompanying notes to financial statements.
Portfolio of Investments
Touchstone Large Cap Core Equity Fund – December 31, 2011
| | | | | | Market | |
| | | Shares | | | Value | |
| | | | | | | | | |
| Common Stocks — 98.6% | | | | | | | | |
| | | | | | | | | |
| Information Technology — 19.2% | | | | | | | | |
| Broadcom Corp. - Class A* | | | 17,924 | | | $ | 526,249 | |
| Google, Inc. - Class A* | | | 1,394 | | | | 900,385 | |
| Intel Corp. | | | 22,946 | | | | 556,440 | |
| International Business Machines Corp. | | | 4,515 | | | | 830,218 | |
| Microsoft Corp. | | | 19,345 | | | | 502,196 | |
| Oracle Corp. | | | 29,021 | | | | 744,389 | |
| Qualcomm, Inc. | | | 15,216 | | | | 832,315 | |
| TE Connectivity Ltd. (Switzerland) | | | 21,867 | | | | 673,722 | |
| Xilinx, Inc. | | | 20,581 | | | | 659,827 | |
| | | | | | | | 6,225,741 | |
| | | | | | | | | |
| Industrials — 13.5% | | | | | | | | |
| Caterpillar, Inc. | | | 2,720 | | | | 246,432 | |
| Cummins, Inc. | | | 2,670 | | | | 235,013 | |
| Danaher Corp. | | | 11,248 | | | | 529,106 | |
| Eaton Corp. | | | 10,686 | | | | 465,162 | |
| Emerson Electric Co. | | | 11,057 | | | | 515,146 | |
| Illinois Tool Works, Inc. | | | 12,056 | | | | 563,136 | |
| Union Pacific Corp. | | | 8,717 | | | | 923,479 | |
| United Technologies Corp. | | | 12,235 | | | | 894,256 | |
| | | | | | | | 4,371,730 | |
| | | | | | | | | |
| Consumer Discretionary — 12.9% | | | | | | | | |
| Coach, Inc. | | | 7,870 | | | | 480,385 | |
| GameStop Corp. - Class A†* | | | 12,622 | | | | 304,569 | |
| Genuine Parts Co. | | | 7,002 | | | | 428,522 | |
| Home Depot, Inc. | | | 9,158 | | | | 385,002 | |
| McDonald's Corp. | | | 8,811 | | | | 884,008 | |
| Ross Stores, Inc. | | | 20,018 | | | | 951,456 | |
| Yum! Brands, Inc. | | | 12,669 | | | | 747,598 | |
| | | | | | | | 4,181,540 | |
| | | | | | | | | |
| Financials — 12.6% | | | | | | | | |
| Aflac, Inc. | | | 22,547 | | | | 975,383 | |
| American Express Co. | | | 14,164 | | | | 668,116 | |
| BlackRock, Inc. | | | 4,110 | | | | 732,566 | |
| Capital One Financial Corp. | | | 6,500 | | | | 274,885 | |
| JPMorgan Chase & Co. | | | 10,040 | | | | 333,830 | |
| MetLife, Inc. | | | 12,882 | | | | 401,661 | |
| State Street Corp. | | | 17,486 | | | | 704,861 | |
| | | | | | | | 4,091,302 | |
| | | | | | | | | |
| Health Care — 11.6% | | | | | | | | |
| Bristol-Myers Squibb Co. | | | 15,221 | | | | 536,388 | |
| Express Scripts, Inc.* | | | 6,102 | | | | 272,698 | |
| Laboratory Corp. of America Holdings* | | | 3,750 | | | | 322,388 | |
| McKesson Corp. | | | 9,507 | | | | 740,690 | |
| Novartis AG ADR | | | 12,560 | | | | 718,055 | |
| Teva Pharmaceutical Industries Ltd. ADR | | | 7,551 | | | | 304,758 | |
| UnitedHealth Group, Inc. | | | 17,342 | | | | 878,893 | |
| | | | | | | | 3,773,870 | |
| | | | | | | | | |
| Energy — 11.6% | | | | | | | | |
| Chevron Corp. | | | 8,838 | | | | 940,363 | |
| ConocoPhillips | | | 10,755 | | | | 783,717 | |
| Ensco PLC ADR | | | 20,317 | | | | 953,274 | |
| Marathon Oil Corp. | | | 23,363 | | | | 683,835 | |
| Marathon Petroleum Corp. | | | 12,361 | | | | 411,498 | |
| | | | | | | | 3,772,687 | |
| | | | | | | | | |
| Consumer Staples — 7.3% | | | | | | | | |
| Altria Group, Inc. | | | 19,120 | | | | 566,908 | |
| Archer-Daniels-Midland Co. | | | 5,560 | | | | 159,016 | |
| PepsiCo, Inc. | | | 8,387 | | | | 556,477 | |
| Philip Morris International, Inc. | | | 13,882 | | | | 1,089,459 | |
| | | | | | | | 2,371,860 | |
| | | | | | | | | |
| Materials — 4.6% | | | | | | | | |
| BHP Billiton Ltd. ADR† | | | 4,015 | | | | 283,579 | |
| Freeport-McMoRan Copper & Gold, Inc. | | | 10,515 | | | | 386,847 | |
| Praxair, Inc. | | | 7,862 | | | | 840,448 | |
| | | | | | | | 1,510,874 | |
| | | | | | | | | |
| Utilities — 2.7% | | | | | | | | |
| Dominion Resources, Inc. | | | 16,604 | | | | 881,340 | |
| | | | | | | | | |
| Telecommunication Services — 2.6% | | | | | | | | |
| AT&T, Inc. | | | 11,995 | | | | 362,729 | |
| Vodafone Group PLC ADR | | | 17,436 | | | | 488,731 | |
| | | | | | | | 851,460 | |
| Total Common Stocks | | | | | | $ | 32,032,404 | |
| | | | | | | | | |
| Investment Funds — 2.9% | | | | | | | | |
| Invesco Liquid Assets Portfolio** | | | 475,187 | | | | 475,187 | |
| Touchstone Institutional Money Market Fund^ | | | 460,371 | | | | 460,371 | |
| Total Investment Funds | | | | | | $ | 935,558 | |
| | | | | | | | | |
| Total Investment Securities — 101.5% | | | | | | | | |
| (Cost $27,736,238) | | | | | | $ | 32,967,962 | |
| | | | | | | | | |
| Liabilities in Excess of Other Assets — (1.5%) | | | | | | | (491,184 | ) |
| | | | | | | | | |
| Net Assets — 100.0% | | | | | | $ | 32,476,778 | |
| † | All or a portion of the security is on loan. The total value of the securites on loan as of December 31, 2011 was $465,229. |
| * | Non-income producing security. |
| ** | Represents collateral for securities loaned. |
| ^ | Affiliated Fund, sub-advised by Fort Washington Investment Advisors, Inc. See Note 4 in Notes to Financial Statements. |
Portfolio Abbreviations:
ADR - American Depositary Receipt
PLC - Public Limited Company
Touchstone Large Cap Core Equity Fund (Continued)
Other Information:
The inputs or methodology used for valuing securities may not be an indication of the risk associated with investing in those securities. For more information on valuation inputs, and their aggregation into the levels used in the table below, please refer to the security valuation section in the accompanying notes to financial statements.
Valuation Inputs at Reporting Date:
| Description | | Level 1 | | | Level 2 | | | Level 3 | | | Total | |
| Common Stocks | | $ | 32,032,404 | | | $ | — | | | $ | — | | | $ | 32,032,404 | |
| Investment Funds | | | 935,558 | | | | — | | | | — | | | | 935,558 | |
| | | | | | | | | | | | | | | $ | 32,967,962 | |
See accompanying notes to financial statements.
Portfolio of Investments
Touchstone Mid Cap Growth Fund – December 31, 2011
| | | | | | Market | |
| | | Shares | | | Value | |
| | | | | | | | | |
| Common Stocks — 99.0% | | | | | | | | |
| | | | | | | | | |
| Information Technology — 24.5% | | | | | | | | |
| Alliance Data Systems Corp.* | | | 6,280 | | | $ | 652,115 | |
| Analog Devices, Inc. | | | 3,750 | | | | 134,175 | |
| Autodesk, Inc.* | | | 15,010 | | | | 455,253 | |
| Avago Technologies Ltd. (Singapore) | | | 10,630 | | | | 306,782 | |
| Check Point Software Technologies Ltd. (Israel)* | | | 9,410 | | | | 494,401 | |
| Gartner, Inc.* | | | 10,660 | | | | 370,648 | |
| Juniper Networks, Inc.* | | | 6,150 | | | | 125,522 | |
| Lam Research Corp.* | | | 5,450 | | | | 201,759 | |
| NICE Systems Ltd. ADR* | | | 14,140 | | | | 487,123 | |
| NXP Semiconductor NV* | | | 11,450 | | | | 175,986 | |
| ON Semiconductor Corp.* | | | 43,610 | | | | 336,669 | |
| Red Hat, Inc.* | | | 11,900 | | | | 491,351 | |
| Salesforce.com, Inc.* | | | 3,740 | | | | 379,460 | |
| Teradata Corp.* | | | 8,210 | | | | 398,267 | |
| | | | | | | | 5,009,511 | |
| | | | | | | | | |
| Industrials — 15.3% | | | | | | | | |
| Cooper Industries PLC | | | 10,330 | | | | 559,370 | |
| Dover Corp. | | | 8,100 | | | | 470,205 | |
| IDEX Corp. | | | 11,550 | | | | 428,621 | |
| IHS, Inc. - Class A* | | | 1,250 | | | | 107,700 | |
| JB Hunt Transport Services, Inc. | | | 8,990 | | | | 405,179 | |
| Precision Castparts Corp. | | | 3,100 | | | | 510,849 | |
| Stanley Black & Decker, Inc. | | | 6,060 | | | | 409,656 | |
| Triumph Group, Inc. | | | 4,010 | | | | 234,385 | |
| | | | | | | | 3,125,965 | |
| | | | | | | | | |
| Consumer Discretionary — 14.6% | | | | | | | | |
| Bed Bath & Beyond, Inc.* | | | 4,900 | | | | 284,053 | |
| Coach, Inc. | | | 7,620 | | | | 465,125 | |
| Discovery Communications, Inc - Class A | | | 9,560 | | | | 391,673 | |
| Dollar General Corp.* | | | 7,750 | | | | 318,835 | |
| Family Dollar Stores, Inc. | | | 5,160 | | | | 297,526 | |
| Lear Corp. | | | 7,770 | | | | 309,246 | |
| Nordstrom, Inc. | | | 8,010 | | | | 398,177 | |
| Penn National Gaming, Inc.* | | | 13,510 | | | | 514,326 | |
| | | | | | | | 2,978,961 | |
| | | | | | | | | |
| Energy — 13.6% | | | | | | | | |
| CONSOL Energy, Inc. | | | 8,970 | | | | 329,199 | |
| Denbury Resources, Inc.* | | | 27,075 | | | | 408,832 | |
| Ensco PLC ADR | | | 8,320 | | | | 390,374 | |
| Tesoro Corp.* | | | 27,310 | | | | 637,962 | |
| Valero Energy Corp. | | | 28,730 | | | | 604,767 | |
| Weatherford International Ltd. (Switzerland)* | | | 28,810 | | | | 421,778 | |
| | | | | | | | 2,792,912 | |
| | | | | | | | | |
| Health Care — 11.0% | | | | | | | | |
| DENTSPLY International, Inc. | | | 19,520 | | | | 683,005 | |
| Mettler-Toledo International, Inc.* | | | 3,340 | | | | 493,351 | |
| United Therapeutics Corp.* | | | 10,540 | | | | 498,015 | |
| Vertex Pharmaceuticals, Inc.* | | | 11,150 | | | | 370,292 | |
| Warner Chilcott PLC - Class A (Ireland)* | | | 14,250 | | | | 215,602 | |
| | | | | | | | 2,260,265 | |
| | | | | | | | | |
| Materials — 8.9% | | | | | | | | |
| Albemarle Corp. | | | 8,780 | | | | 452,258 | |
| Crown Holdings, Inc.* | | | 11,020 | | | | 370,052 | |
| Ecolab, Inc. | | | 9,830 | | | | 568,272 | |
| Solutia, Inc.* | | | 25,330 | | | | 437,702 | |
| | | | | | | | 1,828,284 | |
| | | | | | | | | |
| Financials — 7.0% | | | | | | | | |
| Ameriprise Financial, Inc. | | | 10,130 | | | | 502,853 | |
| Discover Financial Services | | | 12,140 | | | | 291,360 | |
| SunTrust Banks, Inc. | | | 23,240 | | | | 411,348 | |
| Willis Group Holdings PLC | | | 5,840 | | | | 226,592 | |
| | | | | | | | 1,432,153 | |
| | | | | | | | | |
| Consumer Staples — 2.9% | | | | | | | | |
| Ralcorp Holdings, Inc.* | | | 6,890 | | | | 589,095 | |
| | | | | | | | | |
| Telecommunication Services — 1.2% | | | | | | | | |
| NII Holdings, Inc.* | | | 11,530 | | | | 245,589 | |
| Total Common Stocks | | | | | | $ | 20,262,735 | |
| | | | | | | | | |
Total Investment Securities — 99.0% (Cost $20,070,115) | | | | | | $ | 20,262,735 | |
| | | | | | | | | |
| Other Assets in Excess of Liabilities — 1.0% | | | | | | | 211,429 | |
| | | | | | | | | |
| Net Assets — 100.0% | | | | | | $ | 20,474,164 | |
* Non-income producing security.
Portfolio Abbreviations:
ADR - American Depositary Receipt
PLC - Public Limited Company
Other Information:
The inputs or methodology used for valuing securities may not be an indication of the risk associated with investing in those securities. For more information on valuation inputs, and their aggregation into the levels used in the table below, please refer to the security valuation section in the accompanying notes to financial statements.
Valuation inputs at Reporting Date:
| Description | | Level 1 | | | Level 2 | | | Level 3 | | | Total | |
| Common Stocks | | $ | 20,262,735 | | | $ | — | | | $ | — | | | $ | 20,262,735 | |
| | | | | | | | | | | | | | | $ | 20,262,735 | |
See accompanying notes to financial statements.
Portfolio of Investments
Touchstone Money Market Fund – December 31, 2011
Principal
Amount | | | | | Interest
Rate | | | Maturity
Date | | | Value | |
| | | | | | | | | | | | | |
| | | | | Corporate Bonds — 12.7% | | | | | | | | | | | |
| $ | 1,000,000 | | | FBC Chemical Corp.(A) | | | 0.310 | | | | 01/06/12 | | | $ | 1,000,000 | |
| | 2,000,000 | | | Lavonia O Frick Family Trust(A) | | | 0.250 | | | | 01/06/12 | | | | 2,000,000 | |
| | 269,000 | | | Credit Suisse USA, Inc. | | | 6.500 | | | | 01/15/12 | | | | 269,596 | |
| | 110,000 | | | JPMorgan Chase & Co. | | | 4.500 | | | | 01/15/12 | | | | 110,166 | |
| | 110,000 | | | Bear Stearns Cos. LLC (The) | | | 5.350 | | | | 02/01/12 | | | | 110,442 | |
| | 1,050,000 | | | General Electric Capital Corp. MTN | | | 5.875 | | | | 02/15/12 | | | | 1,056,627 | |
| | 372,000 | | | National Rural Utilities Cooperative Finance Corp. | | | 7.250 | | | | 03/01/12 | | | | 376,061 | |
| | 500,000 | | | Bear Stearns Cos. LLC (The) MTN | | | 6.950 | | | | 08/10/12 | | | | 518,544 | |
| | 200,000 | | | General Electric Capital Corp. MTN | | | 5.250 | | | | 10/19/12 | | | | 207,047 | |
| | 530,000 | | | Wells Fargo & Co. | | | 5.250 | | | | 10/23/12 | | | | 549,395 | |
| | 200,000 | | | Bank of New York Mellon Corp. MTN | | | 4.950 | | | | 11/01/12 | | | | 207,134 | |
| | | | | Total Corporate Bonds | | | | | | | | | | $ | 6,405,012 | |
| | | | | | | | | | | | | | | | | |
| | | | | Municipal Bonds — 11.8% | | | | | | | | | | | | |
| | 1,000,000 | | | OH St Higher Edl Fac Commis Rev Hosp Cleveland Clinic Health Ser 2008 A | | | 4.000 | | | | 01/01/12 | | | | 1,000,094 | |
| | 100,000 | | | Dekalb IN Estrn High Sch Bldg Ser 2003 Pre-refunded @ $100 | | | 6.000 | | | | 01/15/12 | | | | 100,211 | |
| | 300,000 | | | Columbia OH LSD UTGO Ser 2011 | | | 2.000 | | | | 01/19/12 | | | | 300,183 | |
| | 150,000 | | | HI St UTGO Ser 2002 CX Pre-refunded @ $100 | | | 5.500 | | | | 02/01/12 | | | | 150,633 | |
| | 370,000 | | | Mason OH EDR Ser 2011 | | | 1.750 | | | | 02/01/12 | | | | 370,170 | |
| | 200,000 | | | New Bedford MA LTGO BANS Ser 2011 | | | 1.950 | | | | 02/10/12 | | | | 200,097 | |
| | 100,000 | | | NV St Cap Impt LTGO Ser 2001 A Pre-refunded @ $100 | | | 5.000 | | | | 03/01/12 | | | | 100,738 | |
| | 150,000 | | | Richland Co SC SD UTGO Ser 2001 A Pre-refunded @ $100 | | | 5.000 | | | | 03/01/12 | | | | 151,107 | |
| | 250,000 | | | Franklin Co OH Ser 2011 (Spl Obl Rev) | | | 1.100 | | | | 03/09/12 | | | | 250,092 | |
| | 100,000 | | | Chelmsford MA LTGO Ser 2002 Pre-refunded @ $101 | | | 5.250 | | | | 04/01/12 | | | | 102,177 | |
| | 100,000 | | | Jackson Twp NJ SD UTGO Ser 2002 Pre-refunded @ $100 | | | 5.000 | | | | 04/15/12 | | | | 101,290 | |
| | 600,000 | | | Northmont OH CSD BANS (Sch Impt) UTGO Ser 2011 | | | 1.625 | | | | 06/05/12 | | | | 602,225 | |
| | 610,000 | | | Bristol CT UTGO BANS Ser 2011 | | | 1.250 | | | | 07/30/12 | | | | 610,958 | |
| | 200,000 | | | Butler Co OH BANS (Fiber Optic Impt) Ser 2011 | | | 0.900 | | | | 08/02/12 | | | | 200,000 | |
| | 500,000 | | | Woodbridge CT UTGO Ser 2011 | | | 1.000 | | | | 08/24/12 | | | | 500,799 | |
| | 500,000 | | | Union Twp OH BANS LTGO Ser 2011 | | | 1.125 | | | | 09/12/12 | | | | 501,642 | |
| | 115,000 | | | Harris Co TX Prerefunded (Perm Impt) LTGO Ser 2002 | | | 5.000 | | | | 10/01/12 | | | | 118,773 | |
| | 600,000 | | | Amp Muni Pwr OH, Inc. BANS Ser 2011 | | | 1.250 | | | | 10/25/12 | | | | 601,228 | |
| | | | | Total Municipal Bonds | | | | | | | | | | | $5,962,417 | |
| | | | | | | | | | | | | | | | | |
| | | | | U.S. Government Agency Obligations — 11.6% | | | | | | | | | | | |
| | 1,043,535 | | | Overseas Private Investment Corp.(A) | | | 0.100 | | | | 01/03/12 | | | | 1,043,535 | |
| | 1,000,000 | | | Overseas Private Investment Corp.(A) | | | 0.080 | | | | 01/06/12 | | | | 1,000,000 | |
| | 500,000 | | | Overseas Private Investment Corp.(A) | | | 0.080 | | | | 01/06/12 | | | | 500,000 | |
| | 1,719,298 | | | Overseas Private Investment Corp.(A) | | | 0.100 | | | | 01/06/12 | | | | 1,719,298 | |
| | 1,119,656 | | | Overseas Private Investment Corp.(A) | | | 0.100 | | | | 01/06/12 | | | | 1,119,656 | |
| | 500,000 | | | Overseas Private Investment Corp.(A) | | | 0.472 | | | | 07/31/12 | | | | 500,989 | |
| | | | | Total U.S. Government Agency Obligations | | | | | | | | | | | $5,883,478 |
| | | | | | | | | | | | | | | | |
| | | | | Time Deposits — 2.2% | | | | | | | | | | | |
| | 800,000 | | | Royal Bank of Canada/NY | | | 0.580 | | | | 01/03/12 | | | | 800,000 | |
| | 300,000 | | | Bank of Nova Scotia/Houston | | | 0.777 | | | | 03/05/12 | | | | 300,040 | |
| | | | | Total Time Deposits | | | | | | | | | | | $1,100,040 | |
| | | | | | | | | | | | | | | | | |
| | | | | Variable Rate Demand Notes — 57.4% | | | | | | | | | | | |
| | 1,200,000
| | | Allen Co OH Hosp Facs Rev (Catholic Healthcare) Ser 2008 B
(LOC: JP Morgan Chase & Co) | | | 0.060 | | | | 01/03/12 | | | | 1,200,000 |
| | 1,100,000 | | | Columbia SC Wtrwks & Swr Sys Ser 2009 (LOC: US Bank NA) | | | 0.050 | | | | 01/03/12 | | | | 1,100,000 | |
| | 200,000 | | | Cuyahoga Co OH Rev ((Cleveland Clinic)) Ser 2004 B3 ((SPA: US Bank NA)) | | | 0.050 | | | | 01/03/12 | | | | 200,000 | |
Touchstone Money Market Fund (Continued)
Principal
Amount | | | | | Interest
Rate | | | Maturity
Date | | | Value | |
| | | | | | | | | | | | | | | | | |
| | | | | Variable Rate Demand Notes — 57.4% (Continued) | | | | | | | | | | | | |
| $ | 295,000 | | | MS St Business Fin Co Ser 2009 G | | | 0.030 | | | | 01/03/12 | | | $ | 295,000 | |
| | 300,000
| | | Pitkin Co. IDR (Aspen Skiing Co) Ser 1994 A (LOC: JP Morgan
Chase Bank NA) | | | 0.070 | | | | 01/03/12 | | | | 300,000 | |
| | 500,000 | | | Toyota Motor Credit Corp. Ser 2011 MTN | | | 0.280 | | | | 01/03/12 | | | | 500,000 | |
| | 1,445,000
| | | VT St Edl & Hlth Bldgs ((North Country Hosp)) Ser 2007 A
(LOC: TD Banknorth NA) | | | 0.050 | | | | 01/03/12 | | | | 1,445,000 | |
| | 1,300,000
| | | WI St Hlth & Edl Facs (Bay Area Med Ctr Inc) Ser 2008
(LOC: BMO Harris Bank NA) | | | 0.080 | | | | 01/03/12 | | | | 1,300,000 | |
| | 925,000 | | | 486 Lesser Street LLC | | | 0.350 | | | | 01/06/12 | | | | 925,000 | |
| | 1,000,000
| | | Abag CA Fin Auth For Nonprofit (Hsg Gaia Bldg) Ser 2000 A-T
(LIQ: FNMA) | | | 0.240 | | | | 01/06/12 | | | | 1,000,000 | |
| | 200,000
| | | Alameda Co CA IDA Rev (Ettore Prods Co) Ser 2005 B
(LOC: Comerica Bank) | | | 0.320 | | | | 01/06/12 | | | | 200,000 | |
| | 520,000
| | | Butler Co OH Capital Funding Rev (CCAO Low Cost) Ser 2005 B
(LOC: US Bank NA) | | | 0.230 | | | | 01/06/12 | | | | 520,000 | |
| | 940,000
| | | CA St Enterprise Dev Auth IDR (Tri Tool Inc) Ser 2007 B
(LOC: Comerica Bank) | | | 0.490 | | | | 01/06/12 | | | | 940,000 | |
| | 375,000
| | | CA St Infra & Econ Dev BK Rev (Hillview Mental) Ser 2008 B
(LOC: Comerica Bank) | | | 0.490 | | | | 01/06/12 | | | | 375,000 | |
| | 490,000 | | | CA St Statewide CDA MFH (Hsg Sunrise) Ser 2000 B-T (LIQ: FNMA) | | | 0.230 | | | | 01/06/12 | | | | 490,000 | |
| | 250,000
| | | Chattanooga TN Hlth Edl & HSG Fac Bd MFH (Ref Windridge)
Ser 2003 B (LIQ:
FNMA) | | | 0.400 | | | | 01/06/12 | | | | 250,000 | |
| | 405,000 | | | Diaz-Upton LLC US Domestic Ser 2004 | | | 0.270 | | | | 01/06/12 | | | | 405,000 | |
| | 281,000 | | | Fitch Denny Funeral Home, Inc. Priv Placement Ser 2004 | | | 0.370 | | | | 01/06/12 | | | | 281,000 | |
| | 25,000
| | | FL St Hsg Fin Corp (MFH (Avalon Reserve)) Ser 2003 R-2
(LIQ: FNMA) | | | 0.270 | | | | 01/06/12 | | | | 25,000 | |
| | 178,000 | | | Hopewell Development Co. | | | 0.310 | | | | 01/06/12 | | | | 178,000 | |
| | 800,000
| | | IL St Dev Fin Auth IDR (Toyal America Inc) Ser 1997
(LOC: BK Tokyo-Mitsubishi UFJ) | | | 0.210 | | | | 01/06/12 | | | | 800,000 | |
| | 480,000 | | | IL St Fin Auth Rev (Cmnty Action) Ser 2008 B (LOC: Harris N.A.) | | | 0.480 | | | | 01/06/12 | | | | 480,000 | |
| | 235,000 | | | JL Capital One LLC US Domestic Ser 2002 | | | 0.270 | | | | 01/06/12 | | | | 235,000 | |
| | 480,000 | | | Labcon North America US Domestic Ser 2010 | | | 0.790 | | | | 01/06/12 | | | | 480,000 | |
| | 960,000 | | | M&P Richfield LLC Ser 2001 | | | 0.270 | | | | 01/06/12 | | | | 960,000 | |
| | 240,000 | | | Maricopa Co AZ IDA (San Angelin Apts) Ser 2004 A (LIQ: FNMA) | | | 0.180 | | | | 01/06/12 | | | | 240,000 | |
| | 1,135,000
| | | Mequon WI IDR (Gateway Plastics) Ser 2001-B
(LOC: Bank One Wisconsin) | | | 0.290 | | | | 01/06/12 | | | | 1,135,000 | |
| | 980,000 | | | Miarko, Inc. US Domestic Ser 2007 | | | 0.270 | | | | 01/06/12 | | | | 980,000 | |
| | 955,000 | | | Mill Street Village LLC Priv Placement Ser 2006 | | | 0.370 | | | | 01/06/12 | | | | 955,000 | |
| | 1,130,000
| | | NJ St Econ Dev Auth Rev (Cascade Corp.) Ser 2008 C
(LOC: Bank of America NA) | | | 1.150 | | | | 01/06/12 | | | | 1,130,000 | |
| | 700,000 | | | NY St HFA (Twr 31 B) Ser 2006 (LIQ: FHLMC) | | | 0.150 | | | | 01/06/12 | | | | 700,000 | |
| | 955,000
| | | Orange Co FL IDA (Trinity Prep Sch Inc) Ser 2005
(LOC: Wells Fargo Bank NA) | | | 0.190 | | | | 01/06/12 | | | | 955,000 | |
| | 1,515,000
| | | Phoenix Realty IL Spl Account Rev (Hsg Brightons Mark) Ser 1999
(LOC: Northern Trust Company) | | | 0.330 | | | | 01/06/12 | | | | 1,515,000 | |
| | 345,000
| | | Sacramento Co CA Hsg Auth MFH Rev (Deer Park Apts)
Ser 2002A-T (LIQ: FNMA) | | | 0.180 | | | | 01/06/12 | | | | 345,000 | |
| | 1,080,000 | | | Secor Realty, Inc. | | | 0.270 | | | | 01/06/12 | | | | 1,080,000 | |
| | 100,000 | | | Simi Valley CA MFH (Parker Ranch) Ser 2002 A-T (LIQ: FNMA) | | | 0.190 | | | | 01/06/12 | | | | 100,000 | |
| | 550,000
| | | Springfield MO IDA (DMP Pptys LLC) Ser 2010
(LOC: Guaranty Bank/FHLB) | | | 0.220 | | | | 01/06/12 | | | | 550,000 | |
| | 55,000
| | | Suffolk Co NY IDA (Hampton Day School) Ser 2001 B
(LOC: Chase Manhattan Bank) | | | 0.440 | | | | 01/06/12 | | | | 55,000 | |
| | 1,000,000 | | | WA St HFC (Clark Island Portfolio) Ser 2007 (LOC: FHLMC) | | | 0.150 | | | | 01/06/12 | | | | 1,000,000 | |
| | 315,000 | | | WA St HFC (Vintage Burien) Ser 2004 B (LIQ: FNMA) | | | 0.300 | | | | 01/06/12 | | | | 315,000 | |
| | 1,088,000 | | | WAI Enterprises LLC US Domestic Ser 2004 | | | 0.450 | | | | 01/06/12 | | | | 1,088,000 | |
| | 1,000,000 | | | Westar Medical Office Building LP Ser 2001 | | | 0.270 | | | | 01/06/12 | | | | 1,000,000 | |
| | 1,000,000
| | | Chatom AL IDB (Powersouth Energy Coop) Ser 2008-A
(SPA: National Rural Utilities Finance) | | | 0.950 | | | | 05/15/12 | | | | 1,000,000 | |
| | | | | Total Variable Rate Demand Notes | | | | | | | | | | $ | 29,027,000 | |
Touchstone Money Market Fund (Continued)
Principal
Amount | | | | | Interest
Rate | | | Maturity
Date | | | Value | |
| | | | | | | | | | | | | | | | | |
| | | | | Repurchase Agreement — 4.4% | | | | | | | | | | | | |
| $ | 2,200,000
| | | BMO Capital Value $2,200,002 Collateralized by US Treasury 1.0% due
10/31/16 and market value of the collateral including accrued interest
was $2,244,030 | | | 0.020 | | | | 01/03/12 | | | $ | 2,200,000 | |
| | | | | | | | | | | | | | | | | |
| | | | | Total Investment Securities — 100.1% (Cost $50,577,947) | | | | | | | | | | $ | 50,577,947 | |
| | | | | | | | | | | | | | | | | |
| | | | | Liabilities in Excess of Other Assets — (0.1%) | | | | | | | | | | | (49,913 | ) |
| | | | | | | | | | | | | | | | | |
| | | | | Net Assets — 100.0% | | | | | | | | | | $ | 50,528,034 | |
(A) Variable rate security - the rate reflected is the rate in effect as of December 31, 2011.
Portfolio Abbreviations:
| BANS - Bond Anticipation Notes | HFA - Housing Finance Authority/Agency | LIQ - Liquidity Agreement |
| | | |
| CCAO - County Commissioner's Association of Ohio | HFC - Housing Finance Commission | LTGO - Limited Tax General Obligation |
| | | |
| CDA - Communities Development Authority | IDA - Industrial Development Authority/Agency | LSD - Local School District |
| | | |
| CSD - City School District | IDB- Industrial Development Board | MFH - Multi-Family Housing |
| | | |
| EDR - Economic Development Revenue | IDR - Industrial Development Revenue | MTN -Medium Term Note |
| | | |
| FHLB - Federal Home Loan Bank | LLC - Limited Liability Company | SD - School District |
| | | |
| FHLMC - Federal Home Loan Mortgage Association | LOC - Letter of Credit | SPA - Stand-by Purchase Agreement |
| | | |
| FNMA - Federal National Mortgage Association | LP - Limited Partnership | UTGO - Unlimited Tax General Obligation |
Other Information:
The inputs or methodology used for valuing securities may not be an indication of the risk associated with investing in those securities. For more information on valuation inputs, and their aggregation into the levels used in the table below, please refer to the security valuation section in the accompanying notes to financial statements.
Valuation inputs at Reporting Date:
| Description | | Level 1 | | | Level 2 | | | Level 3 | | | Total | |
| Corporate Bonds | | $ | — | | | $ | 6,405,012 | | | $ | $— | | | $ | 6,405,012 | |
| Municipal Bonds | | | — | | | | 5,962,417 | | | | — | | | | 5,962,417 | |
| Repurchase Agreement | | | — | | | | 2,200,000 | | | | — | | | | 2,200,000 | |
| Time Deposits | | | — | | | | 1,100,040 | | | | — | | | | 1,100,040 | |
| U.S. Government Agency Obligations | | | — | | | | 5,883,478 | | | | — | | | | 5,883,478 | |
| Variable Rate Demand Notes | | | — | | | | 29,027,000 | | | | — | | | | 29,027,000 | |
| | | | | | | | | | | | | | | | 50,577,947 | |
See accompanying notes to financial statements.
Portfolio of Investments
Touchstone Third Avenue Value Fund – December 31, 2011
| | | Shares | | | Market
Value | |
| | | | | | | | |
| Common Stocks — 96.1% | | | | | | | | |
| | | | | | | | | |
| Financials — 43.3% | | | | | | | | |
| Bank of New York Mellon Corp. | | | 81,758 | | | $ | 1,627,802 | |
| Brookfield Asset Management, Inc. (Canada) - Class A | | | 39,237 | | | | 1,078,233 | |
| Capital Southwest Corp. | | | 4,173 | | | | 340,308 | |
| Cheung Kong Holdings Ltd. | | | 172,000 | | | | 2,046,301 | |
| Forest City Enterprises, Inc. - Class A* | | | 60,500 | | | | 715,110 | |
| Hang Lung Group Ltd. | | | 147,000 | | | | 805,352 | |
| Henderson Land Development Co. Ltd. | | | 450,720 | | | | 2,240,078 | |
| Investment Technology Group, Inc.* | | | 48,523 | | | | 524,534 | |
| Investor AB - Class A (Sweden) | | | 115,000 | | | | 2,058,689 | |
| KeyCorp | | | 45,000 | | | | 346,050 | |
| Westwood Holdings Group, Inc. | | | 31,697 | | | | 1,158,525 | |
| Wheelock & Co. Ltd. | | | 498,000 | | | | 1,233,683 | |
| | | | | | | | 14,174,665 | |
| | | | | | | | | |
| Energy — 14.7% | | | | | | | | |
| Bristow Group, Inc. | | | 28,155 | | | | 1,334,265 | |
| Cenovus Energy, Inc. (Canada) | | | 19,200 | | | | 637,440 | |
| Encana Corp. (Canada)† | | | 49,400 | | | | 915,382 | |
| Pioneer Drilling Co.* | | | 113,359 | | | | 1,097,315 | |
| Tidewater, Inc. | | | 17,000 | | | | 838,100 | |
| | | | | | | | 4,822,502 | |
| | | | | | | | | |
| Materials — 13.1% | | | | | | | | |
| Canfor Corp. (Canada)* | | | 58,800 | | | | 614,695 | |
| Lanxess AG | | | 10,700 | | | | 553,938 | |
| P.H. Glatfelter Co. | | | 49,187 | | | | 694,520 | |
| POSCO ADR† | | | 20,300 | | | | 1,666,630 | |
| Westlake Chemical Corp. | | | 18,786 | | | | 755,949 | |
| | | | | | | | 4,285,732 | |
| | | | | | | | | |
| Consumer Discretionary — 11.7% | | | | | | | | |
| American Eagle Outfitters, Inc. | | | 41,770 | | | | 638,663 | |
| Madison Square Garden, Inc. - Class A* | | | 22,500 | | | | 644,400 | |
| MDC Holdings, Inc.† | | | 12,210 | | | | 215,262 | |
| Skyline Corp. | | | 20,123 | | | | 87,535 | |
| Superior Industries International, Inc. | | | 33,733 | | | | 557,944 | |
| Toyota Industries Corp. | | | 62,000 | | | | 1,687,541 | |
| | | | | | | | 3,831,345 | |
| | | | | | | | | |
| Information Technology — 11.5% | | | | | | | | |
| AVX Corp. | | | 74,000 | | | | 944,240 | |
| Broadridge Financial Solutions, Inc. | | | 24,000 | | | | 541,200 | |
| Electronics for Imaging, Inc.* | | | 14,100 | | | | 200,925 | |
| Lexmark International, Inc. - Class A | | | 18,600 | | | | 615,102 | |
| Sycamore Networks, Inc.* | | | 38,176 | | | | 683,350 | |
| Tellabs, Inc. | | | 198,450 | | | | 801,738 | |
| | | | | | | | 3,786,555 | |
| | | | | | | | | |
| Health Care — 1.8% | | | | | | | | |
| Sanofi | | | 7,877 | | | | 578,554 | |
| Total Common Stocks | | | | | | $ | 31,479,353 | |
| | | | | | | | | |
| Investment Funds — 12.5% | | | | | | | | |
| Invesco Liquid Assets Portfolio** | | | 2,730,035 | | | $ | 2,730,035 | |
| Touchstone Institutional Money Market Fund^ | | | 1,377,156 | | | | 1,377,156 | |
| Total Investment Funds | | | | | | $ | 4,107,191 | |
| | | | | | | | | |
Total Investment Securities — 108.6% (Cost $30,960,827) | | | | | | $ | 35,586,544 | |
| | | | | | | | | |
| Liabilities in Excess of Other Assets — (8.6%) | | | | | | | (2,825,184 | ) |
| | | | | | | | | |
| Net Assets — 100.0% | | | | | | $ | 32,761,360 | |
| † | All or a portion of the security is on loan. The total value of the securites on loan as of December 31, 2011 was $2,685,086. |
| * | Non-income producing security. |
| ** | Represents collateral for securities loaned. |
| ^ | Affiliated Fund, sub-advised by Fort Washington Investment Advisors, Inc. See Note 4 in Notes to Financial Statements. |
Portfolio Abbreviations:
ADR - American Depositary Receipt
Other Information:
The inputs or methodology used for valuing securities may not be an indication of the risk associated with investing in those securities. For more information on valuation inputs, and their aggregation into the levels used in the table below, please refer to the security valuation section in the accompanying notes to financial statements.
Valuation inputs at Reporting Date:
| Description | | Level 1 | | | Level 2 | | | Level 3 | | | Total | |
| Common Stocks | | $ | 31,479,353 | | | $ | — | | | $ | — | | | $ | 31,479,353 | |
| Investment Funds | | | 4,107,191 | | | | — | | | | — | | | | 4,107,191 | |
| | | | | | | | | | | | | | | $ | 35,586,544 | |
See accompanying notes to financial statements.
Portfolio of Investments
Touchstone Aggressive ETF Fund – December 31, 2011
| Shares | | | | | Market
Value | |
| | | | | | | | | |
| | | | | Exchange Traded Funds — 98.8% | | | | |
| | 35,510 | | | iShares Barclays Aggregate Bond Fund | | $ | 3,914,978 | |
| | 49,900 | | | iShares MSCI EAFE Index Fund | | | 2,471,547 | |
| | 48,860 | | | iShares S&P 500 Growth Index Fund | | | 3,294,141 | |
| | 11,230 | | | iShares S&P 500 Index Fund/US | | | 1,414,531 | |
| | 75,990 | | | iShares S&P 500 Value Index Fund† | | | 4,394,502 | |
| | 6,770 | | | iShares S&P MidCap 400 Growth Index Fund† | | | 668,402 | |
| | 8,850 | | | iShares S&P MidCap 400/BARRA Value Index Fund† | | | 672,423 | |
| | 10,050 | | | iShares S&P SmallCap 600 Value Index Fund† | | | 701,088 | |
| | 2,150 | | | iShares S&P SmallCap 600/BARRA Growth Index Fund† | | | 160,110 | |
| | | | | Total Exchange Traded Funds | | $ | 17,691,722 | |
| | | | | | | | | |
| | | | | Investment Funds — 12.8% | | | | |
| | 1,942,905 | | | Invesco Liquid Assets Portfolio** | | | 1,942,905 | |
| | 355,850 | | | Touchstone Institutional Money Market Fund^ | | | 355,850 | |
| | | | | Total Investment Funds | | $ | 2,298,755 | |
| | | | | | | | | |
| | | | | Total Investment Securities — 111.6% (Cost $19,538,966) | | $ | 19,990,477 | |
| | | | | | | | | |
| | | | | Liabilities in Excess of Other Assets — (11.6%) | | | (2,080,699 | ) |
| | | | | | | | | |
| | | | | Net Assets — 100.0% | | $ | 17,909,778 | |
| † | All or a portion of the security is on loan. The total value of the securites on loan as of December 31, 2011 was $1,888,132. |
| ** | Represents collateral for securities loaned. |
| ^ | Affiliated Fund, sub-advised by Fort Washington Investment Advisors, Inc. See Note 4 in Notes to Financial Statements. |
Other Information:
The inputs or methodology used for valuing securities may not be an indication of the risk associated with investing in those securities. For more information on valuation inputs, and their aggregation into the levels used in the table below, please refer to the security valuation section in the accompanying notes to financial statements.
Valuation inputs at Reporting Date:
| Description | | Level 1 | | | Level 2 | | | Level 3 | | | Total | |
| Exchange Traded Funds | | $ | 17,691,722 | | | | — | | | | — | | | $ | 17,691,722 | |
| Investment Funds | | | 2,298,755 | | | | — | | | | — | | | | 2,298,755 | |
| | | | | | | | | | | | | | | $ | 19,990,477 | |
See accompanying notes to financial statements.
Portfolio of Investments
Touchstone Conservative ETF Fund – December 31, 2011
| Shares | | | | | Market
Value | |
| | | | | | | | | |
| | | | | Exchange Traded Funds — 98.6% | | | | |
| | 38,930 | | | iShares Barclays 1-3 Year Treasury Bond Fund | | $ | 3,289,585 | |
| | 106,300 | | | iShares Barclays Aggregate Bond Fund | | | 11,719,575 | |
| | 28,030 | | | iShares MSCI EAFE Index Fund | | | 1,388,326 | |
| | 26,350 | | | iShares S&P 500 Growth Index Fund | | | 1,776,517 | |
| | 8,640 | | | iShares S&P 500 Index Fund/US | | | 1,088,294 | |
| | 42,120 | | | iShares S&P 500 Value Index Fund | | | 2,435,800 | |
| | 3,920 | | | iShares S&P MidCap 400 Growth Index Fund† | | | 387,022 | |
| | 5,130 | | | iShares S&P MidCap 400/BARRA Value Index Fund† | | | 389,777 | |
| | 2,720 | | | iShares S&P SmallCap 600 Value Index Fund† | | | 189,747 | |
| | 2,520 | | | iShares S&P SmallCap 600/BARRA Growth Index Fund† | | | 187,664 | |
| | | | | Total Exchange Traded Funds | | $ | 22,852,307 | |
| | | | | | | | | |
| | | | | Investment Funds — 4.4% | | | | |
| | 647,881 | | | Invesco Liquid Assets Portfolio** | | | 647,881 | |
| | 371,364 | | | Touchstone Institutional Money Market Fund^ | | | 371,364 | |
| | | | | Total Investment Funds | | $ | 1,019,245 | |
| | | | | | | | | |
| | | | | Total Investment Securities — 103.0% (Cost $22,205,090) | | $ | 23,871,552 | |
| | | | | | | | | |
| | | | | Liabilities in Excess of Other Assets — (3.0%) | | | (702,579 | ) |
| | | | | | | | | |
| | | | | Net Assets — 100.0% | | $ | 23,168,973 | |
| † | All or a portion of the security is on loan. The total value of the securites on loan as of December 31, 2011 was $629,605. |
| ** | Represents collateral for securities loaned. |
| ^ | Affiliated Fund, sub-advised by Fort Washington Investment Advisors, Inc. See Note 4 in Notes to Financial Statements. |
Other Information:
The inputs or methodology used for valuing securities may not be an indication of the risk associated with investing in those securities. For more information on valuation inputs, and their aggregation into the levels used in the table below, please refer to the security valuation section in the accompanying notes to financial statements.
Valuation inputs at Reporting Date:
| Description | | Level 1 | | | Level 2 | | | Level 3 | | | Total | |
| Exchange Traded Funds | | $ | 22,852,307 | | | $ | — | | | $ | — | | | $ | 22,852,307 | |
| Investment Funds | | | 1,019,245 | | | | — | | | | — | | | | 1,019,245 | |
| | | | | | | | | | | | | | | $ | 23,871,552 | |
See accompanying notes to financial statements.
Portfolio of Investments
Touchstone Enhanced ETF Fund – December 31, 2011
| Shares | | | | | Market
Value | |
| | | | | | | | | |
| | | | | Exchange Traded Funds — 98.9% | | | | |
| | 22,760 | | | iShares Barclays Aggregate Bond Fund | | $ | 2,509,290 | |
| | 6,490 | | | iShares MSCI EAFE Index Fund | | | 321,450 | |
| | 38,150 | | | iShares S&P 500 Growth Index Fund | | | 2,572,073 | |
| | 5,910 | | | iShares S&P 500 Value Index Fund | | | 341,775 | |
| | 25,620 | | | iShares S&P MidCap 400 Growth Index Fund† | | | 2,529,462 | |
| | 4,520 | | | iShares S&P MidCap 400/BARRA Value Index Fund† | | | 343,430 | |
| | 4,800 | | | iShares S&P SmallCap 600 Value Index Fund† | | | 334,848 | |
| | 33,950 | | | iShares S&P SmallCap 600/BARRA Growth Index Fund† | | | 2,528,256 | |
| | | | | Total Exchange Traded Funds | | $ | 11,480,584 | |
| | | | | | | | | |
| | | | | Investment Funds — 20.3% | | | | |
| | 2,172,955 | | | Invesco Liquid Assets Portfolio** | | | 2,172,955 | |
| | 190,683 | | | Touchstone Institutional Money Market Fund^ | | | 190,683 | |
| | | | | Total Investment Funds | | $ | 2,363,638 | |
| | | | | | | | | |
| | | | | Total Investment Securities — 119.2% (Cost $13,216,355) | | $ | 13,844,222 | |
| | | | | | | | | |
| | | | | Liabilities in Excess of Other Assets — (19.2%) | | | (2,230,981 | ) |
| | | | | | | | | |
| | | | | Net Assets — 100.0% | | $ | 11,613,241 | |
| † | All or a portion of the security is on loan. The total value of the securites on loan as of December 31, 2011 was $2,111,141. |
| ** | Represents collateral for securities loaned. |
| ^ | Affiliated Fund, sub-advised by Fort Washington Investment Advisors, Inc. See Note 4 in Notes to Financial Statements. |
Other Information:
The inputs or methodology used for valuing securities may not be an indication of the risk associated with investing in those securities. For more information on valuation inputs, and their aggregation into the levels used in the table below, please refer to the security valuation section in the accompanying notes to financial statements.
Valuation inputs at Reporting Date:
| Description | | Level 1 | | | Level 2 | | | Level 3 | | | Total | |
| Exchange Traded Funds | | $ | 11,480,584 | | | $ | — | | | $ | — | | | $ | 11,480,584 | |
| Investment Funds | | | 2,363,638 | | | | — | | | | — | | | | 2,363,638 | |
| | | | | | | | | | | | | | | $ | 13,844,222 | |
Portfolio of Investments
Touchstone Moderate ETF Fund – December 31, 2011
| Shares | | | | | Market
Value | |
| | | | | | | | | |
| | | | | Exchange Traded Funds — 98.7% | | | | |
| | 178,960 | | | iShares Barclays Aggregate Bond Fund | | $ | 19,730,340 | |
| | 88,900 | | | iShares MSCI EAFE Index Fund | | | 4,403,217 | |
| | 93,300 | | | iShares S&P 500 Growth Index Fund | | | 6,290,286 | |
| | 20,340 | | | iShares S&P 500 Index Fund/US | | | 2,562,026 | |
| | 139,300 | | | iShares S&P 500 Value Index Fund† | | | 8,055,719 | |
| | 11,990 | | | iShares S&P MidCap 400 Growth IndexFund† | | | 1,183,773 | |
| | 15,540 | | | iShares S&P MidCap 400/BARRA Value Index Fund† | | | 1,180,729 | |
| | 11,560 | | | iShares S&P SmallCap 600 Value Index Fund† | | | 806,426 | |
| | 5,000 | | | iShares S&P SmallCap 600/BARRAGrowth Index Fund† | | | 372,350 | |
| | | | | Total Exchange Traded Funds | | $ | 44,584,866 | |
| | | | | | | | | |
| | | | | Investment Funds — 6.0% | | | | |
| | 1,997,884 | | | Invesco Liquid Assets Portfolio** | | | 1,997,884 | |
| | 726,842 | | | Touchstone Institutional Money Market Fund^ | | | 726,842 | |
| | | | | Total Investment Funds | | $ | 2,724,726 | |
| | | | | | | | | |
| | | | | Total Investment Securities — 104.7% (Cost $43,481,681) | | $ | 47,309,592 | |
| | | | | | | | | |
| | | | | Liabilities in Excess of Other Assets — (4.7%) | | | (2,144,725 | ) |
| | | | | | | | | |
| | | | | Net Assets — 100.0% | | $ | 45,164,867 | |
| † | All or a portion of the security is on loan. The total value of the securities on loan as of December 31, 2011 was $1,945,027. |
| ** | Represents collateral for securities loaned. |
| ^ | Affiliated Fund, sub-advised by Fort Washington Investment Advisors, Inc. See Note 4 in Notes to Financial Statements. |
Other Information:
The inputs or methodology used for valuing securities may not be an indication of the risk associated with investing in those securities. For more information on valuation inputs, and their aggregation into the levels used in the table below, please refer to the security valuation section in the accompanying notes to financial statements.
Valuation inputs at Reporting Date:
| Description | | Level 1 | | | Level 2 | | | Level 3 | | | Total | |
| Exchange Traded Funds | | $ | 44,584,866 | | | $ | — | | | $ | — | | | $ | 44,584,866 | |
| Investment Funds | | | 2,724,726 | | | | — | | | | — | | | | 2,724,726 | |
| | | | | | | | | | | | | | | $ | 47,309,592 | |
See accompanying notes to financial statements.
This page intentionally left blank.
Statements of Assets and Liabilities
December 31, 2011
| | | Touchstone
Baron Small
Cap Growth
Fund | | | Touchstone
Core Bond
Fund | | | Touchstone
High Yield
Fund | | | Touchstone
Large Cap
Core Equity
Fund | |
| | | | | | | | | | | | | |
| Assets | | | | | | | | | | | | | | | | |
| Investments, at cost | | $ | 13,078,815 | | | $ | 53,955,247 | | | $ | 26,788,933 | | | $ | 27,736,238 | |
| Affiliated securities, at market value | | $ | 995,365 | | | $ | 1,017,462 | | | $ | 263,209 | | | $ | 460,371 | |
| Non-affiliated securities, at market value | | | 20,172,276 | | | | 53,286,364 | | | | 26,496,061 | | | | 32,507,591 | |
| Investments, at value (A) | | $ | 21,167,641 | | | $ | 54,303,826 | | | $ | 26,759,270 | | | $ | 32,967,962 | |
| Cash | | | — | | | | — | | | | 5,986 | | | | — | |
| Dividends and interest receivable | | | 12,222 | | | | 404,712 | | | | 488,653 | | | | 62,385 | |
| Receivable for capital shares sold | | | — | | | | 14,056 | | | | 96,511 | | | | — | |
| Receivable for investments sold | | | — | | | | — | | | | — | | | | — | |
| Securities lending income receivable | | | 7,195 | | | | 59 | | | | 81 | | | | 72 | |
| Receivable from Investment Advisor | | | — | | | | — | | | | — | | | | — | |
| Tax reclaim receivable | | | — | | | | — | | | | — | | | | — | |
| Other assets | | | — | | | | — | | | | — | | | | — | |
| Total Assets | | | 21,187,058 | | | | 54,722,653 | | | | 27,350,501 | | | | 33,030,419 | |
| | | | | | | | | | | | | | | | | |
| Liabilities | | | | | | | | | | | | | | | | |
| Bank overdrafts | | | — | | | | 2,527 | | | | — | | | | — | |
| Dividends payable | | | — | | | | — | | | | — | | | | — | |
| Payable for return of collateral for securities on loan | | | 1,353,441 | | | | 47,266 | | | | 86,937 | | | | 475,187 | |
| Payable for capital shares redeemed | | | 22,505 | | | | 68,009 | | | | 299 | | | | 3,734 | |
| Payable for investments purchased | | | 14,266 | | | | — | | | | — | | | | — | |
| Payable to Investment Advisor | | | 17,496 | | | | 25,566 | | | | 11,322 | | | | 17,902 | |
| Payable to other affiliates | | | 23,642 | | | | 36,291 | | | | 32,195 | | | | 33,321 | |
| Payable to Trustees | | | 4,124 | | | | 4,074 | | | | 4,056 | | | | 4,089 | |
| Payable for professional services | | | 16,808 | | | | 17,927 | | | | 17,710 | | | | 17,272 | |
| Other accrued expenses and liabilities | | | 1,599 | | | | 12,135 | | | | 6,986 | | | | 2,136 | |
| Total Liabilities | | | 1,453,881 | | | | 213,795 | | | | 159,505 | | | | 553,641 | |
| | | | | | | | | | | | | | | | | |
| Net Assets | | $ | 19,733,177 | | | $ | 54,508,858 | | | $ | 27,190,996 | | | $ | 32,476,778 | |
| | | | | | | | | | | | | | | | | |
| Net assets consist of: | | | | | | | | | | | | | | | | |
| Paid-in capital | | $ | 8,430,948 | | | $ | 51,038,013 | | | $ | 26,899,931 | | | $ | 43,178,462 | |
| Accumulated net investment income (loss) | | | — | | | | 1,616,864 | | | | 2,077,668 | | | | 521,791 | |
Accumulated net realized gains (losses) on investments and
foreign currency | | | 3,213,403 | | | | 1,505,402 | | | | (1,756,940 | ) | | | (16,455,199 | ) |
Net unrealized appreciation (depreciation) on investments and
foreign currency transactions | | | 8,088,826 | | | | 348,579 | | | | (29,663 | ) | | | 5,231,724 | |
| Net assets applicable to shares outstanding | | $ | 19,733,177 | | | $ | 54,508,858 | | | $ | 27,190,996 | | | $ | 32,476,778 | |
| | | | | | | | | | | | | | | | | |
Shares of beneficial interest outstanding (unlimited number of
shares authorized, no par value) | | | 1,124,448 | | | | 4,916,730 | | | | 3,581,204 | | | | 3,550,960 | |
| Net asset value, offering price and redemption price per share | | $ | 17.55 | | | $ | 11.09 | | | $ | 7.59 | | | $ | 9.15 | |
| | | | | | | | | | | | | | | | | |
| (A) Includes market value of securities on loan of: | | $ | 1,326,521 | | | $ | 46,041 | | | $ | 84,685 | | | $ | 465,229 | |
See accompanying notes to financial statements.
Statements of Assets and Liabilities (Continued)
| | Touchstone
Mid Cap
Growth Fund | | Touchstone
Money Market
Fund | | | Touchstone
Third Avenue
Value Fund | | | Touchstone
Aggressive ETF
Fund | | | Touchstone
Conservative
ETF Fund | | | Touchstone
Enhanced ETF
Fund | | | Touchstone
Moderate ETF
Fund | |
| | | | | | | | | | | | | | | | | | | | | | | | | | |
| | | | | | | | | | | | | | | | | | | | | | | | | | |
| $ | 20,070,115 | | $ | 50,577,947 | | | $ | 30,960,827 | | | $ | 19,538,966 | | | $ | 22,205,090 | | | $ | 13,216,355 | | | $ | 43,481,681 | |
| $ | — | | $ | — | | | $ | 1,377,156 | | | $ | 355,850 | | | $ | 371,364 | | | $ | 190,683 | | | $ | 726,842 | |
| | 20,262,735 | | | 50,577,947 | | | | 34,209,388 | | | | 19,634,627 | | | | 23,500,188 | | | | 13,653,539 | | | | 46,582,750 | |
| $ | 20,262,735 | | $ | 50,577,947 | | | $ | 35,586,544 | | | $ | 19,990,477 | | | $ | 23,871,552 | | | $ | 13,844,222 | | | $ | 47,309,592 | |
| | — | | | 9,075 | | | | — | | | | 84 | | | | 22 | | | | 49 | | | | 83 | |
| | 13,356 | | | 137,699 | | | | 20,555 | | | | 1,056 | | | | 4,517 | | | | 668 | | | | 5,111 | |
| | — | | | — | | | | 1,265 | | | | — | | | | — | | | | — | | | | 1,139 | |
| | 277,678 | | | — | | | | — | | | | — | | | | — | | | | — | | | | 88,550 | |
| | 220 | | | — | | | | 1,451 | | | | 704 | | | | 1,313 | | | | 1,628 | | | | 1,373 | |
| | — | | | 35,457 | | | | — | | | | — | | | | — | | | | — | | | | — | |
| | 357 | | | — | | | | 21 | | | | — | | | | — | | | | — | | | | 3,428 | |
| | — | | | 2 | | | | — | | | | — | | | | — | | | | — | | | | — | |
| | 20,554,346 | | | 50,760,180 | | | | 35,609,836 | | | | 19,992,321 | | | | 23,877,404 | | | | 13,846,567 | | | | 47,409,276 | |
| | | | | | | | | | | | | | | | | | | | | | | | | | |
| | | | | | | | | | | | | | | | | | | | | | | | | | |
| | 18,776 | | | — | | | | — | | | | — | | | | — | | | | — | | | | — | |
| | — | | | 48 | | | | — | | | | — | | | | — | | | | — | | | | — | |
| | — | | | — | | | | 2,730,035 | | | | 1,942,905 | | | | 647,881 | | | | 2,172,955 | | | | 1,997,884 | |
| | 5,763 | | | 145,878 | | | | 8,889 | | | | 2,528 | | | | 3,554 | | | | 12,889 | | | | 1,701 | |
| | — | | | — | | | | — | | | | 88,697 | | | | — | | | | — | | | | 154,491 | |
| | 13,161 | | | — | | | | 45,000 | | | | 15,091 | | | | 10,918 | | | | 22,124 | | | | 15,293 | |
| | 17,634 | | | 58,023 | | | | 40,694 | | | | 8,895 | | | | 23,890 | | | | 3,865 | | | | 51,105 | |
| | 4,078 | | | 4,256 | | | | 4,122 | | | | 4,062 | | | | 4,043 | | | | 4,039 | | | | 4,123 | |
| | 17,552 | | | 18,085 | | | | 17,441 | | | | 17,308 | | | | 17,481 | | | | 17,208 | | | | 18,164 | |
| | 3,218 | | | 5,856 | | | | 2,295 | | | | 3,057 | | | | 664 | | | | 246 | | | | 1,648 | |
| | 80,182 | | | 232,146 | | | | 2,848,476 | | | | 2,082,543 | | | | 708,431 | | | | 2,233,326 | | | | 2,244,409 | |
| | | | | | | | | | | | | | | | | | | | | | | | | | |
| $ | 20,474,164 | | $ | 50,528,034 | | | $ | 32,761,360 | | | $ | 17,909,778 | | | $ | 23,168,973 | | | $ | 11,613,241 | | | $ | 45,164,867 | |
| | | | | | | | | | | | | | | | | | | | | | | | | | |
| | | | | | | | | | | | | | | | | | | | | | | | | | |
| $ | 22,564,853 | | $ | 50,528,972 | | | $ | 37,042,840 | | | $ | 18,313,695 | | | $ | 21,726,479 | | | $ | 20,535,346 | | | $ | 47,023,132 | |
| | — | | | (48 | ) | | | (1,586,412 | ) | | | 253,424 | | | | 398,219 | | | | 83,581 | | | | 826,859 | |
| | | | | | | | | | | | | | | | | | | | | | | | | | |
| | (2,283,309) | | | (890 | ) | | | (7,320,783 | ) | | | (1,108,852 | ) | | | (622,187 | ) | | | (9,633,553 | ) | | | (6,513,462 | ) |
| | | | | | | | | | | | | | | | | | | | | | | | | | |
| | 192,620 | | | — | | | | 4,625,715 | | | | 451,511 | | | | 1,666,462 | | | | 627,867 | | | | 3,828,338 | |
| $ | 20,474,164 | | $ | 50,528,034 | | | $ | 32,761,360 | | | $ | 17,909,778 | | | $ | 23,168,973 | | | $ | 11,613,241 | | | $ | 45,164,867 | |
| | | | | | | | | | | | | | | | | | | | | | | | | | |
| | | | | | | | | | | | | | | | | | | | | | | | | | |
| | 1,729,846 | | | 50,518,407 | | | | 2,246,577 | | | | 1,778,601 | | | | 1,968,189 | | | | 1,519,701 | | | | 3,776,813 | |
| $ | 11.84 | | $ | 1.00 | | | $ | 14.58 | | | $ | 10.07 | | | $ | 11.77 | | | $ | 7.64 | | | $ | 11.96 | |
| | | | | | | | | | | | | | | | | | | | | | | | | | |
| $ | — | | $ | — | | | $ | 2,685,086 | | | $ | 1,888,132 | | | $ | 629,605 | | | $ | 2,111,141 | | | $ | 1,945,027 | |
Statements of Operations
For the Year Ended December 31, 2011
| | | Touchstone
Baron Small
Cap Growth
Fund | | | Touchstone
Core Bond
Fund | | | Touchstone
High Yield
Fund | | | Touchstone
Large Cap
Core Equity
Fund | |
| Investment Income | | | | | | | | | | | | | | | | |
| Dividends from affiliated securities | | $ | 1,401 | | | $ | 5,492 | | | $ | 696 | | | $ | 1,041 | |
| Dividends from non-affiliated securities(A) | | | 139,295 | | | | 16,239 | | | | 19,233 | | | | 928,267 | |
| Interest | | | — | | | | 1,968,344 | | | | 2,372,410 | | | | 1 | |
| Income from securities loaned | | | 27,640 | | | | 322 | | | | 1,459 | | | | 924 | |
| Total Investment Income | | | 168,336 | | | | 1,990,397 | | | | 2,393,798 | | | | 930,233 | |
| | | | | | | | | | | | | | | | | |
| Expenses | | | | | | | | | | | | | | | | |
| Investment advisory fees | | | 233,925 | | | | 258,937 | | | | 149,585 | | | | 264,528 | |
| Administration fees | | | 44,557 | | | | 94,160 | | | | 59,835 | | | | 81,394 | |
| Compliance fees and expenses | | | 1,851 | | | | 1,851 | | | | 1,851 | | | | 1,851 | |
| Custody fees | | | 1,208 | | | | 565 | | | | 1,672 | | | | 2,006 | |
| Professional fees | | | 18,600 | | | | 21,730 | | | | 20,668 | | | | 20,822 | |
| Transfer Agent fees | | | 124 | | | | 182 | | | | 113 | | | | 143 | |
| Reports to Shareholders | | | 1,046 | | | | 1,925 | | | | 1,502 | | | | 1,836 | |
| Shareholder servicing fees | | | 51,172 | | | | 29,138 | | | | 59,646 | | | | 77,124 | |
| Trustee fees | | | 8,340 | | | | 8,294 | | | | 8,273 | | | | 8,310 | |
| Other expenses | | | 2,630 | | | | 21,509 | | | | 9,737 | | | | 2,180 | |
| Total Expenses | | | 363,453 | | | | 438,291 | | | | 312,882 | | | | 460,194 | |
| Fees waived by the Administrator | | | (18,309 | ) | | | — | | | | — | | | | (53,498 | ) |
| Expenses reimbursed by the Investment Advisor | | | — | | | | — | | | | — | | | | — | |
| Net Expenses | | | 345,144 | | | | 438,291 | | | | 312,882 | | | | 406,696 | |
| | | | | | | | | | | | | | | | | |
| Net Investment Income (Loss) | | | (176,808 | ) | | | 1,552,106 | | | | 2,080,916 | | | | 523,537 | |
| | | | | | | | | | | | | | | | | |
| Realized and Unrealized Gain (Loss) on Investments | | | | | | | | | | | | | | | | |
| Net realized gain (loss) on investments | | | 3,619,009 | | | | 1,837,506 | | | | 1,669,862 | | | | 2,253,119 | |
| Net realized loss on foreign currency | | | — | | | | — | | | | — | | | | — | |
| Net change in unrealized appreciation (depreciation) on investments | | | (2,689,719 | ) | | | 283,443 | | | | (2,092,332 | ) | | | (2,788,218 | ) |
| Net change in unrealized depreciation on foreign currency transactions | | | — | | | | — | | | | — | | | | — | |
| | | | | | | | | | | | | | | | | |
| Net Realized and Unrealized Gain (Loss) on Investments | | | 929,290 | | | | 2,120,949 | | | | (422,470 | ) | | | (535,099 | ) |
| | | | | | | | | | | | | | | | | |
| Change in Net Assets Resulting from Operations | | $ | 752,482 | | | $ | 3,673,055 | | | $ | 1,658,446 | | | $ | (11,562 | ) |
| | | | | | | | | | | | | | | | | |
| (A) Net of foreign tax withholding of: | | $ | 83 | | | $ | — | | | $ | — | | | $ | 325 | |
See accompanying notes to financial statements.
Statements of Operations (Continued)
| | Touchstone
Mid Cap
Growth
Fund | | Touchstone
Money
Market
Fund | | | Touchstone
Third Avenue
Value
Fund | | | Touchstone
Aggressive ETF
Fund | | | Touchstone
Conservative
ETF
Fund | | | Touchstone
Enhanced ETF
Fund | | | Touchstone
Moderate ETF
Fund | |
| $ | 976 | | $ | — | | | $ | 4,002 | | | $ | 373 | | | $ | 511 | | | $ | 258 | | | $ | 1,067 | |
| | 145,024 | | | — | | | | 717,386 | | | | 378,071 | | | | 565,547 | | | | 177,503 | | | | 1,194,439 | |
| | — | | | 204,819 | | | | — | | | | — | | | | — | | | | — | | | | — | |
| | 3,325 | | | — | | | | 25,335 | | | | 7,125 | | | | 17,488 | | | | 6,703 | | | | 14,849 | |
| | 149,325 | | | 204,819 | | | | 746,723 | | | | 385,569 | | | | 583,546 | | | | 184,464 | | | | 1,210,355 | |
| | | | | | | | | | | | | | | | | | | | | | | | | | |
| | | | | | | | | | | | | | | | | | | | | | | | | | |
| | 191,646 | | | 100,106 | | | | 354,627 | | | | 68,613 | | | | 92,924 | | | | 52,560 | | | | 195,366 | |
| | 50,657 | | | 111,222 | | | | 88,657 | | | | 34,307 | | | | 46,463 | | | | 26,280 | | | | 97,788 | |
| | 1,851 | | | 1,851 | | | | 1,851 | | | | 1,851 | | | | 1,851 | | | | 1,851 | | | | 1,851 | |
| | 439 | | | 538 | | | | 5,660 | | | | 3,348 | | | | 292 | | | | 172 | | | | 570 | |
| | 20,622 | | | 21,404 | | | | 21,234 | | | | 18,893 | | | | 19,395 | | | | 18,560 | | | | 21,677 | |
| | 2,926 | | | 120 | | | | 113 | | | | 45 | | | | 48 | | | | 45 | | | | 3,178 | |
| | 2,989 | | | 1,538 | | | | 4 | | | | — | | | | 1,153 | | | | 6,170 | | | | 2,038 | |
| | 35,437 | | | 138,965 | | | | 106,276 | | | | 42,822 | | | | 58,054 | | | | 32,814 | | | | 112,306 | |
| | 8,295 | | | 8,478 | | | | 8,295 | | | | 8,276 | | | | 8,258 | | | | 8,251 | | | | 8,347 | |
| | 3,393 | | | 9,871 | | | | 932 | | | | 693 | | | | 828 | | | | 416 | | | | 1,564 | |
| | 318,255 | | | 394,093 | | | | 587,649 | | | | 178,848 | | | | 229,266 | | | | 147,119 | | | | 444,685 | |
| | (8,783 | ) | | (111,222 | ) | | | (69,550 | ) | | | (34,307 | ) | | | (46,463 | ) | | | (26,280 | ) | | | (78,137 | ) |
| | — | | | (83,660 | ) | | | — | | | | (15,923 | ) | | | (8,560 | ) | | | (22,336 | ) | | | — | |
| | 309,472 | | | 199,211 | | | | 518,099 | | | | 128,618 | | | | 174,243 | | | | 98,503 | | | | 366,548 | |
| | | | | | | | | | | | | | | | | | | | | | | | | | |
| | (160,147 | ) | | 5,608 | | | | 228,624 | | | | 256,951 | | | | 409,303 | | | | 85,961 | | | | 843,807 | |
| | | | | | | | | | | | | | | | | | | | | | | | | | |
| | | | | | | | | | | | | | | | | | | | | | | | | | |
| | 2,990,749 | | | (590 | ) | | | 4,422,511 | | | | 2,466,584 | | | | 1,215,892 | | | | 464,463 | | | | 443,087 | |
| | — | | | — | | | | (163 | ) | | | — | | | | — | | | | — | | | | — | |
| | (5,540,489 | ) | | — | | | | (11,061,955 | ) | | | (2,413,231 | ) | | | (819,585 | ) | | | (1,060,650 | ) | | | (273,558 | ) |
| | — | | | — | | | | (99 | ) | | | — | | | | — | | | | — | | | | (15 | ) |
| | | | | | | | | | | | | | | | | | | | | | | | | | |
| | (2,549,740 | ) | | (590 | ) | | | (6,639,706 | ) | | | 53,353 | | | | 396,307 | | | | (596,187 | ) | | | 169,514 | |
| | | | | | | | | | | | | | | | | | | | | | | | | | |
| $ | (2,709,887 | ) | $ | 5,018 | | | $ | (6,411,082 | ) | | $ | 310,304 | | | $ | 805,610 | | | $ | (510,226 | ) | | $ | 1,013,321 | |
| | | | | | | | | | | | | | | | | | | | | | | | | | |
| $ | 183 | | $ | — | | | $ | 41,800 | | | $ | — | | | $ | — | | | $ | — | | | $ | — | |
Statements of Changes in Net Assets
| | | | Touchstone
Baron Small Cap
Growth Fund | | | | Touchstone
Core Bond
Fund | | | | Touchstone
High Yield
Fund | |
| | | | For the Year Ended December 31, 2011 | | | | For the Year Ended December 31, 2010 | | | | For the Year Ended December 31, 2011 | | | | For the Year Ended December 31, 2010 | | | | For the Year Ended December 31, 2011 | | | | For the Year Ended December 31, 2010 | |
| From Operations | | | | | | | | | | | | | | | | | | | | | | | | |
| Net investment income (loss) | | $ | (176,808 | ) | | $ | (90,744 | ) | | $ | 1,552,106 | | | $ | 1,404,021 | | | $ | 2,080,916 | | | $ | 2,424,034 | |
Net realized gain (loss) on
investments | | | 3,619,009 | | | | 1,680,660 | | | | 1,837,506 | | | | 988,660 | | | | 1,669,862 | | | | 1,040,770 | |
Net change in unrealized
appreciation (depreciation) on
investments | | | (2,689,719 | ) | | | 3,268,043 | | | | 283,443 | | | | 507,158 | | | | (2,092,332 | ) | | | 286,665 | |
Change in Net Assets from
Operations | | | 752,482 | | | | 4,857,959 | | | | 3,673,055 | | | | 2,899,839 | | | | 1,658,446 | | | | 3,751,469 | |
| | | | | | | | | | | | | | | | | | | | | | | | | |
Distributions to Shareholders
from: | | | | | | | | | | | | | | | | | | | | | | | |
| Net investment income | | | — | | | | — | | | | (1,448,950 | ) | | | (1,536,204 | ) | | | (2,427,279 | ) | | | (2,820,992 | ) |
| Net realized gains | | | — | | | | — | | | | (1,158,170 | ) | | | — | | | | — | | | | — | |
| Total Distributions | | | — | | | | — | | | | (2,607,120 | ) | | | (1,536,204 | ) | | | (2,427,279 | | | | (2,820,992 | ) |
| | | | | | | | | | | | | | | | | | | | | | | | | |
| Share Transactions | | | | | | | | | | | | | | | | | | | | | | | | |
| Proceeds from shares sold | | | 5,503,958 | | | | 6,898,480 | | | | 20,953,054 | | | | 2,781,682 | | | | 8,370,162 | | | | 14,265,059 | |
| Reinvestment of distributions | | | — | | | | — | | | | 2,607,120 | | | | 1,536,204 | | | | 2,427,279 | | | | 2,820,992 | |
| Cost of shares redeemed | | | (11,104,063 | ) | | | (7,505,095 | ) | | | (10,525,655 | ) | | | (3,859,410 | ) | | | (15,389,451 | ) | | | (20,502,641 | ) |
Change in Net Assets from
Share Transactions | | | (5,600,105 | ) | | | (606,615 | ) | | | 13,034,519 | | | | 458,476 | | | | (4,592,010 | ) | | | (3,416,590 | ) |
| | | | | | | | | | | | | | | | | | | | | | | | | |
Total Increase (Decrease) in Net
Assets | | | (4,847,623 | ) | | | 4,251,344 | | | | 14,100,454 | | | | 1,822,111 | | | | (5,360,843 | ) | | | (2,486,113 | ) |
| | | | | | | | | | | | | | | | | | | | | | | | | |
| Net Assets | | | | | | | | | | | | | | | | | | | | | | | | |
| Beginning of period | | | 24,580,800 | | | | 20,329,456 | | | | 40,408,404 | | | | 38,586,293 | | | | 32,551,839 | | | | 35,037,952 | |
| End of period | | $ | 19,733,177 | | | $ | 24,580,800 | | | $ | 54,508,858 | | | $ | 40,408,404 | | | $ | 27,190,996 | | | $ | 32,551,839 | |
| | | | | | | | | | | | | | | | | | | | | | | | | |
Accumulated Net Investment
Income | | $ | — | | | $ | 233 | | | $ | 1,616,864 | | | $ | 1,446,554 | | | $ | 2,077,668 | | | $ | 2,424,031 | |
See accompanying notes to financial statements.
Statements of Changes in Net Assets (Continued)
| | Touchstone
Large Cap
Core Equity Fund | | | Touchstone
Mid Cap Growth
Fund | |
| | For the Year
Ended
December 31,
2011 | | For the Year
Ended
December 31,
2010 | | | For the Year
Ended
December 31,
2011 | | | For the Year
Ended
December 31,
2010 | |
| | | | | | | | | | | | | | |
| $ | 523,537 | | $ | 569,187 | | | $ | (160,147 | ) | | $ | 81,009 | |
| | 2,253,119 | | | (259,145 | ) | | | 2,990,749 | | | | 859,058 | |
| | (2,788,218) | | | 5,424,768 | | | | (5,540,489 | ) | | | 3,995,232 | |
| | (11,562) | | | 5,734,810 | | | | (2,709,887 | ) | | | 4,935,299 | |
| | | | | | | | | | | | | | |
| | | | | | | | | | | | | |
| | (570,931) | | | (751,349 | ) | | | (72,756 | ) | | | (57,209 | ) |
| — | | | — | | | | — | | | | — | |
| | (570,931) | | | (751,349 | ) | | | (72,756 | ) | | | (57,209 | ) |
| | | | | | | | | | | | | | |
| | | | | | | | | | | | | | |
| | 6,604,252 | | | 7,653,481 | | | | 3,010,829 | | | | 4,650,939 | |
| | 570,931 | | | 751,349 | | | | 72,756 | | | | 57,209 | |
| | (17,236,172) | | | (33,584,365 | ) | | | (7,839,994 | ) | | | (7,094,405 | ) |
| | (10,060,989) | | | (25,179,535 | ) | | | (4,756,409 | ) | | | (2,386,257 | ) |
| | | | | | | | | | | | | | |
| | (10,643,482) | | | (20,196,074 | ) | | | (7,539,052 | ) | | | 2,491,833 | |
| | | | | | | | | | | | | | |
| | | | | | | | | | | | | | |
| | 43,120,260 | | | 63,316,334 | | | | 28,013,216 | | | | 25,521,383 | |
| $ | $32,476,778 | | $ | 43,120,260 | | | $ | 20,474,164 | | | $ | 28,013,216 | |
| | | | | | | | | | | | | | |
| $ | $521,791 | | $ | 569,185 | | | $ | — | | | $ | 79,095 | |
Statements of Changes in Net Assets (Continued)
| | | Touchstone Money Market Fund | | | Touchstone
Third Avenue
Value Fund | | | Touchstone
Aggressive ETF
Fund | |
| | | For the
Year
Ended
December 31,
2011 | | | For the
Year
Ended December 31,
2010 | | | For the
Year
Ended
December 31,
2011 | | | For the Year Ended December 31, 2010 | | | For the
Year
Ended
December 31,
2011 | | | For the
Year
Ended December 31,
2010 | |
| From Operations | | | | | | | | | | | | | | | | | | | | | | | | |
| Net investment income | | $ | 5,608 | | | $ | 12,539 | | | $ | 228,624 | | | $ | 473,782 | | | $ | 256,951 | | | $ | 256,237 | |
Net realized gain (loss) on
investments and foreign
currency transactions | | | (590 | ) | | | 103,132 | | | | 4,422,348 | | | | 1,606,252 | | | | 2,466,584 | | | | (1,177,745 | ) |
Net change in unrealized
appreciation (depreciation) on
investments and foreign
currency transactions | | | — | | | | — | | | | (11,062,054 | ) | | | 7,070,880 | | | | (2,413,231 | ) | | | 3,088,862 | |
Change in Net Assets from
Operations | | | 5,018 | | | | 115,671 | | | | (6,411,082 | ) | | | 9,150,914 | | | | 310,304 | | | | 2,167,354 | |
| | | | | | | | | | | | | | | | | | | | | | | | | |
Distributions to Shareholders
from: | | | | | | | | | | | | | | | | | | | | | | | | |
| Net investment income | | | (5,608 | ) | | | (12,539 | ) | | | (840,849 | ) | | | (3,062,305 | ) | | | (254,769 | ) | | | (296,598 | ) |
| Net realized gains | | | (1,524 | ) | | | (101,798 | ) | | | — | | | | — | | | | — | | | | — | |
| Total Distributions | | | (7,132 | ) | | | (114,337 | ) | | | (840,849 | ) | | | (3,062,305 | ) | | | (254,769 | ) | | | (296,598 | ) |
| | | | | | | | | | | | | | | | | | | | | | | | | |
| Share Transactions | | | | | | | | | | | | | | | | | | | | | | | | |
| Proceeds from shares sold | | | 60,271,112 | | | | 67,206,700 | | | | 1,227,361 | | | | 3,705,779 | | | | 4,349,511 | | | | 5,613,221 | |
| Reinvestment of distributions | | | 2,409 | | | | 112,446 | | | | 840,849 | | | | 3,062,305 | | | | 254,769 | | | | 296,598 | |
| Cost of shares redeemed | | | (66,774,904 | ) | | | (90,037,627 | ) | | | (14,632,572 | ) | | | (13,783,736 | ) | | | (6,091,501 | ) | | | (5,908,851 | ) |
Change in Net Assets from
Share Transactions | | | (6,501,383 | ) | | | (22,718,481 | ) | | | (12,564,362 | ) | | | (7,015,652 | ) | | | (1,487,221 | ) | | | 968 | |
| | | | | | | | | | | | | | | | | | | | | | | | | |
Total Increase (Decrease) in Net
Assets | | | (6,503,497 | ) | | | (22,717,147 | ) | | | (19,816,293 | ) | | | (927,043 | ) | | | (1,431,686 | ) | | | 1,871,724 | |
| | | | | | | | | | | | | | | | | | | | | | | | | |
| Net Assets | | | | | | | | | | | | | | | | | | | | | | | | |
| Beginning of period | | | 57,031,531 | | | | 79,748,678 | | | | 52,577,653 | | | | 53,504,696 | | | | 19,341,464 | | | | 17,469,740 | |
| End of period | | $ | 50,528,034 | | | $ | 57,031,531 | | | $ | 32,761,360 | | | $ | 52,577,653 | | | $ | 17,909,778 | | | $ | 19,341,464 | |
| | | | | | | | | | | | | | | | | | | | | | | | | |
Accumulated Net Investment
Income (Loss) | | $ | (48 | ) | | $ | — | | | $ | (1,586,412 | ) | | $ | (1,688,330 | ) | | $ | 253,424 | | | $ | 254,243 | |
Statements of Changes in Net Assets (Continued)
| | Touchstone
Conservative ETF
Fund | | | Touchstone
Enhanced ETF
Fund | | | Touchstone
Moderate ETF
Fund | |
| | For the
Year
Ended
December 31,
2011 | | For the
Year
Ended
December 31,
2010 | | | For the
Year
Ended
December 31,
2011 | | | For the
Year
Ended
December 31,
2010 | | | For the
Year
Ended
December 31,
2011 | | | For the
Year
Ended
December 31,
2010 | |
| $ | 409,303 | | $ | 446,425 | | | $ | 85,961 | | | $ | 103,471 | | | $ | 843,807 | | | $ | 938,251 | |
| | 1,215,892 | | | 24,956 | | | | 464,463 | | | | 460,542 | | | | 443,087 | | | | (2,034,807 | ) |
| | (819,585) | | | 1,431,467 | | | | (1,060,650 | ) | | | 846,656 | | | | (273,573 | ) | | | 6,712,775 | |
| | 805,610 | | | 1,902,848 | | | | (510,226 | ) | | | 1,410,669 | | | | 1,013,321 | | | | 5,616,219 | |
| | | | | | | | | | | | | | | | | | | | | | |
| | | | | | | | | | | | | | | | | | | | | | |
| | (441,810) | | | (504,733 | ) | | | (103,610 | ) | | | (269,871 | ) | | | (928,782 | ) | | | (1,128,367 | ) |
| | — | | | — | | | | — | | | | — | | | | — | | | | — | |
| | (441,810) | | | (504,733 | ) | | | (103,610 | ) | | | (269,871 | ) | | | (928,782 | ) | | | (1,128,367 | ) |
| | | | | | | | | | | | | | | | | | | | | | |
| | | | | | | | | | | | | | | | | | | | | |
| | 4,130,005 | | | 2,651,876 | | | | 624,805 | | | | 415,122 | | | | 2,533,306 | | | | 6,181,277 | |
| | 441,810 | | | 504,733 | | | | 103,610 | | | | 269,871 | | | | 928,782 | | | | 1,128,367 | |
| | (4,832,382) | | | (4,115,008 | ) | | | (2,806,805 | ) | | | (4,923,695 | ) | | | (11,873,326 | ) | | | (10,810,218 | ) |
| | (260,567) | | | (958,399 | ) | | | (2,078,390 | ) | | | (4,238,702 | ) | | | (8,411,238 | ) | | | (3,500,574 | ) |
| | | | | | | | | | | | | | | | | | | | | | |
| | 103,233 | | | 439,716 | | | | (2,692,226 | ) | | | (3,097,904 | ) | | | (8,326,699 | ) | | | 987,278 | |
| | | | | | | | | | | | | | | | | | | | | | |
| | 23,065,740 | | | 22,626,024 | | | | 14,305,467 | | | | 17,403,371 | | | | 53,491,566 | | | | 52,504,288 | |
| $ | 23,168,973 | | $ | 23,065,740 | | | $ | 11,613,241 | | | $ | 14,305,467 | | | $ | 45,164,867 | | | $ | 53,491,566 | |
| | | | | | | | | | | | | | | | | | | | | | |
| $ | 398,219 | | $ | 439,879 | | | $ | 83,581 | | | $ | 101,821 | | | $ | 826,859 | | | $ | 926,794 | |
Financial Highlights
Touchstone Baron Small Cap Growth Fund
Selected Data for a Share Outstanding
| | Year Ended December 31, | |
| | | 2011 | | | 2010 | | | 2009 | | | 2008 | | | 2007 | |
| Net asset value at beginning of period | | $ | 16.74 | | | $ | 13.40 | | | $ | 10.08 | | | $ | 20.52 | | | $ | 22.86 | |
| Income (loss) from investment operations: | | | | | | | | | | | | | | | | | | | | |
| Net investment loss | | | (0.15 | ) | | | (0.06 | ) | | | (0.08 | ) | | | (0.07 | ) | | | (0.16 | ) |
Net realized and unrealized gains (losses) on
investments | | | 0.96 | | | | 3.40 | | | | 3.40 | | | | (7.11 | ) | | | 0.87 | |
| Total from investment operations | | | 0.81 | | | | 3.34 | | | | 3.32 | | | | (7.18 | ) | | | 0.71 | |
| Distributions from: | | | | | | | | | | | | | | | | | | | | |
| Realized capital gains | | | — | | | | — | | | | — | | | | (3.26 | ) | | | (3.05 | ) |
| Net asset value at end of period | | $ | 17.55 | | | $ | 16.74 | | | $ | 13.40 | | | $ | 10.08 | | | $ | 20.52 | |
| Total return(A) | | | 4.84 | % | | | 24.93 | % | | | 32.94 | % | | | (33.64 | %) | | | 2.76 | % |
| Ratios and supplemental data: | | | | | | | | | | | | | | | | | | | | |
| Net assets at end of period (000's) | | $ | 19,733 | | | $ | 24,581 | | | $ | 20,329 | | | $ | 14,243 | | | $ | 26,216 | |
| Ratio to average net assets: | | | | | | | | | | | | | | | | | | | | |
| Net expenses | | | 1.55 | % | | | 1.55 | % | | | 1.55 | % | | | 1.55 | % | | | 1.49 | % |
| Gross expenses | | | 1.63 | % | | | 1.62 | % | | | 1.81 | % | | | 1.84 | % | | | 1.49 | % |
| Net investment loss | | | (0.79 | %) | | | (0.43 | %) | | | (0.81 | %) | | | (0.51 | %) | | | (0.71 | %) |
| Portfolio turnover rate | | | 15 | % | | | 18 | % | | | 9 | % | | | 7 | % | | | 19 | % |
Touchstone Core Bond Fund
Selected Data for a Share Outstanding
| | | Year Ended December 31, | |
| | | 2011 | | | 2010 | | | 2009 | | | 2008 | | | 2007 | |
| Net asset value at beginning of period | | $ | 10.73 | | | $ | 10.37 | | | $ | 9.49 | | | $ | 10.33 | | | $ | 10.24 | |
| Income (loss) from investment operations: | | | | | | | | | | | | | | | | | | | | |
| Net investment income | | | 0.37 | (B) | | | 0.38 | | | | 0.39 | | | | 0.54 | | | | 0.46 | |
Net realized and unrealized gains (losses) on
investments | | | 0.53 | | | | 0.40 | | | | 1.02 | | | | (0.88 | ) | | | 0.10 | |
| Total from investment operations | | | 0.90 | | | | 0.78 | | | | 1.41 | | | | (0.34 | ) | | | 0.56 | |
| Distributions from: | | | | | | | | | | | | | | | | | | | | |
| Net investment income | | | (0.30 | ) | | | (0.42 | ) | | | (0.48 | ) | | | (0.50 | ) | | | (0.47 | ) |
| Realized capital gains | | | (0.24 | ) | | | — | | | | (0.05 | ) | | | — | | | | — | |
| Total distributions | | | (0.54 | ) | | | (0.42 | ) | | | (0.53 | ) | | | (0.50 | ) | | | (0.47 | ) |
| Net asset value at end of period | | $ | 11.09 | | | $ | 10.73 | | | $ | 10.37 | | | $ | 9.49 | | | $ | 10.33 | |
| Total return(A) | | | 8.45 | % | | | 7.57 | % | | | 14.90 | % | | | (3.26 | %) | | | 5.45 | % |
| Ratios and supplemental data: | | | | | | | | | | | | | | | | | | | | |
| Net assets at end of period (000's) | | $ | 54,509 | | | $ | 40,408 | | | $ | 38,586 | | | $ | 35,435 | | | $ | 39,647 | |
| Ratio to average net assets: | | | | | | | | | | | | | | | | | | | | |
| Net expenses | | | 0.93 | % | | | 0.91 | % | | | 1.00 | % | | | 1.00 | % | | | 0.75 | % |
| Gross expenses | | | 0.93 | % | | | 0.91 | % | | | 1.02 | % | | | 1.03 | % | | | 0.96 | % |
| Net investment income | | | 3.29 | % | | | 3.50 | % | | | 3.67 | % | | | 4.75 | % | | | 4.67 | % |
| Portfolio turnover rate | | | 419 | % | | | 487 | % | | | 422 | % | | | 171 | % | | | 283 | % |
| (A) | Total returns do not include any insurance, sales or administrative charges of variable annuity or life insurance contracts. If these charges were included, the return would be lower. |
| (B) | The net investment income per share is based on average shares outstanding for the period. |
See accompanying notes to financial statements.
Financial Highlights (Continued)
Touchstone High Yield Fund
Selected Data for a Share Outstanding
| | | Year Ended December 31, | |
| | | 2011 | | | 2010 | | | 2009 | | | 2008 | | | 2007 | |
| Net asset value at beginning of period | | $ | 7.86 | | | $ | 7.64 | | | $ | 5.52 | | | $ | 7.94 | | | $ | 8.54 | |
| Income (loss) from investment operations: | | | | | | | | | | | | | | | | | | | | |
| Net investment income | | | 0.74 | | | | 0.72 | | | | 0.67 | | | | 0.21 | | | | 0.87 | |
Net realized and unrealized gains (losses) on
investments | | | (0.26 | ) | | | 0.25 | | | | 1.92 | | | | (2.14 | ) | | | (0.72 | ) |
| Total from investment operations | | | 0.48 | | | | 0.97 | | | | 2.59 | | | | (1.93 | ) | | | 0.15 | |
| Distributions from: | | | | | | | | | | | | | | | | | | | | |
| Net investment income | | | (0.75 | ) | | | (0.75 | ) | | | (0.47 | ) | | | (0.49 | ) | | | (0.75 | ) |
| Net asset value at end of period | | $ | 7.59 | | | $ | 7.86 | | | $ | 7.64 | | | $ | 5.52 | | | $ | 7.94 | |
| Total return(A) | | | 6.08 | % | | | 12.65 | % | | | 46.90 | % | | | (24.31 | %) | | | 1.78 | % |
| Ratios and supplemental data: | | | | | | | | | | | | | | | | | | | | |
| Net assets at end of period (000's) | | $ | 27,191 | | | $ | 32,552 | | | $ | 35,038 | | | $ | 29,081 | | | $ | 27,918 | |
| Ratio to average net assets: | | | | | | | | | | | | | | | | | | | | |
| Net expenses | | | 1.05 | % | | | 1.05 | % | | | 1.05 | % | | | 1.05 | % | | | 0.80 | % |
| Gross expenses | | | 1.05 | % | | | 1.05 | % | | | 1.05 | % | | | 1.15 | % | | | 0.94 | % |
| Net investment income | | | 6.96 | % | | | 7.57 | % | | | 8.72 | % | | | 8.01 | % | | | 6.88 | % |
| Portfolio turnover rate | | | 55 | % | | | 56 | % | | | 61 | % | | | 52 | % | | | 62 | % |
Touchstone Large Cap Core Equity Fund
Selected Data for a Share Outstanding
| | | Year Ended December 31, | |
| | | 2011 | | | 2010 | | | 2009 | | | 2008 | | | 2007 | |
| Net asset value at beginning of period | | $ | 9.04 | | | $ | 8.20 | | | $ | 6.69 | | | $ | 11.22 | | | $ | 10.99 | |
| Income (loss) from investment operations: | | | | | | | | | | | | | | | | | | | | |
| Net investment income (loss) | | | 0.12 | (B) | | | 0.18 | | | | 0.09 | | | | (0.05 | ) | | | 0.24 | |
Net realized and unrealized gains (losses) on
investments | | | 0.15 | (C) | | | 0.82 | | | | 1.52 | | | | (3.92 | ) | | | 0.35 | |
| Total from investment operations | | | 0.27 | | | | 1.00 | | | | 1.61 | | | | (3.97 | ) | | | 0.59 | |
| Distributions from: | | | | | | | | | | | | | | | | | | | | |
| Net investment income | | | (0.16 | ) | | | (0.16 | ) | | | (0.10 | ) | | | (0.07 | ) | | | (0.25 | ) |
| Realized capital gains | | | — | | | | — | | | | — | | | | (0.49 | ) | | | (0.11 | ) |
| Total distributions | | | (0.16 | ) | | | (0.16 | ) | | | (0.10 | ) | | | (0.56 | ) | | | (0.36 | ) |
| Net asset value at end of period | | $ | 9.15 | | | $ | 9.04 | | | $ | 8.20 | | | $ | 6.69 | | | $ | 11.22 | |
| Total return(A) | | | 3.02 | % | | | 12.20 | % | | | 24.06 | % | | | (35.20 | %) | | | 5.32 | % |
| Ratios and supplemental data: | | | | | | | | | | | | | | | | | | | | |
| Net assets at end of period (000's) | | $ | 32,477 | | | $ | 43,120 | | | $ | 63,316 | | | $ | 49,265 | | | $ | 25,362 | |
| Ratio to average net assets: | | | | | | | | | | | | | | | | | | | | |
| Net expenses | | | 1.00 | % | | | 1.00 | % | | | 1.00 | % | | | 1.00 | % | | | 0.75 | % |
| Gross expenses | | | 1.13 | % | | | 1.04 | % | | | 1.06 | % | | | 1.10 | % | | | 1.10 | % |
| Net investment income (loss) | | | 1.29 | % | | | 1.07 | % | | | 1.40 | % | | | (1.42 | %) | | | 1.91 | % |
| Portfolio turnover rate | | | 33 | % | | | 33 | % | | | 38 | % | | | 81 | % | | | 124 | % |
| (A) | Total returns do not include any insurance, sales or administrative charges of variable annuity or life insurance contracts. If these charges were included, the return would be lower. |
| (B) | The net investment income per share is based on average shares outstanding for the period. |
| (C) | The amounts shown for a share outstanding throughout the period does not accord with the change in net realized and unrealized gains (losses) for the period due to the timing of purchases and sales of fund shares in relation to fluctuating market values during the period. |
See accompanying notes to financial statements.
Financial Highlights (Continued)
Touchstone Mid Cap Growth Fund
Selected Data for a Share Outstanding
| | | Year Ended December 31, | |
| | | 2011 | | | 2010 | | | 2009 | | | 2008 | | | 2007 | |
| Net asset value at beginning of period | | $ | 13.40 | | | $ | 11.04 | | | $ | 7.95 | | | $ | 18.55 | | | $ | 19.38 | |
| Income (loss) from investment operations: | | | | | | | | | | | | | | | | | | | | |
| Net investment income (loss) | | | (0.09 | ) | | | 0.04 | | | | 0.03 | | | | 0.02 | | | | (0.05 | ) |
Net realized and unrealized gains (losses) on
investments | | | (1.43 | ) | | | 2.35 | | | | 3.07 | | | | (7.54 | ) | | | 2.85 | |
| Total from investment operations | | | (1.52 | ) | | | 2.39 | | | | 3.10 | | | | (7.52 | ) | | | 2.80 | |
| Distributions from: | | | | | | | | | | | | | | | | | | | | |
| Net investment income | | | (0.04 | ) | | | (0.03 | ) | | | (0.01 | ) | | | — | | | | — | |
| Realized capital gains | | | — | | | | — | | | | — | | | | (3.08 | ) | | | (3.63 | ) |
| Total distributions | | | (0.04 | ) | | | (0.03 | ) | | | (0.01 | ) | | | (3.08 | ) | | | (3.63 | ) |
| Net asset value at end of period | | $ | 11.84 | | | $ | 13.40 | | | $ | 11.04 | | | $ | 7.95 | | | $ | 18.55 | |
| Total return(A) | | | (11.33 | %) | | | 21.63 | % | | | 38.99 | % | | | (39.70 | %) | | | 14.43 | % |
| Ratios and supplemental data: | | | | | | | | | | | | | | | | | | | | |
| Net assets at end of period (000's) | | $ | 20,474 | | | $ | 28,013 | | | $ | 25,521 | | | $ | 20,713 | | | $ | 46,356 | |
| Ratio to average net assets: | | | | | | | | | | | | | | | | | | | | |
| Net expenses | | | 1.22 | % | | | 1.17 | % | | | 1.16 | % | | | 1.16 | % | | | 1.15 | % |
| Gross expenses | | | 1.25 | % | | | 1.27 | % | | | 1.40 | % | | | 1.36 | % | | | 1.17 | % |
| Net investment income (loss) | | | (0.63 | %) | | | 0.31 | % | | | 0.26 | % | | | 0.06 | % | | | (0.29 | %) |
| Portfolio turnover rate | | | 141 | % | | | 60 | % | | | 71 | % | | | 73 | % | | | 83 | % |
Touchstone Money Market Fund
Selected Data for a Share Outstanding
| | | Year Ended December 31, | |
| | | 2011 | | | 2010 | | | 2009 | | | 2008 | | | 2007 | |
| Net asset value at beginning of period | | $ | 1.00 | | | $ | 1.00 | | | $ | 1.00 | | | $ | 1.00 | | | $ | 1.00 | |
| Income (loss) from investment operations: | | | | | | | | | | | | | | | | | | | | |
| Net investment income | | | — | (B) | | | — | (B) | | | 0.01 | | | | 0.03 | | | | 0.05 | |
| Net realized gains on investments | | | — | (B) | | | — | (B) | | | — | (B) | | | — | | | | — | |
| Total from investment operations | | | — | (B) | | | — | (B) | | | 0.01 | | | | 0.03 | | | | 0.05 | |
| Distributions from: | | | | | | | | | | | | | | | | | | | | |
| Net investment income | | | — | (B) | | | — | (B) | | | (0.01 | ) | | | (0.03 | ) | | | (0.05 | ) |
| Realized capital gains | | | — | (B) | | | — | (B) | | | — | | | | — | | | | — | |
| Total distributions | | | — | (B) | | | — | (B) | | | (0.01 | ) | | | (0.03 | ) | | | (0.05 | ) |
| Net asset value at end of period | | $ | 1.00 | | | $ | 1.00 | | | $ | 1.00 | | | $ | 1.00 | | | $ | 1.00 | |
| Total return(A) | | | 0.02 | % | | | 0.19 | % | | | 0.88 | % | | | 2.99 | % | | | 5.17 | % |
| Ratios and supplemental data: | | | | | | | | | | | | | | | | | | | | |
| Net assets at end of period (000's) | | $ | 50,528 | | | $ | 57,032 | | | $ | 79,749 | | | $ | 52,790 | | | $ | 44,988 | |
| Ratio to average net assets: | | | | | | | | | | | | | | | | | | | | |
| Net expenses | | | 0.36 | % | | | 0.53 | % | | | 0.71 | %(C) | | | 0.65 | % | | | 0.28 | % |
| Gross expenses | | | 0.71 | % | | | 0.65 | % | | | 0.72 | % | | | 0.65 | % | | | 0.47 | % |
| Net investment income | | | 0.01 | % | | | 0.02 | % | | | 0.80 | % | | | 2.94 | % | | | 5.06 | % |
| (A) | Total returns do not include any insurance, sales or administrative charges of variable annuity or life insurance contracts. If these charges were included, the return would be lower. |
| (B) | Less than $0.005 per share. |
| (C) | Absent money market insurance, the ratio of net expenses to average net assets would have been 0.67%. |
See accompanying notes to financial statements.
Financial Highlights (Continued)
Touchstone Third Avenue Value Fund
Selected Data for a Share Outstanding
| | | Year Ended December 31, | |
| | | 2011 | | | 2010 | | | 2009 | | | 2008 | | | 2007 | |
| Net asset value at beginning of period | | $ | 17.67 | | | $ | 15.61 | | | $ | 12.93 | | | $ | 26.70 | | | $ | 29.24 | |
| Income (loss) from investment operations: | | | | | | | | | | | | | | | | | | | | |
| Net investment income | | | 0.09 | (A) | | | 0.25 | | | | 0.26 | | | | 0.23 | | | | 0.30 | |
Net realized and unrealized gains (losses) on
investments | | | (2.80 | ) | | | 2.90 | | | | 3.78 | | | | (10.68 | ) | | | (0.79 | ) |
| Total from investment operations | | | (2.71 | ) | | | 3.15 | | | | 4.04 | | | | (10.45 | ) | | | (0.49 | ) |
| Distributions from: | | | | | | | | | | | | | | | | | | | | |
| Net investment income | | | (0.38 | ) | | | (1.09 | ) | | | (0.29 | ) | | | (0.31 | ) | | | (0.20 | ) |
| Realized capital gains | | | — | | | | — | | | | (1.07 | ) | | | (3.01 | ) | | | (1.85 | ) |
| Total distributions | | | (0.38 | ) | | | (1.09 | ) | | | (1.36 | ) | | | (3.32 | ) | | | (2.05 | ) |
| Net asset value at end of period | | $ | 14.58 | | | $ | 17.67 | | | $ | 15.61 | | | $ | 12.93 | | | $ | 26.70 | |
| Total return(B) | | | (15.31 | %) | | | 20.20 | % | | | 31.39 | % | | | (38.50 | %) | | | (1.79 | %) |
| Ratios and supplemental data: | | | | | | | | | | | | | | | | | | | | |
| Net assets at end of period (000's) | | $ | 32,761 | | | $ | 52,578 | | | $ | 53,505 | | | $ | 58,109 | | | $ | 120,717 | |
| Ratio to average net assets: | | | | | | | | | | | | | | | | | | | | |
| Net expenses | | | 1.17 | % | | | 1.17 | % | | | 1.13 | % | | | 1.06 | % | | | 1.05 | % |
| Gross expenses | | | 1.32 | % | | | 1.87 | %(C) | | | 1.34 | % | | | 1.34 | % | | | 1.07 | % |
| Net investment income | | | 0.52 | % | | | 0.93 | % | | | 1.17 | % | | | 1.08 | % | | | 1.03 | % |
| Portfolio turnover rate | | | 4 | % | | | 10 | % | | | 4 | % | | | 12 | % | | | 18 | % |
| (A) | The net investment income per share is based on average shares outstanding for the period. |
| (B) | Total returns do not include any insurance, sales or administrative charges of variable annuity or life insurance contracts. If these charges were included, the return would be lower. |
| (C) | Absent PFIC Tax expenses, the ratio of gross expenses to average net assets would have been 1.37%. |
See accompanying notes to financial statements.
Financial Highlights (Continued)
Touchstone Aggressive ETF Fund
Selected Data for a Share Outstanding
| | | Year Ended December 31, | |
| | | 2011 | | | 2010 | | | 2009 | | | 2008 | | | 2007 | |
| Net asset value at beginning of period | | $ | 10.22 | | | $ | 9.17 | | | $ | 7.80 | | | $ | 12.70 | | | $ | 12.65 | |
| Income (loss) from investment operations: | | | | | | | | | | | | | | | | | | | | |
| Net investment income (loss) | | | 0.16 | | | | 0.14 | | | | (0.09 | ) | | | 0.26 | | | | 0.40 | |
Net realized and unrealized gains (losses) on
investments | | | (0.16 | )(A) | | | 1.07 | | | | 1.78 | | | | (4.00 | ) | | | 0.25 | |
| Total from investment operations | | | — | | | | 1.21 | | | | 1.69 | | | | (3.74 | ) | | | 0.65 | |
| Distributions from: | | | | | | | | | | | | | | | | | | | | |
| Net investment income | | | (0.15 | ) | | | (0.16 | ) | | | (0.20 | ) | | | (0.25 | ) | | | (0.22 | ) |
| Realized capital gains | | | — | | | | — | | | | (0.12 | ) | | | (0.91 | ) | | | (0.38 | ) |
| Total distributions | | | (0.15 | ) | | | (0.16 | ) | | | (0.32 | ) | | | (1.16 | ) | | | (0.60 | ) |
| Net asset value at end of period | | $ | 10.07 | | | $ | 10.22 | | | $ | 9.17 | | | $ | 7.80 | | | $ | 12.70 | |
| Total return(B) | | | (0.05 | %) | | | 13.19 | % | | | 21.72 | % | | | (29.12 | %) | | | 5.12 | % |
| Ratios and supplemental data: | | | | | | | | | | | | | | | | | | | | |
| Net assets at end of period (000's) | | $ | 17,910 | | | $ | 19,341 | | | $ | 17,470 | | | $ | 7,361 | | | $ | 12,610 | |
| Ratio to average net assets: | | | | | | | | | | | | | | | | | | | | |
| Net expenses | | | 0.75 | % | | | 0.75 | % | | | 0.75 | % | | | 0.75 | % | | | 0.50 | % |
| Gross expenses | | | 1.04 | % | | | 1.07 | % | | | 1.21 | % | | | 1.25 | % | | | 0.90 | % |
| Net investment income (loss) | | | 1.50 | % | | | 1.54 | % | | | (2.18 | %) | | | 2.15 | % | | | 1.86 | % |
| Portfolio turnover rate | | | 40 | % | | | 44 | % | | | 45 | % | | | 20 | % | | | 39 | % |
Touchstone Conservative ETF Fund
Selected Data for a Share Outstanding
| | | Year Ended December 31, | |
| | | 2011 | | | 2010 | | | 2009 | | | 2008 | | | 2007 | |
| Net asset value at beginning of period | | $ | 11.60 | | | $ | 10.90 | | | $ | 10.17 | | | $ | 11.92 | | | $ | 11.50 | |
| Income (loss) from investment operations: | | | | | | | | | | | | | | | | | | | | |
| Net investment income (loss) | | | 0.22 | | | | 0.24 | | | | (0.04 | ) | | | 0.53 | | | | 0.35 | |
Net realized and unrealized gains (losses) on
investments | | | 0.18 | | | | 0.72 | | | | 1.24 | | | | (1.67 | ) | | | 0.31 | |
| Total from investment operations | | | 0.40 | | | | 0.96 | | | | 1.20 | | | | (1.14 | ) | | | 0.66 | |
| Distributions from: | | | | | | | | | | | | | | | | | | | | |
| Net investment income | | | (0.23 | ) | | | (0.26 | ) | | | (0.36 | ) | | | (0.34 | ) | | | (0.20 | ) |
| Realized capital gains | | | — | | | | — | | | | (0.11 | ) | | | (0.27 | ) | | | (0.04 | ) |
| Total distributions | | | (0.23 | ) | | | (0.26 | ) | | | (0.47 | ) | | | (0.61 | ) | | | (0.24 | ) |
| Net asset value at end of period | | $ | 11.77 | | | $ | 11.60 | | | $ | 10.90 | | | $ | 10.17 | | | $ | 11.92 | |
| Total return(B) | | | 3.44 | % | | | 8.81 | % | | | 11.79 | % | | | (9.49 | %) | | | 5.76 | % |
| Ratios and supplemental data: | | | | | | | | | | | | | | | | | | | | |
| Net assets at end of period (000's) | | $ | 23,169 | | | $ | 23,066 | | | $ | 22,626 | | | $ | 10,835 | | | $ | 16,197 | |
| Ratio to average net assets: | | | | | | | | | | | | | | | | | | | | |
| Net expenses | | | 0.75 | % | | | 0.75 | % | | | 0.75 | % | | | 0.75 | % | | | 0.50 | % |
| Gross expenses | | | 0.99 | % | | | 1.00 | % | | | 1.10 | % | | | 1.14 | % | | | 0.91 | % |
| Net investment income (loss) | | | 1.76 | % | | | 1.95 | % | | | (2.61 | %) | | | 3.10 | % | | | 3.24 | % |
| Portfolio turnover rate | | | 28 | % | | | 21 | % | | | 40 | % | | | 39 | % | | | 23 | % |
| (A) | The amounts shown for a share outstanding throughout the period does not accord with the change in net realized and unrealized gains (losses) for the period due to the timing of purchases and sales of fund shares in relation to fluctuating market values during the period. |
| (B) | Total returns do not include any insurance, sales or administrative charges of variable annuity or life insurance contracts. If these charges were included, the return would be lower. |
See accompanying notes to financial statements.
Financial Highlights (Continued)
Touchstone Enhanced ETF Fund
Selected Data for a Share Outstanding
| | | Year Ended December 31, | |
| | | 2011 | | | 2010 | | | 2009 | | | 2008 | | | 2007 | |
| Net asset value at beginning of period | | $ | 8.03 | | | $ | 7.34 | | | $ | 6.19 | | | $ | 13.88 | | | $ | 13.73 | |
| Income (loss) from investment operations: | | | | | | | | | | | | | | | | | | | | |
| Net investment income | | | 0.07 | | | | 0.09 | | | | 0.17 | | | | 0.13 | | | | 0.21 | |
Net realized and unrealized gains (losses) on
investments | | | (0.39 | ) | | | 0.75 | | | | 1.20 | | | | (4.69 | ) | | | 0.35 | |
| Total from investment operations | | | (0.32 | ) | | | 0.84 | | | | 1.37 | | | | (4.56 | ) | | | 0.56 | |
| Distributions from: | | | | | | | | | | | | | | | | | | | | |
| Net investment income | | | (0.07 | ) | | | (0.15 | ) | | | (0.22 | ) | | | (0.15 | ) | | | (0.17 | ) |
| Realized capital gains | | | — | | | | — | | | | — | | | | (2.98 | ) | | | (0.24 | ) |
| Total distributions | | | (0.07 | ) | | | (0.15 | ) | | | (0.22 | ) | | | (3.13 | ) | | | (0.41 | ) |
| Net asset value at end of period | | $ | 7.64 | | | $ | 8.03 | | | $ | 7.34 | | | $ | 6.19 | | | $ | 13.88 | |
| Total return(A) | | | (4.01 | %) | | | 11.50 | % | | | 22.17 | % | | | (31.40 | %) | | | 4.03 | % |
| Ratios and supplemental data: | | | | | | | | | | | | | | | | | | | | |
| Net assets at end of period (000's) | | $ | 11,613 | | | $ | 14,305 | | | $ | 17,403 | | | $ | 19,557 | | | $ | 39,526 | |
| Ratio to average net assets: | | | | | | | | | | | | | | | | | | | | |
| Net expenses | | | 0.75 | % | | | 0.75 | % | | | 0.75 | % | | | 0.75 | % | | | 0.50 | % |
| Gross expenses | | | 1.12 | % | | | 1.07 | % | | | 1.14 | % | | | 1.06 | % | | | 0.75 | % |
| Net investment income | | | 0.65 | % | | | 0.68 | % | | | 1.50 | % | | | 1.54 | % | | | 1.13 | % |
| Portfolio turnover rate | | | 101 | % | | | 121 | % | | | 75 | % | | | 78 | % | | | 88 | % |
Touchstone Moderate ETF Fund
Selected Data for a Share Outstanding
| | | Year Ended December 31, | |
| | | 2011 | | | 2010 | | | 2009 | | | 2008 | | | 2007 | |
| Net asset value at beginning of period | | $ | 11.99 | | | $ | 11.01 | | | $ | 9.67 | | | $ | 12.60 | | | $ | 12.21 | |
| Income (loss) from investment operations: | | | | | | | | | | | | | | | | | | | | |
| Net investment income | | | 0.21 | | | | 0.23 | | | | 0.19 | | | | 0.17 | | | | 0.33 | |
Net realized and unrealized gains (losses) on
investments | | | 0.01 | | | | 1.01 | | | | 1.50 | | | | (2.74 | ) | | | 0.31 | |
| Total from investment operations | | | 0.22 | | | | 1.24 | | | | 1.69 | | | | (2.57 | ) | | | 0.64 | |
| Distributions from: | | | | | | | | | | | | | | | | | | | | |
| Net investment income | | | (0.25 | ) | | | (0.26 | ) | | | (0.35 | ) | | | (0.21 | ) | | | (0.16 | ) |
| Realized capital gains | | | — | | | | — | | | | — | | | | (0.15 | ) | | | (0.09 | ) |
| Total distributions | | | (0.25 | ) | | | (0.26 | ) | | | (0.35 | ) | | | (0.36 | ) | | | (0.25 | ) |
| Net asset value at end of period | | $ | 11.96 | | | $ | 11.99 | | | $ | 11.01 | | | $ | 9.67 | | | $ | 12.60 | |
| Total return(A) | | | 1.84 | % | | | 11.25 | % | | | 17.44 | % | | | (20.34 | %) | | | 5.24 | % |
| Ratios and supplemental data: | | | | | | | | | | | | | | | | | | | | |
| Net assets at end of period (000's) | | $ | 45,165 | | | $ | 53,492 | | | $ | 52,504 | | | $ | 33,476 | | | $ | 29,017 | |
| Ratio to average net assets: | | | | | | | | | | | | | | | | | | | | |
| Net expenses | | | 0.75 | % | | | 0.75 | % | | | 0.75 | % | | | 0.75 | % | | | 0.50 | % |
| Gross expenses | | | 0.91 | % | | | 0.89 | % | | | 0.92 | % | | | 0.94 | % | | | 0.77 | % |
| Net investment income | | | 1.73 | % | | | 1.79 | % | | | 2.37 | % | | | 2.85 | % | | | 2.59 | % |
| Portfolio turnover rate | | | 17 | % | | | 19 | % | | | 24 | % | | | 29 | % | | | 12 | % |
| (A) | Total returns do not include any insurance, sales or administrative charges of variable annuity or life insurance contracts. If these charges were included, the return would be lower. |
See accompanying notes to financial statements.
Notes to Financial Statements
December 31, 2011
1. Organization
The Touchstone Variable Series Trust (the “Trust”) is registered under the Investment Company Act of 1940 (the“1940 Act”), as amended, as an open-end management investment company, and was organized as a Massachusetts business trust on February 7, 1994. The Trust consists of the following eleven funds, individually, a “Fund,” and collectively, the “Funds”:
Touchstone Baron Small Cap Growth Fund (“Baron Small Cap Growth Fund”)
Touchstone Core Bond Fund (“Core Bond Fund”)
Touchstone High Yield Fund (“High Yield Fund”)
Touchstone Large Cap Core Equity Fund (“Large Cap Core Equity Fund”)
Touchstone Mid Cap Growth Fund (“Mid Cap Growth Fund”)
Touchstone Money Market Fund (“Money Market Fund”)
Touchstone Third Avenue Value Fund (“Third Avenue Value Fund”)
Touchstone Aggressive ETF Fund (“Aggressive ETF Fund”)
Touchstone Conservative ETF Fund (“Conservative ETF Fund”)
Touchstone Enhanced ETF Fund (“Enhanced ETF Fund”)
Touchstone Moderate ETF Fund (“Moderate ETF Fund”)
Each Fund (except theThird Avenue Value Fund) is an open-end, diversified, management investment company. The Third Avenue Value Fund is an open-end, non-diversified, management investment company.
The Declaration of Trust permits the Trust to issue an unlimited number of shares of beneficial interest of each Fund. Shares of beneficial interest of each Fund are available as a funding vehicle for the separate accounts of life insurance companies issuing variable annuity and variable life insurance policies. As of December 31, 2011, outstanding shares were issued to separate accounts of Western-Southern Life Assurance Company, Integrity Life Insurance Company, National Integrity Life Insurance Company, and Columbus Life Insurance Company, which are all part of The Western & Southern Financial Group (“Western-Southern”), and the majority of the outstanding shares of theTrust were collectively owned by affiliates of Western-Southern and certain supplemental executive retirement plans sponsored by Western-Southern and its affiliates.
All Funds offer a single class of shares. The assets of each Fund are segregated, and a shareholder’s interest is limited to the Fund in which shares are held. The Funds’ prospectus provides a description of each Fund’s investment objectives, policies, and strategies along with information on the classes of shares currently being offered.
2. Significant Accounting Policies
The following is a summary of the Funds’ significant accounting policies:
Security valuation and fair value measurements — All investments in securities are recorded at their estimated fair value. The Funds use various methods to measure fair value of their portfolio securities on a recurring basis. U.S. GAAP establishes a hierarchy that prioritizes inputs to valuation methods. These inputs are summarized in the three broad levels listed below:
| • Level 1 – | quoted prices in active markets for identical securities |
| | |
| • Level 2 – | other significant observable inputs (including quoted prices for similar securities, interest rates, prepayment speeds, credit risk, etc.) |
| | |
| • Level 3 – | significant unobservable inputs (including the Fund’s own assumptions in determining the fair value of investments) |
The inputs or methodology used for valuing securities are not necessarily an indication of the risk associated with investing in those securities. For example, money market instruments are valued using amortized cost,
Notes to Financial Statements (Continued)
in accordance with rules under the Investment Company Act of 1940. Generally, amortized cost approximates the current fair value of a security, but since the value is not obtained from a quoted price in an active market, such securities are reflected as Level 2. Transfers in and out of the levels are recognized at the value at the end of the period. During the period ended December 31, 2011, there were no significant transfers between Levels 1, 2 and 3.
The aggregate value by input level, as of December 31, 2011, for each Fund’s investments, as well as a reconciliation of assets for which significant unobservable inputs (Level 3) were used in determining value, if applicable, is included in each Fund’s Portfolio of Investments, which also includes a breakdown of the Fund’s investments by credit quality, sector and security type.
The Funds’ portfolio securities are valued as of the close of the regular session of trading on the New York Stock Exchange (currently 4:00 p.m., Eastern time). Portfolio securities traded on stock exchanges are valued at the last sale price, and to the extent these securities are actively traded, they are categorized in Level 1 of the fair value hierarchy. Portfolio securities quoted by NASDAQ are valued at the NASDAQ Official Closing Price (“NOCP”). Securities not traded on a particular day, or for which the last sale price is not readily available, are valued at their last broker-quoted bid prices as obtained from one or more of the major market makers for such securities by an independent pricing service and are categorized in Level 2. Debt securities for which market quotations are readily available are valued at their most recent bid prices as obtained from one or more of the major market makers for such securities by an independent pricing service and are categorized in Level 2. Money market instruments and other debt securities with a remaining maturity of less than 60 days are valued at amortized cost, which approximates market value, and are categorized in Level 2. Securities for which market quotations or the NOCP are not readily available are valued based on fair value as determined by or under the direction of the Board of Trustees and are categorized in Level 3. Shares of open end mutual funds in which the Funds invest are valued at their respective net asset values as reported by the underlying funds and are categorized in Level 1. The prices for foreign securities are reported in local currency and converted to U.S. dollars using currency exchange rates.
For securities that principally trade on a foreign market or exchange, a significant gap in time can exist between the time of a particular security’s last trade and the time at which a Fund calculates its net asset value. The closing prices of such securities may no longer reflect their market value at the time the Fund calculates its net asset value if an event that could materially affect the value of those securities (a “Significant Event”) has occurred between the time of the security’s last close and the time that the Fund calculates its net asset value.
Certain Funds invest in securities of other investment companies, including exchange traded funds (“ETFs”), open-end funds and closed-end funds. Open-end funds are investment companies that issue new shares continuously and redeem shares daily. Closed-end funds are investment companies that typically issue a fixed number of shares that trade on a securities exchange or over-the-counter. An ETF is an investment company that seeks to track the performance of an index by holding in its portfolio shares of all the companies, or a representative sample of the companies, that are components of a particular index. ETFs are traded on a securities exchange based on their market value. The risks of investment in other investment companies typically reflect the risks of the types of securities in which investment companies invest. Investments in ETFs and closed-end funds are subject to the additional risk that shares of the fund may trade at a premium or discount to their NAV per share. When the Fund invests in another investment company, shareholders of the Fund bear their proportionate share of the other investment company’s fees and expenses,including operating, registration, trustee, licensing and marketing, as well as their share of the Fund’s fees and expenses.
A Significant Event may relate to a single issuer or to an entire market sector. If the Advisor or Sub-Advisor of a Fund becomes aware of a Significant Event that has occurred with respect to a security or group of securities after the closing of the exchange or market on which the security or securities principally trade, but before the
Notes to Financial Statements (Continued)
time at which the Fund calculates its net asset value, it may request that a Fair Value Committee Meeting be called. In addition, the Funds’ Administrator or Sub-Administrator monitors price movements among certain selected indices, securities and/or baskets of securities that may be an indicator that the closing prices received earlier from foreign exchanges or markets may not reflect market value at the time the Fund calculates its net asset value. If price movements in a monitored index or security exceed levels established by the Advisor, the Sub-Administrator notifies the Advisor or Sub-Advisor for any Fund holding the relevant securities that such limits have been exceeded. In such event, the Advisor makes the determination whether a Fair Value Committee meeting should be called based on the information provided. These securities are categorized in Level 2.
New accounting pronouncements — In May 2011, the Financial Accounting Standards Board (FASB) issued Accounting Standards Update (ASU) No. 2011-04 “Amendments to Achieve Common Fair Value Measurement and Disclosure Requirements in accounting principles generally accepted the United States of America (“ U.S. GAAP”) and the International Financial Reporting Standards (IFRS).” ASU 2011-04 includes common requirements for measurement of and disclosure about fair value between U.S. GAAP and IFRS. ASU 2011-04 will require reporting entities to categorize within Level 3 of the fair value hierarchy: quantitative information about the unobservable inputs used in the fair value measurement, the valuation processes used by the reporting entity and a narrative description of the sensitivity of the fair value measurement to changes in unobservable inputs and the interrelationships between those unobservable inputs. In addition, ASU 2011-04 will require reporting entities to make disclosures about amounts and reasons for all transfers in and out of Level 1 and Level 2 fair value measurements. The new and revised disclosures are effective for fiscal years beginning after December 15, 2011 and for interim periods within those fiscal years. Management is currently evaluating the implications of ASU 2011-04 and its impact on the financial statements.
In December 2011, the FASB issued Accounting Standards Update No. 2011-11, Disclosures about Offsetting Assets and Liabilities (“ASU 2011-11”). ASU 2011-11 requires disclosures to make financial statements that are prepared under U.S. GAAP more comparable to those prepared under International Financial Reporting Standards. The new disclosure requirements mandate that entities disclose both gross and net information about instruments and transactions eligible for offset in the statement of assets and liabilities as well as instruments and transactions subject to an agreement similar to a master netting arrangement. In addition, ASU 2011-11 requires disclosure of collateral received and posted in connection with master netting agreements or similar arrangements. New disclosures are required for annual reporting periods beginning on or after January 1, 2013, and interim periods within those annual periods. Management is evaluating the impact of ASU 2011-11 on the financial statements and disclosures.
Delayed delivery transactions — The Funds may purchase or sell securities on a when-issued or delayed delivery basis. These transactions involve a commitment by the Funds to purchase or sell securities for a predetermined price or yield, with payment and delivery taking place beyond the customary settlement period. When delayed delivery purchases are outstanding, the Funds will set aside liquid assets in an amount sufficient to meet the purchase price. When purchasing a security on a delayed delivery basis, the Funds assume the rights and risks of ownership of the security, including the risk of price and yield fluctuations, and take such fluctuations into account when determining net asset value.The Funds may dispose of or renegotiate a delayed delivery transaction after it is entered into, and may sell when-issued securities before they are delivered, which may result in a capital gain or loss. When the Funds have sold a security on a delayed delivery basis, the Funds do not participate in future gains and losses with respect to the security.
Foreign currency translation — The books and records of the Funds are maintained in U.S. dollars and translated into U.S. dollars on the following basis:
| (1) | fair value of investment securities, assets and liabilities at the current rate of exchange on the valuation date; and |
Notes to Financial Statements (Continued)
| (2) | purchases and sales of investment securities, income and expenses at the relevant rates of exchange prevailing on the respective dates of such transactions. |
The Funds do not isolate that portion of gains and losses on investments in equity securities that is due to changes in the foreign exchange rates from that which is due to changes in market prices of equity securities.
Forward foreign currency contracts — A forward foreign currency contract is an agreement between two parties to buy and sell a specific currency at a price that is set on the date of the contract. The forward contract calls for delivery of the currency on a future date that is specified in the contract. Risks related to the use of forwards include the possible failure of counterparties to meet the terms of the forward agreement, the failure of the counterparties to timely post collateral, the risk that currency movements will not occur thereby reducing the Fund’s total return, and the potential for losses in excess of the Fund’s initial investment.
The market value of a forward foreign currency contract fluctuates with changes in foreign currency exchange rates. Forward foreign currency contracts are marked to market daily and the change in value is recorded by a Fund as an unrealized gain or loss. Realized gains or losses, equal to the difference between the value of the contract at the time it was opened and the value at the time it was closed, are recorded upon delivery or receipt of the currency.
During the period ended December 31, 2011, the Funds used forward foreign currency contracts to enhance potential gains, hedge against anticipated currency exchange rates, maintain diversity and liquidity of the portfolio and adjust exposure to foreign currencies.
As of December 31, 2011, there were no open forward foreign currency contracts.
Portfolio securities loaned — Each Fund may lend its portfolio securities. Lending portfolio securities exposes a Fund to the risk that the borrower may fail to return the loaned securities or may not be able to provide additional collateral or that the Fund may experience delays in recovery of the loaned securities or loss of rights in the collateral if the borrower fails financially. To minimize these risks, the borrower must agree to maintain cash collateral with the Funds’ custodian in an amount at least equal to the market value of the loaned securities. The cash collateral is reinvested by the Funds’ custodian into an approved investment vehicle.
As of December 31, 2011, the following Funds loaned securities and received collateral as follows:
| Fund | | Fair Value of
Securities
Loaned | | | Value of
Collateral
Received | |
| Baron Small Cap Growth Fund | | $ | 1,326,521 | | | $ | 1,353,441 | |
| Core Bond Fund | | | 46,041 | | | | 47,266 | |
| High Yield Fund | | | 84,685 | | | | 86,937 | |
| Large Cap Core Equity Fund | | | 465,229 | | | | 475,187 | |
| Third Avenue Value Fund | | | 2,685,086 | | | | 2,730,035 | |
| Aggressive ETF Fund | | | 1,888,132 | | | | 1,942,905 | |
| Conservative ETF Fund | | | 629,605 | | | | 647,881 | |
| Enhanced ETF Fund | | | 2,111,141 | | | | 2,172,955 | |
| Moderate ETF Fund | | | 1,945,027 | | | | 1,997,884 | |
All collateral received as cash is received, held and administered by the Funds’ custodian for the benefit of the Funds in the applicable custody account or other account established for the purpose of holding collateral.
Funds participating in securities lending receive compensation in the form of fees, or retain a portion of interest or dividends on the investment of any cash received as collateral. The Funds also continue to receive interest or dividends on the securities loaned. The loaned securities are secured by collateral valued at least equal, at all times, to the fair value of the securities loaned plus accrued interest.
Notes to Financial Statements (Continued)
Unrealized gain or loss on the fair value of the securities loaned that may occur during the term of the loan is recognized by the Funds. The Funds have the right under the lending agreement to recover the securities from the borrower on demand.
Share valuation — The net asset value per share is calculated daily by dividing the total value of a Fund’s assets, less liabilities, by its number of outstanding shares.
Investment income — Dividend income from securities is recognized on the ex-dividend date, net of foreign withholding taxes, if any, which are reduced by any amounts reclaimable by the Funds, where applicable. Interest income from securities is recorded on the basis of interest accrued, premium amortized and discount accreted.
Distributions to shareholders — Each Fund, except the Money Market Fund, declares and distributes net investment income, if any, annually as a dividend to shareholders. The Money Market Fund declares dividends daily and distributes dividends monthly. Any realized capital gains on sales of securities for each Fund, net of applicable capital loss carryforwards, are distributed to shareholders at least annually. Income distributions and capital gain distributions are determined in accordance with income tax regulations.
Security transactions — Security transactions are reflected for financial reporting purposes as of the trade date, which may cause the net asset value (“NAV”) as stated in the accompanying financial statements to be different than the NAV applied to Fund share transactions. Realized gains and losses on sales of portfolio securities are calculated using the identified cost basis.
Estimates — The preparation of financial statements in conformity with U.S. GAAP requires management to make estimates and assumptions that affect the reported amounts of assets and liabilities and disclosure of contingent assets and liabilities at the date of the financial statements and the reported amounts of income and expenses during the reporting period. Actual results could differ from those estimates.
3. Investment Transactions
Investment transactions (excluding short-term investments and U.S. Government securities) were as follows for the period ended December 31, 2011:
| | | Baron Small
Cap Growth
Fund | | | Core Bond
Fund | | | High Yield
Fund | |
| Purchases of investment securities | | $ | 3,277,769 | | | $ | 13,093,454 | | | $ | 16,159,731 | |
| Proceeds from sales and maturities | | $ | 8,709,931 | | | $ | 34,835,109 | | | $ | 20,922,012 | |
| | �� | Large Cap
Core Equity
Fund | | | Mid Cap
Growth
Fund | | | Third Avenue
Value
Fund | |
| Purchases of investment securities | | $ | 13,436,534 | | | $ | 35,279,890 | | | $ | 1,667,039 | |
| Proceeds from sales and maturities | | $ | 22,615,639 | | | $ | 40,024,133 | | | $ | 12,817,756 | |
| | | Aggressive
ETF Fund | | | Conservative
ETF Fund | | | Enhanced
ETF Fund | | | Moderate
ETF Fund | |
| Purchases of investment securities | | $ | 6,978,558 | | | $ | 6,459,400 | | | $ | 13,228,235 | | | $ | 8,464,128 | |
| Proceeds from sales and maturities | | $ | 8,529,356 | | | $ | 6,861,701 | | | $ | 15,356,573 | | | $ | 16,966,415 | |
4. Transactions with Affiliates and Other Related Parties
Certain officers of theTrust are also officers of the Advisor (Touchstone Advisors, Inc.), the Underwriter (Touchstone Securities, Inc.) and/or BNY Mellon Investment Servicing (U.S.) Inc. (“BNY Mellon”) the Sub-Administrator
Notes to Financial Statements (Continued)
and Transfer Agent to the Funds. The Advisor and Underwriter are each wholly owned, indirect subsidiaries of The Western and Southern Life Insurance Company (“Western-Southern”).
MANAGEMENT & EXPENSE LIMITATIONS AGREEMENTS
The Advisor provides general investment supervisory services for the Funds, under terms of an Advisory Agreement. Under the Advisory Agreement, the Funds pay the Advisor a fee, which is computed and accrued daily and paid monthly, at an annual rate based on average daily net assets as shown in the table below.
| Baron Small Cap Growth Fund | 1.05% |
| Core Bond Fund | 0.55% on the first $100 million |
| | 0.50% of the next $100 million |
| | 0.45% of the next $100 million |
| | 0.40% of such assets in excess of $300 million |
| High Yield Fund | 0.50% on the first $100 million |
| | 0.45% of the next $100 million |
| | 0.40% of the next $100 million |
| | 0.35% of such assets in excess of $300 million |
| Large Cap Core Equity Fund | 0.65% on the first $100 million |
| | 0.60% of the next $100 million |
| | 0.55% of the next $100 million |
| | 0.50% of such assets in excess of $300 million |
| Mid Cap Growth Fund* | 0.75% on the first $500 million |
| | 0.70% of the next $500 million |
| | 0.65% of such assets in excess of $1 billion |
| Money Market Fund | 0.18% |
| Third Avenue Value Fund | 0.80% on the first $100 million |
| | 0.75% of the next $100 million |
| | 0.70% of the next $100 million |
| | 0.65% of such assets in excess of $300 million |
| Aggressive ETF Fund | 0.40% on the first $50 million |
| Conservative ETF Fund | 0.38% of the next $50 million |
| Enhanced ETF Fund | 0.36% of such assets in excess of $100 million |
| Moderate ETF Fund | |
* Prior to March 1, 2011, the fee for the Mid Cap Growth Fund was 0.80%.
The Advisor has entered into investment sub-advisory agreements with the following parties:
| BAMCO, Inc | Todd/Verdus Asset Management, LLC |
| Baron Small Cap Growth Fund | Large Cap Core Equity Fund |
| | Aggressive ETF Fund |
| Fort Washington Investment Advisors, Inc.* | Conservative ETF Fund |
| Core Bond Fund | Enhanced ETF Fund |
| High Yield Fund | Moderate ETF Fund |
| Money Market Fund | |
| | |
| Third Avenue Management, LLC | Westfield Capital Management Company, L.P. |
| Third Avenue Value Fund | Mid Cap Growth Fund** |
* Affiliate of the Advisor and Western-Southern
** Effective February 23, 2011, TCW Investment Management Company was removed as sub-advisor of the Mid Cap Growth Fund.
The Advisor, not the Funds, pays sub-advisory fees to each Sub-Advisor.
Notes to Financial Statements (Continued)
The Advisor entered into an Expense Limitation Agreement to contractually limit operating expenses of the Funds. The maximum operating expense limit in any year with respect to the Funds is based on a percentage of the average daily net assets of the Funds. The Advisor has agreed to waive advisory fees, administration fees and reimburse expenses in order to maintain expense limitations for the Funds as follows:
| Fund | | |
| Baron Small Cap Growth Fund | 1.55% | |
| Core Bond Fund | 1.00% | |
| High Yield Fund | 1.05% | |
| Large Cap Core Equity Fund | 1.00% | |
| Mid Cap Growth Fund* | 1.26% | |
| Money Market Fund | 0.75% | |
| Third Avenue Value Fund | 1.17% | |
| Aggressive ETF Fund | 0.75% | |
| Conservative ETF Fund | 0.75% | |
| Enhanced ETF Fund | 0.75% | |
| Moderate ETF Fund | 0.75% | |
* Prior to March 1, 2011, the amount for the Mid Cap Growth Fund was 1.17%.
These fee waivers and expense limitations will remain in effect until at least April 29, 2012.
During the period ended December 31, 2011, the Advisor waived investment advisory fees and administration fees and/or reimbursed expenses of the Funds as follows:
| Fund | | Shareholder
Servicing
Fees Waived | | | Administration
Fees Waived | |
| Baron Small Cap Growth Fund | | $ | — | | | $ | 18,309 | |
| Large Cap Core Equity Fund | | | — | | | | 53,498 | |
| Mid Cap Growth Fund | | | — | | | | 8,783 | |
| Money Market Fund | | | 83,660 | | | | 111,222 | |
| Third Avenue Value Fund | | | — | | | | 69,550 | |
| Aggressive ETF Fund | | | 15,923 | | | | 34,307 | |
| Conservative ETF Fund | | | 8,560 | | | | 46,463 | |
| Enhanced ETF Fund | | | 22,336 | | | | 26,280 | |
| Moderate ETF Fund | | | — | | | | 78,137 | |
ADMINISTRATION AGREEMENT
The Advisor entered into an Administration and Accounting Services Agreement with the Trust, whereby the Advisor is responsible for supplying executive and regulatory compliance services, supervises the preparation of tax returns, and coordinates the preparation of reports to shareholders and reports to, and filings with, the Securities and Exchange Commission and state securities authorities, materials for meetings of the Board of Trustees, calculating the daily net asset value per share and maintaining the financial books and records of each Fund. For its services, the Advisor receives an annual fee of 0.20% of the Trust’s aggregate net assets up to $1 billion, 0.16% of the next $1 billion of aggregate net assets and 0.12% on assets in excess of $2 billion.
Effective November 5, 2011, the Advisor has engaged BNY Mellon as the Sub-Administrator to the Trust. BNY Mellon provides administrative and accounting services to the Trust and is compensated directly by the Advisor, not the Trust. Prior to November 5,2011, JPMorgan Chase Bank, N.A. (“JPMorgan”) served as the Sub-Administrator and was compensated directly by the Advisor, not the Trust.
Notes to Financial Statements (Continued)
TRANSFER AGENT AGREEMENT
Effective December 5, 2011, under the terms of the Transfer Agent Agreement between the Trust and BNY Mellon, BNY Mellon maintains the records of each shareholder’s account, answers shareholders’ inquiries concerning their accounts, processed purchases and redemptions of each Fund’s shares, acts as dividend and distribution disbursing agent and performs other shareholder service functions. For these services, BNY Mellon receives a monthly fee per shareholder account from each Fund. In addition, each Fund pays out-of-pocket expenses incurred by BNY Mellon, including, but not limited to, postage and supplies.
Prior to December 5, 2011, under the terms of the Transfer Agent Agreement between the Trust and JPMorgan, JPMorgan maintained the records of each shareholder’s account, answered shareholders’ inquiries concerning their accounts, processed purchases and redemptions of each Fund’s shares, acted as dividend and distribution disbursing agent and performed other shareholder service functions. For these services, JPMorgan received a monthly fee per shareholder account from each Fund. In addition, each Fund paid out-of-pocket expenses incurred by JPMorgan, including, but not limited to, postage and supplies.
PLANS OF DISTRIBUTION
The Trust entered into a Shareholder Servicing Plan for each Fund of the Trust which provides for a fee of 0.25% of average daily net assets attributable to such shares.
UNDERWRITING AGREEMENT
The Underwriter acts as exclusive agent for the distribution of the Funds’ shares. The Underwriter receives no compensation under this agreement.
AFFILIATED INVESTMENTS
Each Fund, except the Money Market Fund, may invest in the Touchstone Institutional Money Market Fund, a series of Touchstone Investment Trust, subject to compliance with several conditions set forth in an order received by the Trust from the Securities and Exchange Commission. To the extent that the other Touchstone Funds are invested in the Touchstone Institutional Money Market Fund, the Advisor and Administrator will be paid additional fees from the Touchstone Institutional Money Market Fund that will not be waived or reimbursed.
A summary of each Fund’s investment, as applicable, in the Touchstone Institutional Money Market Fund for the period ended December 31, 2011, is as follows:
| | | Share Activity | | | | | | | |
| | | Balance
12/31/10 | | | Purchases | | | Sales | | | Balance
12/31/11 | | | Dividends | | | Value
12/31/11 | |
| Baron Small Cap Growth Fund | | | 1,443,090 | | | | 7,643,921 | | | | (8,091,646 | ) | | | 995,365 | | | $ | 1,401 | | | $ | 995,365 | |
| Core Bond Fund | | | 2,705,440 | | | | 89,977,152 | | | | (91,665,130 | ) | | | 1,017,462 | | | | 5,492 | | | | 1,017,462 | |
| High Yield Fund | | | 416,239 | | | | 15,284,238 | | | | (15,437,268 | ) | | | 263,209 | | | | 696 | | | | 263,209 | |
| Large Cap Core Equity Fund | | | 629,519 | | | | 13,489,341 | | | | (13,658,489 | ) | | | 460,371 | | | | 1,041 | | | | 460,371 | |
| Mid Cap Growth Fund | | | 552,764 | | | | 13,385,883 | | | | (13,938,647 | ) | | | — | | | | 976 | | | | — | |
| Third Avenue Value Fund | | | 3,177,555 | | | | 11,372,419 | | | | (13,172,818 | ) | | | 1,377,156 | | | | 4,002 | | | | 1,377,156 | |
| Aggressive ETF Fund | | | 173,668 | | | | 6,905,390 | | | | (6,723,208 | ) | | | 355,850 | | | | 373 | | | | 355,850 | |
| Conservative ETF Fund | | | 255,117 | | | | 7,431,639 | | | | (7,315,392 | ) | | | 371,364 | | | | 511 | | | | 371,364 | |
| Enhanced ETF Fund | | | 165,474 | | | | 2,922,810 | | | | (2,897,601 | ) | | | 190,683 | | | | 258 | | | | 190,683 | |
| Moderate ETF Fund | | | 683,798 | | | | 11,427,931 | | | | (11,376,165 | ) | | | 726,842 | | | | 1,067 | | | | 726,842 | |
Notes to Financial Statements (Continued)
5. Capital Share Transactions
Capital share transactions for the Money Market Fund are identical to the dollar value of those transactions as shown in the Statements of Changes in Net Assets.
Proceeds and payments on capital shares as shown in the Statements of Changes in Net Assets are the result of the following capital share transactions for the periods shown:
| | | Baron Small Cap
Growth Fund | | | Core Bond Fund | |
| | | Year
Ended
December 31,
2011 | | | Year
Ended
December 31,
2010 | | | Year
Ended
December 31,
2011 | | | Year
Ended
December 31,
2010 | |
| Shares issued | | | 318,816 | | | | 475,375 | | | | 1,849,688 | | | | 258,185 | |
| Shares reinvested | | | — | | | | — | | | | 233,202 | | | | 143,704 | |
| Shares redeemed | | | (662,862 | ) | | | (524,328 | ) | | | (932,251 | ) | | | (356,746 | ) |
| Change in shares outstanding | | | (344,046 | ) | | | (48,953 | ) | | | 1,150,639 | | | | 45,143 | |
| Shares outstanding, beginning of period | | | 1,468,494 | | | | 1,517,447 | | | | 3,766,091 | | | | 3,720,948 | |
| Shares outstanding, end of period | | | 1,124,448 | | | | 1,468,494 | | | | 4,916,730 | | | | 3,766,091 | |
| | | High Yield
Fund | | | Large Cap
Core Equity Fund | |
| | | Year
Ended
December 31,
2011 | | | Year
Ended
December 31,
2010 | | | Year
Ended
December 31,
2011 | | | Year
Ended
December 31,
2010 | |
| Shares issued | | | 1,024,340 | | | | 1,785,565 | | | | 706,102 | | | | 909,725 | |
| Shares reinvested | | | 320,222 | | | | 359,362 | | | | 62,125 | | | | 83,206 | |
| Shares redeemed | | | (1,903,922 | ) | | | (2,590,912 | ) | | | (1,987,578 | ) | | | (3,944,970 | ) |
| Change in shares outstanding | | | (559,360 | ) | | | (445,985 | ) | | | (1,219,351 | ) | | | (2,952,039 | ) |
| Shares outstanding, beginning of period | | | 4,140,564 | | | | 4,586,549 | | | | 4,770,311 | | | | 7,722,350 | |
| Shares outstanding, end of period | | | 3,581,204 | | | | 4,140,564 | | | | 3,550,960 | | | | 4,770,311 | |
| | | Mid Cap
Growth Fund | | | Third Avenue
Value Fund | |
| | | Year
Ended
December 31,
2011 | | | Year
Ended
December 31,
2010 | | | Year
Ended
December 31,
2011 | | | Year
Ended
December 31,
2010 | |
| Shares issued | | | 223,176 | | | | 393,136 | | | | 74,258 | | | | 229,281 | |
| Shares reinvested | | | 6,130 | | | | 4,257 | | | | 57,711 | | | | 173,403 | |
| Shares redeemed | | | (589,486 | ) | | | (618,451 | ) | | | (860,686 | ) | | | (854,423 | ) |
| Change in shares outstanding | | | (360,180 | ) | | | (221,058 | ) | | | (728,717 | ) | | | (451,739 | ) |
| Shares outstanding, beginning of period | | | 2,090,026 | | | | 2,311,084 | | | | 2,975,294 | | | | 3,427,033 | |
| Shares outstanding, end of period | | | 1,729,846 | | | | 2,090,026 | | | | 2,246,577 | | | | 2,975,294 | |
Notes to Financial Statements (Continued)
| | | Aggressive
ETF Fund | | | Conservative
ETF Fund | |
| | | Year
Ended
December 31,
2011 | | | Year
Ended
December 31,
2010 | | | Year
Ended
December 31,
2011 | | | Year
Ended
December 31,
2010 | |
| Shares issued | | | 433,536 | | | | 580,451 | | | | 349,551 | | | | 237,540 | |
| Shares reinvested | | | 25,225 | | | | 29,050 | | | | 37,473 | | | | 43,624 | |
| Shares redeemed | | | (572,953 | ) | | | (621,706 | ) | | | (407,926 | ) | | | (367,446 | ) |
| Change in shares outstanding | | | (114,192 | ) | | | (12,205 | ) | | | (20,902 | ) | | | (86,282 | ) |
| Shares outstanding, beginning of period | | | 1,892,793 | | | | 1,904,998 | | | | 1,989,091 | | | | 2,075,373 | |
| Shares outstanding, end of period | | | 1,778,601 | | | | 1,892,793 | | | | 1,968,189 | | | | 1,989,091 | |
| | | Enhanced
ETF Fund | | | Moderated
ETF Fund | |
| | | Year
Ended
December 31,
2011 | | | Year
Ended
December 31,
2010 | | | Year
Ended
December 31,
2011 | | | Year
Ended
December 31,
2010 | |
| Shares issued | | | 77,804 | | | | 55,768 | | | | 207,738 | | | | 545,358 | |
| Shares reinvested | | | 13,491 | | | | 33,608 | | | | 77,463 | | | | 94,266 | |
| Shares redeemed | | | (353,337 | ) | | | (678,122 | ) | | | (969,088 | ) | | | (949,208 | ) |
| Change in shares outstanding | | | (262,042 | ) | | | (588,746 | ) | | | (683,887 | ) | | | (309,584 | ) |
| Shares outstanding, beginning of period | | | 1,781,743 | | | | 2,370,489 | | | | 4,460,700 | | | | 4,770,284 | |
| Shares outstanding, end of period | | | 1,519,701 | | | | 1,781,743 | | | | 3,776,813 | | | | 4,460,700 | |
6. Federal Tax Information
Federal income tax — It is each Fund’s policy to continue to comply with the special provisions of the Internal Revenue Code applicable to regulated investment companies. As provided therein, in any fiscal year in which a Fund so qualifies and distributes at least 90% of its investment company taxable income, the Fund (but not the shareholders) will be relieved of federal income tax on the income distributed. Accordingly, no provision for income taxes has been made.
The tax character of distributions paid for the years ended December 31, 2011 and December 31, 2010 was as follows:
| | | Baron Small Cap
Growth Fund | | | Core Bond Fund | | | High Yield Fund | | | Large Cap
Core Equity Fund | |
| | | 2011 | | | 2010 | | | 2011 | | | 2010 | | | 2011 | | | 2010 | | | 2011 | | | 2010 | |
| From ordinary income | | $ | — | | | $ | — | | | $ | 2,148,434 | | | $ | 1,536,204 | | | $ | 2,427,279 | | | $ | 2,820,992 | | | $ | 570,931 | | | $ | 751,349 | |
| From long-term capital gains | | | — | | | | — | | | | 458,686 | | | | — | | | | — | | | | — | | | | — | | | | — | |
| | | Mid Cap Growth Fund | | | Money Markey Fund | | | Third Avenue
Value Fund | |
| | | 2011 | | | 2010 | | | 2011 | | | 2010 | | | 2011 | | | 2010 | |
| From ordinary income | | $ | 72,756 | | | $ | 57,209 | | | $ | 7,132 | | | $ | 114,337 | | | $ | 840,849 | | | $ | 3,062,305 | |
| From long-term capital gains | | | — | | | | — | | | | — | | | | — | | | | — | | | | — | |
| | | $ | 72,756 | | | $ | 57,209 | | | $ | 7,132 | | | $ | 114,337 | | | $ | 840,849 | | | $ | 3,062,305 | |
Notes to Financial Statements (Continued)
| | | Aggressive
ETF Fund | | | Conservative
ETF Fund | | | Enhanced
ETF Fund | | | Moderate
ETF Fund | |
| | | 2011 | | | 2010 | | | 2011 | | | 2010 | | | 2011 | | | 2010 | | | 2011 | | | 2010 | |
| From ordinary income | | $ | 254,769 | | | $ | 296,598 | | | $ | 441,810 | | | $ | 504,733 | | | $ | 103,610 | | | $ | 269,871 | | | $ | 928,782 | | | $ | 1,128,367 | |
| From long-term captial gains | | | — | | | | — | | | | — | | | | — | | | | — | | | | — | | | | — | | | | — | |
| | | $ | 254,769 | | | $ | 296,598 | | | $ | 441,810 | | | $ | 504,733 | | | $ | 103,610 | | | $ | 269,871 | | | $ | 928,782 | | | $ | 1,128,367 | |
The following information is computed on a tax basis for each item as of December 31, 2011:
| | | Baron Small
Cap Growth
Fund | | | Core Bond
Fund | | | High Yield
Fund | | | Large Cap
Core Equity
Fund | |
| Tax cost of portfolio investments | | $ | 13,078,815 | | | $ | 53,960,749 | | | $ | 26,789,736 | | | $ | 29,713,648 | |
| Gross unrealized appreciation | | | 8,342,428 | | | | 1,533,807 | | | | 710,126 | | | | 5,954,043 | |
| Gross unrealized depreciation | | | (253,602 | ) | | | (1,190,730 | ) | | | (740,592 | ) | | | (2,699,729 | ) |
| Net unrealized appreciation (depreciation) | | | 8,088,826 | | | | 343,077 | | | | (30,466 | ) | | | 3,254,314 | |
| Accumulated capital and other losses | | | — | | | | — | | | | (1,750,878 | ) | | | (14,432,854 | ) |
| Post-October and Qualified Late-Year losses | | | (28,279 | ) | | | — | | | | (6,062 | ) | | | (44,935 | ) |
| Undistributed ordinary income | | | — | | | | 2,812,521 | | | | 2,078,471 | | | | 521,791 | |
| Undistributed capital gains | | | 3,241,682 | | | | 315,247 | | | | — | | | | — | |
| Accumulated earnings (deficit) | | $ | 11,302,229 | | | $ | 3,470,845 | | | $ | 291,065 | | | $ | (10,701,684 | ) |
| | | Mid Cap
Growth Fund | | | Money Market
Fund | | | Third Avenue
Value Fund | |
| Tax cost of portfolio investments | | $ | 20,234,076 | | | $ | 50,577,947 | | | $ | 32,344,606 | |
| Gross unrealized appreciation | | | 1,396,100 | | | | — | | | | 8,423,121 | |
| Gross unrealized depreciation | | | (1,367,441 | ) | | | — | | | | (5,181,183 | ) |
| Net unrealized appreciation | | | 28,659 | | | | — | | | | 3,241,938 | |
Net unrealized appreciation (depreciation) on foreign
currency and translation of other assets and liabilities
denominated in foreign currency | | | — | | | | — | | | | (2 | ) |
| Accumulated capital and other losses | | | (1,565,491 | ) | | | — | | | | (7,320,783 | ) |
| Post-October and Qualified Late-Year losses | | | (553,857 | ) | | | (890 | ) | | | (202,633 | ) |
| Undistributed ordinary income | | | — | | | | — | | | | — | |
| Accumulated earnings | | $ | (2,090,689 | ) | | $ | (890 | ) | | $ | (4,281,480 | ) |
| | | Aggressive
ETF Fund | | | Conservative
ETF Fund | | | Enhanced
ETF Fund | | | Moderate
ETF Fund | |
| Tax cost of portfolio investments | | $ | 20,368,281 | | | $ | 23,210,274 | | | $ | 13,289,175 | | | $ | 46,946,366 | |
| Gross unrealized appreciation | | | 765,250 | | | | 1,713,436 | | | | 988,432 | | | | 3,949,387 | |
| Gross unrealized depreciation | | | (1,143,054 | ) | | | (1,052,158 | ) | | | (433,385 | ) | | | (3,586,161 | ) |
| Net Unrealized appreciation | | | (377,804 | ) | | | 661,278 | | | | 555,047 | | | | 363,226 | |
Net unrealized appreciation (depreciation) on foreign
currency and translation of other assets and liabilities
denominated in foreign currency | | | — | | | | — | | | | — | | | | 427 | |
| Accumulated capital and other losses | | | (279,537 | ) | | | — | | | | (8,851,263 | ) | | | (3,048,777 | ) |
| Post-October and Qualified Late-Year losses | | | — | | | | — | | | | (709,470 | ) | | | — | |
| Undistributed ordinary income | | | 253,424 | | | | 398,219 | | | | 83,581 | | | | 826,859 | |
| Undistributed long-term capital gains | | | — | | | | 382,997 | | | | — | | | | — | |
| Accumulated earnings (deficit) | | $ | (403,917 | ) | | $ | 1,442,494 | | | $ | (8,922,105 | ) | | $ | (1,858,265 | ) |
The difference between the tax cost of portfolio investments and the financial statement cost is primarily due to wash sales loss deferrals, investments in passive foreign investment companies and preferred securities.
Notes to Financial Statements (Continued)
To the extent that the Funds’ net realized capital gains, if any, can be offset by capital loss carryforwards, it is the policy of the Funds not to distribute such gains.The Regulated Investment Company (“RIC”) Modernization Act of 2010 (the “Act”) became effective for the Funds on January 1, 2011. The Act modernizes several of the federal income and exise tax provisions related to RICs to carry forward capital losses indefinitely and to retain the character of capital loss carryforwards as short-term or long-term (“Post-Enactment”). Rules in effect previously limited the carryforward period to eight years and all carryforwards were considered short-term in character (“Pre-Enactment”). Although the Act provides several benefits, including the unlimited carryover of future capital losses, there may be a greater likelihood that all or a portion of each Fund’s Pre-Enactment capital loss carryovers may expire without being utilized due to the fact that Post-Enactment capital losses get utilized before Pre-Enactment capital loss carryovers. As of December 31, 2011 the Funds had no Post-Enactment capital loss carryforwards.
As of December 31, 2011, the Funds had the following Pre-Enactment capital loss carryforwards for federal income tax purposes:
| | | 2015 | | | 2016 | | | 2017 | | | 2018 | | | Total | |
| High Yield Fund | | $ | — | | | $ | — | | | $ | 1,750,878 | | | $ | — | | | $ | 1,750,878 | |
| Large Cap Core Equity Fund | | | 1,418,883 | | | | 2,591,468 | | | | 7,960,612 | | | | 2,461,891 | | | | 14,432,854 | |
| Mid Cap Growth Fund | | | — | | | | — | | | | 1,565,491 | | | | — | | | | 1,565,491 | |
| Third Avenue Value Fund | | | — | | | | — | | | | 7,320,783 | | | | — | | | | 7,320,783 | |
| Aggressive ETF Fund | | | — | | | | — | | | | — | | | | 279,537 | | | | 279,537 | |
| Enhanced ETF Fund | | | — | | | | 1,859,064 | | | | 6,992,199 | | | | — | | | | 8,851,263 | |
| Moderate ETF Fund | | | — | | | | — | | | | 1,836,354 | | | | 1,212,423 | | | | 3,048,777 | |
During the year ended December 31, 2011, the following Funds utilized capital loss carryforwards:
| Fund | | Amount | |
| Baron Small Cap Growth Fund | | $ | 405,606 | |
| High Yield Fund | | | 1,565,305 | |
| Large Cap Core Equity Fund | | | 699,499 | |
| Mid Cap Growth Fund | | | 3,272,680 | |
| Third Avenue Value Fund | | | 4,295,471 | |
| Aggressive ETF Fund | | | 1,492,946 | |
| Conservative ETF Fund | | | 376,189 | |
| Enhanced ETF Fund | | | 763,657 | |
| Moderate ETF Fund | | | 141,529 | |
From November 1, 2011 to December 31, 2011, the Funds shown below incurred the following net losses (“Post-October and Qualified Late Year losses”). The Funds intend to elect to defer these losses and treat them as arising on January 1, 2012:
| Fund | | Amount | |
| Baron Small Cap Growth Fund | | $ | 28,279 | |
| High Yield Fund | | | 6,062 | |
| Mid Cap Growth Fund | | | 553,857 | |
| Large Cap Core Equity Fund | | | 44,935 | |
| Money Market Fund | | | 890 | |
| Third Avenue Value Fund | | | 202,634 | |
| Enhanced ETF Fund | | | 709,470 | |
Certain reclassifications, the result of permanent differences between financial statement and income tax reporting requirements, have been made to the components of capital. These reclassifications have no impact on the net assets or net asset value per share of the Funds and are designed to present the Funds’ capital accounts on a tax basis. The following reclassifications which are primarily attributed to the tax treatment of net investment loss, overdistributions, redesignation of dividends paid, foreign currency gain/loss, paydown gain/loss on mortgage
Notes to Financial Statements (Continued)
backed and asset backed securities, real estate investment trusts and Passive Foreign Investment Companies have been made to the following Funds for the period ended December 31, 2011:
| Fund | | Accumulated
Net Investment
Income (Loss) | | | Accumulated
Net Realized
Gains (Losses) | | | Paid-In
Capital | |
| Baron Small Cap Growth Fund | | $ | 176,575 | | | $ | — | | | $ | (176,575 | ) |
| Core Bond Fund | | | 67,154 | | | | (67,154 | ) | | | — | |
| Mid Cap Growth Fund | | | 153,808 | | | | 3,145 | | | | (156,953 | ) |
| Money Market Fund | | | (48 | ) | | | 48 | | | | — | |
| Third Avenue Value Fund | | | 714,143 | | | | (126,877 | ) | | | (587,266 | ) |
| Aggressive ETF Fund | | | (3,001 | ) | | | 2,998 | | | | 3 | |
| Conservative ETF Fund | | | (9,153 | ) | | | 9,152 | | | | 1 | |
| Enhanced ETF Fund | | | (591 | ) | | | 586 | | | | 5 | |
| Moderate ETF Fund | | | (14,960 | ) | | | 14,960 | | | | — | |
The Funds have analyzed their tax positions taken on Federal income tax returns for all open tax years (tax years ended December 31, 2008 through 2011) and have concluded that no provision for income tax is required in their financial statements.
7. Commitments and Contingencies
The Funds indemnify the Trust’s officers and Trustees for certain liabilities that might arise from their performance of their duties to the Funds. Additionally, in the normal course of business, the Funds enter into contracts that contain a variety of representations and warranties and which provide general indemnifications. The Funds’ maximum exposure under these arrangements is unknown, as this would involve future claims that may be made against the Funds that have not yet occurred. However, based on experience, the Funds expect the risk of loss to be remote.
8. Risks Associated with Foreign Investments
Some of the Funds may invest in the securities of foreign issuers. Investing in securities issued by companies whose principal business activities are outside the U.S. may involve significant risks not present in domestic investments. For example, there is generally less publicly available information about foreign companies, particularly those not subject to the disclosure and reporting requirements of the U.S. securities laws. Foreign issuers are generally not bound by uniform accounting, auditing, and financial reporting requirements and standards of practice comparable to those applicable to domestic issuers. Investments in foreign securities also involve the risk of possible adverse changes in investment or exchange control regulations, expropriation or confiscatory taxation, limitations on the removal of funds or other assets of the Fund, political or financial instability or diplomatic and other developments which could affect such investments. Foreign stock markets, while growing in volume and sophistication, are generally not as developed as those in the U.S., and securities of some foreign issuers (particularly those located in developing countries) may be less liquid and more volatile than securities of comparable U.S. companies. In general, there is less overall governmental supervision and regulation of foreign securities markets, broker-dealers, and issuers than in the U.S.
9. Subsequent Events
Subsequent events occurring after the date of this report have been evaluated for potential impact to this report through the date the financial statements were issued. There were no subsequent events to report that would have a material impact on the Funds’ financial statements.
Report of Independent Registered Public Accounting Firm
To the Board of Trustees and Shareholders of Touchstone Variable Series Trust
We have audited the accompanying statements of assets and liabilities, including the portfolios of investments, of Touchstone Variable Series Trust, comprised of the Baron Small Cap Growth Fund, Core Bond Fund, Mid Cap Growth Fund, High Yield Fund, Large Cap Core Equity Fund, Money Market Fund, Third Avenue Value Fund, Aggressive ETF Fund, Conservative ETF Fund, Enhanced ETF Fund, and Moderate ETF Fund (the “Funds”), as of December 31, 2011, and the related statements of operations for the year then ended, the statements of changes in net assets for each of the two years in the period then ended, and the financial highlights for each of the five years in the periods then ended. These financial statements and financial highlights are the responsibility of the Funds’ management. Our responsibility is to express an opinion on these financial statements and financial highlights based on our audits.
We conducted our audits in accordance with the standards of the Public Company Accounting Oversight Board (United States). Those standards require that we plan and perform the audits to obtain reasonable assurance about whether the financial statements are free of material misstatement. We were not engaged to perform an audit of the Funds’ internal control over financial reporting. Our audits included consideration of internal control over financial reporting as a basis for designing audit procedures that are appropriate in the circumstances, but not for the purpose of expressing an opinion on the effectiveness of the Funds’ internal control over financial reporting. Accordingly, we express no such opinion. An audit also includes examining, on a test basis, evidence supporting the amounts and disclosures in the financial statements, assessing the accounting principles used and significant estimates made by management, and evaluating the overall financial statement presentation. Our procedures included confirmation of securities owned as of December 31, 2011, by correspondence with the custodian and brokers, or by other appropriate auditing procedures where replies from brokers were not received. We believe that our audits provide a reasonable basis for our opinion.
In our opinion, the financial statements and financial highlights referred to above present fairly, in all material respects, the financial position of each of the respective portfolios comprising Touchstone Variable Series Trust at December 31, 2011, the results of their operations for the year then ended, the changes in their net assets for each of the two years in the period then ended, and their financial highlights for each of the five years in the period then ended, in conformity with U.S. generally accepted accounting principles.

Cincinnati, Ohio
February 23, 2012
Other Items (Unaudited)
Dividend Received Deduction
For corporate shareholders, the following ordinary distributions paid during the current fiscal year ended December 31, 2011 qualify for the corporate dividends received deduction:
| Touchstone Large Cap Core Equity Fund | 100% | |
| Touchstone Mid Cap Growth Fund | 100% | |
| Touchstone Third Avenue Value Fund | 100% | |
| Touchstone Aggressive ETF Fund | 100% | |
| Touchstone Conservative ETF Fund | 100% | |
| Touchstone Enhanced ETF Fund | 100% | |
| Touchstone Moderate ETF Fund | 100% | |
For the fiscal year ended December 31, 2011, the Baron Small Cap Growth Fund, the Core Bond Fund and the Conservative ETF Fund designate as long-term capital gains $3,241,682, $458,686 and $382,997, respectively.
Proxy Voting Guidelines
The Sub-Advisors are responsible for exercising the voting rights associated with the securities purchased and held by the Funds. A description of the policies and procedures that the Sub-Advisors use in fulfilling this responsibility and information regarding how those proxies were voted during the twelve-month period ended June 30, 2011 are available without charge upon request by calling toll free 1.800.543.0407. These items are also available on the Securities and Exchange Commission’s (the Commission) website at http://www.sec.gov.
Quarterly Portfolio Disclosure
The Trust files a complete listing of portfolio holdings for each Fund as of the end of the first and third quarters of each fiscal year on Form N-Q. The complete listing (i) is available on the Commission’s website; (ii) may be reviewed and copied at the Commission’s Public Reference Room in Washington, DC; and (iii) will be made available to shareholders upon request by calling 1.800.543.0407. Information on the operation of the Public Reference Room may be obtained by calling 1-800-SEC-0330.
Schedule of Shareholder Expenses
As a shareholder of the Funds, you incur two types of costs: (1) transaction costs, including reinvested dividends or other distributions; and (2) ongoing costs, including investment advisory fees; shareholder servicing fees; and other Fund expenses. This example is intended to help you understand your ongoing costs (in dollars) of investing in the Funds and to compare these costs with the ongoing costs of investing in other mutual funds.
The example is based on an investment of $1,000 invested at the beginning of the period and held for the entire period (July 1, 2011 through December 31, 2011).
Actual Expenses
The first line of the table below provides information about actual account values and actual expenses. You may use the information in this line, together with the amount you invested, to estimate the expenses that you paid over the period. Simply divide your account value by $1,000 (for example, an $8,600 account value divided by $1,000 = 8.6), then multiply the result by the number in the first line under the heading entitled “Expenses Paid During the Six Months Ended December 31, 2011” to estimate the expenses you paid on your account during this period.
Hypothetical Example for Comparison Purposes
The second line of the table below provides information about hypothetical account values and hypothetical expenses based on the Funds’ actual expense ratio and an assumed rate of return of 5% per year before expenses, which is not the Funds’ actual return. The hypothetical account values and expenses may not be used to estimate
Other Items (Continued)
the actual ending account balance or expenses you paid for the period. You may use this information to compare the ongoing costs of investing in the Funds and other funds. To do so, compare this 5% hypothetical example with the 5% hypothetical examples that appear in the shareholder reports of the other funds.
| | | Net Expense
Ratio
Annualized
December 31,
2011 | | | Beginning
Account
Value
July 1,
2011 | | | Ending
Account
Value
December 31,
2011 | | | Expenses
Paid During
the Six Months
Ended
December 31,
2011* | |
| Touchstone Baron Small Cap Growth Fund | | | | | | | | | | | | | | | | |
| Actual | | | 1.55 | % | | $ | 1,000.00 | | | $ | 948.60 | | | $ | 7.61 | |
| Hypothetical | | | 1.55 | % | | $ | 1,000.00 | | | $ | 1,017.39 | | | $ | 7.88 | |
| | | | | | | | | | | | | | | | | |
| Touchstone Core Bond Fund | | | | | | | | | | | | | | | | |
| Actual | | | 0.92 | % | | $ | 1,000.00 | | | $ | 1,054.00 | | | $ | 4.76 | |
| Hypothetical | | | 0.92 | % | | $ | 1,000.00 | | | $ | 1,020.57 | | | $ | 4.69 | |
| | | | | | | | | | | | | | | | | |
| Touchstone High Yield Fund | | | | | | | | | | | | | | | | |
| Actual | | | 1.04 | % | | $ | 1,000.00 | | | $ | 1,015.60 | | | $ | 5.28 | |
| Hypothetical | | | 1.04 | % | | $ | 1,000.00 | | | $ | 1,019.96 | | | $ | 5.30 | |
| | | | | | | | | | | | | | | | | |
| Touchstone Large Cap Core Equity Fund | | | | | | | | | | | | | | | | |
| Actual | | | 1.00 | % | | $ | 1,000.00 | | | $ | 961.10 | | | $ | 4.94 | |
| Hypothetical | | | 1.00 | % | | $ | 1,000.00 | | | $ | 1,020.16 | | | $ | 5.09 | |
| | | | | | | | | | | | | | | | | |
| Touchstone Mid Cap Growth Fund | | | | | | | | | | | | | | | | |
| Actual | | | 1.22 | % | | $ | 1,000.00 | | | $ | 818.90 | | | $ | 5.59 | |
| Hypothetical | | | 1.22 | % | | $ | 1,000.00 | | | $ | 1,019.06 | | | $ | 6.21 | |
| | | | | | | | | | | | | | | | | |
| Touchstone Money Market Fund | | | | | | | | | | | | | | | | |
| Actual | | | 0.31 | % | | $ | 1,000.00 | | | $ | 1,000.10 | | | $ | 1.56 | |
| Hypothetical | | | 0.31 | % | | $ | 1,000.00 | | | $ | 1,023.64 | | | $ | 1.58 | |
| | | | | | | | | | | | | | | | | |
| Touchstone Third Avenue Value Fund | | | | | | | | | | | | | | | | |
| Actual | | | 1.17 | % | | $ | 1,000.00 | | | $ | 814.20 | | | $ | 5.35 | |
| Hypothetical | | | 1.17 | % | | $ | 1,000.00 | | | $ | 1,019.31 | | | $ | 5.96 | |
| | | | | | | | | | | | | | | | | |
| Touchstone Aggressive ETF Fund | | | | | | | | | | | | | | | | |
| Actual | | | 0.75 | % | | $ | 1,000.00 | | | $ | 952.90 | | | $ | 3.69 | |
| Hypothetical | | | 0.75 | % | | $ | 1,000.00 | | | $ | 1,021.42 | | | $ | 3.82 | |
| | | | | | | | | | | | | | | | | |
| Touchstone Conservative ETF Fund | | | | | | | | | | | | | | | | |
| Actual | | | 0.75 | % | | $ | 1,000.00 | | | $ | 1,002.40 | | | $ | 3.79 | |
| Hypothetical | | | 0.75 | % | | $ | 1,000.00 | | | $ | 1,021.42 | | | $ | 3.82 | |
| | | | | | | | | | | | | | | | | |
| Touchstone Enhanced ETF Fund | | | | | | | | | | | | | | | | |
| Actual | | | 0.75 | % | | $ | 1,000.00 | | | $ | 911.10 | | | $ | 3.61 | |
| Hypothetical | | | 0.75 | % | | $ | 1,000.00 | | | $ | 1,021.42 | | | $ | 3.82 | |
| | | | | | | | | | | | | | | | | |
| Touchstone Moderate ETF Fund | | | | | | | | | | | | | | | | |
| Actual | | | 0.75 | % | | $ | 1,000.00 | | | $ | 976.80 | | | $ | 3.74 | |
| Hypothetical | | | 0.75 | % | | $ | 1,000.00 | | | $ | 1,021.42 | | | $ | 3.82 | |
| * | Expenses are equal to the Fund's annualized expense ratio, multiplied by the average account value over the period, multiplied by [number of days in most recent fiscal half-year/365 [or 366]] (to reflect one-half year period). |
Other Items (Continued)
Advisory Agreement Approval Disclosure
At a meeting held on November 17, 2011, the Board of Trustees (the “Board” or “Trustees”) of the Touchstone Variable Series Trust (the “Trust”), and by a separate vote, the Independent Trustees of the Trust, approved the continuance of the Investment Advisory Agreement between the Trust and the Advisor with respect to each Fund of the Trust, and the continuance of each Sub-Advisory Agreement between the Advisor and each Fund’s respective Sub-Advisor.
In determining whether to approve the continuation of the Investment Advisory Agreement and the Sub-Advisory Agreements, the Advisor furnished information necessary for a majority of the Independent Trustees to make the determination that the continuance of the Investment Advisory Agreement and each Sub-Advisory Agreement was in the best interests of the respective Funds and their shareholders. The information provided to the Board included: (1) industry data comparing advisory fees and expense ratios of comparable investment companies; (2) comparative performance information; (3) the Advisor’s and its affiliates’ revenues and costs of providing services to the Funds; and (4) information about the Advisor’s and Sub-Advisors’ personnel. Prior to voting, the Independent Trustees reviewed the proposed continuance of the Investment Advisory Agreement and the Sub-Advisory Agreements with management and with experienced independent legal counsel and received materials from such counsel discussing the legal standards for their consideration of the proposed continuation of the Investment Advisory Agreement and each Sub-Advisory Agreement.The IndependentTrustees also reviewed the proposed continuation of the Investment Advisory Agreement and each Sub-Advisory Agreement with independent legal counsel in private sessions at which no representatives of management were present.
In approving the Funds’ Investment Advisory Agreement, the Board considered various factors, among them: (1) the nature, extent and quality of services provided to the Funds, including the personnel providing services; (2) the Advisor’s compensation and profitability; (3) a comparison of fees and performance with other advisers; (4) economies of scale; and (5) the terms of the Investment Advisory Agreement. The Board’s analysis of these factors is set forth below. The Independent Trustees were advised by independent legal counsel throughout the process.
Nature, Extent and Quality of Advisor Services. The Board considered the level and depth of knowledge of the Advisor, including the professional experience and qualifications of senior personnel. In evaluating the quality of services provided by the Advisor, the Board took into account its familiarity with the Advisor’s senior management through Board meetings, discussions and reports during the preceding year. The Board also took into account the Advisor’s compliance policies and procedures. The quality of administrative and other services, including the Advisor’s role in coordinating the activities of the Funds’ other service providers, was also considered. The Board also considered the Advisor’s relationship with its affiliates and the resources available to them, as well as any potential conflicts of interest.
The Board discussed the Advisor’s effectiveness in monitoring the performance of each Sub-Advisor, including those that were affiliates of the Advisor, and the Advisor’s timeliness in responding to performance issues. The Board considered the Advisor’s process for monitoring each of the Sub-Advisors, which includes an examination of both qualitative and quantitative elements of the Sub-Advisor’s organization, personnel, procedures, investment discipline, infrastructure and performance. The Board considered that the Advisor conducts regular on-site compliance visits with each Sub-Advisor, during which the Advisor examines a wide variety of factors, such as the financial condition of the Sub-Advisor, the quality of the Sub-Advisor’s systems, the effectiveness of the Sub-Advisor’s disaster recovery programs, trade allocation and execution procedures, compliance with the Sub-Advisor’s policies and procedures, results of regulatory examinations and any other factors that might affect the quality of services that the Sub-Advisor provides to the applicable Fund(s). The Board noted that the Advisor’s compliance monitoring processes also include quarterly reviews of compliance reports, and that any issues arising from such reports and the Advisor’s compliance visits to the Sub-Advisors are reported to the Board.
Other Items (Continued)
The Trustees concluded that they were satisfied with the nature, extent and quality of services provided to each Fund by the Advisor under the Investment Advisory Agreement.
Advisor’s Compensation and Profitability.The Board took into consideration the financial condition and profitability of the Advisor and its affiliates (including the Sub-Advisor to certain of the Funds) and the direct and indirect benefits derived by the Advisor and its affiliates from the Advisor’s relationship with the Funds. The information considered by the Board included operating profit margin information for the Advisor’s business as a whole. The Board noted that the Advisor waived a portion of the fees of certain Funds. The Board also noted that the Advisor pays the Sub-Advisors’ sub-advisory fees out of the advisory fees the Advisor receives from the Funds. The Board reviewed the profitability of the Advisor’s relationship with the Funds both before and after tax expenses, and also considered whether the Advisor has the financial wherewithal to continue to provide a high level of services to the Funds, noting the ongoing commitment of the Advisor’s parent company with respect to providing support and resources as needed. The Board considered that the Funds’ distributor, an affiliate of the Advisor, receives Rule 12b-1 distribution fees from the Funds. The Board also noted that the Advisor derives benefits to its reputation and other benefits from its association with the Funds. The Board also considered that affiliates of the Advisor may benefit from certain indirect tax benefits, including those relating to dividend received deductions.
The Board recognized that the Advisor should be entitled to earn a reasonable level of profits in exchange for the level of services it provides to each Fund and the entrepreneurial risk that it assumes as Advisor. Based upon their review, the Trustees concluded that the Advisor’s and its affiliates’ level of profitability, if any, from their relationship with each Fund was reasonable and not excessive.
Expenses and Performance. The Board compared the respective advisory fees and total expense ratios for each of the Funds with various comparative data, including the median and average advisory fees and total expense ratios of each Fund’s respective peer group. The Board also considered, among other data, the Funds’ respective performance results during the six-month, twelve-month and thirty-six-month periods ended June 30, 2011 and noted that the Board reviews on a quarterly basis detailed information about each Fund’s performance results, portfolio composition and investment strategies. The Board also took into account current market conditions and their effect on the Funds’ performance.
The Board also considered the effect of each Fund’s growth and size on its performance and expenses.
The Board noted that the Advisor had waived a portion of the fees of certain Funds in order to reduce those Funds’ respective operating expenses to targeted levels. The Board noted that the sub-advisory fees under the Sub-Advisory Agreement with respect to each Fund were paid by the Advisor out of the advisory fees it receives from the Fund and considered the impact of such sub-advisory fees on the profitability of the Advisor. In reviewing the respective expense ratios and performance of each of the Funds, the Board also took into account the nature, extent and quality of the services provided to the Funds by the Advisor and its affiliates.
The Board considered, among other data, the specific factors and related conclusions set forth below with respect to each Fund:
Touchstone Baron Small Cap Growth Fund. The Fund’s advisory fee and total expense ratio (net of applicable expense waivers) were above the median of its peer group. The Board noted that the Advisor was currently waiving a portion of the Fund’s fees. The Board took into account management’s discussion of the Fund’s expenses, including the impact that the relatively small size of the Fund has upon expenses.The Fund’s performance for the six- and thirty-six-month periods ended June 30, 2011 was in the 2nd quintile of the Fund’s peer group, and the Fund’s performance for the twelve-month period ended June 30, 2011 was in the 4th quintile. The Board noted management’s explanation for the Fund’s short-term underperformance. Based upon their review,
Other Items (Continued)
the Trustees concluded that the Fund’s overall performance was satisfactory and that the advisory fee was reasonable in light of the high quality of services received by the Fund from the Advisor and the other factors considered.
Touchstone Core Bond Fund. The Fund’s advisory fee and total expense ratio were at the median of its peer group. The Board took into account management’s discussion of the Fund’s expenses, including the impact that the relatively small size of the Fund has upon expenses. The Fund’s performance for the six-month period ended June 30, 2011 was in the 3rd quintile of the Fund’s peer group, and the Fund’s performance for the twelve- and thirty-six-month periods ended June 30, 2011 was in the 2nd quintile. Based upon their review, the Trustees concluded that the Fund’s performance was satisfactory and that the advisory fee was reasonable in light of the high quality of services received by the Fund from the Advisor and the other factors considered.
Touchstone High Yield Fund. The Fund’s advisory fee and total expense ratio were below the median and at the median, respectively, of its peer group. The Board took into account management’s discussion of the Fund’s expenses, including the impact that the relatively small size of the Fund has upon expenses. The Fund’s performance for the six- and thirty-six-month periods ended June 30, 2011 was in the 3rd quintile of the Fund’s peer group, and the Fund’s performance for the twelve-month period ended June 30, 2011 was in the 4th quintile. Based upon their review, the Trustees concluded that the Fund’s overall performance was satisfactory and that the advisory fee was reasonable in light of the high quality of services received by the Fund from the Advisor.
Touchstone Large Cap Core Equity Fund. The Fund’s advisory fee and total expense ratio (net of applicable expense waivers) were below the median of its peer group. The Board noted that the Advisor was currently waiving a portion of the Fund’s fees. The Fund’s performance for the six-month period ended June 30, 2011 was in the 1st quintile of the Fund’s peer group, and the Fund’s performance for the twelve- and thirty-six-month periods ended June 30, 2011 was in the 3rd quintile. Based upon their review, the Trustees concluded that the Fund’s performance was satisfactory and that the advisory fee was reasonable in light of the high quality of services received by the Fund from the Advisor.
Touchstone Mid Cap Growth Fund. The Fund’s advisory fee and total expense ratio (net of applicable expense waivers) were at the median and above the median, respectively, of its peer group. The Board noted that the Advisor was currently waiving a portion of the Fund’s fees. The Board also noted the recent addition of breakpoints to the Fund’s advisory fees, as well as the recent change in the Fund’s sub-advisory arrangements. The Fund’s performance for the six- and twelve-month periods ended June 30, 2011 was in the 3rd quintile of the Fund’s peer group, and the Fund’s performance for the thirty-six-month period ended June 30, 2011 was in the 4th quintile. The Board noted management’s explanation for the Fund’s underperformance and management’s continued monitoring of the Fund’s performance. Based upon their review, the Trustees concluded that the Fund’s performance was being addressed and that the advisory fee was reasonable in light of the high quality of services received by the Fund from the Advisor and the other factors considered.
Touchstone Money Market Fund. The Fund’s advisory fee and total expense ratio (net of applicable expense waivers) were below the median of its peer group. The Board noted that the Advisor was currently waiving a portion of the Fund’s fees. The Board took into account management’s discussion of the Fund’s expenses, including the impact that the relatively small size of the Fund has upon expenses. The Fund’s performance for the six-, twelve- and thirty-six-month periods ended June 30, 2011 was in the 1st quintile of the Fund’s peer group. Based upon their review, the Trustees concluded that the Fund’s performance was satisfactory and that the advisory fee was reasonable in light of the high quality of services received by the Fund from the Advisor and the other factors considered.
Touchstone Third Avenue Value Fund. The Fund’s advisory fee and total expense ratio (net of applicable expense waivers) were above the median of its peer group. The Board noted that the Advisor was currently waiving a portion of the Fund’s fees. The Board took into account management’s discussion of the Fund’s
Other Items (Continued)
expenses, including the impact that the relatively small size of the Fund has upon expenses. The Fund’s performance for the six- and thirty-six-month periods ended June 30, 2011 was in the 5th quintile of the Fund’s peer group, and the Fund’s performance for the twelve-month period ended June 30, 2011 was in the 4th quintile. The Board noted management’s explanation for the Fund’s underperformance and management’s continued monitoring of the Fund’s performance. Based upon their review, the Trustees concluded that the Fund’s performance was being addressed and that the advisory fee was reasonable in light of the high quality of services received by the Fund from the Advisor and the other factors considered.
Touchstone Conservative ETF Fund. The Fund’s advisory fee and total expense ratio (net of applicable expense waivers) were above the median and at the median, respectively, of its peer group. The Board noted that the Advisor was currently waiving a portion of the Fund’s fees. The Board took into account management’s discussion of the Fund’s expenses, including the impact that the relatively small size of the Fund has upon expenses. The Fund’s performance for the six-month period ended June 30, 2011 was in the 4th quintile of the Fund’s peer group, the Fund’s performance for the twelve-month period ended June 30, 2011 was in the 5th quintile, and the Fund’s performance for the thirty-six-month period ended June 30, 2011 was in the 3rd quintile. The Board noted management’s discussion of the Fund’s performance. Based upon their review, the Trustees concluded that the Fund’s overall performance was satisfactory and that the advisory fee was reasonable in light of the high quality of services received by the Fund from the Advisor.
Touchstone Moderate ETF Fund. The Fund’s advisory fee and total expense ratio (net of applicable expense waivers) were above the median and below the median, respectively, of its peer group. The Board noted that the Advisor was currently waiving a portion of the Fund’s fees. The Board took into account management’s discussion of the Fund’s expenses, including the impact that the relatively small size of the Fund has upon expenses. The Fund’s performance for the six-month period ended June 30, 2011 was in the 3rd quintile of the Fund’s peer group, the Fund’s performance for the twelve-month period ended June 30, 2011 was in the 4th quintile, and the Fund’s performance for the thirty-six-month period ended June 30, 2011 was in the 2nd quintile. The Board noted management’s discussion of the Fund’s performance. Based upon their review, the Trustees concluded that the Fund’s overall performance was satisfactory and that the advisory fee was reasonable in light of the high quality of services received by the Fund from the Advisor.
Touchstone Aggressive ETF Fund. The Fund’s advisory fee and total expense ratio (net of applicable expense waivers) were above the median and below the median, respectively, of its peer group. The Board noted that the Advisor was currently waiving a portion of the Fund’s fees. The Board took into account management’s discussion of the Fund’s expenses, including the impact that the relatively small size of the Fund has upon expenses. The Fund’s performance for the six-month period ended June 30, 2011 was in the 3rd quintile of the Fund’s peer group, the Fund’s performance for the twelve-month period ended June 30, 2011 was in the 4th quintile, and the Fund’s performance for the thirty-six-month period ended June 30, 2011 was in the 2nd quintile. The Board noted management’s discussion of the Fund’s performance. Based upon their review, the Trustees concluded that the Fund’s overall performance was satisfactory and that the advisory fee was reasonable in light of the high quality of services received by the Fund from the Advisor.
Touchstone Enhanced ETF Fund. The Fund’s advisory fee and total expense ratio (net of applicable expense waivers) were below the median of its peer group. The Board noted that the Advisor was currently waiving a portion of the Fund’s fees. The Fund’s performance for the six-, twelve- and thirty-six-month periods ended June 30, 2011 was in the 5th quintile of the Fund’s peer group. The Board noted management’s explanation for the Fund’s underperformance and management’s continued monitoring of the Fund’s performance. Based upon their review, the Trustees concluded that the Fund’s performance was being addressed and that the advisory fee was reasonable in light of the high quality of services received by the Fund from the Advisor and the other factors considered.
Other Items (Continued)
Economies of Scale. The Board considered the effect of each Fund’s current size and potential growth on its performance and expenses. The Board took into account management’s discussion of the Funds’ advisory fee structure. The Board considered the effective advisory fees under the Investment Advisory Agreement as a percentage of assets at different asset levels and possible economies of scale that might be realized if the assets of each Fund increase. The Board noted that the advisory fee schedules for some of the Funds contain breakpoints that would reduce the respective advisory fee rate on assets above specified levels as the respective Fund’s assets increased and considered the necessity of adding breakpoints with respect to the Funds that did not currently have such breakpoints in their advisory fee schedules. The Board determined that adding breakpoints at specified levels to the advisory fee schedule of each Fund that currently did not have such breakpoints was not appropriate at that time. The Board also noted that if a Fund’s assets increase over time, the Fund might realize other economies of scale if assets increase proportionally more than certain other expenses. The Board also considered the fact that, under the Investment Advisory Agreement, the advisory fee payable to the Advisor by a Fund was reduced by the total sub-advisory fee paid by the Advisor to the Fund’s Sub-Advisor.
Conclusion. In considering the renewal of the Funds’ Investment Advisory Agreement, the Board, including the Independent Trustees, did not identify any single factor as controlling, and each Trustee may have attributed different weights to the various factors. The Trustees evaluated all information available to them on a Fund-by-Fund basis, and their determinations were made separately with respect to each Fund. The Board reached the following conclusions regarding the Funds’ Investment Advisory Agreement with the Advisor, among others: (a) the Advisor demonstrated that it possesses the capability and resources to perform the duties required of it under the Investment Advisory Agreement; (b) the Advisor maintains an appropriate compliance program; (c) the performance of each Fund is satisfactory relative to the performance of funds with similar investment objectives and relevant indices or, as discussed above, is being addressed; and (d) each Fund’s advisory fee is reasonable relative to those of similar funds and the services to be provided by the Advisor. Based on their conclusions, the Trustees determined with respect to each Fund that continuation of the Investment Advisory Agreement was in the best interests of the Fund and its shareholders.
In approving the Funds’ respective Sub-Advisory Agreements, the Board considered various factors with respect to each Fund and the applicable Sub-Advisory Agreement, among them: (1) the nature, extent and quality of services provided to the Fund, including the personnel providing such services; (2) the Sub-Advisor’s compensation; (3) a comparison of the sub-advisory fee and performance with other advisers; and (4) the terms of the Sub-Advisory Agreement. The Board’s analysis of these factors is set forth below. The Independent Trustees were advised by independent legal counsel throughout the process.
Nature, Extent and Quality of Services Provided; Investment Personnel. The Board considered information provided by the Advisor regarding the services provided by each Sub-Advisor, including information presented periodically throughout the previous year. The Board noted the affiliation of the Sub-Advisor to certain of the Funds with the Advisor, noting any potential conflicts of interest. The Board also noted that, on a periodic basis, the Board meets with portfolio managers of the Sub-Advisors to discuss their respective performance and investment processes and strategies. The Board considered each Sub-Advisor’s level of knowledge and investment style. The Board reviewed the experience and credentials of the applicable investment personnel who are responsible for managing the investment of portfolio securities with respect to the Funds. The Board also noted each Sub-Advisor’s brokerage practices.
Sub-Advisor’s Compensation. The Board also took into consideration the financial condition of each Sub-Advisor and any indirect benefits derived by each Sub-Advisor and its affiliates from the Sub-Advisor’s relationship with the Funds. In considering the profitability to each Sub-Advisor of its relationship with the Funds, the Board noted the undertakings of the Advisor to maintain expense limitations for the Funds and also noted that the sub-advisory fees under the Sub-Advisory Agreements were paid by the Advisor out of the advisory fees that it receives under the Investment Advisory Agreement and in addition, with respect to the unaffiliated
Other Items (Continued)
Sub-Advisors, are negotiated at arm’s length. As a consequence, the profitability to each Sub-Advisor of its relationship with a Fund was not a substantial factor in the Board’s deliberations. For similar reasons, the Board did not consider the potential economies of scale in each Sub-Advisor’s management of the applicable Fund to be a substantial factor in its consideration, although the Board noted that the sub-advisory fee schedule for some of the Funds contained breakpoints that would reduce the sub-advisory fee rate on assets above specified levels as the applicable Fund’s assets increased.
Sub-Advisory Fees and Fund Performance. The Board considered that each Fund pays an advisory fee to the Advisor and that the Advisor pays the sub-advisory fee to the Sub-Advisor out of the advisory fee it receives from the respective Fund. The Board also compared the sub-advisory fees paid by the Advisor to fees charged by the Sub-Advisor to manage comparable institutional separate accounts. The Board considered the amount retained by the Advisor and the sub-advisory fee paid to each Sub-Advisor with respect to the various services provided by the Advisor and the Sub-Advisor. The Board also noted that the Advisor negotiated the sub-advisory fee with each of the unaffiliated Sub-Advisors at arm’s length. The Board reviewed the sub-advisory fee for each Fund in relation to various comparative data, including the median and average sub-advisory fees of each Fund’s peer group, and considered the following information:
Touchstone Baron Small Cap Growth Fund. The Fund’s sub-advisory fee was above the median of its peer group. Based upon their review, the Trustees concluded that the sub-advisory fee was reasonable in light of the quality of services received by the Fund from the Sub-Advisor and the other factors considered.
Touchstone Core Bond Fund. The Fund’s sub-advisory fee was above the median of its peer group. Based upon their review, the Trustees concluded that the sub-advisory fee was reasonable in light of the quality of services received by the Fund from the Sub-Advisor and the other factors considered.
Touchstone High Yield Fund. The Fund’s sub-advisory fee was at the median of its peer group. Based upon their review, the Trustees concluded that the sub-advisory fee was reasonable in light of the quality of services received by the Fund from the Sub-Advisor and the other factors considered.
Touchstone Large Cap Core Equity Fund. The Fund’s sub-advisory fee was below the median of its peer group. Based upon their review, the Trustees concluded that the sub-advisory fee was reasonable in light of the quality of services received by the Fund from the Sub-Advisor.
Touchstone Mid Cap Growth Fund. The Fund’s sub-advisory fees were at the median of its peer group. The Board took into account the recent addition of breakpoints in the sub-advisory fee for the Fund. Based upon their review, the Trustees concluded that the sub-advisory fee was reasonable in light of the quality of services received by the Fund from the Sub-Advisor and the other factors considered.
Touchstone Money Market Fund. The Fund’s sub-advisory fee was below the median of its peer group. Based upon their review, the Trustees concluded that the sub-advisory fee was reasonable in light of the quality of services received by the Fund from the Sub-Advisor.
Touchstone Third Avenue Value Fund. The Fund’s sub-advisory fee was above the median of its peer group. Based upon their review, the Trustees concluded that the sub-advisory fee was reasonable in light of the quality of services received by the Fund from the Sub-Advisor and the other factors considered.
Touchstone Conservative ETF Fund. The Fund’s sub-advisory fee was below the median of its peer group. Based upon their review, the Trustees concluded that the sub-advisory fee was reasonable in light of the quality of services received by the Fund from the Sub-Advisor and the other factors considered.
Touchstone Moderate ETF Fund. The Fund’s sub-advisory fee was below the median of its peer group. Based upon their review, the Trustees concluded that the sub-advisory fee was reasonable in light of the quality of services received by the Fund from the Sub-Advisor and the other factors considered.
Other Items (Continued)
Touchstone Aggressive ETF Fund. The Fund’s sub-advisory fee was below the median of its peer group. Based upon their review, the Trustees concluded that the sub-advisory fee was reasonable in light of the quality of services received by the Fund from the Sub-Advisor and the other factors considered.
Touchstone Enhanced ETF Fund. The Fund’s sub-advisory fee was below the median of its peer group. Based upon their review, the Trustees concluded that the sub-advisory fee was reasonable in light of the quality of services received by the Fund from the Sub-Advisor.
As noted above, the Board considered each Fund’s performance during the six-month, twelve-month and thirty-six-month periods ended June 30, 2011 as compared to each Fund’s peer group and noted that the Board reviews on a quarterly basis detailed information about each Fund’s performance results, portfolio composition and investment strategies. The Board noted the Advisor’s expertise and resources in monitoring the performance, investment style and risk-adjusted performance of each Sub-Advisor. The Board was mindful of the Advisor’s focus on each Sub-Advisor’s performance and the Advisor’s ways of addressing underperformance.
Conclusion. In considering the renewal of the Sub-Advisory Agreement with respect to each Fund, the Board, including the Independent Trustees, did not identify any single factor as controlling, and each Trustee may have attributed different weights to the various factors. The Board reached the following conclusions regarding each Sub-Advisory Agreement, among others: (a) the Sub-Advisor is qualified to manage each Fund’s assets in accordance with the Fund’s investment objectives and policies; (b) the Sub-Advisor maintains an appropriate compliance program; (c) the performance of each Fund is satisfactory relative to the performance of funds with similar investment objectives and relevant indices or, as discussed above, is being addressed; (d) each Fund’s advisory fees are reasonable relative to those of similar funds and the services to be provided by the Advisor and the Sub-Advisor; and (e) the Sub-Advisor’s investment strategies are appropriate for pursuing the investment objectives of each Fund. Based on its conclusions, the Board determined that approval of the Sub-Advisory Agreement with respect to each Fund was in the best interests of the Fund and its shareholders.
Management of the Trust (Unaudited)
Listed below is basic information regarding theTrustees and principal officers of theTrust.TheTrust’s Statement of Additional Information includes additional information about the Trustees and is available, without charge, upon request by calling 1.800.543.0407.
| Interested Trustees1: | | | | | | | | | | |
Name Address Age | | Position(s) Held with Trust | | Term of Office2 And Length of Time Served | | Principal Occupation(s) During Past 5 Years | | Number of Funds Overseen in the Touchstone Fund Complex3 | | Other Directorships Held4 |
Jill T. McGruder Touchstone Advisors, Inc 303 Broadway Cincinnati, OH Year of Birth: 1955 | | Trustee and President | | Until retirement at age 75 or until she resigns or is removed Trustee since 1999 | | President and CEO of IFS Financial Services, Inc. (a holding company). | | 43 | | Director of LaRosa’s (a restaurant chain), Capital Analysts Incorporated (an investment advisor and broker-dealer), IFS Financial Services, Inc. (a holding company), Integrity and National Integrity Life Insurance Co., Touchstone Securities (the Trust’s distributor), Touchstone Advisors (the Trust’s investment advisor and administrator) and W&S Financial Group Distributors (a distribution company). |
| Independent Trustees: | | | | | | | | | | |
Phillip R. Cox 105 East Fourth Street Cincinnati, OH Year of Birth: 1947 | | Trustee | | Until retirement at age 75 or until he resigns or is removed Trustee since 1999 | | President and Chief Executive Officer of Cox Financial Corp. (a financial services company). | | 43 | | Director of Cincinnati Bell (a communications company), Bethesda Inc. (a hospital), Timken Co. (a manufacturing company), Diebold (a technology solutions company), and Ohio Business Alliance for Higher Education. Director of Duke Energy from 1994-2008. |
H. Jerome Lerner c/o Touchstone Advisors, Inc. 303 Broadway Cincinnati, OH Year of Birth: 1938 | | Trustee | | Until retirement at age 75 or until he resigns or is removed Trustee since 1989 | | Principal of HJL Enterprises (a privately held investment company). | | 43 | | None |
Management of the Trust (Continued)
| Independent Trustees (Continued): | | | | | | | | | | |
Name Address Age | | Position(s) Held with Trust | | Term of Office2 And Length of Time Served | | Principal Occupation(s) During Past 5 Years | | Number of Funds Overseen in the Touchstone Fund Complex3 | | Other Directorships Held4 |
Donald C. Siekmann c/o Touchstone Advisors, Inc. 303 Broadway Cincinnati, OH Year of Birth: 1938 | | Trustee | | Until retirement at age 75 or until he resigns or is removed Trustee since 2005 | | Executive for Duro Bag Manufacturing Co. (a bag manufacturer) from 2002-2008 | | 43 | | None |
John P. Zanotti c/o Touchstone Advisors, Inc. 303 Broadway Cincinnati, OH Year of Birth: 1948 | | Trustee | | Until retirement at age 75 or until he resigns or is removed Trustee since 2002 | | CEO, Chairman and Director of Avaton, Inc. (a wireless entertainment company) until 2006. President of Cincinnati Biomedical (a life science and economic development company) from 2003-2007. Chairman of Integrated Media Technologies (a media company) | | 43 | | Director of Q Med (a health care management company) from 2004- 2007 |
Susan J. Hickenlooper c/o Touchstone Advisors, Inc. 303 Broadway Cincinnati, OH Year of Birth: 1946 | | Trustee | | Until retirement at age 75 or until he resigns or is removed Trustee since 2009 | | Trustee of Episcopal Retirement Homes Foundation | | 43 | | Trustee of Gateway Trust from 2006-2008, Trustee of Cincinnati Parks Foundation (a charitable organization). |
| 1 | Ms. McGruder, as a director of the Advisor and the Trust's Distributor, and an officer of affiliates of the Advisor and the Trust's Distributor, is an “interested person” of the Trust within the meaning of Section 2(a)(19) of the 1940 Act. |
| 2 | Each Trustee is elected to serve until the age of 75 or until he or she sooner resigns or is removed. |
| 3 | The Touchstone Fund Complex consists of 11 variable annuity series of the Trust, 3 series of Touchstone Tax-Free Trust, 1 series of Touchstone Institutional Funds Trust, 4 series of Touchstone Investment Trust, 4 series of Touchstone Strategic Trust, and 20 series of Touchstone Funds Group Trust. |
| 4 | Each Trustee is also a Trustee of Touchstone Funds Group Trust, Touchstone Institutional Funds Trust, Touchstone Investment Trust, Touchstone Strategic Trust, and Touchstone Tax-Free Trust. |
Management of the Trust (Continued)
| Principal Officers1: | | | | | |
Name Address Age | Position(s) Held with Trust | Term of Office2 And Length of Time Served | Principal Occupation(s) During Past 5 Years | Number of Funds Overseen in the Touchstone Fund Complex2 | Other Directorships Held |
Jill T. McGruder Touchstone Advisors, Inc. 303 Broadway Cincinnati, OH Year of Birth: 1955 | President | Until resignation, removal or disqualification President since 2004; President from 2000-2002 | See biography above. | 43 | See biography above. |
Brian E. Hirsch Touchstone Advisors, Inc. 303 Broadway Cincinnati, OH Year of Birth: 1956 | Vice President | Until resignation, removal or disqualification Vice President since 2003 | Senior Vice President of Compliance and Fund Administration of IFS Financial Services, Inc. | 43 | None |
Steven M. Graziano Touchstone Advisors, Inc. 303 Broadway Cincinnati, OH Year of Birth: 1954 | Vice President | Until resignation, removal or disqualification Vice President since 2009 | President of Touchstone Advisors, Inc.; Executive Vice President of Pioneer Investment Management, Head of Retail Distribution and Strategic Marketing 2007-2008; Executive Vice President of Pioneer Investment Management, Chief Marketing Officer 2002-2007. | 43 | None |
Timothy D. Paulin Touchstone Advisors, Inc. 303 Broadway Cincinnati, OH Year of Birth: 1963 | Vice President | Until resignation, removal or disqualification Vice President since 2010 | Vice President of Investment Research; Principal of Klein Decisions | 43 | None |
Joseph Melcher Touchstone Advisors, Inc. 303 Broadway Cincinnati, OH Year of Birth: 1973 | Chief Compliance Officer | Until resignation, removal or disqualification Chief Compliance Officer since 2010 | Vice President of Compliance of IFS Financial Services (a holding company); Assistant Vice President of Compliance of IFS Financial Services 2005-2010. | 43 | None |
Terrie A. Wiedenheft Touchstone Advisors, Inc. 303 Broadway Cincinnati, OH Year of Birth: 1962 | Controller and Treasurer | Until resignation, removal or disqualification Controller since 2000 Treasurer since 2003 | Chief Financial Officer and Senior Vice President of IFS Financial Services, Inc. | 43 | None |
Management of the Trust (Continued)
| Principal Officers1 (Continued): | | | | | |
Name Address Age | Position(s) Held with Trust | Term of Office2 And Length of Time Served | Principal Occupation(s) During Past 5 Years | Number of Funds Overseen in the Touchstone Fund Complex2 | Other Directorships Held |
Elizabeth R. Freeman BNY Mellon 201 Washington Street Boston, MA Year of Birth: 1962 | Secretary | Until resignation, removal or disqualification. Secretary since 2011 | Managing Diretor and Senior Counsel at BNY Mellon Investment Servicing (US) Inc. | 43 | None |
| 1 | Each officer also holds the same office with Touchstone Funds Group Trust, Touchstone Institutional Funds Trust, Touchstone Investment Trust, Touchstone Tax-Free Trust, and Touchstone Tax-Free Trust. |
| 2 | The Touchstone Fund Complex consists of 11 variable annuity series of the Trust, 3 series of Touchstone Tax-Free Trust, 1 series of Touchstone Institutional Funds Trust, 4 series of Touchstone Investment Trust, 4 series of Touchstone Strategic Trust, and 20 series of Touchstone Funds Group Trust. |
PRIVACY PROTECTION POLICY
We Respect Your Privacy
Thank you for your decision to invest with us. Touchstone and its affiliates have always placed a high value on the trust and confidence our clients place in us. We believe that confidence must be earned and validated through time. In today’s world, when technology allows the sharing of information at light speeds, trust must be reinforced by our sincere pledge to take the steps necessary to ensure that the information you share with us is treated with respect and confidentiality.
Our Pledge to Our Clients
| • | We collect only the information we need to service your account and administer our business. |
| • | We are committed to keeping your information confidential and we place strict limits and controls on the use and sharing of your information. |
| • | We make every effort to ensure the accuracy of your information. |
We Collect the Following Nonpublic Personal Information About You:
| • | Information we receive from you on or in applications or other forms, correspondence, or conversations, including, but not limited to, your name, address, phone number, social security number, assets, income and date of birth; and |
| • | Information about your transactions with us, our affiliates, or others, including, but not limited to, your account number and balance, payment history, parties to transactions, cost basis information, and other financial information. |
Categories of Information We Disclose and Parties to Whom We Disclose
We do not disclose any nonpublic personal information about our current or former clients to nonaffiliated third parties, except as required or permitted by law.
We Place Strict Limits and Controls on the Use and Sharing of Your Information
| • | We restrict access to nonpublic personal information about you to authorized employees who need the information to administer your business. |
| • | We maintain physical, electronic and procedural safeguards that comply with federal standards to protect this information. |
| • | We do not disclose any nonpublic personal information about our current or former clients to anyone, except as required or permitted by law or as described in this document. |
| • | We will not sell your personal information to anyone. |
We May Provide Information to Service Your Account
Sometimes it is necessary to provide information about you to various companies such as transfer agents, custodians, broker-dealers and marketing service firms to facilitate the servicing of your account. These organizations have a legitimate business need to see some of your personal information in order for us to provide service to you. We may disclose to these various companies the information that we collect as described above. We require that these companies, including our own subsidiaries and affiliates, strictly maintain the confidentiality of this information and abide by all applicable laws. Companies within our corporate family that may receive this information are financial service providers and insurance companies. We do not permit these associated companies to sell the information for their own purposes, and we never sell our customer information.
This policy is applicable to the following affiliated companies: Touchstone Funds Group Trust, Touchstone Investment Trust, Touchstone Strategic Trust, Touchstone Tax-Free Trust, Touchstone Variable Series Trust, Touchstone Institutional Funds Trust, Touchstone Securities, Inc.,* Capital Analysts Incorporated and W&S Brokerage Services, Inc.
* Touchstone Securities, Inc. serves as the underwriter to the Touchstone Funds.
A Member of Western & Southern Financial Group®
The Privacy Protection Policy is not part of the Annual Report.
This page intentionally left blank.
This page intentionally left blank.
TSF-1006-TVST-AR-1112
Item 2. Code of Ethics.
| (a) | The registrant, as of the end of the period covered by this report, has adopted a code of ethics that applies to the registrant’s principal executive officer, principal financial officer, principal accounting officer or controller, or persons performing similar functions, regardless of whether these individuals are employed by the registrant or a third party. |
| (c) | There have been no amendments, during the period covered by this report, to a provision of the code of ethics that applies to the registrant’s principal executive officer, principal financial officer, principal accounting officer or controller, or persons performing similar functions, regardless of whether these individuals are employed by the registrant or a third party, and that relates to any element of the code of ethics description. |
| (d) | The registrant has not granted any waivers, including an implicit waiver, from a provision of the code of ethics that applies to the registrant’s principal executive officer, principal financial officer, principal accounting officer or controller, or persons performing similar functions, regardless of whether these individuals are employed by the registrant or a third party, that relates to one or more of the items set forth in paragraph (b) of this item’s instructions. |
Item 3. Audit Committee Financial Expert.
The registrant’s Board of Trustees has determined that the registrant has at least one audit committee financial expert serving on its audit committee. Mr. Donald Siekmann is the registrant’s audit committee financial expert and is an independent trustee within the meaning of the Investment Company Act of 1940, as amended (the “1940 Act”).
Item 4. Principal Accountant Fees and Services.
Audit Fees
| (a) | Audit fees for Touchstone Variable Series Trust totaled $143,000 and $141,800 in fiscal 2011 and 2010, respectively, including fees associated with the annual audits and filings of Form N-1A and Form N-SAR. |
Audit-Related Fees
| (b) | Audit-related fees totaled $7,150 and $0 in fiscal 2011 and 2010, respectively, relating to conversion testing from the Trust’s former fund accountant and transfer agent (JP Morgan) to the Trust’s current fund accountant and transfer agent (BNY Mellon). |
Tax Fees
| (c) | Fees for tax compliance services totaled $29,500 and $40,500 in fiscal 2011 and 2010, respectively. |
All Other Fees
| (d) | There were no other fees for the December 31, 2011 or December 31, 2010 fiscal years. |
Audit Committee Pre-Approval Policies.
| (e)(1) | The Audit Committee’s pre-approval policies describe the types of audit, audit-related, tax and other services that have the general pre-approval of the Audit Committee. The pre-approval policies provide that annual audit service fees, tax services not specifically granted pre-approval, services exceeding pre-approved cost levels and other services that have not received general pre-approval will be subject to specific pre-approval by the Audit Committee. The pre-approval policies further provide that the Committee may grant general pre-approval to other audit services (statutory audits and services associated with SEC registration statements, periodic reports and other documents filed with the SEC or other documents issued in connection with securities offerings), audit-related services (accounting consultations related to accounting, financial reporting or disclosure matters not classified as “audit services,” assistance with understanding and implementing new accounting and financial reporting guidance from rulemaking authorities, agreed-upon or expanded audit procedures related to accounting and/or billing records required to respond to or comply with financial, accounting or regulatory reporting matters and assistance with internal control reporting requirements under Form N-SAR and Form N-CSR), tax services that have historically been provided by the auditor that the Committee believes would not impair the independence of the auditor and are consistent with the SEC’s rules on auditor independence and permissible non-audit services classified as “all other services” that are routine and recurring services. |
| (e)(2) | All services described in paragraphs (b) through (d) of Item 4 were approved by the Audit Committee. |
| (g) | The aggregate non-audit fees billed by the registrant's accountant for services rendered to the registrant, and rendered to the registrant's investment adviser (not including any sub-adviser whose role is primarily portfolio management and is subcontracted with or overseen by another investment adviser), and any entity controlling, controlled by, or under common control with the adviser that provides ongoing services to the registrant for each of the last two fiscal years of the registrant was $61,300 for 2011 and $70,500 for 2010. |
| (h) | The registrant's audit committee of the board of directors has considered whether the provision of non-audit services that were rendered to the registrant's investment adviser (not including any sub-adviser whose role is primarily portfolio management and is subcontracted with or overseen by another investment adviser), and any entity controlling, controlled by, or under common control with the investment adviser that provides ongoing services to the registrant that were not pre-approved pursuant to paragraph (c)(7)(ii) of Rule 2-01 of Regulation S-X is compatible with maintaining the principal accountant's independence. |
Item 5. Audit Committee of Listed registrants.
Not applicable.
Item 6. Investments.
| (a) | Schedule of Investments in securities of unaffiliated issuers as of the close of the reporting period is included as part of the report to shareholders filed under Item 1 of this form. |
Item 7. Disclosure of Proxy Voting Policies and Procedures for Closed-End Management Investment Companies.
Not applicable.
Item 8. Portfolio Managers of Closed-End Management Investment Companies.
Not applicable.
Item 9. Purchases of Equity Securities by Closed-End Management Investment Company and Affiliated Purchasers.
Not applicable.
Item 10. Submission of Matters to a Vote of Security Holders.
There have been no material changes to the procedures by which the shareholders may recommend nominees to the registrant’s board of directors, where those changes were implemented after the registrant last provided disclosure in response to the requirements of Item 407(c)(2)(iv) of Regulation S-K (17 CFR 229.407) (as required by Item 22(b)(15) of Schedule 14A (17 CFR 240.14a-101)), or this Item.
Item 11. Controls and Procedures.
| (a) | The registrant’s principal executive and principal financial officers, or persons performing similar functions, have concluded that the registrant’s disclosure controls and procedures (as defined in Rule 30a-3(c) under the Investment Company Act of 1940, as amended (the “1940 Act”) (17 CFR 270.30a-3(c))) are effective, as of a date within 90 days of the filing date of the report that includes the disclosure required by this paragraph, based on their evaluation of these controls and procedures required by Rule 30a-3(b) under the 1940 Act (17 CFR 270.30a-3(b)) and Rules 13a-15(b) or 15d-15(b) under the Securities Exchange Act of 1934, as amended (17 CFR 240.13a-15(b) or 240.15d-15(b)). |
| (b) | There were no changes in the registrant’s internal control over financial reporting (as defined in Rule 30a-3(d) under the 1940 Act (17 CFR 270.30a-3(d)) that occurred during the registrant’s second fiscal quarter of the period covered by this report that has materially affected, or is reasonably likely to materially affect, the registrant’s internal control over financial reporting. |
Item 12. Exhibits.
| (a)(1) | Code of ethics, or any amendment thereto, that is the subject of disclosure required by Item 2 is attached hereto. |
| (a)(2) | Certifications pursuant to Rule 30a-2(a) under the 1940 Act and Section 302 of the Sarbanes-Oxley Act of 2002 are attached hereto. |
| (b) | Certifications pursuant to Rule 30a-2(b) under the 1940 Act and Section 906 of the Sarbanes- Oxley Act of 2002 are attached hereto. |
SIGNATURES
Pursuant to the requirements of the Securities Exchange Act of 1934 and the Investment Company Act of 1940, the registrant has duly caused this report to be signed on its behalf by the undersigned, thereunto duly authorized.
(Registrant) Touchstone Variable Series Trust
| By (Signature and Title)* | /s/ Jill T. McGruder |
| | Jill T. McGruder, President |
| | (principal executive officer) |
Date 2/29/12
Pursuant to the requirements of the Securities Exchange Act of 1934 and the Investment Company Act of 1940, this report has been signed below by the following persons on behalf of the registrant and in the capacities and on the dates indicated.
| By (Signature and Title)* | /s/ Jill T. McGruder |
| | Jill T. McGruder, President |
| | (principal executive officer) |
Date 2/29/12
| By (Signature and Title)* | /s/ Terrie Wiedenheft |
| | Terrie Wiedenheft, Controller and Treasurer |
| | (principal financial officer) |
Date 2/29/12
* Print the name and title of each signing officer under his or her signature.