UNITED STATES
SECURITIES AND EXCHANGE COMMISSION
Washington, D.C. 20549
FORM N-CSR
CERTIFIED SHAREHOLDER REPORT OF REGISTERED
MANAGEMENT INVESTMENT COMPANIES
Investment Company Act file number | 811-8416 |
|
Touchstone Variable Series Trust |
(Exact name of registrant as specified in charter) |
|
303 Broadway, Cincinnati, Ohio | | 45202 |
(Address of principal executive offices) | | (Zip code) |
|
Jill T. McGruder, 303 Broadway, Cincinnati, Ohio 45202 |
(Name and address of agent for service) |
|
Registrant’s telephone number, including area code: | (513) 878-4066 | |
|
Date of fiscal year end: | 12/31 | |
|
Date of reporting period: | 12/31/10 | |
| | | | | | | | |
Form N-CSR is to be used by management investment companies to file reports with the Commission not later than 10 days after the transmission to stockholders of any report that is required to be transmitted to stockholders under Rule 30e-1 under the Investment Company Act of 1940 (17 CFR 270.30e-1). The Commission may use the information provided on Form N-CSR in its regulatory, disclosure review, inspection and policymaking roles.
A registrant is required to disclose the information specified by Form N-CSR, and the Commission will make this information public. A registrant is not required to respond to the collection of information contained in Form N-CSR unless the Form displays a currently valid Office of Management and Budget ("OMB") control number. Please direct comments concerning the accuracy of the information collection burden estimate and any suggestions for reducing the burden to Secretary, Securities and Exchange Commission, 450 Fifth Street, NW, Washington, DC 20549-0609. The OMB has reviewed this collection of information under the clearance requirements of 44 U.S.C. § 3507.
Item 1. Reports to Stockholders.
Annual Report
December 31, 2010
Annual Report
Touchstone Variable Series Trust
Touchstone Baron Small Cap Growth Fund
Touchstone Core Bond Fund
Touchstone High Yield Fund
Touchstone Large Cap Core Equity Fund
Touchstone Mid Cap Growth Fund
Touchstone Money Market Fund
Touchstone Third Avenue Value Fund
Touchstone Aggressive ETF Fund
Touchstone Conservative ETF Fund
Touchstone Enhanced ETF Fund
Touchstone Moderate ETF Fund

Table of Contents
| | | Page | |
| Letter from the President | | | 3 | | |
|
| Management's Discussion of Fund Performance (Unaudited) | | | 4-24 | | |
|
| Tabular Presentation of Portfolios of Investments (Unaudited) | | | 25-26 | | |
|
| Statements of Assets and Liabilities | | | 27-29 | | |
|
| Statements of Operations | | | 30-32 | | |
|
| Statements of Changes in Net Assets | | | 33-37 | | |
|
| Financial Highlights | | | 38-44 | | |
|
| Notes to Financial Statements | | | 45-57 | | |
|
| Portfolios of Investments: | |
|
| Touchstone Baron Small Cap Growth Fund | | | 58-59 | | |
|
| Touchstone Core Bond Fund | | | 60-64 | | |
|
| Touchstone High Yield Fund | | | 65-68 | | |
|
| Touchstone Large Cap Core Equity Fund | | | 69-70 | | |
|
| Touchstone Mid Cap Growth Fund | | | 71-72 | | |
|
| Touchstone Money Market Fund | | | 73-75 | | |
|
| Touchstone Third Avenue Value Fund | | | 76 | | |
|
| Touchstone Aggressive ETF Fund | | | 77 | | |
|
| Touchstone Conservative ETF Fund | | | 78 | | |
|
| Touchstone Enhanced ETF Fund | | | 79 | | |
|
| Touchstone Moderate ETF Fund | | | 80 | | |
|
| Report of Independent Registered Public Accounting Firm | | | 81 | | |
|
| Other Items (Unaudited) | | | 82-90 | | |
|
| Management of the Trust (Unaudited) | | | 91-93 | | |
|
| Privacy Protection Policy | | | 94 | | |
|
2
Letter from the President
Dear Shareholder:
We are pleased to provide you with the Touchstone Variable Series Trust Annual Report. Inside you will find key financial information, as well as manager commentaries for the year ended December 31, 2010.
All traditional asset classes posted strong positive absolute returns regardless of style or geographic region during the year. The U.S. equity markets had a solid year, despite continued anxiety about the economy and capital markets. For the one-year period ended December 31, 2010, the U.S. stock market outperformed the international equity market. From an investment style and market capitalization perspective, U.S. growth equities outpaced their value counterparts, with mid cap leading the way. In addition, broad investment grade bonds and Treasuries exhibited solid returns.
Interest rates ended 2010 slightly lower than the beginning of the year. The expectation at the start of the year was that the economy would experience a recovery and interest rates would move higher. Interest rates did move higher in the first quarter, but then fell sharply throughout the second and third quarters on the heels of the sovereign debt crisis in Europe and concerns about the strength of the economic recovery. In the fourth quarter, the extension of the Bush-era tax cuts, as well as stronger data on the U.S. economy, increased optimism for 2011 growth and led to sharply higher interest rates.
We continue to believe that diversification is essential to balancing risk and return. We recommend that you continue to work with your financial professional to employ a sound asset allocation strategy that invests in a combination of stock, bond and money market mutual funds to help keep your financial strategy on course. It is critical to maintain a long-term approach to gain the full potential benefits of investing.
Touchstone is committed to helping investors achieve their financial goals by providing access to a distinctive selection of institutional asset managers who are known and respected for proficiency in their specific area of expertise. We hope that you will find the enclosed commentaries helpful.
We greatly appreciate your continued support. Thank you for including Touchstone as part of your investment plan.
Sincerely,

Jill T. McGruder
President
Touchstone Variable Series Trust
3
Management's Discussion of Fund Performance (Unaudited)
Touchstone Baron Small Cap Growth Fund
Sub-Advised by BAMCO, Inc.
Performance and Market Overview
The total return of the Touchstone Baron Small Cap Growth Fund was 24.93% for the year ended December 31, 2010. The total return of the Russell 2000® Growth Index was 29.09% for the same period.
During the year, the Fund maintained its investment focus in what are believed to be well-managed growth businesses that have large opportunities and significant barriers to competition.
Portfolio Review
The Fund underperformed the Russell 2000® Growth Index during the year primarily due to security selection within the Consumer Discretionary, Information Technology and Financials sectors. Within the Consumer Discretionary sector, shares of post-secondary education companies Strayer Education Inc. and DeVry Inc. weighed on the sector. The Fund's underweight position in the Information Technology sector, a key contributor to performance in the benchmark, as well as holdings in the Internet Software & Services and Application Software industries detracted from relative performance during the year. In the Financials sector, an overweight position detracted from relative performance.
The Fund's top detractors in absolute terms during the year were Strayer Education Inc., DeVry Inc. and Tetra Tech Inc. U.S. education stocks Strayer Education Inc. and DeVry Inc. languished all year as investors struggled with regulatory uncertainty facing the industry and what its impact would mean for future growth and profitability. The Fund continues to own these stocks because we are bullish on the long-term fundamentals of the industry and markets in which they operate. We believe the companies are addressing their short-term issues and have solid multi-year growth prospects. Tetra Tech Inc., a leading environmental engineering and consulting firm, also detracted from relative performance in 2010. The company's shares came under pressure on fears of slowing infrastructure spending. After a rare earnings miss during the first quarter, Tetra Tech recovered strongly during the balance of the year.
The Health Care, Energy and Materials sectors contributed positively to relative performance during the year. Edwards Lifesciences Corp., the Fund's top contributor, performed very well as transcatheter heart valve sales exceeded expectations both in the U.S. and internationally. Furthermore, the Fund's underweight position in the Health Care sector also contributed to relative performance. In the Energy sector, shares of SEACOR Holdings Inc. rose 53% for the year due to stronger than expected earnings as a result of its work for BP in assisting in the oil spill cleanup and other logistics in the Gulf of Mexico. In the Materials sector, Molycorp Inc., a producer of rare earths, saw its stock rise 117% in 2010. Tight supply of rare earths coming out of China, the world's leading producer, led prices higher.
The Fund's top performers in absolute terms for 2010 were Edwards Lifesciences Corp., Dick's Sporting Goods Inc. and Genesee & Wyoming Inc.
Edwards Lifesciences Corp. performed well for the year. Edwards is a leading manufacturer of tissue heart valves. The company has been selling transcatheter heart valves in Europe, where sales exceeded expectations throughout 2010. In the U.S., results from the company's PARTNER trial surpassed expectations and met the primary endpoint of the trial. We believe the company will receive regulatory approval to begin selling its SAPIEN transcatheter heart valve in the U.S. in 2011, which will give the company a roughly 3-year lead over its closest competitor. We continue to believe Edwards has a multi-billion dollar market opportunity in transcatheter heart valves, and we continue to have conviction in the investment thesis.
4
Management's Discussion of Fund Performance (Continued)
Dick's Sporting Goods Inc., the country's largest sporting goods retailer, saw same-store sales improve significantly during the year, led by a surge in customer traffic. Inventory per square foot finally increased in the second half of the year, indicating expectations of continued strong sales. The company has continued to grow its store base at a modest rate, but the strong new store productivity levels indicate to us that the company is significantly underpenetrated throughout the country. As a result, Dick's raised its target store count beyond investors' expectations.
Genesee & Wyoming Inc., a leading short-line railroad, performed extremely well during 2010, climbing 62% after the company reported strong double-digit growth in carload volumes, sustained price increases and a significant new acquisition. In June, the company announced that it was acquiring an Australian rail line that is poised to benefit from several mining projects with key export customers in China and India. Combined with Genesee's existing Australian business, we expect the new line will boost international revenue to roughly one-third of the company's total business, offering good diversity and leverage to secular growth drivers in emerging Asian markets.
Current Strategy and Outlook
The Fund's investment strategy is capital appreciation over the long term. It invests in small-sized U.S. growth companies that we believe have a minimum expected return of 100% within four or five years. The Fund may retain companies whose market capitalizations rise beyond their original purchase price range.
We believe the stock market continues to undervalue many publicly-traded companies relative to their prospects and relative to competitive fixed income instruments. Based upon our daily conversations with business executives, we believe the economy is now providing support for those businesses rather than serving as a headwind. Confidence is building and should translate into differentiated valuations and higher earnings multiples. Ultimately we believe investors make the most money when earnings multiples increase, not just when earnings increase. In our opinion, with current historically low interest rates, attractive stock price valuations and economic growth increasing, this could occur.
We also believe that businesses' values over the long term are determined by their growth opportunities, financial strength and earnings, sustainable competitive advantages and management talent. These analyses, valuations and comparisons are how we decide whether our fast growing, publicly-owned businesses are attractively priced, not by guessing whether stock markets will rise or fall in the near term.
5
Management's Discussion of Fund Performance (Continued)

Past performance is not indicative of future performance.
Performance information does not reflect fees that are paid by the separate accounts through which shares of the Fund are sold. Inclusion of those fees would reduce figures for all periods.
The Fund commenced operations on December 14, 1992.
6
Management's Discussion of Fund Performance (Continued)
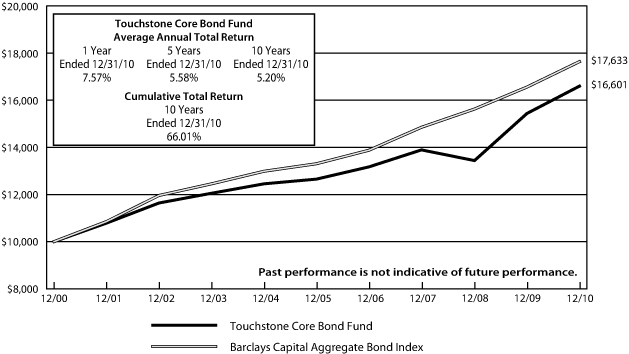
Touchstone Core Bond Fund
Sub-Advised by Fort Washington Investment Advisors, Inc.
Performance and Market Overview
The total return of the Touchstone Core Bond Fund was 7.57% for the year ended December 31, 2010. The total return of the Barclays Capital Aggregate Bond Index was 6.54% for the same period.
For the year, interest rates ended 2010 slightly lower than the beginning of the year. Our expectation to start the year was that the economy would experience a recovery and interest rates would move higher. Interest rates did move higher in the first quarter, but then fell sharply throughout the second and third quarters on the heels of sovereign debt concerns in Europe and concerns about the strength of the economic recovery. In the fourth quarter, the extension of the Bush-era tax cuts as well as stronger data on the U.S. economy increased optimism on 2011 growth and led to sharply higher long-term interest rates. Long-term interest rates rose more than short-term interest rates during the fourth quarter, steepening the yield curve.
Portfolio Review
The Fund outperformed the benchmark for the year, primarily driven by improvements in the credit markets (Corporate Bonds, High Yield, and Commercial Mortgage-Backed Securities), outperformance of Treasury Inflation Protected Securities, and security selection.
The Fund was positioned with less interest rate risk during the first quarter, which detracted from relative performance. In the fourth quarter, the Fund was positioned for the yield curve to flatten which slightly detracted from relative performance. The Fund is currently structured with slightly less interest rate risk than the benchmark, as we expect interest rates to rise over the long-term, but to remain relatively low in the medium-term.
The Treasury Inflation Protected Securities (TIPS) market was quite volatile during 2010 and we tactically allocated to this sector throughout the year. For all of 2010, the Fund's allocations to TIPS contributed to performance. Inflation expectations were relatively stable for the first quarter of 2010, but declined significantly as interest rates fell in the second and third quarters. The market began to anticipate additional action by the Federal Reserve in the third quarter and inflation expectations rose throughout the balance of 2010. Toward the end of the fourth quarter, we reduced exposure to the TIPS market as we believed inflation expectations were no longer attractively priced.
Corporate bonds also contributed to performance. The Fund began the year with a significant overweight to the sector as we viewed the risk premium offered by this sector as attractive and expected fundamentals of corporations to remain solid. Risk premiums narrowed, especially on high quality issuers. In the third quarter, the Fund's position in high quality corporate bonds was reduced in favor of additional allocations to Commercial Mortgage-Backed Securities (CMBS) and High Yield.
The Fund's allocation to High Yield was a significant positive for performance for the year. The Fund had an allocation to High Yield the entire year, but was increased in the third quarter to where it remained at the end of the year.
CMBS was the best performing investment grade sector in 2010 and a significant contributor to performance. The Fund was overweight the sector for much of the year and was increased in the third quarter, which further contributed to performance. Generally, the commercial property market remains difficult, however, security specific analysis is used to manage the risks in the market and select securities that offer attractive risk/reward characteristics. The Fund had a significant overweight to this sector at the end of 2010.
7
Management's Discussion of Fund Performance (Continued)
Current Strategy and Outlook
Given our expectation of unchanged monetary policy and a continuing economic recovery, we anticipate that short- and long-term interest rates are unlikely to change materially from current levels in the near-term. We believe that long-term rates are at risk to rise later in 2011 as the economy continues to grow, the Fed completes the latest asset purchase program, and Treasury supply remains elevated. We think that economic growth will remain solid throughout 2011 and inflation is likely to remain low.
Going forward we plan to position the Fund with slightly less interest rate risk than the benchmark and to opportunistically invest in TIPS. We continue to view the U.S. Treasury and government-related sectors (Agencies, MBS) as relatively unattractive on a long-term basis. We intend to maintain a significant overweight to High Yield and CMBS to take advantage of the yield these sectors offer.
Past performance is not indicative of future performance.
Performance information does not reflect fees that are paid by the separate accounts through which shares of the Fund are sold. Inclusion of those fees would reduce figures for all periods.
The Fund commenced operations on January 1, 1999.
8
Management's Discussion of Fund Performance (Continued)
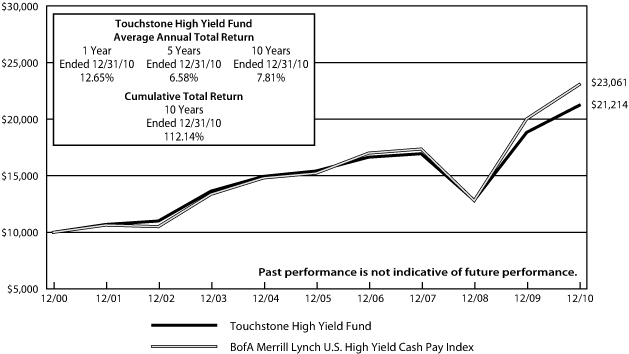
Touchstone High Yield Fund
Sub-Advised by Fort Washington Investment Advisors, Inc.
Performance and Market Overview
The total return of the Touchstone High Yield Fund was 12.65% for the year ended December 31, 2010. The total return of the BofA Merrill Lynch U.S. High Yield Cash Pay Index was 15.24% for the same period.
U.S. financial markets ended calendar year 2010 with a flourish on the back of improved economic performance and surprise developments on both monetary and fiscal policy fronts. The High Yield market participated in this rally even though interest rates increased materially in the quarter. This performance partly reflects stronger economic growth in the U.S. and abroad in recent months. After averaging 2% growth in the second and third quarters, real GDP is estimated to have accelerated to about 3.5% in the fourth quarter, fueled by a pickup in consumption and an improved trade balance. Moreover, unlike the situation in the final quarter of 2009 when growth reached 5% on the back of a surge in inventories, the recent acceleration is based on a pickup in final demand. At the same time, forecasters are becoming more optimistic about the outlook for 2011 due to recent policy developments. In the run-up to the mid-term elections, most were calling for growth to be in the vicinity of 2.0-2.5%, with risks to the downside if the Bush tax cuts were not extended. Today, the consensus is nearly a full percentage point higher, and some economists are calling for growth to reach 4%.
Portfolio Review
Given the significant increase in interest rates during the fourth quarter, higher quality (BB rated) securities actually produced slightly negative returns due to their greater interest rate sensitivity. Conversely, the lowest quality securities (CCC rated) performed well. For calendar year 2010, both BB-rated securities and CCC-rated securities outperformed, while B-rated securities underperformed. With declining interest rates over the full year, BB-rated securities benefited from their longer duration and greater interest rate sensitivity, while CCC-rated securities benefited from significant spread tightening. While the Fund marginally outperformed in the fourth quarter, performance lagged over the calendar year due to its overweight allocation to B-rated securities. Additionally, lack of exposure to certain Financials sectors (generally longer-duration and higher-quality) inhibited performance. In addition, the Fund's overweight position in the Utilities sector detracted from performance.
During the last twelve months, significant value was added from security selection. Whereas the Fund's exposure to the Utilities sector generated negative attribution from sector allocation, positive attribution from security selection within this sector more than offset the impact of sector allocation. Similarly, security selection within the Energy sector contributed to performance. In fact, the Utilities and the Energy sectors were the two largest contributors to performance in 2010.
Current Strategy and Outlook
While the economy is expected to generate solid growth in the first half of 2011, some question whether it will retain momentum in the second half. Some observers, for example, contend that households will save most of the tax windfall, rather than spend it. Others note that the new Republican leadership in Congress is likely to press for significant cuts in government spending, such that the overall thrust of fiscal policy may not be as large as forecasters currently assume. In this regard, we are cautiously optimistic, mainly because of the significant adjustments households, businesses and financial institutions have made. The debt service burden that the household sector faces today, for example, has come down considerably from its pre-crisis peak, while the personal saving rate has increased to 5-6%. With personal disposable income growing at a solid pace and household net worth improving, consumer spending could reach 3% or more. Additionally, the business sector has been able to restore overall profits back to their pre-crisis peak on the back of extensive cost-cutting
9
Management's Discussion of Fund Performance (Continued)
and moderate top-line revenue growth. Businesses also have the wherewithal to boost investment spending out of retained earnings, and there are some signs that the job picture is improving. Finally, the major financial institutions have also strengthened their operating income and balance sheets considerably. Moreover, some are in a position where they will be able to resume dividend payments.
At the same time, we accept that there are still significant risks that could undermine economic expansion. The most concerning are the depressed state of residential housing and potential for further home price declines; the failure to resolve sovereign debt problems in Europe and the potential for greater spill-over if Spain comes under attack; and the reluctance of Chinese policymakers to allow the Renminbi (RMB) to appreciate more freely, which fuels inflation in China and trade frictions abroad. Because there is no resolution to these issues, we are open-minded about whether the U.S. economy will sustain solid growth in the second half of 2011.
While the risk of deflation has diminished, we do not foresee an imminent rise in inflation. The most likely outcome, in our view, is that core inflation will hover around 1% for a while longer, while headline inflation could gravitate to 2%. Headline inflation eventually could reach 2-3%, especially if commodity prices continue to rise.
Although the High Yield sector has performed exceptionally well over the last two years, we continue to be constructive on the outlook for High Yield. With increasing confidence in the economic recovery and declining default rates, valuations remain attractive. While the absolute yields in High Yield are somewhat low, the alternatives appear less compelling. Although returns this year are unlikely to exceed recent returns, we think that High Yield continues to offer attractive relative value, particularly when compared to other fixed income asset classes.
The strength of Fort Washington's High Yield strategy has historically been fundamental credit analysis with particular emphasis on avoiding problem credits. We believe this will continue to add value as negative credit events may have a material impact on returns in this lower return environment. We believe this core competency will provide considerable value to the Fund's investors. We will continue to construct the Fund to exhibit less volatility than the broad market and deliver attractive risk-adjusted returns. It is designed for performance over a full market cycle with focus on protecting principal in down markets, a style that we believe will outperform over the long-term.
10
Management's Discussion of Fund Performance (Continued)
Past performance is not indicative of future performance.
Performance information does not reflect fees that are paid by the separate accounts through which shares of the Fund are sold. Inclusion of those fees would reduce figures for all periods.
The Fund commenced operations on May 1, 1999.
11
Management's Discussion of Fund Performance (Continued)
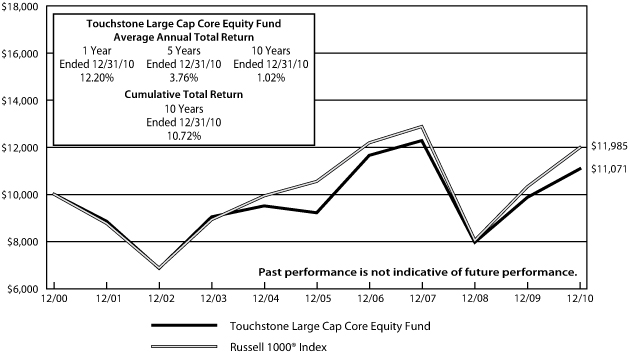
Touchstone Large Cap Core Equity Fund
Sub-Advised by Todd-Veredus Asset Management, LLC
Performance and Market Overview
The total return of the Touchstone Large Cap Core Equity Fund was 12.20% for the year ended December 31, 2010. The total return of the Russell 1000® Index was 16.10% for the same period.
This past year ended with the market breaking out to the upside; investors began to factor in a sustainable economic expansion. We think the economy and markets are in a normal expansionary period that is likely to last a few years, although we think most investors are only begrudgingly accepting that fact.
Most of the market gains for the year occurred during the fourth quarter of 2010. The good news for our style of investing is that money flows are starting to favor domestic stocks again. U.S. companies have had a strong rebound in earnings, and investors are less enamored with bonds. As this occurs, we believe more institutional money is likely to move towards active equity management. This type of development should allow for stock pickers like us to enjoy outperformance.
Portfolio Review
The Touchstone Large Cap Core Equity Fund underperformed the Russell 1000® Index during the year. We believe this is because the market favored riskier stocks of lower quality. As the economic recovery and stock market rally continue, we expect a rotation towards higher quality stocks, which should benefit the Touchstone Large Cap Core Equity Fund.
The Energy, Financials and Information Technology sectors detracted from the Fund's performance this year. Energy stocks outperformed expectations and the Fund was underweight in the sector. Most of the gains came in the fourth quarter as oil prices rose from $79 per barrel to $91 per barrel. The Financials sector overall lagged the Index, so the Fund's underweight in the sector was appropriate. The Fund's stock selection trailed the Index as investors returned to some of the downtrodden large banks. The Fund has been underweight in that portion of the Financials sector. The Fund's' Information Technology sector exposure detracted from performance as a number of the larger technology companies experienced weaker sales or management turmoil.
On the positive side, the Fund's overweight position and stock selection within the Consumer Discretionary and Industrials sectors contributed to performance. We believe that the world economy remains in a recovery and have positioned the Fund to overweight the economically sensitive sectors. Also, the Fund's stock selection within the Consumer Staples and Utilities sectors added to results.
Stocks that contributed to performance during the year included Ross Stores Inc. and Dollar Tree Inc. (both from the Consumer Discretionary sector), Union Pacific Corp. (Industrials sector), Philip Morris International Inc. (Consumer Staples sector), and AFLAC Inc. (Financials sector). Most of these guided estimates up or benefited from an improving economy. Detractors from performance included Transocean Ltd. and Chesapeake Energy Corp. (both from the Energy sector) which have been sold, and Hewlett-Packard Co., Microsoft Corp., and Cisco Systems Inc. (all from the Information Technology sector).
Current Strategy and Outlook
When we look at markets, our focus is in three driving forces; valuation, fundamentals and market sentiment. Based on these factors, we believe equities will end 2011 a fair amount higher than current levels as it becomes clearer we are in a normal recovery.
12
Management's Discussion of Fund Performance (Continued)
We believe the economy will continue to grow in 2011 and may surprise us to the upside. Consensus expectations are for 3.5% to 4.5% growth in 2011, as the tax deal and benefits extensions agreed to last year bolster the outlook. If real demand expands, growth estimates are likely to improve as well.
As we stated, we believe the market is likely to move ahead during the year, however we believe it will do so in a choppy manner. As this recovery develops, we expect later stage cyclical companies to outperform. The Fund is positioned in these types of companies which should be a benefit.
As we look forward, we expect several themes to play out in 2011. History suggests equity markets are likely to return well over 10% this year. This is because we are in the typically strong third year of the presidential cycle, the economy is recovering, investors are underinvested and sentiment remains skeptical. Bonds will probably continue their choppy moves, but longer-term rates should end the year higher than current levels. "Risk on, risk off" trading concerns will probably shift from U.S. unemployment to European sovereign debt, emerging markets slowdowns, and the potential for a new Congress to clash with the Obama Administration. Higher corporate cash balances may lead to higher dividends, share repurchases and a very strong Mergers & Acquisition market.
We like high quality companies with good balance sheets as they are likely to raise dividends, do share repurchases or make accretive acquisitions. We still think the market has the potential to move higher for the next few years, and will remain positioned in the higher quality companies that tend to be the leadership as market recoveries mature.
Past performance is not indicative of future performance.
Performance information does not reflect fees that are paid by the separate accounts through which shares of the Fund are sold. Inclusion of those fees would reduce figures for all periods.
The Fund commenced operations on May 1, 1999.
13
Management's Discussion of Fund Performance (Continued)
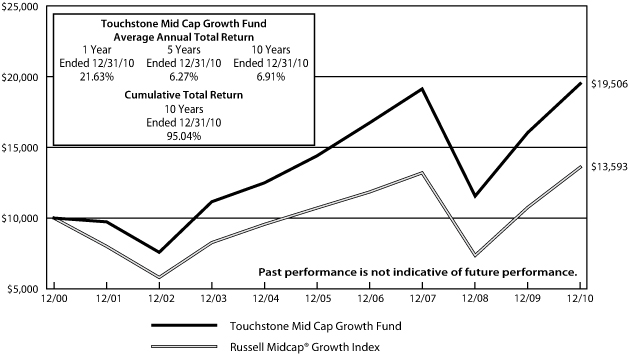
Touchstone Mid Cap Growth Fund
Sub-Advised by TCW Investment Management Company, LLC and Westfield Capital Management Company, LLC
Performance and Market Overview
The total return of the Touchstone Mid Cap Growth Fund was 21.63% for the year ended December 31, 2010. The total return of the Russell Midcap® Growth Index was 26.38% for the same period.
Although the stock market performed well in the first quarter on solid corporate earnings growth and continued momentum from the March 2009 lows, it corrected in April 2010. Investor concerns centered on a number of issues, including the European debt crisis, the oil spill in the Gulf of Mexico, uncertainty regarding the impact of new healthcare and financial reform bills, the sustainability of the housing recovery, and an inventory correction in technology.
The catalyst for the market's second half upswing looks to be Ben Bernanke's Jackson Hole speech in late August in which he outlined the case for further quantitative easing. Citing its dual mandate, the Fed determined that the risk of deflation remained high and the economy was growing too slowly. Strong earnings, attractive valuations, an improving economic outlook, and heightened Merger & Acquisition (M&A) activity also helped propel the stock market. A key event was also upheaval in Washington following the mid-term elections. President Obama's unexpected tack to the center and agreement to extend the Bush tax cuts further lifted stocks.
TCW Investment Management Company, LLC
Portfolio Review
The Industrials, Consumer Discretionary, Utilities, Materials and Information Technology sectors were the primary contributors to 2010 relative performance, while the Financials, Energy and Health Care sectors detracted from performance. The return of M&A activity to the marketplace following the financial crisis proved to be a salutary catalyst to the market and to Fund performance. Burger King Holdings Inc. (Consumer Discretionary sector) and Pactiv Corp. (Materials sector), two fund holdings, received solid take-out offers and were sold. Many pieces of the portfolio also helped performance. The rebound in the industrial economy, driven by strong emerging markets growth and restocking in the developed world helped Industrials sector stocks such as truck-parts manufacturer WABCO Holdings Inc. and mining equipment company Joy Global Inc. As U.S. consumers regained confidence, retailers such as Abercrombie & Fitch Co. and Foot Locker Inc. (both from the Consumer Discretionary sector) posted improved back-to-school and Christmas sales. Strong consumer demand for mobile telephony and increased spending by corporations to replace less efficient servers and to upgrade networks helped Information Technology stocks, such as Ciena Corp. and Avago Technologies Ltd.
The Financials sector was the largest detractor to relative performance in 2010 as results at regional banks were more mixed. While some banks reported improved loan trends, headwinds from financial regulation reform, an uneven housing rebound, little-to-no loan growth and foreclosure issues stifled the rebound. KeyCorp and New York Community Bancorp Inc. were among the better performers. Comerica Inc., a Texas-based business bank, was the first TARP recipient to raise its dividend and the stock rallied late in the year. On the other hand, Wilmington Trust Corp., which had earlier suggested that problem loans had peaked, surprised the market with additional loan losses. Subsequent pressure from regulators revealed that credit problems were more severe than management indicated, forcing the bank into a take-out with M&T Bank Corp. at lower-than-prevailing market prices.
Sector weights at year end show a sequential decrease in the Consumer Discretionary sector and an increase in the Information Technology sector. However, these snapshots miss the strong performance of Consumer
14
Management's Discussion of Fund Performance (Continued)
Discretionary stocks in the portfolio intra-quarter and subsequent trims to a number of positions. While the Information Technology sector remains volatile, we believe a multi-year upswing in tech spending continues to be driven by ongoing corporate efficiency goals and consumer bedazzlement with new mobile computing devices. The Fund remains overweight in the Financials sector. While we don't expect improvements in non-performing loans to be linear, we believe credit problems have peaked. The nuances of Dodd-Frank, such as interchange fees and mortgage issues, remain unresolved, but we believe major policy risk has diminished now that the bill has passed. In short, banks appear to be on a path, albeit choppy, towards more normalized levels of profitability, and we find the valuations compelling. We continue to like the Industrials sector stocks, believing them to be a good proxy for global demand.
Current Strategy and Outlook
We remain bullish on mid-cap value equities based on solid corporate earnings and attractive valuations. Stock movement over the past few years has been driven largely by macro-economic factors as investors put risk on or off according to their interpretation of these events. While the health of the macro-economy remains ever-important, correlations among securities are declining, and old-fashioned bottom-up stock picking appears to be regaining in importance.
The recent rise in M&A activity suggests that companies are starting to take advantage of the valuation gaps in the marketplace. With cash on balance sheets earning little return and borrowing costs low, astute corporate stewards have once again begun snapping up high-quality competitors or bolting on product lines at attractive valuations. Historically 10-20% of the portfolio gets taken out in any year, so the current uptick in M&A activity should be beneficial for Fund performance. Just as we believe many of the stocks in the portfolio are undervalued, so do strategic buyers and private equity shops.
While political factors are unlikely to go away completely, far-sweeping new regulations are likely to be fewer now that a divided Congress and Presidency will have to work together to pass any legislation. Still, passage of the budget and raising the federal debt ceiling are likely to spark contentious debate, which could provide some headline risk.
We think part of the impediment to employment growth has been the generally anti-business and confusing new laws emanating from Washington. These new regulations, including financial reform, healthcare laws, Gulf of Mexico drilling regulations and tax policy have touched significant portions of the economy. While many of the rules still need to be codified, we think businesses can start to hire knowing Washington is unlikely to create additional burdens. Market historians will point to the third year of the Presidential cycle as being salutary for stocks as Washington girds for re-election. We are also encouraged by recent cabinet appointments and job creating rhetoric coming from the White House.
A big wildcard continues to be the health of Europe, which has thus far averted full-blown crisis, but has not fully solved the debt problems in Ireland, Greece, Spain and Portugal. In addition, while inflation as measured by the Fed is not a concern, food and gasoline prices have moved significantly higher over the past year. We are keeping a close eye on China's actions to deal with escalating food and housing prices. We think China is unlikely to slam on the brakes, but its actions are worth watching closely.
These tail risks could provide opportunity to purchase high quality franchises at discounts to their intrinsic value. In the meantime, our process of bottom-up fundamentally-driven investing remains unchanged. It continues to be a stock-by-stock process. We believe the portfolio is well positioned for the current environment.
15
Management's Discussion of Fund Performance (Continued)
Westfield Capital Management Company, LLC
Portfolio Review
Investments in the Energy and Industrials sectors were the primary contributors to relative results, but they were overshadowed by weakness in the Consumer Discretionary, Health Care, Materials and Consumer Staples sectors.
Energy stocks contributed to active returns. Oil & Gas Equipment & Services and Exploration & Production industry companies were boosted by record levels of global capital investment. Spending related to deep water development was particularly robust, bolstering oil & gas equipment company National Oilwell Varco Inc. and making the stock the sector's most sizeable contributor to relative returns. National Oilwell has benefited from an acceleration in orders for premium jackups and new floating rigs. In addition, the company began to see a substantial improvement in its aftermarket parts and services segment during the year due to offshore rig fleet upgrades and higher safety standards. Denbury Resources Inc., which engages in the exploration, development and operation of oil and natural gas properties in the U.S.'s Gulf Coast region, also added to relative performance. Denbury pursued its planned sale of non-core assets and we believe the company will demonstrate a stronger organic production growth profile going forward as it has more capital to devote to its key projects. Coal mining company Massey Energy Co. benefited during the year from metallurgical coal contract prices coming in at levels above investor expectations. In November, Massey revealed that it was considering strategic opportunities and the stock surged, fueled by several competing bids. We believe that even if the buy offers are rejected, Massey's vast reserves of thermal and metallurgical coal should position the company well to achieve superior volume growth and pricing power.
Industrials contributed to relative results. The portfolio's modest overweight to the sector and holdings in the Electrical Components & Equipment sub-industry, Ametek Inc., Roper Industries Inc. and Cooper Industries PLC, drove the majority of excess returns. Like many manufacturers, these companies lowered their costs structures during the economic downturn and posted dramatic margin expansion and earnings growth as volumes recovered during 2010. Industrials was the portfolio's best performing sector, and our valuation discipline led us to sell or trim a number of positions throughout the year as they approached our internal price targets.
The Consumer Discretionary sector was the portfolio's most significant cause of underperformance. Overweight exposure to the Education Services sub-industry, which has encountered regulatory headwinds related to uncertainty around the Department of Education's proposed "gainful employment" laws, negatively impacted performance. These measures would sharply reduce the availability of government loans for students attending for-profit institutions. Strayer Education Inc. was the portfolio's biggest absolute and relative detractor, and we sold the stock in the fourth quarter after Strayer's competitor Apollo Group Inc. announced that it expects new student enrollments to decline over the next two quarters. Priceline.com Inc., an online travel company in the United States, Europe, and Asia, further eroded marginal returns, as it has trailed the market since we purchased it in early November. We expect priceline.com to generate a 20% EPS compound annual growth rate over the next few years, driven by increased airline capacity and a consequent improvement in consumer hotel and car rentals.
The Health Care sector detracted from relative returns, driven by weakness in biotechnology and pharmaceuticals holdings. Vertex Pharmaceuticals Inc., whose lead drug Telaprevir is being developed as a treatment for Hepatitis C, was one of the deficient stocks. While Vertex was pressured in the first half of the year due to fears related to its Phase III trial for Telaprevir, the trial data released in the third quarter showed Telaprevir to be more effective than Merck & Co.'s competing therapy, and we remain confident that Vertex will be able to launch Telaprevir in 2011. Dendreon Corp., which develops oncology therapies, also hurt absolute and relative returns. Its lead product, Provenge, is a novel immunotherapy that is made of a patient's own cells and helps trigger their immune system to fight cancer, which means it works like a vaccine against
16
Management's Discussion of Fund Performance (Continued)
tumors. Dendreon was purchased in early May after it received approval to launch Provenge in the U.S. as a prostate cancer therapy. The company reported lower-than-expected third quarter revenues and earnings and has remained range-bound since then. However, Provenge received a favorable review on patient survival benefit following a technology assessment, which we expect to support utilization and reimbursement trends.
The Materials sector detracted from relative results. Ecolab Inc., a manufacturer of cleaning products, traded off after reporting lower-than-expected third quarter revenues due to sluggishness in its food service and health care segments, which caused it to trail its specialty chemicals peers in the Index. We maintain our view that Ecolab can achieve double-digit earnings growth in the coming years thanks to its margin expansion potential in Europe and underlying organic growth trends. Another detractor was Yamana Gold, Inc., which acquires, explores, develops and operates gold and copper mining properties. While gold prices rose during the period, they failed to keep pace with input commodities such as oil that were propelled higher by global growth, which pressured mining company margins.
Current Strategy and Outlook
While market-wide earnings growth will likely moderate from its pace in 2010 as the cyclical recovery evolves, earnings should remain strong and ahead of Wall Street expectations. The highly-correlated, macro-driven stock price action that has dominated the markets since mid-2008 is showing signs of abating. Correlation of average equity returns appear to have peaked in the third quarter. If this trend persists, 2011 should be a stock-picker's market. Much of the margin benefit from cost-cutting efforts during the economic downturn has been achieved and increasing earnings growth should be driven by revenue growth. At this juncture, we endeavor to identify good top-line growers trading at reasonable valuations.
Past performance is not indicative of future performance.
Performance information does not reflect fees that are paid by the separate accounts through which shares of the Fund are sold. Inclusion of those fees would reduce figures for all periods.
The Fund commenced operations on November 21, 1994.
17
Management's Discussion of Fund Performance (Continued)
Touchstone Third Avenue Value Fund
Sub-Advised by Third Avenue Management, LLC
Performance and Market Overview
The total return of the Touchstone Third Avenue Value Fund was 20.20% for the year ended December 31, 2010. The total return of the Russell 3000® Value Index was 16.23% for the same period.
Equity markets in the U.S. "melted up" during the last quarter of 2010, as economic conditions improved generally, companies reported better than expected earnings and investors grew more comfortable owning equities. The U.S. Federal Reserve Bank continued to support the economy with its second quantitative easing program and, in an unexpectedly productive lame duck congressional session, President Barack Obama and Republicans in the House and Senate agreed to keep income tax rates low, a one year payroll tax holiday and the extension of unemployment benefits. Most of the stocks in the Fund were up for the year, as business fundamentals and operating results continued to improve.
Portfolio Review
The Fund performed well in 2010, beating relevant benchmarks and ending the year well positioned to take advantage of the improving economic climate. The strongest contributor to relative performance was Sycamore Networks Inc. Near the end of the fourth quarter 2010, Sycamore paid shareholders a $6.50 dividend. After the dividend, the company's financial position remains rock solid with cash and investment securities totaling approximately $450 million and no debt. Earlier in 2010, Sycamore announced the impending launch of IQstream, a new flexible data management product for its mobile customer base. Though the product has yet to roll out, Sycamore's management says it has received encouraging feedback from trial customers.
The second strongest contributor to relative performance was Brookfield Asset Management Inc. Brookfield is a well-financed, well-managed investment company with significant investments in real estate, power generation and infrastructure. The company has opportunistically invested a substantial amount of capital in the past year-and-a-half, having participated in the reorganization of General Growth Properties (the largest U.S. real estate-related bankruptcy in history) and leading the $1.5 billion recapitalization of Babcock & Brown Infrastructure. In addition, Brookfield has gained a lot of traction within its asset management business, having raised nearly $10 billion of external capital over the past few years. Third Avenue believes that Brookfield's management team will continue to take advantage of market dislocations to create value by investing its capital alongside its partners in opportunistic investments, which should allow them to continue to increase the company's NAV for the foreseeable future.
The third strongest contributor to relative performance was Cimarex Energy Co. Cimarex had a strong year of improving operating results and growing cash flow that management has used to strengthen the company's already solid balance sheet. Oil and gas reserves have grown more rapidly than many expected. Cimarex also has a sizable interest in the Cana-Woodford shale, an early stage resource play in western Oklahoma whose potential value is increasingly becoming apparent as one of the more attractive shale formations in the region.
The largest detractor to Fund performance during the year was South Korean steel producer POSCO. POSCO's margins suffered in 2010 due to rising materials cost. The company added debt to its balance sheet as well in order to finance its second quarter acquisition of Daewoo International Corporation. However, POSCO remains well financed and has super-attractive access to the credit markets. It recently issued $700 million in 10-year notes at an attractive borrowing rate of 4.2% for money that Third Avenue believes will be put to productive long-term use.
Hong Kong's Henderson Land Development Company Ltd. was the second largest detractor from relative performance during the year. Over the summer, Henderson took a HK$734 million charge to earnings to reflect the effect of failed condominium sales in its Conduit Road project. Though the charge represented less
18
Management's Discussion of Fund Performance (Continued)
than 1% of the company's $66 per share adjusted book value (book value + deferred tax liability), the Hong Kong government soon after announced it would investigate the Conduit Road transactions. Henderson Land re-launched sales of condos in its Conduit Road development in August and shares recovered much of their losses during the second half of the year. However, they declined again late in the fourth quarter when the Hong Kong government announced measures to reduce further price appreciation in the residential market. While Henderson Land was one of the largest detractors during the year, the company remains a core position in the Fund as the company has a strong financial position, trades at an attractive discount to Third Avenue's estimate of NAV, and has attractive prospects for future NAV growth.
During the year positions in the Alamo Group Inc., Arch Capital Group Ltd., Bel Fuse Inc., Cross Country Healthcare Inc., Electro Scientific Industries Inc., JAKKS Pacific Inc., Journal Communications Inc., Mitsui Fudosan Company Ltd., TimberWest Forest Corp. and Tokio Marine Holdings Inc. were sold from the Fund. Third Avenue initiated a position in Canfor Corp., a well-financed Canadian lumber company, and KeyCorp, a well-capitalized U.S.-based regional bank available at a discount to net asset value.
Current Strategy and Outlook
Third Avenue does not manage to a benchmark or invest using an asset allocation model; rather we analyze companies from the bottom up, focusing on business fundamentals in keeping with our time-tested "safe and cheap" investment philosophy. We invest in well-capitalized companies with competent management teams and strong long-term growth prospects. We seek to limit potential investment risk by purchasing the securities of such sound companies at a significant discount to our conservative estimate of net asset value.
Despite the recent market rally, we continue to see opportunities in select securities that meet our strict investment criteria. We believe that our focus on the merits of individual companies enables the Fund to be well positioned for the long run regardless of the macro environment.
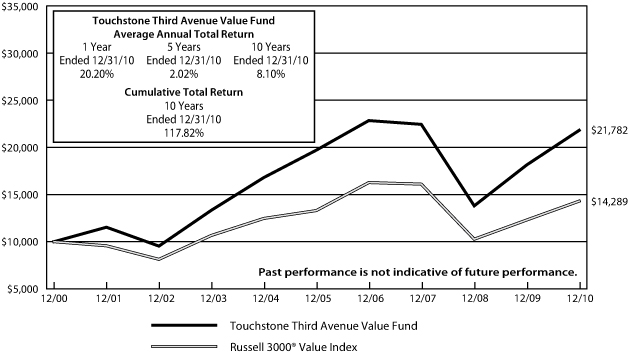
Past performance is not indicative of future performance.
Performance information does not reflect fees that are paid by the separate accounts through which shares of the Fund are sold. Inclusion of those fees would reduce figures for all periods.
The Fund commenced operations on December 14, 1992.
19
Management's Discussion of Fund Performance (Continued)
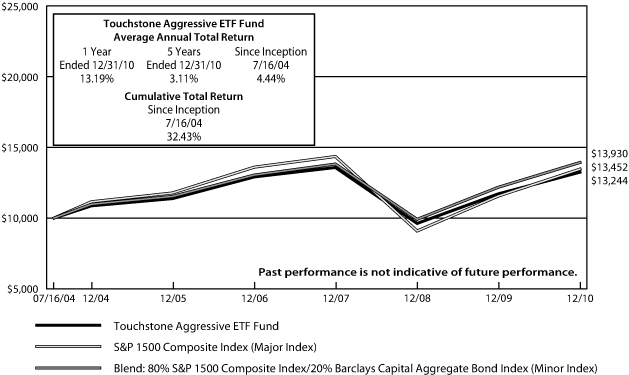
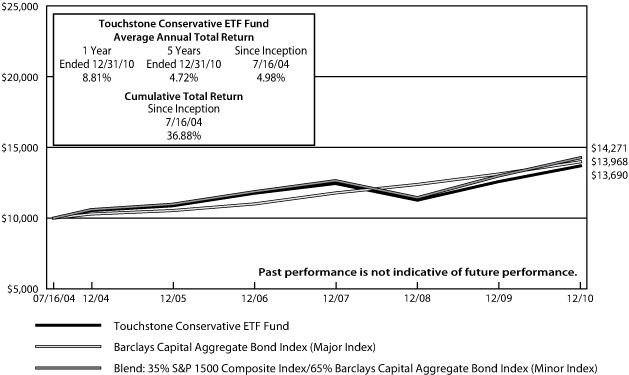
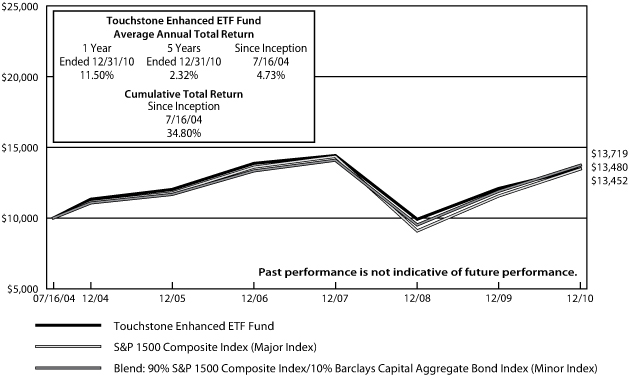
Touchstone ETF Funds
Sub-Advised by Todd-Veredus Asset Management
Touchstone Aggressive ETF Fund
Touchstone Conservative ETF Fund
Touchstone Enhanced ETF Fund
Touchstone Moderate ETF Fund
Four Exchanged Traded Funds (ETFs) are available for investors seeking "lifestyle" products for their annuity holdings. Strategic options include the Conservative, Moderate and Aggressive ETF Funds. These funds use asset allocations of up to nine ETFs that should not change dramatically over time, with higher bond weights for the more conservative funds, and lower bond weights for the more aggressive funds. The fourth option, the Enhanced ETF Fund, uses a tactical asset allocation in an effort to generate better returns.
Performance and Market Overview
The Touchstone Conservative ETF Fund's total return was 8.81% for the year ended December 31, 2010. The total return of the Barclays Capital Aggregate Bond Index was 6.54% for the same period. The Touchstone Moderate ETF Fund's total return was 11.25%, the Touchstone Aggressive ETF Fund 13.19%, and the Touchstone Enhanced ETF Fund 11.50% for the year ended December 31, 2010. The total return of the S&P 1500 Composite Index was 16.38% for the same period. The specific blended benchmark returns were 9.98% for the Conservative ETF Fund, 12.44% for the Moderate ETF Fund, 14.41% for the Aggressive ETF Fund, and 15.40% for the Enhanced ETF Fund.
Portfolio Review
During the year, the strategically-oriented Conservative, Moderate and Aggressive ETF Funds, as well as the tactical Enhanced ETF Fund underperformed their blended benchmarks primarily due to sector allocation. The Fund's relatively good sector weightings in the U.S. were offset by the lower performance of the MSCI EAFE Index. International markets also suffered as concerns about sovereign debt defaults surfaced in Europe, and China began raising interest rates to slow the economy and head off inflationary pressures.
This past year, the strategically-oriented Funds favored mid- and small-cap indexes versus the large-cap. Within those sectors, Todd rebalanced the allocations in May to favor growth slightly more than value. The growth indexes generally outperformed their value counterparts during the year.
The tactically-oriented Enhanced ETF Fund was rebalanced in November to favor large- and mid-cap growth sectors, as well as the MSCI EAFE and the Barclays Capital Aggregate Bond Index. During the fourth quarter, the mid-cap and small-cap sectors outperformed, and thus the Fund underperformed its specifically-blended benchmark for the year.
Current Strategy and Outlook
As we look at the market, our focus is on three driving forces; valuation, fundamentals and market sentiment. Based on these factors, Todd believes equities will end the year a fair amount higher than current levels as it becomes clearer that the economy is in a begrudgingly normal recovery.
Valuation has become much more reasonable over the past ten years based on a normalized five-year earnings chart. Todd believes that unless we see a period where inflation expectations skyrocket, much of the correction in P/Es is probably over. Industrials have seen firm fundamentals and other neglected areas, such as Automobiles and Consumer Durables, are seeing an uptick. New home builds may not improve substantially from here, but
20
Management's Discussion of Fund Performance (Continued)
Todd believes that expectations do not call for any improvement. Real demand for many products is improving, which should lead to better margins on an already lean manufacturing base. This should allow for improved employment expectations as companies begin to bump up against production limitations. Todd expects the economy to continue to grow in 2011 with consensus expectations around 3.5-4.5%. However, it will do so in a choppy manner. Todd expects later stage cyclical companies to outperform in 2011. The Funds are already positioned well for the recovery: invested in high quality companies with good balance sheets who are likely to raise dividends, do share repurchases or make accretive acquisitions.
Past performance is not indicative of future performance.
Performance information does not reflect fees that are paid by the separate accounts through which shares of the Fund are sold. Inclusion of those fees would reduce figures for all periods.
The Fund commenced operations on July 16, 2004.
21
Management's Discussion of Fund Performance (Continued)
Past performance is not indicative of future performance.
Performance information does not reflect fees that are paid by the separate accounts through which shares of the Fund are sold. Inclusion of those fees would reduce figures for all periods.
The Fund commenced operations on July 16, 2004.
22
Management's Discussion of Fund Performance (Continued)
Past performance is not indicative of future performance.
Performance information does not reflect fees that are paid by the separate accounts through which shares of the Fund are sold. Inclusion of those fees would reduce figures for all periods.
The Fund commenced operations on July 16, 2004.
23
Management's Discussion of Fund Performance (Continued)

Past performance is not indicative of future performance.
Performance information does not reflect fees that are paid by the separate accounts through which shares of the Fund are sold. Inclusion of those fees would reduce figures for all periods.
The Fund commenced operations on July 16, 2004.
24
Tabular Presentation of Portfolios of Investments (Unaudited)
December 31, 2010
Touchstone Baron Small Cap Growth Fund
| Sector Allocation | | (% of Net Assets) | |
| Consumer Discretionary | | | 33.3 | | |
| Financials | | | 13.3 | | |
| Health Care | | | 12.2 | | |
| Industrials | | | 10.8 | | |
| Energy | | | 8.7 | | |
| Consumer Staples | | | 6.0 | | |
| Information Technology | | | 3.2 | | |
| Materials | | | 2.9 | | |
| Utilities | | | 2.5 | | |
| Telecommunication Services | | | 2.1 | | |
| Investment Funds | | | 23.8 | | |
| Other Assets/Liabilities (Net) | | | (18.8 | ) | |
| Total | | | 100.0 | | |
Touchstone Core Bond Fund
| Credit Quality | | (% of Total Investments) | |
| U.S. Treasury | | | 27.0 | | |
| U.S. Agency | | | 12.3 | | |
| AAA/Aaa | | | 20.0 | | |
| AA/Aa | | | 1.3 | | |
| A/A | | | 7.9 | | |
| BBB/Baa | | | 11.5 | | |
| BB/Ba | | | 3.9 | | |
| B/B | | | 11.9 | | |
| CCC | | | 4.0 | | |
| CC | | | 0.2 | | |
| Total | | | 100.0 | | |
Touchstone High Yield Fund
| Credit Quality | | (% of Total Investments) | |
| BBB/Baa | | | 3.1 | | |
| BB | | | 15.9 | | |
| B | | | 73.6 | | |
| CCC | | | 5.6 | | |
| CC | | | 0.3 | | |
| NR | | | 0.2 | | |
| Cash | | | 1.3 | | |
| Total | | | 100.0 | | |
Touchstone Large Cap Core Equity Fund
| Sector Allocation | | (% of Net Assets) | |
| InformationTechnology | | | 21.9 | | |
| Industrials | | | 13.5 | | |
| Consumer Discretionary | | | 13.1 | | |
| Financials | | | 13.0 | | |
| Health Care | | | 11.3 | | |
| Energy | | | 11.0 | | |
| Consumer Staples | | | 6.4 | | |
| Materials | | | 3.5 | | |
| Telecommunication Services | | | 2.6 | | |
| Utilities | | | 2.2 | | |
| Investment Funds | | | 5.0 | | |
| Other Assets/Liabilities (Net) | | | (3.5 | ) | |
| Total | | | 100.0 | | |
25
Tabular Presentation of Portfolios of Investments (Unaudited) (Continued)
Touchstone Mid Cap Growth Fund
| Sector Allocation | | (% of Net Assets) | |
| Information Technology | | | 19.0 | | |
| Financials | | | 15.6 | | |
| Industrials | | | 14.3 | | |
| Consumer Discretionary | | | 13.1 | | |
| Energy | | | 10.4 | | |
| Health Care | | | 9.9 | | |
| Materials | | | 9.1 | | |
| Consumer Staples | | | 3.5 | | |
| Utilities | | | 2.2 | | |
| Telecommunication Services | | | 1.3 | | |
| Investment Funds | | | 6.4 | | |
| Other Assets/Liabilities (Net) | | | (4.8 | ) | |
| Total | | | 100.0 | | |
Touchstone Money Market Fund
| Credit Quality | | (% of Total Investments) | |
| A-1/P-1/F-1 | | | 95.2 | | |
| FW1(NR) | | | 4.8 | | |
| Total | | | 100.0 | | |
| Portfolio Allocation | | (% of Net Assets) | |
| Variable Rate Demand Notes | | | 55.5 | | |
| U.S. Government Securities | | | 22.4 | | |
| Taxable Municipal Bonds | | | 10.4 | | |
Corporate Notes/Commercial
Paper | | | 8.8 | | |
| Adjustable Rate Put Bonds | | | 2.8 | | |
| Other Assets/Liabilities (Net) | | | 0.1 | | |
| Total | | | 100.0 | | |
Touchstone Third Avenue Value Fund
| Sector Allocation | | (% of Net Assets) | |
| Financials | | | 40.3 | | |
| Energy | | | 19.9 | | |
| Information Technology | | | 12.6 | | |
| Materials | | | 11.4 | | |
| Consumer Discretionary | | | 8.6 | | |
| Health Care | | | 0.9 | | |
| Investment Funds | | | 8.2 | | |
| Other Assets/Liabilities (Net) | | | (1.9 | ) | |
| Total | | | 100.0 | | |
Touchstone Aggressive ETF Fund
| Sector Allocation | | (% of Net Assets) | |
| Exchange Traded Funds | | | 99.2 | | |
| Investment Funds | | | 25.8 | | |
| Other Assets/Liabilities (Net) | | | (25.0 | ) | |
| Total | | | 100.0 | | |
Touchstone Conservative ETF Fund
| Sector Allocation | | (% of Net Assets) | |
| Exchange Traded Funds | | | 99.1 | | |
| Investment Funds | | | 26.1 | | |
| Other Assets/Liabilities (Net) | | | (25.2 | ) | |
| Total | | | 100.0 | | |
Touchstone Enhanced ETF Fund
| Sector Allocation | | (% of Net Assets) | |
| Exchange Traded Funds | | | 99.3 | | |
| Investment Funds | | | 28.8 | | |
| Other Assets/Liabilities (Net) | | | (28.1 | ) | |
| Total | | | 100.0 | | |
Touchstone Moderate ETF Fund
| Sector Allocation | | (% of Net Assets) | |
| Exchange Traded Funds | | | 98.9 | | |
| Investment Funds | | | 21.7 | | |
| Other Assets/Liabilities (Net) | | | (20.6 | ) | |
| Total | | | 100.0 | | |
26
Statements of Assets and Liabilities
December 31, 2010
| | | Touchstone
Baron Small
Cap Growth
Fund | | Touchstone
Core Bond
Fund | | Touchstone
High Yield
Fund | | Touchstone
Large Cap
Core Equity
Fund | |
| Assets | |
| Investments, at cost | | $ | 18,416,838 | | | $ | 42,753,767 | | | $ | 30,493,293 | | | $ | 36,597,292 | | |
| Affiliated securities, at market value | | $ | 1,443,090 | | | $ | 2,705,440 | | | $ | 416,239 | | | $ | 629,519 | | |
| Non-affiliated securities, at market value | | | 27,752,293 | | | | 40,113,463 | | | | 32,139,723 | | | | 43,987,715 | | |
Investments, at value - including $4,260,837, $106,178, $536,741,and
$1,473,535 of securities loaned for the Baron Small Cap Growth Fund,
Core Bond Fund, High Yield Fund, and Large Cap Core Equity Fund,
respectively. | | $ | 29,195,383 | | | $ | 42,818,903 | | | $ | 32,555,962 | | | $ | 44,617,234 | | |
| Cash | | | — | | | | 6 | | | | — | | | | — | | |
| Receivable for: | |
| Dividends | | | 10,404 | | | | — | | | | — | | | | 59,148 | | |
| Interest | | | — | | | | 345,280 | | | | 631,211 | | | | — | | |
| Fund shares sold | | | 34,545 | | | | — | | | | 3,727 | | | | 9,302 | | |
| Securities lending income | | | 2,270 | | | | 13 | | | | 206 | | | | 126 | | |
| Tax reclaim receivable | | | — | | | | 1,550 | | | | — | | | | — | | |
| Other assets | | | 362 | | | | 696 | | | | 529 | | | | 690 | | |
| Total Assets | | | 29,242,964 | | | | 43,166,448 | | | | 33,191,635 | | | | 44,686,500 | | |
| Liabilities | |
| Payable for: | |
| Return of collateral for securities on loan | | | 4,417,673 | | | | 111,870 | | | | 564,670 | | | | 1,505,069 | | |
| Fund shares redeemed | | | 2,845 | | | | 2,704 | | | | 346 | | | | 2,017 | | |
| Investments purchased | | | 180,433 | | | | 2,586,762 | | | | — | | | | — | | |
| Payable to Investment Advisor | | | 21,562 | | | | 18,870 | | | | 13,558 | | | | 23,587 | | |
| Payable to other affiliates | | | 20,401 | | | | 13,902 | | | | 34,769 | | | | 15,976 | | |
| Payable to Trustees | | | 2,011 | | | | 2,011 | | | | 2,011 | | | | 2,011 | | |
| Other accrued expenses | | | 17,239 | | | | 21,925 | | | | 24,442 | | | | 17,580 | | |
| Total Liabilities | | | 4,662,164 | | | | 2,758,044 | | | | 639,796 | | | | 1,566,240 | | |
| Net Assets | | $ | 24,580,800 | | | $ | 40,408,404 | | | $ | 32,551,839 | | | $ | 43,120,260 | | |
Shares of beneficial interest outstanding (unlimited number
of shares authorized, no par value) | | | 1,468,494 | | | | 3,766,091 | | | | 4,140,564 | | | | 4,770,311 | | |
| Net asset value, offering price and redemption price per share | | $ | 16.74 | | | $ | 10.73 | | | $ | 7.86 | | | $ | 9.04 | | |
| Net assets consist of: | |
| Paid-in capital | | $ | 14,207,628 | | | $ | 38,003,494 | | | $ | 31,491,941 | | | $ | 53,239,451 | | |
| Accumulated net investment income | | | 233 | | | | 1,446,554 | | | | 2,424,031 | | | | 569,185 | | |
| Accumulated net realized gains (losses) on investments | | | (405,606 | ) | | | 893,220 | | | | (3,426,802 | ) | | | (18,708,318 | ) | |
| Net unrealized appreciation on investments | | | 10,778,545 | | | | 65,136 | | | | 2,062,669 | | | | 8,019,942 | | |
| Net assets applicable to shares outstanding | | $ | 24,580,800 | | | $ | 40,408,404 | | | $ | 32,551,839 | | | $ | 43,120,260 | | |
The accompanying notes are an integral part of the financial statements.
27
Statements of Assets and Liabilities (Continued)
| | | Touchstone
Mid Cap
Growth
Fund | | Touchstone
Money
Market
Fund | | Touchstone
Third Avenue
Value
Fund | |
| Assets | |
| Investments, at cost | | $ | 23,616,053 | | | $ | 56,984,928 | | | $ | 37,887,672 | | |
| Affiliated securities, at market value | | $ | 552,764 | | | $ | — | | | $ | 3,177,555 | | |
| Non-affiliated securities, at market value | | | 28,796,398 | | | | 56,984,928 | | | | 50,397,789 | | |
Investments, at value - including $1,199,920 and $1,107,274 of securities loaned
for the Mid Cap Growth Fund and Third Avenue Value Fund, respectively. | | $ | 29,349,162 | | | $ | 56,984,928 | | | $ | 53,575,344 | | |
| Cash | | | — | | | | 484 | | | | 54 | | |
| Receivable for: | |
| Dividends | | | 21,584 | | | | — | | | | 9,795 | | |
| Interest | | | — | | | | 133,552 | | | | — | | |
| Fund shares sold | | | 63,986 | | | | — | | | | 15,453 | | |
| Investments sold | | | 1,237 | | | | — | | | | 190,239 | | |
| Securities lending income | | | 168 | | | | — | | | | 1,284 | | |
| Tax reclaim receivable | | | — | | | | — | | | | 6,874 | | |
| Other assets | | | 430 | | | | 1,047 | | | | 848 | | |
| Total Assets | | | 29,436,567 | | | | 57,120,011 | | | | 53,799,891 | | |
| Liabilities | |
| Payable for: | |
| Return of collateral for securities on loan | | | 1,230,659 | | | | — | | | | 1,128,275 | | |
| Dividends | | | — | | | | 500 | | | | — | | |
| Fund shares redeemed | | | 2,743 | | | | — | | | | 4,231 | | |
| Investments purchased | | | 140,251 | | | | — | | | | — | | |
| Payable to Investment Advisor | | | 18,596 | | | | 9,010 | | | | 34,897 | | |
| Payable to other affiliates | | | 11,081 | | | | 56,444 | | | | 20,767 | | |
| Payable to Trustees | | | 2,011 | | | | 2,011 | | | | 2,011 | | |
| Other accrued expenses | | | 18,010 | | | | 20,515 | | | | 32,057 | | |
| Total Liabilities | | | 1,423,351 | | | | 88,480 | | | | 1,222,238 | | |
| Net Assets | | $ | 28,013,216 | | | $ | 57,031,531 | | | $ | 52,577,653 | | |
Shares of beneficial interest outstanding (unlimited number
of shares authorized, no par value) | | | 2,090,026 | | | | 57,019,790 | | | | 2,975,294 | | |
| Net asset value, offering price and redemption price per share | | $ | 13.40 | | | $ | 1.00 | | | $ | 17.67 | | |
| Net assets consist of: | |
| Paid-in capital | | $ | 27,478,215 | | | $ | 57,030,355 | | | $ | 50,194,468 | | |
| Accumulated net investment income (loss) | | | 79,095 | | | | — | | | | (1,688,330 | ) | |
| Accumulated net realized gains (losses) on investments and foreign currency transactions | | | (5,277,203 | ) | | | 1,176 | | | | (11,616,254 | ) | |
| Net unrealized appreciation on investments and foreign currency transactions | | | 5,733,109 | | | | — | | | | 15,687,769 | | |
| Net assets applicable to shares outstanding | | $ | 28,013,216 | | | $ | 57,031,531 | | | $ | 52,577,653 | | |
The accompanying notes are an integral part of the financial statements.
28
Statements of Assets and Liabilities (Continued)
| | | Touchstone
Aggressive
ETF
Fund | | Touchstone
Conservative
ETF
Fund | | Touchstone
Enhanced
ETF
Fund | | Touchstone
Moderate
ETF
Fund | |
| Assets | |
| Investments, at cost | | $ | 21,318,812 | | | $ | 26,392,401 | | | $ | 16,637,628 | | | $ | 60,429,534 | | |
| Affiliated securities, at market value | | $ | 173,668 | | | $ | 255,117 | | | $ | 165,474 | | | $ | 683,798 | | |
| Non-affiliated securities, at market value | | | 24,009,886 | | | | 28,623,331 | | | | 18,160,671 | | | | 63,847,205 | | |
Investments, at value - including $4,709,884, $5,615,361, $3,839,252 and
$10,680,414 of securities loaned for the Aggressive ETF Fund,
Conservative ETF Fund, Enhanced ETF Fund and Moderate ETF Fund,
respectively. | | $ | 24,183,554 | | | $ | 28,878,448 | | | $ | 18,326,145 | | | $ | 64,531,003 | | |
| Receivable for: | |
| Dividends | | | 13,399 | | | | 41,139 | | | | 10,436 | | | | 69,567 | | |
| Fund shares sold | | | — | | | | 2,299 | | | | — | | | | 67,921 | | |
| Securities lending income | | | 866 | | | | 1,512 | | | | 564 | | | | 1,751 | | |
| Tax reclaim receivable | | | — | | | | — | | | | — | | | | 3,444 | | |
| Other assets | | | 277 | | | | 384 | | | | 154 | | | | 877 | | |
| Total Assets | | | 24,198,096 | | | | 28,923,782 | | | | 18,337,299 | | | | 64,674,563 | | |
| Liabilities | |
| Payable for: | |
| Return of collateral for securities on loan | | | 4,819,831 | | | | 5,764,771 | | | | 3,955,450 | | | | 10,938,116 | | |
| Fund shares redeemed | | | 5,500 | | | | 5,917 | | | | 3,949 | | | | 13,437 | | |
| Investments purchased | | | — | | | | 47,143 | | | | 42,813 | | | | 172,969 | | |
| Payable to Investment Advisor | | | 6,525 | | | | 7,801 | | | | 4,843 | | | | 17,940 | | |
| Payable to other affiliates | | | 2,941 | | | | 12,894 | | | | 5,242 | | | | 20,793 | | |
| Payable to Trustees | | | 2,011 | | | | 2,011 | | | | 2,011 | | | | 2,011 | | |
| Other accrued expenses | | | 19,824 | | | | 17,505 | | | | 17,524 | | | | 17,731 | | |
| Total Liabilities | | | 4,856,632 | | | | 5,858,042 | | | | 4,031,832 | | | | 11,182,997 | | |
| Net Assets | | $ | 19,341,464 | | | $ | 23,065,740 | | | $ | 14,305,467 | | | $ | 53,491,566 | | |
Shares of beneficial interest outstanding (unlimited number
of shares authorized, no par value) | | | 1,892,793 | | | | 1,989,091 | | | | 1,781,743 | | | | 4,460,700 | | |
| Net asset value, offering price and redemption price per share | | $ | 10.22 | | | $ | 11.60 | | | $ | 8.03 | | | $ | 11.99 | | |
| Net assets consist of: | |
| Paid-in capital | | $ | 19,800,913 | | | $ | 21,987,045 | | | $ | 22,613,731 | | | $ | 55,434,370 | | |
| Accumulated net investment income | | | 254,243 | | | | 439,879 | | | | 101,821 | | | | 926,794 | | |
| Accumulated net realized losses on investments | | | (3,578,434 | ) | | | (1,847,231 | ) | | | (10,098,602 | ) | | | (6,971,509 | ) | |
| Net unrealized appreciation on investments | | | 2,864,742 | | | | 2,486,047 | | | | 1,688,517 | | | | 4,101,911 | | |
| Net assets applicable to shares outstanding | | $ | 19,341,464 | | | $ | 23,065,740 | | | $ | 14,305,467 | | | $ | 53,491,566 | | |
The accompanying notes are an integral part of the financial statements.
29
Statements of Operations
For the Year Ended December 31, 2010
| | | Touchstone
Baron Small
Cap Growth
Fund | | Touchstone
Core Bond
Fund | | Touchstone
High Yield
Fund | | Touchstone
Large Cap
Core Equity
Fund | |
| Investment Income | |
| Dividends from affiliated securities | | $ | 4,032 | | | $ | 12,434 | | | $ | 1,191 | | | $ | 2,601 | | |
| Dividends from non-affiliated securities | | | 200,242 | | | | 4,732 | | | | 5,431 | | | | 1,094,136 | | |
| Interest | | | — | | | | 1,753,304 | | | | 2,751,857 | | | | — | | |
| Income from securities loaned | | | 30,203 | | | | 26 | | | | 1,836 | | | | 2,134 | | |
| Total Investment Income | | | 234,477 | | | | 1,770,496 | | | | 2,760,315 | | | | 1,098,871 | | |
| Expenses | |
| Investment advisory fees | | | 220,191 | | | | 220,441 | | | | 160,149 | | | | 344,656 | | |
| Administration fees | | | 41,941 | | | | 80,161 | | | | 64,060 | | | | 106,049 | | |
| Compliance fees and expenses | | | 1,701 | | | | 1,574 | | | | 1,792 | | | | 2,124 | | |
| Custody fees | | | 1,274 | | | | 325 | | | | 7,365 | | | | 1,180 | | |
| Professional fees | | | 16,379 | | | | 18,408 | | | | 18,013 | | | | 19,726 | | |
| Shareholder servicing fees | | | 42,665 | | | | 19,646 | | | | 60,168 | | | | 61,337 | | |
| Transfer Agent fees | | | 21 | | | | 182 | | | | 126 | | | | 215 | | |
| Trustee fees | | | 10,993 | | | | 10,993 | | | | 10,994 | | | | 10,994 | | |
| Other expenses | | | 4,171 | | | | 14,745 | | | | 13,866 | | | | 6,001 | | |
| Total Expenses | | | 339,336 | | | | 366,475 | | | | 336,533 | | | | 552,282 | | |
| Fees waived by the Administrator | | | (14,115 | ) | | | — | | | | (252 | ) | | | (22,598 | ) | |
| Net Expenses | | | 325,221 | | | | 366,475 | | | | 336,281 | | | | 529,684 | | |
| Net Investment Income (Loss) | | | (90,744 | ) | | | 1,404,021 | | | | 2,424,034 | | | | 569,187 | | |
| Realized and Unrealized Gain (Loss) | |
| Net realized gain (loss) on investments | | | 1,680,660 | | | | 988,660 | | | | 1,040,770 | | | | (259,145 | ) | |
| Net change in unrealized appreciation/(depreciation) on investments | | | 3,268,043 | | | | 507,158 | | | | 286,665 | | | | 5,424,768 | | |
| Net Realized and Unrealized Gain | | | 4,948,703 | | | | 1,495,818 | | | | 1,327,435 | | | | 5,165,623 | | |
| Net Increase in Net Assets Resulting from Operations | | $ | 4,857,959 | | | $ | 2,899,839 | | | $ | 3,751,469 | | | $ | 5,734,810 | | |
The accompanying notes are an integral part of the financial statements.
30
Statements of Operations (Continued)
| | | Touchstone
Mid Cap
Growth
Fund | | Touchstone
Money
Market
Fund | | Touchstone
Third Avenue
Value
Fund | |
| Investment Income | |
| Dividends from affiliated securities | | $ | 1,508 | | | $ | — | | | $ | 6,148 | | |
| Dividends from non-affiliated securities (A) | | | 374,387 | | | | — | | | | 1,038,277 | | |
| Interest | | | — | | | | 401,655 | | | | — | | |
| Income from securities loaned | | | 6,341 | | | | — | | | | 22,710 | | |
| Total Investment Income | | | 382,236 | | | | 401,655 | | | | 1,067,135 | | |
| Expenses | |
| Investment advisory fees | | | 205,906 | | | | 131,118 | | | | 405,802 | | |
| Administration fees | | | 51,477 | | | | 145,451 | | | | 101,451 | | |
| Compliance fees and expenses | | | 1,945 | | | | 2,127 | | | | 1,827 | | |
| Custody fees | | | 101 | | | | 1,872 | | | | 14,839 | | |
| Professional fees | | | 17,263 | | | | 21,541 | | | | 18,848 | | |
| Shareholder servicing fees | | | 32,425 | | | | 157,741 | | | | 118,956 | | |
| Transfer Agent fees | | | 1,150 | | | | 129 | | | | 126 | | |
| Trustee fees | | | 10,993 | | | | 10,352 | | | | 10,994 | | |
| Passive Foreign Investment Company tax expense | | | — | | | | — | | | | 252,316 | | |
| Other expenses | | | 5,398 | | | | 634 | | | | 22,032 | | |
| Total Expenses | | | 326,658 | | | | 470,965 | | | | 947,191 | | |
| Fees waived by the Administrator | | | (25,431 | ) | | | (81,849 | ) | | | (101,451 | ) | |
| Expenses reimbursed by the Investment Advisor | | | — | | | | — | | | | (252,387 | ) | |
| Net Expenses | | | 301,227 | | | | 389,116 | | | | 593,353 | | |
| Net Investment Income | | | 81,009 | | | | 12,539 | | | | 473,782 | | |
| Realized and Unrealized Gain | |
| Net realized gain on: | |
| Investments | | | 859,058 | | | | 103,132 | | | | 1,596,516 | | |
| Foreign currency | | | — | | | | — | | | | 9,736 | | |
| Net change in unrealized appreciation/(depreciation) on investments | | | 3,995,232 | | | | — | | | | 7,070,880 | | |
| Net Realized and Unrealized Gain | | | 4,854,290 | | | | 103,132 | | | | 8,677,132 | | |
| Net Increase in Net Assets Resulting from Operations | | $ | 4,935,299 | | | $ | 115,671 | | | $ | 9,150,914 | | |
| (A) Net of foreign tax withholding of: | | $ | 464 | | | $ | — | | | $ | 45,045 | | |
The accompanying notes are an integral part of the financial statements.
31
Statements of Operations (Continued)
| | | Touchstone
Aggressive
ETF
Fund | | Touchstone
Conservative
ETF
Fund | | Touchstone
Enhanced
ETF
Fund | | Touchstone
Moderate
ETF
Fund | |
| Investment Income | |
| Dividends from affiliated securities | | $ | 660 | | | $ | 763 | | | $ | 376 | | | $ | 1,660 | | |
| Dividends from non-affiliated securities | | | 371,225 | | | | 595,174 | | | | 205,016 | | | | 1,308,380 | | |
| Income from securities loaned | | | 9,447 | | | | 22,152 | | | | 11,981 | | | | 22,314 | | |
| Total Investment Income | | | 381,332 | | | | 618,089 | | | | 217,373 | | | | 1,332,354 | | |
| Expenses | |
| Investment advisory fees | | | 66,695 | | | | 91,544 | | | | 60,776 | | | | 209,662 | | |
| Administration fees | | | 33,348 | | | | 45,772 | | | | 30,388 | | | | 105,085 | | |
| Compliance fees and expenses | | | 1,612 | | | | 1,762 | | | | 1,622 | | | | 2,006 | | |
| Custody fees | | | 1,859 | | | | 105 | | | | 1,029 | | | | 1,054 | | |
| Professional fees | | | 16,184 | | | | 17,343 | | | | 16,154 | | | | 20,113 | | |
| Shareholder servicing fees | | | 41,214 | | | | 57,215 | | | | 37,802 | | | | 114,180 | | |
| Transfer Agent fees | | | 90 | | | | 98 | | | | 90 | | | | 2,253 | | |
| Trustees fees | | | 10,993 | | | | 10,994 | | | | 10,993 | | | | 10,994 | | |
| Other expenses | | | 6,211 | | | | 3,667 | | | | 3,527 | | | | 4,930 | | |
| Total Expenses | | | 178,206 | | | | 228,500 | | | | 162,381 | | | | 470,277 | | |
| Fees waived by the Administrator | | | (33,348 | ) | | | (45,772 | ) | | | (30,388 | ) | | | (76,174 | ) | |
| Expenses reimbursed by the Investment Advisor | | | (19,763 | ) | | | (11,064 | ) | | | (18,091 | ) | | | — | | |
| Net Expenses | | | 125,095 | | | | 171,664 | | | | 113,902 | | | | 394,103 | | |
| Net Investment Income | | | 256,237 | | | | 446,425 | | | | 103,471 | | | | 938,251 | | |
| Realized and Unrealized Gain (Loss) | |
| Net realized gain (loss) on investments | | | (1,177,745 | ) | | | 24,956 | | | | 460,542 | | | | (2,034,807 | ) | |
| Net change in unrealized appreciation/(depreciation) on investments | | | 3,088,862 | | | | 1,431,467 | | | | 846,656 | | | | 6,712,775 | | |
| Net Realized and Unrealized Gain | | | 1,911,117 | | | | 1,456,423 | | | | 1,307,198 | | | | 4,677,968 | | |
| Net Increase in Net Assets Resulting from Operations | | $ | 2,167,354 | | | $ | 1,902,848 | | | $ | 1,410,669 | | | $ | 5,616,219 | | |
The accompanying notes are an integral part of the financial statements.
32
Statements of Changes in Net Assets
| | | Touchstone
Baron Small Cap
Growth Fund | | Touchstone
Core Bond
Fund | | Touchstone
High Yield
Fund | |
| | | For the
Year
Ended
December 31,
2010 | | For the
Year
Ended
December 31,
2009 | | For the
Year
Ended
December 31,
2010 | | For the
Year
Ended
December 31,
2009 | | For the
Year
Ended
December 31,
2010 | | For the
Year
Ended
December 31,
2009 | |
| From Operations | |
| Net investment income (loss) | | $ | (90,744 | ) | | $ | (128,399 | ) | | $ | 1,404,021 | | | $ | 1,338,154 | | | $ | 2,424,034 | | | $ | 2,702,430 | | |
| Net realized gain (loss) on investments | | | 1,680,660 | | | | (472,955 | ) | | | 988,660 | | | | 1,268,713 | | | | 1,040,770 | | | | (1,771,133 | ) | |
Net change in unrealized appreciation/
(depreciation) on investments | | | 3,268,043 | | | | 5,085,482 | | | | 507,158 | | | | 2,447,479 | | | | 286,665 | | | | 10,299,698 | | |
Net Increase in Net Assets from
Operations | | | 4,857,959 | | | | 4,484,128 | | | | 2,899,839 | | | | 5,054,346 | | | | 3,751,469 | | | | 11,230,995 | | |
Dividends and Distributions to
Shareholders from | |
| Net investment income | | | — | | | | — | | | | (1,536,204 | ) | | | (1,889,191 | ) | | | (2,820,992 | ) | | | (2,027,665 | ) | |
| Total Dividends and Distributions | | | — | | | | — | | | | (1,536,204 | ) | | | (1,889,191 | ) | | | (2,820,992 | ) | | | (2,027,665 | ) | |
| Share Transactions | |
| Proceeds from shares sold | | | 6,898,480 | | | | 6,798,776 | | | | 2,781,682 | | | | 2,856,635 | | | | 14,265,059 | | | | 16,823,773 | | |
Reinvestment of dividends and
distributions | | | — | | | | — | | | | 1,536,204 | | | | 1,889,191 | | | | 2,820,992 | | | | 2,027,664 | | |
| Cost of shares redeemed | | | (7,505,095 | ) | | | (5,196,619 | ) | | | (3,859,410 | ) | | | (4,760,104 | ) | | | (20,502,641 | ) | | | (22,098,046 | ) | |
Net Increase (Decrease) from
Share Transactions | | | (606,615 | ) | | | 1,602,157 | | | | 458,476 | | | | (14,278 | ) | | | (3,416,590 | ) | | | (3,246,609 | ) | |
| Total Increase (Decrease) in Net Assets | | | 4,251,344 | | | | 6,086,285 | | | | 1,822,111 | | | | 3,150,877 | | | | (2,486,113 | ) | | | 5,956,721 | | |
| Net Assets | |
| Beginning of period | | | 20,329,456 | | | | 14,243,171 | | | | 38,586,293 | | | | 35,435,416 | | | | 35,037,952 | | | | 29,081,231 | | |
| End of period | | $ | 24,580,800 | | | $ | 20,329,456 | | | $ | 40,408,404 | | | $ | 38,586,293 | | | $ | 32,551,839 | | | $ | 35,037,952 | | |
Accumulated Net Investment
Income | | $ | 233 | | | $ | 244 | | | $ | 1,446,554 | | | $ | 1,536,202 | | | $ | 2,424,031 | | | $ | 2,820,989 | | |
The accompanying notes are an integral part of the financial statements.
33
Statements of Changes in Net Assets (Continued)
| | | Touchstone
Large Cap
Core Equity Fund | | Touchstone
Mid Cap Growth
Fund | |
| | | For the
Year
Ended
December 31,
2010 | | For the
Year
Ended
December 31,
2009 | | For the
Year
Ended
December 31,
2010 | | For the
Year
Ended
December 31,
2009 | |
| From Operations | |
| Net investment income | | $ | 569,187 | | | $ | 751,347 | | | $ | 81,009 | | | $ | 57,224 | | |
| Net realized gain (loss) on investments | | | (259,145 | ) | | | (9,400,421 | ) | | | 859,058 | | | | (2,439,965 | ) | |
| Net change in unrealized appreciation/(depreciation) on investments | | | 5,424,768 | | | | 20,749,848 | | | | 3,995,232 | | | | 9,533,445 | | |
| Net Increase in Net Assets from Operations | | | 5,734,810 | | | | 12,100,774 | | | | 4,935,299 | | | | 7,150,704 | | |
| Dividends and Distributions to Shareholders from | |
| Net investment income | | | (751,349 | ) | | | (761,831 | ) | | | (57,209 | ) | | | (22,151 | ) | |
| Total Dividends and Distributions | | | (751,349 | ) | | | (761,831 | ) | | | (57,209 | ) | | | (22,151 | ) | |
| Share Transactions | |
| Proceeds from shares sold | | | 7,653,481 | | | | 12,738,129 | | | | 4,650,939 | | | | 3,113,706 | | |
| Reinvestment of dividends and distributions | | | 751,349 | | | | 761,831 | | | | 57,209 | | | | 22,152 | | |
| Cost of shares redeemed | | | (33,584,365 | ) | | | (10,787,158 | ) | | | (7,094,405 | ) | | | (5,456,457 | ) | |
| Net Increase (Decrease) from Share Transactions | | | (25,179,535 | ) | | | 2,712,802 | | | | (2,386,257 | ) | | | (2,320,599 | ) | |
| Total Increase (Decrease) in Net Assets | | | (20,196,074 | ) | | | 14,051,745 | | | | 2,491,833 | | | | 4,807,954 | | |
| Net Assets | |
| Beginning of period | | | 63,316,334 | | | | 49,264,589 | | | | 25,521,383 | | | | 20,713,429 | | |
| End of period | | $ | 43,120,260 | | | $ | 63,316,334 | | | $ | 28,013,216 | | | $ | 25,521,383 | | |
| Accumulated Net Investment Income | | $ | 569,185 | | | $ | 751,347 | | | $ | 79,095 | | | $ | 57,224 | | |
The accompanying notes are an integral part of the financial statements.
34
Statements of Changes in Net Assets (Continued)
| | | Touchstone
Money Market
Fund | | Touchstone
Third Avenue
Value Fund | |
| | | For the
Year
Ended
December 31,
2010 | | For the
Year
Ended
December 31,
2009 (A) | | For the
Year
Ended
December 31,
2010 | | For the
Year
Ended
December 31,
2009 | |
| From Operations | |
| Net investment income | | $ | 12,539 | | | $ | 1,129,634 | | | $ | 473,782 | | | $ | 638,688 | | |
| Net realized gain (loss) on: | |
| Investments | | | 103,132 | | | | 849 | | | | 1,606,238 | | | | (10,652,440 | ) | |
| Foreign currency | | | — | | | | — | | | | 14 | | | | (11,492 | ) | |
| Net change in unrealized appreciation/(depreciation) on investments | | | — | | | | — | | | | 7,070,880 | | | | 25,086,833 | | |
| Net Increase in Net Assets from Operations | | | 115,671 | | | | 1,130,483 | | | | 9,150,914 | | | | 15,061,589 | | |
| Dividends and Distributions to Shareholders from | |
| Net investment income, Class I | | | (12,539 | ) | | | (693,334 | ) | | | (3,062,305 | ) | | | (977,362 | ) | |
| Net investment income, Class SC | | | — | | | | (436,300 | ) | | | — | | | | — | | |
| Realized capital gains, Class I | | | (101,798 | ) | | | — | | | | — | | | | (3,380,340 | ) | |
| Total Dividends and Distributions | | | (114,337 | ) | | | (1,129,634 | ) | | | (3,062,305 | ) | | | (4,357,702 | ) | |
| Share Transactions | |
| Class I | |
| Proceeds from shares sold | | | 67,206,700 | | | | 135,344,659 | | | | 3,705,779 | | | | 4,407,927 | | |
| Reinvestment of dividends and distributions | | | 112,446 | | | | 690,535 | | | | 3,062,305 | | | | 4,357,704 | | |
| Cost of shares redeemed | | | (90,037,627 | ) | | | (109,071,564 | ) | | | (13,783,736 | ) | | | (24,073,567 | ) | |
| Net Increase (Decrease) from Class I Share Transactions | | | (22,718,481 | ) | | | 26,963,630 | | | | (7,015,652 | ) | | | (15,307,936 | ) | |
| Class SC | |
| Proceeds from shares sold | | | — | | | | 23,035,799 | | | | — | | | | — | | |
| Reinvestment of dividends and distributions | | | — | | | | 430,742 | | | | — | | | | — | | |
| Cost of shares redeemed | | | — | | | | (113,748,510 | ) | | | — | | | | — | | |
| Net Decrease from Class SC Share Transactions | | | — | | | | (90,281,969 | ) | | | — | | | | — | | |
| Total Decrease in Net Assets | | | (22,717,147 | ) | | | (63,317,490 | ) | | | (927,043 | ) | | | (4,604,049 | ) | |
| Net Assets | |
| Beginning of period | | | 79,748,678 | | | | 143,066,168 | | | | 53,504,696 | | | | 58,108,745 | | |
| End of period | | $ | 57,031,531 | | | $ | 79,748,678 | | | $ | 52,577,653 | | | $ | 53,504,696 | | |
| Accumulated Net Investment Income (Loss) | | $ | — | | | $ | — | | | $ | (1,688,330 | ) | | $ | 673,356 | | |
(A) Class SC represents the period from January 1, 2009 through April 26, 2009.
The accompanying notes are an integral part of the financial statements.
35
Statements of Changes in Net Assets (Continued)
| | | Touchstone
Aggressive ETF
Fund | | Touchstone
Conservative ETF
Fund | |
| | | For the
Year
Ended
December 31,
2010 | | For the
Year
Ended
December 31,
2009 (A) | | For the
Year
Ended
December 31,
2010 | | For the
Year
Ended
December 31,
2009 (A) | |
| From Operations | |
| Net investment income | | $ | 256,237 | | | $ | 296,597 | | | $ | 446,425 | | | $ | 504,732 | | |
| Net realized gain (loss) on investments | | | (1,177,745 | ) | | | (2,168,709 | ) | | | 24,956 | | | | (1,263,994 | ) | |
| Net change in unrealized appreciation/(depreciation) on investments | | | 3,088,862 | | | | 4,787,900 | | | | 1,431,467 | | | | 2,960,608 | | |
| Net Increase in Net Assets from Operations | | | 2,167,354 | | | | 2,915,788 | | | | 1,902,848 | | | | 2,201,346 | | |
| Dividends and Distributions to Shareholders from | |
| Net investment income, Class I | | | (296,598 | ) | | | (371,904 | ) | | | (504,733 | ) | | | (719,618 | ) | |
| Realized capital gains, Class I | | | — | | | | (228,228 | ) | | | — | | | | (217,064 | ) | |
| Total Dividends and Distributions | | | (296,598 | ) | | | (600,132 | ) | | | (504,733 | ) | | | (936,682 | ) | |
| Share Transactions | |
| Class I | |
| Proceeds from shares sold | | | 5,613,221 | | | | 11,277,511 | | | | 2,651,876 | | | | 13,883,940 | | |
| Reinvestment of dividends and distributions | | | 296,598 | | | | 600,132 | | | | 504,733 | | | | 936,682 | | |
| Cost of shares redeemed | | | (5,908,851 | ) | | | (816,950 | ) | | | (4,115,008 | ) | | | (3,022,766 | ) | |
| Net Increase (Decrease) from Class I Share Transactions | | | 968 | | | | 11,060,693 | | | | (958,399 | ) | | | 11,797,856 | | |
| Class SC | |
| Proceeds from shares sold | | | — | | | | 2,169,026 | | | | — | | | | 707,710 | | |
| Cost of shares redeemed | | | — | | | | (11,317,860 | ) | | | — | | | | (11,675,336 | ) | |
| Net Decrease from Class SC Share Transactions | | | — | | | | (9,148,834 | ) | | | — | | | | (10,967,626 | ) | |
| Total Increase in Net Assets | | | 1,871,724 | | | | 4,227,515 | | | | 439,716 | | | | 2,094,894 | | |
| Net Assets | |
| Beginning of period | | | 17,469,740 | | | | 13,242,225 | | | | 22,626,024 | | | | 20,531,130 | | |
| End of period | | $ | 19,341,464 | | | $ | 17,469,740 | | | $ | 23,065,740 | | | $ | 22,626,024 | | |
| Accumulated Net Investment Income | | $ | 254,243 | | | $ | 297,188 | | | $ | 439,879 | | | $ | 504,733 | | |
(A) Class SC represents the period from January 1, 2009 through April 26, 2009.
The accompanying notes are an integral part of the financial statements.
36
Statements of Changes in Net Assets (Continued)
| | | Touchstone
Enhanced ETF
Fund | | Touchstone
Moderate ETF
Fund | |
| | | For the
Year
Ended
December 31,
2010 | | For the
Year
Ended
December 31,
2009 (A) | | For the
Year
Ended
December 31,
2010 | | For the
Year
Ended
December 31,
2009 (A) | |
| From Operations | |
| Net investment income | | $ | 103,471 | | | $ | 269,870 | | | $ | 938,251 | | | $ | 1,128,367 | | |
| Net realized gain (loss) on investments | | | 460,542 | | | | (2,812,766 | ) | | | (2,034,807 | ) | | | (3,528,439 | ) | |
| Net change in unrealized appreciation/(depreciation) on investments | | | 846,656 | | | | 5,715,196 | | | | 6,712,775 | | | | 10,009,515 | | |
| Net Increase in Net Assets from Operations | | | 1,410,669 | | | | 3,172,300 | | | | 5,616,219 | | | | 7,609,443 | | |
| Dividends and Distributions to Shareholders from | |
| Net investment income, Class I | | | (269,871 | ) | | | (512,143 | ) | | | (1,128,367 | ) | | | (1,603,350 | ) | |
| Total Dividends and Distributions | | | (269,871 | ) | | | (512,143 | ) | | | (1,128,367 | ) | | | (1,603,350 | ) | |
| Share Transactions | |
| Class I | |
| Proceeds from shares sold | | | 415,122 | | | | 3,098,780 | | | | 6,181,277 | | | | 20,700,506 | | |
| Reinvestment of dividends and distributions | | | 269,871 | | | | 512,143 | | | | 1,128,367 | | | | 1,604,021 | | |
| Cost of shares redeemed | | | (4,923,695 | ) | | | (6,136,584 | ) | | | (10,810,218 | ) | | | (4,076,597 | ) | |
| Net Increase (Decrease) from Class I Share Transactions | | | (4,238,702 | ) | | | (2,525,661 | ) | | | (3,500,574 | ) | | | 18,227,930 | | |
| Class SC | |
| Proceeds from shares sold | | | — | | | | 51,481 | | | | — | | | | 825,177 | | |
| Cost of shares redeemed | | | — | | | | (5,195,370 | ) | | | — | | | | (22,856,001 | ) | |
| Net Decrease from Class SC Share Transactions | | | — | | | | (5,143,889 | ) | | | — | | | | (22,030,824 | ) | |
| Total Increase (Decrease) in Net Assets | | | (3,097,904 | ) | | | (5,009,393 | ) | | | 987,278 | | | | 2,203,199 | | |
| Net Assets | |
| Beginning of period | | | 17,403,371 | | | | 22,412,764 | | | | 52,504,288 | | | | 50,301,089 | | |
| End of period | | $ | 14,305,467 | | | $ | 17,403,371 | | | $ | 53,491,566 | | | $ | 52,504,288 | | |
| Accumulated Net Investment Income | | $ | 101,821 | | | $ | 269,875 | | | $ | 926,794 | | | $ | 1,128,898 | | |
(A) Class SC represents the period from January 1, 2009 through April 26, 2009.
The accompanying notes are an integral part of the financial statements.
37
Financial Highlights
Touchstone Baron Small Cap Growth Fund
Selected Data for a Share Outstanding
| | | For the Year Ended December 31, | |
| | | 2010 | | 2009 | | 2008 | | 2007 | | 2006 | |
| Net asset value, beginning of period | | $ | 13.40 | | | $ | 10.08 | | | $ | 20.52 | | | $ | 22.86 | | | $ | 19.89 | | |
| Income (loss) from investment operations: | |
| Net investment loss | | | (0.06 | ) | | | (0.08 | ) | | | (0.07 | ) | | | (0.16 | ) | | | (0.11 | ) | |
| Net realized and unrealized gain (loss) on investments | | | 3.40 | | | | 3.40 | | | | (7.11 | ) | | | 0.87 | | | | 3.75 | | |
| Total from investment operations | | | 3.34 | | | | 3.32 | | | | (7.18 | ) | | | 0.71 | | | | 3.64 | | |
| Dividends and distributions to shareholders from: | |
| Realized capital gains | | | — | | | | — | | | | (3.26 | ) | | | (3.05 | ) | | | (0.67 | ) | |
| Net asset value, end of period | | $ | 16.74 | | | $ | 13.40 | | | $ | 10.08 | | | $ | 20.52 | | | $ | 22.86 | | |
| Total return (A) | | | 24.93 | % | | | 32.94 | % | | | (33.64 | %) | | | 2.76 | % | | | 18.26 | % | |
| Ratios and supplemental data: | |
| Net assets at end of period (000s) | | $ | 24,581 | | | $ | 20,329 | | | $ | 14,243 | | | $ | 26,216 | | | $ | 29,103 | | |
| Ratios to average net assets: | |
| Net expenses | | | 1.55 | % | | | 1.55 | % | | | 1.55 | % | | | 1.49 | % | | | 1.51 | % | |
| Gross expenses | | | 1.62 | % | | | 1.81 | % | | | 1.84 | % | | | 1.49 | % | | | 1.55 | % | |
| Net investment loss | | | (0.43 | %) | | | (0.81 | %) | | | (0.51 | %) | | | (0.71 | %) | | | (0.51 | %) | |
| Portfolio turnover | | | 18 | % | | | 9 | % | | | 7 | % | | | 19 | % | | | 19 | % | |
Touchstone Core Bond Fund
Selected Data for a Share Outstanding
| | | For the Year Ended December 31, | |
| | | 2010 | | 2009 | | 2008 | | 2007 | | 2006 | |
| Net asset value, beginning of period | | $ | 10.37 | | | $ | 9.49 | | | $ | 10.33 | | | $ | 10.24 | | | $ | 10.28 | | |
| Income (loss) from investment operations: | |
| Net investment income | | | 0.38 | | | | 0.39 | | | | 0.54 | | | | 0.46 | | | | 0.50 | | |
| Net realized and unrealized gain (loss) on investments | | | 0.40 | | | | 1.02 | | | | (0.88 | ) | | | 0.10 | | | | (0.08 | ) | |
| Total from investment operations | | | 0.78 | | | | 1.41 | | | | (0.34 | ) | | | 0.56 | | | | 0.42 | | |
| Dividends and distributions to shareholders from: | |
| Net investment income | | | (0.42 | ) | | | (0.48 | ) | | | (0.50 | ) | | | (0.47 | ) | | | (0.46 | ) | |
| Distributions in excess of net investment income | | | — | | | | (0.05 | ) | | | — | | | | — | | | | — | | |
| Total dividends and distributions | | | (0.42 | ) | | | (0.53 | ) | | | (0.50 | ) | | | (0.47 | ) | | | (0.46 | ) | |
| Net asset value, end of period | | $ | 10.73 | | | $ | 10.37 | | | $ | 9.49 | | | $ | 10.33 | | | $ | 10.24 | | |
| Total return (A) | | | 7.57 | % | | | 14.90 | % | | | (3.26 | %) | | | 5.45 | % | | | 4.05 | % | |
| Ratios and supplemental data: | |
| Net assets at end of period (000s) | | $ | 40,408 | | | $ | 38,586 | | | $ | 35,435 | | | $ | 39,647 | | | $ | 37,358 | | |
| Ratios to average net assets: | |
| Net expenses | | | 0.91 | % | | | 1.00 | % | | | 1.00 | % | | | 0.75 | % | | | 0.75 | % | |
| Gross expenses | | | 0.91 | % | | | 1.02 | % | | | 1.03 | % | | | 0.96 | % | | | 1.01 | % | |
| Net investment income | | | 3.50 | % | | | 3.67 | % | | | 4.75 | % | | | 4.67 | % | | | 4.41 | % | |
| Portfolio turnover | | | 487 | % | | | 422 | % | | | 171 | % | | | 283 | % | | | 231 | % | |
See Notes to Financial Highlights on page 44 .
The accompanying notes are an integral part of the financial statements.
38
Financial Highlights (Continued)
Touchstone High Yield Fund
Selected Data for a Share Outstanding
| | | For the Year Ended December 31, | |
| | | 2010 | | 2009 | | 2008 | | 2007 | | 2006 | |
| Net asset value, beginning of period | | $ | 7.64 | | | $ | 5.52 | | | $ | 7.94 | | | $ | 8.54 | | | $ | 8.53 | | |
| Income (loss) from investment operations: | |
| Net investment income | | | 0.72 | | | | 0.67 | | | | 0.21 | | | | 0.87 | | | | 0.61 | | |
| Net realized and unrealized gain (loss) on investments | | | 0.25 | | | | 1.92 | | | | (2.14 | ) | | | (0.72 | ) | | | 0.06 | | |
| Total from investment operations | | | 0.97 | | | | 2.59 | | | | (1.93 | ) | | | 0.15 | | | | 0.67 | | |
| Dividends and distributions to shareholders from: | |
| Net investment income | | | (0.75 | ) | | | (0.47 | ) | | | (0.49 | ) | | | (0.75 | ) | | | (0.66 | ) | |
| Net asset value, end of period | | $ | 7.86 | | | $ | 7.64 | | | $ | 5.52 | | | $ | 7.94 | | | $ | 8.54 | | |
| Total return (A) | | | 12.65 | % | | | 46.90 | % | | | (24.31 | %) | | | 1.78 | % | | | 7.90 | % | |
| Ratios and supplemental data: | |
| Net assets at end of period (000s) | | $ | 32,552 | | | $ | 35,038 | | | $ | 29,081 | | | $ | 27,918 | | | $ | 37,361 | | |
| Ratios to average net assets: | |
| Net expenses | | | 1.05 | % | | | 1.05 | % | | | 1.05 | % | | | 0.80 | % | | | 0.80 | % | |
| Gross expenses | | | 1.05 | % | | | 1.05 | % | | | 1.15 | % | | | 0.94 | % | | | 0.98 | % | |
| Net investment income | | | 7.57 | % | | | 8.72 | % | | | 8.01 | % | | | 6.88 | % | | | 6.84 | % | |
| Portfolio turnover | | | 56 | % | | | 61 | % | | | 52 | % | | | 62 | % | | | 46 | % | |
Touchstone Large Cap Core Equity Fund
Selected Data for a Share Outstanding
| | | For the Year Ended December 31, | |
| | | 2010 | | 2009 | | 2008 | | 2007 | | 2006 | |
| Net asset value, beginning of period | | $ | 8.20 | | | $ | 6.69 | | | $ | 11.22 | | | $ | 10.99 | | | $ | 8.88 | | |
| Income (loss) from investment operations: | |
| Net investment income (loss) | | | 0.18 | | | | 0.09 | | | | (0.05 | ) | | | 0.24 | | | | 0.28 | | |
| Net realized and unrealized gain (loss) on investments | | | 0.82 | | | | 1.52 | | | | (3.92 | ) | | | 0.35 | | | | 2.08 | | |
| Total from investment operations | | | 1.00 | | | | 1.61 | | | | (3.97 | ) | | | 0.59 | | | | 2.36 | | |
| Dividends and distributions to shareholders from: | |
| Net investment income | | | (0.16 | ) | | | (0.10 | ) | | | (0.07 | ) | | | (0.25 | ) | | | (0.25 | ) | |
| Realized capital gains | | | — | | | | — | | | | (0.49 | ) | | | (0.11 | ) | | | — | | |
| Total dividends and distributions | | | (0.16 | ) | | | (0.10 | ) | | | (0.56 | ) | | | (0.36 | ) | | | (0.25 | ) | |
| Net asset value, end of period | | $ | 9.04 | | | $ | 8.20 | | | $ | 6.69 | | | $ | 11.22 | | | $ | 10.99 | | |
| Total return (A) | | | 12.20 | % | | | 24.06 | % | | | (35.20 | %) | | | 5.32 | % | | | 26.57 | % | |
| Ratios and supplemental data: | |
| Net assets at end of period (000s) | | $ | 43,120 | | | $ | 63,316 | | | $ | 49,265 | | | $ | 25,362 | | | $ | 26,285 | | |
| Ratios to average net assets: | |
| Net expenses | | | 1.00 | % | | | 1.00 | % | | | 1.00 | % | | | 0.75 | % | | | 0.75 | % | |
| Gross expenses | | | 1.04 | % | | | 1.06 | % | | | 1.10 | % | | | 1.10 | % | | | 1.20 | % | |
| Net investment income (loss) | | | 1.07 | % | | | 1.40 | % | | | (1.42 | %) | | | 1.91 | % | | | 2.31 | % | |
| Portfolio turnover | | | 33 | % | | | 38 | % | | | 81 | % | | | 124 | % | | | 53 | % | |
See Notes to Financial Highlights on page 44.
The accompanying notes are an integral part of the financial statements.
39
Financial Highlights (Continued)
Touchstone Mid Cap Growth Fund
Selected Data for a Share Outstanding
| | | For the Year Ended December 31, | |
| | | 2010 | | 2009 | | 2008 | | 2007 | | 2006 | |
| Net asset value, beginning of period | | $ | 11.04 | | | $ | 7.95 | | | $ | 18.55 | | | $ | 19.38 | | | $ | 17.63 | | |
| Income (loss) from investment operations: | |
| Net investment income (loss) | | | 0.04 | | | | 0.03 | | | | 0.02 | | | | (0.05 | ) | | | (0.09 | ) | |
| Net realized and unrealized gain (loss) on investments | | | 2.35 | | | | 3.07 | | | | (7.54 | ) | | | 2.85 | | | | 2.95 | | |
| Total from investment operations | | | 2.39 | | | | 3.10 | | | | (7.52 | ) | | | 2.80 | | | | 2.86 | | |
| Dividends and distributions to shareholders from: | |
| Net investment income | | | (0.03 | ) | | | (0.01 | ) | | | — | | | | — | | | | — | | |
| Realized capital gains | | | — | | | | — | | | | (3.08 | ) | | | (3.63 | ) | | | (1.11 | ) | |
| Total dividends and distributions | | | (0.03 | ) | | | (0.01 | ) | | | (3.08 | ) | | | (3.63 | ) | | | (1.11 | ) | |
| Net asset value, end of period | | $ | 13.40 | | | $ | 11.04 | | | $ | 7.95 | | | $ | 18.55 | | | $ | 19.38 | | |
| Total return (A) | | | 21.63 | % | | | 38.99 | % | | | (39.70 | %) | | | 14.43 | % | | | 16.18 | % | |
| Ratios and supplemental data: | |
| Net assets at end of period (000s) | | $ | 28,013 | | | $ | 25,521 | | | $ | 20,713 | | | $ | 46,356 | | | $ | 35,216 | | |
| Ratios to average net assets: | |
| Net expenses | | | 1.17 | % | | | 1.16 | % | | | 1.16 | % | | | 1.15 | % | | | 1.15 | % | |
| Gross expenses | | | 1.27 | % | | | 1.40 | % | | | 1.36 | % | | | 1.17 | % | | | 1.28 | % | |
| Net investment income (loss) | | | 0.31 | % | | | 0.26 | % | | | 0.06 | % | | | (0.29 | %) | | | (0.49 | %) | |
| Portfolio turnover | | | 60 | % | | | 71 | % | | | 73 | % | | | 83 | % | | | 104 | % | |
Touchstone Money Market Fund
Selected Data for a Share Outstanding
| | | For the Year Ended December 31, | |
| | | 2010 | | 2009 | | 2008 | | 2007 | | 2006 | |
| Net asset value, beginning of period | | $ | 1.00 | | | $ | 1.00 | | | $ | 1.00 | | | $ | 1.00 | | | $ | 1.00 | | |
| Income (loss) from investment operations: | |
| Net investment income | | | 0.00 | (B) | | | 0.01 | | | | 0.03 | | | | 0.05 | | | | 0.05 | | |
| Net realized and unrealized gain (loss) on investments | | | 0.00 | (B) | | | (0.00 | ) (B) | | | — | | | | — | | | | — | | |
| Total from investment operations | | | 0.00 | (B) | | | 0.01 | | | | 0.03 | | | | 0.05 | | | | 0.05 | | |
| Dividends and distributions to shareholders from: | |
| Net investment income | | | (0.00 | ) (B) | | | (0.01 | ) | | | (0.03 | ) | | | (0.05 | ) | | | (0.05 | ) | |
| Realized capital gains | | | (0.00 | ) (B) | | | — | | | | — | | | | — | | | | — | | |
| Total dividends and distributions | | | (0.00 | ) (B) | | | (0.01 | ) | | | (0.03 | ) | | | (0.05 | ) | | | (0.05 | ) | |
| Net asset value, end of period | | $ | 1.00 | | | $ | 1.00 | | | $ | 1.00 | | | $ | 1.00 | | | $ | 1.00 | | |
| Total return (A) | | | 0.19 | % | | | 0.88 | % | | | 2.99 | % | | | 5.17 | % | | | 4.94 | % | |
| Ratios and supplemental data: | |
| Net assets at end of period (000s) | | $ | 57,032 | | | $ | 79,749 | | | $ | 52,790 | | | $ | 44,988 | | | $ | 37,256 | | |
| Ratios to average net assets: | |
| Net expenses | | | 0.53 | % | | | 0.71 | % (C) | | | 0.65 | % | | | 0.28 | % | | | 0.28 | % | |
| Gross expenses | | | 0.65 | % | | | 0.72 | % | | | 0.65 | % | | | 0.47 | % | | | 0.56 | % | |
| Net investment income | | | 0.02 | % | | | 0.80 | % | | | 2.94 | % | | | 5.06 | % | | | 4.82 | % | |
See Notes to Financial Highlights on page 44 .
The accompanying notes are an integral part of the financial statements.
40
Financial Highlights (Continued)
Touchstone Third Avenue Value Fund
Selected Data for a Share Outstanding
| | | For the Year Ended December 31, | |
| | | 2010 | | 2009 | | 2008 | | 2007 | | 2006 | |
| Net asset value, beginning of period | | $ | 15.61 | | | $ | 12.93 | | | $ | 26.70 | | | $ | 29.24 | | | $ | 26.89 | | |
| Income (loss) from investment operations: | |
| Net investment income | | | 0.25 | | | | 0.26 | | | | 0.23 | | | | 0.30 | | | | 0.22 | | |
| Net realized and unrealized gain (loss) on investments | | | 2.90 | | | | 3.78 | | | | (10.68 | ) | | | (0.79 | ) | | | 4.05 | | |
| Total from investment operations | | | 3.15 | | | | 4.04 | | | | (10.45 | ) | | | (0.49 | ) | | | 4.27 | | |
| Dividends and distributions to shareholders from: | |
| Net investment income | | | (1.09 | ) | | | (0.29 | ) | | | (0.31 | ) | | | (0.20 | ) | | | (0.11 | ) | |
| Realized capital gains | | | — | | | | (1.07 | ) | | | (3.01 | ) | | | (1.85 | ) | | | (1.81 | ) | |
| Total dividends and distributions | | | (1.09 | ) | | | (1.36 | ) | | | (3.32 | ) | | | (2.05 | ) | | | (1.92 | ) | |
| Net asset value, end of period | | $ | 17.67 | | | $ | 15.61 | | | $ | 12.93 | | | $ | 26.70 | | | $ | 29.24 | | |
| Total return (A) | | | 20.20 | % | | | 31.39 | % | | | (38.50 | %) | | | (1.79 | %) | | | 15.87 | % | |
| Ratios and supplemental data: | |
| Net assets at end of period (000s) | | $ | 52,578 | | | $ | 53,505 | | | $ | 58,109 | | | $ | 120,717 | | | $ | 125,330 | | |
| Ratios to average net assets: | |
| Net expenses | | | 1.17 | % | | | 1.13 | % | | | 1.06 | % | | | 1.05 | % | | | 1.05 | % | |
| Gross expenses | | | 1.87 | %(D) | | | 1.34 | % | | | 1.34 | % | | | 1.07 | % | | | 1.15 | % | |
| Net investment income | | | 0.93 | % | | | 1.17 | % | | | 1.08 | % | | | 1.03 | % | | | 0.77 | % | |
| Portfolio turnover | | | 10 | % | | | 4 | % | | | 12 | % | | | 18 | % | | | 10 | % | |
See Notes to Financial Highlights on page 44 .
The accompanying notes are an integral part of the financial statements.
41
Financial Highlights (Continued)
Touchstone Aggressive ETF Fund
Selected Data for a Share Outstanding
| | | For the Year Ended December 31, | |
| | | 2010 | | 2009 | | 2008 | | 2007 | | 2006 | |
| Net asset value, beginning of period | | $ | 9.17 | | | $ | 7.80 | | | $ | 12.70 | | | $ | 12.65 | | | $ | 11.30 | | |
| Income (loss) from investment operations: | |
| Net investment income (loss) | | | 0.14 | | | | (0.09 | ) | | | 0.26 | | | | 0.40 | | | | 0.24 | | |
| Net realized and unrealized gain (loss) on investments | | | 1.07 | | | | 1.78 | | | | (4.00 | ) | | | 0.25 | | | | 1.29 | | |
| Total from investment operations | | | 1.21 | | | | 1.69 | | | | (3.74 | ) | | | 0.65 | | | | 1.53 | | |
| Dividends and distributions to shareholders from: | |
| Net investment income | | | (0.16 | ) | | | (0.20 | ) | | | (0.25 | ) | | | (0.22 | ) | | | (0.12 | ) | |
| Realized capital gains | | | — | | | | (0.12 | ) | | | (0.91 | ) | | | (0.38 | ) | | | (0.06 | ) | |
| Total dividends and distributions | | | (0.16 | ) | | | (0.32 | ) | | | (1.16 | ) | | | (0.60 | ) | | | (0.18 | ) | |
| Net asset value, end of period | | $ | 10.22 | | | $ | 9.17 | | | $ | 7.80 | | | $ | 12.70 | | | $ | 12.65 | | |
| Total return (A) | | | 13.19 | % | | | 21.72 | % | | | (29.12 | %) | | | 5.12 | % | | | 13.52 | % | |
| Ratios and supplemental data: | |
| Net assets at end of period (000s) | | $ | 19,341 | | | $ | 17,470 | | | $ | 7,361 | | | $ | 12,610 | | | $ | 17,171 | | |
| Ratios to average net assets: | |
| Net expenses | | | 0.75 | % | | | 0.75 | % | | | 0.75 | % | | | 0.50 | % | | | 0.50 | % | |
| Gross expenses | | | 1.07 | % | | | 1.21 | % | | | 1.25 | % | | | 0.90 | % | | | 1.18 | % | |
| Net investment income (loss) | | | 1.54 | % | | | (2.18 | %) | | | 2.15 | % | | | 1.86 | % | | | 1.94 | % | |
| Portfolio turnover | | | 44 | % | | | 45 | % | | | 20 | % | | | 39 | % | | | 33 | % | |
Touchstone Conservative ETF Fund
Selected Data for a Share Outstanding
| | | For the Year Ended December 31, | |
| | | 2010 | | 2009 | | 2008 | | 2007 | | 2006 | |
| Net asset value, beginning of period | | $ | 10.90 | | | $ | 10.17 | | | $ | 11.92 | | | $ | 11.50 | | | $ | 10.72 | | |
| Income (loss) from investment operations: | |
| Net investment income (loss) | | | 0.24 | | | | (0.04 | ) | | | 0.53 | | | | 0.35 | | | | 0.22 | | |
| Net realized and unrealized gain (loss) on investments | | | 0.72 | | | | 1.24 | | | | (1.67 | ) | | | 0.31 | | | | 0.65 | | |
| Total from investment operations | | | 0.96 | | | | 1.20 | | | | (1.14 | ) | | | 0.66 | | | | 0.87 | | |
| Dividends and distributions to shareholders from: | |
| Net investment income | | | (0.26 | ) | | | (0.36 | ) | | | (0.34 | ) | | | (0.20 | ) | | | (0.08 | ) | |
| Realized capital gains | | | — | | | | (0.11 | ) | | | (0.27 | ) | | | (0.04 | ) | | | (0.01 | ) | |
| Total dividends and distributions | | | (0.26 | ) | | | (0.47 | ) | | | (0.61 | ) | | | (0.24 | ) | | | (0.09 | ) | |
| Net asset value, end of period | | $ | 11.60 | | | $ | 10.90 | | | $ | 10.17 | | | $ | 11.92 | | | $ | 11.50 | | |
| Total return (A) | | | 8.81 | % | | | 11.79 | % | | | (9.49 | %) | | | 5.76 | % | | | 8.15 | % | |
| Ratios and supplemental data: | |
| Net assets at end of period (000s) | | $ | 23,066 | | | $ | 22,626 | | | $ | 10,835 | | | $ | 16,197 | | | $ | 14,213 | | |
| Ratios to average net assets: | |
| Net expenses | | | 0.75 | % | | | 0.75 | % | | | 0.75 | % | | | 0.50 | % | | | 0.50 | % | |
| Gross expenses | | | 1.00 | % | | | 1.10 | % | | | 1.14 | % | | | 0.91 | % | | | 1.41 | % | |
| Net investment income (loss) | | | 1.95 | % | | | (2.61 | %) | | | 3.10 | % | | | 3.24 | % | | | 3.19 | % | |
| Portfolio turnover | | | 21 | % | | | 40 | % | | | 39 | % | | | 23 | % | | | 14 | % | |
See Notes to Financial Highlights on page 44 .
The accompanying notes are an integral part of the financial statements.
42
Financial Highlights (Continued)
Touchstone Enhanced ETF Fund
Selected Data for a Share Outstanding
| | | For the Year Ended December 31, | |
| | | 2010 | | 2009 | | 2008 | | 2007 | | 2006 | |
| Net asset value, beginning of period | | $ | 7.34 | | | $ | 6.19 | | | $ | 13.88 | | | $ | 13.73 | | | $ | 11.98 | | |
| Income (loss) from investment operations: | |
| Net investment income | | | 0.09 | | | | 0.17 | | | | 0.13 | | | | 0.21 | | | | 0.13 | | |
| Net realized and unrealized gain (loss) on investments | | | 0.75 | | | | 1.20 | | | | (4.69 | ) | | | 0.35 | | | | 1.71 | | |
| Total from investment operations | | | 0.84 | | | | 1.37 | | | | (4.56 | ) | | | 0.56 | | | | 1.84 | | |
| Dividends and distributions to shareholders from: | |
| Net investment income | | | (0.15 | ) | | | (0.22 | ) | | | (0.15 | ) | | | (0.17 | ) | | | (0.03 | ) | |
| Realized capital gains | | | — | | | | — | | | | (2.98 | ) | | | (0.24 | ) | | | (0.06 | ) | |
| Total dividends and distributions | | | (0.15 | ) | | | (0.22 | ) | | | (3.13 | ) | | | (0.41 | ) | | | (0.09 | ) | |
| Net asset value, end of period | | $ | 8.03 | | | $ | 7.34 | | | $ | 6.19 | | | $ | 13.88 | | | $ | 13.73 | | |
| Total return (A) | | | 11.50 | % | | | 22.17 | % | | | (31.40 | %) | | | 4.03 | % | | | 15.38 | % | |
| Ratios and supplemental data: | |
| Net assets at end of period (000s) | | $ | 14,305 | | | $ | 17,403 | | | $ | 19,557 | | | $ | 39,526 | | | $ | 47,264 | | |
| Ratios to average net assets: | |
| Net expenses | | | 0.75 | % | | | 0.75 | % | | | 0.75 | % | | | 0.50 | % | | | 0.50 | % | |
| Gross expenses | | | 1.07 | % | | | 1.14 | % | | | 1.06 | % | | | 0.75 | % | | | 0.85 | % | |
| Net investment income | | | 0.68 | % | | | 1.50 | % | | | 1.54 | % | | | 1.13 | % | | | 1.26 | % | |
| Portfolio turnover | | | 121 | % | | | 75 | % | | | 78 | % | | | 88 | % | | | 62 | % | |
Touchstone Moderate ETF Fund
Selected Data for a Share Outstanding
| | | For the Year Ended December 31, | |
| | | 2010 | | 2009 | | 2008 | | 2007 | | 2006 | |
| Net asset value, beginning of period | | $ | 11.01 | | | $ | 9.67 | | | $ | 12.60 | | | $ | 12.21 | | | $ | 11.11 | | |
| Income (loss) from investment operations: | |
| Net investment income | | | 0.23 | | | | 0.19 | | | | 0.17 | | | | 0.33 | | | | 0.22 | | |
| Net realized and unrealized gain (loss) on investments | | | 1.01 | | | | 1.50 | | | | (2.74 | ) | | | 0.31 | | | | 1.00 | | |
| Total from investment operations | | | 1.24 | | | | 1.69 | | | | (2.57 | ) | | | 0.64 | | | | 1.22 | | |
| Dividends and distributions to shareholders from: | |
| Net investment income | | | (0.26 | ) | | | (0.35 | ) | | | (0.21 | ) | | | (0.16 | ) | | | (0.10 | ) | |
| Realized capital gains | | | — | | | | — | | | | (0.15 | ) | | | (0.09 | ) | | | (0.02 | ) | |
| Total dividends and distributions | | | (0.26 | ) | | | (0.35 | ) | | | (0.36 | ) | | | (0.25 | ) | | | (0.12 | ) | |
| Net asset value, end of period | | $ | 11.99 | | | $ | 11.01 | | | $ | 9.67 | | | $ | 12.60 | | | $ | 12.21 | | |
| Total return (A) | | | 11.25 | % | | | 17.44 | % | | | (20.34 | %) | | | 5.24 | % | | | 10.97 | % | |
| Ratios and supplemental data: | |
| Net assets at end of period (000s) | | $ | 53,492 | | | $ | 52,504 | | | $ | 33,476 | | | $ | 29,017 | | | $ | 27,991 | | |
| Ratios to average net assets: | |
| Net expenses | | | 0.75 | % | | | 0.75 | % | | | 0.75 | % | | | 0.50 | % | | | 0.50 | % | |
| Gross expenses | | | 0.89 | % | | | 0.92 | % | | | 0.94 | % | | | 0.77 | % | | | 1.02 | % | |
| Net investment income | | | 1.79 | % | | | 2.37 | % | | | 2.85 | % | | | 2.59 | % | | | 2.57 | % | |
| Portfolio turnover | | | 19 | % | | | 24 | % | | | 29 | % | | | 12 | % | | | 15 | % | |
See Notes to Financial Highlights on page 44 .
The accompanying notes are an integral part of the financial statements.
43
Financial Highlights (Continued)
Notes to Financial Highlights
(A) Total returns do not include any insurance, sales or administrative charges of variable annuity or life insurance contracts. If these charges were included, the return would be lower.
(B) Less than $0.01 per share.
(C) Absent money market insurance, the ratio of net expenses to average net assets would have been 0.67%.
(D) Absent PFIC Tax expenses, the ratio of gross expenses to average net assets would have been 1.37%.
The accompanying notes are an integral part of the financial statements.
44
Notes to Financial Statements
December 31, 2010
1. Organization and Significant Accounting Policies
Touchstone Variable Series Trust (the "Trust") is registered under the Investment Company Act of 1940, as amended (the "1940 Act"), as an open-end management investment company, and was organized as a Massachusetts business trust on February 7, 1994. The Trust consists of the following eleven funds, individually, a "Fund", and collectively, the "Funds":
Touchstone Baron Small Cap Growth Fund ("Baron Small Cap Growth Fund")
Touchstone Core Bond Fund ("Core Bond Fund")
Touchstone High Yield Fund ("High Yield Fund")
Touchstone Large Cap Core Equity Fund ("Large Cap Core Equity Fund")
Touchstone Mid Cap Growth Fund ("Mid Cap Growth Fund")
Touchstone Money Market Fund ("Money Market Fund")
Touchstone Third Avenue Value Fund ("Third Avenue Value Fund")
Touchstone Aggressive ETF Fund ("Aggressive ETF Fund")
Touchstone Conservative ETF Fund ("Conservative ETF Fund")
Touchstone Enhanced ETF Fund ("Enhanced ETF Fund")
Touchstone Moderate ETF Fund ("Moderate ETF Fund")
Each Fund (except the Third Avenue Value Fund) is an open-end, diversified, management investment company. The Third Avenue Value Fund is an open-end, non-diversified, management investment company.
The Declaration of Trust permits the Trust to issue an unlimited number of shares of beneficial interest of each Fund. Shares of beneficial interest of each Fund are available as a funding vehicle for the separate accounts of life insurance companies issuing variable annuity and variable life insurance policies. As of December 31, 2010, outstanding shares were issued to separate accounts of Western-Southern Life Assurance Company, Integrity Life Insurance Company, National Integrity Life Insurance Company, and Columbus Life Insurance Company, which are all part of The Western & Southern Financial Group ("Western-Southern"), and 100% of the outstanding shares of the Trust were collectively owned by affiliates of Western-Southern and certain supplemental executive retirement plans sponsored by Western-Southern and its affiliates.
Prior to April 27, 2009, the Funds were registered to offer different classes of shares: Class I shares and Class SC shares. The Money Market Fund, Aggressive ETF Fund, Conservative ETF Fund, Enhanced ETF Fund, and Moderate ETF Fund offered two classes of shares: Class I shares and Class SC shares. Effective April 27, 2009, Class SC shares were exchanged for Class I shares and all Funds now offer a single class of shares: Class I shares. The assets of each Fund are segregated, and a shareholder's interest is limited to the Fund in which shares are held. The Funds' prospectus provides a description of each Fund's investment objectives, policies, and strategies along with information on the classes of shares currently being offered.
Share valuation — The net asset value per share is calculated daily by dividing the total value of the Fund's assets, less liabilities, by its number of shares outstanding.
Investment valuation — Securities for which market quotations are readily available are valued at the last sale price on a national securities exchange, or, in the absence of recorded sales, at the readily available closing bid price on such exchanges, or at the quoted bid price in the over-the-counter market. Securities which are quoted by NASDAQ are valued at the NASDAQ Official Closing Price. If there are no sales on that day, the securities are valued at the mean between the closing bid and ask prices as reported by NASDAQ. Securities quoted in foreign currencies are translated into U.S. dollars at the current exchange rate. Debt securities are valued by a pricing service that determines valuations based upon market transactions for normal, institutional-size trading units of similar securities. Securities or other assets for which market quotations are not readily available are valued at fair value in good faith by the Advisor under consistently applied procedures in accordance with
45
Notes to Financial Statements (Continued)
procedures approved by the Board of Trustees. Such procedures include the use of independent pricing services, which use prices based upon yields or prices of securities of comparable quality, coupon, maturity and type; indications as to values from dealers; and general market conditions. Money market instruments and other debt securities with a remaining maturity of less than 60 days are valued at amortized cost, which approximates market value. Under the amortized cost valuation method, the discount or premium is amortized on a constant basis to the maturity of the security.
The Funds have adopted Financial Accounting Standards Board ("FASB") ASC 820 "Fair Value Measurements". This standard establishes a single authoritative definition of fair value, sets out a framework for measuring fair value and requires additional disclosures about fair value measurements. Fair Value Measurements applies to fair value measurements already required or permitted by existing standards. The changes to current generally accepted accounting principles (GAAP) from the application of this standard relate to the definition of fair value, the methods used to measure fair value, and the expanded disclosures about fair value measurements.
Various inputs are used in determining the value of the Funds' investments. These inputs are summarized in the three broad levels listed below:
• Level 1 – quoted prices in active markets for identical securities
• Level 2 – other significant observable inputs (including quoted prices for similar securities, interest rates, prepayment speeds, credit risk, etc.)
• Level 3 – significant unobservable inputs (including the Fund's own assumptions in determining the fair value of investments)
The inputs or methodology used for valuing securities are not necessarily an indication of the risk associated with investing in those securities. For example, money market securities are valued using amortized cost, in accordance with rules under the 1940 Act. Generally, amortized cost approximates the current fair value of a security, but since the value is not obtained from a quoted price in an active market, such securities are reflected as Level 2.
The aggregate value by input level, as of December 31, 2010, for each Fund's investments, as well as a reconciliation of assets for which significant unobservable inputs (Level 3) were used in determining fair value, is included in each Fund's Portfolio of Investments, which also includes a breakdown of the Fund's investments by geographic/industry concentration. The Funds did not hold any Level 3 categorized securities during the year ended or at December 31, 2010.
For the year ended December 31, 2010 there were no significant transfers between Levels 1 and 2.
Foreign currency value translation — The books and records of the Funds are maintained in U.S. dollars and translated into U.S. dollars on the following basis:
1) market value of investment securities, assets and liabilities at the current rate of exchange on the valuation date; and
2) purchases and sales of investment securities, income and expenses at the relevant rates of exchange prevailing on the respective dates of such transactions.
The Funds do not isolate that portion of gains and losses on investments in equity securities that is due to changes in the foreign exchange rates from that which is due to changes in market prices of equity securities.
46
Notes to Financial Statements (Continued)
Forward foreign currency and spot contracts — Certain Funds may enter into forward foreign currency and spot contracts to protect securities and related receivables and payables against fluctuations in foreign currency rates. A forward foreign currency contract is an agreement between two parties to buy and sell a specific currency at a price that is set on the date of the contract. The forward contract calls for delivery of the currency on a future date that is specified in the contract. Risks related to the use of forwards include the possible failure of counterparties to meet the terms of the forward agreement, the failure of the counterparties to timely post collateral, the risk that currency movements will not occur thereby reducing the Fund's total return, and the potential for losses in excess of the Fund's initial investment.
The market value of a forward foreign currency contract fluctuates with changes in foreign currency exchange rates. Forward foreign currency contracts are marked to market daily and the change in value is recorded by a Fund as an unrealized gain or loss. Realized gains or losses, equal to the difference between the value of the contract at the time it was opened and the value at the time it was closed, are recorded upon delivery or receipt of the currency.
As of December 31, 2010, there were no open forward foreign currency contracts.
Derivative instruments and hedging activities — The following table sets forth the effect of derivative contracts on the Statement of Operations for the year ended December 31, 2010:
The Effect of Derivative Instruments on the Statement of Operations
for the Year Ended December 31, 2010 | |
Derivatives
not accounted
for as hedging
instruments
under ACS 815 | | Location of
Gain or (Loss)
on Derivatives on
the Statements
of Operations | | Fund | | Realized
Gain or (Loss)
on Derivatives | | Change in
Unrealized
Appreciation
(Depreciation) on
Derivatives | |
| | | Net realized | | | | | |
| |
| | | gains (losses) from foreign | | | | | |
| |
| | | currency transactions, | | | | | |
| |
| Forward | | Net change in unrealized | | | | | |
| |
| foreign currency | | appreciation (depreciation) on | | Third Avenue | | | |
| |
| exchange contracts | | foreign currency transactions | | Value Fund | | $ | (5,262 | ) | | $ | — | | |
Portfolio securities loaned — Each Fund may lend its portfolio securities. Lending portfolio securities exposes a Fund to the risk that the borrower may fail to return the loaned securities or may not be able to provide additional collateral or that the Fund may experience delays in recovery of the loaned securities or loss of rights in the collateral if the borrower fails financially. To minimize these risks, the borrower must agree to maintain cash collateral with the Funds' custodian in an amount at least equal to the market value of the loaned securities. The cash collateral is reinvested by the Funds' custodian into an approved investment vehicle. As of December 31, 2010, the following Funds loaned securities and received collateral as follows:
| Fund | | Securities
Loaned | | Collateral
Received | |
| Baron Small Cap Growth Fund | | $ | 4,260,837 | | | $ | 4,417,673 | | |
| Core Bond Fund | | $ | 106,178 | | | $ | 111,870 | | |
| High Yield Fund | | $ | 536,741 | | | $ | 564,670 | | |
| Large Cap Core Equity Fund | | $ | 1,473,535 | | | $ | 1,505,069 | | |
| Mid Cap Growth Fund | | $ | 1,199,920 | | | $ | 1,230,659 | | |
| Third Avenue Value Fund | | $ | 1,107,274 | | | $ | 1,128,275 | | |
| Aggressive ETF Fund | | $ | 4,709,884 | | | $ | 4,819,831 | | |
| Conservative ETF Fund | | $ | 5,615,361 | | | $ | 5,764,771 | | |
| Enhanced ETF Fund | | $ | 3,839,252 | | | $ | 3,955,450 | | |
| Moderate ETF Fund | | $ | 10,680,414 | | | $ | 10,938,116 | | |
47
Notes to Financial Statements (Continued)
All collateral received as cash and securities is received, held and administered by the Funds' custodian for the benefit of the Funds in the applicable custody account or other account established for the purpose of holding collateral.
Funds participating in securities lending receive compensation in the form of fees, or retain a portion of interest or dividends on the investment of any cash received as collateral. The Funds also continue to receive interest or dividends on the securities loaned. The loaned securities are secured by collateral valued at least equal, at all times, to the fair value of the securities loaned plus accrued interest. Unrealized gain or loss on the fair value of the securities loaned that may occur during the term of the loan is recognized by the Funds. The Funds have the right under the lending agreement to recover the securities from the borrower on demand.
Investment income — Dividend income is recorded on the ex-dividend date except that certain dividends from foreign securities are recorded as soon as the Trust is informed of the ex-dividend date. Interest income, which includes the amortization of premium and accretion of discount, if any, is recorded on an accrual basis. Dividend and interest income is recorded net of foreign taxes where recovery of such taxes is not assured.
Dividends and distributions — Income dividends to shareholders for all Funds in the Trust, except the Money Market Fund, are declared and paid by each Fund annually. The Money Market Fund will declare dividends daily and pay dividends monthly. Distributions to shareholders of net realized capital gains, if any, are declared and paid annually. Income distributions and capital gain distributions are determined in accordance with income tax regulations.
Securities transactions — Security transactions are accounted for on trade date. Securities sold are determined on a specific identification basis.
Estimates — The preparation of financial statements in conformity with U.S. generally accepted accounting principles ("GAAP") requires management to make estimates and assumptions that affect the reported amounts of assets and liabilities and disclosure of contingent assets and liabilities at the date of the financial statements and the reported amounts of income and expenses during the reporting period. Actual results could differ from those estimates.
2. Risks Associated with Foreign Investments
Some of the Funds may invest in the securities of foreign issuers. Investing in securities issued by companies whose principal business activities are outside the U.S. may involve significant risks not present in domestic investments. For example, there is generally less publicly available information about foreign companies, particularly those not subject to the disclosure and reporting requirements of the U.S. securities laws. Foreign issuers are generally not bound by uniform accounting, auditing, financial reporting requirements and standards of practice comparable to those applicable to domestic issuers. Investments in foreign securities also involve the risk of possible adverse changes in investment or exchange control regulations, expropriation or confiscatory taxation, limitations on the removal of funds or other assets of the Fund, political or financial instability or diplomatic and other developments which could affect such investments. Foreign stock markets, while growing in volume and sophistication, are generally not as developed as those in the U.S., and securities of some foreign issuers (particularly those located in developing countries) may be less liquid and more volatile than securities of comparable U.S. companies. In general, there is less overall governmental supervision and regulation of foreign securities markets, broker-dealers, and issuers than in the U.S.
48
Notes to Financial Statements (Continued)
3. Transactions with Affiliates
Certain officers of the Trust are also officers of the Advisor (Touchstone Advisors, Inc.), the Underwriter (Touchstone Securities, Inc.) and/or JPMorgan Chase Bank, N.A. ("JPMorgan"), the Sub-Administrator and Transfer Agent to the Funds. The Advisor and the Underwriter are each wholly-owned indirect subsidiaries of Western-Southern.
Advisory Agreement — The Advisor provides general investment supervisory services for the Funds, under the terms of an Advisory Agreement. Under the Advisory Agreement, the Funds pay the Advisor a fee, which is computed and accrued daily and paid monthly, at an annual rate based on average daily net assets as follows:
| Baron Small Cap Growth Fund | | 1.05% | |
|
| Core Bond Fund | | 0.55% on the first $100 million
0.50% of the next $100 million
0.45% of the next $100 million
0.40% of such assets in excess of $300 million. | |
|
| High Yield Fund | | 0.50% on the first $100 million
0.45% of the next $100 million
0.40% of the next $100 million
0.35% of such assets in excess of $300 million. | |
|
| Large Cap Core Equity Fund | | 0.65% on the first $100 million
0.60% of the next $100 million
0.55% of the next $100 million
0.50% of such assets in excess of $300 million. | |
|
| Mid Cap Growth Fund | | 0.80% | |
|
| Money Market Fund | | 0.18% | |
|
| Third Avenue Value Fund | | 0.80% on the first $100 million
0.75% of the next $100 million
0.70% of the next $100 million
0.65% of such assets in excess of $300 million. | |
|
| Aggressive ETF Fund | | 0.40% on the first $50 million | |
|
| Conservative ETF Fund | | 0.38% of the next $50 million | |
|
| Enhanced ETF Fund | | 0.36% of such assets in excess of $100 million. | |
|
| Moderate ETF Fund | | | |
|
Subject to review and approval by the Board of Trustees, the Advisor has entered into certain sub-advisory agreements for the investment advisory services in connection with the management of each of the Funds .The Advisor (not the Funds) pays each sub-advisor a fee that is computed daily and paid monthly based on average daily net assets, for services provided. For the year ended December 31, 2010, the following sub-advisory agreements were in place:
| Baron Small Cap Growth Fund | | BAMCO, Inc. | |
|
| Core Bond Fund | | Fort Washington Investment Advisors, Inc. | |
|
| High Yield Fund | | Fort Washington Investment Advisors, Inc. | |
|
| Large Cap Core Equity Fund | | Todd/Veredus Asset Management, LLC | |
|
| Mid Cap Growth Fund | | TCW Investment Management Company and Westfield Capital Management Company, L.P. | |
|
| Money Market Fund | | Fort Washington Investment Advisors, Inc. | |
|
| Third Avenue Value Fund | | Third Avenue Management, LLC | |
|
| Aggressive ETF Fund | | Todd/Veredus Asset Management, LLC | |
|
| Conservative ETF Fund | | Todd/Veredus Asset Management, LLC | |
|
| Enhanced ETF Fund | | Todd/Veredus Asset Management, LLC | |
|
| Moderate ETF Fund | | Todd/Veredus Asset Management, LLC | |
|
Fort Washington Investment Advisors, Inc. is an affiliate of the Advisor and of Western-Southern.
49
Notes to Financial Statements (Continued)
Administration and Accounting Services Agreement — The Advisor entered into an Administration and Accounting Services Agreement with the Trust, whereby the Advisor is responsible for supplying executive and regulatory compliance services, supervises the preparation of tax returns, and coordinates the preparation of reports to shareholders and reports to, and filings with, the Securities and Exchange Commission and state securities authorities, materials for meetings of the Board of Trustees, calculating the daily net asset value per share and maintaining the financial books and records of each Fund. For its services, the Advisor receives an annual fee of 0.20% of average daily net assets of the Trust up to and including $1 billion; 0.16% of the next $1 billion of average daily net assets; and 0.12% of all such assets in excess of $2 billion. The fee is allocated among the Funds on the basis of relative daily net assets.
The Advisor has engaged JPMorgan as the Sub-Administrator to the Trust. JPMorgan provides administrative and accounting services to the Trust and is compensated directly by the Advisor, not the Trust.
Transfer Agent Agreement — The Trust entered into a Transfer Agent Agreement between the Trust and JPMorgan. JPMorgan maintains the records of each shareholder's account, answers shareholders' inquiries concerning their accounts, processes purchases and redemptions of each Fund's shares, acts as dividend and distribution disbursing agent and performs other shareholder service functions. Each Fund pays JPMorgan out-of-pocket expenses including, but not limited to, postage and supplies.
Underwriting Agreement — The Underwriter acts as exclusive agent for the distribution of the Funds' shares. The Underwriter receives no compensation under this agreement.
Plan of Distribution — The Trust entered into a Shareholder Servicing Plan for all share classes of the Trust which provides for a fee of 0.25% of average daily net assets attributable to such shares.
Compliance Services Agreement — Under the terms of the Compliance Services Agreement between the Trust and JPMorgan, JPMorgan provides certain compliance services to the Trust and provides administrative support services to the Funds' Compliance Program and Chief Compliance Officer. For these services, JPMorgan receives a quarterly fee from each Fund.
Affiliated Investments — Each Fund, except the Money Market Fund, may invest in the Touchstone Institutional Money Market Fund ("Institutional Money Market Fund"), subject to compliance with the several conditions set forth in an exemptive order received by the Trust from the Securities and Exchange Commission. To the extent that the other Touchstone Funds are invested in the Institutional Money Market Fund, the Advisor and Administrator will be paid additional fees from the Institutional Money Market Fund that will not be waived or reimbursed.
A summary of each Fund's investment in the Institutional Money Market Fund, if any, for the year ended December 31, 2010, is noted below:
| | | Share Activity | | | | | |
| | | Balance
12/31/09 | | Purchases | | Sales | | Balance
12/31/10 | | Dividends | | Value
12/31/10 | |
| Baron Small Cap Growth Fund | | | 1,442,618 | | | | 9,113,707 | | | | (9,113,235 | ) | | | 1,443,090 | | | $ | 4,032 | | | $ | 1,443,090 | | |
| Core Bond Fund | | | 3,499,554 | | | | 53,145,705 | | | | (53,939,819 | ) | | | 2,705,440 | | | $ | 12,434 | | | $ | 2,705,440 | | |
| High Yield Fund | | | 220,834 | | | | 17,138,422 | | | | (16,943,017 | ) | | | 416,239 | | | $ | 1,191 | | | $ | 416,239 | | |
| Large Cap Core Equity Fund | | | 1,256,821 | | | | 26,969,508 | | | | (27,596,810 | ) | | | 629,519 | | | $ | 2,601 | | | $ | 629,519 | | |
| Mid Cap Growth Fund | | | 541,918 | | | | 11,570,656 | | | | (11,559,810 | ) | | | 552,764 | | | $ | 1,508 | | | $ | 552,764 | | |
| Third Avenue Value Fund | | | 1,855,737 | | | | 15,293,012 | | | | (13,971,194 | ) | | | 3,177,555 | | | $ | 6,148 | | | $ | 3,177,555 | | |
| Aggressive ETF Fund | | | 267,582 | | | | 8,038,453 | | | | (8,132,367 | ) | | | 173,668 | | | $ | 660 | | | $ | 173,668 | | |
| Conservative ETF Fund | | | 288,488 | | | | 5,185,264 | | | | (5,218,635 | ) | | | 255,117 | | | $ | 763 | | | $ | 255,117 | | |
| Enhanced ETF Fund | | | 4,458 | | | | 2,850,018 | | | | (2,689,002 | ) | | | 165,474 | | | $ | 376 | | | $ | 165,474 | | |
| Moderate ETF Fund | | | 568,304 | | | | 11,490,304 | | | | (11,374,810 | ) | | | 683,798 | | | $ | 1,660 | | | $ | 683,798 | | |
50
Notes to Financial Statements (Continued)
4. Capital Share Transactions
Capital share transactions for the Money Market Fund are identical to the dollar value of those transactions as shown in the Statements of Changes in Net Assets.
Proceeds and payments on capital shares as shown in the Statements of Changes in Net Assets are the result of the following capital share transactions for the periods shown.
| | | Baron Small Cap
Growth Fund | | Core Bond Fund | |
| | | For the
Year
Ended
December 31,
2010 | | For the
Year
Ended
December 31,
2009 | | For the
Year
Ended
December 31,
2010 | | For the
Year
Ended
December 31,
2009 | |
| Shares issued | | | 475,375 | | | | 581,749 | | | | 258,185 | | | | 283,169 | | |
| Shares reinvested | | | — | | | | — | | | | 143,704 | | | | 182,178 | | |
| Shares redeemed | | | (524,328 | ) | | | (477,507 | ) | | | (356,746 | ) | | | (479,291 | ) | |
| Net increase (decrease) in shares outstanding | | | (48,953 | ) | | | 104,242 | | | | 45,143 | | | | (13,944 | ) | |
| Shares outstanding, beginning of period | | | 1,517,447 | | | | 1,413,205 | | | | 3,720,948 | | | | 3,734,892 | | |
| Shares outstanding, end of period | | | 1,468,494 | | | | 1,517,447 | | | | 3,766,091 | | | | 3,720,948 | | |
| | | High Yield Fund | | Large Cap
Core Equity Fund | |
| | | For the
Year
Ended
December 31,
2010 | | For the
Year
Ended
December 31,
2009 | | For the
Year
Ended
December 31,
2010 | | For the
Year
Ended
December 31,
2009 | |
| Shares issued | | | 1,785,565 | | | | 2,713,474 | | | | 909,725 | | | | 1,798,398 | | |
| Shares reinvested | | | 359,362 | | | | 265,401 | | | | 83,206 | | | | 92,906 | | |
| Shares redeemed | | | (2,590,912 | ) | | | (3,664,252 | ) | | | (3,944,970 | ) | | | (1,531,030 | ) | |
| Net increase (decrease) in shares outstanding | | | (445,985 | ) | | | (685,377 | ) | | | (2,952,039 | ) | | | 360,274 | | |
| Shares outstanding, beginning of period | | | 4,586,549 | | | | 5,271,926 | | | | 7,722,350 | | | | 7,362,076 | | |
| Shares outstanding, end of period | | | 4,140,564 | | | | 4,586,549 | | | | 4,770,311 | | | | 7,722,350 | | |
| | | Mid Cap
Growth Fund | | Third Avenue
Value Fund | |
| | | For the
Year
Ended
December 31,
2010 | | For the
Year
Ended
December 31,
2009 | | For the
Year
Ended
December 31,
2010 | | For the
Year
Ended
December 31,
2009 | |
| Shares issued | | | 393,136 | | | | 327,051 | | | | 229,281 | | | | 312,030 | | |
| Shares reinvested | | | 4,257 | | | | 2,006 | | | | 173,403 | | | | 278,470 | | |
| Shares redeemed | | | (618,451 | ) | | | (623,055 | ) | | | (854,423 | ) | | | (1,658,939 | ) | |
| Net decrease in shares outstanding | | | (221,058 | ) | | | (293,998 | ) | | | (451,739 | ) | | | (1,068,439 | ) | |
| Shares outstanding, beginning of period | | | 2,311,084 | | | | 2,605,082 | | | | 3,427,033 | | | | 4,495,472 | | |
| Shares outstanding, end of period | | | 2,090,026 | | | | 2,311,084 | | | | 2,975,294 | | | | 3,427,033 | | |
51
Notes to Financial Statements (Continued)
| | | Aggressive
ETF Fund | | Conservative
ETF Fund | |
| | | For the
Year
Ended
December 31,
2010 | | For the
Year
Ended
December 31,
2009 | | For the
Year
Ended
December 31,
2010 | | For the
Year
Ended
December 31,
2009 | |
| Shares issued | | | 580,451 | | | | 1,408,451 | | | | 237,540 | | | | 1,351,942 | | |
| Shares reinvested | | | 29,050 | | | | 65,071 | | | | 43,624 | | | | 85,263 | | |
| Shares redeemed | | | (621,706 | ) | | | (512,452 | ) | | | (367,446 | ) | | | (427,125 | ) | |
| Net increase (decrease) in shares outstanding | | | (12,205 | ) | | | 961,070 | | | | (86,282 | ) | | | 1,010,080 | | |
| Shares outstanding, beginning of period | | | 1,904,998 | | | | 943,928 | | | | 2,075,373 | | | | 1,065,293 | | |
| Shares outstanding, end of period | | | 1,892,793 | | | | 1,904,998 | | | | 1,989,091 | | | | 2,075,373 | | |
| | | Enhanced
ETF Fund | | Moderate
ETF Fund | |
| | | For the
Year
Ended
December 31,
2010 | | For the
Year
Ended
December 31,
2009 | | For the
Year
Ended
December 31,
2010 | | For the
Year
Ended
December 31,
2009 | |
| Shares issued | | | 55,768 | | | | 503,350 | | | | 545,358 | | | | 2,144,540 | | |
| Shares reinvested | | | 33,608 | | | | 69,774 | | | | 94,266 | | | | 145,696 | | |
| Shares redeemed | | | (678,122 | ) | | | (1,359,913 | ) | | | (949,208 | ) | | | (981,704 | ) | |
| Net increase (decrease) in shares outstanding | | | (588,746 | ) | | | (786,789 | ) | | | (309,584 | ) | | | 1,308,532 | | |
| Shares outstanding, beginning of period | | | 2,370,489 | | | | 3,157,278 | | | | 4,770,284 | | | | 3,461,752 | | |
| Shares outstanding, end of period | | | 1,781,743 | | | | 2,370,489 | | | | 4,460,700 | | | | 4,770,284 | | |
5. Expense Reductions
The Advisor has contractually agreed to waive its fees or reimburse certain other fees and expenses of each Fund, such that after such waivers and reimbursements, the aggregate operating expenses of each Fund do not exceed that Fund's expense cap (the "Expense Cap"). For this purpose, operating expenses are exclusive of interest, taxes, brokerage commissions and other portfolio transaction expenses, capital expenditures and extraordinary expenses.
Each Fund's Expense Cap, as calculated on an annual basis, and as a percentage of average daily net assets of the Fund, is listed below. Also listed is the Administration fees waived by the Administrator and the amount of other expenses reimbursed by the Advisor for each Fund for the year ended December 31, 2010:
| | | Baron Small
Cap Growth
Fund | | Core Bond
Fund | | High Yield
Fund | | Large Cap
Core Equity
Fund | |
| Expense cap | | | 1.55 | % | | | 1.00 | % | | | 1.05 | % | | | 1.00 | % | |
| Administration fees waived | | $ | 14,115 | | | $ | — | | | $ | 252 | | | $ | 22,598 | | |
| Expenses reimbursed | | $ | — | | | $ | — | | | $ | — | | | $ | — | | |
| | | Mid Cap
Growth Fund | | Money Market
Fund | | Third Avenue
Value Fund | |
| Expense cap | | | 1.17 | % | | | 0.75 | % | | | 1.17 | % | |
| Administration fees waived | | $ | 25,431 | | | $ | 81,849 | | | $ | 101,451 | | |
| Expenses reimbursed for PFIC Tax expense | | $ | — | | | $ | — | | | $ | 252,316 | | |
| Expenses reimbursed — other | | $ | — | | | $ | — | | | $ | 71 | | |
52
Notes to Financial Statements (Continued)
| | | Aggressive
ETF Fund | | Conservative
ETF Fund | | Enhanced
ETF Fund | | Moderate
ETF Fund | |
| Expense cap | | | 0.75 | % | | | 0.75 | % | | | 0.75 | % | | | 0.75 | % | |
| Administration fees waived | | $ | 33,348 | | | $ | 45,772 | | | $ | 30,388 | | | $ | 76,174 | | |
| Expenses reimbursed | | $ | 19,763 | | | $ | 11,064 | | | $ | 18,091 | | | $ | — | | |
The Third Avenue Value Fund incurred a tax expense of $252,316 related to its investments in Passive Foreign Investment Companies (PFICs) which was reimbursed by the Advisor. The gross expense ratio of the Fund would have been 1.37% excluding this expense.
The Advisor has agreed to maintain the expense limitations shown above through at least April 29, 2011.
6. Purchases and Sales of Investment Securities
Investment transactions (excluding purchases and sales of U.S. government obligations, U.S. government agency obligations and short-term investments) for the year ended December 31, 2010 were as follows:
| | | Baron Small
Cap Growth
Fund | | Core Bond
Fund | | High Yield
Fund | |
| Cost of Purchases | | $ | 3,608,888 | | | $ | 17,275,296 | | | $ | 17,190,389 | | |
| Proceeds from Sales | | $ | 4,177,010 | | | $ | 19,079,367 | | | $ | 21,441,983 | | |
| | | Large Cap
Core Equity
Fund | | Mid Cap
Growth
Fund | | Third Avenue
Value
Fund | |
| Cost of Purchases | | $ | 16,950,810 | | | $ | 14,935,279 | | | $ | 4,691,908 | | |
| Proceeds from Sales | | $ | 41,702,617 | | | $ | 17,266,341 | | | $ | 15,808,493 | | |
| | | Aggressive
ETF Fund | | Conservative
ETF Fund | | Enhanced
ETF Fund | | Moderate
ETF Fund | |
| Cost of Purchases | | $ | 7,287,268 | | | $ | 4,803,881 | | | $ | 18,237,805 | | | $ | 9,938,670 | | |
| Proceeds from Sales | | $ | 7,331,822 | | | $ | 5,767,927 | | | $ | 22,613,432 | | | $ | 13,660,020 | | |
7. Federal Tax Information
Federal Income Tax — It is each Fund's policy to continue to comply with the special provisions of the Internal Revenue Code applicable to regulated investment companies. As provided therein, in any fiscal year in which a Fund so qualifies and distributes at least 90% of its taxable net income, the Fund (but not the shareholders) will be relieved of Federal income tax on the income distributed. Accordingly, no provision for income tax has been made.
The tax character of distributions paid for the years ended December 31, 2010 and 2009 was as follows:
| | | Baron Small Cap
Growth Fund | | Core Bond Fund | | High Yield Fund | | Large Cap
Core Equity Fund | |
| | | 2010 | | 2009 | | 2010 | | 2009 | | 2010 | | 2009 | | 2010 | | 2009 | |
| From ordinary income | | $ | — | | | $ | — | | | $ | 1,536,204 | | | $ | 1,889,191 | | | $ | 2,820,992 | | | $ | 2,027,665 | | | $ | 751,349 | | | $ | 761,831 | | |
| | | | | Mid Cap Growth Fund | | Money Market Fund | | Third Avenue
Value Fund | |
| | | | | | | 2010 | | 2009 | | 2010 | | 2009 | | 2010 | | 2009 | |
| From ordinary income | | | | | | $ | 57,209 | | | $ | 22,151 | | | $ | 114,337 | | | $ | 1,129,634 | | | $ | 3,062,305 | | | $ | 977,362 | | |
| From long-term capital gains | | | | | | | — | | | | — | | | | — | | | | — | | | | — | | | | 3,380,340 | | |
| | | | | | | $ | 57,209 | | | $ | 22,151 | | | $ | 114,337 | | | $ | 1,129,634 | | | $ | 3,062,305 | | | $ | 4,357,702 | | |
53
Notes to Financial Statements (Continued)
| | | Aggressive
ETF Fund | | Conservative
ETF Fund | | Enhanced
ETF Fund | | Moderate
ETF Fund | |
| | | 2010 | | 2009 | | 2010 | | 2009 | | 2010 | | 2009 | | 2010 | | 2009 | |
| From ordinary income | | $ | 296,598 | | | $ | 371,904 | | | $ | 504,733 | | | $ | 719,618 | | | $ | 269,871 | | | $ | 512,143 | | | $ | 1,128,367 | | | $ | 1,603,350 | | |
| From long-term capital gains | | | — | | | | 228,228 | | | | — | | | | 217,064 | | | | — | | | | — | | | | — | | | | — | | |
| | | $ | 296,598 | | | $ | 600,132 | | | $ | 504,733 | | | $ | 936,682 | | | $ | 269,871 | | | $ | 512,143 | | | $ | 1,128,367 | | | $ | 1,603,350 | | |
The following information is computed on a tax basis for each item as of December 31, 2010:
| | | Baron Small
Cap Growth
Fund | | Core Bond
Fund | | High Yield
Fund | | Large Cap
Core Equity
Fund | |
| Tax cost of portfolio investments | | $ | 18,416,605 | | | $ | 42,781,091 | | | $ | 30,493,293 | | | $ | 40,173,257 | | |
| Gross unrealized appreciation | | | 10,829,477 | | | | 1,105,447 | | | | 2,168,848 | | | | 5,125,291 | | |
| Gross unrealized depreciation | | | (50,699 | ) | | | (1,067,635 | ) | | | (106,179 | ) | | | (681,314 | ) | |
| Net unrealized appreciation | | | 10,778,778 | | | | 37,812 | | | | 2,062,669 | | | | 4,443,977 | | |
| Capital loss carryforward | | | (405,606 | ) | | | — | | | | (3,316,183 | ) | | | (15,132,353 | ) | |
| Post October losses | | | — | | | | (237,598 | ) | | | (110,619 | ) | | | — | | |
| Undistributed ordinary income | | | — | | | | 2,146,034 | | | | 2,424,031 | | | | 569,185 | | |
| Accumulated capital gains | | | — | | | | 458,662 | | | | — | | | | — | | |
| Accumulated earnings (deficit) | | $ | 10,373,172 | | | $ | 2,404,910 | | | $ | 1,059,898 | | | $ | (10,119,191 | ) | |
| | | Mid Cap
Growth Fund | | Money Market
Fund | | Third Avenue
Value Fund | |
| Tax cost of portfolio investments | | $ | 24,049,571 | | | $ | 56,984,928 | | | $ | 40,415,755 | | |
| Gross unrealized appreciation | | | 5,802,564 | | | | — | | | | 16,255,955 | | |
| Gross unrealized depreciation | | | (502,973 | ) | | | — | | | | (3,096,366 | ) | |
| Net unrealized appreciation | | | 5,299,591 | | | | — | | | | 13,159,589 | | |
Net unrealized appreciation on foreign currency and
translation of other assets and liabilities denominated
in foreign currency | | | — | | | | — | | | | 97 | | |
| Capital loss carryforward | | | (4,840,252 | ) | | | — | | | | (11,616,254 | ) | |
| Post October losses | | | — | | | | — | | | | — | | |
| Undistributed ordinary income | | | 75,662 | | | | 1,176 | | | | 839,753 | | |
| Accumulated earnings | | $ | 535,001 | | | $ | 1,176 | | | $ | 2,383,185 | | |
| | | Aggressive
ETF Fund | | Conservative
ETF Fund | | Enhanced
ETF Fund | | Moderate
ETF Fund | |
| Tax cost of portfolio investments | | $ | 23,124,763 | | | $ | 27,863,443 | | | $ | 16,868,067 | | | $ | 64,210,875 | | |
| Gross unrealized appreciation | | | 1,191,494 | | | | 1,120,272 | | | | 1,525,393 | | | | 2,783,199 | | |
| Gross unrealized depreciation | | | (132,703 | ) | | | (105,267 | ) | | | (67,315 | ) | | | (2,463,071 | ) | |
| Net unrealized appreciation | | | 1,058,791 | | | | 1,015,005 | | | | 1,458,078 | | | | 320,128 | | |
Net unrealized appreciation on foreign currency and
translation of other assets and liabilities denominated
in foreign currency | | | — | | | | — | | | | — | | | | 442 | | |
| Capital loss carryforward | | | (1,772,483 | ) | | | (376,189 | ) | | | (9,614,920 | ) | | | (3,190,168 | ) | |
| Post October losses | | | — | | | | — | | | | (253,243 | ) | | | — | | |
| Undistributed ordinary income | | | 254,243 | | | | 439,879 | | | | 101,821 | | | | 926,794 | | |
| Accumulated earnings (deficit) | | $ | (459,449 | ) | | $ | 1,078,695 | | | $ | (8,308,264 | ) | | $ | (1,942,804 | ) | |
The difference between the tax cost of portfolio investments and the financial statement cost is primarily due to wash sales loss deferrals, investments in passive foreign investment companies, regulated investment companies, and real estate investment trusts.
54
Notes to Financial Statements (Continued)
As of December 31, 2010, the Funds had the following capital loss carryforwards for federal income tax purposes:
| | | Amount | | Expiration Date
December 31, | |
| Baron Small Cap Growth Fund | | $ | 405,606 | | | | 2017 | | |
| High Yield Fund | | $ | 480,001 | | | | 2011 | | |
| | | | 935,126 | | | | 2016 | | |
| | | | 1,901,056 | | | | 2017 | | |
| | | $ | 3,316,183 | | | | |
| Large Cap Core Equity Fund* | | $ | 2,118,382 | | | | 2015 | | |
| | | | 2,591,468 | | | | 2016 | | |
| | | | 7,960,612 | | | | 2017 | | |
| | | | 2,461,891 | | | | 2018 | | |
| | | $ | 15,132,353 | | | | |
| Mid Cap Growth Fund | | $ | 1,166,599 | | | | 2016 | | |
| | | | 3,673,653 | | | | 2017 | | |
| | | $ | 4,840,252 | | | | |
| Third Avenue Value Fund | | $ | 11,616,254 | | | | 2017 | | |
| Aggressive ETF Fund | | $ | 1,026,841 | | | | 2017 | | |
| | | | 745,642 | | | | 2018 | | |
| | | $ | 1,772,483 | | | | |
| Conservative ETF Fund | | $ | 336,006 | | | | 2017 | | |
| | | | 40,183 | | | | 2018 | | |
| | | $ | 376,189 | | | | |
| Enhanced ETF Fund | | $ | 2,622,721 | | | | 2016 | | |
| | | | 6,992,199 | | | | 2017 | | |
| | | $ | 9,614,920 | | | | |
| Moderate ETF Fund* | | $ | 58,366 | | | | 2015 | | |
| | | | 64,383 | | | | 2016 | | |
| | | | 1,855,134 | | | | 2017 | | |
| | | | 1,212,285 | | | | 2018 | | |
| | | $ | 3,190,168 | | | | |
* A portion of the capital losses may be limited under tax regulations.
The capital loss carryforwards may be utilized in future years to offset net realized capital gains, if any, prior to distributing such gains to shareholders.
55
Notes to Financial Statements (Continued)
During the year ended December 31, 2010, the following Funds utilized capital loss carryforwards as follows:
| | | Amount | |
| Baron Small Cap Growth Fund | | $ | 1,680,904 | | |
| Core Bond Fund | | | 52,692 | | |
| High Yield Fund | | | 1,151,101 | | |
| Mid Cap Growth Fund | | | 748,450 | | |
| Money Market Fund | | | 158 | | |
| Third Avenue Value Fund | | | 3,208,164 | | |
| Enhanced ETF Fund | | | 380,060 | | |
During the year ended December 31, 2010, the Large Cap Core Equity Fund had capital losses of $4,692,851 expire unutilized.
From November 1, 2010 to December 31, 2010, the Funds shown below incurred the following net losses ("Post-October losses"). The Funds intend to elect to defer these losses and treat them as arising on January 1, 2011:
| | | Amount | |
| Core Bond Fund | | $ | 237,598 | | |
| High Yield Fund | | | 110,619 | | |
| Enhanced ETF Fund | | | 253,243 | | |
Reclassification of capital accounts — Certain reclassifications, the result of permanent differences between financial statement and income tax reporting requirements have been made to the components of capital. These reclassifications have no impact on the net assets or net asset value per share of the Funds and are designed to present the Funds' capital accounts on a tax basis. The following reclassifications which are primarily attributed to the tax treatment of net investment loss, foreign currency gain/loss, paydown gain/loss on mortgage backed and asset backed securities, expiration of capital loss carryforwards, real estate investment trusts, securities contributed in-kind, Passive Foreign Investment Companies, stock issuance costs and net gains/losses of regulated investment companies have been made to the following Funds for the year ended December 31, 2010:
| | | Undistributed
Net Investment
Income | | Realized
Gain/Loss | | Paid-In
Capital | |
| Baron Small Cap Growth Fund | | $ | 90,733 | | | $ | 244 | | | $ | (90,977 | ) | |
| Core Bond Fund | | | 42,535 | | | | (42,535 | ) | | | — | | |
| Large Cap Core Equity Fund | | | — | | | | 4,692,851 | | | | (4,692,851 | ) | |
| Mid Cap Growth Fund | | | (1,929 | ) | | | 1,929 | | | | — | | |
| Third Avenue Value Fund | | | 226,837 | | | | 1,601,912 | | | | (1,828,749 | ) | |
| Aggressive ETF Fund | | | (2,584 | ) | | | 2,584 | | | | — | | |
| Conservative ETF Fund | | | (6,546 | ) | | | 6,546 | | | | — | | |
| Enhanced ETF Fund | | | (1,654 | ) | | | 1,654 | | | | — | | |
| Moderate ETF Fund | | | (11,988 | ) | | | 11,988 | | | | — | | |
The Funds have analyzed their tax positions taken on Federal income tax returns for all open tax years (tax years ended December 31, 2007 through 2010) and have concluded that no provision for income tax is required in their financial statements.
56
Notes to Financial Statements (Continued)
8. Commitments and Contingencies
The Funds indemnify the Trust's officers and Trustees for certain liabilities that might arise from their performance of their duties to the Funds. Additionally, in the normal course of business, the Funds enter into contracts that contain a variety of representations and warranties and which provide general indemnifications. The Funds' maximum exposure under these arrangements is unknown, as this would involve future claims that may be against the Funds that have not yet occurred. However, based on experience, the Funds expect the risk of loss to be remote.
9. Subsequent Events
During a meeting of the Board of Trustees held February 17, 2011, the Trustees approved the removal of TCW Investment Management Company as Sub-Advisor to the Mid Cap Growth Fund. Westfield Capital Management Company, L.P. will continue to serve as Sub-Advisor to the Fund.
Also, at the February 17, 2011 meeting, the Trustees approved an advisory fee change, effective March 1, 2011, to the base advisory fee of the Mid Cap Growth Fund to include breakpoints as follows:
| Mid Cap Growth Fund | | 0.75% on the first $500 million
0.70% on assets greater than $500 million to $1 billion
0.65% of such assets in excess of $1 billion | |
|
There were no other subsequent events that necessitated recognition or disclosures.
The Regulated Investment Company Modernization Act of 2010 (the "Act") was enacted on December 22, 2010. The Act makes changes to several tax rules impacting the Funds. In general, the provisions of the Act will be effective for the Funds' fiscal year ending December 31, 2011. Although the Act provides several benefits, including the unlimited carryover of future capital losses, there may be a greater likelihood that all or a portion of each fund's pre-enactment capital loss carryovers may expire without being utilized due to the fact that post-enactment capital losses get utilized before pre-enactment capital loss carryovers. Relevant information regarding the impact of the Act on the Fund, if any, will be contained within the "Federal Taxes" section of the financial statement notes for the fiscal year ending December 31, 2011.
57
Portfolio of Investments
Touchstone Baron Small Cap Growth Fund – December 31, 2010
| Common Stocks — 95.0% | | Shares | | Market
Value | |
| Consumer Discretionary — 33.3% | |
| Blue Nile, Inc.* † | | | 2,400 | | | $ | 136,944 | | |
| Choice Hotels International, Inc. | | | 14,500 | | | | 554,915 | | |
| DeVry, Inc. | | | 16,500 | | | | 791,670 | | |
| Dick's Sporting Goods, Inc.* | | | 28,500 | | | | 1,068,750 | | |
| J. Crew Group, Inc.* † | | | 8,410 | | | | 362,807 | | |
| Lamar Advertising Co. - Class A* | | | 5,000 | | | | 199,200 | | |
| LKQ Corp.* | | | 24,000 | | | | 545,280 | | |
| Lumber Liquidators Holdings, Inc.* † | | | 8,600 | | | | 214,226 | | |
| Mohawk Industries, Inc.* | | | 3,500 | | | | 198,660 | | |
| Morningstar, Inc. | | | 7,200 | | | | 382,176 | | |
| New York Times Co. - Class A* † | | | 9,516 | | | | 93,257 | | |
| Panera Bread Co. - Class A* | | | 3,000 | | | | 303,630 | | |
| Peet's Coffee & Tea, Inc.* † | | | 10,000 | | | | 417,400 | | |
| Penn National Gaming, Inc.* | | | 10,000 | | | | 351,500 | | |
| Penske Auto Group, Inc.* | | | 4,700 | | | | 81,874 | | |
| Polo Ralph Lauren Corp. | | | 6,000 | | | | 665,520 | | |
| Strayer Education, Inc. † | | | 3,500 | | | | 532,770 | | |
| Under Armour, Inc. - Class A* † | | | 7,500 | | | | 411,300 | | |
| Vail Resorts, Inc.* | | | 14,000 | | | | 728,560 | | |
| Wynn Resorts Ltd. | | | 1,359 | | | | 141,119 | | |
| | | | | | 8,181,558 | | |
| Financials — 13.3% | |
| Alexander's, Inc. REIT | | | 1,200 | | | | 494,736 | | |
| Alexandria Real Estate Equities, Inc. REIT † | | | 2,500 | | | | 183,150 | | |
| Arch Capital Group Ltd.* | | | 12,000 | | | | 1,056,600 | | |
| Cohen & Steers, Inc. † | | | 5,500 | | | | 143,550 | | |
| Douglas Emmett, Inc. REIT | | | 15,000 | | | | 249,000 | | |
| Eaton Vance Corp. | | | 9,000 | | | | 272,070 | | |
| Green Dot Corp. - Class A* | | | 594 | | | | 33,704 | | |
| Interactive Brokers Group, Inc. - Class A | | | 11,000 | | | | 196,020 | | |
| Jefferies Group, Inc. † | | | 10,000 | | | | 266,300 | | |
| Netspend Holdings, Inc.* | | | 5,000 | | | | 64,100 | | |
| Primerica, Inc. † | | | 13,000 | | | | 315,250 | | |
| | | | | | 3,274,480 | | |
| Health Care — 12.2% | |
| AMERIGROUP Corp.* | | | 15,000 | | | | 658,800 | | |
| Chemed Corp. | | | 3,000 | | | | 190,530 | | |
| Community Health Systems, Inc.* | | | 12,700 | | | | 474,599 | | |
| Edwards Lifesciences Corp.* | | | 16,500 | | | | 1,333,860 | | |
| Gen-Probe, Inc.* | | | 3,500 | | | | 204,225 | | |
| IDEXX Laboratories, Inc.* | | | 800 | | | | 55,376 | | |
| Techne Corp. | | | 1,000 | | | | 65,670 | | |
| | | | | | 2,983,060 | | |
| Industrials — 10.8% | |
| Aecom Technology Corp.* | | | 5,500 | | | | 153,835 | | |
| Copart, Inc.* | | | 15,000 | | | | 560,250 | | |
| CoStar Group, Inc.* † | | | 6,500 | | | | 374,140 | | |
| Generac Holdings, Inc.* | | | 15,000 | | | | 242,550 | | |
| Genesee & Wyoming, Inc. - Class A* | | | 15,750 | | | | 833,962 | | |
| Tetra Tech, Inc.* | | | 14,000 | | | | 350,840 | | |
| Valmont Industries, Inc. | | | 1,500 | | | | 133,095 | | |
| | | | | | 2,648,672 | | |
| | | Shares | | Market
Value | |
| Energy — 8.7% | |
| Brigham Exploration Co.* | | | 11,500 | | | $ | 313,260 | | |
| CARBO Ceramics, Inc. | | | 3,800 | | | | 393,452 | | |
| Denbury Resources, Inc.* | | | 10,000 | | | | 190,900 | | |
| SEACOR Holdings, Inc. | | | 4,500 | | | | 454,905 | | |
| SM Energy Co. | | | 5,500 | | | | 324,115 | | |
| Southern Union Co. | | | 14,000 | | | | 336,980 | | |
| Targa Resources Corp.* | | | 4,600 | | | | 123,326 | | |
| | | | | | 2,136,938 | | |
| Consumer Staples — 6.0% | |
| Church & Dwight Co., Inc. | | | 6,000 | | | | 414,120 | | |
| Diamond Foods, Inc. † | | | 5,500 | | | | 292,490 | | |
| Ralcorp Holdings, Inc.* | | | 4,400 | | | | 286,044 | | |
| TreeHouse Foods, Inc.* | | | 5,000 | | | | 255,450 | | |
| Whole Foods Market, Inc.* | | | 4,500 | | | | 227,655 | | |
| | | | | | 1,475,759 | | |
| Information Technology — 3.2% | |
| Blackboard, Inc.* † | | | 3,000 | | | | 123,900 | | |
| Booz Allen Hamilton Holding Corp.* | | | 1,485 | | | | 28,853 | | |
| Pegasystems, Inc. † | | | 7,000 | | | | 256,410 | | |
| SS&C Technologies Holdings, Inc.* | | | 6,215 | | | | 127,470 | | |
| WebMD Health Corp.* | | | 5,000 | | | | 255,300 | | |
| | | | | | 791,933 | | |
| Materials — 2.9% | |
| Intrepid Potash, Inc.* † | | | 3,000 | | | | 111,870 | | |
| Molycorp, Inc.* † | | | 12,000 | | | | 598,800 | | |
| | | | | | 710,670 | | |
| Utilities — 2.5% | |
| ITC Holdings Corp. | | | 10,000 | | | | 619,800 | | |
| Telecommunication Services — 2.1% | |
| SBA Communications Corp. - Class A* | | | 12,500 | | | | 511,750 | | |
| Total Common Stocks | | | | $ | 23,334,620 | | |
| Investment Funds — 23.8% | |
| Invesco Liquid Assets Portfolio ** | | | 4,417,673 | | | | 4,417,673 | | |
Touchstone Institutional
Money Market Fund^ | | | 1,443,090 | | | | 1,443,090 | | |
| Total Investment Funds | | | | $ | 5,860,763 | | |
Total Investment Securities — 118.8%
(Cost $18,416,838) | | | | $ | 29,195,383 | | |
| Liabilities in Excess of Other Assets — (18.8%) | | | | | (4,614,583 | ) | |
| Net Assets — 100.0% | | | | $ | 24,580,800 | | |
58
Touchstone Baron Small Cap Growth Fund (Continued)
† All or a portion of the security is on loan. The total value of the securities on loan as of December 31, 2010, was $4,260,837.
* Non-income producing security.
** Represents collateral for securities loaned.
^ Affiliated Fund, sub-advised by Fort Washington Investment Advisors, Inc. See Note 3.
Portfolio Abbreviations:
REIT – Real Estate Investment Trust
Other Information:
The inputs or methodology used for valuing securities may not be an indication of the risk associated with investing in those securities. For more information on valuation inputs, and their aggregation into the levels used in the table below, please refer to the security valuation section in the accompanying notes to financial statements.
Valuation Inputs at Reporting Date:
| Description | | Level 1 | | Level 2 | | Level 3 | | Total | |
Common
Stocks | | $ | 23,334,620 | | | $ | — | | | $ | — | | | $ | 23,334,620 | | |
Investment
Funds | | | 5,860,763 | | | | — | | | | — | | | | 5,860,763 | | |
| | | | | | | | | $ | 29,195,383 | | |
The accompanying notes are an integral part of the financial statements.
59
Portfolio of Investments
Touchstone Core Bond Fund – December 31, 2010
Principal
Amount | | | | Market
Value | |
| | | Corporate Bonds — 32.4%
Financials — 7.3% | |
| $ | 15,000 | | | Ally Financial, Inc., 144a,
7.500%, 9/15/20 | | $ | 15,731 | | |
| | 235,000 | | | Bank of America Corp. MTN,
7.375%, 5/15/14 | | | 261,221 | | |
| | 200,000 | | | Brandywine Operating Partnership LP,
5.400%, 11/1/14 | | | 206,472 | | |
| | 190,000 | | | Caterpillar Financial Services Corp. MTN,
5.450%, 4/15/18 | | | 208,511 | | |
| | 20,000 | | | CIT Group, Inc., 7.000%, 5/1/16 | | | 20,075 | | |
| | 10,000 | | | CIT Group, Inc., 7.000%, 5/1/17 | | | 10,025 | | |
| | 170,000 | | | Citigroup, Inc., 5.500%, 4/11/13 | | | 181,021 | | |
| | 250,000 | | | Credit Suisse New York MTN,
4.375%, 8/5/20 | | | 245,450 | | |
| | 200,000 | | | General Electric Capital Corp. MTN,
5.625%, 5/1/18 | | | 218,103 | | |
| | 200,000 | | | Goldman Sachs Group, Inc.,
7.500%, 2/15/19 | | | 233,198 | | |
| | 115,000 | | | HSBC Bank PLC, 144a, 3.500%, 6/28/15 | | | 117,887 | | |
| | 32,000 | | | International Lease Finance Corp.,
144a, 8.750%, 3/15/17 | | | 34,320 | | |
| | 150,000 | | | JPMorgan Chase & Co.,
4.250%, 10/15/20 | | | 146,498 | | |
| | 16,000 | | | Liberty Mutual Group, Inc., 144a,
10.750%, 6/15/58 (A) | | | 19,360 | | |
| | 18,000 | | | Lyondell Chemical Co., 144a,
8.000%, 11/1/17 | | | 19,913 | | |
| | 70,000 | | | MetLife, Inc., 10.750%, 8/1/39 | | | 93,800 | | |
| | 225,000 | | | Morgan Stanley MTN, 5.625%, 1/9/12 | | | 234,932 | | |
| | 52,000 | | | Omega Healthcare Investors, Inc., 144a,
6.750%, 10/15/22 | | | 51,545 | | |
| | 21,000 | | | Pinafore LLC / Pinafore, Inc., 144a,
9.000%, 10/1/18 | | | 22,680 | | |
| | 15,000 | | | Reynolds Group Issuer, Inc. /
Reynolds Group Issuer LLC, 144a,
7.750%, 10/15/16 | | | 15,863 | | |
| | 145,000 | | | Teachers Insurance & Annuity
Association of America, 144a,
6.850%, 12/16/39 | | | 169,650 | | |
| | 175,000 | | | WCI Finance LLC / WEA Finance LLC,
144a, 5.700%, 10/1/16 | | | 188,889 | | |
| | 220,000 | | | Xstrata Finance Canada Ltd., 144a,
5.500%, 11/16/11 | | | 228,348 | | |
| | | | | | | | 2,943,492 | | |
| | | Utilities — 6.8% | |
| | 85,000 | | | AES Corp., 8.000%, 10/15/17 | | | 89,888 | | |
| | 25,000 | | | Calpine Corp., 144a, 7.875%, 7/31/20 | | | 25,312 | | |
| | 30,000 | | | Calpine Corp., 144a, 7.500%, 2/15/21 | | | 29,550 | | |
| | 215,000 | | | CenterPoint Energy, Inc., 5.950%, 2/1/17 | | | 231,006 | | |
| | 15,000 | | | CMS Energy Corp., 8.750%, 6/15/19 | | | 17,643 | | |
| | 200,000 | | | CMS Energy Corp., 6.250%, 2/1/20 | | | 204,106 | | |
Principal
Amount | | | | Market
Value | |
| $ | 135,000 | | | Copano Energy LLC / Copano Energy
Finance Corp., 8.125%, 3/1/16 | | $ | 139,050 | | |
| | 12,000 | | | Crosstex Energy, 8.875%, 2/15/18 | | | 12,855 | | |
| | 160,000 | | | Enel Finance International SA, 144a,
6.250%, 9/15/17 | | | 174,752 | | |
| | 50,000 | | | Genesis Energy LP / Genesis Energy
Finance Corp., 144a, 7.875%, 12/15/18 | | | 49,750 | | |
| | 135,000 | | | GenOn Energy, Inc., 7.875%, 6/15/17 | | | 130,950 | | |
| | 110,000 | | | Intergen NV, 144a, 9.000%, 6/30/17 | | | 116,600 | | |
| | 54,000 | | | MarkWest Energy Partners LP /
MarkWest Energy Finance Corp.,
Ser B, 8.750%, 4/15/18 | | | 58,455 | | |
| | 35,000 | | | MarkWest Energy Partners LP /
MarkWest Energy Finance Corp.,
6.750%, 11/1/20 | | | 35,000 | | |
| | 145,000 | | | NextEra Energy Capital Holdings, Inc.,
6.350%, 10/1/66 (A) | | | 141,737 | | |
| | 180,000 | | | Nisource Finance Corp., 6.150%, 3/1/13 | | | 196,363 | | |
| | 140,000 | | | Plains All American Pipeline LP /
PAA Finance Corp., 6.650%, 1/15/37 | | | 147,151 | | |
| | 165,000 | | | PPL Energy Supply LLC, 6.500%, 5/1/18 | | | 183,714 | | |
| | 40,000 | | | Regency Energy Partners LP / Regency
Energy Finance Corp., 9.375%, 6/1/16 | | | 43,900 | | |
| | 195,000 | | | Rockies Express Pipeline LLC, 144a,
6.250%, 7/15/13 | | | 210,589 | | |
| | 175,000 | | | Southern Power Co., Ser D,
4.875%, 7/15/15 | | | 189,326 | | |
| | 101,000 | | | Targa Resources Partners LP / Targa
Resources Partners Finance Corp.,
144a, 7.875%, 10/15/18 | | | 106,050 | | |
| | 190,000 | | | TransCanada PipeLines Ltd.,
6.100%, 6/1/40 | | | 209,148 | | |
| | | | | | | | 2,742,895 | | |
| | | Consumer Discretionary — 5.4% | |
| | 23,000 | | | Accuride Corp., 144a, 9.500%, 8/1/18 | | | 24,898 | | |
| | 40,000 | | | ACE Hardware Corp., 144a,
9.125%, 6/1/16 | | | 42,800 | | |
| | 15,000 | | | CCO Holdings LLC / CCO Holdings
Capital Corp., 7.875%, 4/30/18 | | | 15,525 | | |
| | 60,000 | | | Cequel Communications Holdings l LLC
and Cequel Capital Corp., 144a,
8.625%, 11/15/17 | | | 62,700 | | |
| | 5,000 | | | Citadel Broadcasting Corp., 144a,
7.750%, 12/15/18 | | | 5,175 | | |
| | 17,000 | | | Clear Channel Worldwide Holdings, Inc.,
Ser B, 9.250%, 12/15/17 | | | 18,615 | | |
| | 1,000 | | | Clear Channel Worldwide Holdings, Inc.,
9.250%, 12/15/17 | | | 1,088 | | |
| | 195,000 | | | Comcast Corp., 5.700%, 7/1/19 | | | 213,185 | | |
| | 24,000 | | | Cooper-Standard Automotive, Inc.,
144a, 8.500%, 5/1/18 | | | 25,440 | | |
| | 50,000 | | | CSC Holdings LLC, 8.625%, 2/15/19 | | | 56,500 | | |
60
Touchstone Core Bond Fund (Continued)
Principal
Amount | | | | Market
Value | |
| | | Corporate Bonds — 32.4% (Continued) | |
| $ | 230,000 | | | DirecTV Holdings LLC / DirecTV
Financing Co., Inc., 7.625%, 5/15/16 | | $ | 255,012 | | |
| | 11,000 | | | Entravision Communications Corp.,
144a, 8.750%, 8/1/17 | | | 11,605 | | |
| | 100,000 | | | Equinox Holdings, Inc., 144a,
9.500%, 2/1/16 | | | 105,625 | | |
| | 35,000 | | | Fisher Communications, Inc.,
8.625%, 9/15/14 | | | 35,525 | | |
| | 28,000 | | | Goodyear Tire & Rubber,
10.500%, 5/15/16 | | | 31,920 | | |
| | 27,000 | | | Icon Health & Fitness, 144a,
11.875%, 10/15/16 | | | 27,270 | | |
| | 22,000 | | | Inergy LP / Inergy Finance Corp., 144a,
7.000%, 10/1/18 | | | 22,165 | | |
| | 30,000 | | | Insight Communications Co., Inc., 144a,
9.375%, 7/15/18 | | | 31,950 | | |
| | 8,000 | | | Lear Corp., 7.875%, 3/15/18 | | | 8,560 | | |
| | 63,000 | | | Libbey Glass, Inc., 144a,
10.000%, 2/15/15 | | | 67,725 | | |
| | 140,000 | | | Macy's Retail Holdings, Inc.,
5.350%, 3/15/12 | | | 144,550 | | |
| | 25,000 | | | Navistar International Corp.,
8.250%, 11/1/21 | | | 26,875 | | |
| | 175,000 | | | News America, Inc., 6.900%, 3/1/19 | | | 209,664 | | |
| | 19,000 | | | Simmons Bedding Co., 144a,
11.250%, 7/15/15 | | | 20,520 | | |
| | 12,000 | | | Tenneco, Inc., 144a, 6.875%, 12/15/20 | | | 12,270 | | |
| | 300,000 | | | Time Warner Cable, Inc.,
4.125%, 2/15/21 | | | 285,464 | | |
| | 130,000 | | | Time Warner, Inc., 3.150%, 7/15/15 | | | 132,082 | | |
| | 25,000 | | | Tower Automotive Holdings USA LLC /
TA Holdings Finance, Inc., 144a,
10.625%, 9/1/17 | | | 26,875 | | |
| | 225,000 | | | Viacom, Inc., 6.250%, 4/30/16 | | | 256,057 | | |
| | | | | | | | 2,177,640 | | |
| | | Energy — 2.9% | |
| | 90,000 | | | Atlas Energy Operating Co. LLC /
Atlas Energy Finance Corp.,
12.125%, 8/1/17 | | | 113,850 | | |
| | 135,000 | | | Basic Energy Services, Inc.,
11.625%, 8/1/14 | | | 149,850 | | |
| | 32,000 | | | Coffeyville Resources LLC, 144a,
10.875%, 4/1/17 | | | 34,400 | | |
| | 10,000 | | | Consol Energy, Inc., 144a,
8.000%, 4/1/17 | | | 10,650 | | |
| | 10,000 | | | Consol Energy, Inc., 144a,
8.250%, 4/1/20 | | | 10,800 | | |
| | 78,000 | | | Helix Energy Solutions Group, Inc.,
144a, 9.500%, 1/15/16 | | | 80,145 | | |
| | 50,000 | | | Hilcorp Energy, 144a, 7.750%, 11/1/15 | | | 51,625 | | |
| | 75,000 | | | Hilcorp Energy, 144a, 9.000%, 6/1/16 | | | 79,312 | | |
Principal
Amount | | | | Market
Value | |
| $ | 135,000 | | | Holly Energy Partners LP / Holly Energy
Finance Corp., 6.250%, 3/1/15 | | $ | 133,650 | | |
| | 14,000 | | | Newfield Exploration Co.,
6.875%, 2/1/20 | | | 14,735 | | |
| | 195,000 | | | NuStar Logistics LP, 6.050%, 3/15/13 | | | 207,381 | | |
| | 105,000 | | | Petrohawk Energy Corp.,
7.250%, 8/15/18 | | | 106,050 | | |
| | 44,000 | | | Pioneer Drilling Co., 9.875%, 3/15/18 | | | 46,530 | | |
| | 135,000 | | | Sabine Pass LNG LP, 7.250%, 11/30/13 | | | 131,288 | | |
| | | | | | | | 1,170,266 | | |
| | | Telecommunication Services — 2.7% | |
| | 225,000 | | | AT&T, Inc., 6.550%, 2/15/39 | | | 244,902 | | |
| | 45,000 | | | Cricket Communications, Inc.,
7.750%, 5/15/16 | | | 46,688 | | |
| | 57,000 | | | Frontier Communications Corp.,
8.500%, 4/15/20 | | | 62,272 | | |
| | 10,000 | | | NII Capital Corp., 10.000%, 8/15/16 | | | 11,075 | | |
| | 6,000 | | | PAETEC Holding Corp., 8.875%, 6/30/17 | | | 6,405 | | |
| | 2,000 | | | Qwest Communications
International, Inc., 7.500%, 2/15/14 | | | 2,025 | | |
| | 12,000 | | | Sprint Capital Corp., 6.875%, 11/15/28 | | | 10,500 | | |
| | 100,000 | | | Sprint Nextel Corp., 8.375%, 8/15/17 † | | | 107,250 | | |
| | 7,000 | | | TW Telecom Holdings, Inc.,
8.000%, 3/1/18 | | | 7,437 | | |
| | 175,000 | | | Verizon Communications, Inc.,
6.250%, 4/1/37 | | | 186,735 | | |
| | 90,000 | | | Virgin Media Finance PLC,
8.375%, 10/15/19 | | | 98,325 | | |
| | 50,000 | | | West Corp., 144a, 8.625%, 10/1/18 | | | 53,000 | | |
| | 100,000 | | | Wind Acquisition Finance SA, 144a,
11.750%, 7/15/17 | | | 112,750 | | |
| | 135,000 | | | Windstream Corp., 8.625%, 8/1/16 | | | 142,088 | | |
| | | | | | | | 1,091,452 | | |
| | | Industrials — 2.5% | |
| | 39,000 | | | Amsted Industries, Inc., 144a,
8.125%, 3/15/18 | | | 41,389 | | |
| | 75,000 | | | ARAMARK Corp., 8.500%, 2/1/15 | | | 78,375 | | |
| | 165,000 | | | Burlington Northern Santa Fe LLC,
5.750%, 5/1/40 | | | 170,712 | | |
| | 50,000 | | | Cenveo Corp., 8.875%, 2/1/18 | | | 48,375 | | |
| | 100,000 | | | Iron Mountain, Inc., 8.000%, 6/15/20 | | | 105,000 | | |
| | 39,000 | | | Kemet Corp., 144a, 10.500%, 5/1/18 | | | 41,925 | | |
| | 25,000 | | | Liberty Tire Recycling, 144a,
11.000%, 10/1/16 | | | 26,812 | | |
| | 47,000 | | | Martin Midstream Partners LP /
Martin Midstream Finance Corp.,
8.875%, 4/1/18 | | | 48,410 | | |
| | 29,000 | | | Navios Maritime Holdings, Inc.,
9.500%, 12/15/14 | | | 30,160 | | |
| | 230,000 | | | Norfolk Southern Corp., 5.750%, 4/1/18 | | | 259,721 | | |
| | 9,000 | | | PHH Corp., 144a, 9.250%, 3/1/16 | | | 9,495 | | |
61
Touchstone Core Bond Fund (Continued)
Principal
Amount | | | | Market
Value | |
| | | Corporate Bonds — 32.4% (Continued) | |
| $ | 20,000 | | | RSC Equipment Rental, Inc. /
RSC Holdings III LLC, 144a,
10.000%, 7/15/17 | | $ | 22,500 | | |
| | 16,000 | | | Seminole Indian Tribe of Florida, 144a,
7.750%, 10/1/17 | | | 16,520 | | |
| | 100,000 | | | TransDigm, Inc., 144a, 7.750%, 12/15/18 | | | 103,500 | | |
| | | | | | | | 1,002,894 | | |
| | | Health Care — 1.8% | |
| | 22,000 | | | Accellent, Inc., 8.375%, 2/1/17 | | | 22,550 | | |
| | 135,000 | | | Apria Healthcare Group, Inc.,
11.250%, 11/1/14 | | | 147,487 | | |
| | 25,000 | | | Axcan Intermediate Holdings, Inc.,
12.750%, 3/1/16 | | | 25,688 | | |
| | 30,000 | | | Capella Healthcare, Inc., 144a,
9.250%, 7/1/17 | | | 31,800 | | |
| | 135,000 | | | HCA, Inc., 9.625%, 11/15/16 | | | 144,619 | | |
| | 155,000 | | | Health Care REIT, Inc., 6.125%, 4/15/20 | | | 163,163 | | |
| | 30,000 | | | NBTY, Inc., 144a, 9.000%, 10/1/18 | | | 32,025 | | |
| | 50,000 | | | Omnicare, Inc., 7.750%, 6/1/20 | | | 51,500 | | |
| | 80,000 | | | Service Corp. International,
8.000%, 11/15/21 | | | 84,000 | | |
| | 40,000 | | | Stonemor Operating LLC / Cornerstone
Family Services of WV / Osiris Holding,
10.250%, 12/1/17 | | | 42,100 | | |
| | | | | | | | 744,932 | | |
| | | Consumer Staples — 1.4% | |
| | 190,000 | | | Anheuser-Busch InBev Worldwide, Inc.,
144a, 8.200%, 1/15/39 | | | 257,754 | | |
| | 135,000 | | | Ingles Markets, Inc., 8.875%, 5/15/17 | | | 144,450 | | |
| | 140,000 | | | Kraft Foods, Inc., 4.125%, 2/9/16 | | | 146,961 | | |
| | | | | | | | 549,165 | | |
| | | Materials — 1.2% | |
| | 50,000 | | | AK Steel Corp., 7.625%, 5/15/20 | | | 50,125 | | |
| | 220,000 | | | ArcelorMittal, 5.375%, 6/1/13 | | | 233,850 | | |
| | 10,000 | | | BWAY Holding Co., 144a,
10.000%, 6/15/18 | | | 10,788 | | |
| | 27,000 | | | Cascades, Inc., 7.750%, 12/15/17 | | | 28,147 | | |
| | 15,000 | | | Cascades, Inc., 7.875%, 1/15/20 | | | 15,675 | | |
| | 30,000 | | | Cloud Peak Energy Resources LLC /
Cloud Peak Energy Finance Corp.,
8.500%, 12/15/19 | | | 32,850 | | |
| | 30,000 | | | Koppers, Inc., 7.875%, 12/1/19 | | | 32,175 | | |
| | 10,000 | | | Novelis, Inc., 144a, 8.375%, 12/15/17 | | | 10,350 | | |
| | 18,000 | | | Penn Virginia Resource Partners LP /
Penn Virginia Resource Finance Corp.,
8.250%, 4/15/18 | | | 18,540 | | |
| | 9,000 | | | PolyOne Corp., 7.375%, 9/15/20 | | | 9,326 | | |
| | 37,000 | | | Tembec Industries, Inc., 144a,
11.250%, 12/15/18 | | | 38,757 | | |
Principal
Amount | | | | Market
Value | |
| $ | 21,000 | | | Texas Industries, Inc., 144a,
9.250%, 8/15/20 | | $ | 22,313 | | |
| | | | | | | | 502,896 | | |
| | | Information Technology — 0.4% | |
| | 117,000 | | | Communications & Power
Industries, Inc., 8.000%, 2/1/12 | | | 117,000 | | |
| | 30,000 | | | Viasat, Inc., 8.875%, 9/15/16 | | | 31,950 | | |
| | | | | | | | 148,950 | | |
| | | | | Total Corporate Bonds | | $ | 13,074,582 | | |
| | | U.S. Treasury Obligations — 26.8% | |
| | 1,115,000 | | | U.S. Treasury Bond, 4.625%, 2/15/40 | | | 1,167,962 | | |
| | 350,000 | | | U.S. Treasury Bond, 3.875%, 8/15/40 | | | 322,383 | | |
| | 2,700,000 | | | U.S. Treasury Note, 0.375%, 10/31/12 | | | 2,691,773 | | |
| | 200,000 | | | U.S. Treasury Note, 0.750%, 8/15/13 | | | 199,594 | | |
| | 625,000 | | | U.S. Treasury Note, 2.625%, 8/15/20 | | | 592,529 | | |
| | 6,215,000 | | | U.S. Treasury Note, 2.625%, 11/15/20 | | | 5,862,492 | | |
| | | | | Total U.S. Treasury Obligations | | $ | 10,836,733 | | |
| | | Mortgage-Backed Securities — 19.1% | |
| | 230,000 | | | Banc of America Commercial
Mortgage, Inc., Ser 2005-4, Class A3,
4.891%, 7/10/45 | | | 236,042 | | |
| | 280,000 | | | Banc of America Commercial
Mortgage, Inc., Ser 2006-2, Class A3,
5.712%, 5/10/45 (A) | | | 297,241 | | |
| | 365,000 | | | Banc of America Commercial
Mortgage, Inc., Ser 2006-6, Class A3,
5.369%, 10/10/45 | | | 378,199 | | |
| | 315,000 | | | Banc of America Commercial
Mortgage, Inc., Ser 2007-1, Class AAB,
5.422%, 1/15/49 | | | 332,141 | | |
| | 450,000 | | | Banc of America Commercial
Mortgage, Inc., Ser 2007-2, Class AAB,
5.639%, 4/10/49 (A) | | | 473,443 | | |
| | 575,000 | | | Bear Stearns Commercial Mortgage
Securities, Ser 2005-PWR9, Class A4A,
4.871%, 9/11/42 | | | 605,732 | | |
| | 230,000 | | | Bear Stearns Commercial Mortgage
Securities, Ser 2006-PW13, Class A3,
5.518%, 9/11/41 | | | 241,232 | | |
| | 550,000 | | | Bear Stearns Commercial Mortgage
Securities, Ser 2007-PW16, Class A4,
5.717%, 6/11/40 (A) | | | 586,831 | | |
| | 150,000 | | | Citigroup Commercial Mortgage Trust,
Ser 2006-C4, Class A2,
5.728%, 3/15/49 (A) | | | 157,278 | | |
| | 100,822 | | | Commercial Mortgage Pass Through
Certificates, Ser 2004-LB4A, Class A3,
4.405%, 10/15/37 | | | 101,864 | | |
| | 135,000 | | | Commercial Mortgage Pass Through
Certificates, Ser 2005-C6, Class A5A,
5.116%, 6/10/44 (A) | | | 144,474 | | |
62
Touchstone Core Bond Fund (Continued)
Principal
Amount | | | | Market
Value | |
| | | Mortgage-Backed Securities — 19.1% (Continued) | |
| $ | 16,918 | | | Credit Suisse First Boston Mortgage
Securities Corp., Ser 2002-CKN2,
Class A2, 5.939%, 4/15/37 | | $ | 16,907 | | |
| | 459,576 | | | Credit Suisse First Boston Mortgage
Securities Corp., Ser 2005-9,
Class 2A1, 5.500%, 10/25/35 | | | 399,337 | | |
| | 600,000 | | | GE Capital Commercial Mortgage
Corp., Ser 2002-2A, Class A3,
5.349%, 8/11/36 | | | 627,745 | | |
| | 79,706 | | | GE Capital Commercial Mortgage
Corp., Ser 2004-C1, Class A2,
3.915%, 11/10/38 | | | 79,669 | | |
| | 364,629 | | | GE Capital Commercial Mortgage
Corp., Ser 2005-C4, Class ASB,
5.283%, 11/10/45 (A) | | | 386,594 | | |
| | 350,000 | | | GS Mortgage Securities Corp. II,
Ser 2006-GG8, Class AAB,
5.535%, 11/10/39 | | | 370,809 | | |
| | 495,000 | | | JP Morgan Chase Commercial
Mortgage Securities Corp.,
Ser 2004-C2, Class A3,
5.232%, 5/15/41 (A) | | | 526,838 | | |
| | 390,000 | | | LB-UBS Commercial Mortgage Trust,
Ser 2006-C3, Class A3,
5.689%, 3/15/32 (A) | | | 412,384 | | |
| | 700,000 | | | Morgan Stanley Mortgage Loan Trust,
Ser 2007-3XS, Class 2A4S,
5.963%, 1/25/47 | | | 463,800 | | |
| | 101,510 | | | Residential Funding Mortgage
Securities I, Ser 2006-S2, Class A2,
5.750%, 2/25/36 | | | 93,003 | | |
| | 205,000 | | | Wachovia Bank Commercial Mortgage
Trust, Ser 2006-C29, Class A3,
5.313%, 11/15/48 | | | 213,659 | | |
| | 330,000 | | | Wachovia Bank Commercial Mortgage
Trust, Ser 2007-C34, Class APB,
5.617%, 5/15/46 | | | 348,186 | | |
| | 229,620 | | | Washington Mutual Mortgage
Pass-Thru Certificates, Ser 2005-9,
Class 2A4, 5.500%, 11/25/35 | | | 220,066 | | |
| | | | | Total Mortgage-Backed Securities | | $ | 7,713,474 | | |
| | | Asset-Backed Securities — 7.0% | |
| | 441,503 | | | Countrywide Asset-Backed Certificates,
Ser 2007-S1, Class A5,
6.018%, 11/25/36 (A) | | | 183,430 | | |
| | 250,000 | | | CW Capital Cobalt Ltd., Ser 2006-C1,
Class A4, 5.223%, 8/15/48 | | | 260,222 | | |
| | 296,229 | | | Deutsche ALT-A Securities, Inc.
Alternate Loan Trust, Ser 2003-2XS,
Class A6, 4.970%, 9/25/33 | | | 281,729 | | |
Principal
Amount | | | | Market
Value | |
| $ | 655,031 | | | Deutsche ALT-A Securities, Inc.
Alternate Loan Trust, Ser 2005-3,
Class 4A4, 5.250%, 6/25/35 | | $ | 599,965 | | |
| | 470,000 | | | Greenwich Capital Commercial
Funding Corp., Ser 2005-GG3,
Class A3, 4.569%, 8/10/42 | | | 480,793 | | |
| | 465,000 | | | Morgan Stanley Capital I, Ser 2006-HQ9,
Class A3, 5.712%, 7/12/44 | | | 495,979 | | |
| | 234,744 | | | Residential Asset Securitization Trust,
Ser 2005-A6CB, Class A8,
5.500%, 6/25/35 | | | 67,719 | | |
| | 275,122 | | | Residential Asset Securitization Trust,
Ser 2006-A1, Class 1A3,
6.000%, 4/25/36 | | | 215,352 | | |
| | 303,997 | | | Structured Asset Securities Corp.,
Ser 2005-17, Class 5A1,
5.500%, 10/25/35 | | | 262,136 | | |
| | | | | Total Asset-Backed Securities | | $ | 2,847,325 | | |
| | | U.S. Government Agency Obligation — 6.4% | |
| | 2,475,000 | | | FNMA, 4.500%, 1/1/18 | | $ | 2,594,496 | | |
| | | U.S. Government Mortgage-Backed
Obligations — 5.9% | |
| | 117,024 | | | FNMA, Pool #254759, 4.500%, 6/1/18 | | | 123,972 | | |
| | 194,257 | | | FNMA, Pool #974403, 4.500%, 4/1/23 | | | 205,475 | | |
| | 146,435 | | | FNMA, Pool #974401, 4.500%, 4/1/23 | | | 154,032 | | |
| | 575,326 | | | FNMA, Pool #983610, 5.000%, 5/1/23 | | | 610,655 | | |
| | 172,610 | | | FNMA, Pool #984256, 5.000%, 6/1/23 | | | 184,072 | | |
| | 231,438 | | | FNMA, Pool #988107, 5.000%, 8/1/23 | | | 245,650 | | |
| | 181,056 | | | FNMA, Pool #995472, 5.000%, 11/1/23 | | | 192,174 | | |
| | 165,228 | | | FNMA, Pool #995529, 5.500%, 11/1/22 | | | 177,766 | | |
| | 180,220 | | | FNMA, Pool #889734, 5.500%, 6/1/37 | | | 193,245 | | |
| | 149,713 | | | FNMA, Pool #995220, 6.000%, 11/1/23 | | | 163,351 | | |
| | 17,946 | | | FNMA, Pool #561741, 7.500%, 1/1/31 | | | 20,580 | | |
| | 28,948 | | | FNMA, Pool #535290, 8.000%, 5/1/30 | | | 33,479 | | |
| | 24,689 | | | GNMA, Pool #G2 8503,
2.625%, 9/20/24 (A) | | | 25,281 | | |
| | 34,693 | | | GNMA, Pool #2003-11 GJ,
4.000%, 10/17/29 | | | 36,633 | | |
| | 4,196 | | | GNMA, Pool #434792, 8.000%, 7/15/30 | | | 4,969 | | |
| | | | | Total U.S. Government
Mortgage-Backed Obligations | | $ | 2,371,334 | | |
| | | Municipal Bonds — 0.9%
California — 0.5% | |
| | 180,000 | | | California St UTGO, Ser 2009,
5.950%, 4/1/16 | | | 188,697 | | |
| | | Georgia — 0.4% | |
| | 190,000 | | | Municipal Electric Auth. of Georgia Rev,
Ser 2010, 6.655%, 4/1/57 | | | 183,772 | | |
| | | | | Total Municipal Bonds | | $ | 372,469 | | |
63
Touchstone Core Bond Fund (Continued)
| Shares | | | | Market
Value | |
| | | Preferred Stock — 0.5%
Financials — 0.5% | |
| | 7,900 | | | Citigroup Capital VIII, 6.95% | | $ | 191,180 | | |
| | | Investment Funds — 7.0% | |
| | 111,870 | | | Invesco Liquid Assets Portfolio ** | | | 111,870 | | |
| | 2,705,440 | | | Touchstone Institutional
Money Market Fund^ | | | 2,705,440 | | |
| | | | | Total Investment Funds | | $ | 2,817,310 | | |
| | | | | Total Investment Securities — 106.0%
(Cost $42,753,767) | | $ | 42,818,903 | | |
| | | | | Liabilities in Excess of
Other Assets — (6.0%) | | | (2,410,499 | ) | |
| | | | | Net Assets — 100.0% | | $ | 40,408,404 | | |
(A) Variable rate security – the rate reflected is the rate in effect as of December 31, 2010.
† All or a portion of the security is on loan. The total value of the securities on loan as of December 31, 2010, was $106,178.
** Represents collateral for securities loaned.
^ Affiliated Fund, sub-advised by Fort Washington Investment Advisors, Inc. See Note 3.
Portfolio Abbreviations:
FNMA – Federal National Mortgage Association
GNMA – Government National Mortgage Association
MTN – Medium Term Note
PLC – Public Limited Company
REIT – Real Estate Investment Trust
UTGO – Unlimited Tax General Obligation
144a – This is a restricted security that was sold in a transaction exempt from Rule 144a of the Securities Act of 1933. This security may be sold in transactions exempt from registration, normally to qualified institutional buyers. At December 31, 2010, these securities were valued at $3,182,417 or 7.9% of net assets.
Other Information:
The inputs or methodology used for valuing securities may not be an indication of the risk associated with investing in those securities. For more information on valuation inputs, and their aggregation into the levels used in the table below, please refer to the security valuation section in the accompanying notes to financial statements.
Valuation Inputs at Reporting Date:
| Description | | Level 1 | | Level 2 | | Level 3 | | Total | |
Corporate
Bonds | | $ | — | | | $ | 13,074,582 | | | $ | — | | | $ | 13,074,582 | | |
U.S. Treasury
Obligations | | | — | | | | 10,836,733 | | | | — | | | | 10,836,733 | | |
Mortgage-Backed
Securities | | | — | | | | 7,713,474 | | | | — | | | | 7,713,474 | | |
Asset-Backed
Securities | | | — | | | | 2,847,325 | | | | — | | | | 2,847,325 | | |
Investment
Funds | | | 2,817,310 | | | | — | | | | — | | | | 2,817,310 | | |
U.S. Government
Agency
Obligations | | | — | | | | 2,594,496 | | | | — | | | | 2,594,496 | | |
U.S. Government
Mortgage-Backed
Obligations | | | — | | | | 2,371,334 | | | | — | | | | 2,371,334 | | |
| Municipal Bonds | | | — | | | | 372,469 | | | | — | | | | 372,469 | | |
| Preferred Stocks | | | 191,180 | | | | — | | | | — | | | | 191,180 | | |
| | | | | | | | | $ | 42,818,903 | | |
The accompanying notes are an integral part of the financial statements.
64
Portfolio of Investments
Touchstone High Yield Fund – December 31, 2010
Principal
Amount | | | | Market
Value | |
| | | Corporate Bonds — 96.7%
Consumer Discretionary — 20.4% | |
| $ | 12,000 | | | Asbury Automotive Group, Inc.,
7.625%, 3/15/17 | | $ | 12,120 | | |
| | 315,000 | | | Beazer Homes USA, Inc.,
6.875%, 7/15/15 | | | 304,763 | | |
| | 163,000 | | | CCO Holdings LLC, 8.125%, 4/30/20 | | | 171,558 | | |
| | 400,000 | | | Cequel Communications Holdings l LLC
and Cequel Capital Corp., 144a,
8.625%, 11/15/17 | | | 418,000 | | |
| | 30,000 | | | Citadel Broadcasting Corp., 144a,
7.750%, 12/15/18 | | | 31,050 | | |
| | 120,000 | | | Clear Channel Worldwide Holdings, Inc.,
Ser B, 9.250%, 12/15/17 | | | 131,400 | | |
| | 7,000 | | | Clear Channel Worldwide Holdings, Inc.,
9.250%, 12/15/17 | | | 7,612 | | |
| | 155,000 | | | Cooper-Standard Automotive, Inc.,
144a, 8.500%, 5/1/18 | | | 164,300 | | |
| | 315,000 | | | CSC Holdings LLC, 8.625%, 2/15/19 | | | 355,950 | | |
| | 149,000 | | | Equinox Holdings, Inc., 144a,
9.500%, 2/1/16 | | | 157,381 | | |
| | 191,000 | | | Fisher Communications, Inc.,
8.625%, 9/15/14 | | | 193,865 | | |
| | 450,000 | | | Goodyear Tire & Rubber,
10.500%, 5/15/16 | | | 513,000 | | |
| | 160,000 | | | Icon Health & Fitness, 144a,
11.875%, 10/15/16 | | | 161,600 | | |
| | 132,000 | | | Inergy LP / Inergy Finance Corp., 144a,
7.000%, 10/1/18 | | | 132,990 | | |
| | 470,000 | | | Insight Communications Co., Inc., 144a,
9.375%, 7/15/18 | | | 500,550 | | |
| | 50,000 | | | Jarden Corp., 8.000%, 5/1/16 | | | 54,437 | | |
| | 139,000 | | | Lamar Media Corp., Ser B,
6.625%, 8/15/15 | | | 141,085 | | |
| | 56,000 | | | Lear Corp., 7.875%, 3/15/18 | | | 59,920 | | |
| | 368,000 | | | Libbey Glass, Inc., 144a,
10.000%, 2/15/15 | | | 395,600 | | |
| | 250,000 | | | Meritage Homes Corp., 6.250%, 3/15/15 | | | 251,250 | | |
| | 166,000 | | | Navistar International Corp.,
8.250%, 11/1/21 | | | 178,450 | | |
| | 346,000 | | | Penske Auto Group, Inc.,
7.750%, 12/15/16 | | | 352,920 | | |
| | 152,000 | | | Quebecor Media, Inc., 7.750%, 3/15/16 | | | 156,940 | | |
| | 560,000 | | | Quebecor Media, Inc., 7.750%, 3/15/16 | | | 578,200 | | |
| | 350,000 | | | QVC, Inc., 144a, 7.500%, 10/1/19 | | | 368,375 | | |
| | 129,000 | | | Sealy Mattress Co., 8.250%, 6/15/14 | | | 131,903 | | |
| | 224,000 | | | Simmons Bedding Co., 144a,
11.250%, 7/15/15 | | | 241,920 | | |
| | 71,000 | | | Tenneco, Inc., 144a, 6.875%, 12/15/20 | | | 72,597 | | |
| | 154,000 | | | Tower Automotive Holdings USA LLC /
TA Holdings Finance, Inc., 144a,
10.625%, 9/1/17 | | | 165,550 | | |
| | 240,000 | | | WMG Acquisition Corp.,
7.375%, 4/15/14 † | | | 230,400 | | |
| | | | | | | | 6,635,686 | | |
Principal
Amount | | | | Market
Value | |
| | | Energy — 15.2% | |
| $ | 139,000 | | | Basic Energy Services, Inc.,
11.625%, 8/1/14* | | $ | 154,290 | | |
| | 396,000 | | | Chesapeake Energy Corp.,
9.500%, 2/15/15 | | | 446,490 | | |
| | 49,000 | | | Chesapeake Energy Corp.,
6.500%, 8/15/17 | | | 49,245 | | |
| | 349,000 | | | Coffeyville Resources LLC, 144a,
10.875%, 4/1/17 | | | 375,175 | | |
| | 66,000 | | | Consol Energy, Inc., 144a,
8.250%, 4/1/20 | | | 71,280 | | |
| | 66,000 | | | Consol Energy, Inc., 144a,
8.000%, 4/1/17 | | | 70,290 | | |
| | 200,000 | | | Expro Finance Luxembourg SCA, 144a,
8.500%, 12/15/16 | | | 191,000 | | |
| | 300,000 | | | Exterran Holdings, Inc., 144a,
7.250%, 12/1/18 | | | 298,500 | | |
| | 485,000 | | | Gibson Energy, 11.750%, 5/27/14 | | | 535,925 | | |
| | 644,000 | | | Helix Energy Solutions Group, Inc., 144a,
9.500%, 1/15/16 | | | 661,710 | | |
| | 44,000 | | | Hilcorp Energy, 144a, 9.000%, 6/1/16 | | | 46,530 | | |
| | 529,000 | | | Hilcorp Energy, 144a, 7.750%, 11/1/15 | | | 546,192 | | |
| | 350,000 | | | Holly Energy Partners LP / Holly Energy
Finance Corp., 6.250%, 3/1/15 | | | 346,500 | | |
| | 306,000 | | | Petrohawk Energy Corp.,
7.250%, 8/15/18 | | | 309,060 | | |
| | 284,000 | | | Pioneer Drilling Co., 9.875%, 3/15/18 | | | 300,330 | | |
| | 543,000 | | | United Refining Co., Ser 2,
10.500%, 8/15/12 | | | 532,140 | | |
| | | | | | | | 4,934,657 | | |
| | | Industrials — 13.8% | |
| | 264,000 | | | Amsted Industries, Inc., 144a,
8.125%, 3/15/18 | | | 280,170 | | |
| | 197,000 | | | Ashtead Capital, Inc., 144a,
9.000%, 8/15/16 | | | 205,373 | | |
| | 90,000 | | | Ashtead Holdings PLC, 144a,
8.625%, 8/1/15 | | | 93,262 | | |
| | 198,000 | | | Baldor Electric Co., 8.625%, 2/15/17 | | | 221,760 | | |
| | 100,000 | | | BE Aerospace, Inc., 8.500%, 7/1/18 | | | 109,500 | | |
| | 150,000 | | | Belden, Inc., 7.000%, 3/15/17 | | | 151,875 | | |
| | 400,000 | | | Cenveo Corp., 8.875%, 2/1/18 | | | 387,000 | | |
| | 12,000 | | | General Cable Corp., 7.125%, 4/1/17 | | | 12,360 | | |
| | 350,000 | | | Interface, Inc., 144a, 7.625%, 12/1/18 | | | 361,375 | | |
| | 484,000 | | | Kemet Corp., 144a, 10.500%, 5/1/18 | | | 520,300 | | |
| | 218,000 | | | Liberty Tire Recycling, 144a,
11.000%, 10/1/16 | | | 233,805 | | |
| | 318,000 | | | Martin Midstream Partners LP /
Martin Midstream Finance Corp.,
8.875%, 4/1/18 | | | 327,540 | | |
| | 120,000 | | | Moog, Inc., 7.250%, 6/15/18 | | | 125,400 | | |
| | 492,000 | | | Mueller Water Products, Inc.,
7.375%, 6/1/17 | | | 474,780 | | |
65
Touchstone High Yield Fund (Continued)
Principal
Amount | | | | Market
Value | |
| | | Corporate Bonds — 96.7% (Continued) | |
| $ | 76,000 | | | Navios Maritime Holdings, Inc.,
9.500%, 12/15/14 | | $ | 79,040 | | |
| | 94,000 | | | RSC Equipment Rental, Inc. /
RSC Holdings III LLC, 144a,
10.000%, 7/15/17 | | | 105,750 | | |
| | 93,000 | | | Seminole Indian Tribe of Florida, 144a,
7.750%, 10/1/17 | | | 96,023 | | |
| | 500,000 | | | TransDigm, Inc., 144a, 7.750%, 12/15/18 | | | 517,500 | | |
| | 200,000 | | | Tutor Perini Corp., 144a, 7.625%, 11/1/18 | | | 201,000 | | |
| | | | | | | | 4,503,813 | | |
| | | Utilities — 12.2% | |
| | 200,000 | | | Atlas Pipeline Partners LP,
8.125%, 12/15/15 | | | 206,000 | | |
| | 164,000 | | | Atlas Pipeline Partners LP,
8.750%, 6/15/18 | | | 171,380 | | |
| | 327,000 | | | Copano Energy LLC / Copano Energy
Finance Corp., 8.125%, 3/1/16 | | | 336,810 | | |
| | 79,000 | | | Crosstex Energy, 8.875%, 2/15/18 | | | 84,629 | | |
| | 200,000 | | | Enterprise Products, Ser A,
8.375%, 8/1/66 (A) | | | 214,750 | | |
| | 367,000 | | | Enterprise Products, 7.000%, 6/1/67 (A) | | | 361,954 | | |
| | 300,000 | | | Genesis Energy LP / Genesis Energy
Finance Corp., 144a, 7.875%, 12/15/18 | | | 298,500 | | |
| | 51,000 | | | GenOn Energy, Inc., 7.625%, 6/15/14 | | | 52,147 | | |
| | 350,000 | | | Intergen NV, 144a, 9.000%, 6/30/17 | | | 371,000 | | |
| | 126,000 | | | MarkWest Energy Partners LP /
MarkWest Energy Finance Corp.,
Ser B, 8.750%, 4/15/18 | | | 136,395 | | |
| | 166,000 | | | MarkWest Energy Partners LP /
MarkWest Energy Finance Corp.,
6.750%, 11/1/20 | | | 166,000 | | |
| | 85,000 | | | North American Energy, 144a,
10.875%, 6/1/16 | | | 94,350 | | |
| | 215,000 | | | PNM Resources, Inc., 9.250%, 5/15/15 | | | 237,575 | | |
| | 104,000 | | | Puget Sound Energy, Inc., Ser A,
6.974%, 6/1/67 (A) | | | 102,384 | | |
| | 250,000 | | | Regency Energy Partners LP / Regency
Energy Finance Corp., 9.375%, 6/1/16 | | | 274,375 | | |
| | 492,000 | | | Sabine Pass LNG LP, 7.250%, 11/30/13 | | | 478,470 | | |
| | 9,000 | | | Targa Resources Partners, 8.250%, 7/1/16 | | | 9,495 | | |
| | 329,000 | | | Targa Resources Partners,
11.250%, 7/15/17 | | | 376,705 | | |
| | | | | | | | 3,972,919 | | |
| | | Telecommunication Services — 10.3% | |
| | 142,000 | | | Cincinnati Bell, Inc., 8.250%, 10/15/17 | | | 140,580 | | |
| | 330,000 | | | Cricket Communications, Inc.,
7.750%, 5/15/16 | | | 342,375 | | |
| | 190,000 | | | Cricket Communications, Inc.,
10.000%, 7/15/15 † | | | 203,538 | | |
| | 364,000 | | | Frontier Communications Corp.,
8.500%, 4/15/20 | | | 397,670 | | |
Principal
Amount | | | | Market
Value | |
| $ | 83,000 | | | Nextel Communications, Inc., Ser E,
6.875%, 10/31/13 | | $ | 83,207 | | |
| | 20,000 | | | NII Capital Corp., 10.000%, 8/15/16 | | | 22,150 | | |
| | 255,000 | | | PAETEC Holding Corp., 8.875%, 6/30/17 | | | 272,212 | | |
| | 150,000 | | | Qwest Communications
International, Inc., 144a, 7.125%, 4/1/18 | | | 155,250 | | |
| | 74,000 | | | Sprint Capital Corp., 6.875%, 11/15/28 | | | 64,750 | | |
| | 139,000 | | | Sprint Nextel Corp., 8.375%, 8/15/17 † | | | 149,077 | | |
| | 41,000 | | | TW Telecom Holdings, Inc.,
8.000%, 3/1/18 | | | 43,562 | | |
| | 390,000 | | | Virgin Media Finance PLC, Ser 1,
9.500%, 8/15/16 | | | 440,700 | | |
| | 279,000 | | | West Corp., 144a, 8.625%, 10/1/18 | | | 295,740 | | |
| | 231,000 | | | Wind Acquisition Finance SA, 144a,
11.750%, 7/15/17 | | | 260,453 | | |
| | 449,000 | | | Windstream Corp., 8.625%, 8/1/16 | | | 472,573 | | |
| | | | | | | | 3,343,837 | | |
| | | Health Care — 10.0% | |
| | 352,000 | | | Accellent, Inc., 8.375%, 2/1/17 | | | 360,800 | | |
| | 200,000 | | | Apria Healthcare Group, Inc.,
11.250%, 11/1/14 | | | 218,500 | | |
| | 250,000 | | | Axcan Intermediate Holdings, Inc.,
9.250%, 3/1/15 | | | 258,750 | | |
| | 451,000 | | | Capella Healthcare, Inc., 144a,
9.250%, 7/1/17 | | | 478,060 | | |
| | 250,346 | | | HCA, Inc., 9.625%, 11/15/16 | | | 268,183 | | |
| | 260,000 | | | HCA, Inc., 5.750%, 3/15/14 | | | 256,100 | | |
| | 45,000 | | | IASIS Healthcare, 8.750%, 6/15/14 | | | 46,181 | | |
| | 500,000 | | | NBTY, Inc., 144a, 9.000%, 10/1/18 | | | 533,750 | | |
| | 32,000 | | | Omnicare, Inc., 7.750%, 6/1/20 | | | 32,960 | | |
| | 300,000 | | | Res-Care, Inc., 144a, 10.750%, 1/15/19 | | | 309,000 | | |
| | 290,000 | | | Stonemor Operating LLC / Cornerstone
Family Services of WV / Osiris Holding,
10.250%, 12/1/17 | | | 305,225 | | |
| | 208,000 | | | Universal Hospital Services, Inc.,
3.834%, 6/1/15 (A) | | | 190,320 | | |
| | | | | | | | 3,257,829 | | |
| | | Financials — 8.5% | |
| | 148,000 | | | CIT Group, Inc., 7.000%, 5/1/16 | | | 148,555 | | |
| | 74,000 | | | CIT Group, Inc., 7.000%, 5/1/17 | | | 74,185 | | |
| | 107,000 | | | Credit Acceptance Corp., 144a,
9.125%, 2/1/17 | | | 112,350 | | |
| | 216,000 | | | Equinix, Inc., 8.125%, 3/1/18 | | | 225,720 | | |
| | 95,000 | | | Holly Energy Partners LP / Holly Energy
Finance Corp., 144a, 8.250%, 3/15/18 | | | 99,275 | | |
| | 401,000 | | | International Lease Finance Corp., 144a,
8.750%, 3/15/17 | | | 430,072 | | |
| | 113,000 | | | Liberty Mutual Group, Inc., 144a,
10.750%, 6/15/58 (A) | | | 136,730 | | |
| | 126,000 | | | Lyondell Chemical Co., 144a,
8.000%, 11/1/17 | | | 139,388 | | |
| | 500,000 | | | MetLife, Inc., 10.750%, 8/1/39 | | | 670,000 | | |
66
Touchstone High Yield Fund (Continued)
Principal
Amount | | | | Market
Value | |
| | | Corporate Bonds — 96.7% (Continued) | |
| $ | 78,000 | | | Omega Healthcare Investors, Inc.,
144a, 6.750%, 10/15/22 | | $ | 77,317 | | |
| | 239,000 | | | Pinafore LLC / Pinafore, Inc., 144a,
9.000%, 10/1/18 | | | 258,120 | | |
| | 341,000 | | | PPF Funding, Inc., 144a,
5.700%, 4/15/17 | | | 322,000 | | |
| | 60,000 | | | Reynolds Group Issuer, Inc. /
Reynolds Group Issuer LLC, 144a,
7.750%, 10/15/16 | | | 63,450 | | |
| | | | | | | | 2,757,162 | | |
| | | Materials — 3.7% | |
| | 91,000 | | | AK Steel Corp., 7.625%, 5/15/20 | | | 91,228 | | |
| | 61,000 | | | BWAY Holding Co., 144a,
10.000%, 6/15/18 | | | 65,804 | | |
| | 228,000 | | | Cascades, Inc., 7.750%, 12/15/17 | | | 237,690 | | |
| | 202,000 | | | Cloud Peak Energy Resources LLC /
Cloud Peak Energy Finance Corp.,
8.500%, 12/15/19 | | | 221,190 | | |
| | 184,000 | | | Koppers, Inc., 7.875%, 12/1/19 | | | 197,340 | | |
| | 75,000 | | | Novelis, Inc., 144a, 8.375%, 12/15/17 | | | 77,625 | | |
| | 145,000 | | | Penn Virginia Resource Partners LP /
Penn Virginia Resource Finance Corp.,
8.250%, 4/15/18 | | | 149,350 | | |
| | 53,000 | | | PolyOne Corp., 7.375%, 9/15/20 | | | 54,921 | | |
| | 30,000 | | | Solo Cup Co., 10.500%, 11/1/13 | | | 31,350 | | |
| | 81,000 | | | US Concrete, Inc., 144a, 9.500%, 8/31/15 | | | 92,745 | | |
| | | | | | | | 1,219,243 | | |
| | | Information Technology — 1.8% | |
| | 67,000 | | | First Data Corp., 144a, 12.625%, 1/15/21 | | | 63,985 | | |
| | 15,000 | | | First Data Corp., 9.875%, 9/24/15 | | | 14,288 | | |
| | 67,000 | | | First Data Corp., 144a, 8.250%, 1/15/21 | | | 64,320 | | |
| | 427,000 | | | Viasat, Inc., 8.875%, 9/15/16 | | | 454,755 | | |
| | | | | | | | 597,348 | | |
| | | Consumer Staples — 0.8% | |
| | 250,000 | | | Ingles Markets, Inc., 8.875%, 5/15/17 | | | 267,500 | | |
| | | | | Total Corporate Bonds | | $ | 31,489,994 | | |
Shares | | | | Market
Value | |
| | | Preferred Stock — 0.3%
Financials — 0.3% | |
| | 90 | | | Ally Financial, Inc., 144a, 7.00% | | $ | 85,059 | | |
| Shares | | | | Market
Value | |
| | | Investment Funds — 3.0% | |
| | 564,670 | | | Invesco Liquid Assets Portfolio ** | | $ | 564,670 | | |
| | 416,239 | | | Touchstone Institutional
Money Market Fund^ | | | 416,239 | | |
| | | Total Investment Funds | | $ | 980,909 | | |
| | | Total Investment Securities — 100.0%
(Cost $30,493,293) | | $ | 32,555,962 | | |
| | | Liabilities in Excess of
Other Assets — 0.0% | | | (4,123 | ) | |
| | | Net Assets — 100.0% | | $ | 32,551,839 | | |
† All or a portion of the security is on loan. The total value of the securities on loan as of December 31, 2010, was $536,741.
* Non-income producing security.
(A) Variable rate security – the rate reflected is the rate in effect as of December 31, 2010.
** Represents collateral for securities loaned.
^ Affiliated Fund, sub-advised by Fort Washington Investment Advisors, Inc. See Note 3.
Portfolio Abbreviations:
PLC – Public Limited Company
144a – This is a restricted security that was sold in a transaction exempt from Rule 144a of the Securities Act of 1933. This security may be sold in transactions exempt from registration, normally to qualified institutional buyers. At December 31, 2010, these securities were valued at $12,569,491 or 38.6% of net assets.
67
Touchstone High Yield Fund (Continued)
Other Information:
The inputs or methodology used for valuing securities may not be an indication of the risk associated with investing in those securities. For more information on valuation inputs, and their aggregation into the levels used in the table below, please refer to the security valuation section in the accompanying notes to financial statements.
Valuation Inputs at Reporting Date:
| Description | | Level 1 | | Level 2 | | Level 3 | | Total | |
Corporate
Bonds | | $ | — | | | $ | 31,489,994 | | | $ | — | | | $ | 31,489,994 | | |
Investment
Funds | | | 980,909 | | | | — | | | | — | | | | 980,909 | | |
Preferred
Stock | | | — | | | | 85,059 | | | | — | | | | 85,059 | | |
| | | | | | | | | $ | 32,555,962 | | |
The accompanying notes are an integral part of the financial statements.
68
Portfolio of Investments
Touchstone Large Cap Core Equity Fund – December 31, 2010
| Common Stocks — 98.5% | | Shares | | Market
Value | |
| Information Technology — 21.9% | |
| Cisco Systems, Inc.* | | | 35,631 | | | $ | 720,815 | | |
| Fiserv, Inc.* | | | 7,540 | | | | 441,542 | | |
| Google, Inc. - Class A* | | | 1,880 | | | | 1,116,664 | | |
| Hewlett-Packard Co. | | | 9,827 | | | | 413,717 | | |
| Intel Corp. | | | 41,236 | | | | 867,193 | | |
| International Business Machines Corp. | | | 6,100 | | | | 895,236 | | |
| Microsoft Corp. | | | 28,990 | | | | 809,401 | | |
| Oracle Corp. | | | 36,869 | | | | 1,154,000 | | |
| QUALCOMM, Inc. | | | 20,585 | | | | 1,018,752 | | |
| Tyco Electronics Ltd. | | | 29,550 | | | | 1,046,070 | | |
| Western Digital Corp.* | | | 15,785 | | | | 535,111 | | |
| Xilinx, Inc. | | | 15,290 | | | | 443,104 | | |
| | | | | | 9,461,605 | | |
| Industrials — 13.5% | |
| Danaher Corp. | | | 15,208 | | | | 717,361 | | |
| Eaton Corp. | | | 7,220 | | | | 732,902 | | |
| Emerson Electric Co. | | | 14,940 | | | | 854,120 | | |
| Honeywell International, Inc. | | | 8,992 | | | | 478,015 | | |
| Illinois Tool Works, Inc. | | | 16,305 | | | | 870,687 | | |
| Union Pacific Corp. | | | 9,174 | | | | 850,063 | | |
| United Technologies Corp. | | | 16,541 | | | | 1,302,107 | | |
| | | | | | 5,805,255 | | |
| Consumer Discretionary — 13.1% | |
| Dollar Tree, Inc.* | | | 11,720 | | | | 657,258 | | |
| Genuine Parts Co. | | | 9,460 | | | | 485,676 | | |
| Home Depot, Inc. | | | 12,380 | | | | 434,043 | | |
| Honda Motor Co. Ltd. ADR | | | 17,817 | | | | 703,771 | | |
| McDonald's Corp. | | | 10,195 | | | | 782,568 | | |
| Ross Stores, Inc. | | | 21,760 | | | | 1,376,320 | | |
| Target Corp. | | | 19,736 | | | | 1,186,726 | | |
| | | | | | 5,626,362 | | |
| Financials — 13.0% | |
| Aflac, Inc. | | | 25,250 | | | | 1,424,858 | | |
| Allstate Corp. | | | 23,392 | | | | 745,737 | | |
| American Express Co. | | | 19,146 | | | | 821,746 | | |
| MetLife, Inc. | | | 17,400 | | | | 773,256 | | |
| NYSE Euronext | | | 25,340 | | | | 759,693 | | |
| State Street Corp. | | | 23,640 | | | | 1,095,478 | | |
| | | | | | 5,620,768 | | |
| Health Care — 11.3% | |
| Bristol-Myers Squibb Co. | | | 20,590 | | | | 545,223 | | |
| Express Scripts, Inc.* | | | 3,900 | | | | 210,795 | | |
| Laboratory Corp. of America Holdings* | | | 5,057 | | | | 444,612 | | |
| McKesson Corp. | | | 12,848 | | | | 904,242 | | |
| Merck & Co., Inc. | | | 10,470 | | | | 377,339 | | |
| Novartis AG ADR † | | | 16,975 | | | | 1,000,676 | | |
| Teva Pharmaceutical Industries Ltd. ADR | | | 10,220 | | | | 532,769 | | |
| UnitedHealth Group, Inc. | | | 23,430 | | | | 846,057 | | |
| | | | | | 4,861,713 | | |
| | | Shares | | Market
Value | |
| Energy — 11.0% | |
| Chevron Corp. | | | 11,946 | | | $ | 1,090,072 | | |
| ConocoPhillips | | | 10,090 | | | | 687,129 | | |
| Ensco PLC ADR | | | 15,924 | | | | 850,023 | | |
| Marathon Oil Corp. | | | 19,604 | | | | 725,936 | | |
| Noble Corp. | | | 17,080 | | | | 610,952 | | |
| Pride International, Inc.* | | | 24,150 | | | | 796,950 | | |
| | | | | | 4,761,062 | | |
| Consumer Staples — 6.4% | |
| Altria Group, Inc. | | | 25,837 | | | | 636,107 | | |
| PepsiCo, Inc. | | | 11,340 | | | | 740,842 | | |
| Philip Morris International, Inc. | | | 23,777 | | | | 1,391,668 | | |
| | | | | | 2,768,617 | | |
| Materials — 3.5% | |
| BHP Billiton Ltd. ADR † | | | 5,430 | | | | 504,555 | | |
| Praxair, Inc. | | | 10,629 | | | | 1,014,751 | | |
| | | | | | 1,519,306 | | |
| Telecommunication Services — 2.6% | |
| AT&T, Inc. | | | 22,543 | | | | 662,313 | | |
| Vodafone Group PLC ADR | | | 16,520 | | | | 436,624 | | |
| | | | | | 1,098,937 | | |
| Utilities — 2.2% | |
| Dominion Resources, Inc. | | | 22,449 | | | | 959,021 | | |
| Total Common Stocks | | | | $ | 42,482,646 | | |
| Investment Funds —5.0% | |
| Invesco Liquid Assets Portfolio ** | | | 1,505,069 | | | | 1,505,069 | | |
Touchstone Institutional
Money Market Fund^ | | | 629,519 | | | | 629,519 | | |
| Total Investment Funds | | | | $ | 2,134,588 | | |
Total Investment Securities — 103.5%
(Cost $36,597,292) | | | | $ | 44,617,234 | | |
| Liabilities in Excess of Other Assets — (3.5%) | | | | | (1,496,974 | ) | |
| Net Assets — 100.0% | | | | $ | 43,120,260 | | |
* Non-income producing security.
† All or a portion of the security is on loan. The total value of the securities on loan as of December 31, 2010, was $1,473,535.
** Represents collateral for securities loaned.
^ Affiliated Fund, sub-advised by Fort Washington Investment Advisors, Inc. See Note 3.
69
Touchstone Large Cap Core Equity Fund (Continued)
Portfolio Abbreviations:
ADR – American Depositary Receipt
PLC – Public Limited Company
Other Information:
The inputs or methodology used for valuing securities may not be an indication of the risk associated with investing in those securities. For more information on valuation inputs, and their aggregation into the levels used in the table below, please refer to the security valuation section in the accompanying notes to financial statements.
Valuation Inputs at Reporting Date:
| Description | | Level 1 | | Level 2 | | Level 3 | | Total | |
Common
Stocks | | $ | 42,482,646 | | | $ | — | | | $ | — | | | $ | 42,482,646 | | |
Investment
Funds | | | 2,134,588 | | | | — | | | | — | | | | 2,134,588 | | |
| | | | | | | | | $ | 44,617,234 | | |
The accompanying notes are an integral part of the financial statements.
70
Portfolio of Investments
Touchstone Mid Cap Growth Fund – December 31, 2010
| Common Stocks — 98.4% | | Shares | | Market
Value | |
| Information Technology — 19.0% | |
| Agilent Technologies, Inc.* | | | 3,845 | | | $ | 159,298 | | |
| Akamai Technologies, Inc.* | | | 4,800 | | | | 225,840 | | |
| Alliance Data Systems Corp.* † | | | 4,300 | | | | 305,429 | | |
| Atheros Communications, Inc.* | | | 4,080 | | | | 146,554 | | |
| Autodesk, Inc.* | | | 10,000 | | | | 382,000 | | |
| Avago Technologies Ltd. | | | 16,530 | | | | 470,609 | | |
| Avnet, Inc.* | | | 3,945 | | | | 130,303 | | |
| BMC Software, Inc.* | | | 5,400 | | | | 254,556 | | |
| Broadcom Corp. - Class A | | | 3,325 | | | | 144,804 | | |
| Brocade Communications Systems, Inc.* | | | 29,800 | | | | 157,642 | | |
| Ciena Corp.* † | | | 7,275 | | | | 153,139 | | |
| Gartner, Inc.* | | | 8,900 | | | | 295,480 | | |
| Longtop Financial Technologies Ltd. ADR* | | | 8,150 | | | | 294,867 | | |
| LSI Corp.* | | | 54,200 | | | | 324,658 | | |
| Maxim Integrated Products, Inc. | | | 5,785 | | | | 136,642 | | |
| NICE Systems Ltd. ADR* | | | 10,900 | | | | 380,410 | | |
| ON Semiconductor Corp.* | | | 44,100 | | | | 435,708 | | |
| QLogic Corp.* | | | 6,115 | | | | 104,077 | | |
| Red Hat, Inc.* | | | 5,900 | | | | 269,335 | | |
| Salesforce.com, Inc.* | | | 2,120 | | | | 279,840 | | |
| Verigy Ltd.* | | | 7,151 | | | | 93,106 | | |
| Western Digital Corp.* | | | 4,900 | | | | 166,110 | | |
| | | | | | 5,310,407 | | |
| Financials — 15.6% | |
| Ameriprise Financial, Inc. | | | 6,700 | | | | 385,585 | | |
| Arch Capital Group Ltd.* | | | 1,731 | | | | 152,415 | | |
| Assurant, Inc. | | | 2,185 | | | | 84,166 | | |
| Boston Properties, Inc. REIT | | | 1,260 | | | | 108,486 | | |
| Comerica, Inc. | | | 4,145 | | | | 175,085 | | |
| Digital Realty Trust, Inc. REIT † | | | 2,580 | | | | 132,973 | | |
| Discover Financial Services | | | 20,400 | | | | 378,012 | | |
| Federal Realty Investment Trust REIT | | | 1,505 | | | | 117,285 | | |
| First Horizon National Corp.* | | | 13,045 | | | | 153,669 | | |
| Fulton Financial Corp. | | | 17,030 | | | | 176,090 | | |
| Health Care REIT, Inc. REIT | | | 2,685 | | | | 127,913 | | |
| Home Properties, Inc. REIT | | | 2,185 | | | | 121,246 | | |
| IntercontinentalExchange, Inc.* | | | 2,170 | | | | 258,556 | | |
| Invesco, Ltd. | | | 8,155 | | | | 196,209 | | |
| KeyCorp | | | 17,875 | | | | 158,194 | | |
| Kilroy Realty Corp. REIT | | | 3,910 | | | | 142,598 | | |
| Knight Capital Group, Inc. - Class A* | | | 12,555 | | | | 173,133 | | |
| Liberty Property Trust REIT | | | 4,435 | | | | 141,565 | | |
| New York Community Bancorp, Inc. | | | 2,726 | | | | 51,385 | | |
| Northern Trust Corp. | | | 2,835 | | | | 157,087 | | |
| NYSE Euronext | | | 9,200 | | | | 275,816 | | |
| PartnerRe Ltd. | | | 1,505 | | | | 120,927 | | |
| Regency Centers Corp. REIT | | | 3,300 | | | | 139,392 | | |
| Synovus Financial Corp. † | | | 54,755 | | | | 144,553 | | |
| TCF Financial Corp. † | | | 9,180 | | | | 135,956 | | |
| Willis Group Holdings PLC | | | 5,000 | | | | 173,150 | | |
| | | | | | 4,381,446 | | |
| | | Shares | | Market
Value | |
| Industrials — 14.3% | |
| AMETEK, Inc. | | | 9,650 | | | $ | 378,762 | | |
| Cooper Industries PLC | | | 6,450 | | | | 375,970 | | |
| Delta Air Lines, Inc.* | | | 15,500 | | | | 195,300 | | |
| Dover Corp. | | | 9,255 | | | | 540,955 | | |
| Hexcel Corp.* | | | 9,830 | | | | 177,825 | | |
| IDEX Corp. | | | 8,900 | | | | 348,168 | | |
| Jacobs Engineering Group, Inc.* | | | 2,855 | | | | 130,902 | | |
| Joy Global, Inc. | | | 2,065 | | | | 179,139 | | |
| Kennametal, Inc. | | | 4,290 | | | | 169,283 | | |
| MSC Industrial Direct Co. - Class A | | | 4,200 | | | | 271,698 | | |
| Precision Castparts Corp. | | | 2,360 | | | | 328,536 | | |
| Rockwell Collins, Inc. | | | 2,510 | | | | 146,233 | | |
| Roper Industries, Inc. | | | 4,450 | | | | 340,113 | | |
| SPX Corp. | | | 2,640 | | | | 188,734 | | |
| WABCO Holdings, Inc.* | | | 3,835 | | | | 233,666 | | |
| | | | | | 4,005,284 | | |
| Consumer Discretionary — 13.1% | |
| Abercrombie & Fitch Co. - Class A | | | 1,775 | | | | 102,293 | | |
| American Eagle Outfitters, Inc. | | | 8,645 | | | | 126,476 | | |
| Bed Bath & Beyond, Inc.* | | | 7,350 | | | | 361,253 | | |
| Coach, Inc. | | | 7,550 | | | | 417,591 | | |
| Discovery Communications, Inc. - Class A* | | | 6,250 | | | | 260,625 | | |
| Foot Locker, Inc. | | | 7,350 | | | | 144,207 | | |
| Fortune Brands, Inc. | | | 3,090 | | | | 186,173 | | |
| International Speedway Corp. - Class A | | | 4,960 | | | | 129,803 | | |
| Jarden Corp. | | | 5,490 | | | | 169,476 | | |
| Lear Corp.* | | | 5,520 | | | | 544,879 | | |
| Lennar Corp. - Class A † | | | 5,675 | | | | 106,406 | | |
| Macy's, Inc. | | | 2,415 | | | | 61,099 | | |
| Marriott International, Inc. - Class A | | | 3,916 | | | | 162,671 | | |
New Oriental Education & Technology
Group ADR* | | | 1,940 | | | | 204,146 | | |
| Nordstrom, Inc. | | | 6,200 | | | | 262,756 | | |
| priceline.com, Inc.* | | | 860 | | | | 343,613 | | |
| Toll Brothers, Inc.* | | | 4,580 | | | | 87,020 | | |
| | | | | | 3,670,487 | | |
| Energy — 10.4% | |
| Cameron International Corp.* | | | 3,965 | | | | 201,144 | | |
| CONSOL Energy, Inc. | | | 10,255 | | | | 499,829 | | |
| Denbury Resources, Inc.* | | | 23,895 | | | | 456,156 | | |
| Massey Energy Co. | | | 8,100 | | | | 434,565 | | |
| Murphy Oil Corp. | | | 2,331 | | | | 173,776 | | |
| National-Oilwell Varco, Inc. | | | 5,882 | | | | 395,565 | | |
| Petrohawk Energy Corp.* | | | 7,685 | | | | 140,251 | | |
| Weatherford International Ltd.* | | | 27,195 | | | | 620,046 | | |
| | | | | | 2,921,332 | | |
| Health Care — 9.9% | |
| Covance, Inc.* | | | 3,775 | | | | 194,073 | | |
| Dendreon Corp.* † | | | 6,200 | | | | 216,504 | | |
| Life Technologies Corp.* | | | 7,150 | | | | 396,825 | | |
| Mettler-Toledo International, Inc.* | | | 1,790 | | | | 270,666 | | |
71
Touchstone Mid Cap Growth Fund (Continued)
| Common Stocks — 98.4% (Continued) | | Shares | | Market
Value | |
| Shire PLC ADR | | | 4,500 | | | $ | 325,710 | | |
| Thermo Fisher Scientific, Inc.* | | | 2,965 | | | | 164,142 | | |
| United Therapeutics Corp.* | | | 4,150 | | | | 262,363 | | |
| Varian Medical Systems, Inc.* | | | 5,000 | | | | 346,400 | | |
| Vertex Pharmaceuticals, Inc.* | | | 9,550 | | | | 334,537 | | |
| Warner Chilcott PLC - Class A | | | 11,000 | | | | 248,160 | | |
| | | | | | 2,759,380 | | |
| Materials — 9.1% | |
| Albemarle Corp. | | | 1,795 | | | | 100,125 | | |
| Celanese Corp. | | | 2,600 | | | | 107,042 | | |
| Commercial Metals Co. | | | 9,820 | | | | 162,914 | | |
| Crown Holdings, Inc.* | | | 15,800 | | | | 527,404 | | |
| Cytec Industries, Inc. | | | 3,475 | | | | 184,384 | | |
| Ecolab, Inc. | | | 5,700 | | | | 287,394 | | |
| Greif, Inc. - Class A | | | 4,000 | | | | 247,600 | | |
| International Flavors & Fragrances, Inc. | | | 3,585 | | | | 199,290 | | |
| Scotts Miracle-Gro Co. (The) - Class A | | | 4,600 | | | | 233,542 | | |
| Solutia, Inc.* | | | 13,400 | | | | 309,272 | | |
| Yamana Gold, Inc. | | | 14,700 | | | | 188,160 | | |
| | | | | | 2,547,127 | | |
| Consumer Staples — 3.5% | |
| BJ's Wholesale Club, Inc.* | | | 2,855 | | | | 136,754 | | |
| Green Mountain Coffee Roasters, Inc.* † | | | 5,300 | | | | 174,158 | | |
| J.M. Smucker Co. (The) | | | 2,435 | | | | 159,858 | | |
| Molson Coors Brewing Co. - Class B | | | 3,385 | | | | 169,893 | | |
| Ralcorp Holdings, Inc.* | | | 5,200 | | | | 338,052 | | |
| | | | | | 978,715 | | |
| Utilities — 2.2% | |
| Consolidated Edison, Inc. | | | 3,095 | | | | 153,419 | | |
| Hawaiian Electric Industries, Inc. | | | 7,055 | | | | 160,783 | | |
| PG&E Corp. | | | 2,375 | | | | 113,620 | | |
| Wisconsin Energy Corp. | | | 3,280 | | | | 193,061 | | |
| | | | | | 620,883 | | |
| Telecommunication Services — 1.3% | |
| NII Holdings, Inc.* | | | 8,300 | | | | 370,678 | | |
| Total Common Stocks | | | | $ | 27,565,739 | | |
| Investment Funds — 6.4% | |
| Invesco Liquid Assets Portfolio ** | | | 1,230,659 | | | | 1,230,659 | | |
Touchstone Institutional
Money Market Fund^ | | | 552,764 | | | | 552,764 | | |
| Total Investment Funds | | | | $ | 1,783,423 | | |
Total Investment Securities — 104.8%
(Cost $23,616,053) | | | | $ | 29,349,162 | | |
| Liabilities in Excess of Other Assets — (4.8%) | | | | | (1,335,946 | ) | |
| Net Assets — 100.0% | | | | $ | 28,013,216 | | |
* Non-income producing security.
† All or a portion of the security is on loan. The total value of the securities on loan as of December 31, 2010, was $1,199,920.
** Represents collateral for securities loaned.
^ Affiliated Fund, sub-advised by Fort Washington Investment Advisors, Inc. See Note 3.
Portfolio Abbreviations:
ADR – American Depositary Receipt
PLC – Public Limited Company
REIT – Real Estate Investment Trust
Other Information:
The inputs or methodology used for valuing securities may not be an indication of the risk associated with investing in those securities. For more information on valuation inputs, and their aggregation into the levels used in the table below, please refer to the security valuation section in the accompanying notes to financial statements.
Valuation Inputs at Reporting Date:
| Description | | Level 1 | | Level 2 | | Level 3 | | Total | |
Common
Stocks | | $ | 27,565,739 | | | $ | — | | | $ | — | | | $ | 27,565,739 | | |
Investment
Funds | | | 1,783,423 | | | | — | | | | — | | | | 1,783,423 | | |
| | | | | | | | | $ | 29,349,162 | | |
The accompanying notes are an integral part of the financial statements.
72
Portfolio of Investments
Touchstone Money Market Fund – December 31, 2010
Principal
Amount | |
| | Interest
Rate | | Maturity
Date | | Value | |
| | | Corporate Bonds — 4.5% | |
| $ | 233,000 | | | Wells Fargo & Co. | | | 4.88 | | | 01/12/11 | | $ | 233,297 | | |
| | 230,000 | | | ConocoPhillips | | | 9.38 | | | 02/15/11 | | | 232,460 | | |
| | 650,000 | | | General Electric Capital Corp. Ser MTNA | | | 6.13 | | | 02/22/11 | | | 654,818 | | |
| | 100,000 | | | Credit Suisse USA, Inc. | | | 5.25 | | | 03/02/11 | | | 100,793 | | |
| | 1,000,000 | | | Countrywide Home Loans, Inc. Ser MTNL | | | 4.00 | | | 03/22/11 | | | 1,006,104 | | |
| | 300,000 | | | Mercantile Safe Deposit & Trust Co. | | | 5.70 | | | 11/15/11 | | | 312,100 | | |
| | | Total Corporate Bonds | | | | | | | | $ | 2,539,572 | | |
| | | Taxable Municipal Bonds — 10.4% | |
| | 325,000 | | | Mason OH EDR Ser 2010 | | | 1.50 | | | 02/02/11 | | | 325,084 | | |
| | 500,000 | | | Franklin OH BANS Ser 2010 | | | 1.10 | | | 03/11/11 | | | 500,187 | | |
| | 450,000 | | | KY Asset / Liability Comm Gnrl Fd Rev Ser 2010 | | | 0.84 | | | 04/01/11 | | | 450,000 | | |
| | 750,000 | | | Hamilton Co IN Redev Dist BANS Ser 2010 | | | 0.75 | | | 07/15/11 | | | 750,001 | | |
| | 300,000 | | | Hamilton Southeastern IN Con Sch Bld Corp UTGO BANS Ser 2010 | | | 1.25 | | | 07/15/11 | | | 300,000 | | |
| | 710,000 | | | Bristol CT GO BANS Ser 2010 | | | 1.25 | | | 08/01/11 | | | 711,680 | | |
| | 300,000 | | | Butler Co OH BANS (Fiber Optic Impt) | | | 1.50 | | | 08/04/11 | | | 300,000 | | |
| | 500,000 | | | Union Twp OH BANS Ser 2010 | | | 1.25 | | | 09/13/11 | | | 501,730 | | |
| | 400,000 | | | Metrowest MA Regl Tran Auth RANS Ser 2010 | | | 1.50 | | | 09/29/11 | | | 401,468 | | |
| | 600,000 | | | American Municipal Power-Ohio, Inc. Rev BANS Ser 2010 | | | 1.50 | | | 10/27/11 | | | 602,464 | | |
| | 100,000 | | | MA Water Resources Auth. Rev Ser 1995 B (Natl Re) | | | 6.25 | | | 12/01/11 | | | 105,048 | | |
| | 300,000 | | | Marshfield WI Rev BANS Ser 2010 | | | 2.00 | | | 12/01/11 | | | 303,274 | | |
| | 700,000 | | | Ramapo NY GO BANS Ser 2010 | | | 2.00 | | | 12/13/11 | | | 704,911 | | |
| | | Total Taxable Municipal Bonds | | | | | | | | $ | 5,955,847 | | |
| | | U.S. Government Agency Obligations — 22.4% | |
| | 1,000,000 | | | FHLB | | | 0.88 | | | 01/20/11 | | | 1,000,193 | | |
| | 1,900,000 | | | FNMA | | | 6.25 | | | 02/01/11 | | | 1,908,272 | | |
| | 1,859,649 | | | Overseas Private Investment Corp. Ser A (A) | | | 0.32 | | | 01/07/11 | | | 1,859,649 | | |
| | 3,366,000 | | | Overseas Private Investment Corp. (A) | | | 0.32 | | | 01/07/11 | | | 3,366,000 | | |
| | 1,565,303 | | | Overseas Private Investment Corp. (A) | | | 0.32 | | | 01/07/11 | | | 1,565,303 | | |
| | 2,271,106 | | | Overseas Private Investment Corp. (A) | | | 0.32 | | | 01/07/11 | | | 2,271,106 | | |
| | 800,000 | | | Overseas Private Investment Corp. Ser 2 (A) | | | 0.28 | | | 01/07/11 | | | 800,000 | | |
| | | Total U.S. Government Agency Obligations | | | | | | | | $ | 12,770,523 | | |
| | | Commercial Paper — 4.3% | |
| | 2,441,000 | | | BNP Paribas Finance, Inc. | | | 0.00 | | | 01/03/11 | | | 2,440,986 | | |
| | | Variable Rate Demand Notes — 58.3% (A) | |
| | 1,100,000 | | | Allen Co OH Hosp Facs Rev Ser 2010 C (LOC: Bank of Nova Scotia) | | | 0.29 | | | 01/01/11 | | | 1,100,000 | | |
| | 500,000 | | | Jackson Co MS Port Fac Rev (Chevron USA) Ser 1993 | | | 0.27 | | | 01/01/11 | | | 500,000 | | |
| | 1,000,000 | | | MS Business Fin Corp Rev BANS Ser 2010 I | | | 0.26 | | | 01/01/11 | | | 1,000,000 | | |
| | 1,100,000 | | | OH St Higher Edl Fac Rev Ser 2002 A (SPA: Landesbank Hessen-Thuringen) | | | 0.34 | | | 01/01/11 | | | 1,100,000 | | |
| | 400,000 | | | Orange Co FL Sch Brd COP Ser 2008 E (LOC: Wachovia Bank) | | | 0.28 | | | 01/01/11 | | | 400,000 | | |
| | 1,200,000 | | | Sarasota Co FL Pub Hosp Dist Rev Ser 2008 A (LOC: Northern Trust Co) | | | 0.26 | | | 01/01/11 | | | 1,200,000 | | |
| | 1,500,000 | | | VT Edl & Hlth Bldgs Fin Agy Rev Ser 2007 A (LOC: TD Bank NA) | | | 0.28 | | | 01/01/11 | | | 1,500,000 | | |
| | 1,960,000 | | | 486 Lesser Street LLC (LOC: Comerica Bank) | | | 0.63 | | | 01/07/11 | | | 1,960,000 | | |
| | 780,000 | | | Agra Enterprises LLC Ser 2004 (LOC: US Bank NA) | | | 0.60 | | | 01/07/11 | | | 780,000 | | |
| | 545,000 | | | Butler Co OH Cap Fdg Rev (CCAO Low Cost) Ser 2005 B (LOC: US Bank NA) | | | 0.47 | | | 01/07/11 | | | 545,000 | | |
| | 455,000 | | | CA Infra & Econ Dev Bk Rev Ser 2008 B (LOC: Comerica Bank) | | | 0.71 | | | 01/07/11 | | | 455,000 | | |
| | 1,485,000 | | | CA St Enterprise Dev Auth IDR (Tri-Tool Inc) Ser 2007 B (LOC: Comerica Bank) | | | 0.71 | | | 01/07/11 | | | 1,485,000 | | |
| | 190,000 | | | CA Statewide CDA MFH (Sunrise Fresno) Ser 2000 B (LOC: FNMA) | | | 0.32 | | | 01/07/11 | | | 190,000 | | |
| | 250,000 | | | Chattanooga TN Hlth Edl & Hsg Fac Bd MFH (Windridgde) Ser 2003 B
(LOC: FNMA) | | | 0.40 | | | 01/07/11 | | | 250,000 | | |
73
Touchstone Money Market Fund (Continued)
Principal
Amount | |
| | Interest
Rate | | Maturity
Date | | Value | |
| | | Variable Rate Demand Notes — 58.3% (A) (Continued) | |
| $ | 435,000 | | | Diaz Upton LLC (LOC: State Street Bank) | | | 0.34 | | | 01/07/11 | | $ | 435,000 | | |
| | 1,490,000 | | | Driftwood Landing Corp. Ser 2002 (LOC: National City Bank) | | | 0.36 | | | 01/07/11 | | | 1,490,000 | | |
| | 297,000 | | | Fitch Denney Funeral Home (LOC: FHLB) | | | 0.47 | | | 01/07/11 | | | 297,000 | | |
| | 85,000 | | | FL St Hsg Fin Corp. MFH (Avalon Reserve) Ser 2003 (LOC: FNMA) | | | 0.38 | | | 01/07/11 | | | 85,000 | | |
| | 535,000 | | | IL St Fin Auth Rev (Community Action) Ser 2008 B (LOC: Harris NA) | | | 0.55 | | | 01/07/11 | | | 535,000 | | |
| | 390,000 | | | JL Capital One LLC Ser 2002 (LOC: Wells Fargo Bank) | | | 0.34 | | | 01/07/11 | | | 390,000 | | |
| | 500,000 | | | Labcon NA Ser 2010 | | | 0.36 | | | 01/07/11 | | | 500,000 | | |
| | 395,000 | | | Lake Oswego OR Redev Agy Rev Ser 2005 B (LOC: Wells Fargo Bank) | | | 0.34 | | | 01/07/11 | | | 395,000 | | |
| | 2,000,000 | | | Lavonia O Frick Family Trust Ser 2006 (LOC: FHLB) | | | 0.34 | | | 01/07/11 | | | 2,000,000 | | |
| | 2,235,000 | | | Mequon WI IDR (Gateway Plastics) Ser 2001 B (LOC: Bank One) | | | 0.44 | | | 01/07/11 | | | 2,235,000 | | |
| | 1,825,000 | | | Miarko, Inc. (LOC: PNC Bank N.A.) | | | 0.36 | | | 01/07/11 | | | 1,825,000 | | |
| | 967,000 | | | Mill Street Village LLC (LOC: FHLB) | | | 0.47 | | | 01/07/11 | | | 967,000 | | |
| | 1,190,000 | | | NJ Economic Dev Auth Rev (Cascade Corp) Ser 2008 C
(LOC: Bank of America NA) | | | 0.47 | | | 01/07/11 | | | 1,190,000 | | |
| | 700,000 | | | NY St Hsg Fin Agy Rev Ser 2005 B (LOC: FHLMC) | | | 0.28 | | | 01/07/11 | | | 700,000 | | |
| | 1,515,000 | | | Phoenix AZ Realty MFH Rev (Brightons Mark) Ser 1999 (LOC: Northern Trust Co.) | | | 0.45 | | | 01/07/11 | | | 1,515,000 | | |
| | 345,000 | | | Sacramento Co CA Hsg Auth MFH Rev (Deer Park Apts) Ser 2002 (LOC: FNMA) | | | 0.27 | | | 01/07/11 | | | 345,000 | | |
| | 100,000 | | | Simi Valley CA MFH Rev (Parker Ranch) Ser 2002 (LOC: FNMA) | | | 0.28 | | | 01/07/11 | | | 100,000 | | |
| | 1,000,000 | | | Springfield MO IDA Rev Ser 2010 D (LOC: Guaranty Bank) | | | 0.47 | | | 01/07/11 | | | 1,000,000 | | |
| | 430,000 | | | St Paul MN Port Auth Dist Heating Rev Ser 2009 (LOC: Deutsche Bank AG) | | | 0.30 | | | 01/07/11 | | | 430,000 | | |
| | 105,000 | | | Suffolk Co NY IDA Civic Fac Rev (Hampton Day School) Ser 2001 B
(LOC: JP Morgan Chase Bank) | | | 0.51 | | | 01/07/11 | | | 105,000 | | |
| | 1,230,000 | | | Tennis for Charity, Inc. FL Rev Ser 2004 (LOC: JP Morgan Chase Bank) | | | 0.29 | | | 01/07/11 | | | 1,230,000 | | |
| | 280,000 | | | Volusia Co FL Dev Auth Ind Dev Rev Ser 2007 B (LOC: LaSalle Bank) | | | 0.90 | | | 01/07/11 | | | 280,000 | | |
| | 1,164,000 | | | WAI Enterprises LLC Ser 2004 (LOC: FHLB) | | | 0.60 | | | 01/07/11 | | | 1,164,000 | | |
| | 400,000 | | | York Co SC PCR Ser 2008 B-3 (SPA: National Rural Utilities Finance) | | | 0.75 | | | 03/01/11 | | | 400,000 | | |
| | 1,200,000 | | | Chatom AL IDB Gulf Opp Zone Ser 2008 A (SPA: National Rural Utilities Finance) | | | 0.83 | | | 05/16/11 | | | 1,200,000 | | |
| | | Total Variable Rate Demand Notes | | | | | | | | $ | 33,278,000 | | |
Total Investment Securities — 99.9%
(Cost $56,984,928) | | $ | 56,984,928 | | |
| Other Assets in Excess of Liabilities — 0.1% | | | 46,603 | | |
| Net Assets — 100.0% | | $ | 57,031,531 | | |
(A) Variable rate security – Interest rate represents the current rate in effect as of December 31, 2010. Maturity date represents the next interest rate reset date.
Portfolio Abbreviations:
BANS - Bond Anticipation Notes
CDA - Communities Development Authority
COP - Certificates of Participation
EDR - Economic Development Revenue
FNMA - Federal National Mortgage Association
FHLB - Federal Home Loan Bank
FHLMC - Federal Home Loan Mortgage Corp.
GO - General Obligation
IDA - Industrial Development Authority/Agency
IDB - Industrial Development Bond
74
Touchstone Money Market Fund (Continued)
IDR - Industrial Development Revenue
LOC - Letter of Credit
MFH - Multi-Family Housing
PCR - Pollution Control Revenue
RANS - Revenue Anticipation Notes
SPA - Stand-by Purchase Agreement
UTGO - Unlimited Tax General Obligation
Other Information:
The inputs or methodology used for valuing securities may not be an indication of the risk associated with investing in those securities. For more information on valuation inputs, and their aggregation into the levels used in the table below, please refer to the security valuation section in the accompanying notes to financial statements.
Valuation Inputs at Reporting Date:
| Description | | Level 1 | | Level 2 | | Level 3 | | Total | |
| Variable Rate Demand Notes | | $ | — | | | $ | 33,278,000 | | | $ | — | | | $ | 33,278,000 | | |
| U.S. Government Agency Obligations | | | — | | | | 12,770,523 | | | | — | | | | 12,770,523 | | |
| Taxable Municipal Bonds | | | — | | | | 5,955,847 | | | | — | | | | 5,955,847 | | |
| Corporate Bonds | | | — | | | | 2,539,572 | | | | — | | | | 2,539,572 | | |
| Commercial Paper | | | — | | | | 2,440,986 | | | | — | | | | 2,440,986 | | |
| | | | | | | | | $ | 56,984,928 | | |
The accompanying notes are an integral part of the financial statements.
75
Portfolio of Investments
Touchstone Third Avenue Value Fund – December 31, 2010
| Common Stocks — 93.7% | | Shares | | Market
Value | |
| Financials — 40.3% | |
| Bank of New York Mellon Corp. | | | 81,758 | | | $ | 2,469,092 | | |
| Brookfield Asset Management, Inc. - Class A | | | 72,237 | | | | 2,404,770 | | |
| Capital Southwest Corp. | | | 4,173 | | | | 433,157 | | |
| Cheung Kong Holdings Ltd. | | | 202,000 | | | | 3,115,969 | | |
| Forest City Enterprises, Inc. - Class A* | | | 67,500 | | | | 1,126,575 | | |
| Hang Lung Group Ltd. | | | 147,000 | | | | 966,408 | | |
| Henderson Land Development Co. Ltd. | | | 450,720 | | | | 3,073,302 | | |
| Investment Technology Group, Inc.* | | | 48,523 | | | | 794,321 | | |
| Investor AB - Class A | | | 140,000 | | | | 2,893,401 | | |
| KeyCorp | | | 45,000 | | | | 398,250 | | |
| St. Joe Company (The)* † | | | 9,600 | | | | 209,760 | | |
| Westwood Holdings Group, Inc. | | | 32,297 | | | | 1,290,588 | | |
| Wheelock & Co. Ltd. | | | 498,000 | | | | 2,014,988 | | |
| | | | | | 21,190,581 | | |
| Energy — 19.9% | |
| Bristow Group, Inc.* | | | 31,155 | | | | 1,475,189 | | |
| Bronco Drilling Co., Inc.* | | | 118,658 | | | | 949,264 | | |
| Cenovus Energy, Inc. | | | 49,400 | | | | 1,642,056 | | |
| Cimarex Energy Co. | | | 20,148 | | | | 1,783,702 | | |
| EnCana Corp. † | | | 49,400 | | | | 1,438,528 | | |
| Nabors Industries Ltd.* | | | 20,000 | | | | 469,200 | | |
| Pioneer Drilling Co.* | | | 141,359 | | | | 1,245,373 | | |
| Tidewater, Inc. | | | 27,000 | | | | 1,453,680 | | |
| | | | | | 10,456,992 | | |
| Information Technology — 12.6% | |
| AVX Corp. | | | 119,000 | | | | 1,836,170 | | |
| Electronics for Imaging, Inc.* | | | 62,600 | | | | 895,806 | | |
| Lexmark International, Inc. - Class A* | | | 21,600 | | | | 752,112 | | |
| Sycamore Networks, Inc. | | | 52,341 | | | | 1,077,701 | | |
| Synopsys, Inc.* | | | 26,700 | | | | 718,497 | | |
| Tellabs, Inc. | | | 198,450 | | | | 1,345,491 | | |
| | | | | | 6,625,777 | | |
| Materials — 11.4% | |
| Canfor Corp.* | | | 58,800 | | | | 656,422 | | |
| Lanxess AG | | | 10,700 | | | | 845,036 | | |
| P.H. Glatfelter Co. | | | 49,187 | | | | 603,524 | | |
| POSCO ADR | | | 22,300 | | | | 2,401,487 | | |
| Westlake Chemical Corp. | | | 33,780 | | | | 1,468,417 | | |
| | | | | | 5,974,886 | | |
| Consumer Discretionary — 8.6% | |
| MDC Holdings, Inc. | | | 12,210 | | | | 351,282 | | |
| Skyline Corp. | | | 20,123 | | | | 524,808 | | |
| Superior Industries International, Inc. | | | 33,733 | | | | 715,814 | | |
| Toyota Industries Corp. | | | 95,000 | | | | 2,949,809 | | |
| | | | | | 4,541,713 | | |
| Health Care — 0.9% | |
| Sanofi-Aventis SA | | | 7,500 | | | | 479,565 | | |
| Total Common Stocks | | | | $ | 49,269,514 | | |
| | | Shares | | Market
Value | |
| Investment Funds — 8.2% | |
| Invesco Liquid Assets Portfolio ** | | | 1,128,275 | | | $ | 1,128,275 | | |
Touchstone Institutional
Money Market Fund^ | | | 3,177,555 | | | | 3,177,555 | | |
| Total Investment Funds | | | | $ | 4,305,830 | | |
Total Investment Securities — 101.9%
(Cost $37,887,672) | | | | $ | 53,575,344 | | |
| Liabilities in Excess of Other Assets — (1.9%) | | | | | (997,691 | ) | |
| Net Assets — 100.0% | | | | $ | 52,577,653 | | |
* Non-income producing security.
† All or a portion of the security is on loan. The total value of the securities on loan as of December 31, 2010, was $1,107,274.
** Represents collateral for securities loaned.
^ Affiliated Fund, sub-advised by Fort Washington Investment Advisors, Inc. See Note 3.
Portfolio Abbreviations:
ADR – American Depositary Receipt
Other Information:
The inputs or methodology used for valuing securities may not be an indication of the risk associated with investing in those securities. For more information on valuation inputs, and their aggregation into the levels used in the table below, please refer to the security valuation section in the accompanying notes to financial statements.
Valuation Inputs at Reporting Date:
| Description | | Level 1 | | Level 2 | | Level 3 | | Total | |
Common
Stocks | | $ | 49,269,514 | | | $ | — | | | $ | — | | | $ | 49,269,514 | | |
Investment
Funds | | | 4,305,830 | | | | — | | | | — | | | | 4,305,830 | | |
| | | | | | | | | $ | 53,575,344 | | |
The accompanying notes are an integral part of the financial statements.
76
Portfolio of Investments
Touchstone Aggressive ETF Fund – December 31, 2010
| Shares | | | | Value | |
| | | Exchange Traded Funds — 99.2% | |
| | 34,640 | | | iShares Barclays Aggregate
Bond Fund | | $ | 3,663,180 | | |
| | 66,410 | | | iShares MSCI EAFE Index Fund | | | 3,867,054 | | |
| | 74,530 | | | iShares S&P 500 Growth Index Fund | | | 4,892,149 | | |
| | 12,210 | | | iShares S&P 500 Index Fund/US † | | | 1,541,513 | | |
| | 50,790 | | | iShares S&P 500 Value Index Fund † | | | 3,026,576 | | |
| | 10,210 | | | iShares S&P MidCap 400 Growth
Index Fund | | | 1,028,351 | | |
| | 9,720 | | | iShares S&P MidCap 400/BARRA
Value Index Fund | | | 772,351 | | |
| | 2,710 | | | iShares S&P SmallCap 600 Value
Index Fund † | | | 194,903 | | |
| | 2,810 | | | iShares S&P SmallCap 600/BARRA
Growth Index Fund † | | | 203,978 | | |
| | | | | Total Exchange Traded Funds | | $ | 19,190,055 | | |
| | | Investment Funds — 25.8% | |
| | 4,819,831 | | | Invesco Liquid Assets Portfolio ** | | | 4,819,831 | | |
| | 173,668 | | | Touchstone Institutional
Money Market Fund^ | | | 173,668 | | |
| | | | | Total Investment Funds | | $ | 4,993,499 | | |
| | | | | Total Investment Securities — 125.0%
(Cost $21,318,812) | | $ | 24,183,554 | | |
| | | | | Liabilities in
Excess of Other Assets — (25.0%) | | | (4,842,090 | ) | |
| | | | | Net Assets — 100.0% | | $ | 19,341,464 | | |
† All or a portion of the security is on loan. The total value of the securities on loan as of December 31, 2010, was $4,709,884.
** Represents collateral for securities loaned.
^ Affiliated Fund, sub-advised by Fort Washington Investment Advisors, Inc. See Note 3.
Other Information:
The inputs or methodology used for valuing securities may not be an indication of the risk associated with investing in those securities. For more information on valuation inputs, and their aggregation into the levels used in the table below, please refer to the security valuation section in the accompanying notes to financial statements.
Valuation Inputs at Reporting Date:
| Description | | Level 1 | | Level 2 | | Level 3 | | Total | |
Exchange
Traded
Funds | | $ | 19,190,055 | | | $ | — | | | $ | — | | | $ | 19,190,055 | | |
Investment
Funds | | | 4,993,499 | | | | — | | | | — | | | | 4,993,499 | | |
| | | | | | | | | $ | 24,183,554 | | |
The accompanying notes are an integral part of the financial statements.
77
Portfolio of Investments
Touchstone Conservative ETF Fund – December 31, 2010
| Shares | | | | Value | |
| | | Exchange Traded Funds — 99.1% | |
| | 34,340 | | | iShares Barclays 1-3 Year Treasury
Bond Fund † | | $ | 2,883,873 | | |
| | 110,580 | | | iShares Barclays Aggregate Bond Fund | | | 11,693,835 | | |
| | 36,610 | | | iShares MSCI EAFE Index Fund | | | 2,131,800 | | |
| | 39,990 | | | iShares S&P 500 Growth Index Fund † | | | 2,624,944 | | |
| | 3,720 | | | iShares S&P 500 Index Fund/US † | | | 469,650 | | |
| | 26,880 | | | iShares S&P 500 Value Index Fund † | | | 1,601,779 | | |
| | 4,990 | | | iShares S&P MidCap 400 Growth
Index Fund | | | 502,593 | | |
| | 5,900 | | | iShares S&P MidCap 400/BARRA
Value Index Fund | | | 468,814 | | |
| | 3,250 | | | iShares S&P SmallCap 600 Value
Index Fund † | | | 233,740 | | |
| | 3,410 | | | iShares S&P SmallCap 600/BARRA
Growth Index Fund † | | | 247,532 | | |
| | | | | Total Exchange Traded Funds | | $ | 22,858,560 | | |
| | | Investment Funds — 26.1% | |
| | 5,764,771 | | | Invesco Liquid Assets Portfolio ** | | | 5,764,771 | | |
| | 255,117 | | | Touchstone Institutional
Money Market Fund^ | | | 255,117 | | |
| | | | | Total Investment Funds | | $ | 6,019,888 | | |
| | | | | Total Investment Securities — 125.2%
(Cost $26,392,401) | | $ | 28,878,448 | | |
| | | | | Liabilities in
Excess of Other Assets — (25.2%) | | | (5,812,708 | ) | |
| | | | | Net Assets — 100.0% | | $ | 23,065,740 | | |
† All or a portion of the security is on loan. The total value of the securities on loan as of December 31, 2010, was $5,615,361.
** Represents collateral for securities loaned.
^ Affiliated Fund, sub-advised by Fort Washington Investment Advisors, Inc. See Note 3.
Other Information:
The inputs or methodology used for valuing securities may not be an indication of the risk associated with investing in those securities. For more information on valuation inputs, and their aggregation into the levels used in the table below, please refer to the security valuation section in the accompanying notes to financial statements.
Valuation Inputs at Reporting Date:
| Description | | Level 1 | | Level 2 | | Level 3 | | Total | |
Exchange
Traded
Funds | | $ | 22,858,560 | | | $ | — | | | $ | — | | | $ | 22,858,560 | | |
Investment
Funds | | | 6,019,888 | | | | — | | | | — | | | | 6,019,888 | | |
| | | | | | | | | $ | 28,878,448 | | |
The accompanying notes are an integral part of the financial statements.
78
Portfolio of Investments
Touchstone Enhanced ETF Fund – December 31, 2010
| Shares | | | | Value | |
| | | Exchange Traded Funds — 99.3% | |
| | 27,710 | | | iShares Barclays Aggregate
Bond Fund † | | $ | 2,930,333 | | |
| | 52,610 | | | iShares MSCI EAFE Index Fund | | | 3,063,480 | | |
| | 47,800 | | | iShares S&P 500 Growth Index Fund † | | | 3,137,592 | | |
| | 7,300 | | | iShares S&P 500 Value Index Fund † | | | 435,007 | | |
| | 32,660 | | | iShares S&P MidCap 400 Growth
Index Fund | | | 3,289,515 | | |
| | 5,560 | | | iShares S&P MidCap 400/BARRA
Value Index Fund | | | 441,798 | | |
| | 6,320 | | | iShares S&P SmallCap 600 Value
Index Fund † | | | 454,534 | | |
| | 6,240 | | | iShares S&P SmallCap 600/BARRA
Growth Index Fund † | | | 452,962 | | |
| | | | | Total Exchange Traded Funds | | $ | 14,205,221 | | |
| | | Investment Funds — 28.8% | |
| | 3,955,450 | | | Invesco Liquid Assets Portfolio ** | | | 3,955,450 | | |
| | 165,474 | | | Touchstone Institutional
Money Market Fund^ | | | 165,474 | | |
| | | | | Total Investment Funds | | $ | 4,120,924 | | |
| | | | | Total Investment Securities — 128.1%
(Cost $16,637,628) | | $ | 18,326,145 | | |
| | | | | Liabilities in
Excess of Other Assets — (28.1%) | | | (4,020,678 | ) | |
| | | | | Net Assets — 100.0% | | $ | 14,305,467 | | |
† All or a portion of the security is on loan. The total value of the securities on loan as of December 31, 2010, was $3,839,252.
** Represents collateral for securities loaned.
^ Affiliated Fund, sub-advised by Fort Washington Investment Advisors, Inc. See Note 3.
Other Information:
The inputs or methodology used for valuing securities may not be an indication of the risk associated with investing in those securities. For more information on valuation inputs, and their aggregation into the levels used in the table below, please refer to the security valuation section in the accompanying notes to financial statements.
Valuation Inputs at Reporting Date:
| Description | | Level 1 | | Level 2 | | Level 3 | | Total | |
Exchange
Traded
Funds | | $ | 14,205,221 | | | $ | — | | | $ | — | | | $ | 14,205,221 | | |
Investment
Funds | | | 4,120,924 | | | | — | | | | — | | | | 4,120,924 | | |
| | | | | | | | | $ | 18,326,145 | | |
The accompanying notes are an integral part of the financial statements.
79
Portfolio of Investments
Touchstone Moderate ETF Fund – December 31, 2010
| Shares | | | | Value | |
| | | Exchange Traded Funds — 98.9% | |
| | 193,660 | | | iShares Barclays Aggregate
Bond Fund | | $ | 20,479,545 | | |
| | 139,480 | | | iShares MSCI EAFE Index Fund | | | 8,121,920 | | |
| | 157,940 | | | iShares S&P 500 Growth Index Fund † | | | 10,367,182 | | |
| | 21,130 | | | iShares S&P 500 Index Fund/US † | | | 2,667,663 | | |
| | 105,100 | | | iShares S&P 500 Value Index Fund † | | | 6,262,909 | | |
| | 22,860 | | | iShares S&P MidCap 400 Growth
Index Fund | | | 2,302,459 | | |
| | 20,140 | | | iShares S&P MidCap 400/BARRA
Value Index Fund | | | 1,600,324 | | |
| | 7,450 | | | iShares S&P SmallCap 600 Value
Index Fund † | | | 535,804 | | |
| | 7,870 | | | iShares S&P SmallCap 600/BARRA
Growth Index Fund † | | | 571,283 | | |
| | | | | Total Exchange Traded Funds | | $ | 52,909,089 | | |
| | | Investment Funds — 21.7% | |
| | 10,938,116 | | | Invesco Liquid Assets Portfolio ** | | | 10,938,116 | | |
| | 683,798 | | | Touchstone Institutional
Money Market Fund^ | | | 683,798 | | |
| | | | | Total Investment Funds | | $ | 11,621,914 | | |
| | | | | Total Investment Securities — 120.6%
(Cost $60,429,534) | | $ | 64,531,003 | | |
| | | | | Liabilities in
Excess of Other Assets — (20.6%) | | | (11,039,437 | ) | |
| | | | | Net Assets — 100.0% | | $ | 53,491,566 | | |
† All or a portion of the security is on loan. The total value of the securities on loan as of December 31, 2010, was $10,680,414.
** Represents collateral for securities loaned.
^ Affiliated Fund, sub-advised by Fort Washington Investment Advisors, Inc. See Note 3.
Other Information:
The inputs or methodology used for valuing securities may not be an indication of the risk associated with investing in those securities. For more information on valuation inputs, and their aggregation into the levels used in the table below, please refer to the security valuation section in the accompanying notes to financial statements.
Valuation Inputs at Reporting Date:
| Description | | Level 1 | | Level 2 | | Level 3 | | Total | |
Exchange
Traded
Funds | | $ | 52,909,089 | | | $ | — | | | $ | — | | | $ | 52,909,089 | | |
Investment
Funds | | | 11,621,914 | | | | — | | | | — | | | | 11,621,914 | | |
| | | | | | | | | $ | 64,531,003 | | |
The accompanying notes are an integral part of the financial statements.
80
Report of Independent Registered Public Accounting Firm
To the Board of Trustees and Shareholders of Touchstone Variable Series Trust
We have audited the accompanying statements of assets and liabilities, including the portfolios of investments, of Touchstone Variable Series Trust, comprised of the Baron Small Cap Growth Fund, Core Bond Fund, Mid Cap Growth Fund, High Yield Fund, Large Cap Core Equity Fund, Money Market Fund, Third Avenue Value Fund, Aggressive ETF Fund, Conservative ETF Fund, Enhanced ETF Fund, and Moderate ETF Fund (the "Funds"), as of December 31, 2010, and the related statements of operations for the year then ended, the statements of changes in net assets for each of the two years in the period then ended, and the financial highlights for each of the five years in the periods then ended. These financial statements and financial highlights are the responsibility of the Funds' management. Our responsibility is to express an opinion on these financial statements and financial highlights based on our audits.
We conducted our audits in accordance with the standards of the Public Company Accounting Oversight Board (United States). Those standards require that we plan and perform the audits to obtain reasonable assurance about whether the financial statements are free of material misstatement. We were not engaged to perform an audit of the Funds' internal control over financial reporting. Our audits included consideration of internal control over financial reporting as a basis for designing audit procedures that are appropriate in the circumstances, but not for the purpose of expressing an opinion on the effectiveness of the Funds' internal control over financial reporting. Accordingly, we express no such opinion. An audit also includes examining, on a test basis, evidence supporting the amounts and disclosures in the financial statements, assessing the accounting principles used and significant estimates made by management, and evaluating the overall financial statement presentation. Our procedures included confirmation of securities owned as of December 31, 2010, by correspondence with the custodian and brokers, or by other appropriate auditing procedures where replies from brokers were not received. We believe that our audits provide a reasonable basis for our opinion.
In our opinion, the financial statements and financial highlights referred to above present fairly, in all material respects, the financial position of each of the respective portfolios comprising Touchstone Variable Series Trust at December 31, 2010, the results of their operations for the year then ended, the changes in their net assets for each of the two years in the period then ended, and their financial highlights for each of the five years in the period then ended, in conformity with U.S. generally accepted accounting principles.
Cincinnati, Ohio
February 25, 2011
81
Other Items (Unaudited)
Dividend Received Deduction
For corporate shareholders, the following ordinary distributions paid during the current fiscal year ended December 31, 2010 qualify for the corporate dividends received deduction:
| Touchstone Core Bond Fund | | | 1 | % | |
| Touchstone Large Cap Core Equity Fund | | | 100 | % | |
| Touchstone Mid Cap Growth Fund | | | 100 | % | |
| Touchstone Third Avenue Value Fund | | | 100 | % | |
| Touchstone Aggressive ETF Fund | | | 100 | % | |
| Touchstone Conservative ETF Fund | | | 100 | % | |
| Touchstone Enhanced ETF Fund | | | 100 | % | |
| Touchstone Moderate ETF Fund | | | 100 | % | |
Proxy Voting Guidelines
The Sub-Advisors are responsible for exercising the voting rights associated with the securities purchased and held by the Funds. A description of the policies and procedures that the Sub-Advisors use in fulfilling this responsibility and information regarding how those proxies were voted during the twelve month period ended June 30 are available without charge upon request by calling toll free 1.800.543.0407. These items are also available on the Securities and Exchange Commission's (the Commission) website at http://www.sec.gov.
Quarterly Portfolio Disclosure
The Trust files a complete listing of portfolio holdings for each Fund as of the end of the first and third quarters of each fiscal year on Form N-Q. The complete listing (i) is available on the Commission's website; (ii) may be reviewed and copied at the Commission's Public Reference Room in Washington, DC; and (iii) will be made available to shareholders upon request by calling 1.800.543.0407. Information on the operation of the Public Reference Room may be obtained by calling 1-800-SEC-0330.
Schedule of Shareholder Expenses
As a shareholder of the Funds, you incur two types of costs: (1) transaction costs, including reinvested dividends or other distributions; and (2) ongoing costs, including investment advisory fees; distribution (12b-1) fees; and other Fund expenses. This example is intended to help you understand your ongoing costs (in dollars) of investing in the Funds and to compare these costs with the ongoing costs of investing in other mutual funds.
The example is based on an investment of $1,000 invested at the beginning of the period and held for the entire period (July 1, 2010 through December 31, 2010).
Actual Expenses
The first line of the table below provides information about actual account values and actual expenses. You may use the information in this line, together with the amount you invested, to estimate the expenses that you paid over the period. Simply divide your account value by $1,000 (for example, an $8,600 account value divided by $1,000 = 8.6), then multiply the result by the number in the first line under the heading entitled "Expenses Paid During the Six Months Ended December 31, 2010" to estimate the expenses you paid on your account during this period.
Hypothetical Example for Comparison Purposes
The second line of the table below provides information about hypothetical account values and hypothetical expenses based on the Funds' actual expense ratio and an assumed rate of return of 5% per year before expenses,
82
Other Items (Continued)
which is not the Funds' actual return. The hypothetical account values and expenses may not be used to estimate the actual ending account balance or expenses you paid for the period. You may use this information to compare the ongoing costs of investing in the Funds and other funds. To do so, compare this 5% hypothetical example with the 5% hypothetical examples that appear in the shareholder reports of the other funds.
| | | Net Expense
Ratio
Annualized
December 31,
2010 | | Beginning
Account
Value
July 1,
2010 | | Ending
Account
Value
December 31,
2010 | | Expenses
Paid During
the Six Months
Ended
December 31,
2010* | |
| Touchstone Baron Small Cap Growth Fund | |
| Actual | | | 1.55 | % | | $ | 1,000.00 | | | $ | 1,244.60 | | | $ | 8.77 | | |
| Hypothetical | | | 1.55 | % | | $ | 1,000.00 | | | $ | 1,017.39 | | | $ | 7.88 | | |
| Touchstone Core Bond Fund | |
| Actual | | | 0.88 | % | | $ | 1,000.00 | | | $ | 1,026.20 | | | $ | 4.49 | | |
| Hypothetical | | | 0.88 | % | | $ | 1,000.00 | | | $ | 1,020.77 | | | $ | 4.48 | | |
| Touchstone High Yield Fund | |
| Actual | | | 1.11 | % | | $ | 1,000.00 | | | $ | 1,095.00 | | | $ | 5.86 | | |
| Hypothetical | | | 1.11 | % | | $ | 1,000.00 | | | $ | 1,019.61 | | | $ | 5.65 | | |
| Touchstone Large Cap Core Equity Fund | |
| Actual | | | 0.98 | % | | $ | 1,000.00 | | | $ | 1,215.40 | | | $ | 5.47 | | |
| Hypothetical | | | 0.98 | % | | $ | 1,000.00 | | | $ | 1,020.27 | | | $ | 4.99 | | |
| Touchstone Mid Cap Growth Fund | |
| Actual | | | 1.17 | % | | $ | 1,000.00 | | | $ | 1,304.90 | | | $ | 6.80 | | |
| Hypothetical | | | 1.17 | % | | $ | 1,000.00 | | | $ | 1,019.31 | | | $ | 5.96 | | |
| Touchstone Money Market Fund | |
| Actual | | | 0.50 | % | | $ | 1,000.00 | | | $ | 1,001.70 | | | $ | 2.52 | | |
| Hypothetical | | | 0.50 | % | | $ | 1,000.00 | | | $ | 1,022.68 | | | $ | 2.55 | | |
| Touchstone Third Avenue Value Fund | |
| Actual | | | 1.17 | % | | $ | 1,000.00 | | | $ | 1,303.00 | | | $ | 6.79 | | |
| Hypothetical | | | 1.17 | % | | $ | 1,000.00 | | | $ | 1,019.31 | | | $ | 5.96 | | |
| Touchstone Aggressive ETF Fund | |
| Actual | | | 0.75 | % | | $ | 1,000.00 | | | $ | 1,186.20 | | | $ | 4.13 | | |
| Hypothetical | | | 0.75 | % | | $ | 1,000.00 | | | $ | 1,021.42 | | | $ | 3.82 | | |
| Touchstone Conservative ETF Fund | |
| Actual | | | 0.75 | % | | $ | 1,000.00 | | | $ | 1,079.10 | | | $ | 3.93 | | |
| Hypothetical | | | 0.75 | % | | $ | 1,000.00 | | | $ | 1,021.42 | | | $ | 3.82 | | |
| Touchstone Enhanced ETF Fund | |
| Actual | | | 0.75 | % | | $ | 1,000.00 | | | $ | 1,205.30 | | | $ | 4.17 | | |
| Hypothetical | | | 0.75 | % | | $ | 1,000.00 | | | $ | 1,021.42 | | | $ | 3.82 | | |
| Touchstone Moderate ETF Fund | |
| Actual | | | 0.75 | % | | $ | 1,000.00 | | | $ | 1,137.30 | | | $ | 4.04 | | |
| Hypothetical | | | 0.75 | % | | $ | 1,000.00 | | | $ | 1,021.42 | | | $ | 3.82 | | |
* Expenses are equal to the Fund's annualized expense ratio, multiplied by the average account value over the period, multiplied by [number of days in most recent fiscal half-year/365 [or 366]] (to reflect one-half year period).
83
Other Items (Continued)
Advisory Agreement Approval Disclosure
At a meeting held on November 18, 2010, the Board of Trustees (the "Board" or "Trustees") of the Touchstone Variable Series Trust (the 'Trust"), and by a separate vote, the Independent Trustees of the Trust, approved the continuance of the Investment Advisory Agreement between the Trust and the Advisor with respect to each Fund of the Trust and the Sub-Advisory Agreement(s) with respect to each Fund between the Advisor and the respective Sub-Advisor(s).
In determining whether to approve the continuation of the Investment Advisory Agreement and the Sub-Advisory Agreements, the Advisor furnished information necessary for a majority of the Independent Trustees to make the determination that the continuance of the Investment Advisory Agreement and the respective Sub-Advisory Agreement(s) was in the best interests of each of the Funds and its respective shareholders. The information provided to the Board included: (1) industry data comparing advisory fees and expense ratios of comparable investment companies; (2) comparative performance information; (3) the Advisor's and its affiliates' revenues and costs of providing services to the Funds; and (4) information about the Advisor's and Sub-Advisors' personnel. Prior to voting, the Independent Trustees reviewed the proposed continuance of the Investment Advisory Agreement and the Sub-Advisory Agreements with management and with experienced independent legal counsel and received materials from such counsel discussing the legal standards for their consideration of the proposed continuation of the Investment Advisory Agreement and the Sub-Advisory Agreement(s) with respect to each Fund. The Independent Trustees also reviewed the proposed continuation of the Investment Advisory Agreement and the Sub-Advisory Agreement(s) with respect to each of the Funds in private sessions with independent legal counsel at which no representatives of management were present.
In approving the Funds' Investment Advisory Agreement, the Board considered various factors, among them: (1) the nature, extent and quality of services provided to the Funds, including the personnel providing services; (2) the Advisor's compensation and profitability; (3) a comparison of fees and performance with other advisers; (4) economies of scale; and (5) the terms of the Investment Advisory Agreement. The Board's analysis of these factors is set forth below. The Independent Trustees were advised by independent legal counsel throughout the process.
Nature, Extent and Quality of Advisor Services. The Board considered the level and depth of knowledge of the Advisor, including the professional experience and qualifications of senior personnel. The Board discussed the Advisor's effectiveness in monitoring the performance of each Sub-Advisor, including those that were affiliates of the Advisor, and the Advisor's timeliness in responding to performance issues. In evaluating the quality of services provided by the Advisor, the Board took into account its familiarity with the Advisor's senior management through Board meetings, discussions and reports during the preceding year. The Board also took into account the Advisor's compliance policies and procedures. The quality of administrative and other services, including the Advisor's role in coordinating the activities of the Funds' other service providers, was also considered. The Board also considered the Advisor's relationship with its affiliates and the resources available to them, as well as any potential conflicts of interest. The Trustees concluded that they were satisfied with the nature, extent and quality of services provided to each Fund by the Advisor under the Investment Advisory Agreement.
Advisor's Compensation and Profitability. The Board took into consideration the financial condition and profitability of the Advisor and its affiliates (including the Sub-Advisors to certain of the Funds) and the direct and indirect benefits derived by the Advisor and its affiliates from the Advisor's relationship with the Funds. The information considered by the Board included operating profit margin information for the Advisor's business as a whole. The Board noted that the Advisor waived advisory fees for certain Funds. The Board also noted that the Advisor pays the Sub-Advisors' sub-advisory fees out of the advisory fees the Advisor receives from the Funds. The Board reviewed the profitability of the Advisor's relationship with the Funds both
84
Other Items (Continued)
before and after tax expenses and whether the Advisor has the financial wherewithal to continue to provide a high level of services to the Funds, noting the ongoing commitment of the Advisor's parent company with respect to providing support and resources as needed. The Board also considered that the Funds' distributor, an affiliate of the Advisor, receives Rule 12b-1 distribution fees from the Funds. The Board also noted that the Advisor derives benefits to its reputation and other benefits from its association with the Funds. The Board also considered that affiliates of the Advisor may benefit from certain indirect tax benefits, including those relating to dividend received deductions.
The Board recognized that the Advisor should be entitled to earn a reasonable level of profits in exchange for the level of services it provides to each Fund and the entrepreneurial risk that it assumes as Advisor. Based upon their review, the Trustees concluded that the Advisor and its affiliates' level of profitability, if any, from their relationship with each Fund was reasonable and not excessive.
Expenses and Performance. The Board compared the respective advisory fees and total expense ratios for each of the Funds with various comparative data, including the median and average advisory fees and total expense ratios of each Fund's respective peer group. The Board also considered, among other data, the Funds' respective performance results during the six-month, twelve-month, and thirty-six month periods ended September 30, 2010 and noted that the Board reviews on a quarterly basis detailed information about each Fund's performance results, portfolio composition and investment strategies. The Board also took into account current market conditions and their effect on the Funds' performance.
The Board also considered the effect of each Fund's growth and size on its performance and expenses. The Board further noted that the Advisor had waived advisory fees for certain Funds in order to reduce those Funds' respective operating expenses to targeted levels. The Board noted that the sub-advisory fees under the Sub-Advisory Agreement(s) with respect to each Fund were paid by the Advisor out of the advisory fees it receives from the Fund and the impact of such sub-advisory fees on the profitability of the Advisor. In reviewing the respective expense ratios and performance of each of the Funds, the Board also took into account the nature, extent and quality of the services provided by the Advisor and its affiliates.
The Board considered, among other data, the specific factors and related conclusions set forth below with respect to each Fund:
Touchstone Baron Small Cap Growth Fund. The Fund's advisory fee and total expense ratio (net of applicable expense waivers) were above the median of its peer group. The Board noted that the Advisor was currently waiving a portion of its advisory fee. The Board took into account management's discussion of the Fund's expenses, including the impact that the relatively small size of the Fund has upon expenses. The Fund's performance for the six-month and twelve-month periods ended September 30, 2010 was in the 4th quartile of its peer group, and the Fund's performance for the thirty-six-month period ended September 30, 2010 was in the 2nd quartile of its peer group. The Board noted management's explanation for the Fund's recent underperformance and management's continued monitoring of the Fund's performance. Based upon their review, the Trustees concluded that the Fund's performance was being addressed and that the advisory fee was reasonable in light of the high quality of services received by the Fund from the Advisor and the other factors considered.
Touchstone Core Bond Fund. The Fund's advisory fee and total expense ratio (net of applicable expense waivers) were above the median of its peer group. The Board noted that the Advisor was currently waiving a portion of its advisory fee. The Board took into account management's discussion of the Fund's expenses, including the impact that the relatively small size of the Fund has upon expenses. The Fund's performance for the six-month and thirty-six-month periods ended September 30, 2010 was in the 3rd quartile of its peer group, and the Fund's performance for the twelve-month period ended September 30, 2010 was in the 2nd quartile
85
Other Items (Continued)
of its peer group. The Board took into account management's discussion of the Fund's performance and management's continued monitoring of such performance. Based upon their review, the Trustees concluded that the Fund's performance was being addressed and that the advisory fee was reasonable in light of the high quality of services received by the Fund from the Advisor and the other factors considered.
Touchstone High Yield Fund. The Fund's advisory fee and total expense ratio were below the median and above the median, respectively, of its peer group. The Board took into account management's discussion of the Fund's expenses, including the impact that the relatively small size of the Fund has upon expenses. The Fund's performance for the six-month and thirty-six-month periods ended September 30, 2010 was in the 2nd quartile of its peer group, and the Fund's performance for the twelve-month period ended September 30, 2010 was in the 3rd quartile of its peer group. The Board took into account management's discussion of the Fund's performance. Based upon their review, the Trustees concluded that the Fund's performance was satisfactory and that the advisory fee was reasonable in light of the high quality of services received by the Fund from the Advisor.
Touchstone Large Cap Core Equity Fund. The Fund's advisory fee and total expense ratio (net of applicable expense waivers) were below the median of its peer group. The Board noted that the Advisor was currently waiving a portion of its advisory fee. The Fund's performance for the six-month and twelve-month periods ended September 30, 2010 was in the 2nd quartile of its peer group, and the Fund's performance for the thirty-six-month period ended September 30, 2010 was in the 3rd quartile of its peer group. Based upon their review, the Trustees concluded that the Fund's performance was satisfactory and that the advisory fee was reasonable in light of the high quality of services received by the Fund from the Advisor.
Touchstone Mid Cap Growth Fund. The Fund's advisory fee and total expense ratio (net of applicable expense waivers) were below the median of its peer group. The Board noted that the Advisor was currently waiving a portion of its advisory fee. The Fund's performance for the six-month and twelve-month periods ended September 30, 2010 was in the 4th quartile of its peer group, and the Fund's performance for the thirty-six-month period ended September 30, 2010 was in the 2nd quartile of its peer group. The Board took into account management's explanation of the Fund's recent underperformance and management's continued monitoring of the Fund's performance. Based upon their review, the Trustees concluded that the Fund's performance was being addressed and that the advisory fee was reasonable in light of the high quality of services received by the Fund from the Advisor and the other factors considered.
Touchstone Money Market Fund. The Fund's advisory fee and total expense ratio were above the median of its peer group. The Board noted that the Advisor was currently reimbursing a portion of the Fund's expenses. The Board took into account management's discussion of the Fund's expenses, including the impact that the relatively small size of the Fund has upon expenses. The Fund's performance for the six-month and twelve-month periods ended September 30, 2010 was in the 2nd quartile of its peer group, and the Fund's performance for the thirty-six-month period ended September 30, 2010 was in the 1st quartile of its peer group. Based upon their review, the Trustees concluded that the Fund's performance was satisfactory and that the advisory fee was reasonable in light of the high quality of services received by the Fund from the Advisor and the other factors considered.
Touchstone Third Avenue Value Fund. The Fund's advisory fee and total expense ratio (net of applicable expense waivers) were above the median of its peer group. The Board noted that the Advisor was currently waiving a portion of its advisory fee. The Board took into account management's discussion of the Fund's expenses, including the impact that the relatively small size of the Fund has upon expenses. The Fund's performance for the six-month, twelve-month and thirty-six-month periods ended September 30, 2010 was in the 1st quartile of its peer group . Based upon their review, the Trustees concluded that the Fund's
86
Other Items (Continued)
performance was satisfactory and that the advisory fee was reasonable in light of the high quality of services received by the Fund from the Advisor and the other factors considered.
Touchstone Conservative ETF Fund. The Fund's advisory fee and total expense ratio (net of applicable expense waivers) were below the median and above the median, respectively, of its peer group. The Board noted that the Advisor was currently waiving a portion of its advisory fee. The Board took into account management's discussion of the Fund's expenses, including the impact that the relatively small size of the Fund has upon expenses. The Fund's performance for the six-month and twelve-month periods ended September 30, 2010 was in the 3rd quartile of its peer group, and the Fund's performance for the thirty-six-month period ended September 30, 2010 was in the 2nd quartile of its peer group. The Board took into account management's explanation of the Fund's recent underperformance and management's continued monitoring of the Fund's performance. Based upon their review, the Trustees concluded that the Fund's performance was being addressed and that the advisory fee was reasonable in light of the high quality of services received by the Fund from the Advisor.
Touchstone Moderate ETF Fund. The Fund's advisory fee and total expense ratio (net of applicable expense waivers) were above the median of its peer group. The Board noted that the Advisor was currently waiving a portion of its advisory fee. The Board took into account management's discussion of the Fund's expenses, including the impact that the relatively small size of the Fund has upon expenses. The Fund's performance for the six-month and thirty-six-month periods ended September 30, 2010 was in the 2nd quartile of its peer group, and the Fund's performance for the twelve-month period ended September 30, 2010 was in the 3rd quartile of its peer group. Based upon their review, the Trustees concluded that the Fund's performance was satisfactory and that the advisory fee was reasonable in light of the high quality of services received by the Fund from the Advisor and the other factors considered.
Touchstone Aggressive ETF Fund. The Fund's advisory fee and total expense ratio (net of applicable expense waivers) were below the median and above the median, respectively, of its peer group. The Board noted that the Advisor was currently waiving a portion of its advisory fee. The Board took into account management's discussion of the Fund's expenses, including the impact that the relatively small size of the Fund has upon expenses. The Fund's performance for the six-month and thirty-six-month periods ended September 30, 2010 was in the 1st quartile of its peer group, and the Fund's performance for the twelve-month period ended September 30, 2010 was in the 3rd quartile of its peer group. Based upon their review, the Trustees concluded that the Fund's performance was satisfactory and that the advisory fee was reasonable in light of the high quality of services received by the Fund from the Advisor.
Touchstone Enhanced ETF Fund. The Fund's advisory fee and total expense ratio (net of applicable expense waivers) were below the median of its peer group. The Board noted that the Advisor was currently waiving a portion of its advisory fee. The Fund's performance was in the 2nd quartile of its peer group for the six-month period ended September 30, 2010, in the 3rd quartile of its peer group for the twelve-month period ended September 30, 2010 and in the 1st quartile of its peer group for the thirty-six-month period ended September 30, 2010. Based upon their review, the Trustees concluded that the Fund's performance was satisfactory and that the advisory fee was reasonable in light of the high quality of services received by the Fund from the Advisor.
Economies of Scale. The Board considered the effect of each Fund's current size and potential growth on its performance and fees. The Board took into account management's discussion of the Funds' advisory fee structure. The Board considered the effective advisory fees under the Investment Advisory Agreement as a percentage of assets at different asset levels and possible economies of scale that might be realized if the assets of each Fund increase. The Board noted that the advisory fee schedules for some of the Funds contain breakpoints that would reduce the respective advisory fee rate on assets above specified levels as the respective
87
Other Items (Continued)
Fund's assets increased and considered the necessity of adding breakpoints with respect to the Funds that did not currently have such breakpoints in their advisory fee schedules. The Board determined that adding breakpoints at specified levels to the advisory fee schedule of such Funds was not appropriate at this time given each Fund's current size. The Board also noted that if a Fund's assets increased over time, the Fund might realize other economies of scale if assets increased proportionally more than certain other expenses. The Board also considered the fact that, under the Investment Advisory Agreement, the advisory fee payable to the Advisor by a Fund was reduced by the total sub-advisory fee(s) paid by the Advisor to the Fund's Sub-Advisor(s).
Conclusion. In considering the renewal of the Funds' Investment Advisory Agreement, the Board, including the Independent Trustees, did not identify any single factor as controlling, and each Trustee may have attributed different weights to the various factors. The Trustees evaluated all information available to them on a Fund-by-Fund basis, and their determinations were made separately with respect to each Fund. The Board reached the following conclusions regarding the Funds' Investment Advisory Agreement with the Advisor, among others: (a) the Advisor had demonstrated that it possesses the capability and resources to perform the duties required of it under the Investment Advisory Agreement; (b) the Advisor maintains an appropriate compliance program; (c) the performance of each Fund is satisfactory in relation to the performance of funds with similar investment objectives and to relevant indices, or if not satisfactory, is being addressed; and (d) each Fund's advisory fee is reasonable in relation to those of similar funds and to the services to be provided by the Advisor. Based on their conclusions, the Trustees determined with respect to each Fund that continuation of the Investment Advisory Agreement was in the best interests of the Fund and its shareholders.
In approving the Funds' Sub-Advisory Agreements, the Board considered various factors with respect to each Fund and its Sub-Advisory Agreement(s), among them: (1) the nature, extent and quality of services provided to the Fund, including the personnel providing services; (2) the Sub-Advisor's compensation; (3) a comparison of the sub-advisory fee(s) and performance with other advisers; and (4) the terms of the Sub-Advisory Agreement(s). The Board's analysis of these factors is set forth below. The Independent Trustees were advised by independent legal counsel throughout the process.
Nature, Extent and Quality of Services Provided; Investment Personnel. The Board considered information provided by the Advisor regarding the services provided by each Sub-Advisor, including information presented periodically throughout the previous year. The Board noted the affiliation of the Sub-Advisors to certain of the Funds with the Advisor, noting any potential conflicts of interest. The Board also noted that, on a periodic basis, the Board meets with portfolio managers of the Sub-Advisors to discuss their respective performance and investment processes and strategies. The Board considered each Sub-Advisor's level of knowledge and investment style. The Board reviewed the experience and credentials of the investment personnel who are responsible for managing the investment of portfolio securities with respect to the Funds. The Board also noted each Sub-Advisor's brokerage practices. The Board also considered each Sub-Advisor's regulatory and compliance history. The Board noted that the Advisor's compliance monitoring processes includes quarterly reviews of compliance reports and annual compliance visits to the Sub-Advisors and that compliance issues, if any, are reported to the Board.
Sub-Advisor's Compensation. The Board also took into consideration the financial condition of each Sub-Advisor and any indirect benefits derived by each Sub-Advisor and its affiliates from the Sub-Advisor's relationship with the Funds. In considering the profitability to each Sub-Advisor of its relationship with the Funds, the Board noted the undertakings of the Advisor to maintain expense limitations for the Funds and also noted that the sub-advisory fees under the Sub-Advisory Agreements were paid by the Advisor out of the advisory fees that it receives under the Investment Advisory Agreement and in addition, with respect to the unaffiliated Sub-Advisors, are negotiated at arms-length. As a consequence, the profitability to each Sub-Advisor of its relationship with a Fund was not a substantial factor in the Board's deliberations. For similar
88
Other Items (Continued)
reasons, the Board did not consider the potential economies of scale in each Sub-Advisor's management of the respective Fund to be a substantial factor in its consideration, although the Board noted that the sub-advisory fee schedules for most of the Funds contained breakpoints that would reduce the sub-advisory fee rate on assets above specified levels if the respective Fund's assets increased.
Sub-Advisory Fees and Fund Performance. The Board considered that each Fund pays an advisory fee to the Advisor and that the Advisor pays the sub-advisory fee(s) to the respective Sub-Advisor(s). The Board also compared the sub-advisory fees paid by the Advisor to fees charged by the Sub-Advisor to manage comparable institutional separate accounts. The Board considered the amount retained by the Advisor and the sub-advisory fee paid to each Sub-Advisor with respect to the various services provided by the Advisor and the Sub-Advisor. The Board compared the sub-advisory fee(s) for each Fund with various comparative data, if available, including the median and average sub-advisory fees of each Fund's peer group, and considered the following information:
Touchstone Baron Small Cap Growth Fund. The Fund's sub-advisory fee was above the median of its peer group. Based upon their review, the Trustees concluded that the sub-advisory fee was reasonable in light of the quality of services received by the Fund from the Sub-Advisor and the other factors considered.
Touchstone Core Bond Fund. The Fund's sub-advisory fee was above the median of its peer group. Based upon their review, the Trustees concluded that the sub-advisory fee was reasonable in light of the quality of services received by the Fund from the Sub-Advisor and the other factors considered.
Touchstone High Yield Fund. The Fund's sub-advisory fee was at the median of its peer group. Based upon their review, the Trustees concluded that the sub-advisory fee was reasonable in light of the quality of services received by the Fund from the Sub-Advisor and the other factors considered.
Touchstone Large Cap Core Equity Fund. The Fund's sub-advisory fee was below the median of its peer group. Based upon their review, the Trustees concluded that the sub-advisory fee was reasonable in light of the quality of services received by the Fund from the Sub-Advisor.
Touchstone Mid Cap Growth Fund. The Fund's sub-advisory fees were above the median of its peer group. Based upon their review, the Trustees concluded that the sub-advisory fee was reasonable in light of the quality of services received by the Fund from the Sub-Advisor and the other factors considered.
Touchstone Money Market Fund. The Fund's sub-advisory fee was below the median of its peer group. Based upon their review, the Trustees concluded that the sub-advisory fee was reasonable in light of the quality of services received by the Fund from the Sub-Advisor.
Touchstone Third Avenue Value Fund. The Fund's sub-advisory fee was above the median of its peer group. Based upon their review, the Trustees concluded that the sub-advisory fee was reasonable in light of the quality of services received by the Fund from the Sub-Advisor and the other factors considered.
Touchstone Conservative ETF Fund. The Fund's sub-advisory fee was above the median of its peer group. Based upon their review, the Trustees concluded that the sub-advisory fee was reasonable in light of the quality of services received by the Fund from the Sub-Advisor and the other factors considered.
Touchstone Moderate ETF Fund. The Fund's sub-advisory fee was at the median of its peer group. Based upon their review, the Trustees concluded that the sub-advisory fee was reasonable in light of the quality of services received by the Fund from the Sub-Advisor and the other factors considered.
89
Other Items (Continued)
Touchstone Aggressive ETF Fund. The Fund's sub-advisory fee was above the median of its peer group. Based upon their review, the Trustees concluded that the sub-advisory fee was reasonable in light of the quality of services received by the Fund from the Sub-Advisor and the other factors considered.
Touchstone Enhanced ETF Fund. The Fund's sub-advisory fee was below the median of its peer group. Based upon their review, the Trustees concluded that the sub-advisory fee was reasonable in light of the quality of services received by the Fund from the Sub-Advisor.
As noted above, the Board considered each Fund's performance during the six-month, twelve-month, and thirty-six month periods ended September 30, 2010 as compared to each Fund's peer group and noted that the Board reviews on a quarterly basis detailed information about each Fund's performance results, portfolio composition and investment strategies. The Board also noted the Advisor's expertise and resources in monitoring the performance, investment style and risk adjusted performance of each Sub-Advisor. The Board was mindful of the Advisor's focus on each Sub-Advisor's performance and the Advisor's ways of addressing underperformance.
Conclusion. In considering the renewal of the Sub-Advisory Agreement(s) with respect to each Fund, the Board, including the Independent Trustees, did not identify any single factor as controlling, and each Trustee may have attributed different weights to the various factors. The Board reached the following conclusions regarding each Sub-Advisory Agreement, among others: (a) the Sub-Advisor was qualified to manage each Fund's assets in accordance with that Fund's investment objectives and policies; (b) the Sub-Advisor maintains an appropriate compliance program; (c) the performance of each Fund was satisfactory in relation to the performance of funds with similar investment objectives and to relevant indices, or if not satisfactory, is being addressed; (d) each Fund's advisory fees are reasonable in relation to those of similar funds and to the services to be provided by the Advisor and the Sub-Advisor; and (e) the Sub-Advisor's investment strategies are appropriate for pursuing the investment objectives of each Fund. Based on its conclusions, the Board determined that approval of the Sub-Advisory Agreement(s) with respect to each Fund was in the best interests of the respective Fund and its shareholders.
90
Management of the Trust (Unaudited)
Listed below is basic information regarding the Trustees and principal officers of the Trust. The Trust's Statement of Additional Information includes additional information about the Trustees and is available, without charge, upon request by calling 1.800.543.0407.
Interested Trustees1:
Name
Address
Age | | Position(s)
Held with
Trust | | Term of
Office2 And
Length of
Time Served | | Principal Occupation(s)
During Past 5 Years | | Number
of Funds
Overseen
in the
Touchstone
Fund
Complex3 | | Other
Directorships
Held4 | |
Jill T. McGruder
Touchstone Advisors, Inc
303 Broadway
Cincinnati, OH
Year of Birth: 1955 | | Trustee and President | | Until retirement at age 75 or until she resigns or is removed
Trustee since 1999 | | President and CEO of IFS Financial Services, Inc. (a holding company). | | | 42 | | | Director of LaRosa's (a restaurant chain), Capital Analysts Incorporated (an investment advisor and broker-dealer), IFS Financial Services, Inc. (a holding company), Integrity and National Integrity Life Insurance Co., Touchstone Securities (the Trust's distributor), Touchstone Advisors (the Trust's investment advisor and administrator) and W&S Financial Group Distributors (a distribution company). | |
|
Independent Trustees:
Phillip R. Cox
105 East Fourth Street
Cincinnati, OH
Year of Birth: 1947 | | Trustee | | Until retirement at age 75 or until he resigns or is removed
Trustee since 1999 | | President and Chief Executive Officer of Cox Financial Corp. (a financial services company). | | | 42 | | | Director of Cincinnati Bell (a communications company), Bethesda Inc. (a hospital), Timken Co. (a manufacturing company), Diebold (a technology solutions company), and Ohio Business Alliance for Higher Education. Director of Duke Energy from 1994-2008. | |
|
H. Jerome Lerner
c/o Touchstone Advisors, Inc.
303 Broadway
Cincinnati, OH
Year of Birth: 1938 | | Trustee | | Until retirement at age 75 or until he resigns or is removed
Trustee since 1989 | | Principal of HJL Enterprises (a privately held investment company). | | | 42 | | | None | |
|
91
Management of the Trust (Continued)
Independent Trustees (Continued):
Name
Address
Age | | Position(s)
Held with
Trust | | Term of
Office2 And
Length of
Time Served | | Principal Occupation(s)
During Past 5 Years | | Number
of Funds
Overseen
in the
Touchstone
Fund
Complex3 | | Other
Directorships
Held4 | |
Donald C. Siekmann
c/o Touchstone Advisors, Inc.
303 Broadway
Cincinnati, OH
Year of Birth: 1938 | | Trustee | | Until retirement at age 75 or until he resigns or is removed
Trustee since 2005 | | Executive for Duro Bag Manufacturing Co. (a bag manufacturer) from 2002-2008. | | | 42 | | | None | |
|
John P. Zanotti
c/o Touchstone Advisors, Inc.
303 Broadway
Cincinnati, OH
Year of Birth: 1948 | | Trustee | | Until retirement at age 75 or until he resigns or is removed
Trustee since 2002 | | CEO, Chairman and Director of Avaton, Inc. (a wireless entertainment company) until 2006. President of Cincinnati Biomedical (a life science and economic development company) from 2003-2007. Chairman of Integrated Media Technologies (a media company) | | | 42 | | | Director of Q Med (a health care management company) from 2004-2007. | |
|
Susan J. Hickenlooper
c/o Touchstone Advisors, Inc.
303 Broadway
Cincinnati, OH
Year of Birth: 1946 | | Trustee | | Until retirement at age 75 or until he resigns or is removed
Trustee since 2009 | | Trustee of Episcopal Retirement Homes Foundation | | | 42 | | | Trustee of Gateway Trust from 2006-2008, Trustee of Cincinnati Parks Foundation (a charitable organization). | |
|
1 Ms. McGruder, as a director of the Advisor and the Trust's Distributor, and an officer of affiliates of the Advisor and the Trust's Distributor, is an "interested person" of the Trust within the meaning of Section 2(a)(19) of the 1940 Act.
2 Each Trustee is elected to serve until the age of 75 or until he or she sooner resigns or is removed.
3 The Touchstone Fund Complex consists of 11 variable annuity series of the Trust, 3 series of Touchstone Tax-Free Trust, 1 series of Touchstone Institutional Funds Trust, 4 series of Touchstone Investment Trust, 4 series of Touchstone Strategic Trust, and 19 series of Touchstone Funds Group Trust.
4 Each Trustee is also a Trustee of Touchstone Funds Group Trust, Touchstone Institutional Funds Trust, Touchstone Investment Trust, Touchstone Strategic Trust, and Touchstone Tax-Free Trust.
92
Management of the Trust (Continued)
Principal Officers1:
Name
Address
Age | | Position(s)
Held with
Trust | | Term of
Office2 And
Length of
Time Served | | Principal Occupation(s)
During Past 5 Years | | Number
of Funds
Overseen
in the
Touchstone
Fund
Complex2 | | Other
Directorships
Held | |
Jill T. McGruder
Touchstone Advisors, Inc.
303 Broadway
Cincinnati, OH
Year of Birth: 1955 | | President | | Until resignation, removal or disqualification
President since 2004; President from 2000-2002 | | See biography above. | | | 42 | | | See biography above. | |
|
Brian E. Hirsch
Touchstone Advisors, Inc.
303 Broadway
Cincinnati, OH
Year of Birth: 1956 | | Vice President | | Until resignation, removal or disqualification
Vice President since 2003 | | Senior Vice President of Compliance and Fund Administration of IFS Financial Services, Inc. | | | 42 | | | None | |
|
Steven M. Graziano
Touchstone Advisors, Inc.
303 Broadway
Cincinnati, OH
Year of Birth: 1954 | | Vice President | | Until resignation, removal or disqualification
Vice President since 2009 | | President of Touchstone Advisors, Inc.; Executive Vice President of Pioneer Investment Management, Head of Retail Distribution and Strategic Marketing 2007-2008; Executive Vice President of Pioneer Investment Management, Chief Marketing Officer 2002-2007. | | | 42 | | | None | |
|
Timothy D. Paulin
Touchstone Advisors, Inc.
303 Broadway
Cincinnati, OH
Year of Birth: 1963 | | Vice President | | Until resignation, removal or disqualification Vice President since 2010 | | Vice President of Investment Research; Principal of Klein Decisions | | | 42 | | | None | |
|
Joseph Melcher
Touchstone Advisors, Inc.
303 Broadway
Cincinnati, OH
Year of Birth: 1973 | | Chief Compliance Officer | | Until resignation, removal or disqualification
Chief Compliance Officer since 2010 | | Vice President of Compliance of IFS Financial Services (a holding company); Assistant Vice President of Compliance of IFS Financial Services 2005-2010. | | | 42 | | | None | |
|
Terrie A. Wiedenheft
Touchstone Advisors, Inc.
303 Broadway
Cincinnati, OH
Year of Birth: 1962 | | Controller and Treasurer | | Until resignation, removal or disqualification
Controller since 2000
Treasurer since 2003 | | Chief Financial Officer and Senior Vice President of IFS Financial Services, Inc. | | | 42 | | | None | |
|
Jay S. Fitton
JPMorgan.
303 Broadway
Cincinnati, OH
Year of Birth: 1970 | | Secretary | | Until resignation, removal or disqualification
Secretary since 2006. Assistant Secretary from 2002-2006 | | Assistant Vice President and Senior Counsel at JPMorgan Chase Bank, N.A. | | | 42 | | | None | |
|
1 Each officer also holds the same office with Touchstone Funds Group Trust, Touchstone Institutional Funds Trust, Touchstone Investment Trust, Touchstone Tax-Free Trust, and Touchstone Tax-Free Trust.
2 The Touchstone Fund Complex consists of 11 variable annuity series of the Trust, 3 series of Touchstone Tax-Free Trust, 1 series of Touchstone Institutional Funds Trust, 4 series of Touchstone Investment Trust, 4 series of Touchstone Strategic Trust, and 19 series of Touchstone Funds Group Trust.
93
PRIVACY PROTECTION POLICY
We Respect Your Privacy
Thank you for your decision to invest with us.Touchstone and its affiliates have always placed a high value on the trust and confidence our clients place in us.We believe that confidence must be earned and validated through time. In today's world, when technology allows the sharing of information at light speeds, trust must be reinforced by our sincere pledge to take the steps necessary to ensure that the information you share with us is treated with respect and confidentiality.
Our Pledge to Our Clients
• We collect only the information we need to service your account and administer our business.
• We are committed to keeping your information confidential and we place strict limits and controls on the use and sharing of your information.
• We make every effort to ensure the accuracy of your information.
We Collect the Following Nonpublic Personal Information About You:
• Information we receive from you on or in applications or other forms, correspondence, or conversations, including, but not limited to, your name, address, phone number, social security number, assets, income and date of birth; and
• Information about your transactions with us, our affiliates, or others, including, but not limited to, your account number and balance, payment history, parties to transactions, cost basis information, and other financial information.
Categories of Information We Disclose and Parties to Whom We Disclose
We do not disclose any nonpublic personal information about our current or former clients to nonaffiliated third parties, except as required or permitted by law.
We Place Strict Limits and Controls on the Use and Sharing of Your Information
• We restrict access to nonpublic personal information about you to authorized employees who need the information to administer your business.
• We maintain physical, electronic and procedural safeguards that comply with federal standards to protect this information.
• We do not disclose any nonpublic personal information about our current or former clients to anyone, except as required or permitted by law or as described in this document.
• We will not sell your personal information to anyone.
We May Provide Information to Service Your Account
Sometimes it is necessary to provide information about you to various companies such as transfer agents, custodians, broker-dealers and marketing service firms to facilitate the servicing of your account.These organizations have a legitimate business need to see some of your personal information in order for us to provide service to you.We may disclose to these various companies the information that we collect as described above.We require that these companies, including our own subsidiaries and affiliates, strictly maintain the confidentiality of this information and abide by all applicable laws. Companies within our corporate family that may receive this information are financial service providers and insurance companies. We do not permit these associated companies to sell the information for their own purposes, and we never sell our customer information.
This policy is applicable to the following affiliated companies: Touchstone Funds Group Trust, Touchstone Investment Trust, Touchstone StrategicTrust, Touchstone Tax-FreeTrust, Touchstone Variable Series Trust, Touchstone Institutional Funds Trust, Touchstone Securities, Inc.*, Capital Analysts Incorporated and W&S Brokerage Services, Inc.
* Touchstone Securities, Inc. serves as the underwriter to the Touchstone Funds.
A Member of Western & Southern Financial Group®
The Privacy Protection Policy is not part of the Annual Report.
94
This page intentionally left blank.

TSF-1006-TVST-AR-1012
Item 2. Code of Ethics.
At the end of the period covered by this report, the registrant has adopted a code of ethics that applies to its principal executive officer and principal financial officer.
Item 3. Audit Committee Financial Expert.
The registrant’s Board of Trustees has determined that the registrant has at least one audit committee financial expert serving on its audit committee. Mr. Don Siekmann is the registrant’s audit committee financial expert and is an independent trustee within the meaning of the Investment Company Act of 1940, as amended (the “1940 Act”).
Item 4. Principal Accountant Fees and Services.
(a) Audit Fees. Audit fees totaled approximately $141,800 for the December 31, 2010 fiscal year and $138,720 for the December 31, 2009 fiscal year, including fees associated with the annual audit and filings of the registrant’s Form N-1A and Form N-SAR.
(b) Audit-Related Fees. Audit-related fees totaled $0 for the December 31, 2010 fiscal year and $15,000 ($9,000 paid by JPMorgan) for the December 31, 2009 fiscal year. The 2009 fees are related to limited internal control testing in of the Trust’s fund accountant and transfer agent.
(c ) Tax Fees. Tax fees totaled $40,500 for the December 31, 2010 fiscal year and $34,100 for the December 31, 2009 fiscal year and consisted of fees for tax compliance services.
(d) All Other Fees. There were no other fees for the December 31, 2010 or December 31, 2009 fiscal years.
(e) (1) Audit Committee Pre-Approval Policies. The Audit Committee’s pre-approval policies describe the types of audit, audit-related, tax and other services that have the general pre-approval of the Audit Committee. The pre-approval policies provide that annual audit service fees, tax services not specifically granted pre-approval, services exceeding pre-approved cost levels and other services that have not received general pre-approval will be subject to specific pre-approval by the Audit Committee. The pre-approval policies further provide that the Committee may grant general pre-approval to other audit services (statutory audits and services associated with SEC registration statements, periodic reports and other documents filed with the SEC or other documents issued in connection with securities offerings), audit-related services (accounting consultations related to accounting, financial reporting or disclosure matters not classified as “audit services,” assistance with understanding and implementing new accounting and financial reporting guidance from rulemaking authorities, agreed-upon or expanded audit procedures related to accounting and/or billing records required to respond to or comply with financial, accounting or regulatory reporting matters and assistance with internal control reporting requirements under Form N-SAR and Form N-CSR), tax services that have historically been provided by the auditor that the Committee believes would not impair the independence of the auditor and are consistent with the SEC’s rules on auditor independence and permissible non-audit services classified as “all other services” that are routine and recurring services.
(e)(2) All services described in paragraphs (b) through (d) of Item 4 were approved by the Audit Committee.
(f) Not applicable
(g) The aggregate non-audit fees for services to the registrant, its investment adviser (excluding its sub-advisors) and any entity controlling, controlled by, or under common control with the adviser that provides ongoing services to the registrant were $70,500 for the December 31, 2010 fiscal year and $64,100 for the December 31, 2009 fiscal year.
(h) Not applicable
Item 5. Audit Committee of Listed Registrants.
Not applicable
Item 6. Schedule of Investments.
The Schedule of Investments in securities of unaffiliated issuers is included in the Annual Report.
Item 7. Disclosure of Proxy Voting Policies and Procedures for Closed-End Management Investment Companies.
Not applicable.
Item 8. Portfolio Managers of Closed-End Management Investment Companies.
Not applicable.
Item 9. Purchases of Equity Securities by Closed-End Management Investment Company and Affiliated Purchasers.
Not applicable.
Item 10. Submission of Matters to a Vote of Security Holders.
No material changes have been made to the procedures by which shareholders may recommend nominees to its Board of Trustees.
Item 11. Controls and Procedures.
(a) Based on an evaluation of the registrant’s disclosure controls and procedures (as defined in Rule 30a-3(c) under the 1940 Act) the registrant’s principal executive officer and principal financial officer have concluded that the registrant’s disclosure controls and procedures are effective as of a date within 90 days of the filing date of this report.
(b) There were no changes in the registrant’s internal control over financial reporting (as defined in Rule 30a-3(d) under the 1940 Act) that occurred during the registrant’s second fiscal half-year that have materially affected, or are reasonably likely to materially affect, the registrant’s internal control over financial reporting.
Item 12. Exhibits.
(a)(1) | The Code of Ethics for Senior Financial Officers was filed with registrant’s N-CSR for the December 31, 2004 fiscal year and is hereby incorporated by reference. |
(a)(2) | Certifications required by Item 12(a)(2) of Form N-CSR are filed herewith. |
(b) | Certification required by Item 11(b) of Form N-CSR is filed herewith. |
SIGNATURES
Pursuant to the requirements of the Securities Exchange Act of 1934 and the Investment Company Act of 1940, the registrant has duly caused this report to be signed on its behalf by the undersigned, thereunto duly authorized.
(Registrant) | Touchstone Variable Series Trust | |
By (Signature and Title)
/s/ Jill T. McGruder | |
Jill T. McGruder | |
President | |
Date: March 1, 2011
Pursuant to the requirements of the Securities Exchange Act of 1934 and the Investment Company Act of 1940, this report has been signed below by the following persons on behalf of the registrant and in the capacities and on the dates indicated.
By (Signature and Title)
/s/ Jill T. McGruder | |
Jill T. McGruder | |
President | |
Date: March 1, 2011
/s/ Terrie A. Wiedenheft | |
Terrie A. Wiedenheft | |
Controller & Treasurer | |
Date: March 1, 2011