UNITED STATES
SECURITIES AND EXCHANGE COMMISSION
WASHINGTON, D.C. 20549
FORM N-CSR
CERTIFIED SHAREHOLDER REPORT OF REGISTERED
MANAGEMENT INVESTMENT COMPANIES
Investment Company Act file number: 811-08426
ALLIANCEBERNSTEIN INTERNATIONAL GROWTH FUND, INC.
(Exact name of registrant as specified in charter)
1345 Avenue of the Americas, New York, New York 10105
(Address of principal executive offices) (Zip code)
Joseph J. Mantineo
AllianceBernstein L.P.
1345 Avenue of the Americas
New York, New York 10105
(Name and address of agent for service)
Registrant’s telephone number, including area code: (800) 221-5672
Date of fiscal year end: June 30, 2010
Date of reporting period: June 30, 2010
| ITEM 1. | REPORTS TO STOCKHOLDERS. |
ANNUAL REPORT
AllianceBernstein International Growth Fund

Annual Report
Investment Products Offered
| | • | | Are Not Bank Guaranteed |
The investment return and principal value of an investment in the Fund will fluctuate as the prices of the individual securities in which it invests fluctuate, so that your shares, when redeemed, may be worth more or less than their original cost. You should consider the investment objectives, risks, charges and expenses of the Fund carefully before investing. For a free copy of the Fund’s prospectus, which contains this and other information, visit our web site at www.alliancebernstein.com or call your financial advisor or AllianceBernstein® at (800) 227-4618. Please read the prospectus carefully before you invest.
You may obtain performance information current to the most recent month-end by visiting www.alliancebernstein.com.
This shareholder report must be preceded or accompanied by the Fund’s prospectus for individuals who are not current shareholders of the Fund.
You may obtain a description of the Fund’s proxy voting policies and procedures, and information regarding how the Fund voted proxies relating to portfolio securities during the most recent 12-month period ended June 30, without charge. Simply visit AllianceBernstein’s web site at www.alliancebernstein.com, or go to the Securities and Exchange Commission’s (the “Commission”) web site at www.sec.gov, or call AllianceBernstein at (800) 227-4618.
The Fund files its complete schedule of portfolio holdings with the Commission for the first and third quarters of each fiscal year on Form N-Q. The Fund’s Forms N-Q are available on the Commission’s web site at www.sec.gov. The Fund’s Forms N-Q may also be reviewed and copied at the Commission’s Public Reference Room in Washington, DC; information on the operation of the Public Reference Room may be obtained by calling (800) SEC-0330. AllianceBernstein publishes full portfolio holdings for the Fund monthly at www.alliancebernstein.com.
AllianceBernstein Investments, Inc. (ABI) is the distributor of the AllianceBernstein family of mutual funds. ABI is a member of FINRA and is an affiliate of AllianceBernstein L.P., the manager of the funds.
AllianceBernstein® and the AB Logo are registered trademarks and service marks used by permission of the owner, AllianceBernstein L.P.
August 20, 2010
Annual Report
This report provides management’s discussion of fund performance for AllianceBernstein International Growth Fund (the “Fund”) for the annual reporting period ended June 30, 2010.
Investment Objective and Policies
The Fund’s investment objective is long-term growth of capital. The Fund invests primarily in an international portfolio of equity securities of companies selected by AllianceBernstein L.P. (the “Adviser”) for their growth potential within various market sectors. Examples of the types of market sectors in which the Fund may invest include, but are not limited to, information technology, telecommunications, health care, financial services, infrastructure, energy and natural resources, and consumer growth.
The Fund invests, under normal circumstances, in the equity securities of companies located in at least three countries (and normally substantially more) other than the United States. The Fund invests in securities of companies in both developed and emerging market countries. Geographic distribution of the Fund’s investments among countries or regions also will be a product of the stock selection process rather than a pre-determined allocation. The Fund may also invest in synthetic foreign equity securities. The Adviser expects that normally the Fund’s portfolio will tend to emphasize investments in larger capitalization companies, although the Fund may invest in smaller or medium capitalization companies. The Fund normally invests in approximately 90-130 companies.
Currencies can have a dramatic impact on equity returns, significantly adding to returns in some years and greatly diminishing them in others. Currency and equity positions are evaluated separately. The Adviser may seek to hedge the currency exposure resulting from securities positions when it finds the currency exposure unattractive. To hedge a portion of its currency risk, the Fund may from time to time invest in currency-related derivatives, including forward currency exchange contracts, futures, options on futures, swaps and other options. The Adviser may also seek investment opportunities by taking long or short positions in currencies through the use of currency-related derivatives.
Investment Results
The table on page 5 provides the performance results for the Fund and its primary benchmark, the MSCI World (ex-US) Index (net). Also included are returns for the Fund’s secondary benchmark, the MSCI AC World (ex-US) Index (net and gross) for the six- and 12-month periods ended June 30, 2010.
The Fund’s Class A shares without sales charges underperformed the MSCI AC World (ex-US) Index (net and gross) and outperformed the MSCI World (ex-US) Index (net) for the six-month period ended June 30, 2010 (the Fund and both benchmarks posted negative returns for the period). For the six-month period, poor stock selection drove underperformance predominantly in the energy and materials sectors. The largest detractor from relative
| | |
| ALLIANCEBERNSTEIN INTERNATIONAL GROWTH FUND • | | 1 |
performance was global integrated oil company BP, which was hit by political pressure to stem the Gulf of Mexico oil spill. The Fund exited this position despite BP’s attractive fundamentals, given risks from the political uncertainty surrounding the company. Sector selection contributed modestly to performance during the period, bolstered by an overweight in the consumer discretionary sector.
The Fund’s Class A shares without sales charges marginally underperformed the MSCI AC World (ex-US) Index (net and gross) while outperforming the MSCI World (ex-US) Index (net) for the 12-month period ended June 30, 2010. Security selection contributed somewhat, with stock selection in the consumer discretionary sector boosting performance, but poor selection in other sectors, like information technology and financials, detracted from performance. Sector allocation was flat overall: an underweight to utilities and an overweight to healthcare and consumer discretionary contributed to performance while an overweight to energy and other sectors detracted from performance.
Market Review and Investment Strategy
The first half of 2010 left the markets down with the MSCI AC World
(ex-US) Index (net) declining -11.06% for the six-month period ended June 30, 2010. The 12-month reporting period showed strength, however, with 2009’s rally positively affecting performance despite 2010’s challenges. For the 12-month period ending June 30, 2010, the MSCI AC World (ex-US) Index (net) returned 10.43%. From a style perspective, the growth style outperformed the value style for both the six- and 12-month periods.
The market rally of 2009 matured in the latter half of the year, and investors showed their confidence by supporting security-specific fundamentals. However, in a sharp turnaround in sentiment, international equity markets declined in the first half of 2010. Even though indicators suggest the economic recovery remains on track, a confluence of forces raised investor jitters in the first half of this year: concerns about sovereign debt emanated from Greece to other European countries, questions mounted over financial burdens in the US and the UK, and investors worried whether China would maintain its pace of expansion, among other things. While the six-month period was a difficult time for the markets, the 12-month period embodied both confidence and pessimism.
| | |
| 2 | | • ALLIANCEBERNSTEIN INTERNATIONAL GROWTH FUND |
HISTORICAL PERFORMANCE
An Important Note About the Value of Historical Performance
The performance shown on the following pages represents past performance and does not guarantee future results. Current performance may be lower or higher than the performance information shown. You may obtain performance information current to the most recent month-end by visiting www.alliancebernstein.com. The investment return and principal value of an investment in the Fund will fluctuate, so that your shares, when redeemed, may be worth more or less than their original cost.
Investors should consider the investment objectives, risks, charges and expenses of the Fund/Portfolio carefully before investing. For copies of our prospectus or summary prospectus, which contain this and other information, visit us online at www.alliancebernstein.com or contact your AllianceBernstein Investments representative. Please read the prospectus and/or summary prospectus carefully before investing.
All fees and expenses related to the operation of the Fund have been deducted. NAV returns do not reflect sales charges; if sales charges were reflected, the Fund’s quoted performance would be lower. SEC returns reflect the applicable sales charges for each share class: a 4.25% maximum front-end sales charge for Class A shares; the applicable contingent deferred sales charge for Class B shares (4% year 1, 3% year 2, 2% year 3, 1% year 4); a 1% 1-year contingent deferred sales charge for Class C shares. Returns for the different share classes will vary due to different expenses associated with each class. Performance assumes reinvestment of distributions and does not account for taxes.
Benchmark Disclosure
Neither the unmanaged Morgan Stanley Capital International (MSCI) World (ex-US) Index (net) nor the unmanaged MSCI All Country (AC) World (ex-US) Index (net) reflect fees and expenses associated with the active management of a mutual fund portfolio. The MSCI World (ex-US) Index (net) is a free float-adjusted market capitalization index that is designed to measure global developed market equity performance in 23 developed market countries, excluding the US. The MSCI AC World (ex-US) Index (net) is a free float-adjusted market capitalization index that is designed to measure equity market performance in the global developed and emerging markets, excluding the US. An investor cannot invest directly in an index, and its results are not indicative of the performance for any specific investment, including the Fund.
The MSCI World (ex-US) Index values are calculated using net returns. The MSCI AC World (ex-US) Index values are calculated using net and gross returns. Net returns approximate the minimum possible dividend reinvestment—the dividend reinvested after deduction of withholding tax, applying the rate to non-resident individuals who do not benefit from double taxation treaties. For values calculated using gross returns, the index series approximates the maximum possible dividend reinvestment. The amount reinvested is the dividend distributed to individuals resident in the country of the company, but does not include tax credits.
A Word About Risk
Substantially all of the Fund’s assets will be invested in foreign securities which may magnify fluctuations due to changes in foreign exchange rates and the possibility of substantial volatility due to political and economic uncertainties in foreign countries. The Fund may invest in securities of emerging market nations. These investments have additional risks, such as those presented by illiquid or thinly traded markets, company management risk, heightened political instability and currency volatility. Accounting standards and market regulations in emerging market nations are not the
(Historical Performance continued on next page)
| | |
| ALLIANCEBERNSTEIN INTERNATIONAL GROWTH FUND • | | 3 |
Historical Performance
HISTORICAL PERFORMANCE
(continued from previous page)
same as those in the US. Growth investing does not guarantee a profit or eliminate
risk. The stocks of these companies have relatively high valuations. Because of these high valuations, an investment in a growth stock can be more risky than an investment in a company with more modest growth expectations. If a growth stock company should fail to meet these high earnings expectations, the price of these stocks can be severely negatively affected. When a Fund borrows money or otherwise leverages its portfolio, it may be volatile because leverage tends to exaggerate the effect of any increase or decrease in the value of the Fund’s investments. The Fund may create leverage through the use of reverse repurchase arrangements, forward currency exchange contracts, forward commitments, dollar rolls or futures contracts or by borrowing money. While the Fund invests principally in common stocks and other equity securities, in order to achieve its investment objectives, the Fund may at times use certain types of investment derivatives, such as options, futures, forwards and swaps. These instruments involve risks different from, and in certain cases, greater than, the risks presented by more traditional investments. These risks are fully discussed in the Fund’s prospectus.
(Historical Performance continued on next page)
| | |
| 4 | | • ALLIANCEBERNSTEIN INTERNATIONAL GROWTH FUND |
Historical Performance
HISTORICAL PERFORMANCE
(continued from previous page)
| | | | | | |
| | | | | | |
THE FUND VS. ITS BENCHMARKS PERIODS ENDED JUNE 30, 2010 | | Returns | | |
| | 6 Months | | 12 Months | | |
AllianceBernstein International Growth Fund | | | | | | |
Class A | | -12.43% | | 10.39% | | |
| |
Class B* | | -12.87% | | 9.49% | | |
| |
Class C | | -12.76% | | 9.56% | | |
| |
Advisor Class† | | -12.30% | | 10.77% | | |
| |
Class R† | | -12.53% | | 10.17% | | |
| |
Class K† | | -12.40% | | 10.51% | | |
| |
Class I† | | -12.31% | | 10.86% | | |
| |
MSCI World (ex-US) Index (Net)†† | | -12.47% | | 7.03% | | |
| |
MSCI All Country (AC) World (ex-US) Index (Net) | | -11.06% | | 10.43% | | |
| |
MSCI All Country (AC) World (ex-US) Index (Gross) | | -10.80% | | 10.87% | | |
| |
* Effective January 31, 2009, Class B shares are no longer available for purchase to new investors. Please see Note A for more information. † Please note that these share classes are for investors purchasing shares through accounts established under certain fee-based programs sponsored and maintained by certain broker-dealers and financial intermediaries, institutional pension plans and/or investment advisory clients of, and certain other persons associated with, the Adviser and its affiliates or the Funds. †† The MSCI World Index (Net) reflects no deduction for fees, expenses or taxes except there investment of dividends at nonwithholding taxes. Please keep in mind that high, double-digit returns are highly unusual and cannot be sustained. Investors should also be aware that these returns were primarily achieved during favorable market conditions. |
| | | | | | |
See Historical Performance and Benchmark disclosures on pages 3-4.
(Historical Performance continued on next page)
| | |
| ALLIANCEBERNSTEIN INTERNATIONAL GROWTH FUND • | | 5 |
Historical Performance
HISTORICAL PERFORMANCE
(continued from previous page)
GROWTH OF A $10,000 INVESTMENT IN THE FUND
6/30/00 TO 6/30/10
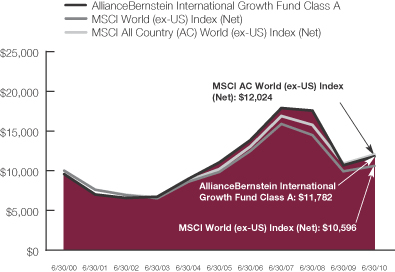
This chart illustrates the total value of an assumed $10,000 investment in AllianceBernstein International Growth Fund Class A shares (from 6/30/00 to 6/30/10) as compared to the performance of the Fund’s benchmarks. The chart reflects the deduction of the maximum 4.25% sales charge from the initial $10,000 investment in the Fund and assumes the reinvestment of dividends and capital gains distributions.
See Historical Performance and Benchmark disclosures on pages 3-4.
(Historical Performance continued on next page)
| | |
| 6 | | • ALLIANCEBERNSTEIN INTERNATIONAL GROWTH FUND |
Historical Performance
HISTORICAL PERFORMANCE
(continued from previous page)
| | | | | | |
| AVERAGE ANNUAL RETURNS AS OF JUNE 30, 2010 | |
| | | NAV Returns | | | SEC Returns | |
| | | | | | |
| Class A Shares | | | | | | |
1 Year | | 10.39 | % | | 5.69 | % |
5 Years | | 1.28 | % | | 0.41 | % |
10 Years | | 2.09 | % | | 1.65 | % |
| | | | | | |
| Class B Shares | | | | | | |
1 Year | | 9.49 | % | | 5.49 | % |
5 Years | | 0.50 | % | | 0.50 | % |
10 Years(a) | | 1.48 | % | | 1.48 | % |
| | | | | | |
| Class C Shares | | | | | | |
1 Year | | 9.56 | % | | 8.56 | % |
5 Years | | 0.57 | % | | 0.57 | % |
10 Years | | 1.35 | % | | 1.35 | % |
| | | | | | |
| Advisor Class Shares† | | | | | | |
1 Year | | 10.77 | % | | 10.77 | % |
5 Years | | 1.59 | % | | 1.59 | % |
10 Years | | 2.41 | % | | 2.41 | % |
| | | | | | |
| Class R Shares† | | | | | | |
1 Year | | 10.17 | % | | 10.17 | % |
5 Years | | 1.03 | % | | 1.03 | % |
Since Inception* | | 0.48 | % | | 0.48 | % |
| | | | | | |
| Class K Shares† | | | | | | |
1 Year | | 10.51 | % | | 10.51 | % |
5 Years | | 1.31 | % | | 1.31 | % |
Since Inception* | | 0.75 | % | | 0.75 | % |
| | | | | | |
| Class I Shares† | | | | | | |
1 Year | | 10.86 | % | | 10.86 | % |
5 Years | | 1.69 | % | | 1.69 | % |
Since Inception* | | 1.12 | % | | 1.12 | % |
The Fund’s current prospectus fee table shows the Fund’s total annual operating expense ratios as 1.34%, 2.12%, 2.07%, 1.05%, 1.56%, 1.28%, and 0.86% for Class��A, Class B, Class C, Advisor Class, Class R, Class K and Class I shares, respectively. The Financial Highlights section of this report sets forth expense ratio data for the current reporting period; the expense ratios shown above may differ from the expense ratios in the Financial Highlights section since they are based on different time periods.
| (a) | | Assumes conversion of Class B shares into Class A shares after eight years. |
| * | | Inception Date: 3/1/05 for Class R, Class K and Class I shares. |
| † | | These share classes are offered at net asset value (NAV) to eligible investors and their SEC returns are the same as the NAV returns. Please note that these share classes are for investors purchasing shares through accounts established under certain fee-based programs sponsored and maintained by certain broker-dealers and financial intermediaries, institutional pension plans and/or investment advisory clients of, and certain other persons associated with, the Adviser and its affiliates or the Funds. The inception date for Class R, Class K and Class I shares is listed above. |
See Historical Performance disclosures on pages 3-4.
(Historical Performance continued on next page)
| | |
| ALLIANCEBERNSTEIN INTERNATIONAL GROWTH FUND • | | 7 |
Historical Performance
HISTORICAL PERFORMANCE
(continued from previous page)
| | | |
SEC AVERAGE ANNUAL RETURNS (WITH ANY APPLICABLE SALES CHARGES) AS OF THE MOST RECENT CALENDAR QUARTER-END (JUNE 30, 2010) | |
| | | SEC Returns | |
| Class A Shares | | | |
1 Year | | 5.69 | % |
5 Years | | 0.41 | % |
10 Years | | 1.65 | % |
| | | |
| Class B Shares | | | |
1 Year | | 5.49 | % |
5 Years | | 0.50 | % |
10 Years(a) | | 1.48 | % |
| | | |
| Class C Shares | | | |
1 Year | | 8.56 | % |
5 Years | | 0.57 | % |
10 Years | | 1.35 | % |
| | | |
| Advisor Class Shares† | | | |
1 Year | | 10.77 | % |
5 Years | | 1.59 | % |
10 Years | | 2.41 | % |
| | | |
| Class R Shares† | | | |
1 Year | | 10.17 | % |
5 Years | | 1.03 | % |
Since Inception* | | 0.48 | % |
| | | |
| Class K Shares† | | | |
1 Year | | 10.51 | % |
5 Years | | 1.31 | % |
Since Inception* | | 0.75 | % |
| | | |
| Class I Shares† | | | |
1 Year | | 10.86 | % |
5 Years | | 1.69 | % |
Since Inception* | | 1.12 | % |
| (a) | | Assumes conversion of Class B shares into Class A shares after eight years. |
| * | | Inception Date: 3/1/05 for Class R, Class K and Class I shares. |
| † | | Please note that these share classes are for investors purchasing shares through accounts established under certain fee-based programs sponsored and maintained by certain broker-dealers and financial intermediaries, institutional pension plans and/or investment advisory clients of, and certain other persons associated with, the Adviser and its affiliates or the Funds. The inception date for Class R, Class K and Class I shares is listed above. |
See Historical Performance disclosures on pages 3-4.
| | |
| 8 | | • ALLIANCEBERNSTEIN INTERNATIONAL GROWTH FUND |
Historical Performance
FUND EXPENSES
(unaudited)
As a shareholder of the Fund, you incur two types of costs: (1) transaction costs, including sales charges (loads) on purchase payments, contingent deferred sales charges on redemptions and (2) ongoing costs, including management fees; distribution (12b-1) fees; and other Fund expenses. This example is intended to help you understand your ongoing costs (in dollars) of investing in the Fund and to compare these costs with the ongoing costs of investing in other mutual funds.
This Example is based on an investment of $1,000 invested at the beginning of the period and held for the entire period as indicated below.
Actual Expenses
The table below provides information about actual account values and actual expenses. You may use the information, together with the amount you invested, to estimate the expenses that you paid over the period. Simply divide your account value by $1,000 (for example, an $8,600 account value divided by $1,000 = 8.6), then multiply the result by the number under the heading entitled “Expenses Paid During Period” to estimate the expenses you paid on your account during this period.
Hypothetical Example for Comparison Purposes
The table below also provides information about hypothetical account values and hypothetical expenses based on the Fund’s actual expense ratio and an assumed annual rate of return of 5% before expenses, which is not the Fund’s actual return. The hypothetical account values and expenses may not be used to estimate the actual ending account balance or expenses you paid for the period. You may use this information to compare the ongoing costs of investing in the Fund and other funds by comparing this 5% hypothetical example with the 5% hypothetical examples that appear in the shareholder reports of other funds.
Please note that the expenses shown in the table are meant to highlight your ongoing costs only and do not reflect any transactional costs, such as sales charges (loads), or contingent deferred sales charges on redemptions. Therefore, the hypothetical example is useful in comparing ongoing costs only, and will not help you determine the relative total costs of owning different funds. In addition, if these transactional costs were included, your costs would have been higher.
| | | | | | | | | | | | | | | | | | |
| | | Beginning
Account Value
January 1, 2010 | | Ending
Account Value
June 30, 2010 | | Expenses Paid
During Period* |
| | | Actual | | Hypothetical | | Actual | | Hypothetical** | | Actual | | Hypothetical |
| Class A | | $ | 1,000 | | $ | 1,000 | | $ | 875.71 | | $ | 1,018.15 | | $ | 6.23 | | $ | 6.71 |
| Class B | | $ | 1,000 | | $ | 1,000 | | $ | 871.29 | | $ | 1,014.18 | | $ | 9.93 | | $ | 10.69 |
| Class C | | $ | 1,000 | | $ | 1,000 | | $ | 872.37 | | $ | 1,014.53 | | $ | 9.61 | | $ | 10.34 |
Advisor Class | | $ | 1,000 | | $ | 1,000 | | $ | 877.02 | | $ | 1,019.64 | | $ | 4.84 | | $ | 5.21 |
| Class R | | $ | 1,000 | | $ | 1,000 | | $ | 874.73 | | $ | 1,016.91 | | $ | 7.39 | | $ | 7.95 |
| Class K | | $ | 1,000 | | $ | 1,000 | | $ | 875.98 | | $ | 1,018.50 | | $ | 5.91 | | $ | 6.36 |
| Class I | | $ | 1,000 | | $ | 1,000 | | $ | 876.94 | | $ | 1,020.38 | | $ | 4.14 | | $ | 4.46 |
| * | | Expenses are equal to the classes’ annualized expense ratios of 1.34%, 2.14%, 2.07%, 1.04%, 1.59%, 1.27% and 0.89%, respectively, multiplied by the average account value over the period, multiplied by 181/365 (to reflect the one-half year period). |
| ** | | Assumes 5% return before expenses. |
| | |
| ALLIANCEBERNSTEIN INTERNATIONAL GROWTH FUND • | | 9 |
Fund Expenses
PORTFOLIO SUMMARY
June 30, 2010 (unaudited)
PORTFOLIO STATISTICS
Net Assets ($mil): $1,555.3
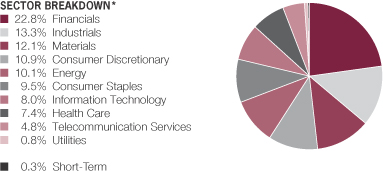
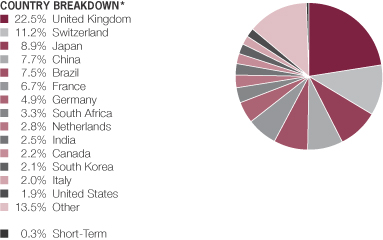
| * | | All data are as of June 30, 2010. The Fund’s sector and country breakdowns are expressed as a percentage of total investments and may vary over time. “Other” country weightings represent less than 1.9% weightings in the following countries: Australia, Belgium, Egypt, Hong Kong, Indonesia, Ireland, Israel, Mexico, Nigeria, Russia, Singapore, Spain, Sweden and Turkey. |
Please note: The sector classifications presented herein are based on the Global Industry Classification Standard (GICS) which was developed by Morgan Stanley Capital International and Standard and Poor’s. The components are divided into sector, industry group, and industry sub-indices as classified by the GICS for each of the market capitalization indices in the Broad Market. These sector classifications are broadly defined. The “Portfolio of Investments” section of the report reflects more specific industry information and is consistent with the investment restrictions discussed in the Fund’s prospectus.
| | |
| 10 | | • ALLIANCEBERNSTEIN INTERNATIONAL GROWTH FUND |
Portfolio Summary
TEN LARGEST HOLDINGS*
June 30, 2010 (unaudited)
| | | | | | |
| Company | | U.S. $ Value | | Percent of
Net Assets | |
Investimentos Itau SA (Preference Shares) | | $ | 49,242,313 | | 3.2 | % |
Nestle SA | | | 36,309,987 | | 2.3 | |
British American Tobacco PLC | | | 33,124,188 | | 2.1 | |
HSBC Holdings PLC | | | 33,035,337 | | 2.1 | |
Partners Group Holding AG | | | 31,400,692 | | 2.0 | |
Tesco PLC | | | 30,933,835 | | 2.0 | |
Schlumberger Ltd. | | | 30,026,211 | | 1.9 | |
Standard Chartered PLC | | | 29,953,740 | | 1.9 | |
Rio Tinto PLC | | | 27,382,728 | | 1.8 | |
Equinox Minerals Ltd. | | | 25,956,746 | | 1.7 | |
| | $ | 327,365,777 | | 21.0 | % |
| | |
| ALLIANCEBERNSTEIN INTERNATIONAL GROWTH FUND • | | 11 |
Ten Largest Holdings
PORTFOLIO OF INVESTMENTS
June 30, 2010
| | | | | |
| Company | | Shares | | U.S. $ Value |
| | | | | | |
| | | | | |
COMMON STOCKS – 99.9% | | | | | |
Financials – 22.3% | | | | | |
Capital Markets - 5.6% | | | | | |
Azimut Holding SpA | | 583,827 | | $ | 4,819,196 |
Credit Suisse Group AG | | 369,211 | | | 13,881,315 |
GAM Holding Ltd.(a) | | 595,352 | | | 6,433,688 |
Julius Baer Group Ltd. | | 702,606 | | | 20,033,115 |
Man Group PLC | | 3,290,849 | | | 10,908,854 |
Partners Group Holding AG | | 260,244 | | | 31,400,692 |
| | | | | |
| | | | | 87,476,860 |
| | | | | |
Commercial Banks – 13.4% | | | | | |
Bank Central Asia TBK PT | | 17,370,000 | | | 11,301,806 |
BNP Paribas | | 238,314 | | | 12,821,482 |
Commercial International Bank Egypt SAE | | 556,635 | | | 6,487,463 |
HDFC Bank Ltd. | | 535 | | | 22,131 |
HSBC Holdings PLC | | 3,616,069 | | | 33,035,337 |
Industrial & Commercial Bank of China-Class H | | 34,580,000 | | | 25,178,582 |
Investimentos Itau SA (Preference Shares) | | 8,299,008 | | | 49,242,313 |
Standard Bank Group Ltd. | | 407,376 | | | 5,402,248 |
Standard Chartered PLC | | 1,230,112 | | | 29,953,740 |
Turkiye Garanti Bankasi AS | | 3,355,212 | | | 13,963,162 |
United Overseas Bank Ltd. | | 1,435,000 | | | 19,963,532 |
| | | | | |
| | | | | 207,371,796 |
| | | | | |
Diversified Financial Services – 1.9% | | | | | |
FirstRand Ltd. | | 2,723,569 | | | 6,374,993 |
IG Group Holdings PLC | | 2,344,668 | | | 14,648,565 |
Singapore Exchange Ltd. | | 1,634,000 | | | 8,569,082 |
| | | | | |
| | | | | 29,592,640 |
| | | | | |
Insurance – 1.4% | | | | | |
China Life Insurance Co., Ltd. - Class H | | 5,099,000 | | | 22,266,920 |
| | | | | |
| | | | | 346,708,216 |
| | | | | |
Industrials – 13.4% | | | | | |
Aerospace & Defense – 0.8% | | | | | |
Safran SA | | 443,200 | | | 12,363,181 |
| | | | | |
| | |
Airlines – 0.5% | | | | | |
British Airways PLC(a) | | 2,508,276 | | | 7,287,226 |
| | | | | |
| | |
Commercial Services & Supplies – 0.8% | | | | | |
Secom Co., Ltd. | | 289,100 | | | 12,837,794 |
| | | | | |
| | |
Construction & Engineering – 1.7% | | | | | |
Samsung Engineering Co., Ltd. | | 138,111 | | | 12,790,071 |
Vinci SA | | 320,118 | | | 13,291,830 |
| | | | | |
| | | | | 26,081,901 |
| | | | | |
| | |
| 12 | | • ALLIANCEBERNSTEIN INTERNATIONAL GROWTH FUND |
Portfolio of Investments
| | | | | |
| Company | | Shares | | U.S. $ Value |
| |
| | | | | |
Electrical Equipment – 1.9% | | | | | |
ABB Ltd.(a) | | 1,013,174 | | $ | 17,639,969 |
SMA Solar Technology AG | | 112,398 | | | 11,512,240 |
| | | | | |
| | | | | 29,152,209 |
| | | | | |
Industrial Conglomerates – 1.3% | | | | | |
Koninklijke Philips Electronics NV | | 664,203 | | | 19,834,474 |
| | | | | |
| | |
Machinery – 3.0% | | | | | |
Komatsu Ltd. | | 872,600 | | | 15,712,149 |
MAN SE | | 188,011 | | | 15,500,006 |
SKF AB | | 868,290 | | | 15,583,363 |
| | | | | |
| | | | | 46,795,518 |
| | | | | |
Marine – 1.4% | | | | | |
China Shipping Development Co.,
Ltd. - Class H | | 10,196,000 | | | 12,862,813 |
Orient Overseas International Ltd.(a) | | 1,388,500 | | | 9,837,172 |
| | | | | |
| | | | | 22,699,985 |
| | | | | |
Road & Rail – 1.1% | | | | | |
East Japan Railway Co. | | 254,700 | | | 16,959,344 |
| | | | | |
| | |
Trading Companies & Distributors – 0.9% | | | | | |
Mitsubishi Corp. | | 720,100 | | | 14,897,747 |
| | | | | |
| | | | | 208,909,379 |
| | | | | |
Materials – 12.2% | | | | | |
Chemicals – 0.3% | | | | | |
Lanxess AG | | 97,900 | | | 4,120,753 |
| | | | | |
| | |
Construction Materials – 0.6% | | | | | |
CRH PLC (London) | | 466,511 | | | 9,611,576 |
| | | | | |
| | |
Metals & Mining – 10.3% | | | | | |
ArcelorMittal (Euronext Amsterdam) | | 277,400 | | | 7,440,363 |
Centamin Egypt Ltd.(a) | | 1,769,600 | | | 4,314,823 |
Equinox Minerals Ltd.(a) | | 7,408,111 | | | 25,956,746 |
Evraz Group SA (Sponsored GDR)(a)(b) | | 291,348 | | | 6,795,127 |
Impala Platinum Holdings Ltd. | | 460,494 | | | 10,717,570 |
MMX Mineracao e Metalicos SA(a) | | 1,208,458 | | | 7,043,201 |
Rio Tinto PLC | | 623,548 | | | 27,382,728 |
Sterlite Industries India Ltd. (ADR) | | 1,079,200 | | | 15,367,808 |
Usinas Siderurgicas de Minas Gerais SA - Class A (Preference Shares) | | 729,036 | | | 19,431,536 |
Vale SA (Sponsored ADR) (Local Preference Shares) | | 684,903 | | | 14,396,661 |
Xstrata PLC | | 1,692,860 | | | 22,167,423 |
| | | | | |
| | | | | 161,013,986 |
| | | | | |
Paper & Forest Products – 1.0% | | | | | |
Fibria Celulose SA (Sponsored ADR)(a) | | 1,027,788 | | | 15,211,262 |
| | | | | |
| | | | | 189,957,577 |
| | | | | |
| | |
| ALLIANCEBERNSTEIN INTERNATIONAL GROWTH FUND • | | 13 |
Portfolio of Investments
| | | | | |
| Company | | Shares | | U.S. $ Value |
| |
| | | | | |
| | | | | |
Consumer Discretionary – 11.0% | | | | | |
Automobiles – 2.0% | | | | | |
Daimler AG(a) | | 378,826 | | $ | 19,163,104 |
Fiat SpA | | 1,113,353 | | | 11,435,926 |
| | | | | |
| | | | | 30,599,030 |
| | | | | |
Distributors – 0.9% | | | | | |
Imperial Holdings Ltd. | | 1,206,158 | | | 13,413,942 |
| | | | | |
| | |
Hotels, Restaurants & Leisure – 2.0% | | | | | |
Carnival PLC | | 389,843 | | | 12,627,555 |
Compass Group PLC | | 594,717 | | | 4,524,300 |
Ctrip.com International Ltd. (ADR)(a) | | 201,200 | | | 7,557,072 |
Oriental Land Co., Ltd. | | 81,900 | | | 6,844,611 |
| | | | | |
| | | | | 31,553,538 |
| | | | | |
Media – 3.6% | | | | | |
British Sky Broadcasting Group PLC | | 277,176 | | | 2,894,212 |
CTC Media, Inc. | | 179,867 | | | 2,597,279 |
Eutelsat Communications | | 646,827 | | | 21,654,228 |
Informa PLC | | 1,311,492 | | | 6,929,069 |
Naspers Ltd. - Class N | | 178,479 | | | 6,010,367 |
SES SA (FDR) | | 489,168 | | | 10,172,992 |
WPP PLC | | 632,853 | | | 5,961,783 |
| | | | | |
| | | | | 56,219,930 |
| | | | | |
Specialty Retail – 1.8% | | | | | |
Belle International Holdings Ltd. | | 6,242,000 | | | 8,871,302 |
Fast Retailing Co., Ltd. | | 61,700 | | | 9,336,105 |
Zhongsheng Group Holdings Ltd.(a) | | 8,160,500 | | | 10,112,988 |
| | | | | |
| | | | | 28,320,395 |
| | | | | |
Textiles, Apparel & Luxury Goods – 0.7% | | | | | |
Cie Financiere Richemont SA | | 333,659 | | | 11,648,797 |
| | | | | |
| | | | | 171,755,632 |
| | | | | |
Energy – 10.2% | | | | | |
Energy Equipment & Services – 2.9% | | | | | |
Saipem SpA | | 497,835 | | | 15,163,171 |
Schlumberger Ltd. | | 542,577 | | | 30,026,211 |
| | | | | |
| | | | | 45,189,382 |
| | | | | |
Oil, Gas & Consumable Fuels – 7.3% | | | | | |
Afren PLC(a) | | 14,789,811 | | | 18,677,035 |
BG Group PLC | | 978,953 | | | 14,559,812 |
China Coal Energy Co.- Class H | | 12,908,000 | | | 16,060,745 |
China Shenhua Energy Co., Ltd.- Class H | | 2,091,500 | | | 7,545,515 |
Gulf Keystone Petroleum Ltd.(a) | | 7,791,300 | | | 7,857,802 |
Heritage Oil PLC(a) | | 1,752,042 | | | 10,260,931 |
Karoon Gas Australia Ltd.(a) | | 1,064,195 | | | 5,279,020 |
Oando PLC | | 19,874,701 | | | 9,063,382 |
Suncor Energy, Inc. (Toronto) | | 286,187 | | | 8,422,562 |
Tullow Oil PLC | | 1,016,057 | | | 15,114,166 |
| | | | | |
| | | | | 112,840,970 |
| | | | | |
| | | | | 158,030,352 |
| | | | | |
| | |
| 14 | | • ALLIANCEBERNSTEIN INTERNATIONAL GROWTH FUND |
Portfolio of Investments
| | | | | |
| Company | | Shares | | U.S. $ Value |
| |
| | | | | |
Consumer Staples – 9.6% | | | | | |
Beverages – 1.4% | | | | | |
Anheuser-Busch InBev NV | | 304,309 | | $ | 14,631,565 |
| | | | | |
Cia de Bebidas das Americas
(Preference Shares) | | 66,500 | | | 6,628,263 |
| | | | | |
| | | | | 21,259,828 |
| | | | | |
Food & Staples Retailing – 3.1% | | | | | |
Seven & I Holdings Co., Ltd. | | 491,600 | | | 11,263,190 |
Tesco PLC | | 5,483,348 | | | 30,933,835 |
Wal-Mart de Mexico SAB de CV | | 2,753,974 | | | 6,100,754 |
| | | | | |
| | | | | 48,297,779 |
| | | | | |
Food Products – 3.0% | | | | | |
Danone | | 186,744 | | | 10,011,382 |
Nestle SA | | 753,025 | | | 36,309,987 |
| | | | | |
| | | | | 46,321,369 |
| | | | | |
Tobacco – 2.1% | | | | | |
British American Tobacco PLC | | 1,043,748 | | | 33,124,188 |
| | | | | |
| | | | | 149,003,164 |
| | | | | |
Information Technology – 8.1% | | | | | |
Communications Equipment – 0.9% | | | | | |
Telefonaktiebolaget LM Ericsson—Class B | | 1,093,072 | | | 12,124,599 |
ZTE Corp.—Class H | | 829,400 | | | 2,518,356 |
| | | | | |
| | | | | 14,642,955 |
| | | | | |
Electronic Equipment, Instruments & Components – 1.1% | | | | | |
Samsung Electro-Mechanics Co., Ltd. | | 80,624 | | | 10,082,011 |
Taiyo Yuden Co., Ltd. | | 486,000 | | | 6,526,577 |
| | | | | |
| | | | | 16,608,588 |
| | | | | |
Internet Software & Services – 0.5% | | | | | |
Yahoo! Japan Corp. | | 20,446 | | | 8,149,263 |
| | | | | |
| | |
IT Services – 1.3% | | | | | |
Cap Gemini SA | | 203,664 | | | 8,950,949 |
Infosys Technologies Ltd. (Sponsored ADR) | | 182,555 | | | 10,936,870 |
| | | | | |
| | | | | 19,887,819 |
| | | | | |
Office Electronics – 0.8% | | | | | |
Canon, Inc. | | 352,600 | | | 13,141,209 |
| | | | | |
| | |
Semiconductors & Semiconductor Equipment – 2.2% | | | | | |
Aixtron AG | | 271,765 | | | 6,424,872 |
ARM Holdings PLC | | 1,853,371 | | | 7,670,890 |
ASML Holding NV | | 337,617 | | | 9,291,174 |
Samsung Electronics Co., Ltd. | | 16,060 | | | 10,073,061 |
| | | | | |
| | | | | 33,459,997 |
| | | | | |
Software – 1.3% | | | | | |
Autonomy Corp. PLC(a) | | 291,360 | | | 7,942,002 |
Nintendo Co., Ltd. | | 40,300 | | | 11,832,451 |
| | | | | |
| | | | | 19,774,453 |
| | | | | |
| | | | | 125,664,284 |
| | | | | |
| | |
| ALLIANCEBERNSTEIN INTERNATIONAL GROWTH FUND • | | 15 |
Portfolio of Investments
| | | | | |
| Company | | Shares | | U.S. $ Value |
| |
| | | | | |
Health Care – 7.4% | | | | | |
Health Care Providers & Services – 0.9% | | | | | |
Diagnosticos da America SA | | 678,200 | | $ | 6,383,722 |
Fresenius Medical Care AG & Co. KGaA | | 143,324 | | | 7,732,983 |
| | | | | |
| | | | | 14,116,705 |
| | | | | |
Life Sciences Tools & Services – 0.4% | | | | | |
QIAGEN NV(a) | | 332,299 | | | 6,464,857 |
| | | | | |
| | |
Pharmaceuticals – 6.1% | | | | | |
Aspen Pharmacare Holdings Ltd.(a) | | 432,719 | | | 4,273,049 |
Bayer AG | | 231,307 | | | 12,925,763 |
Mitsubishi Tanabe Pharma Corp. | | 393,000 | | | 5,987,791 |
Novartis AG | | 404,380 | | | 19,597,520 |
Roche Holding AG | | 142,252 | | | 19,579,810 |
Sanofi-Aventis SA | | 194,606 | | | 11,720,594 |
Shire PLC | | 419,236 | | | 8,600,309 |
Teva Pharmaceutical Industries Ltd. (Sponsored ADR) | | 239,933 | | | 12,474,117 |
| | | | | |
| | | | | 95,158,953 |
| | | | | |
| | | | | 115,740,515 |
| | | | | |
Telecommunication Services – 4.9% | | | | | |
Diversified Telecommunication
Services – 1.3% | | | | | |
Iliad SA | | 62,654 | | | 4,865,324 |
Telefonica SA | | 774,578 | | | 14,348,818 |
XL Axiata TBK PT(a) | | 2,910,000 | | | 1,301,347 |
| | | | | |
| | | | | 20,515,489 |
| | | | | |
Wireless Telecommunication
Services – 3.6% | | | | | |
America Movil SAB de CV Series L (ADR) | | 223,013 | | | 10,593,118 |
China Mobile Ltd. | | 866,500 | | | 8,583,617 |
MTN Group Ltd. | | 431,903 | | | 5,660,155 |
NTT DoCoMo, Inc. | | 4,070 | | | 6,163,159 |
VimpelCom Ltd. (Sponsored ADR)(a) | | 229,845 | | | 3,718,892 |
Vodafone Group PLC | | 10,031,245 | | | 20,669,304 |
| | | | | |
| | | | | 55,388,245 |
| | | | | |
| | | | | 75,903,734 |
| | | | | |
Utilities – 0.8% | | | | | |
Independent Power Producers & Energy Traders – 0.8% | | | | | |
NTPC Ltd. | | 2,923,454 | | | 12,503,928 |
| | | | | |
Total Common Stocks
(cost $1,506,844,643) | | | | | 1,554,176,781 |
| | | | | |
| | |
WARRANTS – 0.8% | | | | | |
Financials – 0.8% | | | | | |
Sberbank of Russian Federation, Merrill Lynch, expiring 11/05/12(a)
(cost $13,671,742) | | 4,779,367 | | | 11,709,449 |
| | | | | |
| | |
| 16 | | • ALLIANCEBERNSTEIN INTERNATIONAL GROWTH FUND |
Portfolio of Investments
| | | | | | | |
| | | Principal Amount
(000) | | U.S. $ Value | |
| | |
SHORT-TERM INVESTMENTS – 0.3% | | | | | | | |
Time Deposit – 0.3% | | | | | | | |
Commerzbank 0.01%, 7/01/10
(cost $5,200,000) | | $ | 5,200 | | $ | 5,200,000 | |
| | | | | | | |
Total Investments – 101.0%
(cost $1,525,716,385) | | | | | | 1,571,086,230 | |
Other assets less liabilities – (1.0)% | | | | | | (15,798,604 | ) |
| | | | | | | |
Net Assets – 100.0% | | | | | $ | 1,555,287,626 | |
| | | | | | | |
| | |
| ALLIANCEBERNSTEIN INTERNATIONAL GROWTH FUND • | | 17 |
Portfolio of Investments
FORWARD CURRENCY EXCHANGE CONTRACTS (see Note D)
| | | | | | | | | | | | |
| | | Contract
Amount
(000) | | U.S. $ Value on
Origination
Date | | U.S. $ Value at June 30, 2010 | | Unrealized
Appreciation/
(Depreciation) | |
Buy Contracts: | | | | | | | | | | | | |
Australian Dollar settling 8/16/10 | | 111,666 | | $ | 99,340,307 | | $ | 93,485,109 | | $ | (5,855,198) | |
British Pound settling 8/16/10 | | 39,461 | | | 58,486,727 | | | 58,957,028 | | | 470,301 | |
British Pound settling 8/16/10 | | 20,087 | | | 30,321,327 | | | 30,011,146 | | | (310,181 | ) |
Euro settling 8/16/10 | | 14,561 | | | 18,017,636 | | | 17,810,074 | | | (207,562 | ) |
Euro settling 8/16/10 | | 63,459 | | | 78,028,552 | | | 77,618,947 | | | (409,605 | ) |
Japanese Yen settling 8/16/10 | | 1,417,713 | | | 15,703,859 | | | 16,046,644 | | | 342,785 | |
Japanese Yen settling 8/16/10 | | 6,182,005 | | | 66,779,063 | | | 69,972,156 | | | 3,193,093 | |
Japanese Yen settling 8/16/10 | | 1,005,184 | | | 11,032,521 | | | 11,377,359 | | | 344,838 | |
New Zealand Dollar settling 8/16/10 | | 9,531 | | | 6,735,557 | | | 6,515,546 | | | (220,011 | ) |
New Zealand Dollar settling 8/16/10 | | 121,076 | | | 86,266,650 | | | 82,769,521 | | | (3,497,129 | ) |
Norwegian Krone settling 8/16/10 | | 541,518 | | | 87,478,474 | | | 83,015,017 | | | (4,463,457 | ) |
Norwegian Krone settling 8/16/10 | | 310,210 | | | 48,092,336 | | | 47,555,369 | | | (536,967 | ) |
Swedish Krona settling 8/16/10 | | 122,731 | | | 15,836,933 | | | 15,739,833 | | | (97,100 | ) |
Swedish Krona settling 8/16/10 | | 665,436 | | | 87,474,498 | | | 85,339,901 | | | (2,134,597 | ) |
| | | | | | | | | | | | |
Sale Contracts: | | | | | | | | | | | | |
Australian Dollar settling 8/16/10 | | 22,935 | | | 20,216,285 | | | 19,200,840 | | | 1,015,445 | |
Australian Dollar settling 8/16/10 | | 19,249 | | | 15,842,120 | | | 16,114,976 | | | (272,856 | ) |
British Pound settling 8/16/10 | | 110,489 | | | 161,769,155 | | | 165,076,989 | | | (3,307,834 | ) |
Canadian Dollar settling 8/16/10 | | 9,047 | | | 8,911,018 | | | 8,496,048 | | | 414,970 | |
Euro settling 8/16/10 | | 41,462 | | | 51,134,670 | | | 50,713,638 | | | 421,032 | |
Euro settling 8/16/10 | | 34,043 | | | 42,148,298 | | | 41,639,197 | | | 509,101 | |
Euro settling 8/16/10 | | 86,498 | | | 108,778,154 | | | 105,798,762 | | | 2,979,392 | |
New Zealand Dollar settling 8/16/10 | | 14,796 | | | 9,911,101 | | | 10,114,786 | | | (203,685 | ) |
New Zealand Dollar settling 8/16/10 | | 5,939 | | | 3,986,257 | | | 4,059,997 | | | (73,740 | ) |
New Zealand Dollar settling 8/16/10 | | 6,544 | | | 4,426,885 | | | 4,473,585 | | | (46,700 | ) |
Norwegian Krone settling 8/16/10 | | 327,613 | | | 50,623,966 | | | 50,223,259 | | | 400,707 | |
Swedish Krona settling 8/16/10 | | 625,019 | | | 80,229,591 | | | 80,156,558 | | | 73,033 | |
Swiss Franc settling 8/16/10 | | 104,540 | | | 93,927,169 | | | 97,065,473 | | | (3,138,304 | ) |
Swiss Franc settling 8/16/10 | | 26,914 | | | 23,282,611 | | | 24,989,670 | | | (1,707,059 | ) |
| (a) | | Non-income producing security. |
| (b) | | Security is exempt from registration under Rule 144A of the Securities Act of 1933. This security is considered liquid and may be resold in transactions exempt from registration, normally to qualified institutional buyers. At June 30, 2010, the market value of this security amounted to $6,795,127 or 0.4% of net assets. |
Glossary:
ADR – American Depository Receipt
FDR – Fiduciary Depositary Receipt
GDR – Global Depository Receipt
See notes to financial statements.
| | |
| 18 | | • ALLIANCEBERNSTEIN INTERNATIONAL GROWTH FUND |
Portfolio of Investments
STATEMENT OF ASSETS & LIABILITIES
June 30, 2010
| | | | |
| Assets | | | | |
Investments in securities, at value (cost $1,525,716,385) | | $ | 1,571,086,230 | |
Cash | | | 85,565 | |
Foreign currencies, at value (cost $15,949,205) | | | 15,996,341 | |
Receivable for investment securities sold and foreign
currency contracts | | | 13,937,587 | |
Unrealized appreciation of forward currency exchange contracts | | | 10,164,697 | |
Dividends and interest receivable | | | 6,385,088 | |
Receivable for capital stock sold | | | 2,295,038 | |
| | | | |
Total assets | | | 1,619,950,546 | |
| | | | |
| Liabilities | | | | |
Unrealized depreciation of forward currency exchange contracts | | | 26,481,985 | |
Payable for investment securities purchased and foreign currency contracts | | | 19,151,815 | |
Payable for capital stock redeemed | | | 16,604,659 | |
Advisory fee payable | | | 1,014,029 | |
Distribution fee payable | | | 463,275 | |
Transfer Agent fee payable | | | 147,277 | |
Administrative fee payable | | | 28,532 | |
Accrued expenses and other liabilities | | | 771,348 | |
| | | | |
Total liabilities | | | 64,662,920 | |
| | | | |
Net Assets | | $ | 1,555,287,626 | |
| | | | |
| Composition of Net Assets | | | | |
Capital stock, at par | | $ | 127,773 | |
Additional paid-in capital | | | 2,648,669,215 | |
Undistributed net investment income | | | 43,656,649 | |
Net realized loss on investment and foreign currency transactions | | | (1,166,119,679 | ) |
Net unrealized appreciation of investments and foreign currency denominated assets and liabilities | | | 28,953,668 | |
| | | | |
| | $ | 1,555,287,626 | |
| | | | |
Net Asset Value Per Share—21 billion shares of capital stock authorized, $.001 par value
| | | | | | | | | |
| Class | | Net Assets | | Shares
Outstanding | | Net Asset
Value | |
| A | | $ | 935,694,939 | | 75,910,294 | | $ | 12.33 | * |
| | |
| B | | $ | 44,166,231 | | 3,952,581 | | $ | 11.17 | |
| | |
| C | | $ | 185,848,219 | | 16,581,616 | | $ | 11.21 | |
| | |
| Advisor | | $ | 306,230,858 | | 24,547,247 | | $ | 12.48 | |
| | |
| R | | $ | 42,586,630 | | 3,486,090 | | $ | 12.22 | |
| | |
| K | | $ | 12,116,981 | | 986,075 | | $ | 12.29 | |
| | |
| I | | $ | 28,643,768 | | 2,309,376 | | $ | 12.40 | |
| | |
| * | | The maximum offering price per share for Class A shares was $12.88 which reflects a sales charge of 4.25%. |
See notes to financial statements.
| | |
| ALLIANCEBERNSTEIN INTERNATIONAL GROWTH FUND • | | 19 |
Statement of Assets & Liabilities
STATEMENT OF OPERATIONS
Year Ended June 30, 2010
| | | | | | | |
| Investment Income | | | | | | | |
Dividends (net of foreign taxes withheld of $3,186,316) | | $ | 39,499,317 | | | | |
Interest | | | 16,106 | | $ | 39,515,423 | |
| | | | | | | |
| Expenses | | | | | | | |
Advisory fee (see Note B) | | | 14,394,558 | | | | |
Distribution fee—Class A | | | 3,544,040 | | | | |
Distribution fee—Class B | | | 576,319 | | | | |
Distribution fee—Class C | | | 2,372,649 | | | | |
Distribution fee—Class R | | | 242,813 | | | | |
Distribution fee—Class K | | | 32,656 | | | | |
Transfer agency—Class A | | | 2,216,574 | | | | |
Transfer agency—Class B | | | 161,642 | | | | |
Transfer agency—Class C | | | 513,395 | | | | |
Transfer agency—Advisor Class | | | 665,321 | | | | |
Transfer agency—Class R | | | 126,263 | | | | |
Transfer agency—Class K | | | 25,556 | | | | |
Transfer agency—Class I | | | 18,784 | | | | |
Printing | | | 424,519 | | | | |
Custodian | | | 392,791 | | | | |
Registration fees | | | 164,089 | | | | |
Administrative | | | 101,311 | | | | |
Audit | | | 63,222 | | | | |
Legal | | | 52,554 | | | | |
Directors’ fees | | | 51,607 | | | | |
Miscellaneous | | | 71,666 | | | | |
| | | | | | | |
Total expenses | | | | | | 26,212,329 | |
| | | | | | | |
Net investment income | | | | | | 13,303,094 | |
| | | | | | | |
| Realized and Unrealized Gain (Loss) on Investment and Foreign Currency Transactions | | | | | | | |
Net realized gain on: | | | | | | | |
Investment transactions | | | | | | 54,033,816 | (a) |
Foreign currency transactions | | | | | | 50,923,428 | |
Net change in unrealized appreciation/depreciation of: | | | | | | | |
Investments | | | | | | 99,111,126 | |
Foreign currency denominated assets and liabilities | | | | | | (3,806,543 | ) |
| | | | | | | |
Net gain on investment and foreign currency transactions | | | | | | 200,261,827 | |
| | | | | | | |
Contributions from Adviser (see Note B) | | | | | | 4,618 | |
| | | | | | | |
Net Increase in Net Assets from Operations | | | | | $ | 213,569,539 | |
| | | | | | | |
| (a) | | Net of foreign capital gain taxes of $703,898. |
See notes to financial statements.
| | |
| 20 | | • ALLIANCEBERNSTEIN INTERNATIONAL GROWTH FUND |
Statement of Operations
STATEMENT OF CHANGES IN NET ASSETS
| | | | | | | | |
| | | Year Ended
June 30, 2010 | | | Year Ended
June 30, 2009 | |
| Increase (Decrease) in Net Assets from Operations | | | | | | | | |
Net investment income | | $ | 13,303,094 | | | $ | 31,064,691 | |
Net realized gain (loss) on investment and foreign currency transactions | | | 104,957,244 | | | | (1,188,012,361 | ) |
Net change in unrealized appreciation/depreciation of investments and foreign currency denominated assets and liabilities | | | 95,304,583 | | | | (319,926,118 | ) |
Contributions from Adviser (see Note B) | | | 4,618 | | | | – 0 | – |
| | | | | | | | |
Net increase (decrease) in net assets from operations | | | 213,569,539 | | | | (1,476,873,788 | ) |
Dividends and Distributions
to Shareholders from | | | | | | | | |
Net investment income | | | | | | | | |
Class A | | | (35,172,897 | ) | | | (31,031,193 | ) |
Class B | | | (1,314,108 | ) | | | (1,246,157 | ) |
Class C | | | (5,375,791 | ) | | | (5,865,485 | ) |
Advisor Class | | | (10,430,217 | ) | | | (8,973,727 | ) |
Class R | | | (1,346,084 | ) | | | (868,294 | ) |
Class K | | | (388,029 | ) | | | (218,825 | ) |
Class I | | | (1,084,276 | ) | | | (469,533 | ) |
Net realized gain on investment and foreign currency transactions | | | | | | | | |
Class A | | | – 0 | – | | | (2,224,458 | ) |
Class B | | | – 0 | – | | | (130,488 | ) |
Class C | | | – 0 | – | | | (614,186 | ) |
Advisor Class | | | – 0 | – | | | (566,166 | ) |
Class R | | | – 0 | – | | | (68,640 | ) |
Class K | | | – 0 | – | | | (15,686 | ) |
Class I | | | – 0 | – | | | (28,456 | ) |
| Capital Stock Transactions | | | | | | | | |
Net decrease | | | (375,161,438 | ) | | | (136,254,236 | ) |
| Capital Contributions | | | | | | | | |
Proceeds from third party regulatory settlement (see Note E) | | | 278,367 | | | | – 0 | – |
| | | | | | | | |
Total decrease | | | (216,424,934 | ) | | | (1,665,449,318 | ) |
| Net Assets | | | | | | | | |
Beginning of period | | | 1,771,712,560 | | | | 3,437,161,878 | |
| | | | | | | | |
End of period (including undistributed net investment income of $43,656,649 and $34,587,152, respectively) | | $ | 1,555,287,626 | | | $ | 1,771,712,560 | |
| | | | | | | | |
See notes to financial statements.
| | |
| ALLIANCEBERNSTEIN INTERNATIONAL GROWTH FUND • | | 21 |
Statement of Changes in Net Assets
NOTES TO FINANCIAL STATEMENTS
June 30, 2010
NOTE A
Significant Accounting Policies
AllianceBernstein International Growth Fund, Inc. (the “Fund”), organized as a Maryland corporation on March 16, 1994, is registered under the Investment Company Act of 1940 as a diversified open-end management investment company. The Fund offers Class A, Class B, Class C, Advisor Class, Class R, Class K and Class I shares. Class A shares are sold with a front-end sales charge of up to 4.25% for purchases not exceeding $1,000,000. With respect to purchases of $1,000,000 or more, Class A shares redeemed within one year of purchase may be subject to a contingent deferred sales charge of 1%. Class B shares are currently sold with a contingent deferred sales charge which declines from 4% to zero depending on the period of time the shares are held. Effective January 31, 2009, sales of Class B shares of the Fund to new investors were suspended. Class B shares will only be issued (i) upon the exchange of Class B shares from another AllianceBernstein Fund, (ii) for purposes of dividend reinvestment, (iii) through the Fund’s Automatic Investment Program (the “Program”) for accounts that established the Program prior to January 31, 2009, and (iv) for purchases of additional shares by Class B shareholders as of January 31, 2009. The ability to establish a new Program for accounts containing Class B shares was suspended as of January 31, 2009. Class B shares will automatically convert to Class A shares eight years after the end of the calendar month of purchase. Class C shares are subject to a contingent deferred sales charge of 1% on redemptions made within the first year after purchase. Class R and Class K shares are sold without an initial or contingent deferred sales charge. Advisor Class and Class I shares are sold without an initial or contingent deferred sales charge and are not subject to ongoing distribution expenses. All seven classes of shares have identical voting, dividend, liquidation and other rights, except that the classes bear different distribution and transfer agency expenses. Each class has exclusive voting rights with respect to its distribution plan. The financial statements have been prepared in conformity with U.S. generally accepted accounting principles (“U.S. GAAP”), which require management to make certain estimates and assumptions that affect the reported amounts of assets and liabilities in the financial statements and amounts of income and expenses during the reporting period. Actual results could differ from those estimates. The following is a summary of significant accounting policies followed by the Fund.
1. Security Valuation
Portfolio securities are valued at their current market value determined on the basis of market quotations or, if market quotations are not readily available or are deemed unreliable, at “fair value” as determined in accordance with procedures established by and under the general supervision of the Fund’s Board of Directors.
In general, the market value of securities which are readily available and deemed reliable are determined as follows. Securities listed on a national securities
| | |
| 22 | | • ALLIANCEBERNSTEIN INTERNATIONAL GROWTH FUND |
Notes to Financial Statements
exchange (other than securities listed on the NASDAQ Stock Market, Inc. (“NASDAQ”)) or on a foreign securities exchange are valued at the last sale price at the close of the exchange or foreign securities exchange. If there has been no sale on such day, the securities are valued at the mean of the closing bid and asked prices on such day. Securities listed on more than one exchange are valued by reference to the principal exchange on which the securities are traded; securities listed only on NASDAQ are valued in accordance with the NASDAQ Official Closing Price; listed put or call options are valued at the last sale price. If there has been no sale on that day, such securities will be valued at the closing bid prices on that day; open futures contracts and options thereon are valued using the closing settlement price or, in the absence of such a price, the most recent quoted bid price. If there are no quotations available for the day of valuation, the last available closing settlement price is used; securities traded in the over-the-counter market (“OTC”) are valued at the mean of the current bid and asked prices as reported by the National Quotation Bureau or other comparable sources; U.S. government securities and other debt instruments having 60 days or less remaining until maturity are valued at amortized cost if their original maturity was 60 days or less; or by amortizing their fair value as of the 61st day prior to maturity if their original term to maturity exceeded 60 days; fixed-income securities, including mortgage backed and asset backed securities, may be valued on the basis of prices provided by a pricing service or at a price obtained from one or more of the major broker/dealers. In cases where broker/dealer quotes are obtained, AllianceBernstein L.P. (the “Adviser”) may establish procedures whereby changes in market yields or spreads are used to adjust, on a daily basis, a recently obtained quoted price on a security; and OTC and other derivatives are valued on the basis of a quoted bid price or spread from a major broker/dealer in such security. Investments in money market funds are valued at their net asset value each day.
Securities for which market quotations are not readily available (including restricted securities) or are deemed unreliable are valued at fair value. Factors considered in making this determination may include, but are not limited to, information obtained by contacting the issuer, analysts, analysis of the issuer’s financial statements or other available documents. In addition, the Fund may use fair value pricing for securities primarily traded in non-U.S. markets because most foreign markets close well before the Fund values its securities at 4:00 p.m., Eastern Time (see Note A.2).
2. Fair Value Measurements
In accordance with U.S. GAAP regarding fair value measurements, fair value is defined as the price that the Fund would receive to sell an asset or pay to transfer a liability in an orderly transaction between market participants at the measurement date. The U.S. GAAP disclosure requirements establish a framework for measuring fair value, and a three-level hierarchy for fair value measurements based upon the transparency of inputs to the valuation of an
| | |
| ALLIANCEBERNSTEIN INTERNATIONAL GROWTH FUND • | | 23 |
Notes to Financial Statements
asset or liability. Inputs may be observable or unobservable and refer broadly to the assumptions that market participants would use in pricing the asset or liability. Observable inputs reflect the assumptions market participants would use in pricing the asset or liability based on market data obtained from sources independent of the Fund. Unobservable inputs reflect the Fund’s own assumptions about the assumptions that market participants would use in pricing the asset or liability based on the best information available in the circumstances. Each investment is assigned a level based upon the observability of the inputs which are significant to the overall valuation. The three-tier hierarchy of inputs is summarized below.
| | • | | Level 1—quoted prices in active markets for identical investments |
| | • | | Level 2—other significant observable inputs (including quoted prices for similar investments, interest rates, prepayment speeds, credit risk, etc.) |
| | • | | Level 3—significant unobservable inputs (including the Fund’s own assumptions in determining the fair value of investments) |
The following table summarizes the valuation of the Fund’s investments by the above fair value hierarchy levels as of June 30, 2010:
| | | | | | | | | | | | | | | | |
Investments in
Securities | | Level 1 | | | Level 2 | | | Level 3 | | | Total | |
Common Stocks: | | | | | | | | | | | | | | | | |
Financials | | $ | 49,242,313 | | | $ | 297,465,903 | | | $ | – 0 | – | | $ | 346,708,216 | |
Industrials | | | – 0 | – | | | 208,909,379 | | | | – 0 | – | | | 208,909,379 | |
Materials | | | 83,010,553 | | | | 106,947,024 | | | | – 0 | – | | | 189,957,577 | |
Consumer Discretionary | | | 20,267,339 | | | | 151,488,293 | | | | – 0 | – | | | 171,755,632 | |
Energy | | | 38,448,773 | | | | 119,581,579 | | | | – 0 | – | | | 158,030,352 | |
Consumer Staples | | | 12,729,017 | | | | 136,274,147 | | | | – 0 | – | | | 149,003,164 | |
Information Technology | | | 10,936,870 | | | | 114,727,414 | | | | – 0 | – | | | 125,664,284 | |
Health Care | | | 18,857,839 | | | | 96,882,676 | | | | – 0 | – | | | 115,740,515 | |
Telecommunication Services | | | 14,312,009 | | | | 61,591,725 | | | | – 0 | – | | | 75,903,734 | |
Utilities | | | – 0 | – | | | 12,503,928 | | | | – 0 | – | | | 12,503,928 | |
Warrants | | | – 0 | – | | | – 0 | – | | | 11,709,449 | | | | 11,709,449 | |
Short-Term-Investments | | | – 0 | – | | | 5,200,000 | | | | – 0 | – | | | 5,200,000 | |
| | | | | | | | | | | | | | | | |
Total Investments in Securities | | | 247,804,713 | | | | 1,311,572,068 | † | | | 11,709,449 | | | | 1,571,086,230 | |
Other Financial Instruments*: | | | | | | | | | | | | | | | | |
Assets | | | | | | | | | | | | | | | | |
Forward Currency Exchange Contracts | | | – 0 | – | | | 10,164,697 | | | | – 0 | – | | | 10,164,697 | |
Liabilities | | | | | | | | | | | | | | | | |
Forward Currency Exchange Contracts | | | – 0 | – | | | (26,481,985 | ) | | | – 0 | – | | | (26,481,985 | ) |
| | | | | | | | | | | | | | | | |
Total | | $ | 247,804,713 | | | $ | 1,295,254,780 | | | $ | 11,709,449 | | | $ | 1,554,768,942 | |
| | | | | | | | | | | | | | | | |
| * | | Other financial instruments are derivative instruments, such as futures, forwards and swap contracts, which are valued at the unrealized appreciation/depreciation on the instrument. |
| | |
| 24 | | • ALLIANCEBERNSTEIN INTERNATIONAL GROWTH FUND |
Notes to Financial Statements
| † | | The earlier close of the foreign markets gives rise to the possibility that significant events, including broad market moves, may have occurred between the close of the foreign markets and the time at which the Fund values its securities which may materially affect the value of securities trading in such markets. To account for this, the Fund may frequently value many of its foreign equity securities using fair value prices based on third party vendor modeling tools to the extent available. Accordingly, a significant portion of the Fund’s investments are categorized as Level 2 investments. |
Following is a reconciliation of investments in which significant unobservable inputs (Level 3) were used in determining value:
| | | | | | | | | | | | |
| | | Financials | | | Warrants | | | Total | |
Balance as of 6/30/09 | | $ | 26,578,882 | | | $ | – 0 | – | | $ | 26,578,882 | |
Accrued discounts/premiums | | | – 0 | – | | | – 0 | – | | | – 0 | – |
Realized gain (loss) | | | (8,126,368 | ) | | | (70,493 | ) | | | (8,196,861 | ) |
Change in unrealized appreciation/depreciation | | | 9,815,046 | | | | (1,962,293 | ) | | | 7,852,753 | |
Net purchases (sales) | | | (28,267,560 | ) | | | 13,742,235 | | | | (14,525,325 | ) |
Net transfers into Level 3 | | | – 0 | – | | | – 0 | – | | | – 0 | – |
Net transfers out of Level 3 | | | – 0 | – | | | – 0 | – | | | – 0 | – |
| | | | | | | | | | | | |
Balance as of 6/30/10 | | $ | – 0 | – | | $ | 11,709,449 | | | $ | 11,709,449 | |
| | | | | | | | | | | | |
Net change in unrealized appreciation/depreciation from investments held as of 6/30/10 | | $ | – 0 | – | | $ | (1,962,293 | ) | | $ | (1,962,293 | ) ** |
| | | | | | | | | | | | |
| ** | | The unrealized appreciation/depreciation is included in net change in unrealized appreciation/depreciation of investments in the accompanying statement of operations. |
3. Currency Translation
Assets and liabilities denominated in foreign currencies and commitments under forward currency exchange contracts are translated into U.S. dollars at the mean of the quoted bid and asked prices of such currencies against the U.S. dollar. Purchases and sales of portfolio securities are translated into U.S. dollars at the rates of exchange prevailing when such securities were acquired or sold. Income and expenses are translated into U.S. dollars at rates of exchange prevailing when accrued.
Net realized gain or loss on foreign currency transactions represents foreign exchange gains and losses from sales and maturities of foreign fixed income investments, foreign currency exchange contracts, holding of foreign currencies, currency gains or losses realized between the trade and settlement dates on foreign investment transactions, and the difference between the amounts of dividends, interest and foreign withholding taxes recorded on the Fund’s books and the U.S. dollar equivalent amounts actually received or paid. Net unrealized currency gains and losses from valuing foreign currency denominated assets and liabilities at period end exchange rates are reflected as a component of net unrealized appreciation and depreciation of investments and foreign currency denominated assets and liabilities.
| | |
| ALLIANCEBERNSTEIN INTERNATIONAL GROWTH FUND • | | 25 |
Notes to Financial Statements
4. Taxes
It is the Fund’s policy to meet the requirements of the Internal Revenue Code applicable to regulated investment companies and to distribute all of its investment company taxable income and net realized gains, if any, to shareholders. Therefore, no provisions for federal income or excise taxes are required. The Fund may be subject to taxes imposed by countries in which it invests. Such taxes are generally based on income and/or capital gains earned or repatriated. Taxes are accrued and applied to net investment income, net realized gains and net unrealized appreciation/depreciation as such income and/or gains are earned.
In accordance with U.S. GAAP requirements regarding accounting for uncertainties in income taxes, management has analyzed the Fund’s tax positions taken on federal and state income tax returns for all open tax years (the current and the prior three tax years) and has concluded that no provision for income tax is required in the Fund’s financial statements.
5. Investment Income and Investment Transactions
Dividend income is recorded on the ex-dividend date or as soon as the Fund is informed of the dividend. Interest income is accrued daily. Investment transactions are accounted for on the date securities are purchased or sold. Investment gains and losses are determined on the identified cost basis. The Fund amortizes premiums and accretes discounts as adjustments to interest income.
6. Class Allocations
All income earned and expenses incurred by the Fund are borne on a pro-rata basis by each settled class of shares, based on the proportionate interest in the Fund represented by the net assets of such class, except for class specific expenses which are allocated to the respective class. Realized and unrealized gains and losses are allocated among the various share classes based on their respective net assets.
7. Dividends and Distributions
Dividends and distributions to shareholders, if any, are recorded on the ex-dividend date. Income dividends and capital gains distributions are determined in accordance with federal tax regulations and may differ from those determined in accordance with U.S. GAAP. To the extent these differences are permanent, such amounts are reclassified within the capital accounts based on their federal tax basis treatment; temporary differences do not require such reclassification.
| | |
| 26 | | • ALLIANCEBERNSTEIN INTERNATIONAL GROWTH FUND |
Notes to Financial Statements
NOTE B
Advisory Fee and Other Transactions with Affiliates
Under the terms of the investment advisory agreement, the Fund pays the Adviser an advisory fee at an annual rate of .75% of the first $2.5 billion, .65% of the next $2.5 billion and .60% in excess of $5 billion, of the Fund’s average daily net assets. The fee is accrued daily and paid monthly.
The Adviser had agreed to waive its fees and bear certain expenses to the extent necessary to limit total operating expenses on an annual basis to 1.65%, 2.35%, 2.35%, 1.35%, 1.85%, 1.60% and 1.35% of the daily average net assets for the Class A, Class B, Class C, Advisor Class, Class R, Class K and Class I shares, respectively (the “Expense Caps”). The Expense Caps will expire on June 30, 2011 and then may be extended by the Adviser for additional one year terms. For the year ended June 30, 2010, there was no such reimbursement.
For the year ended June 30, 2010, the Adviser reimbursed the Fund $4,618 for trading losses incurred due to trade entry errors.
Pursuant to the investment advisory agreement, the Fund may reimburse the Adviser for certain legal and accounting services provided to the Fund by the Adviser. For the year ended June 30, 2010, such fee amounted to $101,311.
The Fund compensates AllianceBernstein Investor Services, Inc. (“ABIS”), a wholly-owned subsidiary of the Adviser, under a Transfer Agency Agreement for providing personnel and facilities to perform transfer agency services for the Fund. ABIS may make payments to intermediaries that provide omnibus account services, sub-accounting services and/or networking services. Such compensation retained by ABIS amounted to $1,361,056 for the year ended June 30, 2010.
For the year ended June 30, 2010, there was no reduction to the expenses of Class A, Class B, Class C and Advisor Class shares under an expense offset arrangement with ABIS.
AllianceBernstein Investments, Inc. (the “Distributor”), a wholly-owned subsidiary of the Adviser, serves as the distributor of the Fund’s shares. The Distributor has advised the Fund that it has retained front-end sales charges of $488,819 from the sale of Class A shares and received $11,426, $76,028 and $10,095 in contingent deferred sales charges imposed upon redemptions by shareholders of Class A, Class B and Class C shares, respectively, for the year ended June 30, 2010.
Brokerage commissions paid on investment transactions for the year ended June 30, 2010, amounted to $5,164,737, none of which was paid to Sanford C. Bernstein & Co. LLC and Sanford C. Bernstein Limited, affiliates of the Adviser.
| | |
| ALLIANCEBERNSTEIN INTERNATIONAL GROWTH FUND • | | 27 |
Notes to Financial Statements
NOTE C
Distribution Services Agreement
The Fund has adopted a Distribution Services Agreement (the “Agreement”) pursuant to Rule 12b-1 under the Investment Company Act of 1940. Under the Agreement, the Fund pays distribution and servicing fees to the Distributor at an annual rate of up to .30% of the Fund’s average daily net assets attributable to Class A shares, 1% of the Fund’s average daily net assets attributable to both Class B and Class C shares, .50% of the Fund’s average daily net assets attributable to Class R shares and .25% of the Fund’s average daily net assets attributable to Class K shares. There are no distribution and servicing fees on the Advisor Class and Class I shares. The fees are accrued daily and paid monthly. The Agreement provides that the Distributor will use such payments in their entirety for distribution assistance and promotional activities. Since the commencement of the Fund’s operations, the Distributor has incurred expenses in excess of the distribution costs reimbursed by the Fund in the amounts of $5,994,117, $3,860,056, $495,527 and $111,849 for Class B, Class C, Class R and Class K shares, respectively. While such costs may be recovered from the Fund in future periods so long as the Agreement is in effect, the rate of the distribution and servicing fees payable under the Agreement may not be increased without a shareholder vote. In accordance with the Agreement, there is no provision for recovery of unreimbursed distribution costs incurred by the Distributor beyond the current fiscal year for Class A shares. The Agreement also provides that the Adviser may use its own resources to finance the distribution of the Fund’s shares.
NOTE D
Investment Transactions
Purchases and sales of investment securities (excluding short-term investments) for the year ended June 30, 2010 were as follows:
| | | | | | | | |
| | | Purchases | | | Sales | |
Investment securities (excluding U.S. government securities) | | $ | 2,236,696,398 | | | $ | 2,583,548,128 | |
U.S. government securities | | | – 0 | – | | | – 0 | – |
The cost of investments for federal income tax purposes, gross unrealized appreciation and unrealized depreciation (excluding forward currency exchange contracts) are as follows:
| | | | |
Cost | | $ | 1,550,378,985 | |
| | | | |
Gross unrealized appreciation | | $ | 163,999,281 | |
Gross unrealized depreciation | | | (143,292,036 | ) |
| | | | |
Net unrealized appreciation | | $ | 20,707,245 | |
| | | | |
| | |
| 28 | | • ALLIANCEBERNSTEIN INTERNATIONAL GROWTH FUND |
Notes to Financial Statements
1. Derivative Financial Instruments
The Fund may use derivatives to earn income and enhance returns, to hedge or adjust the risk profile of its portfolio, to replace more traditional direct investments, or to obtain exposure to otherwise inaccessible markets. The Fund may also use derivatives for non-hedging purposes as a means of making direct investment in foreign currencies, as described below under “Currency Transactions”.
The principal type of derivatives utilized by the Fund, as well as the methods in which they may be used are:
| | • | | Forward Currency Exchange Contracts |
The Fund may enter into forward currency exchange contracts in order to hedge its exposure to changes in foreign currency exchange rates on its foreign portfolio holdings, to hedge certain firm purchase and sale commitments denominated in foreign currencies and for non-hedging purposes as a means of making direct investments in foreign currencies, as described below under “Currency Transactions”.
A forward currency exchange contract is a commitment to purchase or sell a foreign currency at a future date at a negotiated forward rate. The gain or loss arising from the difference between the original contract and the closing of such contract would be included in net realized gain or loss on foreign currency transactions. Fluctuations in the value of open forward currency exchange contracts are recorded for financial reporting purposes as unrealized appreciation and/or depreciation by the Fund. Risks may arise from the potential inability of a counterparty to meet the terms of a contract and from unanticipated movements in the value of a foreign currency relative to the U.S. dollar. The face or contract amount, in U.S. dollars reflects the total exposure the Fund has in that particular currency contract.
At June 30, 2010, the Fund had entered into the following derivatives:
| | | | | | | | | | |
| | | Asset Derivative | | Liability Derivatives |
Derivative Type | | Statement of
Assets and
Liabilities
Location | | Fair Value | | Statement of
Assets and
Liabilities
Location | | Fair Value |
Foreign exchange contracts | | Unrealized appreciation of forward currency exchange contracts | | $ | 10,164,697 | | Unrealized depreciation of forward currency exchange contracts | | $ | 26,481,985 |
| | |
| ALLIANCEBERNSTEIN INTERNATIONAL GROWTH FUND • | | 29 |
Notes to Financial Statements
The effect of derivative instruments on the statement of operations for the year ended June 30, 2010.
| | | | | | | | | |
Derivative Type | | Location of Gain
or (Loss) on
Derivatives | | Realized Gain
or (Loss) on
Derivatives | | Change in
Unrealized
Appreciation or
(Depreciation) | |
Foreign exchange contracts | | Net realized gain (loss) on foreign currency transactions; Net change in unrealized appreciation/depreciation of foreign currency denominated assets and liabilities | | $ | 48,275,549 | | $ | (5,192,537 | ) |
For the year ended June 30, 2010, the average monthly principal amount of forward currency exchange contracts was $1,197,306,714.
2. Currency Transactions
The Fund may invest in non-U.S. Dollar securities on a currency hedged or unhedged basis. The Fund may seek investment opportunities by taking long or short positions in currencies through the use of currency-related derivatives, including forward currency exchange contracts, futures and options on futures, swaps, and options. The Fund may enter into transactions for investment opportunities when it anticipates that a foreign currency will appreciate or depreciate in value but securities denominated in that currency are not held by the Fund and do not present attractive investment opportunities. Such transactions may also be used when the Adviser believes that it may be more efficient than a direct investment in a foreign currency-denominated security. The Fund may also conduct currency exchange contracts on a spot basis (i.e., for cash at the spot rate prevailing in the currency exchange market for buying or selling currencies).
| | |
| 30 | | • ALLIANCEBERNSTEIN INTERNATIONAL GROWTH FUND |
Notes to Financial Statements
NOTE E
Capital Stock
Each class consists of 3,000,000,000 authorized shares. Transactions in capital shares for each class were as follows:
| | | | | | | | | | | | | | | | | | |
| | | | | | | | | | | | | | | | | | |
| | | Shares | | | | | Amount | | | |
| | | Year Ended June 30, 2010 | | | Year Ended June 30, 2009 | | | | | Year Ended June 30, 2010 | | | Year Ended June 30, 2009 | | | |
| | | | | |
| Class A | | | | | | | | | | | | | | | | |
Shares sold | | 13,793,330 | | | 34,430,239 | | | | | $ | 186,499,567 | | | $ | 421,137,742 | | | |
| | | | |
Shares issued in reinvestment of dividends and distributions | | 2,249,920 | | | 1,638,946 | | | | | | 31,410,472 | | | | 29,617,125 | | | |
| | | | |
Shares converted from Class B | | 506,197 | | | 1,318,081 | | | | | | 6,785,228 | | | | 16,297,573 | | | |
| | | | |
Shares issued in connection with the acquisition of AllianceBernstein International Research Growth Fund | | – 0 | – | | 10,343,921 | | | | | | – 0 | – | | | 168,019,089 | | | |
| | | | |
Shares redeemed | | (37,027,255 | ) | | (62,293,020 | ) | | | | | (495,449,817 | ) | | | (737,977,819 | ) | | |
| | | | |
Net decrease | | (20,477,808 | ) | | (14,561,833 | ) | | | | $ | (270,754,550 | ) | | $ | (102,906,290 | ) | | |
| | | | |
| Class B | | | | | | | | | | | | | | | | |
Shares sold | | 224,121 | | | 462,843 | | | | | $ | 2,791,675 | | | $ | 6,303,813 | | | |
| | | | | | | | | | | | | | | | | | | |
Shares issued in reinvestment of dividends and distributions | | 94,465 | | | 140,267 | | | | | | 1,201,734 | | | | 1,257,609 | | | |
| | | | | | | | | | | | | | | | | | | |
Shares converted to Class A | | (557,550 | ) | | (1,445,330 | ) | | | | | (6,785,228 | ) | | | (16,297,573 | ) | | |
| | | | | | | | | | | | | | | | | | | |
Shares issued in connection with the acquisition of AllianceBernstein International Research Growth Fund | | – 0 | – | | 2,048,151 | | | | | | – 0 | – | | | 25,021,335 | | | |
| | | | | | | | | | | | | | | | | | | |
Shares redeemed | | (1,166,194 | ) | | (2,386,097 | ) | | | | | (14,292,976 | ) | | | (24,957,859 | ) | | |
| | | | | | | | | | | | | | | | | | | |
Net decrease | | (1,405,158 | ) | | (1,180,166 | ) | | | | $ | (17,084,795 | ) | | $ | (8,672,675 | ) | | |
| | | | | | | | | | | | | | | | | | | |
| | |
| ALLIANCEBERNSTEIN INTERNATIONAL GROWTH FUND • | | 31 |
Notes to Financial Statements
| | | | | | | | | | | | | | | | | | |
| | | | | | | | | | | | | | | | | | |
| | | Shares | | | | | Amount | | | |
| | | Year Ended June 30, 2010 | | | Year Ended June 30, 2009 | | | | | Year Ended June 30, 2010 | | | Year Ended June 30, 2009 | | | |
| | | | | |
| Class C | | | | | | | | | | | | | | | | |
Shares sold | | 1,347,036 | | | 2,920,151 | | | | | $ | 16,752,601 | | | $ | 41,031,947 | | | |
| | | | |
Shares issued in reinvestment of dividends and distributions | | 382,404 | | | 869,120 | | | | | | 4,876,329 | | | | 5,930,506 | | | |
| | | | |
Shares issued in connection with the acquisition of AllianceBernstein International Research Growth Fund | | – 0 | – | | 2,358,782 | | | | | | – 0 | – | | | 37,479,155 | | | |
| | | | |
Shares redeemed | | (7,014,143 | ) | | (15,229,770 | ) | | | | | (86,038,152 | ) | | | (157,509,461 | ) | | |
| | | | |
Net decrease | | (5,284,703 | ) | | (9,081,717 | ) | | | | $ | (64,409,222 | ) | | $ | (73,067,853 | ) | | |
| | | | |
| Advisor Class | | | | | | | | | | | | | | | | |
Shares sold | | 10,407,985 | | | 17,651,688 | | | | | $ | 139,407,951 | | | $ | 222,430,274 | | | |
| | | | |
Shares issued in reinvestment of dividends and distributions | | 623,504 | | | 796,035 | | | | | | 8,797,646 | | | | 7,366,377 | | | |
| | | | |
Shares issued in connection with the acquisition of AllianceBernstein International Research Growth Fund | | – 0 | – | | 3,054,066 | | | | | | – 0 | – | | | 55,388,940 | | | |
| | | | |
Shares redeemed | | (12,583,436 | ) | | (23,462,888 | ) | | | | | (170,317,176 | ) | | | (254,794,573 | ) | | |
| | | | |
Net increase (decrease) | | (1,551,947 | ) | | (1,961,099 | ) | | | | $ | (22,111,579 | ) | | $ | 30,391,018 | | | |
| | | | |
Class R | | | | | | | | | | | | | | | | | | |
Shares sold | | 1,105,473 | | | 2,319,233 | | | | | $ | 14,806,527 | | | $ | 26,390,889 | | | |
| | | | |
Shares issued in reinvestment of dividends and distributions | | 97,116 | | | 64,550 | | | | | | 1,346,023 | | | | 1,196,518 | | | |
| | | | |
Shares issued in connection with the acquisition of AllianceBernstein International Research Growth Fund | | – 0 | – | | 1,141 | | | | | | – 0 | – | | | 22,933 | | | |
| | | | |
Shares redeemed | | (1,337,984 | ) | | (2,172,421 | ) | | | | | (17,920,275 | ) | | | (22,715,451 | ) | | |
| | | | |
Net increase (decrease) | | (135,395 | ) | | 212,503 | | | | | $ | (1,767,725 | ) | | $ | 4,894,889 | | | |
| | | | |
| | |
| 32 | | • ALLIANCEBERNSTEIN INTERNATIONAL GROWTH FUND |
Notes to Financial Statements
| | | | | | | | | | | | | | | | | | |
| | | | | | | | | | | | | | | | | | |
| | | Shares | | | | | Amount | | | |
| | | Year Ended June 30, 2010 | | | Year Ended June 30, 2009 | | | | | Year Ended June 30, 2010 | | | Year Ended June 30, 2009 | | | |
| | | | | |
Class K | | | | | | | | | | | | | | | | | | |
Shares sold | | 323,497 | | | 480,838 | | | | | $ | 4,361,308 | | | $ | 5,575,210 | | | |
| | | | |
Shares issued in reinvestment of dividends and distributions | | 27,895 | | | 13,007 | | | | | | 388,025 | | | | 234,509 | | | |
| | | | |
Shares issued in connection with the acquisition of AllianceBernstein International Research Growth Fund | | – 0 | – | | 36,980 | | | | | | – 0 | – | | | 807,234 | | | |
| | | | |
Shares redeemed | | (368,099 | ) | | (317,114 | ) | | | | | (4,881,771 | ) | | | (3,624,967 | ) | | |
| | | | |
Net increase (decrease) | | (16,707 | ) | | 213,711 | | | | | $ | (132,438 | ) | | $ | 2,991,986 | | | |
| | | | |
Class I | | | | | | | | | | | | | | | | | | |
Shares sold | | 492,514 | | | 940,674 | | | | | $ | 6,405,946 | | | $ | 9,847,180 | | | |
| | | | |
Shares issued in reinvestment of dividends and distributions | | 77,393 | | | 27,214 | | | | | | 1,084,276 | | | | 492,849 | | | |
| | | | |
Shares issued in connection with the acquisition of AllianceBernstein International Research Growth Fund | | – 0 | – | | 159,915 | | | | | | – 0 | – | | | 3,295,398 | | | |
| | | | |
Shares redeemed | | (481,798 | ) | | (331,350 | ) | | | | | (6,391,351 | ) | | | (3,520,738 | ) | | |
| | | | |
Net increase | | 88,109 | | | 796,453 | | | | | $ | 1,098,871 | | | $ | 10,114,689 | | | |
| | | | |
During the year ended June 30, 2010, the Fund received $278,367 related to a third-party’s settlement of regulatory proceedings involving allegations of improper trading. This amount is presented in the Fund’s statement of changes in net assets. Neither the Fund nor its affiliates were involved in the proceedings or the calculation of the payment.
NOTE F
Risks Involved in Investing in the Fund
Foreign Securities Risk—Investing in securities of foreign companies or foreign governments involves special risks which include changes in foreign currency exchange rates and the possibility of future political and economic developments which could adversely affect the value of such securities. Moreover, securities of many foreign companies or foreign governments and their markets may be less liquid and their prices more volatile than those of comparable U.S. companies or of the U.S. government.
| | |
| ALLIANCEBERNSTEIN INTERNATIONAL GROWTH FUND • | | 33 |
Notes to Financial Statements
Currency Risk—This is the risk that changes in foreign currency exchange rates may negatively affect the value of the Fund’s investments or reduce the returns of the Fund. For example, the value of the Fund’s investments in foreign currency-denominated securities or currencies may decrease if the U.S. Dollar is strong (i.e., gaining value relative to other currencies) and other currencies are weak (i.e., losing value relative to the U.S. Dollar). Currency markets are generally not as regulated as securities markets. Independent of the Fund’s investments in securities denominated in foreign currencies, the Fund’s positions in various foreign currencies may cause the Fund to experience investment losses due to the changes in exchange rates and interest rates.
Derivatives Risk—The Fund may invest in derivatives such as forwards, options, futures and swaps. These investments may be illiquid, difficult to price, and leveraged so that small changes may produce disproportionate losses for the Fund, and subject to counterparty risk to a greater degree than more traditional investments.
Indemnification Risk— In the ordinary course of business, the Fund enters into contracts that contain a variety of indemnifications. The Fund’s maximum exposure under these arrangements is unknown. However, the Fund has not had prior claims or losses pursuant to these indemnification provisions and expects the risk of loss thereunder to be remote. Therefore, the Fund has not accrued any liability in connection with these indemnification provisions.
NOTE G
Joint Credit Facility
A number of open-end mutual funds managed by the Adviser, including the Fund, participate in a $140 million revolving credit facility (the “Facility”) intended to provide short-term financing if necessary, subject to certain restrictions in connection with abnormal redemption activity. Commitment fees related to the Facility are paid by the participating funds and are included in miscellaneous expenses in the statement of operations. The Fund did not utilize the Facility during the year ended June 30, 2010.
NOTE H
Acquisition of AllianceBernstein International Research Growth Fund, Inc. by AllianceBernstein International Growth Fund, Inc. (the “Fund”)
On July 25, 2008, the Fund acquired all of the assets and all of the liabilities of AllianceBernstein International Research Growth Fund, Inc. (“IRG”), pursuant to a plan of reorganization approved on May 8, 2008, by the Boards of Directors of IRG and the Fund. On July 25, 2008, the acquisition was accomplished by a tax-free exchange of 18,002,956 shares of the Fund for 21,703,099 shares of IRG. The aggregate net assets of the Fund and IRG immediately before the acquisition were $3,193,887,109 and $310,313,691 (including $20,279,606 of net unrealized appreciation of investments and foreign currency denominated assets and liabilities), respectively. Immediately
| | |
| 34 | | • ALLIANCEBERNSTEIN INTERNATIONAL GROWTH FUND |
Notes to Financial Statements
after the acquisition, the combined net assets of the Fund amounted to $3,504,200,800.
NOTE I
Distributions to Shareholders
The tax character of distributions paid during the fiscal years ended June 30, 2010 and June 30, 2009 were as follows:
| | | | | | | |
| | | 2010 | | | 2009 |
Distributions paid from: | | | | | | | |
Ordinary income | | $ | 55,111,402 | | | $ | 48,629,616 |
Long-term capital gains | | | – 0 | – | | | 3,691,678 |
| | | | | | | |
Total distributions paid | | $ | 55,111,402 | | | $ | 52,321,294 |
| | | | | | | |
As of June 30, 2010, the components of accumulated earning/(deficit) on a tax basis were as follows:
| | | | |
Undistributed ordinary income | | $ | 37,285,564 | |
Accumulated capital and other losses | | | (1,151,403,301 | )(a) |
Unrealized appreciation/(depreciation) | | | 20,608,375 | (b) |
| | | | |
Total accumulated earnings/(deficit) | | $ | (1,093,509,362 | ) |
| | | | |
| (a) | | On June 30, 2010, the Fund had a net capital loss carryforward for federal income tax purposes of $1,151,403,301 of which $7,476,210 expires in the year 2011, $443,759,952 expires in the year 2017 and $700,167,139 expires in the year 2018. During the fiscal year, $7,970,694 of the Fund’s capital loss carryforwards expired. To the extent future capital gains are offset by capital loss carryforwards, such gains will not be distributed. As a result of the reorganization with AllianceBernstein International Research Growth Fund, Inc., into the Fund, various limitations and reductions regarding the future utilization of certain capital loss carryforwards were applied based on certain provisions in the Internal Revenue Code. |
| (b) | | The difference between book-basis and tax-basis unrealized appreciation/(depreciation) is attributable primarily to the tax deferral of losses on wash sales, the tax treatment of passive foreign investment companies (“PFICs”) and the tax treatment of derivatives. |
During the current fiscal year, permanent differences, primarily due to foreign currency transactions, the tax treatment of PFICs, redesignation of foreign capital gain tax, contribution from adviser, and a capital loss carryforward expiration resulted in a net increase in undistributed net investment income and a net increase in accumulated net realized loss on investment and foreign currency transactions, and a decrease to additional paid in capital. This reclassification had no effect on net assets.
NOTE J
Legal Proceedings
On October 2, 2003, a purported class action complaint entitled Hindo, et al. v. AllianceBernstein Growth & Income Fund, et al. (“Hindo Complaint”) was filed against the Adviser, Alliance Capital Management Holding L.P. (“Alliance Holding”), Alliance Capital Management Corporation, AXA Financial, Inc., the
| | |
| ALLIANCEBERNSTEIN INTERNATIONAL GROWTH FUND • | | 35 |
Notes to Financial Statements
AllianceBernstein Funds, certain officers of the Adviser (“AllianceBernstein defendants”), and certain other unaffiliated defendants, as well as unnamed Doe defendants. The Hindo Complaint was filed in the United States District Court for the Southern District of New York by alleged shareholders of two of the AllianceBernstein Funds. The Hindo Complaint alleges that certain of the AllianceBernstein defendants failed to disclose that they improperly allowed certain hedge funds and other unidentified parties to engage in “late trading” and “market timing” of AllianceBernstein Fund securities, violating Sections 11 and 15 of the Securities Act, Sections 10(b) and 20(a) of the Exchange Act and Sections 206 and 215 of the Advisers Act. Plaintiffs seek an unspecified amount of compensatory damages and rescission of their contracts with the Adviser, including recovery of all fees paid to the Adviser pursuant to such contracts.
Following October 2, 2003, 43 additional lawsuits making factual allegations generally similar to those in the Hindo Complaint were filed in various federal and state courts against the Adviser and certain other defendants. On September 29, 2004, plaintiffs filed consolidated amended complaints with respect to four claim types: mutual fund shareholder claims; mutual fund derivative claims; derivative claims brought on behalf of Alliance Holding; and claims brought under ERISA by participants in the Profit Sharing Plan for Employees of the Adviser. All four complaints include substantially identical factual allegations, which appear to be based in large part on the Order of the SEC dated December 18, 2003 as amended and restated January 15, 2004 (“SEC Order”) and the New York State Attorney General Assurance of Discontinuance dated September 1, 2004 (“NYAG Order”).
On April 21, 2006, the Adviser and attorneys for the plaintiffs in the mutual fund shareholder claims, mutual fund derivative claims, and ERISA claims entered into a confidential memorandum of understanding containing their agreement to settle these claims. The agreement has been documented by a stipulation of settlement and has been approved by the court. The settlement amount ($30 million), which the Adviser previously accrued and disclosed, has been disbursed. The derivative claims brought on behalf of Alliance Holding, in which plaintiffs seek an unspecified amount of damages, remain pending.
It is possible that these matters and/or other developments resulting from these matters could result in increased redemptions of the AllianceBernstein Mutual Funds’ shares or other adverse consequences to the AllianceBernstein Mutual Funds. This may require the AllianceBernstein Mutual Funds to sell investments held by those funds to provide for sufficient liquidity and could also have an adverse effect on the investment performance of the AllianceBernstein Mutual Funds. However, the Adviser believes that these matters are not likely to have a material adverse effect on its ability to perform advisory services relating to the AllianceBernstein Mutual Funds.
| | |
| 36 | | • ALLIANCEBERNSTEIN INTERNATIONAL GROWTH FUND |
Notes to Financial Statements
NOTE K
Change of Independent Registered Public Accounting Firm
On May 5, 2010, Ernst & Young LLP (“E&Y”) was selected as the Fund’s independent registered public accounting firm for the 2010 fiscal year. A majority of the Fund’s Board of Directors, including a majority of the Independent Directors, approved the appointment of E&Y. The predecessor independent registered public accounting firm’s reports on the Fund’s financial statements for each of the years ended June 30, 2009 and 2008 contained no adverse opinion or disclaimer of opinion and were not qualified or modified as to uncertainty, audit scope or accounting principles. During such fiscal periods and through May 5, 2010, there were no disagreements between the Fund and the predecessor independent registered public accounting firm on any matter of accounting principles or practices, financial statement disclosure, or auditing scope or procedures, which such disagreements, if not resolved to the satisfaction of the predecessor independent registered public accounting firm, would have caused them to make reference to the subject matter of the disagreement in connection with their reports on the financial statements for such periods.
NOTE L
Subsequent Events
Management has evaluated subsequent events for possible recognition or disclosure in the financial statements through the date the financial statements are issued. Management has determined that there are no material events that would require disclosure in the Fund’s financial statements through this date.
| | |
| ALLIANCEBERNSTEIN INTERNATIONAL GROWTH FUND • | | 37 |
Notes to Financial Statements
FINANCIAL HIGHLIGHTS
Selected Data For A Share of Capital Stock Outstanding Throughout Each Period
| | | | | | | | | | | | | | | |
| | | Class A | |
| | | Year Ended June 30, | |
| | | 2010 | | | 2009 | | | 2008 | | | 2007 | | | 2006 | |
| | | |
| | | | | | | | | | | | | | | |
Net asset value, beginning of period | | $ 11.48 | | | $ 19.18 | | | $ 20.85 | | | $ 16.93 | | | $ 13.72 | |
| | | |
Income From Investment Operations | | | | | | | | | | | | | | | |
Net investment income(a) | | .10 | | | .19 | | | .27 | | | .23 | | | .20 | |
Net realized and unrealized gain (loss) on investment and foreign currency transactions | | 1.14 | | | (7.59 | ) | | (.53 | ) | | 4.56 | | | 3.22 | |
Contributions from Adviser | | .00 | (b) | | – 0 | – | | .00 | (b) | | .00 | (b) | | – 0 | – |
| | | |
Net increase (decrease) in net asset value from operations | | 1.24 | | | (7.40 | ) | | (.26 | ) | | 4.79 | | | 3.42 | |
| | | |
Less: Dividends and Distributions | | | | | | | | | | | | | | | |
Dividends from net investment income | | (.39 | ) | | (.28 | ) | | (.17 | ) | | (.15 | ) | | (.09 | ) |
Distributions from net realized gain on investment and foreign currency transactions | | – 0 | – | | (.02 | ) | | (1.24 | ) | | (.72 | ) | | (.12 | ) |
| | | |
Total dividends and distributions | | (.39 | ) | | (.30 | ) | | (1.41 | ) | | (.87 | ) | | (.21 | ) |
| | | |
Net asset value, end of period | | $ 12.33 | | | $ 11.48 | | | $ 19.18 | | | $ 20.85 | | | $ 16.93 | |
| | | |
Total Return | | | | | | | | | | | | | | | |
Total investment return based on net asset value(c) | | 10.39 | % | | (39.15 | )% | | (1.80 | )% | | 29.16 | % | | 25.11 | % |
Ratios/Supplemental Data | | | | | | | | | | | | | | | |
Net assets, end of period (000’s omitted) | | $935,695 | | | $1,106,113 | | | $2,128,533 | | | $1,630,491 | | | $952,036 | |
Ratio to average net assets of: | | | | | | | | | | | | | | | |
Expenses, net of waivers/reimbursements | | 1.31 | %(d) | | 1.34 | % | | 1.23 | % | | 1.27 | % | | 1.43 | %(d) |
Expenses, before waivers/reimbursements | | 1.31 | %(d) | | 1.34 | % | | 1.23 | % | | 1.27 | % | | 1.43 | %(d) |
Net investment income | | .73 | %(d) | | 1.58 | % | | 1.35 | % | | 1.21 | % | | 1.26 | %(d) |
Portfolio turnover rate | | 121 | % | | 103 | % | | 90 | % | | 68 | % | | 59 | % |
See footnote summary on page 44.
| | |
| 38 | | • ALLIANCEBERNSTEIN INTERNATIONAL GROWTH FUND |
Financial Highlights
Selected Data For A Share of Capital Stock Outstanding Throughout Each Period
| | | | | | | | | | | | | | | |
| | | Class B | |
| | | Year Ended June 30, | |
| | | 2010 | | | 2009 | | | 2008 | | | 2007 | | | 2006 | |
| | | |
| | | | | | | | | | | | | | | |
Net asset value, beginning of period | | $ 10.42 | | | $ 17.50 | | | $ 19.15 | | | $ 15.65 | | | $ 12.72 | |
| | | |
Income From Investment Operations | | | | | | | | | | | | | | | |
Net investment income (loss)(a) | | (.01 | ) | | .08 | | | .09 | | | .06 | | | .05 | |
Net realized and unrealized
gain (loss) on investment
and foreign currency transactions | | 1.03 | | | (6.95 | ) | | (.45 | ) | | 4.22 | | | 3.01 | |
Contributions from Adviser | | .00 | (b) | | – 0 | – | | .00 | (b) | | .00 | (b) | | – 0 | – |
| | | |
Net increase (decrease) in net asset value from
operations | | 1.02 | | | (6.87 | ) | | (.36 | ) | | 4.28 | | | 3.06 | |
| | | |
Less: Dividends and Distributions | | | | | | | | | | | | | | | |
Dividends from net investment income | | (.27 | ) | | (.19 | ) | | (.05 | ) | | (.06 | ) | | (.01 | ) |
Distributions from net realized
gain on investment and
foreign currency
transactions | | – 0 | – | | (.02 | ) | | (1.24 | ) | | (.72 | ) | | (.12 | ) |
| | | |
Total dividends and
distributions | | (.27 | ) | | (.21 | ) | | (1.29 | ) | | (.78 | ) | | (.13 | ) |
| | | | | | |
Net asset value, end of
period | | $ 11.17 | | | $ 10.42 | | | $ 17.50 | | | $ 19.15 | | | $ 15.65 | |
| | | |
Total Return | | | | | | | | | | | | | | | |
Total investment return based
on net asset value(c) | | 9.49 | % | | (39.70 | ) % | | (2.45 | ) % | | 28.18 | % | | 24.18 | % |
Ratios/Supplemental Data | | | | | | | | | | | | | | | |
Net assets, end of period
(000’s omitted) | | $44,166 | | | $55,832 | | | $114,406 | | | $136,704 | | | $109,706 | |
Ratio to average net assets of: | | | | | | | | | | | | | | | |
Expenses, net of waivers/reimbursements | | 2.10 | %(d) | | 2.12 | % | | 1.97 | % | | 2.00 | % | | 2.18 | %(d) |
Expenses, before waivers/reimbursements | | 2.10 | %(d) | | 2.12 | % | | 1.97 | % | | 2.01 | % | | 2.18 | %(d) |
Net investment income (loss) | | (.06 | )%(d) | | .74 | % | | .48 | % | | .37 | % | | .33 | %(d) |
Portfolio turnover rate | | 121 | % | | 103 | % | | 90 | % | | 68 | % | | 59 | % |
See footnote summary on page 44.
| | |
| ALLIANCEBERNSTEIN INTERNATIONAL GROWTH FUND • | | 39 |
Financial Highlights
Selected Data For A Share of Capital Stock Outstanding Throughout Each Period
| | | | | | | | | | | | | | | |
| | | Class C | |
| | | Year Ended June 30, | |
| | | 2010 | | | 2009 | | | 2008 | | | 2007 | | | 2006 | |
| | | |
| | | | | | | | | | | | | | | |
Net asset value, beginning of period | | $ 10.45 | | | $ 17.53 | | | $ 19.18 | | | $ 15.67 | | | $ 12.72 | |
| | | |
Income From Investment Operations | | | | | | | | | | | | | | | |
Net investment income(a) | | .00 | (b) | | .09 | | | .12 | | | .10 | | | .13 | |
Net realized and unrealized
gain (loss) on investment
and foreign currency transactions | | 1.03 | | | (6.96 | ) | | (.48 | ) | | 4.19 | | | 2.95 | |
Contributions from Adviser | | .00 | (b) | | – 0 | – | | .00 | (b) | | .00 | (b) | | – 0 | – |
| | | |
Net increase (decrease) in net asset value from
operations | | 1.03 | | | (6.87 | ) | | (.36 | ) | | 4.29 | | | 3.08 | |
| | | |
Less: Dividends and Distributions | | | | | | | | | | | | | | | |
Dividends from net investment income | | (.27 | ) | | (.19 | ) | | (.05 | ) | | (.06 | ) | | (.01 | ) |
Distributions from net realized
gain on investment and
foreign currency
transactions | | – 0 | – | | (.02 | ) | | (1.24 | ) | | (.72 | ) | | (.12 | ) |
| | | |
Total dividends and
distributions | | (.27 | ) | | (.21 | ) | | (1.29 | ) | | (.78 | ) | | (.13 | ) |
| | | |
Net asset value, end of
period | | $ 11.21 | | | $ 10.45 | | | $ 17.53 | | | $ 19.18 | | | $ 15.67 | |
| | | |
Total Return | | | | | | | | | | | | | | | |
Total investment return based
on net asset value(c) | | 9.56 | % | | (39.63 | )% | | (2.45 | )% | | 28.21 | % | | 24.34 | % |
Ratios/Supplemental Data | | | | | | | | | | | | | | | |
Net assets, end of period
(000’s omitted) | | $185,848 | | | $228,402 | | | $542,520 | | | $444,496 | | | $210,147 | |
Ratio to average net assets of: | | | | | | | | | | | | | | | |
Expenses, net of waivers/reimbursements | | 2.03 | %(d) | | 2.07 | % | | 1.94 | % | | 1.98 | % | | 2.13 | %(d) |
Expenses, before waivers/reimbursements | | 2.03 | %(d) | | 2.07 | % | | 1.94 | % | | 1.98 | % | | 2.13 | %(d) |
Net investment income | | .01 | %(d) | | .77 | % | | .62 | % | | .55 | % | | .85 | %(d) |
Portfolio turnover rate | | 121 | % | | 103 | % | | 90 | % | | 68 | % | | 59 | % |
See footnote summary on page 44.
| | |
| 40 | | • ALLIANCEBERNSTEIN INTERNATIONAL GROWTH FUND |
Financial Highlights
Selected Data For A Share of Capital Stock Outstanding Throughout Each Period
| | | | | | | | | | | | | | | |
| | | Advisor Class | |
| | | Year Ended June 30, | |
| | | 2010 | | | 2009 | | | 2008 | | | 2007 | | | 2006 | |
| | | |
| | | | | | | | | | | | | | | |
Net asset value, beginning of period | | $ 11.61 | | | $ 19.39 | | | $ 21.05 | | | $ 17.08 | | | $ 13.82 | |
| | | |
Income From Investment Operations | | | | | | | | | | | | | | | |
Net investment income(a) | | .15 | | | .23 | | | .35 | | | .31 | | | .29 | |
Net realized and unrealized
gain (loss) on investment
and foreign currency transactions | | 1.15 | | | (7.67 | ) | | (.54 | ) | | 4.57 | | | 3.21 | |
Contributions from Adviser | | .00 | (b) | | – 0 | – | | .00 | (b) | | .00 | (b) | | – 0 | – |
| | | |
Net increase (decrease) in net asset value from
operations | | 1.30 | | | (7.44 | ) | | (.19 | ) | | 4.88 | | | 3.50 | |
| | | |
Less: Dividends and Distributions | | | | | | | | | | | | | | | |
Dividends from net investment income | | (.43 | ) | | (.32 | ) | | (.23 | ) | | (.19 | ) | | (.12 | ) |
Distributions from net realized
gain on investment and
foreign currency
transactions | | – 0 | – | | (.02 | ) | | (1.24 | ) | | (.72 | ) | | (.12 | ) |
| | | |
Total dividends and
distributions | | (.43 | ) | | (.34 | ) | | (1.47 | ) | | (.91 | ) | | (.24 | ) |
| | | |
Net asset value, end of
period | | $ 12.48 | | | $ 11.61 | | | $ 19.39 | | | $ 21.05 | | | $ 17.08 | |
| | | |
Total Return | | | | | | | | | | | | | | | |
Total investment return based
on net asset value(c) | | 10.77 | % | | (39.02 | )% | | (1.49 | )% | | 29.51 | % | | 25.57 | % |
Ratios/Supplemental Data | | | | | | | | | | | | | | | |
Net assets, end of period
(000’s omitted) | | $306,231 | | | $302,956 | | | $544,154 | | | $319,322 | | | $108,237 | |
Ratio to average net assets of: | | | | | | | | | | | | | | | |
Expenses, net of waivers/reimbursements | | 1.01 | % (d) | | 1.05 | % | | .93 | % | | .97 | % | | 1.13 | %(d) |
Expenses, before waivers/reimbursements | | 1.01 | % (d) | | 1.05 | % | | .93 | % | | .97 | % | | 1.13 | %(d) |
Net investment income | | 1.12 | % (d) | | 1.88 | % | | 1.74 | % | | 1.62 | % | | 1.81 | %(d) |
Portfolio turnover rate | | 121 | % | | 103 | % | | 90 | % | | 68 | % | | 59 | % |
| See | | footnote summary on page 44. |
| | |
| ALLIANCEBERNSTEIN INTERNATIONAL GROWTH FUND • | | 41 |
Financial Highlights
Selected Data For A Share of Capital Stock Outstanding Throughout Each Period
| | | | | | | | | | | | | | | |
| | | Class R | |
| | | Year Ended June 30, | |
| | | 2010 | | | 2009 | | | 2008 | | | 2007 | | | 2006 | |
| | | | | | |
| | | | | | | | | | | | | | | |
Net asset value, beginning of period | | $ 11.39 | | | $ 19.06 | | | $ 20.75 | | | $ 16.90 | | | $ 13.72 | |
Income From Investment Operations | | | | | | | | | | | | | | | |
Net investment income(a) | | .07 | | | .17 | | | .25 | | | .20 | | | .29 | |
Net realized and unrealized
gain (loss) on investment
and foreign currency transactions | | 1.13 | | | (7.57 | ) | | (.55 | ) | | 4.52 | | | 3.09 | |
Contributions from Adviser | | .00 | (b) | | – 0 | – | | .00 | (b) | | .00 | (b) | | – 0 | – |
| | | |
Net increase (decrease) in net asset value from
operations | | 1.20 | | | (7.40 | ) | | (.30 | ) | | 4.72 | | | 3.38 | |
| | | |
Less: Dividends and Distributions | | | | | | | | | | | | | | | |
Dividends from net investment income | | (.37 | ) | | (.25 | ) | | (.15 | ) | | (.15 | ) | | (.08 | ) |
Distributions from net realized
gain on investment and
foreign currency
transactions | | – 0 | – | | (.02 | ) | | (1.24 | ) | | (.72 | ) | | (.12 | ) |
| | | |
Total dividends and
distributions | | (.37 | ) | | (.27 | ) | | (1.39 | ) | | (.87 | ) | | (.20 | ) |
| | | |
Net asset value, end of
period | | $ 12.22 | | | $ 11.39 | | | $ 19.06 | | | $ 20.75 | | | $ 16.90 | |
| | | |
Total Return | | | | | | | | | | | | | | | |
Total investment return based
on net asset value(c) | | 10.17 | % | | (39.33 | )% | | (2.03 | )% | | 28.80 | % | | 24.83 | % |
Ratios/Supplemental Data | | | | | | | | | | | | | | | |
Net assets, end of period
(000’s omitted) | | $42,587 | | | $41,265 | | | $64,985 | | | $29,638 | | | $6,969 | |
Ratio to average net assets of: | | | | | | | | | | | | | | | |
Expenses, net of waivers/reimbursements | | 1.58 | %(d) | | 1.56 | % | | 1.49 | % | | 1.56 | % | | 1.67 | %(d) |
Expenses, before waivers/reimbursements | | 1.58 | %(d) | | 1.56 | % | | 1.49 | % | | 1.56 | % | | 1.67 | %(d) |
Net investment income | | .51 | %(d) | | 1.44 | % | | 1.24 | % | | 1.02 | % | | 1.76 | %(d) |
Portfolio turnover rate | | 121 | % | | 103 | % | | 90 | % | | 68 | % | | 59 | % |
See footnote summary on page 44.
| | |
| 42 | | • ALLIANCEBERNSTEIN INTERNATIONAL GROWTH FUND |
Financial Highlights
Selected Data For A Share of Capital Stock Outstanding Throughout Each Period
| | | | | | | | | | | | | | | |
| | | Class K | |
| | | Year Ended June 30, | |
| | | 2010 | | | 2009 | | | 2008 | | | 2007 | | | 2006 | |
| | | | | | |
| | | | | | | | | | | | | | | |
Net asset value, beginning of period | | $ 11.45 | | | $ 19.14 | | | $ 20.82 | | | $ 16.95 | | | $ 13.73 | |
| | | |
Income From Investment Operations | | | | | | | | | | | | | | | |
Net investment income(a) | | .11 | | | .20 | | | .29 | | | .31 | | | .34 | |
Net realized and unrealized
gain (loss) on investment
and foreign currency transactions | | 1.14 | | | (7.59 | ) | | (.54 | ) | | 4.47 | | | 3.09 | |
Contributions from Adviser | | .00 | (b) | | – 0 | – | | .00 | (b) | | .00 | (b) | | – 0 | – |
| | | |
Net increase (decrease) in net asset value
from operations | | 1.25 | | | (7.39 | ) | | (.25 | ) | | 4.78 | | | 3.43 | |
| | | |
Less: Dividends and Distributions | | | | | | | | | | | | | | | |
Dividends from net investment income | | (.41 | ) | | (.28 | ) | | (.19 | ) | | (.19 | ) | | (.09 | ) |
Distributions from net realized
gain on investment and
foreign currency
transactions | | – 0 | – | | (.02 | ) | | (1.24 | ) | | (.72 | ) | | (.12 | ) |
| | | |
Total dividends and
distributions | | (.41 | ) | | (.30 | ) | | (1.43 | ) | | (.91 | ) | | (.21 | ) |
| | | |
Net asset value, end of
period | | $ 12.29 | | | $ 11.45 | | | $ 19.14 | | | $ 20.82 | | | $ 16.95 | |
| | | |
Total Return | | | | | | | | | | | | | | | |
Total investment return based
on net asset value(c) | | 10.51 | % | | (39.19 | )% | | (1.78 | ) % | | 29.13 | % | | 25.18 | % |
Ratios/Supplemental Data | | | | | | | | | | | | | | | |
Net assets, end of
period (000’s omitted) | | $12,117 | | | $11,486 | | | $15,104 | | | $8,169 | | | $760 | |
Ratio to average net assets of: | | | | | | | | | | | | | | | |
Expenses, net of waivers/ reimbursements | | 1.27 | %(d) | | 1.28 | % | | 1.26 | % | | 1.26 | % | | 1.41 | %(d) |
Expenses, before waivers/ reimbursements | | 1.27 | %(d) | | 1.28 | % | | 1.26 | % | | 1.26 | % | | 1.41 | %(d) |
Net investment income | | 84 | %(d) | | 1.79 | % | | 1.45 | % | | 1.60 | % | | 2.05 | %(d) |
Portfolio turnover rate | | 121 | % | | 103 | % | | 90 | % | | 68 | % | | 59 | % |
See footnote summary on page 44.
| | |
| ALLIANCEBERNSTEIN INTERNATIONAL GROWTH FUND • | | 43 |
Financial Highlights
Selected Data For A Share of Capital Stock Outstanding Throughout Each Period
| | | | | | | | | | | | | | | |
| | | Class I | |
| | | Year Ended June 30, | |
| | | 2010 | | | 2009 | | | 2008 | | | 2007 | | | 2006 | |
| | | |
| | | | | | | | | | | | | | | |
Net asset value, beginning of period | | $ 11.55 | | | $ 19.27 | | | $ 20.92 | | | $ 16.98 | | | $ 13.74 | |
| | | | | | |
Income From Investment Operations | | | | | | | | | | | | | | | |
Net investment income(a) | | .16 | | | .27 | | | .35 | | | .32 | | | .48 | |
Net realized and unrealized
gain (loss) on investment
and foreign currency transactions | | 1.15 | | | (7.64 | ) | | (.52 | ) | | 4.54 | | | 3.01 | |
Contributions from Adviser | | .00 | (b) | | – 0 | – | | .00 | (b) | | .00 | (b) | | – 0 | – |
| | | |
Net increase (decrease) in net asset value from
operations | | 1.31 | | | (7.37 | ) | | (.17 | ) | | 4.86 | | | 3.49 | |
| | | |
Less: Dividends and Distributions | | | | | | | | | | | | | | | |
Dividends from net investment income | | (.46 | ) | | (.33 | ) | | (.24 | ) | | (.20 | ) | | (.13 | ) |
Distributions from net realized
gain on investment and
foreign currency
transactions | | – 0 | – | | (.02 | ) | | (1.24 | ) | | (.72 | ) | | (.12 | ) |
| | | |
Total dividends and
distributions | | (.46 | ) | | (.35 | ) | | (1.48 | ) | | (.92 | ) | | (.25 | ) |
| | | |
Net asset value, end of
period | | $ 12.40 | | | $ 11.55 | | | $ 19.27 | | | $ 20.92 | | | $ 16.98 | |
| | | |
Total Return | | | | | | | | | | | | | | | |
Total investment return based
on net asset value(c) | | 10.86 | % | | (38.90 | ) % | | (1.39 | ) % | | 29.59 | % | | 25.61 | % |
Ratios/Supplemental Data | | | | | | | | | | | | | | | |
Net assets, end of period
(000’s omitted) | | $28,644 | | | $25,659 | | | $27,460 | | | $19,421 | | | $2,497 | |
Ratio to average net assets of: | | | | | | | | | | | | | | | |
Expenses, net of waivers/reimbursements | | .88 | %(d) | | .86 | % | | .84 | % | | .90 | % | | 1.09 | %(d) |
Expenses, before waivers/reimbursements | | .88 | %(d) | | .86 | % | | .84 | % | | .90 | % | | 1.09 | %(d) |
Net investment income | | 1.21 | %(d) | | 2.37 | % | | 1.70 | % | | 1.70 | % | | 2.81 | %(d) |
Portfolio turnover rate | | 121 | % | | 103 | % | | 90 | % | | 68 | % | | 59 | % |
| (a) | | Based on average shares outstanding. |
| (b) | | Amount is less than $0.005. |
| (c) | | Total investment return is calculated assuming an initial investment made at the net asset value at the beginning of the period, reinvestment of all dividends and distributions at net asset value during the period, and redemption on the last day of the period. Initial sales charge or contingent deferred sales charge is not reflected in the calculation of total investment return. Total investment return does not reflect the deduction of taxes that a shareholder would pay on fund distributions or the redemption of fund shares. Total investment return for a period of less than one year is not annualized. |
| (d) | | The ratio includes expenses attributable to costs of proxy solicitation. |
See notes to financial statements.
| | |
| 44 | | • ALLIANCEBERNSTEIN INTERNATIONAL GROWTH FUND |
Financial Highlights
REPORT OF INDEPENDENT REGISTERED
PUBLIC ACCOUNTING FIRM
To the Board of Directors and Shareholders of
AllianceBernstein International Growth Fund, Inc.
We have audited the accompanying statement of assets and liabilities of AllianceBernstein International Growth Fund, Inc. (the “Fund”), including the portfolio of investments, as of June 30, 2010, and the related statement of operations, statement of changes in net assets, and the financial highlights for the year then ended. These financial statements and financial highlights are the responsibility of the Fund’s management. Our responsibility is to express an opinion on these financial statements and financial highlights based on our audit. The statement of changes in net assets for the year ended June 30, 2009 and the financial highlights for each of the four years in the period then ended were audited by other auditors whose report dated August 26, 2009 expressed an unqualified opinion on that statement and financial highlights.
We conducted our audit in accordance with the standards of the Public Company Accounting Oversight Board (United States). Those standards require that we plan and perform the audit to obtain reasonable assurance about whether the financial statements and financial highlights are free of material misstatement. We were not engaged to perform an audit of the Fund’s internal control over financial reporting. Our audit included consideration of internal control over financial reporting as a basis for designing audit procedures that are appropriate in the circumstances, but not for the purpose of expressing an opinion on the effectiveness of the Fund’s internal control over financial reporting. Accordingly, we express no such opinion. An audit also includes examining, on a test basis, evidence supporting the amounts and disclosures in the financial statements and financial highlights, assessing the accounting principles used and significant estimates made by management, and evaluating the overall financial statement presentation. Our procedures included confirmation of securities owned as of June 30, 2010 by correspondence with the custodian and others or by other appropriate auditing procedures where replies from others were not received. We believe that our audit provides a reasonable basis for our opinion.
In our opinion, the financial statements and financial highlights referred to above present fairly, in all material respects, the financial position of AllianceBernstein International Growth Fund, Inc. as of June 30, 2010, and the results of its operations, changes in its net assets and the financial highlights for the year then ended, in conformity with U.S. generally accepted accounting principles.

New York, New York
August 26, 2010
| | |
| ALLIANCEBERNSTEIN INTERNATIONAL GROWTH FUND • | | 45 |
Report of Independent Registered Public Accounting Firm
TAX INFORMATION
(unaudited)
For the fiscal year ended June 30, 2010, the Fund designates the maximum percentage allowable but no more than 100% of its ordinary dividends paid during its fiscal year as qualified dividend income, which is taxed at a maximum rate of 15%. The Fund also designates the maximum amount allowable but no more than $3,851,157 as eligible for the foreign tax credit and the associated foreign gross income of $43,366,580, in accordance with Section 853 of the code.
The information and distributions reported herein may differ from the information and distributions taxable to the shareholders for the calendar year ended December 31, 2010. Complete information will be computed and reported in conjunction with your 2010 Form 1099-DIV.
| | |
| 46 | | • ALLIANCEBERNSTEIN INTERNATIONAL GROWTH FUND |
Tax Information
BOARD OF DIRECTORS
| | |
| William H. Foulk, Jr.,(1) Chairman | | Nancy P. Jacklin(1) |
| John H. Dobkin(1) | | Garry L. Moody(1) |
| Michael J. Downey(1) | | Marshall C. Turner, Jr.(1) |
| D. James Guzy(1) | | Earl D. Weiner(1) |
OFFICERS
| | |
Robert M. Keith, President and Chief Executive Officer Philip L. Kirstein, Senior Vice President and Independent
Compliance Officer Olalekan Akinyanmi, Vice President Isabel Buccellati, Vice President Gregory D. Eckersley(2), Vice President William A. Johnston, Vice President | | Ian Kirwan, Vice President Michele Patri, Vice President Tassos Stassopoulos, Vice President Christopher M. Toub(2), Vice President Emilie D. Wrapp, Secretary Joseph J. Mantineo, Treasurer and Chief Financial Officer Phyllis J. Clarke, Controller |
| | |
Custodian and Accounting Agent Brown Brothers Harriman & Company 40 Water Street Boston, MA 02109-3661 Principal Underwriter AllianceBernstein Investments, Inc. 1345 Avenue of the Americas New York, NY 10105 Transfer Agent AllianceBernstein Investor Services, Inc. P.O. Box 786003 San Antonio, TX 78278-6003 Toll-Free (800) 221-5672 | | Independent Registered Public Accounting Firm Ernst & Young LLP 5 Times Square New York, NY 10036 Legal Counsel Seward & Kissel LLP One Battery Park Plaza New York, NY 10004 |
| |
| |
| |
| |
| |
| |
| |
| |
| |
| |
| |
| |
| |
| |
| |
| (1) | Member of the Audit Committee, the Governance and Nominating Committee and the Independent Directors Committee. Mr. Foulk is the sole member of the Fair Value Pricing Committee. |
| (2) | The day-to-day management of, and investment decisions for, the AllianceBernstein International Growth Fund’s portfolio are made by the Adviser’s International Growth Portfolio Oversight Group in consultation with the International Growth senior sector analysts. Messrs. Eckersley and Toub are the investment professionals with the most significant responsibility for the day-to-day management of the Fund’s portfolio. |
| | |
| ALLIANCEBERNSTEIN INTERNATIONAL GROWTH FUND • | | 47 |
Board of Directors
MANAGEMENT OF THE FUND
Board of Directors Information
The business and affairs of the Fund are managed under the direction of the Board of Directors. Certain information concerning the Fund’s Directors is set forth below.
| | | | | | |
NAME, ADDRESS,* AGE, (FIRST YEAR ELECTED**) | | PRINCIPAL OCCUPATION(S) DURING PAST 5 YEARS AND OTHER RELEVANT QUALIFICATIONS*** | | PORTFOLIOS
IN FUND
COMPLEX
OVERSEEN BY
DIRECTOR | | OTHER
DIRECTORSHIPS
HELD BY
DIRECTOR IN
PAST FIVE YEARS |
| DISINTERESTED DIRECTORS | | | | |
Chairman of the Board William H. Foulk, Jr., #, + 77
(1994) | | Investment Adviser and an Independent Consultant since prior to 2005. Previously, he was Senior Manager of Barrett Associates, Inc., a registered investment adviser. He was formerly Deputy Comptroller and Chief Investment Officer of the State of New York and, prior thereto, Chief Investment Officer of the New York Bank for Savings. He has served as a director or trustee of various AllianceBernstein Funds since 1983 and has been Chairman of the AllianceBernstein Funds and of the Independent Directors Committee of such Funds since 2003. He is also active in a number of mutual fund related organizations and committees. | | 94 | | None |
| | | | | | |
John H. Dobkin, #
68
(1994) | | Independent Consultant since prior to 2005. Formerly, President of Save Venice, Inc. (preservation organization) from 2001-2002, Senior Advisor from June 1999-June 2000 and President of Historic Hudson Valley (historic preservation) from December 1989-May 1999. Previously, Director of the National Academy of Design. He has served as a director or trustee of various AllianceBernstein Funds since 1992, and as Chairman of the Audit Committees of a number of such Funds from 2001-2008. | | 92 | | None |
| | | | | | |
| | |
| 48 | | • ALLIANCEBERNSTEIN INTERNATIONAL GROWTH FUND |
Management of the Fund
| | | | | | |
NAME, ADDRESS,* AGE, (FIRST YEAR ELECTED**) | | PRINCIPAL OCCUPATION(S) DURING PAST 5 YEARS AND OTHER RELEVANT QUALIFICATIONS*** | | PORTFOLIOS
IN FUND
COMPLEX
OVERSEEN BY
DIRECTOR | | OTHER
DIRECTORSHIPS
HELD BY
DIRECTOR IN
PAST FIVE YEARS |
DISINTERESTED DIRECTORS (continued) | | | | |
Michael J. Downey, # 66
(2005) | | Private Investor since prior to 2005. Formerly, managing partner of Lexington Capital, LLC (investment advisory firm) from December 1997 until December 2003. From 1987 until 1993, Chairman and CEO of Prudential Mutual Fund Management, Director of the Prudential Mutual funds, and member of the Executive Committee of Prudential Securities, Inc. He has served as a director or trustee of the AllianceBernstein Funds since 2005 and is director of two other registered investment companies (and Chairman of one of them). | | 92 | | Asia Pacific Fund, Inc., The Merger Fund since prior to 2005 and Prospect Acquisition Corp. (financial services) since 2007 until 2009 |
| | | | | | |
D. James Guzy, # 74
(2005) | | Chairman of the Board of PLX Technology (semi-conductors) and of SRC Computers Inc., with which he has been associated since prior to 2005. He was a director of the Intel Corporation (semi-conductors) from 1969 until 2008, and served as Chairman of the Finance Committee of such company for several years until May 2008. He has served as a director of one or more of the AllianceBernstein Funds since 1982. | | 92 | | Cirrus Logic Corporation (semi-conductors) PLX Technology, Inc. (semi-conductors) since prior to 2005 and Intel Corporation (semi-conductors) since prior to 2005 until 2008 |
| | | | | | |
| | |
| ALLIANCEBERNSTEIN INTERNATIONAL GROWTH FUND • | | 49 |
Management of the Fund
| | | | | | |
NAME, ADDRESS,* AGE, (FIRST YEAR ELECTED**) | | PRINCIPAL OCCUPATION(S) DURING PAST 5 YEARS AND OTHER RELEVANT QUALIFICATIONS*** | | PORTFOLIOS
IN FUND
COMPLEX
OVERSEEN BY
DIRECTOR | | OTHER
DIRECTORSHIPS
HELD BY
DIRECTOR IN
PAST FIVE YEARS |
DISINTERESTED DIRECTORS (continued) | | | | |
Nancy P. Jacklin, # 62
(2006) | | Professorial Lecturer at the Johns Hopkins School of Advanced International Studies since 2008. Formerly, U.S. Executive Director of the International Monetary Fund (December 2002-May 2006); Partner, Clifford Chance (1992-2002); Sector Counsel, International Banking and Finance, and Associate General Counsel, Citicorp (1985-1992); Assistant General Counsel (International), Federal Reserve Board of Governors (1982-1985); and Attorney Advisor, U.S. Department of the Treasury (1973-1982). Member of the Bar of the District of Columbia and of New York; and member of the Council on Foreign Relations. She has served as a director or trustee of the AllianceBernstein Funds since 2006. | | 92 | | None |
| | | | | | |
Garry L. Moody, # 58 (2008) | | Independent Consultant. Formerly, Partner, Deloitte & Touche LLP (1995-2008) where he held a number of senior positions, including Vice Chairman, and U.S. and Global Investment Management Practice Managing Partner; President, Fidelity Accounting and Custody Services Company (1993-1995); and Partner, Ernst & Young LLP (1975-1993), where he served as the National Director of Mutual Fund Tax Services. He is also a member of the Governing Council of the Independent Directors Council (IDC), an organization of independent directors of mutual funds, and serves on that organization’s Education and Communications Committee. He has served as a director or trustee, and as Chairman of the Audit Committee, of most of the AllianceBernstein Funds since 2008. | | 91 | | None |
| | | | | | |
| | |
| 50 | | • ALLIANCEBERNSTEIN INTERNATIONAL GROWTH FUND |
Management of the Fund
| | | | | | |
NAME, ADDRESS,* AGE, (FIRST YEAR ELECTED**) | | PRINCIPAL OCCUPATION(S) DURING PAST 5 YEARS AND OTHER RELEVANT QUALIFICATIONS*** | | PORTFOLIOS
IN FUND
COMPLEX
OVERSEEN BY
DIRECTOR | | OTHER
DIRECTORSHIPS
HELD BY
DIRECTOR IN
PAST FIVE YEARS |
DISINTERESTED DIRECTORS (continued) | | | | |
Marshall C. Turner, Jr., # 68
(2005) | | Private Investor since prior to 2005. Interim CEO of MEMC Electronic Materials, Inc. (semi-conductor and solar cell substrates) from November 2008 until March 2009. He was Chairman and CEO of Dupont Photomasks, Inc. (components of semi-conductor manufacturing), 2003-2005, and President and CEO, 2005-2006, after the company was renamed Toppan Photomasks, Inc. He has extensive experience in venture capital investing including prior service as general partner of three institutional venture capital partnerships, and serves on the boards of a number of education and science-related non-profit organizations. He has served as a director or trustee of one or more of the AllianceBernstein Funds since 1992. | | 92 | | Xilinx, Inc. (programmable logic semi-conductors) and MEMC Electronic Materials, Inc. (semi-conductor and solar cell substrates) since prior to 2005 |
| | | | | | |
Earl D. Weiner, # 71
(2007) | | Of Counsel, and Partner prior to January 2007, of the law firm Sullivan & Cromwell LLP; member of ABA Federal Regulation of Securities Committee Task Force to draft editions of the Fund Director’s Guidebook. He also serves as a director or trustee of various non-profit organizations and has served as Chairman or Vice Chairman of a number of them. He has served as a director or trustee of the AllianceBernstein Funds since 2007 and is Chairman of the Governance and Nominating Committees of most of the Funds. | | 92 | | None |
| * | The address for each of the Fund’s disinterested Directors is c/o AllianceBernstein L.P., Attention: Philip L. Kirstein, 1345 Avenue of the Americas, New York, NY 10105. |
| ** | There is no stated term of office for the Fund’s Directors. |
| *** | The information above includes each Director’s principal occupation during the last five years and other information relating to the experience, attributes, and skills relevant to each Director’s qualifications to serve as a Director, which led to the conclusion that each Director should serve as a Director for the Fund. |
| # | Member of the Audit Committee, the Governance and Nominating Committee and the Independent Directors Committee. |
| + | Member of the Fair Value Pricing Committee. |
| | |
| ALLIANCEBERNSTEIN INTERNATIONAL GROWTH FUND • | | 51 |
Management of the Fund
Officer Information
Certain information concerning the Fund’s Officers is listed below.
| | | | |
NAME, ADDRESS*
AND AGE | | POSITION(S) HELD WITH FUND | | PRINCIPAL OCCUPATION DURING PAST 5 YEARS |
Robert M. Keith 50 | | President and Chief Executive Officer | | Senior Vice President of AllianceBernstein L.P. (the “Adviser”) and the head of AllianceBernstein Investments, Inc. (“ABI”) since July 2008; Director of ABI and President of the AllianceBernstein Mutual Funds. Previously, he served as Executive Managing Director of ABI from December 2006 to June 2008. Prior to joining ABI in 2006, Executive Managing Director of Bernstein Global Wealth Management, and prior thereto, Senior Managing Director and Global Head of Client Service and Sales of the Adviser’s institutional investment management business since 2004. Prior thereto, Managing Director and Head of North American Client Service and Sales in the Adviser’s institutional investment management business, with which he had been associated since prior to 2004. |
| | | | |
Philip L. Kirstein
65 | | Senior Vice President and Independent Compliance Officer | | Senior Vice President and Independent Compliance Officer of the AllianceBernstein Funds, with which he has been associated since October 2004. Prior thereto, he was Of Counsel to Kirkpatrick & Lockhart, LLP from October 2003 to October 2004, and General Counsel of Merrill Lynch Investment Managers, L.P. prior to March 2003. |
| | | | |
Olalekan A. Akinyanmi 38 | | Vice President | | Vice President of the Adviser**, with which he has been associated since May 2006. Prior thereto, he was an Associate Director at UBS Investment Research, covering the oil services industry since prior to 2005. |
| | | | |
Isabel Buccellati 41 | | Vice President | | Vice President of AllianceBernstein Limited (“ABL”)** and a Vice President of the Adviser**, with which she has been associated since prior to 2005. |
| | | | |
Gregory D. Eckersley
45 | | Vice President | | Senior Vice President of the Adviser**, with which he has been associated since prior to 2005. |
| | | | |
William A. Johnston 49 | | Vice President | | Senior Vice President of ABL** and a Vice President of the Adviser**, with which he has been associated since prior to 2005. |
| | |
| 52 | | • ALLIANCEBERNSTEIN INTERNATIONAL GROWTH FUND |
Management of the Fund
| | | | |
NAME, ADDRESS*
AND AGE | | POSITION(S) HELD WITH FUND | | PRINCIPAL OCCUPATION DURING PAST 5 YEARS |
| | | | |
Ian Kirwan 35 | | Vice President | | Vice President of the Adviser**, with which he has been associated since prior to 2005. |
| | | | |
Michele Patri
47 | | Vice President | | Senior Vice President of ABL** and a Vice President of the Adviser**, with which he has been associated since prior to 2005. |
| | | | |
Tassos Stassopoulos 42 | | Vice President | | Vice President of the Adviser**, with which he has been associated since November 2007. Prior thereto, he was a Managing Director since 2005 and a senior analyst and sector head for Pan European Travel and Leisure coverage at Credit Suisse since prior to 2005. |
| | | | |
Christopher M. Toub 51 | | Vice President | | Senior Vice President of the Adviser**, with which he has been associated since prior to 2005. |
| | | | |
Emilie D. Wrapp 54 | | Secretary | | Senior Vice President, Assistant General Counsel and Assistant Secretary of ABI**, with which she has been associated since prior to 2005. |
| | | | |
Joseph J. Mantineo 51 | | Treasurer and Chief Financial Officer | | Senior Vice President of AllianceBernstein Investor Services, Inc. (“ABIS”)**, with which he has been associated since prior to 2005. |
| | | | |
Phyllis J. Clarke 49 | | Controller | | Vice President of ABIS**, with which she has been associated since prior to 2005. |
| * | The address for each of the Fund’s Officers is 1345 Avenue of the Americas, New York, NY 10105. |
| ** | The Adviser, ABI, ABIS and ABL are affiliates of the Fund. |
| | The Fund’s Statement of Additional Information (“SAI”) has additional information about the Fund’s Directors and Officers and is available upon request. Contact your financial representative or AllianceBernstein at 1-800-227-4618 for a free prospectus or SAI. |
| | |
| ALLIANCEBERNSTEIN INTERNATIONAL GROWTH FUND • | | 53 |
Management of the Fund
Information Regarding the Review and Approval of the Fund’s Advisory Agreement
The disinterested directors (the “directors”) of AllianceBernstein International Growth Fund, Inc. (the “Fund”) unanimously approved the continuance of the Fund’s Advisory Agreement with the Adviser at a meeting held on May 4-6, 2010.
Prior to approval of the continuance of the Advisory Agreement, the directors had requested from the Adviser, and received and evaluated, extensive materials. They reviewed the proposed continuance of the Advisory Agreement with the Adviser and with experienced counsel who are independent of the Adviser, who advised on the relevant legal standards. The directors also reviewed an independent evaluation prepared by the Fund’s Senior Officer (who is also the Fund’s Independent Compliance Officer) of the reasonableness of the advisory fee in the Advisory Agreement wherein the Senior Officer concluded that the contractual fee for the Fund was reasonable. The directors also discussed the proposed continuance in private sessions with counsel and the Fund’s Senior Officer.
The directors considered their knowledge of the nature and quality of the services provided by the Adviser to the Fund gained from their experience as directors or trustees of most of the registered investment companies advised by the Adviser, their overall confidence in the Adviser’s integrity and competence they have gained from that experience, the Adviser’s initiative in identifying and raising potential issues with the directors and its responsiveness, frankness and attention to concerns raised by the directors in the past, including the Adviser’s willingness to consider and implement organizational and operational changes designed to improve investment results and the services provided to the AllianceBernstein Funds. The directors noted that they have four regular meetings each year, at each of which they receive presentations from the Adviser on the investment results of the Fund and review extensive materials and information presented by the Adviser.
The directors also considered all other factors they believed relevant, including the specific matters discussed below. In their deliberations, the directors did not identify any particular information that was all-important or controlling, and different directors may have attributed different weights to the various factors. The directors determined that the selection of the Adviser to manage the Fund and the overall arrangements between the Fund and the Adviser, as provided in the Advisory Agreement, including the advisory fee, were fair and reasonable in light of the services performed, expenses incurred and such other matters as the directors considered relevant in the exercise of their business judgment. The material factors and conclusions that formed the basis for the directors’ determinations included the following:
Nature, Extent and Quality of Services Provided
The directors considered the scope and quality of services provided by the Adviser under the Advisory Agreement, including the quality of the investment
| | |
| 54 | | • ALLIANCEBERNSTEIN INTERNATIONAL GROWTH FUND |
research capabilities of the Adviser and the other resources it has dedicated to performing services for the Fund. They also noted the professional experience and qualifications of the Fund’s portfolio management team and other senior personnel of the Adviser. The directors also considered that the Advisory Agreement provides that the Fund will reimburse the Adviser for the cost to it of providing certain clerical, accounting, administrative and other services provided at the Fund’s request by employees of the Adviser or its affiliates. Requests for these reimbursements are approved by the directors on a quarterly basis and, to the extent requested and paid, result in a higher rate of total compensation from the Fund to the Adviser than the fee rate stated in the Fund’s Advisory Agreement. The directors noted that the methodology used to determine the reimbursement amounts had been reviewed by an independent consultant retained by the Fund’s Senior Officer. The quality of administrative and other services, including the Adviser’s role in coordinating the activities of the Fund’s other service providers, also were considered. The directors concluded that, overall, they were satisfied with the nature, extent and quality of services provided to the Fund under the Advisory Agreement.
Costs of Services Provided and Profitability
The directors reviewed a schedule of the revenues, expenses and related notes indicating the profitability of the Fund to the Adviser for calendar years 2008 and 2009 that had been prepared with an expense allocation methodology arrived at in consultation with an independent consultant retained by the Fund’s Senior Officer. The directors reviewed the assumptions and methods of allocation used by the Adviser in preparing fund-specific profitability data and noted that there are a number of potentially acceptable allocation methodologies for information of this type. The directors noted that the profitability information reflected all revenues and expenses of the Adviser’s relationship with the Fund, including those relating to its subsidiaries which provide transfer agency, distribution and brokerage services to the Fund. The directors recognized that it is difficult to make comparisons of profitability between fund advisory contracts because comparative information is not generally publicly available and is affected by numerous factors. The directors focused on the profitability of the Adviser’s relationship with the Fund before taxes and distribution expenses. The directors concluded that they were satisfied that the Adviser’s level of profitability from its relationship with the Fund was not unreasonable.
Fall-Out Benefits
The directors considered the benefits to the Adviser and its affiliates from their relationships with the Fund other than the fees and expense reimbursements payable under the Advisory Agreement, including but not limited to benefits relating to soft dollar arrangements (whereby the Adviser receives brokerage and research services from many of the brokers that execute purchases and sales of securities on behalf of its clients on an agency basis), 12b-1 fees and sales charges received by the Fund’s principal underwriter (which is a wholly owned subsidiary
| | |
| ALLIANCEBERNSTEIN INTERNATIONAL GROWTH FUND • | | 55 |
of the Adviser) in respect of certain classes of the Fund’s shares, transfer agency fees paid by the Fund to a wholly owned subsidiary of the Adviser, and brokerage commissions paid by the Fund to brokers affiliated with the Adviser. The directors recognized that the Adviser’s profitability would be somewhat lower without these benefits. The directors understood that the Adviser also might derive reputational and other benefits from its association with the Fund.
Investment Results
In addition to the information reviewed by the directors in connection with the meeting, the directors receive detailed performance information for the Fund at each regular Board meeting during the year. At the May 2010 meeting, the directors reviewed information prepared by Lipper showing the performance of the Class A Shares of the Fund as compared with that of a group of similar funds selected by Lipper (the “Performance Group”) and as compared with that of a broader array of funds selected by Lipper (the “Performance Universe”), and information prepared by the Adviser showing performance of the Class A Shares as compared with the Morgan Stanley Capital International (MSCI) All Country (AC) World (ex-US) Index (Net) (the “MSCI AC World Index”) and the MSCI World (ex-US) Index (Net) (the “MSCI World Index”), in each case for the 1-, 3-, 5- and 10-year periods ended January 31, 2010, and (in the case of comparisons with the MSCI World Index) the since inception period (June 1994 inception). The directors noted that the Fund was in the 2nd quintile of the Performance Group and the Performance Universe for the 1-year period, in the 5th quintile of the Performance Group and the Performance Universe for the 3-year period, in the 4th quintile of the Performance Group and the Performance Universe for the 5-year period and 2nd out of 4 of the Performance Group and in the 2nd quintile of the Performance Universe for the 10-year period, and that the Fund underperformed the MSCI AC World Index in all periods reviewed and outperformed the MSCI World Index in the 1- and 10-year and the since inception periods but underperformed that index in the 3- and 5-year periods. Based on their review as well as the improvement in relative performance ranking in the 1-year period, the directors concluded that the Fund’s performance was satisfactory.
Advisory Fees and Other Expenses
The directors considered the advisory fee rate paid by the Fund to the Adviser and information prepared by Lipper concerning fee rates paid by other funds in the same Lipper category as the Fund at a common asset level. The directors recognized that it is difficult to make comparisons of advisory fees because there are variations in the services that are included in the fees paid by other funds.
The directors also considered the fees the Adviser charges other clients pursuing an investment style similar to that of the Fund. For this purpose, they reviewed the relevant fee information from the Adviser’s Form ADV and the evaluation from the Fund’s Senior Officer disclosing the institutional fee schedule for
| | |
| 56 | | • ALLIANCEBERNSTEIN INTERNATIONAL GROWTH FUND |
institutional products managed by the Adviser that have an investment style similar to that of the Fund. The directors noted that the institutional fee schedule had breakpoints at lower asset levels than those in the fee schedule applicable to the Fund and that the application of the institutional fee schedule to the level of assets of the Fund would result in a fee rate lower than that in the Fund’s Advisory Agreement. The directors noted that the Adviser may, in some cases, agree to fee rates with large institutional clients that are lower than those reviewed by the directors and that they had previously discussed with the Adviser its policies in respect of such arrangements. The directors also noted that the Adviser advises a portfolio of another AllianceBernstein fund with a substantially similar investment style as the Fund for the same fee schedule as the Fund.
The Adviser reviewed with the directors the significantly greater scope of the services it provides to the Fund relative to institutional clients. The Adviser also noted that because mutual funds are constantly issuing and redeeming shares, they are more difficult to manage than an institutional account, where the assets tend to be relatively stable. In light of the substantial differences in services rendered by the Adviser to institutional clients as compared to funds such as the Fund, the directors considered these fee comparisons inapt and did not place significant weight on them in their deliberations.
The directors also considered the total expense ratio of the Class A shares of the Fund in comparison to the fees and expenses of funds within two comparison groups created by Lipper: an Expense Group and an Expense Universe. Lipper described an Expense Group as a representative sample of funds similar to the Fund and an Expense Universe as a broader group, consisting of all funds in the Fund’s investment classification/objective with a similar load type as the Fund. The directors noted that because of the small number of funds in the Fund’s Lipper category, at the request of the Adviser and the Fund’s Senior Officer, Lipper had expanded the Expense Group of the Fund to include peers that had a similar (but not the same) Lipper investment objective/classification. The Expense Universe for the Fund had also been expanded by Lipper pursuant to Lipper’s standard guidelines and not at the request of the Adviser or the Fund’s Senior Officer. The Class A expense ratio of the Fund was based on the Fund’s latest fiscal year. The directors noted that it was likely that the expense ratios of some funds in the Fund’s Lipper category were lowered by waivers or reimbursements by those funds’ investment advisers, which in some cases were voluntary and perhaps temporary. The directors view the expense ratio information as relevant to their evaluation of the Adviser’s services because the Adviser is responsible for coordinating services provided to the Fund by others.
The directors noted that, at the Fund’s current size, its contractual effective advisory fee rate of 75 basis points, plus the 1 basis point impact of the administrative expense reimbursement in the latest fiscal year, was about the same as the Expense Group median. The directors noted that the Fund’s total expense
| | |
| ALLIANCEBERNSTEIN INTERNATIONAL GROWTH FUND • | | 57 |
ratio, which had been capped by the Adviser (although the expense ratio was currently lower than the cap), was lower than the Expense Group and the Expense Universe medians. The directors concluded that the Fund’s expense ratio was satisfactory.
Economies of Scale
The directors noted that the advisory fee schedule for the Fund contains breakpoints and that the Fund’s net assets were in excess of the first breakpoint level. Accordingly, the Fund’s current effective advisory fee rate would reflect a reduction due to the effect of the breakpoints and would be further reduced to the extent the net assets of the Fund increase further. The directors also considered presentations by an independent consultant discussing economies of scale in the mutual fund industry and for the AllianceBernstein Funds, as well as a presentation by the Adviser concerning certain of its views on economies of scale. The directors believe that economies of scale may be realized (if at all) by the Adviser across a variety of products and services, and not only in respect of a single fund. The directors noted that there is no established methodology for establishing breakpoints that give effect to fund-specific services provided by a fund’s adviser and to the economies of scale that an adviser may realize in its overall mutual fund business or those components of it which directly or indirectly affect a fund’s operations. The directors observed that in the mutual fund industry as a whole, as well as among funds similar to the Fund, there is no uniformity or pattern in the fees and asset levels at which breakpoints (if any) apply. The directors also noted that the advisory agreements for many funds do not have breakpoints at all. Having taken these factors into account, the directors concluded that the Fund’s breakpoint arrangements were acceptable and were resulting in a sharing of economies of scale.
| | |
| 58 | | • ALLIANCEBERNSTEIN INTERNATIONAL GROWTH FUND |
THE FOLLOWING IS NOT PART OF THE SHAREHOLDER REPORT OR THE FINANCIAL STATEMENTS
SUMMARY OF SENIOR OFFICER’S EVALUATION OF INVESTMENT ADVISORY AGREEMENT1
The following is a summary of the evaluation of the Investment Advisory Agreement between AllianceBernstein L.P. (the “Adviser”) and AllianceBernstein International Growth Fund, Inc. (the “Fund”).2 The evaluation of the Investment Advisory Agreement was prepared by Philip L. Kirstein, the Senior Officer of the Fund, for the Directors of the Fund, as required by a September 2004 agreement between the Adviser and the New York State Attorney General (the “NYAG”). The Senior Officer’s evaluation of the Investment Advisory Agreement is not meant to diminish the responsibility or authority of the Board of Directors of the Fund to perform its duties pursuant to Section 15 of the Investment Company Act of 1940 (the “40 Act”) and applicable state law. The purpose of the summary is to provide shareholders with a synopsis of the independent evaluation of the reasonableness of the advisory fees proposed to be paid by the Fund which was provided to the Directors in connection with their review of the proposed approval of the continuance of the Investment Advisory Agreement. The Senior Officer’s evaluation considered the following factors:
| | 1. | Advisory fees charged to institutional and other clients of the Adviser for like services; |
| | 2. | Advisory fees charged by other mutual fund companies for like services; |
| | 3. | Costs to the Adviser and its affiliates of supplying services pursuant to the advisory agreement, excluding any intra-corporate profit; |
| | 4. | Profit margins of the Adviser and its affiliates from supplying such services; |
| | 5. | Possible economies of scale as the Fund grows larger; and |
| | 6. | Nature and quality of the Adviser’s services including the performance of the Fund. |
FUND ADVISORY FEES, NET ASSETS, EXPENSE CAPS & RATIOS
The Adviser proposed that the Fund pay the advisory fee set forth in the table below for receiving the services to be provided pursuant to the Investment Advisory Agreement. The fee schedule below, implemented in January 2004 in consideration of the Adviser’s settlement with the NYAG in December 2003, is
| 1 | | It should be noted that the information in the fee summary was completed on April 21, 2010 and presented to the Board of Directors on May 4-6, 2010. |
| 2 | | On July 25, 2008, the Fund acquired International Research Growth Fund, Inc. Future references to the Fund do not include “AllianceBernstein.” References in the fee summary pertaining to performance and expense ratio rankings refer to the Class A shares of the Fund. |
| | |
| ALLIANCEBERNSTEIN INTERNATIONAL GROWTH FUND • | | 59 |
based on a master schedule that contemplates eight categories of funds with almost all funds in each category having the same advisory fee schedule.3
| | | | | | | |
| Category | | Advisory Fee Based on % of Average Daily Net Assets | | Net Assets 03/31/10 ($MIL) | | Fund |
| International | | 75 bp on 1st $2.5 billion
65 bp on next $2.5 billion 60 bp on the balance | | $ | 1,943.9 | | International Growth Fund, Inc. |
The Adviser is reimbursed as specified in the Investment Advisory Agreement for certain clerical, legal, accounting, administrative and other services provided to the Fund. During the Fund’s most recently completed fiscal year, the Adviser received $99,760 (0.01% of the Fund’s average daily net assets) for such services.
The Adviser has agreed to waive that portion of its management fees and/or reimburse the Fund for that portion of its total operating expenses to the degree necessary to limit the Fund’s expense ratios to the amounts set forth below for the Fund’s fiscal year. The waiver is terminable by the Adviser at the end of the Fund’s fiscal year upon at least 60 days written notice prior to the termination date of the undertaking. It should be noted that the Fund was operating below its expense caps during its most recent semi-annual period; accordingly, the expense limitation undertaking of the Fund was of no effect. In addition, set forth below are the gross expense ratios of the Fund for the most recent semi-annual period:4
| | | | | | | | | | |
| Fund | | Expense Cap Pursuant to
Expense Limitation
Undertaking | | | Gross Expense
Ratio5 (as of 12/31/09) | | | Fiscal
Year End |
| International Growth Fund, Inc. | | Advisor
Class A Class B Class C Class R Class K Class I | | 1.35
1.65 2.35 2.35 1.85 1.60 1.35 | %
% % % % % % | | 0.98
1.28 2.06 2.00 1.57 1.26 0.86 | %
% % % % % % | | June 30 |
| I. | ADVISORY FEES CHARGED TO INSTITUTIONAL AND OTHER CLIENTS |
The advisory fees charged to investment companies which the Adviser manages and sponsors are normally higher than those charged to similar sized institutional accounts, including pension plans and sub-advised investment companies. The fee differential reflects, among other things, different services provided to such clients, and different liabilities assumed. Services provided by the Adviser to the Fund that are not provided to non-investment company clients and
| 3 | | Most of the AllianceBernstein Mutual Funds, which the Adviser manages, were affected by the Adviser’s settlement with the NYAG. |
| 4 | | Semi-annual total expense ratios are unaudited |
| | |
| 60 | | • ALLIANCEBERNSTEIN INTERNATIONAL GROWTH FUND |
sub-advised investment companies include providing office space and personnel to serve as Fund Officers, who among other responsibilities make the certifications required under the Sarbanes–Oxley Act of 2002, and coordinating with and monitoring the Fund’s third party service providers such as Fund counsel, auditors, custodians, transfer agents and pricing services. The accounting, administrative, legal and compliance requirements for the Fund are more costly than those for institutional assets due to the greater complexities and time required for investment companies, although as previously noted, a portion of these expenses are reimbursed by the Fund to the Adviser. Also, retail mutual funds managed by the Adviser are widely held. Servicing the Fund’s investors is more time consuming and labor intensive compared to institutional clients since the Adviser needs to communicate with a more extensive network of financial intermediaries and shareholders. The Adviser also believes that it incurs substantial entrepreneurial risk when offering a new mutual fund since establishing a new mutual fund requires a large upfront investment and it may take a long time for the fund to achieve profitability since the fund must be priced to scale from inception in order to be competitive and assets are acquired one account at a time. In addition, managing the cash flow of an investment company may be more difficult than managing that of a stable pool of assets, such as an institutional account with little cash movement in either direction, particularly, if a fund is in net redemption and the Adviser is frequently forced to sell securities to raise cash for redemptions. However, managing a fund with positive cash flow may be easier at times than managing a stable pool of assets. Finally, in recent years, investment advisers have been sued by institutional clients and have suffered reputational damage both by the attendant publicity and outcomes other than complete victories. Accordingly, the legal and reputational risks associated with institutional accounts are greater than previously thought, although still not equal to those related to the mutual fund industry.
Notwithstanding the Adviser’s view that managing an investment company is not comparable to managing other institutional accounts because the services provided are different, the Supreme Court has indicated consideration should be given to the advisory fees charged to institutional accounts with a similar investment style as the Fund.6 In addition to the AllianceBernstein Institutional fee schedule, set forth below is what would have been the effective advisory fee
| 6 | | The Supreme Court recently held the Gartenberg decision was correct in its basic formulation of what §36(b) requires: to face liability under §36(b), “an investment adviser must charge a fee that is so disproportionately large that it bears no reasonable relationship to the services rendered and could not have been the product of arms length bargaining.” Jones v. Harris Associates L.P., (No. 08-586), slip op. at 9, 559 U.S. 2010. In the Jones v. Harris decision, the Supreme Court stated the Gartenberg approach fully incorporates the correct understanding of fiduciary duty within the context of section §36(b) and noted with approval that “Gartenberg insists that all relevant circumstances be taken into account” and “uses the range of fees that might result from arms-length bargaining as the benchmark for reviewing challenged fees.” Jones v. Harris at 11. |
| | |
| ALLIANCEBERNSTEIN INTERNATIONAL GROWTH FUND • | | 61 |
of the Fund had the AllianceBernstein Institutional fee schedule been applicable to the Fund versus the Fund’s advisory fee based on March 31, 2010 net assets:7
| | | | | | | | | | |
| Fund | | Net
Assets 03/31/10 ($MIL) | | AllianceBernstein
(“AB”) Institutional
(“Inst.”) Fee Schedule | | Effective
AB Inst.
Adv. Fee | | | Fund Advisory
Fee | |
| International Growth Fund, Inc.8 | | $1,943.9 | | International Large Cap
Growth80 bp on 1st $25 million 60 bp on next $25 million 50 bp on next $50 million 40 bp on the balance Minimum Account Size:
$25 m | | 0.410 | % | | 0.750 | % |
The adviser also manages the AllianceBernstein Variable Products Series Fund, Inc. (“AVPS”), which is available through variable annuity and variable life contracts offered by other financial institutions and offers policyholders the option to utilize certain AVPS portfolios as the investment option underlying their insurance contracts. Set forth below is the fee schedule of the AVPS portfolio that has a substantially similar investment style as the Fund.9 Also shown is what would have been the effective advisory fee of the Fund had the AVPS fee schedule been applicable to the Fund:
| | | | | | | | |
Fund | | AVPS Portfolio | | Fee Schedule | | Effective
AVPS
Adv. Fee | | Fund
Advisory
Fee |
| International Growth Fund, Inc. | | International Growth Portfolio | | 0.75% on first $2.5 billion 0.65% on next $2.5 billion 0.60% on the balance | | 0.750% | | 0.750% |
The Adviser represented that it does not sub-advise any registered investment company with a substantially similar investment style as the Fund.
| 7 | | The Adviser has indicated that with respect to institutional accounts with assets greater than $300 million, it will negotiate a fee schedule. Discounts that are negotiated vary based upon each client relationship. |
| 8 | | Fees shown are for the International Large Cap Growth Strategy, which is similar but more concentrated than the Fund’s strategy. |
| 9 | | It should be noted that the AVPS portfolio was also affected by the settlement between the Adviser and the NYAG. As a result, the Fund has the same breakpoints in its advisory fee schedule as the AVPS portfolio. |
| | |
| 62 | | • ALLIANCEBERNSTEIN INTERNATIONAL GROWTH FUND |
| II. | MANAGEMENT FEES CHARGED BY OTHER MUTUAL FUND COMPANIES FOR LIKE SERVICES. |
Lipper, Inc. (“Lipper”), an analytical service that is not affiliated with the Adviser, compared the fees charged to the Fund with fees charged to other investment companies for similar services offered by other investment advisers.10 Lipper’s analysis included the Fund’s ranking with respect to the proposed management fee relative to the median of the Fund’s Lipper Expense Group (“EG”)11 at the approximate current asset level of the Fund.12
Lipper describes an EG as a representative sample of comparable funds. Lipper’s standard methodology for screening funds to be included in an EG entails the consideration of several fund criteria, including fund type, investment classification/objective, load type and similar 12b-1/non-12b-1 service fees, asset (size) comparability, expense components and attributes. An EG will typically consist of seven to twenty funds.
The Fund’s original EG had an insufficient number of peers in the view of the Senior Officer and the Adviser. Consequently, at the request of the Senior Officer and the Adviser, Lipper expanded the Fund’s EG to include peers that have similar but not the same Lipper investment classification/objective.
| | | | | | |
Fund | | Contractual
Management
Fee (%)13 | | Lipper Exp.
Group
Median (%) | | Rank |
International Growth Fund, Inc.14 | | 0.750 | | 0.758 | | 7/14 |
| 10 | | In considering this section, it should be noted that the Supreme Court cautioned against accepting mutual fund fee comparisons without careful scrutiny since “these comparisons are problematic because these fees, like those challenged, may not be the product of the negotiations conducted at arms length.” Jones v. Harris at 14. |
| 11 | | It should be noted that Lipper does not consider average account size when constructing EGs. Funds with relatively small average account sizes tend to have higher transfer agent expense ratio than comparable sized funds that have relatively large average account sizes. Note that there are limitations on Lipper expense category data because different funds categorize expenses differently. |
| 12 | | The contractual management fee is calculated by Lipper using the Fund’s contractual management fee rate at a hypothetical asset level. The hypothetical asset level is based on the combined net assets of all classes of the Fund, rounded up to the next $25 million. Lipper’s total expense ratio information is based on the most recent annual report except as otherwise noted. A ranking of “1” would mean that the Fund had the lowest effective fee rate in the Lipper peer group. |
| 13 | | The contractual management fee does not reflect any expense reimbursements made by the Fund to the Adviser for certain clerical, legal, accounting, administrative and other services. In addition, the contractual management fee would not reflect any advisory fee waivers or expense reimbursements made by the Adviser to the Fund for expense caps that would effectively reduce the actual management fee. |
| 14 | | The Fund’s EG includes the Fund, four other International Large Cap Growth Funds (“ILCG”), seven International Large Cap Core Funds (“ILCC”) and two International Multi-Cap Growth Funds (“IMLG”). |
| | |
| ALLIANCEBERNSTEIN INTERNATIONAL GROWTH FUND • | | 63 |
However, because Lipper had expanded the EG of the Fund, under Lipper’s standard guidelines, the Lipper Expense Universe (“EU”) was also expanded to include the universe of those peers that had a similar but not the same Lipper investment classification/objective.15 A “normal” EU will include funds that have the same investment classification/objective as the subject Fund.16
It should be noted that Lipper uses expense ratio data from financial statements of the most current fiscal year in their database. This has several implications: the total expense ratio of each fund that Lipper uses in their report is based on each fund’s average net assets during its fiscal year. Since funds have different fiscal year ends, the total expense ratios of the funds may cover different twelve month periods, depending on the funds’ fiscal year ends. This is the process that Lipper always follows but given the volatile market conditions during 2008 and 2009, notably the last three months of 2008 through the first three months of 2009, when equity markets declined substantially, and conversely through the remainder of 2009, when equity markets rallied the effects on the funds’ total expense ratio caused by the differences in fiscal year ends may be more pronounced in 2008 and 2009 compared to other years under more normal market conditions.17
| | | | | | | | | | |
Fund | | Expense
Ratio
(%)18 | | Lipper
Exp.
Group
Median
(%) | | Lipper
Group
Rank | | Lipper Exp.
Universe
Median (%) | | Lipper
Universe
Rank |
International Growth
Fund, Inc.19 | | 1.343 | | 1.412 | | 6/14 | | 1.507 | | 19/104 |
Based on this analysis, the Fund has a more favorable ranking on a total expense ratio basis than it does on a management fee basis.
| III. | COSTS TO THE ADVISER AND ITS AFFILIATES OF SUPPLYING SERVICES PURSUANT TO THE ADVISORY FEE ARRANGEMENT, EXCLUDING ANY INTRA-CORPORATE PROFIT. |
| 15 | | It should be noted that the expansion of the Fund’s EU was not requested by the Senior Officer or the Adviser. They requested that only the EG be expanded. |
| 16 | | Except for asset (size) comparability, Lipper uses the same criteria for selecting an EG peer when selecting an EU peer. Unlike the EG, the EU allows for the same adviser to be represented by more than just one fund. |
| 17 | | To cite an example, the average net assets and total expense ratio of a fund with a fiscal year end of March 31, 2008 will not be reflective of the market declines that occurred in the second half of 2008, in contrast to a fund with a fiscal year end of December 31, 2008. Likewise, the same fund’s net assets for fiscal year 2009 will not reflect the post March 2009 market rally. |
| 18 | | The total expense ratios shown are for the Fund’s most recent fiscal year end Class A shares. |
| 19 | | The Fund’s EU includes the Fund, EG and all other ILCG, IMLG and ILCC funds, excluding outliers. |
| | |
| 64 | | • ALLIANCEBERNSTEIN INTERNATIONAL GROWTH FUND |
The Adviser utilizes two profitability reporting systems, which operate independently but are aligned with each other, to estimate the Adviser’s profitability in connection with investment advisory services provided to the Fund. The Senior Officer has retained a consultant to provide independent advice regarding the alignment of the two profitability systems as well as the methodologies and allocations utilized by both profitability systems. See Section IV for additional discussion.
| IV. | PROFIT MARGINS OF THE ADVISER AND ITS AFFILIATES FOR SUPPLYING SUCH SERVICES. |
The Fund’s profitability information, prepared by the Adviser for the Board of Directors, was reviewed by the Senior Officer and the consultant. The Adviser’s profitability from providing investment advisory services to the Fund increased during calendar year 2009, relative to 2008.
In addition to the Adviser’s direct profits from managing the Fund, certain of the Adviser’s affiliates have business relationships with the Fund and may earn a profit from providing other services to the Fund. The courts have referred to this type of business opportunity as “fall-out benefits” to the Adviser and indicated that such benefits should be factored into the evaluation of the total relationship between the Fund and the Adviser. Neither case law nor common business practice precludes the Adviser’s affiliates from earning a reasonable profit on this type of relationship provided the affiliates’ charges and services are competitive and the relationship otherwise complies with the 40 Act restrictions. These affiliates provide transfer agent, distribution and brokerage related services to the Fund and receive transfer agent fees, Rule 12b-1 payments, front-end sales loads, contingent deferred sales charges (“CDSC”) and brokerage commissions. In addition, the Adviser benefits from soft dollar arrangements which offset expenses the Adviser would otherwise incur.
AllianceBernstein Investments, Inc. (“ABI”), an affiliate of the Adviser, is the Fund’s principal underwriter. ABI and the Adviser have disclosed in the Fund’s prospectus that they may make revenue sharing payments from their own resources, in addition to resources derived from sales loads and Rule 12b-1 fees, to firms that sell shares of the Fund. In 2009, ABI paid approximately 0.04% of the average monthly assets of the AllianceBernstein Mutual Funds or approximately $13.8 million for distribution services and educational support (revenue sharing payments). During the Fund’s most recently completed fiscal year, ABI received from the Fund $22,006, $7,835,039 and $299,403 in front-end sales charges, Rule 12b-1 and CDSC fees, respectively.
Fees and reimbursements for out of pocket expenses charged by AllianceBernstein Investor Services, Inc. (“ABIS”), the affiliated transfer agent for the Fund, are charged on a per account basis, based on the level of service provided and the class of share held by the account. ABIS also receives a fee per shareholder
| | |
| ALLIANCEBERNSTEIN INTERNATIONAL GROWTH FUND • | | 65 |
sub-account for each account maintained by an intermediary on an omnibus basis. During the Fund’s most recently completed fiscal year, ABIS received $1,697,663 in fees from the Fund.20
The Fund may effect brokerage transactions through the Adviser’s affiliate, Sanford C. Bernstein & Co., LLC (“SCB & Co.”) and/or its U.K. affiliate, Sanford C. Bernstein Limited (“SCB Ltd.”), collectively “SCB,” and pay commissions for such transactions. During the Fund’s most recently completed fiscal year, the Fund did not effect any brokerage transactions with and pay any commission to SCB. The Adviser represented that SCB’s profitability from any future business conducted with the Fund would be comparable to the profitability of SCB’s dealings with other similar third party clients. In the ordinary course of business, SCB receives and pays liquidity rebates from electronic communications networks (“ECNs”) derived from trading for its clients. These credits and charges are not being passed onto any SCB client. The Adviser also receives certain soft dollar benefits from brokers that execute agency trades for its clients. These soft dollar benefits reduce the Adviser’s cost of doing business and increase its profitability.
| V. | POSSIBLE ECONOMIES OF SCALE |
The Adviser has indicated that economies of scale are being shared with shareholders through fee structures,21 subsidies and enhancement to services. Based on some of the professional literature that has considered economies of scale in the mutual fund industry, it is thought that to the extent economies of scale exist, they may more often exist across a fund family as opposed to a specific fund. This is because the costs incurred by the Adviser, such as investment research or technology for trading or compliance systems can be spread across a greater asset base as the fund family increases in size. It is also possible that as the level of services required to operate a successful investment company has increased over time, and advisory firms make such investments in their business to provide services, there may be a sharing of economies of scale without a reduction in advisory fees.
An independent consultant, retained by the Senior Officer, provided the Board of Directors an update of the Deli22 study on advisory fees and various fund
| 20 | | The fees disclosed are net of any expense offsets with ABIS. An expense offset is created by the interest earned on the positive cash balance that occurs within the transfer agent account as there is a one day lag with regards to money movement from the shareholder’s account to the transfer agent’s account and then the transfer agent’s account to the Fund’s account. During the Fund’s most recently completed fiscal year, the fees paid by the Fund to ABIS were reduced by $15,210 under the offset agreement between the Fund and ABIS. |
| 21 | | Fee structures include fee reductions, pricing at scale and breakpoints in advisory fee schedules. |
| 22 | | The Deli study was originally published in 2002 based on 1997 data. |
| | |
| 66 | | • ALLIANCEBERNSTEIN INTERNATIONAL GROWTH FUND |
characteristics.23 The independent consultant first reiterated the results of his previous two dimensional comparison analysis (fund size and family size) with the Board of Directors.24 The independent consultant then discussed the results of the regression model that was utilized to study the effects of various factors on advisory fees. The regression model output indicated that the bulk of the variation in fees predicted were explained by various factors, but substantially by fund AUM, family AUM, index fund indicator and investment style. The independent consultant also compared the advisory fees of the AllianceBernstein Mutual Funds to similar funds managed by 19 other large asset managers, regardless of the fund size and each Adviser’s proportion of mutual fund assets to non-mutual fund assets.
| VI. | NATURE AND QUALITY OF THE ADVISER’S SERVICES, INCLUDING THE PERFORMANCE OF THE FUND |
With assets under management of approximately $501 billion as of March 31, 2010, the Adviser has the investment experience to manage and provide non-investment services (described in Section I) to the Fund.
The information prepared by Lipper shows the 1, 3, 5, and 10 year performance rankings of the Fund25 relative to its Lipper Performance Group (“PG”) and Lipper Performance Universe (“PU”)26 for the periods ended January 31, 2010.27
| 23 | | As mentioned previously, the Supreme Court cautioned against accepting mutual fund fee comparisons without careful scrutiny since the fees may not be the product of negotiations conducted at arms length. See Jones V. Harris at 14. |
| 24 | | The two dimensional analysis showed patterns of lower advisory fees for funds with larger asset sizes and funds from larger family sizes compared to funds with smaller asset sizes and funds from smaller family sizes, which according to the independent consultant is indicative of a sharing of economies of scale and scope. However, in less liquid and active markets, such is not the case, as the empirical analysis showed potential for diseconomies of scale in those markets. The empirical analysis also showed diminishing economies of scale and scope as funds surpassed a certain high level of assets. |
| 25 | | The performance rankings are for the Class A shares of the Fund. It should be noted that the performance returns of the Fund shown were provided by the Adviser. Lipper maintains its own database that includes the Fund’s performance returns. Rounding differences may cause the Adviser’s Fund returns to be one or two basis points different from Lipper’s own Fund returns. To maintain consistency, the performance returns of the Fund, as reported by the Adviser, are provided instead of Lipper. |
| 26 | | The Fund’s PG/PU are not identical to the Fund’s respective EG/EU as the criteria for including or excluding a fund in a PG or PU are somewhat different from that of an EG or EU. |
| 27 | | Note that the current Lipper investment classification/objective dictates the PG and PU throughout the life of the fund even if a fund had a different investment classification/objective at a different point in time. |
| | |
| ALLIANCEBERNSTEIN INTERNATIONAL GROWTH FUND • | | 67 |
| | | | | | | | | | |
| | | Fund Return (%) | | PG Median (%) | | PU Median (%) | | PG Rank | | PU Rank |
1 year | | 45.30 | | 41.84 | | 38.39 | | 2/5 | | 8/30 |
3 year | | -8.54 | | -6.68 | | -6.68 | | 5/5 | | 20/23 |
5 year | | 3.28 | | 4.59 | | 3.94 | | 4/5 | | 13/19 |
10 year | | 2.08 | | 1.85 | | -0.76 | | 2/4 | | 4/14 |
Set forth below are the 1, 3, 5, 10 year and since inception performance returns of the Fund (in bold)28 versus its benchmark.29 Fund and benchmark volatility and reward-to-variability ratio (“Sharpe Ratio”) information is also shown.30
| | | | | | | | | | | | | | | | |
| | | Periods Ending January 31, 2010 Annualized Performance |
| | | 1
Year
(%) | | 3
Year
(%) | | 5
Year
(%) | | 10
Year
(%) | | Since
Inception
(%) | | Annualized | | Risk
Period
(Year) |
| | | | | | | | Volatility
(%) | | Sharpe
(%) | |
| International Growth Fund, Inc. | | 45.30 | | -8.54 | | 3.28 | | 2.08 | | 7.21 | | 20.27 | | 0.06 | | 10 |
| MSCI AC World ex US Index (Net) | | 47.58 | | -5.20 | | 5.14 | | 2.78 | | N/A | | 18.62 | | 0.09 | | 10 |
| MSCI World ex US Index (Net)31 | | 40.51 | | -7.03 | | 3.49 | | 1.77 | | 4.74 | | 17.86 | | 0.03 | | 10 |
| Inception Date: June 2, 1994 | | |
CONCLUSION:
Based on the factors discussed above the Senior Officer’s conclusion is that the proposed advisory fee for the Fund is reasonable and within the range of what would have been negotiated at arm’s-length in light of all the surrounding circumstances. This conclusion in respect of the Fund is based on an evaluation of all of these factors and no single factor was dispositive.
Dated: June 2, 2010
| 28 | | The performance returns and risk measures shown in the table are for the Class A shares of the Fund. |
| 29 | | The Adviser provided Fund and benchmark performance return information for periods through January 31, 2010. Benchmark since inception date is the nearest month end after the Fund’s inception date. |
| 30 | | Fund and benchmark volatility and Sharpe Ratio information was obtained through Lipper LANA, a database maintained by Lipper. Volatility is a statistical measure of the tendency of a market price or yield to vary over time. A Sharpe Ratio is a risk adjusted measure of return that divides a fund’s return in excess of the riskless return by the fund’s standard deviation. A fund with a greater volatility would be seen as more risky than a fund with equivalent performance but lower volatility; for that reason, a greater return would be demanded for the more risky fund. A fund with a higher Sharpe Ratio would be viewed as better performing than a fund with a lower Sharpe Ratio. |
| 31 | | Prior to November 3, 2008, the Fund’s benchmark was Russell Mid-Cap Growth Index. |
| | |
| 68 | | • ALLIANCEBERNSTEIN INTERNATIONAL GROWTH FUND |
THIS PAGE IS NOT PART OF THE SHAREHOLDER REPORT OR THE FINANCIAL STATEMENTS
ALLIANCEBERNSTEIN FAMILY OF FUNDS
Wealth Strategies Funds
Balanced Wealth Strategy
Wealth Appreciation Strategy
Conservative Wealth Strategy*
Tax-Managed Balanced Wealth Strategy
Tax-Managed Wealth Appreciation Strategy
Tax-Managed Conservative Wealth Strategy*
Blended Style Funds
U.S. Large Cap Portfolio
International Portfolio
Tax-Managed International Portfolio
Growth Funds
Domestic
Growth Fund
Large Cap Growth Fund
Small Cap Growth Portfolio
Small/Mid Cap Growth Fund
U.S. Strategic Research Portfolio*
Global & International
Global Growth Fund
Global Thematic Growth Fund
Greater China ‘97 Fund
International Growth Fund
Value Funds
Domestic
Balanced Shares
Core Opportunities Fund*
Growth & Income Fund
Small/Mid Cap Value Fund
Utility Income Fund
Value Fund
Global & International
Global Real Estate Investment Fund
Global Value Fund
International Value Fund
Taxable Bond Funds
Bond Inflation Strategy
Diversified Yield Fund
Global Bond Fund
High Income Fund
Intermediate Bond Portfolio
Short Duration Portfolio
Municipal Bond Funds
| | |
Arizona Municipal Bond Inflation Strategy California High Income Massachusetts Michigan | | Minnesota National New Jersey New York Ohio Pennsylvania Virginia |
Intermediate Municipal Bond Funds
Intermediate California
Intermediate Diversified
Intermediate New York
Closed-End Funds
AllianceBernstein Global High Income Fund
AllianceBernstein Income Fund
AllianceBernstein National Municipal Income Fund
Alliance California Municipal Income Fund
Alliance New York Municipal Income Fund
The Ibero-America Fund*
Inflation Strategies
Multi-Asset Inflation Strategy
Alternative Strategies
Market Neutral Strategy - U.S.
Market Neutral Strategy - Global
Retirement Strategies Funds
| | | | |
2000 Retirement Strategy | | 2020 Retirement Strategy | | 2040 Retirement Strategy |
2005 Retirement Strategy | | 2025 Retirement Strategy | | 2045 Retirement Strategy |
2010 Retirement Strategy | | 2030 Retirement Strategy | | 2050 Retirement Strategy |
2015 Retirement Strategy | | 2035 Retirement Strategy | | 2055 Retirement Strategy |
We also offer Exchange Reserves,** which serves as the money market fund exchange vehicle for the AllianceBernstein mutual funds.
You should consider the investment objectives, risks, charges and expenses of any AllianceBernstein fund/portfolio carefully before investing. For free copies of our prospectuses, which contain this and other information, visit us online at www.alliancebernstein.com or contact your financial advisor. Please read the prospectus carefully before investing.
| * | | Prior to December 31, 2009, Conservative Wealth Strategy was named Wealth Preservation Strategy, and Tax-Managed Conservative Wealth Strategy was named Tax-Managed Wealth Preservation Strategy. Prior to January 20, 2010, The Ibero-America Fund was named The Spain Fund. Prior to March 1, 2010, Core Opportunities Fund was named the Focused Growth & Income Fund. |
| ** | An investment in the Fund is not a deposit in a bank and is not insured or guaranteed by the Federal Deposit Insurance Corporation or any other government agency. Although the Fund seeks to preserve the value of your investment at $1.00 per share, it is possible to lose money by investing in the Fund. |
| | |
| ALLIANCEBERNSTEIN INTERNATIONAL GROWTH FUND • | | 69 |
AllianceBernstein Family of Funds
NOTES
| | |
| 70 | | • ALLIANCEBERNSTEIN INTERNATIONAL GROWTH FUND |
NOTES
| | |
| ALLIANCEBERNSTEIN INTERNATIONAL GROWTH FUND • | | 71 |
NOTES
| | |
| 72 | | • ALLIANCEBERNSTEIN INTERNATIONAL GROWTH FUND |
ALLIANCEBERNSTEIN INTERNATIONAL GROWTH FUND
1345 Avenue of the Americas
New York, NY 10105
800.221.5672
| | |
| |
| IG-0151-0610 | |  |
(a) The registrant has adopted a code of ethics that applies to its principal executive officer, principal financial officer and principal accounting officer. A copy of the registrant’s code of ethics is filed herewith as Exhibit 12(a)(1).
(b) During the period covered by this report, no material amendments were made to the provisions of the code of ethics adopted in 2(a) above.
(c) During the period covered by this report, no implicit or explicit waivers to the provisions of the code of ethics adopted in 2(a) above were granted.
| ITEM 3. | AUDIT COMMITTEE FINANCIAL EXPERT. |
The registrant’s Board of Directors has determined that independent directors William H. Foulk, Jr. and Garry L. Moody qualify as audit committee financial experts.
| ITEM 4. | PRINCIPAL ACCOUNTANT FEES AND SERVICES. |
(a) - (c) The following table sets forth the aggregate fees billed by the independent registered public accounting firms KPMG LLP in 2009 and Ernst & Young LLP in 2010, for the Fund’s last two fiscal years for professional services rendered for: (i) the audit of the Fund’s annual financial statements included in the Fund’s annual report to stockholders; (ii) assurance and related services that are reasonably related to the performance of the audit of the Fund’s financial statements and are not reported under (i), which include advice and education related to accounting and auditing issues and quarterly press release review (for those Funds which issue press releases), and preferred stock maintenance testing (for those Funds that issue preferred stock); and (iii) tax compliance, tax advice and tax return preparation.
| | | | | | | | | | |
| | | | | Audit Fees | | Audit-Related
Fees | | Tax Fees |
AB International Growth | | 2009 | | $ | 38,842 | | | | $ | 13,200 |
| | 2010 | | $ | 30,500 | | | | $ | 2,581 |
(d) Not applicable.
(e) (1) Beginning with audit and non-audit service contracts entered into on or after May 6, 2003, the Fund’s Audit Committee policies and procedures require the pre-approval of all audit and non-audit services provided to the Fund by the Fund’s independent registered public accounting firm. The Fund’s Audit Committee policies and procedures also require pre-approval of all audit and non-audit services provided to the Adviser and Service Affiliates to the extent that these services are directly related to the operations or financial reporting of the Fund.
(e) (2) All of the amounts for Audit Fees, Audit-Related Fees and Tax Fees in the table under Item 4 (a) – (c) are for services pre-approved by the Fund’s Audit Committee.
(f) Not applicable.
(g) The following table sets forth the aggregate non-audit services provided to the Fund, the Fund’s Adviser and entities that control, are controlled by or under common control with the Adviser that provide ongoing services to the Fund, which include conducting an annual internal control report pursuant to Statement on Auditing Standards No. 70 (“Service Affiliates”):
| | | | | | | | | |
| | | | | All Fees for
Non-Audit Services
Provided to the
Portfolio, the Adviser
and Service Affiliates | | Total Amount of
Foregoing Column Pre-
approved by the Audit
Committee
(Portion Comprised of
Audit Related Fees)
(Portion Comprised of
Tax Fees) | |
AB International Growth | | 2009 | | $ | 284,399 | | $
$ $ | 13,200
— (13,200 |
) |
| | 2010 | | $ | 669,499 | | $
$ $ | 130,296
(127,715 (2,581 |
) ) |
(h) The Audit Committee of the Fund has considered whether the provision of any non-audit services not pre-approved by the Audit Committee provided by the Fund’s independent registered public accounting firm to the Adviser and Service Affiliates is compatible with maintaining the auditor’s independence.
| ITEM 5. | AUDIT COMMITTEE OF LISTED REGISTRANTS. |
Not applicable to the registrant.
| ITEM 6. | SCHEDULE OF INVESTMENTS. |
Please see Schedule of Investments contained in the Report to Shareholders included under Item 1 of this Form N-CSR.
| ITEM 7. | DISCLOSURE OF PROXY VOTING POLICIES AND PROCEDURES FOR CLOSED-END MANAGEMENT INVESTMENT COMPANIES. |
Not applicable to the registrant.
| ITEM 8. | PORTFOLIO MANAGERS OF CLOSED-END MANAGEMENT INVESTMENT COMPANIES. |
Not applicable to the registrant.
| ITEM 9. | PURCHASES OF EQUITY SECURITIES BY CLOSED-END MANAGEMENT INVESTMENT COMPANY AND AFFILIATED PURCHASERS. |
Not applicable to the registrant.
| ITEM 10. | SUBMISSION OF MATTERS TO A VOTE OF SECURITY HOLDERS. |
There have been no material changes to the procedures by which shareholders may recommend nominees to the Fund’s Board of Directors since the Fund last provided disclosure in response to this item.
| ITEM 11. | CONTROLS AND PROCEDURES. |
(a) The registrant’s principal executive officer and principal financial officer have concluded that the registrant’s disclosure controls and procedures (as defined in Rule 30a-2(c) under the Investment Company Act of 1940, as amended) are effective at the reasonable assurance level based on their evaluation of these controls and procedures as of a date within 90 days of the filing date of this document.
(b) There were no changes in the registrant’s internal controls over financial reporting that occurred during the second fiscal quarter of the period that has materially affected, or is reasonably likely to materially affect, the registrant’s internal control over financial reporting.
The following exhibits are attached to this Form N-CSR:
| | |
EXHIBIT NO. | | DESCRIPTION OF EXHIBIT |
| |
12 (a) (1) | | Code of Ethics that is subject to the disclosure of Item 2 hereof |
| |
12 (b) (1) | | Certification of Principal Executive Officer Pursuant to Section 302 of the Sarbanes-Oxley Act of 2002 |
| |
12 (b) (2) | | Certification of Principal Financial Officer Pursuant to Section 302 of the Sarbanes-Oxley Act of 2002 |
| |
12 (c) | | Certification of Principal Executive Officer and Principal Financial Officer Pursuant to Section 906 of the Sarbanes-Oxley Act of 2002 |
SIGNATURES
Pursuant to the requirements of the Securities Exchange Act of 1934 and the Investment Company Act of 1940, the registrant has duly caused this report to be signed on its behalf by the undersigned, thereunto duly authorized.
(Registrant): AllianceBernstein International Growth Fund, Inc.
| | |
| By: | | /S/ ROBERT M. KEITH |
| | Robert M. Keith President |
Date: August 25, 2010
Pursuant to the requirements of the Securities Exchange Act of 1934 and the Investment Company Act of 1940, this report has been signed below by the following persons on behalf of the registrant and in the capacities and on the dates indicated.
| | |
| By: | | /S/ ROBERT M. KEITH |
| | Robert M. Keith President |
Date: August 25, 2010
| | |
| By: | | /S/ JOSEPH J. MANTINEO |
| | Joseph J. Mantineo Treasurer and Chief Financial Officer |
Date: August 25, 2010