UNITED STATES
SECURITIES AND EXCHANGE COMMISSION
WASHINGTON, D.C. 20549
FORM N-CSR
CERTIFIED SHAREHOLDER REPORT OF REGISTERED
MANAGEMENT INVESTMENT COMPANIES
Investment Company Act file number: 811-08426
AB INTERNATIONAL GROWTH FUND, INC.
(Exact name of registrant as specified in charter)
1345 Avenue of the Americas, New York, New York 10105
(Address of principal executive offices) (Zip code)
Joseph J. Mantineo
AllianceBernstein L.P.
1345 Avenue of the Americas
New York, New York 10105
(Name and address of agent for service)
Registrant’s telephone number, including area code: (800) 221-5672
Date of fiscal year end: June 30, 2017
Date of reporting period: December 31, 2016
ITEM 1. REPORTS TO STOCKHOLDERS.
DEC 12.31.16

SEMI-ANNUAL REPORT
AB INTERNATIONAL GROWTH FUND

Investment Products Offered
•Are Not FDIC Insured •May Lose Value •Are Not Bank Guaranteed |
Investors should consider the investment objectives, risks, charges and expenses of the Fund carefully before investing. For copies of our prospectus or summary prospectus, which contain this and other information, visit us online at www.abfunds.com or contact your AB representative. Please read the prospectus and/or summary prospectus carefully before investing.
This shareholder report must be preceded or accompanied by the Fund’s prospectus for individuals who are not current shareholders of the Fund.
You may obtain a description of the Fund’s proxy voting policies and procedures, and information regarding how the Fund voted proxies relating to portfolio securities during the most recent 12-month period ended June 30, without charge. Simply visit AB’s website at www.abfunds.com, or go to the Securities and Exchange Commission’s (the “Commission”) website at www.sec.gov, or call AB at (800) 227-4618.
The Fund files its complete schedule of portfolio holdings with the Commission for the first and third quarters of each fiscal year on Form N-Q. The Fund’s Forms N-Q are available on the Commission’s website at www.sec.gov. The Fund’s Forms N-Q may also be reviewed and copied at the Commission’s Public Reference Room in Washington, DC; information on the operation of the Public Reference Room may be obtained by calling (800) SEC-0330. AB publishes full portfolio holdings for the Fund monthly at www.abfunds.com.
AllianceBernstein Investments, Inc. (ABI) is the distributor of the AB family of mutual funds. ABI is a member of FINRA and is an affiliate of AllianceBernstein L.P., the Adviser of the funds.
The [A/B] logo is a registered service mark of AllianceBernstein and AllianceBernstein® is a registered service mark used by permission of the owner, AllianceBernstein L.P.
February 15, 2017
Semi-Annual Report
This report provides management’s discussion of fund performance for AB International Growth Fund (the “Fund”) for the semi-annual reporting period ended December 31, 2016.
Investment Objective and Policies
The Fund’s investment objective is long-term growth of capital. The Fund invests primarily in an international portfolio of equity securities of companies selected by AllianceBernstein L.P. (the “Adviser”) for their growth potential within various market sectors. Examples of the types of market sectors in which the Fund may invest include, but are not limited to, information technology (which includes telecommunications), health care, financial services, infrastructure, energy and natural resources and consumer groups. The Adviser’s growth analysts seek to identify companies or industries that other investors have underestimated earnings potential—for example, some hidden earnings driver (including, but not limited to, reduced competition, market share gain, better margin trend, increased customer base or similar factors) that would cause a company to grow faster than market forecasts.
The Adviser allocates the Fund’s investments among broad sector groups utilizing the fundamental company research conducted by its internal research staff, assessing the
current and forecasted investment opportunities and conditions, as well as diversification and risk considerations. The Adviser may vary the percentage allocations among market sectors and may change the market sectors in which the Fund invests as companies’ potential for growth within a sector matures and new trends for growth emerge.
The Fund invests, under normal circumstances, in the equity securities of companies located in at least three countries (and normally substantially more) other than the United States. The Fund invests in securities of companies in both developed and emerging-market countries. Geographic distribution of the Fund’s investments among countries or regions also will be a product of the stock selection process rather than a pre-determined allocation. The Fund may also invest in synthetic foreign equity securities, which are various types of warrants used internationally that entitle a holder to buy or sell underlying securities. The Adviser expects that normally the Fund’s portfolio will tend to emphasize investments in larger-capitalization companies, although the Fund may invest in smaller- or medium-capitalization companies.
The Fund may, at times, invest in shares of exchange-traded funds (“ETFs”) in lieu of making direct investments in securities. ETFs may provide more efficient and economical exposure to the types
| AB INTERNATIONAL GROWTH FUND • | 1 |
of companies and geographic locations in which the Fund seeks to invest than direct investments.
Currencies can have a dramatic impact on equity returns, significantly adding to returns in some years and greatly diminishing them in others. Currency and equity positions are evaluated separately. The Adviser may seek to hedge the currency exposure resulting from securities positions when it finds the currency exposure unattractive. To hedge all or a portion of its currency risk, the Fund may, from time to time, invest in currency-related derivatives, including forward currency exchange contracts, futures contracts, options on futures contracts, swaps and options. The Adviser may also seek investment opportunities by taking long or short positions in currencies through the use of currency-related derivatives.
The Fund may enter into other derivatives transactions, such as options, futures contracts, forwards and swaps. The Fund may use options strategies involving the purchase and/or writing of various combinations of call and/or put options, including on individual securities and stock indices, futures contracts (including futures contracts on individual securities and stock indices) or shares of ETFs. These transactions may be used, for example, in an effort to earn extra income, to adjust exposure to individual securities or markets, or to protect all or a portion of the
Fund’s portfolio from a decline in value, sometimes within certain ranges.
Investment Results
The table on page 6 provides the performance results for the Fund and its benchmark, the Morgan Stanley Capital International All Country World Index (“MSCI ACWI”) ex-US (net), for the six- and 12-month periods ended December 31, 2016.
All share classes underperformed the benchmark for both periods, before sales charges. Most of the underperformance was attributed to weakness in the fourth quarter when growth stocks significantly underperformed their value counterparts. For reference, the seismic nature of this impact was last witnessed in the markets during the bursting of the tech bubble in 2001. As a growth manager, the Portfolio’s Senior Investment Management Team (the “Team”) could not escape this style headwind. Additionally, there were several difficult-to-forecast issues, including regulation changes following Donald Trump’s surprise victory in the US presidential election, tighter capital restrictions in China and demonetization in India that combined to negatively impact relative returns. During the six-month period, security selection in the financials, consumer discretionary and health care sectors detracted from returns, relative to the benchmark, as did an overweight in consumer
| 2 | • AB INTERNATIONAL GROWTH FUND |
staples and underweight in materials. An underweight in utilities and overweight in consumer discretionary contributed to returns. An overweight to India and underweight to Japan detracted, while an underweight to South Africa contributed.
For the 12-month period, security selection in the financials, consumer discretionary and materials sectors detracted from returns. Underweight positions in energy and materials also detracted. In contrast, security selection in information technology and industrials contributed to returns. Overweights to India and Denmark detracted, while an underweight to Japan contributed.
Derivatives in the form of currency forwards were utilized for hedging purposes, which added to absolute performance for both periods.
Market Review and Investment Strategy
Equity markets weathered several major pullbacks, finishing the 12-month period ended December 31, 2016, with positive gains. US equities led with international and emerging-market stocks not far behind.
Political surprises had a significant impact on both equity and bond markets in the period, and investors viewed the two biggest—Donald Trump’s win in the US presidential election and Britain’s decision to quit the European Union (“Brexit”)—as likely to lead to policy changes with important implications for economic growth, trade and inflation. Markets were also influenced by the price of oil, which waxed and waned along with prospects of an OPEC production cut.
Central banks also played a prominent role. European central banks generally maintained an easing bias through the period, particularly in the aftermath of Brexit, when the Bank of England enacted a rate cut that was both its first in seven years and a new historic low. The US Federal Reserve, in contrast, raised official rates as expected while telegraphing a faster pace of rate hikes in 2017.
The Team follows a bottom-up stock picking methodology that employs rigorous analysis across geographic borders, in search of companies that are market leaders with attractive earnings growth prospects and potential high return on invested capital.
| AB INTERNATIONAL GROWTH FUND • | 3 |
DISCLOSURES AND RISKS
Benchmark Disclosure
The MSCI ACWI ex-US is unmanaged and does not reflect fees and expenses associated with the active management of a mutual fund portfolio. The MSCI ACWI ex-US (free float-adjusted, market capitalization weighted) represents the equity market performance of developed and emerging markets, excluding the US. MSCI makes no express or implied warranties or representations, and shall have no liability whatsoever with respect to any MSCI data contained herein. The MSCI data may not be further redistributed or used as a basis for other indices, any securities or financial products. This report is not approved, reviewed or produced by MSCI. Net returns include the reinvestment of dividends after deduction of non-US withholding tax. An investor cannot invest directly in an index, and its results are not indicative of the performance for any specific investment, including the Fund.
A Word About Risk
Market Risk: The value of the Fund’s assets will fluctuate as the stock or bond market fluctuates. The value of its investments may decline, sometimes rapidly and unpredictably, simply because of economic changes or other events that affect large portions of the market. It includes the risk that a particular style of investing, such as growth, may underperform the market generally.
Foreign (Non-US) Risk: Investments in securities of non-US issuers may involve more risk than those of US issuers. These securities may fluctuate more widely in price and may be less liquid due to adverse market, economic, political, regulatory or other factors.
Emerging Market Risk: Investments in emerging-market countries may have more risk because the markets are less developed and less liquid as well as being subject to increased economic, political, regulatory or other uncertainties.
Currency Risk: Fluctuations in currency exchange rates may negatively affect the value of the Fund’s investments or reduce its returns.
Capitalization Risk: Investments in small- and mid-capitalization companies may be more volatile than investments in large-capitalization companies. Investments in small-capitalization companies may have additional risks because these companies have limited product lines, markets or financial resources.
Derivatives Risk: Derivatives may be illiquid, difficult to price, and leveraged so that small changes may produce disproportionate losses for the Fund, and may be subject to counterparty risk to a greater degree than more traditional investments.
(Disclosures, Risks and Note about Historical Performance continued on next page)
| 4 | • AB INTERNATIONAL GROWTH FUND |
Disclosures and Risks
DISCLOSURES AND RISKS
(continued from previous page)
Management Risk: The Fund is subject to management risk because it is an actively managed investment fund. The Adviser will apply its investment techniques and risk analyses in making investment decisions for the Fund, but there is no guarantee that its techniques will produce the intended results.
These risks are fully discussed in the Fund’s prospectus. As with all investments, you may lose money by investing in the Fund.
An Important Note About Historical Performance
The investment return and principal value of an investment in the Fund will fluctuate, so that shares, when redeemed, may be worth more or less than their original cost. Performance shown on the following pages represents past performance and does not guarantee future results. Current performance may be lower or higher than the performance information shown. You may obtain performance information current to the most recent month-end by visiting www.abfunds.com.
All fees and expenses related to the operation of the Fund have been deducted. Net asset value (“NAV”) returns do not reflect sales charges; if sales charges were reflected, the Fund’s quoted performance would be lower. SEC returns reflect the applicable sales charges for each share class: a 4.25% maximum front-end sales charge for Class A shares; the applicable contingent deferred sales charge for Class B shares (4% year 1, 3% year 2, 2% year 3, 1% year 4); a 1% 1-year contingent deferred sales charge for Class C shares. Returns for the different share classes will vary due to different expenses associated with each class. Performance assumes reinvestment of distributions and does not account for taxes.
| AB INTERNATIONAL GROWTH FUND • | 5 |
Disclosures and Risks
HISTORICAL PERFORMANCE
| THE FUND VS. ITS BENCHMARK PERIODS ENDED DECEMBER 31, 2016 (unaudited) | NAV Returns | |||||||||||
| 6 Months | 12 Months | |||||||||||
| AB International Growth Fund | ||||||||||||
Class A | -4.80% | -7.10% | ||||||||||
| ||||||||||||
Class B* | -5.21% | -7.91% | ||||||||||
| ||||||||||||
Class C | -5.19% | -7.88% | ||||||||||
| ||||||||||||
Advisor Class† | -4.74% | -6.94% | ||||||||||
| ||||||||||||
Class R† | -4.96% | -7.40% | ||||||||||
| ||||||||||||
Class K† | -4.76% | -7.13% | ||||||||||
| ||||||||||||
Class I† | -4.65% | -6.81% | ||||||||||
| ||||||||||||
| MSCI ACWI ex-US (net) | 5.57% | 4.50% | ||||||||||
| ||||||||||||
* Effective January 31, 2009, Class B Shares are no longer available for purchase to new investors. Please see Note A for additional information.
† Please note that these share classes are for investors purchasing shares through accounts established under certain fee-based programs sponsored and maintained by certain broker-dealers and financial intermediaries, institutional pension plans and/or investment advisory clients of, and certain other persons associated with, the Adviser and its affiliates or the Fund. |
| |||||||||||
See Disclosures, Risks and Note about Historical Performance on pages 4-5.
(Historical Performance continued on next page)
| 6 | • AB INTERNATIONAL GROWTH FUND |
Historical Performance
HISTORICAL PERFORMANCE
(continued from previous page)
| AVERAGE ANNUAL RETURNS AS OF DECEMBER 31, 2016 (unaudited) | ||||||||
| NAV Returns | SEC Returns (reflects applicable sales charges) | |||||||
| Class A Shares | ||||||||
1 Year | -7.10 | % | -11.05 | % | ||||
5 Years | 3.23 | % | 2.34 | % | ||||
10 Years | -0.90 | % | -1.33 | % | ||||
| Class B Shares | ||||||||
1 Year | -7.91 | % | -11.59 | % | ||||
5 Years | 2.43 | % | 2.43 | % | ||||
10 Years(a) | -1.50 | % | -1.50 | % | ||||
| Class C Shares | ||||||||
1 Year | -7.88 | % | -8.80 | % | ||||
5 Years | 2.46 | % | 2.46 | % | ||||
10 Years | -1.63 | % | -1.63 | % | ||||
| Advisor Class Shares* | ||||||||
1 Year | -6.94 | % | -6.94 | % | ||||
5 Years | 3.51 | % | 3.51 | % | ||||
10 Years | -0.62 | % | -0.62 | % | ||||
| Class R Shares* | �� | |||||||
1 Year | -7.40 | % | -7.40 | % | ||||
5 Years | 2.96 | % | 2.96 | % | ||||
10 Years | -1.16 | % | -1.16 | % | ||||
| Class K Shares* | ||||||||
1 Year | -7.13 | % | -7.13 | % | ||||
5 Years | 3.27 | % | 3.27 | % | ||||
10 Years | -0.86 | % | -0.86 | % | ||||
| Class I Shares* | ||||||||
1 Year | -6.81 | % | -6.81 | % | ||||
5 Years | 3.69 | % | 3.69 | % | ||||
10 Years | -0.47 | % | -0.47 | % | ||||
The Fund’s current prospectus fee table shows the Fund’s total annual operating expense ratios as 1.35%, 2.18%, 2.11%, 1.10%, 1.67%, 1.36% and 0.95% for Class A, Class B, Class C, Advisor Class, Class R, Class K and Class I shares, respectively. The Financial Highlights section of this report sets forth expense ratio data for the current reporting period; the expense ratios shown above may differ from the expense ratios in the Financial Highlights section since they are based on different time periods.
| (a) | Assumes conversion of Class B shares into Class A shares after eight years. |
| * | These share classes are offered at NAV to eligible investors and their SEC returns are the same as their NAV returns. Please note that these share classes are for investors purchasing shares through accounts established under certain fee-based programs sponsored and maintained by certain broker-dealers and financial intermediaries, institutional pension plans and/or investment advisory clients of, and certain other persons associated with, the Adviser and its affiliates or the Fund. |
See Disclosures, Risks and Note about Historical Performance on pages 4-5.
(Historical Performance continued on next page)
| AB INTERNATIONAL GROWTH FUND • | 7 |
Historical Performance
HISTORICAL PERFORMANCE
(continued from previous page)
SEC AVERAGE ANNUAL RETURNS AS OF THE MOST RECENT CALENDAR QUARTER-END DECEMBER 31, 2016 (unaudited) | ||||
| SEC Returns (reflects applicable sales charges) | ||||
| Class A Shares | ||||
1 Year | -11.05 | % | ||
5 Years | 2.34 | % | ||
10 Years | -1.33 | % | ||
| Class B Shares | ||||
1 Year | -11.59 | % | ||
5 Years | 2.43 | % | ||
10 Years(a) | -1.50 | % | ||
| Class C Shares | ||||
1 Year | -8.80 | % | ||
5 Years | 2.46 | % | ||
10 Years | -1.63 | % | ||
| Advisor Class Shares* | ||||
1 Year | -6.94 | % | ||
5 Years | 3.51 | % | ||
10 Years | -0.62 | % | ||
| Class R Shares* | ||||
1 Year | -7.40 | % | ||
5 Years | 2.96 | % | ||
10 Years | -1.16 | % | ||
| Class K Shares* | ||||
1 Year | -7.13 | % | ||
5 Years | 3.27 | % | ||
10 Years | -0.86 | % | ||
| Class I Shares* | ||||
1 Year | -6.81 | % | ||
5 Years | 3.69 | % | ||
10 Years | -0.47 | % | ||
| (a) | Assumes conversion of Class B shares into Class A shares after eight years. |
| * | Please note that these share classes are for investors purchasing shares through accounts established under certain fee-based programs sponsored and maintained by certain broker-dealers and financial intermediaries, institutional pension plans and/or investment advisory clients of, and certain other persons associated with, the Adviser and its affiliates or the Fund. |
See Disclosures, Risks and Note about Historical Performance on pages 4-5.
| 8 | • AB INTERNATIONAL GROWTH FUND |
Historical Performance
EXPENSE EXAMPLE
(unaudited)
As a shareholder of the Fund, you incur two types of costs: (1) transaction costs, including sales charges (loads) on purchase payments, contingent deferred sales charges on redemptions and (2) ongoing costs, including management fees; distribution (12b-1) fees; and other Fund expenses. This example is intended to help you understand your ongoing costs (in dollars) of investing in the Fund and to compare these costs with the ongoing costs of investing in other mutual funds.
This Example is based on an investment of $1,000 invested at the beginning of the period and held for the entire period as indicated below.
Actual Expenses
The table below provides information about actual account values and actual expenses. You may use the information, together with the amount you invested, to estimate the expenses that you paid over the period. Simply divide your account value by $1,000 (for example, an $8,600 account value divided by $1,000 = 8.6), then multiply the result by the number under the heading entitled “Expenses Paid During Period” to estimate the expenses you paid on your account during this period.
Hypothetical Example for Comparison Purposes
The table below also provides information about hypothetical account values and hypothetical expenses based on the Fund’s actual expense ratio and an assumed annual rate of return of 5% before expenses, which is not the Fund’s actual return. The hypothetical account values and expenses may not be used to estimate the actual ending account balance or expenses you paid for the period. You may use this information to compare the ongoing costs of investing in the Fund and other funds by comparing this 5% hypothetical example with the 5% hypothetical examples that appear in the shareholder reports of other funds.
Please note that the expenses shown in the table are meant to highlight your ongoing costs only and do not reflect any transactional costs, such as sales charges (loads), or contingent deferred sales charges on redemptions. Therefore, the hypothetical example is useful in comparing ongoing costs only, and will not help you determine the relative total costs of owning different funds. In addition, if these transactional costs were included, your costs would have been higher.
| Beginning Account Value 7/1/2016 | Ending Account Value 12/31/2016 | Expenses Paid During Period* | Annualized Expense Ratio* | Effective Expenses Paid During Period+ | Effective Annualized Expense Ratio+ | |||||||||||||||||||
| Class A | ||||||||||||||||||||||||
Actual | $ | 1,000 | $ | 952.00 | $ | 7.18 | 1.46 | % | $ | 7.23 | 1.47 | % | ||||||||||||
Hypothetical** | $ | 1,000 | $ | 1,017.85 | $ | 7.43 | 1.46 | % | $ | 7.48 | 1.47 | % | ||||||||||||
| Class B | ||||||||||||||||||||||||
Actual | $ | 1,000 | $ | 947.90 | $ | 11.19 | 2.28 | % | $ | 11.24 | 2.29 | % | ||||||||||||
Hypothetical** | $ | 1,000 | $ | 1,013.71 | $ | 11.57 | 2.28 | % | $ | 11.62 | 2.29 | % | ||||||||||||
| AB INTERNATIONAL GROWTH FUND • | 9 |
Expense Example
EXPENSE EXAMPLE
(unaudited)
(continued from previous page)
| Beginning Account Value 7/1/2016 | Ending Account Value 12/31/2016 | Expenses Paid During Period* | Annualized Expense Ratio* | Effective Expenses Paid During Period+ | Effective Annualized Expense Ratio+ | |||||||||||||||||||
| Class C | ||||||||||||||||||||||||
Actual | $ | 1,000 | $ | 948.10 | $ | 10.85 | 2.21 | % | $ | 10.90 | 2.22 | % | ||||||||||||
Hypothetical** | $ | 1,000 | $ | 1,014.06 | $ | 11.22 | 2.21 | % | $ | 11.27 | 2.22 | % | ||||||||||||
| Advisor Class | ||||||||||||||||||||||||
Actual | $ | 1,000 | $ | 952.60 | $ | 5.91 | 1.20 | % | $ | 5.96 | 1.21 | % | ||||||||||||
Hypothetical** | $ | 1,000 | $ | 1,019.16 | $ | 6.11 | 1.20 | % | $ | 6.16 | 1.21 | % | ||||||||||||
| Class R | ||||||||||||||||||||||||
Actual | $ | 1,000 | $ | 950.40 | $ | 8.36 | 1.70 | % | $ | 8.41 | 1.71 | % | ||||||||||||
Hypothetical** | $ | 1,000 | $ | 1,016.64 | $ | 8.64 | 1.70 | % | $ | 8.69 | 1.71 | % | ||||||||||||
| Class K | ||||||||||||||||||||||||
Actual | $ | 1,000 | $ | 952.40 | $ | 6.84 | 1.39 | % | $ | 6.89 | 1.40 | % | ||||||||||||
Hypothetical** | $ | 1,000 | $ | 1,018.20 | $ | 7.07 | 1.39 | % | $ | 7.12 | 1.40 | % | ||||||||||||
| Class I | ||||||||||||||||||||||||
Actual | $ | 1,000 | $ | 953.50 | $ | 5.17 | 1.05 | % | $ | 5.22 | 1.06 | % | ||||||||||||
Hypothetical** | $ | 1,000 | $ | 1,019.91 | $ | 5.35 | 1.05 | % | $ | 5.40 | 1.06 | % | ||||||||||||
| * | Expenses are equal to the classes’ annualized expense ratios multiplied by the average account value over the period, multiplied by 184/365 (to reflect the one-half year period). |
| ** | Assumes 5% annual return before expenses. |
| + | The Fund’s investments in affiliated/unaffiliated underlying portfolios incur no direct expenses, but bear proportionate shares of the acquired fund fees (i.e., operating, administrative and investment advisory fee) of the affiliated/unaffiliated underlying portfolios. Currently the Adviser has voluntarily agreed to waive its investment advisory fee from the Fund in an amount equal to the Fund’s share of the advisory fees of the affiliated underlying portfolios, as borne indirectly by the Fund as an acquired fund fee and expense. The Fund’s effective expenses are equal to the classes’ annualized expense ratio plus the Fund’s pro-rata share of the weighted average expense ratio of the affiliated/unaffiliated underlying portfolios in which it invests, multiplied by the average account value over the period, multiplied by 184/365 (to reflect the one-half year period). |
| 10 | • AB INTERNATIONAL GROWTH FUND |
Expense Example
PORTFOLIO SUMMARY
December 31, 2016 (unaudited)
PORTFOLIO STATISTICS
Net Assets ($mil): $274.4
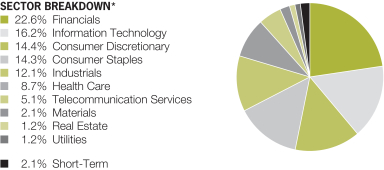
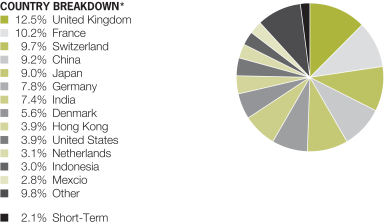
| * | All data are as of December 31, 2016. The Fund’s sector and country breakdowns are expressed as a percentage of total investments (excluding security lending) and may vary over time. The Fund also enters into derivative transactions, which may be used for hedging or investment purposes (see “Portfolio of Investments” section of the report for additional details). “Other” country weightings represent 2.8% or less in the following countries: Austria, Belgium, Ireland, Philippines, South Korea and Taiwan. |
Please note: The sector classifications presented herein are based on the Global Industry Classification Standard (GICS) which was developed by Morgan Stanley Capital International and Standard & Poor’s. The components are divided into sector, industry group, and industry sub-indices as classified by the GICS for each of the market capitalization indices in the broad market. These sector classifications are broadly defined. The “Portfolio of Investments” section of the report reflects more specific industry information and is consistent with the investment restrictions discussed in the Fund’s prospectus.
| AB INTERNATIONAL GROWTH FUND • | 11 |
Portfolio Summary
TEN LARGEST HOLDINGS*
December 31, 2016 (unaudited)
| Company | U.S. $ Value | Percent of Net Assets | ||||||
Partners Group Holding AG | $ | 11,070,526 | 4.0 | % | ||||
AIA Group Ltd. | 9,435,741 | 3.4 | ||||||
Siemens AG (REG) | 9,230,746 | 3.4 | ||||||
Roche Holding AG | 8,412,589 | 3.1 | ||||||
Safran SA | 8,100,716 | 2.9 | ||||||
Taiwan Semiconductor Manufacturing Co., Ltd. | 7,617,708 | 2.8 | ||||||
Schneider Electric SE (Paris) | 7,549,138 | 2.7 | ||||||
Housing Development Finance Corp., Ltd. | 7,450,131 | 2.7 | ||||||
Tencent Holdings Ltd. | 7,322,629 | 2.7 | ||||||
Nestle SA (REG) | 7,282,247 | 2.7 | ||||||
| $ | 83,472,171 | 30.4 | % | |||||
| * | Long-term investments. |
| 12 | • AB INTERNATIONAL GROWTH FUND |
Ten Largest Holdings
PORTFOLIO OF INVESTMENTS
December 31, 2016 (unaudited)
| Company | Shares | U.S. $ Value | ||||||
| ||||||||
COMMON STOCKS – 98.3% | ||||||||
Financials – 22.7% | ||||||||
Banks – 2.0% | ||||||||
HDFC Bank Ltd. | 274,100 | $ | 5,334,995 | |||||
|
| |||||||
Capital Markets – 8.3% | ||||||||
Flow Traders(a) | 96,494 | 3,321,099 | ||||||
IG Group Holdings PLC | 458,901 | 2,788,941 | ||||||
London Stock Exchange Group PLC | 154,350 | 5,516,641 | ||||||
Partners Group Holding AG | 23,648 | 11,070,526 | ||||||
|
| |||||||
| 22,697,207 | ||||||||
|
| |||||||
Consumer Finance – 2.5% | ||||||||
Bharat Financial Inclusion Ltd.(b) | 365,960 | 3,158,579 | ||||||
Gentera SAB de CV | 2,344,330 | 3,770,443 | ||||||
|
| |||||||
| 6,929,022 | ||||||||
|
| |||||||
Insurance – 7.2% | ||||||||
AIA Group Ltd. | 1,684,400 | 9,435,741 | ||||||
Prudential PLC | 362,855 | 7,241,671 | ||||||
St James’s Place PLC | 249,101 | 3,107,231 | ||||||
|
| |||||||
| 19,784,643 | ||||||||
|
| |||||||
Thrifts & Mortgage Finance – 2.7% | ||||||||
Housing Development Finance Corp., Ltd. | 402,095 | 7,450,131 | ||||||
|
| |||||||
| 62,195,998 | ||||||||
|
| |||||||
Information Technology – 16.3% | ||||||||
Internet Software & Services – 5.2% | ||||||||
Alibaba Group Holding Ltd. (Sponsored ADR)(b) | 77,730 | 6,825,471 | ||||||
Tencent Holdings Ltd. | 302,000 | 7,322,629 | ||||||
|
| |||||||
| 14,148,100 | ||||||||
|
| |||||||
Semiconductors & Semiconductor Equipment – 9.6% | ||||||||
ams AG | 157,124 | 4,452,399 | ||||||
Disco Corp. | 30,100 | 3,639,123 | ||||||
Infineon Technologies AG | 323,750 | 5,600,058 | ||||||
NXP Semiconductors NV(b) | 52,550 | 5,150,425 | ||||||
Taiwan Semiconductor Manufacturing Co., Ltd. | 1,360,000 | 7,617,708 | ||||||
|
| |||||||
| 26,459,713 | ||||||||
|
| |||||||
Software – 1.5% | ||||||||
Mobileye NV(b) | 106,446 | 4,057,721 | ||||||
|
| |||||||
| 44,665,534 | ||||||||
|
| |||||||
Consumer Discretionary – 14.5% | ||||||||
Auto Components – 2.4% | ||||||||
Delphi Automotive PLC | 97,500 | 6,566,625 | ||||||
|
| |||||||
Diversified Consumer Services – 0.9% | ||||||||
New Oriental Education & Technology Group, Inc. (Sponsored ADR)(b) | 61,666 | 2,596,139 | ||||||
|
| |||||||
| AB INTERNATIONAL GROWTH FUND • | 13 |
Portfolio of Investments
| Company |
Shares | U.S. $ Value | ||||||
| ||||||||
Hotels, Restaurants & Leisure – 1.5% | ||||||||
Alsea SAB de CV | 1,410,623 | $ | 4,029,836 | |||||
|
| |||||||
Household Durables – 1.5% | ||||||||
Panasonic Corp. | 402,400 | 4,081,205 | ||||||
|
| |||||||
Internet & Direct Marketing Retail – 1.9% | ||||||||
Ctrip.com International Ltd. (ADR)(b) | 131,350 | 5,254,000 | ||||||
|
| |||||||
Multiline Retail – 3.7% | ||||||||
Don Quijote Holdings Co., Ltd. | 143,400 | 5,292,223 | ||||||
Matahari Department Store Tbk PT | 4,282,000 | 4,793,029 | ||||||
|
| |||||||
| 10,085,252 | ||||||||
|
| |||||||
Specialty Retail – 0.5% | ||||||||
Ace Hardware Indonesia Tbk PT | 21,076,700 | 1,306,003 | ||||||
|
| |||||||
Textiles, Apparel & Luxury Goods – 2.1% | ||||||||
Pandora A/S | 34,830 | 4,546,710 | ||||||
Samsonite International SA | 448,500 | 1,276,691 | ||||||
|
| |||||||
| 5,823,401 | ||||||||
|
| |||||||
| 39,742,461 | ||||||||
|
| |||||||
Consumer Staples – 14.3% | ||||||||
Beverages – 2.0% | ||||||||
Anheuser-Busch InBev SA/NV | 52,607 | 5,568,133 | ||||||
|
| |||||||
Food & Staples Retailing – 1.6% | ||||||||
Tsuruha Holdings, Inc. | 47,200 | 4,467,133 | ||||||
|
| |||||||
Food Products – 4.6% | ||||||||
Danone SA | 85,503 | 5,410,506 | ||||||
Nestle SA (REG) | 101,654 | 7,282,247 | ||||||
|
| |||||||
| 12,692,753 | ||||||||
|
| |||||||
Household Products – 5.1% | ||||||||
Pigeon Corp. | 167,100 | 4,260,742 | ||||||
Reckitt Benckiser Group PLC | 77,217 | 6,540,896 | ||||||
Unicharm Corp. | 138,900 | 3,033,614 | ||||||
|
| |||||||
| 13,835,252 | ||||||||
|
| |||||||
Personal Products – 1.0% | ||||||||
Cosmax, Inc.(b) | 26,864 | 2,652,518 | ||||||
|
| |||||||
| 39,215,789 | ||||||||
|
| |||||||
Industrials – 12.2% | ||||||||
Aerospace & Defense – 3.0% | ||||||||
Safran SA | 112,629 | 8,100,716 | ||||||
|
| |||||||
Building Products – 1.2% | ||||||||
Kingspan Group PLC | 126,150 | 3,422,079 | ||||||
|
| |||||||
Electrical Equipment – 4.6% | ||||||||
Schneider Electric SE (Paris) | 108,670 | 7,549,138 | ||||||
Vestas Wind Systems A/S | 78,290 | 5,070,419 | ||||||
|
| |||||||
| 12,619,557 | ||||||||
|
| |||||||
| 14 | • AB INTERNATIONAL GROWTH FUND |
Portfolio of Investments
| Company |
Shares | U.S. $ Value | ||||||
| ||||||||
Industrial Conglomerates – 3.4% | ||||||||
Siemens AG (REG) | 75,390 | $ | 9,230,746 | |||||
|
| |||||||
| 33,373,098 | ||||||||
|
| |||||||
Health Care – 8.7% | ||||||||
Health Care Equipment & Supplies – 2.6% | ||||||||
Essilor International SA | 63,616 | 7,177,679 | ||||||
|
| |||||||
Health Care Providers & Services – 1.6% | ||||||||
Apollo Hospitals Enterprise Ltd. | 257,760 | 4,483,857 | ||||||
|
| |||||||
Pharmaceuticals – 4.5% | ||||||||
Roche Holding AG | 36,905 | 8,412,589 | ||||||
Vectura Group PLC(b) | 2,279,470 | 3,851,439 | ||||||
|
| |||||||
| 12,264,028 | ||||||||
|
| |||||||
| 23,925,564 | ||||||||
|
| |||||||
Telecommunication Services – 5.1% | ||||||||
Diversified Telecommunication Services – 3.1% | ||||||||
Deutsche Telekom AG | 383,050 | 6,572,067 | ||||||
Telekomunikasi Indonesia Persero Tbk PT | 7,086,500 | 2,084,794 | ||||||
|
| |||||||
| 8,656,861 | ||||||||
|
| |||||||
Wireless Telecommunication Services – 2.0% | ||||||||
Vodafone Group PLC | 2,228,380 | 5,483,775 | ||||||
|
| |||||||
| 14,140,636 | ||||||||
|
| |||||||
Materials – 2.1% | ||||||||
Chemicals – 2.1% | ||||||||
Chr Hansen Holding A/S | 103,590 | 5,729,084 | ||||||
|
| |||||||
Real Estate – 1.2% | ||||||||
Real Estate Management & Development – 1.2% | ||||||||
SM Prime Holdings, Inc. | 5,885,100 | 3,350,662 | ||||||
|
| |||||||
Utilities – 1.2% | ||||||||
Water Utilities – 1.2% | ||||||||
Beijing Enterprises Water Group Ltd.(b) | 5,012,000 | 3,317,209 | ||||||
|
| |||||||
Total Common Stocks | 269,656,035 | |||||||
|
| |||||||
SHORT-TERM INVESTMENTS – 2.1% | ||||||||
Investment Companies – 1.9% | ||||||||
AB Fixed Income Shares, Inc. – Government Money Market Portfolio – Class AB, 0.37%(c)(d) | 5,184,997 | 5,184,997 | ||||||
|
| |||||||
| AB INTERNATIONAL GROWTH FUND • | 15 |
Portfolio of Investments
| Principal Amount (000) | U.S. $ Value | |||||||||||
| ||||||||||||
Time Deposits – 0.2% | ||||||||||||
ANZ, London | GBP | 33 | $ | 41,261 | ||||||||
BBH, Grand Cayman | DKK | 685 | 96,963 | |||||||||
(1.45)%, 1/03/17 | CHF | 29 | 28,505 | |||||||||
0.05%, 1/03/17 | CAD | – 0 | –* | 1 | ||||||||
4.88%, 1/03/17 | ZAR | – 0 | –* | 4 | ||||||||
Hong Kong & Shanghai Bank, Hong Kong | HKD | 952 | 122,828 | |||||||||
Sumitomo, Tokyo | ||||||||||||
(0.557)%, 1/02/17 | EUR | 155 | 162,651 | |||||||||
(0.28)%, 1/04/17 | JPY | 8,689 | 74,348 | |||||||||
|
| |||||||||||
Total Time Deposits | 526,561 | |||||||||||
|
| |||||||||||
Total Short-Term Investments | 5,711,558 | |||||||||||
|
| |||||||||||
Total Investments Before Security Lending Collateral for Securities Loaned – 100.4% | 275,367,593 | |||||||||||
|
| |||||||||||
| Shares | ||||||||||||
INVESTMENTS OF CASH COLLATERAL FOR SECURITIES LOANED – 0.0% | ||||||||||||
Investment Companies – 0.0% | ||||||||||||
AB Fixed Income Shares, Inc. – Government Money Market Portfolio – Class AB, 0.37%(c)(d) | 24,150 | 24,150 | ||||||||||
|
| |||||||||||
Total Investments – 100.4% | 275,391,743 | |||||||||||
Other assets less liabilities – (0.4)% | (994,410 | ) | ||||||||||
|
| |||||||||||
Net Assets – 100.0% | $ | 274,397,333 | ||||||||||
|
| |||||||||||
FORWARD CURRENCY EXCHANGE CONTRACTS (see Note D)
| Counterparty | Contracts to Deliver (000) | In Exchange For (000) | Settlement Date | Unrealized Appreciation/ (Depreciation) | ||||||||||||
Bank of America, NA | CHF | 8,218 | USD | 8,460 | 2/16/17 | $ | 365,682 | |||||||||
Bank of America, NA | EUR | 2,363 | USD | 2,505 | 2/16/17 | 11,977 | ||||||||||
Barclays Bank PLC | USD | 8,589 | AUD | 11,186 | 2/16/17 | (525,389 | ) | |||||||||
BNP Paribas SA | TWD | 35,739 | USD | 1,116 | 2/16/17 | 13,610 | ||||||||||
BNP Paribas SA | USD | 1,251 | HKD | 9,694 | 2/16/17 | (435 | ) | |||||||||
Brown Brothers Harriman & Co. | EUR | 763 | USD | 800 | 2/16/17 | (4,978 | ) | |||||||||
| 16 | • AB INTERNATIONAL GROWTH FUND |
Portfolio of Investments
| Counterparty | Contracts to Deliver (000) | In Exchange For (000) | Settlement Date | Unrealized Appreciation/ (Depreciation) | ||||||||||||
Brown Brothers Harriman & Co. | SEK | 3,138 | USD | 339 | 2/16/17 | $ | (5,931 | ) | ||||||||
Brown Brothers Harriman & Co. | USD | 1,691 | GBP | 1,361 | 2/16/17 | (11,811 | ) | |||||||||
Brown Brothers Harriman & Co. | USD | 21,305 | JPY | 2,218,674 | 2/16/17 | (2,278,376 | ) | |||||||||
Citibank, NA | JPY | 475,763 | USD | 4,260 | 2/16/17 | 179,863 | ||||||||||
Citibank, NA | JPY | 145,855 | USD | 1,249 | 2/16/17 | (1,861 | ) | |||||||||
Citibank, NA | USD | 4,323 | CAD | 5,782 | 2/16/17 | (13,931 | ) | |||||||||
Citibank, NA | USD | 7,347 | KRW | 8,409,105 | 2/16/17 | (382,374 | ) | |||||||||
Citibank, NA | USD | 2,588 | RUB | 168,662 | 2/16/17 | 129,763 | ||||||||||
Credit Suisse International | CHF | 1,210 | USD | 1,248 | 2/16/17 | 56,441 | ||||||||||
Credit Suisse International | HKD | 20,275 | USD | 2,616 | 2/16/17 | 827 | ||||||||||
Goldman Sachs Bank USA | CNY | 76,034 | USD | 11,117 | 2/16/17 | 344,638 | ||||||||||
Goldman Sachs Bank USA | KRW | 1,438,851 | USD | 1,212 | 2/16/17 | 20,846 | ||||||||||
Goldman Sachs Bank USA | USD | 5,248 | BRL | 17,586 | 2/16/17 | 87,257 | ||||||||||
Goldman Sachs Bank USA | USD | 1,309 | NOK | 10,794 | 2/16/17 | (59,085 | ) | |||||||||
JPMorgan Chase Bank, NA | CNY | 3,329 | USD | 476 | 2/16/17 | 4,453 | ||||||||||
JPMorgan Chase Bank, NA | GBP | 1,361 | USD | 1,699 | 2/16/17 | 20,153 | ||||||||||
JPMorgan Chase Bank, NA | INR | 613,233 | USD | 9,078 | 2/16/17 | 93,241 | ||||||||||
JPMorgan Chase Bank, NA | USD | 1,138 | TWD | 35,739 | 2/16/17 | (35,453 | ) | |||||||||
Morgan Stanley Capital Services LLC | EUR | 12,818 | USD | 14,211 | 2/16/17 | 688,230 | ||||||||||
Morgan Stanley Capital Services LLC | HKD | 10,614 | USD | 1,370 | 2/16/17 | 729 | ||||||||||
Morgan Stanley Capital Services LLC | NOK | 10,794 | USD | 1,242 | 2/16/17 | (8,591 | ) | |||||||||
Royal Bank of Scotland PLC | CNY | 13,074 | USD | 1,907 | 2/16/17 | 54,382 | ||||||||||
Royal Bank of Scotland PLC | USD | 11,576 | CAD | 15,488 | 2/16/17 | (34,730 | ) | |||||||||
Royal Bank of Scotland PLC | USD | 550 | KRW | 629,347 | 2/16/17 | (28,906 | ) | |||||||||
Standard Chartered Bank | INR | 502,261 | USD | 7,432 | 2/16/17 | 72,958 | ||||||||||
Standard Chartered Bank | USD | 3,151 | CNY | 21,933 | 2/16/17 | (43,443 | ) | |||||||||
Standard Chartered Bank | USD | 1,244 | GBP | 980 | 2/16/17 | (34,399 | ) | |||||||||
Standard Chartered Bank | USD | 3,880 | INR | 269,336 | 2/16/17 | 66,453 | ||||||||||
Standard Chartered Bank | USD | 1,864 | INR | 127,179 | 2/16/17 | (300 | ) | |||||||||
Standard Chartered Bank | USD | 5,987 | SEK | 53,807 | 2/16/17 | (65,467 | ) | |||||||||
| AB INTERNATIONAL GROWTH FUND • | 17 |
Portfolio of Investments
| Counterparty | Contracts to Deliver (000) | In Exchange For (000) | Settlement Date | Unrealized Appreciation/ (Depreciation) | ||||||||||||
State Street Bank & Trust Co. | CHF | 678 | USD | 662 | 2/16/17 | $ | (5,937 | ) | ||||||||
UBS AG | EUR | 2,953 | USD | 3,144 | 2/16/17 | 28,933 | ||||||||||
UBS AG | USD | 3,821 | AUD | 4,998 | 2/16/17 | (217,865 | ) | |||||||||
UBS AG | USD | 3,378 | JPY | 396,624 | 2/16/17 | 23,497 | ||||||||||
UBS AG | USD | 978 | JPY | 100,478 | 2/16/17 | (116,196 | ) | |||||||||
|
| |||||||||||||||
| $ | (1,611,525 | ) | ||||||||||||||
|
| |||||||||||||||
| * | Principal amount less than 500. |
| (a) | Security is exempt from registration under Rule 144A of the Securities Act of 1933. This security is considered restricted, but liquid and may be resold in transactions exempt from registration, normally to qualified institutional buyers. At December 31, 2016, the market value of this security amounted to $3,321,099 or 1.2% of net assets. |
| (b) | Non-income producing security. |
| (c) | Investment in affiliated money market mutual fund. The rate shown represents the 7-day yield as of period end. |
| (d) | To obtain a copy of the fund’s shareholder report, please go to the Securities and Exchange Commission’s website at www.sec.gov, or call AB at (800) 227-4618. |
| Currency Abbreviations: |
| AUD – Australian Dollar |
| BRL – Brazilian Real |
| CAD – Canadian Dollar |
| CHF – Swiss Franc |
| CNY – Chinese Yuan Renminbi |
| DKK – Danish Krone |
| EUR – Euro |
| GBP – Great British Pound |
| HKD – Hong Kong Dollar |
| INR – Indian Rupee |
| JPY – Japanese Yen |
| KRW – South Korean Won |
| NOK – Norwegian Krone |
| RUB – Russian Ruble |
| SEK – Swedish Krona |
| TWD – New Taiwan Dollar |
| USD – United States Dollar |
| ZAR – South African Rand |
Glossary:
|
| ADR – American Depositary Receipt |
| REG – Registered Shares |
See notes to financial statements.
| 18 | • AB INTERNATIONAL GROWTH FUND |
Portfolio of Investments
STATEMENT OF ASSETS & LIABILITIES
December 31, 2016 (unaudited)
| Assets | ||||
Investments in securities, at value | ||||
Unaffiliated issuers (cost $213,940,564) | $ | 270,182,596 | ||
Affiliated issuers (cost $5,209,147—including investment of cash collateral for securities loaned of $24,150) | 5,209,147 | |||
Foreign currencies, at value (cost $27) | 3 | |||
Receivable for investment securities sold | 2,391,590 | |||
Unrealized appreciation on forward currency exchange contracts | 2,263,933 | |||
Dividends receivable | 1,566,543 | |||
Receivable for capital stock sold | 229,042 | |||
Affiliated dividends receivable | 2,095 | |||
|
| |||
Total assets | 281,844,949 | |||
|
| |||
| Liabilities | ||||
Unrealized depreciation on forward currency exchange contracts | 3,875,458 | |||
Payable for capital stock redeemed | 2,534,939 | |||
Due to Custodian | 429,019 | |||
Advisory fee payable | 175,660 | |||
Distribution fee payable | 76,064 | |||
Transfer Agent fee payable | 33,734 | |||
Collateral due to Securities Lending Agent | 24,150 | |||
Administrative fee payable | 15,064 | |||
Accrued expenses and other liabilities | 283,528 | |||
|
| |||
Total liabilities | 7,447,616 | |||
|
| |||
Net Assets | $ | 274,397,333 | ||
|
| |||
| Composition of Net Assets | ||||
Capital stock, at par | $ | 19,167 | ||
Additional paid-in capital | 1,062,261,687 | |||
Distributions in excess of net investment income | (4,575,173 | ) | ||
Accumulated net realized loss on investment and foreign currency transactions | (837,772,593 | ) | ||
Net unrealized appreciation on investments and foreign currency denominated assets and liabilities | 54,464,245 | |||
|
| |||
| $ | 274,397,333 | |||
|
|
Net Asset Value Per Share—21 billion shares of capital stock authorized, $.001 par value
| Class | Net Assets | Shares Outstanding | Net Asset Value | |||||||||
| ||||||||||||
| A | $ | 188,097,765 | 12,966,674 | $ | 14.51 | * | ||||||
| ||||||||||||
| B | $ | 1,393,872 | 107,922 | $ | 12.92 | |||||||
| ||||||||||||
| C | $ | 33,216,769 | 2,558,507 | $ | 12.98 | |||||||
| ||||||||||||
| Advisor | $ | 34,636,602 | 2,349,264 | $ | 14.74 | |||||||
| ||||||||||||
| R | $ | 10,892,424 | 759,694 | $ | 14.34 | |||||||
| ||||||||||||
| K | $ | 4,676,124 | 323,835 | $ | 14.44 | |||||||
| ||||||||||||
| I | $ | 1,483,777 | 101,278 | $ | 14.65 | |||||||
| ||||||||||||
| * | The maximum offering price per share for Class A shares was $15.15, which reflects a sales charge of 4.25%. |
See notes to financial statements.
| AB INTERNATIONAL GROWTH FUND • | 19 |
Statement of Assets & Liabilities
STATEMENT OF OPERATIONS
Six Months Ended December 31, 2016 (unaudited)
| Investment Income | ||||||||
Dividends | ||||||||
Unaffiliated issuers (net of foreign taxes withheld of $76,893) | $ | 1,102,379 | ||||||
Affiliated issuers | 19,179 | |||||||
Securities lending income | 31,617 | $ | 1,153,175 | |||||
|
| |||||||
| Expenses | ||||||||
Advisory fee (see Note B) | 1,179,531 | |||||||
Distribution fee—Class A | 267,600 | |||||||
Distribution fee—Class B | 8,699 | |||||||
Distribution fee—Class C | 195,601 | |||||||
Distribution fee—Class R | 29,888 | |||||||
Distribution fee—Class K | 6,259 | |||||||
Transfer agency—Class A | 284,394 | |||||||
Transfer agency—Class B | 2,941 | |||||||
Transfer agency—Class C | 53,201 | |||||||
Transfer agency—Advisor Class | 54,422 | |||||||
Transfer agency—Class R | 15,542 | |||||||
Transfer agency—Class K | 5,007 | |||||||
Transfer agency—Class I | 832 | |||||||
Custodian | 84,646 | |||||||
Registration fees | 60,315 | |||||||
Printing | 41,129 | |||||||
Audit and tax | 34,015 | |||||||
Administrative | 28,332 | |||||||
Legal | 21,700 | |||||||
Directors’ fees | 13,065 | |||||||
Miscellaneous | 31,605 | |||||||
|
| |||||||
Total expenses | 2,418,724 | |||||||
Less: expenses waived and reimbursed by the Adviser (see Note B and Note E) | (13,007 | ) | ||||||
|
| |||||||
Net expenses | 2,405,717 | |||||||
|
| |||||||
Net investment loss | (1,252,542 | ) | ||||||
|
| |||||||
| Realized and Unrealized Gain (Loss) on Investment and Foreign Currency Transactions | ||||||||
Net realized gain (loss) on: | ||||||||
Investment transactions | 6,214,183 | |||||||
Foreign currency transactions | 570,184 | |||||||
Net change in unrealized appreciation/depreciation on: | ||||||||
Investments | (15,967,665 | ) | ||||||
Foreign currency denominated assets and liabilities | (3,093,443 | ) | ||||||
|
| |||||||
Net loss on investment and foreign currency transactions | (12,276,741 | ) | ||||||
|
| |||||||
Net Decrease in Net Assets from Operations | $ | (13,529,283 | ) | |||||
|
|
See notes to financial statements.
| 20 | • AB INTERNATIONAL GROWTH FUND |
Statement of Operations
STATEMENT OF CHANGES IN NET ASSETS
| Six Months Ended December 31, 2016 (unaudited) | Year Ended June 30, 2016 | |||||||
| Increase (Decrease) in Net Assets from Operations | ||||||||
Net investment income (loss) | $ | (1,252,542 | ) | $ | 1,435,021 | |||
Net realized gain on investment and foreign currency transactions | 6,784,367 | 12,768,962 | ||||||
Net change in unrealized appreciation/depreciation on investments and foreign currency denominated assets and liabilities | (19,061,108 | ) | (50,354,614 | ) | ||||
|
|
|
| |||||
Net decrease in net assets from operations | (13,529,283 | ) | (36,150,631 | ) | ||||
| Dividends to Shareholders from | ||||||||
Net investment income | ||||||||
Class A | (1,469,047 | ) | – 0 | – | ||||
Advisor Class | (346,656 | ) | – 0 | – | ||||
Class R | (43,777 | ) | – 0 | – | ||||
Class K | (38,533 | ) | – 0 | – | ||||
Class I | (18,247 | ) | – 0 | – | ||||
| Capital Stock Transactions | ||||||||
Net decrease | (36,888,561 | ) | (62,445,375 | ) | ||||
Proceeds from third party (see Note F) | – 0 | – | 8,039 | |||||
|
|
|
| |||||
Total decrease | (52,334,104 | ) | (98,587,967 | ) | ||||
| Net Assets | ||||||||
Beginning of period | 326,731,437 | 425,319,404 | ||||||
|
|
|
| |||||
End of period (including distributions in excess of net investment income of $(4,575,173) and $(1,406,371), respectively) | $ | 274,397,333 | $ | 326,731,437 | ||||
|
|
|
| |||||
See notes to financial statements.
| AB INTERNATIONAL GROWTH FUND • | 21 |
Statement of Changes in Net Assets
NOTES TO FINANCIAL STATEMENTS
December 31, 2016 (unaudited)
NOTE A
Significant Accounting Policies
AB International Growth Fund, Inc. (the “Fund”), organized as a Maryland corporation on March 16, 1994, is registered under the Investment Company Act of 1940 as a diversified open-end management investment company. The Fund offers Class A, Class B, Class C, Advisor Class, Class R, Class K and Class I shares. Class A shares are sold with a front-end sales charge of up to 4.25% for purchases not exceeding $1,000,000. With respect to purchases of $1,000,000 or more, Class A shares redeemed within one year of purchase may be subject to a contingent deferred sales charge of 1%. Class B shares are currently sold with a contingent deferred sales charge which declines from 4% to zero depending on the period of time the shares are held. Effective January 31, 2009, sales of Class B shares of the Fund to new investors were suspended. Class B shares will only be issued (i) upon the exchange of Class B shares from another AB Mutual Fund, (ii) for purposes of dividend reinvestment, (iii) through the Fund’s Automatic Investment Program (the “Program”) for accounts that established the Program prior to January 31, 2009, and (iv) for purchases of additional shares by Class B shareholders as of January 31, 2009. The ability to establish a new Program for accounts containing Class B shares was suspended as of January 31, 2009. Class B shares will automatically convert to Class A shares eight years after the end of the calendar month of purchase. Class C shares are subject to a contingent deferred sales charge of 1% on redemptions made within the first year after purchase. Class R and Class K shares are sold without an initial or contingent deferred sales charge. Advisor Class and Class I shares are sold without an initial or contingent deferred sales charge and are not subject to ongoing distribution expenses. All seven classes of shares have identical voting, dividend, liquidation and other rights, except that the classes bear different distribution and transfer agency expenses. Each class has exclusive voting rights with respect to its distribution plan. The financial statements have been prepared in conformity with U.S. generally accepted accounting principles (“U.S. GAAP”), which require management to make certain estimates and assumptions that affect the reported amounts of assets and liabilities in the financial statements and amounts of income and expenses during the reporting period. Actual results could differ from those estimates. The Fund is an investment company under U.S. GAAP and follows the accounting and reporting guidance applicable to investment companies. The following is a summary of significant accounting policies followed by the Fund.
1. Security Valuation
Portfolio securities are valued at their current market value determined on the basis of market quotations or, if market quotations are not readily
| 22 | • AB INTERNATIONAL GROWTH FUND |
Notes to Financial Statements
available or are deemed unreliable, at “fair value” as determined in accordance with procedures established by and under the general supervision of the Fund’s Board of Directors (the “Board”).
In general, the market values of securities which are readily available and deemed reliable are determined as follows: securities listed on a national securities exchange (other than securities listed on the NASDAQ Stock Market, Inc. (“NASDAQ”)) or on a foreign securities exchange are valued at the last sale price at the close of the exchange or foreign securities exchange. If there has been no sale on such day, the securities are valued at the last traded price from the previous day. Securities listed on more than one exchange are valued by reference to the principal exchange on which the securities are traded; securities listed only on NASDAQ are valued in accordance with the NASDAQ Official Closing Price; listed or over the counter (“OTC”) market put or call options are valued at the mid level between the current bid and ask prices. If either a current bid or current ask price is unavailable, AllianceBernstein L.P. (the “Adviser”) will have discretion to determine the best valuation (e.g. last trade price in the case of listed options); open futures are valued using the closing settlement price or, in the absence of such a price, the most recent quoted bid price. If there are no quotations available for the day of valuation, the last available closing settlement price is used; U.S. Government securities and any other debt instruments having 60 days or less remaining until maturity are generally valued at market by an independent pricing vendor, if a market price is available. If a market price is not available, the securities are valued at amortized cost. This methodology is commonly used for short-term securities that have an original maturity of 60 days or less, as well as short-term securities that had an original term to maturity that exceeded 60 days. In instances when amortized cost is utilized, the Valuation Committee (the “Committee”) must reasonably conclude that the utilization of amortized cost is approximately the same as the fair value of the security. Such factors the Committee will consider include, but are not limited to, an impairment of the creditworthiness of the issuer or material changes in interest rates. Fixed-income securities, including mortgage-backed and asset-backed securities, may be valued on the basis of prices provided by a pricing service or at a price obtained from one or more of the major broker-dealers. In cases where broker-dealer quotes are obtained, the Adviser may establish procedures whereby changes in market yields or spreads are used to adjust, on a daily basis, a recently obtained quoted price on a security. Swaps and other derivatives are valued daily, primarily using independent pricing services, independent pricing models using market inputs, as well as third party broker-dealers or counterparties. Open end mutual funds are valued at the closing net asset value per share, while exchange traded funds are valued at the closing market price per share.
| AB INTERNATIONAL GROWTH FUND • | 23 |
Notes to Financial Statements
Securities for which market quotations are not readily available (including restricted securities) or are deemed unreliable are valued at fair value as deemed appropriate by the Adviser. Factors considered in making this determination may include, but are not limited to, information obtained by contacting the issuer, analysts, analysis of the issuer’s financial statements or other available documents. In addition, the Fund may use fair value pricing for securities primarily traded in non-U.S. markets because most foreign markets close well before the Fund values its securities at 4:00 p.m., Eastern Time. The earlier close of these foreign markets gives rise to the possibility that significant events, including broad market moves, may have occurred in the interim and may materially affect the value of those securities. To account for this, the Fund may frequently value many of its foreign equity securities using fair value prices based on third party vendor modeling tools to the extent available.
2. Fair Value Measurements
In accordance with U.S. GAAP regarding fair value measurements, fair value is defined as the price that the Fund would receive to sell an asset or pay to transfer a liability in an orderly transaction between market participants at the measurement date. U.S. GAAP establishes a framework for measuring fair value, and a three-level hierarchy for fair value measurements based upon the transparency of inputs to the valuation of an asset or liability (including those valued based on their market values as described in Note A.1 above). Inputs may be observable or unobservable and refer broadly to the assumptions that market participants would use in pricing the asset or liability. Observable inputs reflect the assumptions market participants would use in pricing the asset or liability based on market data obtained from sources independent of the Fund. Unobservable inputs reflect the Fund’s own assumptions about the assumptions that market participants would use in pricing the asset or liability based on the best information available in the circumstances. Each investment is assigned a level based upon the observability of the inputs which are significant to the overall valuation. The three-tier hierarchy of inputs is summarized below.
| • | Level 1—quoted prices in active markets for identical investments |
| • | Level 2—other significant observable inputs (including quoted prices for similar investments, interest rates, prepayment speeds, credit risk, etc.) |
| • | Level 3—significant unobservable inputs (including the Fund’s own assumptions in determining the fair value of investments) |
Where readily available market prices or relevant bid prices are not available for certain equity investments, such investments may be valued based on similar publicly traded investments, movements in relevant indices
| 24 | • AB INTERNATIONAL GROWTH FUND |
Notes to Financial Statements
since last available prices or based upon underlying company fundamentals and comparable company data (such as multiples to earnings or other multiples to equity). Where an investment is valued using an observable input, such as another publicly traded security, the investment will be classified as Level 2. If management determines that an adjustment is appropriate based on restrictions on resale, illiquidity or uncertainty, and such adjustment is a significant component of the valuation, the investment will be classified as Level 3. An investment will also be classified as Level 3 where management uses company fundamentals and other significant inputs to determine the valuation.
The fair value of debt instruments, such as bonds, and over-the-counter derivatives is generally based on market price quotations, recently executed market transactions (where observable) or industry recognized modeling techniques and are generally classified as Level 2. Pricing vendor inputs to Level 2 valuations may include quoted prices for similar investments in active markets, interest rate curves, coupon rates, currency rates, yield curves, option adjusted spreads, default rates, credit spreads and other unique security features in order to estimate the relevant cash flows which is then discounted to calculate fair values. If these inputs are unobservable and significant to the fair value, these investments will be classified as Level 3. In addition, non-agency rated investments are classified as Level 3.
The following table summarizes the valuation of the Fund’s investments by the above fair value hierarchy levels as of December 31, 2016:
Investments in Securities | Level 1 | Level 2 | Level 3 | Total | ||||||||||||
Assets: | ||||||||||||||||
Common Stocks: | ||||||||||||||||
Financials | $ | 3,770,443 | $ | 58,425,555 | $ | – 0 | – | $ | 62,195,998 | |||||||
Information Technology | 16,033,618 | 28,631,916 | – 0 | – | 44,665,534 | |||||||||||
Consumer Discretionary | 18,446,600 | 21,295,861 | – 0 | – | 39,742,461 | |||||||||||
Consumer Staples | 5,568,133 | 33,647,656 | – 0 | – | 39,215,789 | |||||||||||
Industrials | 2,193,962 | 31,179,136 | – 0 | – | 33,373,098 | |||||||||||
Health Care | 3,851,439 | 20,074,125 | – 0 | – | 23,925,564 | |||||||||||
Telecommunication Services | – 0 | – | 14,140,636 | – 0 | – | 14,140,636 | ||||||||||
Materials | – 0 | – | 5,729,084 | – 0 | – | 5,729,084 | ||||||||||
Real Estate | – 0 | – | 3,350,662 | – 0 | – | 3,350,662 | ||||||||||
Utilities | – 0 | – | 3,317,209 | – 0 | – | 3,317,209 | ||||||||||
Short-Term Investments: | ||||||||||||||||
Investments Companies | 5,184,997 | – 0 | – | – 0 | – | 5,184,997 | ||||||||||
Time Deposits | – 0 | – | 526,561 | – 0 | – | 526,561 | ||||||||||
Investments of Cash Collateral for Securities Loaned in | 24,150 | – 0 | – | – 0 | – | 24,150 | ||||||||||
|
|
|
|
|
|
|
| |||||||||
Total Investments in Securities | 55,073,342 | 220,318,401 | † | – 0 | – | 275,391,743 | ||||||||||
| AB INTERNATIONAL GROWTH FUND • | 25 |
Notes to Financial Statements
Investments in Securities | Level 1 | Level 2 | Level 3 | Total | ||||||||||||
Other Financial Instruments*: | ||||||||||||||||
Assets | ||||||||||||||||
Forward Currency Exchange Contracts | $ | – 0 | – | $ | 2,263,933 | $ | – 0 | – | $ | 2,263,933 | ||||||
Liabilities | ||||||||||||||||
Forward Currency Exchange Contracts | – 0 | – | (3,875,458 | ) | – 0 | – | (3,875,458 | ) | ||||||||
|
|
|
|
|
|
|
| |||||||||
Total^ | $ | 55,073,342 | $ | 218,706,876 | $ | – 0 | – | $ | 273,780,218 | |||||||
|
|
|
|
|
|
|
| |||||||||
| † | A significant portion of the Fund’s foreign equity investments are categorized as Level 2 investments since they are valued using fair value prices based on third party vendor modeling tools to the extent available, see Note A.1. |
| * | Other financial instruments are derivative instruments, such as futures, forwards and swaps, which are valued at the unrealized appreciation/(depreciation) on the instrument. |
| ^ | There were di minimis transfers under 1% of net assets between Level 1 and Level 2 during the reporting period. |
The Fund recognizes all transfers between levels of the fair value hierarchy assuming the financial instruments were transferred at the beginning of the reporting period.
The Adviser established the Committee to oversee the pricing and valuation of all securities held in the Fund. The Committee operates under pricing and valuation policies and procedures established by the Adviser and approved by the Board, including pricing policies which set forth the mechanisms and processes to be employed on a daily basis to implement these policies and procedures. In particular, the pricing policies describe how to determine market quotations for securities and other instruments. The Committee’s responsibilities include: 1) fair value and liquidity determinations (and oversight of any third parties to whom any responsibility for fair value and liquidity determinations is delegated), and 2) regular monitoring of the Adviser’s pricing and valuation policies and procedures and modification or enhancement of these policies and procedures (or recommendation of the modification of these policies and procedures) as the Committee believes appropriate.
The Committee is also responsible for monitoring the implementation of the pricing policies by the Adviser’s Pricing Group (the “Pricing Group”) and any third party which performs certain pricing functions in accordance with the pricing policies. The Pricing Group is responsible for the oversight of the third party on a day-to-day basis. The Committee and the Pricing Group perform a series of activities to provide reasonable assurance of the accuracy of prices including: 1) periodic vendor due diligence meetings, review of methodologies, new developments, and process at vendors, 2) daily comparisons of security valuation versus prior day for all securities that exceeded established thresholds, and 3) daily
| 26 | • AB INTERNATIONAL GROWTH FUND |
Notes to Financial Statements
review of unpriced, stale, and variance reports with exceptions reviewed by senior management and the Committee.
In addition, several processes outside of the pricing process are used to monitor valuation issues including: 1) performance and performance attribution reports are monitored for anomalous impacts based upon benchmark performance, and 2) portfolio managers review all portfolios for performance and analytics (which are generated using the Adviser’s prices).
3. Currency Translation
Assets and liabilities denominated in foreign currencies and commitments under forward currency exchange contracts are translated into U.S. dollars at the mean of the quoted bid and ask prices of such currencies against the U.S. dollar. Purchases and sales of portfolio securities are translated into U.S. dollars at the rates of exchange prevailing when such securities were acquired or sold. Income and expenses are translated into U.S. dollars at rates of exchange prevailing when accrued.
Net realized gain or loss on foreign currency transactions represents foreign exchange gains and losses from sales and maturities of foreign fixed income investments, foreign currency exchange contracts, holding of foreign currencies, currency gains or losses realized between the trade and settlement dates on foreign investment transactions, and the difference between the amounts of dividends, interest and foreign withholding taxes recorded on the Fund’s books and the U.S. dollar equivalent amounts actually received or paid. Net unrealized currency gains and losses from valuing foreign currency denominated assets and liabilities at period end exchange rates are reflected as a component of net unrealized appreciation and depreciation of foreign currency denominated assets and liabilities.
4. Taxes
It is the Fund’s policy to meet the requirements of the Internal Revenue Code applicable to regulated investment companies and to distribute all of its investment company taxable income and net realized gains, if any, to shareholders. Therefore, no provisions for federal income or excise taxes are required. The Fund may be subject to taxes imposed by countries in which it invests. Such taxes are generally based on income and/or capital gains earned or repatriated. Taxes are accrued and applied to net investment income, net realized gains and net unrealized appreciation/depreciation as such income and/or gains are earned.
In accordance with U.S. GAAP requirements regarding accounting for uncertainties in income taxes, management has analyzed the Fund’s tax
| AB INTERNATIONAL GROWTH FUND • | 27 |
Notes to Financial Statements
positions taken or expected to be taken on federal and state income tax returns for all open tax years (the current and the prior three tax years) and has concluded that no provision for income tax is required in the Fund’s financial statements.
5. Investment Income and Investment Transactions
Dividend income is recorded on the ex-dividend date or as soon as the Fund is informed of the dividend. Interest income is accrued daily. Investment transactions are accounted for on the date securities are purchased or sold. Investment gains and losses are determined on the identified cost basis. The Fund amortizes premiums and accretes discounts as adjustments to interest income.
6. Class Allocations
All income earned and expenses incurred by the Fund are borne on a pro-rata basis by each settled class of shares, based on the proportionate interest in the Fund represented by the net assets of such class, except for class specific expenses which are allocated to the respective class. Realized and unrealized gains and losses are allocated among the various share classes based on their respective net assets.
7. Dividends and Distributions
Dividends and distributions to shareholders, if any, are recorded on the ex-dividend date. Income dividends and capital gains distributions are determined in accordance with federal tax regulations and may differ from those determined in accordance with U.S. GAAP. To the extent these differences are permanent, such amounts are reclassified within the capital accounts based on their federal tax basis treatment; temporary differences do not require such reclassification.
NOTE B
Advisory Fee and Other Transactions with Affiliates
Under the terms of the investment advisory agreement, the Fund pays the Adviser an advisory fee at an annual rate of .75% of the first $2.5 billion, .65% of the next $2.5 billion and .60% in excess of $5 billion, of the Fund’s average daily net assets. The fee is accrued daily and paid monthly. The Adviser has agreed to reimburse its fees and bear certain expenses to the extent necessary to limit total operating expenses on an annual basis (the “Expense Caps”) to 1.60%, 2.35%, 2.35%, 1.35%, 1.85%, 1.60% and 1.35% of the daily average net assets for Class A, Class B, Class C, Advisor Class, Class R, Class K and Class I shares, respectively. The Expense Caps will remain in effect until November 1, 2017 and will be automatically extended for one-year periods thereafter unless terminated by the Adviser upon 60 days’ notice to the Fund prior to that date. For the six months ended December 31, 2016, there was no such reimbursement.
| 28 | • AB INTERNATIONAL GROWTH FUND |
Notes to Financial Statements
Pursuant to the investment advisory agreement, the Fund may reimburse the Adviser for certain legal and accounting services provided to the Fund by the Adviser. For the six months ended December 31, 2016, such fee amounted to $28,332.
The Fund compensates AllianceBernstein Investor Services, Inc. (“ABIS”), a wholly-owned subsidiary of the Adviser, under a Transfer Agency Agreement for providing personnel and facilities to perform transfer agency services for the Fund. ABIS may make payments to intermediaries that provide omnibus account services, sub-accounting services and/or networking services. Such compensation retained by ABIS amounted to $144,137 for the six months ended December 31, 2016.
AllianceBernstein Investments, Inc. (the “Distributor”), a wholly-owned subsidiary of the Adviser, serves as the distributor of the Fund’s shares. The Distributor has advised the Fund that it has retained front-end sales charges of $537 from the sale of Class A shares and received $1,129, $529, and $203 in contingent deferred sales charges imposed upon redemptions by shareholders of Class A, Class B and Class C shares, respectively, for the six months ended December 31, 2016.
The Fund may invest in AB Government Money Market Portfolio (the “Government Money Market Portfolio”) which has a contractual annual advisory fee rate of .20% of the Portfolio’s average daily net assets and bear its own expenses. In connection with the investment by the Fund in the Government Money Market Portfolio, the Adviser has agreed to waive its investment advisory fee from the Fund in an amount equal to the Fund’s pro rata share of the effective advisory fees of Government Money Market Portfolio, as borne indirectly by the Fund as an acquired fund fee and expense. For the six months ended December 31, 2016, such waiver amounted to $9,706. A summary of the Fund’s transactions in shares of the Government Money Market Portfolio for the six months ended December 31, 2016 is as follows:
Market Value | Purchases at Cost (000) | Sales Proceeds (000) | Market Value December 31, 2016 (000) | Dividend Income (000) | ||||||||||||||
| $ | 11,043 | $ | 48,909 | $ | 54,767 | $ | 5,185 | $ | 13 | |||||||||
Brokerage commissions paid on investment transactions for the six months ended December 31, 2016 amounted to $102,316, none of which was paid to Sanford C. Bernstein & Co., LLC or Sanford C. Bernstein Limited, respectively, affiliates of the Adviser.
| AB INTERNATIONAL GROWTH FUND • | 29 |
Notes to Financial Statements
NOTE C
Distribution Services Agreement
The Fund has adopted a Distribution Services Agreement (the “Agreement”) pursuant to Rule 12b-1 under the Investment Company Act of 1940. Under the Agreement, the Fund pays distribution and servicing fees to the Distributor at an annual rate of up to .30% of the Fund’s average daily net assets attributable to Class A shares, 1% of the Fund’s average daily net assets attributable to both Class B and Class C shares, .50% of the Fund’s average daily net assets attributable to Class R shares and .25% of the Fund’s average daily net assets attributable to Class K shares. Effective October 31, 2014, payments under the Agreement in respect of Class A shares are limited to an annual rate of .25% of Class A shares’ average daily net assets. There are no distribution and servicing fees on Advisor Class and Class I shares. The fees are accrued daily and paid monthly. The Agreement provides that the Distributor will use such payments in their entirety for distribution assistance and promotional activities. Since the commencement of the Fund’s operations, the Distributor has incurred expenses in excess of the distribution costs reimbursed by the Fund in the amounts of $5,188,283, $4,417,251, $829,849, and $218,154 for Class B, Class C, Class R and Class K shares, respectively. While such costs may be recovered from the Fund in future periods so long as the Agreement is in effect, the rate of the distribution and servicing fees payable under the Agreement may not be increased without a shareholder vote. In accordance with the Agreement, there is no provision for recovery of unreimbursed distribution costs incurred by the Distributor beyond the current fiscal year for Class A shares. The Agreement also provides that the Adviser may use its own resources to finance the distribution of the Fund’s shares.
NOTE D
Investment Transactions
Purchases and sales of investment securities (excluding short-term investments) for the six months ended December 31, 2016 were as follows:
| Purchases | Sales | |||||||
Investment securities (excluding U.S. government securities) | $ | 25,620,885 | $ | 68,419,217 | ||||
U.S. government securities | – 0 | – | – 0 | – | ||||
The cost of investments for federal income tax purposes was substantially the same as cost for financial reporting purposes. Accordingly, gross unrealized appreciation and unrealized depreciation (excluding foreign currency contracts) are as follows:
Gross unrealized appreciation | $ | 64,212,159 | ||
Gross unrealized depreciation | (7,970,127 | ) | ||
|
| |||
Net unrealized appreciation | $ | 56,242,032 | ||
|
|
| 30 | • AB INTERNATIONAL GROWTH FUND |
Notes to Financial Statements
1. Derivative Financial Instruments
The Fund may use derivatives in an effort to earn income and enhance returns, to replace more traditional direct investments, to obtain exposure to otherwise inaccessible markets (collectively, “investment purposes”), or to hedge or adjust the risk profile of its portfolio.
The principal types of derivatives utilized by the Fund, as well as the methods in which they may be used are:
| • | Forward Currency Exchange Contracts |
The Fund may enter into forward currency exchange contracts in order to hedge its exposure to changes in foreign currency exchange rates on its foreign portfolio holdings, to hedge certain firm purchase and sale commitments denominated in foreign currencies and for non-hedging purposes as a means of making direct investments in foreign currencies, as described below under “Currency Transactions”.
A forward currency exchange contract is a commitment to purchase or sell a foreign currency at a future date at a negotiated forward rate. The gain or loss arising from the difference between the original contract and the closing of such contract would be included in net realized gain or loss on foreign currency transactions. Fluctuations in the value of open forward currency exchange contracts are recorded for financial reporting purposes as unrealized appreciation and/or depreciation by the Fund. Risks may arise from the potential inability of a counterparty to meet the terms of a contract and from unanticipated movements in the value of a foreign currency relative to the U.S. dollar.
During the six months ended December 31, 2016, the Fund held forward currency exchange contracts for hedging purposes.
The Fund typically enters into International Swaps and Derivatives Association, Inc. Master Agreements (“ISDA Master Agreement”) or similar master agreements (collectively, “Master Agreements”) with its derivative contract counterparties in order to, among other things, reduce its credit risk to counterparties. ISDA Master Agreements include provisions for general obligations, representations, collateral and events of default or termination. Under an ISDA Master Agreement, the Fund typically may offset with the counterparty certain derivative financial instrument’s payables and/or receivables with collateral held and/or posted and create one single net payment (close-out netting) in the event of default or termination.
| AB INTERNATIONAL GROWTH FUND • | 31 |
Notes to Financial Statements
Various master agreements govern the terms of certain transactions with counterparties, including transactions such as derivative transactions, repurchase and reverse repurchase agreements. These Master Agreements typically attempt to reduce the counterparty risk associated with such transactions by specifying credit protection mechanisms and providing standardization that improves legal certainty. Cross-termination provisions under Master Agreements typically provide that a default in connection with one transaction between the Fund and a counterparty gives the non-defaulting party the right to terminate any other transactions in place with the defaulting party to create one single net payment due to/due from the defaulting party. In the event of a default by a Master Agreements counterparty, the return of collateral with market value in excess of the Fund’s net liability, held by the defaulting party, may be delayed or denied.
The Fund’s Master Agreements may contain provisions for early termination of OTC derivative transactions in the event the net assets of the Fund decline below specific levels (“net asset contingent features”). If these levels are triggered, the Fund’s counterparty has the right to terminate such transaction and require the Fund to pay or receive a settlement amount in connection with the terminated transaction. For additional details, please refer to netting arrangements by counterparty tables below.
During the six months ended December 31, 2016, the Fund had entered into the following derivatives:
Asset Derivatives | Liability Derivatives | |||||||||||
Derivative Type | Statement of | Fair Value | Statement of | Fair Value | ||||||||
Foreign exchange contracts | Unrealized appreciation on forward currency exchange contracts | $ | 2,263,933 |
| Unrealized depreciation on forward currency exchange contracts | $ | 3,875,458 |
| ||||
|
|
|
| |||||||||
Total | $ | 2,263,933 | $ | 3,875,458 | ||||||||
|
|
|
| |||||||||
| 32 | • AB INTERNATIONAL GROWTH FUND |
Notes to Financial Statements
Derivative Type | Location of | Realized Gain or (Loss) on Derivatives | Change in Unrealized Appreciation or (Depreciation) | |||||||
Foreign exchange contracts | Net realized gain/(loss) on foreign currency transactions; Net change in unrealized appreciation/depreciation on foreign currency denominated assets and liabilities | $ | 636,396 |
| $ | (3,015,129 | ) | |||
|
|
|
| |||||||
Total | $ | 636,396 | $ | (3,015,129 | ) | |||||
|
|
|
| |||||||
The following table represents the average monthly volume of the Fund’s derivative transactions during the six months ended December 31, 2016:
Forward Currency Exchange Contracts: | ||||
Average principal amount on buy contracts | $ | 100,089,083 | ||
Average principal amount on sale contracts | $ | 83,979,218 |
For financial reporting purposes, the Fund does not offset derivative assets and derivative liabilities that are subject to netting arrangements in the statement of assets and liabilities.
All derivatives held at year end were subject to netting arrangements. The following tables present the Fund’s derivative assets and liabilities by counterparty net of amounts available for offset under Master Agreements (“MA”) and net of the related collateral received/pledged by the Fund as of December 31, 2016:
Counterparty | Derivative Assets Subject to a MA | Derivatives Available for Offset | Cash Collateral Received | Security Collateral Received | Net Amount of Derivatives Assets | |||||||||||||||
OTC Derivatives: | ||||||||||||||||||||
Bank of America, NA | $ | 377,659 | $ | – 0 | – | $ | – 0 | – | $ | – 0 | – | $ | 377,659 | |||||||
BNP Paribas | 13,610 | (435 | ) | – 0 | – | – 0 | – | 13,175 | ||||||||||||
Citibank, NA | 309,626 | (309,626 | ) | – 0 | – | – 0 | – | – 0 | – | |||||||||||
Credit Suisse International | 57,268 | – 0 | – | – 0 | – | – 0 | – | 57,268 | ||||||||||||
Goldman Sachs Bank USA | 452,741 | (59,085 | ) | – 0 | – | – 0 | – | 393,656 | ||||||||||||
JPMorgan Chase Bank, NA | 117,847 | (35,453 | ) | – 0 | – | – 0 | – | 82,394 | ||||||||||||
Morgan Stanley Capital Services LLC | 688,959 | (8,591 | ) | – 0 | – | – 0 | – | 680,368 | ||||||||||||
Royal Bank of Scotland PLC | 54,382 | (54,382 | ) | – 0 | – | – 0 | – | – 0 | – | |||||||||||
Standard Chartered Bank | 139,411 | (139,411 | ) | – 0 | – | – 0 | – | – 0 | – | |||||||||||
UBS AG | 52,430 | (52,430 | ) | – 0 | – | – 0 | – | – 0 | – | |||||||||||
|
|
|
|
|
|
|
|
|
| |||||||||||
Total | $ | 2,263,933 | $ | (659,413 | ) | $ | – 0 | – | $ | – 0 | – | $ | 1,604,520 | ^ | ||||||
|
|
|
|
|
|
|
|
|
| |||||||||||
| AB INTERNATIONAL GROWTH FUND • | 33 |
Notes to Financial Statements
Counterparty | Derivative Liabilities Subject to a MA | Derivatives Available for Offset | Cash Collateral Pledged | Security Collateral Pledged | Net Amount of Derivatives Liabilities | |||||||||||||||
OTC Derivatives: | ||||||||||||||||||||
Barclays Bank PLC | $ | 525,389 | $ | – 0 | – | $ | – 0 | – | $ | – 0 | – | $ | 525,389 | |||||||
BNP Paribas SA | 435 | (435 | ) | – 0 | – | – 0 | – | – 0 | – | |||||||||||
Brown Brothers Harriman & Co. | 2,301,096 | – 0 | – | – 0 | – | – 0 | – | 2,301,096 | ||||||||||||
Citibank, NA | 398,166 | (309,626 | ) | – 0 | – | – 0 | – | 88,540 | ||||||||||||
Goldman Sachs Bank USA | 59,085 | (59,085 | ) | – 0 | – | – 0 | – | – 0 | – | |||||||||||
JPMorgan Chase Bank, NA | 35,453 | (35,453 | ) | – 0 | – | – 0 | – | – 0 | – | |||||||||||
Morgan Stanley Capital Services LLC | 8,591 | (8,591 | ) | – 0 | – | – 0 | – | – 0 | – | |||||||||||
Royal Bank of Scotland PLC | 63,636 | (54,382 | ) | – 0 | – | – 0 | – | 9,254 | ||||||||||||
Standard Chartered Bank | 143,609 | (139,411 | ) | – 0 | – | – 0 | – | 4,198 | ||||||||||||
State Street Bank & Trust Co. | 5,937 | – 0 | – | – 0 | – | – 0 | – | 5,937 | ||||||||||||
UBS AG | 334,061 | (52,430 | ) | – 0 | – | – 0 | – | 281,631 | ||||||||||||
|
|
|
|
|
|
|
|
|
| |||||||||||
Total | $ | 3,875,458 | $ | (659,413 | ) | $ | – 0 | – | $ | – 0 | – | $ | 3,216,045 | ^ | ||||||
|
|
|
|
|
|
|
|
|
| |||||||||||
| ^ | Net amount represents the net receivable/payable that would be due from/to the counterparty in the event of default or termination. The net amount from OTC financial derivative instruments can only be netted across transactions governed under the same master agreement with the same counterparty. |
2. Currency Transactions
The Fund may invest in non-U.S. Dollar-denominated securities on a currency hedged or unhedged basis. The Fund may seek investment opportunities by taking long or short positions in currencies through the use of currency-related derivatives, including forward currency exchange contracts, futures and options on futures, swaps, and other options. The Fund may enter into transactions for investment opportunities when it anticipates that a foreign currency will appreciate or depreciate in value but securities denominated in that currency are not held by the Fund and do not present attractive investment opportunities. Such transactions may also be used when the Adviser believes that it may be more efficient than a direct investment in a foreign currency-denominated security. The Fund may also conduct currency exchange contracts on a spot basis (i.e., for cash at the spot rate prevailing in the currency exchange market for buying or selling currencies).
NOTE E
Securities Lending
The Fund may enter into securities lending transactions. Under the Fund’s securities lending program, all loans of securities will be collateralized continually by cash. The Fund will be compensated for the loan from a portion of the net return from the income earned on cash collateral after a rebate is paid to the borrower (in some cases, this rebate
| 34 | • AB INTERNATIONAL GROWTH FUND |
Notes to Financial Statements
may be a “negative rebate” or fee paid by the borrower to the Fund in connection with the loan), and payments are made for fees of the securities lending agent and for certain other administrative expenses. It is the policy of the Fund to receive collateral consisting of cash in an amount exceeding the value of the securities loaned. A Fund will have the right to call a loan and obtain the securities loaned at any time on notice to the borrower within the normal and customary settlement time for the securities. While the securities are on loan, the borrower is obligated to pay the Fund amounts equal to any income or other distributions from the securities. The Fund will not have the right to vote on any securities during the existence of a loan, but will have the right to regain ownership of loaned securities in order to exercise voting or other ownership rights. The lending agent has agreed to indemnify the Fund in the case of default of any securities borrower. Collateral received and securities loaned are marked to market daily to ensure that the securities loaned are secured by collateral. The lending agent currently invests the cash collateral received in Government Money Market Portfolio, an eligible money market vehicle, in accordance with the investment restrictions of the Fund, and as approved by the Board. Prior to June 20, 2016, such cash collateral received was invested in AB Exchange Reserves. The collateral received on securities loaned is recorded as an asset as well as a corresponding liability in the statement of assets and liabilities. When the Fund lends securities, its investment performance will continue to reflect changes in the value of the securities loaned. At December 31, 2016, the Fund had no securities on loan and had received cash collateral which has been invested into Government Money Market Portfolio of $24,150. The cash collateral will be adjusted on the next business day to maintain the required collateral amount. The Fund earned securities lending income of $31,617 and $5,837 from the borrowers and Government Money Market Portfolio, respectively, for the six months ended December 31, 2016; these amounts are reflected in the statement of operations. In connection with the cash collateral investment by the Fund in the Government Money Market Portfolio, the Adviser has agreed to waive a portion of the Funds’ share of the advisory fees of Government Money Market Portfolio, as borne indirectly by the Fund as an acquired fund fee and expense. For the six months ended December 31, 2016, such waiver amounted to $3,301. A principal risk of lending portfolio securities is that the borrower may fail to return the loaned securities upon termination of the loan and that the collateral will not be sufficient to replace the loaned securities. A summary of the Fund’s transactions in shares of Government Money Market Portfolio for the six months ended December 31, 2016 is as follows:
Market Value | Purchases at Cost (000) | Sales Proceeds (000) | Market Value December 31, 2016 (000) | |||||||||||
| $ | 6,474 | $ | 42,454 | $ | 48,904 | $ | 24 | |||||||
| AB INTERNATIONAL GROWTH FUND • | 35 |
Notes to Financial Statements
NOTE F
Capital Stock
Each class consists of 3,000,000,000 authorized shares. Transactions in capital shares for each class were as follows:
| Shares | Amount | |||||||||||||||||||||||
| Six Months Ended December 31, 2016 (unaudited) | Year Ended June 30, 2016 | Six Months Ended December 31, 2016 (unaudited) | Year Ended June 30, 2016 | |||||||||||||||||||||
|
| |||||||||||||||||||||||
| Class A | ||||||||||||||||||||||||
Shares sold | 258,221 | 598,800 | $ | 3,927,126 | $ | 9,220,702 | ||||||||||||||||||
| ||||||||||||||||||||||||
Shares issued in reinvestment of dividends | 83,756 | – 0 | – | 1,207,760 | – 0 | – | ||||||||||||||||||
| ||||||||||||||||||||||||
Shares converted from Class B | 26,802 | 149,050 | 413,755 | 2,327,029 | ||||||||||||||||||||
| ||||||||||||||||||||||||
Shares redeemed | (1,671,382 | ) | (3,069,704 | ) | (25,798,026 | ) | (47,225,161 | ) | ||||||||||||||||
| ||||||||||||||||||||||||
Net decrease | (1,302,603 | ) | (2,321,854 | ) | $ | (20,249,385 | ) | $ | (35,677,430 | ) | ||||||||||||||
| ||||||||||||||||||||||||
| Class B | ||||||||||||||||||||||||
Shares sold | 5,514 | 7,409 | $ | 76,772 | $ | 102,548 | ||||||||||||||||||
| ||||||||||||||||||||||||
Shares converted to Class A | (30,262 | ) | (167,232 | ) | (413,755 | ) | (2,327,029 | ) | ||||||||||||||||
| ||||||||||||||||||||||||
Shares redeemed | (14,069 | ) | (42,988 | ) | (195,718 | ) | (599,128 | ) | ||||||||||||||||
| ||||||||||||||||||||||||
Net decrease | (38,817 | ) | (202,811 | ) | $ | (532,701 | ) | $ | (2,823,609 | ) | ||||||||||||||
| ||||||||||||||||||||||||
| Class C | ||||||||||||||||||||||||
Shares sold | 24,780 | 93,086 | $ | 338,517 | $ | 1,298,831 | ||||||||||||||||||
| ||||||||||||||||||||||||
Shares redeemed | (445,852 | ) | (891,526 | ) | (6,109,533 | ) | (12,295,924 | ) | ||||||||||||||||
| ||||||||||||||||||||||||
Net decrease | (421,072 | ) | (798,440 | ) | $ | (5,771,016 | ) | $ | (10,997,093 | ) | ||||||||||||||
| ||||||||||||||||||||||||
| Advisor Class | ||||||||||||||||||||||||
Shares sold | 158,604 | 452,528 | $ | 2,490,545 | $ | 7,180,825 | ||||||||||||||||||
| ||||||||||||||||||||||||
Shares issued in reinvestment of dividends | 18,994 | – 0 | – | 278,451 | – 0 | – | ||||||||||||||||||
| ||||||||||||||||||||||||
Shares redeemed | (759,980 | ) | (1,179,070 | ) | (12,171,143 | ) | (18,018,786 | ) | ||||||||||||||||
| ||||||||||||||||||||||||
Net decrease | (582,382 | ) | (726,542 | ) | $ | (9,402,147 | ) | $ | (10,837,961 | ) | ||||||||||||||
| ||||||||||||||||||||||||
| Class R | ||||||||||||||||||||||||
Shares sold | 78,382 | 184,546 | $ | 1,181,973 | $ | 2,812,720 | ||||||||||||||||||
| ||||||||||||||||||||||||
Shares issued in reinvestment of dividends | 3,070 | – 0 | – | 43,777 | – 0 | – | ||||||||||||||||||
| ||||||||||||||||||||||||
Shares redeemed | (143,744 | ) | (291,324 | ) | (2,198,488 | ) | (4,423,917 | ) | ||||||||||||||||
| ||||||||||||||||||||||||
Net decrease | (62,292 | ) | (106,778 | ) | $ | (972,738 | ) | $ | (1,611,197 | ) | ||||||||||||||
| ||||||||||||||||||||||||
| 36 | • AB INTERNATIONAL GROWTH FUND |
Notes to Financial Statements
| Shares | Amount | |||||||||||||||||||||||
| Six Months Ended December 31, 2016 (unaudited) | Year Ended June 30, 2016 | Six Months Ended December 31, 2016 (unaudited) | Year Ended June 30, 2016 | |||||||||||||||||||||
|
| |||||||||||||||||||||||
| Class K | ||||||||||||||||||||||||
Shares sold | 32,915 | 103,543 | $ | 511,395 | $ | 1,562,820 | ||||||||||||||||||
| ||||||||||||||||||||||||
Shares issued in reinvestment of dividends | 2,685 | – 0 | – | 38,533 | – 0 | – | ||||||||||||||||||
| ||||||||||||||||||||||||
Shares redeemed | (38,743 | ) | (149,596 | ) | (599,028 | ) | (2,286,704 | ) | ||||||||||||||||
| ||||||||||||||||||||||||
Net decrease | (3,143 | ) | (46,053 | ) | $ | (49,100 | ) | $ | (723,884 | ) | ||||||||||||||
| ||||||||||||||||||||||||
| Class I | ||||||||||||||||||||||||
Shares sold | 7,698 | 51,931 | $ | 118,890 | $ | 809,579 | ||||||||||||||||||
| ||||||||||||||||||||||||
Shares issued in reinvestment of dividends | 1,253 | – 0 | – | 18,247 | – 0 | – | ||||||||||||||||||
| ||||||||||||||||||||||||
Shares redeemed | (3,074 | ) | (37,937 | ) | (48,611 | ) | (583,780 | ) | ||||||||||||||||
| ||||||||||||||||||||||||
Net increase | 5,877 | 13,994 | $ | 88,526 | $ | 225,799 | ||||||||||||||||||
| ||||||||||||||||||||||||
For the year ended June 30, 2016, the Fund received $8,039 related to a third party trading error. This amount is presented in the Fund’s statement of changes in net assets.
NOTE G
Risks Involved in Investing in the Fund
Foreign (Non-U.S.) Risk—Investments in securities of non-U.S. issuers may involve more risk than those of U.S. issuers. These securities may fluctuate more widely in price and may be less liquid due to adverse market, economic, political, regulatory or other factors.
Emerging Market Risk—Investments in emerging market countries may have more risk because the markets are less developed and less liquid as well as being subject to increased economic, political, regulatory or other uncertainties.
Currency Risk—Fluctuations in currency exchange rates may negatively affect the value of the Fund’s investments or reduce its returns.
Capitalization Risk—Investments in small- and mid-capitalization companies may be more volatile than investments in large-capitalization companies. Investments in small-capitalization companies may have additional risks because these companies have limited product lines, markets or financial resources.
Derivatives Risk—The Fund may enter into derivative transactions such as forwards, options, futures and swaps. Derivatives may be illiquid, difficult
| AB INTERNATIONAL GROWTH FUND • | 37 |
Notes to Financial Statements
to price, and leveraged so that small changes may produce disproportionate losses for the Fund, and subject to counterparty risk to a greater degree than more traditional investments. Derivatives may result in significant losses, including losses that are far greater than the value of the derivatives reflected in the statement of assets and liabilities.
Indemnification Risk—In the ordinary course of business, the Fund enters into contracts that contain a variety of indemnifications. The Fund’s maximum exposure under these arrangements is unknown. However, the Fund has not had prior claims or losses pursuant to these indemnification provisions and expects the risk of loss thereunder to be remote. Therefore, the Fund has not accrued any liability in connection with these indemnification provisions.
NOTE H
Joint Credit Facility
A number of open-end mutual funds managed by the Adviser, including the Fund, participate in a $280 million revolving credit facility (the “Facility”) intended to provide short-term financing if necessary, subject to certain restrictions in connection with abnormal redemption activity. Commitment fees related to the Facility are paid by the participating funds and are included in miscellaneous expenses in the statement of operations. The Fund did not utilize the Facility during the six months ended December 31, 2016.
NOTE I
Tax Information
The tax character of distributions paid for the year ending June 30, 2017 will be determined at the end of the current fiscal year.
As of June 30, 2016, the components of accumulated earnings/(deficit) on a tax basis were as follows:
Accumulated capital and other losses | $ | (844,075,330 | )(a) | |
Unrealized appreciation/(depreciation) | 71,637,352 | (b) | ||
|
| |||
Total accumulated earnings/(deficit) | $ | (772,437,978 | ) | |
|
|
| (a) | As of June 30, 2016, the Fund had a net capital loss carryforward for federal income tax purposes of $844,075,330. During the fiscal year, the Fund utilized $11,406,430 of capital loss carryforwards to offset current year net realized gains. |
| (b) | The differences between book-basis and tax-basis unrealized appreciation/(depreciation) are attributable primarily to the tax deferral of losses on wash sales and the realization for tax purposes of gains/losses on certain derivative instruments. |
For tax purposes, net capital losses may be carried over to offset future capital gains, if any. Funds are permitted to carry forward capital losses incurred in taxable years beginning after December 22, 2010 for an
| 38 | • AB INTERNATIONAL GROWTH FUND |
Notes to Financial Statements
indefinite period. These post-enactment capital losses must be utilized prior to the pre-enactment capital losses, which are subject to expiration. Post-enactment capital loss carryforwards will retain their character as either short-term or long-term capital losses rather than being considered short-term as under previous regulation.
As of June 30, 2016, the Fund had a net capital loss carryforward of $844,075,330 which will expire as follows:
Short-Term Amount | Long-Term Amount | Expiration | ||
| $143,955,322 | N/A | 2017 | ||
| 700,120,008 | N/A | 2018 |
NOTE J
Other
In October 2016, the U.S. Securities and Exchange Commission adopted new rules and amended existing rules (together, “final rules”) intended to modernize the reporting and disclosure of information by registered investment companies. In part, the final rules amend Regulation S-X and require standardized, enhanced disclosure about derivatives in investment company financial statements, as well as other amendments. The compliance date for the amendments to Regulation S-X is August 1, 2017. Management is currently evaluating the impact that the adoption of the amendments to Regulation S-X will have on the financial statements and related disclosures.
NOTE K
Subsequent Events
Management has evaluated subsequent events for possible recognition or disclosure in the financial statements through the date the financial statements are issued. Management has determined that there are no material events that would require disclosure in the Fund’s financial statements through this date.
| AB INTERNATIONAL GROWTH FUND • | 39 |
Notes to Financial Statements
FINANCIAL HIGHLIGHTS
Selected Data For A Share Of Capital Stock Outstanding Throughout Each Period
| Class A | ||||||||||||||||||||||||
| Six Months Ended December 31, 2016 (unaudited) | Year Ended June 30, | |||||||||||||||||||||||
| 2016 | 2015 | 2014 | 2013 | 2012 | ||||||||||||||||||||
|
| |||||||||||||||||||||||
Net asset value, beginning of period | $ 15.36 | $ 16.76 | $ 17.23 | $ 14.65 | $ 13.07 | $ 15.61 | ||||||||||||||||||
|
| |||||||||||||||||||||||
Income From Investment Operations | ||||||||||||||||||||||||
Net investment income (loss)(a) | (.06 | )(b) | .08 | (b) | .10 | .14 | .13 | .10 | ||||||||||||||||
Net realized and unrealized gain (loss) on investment and foreign currency transactions | (.68 | ) | (1.48 | ) | (.57 | ) | 2.61 | 1.57 | (2.52 | ) | ||||||||||||||
|
| |||||||||||||||||||||||
Net increase (decrease) in net asset value from operations | (.74 | ) | (1.40 | ) | (.47 | ) | 2.75 | 1.70 | (2.42 | ) | ||||||||||||||
|
| |||||||||||||||||||||||
Less: Dividends | ||||||||||||||||||||||||
Dividends from net investment income | (.11 | ) | – 0 | – | – 0 | – | (.17 | ) | (.12 | ) | (.12 | ) | ||||||||||||
|
| |||||||||||||||||||||||
Net asset value, end of period | $ 14.51 | $ 15.36 | $ 16.76 | $ 17.23 | $ 14.65 | $ 13.07 | ||||||||||||||||||
|
| |||||||||||||||||||||||
Total Return | ||||||||||||||||||||||||
Total investment return based on net asset value(c) | (4.80 | )% | (8.35 | )% | (2.78 | )% | 18.94 | %† | 12.99 | %* | (15.47 | )% | ||||||||||||
Ratios/Supplemental Data | ||||||||||||||||||||||||
Net assets, end of period (000’s omitted) | $188,098 | $219,182 | $278,008 | $358,142 | $399,308 | $534,900 | ||||||||||||||||||
Ratio to average net assets of: | ||||||||||||||||||||||||
Expenses, net of waivers/reimbursements(d) | 1.46 | %(e) | 1.35 | % | 1.39 | % | 1.37 | % | 1.32 | % | 1.40 | % | ||||||||||||
Expenses, before waivers/reimbursements(d) | 1.47 | %(e) | 1.35 | % | 1.39 | % | 1.37 | % | 1.32 | % | 1.40 | % | ||||||||||||
Net investment income (loss) | (.73 | )%(b)(e) | .49 | %(b) | .58 | % | .87 | % | .93 | % | .77 | % | ||||||||||||
Portfolio turnover rate | 9 | % | 45 | % | 18 | % | 36 | % | 30 | % | 63 | % | ||||||||||||
See footnote summary on page 47.
| 40 | • AB INTERNATIONAL GROWTH FUND |
Financial Highlights
Selected Data For A Share Of Capital Stock Outstanding Throughout Each Period
| Class B | ||||||||||||||||||||||||
| Six Months Ended December 31, 2016 (unaudited) | Year Ended June 30, | |||||||||||||||||||||||
| 2016 | 2015 | 2014 | 2013 | 2012 | ||||||||||||||||||||
|
| |||||||||||||||||||||||
Net asset value, beginning of period | $ 13.63 | $ 14.99 | $ 15.54 | $ 13.26 | $ 11.83 | $ 14.09 | ||||||||||||||||||
|
| |||||||||||||||||||||||
Income From Investment Operations | ||||||||||||||||||||||||
Net investment income (loss)(a) | (.11 | )(b) | (.07 | )(b) | (.05 | ) | (.00 | )(f) | .02 | (.00 | )(f) | |||||||||||||
Net realized and unrealized gain (loss) on investment and foreign currency transactions | (.60 | ) | (1.29 | ) | (.50 | ) | 2.38 | 1.41 | (2.26 | ) | ||||||||||||||
|
| |||||||||||||||||||||||
Net increase (decrease) in net asset value from operations | (.71 | ) | (1.36 | ) | (.55 | ) | 2.38 | 1.43 | (2.26 | ) | ||||||||||||||
|
| |||||||||||||||||||||||
Less: Dividends | ||||||||||||||||||||||||
Dividends from net investment income | – 0 | – | – 0 | – | – 0 | – | (.10 | ) | – 0 | – | – 0 | – | ||||||||||||
|
| |||||||||||||||||||||||
Net asset value, end of period | $ 12.92 | $ 13.63 | $ 14.99 | $ 15.54 | $ 13.26 | $ 11.83 | ||||||||||||||||||
|
| |||||||||||||||||||||||
Total Return | ||||||||||||||||||||||||
Total investment return based on net asset value(c) | (5.21 | )% | (9.07 | )% | (3.54 | )% | 18.06 | %† | 12.09 | %* | (16.04 | )% | ||||||||||||
Ratios/Supplemental Data | ||||||||||||||||||||||||
Net assets, end of period (000’s omitted) | $1,394 | $2,000 | $5,240 | $10,793 | $16,753 | $22,731 | ||||||||||||||||||
Ratio to average net assets of: | ||||||||||||||||||||||||
Expenses, net of waivers/reimbursements(d) | 2.28 | %(e) | 2.18 | % | 2.16 | % | 2.11 | % | 2.07 | % | 2.18 | % | ||||||||||||
Expenses, before waivers/reimbursements(d) | 2.29 | %(e) | 2.18 | % | 2.16 | % | 2.11 | % | 2.07 | % | 2.18 | % | ||||||||||||
Net investment income (loss) | (1.55 | )%(b)(e) | (.49 | )%(b) | (.34 | )% | (.01 | )% | .14 | % | (.01 | )% | ||||||||||||
Portfolio turnover rate | 9 | % | 45 | % | 18 | % | 36 | % | 30 | % | 63 | % | ||||||||||||
See footnote summary on page 47.
| AB INTERNATIONAL GROWTH FUND • | 41 |
Financial Highlights
Selected Data For A Share Of Capital Stock Outstanding Throughout Each Period
| Class C | ||||||||||||||||||||||||
| Six Months Ended December 31, 2016 (unaudited) | Year Ended June 30, | |||||||||||||||||||||||
| 2016 | 2015 | 2014 | 2013 | 2012 | ||||||||||||||||||||
|
| |||||||||||||||||||||||
Net asset value, beginning of period | $ 13.69 | $ 15.05 | $ 15.60 | $ 13.32 | $ 11.87 | $ 14.14 | ||||||||||||||||||
|
| |||||||||||||||||||||||
Income From Investment Operations | ||||||||||||||||||||||||
Net investment income (loss)(a) | (.10 | )(b) | (.04 | )(b) | (.02 | ) | .02 | .03 | .00 | (f) | ||||||||||||||
Net realized and unrealized gain (loss) on investment and foreign currency transactions | (.61 | ) | (1.32 | ) | (.53 | ) | 2.38 | 1.42 | (2.27 | ) | ||||||||||||||
|
| |||||||||||||||||||||||
Net increase (decrease) in net asset value from operations | (.71 | ) | (1.36 | ) | (.55 | ) | 2.40 | 1.45 | (2.27 | ) | ||||||||||||||
|
| |||||||||||||||||||||||
Less: Dividends | ||||||||||||||||||||||||
Dividends from net investment income | – 0 | – | – 0 | – | – 0 | – | (.12 | ) | – 0 | – | – 0 | – | ||||||||||||
|
| |||||||||||||||||||||||
Net asset value, end of period | $ 12.98 | $ 13.69 | $ 15.05 | $ 15.60 | $ 13.32 | $ 11.87 | ||||||||||||||||||
|
| |||||||||||||||||||||||
Total Return | ||||||||||||||||||||||||
Total investment return based on net asset value(c) | (5.19 | )% | (9.04 | )% | (3.52 | )% | 18.09 | %† | 12.22 | %* | (16.05 | )% | ||||||||||||
Ratios/Supplemental Data | ||||||||||||||||||||||||
Net assets, end of period (000’s omitted) | $33,217 | $40,800 | $56,865 | $70,259 | $74,259 | $90,590 | ||||||||||||||||||
Ratio to average net assets of: | ||||||||||||||||||||||||
Expenses, net of waivers/reimbursements(d) | 2.21 | %(e) | 2.11 | % | 2.13 | % | 2.07 | % | 2.03 | % | 2.13 | % | ||||||||||||
Expenses, before waivers/reimbursements(d) | 2.22 | %(e) | 2.11 | % | 2.13 | % | 2.07 | % | 2.03 | % | 2.13 | % | ||||||||||||
Net investment income (loss) | (1.48 | )%(b)(e) | (.30 | )%(b) | (.16 | )% | .16 | % | .21 | % | .03 | % | ||||||||||||
Portfolio turnover rate | 9 | % | 45 | % | 18 | % | 36 | % | 30 | % | 63 | % | ||||||||||||
See footnote summary on page 47.
| 42 | • AB INTERNATIONAL GROWTH FUND |
Financial Highlights
Selected Data For A Share Of Capital Stock Outstanding Throughout Each Period
| Advisor Class | ||||||||||||||||||||||||
| Six Months Ended December 31, 2016 (unaudited) | Year Ended June 30, | |||||||||||||||||||||||
| 2016 | 2015 | 2014 | 2013 | 2012 | ||||||||||||||||||||
|
| |||||||||||||||||||||||
Net asset value, beginning of period | $ 15.63 | $ 17.01 | $ 17.45 | $ 14.81 | $ 13.24 | $ 15.80 | ||||||||||||||||||
|
| |||||||||||||||||||||||
Income From Investment Operations | ||||||||||||||||||||||||
Net investment income (loss)(a) | (.04 | )(b) | .11 | (b) | .14 | .19 | .18 | .14 | ||||||||||||||||
Net realized and unrealized gain (loss) on investment and foreign currency transactions | (.70 | ) | (1.49 | ) | (.58 | ) | 2.65 | 1.58 | (2.54 | ) | ||||||||||||||
|
| |||||||||||||||||||||||
Net increase (decrease) in net asset value from operations | (.74 | ) | (1.38 | ) | (.44 | ) | 2.84 | 1.76 | (2.40 | ) | ||||||||||||||
|
| |||||||||||||||||||||||
Less: Dividends | ||||||||||||||||||||||||
Dividends from net investment income | (.15 | ) | – 0 | – | – 0 | – | (.20 | ) | (.19 | ) | (.16 | ) | ||||||||||||
|
| |||||||||||||||||||||||
Net asset value, end of period | $ 14.74 | $ 15.63 | $ 17.01 | $ 17.45 | $ 14.81 | $ 13.24 | ||||||||||||||||||
|
| |||||||||||||||||||||||
Total Return | ||||||||||||||||||||||||
Total investment return based on net asset value(c) | (4.74 | )% | (8.11 | )% | (2.52 | )% | 19.32 | %† | 13.27 | %* | (15.15 | )% | ||||||||||||
Ratios/Supplemental Data | ||||||||||||||||||||||||
Net assets, end of period (000’s omitted) | $34,637 | $45,816 | $62,213 | $83,622 | $84,113 | $107,284 | ||||||||||||||||||
Ratio to average net assets of: | ||||||||||||||||||||||||
Expenses, net of waivers/reimbursements(d) | 1.20 | %(e) | 1.10 | % | 1.12 | % | 1.06 | % | 1.02 | % | 1.10 | % | ||||||||||||
Expenses, before waivers/reimbursements(d) | 1.21 | %(e) | 1.10 | % | 1.12 | % | 1.06 | % | 1.02 | % | 1.10 | % | ||||||||||||
Net investment income (loss) | (.47 | )%(b)(e) | .69 | %(b) | .85 | % | 1.17 | % | 1.23 | % | 1.01 | % | ||||||||||||
Portfolio turnover rate | 9 | % | 45 | % | 18 | % | 36 | % | 30 | % | 63 | % | ||||||||||||
See footnote summary on page 47.
| AB INTERNATIONAL GROWTH FUND • | 43 |
Financial Highlights
Selected Data For A Share Of Capital Stock Outstanding Throughout Each Period
| Class R | ||||||||||||||||||||||||
| Six Months Ended December 31, 2016 (unaudited) | Year Ended June 30, | |||||||||||||||||||||||
| 2016 | 2015 | 2014 | 2013 | 2012 | ||||||||||||||||||||
|
| |||||||||||||||||||||||
Net asset value, beginning of period | $ 15.15 | $ 16.57 | $ 17.09 | $ 14.54 | $ 12.97 | $ 15.45 | ||||||||||||||||||
|
| |||||||||||||||||||||||
Income From Investment Operations | ||||||||||||||||||||||||
Net investment income (loss)(a) | (.08 | )(b) | .03 | (b) | .06 | .09 | .09 | .08 | ||||||||||||||||
Net realized and unrealized gain (loss) on investment and foreign currency transactions | (.67 | ) | (1.45 | ) | (.58 | ) | 2.60 | 1.56 | (2.50 | ) | ||||||||||||||
|
| |||||||||||||||||||||||
Net increase (decrease) in net asset value from operations | (.75 | ) | (1.42 | ) | (.52 | ) | 2.69 | 1.65 | (2.42 | ) | ||||||||||||||
|
| |||||||||||||||||||||||
Less: Dividends | ||||||||||||||||||||||||
Dividends from net investment income | (.06 | ) | – 0 | – | – 0 | – | (.14 | ) | (.08 | ) | (.06 | ) | ||||||||||||
|
| |||||||||||||||||||||||
Net asset value, end of period | $ 14.34 | $ 15.15 | $ 16.57 | $ 17.09 | $ 14.54 | $ 12.97 | ||||||||||||||||||
|
| |||||||||||||||||||||||
Total Return | ||||||||||||||||||||||||
Total investment return based on net asset value(c) | (4.96 | )% | (8.57 | )% | (3.04 | )% | 18.59 | %† | 12.69 | %* | (15.63 | )% | ||||||||||||
Ratios/Supplemental Data | ||||||||||||||||||||||||
Net assets, end of period (000’s omitted) | $10,892 | $12,449 | $15,394 | $18,149 | $20,995 | $26,541 | ||||||||||||||||||
Ratio to average net assets of: | ||||||||||||||||||||||||
Expenses, net of waivers/reimbursements(d) | 1.70 | %(e) | 1.67 | % | 1.64 | % | 1.62 | % | 1.58 | % | 1.60 | % | ||||||||||||
Expenses, before waivers/reimbursements(d) | 1.71 | %(e) | 1.67 | % | 1.64 | % | 1.62 | % | 1.58 | % | 1.60 | % | ||||||||||||
Net investment income (loss) | (.97 | )%(b)(e) | .17 | %(b) | .34 | % | .58 | % | .64 | % | .59 | % | ||||||||||||
Portfolio turnover rate | 9 | % | 45 | % | 18 | % | 36 | % | 30 | % | 63 | % | ||||||||||||
See footnote summary on page 47.
| 44 | • AB INTERNATIONAL GROWTH FUND |
Financial Highlights
Selected Data For A Share Of Capital Stock Outstanding Throughout Each Period
| Class K | ||||||||||||||||||||||||
| Six Months Ended December 31, 2016 (unaudited) | Year Ended June 30, | |||||||||||||||||||||||
| 2016 | 2015 | 2014 | 2013 | 2012 | ||||||||||||||||||||
|
| |||||||||||||||||||||||
Net asset value, beginning of period | $ 15.29 | $ 16.69 | $ 17.15 | $ 14.57 | $ 13.03 | $ 15.54 | ||||||||||||||||||
|
| |||||||||||||||||||||||
Income From Investment Operations | ||||||||||||||||||||||||
Net investment income (loss)(a) | (.05 | )(b) | .08 | (b) | .11 | .15 | .12 | .13 | ||||||||||||||||
Net realized and unrealized gain (loss) on investment and foreign currency transactions | (.68 | ) | (1.48 | ) | (.57 | ) | 2.60 | 1.56 | (2.52 | ) | ||||||||||||||
|
| |||||||||||||||||||||||
Net increase (decrease) in net asset value from operations | (.73 | ) | (1.40 | ) | (.46 | ) | 2.75 | 1.68 | (2.39 | ) | ||||||||||||||
|
| |||||||||||||||||||||||
Less: Dividends | ||||||||||||||||||||||||
Dividends from net investment income | (.12 | ) | – 0 | – | – 0 | – | (.17 | ) | (.14 | ) | (.12 | ) | ||||||||||||
|
| |||||||||||||||||||||||
Net asset value, end of period | $ 14.44 | $ 15.29 | $ 16.69 | $ 17.15 | $ 14.57 | $ 13.03 | ||||||||||||||||||
|
| |||||||||||||||||||||||
Total Return | ||||||||||||||||||||||||
Total investment return based on net asset value(c) | (4.76 | )% | (8.39 | )% | (2.68 | )% | 18.99 | %† | 12.93 | %* | (15.39 | )% | ||||||||||||
Ratios/Supplemental Data | ||||||||||||||||||||||||
Net assets, end of period (000’s omitted) | $4,676 | $5,001 | $6,224 | $6,146 | $5,434 | $8,618 | ||||||||||||||||||
Ratio to average net assets of: | ||||||||||||||||||||||||
Expenses, net of waivers/reimbursements(d) | 1.39 | %(e) | 1.36 | % | 1.33 | % | 1.31 | % | 1.28 | % | 1.29 | % | ||||||||||||
Expenses, before waivers/reimbursements(d) | 1.40 | %(e) | 1.36 | % | 1.33 | % | 1.31 | % | 1.28 | % | 1.29 | % | ||||||||||||
Net investment income (loss) | (.66 | )%(b)(e) | .52 | %(b) | .67 | % | .97 | % | .86 | % | .93 | % | ||||||||||||
Portfolio turnover rate | 9 | % | 45 | % | 18 | % | 36 | % | 30 | % | 63 | % | ||||||||||||
See footnote summary on page 47.
| AB INTERNATIONAL GROWTH FUND • | 45 |
Financial Highlights
Selected Data For A Share Of Capital Stock Outstanding Throughout Each Period
| Class I | ||||||||||||||||||||||||
| Six Months Ended December 31, 2016 (unaudited) | Year Ended June 30, | |||||||||||||||||||||||
| 2016 | 2015 | 2014 | 2013 | 2012 | ||||||||||||||||||||
|
| |||||||||||||||||||||||
Net asset value, beginning of period | $ 15.56 | $ 16.90 | $ 17.30 | $ 14.67 | $ 13.15 | $ 15.71 | ||||||||||||||||||
|
| |||||||||||||||||||||||
Income From Investment Operations | ||||||||||||||||||||||||
Net investment income (loss)(a) | (.03 | )(b) | .14 | (b) | .19 | .15 | .21 | .18 | ||||||||||||||||
Net realized and unrealized gain (loss) on investment and foreign currency transactions | (.70 | ) | (1.48 | ) | (.59 | ) | 2.69 | 1.56 | (2.55 | ) | ||||||||||||||
|
| |||||||||||||||||||||||
Net increase (decrease) in net asset value from operations | (.73 | ) | (1.34 | ) | (.40 | ) | 2.84 | 1.77 | (2.37 | ) | ||||||||||||||
|
| |||||||||||||||||||||||
Less: Dividends | ||||||||||||||||||||||||
Dividends from net investment income | (.18 | ) | – 0 | – | – 0 | – | (.21 | ) | (.25 | ) | (.19 | ) | ||||||||||||
|
| |||||||||||||||||||||||
Net asset value, end of period | $ 14.65 | $ 15.56 | $ 16.90 | $ 17.30 | $ 14.67 | $ 13.15 | ||||||||||||||||||
|
| |||||||||||||||||||||||
Total Return | ||||||||||||||||||||||||
Total investment return based on net asset value(c) | (4.65 | )% | (7.93 | )% | (2.31 | )% | 19.48 | %† | 13.45 | %* | (15.02 | )% | ||||||||||||
Ratios/Supplemental Data | ||||||||||||||||||||||||
Net assets, end of period (000’s omitted) | $1,484 | $1,484 | $1,376 | $1,123 | $19,171 | $20,258 | ||||||||||||||||||
Ratio to average net assets of: | ||||||||||||||||||||||||
Expenses, net of waivers/reimbursements(d) | 1.05 | %(e) | .95 | % | .90 | % | .92 | % | .87 | % | .90 | % | ||||||||||||
Expenses, before waivers/reimbursements(d) | 1.06 | %(e) | .95 | % | .90 | % | .92 | % | .87 | % | .90 | % | ||||||||||||
Net investment income (loss) | (.32 | )%(b)(e) | .92 | %(b) | 1.15 | % | .97 | % | 1.42 | % | 1.35 | % | ||||||||||||
Portfolio turnover rate | 9 | % | 45 | % | 18 | % | 36 | % | 30 | % | 63 | % | ||||||||||||
See footnote summary on page 47.
| 46 | • AB INTERNATIONAL GROWTH FUND |
Financial Highlights
| (a) | Based on average shares outstanding. |
| (b) | Net of expenses waived/reimbursed by the Adviser. |
| (c) | Total investment return is calculated assuming an initial investment made at the net asset value at the beginning of the period, reinvestment of all dividends and distributions at net asset value during the period, and redemption on the last day of the period. Initial sales charge or contingent deferred sales charge is not reflected in the calculation of total investment return. Total investment return does not reflect the deduction of taxes that a shareholder would pay on fund distributions or the redemption of fund shares. Total investment return for a period of less than one year is not annualized. |
| (d) | The Fund’s investments in affiliated underlying portfolios incur no direct expenses, but bear proportionate shares of the acquired fund fees (i.e., operating, administrative and investment advisory fee) of the affiliated underlying portfolios. The Adviser has voluntarily agreed to waive certain acquired fund fees and for the six months ended December 31, 2016, such waiver amounted to .01% annualized for the Fund. |
| (e) | Annualized. |
| (f) | Amount is less than $0.005. |
| † | Includes the impact of proceeds received and credited to the Fund resulting from third party regulatory settlements, which enhanced the Fund’s performance for the year ended June 30, 2014 by 0.01%. |
| * | Includes the impact of proceeds received and credited to the Fund resulting from class action settlements, which enhanced the Fund’s performance for the year ended June 30, 2013 by 0.01%. |
See notes to financial statements.
| AB INTERNATIONAL GROWTH FUND • | 47 |
Financial Highlights
BOARD OF DIRECTORS
Marshall C. Turner, Jr.(1), Chairman John H. Dobkin(1) Michael J. Downey(1) William H. Foulk, Jr.(1) D. James Guzy(1) Nancy P. Jacklin(1) | Robert M. Keith, President and Chief Executive Officer Carol C. McMullen(1) Garry L. Moody(1) Earl D. Weiner(1) |
OFFICERS
Philip L. Kirstein, Senior Vice President and Independent Daniel C. Roarty(2), Vice President Emilie D. Wrapp, Secretary | Joseph J. Mantineo, Treasurer and Chief Financial Officer Phyllis J. Clarke, Controller Vincent S. Noto, Chief Compliance Officer |
Custodian and Accounting Agent Brown Brothers Harriman & Co. 50 Post Office Square Boston, MA 02110
Principal Underwriter AllianceBernstein Investments, Inc. 1345 Avenue of the Americas New York, NY 10105
Transfer Agent AllianceBernstein Investor Services, Inc. P.O. Box 786003 San Antonio, TX 78278-6003 Toll-Free 1-(800) 221-5672 | Independent Registered Public Accounting Firm Ernst & Young LLP 5 Times Square New York, NY 10036
Legal Counsel Seward & Kissel LLP One Battery Park Plaza New York, NY 10004 | |
| (1) | Member of the Audit Committee, the Governance and Nominating Committee and the Independent Directors Committee. |
| (2) | The day-to-day management of, and investment decisions for, the AB International Growth Fund’s portfolio are made by the Adviser’s Global Growth and Thematic Investment Team. Mr. Daniel C. Roarty is the investment professional with the most significant responsibility for the day-to-day management of the Fund’s portfolio. |
| 48 | • AB INTERNATIONAL GROWTH FUND |
Board of Directors
Information Regarding the Review and Approval of the Fund’s Advisory Agreement
The disinterested directors (the “directors”) of AB International Growth Fund, Inc. (the “Fund”) unanimously approved the continuance of the Fund’s Advisory Agreement with the Adviser at a meeting held on May 3-5, 2016 (the “Meeting”).
Prior to approval of the continuance of the Advisory Agreement, the directors had requested from the Adviser, and received and evaluated, extensive materials. They reviewed the proposed continuance of the Advisory Agreement with the Adviser and with experienced counsel who are independent of the Adviser, who advised on the relevant legal standards. The directors also reviewed an independent evaluation prepared by the Fund’s Senior Officer (who is also the Fund’s Independent Compliance Officer) of the reasonableness of the advisory fee, in which the Senior Officer concluded that the contractual fee for the Fund was reasonable. The directors also discussed the proposed continuance in private sessions with counsel and the Fund’s Senior Officer.
The directors considered their knowledge of the nature and quality of the services provided by the Adviser to the Fund gained from their experience as directors or trustees of most of the registered investment companies advised by the Adviser, their overall confidence in the Adviser’s integrity and competence they have gained from that experience, the Adviser’s initiative in identifying and raising potential issues with the directors and its responsiveness, frankness and attention to concerns raised by the directors in the past, including the Adviser’s willingness to consider and implement organizational and operational changes designed to improve investment results and the services provided to the AB Funds. The directors noted that they have four regular meetings each year, at each of which they receive presentations from the Adviser on the investment results of the Fund and review extensive materials and information presented by the Adviser.
The directors also considered all other factors they believed relevant, including the specific matters discussed below. In their deliberations, the directors did not identify any particular information that was all-important or controlling, and different directors may have attributed different weights to the various factors. The directors determined that the selection of the Adviser to manage the Fund and the overall arrangements between the Fund and the Adviser, as provided in the Advisory Agreement, including the advisory fee, were fair and reasonable in light of the services performed, expenses incurred and such other matters as the directors considered relevant in the exercise of their business
| AB INTERNATIONAL GROWTH FUND • | 49 |
judgment. The material factors and conclusions that formed the basis for the directors’ determinations included the following:
Nature, Extent and Quality of Services Provided
The directors considered the scope and quality of services provided by the Adviser under the Advisory Agreement, including the quality of the investment research capabilities of the Adviser and the other resources it has dedicated to performing services for the Fund. They also noted the professional experience and qualifications of the Fund’s portfolio management team and other senior personnel of the Adviser. The directors also considered that the Advisory Agreement provides that the Fund will reimburse the Adviser for the cost to it of providing certain clerical, accounting, administrative and other services to the Fund by employees of the Adviser or its affiliates. Requests for these reimbursements are made on a quarterly basis and subject to approval by the directors. Reimbursements, to the extent requested and paid, result in a higher rate of total compensation from the Fund to the Adviser than the fee rate stated in the Advisory Agreement. The directors noted that the methodology used to determine the reimbursement amounts had been reviewed by an independent consultant retained by the Fund’s Senior Officer. The quality of administrative and other services, including the Adviser’s role in coordinating the activities of the Fund’s other service providers, also was considered. The directors concluded that, overall, they were satisfied with the nature, extent and quality of services provided to the Fund under the Advisory Agreement.
Costs of Services Provided and Profitability
The directors reviewed a schedule of the revenues, expenses and related notes indicating the profitability of the Fund to the Adviser for calendar years 2014 and 2015 that had been prepared with an expense allocation methodology arrived at in consultation with an independent consultant retained by the Fund’s Senior Officer. The directors noted the assumptions and methods of allocation used by the Adviser in preparing fund-specific profitability data and understood that there are a number of potentially acceptable allocation methodologies for information of this type. The directors noted that the profitability information reflected all revenues and expenses of the Adviser’s relationship with the Fund, including those relating to its subsidiaries that provide transfer agency, distribution and brokerage services to the Fund. The directors recognized that it is difficult to make comparisons of the profitability of the Advisory Agreement with the profitability of advisory contracts for unaffiliated funds because comparative information is not generally publicly available and is affected by numerous factors. The directors focused on the profitability of the Adviser’s relationship with the Fund before taxes and distribution expenses. The directors concluded that the Adviser’s level of profitability from its relationship with the Fund was not unreasonable.
| 50 | • AB INTERNATIONAL GROWTH FUND |
Fall-Out Benefits
The directors considered the other benefits to the Adviser and its affiliates from their relationships with the Fund, including, but not limited to, benefits relating to soft dollar arrangements (whereby investment advisers receive brokerage and research services from brokers that execute agency transactions for their clients); 12b-1 fees and sales charges received by the Fund’s principal underwriter (which is a wholly owned subsidiary of the Adviser) in respect of certain classes of the Fund’s shares; brokerage commissions paid by the Fund to brokers affiliated with the Adviser; and transfer agency fees paid by the Fund to a wholly owned subsidiary of the Adviser. The directors recognized that the Adviser’s profitability would be somewhat lower without these benefits. The directors understood that the Adviser also might derive reputational and other benefits from its association with the Fund.
Investment Results
In addition to the information reviewed by the directors in connection with the Meeting, the directors receive detailed performance information for the Fund at each regular Board meeting during the year.
At the Meeting, the directors reviewed information prepared by Broadridge Financial Solutions, Inc. (“Broadridge”), an analytical service that is not affiliated with the Adviser, showing the performance of the Class A Shares of the Fund against a peer group and a peer universe selected by Broadridge, and information prepared by the Adviser showing performance of the Class A Shares against a broad-based securities market index, in each case for the 1-, 3-, 5- and 10-year periods ended February 29, 2016. Based on their review, the directors concluded that the Fund’s investment performance was acceptable.
Advisory Fees and Other Expenses
The directors considered the advisory fee rate paid by the Fund to the Adviser and information prepared by Broadridge concerning advisory fee rates paid by other funds in the same Broadridge category as the Fund at a common asset level. The directors recognized that it is difficult to make comparisons of advisory fees because there are variations in the services that are included in the fees paid by other funds. The directors considered the Fund’s contractual effective advisory fee rate against a peer group median and took into account the impact on the advisory fee rate of the administrative expense reimbursement paid to the Adviser in the latest fiscal year.
The directors also considered the Adviser’s fee schedule for institutional clients pursuing a similar investment style. For this purpose, they reviewed the relevant advisory fee information from the Adviser’s Form
| AB INTERNATIONAL GROWTH FUND • | 51 |
ADV and the evaluation from the Fund’s Senior Officer and noted the differences between the Fund’s fee schedule, on the one hand, and the institutional fee schedule and the schedule of fees charged to any offshore funds and any sub-advised funds, on the other. The directors noted that the Adviser may, in some cases, agree to fee rates with large institutional clients that are lower than those reviewed by the directors and that they had previously discussed with the Adviser its policies in respect of such arrangements. The directors also noted that the Adviser advises another AB Fund with a substantially similar investment style as the Fund for the same fee schedule as the Fund. The directors also considered that a portfolio of Sanford C. Bernstein Fund, Inc. pursuing a somewhat similar investment style has higher fee rates at each breakpoint of its fee schedule, and that the Adviser has been waiving 5 basis points of the advisory fee payable by that portfolio under its contract since November 2011.
The Adviser reviewed with the directors the significantly greater scope of the services it provides to the Fund relative to institutional, offshore fund and sub-advised fund clients. In light of the substantial differences in services rendered by the Adviser to institutional, offshore fund and sub-advised fund clients as compared to funds such as the Fund, the directors considered these fee comparisons inapt and did not place significant weight on them in their deliberations.
The directors also considered the total expense ratio of the Class A shares of the Fund in comparison to a peer group and a peer universe selected by Broadridge. The Class A expense ratio of the Fund was based on the Fund’s latest fiscal year. The directors noted the effects of any fee waivers and/or expense reimbursements as a result of an undertaking by the Adviser. The directors noted that it was likely that the expense ratios of some of the other funds in the Fund’s Broadridge category were lowered by waivers or reimbursements by those funds’ investment advisers, which in some cases might be voluntary or temporary. The directors view expense ratio information as relevant to their evaluation of the Adviser’s services because the Adviser is responsible for coordinating services provided to the Fund by others. Based on their review, the directors concluded that the Fund’s expense ratio was acceptable.
Economies of Scale
The directors noted that the advisory fee schedule for the Fund contains breakpoints that reduce the fee rates on assets above specified levels. The directors took into consideration prior presentations by an independent consultant on economies of scale in the mutual fund industry and for the AB Funds, and by the Adviser concerning certain of its views on economies of scale. The directors also had requested and received from the Adviser certain updates on economies of scale in advance of the Meeting.
| 52 | • AB INTERNATIONAL GROWTH FUND |
The directors believe that economies of scale may be realized (if at all) by the Adviser across a variety of products and services, and not only in respect of a single fund. The directors noted that there is no established methodology for setting breakpoints that give effect to the fund-specific services provided by a fund’s adviser and to the economies of scale that an adviser may realize in its overall mutual fund business or those components of it which directly or indirectly affect a fund’s operations. The directors observed that in the mutual fund industry as a whole, as well as among funds similar to the Fund, there is no uniformity or pattern in the fees and asset levels at which breakpoints (if any) apply. The directors also noted that the advisory agreements for many funds do not have breakpoints at all. Having taken these factors into account, the directors concluded that the Fund’s shareholders would benefit from a sharing of economies of scale in the event the Fund’s net assets exceed a breakpoint in the future.
| AB INTERNATIONAL GROWTH FUND • | 53 |
THIS PAGE IS NOT PART OF THE SHAREHOLDER REPORT OR THE FINANCIAL STATEMENTS
AB FAMILY OF FUNDS
US EQUITY
US Core
Core Opportunities Fund
Select US Equity Portfolio
US Growth
Concentrated Growth Fund
Discovery Growth Fund
Growth Fund
Large Cap Growth Fund
Small Cap Growth Portfolio
US Value
Discovery Value Fund
Equity Income Fund
Relative Value Fund*
Small Cap Value Portfolio
Value Fund
INTERNATIONAL/ GLOBAL EQUITY
International/Global Core
Global Core Equity Portfolio
International Portfolio
International Strategic Core Portfolio
Sustainable Global Thematic Fund*
Tax-Managed International Portfolio
International/Global Growth
Concentrated International Growth Portfolio
International Growth Fund
International/Global Value
Asia ex-Japan Equity Portfolio
International Value Fund
FIXED INCOME
Municipal
High Income Municipal Portfolio
Intermediate California Municipal Portfolio
Intermediate Diversified Municipal Portfolio
Intermediate New York Municipal Portfolio
FIXED INCOME (continued)
Municipal Bond Inflation Strategy
Tax-Aware Fixed Income Portfolio
National Portfolio
Arizona Portfolio
California Portfolio
Massachusetts Portfolio
Minnesota Portfolio
New Jersey Portfolio
New York Portfolio
Ohio Portfolio
Pennsylvania Portfolio
Virginia Portfolio
Taxable
Bond Inflation Strategy
Global Bond Fund
High Income Fund
High Yield Portfolio
Income Fund
Intermediate Bond Portfolio
Limited Duration High Income Portfolio
Short Duration Portfolio
ALTERNATIVES
All Market Real Return Portfolio
Credit Long/Short Portfolio
Global Real Estate Investment Fund
Long/Short Multi-Manager Fund
Multi-Manager Alternative Strategies Fund
Select US Long/Short Portfolio
Unconstrained Bond Fund
MULTI-ASSET
All Market Income Portfolio
Emerging Markets Multi-Asset Portfolio
Global Risk Allocation Fund
MULTI-ASSET (continued)
Target-Date
Multi-Manager Select Retirement Allocation Fund
Multi-Manager Select 2010 Fund
Multi-Manager Select 2015 Fund
Multi-Manager Select 2020 Fund
Multi-Manager Select 2025 Fund
Multi-Manager Select 2030 Fund
Multi-Manager Select 2035 Fund
Multi-Manager Select 2040 Fund
Multi-Manager Select 2045 Fund
Multi-Manager Select 2050 Fund
Multi-Manager Select 2055 Fund
Wealth Strategies
Balanced Wealth Strategy
Conservative Wealth Strategy
Wealth Appreciation Strategy
Tax-Managed Balanced Wealth Strategy
Tax-Managed Wealth Appreciation Strategy
CLOSED-END FUNDS
AB Multi-Manager Alternative Fund
Alliance California Municipal Income Fund
AllianceBernstein Global High Income Fund
AllianceBernstein National Municipal Income Fund
We also offer Government Exchange Reserves, which serves as the money market fund exchange vehicle for the AB mutual funds. An investment in Government Exchange Reserves is not a deposit in a bank and is not insured or guaranteed by the Federal Deposit Insurance Corporation or any other government agency. Although the Fund seeks to preserve the value of your investment at $1.00 per share, it is possible to lose money by investing in the Fund.
Investors should consider the investment objectives, risks, charges and expenses of the Fund carefully before investing. For copies of our prospectus or summary prospectus, which contain this and other information, visit us online at www.abfunds.com or contact your AB representative. Please read the prospectus and/or summary prospectus carefully before investing.
* Prior to January 9, 2017, Relative Value Fund was named Growth & Income Fund; prior to November 1, 2016, Sustainable Global Thematic Fund was named Global Thematic Growth Fund.
| 54 | • AB INTERNATIONAL GROWTH FUND |
AB Family of Funds
NOTES
| AB INTERNATIONAL GROWTH FUND • | 55 |
NOTES
| 56 | • AB INTERNATIONAL GROWTH FUND |
NOTES
| AB INTERNATIONAL GROWTH FUND • | 57 |
NOTES
| 58 | • AB INTERNATIONAL GROWTH FUND |
NOTES
| AB INTERNATIONAL GROWTH FUND • | 59 |
NOTES
| 60 | • AB INTERNATIONAL GROWTH FUND |
AB INTERNATIONAL GROWTH FUND
1345 Avenue of the Americas
New York, NY 10105
800.221.5672
IG-0152-1216 
ITEM 2. CODE OF ETHICS.
Not applicable when filing a semi-annual report to shareholders.
ITEM 3. AUDIT COMMITTEE FINANCIAL EXPERT.
Not applicable when filing a semi-annual report to shareholders.
ITEM 4. PRINCIPAL ACCOUNTANT FEES AND SERVICES.
Not applicable when filing a semi-annual report to shareholders.
ITEM 5. AUDIT COMMITTEE OF LISTED REGISTRANTS.
Not applicable to the registrant.
ITEM 6. SCHEDULE OF INVESTMENTS.
Please see Schedule of Investments contained in the Report to Shareholders included under Item 1 of this Form N-CSR.
ITEM 7. DISCLOSURE OF PROXY VOTING POLICIES AND PROCEDURES FOR CLOSED-END MANAGEMENT INVESTMENT COMPANIES.
Not applicable to the registrant.
ITEM 8. PORTFOLIO MANAGERS OF CLOSED-END MANAGEMENT INVESTMENT COMPANIES.
Not applicable to the registrant.
ITEM 9. PURCHASES OF EQUITY SECURITIES BY CLOSED-END MANAGEMENT INVESTMENT COMPANY AND AFFILIATED PURCHASERS.
Not applicable to the registrant.
ITEM 10. SUBMISSION OF MATTERS TO A VOTE OF SECURITY HOLDERS.
There have been no material changes to the procedures by which shareholders may recommend nominees to the Fund’s Board of Directors since the Fund last provided disclosure in response to this item.
ITEM 11. CONTROLS AND PROCEDURES.
(a) The registrant’s principal executive officer and principal financial officer have concluded that the registrant’s disclosure controls and procedures (as defined in Rule 30a-3(c) under the Investment Company Act of 1940, as amended) are effective at the reasonable assurance level based on their evaluation of these controls and procedures as of a date within 90 days of the filing date of this document.
(b) There were no changes in the registrant’s internal controls over financial reporting that occurred during the second fiscal quarter of the period that has materially affected, or is reasonably likely to materially affect, the registrant’s internal control over financial reporting.
ITEM 12. EXHIBITS.
The following exhibits are attached to this Form N-CSR:
EXHIBIT NO. | DESCRIPTION OF EXHIBIT | |
| 12 (b) (1) | Certification of Principal Executive Officer Pursuant to Section 302 of the Sarbanes-Oxley Act of 2002 | |
| 12 (b) (2) | Certification of Principal Financial Officer Pursuant to Section 302 of the Sarbanes-Oxley Act of 2002 | |
| 12 (c) | Certification of Principal Executive Officer and Principal Financial Officer Pursuant to Section 906 of the Sarbanes-Oxley Act of 2002 | |
SIGNATURES
Pursuant to the requirements of the Securities Exchange Act of 1934 and the Investment Company Act of 1940, the registrant has duly caused this report to be signed on its behalf by the undersigned, thereunto duly authorized.
| (Registrant): AB International Growth Fund, Inc. | ||
| By: | /s/ Robert M. Keith | |
Robert M. Keith President | ||
| Date: | February 27, 2017 | |
Pursuant to the requirements of the Securities Exchange Act of 1934 and the Investment Company Act of 1940, this report has been signed below by the following persons on behalf of the registrant and in the capacities and on the dates indicated.
| By: | /s/ Robert M. Keith | |
Robert M. Keith President | ||
| Date: | February 27, 2017 | |
| By: | /s/ Joseph J. Mantineo | |
Joseph J. Mantineo Treasurer and Chief Financial Officer | ||
| Date: | February 27, 2017 | |