UNITED STATES
SECURITIES AND EXCHANGE COMMISSION
WASHINGTON, D.C. 20549
FORMN-CSR
CERTIFIED SHAREHOLDER REPORT OF REGISTERED
MANAGEMENT INVESTMENT COMPANIES
Investment Company Act file number:811-08426
AB SUSTAINABLE INTERNATIONAL THEMATIC FUND, INC.
(Exact name of registrant as specified in charter)
1345 Avenue of the Americas, New York, New York 10105
(Address of principal executive offices) (Zip code)
Joseph J. Mantineo
AllianceBernstein L.P.
1345 Avenue of the Americas
New York, New York 10105
(Name and address of agent for service)
Registrant’s telephone number, including area code: (800)221-5672
Date of fiscal year end: June 30, 2019
Date of reporting period: December 31, 2018
ITEM 1. REPORTS TO STOCKHOLDERS.
DEC 12.31.18

SEMI-ANNUAL REPORT
AB SUSTAINABLE INTERNATIONAL THEMATIC FUND

Beginning January 1, 2021, as permitted by new regulations adopted by the Securities and Exchange Commission, the Fund’s annual and semi-annual shareholder reports will no longer be sent by mail, unless you specifically request paper copies of the reports. Instead, the reports will be made available on a website, and you will be notified by mail each time a report is posted and provided with a website address to access the report.
If you already elected to receive shareholder reports electronically, you will not be affected by this change and you need not take any action. You may elect to receive shareholder reports and other communications from the Fund electronically at any time by contacting your financial intermediary (such as a broker-dealer or bank) or, if you are a direct investor, by calling the Fund at (800) 221 5672.
You may elect to receive all future reports in paper form free of charge. If you invest through a financial intermediary, you can contact your financial intermediary to request that you continue to receive paper copies of your shareholder reports; if you invest directly with the Fund, you can call the Fund at (800) 221 5672. Your election to receive reports in paper form will apply to all funds held in your account with your financial intermediary or, if you invest directly, to all AB Mutual Funds you hold.
| Investment Products Offered | • Are Not FDIC Insured• May Lose Value• Are Not Bank Guaranteed | |
Investors should consider the investment objectives, risks, charges and expenses of the Fund carefully before investing. For copies of our prospectus or summary prospectus, which contain this and other information, visit us online at www.abfunds.com or contact your AB representative. Please read the prospectus and/or summary prospectus carefully before investing.
This shareholder report must be preceded or accompanied by the Fund’s prospectus for individuals who are not current shareholders of the Fund.
You may obtain a description of the Fund’s proxy voting policies and procedures, and information regarding how the Fund voted proxies relating to portfolio securities during the most recent12-month period ended June 30, without charge. Simply visit AB’s website at www.abfunds.com, or go to the Securities and Exchange Commission’s (the “Commission”) website at www.sec.gov, or call AB at (800) 227 4618.
The Fund files its complete schedule of portfolio holdings with the Commission for the first and third quarters of each fiscal year. The Fund’s portfolio holdings reports are available on the Commission’s website at www.sec.gov. The Fund’s portfolio holdings reports may also be reviewed and copied at the Commission’s Public Reference Room in Washington, DC; information on the operation of the Public Reference Room may be obtained by calling (800) SEC 0330. AB publishes full portfolio holdings for the Fund monthly at www.abfunds.com.
AllianceBernstein Investments, Inc. (ABI) is the distributor of the AB family of mutual funds. ABI is a member of FINRA and is an affiliate of AllianceBernstein L.P., the Adviser of the funds.
The [A/B] logo is a registered service mark of AllianceBernstein and AllianceBernstein® is a registered service mark used by permission of the owner, AllianceBernstein L.P.
| FROM THE PRESIDENT |  |
Dear Shareholder,
We are pleased to provide this report for AB Sustainable International Thematic Fund (the “Fund”). Please review the discussion of Fund performance, the market conditions during the reporting period and the Fund’s investment strategy.
As always, AB strives to keep clients ahead of what’s next by:
| + | Transforming uncommon insights into uncommon knowledge with a global research scope |
| + | Navigating markets with seasoned investment experience and sophisticated solutions |
| + | Providing thoughtful investment insights and actionable ideas |
Whether you’re an individual investor or a multi-billion-dollar institution, we put knowledge and experience to work for you.
AB’s global research organization connects and collaborates across platforms and teams to deliver impactful insights and innovative products. Better insights lead to better opportunities—anywhere in the world.
For additional information about AB’s range of products and shareholder resources, please log on to www.abfunds.com.
Thank you for your investment in the AB Mutual Funds.
Sincerely,

Robert M. Keith
President and Chief Executive Officer, AB Mutual Funds
| abfunds.com | AB SUSTAINABLE INTERNATIONAL THEMATIC FUND | 1 | |
SEMI-ANNUAL REPORT
February 19, 2019
This report provides management’s discussion of fund performance for AB Sustainable International Thematic Fund (formerly, AB International Growth Fund) for the semi-annual reporting period ended December 31, 2018.
The Board of Directors of the Fund previously approved changes to the Fund’s name from AB International Growth Fund to AB Sustainable International Thematic Fund, and to the Fund’s principal investment strategy to reflect a focus on investing in securities of companies that are positively exposed to sustainable investment themes. These changes to the Fund’s name and principal investment strategies became effective January 8, 2018.
The Fund’s investment objective is long-term growth of capital.
NAV RETURNS AS OF DECEMBER 31, 2018(unaudited)
| 6 Months | 12 Months | |||||||
| AB SUSTAINABLE INTERNATIONAL THEMATIC FUND | ||||||||
| Class A Shares | -13.34% | -17.34% | ||||||
| Class B Shares1 | -13.65% | -18.01% | ||||||
| Class C Shares | -13.63% | -17.97% | ||||||
| Advisor Class Shares2 | -13.19% | -17.12% | ||||||
| Class R Shares2 | -13.40% | -17.59% | ||||||
| Class K Shares2 | -13.29% | -17.31% | ||||||
| Class I Shares2 | -13.14% | -17.05% | ||||||
| MSCI ACWIex-US (net) | -10.84% | -14.20% | ||||||
| 1 | Effective January 31, 2009, Class B Shares are no longer available for purchase to new investors. Please see Note A for additional information. |
| 2 | Please note that these share classes are for investors purchasing shares through accounts established under certainfee-based programs sponsored and maintained by certain broker-dealers and financial intermediaries, institutional pension plans and/or investment advisory clients of, and certain other persons associated with, the Adviser and its affiliates or the Fund. |
INVESTMENT RESULTS
The table above shows the Fund’s performance compared with its benchmark, the Morgan Stanley Capital International All Country World Index (“MSCI ACWI”)ex-US (net), for thesix- and12-month periods ended December 31, 2018.
All share classes underperformed the benchmark for both periods, before sales charges. For thesix-month period, security selection in the consumer-discretionary and technology sectors detracted the most,
| 2 | AB SUSTAINABLE INTERNATIONAL THEMATIC FUND | abfunds.com | |
versus the benchmark. An overweight to the technology sector also detracted. Security selection in health care contributed, as did cash holdings (held for transactional purposes) in a declining equity market. Security selection contributed in Ireland and Denmark and detracted in the US and France.
For the12-month period, security selection in the consumer-discretionary and utilities sectors detracted the most. An underweight to the energy sector also detracted. Security selection in financials contributed, as did cash holdings. Security selection contributed in Ireland and India and detracted in the US and France.
Derivatives in the form of currency forwards were utilized for hedging purposes, which had no material impact on absolute performance for either period.
MARKET REVIEW AND INVESTMENT STRATEGY
During the six-month period ended December 31, 2018, global equities declined. In the US, performance was strong early in the period amid robust corporate earnings and economic data, which sent some US stock indices to record highs. However, concerns about slowing global growth, rising interest rates and worsening trade tensions caused volatility to spike and equities to decline precipitously at the end of the period. Some US indices temporarily entered bear market territory, which is considered a 20% or more decline from their recent highs. In Europe, budget disputes between Italy and its European Union partners weighed on performance, as did unresolved and ongoing Brexit negotiations. A dramatic decline in the price of oil in the fourth quarter caused a wide dispersion in performance among emerging-market countries, with oil-importing countries benefiting and oil-exporting countries underperforming.
The Fund’s Senior Investment Management Team’s (the “Team’s”) approach to building a sustainable portfolio with attractive financial return potential has been to align with the UN Sustainable Development Goals, which 193 nations have committed to advancing. The estimated costs to achieve these goals between 2016 and 2030 is $90 trillion, creating a massive investment opportunity for companies aligned with these goals. As evidence of the potency of this global initiative, the profitability and long-term earnings growth potential of the Fund’s holdings are appreciably higher than the benchmark’s, and the Team believes these holdings will continue to reward investors over themid-to-long term.
INVESTMENT POLICIES
The Fund invests primarily in a focused international portfolio of equity securities of companies that are positively exposed to sustainable
(continued on next page)
| abfunds.com | AB SUSTAINABLE INTERNATIONAL THEMATIC FUND | 3 | |
investment themes. Under normal circumstances, the Fund invests at least 80% of its net assets in equity securities of issuers located outside of the United States that the Adviser believes are positively exposed to sustainable investment themes at the time of purchase, and related derivatives.
The Adviser employs a combination of“top-down” and“bottom-up” investment processes with the goal of identifying securities of companies worldwide, fitting into sustainable investment themes. The Adviser identifies through its“top-down” process sustainable investment themes that are broadly consistent with achieving the United Nations Sustainable Development Goals. These themes include climate, health and empowerment and are expected to change over time based on the Adviser’s research. In addition to this“top-down” thematic approach, the Adviser also uses a“bottom-up” analysis of individual companies, focusing on prospective earnings growth, valuation, and quality of company management and on evaluating a company’s exposure to environmental, social and corporate governance (“ESG”) factors. The Adviser emphasizes company-specific positive selection criteria over broad-based negative screens in assessing a company’s exposure to ESG factors.
The Adviser normally considers a large universe ofmid- to large-capitalization companies worldwide for investment, but may invest in companies of any size. The Fund invests, under normal circumstances, in the equity securities of companies located in at least three countries (and normally substantially more) other than the United States. The Fund invests in securities of companies in both developed and emerging-market countries, with the stock selection process determining the geographic distribution of the Fund’s investments. The Fund may sell securities that no longer meet the investment criteria described above.
Currencies can have a dramatic impact on equity returns, significantly adding to returns in some years and greatly diminishing them in others. Currency and equity positions are evaluated separately. The Adviser may seek to hedge the currency exposure resulting from securities positions when it finds the currency exposure unattractive. To hedge all or a portion of its currency risk, the Fund may, from time to time, invest in currency-related derivatives, including forward currency exchange contracts, futures contracts, options on futures contracts, swaps and options. The Adviser may also seek investment opportunities by taking long or short positions in currencies through the use of currency-related derivatives.
| 4 | AB SUSTAINABLE INTERNATIONAL THEMATIC FUND | abfunds.com | |
(continued on next page)
The Fund may enter into other derivatives transactions, such as
options, futures contracts, forwards and swaps. The Fund may use options strategies involving the purchase and/or writing of various combinations of call and/or put options, including on individual securities and stock indices, futures contracts (including futures contracts on individual securities and stock indices) or shares of exchange-traded funds. These transactions may be used, for example, in an effort to earn extra income, to adjust exposure to individual securities or markets, or to protect all or a portion of the Fund’s portfolio from a decline in value, sometimes within certain ranges.
| abfunds.com | AB SUSTAINABLE INTERNATIONAL THEMATIC FUND | 5 | |
DISCLOSURES AND RISKS
Benchmark Disclosure
The MSCI ACWIex-US is unmanaged and does not reflect fees and expenses associated with the active management of a mutual fund portfolio. The MSCI ACWIex-US (net, free float-adjusted, market capitalization weighted) represents the equity market performance of developed and emerging markets, excluding the US. MSCI makes no express or implied warranties or representations, and shall have no liability whatsoever with respect to any MSCI data contained herein. The MSCI data may not be further redistributed or used as a basis for other indices, any securities or financial products. This report is not approved, reviewed or produced by MSCI. Net returns include the reinvestment of dividends after deduction ofnon-US withholding tax. An investor cannot invest directly in an index, and its results are not indicative of the performance for any specific investment, including the Fund.
A Word About Risk
Market Risk: The value of the Fund’s assets will fluctuate as the stock or bond market fluctuates. The value of its investments may decline, sometimes rapidly and unpredictably, simply because of economic changes or other events that affect large portions of the market. It includes the risk that a particular style of investing, such as growth, may underperform the market generally.
Focused Portfolio Risk: Investments in a limited number of companies may have more risk because changes in the value of a single security may have a more significant effect, either negative or positive, on the Fund’s net asset value (“NAV”).
Sector Risk: The Fund may have more risk because of concentrated investments in a particular market sector, such as the technology or financial-services sector. Market or economic factors affecting that sector could have a major effect on the value of the Fund’s investments.
ESG Risk: Applying ESG and sustainability criteria to the investment process may exclude securities of certain issuers fornon-investment reasons and therefore the Fund may forgo some market opportunities available to funds that do not use ESG or sustainability criteria. Securities of companies with ESG practices may shift into and out of favor depending on market and economic conditions, and the Fund’s performance may at times be better or worse than the performance of funds that do not use ESG or sustainability criteria.
Foreign(Non-US) Risk: Investments in securities ofnon-US issuers may involve more risk than those of US issuers. These securities may fluctuate more widely in price and may be less liquid due to adverse market, economic, political, regulatory or other factors.
| 6 | AB SUSTAINABLE INTERNATIONAL THEMATIC FUND | abfunds.com | |
DISCLOSURES AND RISKS(continued)
Emerging-Market Risk: Investments in emerging-market countries may have more risk because the markets are less developed and less liquid as well as being subject to increased economic, political, regulatory or other uncertainties.
Currency Risk: Fluctuations in currency exchange rates may negatively affect the value of the Fund’s investments or reduce its returns.
Capitalization Risk: Investments in small- andmid-capitalization companies may be more volatile than investments in large-capitalization companies. Investments in small-capitalization companies may have additional risks because these companies have limited product lines, markets or financial resources.
Derivatives Risk: Derivatives may be illiquid, difficult to price, and leveraged so that small changes may produce disproportionate losses for the Fund, and may be subject to counterparty risk to a greater degree than more traditional investments.
Management Risk: The Fund is subject to management risk because it is an actively managed investment fund. The Adviser will apply its investment techniques and risk analyses in making investment decisions for the Fund, but there is no guarantee that its techniques will produce the intended results.
These risks are fully discussed in the Fund’s prospectus. As with all investments, you may lose money by investing in the Fund.
An Important Note About Historical Performance
The investment return and principal value of an investment in the Fund will fluctuate, so that shares, when redeemed, may be worth more or less than their original cost. Performance shown in this report represents past performance and does not guarantee future results. Current performance may be lower or higher than the performance information shown. You may obtain performance information current to the most recentmonth-end by visiting www.abfunds.com.
All fees and expenses related to the operation of the Fund have been deducted. NAV returns do not reflect sales charges; if sales charges were reflected, the Fund’s quoted performance would be lower. SEC returns reflect the applicable sales charges for each share class: a 4.25% maximumfront-end sales charge for Class A shares; the applicable contingent deferred sales charge for Class B shares (4% year 1, 3% year 2, 2% year 3, 1% year 4) and a 1%1-year contingent deferred sales charge for Class C shares. Returns for the different share classes will vary due to different expenses associated with each class. Performance assumes reinvestment of distributions and does not account for taxes.
| abfunds.com | AB SUSTAINABLE INTERNATIONAL THEMATIC FUND | 7 | |
HISTORICAL PERFORMANCE
AVERAGE ANNUAL RETURNS AS OF DECEMBER 31, 2018(unaudited)
| NAV Returns | SEC Returns (reflects applicable sales charges) | |||||||
| CLASS A SHARES | ||||||||
| 1 Year | -17.34% | -20.87% | ||||||
| 5 Years | -0.07% | -0.93% | ||||||
| 10 Years | 5.53% | 5.07% | ||||||
| CLASS B SHARES | ||||||||
| 1 Year | -18.01% | -20.82% | ||||||
| 5 Years | -0.87% | -0.87% | ||||||
| 10 Years1 | 4.87% | 4.87% | ||||||
| CLASS C SHARES | ||||||||
| 1 Year | -17.97% | -18.67% | ||||||
| 5 Years | -0.81% | -0.81% | ||||||
| 10 Years | 4.76% | 4.76% | ||||||
| ADVISOR CLASS SHARES2 | ||||||||
| 1 Year | -17.12% | -17.12% | ||||||
| 5 Years | 0.19% | 0.19% | ||||||
| 10 Years | 5.83% | 5.83% | ||||||
| CLASS R SHARES2 | ||||||||
| 1 Year | -17.59% | -17.59% | ||||||
| 5 Years | -0.36% | -0.36% | ||||||
| 10 Years | 5.26% | 5.26% | ||||||
| CLASS K SHARES2 | ||||||||
| 1 Year | -17.31% | -17.31% | ||||||
| 5 Years | -0.06% | -0.06% | ||||||
| 10 Years | 5.58% | 5.58% | ||||||
| CLASS I SHARES2 | ||||||||
| 1 Year | -17.05% | -17.05% | ||||||
| 5 Years | 0.33% | 0.33% | ||||||
| 10 Years | 5.99% | 5.99% | ||||||
The Fund’s current prospectus fee table shows the Fund’s total annual operating expense ratios as 1.41%, 2.23%, 2.16%, 1.16%, 1.72%, 1.42% and 1.05% for Class A, Class B, Class C, Advisor Class, Class R, Class K and Class I shares, respectively. The Financial Highlights section of this report sets forth expense ratio data for the current reporting period; the expense ratios shown above may differ from the expense ratios in the Financial Highlights section since they are based on different time periods.
| 1 | Assumes conversion of Class B shares into Class A shares after eight years. |
| 2 | These share classes are offered at NAV to eligible investors and their SEC returns are the same as their NAV returns. Please note that these share classes are for investors purchasing shares through accounts established under certainfee-based programs sponsored and maintained by certain broker-dealers and financial intermediaries, institutional pension plans and/or investment advisory clients of, and certain other persons associated with, the Adviser and its affiliates or the Fund. |
| 8 | AB SUSTAINABLE INTERNATIONAL THEMATIC FUND | abfunds.com | |
HISTORICAL PERFORMANCE(continued)
SEC AVERAGE ANNUAL RETURNS
AS OF THE MOST RECENT CALENDARQUARTER-END
DECEMBER 31, 2018(unaudited)
| SEC Returns (reflects applicable sales charges) | ||||
| CLASS A SHARES | ||||
| 1 Year | -20.87% | |||
| 5 Years | -0.93% | |||
| 10 Years | 5.07% | |||
| CLASS B SHARES | ||||
| 1 Year | -20.82% | |||
| 5 Years | -0.87% | |||
| 10 Years1 | 4.87% | |||
| CLASS C SHARES | ||||
| 1 Year | -18.67% | |||
| 5 Years | -0.81% | |||
| 10 Years | 4.76% | |||
| ADVISOR CLASS SHARES2 | ||||
| 1 Year | -17.12% | |||
| 5 Years | 0.19% | |||
| 10 Years | 5.83% | |||
| CLASS R SHARES2 | ||||
| 1 Year | -17.59% | |||
| 5 Years | -0.36% | |||
| 10 Years | 5.26% | |||
| CLASS K SHARES2 | ||||
| 1 Year | -17.31% | |||
| 5 Years | -0.06% | |||
| 10 Years | 5.58% | |||
| CLASS I SHARES2 | ||||
| 1 Year | -17.05% | |||
| 5 Years | 0.33% | |||
| 10 Years | 5.99% | |||
| 1 | Assumes conversion of Class B shares into Class A shares after eight years. |
| 2 | Please note that these share classes are for investors purchasing shares through accounts established under certainfee-based programs sponsored and maintained by certain broker-dealers and financial intermediaries, institutional pension plans and/or investment advisory clients of, and certain other persons associated with, the Adviser and its affiliates or the Fund. |
| abfunds.com | AB SUSTAINABLE INTERNATIONAL THEMATIC FUND | 9 | |
EXPENSE EXAMPLE
(unaudited)
As a shareholder of the Fund, you incur two types of costs: (1) transaction costs, including sales charges (loads) on purchase payments, contingent deferred sales charges on redemptions and (2) ongoing costs, including management fees; distribution(12b-1) fees; and other Fund expenses. This example is intended to help you understand your ongoing costs (in dollars) of investing in the Fund and to compare these costs with the ongoing costs of investing in other mutual funds.
This Example is based on an investment of $1,000 invested at the beginning of the period and held for the entire period as indicated below.
Actual Expenses
The table below provides information about actual account values and actual expenses. You may use the information, together with the amount you invested, to estimate the expenses that you paid over the period. Simply divide your account value by $1,000 (for example, an $8,600 account value divided by $1,000 = 8.6), then multiply the result by the number under the heading entitled “Expenses Paid During Period” to estimate the expenses you paid on your account during this period.
Hypothetical Example for Comparison Purposes
The table below also provides information about hypothetical account values and hypothetical expenses based on the Fund’s actual expense ratio and an assumed annual rate of return of 5% before expenses, which is not the Fund’s actual return. The hypothetical account values and expenses may not be used to estimate the actual ending account balance or expenses you paid for the period. You may use this information to compare the ongoing costs of investing in the Fund and other funds by comparing this 5% hypothetical example with the 5% hypothetical examples that appear in the shareholder reports of other funds.
Please note that the expenses shown in the table are meant to highlight your ongoing costs only and do not reflect any transactional costs, such as sales charges (loads), or contingent deferred sales charges on redemptions. Therefore, the hypothetical example is useful in comparing ongoing costs only, and will not help you determine the relative total costs of owning different funds. In addition, if these transactional costs were included, your costs would have been higher.
| Beginning Account Value 7/1/2018 | Ending Account Value 12/31/2018 | Expenses Paid During Period* | Annualized Expense Ratio* | Total Expenses Paid During Period+ | Total Annualized Expense Ratio+ | |||||||||||||||||||
| Class A | ||||||||||||||||||||||||
Actual | $ | 1,000 | $ | 866.60 | $ | 6.82 | 1.45 | % | $ | 6.87 | 1.46 | % | ||||||||||||
Hypothetical** | $ | 1,000 | $ | 1,017.85 | $ | 7.38 | 1.45 | % | $ | 7.43 | 1.46 | % | ||||||||||||
| 10 | AB SUSTAINABLE INTERNATIONAL THEMATIC FUND | abfunds.com | |
EXPENSE EXAMPLE(continued)
| Beginning Account Value 7/1/2018 | Ending Account Value 12/31/2018 | Expenses Paid During Period* | Annualized Expense Ratio* | Total Expenses Paid During Period+ | Total Annualized Expense Ratio+ | |||||||||||||||||||
| Class B | ||||||||||||||||||||||||
Actual | $ | 1,000 | $ | 863.50 | $ | 10.71 | 2.28 | % | $ | 10.76 | 2.29 | % | ||||||||||||
Hypothetical** | $ | 1,000 | $ | 1,013.66 | $ | 11.57 | 2.28 | % | $ | 11.62 | 2.29 | % | ||||||||||||
| Class C | ||||||||||||||||||||||||
Actual | $ | 1,000 | $ | 863.70 | $ | 10.38 | 2.21 | % | $ | 10.43 | 2.22 | % | ||||||||||||
Hypothetical** | $ | 1,000 | $ | 1,014.06 | $ | 11.22 | 2.21 | % | $ | 11.27 | 2.22 | % | ||||||||||||
| Advisor Class | ||||||||||||||||||||||||
Actual | $ | 1,000 | $ | 868.10 | $ | 5.70 | 1.21 | % | $ | 5.74 | 1.22 | % | ||||||||||||
Hypothetical** | $ | 1,000 | $ | 1,019.11 | $ | 6.16 | 1.21 | % | $ | 6.21 | 1.22 | % | ||||||||||||
| Class R | ||||||||||||||||||||||||
Actual | $ | 1,000 | $ | 866.00 | $ | 8.23 | 1.75 | % | $ | 8.28 | 1.76 | % | ||||||||||||
Hypothetical** | $ | 1,000 | $ | 1,016.33 | $ | 8.89 | 1.75 | % | $ | 8.94 | 1.76 | % | ||||||||||||
| Class K | ||||||||||||||||||||||||
Actual | $ | 1,000 | $ | 867.10 | $ | 6.78 | 1.44 | % | $ | 6.82 | 1.45 | % | ||||||||||||
Hypothetical** | $ | 1,000 | $ | 1,017.95 | $ | 7.32 | 1.44 | % | $ | 7.38 | 1.45 | % | ||||||||||||
| Class I | ||||||||||||||||||||||||
Actual | $ | 1,000 | $ | 868.60 | $ | 5.09 | 1.08 | % | $ | 5.13 | 1.09 | % | ||||||||||||
Hypothetical** | $ | 1,000 | $ | 1,019.76 | $ | 5.50 | 1.08 | % | $ | 5.55 | 1.09 | % | ||||||||||||
| * | Expenses are equal to the classes’ annualized expense ratios multiplied by the average account value over the period, multiplied by 184/365 ((to reflect theone-half year period). |
| + | In connection with the Fund’s investments in affiliated/unaffiliated underlying portfolios, the Fund incurs no direct expenses, but bears proportionate shares of the fees and expenses (i.e., operating, administrative and investment advisory fees) of the affiliated/unaffiliated underlying portfolios. The Adviser has contractually agreed to waive its fees from the Fund in an amount equal to the Fund’s pro rata share of certain acquired fund fees and expenses of the affiliated underlying portfolios. The Fund’s total expenses are equal to the classes’ annualized expense ratio plus the Fund’s pro rata share of the weighted average expense ratio of the affiliated/unaffiliated underlying portfolios in which it invests, multiplied by the average account value over the period, multiplied by 184/365 (to reflect theone-half year period). |
| ** | Assumes 5% annual return before expenses. |
| abfunds.com | AB SUSTAINABLE INTERNATIONAL THEMATIC FUND | 11 | |
PORTFOLIO SUMMARY
December 31, 2018(unaudited)
PORTFOLIO STATISTICS
Net Assets ($mil): $226.2
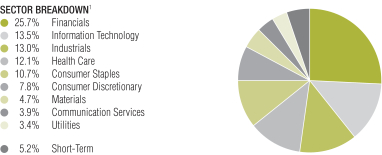
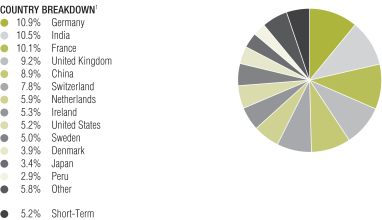
| 1 | All data are as of December 31, 2018. The Fund’s sector and country breakdowns are expressed as a percentage of total investments and may vary over time. The Fund also enters into derivative transactions, which may be used for hedging or investment purposes (see “Portfolio of Investments” section of the report for additional details). “Other” country weightings represent 2.9% or less in the following countries: Belgium, Hong Kong and Taiwan. |
Please note: The sector classifications presented herein are based on the Global Industry Classification Standard (GICS) which was developed by Morgan Stanley Capital International and Standard & Poor’s. The components are divided into sector, industry group, and industrysub-indices as classified by the GICS for each of the market capitalization indices in the broad market. These sector classifications are broadly defined. The “Portfolio of Investments” section of the report reflects more specific industry information and is consistent with the investment restrictions discussed in the Fund’s prospectus.
| 12 | AB SUSTAINABLE INTERNATIONAL THEMATIC FUND | abfunds.com | |
PORTFOLIO SUMMARY(continued)
December 31, 2018(unaudited)
TEN LARGEST HOLDINGS1
| Company | U.S. $ Value | Percent of Net Assets | ||||||
| Siemens AG (REG) | $ | 7,167,837 | 3.2 | % | ||||
| HDFC Bank Ltd. | 7,141,117 | 3.2 | ||||||
| Credicorp Ltd. | 6,561,432 | 2.9 | ||||||
| Kingspan Group PLC (London) | 6,523,367 | 2.9 | ||||||
| AIA Group Ltd. | 6,514,204 | 2.9 | ||||||
| Partners Group Holding AG | 6,432,658 | 2.8 | ||||||
| Swedbank AB – Class A | 6,369,164 | 2.8 | ||||||
| Housing Development Finance Corp., Ltd. | 6,192,717 | 2.7 | ||||||
| Koninklijke DSM NV | 6,176,915 | 2.7 | ||||||
| Schneider Electric SE (Paris) | 5,717,430 | 2.5 | ||||||
| $ | 64,796,841 | 28.6 | % | |||||
| 1 | Long-term investments. |
| abfunds.com | AB SUSTAINABLE INTERNATIONAL THEMATIC FUND | 13 | |
PORTFOLIO OF INVESTMENTS
December 31, 2018(unaudited)
| Company | Shares | U.S. $ Value | ||||||||||
| ||||||||||||
COMMON STOCKS – 95.0% |
| |||||||||||
Financials – 25.8% |
| |||||||||||
Banks – 11.1% |
| |||||||||||
Credicorp Ltd. | 29,600 | $ | 6,561,432 | |||||||||
HDFC Bank Ltd. | 234,980 | 7,141,117 | ||||||||||
Svenska Handelsbanken AB – Class A | 443,683 | 4,936,273 | ||||||||||
Swedbank AB – Class A | 284,959 | 6,369,164 | ||||||||||
|
| |||||||||||
| 25,007,986 | ||||||||||||
|
| |||||||||||
Capital Markets – 5.2% |
| |||||||||||
London Stock Exchange Group PLC | 101,490 | 5,265,359 | ||||||||||
Partners Group Holding AG | 10,574 | 6,432,658 | ||||||||||
|
| |||||||||||
| 11,698,017 | ||||||||||||
|
| |||||||||||
Consumer Finance – 2.1% |
| |||||||||||
Bharat Financial Inclusion Ltd.(a) | 332,650 | 4,823,353 | ||||||||||
|
| |||||||||||
Insurance – 4.7% |
| |||||||||||
AIA Group Ltd. | 784,200 | 6,514,204 | ||||||||||
Prudential PLC | 226,706 | 4,048,167 | ||||||||||
|
| |||||||||||
| 10,562,371 | ||||||||||||
|
| |||||||||||
Thrifts & Mortgage Finance – 2.7% |
| |||||||||||
Housing Development Finance Corp., Ltd. | 220,175 | 6,192,717 | ||||||||||
|
| |||||||||||
| 58,284,444 | ||||||||||||
|
| |||||||||||
Information Technology – 13.6% |
| |||||||||||
Electronic Equipment, Instruments & Components – 3.1% | ||||||||||||
Halma PLC | 271,489 | 4,729,456 | ||||||||||
Keyence Corp. | 4,600 | 2,325,051 | ||||||||||
|
| |||||||||||
| 7,054,507 | ||||||||||||
|
| |||||||||||
IT Services – 1.6% |
| |||||||||||
Wirecard AG | 23,680 | 3,569,814 | ||||||||||
|
| |||||||||||
Semiconductors & Semiconductor Equipment – 6.5% | ||||||||||||
ASML Holding NV | 24,816 | 3,887,665 | ||||||||||
Infineon Technologies AG | 258,472 | 5,175,042 | ||||||||||
Taiwan Semiconductor Manufacturing Co., Ltd. | 769,000 | 5,583,889 | ||||||||||
|
| |||||||||||
| 14,646,596 | ||||||||||||
|
| |||||||||||
Software – 2.4% |
| |||||||||||
Dassault Systemes SE | 45,420 | 5,394,981 | ||||||||||
|
| |||||||||||
| 30,665,898 | ||||||||||||
|
| |||||||||||
Industrials – 13.0% |
| |||||||||||
Building Products – 2.9% |
| |||||||||||
Kingspan Group PLC | 80,784 | 3,463,005 | ||||||||||
Kingspan Group PLC (London) | 72,900 | 3,060,362 | ||||||||||
|
| |||||||||||
| 6,523,367 | ||||||||||||
|
| |||||||||||
| 14 | AB SUSTAINABLE INTERNATIONAL THEMATIC FUND | abfunds.com | |
PORTFOLIO OF INVESTMENTS(continued)
| Company | Shares | U.S. $ Value | ||||||||||
| ||||||||||||
Commercial Services & Supplies – 2.0% |
| |||||||||||
China Everbright International Ltd. | 5,106,000 | $ | 4,575,631 | |||||||||
|
| |||||||||||
Electrical Equipment – 4.9% |
| |||||||||||
Schneider Electric SE (Paris) | 84,289 | 5,717,430 | ||||||||||
Vestas Wind Systems A/S | 71,620 | 5,421,538 | ||||||||||
|
| |||||||||||
| 11,138,968 | ||||||||||||
|
| |||||||||||
Industrial Conglomerates – 3.2% |
| |||||||||||
Siemens AG (REG) | 64,227 | 7,167,837 | ||||||||||
|
| |||||||||||
| 29,405,803 | ||||||||||||
|
| |||||||||||
Health Care – 12.1% |
| |||||||||||
Health Care Equipment & Supplies – 1.5% |
| |||||||||||
Koninklijke Philips NV | 96,230 | 3,373,775 | ||||||||||
|
| |||||||||||
Health Care Providers & Services – 2.5% |
| |||||||||||
Apollo Hospitals Enterprise Ltd. | 315,185 | 5,662,247 | ||||||||||
|
| |||||||||||
Life Sciences Tools & Services – 6.5% |
| |||||||||||
Gerresheimer AG | 59,200 | 3,890,092 | ||||||||||
ICON PLC(a) | 22,620 | 2,922,730 | ||||||||||
QIAGEN NV(a) | 101,270 | 3,460,473 | ||||||||||
Tecan Group AG | 23,070 | 4,490,252 | ||||||||||
|
| |||||||||||
| 14,763,547 | ||||||||||||
|
| |||||||||||
Pharmaceuticals – 1.6% |
| |||||||||||
Roche Holding AG | 9,357 | 2,322,958 | ||||||||||
Vectura Group PLC(a) | 1,420,506 | 1,269,133 | ||||||||||
|
| |||||||||||
| 3,592,091 | ||||||||||||
|
| |||||||||||
| 27,391,660 | ||||||||||||
|
| |||||||||||
Consumer Staples – 10.7% |
| |||||||||||
Food Products – 6.0% |
| |||||||||||
Danone SA | 49,920 | 3,518,492 | ||||||||||
Kerry Group PLC – Class A | 55,845 | 5,486,663 | ||||||||||
Nestle SA (REG) | 55,729 | 4,523,121 | ||||||||||
|
| |||||||||||
| 13,528,276 | ||||||||||||
|
| |||||||||||
Household Products – 2.3% |
| |||||||||||
Unicharm Corp. | 163,200 | 5,278,210 | ||||||||||
|
| |||||||||||
Personal Products – 2.4% |
| |||||||||||
Unilever PLC | 103,500 | 5,434,041 | ||||||||||
|
| |||||||||||
| 24,240,527 | ||||||||||||
|
| |||||||||||
Consumer Discretionary – 7.8% |
| |||||||||||
Auto Components – 2.3% |
| |||||||||||
Aptiv PLC | 86,519 | 5,326,975 | ||||||||||
|
| |||||||||||
| abfunds.com | AB SUSTAINABLE INTERNATIONAL THEMATIC FUND | 15 | |
PORTFOLIO OF INVESTMENTS(continued)
| Company | Shares | U.S. $ Value | ||||||||||
| ||||||||||||
Internet & Direct Marketing Retail – 1.8% |
| |||||||||||
Alibaba Group Holding Ltd. (Sponsored ADR)(a) | 29,100 | $ | 3,988,737 | |||||||||
|
| |||||||||||
Textiles, Apparel & Luxury Goods – 3.7% |
| |||||||||||
EssilorLuxottica SA | 32,036 | 4,060,817 | ||||||||||
Shenzhou International Group Holdings Ltd. | 384,000 | 4,364,488 | ||||||||||
|
| |||||||||||
| 8,425,305 | ||||||||||||
|
| |||||||||||
| 17,741,017 | ||||||||||||
|
| |||||||||||
Materials – 4.7% | ||||||||||||
Chemicals – 4.7% | ||||||||||||
Chr Hansen Holding A/S | 38,847 | 3,448,321 | ||||||||||
Koninklijke DSM NV | 76,140 | 6,176,915 | ||||||||||
Umicore SA | 28,407 | 1,133,582 | ||||||||||
|
| |||||||||||
| 10,758,818 | ||||||||||||
|
| |||||||||||
Communication Services – 3.9% | ||||||||||||
Diversified Telecommunication | ||||||||||||
Deutsche Telekom AG (REG) | 287,875 | 4,892,933 | ||||||||||
|
| |||||||||||
Interactive Media & Services – 1.7% | ||||||||||||
Tencent Holdings Ltd. | 96,000 | 3,847,714 | ||||||||||
|
| |||||||||||
| 8,740,647 | ||||||||||||
|
| |||||||||||
Utilities – 3.4% | ||||||||||||
Multi-Utilities – 1.9% | ||||||||||||
Suez | 317,290 | 4,191,559 | ||||||||||
|
| |||||||||||
Water Utilities – 1.5% | ||||||||||||
Beijing Enterprises Water Group Ltd.(a) | 6,762,000 | 3,451,496 | ||||||||||
|
| |||||||||||
| 7,643,055 | ||||||||||||
|
| |||||||||||
Total Common Stocks | 214,871,869 | |||||||||||
|
| |||||||||||
SHORT-TERM INVESTMENTS – 5.2% | ||||||||||||
Investment Companies – 5.1% | ||||||||||||
AB Fixed Income Shares, Inc. – Government Money Market Portfolio – Class AB, 2.31%(b)(c)(d) | 11,624,493 | 11,624,493 | ||||||||||
|
| |||||||||||
| 16 | AB SUSTAINABLE INTERNATIONAL THEMATIC FUND | abfunds.com | |
PORTFOLIO OF INVESTMENTS(continued)
| Principal Amount (000) | U.S. $ Value | |||||||||||
|
| |||||||||||
Time Deposits – 0.1% | ||||||||||||
BBH Grand Cayman | CHF | 23 | $ | 22,957 | ||||||||
(0.57)%, 1/02/19 | EUR | 20 | 22,892 | |||||||||
0.37%, 1/02/19 | GBP | 19 | 23,762 | |||||||||
0.84%, 1/02/19 | CAD | 0 | * | 1 | ||||||||
1.77%, 1/02/19 | USD | 2 | 1,859 | |||||||||
4.84%, 1/02/19 | ZAR | 0 | * | 4 | ||||||||
Hong Kong & Shanghai Bank, Hong Kong | HKD | 195 | 24,926 | |||||||||
|
| |||||||||||
Total Time Deposits | 96,401 | |||||||||||
|
| |||||||||||
Total Short-Term Investments | 11,720,894 | |||||||||||
|
| |||||||||||
Total Investments – 100.2% | 226,592,763 | |||||||||||
Other assets less liabilities – (0.2)% | (389,158 | ) | ||||||||||
|
| |||||||||||
Net Assets – 100.0% | $ | 226,203,605 | ||||||||||
|
| |||||||||||
FORWARD CURRENCY EXCHANGE CONTRACTS (see Note D)
| Counterparty | Contracts to Deliver (000) | In Exchange For (000) | Settlement Date | Unrealized Appreciation/ (Depreciation) | ||||||||||||
Bank of America, NA | CHF | 2,369 | USD | 2,405 | 2/14/19 | $ | (14,610 | ) | ||||||||
Bank of America, NA | GBP | 3,101 | USD | 4,000 | 2/14/19 | 39,106 | ||||||||||
Barclays Bank PLC | CNY | 27,136 | USD | 3,903 | 1/24/19 | (48,377 | ) | |||||||||
Barclays Bank PLC | CHF | 643 | USD | 659 | 2/14/19 | 1,938 | ||||||||||
Barclays Bank PLC | JPY | 211,705 | USD | 1,910 | 2/14/19 | (28,455 | ) | |||||||||
Barclays Bank PLC | USD | 687 | EUR | 597 | 2/14/19 | (67 | ) | |||||||||
Barclays Bank PLC | USD | 1,513 | ZAR | 21,844 | 2/14/19 | (2,976 | ) | |||||||||
BNP Paribas SA | CNY | 4,294 | USD | 614 | 1/24/19 | (10,883 | ) | |||||||||
BNP Paribas SA | INR | 53,066 | USD | 752 | 3/18/19 | (5,121 | ) | |||||||||
Brown Brothers Harriman & Co. | JPY | 103,000 | USD | 929 | 1/04/19 | (10,473 | ) | |||||||||
Brown Brothers Harriman & Co. | JPY | 51,400 | USD | 466 | 1/07/19 | (3,199 | ) | |||||||||
Brown Brothers Harriman & Co. | CHF | 3,313 | USD | 3,328 | 2/14/19 | (56,039 | ) | |||||||||
Brown Brothers Harriman & Co. | EUR | 1,167 | USD | 1,369 | 2/14/19 | 26,841 | ||||||||||
Brown Brothers Harriman & Co. | GBP | 970 | USD | 1,230 | 2/14/19 | (8,771 | ) | |||||||||
Brown Brothers Harriman & Co. | MXN | 10,127 | USD | 491 | 2/14/19 | (20,998 | ) | |||||||||
Brown Brothers Harriman & Co. | USD | 3,402 | CHF | 3,363 | 2/14/19 | 33,115 | ||||||||||
Brown Brothers Harriman & Co. | USD | 896 | EUR | 784 | 2/14/19 | 5,974 | ||||||||||
Brown Brothers Harriman & Co. | USD | 3,397 | JPY | 378,329 | 2/14/19 | 66,324 | ||||||||||
Brown Brothers Harriman & Co. | USD | 313 | NZD | 463 | 2/14/19 | (1,683 | ) | |||||||||
Citibank, NA | AUD | 1,719 | USD | 1,236 | 2/14/19 | 23,933 | ||||||||||
Citibank, NA | EUR | 10,892 | USD | 12,583 | 2/14/19 | 58,065 | ||||||||||
| abfunds.com | AB SUSTAINABLE INTERNATIONAL THEMATIC FUND | 17 | |
PORTFOLIO OF INVESTMENTS(continued)
| Counterparty | Contracts to Deliver (000) | In Exchange For (000) | Settlement Date | Unrealized Appreciation/ (Depreciation) | ||||||||||||
Citibank, NA | GBP | 446 | USD | 567 | 2/14/19 | $ | (2,563 | ) | ||||||||
Citibank, NA | SEK | 61,169 | USD | 6,811 | 2/14/19 | (114,799 | ) | |||||||||
Citibank, NA | USD | 12,790 | GBP | 9,760 | 2/14/19 | (323,616 | ) | |||||||||
Citibank, NA | USD | 28,027 | JPY | 3,160,895 | 2/14/19 | 908,579 | ||||||||||
Citibank, NA | USD | 8,343 | KRW | 9,367,460 | 2/20/19 | 81,096 | ||||||||||
Deutsche Bank AG | CHF | 788 | USD | 808 | 2/14/19 | 2,830 | ||||||||||
Deutsche Bank AG | EUR | 20,711 | USD | 23,726 | 2/14/19 | (88,849 | ) | |||||||||
Deutsche Bank AG | USD | 2,609 | EUR | 2,292 | 2/14/19 | 26,933 | ||||||||||
Deutsche Bank AG | USD | 1,224 | JPY | 136,305 | 2/14/19 | 23,391 | ||||||||||
Deutsche Bank AG | INR | 1,329,505 | USD | 18,632 | 3/18/19 | (329,696 | ) | |||||||||
Goldman Sachs Bank USA | USD | 1,835 | MXN | 37,785 | 2/14/19 | 74,971 | ||||||||||
Goldman Sachs Bank USA | ZAR | 8,143 | USD | 562 | 2/14/19 | (1,082 | ) | |||||||||
Goldman Sachs Bank USA | USD | 3,365 | INR | 246,916 | 3/18/19 | 156,266 | ||||||||||
JPMorgan Chase Bank, NA | GBP | 467 | USD | 601 | 2/14/19 | 4,358 | ||||||||||
JPMorgan Chase Bank, NA | JPY | 69,481 | USD | 615 | 2/14/19 | (20,617 | ) | |||||||||
JPMorgan Chase Bank, NA | USD | 9,349 | AUD | 12,890 | 2/14/19 | (262,907 | ) | |||||||||
JPMorgan Chase Bank, NA | USD | 16,064 | CAD | 21,161 | 2/14/19 | (546,824 | ) | |||||||||
JPMorgan Chase Bank, NA | USD | 542 | CHF | 538 | 2/14/19 | 7,904 | ||||||||||
JPMorgan Chase Bank, NA | USD | 635 | EUR | 553 | 2/14/19 | 705 | ||||||||||
JPMorgan Chase Bank, NA | USD | 2,371 | ZAR | 33,509 | 2/14/19 | (53,637 | ) | |||||||||
Morgan Stanley & Co. LLC | USD | 4,181 | BRL | 16,292 | 1/03/19 | 22,278 | ||||||||||
Morgan Stanley & Co. LLC | BRL | 16,292 | USD | 4,205 | 1/03/19 | 1,031 | ||||||||||
Morgan Stanley & Co. LLC | BRL | 16,292 | USD | 4,144 | 1/03/19 | (59,081 | ) | |||||||||
Morgan Stanley & Co. LLC | USD | 4,205 | BRL | 16,292 | 1/03/19 | (1,031 | ) | |||||||||
Morgan Stanley & Co. LLC | USD | 2,272 | RUB | 151,370 | 1/24/19 | (106,662 | ) | |||||||||
Morgan Stanley & Co. LLC | USD | 4,137 | BRL | 16,292 | 2/04/19 | 58,152 | ||||||||||
Morgan Stanley & Co. LLC | EUR | 1,330 | USD | 1,527 | 2/14/19 | (1,869 | ) | |||||||||
Morgan Stanley & Co. LLC | JPY | 245,954 | USD | 2,197 | 2/14/19 | (54,939 | ) | |||||||||
Morgan Stanley & Co. LLC | USD | 2,381 | AUD | 3,310 | 2/14/19 | (48,007 | ) | |||||||||
Morgan Stanley & Co. LLC | USD | 1,322 | NOK | 11,077 | 2/14/19 | (38,824 | ) | |||||||||
Morgan Stanley & Co. LLC | USD | 614 | TWD | 18,643 | 3/14/19 | (209 | ) | |||||||||
Royal Bank of Scotland PLC | CHF | 1,229 | USD | 1,257 | 2/14/19 | 1,566 | ||||||||||
Royal Bank of Scotland PLC | GBP | 1,027 | USD | 1,303 | 2/14/19 | (8,986 | ) | |||||||||
Royal Bank of Scotland PLC | JPY | 79,459 | USD | 708 | 2/14/19 | (19,796 | ) | |||||||||
Royal Bank of Scotland PLC | KRW | 2,613,727 | USD | 2,317 | 2/20/19 | (33,154 | ) | |||||||||
Standard Chartered Bank | USD | 1,988 | CNY | 13,849 | 1/24/19 | 29,242 | ||||||||||
Standard Chartered Bank | JPY | 146,550 | USD | 1,311 | 2/14/19 | (30,345 | ) | |||||||||
Standard Chartered Bank | USD | 2,861 | JPY | 316,101 | 2/14/19 | 33,122 | ||||||||||
State Street Bank & Trust Co. | CAD | 1,958 | USD | 1,450 | 2/14/19 | 14,603 | ||||||||||
State Street Bank & Trust Co. | HKD | 4,145 | USD | 531 | 2/14/19 | 578 | ||||||||||
State Street Bank & Trust Co. | USD | 617 | CHF | 608 | 2/14/19 | 3,694 | ||||||||||
|
| |||||||||||||||
| $ | (652,550 | ) | ||||||||||||||
|
| |||||||||||||||
| * | Principal amount less than 500. |
| (a) | Non-income producing security. |
| (b) | The rate shown represents the7-day yield as of period end. |
| (c) | To obtain a copy of the fund’s shareholder report, please go to the Securities and Exchange Commission’s website at www.sec.gov, or call AB at(800) 227-4618. |
| (d) | Affiliated investments. |
| 18 | AB SUSTAINABLE INTERNATIONAL THEMATIC FUND | abfunds.com | |
PORTFOLIO OF INVESTMENTS(continued)
Currency Abbreviations:
AUD – Australian Dollar
BRL – Brazilian Real
CAD – Canadian Dollar
CHF – Swiss Franc
CNY – Chinese Yuan Renminbi
EUR – Euro
GBP – Great British Pound
HKD – Hong Kong Dollar
INR – Indian Rupee
JPY – Japanese Yen
KRW – South Korean Won
MXN – Mexican Peso
NOK – Norwegian Krone
NZD – New Zealand Dollar
RUB – Russian Ruble
SEK – Swedish Krona
TWD – New Taiwan Dollar
USD – United States Dollar
ZAR – South African Rand
Glossary:
ADR – American Depositary Receipt
REG – Registered Shares
See notes to financial statements.
| abfunds.com | AB SUSTAINABLE INTERNATIONAL THEMATIC FUND | 19 | |
STATEMENT OF ASSETS & LIABILITIES
December 31, 2018(unaudited)
| Assets | ||||
Investments in securities, at value | $ | 214,968,270 | ||
Affiliated issuers (cost $11,624,493) | 11,624,493 | |||
Foreign currencies, at value (cost $102,406) | 104,364 | |||
Unrealized appreciation on forward currency exchange contracts | 1,706,595 | |||
Receivable for investment securities sold | 1,408,187 | |||
Unaffiliated dividends receivable | 833,016 | |||
Receivable for capital stock sold | 314,790 | |||
Affiliated dividends receivable | 18,107 | |||
|
| |||
Total assets | 230,977,822 | |||
|
| |||
| Liabilities | ||||
Unrealized depreciation on forward currency exchange contracts | 2,359,145 | |||
Payable for capital stock redeemed | 1,947,632 | |||
Advisory fee payable | 137,867 | |||
Distribution fee payable | 41,268 | |||
Transfer Agent fee payable | 38,203 | |||
Administrative fee payable | 15,035 | |||
Due to Custodian | 54 | |||
Directors’ fee payable | 53 | |||
Accrued expenses and other liabilities | 234,960 | |||
|
| |||
Total liabilities | 4,774,217 | |||
|
| |||
Net Assets | $ | 226,203,605 | ||
|
| |||
| Composition of Net Assets | ||||
Capital stock, at par | $ | 16,028 | ||
Additionalpaid-in capital | 231,186,003 | |||
Accumulated loss | (4,998,426 | ) | ||
|
| |||
| $ | 226,203,605 | |||
|
|
Net Asset Value Per Share—24 billion shares of capital stock authorized, $.001 par value
| Class | Net Assets | Shares Outstanding | Net Asset Value | |||||||||
| ||||||||||||
| A | $ | 159,001,675 | 11,266,440 | $ | 14.11 | * | ||||||
|
|
|
|
|
|
| ||||||
| B | $ | 738,563 | 60,995 | $ | 12.11 | |||||||
|
|
|
|
|
|
| ||||||
| C | $ | 5,468,190 | 448,130 | $ | 12.20 | |||||||
|
|
|
|
|
|
| ||||||
| Advisor | $ | 46,941,535 | 3,246,682 | $ | 14.46 | |||||||
|
|
|
|
|
|
| ||||||
| R | $ | 7,049,299 | 509,837 | $ | 13.83 | |||||||
|
|
|
|
|
|
| ||||||
| K | $ | 5,252,656 | 374,156 | $ | 14.04 | |||||||
|
|
|
|
|
|
| ||||||
| I | $ | 1,751,687 | 121,720 | $ | 14.39 | |||||||
|
|
|
|
|
|
| ||||||
| * | The maximum offering price per share for Class A shares was $14.74, which reflects a sales charge of 4.25%. |
See notes to financial statements.
| 20 | AB SUSTAINABLE INTERNATIONAL THEMATIC FUND | abfunds.com | |
STATEMENT OF OPERATIONS
Six Months Ended December 31, 2018(unaudited)
| Investment Income | ||||||||
Dividends | ||||||||
Unaffiliated issuers (net of foreign taxes withheld of $21,191) | $ | 727,500 | ||||||
Affiliated issuers | 180,496 | $ | 907,996 | |||||
|
| |||||||
| Expenses | ||||||||
Advisory fee (see Note B) | 982,994 | |||||||
Distribution fee—Class A | 235,170 | |||||||
Distribution fee—Class B | 4,289 | |||||||
Distribution fee—Class C | 35,284 | |||||||
Distribution fee—Class R | 19,775 | |||||||
Distribution fee—Class K | 8,039 | |||||||
Transfer agency—Class A | 203,208 | |||||||
Transfer agency—Class B | 1,258 | |||||||
Transfer agency—Class C | 7,866 | |||||||
Transfer agency—Advisor Class | 54,091 | |||||||
Transfer agency—Class R | 10,283 | |||||||
Transfer agency—Class K | 6,431 | |||||||
Transfer agency—Class I | 809 | |||||||
Custodian | 78,159 | |||||||
Registration fees | 58,981 | |||||||
Printing | 39,267 | |||||||
Audit and tax | 34,975 | |||||||
Administrative | 34,454 | |||||||
Legal | 20,476 | |||||||
Directors’ fees | 12,483 | |||||||
Miscellaneous | 46,273 | |||||||
|
| |||||||
Total expenses | 1,894,565 | |||||||
|
| |||||||
Less: expenses waived and reimbursed by the Adviser (see Note B) | (11,137 | ) | ||||||
|
| |||||||
Net expenses | 1,883,428 | |||||||
|
| |||||||
Net investment loss | (975,432 | ) | ||||||
|
| |||||||
| Realized and Unrealized Gain (Loss) on Investment and Foreign Currency Transactions | ||||||||
Net realized gain (loss) on: | ||||||||
Investment transactions | (600,931 | ) | ||||||
Forward currency exchange contracts | (2,124,803 | ) | ||||||
Foreign currency transactions | 13,933 | |||||||
Net change in unrealized appreciation/depreciation on: | ||||||||
Investments | (33,895,532 | ) | ||||||
Forward currency exchange contracts | 1,095,248 | |||||||
Foreign currency denominated assets and liabilities | 30,935 | |||||||
|
| |||||||
Net loss on investment and foreign currency transactions | (35,481,150 | ) | ||||||
|
| |||||||
Net Decrease in Net Assets from Operations | $ | (36,456,582 | ) | |||||
|
|
See notes to financial statements.
| abfunds.com | AB SUSTAINABLE INTERNATIONAL THEMATIC FUND | 21 | |
STATEMENT OF CHANGES IN NET ASSETS
| Six Months Ended December 31, 2018 (unaudited) | Year Ended June 30, 2018 | |||||||
| Increase (Decrease) in Net Assets from Operations | ||||||||
Net investment income (loss) | $ | (975,432 | ) | $ | 1,397,273 | |||
Net realized gain (loss) on investment and foreign currency transactions | (2,711,801 | ) | 52,339,334 | |||||
Net change in unrealized depreciation on investments and foreign currency denominated assets and liabilities | (32,769,349 | ) | (37,660,283 | ) | ||||
|
|
|
| |||||
Net increase (decrease) in net assets from operations | (36,456,582 | ) | 16,076,324 | |||||
| Distributions to Shareholders | ||||||||
Class A | (20,636,697 | ) | – 0 | – | ||||
Class B | (106,450 | ) | – 0 | – | ||||
Class C | (815,838 | ) | – 0 | – | ||||
Advisor Class | (6,065,191 | ) | – 0 | – | ||||
Class R | (896,448 | ) | – 0 | – | ||||
Class K | (661,921 | ) | – 0 | – | ||||
Class I | (217,834 | ) | – 0 | – | ||||
| Capital Stock Transactions | ||||||||
Net increase (decrease) | 13,312,060 | (44,789,595 | ) | |||||
|
|
|
| |||||
Total decrease | (52,544,901 | ) | (28,713,271 | ) | ||||
| Net Assets | ||||||||
Beginning of period | 278,748,506 | 307,461,777 | ||||||
|
|
|
| |||||
End of period | $ | 226,203,605 | $ | 278,748,506 | ||||
|
|
|
| |||||
See notes to financial statements.
| 22 | AB SUSTAINABLE INTERNATIONAL THEMATIC FUND | abfunds.com | |
NOTES TO FINANCIAL STATEMENTS
December 31, 2018(unaudited)
NOTE A
Significant Accounting Policies
AB Sustainable International Thematic Fund, Inc. (the “Fund”), organized as a Maryland corporation on March 16, 1994, is registered under the Investment Company Act of 1940 as a diversifiedopen-end management investment company. On January 8, 2018, the Fund’s name was changed from AB International Growth Fund, Inc. to AB Sustainable International Thematic Fund, Inc. The Fund offers Class A, Class B, Class C, Advisor Class, Class R, Class K and Class I shares. Class T shares have been authorized but currently are not offered. Class A shares are sold with afront-end sales charge of up to 4.25% for purchases not exceeding $1,000,000. With respect to purchases of $1,000,000 or more, Class A shares redeemed within one year of purchase may be subject to a contingent deferred sales charge of 1%. Class B shares are currently sold with a contingent deferred sales charge which declines from 4% to 0% depending on the period of time the shares are held. Effective January 31, 2009, sales of Class B shares of the Fund to new investors were suspended. Class B shares will only be issued (i) upon the exchange of Class B shares from another AB mutual fund, (ii) for purposes of dividend reinvestment, (iii) through the Fund’s Automatic Investment Program (the “Program”) for accounts that established the Program prior to January 31, 2009, and (iv) for purchases of additional shares by Class B shareholders as of January 31, 2009. The ability to establish a new Program for accounts containing Class B shares was suspended as of January 31, 2009. Class B shares will automatically convert to Class A shares eight years after the end of the calendar month of purchase. Class C shares are subject to a contingent deferred sales charge of 1% on redemptions made within the first year after purchase, and 0% after the first year of purchase. Class C shares will automatically convert to Class A shares ten years after the end of the calendar month of purchase. Class R and Class K shares are sold without an initial or contingent deferred sales charge. Advisor Class and Class I shares are sold without an initial or contingent deferred sales charge and are not subject to ongoing distribution expenses. All eight classes of shares have identical voting, dividend, liquidation and other rights, except that the classes bear different distribution and transfer agency expenses. Each class has exclusive voting rights with respect to its distribution plan. The financial statements have been prepared in conformity with U.S. generally accepted accounting principles (“U.S. GAAP”), which require management to make certain estimates and assumptions that affect the reported amounts of assets and liabilities in the financial statements and amounts of income and expenses during the reporting period. Actual results could differ from those estimates. The Fund is an investment company under U.S. GAAP and follows the accounting and reporting guidance applicable to investment companies. The following is a summary of significant accounting policies followed by the Fund.
| abfunds.com | AB SUSTAINABLE INTERNATIONAL THEMATIC FUND | 23 | |
NOTES TO FINANCIAL STATEMENTS(continued)
1. Security Valuation
Portfolio securities are valued at their current market value determined on the basis of market quotations or, if market quotations are not readily available or are deemed unreliable, at “fair value” as determined in accordance with procedures established by and under the general supervision of the Fund’s Board of Directors (the “Board”).
In general, the market values of securities which are readily available and deemed reliable are determined as follows: securities listed on a national securities exchange (other than securities listed on the NASDAQ Stock Market, Inc. (“NASDAQ”)) or on a foreign securities exchange are valued at the last sale price at the close of the exchange or foreign securities exchange. If there has been no sale on such day, the securities are valued at the last traded price from the previous day. Securities listed on more than one exchange are valued by reference to the principal exchange on which the securities are traded; securities listed only on NASDAQ are valued in accordance with the NASDAQ Official Closing Price; listed or over the counter (“OTC”) market put or call options are valued at the mid level between the current bid and ask prices. If either a current bid or current ask price is unavailable, AllianceBernstein L.P. (the “Adviser”) will have discretion to determine the best valuation (e.g., last trade price in the case of listed options); open futures are valued using the closing settlement price or, in the absence of such a price, the most recent quoted bid price. If there are no quotations available for the day of valuation, the last available closing settlement price is used; U.S. Government securities and any other debt instruments having 60 days or less remaining until maturity are generally valued at market by an independent pricing vendor, if a market price is available. If a market price is not available, the securities are valued at amortized cost. This methodology is commonly used for short term securities that have an original maturity of 60 days or less, as well as short term securities that had an original term to maturity that exceeded 60 days. In instances when amortized cost is utilized, the Valuation Committee (the “Committee”) must reasonably conclude that the utilization of amortized cost is approximately the same as the fair value of the security. Such factors the Committee will consider include, but are not limited to, an impairment of the creditworthiness of the issuer or material changes in interest rates. Fixed-income securities, including mortgage-backed and asset-backed securities, may be valued on the basis of prices provided by a pricing service or at a price obtained from one or more of the major broker-dealers. In cases where broker-dealer quotes are obtained, the Adviser may establish procedures whereby changes in market yields or spreads are used to adjust, on a daily basis, a recently obtained quoted price on a security. Swaps and other derivatives are valued daily, primarily using independent pricing services, independent pricing models using market inputs, as well as third party broker-dealers or counterparties.
| 24 | AB SUSTAINABLE INTERNATIONAL THEMATIC FUND | abfunds.com | |
NOTES TO FINANCIAL STATEMENTS(continued)
Open end mutual funds are valued at the closing net asset value per share, while exchange traded funds are valued at the closing market price per share.
Securities for which market quotations are not readily available (including restricted securities) or are deemed unreliable are valued at fair value as deemed appropriate by the Adviser. Factors considered in making this determination may include, but are not limited to, information obtained by contacting the issuer, analysts, analysis of the issuer’s financial statements or other available documents. In addition, the Fund may use fair value pricing for securities primarily traded innon-U.S. markets because most foreign markets close well before the Fund values its securities at 4:00 p.m., Eastern Time. The earlier close of these foreign markets gives rise to the possibility that significant events, including broad market moves, may have occurred in the interim and may materially affect the value of those securities. To account for this, the Fund generally values many of its foreign equity securities using fair value prices based on third party vendor modeling tools to the extent available.
2. Fair Value Measurements
In accordance with U.S. GAAP regarding fair value measurements, fair value is defined as the price that the Fund would receive to sell an asset or pay to transfer a liability in an orderly transaction between market participants at the measurement date. U.S. GAAP establishes a framework for measuring fair value, and a three-level hierarchy for fair value measurements based upon the transparency of inputs to the valuation of an asset or liability (including those valued based on their market values as described in Note A.1 above). Inputs may be observable or unobservable and refer broadly to the assumptions that market participants would use in pricing the asset or liability. Observable inputs reflect the assumptions market participants would use in pricing the asset or liability based on market data obtained from sources independent of the Fund. Unobservable inputs reflect the Fund’s own assumptions about the assumptions that market participants would use in pricing the asset or liability based on the best information available in the circumstances. Each investment is assigned a level based upon the observability of the inputs which are significant to the overall valuation. The three-tier hierarchy of inputs is summarized below.
| • | Level 1—quoted prices in active markets for identical investments |
| • | Level 2—other significant observable inputs (including quoted prices for similar investments, interest rates, prepayment speeds, credit risk, etc.) |
| • | Level 3—significant unobservable inputs (including the Fund’s own assumptions in determining the fair value of investments) |
| abfunds.com | AB SUSTAINABLE INTERNATIONAL THEMATIC FUND | 25 | |
NOTES TO FINANCIAL STATEMENTS(continued)
The fair value of debt instruments, such as bonds, andover-the-counter derivatives is generally based on market price quotations, recently executed market transactions (where observable) or industry recognized modeling techniques and are generally classified as Level 2. Pricing vendor inputs to Level 2 valuations may include quoted prices for similar investments in active markets, interest rate curves, coupon rates, currency rates, yield curves, option adjusted spreads, default rates, credit spreads and other unique security features in order to estimate the relevant cash flows which is then discounted to calculate fair values. If these inputs are unobservable and significant to the fair value, these investments will be classified as Level 3. In addition,non-agency rated investments are classified as Level 3.
Where readily available market prices or relevant bid prices are not available for certain equity investments, such investments may be valued based on similar publicly traded investments, movements in relevant indices since last available prices or based upon underlying company fundamentals and comparable company data (such as multiples to earnings or other multiples to equity). Where an investment is valued using an observable input, such as another publicly traded security, the investment will be classified as Level 2. If management determines that an adjustment is appropriate based on restrictions on resale, illiquidity or uncertainty, and such adjustment is a significant component of the valuation, the investment will be classified as Level 3. An investment will also be classified as Level 3 where management uses company fundamentals and other significant inputs to determine the valuation.
The following table summarizes the valuation of the Fund’s investments by the above fair value hierarchy levels as of December 31, 2018:
Investments in | Level 1 | Level 2 | Level 3 | Total | ||||||||||||
Assets: | ||||||||||||||||
Common Stocks: | ||||||||||||||||
Financials | $ | 13,702,549 | $ | 44,581,895 | $ | – 0 | – | $ | 58,284,444 | |||||||
Information Technology | – 0 | – | 30,665,898 | – 0 | – | 30,665,898 | ||||||||||
Industrials | 3,060,362 | 26,345,441 | – 0 | – | 29,405,803 | |||||||||||
Health Care | 2,922,730 | 24,468,930 | – 0 | – | 27,391,660 | |||||||||||
Consumer Staples | 5,486,663 | 18,753,864 | – 0 | – | 24,240,527 | |||||||||||
Consumer Discretionary | 9,315,712 | 8,425,305 | – 0 | – | 17,741,017 | |||||||||||
Materials | – 0 | – | 10,758,818 | – 0 | – | 10,758,818 | ||||||||||
Communication Services | – 0 | – | 8,740,647 | – 0 | – | 8,740,647 | ||||||||||
Utilities | 4,191,559 | 3,451,496 | – 0 | – | 7,643,055 | |||||||||||
Short-Term Investments: | ||||||||||||||||
Investment Companies | 11,624,493 | – 0 | – | – 0 | – | 11,624,493 | ||||||||||
Time Deposits | – 0 | – | 96,401 | – 0 | – | 96,401 | ||||||||||
|
|
|
|
|
|
|
| |||||||||
Total Investments in Securities | 50,304,068 | 176,288,695 | † | – 0 | – | 226,592,763 | ||||||||||
| 26 | AB SUSTAINABLE INTERNATIONAL THEMATIC FUND | abfunds.com | |
NOTES TO FINANCIAL STATEMENTS(continued)
Investments in | Level 1 | Level 2 | Level 3 | Total | ||||||||||||
Other Financial Instruments*: | ||||||||||||||||
Assets | ||||||||||||||||
Forward Currency Exchange Contracts | $ | – 0 | – | $ | 1,706,595 | $ | – 0 | – | $ | 1,706,595 | ||||||
Liabilities | ||||||||||||||||
Forward Currency Exchange Contracts | – 0 | – | (2,359,145 | ) | – 0 | – | (2,359,145 | ) | ||||||||
|
|
|
|
|
|
|
| |||||||||
Total^ | $ | 50,304,068 | $ | 175,636,145 | $ | – 0 | – | $ | 225,940,213 | |||||||
|
|
|
|
|
|
|
| |||||||||
| † | A significant portion of the Fund’s foreign equity investments are categorized as Level 2 investments since they are valued using fair value prices based on third party vendor modeling tools to the extent available, see Note A.1. |
| * | Other financial instruments are derivative instruments, such as futures, forwards and swaps, which are valued at the unrealized appreciation/(depreciation) on the instrument. Other financial instruments may also include swaps with upfront premiums, options written and swaptions written which are valued at market value. |
| ^ | An amount of $4,045,280 was transferred from Level 1 to Level 2 due to the above mentioned foreign equity fair valuation using third party vendor modeling tools during the reporting period. An amount of $13,255,727 was transferred from Level 2 to Level 1 due to the above mentioned foreign equity fair valuation using third party vendor modeling tools not being used during the reporting period. |
The Fund recognizes all transfers between levels of the fair value hierarchy assuming the financial instrument was transferred at the beginning of the reporting period.
The Adviser established the Committee to oversee the pricing and valuation of all securities held in the Fund. The Committee operates under pricing and valuation policies and procedures established by the Adviser and approved by the Board, including pricing policies which set forth the mechanisms and processes to be employed on a daily basis to implement these policies and procedures. In particular, the pricing policies describe how to determine market quotations for securities and other instruments. The Committee’s responsibilities include: 1) fair value and liquidity determinations (and oversight of any third parties to whom any responsibility for fair value and liquidity determinations is delegated), and 2) regular monitoring of the Adviser’s pricing and valuation policies and procedures and modification or enhancement of these policies and procedures (or recommendation of the modification of these policies and procedures) as the Committee believes appropriate.
The Committee is also responsible for monitoring the implementation of the pricing policies by the Adviser’s Pricing Group (the “Pricing Group”) and any third party which performs certain pricing functions in accordance with the pricing policies. The Pricing Group is responsible for the oversight of the third party on aday-to-day basis. The Committee and the Pricing Group perform a series of activities to provide reasonable assurance of the accuracy of prices including: 1) periodic vendor due diligence meetings, review of methodologies, new developments and process at vendors, 2) daily
| abfunds.com | AB SUSTAINABLE INTERNATIONAL THEMATIC FUND | 27 | |
NOTES TO FINANCIAL STATEMENTS(continued)
comparison of security valuation versus prior day for all securities that exceeded established thresholds, and 3) daily review of unpriced, stale, and variance reports with exceptions reviewed by senior management and the Committee.
In addition, several processes outside of the pricing process are used to monitor valuation issues including: 1) performance and performance attribution reports are monitored for anomalous impacts based upon benchmark performance, and 2) portfolio managers review all portfolios for performance and analytics (which are generated using the Adviser’s prices).
3. Currency Translation
Assets and liabilities denominated in foreign currencies and commitments under forward currency exchange contracts are translated into U.S. dollars at the mean of the quoted bid and ask prices of such currencies against the U.S. dollar. Purchases and sales of portfolio securities are translated into U.S. dollars at the rates of exchange prevailing when such securities were acquired or sold. Income and expenses are translated into U.S. dollars at rates of exchange prevailing when accrued.
Net realized gain or loss on foreign currency transactions represents foreign exchange gains and losses from sales and maturities of foreign fixed income investments, holding of foreign currencies, currency gains or losses realized between the trade and settlement dates on foreign investment transactions, and the difference between the amounts of dividends, interest and foreign withholding taxes recorded on the Fund’s books and the U.S. dollar equivalent amounts actually received or paid. Net unrealized currency gains and losses from valuing foreign currency denominated assets and liabilities at period end exchange rates are reflected as a component of net unrealized appreciation and depreciation of foreign currency denominated assets and liabilities.
4. Taxes
It is the Fund’s policy to meet the requirements of the Internal Revenue Code applicable to regulated investment companies and to distribute all of its investment company taxable income and net realized gains, if any, to shareholders. Therefore, no provisions for federal income or excise taxes are required. The Fund may be subject to taxes imposed by countries in which it invests. Such taxes are generally based on income and/or capital gains earned or repatriated. Taxes are accrued and applied to net investment income, net realized gains and net unrealized appreciation/depreciation as such income and/or gains are earned.
In accordance with U.S. GAAP requirements regarding accounting for uncertainties in income taxes, management has analyzed the Fund’s tax
| 28 | AB SUSTAINABLE INTERNATIONAL THEMATIC FUND | abfunds.com | |
NOTES TO FINANCIAL STATEMENTS(continued)
positions taken or expected to be taken on federal and state income tax returns for all open tax years (the current and the prior three tax years) and has concluded that no provision for income tax is required in the Fund’s financial statements.
5. Investment Income and Investment Transactions
Dividend income is recorded on theex-dividend date or as soon as the Fund is informed of the dividend. Interest income is accrued daily. Investment transactions are accounted for on the date securities are purchased or sold. Investment gains and losses are determined on the identified cost basis. The Fund amortizes premiums and accretes discounts as adjustments to interest income.
6. Class Allocations
All income earned and expenses incurred by the Fund are borne on apro-rata basis by each settled class of shares, based on the proportionate interest in the Fund represented by the net assets of such class, except for class specific expenses which are allocated to the respective class. Realized and unrealized gains and losses are allocated among the various share classes based on their respective net assets.
7. Dividends and Distributions
Dividends and distributions to shareholders, if any, are recorded on theex-dividend date. Income dividends and capital gains distributions are determined in accordance with federal tax regulations and may differ from those determined in accordance with U.S. GAAP. To the extent these differences are permanent, such amounts are reclassified within the capital accounts based on their federal tax basis treatment; temporary differences do not require such reclassification.
NOTE B
Advisory Fee and Other Transactions with Affiliates
Under the terms of the investment advisory agreement, the Fund pays the Adviser an advisory fee at an annual rate of .75% of the first $2.5 billion, .65% of the next $2.5 billion and .60% in excess of $5 billion, of the Fund’s average daily net assets. The fee is accrued daily and paid monthly. The Adviser has agreed to reimburse its fees and bear certain expenses to the extent necessary to limit total operating expenses on an annual basis (the “Expense Caps”) to 1.60%, 2.35%, 2.35%, 1.35%, 1.85%, 1.60% and 1.35% of the daily average net assets for Class A, Class B, Class C, Advisor Class, Class R, Class K and Class I shares, respectively. For the six months ended December 31, 2018, there was no such reimbursement. The Expense Caps will remain in effect until October 31, 2018 and will be automatically extended forone-year periods thereafter unless terminated by the Adviser upon 60 days’ notice to the Fund prior to that date.
| abfunds.com | AB SUSTAINABLE INTERNATIONAL THEMATIC FUND | 29 | |
NOTES TO FINANCIAL STATEMENTS(continued)
Pursuant to the investment advisory agreement, the Fund may reimburse the Adviser for certain legal and accounting services provided to the Fund by the Adviser. For the six months ended December 31, 2018, the reimbursement for such services amounted to $34,454.
The Fund compensates AllianceBernstein Investor Services, Inc. (“ABIS”), a wholly-owned subsidiary of the Adviser, under a Transfer Agency Agreement for providing personnel and facilities to perform transfer agency services for the Fund. ABIS may make payments to intermediaries that provide omnibus account services,sub-accounting services and/or networking services. Such compensation retained by ABIS amounted to $115,865 for the six months ended December 31, 2018.
AllianceBernstein Investments, Inc. (the “Distributor”), a wholly-owned subsidiary of the Adviser, serves as the distributor of the Fund’s shares. The Distributor has advised the Fund that it has retainedfront-end sales charges of $277 from the sale of Class A shares and received $1,025, $209, and $92 in contingent deferred sales charges imposed upon redemptions by shareholders of Class A, Class B and Class C shares, respectively, for the six months ended December 31, 2018.
The Fund may invest in AB Government Money Market Portfolio (the “Government Money Market Portfolio”) which has a contractual annual advisory fee rate of ..20% of the portfolio’s average daily net assets and bears its own expenses. Effective August 1, 2018, the Adviser has contractually agreed to waive .10% of the advisory fee of Government Money Market Portfolio until August 31, 2019. In connection with the investment by the Fund in Government Money Market Portfolio, the Adviser has contractually agreed to waive its advisory fee from the Fund in an amount equal to the Fund’s pro rata share of the effective advisory fee of Government Money Market Portfolio, as borne indirectly by the Fund as an acquired fund fee and expense. For the six months ended December 31, 2018, such waiver amounted to $11,137.
A summary of the Fund’s transactions in AB mutual funds for the six months ended December 31, 2018 is as follows:
Fund | Market Value 06/30/18 (000) | Purchases at Cost (000) | Sales Proceeds (000) | Market Value 12/31/18 (000) | Dividend Income (000) | |||||||||||||||
Government Money Market Portfolio | $ | 20,896 | $ | 50,209 | $ | 59,481 | $ | 11,624 | $ | 180 | ||||||||||
| 30 | AB SUSTAINABLE INTERNATIONAL THEMATIC FUND | abfunds.com | |
NOTES TO FINANCIAL STATEMENTS(continued)
Brokerage commissions paid on investment transactions for the six months ended December 31, 2018 amounted to $92,653, of which $0 and $0, respectively, was paid to Sanford C. Bernstein & Co., LLC and Sanford C. Bernstein Limited, affiliates of the Adviser.
NOTE C
Distribution Services Agreement
The Fund has adopted a Distribution Services Agreement (the “Agreement”) pursuant to Rule12b-1 under the Investment Company Act of 1940. Under the Agreement, the Fund pays distribution and servicing fees to the Distributor at an annual rate of up to .30% of the Fund’s average daily net assets attributable to Class A shares, 1% of the Fund’s average daily net assets attributable to both Class B and Class C shares, .50% of the Fund’s average daily net assets attributable to Class R shares and .25% of the Fund’s average daily net assets attributable to Class K shares. Effective October 31, 2014, payments under the Agreement in respect of Class A shares are limited to an annual rate of .25% of Class A shares’ average daily net assets. There are no distribution and servicing fees on Advisor Class and Class I shares. The fees are accrued daily and paid monthly. The Agreement provides that the Distributor will use such payments in their entirety for distribution assistance and promotional activities. Since the commencement of the Fund’s operations, the Distributor has incurred expenses in excess of the distribution costs reimbursed by the Fund in the amounts of $5,177,158, $4,450,776, $860,621 and $223,626 for Class B, Class C, Class R and Class K shares, respectively. While such costs may be recovered from the Fund in future periods so long as the Agreement is in effect, the rate of the distribution and servicing fees payable under the Agreement may not be increased without a shareholder vote. In accordance with the Agreement, there is no provision for recovery of unreimbursed distribution costs incurred by the Distributor beyond the current fiscal year for Class A shares. The Agreement also provides that the Adviser may use its own resources to finance the distribution of the Fund’s shares.
NOTE D
Investment Transactions
Purchases and sales of investment securities (excluding short-term investments) for the six months ended December 31, 2018 were as follows:
| Purchases | Sales | |||||||
Investment securities (excluding | $ | 70,905,333 | $ | 78,661,309 | ||||
U.S. government securities | – 0 | – | – 0 | – | ||||
| abfunds.com | AB SUSTAINABLE INTERNATIONAL THEMATIC FUND | 31 | |
NOTES TO FINANCIAL STATEMENTS(continued)
The cost of investments for federal income tax purposes was substantially the same as cost for financial reporting purposes. Accordingly, gross unrealized appreciation and unrealized depreciation (excluding foreign currency contracts) are as follows:
Gross unrealized appreciation | $ | 45,313,160 | ||
Gross unrealized depreciation | (18,658,966 | ) | ||
|
| |||
Net unrealized appreciation | $ | 26,654,194 | ||
|
|
1. Derivative Financial Instruments
The Fund may use derivatives in an effort to earn income and enhance returns, to replace more traditional direct investments, to obtain exposure to otherwise inaccessible markets (collectively, “investment purposes”), or to hedge or adjust the risk profile of its portfolio.
The principal types of derivatives utilized by the Fund, as well as the methods in which they may be used are:
| • | Forward Currency Exchange Contracts |
The Fund may enter into forward currency exchange contracts in order to hedge its exposure to changes in foreign currency exchange rates on its foreign portfolio holdings, to hedge certain firm purchase and sale commitments denominated in foreign currencies and fornon-hedging purposes as a means of making direct investments in foreign currencies, as described below under “Currency Transactions”.
A forward currency exchange contract is a commitment to purchase or sell a foreign currency at a future date at a negotiated forward rate. The gain or loss arising from the difference between the original contract and the closing of such contract would be included in net realized gain or loss on forward currency exchange contracts. Fluctuations in the value of open forward currency exchange contracts are recorded for financial reporting purposes as unrealized appreciation and/or depreciation by the Fund. Risks may arise from the potential inability of a counterparty to meet the terms of a contract and from unanticipated movements in the value of a foreign currency relative to the U.S. dollar.
During the six months ended December 31, 2018, the Fund held forward currency exchange contracts for hedging purposes.
The Fund typically enters into International Swaps and Derivatives Association, Inc. Master Agreements (“ISDA Master Agreement”) with its OTC derivative contract counterparties in order to, among other things, reduce its credit risk to OTC counterparties. ISDA Master Agreements include provisions for general obligations, representations, collateral and events of
| 32 | AB SUSTAINABLE INTERNATIONAL THEMATIC FUND | abfunds.com | |
NOTES TO FINANCIAL STATEMENTS(continued)
default or termination. Under an ISDA Master Agreement, the Fund typically may offset with the OTC counterparty certain derivative financial instrument’s payables and/or receivables with collateral held and/or posted and create one single net payment(close-out netting) in the event of default or termination. In the event of a default by an OTC counterparty, the return of collateral with market value in excess of the Fund’s net liability, held by the defaulting party, may be delayed or denied.
The Fund’s ISDA Master Agreements may contain provisions for early termination of OTC derivative transactions in the event the net assets of the Fund decline below specific levels (“net asset contingent features”). If these levels are triggered, the Fund’s OTC counterparty has the right to terminate such transaction and require the Fund to pay or receive a settlement amount in connection with the terminated transaction. If OTC derivatives were held at period end, please refer to netting arrangements by the OTC counterparty table below for additional details.
During the six months ended December 31, 2018, the Fund had entered into the following derivatives:
| Asset Derivatives | Liability Derivatives | |||||||||||||
Derivative Type | Statement of Assets and Liabilities Location | Fair Value | Statement of Assets and Liabilities Location | Fair Value | ||||||||||
Foreign currency contracts | Unrealized appreciation on forward currency exchange contracts | $ | 1,706,595 | | Unrealized depreciation on forward currency exchange contracts | $ | 2,359,145 | |||||||
|
|
|
| |||||||||||
Total | $ | 1,706,595 | $ | 2,359,145 | ||||||||||
|
|
|
| |||||||||||
Derivative Type | Location of | Realized Gain or (Loss) on Derivatives | Change in Unrealized Appreciation or (Depreciation) | |||||||
Foreign currency contracts | Net realized gain/(loss) on forward currency exchange contracts; Net change in unrealized appreciation/depreciation on forward currency exchange contracts | $ | (2,124,803 | ) | $ | 1,095,248 | ||||
|
|
|
| |||||||
Total | $ | (2,124,803 | ) | $ | 1,095,248 | |||||
|
|
|
| |||||||
| abfunds.com | AB SUSTAINABLE INTERNATIONAL THEMATIC FUND | 33 | |
NOTES TO FINANCIAL STATEMENTS(continued)
The following table represents the average monthly volume of the Fund’s derivative transactions during the six months ended December 31, 2018:
Forward Currency Exchange Contracts: | ||||
Average principal amount of buy contracts | $ | 122,715,129 | ||
Average principal amount of sale contracts | $ | 99,153,129 |
For financial reporting purposes, the Fund does not offset derivative assets and derivative liabilities that are subject to netting arrangements in the statement of assets and liabilities.
All OTC derivatives held at period end were subject to netting arrangements. The following table presents the Fund’s derivative assets and liabilities by OTC counterparty net of amounts available for offset under ISDA Master Agreements (“MA”) and net of the related collateral received/pledged by the Fund as of December 31, 2018. Exchange-traded derivatives and centrally cleared swaps are not subject to netting arrangements and as such are excluded from the table.
Counterparty | Derivative Assets Subject to a MA | Derivatives Available for Offset | Cash Collateral Received* | Security Collateral Received* | Net Amount of Derivatives Assets | |||||||||||||||
Bank of America, NA. | $ | 39,106 | $ | (14,610 | ) | $ | – 0 | – | $ | – 0 | – | $ | 24,496 | |||||||
Barclays Bank PLC | 1,938 | (1,938 | ) | – 0 | – | – 0 | – | – 0 | – | |||||||||||
Brown Brothers Harriman & Co. | 132,254 | (101,163 | ) | – 0 | – | – 0 | – | 31,091 | ||||||||||||
Citibank, NA. | 1,071,673 | (440,978 | ) | – 0 | – | – 0 | – | 630,695 | ||||||||||||
Deutsche Bank AG | 53,154 | (53,154 | ) | – 0 | – | – 0 | – | – 0 | – | |||||||||||
Goldman Sachs Bank USA | 231,237 | (1,082 | ) | – 0 | – | – 0 | – | 230,155 | ||||||||||||
JPMorgan Chase Bank, NA. | 12,967 | (12,967 | ) | – 0 | – | – 0 | – | – 0 | – | |||||||||||
Morgan Stanley & Co. LLC. | 81,461 | (81,461 | ) | – 0 | – | – 0 | – | – 0 | – | |||||||||||
Royal Bank of Scotland PLC | 1,566 | (1,566 | ) | – 0 | – | – 0 | – | – 0 | – | |||||||||||
Standard Chartered Bank. | 62,364 | (30,345 | ) | – 0 | – | – 0 | – | 32,019 | ||||||||||||
State Street Bank & Trust Co | 18,875 | – 0 | – | – 0 | – | – 0 | – | 18,875 | ||||||||||||
|
|
|
|
|
|
|
|
|
| |||||||||||
Total | $ | 1,706,595 | $ | (739,264 | ) | $ | – 0 | – | $ | – 0 | – | $ | 967,331 | ^ | ||||||
|
|
|
|
|
|
|
|
|
| |||||||||||
| 34 | AB SUSTAINABLE INTERNATIONAL THEMATIC FUND | abfunds.com | |
NOTES TO FINANCIAL STATEMENTS(continued)
Counterparty | Derivative Liabilities Subject to a MA | Derivatives Available for Offset | Cash Collateral Pledged* | Security Collateral Pledged* | Net Amount of Derivatives Liabilities | |||||||||||||||
Bank of America, NA. | $ | 14,610 | $ | (14,610 | ) | $ | – 0 | – | $ | – 0 | – | $ | – 0 | – | ||||||
Barclays Bank PLC | 79,875 | (1,938 | ) | – 0 | – | – 0 | – | 77,937 | ||||||||||||
BNP Paribas | 16,004 | – 0 | – | – 0 | – | – 0 | – | 16,004 | ||||||||||||
Brown Brothers Harriman & Co. | 101,163 | (101,163 | ) | – 0 | – | – 0 | – | – 0 | – | |||||||||||
Citibank, NA. | 440,978 | (440,978 | ) | – 0 | – | – 0 | – | – 0 | – | |||||||||||
Deutsche Bank AG | 418,545 | (53,154 | ) | – 0 | – | – 0 | – | 365,391 | ||||||||||||
Goldman Sachs Bank USA | 1,082 | (1,082 | ) | – 0 | – | – 0 | – | – 0 | – | |||||||||||
JPMorgan Chase Bank, NA. | 883,985 | (12,967 | ) | – 0 | – | – 0 | – | 871,018 | ||||||||||||
Morgan Stanley & Co. LLC. | 310,622 | (81,461 | ) | – 0 | – | – 0 | – | 229,161 | ||||||||||||
Royal Bank of Scotland PLC | 61,936 | (1,566 | ) | – 0 | – | – 0 | – | 60,370 | ||||||||||||
Standard Chartered Bank. | 30,345 | (30,345 | ) | – 0 | – | – 0 | – | – 0 | – | |||||||||||
|
|
|
|
|
|
|
|
|
| |||||||||||
Total | $ | 2,359,145 | $ | (739,264 | ) | $ | – 0 | – | $ | – 0 | – | $ | 1,619,881 | ^ | ||||||
|
|
|
|
|
|
|
|
|
| |||||||||||
| * | The actual collateral received/pledged may be more than the amount reported due to overcollateralization. |
| ^ | Net amount represents the net receivable/payable that would be due from/to the counterparty in the event of default or termination. The net amount from OTC financial derivative instruments can only be netted across transactions governed under the same master agreement with the same counterparty. |
2. Currency Transactions
The Fund may invest innon-U.S. Dollar-denominated securities on a currency hedged or unhedged basis. The Fund may seek investment opportunities by taking long or short positions in currencies through the use of currency-related derivatives, including forward currency exchange contracts, futures and options on futures, swaps, and other options. The Fund may enter into transactions for investment opportunities when it anticipates that a foreign currency will appreciate or depreciate in value but securities denominated in that currency are not held by the Fund and do not present attractive investment opportunities. Such transactions may also be used when the Adviser believes that it may be more efficient than a direct investment in a foreign currency-denominated security. The Fund may also conduct currency exchange contracts on a spot basis (i.e., for cash at the spot rate prevailing in the currency exchange market for buying or selling currencies).
| abfunds.com | AB SUSTAINABLE INTERNATIONAL THEMATIC FUND | 35 | |
NOTES TO FINANCIAL STATEMENTS(continued)
NOTE E
Capital Stock
Each class consists of 3,000,000,000 authorized shares. Transactions in capital shares for each class were as follows:
| Shares | Amount | |||||||||||||||||||||||
| Six Months Ended December 31, 2018 (unaudited) | Year Ended June 30, 2018 | Six Months Ended December 31, 2018 (unaudited) | Year Ended June 30, 2018 | |||||||||||||||||||||
|
| |||||||||||||||||||||||
| Class A | ||||||||||||||||||||||||
Shares sold | 319,857 | 512,397 | $ | 5,408,064 | $ | 9,848,551 | ||||||||||||||||||
| ||||||||||||||||||||||||
Shares issued in reinvestment of dividends and distributions | 1,245,766 | – 0 | – | 17,764,630 | – 0 | – | ||||||||||||||||||
| ||||||||||||||||||||||||
Shares converted from Class B | 4,688 | 16,034 | 84,159 | 306,726 | ||||||||||||||||||||
| ||||||||||||||||||||||||
Shares converted from Class C | 71,243 | 217,247 | 1,296,877 | 4,144,327 | ||||||||||||||||||||
| ||||||||||||||||||||||||
Shares redeemed | (1,436,476 | ) | (2,695,068 | ) | (24,782,429 | ) | (51,914,539 | ) | ||||||||||||||||
| ||||||||||||||||||||||||
Net increase (decrease) | 205,078 | (1,949,390 | ) | $ | (228,699 | ) | $ | (37,614,935 | ) | |||||||||||||||
| ||||||||||||||||||||||||
| Class B | ||||||||||||||||||||||||
Shares sold | 1,542 | 3,737 | $ | 23,116 | $ | 63,663 | ||||||||||||||||||
| ||||||||||||||||||||||||
Shares issued in reinvestment of dividends and distributions | 8,543 | – 0 | – | 104,567 | – 0 | – | ||||||||||||||||||
| ||||||||||||||||||||||||
Shares converted to Class A | (5,340 | ) | (18,155 | ) | (84,159 | ) | (306,726 | ) | ||||||||||||||||
| ||||||||||||||||||||||||
Shares redeemed | (2,100 | ) | (10,121 | ) | (32,364 | ) | (171,343 | ) | ||||||||||||||||
| ||||||||||||||||||||||||
Net increase (decrease) | 2,645 | (24,539 | ) | $ | 11,160 | $ | (414,406 | ) | ||||||||||||||||
| ||||||||||||||||||||||||
| Class C | ||||||||||||||||||||||||
Shares sold | 7,973 | 60,486 | $ | 115,466 | $ | 1,027,453 | ||||||||||||||||||
| ||||||||||||||||||||||||
Shares issued in reinvestment of dividends and distributions | 59,076 | – 0 | – | 728,402 | – 0 | – | ||||||||||||||||||
| ||||||||||||||||||||||||
Shares converted to Class A | (80,627 | ) | (244,458 | ) | (1,296,877 | ) | (4,144,327 | ) | ||||||||||||||||
| ||||||||||||||||||||||||
Shares redeemed | (61,761 | ) | (193,922 | ) | (921,063 | ) | (3,302,759 | ) | ||||||||||||||||
| ||||||||||||||||||||||||
Net decrease | (75,339 | ) | (377,894 | ) | $ | (1,374,072 | ) | $ | (6,419,633 | ) | ||||||||||||||
| ||||||||||||||||||||||||
| 36 | AB SUSTAINABLE INTERNATIONAL THEMATIC FUND | abfunds.com | |
NOTES TO FINANCIAL STATEMENTS(continued)
| Shares | Amount | |||||||||||||||||||||||
| Six Months Ended December 31, 2018 (unaudited) | Year Ended June 30, 2018 | Six Months Ended December 31, 2018 (unaudited) | Year Ended June 30, 2018 | |||||||||||||||||||||
|
| |||||||||||||||||||||||
| Advisor Class | ||||||||||||||||||||||||
Shares sold | 1,183,760 | 811,720 | $ | 21,189,284 | $ | 15,909,043 | ||||||||||||||||||
| ||||||||||||||||||||||||
Shares issued in reinvestment of dividends and distributions | 381,447 | – 0 | – | 5,572,947 | – 0 | – | ||||||||||||||||||
| ||||||||||||||||||||||||
Shares redeemed | (672,700 | ) | (757,613 | ) | (11,299,597 | ) | (14,779,274 | ) | ||||||||||||||||
| ||||||||||||||||||||||||
Net increase | 892,507 | 54,107 | $ | 15,462,634 | $ | 1,129,769 | ||||||||||||||||||
| ||||||||||||||||||||||||
| Class R | ||||||||||||||||||||||||
Shares sold | 51,731 | 108,950 | $ | 847,421 | $ | 2,068,281 | ||||||||||||||||||
| ||||||||||||||||||||||||
Shares issued in reinvestment of dividends and distributions | 64,079 | – 0 | – | 895,186 | – 0 | – | ||||||||||||||||||
| ||||||||||||||||||||||||
Shares redeemed | (110,328 | ) | (269,580 | ) | (1,946,766 | ) | (5,114,349 | ) | ||||||||||||||||
| ||||||||||||||||||||||||
Net increase (decrease) | 5,482 | (160,630 | ) | $ | (204,159 | ) | $ | (3,046,068 | ) | |||||||||||||||
| ||||||||||||||||||||||||
| Class K | ||||||||||||||||||||||||
Shares sold | 30,936 | 171,333 | $ | 526,277 | $ | 3,305,427 | ||||||||||||||||||
| ||||||||||||||||||||||||
Shares issued in reinvestment of dividends and distributions | 46,679 | – 0 | – | 661,912 | – 0 | – | ||||||||||||||||||
| ||||||||||||||||||||||||
Shares redeemed | (102,429 | ) | (89,341 | ) | (1,794,104 | ) | (1,722,490 | ) | ||||||||||||||||
| ||||||||||||||||||||||||
Net increase (decrease) | (24,814 | ) | 81,992 | $ | (605,915 | ) | $ | 1,582,937 | ||||||||||||||||
| ||||||||||||||||||||||||
| Class I | ||||||||||||||||||||||||
Shares sold | 6,404 | 24,321 | $ | 113,708 | $ | 474,547 | ||||||||||||||||||
| ||||||||||||||||||||||||
Shares issued in reinvestment of dividends and distributions | 14,678 | – 0 | – | 213,436 | – 0 | – | ||||||||||||||||||
| ||||||||||||||||||||||||
Shares redeemed | (4,183 | ) | (24,693 | ) | (76,033 | ) | (481,806 | ) | ||||||||||||||||
| ||||||||||||||||||||||||
Net increase (decrease) | 16,899 | (372 | ) | $ | 251,111 | $ | (7,259 | ) | ||||||||||||||||
| ||||||||||||||||||||||||
NOTE F
Risks Involved in Investing in the Fund
Focused Portfolio Risk—Investments in a limited number of companies may have more risk because changes in the value of a single security may have a more significant effect, either negative or positive, on the Fund’s net asset value, or NAV.
| abfunds.com | AB SUSTAINABLE INTERNATIONAL THEMATIC FUND | 37 | |
NOTES TO FINANCIAL STATEMENTS(continued)
Sector Risk—The Fund may have more risk because of concentrated investments in a particular market sector, such as the technology or financial services sector. Market or economic factors affecting that sector could have a major effect on the value of the Fund’s investments.
ESG Risk—Applying ESG and sustainability criteria to the investment process may exclude securities of certain issuers fornon-investment reasons and therefore the Fund may forgo some market opportunities available to funds that do not use ESG or sustainability criteria. Securities of companies with ESG practices may shift into and out of favor depending on market and economic conditions, and the Fund’s performance may at times be better or worse than the performance of funds that do not use ESG or sustainability criteria.
Foreign (Non-U.S.) Risk—Investments in securities ofnon-U.S. issuers may involve more risk than those of U.S. issuers. These securities may fluctuate more widely in price and may be less liquid due to adverse market, economic, political, regulatory or other factors.
Emerging Market Risk—Investments in emerging market countries may have more risk because the markets are less developed and less liquid as well as being subject to increased economic, political, regulatory or other uncertainties.
Currency Risk—Fluctuations in currency exchange rates may negatively affect the value of the Fund’s investments or reduce its returns.
Capitalization Risk—Investments in small- andmid-capitalization companies may be more volatile than investments in large-capitalization companies. Investments in small-capitalization companies may have additional risks because these companies have limited product lines, markets or financial resources.
Derivatives Risk—Derivatives may be illiquid, difficult to price, and leveraged so that small changes may produce disproportionate losses for the Fund, and may be subject to counterparty risk to a greater degree than more traditional investments.
Indemnification Risk—In the ordinary course of business, the Fund enters into contracts that contain a variety of indemnifications. The Fund’s maximum exposure under these arrangements is unknown. However, the Fund has not had prior claims or losses pursuant to these indemnification provisions and expects the risk of loss thereunder to be remote. Therefore, the Fund has not accrued any liability in connection with these indemnification provisions.
| 38 | AB SUSTAINABLE INTERNATIONAL THEMATIC FUND | abfunds.com | |
NOTES TO FINANCIAL STATEMENTS(continued)
NOTE G
Joint Credit Facility
A number ofopen-end mutual funds managed by the Adviser, including the Fund, participate in a $325 million revolving credit facility (the “Facility”) intended to provide short-term financing if necessary, subject to certain restrictions in connection with abnormal redemption activity. Commitment fees related to the Facility are paid by the participating funds and are included in miscellaneous expenses in the statement of operations. The Fund did not utilize the Facility during the six months ended December 31, 2018.
NOTE H
Distributions to Shareholders
The tax character of distributions paid for the year ending June 30, 2019 will be determined at the end of the current fiscal year.
The tax character of distributions paid during the fiscal years ended June 30, 2018 and June 30, 2017 were as follows:
| 2018 | 2017 | |||||||
Distributions paid from: | ||||||||
Ordinary income | $ | – 0 | – | $ | 1,916,260 | |||
|
|
|
| |||||
Total taxable distributions paid | $ | – 0 | – | $ | 1,916,260 | |||
|
|
|
| |||||
As of June 30, 2018, the components of accumulated earnings/(deficit) on a tax basis were as follows:
Accumulated capital and other losses | $ | 0 | (a) | |
Unrealized appreciation/(depreciation) | 60,858,535 | (b) | ||
|
| |||
Total accumulated earnings/(deficit) | $ | 60,858,535 | ||
|
|
| (a) | During the fiscal year, the Fund utilized $49,985,644 of capital loss carry forwards to offset current year net realized gains. The Fund also had $650,134,364 of capital loss carryforwards expire during the fiscal year. |
| (b) | The differences between book-basis andtax-basis unrealized appreciation/(depreciation) are attributable primarily to the tax deferral of losses on wash sales and the recognition for tax purposes of unrealized gains/losses on certain derivative instruments. |
For tax purposes, net realized capital losses may be carried over to offset future capital gains, if any. Funds are permitted to carry forward capital losses for an indefinite period, and such losses will retain their character as either short-term or long-term capital losses. As of June 30, 2018, the Fund did not have any capital loss carryforwards.
| abfunds.com | AB SUSTAINABLE INTERNATIONAL THEMATIC FUND | 39 | |
NOTES TO FINANCIAL STATEMENTS(continued)
NOTE I
Recent Accounting Pronouncements
In August 2018, the Financial Accounting Standards Board issued an Accounting Standards Update, ASU2018-13, Fair Value Measurement (Topic 820), Disclosure Framework-Changes to the Disclosure Requirements for Fair Value Measurement which removes, modifies and adds disclosures to Topic 820. The amendments in this ASU2018-13 apply to all entities that are required, under existing U.S. GAAP, to make disclosures about recurring or nonrecurring fair value measurements. The amendments in this ASU2018-13 are effective for all entities for fiscal years, and interim periods within those fiscal years, beginning after December 15, 2019. At this time, management is evaluating the implications of these changes on the financial statements.
In October 2018, the U.S. Securities and Exchange Commission adopted amendments to certain disclosure requirements included in RegulationS-X that had become “redundant, duplicative, overlapping, outdated or superseded, in light of the other Commission disclosure requirements, GAAP or changes in the information environment.” The compliance date for the amendments to RegulationS-X was November 5, 2018 (for reporting period end dates of September 30, 2018 or after). Management has adopted the amendments which simplified certain disclosure requirements on the financial statements.
NOTE J
Subsequent Events
Management has evaluated subsequent events for possible recognition or disclosure in the financial statements through the date the financial statements are issued. Management has determined that there are no other material events that would require disclosure in the Fund’s financial statements through this date.
| 40 | AB SUSTAINABLE INTERNATIONAL THEMATIC FUND | abfunds.com | |
FINANCIAL HIGHLIGHTS
Selected Data For A Share Of Capital Stock Outstanding Throughout Each Period
| Class A | ||||||||||||||||||||||||
| Six Months Ended December 31, 2018 (unaudited) | Year Ended June 30, | |||||||||||||||||||||||
| 2018 | 2017 | 2016 | 2015 | 2014 | ||||||||||||||||||||
|
| |||||||||||||||||||||||
Net asset value, beginning of period | $ 18.61 | $ 17.77 | $ 15.36 | $ 16.76 | $ 17.23 | $ 14.65 | ||||||||||||||||||
|
| |||||||||||||||||||||||
Income From Investment Operations | ||||||||||||||||||||||||
Net investment income (loss)(a) | (.07 | )(b) | .09 | (b) | (.00 | )(b)(c) | .08 | (b) | .10 | .14 | ||||||||||||||
Net realized and unrealized gain (loss) on investment and foreign currency transactions | (2.39 | ) | .75 | 2.52 | (1.48 | ) | (.57 | ) | 2.61 | |||||||||||||||
|
| |||||||||||||||||||||||
Net increase (decrease) in net asset value from operations | (2.46 | ) | .84 | 2.52 | (1.40 | ) | (.47 | ) | 2.75 | |||||||||||||||
|
| |||||||||||||||||||||||
Less: Dividends and Distributions | ||||||||||||||||||||||||
Dividends from net investment income | – 0 | – | – 0 | – | (.11 | ) | – 0 | – | – 0 | – | (.17 | ) | ||||||||||||
Distributions from net realized gain on investment and foreign currency transactions | (2.04 | ) | – 0 | – | – 0 | – | – 0 | – | – 0 | – | – 0 | – | ||||||||||||
|
| |||||||||||||||||||||||
Total dividends and distributions | (2.04 | ) | – 0 | – | (.11 | ) | – 0 | – | – 0 | – | (.17 | ) | ||||||||||||
|
| |||||||||||||||||||||||
Net asset value, end of period | $ 14.11 | $ 18.61 | $ 17.77 | $ 15.36 | $ 16.76 | $ 17.23 | ||||||||||||||||||
|
| |||||||||||||||||||||||
Total Return | ||||||||||||||||||||||||
Total investment return based on net asset value(d)^ | (13.34 | )% | 4.73 | % | 16.59 | % | (8.35 | )% | (2.78 | )% | 18.94 | % | ||||||||||||
Ratios/Supplemental Data | ||||||||||||||||||||||||
Net assets, end of period (000’s omitted) | $159,002 | $205,869 | $231,141 | $219,182 | $278,008 | $358,142 | ||||||||||||||||||
Ratio to average net assets of: | ||||||||||||||||||||||||
Expenses, net of waivers/reimbursements(e)† | 1.45 | %(f) | 1.39 | % | 1.42 | % | 1.35 | % | 1.39 | % | 1.37 | % | ||||||||||||
Expenses, before waivers/reimbursements(e)† | 1.46 | %(f) | 1.40 | % | 1.43 | % | 1.35 | % | 1.39 | % | 1.37 | % | ||||||||||||
Net investment income (loss) | (.76 | )%(b)(f) | .46 | %(b) | (.02 | )%(b) | .49 | %(b) | .58 | % | .87 | % | ||||||||||||
Portfolio turnover rate | 29 | % | 36 | % | 27 | % | 45 | % | 18 | % | 36 | % | ||||||||||||
† Expense ratios exclude the estimated acquired fund fees of affiliated/unaffiliated underlying |
| |||||||||||||||||||||||
portfolios | .01 | % | .01 | % | .01 | % | .00 | %(g) | .00 | %(g) | .00 | %(g) | ||||||||||||
See footnote summary on page 48.
| abfunds.com | AB SUSTAINABLE INTERNATIONAL THEMATIC FUND | 41 | |
FINANCIAL HIGHLIGHTS(continued)
Selected Data For A Share Of Capital Stock Outstanding Throughout Each Period
| Class B | ||||||||||||||||||||||||
| Six Months Ended December 31, 2018 (unaudited) | Year Ended June 30, | |||||||||||||||||||||||
| 2018 | 2017 | 2016 | 2015 | 2014 | ||||||||||||||||||||
|
| |||||||||||||||||||||||
Net asset value, beginning of period | $ 16.37 | $ 15.75 | $ 13.63 | $ 14.99 | $ 15.54 | $ 13.26 | ||||||||||||||||||
|
| |||||||||||||||||||||||
Income From Investment Operations | ||||||||||||||||||||||||
Net investment loss(a) | (.12 | )(b) | (.08 | )(b) | (.14 | )(b) | (.07 | )(b) | (.05 | ) | (.00 | )(c) | ||||||||||||
Net realized and unrealized gain (loss) on investment and foreign currency transactions | (2.10 | ) | .70 | 2.26 | (1.29 | ) | (.50 | ) | 2.38 | |||||||||||||||
|
| |||||||||||||||||||||||
Net increase (decrease) in net asset value from operations | (2.22 | ) | .62 | 2.12 | (1.36 | ) | (.55 | ) | 2.38 | |||||||||||||||
|
| |||||||||||||||||||||||
Less: Dividends and Distributions | ||||||||||||||||||||||||
Dividends from net investment income | – 0 | – | – 0 | – | – 0 | – | – 0 | – | – 0 | – | (.10 | ) | ||||||||||||
Distributions from net realized gain on investment and foreign currency transactions | (2.04 | ) | – 0 | – | – 0 | – | – 0 | – | – 0 | – | – 0 | – | ||||||||||||
|
| |||||||||||||||||||||||
Total dividends and distributions | (2.04 | ) | – 0 | – | – 0 | – | – 0 | – | – 0 | – | (.10 | ) | ||||||||||||
|
| |||||||||||||||||||||||
Net asset value, end of period | $ 12.11 | $ 16.37 | $ 15.75 | $ 13.63 | $ 14.99 | $ 15.54 | ||||||||||||||||||
|
| |||||||||||||||||||||||
Total Return | �� | |||||||||||||||||||||||
Total investment return based on net asset value(d)^ | (13.65 | )% | 3.94 | %* | 15.55 | % | (9.07 | )% | (3.54 | )% | 18.06 | % | ||||||||||||
Ratios/Supplemental Data | ||||||||||||||||||||||||
Net assets, end of period (000’s omitted) | $739 | $955 | $1,306 | $2,000 | $5,240 | $10,793 | ||||||||||||||||||
Ratio to average net assets of: | ||||||||||||||||||||||||
Expenses, net of waivers/reimbursements(e)† | 2.28 | %(f) | 2.21 | % | 2.26 | % | 2.18 | % | 2.16 | % | 2.11 | % | ||||||||||||
Expenses, before waivers/reimbursements(e)† | 2.29 | %(f) | 2.22 | % | 2.26 | % | 2.18 | % | 2.16 | % | 2.11 | % | ||||||||||||
Net investment loss | (1.59 | )%(b)(f) | (.45 | )%(b) | (.97 | )%(b) | (.49 | )%(b) | (.34 | )% | (.01 | )% | ||||||||||||
Portfolio turnover rate | 29 | % | 36 | % | 27 | % | 45 | % | 18 | % | 36 | % | ||||||||||||
† Expense ratios exclude the estimated acquired fund fees of affiliated/unaffiliated underlying |
| |||||||||||||||||||||||
portfolios | .01 | % | .01 | % | .01 | % | .00 | %(g) | .00 | %(g) | .00 | %(g) | ||||||||||||
See footnote summary on page 48.
| 42 | AB SUSTAINABLE INTERNATIONAL THEMATIC FUND | abfunds.com | |
FINANCIAL HIGHLIGHTS(continued)
Selected Data For A Share Of Capital Stock Outstanding Throughout Each Period
| Class C | ||||||||||||||||||||||||
| Six Months Ended December 31, 2018 (unaudited) | Year Ended June 30, | |||||||||||||||||||||||
| 2018 | 2017 | 2016 | 2015 | 2014 | ||||||||||||||||||||
|
| |||||||||||||||||||||||
Net asset value, beginning of period | $ 16.47 | $ 15.84 | $ 13.69 | $ 15.05 | $ 15.60 | $ 13.32 | ||||||||||||||||||
|
| |||||||||||||||||||||||
Income From Investment Operations | ||||||||||||||||||||||||
Net investment income (loss)(a) | (.12 | )(b) | (.08 | )(b) | (.15 | )(b) | (.04 | )(b) | (.02 | ) | .02 | |||||||||||||
Net realized and unrealized gain (loss) on investment and foreign currency transactions | (2.11 | ) | .71 | 2.30 | (1.32 | ) | (.53 | ) | 2.38 | |||||||||||||||
|
| |||||||||||||||||||||||
Net increase (decrease) in net asset value from operations | (2.23 | ) | .63 | 2.15 | (1.36 | ) | (.55 | ) | 2.40 | |||||||||||||||
|
| |||||||||||||||||||||||
Less: Dividends and Distributions | ||||||||||||||||||||||||
Dividends from net investment income | – 0 | – | – 0 | – | – 0 | – | – 0 | – | – 0 | – | (.12 | ) | ||||||||||||
Distributions from net realized gain on investment and foreign currency transactions | (2.04 | ) | – 0 | – | – 0 | – | – 0 | – | – 0 | – | – 0 | – | ||||||||||||
|
| |||||||||||||||||||||||
Total dividends and distributions | (2.04 | ) | – 0 | – | – 0 | – | – 0 | – | – 0 | – | (.12 | ) | ||||||||||||
|
| |||||||||||||||||||||||
Net asset value, end of period | $ 12.20 | $ 16.47 | $ 15.84 | $ 13.69 | $ 15.05 | $ 15.60 | ||||||||||||||||||
|
| |||||||||||||||||||||||
Total Return | ||||||||||||||||||||||||
Total investment return based on net asset value(d)^ | (13.63 | )% | 3.98 | %* | 15.70 | % | (9.04 | )% | (3.52 | )% | 18.09 | % | ||||||||||||
Ratios/Supplemental Data | ||||||||||||||||||||||||
Net assets, end of period (000’s omitted) | $5,468 | $8,621 | $14,278 | $40,800 | $56,865 | $70,259 | ||||||||||||||||||
Ratio to average net assets of: | ||||||||||||||||||||||||
Expenses, net of waivers/reimbursements(e)† | 2.21 | %(f) | 2.14 | % | 2.20 | % | 2.11 | % | 2.13 | % | 2.07 | % | ||||||||||||
Expenses, before waivers/reimbursements(e)† | 2.22 | %(f) | 2.16 | % | 2.20 | % | 2.11 | % | 2.13 | % | 2.07 | % | ||||||||||||
Net investment income (loss) | (1.52 | )%(b)(f) | (.46 | )%(b) | (1.03 | )%(b) | (.30 | )%(b) | (.16 | )% | .16 | % | ||||||||||||
Portfolio turnover rate | 29 | % | 36 | % | 27 | % | 45 | % | 18 | % | 36 | % | ||||||||||||
† Expense ratios exclude the estimated acquired fund fees of affiliated/unaffiliated underlying |
| |||||||||||||||||||||||
portfolios | .01 | % | .01 | % | .01 | % | .00 | %(g) | .00 | %(g) | .00 | %(g) | ||||||||||||
See footnote summary on page 48.
| abfunds.com | AB SUSTAINABLE INTERNATIONAL THEMATIC FUND | 43 | |
FINANCIAL HIGHLIGHTS(continued)
Selected Data For A Share Of Capital Stock Outstanding Throughout Each Period
| Advisor Class | ||||||||||||||||||||||||
| Six Months Ended December 31, 2018 (unaudited) | Year Ended June 30, | |||||||||||||||||||||||
| 2018 | 2017 | 2016 | 2015 | 2014 | ||||||||||||||||||||
|
| |||||||||||||||||||||||
Net asset value, beginning of period | $ 18.99 | $ 18.08 | $ 15.63 | $ 17.01 | $ 17.45 | $ 14.81 | ||||||||||||||||||
|
| |||||||||||||||||||||||
Income From Investment Operations | ||||||||||||||||||||||||
Net investment income (loss)(a) | (.05 | )(b) | .14 | (b) | .04 | (b) | .11 | (b) | .14 | .19 | ||||||||||||||
Net realized and unrealized gain (loss) on investment and foreign currency transactions | (2.44 | ) | .77 | 2.56 | (1.49 | ) | (.58 | ) | 2.65 | |||||||||||||||
|
| |||||||||||||||||||||||
Net increase (decrease) in net asset value from operations | (2.49 | ) | .91 | 2.60 | (1.38 | ) | (.44 | ) | 2.84 | |||||||||||||||
|
| |||||||||||||||||||||||
Less: Dividends and Distributions | ||||||||||||||||||||||||
Dividends from net investment income | – 0 | – | – 0 | – | (.15 | ) | – 0 | – | – 0 | – | (.20 | ) | ||||||||||||
Distributions from net realized gain on investment and foreign currency transactions | (2.04 | ) | – 0 | – | – 0 | – | – 0 | – | – 0 | – | – 0 | – | ||||||||||||
|
| |||||||||||||||||||||||
Total dividends and distributions | (2.04 | ) | – 0 | – | (.15 | ) | – 0 | – | – 0 | – | (.20 | ) | ||||||||||||
|
| |||||||||||||||||||||||
Net asset value, end of period | $ 14.46 | $ 18.99 | $ 18.08 | $ 15.63 | $ 17.01 | $ 17.45 | ||||||||||||||||||
|
| |||||||||||||||||||||||
Total Return | ||||||||||||||||||||||||
Total investment return based on net asset value(d)^ | (13.19 | )% | 5.03 | %* | 16.84 | % | (8.11 | )% | (2.52 | )% | 19.32 | % | ||||||||||||
Ratios/Supplemental Data | ||||||||||||||||||||||||
Net assets, end of period (000’s omitted) | $46,942 | $44,697 | $41,582 | $45,816 | $62,213 | $83,622 | ||||||||||||||||||
Ratio to average net assets of: | ||||||||||||||||||||||||
Expenses, net of waivers/reimbursements(e)† | 1.21 | %(f) | 1.14 | % | 1.17 | % | 1.10 | % | 1.12 | % | 1.06 | % | ||||||||||||
Expenses, before waivers/reimbursements(e)† | 1.22 | %(f) | 1.15 | % | 1.18 | % | 1.10 | % | 1.12 | % | 1.06 | % | ||||||||||||
Net investment income (loss) | (.53 | )%(b)(f) | .73 | %(b) | .22 | %(b) | .69 | %(b) | .85 | % | 1.17 | % | ||||||||||||
Portfolio turnover rate | 29 | % | 36 | % | 27 | % | 45 | % | 18 | % | 36 | % | ||||||||||||
† Expense ratios exclude the estimated acquired fund fees of affiliated/unaffiliated underlying |
| |||||||||||||||||||||||
portfolios | .01 | % | .01 | % | .01 | % | .00 | %(g) | .00 | %(g) | .00 | %(g) | ||||||||||||
See footnote summary on page 48.
| 44 | AB SUSTAINABLE INTERNATIONAL THEMATIC FUND | abfunds.com | |
FINANCIAL HIGHLIGHTS(continued)
Selected Data For A Share Of Capital Stock Outstanding Throughout Each Period
| Class R | ||||||||||||||||||||||||
| Six Months Ended December 31, 2018 (unaudited) | Year Ended June 30, | |||||||||||||||||||||||
| 2018 | 2017 | 2016 | 2015 | 2014 | ||||||||||||||||||||
|
| |||||||||||||||||||||||
Net asset value, beginning of period | $ 18.31 | $ 17.53 | $ 15.15 | $ 16.57 | $ 17.09 | $ 14.54 | ||||||||||||||||||
|
| |||||||||||||||||||||||
Income From Investment Operations | ||||||||||||||||||||||||
Net investment income (loss)(a) | (.09 | )(b) | .01 | (b) | (.05 | )(b) | .03 | (b) | .06 | .09 | ||||||||||||||
Net realized and unrealized gain (loss) on investment and foreign currency transactions | (2.35 | ) | .77 | 2.49 | (1.45 | ) | (.58 | ) | 2.60 | |||||||||||||||
|
| |||||||||||||||||||||||
Net increase (decrease) in net asset value from operations | (2.44 | ) | .78 | 2.44 | (1.42 | ) | (.52 | ) | 2.69 | |||||||||||||||
|
| |||||||||||||||||||||||
Less: Dividends and Distributions | ||||||||||||||||||||||||
Dividends from net investment income | – 0 | – | – 0 | – | (.06 | ) | – 0 | – | – 0 | – | (.14 | ) | ||||||||||||
Distributions from net realized gain on investment and foreign currency transactions | (2.04 | ) | – 0 | – | – 0 | – | – 0 | – | – 0 | – | – 0 | – | ||||||||||||
|
| |||||||||||||||||||||||
Total dividends and distributions | (2.04 | ) | – 0 | – | (.06 | ) | – 0 | – | – 0 | – | (.14 | ) | ||||||||||||
|
| |||||||||||||||||||||||
Net asset value, end of period | $ 13.83 | $ 18.31 | $ 17.53 | $ 15.15 | $ 16.57 | $ 17.09 | ||||||||||||||||||
|
| |||||||||||||||||||||||
Total Return | ||||||||||||||||||||||||
Total investment return based on net asset value(d)^ | (13.40 | )% | 4.45 | %* | 16.19 | % | (8.57 | )% | (3.04 | )% | 18.59 | % | ||||||||||||
Ratios/Supplemental Data | ||||||||||||||||||||||||
Net assets, end of period (000’s omitted) | $7,049 | $9,234 | $11,659 | $12,449 | $15,394 | $18,149 | ||||||||||||||||||
Ratio to average net assets of: | ||||||||||||||||||||||||
Expenses, net of waivers/reimbursements(e)† | 1.75 | %(f) | 1.70 | % | 1.71 | % | 1.67 | % | 1.64 | % | 1.62 | % | ||||||||||||
Expenses, before waivers/reimbursements(e)† | 1.76 | %(f) | 1.72 | % | 1.72 | % | 1.67 | % | 1.64 | % | 1.62 | % | ||||||||||||
Net investment income (loss) | (1.06 | )%(b)(f) | .08 | %(b) | (.33 | )%(b) | .17 | %(b) | .34 | % | .58 | % | ||||||||||||
Portfolio turnover rate | 29 | % | 36 | % | 27 | % | 45 | % | 18 | % | 36 | % | ||||||||||||
† Expense ratios exclude the estimated acquired fund fees of affiliated/unaffiliated underlying |
| |||||||||||||||||||||||
portfolios | .01 | % | .01 | % | .01 | % | .00 | %(g) | .00 | %(g) | .00 | %(g) | ||||||||||||
See footnote summary on page 48.
| abfunds.com | AB SUSTAINABLE INTERNATIONAL THEMATIC FUND | 45 | |
FINANCIAL HIGHLIGHTS(continued)
Selected Data For A Share Of Capital Stock Outstanding Throughout Each Period
| Class K | ||||||||||||||||||||||||
| Six Months Ended December 31, 2018 (unaudited) | Year Ended June 30, | |||||||||||||||||||||||
| 2018 | 2017 | 2016 | 2015 | 2014 | ||||||||||||||||||||
|
| |||||||||||||||||||||||
Net asset value, beginning of period | $ 18.52 | $ 17.68 | $ 15.29 | $ 16.69 | $ 17.15 | $ 14.57 | ||||||||||||||||||
|
| |||||||||||||||||||||||
Income From Investment Operations | ||||||||||||||||||||||||
Net investment income (loss)(a) | (.06 | )(b) | .12 | (b) | .01 | (b) | .08 | (b) | .11 | .15 | ||||||||||||||
Net realized and unrealized gain (loss) on investment and foreign currency transactions | (2.38 | ) | .72 | 2.50 | (1.48 | ) | (.57 | ) | 2.60 | |||||||||||||||
|
| |||||||||||||||||||||||
Net increase (decrease) in net asset value from operations | (2.44 | ) | .84 | 2.51 | (1.40 | ) | (.46 | ) | 2.75 | |||||||||||||||
|
| |||||||||||||||||||||||
Less: Dividends and Distributions | ||||||||||||||||||||||||
Dividends from net investment income | – 0 | – | – 0 | – | (.12 | ) | – 0 | – | – 0 | – | (.17 | ) | ||||||||||||
Distributions from net realized gain on investment and foreign currency transactions | (2.04 | ) | – 0 | – | – 0 | – | – 0 | – | – 0 | – | – 0 | – | ||||||||||||
|
| |||||||||||||||||||||||
Total dividends and distributions | (2.04 | ) | – 0 | – | (.12 | ) | – 0 | – | – 0 | – | (.17 | ) | ||||||||||||
|
| |||||||||||||||||||||||
Net asset value, end of period | $ 14.04 | $ 18.52 | $ 17.68 | $ 15.29 | $ 16.69 | $ 17.15 | ||||||||||||||||||
|
| |||||||||||||||||||||||
Total Return | ||||||||||||||||||||||||
Total investment return based on net asset value(d)^ | (13.29 | )% | 4.75 | % | 16.60 | % | (8.39 | )% | (2.68 | )% | 18.99 | % | ||||||||||||
Ratios/Supplemental Data | ||||||||||||||||||||||||
Net assets, end of period (000’s omitted) | $5,253 | $7,391 | $5,605 | $5,001 | $6,224 | $6,146 | ||||||||||||||||||
Ratio to average net assets of: | ||||||||||||||||||||||||
Expenses, net of waivers/reimbursements(e)† | 1.44 | %(f) | 1.40 | % | 1.40 | % | 1.36 | % | 1.33 | % | 1.31 | % | ||||||||||||
Expenses, before waivers/reimbursements(e)† | 1.45 | %(f) | 1.42 | % | 1.41 | % | 1.36 | % | 1.33 | % | 1.31 | % | ||||||||||||
Net investment income (loss) | (.74 | )%(b)(f) | .61 | %(b) | .03 | %(b) | .52 | %(b) | .67 | % | .97 | % | ||||||||||||
Portfolio turnover rate | 29 | % | 36 | % | 27 | % | 45 | % | 18 | % | 36 | % | ||||||||||||
† Expense ratios exclude the estimated acquired fund fees of affiliated/unaffiliated underlying |
| |||||||||||||||||||||||
portfolios | .01 | % | .01 | % | .01 | % | .00 | %(g) | .00 | %(g) | .00 | %(g) | ||||||||||||
See footnote summary on page 48.
| 46 | AB SUSTAINABLE INTERNATIONAL THEMATIC FUND | abfunds.com | |
FINANCIAL HIGHLIGHTS(continued)
Selected Data For A Share Of Capital Stock Outstanding Throughout Each Period
| Class I | ||||||||||||||||||||||||
| Six Months Ended December 31, 2018 (unaudited) | Year Ended June 30, | |||||||||||||||||||||||
| 2018 | 2017 | 2016 | 2015 | 2014 | ||||||||||||||||||||
|
| |||||||||||||||||||||||
Net asset value, beginning of period | $ 18.90 | $ 17.97 | $ 15.56 | $ 16.90 | $ 17.30 | $ 14.67 | ||||||||||||||||||
|
| |||||||||||||||||||||||
Income From Investment Operations | ||||||||||||||||||||||||
Net investment income (loss)(a) | (.03 | )(b) | .18 | (b) | .06 | (b) | .14 | (b) | .19 | .15 | ||||||||||||||
Net realized and unrealized gain (loss) on investment and foreign currency transactions | (2.44 | ) | .75 | 2.53 | (1.48 | ) | (.59 | ) | 2.69 | |||||||||||||||
|
| |||||||||||||||||||||||
Net increase (decrease) in net asset value from operations | (2.47 | ) | .93 | 2.59 | (1.34 | ) | (.40 | ) | 2.84 | |||||||||||||||
|
| |||||||||||||||||||||||
Less: Dividends and Distributions | ||||||||||||||||||||||||
Dividends from net investment income | – 0 | – | – 0 | – | (.18 | ) | – 0 | – | – 0 | – | (.21 | ) | ||||||||||||
Distributions from net realized gain on investment and foreign currency transactions | (2.04 | ) | – 0 | – | – 0 | – | – 0 | – | – 0 | – | – 0 | – | ||||||||||||
|
| |||||||||||||||||||||||
Total dividends and distributions | (2.04 | ) | – 0 | – | (.18 | ) | – 0 | – | – 0 | – | (.21 | ) | ||||||||||||
|
| |||||||||||||||||||||||
Net asset value, end of period | $ 14.39 | $ 18.90 | $ 17.97 | $ 15.56 | $ 16.90 | $ 17.30 | ||||||||||||||||||
|
| |||||||||||||||||||||||
Total Return | ||||||||||||||||||||||||
Total investment return based on net asset value(d)^ | (13.14 | )% | 5.17 | %* | 16.95 | % | (7.93 | )% | (2.31 | )% | 19.48 | % | ||||||||||||
Ratios/Supplemental Data | ||||||||||||||||||||||||
Net assets, end of period (000’s omitted) | $1,752 | $1,981 | $1,891 | $1,484 | $1,376 | $1,123 | ||||||||||||||||||
Ratio to average net assets of: | ||||||||||||||||||||||||
Expenses, net of waivers/reimbursements(e)† | 1.08 | %(f) | 1.03 | % | 1.05 | % | .95 | % | .90 | % | .92 | % | ||||||||||||
Expenses, before waivers/reimbursements(e)† | 1.08 | %(f) | 1.05 | % | 1.06 | % | .95 | % | .90 | % | .92 | % | ||||||||||||
Net investment income (loss) | (.38 | )%(b)(f) | .91 | %(b) | .39 | %(b) | .92 | %(b) | 1.15 | % | .97 | % | ||||||||||||
Portfolio turnover rate | 29 | % | 36 | % | 27 | % | 45 | % | 18 | % | 36 | % | ||||||||||||
† Expense ratios exclude the estimated acquired fund fees of affiliated/unaffiliated underlying |
| |||||||||||||||||||||||
portfolios | .01 | % | .01 | % | .01 | % | .00 | %(g) | .00 | %(g) | .00 | %(g) | ||||||||||||
See footnote summary on page 48.
| abfunds.com | AB SUSTAINABLE INTERNATIONAL THEMATIC FUND | 47 | |
FINANCIAL HIGHLIGHTS(continued)
Selected Data For A Share Of Capital Stock Outstanding Throughout Each Period
| (a) | Based on average shares outstanding. |
| (b) | Net of expenses waived/reimbursed by the Adviser. |
| (c) | Amount is less than $0.005. |
| (d) | Total investment return is calculated assuming an initial investment made at the net asset value at the beginning of the period, reinvestment of all dividends and distributions at net asset value during the period, and redemption on the last day of the period. Initial sales charge or contingent deferred sales charge is not reflected in the calculation of total investment return. Total investment return does not reflect the deduction of taxes that a shareholder would pay on fund distributions or the redemption of fund shares. Total investment return for a period of less than one year is not annualized. |
| (e) | In connection with the Fund’s investments in affiliated underlying portfolios, the Fund incurs no direct expenses but bears proportionate shares of the acquired fund fees and expenses (i.e. operating, administrative and investment advisory fees) of the affiliated underlying portfolios. The Adviser has contractually agreed to waive its fees from the Fund in an amount equal to the Fund’s pro rata share of certain acquired fund fees and expenses, and for the six months ended December 31, 2018 and the years ended June 30, 2018 and June 30, 2017, such waiver amounted to 0.01% (annualized), 0.01% and less than 0.01%, respectively. |
| (f) | Annualized. |
| (g) | Amount is less than 0.005%. |
| * | The net asset value and total return include adjustments in accordance with accounting principles generally accepted in the United States of America for financial reporting purposes. As such, the net asset value and total return for shareholder transactions may differ from financial statements. |
| ^ | Includes the impact of proceeds received and credited to the Fund resulting from third party regulatory settlements, which enhanced the Fund’s performance for the year ended June 30, 2014 by 0.01%. |
See notes to financial statements.
| 48 | AB SUSTAINABLE INTERNATIONAL THEMATIC FUND | abfunds.com | |
RESULTS OF STOCKHOLDER MEETING
(unaudited)
A Special Meeting of Stockholders of the AB Sustainable International Thematic Fund, Inc. (the “Fund”) was held on October 11, 2018 and adjourned until December 11, 2018. A description of the proposals and number of shares voted at the Meeting are as follows (the proposal number shown below corresponds to the proposal number in the Fund’s proxy statement):
| 1. | To approve and vote upon the election of Directors for the Fund, each such Director to serve for a term of indefinite duration and until his or her successor is duly elected and qualifies. |
Director: | Voted For: | Authority Withheld: | ||||||
Michael J. Downey | 6,967,162 | 342,283 | ||||||
William H. Foulk, Jr.* | 6,946,223 | 363,222 | ||||||
Nancy P. Jacklin | 6,967,890 | 341,554 | ||||||
Robert M. Keith | 6,959,973 | 349,472 | ||||||
Carol C. McMullen | 6,973,394 | 336,051 | ||||||
Gary L. Moody | 6,948,604 | 360,841 | ||||||
Marshall C. Turner, Jr. | 6,937,700 | 371,745 | ||||||
Earl D. Weiner | 6,941,404 | 368,040 | ||||||
| * | Mr. Foulk retired on December 31, 2018. |
| abfunds.com | AB SUSTAINABLE INTERNATIONAL THEMATIC FUND | 49 | |
BOARD OF DIRECTORS
Marshall C. Turner, Jr.(1), Chairman Michael J. Downey(1) Nancy P. Jacklin(1) Robert M. Keith,President and Chief Executive Officer | Carol C. McMullen(1) Garry L. Moody(1) Earl D. Weiner(1) |
OFFICERS
Daniel C. Roarty(2),Vice President William Johnston(2),Vice President Emilie D. Wrapp,Secretary Michael B. Reyes,Senior Officer | Joseph J. Mantineo,Treasurer and Chief Financial Officer Phyllis J. Clarke,Controller Vincent S. Noto,Chief Compliance Officer |
Custodian and Accounting Agent Brown Brothers Harriman & Co. 50 Post Office Square Boston, MA 02110
Principal Underwriter AllianceBernstein Investments, Inc. 1345 Avenue of the Americas New York, NY 10105
Transfer Agent AllianceBernstein Investor Services, Inc. P.O. Box 786003 San Antonio, TX 78278-6003 Toll-Free 1-(800) 221-5672 | Independent Registered Public Accounting Firm Ernst & Young LLP 5 Times Square New York, NY 10036
Legal Counsel Seward & Kissel LLP One Battery Park Plaza New York, NY 10004 | |
| 1 | Member of the Audit Committee, the Governance and Nominating Committee and the Independent Directors Committee. |
| 2 | The day-to-day management of, and investment decisions for, the Fund’s portfolio are made by the Adviser’s Global Growth and Thematic Investment Team. Messrs. Roarty and Johnston are the investment professional with the most significant responsibility for the day-to-day management of the Fund’s portfolio. |
| 50 | AB SUSTAINABLE INTERNATIONAL THEMATIC FUND | abfunds.com | |
Information Regarding the Review and Approval of the Fund’s Advisory Agreement
As described in more detail in the Proxy Statement for the AB Funds dated August 20, 2018 (the “August 2018 Proxy Statement”), the Boards of the AB Funds, at a meeting held onJuly 31-August 2, 2018, approved new advisory agreements with the Adviser (the “Proposed Agreements”) for the AB Funds, including AB Sustainable International Thematic Fund, Inc. (the “Fund”), in connection with the planned disposition by AXA S.A. of its remaining shares of AXA Equitable Holdings, Inc. (the indirect holder of a majority of the partnership interests in the Adviser and the indirect parent of AllianceBernstein Corporation, the general partner of the Adviser) in one or more transactions and the related potential for one or more “assignments” (within the meaning of section 2(a)(4) of the Investment Company Act) of the advisory agreements for the AB Funds, including the Fund’s Advisory Agreement, resulting in the automatic termination of such advisory agreements.
At the same meeting, the AB Boards also considered and approved interim advisory agreements with the Adviser (the “Interim Advisory Agreements”) for the AB Funds, including the Fund, to be effective only in the event that stockholder approval of a Proposed Agreement had not been obtained as of the date of one or more transactions resulting in an “assignment” of the Adviser’s advisory agreements, resulting in the automatic termination of such advisory agreements.
As indicated in a supplement dated January 7, 2019 to the August 2018 Proxy Statement, the annual meeting of shareholders with respect to the Fund has been adjourned until March 12, 2019 for the purpose of voting on the Proposed Agreements.
A discussion regarding the basis for the Boards’ approvals at a meeting held onJuly 31-August 2, 2018 is set forth below.
Information Regarding the Review and Approval of the Fund’s Proposed New Advisory Agreement and Interim Advisory Agreement in the Context of Potential Assignments
At a meeting of the AB Boards held on July31-August 2, 2018, the Adviser presented its recommendation that the Boards consider and approve the Proposed Agreements. Section 15(c) of the 1940 Act provides that, after an initial period, a Fund’s Current Agreement and currentsub-advisory agreement, as applicable, will remain in effect only if the Board, including a majority of the Independent Directors, annually reviews and approves them. Each of the Current Agreements had been approved by a Board within theone-year period prior to approval of its related Proposed Agreement, except that the Current Agreements for certain FlexFee funds were approved in February 2017. In connection with their approval of the Proposed Agreements, the Boards considered their conclusions in
| abfunds.com | AB SUSTAINABLE INTERNATIONAL THEMATIC FUND | 51 | |
connection with their most recent approvals of the Current Agreements, in particular in cases where the last approval of a Current Agreement was relatively recent, including the Boards’ general satisfaction with the nature and quality of services being provided and, as applicable, in the case of certain Funds, actions taken or to be taken in an effort to improve investment performance or reduce expense ratios. The Directors also reviewed updated information provided by the Adviser in respect of each Fund. Also in connection with their approval of the Proposed Agreements, the Boards considered a representation made to them at that time by the Adviser that there were no additional developments not already disclosed to the Boards since their most recent approvals of the Current Agreements that would be a material consideration to the Boards in connection with their consideration of the Proposed Agreements, except for matters disclosed to the Boards by the Adviser. The Directors considered the fact that each Proposed Agreement would have corresponding terms and conditions identical to those of the corresponding Current Agreement with the exception of the effective date and initial term under the Proposed Agreement.
The Directors considered their knowledge of the nature and quality of the services provided by the Adviser to each Fund gained from their experience as directors or trustees of registered investment companies advised by the Adviser, their overall confidence in the Adviser’s integrity and competence they have gained from that experience, the Adviser’s initiative in identifying and raising potential issues with the Directors and its responsiveness, frankness and attention to concerns raised by the Directors in the past, including the Adviser’s willingness to consider and implement organizational and operational changes designed to improve investment results and the services provided to the Funds. The Directors noted that they have four regular meetings each year, at each of which they review extensive materials and information from the Adviser, including information on the investment performance of each Fund.
The Directors also considered all factors they believed relevant, including the specific matters discussed below. During the course of their deliberations, the Directors evaluated, among other things, the reasonableness of the management fees of the Funds they oversee. The Directors did not identify any particular information that was all-important or controlling, and different Directors may have attributed different weights to the various factors. The Directors determined that the selection of the Adviser to manage the Funds, and the overall arrangements between the Funds and the Adviser, as provided in the Proposed Agreements, including the management fees, were fair and reasonable in light of the services performed under the Current Agreements and to be performed under the Proposed Agreements, expenses incurred and to be incurred and such other matters as the Directors considered relevant in the exercise of their
| 52 | AB SUSTAINABLE INTERNATIONAL THEMATIC FUND | abfunds.com | |
business judgment. The material factors and conclusions that formed the basis for the Directors’ determinations included the following:
Nature, Extent and Quality of Services Provided
The Directors considered the scope and quality of services to be provided by the Adviser under the Proposed Agreements, including the quality of the investment research capabilities of the Adviser and the other resources it has dedicated to performing services for the Funds. They also considered the information that had been provided to them by the Adviser concerning the anticipated implementation of the Plan and the Adviser’s representation that it did not anticipate that such implementation would affect the management or structure of the Adviser, have a material adverse effect on the Adviser, or adversely affect the quality of the services provided to the Funds by the Adviser and its affiliates. The Directors noted that the Adviser from time to time reviews each Fund’s investment strategies and from time to time proposes changes intended to improve the Fund’s relative or absolute performance for the Directors’ consideration. They also noted the professional experience and qualifications of each Fund’s portfolio management team and other senior personnel of the Adviser. The Directors also considered that certain Proposed Agreements, similar to the corresponding Current Agreements, provide that the Funds will reimburse the Adviser for the cost to it of providing certain clerical, accounting, administrative and other services to the Funds by employees of the Adviser or its affiliates. Requests for these reimbursements are made on a quarterly basis and subject to approval by the Directors. The Directors noted that the Adviser did not request any reimbursements from certain Funds in the Fund’s latest fiscal year reviewed. The Directors noted that the methodology to be used to determine the reimbursement amounts had been reviewed by an independent consultant retained by the Funds’ former Senior Officer/Independent Compliance Officer. The quality of administrative and other services, including the Adviser’s role in coordinating the activities of the Funds’ other service providers, also was considered. The Directors of each Fund concluded that, overall, they were satisfied with the nature, extent and quality of services to be provided to the Funds under the Proposed Agreement for the Fund.
Costs of Services to be Provided and Profitability
The Directors reviewed a schedule of the revenues and expenses and related notes indicating the profitability of each Fund to the Adviser for calendar years 2016 and 2017, as applicable, that had been prepared with an expense allocation methodology arrived at in consultation with an independent consultant retained by the Funds’ former Senior Officer/Independent Compliance Officer. The Directors noted the assumptions and methods of allocation used by the Adviser in preparing fund-specific profitability data and understood that there are a number of potentially acceptable allocation methodologies for information of this type. The Directors noted that the profitability information reflected all revenues and
| abfunds.com | AB SUSTAINABLE INTERNATIONAL THEMATIC FUND | 53 | |
expenses of the Adviser’s relationship with a Fund, including those relating to its subsidiaries that provide transfer agency, distribution and brokerage services to the Fund, as applicable. The Directors recognized that it is difficult to make comparisons of the profitability of the Proposed Agreements with the profitability of fund advisory contracts for unaffiliated funds because comparative information is not generally publicly available and is affected by numerous factors. The Directors focused on the profitability of the Adviser’s relationship with each Fund before taxes and distribution expenses, as applicable. The Directors noted that certain Funds were not profitable to the Adviser in one or more periods reviewed. The Directors concluded that the Adviser’s level of profitability from its relationship with the other Funds was not unreasonable. The Directors were unable to consider historical information about the profitability of certain Funds that had recently commenced operations and for which historical profitability information was not available. The Adviser agreed to provide the Directors with profitability information in connection with future proposed continuances of the Proposed Agreements.
Fall-Out Benefits
The Directors considered the other benefits to the Adviser and its affiliates from their relationships with the Funds, including, but not limited to, as applicable, benefits relating to soft dollar arrangements (whereby investment advisers receive brokerage and research services from brokers that execute agency transactions for their clients) in the case of certain Funds;12b-1 fees and sales charges received by the principal underwriter (which is a wholly owned subsidiary of the Adviser) in respect of certain classes of the shares of most of the Funds; brokerage commissions paid by certain Funds to brokers affiliated with the Adviser; and transfer agency fees paid by most of the Funds to a wholly owned subsidiary of the Adviser. The Directors recognized that the Adviser’s profitability would be somewhat lower, and that a Fund’s unprofitability to the Adviser would be exacerbated, without these benefits. The Directors understood that the Adviser also might derive reputational and other benefits from its association with the Funds.
Investment Results
In addition to the information reviewed by the Directors in connection with the Board meeting at which the Proposed Agreements were approved, the Directors receive detailed performance information for the Funds at each regular Board meeting during the year.
The Boards’ consideration of each Proposed Agreement was informed by their most recent approval of the related Current Agreement, and, in the case of certain Funds, their discussion with the Adviser of the reasons for those Funds’ underperformance in certain periods. The Directors also reviewed updated performance information and, in some cases, discussed with the Adviser the reasons for changes in performance or continued
| 54 | AB SUSTAINABLE INTERNATIONAL THEMATIC FUND | abfunds.com | |
underperformance. On the basis of this review, the Directors concluded that each Fund’s investment performance was acceptable.
Management Fees and Other Expenses
The Directors considered the management fee rate payable by each Fund to the Adviser and information prepared by an independent service provider (the “15(c) provider”) concerning management fee rates payable by other funds in the same category as the Fund. The Directors recognized that it is difficult to make comparisons of management fees because there are variations in the services that are included in the fees paid by other funds. The Directors compared each Fund’s contractual management fee rate with a peer group median, and where applicable, took into account the impact on the management fee rate of the administrative expense reimbursement paid to the Adviser in the latest fiscal year. In the case of the ACS Funds, the Directors noted that the management fee rate is zero but also were cognizant that the Adviser is indirectly compensated by the wrap fee program sponsors that use the ACS Funds as an investment vehicle for their clients.
The Directors also considered the Adviser’s fee schedule for other clients pursuing a similar investment style to each Fund. For this purpose, they reviewed the relevant advisory fee information from the Adviser’s Form ADV and in a report from the Funds’ Senior Analyst and noted the differences between a Fund’s fee schedule, on the one hand, and the Adviser’s institutional fee schedule and the schedule of fees charged by the Adviser to any offshore funds and for services to anysub-advised funds pursuing a similar investment strategy as the Fund, on the other, as applicable. The Directors noted that the Adviser may, in some cases, agree to fee rates with large institutional clients that are lower than those reviewed by the Directors and that they had previously discussed with the Adviser its policies in respect of such arrangements. The Adviser also informed the Directors that, in the case of certain Funds, there were no institutional products managed by the Adviser that have a substantially similar investment style. The Directors also discussed these matters with their independent fee consultant.
The Adviser reviewed with the Directors the significantly greater scope of the services it provides to each Fund relative to institutional, offshore fund andsub-advised fund clients, as applicable. In this regard, the Adviser noted, among other things, that, compared to institutional and offshore orsub-advisory accounts, each Fund, as applicable, (i) demands considerably more portfolio management, research and trading resources due to significantly higher daily cash flows (in the case ofopen-end Funds); (ii) has more tax and regulatory restrictions and compliance obligations; (iii) must prepare and file or distribute regulatory and other communications about fund operations; and (iv) must provide shareholder servicing to retail investors. The Adviser also reviewed the greater legal risks presented by the large and changing population of Fund shareholders who may assert
| abfunds.com | AB SUSTAINABLE INTERNATIONAL THEMATIC FUND | 55 | |
claims against the Adviser in individual or class actions, and the greater entrepreneurial risk in offering new fund products, which require substantial investment to launch, may not succeed, and generally must be priced to compete with larger, more established funds resulting in lack of profitability to the Adviser until a new fund achieves scale. In light of the substantial differences in services rendered by the Adviser to institutional, offshore fund andsub-advised fund clients as compared to the Funds, and the different risk profile, the Directors considered these fee comparisons inapt and did not place significant weight on them in their deliberations.
The Directors noted that many of the Funds may invest in shares of exchange-traded funds (“ETFs”), subject to the restrictions and limitations of the 1940 Act as these may be varied as a result of exemptive orders issued by the SEC. The Directors also noted that ETFs pay advisory fees pursuant to their advisory contracts. The Directors concluded, based on the Adviser’s explanation of how it uses ETFs when they are the most cost-effective way to obtain desired exposures, in some cases pending purchases of underlying securities, that each Fund’s management fee would be for services that would be in addition to, rather than duplicative of, the services provided under the advisory contracts of the ETFs.
With respect to each Fund’s management fee, the Directors considered the total expense ratio of the Fund in comparison to a peer group and peer universe selected by the 15(c) service provider. The Directors also considered the Adviser’s expense caps for certain Funds. The Directors view expense ratio information as relevant to their evaluation of the Adviser’s services because the Adviser is responsible for coordinating services provided to a Fund by others.
The Boards’ consideration of each Proposed Agreement was informed by their most recent approval of the related Current Agreement, and, in the case of certain Funds, their discussion with the Adviser of the reasons for those Funds’ expense ratios in certain periods. The Directors also reviewed updated expense ratio information and, in some cases, discussed with the Adviser the reasons for the expense ratios of certain Funds. On the basis of this review, the Directors concluded that each Fund’s expense ratio was acceptable.
The Directors did not consider comparative expense information for the ACS Funds because those Funds do not bear ordinary expenses.
Economies of Scale
The Directors noted that the management fee schedules for certain Funds do not contain breakpoints and that they had discussed their strong preference for breakpoints in advisory contracts with the Adviser. The Directors took into consideration prior presentations by an independent consultant on economies of scale in the mutual fund industry and for the
| 56 | AB SUSTAINABLE INTERNATIONAL THEMATIC FUND | abfunds.com | |
Funds, and by the Adviser concerning certain of its views on economies of scale. The Directors also had requested and received from the Adviser certain updates on economies of scale in advance of the Board meeting. The Directors believe that economies of scale may be realized (if at all) by the Adviser across a variety of products and services, and not only in respect of a single fund. The Directors noted that there is no established methodology for setting breakpoints that give effect to the fund-specific services provided by a fund’s adviser and to the economies of scale that an adviser may realize in its overall mutual fund business or those components of it which directly or indirectly affect a fund’s operations. The Directors observed that in the mutual fund industry as a whole, as well as among funds similar to each Fund, there is no uniformity or pattern in the fees and asset levels at which breakpoints (if any) apply. The Directors also noted that the advisory agreements for many funds do not have breakpoints at all. The Directors informed the Adviser that they would monitor the asset levels of the Funds without breakpoints and their profitability to the Adviser and anticipated revisiting the question of breakpoints in the future if circumstances warrant doing so.
The Directors did not consider the extent to which fee levels in the Advisory Agreement for the ACS Funds reflect economies of scale because that Advisory Agreement does not provide for any compensation to be paid to the Adviser by the ACS Funds and the expense ratio of each of those Funds is zero.
Interim Advisory Agreements
In approving the Interim Advisory Agreements, the Boards, with the assistance of independent counsel, considered similar factors to those considered in approving the Proposed Agreements. The Interim Advisory Agreements approved by the Boards are identical to the Proposed Agreements, as well as the Current Agreements, in all material respects except for their proposed effective and termination dates and provisions intended to comply with the requirements of the relevant SEC rule, such as provisions requiring escrow of advisory fees. Under the Interim Advisory Agreements, the Adviser would continue to manage a Fund pursuant to an Interim Advisory Agreement until a new advisory agreement was approved by stockholders or until the end of the150-day period, whichever would occur earlier. All fees earned by the Adviser under an Interim Advisory Agreement would be held in escrow pending shareholder approval of the Proposed Agreement. Upon approval of a new advisory agreement by stockholders, the escrowed management fees would be paid to the Adviser, and the Interim Advisory Agreement would terminate.
Information Regarding the Review and Approval of the Fund’s Current Advisory Agreement
The disinterested directors (the “directors”) of AB Sustainable International Thematic Fund, Inc. (formerly named AB International Growth Fund, Inc.)
| abfunds.com | AB SUSTAINABLE INTERNATIONAL THEMATIC FUND | 57 | |
(the “Fund”) unanimously approved the continuance of the Fund’s Advisory Agreement with the Adviser at a meeting held on May1-3, 2018 (the “Meeting”).
Prior to approval of the continuance of the Advisory Agreement, the directors had requested from the Adviser, and received and evaluated, extensive materials. They reviewed the proposed continuance of the Advisory Agreement with the Adviser and with experienced counsel who are independent of the Adviser, who advised on the relevant legal standards. The directors also reviewed additional materials, including materials from an outside consultant, who acted as their independent fee consultant, and comparative analytical data prepared by the Senior Analyst for the Fund. The directors also discussed the proposed continuance in private sessions with counsel.
The directors considered their knowledge of the nature and quality of the services provided by the Adviser to the Fund gained from their experience as directors or trustees of most of the registered investment companies advised by the Adviser, their overall confidence in the Adviser’s integrity and competence they have gained from that experience, the Adviser’s initiative in identifying and raising potential issues with the directors and its responsiveness, frankness and attention to concerns raised by the directors in the past, including the Adviser’s willingness to consider and implement organizational and operational changes designed to improve investment results and the services provided to the AB Funds. The directors noted that they have four regular meetings each year, at each of which they review extensive materials and information from the Adviser, including information on the investment performance of the Fund.
The directors also considered all factors they believed relevant, including the specific matters discussed below. During the course of their deliberations, the directors evaluated, among other things, the reasonableness of the advisory fee. The directors did not identify any particular information that wasall-important or controlling, and different directors may have attributed different weights to the various factors. The directors determined that the selection of the Adviser to manage the Fund and the overall arrangements between the Fund and the Adviser, as provided in the Advisory Agreement, including the advisory fee, were fair and reasonable in light of the services performed, expenses incurred and such other matters as the directors considered relevant in the exercise of their business judgment. The material factors and conclusions that formed the basis for the directors’ determinations included the following:
Nature, Extent and Quality of Services Provided
The directors considered the scope and quality of services provided by the Adviser under the Advisory Agreement, including the quality of the investment research capabilities of the Adviser and the other resources it has
| 58 | AB SUSTAINABLE INTERNATIONAL THEMATIC FUND | abfunds.com | |
dedicated to performing services for the Fund. The directors noted that the Adviser from time to time reviews the Fund’s investment strategies and from time to time proposes changes intended to improve the Fund’s relative or absolute performance for the directors’ consideration. They also noted the professional experience and qualifications of the Fund’s portfolio management team and other senior personnel of the Adviser. The directors also considered that the Advisory Agreement provides that the Fund will reimburse the Adviser for the cost to it of providing certain clerical, accounting, administrative and other services to the Fund by employees of the Adviser or its affiliates. Requests for these reimbursements are made on a quarterly basis and subject to approval by the directors. Reimbursements, to the extent requested and paid, result in a higher rate of total compensation from the Fund to the Adviser than the fee rate stated in the Advisory Agreement. The directors noted that the methodology used to determine the reimbursement amounts had been reviewed by an independent consultant retained by the Fund’s former Independent Compliance Officer. The quality of administrative and other services, including the Adviser’s role in coordinating the activities of the Fund’s other service providers, also was considered. The directors concluded that, overall, they were satisfied with the nature, extent and quality of services provided to the Fund under the Advisory Agreement.
Costs of Services Provided and Profitability
The directors reviewed a schedule of the revenues and expenses and related notes indicating the profitability of the Fund to the Adviser for calendar years 2016 and 2017 that had been prepared with an expense allocation methodology arrived at in consultation with an independent consultant retained by the Fund’s former Independent Compliance Officer. The directors noted the assumptions and methods of allocation used by the Adviser in preparing fund-specific profitability data and understood that there are a number of potentially acceptable allocation methodologies for information of this type. The directors noted that the profitability information reflected all revenues and expenses of the Adviser’s relationship with the Fund, including those relating to its subsidiaries that provide transfer agency, distribution and brokerage services to the Fund. The directors recognized that it is difficult to make comparisons of the profitability of the Advisory Agreement with the profitability of advisory contracts for unaffiliated funds because comparative information is not generally publicly available and is affected by numerous factors. The directors focused on the profitability of the Adviser’s relationship with the Fund before taxes and distribution expenses. The directors concluded that the Adviser’s level of profitability from its relationship with the Fund was not unreasonable.
Fall-Out Benefits
The directors considered the other benefits to the Adviser and its affiliates from their relationships with the Fund, including, but not limited to, benefits
| abfunds.com | AB SUSTAINABLE INTERNATIONAL THEMATIC FUND | 59 | |
relating to soft dollar arrangements (whereby investment advisers receive brokerage and research services from brokers that execute agency transactions for their clients);12b-1 fees and sales charges received by the Fund’s principal underwriter (which is a wholly owned subsidiary of the Adviser) in respect of certain classes of the Fund’s shares; brokerage commissions paid by the Fund to brokers affiliated with the Adviser; and transfer agency fees paid by the Fund to a wholly owned subsidiary of the Adviser. The directors recognized that the Adviser’s profitability would be somewhat lower without these benefits. The directors understood that the Adviser also might derive reputational and other benefits from its association with the Fund.
Investment Results
In addition to the information reviewed by the directors in connection with the Meeting, the directors receive detailed performance information for the Fund at each regular Board meeting during the year.
At the Meeting, the directors reviewed performance information prepared by an analytical service that is not affiliated with the Adviser (the “15(c) service provider”), showing the performance of the Class A Shares of the Fund against a group of similar funds (“peer group”) and a larger group of similar funds (“peer universe”), each selected by the 15(c) service provider, and information prepared by the Adviser showing performance of the Class A Shares against a broad-based securities market index, in each case for the1-,3-,5- and10-year periods ended February 28, 2018. Based on their review, the directors concluded that the Fund’s investment performance was acceptable.
Advisory Fees and Other Expenses
The directors considered the advisory fee rate payable by the Fund to the Adviser and information prepared by the 15(c) service provider concerning advisory fee rates payable by other funds in the same category as the Fund. The directors recognized that it is difficult to make comparisons of advisory fees because there are variations in the services that are included in the fees paid by other funds. The directors compared the Fund’s contractual effective advisory fee rate with a peer group median and took into account the impact on the advisory fee rate of the administrative expense reimbursement paid to the Adviser in the latest fiscal year.
The directors also considered the Adviser’s fee schedule for other clients pursuing a similar investment style. For this purpose, they reviewed the relevant advisory fee information from the Adviser’s Form ADV and the materials from the Fund’s Senior Analyst and noted the differences between the Fund’s fee schedule, on the one hand, and the Adviser’s institutional fee schedule, on the other. The directors noted that the Adviser may, in some cases, agree to fee rates with large institutional clients that are lower than those reviewed by the directors and that they had
| 60 | AB SUSTAINABLE INTERNATIONAL THEMATIC FUND | abfunds.com | |
previously discussed with the Adviser its policies in respect of such arrangements. The directors also compared the advisory fee rate for the Fund with that for another AB Fund with a similar investment style.
The Adviser reviewed with the directors the significantly greater scope of the services it provides to the Fund relative to institutional clients. In this regard, the Adviser noted, among other things, that, compared to institutional accounts, the Fund (i) demands considerably more portfolio management, research and trading resources due to significantly higher daily cash flows; (ii) has more tax and regulatory restrictions; (iii) must prepare and distribute regulatory and other communications about fund operations; and (iv) must provide shareholder servicing to retail investors. The Adviser also reviewed the greater legal risks presented by the large and changing population of Fund shareholders who may assert claims against the Adviser in individual or class actions, and the greater entrepreneurial risk in offering new fund products, which require substantial investment to launch, may not succeed, and generally must be priced to compete with larger, more established funds resulting in lack of profitability to the Adviser until a new fund achieves scale. In light of the substantial differences in services rendered by the Adviser to institutional clients as compared to funds such as the Fund, and the different risk profile, the directors considered these fee comparisons inapt and did not place significant weight on them in their deliberations.
The directors also considered the total expense ratio of the Class A shares of the Fund in comparison to a peer group and a peer universe selected by the 15(c) service provider. The Class A expense ratio of the Fund was based on the Fund’s latest fiscal year and the directors considered the effects of any fee waivers and/or expense reimbursements as a result of the Adviser’s expense cap (although the directors noted that the Fund’s expense ratio was currently below the Adviser’s expense cap). The directors noted that it was likely that the expense ratios of some of the other funds in the Fund’s category were lowered by waivers or reimbursements by those funds’ investment advisers, which in some cases might be voluntary or temporary. The directors view expense ratio information as relevant to their evaluation of the Adviser’s services because the Adviser is responsible for coordinating services provided to the Fund by others. The directors noted that the Fund’s expense ratio was above the medians. After reviewing and discussing the Adviser’s explanations of the reasons for this, the directors concluded that the Fund’s expense ratio was acceptable.
Economies of Scale
The directors noted that the advisory fee schedule for the Fund contains breakpoints that reduce the fee rates on assets above specified levels. The directors took into consideration prior presentations by an independent consultant on economies of scale in the mutual fund industry and for the AB Funds, and by the Adviser concerning certain of its views on economies
| abfunds.com | AB SUSTAINABLE INTERNATIONAL THEMATIC FUND | 61 | |
of scale. The directors also had requested and received from the Adviser certain updates on economies of scale in advance of the Meeting. The directors believe that economies of scale may be realized (if at all) by the Adviser across a variety of products and services, and not only in respect of a single fund. The directors noted that there is no established methodology for setting breakpoints that give effect to the fund-specific services provided by a fund’s adviser and to the economies of scale that an adviser may realize in its overall mutual fund business or those components of it which directly or indirectly affect a fund’s operations. The directors observed that in the mutual fund industry as a whole, as well as among funds similar to the Fund, there is no uniformity or pattern in the fees and asset levels at which breakpoints (if any) apply. The directors also noted that the advisory agreements for many funds do not have breakpoints at all. Having taken these factors into account, the directors concluded that the Fund’s shareholders would benefit from a sharing of economies of scale in the event the Fund’s net assets exceed a breakpoint in the future.
| 62 | AB SUSTAINABLE INTERNATIONAL THEMATIC FUND | abfunds.com | |
This page is not part of the Shareholder Report or the Financial Statements.
AB FAMILY OF FUNDS
US EQUITY
US CORE
Core Opportunities Fund
FlexFee™ US Thematic Portfolio
Select US Equity Portfolio
US GROWTH
Concentrated Growth Fund
Discovery Growth Fund
FlexFee™ Large Cap Growth Portfolio
Growth Fund
Large Cap Growth Fund
Small Cap Growth Portfolio
US VALUE
Discovery Value Fund
Equity Income Fund
Relative Value Fund
Small Cap Value Portfolio
Value Fund
INTERNATIONAL/ GLOBAL EQUITY
INTERNATIONAL/ GLOBAL CORE
FlexFee™ International Strategic Core Portfolio
Global Core Equity Portfolio
International Portfolio
International Strategic Core Portfolio
Sustainable Global Thematic Fund
Tax-Managed International Portfolio
Tax-Managed Wealth Appreciation Strategy
Wealth Appreciation Strategy
INTERNATIONAL/ GLOBAL GROWTH
Concentrated International Growth Portfolio
FlexFee™ Emerging Markets Growth Portfolio
INTERNATIONAL/ GLOBAL EQUITY(continued)
Sustainable International Thematic Fund
INTERNATIONAL/ GLOBAL VALUE
All China Equity Portfolio
International Value Fund
FIXED INCOME
MUNICIPAL
High Income Municipal Portfolio
Intermediate California Municipal Portfolio
Intermediate Diversified Municipal Portfolio
Intermediate New York Municipal Portfolio
Municipal Bond Inflation Strategy
Tax-Aware Fixed Income Portfolio
National Portfolio
Arizona Portfolio
California Portfolio
Massachusetts Portfolio
Minnesota Portfolio
New Jersey Portfolio
New York Portfolio
Ohio Portfolio
Pennsylvania Portfolio
Virginia Portfolio
TAXABLE
Bond Inflation Strategy
FlexFee™ High Yield Portfolio1
FlexFee™ International Bond Portfolio
Global Bond Fund
High Income Fund
Income Fund
Intermediate Bond Portfolio
Limited Duration High Income Portfolio
Short Duration Portfolio
ALTERNATIVES
All Market Real Return Portfolio
Global Real Estate Investment Fund
Select US Long/Short Portfolio
Unconstrained Bond Fund
MULTI-ASSET
All Market Income Portfolio
All Market Total Return Portfolio
Conservative Wealth Strategy
Emerging Markets Multi-Asset Portfolio
Global Risk Allocation Fund
Tax-Managed All Market Income Portfolio
TARGET-DATE
Multi-Manager Select Retirement Allocation Fund
Multi-Manager Select 2010 Fund
Multi-Manager Select 2015 Fund
Multi-Manager Select 2020 Fund
Multi-Manager Select 2025 Fund
Multi-Manager Select 2030 Fund
Multi-Manager Select 2035 Fund
Multi-Manager Select 2040 Fund
Multi-Manager Select 2045 Fund
Multi-Manager Select 2050 Fund
Multi-Manager Select 2055 Fund
Multi-Manager Select 2060 Fund
CLOSED-END FUNDS
Alliance California Municipal Income Fund
AllianceBernstein Global High Income Fund
AllianceBernstein National Municipal Income Fund
We also offer Government Money Market Portfolio, which serves as the money market fund exchange vehicle for the AB mutual funds. You could lose money by investing in the Fund. Although the Fund seeks to preserve the value of your investment at $1.00 per share, it cannot guarantee it will do so. The Fund may impose a fee upon sale of your shares or may temporarily suspend your ability to sell shares if the Fund’s liquidity falls below required minimums because of market conditions or other factors. An investment in the Fund is not insured or guaranteed by the Federal Deposit Insurance Corporation or any other government agency. The Fund’s sponsor has no legal obligation to provide financial support to the Fund, and you should not expect that the sponsor will provide financial support to the Fund at any time.
Investors should consider the investment objectives, risks, charges and expenses of the Fund carefully before investing. For copies of our prospectus or summary prospectus, which contain this and other information, visit us online at www.abfunds.com or contact your AB representative. Please read the prospectus and/or summary prospectus carefully before investing.
| 1 | Prior to February 23, 2018, FlexFee High Yield Portfolio was named High Yield Portfolio. |
| abfunds.com | AB SUSTAINABLE INTERNATIONAL THEMATIC FUND | 63 | |
NOTES
| 64 | AB SUSTAINABLE INTERNATIONAL THEMATIC FUND | abfunds.com | |
NOTES
| abfunds.com | AB SUSTAINABLE INTERNATIONAL THEMATIC FUND | 65 | |
NOTES
| 66 | AB SUSTAINABLE INTERNATIONAL THEMATIC FUND | abfunds.com | |
NOTES
| abfunds.com | AB SUSTAINABLE INTERNATIONAL THEMATIC FUND | 67 | |
NOTES
| 68 | AB SUSTAINABLE INTERNATIONAL THEMATIC FUND | abfunds.com | |
AB SUSTAINABLE INTERNATIONAL THEMATIC FUND
1345 Avenue of the Americas
New York, NY 10105
800 221 5672
SIT-0152-1218 
ITEM 2. CODE OF ETHICS.
Not applicable when filing a semi-annual report to shareholders.
ITEM 3. AUDIT COMMITTEE FINANCIAL EXPERT.
Not applicable when filing a semi-annual report to shareholders.
ITEM 4. PRINCIPAL ACCOUNTANT FEES AND SERVICES.
Not applicable when filing a semi-annual report to shareholders.
ITEM 5. AUDIT COMMITTEE OF LISTED REGISTRANTS.
Not applicable to the registrant.
ITEM 6. SCHEDULE OF INVESTMENTS.
Please see Schedule of Investments contained in the Report to Shareholders included under Item 1 of this FormN-CSR.
ITEM 7. DISCLOSURE OF PROXY VOTING POLICIES AND PROCEDURES FORCLOSED-END MANAGEMENT INVESTMENT COMPANIES.
Not applicable to the registrant.
ITEM 8. PORTFOLIO MANAGERS OFCLOSED-END MANAGEMENT INVESTMENT COMPANIES.
Not applicable to the registrant.
ITEM 9. PURCHASES OF EQUITY SECURITIES BYCLOSED-END MANAGEMENT INVESTMENT COMPANY AND AFFILIATED PURCHASERS.
Not applicable to the registrant.
ITEM 10. SUBMISSION OF MATTERS TO A VOTE OF SECURITY HOLDERS.
There have been no material changes to the procedures by which shareholders may recommend nominees to the Fund’s Board of Directors since the Fund last provided disclosure in response to this item.
ITEM 11. CONTROLS AND PROCEDURES.
(a) The registrant’s principal executive officer and principal financial officer have concluded that the registrant’s disclosure controls and procedures (as defined in Rule30a-3(c) under the Investment Company Act of 1940, as amended) are effective at the reasonable assurance level based on their evaluation of these controls and procedures as of a date within 90 days of the filing date of this document.
(b) There were no changes in the registrant’s internal controls over financial reporting that occurred during the second fiscal quarter of the period that has materially affected, or is reasonably likely to materially affect, the registrant’s internal control over financial reporting.
ITEM 12. EXHIBITS.
The following exhibits are attached to this FormN-CSR:
EXHIBIT NO. | DESCRIPTION OF EXHIBIT | |
| 12 (b) (1) | Certification of Principal Executive Officer Pursuant to Section 302 of the Sarbanes-Oxley Act of 2002 | |
| 12 (b) (2) | Certification of Principal Financial Officer Pursuant to Section 302 of the Sarbanes-Oxley Act of 2002 | |
| 12 (c) | Certification of Principal Executive Officer and Principal Financial Officer Pursuant to Section 906 of theSarbanes-Oxley Act of 2002 | |
SIGNATURES
Pursuant to the requirements of the Securities Exchange Act of 1934 and the Investment Company Act of 1940, the registrant has duly caused this report to be signed on its behalf by the undersigned, thereunto duly authorized.
(Registrant): AB Sustainable International Thematic Fund, Inc.
| By: | /s/ Robert M. Keith | |
Robert M. Keith President | ||
| Date: | February 26, 2019 | |
Pursuant to the requirements of the Securities Exchange Act of 1934 and the Investment Company Act of 1940, this report has been signed below by the following persons on behalf of the registrant and in the capacities and on the dates indicated.
| By: | /s/ Robert M. Keith | |
Robert M. Keith President | ||
| Date: | February 26, 2019 | |
| By: | /s/ Joseph J. Mantineo | |
Joseph J. Mantineo Treasurer and Chief Financial Officer | ||
| Date: | February 26, 2019 | |