Investor Presentation
July 2006

Certain statements in this presentation, including, without limitation,
statements containing the words “believes”, “anticipates”, “intends”, and
“expects”, and words of similar import, constitute “forward-looking
statements” within the meaning of Section 27A of the Securities Act of 1933
and Section 21E of the Securities Exchange Act of 1934. Such forward looking
statements involve known and unknown risks, uncertainties and other factors
that may cause the actual results, performance or achievements of the
Company to be materially different from any future results, performance or
achievements expressed or implied by such forward-looking statements. Such
factors include, among others, the following; general economic and business
conditions in those areas in which the Company operates, demographic
changes, competition, fluctuations in interest rates, changes in business
strategy or developments plans, changes in governmental regulation, credit
quality, the availability of capital to fund the expansion of the Company’s
business, and other factors referenced in the Company’s filings with the SEC
and this presentation. The Company disclaims any obligation to update any
such factors or to publicly announce the results of any revisions to any of the
forward-looking statements contained herein to reflect future events o
r developments.
2

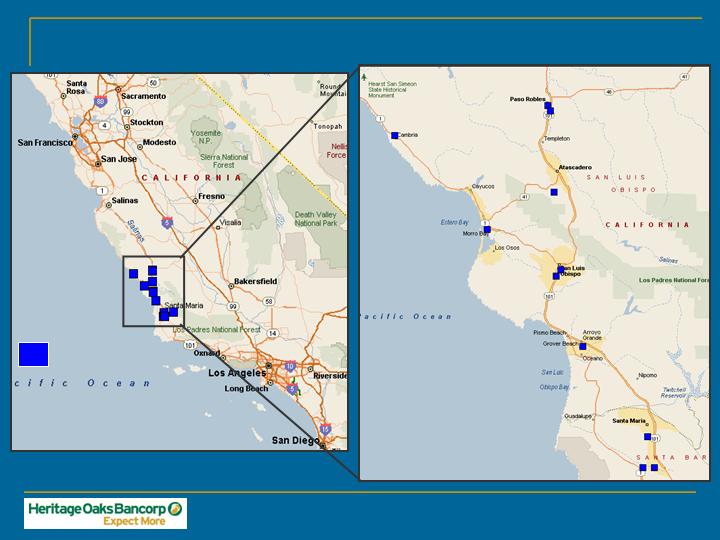
Company Overview
The Leading community bank on California’s
Central Coast
Headquartered in Paso Robles, CA with $520
million in assets as of June 30, 2006
Covering the growing markets of San Luis
Obispo and Northern Santa Barbara Counties
Heritage is Focused on Building Core Deposit Relationships
3
Source: SNL Securities
Market Areas: Branch Locations
11 Branches
4

Market Areas: Distinct Markets
Our Growing Home Market – Three Branches from
Paso Robles to Atascadero, fourth opening in
Templeton, August 2006
The Progressive Village – Two Branches in
San Luis Obispo
The Gold Coast – Two Branches from Cambria to
Morro Bay, One Branch in Arroyo Grande
Central Coast Wine Country – Three Branches in
Northern Santa Barbara County
Heritage is Capitalizing on Market Diversity and Poised for Growth
5

Market Areas: Our Growing Home Market
Paso Robles, Templeton and Atascadero
Small town environment with transitioning culture and
diversifying industry
A pocket of “relatively” affordable housing and one of
California’s least populated Coastal areas
Halfway between San Francisco and Los Angeles on
US101 and on the main Hwy 46 corridor to the coast
from rapidly growing Fresno and Bakersfield
Heritage Oaks had 23% Market Share in Paso Robles at June 2005
6

Market Areas: Our Growing Home Market
Paso Robles - The Next Napa
What the world’s top wine critic says about Paso Robles:
“… there is vast untapped potential in the limestone
hillsides west of California Route 101. ”
“…a stunning wine that showcases the magnificent
fruit that emerges from some of the vineyards planted
on Paso Robles’ limestone ridges.”
- Robert M. Parker, Jr.
The Wine Advocate
The Wine Industry has Sparked Commercial Development and Lending
7

Market Areas: The Progressive Village
San Luis Obispo
California State Polytechnic University – Tops in the
Nation and the CA State University System
Active Real Estate Market – A highly attractive mix
of Culture, Country and Coast
Dynamic environment of growth and cultural evolution
Heritage Effectively Competing in an “Over-Banked” Market by Earning
the Fierce Loyalty of Clients through World-Class Service
8

Market Areas: The Gold Coast
Cambria, San Simeon, Morro Bay, Pismo
Beach and Arroyo Grande
Some of the finest and most underdeveloped and
accessible coastline left in California
At the ocean terminus of Hwy 46 from the Central
Valley, these enclaves have attracted investment by
many living in growing Fresno, Bakersfield and other
Valley communities
Necessary Ingredients Intact for Economic Transition and Development
9

Market Areas: Central Coast Wine Country
Santa Maria
Combination of family communities, resort
destinations and agricultural zones
Largest developable coastal area in the region
Santa Maria is the largest city in the Central Coast
region
This Market Presents Market Share and Market Extension
Opportunities in Both Business and Retail Client Relationships
10

Deposit Market Share (June 1998 vs. June 2005)
San Luis Obispo County
Source: SNL Securities and FDIC
Deposit
Deposit
June
Market
Pro
June
Market
1998 Rank
Institution
Share
Forma
2005 Rank
Institution
Share
1
Mid-State Bank*
21.1%
24.1%
1
Mid-State Bank
21.5%
2
Bank of America
19.4%
2
Washington Mutual
17.2%
3
Washington Mutual*
15.0%
23.2%
3
Bank of America
16.2%
4
Home Savings*
8.2%
4
Heritage Oaks Bank
7.9%
5
Wells Fargo
5.5%
5
Wells Fargo
7.5%
6
CalFed
5.4%
6
First Bank of SLO
5.8%
7
First Bank of SLO
5.1%
7
Santa Lucia Bank
4.4%
8
Heritage Oaks Bank*
4.0%
5.9%
8
Los Padres Bank
3.5%
9
Los Padres Bank
3.8%
9
Coast National Bank
3.5%
10
Santa Lucia Bank
3.4%
10
San Luis Trust
3.3%
11
Bank of Santa Maria*
3.0%
11
Downey Savings
3.1%
12
Union Bank
2.0%
12
Mission Community
2.7%
13
Westamerica*
1.9%
13
Citibank
1.8%
14
Coast National Bank
1.8%
14
Union Bank
1.6%
15
Mission Community Bk
0.5%
* Mid-State Bank acquired Bank of Santa Maria; Washington Mutual acquired Home Savings; Heritage Oaks acquired Westamerica's in-market branches
Heritage has Achieved Growth in a Competitive Environment
11

2006...a Year of Building For
Continued Success
Capital Planning
Stock Repurchase Plan
Quarterly Cash Dividend
De Novo Branching
New Branch in Templeton to open in 3Q06, bringing branch
network to 12 locations
Bank Branding Project
Assessment of Delivery Channels
Implementation of Comprehensive Marketing Strategic
Plan
Strategic Staffing
Hired Joni Watson as EVP/HR in 2Q06
12

YTD 2006 Financial Highlights
Compared to YTD June 05 results
Net income increased 8.4% to $3.3 million
Revenues increased 9.4% to $15.5 million
Net interest margin improved 36 basis points to 5.97%
Pre-tax income rose 7.2% to $5.2 million
Return on average equity was 14.13% and return on
average assets was 1.35%
Net loans increased 6.5% to $386 million
Non-performing loans were just 0.06% of total net loans
Non-interest, non-volatile demand deposits increased
9.9% or $10.1 million
Heritage Oaks, Earning the Respect of Our Community, Clients,
Employees and Shareholders Alike
13
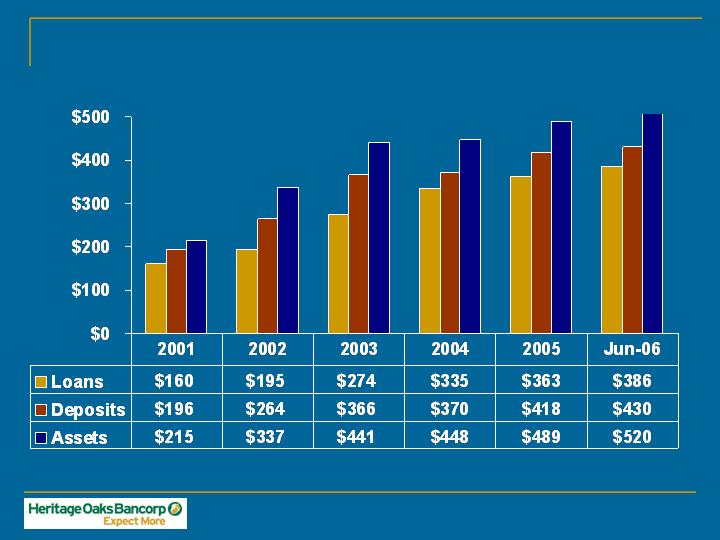
Balance Sheet Growth ($ in millions)
Assets CAGR
22.8%
2001-2005
14
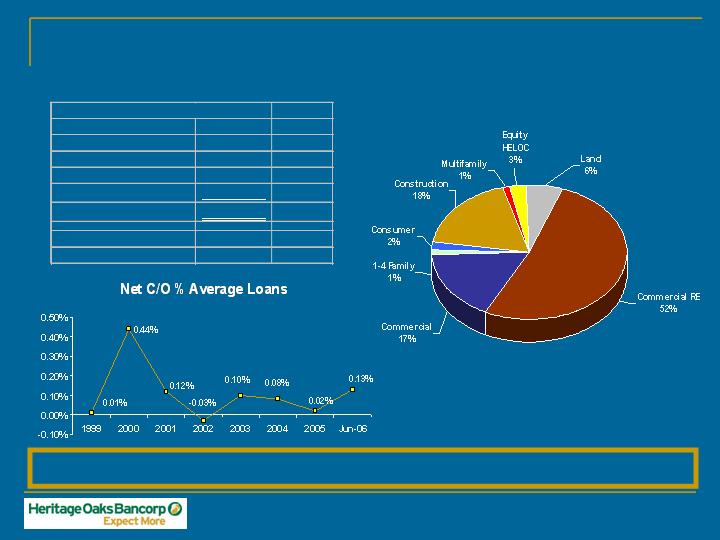
Loan Portfolio at June 30, 2006
Prime-Based Lending Contributes to an Asset Sensitive Balance Sheet
15
% of
Re-Pricing
Balance
Total
< 1 Year
239,080
$
61%
1-3 Years
93,844
24%
3-5 Years
42,409
11%
> 5 Years
15,597
4%
390,931
$
100%
Non-performing loans
232
$
As % Gross Loans
0.06%
Total Gross Loans

Deposit Mix at June 30, 2006
Increasing Margins
A 1.48% Average Cost of Deposits for YTD June 2006
74% of Deposits are Low-Cost
16

Net Income
24.2%
CAGR
2000-2005
($ in thousands)
17.6%
CAGR
2000-2005
Diluted EPS
Efficiency Ratio
Heritage Oaks has Delivered Shareholder Value through Performance
17

Market Capitalization and Stock Price
(Adj. for Stock Dividend Activity)
At December 31
($ in thousands)
34.8%
CAGR
2000-2005
42.5%
CAGR
2000-2005
Growth in Earnings has Resulted in Shareholder Value
18

Financial Targets
By Serving the Best Interests of our Clients, We are committed to
being the Best Community Bank in California
10.83%
11.58%
Total Risk-Based Cap Ratio
9.95%
10.73%
Tier I Risk-Based Cap Ratio
9.93%
9.83%
Leverage Cap Ratio
<60.00%
63.38%
64.68%
62.66%
64.34%
Efficiency Ratio
20.00%
15.36%
14.13%
15.94%
14.33%
Return on Average Equity
1.50%
1.30%
1.35%
1.37%
1.37%
Return on Average Asset
2007
Targets
2005
YTD
2006
YTD
2005
Q2
2006
Q2
19