Exhibit 96.3
Explanatory Note
SSR Mining Inc. (the “Company”) previously filed the Seabee 2021 Technical Report Summary (the “Seabee21TRS”), with an effective date of December 31, 2021 and issued on February 23, 2022, as Exhibit 96.3 to its Annual Report on Form 10-K for the year ended December 31, 2021, as amended. The Seabee21TRS has been amended to reflect certain revisions in compliance with Subpart 1300 of Regulation S-K, which revisions consist of adding confirmatory statements and other modifications that SSR does not consider material. The amended Seabee21TRS has been reissued as of September 29, 2022 and is presented with an effective date of December 31, 2021. The information in this amended Seabee21TRS has not been updated to reflect events, information or developments occurring after the effective date.
This page does not constitute a part of the amended Seabee21TRS.
Title Page
| | | | | |
| Project Name: | Seabee Gold Operation |
| Title: | Seabee 2021 Technical Report Summary |
| Location: | Saskatchewan, Canada |
| Effective Date of Technical Report Summary | 31 December 2021 |
| Effective Date of Mineral Resources: | 31 December 2021 |
| Effective Date of Mineral Reserves: | 31 December 2021 |
Qualified Persons (QPs):
•Bernard Peters, BEng (Mining), FAusIMM (201743), employed by OreWin Pty Ltd as Technical Director - Mining, was responsible for the overall preparation of the Seabee21TRS and, the Mineral Reserve estimates, Sections 1 to 5; Sections 10; Section 12 to 25.
•Sharron Sylvester, BSc (Geol), RPGeo AIG (10125), employed by OreWin Pty Ltd as Technical Director - Geology, was responsible for the preparation of the Mineral Resources, Sections 1 to 3; Section 6 to 9; Section 11; Sections 22 to 25.
OreWin Pty Ltd ACN 165 722 574
140 South Terrace Adelaide 5000
P +61 8 8210 5600 E orewin@orewin.com W orewin.comi
Signature Page
| | | | | |
| Project Name: | Seabee Gold Operation |
| Title: | Seabee 2021 Technical Report Summary |
| Location: | Saskatchewan, Canada |
| Date of Signing: | 29 September 2022 |
| Effective Date of Technical Report Summary: | 31 December 2021 |
/s/ Bernard Peters
Bernard Peters, Technical Director – Mining, OreWin Pty Ltd, BEng (Mining), FAusIMM
(201743)
/s/ Sharron Sylvester
Sharron Sylvester, Technical Director – Geology, OreWin Pty Ltd, BSc (Geol), RPGeo AIG (10125)
21014Seabee21TRS220927Rev0.docx ii
TABLE OF CONTENTS
| | | | | |
| 1 |
| 1 |
| 2 |
| 2 |
| 3 |
| 3 |
| 3 |
| 4 |
| 5 |
| 5 |
| 5 |
| 6 |
| 7 |
| 8 |
| 9 |
| 9 |
| 12 |
| 12 |
| 15 |
| 15 |
| 15 |
| 15 |
| 15 |
| 17 |
| 17 |
21014Seabee21TRS220927Rev0.docx iii
| | | | | |
| 18 |
| 18 |
| 18 |
| 18 |
| 19 |
| 19 |
| 20 |
| 20 |
| 25 |
| 25 |
| 26 |
| 26 |
| 27 |
| 27 |
| 27 |
| 29 |
| 30 |
| 31 |
| 33 |
| 33 |
| 35 |
| 36 |
| 38 |
| 41 |
| 42 |
21014Seabee21TRS220927Rev0.docx iv
| | | | | |
| 42 |
| 42 |
| 43 |
| 45 |
| 45 |
| 47 |
| 48 |
| 49 |
| 49 |
| 50 |
| 50 |
| 51 |
| 52 |
| 54 |
| 55 |
| 55 |
| 55 |
| 55 |
| 55 |
| 56 |
| 57 |
| 57 |
| 59 |
| 59 |
| 60 |
| 60 |
21014Seabee21TRS220927Rev0.docx v
| | | | | |
| 63 |
| 64 |
| 64 |
| 64 |
| 64 |
| 64 |
| 66 |
| 67 |
| 68 |
| 68 |
| 68 |
| 69 |
| 70 |
| 70 |
| 71 |
| 71 |
| 73 |
| 73 |
| 73 |
| 73 |
| 74 |
| 75 |
| 75 |
| 76 |
| 77 |
21014Seabee21TRS220927Rev0.docx vi
| | | | | |
| 77 |
| 80 |
| 81 |
| 81 |
| 82 |
| 82 |
| 82 |
| 83 |
| 83 |
| 83 |
| 83 |
| 83 |
| 85 |
| 85 |
| 86 |
| 89 |
| 91 |
| 92 |
| 92 |
| 95 |
| 95 |
| 95 |
| 95 |
| 95 |
| 95 |
21014Seabee21TRS220927Rev0.docx vii
| | | | | |
| 96 |
| 96 |
| 96 |
| 97 |
| 101 |
| 101 |
| 102 |
| 102 |
| 102 |
| 102 |
| 102 |
| 102 |
| 102 |
| 103 |
| 103 |
| 104 |
| 105 |
| 105 |
| 106 |
| 106 |
| 106 |
| 106 |
| 107 |
| 107 |
| 107 |
21014Seabee21TRS220927Rev0.docx viii
| | | | | |
| 108 |
| 108 |
| 109 |
| 109 |
| 110 |
| 113 |
| 113 |
| 114 |
| 115 |
| 115 |
| 116 |
| 117 |
| 117 |
| 117 |
| 117 |
| 118 |
| 118 |
| 121 |
| 126 |
| 128 |
| 129 |
| 129 |
| 129 |
| 130 |
| 130 |
21014Seabee21TRS220927Rev0.docx ix
TABLES
| | | | | |
| 6 |
| 6 |
| 7 |
| 8 |
| 10 |
| 12 |
| 12 |
| 13 |
| 13 |
| 14 |
| 14 |
| 20 |
| 32 |
| 40 |
| 46 |
| 61 |
| 69 |
21014Seabee21TRS220927Rev0.docx x
| | | | | |
| 71 |
| 72 |
| 72 |
| 73 |
| 74 |
| 76 |
| 76 |
| 81 |
| 83 |
| 84 |
| 84 |
| 84 |
| 91 |
| 93 |
| 106 |
| 115 |
| 116 |
| 117 |
| 117 |
| 118 |
| 119 |
21014Seabee21TRS220927Rev0.docx xi
FIGURES
| | | | | |
| 1 |
| 10 |
| 11 |
| 11 |
| 14 |
| 19 |
| 20 |
| 24 |
| 28 |
| 33 |
| 34 |
| 36 |
| 38 |
| 39 |
| 42 |
| 43 |
21014Seabee21TRS220927Rev0.docx xii
| | | | | |
| 47 |
| 65 |
| 65 |
| 67 |
| 78 |
| 79 |
| 80 |
| 89 |
| 89 |
| 90 |
| 90 |
| 91 |
| 94 |
| 98 |
| 99 |
| 100 |
| 101 |
| 119 |
| 120 |
| 120 |
| 124 |
| 127 |
21014Seabee21TRS220927Rev0.docx xiii
1 EXECUTIVE SUMMARY
1.1 Introduction
The Seabee 2021 Technical Report Summary (Seabee21TRS) is an independent Technical Report Summary that has been in prepared in accordance with the U.S. Securities and Exchange Commission (US SEC) Regulation S-K subpart 1300 rules for Property Disclosures for Mining Registrants (S-K 1300) for SSR Mining Inc. (SSR), on the Seabee Gold Operation (SGO, or the Project).
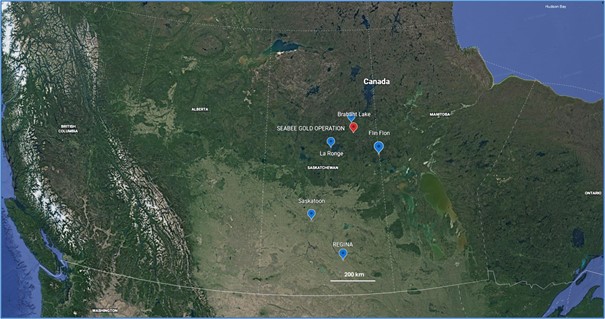
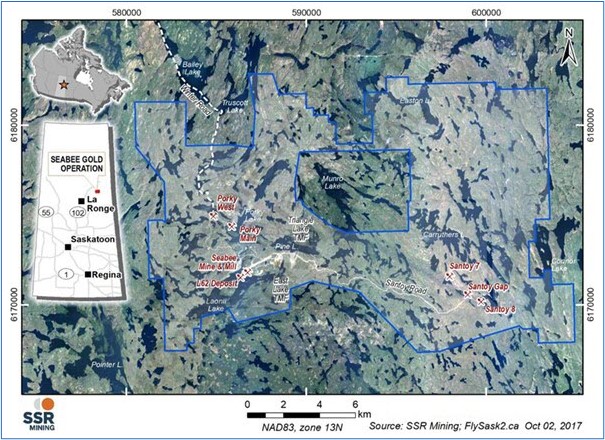
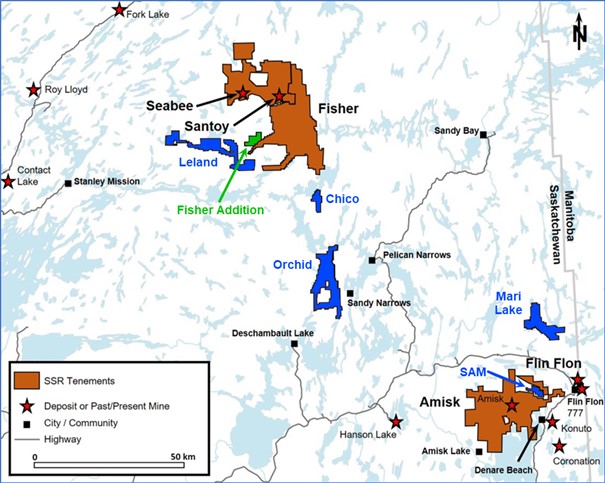
The Project is located in Saskatchewan, Canada, at the northern end of Laonil Lake, approximately 125 km north-east of the town of La Ronge (Figure 1.1).
The SGO property hosts the Santoy mine, which has been in continuous commercial production since 2014. Commercial production at the now-depleted Seabee mine commenced in 1991 and was ceased in 2018.
Figure 1.1 Project Location Map
Google Earth, 2022
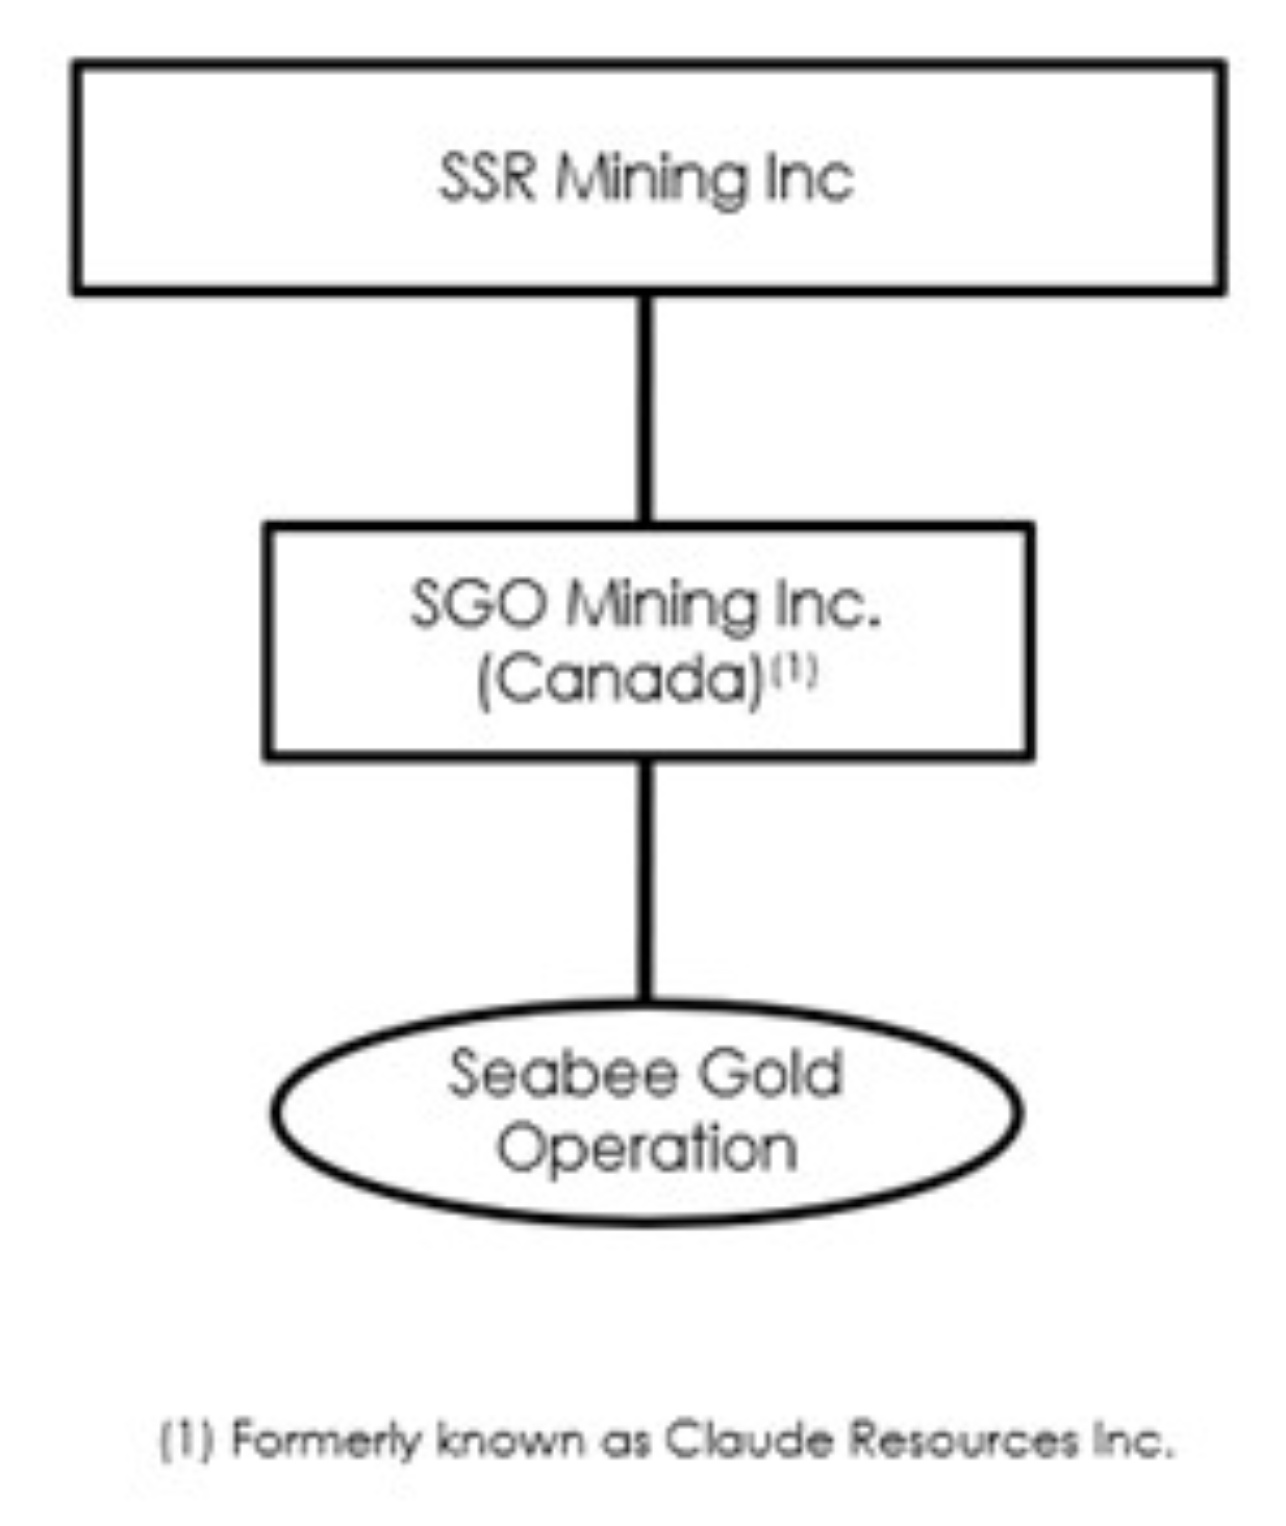
The SGO is directly owned (100%) by SSR through its wholly owned subsidiary company, SGO Mining Inc. (SGO Mining). SSR acquired the SGO on 31 May 2016 as a result of the acquisition of Claude Resources Inc.
SSR is a gold mining company with four producing assets located in the USA, Turkey, Canada, and Argentina, and with development and exploration assets in the USA, Turkey, Mexico, Peru, and Canada. SSR is listed on the NASDAQ (NASDAQ:SSRM), the Toronto Stock Exchange (TSX:SSRM), and the Australian Stock Exchange (ASX:SSR).
21014Seabee21TRS220927Rev0.docx 1
The Seabee21TRS Qualified Persons (QPs) have reviewed the supplied data and information and accept this information as being accurate and complete and suitable for use in the Seabee21TRS. Information and data supplied by SSR that were outside the areas of expertise of the QPs and was relied upon when forming the findings and conclusions of this report are detailed in Section 25. Any individual or entity referenced as having completed work relevant to the Seabee21TRS, but not identified therein as a QP, does not constitute a QP for the Seabee21TRS.
The Seabee21TRS should be construed in light of the methods, procedures, and techniques used to prepare the Seabee21TRS. Sections or parts of the Seabee21TRS should not be read, or removed from, their original context.
1.2 Land Tenure and Ownership
The SGO is comprised of seven mineral leases and 102 mineral claims that cover an area of approximately 62,158 ha.
SGO Mining holds a 100% interest in the property.
1.3 Property Description and Location
Activities at the property are centred at approximately 55.7° latitude north and 103.5° longitude west.
Access to the SGO is by fixed-wing aircraft to the 1,275 m airstrip located on the property. During the winter months, a 60 km winter road is built between the mine site and Brabant Lake to transport heavy supplies and equipment by truck. Mining operations are conducted year-round.
The climate is borderline subarctic. Winters are long, dry, and cold (average –24°C) while summer is short, wet, and moderately warm (average +24°C). Precipitation is low, with an annual average of 486.2 mm.
The site is relatively flat, with much of the area comprised of irregular, hummocky, rocky exposures. Overburden soils are thin in this area, and often the rock outcrops are exposed.
21014Seabee21TRS220927Rev0.docx 2
1.4 Geological Setting and Mineralisation
The SGO is located within the northern portion of the Pine Lake greenstone belt. The belt has a strike length in excess of 50 km and comprises a variety of geochemically distinct tholeiitic mafic volcanic rocks formed in juvenile island arc settings, along with contemporaneous mafic intrusive rocks, volcaniclastics, sediments, and felsic intrusions of varying age. Metamorphic grade across the Pine Lake greenstone belt ranges from upper greenschist to upper amphibolite, with the SGO hosted in the latter. The belt has been complexly folded by at least four major phases of deformation that are observed across the SGO site and elsewhere in the Glennie domain of the Proterozoic Trans-Hudson Orogen.
The SGO can be subdivided into three main geological domains:
•The now-ceased Seabee mine is hosted within a coarsely layered mafic intrusion dominated by gabbro in the mine sequence.
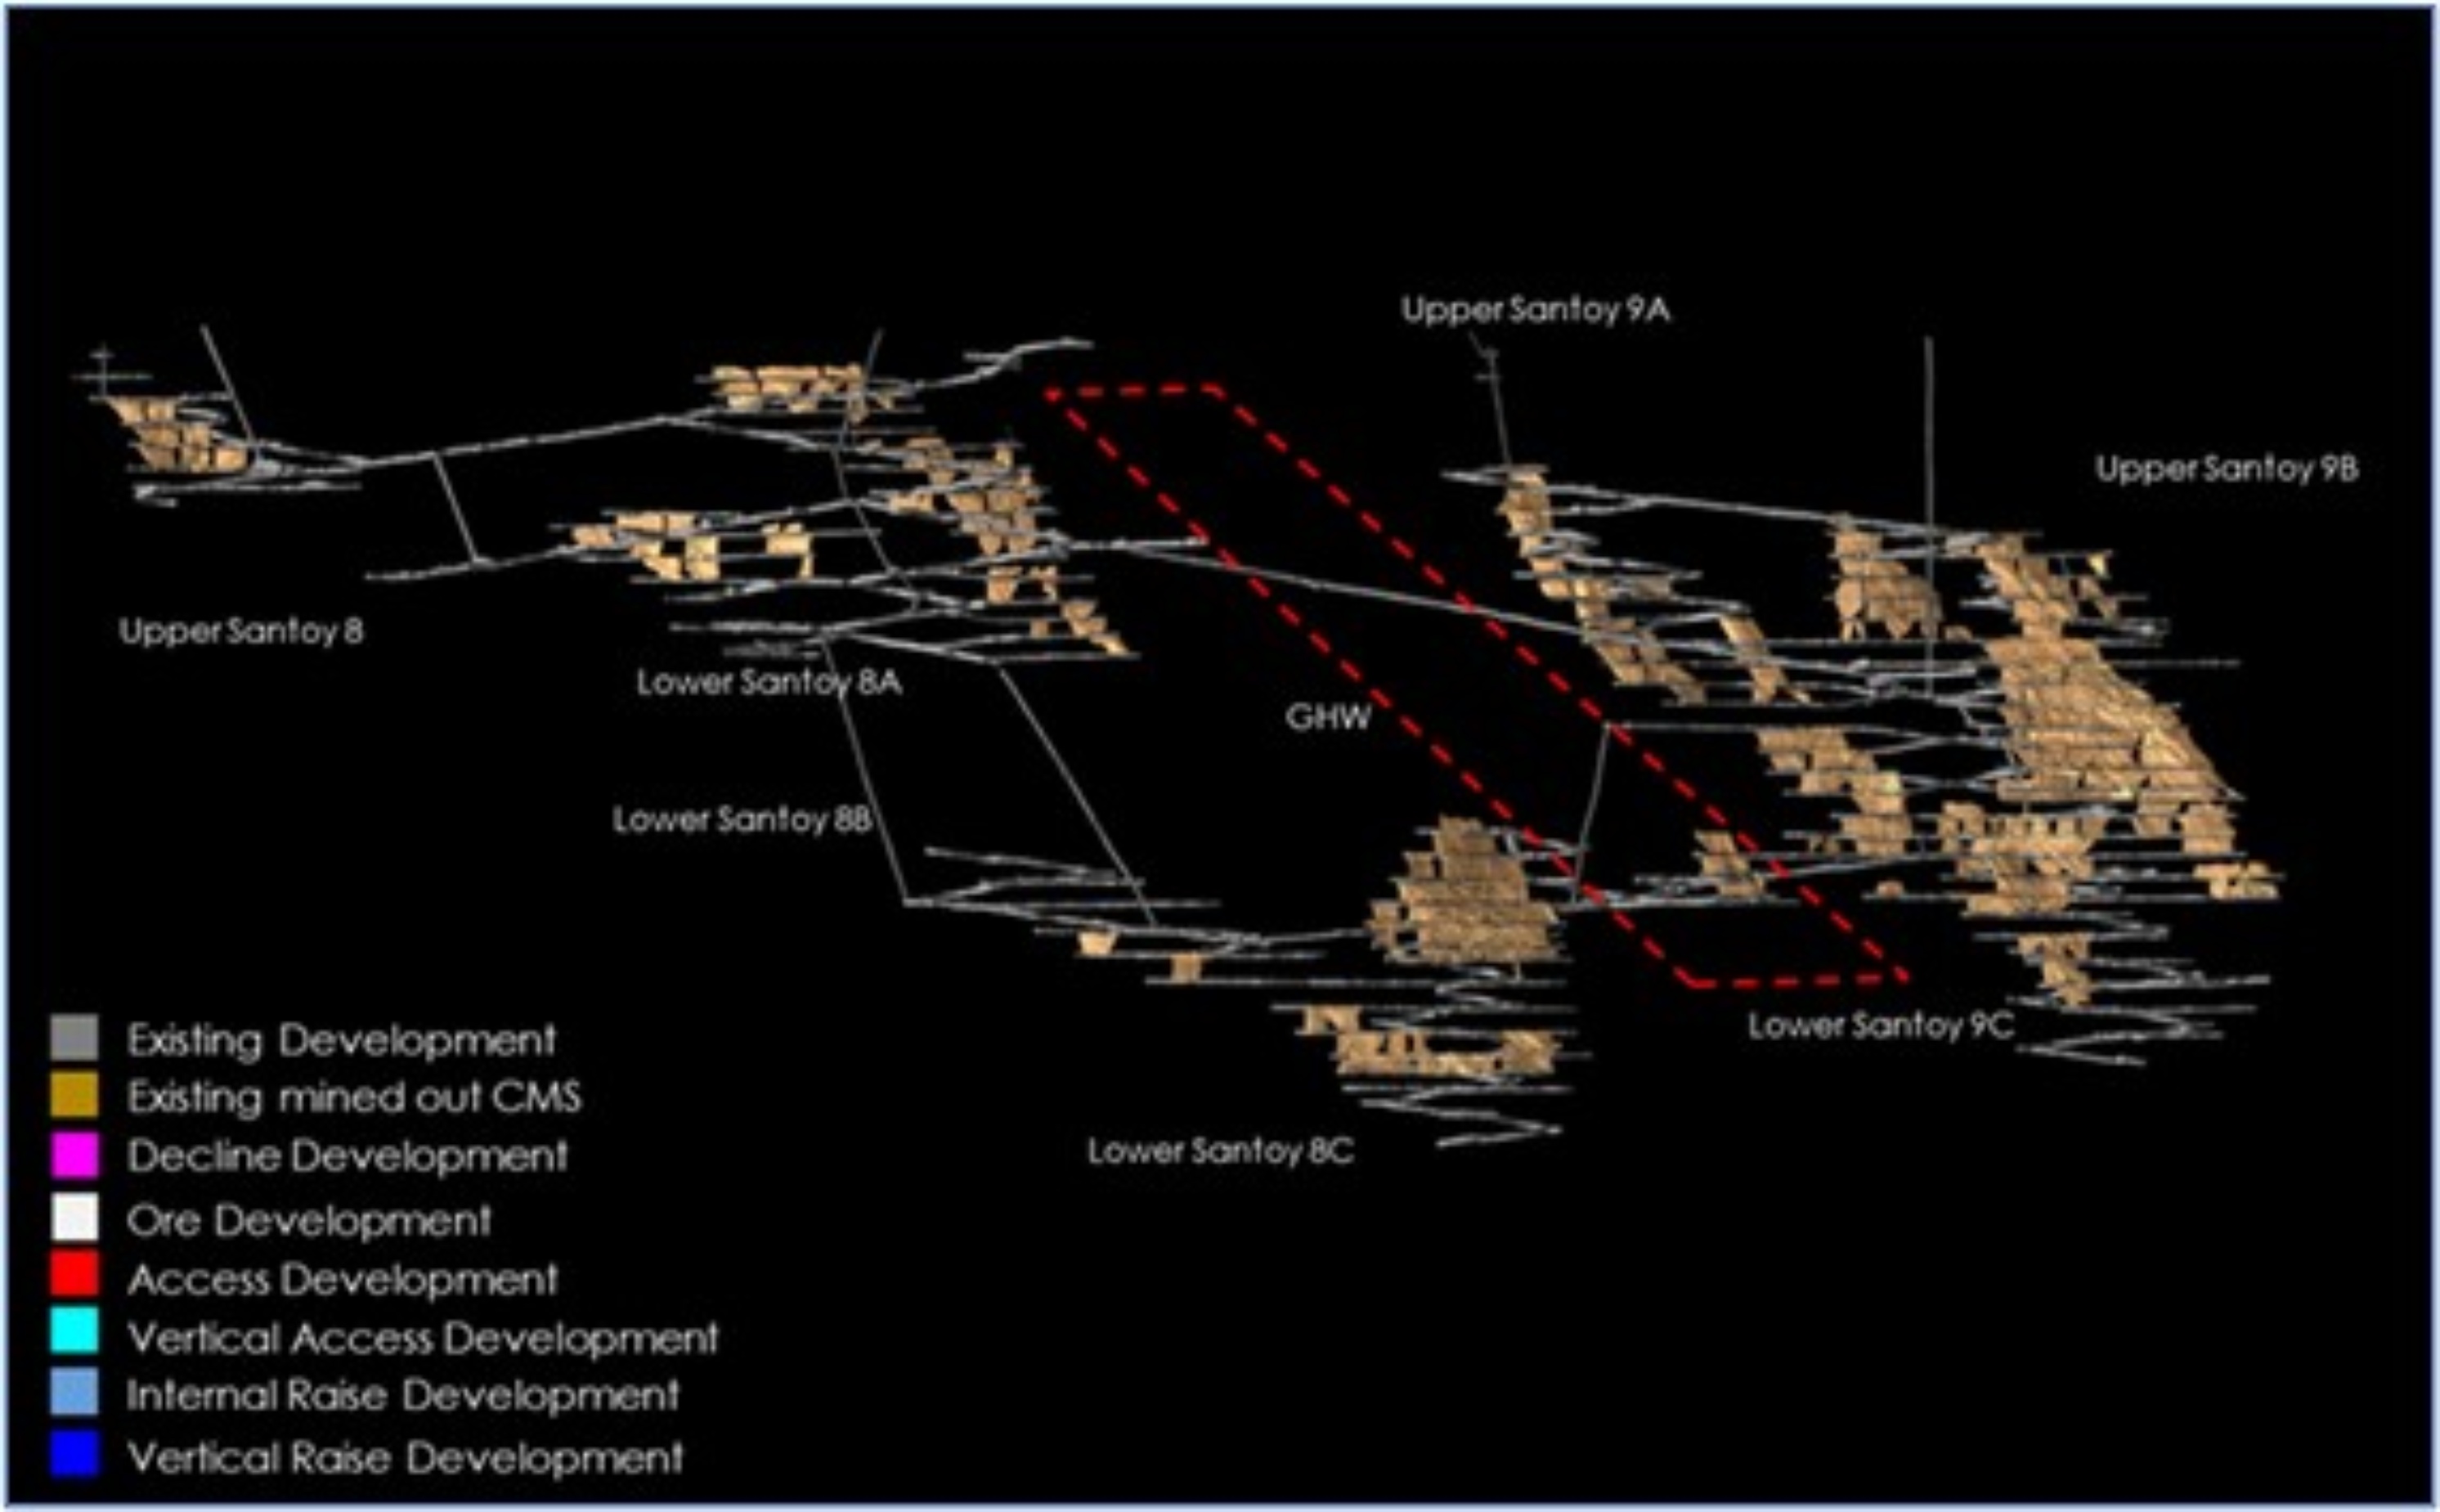
•The Santoy mine area is hosted within a sequence of mafic volcano-sedimentary and intrusive rocks separated by generally north–south trending thrust faults.
•The Porky deposit area is a mineralised trend hosted along a 12 km long openly folded unconformity, separating arenaceous sedimentary rocks of the Rae Lake synform to the north from mafic volcanic rocks of the Seabee mine area to the south.
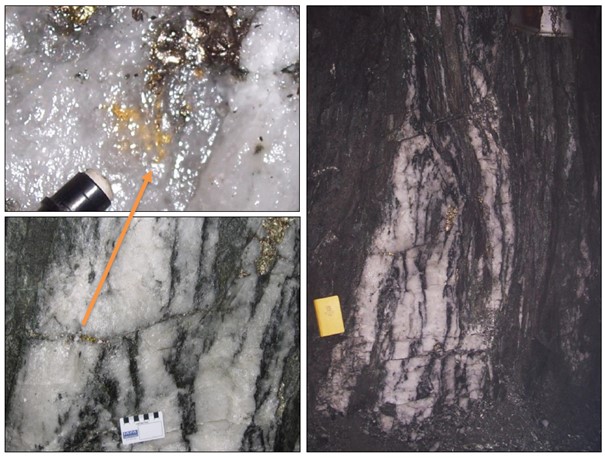
Gold mineralisation at the Santoy mine is hosted within calc-silicate altered shear structures with diopside-albite ±titanite-bearing quartz veins and occurs in gold-sulfide-chlorite-quartz veins in the shear zones, near or in the granodiorite and granite sills. Diopside-albite calc-silicate alteration facies are the main host to gold mineralisation in the Santoy 8A and Santoy 9A, 9B, and 9C zones. The Gap Hangingwall (GHW) deposit is hosted within a shallow dipping, north plunging, folded limb of the Lizard Lake Pluton. Mineralisation is concentrated near the fold hinge within centimetre to metre-scale quartz veining that strikes roughly north–south and dip sub-vertically.
At the Porky deposit, the brittle-ductile lode gold system is hosted along a thick corridor of calc-silicate altered mafic volcanics and arenaceous sedimentary rocks that straddle a major unconformity along the southern margin of the Rae Lake synform. Both the Porky Main and Porky West deposits are characterised by the same calc-silicate alteration package; however, the unconformity and arenites host most of the auriferous quartz veins at the Porky West deposit.
1.5 Exploration
1.5.1 History
The Laonil Lake region has been intermittently explored since the 1940s, with the first gold discovery made in 1947. Cominco conducted an extensive prospecting, geological mapping, trenching, and diamond drilling programme between 1947 and 1950, and in 1958 was granted 10 quartz mining leases covering the property on which the SGO is located. From 1974 through 1983, Cominco conducted detailed drilling and exploration, and in 1983 sold the property to BEC International Corporation (BEC). BEC subsequently sold the property to Claude Resources in 1985.
In June 1985, Claude Resources optioned the property to Placer Development Limited (subsequently Placer Dome Inc. (Placer)). Placer conducted an extensive exploration programme, however, on completion it allowed its option to expire and returned the property to Claude Resources in June 1988.
Claude Resources completed bulk sampling and drilling as part of a feasibility study for the Seabee deposit and reported a Mineral Reserve estimate in December 1988. Construction of the Seabee mill was completed in late 1991, and mining commenced in December 1991.
21014Seabee21TRS220927Rev0.docx 3
In 1998, prospecting and mapping identified several new discoveries including the Porky West zone in 2002, the Santoy 7 deposit in 2004, the Santoy 8 and Santoy 8 East deposits in 2005, and the Santoy Gap deposit in 2010.
Commercial production at the Santoy 7 deposit was achieved in 2007, and an economic study to evaluate the Mineral Resource at the Santoy 8 deposit was conducted in 2008. Portal construction and surface infrastructure development of the Santoy mine was initiated in late 2009, and environmental studies and permitting for commercial mining of the Santoy 8 and Santoy 8 East deposits were completed in 2010. Underground development continued in 2010, and the Santoy mine advanced towards commercial production in the second quarter of 2011.
On 31 May 2016, SSR acquired Claude Resources, thereby taking ownership of the SGO.
SSR filed the previous NI 43-101 Technical Report on the SGO in October 2017, with an effective date of 31 December 2016.
1.5.2 Exploration Activities
Since 1947, exploration at the SGO has comprised of surficial geochemical sampling, airborne and ground geophysical surveys, and extensive drilling. To 31 December 2021, drilling completed on the SGO property (by SSR and previous operators) includes:
•2,324 surface drillholes totalling 496,197 m and
•6,139 underground drillholes totalling 1,161,184 m.
Exploration surface drilling and infill surface and underground drilling completed by SSR since 2017 has been executed in the Carruthers, Herb Lake, Porky Main, Porky West, Seabee, and Santoy areas.
The objective of ongoing exploration conducted by SSR is to delineate, increase, and upgrade Mineral Resources. Underground drilling since 2016 focused on Santoy 8 and 9, GHW, and Santoy Hangingwall.
At the SGO, the 3-year budget calls for an average of 80 km of combined surface and underground drilling per year between 2022 and 2024. This drilling is for testing of targets to maximise Mineral Resource potential at the mine as SSR develops its long-term strategy for continuing to replenish its 3–5-year reserve inventory in the same way it has for more than 20 years, with particular focus on bringing higher grade zones on stream to displace lower tenor inventory that currently occurs in the schedule from 2024 onwards.
21014Seabee21TRS220927Rev0.docx 4
1.6 Development and Operations
The life-of-mine (LOM) plan of the Mineral Reserve at the SGO, commencing 1 January 2022, includes 2.68 Mt at an average grade of 6.7 grams of gold per metric tonne (g/t Au). A total of 580 koz of gold will be delivered to the mill.
There is currently one operating mine as part of the SGO, that being Santoy. Mining will continue at the Santoy mine to provide feed to the mill located near the old Seabee mine.
Access underground at the Santoy mine is provided from the surface at the Santoy portal via a main ramp with sublevels spaced between 17–20 m vertically. Mining is carried out using sublevel open stoping mining methods with backfill. Stopes are filled with a combination of rock fill (RF) and cemented rock fill (CRF), mined in a bottom-up mining sequence. Sill pillars are mined on retreat once the stopes below and above have been mined (stopes above filled with CRF and allowed to cure). The mining sequence will continue to proceed in several longitudinally retreating, bottom-up advancing mining fronts. Current practice for material handling will remain with ore being truck hauled to surface and then hauled 14 km to the mill.
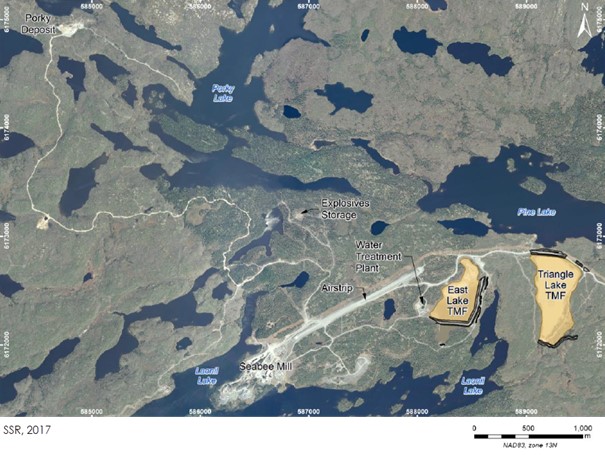
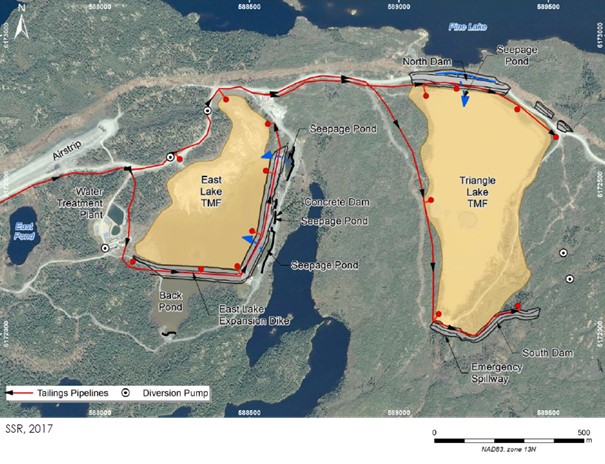
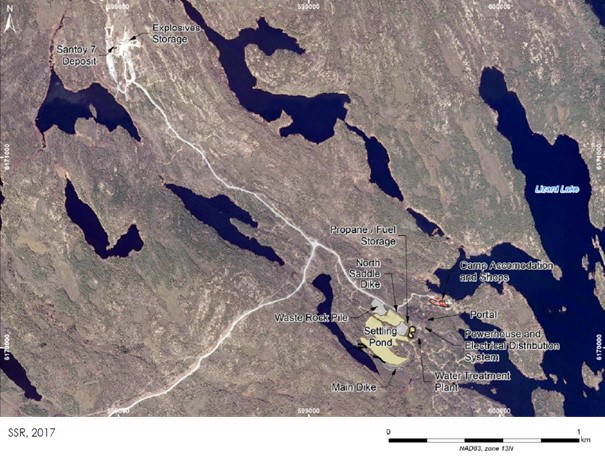
The major infrastructure at the SGO site includes roads and an airstrip, powerhouse and electrical distribution system, mill buildings and related services facilities, portal and ventilation raises, fuel storage, explosive storage, water supply and distribution, water management ponds and water treatment plant, tailings management facilities (TMFs), administrative buildings, and camp accommodation.
There are currently two TMFs that are being used by the mill: the East Lake TMF and the Triangle Lake TMF. Tailings deposition alternates between the two TMFs where winter deposition occurs in the Triangle Lake TMF and summer deposition is in the East Lake TMF. The remaining storage capacities of both facilities, based on the planned production rates, will potentially reach maximum capacity towards the end of 2030. To ensure that water treatment volumes are attained, a water treatment plant was constructed at East Lake TMF.
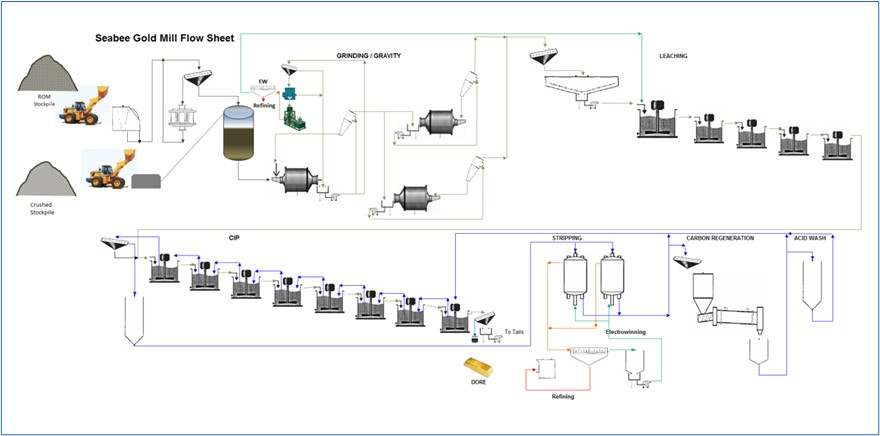
1.7 Processing and Recovery
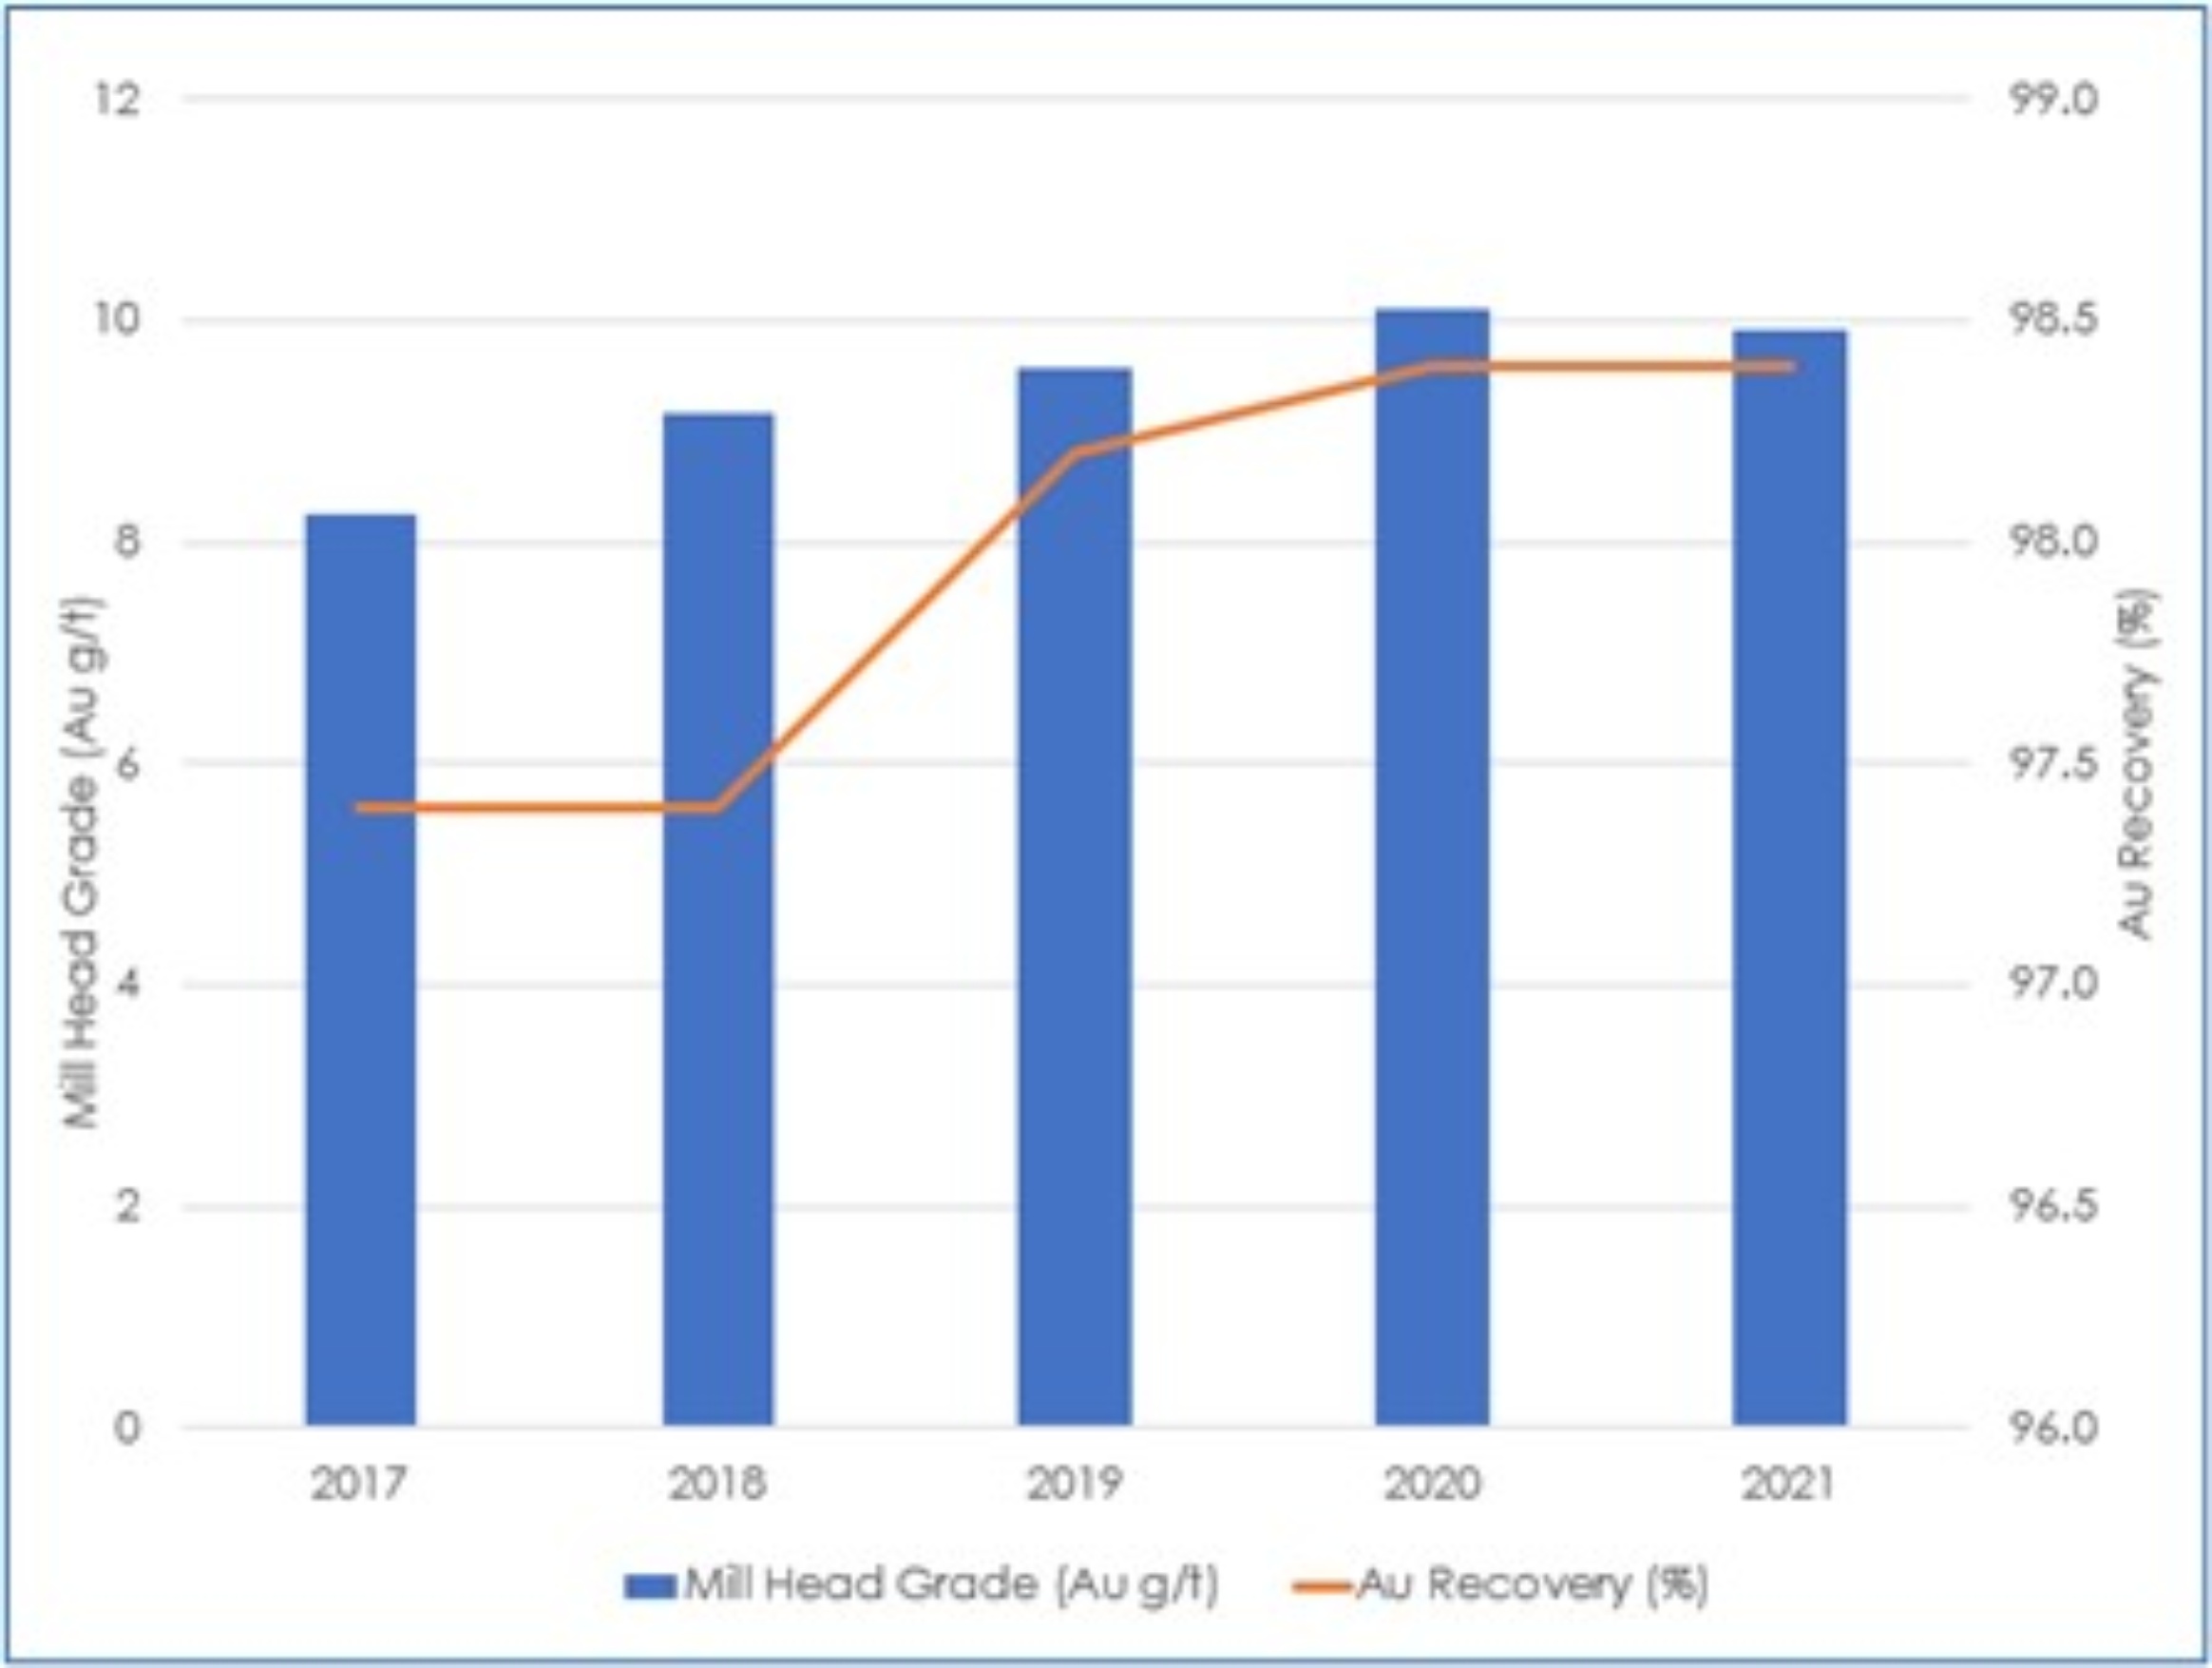
SGO was originally developed based on bench scale metallurgical testwork that characterised the Seabee deposit as a lode gold style of mineralisation that was free milling and that would respond to a standard flow sheet employing gravity recovery and cyanidation. The Seabee deposit was processed for 25 years in the mill constructed immediately adjacent to the Seabee shaft and the plant is now used to process ore from the Santoy mine.
The mill flow sheet is a conventional crushing and grinding circuit employing gravity gold recovery and cyanide leaching with carbon-in-pulp for recovery and production of doré gold on site. The initial capacity was 500 tonnes per day (tpd), which was later expanded to 1,000 tpd with the addition of a third grinding mill.
Historical recovery at the Seabee mill was in the 94%–96% range, with routine low levels of losses both in the tailings solids and solution. Future recovery estimates are 98% and are based on the recent mill performance with mill recoveries of more than 98%. These improvements are attributed to the better condition of the leach equipment as well as the restored leach capacity.
1.7.1 Reasonable Prospects for Eventual Economic Extraction
The Mineral Resources in the Seabee21TRS were assessed for reasonable prospects for eventual economic extraction by reporting only material that fell within conceptual underground shapes and using a cut-off grade of 2.07 g/t Au that is based on a gold price of $1,750/oz.
21014Seabee21TRS220927Rev0.docx 5
1.8 Mineral Resources Estimate
The Mineral Resources have been estimated for the SGO by the SSR technical department on site. The QPs reviewed the assumptions, parameters, and methods used to prepare the Mineral Resource Statement and is of the opinion that the Mineral Resources are estimated and prepared in accordance with S-K 1300.
The Mineral Resources are estimated based on cell models representative of the mineralised veins and using an assumed gold price of $1,750/oz.
The Mineral Resources estimates are based on all available data as of 31 December 2021. The Mineral Resources are reported exclusive of Mineral Reserves in Table 1.1 and Table 1.2.
Table 1.1 Summary of Seabee21TRS Mineral Resource Estimates Exclusive of Mineral Reserves (as at 31 December 2021)
Based on $1,750/oz Gold Price
| | | | | | | | | | | | | | | | | | | | | | | | | | |
| Area | Mineral Resources Classification |
| Measured | Indicated | Measured + Indicated | Inferred |
Tonnage
(kt) | Au
(g/t) | Tonnage
(kt) | Au
(g/t) | Tonnage
(kt) | Au
(g/t) | Tonnage
(kt) | Au
(g/t) |
| Santoy Mine | 71 | 19.75 | 745 | 12.74 | 816 | 13.35 | 2,238 | 6.43 |
| Porky West | – | – | 52 | 5.03 | 52 | 5.03 | 516 | 4.42 |
| Total SGO | 71 | 19.75 | 797 | 12.23 | 869 | 12.85 | 2,754 | 6.05 |
1. Mineral Resources are reported based on 31 December 2021 as-mined survey data.
2. Mineral Resources are reported exclusive of Mineral Reserves.
3. Mineral Resources are shown on a 100% basis.
4. The Mineral Resources estimates are based on a 2.07 g/t Au cut-off with a gold price assumption of $1,750/oz.
5. Santoy Mine includes Santoy 8, Santoy 9, and GHW lodes.
6. The Mineral Resources in the Seabee21TRS were assessed for reasonable prospects for eventual economic extraction by reporting only material that fell within conceptual underground shapes.
7. SSR has 100% ownership of the Project.
8. The point of reference for Mineral Reserves is the point of feed into the processing facility.
9. Tonnage is metric tonnes and g/t represents grams per metric tonne.
10. Totals may vary due to rounding.
Table 1.2 Summary of Cut-off Values and Metallurgical Recoveries, of Seabee21TRS Mineral Resources Estimates Exclusive of Mineral Reserves
(as at 31 December 2021) Based on $1,750/oz Gold Price
| | | | | | | | | | | | | | | | | |
Mineral Resources
Classification | Tonnage
(kt) | Au
(g/t) | Contained Gold (koz) | Cut-off
(Au g/t) | Metallurgical Recovery (%) |
| Measured | 71 | 19.75 | 45 | 2.07 | 98 |
| Indicated | 797 | 12.23 | 313 | 2.07 | 98 |
| Measured + Indicated | 869 | 12.85 | 359 | 2.07 | 98 |
| Inferred | 2,754 | 6.05 | 536 | 2.07 | 98 |
1. Mineral Resources are reported based on 31 December 2021as-mined survey data.
2. Mineral Resources are reported exclusive of Mineral Reserves.
3. Mineral Resources are shown on a 100% basis.
4. The Mineral Resources estimates are based on a 2.07 g/t Au cut-off with a gold price assumption of $1,750/oz.
5. Santoy Mine includes Santoy 8, Santoy 9, and GHW lodes.
6. The Mineral Resources in the Seabee21TRS were assessed for reasonable prospects for eventual economic extraction by reporting only material that fell within conceptual underground shapes.
7. SSR has 100% ownership of the Project.
8. The point of reference for Mineral Reserves is the point of feed into the processing facility.
9. Tonnage is metric tonnes, ounces represent troy ounces, and g/t represents grams per metric tonne.
10. Totals may vary due to rounding.
21014Seabee21TRS220927Rev0.docx 6
1.9 Mineral Reserves Estimate
The SGO Mineral Reserves estimate was completed by the SSR technical department on site. The QPs reviewed the assumptions, parameters, and methods used to prepare the Mineral Reserve Statement and is of the opinion that the Mineral Reserve is estimated and prepared in accordance with S-K 1300.
The Mineral Reserve Statement is reported in Table 1.3 and Table 1.4. The reference point at which the Mineral Reserve is identified is where ore is delivered to the processing plant (i.e., mill feed). The QPs are unaware of any environmental, permitting, legal, title, taxation, socio-economic, marketing, political, or other relevant issues that may materially affect the Mineral Reserve estimate. However, the Mineral Reserve may be affected by further infill and exploration drilling that may result in increases or decreases in subsequent Mineral Resource and Mineral Reserve estimates. The Mineral Reserve may also be affected by subsequent assessments of mining, environmental, processing, permitting, taxation, socio-economic, and other factors. The effective date of the Mineral Reserve Statement is 31 December 2021.
Table 1.3 Summary of Seabee21TRS Mineral Reserves Estimate (as at 31 December 2021)
Based on $1,600/oz Gold Price
| | | | | | | | | | | | | | | | | | | | |
| Area | Mineral Reserve Classification |
| Proven | Probable | Total |
Tonnage
(kt) | Grade (Au g/t) | Tonnage
(kt) | Grade (Au g/t) | Tonnage
(kt) | Grade (Au g/t) |
| Santoy Mine | 304 | 9.16 | 2,379 | 6.40 | 2,684 | 6.72 |
1. Mineral Reserves are reported based on 31 December 2021as-mined survey data.
2. The Mineral Reserves estimates are based on metal price assumptions of $1,600 gold.
3. The Mineral Reserves estimates are reported at a cut-off grade of 2.52 g/t Au.
4. Economic analysis for the Mineral Reserves has been prepared using long-term metal prices of $1,600/oz gold.
5. No mining dilution is applied to the grade of the Mineral Reserves. Dilution intrinsic to the Mineral Reserves estimate is considered sufficient to represent the mining selectivity considered.
6. Processing recoveries vary based on the feed grade. The average recovery is estimated to be 98%.
7. SSR has 100% ownership of the Project.
8. Santoy Mine includes Santoy 8, Santoy 9, and Gap Hangingwall lodes.
9. Metals shown in this table are the contained metals in ore mined and processed.
10. The point of reference for Mineral Resources is the point of feed into the processing facility.
11. Tonnage is metric tonnes and g/t represents grams per metric tonne.
12. Totals may vary due to rounding.
21014Seabee21TRS220927Rev0.docx 7
Table 1.4 Summary of Cut-off Values and Metallurgical Recoveries, of Seabee21TRS Mineral Reserves Estimate (as at 31 December 2021)
Based on $1,600/oz Gold Price
| | | | | | | | | | | | | | | | | |
| Mineral Reserve Classification | Tonnage
(kt) | Grade
(Au g/t) | Contained Gold (koz) | Cut-off
Value (Au g/t) | Metallurgical Recovery (%) |
| Proven | 304 | 9.16 | 90 | 2.52 | 98 |
| Probable | 2,379 | 6.40 | 490 | 2.52 | 98 |
| Total Mineral Reserves | 2,684 | 6.72 | 580 | 2.52 | 98 |
1. Mineral Reserves are reported based on 31 December 2021as-mined survey data.
2. The Mineral Reserves estimates are based on metal price assumptions of $1,600 gold.
3. The Mineral Reserves estimates are reported at a cut-off grade of 2.52 g/t Au.
4. Economic analysis for the Mineral Reserves has been prepared using long-term metal prices of $1,600/oz gold.
5. No mining dilution is applied to the grade of the Mineral Reserves. Dilution intrinsic to the Mineral Reserves estimate is considered sufficient to represent the mining selectivity considered.
6. Processing recoveries vary based on the feed grade. The average recovery is estimated to be 98%.
7. SSR has 100% ownership of the Project.
8. Metals shown in this table are the contained metals in ore mined and processed.
9. The point of reference for Mineral Reserves is the point of feed into the processing facility.
10. Tonnage is metric tonnes, ounces represent troy ounces, and g/t represents grams per metric tonne.
11. Totals may vary due to rounding.
The 2021 Mineral Reserves are a net increase of 86 koz (18%) total contained gold ounces as compared with the 2020 Mineral Reserves. Although mining depletion has occurred in the Santoy 8A and 9A mining zones, the 2021 Mineral Reserve has increased with the conversion of the Santoy Mineral Resources in the GHW zone into Mineral Reserves. An increase in the gold commodity price has also resulted in a decrease in the Mineral Reserve cut-off grade.
1.10 Metallurgy and Processing
The Seabee Gold Operation (SGO) was originally developed based on bench scale metallurgical testwork that characterised the Seabee deposit as a lode gold style of mineralisation that was free milling and that would respond to a standard flow sheet employing gravity recovery and cyanidation. After the successful commissioning of the Seabee mill and the operation matured the mill became the reference flow sheet for other mineralisation that was identified as a possible mill feed source.
The SGO deposits, are classified as lode gold style deposits with the gold in quartz veins typically in shear zones with some variations of the host rock mineralisation, with gabbros at Seabee and mafic metavolcanics at the Santoy and Porky deposits. As the satellite deposits advanced to potential development, bench scale testing was employed to confirm the free milling potential and the presence of any deleterious elements.
With the consistent long-term metallurgical response of the Seabee and Santoy deposits processed to-date, the focus of metallurgical investigations has been on improvements to process capacity constraints and process operating cost reductions.
The Seabee process plant was originally built as a 500 tpd operation. Subsequent capital projects have included the addition of the primary ball mill, addition of a second Knelson concentrator and Acacia gravity gold recovery. Process improvements have included, improved grind size control, improved gravity circuit utilisation, improved leach feed thickener chemistry and reduction in flocculant addition, and carbon and cyanide management.
Historical recovery at the Seabee mill was in the 94%–96% range, with routine low levels of losses both in the tailings solids and solution. Future recovery estimates are 98% and are based on the recent mill performance with mill recoveries of more than 98%. These improvements are attributed to the better condition of the leach equipment as well as the restored leach capacity.
21014Seabee21TRS220927Rev0.docx 8
The Seabee operation is characterised by coarse gold making the gravity recovery circuit critical to the overall gold recovery of the process plant. Historically gravity recovery was approximately 40%. In recent years with incorporation of gravity circuit improvements including the Acacia circuit gravity gold recovery has improved to 60%–70% of recovered gold, with the CIP accounting for 30%–40%. Overall gold recovery is estimated at 97%–98.5%.
1.11 Environment, Communities, and Permitting
SSR has successfully completed three environmental assessments for the SGO to date. The site is regulated by both the Saskatchewan Ministry of Environment and Environment and Climate Change Canada. In accordance with provincial environmental legislation and regulations, the operation must adhere to the terms and conditions of an Approval to Operate a Pollutant Control Facility (Approval to Operate). The SGO is in compliance with all the terms and conditions of its current Approval to Operate number PO19-193, issued in October 2019 with an expiry date of September 2022. SSR is responsible to apply to renew this Approval to Operate a minimum of 90 days prior to the expiry date.
The dominant environmental liability at the SGO is the management of the mill tailings and associated tailings effluent. Appropriate infrastructure and operational plans are in place to reduce operational and closure risks associated with these liabilities to acceptable levels.
In 2016 SSR initiated a thorough stakeholder engagement plan designed to strengthen its relationship with communities impacted by the SGO, and the existing social licence to continue operations of the facility. No significant public concern with the SGO was expressed during the stakeholder engagement process.
There are no known environmental concerns at the SGO that cannot be successfully mitigated through the implementation of the various approved management plans that have been developed based on accepted scientific and engineering practices.
In accordance with provincial regulations, SSR has submitted an updated decommissioning and reclamation plan and cost estimate every five years, since 1996. Following initial regulatory review and subsequent edits by SSR, the 2020 revision to the preliminary decommissioning and reclamation plan was approved by the Ministry of Environment. Work on a revision is currently underway to cover the expanded Triangle Lake TMF. The total cost to implement the closure plan using a third-party contractor is currently C$12.0M. This cost estimate incorporates costs to cover release of the property, following the successful implementation of the closure plan, back to the province by way of Saskatchewan’s Institutional Control Program.
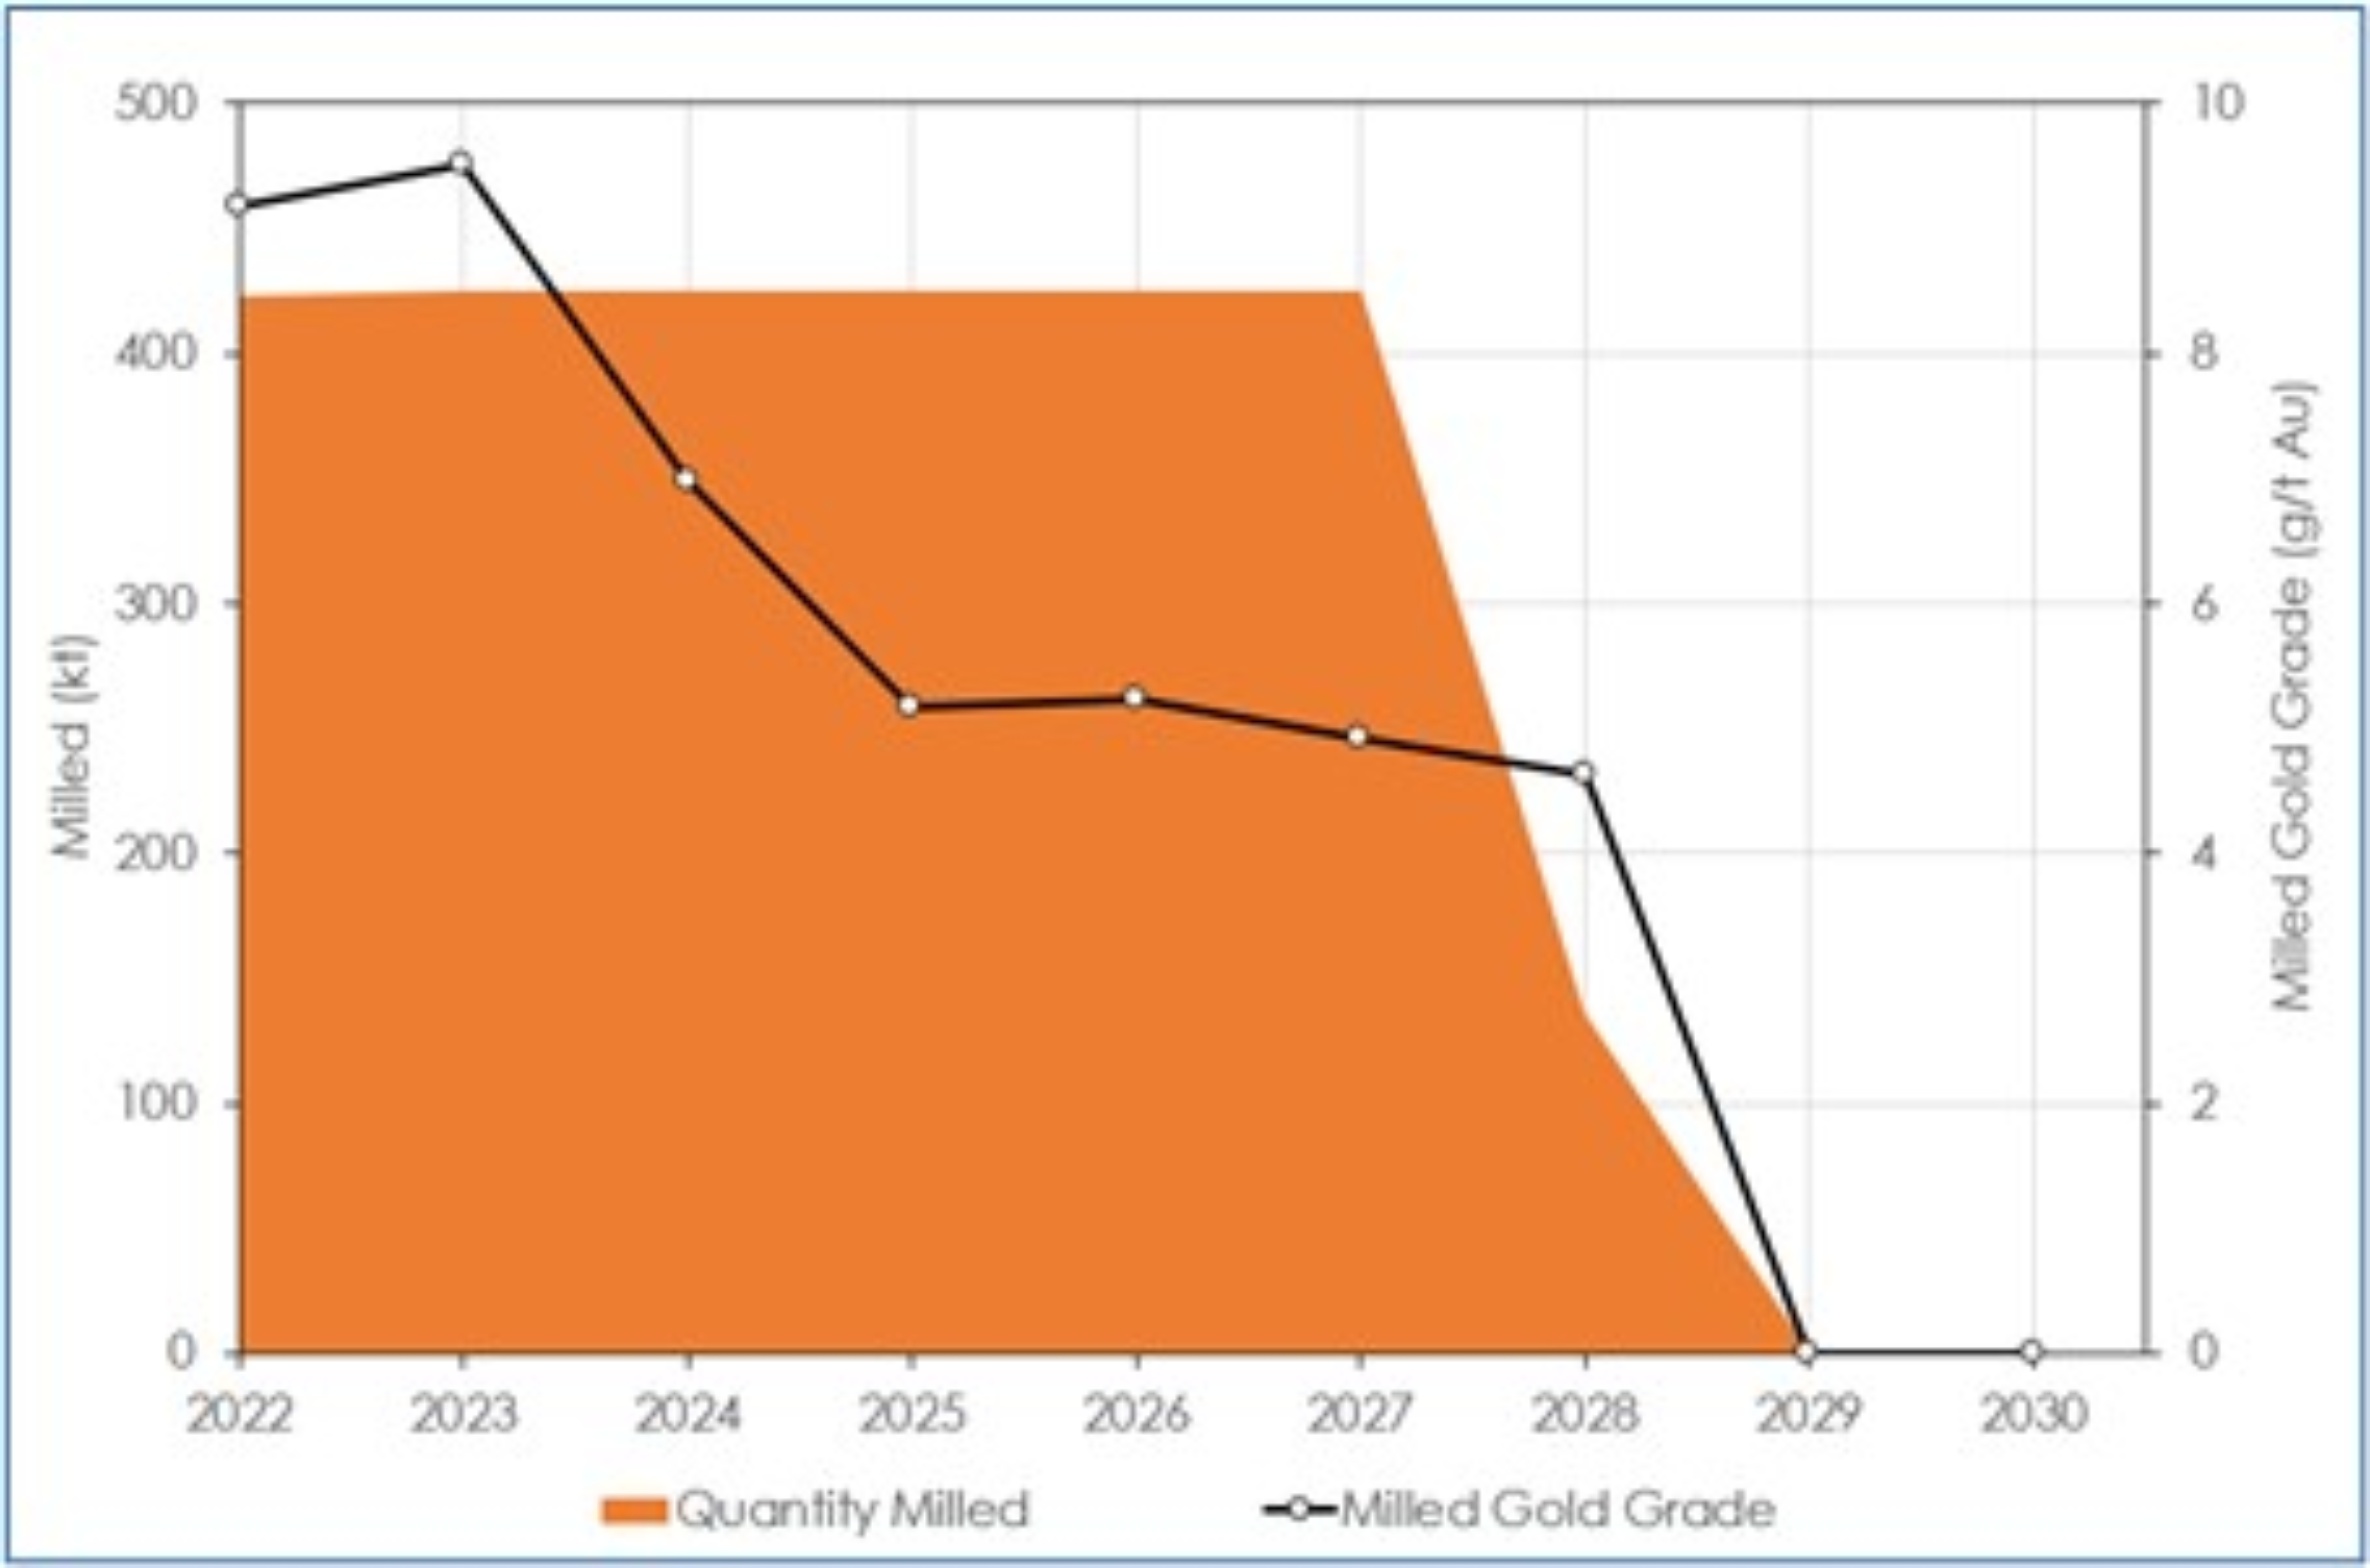
1.12 Production
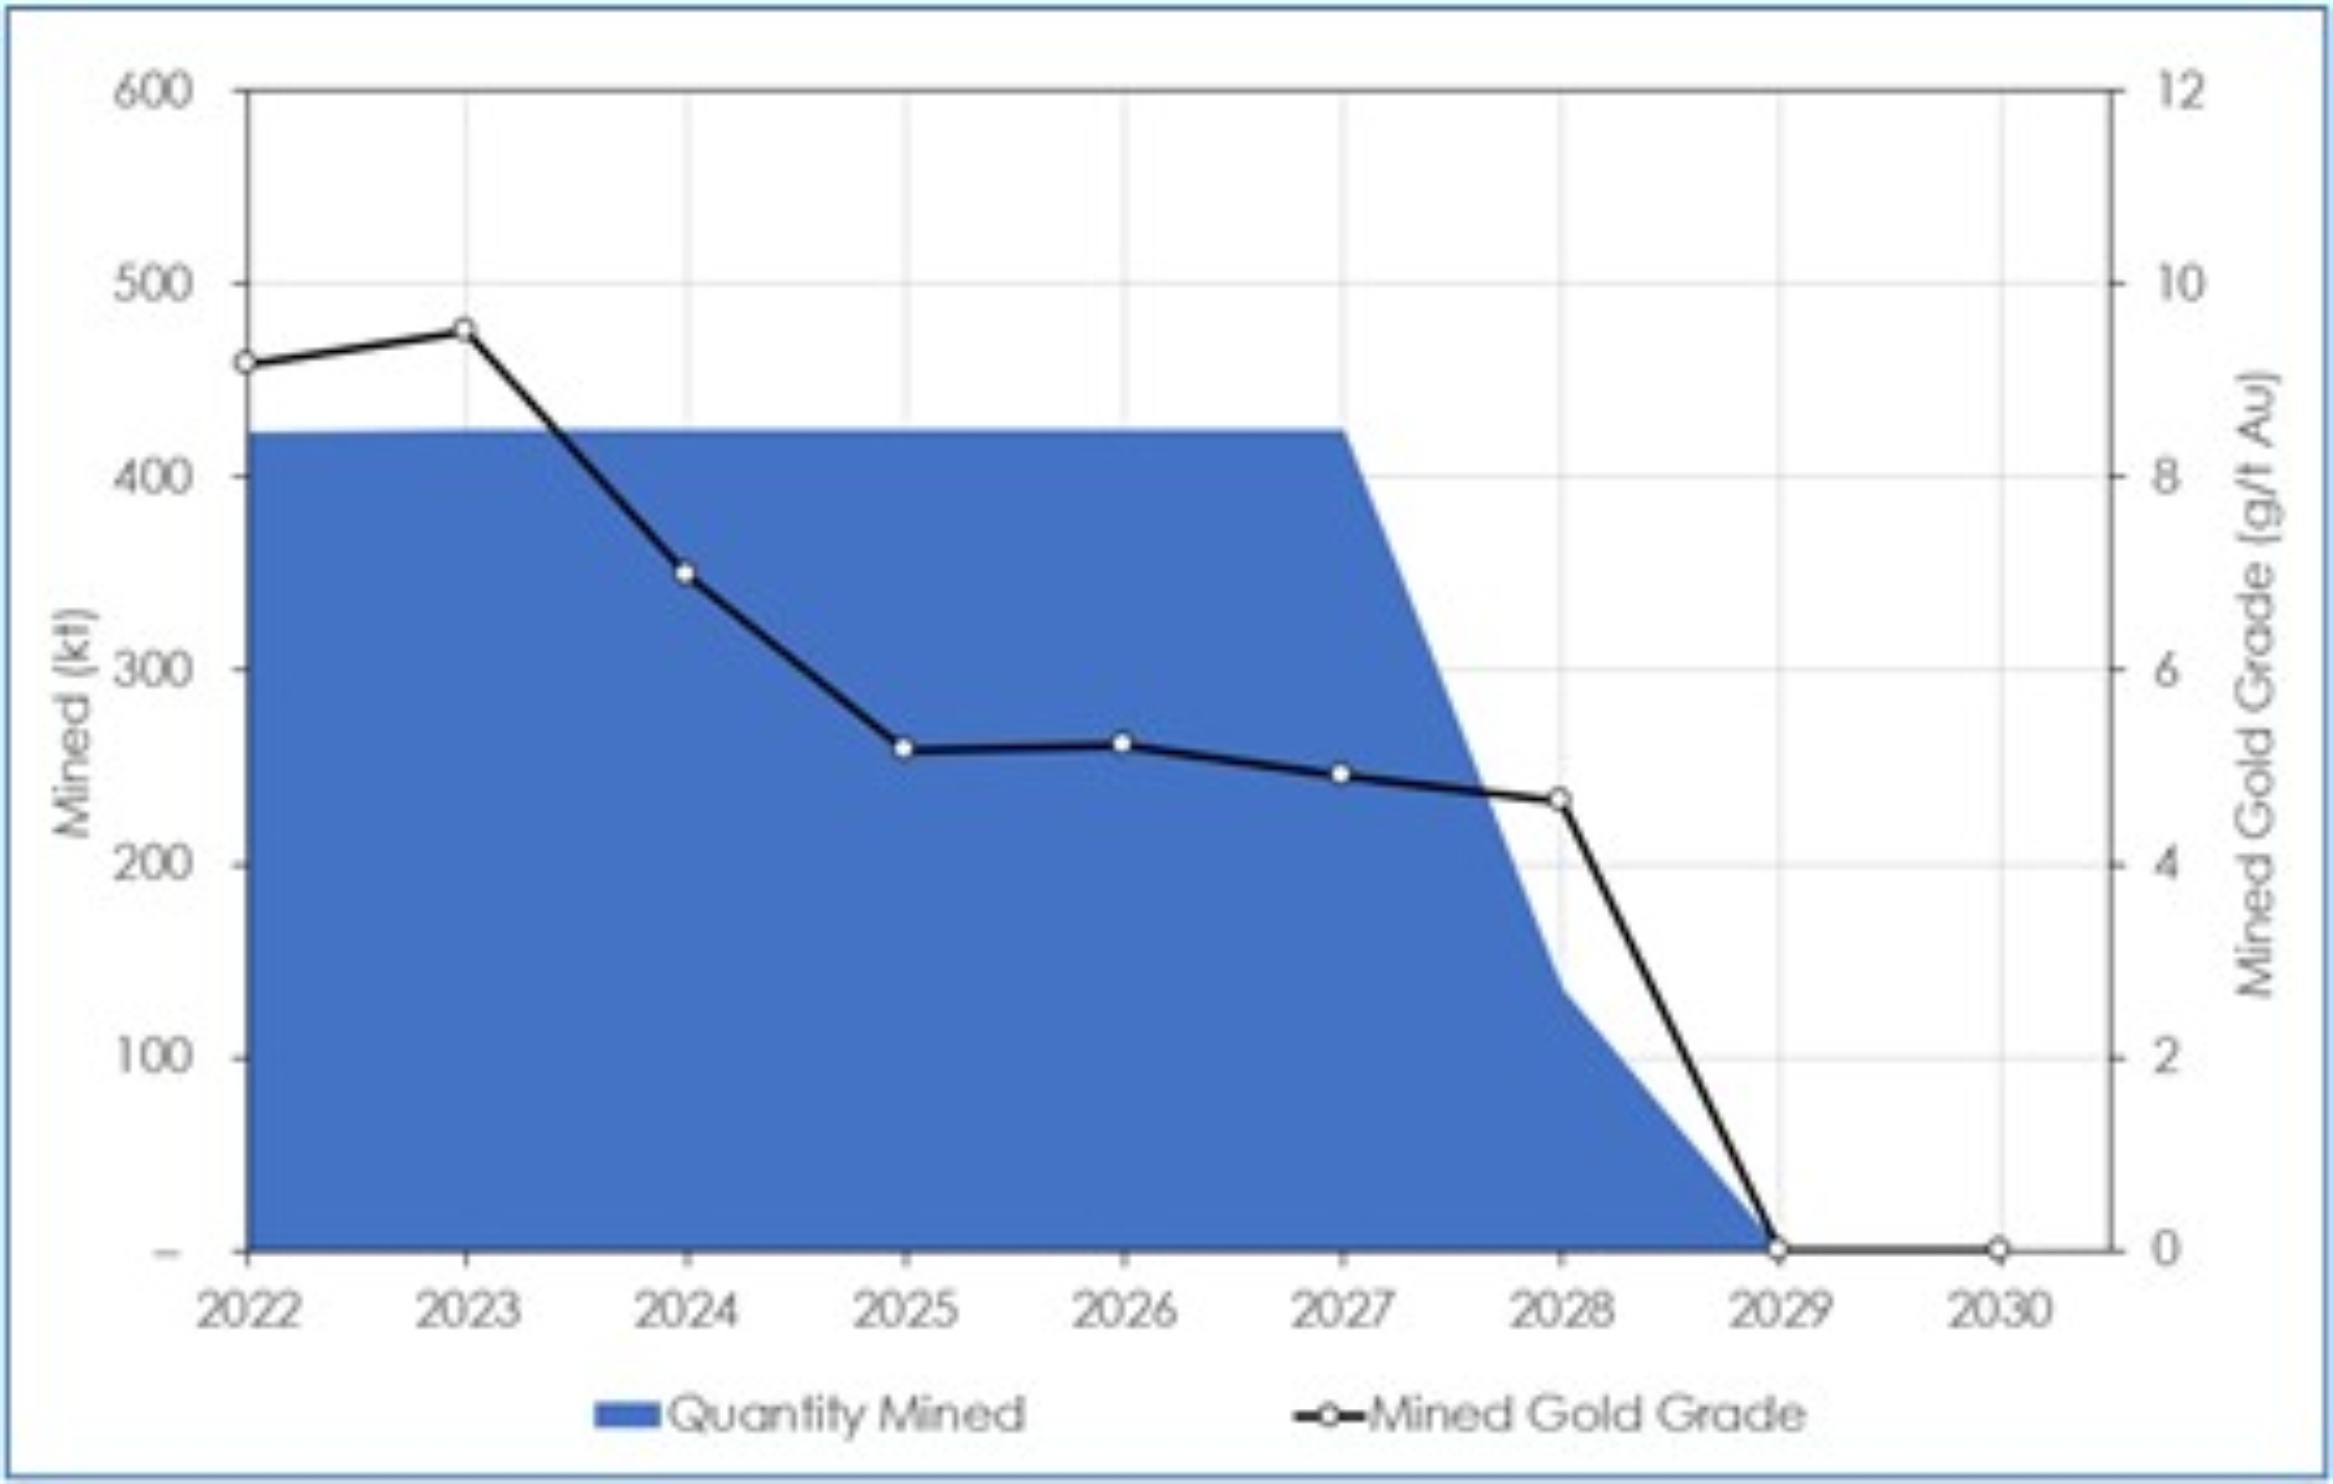
Future proposed mine production has been scheduled to optimise the mine output and meet the plant capacity.
The mining production forecasts are shown in Table 1.5.
Mine, process, and metal production are shown in Figure 1.2 through Figure 1.4.
21014Seabee21TRS220927Rev0.docx 9
Table 1.5 Mining Production Statistics
| | | | | | | | | | | | | | |
| Item | Unit | Total LOM | 2-Year Annual Average | LOM Annual Average |
| Gold Feed – Tonnes Processed |
| Quantity Ore Tonnes Treated | kt | 2,684 | 424 | 424 |
| Au Feed Grade | g/t | 6.72 | 9.34 | 6.72 |
| Gold Recovery | % | 98.0 | 98.0 | 98.0 |
| Metal Produced |
| Gold | koz | 568 | 125 | 90 |
Figure 1.2 Mining Production Profile
OreWin, 2021
21014Seabee21TRS220927Rev0.docx 10
Figure 1.3 Process Feed Profile
OreWin, 2021
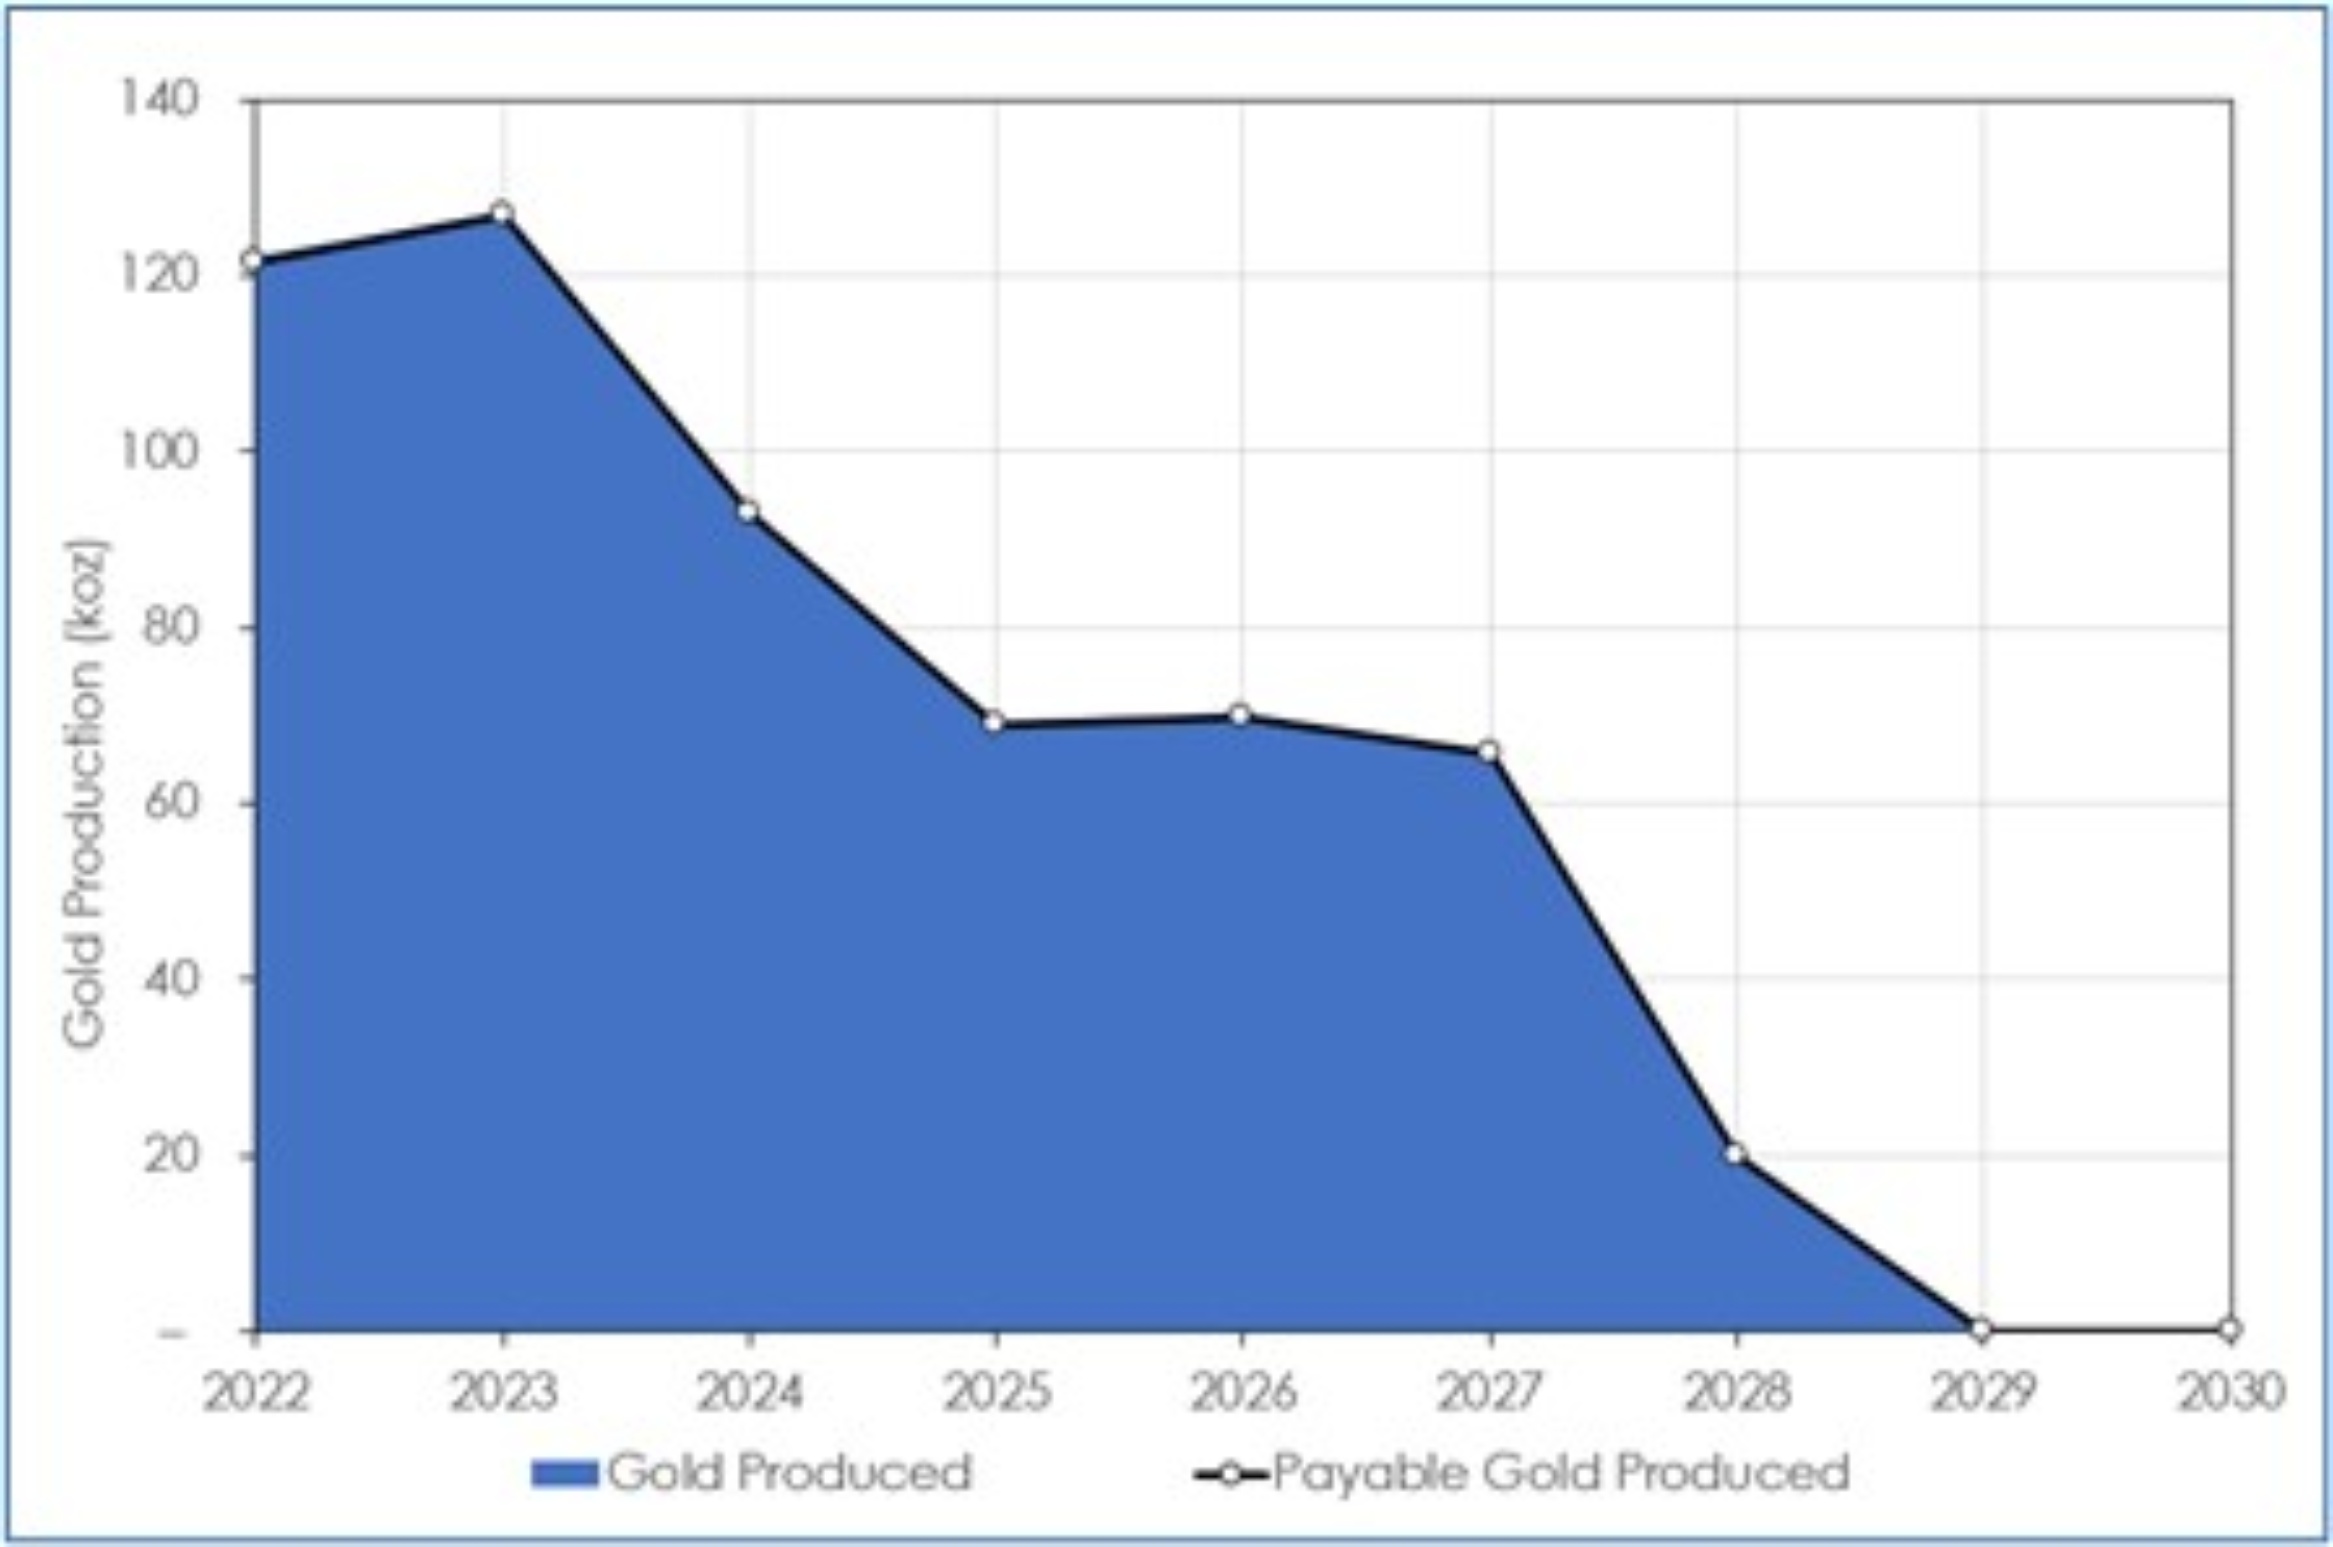
Figure 1.4 Gold Production
OreWin, 2021
21014Seabee21TRS220927Rev0.docx 11
1.13 Capital and Operating Costs
The cost estimate was prepared by the SSR technical department at both the SGO site and Saskatoon office. The QPs reviewed the assumptions, parameters, and methods used to prepare the cost estimate and is of the opinion that they are sufficient for the purposes of validating the economics of the Mineral Reserves. Total capital expenditure is estimated to be $162M.
The life of mine operating costs are approximately $155/t of ore milled, as summarised in Table 1.6.
Table 1.6 LOM Average Operating Costs Estimate
| | | | | |
| Cost Component | $/t milled |
| Mining | 46 |
| Surface Haulage | 6 |
| Milling (incl. Fixed Plant) | 35 |
| G&A | 68 |
| Total Operating Cost | 155 |
Sum of individual values may not match total due to rounding
1.14 Economic Analysis
The estimates of cash flows have been prepared on a real basis as at 1 January 2022 and a mid-year discounting is used to calculate NPV.
The projected financial results include:
•After-tax NPV at a 5% real discount rate is $249M
•Mine life of six years
The estimated total cash costs for the first two years of production is $538 per payable ounce of gold, with a LOM average of $735. The all-in sustaining costs (AISC), which includes infrastructure capital and capital development, is $868 per payable ounce of gold for the first two years of production, with a LOM average of $1,021.
The gold prices assumptions used for the economic analysis are shown in Table 1.7. Gold provides the only revenue included in the analysis.
Table 1.7 Gold Price Assumptions
| | | | | | | | | | | | | | | | | | | | |
| Commodity | Unit | 2022 | 2023 | 2024 | 2025 | Long- Term |
| Gold | $/oz | 1,800 | 1,740 | 1,710 | 1,670 | 1,600 |
Other key economic assumptions for the discounted cash flow analyses are shown in Table 1.8.
21014Seabee21TRS220927Rev0.docx 12
Table 1.8 Key Economic Assumptions
| | | | | | | | |
| Model Assumption | Unit | Value |
| Refinery Charge | $/oz gold | 0.45 |
| Gold Payability | % | 99.5 |
| Tax Rate | % | 25.9 |
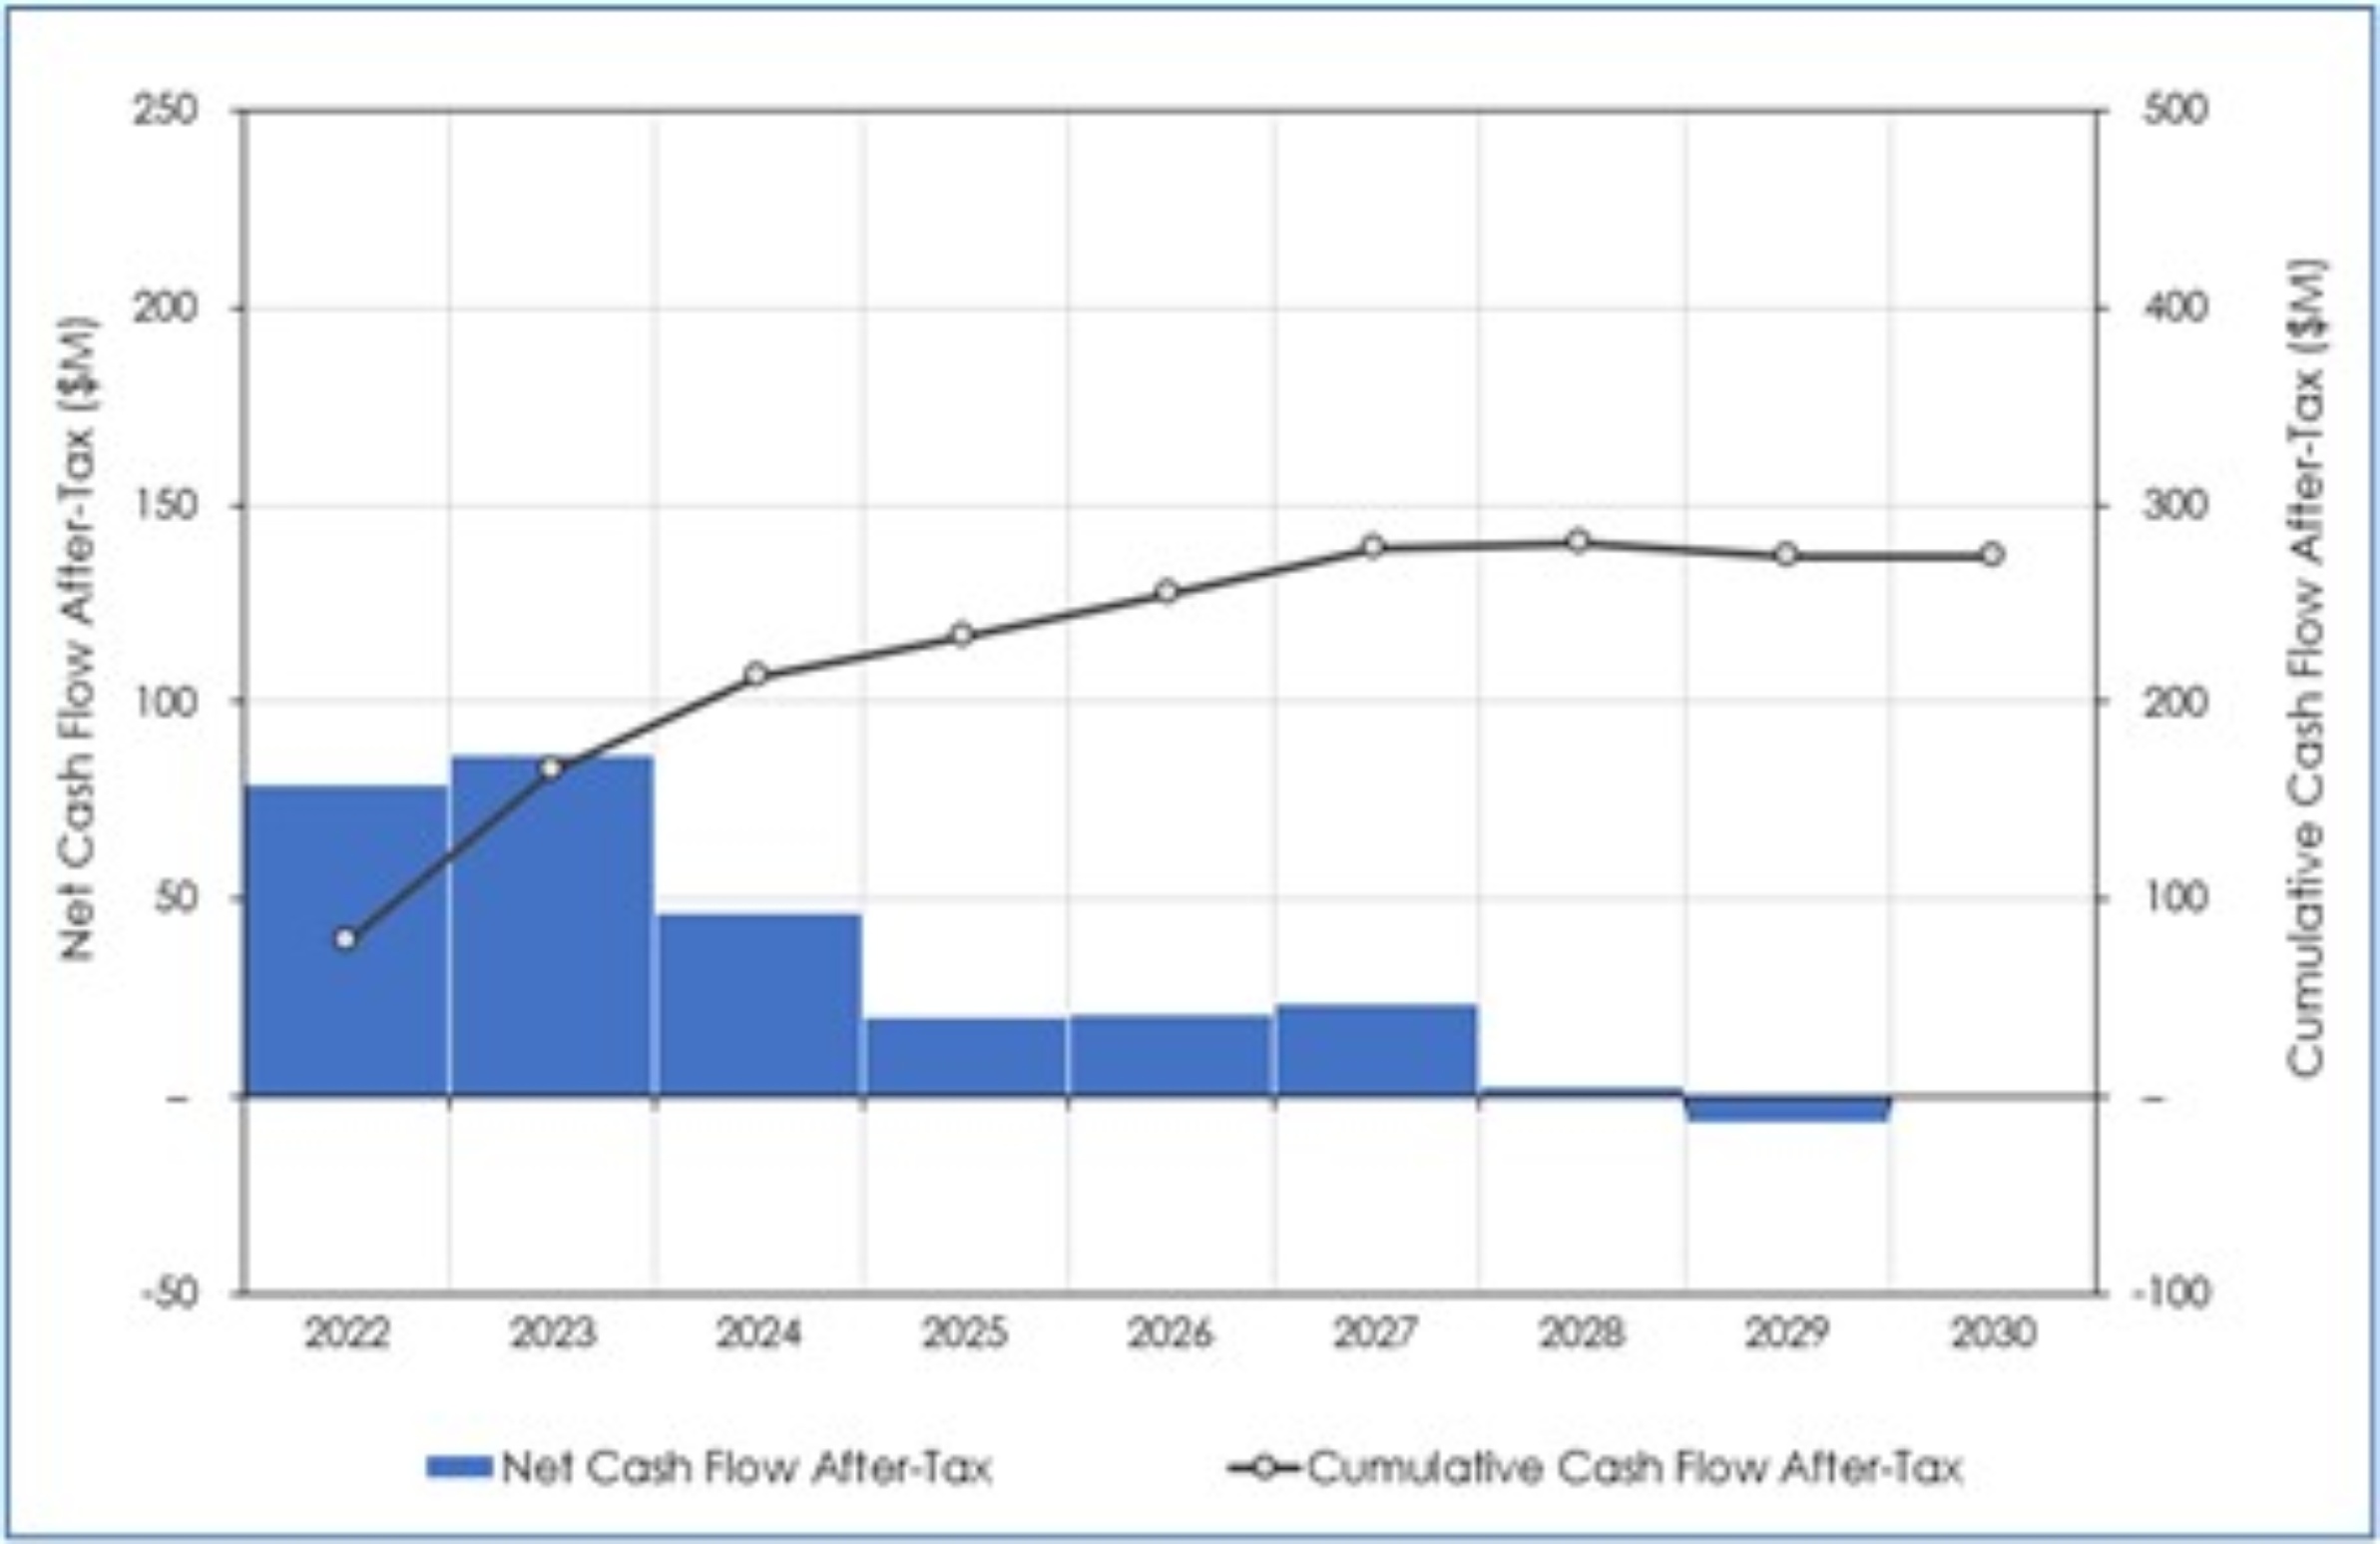
The key results of the Seabee21TRS are summarised in Table 1.9. The projected financial results for undiscounted and discounted cash flows, at a range of discount rates are shown in Table 1.10. The estimates of cash flows have been prepared on a real basis as 1 January 2022 and a mid-year discounting is used to calculate net present value (NPV).
The results of NPV5% sensitivity analysis to a range of changes in gold price and discount rates is shown in Table 1.11. A chart of the cumulative cash flow is shown in Figure 1.5.
Table 1.9 Seabee21TRS Results Summary
| | | | | | | | |
| Description | Unit | Total LOM |
| Ore Processed | | |
| Ore Tonnes Treated | kt | 2,684 |
| Au Feed Grade | g/t | 6.72 |
| Gold Recovery | % | 98.0 |
| Metal Produced | | |
| Gold | koz | 568 |
| Key Financial Results | | |
| Site Operating Costs | $/t milled | 155 |
| Mine Site Cash Cost | $/oz payable gold | 734 |
| Royalties and Refining | $/oz payable gold | 0.5 |
| Total Cash Costs (CC) | $/oz payable gold | 735 |
| All-in Sustaining Costs (AISC) | $/oz payable gold | 1,021 |
| Average Gold Price | $/oz payable gold | 1,701 |
| NPV | $M | 249 |
| Discount Rate | % | 5 |
| Project Life | years | 6 |
21014Seabee21TRS220927Rev0.docx 13
Table 1.10 Financial Results
| | | | | | | | |
| Discount Rate | NPV ($M) |
| Before-Tax | After-Tax |
| Undiscounted | 372 | 274 |
| 2% | 358 | 263 |
| 5% | 338 | 249 |
| 10% | 309 | 228 |
| 12% | 299 | 221 |
| 15% | 285 | 211 |
| 18% | 273 | 201 |
| 20% | 265 | 196 |
Table 1.11 After-Tax NPV Sensitivity to Gold Price and Discount Rates
| | | | | | | | | | | | | | | | | | | | | | | | | | | | | |
| Discount Rate | Relative Gold Price
($/oz) |
| –400 | –300 | –200 | –100 | – | +100 | +200 | +300 | +400 |
| Undiscounted | 106 | 148 | 190 | 232 | 274 | 316 | 358 | 400 | 442 |
| 2% | 104 | 144 | 184 | 224 | 263 | 303 | 343 | 383 | 422 |
| 5% | 101 | 138 | 175 | 212 | 249 | 286 | 323 | 360 | 396 |
| 10% | 96 | 129 | 162 | 195 | 228 | 261 | 294 | 327 | 359 |
| 12% | 94 | 126 | 158 | 189 | 221 | 252 | 284 | 315 | 347 |
Figure 1.5 After-Tax Annual and Cumulative Cash Flow
OreWin, 2021
21014Seabee21TRS220927Rev0.docx 14
1.15 Interpretation and Conclusions
1.15.1 Mineral Resources
Mineral Resources for the Seabee21TRS have been estimated in and prepared in accordance with S-K 1300.
Areas of uncertainty that may materially impact the Mineral Resource estimates include:
•Assumptions used to generate the data for consideration of reasonable prospects of eventual economic extraction for the Seabee deposit.
GHW mining recovery could be lower, and dilution increased. Early stoping in GHW should be used to confirm mining method parameters for the GHW zone in terms of costs, dilution, and mining recovery. Early development will also provide access to data and metallurgical samples at a bulk scale that cannot be collected at the scale of a drill sample.
•Environmental, permitting, legal, title, taxation, socio-political, marketing, or other relevant issues.
•Commodity prices and exchange rates.
•Cut-off grades.
1.15.2 Mineral Reserves
Mineral Reserves for the Seabee21TRS have been estimated in and prepared in accordance with S-K 1300.
Areas of uncertainty that may impact the Mineral Reserve estimate include:
•Any changes to the resource model as a result of further definition drilling at the site.
•Changes to mining conditions that have an impact to operating costs, production rates or mining recovery factors.
•Commodity prices and exchange rates.
1.16 Recommendations
The QPs are not aware of any significant risks and uncertainties that could be expected to affect the reliability or confidence in the information discussed herein.
1.16.1 Further Assessment
The key areas for further studies / work are:
•Ongoing drilling to expand the Mineral Resource aimed to increase mine life and optimise grade in years 2024 and beyond, as Seabee has managed to do for many years.
•Ongoing geotechnical drilling and logging will be required to increase the confidence in geotechnical data as the project develops.
•Ongoing geotechnical mapping should take place at regular intervals in the planned developments to verify the rock mass conditions determined and to assess the rock mass quality where there is currently little information. This will also allow for the identification of localised weak zones and potentially unstable wedges which should be appropriately supported.
21014Seabee21TRS220927Rev0.docx 15
•While the structural analysis provides an impression of the major joint sets across the project area, further geotechnical scanline mapping should be conducted regularly as mining commences to allow for the identification of low angle joints in the hangingwall, localised joint sets and for potential wedges and instabilities.
•Update the Santoy geotechnical model to include the expanded GHW mining zone.
•Early stoping in GHW should be used to confirm mining method parameters for the GHW zone in terms of costs, dilution, and mining recovery. Early development will also provide access to data and metallurgical samples at a bulk scale that cannot be collected at the scale of a drill sample.
•Update site standard operating procedures to include a more transparent Mineral Resource and Mineral Reserve process, clearly documenting the key input parameters applied, and an audit trail of approvals for each phase of the work performed.
•Implementation of Operational Excellence projects identified based on SSR’s recent operational review may present incremental improvements to production and operating costs.
•Continue with ongoing review of capital and operating cost estimates and performance and productivity tracking.
21014Seabee21TRS220927Rev0.docx 16
2 INTRODUCTION
The Seabee21TRS has been prepared in accordance with the U.S. Securities and Exchange Commission (US SEC) Regulation S-K subpart 1300 rules for Property Disclosures for Mining Registrants (S-K 1300).
The Seabee Gold Operation (SGO, or the Project) is owned and operated by SGO Mining Inc., a wholly owned subsidiary of SSR. In most cases, the parent company will be referred to as SSR throughout this Technical Report Summary. SSR has reported that the total cost of the gross mineral properties, plant and equipment as of 31 December 2021 was $465.5M.
SSR is a gold mining company with four producing assets located in the USA, Turkey, Canada, and Argentina, and with development and exploration assets in the USA, Turkey, Mexico, Peru, and Canada. SSR is listed on the NASDAQ (NASDAQ:SSRM), the Toronto Stock Exchange (TSX:SSRM), and on the Australian Stock Exchange (ASX:SSR).
2.1 Terms of Reference
The Seabee21TRS is an independent Technical Report Summary (TRS) on the Project, prepared for SSR by the Seabee21TRS Qualified Persons (QPs). The Seabee21TRS is based on information and data supplied to the QPs by SSR and other parties where necessary. Any individual or entity referenced as having completed work relevant to the Seabee21TRS, but not identified therein as a QP, does not constitute a QP. Seabee21TRS QPs have reviewed the supplied data and information and it appears accurate and complete and accept this information for use in the Seabee21TRS. The primary source of data for the Seabee21TRS is the Seabee 2021 Project Update.
Section 25 describes any information and data supplied by SSR that was outside the areas of expertise of the QPs and was relied upon when forming the findings and conclusions of this report.
The QPs have used their experience and industry expertise to produce the estimates and approximations in the Seabee21TRS. It should be noted that all estimates and approximations contained in the Seabee21TRS will be prone to fluctuations with time and changing industry circumstances.
The purpose of this Seabee21TRS is to report the Mineral Resources and Mineral Reserves for the project. This report is a Feasibility Study (FS) that represents forward-looking information. The forward-looking information includes metal price assumptions, cash flow forecasts, projected capital and operating costs, metal recoveries, mine life and production rates, and other assumptions used in the FS. Readers are cautioned that actual results may vary from those presented. The factors and assumptions used to develop the forward-looking information, and the risks that could cause the actual results to differ materially are presented in the body of this report under each relevant section.
The conclusions and estimates stated in the Seabee21TRS are to the accuracy stated in the Seabee21TRS only and rely on assumptions stated in the Seabee21TRS. The results of further work may indicate that the conclusions, estimates and assumptions in the Seabee21TRS need to be revised or reviewed.
The Seabee21TRS should be construed in light of the methods, procedures, and techniques used to prepare the Seabee21TRS. Sections or parts of the Seabee21TRS should not be read in isolation of, or removed from, their original context.
21014Seabee21TRS220927Rev0.docx 17
The Seabee21TRS is intended to be used by SSR, subject to the terms and conditions of its contract with OreWin. Recognising that SSR has legal and regulatory obligations, OreWin has consented to the filing of the Seabee21TRS with US SEC. Except for the purposes legislated, any other use of this report by any third party is at that party's sole risk.
A list of the references used to prepare the Seabee21TRS is provided in Section 24.
2.2 Qualified Persons
The following people served as the QPs as defined in subpart 1300 of US Regulation S-K Mining Property Disclosure Rules (S-K 1300):
•Bernard Peters, BEng (Mining), FAusIMM (201743), employed by OreWin Pty Ltd as Technical Director – Mining, was responsible for the overall preparation of the Seabee21TRS and, the Mineral Reserve estimates, Sections 1 to 4; Sections 5 and 6; Section 13; and Sections 15 to 27.
•Sharron Sylvester, BSc (Geol), RPGeo AIG (10125), employed by OreWin Pty Ltd as Technical Director – Geology, was responsible for the preparation of the Mineral Resources, Sections 1 to 4; Sections 7 to 12; Section 14; and Sections 25 to 27.
2.3 Qualified Persons Property Inspection
OreWin personnel, Sharron Sylvester Technical Director – Geology and QP, and Graeme Baker Principal Mining Consultant visited the Project 6 February 2020. The site visit included briefings from mining, geology, and exploration personnel; site inspections of potential areas for mining, including underground; discussions with staff; and review of the existing infrastructure and facilities around the Project site.
Bernard Peters has not visited the site due to travel restrictions.
2.4 Units and Currency
This Report uses metric measurements except where otherwise noted. The currency used is US dollars ($) unless otherwise stated.
2.5 Effective Dates
The report has a number of effective dates, as follows:
•Effective date of the Technical Report Summary: 31 December 2021
•Drillhole database close-out date for Mineral Resource estimate: 15 November 2020
•Effective date of Mineral Resources: 31 December 2021
•Effective date of Mineral Reserves: 31 December 2021
21014Seabee21TRS220927Rev0.docx 18
3 PROPERTY DESCRIPTION
3.1 Location
The Seabee Gold Operation (SGO) is located at the northern end of Laonil Lake, approximately 125 km north-east of the town of La Ronge, in Saskatchewan, Canada (Figure 3.1). The centre of the property is located at approximately 55.7° latitude north and 103.5° longitude west.
The mine is a remote operation with access to the mine site by fixed wing aircraft to a 1,275 m airstrip located on the property. Equipment and major resupply items are transported to the site via a 60 km winter ice road, which is typically in use from end of January through to the end of March.
Figure 3.1 Location of the Seabee Gold Operation
SSR, 2017
SGO has been in continuous operation since 1991. Ore is currently produced from the Santoy underground mine from a ramp access / surface portal and is hauled 14 km to the mill located at the Seabee site. A second underground mine, also having ramp access, was operated from 1991–2018 at Seabee.
21014Seabee21TRS220927Rev0.docx 19
3.2 Ownership
SSR Mining Inc. (SSR) holds a 100% interest in the property through its wholly-owned subsidiary, SGO Mining Inc. (SGO Mining). SSR acquired the SGO on 31 May 2016 as a result of the acquisition of Claude Resources Inc.. The structure is shown in Figure 3.2.
SSR is a gold mining company with four producing assets, located in the USA, Turkey, Canada, and Argentina, and with development and exploration assets in the USA, Turkey, Mexico, Peru, and Canada. SSR is listed on the NASDAQ (NASDAQ:SSRM), the Toronto Stock Exchange (TSX:SSRM), and on the Australian Stock Exchange (ASX:SSR).
Figure 3.2 Seabee Corporate Structure
3.3 Mineral Tenure
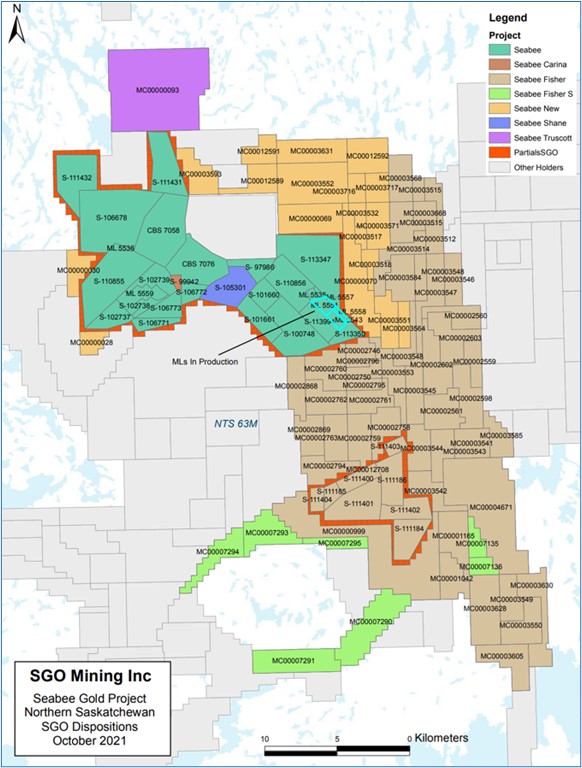
The SGO is comprised of seven mineral leases and 102 mineral claims that cover an area of approximately 62,158 ha (Table 3.1 and Figure 3.3).
SSR holds a 100% interest in the property through its wholly owned subsidiary, SGO Mining.
Table 3.1 Mineral Tenure Information – All Tenements 100% SGO Mining Inc. Owned
| | | | | | | | | | | |
| Area | Tenement Number | Expiry Date | Area
(ha) |
| Seabee Area | CBS 7058 | 08 May 2031 | 1,230 |
| CBS 7076 | 31 May 2031 | 856 |
| ML 5535 | 01 July 2035 | 45 |
| ML 5536 | 01 August 2025 | 50 |
| ML 5543 iP | 24 January 2033 | 86 |
21014Seabee21TRS220927Rev0.docx 20
| | | | | | | | | | | |
| ML 5551 iP | 31 December 2024 | 115 |
| ML 5557 | 01 February 2029 | 42 |
| ML 5558 iP | 01 February 2029 | 36 |
| ML 5559 | 21 November 2034 | 333 |
| S-97986 | 19 June 2031 | 250 |
| S-100748 | 13 November 2029 | 930 |
| S-101660 | 13 November 2029 | 280 |
| S-101661 | 13 November 2029 | 425 |
| S-102737 | 08 May 2029 | 360 |
| S-102738 | 08 May 2029 | 130 |
| S-102739 | 08 May 2029 | 380 |
| S-106678 | 23 September 2029 | 1,880 |
| S-106771 | 24 June 2029 | 196 |
| S-106772 | 24 June 2029 | 193 |
| S-106773 | 27 December 2029 | 328 |
| S-110855 | 07 May 2031 | 1,321 |
| S-110856 | 04 December 2029 | 693 |
| S-111431 | 22 November 2030 | 774 |
| S-111432 | 22 November 2029 | 847 |
| S-113347 | 26 October 2029 | 1,309 |
| S-113350 | 05 December 2029 | 197 |
| S-113993 | 05 December 2029 | 29 |
| S-113994 | 05 December 2029 | 341 |
| Seabee Area Subtotal | 13,657 |
| Seabee, Carina | S-99942 | 31 October 2029 | 65 |
| Seabee Fisher | MC00000999 | 16 November 2027 | 2,757 |
| MC00001042 | 07 January 2029 | 513 |
| MC00001165 | 16 February 2029 | 675 |
| MC00002559 | 17 December 2027 | 329 |
| MC00002560 | 17 December 2027 | 429 |
| MC00002561 | 17 December 2027 | 641 |
| MC00002598 | 18 December 2027 | 643 |
| MC00002602 | 18 December 2028 | 702 |
| MC00002603 | 18 December 2028 | 711 |
| MC00002746 | 14 January 2029 | 280 |
| MC00002750 | 14 January 2028 | 232 |
| MC00002758 | 15 January 2029 | 517 |
| MC00002759 | 15 January 2028 | 544 |
| MC00002760 | 15 January 2028 | 675 |
| MC00002761 | 15 January 2029 | 496 |
| MC00002762 | 15 January 2029 | 559 |
| MC00002763 | 15 January 2028 | 528 |
| MC00002794 | 22 January 2028 | 495 |
21014Seabee21TRS220927Rev0.docx 21
| | | | | | | | | | | |
| MC00002795 | 22 January 2029 | 197 |
| MC00002796 | 22 January 2029 | 69 |
| MC00002868 | 02 February 2028 | 498 |
| MC00002869 | 02 February 2028 | 507 |
| MC00003512 | 29 July 2027 | 495 |
| MC00003514 | 29 July 2029 | 524 |
| MC00003515 | 29 July 2029 | 626 |
| MC00003541 | 05 August 2027 | 495 |
| MC00003542 | 05 August 2027 | 492 |
| MC00003543 | 05 August 2027 | 461 |
| MC00003544 | 05 August 2028 | 480 |
| MC00003545 | 05 August 2027 | 564 |
| MC00003546 | 05 August 2027 | 439 |
| MC00003547 | 05 August 2027 | 616 |
| MC00003548 | 05 August 2027 | 563 |
| MC00003549 | 05 August 2027 | 460 |
| MC00003550 | 05 August 2027 | 654 |
| MC00003553 | 06 August 2027 | 575 |
| MC00003568 | 09 August 2029 | 526 |
| Seabee Fisher, cont.d | MC00003584 | 11 August 2027 | 591 |
| MC00003585 | 11 August 2027 | 414 |
| MC00003605 | 17 August 2027 | 710 |
| MC00003628 | 23 August 2027 | 1,031 |
| MC00003630 | 23 August 2027 | 731 |
| MC00003668 | 31 August 2029 | 265 |
| MC00004671 | 19 March 2029 | 2,739 |
| MC00012708 | 13 May 2028 | 17 |
| S-111184 | 16 February 2029 | 526 |
| S-111185 | 16 February 2029 | 150 |
| S-111186 | 16 February 2029 | 529 |
| S-111400 | 06 October 2029 | 300 |
| S-111401 | 06 October 2029 | 791 |
| S-111402 | 06 October 2029 | 434 |
| S-111403 | 06 October 2029 | 143 |
| S-111404 | 06 October 2029 | 155 |
| Seabee Fisher Subtotal | 30,493 |
| Seabee Fisher S | MC00007135 | 13 November 2028 | 251 |
| MC00007136 | 13 November 2028 | 214 |
| MC00007290 | 20 November 2028 | 1,167 |
| MC00007291 | 20 November 2028 | 934 |
| MC00007293 | 20 November 2028 | 705 |
| MC00007294 | 20 November 2028 | 598 |
| MC00007295 | 20 November 2028 | 296 |
21014Seabee21TRS220927Rev0.docx 22
| | | | | | | | | | | |
| Seabee Fisher S Subtotal | 4,165 |
| Seabee New | MC00000028 | 14 March 2030 | 262 |
| MC00000030 | 14 March 2030 | 392 |
| MC00000069 | 19 March 2028 | 905 |
| MC00000070 | 19 March 2029 | 1,226 |
| MC00003517 | 30 July 2029 | 113 |
| MC00003518 | 30 July 2029 | 216 |
| MC00003532 | 04 August 2029 | 163 |
| MC00003551 | 05 August 2028 | 494 |
| MC00003552 | 06 August 2029 | 1,382 |
| MC00003564 | 09 August 2027 | 260 |
| MC00003571 | 10 August 2029 | 526 |
| MC00003593 | 13 August 2029 | 574 |
| Seabee New, cont.d | MC00003631 | 23 August 2029 | 783 |
| MC00003716 | 10 August 2029 | 244 |
| MC00003717 | 10 August 2029 | 330 |
| MC00012589 | 27 February 2030 | 497 |
| MC00012591 | 27 February 2030 | 393 |
| MC00012592 | 27 February 2030 | 682 |
| Seabee New Subtotal | 9,442 |
| Seabee Shane | S-105301 | 07 November 2033 | 642 |
| Seabee Truscott | MC00000093 | 19 March 2030 | 3,695 |
| GRAND TOTAL | 62,158 |
iP Mineral leases from which the SGO is currently producing
Note: Work filings have been submitted to the Saskatchewan Ministry of the Economy and are pending review
Claude Resources initially staked or acquired the SGO mineral leases and mineral claims prior to SSR’s acquisition of the property on 31 May 2016.
In January 1999, after Claude Resources fulfilled the conditions of an option agreement and obtained a 100% interest in the adjoining Currie Rose property, a portion of a previous claim CBS 7057 was converted to a mineral lease (ML 5520). The original 10 quartz mineral claims covering the Seabee mine site were consolidated into a single mineral lease (ML 5519) granted by the Provincial Crown in November 1999. In July 2021, a formal request from SGO operations to consolidate ML 5519 and ML 5520 into a single mineral lease ML 5559, a non-producing lease expiring in 2034, was granted.
Additional mineral leases were added at the Santoy 7 deposit (ML 5535) and Porky West deposit (ML 5536) in 2007, at the Santoy 8 deposit (ML 5543) in 2009, and at the Santoy Gap deposit (ML 5551) in 2013. The SGO is currently producing from mineral leases ML 5558, ML 5543, and ML 5551.
Annual rental and mining land taxes, and the fulfillment of work commitments, are required by SSR to ensure that the mineral leases and mineral claims remain in good standing.
21014Seabee21TRS220927Rev0.docx 23
Figure 3.3 SGO Mining Land Tenure Map
SGO, 2021
21014Seabee21TRS220927Rev0.docx 24
3.4 Underlying Agreements
The SGO is subject to production and net smelter return (NSR) royalties payable to third parties.
Claude Resources entered into a royalty agreement with Orion Mine Financial Fund (Orion) in 2014 to grant a 3% NSR royalty on gold sales from the SGO. Payments are to be paid quarterly in cash or in physical gold at the average price of gold in each calendar month. This royalty has subsequently been transferred by Orion to Osisko Gold Royalties Ltd.
In the first quarter of 2016, Claude Resources also granted an aggregate 1% NSR royalty on gold production from certain mineral dispositions to an individual and a private company. These dispositions include MC00003518, MC00003532, MC00003571, MC00003573, MC00003594, MC00003631, MC00003716, and MC00003717 from which the SGO is not currently producing. SSR has an option to re-purchase one half of this NSR royalty for C$1.0M.
The SGO is also subject to certain royalty payments to the Province of Saskatchewan that are calculated on 10% of net operating profits and are payable once capital and exploration costs are recovered. No royalty payments have been made to the Province of Saskatchewan to date.
To the extent known, no other significant factors or risks affect access, title, or the right or ability to perform work at the SGO.
3.5 Environmental Considerations
Further discussion is provided in Sections 15 and 17 of this Seabee21TRS. The primary environmental considerations and potential liabilities with the SGO are related to the operation’s solid waste (mill tailings) and the treatment and release of mine and mill effluent.
The tailings produced at the mill are currently managed in permanent management facilities (the East Lake tailings management facility (TMF) and the Triangle Lake TMF). The operation of these two facilities is conducted in accordance with the SGO’s Tailings Operation, Maintenance, and Surveillance Manual (SRK, 2020) and the Canadian Dam Safety Guidelines. In addition, the current approved SGO Preliminary Decommissioning and Reclamation Plan, 2016 Update (SRK, 2017b) addresses all potential long-term environmental and physical stability issues of the containment structures in accordance with the Canadian Dam Association Guidelines. The SGO cost estimate for closure activities were updated in 2020 and approved by the Ministry of Environment in July 2020 (Ministry of Environment, 2020).
With respect to water management and treatment, three discharge points exist at the operation. Mine water from the old Seabee mine (also referred to as the 2B mine, not currently in operation) is pumped to surface settling ponds that discharge to Laonil Lake. Mine water collected in the Santoy mine is pumped to surface and discharged to the Santoy settling ponds, which is treated in a Moving Biological Bed Reactor (MBBR) water treatment plant in order to remove ammonia and nutrients from the water prior to discharge to Lizard Lake.
In addition, mill effluent accumulating in the two TMFs that is not recycled to the mill as make up process water is treated in a chemical treatment plant through the addition of lime, hydrogen peroxide and ferric sulfate. The treated water from this plant currently discharges to the East Pond which flows through a series of wetlands and ultimately reports to the northern arm of Laonil Lake. A new chemical treatment plant combined with a MBBR was recently constructed to replace the existing chemical treatment plant. Both water treatment plants operate in compliance with the SGO’s Approval to Operate. All water discharges to the environment are in compliance with applicable provincial and federal regulations.
21014Seabee21TRS220927Rev0.docx 25
3.6 Permits and Authorisation
Following a successful environmental assessment for a proposed gold mine development in the Province of Saskatchewan, applicants must secure a Surface Lease Agreement and subsequently an Approval to Operate a Pollutant Control Facilities (Approval to Operate) both issued from the Province of Saskatchewan’s Ministry of Environment.
The SGO currently has a valid surface lease with the Province of Saskatchewan, which was amended in March 2010. This surface lease provides SSR the Crown Land surface rights necessary to carry out the mining, milling, and associated operations at the SGO. The existing surface lease is in effect from March 2010 to its expiry date of 31 May 2040 (SMOE, 2010).
The SGO also holds an Approval to Operate No. PO19-193. This approval is issued by the Province of Saskatchewan’s Ministry of Environment pursuant to The Environmental Management and Protection Act, 2010 and its regulations. This approval was issued in October 2019 and is valid until September 2022. Renewal of this approval is triggered through an application submitted to the Ministry of Environment at least 90 days prior to its expiry date. Subject to the terms and conditions of this approval, SSR is authorised to operate all pollutant control facilities associated with the operation’s mine and mill (SMOE, 2016).
The SGO is also obligated to operate in compliance with the Canadian Metal and Diamond Mining Effluent Regulations issued pursuant to the Canadian Fisheries Act.
The SGO is currently in compliance with all environmental approvals and authorisations.
3.7 Other Significant Factors and Risks
SSR have advised that there are no other known significant risks that may affect access, title or the right or ability to perform mining related work on the Property.
Legal matters such as statutory and regulatory interpretations affecting the mine plan and environmental matters are outside the expertise of the QPs (see Section 25).
The Seabee21TRS QPs considers it reasonable to rely on SSR because SSR employs professionals and other personnel with responsibility in these areas and these personnel have the best understanding of these areas.
Additionally, the project has been in operation for a number of years, and following a review of the current supplied information, the opinion of the QPs is the current plans appear adequate to address any issues related to environmental compliance, permitting, and local individuals or groups.
21014Seabee21TRS220927Rev0.docx 26
4 ACCESSIBILITY, CLIMATE, LOCAL RESOURCES, INFRASTRUCTURE AND PHYSIOGRAPHY
4.1 Accessibility
Access to the SGO is by fixed-wing aircraft from the town of La Ronge, Saskatchewan to a 1,275 m airstrip located on the property (Figure 4.1). During the winter months, a 60 km winter road is built between the mine site and Brabant Lake on Highway 102, approximately 120 km north of La Ronge, to transport heavy supplies and equipment by truck.
4.2 Physiography, Climate, and Vegetation
The SGO is located within the Precambrian Canadian Shield environment. The site is relatively flat, with much of the area comprised of irregular, hummocky, rocky exposures. Low areas between hummocks that may have 5–9 m of relief are commonly filled with pockets of glacial till, and occasionally with muskeg. Overburden soils are thin in this area, and often the rock outcrops are exposed (Golder 2009).
The province of Saskatchewan is generally considered to have a continental climate, with temperatures and precipitation that vary significantly between seasons; winter is typically cold and dry, while summer is warm and wet. The majority of the province’s precipitation comes from summer rainfall, however, cool winters with long-surviving snowpack also contribute to greater precipitation.
The climate at the SGO is similar to that of the nearby Environment Canada weather station at Island Falls. The mean monthly temperatures recorded at this station between 1981 and 2010 range from –22.2°C in January to 17.3°C in July. Daily maximum temperatures have ranged on average from –15.9°C in January to 22.9°C in July, while daily minimum temperatures have ranged on average from –28.4°C in January to 11.6°C in July.
In the spring and summer months, historical total rainfall ranges on average from 6.8 mm in April to 84.6 mm in July, with mean annual rainfall totalling 347.9 mm. The winter months can experience significant snowfall, with historical monthly averages of 17.9 cm in February and March and up to 26.9 cm in November, with mean annual snowfall totalling 138.5 cm. A mixture of rain and snowfall is commonly experienced during the spring and fall.
Water inflow is well understood at the SGO based on actual data and is not expected to change during the life of mine. The current dewatering infrastructure system adequately manages water inflows and the system is expected to be expanded as the footprint of the Santoy mine expands.
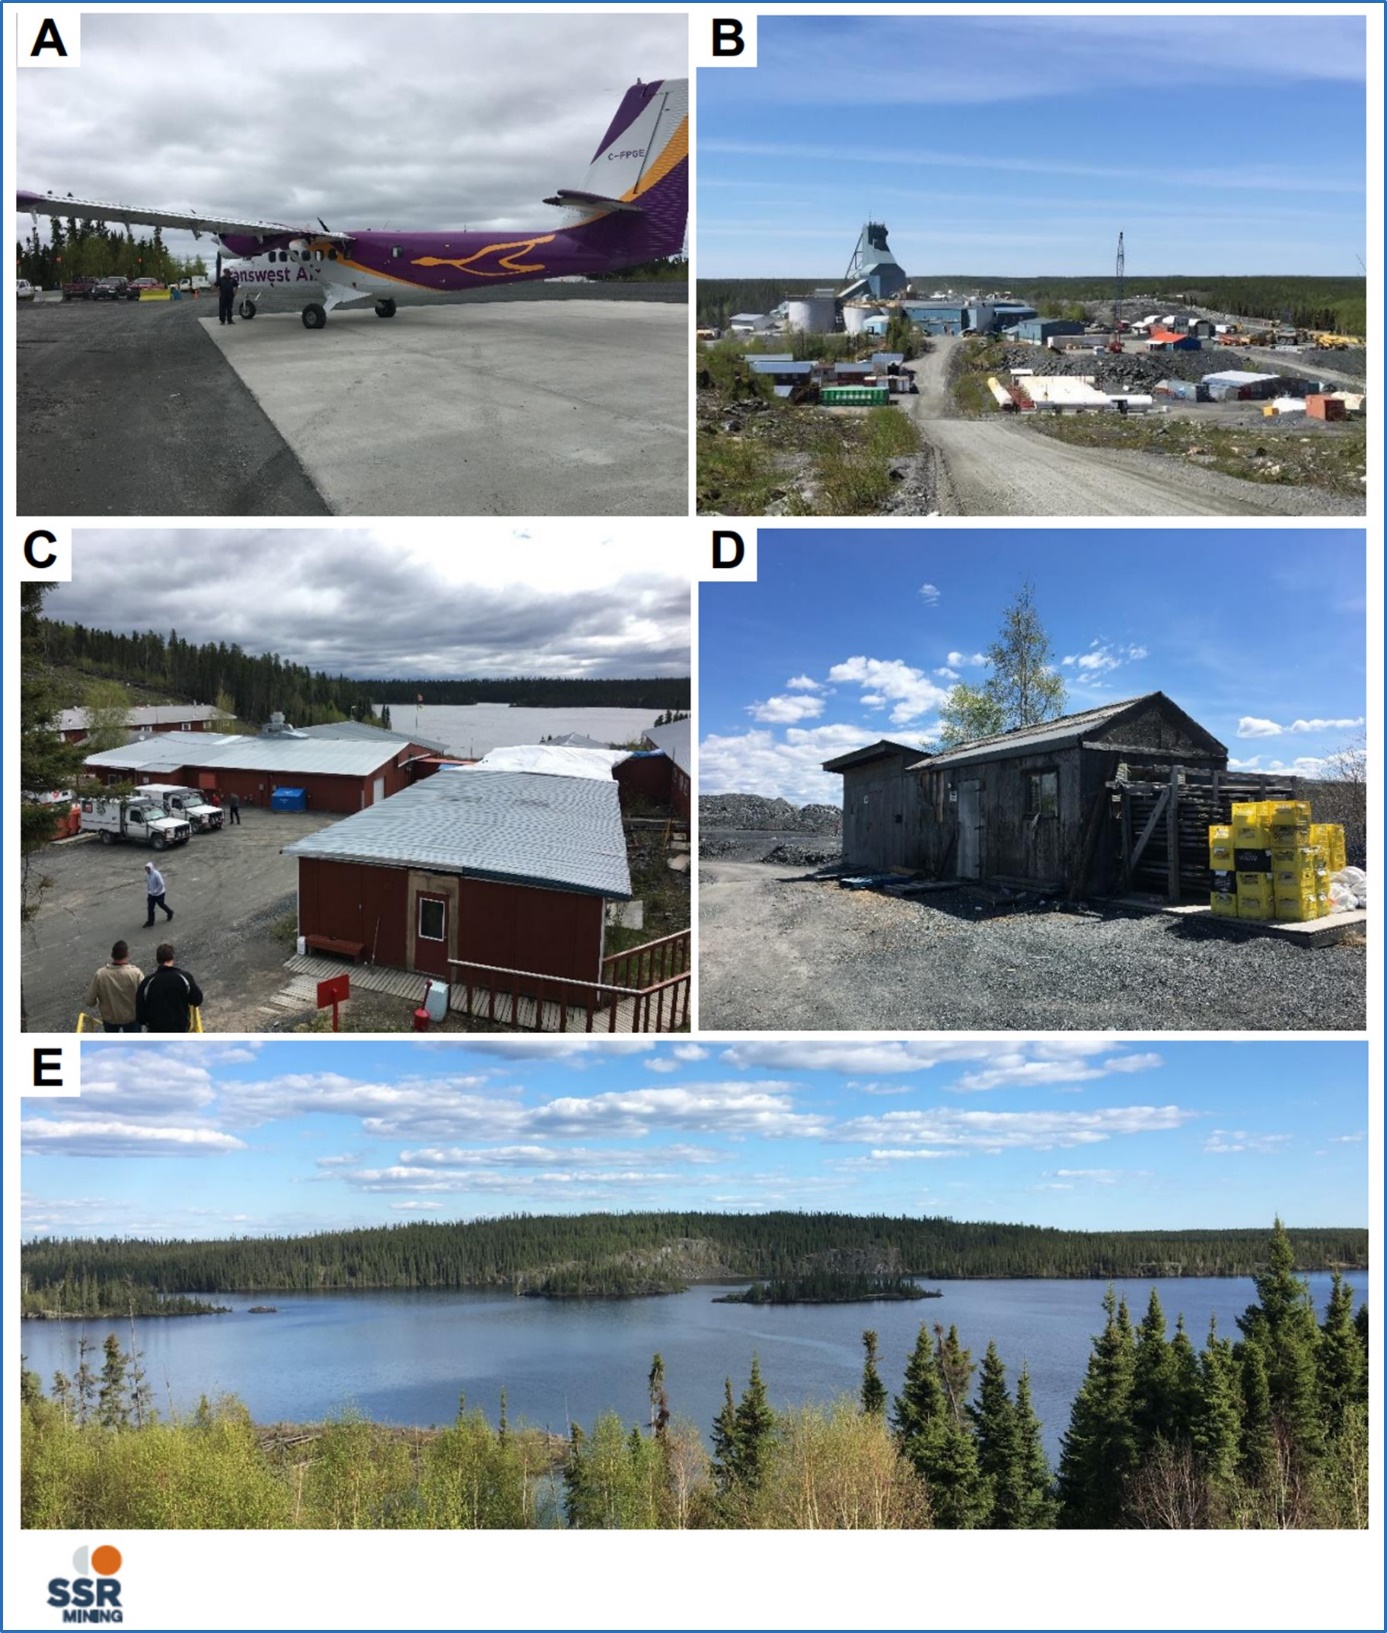
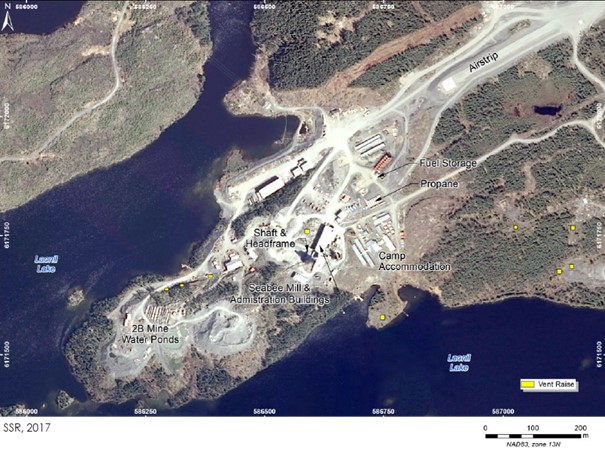
The site is vegetated with a mixture of deciduous and coniferous trees and shrubs typical of a boreal forest, as shown in Figure 4.1. The area has been glacially scoured and is comprised of rocky, ice moulded ridges separated by lakes or muskeg filled depressions. Local relief in the surrounding area can be high, with the shoreline rising sharply to an elevation of 15–20 m above the lake surface (Golder 2009).
21014Seabee21TRS220927Rev0.docx 27
Figure 4.1 Infrastructure at SGO and Typical Landscape of Project Area
A: SGO on-site airstrip apron
B: Seabee mine site
C: Seabee mine camp
D: Core shack
E: Typical landscape with view of Laonil Lake
21014Seabee21TRS220927Rev0.docx 28
4.3 Local Resources and Infrastructure
SSR employs a workforce of approximately 350 employees who work on rotating schedules at the SGO. Up to 251 employees can be accommodated at the mine camps, which are equipped with kitchen and dining facilities, and a recreation room.
Electrical power to the property is provided by the provincial power authority, the Saskatchewan Power Corporation, via a 138 kV hydroelectric transmission line from Island Falls.
Potable water is obtained locally through SSR’s on-site potable water system.
21014Seabee21TRS220927Rev0.docx 29
5 HISTORY
The Laonil Lake region has been intermittently explored since the 1940s, with the first gold discovery made in 1947 by prospectors working on behalf of Cominco Inc. (Cominco). Cominco conducted an extensive prospecting, geological mapping, trenching and diamond drilling programme between 1947 and 1950, and in 1958 was granted 10 quartz mining leases covering the property on which the Seabee Gold Operation (SGO) is located. From 1974 through 1983, Cominco conducted detailed drilling and exploration, and in 1983 sold the property to BEC International Corporation (BEC). BEC subsequently sold the property to Claude Resources in 1985.
In June 1985, Claude Resources optioned the property to Placer Development Limited (subsequently Placer Dome Inc. (Placer)). Placer conducted an extensive exploration programme, which involved geological mapping, trenching and stripping, geophysical, geochemical, environmental, and metallurgical studies, as well as surface and underground drilling. Upon completion of the programme, Placer allowed its option to expire and returned the property to Claude Resources in June 1988.
Claude Resources performed a geological review and analytical study to validate the work completed by Placer, and Cominco Engineering Services Limited (Cominco Engineering) subsequently completed bulk sampling and drilling as part of a feasibility study for the Seabee deposit. A Mineral Reserve estimate was completed in December 1988 and a positive feasibility study was completed in August 1989, which was further revised in May 1990. In the summer of 1990, Claude Resources placed the Seabee deposit into production and construction of the Seabee mine was initiated. Mill construction was completed in late 1991, and mining commenced in December 1991.
In 1998, prospecting and mapping was conducted by Claude Resources on the SGO site and a number of new discoveries were made, including the Porky West zone in 2002, the Santoy 7 deposit in 2004, the Santoy 8 and Santoy 8 East deposits in 2005, and the Santoy Gap deposit in 2010. Permit applications were submitted in 2005 to build an all-weather access road and conduct bulk sampling, and permission was subsequently granted to bulk sample the Santoy 7 and Porky West zones.
Commercial production at the Santoy 7 deposit was achieved in 2007, and an economic study to evaluate the Mineral Resource at the Santoy 8 deposit was conducted in 2008. Portal construction and surface infrastructure development of the Santoy mine was initiated in late 2009, and environmental studies and permitting for commercial mining of the Santoy 8 and Santoy 8 East deposits were completed in 2010. Underground development continued in 2010, and the Santoy mine advanced towards commercial production in the second quarter of 2011.
Claude Resources’ 2012 and 2013 exploration programmes focused on the Santoy deposit and establishing its geological and structural relationship to the Santoy 8 deposit. In February 2013, a shaft extension project was completed at the Seabee mine to reduce trucking distance and ore handling. In 2014, the ventilation raise at the Santoy deposit was completed and production was initiated. During 2015, an underground drill chamber was completed to begin drill testing the plunge continuity of the Santoy 8 deposit.
On 31 May 2016, SSR acquired Claude Resources and the SGO.
21014Seabee21TRS220927Rev0.docx 30
5.1 Previous NI 43-101 Technical Reports
Mineral Resource and Mineral Reserve estimates have been prepared at various stages for the SGO. The two most recent are described below.
•The 2013 NI 43-101 Technical Report (Claude 2013) for the SGO, filed prior to SSR’s ownership, reported (as at 31 December 2012):
•Measured plus Indicated Mineral Resources of 469.6 kt at a grade of 5.10 g/t Au for 77 koz of contained gold, and
•Inferred Mineral Resources of 2,957.6 kt at a grade of 6.35 g/t Au for 603.4 koz of contained gold.
•Proven and Probable Mineral Reserves of 2,785.2 kt at a grade of 6.19 g/t Au for 554.1 koz of contained gold.
•The 2017 NI 43-101 Technical Report (SGOTR17) for the SGO:
'NI 43-101 Technical Report for the Seabee Gold Operation, Saskatchewan, Canada; Michael Selby, P. Eng; Dominic Chartier, P. Geo; Mark Liskowich, P. Geo; Jeffrey Kulas, P. Geo; reviewed by: Gary Poxleitner, P. Eng and Glen Cole, P. Geo, with Trevor Podaima, P. Eng., G. Ross MacFarlane, P. Eng,, and Caitlyn Adams, GIT, dated 20 October 2017,
filed prior to SSR’s ownership, reported (as at 31 December 2016):
•Measured plus Indicated Mineral Resources of 2,074 kt at a grade of 8.02 g/t Au for 535 koz of contained gold, and
•Inferred Mineral Resources of 2,495 kt at a grade of 7.66 g/t Au for 615 koz of contained gold.
•Proven and Probable Mineral Reserves of 1,371 kt at a grade of 8.19 g/t Au for 361 koz of contained gold.
These earlier reports are superseded by the Mineral Resource and Mineral Reserve estimates documented in this Seabee21TRS.
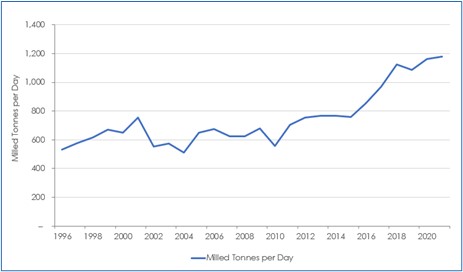
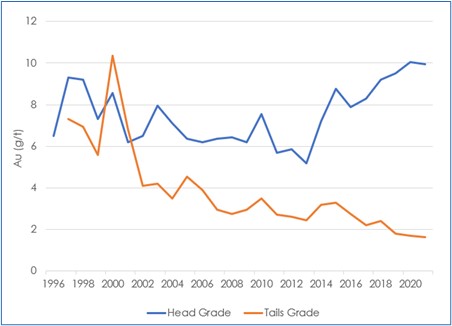
The SGO has produced over 1.6 Moz of gold since production began in 1991. Production has steadily increased to achieve a peak output of 84 koz, 96 koz, and 112 koz of gold during 2017, 2018, and 2019, respectively. A drop in gold production was experienced in 2020 due to impacts from the COVID-19 pandemic, resulting in less tonnes being processed. A summary of the production history of the SGO since 1996 is presented in Table 5.1.
21014Seabee21TRS220927Rev0.docx 31
Table 5.1 Historical Production from the SGO (1996–2021)
| | | | | | | | | | | | | | | | | | | | | | | |
| Year | Milled Ore | Recovery
(%) | Gold Produced
(oz) | Cash Cost
($/oz) | Kitco
Gold
Price
($/oz) |
| ktpa | tpd | Grade (Au g/t) |
| 1996 | 194 | 531 | 6.45 |
| 36,709 | 345 | 388 |
| 1997 | 211 | 579 | 9.36 | 92.2 | 58,467 | 215 | 331 |
| 1998 | 225 | 615 | 9.27 | 92.6 | 60,200 | 168 | 294 |
| 1999 | 245 | 672 | 7.30 | 92.3 | 54,100 | 193 | 279 |
| 2000 | 238 | 651 | 8.58 | 87.9 | 58,300 | 190 | 279 |
| 2001 | 275 | 753 | 6.13 | 88.8 | 46,300 | 221 | 271 |
| 2002 | 202 | 553 | 6.59 | 93.7 | 41,500 | 246 | 310 |
| 2003 | 209 | 572 | 7.95 | 94.7 | 50,800 | 253 | 363 |
| 2004 | 187 | 512 | 7.15 | 95.2 | 41,200 | 297 | 410 |
| 2005 | 236 | 648 | 6.32 | 92.9 | 42,200 | 358 | 445 |
| 2006 | 246 | 674 | 6.16 | 93.6 | 46,300 | 396 | 603 |
| 2007 | 228 | 624 | 6.35 | 95.4 | 44,323 | 586 | 695 |
| 2008 | 228 | 626 | 6.46 | 95.8 | 45,466 | 683 | 872 |
| 2009 | 248 | 678 | 6.17 | 95.3 | 46,827 | 613 | 972 |
| 2010 | 204 | 559 | 7.55 | 95.5 | 47,270 | 692 | 1,225 |
| 2011 | 257 | 705 | 5.68 | 95.3 | 44,750 | 918 | 1,572 |
| 2012 | 275 | 754 | 5.86 | 95.6 | 44,756 | 998 | 1,669 |
| 2013 | 280 | 767 | 5.11 | 95.3 | 43,850 | 954 | 1,411 |
| 2014 | 280 | 766 | 7.32 | 95.7 | 62,984 | 757 | 1,266 |
| 2015 | 277 | 760 | 8.82 | 96.3 | 75,748 | 525 | 1,165 |
| 2016 | 313 | 857 | 7.91 | 96.6 | 80,351 | 639 | 1,250 |
| 2017 | 330 | 967 | 8.25 | 97.4 | 83,998 | 602 | 1,259 |
| 2018 | 352 | 1,125 | 9.16 | 97.4 | 95,602 | 505 | 1,267 |
| 2019 | 344 | 1,087 | 9.56 | 98.2 | 112,137 | 464 | 1,398 |
| 2020 | 255 | 1,163 | 10.10 | 98.4 | 81,686 | 534 | 1,790 |
| 2021 | 382 | 1,180 | 9.92 | 98.4 | 118,888 | 514 | 1,799 |
Period from and after acquisition of Claude Resources by SSR on 31 May 2016 by SSR
21014Seabee21TRS220927Rev0.docx 32
6 GEOLOGICAL SETTING, MINERALISATION, AND DEPOSIT
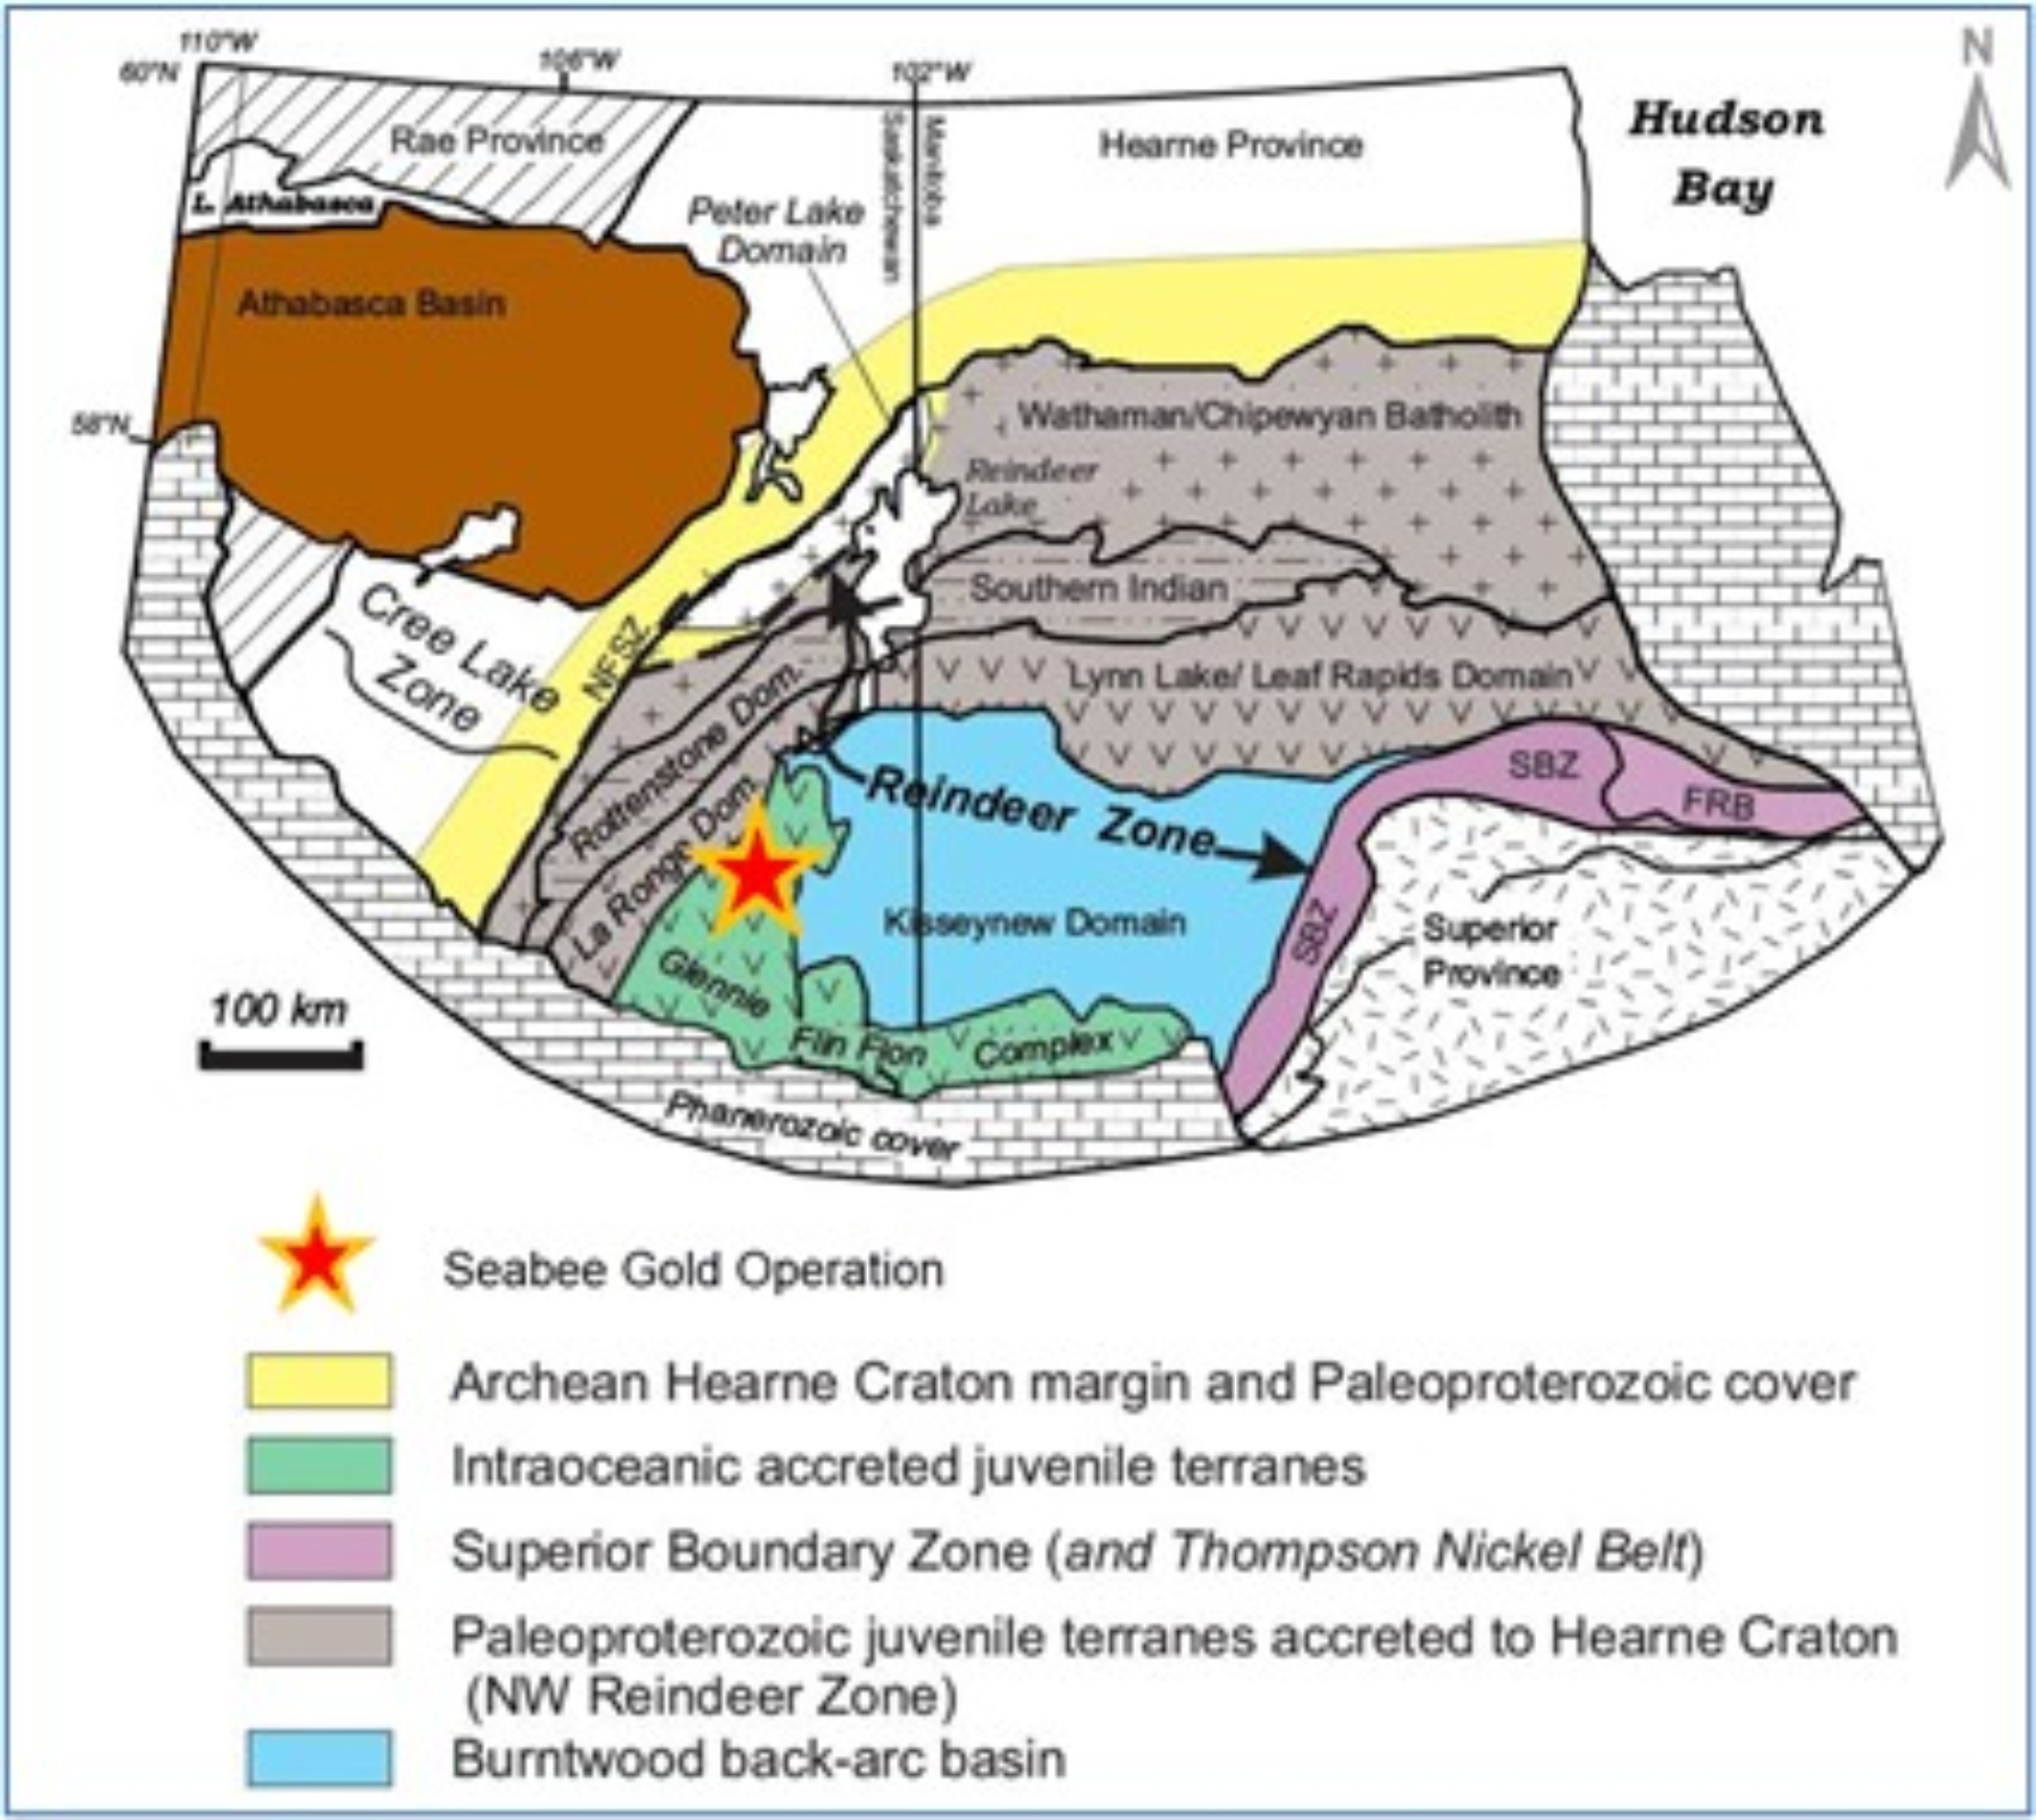
6.1 Regional Geology
Northern Saskatchewan forms part of the Churchill Province of the Canadian Shield and has been subdivided into a series of litho-structural crustal units, of which the Seabee Gold Operation (SGO) is located within the Glennie domain of the Proterozoic Trans-Hudson Orogen (Figure 6.1 and Figure 6.2; Corrigan et al. 2007). The Trans-Hudson Orogen marks the collisional suture zone between the Rae-Hearne, Sask and Superior cratons formed during the closure of the Manikewan ocean (Stauffer 1984) and is divided into two distinct zones: namely, the Cree Lake Zone and the Reindeer Zone. The Cree Lake zone is composed of early Proterozoic continental shelf sedimentary rocks that overlie Archean rocks of the Hearne Province to the west. The Reindeer zone is comprised of mid-oceanic ridge basalts, oceanic island-arc basalts, inter-arc volcanogenic sedimentary rocks, and molasse-type sedimentary rocks. Plutonic rocks of various composition and age intrude the supracrustal sequence.
Figure 6.1 Cree Lake Zone and Reindeer Zone of the Trans-Hudson Orogen
Corrigan et al, 2007
21014Seabee21TRS220927Rev0.docx 33
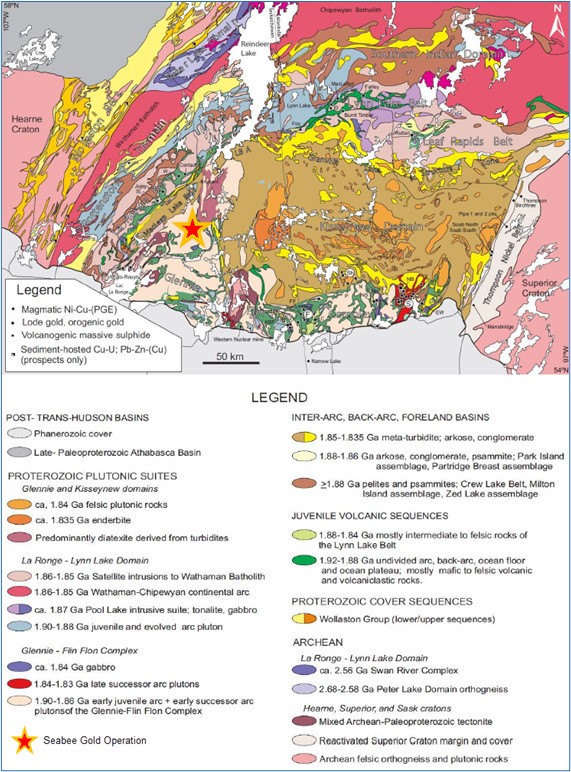
Figure 6.2 Regional Geology of the South-Western Trans-Hudson Orogen
Corrigan et al, 2007
21014Seabee21TRS220927Rev0.docx 34
The Reindeer zone is further subdivided into litho-tectonic domains based on similarities of lithology, metamorphic grade, and structure (Lewry and Sibbald 1977), of which the Glennie domain is one such component. The Glennie domain is wedge shaped and is characterised by arcuate belts of Lower Proterozoic supracrustal rocks separated by granitoid gneisses and granitoid intrusions (Macdonald, 1987). It is bounded on the west by the north–north-east trending Stanley shear zone and bounded on the east by the north–south trending Tabbernor fault zone. To the south, Phanerozoic sedimentary rocks cover the Glennie domain.
Lewry et al. (1990) interpreted the Reindeer zone as a folded stack of nappes and thrust complexes divided by ductile mylonitic zones, emplaced during the terminal collision of the Trans-Hudson Orogen. The interpretation was based on Archean rocks that were found within the Glennie domain and neighbouring Hanson Lake block (Bell and Macdonald, 1982; Chiarenzelli et al., 1987; Craig, 1989) and imply that the Reindeer zone is underlain in part by Archean rocks (Lewry et al. 1990; Bickford et al. 1990). Extensive seismic geophysical studies (White et al., 1994) and samarium-neodymium systematics (Chauvel et al., 1987) support the interpretation.
The SGO is contained within one of the nappe sheets, referred to as the Wapassini Allochthon, and is interpreted as an upper tectonic assemblage separated from a lower sequence (the Iskwatikan Subdomain) by a high strain zone known as the Guncoat Gneisses (Macdonald, 1987). The allochthon was refolded and intruded by later plutons.
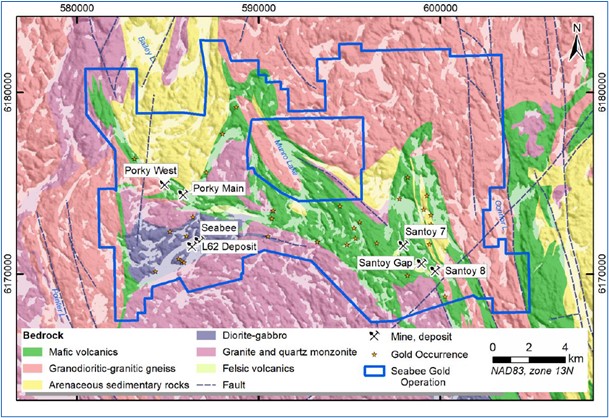
6.2 District Geology
The SGO is located within the northern portion of the Pine Lake greenstone belt. The belt has a strike length in excess of 50 km and comprises a variety of geochemically distinct tholeiitic mafic volcanic rocks formed in juvenile island arc settings, along with contemporaneous mafic intrusive rocks, volcaniclastics, sediments and felsic intrusions of varying age, as shown in Figure 6.3. Metamorphic grade across the Pine Lake greenstone belt ranges from upper greenschist to upper amphibolite, with the SGO hosted in the latter. The belt has been complexly folded by at least four major phases of deformation that are observed across the SGO site and elsewhere in the Glennie domain.
The SGO can be subdivided into three main geological domains:
•Seabee mine: The Seabee mine area is hosted within a coarsely layered mafic intrusion dominated by gabbro in the mine sequence.
•Santoy: The Santoy mine area is hosted within a sequence of mafic volcano-sedimentary rocks variably intruded by granodioritic rocks and separated by generally north–south trending thrust faults.
•Porky: The Porky deposit area is a mineralised trend hosted along a 12 km long openly folded unconformity, separating arenaceous sedimentary rocks of the Rae Lake synform to the north from mafic volcanic rocks of the Seabee mine area to the south.
21014Seabee21TRS220927Rev0.docx 35
Figure 6.3 Local Geology Setting
SK GeoAtlas, 2017
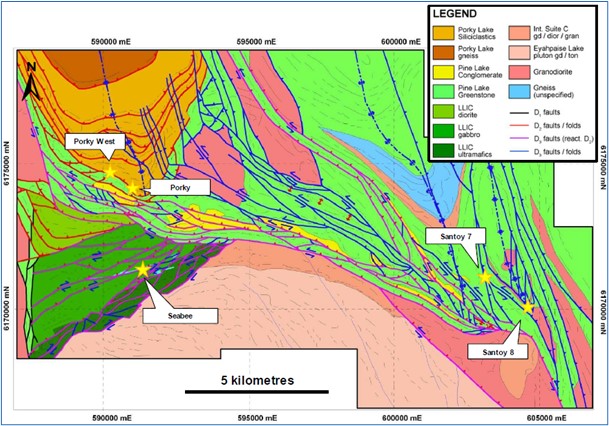
6.3 Structural Setting
Coeval folding and thrusting during a protracted period of progressive deformation associated with the collision and amalgamation of several Archean continental fragments resulted in four major phases of deformation on the SGO property and are characterised as follows (SRK 2009):
•D1 (approximately 1,870 million years ago (Ma) to 1,845 Ma): Development of gneissic foliation and intrafolial folds associated with amalgamation of the Glennie and Flin Flon domains.
•D2 (approximately 1,845 Ma to 1,830 Ma): South directed thrusting and roughly east–west folding associated with the collision of the Reindeer zone and Sask craton.
•D3 (approximately 1,830 Ma to 1,800 Ma): West directed thrusting associated with north– north-west trending folding and transposition, and strike-slip reactivation of D2 shear zones controlled by the collision of the Superior and Sask cratons. Peak amphibolite grade metamorphism was reached at approximately 1,810 Ma.
•D4 (approximately 1,830 Ma): Refolding of D3 folds into regional type 1 and type 2 interference patterns associated with the final formation of the Trans-Hudson Orogen.
21014Seabee21TRS220927Rev0.docx 36
SRK (2009) generated an integrated interpretation using published literature, regional mapping data, drilling data, and geophysical data that was collected during Goldak Airborne Surveys’ (Goldak) 2007 (Goldak 2007) aeromagnetic survey over the SGO (see Section 7.1.2.1). The following observations were made (Figure 6.4):
•Minor D1 faults trend north–south in the south-west corner of the interpretation area; Gneissic foliation and intrafolial folds cannot be observed on the scale of interpretation. D1 faults are present where a narrow strip of Pine Lake greenstone is interpreted to make the boundary between the Laonil Lake intrusive complex to the east and granodiorite units to the west. Any larger scale D1 features have been overprinted by subsequent deformation events.
•Regional north–south compression during D2 focussed on main deformation corridors and lithological contacts in the Laonil Lake intrusive complex. The Porky Lake metasedimentary belt was emplaced as late-stage southward thrust sheet(s) on the Pine Lake greenstone belt:
•Early-D2 gold mineralisation in the Seabee deposit is hosted in isoclinally folded quartz veins within D2 reverse shear zones that were reactivated as dextral shear zones during D3. Mapped veins appear offset by late-D2 structures that are subparallel to the Eyahpaise Lake pluton intrusive margin (1,859 Ma), suggesting that gold emplacement commenced prior to 1,859 Ma.
•Late-D2 gold mineralisation in the Porky deposits are associated with the development of a south verging thrust fault which formed late in the D2 phase when the Porky Lake metasedimentary belt was emplaced on the Pine Lake greenstone belt. The hosting fault was subsequently folded along a north–south axis, the Ray Lake synform, during D3 deformation.
•East–west compression during D3 reactivated deformation corridors and D2 structures in the Laonil Lake intrusive complex. Dextral kinematics were observed on west–south-west components, and sinistral kinematics were observed on all other components. Sinistral strike-slip shear zones observed in the central domain of the interpretation area, and north to north-west trending oblique-slip shear zones and folds in the eastern and western domains of the interpretation area. D3 folding affects D2 thrust faults (i.e., Ray Lake synform):
•Gold mineralisation in the Santoy deposits are associated with north–north- west trending D3 reverses and sinistral-reverse shear zones. It is possible the deposits are controlled by fault intersections, enhancing permeability.
21014Seabee21TRS220927Rev0.docx 37
Figure 6.4 Integrated Structural Analysis of the SGO by SRK (2009) Based on Goldak’s 2007 Aeromagnetic Survey
SSR, 2009
6.4 Mineralisation
Gold mineralisation at the (now ceased) Seabee mine is hosted within an extensive network of sub-parallel shear structures, which crosscut the Laonil Lake intrusive complex. Vein mineralogy is dominantly quartz with pyrite, pyrrhotite, and chalcopyrite, and accessory tourmaline and carbonate. Gold occurs primarily as free, finely disseminated flakes and films replacing pyrite or at sulfide boundaries. Higher grade gold values are most often associated within sulfide-rich zones or at vein junctions (Figure 6.5). Silicification is the most common alteration type observed at the Seabee mine.
Gold mineralisation at the Santoy mine is hosted within calc-silicate altered shear structures with diopside-albite ±titanite-bearing quartz veins and occurs in gold-sulfide-chlorite-quartz veins in the shear zones, near or in the granodiorite and granite sills. Diopside-albite calc-silicate alteration facies are the main host to gold mineralisation in the Santoy 8A and Santoy 9A, 9B, and 9C zones. The Gap Hangingwall (GHW) deposit is hosted within a shallowly dipping, north plunging, folded limb of the Lizard Lake Pluton. Mineralisation is concentrated near the fold hinge within cm to m scale quartz veining which strikes roughly north south and dip sub-vertically.
21014Seabee21TRS220927Rev0.docx 38
Figure 6.5 Typical Mineralisation Observed at the SGO
SGO, 2017
In the Porky deposit, the brittle-ductile lode gold system is hosted along a thick corridor of calc-silicate altered mafic volcanic and arenaceous sedimentary rocks that straddle a major unconformity along the southern margin of the Rae Lake synform. Both the Porky Main and Porky West deposits are characterised by the same calc-silicate alteration package, however, the unconformity and arenites host most of the auriferous quartz veins at the Porky West deposit.
Table 6.1 summarises the key stratigraphic and structural elements controlling the mineralisation at each of the SGO deposits.
21014Seabee21TRS220927Rev0.docx 39
Table 6.1 Key Stratigraphic and Structural Elements Controlling Mineralisation at the Seabee, Santoy, and Porky Deposits (SSR, 2017b)
| | | | | | | | | | | | | | | | | | | | | | | |
| Area | Zone Name | Main Control of Mineralisation | Host Rock | Strike Length
(m) | Vertical Extent
(m) | Thickness
(m) | Strike |
| Seabee | L62 | Quartz-tourmaline veins in shear zones | Laonil Lake Intrusive Complex gabbro | 150 | 700 | 1–11 | E |
| 2 Vein | Quartz-tourmaline veins in shear zones | Laonil Lake Intrusive Complex gabbro | 1,800 | 1,400 | 2–7 | ENE |
| 5-1 Shear | Quartz-tourmaline veins in shear zones | Laonil Lake Intrusive Complex gabbro | 800 | 1,100 | 1–11 | ENE |
| Santoy | Zone 7 | Quartz veins in diopside-albite (calc- silicate) altered shear zones | Mafic metavolcanic rocks and lesser dioritic to granodioritic sills | 330 | 120 | 2–10 | N |
| Zone 8 | Quartz veins in diopside-albite (calc-silicate) altered shear zones | Mafic metavolcanic rocks and lesser dioritic to granodioritic sills | 600 | 500 | 2.5–7 | NW |
| Zone 8 East | Quartz veins and flooding in sheared and isoclinally folded granodiorite | Granodiorite stock in fold nose near hanging wall contact with mafic metavolcanic rocks | 200 | 250 | 1.5–15 | NNW |
| Zone 9 | Quartz veins in diopside-albite (calc-silicate) altered shear zones | Mafic metavolcanic rocks and lesser dioritic to granodioritic sills | 650 | 650 | 2–30 | NW |
| Gap Hanging-wall | Quartz veins in folded granodiorite intrusion | Lizard Lake Pluton | 200 | 800 | 1–20 | EW |
| Porky | Porky Main | Quartz veins in diopside-chlorite- actinolite (calc-silicate) altered shear zones | Mafic metavolcanic rocks and to a lesser extent arenaceous sedimentary rocks | 280 | 180 | 1–4 | SSE |
| Porky West | Quartz veins in silicified calc-silicate altered shear zones | Arenaceous sedimentary rocks and to a lesser extent mafic metavolcanic rocks | 400 | 250 | 1.5–12 | E |
21014Seabee21TRS220927Rev0.docx 40
6.5 Deposit Types
The Seabee mine, Santoy mine, and Porky deposits host mesothermal, quartz-vein hosted lode gold deposits developed in major brittle-ductile to ductile shear systems. The gold mineralisation throughout the SGO exhibits complex geometrical patterns attributed to a combination of structural and/or lithological controls.
Mesothermal gold deposits typically emplaced as a system of en echelon veins, forming tabular veins in competent host rock lithologies, or as stockwork veinlets and stringers in less competent host rock lithologies. Lower grade bulk-tonnage style mineralisation with gold associated with disseminated sulfides may develop in areas peripheral to quartz veins. Mesothermal gold deposits can also be related to broad areas of fracturing, where gold and sulfides are associated with quartz veinlet networks. The quartz veins are typically in sharp contact with the wall-rock and can display a variety of textures including massive, ribboned or banded, and stockworks with anastomosing gashes and dilations, which may subsequently be altered or destroyed during deformation. Gold-quartz veins are found within zones of intense and pervasive carbonate alteration along faults proximal to trans crustal breaks, and often occur at a high angle to the primary collisional fault zone. They are commonly associated with late syn-collisional, structurally controlled intermediate to felsic magmatism, with economic deposits generally hosted by large competent units, such as intrusions or blocks of obducted oceanic crust (Ash and Alldrick, 1996).
Delaney (1992) suggested that lithological heterogeneities between feldspar porphyry dikes and gabbros of the Laonil Lake Intrusive Complex are responsible for the localisation and propagation of the shear zone. At Seabee, the structures trend between 045° to 085°, and dip north near vertically. Three discrete subsets of structures have been recognised trending at 070°, 085°, and 045°, with the 070° structures containing the auriferous veins. At Santoy, the structures trend between 340° to 315°, and dip moderately to the east. Vein geometry within the shear zones are commonly a combination of ‘S’ and ‘Z’ oblique and extensional types, and second order or Riedel shears.
High gold grades occur at the intersection of the primary ‘S’ shears with subordinate shear structures and/or where potassic altered diorite dikes have intruded the Laonil Lake gabbro prior to strain occurrence. It is probable that secondary dikes introduced additional gold to the system, which was later remobilised under strain conditions.
Exploration at the SGO is guided by applying techniques consistent with the identification and discovery of other quartz-vein lode gold systems. Airborne magnetic data is used in surface exploration to identify structural corridors and asymmetrical features, folds and target areas that are known to host gold on the property. This geophysical data is used in conjunction with regional and detailed geological mapping to identify major zones of shearing and alteration, of which calc-silicate alteration has proven to be the most prospective variety on the SGO property.
Geochemical soil sampling is also used as a regional exploration technique to identify gold and trace element vectors associated with Seabee-style gold mineralisation and has successfully identified gold mineralisation at various locations across the property. Once targets have been delineated by the above exploration methods, diamond drilling at wide spacing is used to test the structural systems to allow for SSR’s minimum threshold deposit size to be identified based on observed local grade.
21014Seabee21TRS220927Rev0.docx 41
7 EXPLORATION
7.1 Surficial Exploration
7.1.1 Geochemistry
Historically, several rock and soil sampling programmes have been executed on the Seabee Gold Operation (SGO) property (Figure 7.1 and Figure 7.2).
Placer collected over 1,200 surface rock samples and nearly 7,000 soil samples between 1985 and 1988. The majority of samples were collected from the western portion of the property in the vicinity of Laonil Lake and Pine Lake, and proximal to and north of Porky Lake. Sample spacing was approximately every 20–25 m on 100 m spaced lines.
Claude Resources collected nearly 2,000 surface rock samples and over 7,000 soil samples between 1990 and 2013. Soil samples were primarily collected from the western portion of the property, with additional samples collected in the south-central portion of the property and in the Santoy area. Sample spacing was planned every 20–25 m on 100 m spaced lines. In 1990, rock samples were largely collected around the Laonil Lake, Porky Lake and Pine Lake areas, after which time the focus of exploration shifted to the Santoy area and samples were collected from the south-eastern portion of the SGO property.
Figure 7.1 Historical Rock Samples Collected at the SGO
SGO, 2017
21014Seabee21TRS220927Rev0.docx 42
Figure 7.2 Historical Rock Samples Collected at the SGO
SGO, 2017
Upon its acquisition of the SGO, SSR undertook a review of all exploration activities conducted on the property by previous operators. An exploration programme was subsequently undertaken, including detailed mapping of the Herb West and Santoy Lake areas, as well as the collection of accompanying soil samples to be submitted for gold assay. Limited anomalous occurrences were identified from grab and soil sample results, and no new showings or gold in soil trends were recognised. SSR plans to map additional regions to the north and east within the Herb Lake area as additional shear zones are targeted.
In the Santoy Lake area, mapping extended from Santoy Lake to the west end of the Santoy mine. Soil sampling conducted over the same area resulted in the collection of 501 samples taken every 25 m on lines spaced 200 m apart. No anomalous trends of significance were identified. However, SSR has planned further exploration in prospective areas east and west of the 2016 exploration programme area.
7.1.2 Geophysical Surveys
7.1.2.1 Fixed Wing Aeromagnetic Survey 2007
Goldak performed an aeromagnetic survey over the SGO property on behalf of Claude Resources from 25 February to 15 March 2007 (Goldak, 2007). North–south traverse lines were flown with 100 m spacing and a control line separation of 1,000 m, totalling 2,284 line kilometres of high-resolution magnetic data collected. Nominal terrain clearance was 80 m above ground level.
21014Seabee21TRS220927Rev0.docx 43
In 2009, SRK reviewed the aeromagnetic survey to make an integrated interpretation with the addition of using published literature, regional mapping data, and drilling data (Figure 6.4). The following recommendations were made regarding regional targeting:
•Regional deformation corridors have high prospectivity for gold, as structural complexity in the region over time has enhanced permeability.
•Key locations for gold mineralisation can be identified by understanding the kinematics active during gold mineralisation in combination with the interpreted fault geometry:
•Dilational jogs along D2 and D3 shear zones: shallower dipping segments of D2 and D3 reverse shear zones (similar setting to Santoy 7), left steps along D3 sinistral shear zones, and right steps along D3 dextral shear zones.
•Fault intersections (i.e., deformation corridors).
•Additional parameters that enhance gold mineralisation in the Seabee area include:
•High competency contrast (i.e., variations in lithology).
•Presence of multiple intrusions exploiting similar structural pathways as potential hydrothermal fluids.
•Proximity to the Pine Lake conglomerates, a structurally bound conglomerate package similar to the Abitibi Timiskaming conglomerates.
7.1.2.2 Titan-24 DC / IP and MT Survey 2010
In early 2010, Quantec Geoscience Ltd. (Quantec) were commissioned to perform a Titan-24 direct current / induced polarisation and audio-magnetotelluric ground geophysical survey over the Santoy area on behalf of Claude Resources. The Titan-24 direct current and induced polarisation data were inverted to produce cross-sections of the resistivity and chargeability variations along four survey lines. In its standard configuration, the Titan-24 surveys typically image direct current resistivity and induced polarisation to 500–750 m in sub-vertical tabular geological settings, and up to 50% more for sub-horizontal geological settings. Audio-magnetotelluric inversion depth is generally limited to approximately half the length of the survey line or profile.
Quantec (2013) made the following observations and interpretations based on the 2010 survey results:
•Based on common features observed in the four lines, both the chargeability and resistivity showed weak to strong chargeability responses and low to high resistivity distribution.
•A major difference in the direct current / induced polarisation and audio-magnetotelluric signatures between the north-east, central and south-western regions of the survey lines was observed. The highest conductivity was observed from near surface to approximately 100 m depth in both direct current and audio-magnetotelluric resistivity models. The conductive cap was found above a thick, highly resistive body in the central part of the grid. The central part is relatively more resistive, which potentially depicted the mineralisation of interest having gold traces. Drill data provided by Claude Resources confirmed the presence of gold traces related to high resistivity in audio-magnetotelluric sections and at gradient zone of direct current resistivity sections where resistivity changed in nearly two orders of magnitude.
•It is possible that the direct current and audio-magnetotelluric inversions could be affected by 3D signatures of linear structures which may run parallel and/or sub-parallel to the survey lines. The observed high resistivity contrast in direct current and audio-magnetotelluric inversion models potentially defines the geological structures, lithological units and alteration zones which may be related to gold mineralisation.
21014Seabee21TRS220927Rev0.docx 44
•Low chargeability responses were generally observed from near surface to approximately 100 m depth and associated with the conductive cap. The north-eastern part of the lines represents high chargeability from near surface to a greater depth than the rest of the grid and may be associated with a geological contact and/or fault zone.
•Below the low chargeability top layer, the central part of the grid shows moderate chargeability associated with high resistivity potentially consisting of the mineralisation of interest. Drilling data provided by Claude Resources confirmed the presence of gold traces related to moderate chargeability. The change in chargeability between the north-east and central areas may describe the alteration zone related to gold mineralisation.
•The geological setting of the region giving rise to a variety of geophysical responses for possible mineralisation, and the inversion results of the direct current / induced polarisation and audio-magnetotelluric models along with drilling data, confirmed that the gold deposit in this area is structurally controlled and dominated at gradient zones.
7.1.3 Airborne Magnetic and Radiometric Survey 2016
SSR contracted Precision GeoSurveys Inc. (Precision) to complete a high resolution airborne magnetic and radiometric survey over the most recently staked portion of the SGO land package from 30 August to 4 September 2016 (Precision 2016). The survey block covered an area of 22.9 km x 15.0 km and included 150 survey lines and 25 tie lines that totalled 1,815 line kilometres. Survey lines were spaced 100 m in an east–west orientation and tie lines were spaced 1,000 m in a north–south orientation. Nominal terrain clearance was specified at 75 m.
Selected suspect anomalies were re-flown for confirmation, specifically those found on a single flight line. Lines to be re-flown were a minimum of 2,000 m long, so that survey line re-flights crossed at least two tie lines and tie line re-flights crossed at least five survey lines.
Survey overview maps (flight lines and digital terrain model), magnetic maps (total magnetic intensity, residual magnetic intensity and calculated vertical gradient of the residual magnetic intensity), and radiometric maps were produced by Precision, with the objective of identifying potential new targets for gold mineralisation on the Seabee property.
The magnetic data was collected to better observe the structural nature of the underlying bedrock and, where possible, determine major breaks in the regional stratigraphy along which shear zones can propagate, and the radiometric data was used to determine the relative amounts of uranium, thorium and potassium in the surficial rocks and soils to be used for the mapping of bedrock lithology, alteration and structure. The resultant data were found to be consistent with the structure of the bedrock and major lithological breaks previously interpreted by geological mapping, air photo interpretation and drilling. The data was also consistent with the two-dimensional structural architecture and intensity of previously flown surveys within juxtaposed survey blocks.
7.2 Drilling
Prior to SSR’s acquisition of the SGO, and as at 31 December 2015, a total of 2,037 surface drillholes totalling approximately 389,281 m and 4,818 underground holes totalling approximately 861,514 m had been completed on the property.
For the year ended 31 December 2021, SSR has drilled an additional 287 surface holes totalling approximately 106,916 m and 1,321 underground holes totalling approximately 299,670 m since acquiring the property from Claude Resources Inc.
Table 7.1 summarises the drilling completed on the property. Figure 7.3 displays the surface holes completed on the property. Details regarding the salient drill programmes are discussed in greater detail in the subsections below.
21014Seabee21TRS220927Rev0.docx 45
Table 7.1 Surface and Underground Drilling Completed on the SGO to 31 December 2021
| | | | | | | | | | | | | | | | | | | | | | | |
| Drilling Programme | Company | No. Surface Drillholes | Surface Metres Drilled | No. Underground Drillholes | Underground Metres Drilled | Total Number of Drillholes | Total Metres |
| 1947–1988 | Various (Cominco, Claude Resources, Placer) | 278 | 35,419 | 77 | 6,491 | 355 | 41,910 |
| 1989–2012 | Claude Resources | 1,742 | 344,415 | 4,190 | 724,858 | 5,932 | 1,069,273 |
| 2013–2015 | Claude Resources | 17 | 9,447 | 551 | 130,165 | 568 | 139,612 |
| 2016 | Claude Resources / SSR | 51 | 19,817 | 306 | 65,021 | 357 | 84,838 |
| 2017 | SSR | 14 | 10,506 | 159 | 61,179 | 173 | 71,685 |
| 2018 | SSR | 83 | 24,389 | 229 | 52,500 | 312 | 76,889 |
| 2019 | SSR | 44 | 16,888 | 174 | 51,278 | 218 | 68,166 |
| 2020 | SSR | 21 | 9,638 | 177 | 30,040 | 198 | 39,678 |
| 2021 | SSR | 74 | 25,678 | 276 | 39,652 | 350 | 65,330 |
| Total | 2,324 | 496,197 | 6,139 | 1,161,184 | 8,463 | 1,657,381 |
21014Seabee21TRS220927Rev0.docx 46
7.2.1 Drilling by Cominco, Claude Resources, and Placer 1947–1988
Cominco identified four gold-bearing zones on the SGO property from 1947 through 1950, after drilling 79 holes totalling 4,414 m, and in 1961 drilled two shallow holes of 41 m as part of an overall review of the known property data. In 1974, Cominco drill tested additional vein structures with 16 holes totalling 458 m, and commenced further exploration from 1982 through 1983 whereby 20 holes were drilled totalling 3,776 m. This drill programme was not completed before Cominco sold the property in 1983.
Upon acquisition of the property, Claude Resources drilled three holes totalling 226 m to corroborate Cominco’s work and property estimates. Pursuant to an option agreement with Claude Resources, Placer executed an extensive surface and underground drilling programme from June 1985 to June 1988, whereby a total of 95 surface holes and 72 underground holes were completed. Placer determined the property did not meet its criteria for development and returned the property to Claude Resources in 1988.
Figure 7.3 Map Showing the Distribution of Surface Drilling in Relation to the Seabee, Santoy and Porky Deposits, and other known Gold Occurrences on the Seabee Property
SGO, 2017
21014Seabee21TRS220927Rev0.docx 47
7.2.2 Drilling by Claude Resources 1989–2015
7.2.2.1 Seabee Area
After obtaining a 100% interest in the Currie Rose property from Currie Rose Resources Inc. in 1994, which consisted of over 4,000 ha surrounding the Seabee mine, Claude Resources conducted a drilling programme to test gold-bearing structures identified the previous year during a prospecting programme. The drill programme consisted of 27 holes totalling 3,458 m. In 1996, drilling defined the 10 zone, identified the previous year and found adjacent to the western boundary of the Seabee mine. A total of 23 holes were drilled totalling 2,567 m. Diamond drilling in 1997 explored the vein extensions of the 10 vein and 2C vein structures with seven holes totalling 1,573 m. The 1999 drill programme focused on an area south-west of the Seabee mine trend and consisted of 7,726 m drilled in 47 holes.
As a follow-up, the majority of holes drilled in 2000 were collared to the west of mining lease ML 5520 in the Bird Lake area, to explore for mineralised structures parallel to the Seabee 2 vein. Targets in the Porky Lake and Pine Lake areas were also tested. Six additional remote targets, namely the Scoop, Porky, Herb, Pine, East, and West Bird Lakes were explored in 2001, with anomalous gold values encountered within variably sheared host rocks.
In 2002, drilling focused on a laterally extensive geochemical soil anomaly on the west shore of Porky Lake, and on a series of quartz-bearing shear structures north and east of the No. 5 ramp access. The drill programme successfully discovered the Porky West zone and produced elevated gold values over narrow widths at the No. 5 ramp access.
Drilling in 2003 in the Porky area discovered the Porky West zone, an arenite-hosted high-grade gold lens. Subsequent drilling in 2004 focused on delineation drilling at the Porky Main and Porky West zones, and exploration drilling on the eastern limb of the Porky Lake anticline targeted the contact between the mafic metavolcanics rocks and feldspathic arenite.
A small diamond drill programme was completed in 2009, which extended the down plunge extent of the Porky West ore shoots.
Evaluation of the Neptune target, located approximately 6 km north of the Seabee mine, was the focus of exploration in 2010, where drill testing included two holes. Exploration efforts in 2011 included a further 28 drillholes to test the 1.8 km strike length of the soil anomaly to vertical depths of up to 250 m, and in 2012, further drilling at the Neptune target confirmed the sporadic nature of the gold-bearing system.
7.2.2.2 Santoy Area
Prospecting and geological mapping in 1998 resulted in the discovery of numerous new veins in the Santoy area. The targets were drill tested in 2002 with encouraging results and became the focus of additional exploration programmes leading to the discovery of the Santoy 7, and Santoy 8 and Santoy 8 East deposits in 2004 and 2005. In 2004, five holes totalling 598 m were drilled at Santoy 6, 48 holes totalling 6,164 m were drilled at Santoy 7, and 21 holes totalling 2,797 m were drilled at Santoy 8. Drilling of the Santoy 8 and Santoy 8 East zones in 2005 was aimed at testing the north–north-west plunge and dip extensions of the mineralised shear structures outlined in previous drill programmes. Sixty-eight holes totalling 15,296 m were drilled, with an additional 20 holes totalling 6,272 m drilled in the summer of 2005. Infill drilling continued in 2007 to collect information for proposed mine plans with 25 m infill data to a depth of 250 m completed on the Santoy 8 and Santoy 8 East deposits. A total of 31,670 m was drilled from 147 holes.
Exploration drilling in 2010 targeted the Santoy Gap area to test the Santoy shear system between the Santoy 7 and Santoy 8 deposits, as well as to continue to investigate the down-plunge continuity of the Santoy 8 and Santoy 8 East deposits. Results from the programme outlined continuity at depth for both the Santoy 8 and Santoy 8 East deposit.
21014Seabee21TRS220927Rev0.docx 48
Drilling defined the Santoy deposit in 2011. Multiple high-grade intervals were intercepted, expanding the strike length and width of the known mineralisation. During 2012, exploration focused on defining the relationship between the Santoy and Santoy 8 deposits to depths up to 750 m. Infill and exploration drilling around the Santoy lens and Santoy Shear zone continued to confirm and expand the Santoy system, and also identified a sub-parallel lens approximately 150 m of the east of the Santoy deposit.
In 2013, surface drilling programmes targeted the down plunge extension of the Santoy and Santoy 8 deposits, resulting in two out of three step-out holes returning high-grade gold intercepts. The Santoy system was extended down plunge to 650 m depth and the Santoy 8 deposit was extended 400 m below the base of the previously estimated Inferred Mineral Resource.
Underground drilling in 2014 focused on defining and expanding the Mineral Reserve and Mineral Resource at the Santoy deposit. Results identified high-grade and promising widths of gold mineralisation hosted within three vein systems, named the Santoy 9A, 9B, and 9C deposits. Additional underground drilling in 2015 focused on the expansion of Mineral Reserve and Mineral Resource at the Santoy deposit, and a 6,000 m drill programme targeted the plunge continuity of the Santoy 8 deposit. Results from the Santoy up-dip drilling demonstrated the potential for expansion of the deposit, and drilling results within, down-dip and down plunge also increased confidence in the continuity of the deposit at depth.
7.2.3 Drilling by Claude Resources and SSR 2016
Drilling in 2016 on the SGO property had the objective of increasing and converting the Mineral Resource to Mineral Reserve.
An underground diamond drilling programme to upgrade the Inferred Mineral Resource and explore the extension of the Santoy 8A and Santoy deposits was completed by SSR. From surface, drilling was conducted to upgrade the up-plunge extension of the Santoy 9A, 9B, and 9C deposits as well as to complete deeper infill drilling on the Santoy 8A Inferred Mineral Resource.
At the Seabee mine, five holes were drilled on the 15 Vein target, an offset mineralised structure along the 19 Shear. At the Carr target, located 4 km along strike to the north of the Santoy mine, SSR drilled nine holes over a 2 km strike length, totalling approximately 2,500 m. At the Herb West target, located 2.2 km west–north-west of the Seabee mine, four holes totalling approximately 1,130 m were completed. Results from drilling the above targets revealed shear-hosted quartz-veining structures with gold-bearing sulfide mineralisation and warranted follow-up drilling.
7.2.4 Drilling by SSR Mining 2017 Onwards
Drilling in 2017 from underground continued to focus primarily on the definition and expansion of the resources on the Santoy 8 and 9 veins. During 2017 the first underground programme designed to test the Gap Hangingwall (GHW) target was implemented. A limited surface programme focused on defining the margins of the Santoy 8 and 9 veins that could not be tested from underground. The Exploration team drilled four surface holes attempting to locate the depth continuity of the Santoy 6 showing without success.
Drilling in 2018 from underground continued to focus primarily on the definition and expansion of the resources on the Santoy 8 and 9 veins. One underground drill was dedicated to exploring the Santoy Hangingwall target. Surface drilling focused on the definition of near surface Santoy 9 veins. A surface based deep exploration programme was completed in an attempt to intersect the 926 zone.
21014Seabee21TRS220927Rev0.docx 49
Drilling in 2019 from underground shifted significantly to focus on the definition and expansion of the GHW target. Limited underground drilling was conducted on the Santoy 8 and 9 veins largely due to a paucity of suitable drill bays. Surface drilling also focused on the definition and expansion of the GHW target; the result of which was a maiden resource for the GHW deposit at year end of 1.15 Mt at 7.5 g/t Au Indicated and 850 Mt at 7.9 g/t Au Inferred for 496 koz gold. The Exploration team conducted a limited programme along strike of the GHW target within the Lizard Lake Pluton following up on the previous year’s prospecting and soil sampling programme with limited success.
Underground drilling in 2020 focused almost exclusively on the definition and expansion of the GHW deposit with limited definition drilling conducted on the Santoy 8 and 9 veins due largely to a paucity of suitable drill bays and size of the GHW. Surface drilling shifted focus to the Santoy Hangingwall target with several smaller programmes also conducted to test near-mine targets that could not be reached from underground platforms. Of the surface targets tested in in 2020 only the Santoy Hangingwall showed promise for developing into a resource. The exploration team conducted limited follow up on their 2019 programme along strike of the GHW with mixed success.
7.3 SSR Drilling Procedures
7.3.1 Underground Drilling Procedures
The most important dataset informing the current Mineral Resource at the SGO is derived from underground drilling. Underground drill layouts are created using Geovia GEMS software three-dimensional software. Three dimensional lines are created between a desired pierce point and a collar location for each planned hole. The resulting azimuths from the developed hole traces are given to the survey department as a digital plan map, which is then uploaded into the Mine Markup tablet. All underground drill layouts are created in mine grid coordinates. The survey crew then goes underground to physically paint the drill lines of all holes on the excavation walls by means of numbered lines, with front sight and back sight marked accordingly. Spads are drilled into the lines with which the line number and azimuth are marked on flagging tape in the event the painted lines become obscured or illegible over time.
Underground drills are equipped with laser sighting systems for accurate alignment on the specified drill line. Dips are set using digital inclinometers magnetically attached on the drill’s feed frame. Completed drillholes are surveyed using a Reflex multi-shot tool and wireless palm unit to measure the azimuth, dip and total magnetic field. Drillholes are surveyed at 10 m intervals from the bottom of the hole to the collar. For holes exceeding 500 m, it is common practice to take single shots every 30–50 m as the hole advances to ensure that deviation is within acceptable ranges. Stored data is transferred to a memory stick from the palm unit and is then uploaded into a programme called S-Process where the data is visually verified, and then transferred into the GEMS MS Access database as a comma-delimited text file (*.csv). Upon completion of each hole, the collar locations and azimuths are recorded by mine surveyors and the data is transferred to the drill geologist as a .csv file for inclusion into the GEMS survey field in the MS Access database. Completed holes are checked against planned hole traces to verify that they are spatially correct in the three-dimensional model.
21014Seabee21TRS220927Rev0.docx 50
Underground drill logging takes place at the drill chamber underground. Data from logging is captured on paper log sheets and include header data containing the drillhole identification number, date, the logging geologist’s name and planned hole directional data. The main body of the log contains row and column fields for depth intervals, lithological descriptions, sample numbers, assay results and rock quality data measurements. Upon completion of logging, the information is manually entered into the GEMS database by a mine geologist. Completed drill logs are placed in a file folder for future verification by the senior mine geologist before inclusion into resource updates. Completed assay data is housed in an excel database owned by the Seabee mine laboratory. The geology department has read only access to this file and can copy and paste results into the GEMS database. Underground chip and muck sample data is recorded in a sample tag book and later manually entered into the Chips MS Access database by the mine geologist, which is updated with assay results as they are made available in the laboratory excel database.
7.3.2 Surface Exploration Drilling Procedures
Upon establishing drill targets, three-dimensional points representing surface drillhole locations are created. Drillhole traces are planned to pierce the target as close to orthogonal as possible to obtain a true thickness of the stratigraphy. After the anticipated hole deviation is accounted for and an optimal trace is obtained, the surface location is inspected to ensure suitability.
In the field, hole collar locations and two front sights are recorded with a handheld GPS prior to data being entered into the MS Access-based Core Logger software. Alternatively, the drill contractor may align the drill using the DeviSight tool which uses GPS to derive an azimuth which is preferable to a compass and front sights due to the elimination of magnetic interference and operator error when aligning two pickets.
Reflex EZ_Shot multi-shot device tests record the hole’s azimuth and dip. Tests are completed at 100 m intervals during down-hole drilling and are collected at 30–100 m intervals upon completion of the hole as rods are being pulled if the desired density of measurements is insufficient with the shots taken while drilling. The data are collected via a handheld device that syncs to the Reflex tool down hole and are recorded onto Reflex paper sheets. The paper sheet and digital data are delivered to the supervising exploration geologist and are downloaded and input into a database to track the hole progression, ensuring that unexpected and/or excessive deviation has not occurred.
Once a hole has been completed an aluminium plug is placed approximately 10 m downhole from the base of the casing and the hole is cemented to the top. The SGO mine survey team then takes a DGPS waypoint of the collar location with the base station for final verification of its location, providing accuracy within 0.3 m of the hole location. Drillholes where this level of accuracy is not required may be surveyed in by handheld GPS unit or using the DeviSight’s GPS coordinates giving an accuracy on the order of +/–3 m. The digital data is sent to the supervising exploration geologist and the final three-dimensional coordinates of the hole are entered into MS Access database and tracking software.
Drill core is transported to the core logging facility, where it is marked and logged. Data from individual drill programmes is captured in an MS Access database, including drillhole collar and header information, detailed descriptions of lithological units, structures, alteration and mineralisation, core recovery and RQD data, and sample information. Photographs of core are taken both wet and dry, and digital copies are archived. Upon receiving laboratory results and confirming quality control results, the entire dataset is combined into a master MS Access database and incorporated into the tracking software. Core boxes are stacked and stored at the SGO core storage yard with metal tags affixed by staples indicating BHID, box number, and interval contained.
21014Seabee21TRS220927Rev0.docx 51
7.3.3 Drill Sampling
7.3.3.1 Sampling by Previous Operators 1949–2009
Generally, historical sampling on the SGO was conducted by a geologist selecting mineralised intervals based on visual inspection of drill core. Selected intervals were split by hydraulic or manual power splitter and sent for analyses at the on-site laboratory or an offsite laboratory.
Information regarding historical sample preparation and analyses is incomplete or unavailable and is therefore not discussed in detail in this Seabee21TRS. Multiple sampling methods are attributed to individual drilling campaigns without differentiation of the method applied to each hole.
Furthermore, drilling prior to 2009 tends only to have dip surveys and no control on azimuth, and is therefore unreliable.
Current Mineral Resource and Mineral Reserve estimates at the SGO are informed almost entirely by drilling post-2009, excluding the Mineral Resources attributed to the Porky West deposit. The historical sample preparation and analyses therefore does not have a significant material impact on the property.
7.3.3.2 Drill Core Sampling by Claude Resources and SSR 2009 to Present
Drill core is logged in detail on site by SSR geologists. Rock quality and core recovery are documented, zones of potential mineralisation are marked for sampling, and three to five samples are marked in both the hangingwall and footwall.
Surface diamond drill core samples are chosen based on geology and average 1.0–1.5 m in width, with 0.3 m width samples taken for geological interpretation purposes. The sampling interval was established by minimum or maximum sampling lengths, and geological and/or structural criteria, and are no less than 0.10 m. Discrete intervals of mineralised or prospective lithologies which measure more than 0.10 m and less than 1.0 m may be sampled as a single sample. Mineralised or prospective lithologies which are greater than 1.0 m in width tend to be broken into one metre sample intervals internal to the interval of interest. Intervals immediately adjacent to mineralised or prospective lithologies are sampled, at a minimum, 1.0 m from the contact with the prospective mineralogy. Sampling of less prospective, or weakly altered lithologies, may be sampled at 1.5–2.0 m intervals at the discretion of the logging geologist.
Intervals deemed unprospective for gold mineralisation by the geologist are sampled using a composite sample, not exceeding 8 m in length. The composite sample consists of no less than one 10 cm piece of core selected per 1.5 m in the total 8 m sample interval. The composite sample is used to ensure that mineralised zones not immediately recognised by the geologist are not missed. If a composite sample grades more than 0.10 g/t Au, then the interval is re-logged and re-sampled at a 1 m sample interval to determine the source of the anomalous gold grade. Field geologists are trained to sample additional intervals that may have associated gold mineralisation, such as zones of increased sulfide mineral content or quartz veining not previously associated with a known mineralised zone. Sample intervals are recorded in a MS Access database, and photographs of each core box are taken. Certified reference material, blanks or duplicate samples are inserted into the sample stream at regular intervals of at least 1-in-20 samples.
21014Seabee21TRS220927Rev0.docx 52
After the drill core is logged and marked for assay it is transferred to the core splitting facility, where the selected intervals are sawed lengthwise. The half core to be analysed is double-bagged, sealed, and labelled with coded security tags, while the other half remains in the core box as a record. In the case of duplicate samples or re-sampling, core is sawn in quarters and a quarter core is retained as a record. Some core intervals are destroyed in metallurgical testing and are marked by survey stakes with metal labels in the core boxes from which the interval is removed from. Samples to be sent for analyses are placed in white rice bags, weighed and closed with a uniquely coded security zip tie. Sample submittal forms are sent to the appropriate laboratory indicating the number of samples, weight and security tag numbers of each sample in the shipment. This data is verified by the laboratory when the shipment is received, and any broken tags or sample bags that appear to have been tampered with are reported.
Underground drill core is logged by geologists in the underground drill chamber. Sample intervals are selected by the logging geologist and measure no less than 0.10 m. Discrete intervals of mineralised or prospective lithologies which measure more than 0.10 m and less than 1.0 m may be taken as a single sample. Mineralised or prospective lithologies that are greater than 1.0 m in width are typically divided into 1 m sample intervals. Intervals immediately adjacent to mineralised or prospective lithologies are sampled, at a minimum, 1.0 m from the contact with the prospective mineralogy. Less-prospective, or weakly altered lithologies may be sampled at 1.5–2.0 m intervals at the discretion of the logging geologist. No samples are taken of core considered by the geologist to be unmineralised. Sample intervals are recorded on paper logs and later transcribed by hand into a GEMS project database. Certified reference material standards (CRM) are inserted at a rate of 1-in-20 samples.
Once the intervals to be sampled are selected, the whole core is placed in a sample bag with a uniquely numbered identification tag and delivered to the Seabee laboratory for analyses. Unsampled core is dumped near the drill chamber and used as fill in the mine.
Unauthorised personnel are not permitted access to the drill machines or the core logging and core splitting facilities.
7.3.3.3 Underground Chip and Muck Sampling
Chip samples are collected by a geologist at the working face; the hangingwall to footwall is sampled, with intervals divided based on lithological boundaries and not exceeding 1.5 m in width. Wall rock is also included in this sample type, as it is primarily used as a daily estimate of grade being delivered to the mill. Muck samples are obtained by the geologist when they are unable to reach the working face in a heading. These samples consist of grabs of muck on the floor of the drift, with no less than three muck samples taken at a face unless extenuating circumstances requires fewer samples. Chip samples retain their specific width weighting, while muck samples are assigned a proxy interval based on the number of samples collected and the width of the sill from which the samples are collected. The samples are bagged, tagged with a unique identifying number and transported to the Seabee laboratory for analyses following the methodology described in the previous section. Assay values are tracked in an MS Access database.
21014Seabee21TRS220927Rev0.docx 53
7.4 Density
Density data was collected from NQ diameter drill core during the 2011 Santoy drilling programme by the SGO exploration department. Half core was weighed within mineralised zones, while whole core was weighed within waste domains. A total of 433 density measurements were collected from 45 different holes. The results were tabulated, sorted, and averaged by lithology. Initially weight percent estimates of the various ore zones were calculated based on drill core and underground observations. Assigned densities are reviewed annually by comparing to collected daily density determinations carried out on mill feed samples. Analyses were performed on site by water displacement using the following methodology:
•Place a dry glass vessel on a balance and zero the weight;
•Collect a 20–25 cm piece of half core or whole core from the interval of interest and place into the vessel;
•Record the weight of the core, and zero the balance;
•Fill the vessel to marked line with cold water; and
•Suspend core in water and weigh the vessel with the water and core.
The difference between the original water weight and the second reading is equal to the volume of water displaced by the core, from which the density was calculated using the original weight of the core sample. From this data, an average density value was calculated based on lithology.
Since mid-2014, the Seabee mill has been performing a daily density determination from an approximately 5 kg 24-hour composite sample collected from the belt. The samples are analysed on site by water displacement using the following methodology:
•Riffle composite sample down to an approximately 1 kg representative sample;
•Place a dry flask on a 200 g balance and zero the weight;
•Add sample to the flask (greater than 55 g);
•Record the weight of the sample, and zero the balance;
•Fill the flask to marked line with cold water and ensure outside of flask is dry; and
•Place the flask back on the balance and record the weight.
Two 200 ml flasks have been labelled by SSR staff with the water weight when filled to a specified line to be used for the original water weight. The difference between the original water weight and the second reading is equal to the volume of water displaced by the sample, from which the density is calculated using the original weight of the dry sample.
21014Seabee21TRS220927Rev0.docx 54
8 SAMPLE PREPARATION, ANALYSES, AND SECURITY
8.1 Historical Samples
The drillhole sampling, sample preparation, analyses, and security procedures applied prior to 1989 have not been documented in detail.
8.2 Diamond Core Samples (1989 to Present)
Drill core is monitored by SSR staff from the time it is taken out of the ground until it is split and the samples are delivered to the laboratory. Unauthorised personnel are not permitted access to the drill machines or the core logging and splitting facility. Samples that are split for assaying are double bagged within the splitting facility and identified with a coded security tag. Upon receipt of samples at the laboratory, any sample tags that are broken or any sample bags that appear to have been tampered with are reported to SSR.
All underground samples are assayed at the non-accredited Seabee Gold Operation (SGO) laboratory. Samples are dried for 30–60 minutes, crushed to 10 mesh, and riffle split using a Jones splitter until only 200 g of material remains. The samples are then pulverised in a ring and puck pulveriser until greater than 80% passes through a 200 mesh screen. Thirty grams of pulp material is then analysed for gold by fire assay with gravimetric finish using a 0.01 g/t Au detection limit.
Most surface drilling samples are assayed at TSL Laboratories Inc. (TSL) in Saskatoon, Saskatchewan. TSL is independent of SSR. The laboratory was ISO/IEC 17025 accredited until 18 April 2017 and has since withdrawn from the Standard Council of Canada’s system.
Upon receipt of samples, TSL attaches a bar code label to the original sample bag, and the label is scanned to record the sample weight, date, time, equipment used and operator name, allowing for complete traceability of each sample during the laboratory process. Samples are crushed to 70% passing 10 mesh in two stages. The crushed reject is homogenised by passing it once through a Jones riffle splitter down to 250 g and then recombining the two halves, from which 250 g are split using the same riffle splitter. The split is then ring pulverised to 95% passing 200 mesh. Samples are analysed for gold by 30 g fire assay with gravimetric finish using a 0.03 g/t Au detection limit. Pulps and rejects are stored in containers on the TSL laboratory property.
TSL employs comprehensive quality assurance and quality control protocol and control charts for standards assayed at the laboratory show routine performance within two standard deviations of the certified value. The relative precision for gold meets contract specifications and established limits.
8.3 Chip and Muck Samples
Chip and muck samples are bagged, tagged with a unique identification number and transported to the SGO laboratory for analysis following the same methodology as described in Section 8.2.
8.4 Quality Assurance and Quality Control Programmes
In 2006, the SGO geology department introduced an analytical quality assurance and quality control (QA/QC) programme to verify the accuracy of its internal, non-accredited assay laboratory. The programme has since been adopted and modified by SSR and involves the insertion of certified reference material (CRM) standards, duplicate assays, and monthly umpire check assays at an external certified laboratory.
21014Seabee21TRS220927Rev0.docx 55
A Rocklabs Ltd. (Rocklabs) CRM is inserted by a mine geologist at a frequency of one per 20 samples, regardless of the sample type. Three distinct CRM samples are typically cycled through the process; one low-grade, one average grade, and one high grade. The mine geologist records the identification numbers of the CRM samples introduced into the assay stream and checks them as a pass or fail upon receipt of laboratory results. Assay batches with failed CRM results are re-analysed. CRM results are recorded digitally in a spreadsheet provided by Rocklabs to track the pass and fail rates of each of the various reference materials used. The results are compiled in a monthly report and shared with the relevant departments involved in the process.
On a monthly basis, an average of 20 pulp samples are submitted for external analyses by TSL in Saskatoon, Saskatchewan. One CRM is included in each batch of external check samples, and a sieve analysis is performed on one of the pulps to determine percentages passing through –150 and –200 mesh. Results from the analyses at TSL are compared to the on-site results and included in a monthly report.
A blank sample of a coarse-grained quartz-rich rock is inserted after every sample containing visible gold, and pulp duplicates are run every tenth sample by the laboratory. According to SSR, blanks were used and recorded from 2010 to 2014.
SSR reviews the results from the above control samples to accept the data from each individual batch or to reject the data and request a re-run. A batch is rejected if the result for the standard exceeds the tolerance of the 95% confidence level stated on the standard’s certificate. The failure trigger for pulp duplicates is less defined due to the lode-gold nature of the mineralisation; however, batches are considered for re-run when duplicate assay values are greater than ±10%. With respect to coarse-grained blanks, sample batches are rejected if the result is greater than three times the detection limit of the laboratory.
8.5 Conclusions and Recommendations
In the opinion of the QP the sample preparation, security, and analytical procedures meets industry standards for data quality and integrity. There are no factors related to sampling or sample preparation that would materially impact the accuracy or reliability of the samples or the assay results. The outcomes of the QA/QC procedures indicate that the assay results are within acceptable levels of accuracy and precision and the resulting database is sufficient to support the estimation of Mineral Resources.
21014Seabee21TRS220927Rev0.docx 56
9 DATA VERIFICATION
9.1 Verifications by SSR
All exploration and production procedures undertaken by SSR follow detailed procedures and exploration and production data are verified prior to consideration for geological modelling and Mineral Resource estimation. Experienced mine geologists implement industry standard measures to ensure the reliability and trustworthiness of data.
SSR closely monitors analytical quality control data, and upon receipt of results from the lab confirm that sample batches have either passed or failed. Quality control failures are investigated, and failing batches are requested for re-assaying. In addition, monthly check assays are sent for external analysis at TSL and compared to the on-site results. Monthly reports are compiled outlining the performance of analytical quality control data and distributed amongst departments involved in the process.
In 2016, SSR commissioned a review of the exploration and mine geology department databases at the (SGO). The mine databases encompassed the period 2004–2017, whereas the exploration review involved the 2016 database only.
In early 2016, 585 pulp duplicates from the mine database were evaluated from randomly chosen samples, representative of the Santoy deposit. The following assay audit observations were made (Konst, 2016a):
•Of the matched pairs, 60 outliers (10%) were identified to exhibit significant nugget effect. Outliers were defined as matched pairs with a grade difference over 0.1 g/t Au and greater than 100% precision, and those with a grade difference over 0.5 g/t Au and greater than 25% precision.
•A total of 102 of the second pulp analyses returned higher assay values, 116 returned lower assay values, and 367 returned the same value. Of the matched pairs, the original gold analyses had a mean gold grade of 2.19 g/t Au while the second pulp returned a mean value of 2.51 g/t Au, a 13.4% difference.
•A total of 223 matched pairs above the lower reporting limit were considered suitable for precision evaluation. Calculated precision, including outliers, was 24% at a cut-off grade of 3.0 g/t Au and 23% at a cut-off grade of 5.0 g/t Au.
•The evaluation indicated likely issues with gold grain size for the analytical method used. The more erratic higher grade matched pairs represented 27% of the pulp duplicates reporting above the lower detection limit and represented approximately 35% of the gold contained within the matched pair sample set. Improvements to the analytical method, in the form of screen-metallic assays, was suggested.
A total of 54 screen metallic assay results were chosen, based on grade, from the 585 pulp duplicates for evaluation. Konst (2016b) concluded the following from his investigation:
•Evaluation of the screen fire assay results confirmed the presence of significant coarse gold in the selected samples and highlighted its potential impact on grade estimation. The percentage of contained metal present as coarse gold could not be quantified as details were lacking regarding the screen fire assay determinations.
•Samples were selected based on having original average grades greater than 5.0 g/t Au, forming a selection bias. Samples that returned low initial grades, but that may have contained unassayed nuggets of coarse gold that would have been picked up in a screen fire assay, were excluded. This bias exaggerates the apparent impact that coarse gold may have on the deposit as a whole, and a direct comparison of mean gold grades suggested that the original gold grades were overestimated by 23%.
21014Seabee21TRS220927Rev0.docx 57
•Based on pulp duplicates alone, the analytical precision well above detection was 15%. Subtracting it from the pulp-duplicate and screen fire assay precision of 31% indicated that the overall bias between the two datasets was closer to 16%, exaggerating grade by 16%. This, however, is not indicative of the exploration assay data because nugget samples, which reported below their true grade, were not selected for analysis in the screen fire assay study.
•A comprehensive screen fire assay programme was recommended for zones of interest to provide an accurate determination of gold content in deposits of this nature.
•Gold grain size analyses would assist in determining screen size for future screen fire assays and given the coarse nature of gold in the deposit, it was recommended to use a rigorous multi-subsample “no-roll” method of selecting aliquots from pulps and minus fractions for assay.
An audit of drilling and assay data indicated poor precision was noted (23% at 5.0 g/t Au and a detection limit of 0.1 g/t Au) but was assumed to have negligible impact on Mineral Resource estimates due to the abrupt nature of the mineralisation boundaries. Significant re-tooling steps were not deemed necessary, however low-cost steps to improve assay precision, and additional recommendations aimed at improving overall assay and survey accuracy, process efficiencies, and auditability were made.
A portion of the database was compared to the source information to understand the nature and frequency of database errors. Disagreement between surveyed collar azimuths and downhole magnetic surveys of six drillholes, and significant disagreements between high-grade assays and re-runs were the most notable issues identified and are described as follows (Konst, 2016c):
•Variations in azimuth, ranging from 2° to 16°, were observed when corrected FlexIT survey comma delimited files were compared to GEMS database exports of downhole surveys, implying a possible counter-clockwise rotation of the local magnetic field due to local concentrations of magnetic minerals. A non-magnetic survey was recommended where historical drillholes could be re-surveyed.
•A total of 204 assay results from mine geology drill core and quality assurance / quality control samples were randomly selected from mine lab worksheets dated February, March, May, and June 2016 and compared to an August 2016 GEMS database export of assay results. Two high-grade assay re-runs returned nil values, which is what resides in the current database. The errors affect only 1% of the test data, but amount to a simple average grade for the GEMS dataset that is 20% lower than the original laboratory results. A lack of documentation made it unclear as to which results, or combination of results, should be deemed correct and included in the database, and it was recommended that assays greater than 60 g/t Au be reviewed to ensure all relevant assay data is included in the final assay database.
•An addendum to the original Seabee mine site drilling and assay audit involved the inclusion of exploration collar survey data from six randomly selected Santoy drillholes. Variations between the final database and original azimuth ranging from 7.6° to –2.8° reinforced the recommendation that non-magnetic surveys be executed where historical holes are available for re-survey.
Konst (2016d) also conducted a review of the sampling, preparation, and analytical quality assurance of the 2016 Seabee exploration programme and made the following recommendations:
•Blanks were submitted as pre-prepared pulps. It was recommended that barren half-core be used instead and inserted following mineralised samples to properly test for contamination during the sample preparation process.
•CRM analysed at TSL were submitted at a frequency of 1-in-40, however samples were assayed in batches of 20, meaning that only half of the analytical batches were controlled for accuracy. The insertion rate of quality control standards was recommended to be increased to 1-in-20 to test all analytical batches.
21014Seabee21TRS220927Rev0.docx 58
•Improvements in grind quality control at the Seabee mine was highlighted, as TSL’s analytical precision was observed to be significantly better.
•A lack of sufficient data to quantify prep precision and sampling precision, and how it varies with grade, was identified. Crush duplicates to quantify prep precision were recommended to be incorporated into the Seabee quality assurance protocol, and half-core field duplicates over quarter-core were recommended to provide a true measure of sampling precision.
•A comparison of analytical methods indicated that results by fire assay with a gravimetric finish be given priority over fire assay with an atomic absorption spectrometry finish.
•TSL’s greater than 5.0 g/t Au protocol for selecting screen metal assay samples has a selection bias. A site driven protocol such as selecting zones containing visible gold was recommended.
An evaluation of 240 umpire pulp duplicates provided as matched pairs of Seabee mine data from January to November 2016 and January 2017 was performed. The matched pairs were created by taking a second random selection of pulp material from Seabee mine pulp samples and sending them to TSL for check analysis. A total of 238 matched pairs returned results above the reported lower detection limit of 0.03 g/t Au and were therefore suitable for precision analysis. The following observations and recommendations were made by Konst (2017):
•Only one (9%) of the 11 samples sieve tested passed the 95% passing 150 mesh pulverisation specifications. The remaining 10 reported over 80% passing 150 mesh. It was recommended that the mine laboratory increase its efforts to meet grind specifications.
•The 2016 calculated analytical precision was 32% at a cut-off grade of 3.0 g/t Au. The mine versus TSL precision was confirmed by TSL versus TSL pulp duplicate precision, indicating precision issues are not attributable to the Seabee mine laboratory performance, but that gold grain size distribution presents significant challenges for the analysis method used.
•Screen metallic assays previously reported on indicated the average proportion of coarse gold was 32% but could range up to 72% of the total grade. There was no direct correlation between coarse gold and grade, and other geologic controls influenced the distribution of ‘nugget’ gold.
Mr. Konst was subsequently contracted by SSR to perform routine reviews of the monthly quality assurance and quality control results of the SGO.
9.2 Verifications by OreWin
9.2.1 Site Visit
In accordance with S-K 1300 guidelines, OreWin visited the SGO on 6 February 2020, accompanied by representatives of SSR. The OreWin team included Sharron Sylvester BSc (Geol), RPGeo AIG (10125), employed by OreWin Pty Ltd as Technical Director and Graeme Baker, BEng (Mining ), Fellow AusIMM (200051), employed by OreWin Pty Ltd as Principal Mining Consultant.
The site visits took place during active drilling and production activities. All aspects that could materially impact the integrity of the data informing the Mineral Resource estimate (core logging, sampling, analytical results, and database management) were reviewed with SSR staff. OreWin spoke with mine staff to ascertain exploration and production procedures and protocols. OreWin observed core from six drillholes and confirmed that the logging information accurately reflects actual core. The lithology contacts checked by OreWin match the information reported in the core logs. OreWin toured the underground operations at Santoy and assessed the attributes of the shear-hosted gold-sulfide-chlorite-quartz veins.
21014Seabee21TRS220927Rev0.docx 59
9.2.2 Verifications of Analytical Quality Control Data
To assess the accuracy and precision of analytical quality control data, OreWin routinely analyses such data. Analytical quality control data typically comprises analyses from standard reference material, blank samples, and a variety of duplicate data. Analyses of data from standard reference material and blank samples typically involve time series plots to identify extreme values (outliers) or trends that may indicate issues with the overall data quality. To assess the repeatability of assay data, several tests can be performed, of which most rely on certain statistical tools. OreWin routinely plots and assesses the following charts for duplicate data:
•Bias charts
•Quantile-quantile (Q-Q) plots
•Mean versus half relative deviation (HRD) plots
•Mean versus half absolute relative deviation plot
•Ranked half absolute relative deviation (HARD) plot
9.2.3 Discussion
OreWin analysed the available analytical quality control data of the SGO to confirm that the analytical results are reliable for informing Mineral Resource estimates. All data were provided in Microsoft Excel spreadsheets from SSR, and OreWin aggregated the assay results for the external quality control samples for further analysis. Control samples (blanks and CRM) were summarised on time series plots to highlight the performance of the control samples. Field duplicates and umpire laboratory pulp duplicates were analysed using bias charts, quantile-quantile, and relative precision plots.
The analytical quality control data produced between 2010 and early 2017 are summarised in Table 9.1. The data produced on the SGO represents approximately 4.1% of the total number of samples.
21014Seabee21TRS220927Rev0.docx 60
Table 9.1 Summary of Analytical QA/QC Data
| | | | | | | | | | | | | | | | | | | | | | | | | | | | | |
| Sample | ALS | (%) | TSL | (%) | Seabee | (%) | Total | (%) | Comment |
| Sample count | 181,288 |
| 71,325 |
| 59,607 |
| 312,220 |
| |
| Blanks | 310 | 0.17 | 155 | 0.22 | 849 | 1.42 | 1,314 | 0.42 | |
| QC samples | 624 | 0.34 | 257 | 0.36 | 4,139 | 6.94 | 5,020 | 1.61 | |
| CRMs |
|
|
|
|
|
|
|
| |
| - SE29 | 16 | 0.01 | 17 | 0.02 |
|
| 33 | 0.01 | 0.597 g/t Au |
| - SE44 |
|
|
|
| 98 | 0.16 | 98 | 0.03 | 0.660 g/t Au |
| - SF57 |
|
| 11 | 0.02 | 139 | 0.23 | 150 | 0.05 | 0.848 g/t Au |
| - SF85 |
|
|
|
| 131 | 0.22 | 131 | 0.04 | 0.848 g/t Au |
| - SG40 | 174 | 0.10 | 41 | 0.06 | 95 | 0.16 | 310 | 0.10 | 0.976 g/t Au |
| - SG56 |
|
|
|
| 191 | 0.32 | 191 | 0.06 | 1.027 g/t Au |
| - SH35 | 57 | 0.03 | 48 | 0.07 |
|
| 105 | 0.03 | 1.323 g/t Au |
| - SH24 | 18 | 0.01 | 23 | 0.03 | 14 | 0.02 | 55 | 0.02 | 1.326 g/t Au |
| - SH82 |
|
|
|
| 43 | 0.07 | 43 | 0.01 | 1.333 g/t Au |
| - SH41 | 157 | 0.09 | 27 | 0.04 |
|
| 184 | 0.06 | 1.344 g/t Au |
| - SH69 |
|
|
|
| 652 | 1.09 | 652 | 0.21 | 1.346 g/t Au |
| - SH65 |
|
|
|
| 54 | 0.09 | 54 | 0.02 | 1.348 g/t Au |
| - SJ63 |
|
|
|
| 685 | 1.15 | 685 | 0.22 | 2.632 g/t Au |
| - SJ53 |
|
|
|
| 96 | 0.16 | 96 | 0.03 | 2.637 g/t Au |
| - SJ80 |
|
|
|
| 160 | 0.27 | 160 | 0.05 | 2.656 g/t Au |
| - SK62 |
|
|
|
| 98 | 0.16 | 98 | 0.03 | 4.075 g/t Au |
| - SL46 | 56 | 0.03 | 44 | 0.06 | 97 | 0.16 | 197 | 0.06 | 5.867 g/t Au |
| - SL51 | 79 | 0.04 |
|
| 92 | 0.15 | 171 | 0.05 | 5.909 g/t Au |
| - SL61 | 35 | 0.02 | 30 | 0.04 | 301 | 0.50 | 366 | 0.12 | 5.931 g/t Au |
21014Seabee21TRS220927Rev0.docx 61
| | | | | | | | | | | | | | | | | | | | | | | | | | | | | |
| - SL76 |
|
|
|
| 131 | 0.22 | 131 | 0.04 | 5.960 g/t Au |
| - SN16 |
|
|
|
| 90 | 0.15 | 90 | 0.03 | 8.367 g/t Au |
| - SN60 |
|
|
|
| 58 | 0.10 | 58 | 0.02 | 8.595 g/t Au |
| - SN50 |
|
|
|
| 97 | 0.16 | 97 | 0.03 | 8.685 g/t Au |
| - SP59 |
|
|
|
| 354 | 0.59 | 354 | 0.11 | 18.12 g/t Au |
| - SP73 |
|
|
|
| 121 | 0.20 | 121 | 0.04 | 18.17 g/t Au |
| - SQ36 | 19 | 0.01 | 15 | 0.02 |
|
| 34 | 0.01 | 30.04 g/t Au |
| - SQ48 | 13 | 0.01 | 1 | <0.01 | 342 | 0.57 | 356 | 0.11 | 30.25 g/t Au |
| Field duplicates | 186 | 0.10 | 73 | 0.10 |
|
| 259 | 0.08 | |
| Check assays |
|
| 902 | 1.26 |
|
| 902 | 0.29 | |
| Total QC Samples | 1,120 | 0.62% | 1,387 | 1.94% | 4,988 | 8.37% | 12,695 | 4.07% | |
21014Seabee21TRS220927Rev0.docx 62
Blank samples analysed at the Seabee mine laboratory, TSL, and historically at ALS Limited (ALS), indicated acceptable performance. Several samples, however, yielded values above the warning limit (defined as ten times the lower detection limit), though, this occurred 5% of the time or less at each laboratory. Further examination identified a number of blank samples analysed at the Seabee mine laboratory between 2010 and 2011 that displayed anomalously high gold grades and indicated potential contamination during the sample preparation process or possible mislabelling of blank material. After 2011, the abundance of failed blanks appeared to be rectified, with all blank samples assaying at or below the warning limit. Post-2013, however, blank material has not been submitted to the Seabee mine laboratory. OreWin strongly recommends that blank material, such as barren half core, be inserted routinely into the sample stream to monitor any potential contamination during sample preparation.
SSR uses a series of CRM (standards) which are submitted with mine geology samples at the Seabee mine laboratory, and with exploration samples at TSL, and historically at ALS. Standards submitted to the Seabee mine laboratory and TSL largely performed within expected ranges, and mean grades are similar to expected values. Several significant outliers, however, have been observed, which are likely attributed to the mislabelling of other standards used at the time or from the possible mislabelling of blank material. Standards submitted to ALS demonstrate an overall worse performance than those submitted to TSL; however, due to the historical nature of the samples, the cause of the deficiency remains unknown. OreWin recommends that SSR continue to monitor the performance of standards and investigate and identify the cause of any significant outliers.
Monthly umpire check assaying is performed at TSL of pulp duplicate samples processed at the Seabee mine laboratory. HARD plots suggest that approximately 60% of umpire samples have HARD below 10%, indicating that the umpire laboratory had difficulty consistently reproducing pulp assay results from Seabee mine laboratory.
9.3 QP Opinion
In the opinion of the QP the data is adequate for the purposes used in the Seabee21TRS. No material sample bias was identified during the review of the drill data and assays. Observation of the drill core during the site visit and inspection and validation of the data collected indicate that the drill data is adequate for the estimation of Mineral Resources.
21014Seabee21TRS220927Rev0.docx 63
10 MINERAL PROCESSING AND METALLURGICAL TESTING
10.1 Style of Mineralisation
The Seabee Gold Operation (SGO) was originally developed based on bench scale metallurgical testwork that characterised the Seabee deposit as a lode gold style of mineralisation that was free milling and that would respond to a standard flow sheet employing gravity recovery and cyanidation. After the successful commissioning of the Seabee mill and the operation matured the mill became the reference flow sheet for other mineralisation that was identified as a possible mill feed source.
The SGO deposits, are classified as lode gold style deposits with the gold in quartz veins typically in shear zones with some variations of the host rock mineralisation, with gabbros at Seabee and mafic metavolcanics at the Santoy and Porky deposits. As the satellite deposits advanced to potential development, bench scale testing was employed to confirm the free milling potential and the presence of any deleterious elements.
10.2 Metallurgical Investigations
10.2.1 Metallurgical Testwork
With the introduction of Santoy ore to the process plant metallurgical testing of drill composites has been undertaken. The composites selected from the diamond drilling represent the footwall, centre and hanging wall of the stacked vein zones.
The results of the testwork indicate the following key metallurgical parameters:
•Diagnostic leach testing of the Master Composite indicated that 99% of the gold was extractable by cyanide leach, indicating the material is free milling.
•In the Master Composite approximately 55% of the gold grains were >100 micron in size. Indicating the gold is gravity recoverable.
•High gravity recoverable gold of up to 91% to gravity concentrate at a 0.18% mass pull
•High cyanide gold recovery of gravity tailings at 95%.
•The overall gold recovery, by gravity and cyanide leach, was 95% to 99% for the size samples tested.
•SSR is not aware of any processing factors or deleterious elements that could impact potential economic extraction.
10.2.2 Process Plant Improvements
With the consistent long-term metallurgical response of the Seabee and Santoy deposits processed to-date, the focus of metallurgical investigations has been on improvements to process capacity constraints and process operating cost reductions.
The Seabee process plant was originally built as a 500 tpd operation. Subsequent capital projects have included the addition of the primary ball mill, addition of a second Knelson concentrator and Acacia gravity gold recovery. Process improvements have included, improved grind size control, improved gravity circuit utilisation, improved leach feed thickener chemistry and reduction in flocculant addition, and carbon and cyanide management.
The Figure 10.1 shows the average annual milled tonnes per day. The current Seabee process plant capacity is nominally 1,320 tpd or 1,240 tpd annual average.
21014Seabee21TRS220927Rev0.docx 64
Figure 10.1 Historical Annual Milled Daily Throughput
SSR, 2021
While throughput has increased since commencement of operations as shown in Figure 10.1, metallurgical performance has improved with improvement in metallurgical control with a consistent trend in reduction of tailings losses, even with increasing head grade, as shown in Figure 10.2.
Figure 10.2 Historical Annual Head and Tailings Grade Trend
SSR, 2021
21014Seabee21TRS220927Rev0.docx 65
A number of further capacity improvement projects are being investigated including:
•Optimisation of the gravity gold Acacia recovery circuit.
•Optimisation of grinding cyclone performance.
•Improvements in thickener performance and flocculant usage.
•Improvements in carbon management, with recovery of fine carbon and carbon activity improvement.
These programmes are expected to provide further improvements in throughput, gold recovery and reduction in operating costs.
10.3 Recovery Estimates
Historical recovery at the Seabee mill was in the 94%–96% range, with routine low levels of losses both in the tailings solids and solution. Future recovery estimates are 98% and are based on the recent mill performance with mill recoveries of more than 98%. These improvements are attributed to the better condition of the leach equipment as well as the restored leach capacity.
The Seabee operation is characterised by coarse gold making the gravity recovery circuit critical to the overall gold recovery of the process plant. Historically gravity recovery was approximately 40%. In recent years with incorporation of gravity circuit improvements including the Acacia circuit gravity gold recovery has improved to 60%–70% of recovered gold, with the CIP accounting for 30%–40%. Overall gold recovery is estimated at 97%–98.5%.
Figure 10.3, indicates the Mill feed grade and recovery for 2017 to 2020.
21014Seabee21TRS220927Rev0.docx 66
Figure 10.3 Mill Feed Grade and Gold Recovery 2017–2020
SSR, 2021
The future recovery estimates of 98% are based on the recent mill performance with mill recoveries of more than 96.5%.
10.4 QP Opinion
In the opinion of the QP the data is adequate for the purposes used in the Seabee21TRS and the analytical procedures used in the analysis are of conventional industry practice.
21014Seabee21TRS220927Rev0.docx 67
11 MINERAL RESOURCES ESTIMATES
The Mineral Resources for the Seabee Gold Operation (SGO) comprise the Santoy 8, 9, GHW, and the Porky West deposits. The deposits are mined by underground mining methods.
The Mineral Resources estimates for SGO were completed by the SSR technical department on site. The Seabee21TRS QPs have reviewed and accepted this information for use in the Seabee21TRS.
This section summarises the Mineral Resource estimation methods and the key assumptions and parameters.
11.1 Resource Modelling Methods
Cell modelling techniques were used for Mineral Resource evaluation for all deposit areas. The resource models used to report Mineral resource estimates were created using data to 31 December 2020.
Geovia GEMS software was used to construct the geological solids, conduct geostatistical analysis and variography, construct the cell model, estimate metal grades, and to report the Mineral Resource. Cell modelling methodologies have been adapted and refined from previous audits in 2011, 2014, and 2016.
The Mineral Resource evaluation methodology involves the following procedures:
•Database compilation and verification.
•Construction of wireframe models for the boundaries of the gold vein mineralisation.
•Data conditioning (compositing and capping) for geostatistical analysis and variography.
•Cell modelling and grade interpolation.
•Definition of Mineral Resource classification domains and validation.
•Assessment of “reasonable prospects for eventual economic extraction”.
•Preparation of the Mineral Resource Statement.
11.1.1 Santoy Mine
The Santoy mine is comprised of three zones: Santoy 8, Santoy 9, and Gap Hangingwall (GHW). Mineral Resources are reported for all three areas. Mining and drilling at Santoy 8 has defined sub-parallel ore bodies dipping from 40°–60° east and plunging to the north. Similarly, mining and drilling at Santoy 9 has defined sub-parallel veins dipping from 45°–55° east and plunging to the north. Drilling and mining at the GHW has identified a body of north–south oriented quartz veins occupying the hinge of a folded limb of the Lizard Lake Pluton. The mineralised envelope plunges to the north and the dip of the orebody ranges from <40° to 50°. Both the lateral and horizontal limits of the Santoy 8 and Santoy 9 veins have been defined through underground development and core drilling from surface and underground. The central area of the GHW has seen underground development on two levels. The horizontal and vertical extremities of the orebody are currently only defined by surface and underground diamond drilling.
The Santoy mine drill database contains 2,030 underground diamond drillholes for 394,345 m, and 774 surface diamond drillholes for 248,048 m.
21014Seabee21TRS220927Rev0.docx 68
Mineral Resources for all veins from the Santoy mine are estimated using cell modelling methods. The Santoy 8 veins are: 8A, 8B, 8C, 8D, 8F and 8G. The Santoy 9 veins are: 9A, 9B, and 9C. GHW is reported as a single entity. Drilling data are used to generate 10–30 m spaced vein sectional and/or plan polylines. Vein polylines are linked to create vein solids that are used to code Mineral Resource cells.
The individual assays are composited to 1.0 m length for all veins. Residual composites less than 10% of the composite length are excluded. Grade capping is applied on composites in each vein separately. Several capping assessments were undertaken, incorporating the use of histograms, cumulative frequency curves, and probability plots. Statistical impacts are also verified with cap percentiles, coefficient of variation, and changes in mean values. Capping at Santoy 8 ranges between 15–110 g/t Au, Santoy 9 ranges between 91–110 g/t Au, and GHW is capped at 45 g/t Au (Table 11.1).
Table 11.1 Capping Values at Santoy Mine
| | | | | |
| Vein | Capping
(g/t Au) |
| Santoy 8A | 110 |
| Santoy 8B | 25 |
| Santoy 8C | 29 |
| Santoy 8D | 29 |
| Santoy 8F | 45 |
| Santoy 8G | 15 |
| Santoy 9A | 110 |
| Santoy 9B | 91 |
| Santoy 9C | 110 |
| Gap Hangingwall | 45 |
A combination of linear semi-variography and variography is performed on the capped composited data to determine the variograms, search ellipses, and estimation parameters. A standard cell size of 3 m x 3 m x 3 m is used. Ordinary kriging is used to interpolate gold grades in the cell model. For the GHW the broadest interpolation is inverse distance squared (ID2).
The density assigned to veins is 2.75 t/m3 at Santoy 8 and Santoy 9 and GHW ore is assigned a density of 2.65 t/m3. Waste density is set to 2.91 t/m3. Density values are based on the average density of samples measured using the water displacement method.
11.1.2 Porky Deposit Area
The Porky deposit area is comprised of two zones: Porky West and Porky Main. Drilling and mining at Porky West has defined sub-vertical structures dipping approximately 65° to the south-west. Drilling at Porky Main defined shear zones plunging at about 45° to the south-east.
The Porky West drill database contains 89 surface diamond holes for 17,647 m drilled between 2003 and 2009. In addition, 166 underground chip and muck sample traverses (1,291 samples) were completed. The polygonal Mineral Resource estimation at Porky West was completed in 2009 using GEMS software and verified recently by the mine geology team. A capping value of 15 g/t Au was determined using the 95th percentile. Density of 2.70 t/m3 was used based on testwork completed at the Seabee assay lab. Due to the 65° dip of the orebody, the GEMS polygonal resources were estimated using an inclined longitudinal section method.
21014Seabee21TRS220927Rev0.docx 69
Porky Main was estimated using polygonal methods by Claude Resources in 2005. However, SSR has not been able to verify the results of this polygonal estimate, therefore Porky Main is not included in the Mineral Resource Statement contained herein but may be included in the future pending additional drilling and modelling.
11.2 Cell Model Validation
SSR used a variety of methods to validate the Mineral Resources determined by cell modelling.
Validation of the high-grade capping thresholds was performed by an independent selection of capping values. Capping for each domain was based on probability plots and a proprietary statistical utility.
For all domains, SSR validated the cell model using a visual comparison of model estimates and the drillhole composites for each domain on sections and plans. The grades can be seen to follow the orientation of the search ellipses. Visual validation of model grades in addition to reconciliation data, as described in Section 11.6, have been the primary methods of cell model validation.
11.3 Mineral Resource Classification
Industry best practices suggest that Mineral Resource classification should consider the confidence in the geological continuity of the mineralised structures, the quality and quantity of exploration data supporting the estimates, and the geostatistical confidence in the tonnage and grade estimates. Appropriate classification criteria should aim at integrating these concepts to delineate regular areas at similar resource classification.
SSR is satisfied that the geological modelling honours the current geological information and knowledge. The location of the samples and the assay data are sufficiently reliable to support Mineral Resource evaluation. The sampling information was acquired primarily by closely spaced surface and underground core drilling and supported by underground development and chip sampling.
SSR considers that the gold mineralised zones show good geological continuity, respecting the direction of maximum continuity, and defined by an adequate drill spacing with reliable sampling information allowing classified within the meaning of the S-K 1300 Regulations for Mineral Resources and Mineral Reserves. Mineral Resources are reported within wireframed classification domains at a specified cut-off grade determined annually. The classification parameters used to define classification domains are detailed in Table 11.2.
Generally, for gold mineralisation exhibiting good geological continuity, SSR considers that zones can be classified as Measured if one (or more) of the following criteria is applicable:
•The zone is sampled in two-dimensions by mine development within a maximum of 1 or 2 sublevel spacing.
•The zone is sampled in one dimension by mine development and informed by core drilling at a drill spacing of less than 25 m while respecting the direction of maximum continuity.
•Despite no adjacent sampled mine development, the drill spacing is less than 15 m while respecting the direction of maximum continuity.
Similarly, SSR considers that gold mineralised zones can be classified as Indicated if the zone is sampled in one dimension by mine development and informed by core drilling at a drill spacing of less than 35 m while respecting the direction of maximum continuity; or drilled at a spacing of 25 m or less with no adjoining underground development.
21014Seabee21TRS220927Rev0.docx 70
Table 11.2 Parameters for Mineral Resource Classification
| | | | | | | | | | | | | | |
| Classification | Areas – Underground Development |
| Two Dimensions | One Dimension | None |
| Measured | Distance from Development | 1 or 2 sublevel spacing | Projected no more than the spacing of 2 sublevels | – |
| Drill Spacing | – | Closely spaced drilling on the same structure (~<25m) | Drill spacing of ~<15m |
| Indicated | Distance from Development | – | Projected no more than the spacing of 4 sublevels | – |
| Drill Spacing | – | Closely spaced drilling on the same structure (~<35m) | Drill spacing of ~<25m |
| Inferred | Distance from Development | – | – | – |
| Drill Spacing | – | Closely spaced drilling on the same structure (~<75m) | Taken to the extents of the inferred search ellipse while being subject to geological interpretation |
Conversely, gold mineralised zones sampled in one direction of mine development and informed by drill spacing of less than 75 m or estimated at the extent of the search ellipse can appropriately classified in the Inferred category because the confidence in the estimate is insufficient to allow for the meaningful application of technical and economic parameters or to enable an evaluation of economic viability.
11.4 Reasonable Prospects for Eventual Economic Extraction
The Mineral Resources in the Seabee21TRS were assessed for reasonable prospects for eventual economic extraction by reporting only material that fell within conceptual underground shapes and using a cut-off grade of 2.07 g/t Au that is based on a gold price of $1,750/oz.
11.5 Mineral Resource Statement
The Mineral Resources estimates for SGO were completed by the SSR technical department on site. The Seabee21TRS QP has reviewed and accepted this information for use in the Seabee21TRS. The Seabee21TRS QP reviewed the assumptions, parameters, and methods used to prepare the Mineral Resource Statement and is of the opinion that the Mineral Resource is estimated and prepared in accordance with the U.S. Securities and Exchange Commission (US SEC) Regulation S-K subpart 1300 rules for Property Disclosures for Mining Registrants (S-K 1300).
The Mineral Resources are estimated based on cell models representative of the mineralised veins and using an assumed gold price of $1,750/oz.
The gold price of $1,750/oz was selected after consideration of the pricing information described in Section 16, which includes a description of the time frame used for the selection of the price and the reasons for selection of such a time frame. The metal price is representative of the range of price estimates publicly reported for Mineral Resource cut-offs. The Mineral Resources are assumed to be mined by underground stoping.
21014Seabee21TRS220927Rev0.docx 71
In determining the cut-off grade, the reasonable prospects for eventual economic extraction requirement generally implies that the quantity and grade estimates meet certain economic thresholds considering an underground stoping extraction scenario and on-site processing. Using this operating scenario, the cut-off grade is estimated to be 2.07 g/t Au.
Mineral Resources are reported exclusive of Mineral Reserves and have been summarised by project and resource classification in Table 11.3.
Table 11.4 shows the cut-off values and metallurgical recoveries associated with the Mineral Resources.
Table 11.3 Summary of Seabee21TRS Mineral Resources Estimates Exclusive of Mineral Reserves (as at 31 December 2021)
Based on $1,750/oz Gold Price
| | | | | | | | | | | | | | | | | | | | | | | | | | |
| Area | Mineral Resources Classification |
| Measured | Indicated | Measured + Indicated | Inferred |
Tonnage
(kt) | Grade (Au g/t) | Tonnage
(kt) | Grade (Au g/t) | Tonnage
(kt) | Grade (Au g/t) | Tonnage
(kt) | Grade (Au g/t) |
| Santoy Mine | 71 | 19.75 | 745 | 12.74 | 816 | 13.35 | 2,238 | 6.43 |
| Porky West | – | – | 52 | 5.03 | 52 | 5.03 | 516 | 4.42 |
| Total SGO | 71 | 19.75 | 797 | 12.23 | 869 | 12.85 | 2,754 | 6.05 |
1. Mineral Resources are reported based on 31 December 2021 as-mined survey data.
2. Mineral Resources are reported exclusive of Mineral Reserves
3. Mineral Resources are shown on a 100% basis
4. The Mineral Resources estimates are based on a 2.07 g/t Au cut-off with a gold price assumption of $1,750/oz.
5. Santoy Mine includes Santoy 8, Santoy 9, and GHW lodes.
6. The Mineral Resources in the Seabee21TRS were assessed for reasonable prospects for eventual economic extraction by reporting only material that fell within conceptual underground shapes.
7. SSR has 100% ownership of the Project.
8. The point of reference for Mineral Resources is the point of feed into the processing facility.
9. Tonnage is metric tonnes and g/t represents grams per metric tonne.
10. Totals may vary due to rounding.
Table 11.4 Summary of Cut-off Values and Metallurgical Recoveries of Seabee21TRS Mineral Resources Estimates Exclusive of Mineral Reserves
(as at 31 December 2021)
Based on $1,750/oz Gold Price
| | | | | | | | | | | | | | | | | |
Mineral Resources
Classification | Tonnage
(kt) | Grade
(Au g/t) | Contained Gold (koz) | Cut-off Value (Au g/t) | Metallurgical Recovery (%) |
| Measured | 71 | 19.75 | 45 | 2.07 | 98 |
| Indicated | 797 | 12.23 | 313 | 2.07 | 98 |
| Measured + Indicated | 869 | 12.85 | 359 | 2.07 | 98 |
| Inferred | 2,754 | 6.05 | 536 | 2.07 | 98 |
1. Mineral Resources are reported based on 31 December 2021as-mined survey data.
2. Mineral Resources are reported exclusive of Mineral Reserves
3. Mineral Resources are shown on a 100% basis
4. The Mineral Resources estimates are based on a 2.07 g/t Au cut-off with a gold price assumption of $1,750/oz.
5. Santoy Mine includes Santoy 8, Santoy 9, and GHW lodes.
6. The Mineral Resources in the Seabee21TRS were assessed for reasonable prospects for eventual economic extraction by reporting only material that fell within conceptual underground shapes.
7. SSR has 100% ownership of the Project.
8. The point of reference for Mineral Resources is the point of feed into the processing facility.
9. Tonnage is metric tonnes, ounces represent troy ounces, and g/t represents grams per metric tonne.
10. Totals may vary due to rounding.
21014Seabee21TRS220927Rev0.docx 72
11.6 Reconciliation
The SGO routinely compares the Mineral Resource and Mineral Reserve models with production results. As an example, the yearly grade reconciliation between the Mineral Resource model and the actual mined grade from the Santoy underground workings for the period 2020 to 2021, is presented in Table 11.5. The reconciliation between the Mineral Resource model and recovered grades is reasonable. This demonstrates that the Mineral Resource model adequately predicts grades achieved during mining.
Table 11.5 Annual Grade Reconciliation at Santoy for 2020 and 2021
| | | | | | | | | | | |
| Period | M&I Mineral Resources Estimate Grade
(g/t Au) | Mine Grade
(g/t Au) | Variance |
| 2020 | 10.61 | 10.40 | –2% |
| 2021 | 10.38 | 10.11 | –3% |
11.7 Comparison with Previous Estimates
The Mineral Resources have been compared to the previous Mineral Resources. Comparison of the 2021 Mineral Resource with the 2020 Mineral Resources shows a net decrease in contained gold of 36 koz (–2.4%).
Key changes in the Mineral Resources (contained metal) have resulted from:
•Santoy mine depletion (–8.3%)
•Santoy 8 conversion (+1.5%)
•Santoy 9 conversion (+0.9%)
•Gap HW conversion (+5.5%)
•Porky West remodel (–2.1%)
11.8 QP Opinion
The Seabee21TRS QP has not identified any relevant technical and/or economic factors that require resolution with regards to the Mineral Resources estimate.
The Seabee21TRS QP reviewed the assumptions, parameters, and methods used to prepare the Mineral Resources Statement and is of the opinion that the Mineral Resources are estimated and prepared in accordance with the U.S. Securities and Exchange Commission (US SEC) Regulation S-K subpart 1300 rules for Property Disclosures for Mining Registrants (S-K 1300).
11.9 Canadian National Instrument 43-101 Standards of Disclosure for Mineral Projects
The Mineral Resources reported in the Seabee21TRS are suitable for reporting as Mineral Resources using the Canadian National Instrument 43-101 Standards of Disclosure for Mineral Projects (NI 43-101).
21014Seabee21TRS220927Rev0.docx 73
12 MINERAL RESERVES ESTIMATES
This section summarises the key assumptions, parameters, and methods used in the preparation of the Mineral Reserves Statement for the Seabee Gold Operation (SGO).
The Mineral Reserves estimate was completed by the SSR technical department on site at the SGO. The QP reviewed the assumptions, parameters, and methods used to prepare the Mineral Reserve Statement and is of the opinion that the Mineral Reserve is estimated and prepared in accordance with the U.S. Securities and Exchange Commission (US SEC) Regulation S-K subpart 1300 rules for Property Disclosures for Mining Registrants (S-K 1300).
Access underground at the Santoy mine is provided from surface at the Santoy portal via a main ramp, with sublevels spaced between 17–20 m vertically. Mining is carried out using sublevel open stoping mining methods with backfill.
Stopes are filled with a combination of rock fill (RF) and cemented rock fill (CRF), mined in a bottom-up mining sequence. Sill pillars are mined on retreat once the stopes below and above have been mined (stopes above filled with CRF and allowed to cure).
The estimated cut-off grade for Mineral Reserves was based on a $1,600/oz gold price and current operating costs and metallurgical performance. Table 12.1 details the basic parameters used for Mineral Reserves definition.
Table 12.1 Mineral Reserves Input Parameters
| | | | | | | | |
| Item | Unit | Rate |
| Minimum Mining Width | m | 1.8 |
| Hangingwall Dilution | m | 0.18 |
| Footwall Dilution | m | 0.18 |
| Minimum Dip | degrees | 45 |
| Maximum Stope Length | m | 20 |
| Mining Recovery | % | 94 |
| Process Recovery | % | 98 |
| Gold Price | $/oz | $1,600 |
The gold price of $1,600/oz was selected after consideration of the pricing information described in Section 16, which includes a description of the time frame used for the selection of the price and the reasons for selection of such a time frame. The metal price is representative of the range of price estimates publicly reported for Mineral Reserve cut-offs.
Dilution and mining recovery factors were derived from ongoing stope reconciliations using actual mucking and cavity monitor survey data.
21014Seabee21TRS220927Rev0.docx 74
A cut-off grade of 2.52 g/t Au was used to estimate the Mineral Reserves. The cut-off grade was determined based on the following:
•Gold price of $1,600/oz
•Exchange rate of C$1.26:US$1.00
•Average milling recovery of 98%
•Royalty of 3.0%
•Payable factor of 99.5%
•Refinery charge of $3.09/oz
•Operating cost of $128/t
12.1 Mineral Reserves Statement
The SGO Mineral Reserves estimate was completed by the SSR technical department on site. The Seabee21TRS QP has reviewed and accepted this information for use in the Seabee21TRS. The Seabee21TRS QP reviewed the assumptions, parameters, and methods used to prepare the Mineral Reserves Statement and is of the opinion that the Mineral Reserves are estimated and prepared in accordance with the U.S. Securities and Exchange Commission (US SEC) Regulation S-K subpart 1300 rules for Property Disclosures for Mining Registrants (S-K 1300).
The Mineral Reserves Statement is reported in Table 1.3 and Table 1.4. The reference point at which the Mineral Reserves are identified is where ore is delivered to the processing plant (i.e., mill feed). The QPs are unaware of any environmental, permitting, legal, title, taxation, socio-economic, marketing, political, or other relevant issues that may materially affect the Mineral Reserves estimate. However, the Mineral Reserves may be affected by further infill and exploration drilling that may result in increases or decreases in subsequent Mineral Resources and Mineral Reserves estimates. The Mineral Reserves may also be affected by subsequent assessments of mining, environmental, processing, permitting, taxation, socio-economic, and other factors. The effective date of the Mineral Reserves Statement is 31 December 2021.
12.2 Comparison with Previous Estimates
The 2021 Mineral Reserves represent a net increase of 86 koz (18%) total contained gold ounces as compared with the 2020 Mineral Reserves. Although mining depletion has occurred in the Santoy 8A and 9A mining zones, the 2021 Mineral Reserves have increased the conversion of the Santoy Mineral Resources in the GHW zone into a Mineral Reserves. An increase in the gold commodity price has also resulted in a decrease in the Mineral Reserves cut-off grade.
21014Seabee21TRS220927Rev0.docx 75
Table 12.2 Summary of Seabee21TRS Mineral Reserves Estimate (as at 31 December 2021)
Based on $1,600/oz Gold Price
| | | | | | | | | | | | | | | | | | | | |
| Area | Mineral Reserves Classification |
| Proven | Probable | Total |
Tonnage
(kt) | Grade (Au g/t) | Tonnage
(kt) | Grade (Au g/t) | Tonnage
(kt) | Grade (Au g/t) |
| Santoy Mine | 304 | 9.16 | 2,379 | 6.40 | 2,684 | 6.72 |
1. Mineral Reserves are reported based on 31 December 2021as-mined survey data.
2. The Mineral Reserves estimate is based on metal price assumptions of $1,600 gold.
3. The Mineral Reserves estimate is reported at a cut-off grade of 2.52 g/t Au.
4. Economic analysis for the Mineral Reserves has been prepared using long-term metal prices of $1,600/oz of gold.
5. No mining dilution is applied to the grade of the Mineral Reserves. Dilution intrinsic to the Mineral Reserves estimate is considered sufficient to represent the mining selectivity considered.
6. Processing recoveries vary based on the feed grade. The average recovery is estimated to be 98%.
7. SSR has 100% ownership of the Project.
8. Santoy Mine includes Santoy 8, Santoy 9, and Gap Hangingwall lodes.
9. Metals shown in this table are the contained metals in ore mined and processed.
10. The point of reference for Mineral Resources is the point of feed into the processing facility.
11. Tonnage is metric tonnes and g/t represents grams per metric tonne.
12. Totals may vary due to rounding.
Table 12.3 Summary of Cut-off Values and Metallurgical Recoveries, of Seabee21TRS Mineral Reserves Estimate (as at 31 December 2021)
Based on $1,600/oz Gold Price
| | | | | | | | | | | | | | | | | |
| Mineral Reserves Classification | Tonnage
(kt) | Grade
(Au g/t) | Contained Gold (koz) | Cut-off
Value (Au g/t) | Metallurgical Recovery (%) |
| Proven Mineral Reserves | 304 | 9.16 | 90 | 2.52 | 98 |
| Probable Mineral Reserves | 2,379 | 6.40 | 490 | 2.52 | 98 |
| Total Mineral Reserves | 2,684 | 6.72 | 580 | 2.52 | 98 |
1. Mineral Reserves are reported based on 31 December 2021as-mined survey data.
2. The Mineral Reserves estimate is based on metal price assumptions of $1,600 gold.
3. The Mineral Reserves estimate is reported at a cut-off grade of 2.52 g/t Au.
4. Economic analysis for the Mineral Reserves has been prepared using long-term metal prices of $1,600/oz of gold.
5. No mining dilution is applied to the grade of the Mineral Reserves. Dilution intrinsic to the Mineral Reserves estimate is considered sufficient to represent the mining selectivity considered.
6. Processing recoveries vary based on the feed grade. The average recovery is estimated to be 98%.
7. SSR has 100% ownership of the Project.
8. Metals shown in this table are the contained metals in ore mined and processed.
9. The point of reference for Mineral Reserves is the point of feed into the processing facility.
10. Tonnage is metric tonnes, ounces represent troy ounces, and g/t represents grams per metric tonne.
11. Totals may vary due to rounding.
12.3 Canadian National Instrument 43-101 Standards of Disclosure for Mineral Projects
The Mineral Reserves reported in the Seabee21TRS are suitable for reporting as Mineral Reserves using the Canadian National Instrument 43-101 Standards of Disclosure for Mineral Projects (NI 43-101).
21014Seabee21TRS220927Rev0.docx 76
13 MINING METHODS
13.1 Introduction
This section summarises the key components of the mine plan that form the basis of extracting the Mineral Reserves. Actual data and current operating practice are referenced heavily as the mine plan is based on the successful continuation of current practice. Mining at Seabee is now complete therefore all mining references in this Seabee21TRS relate to the Santoy mine.
The mine plan was initially completed by the SSR technical department on site at the SGO and included plans for the overall extraction of the Mineral Resources. OreWin has since reviewed the mine plan and made the appropriate modifications to include extraction of only the Mineral Reserves.
The LOM plan of the Mineral Reserves at the SGO, commencing 1 January 2022, includes 2.68 Mt at an average grade of 6.7 g/t Au. The Mineral Reserves estimate includes dilution from hangingwall and footwall overbreak based on ongoing stope reconciliation. A total of 580 koz of gold will be delivered to the mill.
Access underground at the Santoy mine is provided from surface at the Santoy portal via a main ramp, with sublevels spaced between 17–20 m vertically. Mining is carried out using sublevel open stoping mining methods with backfill.
Stopes are filled with a combination of rock fill (RF) and cemented rock Fill (CRF), mined in a bottom-up mining sequence. Sill pillars are mined on retreat once the stopes below and above have been mined (stopes above filled with CRF and allowed to cure).
Mining factors are derived from ongoing analysis of site performance data.
Ore is trucked to surface and dumped on a surface mine ore pad. Ore is then loaded into surface trucks for a 14 km haul to the run-of-mine (ROM) stockpile at the mill, located at the old Seabee mine. A longitudinal section of the existing Santoy mine is provided in Figure 13.1 and Figure 13.2 and Figure 13.3 show the Santoy LOM design.
21014Seabee21TRS220927Rev0.docx 77
Figure 13.1 Santoy Mine – Existing Development
OreWin, 2021
21014Seabee21TRS220927Rev0.docx 78
Figure 13.2 Santoy Mine – 2021 Life-of-Mine Development Design
OreWin, 2021
21014Seabee21TRS220927Rev0.docx 79
Figure 13.3 Santoy Mine – 2021 Life-of-Mine Stope Designs
OreWin, 2021
13.2 Mining Methods
The primary mining method at the Santoy mine is longitudinal retreat (longhole open stoping). Avoca mining (which is similar in its process) is also used when access from both sides of the sill is available. The minimum mining width is 1.8 m. Planned stopes typically range in width from 3.9–9.0 m. The length of the stopes varies based on deposit geometry and geotechnical guidance. Typical stope extents range from 20–30 m along strike, with a maximum stope strike length of 40 m. External dilution is included based on ongoing stope reconciliations using actual mucking and cavity monitor survey data.
Level spacing varies from 17–20 m (vertical), floor-to-floor. The sill drifts on the levels are connected to a ramp to permit access for the rubber-tired mobile equipment fleet.
Longhole drills are used to drill down from the top level to breakthrough into the bottom level of the stope.
For localised areas with minimal strike length, Alimak mining methods, or captive longhole mining methods, are used to reduce lateral development costs. Access to the captive stopes is provided via an Alimak raise. Where the stope extends less than 15 m from the Alimak raise, production drilling is completed from the Alimak raise climber. For larger stopes, sub-drifts are driven to permit access for a longhole drill.
On completion of mining, stopes are backfilled with development waste rock. A cemented waste rock rib pillar is placed when mining occurs adjacent to backfill stopes. Based on stope sequence and long-term access requirements, some stopes can be left open without backfill.
21014Seabee21TRS220927Rev0.docx 80
13.3 Primary Access
Primary access is provided via a main ramp from the surface to the deepest levels. The main ramp begins at the Santoy portal, which is located at the top of the Santoy 8 deposit. Depending on the geometry of the deposit, the main ramp splays into secondary ramps to access longitudinally separated sections of the mine. The ramps are driven 5 m wide x 5 m high to permit access for the 45 t haulage trucks. Extensions to the existing ramps and additional ramps will be driven to provide access to planned mining levels.
13.4 Level Design
Mining levels are driven from access crosscut drifts from the ramps. A standoff distance of at least 25 m from the ramp to the orebody is used when accessing from the footwall side, and 20 m when accessing from the hangingwall side. Typical level infrastructure excavations include a sump and a truck dump / remuck. Some levels include a drift to access and transfer ventilation from the levels above or below. Access to the longhole stopes is accomplished with sill drifts driven from the access crosscuts. The sill drifts are used for deposit definition, production mucking, and production drilling. The sill drifts are driven 4.2 m high with the width varying to suit the width of the ore (minimum 4.6 m), to a maximum of 8 m.
For a typical Alimak stope, level development consists of a haulage drift, a sill drift, and an Alimak chamber on the lower level and an access drift on the upper level.
The permanent and temporary excavation dimensions at the Santoy mine are provided in Table 13.1. Temporary excavations are openings that are typically only used for less than two years before they are shut down or backfilled.
Table 13.1 Excavation Dimensions
| | | | | | | | |
| Category | Width (m) | Height (m) |
| Permanent Excavations |
| Ramp | 5.0 | 5.2 |
| Remuck | 5.0 | 5.2 |
| Truck Dump | 5.0 | 6.7 |
| Haulage | 4.6 | 4.2 |
| Sump | 4.0 | 4.0 |
| Refuge Station | 6.0 | 5.0 |
| Safety Bay | 1.5 | 2.4 |
| Ventilation Access | 4.6 | 4.2 |
| Ventilation Raise – Alimak | 3.0 | 3.0 |
| Ventilation Raise – Longhole | 4.0 | 4.0 |
| Temporary Excavations |
| Sill | 8.0 * max. | 4.2 |
| Access | 4.6 | 4.2 |
| Alimak Chamber | 4.2 | 4.2 |
| Alimak Nest | 4.2 | 6.5 |
| Alimak Sublevel | 7.0* max. | 3.0 |
* Width varying to suit the width of the mineralised zone
21014Seabee21TRS220927Rev0.docx 81
13.5 Material Handling
Ore and waste are hauled via 45 t haulage trucks. Ore is transported to surface where it is dumped and transferred via a wheeled loader into 40 t articulated dump trucks. The ore is then hauled 14 km to the mill ROM stockpile located near the old Seabee mine. Waste rock remains underground for deposition into mined stopes where possible, otherwise stockpiled on surface for later back haul as backfill.
13.6 Ventilation
The Santoy primary ventilation circuit currently provides 170 m3 per second (360,000 ft3 per minute (CFM)) downcasting through two ventilation raises located centrally at the Gap Main fresh air raise (FAR) and the Santoy 8 Main FAR, and exhaust via the main ramp and the Santoy 8 East return air raise (RAR). The Gap Main FAR provides fresh air via two fans in parallel with a total power of 597 kw (800 hp), while the Santoy 8 Main FAR provides fresh air via a single fan with a total power of 149 kw (200 hp).
From the Gap Main FAR fans, roughly 113 m3 per second (240,000 CFM) is sent down the raise until it reaches 31L vent drift where roughly 42 m3 per second (90,000 CFM) is split off and sent down to the bottom of the Gap decline with the help of a 74 kw (100 hp) booster fan located in 31L vent drift. The remaining 56 m3 per second (120,000 CFM) continues down a system of raises on the 41 decline until it reaches the bottom of the face. There is a 149 kw (200 hp) booster fan located on 47L of the 41 decline to assist with the movement of air to this area.
The Santoy 8 Main FAR pushes roughly 56 m3 per second (120,000 CFM) from surface to the bottom of 48 decline through a system of raises. At the bottom of this system are two 74 kw (100 hp) booster fans in parallel that assist with airflow. From here, 38 m3 per second (80,000 CFM) moves up the 49 incline and provides ventilation at the face, while the remaining 19 m3 per second (40,000 CFM) is sent up the 48 decline and returns to the main exhaust system.
The Gap Hangingwall (GHW) development is currently ventilated using auxiliary fans (located at 46L on the Gap decline) and ducting pulling from the 90,000 + 40,000 CFM provided by the Gap decline and the 8 Main FAR respectively. General ventilation plans have been established for the future LOM at Santoy, with ventilation raises being developed at each working level as mining continues. No additional significant capital expenditures have been identified in the current LOM Ventilation plans.
Fresh air is heated by existing propane heaters during the colder winter months.
13.7 Backfill
Rock fill (RF) and cemented rock fill (CRF) using mine waste rock is used for backfill at the Santoy mine. Waste rock is stockpiled on surface temporarily when open stopes are unavailable for deposition.
CRF is used, but not limited to, the creation of sill pillars at the start of a mining front. This is implemented to create a solid barrier between mining fronts. The CRF consists of run-of-mine waste mixed with a cement binder. Santoy mine uses 5% binder in CRF backfilling for sill pillar creation and as low as 3% binder is used for less critical locations. The cement for the backfill comes from a bagged dry-mix product that is turned into useable wet cement near the workplace using a transportable mixer. The bagged dry-mix is stored on surface and brought underground as required.
Based on the underground development design and schedule, there will be sufficient backfill material available from development waste rock.
21014Seabee21TRS220927Rev0.docx 82
13.8 Dewatering
Main dewatering is accomplished via main sump / pumping station on 28L and 30L at the Santoy deposit. The water is pumped to the Santoy 8 deposit underground settling sump and then to the surface mine water management pond located near the Santoy portal.
The Santoy mine dewatering requirements are summarised in Table 13.2 and are based on actual ground water inflows and mining activities.
Table 13.2 Santoy Mine Dewatering Requirements
| | | | | | | | |
| Source | Dewatering Requirement |
m3/day | US gallons/min |
| Ground Water | 280 | 50 |
| Mining Activities | 150 | 28 |
| Total | 430 | 78 |
13.9 Hydrology Considerations
Water inflow is well understood at the SGO based on actual data and is not expected to change during the LOM. The current dewatering infrastructure system adequately manages water inflows and the system will continue to be expanded as the footprint of the Santoy mine expands.
13.10 Geotechnical Considerations
13.10.1 Rock Mass Quality and Rock Properties
The rock mass at the Santoy mine is generally classified as good with a rock mass rating (Bieniawski, 1976) (RMR76) of 71%–79%. There are some areas classified as fair, with a RMR76 of 52%–57%.
Rock property testing has not been performed at the Santoy mine, but rock property testing performed for the Seabee mine provides analogous results (Table 13.3, Table 13.4, and Table 13.5).
13.10.2 Stress Regime and Most Likely Mode of Failure
Stress monitoring and in situ stress measurements have not been conducted at the Santoy mine. It is assumed, based on typical Precambrian Canadian Shield conditions (Herget 1988) that the horizontal to vertical stress ratio is two and that the major principal stress direction is horizontal and parallel to the strike of the orebody.
The most likely mode of failure at the Santoy mine is either structural or rock mass driven failure. In areas where the RMR is 71%–79%, the dominant mode of failure will be structural. In areas where the RMR is 52%–57%, the dominant mode of failure will be wedge failure. Gravity is the driving force for failure as high stress with seismic activity and rock bursting is not a concern due to the shallow depth of mining.
21014Seabee21TRS220927Rev0.docx 83
Table 13.3 Summary of Testing Results for the Hangingwall Structure at Seabee Mine
| | | | | | | | | | | | | | | | | | | | | | | | | | | | | | | | |
| Zone / Box | Conversion Factor, K | UCS Point Load
(MPa) | UCS
(MPa) | Tensile Strength
(MPa) | Static E
(GPa) | Static v | Dynamic E
(GPa) | Dynamic v | Φ | C
(MPa) |
| HW / U11-037 | 18 | 100 ± 19 (10) | 102 ± 53 (6) | | 43 ± 9 (2) | 0.29 ± 0.06 (2) | 56 ± 10 (10) | 0.23 ± 0.03 (10) | | |
| HW / U11-357 | 18 | 109 ± 29 (9) | 100 ± 5 (4) | 13 ± 2.4 (10) | 43 ± 12 (3) | 0.19 ± 0.08 (3) | 51 ± 3 (4) | 0.28 ± 0.01 (4) | | |
| Average* | 18 | 105 ± 25 | 102 ± 41 | 13 ± 2.4 | 43 ± 11 | 0.23 ± 0.09 | 54 ± 9 | 0.24 ± 0.03 | 45° | 12 |
Table 13.4 Summary of Testing Results for the Footwall Structure at Seabee Mine
| | | | | | | | | | | | | | | | | | | | | | | | | | | | | | | | |
| Zone / Box | Conversion Factor, K | UCS Point Load
(MPa) | UCS
(MPa) | Tensile Strength (MPa) | Static E
(GPa) | Static v | Dynamic E (GPa) | Dynamic v | Φ | C
(MPa) |
| HW / U11-037 | 22 | 169 ± 45 (10) | 171 ± 48 (6) | | 75 ± 12 (2) | 0.20 ± 0.05 (2) | 62 ± 7 (10) | 0.17 ± 0.06 (10) | | |
| HW / U11-357 | 11 | 90 ± 22 (11) | 90 ± 35 (4) | 12.8 ± 2.6 (10) | 78 ± 21 (4) | 0.21 ± 0.11 (4) | 76 ± 15 (4) | 0.22 ± 0.05 (4) | | |
| Average* | 17 | 138 ± 35 | 139 ± 59 | 12.8 ± 2.6 | 77 ± 18 | 0.21 ± 0.09 | 67 ± 11 | 0.18 ± 0.06 | 48° | 30 |
* Averages are calculated from all test results
Table 13.5 Summary of Testing Results for the Orezone Structure at Seabee Mine
| | | | | | | | | | | | | | | | | | | | | | | | | | | | | | | | |
| Zone / Box | Conversion Factor, K | UCS Point Load
(MPa) | UCS
(MPa) | Tensile Strength
(MPa) | Static E
(GPa) | Static v | Dynamic E
(GPa) | Dynamic v | Φ | C
(MPa) |
| OZ / U11-037 | | | | 17.6 ± 2.0 (10) | | | | | | |
| OZ / U11-357 | 8 | 71 ± 26 (20) | 70 ± 18 (10) | | 35 E 18 (5) | 0.17 ± 0.05 (5) | 55 ± 9 (14) | 0.21 ± 0.04 (14) | 57° | 23 |
(x) Number of tests completed
21014Seabee21TRS220927Rev0.docx 84
13.10.3 Specific Geotechnical Risk
The geotechnical risks at the Santoy mine are structural and rock mass driven failure. Based on geotechnical underground mapping, the Santoy mine has three primary joint sets that contribute to potential structural failure (Figure 13.4):
•JS1 – 58°/358°
•JS2 – 80°/267°
•JS3 – 13°/195°
In the areas where the rock mass is fair the failure mode will likely be wedge failure due to gravity in sills that are greater than 8 m in width. In areas of with a good rock mass or under 8 m span, the failure mode will likely be structural.
13.10.4 Current Mitigation Measures Used to Minimise the Geotechnical Risk Support System
At the Santoy mine there are currently several ground support systems in place that are selected depending on the width of the excavation and its application:
•Inclines / declines: 2.4 m threaded-both-end mechanical rock bolts on a 1.2 m x 1.2 m pattern in the back, 10 mm x 10 mm 6-gauge screen on the back and walls, and 1.8 m split sets on 1.2 m x 1.2 m pattern in the walls.
•Intersections 6–9 m wide: 2.4 m #6 rebar on a 1.2 m x 1.2 m pattern in the back, 10 mm x 10 mm 6-gauge screen on the back and walls, and 1.8 m split sets on 1.2 m x 1.2 m pattern in the walls.
•Sills less than 6 m wide: 1.8 m threaded-both-end mechanical rock bolts on a 1.2 m x 1.2 m pattern in the back, 10 mm x 10 mm 6-gauge screen on the back and walls, and 1.8 m split sets on 1.2 m x 1.2 m pattern in the walls.
•Sills 6–7 m wide: 2.4 m threaded-both-end mechanical rock bolts on a 1.2 m x 1.2 m pattern in the back, 10 mm x 10 mm 6-gauge screen on the back and walls, and 1.8 m split sets on 1.2 m x 1.2 m pattern in the walls.
•Sills greater than 7 m wide: designed cable bolt plan that is dependent on site investigation.
13.10.4.1 Barrier Pillar
Currently the only barrier pillar at Santoy is the 37L to 38L CRF pillar. Barrier pillars are located at the bottom of the first stoping block, and in the future, there will be uphole stoping directly underneath the CRF pillar. CRF barrier pillars are composed of 5% binder mixed with development waste rock.
13.10.4.2 Extraction Sequence
The extraction sequence includes stopes being extracted from the bottom of the stoping block to the top of the stoping block, and from the extremities of the level towards the access near the centre.
13.10.4.3 Backfill
At the Santoy mine, two types of backfill are used: unconsolidated RF, and CRF. CRF is used when mining occurs directly adjacent to the backfill stopes. All other stopes that are backfilled, are filled with unconsolidated waste rock from development elsewhere in the mine.
21014Seabee21TRS220927Rev0.docx 85
13.10.5 Geotechnical Reports Review
A review of previously completed geotechnical studies for SGO has been undertaken. The purpose of the review is to confirm the studies that have been completed to date are appropriate and identify any gaps or areas of residual concern. The following six geotechnical reports were reviewed:
•2015 – Stantec Study
•2017 – Pakalnis & Associates Study
•2017 – SRK NI 43-101 Technical Report
•2018 – Northern Rock Mining Solutions
•2020 – Northern Rock Mining Solutions
•2021 – SSR Internal Report
•2021 – SSR Ground Control Management Plan (GCMP)
Stantec Geomechanical Overview of Stope and Pillar Stability – Santoy Orebody (March 2015)
The Stantec 2015 Study provided a review of stope and pillar design for the Santoy orebody. Designs are based on rock mechanics utilising empirical design methods using available core logging and very limited intact strength testing to define geotechnical rock mass ratings (Q’ and RMR89). Q’ was assessed as ranging from 10–33 (‘Good’ rock) and RMR89 ranging from 51–77 (‘Fair’ to ‘Good’ rock).
Mapping from development within the area indicated three defect sets: foliation/bedding dipping moderately to the east of south (54°/160°), dominant joint set dipping steeply to the northeast (74°/059°) and a minor joint set dipping moderately to the west (46°/286°).
The Mathews Potvin Stability Graph Method was utilised to assess stope dimensions and indicating hangingwall dimensions not to exceed 25 m down dip and open strike length of 20 m. Mathews Potvin approach to stope design requires appropriate understanding of the structural pattern and at Seabee the appropriate dip of foliation / bedding is critical.
MAP3d numerical analyses was utilised to assess stability of interstitial pillars (i.e., pillars left between parallel ore zones) and indicating backfill of stope is required to mitigate interstitial pillar failure coupled with bottom up sequence and lag mining in hangingwall by one stope.
No support designs were provided for development drives, albeit there was comment that for drifts wider than 5 m, longer support such as cables may be required.
Pakalnis & Associates Report on Site Visit – Santoy Mine (June 2017)
Pakalnis & Associates undertook a site visit in June 2017 and reviewed aspects of development support for the Santoy mine. The key driver in engaging the review was two falls of ground (FOG) on 34L, one in January 2017 and the other in April 2017. Key findings of the report were that the standard support using either 1.8 m or 2.4 m long anchors on a 1.2 m x 1.2 m pattern was not adequate where wide spans were utilised in areas where rock mass quality (RMR) is reduced with the presence of “south dipping 30° structure”. Indications that “unstable unless supported by dead-weight requirements”. The “south dipping 30° structure” noted in both FOG are not present in the structural pattern noted in the Stantec 2015 Study.
21014Seabee21TRS220927Rev0.docx 86
SRK NI 43-101 Technical Report for the Seabee Gold Operation (October 2017)
The SRK 2017 report was a NI 43-101 Technical Report for the Seabee operation and the review focused on Section 16.10 of SRK 2017 report regarding Geotechnical Considerations. Key findings of the SRK Study comprise:
•RMR76 typically ‘Good’ ranging from 71–79 with some areas classed as Fair ranging from 52–57.
•Structural pattern noted as: foliation/bedding dipping moderately to the north (58°/358°), dominant joint set dipping steeply to the west (80°/267°) and a minor joint set shallow dipping to the south (13°/195°).
•In areas of ‘Fair’ rock mass quality and for spans greater than 8 m failure mode is likely to be wedges. In areas of ‘Good’ rock mass quality or under 8 m span the failure mode will likely be structural.
Observations and comments of the review are as follows:
•The difference between RMR76 and RMR89 relates to slightly different ratings in the Bieniawski system over time and typically the latter provides values 5 points higher.
•The structural pattern noted by SRK is distinctly different to that noted in the Stantec 2015 Study but largely identical to that later presented in 2021 SSR Ground Control Management Plan. Two key aspects are indicated. Firstly, stope design needs appropriate consideration of local foliation/bedding dips. Secondly, the SRK structural pattern includes the flat south dipping structures, which was a critical issue in the FOG’s noted in the Pakalnis & Associates 2017 Study.
•The SRK Study does not provide an update on stope design parameters or ground support in development and simply states the support types in use for the latter.
NRMS Ramp Inspection and Related Mining Geotechnics (November 2018)
North Rock Mining Solutions (NRMS) provides a review of the Santoy operation. Key aspects of note in the review include:
•Rock mass quality ratings in keeping with the Stantec 2015 Study.
•NRMS indicates support in the declines somewhat conservative.
•Wider spans (>8 m to 10 m) have experienced brow and back failures although a conservative design is suggested based on the rock mass rating and tight cable spacing utilised (nominally 1.5 x 1.0 to 0.75 m).
NRMS provides several potential causes for the failures in what would be expected to be conservative designs. The two most significant issues raised by NRMS to explain the failures include: large discrete structures (which require dead-weight consideration in support design) and undercutting of the hangingwall though inappropriate consideration in the design (this would comprise the hangingwall design being steeper than the local geological bedding / foliation).
NRMS Q4 Mining-Geotechnical Site Visit Summary Notes (September 2020)
In 2020, Northern Rock Mining Solutions (NRMS) provided a further review of the Santoy operation. Part of this review focused on the GHW zone. It was noted that the variability in the bedding/foliation, whilst typically dipping east of north, shows local areas with dip direction to the west and with dips ranging from 35º to 85°. NRMS state: “excavation stability during mining operations largely governed by the presence, detection, and subsequent handling of stope-scale geologic ‘contact’ structures located in the HW, and less frequently within the FW”.
21014Seabee21TRS220927Rev0.docx 87
SSR Ground Control Analysis (June 2021)
In 2021 SGO provided a report on the GHW deposit focused on stope stability and ground control. The report was based on a combination of site-specific drilling, mapping and laboratory testing. Key aspects of report include:
•Presented mapping data: foliation / bedding dipping steeply to the north (74°/004°), dominant joint set dipping steeply to the south-east (78°/134°) and a minor joint set near horizontal. SGO notes the structural pattern has a significant role in determination of rock mass characterisation.
•Logging data indicates geotechnical rock mass ratings of Q ranging from 10–40 (‘Good’ rock) and RMR ranging from 80–85 (‘Very Good’ rock).
•Implications of these rock mass ratings indicating wide spans (up to 12 m) before systematic bolting required and with potential to increase strike length of stopes of up to 30 m.
•The study looked at the option of using transverse stopes and with uncemented backfill of stopes to limit failure of proposed narrow transverse pillars.
Of note in the study is the approach to ground control support at Santoy since the 2017 FOG incidents and rationale as to why potential wider spans can be considered with the current systematic support of 2.4 m long rebar on a 1.5 m x1.5 m dice pattern.
SSR notes: “QA/QC programme to ensure frequent and continuous evaluation of the rock mass and joint sets is available to show that the large wedges predicted by the deadweight analysis cannot form”.
SSR Ground Control Management Plan (2021)
The SSR 2021 Ground Control Management Plan (GCMP) is considered comprehensive and provides an appropriate overview of the support requirements and stope designs at Seabee and appropriate components of a management plan of a principal hazard.
Geotechnical Studies Review Comments
The following comments represent perceived gaps:
•Whilst latter reporting from NRMS and internal SSR reporting indicate potential for wider spans and less support. While the data supports this being feasible in principle, this is not advisable at a practicable level without appropriate mapping, rock mass evaluation, and design assessment.
•The structural pattern / data is a key driver in the stope designs and support in wider spans as indicated in the Pakalnis & Associates 2017 Study. Whilst the SRK 2017 Study and SSR 2021 GCMP indicate an identical structural pattern, the Stantec 2015 Study and the SGO / SSR 2021 Study indicate distinctly different structural patterns and highlight potential for local variation.
•There is concern for the QA/QC being implemented as it is required to confirm viability of wider spans and less support suggested in the latter geotechnical reporting. The structural data shown in Figure 13.4, for the SRK 2017 Study (320 data points) compared to that presented in Figure 13.5, for the SSR 2021 GCMP (322 data points) is largely identical. This suggests only 12 additional mapping points have been collected in three years, whilst this may not be the case, it somewhat confirms the concern.
•The SSR 2021 GCMP comments on use of a cemented rockfill sill pillar as a solid barrier between mining fronts. However, there is no guidance on the vertical separation between mining fronts in any of the above technical reports that have been reviewed.
21014Seabee21TRS220927Rev0.docx 88
Figure 13.4 2017 Structural Data
SRK, 2017
Figure 13.5 2021 Structural Data
SSR, 2021
13.11 Mine Schedule
The Mineral Reserve life of mine extends to the first quarter of 2029 at a production rate of 425 ktpa. The Mineral Reserve production profile tonnage and recovered gold ounces are shown in Figure 13.6 and Figure 13.7.
21014Seabee21TRS220927Rev0.docx 89
Figure 13.6 Production Plan Tonnage
OreWin, 2021
Figure 13.7 Processing Schedule
OreWin, 2021
21014Seabee21TRS220927Rev0.docx 90
Figure 13.8 Production Plan Recovered Gold Ounces
OreWin, 2021
The underground development requirements to realise the LOM production plan are summarised in Table 13.6. Annual waste rock generation and backfill requirements are also included in Table 13.6.
Table 13.6 Development, Waste Rock, and Backfill Summary
| | | | | | | | | | | | | | | | | | | | | | | | | | | | | |
| Item | Unit | 2022 | 2023 | 2024 | 2025 | 2026 | 2027 | 2028 | Total |
| Development |
| Capital Lateral | m | 4,176 | 3,673 | 3,431 | 2,308 | 1,672 | 469 | – | 15,729 |
| Operating Lateral | m | 2,508 | 2,794 | 1,903 | 1,761 | 756 | 148 | – | 9,871 |
| Capital Alimak | m | 51 | – | – | – | 57 | – | – | 109 |
| Operating Alimak | m | 186 | 116 | 151 | 40 | 379 | 106 | – | 978 |
| Total | m | 6,922 | 6,583 | 5,485 | 4,108 | 2,865 | 724 | – | 26,686 |
| Waste Rock Generated | kt | 506 | 389 | 493 | 393 | 258 | 109 | – | 2,149 |
| Backfill Requirement | kt | 1,564 | 278 | 308 | 269 | 305 | 326 | 78 | 1,564 |
Sum of individual values may not match total due to rounding
13.12 Mobile Equipment
The existing equipment fleet will fulfil the peak requirements of the schedule, capital allowances have been made for the rebuild or replacement of equipment as required over the LOM.
21014Seabee21TRS220927Rev0.docx 91
14 PROCESSING AND RECOVERY METHODS
14.1 General
The Seabee deposit was processed for 25 years in the mill constructed immediately adjacent to the Seabee shaft.
The remote location of the mine in northern Saskatchewan is sustained by air transport for the workforce and winter road access for supplies. The operation was initially developed and operated on diesel power and later connected to Saskatchewan grid power in 1992. The initial capacity was 500 tpd, which was later expanded to 1,000 tpd with the addition of a third grinding mill. The mill flow sheet as shown in Figure 14.1 is a conventional crushing and grinding circuit employing gravity gold recovery and cyanide leaching with carbon-in-pulp (CIP) for recovery and production of doré gold on site.
Table 14.1 shows the main operating statistics for the Seabee mill over the last ten years, which was the main reference in planning the future operations on other deposits in the area as well as the Santoy deposit.
The mill maintains a high availability and routinely averages more than 94% operating time with the average monthly rate from 2014 to the present being 94.6%. Currently, an addition to the gravity recovery circuit is being installed that will increase the gravity gold recovery and reduce the limitations of the main cyanide leach circuit.
21014Seabee21TRS220927Rev0.docx 92
Table 14.1 Seabee Mill Production Statistics 2006–2021
| | | | | | | | | | | | | | | | | | | | | | | | | | | | | |
| Item | Unit | 2006 | 2007 | 2008 | 2009 | 2010 | 2011 | 2012 | 2013 |
| Production | t | 246,000 | 227,700 | 228,400 | 247,641 | 203,958 | 257,181 | 275,235 | 280,054 |
| Daily Rate | tpd | 674 | 624 | 626 | 678 | 559 | 705 | 754 | 767 |
| Mill Head Grade | g/t | 6.16 | 6.35 | 6.46 | 6.17 | 7.55 | 5.68 | 5.86 | 5.11 |
| Recovery | % | 93.6 | 95.4 | 95.8 | 95.3 | 95.5 | 95.3 | 95.6 | 95.3 |
| Gold Produced | oz | 46,300 | 44,323 | 45,466 | 46,827 | 47,270 | 44,750 | 44,756 | 43,850 |
| | | | | | | | | |
| Item | Unit | 2014 | 2015 | 2016 | 2017 | 2018 | 2019 | 2020 | 2021 |
| Production | t | 279,597 | 277,386 | 312,679 | 330,415 | 352,000 | 344,040 | 255,172 | 382,478 |
| Daily Rate | tpd | 756 | 760 | 857 | 967 | 1,125 | 1,087 | 1,163 | 1,180 |
| Mill Head Grade | g/t | 7.32 | 8.82 | 7.91 | 8.25 | 9.16 | 9.56 | 10.10 | 9.92 |
| Recovery | % | 95.7 | 96.3 | 96.6 | 97.4 | 97.4 | 98.2 | 98.4 | 98.4 |
| Gold Produced | oz | 62,984 | 75,748 | 80,351 | 85,395 | 100,953 | 110,864 | 81,540 | 120,030 |
21014Seabee21TRS220927Rev0.docx 93
Figure 14.1 Seabee Mill Flow Sheet
SSR, 2021
21014Seabee21TRS220916A.docx Page 94 of 153
14.2 Crushing
The run of mine ore is crushed at the mil. The circuit consists of primary crushing with a jaw crusher followed by secondary crushing with a cone crusher in closed circuit with a triple deck screen. The product from the crushing circuit, at minus 20 mm, is conveyed to the ore storage bin, which has a live capacity of 400 t. To increase the storage capacity between the crusher and the grinding circuit, and allow for crusher breakdowns or scheduled maintenance, fine crushed ore is stockpile and fed into the circuit through the original crushing feed point.
14.3 Grinding
The grinding circuit consists of a ball mill 2.9 m in diameter and 3.7 m long serving as the primary grinding mill. Two secondary mills, 2.7 m in diameter and 2.6 m long, complete the grinding to 80% passing 200 mesh. The grinding mills operate in closed circuit with hydrocyclones. The ground product is thickened to 48% solids in a 12 m thickener prior to entering the leach circuit. Lime is introduced to the grinding circuit to maintain the pH and free cyanide levels for optimum leach conditions.
14.4 Gravity Recovery
A portion of the cyclone underflow on the primary grinding mill is directed to a Knelson concentrator for further concentration on a vibrating table. The gravity concentrate, averaging approximately 65% of the total gold recovered, is refined with the gold recovered in the hydrometallurgical circuit.
The gravity recovery circuit consists of two Knelson concentrators and an Acacia reactor, which recovers the gravity gold in a separate intense cyanide leach and electrowinning circuit. Installation of this equipment was complete later in 2017. Further optimisation of the Acacia circuit is being undertaken to further improve gravity gold recovery.
14.5 Cyanide Leaching
The leach circuit consists of five agitated leach tanks: one of which is 14.6 m in diameter and 14.6 m in height, and four of which are 8.8 m in diameter and 8.8 m in height. Air injection is maintained in all tanks as well as cyanide addition to the initial tank to maintain the free cyanide level to complete gold dissolution. At the nominal mill capacity, the circuit provides 39 hours of leach time.
14.6 Carbon-in-Pulp
The carbon absorption circuit consists of eight tanks that are 3.4 m in diameter and 4.6 m in height equipped with launder screens to maintain the activated carbon captive in the tanks. The carbon circuit typically has about 17.2 t of activated carbon distributed in the tanks. The CIP tankage provides about three hours of retention time with the gold loaded carbon routinely advanced to the strip circuit.
14.7 Carbon Elution and Electrowinning
The loaded carbon is stripped at atmospheric pressure with a heated solution of caustic and iso-propyl alcohol over an average of three days. Gold is collected on stainless steel cathodes in a single electrowinning cell.
21014Seabee21TRS220916A.docx Page 95 of 153
14.8 Gold Refining
The gold recovered by electrowinning from the CIP circuit and the gold recovered by gravity is periodically refined in a gas-fired furnace and poured in doré gold bars on site.
14.9 Carbon Regeneration
To maintain the activity level of the carbon inventory, the Seabee mill has a carbon regeneration process. Prior to elution, the carbon is washed in hydrochloric acid for removal of calcium and other acid soluble impurities. Following elution, the carbon is subjected to heat treatment and attrition in a rotary kiln and screened to remove fines prior to recycle to the CIP circuit.
14.10 Mill Tailings
All tailings solutions in excess of the mill recycle water that are released to the environment are treated with cyanide destruction to maintain the water quality below release quality standards.
The mill operates primarily on recycled water with 96% of the mill water requirements recycled within the grinding circuit and from reclaim water from the tailings management area.
21014Seabee21TRS220916A.docx Page 96 of 153
15 INFRASTRUCTURE
The major infrastructure at the Seabee mine is shown in Figure 15.1, Figure 15.2, and Figure 15.3 and includes:
•Roads and airstrip.
•Mill buildings and related services facilities including maintenance and truck shops, assay lab, crushing plant, shops and storage buildings, and miscellaneous infrastructure.
•Shaft and headframe.
•Portal.
•Ventilation raises.
•2B mine water management ponds.
•Administrative buildings.
•Water supply and distribution.
•Waste management.
•Fuel storage.
•On-site explosive storage.
•Powerhouse and electrical distribution system.
•Ore stockpile.
•TMFs and water management.
•East Lake water treatment plant.
•Camp accommodation.
•Winter road portages.
21014Seabee21TRS220916A.docx Page 97 of 153
Figure 15.1 Seabee Gold Operation Major Infrastructure
21014Seabee21TRS220916A.docx Page 98 of 153
Figure 15.2 Seabee Gold Operation Mill Site Infrastructure
21014Seabee21TRS220916A.docx Page 99 of 153
Figure 15.3 Seabee Gold Operation Tailings Management Facility Infrastructure
The major infrastructure at the Santoy mine is shown in Figure 15.4 and includes:
•Roads
•Administrative and shop buildings
•Powerhouse and electrical distribution system
•Portal
•Vent raises
•Ore stockpiles
•Waste rock pile
•Settling ponds
•Water treatment plant
21014Seabee21TRS220916A.docx Page 100 of 153
Figure 15.4 Santoy Mine Major Infrastructure
15.1 Site Access Roads
As previously stated, the site can be accessed by an 8 km winter road, which begins at Highway 102 near the community of Brabant Lake, Saskatchewan and consists of 12 portages spanning 11 lakes. The majority of annual supplies are transported to site via the winter road, typically throughout the months of February and March, and until mid-April depending on ice quality.
The two mines are connected via a 14 km haul road, called the Santoy Road. This access road is a one-way road that is operated using radio callouts every 1 km and has specific travel convoy times throughout the day. There are also several miscellaneous roads throughout both the Seabee mine and Santoy mine sites that provide access to infrastructure.
15.2 Product Loadout
The product from the processing facility (doré bars) is transported by air to a third-party refinery.
21014Seabee21TRS220916A.docx Page 101 of 153
15.3 Utilities
The current camp facilities at the Seabee mine and Santoy mine can accommodate up to 251 employees.
15.3.1 Water
Potable water is obtainable locally through SSR’s potable water system at both the Seabee and Santoy mine sites. The site currently uses a slow sand filter system. To better meet the current and future site water needs, a new ultrafiltration potable water system has been installed on site and will be commissioned in Spring of 2022.
15.3.2 Sewage Disposal
At the Seabee mine, sewage is treated in the mill and discharged with the tailings to either the East Lake tailings management facility (TMF) or Triangle Lake TMF.
The septic system at the Santoy mine is a mound system, which is pumped every second day by a vacuum truck to prevent leakage from the system.
15.3.3 Power
Electrical power is provided by a transmission line to the mine by the provincial power authority, Saskatchewan Power Corporation. The mine is connected to a 138 KV hydroelectric power line from Island Falls.
The total power usage for SGO is approximately 8.9 MV amperes and the electrical distribution system has an installed capacity of 10.0 MV.
15.3.4 Fuel Storage
Fuel farms and propane tanks are located at both the Seabee mine and Santoy mine sites.
15.3.5 Explosives Storage
A magazine and an explosives storage area are located at the Santoy 7 deposit servicing the Santoy mine, with a secondary magazine and explosive storage area used previously for the old Seabee mine site situated just off the Porky access road, approximately 1.3 km north-east from the Seabee mill area. Both of these areas have been designed and prepared in accordance with the Mines Regulations (The Mines Regulations 2018, Saskatchewan Employment Act).
15.4 Tailings Management Facilities
There are currently two tailings management facilities (TMF) that are being utilised by the Seabee mill: the East Lake TMF and the Triangle Lake TMF, as shown in Figure 15.3. Tailings deposition alternates between the two TMFs where winter deposition occurs in the Triangle Lake TMF and summer deposition is in the East Lake TMF. The current remaining storage capacities of both TMFs, based on an average production rate at 1,200 tpd, will potentially be reached in late-2030.
Maximum capacities also allow that 200,000 m3 of water are treated and discharged from the tailings management facilities each year. To ensure the treatment volumes are attained, a new water treatment plant at East Lake TMF was constructed in 2017.
21014Seabee21TRS220916A.docx Page 102 of 153
Work is currently underway investigating options for extending the life of the TMFs to accommodate any further extensions of the SGO life.
15.4.1 East Lake Tailings Management Facility
East Lake was a natural lake that was converted to a TMF when the Seabee mine was initially developed in 1991. East Lake was partially dewatered prior to tailings deposition, which provided containment for the first six years of operation. Subsequently, vertical concrete dams lined with high density polyethylene (HDPE) were constructed along the topographic lows along the east and south flanks of the TMFto provide additional storage capacity up to mid-2004. At this time, tailings deposition was relocated to the newly constructed Triangle Lake TMF. To accommodate an increased mine life, further expansion of the East Lake TMF was implemented in 2015. The expansion consists of a 6 m high expansion dike that is comprised of waste rock. Stage 1 construction of the expansion dike (Crest elevation 463 m) was completed in 2016 and additional raises have lifted the dike to its current elevation of 465 m.
The existing tailings line is a 6” diameter HDPE pipe that is approximately 2 km in length and stretches from the mill to the East Lake TMF. Spigot locations at the TMFvary over time.
Supernatant water during tailings deposition in the East Lake TMF is regulated by a pump station situated at the north-east corner of the facility. The pond level is maintained below the maximum operating level by pumping and discharging supernatant to either the Back Pond or to the Triangle Lake TMF. There are also three freshwater diversion pumps situated along the western flank of the East Lake TMF that capture and divert water towards Laonil Lake.
15.4.2 Triangle Lake Tailings Management Facility
Similar to the East Lake TMF, the Triangle Lake TMF was a natural lake that was converted to a TMF. To provide initial containment, a North dam was constructed along the northern shoreline of the TMF and tailings deposition commenced in 2004. In 2007, the north dam was raised and the south dam was constructed along the southern shoreline of the TMF. Both dams were vertical concrete structures lined with HDPE.
As part of the combined East Lake TMF and Triangle Lake TMF expansion to accommodate an increased mine life, the design of the Triangle Lake TMF was modified so that both structures would be raised with mine rock and lined with non-woven geotextile and HDPE liner. The expansion of the TMF was staged, which also included construction of two saddle dikes: saddle dikes W2 and W2A, situated east of the North dam. The design of the saddle dikes was consistent with the raise to the North dam (i.e., rockfill construction with non-woven geotextile and HDPE liner). In the final stage of construction, an emergency spillway was situated at the west abutment of the South dam, accommodating the design storm event for the TMF.
Further wall lifts have been completed on the Triangle Lake TMF and it is currently constructed to its final permitted elevation at 466 m, which will accommodate tailings until late 2030.
Construction of a seepage collection system commenced in the summer of 2014 along the downstream toe of the North dam to collect and manage seepage.
There is a 6″ diameter HDPE pipe that connects to the tailings line at the East Lake TMF and extends approximately 1.2 km to either the North or South dams at the Triangle Lake TMF. Spigot locations at the TMF vary over time.
21014Seabee21TRS220916A.docx Page 103 of 153
Water from the East Lake TMF is immediately discharged to the Triangle Lake TMF and thus the water repository and overall water management is accommodated and regulated at the Triangle Lake TMF. Reclaimed supernatant from the Triangle Lake TMF is discharged into the Back Pond, which serves as a lift station, where supernatant is either pumped to the East Lake water treatment plant for treatment or to the Seabee mill as reclaim. Two freshwater diversion pumps are situated along the eastern flank of the TMF that capture and divert water towards Laonil Lake.
15.4.2.1 Tailings Dam Geotechnical Report Review
A review of previous Geotechnical studies was conducted. The purpose of the review is to confirm the completed studies are appropriate and identify any gaps or areas of residual concern. The following eight reports formed the basis of the review:
•2001 – KHS EIS Study
•2016 – SRK study to evaluate tailings alternatives
•2016 – SRK Annual review
•2017 – SRK Dam Safety Review
•2018 – SRK Design study for Triangle Lake TMF Expansion
•2018 – SRK annual review
•2019 – SRK Dam Break Analysis
•2019 – Newfields independent review
Whilst the above does not comprise the full extent of reporting the above reports represent key information to allow an appropriate geotechnical review to be conducted.
Below is a summary of key points from the geotechnical reports review related to the tailings dam:
•There are seven dams noted in the reporting. Of the seven dams, up to seventeen structures/elements are noted and have been reviewed.
•The extent of ongoing review is comprehensive with Golder having been involved between 2007 and 2013, SRK commencing studies in 2012 and with SRK completing all studies since 2013.
•The SRK studies have involved annual reviews and Dam Safety reviews. Whilst all the historical reporting has not been reviewed, the available SRK reporting since 2016 is comprehensive and involving appropriate rigour and detail.
•The SRK studies are comprehensive and have involved numerous SRK staff at various technical levels to indicate appropriate internal review and maintain a high standard
•A third-party review by Newfields of SRK’s design for Triangle Lake TMF Expansion stated “well done and meets required standards”.
In view of the latter comments in the bullet points above, there are no perceived gaps in the technical studies with regard to the tailings dams at Seabee and with appropriate dam management being practiced.
15.5 Waste Rock Structures
Access roads, the airstrip, dams, dikes, laydown areas, and general site areas were constructed using waste rock, which was characterised as non-acid generating.
21014Seabee21TRS220916A.docx Page 104 of 153
15.6 Rock Quarry
In order to sustain waste rock requirements for construction, SSR developed a rock quarry at the SGO. The location of the quarry is adjacent to the existing Triangle Lake TMF. To date, the main consumption of the waste rock has been for the expansions of both TMFs and for the Santoy road upgrade / maintenance.
15.7 Water Facilities
The Santoy mine has one water management structure, which is the Santoy 8 deposit water management pond. The old Seabee mine has two water management structures: the East Lake water treatment plant and the 2B mine water settling ponds.
15.7.1.1 Santoy Mine
Mine water from the Santoy underground mine is discharged into the north-west corner of the Santoy 8 deposit water management pond where it is then pumped to a water treatment plant. The water is treated by a moving bed bioreactor unit to reduce ammonia concentrations. The treated water is pumped into settling Pond 1 where biomass from the process settles out and from there water flows to settling Pond 2 via an overflow spillway. The water is discharged from settling Pond 2 through a culvert and into the north-east corner of the mine water management pond for final settling. Final discharge to the environment is done via a pump situated at the south end of the mine water management pond. Approximately 100,000 m3 of water from the underground mine is treated and discharged annually.
Settling Ponds 1 and 2 have a perimeter of approximately 105 m and 90 m, respectively, and a maximum height of approximately 3.3 m and 3.8 m, respectively. The ponds are lined with 60 mil HDPE and have a combined total storage volume of approximately 2,250 m3.
The mine water management pond is contained by a main dike situated at the south end of the facility and a north saddle dike located at the north-west flank. Both structures are comprised of waste rock with slopes graded at 2.0H:1V. The upstream slopes are lined with 60 mil HDPE, which are keyed into a low permeable till foundation. The main dike and north saddle dike are approximately 180 m and 120 m in length, respectively and have a maximum height of approximately 7 m and 3.5 m, respectively. The storage volume of the mine water management pond is approximately 40,000 m3.
15.7.1.2 Seabee Mine
The East Lake water treatment plant and associated settling ponds 1 and 2 are used to treat and settle the supernatant water from the East Lake TMF and Triangle Lake TMF. Supernatant is transferred from the Back Pond at the East Lake TMF to the water treatment plant where it is initially treated with lime, ferric sulfate, and peroxide. Subsequently, the treated water is discharged to settling pond 1, which overflows to settling pond 2. From here the treated water is pumped to East Pond where it is monitored prior to the final discharge to the environment. Settling ponds 1 and 2 have a perimeter of approximately 190 m and 100 m, respectively, and a depth of 2.5 m and 6 m, respectively. The ponds are lined with 60 mil HDPE and have a combined storage capacity of approximately 13,000 m3. Approximately 80,000–100,000 m3 are treated and discharged to the environment annually, which correlates to a treatment rate of approximately 835 m3 per day, based on a four-month treatment period.
As previously stated, a water treatment plant was constructed in 2017. The water treatment plant has capacity to treat up to 3,400 m3 per day, removing cyanide, ammonia, and copper from the TMF supernatant. In general, the treatment process consists of a pre-treatment step for removal of copper and cyanide followed by a moving bed bioreactor unit for removal of ammonia.
21014Seabee21TRS220916A.docx Page 105 of 153
16 MARKET STUDIES
16.1 Marketing and Metal Prices
The metal prices used in this Seabee21TRS are based on an SSR internal assessment of recent market prices, long-term forward curve prices, and consensus amongst analysts regarding price estimates. The metal prices selected for the Seabee Gold Operation (SGO), have taken into account the current project life. For the economic analysis in the Seabee21TRS, the metal prices shown in Table 16.1 were used.
Table 16.1 Seabee21TRS Economic Analysis Gold Price Assumptions
| | | | | | | | | | | | | | | | | | | | |
| Commodity | Unit | 2022 | 2023 | 2024 | 2025 | Long- Term |
| Gold | $/oz | 1,800 | 1,740 | 1,710 | 1,670 | 1,600 |
SGO currently produces doré bars. The doré refining terms are typical and consistent with standard industry practices and similar to contracts for the refining of doré elsewhere.
The doré is transported by secure freight to a refinery, refined into gold bullion and sold by SSR to banks that specialise in the purchase and sale of gold bullion.
No external consultants or market studies were directly relied on to assist with the sales terms and commodity price projections used in the Seabee21TRS. The QP for this Section 16 agrees with the assumptions and projections presented.
16.2 Contracts
There are a number of acceptable refineries with capacity to refine doré. Currently, SSR is in a non-exclusive contractual relationship with Asahi Refining Canada Ltd. (Asahi). The terms of this contract with Asahi are within industry norms. The cost for transport and refining of the doré is in accordance with industry standards.
16.3 QP Opinion
Data and assumptions for macroeconomic trends, taxes, royalties, interest rates, marketing information and plans, legal matters such as statutory and regulatory interpretations affecting the mine plan, and environmental matters are outside the expertise of the QP and are within the control of the registrant (see Section 25).
The Seabee21TRS QP considers it reasonable to rely on SSR because SSR employs professionals and other personnel with responsibility in these areas and these personnel have the best understanding of these areas.
Additionally, the project has been in operation for a number of years, and following a review of the current supplied information, the opinion of the QP is the current plans and input parameters appear adequate for use as inputs to the Seabee21TRS.
21014Seabee21TRS220916A.docx Page 106 of 153
17 ENVIRONMENTAL STUDIES, PERMITTING, AND PLANS, NEGOTIATIONS, OR AGREEMENTS WITH LOCAL INDIVIDUALS OR GROUPS
17.1 Regulatory Setting
The environmental assessment and permitting framework for mining in Canada is well established. Proposed projects are screened both federally and provincially to determine whether an environmental assessment under federal, provincial, or both levels of legislation is required. Following the assessment decision, the project advances to a licensing and permitting phase.
In the event the project’s environmental assessment is successful and all necessary licences and permits are granted, the project is then regulated through all phases (construction, operation, closure, and post closure) by both federal and provincial departments and agencies.
17.2 Federal Environmental Assessment Process
In the spring of 2012, the Canadian Environmental Assessment Act (1992) was amended and replaced by the Canadian Environmental Assessment Act (2012) (CEAA 2012). Two significant results of this amendment were the re-definition of what triggers a federal environmental assessment and the introduction of legislated time periods within a federal environmental assessment, if required.
Under CEAA 2012, an environmental assessment focuses on potential adverse environmental effects that are within federal jurisdiction including:
•Fish and fish habitat.
•Other aquatic species.
•Migratory birds.
•Federal lands.
•Effects that cross provincial or international boundaries.
•Effects that impact on aboriginal peoples, such as their use of lands and resources for traditional purposes.
•Changes to the environment that are directly linked to or necessarily incidental to any federal decisions about a project.
Under the CEAA 2012, there are two main scenarios in which a federal environmental assessment could be required:
1. A proposed project will require an environmental assessment if the project is described in the Regulations Designating Physical Activities, CEAA 2012.
2. Section 14(2) of CEAA 2012 allows the federal Minister of Environment to (by order) designate a physical activity that is not prescribed by regulation if, in the Minister’s opinion, either the carrying out of that physical activity may cause adverse environmental effects or public concerns related to those effects may warrant the designation.
21014Seabee21TRS220916A.docx Page 107 of 153
17.3 Provincial Environmental Assessment Process
The provincial environmental assessment process begins with the submission of a technical proposal to the Saskatchewan Environmental Assessment Branch (EAB) of the Ministry of Environment (MOE) to determine if the project is considered a ‘development’. The MOE will coordinate an inter-ministry review of the technical proposal and the environmental impact statement using a standing panel of representatives from provincial departments and agencies, which is known as the Saskatchewan Environmental Assessment Review Panel (SEARP).
The Saskatchewan Environmental Assessment Act (SEAA 2013) states:
A ‘development’ means any project, operation or activity or any alteration or expansion of any project, operation, or activity, which is likely to:
•have an effect on any unique, rare, or endangered feature of the environment;
•substantially utilise any provincial resource and in so doing pre-empt the use, or potential use, of that resource for any other purpose;
•cause the emission of any pollutants or create by-products, residual or waste products which require handling and disposal in a manner that is not regulated by another act or regulation;
•cause widespread public concern because of potential environmental changes;
•involve a new technology that is concerned with resource utilisation and that may induce significant environmental change; or
•have a significant effect on the environment or necessitate a further development which is likely to have a significant effect on the environment.
17.4 SGO Environmental Assessments
The SGO has been in production since 1991. As part of the initial environmental assessment, approvals and the subsequent expansions at the operation, the existing environment was characterised in three environmental assessments, in accordance with the SEAA 2013. The initial environmental assessment focused on the original Seabee mine and mill and was completed in 1990 (Beak, 1990). The second environmental assessment was necessary to assess the potential environmental impacts associated with the construction and operation of the Triangle Lake TMF and was completed in 2001 (KHS, 2001). The third environmental assessment was necessary to assess the potential environmental impacts associated with the development of the Santoy mine and was completed in 2009 (Golder 2009). For each of these assessments, baseline data was collected, and the potential environmental impacts associated with the proposed project were assessed. In all three environmental assessments, no significant potential environmental impacts were identified that could not be mitigated through the implementation of management plans. Subsequently, Ministerial Approvals to proceed to construction and operation were granted for each of the three environmental assessments.
The Triangle Lake TMF, as well as the Santoy mine projects, were screened by the Canadian Environmental Assessment Agency in 2001 and 2009, respectively. The SGO has never required a federal environmental assessment.
21014Seabee21TRS220916A.docx Page 108 of 153
17.5 Environmental Permits/Authorisations
Following a successful environmental assessment, the SGO is required to obtain a number of federal and provincial permits / approvals / licences. These permits outline the environmental operating specifications and reporting requirements of the operation. Although all regulatory permits and approvals carry the same level of importance, the Provincial Approval to Operate (PO) is the primary regulatory approval required to operate a gold mine in Saskatchewan. The PO is issued in accordance with numerous provincial legislation and regulations governing Saskatchewan’s mining industry.
Since its inception, the SGO has operated under the terms and conditions of a PO, issued by the MOE. As discussed in Section 3.6, the operation’s current Approval to Operate number PO19-193, was issued in October 2019 and expires in September 2022. This approval outlines all monitoring and reporting requirements for all operations, including:
•Surface and groundwater in immediate and surrounding areas
•Sediment quality of surrounding lakes
•Aquatic biota in surrounding lakes
•Facilities and areas requiring daily, weekly, and monthly inspections
•Regular acid rock drainage/metal leaching testing
•Annual geotechnical inspection by a Professional Geotechnical Engineer
•Development and regular updates to a variety of management plans
The SGO is in compliance with the terms and conditions of this approval.
17.6 Environmental Considerations
Additional environmental baseline information was gathered to augment the existing environmental baseline database. These completed studies included:
•Heritage Resource Impact Assessment (CanNorth, 2016a)
•Vegetation Inventory Study (CanNorth, 2016b)
•Seabee Mine Quarry Rock ML/ARD Assessment (SRK, 2016a)
Following the completion of the above studies and the integration of those results with the existing baseline database developed for the operation as a result of its three previous environmental assessments, a self-screening of the proposed quarry was completed. The quarry project did not require a formal environmental assessment and the quarry has been established to provide waste rock for TMF expansions and other site projects.
Solid non-hazardous waste generated at the site is disposed of in the approved landfill. In accordance with the SGO’s Approval to Operate, hazardous wastes are stored in approved facilities at the site until the winter, when these materials are transported off site for disposal at approved hazardous waste disposal facilities. In addition, recyclable materials such as scrap metal are stored in segregated piles on an approved lay down area, and later transferred off site as backhaul material on emptied supply trucks via the winter road.
Sodium cyanide, ferric sulfate, lime, hydrogen peroxide, diesel, gasoline, propane, and all other consumables are transported to the site via truck over the winter road, which is generally operational from the end of January through to the end of March each year. All consumables are transported to the site in accordance with the Transport Canada Transportation of Dangerous Goods Regulations and stored in approved bulk storage facilities in accordance with the SGO’s Approval to Operate and Saskatchewan’s Hazardous Substances and Waste Dangerous Goods Regulations.
21014Seabee21TRS220916A.docx Page 109 of 153
SSR has characterised mine rock and tailings for the potential of acid rock drainage/metal leaching at the SGO since 2012. The results of these analyses are reported to the MOE as part of the operation’s annual reporting commitments. Similar programmes will be refined and periodically carried out as operations continue. To date, the findings indicate that the mine rock is non-acid generating. All ores mined at the SGO have a low sulfide content, which is consistent with most vein hosted gold deposits. The current data set shows the Santoy ores carry a lower sulfide content than the ores of the now-ceased Seabee mine. From a geochemical perspective, this means the tailings with the higher sulfur content are located in the lower elevations of the tailings facilities, which are typically saturated or partially saturated. These tailings are then covered stratigraphically by the Santoy tailings through continued operation. The Santoy tailings display the lowest sulfur content (less than 1%) and an equivalent balance of carbonate content, meaning that the residual sulfur content after the carbonate is consumed in the neutralisation process, would not likely support acidic drainage from the upper-most layers of tailings in both facilities. Thus, tailings found in the unsaturated zones of the facilities that will be more readily oxidised are the most geochemically stable tailings. Following 25 years of operation, the site continues to display no evidence of acid drainage.
The geochemical characterisation to date, combined with the tailings operational plan, which ensures that at closure, the unsaturated zone consists of low sulfur bearings tailings, supports the current closure plans for these facilities.
There are no known environmental concerns at the SGO that cannot be successfully mitigated through the implementation of the various approved management plans that have been developed based on accepted scientific and engineering practices.
17.7 Mine Closure
In accordance with Saskatchewan’s Mineral Industry Environmental Protection Regulations (1996), the SGO has, since 1996, submitted to the MOE a decommissioning and reclamation plan (closure plan) and cost estimate to implement this plan every five years or when required by the Ministry. In accordance with these regulations and the site’s Approval to Operate, this closure plan is required to be revised and submitted for review and approval at least every five years or as requested by the MOE. The most recent closure plan (SGO Preliminary Decommissioning and Reclamation Plan, 2016 Update) was submitted in January 2017 and accepted by the Government of Saskatchewan in July 2020.
The closure plan meets the following objectives:
•Complies with previous environmental assessment and existing commitments as outlined in the SGO’s Approval to Operate.
•Meets the MOE’s final mine closure objectives as outlined in the Guidelines for Northern Mine Decommissioning and Reclamation (SMOE 2008), specifically:
•Leaves all disturbed areas safe for traditional land uses and in an ecological condition that is consistent with the surrounding physical and biological environment.
•Leaves the site in a state that requires minimal or no maintenance.
•Eliminates potential short and long-term health, safety and environmental risks associated with any aspect of the site.
•Ensures long term physical stability of all landforms and containment structures, in accordance with the Canadian Dam Association Guidelines.
The total estimated cost to implement the closure plan through an independent contractor is approximately C$12M.
21014Seabee21TRS220916A.docx Page 110 of 153
SSR, in accordance with the Mineral Industry Environmental Protection Regulations, is responsible to post financial assurance equalling the closure cost estimate with the Government of Saskatchewan. An update to the closure estimate is currently underway, to cover the approved expanded TMF.
In accordance with the EAB guidance, effluent discharges from the site during the implementation of closure activities will meet Saskatchewan Effluent Quality Limits. Final decommissioning and reclamation water quality objectives for the site, which are determined jointly by the operator and the MOE, will be met at the site prior to the Ministry’s acceptance of the property into its Institutional Control Program. The previously approved closure plan and its current reiteration, which is under final review, assume these final water quality objectives will meet Saskatchewan Environmental Quality Standards for Surface Water guidelines which are more stringent than Saskatchewan’s Effluent Quality Limits.
The total estimated cost to implement the closure plan (under existing site conditions as of December 2020) through an independent contractor is approximately C$12M. The closure cost estimate allows for the full life cycle of mine closure, which includes the following three phases: 1) a decommissioning and reclamation phase to complete the closure activities; 2) a transitional phase to allow for the monitoring of all decommissioning and reclamation activities, ensuring that all closure criteria have been met; and 3) an institutional control phase. Saskatchewan’s Institutional Control Programme requires funds to be set aside for maintenance and monitoring during a 70-year period and requires additional funds to manage the maintenance that may occur as a result of unforeseen events. SSR, in accordance with the Mineral Industry Environmental Protection Regulations, is responsible to post financial assurance equalling the closure cost estimate with the Government of Saskatchewan, covering the three phases of mine closure.
The proposed closure activities for the main components of the SGO, as described in the SGO Preliminary Decommissioning and Reclamation Plan, 2016 Update are summarised below.
17.7.1.1 Mill, Headframe and Supporting Infrastructure
All infrastructures will go through a systematic process of decontamination of potentially hazardous wastes. All assets will be removed and staged on site for transport off site. The remaining structures will be demolished with the use of heavy equipment and recyclable metal will be segregated and stored for transport off site. The soils, if present under and around the foundations, will be characterised for potential contamination of hydrocarbons or metals. If contamination is identified the extent will be delineated and removed for disposal or onsite remediation in accordance with the applicable regulations. All non-recyclable demolition debris will be buried or disposed of in a designated area on site.
17.7.1.2 Tailings Management Facilities and Water Treatment Sludge
Each TMF will be decommissioned and reclaimed using a dry cover, graded towards a spillway, located at the south end of each of the tailings facilities. A 0.3 m cover of erosion-resistant mine rock will be placed on the tailings to form the final cover. This rock cover will mimic the grading of the underlying tailings and eliminate the migration of windblown tailings from the facilities. Dams are constructed of erosion-resistant rock fill and no further closure activities are proposed. The dams are designed and operated in accordance with the guidelines of the Canadian Dam Association, which are reviewed and approved by the MOE. All closure activities associated with the containment structures will comply with the guidelines of the Canadian Dam Association (CDA, 2013).
The plan and costing allows for water treatment to occur until such time as the quality of any remaining ponded water meets site specific water quality objectives.
21014Seabee21TRS220916A.docx Page 111 of 153
Water treatment sludges at the mine are relatively small in volume. Following the decommissioning and reclamation of the water treatment plant, the sludges will be covered in place with a till cover or a combination of a liner / till / sand / mine rock cover.
17.7.1.3 Mine Rock and Ore Stockpiles
No mine rock associated with the SGO is characterised as potentially acid generating, and therefore the closure objective is to ensure long-term physical stability of the piles. The largest single source of mine rock in a central location forms the foundation of the airstrip. All of this material will be used as the construction material for the tailings facility covers. A portion of the remaining mine rock will be used as cover material for the clean demolition debris and backfill material for the existing portals and mine openings, where appropriate. Any remaining mine rock not used as construction material in the decommissioning and reclamation activities, will be contoured to a 3:1 slope and allowed to naturally revegetate.
Prior to the completion of operations, all ore stockpiles will be processed.
17.7.1.4 Contaminated Soils
In the event hydrocarbon contaminated material is identified, the material will be excavated and land farmed in a designated area. Any liquid product produced from the land farm will be transferred into drums and sent offsite for disposal in a licenced facility or used in the waste oil burner.
Due to the low sulfide nature of the orebody, and the clean characterisation of the mine rock, soils containing metals that exceed Canadian Council of Ministers of the Environment Canadian Environmental Quality Guidelines are not expected to be encountered; however, should they be, the material will be hauled to and disposed of within the tailings facility.
17.7.1.5 Non-Hazardous Waste Landfill
The current operating procedures for the landfill call for progressive reclamation. Following placement of refuse, it is covered with mine rock. At closure, all slopes of the covered landfill will be contoured to a minimum of a 3:1 slope.
17.7.1.6 Water Treatment Plants
The Santoy mine will be allowed to flood naturally following operations, and therefore the Santoy water treatment plant will be decommissioned. Its components will be either transported off site as assets or disposed of on site as non-hazardous waste.
The East Lake water treatment plants will remain operational throughout the decommissioning and reclamation activities until such time as further water treatment is not required. Following the need for water treatment, the plants will be dismantled and removed from site.
17.7.1.7 Mines
Following completion of production, all rolling stock will be removed from the underground, stored at the staging area, and prepared for transportation off site for either resale or salvage. The underground workings will be inspected and all hazardous wastes and dangerous goods will be transferred to the surface and ultimately off site for disposal at an approved facility. Following this recovery of assets and decontamination, the mines will be allowed to flood naturally.
21014Seabee21TRS220916A.docx Page 112 of 153
There are 12 vertical to sub-vertical vent raises and one shaft associated with the SGO . Each of these openings will also be fitted with an engineered concrete reinforced cap keyed into bedrock, in accordance with accepted industry practices. The sub-horizontal openings (five portals) will be backfilled with approximately 15 m of waste rock. The waste rock will be extended past the portal entrance and will be contoured to a slope of 3:1.
A final evaluation of all crown pillars will be completed as part of the engineering of the final closure plan. Crown pillars determined to pose a higher risk of failure will be collapsed as part of the decommissioning process. There are currently 17 crown pillars that do not pose a long-term risk of failure, and six crown pillars, which may require collapse and backfilling as part of the decommissioning and reclamation activities.
17.7.1.8 Miscellaneous Infrastructure
All roads, parking areas, lay down areas, settling ponds, winter road portages, and footprint of the air strip will be scarified to support revegetation following the removal of all culverts, power lines, pipelines, and other miscellaneous infrastructure. This infrastructure will be disposed of as part of the major infrastructure decommissioning and reclamation plan.
17.7.1.9 Revegetation
The site will be revegetated in accordance with MOE’s Guidelines for Northern Mine Decommissioning and Reclamation through a combination of natural and active revegetation.
17.8 Social and Community Impact
The SGO is within the Treaty 10 area and borders the Pelican Narrows and Brabant Lake community areas of influence (SMOE 2003). These communities were consulted during the completion of previous environmental assessments in support of the project throughout its operating history. The socio-economic study area for the Santoy mine environmental impact statement (the most recent environmental assessment completed in 2009) included La Ronge, Air Ronge, Kitsakie IR 156B, Lac La Ronge IR 156, Nemeiben River IR 156C, Stanley Mission IR 157, Grandmother’s Bay IR 219, Brabant Lake, Pelican Narrows IR 184B, Pelican Narrows, Sandy Lake, Southend IR 200, and Deschambault Lake IR 203.
In accordance with the terms and conditions of the operation’s Surface Lease Agreement, continual effort has been made at the SGO to engage the nearby communities in order to maximise northern employment opportunities as well as the local purchase of goods and services to support the mine. As of the end of 2021, approximately 19% of the nearly 360 employees at the SGO are northern Saskatchewan residents. The operation continues to honour its social commitments outlined in the project’s surface lease agreement.
Since SSR’s purchase of the SGO, a concerted effort has been made to maintain and strengthen the relationship with the surrounding communities, including the Lac La Ronge Indian Band and the Peter Ballantyne Cree Nation.
In addition, stakeholder engagement plans have been developed to support the proposed quarry. Engagement activities defined in these plans are currently underway.
17.9 Safety
The management of safety and health at the SGO reflects the effective management of risk. The mine’s safety and health strategy is two-fold: to ensure full compliance with the Saskatchewan Mine Act regulations; and to minimise residual risk in relation to regulatory compliance through a risk-centred safety and health management system.
21014Seabee21TRS220916A.docx Page 113 of 153
SGO is committed to continuous improvement in all functions and especially in Safety Health and Environment. In 2021, SGO more than halved its TRIFR (Total Recordable Injury Frequency Rate – per million work hours) from 23.0 in 2020 to 10.8 in 2021. SGO has set a target to halve the TRIFR again in 2022.
Mining-related hazards are inventoried and characterised in terms of their risk, i.e., development of a comprehensive risk registry. Controls, in the form of appropriate engineering and mine design, fixed and mobile equipment optimisation, work processes, training and competency verification, and others, are implemented in relation to risks with proportional emphasis on catastrophic risk. Special emphasis is given to risks such as geotechnical, mine design and operational risk.
In addition to the central risk management framework, the mine employs a wide variety of policies, processes and procedures that populate the safety and health management system including, but not limited to, safety committees, daily workplace audits, safety communication, proper use of protective equipment, job hazard analysis and standard operating equipment, contractor management, a focus on behaviour modification and human error, and incident investigation and root cause analysis, among others.
In instances where changes to risk management practices occur as a result of changes to mine equipment, practices, geotechnical information as well as other change criteria, the mine undertakes a change management review to ensure that those changes do not result in an increase in potential risk. Where change does result in additional risk, relevant control measures are modified.
While the SGO’s approach to risk management is primarily focused on the prevention of incidents, and has substantially reduced safety incidents, the operation also maintains a properly staffed, trained, and provisioned mine rescue team that is prepared to address any foreseeable emergency that might occur underground or on surface. Dedication, and diligent preparation and training have resulted in provincial recognition for the mine’s rescue team and system.
SGO’s safety and health management system, like all effective management systems, undergoes review of continuous improvement involving performance metrics and other training and leading key performance indicators. However, SSR also recognises that the system is only as effective as the organisational culture and the degree to which the system is adopted by its members as common practice. Accordingly, there is also recognition that the behaviour of leaders at the mine has a substantial impact on the mine’s operational culture. As such, the mine emphasises culture assessment and enhancement through leadership development.
17.10 QP Opinion
Legal matters such as statutory and regulatory interpretations affecting the mine plan and environmental matters are outside the expertise of the QP and are within the control of the registrant (see Section 25).
Following a review of the information supplied, the opinion of the QPs is that it is reasonable to rely on the information provided by SSR as outlined above for use in the Seabee21TRS because a significant environmental and social analysis has been conducted for the project over an extended period, the project has been in operation for a number of years, SSR employs professionals and other personnel with responsibility in these areas and these personnel have the best understanding of these areas.
21014Seabee21TRS220916A.docx Page 114 of 153
18 CAPITAL AND OPERATING COSTS
This section summarises the costs used by the QPs to validate the economics of the Mineral Reserve estimate for the SGO. The cost estimate was prepared by the SSR technical department at both the SGO site and Saskatoon office. The QPs reviewed the assumptions, parameters, and methods used to prepare the cost estimate and is of the opinion that they are sufficient for the purposes of validating the economics of the Mineral Reserves.
The cost estimates were completed in C$ and converted to US$ at an exchange rate of C$1.26:US$1.00.
Cash costs and all-in sustaining costs (AISC) per payable ounce of gold sold are non-GAAP financial measures. Please see “Cautionary Note Regarding Forward-Looking Statements” in this Seabee21TRS.
18.1 Capital Costs
The estimated capital costs required to achieve the Mineral Reserve LOM are summarised in Table 18.1. The capital costs were estimated from historical construction costs and equipment purchase prices, actual development costs, as well as results from study work completed by OreWin and third-party consulting firms. Where costs were not available for some minor components, an experience-based allowance was included.
Table 18.2 represents the categorised capital costs estimated as of the beginning of 2022. As the project has been in operation for a number of years, the level of project definition for the capital cost estimate is very high. Given some new capital projects are planned, a contingency of 10% was included for capital costs outside of mine development from 2023 onwards. The QP considers the capital estimate to be in the accuracy range of +/–15%.The sustaining capital costs include:
•Surface infrastructure construction such as upgrades to the camp and kitchen, IT upgrades, and asset integrity costs.
•Mill improvements and replacement of major components.
•TMF construction costs.
•Mobile equipment such as new and replacement purchases and major rebuilds.
Table 18.1 Capital Costs Estimate
| | | | | |
| Cost Component | $M |
| Capital Development | 85 |
| Sustaining Capital | 71 |
| Capital Cost Before Contingency | 156 |
| Contingency | 6 |
| Total Capital Cost | 162 |
21014Seabee21TRS220916A.docx Page 115 of 153
18.2 Operating Costs
The operating costs were estimated based on the actual operating expenditures at the SGO in 2021. The costs were estimated by process / activity with fixed and variable components.
The operating expenses estimated to validate the positive cash flow for the Mineral Reserve LOM are summarised in Table 18.2. The mining expense includes all labour, supplies / consumables, and equipment maintenance to complete mining related processes / activities, less exploration diamond drilling and capital excavations and construction. The milling expense includes all labour and supplies / consumables to complete milling related processes / activities. The administrative expense includes all labour, supplies / consumables, and equipment maintenance to complete administrative, finance, human resources, environmental, safety, supply chain, site services, camp and kitchen, and travel related processes / activities.
As the project has been in operation for a number of years, the level of project definition for the operating cost estimates is very high. Given the available project performance data and the high level of project definition, no contingency was included in the operating cost estimate. The QP considers the operating cost estimate to be in the accuracy range of +/–15%.
Table 18.2 LOM Average Operating Costs Estimate
| | | | | |
| Cost Component | $/t milled |
| Mining | 46 |
| Surface Haulage | 6 |
| Milling (incl. Fixed Plant) | 35 |
| G&A | 68 |
| Total Operating Cost | 155 |
Sum of individual values may not match total due to rounding
The estimated total cash costs for the first two years of production is $538 per payable ounce of gold, with a LOM average of $735. The AISC, which includes infrastructure capital and capital development, is $868 per payable ounce of gold for the first two years of production, with a LOM average of $1,021.
21014Seabee21TRS220916A.docx Page 116 of 153
19 ECONOMIC ANALYSIS
19.1 Economic Assumptions
The modelling and taxation assumptions used in the Seabee21TRS are discussed in detail below.
All monetary figures expressed in this report are in US Dollars ($) unless otherwise stated. The SGO financial model is presented in 2021 constant US dollars, cash flows are assumed to occur evenly during each year and a mid-year discounting approach is taken.
19.1.1 Pricing and Discount Rate Assumptions
The gold prices used for the economic analysis are shown in Table 19.1. Gold provides the only revenue included in the analysis.
Table 19.1 Seabee21TRS Economic Analysis Gold Price Assumptions
| | | | | | | | | | | | | | | | | | | | |
| Commodity | Unit | 2022 | 2023 | 2024 | 2025 | Long- Term |
| Gold | $/oz | 1,800 | 1,740 | 1,710 | 1,670 | 1,600 |
Other key assumptions in the economic modelling relating to product pricing are tabulated in Table 19.2. A discount rate of 5% is used for calculating net present value (NPV).
Table 19.2 Seabee21TRS Key Economic Assumptions
| | | | | | | | |
| Model Assumption | Unit | Value |
| Refinery Charge | $/oz gold | 0.45 |
| Gold Payability | % | 99.5 |
| Tax Rate | % | 25.9 |
The estimates of cash flows have been prepared on a real basis as 1 January 2022 and a mid-year discounting is used to calculate NPV.
In the analysis, carry balances such as tax and working capital calculations are based on nominal dollars and outputs are then deflated for use in the integrated cash flow calculation.
19.1.2 QP Opinion on Inputs
Data and assumptions for macroeconomic trends, taxes, royalties, interest rates, marketing information and plans, legal matters such as statutory and regulatory interpretations affecting the mine plan, and environmental matters are outside the expertise of the QP and are within the control of the registrant (see Section 25).
The Seabee21TRS QP considers it reasonable to rely on SSR because SSR employs professionals and other personnel with responsibility in these areas and these personnel have the best understanding of these areas.
21014Seabee21TRS220916A.docx Page 117 of 153
Additionally, the project has been in operation for a number of years, and following a review of the current supplied information, the opinion of the QP is the current plans and input parameters appear adequate for use as inputs to the Seabee21TRS.
19.2 Overview and Results
The projected financial results include:
•After-tax NPV at a 5% real discount rate is $249M
•Mine life of six years
As SGO is an existing operation with a forecast of positive cash flows, internal rate of return, and payback calculations were not required.
The estimated total cash costs for the first two years of production is $538 per payable ounce of gold, with a LOM average of $735. The AISC, which includes infrastructure capital and capital development, is $868 per payable ounce of gold for the first two years of production, with a LOM average of $1,021.
There are no credits from metals other than gold included in the cash cost.
The key results of the Seabee21TRS are summarised in Table 19.3.
Table 19.3 Seabee21TRS Results Summary
| | | | | | | | | | | |
| Description | Unit | Seabee21TRS |
| Ore Processed | | |
| Ore Tonnes Treated | kt | 2,684 |
| Au Feed Grade | g/t | 6.72 |
| Gold Recovery | % | 98.0 |
| Metal Produced | | |
| Gold | koz | 568 |
| Key Cost Results | | |
| Site Operating Costs | $/t milled | 155 |
| Mine Site Cash Cost | $/oz payable gold | 734 |
| Royalties and Refining | $/oz payable gold | 0.5 |
| Total Cash Costs (CC) | $/oz payable gold | 735 |
| All-in Sustaining Costs (AISC) | $/oz payable gold | 1,021 |
| Average Gold Price | $/oz payable gold | 1,701 |
| NPV | $M | 249 |
| Discount Rate | % | 5 |
| Project Life | years | 6 |
19.2.1 Production and Cost Summary
The process production forecasts are shown in Table 19.4 and forecast ore tonnes mined are shown in Figure 19.1. The processing tonnes and metal production are summarised in Figure 19.2 and Figure 19.3 respectively.
21014Seabee21TRS220916A.docx Page 118 of 153
Table 19.4 Production Statistics
| | | | | | | | | | | | | | |
| Item | Unit | Total LOM | 2-Year Annual Average | LOM Annual Average |
| Ore Processed |
| Ore Tonnes Treated | kt | 2,684 | 424 | 424 |
| Au Feed Grade | g/t | 6.72 | 9.34 | 6.72 |
| Gold Recovery | % | 98.0 | 98.0 | 98.0 |
| Metal Produced |
| Gold | koz | 568 | 125 | 90 |
Figure 19.1 Production Plan Tonnage
OreWin, 2021
21014Seabee21TRS220916A.docx Page 119 of 153
Figure 19.2 Processing Schedule
OreWin, 2021
Figure 19.3 Production Plan Recovered Gold Ounces
OreWin, 2021
21014Seabee21TRS220916A.docx Page 120 of 153
19.2.2 Project Financial Analysis
The estimated Mine Site Cash Cost is shown in Table 19.5. These estimated costs include only direct operating costs of the mine site, namely:
•Mining
•Processing
•Tailings
•General and administrative (G&A) costs
•Government fees and charges (excluding corporate taxation)
The projected financial results include:
•After-tax net present value (NPV) at an 5% real discount rate is $249M.
•Mine life of six years.
Table 19.5 Cash Costs
| | | | | | | | |
| Description | 2-Year Average
($/oz) | LOM Average
($/oz) |
| Mine Site Cash Cost | 538 | 734 |
| Royalties and Refining Charges | 0.5 | 0.5 |
| Total Cash Costs (CC) | 538 | 735 |
| All-in Sustaining Costs (AISC) | 868 | 1,021 |
The estimated revenues and operating costs have been presented in Table 19.6, along with the estimated net sales revenue value attributable to each key period of operation.
The gold prices used for the economic analysis are shown in Table 19.1. Gold provides the only revenue included in the analysis.
The gold price used in this Seabee21TRS is based on an SSR internal assessment of recent market prices, long-term forward curve prices, and consensus amongst analysts regarding price estimates. The gold price selected for SGO have taken into account the current project life.
The estimated total Project direct capital costs are shown in Table 19.7.
21014Seabee21TRS220916A.docx Page 121 of 153
Table 19.6 Operating Costs and Revenues
| | | | | | | | | | | |
| Description | Total
($M) | 2-Year Average
($/t Milled) | LOM Average
($/t Milled) |
| Revenue |
| Gross Sales Revenue | 961 | 518 | 358 |
| Less Realisation Costs |
| Treatment and Refining Charges | 0.3 | 0.1 | 0.1 |
| Total Realisation Costs | 0.3 | 0.1 | 0.1 |
| Net Sales Revenue | 961 | 518 | 358 |
| Less Site Operating Costs |
| Mining | 124 | 49 | 46 |
| Surface Haul | 15 | 6 | 6 |
| Milling (incl. Fixed Plant) | 95 | 35 | 35 |
| G&A | 181 | 68 | 68 |
| Total Operating Costs | 415 | 157 | 155 |
| Operating Margin | 546 | 361 | 204 |
Table 19.7 Total Project Capital Cost
| | | | | |
| Item | Total
($M) |
| Mine Development | 85 |
| Sustaining | 71 |
| Capital Cost Before Contingency | 156 |
| Contingency – 10% | 6 |
| Capital Cost After Contingency | 162 |
Capital includes only direct project costs and does not include non-cash shareholder interest, management payments, foreign exchange gains or losses, foreign exchange movements, tax pre-payments, or exploration phase expenditure.
The projected financial results for undiscounted and discounted cash flows at a range of discount rates are shown in Table 19.8.
21014Seabee21TRS220916A.docx Page 122 of 153
Table 19.8 Financial Results
| | | | | | | | |
| Discount Rate | NPV ($M) |
| Before-Tax | After-Tax |
| Undiscounted | 372 | 274 |
| 2% | 358 | 263 |
| 5% | 338 | 249 |
| 10% | 309 | 228 |
| 12% | 299 | 221 |
| 15% | 285 | 211 |
| 18% | 273 | 201 |
| 20% | 265 | 196 |
The results of NPV sensitivity analysis to a range of changes in gold price and discount rates are shown in Table 19.9. NPV sensitivity analysis for changes to operating and capital costs are shown in Table 19.10. The estimated cumulative cash flow is depicted in Figure 19.4 and a complete cash flow is provided in Table 19.11.
Table 19.9 After-Tax NPV5% Sensitivity to Gold Price and Discount Rates
| | | | | | | | | | | | | | | | | | | | | | | | | | | | | |
| Discount Rate | Gold Price
($/oz) |
| –400 | –300 | –200 | –100 | – | +100 | +200 | +300 | +400 |
| Undiscounted | 106 | 148 | 190 | 232 | 274 | 316 | 358 | 400 | 442 |
| 2% | 104 | 144 | 184 | 224 | 263 | 303 | 343 | 383 | 422 |
| 5% | 101 | 138 | 175 | 212 | 249 | 286 | 323 | 360 | 396 |
| 10% | 96 | 129 | 162 | 195 | 228 | 261 | 294 | 327 | 359 |
| 12% | 94 | 126 | 158 | 189 | 221 | 252 | 284 | 315 | 347 |
Table shows NPV5% $M
Table 19.10 After-Tax NPV5% Sensitivity to Operating and Capital Cost Changes
| | | | | | | | | | | | | | | | | | | | | | | | | | | | | |
| Item | Changes to Cost
(%) |
| –30% | –20% | –10% | –5% | – | +5% | +10% | +20% | +30% |
| Operating Cost | 328 | 302 | 275 | 262 | 249 | 236 | 223 | 196 | 169 |
| Capital Cost | 280 | 269 | 259 | 254 | 249 | 244 | 239 | 230 | 221 |
Table shows NPV5% $M
21014Seabee21TRS220916A.docx Page 123 of 153
Figure 19.4 Cumulative Cash Flow
OreWin, 2021
21014Seabee21TRS220916A.docx Page 124 of 153
Table 19.11 Estimated Cash Flow
| | | | | | | | | | | | | | | | | | | | | | | | | | | | | | | | | | | |
| Description | Unit | Total | 2022 | 2023 | 2024 | 2025 | 2026 | 2027 | 2028 | 2029 | 2030 |
| Total Gross Revenue | $M | 961.4 | 218.8 | 220.4 | 158.8 | 115.1 | 111.6 | 104.9 | 31.7 | – | – |
| Total Realisation Costs | $M | 0.3 | 0.1 | 0.1 | 0.0 | 0.0 | 0.0 | 0.0 | 0.0 | – | – |
| Net Revenue | $M | 961.1 | 218.7 | 220.4 | 158.8 | 115.1 | 111.6 | 104.8 | 31.7 | – | – |
| Site Operating Costs | |
|
|
|
|
|
|
|
|
|
|
| Mining | $M | 123.9 | 20.8 | 20.8 | 20.4 | 19.9 | 19.3 | 17.4 | 5.4 | – | – |
| Milling (incl. Fixed Plant) | $M | 109.8 | 17.3 | 17.4 | 17.4 | 17.4 | 17.4 | 17.4 | 5.7 | – | – |
| G&A | $M | 181.3 | 28.6 | 28.6 | 28.6 | 28.6 | 28.6 | 28.6 | 9.5 | – | – |
| Total Operating Costs | $M | 415.0 | 66.7 | 66.7 | 66.3 | 65.9 | 65.3 | 63.4 | 20.6 | – | – |
| Operating Surplus / (Deficit) | $M | 546.2 | 152.0 | 153.6 | 92.5 | 49.2 | 46.3 | 41.4 | 11.2 | – | – |
| Capital Costs | |
|
|
|
|
|
|
|
|
|
|
| Mine Development | $M | 84.8 | 25.3 | 23.8 | 17.3 | 7.8 | 8.2 | 2.4 | – | – | – |
| Sustaining | $M | 83.0 | 19.8 | 11.9 | 11.1 | 12.6 | 8.4 | 6.2 | 6.8 | 6.0 | – |
| Contingency | $M | 6.1 | – | 1.1 | 1.0 | 1.3 | 0.8 | 0.6 | 0.7 | 0.6 | – |
| Total Capital | $M | 173.8 | 45.1 | 36.9 | 29.4 | 21.6 | 17.4 | 9.3 | 7.5 | 6.6 | – |
| Pre-tax Cash flow | $M | 372.4 | 106.9 | 116.8 | 63.1 | 27.6 | 28.8 | 32.2 | 3.6 | –6.6 | – |
| Tax Payable | $M | 98.3 | 27.7 | 30.3 | 16.3 | 7.1 | 7.5 | 8.3 | 0.9 | – | – |
| After-tax Cash Flow | $M | 274.1 | 79.2 | 86.5 | 46.7 | 20.4 | 21.3 | 23.8 | 2.7 | –6.6 | – |
21014Seabee21TRS220916A.docx Page 125 of 135
20 ADJACENT PROPERTIES
On 2 December 2021, SSR announced the proposed acquisition of Taiga Gold Corp. for $21M (“Taiga”) for C$0.265 per Taiga share, implying an equity value of $21M. The transaction consolidated a 100% interest in the Fisher property contiguous to the SGO, eliminated an existing 2.5% net smelter return (NSR) royalty on the Fisher property, and added five new properties covering 30,480 ha to complement SSR’s existing exploration platform in the underexplored and highly geologically prospective Province of Saskatchewan. The transaction, which is subject to Taiga shareholder approval, court and regulatory approvals, and customary closing conditions, is expected to close in the first half of 2022.
Since optioning the Fisher Property in 2016, SSR has fulfilled all the minimum work and payment requirements to trigger the current 80/20 joint venture. During this time, SSR has completed extensive systematic exploration including prospecting, soil geochemical sampling, detailed geological mapping, geophysical surveys and 36,897 m of diamond drilling in 95 holes. SSR expenditure to date on the Fisher property totals more than $11M. In addition, SSR has made cash payments to Taiga and predecessor Eagle Plains Resources of more than $2.9M as outlined in the original option agreement.
The acquisition of Taiga would provide SSR with 100% ownership of the Fisher property (33,171 ha) as well as an additional five new properties (34,569 ha) providing new exploration targets south from the SGO to SSR’s 100%-owned Amisk property (Figure 20.1). The deal would also unencumber the Fisher property through the elimination of a 2.5% NSR royalty covering much of the Fisher property.
Based on the technical work completed to-date, the Fisher property appears integral to the future life of mine plan at the SGO. Drilling completed over the past four years indicates strong exploration potential across the Fisher property with several large target areas yet to be tested. Initial due-diligence work completed for the additional five properties also indicates high exploration potential evidenced by excellent historical results that have yet to be properly tested using modern exploration techniques in a robust gold-price environment.
21014Seabee21TRS220916A.docx Page 126 of 135
Figure 20.1 Location of the Six Properties included in the Taiga Gold Transaction with Respect to the Seabee Gold Operation
SSR, 2022
21014Seabee21TRS220916A.docx Page 127 of 135
21 OTHER RELEVANT DATA AND INFORMATION
There is no other relevant data or information.
21014Seabee21TRS220916A.docx Page 128 of 135
22 INTERPRETATION AND CONCLUSIONS
Data and assumptions for macroeconomic trends, taxes, royalties, interest rates, marketing information and plans, legal matters such as statutory and regulatory interpretations affecting the mine plan, and environmental matters are outside the expertise of the QP and are within the control of the registrant (see Section 25).
Following a review of the information supplied, the opinion of the QPs is that it is reasonable to rely on the information provided by SSR as outlined above for use in the Seabee21TRS because a significant environmental and social analysis has been conducted for the project over an extended period, the project has been in operation for a number of years, SSR employs professionals and other personnel with responsibility in these areas and these personnel have the best understanding of these areas.
22.1 Mineral Resources
Mineral Resources in the Seabee21TRS are reported in accordance with subpart 1300 of US Regulation S-K Mining Property Disclosure Rules (S-K 1300).
Areas of uncertainty that may materially impact the Mineral Resource estimates include:
•Assumptions used to generate the data for consideration of reasonable prospects of eventual economic extraction.
•Gap Hangingwall (GHW) mining recovery could be lower, and dilution increased. Early stoping in GHW should be used to confirm mining method parameters for the GHW zone in terms of costs, dilution, and mining recovery. Early development will also provide access to data and metallurgical samples at a bulk scale that cannot be collected at the scale of a drill sample.
•Commodity prices and exchange rates.
•Cut-off grades.
22.2 Mineral Reserves Estimation
Mineral Reserves in the Seabee21TRS are reported in accordance with subpart 1300 of US Regulation S-K Mining Property Disclosure Rules (S-K 1300).
Areas of uncertainty that may impact the Mineral Reserve estimate include:
•Any changes to the resource model as a result of further definition drilling at the site.
•Changes to mining conditions that have an impact to operating costs, production rates or mining recovery factors.
•Commodity prices and exchange rates.
21014Seabee21TRS220916A.docx Page 129 of 135
23 RECOMMENDATIONS
The QPs are not aware of any significant risks and uncertainties that could be expected to affect the reliability or confidence in the information discussed herein.
23.1 Further Assessment
The key areas for further studies / work are:
•Ongoing drilling to expand the Mineral Resource aimed to increase mine life and grade in years 2024 and beyond, as SGO has managed to do for many years.
•Ongoing geotechnical drilling and logging will be required to increase the confidence in geotechnical data as the project develops.
•Ongoing geotechnical mapping should take place at regular intervals in the planned developments to verify the rock mass conditions determined and to assess the rock mass quality where there is currently little information. This will also allow for the identification of localised weak zones and potentially unstable wedges which should be appropriately supported.
•While the structural analysis provides an impression of the major joint sets across the project area, further geotechnical scanline mapping should be conducted regularly as mining commences to allow for the identification of low angle joints in the hanging wall, localised joint sets and for potential wedges and instabilities.
•Update the Santoy geotechnical model to include the expanded GHW mining zone.
•Early stoping in GHW should be used to confirm mining method parameters for the GHW zone in terms of costs, dilution, and mining recovery. Early development will also provide access to data and metallurgical samples at a bulk scale that cannot be collected at the scale of a drill sample.
•Update site standard operating procedures to include a more transparent Mineral Resource and Mineral Reserve process, clearly documenting the key input parameters applied, and an audit trail of approvals for each phase of the work performed.
•Implementation of Operational Excellence projects identified based on SSR’s recent operational review may present incremental improvements to production and operating costs.
•Continue with ongoing review of capital and operating cost estimates and performance and productivity tracking.
21014Seabee21TRS220916A.docx Page 130 of 135
24 REFERENCES
Ash, C. and Alldrick, D., 1996. Au-quartz Veins; in Lefebure, D.V. and Hõy, T. (eds.) Selected British Columbia Mineral Deposit Profiles Volume 2 – Metallic Deposits, British Columbia Ministry of Employment and Investment, Open File 1996-13, pp. 57–58.
Beak Associates Consulting Ltd., 1990. Seabee Project: Environmental Impact Statement. Prepared for Claude Resources Inc.
Bell, K. and Macdonald, R., 1982. Geochronological Calibration of the Precambrian Shield in Saskatchewan; in Summary of Investigations. Saskatchewan Geological Survey, Saskatchewan Energy and mines Miscellaneous Report 82-4, pp. 17–22.
Bickford, M.E., Collerson, K.D., Lewry, J.F., Van Schmus, W.R., and Chiarenzelli, J.R., 1990. Proterozoic Collisional Tectonism in the Trans-Hudson Orogen, Saskatchewan; Geology, v. 18, pp. 17–22.
CanNorth Environmental Services, 2016a. Silver Standard Resources Inc. Seabee Gold Operations Tailings Management Facility Expansion and Rock Quarry Heritage Resources Impact Assessment.
CanNorth Environmental Services, 2016b. Vegetation Inventory Studies for the Silver Standard Seabee Gold Operations’ Triangle Lake Tailings Management Facility Expansion.
Chauvel, C., Arndt, N.T., Kielinzcuk, S., and Thom, A. 1987. Formation of Canadian 1.9 Gold Continental Crust. I: Nd Isotopic Data; Canadian Journal of Earth Science, v. 24, pp. 14–18.
Chiarenzelli, J.R., Lewry, J.F., and Landon, M., 1987. Bedrock Geology, Iskwatikan Lake Area: Evidence for Hudsonian Juxtaposition of Proterozoic and Archean Rocks along a Ductile Detachment Surface; In Summary of Investigations 1987, Saskatchewan Geological Survey, Saskatchewan Energy and Mines, Miscellaneous Report 87-4, pp. 46–51.
Corrigan, D., Galley, A.G., Pehrsson, S., 2007. Tectonic evolution and metallogeny of the southwestern Trans-Hudson Orogen; in Goodfellow, W.D. (ed.), Mineral Deposits of Canada: A Synthesis of Major Deposit-Types, District Metallogeny, the Evolution of Geological Provinces, and Exploration Methods: Geological Association of Canada, Mineral Deposit Division, Special Publication No. 5, pp. 881–902.
Claude Resources Inc., 2013. Mineral Resource and Mineral Reserve Estimate Seabee Gold Operation Saskatchewan, Canada; 2012 Year End NI 43-101 Technical Report.
Craig, L., 1989. Geology of the Pelican Narrows Area of East Central Saskatchewan; Unpublished Ph.D. thesis, University of Saskatchewan.
Delaney, G.D., 1992. Gold in the Glennie Domain; Saskatchewan Energy and Mines, Miscellaneous report 92-5, 71 pp.
Goldak Airborne Surveys., 2007. Technical Report on a Fixed Wing Gradiometer Survey, Seabee Block Central Saskatchewan; Internal report prepared for Claude Resources Inc.
Golder Associates Ltd., 2009. Environmental Impact Statement for the Proposed Santoy 8 Satellite Mine at Seabee Gold Mine, Saskatchewan.
Herget, G., 1988. Stresses in rock. Rotterdam: Balkema.
KHS Environmental Management Group Ltd., 2001. Seabee Mine Tailings Management Facility Expansion Environmental Impact Statement.
21014Seabee21TRS220916A.docx Page 131 of 135
KHS Environmental Management Group Ltd, 2001. Seabee Mine, Tailings Management Facility Expansion – EIS SGO-1700, December 2001.
Konst, R., 2016a. Project Clydesdale Analytical Precision. Internal report prepared for Silver Standard Resources Inc.
Konst, R. 2016b. Project Clydesdale Screen Fire Assays. Internal report prepared for Silver Standard Resources Inc.
Konst, R., 2016c. Seabee Mine Site Drilling and Assay Audit; Internal report prepared for Silver Standard Resources Inc.
Konst, R., 2016d. Seabee Exploration Program 2016 Sampling, Preparation, and Analytical Quality Assurance. Internal report prepared for Silver Standard Resources Inc.
Konst, R., 2017. Seabee Mine Analytical Precision; Internal report prepared for Silver Standard Resources Inc.
Lewry, J.F., Sibbald, T.I.I., 1977. Variation in Lithology and Tectonometamorphic Relationships in the Precambrian Basement of Northern Saskatchewan; Canadian Journal of Earth Sciences, v. 14, pp. 1453–1467.
Lewry, J.F., Thomas, D.J., Macdonald, R., and Chiarenzelli, J., 1990. Structural relations in accreted terranes of the Trans-Hudson Orogen, Saskatchewan: telescoping in a collisional regime?; in Lewry, J.F. and Stauffer, M.R. (eds.), The Early Proterozoic Trans-Hudson Orogen of North America, Geological Association of Canada, Special Paper 37, pp. 75–94.
Macdonald, R., 1987. Update on the Precambrian Geology and Domainal Classification of Northern Saskatchewan; in Summary of Investigations. Saskatchewan Geological Survey, Saskatchewan Energy and Mines, Miscellaneous Report 87-4, pp. 87–104.
Ministry of Environment, 2020. Acceptance of Decommissioning and Reclamation Plan and Update to Financial Assurance, Letter from Government of Saskatchewan Ministry of Environment, 2 July 2020.
NewFields, 2019. Independent Technical Review Seabee Mine – Triangle Lake TMF Expansion, Northern Saskatchewan No. 680.0002.000, January 2019.
North Rock Mining Solutions, 2018. Santoy Mine – 2018 Ramp Inspection and Related Mining Geotechnics, November 2018.
North Rock Mining Solutions, 2020. Q4 Mining-Geotechnical Site Visit Summary Notes, September 2020.
Pakalnis & Associates, 2017. Report on site visit – Santoy mine, Seabee gold operation silver standard SGM-01/17, June 2017.
Precision GeoSurveys Inc., 2016. Airborne Geophysical Survey Report, Seabee Block; Internal report prepared for Silver Standard Resources Inc.
Quantec Geoscience Ltd., 2013. Titan-24 DC/IP and MT Survey Geophysical Report (Santoy Gap), Seabee Gold Project, La Ronge, Saskatchewan, Canada; Internal report prepared for Claude Resources Inc.
Silver Standard Resources Inc., 2017a. Silver Standard Seabee Gold Operations 2017 Life of Mine Plan.
Silver Standard Resources Inc., 2017b. Silver Standard Annual Information Form.
21014Seabee21TRS220916A.docx Page 132 of 135
SGO Mining Inc., 2021. Seabee Gold Operation, Ground Control Analysis – GHW Mining GCA-20200225, June 2021.
[SMOE] Saskatchewan Ministry of Environment, 2003. Amisk-Atik Integrated Forest Land Use Plan.
[SMOE] Saskatchewan Ministry of Environment, 2008. Guidelines for northern mine decommissioning and reclamation, version 6. Saskatchewan Ministry of Environment, Industrial, Uranium and Hardrock Mining Unit, EPB 381.
[SMOE] Saskatchewan Ministry of Environment, 2010. Seabee Surface Lease Agreement.
[SMOE] Saskatchewan Ministry of Environment, 2016. Approval to Operate a Pollutant Control Facilities Approval No. Po16-002.
SRK Consulting (Canada) Inc., 2017. Seabee Mine, Tailings Alternatives Assessment (Draft) ICC042.006, March 2016
SRK Consulting (Canada) Inc., 2016. Annual Geotechnical, Inspection of Tailings Facilities and Water Management Ponds ICC042.013, March 2017.
SRK Consulting (Canada) Inc., 2018. Triangle Lake TMF Expansion Detailed Design ICC042.025, July 2018.
SRK Consulting (Canada) Inc., 2018 Annual Geotechnical Inspection of Tailings Facilities and Water Management Ponds ICC042.025, July 2018.
SRK Consulting (Canada) Inc., 2018. Triangle Lake and East Lake Tailings Management Facilities – Dam Breach Analysis – DRAFT ICC042.029.500, August 2019.
SRK Consulting (Canada) Inc., 2019. Triangle Lake and East Lake Tailings Management Facilities – Dam Breach Analysis – DRAFT ICC042.029.500, August 2019.
SRK Consulting (Canada) Inc., 2009. Structural Interpretation of Aeromagnetic Data. Seabee Gold Project Saskatchewan, Canada. Internal report prepared for Claude Resources Inc.
SRK Consulting (Canada) Inc., 2016a. Seabee Mine Quarry Rock ML/ARD Assessment. SRK Consulting (Canada) Inc. 2016b. Seabee Mine Tailings Alternatives Assessment. Claude Resources Inc.
SRK Consulting (Canada) Inc., 2020. Seabee Tailings Operation, Maintenance and Surveillance (OSM) Manual.
SRK Consulting (Canada) Inc., 2017b. Seabee Gold Operation Preliminary Decommissioning and Reclamation Plan, 2016 Update – Final.
SRK Consulting (Canada) Inc., 2017. NI 43-101 Technical Report for the Seabee Gold Operation, Saskatchewan, Canada, 5CS010.001, October 2017. (SGOTR17)
SSR Mining Inc., 2021. Seabee Gold Operation, Standards and Guidelines - Ground Control SGO-1700, May 2021.
Stantec Mining, 2015. Geomechanical Overview of Stope and Pillar Stability for the Santoy Gap Orebody Project no. 169514558, March 2015.
Stauffer, M.R., 1984. Manikewan: and early Proterozoic ocean in central Canada, its igneous history and orogenic closure; Precambrian Research, v. 25, pp. 257–281.
21014Seabee21TRS220916A.docx Page 133 of 135
The Mines Regulations, 2003. Chapter 0-1.1 Reg 2 (effective July 16, 2003).
White, D.J., Lucas, S.D., Hajnal, A., Green, A.G., Lewry, J.F., Weber, W., Bailes, A.H., Syme, E.C., and Ashton, K., 1994. Paleo-Proterozoic Thick-Skinned Tectonics: Lithoprobe Seismic Reflection Results from the Eastern Trans-Hudson Orogen; Canadian Journal of Earth Sciences, v. 31, pp. 458–469.
Wood, C.R., 2016. Structural study of the auriferous Santoy shear zone, northeastern Glennie domain, Saskatchewan; Unpublished masters thesis, University of Regina, Regina, Saskatchewan.
21014Seabee21TRS220916A.docx Page 134 of 135
25 RELIANCE ON INFORMATION PROVIDED BY THE REGISTRANT
The Seabee21TRS QPs have relied on the following information provided by SSR in preparing the findings and conclusions in this Technical Report Summary regarding the following aspects of modifying factors:
•Macroeconomic trends, taxes, royalties, data, and assumptions, and interest rates.
•This has been used in Section 19 as described in this section. The QPs have relied exclusively on SSR for this information.
•Marketing information and plans within the control of the registrant.
•This has been used in Sections 16 and 19 as described in those sections
•Legal matters outside the expertise of the qualified person, such as statutory and regulatory interpretations affecting the mine plan.
•Content in Sections 3 and 17 are based exclusively on information and data supplied by SSR. The QPs have relied exclusively on SSR for this information.
•Environmental matters outside the expertise of the qualified person.
•Content in Sections 3 and 17 are based exclusively on information and data supplied by SSR
•Accommodations the registrant commits or plans to provide to local individuals or groups in connection with its mine plans.
•Content in Sections 3 and 17 are based exclusively on information and data supplied by SSR
•Governmental factors outside the expertise of the qualified person.
•Content in Sections 3 and 17 are based exclusively on information and data supplied by SSR
Following a review of the information supplied, the opinion of the QPs is, that it is reasonable to rely on the information provided by SSR as outlined above for use in the Seabee21TRS because a significant environmental and social analysis has been conducted for the project over an extended period, the project has been in operation for a number of years, SSR employs professionals and other personnel with responsibility in these areas and these personnel have the best understanding of these areas.
21014Seabee21TRS220916A.docx Page 135 of 135