Exhibit 96.4
Explanatory Note
SSR Mining Inc. (the “Company”) previously filed the Puna 2021 Technical Report Summary (the “Puna21TRS”), with an effective date of December 31, 2021 and issued on February 23, 2022, as Exhibit 96.4 to its Annual Report on Form 10-K for the year ended December 31, 2021, as amended (the “Form 10-K/A”). The Puna21TRS has been amended to reflect certain revisions in compliance with Subpart 1300 of Regulation S-K, which revisions consist of adding confirmatory statements and other modifications that SSR does not consider material. The amended Puna21TRS has been reissued as of September 29, 2022 and is presented with an effective date of December 31, 2021. The information in this amended Puna21TRS has not been updated to reflect events, information or developments occurring after the effective date.
The Contained Metal amounts for lead and zinc are reported in Table 1.1, Table 1.3, Table 1.5, and Table 11.11 of the Puna21TRS in thousands of pounds (klb) for internal consistency. In the Company’s filings with the Securities and Exchange Commission (the “SEC”), including in its Form 10-K/A, the same information is reported in millions of pounds (Mlb). Any inconsistencies between the amounts reported in the Puna21TRS and the amounts reported in other SEC filings of the Company are generally a result of rounding through the conversion.
The Form 10-K/A reported the inferred contained metal amount of zinc incorrectly on page 37 due to a typographical error. The amount presented in the Puna21TRS in Table 1.3 and Table 11.11 (177,394 klb) is consistent with the information correctly reported elsewhere in the Form 10-K/A.
The Form 10-K/A reported the probable zinc reserve for Chinchillas (Stockpile) incorrectly on page 36 due to a typographical error. The amount presented in the Puna21TRS in Table 1.5 and Table 12.1 (2,056 klb) is consistent with the information correctly reported elsewhere in the Form 10-K/A.
The Form 10-K/A reported the indicated and measured and indicated contained metal amounts of lead in respect of the Pirquitas property incorrectly on page 37 due to immaterial rounding errors. The amounts presented in the Puna21TRS in Table 1.3 and Table 11.11 (895 klb and 1,240 klb, respectively) are correct and consistent with other information regarding lead amounts correctly reported elsewhere in the Form 10-K/A.
This page does not constitute a part of the amended Puna21TRS.
Title Page
| | | | | |
| Project Name: | Puna Operations |
| Title: | Puna 2021 Technical Report Summary |
| Location: | Jujuy, Argentina |
| Effective Date of Technical Report Summary: | 31 December 2021 |
| Effective Date of Mineral Resources: | 31 December 2021 |
| Effective Date of Mineral Reserves: | 31 December 2021 |
Qualified Persons (QPs):
•Gregory Gibson, BSc (Mining Engineering), MSc (Mining & Earth Systems Engineering), SME Registered Member (4134135), employed by SSR Mining Inc. as Vice President of Operations - Americas, was responsible for the preparation of Sections 1 to 25.
•Bernard Peters, BEng (Mining), FAusIMM (201743), employed by OreWin Pty Ltd as Technical Director – Mining, was responsible for the overall preparation, the Mineral Reserves estimates, and Sections 1 to 5; Section 10; and Sections 12 to 25.
•Sharron Sylvester, BSc (Geol), RPGeo AIG (10125), employed by OreWin Pty Ltd as Technical Director – Geology, was responsible for the preparation of the Mineral Resources, Sections 1 to 3; Sections 6 to 9; Section 11; and Sections 22 to 25.
OreWin Pty Ltd ACN 165 722 574
140 South Terrace Adelaide 5000
P +61 8 8210 5600 E orewin@orewin.com W orewin.comi
Signature Page
| | | | | |
| Project Name: | Puna Operations |
| Title: | Puna 2021 Technical Report Summary |
| Location: | Jujuy, Argentina |
| Date of Signing: | 29 September 2022 |
| Effective Date of Technical Report Summary: | 31 December 2021 |
/s/ Gregory Gibson
Gregory Gibson, Vice President Operations - Americas, SSR Mining Inc., BSc (Mining Engineering), MSc (Mining & Earth Systems Engineering), SME Registered Member (4134135)
/s/ Bernard Peters
Bernard Peters, Technical Director – Mining, OreWin Pty Ltd, BEng (Mining), FAusIMM (201743)
/s/ Sharron Sylvester
Sharron Sylvester, Technical Director – Geology, OreWin Pty Ltd, BSc (Geol), RPGeo AIG (10125)
21015Puna21TRS220927Rev0.docx ii
TABLE OF CONTENTS
21015Puna21TRS220927Rev0.docx iii
| | | | | |
| |
| |
| |
| |
| |
| |
| |
| |
| 20 |
| 20 |
| 21 |
| 21 |
| 22 |
| 23 |
| 23 |
| 25 |
| 27 |
| 28 |
| 28 |
| 28 |
| 29 |
| 29 |
| 30 |
| 31 |
| 31 |
21015Puna21TRS220927Rev0.docx iv
| | | | | |
| 32 |
| 33 |
| 33 |
| 33 |
| 33 |
| 34 |
| 37 |
| 39 |
| 39 |
| 48 |
| 54 |
| 54 |
| 54 |
| 54 |
| 55 |
| 57 |
| 58 |
| 58 |
| 58 |
| 58 |
| 58 |
| 58 |
| 59 |
| 59 |
| 65 |
| 65 |
21015Puna21TRS220927Rev0.docx v
| | | | | |
| 65 |
| 66 |
| 66 |
| 67 |
| 68 |
| 68 |
| 68 |
| 69 |
| 69 |
| 69 |
| 69 |
| 70 |
| 71 |
| 71 |
| 71 |
| 71 |
| 72 |
| 72 |
| 72 |
| 72 |
| 73 |
| 77 |
| 77 |
| 78 |
| 79 |
| 79 |
21015Puna21TRS220927Rev0.docx vi
| | | | | |
| 80 |
| 80 |
| 80 |
| 81 |
| 81 |
| 83 |
| 83 |
| 89 |
| 89 |
| 90 |
| 91 |
| 92 |
| 92 |
| 93 |
| 94 |
| 98 |
| 98 |
| 98 |
| 98 |
| 102 |
| 103 |
| 105 |
| 106 |
| 109 |
| 109 |
| 109 |
21015Puna21TRS220927Rev0.docx vii
| | | | | |
| 109 |
| 109 |
| 109 |
| 110 |
| 110 |
| 110 |
| 110 |
| 112 |
| 112 |
| 113 |
| 113 |
| 113 |
| 115 |
| 117 |
| 117 |
| 117 |
| 118 |
| 119 |
| 119 |
| 121 |
| 121 |
| 122 |
| 122 |
| 124 |
21015Puna21TRS220927Rev0.docx viii
| | | | | |
| 124 |
| 125 |
| 125 |
| 125 |
| 126 |
| 127 |
| 127 |
| 128 |
| 129 |
| 129 |
| 130 |
| 130 |
| 130 |
| 131 |
| 132 |
| 132 |
| 133 |
| 133 |
| 134 |
| 134 |
| 134 |
| 136 |
| 137 |
| 137 |
| 137 |
21015Puna21TRS220927Rev0.docx ix
| | | | | |
| 138 |
| 139 |
| 141 |
| 143 |
| 146 |
| 148 |
| 148 |
| 148 |
| 149 |
| 151 |
| 151 |
| 151 |
| 151 |
| 152 |
| 152 |
| 155 |
| 156 |
| 157 |
| 157 |
| 157 |
| 159 |
| 159 |
| 159 |
| 160 |
| 160 |
| 162 |
21015Puna21TRS220927Rev0.docx x
TABLES
21015Puna21TRS220927Rev0.docx xi
| | | | | |
| |
| |
| 23 |
| 25 |
| 54 |
| 57 |
| 59 |
| 76 |
| 78 |
| 78 |
| 78 |
| 82 |
| 83 |
| 89 |
| 92 |
| 94 |
| 95 |
| 99 |
| 102 |
| 104 |
| 104 |
| 105 |
21015Puna21TRS220927Rev0.docx xii
| | | | | |
| 106 |
| 107 |
| 108 |
| 111 |
| 112 |
| 116 |
| 117 |
| 122 |
| 128 |
| 134 |
| 135 |
| 157 |
| 158 |
| 159 |
| 159 |
| 161 |
| 162 |
| 164 |
| 164 |
| 165 |
| 166 |
| 166 |
21015Puna21TRS220927Rev0.docx xiii
FIGURES
| | | | | |
| 11 |
| 12 |
| 12 |
| |
| 21 |
| 22 |
| 24 |
| 26 |
| 35 |
| 36 |
| 38 |
| 39 |
| 40 |
| 41 |
| 42 |
| 43 |
| 45 |
| 47 |
| 48 |
21015Puna21TRS220927Rev0.docx xiv
| | | | | |
| 49 |
| 50 |
| 51 |
| 52 |
| 55 |
| 61 |
| 62 |
| 62 |
| 63 |
| 63 |
| 64 |
| 65 |
| 70 |
| 74 |
| 75 |
| 81 |
| 83 |
| 84 |
| 85 |
| 86 |
| 87 |
| 88 |
21015Puna21TRS220927Rev0.docx xv
| | | | | |
| 90 |
| 91 |
| 93 |
| 95 |
| 96 |
| 97 |
| 100 |
| 114 |
| 115 |
| 120 |
| 121 |
| 123 |
| 124 |
| 125 |
| 126 |
| 127 |
| 129 |
| 131 |
| 135 |
| 138 |
| 142 |
| 143 |
| 144 |
21015Puna21TRS220927Rev0.docx xvi
21015Puna21TRS220927Rev0.docx xvii
1 EXECUTIVE SUMMARY
1.1 Introduction
This Puna 2021 Technical Report Summary (Puna21TRS) is an independent Technical Report Summary that has been prepared in accordance with the U.S. Securities and Exchange Commission (US SEC) Regulation S-K subpart 1300 rules for Property Disclosures for Mining Registrants (S-K 1300) for SSR Mining Inc. (SSR), on the Puna project (Puna, or the Project).
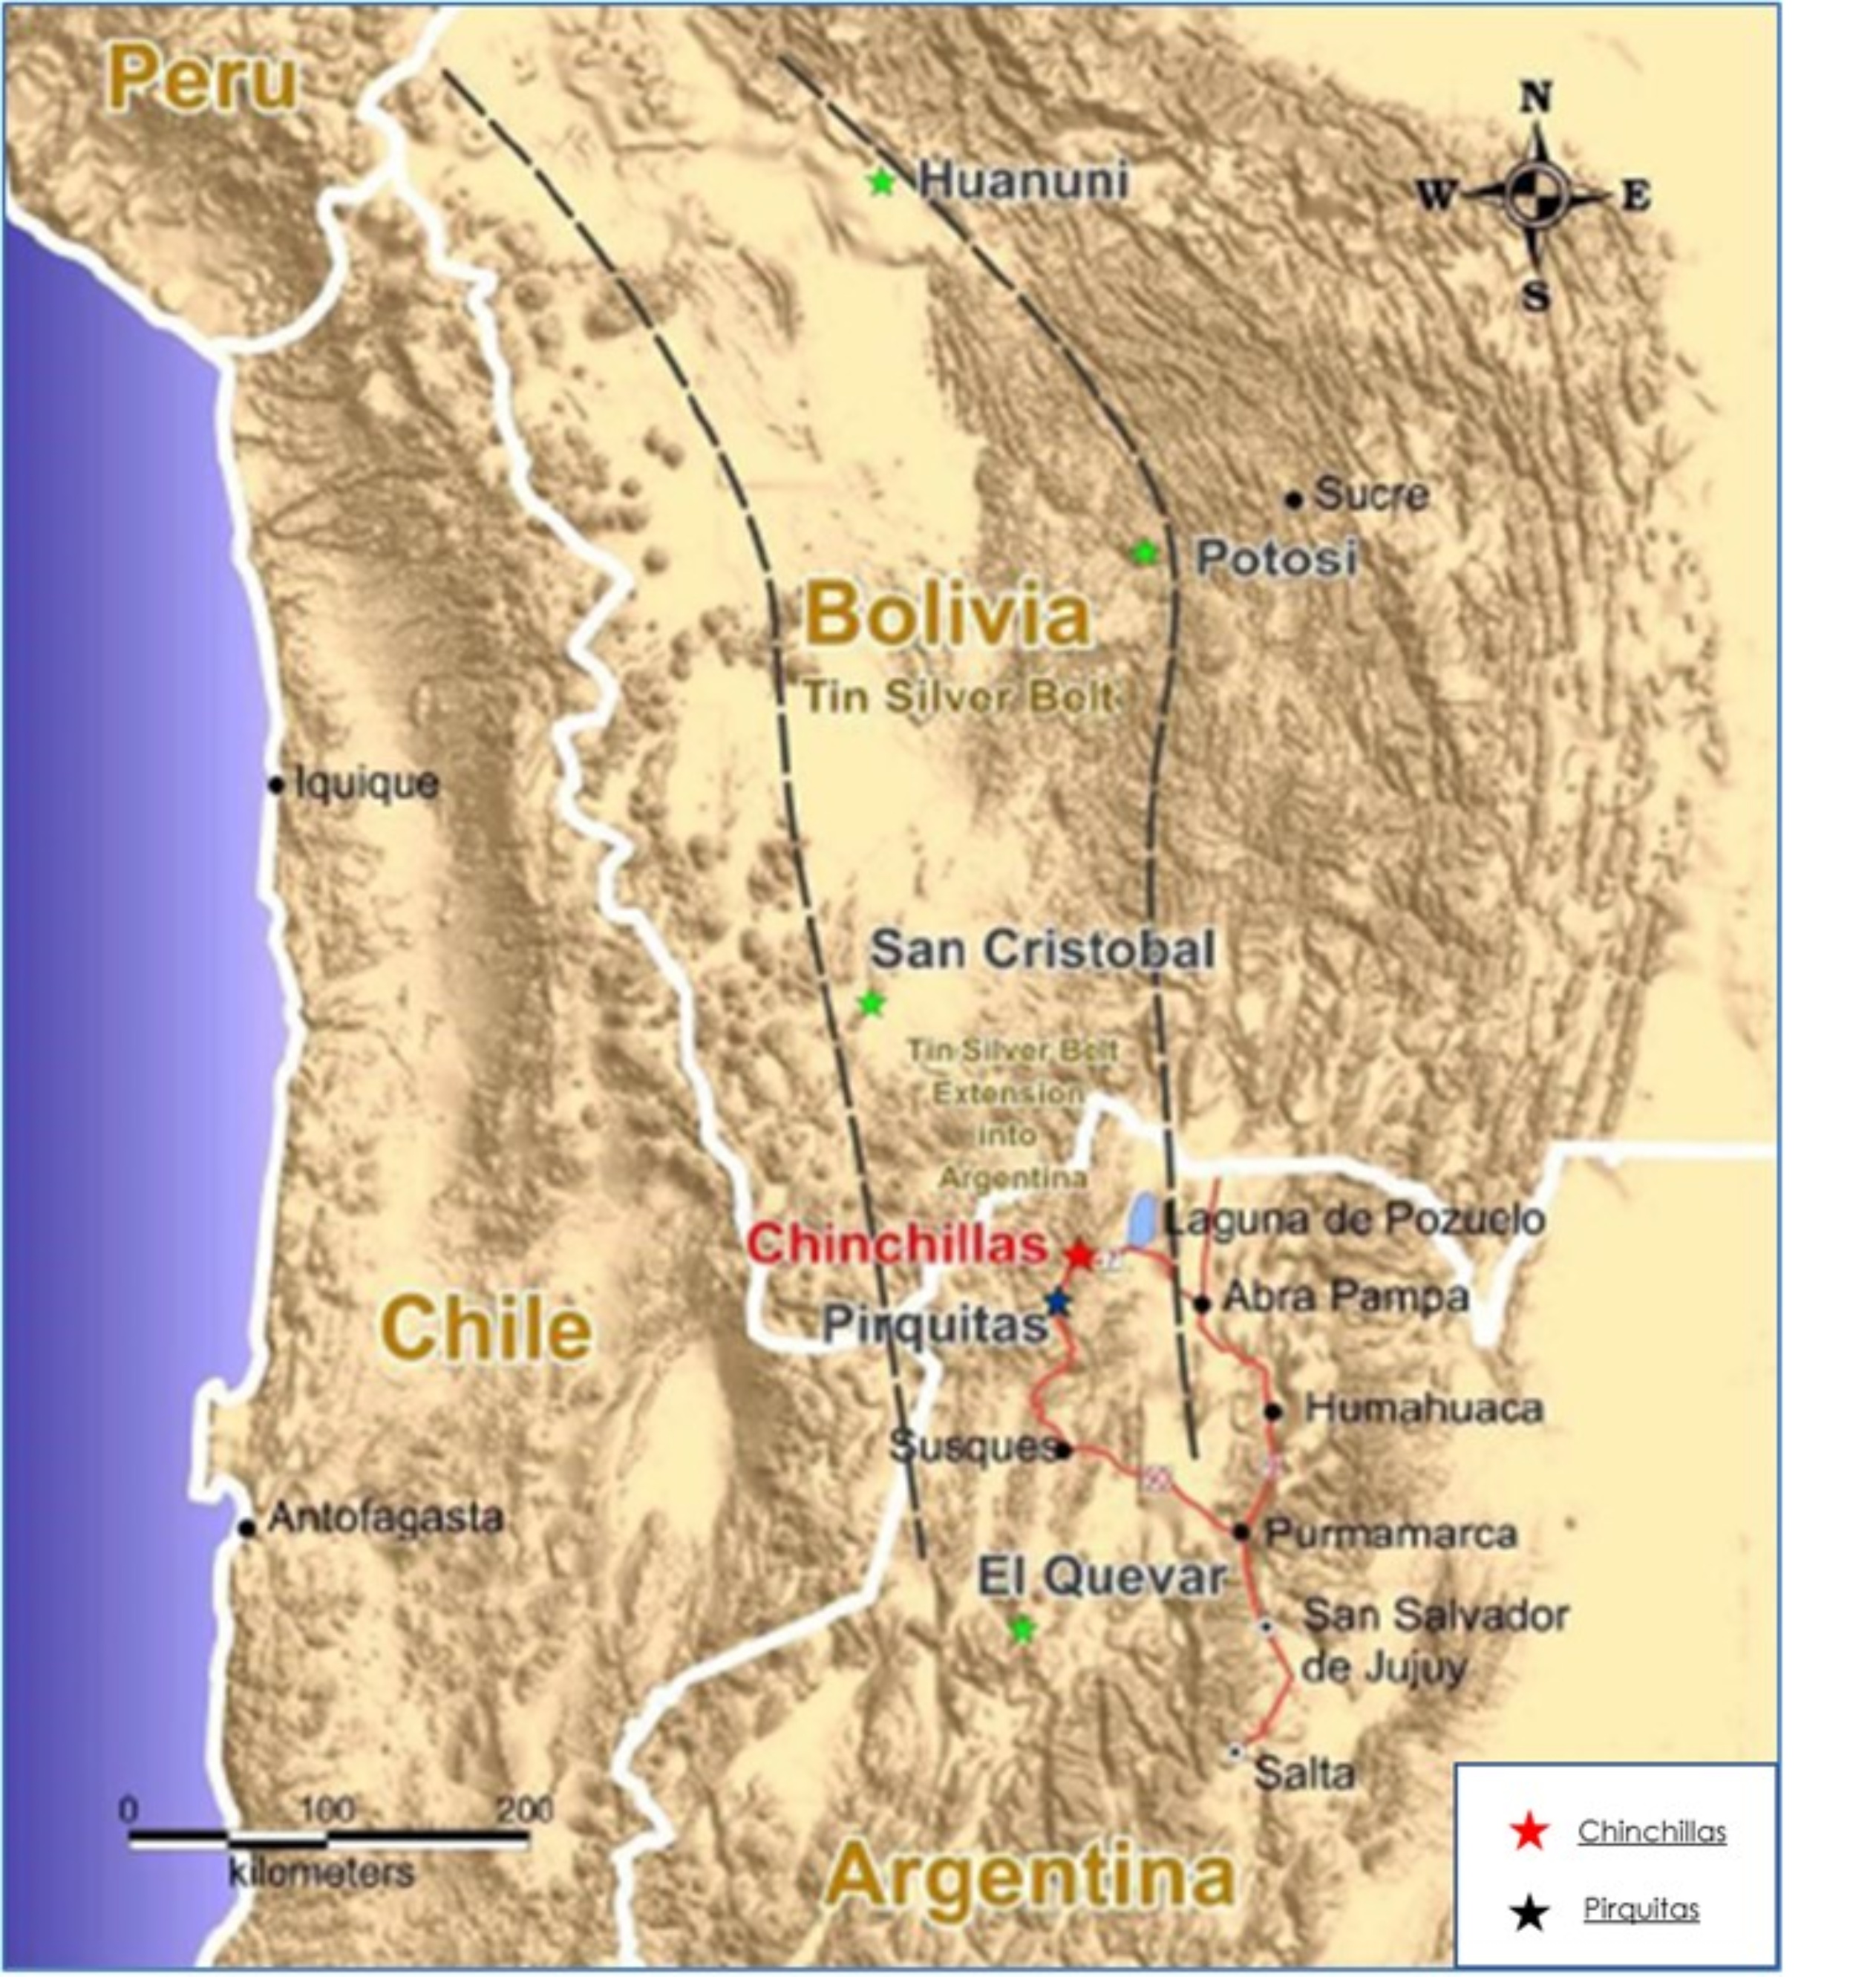
The Project comprises the Chinchillas property and the Pirquitas property, both of which are located the Jujuy Province in far north Argentina.
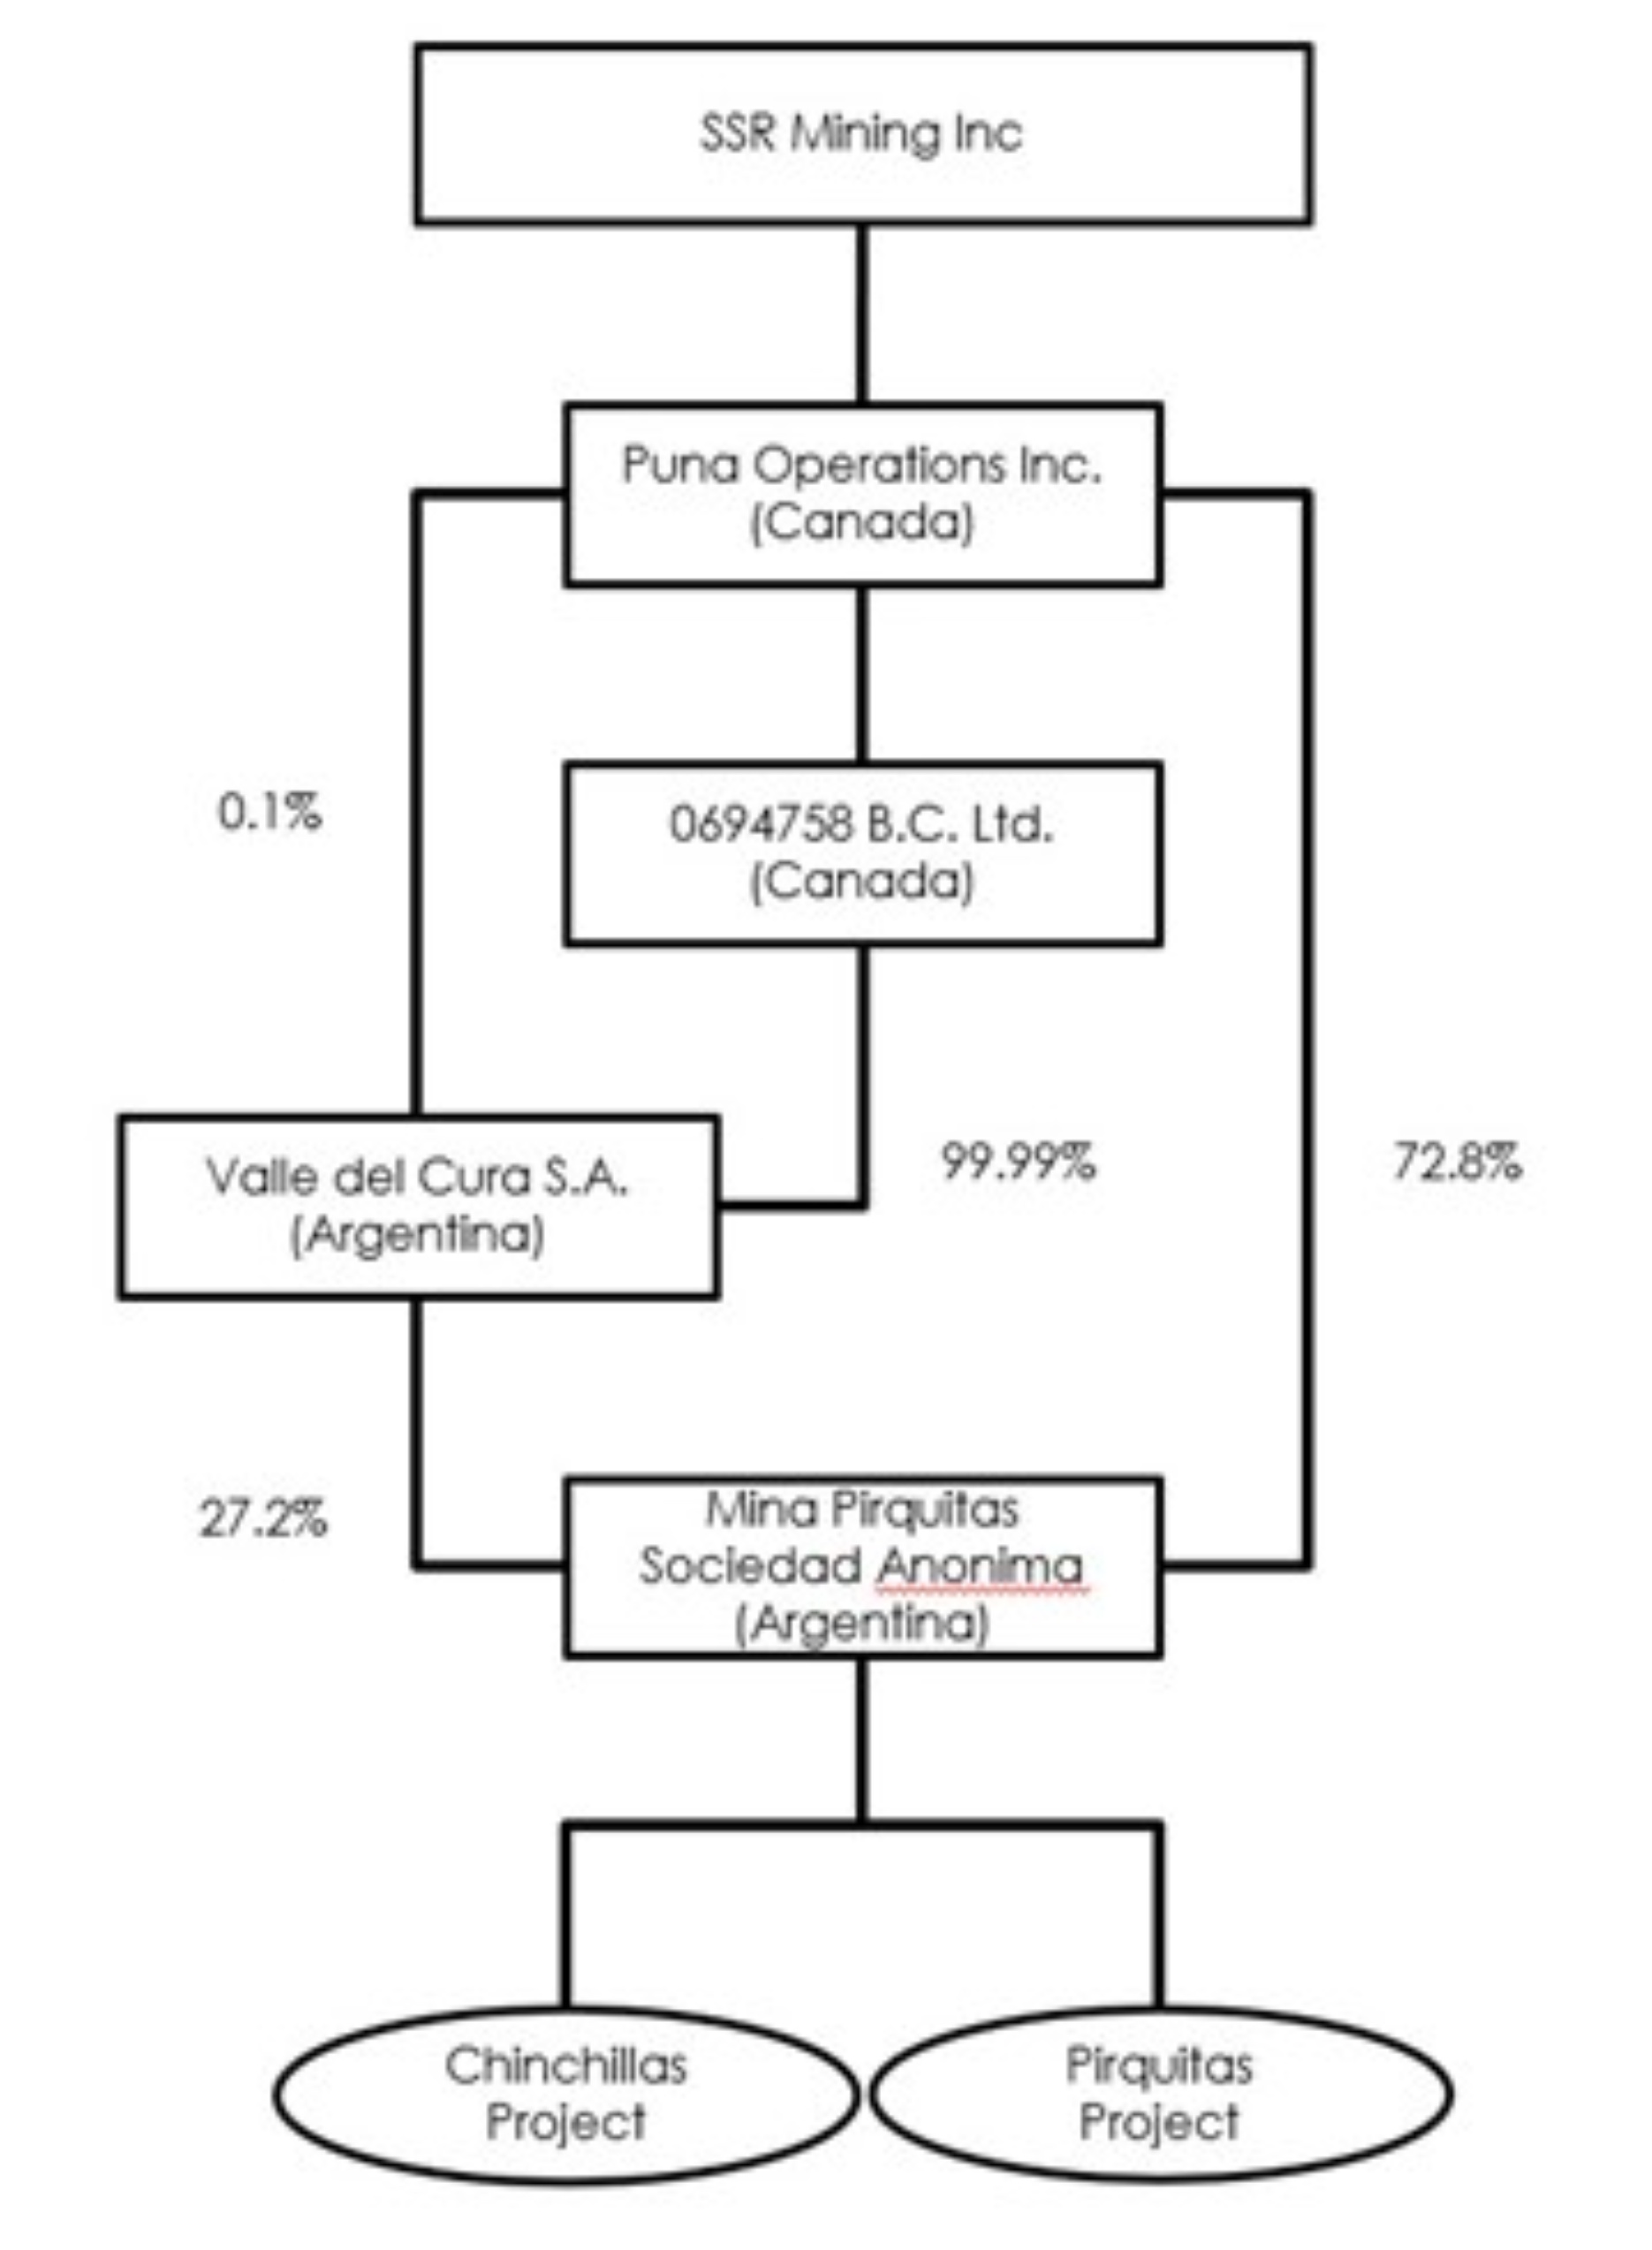
Puna is directly owned (100%) by SSR through a subsidiary company Puna Operations Inc. (POI), which, through other 100% owned subsidiaries owns Mina Pirquitas S.A. (MPSA). MPSA operates the Project.
Ore from the Chinchillas mine is transported to the Pirquitas plant for processing. The Chinchillas mine is located approximately 45 km from the Pirquitas plant. The open pit mine at Pirquitas has been completed.
SSR is a gold mining company with four producing assets located in the USA, Turkey, Canada, and Argentina, and with development and exploration assets in the USA, Turkey, Mexico, Peru, and Canada. SSR is listed on the NASDAQ (NASDAQ:SSRM), the Toronto Stock Exchange (TSX:SSRM), and the Australian Stock Exchange (ASX:SSR).
The Puna21TRS Qualified Persons (QPs) have reviewed the supplied data and information and accept this information as being accurate and complete and suitable for use in the Puna21TRS. Information and data supplied by SSR that were outside the areas of expertise of the QPs and was relied upon when forming the findings and conclusions of this report are detailed in Section 25. Any individual or entity referenced as having completed work relevant to the Puna21TRS, but not identified therein as a QP, does not constitute a QP for the Puna21TRS.
The Puna21TRS should be construed in light of the methods, procedures, and techniques used to prepare the Puna21TRS. Sections or parts of the Puna21TRS should not be read in isolation of, or removed from, their original context.
1.2 Land Tenure and Ownership
The Chinchillas property is composed of three contiguous claims totalling 2,041 ha, and the Pirquitas property includes surface rights covering an area of approximately 7,500 ha, which is used for purposes such as housing, infrastructure facilities, processing facilities, tailings facility and other facilities to support mining operations for the Project.
POI holds a 100% interest in the property.
21015Puna21TRS220927Rev0.docx Page 1 of 175
1.3 Property Description and Location
1.3.1 Property Description and Location – Chinchillas
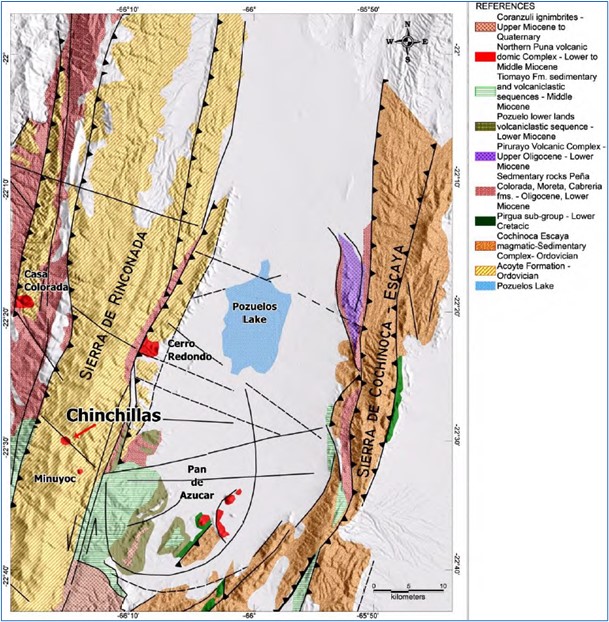
The Chinchillas property is located in the Puna region of north-western Argentina, in the province of Jujuy, department of Rinconada, approximately 290 km north-west of San Salvador de Jujuy, the capital of Jujuy Province. The property is centred at approximately 3,473,150E and 7,512,360N (Gauss Kruger, Argentina, Posgar Zone 3; 22°30′13″ S, 66°15′39″ W) at elevations ranging from 4,000–4,200 metres above sea level (masl).
Access to the Chinchillas property is by paved road to the town of Abra Pampa via National Route No. 9 and then 66 km west across public gravel roads, through the village of Santo Domingo. Santo Domingo is serviced with electricity and water. Abra Pampa has a hospital, and, along with San Salvador, provides other supplies necessary for exploration.
Access between the Pirquitas Operation and the Chinchillas property is via National Route No. 40 that leads to Provincial Route No. 70.
1.3.2 Property Description and Location – Pirquitas
The Pirquitas property is also located in the Rinconada Department in the Province of Jujuy, approximately 45 km south-west of the Chinchillas property and approximately 335 km north-west of San Salvador. Activities at the Property are centred at 22°42′ south latitude and 66°30′ west longitude at elevations of between 4,000–4,450 masl.
1.4 Geological Setting and Mineralisation
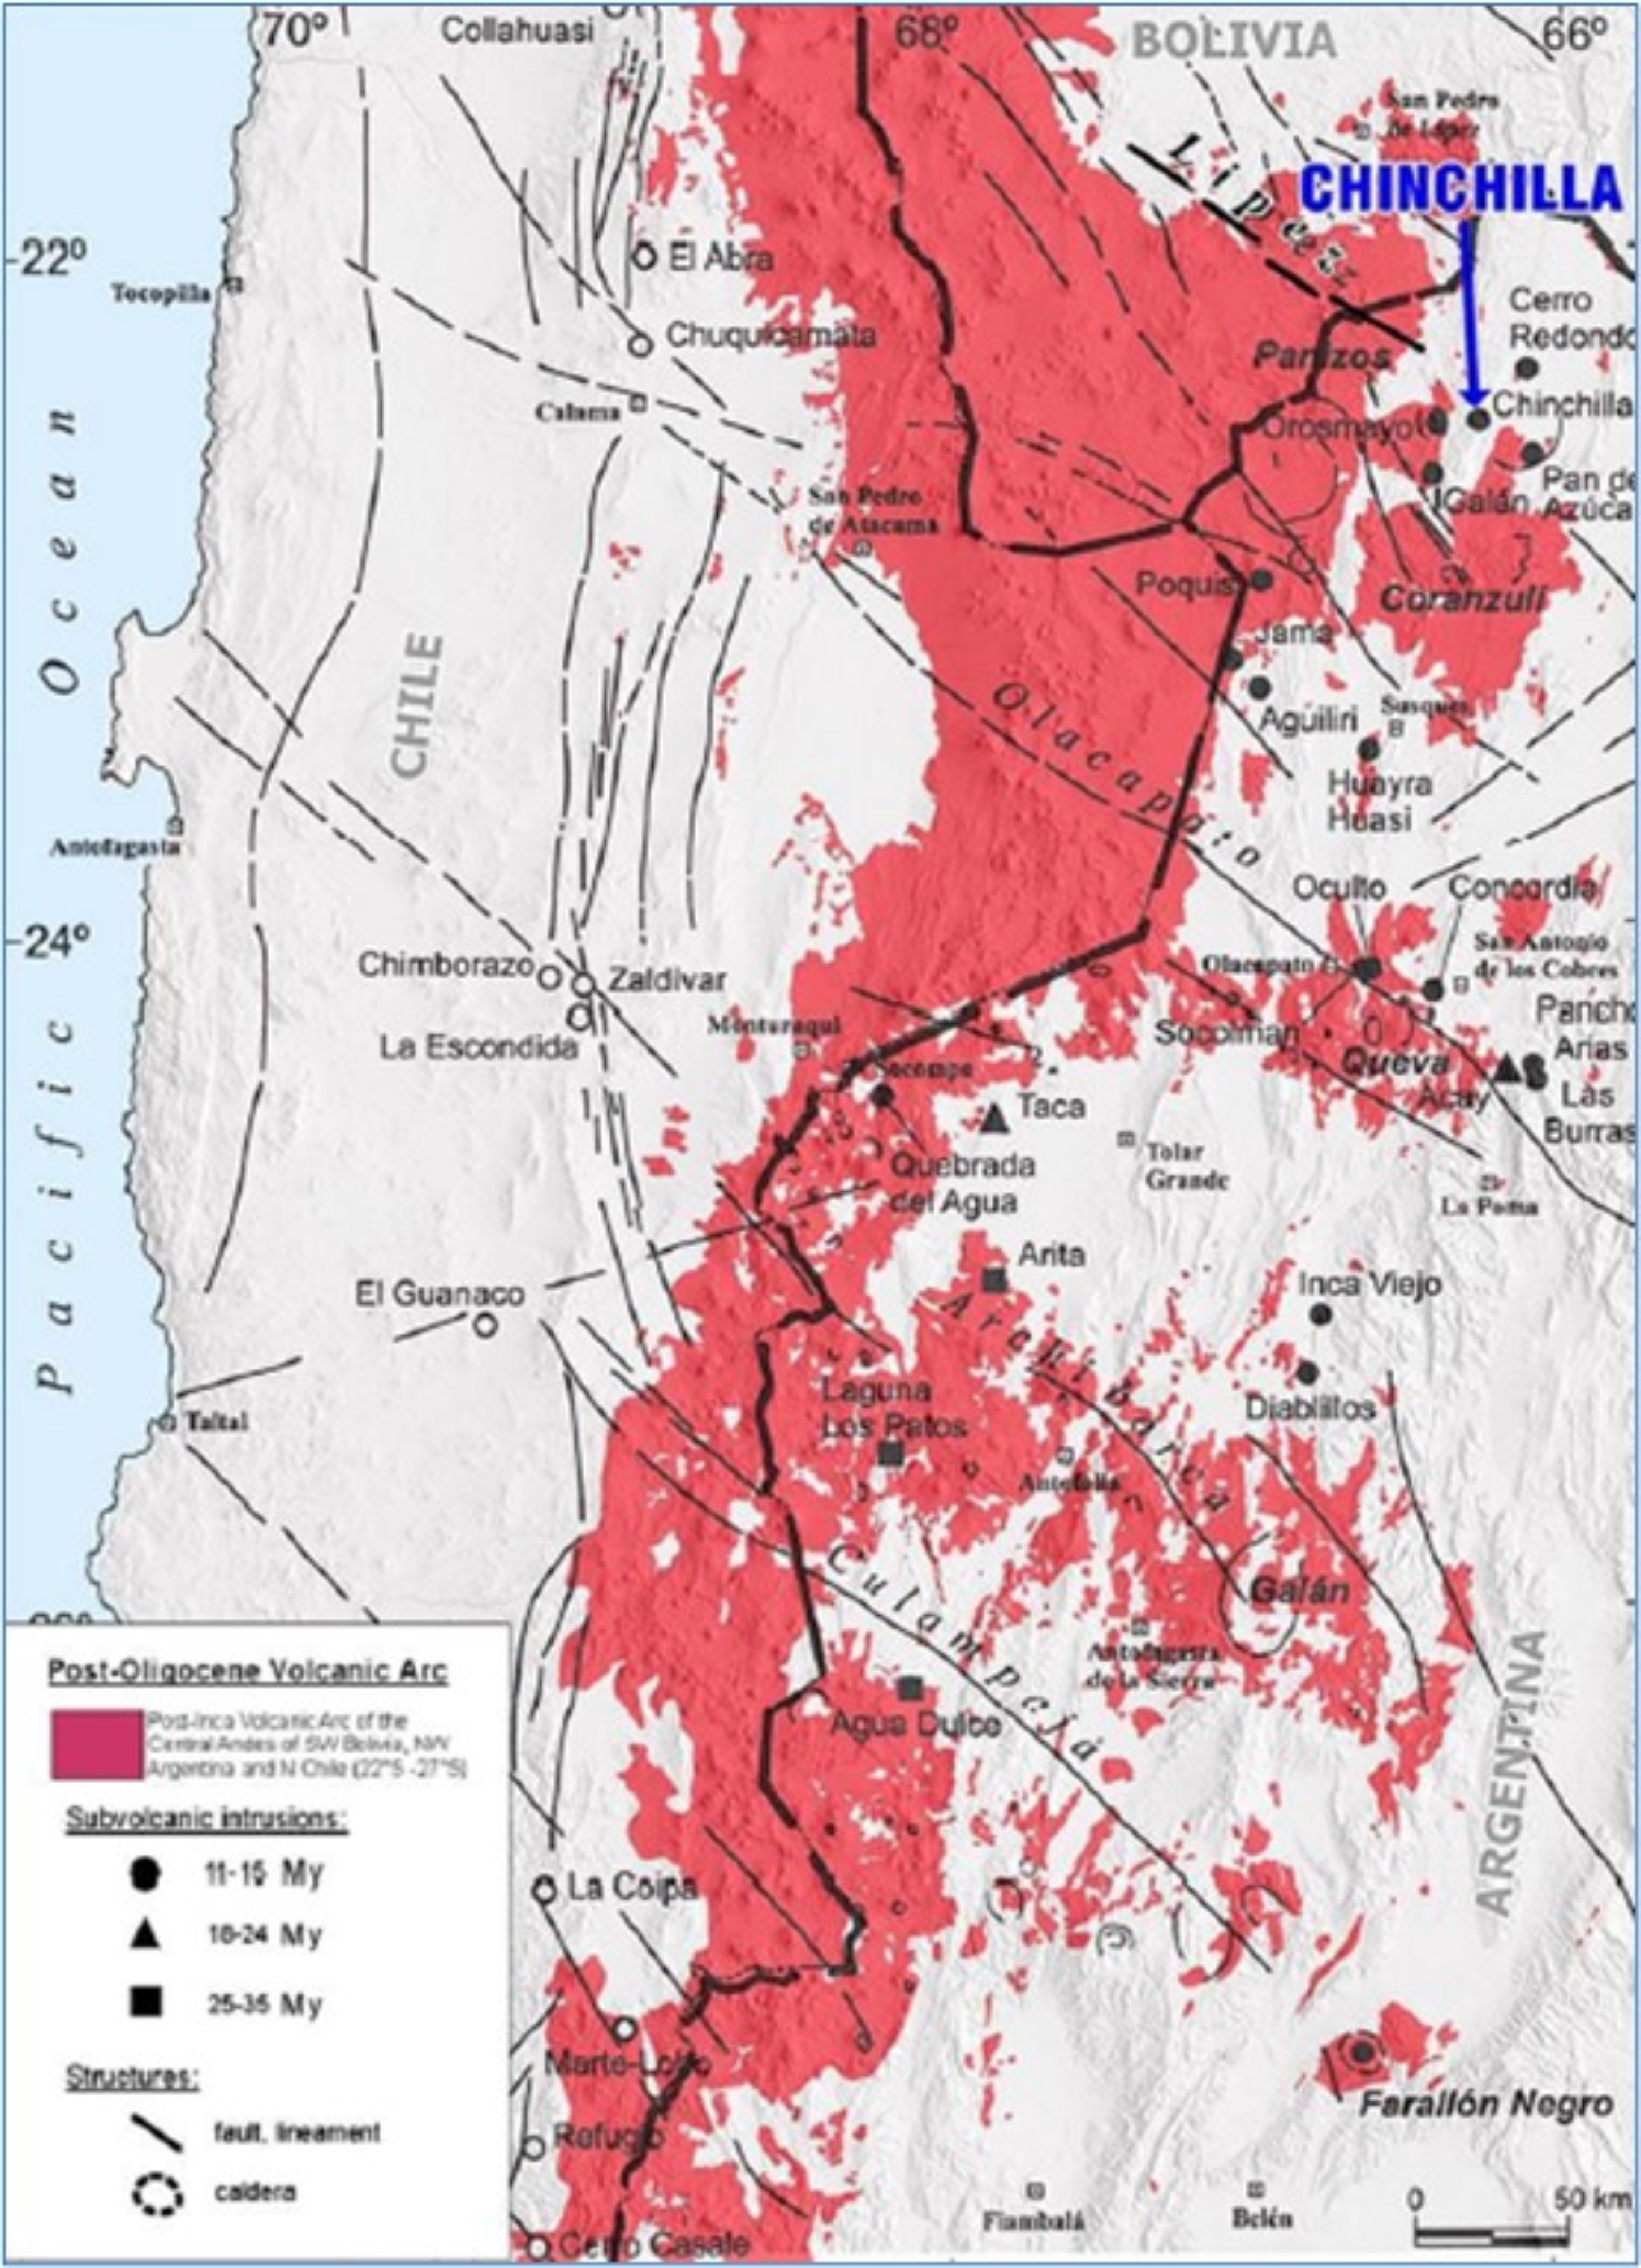
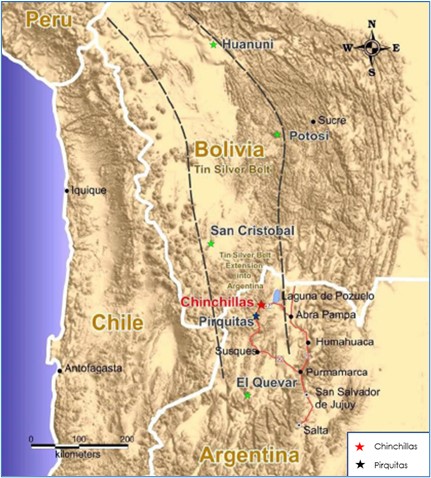
The Chinchillas and Pirquitas properties are within the Bolivian tin-silver-zinc belt that extends from the San Rafael tin copper deposit in southern Peru into the Puna region of Jujuy. Deposits with similar environments and styles of mineralisation include San Cristóbal, Potosí, and Pulacayo.
These deposits are generally associated with intrusion of dacite dome complexes. Mineralisation is hosted in shear zones and breccias within the dacite domes and/or shear zones and breccias within the host rocks. More rarely, as in the case of the Chinchillas property and San Cristóbal, the deposits also contain flat-lying manto bodies within sedimentary and pyroclastic rocks that are cut by ‘feeder’ shear zones. All the deposits have large vertical extents.
The Chinchillas and Pirquitas properties are within the Puna geological belt. Stratigraphy in the belt includes metamorphosed Proterozoic sedimentary rocks in the basement, Paleozoic marine back arc sedimentary rocks, and younger volcanic and continental sedimentary rocks. In the Jujuy Province, the Puna terrane is an important host for mineral deposits, including mesothermal quartz veins with native gold and base metals; polymetallic quartz-sulfide veins with base and precious metals; gold, tin, and copper placer deposits; sedimentary exhalative (SEDEX) deposits with lead zinc–silver; and Bolivian-type tin-silver-sulfide veins related to intrusive stocks.
21015Puna21TRS220927Rev0.docx Page 2 of 175
1.4.1 Geological Setting and Mineralisation – Chinchillas
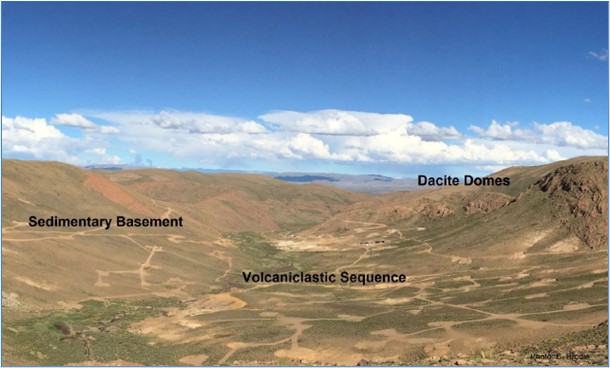
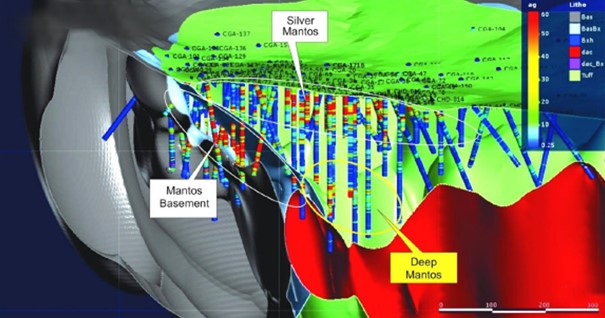
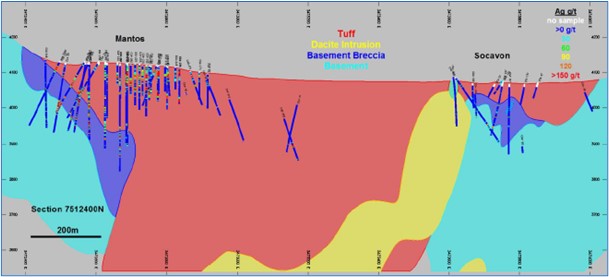
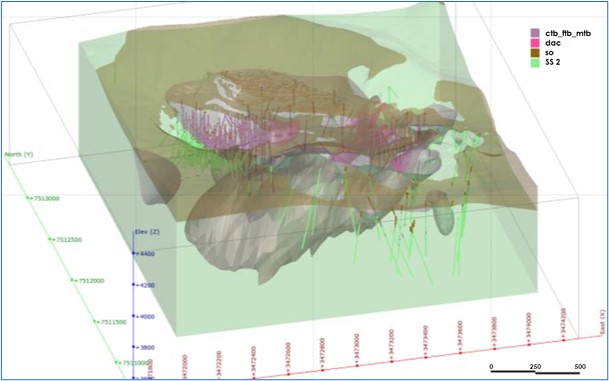
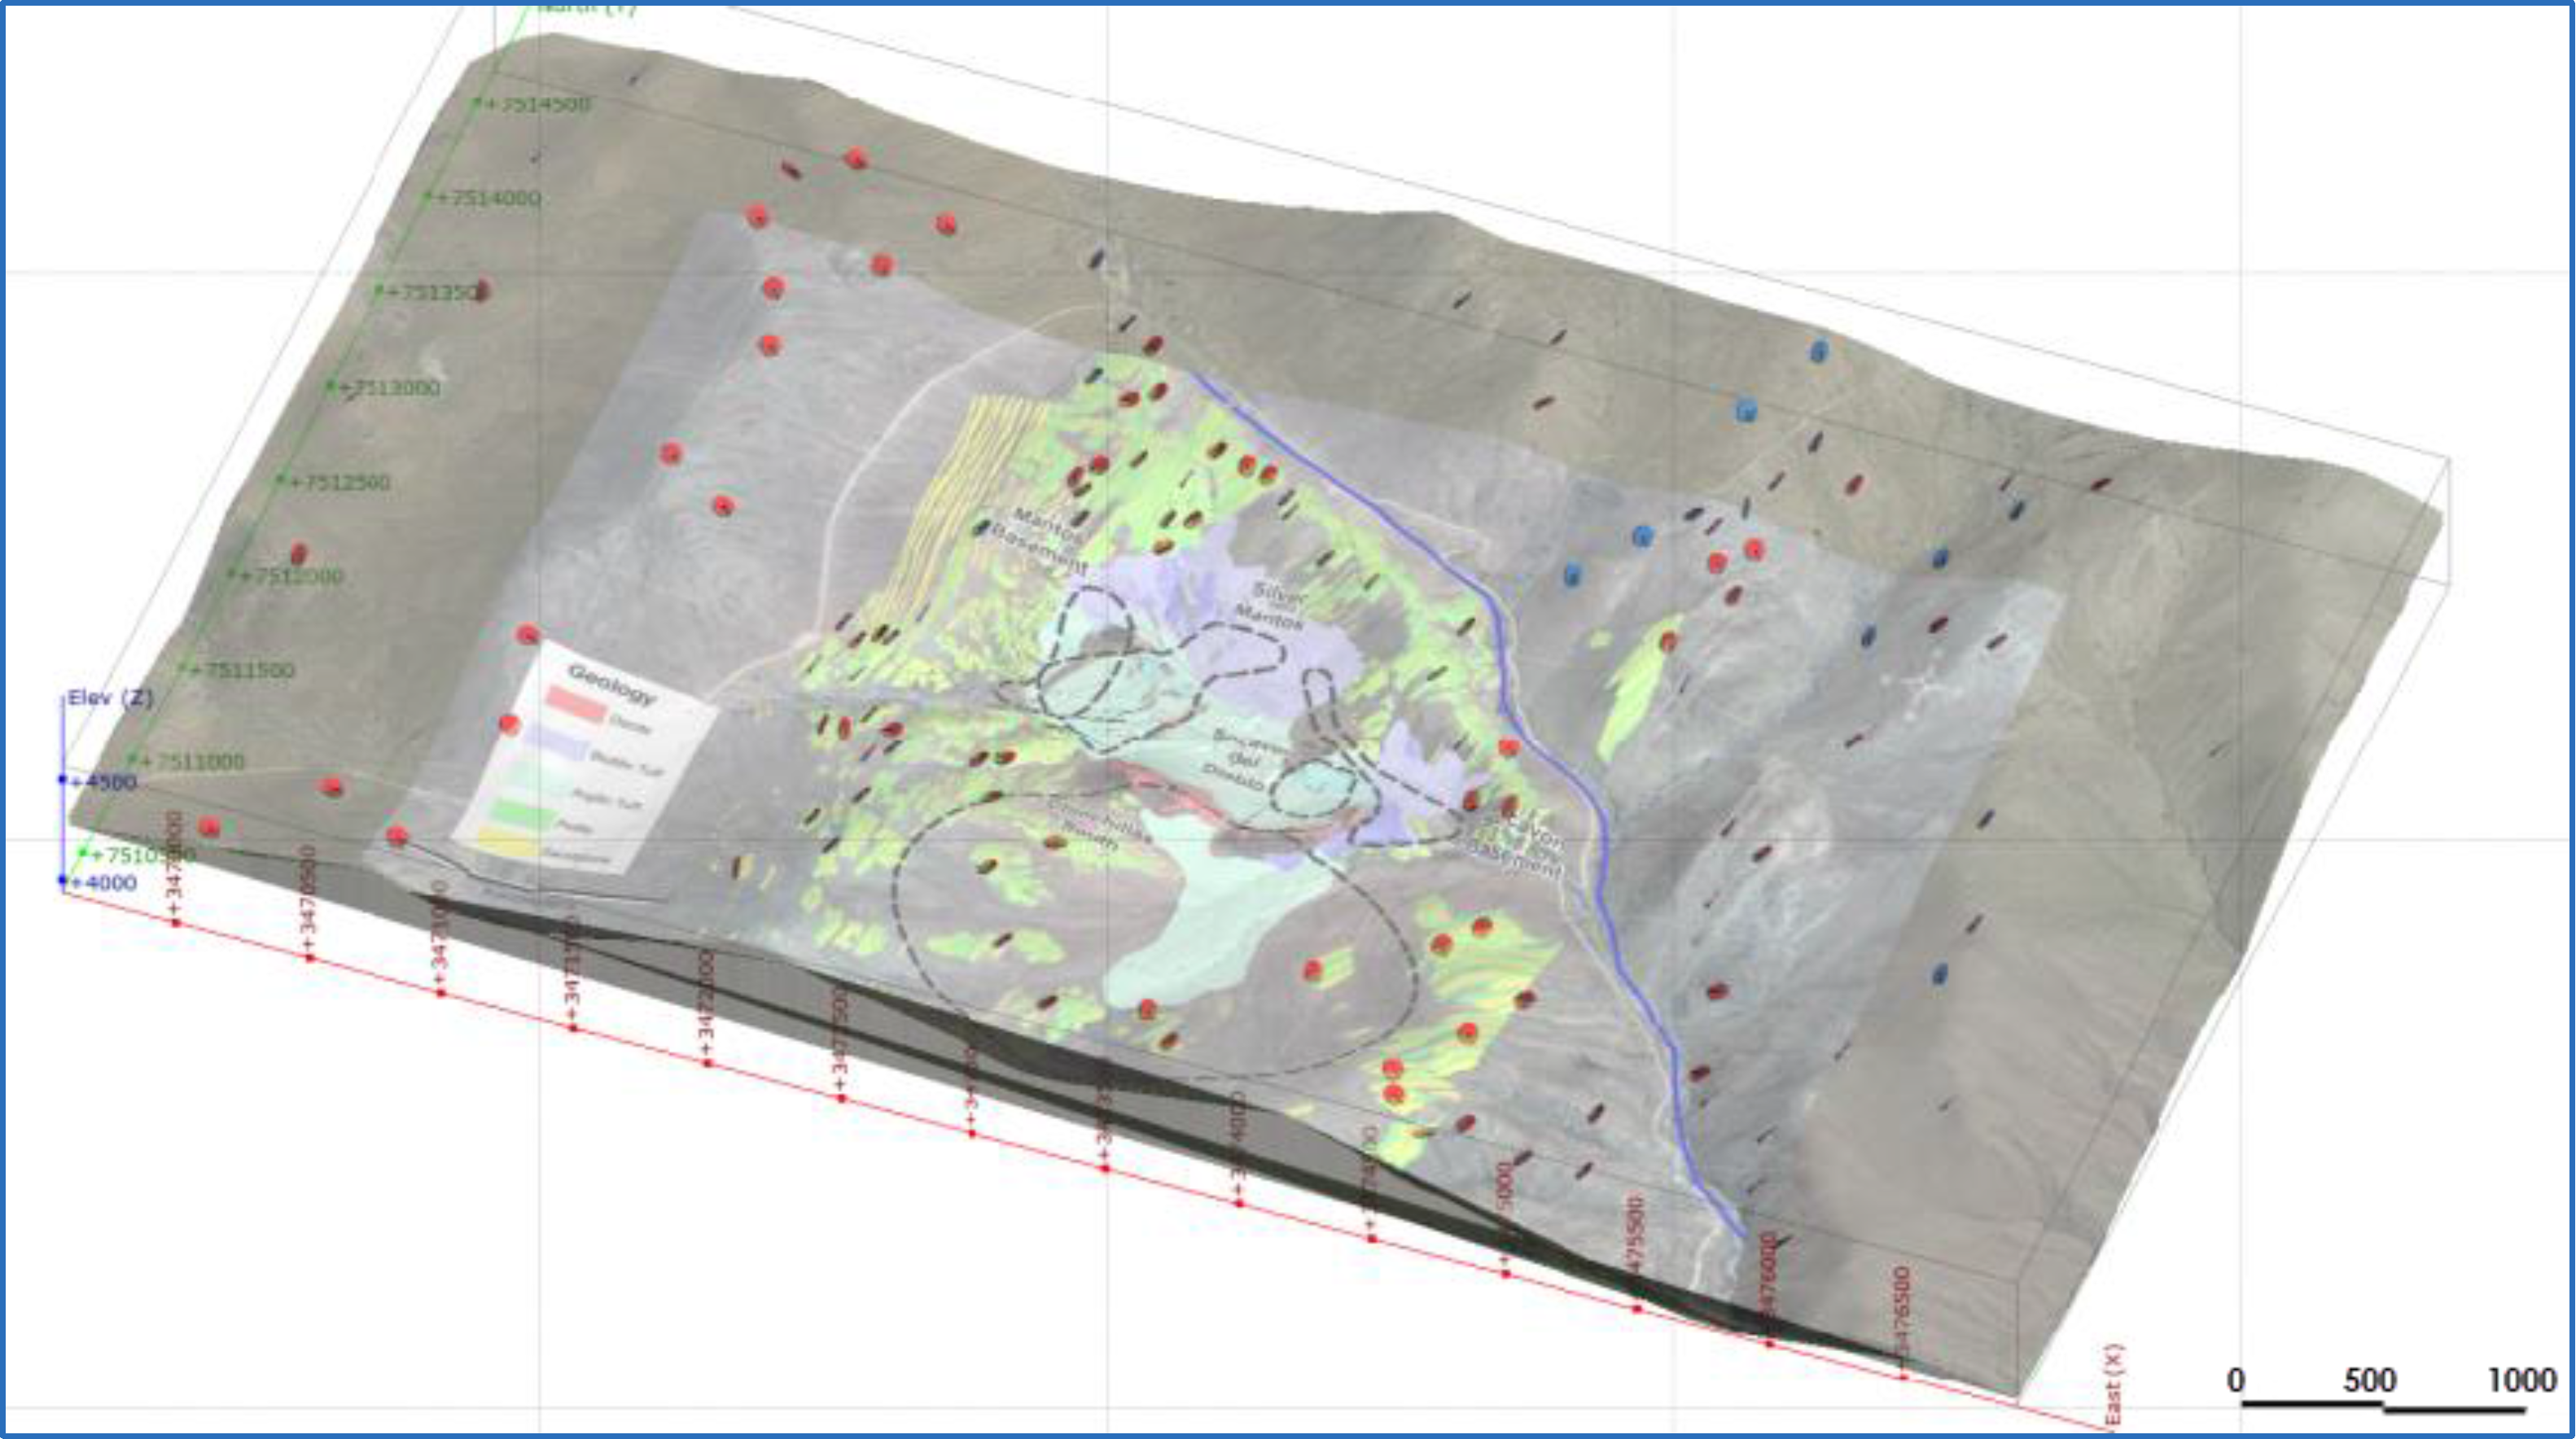
The Chinchillas deposit is within a dacitic volcanic centre. The deposit was controlled by a dilational jog on a regional scale east–west trending fault where magma has intruded through marine meta-sedimentary basement rocks. The explosive volcanic eruption resulted in an elliptical shaped topographic depression approximately 2 km long by 1.6 km wide, subsequently infilled with pyroclastic rocks including breccias and tuffs. At the contact between pyroclastic volcanic rocks and basement metasedimentary rock, a wide zone of hydraulic fracturing and brecciation formed. Dacitic lavas, flow domes and subvolcanic intrusions occur on the southern margin of the basin at the contact between metasedimentary and pyroclastic rocks.
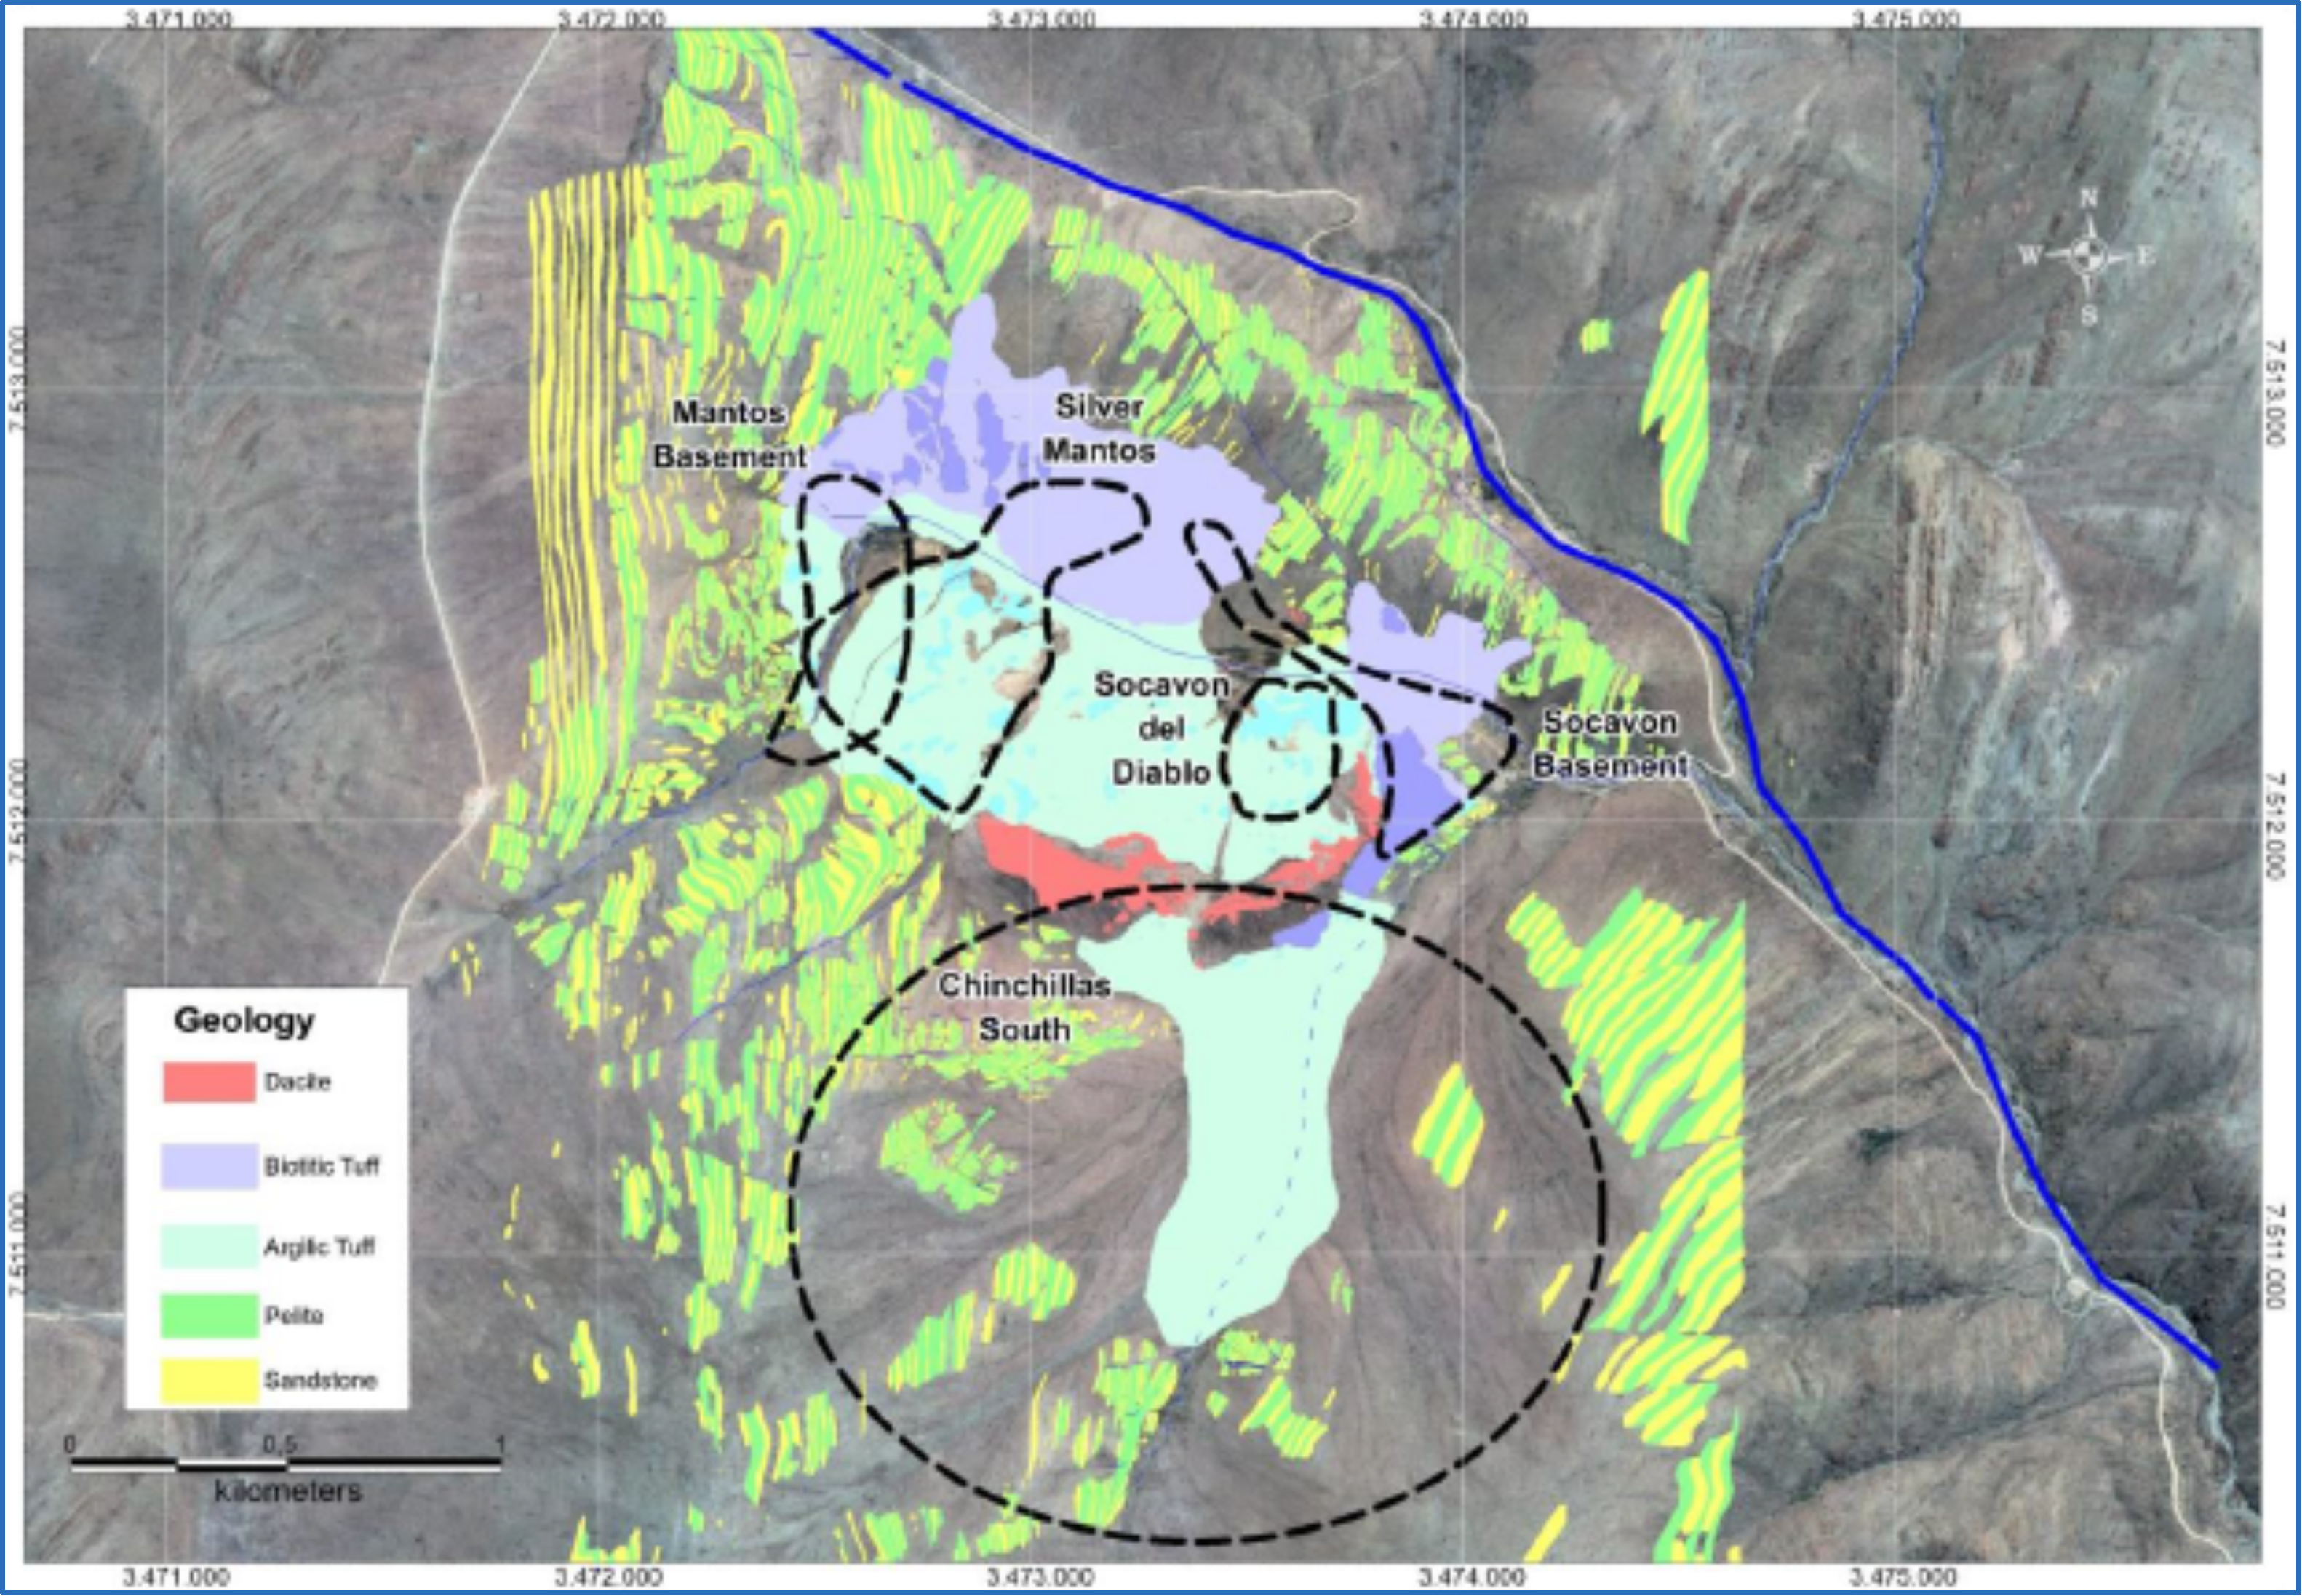
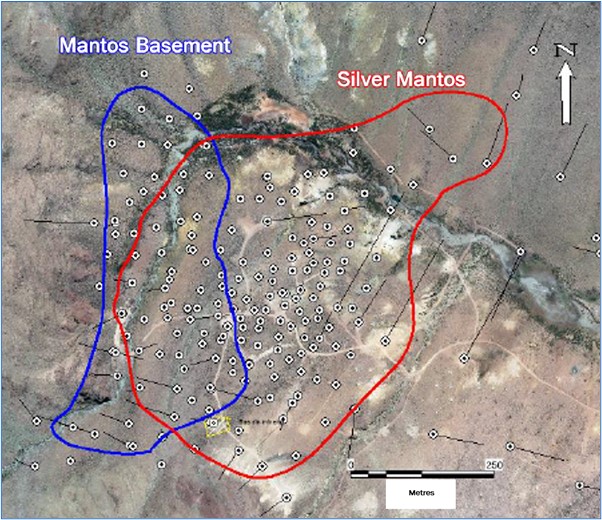
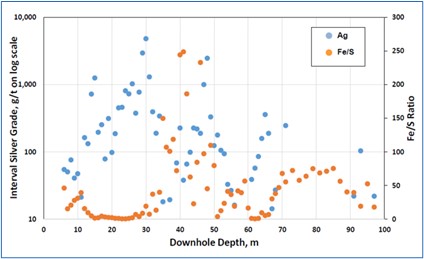
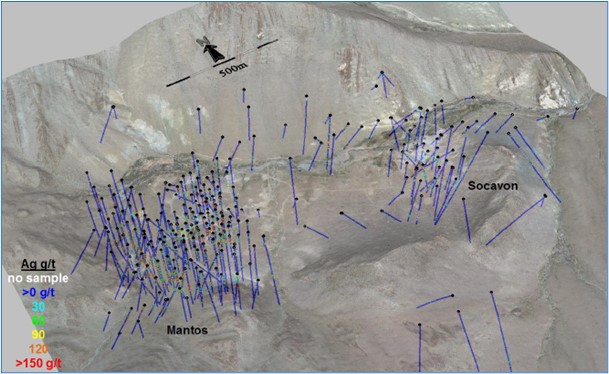
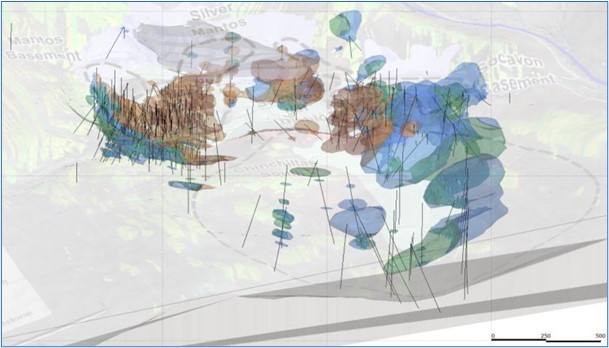
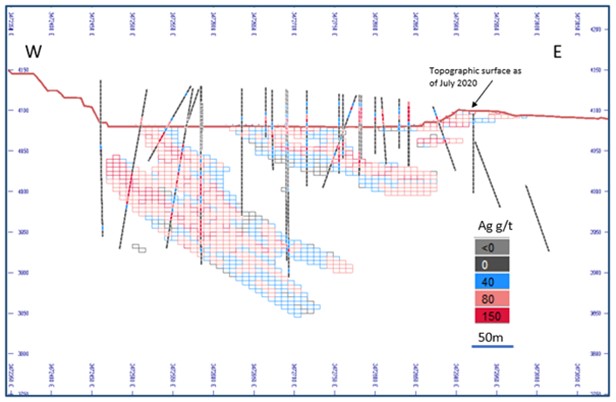
Significant silver-lead-zinc mineralisation occurs in four main areas at Chinchillas: the Silver Mantos and Mantos Basement zones in the west part of the Project, and the Socavon del Diablo and Socavon Basement zones in the east part.
1.4.2 Geological Setting and Mineralisation – Pirquitas
The Pirquitas deposit is hosted by the Ordovician Acoite Formation, a strongly folded package of low-grade metamorphosed marine sandstone, siltstone, and minor shale beds. These rocks crop out within fault-bounded and likely uplifted structural blocks that occur south-west and east of the mine area. Late Ordovician to Early Devonian compressional tectonism resulted infolding of the Paleozoic sedimentary rocks and development of well-defined axial planar cleavage. High-angle thrust faults were also generated during this event. In the area of the mine, axial planes of folds strike north to north–north-east and are sub-vertical to moderately inclined.
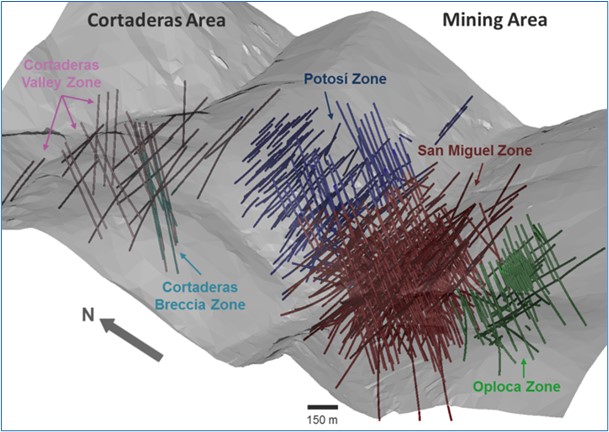
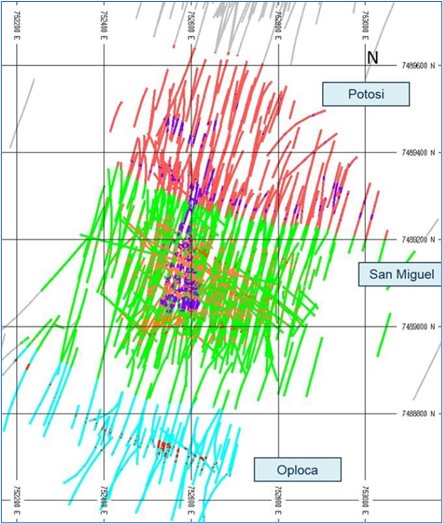
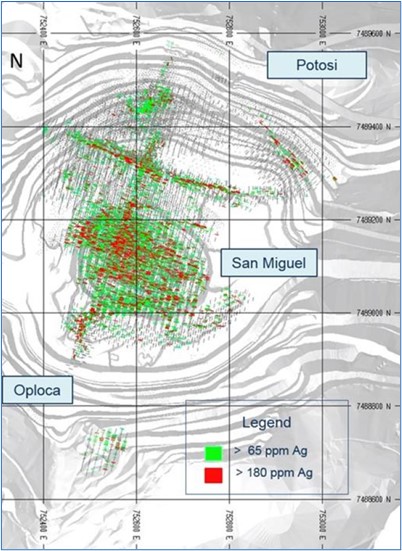
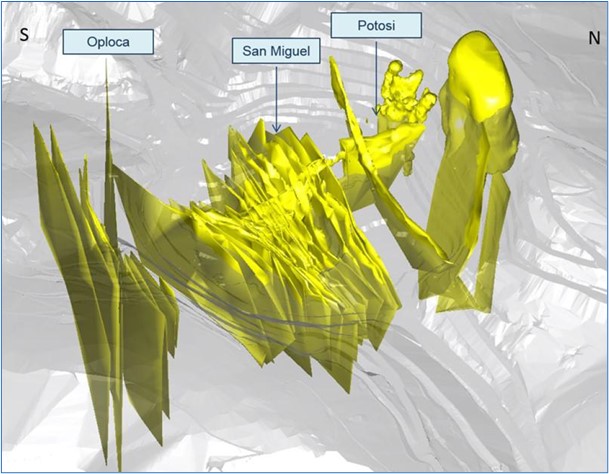
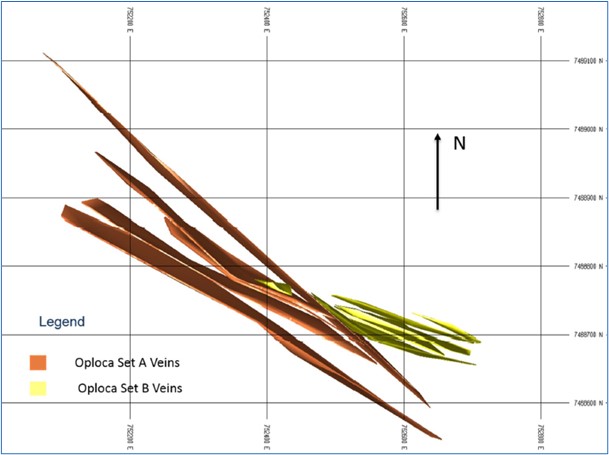
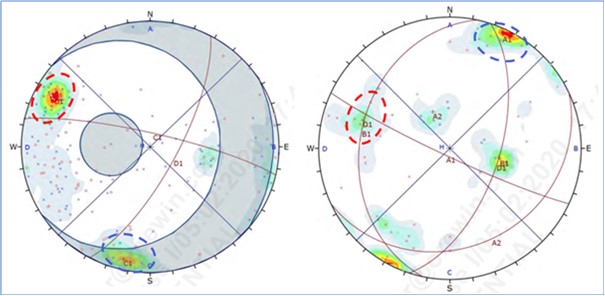
Sulphide-rich veins cut the axial planes of the folds and the related axial planar cleavage at high angles. Four main vein sets are recognised on the Pirquitas property.
Bolivian-type Ag-Sn deposits generally consist of sulphide and quartz-sulphide vein systems typically containing cassiterite and a diverse suite of base and trace metals, including silver, in a complex assemblage of sulphide and sulfosalt minerals. The vein systems are generally spatially and likely genetically associated with epizonal (subvolcanic) quartz-bearing peraluminous intrusions 1–2 km in diameter but may be entirely hosted by the country rocks into which the intrusive stocks were emplaced.
1.5 Exploration
1.5.1 Exploration Activities – Chinchillas
At Chinchillas, surface exploration programmes included detailed mapping with emphasis on structure, rock chip sampling, trenching, soil sampling and talus sampling. These programmes identified major structural zones, the strong east–west control on basin formation, and new mineralised target areas. Geophysical surveys were also conducted, including induced polarisation / resistivity (IP), controlled source audio-frequency magneto-telluric (CSAMT) surveys, and magnetics.
Prior to SSR, Golden Arrow completed five drilling programmes (~50,000 m of drilling) that contributed to the initial resource database.
21015Puna21TRS220927Rev0.docx Page 3 of 175
1.5.2 Exploration Activities – Pirquitas
Prior to SSR, the Sunshine Mining and Refining Company (Sunshine) completed comprehensive mineral exploration on the Pirquitas property, including geological mapping, geophysical surveying (44 line-kilometres of ground magnetics and 19.2 line-kilometres of induced polarisation surveying), underground rock samplin,g and multiple programmes of reverse circulation (RC) and diamond drilling (DD). In May 2004, SSR fully acquired Sunshine’s ownership in the property and continued to advance the project through detailed drilling, underground resource definition, and mining.
1.6 Sample Preparation, Analyses, and Security
All drilling was completed by professional drilling companies using standard industry methods.
Sample and assay procedures applied in the drilling programme are consistent with generally accepted industry best practices. The statistical analysis of quality control data shows good accuracy and precision with no significant contamination.
1.7 Data Verification
No material sample bias was identified during the review of the drill data and assays. SSR has identified an issue with some pre-2009 drillhole collar locations in the Pirquitas drilling and has made a reasonable attempt at rectifying the issue. This issue is not expected to have a material effect on the quantity and quality of the Mineral Resources inventory and should be able to be managed operationally.
Data collection procedures are in accordance with generally accepted industry best practices and the resultant data is suitable for use in mineral resource estimation.
1.8 Mineral Resources Estimates
1.8.1 Mineral Resources Estimate – Chinchillas Property
The Mineral Resources have been estimated for the Chinchillas property in conformity with generally accepted practices and reported in accordance with S-K 1300. The Chinchillas resource model presented in this Puna21TRS was completed on 28 August 2020.
The Mineral Resources estimate has been generated for the Mantos deposit from drillhole sample assay results and the interpretation of a geological model which relates to the spatial distribution of silver, lead, and zinc. Interpolation characteristics were defined based on the geology, drillhole spacing, and geostatistical analysis of the data.
Estimations were made from three-dimensional (3D) cell models based on geostatistical applications using commercial software. The model uses a cell size of 8 m L x 8 m W x 5 m H.
The Mineral Resources were classified according to proximity to sample data locations.
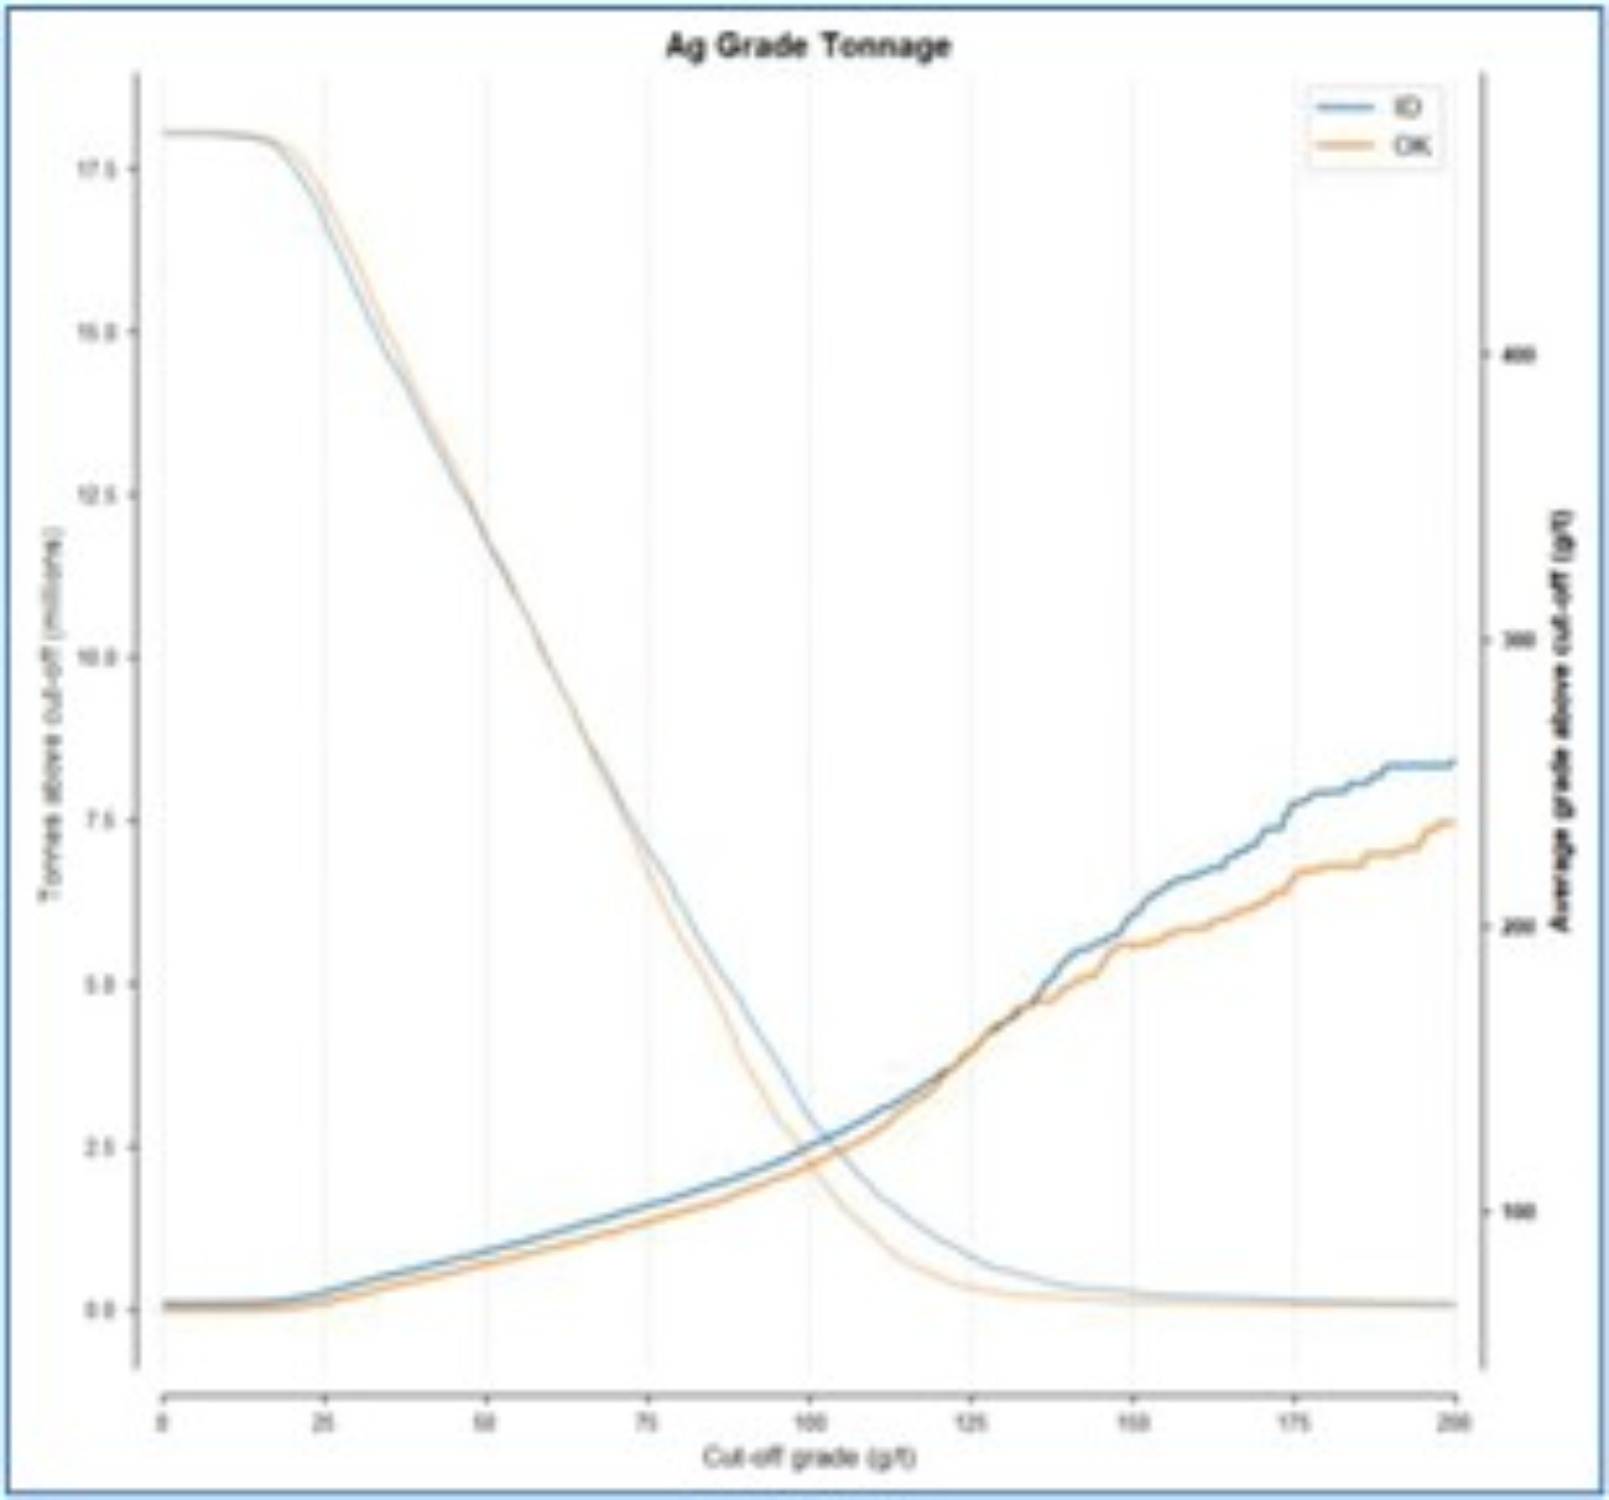
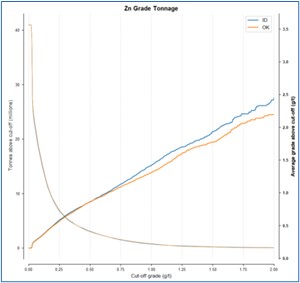
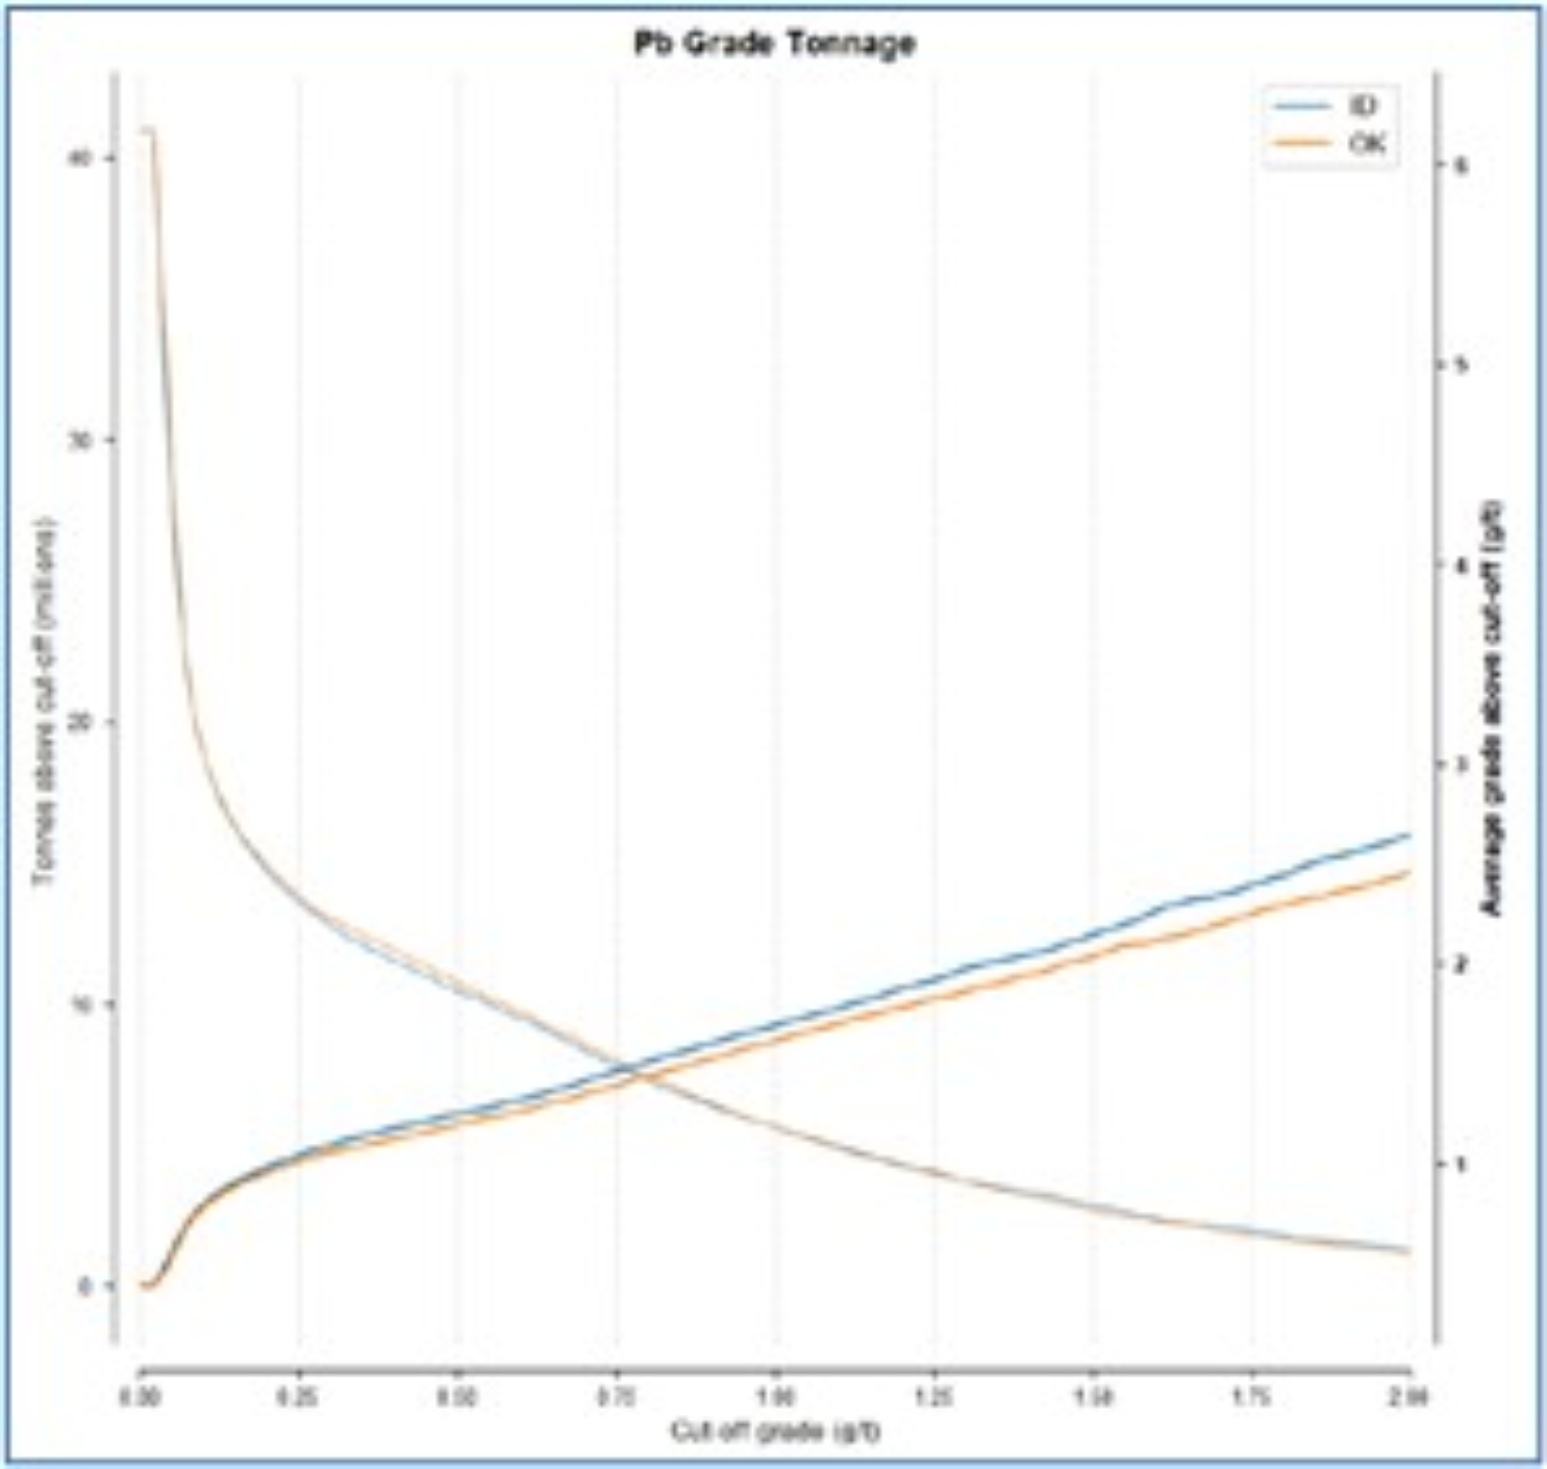
Table 1.1 and Table 1.2 summarise the estimate of Mineral Resources for the Chinchillas project, effective as at 31 December 2021. Mineral Resources that are not Mineral Reserves do not have demonstrated economic viability. The estimate of Mineral Resources may be materially affected by environmental, permitting, legal, title, taxation, socio-political, marketing, or other relevant issues. The quantity and grade of reported Inferred Mineral Resources are uncertain in nature and there has been insufficient exploration to classify these Inferred Mineral Resources as Indicated or Measured Mineral Resources. It cannot be assumed that all or any part of an Inferred Mineral Resource will be upgraded to an Indicated or Measured Mineral Resources as a result of continued exploration.
21015Puna21TRS220927Rev0.docx Page 4 of 175
In determining the cut-off grade, the reasonable prospects for eventual economic extraction requirement generally implies that the quantity and grade estimates meet certain economic thresholds taking into account an open pit extraction scenario with road transport and processing at the Pirquitas Operation. This includes consideration of the technical and economic parameters listed above, but also includes additional operating costs, estimated at $12/t, related to the handling and transportation of ore from the Chinchillas property to the Pirquitas Operation.
1.8.1.1 Mineral Resources Estimate – Socavon Deposit
A review of the pit optimisation work for the Socavon deposit was undertaken using the NSR and other assumptions used for the Mantos deposit. The review concluded that there was no suitable pit shell produced to meet the standard of reasonable prospects for extraction. Therefore, the Socavon Mineral Resources previously reported by SSR have not been included in the 2021 Puna Mineral Resources.
Table 1.1 Summary of Chinchillas Mineral Resources Estimate Exclusive of Mineral Reserves (as at 31 December 2021)
Based on $22.00/oz Silver, $0.95/lb Lead, and $1.15/lb Zinc
| | | | | | | | | | | | | | | | | | | | | | | |
| Mineral Resources Classification | Tonnage
(kt) | Grades | Contained Metal |
Ag
(g/t) | Pb
(%) | Zn
(%) | Silver
(koz) | Lead
(klb) | Zinc
(klb) |
| Measured | 1,110 | 99.2 | 0.86 | 0.31 | 3,540 | 21,015 | 7,552 |
| Indicated | 4,904 | 101.1 | 0.88 | 0.19 | 15,943 | 95,632 | 20,454 |
| Measured + Indicated | 6,013 | 100.8 | 0.88 | 0.21 | 19,483 | 116,647 | 28,006 |
| Inferred | 165 | 101.9 | 0.48 | 0.16 | 540 | 1,746 | 582 |
1. Mineral Resources are reported based on 31 December 2021 topography surface.
2. The Mineral Resources are contained within a pit shell generated using an NSR cut-off of $33.20/t.
3. The Mineral Resources estimates are based on metal price assumptions of $22.00/oz silver, $0.95/lb lead, and $1.15/lb zinc.
4. Metallurgical recoveries vary with grade and average recoveries are, 98% silver, 95% lead and 63% for zinc.
5. The point of reference for Mineral Resources is the point of feed into the processing facility.
6. Mineral Resources are reported exclusive of Mineral Reserves.
7. SSR has 100% ownership of the Project.
8. All ounces reported represent troy ounces, and g/t represents grams per metric tonne.
9. Totals may vary due to rounding.
21015Puna21TRS220927Rev0.docx Page 5 of 175
Table 1.2 Summary of Metallurgical Recoveries and Cut-off Values of Chinchillas Mineral Resources Estimate Exclusive of Mineral Reserves
(as at 31 December 2021)
Based on $22.00/oz Silver, $0.95/lb Lead, and $1.15/lb Zinc
| | | | | | | | | | | | | | | | | | | | | | | | | | |
| Mineral Resources Classification | Tonnage
(kt) | Grades | Metallurgical Recovery | Cut-off NSR ($/t) |
Ag
(g/t) | Pb
(%) | Zn
(%) | Silver
(%) | Lead
(%) | Zinc
(%) |
| Measured | 1,110 | 99.2 | 0.86 | 0.31 | 98 | 95 | 63 | 33.2 |
| Indicated | 4,904 | 101.1 | 0.88 | 0.19 | 98 | 95 | 63 | 33.2 |
| Measured + Indicated | 6,013 | 100.8 | 0.88 | 0.21 | 98 | 95 | 63 | 33.2 |
| Inferred | 165 | 101.9 | 0.48 | 0.16 | 98 | 95 | 63 | 33.2 |
1. Mineral Resources are reported based on 31 December 2021 topography surface.
2. The Mineral Resources are contained within a pit shell generated using an NSR cut-off of $33.20/t.
3. The Mineral Resources estimates are based on metal price assumptions of $22.00/oz silver, $0.95/lb lead, and $1.15/lb zinc.
4. Metallurgical recoveries vary with grade and average recoveries are, 98% silver, 95% lead and 63% for zinc.
5. The point of reference for Mineral Resources is the point of feed into the processing facility.
6. Mineral Resources are reported exclusive of Mineral Reserves.
7. SSR has 100% ownership of the Project.
8. All ounces reported represent troy ounces, and g/t represents grams per metric tonne.
9. Totals may vary due to rounding.
1.8.2 Mineral Resources Estimate – Pirquitas Deposit
The Mineral Resources have been estimated for the Pirquitas property in conformity with generally accepted guidelines and reported in accordance with S-K 1300. The Pirquitas resource model presented in this Puna21TRS was completed on 30 September 2013 and the reasonable prospects of the underground mining scenario was completed on 24 January 2018.
The Mineral Resources estimate has been generated for the Mining Area veins from drillhole sample assay results and the interpretation of a geological model which relates to the spatial distribution of silver and zinc. Interpolation characteristics were defined based on the geology, drillhole spacing, and geostatistical analysis of the data.
Estimations were made from 3D cell models based on geostatistical applications using commercial software. The model uses a cell size of 4 m x 4 m x 8 m cells to be compatible with the grade control model.
The Mineral Resources were classified according to proximity to sample data locations.
Table 1.3 and Table 1.4 summarise the estimate of Mineral Resources for the Pirquitas project effective as of 31 December 2021. Mineral Resources that are not Mineral Reserves do not have demonstrated economic viability. The estimate of Mineral Resources may be materially affected by environmental, permitting, legal, title, taxation, socio-political, marketing, or other relevant issues. The quantity and grade of reported Inferred Mineral Resources are uncertain in nature and there has been insufficient exploration to classify these Inferred Mineral Resources as Indicated or Measured Mineral Resources. It cannot be assumed that all or any part of an Inferred Mineral Resource will be upgraded to an Indicated or Measured Mineral Resources as a result of continued exploration.
In determining the cut-off grade, the reasonable prospects for eventual economic extraction requirement generally implies that the quantity and grade estimates meet certain economic thresholds, taking into account an underground mining extraction scenario.
21015Puna21TRS220927Rev0.docx Page 6 of 175
Table 1.3 Summary of Pirquitas Mineral Resources Estimate Exclusive of Mineral Reserves (as at 31 December 2021)
Based on $20.00/oz Silver, $1.10/lb Lead, and $1.30/lb Zinc
| | | | | | | | | | | | | | | | | | | | | | | |
| Mineral Resources Classification | Tonnage
(kt) | Grades | Contained Metal |
Ag
(g/t) | Pb
(%) | Zn
(%) | Silver
(koz) | Lead
(klb) | Zinc
(klb) |
| Measured | 79 | 444.5 | 0.197 | 1.17 | 1,129 | 343 | 2,044 |
| Indicated | 2,555 | 287.7 | 0.016 | 4.56 | 23,627 | 895 | 256,672 |
| Measured + Indicated | 2,634 | 292.4 | 0.021 | 4.46 | 24,756 | 1,240 | 258,715 |
| Inferred | 1,080 | 206.9 | 0.004 | 7.45 | 7,185 | 95 | 177,394 |
1. The Mineral Resources estimates are contained within underground mining shapes based on $90/t to $100/t NSR cut-off.
2. The Mineral Resources estimates are based on metal price assumptions of $20.00/oz silver, $1.30/lb zinc, and $1.10/lb lead.
3. Metallurgical recoveries vary with grade and on average are, 87% silver and 85% for zinc and 50% for lead.
4. The point of reference for Mineral Resources is the point of feed into the processing facility
5. Mineral Resources are reported exclusive of Mineral Reserves.
6. SSR has 100% ownership of the Project.
7. All ounces reported represent troy ounces, and g/t represents grams per metric tonne.
8. Totals may vary due to rounding.
Table 1.4 Summary of Metallurgical Recoveries and Ownership of Pirquitas Mineral Resources Estimate Exclusive of Mineral Reserves (as at 31 December 2021) Based on $20.00/oz Silver, $1.10/lb Lead, and $1.30/lb Zinc
| | | | | | | | | | | | | | | | | | | | | | | | | | | | | |
| Mineral Resources Classification | Tonnage
(kt) | Grades | Metallurgical Recovery | Cut-off NSR ($/t) |
Ag
(g/t) | Pb
(%) | Zn
(%) | Silver
(%) | Lead
(%) | Zinc
(%) |
| Measured | 79 | 444.5 | 0.197 | 1.17 | 87 | 50 | 85 | 100 |
| Indicated | 2,555 | 287.7 | 0.016 | 4.56 | 87 | 50 | 85 | 100 |
| Measured + Indicated | 2,634 | 292.4 | 0.021 | 4.46 | 87 | 50 | 85 | 100 |
| Inferred | 1,080 | 206.9 | 0.004 | 7.45 | 87 | 50 | 85 | 100 |
1. The Mineral Resources estimate is contained within underground mining shapes based on $90/t to $100/t NSR cut-off.
2. The Mineral Resources estimates are based on metal price assumptions of $20.00/oz silver, $1.30/lb zinc, and $1.10/lb lead.
3. Metallurgical recoveries vary with grade and on average are, 87% silver and 85% for zinc and 50% for lead.
4. The point of reference for Mineral Resources is the point of feed into the processing facility
5. Mineral Resources are reported exclusive of Mineral Reserves.
6. SSR has 100% ownership of the Project.
7. All ounces reported represent troy ounces, and g/t represents grams per metric tonne.
8. Totals may vary due to rounding.
21015Puna21TRS220927Rev0.docx Page 7 of 175
1.9 Mineral Reserves Estimates
1.9.1 Mineral Reserves Estimate – Chinchillas
Open pit mining is carried out by MPSA as an owner-mining operation with ore hauled from the Chinchillas pit to the Pirquitas plant. The Mineral Reserves were developed based on mine planning work completed in 2021 that included pit optimisation and re-design of the pit phases. Table 1.5 and Table 1.6 summarise the Mineral Reserves for Chinchillas. The Chinchillas Mineral Reserves estimate has been generated for the Mantos deposit based on the following inputs: metal prices, resource model, geotechnical information, operating costs, mineral processing recoveries, concentrate transport, and off site costs and charges. Costs for all areas of the operation are estimated from actual costs. These were used to calculate a net smelter return (NSR) and $44.11/t NSR was used for the Mineral Reserves cut-off.
Metal prices for the Mineral Reserves cut-off were estimated after analysis of consensus industry forecasts and compared to metal prices used in other published studies. The prices selected were then reduced from the average long-term prices to take a conservative view of the long-term price. The long-term prices for the cut-off were assumed to apply from the start of 2026. The metal prices are representative of the range of price estimates publicly reported for Mineral Reserves cut-offs.
Table 1.5 Summary of Chinchillas Mineral Reserves Estimate (as at 31 December 2021)
Based on $18.50/oz Silver, $0.90/lb Lead, and $1.05/lb Zinc
| | | | | | | | | | | | | | | | | | | | | | | |
| Mineral Reserves Classification | Tonnage
(kt) | Grade | Contained Metal |
Ag
(g/t) | Pb
(%) | Zn
(%) | Silver
(koz) | Lead
(klb) | Zinc
(klb) |
| Proven | 2,379 | 168.9 | 1.33 | 0.34 | 12,918 | 69,735 | 17,827 |
| Probable | 5,041 | 155.3 | 1.29 | 0.25 | 25,174 | 143,344 | 27,780 |
| Probable Stockpiles | 187 | 141.0 | 1.33 | 0.50 | 846 | 5,470 | 2,056 |
| Proven + Probable | 7,606 | 159.2 | 1.30 | 0.28 | 38,938 | 218,681 | 47,692 |
1. Mineral Reserves are reported based on 31 December 2021 topography surface.
2. The Mineral Reserves estimates are based on metal price assumptions of $18.50/oz silver, $0.90/lb lead, and $1.05/lb zinc.
3. The Mineral Reserves estimates are reported at a cut-off grade of $44.11/t NSR.
4. Economic analysis for the Mineral Reserves has been prepared using long-term metal prices of $21.00/oz silver, $0.90/lb lead, and $1.20/lb zinc
5. Processing recoveries vary based on the feed grade. The average recovery is estimated to be 98% for silver, 95% for lead and approximately 63% for zinc.
6. Metals shown in this table are the contained metals in ore mined and processed.
7. The point of reference for Mineral Resources is the point of feed into the processing facility.
8. SSR has 100% ownership of the Project.
9. All ounces reported represent troy ounces, and g/t represents grams per metric tonne.
10. Totals may vary due to rounding.
21015Puna21TRS220927Rev0.docx Page 8 of 175
Table 1.6 Summary of Metallurgical Recoveries of Chinchillas Mineral Reserves Estimate (as at 31 December 2021)
Based on $18.50/oz Silver, $0.90/lb Lead, and $1.05/lb Zinc
| | | | | | | | | | | | | | | | | | | | | | | | | | | | | |
| Mineral Reserves Classification | Tonnage
(kt) | Grades | Metallurgical Recovery | Cut-off NSR ($/t) |
Ag
(g/t) | Pb
(%) | Zn
(%) | Silver
(%) | Lead
(%) | Zinc
(%) |
| Proven | 2,379 | 168.9 | 1.33 | 0.34 | 98 | 95 | 63 | 44.11 |
| Probable | 5,041 | 155.3 | 1.29 | 0.25 | 98 | 95 | 63 | 44.11 |
| Probable Stockpiles | 187 | 141.0 | 1.33 | 0.50 | 98 | 95 | 63 | 44.11 |
| Proven + Probable | 7,606 | 159.2 | 1.30 | 0.28 | 98 | 95 | 63 | 44.11 |
1. Mineral Reserves are reported based on 31 December 2021 topography surface.
2. The Mineral Reserves estimates are based on metal price assumptions of $18.50/oz silver, $0.90/lb lead, and $1.05/lb zinc.
3. The Mineral Reserves estimates are reported at a cut-off grade of $44.11/t NSR.
4. Economic analysis for the Mineral Reserves has been prepared using long-term metal prices of $21.00/oz silver, $0.90/lb lead, and $1.20/lb zinc
5. Processing recoveries vary based on the feed grade. The average recovery is estimated to be 98% for silver, 95% for lead and approximately 63% for zinc.
6. Metals shown in this table are the contained metals in ore mined and processed.
7. The point of reference for Mineral Resources is the point of feed into the processing facility.
8. SSR has 100% ownership of the Project.
9. All ounces reported represent troy ounces, and g/t represents grams per metric tonne.
10. Totals may vary due to rounding.
1.10 Metallurgy and Processing
The metallurgical testing of Chinchillas ore types commenced in 2013 and continued until 2016. The first testwork was focused on silver recovery by both leaching and flotation methods with flotation proving to be superior at this early stage. The second programme continued process development of flotation into separate lead / silver and zinc concentrates. The third testwork campaign was designed to advance the flotation process and test specifically these ore types in the Pirquitas mill flow sheet.
The Pirquitas process plant operating performance since commencement on Chinchillas ores is used to provide the concentrate grade recovery and mass pull relationships, Table 1.7 and Table 1.8.
Table 1.7 Silver / Lead Concentrate Relationships
| | | | | |
| Variable | Variable Formula |
| Ag Recovery | (–0.0631 x Pb recovery2) + (11.655 x Pb recovery) -447.4 |
| Pb Recovery | (–2.6303x Pb Feed2) + (12.329 x Pb Feed) + 80.654 |
| Zn Recovery | (-5.2817 x Zn Feed2)+(Zn Feed x –6.31) + 20.546 |
| Mass Pull | (–0.0024 x Pb Feed2) + (0.0164 x Pb Feed)+-0.0007 |
21015Puna21TRS220927Rev0.docx Page 9 of 175
Table 1.8 Zinc Concentrate Relationships
| | | | | |
| Variable | Variable Formula |
| Ag recovery | (–3.4843 x Zn feed2) + (7.2499 x Zn feed)+0.8295 |
| Pb recovery | (0.024 x (Pb feed / Zn feed)2) + (-0.5988 x (Pb feed / Zn feed)+ 3.1292 |
| Zn recovery | (–195921 x (mass pull Zn)2 + (5620.3 x mass pull Zn)+28.709 |
| Mass Pull | (0.007 x Zn feed2) + (0.0041 x Zn feed+0.0011 |
1.11 Environment, Communities, and Permitting
There are seven communities located in the project's area of influence. and are included in management plans for training and capacity building.
The Puna project does not intrude upon any protected areas. Water quality in the surface waters draining the Project area is typical of a mineralised zone, including some observed elevated metals parameters, but with generally neutral pH. The waste rock is expected to be largely non-acid generating, with a small portion that may be weakly acid generating under certain oxidising conditions. The waste rock with potential for acid production will be placed so any drainage will report to the pit and avoid introduction to the environment.
Although there is no specific mine closure legislation nor bonding requirements in Argentina, a conceptual closure plan has been developed for the Project. Closure costs are estimated at $30.6M. MPSA is also responsible for the closure costs associated with the Pirquitas pit.
An Environmental and Social Impact Assessment (ESIA) was completed for the Chinchillas project and submitted to the regulatory authorities of the province of Jujuy for review, with the license obtained in December 2017. The biannual update of the ESIA was submitted in due time and form, being pending approval by the regulatory authorities of the province of Jujuy. In addition, an addendum to the ESIA for the Pirquitas mine was obtained from MPSA to use the Pirquitas pit for tailings deposition at the Pirquitas Operation, and this authorization must be renewed.
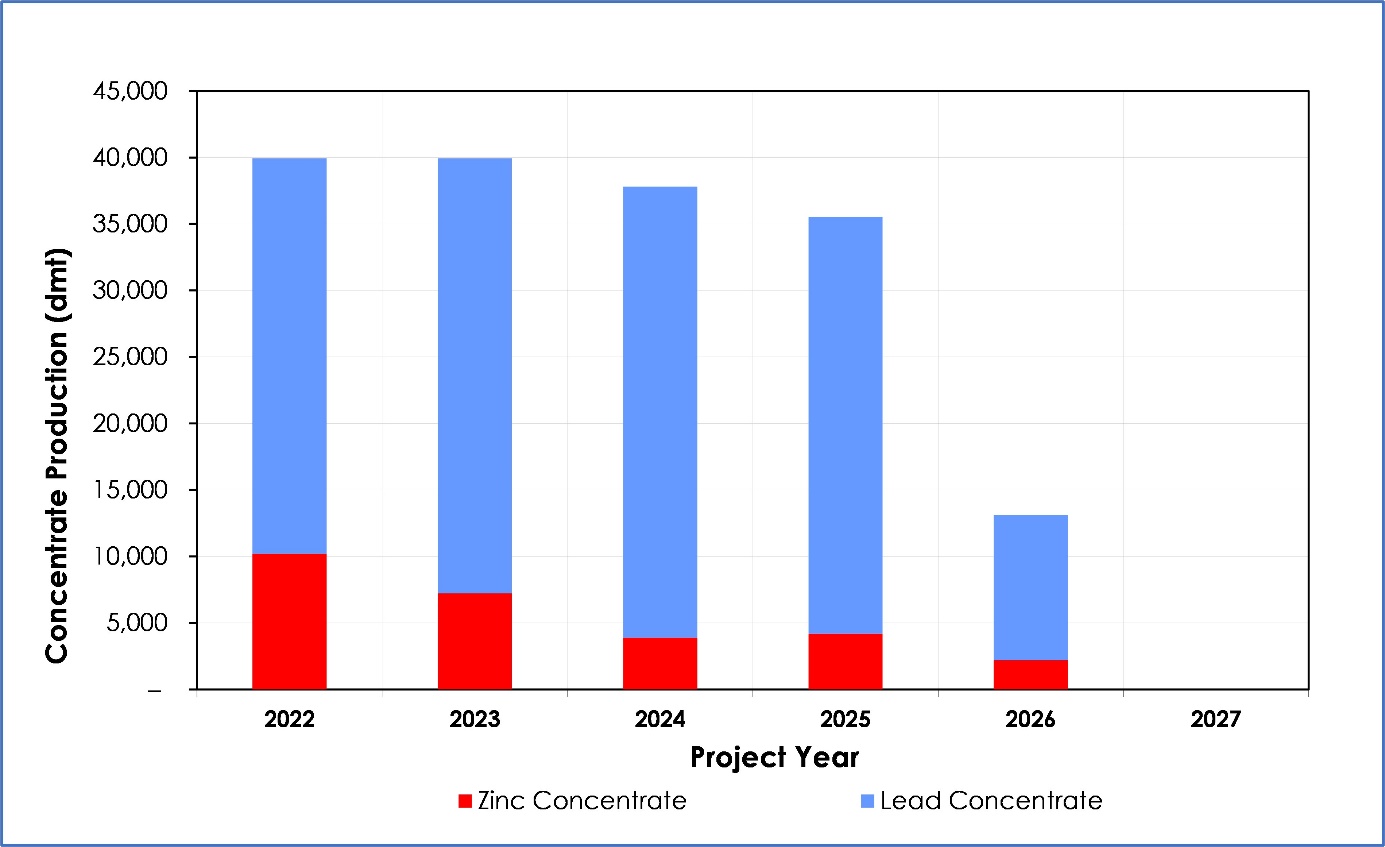
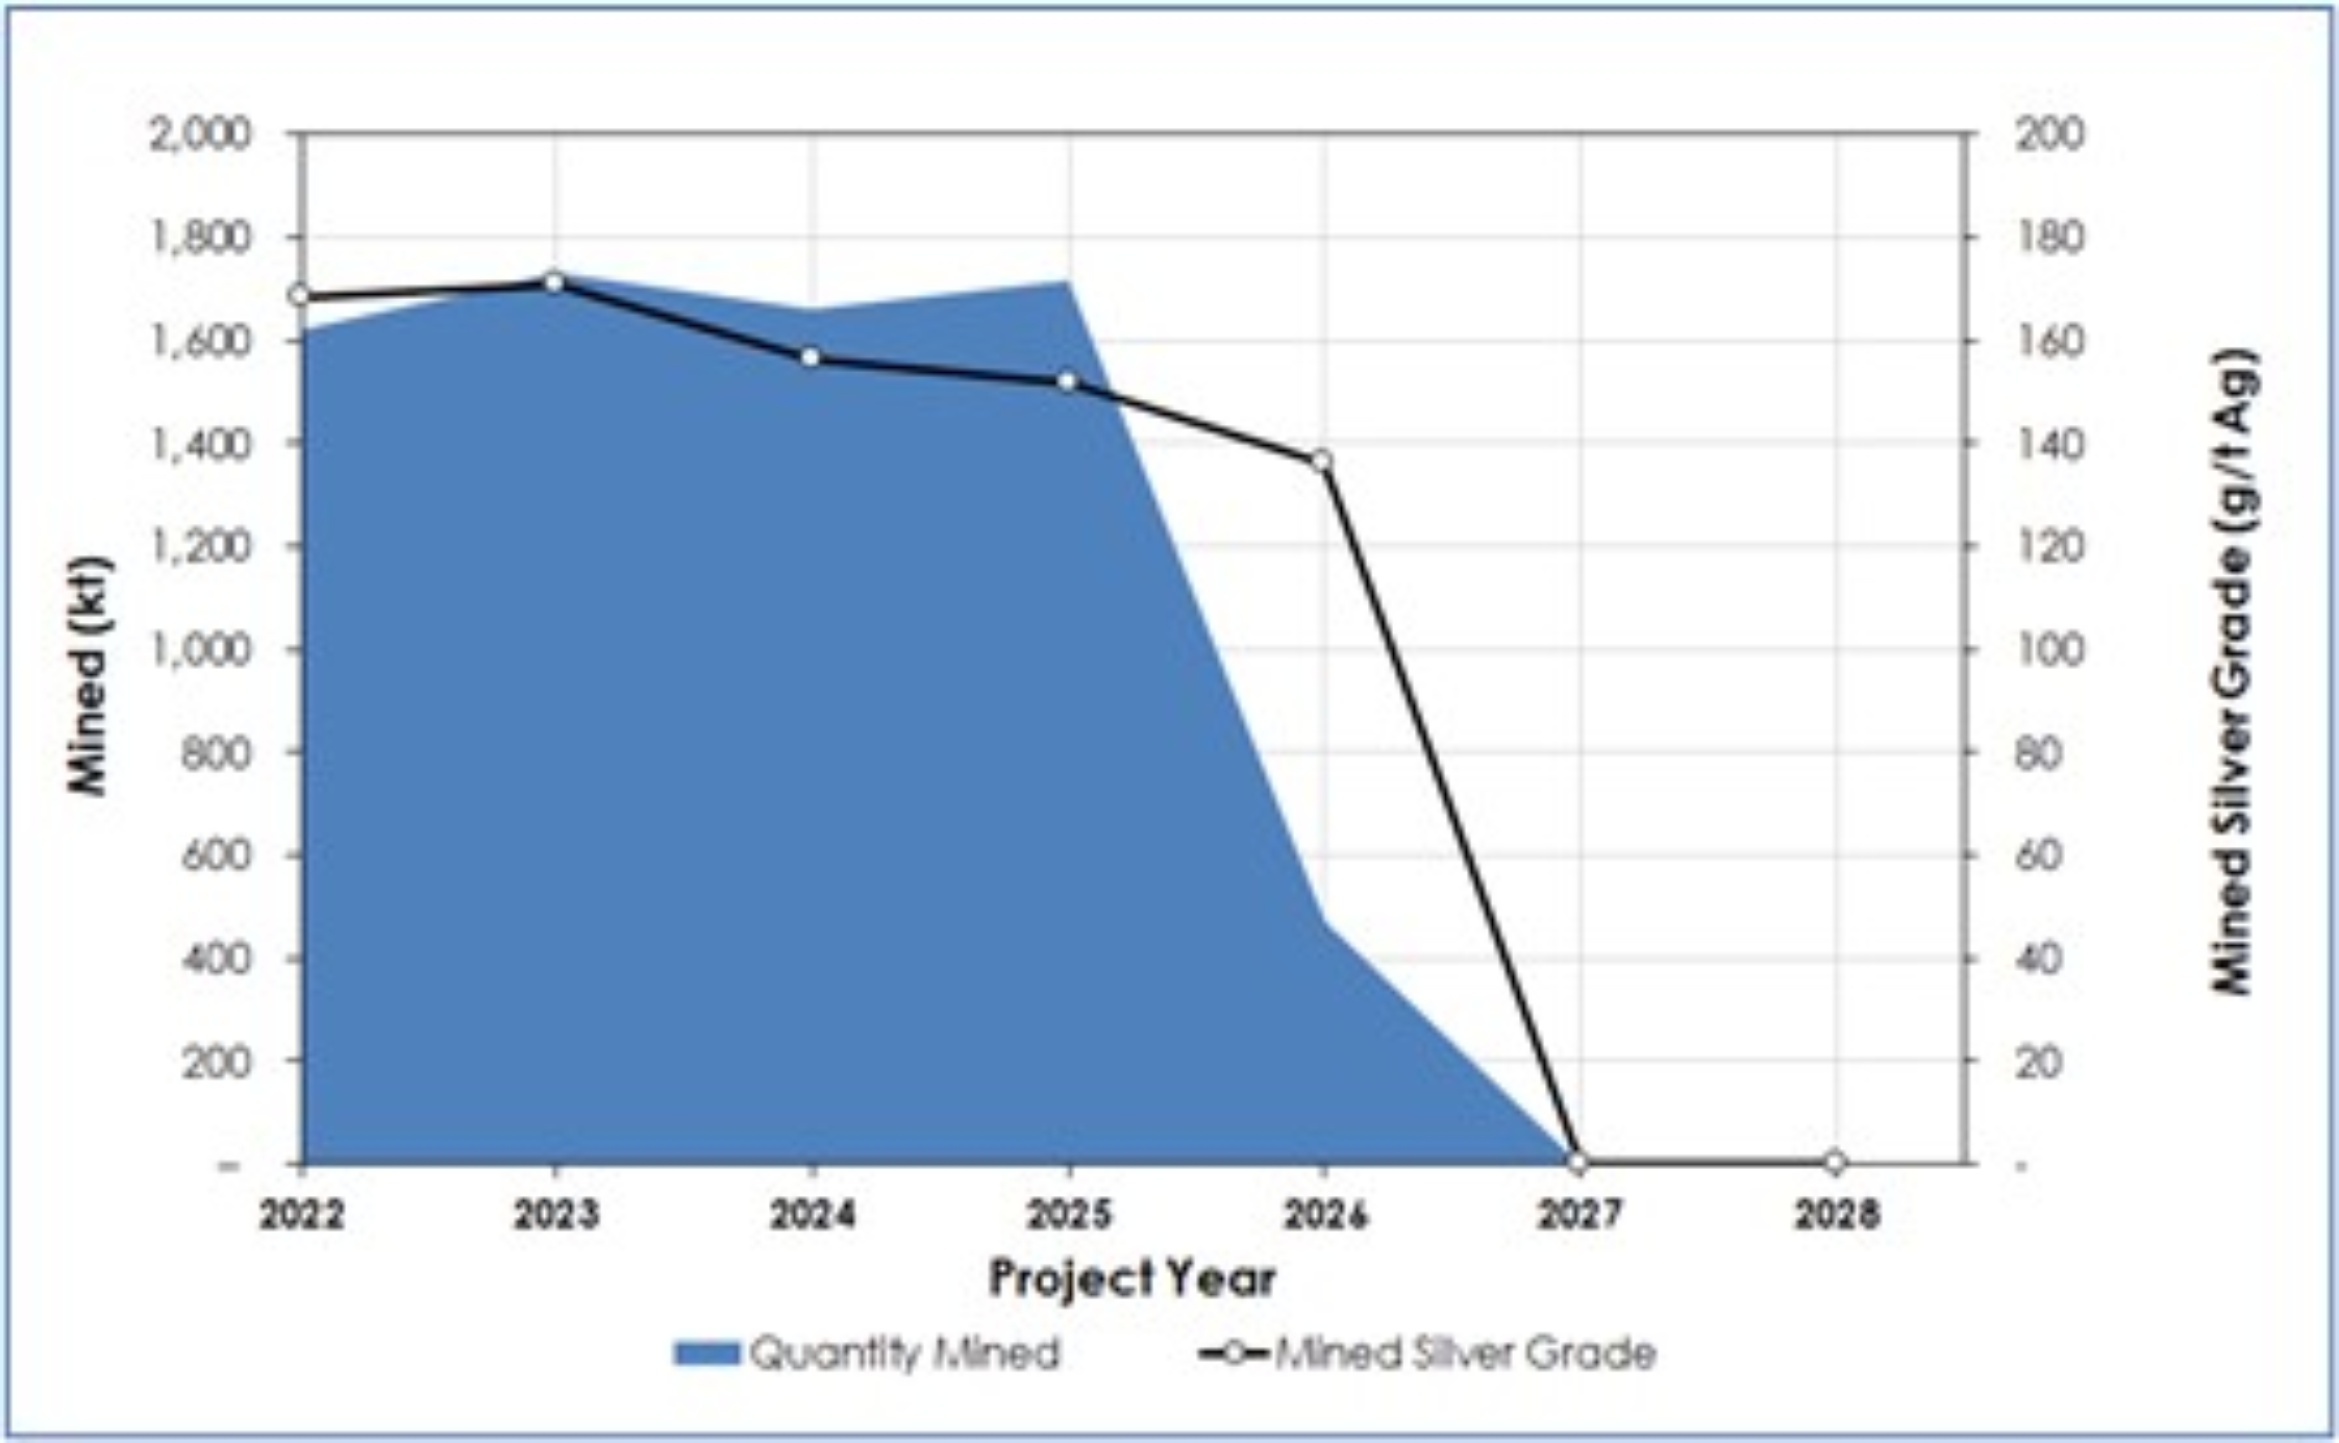
1.12 Production
Future proposed mine production has been scheduled to optimise the mine output and meet the plant capacity. The mining production forecasts are shown in Table 1.9. Mine, process, and metal production are shown in Figure 1.1 to Figure 1.3.
21015Puna21TRS220927Rev0.docx Page 10 of 175
Table 1.9 Mining Production Statistics
| | | | | | | | |
| Item | Unit | Total LOM |
| Ore Processed | | |
| Processed | kt | 7,352 |
| Ag Feed Grade | g/t | 160 |
| Pb Feed grade | % | 1.32 |
| Zn Feed grade | % | 0.29 |
| Silver Recovery | % | 95.5 |
| Concentrate Produced | | |
| Lead Concentrate – in Stockpile | kt | 4 |
| Zinc Concentrate – in Stockpile | kt | 1 |
| Lead Concentrate – Produced | kt | 135 |
| Zinc Concentrate – Produced | kt | 27 |
| Lead Concentrate - Total | kt | 139 |
| Zinc Concentrate - Total | kt | 28 |
| Metal Produced | | |
| Silver | koz | 37,210 |
| Lead | Mlb | 204 |
| Zinc | Mlb | 29 |
Metal produced includes current concentrate stockpiles containing 242 koz silver and 5 Mlb lead.
Figure 1.1 Mining Production Profile
OreWin, 2021
21015Puna21TRS220927Rev0.docx Page 11 of 175
Figure 1.2 Process Feed Profile
OreWin, 2021
Figure 1.3 Silver Production
OreWin, 2021
21015Puna21TRS220927Rev0.docx Page 12 of 175
1.13 Capital and Operating Costs
The cost estimate was prepared by the SSR technical department at site. The QPs reviewed the assumptions, parameters, and methods used to prepare the cost estimate and are of the opinion that they are sufficient for the purposes of validating the economics of the Mineral Reserves. Total capital expenditure is estimated to be $99M.
The life-of-mine (LOM) operating costs are approximately $52.67/t of ore milled, as summarised in Table 1.10.
Table 1.10 Operating Costs Estimate
| | | | | | | | |
| Cost Component | Amount
($M) | LOM Average
($/t milled) |
| Mining | 110 | 15.01 |
| Processing | 183 | 24.95 |
| G&A | 93 | 12.71 |
| Total Operating Costs | 387 | 52.67 |
1.14 Economic Analysis
The estimates of cash flows have been prepared on a real basis as at 1 January 2022 and a mid-year discounting is used to calculate NPV.
The projected financial results include:
•After-tax NPV at a 5% real discount rate is $228M.
•Mine life of five years.
The estimated total cash costs for the LOM is $11.63/oz payable silver. The all-in sustaining costs (AISC) for the LOM, which includes infrastructure capital, capital development and reclamation, averages $13.57/oz payable silver. Unit costs include concentrate in stockpile. Silver provides the primary revenue for the analysis, with contributions from lead and zinc. Credits from lead and zinc are included in the cash cost.
Metal price assumptions used for the economic analysis are shown in Table 1.11.
Table 1.11 Metal Price Assumptions
| | | | | | | | | | | | | | | | | | | | |
| Commodity | Unit | 2022 | 2023 | 2024 | 2025 | Long-Term |
| Silver | $/oz | 24.00 | 23.00 | 22.00 | 21.00 | 21.00 |
| Lead | $/lb | 1.00 | 0.95 | 0.93 | 0.92 | 0.90 |
| Zinc | $/lb | 1.30 | 1.20 | 1.20 | 1.20 | 1.20 |
Other key economic assumptions for the discounted cash flow analyses are shown in Table 1.12.
21015Puna21TRS220927Rev0.docx Page 13 of 175
Table 1.12 Key Economic Assumptions
| | | | | | | | | | | |
| Model Assumption | Unit | Lead Concentrate | Zinc Concentrate |
| Treatment Charge and Refinery Charge(TCRC) | $/t Conc. | 1,191 | 724 |
| Payability – Silver | % | 95 | 75 |
| Payability – Lead | % | 95 | |
| Payability – Zinc | % | | 85 |
| Deduction – Lead | % | 3 | |
| Deduction – Zinc | % | | 8 |
| Minimum Payout Factor | % | 63 | 39 |
| Royalty | % | 3 | 3 |
| Export Duty (revenue minus TCRC's) | % | 4.5 | 4.5 |
| Puna Credit (revenue minus TCRC's) | % | 2.5 | 2.5 |
The key results of the Puna21TRS are summarised in Table 1.13. The projected financial results at a range of discount rates for undiscounted and discounted cash flows and before and after tax are shown in Table 1.14.
The results of NPV5% sensitivity analysis to a range of changes in silver price (primary commodity) and discount rates is shown in Table 1.15. A chart of the cumulative cash flow is shown in Figure 1.4.
21015Puna21TRS220927Rev0.docx Page 14 of 175
Table 1.13 Puna21TRS Results Summary
| | | | | | | | |
| Description | Unit | Total LOM |
| Ore Processed | | |
| Ore Tonnes Treated | kt | 7,352 |
| Ag Feed grade | g/t | 160 |
| Pb Feed grade | % | 1.32 |
| Zn Feed grade | % | 0.29 |
| Silver Recovery | % | 95.5 |
| Concentrates | | |
| Lead Concentrate – in Stockpile | kt | 4 |
| Zinc Concentrate – in Stockpile | kt | 1 |
| Lead Concentrate – Produced | kt | 135 |
| Zinc Concentrate – Produced | kt | 27 |
| Lead Concentrate - Total | kt | 139 |
| Zinc Concentrate - Total | kt | 28 |
| Metal Produced | | |
| Silver | koz | 37,210 |
| Lead | Mlb | 204 |
| Zinc | Mlb | 29 |
| Key Financial Results | | |
| Mine Site Cash Cost | $/oz payable silver | 11.61 |
Royalties and Refining Costs1 | $/oz payable silver | 6.10 |
| Credits | $/oz payable silver | –6.08 |
Total Cash Costs (CC) (after credits)1 | $/oz payable silver | 11.63 |
| All-in Sustaining Costs (AISC) | $/oz payable silver | 13.57 |
| Site Operating Costs | $/t milled | 52.67 |
| Average Silver Price | $/oz | 22.38 |
NPV1 | $M | 228 |
| Discount Rate | % | 5 |
| Mine Life | years | 5 |
1 Metal produced includes current concentrate stockpiles containing 242 koz silver and 5 Mlb lead.
21015Puna21TRS220927Rev0.docx Page 15 of 175
Table 1.14 Financial Results
| | | | | | | | |
| Discount Rate | NPV
($M) |
| Before-Tax | After-Tax |
| Undiscounted | 279 | 253 |
| 2% | 268 | 242 |
| 5% | 253 | 228 |
| 10% | 231 | 206 |
| 12% | 223 | 199 |
| 15% | 212 | 188 |
| 18% | 202 | 179 |
| 20% | 195 | 173 |
Note: NPV includes concentrate in stockpile
Table 1.15 After-Tax NPV Sensitivity to Silver Price and Discount Rates
| | | | | | | | | | | | | | | | | | | | | | | | | | | | | |
| After-Tax NPV | Silver Price
($/oz) |
| 10.00 | 15.00 | 18.50 | 19.00 | 21.00 | 22.00 | 24.00 | 27.00 | 30.00 |
| Discount Rate | $M | $M | $M | $M | $M | $M | $M | $M | $M |
| Undiscounted | –17 | 105 | 192 | 204 | 253 | 278 | 327 | 401 | 474 |
| 2% | –17 | 101 | 183 | 195 | 242 | 266 | 313 | 384 | 454 |
| 5% | –16 | 95 | 172 | 183 | 228 | 250 | 294 | 360 | 427 |
| 10% | –14 | 86 | 156 | 166 | 206 | 226 | 266 | 327 | 387 |
| 12% | –14 | 83 | 150 | 160 | 199 | 218 | 257 | 315 | 373 |
21015Puna21TRS220927Rev0.docx Page 16 of 175
Figure 1.4 After-Tax Annual and Cumulative Cash Flow
OreWin, 2021
1.15 Interpretation and Conclusions
1.15.1 Mineral Resources
Mineral Resources for the Puna21TRS are reported in accordance with S-K 1300.
Areas of uncertainty that may materially impact the Mineral Resources estimates include:
•Assumptions used to generate the data for consideration of reasonable prospects of eventual economic extraction for the Puna deposit.
•Environmental, permitting, legal, title, taxation, socio-political, marketing, or other relevant issues.
•Commodity prices and exchange rates.
•Cut-off grades.
1.15.1.1 Chinchillas
The resource model developed for the Chinchillas deposit uses accepted modelling and grade estimation methods. The model is a reasonable reflection of deposit geology. The approach used to generate the cell model is in accordance with accepted industry standards. The QP has checked the data and methods used to develop the resource model and has validated the resource models. The methods used for the estimate of Mineral Resources and Mineral Reserves is in accordance with S-K 1300.
21015Puna21TRS220927Rev0.docx Page 17 of 175
1.15.1.2 Pirquitas
The resource model developed for the Pirquitas deposit uses accepted modelling and grade estimation methods. The model is a reasonable reflection of deposit geology. The approach used to generate the cell model is in accordance with accepted industry standards. The QP has checked the data and methods used to develop the resource model and has validated the resource models. The methods used for the estimate of Mineral Resources and Mineral Reserves is in accordance with S-K 1300.
1.15.2 Mineral Reserves
Mineral Reserves for the Puna21TRS are reported in accordance with S-K 1300.
Areas of uncertainty that may impact the Mineral Reserves estimate include:
•Any changes to the resource model as a result of further definition drilling at the site.
•Changes to mining conditions that have an impact to operating costs, production rates or mining recovery factors.
•Commodity prices and exchange rates.
1.16 Recommendations
The QPs are not aware of any significant risks and uncertainties that could be expected to affect the reliability or confidence in the information discussed herein.
1.16.1 Further Assessment
The key areas for further studies / work are:
•Potential remains to expand the current Mineral Resource, and to define new Mineral Resources on the property.
•Optimisation of metal prices and cost input parameters.
•More detailed planning and design for rock storage and the general site layout.
•Additional metallurgical laboratory testwork as detailed in Section 10.4.
•Update site standard operating procedures to include a transparent Mineral Resources estimation and Mineral Reserves estimation process, clearly documenting the key input parameters applied, and an audit trail of approvals for each phase of the work performed.
•Continue with ongoing review of capital and operating cost estimates and performance and productivity tracking.
21015Puna21TRS220927Rev0.docx Page 18 of 175
2 INTRODUCTION
The Puna21TRS has been in prepared in accordance with the U.S. Securities and Exchange Commission (US SEC) Regulation S-K subpart 1300 rules for Property Disclosures for Mining Registrants (S-K 1300). This is the first Technical Report Summary for the Puna project.
The Puna project (Puna, or the Project) is directly owned (100%) by SSR Mining Inc. (SSR) through a subsidiary company Puna Operations Inc. (POI) which through other 100% owned subsidiaries owns Mina Pirquitas S.A. (MPSA). MPSA operates the project. SSR has reported that the total cost of the gross mineral properties, plant, and equipment as of 31 December 2021 was $372.4M.
SSR is a gold mining company with four producing assets located in the USA, Turkey, Canada, and Argentina, and with development and exploration assets in the USA, Turkey, Mexico, Peru, and Canada. SSR is listed on the NASDAQ Capital Markets (NASDAQ:SSRM), the Toronto Stock Exchange (TSX:SSRM), and the Australian Stock Exchange (ASX:SSR).
The Project comprises Chinchillas and the Pirquitas property, both of which are located the Jujuy Province in far north Argentina. Ore from the Chinchillas mine is transported to the Pirquitas plant for processing. The Chinchillas mine is located approximately 45 km from the Pirquitas plant. The open pit mine at Pirquitas has been completed.
2.1 Terms of Reference
The Puna21TRS is an independent Technical Report Summary (TRS) on the Project, prepared for SSR by the Puna21TRS Qualified Persons (QPs). The Puna21TRS is based on information and data supplied to the QPs by SSR and other parties where necessary. Any individual or entity referenced as having completed work relevant to the Puna21TRS, but not identified therein as a QP, does not constitute a QP. Puna21TRS QPs have reviewed the supplied data and information and accept this information as being accurate and complete and suitable for use in the Puna21TRS. The primary source of data for the Puna21TRS is the Puna 2021 Project Update Report.
Section 25 describes any information and data supplied by SSR that was outside the areas of expertise of the QPs and was relied upon when forming the findings and conclusions of this report.
The QPs have used their experience and industry expertise to produce the estimates and approximations in the Puna21TRS. It should be noted that all estimates and approximations contained in the Puna21TRS will be prone to fluctuations with time and changing industry circumstances.
The purpose of this Puna21TRS is to report the Mineral Resources and Mineral Reserves for the project. This report is a Feasibility Study (FS) that represents forward-looking information. The forward-looking information includes metal price assumptions, cash flow forecasts, projected capital and operating costs, metal recoveries, mine life and production rates, and other assumptions used in the FS. Readers are cautioned that actual results may vary from those presented. The factors and assumptions used to develop the forward-looking information, and the risks that could cause the actual results to differ materially are presented in the body of this report under each relevant section.
The conclusions and estimates stated in the Puna21TRS are to the accuracy stated in the Puna21TRS only and rely on assumptions stated in the Puna21TRS. The results of further work may indicate that the conclusions, estimates, and assumptions in the Puna21TRS need to be revised or reviewed.
21015Puna21TRS220927Rev0.docx Page 19 of 175
The Puna21TRS should be construed in light of the methods, procedures, and techniques used to prepare the Puna21TRS. Sections or parts of the Puna21TRS should not be read in isolation of, or removed from, their original context.
The Puna21TRS is intended to be used by SSR, subject to the terms and conditions of its contract with OreWin. Recognising that SSR has legal and regulatory obligations, OreWin has consented to the filing of the Puna21TRS with US SEC. Except for the purposes legislated, any other use of this report by any third party is at that party's sole risk.
A list of the references used to prepare the Puna21TRS is provided in Section 24.
2.2 Qualified Persons
The following people served as the QPs as defined in subpart 1300 of US Regulation S-K Mining Property Disclosure Rules (S-K 1300):
•Gregory Gibson, BSc (Mining Engineering), MSc (Mining & Earth Systems Engineering), SME Registered Member (4134135), employed by SSR Mining Inc. as Vice President of Operations - Americas, was responsible for the preparation of Sections 1 to 25.
•Bernard Peters, BEng (Mining), FAusIMM (201743), employed by OreWin Pty Ltd as Technical Director – Mining, was responsible for the overall preparation, the Mineral Reserves estimates, and Sections 1 to 5; Section 10; and Sections 12 to 25.
•Sharron Sylvester, BSc (Geol), RPGeo AIG (10125), employed by OreWin Pty Ltd as Technical Director – Geology, was responsible for the preparation of the Mineral Resources, Sections 1 to 3; Sections 6 to 9; Section 11; and Sections 22 to 25.
2.3 Qualified Persons Property Inspections
Gregory Gibson visited the project 17 June 2021 to 1 July 2021 and 28 January 2022 to 9 February 2022. The site visits included briefings on geology, mine operations, processing, environmental, permitting, and site inspections of current mining and plant and infrastructure. In addition, Gregory has weekly calls with site leadership regarding the day-to-day operations and quarterly reviews of the operation performance.
Bernard Peters has not visited the site due to travel restrictions.
Sharron Sylvester has not visited the site due to travel restrictions.
2.4 Units and Currency
This Technical Report Summary uses metric measurements except where otherwise noted. The currency used is US dollars ($) unless otherwise stated.
2.5 Effective Dates
The report has several effective dates, as follows:
•Effective date of the Technical Report Summary: 31 December 2021
•Effective date of Mineral Resources: 31 December 2021
•Effective date of Mineral Reserves: 31 December 2021
21015Puna21TRS220927Rev0.docx Page 20 of 175
3 PROPERTY DESCRIPTION
3.1 Location
The Chinchillas property is located in the Puna region of north-western Argentina, in the province of Jujuy, department of Rinconada, approximately 290 km from the provincial capital of San Salvador de Jujuy (Figure 3.1). The property is centred at approximately at 3,473,150 mE and 7,512,360 mN (Gauss Kruger, Argentina, Posgar Zone 3; 22°30′13″ S, 66°15′39″ W) at elevations ranging from 4,000–4,200 metres above sea level (masl).
The Pirquitas Operation is also located in the Rinconada Department in the Province of Jujuy. The property is centred at 22°42′ south latitude and 66°30′ minutes west longitude. The city of San Salvador de Jujuy, (Jujuy) the provincial capital, is located approximately 335 km south-east of the property (Figure 1.2). The property is characterised by sparsely vegetated, mountainous terrain at elevations of between 4,000–4,450 masl.
Figure 3.1 Puna Operation Location
SSR, 2021
21015Puna21TRS220927Rev0.docx Page 21 of 175
3.2 Ownership
SSR has 100% ownership of the Puna project. Puna is directly owned (100%) by SSR Mining Inc. (SSR) through a subsidiary company Puna Operations Inc. (POI) which through other 100% owned subsidiaries owns Mina Pirquitas S.A. (MPSA). MPSA operates the project. The corporate structure that links the Puna project and SSR is shown in Figure 3.2.
Figure 3.2 Puna Corporate Structure
SSR, 2021
21015Puna21TRS220927Rev0.docx Page 22 of 175
3.3 Mineral Tenure
3.3.1 Chinchillas Mineral Tenure
Exploitation concessions in Argentina are called ‘Minas’. Minas are defined by the following categories:
•First Category Minas include substances such as gold, silver, platinum, iron, lead, copper, zinc, aluminium, lithium, potassium, etc., and
•Second Category Minas comprise substances such as precious stones in riverbeds, any metal not included in the first category, and others.
The Mina is comprised of one or more ‘pertenencias’, which are units of mining properties. Pertenencias must be rectangular in shape.
In disseminated deposits, such as Chinchillas, the pertenencias can encompass up to 100 ha. The mining property fee or ‘canon’ for a Mina is charged every year. It is currently ARS$320 per pertenencia per year (article 215 Mining Code).
Individuals are entitled to explore for, exploit, and dispose of Minas as owners by means of a legal licence or legal concession granted by the competent authority under the provisions of the Argentine Mining Code. The legal concessions granted for the exploitation of Minas are valid for an undetermined period of time and are considered ‘real property’ giving the concessionaire the right to recover metals from the subsurface vertically underneath the concession, provided that the title holder complies with the obligations set out in the Argentine Mining Code.
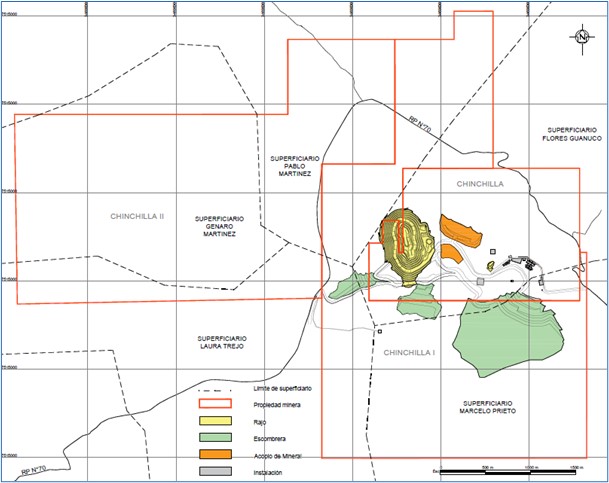
The Chinchillas property consists of three contiguous First Category Minas that cover an area of approximately 2,042.56 ha, as set out in Table 3.1 (see also Figure 3.3).
Table 3.1 Chinchillas Exploitation Concessions
| | | | | | | | |
| Concession | File No. | Area
(ha) |
| Chinchilla | 469-M-56 | 329 |
| Chinchilla I | 079-D-96 | 830.98 |
| Chinchilla II | 1943-V-2013 | 882.58 |
The Chinchilla Mina comprises four pertenencias, while the Chinchilla I and Chinchilla II Minas each comprise nine pertenencias.
All Minas are valid and in good standing.
By July 2015, Valle Del Cura S.A. (VDC) completed option payments to earn a 100% interest in the Chinchilla and Chinchilla I properties, to a total of $1,866,000 paid.
Subsequently, Mina Pirquitas S.A., upon commencement to build a mine on these two properties, paid $1,200,000 to the vendors.
The Chinchilla II Mina was acquired directly by VDC and is not subject to option payments.
Concentrates produced at the Project are subject to a maximum 3% ‘mouth of mine value’ royalty that is payable to the Province of Jujuy. This royalty payment is based on the net recoverable value of the contained metals less certain operating costs.
21015Puna21TRS220927Rev0.docx Page 23 of 175
MPSA and SSR have advised that all necessary permits and titles are in place for the current operations. Additional permitting updates may be required but MPSA advise that these are expected to be approved.
Figure 3.3 Property Map Showing Chinchilla, Chinchilla I and Chinchilla II Concessions
SSR, 2021
3.3.1.1 Chinchillas Surface Rights
MPSA entered into agreements with occupants and owners of the land on which Mina Chinchilla, Mina Chinchilla I, and Mina Chinchilla II are located to acquire the rights to carry out the Project. All of the Minas comprising the Chinchillas property, which provide exploration and exploitation rights, are valid and in good standing.
3.3.1.2 Chinchillas Permitting
According to the biannual Environmental Impact Study renewal, MPSA also submitted the second Update of Chinchillas mine in October 2021. This report is currently being reviewed by Mining Authorities.
21015Puna21TRS220927Rev0.docx Page 24 of 175
3.3.1.3 Chinchillas Environmental Liabilities
Prior to initiating work on the Chinchilla Mina, an inspection was performed by the mining and environmental authorities regarding potential pre-existing environmental liabilities. There are remnants of historical mining activities in the Project area, such as small buildings, small areas of workings excavated in the 1960’s, historical drilling platforms, trenches and holes. All of these liabilities were declared as pre-existing in Golden Arrow’s ESIA for the Chinchilla Mina, there were no findings and/or requests by the environmental authorities, and the Chinchilla ESIA report was approved.
3.3.1.4 Chinchillas Tenure Factors and Risks
Except as set out herein, to the extent known, there are no additional factors or risks that may affect the access, title, right or ability to perform work on the Chinchillas property.
3.3.2 Pirquitas Mineral Tenure
MPSA and SSR have advised that all necessary permits and titles are in place for the current operations. Additional permitting updates may be required but MPSA advise that these are expected to be approved.
3.3.2.1 Pirquitas Operation Surface Rights
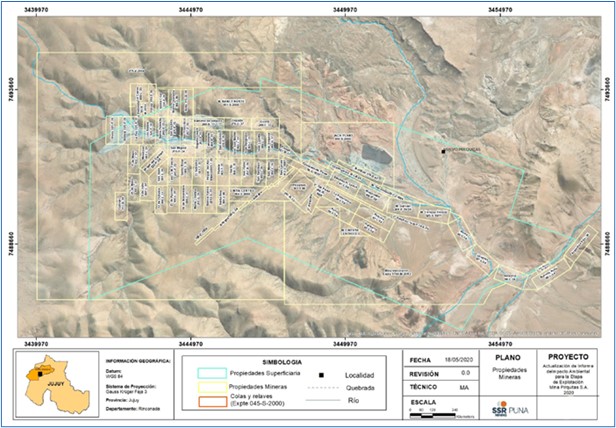
The Pirquitas Operation includes the surface rights to a group of nine contiguous land parcels covering an area of approximately 7,500 ha, as set out in Table 3.2 and shown in Figure 3.4. This area corresponds to the surface property owned by MPSA, the area of the mining concession is larger.
3.3.2.2 Pirquitas Exploitation Concessions
Mina Pirquitas comprises 54 mining properties (concessions) that cover an area of approximately 9,742 ha shown in Figure 3.4. These parcels were used for purposes such as housing, infrastructure, processing, and tailings facilities. MPSA is the freehold title holder of the area covered by such surface rights.
Table 3.2 Pirquitas Operation Surface Rights
| | | | | | | | |
| Parcel No. | Registration No. | Area
(ha) |
| 531 | L-1111 | 1,000.1 |
| 532 | L-1112 | 1,000.0 |
| 533 | L-1113 | 750.0 |
| 534 | L-1114 | 749.6 |
| 535 | L-1115 | 1,000.0 |
| 536 | L-1116 | 1,000.0 |
| 537 | L-1117 | 1,005.0 |
| 538 | L-1118 | 496.0 |
| 539 | L-1119 | 500.1 |
21015Puna21TRS220927Rev0.docx Page 25 of 175
Figure 3.4 Property Map Showing Pirquitas Concessions
MPSA, 2020
3.3.2.3 Pirquitas Operation Permitting
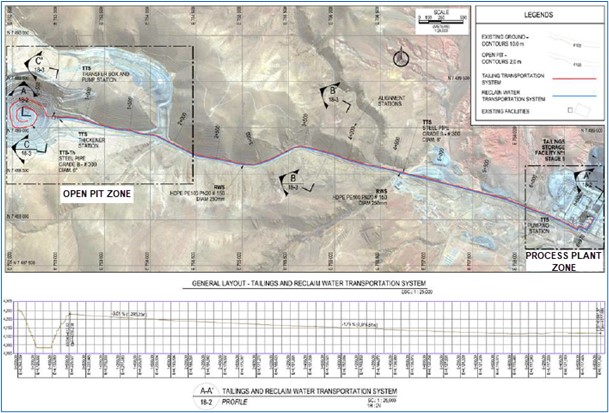
The capacity of the current tailings facility at Pirquitas has been exhausted and to maintain mining and processing production disposal of tailings has been into the Pirquitas pit. Mining at the Pirquitas pit was completed in January 2017, a number of upgrades have been undertaken to allow tailings to be transported from the Chinchillas Project to a portion of the Pirquitas pit. These upgrades included constructing a pipeline for in-pit disposal, and construction of the discharge system from the tailings transport pipeline, an in-pit water reclaim system, and a pipeline from the Pirquitas pit to the Pirquitas plant to return water for reuse. These upgrades have allowed for additional tailings capacity for the processing of Chinchillas ore.
The use of the Pirquitas pit for tailings deposition at the Pirquitas Operation is a modification to the mining activities not contemplated in MPSA’s ESIA for the Pirquitas mine until 2016. On August 2017 MPSA issued to Mining Authorities an Addendum of the 2016 ESIA Update that included the upgrades to conduct the tailings to the pit of Mina Pirquitas. The permit was obtained on 24 September 2018 by Resolution No. 056/2018. Since then, MPSA has submitted to Mining Authorities the ESIA Update for Mina Pirquitas in September 2020, which is under review.
21015Puna21TRS220927Rev0.docx Page 26 of 175
3.3.2.4 Pirquitas Tenure Factors and Risks
Except as set out herein, to the extent known, there are no additional factors or risks that may affect the access, title, right or ability to perform work on the Pirquitas property.
3.4 Other Significant Factors and Risks
SSR have advised that there are no other known significant risks that may affect access, title or the right or ability to perform mining related work on the Property.
Legal matters such as statutory and regulatory interpretations affecting the mine plan and environmental matters are outside the expertise of the QPs (see Section 25).
The Puna21TRS QPs consider it reasonable to rely on SSR because SSR employs professionals and other personnel with responsibility in these areas and these personnel have the best understanding of these areas.
Additionally, the project has been in operation for a number of years, and following a review of the current supplied information, the opinion of the Puna21TRS QPs is that the current plans appear adequate to address any issues related to environmental compliance, permitting, and local individuals or groups.
21015Puna21TRS220927Rev0.docx Page 27 of 175
4 ACCESSIBILITY, CLIMATE, LOCAL RESOURCES, INFRASTRUCTURE AND PHYSIOGRAPHY
Ore from the Chinchillas mine is transported to the Pirquitas plant for processing. The Chinchillas mine is located approximately 45 km from the Pirquitas plant.
4.1 Accessibility
The Chinchillas property is accessed most directly from the provincial capital of San Salvador de Jujuy via National Route No. 9, northwards along the Humahuaca River to the town of Abra Pampa. The route continues along Provincial Route No. 7 westward for 66 km, through the village of Santo Domingo. The roads are maintained by the Province and are accessible year round. Several temporary rivers cross the route so four wheel drive vehicles are recommended in the rainy season.
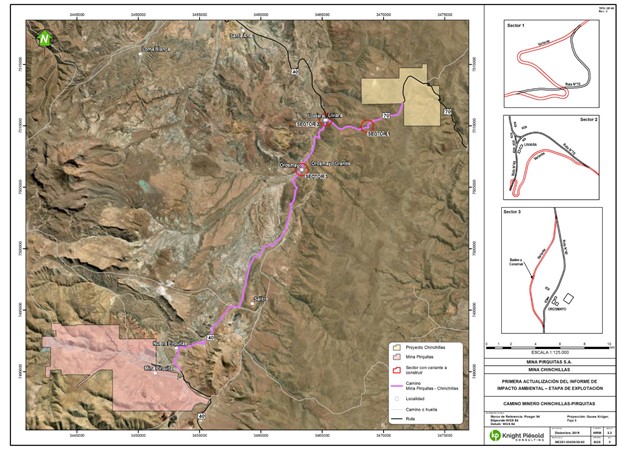
The other route to the Chinchillas property and to the Pirquitas Operation follows National Route No. 9 northwards from San Salvador de Jujuy to Purmamarca, then turns north-west on paved road No. 52 to the town of Susques. From there, National Route No. 40 heads to Provincial Route No. 70 that leads to Chinchillas at the Fundiciones mountain pass. This route is more appropriate for heavy transport vehicles and is used by traffic to the Pirquitas mine and mill, located approximately 45 km to the south-west of Chinchillas along the route.
Concentrate shipments from Pirquitas are currently trucked to Susques, Jujuy from Pirquitas via Route 77, and from there to Buenos Aires via Route 9. At arrival to the terminal, the material is directly dispatched from the port facilities to the concentrate buyers.
4.2 Physiography, Climate, and Vegetation
The Chinchillas deposit terrain has an elliptical, caldera-like shape with steep rolling hills surrounding the caldera depression. It is located near the Fundiciones mountain pass, with the Rinconada and Carahuasi ranges extending from north–south. Elevations range from about 4,000–4,200 masl. The highest elevation in the area is Cerro Granada at 5,696 masl, 28 km to the south-west. The Uquillayoc river runs through the Project area and is fed by many small tributaries.
At Pirquitas, elevations on the property range from 4,000–4,450 masl. The processing plant, tailings impoundment and main workers camp are located in the eastern third of the Pirquitas property in an area of relatively open ground that lies at an elevation of 4,100 masl, and the Pirquitas pit, which ceased mining operations in January 2017, is situated about 7 km west of the mill at a slightly higher elevation.
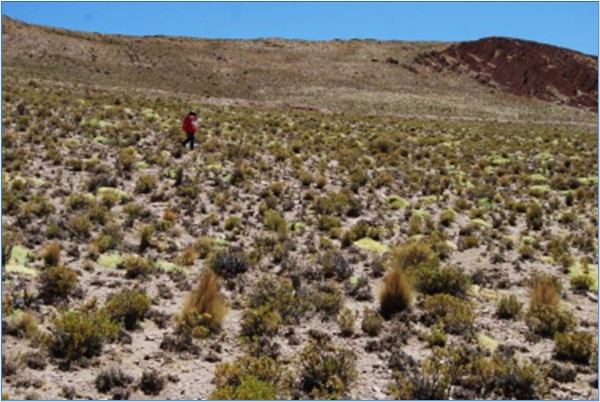
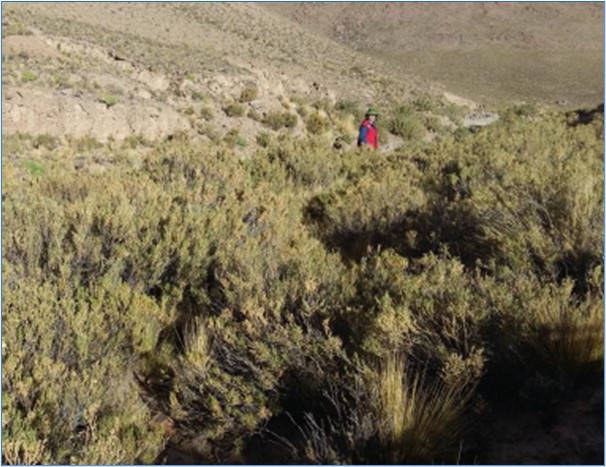
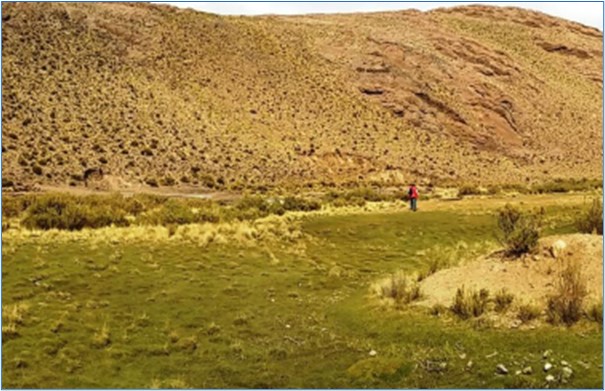
The regional climate is similar at both Chinchillas and Pirquitas and is arid to semi-arid, tropical-subtropical influenced by high desert (Blasco, 2011). Rain is scarce and mainly occurs during the rainy season (November to March), with a mean annual precipitation of 300 mm. The annual mean temperature is 18°C, however during the winter it ranges down to –7.7 ºC to 7.5 ºC. Dry and windy conditions often prevail in the area. Natural vegetation is patchy to sparse and consists of xerophilous and steppe bushes like iro (Festuca ortophylia), and coirón (Stipachrysophylla). Acantoliphia haustata is the predominant species with the Yareta (Azorella compacta), less frequent. The tola (Parastrepia ssp.) and small trees like the queñoa (Polylepis tomentella) can be found in depressions (Blasco, 2011).
Animal species found in the area include mammals such as llamas, puna foxes, and vizcachas, as well as several mice species, chinchillas and ferrets. Other fauna in the area include lizards, and birds such as small rheas, owls, ducks, condors, and falcons (Blasco, 2011).
21015Puna21TRS220927Rev0.docx Page 28 of 175
4.3 Local Resources and Infrastructure
Chinchillas and Pirquitas are located in the rural zone of Rinconada Department, with an approximate population of 2,500 people. It covers an area of 6,407 km2, includes over twenty small communities, and has basic public services including a police department and health centre. The nearest community to Chinchillas is the village of Santo Domingo, and nearest to Pirquitas is the village of Nuevo Pirquitas. Historically, the local population was mainly employed in ranching, however the operation at Pirquitas has created a significant local trained mining workforce. Basic amenities are supplied from Susques and Abra Pampa, while supplies for mining are obtained through the provincial capital of San Salvador de Jujuy, which has an airport with daily commercial air service to Buenos Aires.
The nearest hospital is located in Abra Pampa, 66 km east of Chinchillas.
4.3.1 Chinchillas Infrastructure
The Chinchillas site has offices, workshops, a lunchroom, change room, explosives magazines, security and first aid buildings, solid waste storage facility, open pit, and waste dumps at the site. Existing exploration infrastructure includes two office containers, a core logging facility, a core cutting machine, two storage tents, two cisterns for diesel fuel (1,500 and 10,000 litres) and six warehouses of 144 m2 each, for the storage of the core boxes.
To generate electricity, the Pirquitas Operation uses natural gas to power three Wärtsila generator sets, each with a capacity of five megawatts (MW) of power. In addition, the same electrical plant has three diesel-powered Cummins generators, each yielding 1.1 MW. There is 6.7 km of gas pipeline on the Pirquitas property. The pipeline is 152 mm diameter and constructed of API5L Grade B steel with 4.8 mm wall thickness in normal applications and 7.1 mm wall thickness at river or drainage crossings.
Power for the Chinchillas mine site supplied along existing power lines from the natural gas powered generators at Pirquitas. EJESA is the local power authority that owns the lines. The power line from Pirquitas that goes directly past the rural EJESA line at the town of Nuevo Pirquitas (approximately 5 km from Pirquitas). The rural power line then goes from Nuevo Pirquitas to all villages along Route No. 40 and Route No. 70 and directly to Santo Domingo. This line is able to carry the 1 MW load for Chinchillas, with a small spur line (approximately 4 km in length) to take power into the mine.
No ore processing is done at Chinchillas therefore power requirements are minimal. In the event of power loss at Pirquitas. Back-up power from the EJESA grid that amounts to 100 kVa can be drawn. This back-up power is designated for critical telecommunications systems and the first aid building.
21015Puna21TRS220927Rev0.docx Page 29 of 175
4.3.2 Pirquitas Infrastructure
Pirquitas has been a permitted commercial mine operated by SSR since December 2009, with existing infrastructure that includes:
•A processing plant;
•A permitted tailings facility;
•A fully serviced workers camp sufficient for approximately 670 personnel;
•A communications system including cellular and intranet access;
•Fully serviced office buildings; and
•Wastewater treatment facilities, organic waste landfill and a recycling centr.e
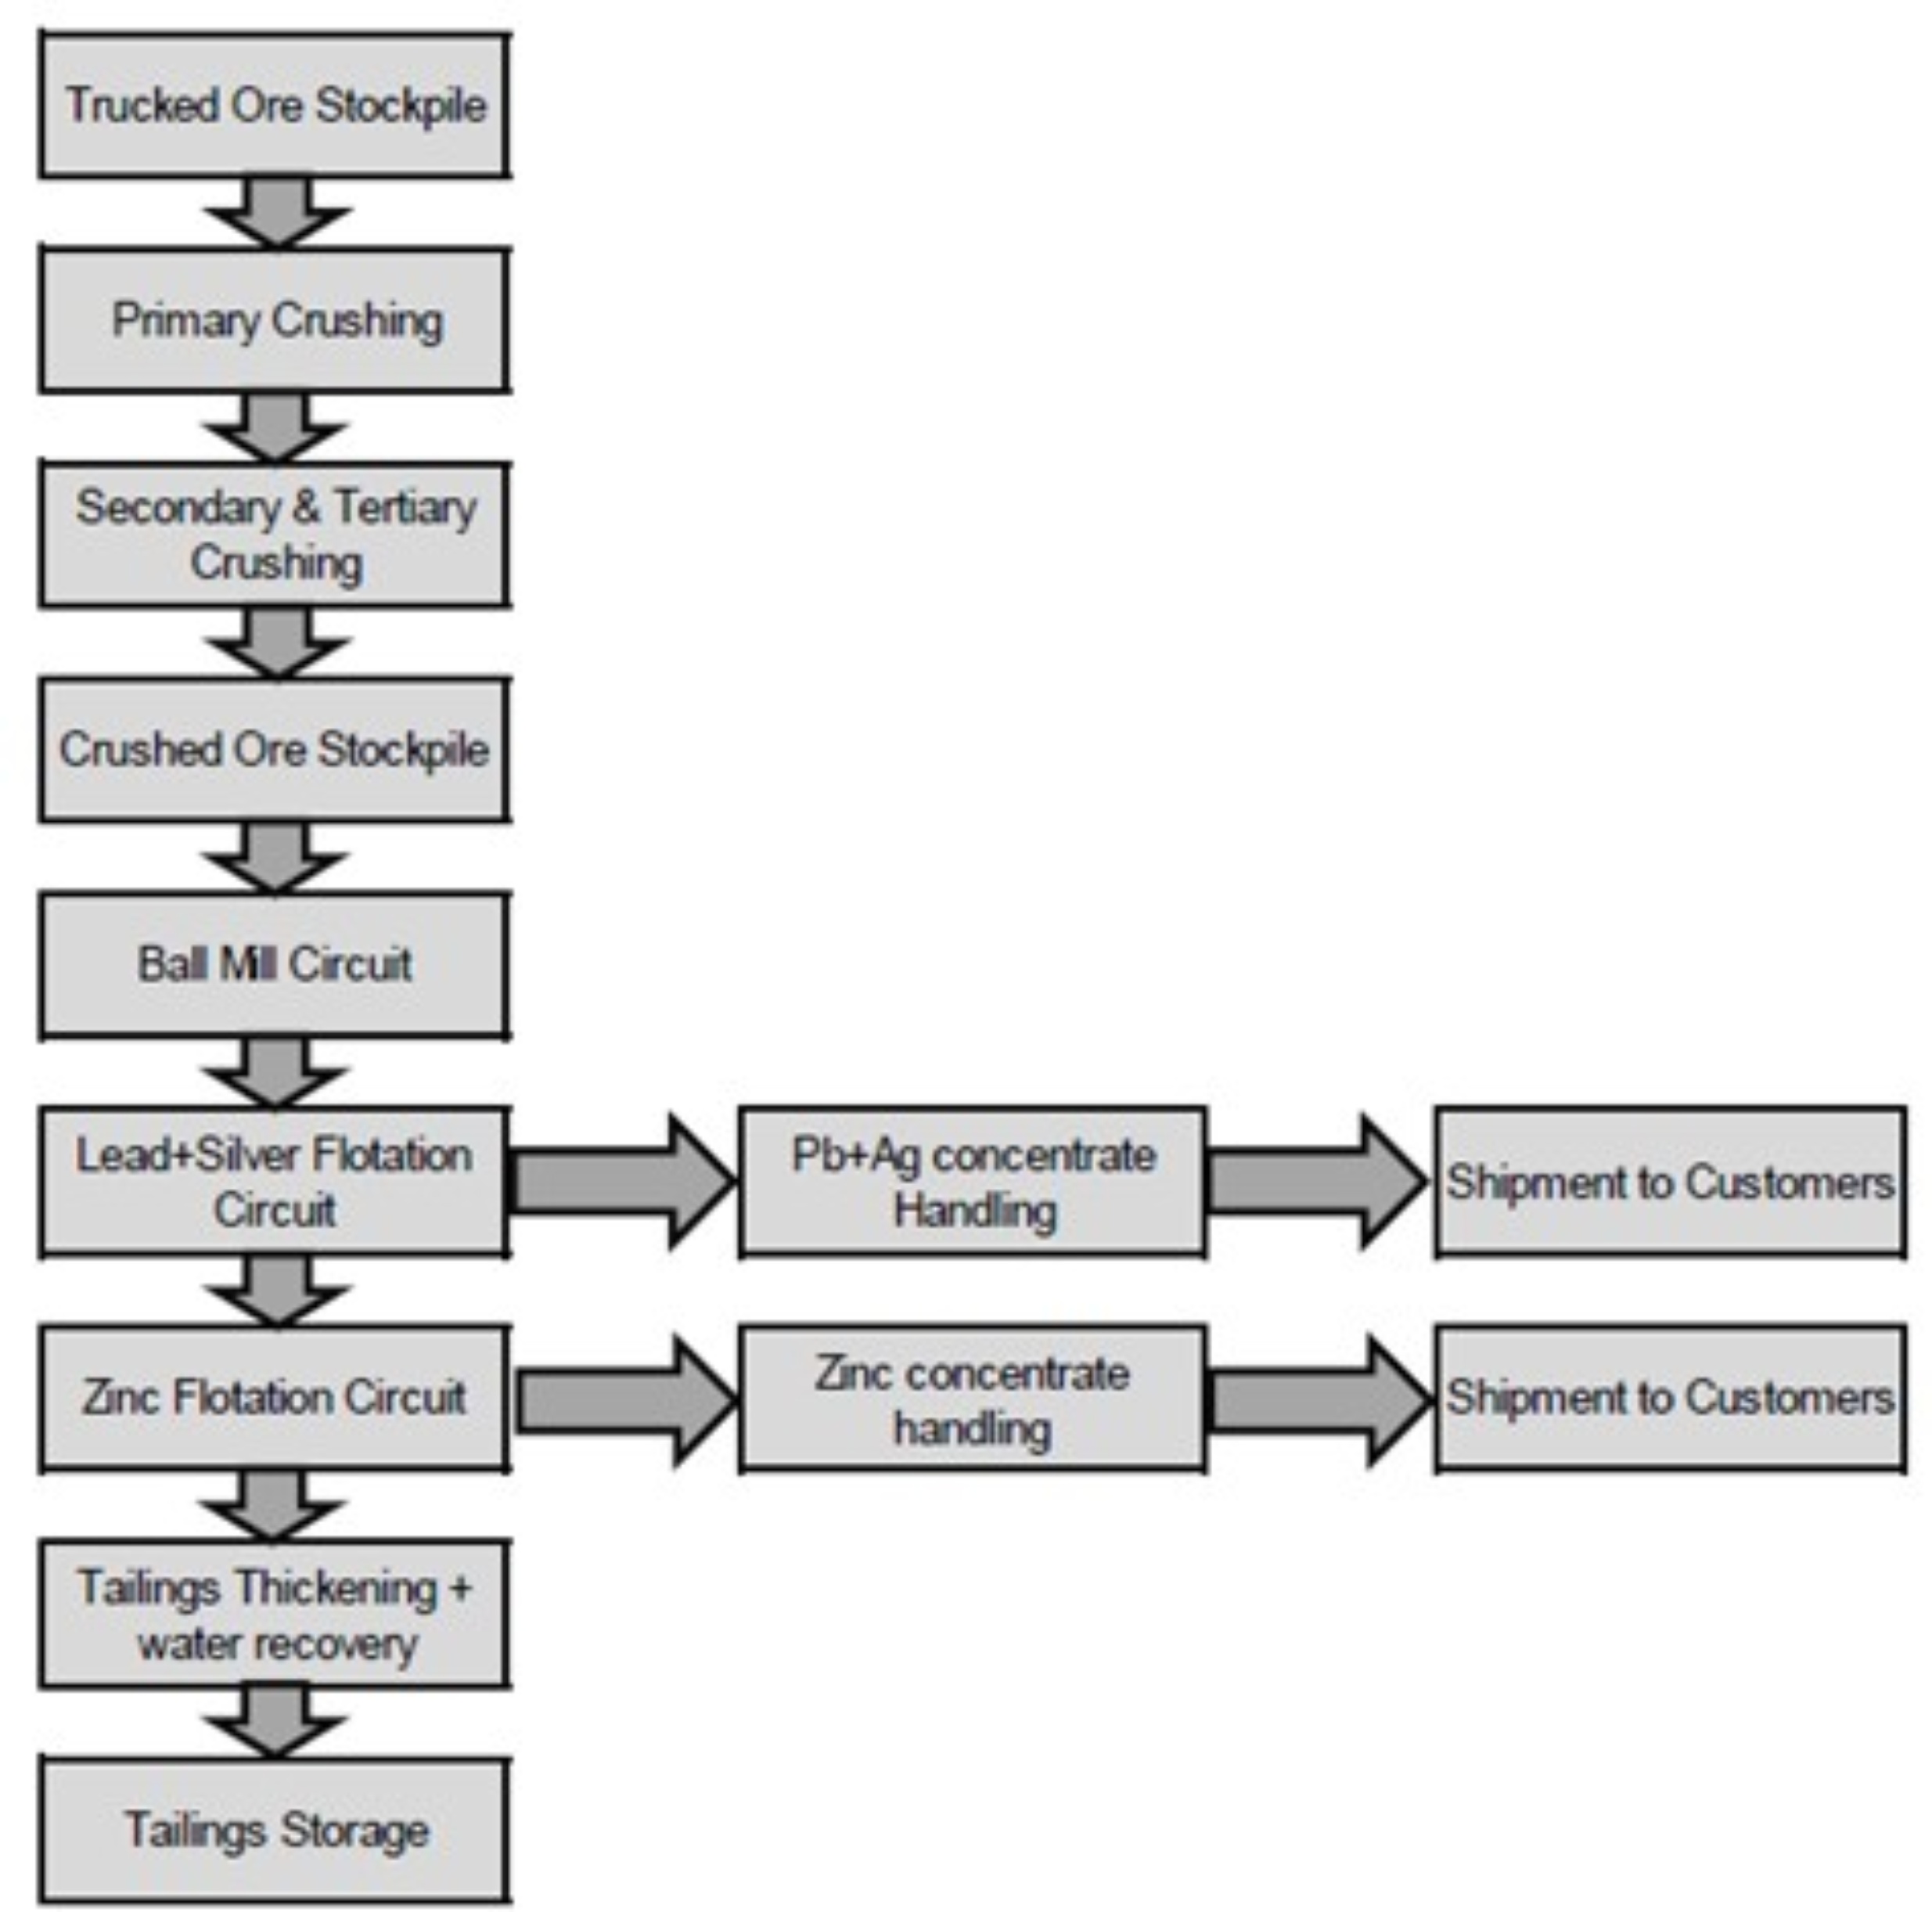
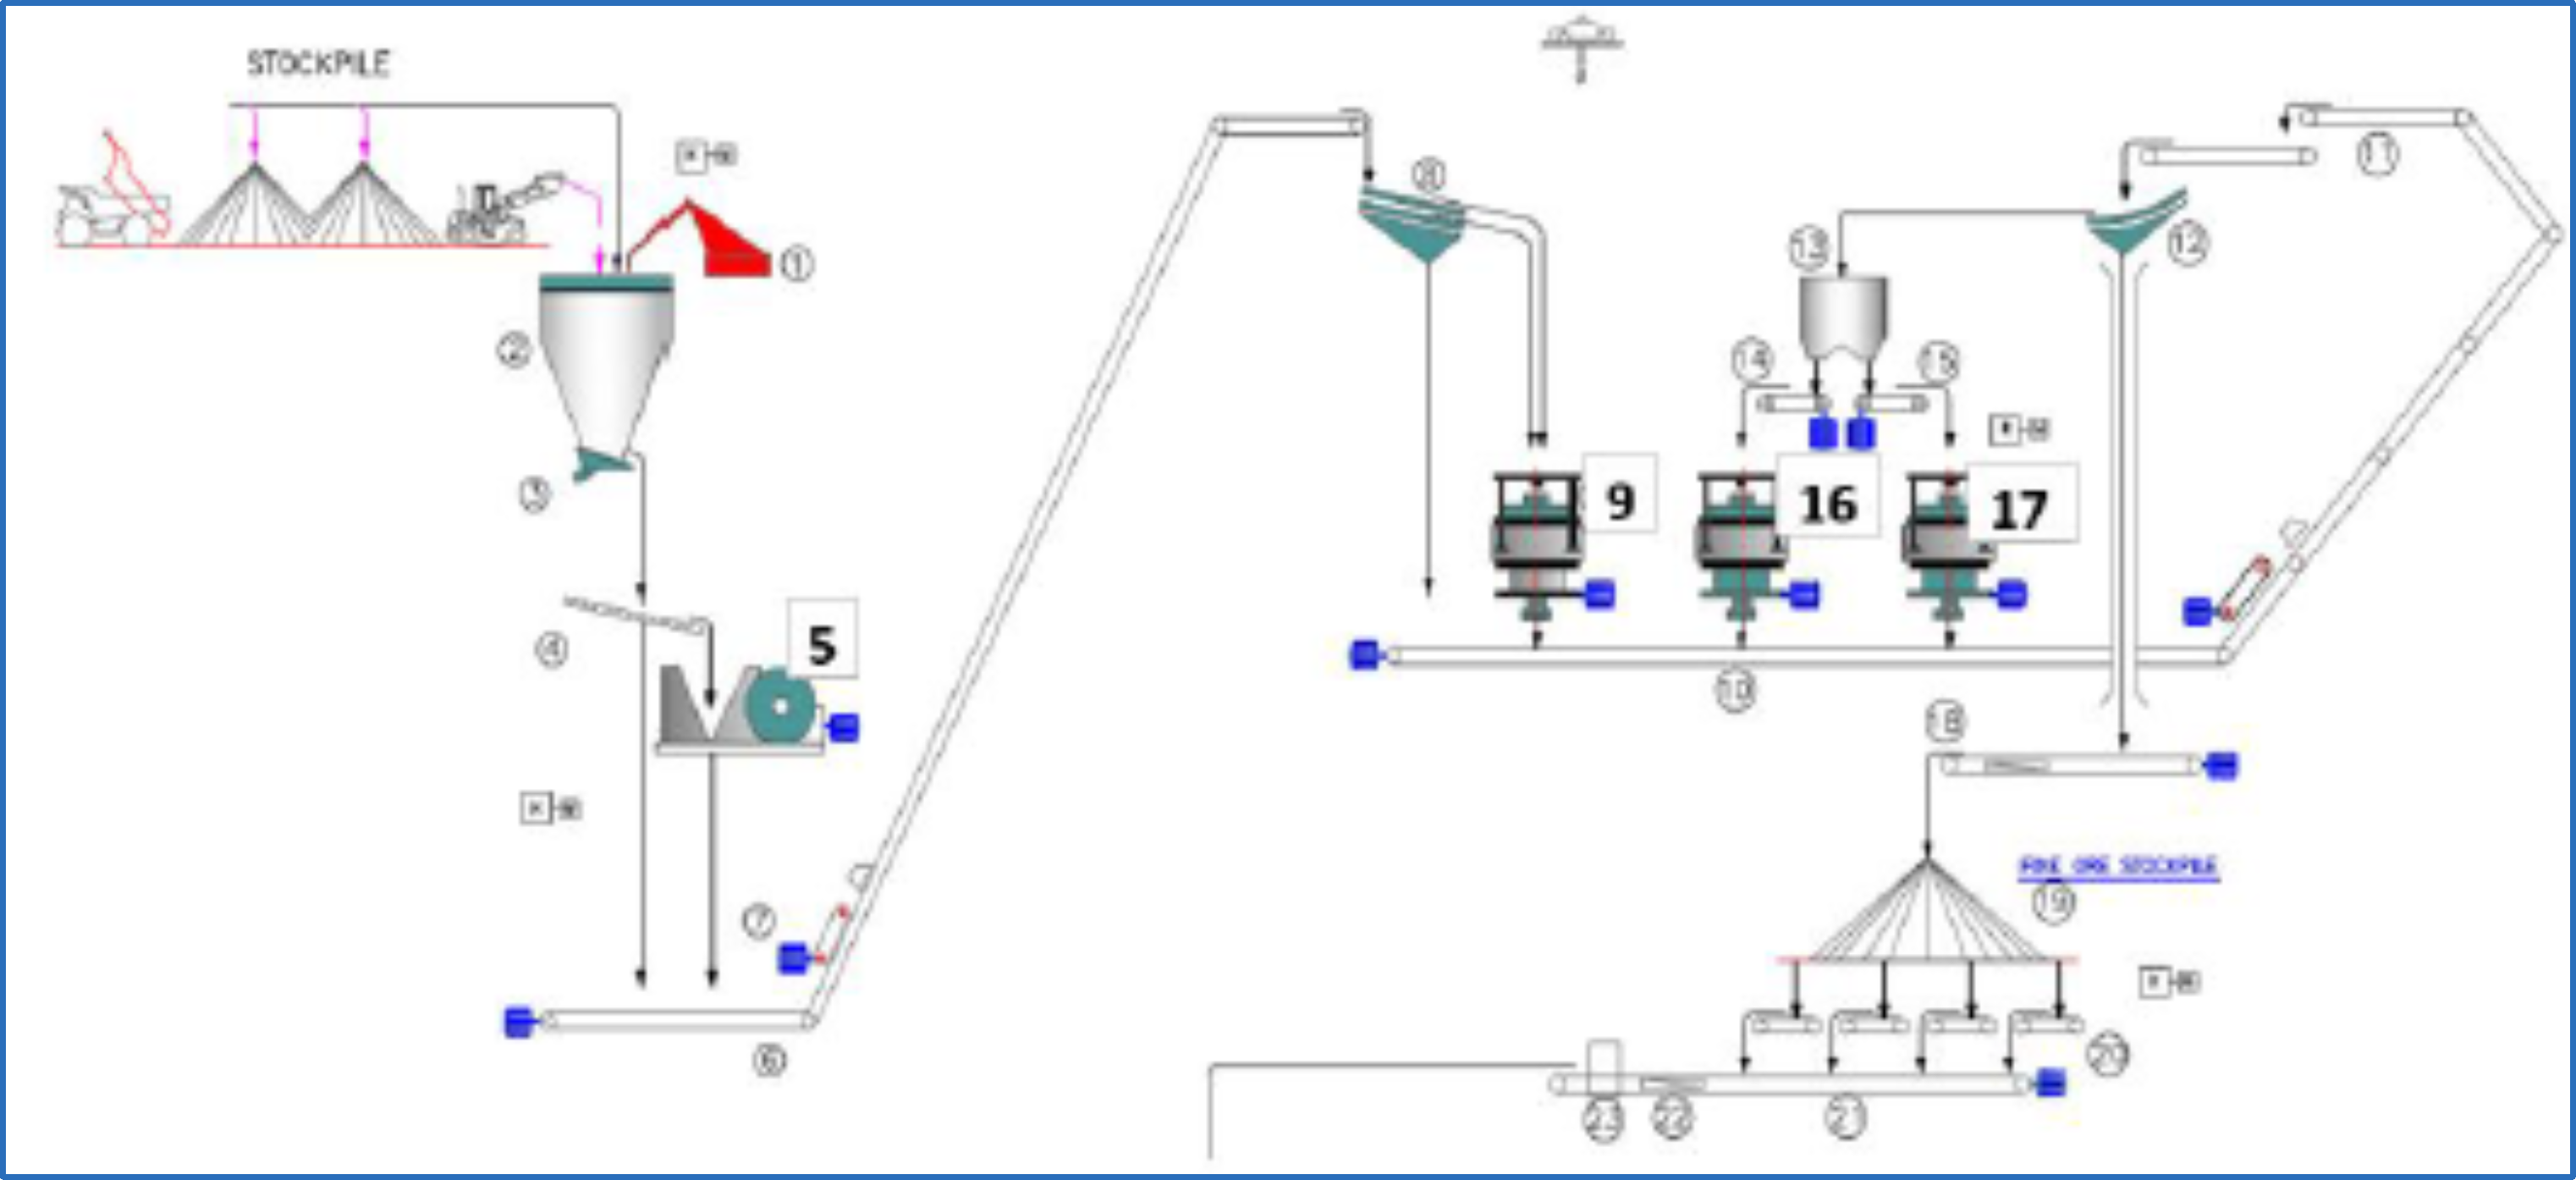
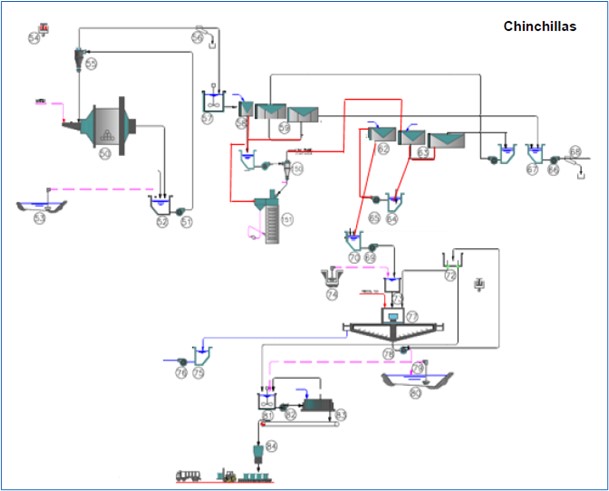
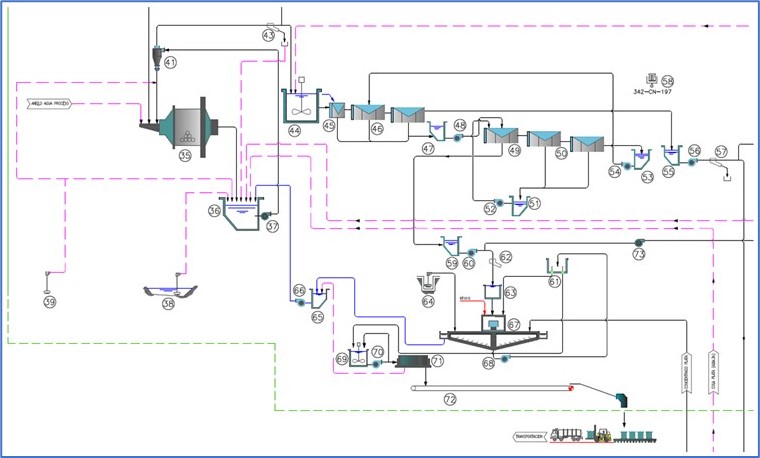
The Pirquitas processing plant consists of primary, secondary, and tertiary crushing operations which deliver ore to a stockpile. The crushing circuit throughput is 6,000 tpd. Ore is transferred from the crushed ore stockpile to a ball mill and after that a differential flotation circuit to obtain lead / silver and zinc concentrates.
The Pirquitas plant uses a tailings thickener to improve water recovery. Post thickened tailings are deposited in the tailings storage facility and secondary water recovery is achieved using barge mounted reclaim pumps.
MPSA has the surface rights covering the Pirquitas Operation. Electricity is produced from natural gas and diesel generators at the Pirquitas site.
Water supply is from a San Marcos, which is located within the property a short distance downstream from where the Pirquitas River drains into the Collahuaima River. Domestic water is pumped from a diversion upstream of the open pit for use at the camp. Potable water is supplied by MPSA from bottled water.
Pirquitas has a trained workforce for the processing plant and open pit mining operations, including local workers, operators, supervision, management, and senior staff.
21015Puna21TRS220927Rev0.docx Page 30 of 175
5 HISTORY
5.1 Chinchillas History
Chinchillas was first prospected and mined in small scale in the eighteenth century by Jesuit missionaries. Relics of furnaces used to melt lead and silver can still be found at the Chinchillas property (Kulemeyer, 2011). In 1956, Mr. Antonio Mercado requested a concession based on the discovery of galena veins in the basement rock. In 1968, the mine was sold to Ing. Pichetti, who later formed the Sociedad Pirquihuasi Company together with the Pirquitas Company, and some adits and tunnels were opened for small scale production. In 1982, the mine licence expired, and the mine was acquired by Shell CAPSA S.A. From December 1982 to 1989, a consulting geologist for Shell, Jorge Daroca, carried out exploration work and, after Shell dropped the property, Mr. Daroca requested it for himself, convinced of the good potential of the area (Daroca, undated). Roads, remnants of infrastructure, and minor underground workings remain from this activity, but no records of this work are available.
In 1994, Aranlee Resources conducted surface sampling and drilled seven reverse circulation drillholes for a total of approximately 780 m. Assay results from this work are available, but there are no samples for re-analysis or quality control information, therefore the data have not been incorporated into the Mineral Resources estimate. In 2004 Silex, a subsidiary of Apex Silver, conducted preliminary reconnaissance work including trenching, pitting and surface sampling, with a total of 165 samples taken. Between October 2007 and July 2008, 40 manual pits and nine trenches were sampled. Surface mapping was also completed at different scales across the Chinchillas property, and a total of 1,036 surface samples were collected. At the beginning of 2008, Quantec Geoscience Argentina S.A. (Quantec) performed a 16 km IP resistivity survey, comprising nine sections. The pole-dipole interval was 50 m with 300 m depth readings. The objective of the programme was to detect and delineate sulfides related to an intermediate to high-sulfidation epithermal system, however the mineralised zones at Chinchillas do not appear to be related to chargeability. Nevertheless, there is a strong resistivity contrast between volcanic units and basement schists and the resistivity data have been an effective tool for imaging the volcanic diatreme shape (Quantec, 2008). Silex subsequently drilled 2,220 m in seven diamond drillholes with drillhole samples taken at 1–2 m intervals. Silex had planned to drill 22 holes but cut the programme short during the 2008–2009 global financial crisis. In early 2009 Apex entered Chapter 11 bankruptcy protection, and with a payment due on the property, opted to drop Chinchillas in favour of its more advanced El Quevar project. The core from the Silex drill programme remains at Chinchillas (Silex, 2008 and Caranza and Carlson, 2012).
In 2011, Golden Arrow acquired the property, completed five phases of drilling over the subsequent five years and outlined mineral resources which are summarised in six technical reports and preliminary economic assessments (Davis and Howie 2013, Davis et al., 2014, Davis et al., 2015, Davis et al., 2016, Kuchling et al., 2014, Kuchling et al., 2015). In October 2015 Golden Arrow announced that it had entered into the Agreement with SSR to form a joint venture comprising of the Chinchillas property, the Pirquitas pit and the Pirquitas Operation. The agreement included an 18-month pre-development period to advance Chinchillas, including the infill drilling, engineering and environmental studies, and permitting.
On 18 September 2019, the Company completed the acquisition of the remaining 25% interest in Puna from Golden Arrow Resources Corporation for aggregate consideration totalling approximately $32.4M. The transaction allowed the Company to consolidate ownership in Puna and streamline its reporting.
21015Puna21TRS220927Rev0.docx Page 31 of 175
5.2 Pirquitas History
Between the 1930s and 1995, the area of the Pirquitas mine had multiple small mining operations to recover silver and tin from placer and vein deposits.
The Argentine branch of Sunshine Mining and Refining Company acquired the Pirquitas mining concessions in November 1995. In the years following its acquisition of Pirquitas, Sunshine Argentina carried out comprehensive mineral exploration on the property, including underground rock sampling and multiple programmes of revere circulation and diamond drilling. These culminated in a feasibility study in February of 2000.
In May 2002, Silver Standard acquired 43.4% of Sunshine Argentina, Inc. (Sunshine Argentina) from Stonehill Capital Management of New York and in October 2004. Silver Standard acquired the remaining 56.6% of Sunshine Argentina from Elliott International L.P., The Liverpool Limited Partnership and Highwood Partners, L.P. Silver Standard operated the Pirquitas mine property as Sunshine Argentina until it changed the company name to Mina Pirquitas, Inc. in May 2008, and further changed the name to MPLLC in December 2014. In August 2018, Mina Pirquitas LLC. changed its name to Mina Pirquitas S.A.(MPSA).
On 24 November 2015, MPSA was incorporated as 1056353 B.C. Ltd., and changed its name to Puna Operations Inc. on 2 May 2017.
Silver Standard approved the start of the Pirquitas mine in October 2006 commenced construction in 2007. The Pirquitas processing plant has been in continuous operation since such date.
The Pirquitas plant has not been expanded since start up; however, minor changes in the flotation flow sheets have occurred to optimise performance. Since 2010, no tin concentrate production has occurred.
Historical records for metal production from the Pirquitas property between 1933 and 1989 indicate that approximately 777,600 kg of silver, or about 25 Moz, along with 18,200 t of tin were recovered by previous operators. An additional 9,100 t of tin was reportedly recovered from the placer deposits found downstream from the lode deposits.
21015Puna21TRS220927Rev0.docx Page 32 of 175
6 GEOLOGICAL SETTING, MINERALISATION, AND DEPOSIT
6.1 Regional Geology
North-western Argentina consists of three main geological belts or terranes that together trend north–north-east. These are, from east to west, the Sub-Andean Range (Sierras Subandinas), the Eastern Cordillera (Cordillera Oriental), and the Argentine Altiplano or Puna belt.
These belts are distinguished by their basement lithology complexes, tectonic histories, magmatism, metallogeny and geomorphological features. The Pirquitas and Chinchillas deposits are located in the Puna belt.
6.1.1 The Sub-Andean Belt
The Sub-Andean belt comprises multiple north to north-west trending, low mountain ranges separated by broad flatlands. Elevations range from about 300 masl to a maximum of 2,500 masl. An Early Cambrian to Middle Ordovician carbonate platform, which defines a passive continental margin, dominates this belt. Middle to Upper Ordovician clastic marine rocks cover the carbonate platform in the eastern and central sectors. Paleozoic sedimentary successions display regional-scale open folds. Large intrusions and volcanic complexes related to Andean tectonism are not present in this belt. Mineral deposits of economic significance are rare, although natural gas fields are exploited in the eastern lowlands.
6.1.2 The Eastern Cordillera
The Eastern Cordillera is a 70–130 km wide fold and thrust belt with elevations ranging from 1,300–6,200 masl. Proterozoic basement consisting of medium grade metamorphosed sedimentary rocks are unconformably overlain by Paleozoic sedimentary rocks deposited in a back arc basin. The back arc sequence is composed of Early Cambrian to Middle Ordovician clastic marine sedimentary rocks, which in turn are unconformably overlain by Silurian to Devonian sedimentary rocks (Ramos, 2000). The Paleozoic successions are locally covered by Cretaceous sedimentary rocks belonging to the Salta Group.
Late Ordovician to Devonian collision of the composite Arequipa-Antofalla metamorphic basement terrane with the Pampian terrane, which forms the crustal basement in of the majority of north-western Argentina, resulted in folding and faulting of the Paleozoic rocks at Pirquitas (Ramos, 2000). The faults and axial planes related to the large-scale folds formed during this event strike north to north-east. Uplift of structural blocks has exposed elongate, Ordovician-age batholithic granitoid intrusions.
The metallogeny of the Eastern Cordillera is relatively simple. The most important mineral deposit in the belt is the Ordovician age Aguilar sedimentary exhalative (SEDEX) type
Pb-Zn(-Ag) deposit, located about 50 km south of Abra Pampa.
21015Puna21TRS220927Rev0.docx Page 33 of 175
6.1.3 Puna Belt
To the west of the Eastern Cordillera, at elevations of 3,900–6,700 masl, is the Puna belt. The Puna belt consists of nearly the same sedimentary sequences that occur in the Eastern Cordillera. Late Ordovician to Early Devonian compressive tectonism also affected the Paleozoic rocks in the Puna belt, but to a lesser degree than in the Eastern Cordillera. A Paleogene compressive event related to Andean-style tectonics resulted in minor folding and thrust-faulting. By the Late Miocene the tectonic regime transitioned to extension, resulting in basin and range geomorphology. Thinning of the upper crust resulted in the upwelling of magma and the development of andesitic to dacitic stratovolcanoes as well as multiple very large calderas (Figure 6.1). Large volumes of regionally extensive ignimbrite sheets erupted from the calderas, with approximately 1,800–1,200 km3 of material ejected from the Valdema caldera alone (Soler et al., 2007). Sub-aerial volcanism continued into the Pleistocene. This volcanic activity, and associated mineral deposits, was concentrated along corridors defined by lineaments such as Coranzuli Lipez, El Toro Olacapato and Arizaro (Figure 6.2) (Ramos, 1999, Coira et al., 2004, Gorustovich et al., 2011).
Younger rocks include basaltic lavas, continental sedimentary rocks, and the formation of high-altitude salt flats. In terms of mineral deposit endowment, the Puna belt is by far the most important of the three terranes in Jujuy Province. Below are the main deposit types documented in the Puna belt:
•Devonian mesothermal quartz veins and saddle reefs containing native gold, minor base metals and accessory gangue minerals of ankerite and chlorite, with the Rinconada district being the most important for this type of mineralisation.
•Polymetallic quartz-sulphide veins related to eroded Neogene volcanic centers, with the veins containing variable amounts of Pb, Zn, Sb, As, Ag, and Au.
•Bolivian-type Sn-Ag sulphide-rich veins related to Middle to Late Miocene subvolcanic intrusive stocks.
•Pleistocene to recent placer deposits of Au (Rinconada), Sn (Pirquitas) and Au-Cu (Eureka).
21015Puna21TRS220927Rev0.docx Page 34 of 175
Figure 6.1 Map Showing Tertiary Volcanism from Mega Caldera Complexes Near the Chinchillas Deposit
Note the location of the Chinchillas deposit relative to major faults Modified from Caffe 2002
21015Puna21TRS220927Rev0.docx Page 35 of 175
Figure 6.2 Oligocene-Miocene Volcanic Arc. Subvolcanic Intrusions
MPSA, 2020
21015Puna21TRS220927Rev0.docx Page 36 of 175
6.2 Deposit Types
The Chinchillas and Pirquitas deposits are within the Bolivian tin-silver-zinc belt which occupies the back-arc portion of the central Andes and extends from the San Rafael tin-copper deposit in southern Peru to northern Argentina (Figure 6.3). The Bolivian tin-silver deposits are typically associated with felsic volcanic domes of broadly rhyodacitic composition (Cunningham et al., 1991). Bolivian-type Ag-Sn deposits generally consist of sulphide and quartz-sulphide vein systems typically containing cassiterite and a diverse suite of base and trace metals, including Ag in a complex assemblage of sulphide and sulfosalt minerals. The vein systems are generally spatially and likely genetically associated with epizonal (subvolcanic) quartz-bearing peraluminous intrusions one to 2 km in diameter, although the mineralisation may be entirely hosted by the country rocks into which the intrusive stocks were emplaced. The Chinchillas deposit is modelled as a Tertiary-aged diatreme volcanic centre that has intruded Paleozoic sedimentary basement rocks. The mineralisation occurs mostly as disseminations, veinlets, and matrix fill (Figure 6.4).
Most of these deposits depicted in Figure 6.3 are characterised by the intrusion of dacite dome complexes with mineralisation hosted in shear zones and breccia within the dacite domes and/or within shear zones and breccia within the host rocks. At Pulacayo, Potosí and San Cristóbal, where associated domes are present, there is significant mineralisation within the domes. More rarely, as in the case of Chinchillas and San Cristóbal, the deposits include disseminated mineralisation in flat lying manto bodies within sedimentary and pyroclastic rocks. Chinchillas demonstrates phreatomagmatic diatreme morphology associated with a dome structure.
21015Puna21TRS220927Rev0.docx Page 37 of 175
Figure 6.3 Bolivian Tin-Silver-Zinc Belt with Major Deposits
Golden Arrow, 2013
21015Puna21TRS220927Rev0.docx Page 38 of 175
Figure 6.4 Schematic Geological Model on West–East Cross-Section showing Chinchillas Deposit
Golden Arrow, 2015
6.3 District Geology
6.3.1 Chinchillas Geology
The Chinchillas silver lead zinc deposit is in the north–north–east trending Puna belt in the western half of Jujuy province and southern part of the Rinconada Range (Figure 6.1). The range has a regional north–north–east trend and is delimited by thrust faults to the west and east. Miocene–age volcanic dome complexes and associated hydrothermal alteration are present in the area, including Cerro Redondo, Pan de Azucar, Rachaite, and the Chinchillas dome complex. High angle faulting and folding also characterise the area. Chinchillas is located within a structural window at the intersection of north-west fracturing associated with the Lipez-Coranzuli regional lineament, the east–west controlling structure, and lesser north-east trending structures.
The Chinchillas deposit is hosted by the Ordovician Acoite Formation and Miocene dacite. The Acoite Formation, described by Board et. al., (2011), is a strongly folded package of low-grade metamorphosed marine sandstone, siltstone and minor shale beds. Deformation of these sedimentary rock occurred during the Ocloyic Phase (Coira et al., 2004) of the late Ordovician. The Acoite Formation is unconformably overlain by Cretaceous marine clastic sedimentary rocks. The Cretaceous sedimentary rocks are overlain by Oligocene to Middle Miocene dacite tuff, continental sedimentary rocks, and volcaniclastic lithologies. The dacitic volcanic centre has an age of 13±1 Ma (Caffe and Coira, 2008) and is a product of a phreatomagmatic diatreme. The resulting topographic depression is elliptical in shape, approximately 2 km long by 1.6 km wide, and infilled with pyroclastic rocks (breccias and tuffs). At the contact between pyroclastic volcanic rocks and basement metasedimentary rocks is a zone of hydraulic fracturing and brecciation up to 150 m wide which is the main host of basement mineralisation. Dacitic lavas, flow domes and subvolcanic intrusions occur on the southern margin of the basin at the contact between metasedimentary and pyroclastic rocks (Figure 6.5).
21015Puna21TRS220927Rev0.docx Page 39 of 175
Pyroclastic breccias and tuffs erupted from the volcanic centre and filled in the resulting depression, contouring the vent walls. This most likely occurred via airfall deposition and flows of ignimbrites as there is no observed evidence of water-lain deposits or sediments. The breccias and tuffs are mainly matrix-supported and rarely are clast-supported. The clasts are sub-rounded to angular and vary from fine grained to large metre-scale blocks. The clasts are predominantly fragments of re-worked pyroclastic tuffs, lava, dacite, and basement pelite and sandstone. Most of the volcanic clasts and matrix are altered by intense hydrothermal activity, whereas the sedimentary basement clasts are generally better preserved (Figure 6.9).
Three main dacite domes outcrop along the south-east edge of the Chinchillas basin between the pyroclastic breccias and basement contact. The domes have a medium to fine-grained porphyrytic texture with phenocrysts of quartz, (35% to 45%) plagioclase, biotite and minor sanidine (Caffe and Coira, 2008). The dacite domes are generally massive with limited flow banding and some flow brecciation along the margins. Drilling confirms that the dacite outcrops are part of larger bodies below the Socavon del Diablo area. At surface they lie horizontally above tuff breccias.
Figure 6.5 View of the Chinchillas Deposit, Looking East
Note: outcrop of the sedimentary basement rocks, the volcaniclastic sequence infilling the depression, and the dacite domes flanking the southern border of the deposit.
MPSA, 2020
21015Puna21TRS220927Rev0.docx Page 40 of 175
Figure 6.6 Chinchillas Geology Map
MPSA, 2020
21015Puna21TRS220927Rev0.docx Page 41 of 175
Figure 6.7 Interbedded Sequence of Marine Sandstone and Pelite with
Near-Vertical Dip at Chinchillas
MPSA, 2020
21015Puna21TRS220927Rev0.docx Page 42 of 175
Figure 6.8 Brecciated Basement Sediments with Fine Volcanic Matrix Near the Contact Between Pyroclastic Sequence and Basement Sediments
MPSA, 2020
21015Puna21TRS220927Rev0.docx Page 43 of 175
Figure 6.9 Typical Chinchillas Medium Grained Pyroclastic Breccia
With Dacitic Volcanic Clasts Dominant and Secondary Dark Grey Clasts of Basement Sandstone and Pelite
MPSA, 2020
6.3.1.1 Chinchillas Alteration
Typical hydrothermal alteration is described below for basement sedimentary sequences, pyroclastic volcanic rocks and dacite flows.
Alteration in the Marine Sedimentary Basement
In the basement sedimentary sequence mineralisation is restricted to breccias, fracture filling, and veinlets with variable frequency and intensity. Alteration of the host pelite or sandstone is typically very weak, typified by carbonate, clay, and chlorite alteration proximal to sheared structures. Abundant siderite with lesser iron and manganese oxides are observed on fractures. Disseminated diagenetic pyrite is abundant in sedimentary rocks.
21015Puna21TRS220927Rev0.docx Page 44 of 175
Figure 6.9 Contact Between Dacite Flow Overlaying the Tuff Breccias
MPSA, 2020
Alteration in Pyroclastic Tuffs and Breccias
Pyroclastic tuffs and breccias have undergone several different types of alteration, including clay alteration, sericitisation, silicification, and carbonate alteration primarily as siderite. Clay alteration is most extensive with feldspar, silica and pumiceous fragments altered to various assemblages including quartz–adularia–sericite, illite–quartz-sulfide, and siderite-sphalerite-pyrite. Biotite is commonly altered to sericite-kaolinite-quartz (Caffe, 2013). Extensive fine-grained silicification within the suite of rocks is also documented. Clay alteration, sericitisation and silicification are observed to overprint each other, indicating the alteration event was prolonged and the result of a range of temperature and pressure. Carbonate alteration is locally pervasive and appears late in the paragenesis based on thin section analysis(Marshall and Mustard, 2012). Plagioclase feldspar is commonly replaced by siderite and illite (Caffe, 2013).
Alteration in the Dacitic Domes
Porphyritic dacite rocks were hydrothermally altered to sericite and siderite with minor silicification. Alteration is more developed in the matrix and in the plagioclases crystals (Caffe, 2013).
21015Puna21TRS220927Rev0.docx Page 45 of 175
6.3.1.2 Chinchillas Mineralisation
Mineralisation at Chinchillas is dominated by silver with lesser amounts of lead and zinc. Mineralisation occurs as disseminated sulfides, matrix infilling within the volcanic tuffs, and as matrix and fracture filling in breccias within the basement metasediments. Dacite volcanic rocks are rarely mineralised in shear zones, veinlets or vein-like structures. Within the basement lithologies shear zones and faults are more commonly mineralised. Depth of oxidation is a few metres within the volcanic rocks and is insignificant within the basement rocks. Silver, lead, and zinc-bearing minerals include silver sulfosalts, freibergite, boulangerite, tetrahedrite, schalenblende, sphalerite, and galena. Associated mineral associations include chalcopyrite, quartz, pyrite, siderite, limonites, manganese oxides, cerussite, smithsonite, anglesite, and malachite (Marshall and Mustard, 2012 and Coira et al., 1993).
The geological model for the Chinchillas deposit includes significant silver-lead-zinc mineralisation in the Silver Mantos and Mantos Basement zones in the western part of the Project (Figure 6.10 and Figure 6.11). Similar mineralisation is present at the adjacent Socavon deposit. A recent review of the Socavon deposit has resulted in its removal from Mineral Resources inventory in 2022.
The main structural elements controlling the location of mineralisation are the contact between basement sediments and overlying volcanic rocks and the dominant east–west and subordinate north-west, north, and north–north-east trending structures that control the Chinchillas volcanic centre. The phreatomagmatic explosion that produced the diatreme generated a symmetrical cylindrical shaped caldera, with mineralised brecciated basement rocks along the contacts and disseminated mineralisation in sub-horizontal tuff layers.
Silver Mantos Mineralisation
Mineralisation is disseminated in several shallow (+/– 5°) dipping layers hosted within clay altered pyroclastic tuffs and breccias. The mineralisation occurs between surface and 100 m depth in sub-horizontal mantos that range between two and 60 m thick, averaging greater than 20 m in thickness. These layers are open for expansion to the east.
Mantos Basement Mineralisation
Located below the Silver Mantos, the Mantos Basement comprises an area 600 m wide and up to 210 m thick, with an average thickness of 80 m, dipping at approximately 40° to the east (Figure 6.100). The zone has been traced down dip approximately 350 m. The Mantos Basement is hosted entirely within basement pelites and sandstones and is comprised predominantly of breccias, crackle breccias with minor small veinlets, and fracture fill.
Socavon del Diablo Mineralisation
The Socavon del Diablo zone (Socavon) is located in the eastern area of the deposit (Figure 6.10). Mineralisation is dominated by manto-style disseminated sulfides within favourable shallow dipping volcanic tuff horizons.
Mineral occurrences, textures, alteration and ore types within the volcaniclastic lithologies are similar to those described for the Silver Mantos target but the mineralisation is thought to be related to a different fluid event based on compositional differences. There may have been a different vent source within the volcanic centre as the Socavon del Diablo mineralisation is generally lower in silver and higher in zinc content.
A recent review of the economics of the Socavon deposit has resulted in its removal from Mineral Resources inventory in 2022.
21015Puna21TRS220927Rev0.docx Page 46 of 175
Socavon Basement Mineralisation
The Socavon Basement zone is mainly hosted within the Ordovician interbedded pelite and sandstone basement. The east limit of the Socavon del Diablo zone is a dacitic dome intruded in the tuff units and flowed over the tuff at surface (Figure 6.9). Immediately to the east of the dacite dome, biotitic sub-horizontal tuff layers of up to 80 m thick cover the Socavon Basement zone. Here, the mineralisation is hosted in breccias filled with argentiferous galena and a stockwork of sphalerite-siderite-galena within a halo of low-grade zinc of up to 320 m thickness.
The most significant mineralisation in this target is located at more than 150 m depth from surface. The mineralised fluids may have precipitated sulfide minerals as a result of interaction with the water table or decrease in pressure.
A recent review of the economics of the Socavon deposit has resulted in its removal from Mineral Resources inventory in 2022.
Figure 6.10 Silver Mantos and Mantos Basement Zones with Drillhole Locations and Mineralised Zones Projected to Surface
MPSA, 2020
21015Puna21TRS220927Rev0.docx Page 47 of 175
Figure 6.11 East–West Cross-Section with Deep Manto Mineralisation
MPSA, 2020
6.3.1.3 Chinchillas Resource Expansion Opportunities
Mineralisation at Chinchillas in the Silver Mantos, Mantos Basement, Socavon Basement, and Socavon del Diablo are still open to expansion, particularly the deeper zones of Silver Mantos and Socavon Basement. Other targets include: the northern slope of the basin; the area between the Silver Mantos and Socavon zones; and the dacite domes.
A recent review of the economics of the Socavon deposit has resulted in its removal from Mineral Resources inventory in 2022.
6.3.2 Pirquitas Geology
The majority of the Pirquitas property covers intensely folded Ordovician Acoite Formation marine sedimentary rocks (Figure 6.12). Well exposed along the length of the Pircas River valley, this formation is composed of interbeds fine to medium grained lithic wacke tens of centimetres to a few meters thick, greywacke siltstone, and less abundant black shale that range in thickness from a few centimetres up to several metres. Underlying the north-eastern sector of the property is a sequence of continental sedimentary rocks, mainly hematite-stained arkosic sandstone intercalated with thin polymictic conglomerate beds and cream-coloured reworked dacitic tuff units. This sequence is inferred to belong to the shallow east–north-east dipping Tiomayo Formation of Early to Middle Miocene age. Several kilometres east of the property, a medium-grained granodiorite intrusion forms the small mountain of Cerro Galan, which represents the only substantial intrusive rock body proximal to the mine area.
21015Puna21TRS220927Rev0.docx Page 48 of 175
Figure 6.12 Pirquitas Geology Map
MPSA, 2020
Folds with shallow-plunging hinge lines and amplitudes ranging from tens of metres to several hundred metres crop out in this area (Figure 6.13). Mining on the north face of the San Miguel open pit has exposed a ‘textbook’ example of a chevron-style anticline (Figure 6.14). High-angle, mostly reverse faults cut the folds, displacing fold limbs by metres to tens of metres.
Axial planar cleavage is well developed in the Paleozoic rocks, especially in the siltstone and shale beds. The well-formed cleavage does not appear to have acted as a receptive structural fabric for quartz-hosted Ag-bearing Fe-Zn-Sn-Pb sulphide veins, although a minor amount of weakly-auriferous quartz veins were deposited along cleavage planes.
21015Puna21TRS220927Rev0.docx Page 49 of 175
Figure 6.13 Anticline Developed in Interbedded Sandstone, Siltstone and Shale of the Ordovician Acoite Formation, Pircas River Valley, Pirquitas Mine Area
MPSA, 2020
21015Puna21TRS220927Rev0.docx Page 50 of 175
Figure 6.14 Chevron Fold and High Angle Thrust Fault in the Acoite Formation Host Rocks, North Wall San Miguel Open Pit
MPSA, 2020
The Pirquitas mine open pit exploits previously un-mined portions of the Potosí, San Miguel and Chocoya vein systems. Sheeted sulphide veins and associated disseminated mineralization of the San Miguel system occur in a swarm that is 160 m wide in the north-south direction and a maximum of 400 m along strike in the east–west direction. The Potosí Vein is located on the northern margin of the current pit; the Chocaya Vein system is located on the southern margin and the uppermost part of the Oploca system, known as the Oploca breccia, was exploited by the southern edge of the open pit.
A major system of sulphide-rich veins cut the axial surfaces of the folds and the related cleavage fabric at high angles. Three main and one minor vein sets are recognised at the Pirquitas mine:
Vein Set 1
In the dominant orientation veins strike close to 290° and are generally subvertical. Veins with this orientation include the majority of those in the Potosí, San Miguel, Chocaya, and Oploca areas (Figure 6.15). The Potosí Vein is the largest known single vein on the property, with a strike length of approximately 500 m and maximum thickness of 2.5–3.0 m. Other veins of this orientation typically have a strike length between 100 and 500 m, with average widths of 30–50 cm. The larger of these veins include localised matrix-supported breccias with angular clasts of quartz-sericite altered wallrock in a matrix of Fe and Zn +/– Sn-Ag-Cu sulphides.
21015Puna21TRS220927Rev0.docx Page 51 of 175
Vein Set 2
The secondary vein set is represented by the Veta Blanca and Colquechaca, veins and narrow (50 cm to 2 m) veins in the Oploca area. The veins are steeply to moderately south dipping and strike close to 310°.
Vein Set 3
The Crucero vein is a series of saddle reefs that follow the axial plane of the antiform in the middle of the Pirquitas pit. Sulphide mineralisation within the Crucero vein is irregularly developed along fractures within white crystalline syn-deformational quartz.
Vein Set 4
At approximately 200 m below surface to the south of the pit is a 4 m thick, 100 x 200 m vein that dips 30° to the north-east and strikes close to 320°. In addition to the veins, zinc-rich mineralisation is hosted within pipe-like breccia bodies that are interpreted to be breccia diatremes.
The Pirquitas open pit exploited previously un-mined portions of the Potosí and San Miguel veins in addition to a set of sheeted sulphide veinlets with associated disseminated mineralisation. The sheeted veins occur in a swarm that is 120–140 m wide in the north–south direction and a maximum of 300 m along strike in the east–west direction. The Potosí Vein is in the northern margin of the current pit; the Chocaya Vein system is south of the open pit (Figure 6.15)
Figure 6.15 Map of the Pircas Valley showing Main Ag-Sn-Zn Vein Systems
Red outline represents approximate limits of San Miguel open pit
SSR, 2020
21015Puna21TRS220927Rev0.docx Page 52 of 175
6.3.2.1 Pirquitas Alteration
Hydrothermal alteration is not particularly well-developed in the host rocks of the Pirquitas deposit (Board et. al., 2011). An assemblage of sericite+quartz+disseminated pyrite replaces original wallrock minerals along the margins of the larger veins, thus forming thin bleached halos to the veins. This sericite-quartz-pyrite alteration is also recognised in wallrock clasts within vein breccia. Disseminated subhedral pyrite is widespread in the deposit, generally constituting less than a few percent of the wallrock by volume; it tends to be more abundant in shale and siltstone beds.
6.3.2.2 Pirquitas Mineralisation
The fracture and breccia-hosted mineralisation at the Pirquitas mine consists of Fe and Zn sulphides with accessory cassiterite (Sn oxide) and a large variety of Ag-Sn-Zn (+/– Pb-Sb-As-Cu-Bi) sulphides and sulfosalts. Crystalline quartz, along with chalcedony in the upper levels of the system, and kaolinite are the main gangue minerals in the veins and mineralised breccias. The main sulphides, specifically pyrite, pyrrhotite, sphalerite and wurtzite, form colloform bands parallel to vein margins, which together with crustiform and drusy vein textures suggest that the mineralisation is epithermal in origin. The vein textures imply that the mineralisation was deposited from relatively low temperature hydrothermal fluids within about 500 m of the paleosurface. However, mineralogical evidence suggests that the initial temperature of the mineralising fluids was possibly greater than 400°C. A detailed study by L. Malvicini (1978) provides relationships between 26 sulphide and sulphosalt mineral phases.
21015Puna21TRS220927Rev0.docx Page 53 of 175
7 EXPLORATION
7.1 Surficial Exploration
Emphasis was placed on mapping lithologies, alteration and structures to understand the controls of the mineralisation. In the basement rocks bedding, foliation and brecciation were recorded. A handheld x-ray fluorescence (XRF) analyser was used to measure approximate silver, lead, and zinc values at all prospective outcrops.
Geophysical surveys (IP / resistivity, CSAMT, magnetics) conducted in 2013, together with the re-interpretation of the 2008 IP survey, was used to target the Chinchillas South area, detecting deep structure and defining the contact between the tuff unit and basement rocks. The methods used to explore the Chinchillas property are in accordance with industry standards and there are no indications of sample biases.
SSR’s exploration at Pirquitas has predominantly involved RC and DD drilling. Sunshine Argentina completed detailed geological mapping on the property and commissioned approximately 44 line-kilometres of ground magnetics surveying and 19.2 line-kilometres of induced polarisation surveying centred on what is now the San Miguel open pit. Sunshine Argentina’s drilling programmes ended in September 1998, after which the parent company completed an internal pre-feasibility study of the project. Since fully acquiring the project in 2005, the Company has carried out additional geophysical programmes, including in 2012 a 14.4 line-kilometre Quantec Titan-24 DC-IP survey, a ground gravity and differential GPS survey, and in 2018 a Drone Airborne magnetic survey. Between 2008 and 2021 numerous prospecting and geological mapping surveys evaluated the mineral potential of the property.
7.2 Drilling
7.2.1 Chinchillas Summary
The historical drilling programmes at Chinchillas are summarised in Table 7.1. Aranlee Resources completed the first programme in 1994, which comprised seven RC holes. The results from the Aranlee holes were not used in any mineral resource modelling as there is no quality control data.
Table 7.1 Drill Programmes Completed at the Chinchillas Property
| | | | | | | | | | | | | | |
| Company | BHIDs Sequence | Count | Year | Metres drilled |
| Aranlee Resources | CH-1–7 | 7 | 1994 | 782 |
| Silex Argentina S.A. | CHD-010–016 | 7 | 2007–2008 | 2,220 |
Golden Arrow
(Phase 1-V) | CGA-017–297 | 284 | 2012–2015 | 45,803 |
Golden Arrow / SSR
(Phase VI – VII) | CGA-212W + CGA-298–340 | 44 | 2016 | 8,945 |
The average recovery from the 45,803 m of Golden Arrow drilling used in the 2017 Mineral Resources estimate was 94%, including the first 6 m where recovery was commonly less than 50%. Figure 7.1 shows the location of the Golden Arrow drilling separated into six different phases. For details on Chinchillas historical drilling refer to the 2017 technical report, (Kuchling et. al., 2017).
21015Puna21TRS220927Rev0.docx Page 54 of 175
Figure 7.1 Location of Drillhole Collars at the Chinchillas Deposit
Golden Arrow, 2016
7.2.2 Pirquitas Summary
Initial drilling on the Pirquitas property was conducted by Sunshine Argentina and included a total of 51,863.62 m in 241 drillholes (Table 7.2).
The 2005 drilling programme was designed to test targets in the Oploca, Llallagua, and Colquechaca areas (Table 7.2). The 2007 and 2008 drilling programmes included exploration drilling, resource definition drilling, drilling for metallurgical testing, and condemnation drilling. All drilling was conducted from surface, with the majority completed by RC methods (approximately 84% of the total metreage drilled). Diamond drillholes were generally drilled HQ-size, sequentially reducing to NQ then BQ at depth, as needed.
Diamond core drilling was conducted between July 2010 and September 2011. The majority of this drilling was for resource definition in and around the existing open pit (approximately 89% of the drillholes), with the remainder consisting of exploration drillholes targeting the Cortaderas Breccia Zone (approximately 6% of the drillholes) and other exploration targets (e.g., Veta Blanca).
In 2012, diamond core drilling was conducted between March and November. Most of the drilling was for resource definition in the Cortaderas Breccia Zone (approximately 89% of the drillholes), with the remaining drillholes being exploration drillholes at the pit margins.
21015Puna21TRS220927Rev0.docx Page 55 of 175
The main objective of the 2018 Potosí drilling programme was to determine if the vein extends eastwards, and to study whether the vein crosses the proposed descending ramp that would access the Cortaderas vein breccia located 500 m to the north. While the main 2–3 m wide Potosi vein does not project into the area, there is a thin and commonly less than 1 m vein intersected in select drillholes.
In 2019–2020, the objective of the deep Granada drill programme was to test the theorised intersection between the south-west dipping Cortaderas vein breccia and the steeply north-dipping Potosi vein beneath the San Miguel pit. Three HQ holes were completed between 6 October 2019 and 31 January 2020 for a total length drilled of 3,430.40 m. Holes from the Granada programme intersected two different mineral compositions that correspond with historically described veins. Mineralisation commonly fills open spaces related to fracturing, brecciation, and faulting, usually as massive or semi-massive veins or veinlets. These veins and veinlets typically range in width from 5–30 cm but may locally approach 3.5 m. The Granada target was not encountered at the anticipated depth, but the programme did identify significant intersections of gold values below the elevation of previous mining within the San Miguel open pit (approximately 4,000 m). The Au grades are commonly associated with elevated concentrations of Ag, As, Bi, Cu, and Sn. The most encouraging broad, low-grade interval from this programme was intersected in GR-396.
As a result of the elevated gold results encountered in the deep drilling in the 2019–2020 Granada drilling programme, select reject and pulp material from historical Cortaderas drilling programmes were re-analysed in 2021 using fire assay gold and multi-element ICP. There were no gold analyses included for any of the original Cortaderas drilling programmes. Two phases of sampling were completed with the first phase including samples from 13 drillholes. The intervals were selected to test a range of high-grade Ag, Zn, and/or Sn intercepts and addition to multiple elevations ranging from the upper portion of the vein (elevation 4,100–4,200 m) to deeper in the breccia system (elevation 3,850–4,000 m). Gold demonstrates a positive correlation between Sb, Cu, Ag, Bi, Mn, and Zn. As a result of the anomalous results, a more-detailed Phase 2 sampling programme was completed that included re-analysis of samples from two drillholes, DDH-214 and DDH-230. An additional 198 rejects were submitted for evaluation and represent continuous intervals (DDH-214: 150 m; DDH-230: 219 m). These results further support an elevation control to the gold mineralisation, with higher grades in the lowermost area of the deposit.
21015Puna21TRS220927Rev0.docx Page 56 of 175
Table 7.2 Drilling Programmes Completed at the Pirquitas Property
| | | | | | | | | | | | | | |
| Company | Programme Description | Count | Year | Metres drilled |
| Sunshine Argentina | San Miguel Deposit (DD) | 46 | Pre-2004 | 12,645.72 |
| Underground (DD) | 25 | Pre-2004 | 4,284.50 |
| San Miguel Deposit (RC) | 170 | Pre-2004 | 34,933.40 |
| SSR | Oploca (4), Llallagua (6), Colquechaca (4) | 14 * | 2005 | 3,299.65 |
| San Miguel (24), Cortaderas (6), San Miguel (4), Potosí (1) | 35 * | 2007 | 7,723.45 |
| San Miguel (115), Potosí (52), Oploca (32), Cortaderas (12), Pircas (4), Médanos (10) | 225 * | 2008 | 41,112 |
| San Miguel (38), Oploca (17), Veta Blanca (2), Cortaderas (4) | 61 * | 2010–2011 | 12,665.40 |
| San Miguel (69), Cortaderas (5), Other Targets (5) | 79 * | 2011 | 17,549.95 |
| Cortaderas (126), Médanos (1), West of Pit (9), South of Pit (4), North of Pit (2) | 142 * | 2012 | 52,804.30 |
| Pirquitas Property | 17 | 2013 | 6,923.00 |
| Pirquitas Surface (16) and underground (2) | 18 | 2014 | 3,553.00 |
| Pirquitas Underground | 44 | 2015 | 10,961.00 |
| Potosi – East Extension | 15 | 2018 | 2,399.30 |
| Deep Granada | 3 | 2019–2020 | 3,430.40 |
* Drillholes used in the 2013 resource modelling
7.3 Drill Core Handling Protocol
The diamond drill core is extracted from the core tube and placed in appropriate boxes marked with drillhole number and the hole depth in metres. The boxes are transported, by pickup truck, from the drill site to the core shack at the end of each shift by trained personnel. The drill contractor used a single shot Reflex survey instrument to measure the down hole deviation. Following completion of the hole, a PVC tube is cemented at the drill collar with hole number, depth, and azimuth inscribed on a metal ticket.
Measurements of core recovery and geotechnical measurements (fracture frequencies and rock quality designation (RQD)) are recorded. The core boxes are then photographed and select intervals are temporarily removed for specific gravity measurements. Geological descriptions are recorded and the samples for analysis are marked at 1 m intervals in mineralised zones and 2 m intervals in areas with no expected mineralisation. The drill core is split using an electric diamond core saw and sampled according to the marked intervals.
21015Puna21TRS220927Rev0.docx Page 57 of 175
8 SAMPLE PREPARATION, ANALYSES, AND SECURITY
8.1 Sample Preparation, Analyses, and Security – Chinchillas
The following summarises the sample preparation, analysis and security details used by Golden Arrow and SSR in their drill campaigns at Chinchillas and remains unchanged from the most-recent Technical Report (Davis et al, 2016). For details of methodologies used by Silex in the earlier drill campaign, the reader is referred to the penultimate Technical Report (Davis and Howie, 2013).
8.1.1 Sampling Method – Chinchillas
Following the splitting of core, half the core is returned to the box while the other half is bagged. Corresponding tags are inserted, one in the plastic sample bag and the second in the core box. Quality control samples are inserted in sample bags and allocated in order for the laboratory to have a control sample in every batch.
8.1.2 Sample Custody and Security – Chinchillas
Samples bags are placed in larger sacks (between six and ten samples per sack) and are sealed. Sealing numbers are recorded in the Chain of Custody database. The sacks were shipped by private truck to the Alex Stewart (Assayers) Argentina S.A. laboratory in Mendoza, (Alex Stewart) where the sample preparation and analysis are performed.
Samples are received by the laboratory and the reception is reported to Golden Arrow. No damaged or missing samples were ever reported during transportation.
8.1.3 Sample Preparation – Chinchillas
Samples are prepared by method ‘P-5’, which includes drying the samples at 90°C, crushing the entire sample up to 80% passing 10 mesh, splitting 1,000 g with a Jones riffle splitter and pulverising to 95% passing 140 mesh. The pulverised material or pulp is then sampled, and 200 g of pulp is sent to the laboratory.
8.1.4 Sample Analysis – Chinchillas
Alex Stewart was the primary laboratory and ALS in Peru (ALS) was used as the secondary laboratory for check samples (see Section 8.1.6.4 for details). All samples are tested for a suite of 39 elements including silver, lead, and zinc by a four-acid digestion method and analysis by Inductively Coupled Plasma inductively coupled plasmaatomic emission spectroscopy (ICP) (method ICP-MA-39). Silver greater than 200 ppm is assayed by fire assay using a 50 g sample with gravimetric finish (method Ag4A-50). Lead and zinc greater than 10,000 ppm are re-assayed by an oxidising acid digestion for ore grade material and reading by ICP (method ICP-ORE).
In order to speed the reception of assay results, ALS acted as the primary laboratory for one batch of 876 samples in the Phase V programme. Quality control procedures were applied in the same manner as with the rest of the samples.
Alex Stewart is an international laboratory certified under ISO 9001:2008, ISO 17025:2008 and ISO 14001: 2004. Alex Stewart is independent from Golden Arrow and SSR.
21015Puna21TRS220927Rev0.docx Page 58 of 175
8.1.5 Density – Chinchillas
To determine density, samples of drill core measuring about ten centimetres in length, at approximately 15 m intervals are collected. Samples are dried for two hours at 90°C in an electric oven. After cooling, the samples are sealed with plastic (cellophane) film. The weight of the plastic is ignored in the calculations since the volume is insignificant (less than 1 g of plastic film compared with the 900 g average weight of each sample). The samples are weighed in air and then weighed again while submerged in water. The formula used to calculate density values is as follows:
Density = (Weight in air) / (Weight in water)
A total of 2,586 samples of drill core were tested for density from Phases II, III, IV and V drilling. The results averaged 2.59 t/m3 for the basement rocks, 2.40 t/m3 for the dacites and 2.08 t/m3 for the tuffs, with an overall average of 2.31 t/m3.
8.1.6 Quality Assurance and Quality Control – Chinchillas
Golden Arrow established a quality assurance and quality control (QA/QC) system for its drilling programmes. The system specified the procedures for handling and sampling of drill core including, logging procedures, the frequency of inclusion of QA/QC samples and the procedure for the chain of custody between the drill and the assay lab. QA/QC samples, including blanks and certified reference materials (CRM) are inserted in each batch in the field to check the precision and accuracy of the laboratory. This section reports the results from the Phase V programme. Results from prior phases of drilling are detailed in the previous Technical Reports (Davis & Howie, 2013; Davis et al., 2014, Davis et al., 2015). The QA/QC results from previous drilling programmes indicate the samples from those programmes are of sufficient quality to support Mineral Resources estimation.
A total of 1,792 quality control samples were inserted as shown in Table 8.1.
Table 8.1 Summary of QA/QC Samples – Chinchillas
| | | | | | | | |
| Type of Sample | Number of Samples | Percentage of Total
(%) |
| Core samples | 10,468 | 85.4 |
| Coarse Blanks | 369 | 3.0 |
| Fine Blanks | 377 | 3.1 |
| Coarse Duplicates Lab. 1 | 185 | 1.5 |
| Fine Duplicates Lab. 1 | 191 | 1.6 |
| Fine Duplicates Lab. 2 | 293 | 2.4 |
| Reference Material | 377 | 3.1 |
| Total | 12,260 | 100 |
21015Puna21TRS220927Rev0.docx Page 59 of 175
8.1.6.1 Blanks – Chinchillas
Coarse and fine blanks were used to detect contamination problems and cross labelling in the process. The blank used was not a certified material from a vendor. The coarse blank, named BL-CH-1G, was made from a tuff breccia with no silver mineralisation and low-grade base metals values. It was sampled by Golden Arrow personnel and assayed by Alex Stewart Assayers.
The blank material used for QA/QC purposes was not certified by a round robin process at several accredited laboratories; however, assay QA/QC results indicate the material appears to be sufficiently homogeneous to detect sample contamination. The acceptance values were three times the reference value. In the case of the Ag the acceptance value was three times the detection limit (1.5 ppm Ag).
From the 369 coarse blank samples, all Ag, Pb, and Zn values are under the acceptance limit except for one sample with 221 ppm Pb, just above the limit of 198 ppm Pb.
The fine blanks were made from the fine rejects of coarse blanks of the previous drilling phase. They were named BL-CH-2F, BL-CH-2aF and BL-CH-3F. The original assays were averaged, and internal reports were produced. The acceptance values were three times the reference value. During the Phase V drilling programme, a total of 377 fine blanks were inserted in the batches as part of the QA/QC programme. Ag values were always below the acceptance limit of 1.5 ppm Ag. Lead and zinc values were also below the acceptance limit except for two outliers in Pb and Zn. These outliers might reflect some contamination in the laboratory but the absolute values, even above the acceptance limit, are not considered significant.
8.1.6.2 Coarse and Fine Duplicates – Chinchillas
During the Phase V drill programme coarse and fine duplicates were incorporated in the quality control process. A total of 185 of the coarse rejects (at 10 mesh) were re-labelled with a new number, re-assayed at Alex Stewart and considered as coarse duplicates. The same procedure was applied to 191 fine rejects (pulps), and these were considered as fine duplicates. Assay of the fine duplicates is not intended to validate the assay process since each part of the duplicate pair was assayed in the same laboratory. Pairs of values below 3 ppm Ag were removed due to the poor precision of results. Figure 8.1 shows a summary of the coarse and fine duplicates for Ag comparing the mean percentage difference (MPD) to the accumulated MPD. The MPD is calculated as the percentage of Ix1-x2I / (x1+x2) / 2.
Curves for Pb and Zn show similar tendency as for Ag.
Field duplicates were not taken during the Phase V drill programme. As shown in previous phases, the comparison between quarter-core versus half- core had low representativeness and usefulness.
21015Puna21TRS220927Rev0.docx Page 60 of 175
Figure 8.1 Ag Values for the Two Types of Duplicates – Chinchillas
SSR, 2020
8.1.6.3 Certified Reference Materials – Chinchillas
A set of certified reference materials (CRM) standards was used to check the accuracy and precision of the laboratory. The same three CRMs used during Phases III and IV were used during the Phase V programme, referred to as 1-CH, 2-CH and 3-CH. These standards were originally prepared by ACME-Mendoza, at the request of Golden Arrow, from rejects of previous drill core from the Chinchillas property. CRMs 1-CH and 2-CH have low (41 ppm) and intermediate (146 ppm) Ag grades and were packaged in 30 g envelopes because they do not require fire assay. Standard 3-CH has higher silver content (862 ppm) and, therefore, was packaged in 120 g envelopes to accommodate the larger sample requirements of the fire assay testing.
A total of 148 CRM of 1-CH, 157 of 2-CH, and 72 of 3-CH were inserted along the Phase V drilling. The assay results from the 1-CH all fall within three standard deviations (SD)of the accepted value (Figure 8.2). In the case of the 2-CH, only one value is above three SD of the accepted value. The results of 3-CH, shown in Figure 8.3, indicate that all assay results are within two SD of the accepted value.
21015Puna21TRS220927Rev0.docx Page 61 of 175
Figure 8.2 Ag Values from CRM 1-CH and 2-CH – Chinchillas
MPSA, 2020
Figure 8.3 Ag Values from CRM 3-CH – Chinchillas
MPSA, 2020
The results for lead, shown in Figure 8.4, indicates some outliers in standard 2-CH. Samples immediately before and after this potentially suspect standard result were re-assayed and no significant difference was detected from the original assays.
21015Puna21TRS220927Rev0.docx Page 62 of 175
Figure 8.4 Pb Values from CRM 1-CH, 2-CH and 3-CH – Chinchillas
MPSA, 2020
In the case of zinc, reference materials 2-CH and 3-CH were assayed by method ICP-MA and all values are within +/– two SD, except for one sample that is less than three SD from the accepted value (Figure 8.5 and Figure 8.6).
Figure 8.5 Zn Values from CRM 1-CH and 3-CH – Chinchillas
MPSA, 2020
21015Puna21TRS220927Rev0.docx Page 63 of 175
Figure 8.6 Zn Values from CRM 2-CH – Chinchillas
MPSA, 2020
8.1.6.4 Secondary Laboratory for Checks – Chinchillas
ALS was used as secondary laboratory. A total of 293 pulps were sent to ALS to be tested by method ME-ICP61 based on a four-acid digestion and reading by ICP. Samples greater than 1% Pb or 1% Zn were re-tested using ore grade method Pb-OG62 and Zn-OG62. Samples greater than 100 ppm Ag were re-assayed by fire assay with gravimetric finish (method Ag-GRA22). ALS is part of an international laboratory system and has ISO 9001:2008 and 17025:2005 certifications. ALS is independent from Golden Arrow and SSR.
As with the field / coarse duplicates, the laboratory duplicate pairs with values close to the lower limit of detection were removed due to the poor precision of results, leaving only the greater than 3 ppm Ag values.
Figure 8.7 shows the MPD of the Ag, Pb, and Zn values in check samples between the primary and secondary laboratory.
21015Puna21TRS220927Rev0.docx Page 64 of 175
Figure 8.7 Comparison of Ag, Pb, and Zn Laboratory Duplicates – Chinchillas
MPSA, 2020
8.1.7 Conclusions and Recommendations – Chinchillas
In the opinion of the QPs the sample preparation, security, and analytical procedures meet or exceed industry standards for data quality and integrity. There are no factors related to sampling or sample preparation that would materially impact the accuracy or reliability of the samples or the assay results. The outcomes of the QA/QC procedures indicate that the assay results are within acceptable levels of accuracy and precision and the resulting database is sufficient to support the estimation of Mineral Resources.
8.2 Sample Preparation, Analyses, and Security – Pirquitas
The following summarises the sample preparation, analysis and security details used by Sunshine Argentina and SSR in their drill campaigns at Pirquitas and remains unchanged from the most-recent NI 43-101 Technical Report (Board et al, 2011).
8.2.1 Sampling Method – Pirquitas
8.2.1.1 Sunshine Argentina
RC drillhole cuttings were collected and split into 30–40 kg samples at the drill rig. A three-tier Jones-style splitter was used to split these samples. A 3–5 kg sample was sent to the relevant analytical laboratory for sample preparation and analysis.
Drillhole core (HQ and NQ) was marked for sampling and cut in half using a diamond saw. One half of the core was geologically logged and stored on site. The other half of the core was sent to the laboratory for sample preparation and analysis.
21015Puna21TRS220927Rev0.docx Page 65 of 175
A total of 2,788 underground channel samples were collected over a total distance of 1,600 m from mineralised veins and sheeted vein systems in the main ore zone of the San Miguel zone, as well as from the Oploca, Potosí, Blanca, San Pedro, and Llallagua vein systems. Samples of approximately 2 kg per linear metre were chiselled from channels.
8.2.1.2 SSR
Dry RC samples were split to approximately one-eighth (~12.5%) of the original sample size using a three-tier Jones-style splitter, then split to one-sixteenth using a one-tier Jones splitter. This sample was sent to the laboratory. Wet RC samples were initially halved using a wet splitter, with one half split again to one-eighth using a three-tier Jones splitter, then halved again to produce a one-sixteenth sample to be sent to the laboratory.
Drillhole core was marked for sampling and cut in half using a diamond saw. One half of the core was geologically logged and stored on site. The other half of the core was sent to the laboratory for sample preparation and analysis. All drillhole samples generated from the 2010–2011 drilling programmes were diamond drillhole core samples.
Following the splitting of core, half the core is returned to the box while the other half is bagged. Corresponding tags are inserted, one in the plastic sample bag and the second in the core box. Quality control samples are inserted in sample bags and allocated in order for the laboratory to have a control sample in every batch.
8.2.2 Sample Custody and Security – Pirquitas
The analytical laboratories took possession of the samples at the Pirquitas site, and the samples were in their custody throughout the sample preparation and analysis steps, including sample transportation from site to the respective analytical laboratory.
SSRs sampling protocol included the labelling of sample bags and closing with a security seal. The samples were then sent to Jujuy by company truck.
8.2.3 Sample Preparation – Pirquitas
8.2.3.1 Sunshine Argentina
Sunshine Argentina’s drilling programme was effectively conducted in two phases, with the transition being marked by a change in analytical laboratories from American Assay Laboratories (AAL) to the SGS Chile laboratory partway through its drilling programme. RC drillholes AR 001-AR 092 and diamond core drillholes DDH 001-DDH 042 were analysed by AAL, RC drillholes AR 093-AR 164 and diamond core drillholes DDH 043-DDH 069 were analysed by SGS Chile.
Sample preparation procedures were similar at both analytical laboratories:
•Samples were initially dried for two to three hours at 105°C.
•Dried samples were crushed to less than 18 mm in diameter using a jaw crusher, through to less than 2 mm to less than 0.18 mm in diameter using a roll crusher.
•A Jones-style riffle splitter was used to collect sample splits of approximately 250 g (AAL) and 400 g (SGS Chile).
•Sample splits were pulverised in ring / disk pulverisers to less than 0.10 mm in diameter, homogenised, and packaged for analysis.
21015Puna21TRS220927Rev0.docx Page 66 of 175
All coarse rejects from the AAL prepared sample splits were stored on-site at Pirquitas; a minimum of 0.25 kg per sample was returned for on-site storage at Pirquitas by SGS Chile. A split of each sample pulp was also returned for on-site storage at Pirquitas.
8.2.3.2 SSR
RC and DD samples were shipped to the ALS Chemex analytical laboratory in Mendoza, Argentina. The following sample preparation was conducted by ALS Chemex:
•Samples were logged into the ALS Chemex Webtrieve sample tracking system (ALS Chemex procedure LOG-21), weighed (WEI-21), and then dried (DRY-21).
•Dried samples were crushed to between 70% and 80% passing a nominal –2 mm (CRU-31 or CRU-35), and split using a riffle splitter (SPL-21) to produce a representative 250 g split for pulverisation. The sample split was pulverised to better than 85% passing 75 µm (PUL-31 or PUL-32, depending on sample size).
8.2.4 Sample Analysis – Pirquitas
8.2.4.1 Sunshine Argentina
Sample pulps were digested in aqua regia and analysed for Ag using atomic absorption spectrometry (AAS). Samples with values higher than 500 ppm Ag were analysed a second time using fire assay methods. For Sn analyses, the sample pulps were fused with sodium peroxide and caustic pellets to ensure the Sn was completely dissolved before being analysed by AAS.
A total of six assay laboratories were used during Sunshine’s two drilling phases:
•Phase I – After sample preparation, AAL sent the samples to the Laboratorio Quimíco Guayacan Ltda. Analytical laboratory in La Serena, Chile for Ag analysis, and to the AAL analytical laboratory in Santiago, Chile for Sn analysis. Samples were also submitted to the Centro de Investigación Minera y Metalúrgica (CIMM) in Santiago, Chile for check assaying of Ag, and to the Instituto de Investigaciónes Minero-Metalúrgicas in Oruro, Bolivia for check assaying of Sn.
•Phase II – Prepared samples were sent to the SGS Chile analytical laboratory in Quilicura, Santiago, Chile for assaying, and to the Acme Labs in Santiago, Chile analytical laboratory for check assaying purposes. The analytical laboratories received 60 g pulps for Ag analyses and 20 g pulps for Sn analyses.
8.2.4.2 SSR
The analytical methodology changed during SSRs 2005–2008 drilling programme. Samples were initially analysed using the ICP mass spectrometry method, then aqua regia digestion followed by 36 element atomic emission ICP spectroscopy (ME-ICP41). Ag grades were found to be understated by both the ICP mass spectrometry method and, to a lesser degree, the ICP agua regia method. As a result of this SSR elected to switch to a third method: Four-acid ‘near total’ digestion followed by 34 element atomic emission ICP spectroscopy (ME-ICP61a, including Sn). Over limit Pb (>10%), Zn (>10%), and Ag (>200 ppm) grades were re-analysed using a four-acid digestion followed by AAS finish (Pb, Zn, or Ag-AA62 procedures). Ag grades still over limit (>1,500 ppm) were analysed by fire assay with a gravimetric finish (Ag-GRA21). Additional Sn analyses were conducted using AAS (Sn-AA82). All ICP mass spectrometry samples were re-assayed using this method by ALS Chemex.
Four-acid ‘near total’ digestion followed by 34 element atomic emission ICP spectroscopy (ME-ICP61a, including Sn) was the primary analytical technique used during the 2010–2011 drilling programme.
21015Puna21TRS220927Rev0.docx Page 67 of 175
8.2.5 Density – Pirquitas
The method of density determination is not specifically discussed in historical documentation.
8.2.6 Quality Assurance and Quality Control – Pirquitas
8.2.6.1 Sunshine Argentina
Approximately 12% of the samples submitted for assays were QA/QC samples consisting of field standard, blank, and duplicate control samples. The QA/QC results showed that:
•Overall, Ag analyses of CRM and blank control samples were within acceptable limits.
•Field duplicate control samples of Ag were considered acceptable.
•Sn analyses were initially biased low, resulting in the re-assaying of 3,252 samples. No significant biases were noted in the Sn assay data for the Phase II drilling. Limited cross-contamination in Sn assay data was rectified through a programme of sample batch re-assaying. Sn data displayed a relatively high degree of inherent variability.
8.2.6.2 CRM
CRM standard, blank, and field duplicate control samples were inserted into the sample stream on a one-in-twenty basis. Approximately 5% of the total number of submitted samples was submitted to the third-party analytical laboratory for check assaying. QA/QC samples included six different reference CRMs covering a representative range of Ag, Sn, and Zn grades, blanks generated from barren sandstone, and field duplicates (prepared as discussed above).
The QA/QC results showed that:
•The control values of the CRMs were not initially correctly calibrated, resulting in extensive failures of the field standard control samples relative to no failures in the analytical laboratory standard control samples. Recalibration of these values indicates that the key assay data from the 2005 through 2008 drilling programmes are unbiased and accurate.
•Field blank control samples indicated that sample cross-contamination was generally not an issue during the analytical work conducted on SSRs 2005–2008 drilling data.
•Field duplicate control samples, whilst indicating a degree of variability in the assay data, were reported at acceptable levels of precision for Ag, Sn, and Zn, given the nugget effect (inherent variability) and the variability associated with quarter-core versus half-core samples.
8.2.7 Conclusions and Recommendations – Pirquitas
In the opinion of the QPs the sample preparation, security, and analytical procedures meets industry standards for data quality and integrity. There are no factors related to sampling or sample preparation that would materially impact the accuracy or reliability of the samples or the assay results. The outcomes of the QA/QC procedures indicate that the assay results are within acceptable levels of accuracy and precision and the resulting database is sufficient to support the estimation of Mineral Resources.
21015Puna21TRS220927Rev0.docx Page 68 of 175
9 DATA VERIFICATION
9.1 Database Validation
9.1.1 Collar Coordinate Validation
9.1.1.1 Collar Coordinate Validation – Chinchillas
Validation of collar elevation data at Chinchillas was done by comparing elevations from DGPS field surveys against the satellite photo digital elevation model (DEM). Precision of the DGPS is between 15–70 cm.
9.1.1.2 Collar Coordinate Validation – Pirquitas
Drillhole collar locations at Pirquitas were validated by an independent surveyor for the 2011 resource modelling study.
In the 2013 modelling study, it became apparent that there was a discrepancy in some pre-2009 holes in the form of displacement of mineralised vein intervals relative to the vein interpretation and grade control data. An example of this issue is shown for drillhole AR-315, which has a high-grade interval that falls outside of the Veta Blanca vein model (Figure 9.1). The vein model in this location has been informed by many grade control drillholes, causing the position of AR-315 to be called into question.
A thorough investigation was undertaken, and similar issues were identified in 96 drillholes.
Efforts were made to identify the possible source of the issue and, if a transposition error, remedy those errors definitively, however the age of the data and the inability to re-survey the collars due to them having been mined made this unachievable.
To remedy the issue in the modelling, the collar locations of the affected holes were adjusted to bring the vein intercept into expected location, making it concordant with observations in surrounding holes. While this is not an ideal situation, the intervals in question are likely to be captured by grade control at the time of mining, therefore it is not expected to cause a volumetric difference. However, further ongoing assessment would be required to definitively identify and remedy the incorrect historical data. Some new drilling should be considered to re-check vein locations in the areas afflicted by suspect holes.
9.1.2 Downhole Survey Validation
The down-hole survey data were validated by searching for large discrepancies between the dip and azimuth reading against the previous reading. No significant discrepancies were found.
Before the beginning of Phase III drilling at Chinchillas it was noted that the correction of the magnetic declination between true north and magnetic north was correct in angle but had the opposite direction. For this reason, all azimuths of drillholes of Phases I and II were corrected by 13° counterclockwise. No other adjustments were necessary for the other drilling phases.
21015Puna21TRS220927Rev0.docx Page 69 of 175
Figure 9.1 Vein model with Exploration Drillhole AR-315 Outside of the Vein
MPSA, 2013
9.1.3 Assay Verification
To validate the Chinchillas data, the following checks were confirmed:
•The maximum depth of samples were checked against hole depth;
•The values of less than the detection limit were converted into a positive number half the detection limit;
•The highest Ag values and at least one random value from each drillhole were checked against the original assay certificate;
•The units were converted from ppm into percent (%) for Pb and Zn values; and
•Silex drillhole assay data were validated as reported in a previous Mineral Resources estimate (Davis et al, 2013).
For Pirquitas, approximately 10% of the pre-2010 drilling assay data set was checked and compared to the original assay certificates, to generate additional confidence in this data. Detailed checks of assay data from the 2010–2011 drilling programme was undertaken, with iterative corrections made for any anomalies (generally typographic errors, including mis-labelled samples, and mis-labelled sample intervals).
21015Puna21TRS220927Rev0.docx Page 70 of 175
9.2 QA/QC Protocol
A review of the Chinchillas QA/QC protocols was conducted prior to drilling and formalised in a detailed QA/QC manual developed by Golden Arrow. Onsite reviews were conducted during all drilling phases by a QP. The procedures for core processing, the insertion of blanks and standards were examined and considered appropriate.
At Pirquitas, QA/QC information for all exploration drilling programmes was analysed. Review of real-time QA/QC data monitoring was undertaken by SSR, especially timing and effectiveness of remedial action taken with respect to failed batches.
9.3 Geological Data Verification and Interpretation
While several geology variables were captured during core logging, only lithology was used to constrain the Chinchillas Mineral Resources estimation. Therefore, geology data verification was limited to determining that the lithology designation was correct in each sample interval. This included the following:
•FROM – TO intervals for gaps, overlaps and duplicated intervals;
•Collar and SampleID mismatches; and
•Correct geology codes.
A geological legend was provided by Golden Arrow and compared to the values logged in the database. Data were examined on screen for discrepancies in logging.
9.4 Assay Database Verification
The assay data from 15 randomly selected drillholes, representing approximately 5% of the Chinchillas database, was manually compared to the original assay certificates. These holes contained a total of 1,890 individual samples, in which eight samples were found to have differences in the values of the second decimal value. Differences of this nature are not considered to be ‘errors’ as they have no measurable impact on the estimation of Mineral Resources. The results of this test indicate the database is sound and free of errors.
For Pirquitas, approximately 10% of the pre-2010 drilling assay data set was checked and compared to the original assay certificates. Detailed checks of assay data from the 2010–2011 drilling programme was undertaken.
9.5 QP Opinion
It is the opinion of the QPs that the data is adequate for the purposes used in the Puna21TRS. No material sample bias was identified during the review of the drill data and assays. Review of the data validation processes indicates that the drill data is adequate for the estimation of Mineral Resources.
21015Puna21TRS220927Rev0.docx Page 71 of 175
10 MINERAL PROCESSING AND METALLURGICAL TESTING
10.1 Chinchillas
The metallurgical development of Chinchillas ore types commenced in 2013 and continued through 2016. The first testwork was focussed on silver recovery by both leaching and flotation methods, with flotation proving to be superior at the early stage. The second programme continued process development of flotation into separate lead / silver and zinc concentrates. The third testwork campaign was designed to advance the flotation process and test specifically these ore types to the Pirquitas mill flow sheet.
10.1.1 Initial Testwork 2013
A scoping metallurgical test programme was initiated in January 2013. This testwork was undertaken by Bureau Veritas Commodities Canada Ltd. All testing was bench-scale. Results from the early testwork stages are summarised in a previous NI 43-101 Technical Report (Kuchling et al, 2014).
10.1.2 Second Phase Testwork 2014
The second testing programme was conducted on composite samples from the silver Mantos zone (MAN-2), the Socavon Del Diablo Zone (SOC-2) and the Mantos Basement zone (BAS-1). This programme included locked cycle testing and provided the most representative view of the overall metallurgical performance of the samples to date. The following summary is an excerpt from the final report titled “2014 Project Report on Metallurgical Testing on the Chinchillas Project” prepared by Bureau Veritas Commodities Canada Ltd, Inspectorate Metallurgical Division, (Chen and Redfearn, 2014):
“Seven core samples (received on October 15, 2013 weighing 102 kg), were air dried and separated into three composites. Each composite was individually crushed to 6 mesh, mixed and split into the required samples for testing. Silver contents range from 94.2–150.6 g/t and base metals include lead and zinc.
In this testing programme, it was confirmed that Chinchillas samples are usually amenable to the conventional lead and zinc sequential flotation process. For most of the samples, the majority of silver was recovered in the lead circuit. Overall silver, lead, and zinc recoveries are above 95%. Most rougher concentrates responded well to the subsequent cleaner flotation stages. Upgrading of composites BAS-1, MAN-2, and SOC-2 generated lead final concentrates with grades ranging from 65% to 79% lead and zinc final concentrates with grades from 52% to 62% zinc.”
Locked cycle tests on three samples (BAS-1, MAN-2, and SOC-2) showed that high silver and lead recoveries in the lead circuit can be achieved along with good lead final concentrate grades. For composites BAS-1 and SOC-2, good final zinc concentrates grading 51.8% and 60.1% respectively were obtained.
To assist with future metallurgical development, mineralogical analysis was undertaken on the three ore types (BAS, MAN, SOC) and two flotation testwork concentrates (BAS lead second cleaner concentrate and lead scavenger concentrate generated during one of the flotation tests).
21015Puna21TRS220927Rev0.docx Page 72 of 175
The report concluded:
“The three composites assayed 100–150 g/t silver and 0.6% to 2.2% lead. Freibergite was the dominant silver bearing mineral, constituting over 75% of the total feed silver. The remaining silver was contained in pyrargyrite, stephanite and tetrahedrite. The lead was mostly contained in galena.
The three composites also assayed 70–300 g/t copper and 130–330 g/t arsenic. The copper was predominantly carried by freibergite and chalcopyrite.
The arsenic was mostly carried by arsenopyrite and krutovite.”
The objective of this second phase flotation testwork was to produce sequential lead / silver and zinc concentrates. This was successful with high recoveries achieved of the target metals to marketable quality concentrates. The mineralogical analysis highlighted that the lead was contained in galena, and the silver was contained in the very typical series of silver sulfosalt minerals.
10.1.3 Third Phase Testwork 2016
The 2016 flotation testing programme was developed to determine the compatibility of Chinchillas mineralisation types to the Pirquitas process plant flow sheet and capacity. Testwork included comminution and focused on producing lead / silver and zinc concentrates by sequential flotation. In addition, a comparison between the flotation reagent scheme used in the historical testwork programmes and the current Pirquitas scheme was undertaken.
The testwork was completed at ALS Metallurgy, Kamloops, British Columbia, Canada.
10.1.3.1 Selection of Drill Intervals for Testing
A review of the drill assay database assays was used to imply mineralogy; specifically, iron to sulfur ratio (Fe:S, a proxy for pyrite content). It was suggested at the start of the testwork programme that silver might be partially associated with pyrite. A typical example of both silver content and Fe:S versus drillhole depth is shown for drillhole CGA-35 in Figure 10.1. However, the varying iron to sulfur ratio appeared to be independent of Ag grade – therefore, a poor association with pyrite.
The criteria for selection of individual core intervals for selection for metallurgical testing were:
•Within pit shell (excluding the SOC zone, not in the initial mine plan)
•Ag grades similar to mine plan grades
•Fe:S ratio into High and Low classes
•Lithology into either Manto or Basement
21015Puna21TRS220927Rev0.docx Page 73 of 175
Figure 10.1 Drillhole CGA, Variation in Ag Grade and Fe:S Ratio Downhole
MPSA, 2020
Nominally four separate drillhole intervals were identified for each of the four mineralisation types. These were named ‘Manto Low’ and ‘Manto High’, and ‘Basement Low’ and ‘Basement High’ with the designations corresponding to Fe:S ranges of >15 or <5 respectively. Figure 10.2 shows the selected drill interval locations within the pit. The pit is planned in two mining phases, the first shown as the red pit shell and the second as the green pit shell.
These identified intervals were recovered from the Chinchillas site drill core library and re-sawn into quarter core by Golden Arrow geological staff. Once securely bagged and labelled, approximately 350 kg of material was shipped directly to the laboratory in Kamloops, Canada.
In addition to the economic metals, additional analysis was completed for lead and zinc oxides, total and sulfide sulfur and silver (by both fire assay and three-acid ICP methods).
Observations included:
•Low amounts of lead and zinc oxide with no effect expected on flotation.
•High proportion of the total sulfur is present as sulfide (i.e., limited sulfates).
•Variation of silver by the two methods is low which implies most silver is sulfide hosted.
21015Puna21TRS220927Rev0.docx Page 74 of 175
Figure 10.2 Metallurgical Sample Locations within the Two Pit Shells (Mining Phases)
MPSA, 2020
The Master composites ranged in grade between 154–238 g/t Ag, 0.31%–1.77% Pb and 0.16%–1.02% Zn. The Fe:S ratio ranged from 5–30. In terms of composite grades, the selection of samples was based on an initial mine plan. This initial plan had no mining in Socavon zones and therefore, no samples were selected from this Project area for the 2016 flotation testwork programme. Variability samples are selected to cover a range of grades above and below this mine plan.
Metallurgical testwork development followed a general plan of:
•comminution testing;
•reagent optimisation on the four Master composites;
•batch rougher / cleaner flotation on Master and Variability composites;
•locked cycle flotation on the four Master composites; and
•additional flotation tailings were generated for thickening tests and water chemistry.
10.1.3.2 Comminution
Two of the Master composites, Basement Low and Manto Low, and individual composite CGA-89 Manto High, were tested for Bond Work Index (BWi) values. For comparison, the Pirquitas plant design was 15.2 kWh/t (Table 10.1).
21015Puna21TRS220927Rev0.docx Page 75 of 175
Table 10.1 Bond Ball Mill Work Index Test Results
| | | | | |
| Composite Sample | BWi, kWh/t |
| Basement Low | 11.5 |
| Manto Low | 15.5 |
| Manto High (CGA-89) | 16.2 |
10.1.3.3 Master Composite Rougher Flotation
The previous metallurgical programme in 2013 utilised a flotation reagent scheme quite different from the standard Pirquitas flotation reagent scheme. The initial series of batch sequential rougher flotation tests were performed on the four Master composites testing these two alternate reagent schemes. Neither of these schemes utilised sodium cyanide for pyrite or sphalerite depression.
Primary grind was maintained in the target P80 size range of 120–160 µm, consistent with both previous testwork and Pirquitas operating experience on similar ore types.
The Pirquitas reagent scheme recovered more silver to the lead concentrate. For Basement Low and High samples, the increase in silver recovery to the lead / silver concentrates was 3.6% and 11.8%. For Manto Low and High, the increase in silver recovery to the lead / silver concentrates was 19.6% and 28.7%. Therefore, the Pirquitas reagent scheme was used for all subsequent flotation testing (both batch rougher / cleaner and locked cycle work).
10.1.3.4 Master Composite Rougher / Cleaner Flotation
For each of the four Master composites, a rougher / regrind / cleaner test was completed, yielding separate lead and zinc concentrates.
For all Master composites, a high Pb grade lead concentrate was produced, with the contained Ag grade varying directly with the lead to silver proportion in the heads. Open circuit cleaning recovery was good. For the very low zinc grade Manto High composite, no zinc flotation was attempted. The remaining three Master composites produced marketable zinc concentrates.
10.1.3.5 Variability Composite Rougher / Cleaner Flotation
For each of the Variability composites, a rougher / cleaner flotation test was completed to assess the effect of head grade variation on metal recoveries and cleaner concentrate grades.
Pirquitas’ operating experience has demonstrated difficulty in achieving a marketable grade zinc concentrate when zinc feed grades are below 0.4% Zn. For the Chinchillas variability testwork, no zinc flotation was completed for any composite with a head grade below 0.2% Zn.
As with lead / silver flotation, there is generally consistent flotation performance between the Master and the Variability composites.
This reagent scheme employed at the Pirquitas plant, using ZnSO4, lime, AP3418A and MIBC, avoids the use of cyanide in the lead flotation stage, thus eliminating any cyanide concerns with tailings effluent and the possible need for cyanide destruction.
21015Puna21TRS220927Rev0.docx Page 76 of 175
10.2 Socavon / Chinchilla
10.2.1 Testwork 2018
In 2018, ALS Metallurgy, Argentina conducted preliminary metallurgical testwork on Socavon / Chinchilla and Pirquitas Manto / Basement composites.
The Socavon / Chinchillas composites were tested by flotation to determine if a lead / silver and a marketable zinc concentrate could be produced. Additionally, to access the blend results of the Socavon / Chinchilla and Pirquitas Manto / Basement composites. Two metallurgical test composites were constructed representative of the Socavon zone of the Chinchillas deposit. The composites were identified as Socavon / Chinchillas Composite A and Socavon / Chinchillas Composite D. An additional composite was constructed for blend testing and was identified as Pirquitas Basement / Manto composite.
The primary objective of the test programme was to determine the effect of blending the Socavon / Chinchillas composites with a Pirquitas Manto / Basement composite. Lead feed grade measured 0.56% and 0.78% in Socavon / Chinchillas Composite A and D, respectively. The Pirquitas Basement / Manto composite measured the highest lead grade at 0.96%. Lead soluble in ammonium acetate digestion, indicative of lead in oxide form measured about 20% of the total lead in the Socavon / Chinchillas Composite A.
Zinc feed grade measured 0.56% and 1.78% for Socavon / Chinchillas Composite A and D, respectively. The Pirquitas Basement / Manto composite measured approximately 0.76% Zn. Zinc soluble in an ammonium acetate digestion measured 0.06% or less indicating a low percent of the zinc as non-sulphide minerals. Silver feed grade measured 16–34 g/t Ag for the Socavon / Chinchillas Composites A and D, respectively, and measured significantly higher in the Pirquitas Basement / Manto composite at 190 g/t Ag. Sulphur content in the samples ranged from 0.7%–4.4% S.
Initial cleaner testing on the Socavon / Chinchillas Composites A and D indicated that approximately 71% and 87% of the lead could be recovered to lead concentrates grading 55% and 30% respectively. Lower lead recoveries measured in the Socavon / Chinchillas Composite A test was likely due to the high percentage of the lead in the feed associated with lead oxide minerals. About 87% and 83% of the silver was also recovered to the respective lead concentrates. The low lead grade of the Composite D concentrate was due the high levels of zinc dilution in the lead concentrate. Optical microscope assessment of the lead concentrate indicated that the majority of the zinc minerals were well liberated, and rejection should be possible with the correct flotation chemistry.
The Pirquitas Basement / Manto composite was tested using similar test conditions and recovered 94% of the lead and 92% of the silver to the lead cleaner concentrate which graded about 60% lead and 1.1g/t Ag. Zinc recovery to the lead concentrate was about 20%, similar to the Socavon / Chinchillas Composite A.
A series of blend tests were conducted using the Socavon / Chinchillas and Pirquitas composites. Results from these tests indicated that lead and silver recoveries to the lead concentrates typically decreased when higher ratios of the Socavon / Chinchillas composites were added to the various blends. The lead grade in the Socavon / Chinchillas Composite D blend tests decreased as more of the composite was used in the blends, as a result of increased zinc in the lead concentrate. This trend was also observed for zinc in the zinc circuit.
Measured lead and zinc recoveries in the blend tests were typically lower than the calculated recoveries of the various blend ratios. However, the measured concentrate grades for the blend tests were higher than the calculated concentrate grades and it is likely they exist on a similar grade recovery curve. Zinc recoveries to the lead concentrates were about 5% lower than calculated values. This suggests that there was room for improvement within the lead circuit in the baseline Socavon / Chinchillas tests.
21015Puna21TRS220927Rev0.docx Page 77 of 175
Tests were conducted using MBS as a replacement for zinc sulphate and the results indicated that the addition of MBS at the dosages employed had no significant effect on depressing zinc in the lead circuit. Additionally, closed circuit testing would be beneficial for providing a better estimate of metallurgical performance in the zinc circuit.
Preliminary relationships, Table 10.2, of recovery and mass pull to produce a silver / lead concentrate and zinc concentrate for Socavon material have been derived.
Table 10.2 Preliminary Socavon Recovery Relationships
| | | | | | | | | | | | | | |
| | Unit | Silver / Lead Concentrate | Zinc Concentrate |
| Recovery | Silver | % | 90 | 2.5 |
| Lead | % | 55 x Pb% feed + 45 | 1 |
| Zinc | % | (Pb/Zn feed x –46) + 56 | Zn feed x 13.8 + 21.5 |
| Mass Pull to concentrate | Concentrate | t conc./
t feed | Pb% feed x 0.055 – 0.02 | Zn% feed x 0.004 + 0.001 |
Further optimisation flotation testwork is recommended including liberation testing, mineralogy and flotation reagent optimisation.
10.3 Metallurgical Performance Estimates
The Pirquitas process plant operating performance since commencement on Chinchillas ores is used to provide the concentrate grade recovery and mass pull relationships, Table 10.3 and Table 10.4.
Table 10.3 Silver / Lead Concentrate Relationships
| | | | | |
| Variable | Variable Formula |
| Ag Recovery | (–0.0631 x Pb recovery2) + (11.655 x Pb recovery) -447.4 |
| Pb Recovery | (–2.6303x Pb Feed2) + (12.329 x Pb Feed) + 80.654 |
| Zn Recovery | (-5.2817 x Zn Feed2)+(Zn Feed x –6.31) + 20.546 |
| Mass Pull | (–0.0024 x Pb Feed2) + (0.0164 x Pb Feed)+-0.0007 |
Table 10.4 Zinc Concentrate Relationships
| | | | | |
| Variable | Variable Formula |
| Ag recovery | (–3.4843 x Zn feed2) + (7.2499 x Zn feed)+0.8295 |
| Pb recovery | (0.024 x (Pb feed / Zn feed)2) + (-0.5988 x (Pb feed / Zn feed)+ 3.1292 |
| Zn recovery | (–195921 x (mass pull Zn)2 + (5620.3 x mass pull Zn)+28.709 |
| Zn recovery | |
| Mass Pull | (0.007 x Zn feed2) + (0.0041 x Zn feed+0.0011 |
21015Puna21TRS220927Rev0.docx Page 78 of 175
10.4 Recommendations for Additional Testwork
It was identified that low zinc grade material would not generate a saleable zinc concentrate and the zinc circuit would be bypassed when Zn grade is less than 0.4%.
The Chinchillas mineralogy showed lead occurred predominantly as galena, silver as a series of sulfosalts and zinc as sphalerite.
Additional metallurgical laboratory testwork should include the following:
•Detailed geometallurgical study to understand the distribution of possible future smelter penalty elements (e.g., antimony for lead concentrate and silica for zinc concentrate).
•Additional Bond Work and Abrasion Index testing on samples throughout the deposit.
10.5 QP Opinion
It is the opinion of the QPs that the data is adequate for the purposes used in the Puna21TRS and the analytical procedures used in the analysis are of conventional industry practice.
21015Puna21TRS220927Rev0.docx Page 79 of 175
11 MINERAL RESOURCES ESTIMATES
11.1 Mineral Resources Estimate – Chinchillas
The Chinchillas Mineral Resources estimate was developed in August 2020 by independent consultant company Red Pennant Geoscience. The Puna21TRS QPs have reviewed and accepted this information for use in the Puna21TRS. The Chinchillas Mineral Resources have been estimated in accordance with generally accepted industry guidelines and are reported in accordance with S-K 1300. Mineral Resources are not Mineral Reserves and they do not have demonstrated economic viability.
The effective date of the resource cell model is 28 August 2020. The effective date of the Mineral Resources is 31 December 2021 after accounting for depletion from mining from the August 2020 model.
The previous Mineral Resources estimate for the Chinchillas property had an effective date of 12 April 2016 and is described in the NI 43-101 Technical Report dated 27 May 2016, (Davis, et al., 2016).
11.1.1 Available Data – Chinchillas
The database available at the time of the resource modelling comprised a total of 335 diamond drill (DD) holes with 56,641 m of logged data and 55,905 m of assay data.
The spatial distribution of the drilling is shown in Figure 11.1.
Figure 11.1 Isometric View showing the Chinchillas Drillhole Database used in Resource Modelling
MPSA, 2020
21015Puna21TRS220927Rev0.docx Page 80 of 175
11.1.2 Compositing – Chinchillas
Raw sample lengths were generally up to 2 m in waste rock and 1 m or less in mineralised rock. A minimum sample length of 0.1 m was permitted on samples from highly mineralised structures such as veins, stockworks, and breccias.
A composite length of 5 m was considered most suitable for the Chinchillas drillhole data. Data were composited to the selected composite length within the interpreted wireframe solid. Residual lengths were retained.
11.1.3 Exploratory Data Analysis – Chinchillas
Exploratory data analysis was conducted to understand the distribution of the metals within the different lithological units and as well in different structural domains.
Five estimation domains were used to inform the estimation process, the lithological data along with the rock geochemistry informed these estimation domains. The raw and composited statistics for silver, lead and zinc are provided in Table 11.1.
Table 11.1 Estimation Domain Statistics
| | | | | | | | | | | | | | | | | | | | |
| | Count | Min. | Max. | Mean | SD | CV |
| Domain 1 |
| Ag (g/t) | 3,270 | 0.25 | 2,908.62 | 81.70 | 181.23 | 2.22 |
| Pb (%) | 3,270 | – | 29.64 | 0.79 | 1.63 | 2.07 |
| Zn (%) | 3,270 | – | 8.99 | 0.29 | 0.59 | 2.04 |
| Domain 2 |
| Ag (g/t) | 3,635 | 0.25 | 8,970.34 | 72.71 | 211.79 | 2.91 |
| Pb (%) | 3,635 | – | 28.00 | 0.69 | 1.37 | 1.98 |
| Zn (%) | 3,635 | 0.01 | 6.10 | 0.39 | 0.60 | 1.52 |
| Domain 3 |
| Ag (g/t) | 5,444 | 0.25 | 5,395.45 | 87.77 | 238.53 | 2.72 |
| Pb (%) | 5,444 | – | 15.38 | 0.62 | 1.02 | 1.66 |
| Zn (%) | 5,444 | – | 11.90 | 0.74 | 1.19 | 1.60 |
Domain 4 |
| Ag (g/t) | 3,061 | 0.25 | 2,466.14 | 47.68 | 112.85 | 2.37 |
| Pb (%) | 3,061 | – | 12.44 | 0.34 | 0.72 | 2.14 |
| Zn (%) | 3,061 | – | 13.08 | 0.21 | 0.57 | 2.72 |
| Domain LO |
| Ag (g/t) | 20,821 | 0.25 | 2,466.14 | 47.68 | 112.85 | 2.37 |
| Pb (%) | 20,821 | – | 10.90 | 0.07 | 0.15 | 2.10 |
| Zn (%) | 20,821 | – | 15.31 | 0.15 | 0.38 | 2.52 |
21015Puna21TRS220927Rev0.docx Page 81 of 175
The majority of the samples were analysed by ICP for a suite of 39 elements. The silver, lead, zinc, and sulfur data was extracted from the main database for use in the development of the resource model.
The database contains a total of 2,586 samples that have been tested for density. These samples were obtained from core selected at approximately 15 m intervals down most drillholes giving a relatively consistent distribution of density data throughout the deposit areas.
Individual assay sample intervals ranged from 0.1–10 m and averaged 1.34 m in length. Some 72% of the samples were exactly 1 m in length and 25% of the samples are 2 m long. Values analysed below the detection limit (<DL) were assigned values equal to one half of the detection limit (½DL).
Diamond drill core recovery averages 96%. Recoveries do not vary significantly between rock types (average recoveries: tuff 95%, dacite 98%, basement breccia 97% and basement 97%). There was no indication of a relationship between core recovery and grade.
11.1.4 Evaluation of Outlier Grades – Chinchillas
The 5m composited data were examined for outliers using cumulative probability plots and for loss metal of due to capping of higher-grade values. Multiple scenarios were run to understand the effect of capping and compared with the tonnes and grade within the mined out areas. The capping shown in Table 11.2 was used in the estimation domains.
Table 11.2 Estimation Domain Capping
| | | | | | | | | | | | | | | | | |
| | Domain 1 | Domain 2 | Domain 3 | Domain 4 | Domain LO |
| Ag (g/t) | 900 | 1,000.00 | 1,300.00 | 843.50 | 12.60 |
| Pb (%) | 8 | 7.90 | 6.30 | 5.00 | 1.00 |
| Zn (%) | 3 | 2.50 | 5.00 | 2.50 | 1.50 |
11.1.5 Geological Model – Chinchillas
As described in Section 6.2, the Chinchillas deposit is interpreted to be formed as a result of a Tertiary aged diatreme intrusion into a host of Paleozoic basement schists. Heat from the intrusion resulted in mineralisation in the form of disseminations, veinlets, and matrix filling within the volcanic breccias and tuffs as well as within the original schists.
11.1.5.1 Lithological Model – Chinchillas
The general spatial distribution of the main lithological units at Chinchillas is shown in cross-section in Figure 11.2. The higher grade silver-lead-zinc mineralisation occurs predominantly in the tuffaceous phase of the intrusive rocks and also within the brecciated zone in the underlying basement schists. However, relatively high-grade mineralisation can be found in all rock types.
21015Puna21TRS220927Rev0.docx Page 82 of 175
Figure 11.2 Cross-Section showing Rock Types and Silver Grades in Drilling
MPSA, 2020
The mineralisation in the Mantos area of the deposit exhibits two general styles or trends; a more flat-lying mantos-style distribution which is more common in the tuffs and a second basement trend of mineralisation which tends to be sub-parallel to the basement / tuff contact.
The comprehensive logging of lithological types (20) and alteration style (6) and intensity (5) results in the potential for 600 combinations. The lithological and alteration codes were rationalised into a small number of units for practical purposes.
A simplified 3D implicit model was created of the key lithological units (Figure 11.3):
•‘so’ (surficial materials)
•‘dac’ (dacite intrusive)
•combined ‘ctb’, ‘ftb’ and ‘mtb’ tuff and breccia units
•Ss2 basement
21015Puna21TRS220927Rev0.docx Page 83 of 175
Figure 11.3 Isometric View of Simplified Lithology Model
MPSA, 2020
11.1.5.2 Structural Model – Chinchillas
High resolution satellite imagery and SRTM and client-supplied topography data were combined into a 3D model. As the outcrop patterns are not obscured by vegetation, it was possible to carry out a ‘virtual’ field mapping exercise to measure the strike and dip of the locality (Figure 11.4). These measurements were used to develop a structural model in the form of structural surfaces to aid interpretation of the morphology and depth extension of the diatreme.
21015Puna21TRS220927Rev0.docx Page 84 of 175
Figure 11.4 Bedding Attitudes Represented as Disks Mapped on Topographic DTM
MPSA, 2020
11.1.5.3 Multi-Element Geochemistry Model – Chinchillas
An implicit geochemistry-based model was constructed using K-means clusters defined by assay statistics.
A clustering algorithm was used to partition the assay dataset into distinct, exclusive clusters so that the data points within each group show as little variability as possible. The reduction in variability within each of the clusters should help to minimise the coefficient of variation and improve geostatistical estimation within each domain by improving the likelihood of geostatistical stationarity. The advantage of the clustering process is that the variability can be automatically and quantifiably assessed by a computer algorithm much more efficiently than by human visual processing.
The elements used for the clustering exercise were: Ag, Al, As, Ba, Ca, Co, Cr, Fe, Ga, K, La, Li, Mg, Mn, Mo, Na, Nb, Ni, P, Pb, S, Sr, Ti, V, Y, Zn, and Zr.
Generally, the way K-means algorithms proceeds via an iterative refinement process, as follows:
•Each data point is randomly assigned to a cluster (number of clusters is pre-determined),
•The centroid of each cluster (the mean within the cluster) is calculated in n-dimensional space, and
•Each data point is assigned to its nearest centroid (iteratively to minimise the within-cluster variation).
Two cluster cases were assessed: four-cluster and seven-cluster solutions. The seven-cluster solution was geometrically complex and was not pursued further.
21015Puna21TRS220927Rev0.docx Page 85 of 175
The pattern of the four-cluster solution was simpler than the seven-cluster solution, conformed to the general geometry of known geological features, and provided only 14% more variability. Consequently, it was decided to proceed with the simpler four-cluster solution. The cluster allocation was coded onto the drillhole data (Figure 11.5). A 3D model was made of the four-cluster geochemical model using known geometry, including the trends of the diatreme and associated lithological units. Clusters 1 and 2 were largely confined to the exterior of the diatreme, while clusters 3 and 4 show a flatter geometry interior to the steep west-plunging diatreme.
Figure 11.5 K-means Four-Cluster Multi-Element Geochemistry Model
MPSA, 2020
11.1.5.4 Indicator Probability Constraint – Chinchillas
To provide a limit to estimation and to partly fulfil the requirement of ‘reasonable prospects of eventual economic extraction’, an indicator interpolant was created. Based on experimentation, a 15 g/t Ag value and a 30% probability were used to provide the limiting probability shell. Experimental indicator variograms were modelled and used in the indicator estimation.
The resulting indicator shells conformed to the geometry of the mineralised zones and were used to restrict the four-cluster domains to better mineralised regions (Figure 11.6).
21015Puna21TRS220927Rev0.docx Page 86 of 175
Figure 11.6 Volumes with >30% Probability of Exceeding 15 g/t Ag
MPSA, 2020
The cluster model combined with the probability shell provided the final estimation domain framework (Figure 11.7).
21015Puna21TRS220927Rev0.docx Page 87 of 175
Figure 11.7 Estimation Domains based on K-Means Clusters of Multi-Element Geochemistry
MPSA, 2020
21015Puna21TRS220927Rev0.docx Page 88 of 175
11.1.6 Grade Estimation – Chinchillas
Estimation was carried out within a cell model with 16 m x 16 m x 10 m cells (Table 11.3). Sub-cells of 4 m x 4 m x 5 m were permitted to improve boundary resolution. The model is not rotated.
The cell model was subsequently split down into 8 m x 8 m x 5 m cell sizes for mine planning purposes.
Table 11.3 Cell Model Limits – Chinchillas
| | | | | | | | | | | | | | |
| Direction | Minimum | Maximum | Cell Size
(m) | Number of Cells |
| East | 3,472,100 | 3,474,404 | 8 | 288 |
| North | 7,510,644 | 7,512,996 | 8 | 294 |
| Elevation | 3,750 | 4,300 | 5 | 110 |
Cells in the model were coded on a majority basis with the various domains.
The proportion of cells that occur below the topographic surface are also calculated and stored in the model as individual percentage items. These values are used as weighting factors when determining the in situ Mineral Resources for the deposit.
Estimation was undertaken within the four-cluster domains as well as outside of those domains, with only like-coded samples permitted to inform the estimates. Grades within peripheral unestimated blocks and the rock dumps were set to zero.
Three methods were used to populate Ag, Pb, Zn, and S estimates into the cell model:
•Nearest neighbour (NN),
•Inverse distance to the power of two (ID2), and
•Ordinary kriging (OK).
Normal scores variography was modelled and a locally varying orientation was used for both the ID2 and OK estimates. The varying directions follow the generally centrally dipping pattern seen in the geological modelling of the flat Mantos and steep Socavon marginal zones.
The OK grade estimates are regarded as definitive, while the ID2 and NN estimates were used for validation purposes.
11.1.7 Density – Chinchillas
Density was estimated from the previous PFS model using a nearest neighbour approach.
Density was estimated in the 2016 using the ID2 method. Densities are estimated with a maximum of two composites per drillhole and a maximum of six composites in total. The lithology domains provide hard boundary conditions during estimation and samples below 1.75 t/m3 excluded as these are considered to be anomalous.
21015Puna21TRS220927Rev0.docx Page 89 of 175
11.1.8 Validation – Chinchillas
Grade-tonnage comparisons of the ID2 vs. OK estimates were undertaken to validate the estimates (see Figure 11.8). In general, the ID2 and OK results are similar.
A cross-section showing the conformity between exploration drillhole data and the model estimates is shown in Figure 11.9.
Figure 11.8 Chinchillas Grade Tonnage Comparison within Pit 3 Volume – Ag, Zn, and P
MPSA, 2020
21015Puna21TRS220927Rev0.docx Page 90 of 175
Figure 11.9 Chinchillas Cross-Section at 7,512,400 mN showing
Ag Composites and Estimates
MPSA, 2020
11.1.9 Classification – Chinchillas
Classification was undertaking in accordance with the same method used in the 2016 resource model; that being minimum and maximum distance from drillhole data. The classification criteria used are shown in Table 11.4. Model cells that sit within the economic pit shell and meet the classification criteria are reported as Mineral Resource.
21015Puna21TRS220927Rev0.docx Page 91 of 175
Table 11.4 Classification Parameters – Chinchillas
| | | | | | | | | | | |
| Class Description | Class Number | Average Distance to Assay from Three Drillholes |
| Minimum | Maximum |
| Measured | 1 | 0 | 25 |
| Indicated | 2 | 25 | 50 |
| Inferred | 3 | 50 | 75 |
11.2 Pirquitas
11.2.1 Available Data – Pirquitas
The 2011 Mineral Resources estimate database contains assay data derived from DD and RC drillholes. The finalised valid drillhole database used as input for the modelling contains 551 collars (326 DDH and 225 RC).
The spatial distribution of the drilling completed to date at Pirquitas is shown in Figure 11.1.
21015Puna21TRS220927Rev0.docx Page 92 of 175
Figure 11.10 Isometric View showing the Pirquitas Drillhole Database
used in Resource Modelling
MPSA, 2011
11.2.2 Exploratory Data Analysis – Pirquitas
The 2013 modelling dataset contains 14,246 downhole survey, and 88,220 sample records, of which 88,788 have associated Ag assay data (for a total metreage of 108,815.6 m of Ag assays).
The majority of the samples were analysed by four-acid ‘near total’ digestion followed by 34-element atomic emission ICP spectroscopy (ME-ICP61a, including Sn).
Individual assay sample intervals in the database ranged from 0.001–5.0 m and averaged 1.31 m in length. Values analysed below the detection limit (DL) were assigned values equal to one half of the DL. The basic statistical summary of the assay sample data used in the 2013 resource modelling at Pirquitas is shown in Table 11.5.
21015Puna21TRS220927Rev0.docx Page 93 of 175
Table 11.5 Statistical Summary of Raw Assay Data Used in 2013 Modelling – Pirquitas
| | | | | | | | | | | | | | | | | | | | |
| Element | Count | Min. | Max. | Mean | SD | CV |
| Ag (g/t) | 82,788 | 0.10 | 41,330 | 43.45 | 341.09 | 7.85 |
| Zn (%) | 82,787 | 0.001 | 36.6 | 0.93 | 2.34 | 2.51 |
Drilling recovery generally ranged between 95% and 100% for diamond core drillholes, and generally between 80% and 100% for RC drillholes, except where drillholes intersected old underground workings.
11.2.3 Domain Interpretations – Pirquitas
SSR considers the Pirquitas deposit as comprising the Mining Area, which includes the San Miguel, Potosi, and Oploca Vein zone, and the Cortaderas area, which consists of the Cortaderas Breccia zone and the Cortaderas Valley zone (see Figure 11.10). It is the Mining Area that is the subject area for the 2013 resource modelling.
From July to October 2013, wireframes of the majority of mappable veins within the San Miguel, Potosi, and Oploca areas were created in MineSight software using a 65 ppm Ag-equivalent (AgEq) cut-off to define vein margins. The AgEq is calculated using the following formula:
AgEq = Ag (ppm) + 14 x Zn%
Visual analysis of colour-coded uncomposited grade control bench assay data was conducted to assess the general orientation of the veins within the domains. Figure 11.12 shows the available grade control data, colour coded for AgEq. Clear trends of veins are obvious at this scale, the 010° trend follows the orientation of an anticline hinge where there is a concentration of mineralisation where it is intersected by the more common north-west trending veins.
For the majority of veins, the process of wireframe construction began with the snapping of points on what were determined to be hangingwall and footwall pierce points of veins on the exploration drillholes. This was done in 3D space on a vein by vein basis. A different methodology was applied to the central part of the Crucero vein where it crosses the San Miguel pit and the Potosi Breccia. For these models, bench polygons were made around >65 g/t AgEq grade intercepts and then linked to form wireframes.
The wireframes were trimmed at surface where they were not controlled by exploration drilling to ensure that they did not extend above topography or overburden material. They were also intersected where one vein crossed or touched another in order to reduce the possibility of coding errors.
The result of this process was that the Mining Area was broadly sub-domained into three zones:
•Central San Miguel zone – characterised in the field by essentially sub-vertical veins and vein stockworks.
•Northern Potosí zone – characterised in the field by veins and vein stockworks steeply dipping toward the north.
•Southern Oploca Vein zone – characterised in the field by veins steeply dipping toward the south.
Details of the domain coding used in the generation of the 2013 model are shown in Figure 11.11.
21015Puna21TRS220927Rev0.docx Page 94 of 175
Figure 11.11 Pirquitas Plan showing Drillholes Coded using Wireframe Vein Models
MPSA, 2013
Table 11.6 Pirquitas Mineralisation Domain Codes
| | | | | | | | |
| Location | Zone | Mineralisation Domain Code |
| Mining Area | San Miguel | 10 |
| Potosí | 20 |
| Oploca | 30 |
21015Puna21TRS220927Rev0.docx Page 95 of 175
Figure 11.12 Plan showing Grade Control Bench Assays
MPSA, 2013
Wireframe models for Pirquitas are presented as an isometric view inside the September 2013 EOM survey pickup and 2013 designed pit in Figure 4.3.
21015Puna21TRS220927Rev0.docx Page 96 of 175
Figure 11.13 Isometric View of Final Pirquitas Wireframe Vein Models
– 2013 Resource Model
MPSA, 2013
After the wireframes were created the ‘LITHO’ field in the drillhole file was coded for the domains and vein wireframes. Each intercept on different veins was given a unique identifier representing a ‘material type’. This assignment of material type codes by vein allowed for the control of grade estimation within the veins. The drillhole traces back-coded for vein material types are shown in Figure 11.11.
21015Puna21TRS220927Rev0.docx Page 97 of 175
11.2.4 Compositing – Pirquitas
Raw sample lengths were generally up to 2 m in waste rock and 1 m or less in mineralised rock. A minimum sample length of 0.1 m was permitted on samples from highly mineralised structures such as veins, stockworks, and breccias.
A composite length of 2 m was considered most suitable for the Pirquitas drillhole data. Data were composited to the selected composite length within the interpreted wireframe solid. Residual lengths were retained.
11.2.5 Evaluation of Outlier Grades – Pirquitas
Top cut analyses were conducted on all finalised domain-coded drillhole composite data to assess the potential impact of extreme values during grade estimation.
The process of assessing the need for top cuts was an iterative one and included the analysis of statistics including lognormal probability distribution plots and the reconciliation of estimated parent cell grades to grade control. Ultimately, the best reconciliation to grade control was obtained by applying a 9,000 g/t Ag upper cut and a 20% Zn upper cut.
11.2.6 Continuity Analysis – Pirquitas
A variographic analysis was undertaken to help define the continuity characteristics of the domained data.
Three dimensional variography analysis (pairwise relative) was undertaken on 2 m composite intervals for Ag and Zn. Downhole variograms (omni-directional) were used to determine the nugget effect.
Due to the low amount of data within each vein wireframe the general orientation and shape of the veins or groups of veins (San Miguel and Oploca) was used to determine the orientation and dimensions of the search parameters for grade interpolation. Thus, the variogram parameters from the variogram model, that is the nugget, first, and second structure were the same for all kriging interpolations for both Ag and Zn, the search ellipse orientation and dimensions.
11.2.7 Grades Estimation – Pirquitas
Estimation was carried out within a cell model with 4 m x 4 m x 8 m cells to be compatible with the grade control model. The Cell model limits are shown in Table 11.7. The model is not rotated.
21015Puna21TRS220927Rev0.docx Page 98 of 175
Table 11.7 Cell Model Limits – Pirquitas
| | | | | | | | | | | | | | |
| Direction | Minimum | Maximum | Cell Size
(m) | Number of Cells |
| East | 751,900 | 753,340 | 4 | 360 |
| North | 7,488,300 | 7,490,340 | 4 | 510 |
| Elevation | 3,838 | 4,510 | 8 | 84 |
Cells in the model were coded with the various domains on a majority basis.
The wireframe surfaces and solids representing topography, oxide surface, overburden, and vein interpretation were used to code each cell with the proportion of its volume relative to these features.
11.2.7.1 Grades Estimation – Pirquitas Mining Area
Ag and Zn grades were estimated into Domains 10, 20, and 30 in the cell model using ordinary kriging (OK). The vein boundaries were treated as hard boundaries such that the composites within the vein interpretations were only permitted to inform estimates in cells that fall within the veins (this estimate is stored in a field called ‘AGPV’ for Ag and ‘ZN%V’ for the Zn estimates), and likewise composites outside the veins were only permitted to inform estimates in cells that have some proportion outside of the veins (this estimate is stored in a field called ‘AGPVD’ for Ag estimates and ‘ZNPVD’ for Zn estimates).
Veins in the San Miguel and Oploca areas were estimated separately. The veins in the Oploca area were separated into two sets for estimation: Oploca Set A and Set B veins have generally different orientations these are shown in Figure 11.14.
Figure 11.14 Pirquitas Cross-Section showing Two Distinct Oploca Vein Sets
21015Puna21TRS220927Rev0.docx Page 99 of 175
MPSA, 2013
Whole cell grades were calculated after estimation completed into fields called ‘AGP’ for silver and ‘ZN%’ for zinc. The calculation takes into account the proportion of the cell that is inside / outside the vein by calculating the weighted average based on stored volume information.
21015Puna21TRS220927Rev0.docx Page 100 of 175
11.2.7.2 Density – Pirquitas
An analysis of density data was undertaken. It was determined that density could be estimated satisfactorily using a formula underpinned by Ag grade as follows:
agp = agpv * veinp / 100 + agpvd * (100 – veinp) / 100
temp = 0.39 * (ALOG (agp + 10) / ALOG (10)-1) + 2.64 * (1 – oxide) + 1.8 * oxide
bulk density = temp * (1 – void% / 100)
Where:
AGPV = estimated Ag grade from sample inside a vein
VEINP = proportion of the cell that falls inside a vein wireframe
AGPVD = estimated Ag grade from sample outside the veins
OXIDE = proportion of cell in oxide material
VOID% = proportion of cell not in rock (i.e., in underground workings)
2.64 = the average density of fresh waste rock
1.8 = the average density of oxidised rock
11.2.7.3 Validation – Pirquitas
Validation was conducted at the end of each model preparation step, as well as of the completion of the process. Model validation included visual validation in plan and section, and statistical validation by domain, of cell model codes. Additional validation was conducted on cells coded with UGVOID% values of greater than 0.001% to ensure that the in situ volume estimate was correctly discounted for previously mined material.
In addition to the ongoing and iterative validation steps conducted throughout the modelling process, the resultant model that forms the basis of the Mineral Resources estimate was subjected to the following validation steps:
•Visual comparison of estimated grades for Ag and Zn against the input drillhole data on a series of plan views and oblique cross-sections through the model. This was reviewed at numerous times during model generation to ensure that the modelled grades and grade distribution closely reflected that of the input data.
•Comparison of average grades for each grade variable in each domain between the input drillhole data and model estimates, to assess for potential global estimation bias in the model.
•Comparison of average grades for each grade variable in each domain between the input drillhole data and the cell model along northing, easting, and elevation swathes to assess potential spatial bias in the model.
•Grade-tonnage data were reported using different software to ensure validity of final grade-tonnage reports.
•Reconciliation of the cell model to grade control and production data on a bench-by-bench basis in the mined-out part of the deposit.
Results of the various detailed model validation steps summarised above indicate that the 2013 grade estimates are honour the input geological and drillhole data both globally and locally and have an acceptable level of smoothing for the cell size selected.
21015Puna21TRS220927Rev0.docx Page 101 of 175
11.2.7.4 Mineral Resources Classification – Pirquitas
Following an assessment to determine suitability, the resource confidence classification method for the 2013 model used the same method described in the 2011 NI 43-101 Technical Report. The following is a description of the 2011 analysis.
Mineral Resources classification was conducted using a combination of drillhole spacing, search volume, distance from underground workings, mineralisation continuity considerations, comparisons in locations of high-grade vein and stockwork structures between the model and open-pit observations, reconciliation between the model and grade control and production data, and discussions with mine-based geological staff. Resource confidence classification was focussed on the Ag variable, being the most economically important constituent at the Pirquitas deposit, however, prior to finalisation, the classification was reviewed with respect to Zn and Sn to ensure that there were no anomalies. Care was taken to ensure that coherent zones of high-confidence (Measured Mineral Resources) and reasonably good confidence (Indicated Mineral Resources) estimates were modelled to avoid a scattered resource classification. To this end the various model classification criteria discussed above were incorporated in the generation of wireframe solids for the classification of the Mineral Resources into Measured and Indicated Mineral Resources.
The Mineral Resources confidence classification scheme can be broadly simplified as follows:
•All estimates informed by the third search pass in the Mining Area (Domains 10, 20, & 30) were classified as Inferred Mineral Resource.
•All estimates informed by sufficient samples from drillholes spaced closer than effectively 40 m (generally 20–35 m), in areas where there is reasonably good confidence in the modelled location of the mineralised veins and for which there is reasonably good confidence in the modelled location of the underground workings, were classified as Indicated Mineral Resources.
•Estimates classified as Measured Mineral Resources were informed by sufficient samples from drillholes spaced closer than effectively 25 m (generally less than 15 m), in areas for which there is high confidence in the modelled location of the mineralised veins and for which there is high confidence in the modelled location of the underground workings.
The wireframes used for classification in 2011 were added to the 2013 cell model. The ranges of distance to the cell centroid from the nearest composite, number of holes and number of composites relative to the 2011 resource cell model are given in Table 8.1.
Table 11.8 Pirquitas 2013 Mineral Resources Classification Results,
Valid at a Cut-off of 65 g/t AgEq
| | | | | | | | | | | |
| Mineral Resources Classification | Average Distance | Average No. of Holes | Average No. of Composites |
| Measured | 17.44 | 7 | 21 |
| Indicated | 29.70 | 6 | 6 |
| Inferred | 51.85 | 2 | 4 |
21015Puna21TRS220927Rev0.docx Page 102 of 175
11.3 Mineral Resources Estimate
11.3.1 Chinchillas Mineral Resources
The Chinchillas Mineral Resources estimate is contained within a pit shell generated using an NSR cut-off of $33.20/t that is based on metal prices of $22.00/oz for silver, $0.90/lb lead, and $1.15/lb for zinc.
Metal prices for the Mineral Resources cut-off were selected after consideration of the pricing information described in Section 16, which includes a description of the time frame used for the selection of the price and the reasons for selection of such a time frame. The metal prices are representative of the range of price estimates publicly reported for Mineral Resources cut-offs. The Chinchillas Mineral Resources are assumed to be mined by open pit.
In determining the cut-off grade, the reasonable prospects for eventual economic extraction requirement generally implies that the quantity and grade estimates meet certain economic thresholds taking into account an open pit extraction scenario with road transport and processing at the Pirquitas plant. This includes consideration of the technical and economic parameters listed above, but also includes additional operating costs, estimated at $12/t, related to the handling and transportation of ore from the Chinchillas property to the Pirquitas plant. Using this operating scenario, the cut-off grade is estimated to be 60 g/t AgEq. It should be noted that this determination considers site operating costs and ignores the pay factors for any concentrate generated and sold to a smelter.
MPSA have advised that there are no known factors related to environmental, permitting, legal, title, taxation, socio-economic, marketing, or political issues that could materially affect the Mineral Resources estimate. Mineral Resources that are not Mineral Reserves do not have demonstrated economic viability. The estimate of Mineral Resources may be materially affected by environmental, permitting, legal, title, taxation, socio-political, marketing, or other relevant issues. The quantity and grade of reported Inferred Mineral Resources are uncertain in nature and there has been insufficient exploration to classify these Inferred Mineral Resources as Indicated or Measured Mineral Resources. It cannot be assumed that all or any part of an Inferred Mineral Resource will be upgraded to an Indicated or Measured Mineral Resources as a result of continued exploration.
Mineral Resources are reported exclusive of Mineral Reserves.
The Chinchillas Mineral Resources by classification are summarised in Table 11.9 and shown with recovery and ownership detail in Table 11.10.
21015Puna21TRS220927Rev0.docx Page 103 of 175
Table 11.9 Summary of Chinchillas Mineral Resources Estimate Exclusive of Mineral Reserves (as at 31 December 2021)
Based on $22.00/oz Silver, $0.95/lb Lead, and $1.15/lb Zinc
| | | | | | | | | | | | | | | | | | | | | | | |
| Mineral Resources Classification | Tonnage
(kt) | Grades | Contained Metal |
Ag
(g/t) | Pb
(%) | Zn
(%) | Silver
(koz) | Lead
(klb) | Zinc
(klb) |
| Measured | 1,110 | 99.2 | 0.86 | 0.31 | 3,540 | 21,015 | 7,552 |
| Indicated | 4,904 | 101.1 | 0.88 | 0.19 | 15,943 | 95,632 | 20,454 |
| Measured + Indicated | 6,013 | 100.8 | 0.88 | 0.21 | 19,483 | 116,647 | 28,006 |
| Inferred | 165 | 101.9 | 0.48 | 0.16 | 540 | 1,746 | 582 |
1. Mineral Resources are reported based on 31 December 2021 topography surface.
2. The Mineral Resources are contained within a pit shell generated using an NSR cut-off of $33.20/t.
3. The Mineral Resources estimate is based on metal price assumptions of $22.00/oz silver, $0.95/lb lead, and $1.15/lb zinc.
4. Metallurgical recoveries vary with grade and average recoveries are, 98% silver, 95% lead, and 63% for zinc.
5. The point of reference for Mineral Resources is the point of feed into the processing facility.
6. Mineral Resources are reported exclusive of Mineral Reserves.
7. SSR has 100% ownership of the Project.
8. All ounces reported represent troy ounces, and g/t represents grams per metric tonne.
9. Totals may vary due to rounding.
Table 11.10 Summary of Metallurgical Recoveries and Ownership of Chinchillas Mineral Resources Estimate Exclusive of Mineral Reserves (as at 31 December 2021)
Based on $22.00/oz Silver, $0.95/lb Lead, and $1.15/lb Zinc
| | | | | | | | | | | | | | | | | | | | | | | | | | |
| Mineral Resources Classification | Tonnage
(kt) | Grades | Metallurgical Recovery | Cut-off NSR ($/t) |
Ag
(g/t) | Pb
(%) | Zn
(%) | Silver
(%) | Lead
(%) | Zinc
(%) |
| Measured | 1,110 | 99.2 | 0.86 | 0.31 | 98 | 95 | 63 | 33.2 |
| Indicated | 4,904 | 101.1 | 0.88 | 0.19 | 98 | 95 | 63 | 33.2 |
| Measured + Indicated | 6,013 | 100.8 | 0.88 | 0.21 | 98 | 95 | 63 | 33.2 |
| Inferred | 165 | 101.9 | 0.48 | 0.16 | 98 | 95 | 63 | 33.2 |
1. Mineral Resources are reported based on 31 December 2021 topography surface.
2. The Mineral Resources are contained within a pit shell generated using an NSR cut-off of $33.20/t.
3. The Mineral Resources estimate is based on metal price assumptions of $22.00/oz silver, $0.95/lb lead, and $1.15/lb zinc.
4. Metallurgical recoveries vary with grade and average recoveries are, 98% silver, 95% lead, and 63% for zinc.
5. The point of reference for Mineral Resources is the point of feed into the processing facility.
6. Mineral Resources are reported exclusive of Mineral Reserves.
7. SSR has 100% ownership of the Project.
8. All ounces reported represent troy ounces, and g/t represents grams per metric tonne.
9. Totals may vary due to rounding.
21015Puna21TRS220927Rev0.docx Page 104 of 175
11.3.2 Pirquitas Mineral Resources
The Pirquitas Mineral Resources estimate is contained within underground mining shapes using an NSR cut-off of $100/t that is based on metal prices of $20.00/oz for silver, $1.10 for lead, and $1.30/lb for zinc. The NSR cut-off grade selected for the Pirquitas Mineral Resources assumes underground mining will be used for extraction, that the processing facility could be used for processing. It is recommended that the Mineral Resources estimate be re-evaluated and assessed with a study to determine the development horizon available prior to the completion of the Chinchillas open pit and the impact of the current operation on the Pirquitas Mineral Resource.
Metal prices for the Mineral Resources cut-off were selected after consideration of the pricing information described in Section 16, which includes a description of the time frame used for the selection of the price and the reasons for selection of such a time frame. The metal prices are representative of the range of price estimates publicly reported for Mineral Resources cut-offs.
The Pirquitas Mineral Resources by classification is summarised in Table 11.11 and shown with recovery and ownership detail in Table 11.11.
SSR has advised that there are no known factors related to environmental, permitting, legal, title, taxation, socio-economic, marketing, or political issues that could materially affect the Mineral Resources estimates. Mineral Resources that are not Mineral Reserves do not have demonstrated economic viability. The estimates of Mineral Resources may be materially affected by environmental, permitting, legal, title, taxation, socio-political, marketing, or other relevant issues. The quantity and grade of reported Inferred Mineral Resources are uncertain in nature and there has been insufficient exploration to classify these Inferred Mineral Resources as Indicated or Measured Mineral Resources. It cannot be assumed that all or any part of an Inferred Mineral Resource will be upgraded to an Indicated or Measured Mineral Resources as a result of continued exploration.
Mineral Resources are reported exclusive of Mineral Reserves.
Table 11.11 Summary of Pirquitas Mineral Resources Estimate Exclusive of Mineral Reserves (as at 31 December 2021)
Based on $20.00/oz Silver, $1.10/lb Lead, and $1.30/lb Zinc
| | | | | | | | | | | | | | | | | | | | | | | |
| Mineral Resources Classification | Tonnage
(kt) | Grades | Contained Metal |
Ag
(g/t) | Pb
(%) | Zn
(%) | Silver
(koz) | Lead
(klb) | Zinc
(klb) |
| Measured | 79 | 444.5 | 0.197 | 1.17 | 1,129 | 343 | 2,044 |
| Indicated | 2,555 | 287.7 | 0.016 | 4.56 | 23,627 | 895 | 256,672 |
| Measured + Indicated | 2,634 | 292.4 | 0.021 | 4.46 | 24,756 | 1,240 | 258,715 |
| Inferred | 1,080 | 206.9 | 0.004 | 7.45 | 7,185 | 95 | 177,394 |
1. The Mineral Resources estimate is contained within underground mining shapes based on $90/t to $100/t NSR cut-off.
2. The Mineral Resources estimate is based on metal price assumptions of $20.00/oz silver, $1.30/lb zinc, and $1.10/lb lead.
3. Metallurgical recoveries vary with grade and on average are, 87% silver, 85% for zinc, and 50% for lead.
4. The point of reference for Mineral Resources is the point of feed into the processing facility
5. Mineral Resources are reported exclusive of Mineral Reserves.
6. SSR has 100% ownership of the Project.
7. All ounces reported represent troy ounces, and g/t represents grams per metric tonne.
8. Totals may vary due to rounding.
21015Puna21TRS220927Rev0.docx Page 105 of 175
Table 11.12 Summary of Metallurgical Recoveries and Ownership of Pirquitas Mineral Resources Estimate Exclusive of Mineral Reserves (as at 31 December 2021)
Based on $20.00/oz Silver, $1.10/lb Lead, and $1.30/lb Zinc
| | | | | | | | | | | | | | | | | | | | | | | | | | |
| Mineral Resources Classification | Tonnage
(kt) | Grades | Metallurgical Recovery | Cut-off NSR ($/t) |
Ag
(g/t) | Pb
(%) | Zn
(%) | Silver
(%) | Lead
(%) | Zinc
(%) |
| Measured | 79 | 444.5 | 0.197 | 1.17 | 87 | 50 | 85 | 100 |
| Indicated | 2,555 | 287.7 | 0.016 | 4.56 | 87 | 50 | 85 | 100 |
| Measured + Indicated | 2,634 | 292.4 | 0.021 | 4.46 | 87 | 50 | 85 | 100 |
| Inferred | 1,080 | 206.9 | 0.004 | 7.45 | 87 | 50 | 85 | 100 |
1. The Mineral Resources estimate is contained within underground mining shapes based on $90/t to $100/t NSR cut-off.
2. The Mineral Resources estimate is based on metal price assumptions of $20.00/oz silver, $1.30/lb zinc, and $1.10/lb lead.
3. Metallurgical recoveries vary with grade and on average are, 87% silver, 85% for zinc, and 50% for lead.
4. The point of reference for Mineral Resources is the point of feed into the processing facility
5. Mineral Resources are reported exclusive of Mineral Reserves.
6. SSR has 100% ownership of the Project.
7. All ounces reported represent troy ounces, and g/t represents grams per metric tonne.
8. Totals may vary due to rounding.
11.3.3 Mineral Resources Statement
The Mineral Resources estimate for Puna was completed by the SSR technical department on site. The Puna21TRS QPs have reviewed and accepted this information for use in the Puna21TRS. The Puna21TRS QPs reviewed the assumptions, parameters, and methods used to prepare the Mineral Resources Statement and are of the opinion that the Mineral Resources are estimated and prepared in accordance with the U.S. Securities and Exchange Commission (US SEC) Regulation S-K subpart 1300 rules for Property Disclosures for Mining Registrants (S-K 1300).
Mineral Resources are reported exclusive of Mineral Reserves and have been summarised by project and resource classification in Table 11.3.
Table 11.4 shows the cut-off values and metallurgical recoveries associated with the Mineral Resources.
21015Puna21TRS220927Rev0.docx Page 106 of 175
Table 11.13 Summary of Puna21TRS Mineral Resources Estimates Exclusive of Mineral Reserves (as at 31 December 2021)
| | | | | | | | | | | | | | | | | | | | | | | | | | | | | | | | | | | | | | | | | |
| Mineral Resources Classification | Chinchillas | Pirquitas | TOTAL |
Tonnage
(kt) | Grades | Tonnage
(kt) | Grades | Tonnage
(kt) | Grades |
Ag
(g/t) | Pb
(%) | Zn
(%) | Ag
(g/t) | Pb
(%) | Zn
(%) | Ag
(g/t) | Pb
(%) | Zn
(%) |
| Measured | 1,110 | 99.2 | 0.86 | 0.31 | 79 | 444.5 | 0.197 | 1.17 | 1,189 | 122.2 | 0.81 | 0.37 |
| Indicated | 4,904 | 101.1 | 0.88 | 0.19 | 2,555 | 287.7 | 0.016 | 4.56 | 7,458 | 165.0 | 0.59 | 1.69 |
| Measured + Indicated | 6,013 | 100.8 | 0.88 | 0.21 | 2,634 | 292.4 | 0.021 | 4.46 | 8,647 | 159.1 | 0.62 | 1.50 |
| Inferred | 165 | 101.9 | 0.48 | 0.16 | 1,080 | 206.9 | 0.004 | 7.45 | 1,245 | 192.9 | 0.07 | 6.48 |
1. Mineral Resources are reported based on 31 December 2021 topography surface.
2. The Chinchillas Mineral Resources are contained within a pit shell generated using an NSR cut-off of $33.20/t. The Pirquitas Mineral Resources estimate is contained within underground mining shapes based on $90/t to $100/t NSR cut-off.
3. The Chinchillas Mineral Resources estimate is based on metal price assumptions of $22.00/oz silver, $0.95/lb lead, and $1.15/lb zinc. The Pirquitas Mineral Resources estimate is based on metal price assumptions of $20.00/oz silver, $1.30/lb zinc, and $1.10/lb lead.
4. The Chinchillas metallurgical recoveries vary with grade and average recoveries are, 98% silver, 95% lead ,and 63% for zinc. The Pirquitas metallurgical recoveries vary with grade and on average are, 87% silver, 85% for zinc, and 50% for lead.
5. The point of reference for Mineral Resources is the point of feed into the processing facility.
6. Mineral Resources are reported exclusive of Mineral Reserves.
7. SSR has 100% ownership of the Project.
8. All ounces reported represent troy ounces, and g/t represents grams per metric tonne.
9. Totals may vary due to rounding.
21015Puna21TRS220927Rev0.docx Page 107 of 175
Table 11.14 Summary of Cut-off Values and Metallurgical Recoveries of Puna21TRS Mineral Resources Estimates
Exclusive of Mineral Reserves (as at 31 December 2021)
| | | | | | | | | | | | | | | | | | | | | | | | | | |
Mineral Resources
Classification | Tonnage
(kt) | Grades | Metallurgical Recovery | Cut-off NSR ($/t) |
Ag
(g/t) | Pb
(%) | Zn
(%) | Silver
(%) | Lead
(%) | Zinc
(%) |
| Measured – Chinchillas | 1,110 | 99.2 | 0.86 | 0.31 | 98 | 95 | 63 | 33.2 |
| Measured – Pirquitas | 79 | 444.5 | 0.197 | 1.17 | 87 | 50 | 85 | 100.0 |
| Indicated – Chinchillas | 4,904 | 101.1 | 0.88 | 0.19 | 98 | 95 | 63 | 33.2 |
| Indicated – Pirquitas | 2,555 | 287.7 | 0.016 | 4.56 | 87 | 50 | 85 | 100.0 |
| TOTAL – Measured | 1,189 | 122.2 | 0.81 | 0.37 | 95 | 94 | 63 | see above |
| TOTAL – Indicated | 7,458 | 165.0 | 0.59 | 1.69 | 91 | 90 | 64 |
| TOTAL – Measured + Indicated | 8,647 | 159.1 | 0.62 | 1.50 | 92 | 91 | 64 |
| Inferred – Chinchillas | 165 | 101.9 | 0.48 | 0.16 | 98 | 95 | 63 | 33.2 |
| Inferred – Pirquitas | 1,080 | 206.9 | 0.004 | 7.45 | 87 | 50 | 85 | 100.0 |
| TOTAL – Inferred | 1,245 | 192.9 | 0.07 | 6.48 | 88 | 95 | 76 | see above |
1. Mineral Resources are reported based on 31 December 2021 topography surface.
2. The Chinchillas Mineral Resources are contained within a pit shell generated using an NSR cut-off of $33.20/t. The Pirquitas Mineral Resources estimate is contained within underground mining shapes based on $90/t to $100/t NSR cut-off.
3. The Chinchillas Mineral Resources estimate is based on metal price assumptions of $22.00/oz silver, $0.95/lb lead, and $1.15/lb zinc. The Pirquitas Mineral Resources estimate is based on metal price assumptions of $20.00/oz silver, $1.30/lb zinc, and $1.10/lb lead.
4. The Chinchillas metallurgical recoveries vary with grade and average recoveries are, 98% silver, 95% lead, and 63% for zinc. The Pirquitas metallurgical recoveries vary with grade and on average are, 87% silver, 85% for zinc, and 50% for lead.
5. The point of reference for Mineral Resources is the point of feed into the processing facility.
6. Mineral Resources are reported exclusive of Mineral Reserves.
7. SSR has 100% ownership of the Project.
8. All ounces reported represent troy ounces, and g/t represents grams per metric tonne.
9. Totals may vary due to rounding.
21015Puna21TRS220927Rev0.docx Page 108 of 175
11.4 Comparison with Previous Mineral Resources Estimates
11.4.1 Chinchillas Comparison – 2021 vs. 2020
The Mineral Resources have been compared to the previous Mineral Resources, which were based on the EOY 2020 pit surface.
Key changes in the Mineral Resources (contained metal) have resulted from:
•Mining depletion (–6%).
•Socavon Resource write down (–26%).
•A review of the pit optimisation work for the Socavon deposit was undertaken using the NSR and other assumptions used for the Mantos deposit. The review concluded that there was no suitable pit shell produced to meet the standard of reasonable prospects for extraction. Therefore, the Socavon Mineral Resources previously reported by SSR have not been included in the 2021 Puna Mineral Resource.
•Engineering changes (–14%) due to updating of the Resource pit shell used.
11.4.2 Pirquitas Comparison – 2021 vs. 2011
The new Mineral Resources estimate is compared to the previous Mineral Resources estimate from 2011 and detailed in the NI 43-101 Technical Report dated 27 May 2016 (Davis et al., 2016). The Mineral Resources estimated in 2011 were based on metal prices of $11/oz silver, $0.70/lb lead, $0.70/lb zinc, and $5.00/ln Sn, and an NSR cut-off of $15.00/t NSR.
There was no change since EOY 2020 as there was no updated work on the Mineral Resources.
11.5 Conclusions and Recommendations
For the Chinchillas deposit it is recommended that MPSA examine advanced grade control (using reverse circulation drilling) at a grid spacing of 20 m, to determine if it will improve prediction particularly where the grade trends are horizontal. The shallow eastward dip of high grades should be carefully managed by pit mapping and advanced grade control drilling to provide appropriate levels of confidence to manage risk.
For the Pirquitas deposit it is recommended that the Mineral Resources estimate be re-evaluated and assessed with a study to determine the development horizon available prior to the completion of the Chinchillas open pit and the impact of the current operation on the Pirquitas Mineral Resource.
11.6 QP Opinion
The Puna21TRS QPs have not identified any relevant technical and/or economic factors that require resolution with regards to the Mineral Resources estimates.
11.7 Canadian National Instrument 43-101 Standards of Disclosure for Mineral Projects
The Mineral Resources reported in the Puna21TRS are suitable for reporting as Mineral Resources using the Canadian National Instrument 43-101 Standards of Disclosure for Mineral Projects (NI 43-101).
21015Puna21TRS220927Rev0.docx Page 109 of 175
12 MINERAL RESERVES ESTIMATES
12.1 Summary
The Mineral Reserve estimates for the Project were completed by the SSR technical department on site. The Puna21TRS QPs have reviewed and accepted this information for use in the Puna21TRS.
This section describes the methodology and parameters used to estimate the Mineral Reserves for the Project.
Open pit mining is carried out by MPSA as an owner mining operation with ore hauled from Chinchillas pit to the Pirquitas plant. The Mineral Reserves were developed based on mine planning work completed in 2021 that included pit optimisation and re-design of the pit phases. The Puna21TRS QPs have reviewed and accepted this information for use in the Puna21TRS. Table 12.1and Table 12.2 summarise the Mineral Reserves for Chinchillas. The Chinchillas Mineral Reserves estimate has been generated for the Mantos deposit based on the following inputs: metal prices, resource model, geotechnical information, operating costs, mineral processing recoveries, concentrate transport, and off site costs and charges. Costs for all areas of the operation are estimated from actual costs. These were used to calculate an NSR of $44.11/t used for the Mineral Reserves cut-off.
Metal prices for the Mineral Reserves cut-off were selected after consideration of the pricing information described in Section 16, which includes a description of the time frame used for the selection of the price and the reasons for selection of such a time frame. The long-term prices for the cut-off were assumed to apply from the start of 2026. The metal prices are representative of the range of price estimates publicly reported for Mineral Reserves cut-offs.
12.2 Mineral Reserves Statement
Table 12.1 summarises the Mineral Reserves statement for the Puna Operations.
12.3 Factors that Affect the Mineral Reserves Estimates
Factors that affect the Mineral Reserves estimates include but are not limited to dilution; metal prices; off-site costs; metallurgical recoveries, pit slope designs; capital and operating cost estimates; and the effectiveness of managing environmental impacts. The main factors that affect the Mineral Reserves estimations reported in this section are:
•Commodity prices, particularly silver price.
•Processing recoveries.
•The effectiveness of managing environmental impacts for waste rock and downstream water flows.
•Pit slope design criteria.
The Mineral Reserves estimate has taken into account all known legal, political, environmental or other risks that could materially affect the potential development of the Mineral Reserves, as discussed in various sections of this Puna21TRS.
21015Puna21TRS220927Rev0.docx Page 110 of 175
Table 12.1 Summary of Chinchillas Mineral Reserves Estimate (as at 31 December 2021) Based on $18.50/oz Silver, $0.90/lb Lead, and $1.05/lb Zinc
| | | | | | | | | | | | | | | | | | | | | | | |
| Mineral Reserves Classification | Tonnage
(kt) | Grade | Contained Metal |
Ag
(g/t) | Pb
(%) | Zn
(%) | Silver
(koz) | Lead
(klb) | Zinc
(klb) |
| Proven | 2,379 | 168.9 | 1.33 | 0.34 | 12,918 | 69,735 | 17,827 |
| Probable | 5,041 | 155.3 | 1.29 | 0.25 | 25,174 | 143,344 | 27,780 |
| Probable Stockpiles | 187 | 141.0 | 1.33 | 0.50 | 846 | 5,470 | 2,056 |
| Proven + Probable | 7,606 | 159.2 | 1.30 | 0.28 | 38,938 | 218,681 | 47,692 |
1. Mineral Reserves are reported based on 31 December 2021 topography surface.
2. The Mineral Reserves estimate is based on metal price assumptions of $18.50/oz silver, $0.90/lb lead, and $1.05/lb zinc.
3. The Mineral Reserves estimate is reported at a cut-off grade of $44.11/t NSR.
4. Economic analysis for the Mineral Reserves has been prepared using long-term metal prices of $21.00/oz silver, $0.90/lb lead, and $1.20/lb zinc
5. Processing recoveries vary based on the feed grade. The average recovery is estimated to be 98% for silver, 95% for lead, and approximately 63% for zinc.
6. Metals shown in this table are the contained metals in ore mined and processed.
7. The point of reference for Mineral Reserves is the point of feed into the processing facility.
8. SSR has 100% ownership of the Project.
9. All ounces reported represent troy ounces, and g/t represents grams per metric tonne.
10. Totals may vary due to rounding.
21015Puna21TRS220927Rev0.docx Page 111 of 175
Table 12.2 Summary of Metallurgical Recoveries of Chinchillas Mineral Reserves Estimate (as at 31 December 2021)
Based on $18.50/oz Silver, $0.90/lb Lead, and $1.05/lb Zinc
| | | | | | | | | | | | | | | | | | | | | | | | | | | | | |
| Mineral Reserve Classification | Tonnage
(kt) | Grades | Metallurgical Recovery | Cut-off NSR ($/t) |
Ag
(g/t) | Pb
(%) | Zn
(%) | Silver
(%) | Lead
(%) | Zinc
(%) |
| Proven | 2,379 | 168.9 | 1.33 | 0.34 | 98 | 95 | 63 | 44.11 |
| Probable | 5,041 | 155.3 | 1.29 | 0.25 | 98 | 95 | 63 | 44.11 |
| Probable Stockpiles | 187 | 141.0 | 1.33 | 0.50 | 98 | 95 | 63 | 44.11 |
| Proven + Probable | 7,606 | 159.2 | 1.30 | 0.28 | 98 | 95 | 63 | 44.11 |
1. Mineral Reserves are reported based on 31 December 2021 topography surface.
2. The Mineral Reserves estimate is based on metal price assumptions of $18.50/oz silver, $0.90/lb lead, and $1.05/lb zinc.
3. The Mineral Reserves estimate is reported at a cut-off grade of $44.11/t NSR.
4. Economic analysis for the Mineral Reserves has been prepared using long-term metal prices of $21.00/oz silver, $0.90/lb lead, and $1.20/lb zinc
5. Processing recoveries vary based on the feed grade. The average recovery is estimated to be 98% for silver, 95% for lead, and approximately 63% for zinc.
6. Metals shown in this table are the contained metals in ore mined and processed.
7. The point of reference for Mineral Resources is the point of feed into the processing facility.
8. SSR has 100% ownership of the Project.
9. All ounces reported represent troy ounces, and g/t represents grams per metric tonne.
10. Totals may vary due to rounding.
12.4 Comparison with Previous Mineral Reserves Estimates
The Mineral Reserves have been compared to the previous Mineral Reserves, which were based on the EOY 2020 pit surface. Comparison of the 2021 Mineral Reserves with the 2020 Mineral Reserves shows a net decrease in contained silver of 4.07 Moz (–9%).
Changes in Mineral Reserves (contained silver) can be summarised as Mining depletion (–16%) and Engineering changes (+5%) due to model updates, pit design changes and a small impact from increased metal prices.
12.5 Canadian National Instrument 43-101 Standards of Disclosure for Mineral Projects
The Mineral Reserves reported in the Puna21TRS are suitable for reporting as Mineral Reserves using the Canadian National Instrument 43-101 Standards of Disclosure for Mineral Projects (NI 43-101).
21015Puna21TRS220927Rev0.docx Page 112 of 175
13 MINING METHODS
13.1 Geotechnical Review
A review of the geotechnical reports provided by MPSA was carried out. The following reports were provided and form the basis of this review:
•Knight Piesold, 2016. 2015 Geotechnical Site Investigation Report
•Knight Piesold, 2016. Pre-Feasibility Pit Slope Design VA201-439/3-2 Rev0
•Knight Piesold, 2016. Hydrogeologic Conceptual Model and Preliminary Pit Inflow Estimates
•Puna Operations Inc, 2016. NI 43-101 Technical Report
It is important to note, the Knight Piesold - 2015 Site Investigations report suggested a study regarding waste rock dumps (WRD) but have not been sourced or reviewed. SSR report that the review has not been undertaken. Knight Piesold prepared a report in 2020 after an inspection of the pit. The QPs did not review this report as it was not available during the Puna21TRS preparation.
13.1.1 Knight Piesold 2015 Site Investigation
The Knight Piesold 2015 site investigations were addressed in a report issued in February 2016. The report and the data therein provided the key source of information for additional Knight Piesold Geotechnical studies.
Figure 13.1 provides an overview of the extent of the Knight Piesold site investigations of which comprised:
•Five cored boreholes, geotechnically logged and with oriented core utilised in defining orientation of defects where possible.
•Packer testing was conducted in two boreholes and falling head testing in the other three boreholes.
•Observation wells in three vertical exploration boreholes and with slug testing therein.
Of particular note, Knight Piesold utilised mapping data of exposures carried out by GAR during exploration, Figure 13.1.
21015Puna21TRS220927Rev0.docx Page 113 of 175
Figure 13.1 Overview of Knight Piesold Site Investigation
Knight Piesold, 2015
The extent of studies is considered appropriate. Key aspects of note from the studies include the following:
•Two key lithologies are present, metasediments (basement sandstone), which has been overlain by a pyroclastic tuff, Figure 13.1.
•Metasediments are steeply dipping to the west. Intact strength is potentially underestimated from laboratory testing (average UCS of 30 MPa).
•Pyroclastic tuff has shallow bedding and has low intact strength due to alteration and with UCS of 10 MPa.
•The available orientated data in the pyroclastic tuff (from two boreholes) is limited. There are 33 data points, which indicate widely spaced defects.
21015Puna21TRS220927Rev0.docx Page 114 of 175
•The available orientated data in the metasediments (from four boreholes) is significant. Nearly 700 data points, which indicate a more jointed rock mass but with a lack of orientation of any faulting. Review of the logging and core photos suggest such faulting is present and the absence of understanding of orientation is considered as a significant gap in the studies.
•As shown in Figure 13.2, comparison of the surface mapping (mostly in metasediments) and orientated data from borehole CGA-209-G (in closest proximity to mapping and entirely in metasediments) indicates very good comparison. Of note is the good match between defect sets ‘D1’ (circled in red) and sets ‘C1’ and ‘A1’ (circled in blue). Of note is slightly flatter dip of set ‘D1’ in the surface mapping. The oriented data indicates the bedding (diamond symbols in set ‘D1’) is steeply dipping south to east. The variance from the broader interpretation noted above is owing to rotation introduced by intrusion of an underlying diatreme. However, the bedding noted in the surface mapping is moderately dipping to the south-west (set ‘A2’) and also moderately dipping to the west (set ‘B1’). This is at odds with the provided geological overview where bedding is steeply dipping in the metasediment and shallow dipping in the pyroclastic tuffs. The bedding has the potential to significantly control stability of the overall slopes, therefore this discrepancy needs to be resolved.
•Other oriented boreholes in the metasediments provide somewhat poorer comparison with mapping as this is a function of the blind zones impacting on the other boreholes.
Figure 13.2 Surface Mapping and orientated data from borehole GCA-209-G
Knight Piesold, 2016
Note: Defect sets annotated by OreWin. The blind zone (grey shading), where defects will be under-represented in oriented core.
Defect sets ‘D1’ = circled in red and ‘C1’ and ‘A1’ = circled in blue; bedding = diamond symbols in set ‘D1’
13.1.2 Knight Piesold PFS Pit Slope Design
The Knight Piesold 2016 report 'Pre-Feasibility Pit Slope Design VA201-439/3-2 Rev0' provides the pit slope recommendations for PFS studies. The following comments are based on a review of this report:
21015Puna21TRS220927Rev0.docx Page 115 of 175
•The kinematic assessment, which has been largely utilised to provide batter angles is considered appropriate for the metasediments. However, owing to the lack of knowledge on faults, there is a degree of uncertainty on interramp scale stability.
•Overall pit wall stability has been addressed through limit equilibrium stability analyses. The analyses utilised the Hoek & Brown (HB) rock mass strength criterion. The inputs of the analysis are considered largely appropriate based on the 2015 Geotechnical Site Investigation Report , however caution of the following three aspects:
•Knight Piesold have assumed a Disturbance Factor (D value) of 0.85. This value may be appropriate near created slope faces where blast damage may be present but is not considered appropriate for the rock mass within the pit slope.
•Knight Piesold have adopted an Ru value of 0.2 in the analyses, which nominally equates to a slope where the phreatic surface aligns with the mined surface and groundwater conditions are nominally 50% hydrostatic. This level of depressurisation is considered optimistic at the PFS stage.
•The HB criterion is poorly suited for rocks of low intact strength such as the pyroclastic tuff. As such, the interramp slope angle (IRA) in the tuff is considered marginally high and an overall angle in the order of 37° is considered more appropriate.
•The Knight Piesold design parameters are shown in Table 13.1. These parameters maintain similar berm widths in all areas and with variation in batter angle. An alternative would be to utilise 70° batter angles in all areas and utilise 10 m wide berms in the south-west and north-west (IRA of 49° maintained), 14 m wide berms in the south (IRA of 43° maintained) and 17 m wide berms in the east (IRA of 39°). A haul road would reduce the overall angle in the east wall but depending on placement may require revision of berm widths.
•Knight Piesold recommend that for the west wall, the uninterrupted IRA not exceed 150 m in height and with a wider bench or haul ramp of the order of 20–30 m to limit overall angle to 46° to 47°. In practice, with the ramp location unknown, would suggest placement of a wider berm in the south-west and north-west at nominally mid-height of the overall slope.
Table 13.1 Knight Piesold Recommended Interramp Angles
| | | | | | | | | | | | | | | | | |
| Pit Design Sector | Geotechnical Unit | Bench Face Angle
(°) | Bench Height
(m) | Bench Width
(m) | Interramp Angle
(°) |
| East | Pyroclastic | 60 | 20 | 10 | 43 |
| South | Basement Sandstone and Pyroclastic | 60 | 20 | 10 | 43 |
| South-west | Basement Sandstone | 70 | 20 | 10 | 49 |
| North-west | Basement Sandstone | 70 | 20 | 10 | 49 |
Recommended angles assume quadruple benching
21015Puna21TRS220927Rev0.docx Page 116 of 175
13.1.3 2021 Pit Design Slope Criteria
SSR prepared new pit designs in 2021, the interpretation of the slope design recommendations used by SSR in the 2021 designs is shown in Table 13.2. The pit slope angles for both pit and dumps were based on those recommended by Knight Piesold but subject to some alteration by SSR. The 2021 pit designs have not been subjected to an independent geotechnical review and it is important that this review is carried out and the revised designs confirmed to meet the slope design criteria. This should be carried out as soon as possible in 2022.
Ore and waste are mined in 5 m benches. Final wall 20 m benches are formed by joining four working benches together. Haulage roads are 30 m wide, which is sufficient for two-way traffic of 100 t trucks, plus enough space to build a ditch and a safety berm. Interramp angles for the west and east walls are 49° and 43°, respectively. For every 150 m of slope height, either a 20 m geotechnical berm or a haulage road was added to the slope.
Table 13.2 Mine Design Criteria
| | | | | | | | | | | |
| Criteria | Unit | Value | Remarks |
| Bench height (final wall) | m | 20 | Ore and waste will be mined in 5 m benches |
| Bench face angle | degree | 60 and 75 | 60° in east and south; the rest 75° |
| Catch bench width | m | 11.4–13.3 | On final walls |
| Geotechnical berm | m | 20 | For every 150 m height |
| Interramp angle | degree | 40, 47, and 50 | 40° in east and south; 47° in the south-west; the rest 50° |
| Haulage road width | m | 30 | Two-way roads, includes berm and ditch |
| Maximum road grade | % | 10 | |
| Rock dump face angle of repose | degree | 35 | 25 m lifts and overall slope of 26° |
13.1.4 Knight Piesold Hydrogeologic Conceptual Model and Preliminary Pit Inflow Estimates
The 2016 Hydrogeologic Conceptual Model and Preliminary Pit Inflow Estimates report has utilised the available knowledge to summarise hydrogeological parameters, provide a conceptual groundwater model and provide inflow estimates. This study is considered appropriate at a PFS level.
13.1.5 NI 43-101 Technical Report
The NI 43-101 Technical Report of December 2016 provides limited additional geotechnical value to that indicated in the previous Knight Piesold reports. The pit designs utilised overall angles 3° flatter than those indicated in Table 13.1. The flatter slope angle was to allow for haulage ramps (20–30 m width) and a geotechnical berm every 150 m of slope height as proposed by Knight Piesold (albeit this was only recommended for the west wall).
The haul road placement shown in the NI 43-101 Technical Report , and as provided by OreWin, transects the east wall and such that the overall angle of 37° is largely achieved.
21015Puna21TRS220927Rev0.docx Page 117 of 175
The report places the ex-pit waste dump to the north-east of the pit, which is represented by a red dashed line in Figure 13.1, and where the topography suggests a somewhat uniform slope dipping to the south. The following information is inferred:
•The dump footprint has a dip of nominally 13°.
•The dump would be constructed in a bottom-up sequence.
The waste rock dump (WRD) investigations in the 2015 Geotechnical Site Investigation report utilised test pitting, indicated typically a shallow depth to rock in the dump footprint. Although no previous WRD geotechnical studies have been sourced for this review, it is anticipated with clearing of overburden from the footprint of the first dump lift there should be negligible risk of waste dump instability.
13.1.6 Summary of Geotechnical Studies Review
the following is an overview of comments for the geotechnical studies review for the Chinchillas project:
•Review of the logging and core photos in the metasediments suggest faulting is present. The absence of understanding of orientation is considered as a significant gap in the geotechnical studies. Owing to the lack of knowledge on faults, there is a degree of uncertainty on interramp scale stability. It is recommended that MPSA considers three boreholes in the western quadrant with use of televiewer (ATV) logging. ATV, which uses scanning of the borehole wall, is far more reliable in providing the orientation of major structures which are typically present in recovered core as rubble zones, broken core or highly jointed zones, which invariably cannot be orientated in oriented core as used in the PFS investigations.
•Bedding in the surface mapping shown in Figure 13.2, is moderately dipping to the south-west (set ‘A2’) and moderately dipping to the west (set ‘B1’). This is at odds with the provided geological overview where bedding is steeply dipping in the metasediment and shallow dipping in the pyroclastic tuffs. As bedding has the potential to significantly control stability of the overall slopes this discrepancy needs to be resolved.
•Overall pit wall stability was addressed in the PFS study through limit equilibrium stability analyses utilising the Hoek & Brown rock mass strength criterion. It is considered the inputs as largely appropriate. However, caution of the following three aspects is recommended.
•Knight Piesold have assumed a Disturbance Factor (D value) of 0.85. This value may be appropriate near created slope faces where blast damage may be present but is not considered appropriate for the rock mass within the pit slope.
•The level of depressurisation in the analyses is optimistic at PFS stage.
•The Hoek & Brown criterion is poorly suited for rocks of low intact strength such as the pyroclastic tuff. As such, the IRA in the tuff is considered marginally high and an overall angle in the order of 37° is considered more appropriate.
•The Knight Piesold design parameters, shown in Table 13.1, maintain similar berm widths in all areas and with variation in batter angle. An alternative would be to utilise 70° batter angles in all areas and utilise 10 m wide berms in the south-west and north-west (IRA of 49° maintained), 14 m wide berms in the south (IRA of 43° maintained) and 17 m wide berms in the east (IRA of 39°). A haul road would reduce the overall angle in the east wall but depending on placement may require revision of berm widths.
•The 2021 pit designs have not been subjected to an independent geotechnical review and it is important that this review is carried out and the revised designs confirmed to meet the slope design criteria. This should be carried out as soon as possible in 2022.
21015Puna21TRS220927Rev0.docx Page 118 of 175
13.2 Mining
Open pit mining is carried out by MPSA as an owner-mining operation with ore hauled from Chinchillas pit to the Pirquitas plant.
The Chinchillas deposit is located in the high lands of the Andes. The topography of the property consists of several mountains and hills on the sides of property with a small valley in the middle. The orebody is located mainly in the bottom of the valley with extensions stretching to the west on the hillside. The elevation varies from about 4,090 metres above sea level (masl) in the east side of the valley to 4,300 masl on the peaks in the west. There is a small creek in the middle of valley running from west to the east.
The Chinchillas deposit is mined as a conventional open pit operation. Most of the in-pit haulage for both ore and waste is carried out using 100 t haulage trucks. Ore is mined in 5 m benches and stockpiled in a staging area close to the pit. From the staging area, ore is transported to the crusher at the Pirquitas Operation which is 42 km away from Chinchillas. Throughout the mining operation, low grade ore is stockpiled near the pit rim to be processed at the end of mine life. The mining operation is conducted by the owner. Ore haulage was changed to owner operated in 2021.
Waste rock is mined and hauled to two major on-site rock storage facilities based on geochemical characteristics.
For the mine planning work the NSR is calculated for each block. No dilution is included in the block model. Ore is placed in the ore staging area as it is mined from the pit. The ore is then loaded onto haul trucks and transferred to Pirquitas on a daily basis. Material that falls between the Resource cut-off and the Reserve cut-off is stockpiled separately as mineralised waste.
13.3 Mine Design
The Mineral Reserves were developed based on mine planning work completed in 2021 that included pit optimisation and re-design of the pit phases. The 2021 ultimate pit design and the waste dumps at Chinchillas are shown in Figure 13.3.
Figure 13.4 shows a long-section of the main pit from west to east.
21015Puna21TRS220927Rev0.docx Page 119 of 175
Figure 13.3 Chinchillas 2021 Ultimate Pit Design
MPSA, 2020
21015Puna21TRS220927Rev0.docx Page 120 of 175
Figure 13.4 Long-Section of the 2021 Pit Design
MPSA, 2020. (A=west, A’=east)
13.4 Rock Storage Facilities
Some of the waste types have the potential to leach metals and are separated from the neutral waste material. Based on geochemical characteristics, waste is classified into three groups designated ‘A’, ‘B’, and ‘C’. Type ‘A’ waste is stored close to the pit as it has the potential to leach metals. This is so that the drainage can be collected in the pit and if necessary be treated. Types ‘B’ and ‘C’ are stored together in the same location.
According to this classification, two waste rock storage facilities have been designed for Chinchillas to accommodate different rock types. These can be seen in the general site layout Figure 13.3.
Rock storage ‘A’ is close to the pit, on a hill side to the north-east of the Chinchillas pit. The toe of this dump is 100 m offset from the pit rim. Rock storage ‘B’ and ‘C’ are located to the south-east of the active mining area on somewhat flatter terrain. Waste Rock Facilities are built with 25 m lifts and 15 m berms. The angle of repose for each lift is 35° and the overall slope angle of dumps is 26°. Access to the dump is by 30 m wide haulage roads. The total height of the dumps are approximately 100 m.
13.5 Mining Equipment and Personnel
The mine operates 355 days a year with two 12-hour shifts per day. The amount of mining equipment required for the operation varies by the tonnages of material moved in each period.
The mining operation utilises 12 m3 wheel loaders to load 100 t off-highway trucks. Two main drills and two smaller drills will be sufficient for the life of mine. Dozers (D9) and graders provide ancillary support. The graders are also used for maintaining the 42 km ore haulage road.
The mining personnel are grouped into three sections: operation, maintenance, and management / technical.
21015Puna21TRS220927Rev0.docx Page 121 of 175
13.6 Production Scheduling
Mining production is scheduled throughout the current mine life which is five years. Ore is classified into grade bins: low grade and high-grade ore. Milling cut-off grade is calculated to be $44.11/t NSR.
Table 13.3 Production Schedule for Chinchillas Project
| | | | | | | | | | | | | | | | | | | | | | | |
| Description | Unit | Total | Project Year |
| 2022 | 2023 | 2024 | 2025 | 2026 |
| Total Movement | kt | 29,671 | 10,652 | 9,168 | 5,316 | 3,725 | 809 |
| Waste Mined | kt | 22,469 | 9,033 | 7,437 | 3,655 | 2,008 | 336 |
| Ore Mined | kt | 7,202 | 1,619 | 1,732 | 1,661 | 1,717 | 473 |
| Strip Ratio | kt | 3.1 | 5.6 | 4.3 | 2.2 | 1.2 | 0.7 |
| Processed | kt | 7,352 | 1,643 | 1,643 | 1,647 | 1,647 | 773 |
| Silver Feed grade | g/t | 160 | 168 | 176 | 158 | 158 | 123 |
| Lead Feed grade | % | 1.32 | 1.24 | 1.38 | 1.43 | 1.43 | 0.94 |
| Zinc Feed grade | % | 0.29 | 0.47 | 0.34 | 0.19 | 0.19 | 0.22 |
| Ag Recovery | % | 95.5 | 96.2 | 96.2 | 96.2 | 93.6 | 94.7 |
| Ag Produced | koz | 37,210 | 8,529 | 8,924 | 8,026 | 7,809 | 3,921 |
| Payable Ag Produced | koz | 35,135 | 8,051 | 8,427 | 7,581 | 7,375 | 3,701 |
Metal produced includes current concentrate stockpiles containing 242 koz silver and 5 Mlb lead.
13.7 General Mine Site Layout
Figure 13.5 shows the general site layout of Chinchillas mine.
21015Puna21TRS220927Rev0.docx Page 122 of 175
Figure 13.5 Chinchillas General Mine Site Layout
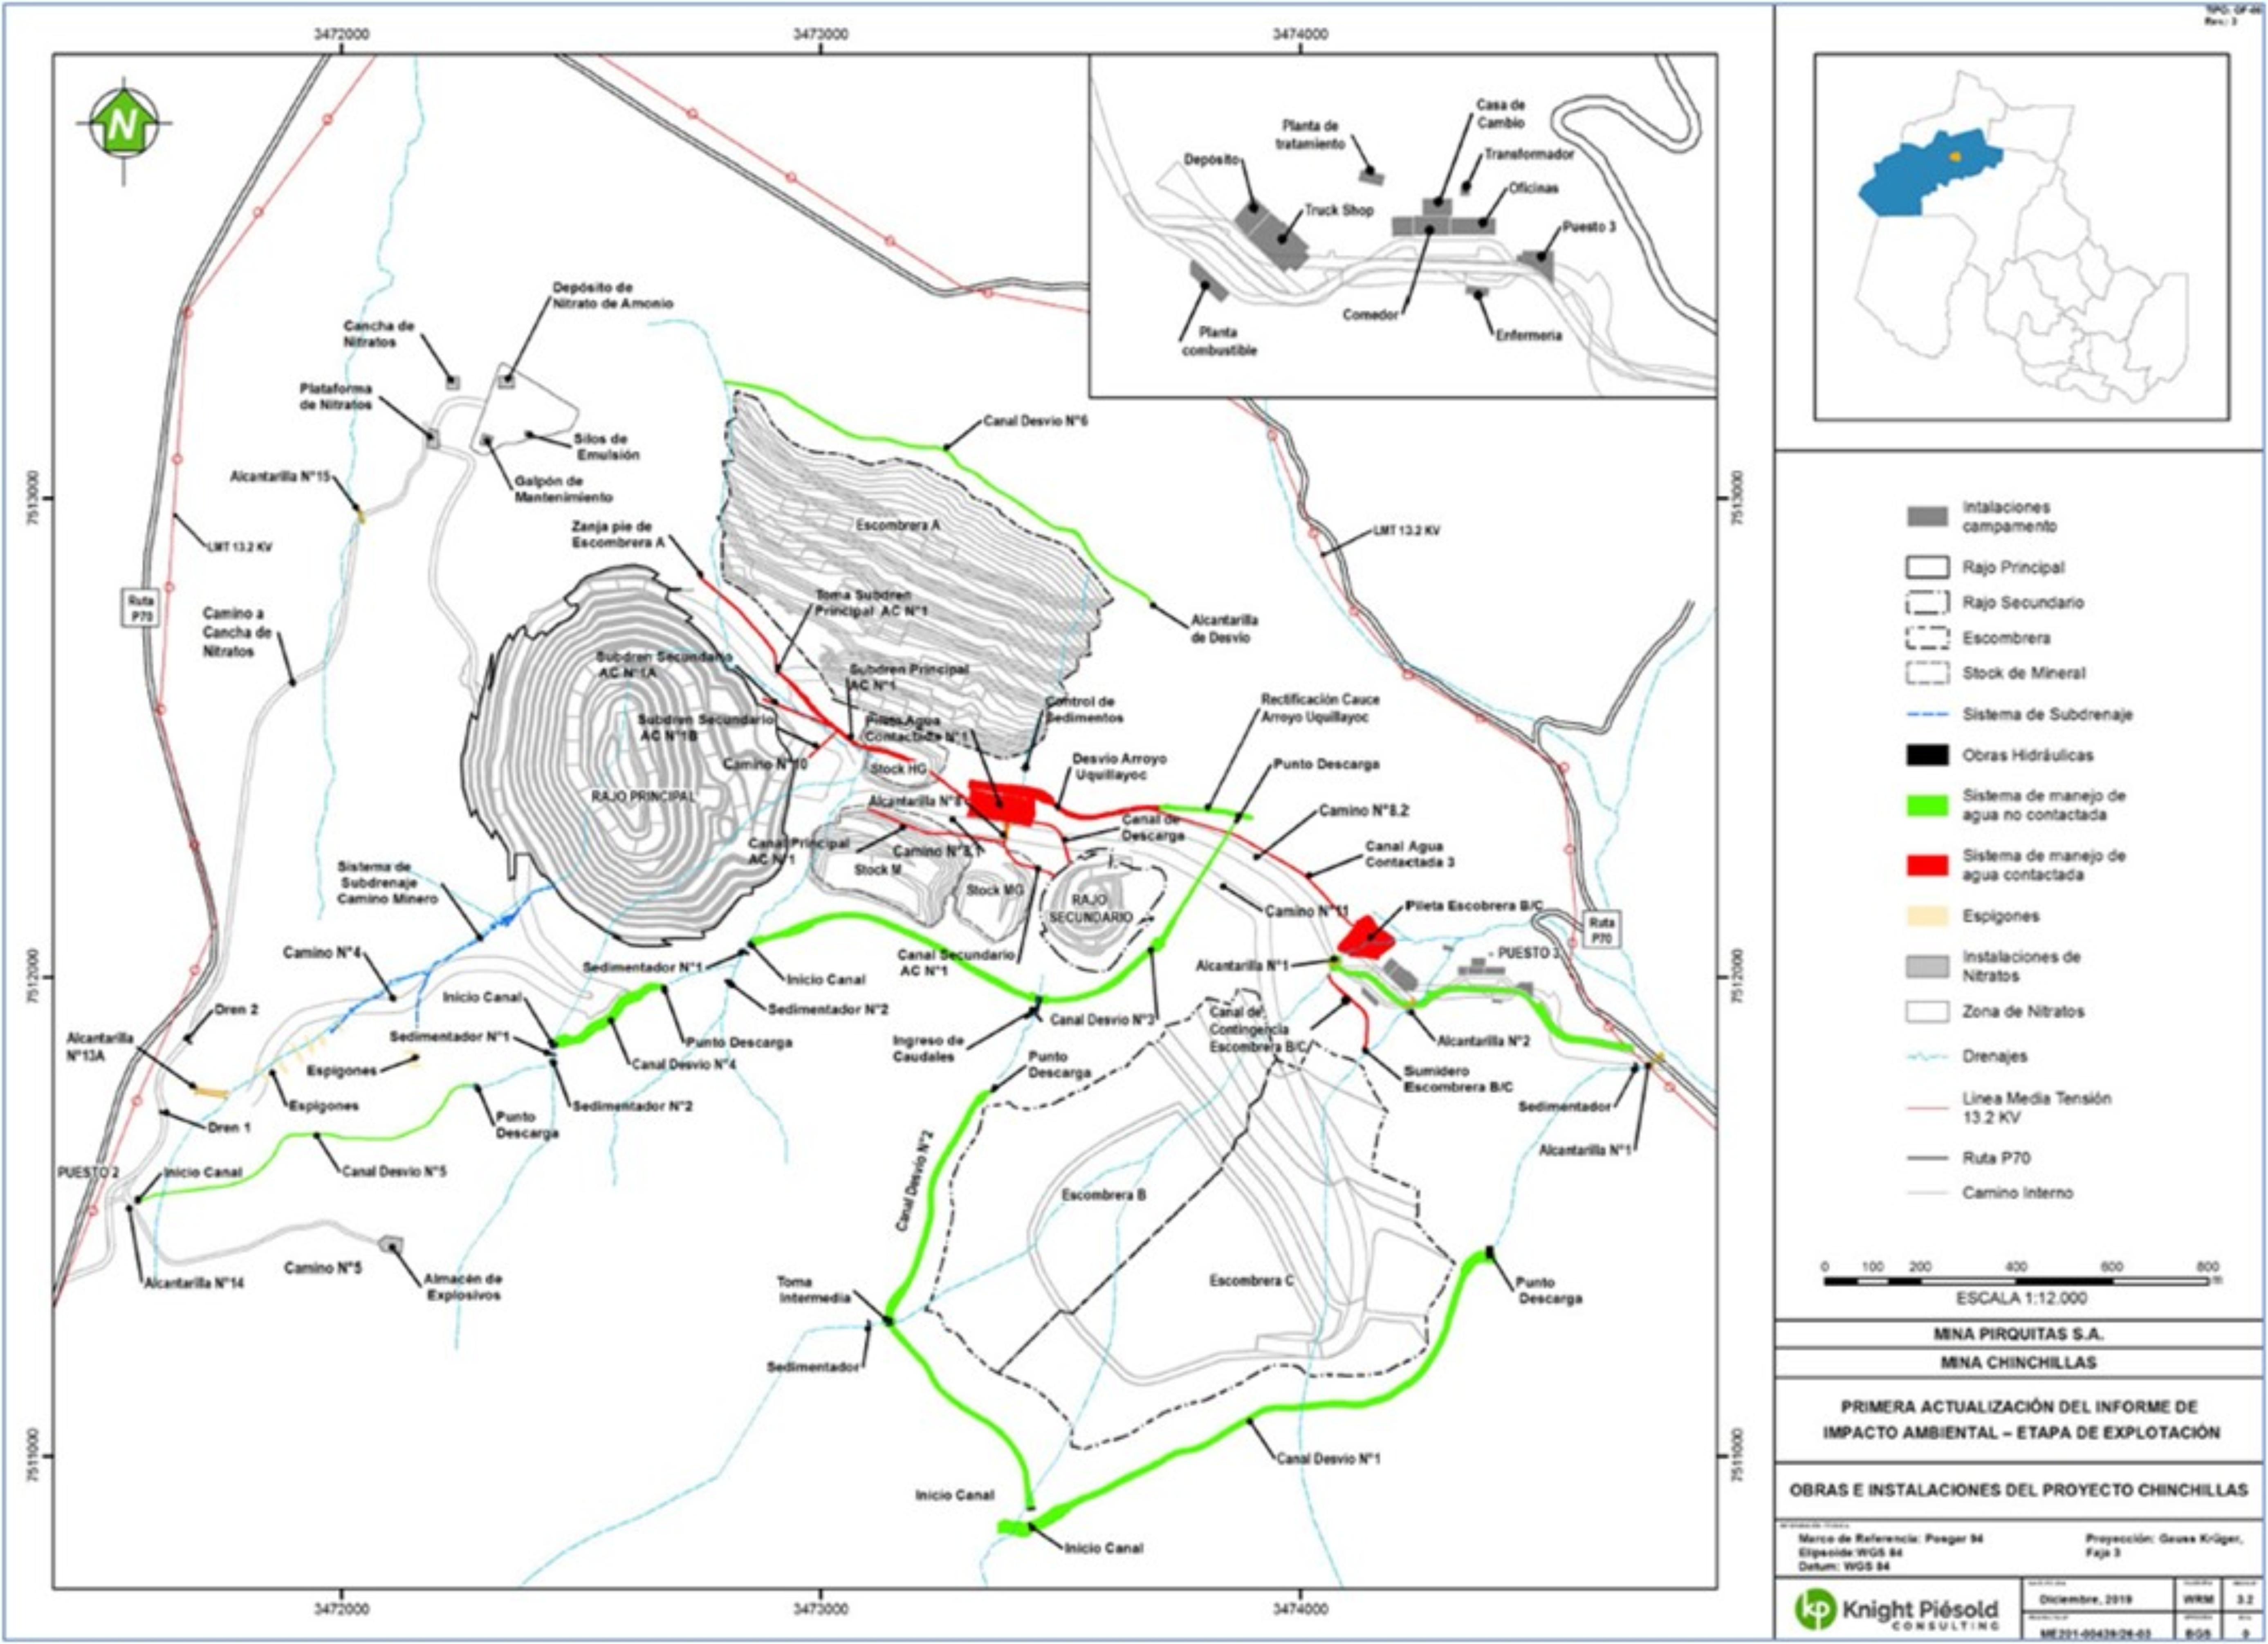
Knight Piesold, 201921015Puna21TRS220927Rev0.docx Page 123 of 175
14 PROCESSING AND RECOVERY METHODS
Chinchillas material is processed at a rate of up to 1.7 Mtpa through the existing Pirquitas Operation process plant. The Pirquitas plant was commissioned in 2009 and has since been in continuous operation.
The plant has not been expanded since start-up; however, minor changes in the flotation flow sheets have occurred to optimise performance.
14.1 Process Overview for Chinchillas
The Pirquitas plant was upgraded in 2017 to process the Chinchillas ore types, producing a silver / lead concentrate and a zinc concentrate.
A schematic diagram of the Chinchillas process flow sheet is shown in Figure 14.1.
Figure 14.1 Chinchillas Processing Flow Sheet Overview
MPSA, 2021
21015Puna21TRS220927Rev0.docx Page 124 of 175
14.1.1 Stockpiling and Crushing
The trucked material is delivered to suitable stockpiles at the primary jaw crusher. The jaw crusher is fed directly via 35–42 t truck dumping or with a front-end loader. Mill operations decides daily feed blending from the ore stocked looking for steady head grade according to the production plan.
Secondary / tertiary crushing and screening operations will reduce this material to an 80% passing size of 9 mm. This material is discharged onto a crushed feed stockpile with four feeders located beneath the stockpile.
The crushing circuit was designed to process up to 6,000 tpd.
Figure 14.2 shows the crushing circuit flow sheet.
Figure 14.2 Chinchillas Crushing Circuit
MPSA, 2021
14.1.2 Grinding
The ball mill circuit grinds crushed ore to the optimum size at a rate of 4,500 tpd. The ball mill is 4.8 m in diameter by 6.25 m long with 2,400 kW of installed power. Mill discharge is pumped to a cyclone nest where the underflow is returned to milling operations and the overflow reports to flotation.
The addition of granular lime to the ball mill feed belt is done for flotation pH control. The pyrite / sphalerite depressant and frother are added into the mill. The lead / silver flotation collector and a reinforcement of frother are added to the cyclone overflow.
14.1.3 Lead / Silver Flotation
The lead / silver flotation section consists of rougher, and in the concentrate cleaning stage with a scavenger stage.
Figure 14.3 shows the lead / silver recovery circuit for Chinchillas ore.
21015Puna21TRS220927Rev0.docx Page 125 of 175
Figure 14.3 Grinding and Lead / Silver Recovery Circuits for Chinchillas
MPSA, 2021
14.1.4 Zinc Flotation
The zinc flotation circuit consists of rougher, and one stage of conventional cell concentrate cleaning followed by one stage of column cell cleaning.
Figure 14.4 shows the zinc recovery flow sheet for processing Chinchillas material.
21015Puna21TRS220927Rev0.docx Page 126 of 175
Figure 14.4 Zinc Recovery Circuit for Chinchillas
MPSA, 2021
14.1.5 Concentrate Handling
The Pirquitas silver / lead concentrate dewatering circuit consists of a thickener, holding tank and pressure filter. However, as higher lead feed grades are mined after the first few years of operation, the existing tin concentrate thickener will be recommissioned along with an additional new filter press to handle the higher lead / silver concentrate production.
The Pirquitas zinc concentrate dewatering circuit consists of a thickener, holding tank and filter.
After filtering, the concentrates are bagged into one tonne bulk bags. Sampling will be by manually inserted spear samplers.
14.1.6 Tailings Handling
The Pirquitas plant tailings thickener was designed to treat a low density, tin circuit tailings (approximately 20% solids) at 4,090 tpd. The Pirquitas plant has operated successfully on zinc tailings at higher tonnages. The thickened solids (55% to 58% solids) are pumped 6 km to a portion of the mined-out Pirquitas pit for storage. Water recovery is a combination of tailings thickener overflow and in-pit pond, both recycled to the plant reclaim water system.
21015Puna21TRS220927Rev0.docx Page 127 of 175
14.2 Process Plant Performance
The Pirquitas process plant has continued to improve performance after upgrading and converting to Chinchillas ores in 2018. These improvements have included better understanding of flotation characteristics of the ores, improved operating and maintenance practices and a change of cyclone in the grinding circuit.
These changes have seen improvement from the expected 4,000 tpd capacity to 4,500 tpd achieved in 2021.
Table 14.1 summarises mill feed and grade, with recovery and production for metals in concentrate.
Table 14.1 Mill Production Summary 2018 to 2021
| | | | | | | | | | | | | | | | | |
| Unit | 2018 | 2019 | 2020 | 2021 |
| Ore Milled | kt | 1,420 | 1,393 | 1,118 | 1,643 |
| Ag Feed | g/t | 114 | 184 | 164 | 158 |
| Zn feed | % | 0.84 | 0.54 | 0.51 | 0.57 |
| Pb Feed | % | 0.85 | 0.89 | 0.77 | 1.12 |
| Silver Recovery | % | 72.1 | 93.2 | 94.6 | 95.8 |
| Zinc Recovery | % | 39.3 | 49.2 | 55.5 | 65.6 |
| Lead Recovery | % | 82.6 | 85.8 | 90.2 | 93.0 |
| Silver Produced | koz | 3,747 | 7,674 | 5,581 | 8,010 |
| Zinc Produced | klb | 8,775 | 8,392 | 6,988 | 13,641 |
| Lead Produced | klb | 3,107 | 23,958 | 17,193 | 37,695 |
21015Puna21TRS220927Rev0.docx Page 128 of 175
15 INFRASTRUCTURE
The main approach to infrastructure for the Project is to maximise the use of existing infrastructure and facilities at the Pirquitas Operation and minimise the building of new items at the Chinchillas site.
The Pirquitas Operation includes significant infrastructure used to sustain mining and processing operations over the last seven years, much of which remains suitable for continued operation. These facilities include roads, a gas pipeline, power generation facilities, water diversion systems, tailings dams, mine waste stockpiles, camp facilities, office buildings, maintenance shops and communications systems.
15.1 Ore Haulage
The ore transport road from Pirquitas to Chinchillas is the National Route No. 40 (Route 40) that leads to Provincial Route No. 70 (Route 70). The route required upgrading in order to have the increased traffic, including 35-42 t ore haulage trucks, safely and efficiently travel the route. A road survey was completed, and a road design was developed and constructed to widen roads and improve route conditions, including bypasses of the local villages of Orosmayo and Liviara to minimise social impacts. This design, along with improved river and creek crossings and the requirement for road surface topping. Figure 15.1 shows the access road route.
Figure 15.1 Access Road for the Project and Proposed Modifications
Knight Piesold, 2019
21015Puna21TRS220927Rev0.docx Page 129 of 175
15.2 Gas Pipeline and Power Supply
For its source of electricity, the Pirquitas Operation uses natural gas to power three Wärtsila generator sets, each with a capacity of five megawatts (MW) of power. In addition, the same electrical plant has three diesel-powered Cummins generators, each yielding 1.1 MW. There is 6.7 km of gas pipeline on the Pirquitas property. The pipeline is 152 mm diameter, constructed of API5L Grade B steel with 4.8 mm wall thickness in normal applications and 7.1 mm wall thickness at river or drainage crossings.
Power for the Chinchillas mine site supplied along existing power lines from the natural gas powered generators at Pirquitas. EJESA is the local power authority that owns the lines. The power line from Pirquitas that goes directly past the rural EJESA line at the town of Nuevo Pirquitas (approximately 5 km from Pirquitas). The rural power line then goes from Nuevo Pirquitas to all villages along Route 40 and Route 70 and directly to Santo Domingo. This line is able to carry the 1 MW load for Chinchillas, with a small spur line (approximately 4 km in length) to take power into the mine.
No ore processing is done at Chinchillas therefore power requirements are minimal. In the event of power loss at Pirquitas. Back-up power from the EJESA grid that amounts to 100 kVa can be drawn. This back-up power is designated for critical telecommunications systems and the first aid building.
15.3 Water Supply
Water supply for the Pirquitas Operation comes from the northwards flowing Collahuaima River which lies immediately east of the property. Water is pumped 7 km to the mill from a site known as San Marcos located within the mine property, a short distance downstream from where the Pirquitas River drains into the Collahuaima River. By means of Permit No. 201/002, originally granted to Sunshine Argentina by the Dirección Provincial de Recursos Hidricos de Jujuy and recorded by the Ministerio de Obras y Servicios Publicos on 23 July 1998, the mine is allowed to draw up to 32 L/s of water from the river.
Water supply for the Chinchillas mine will be supplied via local pumping wells. There is allowance for a water distribution system, equipment washing, road dust control, sewage and fire water facilities. Potable water for Chinchillas will be supplied by bottles and larger water totes.
15.4 Tailings
MPSA is currently using the Pirquitas pit as a tailings reservoir. These tailings come from the processing of the Mina Chinchillas ore.
The use of the pit as a tailings reservoir was approved by the Authority through Resolution No. 056/2018, after submitting the Addendum to the Authority in August 2017.
Placing the tailings inside the pit involves transporting them from the process plant to the pit by means of a pumping system and a 6.3 km pipeline to the tailings box located on the edge of the pit, to be discharged to the pit. Likewise, the tailings reservoir has a water recovery system to pump the water (from the tailings, the flows that enter the pit by filtration, direct rain and surface run-off) to the process plant for reuse. This pipe follows the same route as the pipe that transports the tails. The disposal of the tailings in the pit began in April 2019.
21015Puna21TRS220927Rev0.docx Page 130 of 175
Thickened tailings (55% solids) are transported to a portion of the Pirquitas pit through a pipeline for in-pit disposal, tailings in-pit discharge system from the tailings transport pipeline, in-pit water reclaim system, and pipeline from the Pirquitas pit to the Pirquitas plant for reuse. Water recovery will be a combination of tailings thickener overflow and in-pit pond, both recycled to the plant reclaim water system. These proposed upgrades will allow for additional tailings capacity in connection with the processing of Chinchillas ore. The distance from the Pirquitas plant to the Pirquitas pit is 6 km and the grades vary from 1.7% to 3.0% uphill. The alignment and gradient is shown in Figure 15.2.
Figure 15.2 Alignment and Gradient of the Tailings Line for In-pit Disposal
MPSA, 2021
15.5 Communications Systems
The Pirquitas site is equipped with both cellular and landlines. This equipment uses cell phone towers to communicate to Abra Pampa and is connected via a land line to the Pirquitas mine offices and buildings. On-site communication at Chinchillas is via radio communication and local phone.
21015Puna21TRS220927Rev0.docx Page 131 of 175
15.6 Camp, Office, and Chinchillas Infrastructure
The Pirquitas camp site is equipped with housing sufficient for a maximum of 673 personnel. This housing is a mix of rehabilitated housing from prior mining operations and modular housing that was installed during construction. It is anticipated that Chinchillas and Pirquitas operating management and senior staff will be housed at the Pirquitas camp while local workers and operators will be transported to their local villages.
Camp food is catered by a contractor and is provided on a seven day per week schedule. Food as required by Chinchillas workers will be delivered daily to Chinchillas.
Office buildings at Pirquitas are a mix of rehabilitated offices from prior mining operations and modular office space installed during mine construction.
The following facilities are located at Chinchillas:
•Mine and administration offices
•Truck shop
•Lunchroom (food preparation and storage is at the Pirquitas camp – daily delivery)
•Change room / Bathrooms / Training room
•Water wells, distribution and sewage system
•Lighting and heating facilities
•IT network
•Explosives magazines, and transfer of emulsion silos from MPLLC
•Fire and lightening protection
•Oil and fuel storage
•Security and first aid buildings
•Solid waste storage facility
Solid waste materials will be collected at the mine site and will be delivered to Pirquitas for recycling. A small landfill facility will be developed at Chinchillas site for small amount of solid waste produced at site. The explosives facilities are located at Pirquitas in accordance with Argentine mining regulations.
The infrastructure and facilities listed above can be seen in general site layout in Figure 13.5.
15.7 Mine Short-Term / Long-Term Ore Stockpiles
In the east side of the pit, adjacent to the pit rim, a pad has been developed using Type ‘C’ waste materials for multi-purpose tasks. The size of the pad is approximately 400 m x 300 m. This includes a staging area for loading ore onto the haulage trucks to be transported to the mill. A short-term ore stockpile of ore will be formed in this area, with the amount of stockpiling varying by period. A small amount (690 kt) of low-grade ore will also be stockpiled on this pad as long-term stockpile. This will be milled at the end of mine life before closing the mine. Refer to Figure 13.5 for general site layout where the location of short-term and long-term stockpiles are shown.
21015Puna21TRS220927Rev0.docx Page 132 of 175
15.8 Rock Storage Facilities
The mine currently has two waste stockpiles as described in Section 13.4. Rock storage facilities are classified by their geochemistry attributes as discussed in Section 17. Potential acid generating rock (Type ‘A’) will be disposed close to the pit rim so that its drainage will be collected in the pit and treated accordingly at closure. Mineralised waste will be separated and stockpiled with Type ‘A’ material, but adjacent to the ore stockpiles, for potential processing opportunities at a later date. High metal leaching materials (Type ‘B’) will be stored with Type ‘C’ (non-hazardous materials) with a controlled drainage system. Rock storage facilities can be seen in general site layout at Figure 13.5. More information about managing Type ‘A’ and ‘B’ materials can be found in Section 17.
15.9 Other Pirquitas Infrastructure
The Pirquitas site has a permitted wastewater treatment facility for treatment of liquid waste from camp operations. This system is designed to allow for discharge of treated wastewater to national standards.
The site has a landfill for organic waste and a recycling centre for plastics, wood, and metal products. Most wood products are donated to the local communities and are used as fuel or for construction supplies. Scrap steel and specialty steels are recycled via local vendors.
Domestic water comes from a water diversion located in the Medano Canyon area which is approximately 300 m upstream from the Pirquitas mine open pit. Water is pumped from that location to a site water treatment facility for filtering and chlorination and is then used within the camp site. At the date of this Puna21TRS, potable water is currently supplied by bottles and totes for drinking and cooking purposes.
Concentrate shipments from Pirquitas are currently trucked to Susques, Jujuy from Pirquitas via Route No. 77, and from there to Buenos Aires via Route No. 9. At arrival to the terminal, the material is directly dispatched from the port facilities to the concentrate buyers.
21015Puna21TRS220927Rev0.docx Page 133 of 175
16 MARKET STUDIES
The Project is a poly-metallic project containing three principal metals – silver, lead, and zinc. Production is from two separate concentrates: a high silver content lead concentrate and a zinc concentrate.
The lead concentrate contains most of the recovered silver metal and is the more valuable of the two concentrates. Trace amounts of minor penalty elements are present in both of the concentrates.
16.1 Marketing and Metal Prices
Silver is traded on a global basis on a number of metals and commodity market exchanges. The price is determined by a number of factors that follow short and long-term trends and is most commonly established on the London Metal Exchange.
Metal prices for the economic analysis were estimated after analysis of consensus industry forecasts and compared to metal prices used in other published studies. The metal prices selected have taken into account the current project life. The metal prices are representative of industry forecasts. Lead and zinc are relatively low compared to the consensus prices. The prices used for the economic analysis are shown in Table 16.1.
Table 16.1 Metal Price Assumptions
| | | | | | | | | | | | | | | | | | | | |
| Commodity | Unit | 2022 | 2023 | 2024 | 2025 | Long-Term |
| Silver | $/oz | 24.00 | 23.00 | 22.00 | 21.00 | 21.00 |
| Lead | $/lb | 1.00 | 0.95 | 0.93 | 0.92 | 0.90 |
| Zinc | $/lb | 1.30 | 1.20 | 1.20 | 1.20 | 1.20 |
No external consultants or market studies were directly relied on to assist with the sales terms and commodity price projections used in the Puna21TRS. The QPs for this Section 16 agree with the assumptions and projections presented.
16.2 Concentrate Terms
The Chinchillas concentrates are commodities and are sold and traded in global markets. Sales are either made directly to smelter operations or through commodity traders.
The logistics, required customs procedures, and exporting requirements are therefore well understood by the MPSA.
Average concentrate terms and transport are based on experience at the Puna Operations and are shown in Table 16.2.
21015Puna21TRS220927Rev0.docx Page 134 of 175
Table 16.2 Concentrate Marketing Terms and Charges
| | | | | | | | | | | |
| Item | Unit | Lead Concentrate | Zinc Concentrate |
| Treatment Charge and Refinery Charge (TCRC) | $/t Conc. | 1,191 | 724 |
| Payability – Silver | % | 95 | 75 |
| Payability – Lead | % | 95 | – |
| Payability – Zinc | % | – | 85 |
| Deduction – Lead | % | 3 | – |
| Deduction – Zinc | % | – | 8 |
| Minimum Payout Factor | % | 63 | 39 |
| Royalty | % | 3 | 3 |
| Export Duty (revenue minus TCRC's) | % | 5 | 5 |
| Puna Credit (revenue minus TCRC's) | % | 2.5 | 3 |
The concentrate quantities produced by period are displayed graphically in Figure 15.2 and are derived from the annual mine production schedule.
Figure 16.1 Concentrate Production
OreWin, 2021
21015Puna21TRS220927Rev0.docx Page 135 of 175
16.3 QP Opinion
Data and assumptions for macroeconomic trends, taxes, royalties, interest rates, marketing information and plans, legal matters such as statutory and regulatory interpretations affecting the mine plan, and environmental matters are outside the expertise of the QPs and are within the control of the registrant (see Section 25).
The Puna21TRS QPs consider it reasonable to rely on SSR because SSR employs professionals and other personnel with responsibility in these areas and these personnel have the best understanding of these areas.
Additionally, the project has been in operation for a number of years, and following a review of the current supplied information, the opinion of the Puna21TRS QPs is that he current plans and input parameters appear adequate for use as inputs to the Puna21TRS.
21015Puna21TRS220927Rev0.docx Page 136 of 175
17 ENVIRONMENTAL STUDIES, PERMITTING AND PLANS, NEGOTIATIONS, OR AGREEMENTS WITH LOCAL INDIVIDUALS OR GROUPS
Significant environmental and social analysis has been conducted for both mines. A summary of key physical, chemical, and biological information is provided in the following sub-sections.
17.1 Chinchillas
17.1.1 Surface Hydrology and Water Quality
The Chinchillas property is located in a small, contained valley near the headwaters of the Colquimayo and Orosmayo rivers. Drainage from small ephemeral streams into the Project area collect in the valley bottom in the Arroyo Uquillayoc, which drains to the east into Rio Colquimayo.
Flows in the small tributaries that drain the Project area are governed primarily by rainfall, which is typically highest between December and March. Typical flows in the Arroyo Uquillayoc near the Project site are low, ranging from 0–1.5 litres per second (L/s) during the dry period, and between 0.3 and 20 L/s during the rainy season.
Surface water quality samples were obtained and analysed from 22 sites between 2011 and 2016, from within the Project area in the Arroyo Uquillayoc as well as far-afield sites in Quebrada San Pedro, the Rio Colquimayo and Rio Cincel, as well as the Rio Orosmayo.
Both surface and groundwater baseline sampling show the influence of native mineralisation in the host rock. While surface water chemistry is generally circumneutral, Arroyo Uquillayoc near the Project site seasonally shows variation from acidic (pH 5.9) during higher flows to basic (maximum pH 8.0) during lower flows. Annual average pH at these sites was neutral, between 6.8 and 7.2.
In Argentina, the Environmental Protection for Mining Activity Law (Ley de Protección Ambiental para la Actividad Minera in Spanish) specifies limits of parameter concentrations in water quality in the absence of site-specific data for various end uses, including drinking water, aquatic life, irrigation, and livestock watering. Metals such as aluminium, antimony, arsenic, barium, boron, cadmium, copper, chromium, iron, lead, manganese, nickel, vanadium, and zinc occasionally are at, or exceed, these concentrations in the baseline water sampling.
Surface water parameters in the Quebrada de San Pedro exhibited generally more neutral pH, but with similar metal concentrations.
The sampling location in the Arroyo Uquillayoc as it exits the Chinchillas valley will be used during operations as a point of control to monitor water quality during operations. In the baseline condition, samples from the Arroyo Uquillayoc at the outlet of the Chinchillas valley exhibited exceedances for a number of the limits set by the Environmental Protection for Mining Activity Law. This suggests that some metal parameters occur naturally in higher concentrations in Project area waters, which would be expected, as they are draining the valley that contains the mineralised zone. Mitigation and management programmes are part of the Project permitting. These programmes consider the naturally elevated baseline parameters.
Currently MPSA monitors 17 of the original 22 sites given the expansion of the mine. The monitoring programme includes 1 control point and two compliance points. MPSA monitoring to indicates that the water quality values are between the maximum and minimum baseline parameters.
21015Puna21TRS220927Rev0.docx Page 137 of 175
17.1.2 Hydrogeology
The Chinchillas site is located in a caldera or bowl-like feature in the side of the mountain range, resulting in some flow towards the bowl from the north and south as well as from the east. The bowl is somewhat like a shallow open pit.
Groundwater discharges to topographic lows, such as the local drainage in the deposit area depression and to the regional low elevation at the base of the range to the east and west of the Project area. Elevations are highest along the south–south-west / north–north-east divide of the Sierras and decrease towards the east and west. Groundwater gradients are therefore steepest towards the east and west, and groundwater is expected to generally flow in these directions following topography.
Hydrogeological data were collected during a 2015 site investigation consisting of drillhole logs, hydraulic conductivity testing (packer tests and open-hole tests), water level observations, and drilling circulation records. Sixteen packer tests and nine open hole falling head tests were completed in three geotechnical drillholes in the deposit area. Hydraulic conductivity values estimated from the packer tests range from less than 1 x 10⁻⁸ m/s to 1 x 10⁻⁵ m/s (Figure 17.1).
Figure 17.1 Response Test Hydraulic Conductivity by Lithology
MPSA, 2021
The metasediments outside the caldera feature are expected to have a relatively low hydraulic conductivity. Storage values are expected to be low, provided almost entirely by joints, fractures, bedding planes and faults. Within approximately 300 m from the contact margins with the overlying tertiary pyroclastics, the permeability of the metasediments increases due to the strongly fractured nature of the rock.
21015Puna21TRS220927Rev0.docx Page 138 of 175
North-west trending faults likely provide partial barriers to groundwater flow across the faults and enhanced flow parallel to faults. The fractured zone adjacent to the metasediments has relatively high hydraulic conductivity, likely in excess of 1 x 10⁻⁶ m/s.
Groundwater discharges occur primarily in topographic lows, often into stream beds. The indications from the available surface flow measurements are that groundwater discharge contributes from 1.5 L/s to upwards of 4 L/s to stream flows at the eastern extent of the Chinchillas valley. The groundwater reporting to the pit area is estimated to be 1.8 L/s.
Arid climatic conditions result in relatively high evapotranspiration rates that ultimately minimise the amount of precipitation available for groundwater recharge. The variation in annual precipitation impacts the precipitation available for groundwater recharge from one year to the next.
Recharge could vary from insignificant to about 50 mmpa, depending on climatic conditions and surface materials. This is expected to result in water level increases of a few metres in wet years, which would decrease over drier years. Smaller variations can be expected on a seasonal basis.
Currently the dewatering system consists of sumps located on the base of the pit and discharged through a pump to a contact water pool near the facility (‘A’ Pond – contact water). This water is used for dust control.
MPSA is evaluating the necessity of a dewatering system consisting of wells containing submersible pumps located in the perimeter of the pit.
Groundwater quality samples from monitoring wells immediately adjacent to the Project area were collected in 2015 and 2016. Similar water quality parameters were observed in the groundwater to those identified in the surface water samples discussed above.
Sample results were compared to limits specified in the Environmental Protection for Mining Activity Law. As was noted in the surface water, exceedances were noted in the baseline condition for some metals parameters. These variably included exceedances of the drinking water, aquatic life, irrigation, and livestock watering limits. However, these exceedances are considered natural and represent water that drains from within and around the mineralised zone and are carefully documented as part of the baseline monitoring programme.
The current monitoring programme includes one well located downstream of the Chinchillas mine. The most recent shows water quality values are between the maximum and minimum baseline parameters.
17.1.3 Geochemistry
Geochemical investigations were undertaken in order to assess the potential for net acid generation and the potential for metal leaching. As described above, both surface water samples and groundwater samples in the area of the mineralisation show circum-neutral pH values. Water samples exhibited slightly elevated sulfates (ranging from <25 mg/L SO4 to 100 mg/L SO4), alkalinity up to 100 mg/L and a range of dissolved and total metals. There are no strongly acidic seepages found in the Project area, either in the surface drainage or the groundwater. Of particular interest in the prediction of water chemistry from the Project, there are slightly elevated values of Al, Zn, Cd, Fe, Mn, and Sb found in some baseline samples. These metals are consistent with the mineralisation of the Project area and the Chinchillas deposit.
21015Puna21TRS220927Rev0.docx Page 139 of 175
The regional geology comprises a package of sediments overlain by volcanics. Within this region, the deposit was formed by a major east–west trending fault structure along which volcanic intrusions and mineralising events have resulted a zone of pyroclastic rocks (breccias, tuffs and ash) forming a roughly elliptical deposit. The deposit has undergone several different types of alteration, primarily clay alteration with lesser sericitisation, silicification, and carbonate alteration. The deposit lithology is therefore broadly grouped by lithology into (meta)sediments and volcanics, and further by alteration.
Silver, lead, and zinc bearing minerals include silver sulfosalts, boulangerite, tetrahedrite, freibergite, sphalerite, and galena. Associated mineral assemblages include chalcopyrite, pyrite, siderite, limonites, manganese oxides, and malachite. The mineralisation occurs as disseminated within the breccias but primarily along structure within the volcanics and basement rocks. Considering the environmental geochemistry, this deposit would be considered a low sulfide system and a low carbonate (alkalinity) system.
A suite of 34 samples were selected for geochemical testing to provide spatial coverage of the expected mine areas and to evaluate the characteristics of the various lithological and alteration units, and mineralisation within ore and waste for the deposit. The extensive exploration ICP database was evaluated before selecting the samples in order to ensure that representatives of low grade ore and waste rock were selected.
Testing included both standard elemental analyses (by ICP) and acid base accounting to characterise the range of sulfide content (and therefore potential for acid generation) and carbonate content (and therefore potential for neutralisation).
The static test results are consistent with those expected from the deposit geology; relatively low sulfur content and low carbonate content, and mineralisation concentrated in the breccias. The metal contents reflect the main minerals in the deposit, with Zn and Cd associated with the sphalerite, Al associated with the clay alteration, and Cu occurring in the freibergite and chalcopyrite.
The key findings with respect to the potential for net acid generation are:
•Paste pH of the samples range from neutral to slightly acidic, with the majority of the samples between paste pH of 5.7 to 8.1.
•Total sulfide content of the samples is low, ranging from <0.01% to 4% S, with one sample of breccia at 7% S. This is consistent with the statistical analysis of the entire exploration IPC database of the deposit (including ore) which shows sulfide concentrations range from <0.1 wt% to >10 wt% with an average of 0.75 wt% for the deposit.
•Carbonate concentrations are relatively low, ranging from less than detection to 4.3 kg/t CaCO3 equivalent.
•Sulfate sulfur concentrations are low in the rock samples, indicating minimal in situ oxidation of the sulfides. This is consistent with the geological model of a shallow oxidation front.
•The ratio of neutralisation potential to acid potential (NP:AP) is used to indicate the potential for net acid generation from a static test. Approximately 75% of the samples are considered non-acid generating based on the NP:AP ratio or the low sulfur content. Approximately 25% of the samples could be considered potentially weakly acid generating, however given the relatively low sulfide content this may represent only local zones of potential net acidity.
This is consistent with the baseline observations of generally circum-neutral water quality in the project area.
21015Puna21TRS220927Rev0.docx Page 140 of 175
Selected samples were tested using various short-term leach extraction tests to provide an indication of potential metal leaching from these samples. These tests are designed as ‘batch’ or instantaneous tests to maximise dissolution of metals from a sample; these tests can overestimate actual drainage water chemistry in the longer term. The short-term filter extraction tests were used to indicate the potential for metal leaching for the range of rock samples encountered in both waste rock and low grade materials. Sample results indicated that certain units of waste rock may have leachable aluminium, cadmium, copper, lead, and zinc where lower pH values occur.
The static tests and the evaluation of the ICP database confirm that the samples selected cover the range of expected sulfide concentrations in the mining material. On-site materials have a low neutralisation potential. Therefore, the classification of materials is primarily a function of the content of sulfur and metal. These results indicate that most of the waste rock has low potential for acid drainage and metal leaching, mainly due to relatively low sulfide and mineralisation outside the ore zones.
A combination of sulfide, zinc, and paste pH are used to identify waste rock that is a potential source of metals leaching or acid drainage. These parameters are included in the mine block model and are used for the design of the waste rock handling.
The mine block model is used to manage the waste rock according to the net acid generation potential and/or metal leaching potential in the waste rock storage areas. This is accomplished through segregation of potentially reactive waste rock (Class ‘A’) placement in the dumps with contained drainage. These waste rock storage areas have controlled drainage and, in the long term, can be directed to the open pit if necessary. Non-reactive waste rock (Class ‘B’ or ‘C’) are placed separately further downstream in the catchment.
A rock sampling programme is projected on 2022 in order to update the geochemical information. The programme will include kinetic acid rock drainage testing of the rock.
17.1.4 Water Management
During the Project life, water quantity and quality is managed to maximise diversions and maintain ‘non-contact’ water. The site water management plan is designed to ‘keep clean water clean’ as much as possible. Diversion ditches have been designed around the dumps, pit and stockpiles to convey clean or non-contact freshwater around these disturbed areas, where it is physically practical. The ‘Class A’ Rock Storage Area stores potentially reactive rock and is located such that it can drain into a contact water pond (A Pond – Contact Water), to allow monitoring and batch treatment if required before discharge. Currently the contact water is used for dust control given that the quality is appropriate for this use.
Water that accumulates on Project infrastructure is collected for settling and testing prior to any discharge. No water will be discharged to the environment that would have adverse environmental impact.
The dewatering and water management plan is comprised of three systems:
•Diversion ditches
•Pit groundwater dewatering sumps (non-contact water)
•Surface contact water ru-noff dewatering
Water collected within the catchments of the open pit and each waste rock dump area are directed to two ponds constructed at the low point of each area. The water of both ponds in used for dust control. A general arrangement of this system is included in Figure 17.2. The contact water diversion channels water is currently used for dust control. The non-contact water diversion channels water flows are drained to Uquillayoc river.
21015Puna21TRS220927Rev0.docx Page 141 of 175
Figure 17.2 Project General Arrangement and Water Management Features
MPSA, 2021
The contact water diversion channels are shown in red; this water is currently used for dust control. The non-contact water diversion channels are shown in green; these water flows are drained to Uquillayoc river.
21015Puna21TRS220927Rev0.docx Page 142 of 175
17.1.5 Flora and Fauna
The Chinchillas property area is a mix of high Andean plains and Puna landscape, characterised by grassy steppes and low-growing shrub land (Figure 17.3 and Figure 17.4), interspersed with bare soil and alkaline wetlands (peladares). Where standing water is encountered, such as at ponds and streams, surrounding wetland vegetation are collectively known as ‘vegas’, dominated by the families Juncaceae, Cyperaceae, Poaceae, Oxalidáceas and Scrofulariaceas (Figure 17.5). In upland drier zones, cactus such as Maihueniopsis and Lobivia can be found.
Figure 17.3 Grassland Steppes on the Western Edge of the Project Area
MPSA, 2021
21015Puna21TRS220927Rev0.docx Page 143 of 175
Figure 17.4 Shrub Land on the Northern Edge of the Project Area
MPSA, 2021
21015Puna21TRS220927Rev0.docx Page 144 of 175
Figure 17.5 Vega Habitat
MPSA, 2021
The effects of the high-altitude environment include increased solar radiation, constant winds, and large temperature fluctuations. Soils are typically young with low levels of organic material. These conditions have influenced the development of plant species in this area, where species of different families often show similar morphologies. Grasses typically have a high proportion of cellulose and lignin for added rigidity, and extra layers of cutin or suberin to restrict water loss. Woody plants are typically found as shrubs, with almost no tree layers evident.
Fauna of the Project area are highly correlated to wetter and humid areas, including the vegas. Several species of insects have been recorded, along with three species of amphibians. Three species of reptiles (two lizards and one snake) have also been documented in the area.
There are at least 72 species of birds known to be present for at least part of the year in the Project area. The most abundant of these are the Ash-breasted Sierra Finch (Phygilus atriceps) and the Bright-rumped Yellow Finch (Sicalis uropygialis). Other birds in the area of note include the Andean Condor (Vultur gryphus), the Ornate Tinamou (Nothoprocta ornate), the Puna Rhea (Pterocnemia tarapacensis), the Mountain Parakeet (Bulborhynchus aurifrons), and the Bare-faced Ground Dove (Metriopelia ceciliae).
21015Puna21TRS220927Rev0.docx Page 145 of 175
Studies completed in 2015 identified nine native and one exotic mammalian species. Numerous domestic species (e.g., llamas) were also noted in the area. The most common native mammals were the Vicuña (Vicugna vicugna) and the Vizcacha (Lagidium viscacia).
Some displacement of vegetation communities and attendant wildlife habitat has occurred within and adjacent to the Project footprint as a result of project development. These impacts have been assessed and approved in the Resolution No. 014/2017 (DIA Mina Chinchillas). As a result of the approval of the EISA of Chinchillas Mine, since 2018 MPSA developed a biannual Community Environmental Monitoring Program that includes fixed monitoring stations of flora, fauna, and limnology, as well as water, air, and soil quality.
17.1.6 Protected Areas
There are 15 protected areas within the Province of Jujuy, however the majority of these are far removed from the Project area. The Laguna de Pozuelos represents the most important protected area within the Chinchillas property region.
The Laguna de Pozuelos is a large, permanent, high-altitude lake located approximately 25 km from the Project area. It is an important migratory bird stopover, particularly known as habitat for the Andean Flamingo, as well as many other species.
The Laguna is located within a National Natural Monument, protected by the ‘Administracion de Parques Nacionales’ (National Parks Administration) as well as a United Nations Educational Scientific and Cultural Organisation (UNESCO) designated Biosphere Reserve and RAMSAR Wetland of International Importance. The National Natural Monument covers a surface of approximately 16,000 ha and in this area all economic activities, including mining, are prohibited.
The National Natural Monument is surrounded by a buffer zone of approximately 380,000 ha defined as a RAMSAR Wetland of International Importance that is administered by the multi-sector organisation ‘Corporación para el Desarrollo de la Cuenca de Pozuelos’ (CODEPO: Corporation for the Development of the Pozuelos Watershed) that is responsible for promoting sustainable development in the buffer zone. This buffer zone is recognised by UNESCO, who note that one of the objectives of the Reserve buffer zone is to make development compatible with conservation (www.unesco.org).
As shown in Figure 17.6, the Jujuy Ministry of Mining GIS data indicates that the Chinchillas property is located just inside the buffer zone, while boundaries provided by the University Nacional de Jujuy (UNJ) follow the UNESCO model and divide the buffer zone into an outer transition zone, with the Chinchillas property located outside of both zones. Taking the Ministry data of the buffer outline as the most recent and correct suggests that Chinchillas falls within the Ministry buffer zone, and within the UNESCO transition zone. In either case, economic activities, including mining and exploration, are permitted in these areas.
21015Puna21TRS220927Rev0.docx Page 146 of 175
Figure 17.6 Laguna de los Pozuelos Buffer Zones
MPSA, 2021
21015Puna21TRS220927Rev0.docx Page 147 of 175
17.2 Social and Community Engagement
17.2.1 Local Communities
The Project is located in a rural area in the department of Rinconada in the province of Jujuy. The Rinconada department has an area of 6,407 km2 and a population of only 2,489 (2010 Census). The department is divided into two municipalities; Rinconada Municipality and Mina Pirquitas Municipality.
The nearest population centres to the Project include the village of Santo Domingo (approximately 6 km distant) and the larger city of Abra Pampa (approximately 75 km distant), which is located in the adjacent department of Cochinoca. Additionally, there are four villages located between the Chinchillas site and the Pirquitas Operation; Liviara (approximately 9 km distant) Orosmayo Grande and Orosmayo (approximately 14 km distance), Coyaguayma (40 km distance) and Nuevo Pirquitas (approximately 29 km distance). Each community is considered aboriginal communities, with predominant Colla ethnicity. Colla people historically occupied the high Puna regions throughout northern Argentina, western Chile, and southern Bolivia. They traditionally speak a dialect of the Quechua language.
It is estimated that 78 people live in Santo Domingo, the village most proximate to the Project. A further 60 people are estimated to live dispersed throughout the surrounding area. Similarly, an estimated 17 people live in Liviara, 12 in Orosmayo, 25 in Osormayo Grande and 116 in Nuevo Pirquitas. Abra Pampa, the largest urban area in the region, has a population of approximately 16,000.
The livelihood of the area’s population is primarily tied to small-scale livestock management, typically goats and llamas, with some limited production of sheep. Sale of livestock, meat, and wool is typically done in Abra Pampa, from where it may eventually reach markets farther afield such as San Salvador de Jujuy.
Outside of agriculture, regional inhabitants are employed by the public sector (e.g., schoolteachers), or work in the mining industry. Many local rivers are exploited for low volumes of placer gold, and several hard rock mines, including the Pirquitas mine, have operated in the area. The majority of workers from Liviara and Orosmayo are employees of the Pirquitas mine.
Currently MPSA employs or hires 149 workers that come from direct and indirect communities (ESIA Mina Chinchillas 2021).
17.2.2 Archaeology
The Puna region of Argentina has a rich history of occupation, dating from at least 10,000 years before present. Hunter gatherers roamed throughout the region, gradually domesticating llamas and moving to greater reliance on agriculture within the last 3,000 years. The Incas arrived in the region in 1475, which had a great effect on the social order and use of resources. Spanish conquistadors arrived in 1535, further altering the socio-economy of the area and ushering in the colonial era.
Mining occurred historically at the Chinchillas area on a small scale in the eighteenth century by Jesuit missionaries. In the late 1960’s, there was a period of small underground production by a local company using adits and tunnels.
21015Puna21TRS220927Rev0.docx Page 148 of 175
An archaeological survey was conducted at the Chinchillas property in 2015. A total of 11 archaeological sites were identified proximate to the project itself. Other sites were identified in the surrounding area totalling 31 finds.
Prior to the start of exploitation of the Chinchillas Mine, in February 2018 the archaeological clearance of 15 sites that were going to be affected by the mine facilities was carried out (approved in Resolution No. 014/2017 - DIA of the Chinchillas Mine). The final clearance was obtained by Resolution No. 453/2018 issued by Cultural and Tourism Ministry. In April 2019 an additional clearance of a historical sites carried out under the authorization of Resolution No. 151/2019. The remaining sites are being protected by the company and are subject to annual monitoring.
17.3 Project Permitting
The legal framework for mine permitting is derived mainly of the second section of the Mining Code of the Nation and its supporting National Law No. 24.585. The institutional Framework for the permitting process is driven by stipulations in Law No. 24.585, with technical support of UGAMP and the National Mining Secretariat.
The main focus of permitting is the detailed Environmental and Social Impact Assessment, which must be submitted prior to commencement of operations. Upon successful review of the ESIA, a DIA is awarded. Annex III of Law 24.585 establishes the minimum contents of the EIA, which must include:
•Description of the Environment (physical, biological, and socio-economic);
•Project Description;
•Description of Environmental Impacts;
•Environmental Management Plan (which includes measures and actions to prevent and mitigate environmental impact);
•Plan of Action on Environmental Contingencies; and
•Methodology Used.
An ESIA for the Project was developed and submitted for review in September 2016. which was subject to review by the Mining Department and UGAMP and approved on 22 December 2017 by Resolution No. 014/2017. It is subject to review by the Mining Department and UGAMP, a process that is expected to conclude with issue of a DIA in mid to late-2022 . Since then, two more ESIA Updates have been developed and submitted to Mining Authorities, ESIA Mina Chinchillas 2019 and ESIA Mina Chinchillas 2021. Both are being reviewed by Mining Authorities and it is expected to have the final DIA soon.
21015Puna21TRS220927Rev0.docx Page 149 of 175
The UGAMP is a multi-stakeholder group chaired by a technical appointee from the Mining Department who recommends approval or rejection of the ESIA and related work application to the provincial mining authorities. Meetings are held to allow UGAMP members to review the proposed materials with members of Golden Arrow. UGAMP representatives appurtenant to the Project include:
•Representatives from the local Communities of Santo Domingo, Orosmayo, Liviara, Orosmayo Grande, Nuevo Pirquitas and Coyaguayma;
•Mining Workers Unions;
•Provincial Department of Water Resources;
•Department of Mines and Energy;
•Provincial Secretary of Mining;
•Surface Landowners;
•Provincial Collage of Geologists;
•Provincial Department of Environment;
•Provincial Department of Human Rights and Indigenous Communities;
•National University of Jujuy;
•Jujuy Chamber Mining;
•National Parks Administration;
•Corporation for the Development of the Pozuelos River;
•Provincial Secretary of Public Health;
•Provincial Department of Agriculture and Livestock Control; and
•Provincial Department of Industry and Commerce.
Chinchillas has maintained all previous exploration activity permits in good standing, each of which required the submission of an ESIA and receipt of a DIA. As the review of the mining ESIA proceeds, precedent suggests that the DIA will also be granted.
The use of the Pirquitas pit for tailings deposition at the Pirquitas Operation is a modification to the mining activities not contemplated in MPSA’s ESIA until 2016 for the Pirquitas mine. In August 2017, MPSA issued to Mining Authorities an Addendum of the 2016 ESIA Update that included the upgrades to conduct the tailings to the pit of Mina Pirquitas. The permit was obtained on 24 September 2018 by Resolution No. 056/2018. Since then, MPSA has submitted to Mining Authorities the ESIA Update for Mina Pirquitas in September 2020, which is under review.
21015Puna21TRS220927Rev0.docx Page 150 of 175
17.4 Mine Closure
A conceptual closure plan and cost has been developed for the Project. There are no specific laws in Argentina that specify mine closure requirements, and there is no bonding requirement. The closure plan for the Project has been developed in consideration of best industry practice. The closure plan was designed to accommodate the following objectives:
•Health and security of the public
•Protection of the environment
•Ensure physical and chemical stability of post-closure structures
•Ensure unrestricted and unimpacted natural surface water flow
•Prevent erosion of post-closure structures from wind or water
•Safe removal of impacted surface structures and buildings
•Safety and security for people, wildlife, and livestock
17.4.1 Closure Activities
Buildings and surface structures will be cleaned of residual fuels, lubricants, reagents, and wastes prior to being deconstructed and dismantled. Recyclable wastes will be reused wherever possible. All structures will be removed to ground level, with concrete slabs or other inert foundations covered with stored topsoil. All access roads to the pit and waste rock storage areas will be blocked for safety using earthen berms accompanied by warning signs.
The water diversion systems employed during operations will be fortified for long term use in managing water post-closure. This will include maintaining all upgradient run-off as non-contact water passed downstream to the Arroyo Uquillayoc.
The pit will be allowed to flood to the phreatic level. A large safety berm accompanied by appropriate signage will be constructed around the pit rim to prevent access.
Ongoing monitoring of the closure measures will be conducted over a period of five years to ensure successful implementation. Due to the fact that the exploitation and mineral extraction stage of the Pirquitas pit has ended, some components of the Pirquitas Mine are currently in the mine closure stage, so the activities currently being carried out are those linked to the ore processing and mine closure. Closure costs for Chinchillas mine have been estimated at $30.6M. MPSA is reviewing these costs and suggested that the closure costs will be lower than this.
17.5 Pirquitas Mine
17.5.1 In-Pit Tailings Disposal
MPSA is currently using the Pirquitas pit as tailings reservoir. These tailing comes from the processing of the Mina Chinchillas ore. The use of the pit as a tailings reservoir was approved by the Authority through Resolution No. 056/2018, after submitting the Addendum to the Authority in August 2017.
Placing the tailings inside the pit involves transporting them from the process plant to the pit by means of a pumping system and a 6.3 km pipeline to the tailings box located on the edge of the pit, to be discharged to the pit. Likewise, the tailings reservoir has a water recovery system to pump the water (from the tailings, the flows that enter the pit by filtration, direct rain, and surface run-off) to the process plant for reuse. This pipe follows the same route as the pipe that transports the tails. The disposal of the tailings in the pit began in April 2019.
21015Puna21TRS220927Rev0.docx Page 151 of 175
Due to the fact that the exploitation and mineral extraction stage of the Pirquitas pit has ended, some components of the Pirquitas mine are currently in the mine closure stage, so the activities currently being carried out are those linked to the ore processing and mine closure.
17.5.2 Pirquitas Pit
Pirquitas pit within the same watershed as the Homonymous River. During the operation of Mina Pirquitas, the surface run-off influent to the pit was captured and conveyed along the southern perimeter of the pit to a discharge point in the Pircas River, downstream of the pit. The main tributaries to the pit correspond to the Pircas and Maray streams (contacted waters in the Pircas dump), and the Médanos stream (waters not contacted), the convergence of these three channels naturally formed the Pircas River, precisely in the pit sector.
In January 2017, with the cessation of mining in Pirquitas, the mine dewatering ceased and surface run-off from the upper basins was directed towards the pit. As a result, the pit lagoon increased in volume until it reached approximately 40% of the depth of the pit. The increase in volume led to various hydrogeological studies and models, to establish the design criteria for the tailings reservoir.
The studies concluded that the open pit acts as a sink and can contain the tailings and their processes associated with the proposed methodology for the disposal of the tailings.
As a result of the studies, a critical maximum elevation of the water level has been determined at 4,207.7 masl, where the pit would cease to be a sink. Likewise, the overflow level of the pit was established at 4,230 masl.
To maintain the required water levels for the tailings reservoir, it was necessary to construct a water management system to avoid the inflow of surface water to the pit. These works were completed in February 2020.
Based on the operational and meteorological conditions, the pit water balance is annually updated.
17.5.3 Environmental and Social description and Closure
17.5.3.1 Water Quality
In December 1998, consulting engineering firm KP completed an ESIA for Sunshine Argentina. The ESIA contained a description and evaluation of environmental conditions that existed at the time, as well as foreseeable potential effects that development of the Pirquitas mine could have on the surrounding environment. The scope of the ESIA was commensurate with the norms for environmental protection associated with Argentina’s applicable mining laws and guidelines established by international lending institutions such as the World Bank. The discussion below is either paraphrased or taken directly from the ESIA, with updates to include information about the Pirquitas mine subsequent to the date of such ESIA.
Remnants of historical mining activities at the Pirquitas mine included derelict buildings, mine structures and tin-silver jig tailings and tin placer tailings along the Río Pircas. Flotation tailings had been discharged into the Río Pircas and piles of gold placer tailings were left above the current level of the Río Pircas on paleo-river terraces near the mine camp. These areas comprise some 107 ha of surface disturbance that existed prior to Sunshine Argentina’s acquisition of the property, some of which are now associated with acid rock drainage into the Río Pircas watershed.
21015Puna21TRS220927Rev0.docx Page 152 of 175
Surface and ground waters are known to be acidic and metalliferous down gradient from the historical mines above the Río Pircas canyon at Tres Placas, which is located downstream from the Pirquitas pit. In addition, acidic and metalliferous ground water is present in the abandoned underground workings and some natural springs in the area, suggesting natural oxidation of sulfide mineralisation which is widespread in the rocks found on the property is also contributing to background surface water contamination.
Furthermore, the only condition the Argentina Ministry of Mines and Energy applied to its approval of Sunshine Argentina’s ESIA, apart from the mandatory two-year update to the report, was the requirement that water quality monitoring be carried out.
MPSA is currently monitoring the water quality both upstream and downstream of the mine. The monitoring programme includes 21 sites for superficial water and eight sites for groundwater monitoring. The general characterisation of the water continues the same as the original in 1998.
17.5.3.2 Flora and Fauna
In the area of influence of Mina Pirquitas, the Altoandina and Puna ecoregions are distinguished. The physiognomy of the climax vegetation corresponds to an herbaceous (High Andean) or shrubby (Puna) steppe, however, it is possible to find a mixed ecotonal community between these two ecoregions in nearby environments.
The plant physiognomy in the Puna consists of shrubby and gramineous steppes or grasslands, with low plant cover and extensive areas of bare areas. In the sectors associated with wetlands, such as lagoons and streams, there are springs, with vegetation dominated by grasses such as Festuca sp. (chillagua), sedges such as Scirpus sp., and rushes that completely cover the ground, constituting a privileged habitat for being sites where there is a high concentration of biodiversity. In the rocky areas there are species of cacti of the Maihueniopsis and Lobivia genera.
The species, both herbaceous and shrubby, have the shape of cushions (camephytes or hemicryptophytes), and settle on the ground in a scattered manner, leaving areas of bare soil. The physiognomy of the vegetation resembles a high altitude desert; however, there are endemic species and others that only appear in the rainy season (late-summer), which provides a significant richness of species. The families best represented in these environments are: Poaceae, Asteraceae and Solanaceae
Given that in the Mina Pirquitas area, there is great variability in terms of the floristic composition of the vegetation units, the area of influence was subdivided into six sub-basins. These areas are monitored twice a year since 2011.
The area of Mina Pirquitas and its immediate surroundings in Jujuy, has a high conservation value, mainly of Puno and high Andean habitats, but also in terms of its biodiversity.
The upper Pilcomayo basin, represented by the Pirquitas area, constitutes, together with the adjoining endorheic basins of Pozuelos and Vilama, a considerable area of outstanding quality of this ecosystem.
The faunal indicators selected to carry out fauna monitoring did not show, at a general level, tangible changes in the richness of species in the area and in the structure of the communities, which at this scale shows that the impacts of the activities carried out in Mina Pirquitas for the groups of fauna involved, they are stable or compensated on this spatial and temporal scale.
As a result of the approval of the EISA of Pirquitas mine, since 2018 MPSA have developed a biannual Community Environmental Monitoring Program that includes fixed monitoring stations of flora, fauna, and limnology, as well as water, air, and soil quality
21015Puna21TRS220927Rev0.docx Page 153 of 175
17.5.3.3 Local Communities
The Area of Direct Influence is made up of the localities that have the greatest connection with the mine, either due to geographical proximity, because of the employment relationship of a large part of the active labour population, or because of the community relationship programmes that are implemented jointly, with the company.
The localities are: Nueva Pirquitas (approximately 4.5 km), Loma Blanca (approximately 50 km distance), Coyaguayma (14 km), Orosmayo- Orosmayo Grande (25 km) and Liviara (30 km).
The linkages that are carried out between the locations of the AID and the mine are fundamentally due to the proximity that exists between the operational areas and the communities, where they share communication routes and road infrastructure; Part of the workforce of the mine is from nearby towns and community investment policies are executed by the Company, which is headed by the Municipal Commission of Nueva Pirquitas.
The highest percentage of personnel working at Mina Pirquitas S.A belongs to the Province of Jujuy. That is, 163 people belong to the province of Jujuy, 96 people to the communities of the Area of Direct Influence, 17 people to the communities of the Area of Indirect Influence (AII).
17.5.3.4 Pirquitas Permitting
In 1998, the Original ESIA of the Pirquitas Project was developed by KP firm, which was prepared in accordance with the requirements of the National Law for Mining Environmental Protection, Law No. 24,585 and other substantive and formal regulations in force. The document was approved by Resolution No. 16/99. However, the mining activities provided for in the 1998 ESIA for the exploitation of the mine were not started.
In 2005, a new stage of exploration began in order to identify new mineralised areas. This year, the primary focus was a geological reconnaissance of the Oploca veins, with the aim of expanding in-depth geological and mineralogical knowledge.
The first Update of the ESIA was delivered to authorities in 2008 and was approved by Resolution No. 35/08. In June 2008, the pre-production stage began, starting the production of concentrates on April 6, 2009.In 2008, a second ESIA was completed by KP following start-up of mining activities and initiation of plant construction. While there were no observations or restrictions placed on MPSA at that time, this study began to focus on the water management plan and conceptual plans for mine waste stockpiles. A conceptual water treatment plant for neutralisation of acid waters was proposed as a contingency with a treatment capacity estimated to be as much as 150 L/s. Alternative water management measures to date have reduced the source of acidic waters, and such treatment plant has not yet been required.
A party wishing to commence or modify any exploration or mining-related activity under Argentina’s mining laws, including property abandonment or mine closure activity, must prepare and submit an ESIA, which must include a description of the nature of the proposed work, its potential risk to the environment and the measures that will be taken to mitigate that risk. The most recent update permit to MPSA’s ESIA for the Pirquitas mine, which included engineering studies for the design of water management structures and mine closure design, was submitted in December September 2016 and the addendum for in-pit disposal was submitted in August 2017. These ESIA’s were approved in September 2018 by Resolution No. 056/2018.
21015Puna21TRS220927Rev0.docx Page 154 of 175
The preceding update was submitted in December 2014 and formally approved in January 2016. An addendum to this ESIA regarding the closure of the Pirquitas mine was filed in December 2015, which reflected the revised mine plan projecting the completion of the Pirquitas pit, with lower grade stockpile processing expected to commence upon cessation of open pit mining activities at the Pirquitas pit. In July 2016, an updated closure plan, which included more detailed engineering of the selected closure measures and costing for both active closure and longer term care and maintenance, was submitted to the regulatory authorities. Due to the approval of Mina Chinchillas ESIA in December 2017 (Resolution No. 014/2017) the closure plan for Pirquitas mine was archived and any work proposed on this closure plan in currently submitted in the ESIA Updates every two years. and is currently under review.
The most recent ESIA submitted to authorities is the ESIA 2020 Update which is currently on revision under review by mining authorities.
The cessation of open pit mining activities at the Pirquitas pit in January 2017 has resulted in a significant reduction in workforce, as well as reduced indirect economic benefits to the surrounding and supporting communities with the start of exploitation of the Chinchillas mine, new contracts were made at Mina Pirquitas as of 2018 and currently MPSA hires 840 workers between Chinchillas and Pirquitas mines. A social impact assessment study was commissioned in 2015 and formed the basis of the social closure plan for the Pirquitas mine. The potential risks, as well as actions to reduce those risks and support the employees and the community, were developed as part of the reclamation and closure plan submitted in 2016 .
17.5.4 Closure
Argentina currently has no specific mine closure legislation other than the requirement to prepare and submit and regularly update an ESIA, including with respect to mine closure activity. However, it is expected that closure options will be proposed as part of the review of MPSA’s updated closure plan and may include passive or active neutralisation features to return discharged waters to baseline conditions (acidic at the time of baseline studies) with monitoring requirements. The closure requirements for the Pirquitas pit may change in the future and MPSA may be subject to increased obligations for both the technical and social aspects associated with such mine closure and reclamation, which would impact the closure plan and the duration of the associated closure activities.
The current closure and reclamation plan addresses a range of closure risks, design criteria and costs that are anticipated in order to comply with internationally accepted practices. It considers both the physical reclamation of the site and the social closure plan for the neighbouring communities for whom the mine provides employment and community support. The closure plan considers the short-term decommissioning and reclamation measures, as well as longer term care and maintenance activities and related costs and risks. The actual costs of reclamation and mine closure are uncertain and planned expenditures may differ from the actual expenditures required. Therefore, the amount required to be spent could be materially higher than current estimates.
MPSA is developing an update of the Puna closure plan that will includes both Chinchillas and Pirquitas mines to possible changes to the closure requirements and obligations.
21015Puna21TRS220927Rev0.docx Page 155 of 175
17.6 QP Opinion
Legal matters such as statutory and regulatory interpretations affecting the mine plan and environmental matters are outside the expertise of the QPs and are within the control of the registrant (see Section 25).
Following a review of the information supplied, the opinion of the QPs is that it is reasonable to rely on the information provided by SSR as outlined above for use in the Puna21TRS because a significant environmental and social analysis has been conducted for the project over an extended period, the project has been in operation for a number of years, SSR employs professionals and other personnel with responsibility in these areas and these personnel have the best understanding of these areas.
21015Puna21TRS220927Rev0.docx Page 156 of 175
18 CAPITAL AND OPERATING COSTS
18.1 Capital Costs
The Project utilises the existing processing facilities at the Pirquitas Operation, therefore most capital items are related to the mining equipment and infrastructure required at the mine site.
The estimated capital costs required to achieve the Mineral Reserves LOM are summarised in Table 18.1. The capital costs were estimated by the MPSA using actual costs and other information.
As the project has been in operation for a number of years, the level of project definition for the capital cost estimate is very high. Given the remaining capital scope, and the level of project definition, no contingency was included in the cost estimate. The QPs consider the capital estimate to be in the accuracy range of +/–15%.
The sustaining capital costs include:
•Surface infrastructure construction such as upgrades to the camp and kitchen, IT upgrades, and asset integrity costs.
•Mill improvements and replacement of major components.
•Tailings management facility costs.
•Mobile equipment such as new and replacement purchases and major rebuilds.
Table 18.1 Capital Costs Estimate
| | | | | |
| Cost Component | $M |
| Exploration and Development | 21 |
| Sustaining Capex | 47 |
| Closure and Reclamation | 31 |
| Total Capital Cost | 99 |
Capital includes only direct project costs and does not include non-cash shareholder interest, management payments, foreign exchange gains or losses, foreign exchange movements, or tax pre-payments.
18.2 Operating Costs
Operating costs are estimated using current operating experience at Pirquitas operation, actual quotes from vendors and first principles. Operating costs are estimated by MPSA for the areas such as mining, processing, tailings and general and administration.
As the project has been in operation for a number of years, the level of project definition for the operating cost estimates is very high. Given the available project performance data and the high project definition, no contingency was included in the cost estimate. The QPs consider the operating cost estimate to be in the accuracy range of +/–15%.
The operating expenses estimated to validate the positive cash flow for the Mineral Reserves LOM. The LOM operating costs are approximately $52.67/t of ore milled, as are summarised in Table 18.2. The mining expense includes all labour, supplies / consumables, and equipment maintenance to complete mining related processes / activities, less exploration diamond drilling and capital excavations and construction. The milling expense includes all labour and supplies / consumables to complete milling related processes / activities. The administrative expense includes all labour, supplies / consumables, and equipment maintenance to complete administrative, finance, human resources, environmental, safety, supply chain, site services, camp, and kitchen, and travel related processes / activities.
21015Puna21TRS220927Rev0.docx Page 157 of 175
Table 18.2 Operating Costs Estimate
| | | | | | | | |
| Cost Component | Total
($M) | LOM Average
($/t milled) |
| Mining | 110 | 15.01 |
| Processing | 183 | 24.95 |
| G&A | 93 | 12.71 |
| Total Operating Costs | 387 | 52.67 |
21015Puna21TRS220927Rev0.docx Page 158 of 175
19 ECONOMIC ANALYSIS
19.1 Economic Assumptions
The modelling and taxation assumptions used in the Puna21TRS are discussed in detail below.
All monetary figures expressed in this report are in US Dollars ($) unless otherwise stated. Cash flows are assumed to occur evenly during each year and a mid-year discounting approach is taken. The estimates of cash flows have been prepared on a real basis as 1 January 2022 and a mid-year discounting is used to calculate net present value (NPV).
19.1.1 Pricing and Discount Rate Assumptions
Metal price assumptions are shown in Table 19.1. Other key assumptions in the economic modelling relating to product pricing are tabulated in Table 19.2. A discount rate of 5% is used for calculating net present value (NPV).
Table 19.1 Metal Price Assumptions
| | | | | | | | | | | | | | | | | | | | |
| Commodity | Unit | 2022 | 2023 | 2024 | 2025 | Long-Term |
| Silver | $/oz | 24.00 | 23.00 | 22.00 | 21.00 | 21.00 |
| Lead | $/lb | 1.00 | 0.95 | 0.93 | 0.92 | 0.90 |
| Zinc | $/lb | 1.30 | 1.20 | 1.20 | 1.20 | 1.20 |
Table 19.2 Key Economic Assumptions
| | | | | | | | | | | |
| Item | Unit | Lead Concentrate | Zinc Concentrate |
| Treatment Charge and Refinery Charge(TCRC) | $/t Conc. | 1,191 | 724 |
| Payability – Silver | % | 95 | 75 |
| Payability – Lead | % | 95 | |
| Payability – Zinc | % | | 85 |
| Deduction – Lead | % | 3 | |
| Deduction – Zinc | % | | 8 |
| Minimum Payout Factor | % | 63 | 39 |
| Royalty | % | 3 | 3 |
| Export Duty (revenue minus TCRC's) | % | 4.5 | 4.5 |
| Puna Credit (revenue minus TCRC's) | % | 2.5 | 2.5 |
In the analysis, carry balances such as tax and working capital calculations are based on nominal dollars and outputs are then deflated for use in the integrated cash flow calculation.
21015Puna21TRS220927Rev0.docx Page 159 of 175
19.1.2 QP Opinion on Inputs
Data and assumptions for macroeconomic trends, taxes, royalties, interest rates, marketing information and plans, legal matters such as statutory and regulatory interpretations affecting the mine plan, and environmental matters are outside the expertise of the QPs and are within the control of the registrant (see Section 25).
The Puna21TRS QPs consider it reasonable to rely on SSR because SSR employs professionals and other personnel with responsibility in these areas and these personnel have the best understanding of these areas.
Additionally, the project has been in operation for a number of years, and following a review of the current supplied information, it is the opinion of the Puna21TRS QPs that the current plans and input parameters appear adequate for use as inputs to the Puna21TRS.
19.2 Overview and Results
The estimates of cash flows have been prepared on a real basis as at 1 January 2022 and a mid-year discounting is used to calculate NPV.
The projected financial results include:
•After-tax NPV at an 5% real discount rate is $228M
•Mine life of five years
The estimated total cash costs for the LOM is $11.63/oz silver. The all-in sustaining costs (AISC), which includes infrastructure capital, capital development and reclamation, average for the LOM is $13.57 per payable ounce of silver sold. Unit costs include concentrate in stockpile. Silver provides the primary revenue for the analysis, with contributions from lead and zinc. Credits from lead and zinc are included in the cash cost.
The key results of the Puna21TRS are summarised in Table 19.3.
21015Puna21TRS220927Rev0.docx Page 160 of 175
Table 19.3 Puna21TRS Results Summary
| | | | | | | | |
| Description | Unit | Total LOM |
| Ore Processed | | |
| Ore Tonnes Treated | kt | 7,352 |
| Ag Feed grade | g/t | 160 |
| Pb Feed grade | % | 1.32 |
| Zn Feed grade | % | 0.29 |
| Silver Recovery | % | 95.5 |
| Concentrates | | |
| Lead Concentrate – in Stockpile | kt | 4 |
| Zinc Concentrate – in Stockpile | kt | 1 |
| Lead Concentrate – Produced | kt | 135 |
| Zinc Concentrate – Produced | kt | 27 |
| Lead Concentrate – Total | kt | 139 |
| Zinc Concentrate – Total | kt | 28 |
| Metal Produced | | |
| Silver | koz | 37,210 |
| Lead | Mlb | 204 |
| Zinc | Mlb | 29 |
| Key Financial Results | | |
| Mine Site Cash Cost | $/oz payable silver | 11.61 |
Royalties and Refining Costs1 | $/oz payable silver | 6.10 |
| Credits | $/oz payable silver | –6.08 |
Total Cash Costs (after credits)1 | $/oz payable silver | 11.63 |
| All-in Sustaining Costs (AISC) | $/oz payable silver | 13.57 |
| Site Operating Costs | $/t milled | 52.67 |
| Average Silver Price | $/oz | 22.38 |
NPV1 | $M | 228 |
| Discount Rate | % | 5 |
| Project Life | years | 5 |
Metal produced includes current concentrate stockpiles containing 242 koz silver and 5 Mlb lead.
21015Puna21TRS220927Rev0.docx Page 161 of 175
19.2.1 Production and Cost Summary
The process production forecasts are shown in Table 19.4 and forecast tonnes mined are shown in Figure 19.1. The processing tonnes and metal production are summarised in Figure 19.2 and Figure 19.3 respectively.
Table 19.4 Production Forecast
| | | | | | | | |
| Item | Unit | Total LOM |
| Ore Processed | | |
| Ore Tonnes Treated | kt | 7,352 |
| Ag Feed Grade | g/t | 160 |
| Pb Feed grade | % | 1.32 |
| Zn Feed grade | % | 0.29 |
| Silver Recovery | % | 95.5 |
| Concentrate Produced | | |
| Lead Concentrate – in Stockpile | kt | 4 |
| Zinc Concentrate – in Stockpile | kt | 1 |
| Lead Concentrate – Produced | kt | 135 |
| Zinc Concentrate – Produced | kt | 27 |
| Lead Concentrate – Total | kt | 139 |
| Zinc Concentrate – Total | kt | 28 |
| Metal Produced | | |
| Silver | koz | 37,210 |
| Lead | Mlb | 204 |
| Zinc | Mlb | 29 |
Metal produced includes current concentrate stockpiles containing 242 koz silver and 5 Mlb lead.
Figure 19.1 Mining Production Profile
OreWin, 2021
21015Puna21TRS220927Rev0.docx Page 162 of 175
Figure 19.2 Process Feed Profile
OreWin, 2021
Figure 19.3 Silver Production
OreWin, 2021
The estimated mine site cash costs are shown in Table 19.5. The estimated total cash costs for the LOM is $11.63/oz payable silver. The AISC, which includes infrastructure capital, capital development, and reclamation, average for the LOM is $13.57/oz payable silver. Silver provides the primary revenue for the analysis, with contributions from lead and zinc. Credits from lead and zinc are included in the cash cost.
21015Puna21TRS220927Rev0.docx Page 163 of 175
These estimated costs include only direct operating costs of the mine site, namely:
•Mining
•Processing
•General and administrative (G&A) costs
•Government fees and charges (excluding corporate taxation)
The projected financial results include:
•After-tax net present value (NPV) at an 5% real discount rate is $228M
•Mine life five years
Table 19.5 Cash Costs
| | | | | |
| Item | LOM Average
($/oz Ag) |
| Mine Site Cash Cost | 11.61 |
| Royalties and Refining Costs | 6.10 |
| Credits | –6.08 |
| Total Cash Costs (CC) (after credits) | 11.63 |
| All-in Sustaining Costs (AISC) (after credits) | 13.57 |
Note: Includes concentrate in stockpile
The estimated revenues and operating costs have been presented in Table 19.6, along with the estimated net sales revenue value.
The metal prices used for the economic analysis are shown in Table 19.1. The metal prices used in this Puna21TRS are based on an SSR internal assessment of recent market prices, long-term forward curve prices, and consensus amongst analysts regarding price estimates. The metal prices selected for Puna Operations have taken into account the current project life.
Table 19.6 Operating Costs and Revenues
| | | | | | | | |
| Description | TOTAL ($M) | LOM Average ($/t milled) |
| Revenue | | |
| Gross Sales Revenue | 1,000 | 136.01 |
| Less Realisation Costs |
|
|
| Treatment & Refining Charges | 179 | 24.28 |
| Royalties | 36 | 4.89 |
| Total Realisation Costs | 214 | 29.17 |
| Net Sales Revenue | 785 | 106.84 |
| Less Site Operating Costs |
|
|
| Mining Costs | 110 | 15.01 |
| Processing Costs | 183 | 24.95 |
| G&A Costs | 93 | 12.71 |
| Total | 387 | 52.67 |
| Operating Margin | 398 | 54.17 |
Note: Includes concentrate in stockpile 21015Puna21TRS220927Rev0.docx Page 164 of 175
Table 19.7 Total Project Capital Costs
| | | | | |
| Item | Total ($M) |
| Exploration & Development | 21 |
| Sustaining Capex | 47 |
| Closure & Reclamation | 31 |
| Total Capital Cost | 99 |
Capital includes only direct project costs and does not include non-cash shareholder interest, management payments, foreign exchange gains or losses, foreign exchange movements, tax pre-payments, or exploration phase expenditure.
The projected financial results for undiscounted and discounted cash flows, at a range of discount rates are shown in Table 19.8.
The results of NPV5% sensitivity analysis to a range of changes in silver price (primary commodity) and discount rates is shown in Table 19.9. NPV sensitivity analysis for changes to operating and capital costs are shown in Table 19.9.
A chart of the after tax cumulative cash flow is shown in Figure 19.4 and details of the cash flow is shown in Table 19.11.
21015Puna21TRS220927Rev0.docx Page 165 of 175
Figure 19.4 After-Tax Annual and Cumulative Cash Flow
OreWin, 2021
Table 19.8 Financial Results
| | | | | | | | |
| Discount Rate | NPV
($M) |
| Before-Tax | After-Tax |
| Undiscounted | 279 | 253 |
| 2% | 268 | 242 |
| 5% | 253 | 228 |
| 10% | 231 | 206 |
| 12% | 223 | 199 |
Note: Includes concentrate in stockpile
Table 19.9 After-Tax NPV Sensitivity to Silver Price and Discount Rates
| | | | | | | | | | | | | | | | | | | | | | | | | | | | | |
| After Tax NPV5% | Long-Term Silver Price
($/oz Ag) |
| 10.00 | 15.00 | 18.50 | 19.00 | 21.00 | 22.00 | 24.00 | 27.00 | 30.00 |
| Discount Rate | $M | $M | $M | $M | $M | $M | $M | $M | $M |
| Undiscounted | –17 | 105 | 192 | 204 | 253 | 278 | 327 | 401 | 474 |
| 2% | –17 | 101 | 183 | 195 | 242 | 266 | 313 | 384 | 454 |
| 5% | –16 | 95 | 172 | 183 | 228 | 250 | 294 | 360 | 427 |
| 10% | –14 | 86 | 156 | 166 | 206 | 226 | 266 | 327 | 387 |
| 12% | –14 | 83 | 150 | 160 | 199 | 218 | 257 | 315 | 373 |
Note: NPV includes concentrate in stockpile
21015Puna21TRS220927Rev0.docx Page 166 of 175
Table 19.10 After-Tax NPV5% Sensitivity to Operating and Capital Cost Changes
| | | | | | | | | | | | | | | | | | | | | | | | | | | | | |
| Item | Changes to Cost (%) |
| –30% | –20% | –10% | –5% | – | +5% | +10% | +20% | +30% |
| Operating Cost | 342 | 304 | 266 | 247 | 228 | 208 | 189 | 151 | 113 |
| Capital Cost | 238 | 234 | 231 | 229 | 228 | 226 | 224 | 221 | 217 |
Note: NPV includes concentrate in stockpile
Table 19.11 Estimated Cash Flow
| | | | | | | | | | | | | | | | | | | | | | | | | | |
| Description | Total | 2022 | 2023 | 2024 | 2025 | 2026 | 2027 | 2028 |
| ($M) | ($M) | ($M) | ($M) | ($M) | ($M) | ($M) | ($M) |
| Total Gross Revenue | 999.9 | 245.2 | 244.0 | 214.4 | 198.7 | 97.7 | – | – |
| Total Realisation Costs | 214.5 | 50.1 | 50.8 | 47.7 | 43.9 | 21.9 | – | – |
| Net Revenue | 785.5 | 195.0 | 193.2 | 166.7 | 154.7 | 75.8 | – | – |
| Site Operating Costs |
| Mining | 110.3 | 35.4 | 30.6 | 24.6 | 12.8 | 7.0 | – | – |
| Processing | 183.4 | 41.6 | 40.8 | 41.3 | 42.0 | 17.9 | – | – |
| G&A | 93.5 | 22.2 | 21.0 | 20.8 | 19.8 | 9.8 | – | – |
| Total Operating Costs | 387.2 | 99.2 | 92.3 | 86.6 | 74.5 | 34.6 | – | – |
| Operating Surplus / (Deficit) | 398.3 | 95.9 | 100.9 | 80.1 | 80.2 | 41.2 | – | – |
| Capital Costs |
| Exploration & Development | 20.8 | 3.1 | 4.7 | 10.1 | – | 2.9 | – | – |
| Sustaining Capex | 47.2 | 15.6 | 13.9 | 9.8 | 4.8 | 3.1 | – | – |
| Closure & Reclamation | 30.6 | 3.8 | 7.8 | – | – | – | 14.7 | 4.4 |
| Total Capital | 98.6 | 22.4 | 26.4 | 19.9 | 4.8 | 5.9 | 14.7 | 4.4 |
| Working Capital | 20.6 | 5.1 | 10.2 | –0.2 | 3.3 | 2.2 | – | – |
| Pre-tax Cash Flow | 279.1 | 68.3 | 64.3 | 60.4 | 72.1 | 33.0 | –14.7 | –4.4 |
| Tax Payable | 26.0 | 13.0 | 8.5 | 6.0 | 1.6 | 10.1 | –12.8 | –0.2 |
| After-tax Cash Flow | 253.0 | 55.4 | 55.9 | 54.4 | 70.5 | 23.0 | –2.0 | –4.1 |
Note: Table shows $M, includes concentrate in stockpile
21015Puna21TRS220927Rev0.docx Page 167 of 175
20 ADJACENT PROPERTIES
This section is intentionally blank.
21015Puna21TRS220927Rev0.docx Page 168 of 175
21 OTHER RELEVANT DATA AND INFORMATION
This section is intentionally blank.
21015Puna21TRS220927Rev0.docx Page 169 of 175
22 INTERPRETATION AND CONCLUSIONS
Data and assumptions for macroeconomic trends, taxes, royalties, interest rates, marketing information and plans, legal matters such as statutory and regulatory interpretations affecting the mine plan, and environmental matters are outside the expertise of the QPs and are within the control of the registrant (see Section 25).
Following a review of the information supplied, the opinion of the QPs is that it is reasonable to rely on the information provided by SSR as outlined above for use in the Puna21TRS because a significant environmental and social analysis has been conducted for the project over an extended period, the project has been in operation for a number of years, SSR employs professionals and other personnel with responsibility in these areas and these personnel have the best understanding of these areas.
Mineral Resources and Mineral Reserves in the Puna21TRS are reported in accordance with subpart 1300 of US Regulation S-K Mining Property Disclosure Rules (S-K 1300).
Significant factors that could materially affect the Mineral Resources and Mineral Reserves are:
•Environmental, Permitting Social and Community – Argentina currently has no specific mine closure legislation other than the requirement to prepare and submit and regularly update an ESIA, including with respect to mine closure activity. MPSA is developing an update of the Puna closure plan that will includes both Chinchillas and Pirquitas mines to possible changes to the closure requirements and obligations. In order to operate the mine, MPSA must maintain appropriate relations with all the authorities and stakeholders. Social, community and government relations are managed by MPSA and include programmes and engagement with the local communities and both local and national governments.
•Mine planning to maximise the current Mineral Resources is an important activity that MPSA has identified and commenced. Expediting this work will optimise the project and has the potential expand on the current project opportunities.
•Metal price impacts – silver is the primary revenue component and is produced from lead and zinc concentrates. Zinc prices have been relatively high compared to the long-term forecasts. As the operation has a short life evaluation of the prices for all metals will needed to maximise the value of extracted metal.
•Geotechnical impacts – the mine designs for Chinchillas were revised in 2021, a review by geotechnical engineers of the updated designs should be prepared to confirm that the designs are suitable for the current slope recommendations.
•The location of the project means that the concentrates are required to be transport ed a significant distance to customers. Delays or other issues pose a risk to revenue and MPSA needs to maintain planning and strategies to provide for an efficient logistics function.
•Closure of the processing plant may limit the development options of the Pirquitas underground Mineral Resource.
21015Puna21TRS220927Rev0.docx Page 170 of 175
23 RECOMMENDATIONS
Key recommendations for the project are:
•Potential remains to expand the current Mineral Resources and to define new Mineral Resources on the property.
•At Chinchillas it is recommended that MPSA examine advanced grade control (using reverse circulation drilling) at a grid spacing of 20 m, to determine if it will improve prediction particularly where the grade trends are horizontal. This examination should identify the targets and cost of the programme.
•The shallow eastward dip of high grades should be carefully managed by pit mapping and advanced grade control drilling to provide appropriate levels of confidence to manage risk. A detailed review of Socavon should be undertaken to determine whether portions may be amenable to economic extraction.
•Prepare a study to re-evaluate and assess the Pirquitas Mineral Resources and determine the development horizon available prior to the completion of the Chinchillas open pit and the impact of the current operation.
•Upgrade the Pirquitas density estimation method in future modelling.
•Conduct a review by geotechnical engineers of the updated designs should be prepared to confirm that the designs are suitable for the current slope recommendations.
•Undertake a geotechnical study of the waste rock dumps.
•Further pit optimisation using a range of metal prices and cost input parameters.
•Prepare additional detailed planning and design for rock storage and the general site layout.
•Prepare a geometallurgical study and design a testwork programme.
•Continue with ongoing review of capital and operating cost estimates and performance and productivity tracking.
•Finalise the update of the Puna closure plan and associated costs for Chinchillas and Pirquitas mines including analysis of the possible changes to requirements and obligations.
Costs for this work cost included in the cash flows and as the work will be primarily undertaken by site and other SSR personnel the costs are not considered significant extra costs above the budgeted operating and capital costs.
21015Puna21TRS220927Rev0.docx Page 171 of 175
24 REFERENCES
Armstrong, R. and Spratt, J., 2016. EPMA study of Ag-bearing Minerals from the Pb-Zn-Ag Mineralization of the Chinchillas Project. Unpublished report prepared by the Natural History Museum for Golden Arrow Resources Corporation.
Board W., Kennedy B. and Yeomans T., 2011. NI 43-101 Technical Report on the Pirquitas Mine, Jujuy Province, Argentina. 23 December 2011. Prepared for Silver Standard Resources Inc.
Blasco, G. G., 2011. Actualización bianual estudio de impacto ambiental etapa de exploración: Golden Arrow environmental impact assessment actualization report for exploration stage, 2011, 51 p.
Caffe P., 2002. Estilos eruptivos del complejo dómico Pan de Azucar – Puna Norte. Revista de la Asociación Geológica Argentina, 57 (3) 232-250.
Caffe P., 2013. Petrografía de muestras de testigo y roca. Mina Chinchillas. Unpublished report prepared for Golden Arrow Resources.
Caffe P. and Coira B., 2008. Depósitos epitermales polimetálicos asociados a complejos volcánicos domicos: Casa Colorada, Pan de Azucar, Chinchillas y Cerro Redondo, en: Relatorio del XVII Congreso GeológicoArgentino, JUJUY, 2008.
Canadian Securities Administrators (CSA), 2011. National Instrument 43-101 Standards of Disclosure for Mineral Projects. Retrieved from: https://www.bcsc.bc.ca/Securities_Law/Policies/Policy4/43-101_Standards_of_Disclosure_for_Mineral_Projects NI 43-101
Caranza, H., and Carlson, G. G., 2012. Final report on the phase I drill program Chinchillas Ag-Pb-Zn Project. Golden Arrow internal report, 2012, 1360 p.
CIM, 2003. Estimation of Mineral Resources and Mineral Reserves Best Practices Guidelines Retrieved from: http://web.cim.org/
CIM Standing Committee on Reserve Definitions, 2014. CIM Definition Standards - For Mineral Resources and Mineral Reserves. Retrieved from: http://web.cim.org/
Chen, S. and Redfearn, M., 2014. 2014 Project Report on Metallurgical Testing on the Chinchillas Project. Unpublished report prepared by Bureau Veritas Commodities Canada Ltd, Inspectorate Metallurgical Division, for Golden Arrow Resources Corporation.
Coira, B., Caffe P., Ramirez A., Chayle W., Diaz A., Rosas S., Perez A., Perez B., Orozco O. and Martinez M., 2004. Hoja Geológica 2366-I/ 2166/III Mina Pirquitas, Provincia de Jujuy. Servicio Geológico Minero Argentino, Boletin 269.
Coira B., Diaz A., Chayle W., Pérez A., and Ramírez A., 1993. Chinchillas, un modelo de complejo volcánico domico portador de depósitos de metales de base con Ag y Sn, en Puna Jujeña. XII Congreso Geológico Argentino y II Congreso de Exploración de Hidrocarburos. Actas Tomo IV (270-276).
Cunningham, C., McNamee J., Pinto J. and Ericksen G., 1991. A model of volcanic dome-hosted precious metal deposits. Econ Geol 86: 415-421.
Daroca, J. A., Undated. Lapacha S.R.L. report on Aranlee work at Chinchillas Project. Prepared for Aranlee Resources.
Davis, B. and Howie, K., 2013. Mineral Resource Estimate for the Chinchillas Silver-Lead-Zinc Project, Jujuy Province, Argentina. 20 June 2013. Retrieved from http://www.sedar.com/.
21015Puna21TRS220927Rev0.docx Page 172 of 175
Davis, B., Howie, K., and Smith, B., 2014. Mineral Resource Estimate for the Chinchillas Silver-Lead- Zinc Project, Jujuy Province, Argentina. 10 October 2014. Retrieved from http://www.sedar.com/.
Davis, B., Sim, R., and Smith, B., 2015. Mineral Resource Estimate for the Chinchillas Silver-Lead-Zinc Project, Jujuy Province, Argentina. 2 November 2015. Retrieved from http://www.sedar.com/.
Davis, B., Sim, R., and McEwen, B., 2016. Mineral Resource Estimate for the Chinchillas Silver-Lead- Zinc Project, Jujuy Province, Argentina. May 27, 2016. Retrieved from http://www.sedar.com/.
Glencore, 2015. Resources and Reserves as at 31 December 2016. Retrieved from http://www.glencore.com/assets/investors/doc/reports_and_results/2016/GLEN-2016-Resources- Reserves-Report.pdf
Golden Arrow Resources Corporation, 2015a. Silver Standard Plans up to US$12.6M to Advance to Feasibility Golden Arrow’s Chinchillas Project for a Business Combination with Pirquitas Mine [News Release 1 October 2015]. Retrieved from https://goldenarrowresources.com/news/2015
Golden Arrow Resources Corporation, 2015b. Management Information Circular. 20 November 2015. Retrieved from http://www.sedar.com/
Gorustovich, S., Monaldi C. and Salfity J., 2011. Geology and metal ore deposits in the Argentina Puna. In Cenozoic Geology of the Central Andes of Argentina, 169-187, SCS Publisher.
Jacobs Engineering Group, 1999. Feasibility Study Pirquitas Silver-Tin Project, Jujuy Province, Argentina. Prepared for Sunshine Argentina Inc.
Journel, A.G. and C.J. Huijbregts, 1978. Mining Geostatistics, Academic Press London
Kuchling, K., Davis, B., Howie, K., Embree, K. and Fox, J., 2014. Preliminary Economic Assessment for the Chinchillas Silver-Lead-Zinc Project, Jujuy Province, Argentina. 20 January 2014. Retrieved from http://www.sedar.com/
Kuchling, K., Davis, B., Embree, K., Fox, J., Howie, K., and Smith, B., 2015. Preliminary Economic Assessment Update for the Chinchillas Silver-Lead-Zinc Project, Jujuy Province, Argentina. Amended Date February 13th, 2015. Retrieved from http://www.sedar.com/.
Kulemeyer, J. A., 2011. Anexo sobre el patrimonio cultural, arqueológico, paleontológico e histórico de Santo Domingo, departamento de Rinconada, de la actualización bianual del estudio de impacto ambiental - etapa de exploración. Proyecto minero Chinchillas: Golden Arrow environmental impact assessment actualization report for exploration stage annex, 2011, 72 p.
Lorenz, V. and Kurszlaukis S., 2007. Root zone processes in the phreatomagmatic emplacement model and consequences for the evolution of maar-diatreme volcanoes. Journal of Volcanology and Geothermal Research, Vol 159:4-32.
Ma, W., and Redfearn, M., 2014. Mineralogical Assessments on Five Test Products. Unpublished report prepared by Bureau Veritas Commodities Canada Ltd, Inspectorate Metallurgical Division, for Golden Arrow Resources Corporation.
Marshall, D., and Mustard, P., 2012. Chinchillas Intermediate Sulphidation Epithermal system. Unpublished report prepared by Vancouver Petrographics Ltd for Golden Arrow Resources Corporation.
21015Puna21TRS220927Rev0.docx Page 173 of 175
OreWin, 2022, Puna 2021 Project Update Report
O’Brien, M. F., 2020. Technical Memorandum No. 2 on Geological Model and Grade Estimation for the Chinchillas Silver-Lead-Zinc Mine, San Salvador de Jujuy, Argentina, for Mina Pirquitas SA.
Peacey, J., 2016. Guidance on Treatment terms for Chinchillas Pb-Ag and Zn concentrates. Unpublished report prepared by Kingston Process Metallurgy for Silver Standard Resources Inc.
Puritch, E., 2020. Pirquitas Mine – Underground Mineral Resource Estimate.
Quantec Geoscience Argentina S.A., 2008. Geophysical report on: pole-dipole array, induced polarization and resistivity survey at the Chinchilla Project, Jujuy Province, Argentina, on behalf of Silex Argentina S.A.
Ramos V., 1999. Rasgos estructurales del territorio argentino, Instituto de Geologia y recursos Minerales, Anales 29 (24), Buenos Aires.
Silex Argentina S.A., 2008. Internal report on the Chinchillas Ag-Pb-Zn deposit.
Stanley, C.J., and Armstrong, R.N., 2016. The Opaque Mineralogy of 28 samples from the Pb-Zn-Ag Mineralization of the Chinchillas Project. Unpublished report by the Natural History Museum prepared for Golden Arrow Resources Corporation.
Soler M., Caffe P., Coira B., Onoe A., and Mahlburg Kay S., 2007. Geology of the Vilama caldera: A new interpretation of a large-scale explosive event in the Central Andean plateau during the Upper Miocene, in Journal of Volcanology and Geothermal Research, Vol.164, 27pp.
21015Puna21TRS220927Rev0.docx Page 174 of 175
25 RELIANCE ON INFORMATION PROVIDED BY THE REGISTRANT
The Puna21TRS QPs have relied on the following information provided by SSR in preparing the findings and conclusions in this Technical Report Summary regarding the following aspects of modifying factors:
•Macroeconomic trends, taxes, royalties, data, and assumptions, and interest rates.
•Used in Section 19, as described in that section. The QPs have relied exclusively on SSR for this information.
•Marketing information and plans within the control of the registrant.
•Used in Sections 16 and 19, as described in those sections. The QPs have relied exclusively on SSR for this information.
•Legal matters outside the expertise of the QPs, such as statutory and regulatory interpretations affecting the mine plan. The QPs have relied exclusively on SSR for this information.
•Content in Sections 3 and 17 are based exclusively on information and data supplied by SSR.
•Environmental matters outside the expertise of the qualified person.
•Content in Sections 3 and 17 are based exclusively on information and data supplied by SSR.
•Accommodations the registrant commits or plans to provide to local individuals or groups in connection with its mine plans.
•Content in Sections 3 and 17 are based exclusively on information and data supplied by SSR.
•Governmental factors outside the expertise of the qualified person.
•Content in Sections 3 and 17 are based exclusively on information and data supplied by SSR.
Following a review of the information supplied, the opinion of the QPs is, that it is reasonable to rely on the information provided by SSR as outlined above for use in the Puna21TRS because a significant environmental and social analysis has been conducted for the project over an extended period, the project has been in operation for a number of years, SSR employs professionals and other personnel with responsibility in these areas and these personnel have the best understanding of these areas.
21015Puna21TRS220927Rev0.docx Page 175 of 175