Exhibit 99.1

PURPOSE:
| • | Aimco is issuing this update, ahead of upcoming investor meetings, to inform the investment community of our 3Q 2019 progress through the important summer leasing months of July and August. |
| • | Also, with the AFFO headwinds created by the sale of its Asset Management business in 3Q 2018 largely in the rearview mirror, Aimco is taking this opportunity to communicate its “Base Case Model” for AFFO and NAV for 2020. |
By “Base Case Model”, we mean that what follows provides reasonable calculations based on what we know now. As is its practice, Aimco will provide 2020 guidance early in the new year. That guidance may well differ from this Base Case Model because of unexpected external events such as changes in interest rates, valuations, and the general economy. That guidance will also be informed by completion of the budget process, decisions to increase Redevelopment or Development spending, any acquisitions whether accretive or with short-term dilution for long-term gain, board decisions regarding the 2020 dividend rate, and so on.
TABLE OF CONTENTS:
| |
Operating Update | 2 |
Base Case Model for 2020 AFFO | 4 |
Base Case Model for 2020 NAV | 8 |
Share Price Valuation | 9 |
Summary | 10 |
FORWARD-LOOKING STATEMENTS:
As more fully described on page 11, the information in this document contains forward-looking statements within the meaning of the federal securities laws, which statements are based on management's judgment as of this date. This information includes certain risks and uncertainties and may be affected by a variety of factors, some of which are beyond Aimco's control. Additional information regarding forward-looking statements and risks and uncertainties that may affect future results may be found on page 11 below.

2019 SAME STORE RESULTS
YTD through June 30, 2019, Aimco delivered peer-leading growth in Same Store revenue, expense, and NOI.
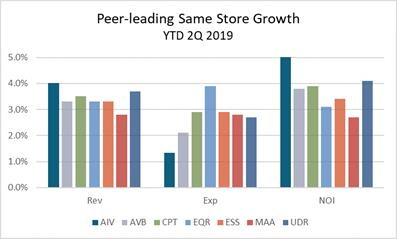
Aimco also led the peer group with the highest YTD Same Store NOI margin: 73.2%, 70 bps ahead of the next closest peer.
Through August, Aimco has: | CHANGES IN 2019 SAME STORE RENTAL RATES | 1Q | 2Q | QTD Aug | YTD Aug |
• Completed about 85% of leasing activity expected for the year; • Increased average daily occupancy (“ADO”) year-over-year by 70 bps; and • Improved blended lease rates year-over-year by 3.5% | RENEWALS | 5.2% | 5.0% | 4.7% | 4.9% |
NEW LEASES | 0.8% | 2.0% | 2.6% | 2.0% |
WT. AVG. | 2.9% | 3.6% | 3.7% | 3.5% |
AVERAGE DAILY OCCUPANCY (“ADO”) | 97.0% | 96.9% | 96.8% | 96.9% |
YOY ADO Growth | 0.9% | 0.6% | 0.5% | 0.7% |
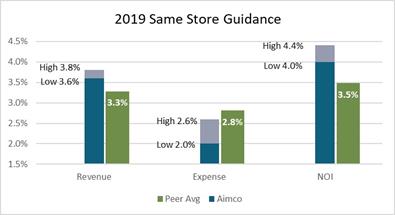
Aimco expects to meet its 2019 guidance, which is highest among peers. (1)
| |
(1) Peer guidance and peer averages are calculated based on using the midpoints of guidance ranges provided by AVB, CPT, EQR, ESS. MAA, and UDR. | |
| |
| 2 |
INNOVATION AND PRODUCTIVITY
Focus on efficient, productive operations: Aimco considers Controllable Operating Expenses ("COE"), defined as property-level expenses before taxes, insurance, and utilities, as one measure of operating efficiency.
For the five years ended 2018:
| • | Aimco Same Store COE growth was 1.1%, 100 bps below the peer average.(1) |
| • | Aimco Same Store Expense growth was 2.0%, 110 bps below the peer average.(1) |
For the ten years ended 2018:
| • | Aimco Same Store COE growth was flat. (2) |
| • | Aimco Same Store Expense growth was 1.2%, 120 bps below the peer average.(1) |
Disciplined innovation is the foundation of Aimco cost control efforts. In 2019, Aimco guidance for Same Store COE growth is 50 bps.
Innovative activities include:
| • | Redesign work: moving administrative tasks to the Shared Service Center to reduce cost and allow site teams to focus on sales and service. |
| • | Standardize processes and purchases: reducing complexity, enhancing productivity, and increasing volume discounts. |
| • | Invest consistently: focus on total lifecycle costs by installing more durable in-unit materials such as plank flooring instead of carpet, and stone countertops instead of laminate. |
| • | Leverage Technology: meet today’s customer preference for on-line self-service and convenience, while also reducing costs through such innovations as software controls, package lockers, and smart home technology. |
For example: As of September 2019, Aimco has installed smart home technology, including smart thermostats, keyless door locks, and water leak detectors in more than 29k or 85% of its apartment homes.
| |
(1) Peer group consists of AVB, CPT, EQR, ESS, MAA, and UDR. Peer average COE is calculated, per Aimco’s COE definition, as the CAGR of peer averages. SS COE Expense breakout was not publicly reported by MAA in 2014, therefore it was excluded from the 5-year COE average. (2) Due to insufficient public disclosure from peers, a ten-year comparison is not available. | |
| |
| 3 |

2020 AFFO OUTLOOK
For the five years ended 2017, Aimco AFFO grew at a compounded annual rate of 9.6%, 200 bps better than the peer average.
Aimco accepted near-term earnings dilution in 2018 when it sold its Asset Management business. 4Q 2019 will be the first quarter when the increasing profitability of apartment operations will be apparent in year-over-year comparisons of FFO and AFFO. Using the midpoint of implied fourth quarter pro forma FFO guidance, adjusted for comparable capital replacement spending, Aimco expects year-over-year AFFO growth to accelerate to ~8%.
Aimco also expects year-over year AFFO growth to continue at a higher rate in 2020 as comparisons are clear of the dilution resulting from the sale of the Asset Management business.
Aimco’s Base Case Model for 2020 AFFO is 6% to 8% growth from 2019’s expected results; an increase of $0.13 to $0.18 per share. AFFO growth will come primarily from Same Store communities, which are expected to add between $0.13 and $0.15 per share; plus contribution from lease-ups and lower interest expense; less earnings from properties sold to reduce leverage to the Aimco target amount and to fund 2020 redevelopment spending. Importantly, Aimco’s Base Case Model for 2020 does not include ~$27M ($0.18 per share) expected in future years from the stabilization of the investments made in or before 2020.
| 2019 Current Midpoint of Guidance | 2020 Base Case Model |
Pro forma FFO per share (Growth) | $2.48 | $2.59 to $2.64 (5% to 7%) |
AFFO per share (Growth) | $2.19 | $2.31 to $2.35 (6% to 8%) |
Revenue change compared to prior year | 3.70% | 3.2% to 3.6% |
Expense change compared to prior year | 2.30% | 1.8% to 2.2% |
NOI change compared to prior year | 4.20% | 3.7% to 4.1% |
SAME STORE:
In 2020, the Aimco Base Case Model forecasts Same Store results to be up 3.7% to 4.1%, adding $0.13 to $0.15 per share to 2020 AFFO. Revenue expectations incorporate the year-over-year lower growth rate in rents expected by some third-party firms, and a modest increase in Average Daily Occupancy. Operating expense growth reflects Aimco disciplined innovations in controllable costs as well as continued pressures from property tax increases.
LEASE-UP CONTRIBUTION:
In 2020, the Aimco Base Case Model forecasts positive contribution to AFFO from completing the lease up of One Ardmore, Parc Mosaic, 707 Leahy, and 1001 Brickell Bay Drive. The Aimco Base Case Model also forecasts beginning the lease up of The Fremont and 50 Rogers, both now under construction. The Aimco Base Case Model further forecasts the dilution expected from de-leasing the single 2020 redevelopment start now planned, although not yet approved. The Aimco Base Case Model does not include the estimated $27M of incremental annual income, net of incremental expenses, expected in later years from properties not yet stabilized at 2020 year-end.
BALANCE SHEET SAVINGS:
In the past year, by refinancing property debt and redeeming preferred stock to benefit from lower interest rates, Aimco has reduced its weighted-average cost of leverage by more than 50 bps, while also extending the weighted-average duration of its property debt. In 2020, the Aimco Base Case Model forecasts 2020 leverage to be lower year-over-year by ~$100M and leverage costs to be lower year-over-year by ~$10M.
OTHER CONSIDERATIONS:
As ever, the future is uncertain. While business conditions in the United States seem excellent, some economists predict a softening economy in 2020.
The Aimco Base Case Model for 2020 incorporates third-party forecasts that predict slower growth in new lease rates. Aimco notes that its 2019 summer leasing season did not reflect such a slowdown. Nevertheless, Aimco recognizes that there will be future downturns in the economy, and some will be unexpected when they arrive. When that happens, Aimco will be prepared.
Most fundamentally, Aimco capital is invested in rental apartments, an asset class that has provided stable operating results during previous downturns, including the Global Financial Crisis. Continued increases in new supply are being met with predictable consumer demand: downsizing Baby Boomers offset the decline in demand from Millennials, as that younger generation turns to single family homes. Consumer incomes are growing smartly. Customers have increased capacity to pay rent increases.
More specifically, Aimco policies anticipate unexpected recessions by disciplined focus on five key business areas:
| o | Maintains its book of business with high occupancies by residents with good credit and historic low rates of delinquency or default; |
| o | Provides high levels of customer service and measured satisfaction that result in peer-leading retention of residents and stability of cash flows from operations; and |
| o | Maintains the physical condition of its properties through consistent and systematic investment in general repairs and maintenance, capital replacements, and property upgrades. |
| • | In Redevelopment, Aimco: |
| o | Has explicit policies limiting financial exposure to costs of completion and lease-up risk. |
| ▪ | As of September 1st, Aimco had approximately $250M of further spending required to complete three major redevelopments and two properties under development … an amount less than 2% of Aimco’s Gross Asset Value and substantially less than the undrawn capacity on Aimco’s $800M line of credit. |
| ▪ | The Aimco Base Case Model for 2020 assumes the single 2020 start now planned, but not yet approved, and forecasts the cost to complete major redevelopment and development activities to be ~$135M at year-end. |
| ▪ | At present, Aimco has lease up risk on ~900 apartment homes, largely still under construction and in total less than 3% of its portfolio. The Aimco Base Case Model for 2020 expects lease up risk at 2020 year-end to be ~400 apartment homes, about 1% of its total portfolio. |
| • | In Portfolio Management, Aimco: |
| o | Owns a portfolio of communities that are intentionally diversified by geography and price point. |
| ▪ | Geographic diversification across 12 target markets, each with a different exposure to the business cycle, dampens volatility, as a slowing economy will impact each market differently. |
| ▪ | Price point diversification also dampens volatility insofar as approximately one half of Aimco capital is invested in Class A apartment communities and one half in historically more defensive Class B/C+ apartment communities whose rent growth is typically stable…even when the economy is not. |
| • | In financial matters, Aimco: |
| o | Maintains a safe balance sheet with long-dated, non-recourse, fixed-rate, property-level debt with balances amortizing over time to reduce refunding risk. Aimco leverage is structurally safer than the shorter-term recourse borrowings made by peers. Aimco has: |
| ▪ | 2020 maturities of $80M, less than 2% of Aimco’s outstanding borrowings; |
| ▪ | 2021 maturities of $490M, about 12% of Aimco’s outstanding borrowings; and |
| ▪ | 2020-21 maturities with balances at maturity averaging a loan-to-value of ~35%. |
| o | Maintains ample liquidity and access to ‘dry powder’ including an $800M undrawn line of credit and unencumbered properties worth $2.3B. |
| o | Match-funds long-term investments with long-term or permanent capital. |
| o | Expects Leverage and Leverage to EBITDA to be $3.9B and 7.0x at year-end 2019 and the Aimco Base Case Model forecasts Leverage and Leverage to EBITDA to be $3.8B and ~6.6x at year-end 2020. |
| o | Maintains investment grade ratings as confirmation of the safety of its balance sheet. |
| o | Has a high quality of earnings, with core real estate operations contributing ~98% of AFFO. |
| o | Is cohesive, deep, and stable: the two dozen senior leaders have Aimco tenure averaging 16 years and are experienced in working together, with a long record of superior results. |
| o | Embodies Aimco’s intentional culture and corporate values which are grounded in integrity, respect, collaboration, customer focus, and performance. |

Net Asset Value = The market value of a company's assets less its liabilities and obligations
| • | Net Asset Value (NAV) is used by many investors in real estate companies because the value of company assets can be readily estimated, even for non-earning assets such as land or properties under development. NAV has the advantage of incorporating the investment decisions of thousands of real estate investors. It enhances comparability among companies that have differences in their accounting. It avoids distortions that can result from application of GAAP to different investment properties and ownership structures. |
| • | While NAV is not identical to liquidation value in that some costs and some benefits are disregarded, it is often considered a floor with upside for value ascribed to the operating platform. NAV also provides an objective basis for the perceived quality and predictability of future cash flows as well as their expected growth as these are factors considered by real estate investors. As a result, NAV can be a valuable starting point for projecting future earnings. |
| • | Aimco publishes semi-annually its internal estimate of Net Asset Value. As of 1Q 2019, Aimco estimated its NAV at $56 per share, up $2 from 1Q 2018. |
| • | Given Aimco’s forecast of 4Q results and assuming unchanged market pricing, Aimco expects its NAV at YE 2019 to be ~$59 per share. |
| • | Given the Aimco Base Case Model forecasted results and assuming unchanged market pricing, Aimco NAV at YE 2020 would be ~$62 to $64 per share. |
Aimco’s primary measure of long-term financial performance is Economic Income.
Economic Income measures shareholder value creation by the per share change in NAV plus Cash Dividends paid. Total shareholder return tracks Economic Income over time.
| • | For the past 25 years, Aimco Economic Income has provided a compounded annual return of 14%, outperforming its peer group average by 30 bps. Over the same 25 years, Aimco has provided a compounded annual return of 11.4% (based on the increased share price and assumed reinvestment of dividends). For the same period, the S&P 500 provided a compounded annual return of 9.8% (calculated similarly).(1) |
| • | Assuming the NAV increases described above, 2019 dividends, and 2020 cash dividends increased to reflect forecasted AFFO, Economic Income is expected to provide ~8% return in 2019 and would provide an 8% to 11% return in 2020. |
| 2019 Estimate | 2020 Base Case Model |
NAV Growth | ~5% | ~5% to 8% |
Dividends | ~3% | ~3% |
Economic Income | ~8% | ~8% to 11% |
| |
(1) Compounded annual returns have been calculated as of August 31, 2019. | |
| |
| 8 |

Over the past few years, Aimco shares have been valued at a wider discount to NAV and at an AFFO multiple lower than the averages of its multifamily peers. This discount and lower multiple are inconsistent with the results expected for 2019 and forecasted in the Aimco Base Case Model.
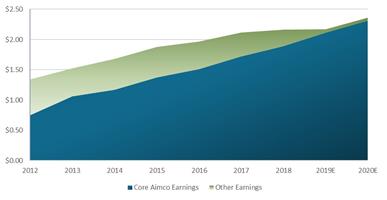
The growth rates for Aimco earnings and Economic Income are superior to peer averages. The Aimco balance sheet is structurally safer than are peers’. Aimco portfolio quality as measured by average monthly rents is comparable to peer averages, and as measured by diversification among markets and price points is superior to peer averages. The quality of earnings has been simplified and improved as shown below.
| • | In 2012, Aimco’s core real estate operations contributed 56% of AFFO. |
| • | Over the past seven years, Aimco has transformed its portfolio and significantly increased the contribution to AFFO from real estate operations, now at 98% of AFFO. |
The inconsistency between Aimco expected and forecasted results and the current share price provides an attractive investment opportunity.
| • | A peer average AFFO multiple of the midpoint of the forecast in the Aimco Base Case Model would provide a share price of ~$57, or a ~14% total return over the next 15 months on an investment made today.(1) |
| • | An increase in the Aimco share price to the NAV forecasted by the Aimco Base Case Model of $62 to $64 would provide a total return of ~23% to 27% over the next 15 months on an investment made today.(1) |
| |
(1) Total return is calculated using Aimco’s closing share price on 9/27/2019 of $51.82 and a 3% dividend yield. | |
| |
| 9 |

Aimco is on target to achieve its twice-raised Same Store and AFFO guidance given with the 2Q 2019 Earnings Release.
We expect 2020 to be another good year for Aimco with our Base Case Model forecasting AFFO growth of 6% to 8%, and Economic Income growth of ~8% to 11%. These expectations are based on growth from solid operations, contributions from profitable redevelopment and development, earn-in from recent acquisitions, lift from completed and in-process refinancings, and a cohesive team ready to tackle the hard work necessary to take good prospects from expectation to reality.

This presentation contains forward-looking statements within the meaning of the federal securities laws, including, without limitation, statements regarding projected results and specifically forecasts of 2019 and 2020 expectations, including but not limited to: AFFO and selected components thereof; Aimco redevelopment and development investments and projected value creation from such investments; Aimco refinancing activities; and Aimco liquidity and leverage metrics.
These forward-looking statements are based on management’s judgment as of this date, which is subject to risks and uncertainties. Risks and uncertainties include, but are not limited to: Aimco’s ability to maintain current or meet projected occupancy, rental rate and property operating results; the effect of acquisitions, dispositions, redevelopments and developments; Aimco’s ability to meet budgeted costs and timelines and achieve budgeted rental rates related to Aimco redevelopments and developments; and Aimco’s ability to comply with debt covenants, including financial coverage ratios. Actual results may differ materially from those described in these forward-looking statements and, in addition, will be affected by a variety of risks and factors, some of which are beyond Aimco’s control, including, without limitation:
| • | Real estate and operating risks, including fluctuations in real estate values and the general economic climate in the markets in which Aimco operates and competition for residents in such markets; national and local economic conditions, including the pace of job growth and the level of unemployment; the amount, location and quality of competitive new housing supply; the timing of acquisitions, dispositions, redevelopments and developments; and changes in operating costs, including energy costs; |
| • | Financing risks, including the availability and cost of capital markets’ financing; the risk that cash flows from operations may be insufficient to meet required payments of principal and interest; and the risk that earnings may not be sufficient to maintain compliance with debt covenants; |
| • | Insurance risks, including the cost of insurance, and natural disasters and severe weather such as hurricanes; and |
| • | Legal and regulatory risks, including costs associated with prosecuting or defending claims and any adverse outcomes; the terms of governmental regulations that affect Aimco and interpretations of those regulations; and possible environmental liabilities, including costs, fines or penalties that may be incurred due to necessary remediation of contamination of apartment communities presently or previously owned by Aimco. |
In addition, Aimco’s current and continuing qualification as a real estate investment trust involves the application of highly technical and complex provisions of the Internal Revenue Code and depends on Aimco’s ability to meet the various requirements imposed by the Internal Revenue Code, through actual operating results, distribution levels and diversity of stock ownership.
Pursuant to its existing authority to repurchase up to an additional 10.6M shares, Aimco may make repurchases from time to time in the open market or in privately negotiated transactions at the Aimco’s discretion and in accordance with the requirements of the SEC. The timing and amount of repurchases, if at all, will depend on market pricing as well as other conditions.
Readers should carefully review Aimco’s financial statements and the notes thereto, as well as the section entitled “Risk Factors” in Item 1A of Aimco’s Annual Report on Form 10-K for the year ended December 31, 2018, and the other documents Aimco files from time to time with the Securities and Exchange Commission.
These forward-looking statements reflect management’s judgment as of this date, and Aimco assumes no obligation to revise or update them to reflect future events or circumstances. This presentation does not constitute an offer of securities for sale.
This outlook is not intended as guidance. It reflects a base case scenario. For example, it does not contemplate additional acquisitions or transactions beyond our base case, changes in market capitalization rates, or other variables that could impact, either positively or negatively, Aimco’s performance in the defined periods.
Glossary & Reconciliations of Non-GAAP Financial and Operating Measures
Financial and operating measures discussed in this document include certain financial measures used by Aimco management, that are measures not defined under accounting principles generally accepted in the United States, or GAAP. Certain Aimco terms and Non-GAAP measures are defined in the Glossary and Reconciliations of Non-GAAP Financial and Operating Measures included in Aimco’s Second Quarter 2019 Earnings Release dated August 1, 2019.