UNITED STATES
SECURITIES AND EXCHANGE COMMISSION
Washington, D.C. 20549
FORM N-CSR
CERTIFIED SHAREHOLDER REPORT OF REGISTERED
MANAGEMENT INVESTMENT COMPANIES
Investment Company Act File Number: 811-07173
T. Rowe Price Spectrum Funds II, Inc.
(Exact name of registrant as specified in charter)
100 East Pratt Street, Baltimore, MD 21202
(Address of principal executive offices)
David Oestreicher
100 East Pratt Street, Baltimore, MD 21202
(Name and address of agent for service)
Registrant’s telephone number, including area code: (410) 345-2000
Date of fiscal year end: May 31
Date of reporting period: May 31, 2024
Item 1. Reports to Shareholders
(a) Report pursuant to Rule 30e-1
Annual Shareholder Report
May 31, 2024
Spectrum Moderate Growth Allocation Fund
This annual shareholder report contains important information about Spectrum Moderate Growth Allocation Fund (the "fund") for the period of June 1, 2023 to May 31, 2024. You can find the fund’s prospectus, financial information on Form N-CSR (which includes required tax information for dividends), holdings, proxy voting information, and other information atwww.troweprice.com/prospectus. You can also request this information without charge by contacting T. Rowe Price at 1-800-638-5660 or info@troweprice.com or contacting your intermediary.
What were the fund costs for the last year? (based on a hypothetical $10,000 investment)
| Costs of a $10,000 investment | Costs paid as a percentage of a $10,000 investment |
|---|
| Spectrum Moderate Growth Allocation Fund - I Class | $53 | 0.48% |
What drove fund performance during the past 12 months?
Global stock indexes were broadly positive, while fixed income markets were mixed for the 12 months ended May 31, 2024. Many central banks maintained tight monetary policy to combat inflation, and markets fluctuated amid shifting expectations for interest rate cuts as rates remained higher for longer. Nevertheless, investor sentiment was elevated by resilient corporate earnings and enthusiasm around the potential impacts from artificial intelligence.
Versus the style-specific Morningstar Moderately Aggressive Target Risk Index, security selection in the underlying large-cap value strategy contributed for the trailing one-year period. The fund’s allocation in this space outperformed its style-specific benchmark, which added value on a relative basis. Likewise, security selection within large-cap growth equities also had a positive impact.
On the negative side, security selection in international equities was a leading detractor during the period. In particular, allocations to both emerging markets equities and international developed markets equities trailed their respective benchmarks and weighed on relative performance.
The fund seeks the highest total return over time consistent with a primary emphasis on capital growth and a secondary emphasis on income. It is designed to provide investors with a core multi-asset portfolio that is globally diversified across traditional and alternative asset classes, with an emphasis on the roles of broad diversification, fundamental research, tactical allocation, and risk management.
How has the fund performed?
Cumulative Returns of a Hypothetical $500,000 Investment as of May 31, 2024

| I Class | Regulatory Benchmark | Strategy Benchmark |
|---|
| 3/23/16 | 500,000 | 500,000 | 500,000 |
| 5/31/16 | 514,743 | 514,168 | 516,555 |
| 8/31/16 | 535,311 | 534,870 | 539,228 |
| 11/30/16 | 536,039 | 533,035 | 539,941 |
| 2/28/17 | 571,864 | 575,132 | 574,426 |
| 5/31/17 | 600,531 | 604,297 | 593,561 |
| 8/31/17 | 625,476 | 626,401 | 612,126 |
| 11/30/17 | 658,797 | 664,378 | 644,275 |
| 2/28/18 | 675,157 | 683,223 | 654,680 |
| 5/31/18 | 676,522 | 675,825 | 654,354 |
| 8/31/18 | 692,128 | 697,876 | 674,532 |
| 11/30/18 | 660,331 | 657,870 | 643,603 |
| 2/28/19 | 686,456 | 677,468 | 666,646 |
| 5/31/19 | 681,867 | 667,085 | 660,799 |
| 8/31/19 | 715,240 | 695,937 | 687,061 |
| 11/30/19 | 749,866 | 747,850 | 728,642 |
| 2/29/20 | 721,492 | 703,794 | 694,431 |
| 5/31/20 | 720,637 | 703,308 | 690,304 |
| 8/31/20 | 815,153 | 810,935 | 766,604 |
| 11/30/20 | 865,833 | 860,095 | 817,670 |
| 2/28/21 | 924,342 | 916,688 | 865,080 |
| 5/31/21 | 985,188 | 997,610 | 929,779 |
| 8/31/21 | 1,025,606 | 1,043,193 | 958,185 |
| 11/30/21 | 1,001,224 | 1,025,836 | 934,576 |
| 2/28/22 | 950,565 | 988,272 | 911,613 |
| 5/31/22 | 882,134 | 929,948 | 861,051 |
| 8/31/22 | 840,690 | 877,484 | 818,003 |
| 11/30/22 | 857,557 | 906,626 | 841,934 |
| 2/28/23 | 853,565 | 906,626 | 845,961 |
| 5/31/23 | 877,752 | 937,858 | 850,234 |
| 8/31/23 | 921,445 | 999,894 | 893,138 |
| 11/30/23 | 932,628 | 1,015,537 | 901,501 |
| 2/29/24 | 1,016,071 | 1,116,497 | 973,750 |
| 5/31/24 | 1,053,212 | 1,158,784 | 995,994 |
202405-3565004, 202407-3567338
Average Annual Total Returns
| 1 Year | 5 Years | Since Inception 3/23/2016 |
|---|
| Spectrum Moderate Growth Allocation Fund (I Class) | 19.99% | 9.08% | 9.52% |
| MSCI All Country World Index Net (Regulatory Benchmark) | 23.56 | 11.68 | 10.81 |
| Morningstar Moderately Aggressive Target Risk Index (Strategy Benchmark) | 17.14 | 8.55 | 8.78 |
The preceding line graph shows the value of a hypothetical $500,000 investment in the fund over the past 10 fiscal year periods or since inception (for funds lacking 10-year records). The fund’s performance information included in the line graph and table above is compared with a regulatory required index that represents an overall securities market (Regulatory Benchmark). In addition, the line graph and table may also include one or more indexes that more closely aligns to the fund's investment strategy (Strategy Benchmark(s)). Due to new SEC Rules on shareholder reporting the fund adopted a new broad-based securities market index, referred to as the Regulatory Benchmark. Market index returns do not include expenses, which are deducted from fund returns. The fund's total return figures reflect the reinvestment of dividends and capital gains, if any. Neither the fund’s returns nor the index returns reflect the deduction of taxes that a shareholder would pay on fund distributions or redemptions of fund shares. The fund’s past performance is not a good predictor of the fund’s future performance. Updated performance information can be found at www.troweprice.com.
What are some fund statistics?
| Total Net Assets (000s) | $3,339,399 |
| Number of Portfolio Holdings | 1,787 |
| Investment Advisory Fees Paid (000s) | $14,095 |
| Portfolio Turnover Rate | 42.9% |
What did the fund invest in?
Security Allocation (as a % of Net Assets)
| Common Stocks | 69.9% |
| Equity Mutual Funds | 12.7 |
| Bond Mutual Funds | 7.4 |
| U.S. Government Agency Obligations (Excluding Mortgage-Backed) | 2.2 |
| Private Investment Companies | 2.0 |
| U.S. Government & Agency Mortgage-Backed Securities | 2.0 |
| Corporate Bonds | 1.8 |
| Asset-Backed Securities | 0.5 |
| Short-Term and Other | 1.5 |
Top Ten Holdings (as a % of Net Assets)
| T. Rowe Price Real Assets Fund - I Class | 5.4% |
| T. Rowe Price Institutional Emerging Markets Equity Fund | 5.3 |
| Microsoft | 3.3 |
| NVIDIA | 2.8 |
| T. Rowe Price Multi-Strategy Total Return Fund - I Class | 2.1 |
| T. Rowe Price International Bond Fund (USD Hedged) - I Class | 2.0 |
| T. Rowe Price U.S. Treasury Long-Term Index Fund - I Class | 2.0 |
| Apple | 2.0 |
| Blackstone Partners Offshore Fund | 2.0 |
| Amazon.com | 1.9 |
If you invest directly with T. Rowe Price, you can elect to receive future shareholder reports or other important documents through electronic delivery by enrolling at www.troweprice.com/paperless. If you invest through a financial intermediary such as an investment advisor, a bank, retirement plan sponsor or a brokerage firm, please contact that organization and ask if it can provide electronic delivery.
MSCI and Morningstar do not accept any liability for any errors or omissions in the indexes or data, and hereby expressly disclaim all warranties of originality, accuracy, completeness, timeliness, merchantability and fitness for a particular purpose. No party may rely on any indexes or data contained in this communication. Visit www.troweprice.com/en/us/market-data-disclosures for additional legal notices & disclaimers.
Spectrum Moderate Growth Allocation Fund
I Class (TGIPX)
T. Rowe Price Investment Services, Inc.
100 East Pratt Street
Baltimore, MD 21202
Annual Shareholder Report
May 31, 2024
Spectrum Moderate Growth Allocation Fund
This annual shareholder report contains important information about Spectrum Moderate Growth Allocation Fund (the "fund") for the period of June 1, 2023 to May 31, 2024. You can find the fund’s prospectus, financial information on Form N-CSR (which includes required tax information for dividends), holdings, proxy voting information, and other information atwww.troweprice.com/prospectus. You can also request this information without charge by contacting T. Rowe Price at 1-800-638-5660 or info@troweprice.com or contacting your intermediary.
What were the fund costs for the last year? (based on a hypothetical $10,000 investment)
| Costs of a $10,000 investment | Costs paid as a percentage of a $10,000 investment |
|---|
| Spectrum Moderate Growth Allocation Fund - Investor Class | $68 | 0.62% |
What drove fund performance during the past 12 months?
Global stock indexes were broadly positive, while fixed income markets were mixed for the 12 months ended May 31, 2024. Many central banks maintained tight monetary policy to combat inflation, and markets fluctuated amid shifting expectations for interest rate cuts as rates remained higher for longer. Nevertheless, investor sentiment was elevated by resilient corporate earnings and enthusiasm around the potential impacts from artificial intelligence.
Versus the style-specific Morningstar Moderately Aggressive Target Risk Index, security selection in the underlying large-cap value strategy contributed for the trailing one-year period. The fund’s allocation in this space outperformed its style-specific benchmark, which added value on a relative basis. Likewise, security selection within large-cap growth equities also had a positive impact.
On the negative side, security selection in international equities was a leading detractor during the period. In particular, allocations to both emerging markets equities and international developed markets equities trailed their respective benchmarks and weighed on relative performance.
The fund seeks the highest total return over time consistent with a primary emphasis on capital growth and a secondary emphasis on income. It is designed to provide investors with a core multi-asset portfolio that is globally diversified across traditional and alternative asset classes, with an emphasis on the roles of broad diversification, fundamental research, tactical allocation, and risk management.
How has the fund performed?
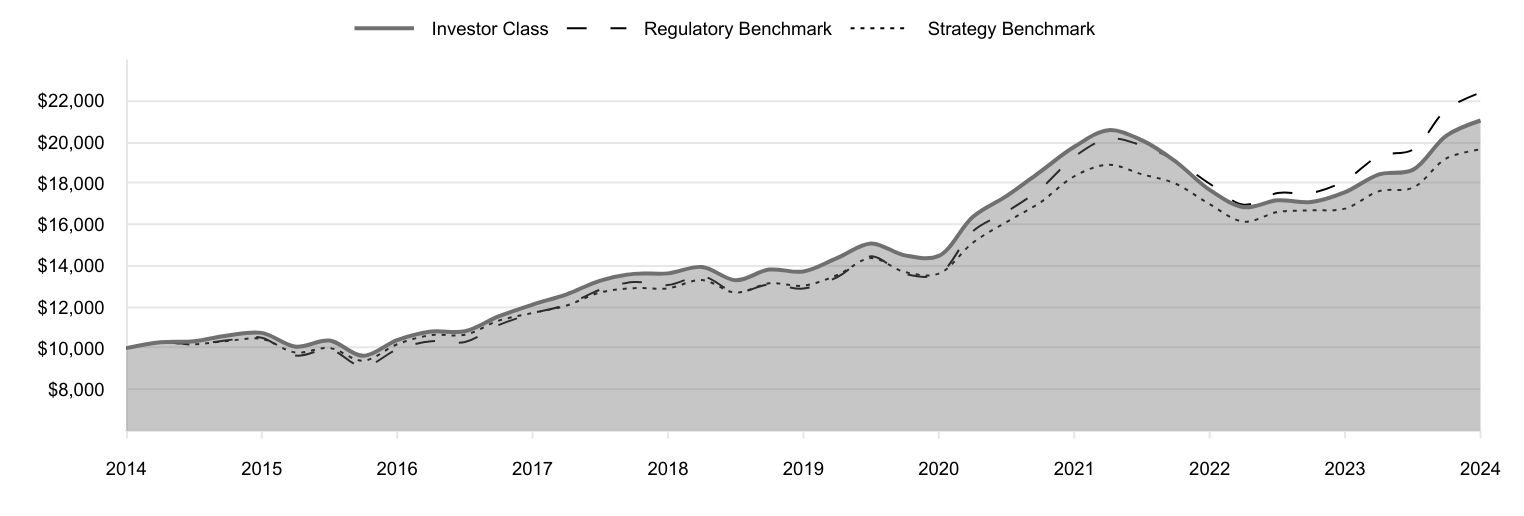
Cumulative Returns of a Hypothetical $10,000 Investment as of May 31, 2024
| Investor Class | Regulatory Benchmark | Strategy Benchmark |
|---|
| 2014 | 10,000 | 10,000 | 10,000 |
| 2014 | 10,285 | 10,287 | 10,268 |
| 2014 | 10,335 | 10,191 | 10,186 |
| 2015 | 10,614 | 10,386 | 10,353 |
| 2015 | 10,741 | 10,508 | 10,450 |
| 2015 | 10,074 | 9,640 | 9,787 |
| 2015 | 10,369 | 9,937 | 10,011 |
| 2016 | 9,628 | 9,107 | 9,392 |
| 2016 | 10,393 | 9,938 | 10,188 |
| 2016 | 10,808 | 10,339 | 10,635 |
| 2016 | 10,819 | 10,303 | 10,649 |
| 2017 | 11,539 | 11,117 | 11,330 |
| 2017 | 12,114 | 11,681 | 11,707 |
| 2017 | 12,614 | 12,108 | 12,073 |
| 2017 | 13,279 | 12,842 | 12,707 |
| 2018 | 13,605 | 13,206 | 12,912 |
| 2018 | 13,628 | 13,063 | 12,906 |
| 2018 | 13,939 | 13,489 | 13,304 |
| 2018 | 13,294 | 12,716 | 12,694 |
| 2019 | 13,812 | 13,095 | 13,148 |
| 2019 | 13,719 | 12,894 | 13,033 |
| 2019 | 14,384 | 13,452 | 13,551 |
| 2019 | 15,077 | 14,455 | 14,371 |
| 2020 | 14,502 | 13,604 | 13,696 |
| 2020 | 14,480 | 13,594 | 13,615 |
| 2020 | 16,371 | 15,675 | 15,120 |
| 2020 | 17,384 | 16,625 | 16,127 |
| 2021 | 18,553 | 17,719 | 17,062 |
| 2021 | 19,769 | 19,283 | 18,338 |
| 2021 | 20,574 | 20,164 | 18,899 |
| 2021 | 20,079 | 19,829 | 18,433 |
| 2022 | 19,056 | 19,102 | 17,980 |
| 2022 | 17,676 | 17,975 | 16,983 |
| 2022 | 16,838 | 16,961 | 16,134 |
| 2022 | 17,173 | 17,524 | 16,606 |
| 2023 | 17,087 | 17,524 | 16,685 |
| 2023 | 17,566 | 18,128 | 16,769 |
| 2023 | 18,431 | 19,327 | 17,616 |
| 2023 | 18,650 | 19,629 | 17,781 |
| 2024 | 20,312 | 21,581 | 19,206 |
| 2024 | 21,044 | 22,398 | 19,644 |
202405-3565004, 202407-3567338
Average Annual Total Returns
| 1 Year | 5 Years | 10 Years |
|---|
| Spectrum Moderate Growth Allocation Fund (Investor Class) | 19.80% | 8.93% | 7.72% |
| MSCI All Country World Index Net (Regulatory Benchmark) | 23.56 | 11.68 | 8.40 |
| Morningstar Moderately Aggressive Target Risk Index (Strategy Benchmark) | 17.14 | 8.55 | 6.99 |
The preceding line graph shows the value of a hypothetical $10,000 investment in the fund over the past 10 fiscal year periods or since inception (for funds lacking 10-year records). The fund’s performance information included in the line graph and table above is compared with a regulatory required index that represents an overall securities market (Regulatory Benchmark). In addition, the line graph and table may also include one or more indexes that more closely aligns to the fund's investment strategy (Strategy Benchmark(s)). Due to new SEC Rules on shareholder reporting the fund adopted a new broad-based securities market index, referred to as the Regulatory Benchmark. Market index returns do not include expenses, which are deducted from fund returns. The fund's total return figures reflect the reinvestment of dividends and capital gains, if any. Neither the fund’s returns nor the index returns reflect the deduction of taxes that a shareholder would pay on fund distributions or redemptions of fund shares. The fund’s past performance is not a good predictor of the fund’s future performance. Updated performance information can be found at www.troweprice.com.
What are some fund statistics?
| Total Net Assets (000s) | $3,339,399 |
| Number of Portfolio Holdings | 1,787 |
| Investment Advisory Fees Paid (000s) | $14,095 |
| Portfolio Turnover Rate | 42.9% |
What did the fund invest in?
Security Allocation (as a % of Net Assets)
| Common Stocks | 69.9% |
| Equity Mutual Funds | 12.7 |
| Bond Mutual Funds | 7.4 |
| U.S. Government Agency Obligations (Excluding Mortgage-Backed) | 2.2 |
| Private Investment Companies | 2.0 |
| U.S. Government & Agency Mortgage-Backed Securities | 2.0 |
| Corporate Bonds | 1.8 |
| Asset-Backed Securities | 0.5 |
| Short-Term and Other | 1.5 |
Top Ten Holdings (as a % of Net Assets)
| T. Rowe Price Real Assets Fund - I Class | 5.4% |
| T. Rowe Price Institutional Emerging Markets Equity Fund | 5.3 |
| Microsoft | 3.3 |
| NVIDIA | 2.8 |
| T. Rowe Price Multi-Strategy Total Return Fund - I Class | 2.1 |
| T. Rowe Price International Bond Fund (USD Hedged) - I Class | 2.0 |
| T. Rowe Price U.S. Treasury Long-Term Index Fund - I Class | 2.0 |
| Apple | 2.0 |
| Blackstone Partners Offshore Fund | 2.0 |
| Amazon.com | 1.9 |
If you invest directly with T. Rowe Price, you can elect to receive future shareholder reports or other important documents through electronic delivery by enrolling at www.troweprice.com/paperless. If you invest through a financial intermediary such as an investment advisor, a bank, retirement plan sponsor or a brokerage firm, please contact that organization and ask if it can provide electronic delivery.
MSCI and Morningstar do not accept any liability for any errors or omissions in the indexes or data, and hereby expressly disclaim all warranties of originality, accuracy, completeness, timeliness, merchantability and fitness for a particular purpose. No party may rely on any indexes or data contained in this communication. Visit www.troweprice.com/en/us/market-data-disclosures for additional legal notices & disclaimers.
Spectrum Moderate Growth Allocation Fund
Investor Class (TRSGX)
T. Rowe Price Investment Services, Inc.
100 East Pratt Street
Baltimore, MD 21202
Item 1. (b) Notice pursuant to Rule 30e-3.
Not applicable.
Item 2. Code of Ethics.
The registrant has adopted a code of ethics, as defined in Item 2 of Form N-CSR, applicable to its principal executive officer, principal financial officer, principal accounting officer or controller, or persons performing similar functions. A copy of this code of ethics is filed as an exhibit to this Form N-CSR. No substantive amendments were approved or waivers were granted to this code of ethics during the period covered by this report.
Item 3. Audit Committee Financial Expert.
The registrant’s Board of Directors has determined that Mr. Paul F. McBride qualifies as an audit committee financial expert, as defined in Item 3 of Form N-CSR. Mr. McBride is considered independent for purposes of Item 3 of Form N-CSR.
Item 4. Principal Accountant Fees and Services.
(a) – (d) Aggregate fees billed for the last two fiscal years for professional services rendered to, or on behalf of, the registrant by the registrant’s principal accountant were as follows:
| | | | | | | | | | | | | | |
| | | 2024 | | | | | | 2023 | | | |
Audit Fees | | $ | 46,029 | | | | | | | $ | 45,097 | |
Audit-Related Fees | | | - | | | | | | | | - | |
Tax Fees | | | - | | | | | | | | 5,727 | |
All Other Fees | | | - | | | | | | | | - | |
Audit fees include amounts related to the audit of the registrant’s annual financial statements and services normally provided by the accountant in connection with statutory and regulatory filings. Audit-related fees include amounts reasonably related to the performance of the audit of the registrant’s financial statements and specifically include the issuance of a report on internal controls and, if applicable, agreed-upon procedures related to fund acquisitions. Tax fees include amounts related to services for tax compliance, tax planning, and tax advice. The nature of these services specifically includes the review of distribution calculations and the preparation of Federal, state, and excise tax returns. All other fees include the registrant’s pro-rata share of amounts for agreed-upon procedures in conjunction with service contract approvals by the registrant’s Board of Directors/Trustees.
(e)(1) The registrant’s audit committee has adopted a policy whereby audit and non-audit services performed by the registrant’s principal accountant for the registrant, its investment adviser, and any entity controlling, controlled by, or under common control with the investment adviser that provides ongoing services to the registrant require pre-approval in advance at regularly scheduled audit committee meetings. If such a service is required between regularly scheduled audit committee meetings, pre-approval may be authorized by one audit committee member with ratification at the next scheduled audit committee meeting. Waiver of pre-approval for audit or non-audit services requiring fees of a de minimis amount is not permitted.
(2) No services included in (b) – (d) above were approved pursuant to paragraph (c)(7)(i)(C) of Rule 2-01 of Regulation S-X.
(f) Less than 50 percent of the hours expended on the principal accountant’s engagement to audit the registrant’s financial statements for the most recent fiscal year were attributed to work performed by persons other than the principal accountant’s full-time, permanent employees.
(g) The aggregate fees billed for the most recent fiscal year and the preceding fiscal year by the registrant’s principal accountant for non-audit services rendered to the registrant, its investment adviser, and any entity controlling, controlled by, or under common control with the investment adviser that provides ongoing services to the registrant were $1,230,000 and $1,521,000, respectively.
(h) All non-audit services rendered in (g) above were pre-approved by the registrant’s audit committee. Accordingly, these services were considered by the registrant’s audit committee in maintaining the principal accountant’s independence.
(i) Not applicable.
(j) Not applicable.
Item 5. Audit Committee of Listed Registrants.
Not applicable.
Item 6. Investments.
(a) Not applicable. The complete schedule of investments is included in Item 7 of this Form N-CSR.
(b) Not applicable.
Item 7. Financial Statements and Financial Highlights for Open-End Management Investment Companies.
(a – b) Report pursuant to Regulation S-X.
Financial
Highlights
Portfolio
of
Investments
Financial
Statements
and
Notes
Additional
Fund
Information
Financial
Statements
and
Other
Information
For
more
insights
from
T.
Rowe
Price
investment
professionals,
go
to
troweprice.com
.
T.
ROWE
PRICE
TRSGX
Spectrum
Moderate
Growth
Allocation
Fund
–
.
TGIPX
Spectrum
Moderate
Growth
Allocation
Fund–
.
I Class
T.
ROWE
PRICE
Spectrum
Moderate
Growth
Allocation
Fund
Go
Paperless
Going
paperless
offers
a
host
of
benefits,
which
include:
Timely
delivery
of
important
documents
Convenient
access
to
your
documents
anytime,
anywhere
Strong
security
protocols
to
safeguard
sensitive
data
Waive
your
account
service
fee
by
going
paperless.*
To
Enroll:
˃
If
you
invest
directly
with
T.
Rowe
Price,
go
to
troweprice.com/paperless
.
If
you
invest
through
a
financial
intermediary
such
as
an
investment
advisor,
a
bank,
or
a
brokerage
firm,
please
contact
that
organization
and
ask
if
it
can
provide
electronic
documentation.
Log
in
to
your
account
at
troweprice.com
for
more
information.
*
An
account
service
fee
will
be
charged
annually
for
each
T.
Rowe
Price
mutual
fund
account
unless
you
meet
criteria
for
a
fee
waiver.
Go
to
troweprice.com/personal-investing/
help/fees-and-minimums.html
to
learn
more
about
this
account
service
fee,
including
other
ways
to
waive
it.
T.
ROWE
PRICE
Spectrum
Moderate
Growth
Allocation
Fund
For
a
share
outstanding
throughout
each
period
Investor
Class
..
Year
..
..
Ended
.
5/31/24
5/31/23
5/31/22
5/31/21
5/31/20
NET
ASSET
VALUE
Beginning
of
period
$
33
.70
$
36
.50
$
44
.67
$
33
.61
$
32
.63
Investment
activities
Net
investment
income
(1)(2)
0
.59
0
.48
0
.36
0
.32
0
.40
Net
realized
and
unrealized
gain/loss
6
.03
(
0
.86
)
(
4
.55
)
11
.80
1
.45
Total
from
investment
activities
6
.62
(
0
.38
)
(
4
.19
)
12
.12
1
.85
Distributions
Net
investment
income
(
0
.68
)
(
0
.44
)
(
0
.30
)
(
0
.34
)
(
0
.48
)
Net
realized
gain
—
(
1
.98
)
(
3
.68
)
(
0
.72
)
(
0
.39
)
Total
distributions
(
0
.68
)
(
2
.42
)
(
3
.98
)
(
1
.06
)
(
0
.87
)
NET
ASSET
VALUE
End
of
period
$
39
.64
$
33
.70
$
36
.50
$
44
.67
$
33
.61
T.
ROWE
PRICE
Spectrum
Moderate
Growth
Allocation
Fund
For
a
share
outstanding
throughout
each
period
The
accompanying
notes
are
an
integral
part
of
these
financial
statements.
Investor
Class
..
Year
..
..
Ended
.
5/31/24
5/31/23
5/31/22
5/31/21
5/31/20
Ratios/Supplemental
Data
Total
return
(2)(3)
19
.80
%
(
0
.62
)
%
(
10
.59
)
%
36
.53
%
(4)
5
.54
%
Ratios
to
average
net
assets:
(2)
Gross
expenses
before
waivers/payments
by
Price
Associates
0
.76
%
0
.76
%
0
.74
%
0
.73
%
0
.74
%
Net
expenses
after
waivers/
payments
by
Price
Associates
0
.62
%
0
.62
%
0
.61
%
0
.62
%
0
.63
%
Net
investment
income
1
.61
%
1
.42
%
0
.84
%
0
.81
%
1
.17
%
Portfolio
turnover
rate
42
.9
%
62
.2
%
73
.5
%
55
.0
%
74
.0
%
Net
assets,
end
of
period
(in
millions)
$1,394
$1,358
$1,677
$3,245
$2,463
0
%
0
%
0
%
0
%
0
%
(1)
Per
share
amounts
calculated
using
average
shares
outstanding
method.
(2)
Includes
the
impact
of
expense-related
arrangements
with
Price
Associates.
(3)
Total
return
reflects
the
rate
that
an
investor
would
have
earned
on
an
investment
in
the
fund
during
each
period,
assuming
reinvestment
of
all
distributions,
and
payment
of
no
redemption
or
account
fees,
if
applicable.
(4)
Total
return
calculated
through
the
fund’s
last
business
day
of
the
fiscal
year,
5/28/21.
Total
return
calculated
as
of
the
close
of
the
reporting
period
is
36.44%.
T.
ROWE
PRICE
Spectrum
Moderate
Growth
Allocation
Fund
For
a
share
outstanding
throughout
each
period
I
Class
..
Year
..
..
Ended
.
5/31/24
5/31/23
5/31/22
5/31/21
5/31/20
NET
ASSET
VALUE
Beginning
of
period
$
33
.75
$
36
.61
$
44
.82
$
33
.70
$
32
.69
Investment
activities
Net
investment
income
(1)(2)
0
.64
0
.54
0
.49
0
.37
0
.44
Net
realized
and
unrealized
gain/loss
6
.04
(
0
.88
)
(
4
.63
)
11
.84
1
.46
Total
from
investment
activities
6
.68
(
0
.34
)
(
4
.14
)
12
.21
1
.90
Distributions
Net
investment
income
(
0
.73
)
(
0
.54
)
(
0
.39
)
(
0
.37
)
(
0
.50
)
Net
realized
gain
—
(
1
.98
)
(
3
.68
)
(
0
.72
)
(
0
.39
)
Total
distributions
(
0
.73
)
(
2
.52
)
(
4
.07
)
(
1
.09
)
(
0
.89
)
NET
ASSET
VALUE
End
of
period
$
39
.70
$
33
.75
$
36
.61
$
44
.82
$
33
.70
T.
ROWE
PRICE
Spectrum
Moderate
Growth
Allocation
Fund
For
a
share
outstanding
throughout
each
period
The
accompanying
notes
are
an
integral
part
of
these
financial
statements.
I
Class
..
Year
..
..
Ended
.
5/31/24
5/31/23
5/31/22
5/31/21
5/31/20
Ratios/Supplemental
Data
Total
return
(2)(3)
19
.99
%
(
0
.50
)
%
(
10
.46
)
%
36
.71
%
(4)
5
.69
%
Ratios
to
average
net
assets:
(2)
Gross
expenses
before
waivers/payments
by
Price
Associates
0
.62
%
0
.62
%
0
.61
%
0
.61
%
0
.62
%
Net
expenses
after
waivers/
payments
by
Price
Associates
0
.48
%
0
.47
%
0
.48
%
0
.50
%
0
.51
%
Net
investment
income
1
.77
%
1
.59
%
1
.17
%
0
.94
%
1
.29
%
Portfolio
turnover
rate
42
.9
%
62
.2
%
73
.5
%
55
.0
%
74
.0
%
Net
assets,
end
of
period
(in
thousands)
$1,945,571
$1,655,328
$1,700,728
$564,680
$407,025
0
%
0
%
0
%
0
%
0
%
(1)
Per
share
amounts
calculated
using
average
shares
outstanding
method.
(2)
Includes
the
impact
of
expense-related
arrangements
with
Price
Associates.
(3)
Total
return
reflects
the
rate
that
an
investor
would
have
earned
on
an
investment
in
the
fund
during
each
period,
assuming
reinvestment
of
all
distributions,
and
payment
of
no
redemption
or
account
fees,
if
applicable.
(4)
Total
return
calculated
through
the
fund’s
last
business
day
of
the
fiscal
year,
5/28/21.
Total
return
calculated
as
of
the
close
of
the
reporting
period
is
36.62%.
T.
ROWE
PRICE
Spectrum
Moderate
Growth
Allocation
Fund
May
31,
2024
Shares/Par
$
Value
(Cost
and
value
in
$000s)
‡
ASSET-BACKED
SECURITIES
0.5%
AmeriCredit
Automobile
Receivables
Trust
Series 2020-3,
Class
D
1.49%,
9/18/26
225,000
218
AmeriCredit
Automobile
Receivables
Trust
Series 2021-1,
Class
D
1.21%,
12/18/26
122,000
116
AmeriCredit
Automobile
Receivables
Trust
Series 2023-1,
Class
C
5.80%,
12/18/28
215,000
217
Amur
Equipment
Finance
Receivables
X
Series 2022-1A,
Class
D
2.91%,
8/21/28 (1)
135,000
129
Amur
Equipment
Finance
Receivables
XIII
Series 2024-1A,
Class
A2
5.38%,
1/21/31 (1)
210,000
209
Applebee's
Funding
Series 2023-1A,
Class
A2
7.824%,
3/5/53 (1)
110,000
114
Bayview
Opportunity
Master
Fund
VII
Series 2024-CAR1,
Class
A,
FRN
SOFR30A
+
1.10%,
6.424%,
12/26/31 (1)
232,822
233
Bayview
Opportunity
Master
Fund
VII
Series 2024-CAR1,
Class
C,
FRN
SOFR30A
+
1.50%,
6.824%,
12/26/31 (1)
232,822
233
CarMax
Auto
Owner
Trust
Series 2022-1,
Class
D
2.47%,
7/17/28
140,000
131
CarMax
Auto
Owner
Trust
Series 2024-1,
Class
B
5.17%,
8/15/29
40,000
40
Carvana
Auto
Receivables
Trust
Series 2022-P1,
Class
C
3.30%,
4/10/28
200,000
186
Carvana
Auto
Receivables
Trust
Series 2024-N1,
Class
A3
5.60%,
3/10/28 (1)
95,000
95
Carvana
Auto
Receivables
Trust
Series 2024-N1,
Class
B
5.63%,
5/10/30 (1)
120,000
120
CIFC
Funding
Series 2020-1A,
Class
A1R,
CLO,
FRN
3M
TSFR
+
1.412%,
6.74%,
7/15/36 (1)
280,000
280
Crown
Point
Series 2018-7A,
Class
AR,
CLO,
FRN
3M
TSFR
+
1.23%,
6.556%,
10/20/31 (1)
300,000
300
T.
ROWE
PRICE
Spectrum
Moderate
Growth
Allocation
Fund
Shares/Par
$
Value
(Cost
and
value
in
$000s)
‡
CyrusOne
Data
Centers
Issuer
I
Series 2024-1A,
Class
A2
4.76%,
3/22/49 (1)
85,000
80
CyrusOne
Data
Centers
Issuer
I
Series 2024-2A,
Class
A2
4.50%,
5/20/49 (1)
595,000
548
CyrusOne
Data
Centers
Issuer
I
Series 2024-3A,
Class
A2
4.65%,
5/20/49 (1)
230,000
207
Dell
Equipment
Finance
Trust
Series 2023-3,
Class
C
6.17%,
4/23/29 (1)
100,000
101
Dell
Equipment
Finance
Trust
Series 2024-1,
Class
A3
5.39%,
3/22/30 (1)
100,000
100
Dell
Equipment
Finance
Trust
Series 2024-1,
Class
C
5.73%,
3/22/30 (1)
100,000
100
DLLST
Series 2024-1A,
Class
A3
5.05%,
8/20/27 (1)
100,000
99
DLLST
Series 2024-1A,
Class
A4
4.93%,
4/22/30 (1)
25,000
25
Driven
Brands
Funding
Series 2019-1A,
Class
A2
4.641%,
4/20/49 (1)
85,275
83
Driven
Brands
Funding
Series 2020-1A,
Class
A2
3.786%,
7/20/50 (1)
125,125
116
Driven
Brands
Funding
Series 2020-2A,
Class
A2
3.237%,
1/20/51 (1)
208,013
188
Dryden
Series 2020-86A,
Class
A1R,
CLO,
FRN
3M
TSFR
+
1.362%,
6.679%,
7/17/34 (1)
265,000
265
Elara
HGV
Timeshare
Issuer
Series 2023-A,
Class
B
6.53%,
2/25/38 (1)
79,773
80
Elmwood
Series 2022-7A,
Class
AR,
CLO,
FRN
3M
TSFR
+
1.50%,
6.823%,
1/17/37 (1)
250,000
250
Enterprise
Fleet
Financing
Series 2024-1,
Class
A2
5.23%,
3/20/30 (1)
195,000
194
T.
ROWE
PRICE
Spectrum
Moderate
Growth
Allocation
Fund
Shares/Par
$
Value
(Cost
and
value
in
$000s)
‡
Enterprise
Fleet
Financing
Series 2024-1,
Class
A3
5.16%,
9/20/30 (1)
145,000
144
Exeter
Automobile
Receivables
Trust
Series 2022-1A,
Class
D
3.02%,
6/15/28
390,000
374
Exeter
Automobile
Receivables
Trust
Series 2022-3A,
Class
C
5.30%,
9/15/27
275,000
274
Exeter
Automobile
Receivables
Trust
Series 2023-1A,
Class
D
6.69%,
6/15/29
45,000
45
FirstKey
Homes
Trust
Series 2020-SFR2,
Class
C
1.667%,
10/19/37 (1)
180,000
169
Ford
Credit
Auto
Lease
Trust
Series 2023-A,
Class
C
5.54%,
12/15/26
500,000
498
Ford
Credit
Auto
Lease
Trust
Series 2024-A,
Class
A4
5.05%,
6/15/27
65,000
65
Ford
Credit
Auto
Owner
Trust
Series 2022-C,
Class
C
5.22%,
3/15/30
110,000
109
Ford
Credit
Auto
Owner
Trust
Series 2023-1,
Class
A
4.85%,
8/15/35 (1)
465,000
458
Golub
Capital
Partners
Series 2022-60A,
Class
AR,
CLO,
FRN
3M
TSFR
+
1.31%,
10/25/34 (1)(2)
250,000
250
Hardee's
Funding
Series 2021-1A,
Class
A2
2.865%,
6/20/51 (1)
131,288
111
Hardee's
Funding
Series 2024-1A,
Class
A2
7.253%,
3/20/54 (1)
330,000
329
HPEFS
Equipment
Trust
Series 2022-1A,
Class
C
1.96%,
5/21/29 (1)
160,000
157
HPEFS
Equipment
Trust
Series 2022-1A,
Class
D
2.40%,
11/20/29 (1)
175,000
169
HPEFS
Equipment
Trust
Series 2022-3A,
Class
C
6.13%,
8/20/29 (1)
325,000
326
T.
ROWE
PRICE
Spectrum
Moderate
Growth
Allocation
Fund
Shares/Par
$
Value
(Cost
and
value
in
$000s)
‡
HPEFS
Equipment
Trust
Series 2023-2A,
Class
B
6.25%,
1/21/31 (1)
100,000
101
HPEFS
Equipment
Trust
Series 2023-2A,
Class
C
6.48%,
1/21/31 (1)
100,000
101
HPEFS
Equipment
Trust
Series 2023-2A,
Class
D
6.97%,
7/21/31 (1)
100,000
102
Hyundai
Auto
Lease
Securitization
Trust
Series 2024-A,
Class
A4
5.07%,
2/15/28 (1)
100,000
99
Invesco
U.S.
Series 2023-1A,
Class
AR,
CLO,
FRN
3M
TSFR
+
1.57%,
6.856%,
4/22/37 (1)
270,000
272
Jamestown
XV
Series 2020-15A,
Class
A1R,
CLO,
FRN
3M
TSFR
+
1.37%,
7/15/35 (1)(2)
250,000
250
Kubota
Credit
Owner
Trust
Series 2023-1A,
Class
A4
5.07%,
2/15/29 (1)
50,000
50
Madison
Park
Funding
XXXIII
Series 2019-33A,
Class
AR,
CLO,
FRN
3M
TSFR
+
1.29%,
6.619%,
10/15/32 (1)
250,000
250
MidOcean
Credit
XI
Series 2022-11A,
Class
A1R,
CLO,
FRN
3M
TSFR
+
1.73%,
7.057%,
10/18/33 (1)
250,000
251
MMAF
Equipment
Finance
Series 2021-A,
Class
A5
1.19%,
11/13/43 (1)
100,000
92
MMAF
Equipment
Finance
Series 2024-A,
Class
A3
4.95%,
7/14/31 (1)
335,000
331
MVW
Series 2023-1A,
Class
A
4.93%,
10/20/40 (1)
302,512
298
MVW
Series 2023-2A,
Class
B
6.33%,
11/20/40 (1)
87,901
89
Navistar
Financial
Dealer
Note
Master
Owner
Trust
Series 2024-1,
Class
A
5.59%,
4/25/29 (1)
155,000
155
Nissan
Auto
Lease
Trust
Series 2024-A,
Class
A4
4.97%,
9/15/28
85,000
84
T.
ROWE
PRICE
Spectrum
Moderate
Growth
Allocation
Fund
Shares/Par
$
Value
(Cost
and
value
in
$000s)
‡
Northwoods
Capital
XIV-B
Series 2018-14BA,
Class
AR,
CLO,
FRN
3M
TSFR
+
1.25%,
6.574%,
11/13/31 (1)
250,000
251
OCP
Series 2014-7A,
Class
A2RR,
CLO,
FRN
3M
TSFR
+
1.912%,
7.236%,
7/20/29 (1)
250,000
250
Octagon
Investment
Partners
49
Series 2020-5A,
Class
AR,
CLO,
FRN
3M
TSFR
+
1.52%,
6.811%,
4/15/37 (1)
265,000
266
Octane
Receivables
Trust
Series 2023-1A,
Class
A
5.87%,
5/21/29 (1)
47,821
48
Octane
Receivables
Trust
Series 2023-3A,
Class
B
6.48%,
7/20/29 (1)
100,000
101
Octane
Receivables
Trust
Series 2023-3A,
Class
C
6.74%,
8/20/29 (1)
100,000
101
Octane
Receivables
Trust
Series 2024-1A,
Class
A2
5.68%,
5/20/30 (1)
140,000
140
Palmer
Square
Series 2020-3A,
Class
A1R2,
CLO,
FRN
3M
TSFR
+
1.65%,
6.972%,
11/15/36 (1)
250,000
252
Post
Road
Equipment
Finance
Series 2024-1A,
Class
A2
5.59%,
11/15/29 (1)
100,000
100
Progress
Residential
Trust
Series 2020-SFR3,
Class
B
1.495%,
10/17/27 (1)
100,000
94
RR
28
Series 2024-28RA,
Class
A1R,
CLO,
FRN
3M
TSFR
+
1.55%,
6.841%,
4/15/37 (1)
315,000
314
Santander
Bank
Series 2021-1A,
Class
B
1.833%,
12/15/31 (1)
29,021
29
Santander
Drive
Auto
Receivables
Trust
Series 2021-4,
Class
D
1.67%,
10/15/27
155,000
148
Santander
Drive
Auto
Receivables
Trust
Series 2022-5,
Class
C
4.74%,
10/16/28
140,000
138
Santander
Drive
Auto
Receivables
Trust
Series 2022-6,
Class
B
4.72%,
6/15/27
440,000
437
T.
ROWE
PRICE
Spectrum
Moderate
Growth
Allocation
Fund
Shares/Par
$
Value
(Cost
and
value
in
$000s)
‡
SBNA
Auto
Lease
Trust
Series 2024-A,
Class
A3
5.39%,
11/20/26 (1)
90,000
90
SBNA
Auto
Lease
Trust
Series 2024-A,
Class
A4
5.24%,
1/22/29 (1)
85,000
85
SEB
Funding
Series 2024-1A,
Class
A2
7.386%,
4/30/54 (1)
380,000
380
ServiceMaster
Funding
Series 2021-1,
Class
A2I
2.865%,
7/30/51 (1)
277,711
242
SFS
Auto
Receivables
Securitization
Trust
Series 2024-1A,
Class
A4
4.94%,
1/21/31 (1)
65,000
64
SFS
Auto
Receivables
Securitization
Trust
Series 2024-1A,
Class
C
5.51%,
1/20/32 (1)
35,000
35
SFS
Auto
Receivables
Securitization
Trust
Series 2024-2A,
Class
A3
5.33%,
11/20/29 (1)
185,000
185
SFS
Auto
Receivables
Securitization
Trust
Series 2024-2A,
Class
B
5.41%,
8/20/30 (1)
45,000
45
Signal
Peak
Series 2018-5A,
Class
A1R,
CLO,
FRN
3M
TSFR
+
1.55%,
6.876%,
4/25/37 (1)
415,000
414
SMB
Private
Education
Loan
Trust
Series 2021-A,
Class
B
2.31%,
1/15/53 (1)
218,519
204
Symphony
XVI
Series 2015-16A,
Class
ARR,
CLO,
FRN
3M
TSFR
+
1.20%,
6.523%,
10/15/31 (1)
555,000
554
Symphony
XXXI
Series 2022-31A,
Class
B,
CLO,
FRN
3M
TSFR
+
1.85%,
7.175%,
4/22/35 (1)
250,000
249
TIAA
Series 2016-1A,
Class
ARR,
CLO,
FRN
3M
TSFR
+
1.25%,
6.575%,
7/20/31 (1)
395,000
396
Tricon
Residential
Trust
Series 2024-SFR2,
Class
A
4.75%,
6/17/40 (1)
340,000
328
Trinitas
VI
Series 2017-6A,
Class
ARRR,
CLO,
FRN
3M
TSFR
+
1.33%,
1/25/34 (1)(2)
605,000
605
T.
ROWE
PRICE
Spectrum
Moderate
Growth
Allocation
Fund
Shares/Par
$
Value
(Cost
and
value
in
$000s)
‡
U.S.
Bank
Series 2023-1,
Class
B
6.789%,
8/25/32 (1)
194,024
195
Verdant
Receivables
Series 2024-1A,
Class
A2
5.68%,
12/12/31 (1)
100,000
100
Verizon
Master
Trust
Series 2023-1,
Class
C
4.98%,
1/22/29
130,000
128
Wellfleet
Series 2017-2A,
Class
A1R,
CLO,
FRN
3M
TSFR
+
1.322%,
6.646%,
10/20/29 (1)
19,763
20
World
Omni
Auto
Receivables
Trust
Series 2023-A,
Class
B
5.03%,
5/15/29
210,000
208
Total
Asset-Backed
Securities
(Cost
$18,421)
18,256
BOND
MUTUAL
FUNDS
7.4%
T.
Rowe
Price
Inflation
Protected
Bond
Fund
-
I
Class,
9.60% (3)(4)
427,641
4,434
T.
Rowe
Price
Institutional
Emerging
Markets
Bond
Fund,
6.27% (3)(4)
6,162,421
40,980
T.
Rowe
Price
Institutional
Floating
Rate
Fund
-
Institutional
Class,
8.44% (3)(4)
1,657,673
15,715
T.
Rowe
Price
Institutional
High
Yield
Fund
-
Institutional
Class,
7.20% (3)(4)
5,382,936
41,502
T.
Rowe
Price
International
Bond
Fund
(USD
Hedged)
-
I
Class,
3.82% (3)(4)
8,161,768
68,151
T.
Rowe
Price
Limited
Duration
Inflation
Focused
Bond
Fund
-
I
Class,
9.22% (3)(4)
1,675,312
7,824
T.
Rowe
Price
U.S.
Treasury
Long-Term
Index
Fund
-
I
Class,
4.71% (3)(4)
9,314,459
67,530
Total
Bond
Mutual
Funds
(Cost
$302,123)
246,136
COMMON
STOCKS
69.9%
COMMUNICATION
SERVICES
4.8%
Diversified
Telecommunication
Services
0.4%
BT
Group
(GBP) (5)
1,838,668
3,078
Frontier
Communications
Parent (6)
28,823
768
KT
(KRW)
82,241
2,196
Nippon
Telegraph
&
Telephone
(JPY)
6,412,900
6,298
12,340
T.
ROWE
PRICE
Spectrum
Moderate
Growth
Allocation
Fund
Shares/Par
$
Value
(Cost
and
value
in
$000s)
‡
Entertainment
0.6%
Electronic
Arts
28,115
3,736
Liberty
Media
Corp-Liberty
Live,
Class
C (6)
27,429
1,044
Netflix (6)
23,318
14,961
Sea,
ADR (6)
20,221
1,366
21,107
Interactive
Media
&
Services
3.0%
Alphabet,
Class
A (6)
45,234
7,803
Alphabet,
Class
C (6)
310,551
54,023
LY
(JPY)
508,300
1,208
Match
Group (6)
7,300
224
Meta
Platforms,
Class
A
69,267
32,336
NAVER
(KRW)
16,042
1,986
Reddit
,
Class
A (6)
4,556
247
Tencent
Holdings
(HKD)
23,000
1,067
Vimeo (6)
116,307
451
99,345
Media
0.3%
Comcast,
Class
A
69,600
2,786
CyberAgent
(JPY)
253,000
1,525
Ibotta
,
Class
A (6)
2,153
209
WPP
(GBP)
389,744
4,080
8,600
Wireless
Telecommunication
Services
0.5%
T-Mobile
U.S.
90,961
15,915
15,915
Total
Communication
Services
157,307
CONSUMER
DISCRETIONARY
6.5%
Automobile
Components
0.4%
Autoliv
,
SDR
(SEK)
31,083
3,973
Denso
(JPY)
233,900
3,801
Dowlais
Group
(GBP)
782,051
695
Magna
International
61,228
2,768
Modine
Manufacturing (6)
4,300
434
Stanley
Electric
(JPY)
64,300
1,183
12,854
Automobiles
0.6%
Honda
Motor
(JPY)
122,400
1,386
Suzuki
Motor
(JPY)
228,100
2,719
Tesla (6)
38,704
6,892
T.
ROWE
PRICE
Spectrum
Moderate
Growth
Allocation
Fund
Shares/Par
$
Value
(Cost
and
value
in
$000s)
‡
Toyota
Motor
(JPY)
353,700
7,705
18,702
Broadline
Retail
2.1%
Alibaba
Group
Holding,
ADR
11,589
908
Amazon.com (6)
353,755
62,417
Etsy (6)
6,800
432
Next
(GBP)
34,370
4,116
Ollie's
Bargain
Outlet
Holdings (6)
8,680
715
Savers
Value
Village (6)
18,177
246
68,834
Diversified
Consumer
Services
0.1%
Bright
Horizons
Family
Solutions (6)
12,392
1,303
Duolingo
(6)
3,074
588
Service
Corp.
International
10,647
763
Strategic
Education
10,290
1,167
3,821
Hotels,
Restaurants
&
Leisure
1.5%
Amadeus
IT
Group
(EUR)
50,475
3,603
BJ's
Restaurants (6)
19,544
685
Booking
Holdings
3,073
11,605
Cava
Group (6)
7,894
731
Chipotle
Mexican
Grill (6)
1,813
5,674
Compass
Group
(GBP)
201,282
5,651
DoorDash
,
Class
A (6)
11,535
1,270
Dutch
Bros,
Class
A (6)
27,034
957
Hilton
Worldwide
Holdings
28,146
5,646
McDonald's
32,714
8,469
Norwegian
Cruise
Line
Holdings (6)
77,674
1,289
Papa
John's
International
16,909
786
Red
Rock
Resorts,
Class
A
12,511
641
Shake
Shack,
Class
A (6)
7,400
702
Torchys
Holdings,
Class
A,
Acquisition
Date:
11/13/20,
Cost $771 (6)(7)(8)(9)
90,236
395
Wyndham
Hotels
&
Resorts
11,932
844
48,948
Household
Durables
0.3%
Installed
Building
Products
3,255
690
Panasonic
Holdings
(JPY)
309,400
2,733
Persimmon
(GBP)
114,169
2,133
Skyline
Champion (6)
15,040
1,047
Sony
Group
(JPY)
59,600
4,893
11,496
T.
ROWE
PRICE
Spectrum
Moderate
Growth
Allocation
Fund
Shares/Par
$
Value
(Cost
and
value
in
$000s)
‡
Specialty
Retail
1.1%
AutoZone (6)
1,111
3,077
Burlington
Stores (6)
3,592
862
Caleres
18,426
639
Carvana
(6)
33,924
3,392
Five
Below (6)
2,864
396
Floor
&
Decor
Holdings,
Class
A (6)
2,968
347
Home
Depot
7,240
2,424
Kingfisher
(GBP)
1,173,917
3,974
Leslie's (6)
55,747
319
O'Reilly
Automotive (6)
3,670
3,535
RH (6)
2,358
641
Ross
Stores
19,812
2,769
TJX
67,693
6,979
Tractor
Supply
21,962
6,266
Warby
Parker,
Class
A (6)
33,201
588
36,208
Textiles,
Apparel
&
Luxury
Goods
0.4%
Cie
Financiere
Richemont
(CHF)
23,426
3,770
Kering
(EUR)
6,489
2,243
Lululemon
Athletica
(6)
3,136
978
Moncler
(EUR)
48,158
3,214
NIKE,
Class
B
11,194
1,064
Samsonite
International
(HKD) (6)
502,800
1,598
Skechers
USA,
Class
A (6)
11,620
830
13,697
Total
Consumer
Discretionary
214,560
CONSUMER
STAPLES
4.4%
Beverages
0.9%
Boston
Beer,
Class
A (6)
3,553
1,114
Coca-Cola
225,246
14,175
Coca-Cola
Consolidated
37
36
Diageo
(GBP)
115,482
3,888
Heineken
(EUR)
44,543
4,469
Keurig
Dr
Pepper
181,485
6,216
Kirin
Holdings
(JPY)
103,800
1,434
31,332
Consumer
Staples
Distribution
&
Retail
0.8%
Dollar
General
20,530
2,811
Dollar
Tree (6)
23,600
2,784
Seven
&
i
Holdings
(JPY)
308,700
3,984
Target
23,336
3,644
T.
ROWE
PRICE
Spectrum
Moderate
Growth
Allocation
Fund
Shares/Par
$
Value
(Cost
and
value
in
$000s)
‡
Walmart
198,003
13,021
Welcia
Holdings
(JPY)
44,600
615
26,859
Food
Products
0.8%
Barry
Callebaut
(CHF)
1,278
2,222
Farmers
Business
Network,
Acquisition
Date:
11/3/17,
Cost $220 (6)(7)(8)
11,919
45
Mondelez
International,
Class
A
51,506
3,530
Nestle
(CHF)
131,613
13,970
Post
Holdings (6)
9,884
1,053
Simply
Good
Foods (6)
22,347
860
Utz
Brands
42,120
781
Wilmar
International
(SGD)
1,153,300
2,645
25,106
Household
Products
0.9%
Colgate-Palmolive
150,395
13,981
Procter
&
Gamble
95,276
15,676
29,657
Personal
Care
Products
1.0%
BellRing
Brands (6)
31,670
1,842
Kenvue
670,052
12,932
L'Oreal
(EUR)
10,535
5,200
Puig
Brands,
Class
B
(EUR) (6)
53,317
1,504
Unilever
(GBP)
188,680
10,333
31,811
Total
Consumer
Staples
144,765
ENERGY
3.7%
Energy
Equipment
&
Services
1.0%
Cactus,
Class
A
13,800
709
ChampionX
18,503
604
Expro
Group
Holdings (6)
41,660
914
Halliburton
414,604
15,216
Liberty
Energy
28,962
715
Noble
9,498
441
Schlumberger
284,399
13,051
TechnipFMC
53,828
1,410
Weatherford
International (6)
11,894
1,431
34,491
Oil,
Gas
&
Consumable
Fuels
2.7%
Antero
Resources (6)
32,737
1,166
Chesapeake
Energy
44,716
4,066
T.
ROWE
PRICE
Spectrum
Moderate
Growth
Allocation
Fund
Shares/Par
$
Value
(Cost
and
value
in
$000s)
‡
Chevron
19,510
3,167
ConocoPhillips
110,560
12,878
Diamondback
Energy
44,040
8,775
DT
Midstream
13,467
903
EQT
311,797
12,812
Equinor
(NOK)
236,418
6,863
Exxon
Mobil
53,021
6,217
Hess
5,073
782
Kimbell
Royalty
Partners
25,593
429
Kinder
Morgan
92,485
1,803
Magnolia
Oil
&
Gas,
Class
A
46,961
1,219
Matador
Resources
10,492
666
Phillips
66
7,600
1,080
Range
Resources
246,568
9,101
Shell,
ADR
80,398
5,851
SM
Energy
11,221
566
Southwestern
Energy (6)
212,476
1,600
TotalEnergies
(EUR)
127,974
9,376
Viper
Energy
14,949
575
Williams
43,564
1,808
91,703
Total
Energy
126,194
FINANCIALS
11.4%
Banks
3.6%
ANZ
Group
Holdings
(AUD)
128,794
2,431
Banc
of
California
33,900
470
Bank
of
America
292,198
11,685
BankUnited
7,375
212
Blue
Foundry
Bancorp (6)
16,017
147
BNP
Paribas
(EUR)
44,455
3,282
Cadence
Bank
31,466
898
Capitol
Federal
Financial
76,338
395
Citigroup
86,473
5,388
Columbia
Banking
System
43,181
833
CRB
Group,
Acquisition
Date:
4/14/22,
Cost $64 (6)(7)(8)
605
44
CrossFirst
Bankshares
(6)
33,538
439
DBS
Group
Holdings
(SGD)
113,691
3,032
Dime
Community
Bancshares
19,943
368
DNB
Bank
(NOK)
316,302
6,194
Dogwood
State
Bank,
Non-Voting
Shares,
Acquisition
Date:
5/6/19
-
4/5/24,
Cost $64 (6)(7)(8)
6,401
114
Dogwood
State
Bank,
Voting
Shares,
Acquisition
Date:
5/6/19,
Cost $27 (6)(7)(8)
2,736
49
T.
ROWE
PRICE
Spectrum
Moderate
Growth
Allocation
Fund
Shares/Par
$
Value
(Cost
and
value
in
$000s)
‡
East
West
Bancorp
35,712
2,649
Eastern
Bankshares
40,218
551
Equity
Bancshares,
Class
A
15,184
512
FB
Financial
21,950
812
First
Bancshares
20,934
531
Five
Star
Bancorp
19,762
453
Grasshopper
Bancorp,
Acquisition
Date:
10/12/18
-
5/2/19,
Cost $93 (6)(7)(8)
9,254
28
Grasshopper
Bancorp,
Warrants,
10/12/28,
Acquisition
Date:
10/12/18,
Cost $— (6)(7)(8)
1,736
1
HarborOne
Bancorp
21,345
222
HDFC
Bank
(INR)
155,352
2,843
Home
BancShares
25,237
594
ING
Groep
(EUR)
447,034
7,986
Intesa
Sanpaolo
(EUR)
916,092
3,609
JPMorgan
Chase
135,041
27,363
Kearny
Financial
32,148
182
Live
Oak
Bancshares
24,572
847
Mitsubishi
UFJ
Financial
Group
(JPY)
434,800
4,618
National
Bank
of
Canada
(CAD)
64,723
5,532
Origin
Bancorp
18,052
564
Pacific
Premier
Bancorp
22,212
494
Pinnacle
Financial
Partners
13,924
1,107
PNC
Financial
Services
Group
6,480
1,020
Popular
8,151
725
Prosperity
Bancshares
12,800
797
SouthState
15,387
1,190
Standard
Chartered
(GBP)
312,855
3,116
Sumitomo
Mitsui
Trust
Holdings
(JPY)
77,516
1,802
Svenska
Handelsbanken
,
Class
A
(SEK)
359,438
3,383
Texas
Capital
Bancshares (6)
11,143
672
United
Overseas
Bank
(SGD)
185,400
4,227
Wells
Fargo
61,500
3,685
Western
Alliance
Bancorp
13,868
874
118,970
Capital
Markets
1.5%
Bridgepoint
Group
(GBP)
423,310
1,233
Brookfield
(CAD)
79,762
3,473
Cboe
Global
Markets
9,650
1,669
Charles
Schwab
121,522
8,905
CME
Group
14,630
2,970
CVC
Capital
Partners
(EUR) (6)
96,454
1,865
Goldman
Sachs
Group
26,315
12,013
T.
ROWE
PRICE
Spectrum
Moderate
Growth
Allocation
Fund
Shares/Par
$
Value
(Cost
and
value
in
$000s)
‡
Julius
Baer
Group
(CHF)
55,739
3,348
LPL
Financial
Holdings
18,262
5,227
Macquarie
Group
(AUD)
20,983
2,679
Morgan
Stanley
22,635
2,215
MSCI
863
427
Onex
(CAD)
9,348
663
S&P
Global
5,287
2,260
StepStone
Group,
Class
A
17,895
768
Stifel
Financial
8,500
688
TMX
Group
(CAD)
31,817
854
51,257
Consumer
Finance
0.4%
American
Express
48,771
11,705
Encore
Capital
Group (6)
11,993
531
PRA
Group (6)
12,654
273
12,509
Energy
0.3%
Sun
Life
Financial
(CAD)
77,704
3,895
Tokio
Marine
Holdings
(JPY)
189,100
6,551
10,446
Financial
Services
2.6%
Adyen
(EUR) (6)
1,785
2,315
ANT
Group,
Acquisition
Date:
8/14/23,
Cost $370 (6)(7)(8)
370,385
374
Berkshire
Hathaway,
Class
B (6)
45,473
18,844
Challenger
(AUD)
216,063
934
Corebridge
Financial
71,694
2,091
Corpay
(6)
7,440
1,991
Fiserv (6)
78,308
11,727
Mastercard
,
Class
A
26,576
11,881
Mitsubishi
HC
Capital
(JPY)
233,400
1,549
PennyMac
Financial
Services
22,256
2,018
Toast,
Class
A (6)
25,503
618
Visa,
Class
A
112,914
30,765
85,107
Insurance
3.0%
AIA
Group
(HKD)
467,400
3,630
Allstate
56,317
9,434
Assurant
8,817
1,529
AXA
(EUR)
243,853
8,805
Axis
Capital
Holdings
9,407
695
Bowhead
Specialty
Holdings (6)
3,722
100
Chubb
26,782
7,253
T.
ROWE
PRICE
Spectrum
Moderate
Growth
Allocation
Fund
Shares/Par
$
Value
(Cost
and
value
in
$000s)
‡
Definity
Financial
(CAD)
46,618
1,479
First
American
Financial
12,501
695
Goosehead
Insurance,
Class
A (6)
10,822
698
Hanover
Insurance
Group
8,979
1,185
Hartford
Financial
Services
Group
5,468
566
Mandatum
(EUR)
94,835
426
Marsh
&
McLennan
37,101
7,701
MetLife
150,752
10,910
Munich
Re
(EUR)
19,892
9,920
Oscar
Health,
Class
A (6)
59,100
1,180
Progressive
44,427
9,382
RLI
4,374
639
Sampo
,
Class
A
(EUR)
98,562
4,219
Selective
Insurance
Group
18,976
1,852
Storebrand
(NOK)
332,317
3,601
Travelers
40,238
8,679
White
Mountains
Insurance
Group
489
884
Zurich
Insurance
Group
(CHF)
10,048
5,288
100,750
Total
Financials
379,039
HEALTH
CARE
9.4%
Biotechnology
0.7%
AbbVie
30,676
4,946
Apellis
Pharmaceuticals (6)
7,977
313
Arcellx
(6)
9,265
482
Argenx
,
ADR (6)
8,684
3,222
Arrowhead
Pharmaceuticals (6)
19,400
445
Ascendis
Pharma,
ADR (6)
1,473
199
Black
Diamond
Therapeutics (6)
47,591
228
Blueprint
Medicines (6)
7,725
815
Bridgebio
Pharma (6)
10,905
305
Cabaletta
Bio (6)
16,214
165
CG
oncology (6)
4,797
156
Crinetics
Pharmaceuticals (6)
13,866
616
CRISPR
Therapeutics (6)
4,308
232
Cytokinetics (6)
22,400
1,087
Genmab
(DKK) (6)
6,287
1,775
HilleVax
(6)
19,390
235
Immatics
(6)
38,829
428
Immunocore
Holdings,
ADR (6)
6,760
331
Immunovant
(6)
13,100
333
Insmed
(6)
16,333
899
Ionis
Pharmaceuticals (6)
17,500
657
T.
ROWE
PRICE
Spectrum
Moderate
Growth
Allocation
Fund
Shares/Par
$
Value
(Cost
and
value
in
$000s)
‡
Merus
(6)
5,300
282
MoonLake
Immunotherapeutics
(6)
4,856
197
Nurix
Therapeutics (6)
12,042
190
Prime
Medicine (6)
17,937
116
Sana
Biotechnology (6)
16,544
124
Scholar
Rock,
Warrants,
12/31/25,
Acquisition
Date:
6/17/22,
Cost $— (6)(8)
2,126
9
Syndax
Pharmaceuticals (6)
5,166
100
Tango
Therapeutics (6)
23,147
160
Vaxcyte
(6)
16,403
1,153
Vertex
Pharmaceuticals (6)
8,982
4,090
Verve
Therapeutics (6)
23,193
120
Xenon
Pharmaceuticals (6)
7,714
294
Zentalis
Pharmaceuticals (6)
18,602
221
24,925
Health
Care
Equipment
&
Supplies
1.1%
Alcon
(CHF)
29,164
2,620
Align
Technology (6)
962
248
Elekta
,
Class
B
(SEK)
242,321
1,993
EssilorLuxottica
(EUR)
15,094
3,385
GE
HealthCare
Technologies
29,963
2,337
Haemonetics
(6)
10,195
857
Hologic
(6)
23,429
1,729
Intuitive
Surgical (6)
19,137
7,695
Koninklijke
Philips
(EUR) (6)
143,343
3,915
Masimo
(6)
12,443
1,549
Neogen
(6)
57,756
760
Novocure
(6)
11,030
243
Pax
Labs,
Class
A,
Acquisition
Date:
4/18/19,
Cost $264 (6)(7)
(8)
70,144
28
Penumbra (6)
2,210
419
PROCEPT
BioRobotics
(6)
14,660
973
QuidelOrtho
(6)
16,392
724
Siemens
Healthineers
(EUR)
80,269
4,684
Stryker
8,107
2,765
Teleflex
2,446
511
37,435
Health
Care
Providers
&
Services
2.9%
Alignment
Healthcare (6)
63,468
500
Cencora
62,129
14,077
Cigna
Group
11,930
4,111
Elevance
Health
43,123
23,221
Fresenius
(EUR) (6)
91,335
2,914
T.
ROWE
PRICE
Spectrum
Moderate
Growth
Allocation
Fund
Shares/Par
$
Value
(Cost
and
value
in
$000s)
‡
HCA
Healthcare
9,270
3,149
Humana
5,881
2,106
Molina
Healthcare (6)
17,463
5,494
NeoGenomics
(6)
72,050
988
Privia
Health
Group (6)
50,599
879
RadNet
(6)
5,566
326
Tenet
Healthcare (6)
36,870
4,986
U.S.
Physical
Therapy
7,349
754
UnitedHealth
Group
64,619
32,010
95,515
Health
Care
Technology
0.0%
Certara
(6)
36,844
625
625
Life
Sciences
Tools
&
Services
1.2%
10X
Genomics,
Class
A (6)
23,494
527
Agilent
Technologies
29,704
3,874
Azenta
(6)
3,550
179
Bruker
19,132
1,253
Danaher
28,223
7,248
Evotec
(EUR) (6)
68,632
651
Repligen
(6)
4,526
675
Revvity
32,800
3,584
Sotera
Health (6)
40,952
458
Stevanato
Group
35,756
726
Thermo
Fisher
Scientific
38,214
21,705
40,880
Pharmaceuticals
3.5%
Astellas
Pharma
(JPY)
372,000
3,652
AstraZeneca,
ADR
254,509
19,857
Bayer
(EUR)
64,101
1,972
Bristol-Myers
Squibb
24,200
994
Elanco
Animal
Health (6)
53,457
945
Eli
Lilly
31,112
25,522
EyePoint
Pharmaceuticals (6)
9,081
97
GSK,
ADR
36,496
1,634
Johnson
&
Johnson
79,595
11,674
Merck
103,365
12,976
Neumora
Therapeutics (6)
22,472
223
Novartis
(CHF)
77,457
8,017
Novo
Nordisk,
Class
B
(DKK)
73,911
10,014
Otsuka
Holdings
(JPY)
35,000
1,445
Roche
Holding
(CHF)
26,418
6,745
T.
ROWE
PRICE
Spectrum
Moderate
Growth
Allocation
Fund
Shares/Par
$
Value
(Cost
and
value
in
$000s)
‡
Sanofi
(EUR)
79,558
7,789
Shionogi
(JPY)
29,600
1,334
Structure
Therapeutics,
ADR (6)
5,982
205
Zoetis
12,792
2,169
117,264
Total
Health
Care
316,644
INDUSTRIALS
&
BUSINESS
SERVICES
8.6%
Aerospace
&
Defense
1.2%
Boeing (6)
14,300
2,540
Cadre
Holdings
9,919
326
General
Dynamics
39,857
11,948
General
Electric
50,433
8,328
L3Harris
Technologies
21,500
4,834
Leonardo
DRS (6)
38,028
896
Loar
Holdings (6)
3,645
208
Melrose
Industries
(GBP)
527,312
4,173
Safran
(EUR)
23,315
5,460
TransDigm
Group
1,108
1,488
40,201
Air
Freight
&
Logistics
0.1%
FedEx
12,100
3,073
3,073
Building
Products
0.1%
AAON
14,952
1,122
AZZ
23,066
1,935
CSW
Industrials
4,089
1,040
Zurn
Elkay
Water
Solutions
21,473
672
4,769
Commercial
Services
&
Supplies
0.5%
Casella
Waste
Systems,
Class
A (6)
9,430
949
Cintas
1,480
1,003
Element
Fleet
Management
(CAD)
286,928
5,099
Rentokil
Initial
(GBP)
161,516
861
Republic
Services
32,944
6,101
Stericycle (6)
17,411
897
Tetra
Tech
3,277
687
Veralto
4,416
435
VSE
9,815
803
16,835
Construction
&
Engineering
0.2%
API
Group (6)
18,290
652
T.
ROWE
PRICE
Spectrum
Moderate
Growth
Allocation
Fund
Shares/Par
$
Value
(Cost
and
value
in
$000s)
‡
Arcosa
8,758
770
WillScot
Mobile
Mini
Holdings (6)
24,277
957
Worley
(AUD)
275,899
2,693
5,072
Electrical
Equipment
1.3%
ABB
(CHF)
133,496
7,360
AMETEK
55,263
9,372
GE
Vernova
(6)
23,787
4,184
Legrand
(EUR)
43,522
4,726
Mitsubishi
Electric
(JPY)
316,800
5,505
Prysmian
(EUR)
92,039
6,054
Rockwell
Automation
20,900
5,382
Thermon
Group
Holdings (6)
24,919
841
43,424
Ground
Transportation
1.0%
Central
Japan
Railway
(JPY)
71,000
1,584
CSX
403,255
13,610
Landstar
System
3,861
703
Norfolk
Southern
12,457
2,800
Old
Dominion
Freight
Line
38,983
6,832
Saia (6)
4,064
1,664
Union
Pacific
24,540
5,713
32,906
Industrial
Conglomerates
1.0%
DCC
(GBP)
36,556
2,669
Honeywell
International
40,061
8,100
Roper
Technologies
5,963
3,177
Siemens
(EUR)
95,610
18,428
32,374
Machinery
2.0%
Crane
6,480
966
Cummins
43,834
12,349
Deere
14,797
5,545
Dover
30,391
5,587
Enerpac
Tool
Group
22,752
895
Enpro
6,642
1,018
Esab
16,761
1,723
ESCO
Technologies
6,276
685
Federal
Signal
19,345
1,780
Graco
8,516
688
IDEX
20,007
4,174
Ingersoll
Rand
45,795
4,261
T.
ROWE
PRICE
Spectrum
Moderate
Growth
Allocation
Fund
Shares/Par
$
Value
(Cost
and
value
in
$000s)
‡
John
Bean
Technologies
7,222
690
KION
Group
(EUR)
43,218
2,045
Mueller
Water
Products,
Class
A
46,595
865
RBC
Bearings (6)
6,470
1,910
Sandvik
(SEK)
163,150
3,602
SMC
(JPY)
2,700
1,364
Spirax-Sarco
Engineering
(GBP)
4,632
530
SPX
Technologies (6)
12,668
1,766
THK
(JPY)
67,300
1,305
Toro
7,449
597
Westinghouse
Air
Brake
Technologies
77,706
13,150
67,495
Professional
Services
0.6%
Booz
Allen
Hamilton
Holding
31,804
4,841
Broadridge
Financial
Solutions
20,565
4,129
Checkr
,
Acquisition
Date:
6/29/18
-
12/2/19,
Cost $93 (6)(7)(8)
11,790
51
NV5
Global (6)
4,667
439
Parsons (6)
20,505
1,561
Paycor
HCM (6)
51,025
631
Paylocity
Holding (6)
3,900
554
Recruit
Holdings
(JPY)
73,900
3,731
TechnoPro
Holdings
(JPY)
101,600
1,691
Teleperformance
(EUR)
12,813
1,466
Verra
Mobility (6)
36,698
978
20,072
Trading
Companies
&
Distributors
0.6%
Ashtead
Group
(GBP)
30,965
2,268
Beacon
Roofing
Supply (6)
14,348
1,393
Bunzl
(GBP)
73,896
2,778
Ferguson
11,823
2,432
FTAI
Aviation
12,954
1,092
GMS (6)
7,700
723
Mitsubishi
(JPY)
129,800
2,740
MSC
Industrial
Direct,
Class
A
5,693
489
Rush
Enterprises,
Class
A
13,235
597
SiteOne
Landscape
Supply (6)
10,448
1,618
Sumitomo
(JPY)
170,300
4,432
Transcat
(6)
1,845
235
20,797
Total
Industrials
&
Business
Services
287,018
T.
ROWE
PRICE
Spectrum
Moderate
Growth
Allocation
Fund
Shares/Par
$
Value
(Cost
and
value
in
$000s)
‡
INFORMATION
TECHNOLOGY
16.0%
Communications
Equipment
0.1%
LM
Ericsson,
Class
B
(SEK) (5)
501,609
3,091
3,091
Electronic
Equipment,
Instruments
&
Components
1.4%
Amphenol,
Class
A
77,999
10,325
Cognex
8,995
410
CTS
17,943
950
Hamamatsu
Photonics
(JPY)
50,600
1,496
Insight
Enterprises (6)
5,700
1,114
Keysight
Technologies (6)
58,322
8,076
Largan
Precision
(TWD)
12,000
848
Mirion
Technologies (6)
135,485
1,471
Murata
Manufacturing
(JPY)
153,800
2,909
Napco
Security
Technologies
16,243
807
Novanta
(6)
4,185
679
Omron
(JPY)
30,800
1,006
PAR
Technology (6)
47,717
2,129
PAR
Technology
PIPE,
Acquisition
Date:
3/8/24,
Cost $255 (6)
(8)
6,599
294
TE
Connectivity
82,967
12,420
Teledyne
Technologies (6)
3,833
1,522
Vontier
17,216
688
47,144
IT
Services
0.4%
Accenture,
Class
A
12,262
3,461
ASGN (6)
4,432
416
MongoDB (6)
6,107
1,442
NTT
Data
Group
(JPY)
334,000
5,136
ServiceTitan
,
Acquisition
Date:
11/9/18
-
5/4/21,
Cost $22 (6)
(7)(8)
458
36
Shopify,
Class
A (6)
40,647
2,404
Snowflake,
Class
A (6)
4,735
645
Themis
Solutions,
Acquisition
Date:
4/14/21,
Cost $61 (6)(7)(8)
2,720
93
13,633
Semiconductors
&
Semiconductor
Equipment
7.1%
Advanced
Micro
Devices (6)
20,660
3,448
Allegro
MicroSystems
(6)
20,981
632
Analog
Devices
49,471
11,600
Applied
Materials
45,890
9,870
ASML
Holding
(EUR)
13,187
12,617
ASML
Holding
6,597
6,335
T.
ROWE
PRICE
Spectrum
Moderate
Growth
Allocation
Fund
Shares/Par
$
Value
(Cost
and
value
in
$000s)
‡
Astera
Labs (6)
1,560
101
Broadcom
6,691
8,889
Entegris
7,646
966
Intel
122,230
3,771
KLA
9,805
7,447
Lam
Research
3,438
3,206
Lattice
Semiconductor (6)
23,741
1,762
MACOM
Technology
Solutions
Holdings (6)
14,421
1,458
Micron
Technology
79,231
9,904
Monolithic
Power
Systems
4,071
2,995
NVIDIA
86,470
94,800
NXP
Semiconductors
54,199
14,748
Onto
Innovation (6)
9,411
2,039
Power
Integrations
12,601
958
QUALCOMM
37,413
7,634
Renesas
Electronics
(JPY)
124,800
2,300
Taiwan
Semiconductor
Manufacturing
(TWD)
520,759
13,336
Taiwan
Semiconductor
Manufacturing,
ADR
14,376
2,171
Texas
Instruments
47,878
9,337
Tokyo
Electron
(JPY)
21,900
4,651
236,975
Software
4.8%
Adobe (6)
8,986
3,997
Agilysys
(6)
6,078
580
Altair
Engineering,
Class
A (6)
11,794
1,030
Amplitude,
Class
A (6)
80,427
717
Appfolio
,
Class
A (6)
3,021
690
Atlassian
,
Class
A (6)
6,738
1,057
Aurora
Innovation (6)
130,806
313
BILL
Holdings (6)
11,370
592
Braze,
Class
A (6)
21,557
812
Canva
,
Acquisition
Date:
8/16/21
-
12/17/21,
Cost $818 (6)(7)
(8)
480
512
CCC
Intelligent
Solutions
Holdings (6)
68,603
767
Confluent,
Class
A (6)
20,423
530
Crowdstrike
Holdings,
Class
A (6)
3,738
1,172
Datadog
,
Class
A (6)
7,629
841
Descartes
Systems
Group (6)
15,950
1,473
DoubleVerify
Holdings (6)
45,446
827
Envestnet
(6)
14,646
959
Fortinet (6)
61,921
3,673
Gusto,
Acquisition
Date:
10/4/21,
Cost $265 (6)(7)(8)
9,216
171
Intapp
(6)
27,295
980
T.
ROWE
PRICE
Spectrum
Moderate
Growth
Allocation
Fund
Shares/Par
$
Value
(Cost
and
value
in
$000s)
‡
Intuit
8,344
4,810
JFrog
(6)
21,300
685
Manhattan
Associates (6)
2,063
453
Microsoft
262,772
109,085
SAP
(EUR)
38,403
7,003
ServiceNow
(6)
14,885
9,778
Socure
,
Acquisition
Date:
12/22/21,
Cost $46 (6)(7)(8)
2,872
18
Synopsys (6)
10,205
5,723
Varonis
Systems (6)
15,500
666
Workiva
(6)
14,281
1,099
161,013
Technology
Hardware,
Storage
&
Peripherals
2.2%
Apple
346,420
66,599
Samsung
Electronics
(KRW)
125,270
6,637
73,236
Total
Information
Technology
535,092
MATERIALS
2.8%
Chemicals
1.1%
Air
Liquide
(EUR)
25,225
4,966
Akzo
Nobel
(EUR)
38,645
2,711
Asahi
Kasei
(JPY)
232,600
1,516
BASF
(EUR)
49,760
2,634
Covestro
(EUR) (6)
45,401
2,446
Element
Solutions
70,265
1,689
HB
Fuller
10,564
841
Johnson
Matthey
(GBP)
92,932
2,090
Linde
26,612
11,590
Mosaic
57,100
1,766
Nutrien
15,892
931
Sherwin-Williams
6,644
2,018
Umicore
(EUR) (5)
73,375
1,453
36,651
Construction
Materials
0.2%
Martin
Marietta
Materials
10,632
6,082
6,082
Containers
&
Packaging
0.4%
Amcor,
CDI
(AUD)
97,971
971
International
Paper
227,663
10,265
Sealed
Air
19,601
762
11,998
T.
ROWE
PRICE
Spectrum
Moderate
Growth
Allocation
Fund
Shares/Par
$
Value
(Cost
and
value
in
$000s)
‡
Metals
&
Mining
1.0%
Antofagasta
(GBP)
151,857
4,308
BHP
Group
(AUD)
80,794
2,405
BHP
Group
(GBP) (5)
116,052
3,464
Constellium
(6)
72,956
1,581
ERO
Copper
(CAD) (6)
44,510
948
Franco-Nevada
16,400
2,030
Freeport-McMoRan
77,314
4,077
IGO
(AUD)
292,967
1,372
Pilbara
Minerals
(AUD)
868,992
2,212
Royal
Gold
6,427
824
South32
(AUD)
730,548
1,936
Southern
Copper
53,505
6,347
Wheaton
Precious
Metals
43,068
2,373
33,877
Paper
&
Forest
Products
0.1%
Louisiana-Pacific
9,300
853
Stora
Enso,
Class
R
(EUR)
164,028
2,403
West
Fraser
Timber
(CAD)
8,877
710
3,966
Total
Materials
92,574
REAL
ESTATE
0.9%
Health
Care
Real
Estate
Investment
Trusts
0.0%
Healthcare
Realty
Trust,
REIT
42,008
682
682
Industrial
Real
Estate
Investment
Trusts
0.1%
EastGroup
Properties,
REIT
7,328
1,211
Prologis,
REIT
12,709
1,404
Rexford
Industrial
Realty,
REIT
15,712
713
Terreno
Realty,
REIT
19,659
1,112
4,440
Office
Real
Estate
Investment
Trusts
0.0%
Great
Portland
Estates
(GBP)
215,680
954
Great
Portland
Estates,
Rights,
6/11/24
(GBP) (6)
123,203
168
1,122
Real
Estate
Management
&
Development
0.2%
Colliers
International
Group
7,362
826
DigitalBridge
Group
88,021
1,201
FirstService
10,271
1,511
Mitsui
Fudosan
(JPY)
514,900
4,730
8,268
T.
ROWE
PRICE
Spectrum
Moderate
Growth
Allocation
Fund
Shares/Par
$
Value
(Cost
and
value
in
$000s)
‡
Residential
Real
Estate
Investment
Trusts
0.1%
Equity
LifeStyle
Properties,
REIT
38,597
2,423
Flagship
Communities
REIT
25,948
387
Independence
Realty
Trust,
REIT
65,717
1,097
3,907
Retail
Real
Estate
Investment
Trusts
0.1%
Scentre
Group
(AUD)
1,454,517
3,069
3,069
Specialized
Real
Estate
Investment
Trusts
0.4%
CubeSmart
,
REIT
29,676
1,255
Public
Storage,
REIT
28,502
7,805
Weyerhaeuser,
REIT
114,481
3,438
12,498
Total
Real
Estate
33,986
UTILITIES
1.3%
Electric
Utilities
0.7%
Constellation
Energy
58,361
12,679
IDACORP
7,190
686
NextEra
Energy
59,403
4,753
OGE
Energy
20,214
734
PNM
Resources
25,614
982
Xcel
Energy
59,308
3,289
23,123
Gas
Utilities
0.1%
Beijing
Enterprises
Holdings
(HKD)
258,000
909
Chesapeake
Utilities
15,097
1,691
2,600
Independent
Power
&
Renewable
Electricity
Producers
0.1%
Electric
Power
Development
(JPY)
125,400
2,107
Talen
Energy (6)
6,046
696
2,803
Multi-Utilities
0.4%
Ameren
50,077
3,674
Engie
(EUR)
393,039
6,659
National
Grid
(GBP)
313,453
3,552
National
Grid,
Rights,
6/12/24
(GBP) (6)
91,424
228
14,113
Water
Utilities
0.0%
California
Water
Service
Group
19,404
968
T.
ROWE
PRICE
Spectrum
Moderate
Growth
Allocation
Fund
Shares/Par
$
Value
(Cost
and
value
in
$000s)
‡
Middlesex
Water
6,656
359
1,327
Total
Utilities
43,966
Total
Miscellaneous
Common
Stocks
0.1%
(10)
4,657
Total
Common
Stocks
(Cost
$1,325,393)
2,335,802
CONVERTIBLE
BONDS
0.0%
Kardium
,
10.00%,
12/31/26,
Acquisition
Date:
5/31/24,
Cost $113 (6)(7)(8)
112,600
113
Total
Convertible
Bonds
(Cost
$113)
113
CONVERTIBLE
PREFERRED
STOCKS
0.2%
CONSUMER
DISCRETIONARY
0.0%
Hotels,
Restaurants
&
Leisure
0.0%
Torchys
Holdings,
Acquisition
Date:
11/13/20,
Cost $159 (6)(7)
(8)(9)
17,718
78
78
Specialty
Retail
0.0%
1661,
Series
F,
Acquisition
Date:
5/28/21,
Cost $242 (6)(7)(8)
41,545
41
41
Total
Consumer
Discretionary
119
CONSUMER
STAPLES
0.0%
Food
Products
0.0%
Farmers
Business
Network,
Series
D,
Acquisition
Date:
11/3/17,
Cost $1 (6)(7)(8)
32
—
Total
Consumer
Staples
—
FINANCIALS
0.0%
Banks
0.0%
CRB
Group,
Series
D,
Acquisition
Date:
1/28/22,
Cost $224 (6)
(7)(8)
2,133
156
Total
Financials
156
HEALTH
CARE
0.1%
Biotechnology
0.0%
Caris
Life
Sciences,
Series
C,
Acquisition
Date:
8/14/20,
Cost $107 (6)(7)(8)
38,898
141
Caris
Life
Sciences,
Series
D,
Acquisition
Date:
5/11/21,
Cost $180 (6)(7)(8)
22,236
81
222
T.
ROWE
PRICE
Spectrum
Moderate
Growth
Allocation
Fund
Shares/Par
$
Value
(Cost
and
value
in
$000s)
‡
Health
Care
Equipment
&
Supplies
0.0%
Kardium
,
Series
D-6,
Acquisition
Date:
1/8/21,
Cost $120 (6)(7)
(8)
118,345
101
101
Health
Care
Providers
&
Services
0.0%
Honor
Technology,
Series
D,
Acquisition
Date:
10/16/20,
Cost $223 (6)(7)(8)
92,428
158
158
Life
Sciences
Tools
&
Services
0.1%
Cleerly
,
Series
C,
Acquisition
Date:
7/8/22,
Cost $118 (6)(7)(8)
10,046
90
Inscripta
,
Series
E,
Acquisition
Date:
3/30/21,
Cost $128 (6)(7)
(8)
14,444
27
National
Resilience,
Series
B,
Acquisition
Date:
10/23/20,
Cost $160 (6)(7)(8)
11,776
715
National
Resilience,
Series
C,
Acquisition
Date:
6/9/21,
Cost $262 (6)(7)(8)
5,896
358
1,190
Total
Health
Care
1,671
INDUSTRIALS
&
BUSINESS
SERVICES
0.0%
Aerospace
&
Defense
0.0%
ABL
Space
Systems,
Series
B,
Acquisition
Date:
3/24/21,
Cost $129 (6)(7)(8)
2,868
101
Epirus,
Series
C-2,
Acquisition
Date:
1/28/22,
Cost $283 (6)(7)
(8)
50,717
247
348
Air
Freight
&
Logistics
0.0%
Flexe
,
Series
C,
Acquisition
Date:
11/18/20,
Cost $119 (6)(7)(8)
9,815
63
Flexe
,
Series
D,
Acquisition
Date:
4/7/22,
Cost $75 (6)(7)(8)
3,669
23
86
Electrical
Equipment
0.0%
CELLINK,
Series
D,
Acquisition
Date:
1/20/22,
Cost $139 (6)
(7)(8)
6,676
19
19
Professional
Services
0.0%
Checkr
,
Series
C,
Acquisition
Date:
4/10/18,
Cost $67 (6)(7)(8)
14,736
64
Checkr
,
Series
D,
Acquisition
Date:
9/6/19,
Cost $263 (6)(7)(8)
26,046
112
176
Total
Industrials
&
Business
Services
629
T.
ROWE
PRICE
Spectrum
Moderate
Growth
Allocation
Fund
Shares/Par
$
Value
(Cost
and
value
in
$000s)
‡
INFORMATION
TECHNOLOGY
0.1%
IT
Services
0.0%
Haul
Hub,
Series
B,
Acquisition
Date:
2/14/20
-
3/3/21,
Cost $98 (6)(7)(8)
6,732
48
Haul
Hub,
Series
C,
Acquisition
Date:
4/14/22,
Cost $45 (6)(7)
(8)
2,367
17
ServiceTitan
,
Series
A-1,
Acquisition
Date:
11/9/18,
Cost $— (6)
(7)(8)
7
—
ServiceTitan
,
Series
D,
Acquisition
Date:
11/9/18,
Cost $87 (6)
(7)(8)
3,321
262
ServiceTitan
,
Series
F,
Acquisition
Date:
3/25/21,
Cost $22 (6)
(7)(8)
204
16
Themis
Solutions,
Series
AA,
Acquisition
Date:
4/14/21,
Cost $14 (6)(7)(8)
610
21
Themis
Solutions,
Series
AB,
Acquisition
Date:
4/14/21,
Cost $1 (6)(7)(8)
60
2
Themis
Solutions,
Series
B,
Acquisition
Date:
4/14/21,
Cost $2 (6)(7)(8)
70
2
Themis
Solutions,
Series
E,
Acquisition
Date:
4/14/21,
Cost $174 (6)(7)(8)
7,740
263
631
Software
0.1%
Canva
,
Series
A,
Acquisition
Date:
11/4/21
-
12/17/21,
Cost $51 (6)(7)(8)
30
32
Canva
,
Series
A-3,
Acquisition
Date:
12/17/21,
Cost $3 (6)(7)(8)
2
2
Databricks
,
Series
G,
Acquisition
Date:
2/1/21,
Cost $260 (6)
(7)(8)
4,398
323
Databricks
,
Series
H,
Acquisition
Date:
8/31/21,
Cost $765 (6)
(7)(8)
10,416
766
Databricks
,
Series
I,
Acquisition
Date:
9/14/23,
Cost $88 (6)(7)
(8)
1,201
88
Gusto,
Series
E,
Acquisition
Date:
7/13/21,
Cost $380 (6)(7)(8)
12,516
233
Nuro
,
Series
C,
Acquisition
Date:
10/30/20
-
3/2/21,
Cost $271 (6)(7)(8)
20,748
85
Nuro
,
Series
D,
Acquisition
Date:
10/29/21,
Cost $124 (6)(7)(8)
5,932
24
SecurityScorecard
,
Series
E,
Acquisition
Date:
3/5/21,
Cost $118 (6)(7)(8)
23,436
124
Seismic
Software,
Series
E,
Acquisition
Date:
12/13/18,
Cost $127 (6)(7)(8)
20,060
114
Seismic
Software,
Series
F,
Acquisition
Date:
9/25/20,
Cost $17 (6)(7)(8)
1,875
11
Socure
,
Series
A,
Acquisition
Date:
12/22/21,
Cost $56 (6)(7)(8)
3,491
22
Socure
,
Series
A-1,
Acquisition
Date:
12/22/21,
Cost $46 (6)(7)
(8)
2,865
18
Socure
,
Series
B,
Acquisition
Date:
12/22/21,
Cost $1 (6)(7)(8)
52
—
T.
ROWE
PRICE
Spectrum
Moderate
Growth
Allocation
Fund
Shares/Par
$
Value
(Cost
and
value
in
$000s)
‡
Socure
,
Series
E,
Acquisition
Date:
10/27/21,
Cost $107 (6)(7)
(8)
6,640
41
1,883
Total
Information
Technology
2,514
MATERIALS
0.0%
Chemicals
0.0%
Redwood
Materials,
Series
C,
Acquisition
Date:
5/28/21,
Cost $159 (6)(7)(8)
3,356
160
Sila
Nano,
Series
F,
Acquisition
Date:
1/7/21,
Cost $217 (6)(7)
(8)
5,247
106
266
Metals
&
Mining
0.0%
Kobold
Metals,
Series
B-1,
Acquisition
Date:
1/10/22,
Cost $144 (6)(7)(8)
5,255
385
385
Total
Materials
651
Total
Convertible
Preferred
Stocks
(Cost
$6,376)
5,740
CORPORATE
BONDS
1.8%
AbbVie,
4.05%,
11/21/39
355,000
308
AbbVie,
4.50%,
5/14/35
302,000
284
AbbVie,
5.05%,
3/15/34
335,000
331
AerCap
Ireland
Capital,
3.30%,
1/30/32
365,000
312
AerCap
Ireland
Capital,
5.10%,
1/19/29
150,000
147
AGCO,
5.80%,
3/21/34
60,000
60
Alexandria
Real
Estate
Equities,
5.25%,
5/15/36
35,000
33
American
Electric
Power,
5.20%,
1/15/29
170,000
169
American
Tower,
5.20%,
2/15/29
90,000
89
American
Tower,
5.45%,
2/15/34
260,000
257
Anheuser-Busch
InBev
Worldwide,
5.55%,
1/23/49
335,000
334
Aon,
2.80%,
5/15/30
80,000
70
Astrazeneca
Finance,
5.00%,
2/26/34
370,000
365
AT&T,
3.50%,
9/15/53
159,000
107
Athene
Global
Funding,
5.684%,
2/23/26 (1)
335,000
334
Atlassian
,
5.25%,
5/15/29
75,000
75
Autostrade
per
l'Italia
,
2.00%,
1/15/30
(EUR)
250,000
242
BAE
Systems,
5.30%,
3/26/34 (1)
200,000
197
Baltimore
Gas
&
Electric,
5.40%,
6/1/53
105,000
101
Banco
Bilbao
Vizcaya
Argentaria,
VR,
6.033%,
3/13/35 (11)
200,000
200
Bank
of
America,
VR,
1.898%,
7/23/31 (11)
1,695,000
1,380
Bank
of
America,
VR,
5.819%,
9/15/29 (11)
710,000
720
T.
ROWE
PRICE
Spectrum
Moderate
Growth
Allocation
Fund
Shares/Par
$
Value
(Cost
and
value
in
$000s)
‡
Bank
of
New
York
Mellon,
VR,
5.188%,
3/14/35 (11)
225,000
221
Bank
of
New
York
Mellon,
VR,
6.474%,
10/25/34 (11)
260,000
280
Barclays,
VR,
2.852%,
5/7/26 (11)
200,000
195
Barclays,
VR,
5.501%,
8/9/28 (11)
200,000
199
Barclays,
VR,
5.69%,
3/12/30 (11)
210,000
210
Barclays,
VR,
6.692%,
9/13/34 (5)(11)
365,000
386
BAT
Capital,
2.259%,
3/25/28
80,000
71
BAT
Capital,
6.00%,
2/20/34
130,000
132
BAT
Capital,
6.343%,
8/2/30
45,000
47
BAT
Capital,
7.079%,
8/2/43
110,000
117
BAT
Capital,
7.081%,
8/2/53
210,000
226
Bayer
U.S.
Finance,
6.375%,
11/21/30 (1)
275,000
280
Becton
Dickinson
&
Company,
2.823%,
5/20/30
115,000
101
Becton
Dickinson
&
Company,
4.298%,
8/22/32
70,000
65
Bimbo
Bakeries
USA,
5.375%,
1/9/36 (1)
200,000
193
Bimbo
Bakeries
USA,
6.40%,
1/15/34 (1)
200,000
211
BNP
Paribas,
VR,
5.738%,
2/20/35 (1)(11)
305,000
303
Boardwalk
Pipelines,
3.40%,
2/15/31
200,000
174
Boeing,
3.25%,
2/1/28
55,000
50
Boeing,
3.75%,
2/1/50
76,000
50
Boeing,
5.04%,
5/1/27
320,000
313
Boeing,
6.388%,
5/1/31 (1)
125,000
127
Boeing,
6.528%,
5/1/34 (1)
290,000
294
Boeing,
6.858%,
5/1/54 (1)
95,000
96
Booz
Allen
Hamilton,
5.95%,
8/4/33
95,000
98
Boston
Gas,
6.119%,
7/20/53 (1)
75,000
74
Bristol-Myers
Squibb,
5.55%,
2/22/54
105,000
103
Bristol-Myers
Squibb,
5.65%,
2/22/64
140,000
137
Bristol-Myers
Squibb,
6.25%,
11/15/53
162,000
174
Brixmor
Operating
Partnership,
4.05%,
7/1/30
57,000
52
Brixmor
Operating
Partnership,
4.125%,
5/15/29
504,000
473
Broadcom,
2.60%,
2/15/33 (1)
175,000
139
Broadcom,
3.419%,
4/15/33 (1)
240,000
205
CaixaBank
,
VR,
6.037%,
6/15/35 (1)(11)
290,000
290
CaixaBank
,
VR,
6.208%,
1/18/29 (1)(11)
260,000
264
CaixaBank
,
VR,
6.684%,
9/13/27 (1)(11)
225,000
229
CaixaBank
,
VR,
6.84%,
9/13/34 (1)(11)
265,000
281
Capital
One
Financial,
3.75%,
3/9/27
50,000
48
Capital
One
Financial,
VR,
2.359%,
7/29/32 (11)
182,000
142
Capital
One
Financial,
VR,
3.273%,
3/1/30 (11)
130,000
117
Capital
One
Financial,
VR,
5.247%,
7/26/30 (11)
75,000
73
Capital
One
Financial,
VR,
5.468%,
2/1/29 (11)
410,000
406
Capital
One
Financial,
VR,
5.70%,
2/1/30 (11)
49,000
49
T.
ROWE
PRICE
Spectrum
Moderate
Growth
Allocation
Fund
Shares/Par
$
Value
(Cost
and
value
in
$000s)
‡
Capital
One
Financial,
VR,
6.051%,
2/1/35 (11)
135,000
136
Capital
One
Financial,
VR,
7.624%,
10/30/31 (11)
45,000
49
Carvana
,
12.00%,
12/1/28,
(12.00%
PIK) (1)(12)
284,759
297
Carvana
,
13.00%,
6/1/30,
(13.00%
PIK) (1)(12)
428,984
441
Carvana
,
14.00%,
6/1/31,
(14.00%
PIK) (1)(12)
510,613
537
Cellnex
Finance,
2.00%,
2/15/33
(EUR)
100,000
91
Cellnex
Telecom,
1.75%,
10/23/30
(EUR)
300,000
284
Centene
,
2.50%,
3/1/31
260,000
212
Centene
,
2.625%,
8/1/31
685,000
556
Centene
,
4.25%,
12/15/27
50,000
47
Centene
,
4.625%,
12/15/29
231,000
216
Charter
Communications
Operating,
2.80%,
4/1/31
305,000
248
Charter
Communications
Operating,
3.75%,
2/15/28
130,000
121
Charter
Communications
Operating,
5.25%,
4/1/53
330,000
260
Charter
Communications
Operating,
6.484%,
10/23/45
50,000
46
Charter
Communications
Operating,
6.65%,
2/1/34
290,000
294
Cheniere
Corpus
Christi
Holdings,
5.125%,
6/30/27
120,000
119
Cheniere
Energy,
4.625%,
10/15/28
100,000
97
Cheniere
Energy,
5.65%,
4/15/34 (1)
245,000
243
Cheniere
Energy
Partners,
4.50%,
10/1/29
67,000
64
Cheniere
Energy
Partners,
5.75%,
8/15/34 (1)
370,000
367
Cheniere
Energy
Partners,
5.95%,
6/30/33
195,000
196
Citigroup,
4.45%,
9/29/27
75,000
73
Citigroup,
VR,
3.106%,
4/8/26 (11)
110,000
108
Citigroup,
VR,
5.827%,
2/13/35 (11)
840,000
832
CNO
Financial
Group,
5.25%,
5/30/25
79,000
78
Columbia
Pipelines
Holding,
5.681%,
1/15/34 (1)
240,000
235
Comcast,
3.25%,
11/1/39
300,000
229
Continental
Resources,
4.375%,
1/15/28
50,000
48
Corebridge
Financial,
3.85%,
4/5/29
50,000
46
Corebridge
Financial,
3.90%,
4/5/32
245,000
219
Corebridge
Global
Funding,
5.20%,
1/12/29 (1)
50,000
50
Crown
Castle,
2.25%,
1/15/31
230,000
188
Crown
Castle,
4.80%,
9/1/28
50,000
49
Crown
Castle,
5.60%,
6/1/29
185,000
186
Crown
Castle,
5.80%,
3/1/34
120,000
121
Crown
Castle
Towers,
3.663%,
5/15/25 (1)
355,000
347
CVS
Health,
5.05%,
3/25/48
491,000
424
CVS
Health,
5.625%,
2/21/53
225,000
209
CVS
Health,
5.875%,
6/1/53
125,000
120
Daimler
Truck
Finance
North
America,
5.375%,
1/18/34 (1)
150,000
148
Danske
Bank,
VR,
3.244%,
12/20/25 (1)(11)
260,000
256
Danske
Bank,
VR,
5.705%,
3/1/30 (1)(11)
200,000
200
T.
ROWE
PRICE
Spectrum
Moderate
Growth
Allocation
Fund
Shares/Par
$
Value
(Cost
and
value
in
$000s)
‡
Deutsche
Bank,
VR,
3.961%,
11/26/25 (11)
170,000
168
Diamondback
Energy,
5.15%,
1/30/30
85,000
84
Diamondback
Energy,
5.40%,
4/18/34
380,000
374
Diamondback
Energy,
5.75%,
4/18/54
130,000
125
Diamondback
Energy,
5.90%,
4/18/64
160,000
154
Diamondback
Energy,
6.25%,
3/15/53
115,000
119
Dollar
General,
5.45%,
7/5/33
18,000
18
DTE
Energy,
4.875%,
6/1/28
45,000
44
DTE
Energy,
5.10%,
3/1/29
340,000
335
Duke
Energy,
5.00%,
8/15/52
295,000
257
Duke
Energy,
6.10%,
9/15/53
135,000
138
Edison
International,
6.95%,
11/15/29
45,000
48
Elevance
Health,
5.125%,
2/15/53
115,000
106
Eli
Lilly,
4.70%,
2/9/34
380,000
369
Enbridge,
5.30%,
4/5/29
145,000
144
Enbridge,
5.625%,
4/5/34
200,000
198
Enbridge,
6.20%,
11/15/30
75,000
78
Enbridge,
6.70%,
11/15/53
120,000
131
Energy
Transfer,
2.90%,
5/15/25
465,000
452
Energy
Transfer,
5.55%,
5/15/34
130,000
128
Energy
Transfer,
5.95%,
5/15/54
85,000
82
Energy
Transfer,
6.40%,
12/1/30
160,000
167
Energy
Transfer,
6.55%,
12/1/33
80,000
84
Engie
,
5.25%,
4/10/29 (1)
200,000
199
Engie
,
5.625%,
4/10/34 (1)
200,000
200
Eni,
5.50%,
5/15/34 (1)
200,000
199
Eni,
5.95%,
5/15/54 (1)
230,000
228
Eversource
Energy,
5.85%,
4/15/31
190,000
192
Eversource
Energy,
5.95%,
7/15/34
360,000
362
Exelon,
5.45%,
3/15/34
125,000
124
Exelon,
5.60%,
3/15/53
380,000
366
Fifth
Third
Bancorp,
2.375%,
1/28/25
50,000
49
Fifth
Third
Bancorp,
2.55%,
5/5/27
25,000
23
Fifth
Third
Bancorp,
3.95%,
3/14/28
81,000
77
Fifth
Third
Bancorp,
VR,
5.631%,
1/29/32 (11)
80,000
79
Fifth
Third
Bancorp,
VR,
6.339%,
7/27/29 (11)
170,000
174
FirstEnergy,
2.65%,
3/1/30
85,000
73
FirstEnergy,
Series B,
2.25%,
9/1/30
41,000
34
FirstEnergy,
Series C,
3.40%,
3/1/50
285,000
188
Fiserv,
4.20%,
10/1/28
50,000
48
Ford
Motor,
9.625%,
4/22/30
40,000
46
Ford
Motor
Credit,
5.80%,
3/5/27
380,000
379
Ford
Motor
Credit,
6.798%,
11/7/28
200,000
207
T.
ROWE
PRICE
Spectrum
Moderate
Growth
Allocation
Fund
Shares/Par
$
Value
(Cost
and
value
in
$000s)
‡
Ford
Motor
Credit,
7.122%,
11/7/33
200,000
213
Freeport-McMoRan,
4.375%,
8/1/28
99,000
95
Freeport-McMoRan,
5.00%,
9/1/27
22,000
22
General
Motors
Financial,
5.55%,
7/15/29
185,000
184
General
Motors
Financial,
5.80%,
6/23/28
90,000
91
Georgia
Power,
4.95%,
5/17/33
240,000
233
Georgia
Power,
5.25%,
3/15/34
165,000
164
GLP
Capital,
3.35%,
9/1/24
60,000
60
Goldman
Sachs
Group,
VR,
2.615%,
4/22/32 (11)
780,000
647
Goldman
Sachs
Group,
VR,
3.615%,
3/15/28 (11)
275,000
262
Goldman
Sachs
Group,
VR,
3.691%,
6/5/28 (11)
100,000
95
Goldman
Sachs
Group,
VR,
4.482%,
8/23/28 (11)
315,000
307
HCA,
2.375%,
7/15/31
100,000
82
HCA,
3.50%,
9/1/30
249,000
222
Healthcare
Realty
Holdings,
2.05%,
3/15/31
95,000
73
Healthcare
Realty
Holdings,
3.625%,
1/15/28
260,000
238
Humana,
4.875%,
4/1/30
230,000
224
Humana,
5.375%,
4/15/31
220,000
217
Humana,
5.75%,
4/15/54
90,000
87
Humana,
5.95%,
3/15/34
135,000
137
Hyundai
Capital
America,
5.35%,
3/19/29 (1)
80,000
79
Hyundai
Capital
America,
5.40%,
1/8/31 (1)
50,000
50
Hyundai
Capital
America,
5.50%,
3/30/26 (1)
70,000
70
Hyundai
Capital
America,
6.50%,
1/16/29 (1)
95,000
98
Icon
Investments
Six,
5.849%,
5/8/29
200,000
202
Icon
Investments
Six,
6.00%,
5/8/34
200,000
203
Indianapolis
Power
&
Light,
5.70%,
4/1/54 (1)
80,000
78
ING
Groep
,
VR,
6.114%,
9/11/34 (11)
400,000
412
Ingersoll
Rand,
5.314%,
6/15/31
120,000
120
Ingersoll
Rand,
5.45%,
6/15/34
100,000
100
Ingersoll
Rand,
5.70%,
6/15/54
80,000
81
Interpublic
Group,
4.65%,
10/1/28
110,000
107
Invitation
Homes
Operating
Partnership,
5.45%,
8/15/30
66,000
66
IPALCO
Enterprises,
5.75%,
4/1/34 (1)
140,000
138
IQVIA,
6.25%,
2/1/29
195,000
199
JPMorgan
Chase,
VR,
2.522%,
4/22/31 (11)
70,000
60
JPMorgan
Chase,
VR,
2.739%,
10/15/30 (11)
110,000
96
JPMorgan
Chase,
VR,
2.956%,
5/13/31 (11)
485,000
419
JPMorgan
Chase,
VR,
5.04%,
1/23/28 (11)
140,000
138
JPMorgan
Chase,
VR,
5.336%,
1/23/35 (11)
130,000
128
Kilroy
Realty,
3.45%,
12/15/24
470,000
464
Las
Vegas
Sands,
3.50%,
8/18/26
95,000
90
Las
Vegas
Sands,
5.90%,
6/1/27
55,000
55
T.
ROWE
PRICE
Spectrum
Moderate
Growth
Allocation
Fund
Shares/Par
$
Value
(Cost
and
value
in
$000s)
‡
Lowe's,
4.25%,
4/1/52
59,000
46
Lowe's,
5.625%,
4/15/53
80,000
77
Lowe's,
5.75%,
7/1/53
80,000
79
Lseg
U.S.
Fin,
5.297%,
3/28/34 (1)
200,000
198
LSEGA
Financing,
2.50%,
4/6/31 (1)
200,000
167
LSEGA
Financing,
3.20%,
4/6/41 (1)
200,000
149
Mars,
4.75%,
4/20/33 (1)
220,000
212
Marsh
&
McLennan,
5.70%,
9/15/53
285,000
286
Mattel,
5.875%,
12/15/27 (1)
215,000
213
Meta
Platforms,
5.60%,
5/15/53
310,000
313
Metropolitan
Life
Global
Funding
I,
5.15%,
3/28/33 (1)
150,000
147
Micron
Technology,
5.327%,
2/6/29
115,000
115
Micron
Technology,
6.75%,
11/1/29
155,000
164
MidAmerican
Energy,
5.85%,
9/15/54
90,000
92
Morgan
Stanley,
VR,
5.123%,
2/1/29 (11)
345,000
342
Morgan
Stanley,
VR,
5.173%,
1/16/30 (11)
225,000
223
Motorola
Solutions,
5.00%,
4/15/29
95,000
93
Motorola
Solutions,
5.40%,
4/15/34
115,000
114
Netflix,
4.625%,
5/15/29
(EUR)
290,000
327
NextEra
Energy
Capital
Holdings,
2.44%,
1/15/32
131,000
107
Niagara
Mohawk
Power,
5.664%,
1/17/54 (1)
135,000
130
NiSource,
5.25%,
3/30/28
45,000
45
NRG
Energy,
4.45%,
6/15/29 (1)
85,000
80
Occidental
Petroleum,
6.125%,
1/1/31
225,000
230
Occidental
Petroleum,
6.20%,
3/15/40
115,000
115
Occidental
Petroleum,
6.375%,
9/1/28
65,000
67
Occidental
Petroleum,
6.625%,
9/1/30
310,000
324
Occidental
Petroleum,
7.50%,
5/1/31
185,000
204
Occidental
Petroleum,
8.875%,
7/15/30
540,000
616
ONEOK,
5.65%,
11/1/28
45,000
45
ONEOK,
5.80%,
11/1/30
130,000
132
ONEOK,
6.05%,
9/1/33
130,000
133
Oracle,
4.90%,
2/6/33
240,000
231
Ovintiv
,
5.65%,
5/15/28
95,000
96
Owens
Corning,
5.70%,
6/15/34
130,000
130
Owens
Corning,
5.95%,
6/15/54
135,000
135
Pacific
Gas
&
Electric,
2.10%,
8/1/27
74,000
67
Pacific
Gas
&
Electric,
2.50%,
2/1/31
205,000
169
Pacific
Gas
&
Electric,
4.55%,
7/1/30
245,000
231
Pacific
Gas
&
Electric,
5.80%,
5/15/34
185,000
185
Pacific
Gas
&
Electric,
5.90%,
6/15/32
80,000
80
Pacific
Gas
&
Electric,
6.70%,
4/1/53
80,000
84
Pacific
Gas
&
Electric,
6.75%,
1/15/53
195,000
206
T.
ROWE
PRICE
Spectrum
Moderate
Growth
Allocation
Fund
Shares/Par
$
Value
(Cost
and
value
in
$000s)
‡
Pacific
Gas
&
Electric,
6.95%,
3/15/34
135,000
146
PacifiCorp,
5.30%,
2/15/31
200,000
198
Palomino
Funding
Trust
I,
7.233%,
5/17/28 (1)
540,000
561
Pfizer
Investment
Enterprises,
5.30%,
5/19/53
145,000
139
Pfizer
Investment
Enterprises,
5.34%,
5/19/63
220,000
207
Philip
Morris
International,
5.125%,
2/15/30
150,000
149
PNC
Financial
Services
Group,
VR,
5.30%,
1/21/28 (11)
70,000
70
PNC
Financial
Services
Group,
VR,
6.875%,
10/20/34 (11)
135,000
146
Raizen
Fuels
Finance,
6.45%,
3/5/34 (1)
200,000
203
Raizen
Fuels
Finance,
6.95%,
3/5/54 (1)
200,000
202
Revvity
,
1.90%,
9/15/28
185,000
160
Revvity
,
2.25%,
9/15/31
100,000
81
Revvity
,
3.30%,
9/15/29
109,000
99
Rogers
Communications,
3.80%,
3/15/32
150,000
133
Rogers
Communications,
4.35%,
5/1/49
20,000
16
Rogers
Communications,
4.55%,
3/15/52
720,000
584
Rogers
Communications,
5.00%,
2/15/29
270,000
265
Rogers
Communications,
5.30%,
2/15/34
305,000
296
Ross
Stores,
1.875%,
4/15/31
260,000
211
Sabine
Pass
Liquefaction,
4.20%,
3/15/28
55,000
53
Santander
Holdings
USA,
VR,
6.124%,
5/31/27 (11)
65,000
65
Santander
Holdings
USA,
VR,
6.342%,
5/31/35 (11)
315,000
315
Santander
UK
Group
Holdings,
VR,
1.532%,
8/21/26 (11)
545,000
516
Sartorius
Finance,
4.875%,
9/14/35
(EUR)
200,000
227
SBA
Tower
Trust,
1.84%,
4/15/27 (1)
290,000
259
SBA
Tower
Trust,
2.328%,
1/15/28 (1)
40,000
35
SBA
Tower
Trust,
2.593%,
10/15/31 (1)
235,000
190
Sempra,
3.40%,
2/1/28
50,000
47
Sempra,
3.70%,
4/1/29
75,000
70
Societe
Generale
,
VR,
5.519%,
1/19/28 (1)(11)
490,000
484
Societe
Generale
,
VR,
5.634%,
1/19/30 (1)(11)
240,000
238
Solventum
,
5.40%,
3/1/29 (1)
230,000
229
Solventum
,
5.60%,
3/23/34 (1)
240,000
236
Solventum
,
5.90%,
4/30/54 (1)
245,000
235
Solventum
,
6.00%,
5/15/64 (1)
245,000
234
Southern,
5.20%,
6/15/33
355,000
348
Southern,
5.70%,
3/15/34
285,000
289
Southern
California
Edison,
5.45%,
6/1/31
65,000
65
Southern
California
Edison,
5.70%,
3/1/53
115,000
112
Sprint
Capital,
6.875%,
11/15/28
305,000
321
Sprint
Capital,
8.75%,
3/15/32
215,000
256
Standard
Chartered,
VR,
5.905%,
5/14/35 (1)(11)
420,000
420
Stanley
Black
&
Decker,
2.75%,
11/15/50
99,000
56
T.
ROWE
PRICE
Spectrum
Moderate
Growth
Allocation
Fund
Shares/Par
$
Value
(Cost
and
value
in
$000s)
‡
Sutter
Health,
5.164%,
8/15/33
75,000
75
T-Mobile
USA,
5.75%,
1/15/54
465,000
463
T-Mobile
USA,
6.00%,
6/15/54
275,000
284
Targa
Resources,
6.15%,
3/1/29
91,000
93
Targa
Resources
Partners,
5.00%,
1/15/28
45,000
44
Targa
Resources
Partners,
5.50%,
3/1/30
320,000
315
Targa
Resources
Partners,
6.875%,
1/15/29
57,000
58
U.S.
Bancorp,
VR,
5.384%,
1/23/30 (11)
100,000
99
U.S.
Bancorp,
VR,
5.678%,
1/23/35 (11)
305,000
304
UBS
Group,
VR,
3.091%,
5/14/32 (1)(11)
285,000
243
UBS
Group,
VR,
6.301%,
9/22/34 (1)(11)
200,000
208
UBS
Group,
VR,
6.537%,
8/12/33 (1)(11)
480,000
505
UBS
Group,
VR,
9.25% (1)(11)(13)
200,000
213
UnitedHealth
Group,
4.50%,
4/15/33
225,000
214
UnitedHealth
Group,
5.00%,
4/15/34
325,000
318
UnitedHealth
Group,
5.05%,
4/15/53
365,000
340
UnitedHealth
Group,
5.875%,
2/15/53
185,000
193
VF,
2.95%,
4/23/30
239,000
193
Vistra
Operations,
6.00%,
4/15/34 (1)
85,000
85
Vistra
Operations,
6.95%,
10/15/33 (1)
100,000
106
Volkswagen
Group
of
America
Finance,
5.60%,
3/22/34 (1)
210,000
208
Walt
Disney,
3.60%,
1/13/51
135,000
100
Warnermedia
Holdings,
3.755%,
3/15/27
326,000
309
Wells
Fargo,
VR,
2.572%,
2/11/31 (11)
1,773,000
1,525
Western
Midstream
Operating,
4.50%,
3/1/28
50,000
48
Western
Midstream
Operating,
6.35%,
1/15/29
45,000
46
Westlake,
1.625%,
7/17/29
(EUR)
300,000
288
Xcel
Energy,
3.40%,
6/1/30
255,000
228
Total
Corporate
Bonds
(Cost
$62,165)
60,523
EQUITY
MUTUAL
FUNDS
12.7%
T.
Rowe
Price
Institutional
Emerging
Markets
Equity
Fund (3)
5,676,635
176,884
T.
Rowe
Price
Multi-Strategy
Total
Return
Fund
-
I
Class (3)
7,109,842
68,539
T.
Rowe
Price
Real
Assets
Fund
-
I
Class (3)
12,301,532
179,110
Total
Equity
Mutual
Funds
(Cost
$416,032)
424,533
FOREIGN
GOVERNMENT
OBLIGATIONS
&
MUNICIPALITIES
0.1%
Corp.
Nacional
del
Cobre
de
Chile,
6.30%,
9/8/53
200,000
196
Corp.
Nacional
del
Cobre
de
Chile,
6.30%,
9/8/53 (1)
200,000
196
Corp.
Nacional
del
Cobre
de
Chile,
6.44%,
1/26/36 (1)
200,000
204
Freeport
Indonesia,
5.315%,
4/14/32
260,000
251
T.
ROWE
PRICE
Spectrum
Moderate
Growth
Allocation
Fund
Shares/Par
$
Value
(Cost
and
value
in
$000s)
‡
Gaci
First
Investment,
4.875%,
2/14/35
245,000
231
Gaci
First
Investment,
5.125%,
2/14/53
420,000
360
Kingdom
of
Saudi
Arabia,
5.75%,
1/16/54 (1)
200,000
194
Petroleos
Mexicanos
,
6.50%,
3/13/27
620,000
587
Republic
of
Panama,
7.50%,
3/1/31
455,000
471
Republic
of
Romania,
5.875%,
1/30/29 (1)
270,000
268
United
Mexican
States,
5.00%,
5/7/29
240,000
234
United
Mexican
States,
6.00%,
5/7/36
230,000
226
Total
Foreign
Government
Obligations
&
Municipalities
(Cost
$3,408)
3,418
MUNICIPAL
SECURITIES
0.0%
California
0.0%
Los
Angeles
Dept.
of
Airports,
Build
America,
6.582%,
5/15/39
45,000
48
48
Illinois
0.0%
Illinois,
Build
America,
GO,
7.35%,
7/1/35
51,429
55
55
Total
Municipal
Securities
(Cost
$102)
103
NON-U.S.
GOVERNMENT
MORTGAGE-BACKED
SECURITIES
0.2%
Bayview
MSR
Opportunity
Master
Fund
Trust,
Series 2021-4,
Class
A20,
CMO,
ARM,
2.50%,
10/25/51 (1)
252,431
195
BBCMS
Mortgage
Trust,
Series 2019-BWAY,
Class
D,
ARM,
1M
TSFR
+
2.274%,
7.591%,
11/15/34 (1)
135,000
17
BINOM
Securitization
Trust,
Series 2021-INV1,
Class
A1,
CMO,
ARM,
2.034%,
6/25/56 (1)
117,550
101
BX
Commercial
Mortgage
Trust,
Series 2024-MDHS,
Class
A,
ARM,
1M
TSFR
+
1.641%,
6.991%,
5/15/41 (1)
595,000
596
BX
Trust,
Series 2021-ARIA,
Class
B,
ARM,
1M
TSFR
+
1.411%,
6.728%,
10/15/36 (1)
150,000
148
CIM
Trust,
Series 2021-INV1,
Class
A29,
CMO,
ARM,
2.50%,
7/1/51 (1)
251,396
195
Citigroup
Commercial
Mortgage
Trust,
Series 2020-555,
Class
B,
2.829%,
12/10/41 (1)
120,000
102
Citigroup
Commercial
Mortgage
Trust,
Series 2020-555,
Class
C,
3.031%,
12/10/41 (1)
100,000
84
Citigroup
Mortgage
Loan
Trust,
Series 2022-INV1,
Class
A4B,
CMO,
ARM,
3.00%,
11/27/51 (1)
104,389
84
Cold
Storage
Trust,
Series 2020-ICE5,
Class
A,
ARM,
1M
TSFR
+
1.014%,
6.334%,
11/15/37 (1)
132,704
133
T.
ROWE
PRICE
Spectrum
Moderate
Growth
Allocation
Fund
Shares/Par
$
Value
(Cost
and
value
in
$000s)
‡
COLT
Mortgage
Loan
Trust,
Series 2020-3,
Class
A3,
CMO,
ARM,
2.38%,
4/27/65 (1)
21,375
20
Commercial
Mortgage
Trust,
Series 2016-CR28,
Class
AHR,
3.651%,
2/10/49
121,182
119
Commercial
Mortgage
Trust,
Series 2017-PANW,
Class
A,
3.244%,
10/10/29 (1)
480,000
442
Commercial
Mortgage
Trust,
Series 2017-PANW,
Class
B,
ARM,
3.413%,
10/10/29 (1)
170,000
155
Connecticut
Avenue
Securities,
Series 2017-C06,
Class
2ED1,
CMO,
ARM,
SOFR30A
+
1.114%,
6.438%,
2/25/30
16,560
17
Credit
Suisse
Mortgage
Trust,
Series 2020-NET,
Class
A,
2.257%,
8/15/37 (1)
112,475
106
DBCG
Mortgage
Trust,
Series 2017-BBG,
Class
A,
ARM,
PRIME
+
0.00%,
8.50%,
6/15/34 (1)
360,000
360
Finance
of
America
HECM
Buyout,
Series 2022-HB2,
Class
A1A,
ARM,
4.00%,
8/1/32 (1)
102,891
102
Flagstar
Mortgage
Trust,
Series 2020-1INV,
Class
A11,
CMO,
ARM,
1M
TSFR
+
0.964%,
6.00%,
3/25/50 (1)
73,372
69
Galton
Funding
Mortgage
Trust,
Series 2018-1,
Class
A23,
CMO,
ARM,
3.50%,
11/25/57 (1)
13,847
12
Galton
Funding
Mortgage
Trust,
Series 2018-1,
Class
A33,
CMO,
ARM,
3.50%,
11/25/57 (1)
53,724
47
Galton
Funding
Mortgage
Trust,
Series 2018-2,
Class
A22,
CMO,
ARM,
4.00%,
10/25/58 (1)
9,552
9
GS
Mortgage-Backed
Securities
Trust,
Series 2014-EB1A,
Class
2A1,
CMO,
ARM,
5.802%,
7/25/44 (1)
2,399
2
GS
Mortgage-Backed
Securities
Trust,
Series 2020-INV1,
Class
A14,
CMO,
ARM,
2.921%,
10/25/50 (1)
152,283
125
GS
Mortgage-Backed
Securities
Trust,
Series 2021-GR1,
Class
A4,
CMO,
ARM,
2.50%,
11/25/51 (1)
192,003
149
GS
Mortgage-Backed
Securities
Trust,
Series 2021-GR2,
Class
A4,
CMO,
ARM,
2.50%,
2/25/52 (1)
193,028
150
Imperial
Fund
Mortgage
Trust,
Series 2021-NQM2,
Class
A1,
CMO,
ARM,
1.073%,
9/25/56 (1)
82,172
67
JPMorgan
Chase
Commercial
Mortgage
Securities
Trust,
Series 2018-WPT,
Class
AFX,
4.248%,
7/5/33 (1)
80,000
74
JPMorgan
Mortgage
Trust,
Series 2019-INV3,
Class
A15,
CMO,
ARM,
3.50%,
5/25/50 (1)
41,818
37
JPMorgan
Mortgage
Trust,
Series 2019-INV3,
Class
A3,
CMO,
ARM,
3.50%,
5/25/50 (1)
48,509
43
JPMorgan
Mortgage
Trust,
Series 2020-5,
Class
B2,
CMO,
ARM,
3.572%,
12/25/50 (1)
155,242
130
JPMorgan
Mortgage
Trust,
Series 2020-LTV1,
Class
A15,
CMO,
ARM,
3.50%,
6/25/50 (1)
2,794
3
JPMorgan
Mortgage
Trust,
Series 2020-LTV1,
Class
A3,
CMO,
ARM,
3.50%,
6/25/50 (1)
6,286
6
T.
ROWE
PRICE
Spectrum
Moderate
Growth
Allocation
Fund
Shares/Par
$
Value
(Cost
and
value
in
$000s)
‡
JPMorgan
Mortgage
Trust,
Series 2020-LTV1,
Class
B1A,
CMO,
ARM,
3.237%,
6/25/50 (1)
156,918
129
KIND
Trust,
Series 2021-KIND,
Class
B,
ARM,
1M
TSFR
+
1.464%,
6.784%,
8/15/38 (1)
446,284
435
MARQ
Trust,
Series 2024-HOU,
Class
A,
ARM,
1M
TSFR
+
1.591%,
6.91%,
6/15/29 (1)
120,000
120
MED
Commercial
Mortgage
Trust,
Series 2024-MOB,
Class
A,
ARM,
1M
TSFR
+
1.592%,
6.908%,
5/15/41 (1)
155,000
155
Morgan
Stanley
Residential
Mortgage
Loan
Trust,
Series 2023-
NQM1,
Class
A2,
CMO,
STEP,
7.53%,
9/25/68 (1)
92,876
94
New
Residential
Mortgage
Loan
Trust,
Series 2021-INV2,
Class
A4,
CMO,
ARM,
2.50%,
9/25/51 (1)
156,937
123
OBX
Trust,
Series 2020-EXP1,
Class
1A8,
CMO,
ARM,
3.50%,
2/25/60 (1)
107,488
94
OBX
Trust,
Series 2023-NQM9,
Class
A2,
CMO,
STEP,
7.513%,
10/25/63 (1)
89,888
91
SDR
Commercial
Mortgage
Trust,
Series 2024-DSNY,
Class
A,
ARM,
1M
TSFR
+
1.392%,
6.692%,
5/15/39 (1)
355,000
355
Sequoia
Mortgage
Trust,
Series 2013-4,
Class
B1,
CMO,
ARM,
3.437%,
4/25/43
65,923
61
Sequoia
Mortgage
Trust,
Series 2017-5,
Class
B1,
CMO,
ARM,
3.782%,
8/25/47 (1)
101,555
91
Sequoia
Mortgage
Trust,
Series 2017-CH2,
Class
A19,
CMO,
ARM,
4.00%,
12/25/47 (1)
17,833
16
Sequoia
Mortgage
Trust,
Series 2018-CH1,
Class
A2,
CMO,
ARM,
3.50%,
3/25/48 (1)
4,519
4
Sequoia
Mortgage
Trust,
Series 2018-CH2,
Class
A21,
CMO,
ARM,
4.00%,
6/25/48 (1)
14,163
13
Sequoia
Mortgage
Trust,
Series 2018-CH2,
Class
A3,
CMO,
ARM,
4.00%,
6/25/48 (1)
42,589
39
SG
Residential
Mortgage
Trust,
Series 2019-3,
Class
A1,
CMO,
ARM,
2.703%,
9/25/59 (1)
2,534
2
Structured
Agency
Credit
Risk
Debt
Notes,
Series 2024-DNA2,
Class
A1,
CMO,
ARM,
SOFR30A
+
1.25%,
6.574%,
5/25/44 (1)
185,000
185
Towd
Point
Mortgage
Trust,
Series 2019-HY3,
Class
A1A,
ARM,
1M
TSFR
+
1.114%,
6.439%,
10/25/59 (1)
111,871
113
UWM
Mortgage
Trust,
Series 2021-INV2,
Class
A15,
CMO,
ARM,
2.50%,
9/25/51 (1)
203,471
157
Verus
Securitization
Trust,
Series 2020-INV1,
Class
A3,
CMO,
ARM,
4.889%,
3/25/60 (1)
100,000
97
Verus
Securitization
Trust,
Series 2021-5,
Class
A2,
CMO,
ARM,
1.218%,
9/25/66 (1)
111,003
91
WB
Commercial
Mortgage
Trust,
Series 2024-HQ,
Class
A,
ARM,
5.937%,
3/15/40 (1)
100,000
100
Wells
Fargo
Commercial
Mortgage
Trust,
Series 2016-C35,
Class
AS,
3.184%,
7/15/48
370,000
347
T.
ROWE
PRICE
Spectrum
Moderate
Growth
Allocation
Fund
Shares/Par
$
Value
(Cost
and
value
in
$000s)
‡
Worldwide
Plaza
Trust,
Series 2017-WWP,
Class
A,
3.526%,
11/10/36 (1)
100,000
73
Total
Non-U.S.
Government
Mortgage-Backed
Securities
(Cost
$7,674)
6,884
PREFERRED
STOCKS
0.1%
CONSUMER
DISCRETIONARY
0.1%
Automobiles
0.1%
Dr.
Ing
.
h.c
.
F.
Porsche
(EUR)
32,276
2,681
Total
Consumer
Discretionary
2,681
Total
Preferred
Stocks
(Cost
$2,730)
2,681
PRIVATE
INVESTMENT
COMPANIES
2.0%
Blackstone
Partners
Offshore
Fund (6)(7)
27,065
66,169
Total
Private
Investment
Companies
(Cost
$42,103)
66,169
U.S.
GOVERNMENT
&
AGENCY
MORTGAGE-BACKED
SECURITIES
2.0%
U.S.
Government
Agency
Obligations
1.5%
Federal
Home
Loan
Mortgage
2.50%,
4/1/30
46,376
44
3.00%,
12/1/42
-
2/1/47
269,018
236
3.50%,
8/1/42
-
3/1/46
439,174
399
4.00%,
10/1/40
-
12/1/41
92,916
86
4.50%,
6/1/39
-
5/1/42
130,738
127
5.00%,
7/1/25
-
8/1/40
37,490
36
5.50%,
1/1/40
78
—
6.00%,
3/1/33
-
8/1/38
36,883
38
6.50%,
9/1/32
1,908
2
7.00%,
6/1/32
375
—
Federal
Home
Loan
Mortgage,
ARM
RFUCCT1Y
+
1.785%,
6.035%,
2/1/37
340
—
RFUCCT1Y
+
1.842%,
6.091%,
1/1/37
3,700
4
RFUCCT1Y
+
1.917%,
6.291%,
2/1/37
3,100
3
Federal
Home
Loan
Mortgage,
UMBS
1.50%,
2/1/36
41,790
36
2.00%,
8/1/36
-
9/1/52
4,561,045
3,578
2.50%,
3/1/42
-
5/1/52
3,703,722
3,024
3.00%,
5/1/31
-
8/1/52
2,596,239
2,261
3.50%,
6/1/35
-
11/1/52
1,002,673
898
T.
ROWE
PRICE
Spectrum
Moderate
Growth
Allocation
Fund
Shares/Par
$
Value
(Cost
and
value
in
$000s)
‡
4.00%,
8/1/37
-
5/1/52
371,127
347
4.50%,
5/1/50
-
11/1/52
752,823
705
5.00%,
9/1/52
-
11/1/53
293,963
283
5.50%,
8/1/53
-
2/1/54
694,599
684
6.00%,
9/1/53
126,082
126
6.50%,
1/1/54
69,720
71
Federal
National
Mortgage
Assn.
3.00%,
6/1/33
-
8/1/46
37,515
33
3.50%,
6/1/42
-
5/1/46
295,151
267
4.00%,
11/1/40
93,105
88
Federal
National
Mortgage
Assn.,
ARM
RFUCCT1Y
+
1.77%,
6.145%,
12/1/35
636
1
RFUCCT1Y
+
1.892%,
6.142%,
12/1/35
1,636
2
Federal
National
Mortgage
Assn.,
CMO,
IO,
6.50%,
2/25/32
557
—
Federal
National
Mortgage
Assn.,
UMBS
1.50%,
5/1/37
-
1/1/42
1,216,321
1,019
2.00%,
5/1/36
-
6/1/52
14,238,038
11,353
2.50%,
8/1/30
-
6/1/52
8,635,627
7,121
3.00%,
1/1/27
-
4/1/52
4,731,592
4,129
3.50%,
2/1/35
-
7/1/50
2,142,344
1,940
4.00%,
7/1/35
-
12/1/52
2,760,302
2,548
4.50%,
7/1/39
-
8/1/52
1,825,654
1,731
5.00%,
3/1/25
-
11/1/53
1,699,860
1,651
5.50%,
9/1/34
-
2/1/54
1,586,031
1,566
6.00%,
2/1/33
-
1/1/54
2,178,800
2,196
6.50%,
7/1/32
-
1/1/54
653,960
668
UMBS,
TBA (14)
3.50%,
6/1/54
840,000
736
5.00%,
6/1/54
685,000
659
5.50%,
6/1/54
315,000
310
6.00%,
6/1/54
90,000
90
6.50%,
6/1/54
560,000
569
51,665
U.S.
Government
Obligations
0.5%
Government
National
Mortgage
Assn.
1.50%,
12/20/36
-
5/20/37
145,352
123
2.00%,
1/20/51
-
3/20/52
3,564,742
2,859
2.50%,
8/20/50
-
3/20/52
3,733,816
3,113
3.00%,
9/15/42
-
6/20/52
2,807,334
2,430
3.50%,
12/20/42
-
7/20/52
1,998,189
1,809
4.00%,
7/20/42
-
10/20/52
1,781,072
1,647
4.50%,
11/20/39
-
4/20/53
1,157,527
1,103
5.00%,
7/20/39
-
6/20/49
472,693
467
T.
ROWE
PRICE
Spectrum
Moderate
Growth
Allocation
Fund
Shares/Par
$
Value
(Cost
and
value
in
$000s)
‡
5.50%,
1/20/36
-
3/20/49
248,629
252
6.00%,
12/20/38
13,851
14
6.50%,
3/15/26
93
—
8.00%,
10/20/25
9
—
Government
National
Mortgage
Assn.,
CMO
3.00%,
11/20/47
-
12/20/47
25,145
22
3.50%,
10/20/50
135,000
109
Government
National
Mortgage
Assn.,
CMO,
IO
3.50%,
5/20/43
21,564
3
4.00%,
2/20/43
12,044
1
Government
National
Mortgage
Assn.,
TBA (14)
2.50%,
6/20/54
365,000
304
5.00%,
6/20/54
620,000
602
5.50%,
6/20/53
795,000
789
6.00%,
6/20/54
785,000
790
6.50%,
6/20/54
435,000
442
16,879
Total
U.S.
Government
&
Agency
Mortgage-Backed
Securities
(Cost
$73,790)
68,544
U.S.
GOVERNMENT
AGENCY
OBLIGATIONS
(EXCLUDING
MORTGAGE-BACKED)
2.2%
U.S.
Treasury
Obligations
2.2%
U.S.
Treasury
Bonds,
3.375%,
8/15/42
4,135,000
3,454
U.S.
Treasury
Bonds,
3.875%,
2/15/43 (15)
2,195,000
1,963
U.S.
Treasury
Bonds,
4.00%,
11/15/42 (15)(16)
4,305,000
3,924
U.S.
Treasury
Bonds,
4.25%,
2/15/54
3,775,000
3,541
U.S.
Treasury
Bonds,
4.375%,
8/15/43
355,000
339
U.S.
Treasury
Bonds,
4.50%,
2/15/44
7,320,000
7,105
U.S.
Treasury
Bonds,
4.75%,
11/15/43
835,000
837
U.S.
Treasury
Inflation-Indexed
Notes,
1.375%,
7/15/33
1,749,103
1,646
U.S.
Treasury
Inflation-Indexed
Notes,
1.75%,
1/15/34
8,259,633
7,985
U.S.
Treasury
Notes,
1.50%,
1/31/27
2,950,000
2,715
U.S.
Treasury
Notes,
3.25%,
6/30/27
4,080,000
3,918
U.S.
Treasury
Notes,
4.125%,
6/15/26 (15)
6,590,000
6,496
U.S.
Treasury
Notes,
4.50%,
7/15/26 (15)
4,600,000
4,568
U.S.
Treasury
Notes,
4.625%,
9/15/26 (15)(16)
10,732,500
10,691
U.S.
Treasury
Notes,
4.625%,
10/15/26
4,430,000
4,415
U.S.
Treasury
Notes,
4.625%,
9/30/28
10,750,000
10,780
74,377
Total
U.S.
Government
Agency
Obligations
(Excluding
Mortgage-Backed)
(Cost
$75,602)
74,377
T.
ROWE
PRICE
Spectrum
Moderate
Growth
Allocation
Fund
Shares/Par
$
Value
(Cost
and
value
in
$000s)
‡
SHORT-TERM
INVESTMENTS
0.9%
Money
Market
Funds
0.9%
T.
Rowe
Price
Treasury
Reserve
Fund,
5.38% (3)(17)
28,783,801
28,784
Total
Short-Term
Investments
(Cost
$28,784)
28,784
SECURITIES
LENDING
COLLATERAL
0.3%
INVESTMENTS
IN
A
POOLED
ACCOUNT
THROUGH
SECURITIES
LENDING
PROGRAM
WITH
JPMORGAN
CHASE
BANK 0.3%
Money
Market
Funds 0.3%
T.
Rowe
Price
Government
Reserve
Fund,
5.39% (3)(17)
8,459,590
8,460
Total
Investments
in
a
Pooled
Account
through
Securities
Lending
Program
with
JPMorgan
Chase
Bank
8,460
Total
Securities
Lending
Collateral
(Cost
$8,460)
8,460
(Amounts
in
000s,
except
for
contracts)
OPTIONS
PURCHASED 0.0%
Exchange-Traded
Options
Purchased 0.0%
Description
Contracts
Notional
Amount
$
Value
U.S.
Treasury
10-Year
Notes
Futures,
Put,
6/21/24
@
$107.75 (6)
67
7,289
16
Total
Exchange-Traded
Options
Purchased
(Cost
$33)
16
OTC
Options
Purchased 0.0%
Counterparty
Description
Contracts
Notional
Amount
$
Value
Barclays
Bank
30
Year
Interest
Rate
Swap,
8/12/54
Pay
Fixed
3.80%
Annually,
Receive
Variable
5.34%
(SOFR)
Annually,
8/8/24
@
3.80%* (6)
1
1,666
50
Barclays
Bank
30
Year
Interest
Rate
Swap,
8/13/54
Pay
Fixed
3.80%
Annually,
Receive
Variable
5.34%
(SOFR)
Annually,
8/9/24
@
3.80%* (6)
1
2,938
88
T.
ROWE
PRICE
Spectrum
Moderate
Growth
Allocation
Fund
(Amounts
in
000s,
except
for
contracts)
Counterparty
Description
Contracts
Notional
Amount
$
Value
Goldman
Sachs
30
Year
Interest
Rate
Swap,
8/13/54
Pay
Fixed
3.80%
Annually,
Receive
Variable
5.34%
(SOFR)
Annually,
8/9/24
@
3.80%* (6)
1
1,469
44
Morgan
Stanley
30
Year
Interest
Rate
Swap,
8/12/54
Pay
Fixed
3.80%
Annually,
Receive
Variable
5.34%
(SOFR)
Annually,
8/8/24
@
3.80%* (6)
1
1,469
44
Morgan
Stanley
30
Year
Interest
Rate
Swap,
8/13/54
Pay
Fixed
3.80%
Annually,
Receive
Variable
5.34%
(SOFR)
Annually,
8/9/24
@
3.80%* (6)
1
2,938
89
Total
OTC
Options
Purchased
(Cost
$331)
315
Total
Options
Purchased
(Cost
$364)
331
Total
Investments
in
Securities
100.3%
of
Net
Assets
(Cost
$2,373,640)
$
3,350,854
‡
Shares/Par
and
Notional
Amount
are
denominated
in
U.S.
dollars
unless
otherwise
noted.
*
Exercise
Spread
(1)
Security
was
purchased
pursuant
to
Rule
144A
under
the
Securities
Act
of
1933
and
may
be
resold
in
transactions
exempt
from
registration
only
to
qualified
institutional
buyers.
Total
value
of
such
securities
at
period-end
amounts
to
$36,409
and
represents
1.1%
of
net
assets.
(2)
All
or
a
portion
of
this
loan
is
unsettled
as
of
May
31,
2024.
The
interest
rate
for
unsettled
loans
will
be
determined
upon
settlement
after
period
end.
(3)
Affiliated
Companies
(4)
SEC
30-day
yield
(5)
See
Note
4.
All
or
a
portion
of
this
security
is
on
loan
at
May
31,
2024.
(6)
Non-income
producing
(7)
See
Note
2.
Level
3
in
fair
value
hierarchy.
T.
ROWE
PRICE
Spectrum
Moderate
Growth
Allocation
Fund
.
.
.
.
.
.
.
.
.
.
(8)
Security
cannot
be
offered
for
public
resale
without
first
being
registered
under
the
Securities
Act
of
1933
and
related
rules
("restricted
security").
Acquisition
date
represents
the
day
on
which
an
enforceable
right
to
acquire
such
security
is
obtained
and
is
presented
along
with
related
cost
in
the
security
description.
The
fund
may
have
registration
rights
for
certain
restricted
securities.
Any
costs
related
to
such
registration
are
generally
borne
by
the
issuer.
The
aggregate
value
of
restricted
securities
(excluding
144A
holdings)
at
period
end
amounts
to
$8,115
and
represents
0.2%
of
net
assets.
(9)
Investment
in
a
partnership
held
indirectly
through
a
limited
liability
company
that
is
owned
by
the
fund
and
treated
as
a
corporation
for
U.S.
tax
purposes.
(10)
The
identity
of
certain
securities
has
been
concealed
to
protect
the
fund
while
it
completes
a
purchase
or
selling
program
for
the
securities.
(11)
Security
is
a
fix-to-float
security,
which
carries
a
fixed
coupon
until
a
certain
date,
upon
which
it
switches
to
a
floating
rate.
Reference
rate
and
spread
are
provided
if
the
rate
is
currently
floating.
(12)
Security
has
the
ability
to
pay
in-kind
or
pay
in
cash.
When
applicable,
separate
rates
of
such
payments
are
disclosed.
(13)
Perpetual
security
with
no
stated
maturity
date.
(14)
See
Note
4.
To-Be-Announced
purchase
commitment.
Total
value
of
such
securities
at
period-end
amounts
to
$5,291
and
represents
0.2%
of
net
assets.
(15)
At
May
31,
2024,
all
or
a
portion
of
this
security
is
pledged
as
collateral
and/
or
margin
deposit
to
cover
future
funding
obligations.
(16)
All
or
a
portion
of
this
security
is
pledged
to
cover
or
as
collateral
for
written
call
options
at
May
31,
2024.
(17)
Seven-day
yield
1M
TSFR
One
month
term
SOFR
(Secured
overnight
financing
rate)
3M
TSFR
Three
month
term
SOFR
(Secured
overnight
financing
rate)
ADR
American
Depositary
Receipts
ARM
Adjustable
Rate
Mortgage
(ARM);
rate
shown
is
effective
rate
at
period-end.
The
rates
for
certain
ARMs
are
not
based
on
a
published
reference
rate
and
spread
but
may
be
determined
using
a
formula
based
on
the
rates
of
the
underlying
loans.
AUD
Australian
Dollar
CAD
Canadian
Dollar
CDI
CHESS
or
CREST
Depositary
Interest
CHF
Swiss
Franc
CLO
Collateralized
Loan
Obligation
CMO
Collateralized
Mortgage
Obligation
DKK
Danish
Krone
ETF
Exchange-Traded
Fund
EUR
Euro
FRN
Floating
Rate
Note
GBP
British
Pound
T.
ROWE
PRICE
Spectrum
Moderate
Growth
Allocation
Fund
.
.
.
.
.
.
.
.
.
.
GO
General
Obligation
HKD
Hong
Kong
Dollar
INR
Indian
Rupee
IO
Interest-only
security
for
which
the
fund
receives
interest
on
notional
principal
JPY
Japanese
Yen
KRW
South
Korean
Won
NOK
Norwegian
Krone
OTC
Over-the-counter
PIK
Payment-in-kind
PIPE
Private
Investment
in
Public
Equity
PRIME
Prime
rate
REIT
A
domestic
Real
Estate
Investment
Trust
whose
distributions
pass-through
with
original
tax
character
to
the
shareholder
RFUCCT1Y
Twelve
month
Refinitiv
USD
IBOR
Consumer
Cash
Fallback
SDR
Swedish
Depository
Receipts
SEK
Swedish
Krona
SGD
Singapore
Dollar
SOFR
Secured
overnight
financing
rate
SOFR30A
30-day
Average
SOFR
(Secured
overnight
financing
rate)
STEP
Stepped
coupon
bond
for
which
the
coupon
rate
of
interest
adjusts
on
specified
date(s);
rate
shown
is
effective
rate
at
period-end.
TBA
To-Be-Announced
TWD
Taiwan
Dollar
UMBS
Uniform
Mortgage-Backed
Securities
USD
U.S.
Dollar
VR
Variable
Rate;
rate
shown
is
effective
rate
at
period-end.
The
rates
for
certain
variable
rate
securities
are
not
based
on
a
published
reference
rate
and
spread
but
are
determined
by
the
issuer
or
agent
and
based
on
current
market
conditions.
T.
ROWE
PRICE
Spectrum
Moderate
Growth
Allocation
Fund
(Amounts
in
000s,
except
for
contracts)
OPTIONS
WRITTEN
(0.2)%
OTC
Options
Written (0.2)%
Counterparty
Description
Contracts
Notional
Amount
$
Value
Barclays
Bank
2
Year
Interest
Rate
Swap,
8/12/26
Pay
Fixed
4.20%
Annually,
Receive
Variable
5.34%
(SOFR)
Annually,
8/8/24
@
4.20%*
1
13,377
(122)
Barclays
Bank
2
Year
Interest
Rate
Swap,
8/13/26
Pay
Fixed
4.20%
Annually,
Receive
Variable
5.34%
(SOFR)
Annually,
8/9/24
@
4.20%*
1
23,703
(217)
Goldman
Sachs
2
Year
Interest
Rate
Swap,
8/13/26
Pay
Fixed
4.20%
Annually,
Receive
Variable
5.34%
(SOFR)
Annually,
8/9/24
@
4.20%*
1
11,669
(107)
Goldman
Sachs
iShares
iBoxx
High
Yield
Corporate
Bond
ETF,
Call,
6/21/24
@
$77.00
1,657
12,780
(46)
Goldman
Sachs
iShares
iBoxx
High
Yield
Corporate
Bond
ETF,
Put,
6/21/24
@
$76.00
5,905
45,545
(77)
Morgan
Stanley
2
Year
Interest
Rate
Swap,
8/12/26
Pay
Fixed
4.20%
Annually,
Receive
Variable
5.34%
(SOFR)
Annually,
8/8/24
@
4.20%*
1
12,180
(112)
Morgan
Stanley
2
Year
Interest
Rate
Swap,
8/13/26
Pay
Fixed
4.20%
Annually,
Receive
Variable
5.34%
(SOFR)
Annually,
8/9/24
@
4.20%*
1
23,704
(217)
Morgan
Stanley
S&P
500
Index,
Call,
7/19/24
@
$5,250.00
395
208,462
(4,977)
Wells
Fargo
iShares
iBoxx
High
Yield
Corporate
Bond
ETF,
Call,
7/19/24
@
$77.00
2,499
19,275
(95)
Wells
Fargo
iShares
iBoxx
High
Yield
Corporate
Bond
ETF,
Put,
7/19/24
@
$76.00
2,499
19,275
(75)
Total
Options
Written
(Premiums
$(4,295))
$
(6,045)
T.
ROWE
PRICE
Spectrum
Moderate
Growth
Allocation
Fund
(Amounts
in
000s)
SWAPS
0.0%
Description
Notional
Amount
$
Value
Upfront
Payments/
$
(Receipts)
**
Unrealized
$
Gain/(Loss)
BILATERAL
SWAPS
0.0%
Credit
Default
Swaps,
Protection
Bought
0.0%
Morgan
Stanley,
Protection
Bought
(Relevant
Credit:
Markit
CMBX.
NA.AAA-S15,
40
Year
Index),
Pay
0.50%
Monthly,
Receive
upon
credit
default,
11/18/64
4,349
53
112
(59)
Total
Bilateral
Credit
Default
Swaps,
Protection
Bought
112
(59)
Credit
Default
Swaps,
Protection
Sold
0.0%
JPMorgan
Chase,
Protection
Sold
(Relevant
Credit:
Barclays
Bank,
Baa1*),
Receive
1.00%
Quarterly,
Pay
upon
credit
default,
6/20/24
(EUR)
47
—
—
—
Total
Bilateral
Credit
Default
Swaps,
Protection
Sold
—
—
Total
Return
Swaps
(0.0)%
JPMorgan
Chase,
Receive
Underlying
Reference:
iBoxx
USD
Liquid
Investment
Grade
Index
at
Maturity,
Pay
Variable
5.343%
(SOFR
+
(0.00)%)
at
Maturity,
6/20/24
269
(2)
(2)
—
Morgan
Stanley,
Receive
Underlying
Reference:
iBoxx
USD
Liquid
Investment
Grade
Index
at
Maturity,
Pay
Variable
5.310%
(SOFR
+
(0.00)%)
at
Maturity,
6/20/24
303
2
(2)
4
Morgan
Stanley,
Receive
Underlying
Reference:
iBoxx
USD
Liquid
Investment
Grade
Index
at
Maturity,
Pay
Variable
5.343%
(SOFR
+
(0.00)%)
at
Maturity,
6/20/24
304
(3)
(2)
(1)
Morgan
Stanley,
Receive
Underlying
Reference:
iBoxx
USD
Liquid
Investment
Grade
Index
at
Maturity,
Pay
Variable
5.343%
(SOFR
+
(0.00)%)
at
Maturity,
6/20/24
304
(2)
(3)
1
Total
Bilateral
Total
Return
Swaps
(9)
4
Total
Bilateral
Swaps
103
(55)
T.
ROWE
PRICE
Spectrum
Moderate
Growth
Allocation
Fund
(Amounts
in
000s)
Description
Notional
Amount
$
Value
Initial
$
Value
**
Unrealized
$
Gain/(Loss)
CENTRALLY
CLEARED
SWAPS
0.0%
Credit
Default
Swaps,
Protection
Sold
0.0%
Protection
Sold
(Relevant
Credit:
Freeport-McMoRan,
Baa2*),
Receive
1.00%
Quarterly,
Pay
upon
credit
default,
6/20/29
*
290
4
—
4
Protection
Sold
(Relevant
Credit:
Markit
CDX.NA.HY-S42,
5
Year
Index),
Receive
5.00%
Quarterly,
Pay
upon
credit
default,
6/20/29
1,693
132
121
11
Protection
Sold
(Relevant
Credit:
Markit
CDX.NA.IG-S42,
5
Year
Index),
Receive
1.00%
Quarterly,
Pay
upon
credit
default,
6/20/29
18,231
445
402
43
Protection
Sold
(Relevant
Credit:
United
Mexican
States,
Baa2*),
Receive
1.00%
Quarterly,
Pay
upon
credit
default,
6/20/29
*
4,753
21
12
9
Total
Centrally
Cleared
Credit
Default
Swaps,
Protection
Sold
67
Total
Centrally
Cleared
Swaps
67
Net
payments
(receipts)
of
variation
margin
to
date
(62)
Variation
margin
receivable
(payable)
on
centrally
cleared
swaps
$
5
*
Credit
ratings
as
of
May
31,
2024.
Ratings
shown
are
from
Moody’s
Investors
Service
and
if
Moody’s
does
not
rate
a
security,
then
Standard
&
Poor’s
(S&P)
is
used.
Fitch
is
used
for
securities
that
are
not
rated
by
either
Moody’s
or
S&P.
**
Includes
interest
purchased
or
sold
but
not
yet
collected
of
$9.
T.
ROWE
PRICE
Spectrum
Moderate
Growth
Allocation
Fund
(Amounts
in
000s)
FORWARD
CURRENCY
EXCHANGE
CONTRACTS
Counterparty
Settlement
Receive
Deliver
Unrealized
Gain/(Loss)
UBS
Investment
Bank
8/23/24
USD
1,390
EUR
1,274
$
3
Net
unrealized
gain
(loss)
on
open
forward
currency
exchange
contracts
$
3
T.
ROWE
PRICE
Spectrum
Moderate
Growth
Allocation
Fund
FUTURES
CONTRACTS
($000s)
Expiration
Date
Notional
Amount
Value
and
Unrealized
Gain
(Loss)
Short,
77
MSCI
EAFE
Index
contracts
6/24
(9,125)
$
(122)
Long,
337
S&P
500
E-Mini
Index
contracts
6/24
89,229
236
Long,
26
U.S.
Treasury
Notes
five
year
contracts
9/24
2,751
(1)
Short,
136
U.S.
Treasury
Notes
two
year
contracts
9/24
(27,704)
(13)
Long,
58
Ultra
U.S.
Treasury
Bonds
contracts
9/24
7,101
(88)
Short,
79
Ultra
U.S.
Treasury
Notes
ten
year
contracts
9/24
(8,850)
20
Net
payments
(receipts)
of
variation
margin
to
date
352
Variation
margin
receivable
(payable)
on
open
futures
contracts
$
384
T.
ROWE
PRICE
Spectrum
Moderate
Growth
Allocation
Fund
AFFILIATED
COMPANIES
($000s)
The
fund
may
invest
in
certain
securities
that
are
considered
affiliated
companies.
As
defined
by
the
1940
Act,
an
affiliated
company
is
one
in
which
the
fund
owns
5%
or
more
of
the
outstanding
voting
securities,
or
a
company
that
is
under
common
ownership
or
control.
The
following
securities
were
considered
affiliated
companies
for
all
or
some
portion
of
the
year
ended
May
31,
2024.
Net
realized
gain
(loss),
investment
income,
change
in
net
unrealized
gain/loss,
and
purchase
and
sales
cost
reflect
all
activity
for
the
period
then
ended.
Affiliate
Net
Realized
Gain
(Loss)
Change
in
Net
Unrealized
Gain/Loss
Investment
Income
T.
Rowe
Price
Inflation
Protected
Bond
Fund
-
I
Class,
9.60%
$
—
$
27
$
1
T.
Rowe
Price
Institutional
Emerging
Markets
Bond
Fund,
6.27%
(363)
2,869
2,240
T.
Rowe
Price
Institutional
Emerging
Markets
Equity
Fund
(866)
(3,114)
3,240
T.
Rowe
Price
Institutional
Floating
Rate
Fund
-
Institutional
Class,
8.44%
(194)
674
1,384
T.
Rowe
Price
Institutional
High
Yield
Fund
-
Institutional
Class,
7.20%
(178)
1,670
2,705
T.
Rowe
Price
International
Bond
Fund
(USD
Hedged)
-
I
Class,
3.82%
(55)
1,882
1,962
T.
Rowe
Price
Limited
Duration
Inflation
Focused
Bond
Fund
-
I
Class,
9.22%
—
99
28
T.
Rowe
Price
Multi-Strategy
Total
Return
Fund
-
I
Class
(1,210)
2,579
4,103
T.
Rowe
Price
Real
Assets
Fund
-
I
Class
—
18,774
3,078
T.
Rowe
Price
U.S.
Treasury
Long-Term
Index
Fund
-
I
Class,
4.71%
—
(7,973)
2,581
T.
Rowe
Price
Government
Reserve
Fund,
5.39%
—
—
—++
T.
Rowe
Price
Treasury
Reserve
Fund,
5.38%
—
—
3,132
Affiliates
not
held
at
period
end
—
—
4
Totals
$
(2,866)#
$
17,487
$
24,458+
T.
ROWE
PRICE
Spectrum
Moderate
Growth
Allocation
Fund
AFFILIATED
COMPANIES
(CONTINUED)
($000s)
Supplementary
Investment
Schedule
Affiliate
Value
05/31/23
Purchase
Cost
Sales
Cost
Value
05/31/24
T.
Rowe
Price
Inflation
Protected
Bond
Fund
-
I
Class,
9.60%
$
6
$
4,401
$
—
$
4,434
T.
Rowe
Price
Institutional
Emerging
Markets
Bond
Fund,
6.27%
37,222
2,252
1,363
40,980
T.
Rowe
Price
Institutional
Emerging
Markets
Equity
Fund
172,824
10,040
2,866
176,884
T.
Rowe
Price
Institutional
Floating
Rate
Fund
-
Institutional
Class,
8.44%
17,585
1,390
3,934
15,715
T.
Rowe
Price
Institutional
High
Yield
Fund
-
Institutional
Class,
7.20%
38,290
2,720
1,178
41,502
T.
Rowe
Price
International
Bond
Fund
(USD
Hedged)
-
I
Class,
3.82%
63,900
2,674
305
68,151
T.
Rowe
Price
Limited
Duration
Inflation
Focused
Bond
Fund
-
I
Class,
9.22%
87
7,638
—
7,824
T.
Rowe
Price
Multi-Strategy
Total
Return
Fund
-
I
Class
73,067
4,103
11,210
68,539
T.
Rowe
Price
Real
Assets
Fund
-
I
Class
113,343
46,993
—
179,110
T.
Rowe
Price
U.S.
Treasury
Long-Term
Index
Fund
-
I
Class,
4.71%
71,408
4,095
—
67,530
T.
Rowe
Price
Government
Reserve
Fund,
5.39%
394
¤
¤
8,460
T.
Rowe
Price
Treasury
Reserve
Fund,
5.38%
74,736
¤
¤
28,784
Total
$
707,913^
T.
ROWE
PRICE
Spectrum
Moderate
Growth
Allocation
Fund
The
accompanying
notes
are
an
integral
part
of
these
financial
statements.
#
Capital
gain
distributions
from
underlying
Price
funds
represented
$0
of
the
net
realized
gain
(loss).
++
Excludes
earnings
on
securities
lending
collateral,
which
are
subject
to
rebates
and
fees
as
described
in
Note
4.
+
Investment
income
comprised
$24,458
of
dividend
income
and
$0
of
interest
income.
¤
Purchase
and
sale
information
not
shown
for
cash
management
funds.
^
The
cost
basis
of
investments
in
affiliated
companies
was
$755,399.
T.
ROWE
PRICE
Spectrum
Moderate
Growth
Allocation
Fund
May
31,
2024
Statement
of
Assets
and
Liabilities
($000s,
except
shares
and
per
share
amounts)
Assets
Investments
in
securities,
at
value
(cost
$2,373,640)
$
3,350,854
Receivable
for
investment
securities
sold
6,880
Dividends
and
interest
receivable
5,126
Receivable
for
shares
sold
757
Foreign
currency
(cost
$593)
593
Variation
margin
receivable
on
futures
contracts
384
Cash
134
Bilateral
swap
premiums
paid
112
Variation
margin
receivable
on
centrally
cleared
swaps
5
Unrealized
gain
on
bilateral
swaps
5
Unrealized
gain
on
forward
currency
exchange
contracts
3
Other
assets
6,886
Total
assets
3,371,739
Liabilities
Payable
for
investment
securities
purchased
11,082
Obligation
to
return
securities
lending
collateral
8,460
Options
written
(premiums
$4,295)
6,045
Investment
management
fees
payable
1,249
Payable
for
shares
redeemed
649
Due
to
affiliates
87
Unrealized
loss
on
bilateral
swaps
60
Bilateral
swap
premiums
received
9
Payable
to
directors
2
Other
liabilities
4,697
Total
liabilities
32,340
NET
ASSETS
$
3,339,399
T.
ROWE
PRICE
Spectrum
Moderate
Growth
Allocation
Fund
May
31,
2024
Statement
of
Assets
and
Liabilities
($000s,
except
shares
and
per
share
amounts)
The
accompanying
notes
are
an
integral
part
of
these
financial
statements.
Net
Assets
Consist
of:
Total
distributable
earnings
(loss)
$
1,027,108
Paid-in
capital
applicable
to
84,171,787
shares
of
$0.0001
par
value
capital
stock
outstanding;
1,000,000,000
shares
of
the
Corporation
authorized
2,312,291
NET
ASSETS
$
3,339,399
NET
ASSET
VALUE
PER
SHARE
Investor
Class
(Net
assets:
$1,393,828;
Shares
outstanding:
35,162,310)
$
39.64
I
Class
(Net
assets:
$1,945,571;
Shares
outstanding:
49,009,477)
$
39.70
T.
ROWE
PRICE
Spectrum
Moderate
Growth
Allocation
Fund
Year
Ended
5/31/24
Investment
Income
(Loss)
Income
Dividend
(net
of
foreign
taxes
of
$1,610)
$
61,508
Interest
9,404
Securities
lending
80
Other
3
Total
income
70,995
Expenses
Investment
management
18,530
Shareholder
servicing
Investor
Class
$
2,077
I
Class
179
2,256
Prospectus
and
shareholder
reports
Investor
Class
76
I
Class
17
93
Custody
and
accounting
402
Legal
and
audit
76
Registration
60
Proxy
and
annual
meeting
23
Directors
11
Miscellaneous
132
Waived
/
paid
by
Price
Associates
(
4,435
)
Total
expenses
17,148
Net
investment
income
53,847
T.
ROWE
PRICE
Spectrum
Moderate
Growth
Allocation
Fund
The
accompanying
notes
are
an
integral
part
of
these
financial
statements.
Year
Ended
5/31/24
Realized
and
Unrealized
Gain
/
Loss
–
Net
realized
gain
(loss)
Securities
180,230
Futures
15,474
Swaps
119
Options
written
(
25,339
)
Forward
currency
exchange
contracts
(
99
)
Foreign
currency
transactions
(
11
)
Net
realized
gain
170,374
Change
in
net
unrealized
gain
/
loss
Securities
355,232
Futures
766
Swaps
(
65
)
Options
written
(
1,569
)
Forward
currency
exchange
contracts
41
Other
assets
and
liabilities
denominated
in
foreign
currencies
58
Change
in
net
unrealized
gain
/
loss
354,463
Net
realized
and
unrealized
gain
/
loss
524,837
INCREASE
IN
NET
ASSETS
FROM
OPERATIONS
$
578,684
T.
ROWE
PRICE
Spectrum
Moderate
Growth
Allocation
Fund
Statement
of
Changes
in
Net
Assets
The
accompanying
notes
are
an
integral
part
of
these
financial
statements.
Year
.
.
.
.
.
.
.
.
.
.
.
.
.
.
Ended
.
.
.
.
.
.
.
.
.
.
.
.
.
.
5/31/24
5/31/23
Increase
(Decrease)
in
Net
Assets
Operations
Net
investment
income
$
53,847
$
46,207
Net
realized
gain
(loss)
170,374
(
21,607
)
Change
in
net
unrealized
gain
/
loss
354,463
(
64,108
)
Increase
(decrease)
in
net
assets
from
operations
578,684
(
39,508
)
Distributions
to
shareholders
Net
earnings
Investor
Class
(
25,335
)
(
95,888
)
I
Class
(
35,719
)
(
115,051
)
Decrease
in
net
assets
from
distributions
(
61,054
)
(
210,939
)
Capital
share
transactions
*
Shares
sold
Investor
Class
94,501
124,944
I
Class
286,393
241,711
Distributions
reinvested
Investor
Class
24,672
93,496
I
Class
35,055
112,982
Shares
redeemed
Investor
Class
(
307,223
)
(
410,984
)
I
Class
(
324,674
)
(
276,767
)
Decrease
in
net
assets
from
capital
share
transactions
(
191,276
)
(
114,618
)
Net
Assets
Increase
(decrease)
during
period
326,354
(
365,065
)
Beginning
of
period
3,013,045
3,378,110
End
of
period
$
3,339,399
$
3,013,045
*Share
information
(000s)
Shares
sold
Investor
Class
2,594
3,696
I
Class
7,865
7,278
Distributions
reinvested
Investor
Class
675
2,955
I
Class
959
3,568
Shares
redeemed
Investor
Class
(
8,399
)
(
12,312
)
I
Class
(
8,863
)
(
8,256
)
Decrease
in
shares
outstanding
(
5,169
)
(
3,071
)
T.
ROWE
PRICE
Spectrum
Moderate
Growth
Allocation
Fund
NOTES
TO
FINANCIAL
STATEMENTS
T.
Rowe
Price
Spectrum
Funds
II,
Inc. (the
corporation) is
registered
under
the
Investment
Company
Act
of
1940
(the
1940
Act).
The
Spectrum
Moderate
Growth
Allocation
Fund
(the
fund)
is a
diversified, open-end
management
investment
company
established
by
the
corporation. The
fund
seeks
the
highest
total
return
over
time
consistent
with
a
primary
emphasis
on
capital
growth
and
a
secondary
emphasis
on
income.
The
fund
has two classes
of
shares:
the
Spectrum
Moderate
Growth
Allocation
Fund
(Investor
Class)
and
the
Spectrum
Moderate
Growth
Allocation
Fund–I
Class
(I
Class).
I
Class
shares
require
a
$500,000
initial
investment
minimum,
although
the
minimum
generally
is
waived
or
reduced
for
financial
intermediaries,
eligible
retirement
plans,
and
certain
other
accounts. Each
class
has
exclusive
voting
rights
on
matters
related
solely
to
that
class;
separate
voting
rights
on
matters
that
relate
to
both
classes;
and,
in
all
other
respects,
the
same
rights
and
obligations
as
the
other
class.
NOTE
1
-
SIGNIFICANT
ACCOUNTING
POLICIES
Basis
of
Preparation
The fund
is
an
investment
company
and
follows
accounting
and
reporting
guidance
in
the
Financial
Accounting
Standards
Board
(FASB)
Accounting
Standards
Codification
Topic
946
(ASC
946).
The
accompanying
financial
statements
were
prepared
in
accordance
with
accounting
principles
generally
accepted
in
the
United
States
of
America
(GAAP),
including,
but
not
limited
to,
ASC
946.
GAAP
requires
the
use
of
estimates
made
by
management.
Management
believes
that
estimates
and
valuations
are
appropriate;
however,
actual
results
may
differ
from
those
estimates,
and
the
valuations
reflected
in
the
accompanying
financial
statements
may
differ
from
the
value
ultimately
realized
upon
sale
or
maturity.
Investment
Transactions,
Investment
Income,
and
Distributions
Investment
transactions
are
accounted
for
on
the
trade
date
basis.
Income
and
expenses
are
recorded
on
the
accrual
basis.
Realized
gains
and
losses
are
reported
on
the
identified
cost
basis. Premiums
and
discounts
on
debt
securities
are
amortized
for
financial
reporting
purposes. Paydown
gains
and
losses
are
recorded
as
an
adjustment
to
interest
income. Inflation
adjustments
to
the
principal
amount
of
inflation-indexed
bonds
are
reflected
as
interest
income. Income
tax-related
interest
and
penalties,
if
incurred,
are
recorded
as
income
tax
expense. Dividends
received
from other
investment
companies are
reflected
as
dividend income;
capital
gain
distributions
are
reflected
as
realized
gain/loss. Dividend
income and
capital
gain
distributions
T.
ROWE
PRICE
Spectrum
Moderate
Growth
Allocation
Fund
are
recorded
on
the
ex-dividend
date. Earnings
on
investments
recognized
as
partnerships
for
federal
income
tax
purposes
reflect
the
tax
character
of
such
earnings. Distributions
from
REITs
are
initially
recorded
as
dividend
income
and,
to
the
extent
such
represent
a
return
of
capital
or
capital
gain
for
tax
purposes,
are
reclassified
when
such
information
becomes
available. Non-cash
dividends,
if
any,
are
recorded
at
the
fair
market
value
of
the
asset
received. Proceeds
from
litigation
payments,
if
any,
are
included
in
either
net
realized
gain
(loss)
or
change
in
net
unrealized
gain/loss
from
securities. Distributions
to
shareholders
are
recorded
on
the
ex-dividend
date. Income
distributions,
if
any,
are
declared
and
paid
by
each
class annually. A
capital
gain
distribution,
if
any, may
also
be
declared
and
paid
by
the
fund
annually.
Currency
Translation
Assets,
including
investments,
and
liabilities
denominated
in
foreign
currencies
are
translated
into
U.S.
dollar
values
each
day
at
the
prevailing
exchange
rate,
using
the
mean
of
the
bid
and
asked
prices
of
such
currencies
against
U.S.
dollars
as
provided
by
an
outside
pricing
service.
Purchases
and
sales
of
securities,
income,
and
expenses
are
translated
into
U.S.
dollars
at
the
prevailing
exchange
rate
on
the
respective
date
of
such
transaction.
The
effect
of
changes
in
foreign
currency
exchange
rates
on
realized
and
unrealized
security
gains
and
losses
is
not
bifurcated
from
the
portion
attributable
to
changes
in
market
prices.
Class
Accounting
Shareholder
servicing,
prospectus,
and
shareholder
report
expenses
incurred
by
each
class
are
charged
directly
to
the
class
to
which
they
relate.
Expenses
common
to
all
classes,
investment
income,
and
realized
and
unrealized
gains
and
losses
are
allocated
to
the
classes
based
upon
the
relative
daily
net
assets
of
each
class.
Capital
Transactions
Each
investor’s
interest
in
the
net
assets
of the
fund
is
represented
by
fund
shares. The
fund’s
net
asset
value
(NAV)
per
share
is
computed
at
the
close
of
the
New
York
Stock
Exchange
(NYSE),
normally
4
p.m.
ET,
each
day
the
NYSE
is
open
for
business.
However,
the
NAV
per
share
may
be
calculated
at
a
time
other
than
the
normal
close
of
the
NYSE
if
trading
on
the
NYSE
is
restricted,
if
the
NYSE
closes
earlier,
or
as
may
be
permitted
by
the
SEC.
Purchases
and
redemptions
of
fund
shares
are
transacted
at
the
next-computed
NAV
per
share,
after
receipt
of
the
transaction
order
by
T.
Rowe
Price
Associates,
Inc.,
or
its
agents.
T.
ROWE
PRICE
Spectrum
Moderate
Growth
Allocation
Fund
Indemnification
In
the
normal
course
of
business, the
fund
may
provide
indemnification
in
connection
with
its
officers
and
directors,
service
providers,
and/or
private
company
investments. The
fund’s
maximum
exposure
under
these
arrangements
is
unknown;
however,
the
risk
of
material
loss
is
currently
considered
to
be
remote.
NOTE
2
-
VALUATION
Fair
Value
The
fund’s
financial
instruments
are
valued
at
the
close
of
the
NYSE
and
are
reported
at
fair
value,
which
GAAP
defines
as
the
price
that
would
be
received
to
sell
an
asset
or
paid
to
transfer
a
liability
in
an
orderly
transaction
between
market
participants
at
the
measurement
date. The fund’s
Board
of
Directors
(the
Board)
has
designated
T.
Rowe
Price
Associates,
Inc.
as
the
fund’s
valuation
designee
(Valuation
Designee).
Subject
to
oversight
by
the
Board,
the
Valuation
Designee
performs
the
following
functions
in
performing
fair
value
determinations:
assesses
and
manages
valuation
risks;
establishes
and
applies
fair
value
methodologies;
tests
fair
value
methodologies;
and
evaluates
pricing
vendors
and
pricing
agents.
The
duties
and
responsibilities
of
the
Valuation
Designee
are
performed
by
its
Valuation
Committee. The
Valuation
Designee provides
periodic
reporting
to
the
Board
on
valuation
matters.
Various
valuation
techniques
and
inputs
are
used
to
determine
the
fair
value
of
financial
instruments.
GAAP
establishes
the
following
fair
value
hierarchy
that
categorizes
the
inputs
used
to
measure
fair
value:
Level
1
–
quoted
prices
(unadjusted)
in
active
markets
for
identical
financial
instruments
that
the
fund
can
access
at
the
reporting
date
Level
2
–
inputs
other
than
Level
1
quoted
prices
that
are
observable,
either
directly
or
indirectly
(including,
but
not
limited
to,
quoted
prices
for
similar
financial
instruments
in
active
markets,
quoted
prices
for
identical
or
similar
financial
instruments
in
inactive
markets,
interest
rates
and
yield
curves,
implied
volatilities,
and
credit
spreads)
Level
3
–
unobservable
inputs
(including
the Valuation
Designee’s assumptions
in
determining
fair
value)
Observable
inputs
are
developed
using
market
data,
such
as
publicly
available
information
about
actual
events
or
transactions,
and
reflect
the
assumptions
that
market
participants
would
use
to
price
the
financial
instrument.
Unobservable
inputs
are
those
for
which
market
data
are
not
available
and
are
developed
T.
ROWE
PRICE
Spectrum
Moderate
Growth
Allocation
Fund
using
the
best
information
available
about
the
assumptions
that
market
participants
would
use
to
price
the
financial
instrument.
GAAP
requires
valuation
techniques
to
maximize
the
use
of
relevant
observable
inputs
and
minimize
the
use
of
unobservable
inputs.
When
multiple
inputs
are
used
to
derive
fair
value,
the
financial
instrument
is
assigned
to
the
level
within
the
fair
value
hierarchy
based
on
the
lowest-level
input
that
is
significant
to
the
fair
value
of
the
financial
instrument.
Input
levels
are
not
necessarily
an
indication
of
the
risk
or
liquidity
associated
with
financial
instruments
at
that
level
but
rather
the
degree
of
judgment
used
in
determining
those
values.
Valuation
Techniques
Equity
securities,
including
exchange-traded
funds, listed
or
regularly
traded
on
a
securities
exchange
or
in
the
over-the-
counter
(OTC)
market
are
valued
at
the
last
quoted
sale
price
or,
for
certain
markets,
the
official
closing
price
at
the
time
the
valuations
are
made.
OTC
Bulletin
Board
securities
are
valued
at
the
mean
of
the
closing
bid
and
asked
prices.
A
security
that
is
listed
or
traded
on
more
than
one
exchange
is
valued
at
the
quotation
on
the
exchange
determined
to
be
the
primary
market
for
such
security.
Listed
securities
not
traded
on
a
particular
day
are
valued
at
the
mean
of
the
closing
bid
and
asked
prices
for
domestic
securities
and
the
last
quoted
sale
or
closing
price
for
international
securities.
The
last
quoted
prices
of
non-U.S.
equity
securities
may
be
adjusted
to
reflect
the
fair
value
of
such
securities
at
the
close
of
the
NYSE,
if
the Valuation
Designee
determines
that
developments
between
the
close
of
a
foreign
market
and
the
close
of
the
NYSE
will
affect
the
value
of
some
or
all
of
the
fund’s portfolio
securities.
Each
business
day,
the
Valuation
Designee uses
information
from
outside
pricing
services
to
evaluate
the
quoted
prices
of
portfolio
securities
and,
if
appropriate,
decide whether
it
is
necessary
to
adjust
quoted
prices
to
reflect
fair
value
by
reviewing
a
variety
of
factors,
including
developments
in
foreign
markets,
the
performance
of
U.S.
securities
markets,
and
the
performance
of
instruments
trading
in
U.S.
markets
that
represent
foreign
securities
and
baskets
of
foreign
securities. The Valuation
Designee
uses
outside
pricing
services
to
provide
it
with
quoted
prices
and
information
to
evaluate
or
adjust
those
prices.
The Valuation
Designee
cannot
predict
how
often
it
will
use
quoted
prices
and
how
often
it
will
determine
it
necessary
to
adjust
those
prices
to
reflect
fair
value.
Debt
securities
generally
are
traded
in
the over-the-counter
(OTC)
market
and
are
valued
at
prices
furnished
by
independent
pricing
services
or
by
broker
dealers
who
make
markets
in
such
securities.
When
valuing
securities,
the
T.
ROWE
PRICE
Spectrum
Moderate
Growth
Allocation
Fund
independent
pricing
services
consider
factors
such
as,
but
not
limited
to,
the
yield
or
price
of
bonds
of
comparable
quality,
coupon,
maturity,
and
type,
as
well
as
prices
quoted
by
dealers
who
make
markets
in
such
securities.
Investments
in
mutual
funds
are
valued
at
the
mutual
fund’s
closing
NAV
per
share
on
the
day
of
valuation.
Investments
in
private
investment
companies
are
valued
at
the
investee’s
NAV
per
share
as
of
the
valuation
date,
if
available.
If
the
investee’s
NAV
is
not
available
as
of
the
valuation
date
or
is
not
calculated
in
accordance
with
GAAP,
the
Valuation Designee
may
adjust
the
investee’s
NAV
to
reflect
fair
value
at
the
valuation
date.
Listed
options,
and
OTC
options
with
a
listed
equivalent,
are
valued
at
the
mean
of
the
closing
bid
and
asked
prices
and
exchange-traded
options
on
futures
contracts
are
valued
at
closing
settlement
prices.
Futures
contracts
are
valued
at
closing
settlement
prices.
Forward
currency
exchange
contracts
are
valued
using
the
prevailing
forward
exchange
rate.
Swaps
are
valued
at
prices
furnished
by
an
independent
pricing
service
or
independent
swap
dealers.
Assets
and
liabilities
other
than
financial
instruments,
including
short-term
receivables
and
payables,
are
carried
at
cost,
or
estimated
realizable
value,
if
less,
which
approximates
fair
value.
Investments
for
which
market
quotations are
not
readily
available
or
deemed
unreliable
are
valued
at
fair
value
as
determined
in
good
faith
by
the
Valuation
Designee.
The
Valuation
Designee
has
adopted
methodologies
for
determining
the
fair
value
of
investments
for
which
market
quotations
are
not
readily
available
or
deemed
unreliable,
including
the
use
of
other
pricing
sources.
Factors
used
in
determining
fair
value
vary
by
type
of
investment
and
may
include
market
or
investment
specific
considerations.
The
Valuation
Designee typically
will
afford
greatest
weight
to
actual
prices
in
arm’s
length
transactions,
to
the
extent
they
represent
orderly
transactions
between
market
participants,
transaction
information
can
be
reliably
obtained,
and
prices
are
deemed
representative
of
fair
value.
However,
the
Valuation
Designee may
also
consider
other
valuation
methods
such
as
market-based
valuation
multiples;
a
discount
or
premium
from
market
value
of
a
similar,
freely
traded
security
of
the
same
issuer;
discounted
cash
flows;
yield
to
maturity;
or
some
combination.
Fair
value
determinations
are
reviewed
on
a
regular
basis.
Because
any
fair
value
determination
involves
a
significant
amount
of
judgment,
there
is
a
degree
of
subjectivity
inherent
in
such
pricing
decisions. Fair
value
prices
determined
by
the
Valuation
Designee could
differ
from
those
of
other
market
participants,
and
it
is
possible
that
the
fair
value
determined
for
a
security
may
be
materially
different
from
the
value
that
could
be
realized
upon
the
sale
of
that
security.
T.
ROWE
PRICE
Spectrum
Moderate
Growth
Allocation
Fund
Valuation
Inputs
The
following
table
summarizes
the
fund’s
financial
instruments,
based
on
the
inputs
used
to
determine
their
fair
values
on
May
31,
2024
(for
further
detail
by
category,
please
refer
to
the
accompanying
Portfolio
of
Investments):
($000s)
Level
1
Level
2
Level
3
Total
Value
Assets
Fixed
Income
Securities
1
$
—
$
232,105
$
—
$
232,105
Bond
Mutual
Funds
246,136
—
—
246,136
Common
Stocks
1,789,507
544,336
1,959
2,335,802
Convertible
Bonds
—
—
113
113
Convertible
Preferred
Stocks
—
—
5,740
5,740
Equity
Mutual
Funds
424,533
—
—
424,533
Preferred
Stocks
—
2,681
—
2,681
Private
Investment
Companies
—
—
66,169
66,169
Short-Term
Investments
28,784
—
—
28,784
Securities
Lending
Collateral
8,460
—
—
8,460
Options
Purchased
16
315
—
331
Total
Securities
2,497,436
779,437
73,981
3,350,854
Swaps*
—
122
—
122
Forward
Currency
Exchange
Contracts
—
3
—
3
Futures
Contracts*
256
—
—
256
Total
$
2,497,692
$
779,562
$
73,981
$
3,351,235
Liabilities
Options
Written
$
—
$
6,045
$
—
$
6,045
Swaps
—
7
—
7
Futures
Contracts*
224
—
—
224
Total
$
224
$
6,052
$
—
$
6,276
T.
ROWE
PRICE
Spectrum
Moderate
Growth
Allocation
Fund
Following
is
a
reconciliation
of
the
fund’s
Level
3
holdings
for
the
year ended
May
31,
2024.
Gain
(loss)
reflects
both
realized
and
change
in
unrealized
gain/loss
on
Level
3
holdings
during
the
period,
if
any,
and
is
included
on
the
accompanying
Statement
of
Operations.
The
change
in
unrealized
gain/
loss
on
Level
3
instruments
held
at
May
31,
2024,
totaled $5,515,000 for
the
year ended
May
31,
2024.
NOTE
3
-
DERIVATIVE
INSTRUMENTS
During
the
year ended
May
31,
2024,
the
fund
invested
in
derivative
instruments.
As
defined
by
GAAP,
a
derivative
is
a
financial
instrument
whose
value
is
derived
from
an
underlying
security
price,
foreign
exchange
rate,
interest
rate,
index
of
prices
or
rates,
or
other
variable;
it
requires
little
or
no
initial
investment
and
permits
or
requires
net
settlement.
The
fund
invests
in
derivatives
only
if
the
expected
risks
and
rewards
are
consistent
with
its
investment
objectives,
policies,
and
overall
risk
profile,
as
described
in
its
prospectus
and
Statement
of
Additional
Information.
The
fund
may
use
derivatives
for
a
variety
of
purposes
and
may
use
them
to
establish
both
long
and
short
positions
within
the
fund’s
portfolio.
Potential
uses
include
to
hedge
1
Includes
Asset-Backed
Securities,
Corporate
Bonds,
Foreign
Government
Obligations
&
Municipalities,
Municipal
Securities,
Non-U.S.
Government
Mortgage-Backed
Securities,
U.S.
Government
&
Agency
Mortgage-Backed
Securities
and
U.S.
Government
Agency
Obligations
(Excluding
Mortgage-Backed).
*
The
fair
value
presented
includes
cumulative
gain
(loss)
on
open
futures
contracts
and
centrally
cleared
swaps;
however,
the
net
value
reflected
on
the
accompanying
Portfolio
of
Investments
is
only
the
unsettled
variation
margin
receivable
(payable)
at
that
date.
($000s)
Beginning
Balance
5/31/23
Gain
(Loss)
During
Period
Total
Purchases
Total
Sales
Ending
Balance
5/31/24
Investment
in
Securities
Common
Stocks
$
3,405
$
8
$
600
$
(2,054)
$
1,959
Convertible
Bonds
16
(16)
113
—
113
Convertible
Preferred
Stocks
7,902
(1,327)
88
(923)
5,740
Private
Investment
Companies
60,217
5,952
—
—
66,169
Total
$
71,540
$
4,617
$
801
$
(2,977)
$
73,981
T.
ROWE
PRICE
Spectrum
Moderate
Growth
Allocation
Fund
against
declines
in
principal
value,
increase
yield,
invest
in
an
asset
with
greater
efficiency
and
at
a
lower
cost
than
is
possible
through
direct
investment,
to
enhance
return,
or
to
adjust
credit
exposure.
The
risks
associated
with
the
use
of
derivatives
are
different
from,
and
potentially
much
greater
than,
the
risks
associated
with
investing
directly
in
the
instruments
on
which
the
derivatives
are
based.
The
fund
values
its
derivatives
at
fair
value
and
recognizes
changes
in
fair
value
currently
in
its
results
of
operations.
Accordingly,
the
fund
does
not
follow
hedge
accounting,
even
for
derivatives
employed
as
economic
hedges.
Generally,
the
fund
accounts
for
its
derivatives
on
a
gross
basis.
It
does
not
offset
the
fair
value
of
derivative
liabilities
against
the
fair
value
of
derivative
assets
on
its
financial
statements,
nor
does
it
offset
the
fair
value
of
derivative
instruments
against
the
right
to
reclaim
or
obligation
to
return
collateral.
The
following
table
summarizes
the
fair
value
of
the
fund’s
derivative
instruments
held
as
of
May
31,
2024,
and
the
related
location
on
the
accompanying
Statement
of
Assets
and
Liabilities,
presented
by
primary
underlying
risk
exposure:
($000s)
Location
on
Statement
of
Assets
and
Liabilities
Fair
Value*
Assets
Interest
rate
derivatives
Futures,
Securities^
$
351
Foreign
exchange
derivatives
Forwards
3
Credit
derivatives
Bilateral
Swaps
and
Premiums,
Centrally
Cleared
Swaps
122
Equity
derivatives
Futures
236
^
,*
Total
$
712
^
,*
Liabilities
Interest
rate
derivatives
Futures,
Options
Written
$
877
Credit
derivatives
Bilateral
Swaps
and
Premiums,
Options
Written
300
Equity
derivatives
Futures,
Options
Written
5,099
Total
$
6,276
T.
ROWE
PRICE
Spectrum
Moderate
Growth
Allocation
Fund
Additionally,
the
amount
of
gains
and
losses
on
derivative
instruments
recognized
in
fund
earnings
during
the
year ended
May
31,
2024,
and
the
related
location
on
the
accompanying
Statement
of
Operations
is
summarized
in
the
following
table
by
primary
underlying
risk
exposure:
*
The
fair
value
presented
includes
cumulative
gain
(loss)
on
open
futures
contracts
and
centrally
cleared
swaps;
however,
the
value
reflected
on
the
accompanying
Statement
of
Assets
and
Liabilities
is
only
the
unsettled
variation
margin
receivable
(payable)
at
that
date.
^
Options
purchased
are
reported
as
securities
and
are
reflected
in
the
accompanying
Portfolio
of
Investments.
($000s)
Location
of
Gain
(Loss)
on
Statement
of
Operations
Securities^
Options
Written
Futures
Forward
Currency
Exchange
Contracts
Swaps
Total
Realized
Gain
(Loss)
Interest
rate
derivatives
$
9
$
—
$
(1,449)
$
—
$
(387)
$
(1,827)
Foreign
exchange
derivatives
(82)
—
—
(99)
—
(181)
Credit
derivatives
(30)
840
—
—
506
1,316
Equity
derivatives
—
(26,179)
16,923
—
—
(9,256)
Total
$
(103)
$
(25,339)
$
15,474
$
(99)
$
119
$
(9,948)
T.
ROWE
PRICE
Spectrum
Moderate
Growth
Allocation
Fund
Counterparty
Risk
and
Collateral
The
fund
invests
in
derivatives
in
various
markets,
which
expose
it
to
differing
levels
of
counterparty
risk.
Counterparty
risk
on
exchange-traded
and
centrally
cleared
derivative
contracts,
such
as
futures,
exchange-traded
options,
and
centrally
cleared
swaps,
is
minimal
because
the
clearinghouse
provides
protection
against
counterparty
defaults.
For
futures
and
centrally
cleared
swaps,
the
fund
is
required
to
deposit
collateral
in
an
amount
specified
by
the
clearinghouse
and
the
clearing
firm
(margin
requirement),
and
the
margin
requirement
must
be
maintained
over
the
life
of
the
contract.
Each
clearinghouse
and
clearing
firm,
in
its
sole
discretion,
may
adjust
the
margin
requirements
applicable
to
the
fund.
Derivatives,
such
as
non-cleared bilateral
swaps,
forward
currency
exchange
contracts,
and
OTC
options,
that
are
transacted
and
settle
directly
with
a
counterparty
(bilateral
derivatives)
may
expose
the
fund
to
greater
counterparty
risk.
To
mitigate
this
risk,
the
fund
has
entered
into
master
netting
arrangements
(MNAs)
with
certain
counterparties
that
permit
net
settlement
under
specified
conditions
and,
for
certain
counterparties,
also
require
the
exchange
of
collateral
($000s)
Location
of
Gain
(Loss)
on
Statement
of
Operations
Securities^
Options
Written
Futures
Forward
Currency
Exchange
Contracts
Swaps
Total
Change
in
Unrealized
Gain
(Loss)
Interest
rate
derivatives
$
(33)
$
(458)
$
17
$
—
$
—
$
(474)
Foreign
exchange
derivatives
48
—
—
41
—
89
Credit
derivatives
—
225
—
—
(65)
160
Equity
derivatives
—
(1,336)
749
—
—
(587)
Total
$
15
$
(1,569)
$
766
$
41
$
(65)
$
(812)
^
Options
purchased
are
reported
as
securities.
T.
ROWE
PRICE
Spectrum
Moderate
Growth
Allocation
Fund
to
cover
mark-to-market
exposure.
MNAs
may
be
in
the
form
of
International
Swaps
and
Derivatives
Association
master
agreements
(ISDAs)
or
foreign
exchange
letter
agreements
(FX
letters).
MNAs
provide
the
ability
to
offset
amounts
the
fund
owes
a
counterparty
against
amounts
the
counterparty
owes
the
fund
(net
settlement).
Both
ISDAs
and
FX
letters
generally
allow
termination
of
transactions
and
net
settlement
upon
the
occurrence
of
contractually
specified
events,
such
as
failure
to
pay
or
bankruptcy.
In
addition,
ISDAs
specify
other
events,
the
occurrence
of
which
would
allow
one
of
the
parties
to
terminate.
For
example,
a
downgrade
in
credit
rating
of
a
counterparty
below
a
specified
rating
would
allow
the
fund
to
terminate,
while
a
decline
in
the
fund’s
net
assets
of
more
than
a
specified
percentage
would
allow
the
counterparty
to
terminate.
Upon
termination,
all
transactions
with
that
counterparty
would
be
liquidated
and
a
net
termination
amount
settled.
ISDAs
typically
include
collateral
agreements
whereas
FX
letters
do
not.
Collateral
requirements
are
determined
daily
based
on
the
net
aggregate
unrealized
gain
or
loss
on
all
bilateral
derivatives
with
a
counterparty,
subject
to
minimum
transfer
amounts
that
typically
range
from
$100,000
to
$250,000.
Any
additional
collateral
required
due
to
changes
in
security
values
is
typically
transferred
the
next
business
day.
Collateral
may
be
in
the
form
of
cash
or
debt
securities
issued
by
the
U.S.
government
or
related
agencies,
although
other
securities
may
be
used
depending
on
the
terms
outlined
in
the
applicable
MNA.
Cash
posted
by
the
fund
is
reflected
as
cash
deposits
in
the
accompanying
financial
statements
and
generally
is
restricted
from
withdrawal
by
the
fund;
securities
posted
by
the
fund
are
so
noted
in
the
accompanying
Portfolio
of
Investments;
both
remain
in
the
fund’s
assets.
Collateral
pledged
by
counterparties
is
not
included
in
the
fund’s
assets
because
the
fund
does
not
obtain
effective
control
over
those
assets.
For
bilateral
derivatives,
collateral
posted
or
received
by
the
fund
is
held
in
a
segregated
account
at
the
fund’s
custodian.
While
typically
not
sold
in
the
same
manner
as
equity
or
fixed
income
securities,
exchange-traded
or
centrally
cleared
derivatives
may
be
closed
out
only
on
the
exchange
or
clearinghouse
where
the
contracts
were
cleared,
and
OTC
and
bilateral
derivatives
may
be
unwound
with
counterparties
or
transactions
assigned
to
other
counterparties
to
allow
the
fund
to
exit
the
transaction.
This
ability
is
subject
to
the
liquidity
of
underlying
positions. As
of
May
31,
2024,
securities
valued
at $5,896,000 had
been
pledged
or
posted
by
the
fund
to
counterparties
for
bilateral
derivatives. As
of
May
31,
2024,
no
collateral
was
pledged
by
counterparties
to
the
fund
for
T.
ROWE
PRICE
Spectrum
Moderate
Growth
Allocation
Fund
bilateral
derivatives. As
of
May
31,
2024,
securities
valued
at $10,611,000
had
been
posted
by
the
fund
for
exchange-traded
and/or
centrally
cleared
derivatives.
Forward
Currency
Exchange
Contracts
The
fund
is
subject
to
foreign
currency
exchange
rate
risk
in
the
normal
course
of
pursuing
its
investment
objectives.
It may use
forward
currency
exchange
contracts
(forwards)
primarily
to
protect
its
non-U.S.
dollar-denominated
securities
from
adverse
currency
movements
or
to
increase
exposure
to
a
particular
foreign
currency,
to
shift
the
fund’s
foreign
currency
exposure
from
one
country
to
another,
or
to
enhance
the
fund’s
return.
A
forward
involves
an
obligation
to
purchase
or
sell
a
fixed
amount
of
a
specific
currency
on
a
future
date
at
a
price
set
at
the
time
of
the
contract.
Although
certain
forwards
may
be
settled
by
exchanging
only
the
net
gain
or
loss
on
the
contract,
most
forwards
are
settled
with
the
exchange
of
the
underlying
currencies
in
accordance
with
the
specified
terms.
Forwards
are
valued
at
the
unrealized
gain
or
loss
on
the
contract,
which
reflects
the
net
amount
the
fund
either
is
entitled
to
receive
or
obligated
to
deliver,
as
measured
by
the
difference
between
the
forward
exchange
rates
at
the
date
of
entry
into
the
contract
and
the
forward
rates
at
the
reporting
date.
Appreciated
forwards
are
reflected
as
assets
and
depreciated
forwards
are
reflected
as
liabilities
on
the
accompanying
Statement
of
Assets
and
Liabilities.
When
a
contract
is
closed,
a
realized
gain
or
loss
is
recorded
on
the
accompanying
Statement
of
Operations.
Risks
related
to
the
use
of
forwards
include
the
possible
failure
of
counterparties
to
meet
the
terms
of
the
agreements;
that
anticipated
currency
movements
will
not
occur,
thereby
reducing
the
fund’s
total
return;
and
the
potential
for
losses
in
excess
of
the
fund’s
initial
investment.
During
the
year ended
May
31,
2024,
the
volume
of
the
fund’s
activity
in
forwards,
based
on
underlying
notional
amounts,
was
generally
less
than
1%
of
net
assets.
Futures
Contracts
The
fund
is
subject
to interest
rate
risk
and
equity
price
risk in
the
normal
course
of
pursuing
its
investment
objectives
and
uses
futures
contracts
to
help
manage
such
risks.
The fund
may
enter
into
futures
contracts
to
manage
exposure
to
interest
rates,
security
prices,
foreign
currencies,
and
credit
quality;
as
an
efficient
means
of
adjusting
exposure
to
all
or
part
of
a
target
market;
to
enhance
income;
as
a
cash
management
tool;
or
to
adjust
credit
exposure. A
futures
contract
provides
for
the
future
sale
by
one
party
and
purchase
by
another
of
a
specified
amount
of
a
specific
underlying
financial
instrument
at
an
agreed-upon
price,
date,
time,
and
place.
The
fund
currently
invests
only
in
exchange-traded
futures,
which
generally
are
standardized
as
to
maturity
date,
underlying
financial
instrument,
and
other
contract
terms.
Payments
are
made
or
received
by
the
fund
each
day
to
settle
daily
fluctuations
T.
ROWE
PRICE
Spectrum
Moderate
Growth
Allocation
Fund
in
the
value
of
the
contract
(variation
margin),
which
reflect
changes
in
the
value
of
the
underlying
financial
instrument.
Variation
margin
is
recorded
as
unrealized
gain
or
loss
until
the
contract
is
closed.
The
value
of
a
futures
contract
included
in
net
assets
is
the
amount
of
unsettled
variation
margin;
net
variation
margin
receivable
is
reflected
as
an
asset
and
net
variation
margin
payable
is
reflected
as
a
liability
on
the
accompanying
Statement
of
Assets
and
Liabilities.
When
a
contract
is
closed,
a
realized
gain
or
loss
is
recorded
on
the
accompanying
Statement
of
Operations.
Risks
related
to
the
use
of
futures
contracts
include
possible
illiquidity
of
the
futures
markets,
contract
prices
that
can
be
highly
volatile
and
imperfectly
correlated
to
movements
in
hedged
security
values
and/
or
interest
rates,
and
potential
losses
in
excess
of
the
fund’s
initial
investment.
During
the
year ended
May
31,
2024,
the
volume
of
the
fund’s
activity
in
futures,
based
on
underlying
notional
amounts,
was
generally
between
3%
and
6%
of
net
assets.
Options
The
fund
is
subject
to interest
rate
risk,
foreign
currency
exchange
rate
risk,
credit
risk
and
equity
price
risk in
the
normal
course
of
pursuing
its
investment
objectives
and
uses
options
to
help
manage
such
risks.
The
fund
may
use
options
to
manage
exposure
to
security
prices,
interest
rates,
foreign
currencies,
and
credit
quality;
as
an
efficient
means
of
adjusting
exposure
to
all
or
a
part
of
a
target
market;
to
enhance
income;
as
a
cash
management
tool;
or
to
adjust
credit
exposure.
The
fund
may
buy
or
sell
options
that
can
be
settled
either
directly
with
the
counterparty
(OTC
option)
or
through
a
central
clearinghouse
(exchange-traded
option).
Options
are
included
in
net
assets
at
fair
value,
options
purchased
are
included
in
Investments
in
Securities,
and
options
written
are
separately
reflected
as
a
liability
on
the
accompanying
Statement
of
Assets
and
Liabilities.
Premiums
on
unexercised,
expired
options
are
recorded
as
realized
gains
or
losses
on
the
accompanying
Statement
of
Operations;
premiums
on
exercised
options
are
recorded
as
an
adjustment
to
the
proceeds
from
the
sale
or
cost
of
the
purchase.
The
difference
between
the
premium
and
the
amount
received
or
paid
in
a
closing
transaction
is
also
treated
as
realized
gain
or
loss
on
the
accompanying
Statement
of
Operations.
In
return
for
a
premium
paid,
currency
options
give
the
holder
the
right,
but
not
the
obligation,
to
buy
and
sell
currency
at
a
specified
exchange
rate;
although
certain
currency
options
may
be
settled
by
exchanging
only
the
net
gain
or
loss
on
the
contract.
In
return
for
a
premium
paid,
call
and
put
options
on
futures
give
the
holder
the
right,
but
not
the
obligation,
to
purchase
or
sell,
respectively,
a
position
in
a
particular
futures
contract
at
a
specified
exercise
price.
In
return
for
a
premium
paid,
call
and
put
index
options
give
the
holder
the
right,
but
not
the
obligation,
to
receive
cash
equal
to
the
difference
between
T.
ROWE
PRICE
Spectrum
Moderate
Growth
Allocation
Fund
the
value
of
the
reference
index
on
the
exercise
date
and
the
exercise
price
of
the
option.
In
return
for
a
premium
paid,
options
on
swaps
give
the
holder
the
right,
but
not
the
obligation,
to
enter
a
specified
swap
contract
on
predefined
terms.
The
exercise
price
of
an
option
on
a
credit
default
swap
is
stated
in
terms
of
a
specified
spread
that
represents
the
cost
of
credit
protection
on
the
reference
asset,
including
both
the
upfront
premium
to
open
the
position
and
future
periodic
payments.
The
exercise
price
of
an
interest
rate
swap
is
stated
in
terms
of
a
fixed
interest
rate;
generally,
there
is
no
upfront
payment
to
open
the
position. Risks related
to
the
use
of
options
include
possible
illiquidity
of
the
options
markets;
trading
restrictions
imposed
by
an
exchange
or
counterparty;
possible
failure
of
counterparties
to
meet
the
terms
of
the
agreements;
movements
in
the
underlying
asset
values,
interest
rates,
currency
values
and
credit
ratings;
and,
for
options
written,
the
potential
for
losses
to
exceed
any
premium
received
by
the
fund.
During
the
year ended
May
31,
2024,
the
volume
of
the
fund’s
activity
in
options,
based
on
underlying
notional
amounts,
was
generally
between
6%
and
13%
of
net
assets.
Swaps
The
fund
is
subject
to
interest
rate
risk
and
credit
risk in
the
normal
course
of
pursuing
its
investment
objectives
and
uses
swap
contracts
to
help
manage
such
risks.
The
fund
may
use
swaps
in
an
effort
to
manage
both
long
and
short
exposure
to
changes
in
interest
rates,
inflation
rates,
and
credit
quality;
to
adjust
overall
exposure
to
certain
markets;
to
enhance
total
return
or
protect
the
value
of
portfolio
securities;
to
serve
as
a
cash
management
tool;
or
to
adjust
credit
exposure.
Swap
agreements
can
be
settled
either
directly
with
the
counterparty
(bilateral
swap)
or
through
a
central
clearinghouse
(centrally
cleared
swap).
Fluctuations
in
the
fair
value
of
a
contract
are
reflected
in
unrealized
gain
or
loss
and
are
reclassified
to
realized
gain
or
loss
on
the
accompanying
Statement
of
Operations upon
contract
termination
or
cash
settlement.
Net
periodic
receipts
or
payments
required
by
a
contract
increase
or
decrease,
respectively,
the
value
of
the
contract
until
the
contractual
payment
date,
at
which
time
such
amounts
are
reclassified
from
unrealized
to
realized
gain
or
loss
on
the
accompanying
Statement
of
Operations.
For
bilateral
swaps,
cash
payments
are
made
or
received
by
the
fund
on
a
periodic
basis
in
accordance
with
contract
terms;
unrealized
gain
on
contracts
and
premiums
paid
are
reflected
as
assets
and
unrealized
loss
on
contracts
and
premiums
received
are
reflected
as
liabilities
on
the
accompanying
Statement
of
Assets
and
Liabilities.
For
bilateral
swaps,
premiums
paid
or
received
are
amortized
over
the
life
of
the
swap
and
are
recognized
as
realized
gain
or
loss
on
the
accompanying
Statement
of
Operations.
For
centrally
cleared
swaps,
payments
are
made
or
received
by
the
fund
each
day
to
settle
the
daily
fluctuation
in
the
T.
ROWE
PRICE
Spectrum
Moderate
Growth
Allocation
Fund
value
of
the
contract
(variation
margin).
Accordingly,
the
value
of
a
centrally
cleared
swap
included
in
net
assets
is
the
unsettled
variation
margin;
net
variation
margin
receivable
is
reflected
as
an
asset
and
net
variation
margin
payable
is
reflected
as
a
liability
on
the
accompanying
Statement
of
Assets
and
Liabilities.
Interest
rate
swaps
are
agreements
to
exchange
cash
flows
based
on
the
difference
between
specified
interest
rates
applied
to
a
notional
principal
amount
for
a
specified
period
of
time.
Risks
related
to
the
use
of
interest
rate
swaps
include
the
potential
for
unanticipated
movements
in
interest
or
currency
rates,
the
possible
failure
of
a
counterparty
to
perform
in
accordance
with
the
terms
of
the
swap
agreements,
potential
government
regulation
that
could
adversely
affect
the
fund’s
swap
investments,
and
potential
losses
in
excess
of
the
fund’s
initial
investment.
Credit
default
swaps
are
agreements
where
one
party
(the
protection
buyer)
agrees
to
make
periodic
payments
to
another
party
(the
protection
seller)
in
exchange
for
protection
against
specified
credit
events,
such
as
certain
defaults
and
bankruptcies
related
to
an
underlying
credit
instrument,
or
issuer
or
index
of
such
instruments.
Upon
occurrence
of
a
specified
credit
event,
the
protection
seller
is
required
to
pay
the
buyer
the
difference
between
the
notional
amount
of
the
swap
and
the
value
of
the
underlying
credit,
either
in
the
form
of
a
net
cash
settlement
or
by
paying
the
gross
notional
amount
and
accepting
delivery
of
the
relevant
underlying
credit.
For
credit
default
swaps
where
the
underlying
credit
is
an
index,
a
specified
credit
event
may
affect
all
or
individual
underlying
securities
included
in
the
index
and
will
be
settled
based
upon
the
relative
weighting
of
the
affected
underlying
security(ies)
within
the
index. Generally,
the
payment
risk
for
the
seller
of
protection
is
inversely
related
to
the
current
market
price
or
credit
rating
of
the
underlying
credit
or
the
market
value
of
the
contract
relative
to
the
notional
amount,
which
are
indicators
of
the
markets’
valuation
of
credit
quality.
As
of
May
31,
2024,
the
notional
amount
of
protection
sold
by
the
fund
totaled $25,019,000
(0.8%
of
net
assets),
which
reflects
the
maximum
potential
amount
the
fund
could
be
required
to
pay
under
such
contracts.
Risks
related
to
the
use
of
credit
default
swaps
include
the
possible
inability
of
the
fund
to
accurately
assess
the
current
and
future
creditworthiness
of
underlying
issuers,
the
possible
failure
of
a
counterparty
to
perform
in
accordance
with
the
terms
of
the
swap
agreements,
potential
government
regulation
that
could
adversely
affect
the
fund’s
swap
investments,
and
potential
losses
in
excess
of
the
fund’s
initial
investment.
T.
ROWE
PRICE
Spectrum
Moderate
Growth
Allocation
Fund
Total
return
swaps
are
agreements
in
which
one
party
makes
payments
based
on
a
set
rate,
either
fixed
or
variable,
while
the
other
party
makes
payments
based
on
the
return
of
an
underlying
asset
(reference
asset),
such
as
an
index,
equity
security,
fixed
income
security
or
commodity-based
exchange-
traded
fund,
which
includes
both
the
income
it
generates
and
any
change
in
its
value.
Risks
related
to
the
use
of
total
return
swaps
include
the
potential
for
unfavorable
changes
in
the
reference
asset,
the
possible
failure
of
a
counterparty
to
perform
in
accordance
with
the
terms
of
the
swap
agreements,
potential
government
regulation
that
could
adversely
affect
the
fund’s
swap
investments,
and
potential
losses
in
excess
of
the
fund’s
initial
investment.
During
the
year ended
May
31,
2024,
the
volume
of
the
fund’s
activity
in
swaps,
based
on
underlying
notional
amounts,
was
generally
between
0%
and
2%
of
net
assets.
NOTE
4
-
OTHER
INVESTMENT
TRANSACTIONS
Consistent
with
its
investment
objective, the
fund
engages
in
the
following
practices
to
manage
exposure
to
certain
risks
and/or
to
enhance
performance.
The
investment
objective,
policies,
program,
and
risk
factors
of the
fund
are
described
more
fully
in the
fund’s prospectus
and
Statement
of
Additional
Information.
Emerging
and
Frontier
Markets
The fund
invests,
either
directly
or
through
investments
in
other
T.
Rowe
Price
funds,
in
securities
of
companies
located
in,
issued
by
governments
of,
or
denominated
in
or
linked
to
the
currencies
of
emerging
and
frontier
market
countries.
Emerging
markets,
and
to
a
greater
extent
frontier
markets, tend
to
have
economic
structures
that
are
less
diverse
and
mature,
less
developed
legal
and
regulatory
regimes,
and
political
systems
that
are
less
stable,
than
those
of
developed
countries.
These
markets
may
be
subject
to
greater
political,
economic,
and
social
uncertainty
and
differing
accounting
standards
and
regulatory
environments
that
may
potentially
impact
the
fund’s
ability
to
buy
or
sell
certain
securities
or
repatriate
proceeds
to
U.S.
dollars.
Emerging
markets
securities
exchanges
are
more
likely
to
experience
delays
with
the
clearing
and
settling
of
trades,
as
well
as
the
custody
of
holdings
by
local
banks,
agents,
and
depositories.
Such
securities
are
often
subject
to
greater
price
volatility,
less
liquidity,
and
higher
rates
of
inflation
than
U.S.
securities.
Investing
in
frontier
markets
is
typically
significantly
riskier
than
investing
in
other
countries,
including
emerging
markets.
T.
ROWE
PRICE
Spectrum
Moderate
Growth
Allocation
Fund
Restricted
Securities
The
fund
invests
in
securities
that
are
subject
to
legal
or
contractual
restrictions
on
resale.
Prompt
sale
of
such
securities
at
an
acceptable
price
may
be
difficult
and
may
involve
substantial
delays
and
additional
costs.
Collateralized
Loan
Obligations
The
fund
invests
in
collateralized
loan
obligations
(CLOs)
which
are
entities
backed
by
a
diversified
pool
of
syndicated
bank
loans.
The
cash
flows
of
the
CLO
can
be
split
into
multiple
segments,
called
“tranches”
or
“classes”,
which
will
vary
in
risk
profile
and
yield.
The
riskiest
segments,
which
are
the
subordinate
or
“equity”
tranches,
bear
the
greatest
risk
of
loss
from
defaults
in
the
underlying
assets
of
the
CLO
and
serve
to
protect
the
other,
more
senior,
tranches.
Senior
tranches
will
typically
have
higher
credit
ratings
and
lower
yields
than
the
securities
underlying
the
CLO.
Despite
the
protection
from
the
more
junior
tranches,
senior
tranches
can
experience
substantial
losses.
Mortgage-Backed
Securities
The
fund
invests
in
mortgage-backed
securities
(MBS
or
pass-through
certificates)
that
represent
an
interest
in
a
pool
of
specific
underlying
mortgage
loans
and
entitle
the
fund
to
the
periodic
payments
of
principal
and
interest
from
those
mortgages.
MBS
may
be
issued
by
government
agencies
or
corporations,
or
private
issuers.
Most
MBS
issued
by
government
agencies
are
guaranteed;
however,
the
degree
of
protection
differs
based
on
the
issuer.
The
fund
also
invests
in
stripped
MBS,
created
when
a
traditional
MBS
is
split
into
an
interest-only
(IO)
and
a
principal-only
(PO)
strip.
MBS,
including
IOs
and
POs, are
sensitive
to
changes
in
economic
conditions
that
affect
the
rate
of
prepayments
and
defaults
on
the
underlying
mortgages;
accordingly,
the
value,
income,
and
related
cash
flows
from
MBS
may
be
more
volatile
than
other
debt
instruments.
IOs
also
risk
loss
of
invested
principal
from
faster-than-anticipated
prepayments.
TBA
Purchase,
Sale
Commitments
and
Forward
Settling
Mortgage
Obligations
The
fund
enters
into
to-be-announced
(TBA)
purchase
or
sale
commitments
(collectively,
TBA
transactions),
pursuant
to
which
it
agrees
to
purchase
or
sell,
respectively,
mortgage-backed
securities
for
a
fixed
unit
price,
with
payment
and
delivery
at
a
scheduled
future
date
beyond
the
customary
settlement
period
for
such
securities.
With
TBA
transactions,
the
particular
securities
to
be
received
or
delivered
by
the
fund
are
not
identified
at
the
trade
date;
however,
the
securities
must
meet
specified
terms,
including
rate
and
mortgage
term,
and
be
within
industry-accepted
“good
delivery”
standards.
The
fund
may
enter
into
TBA
transactions
with
the
intention
of
taking
possession
of
T.
ROWE
PRICE
Spectrum
Moderate
Growth
Allocation
Fund
or
relinquishing
the
underlying
securities,
may
elect
to
extend
the
settlement
by
“rolling”
the
transaction,
and/or
may
use
TBA
transactions
to
gain
or
reduce
interim
exposure
to
underlying
securities.
To
mitigate
counterparty
risk,
the
fund
has
entered
into
Master
Securities
Forward
Transaction
Agreements
(MSFTA)
with
counterparties
that
provide
for
collateral
and
the
right
to
offset
amounts
due
to
or
from
those
counterparties
under
specified
conditions.
Subject
to
minimum
transfer
amounts,
collateral
requirements
are
determined
and
transfers
made
based
on
the
net
aggregate
unrealized
gain
or
loss
on
all
TBA
commitments
and
other
forward
settling
mortgage
obligations
with
a
particular
counterparty
(collectively,
MSFTA
Transactions).
At
any
time,
the
fund’s
risk
of
loss
from
a
particular
counterparty
related
to
its
MSFTA
Transactions
is
the
aggregate
unrealized
gain
on
appreciated
MSFTA
Transactions
in
excess
of
unrealized
loss
on
depreciated
MSFTA
Transactions
and
collateral
received,
if
any,
from
such
counterparty. As
of
May
31,
2024,
no
collateral
was
pledged
by
the
fund
or
counterparties
for
MSFTA
Transactions.
Investment
in
Blackstone
Partners
Offshore
Fund
The
fund
invested
in
Blackstone
Partners
Offshore
Fund
Ltd.
(Blackstone
Partners),
a
multi-strategy
hedge
fund-of-funds
offered
by
Blackstone
Alternative
Asset
Management
(BAAM),
a
unit
of
Blackstone
Group
L.P.
(Blackstone).
Blackstone
Partners
provides
the
fund
exposure
to
alternative
investments
primarily
through
Blackstone
Partners’
investments
in
underlying
private
investment
funds,
and
the
underlying
funds
are
mostly
managed
by
investment
managers
unaffiliated
with
BAAM
or
Blackstone.
Blackstone
Partners
and
the
underlying
funds
may
use
leverage,
engage
in
short-selling,
and
invest
in
commodities
or
other
speculative
investments,
which
may
increase
the
risk
of
investment
loss.
Blackstone
Partners
and
the
underlying
funds
are
not
subject
to
the
same
regulatory
requirements
as
open-end
mutual
funds,
and,
therefore,
their
investments
and
related
valuations
may
not
be
as
transparent.
Ownership
interests
in
Blackstone
Partners
are
not
transferable
and
are
subject
to
various
redemption
restrictions,
such
as
advance
notice
requirements,
limited
redemption
dates,
and
possible
suspension
of
redemption
rights.
In
addition,
Blackstone
Partners’
ownership
in
the
underlying
funds
may
also
be
subject
to
transfer
and
redemption
restrictions,
such
as
advance
notice
requirements,
limited
redemption
dates,
and
possible
suspension
of
redemption
rights.
All
of
these
restrictions
are
subject
to
change
at
the
sole
discretion
of
Blackstone
Partners
or
an
underlying
fund’s
management.
As
of
May
31,
2024,
the
fund’s
investment
in
Blackstone
Partners
is
subject
to
semi-annual
redemption
with
95
days
prior
written
notice
and
is
considered
an
illiquid
asset.
T.
ROWE
PRICE
Spectrum
Moderate
Growth
Allocation
Fund
Securities
Lending
The fund
may
lend
its
securities
to
approved
borrowers
to
earn
additional
income.
Its
securities
lending
activities
are
administered
by
a
lending
agent
in
accordance
with
a
securities
lending
agreement.
Security
loans
generally
do
not
have
stated
maturity
dates,
and
the
fund
may
recall
a
security
at
any
time.
The
fund
receives
collateral
in
the
form
of
cash
or
U.S.
government
securities.
Collateral
is
maintained
over
the
life
of
the
loan
in
an
amount
not
less
than
the
value
of
loaned
securities;
any
additional
collateral
required
due
to
changes
in
security
values
is
delivered
to
the
fund
the
next
business
day.
Cash
collateral
is
invested
in
accordance
with
investment
guidelines
approved
by
fund
management.
Additionally,
the
lending
agent
indemnifies
the
fund
against
losses
resulting
from
borrower
default.
Although
risk
is
mitigated
by
the
collateral
and
indemnification,
the
fund
could
experience
a
delay
in
recovering
its
securities
and
a
possible
loss
of
income
or
value
if
the
borrower
fails
to
return
the
securities,
collateral
investments
decline
in
value,
and
the
lending
agent
fails
to
perform.
Securities
lending
revenue
consists
of
earnings
on
invested
collateral
and
borrowing
fees,
net
of
any
rebates
to
the
borrower,
compensation
to
the
lending
agent,
and
other
administrative
costs.
In
accordance
with
GAAP,
investments
made
with
cash
collateral
are
reflected
in
the
accompanying
financial
statements,
but
collateral
received
in
the
form
of
securities
is
not.
At
May
31,
2024,
the
value
of
loaned
securities
was
$8,011,000;
the
value
of
cash
collateral
and
related
investments
was
$8,460,000.
Other
Purchases
and
sales
of
portfolio
securities
other
than
in-kind
transactions,
if
any,
short-term and
U.S.
government
securities
aggregated $980,618,000 and
$1,163,037,000,
respectively,
for
the
year ended
May
31,
2024.
Purchases
and
sales
of
U.S.
government
securities
aggregated
$353,725,000 and
$335,231,000,
respectively,
for
the
year ended
May
31,
2024.
NOTE
5
-
FEDERAL
INCOME
TAXES
Generally,
no
provision
for
federal
income
taxes
is
required
since
the
fund
intends
to continue
to
qualify
as
a
regulated
investment
company
under
Subchapter
M
of
the
Internal
Revenue
Code
and
distribute
to
shareholders
all
of
its taxable
income
and
gains.
Distributions
determined
in
accordance
with
federal
income
tax
regulations
may
differ
in
amount
or
character
from
net
investment
income
and
realized
gains
for
financial
reporting
purposes.
The
fund
files
U.S.
federal,
state,
and
local
tax
returns
as
required.
The
fund’s
tax
returns
are
subject
to
examination
by
the
relevant
tax
authorities
until
expiration
of
the
applicable
statute
of
limitations,
which
is
generally
three
years
T.
ROWE
PRICE
Spectrum
Moderate
Growth
Allocation
Fund
after
the
filing
of
the
tax
return
but
which
can
be
extended
to
six
years
in
certain
circumstances.
Tax
returns
for
open
years
have
incorporated
no
uncertain
tax
positions
that
require
a
provision
for
income
taxes.
Capital
accounts
within
the
financial
reporting
records
are
adjusted
for
permanent
book/tax
differences
to
reflect
tax
character
but
are
not
adjusted
for
temporary
differences.
The
permanent
book/tax
adjustments,
if
any,
have
no
impact
on
results
of
operations
or
net
assets.
The
permanent
book/tax
adjustments
relate
primarily
to
deemed
distributions
on
shareholder
redemptions.
The
tax
character
of
distributions
paid
for
the
periods
presented
was
as
follows:
At
May
31,
2024,
the
tax-basis
cost
of
investments
(including
derivatives,
if
any)
and
gross
unrealized
appreciation
and
depreciation
were as
follows:
($000s)
May
31,
2024
May
31,
2023
Ordinary
income
(including
short-term
capital
gains,
if
any)
$
61,054
$
48,916
Long-term
capital
gain
—
162,023
Total
distributions
$
61,054
$
210,939
($000s)
Cost
of
investments
$
2,428,808
Unrealized
appreciation
$
1,126,326
Unrealized
depreciation
(209,672)
Net
unrealized
appreciation
(depreciation)
$
916,654
T.
ROWE
PRICE
Spectrum
Moderate
Growth
Allocation
Fund
At
May
31,
2024,
the
tax-basis
components
of
accumulated
net
earnings
(loss)
were
as
follows:
Temporary
differences
between
book-basis
and
tax-basis
components
of
total
distributable
earnings
(loss)
arise
when
certain
items
of
income,
gain,
or
loss
are
recognized
in
different
periods
for
financial
statement
purposes
versus
for
tax
purposes;
these
differences
will
reverse
in
a
subsequent
reporting
period.
The
temporary
differences
relate
primarily
to
the
deferral
of
losses
from
wash
sales
and
the
realization
of
gains/losses
on
passive
foreign
investment
companies.
The
loss
carryforwards
and
deferrals
primarily
relate
to
straddle
deferrals.
During
the
year
ended
May
31,
2024,
the
fund
utilized
$63,749,000
of
capital
loss
carryforwards.
NOTE
6
-
FOREIGN TAXES
The
fund
is
subject
to
foreign
income
taxes
imposed
by
certain
countries
in
which
it
invests.
Additionally,
capital
gains
realized
upon
disposition
of
securities
issued
in
or
by
certain
foreign
countries
are
subject
to
capital
gains
tax
imposed
by
those
countries.
All
taxes
are
computed
in
accordance
with
the
applicable
foreign
tax
law,
and,
to
the
extent
permitted,
capital
losses
are
used
to
offset
capital
gains.
Taxes
attributable
to
income
are
accrued
by
the
fund
as
a
reduction
of
income.
Current
and
deferred
tax
expense
attributable
to
capital
gains
is
reflected
as
a
component
of
realized
or
change
in
unrealized
gain/
loss
on
securities
in
the
accompanying
financial
statements.
To
the
extent
that
the
fund
has
country
specific
capital
loss
carryforwards,
such
carryforwards
are
applied
against
net
unrealized
gains
when
determining
the
deferred
tax
liability.
Any
deferred
tax
liability
incurred
by
the
fund
is
included
in
either
Other
liabilities
or
Deferred
tax
liability
on
the
accompanying
Statement
of
Assets
and
Liabilities.
($000s)
Undistributed
ordinary
income
$
24,089
Undistributed
long-term
capital
gain
86,373
Net
unrealized
appreciation
(depreciation)
916,654
Loss
carryforwards
and
deferrals
(8)
Total
distributable
earnings
(loss)
$
1,027,108
T.
ROWE
PRICE
Spectrum
Moderate
Growth
Allocation
Fund
NOTE
7
-
RELATED
PARTY
TRANSACTIONS
The
fund
is
managed
by
T.
Rowe
Price
Associates,
Inc.
(Price
Associates),
a
wholly
owned
subsidiary
of
T.
Rowe
Price
Group,
Inc.
(Price
Group). Price
Associates
has
entered
into
a
sub-advisory
agreement(s)
with
one
or
more
of
its
wholly
owned
subsidiaries,
to
provide
investment
advisory
services
to
the
fund.
The
investment
management
agreement
between
the
fund
and
Price
Associates
provides
for
an
annual
investment
management
fee,
which
is
computed
daily
and
paid
monthly. The
fee
consists
of
an
individual
fund
fee,
equal
to
0.30%
of
the
fund’s
average
daily
net
assets,
and
a
group
fee.
The
group
fee
rate
is
calculated
based
on
the
combined
net
assets
of
certain
mutual
funds
sponsored
by
Price
Associates
(the
group)
applied
to
a
graduated
fee
schedule,
with
rates
ranging
from
0.48%
for
the
first
$1
billion
of
assets
to
0.260%
for
assets
in
excess
of
$845
billion.
The
fund’s
group
fee
is
determined
by
applying
the
group
fee
rate
to
the
fund’s
average
daily
net
assets. At
May
31,
2024,
the
effective
annual
group
fee
rate
was
0.29%.
Effective
November
1,
2023,
the Investor
Class is
subject
to
a
contractual
expense
limitation
through
the
expense
limitation
date
indicated
in
the
table
below.
This
agreement
will
continue
through
the
expense
limitation
date
indicated
in
the
table
below,
and
may
be
renewed,
revised,
or
revoked
only
with
approval
of
the
fund’s
Board.
Prior
to
November
1,
2023,
the
Investor
Class was
not
subject
to
a
contractual
expense
limitation.
During
the
limitation
period,
Price
Associates
is required
to
waive
or
pay
any
expenses
(excluding
interest;
expenses
related
to
borrowings,
taxes,
and
brokerage;
non-recurring,
extraordinary
expenses;
and
acquired
fund
fees
and
expenses)
that
would
otherwise
cause
the
class’s
ratio
of
annualized
total
expenses
to
average
net
assets
(net
expense
ratio)
to
exceed
its
expense
limitation.
The
class
is
required
to
repay
Price
Associates
for
expenses
previously
waived/paid
to
the
extent
the
class’s
net
assets
grow
or
expenses
decline
sufficiently
to
allow
repayment
without
causing
the
class’s
net
expense
ratio
(after
the
repayment
is
taken
into
account)
to
exceed
the
lesser
of:
(1)
the
expense
limitation
in
place
at
the
time
such
amounts
were
waived;
or
(2)
the
class’s
current
expense
limitation.
However,
no
repayment
will
be
made
more
than
three
years
after
the
date
of
a
payment
or
waiver.
The
I
Class
is
also
subject
to
an
operating
expense
limitation
(I
Class
Limit)
pursuant
to
which
Price
Associates
is
contractually
required
to
pay
all
operating
expenses
of
the
I
Class,
excluding
management
fees;
interest;
expenses
related
to
borrowings,
taxes,
and
brokerage; non-recurring,
extraordinary expenses; and
acquired
fund
fees
and
expenses, to
the
extent
such
operating
expenses,
on
T.
ROWE
PRICE
Spectrum
Moderate
Growth
Allocation
Fund
an
annualized
basis,
exceed
the
I
Class
Limit. This
agreement
will
continue
through
the
expense
limitation
date
indicated
in
the
table
below,
and
may
be
renewed,
revised,
or
revoked
only
with
approval
of
the
fund’s
Board.
The
I
Class
is
required
to
repay
Price
Associates
for
expenses
previously
paid
to
the
extent
the
class’s
net
assets
grow
or
expenses
decline
sufficiently
to
allow
repayment
without
causing
the
class’s
operating
expenses
(after
the
repayment
is
taken
into
account)
to
exceed
the
lesser
of:
(1)
the
I
Class
Limit
in
place
at
the
time
such
amounts
were
paid;
or
(2)
the
current
I
Class
Limit.
However,
no
repayment
will
be
made
more
than
three
years
after
the
date
of
a
payment
or
waiver.
Pursuant
to
these
agreements,
expenses
were
waived/paid
by
and/or
repaid
to
Price
Associates
during
the
year ended May
31,
2024
as
indicated
in
the
table
below.
At
May
31,
2024,
there
were
no
amounts
subject
to
repayment
by
the
fund.
Any
repayment
of
expenses
previously
waived/paid
by
Price
Associates
during
the
period
would
be
included
in
the
net
investment
income
and
expense
ratios
presented
on
the
accompanying
Financial
Highlights.
In
addition,
the
fund
has
entered
into
service
agreements
with
Price
Associates
and
two
wholly
owned
subsidiaries
of
Price
Associates,
each
an
affiliate
of
the
fund
(collectively,
Price).
Price
Associates
provides
certain
accounting
and
administrative
services
to
the
fund.
T.
Rowe
Price
Services,
Inc.
provides
shareholder
and
administrative
services
in
its
capacity
as
the
fund’s
transfer
and
dividend-disbursing
agent.
T.
Rowe
Price
Retirement
Plan
Services,
Inc.
provides
subaccounting
and
recordkeeping
services
for
certain
retirement
accounts
invested
in
the
Investor
Class.
For
the
year
ended
May
31,
2024,
expenses
incurred
pursuant
to
these
service
agreements
were
$111,000
for
Price
Associates;
$994,000
for
T.
Rowe
Price
Services,
Inc.;
and
$63,000
for
T.
Rowe
Price
Retirement
Plan
Services,
Inc.
All
amounts
due
to
and
due
from
Price,
exclusive
of
investment
management
fees
payable,
are
presented
net
on
the
accompanying
Statement
of
Assets
and
Liabilities.
Investor
Class
I
Class
Expense
limitation/I
Class
Limit
0.94%
0.05%
Expense
limitation
date
09/30/25
07/31/27
(Waived)/repaid
during
the
period
($000s)
$—
$—
T.
ROWE
PRICE
Spectrum
Moderate
Growth
Allocation
Fund
T.
Rowe
Price
Investment
Services,
Inc.
(Investment
Services)
serves
as
distributor
to
the
fund.
Pursuant
to
an
underwriting
agreement,
no
compensation
for
any
distribution
services
provided
is
paid
to
Investment
Services
by
the
fund
(except
for
12b-1
fees
under
a
Board-approved
Rule
12b-1
plan).
The fund
may
invest
its
cash
reserves
in
certain
open-end
management
investment
companies
managed
by
Price
Associates
and
considered
affiliates
of
the
fund:
the
T.
Rowe
Price
Government
Reserve
Fund
or
the
T.
Rowe
Price
Treasury
Reserve
Fund,
organized
as
money
market
funds
(together,
the
Price
Reserve
Funds).
The
Price
Reserve
Funds
are
offered
as
short-term
investment
options
to
mutual
funds,
trusts,
and
other
accounts
managed
by
Price
Associates
or
its
affiliates
and
are
not
available
for
direct
purchase
by
members
of
the
public.
Cash
collateral
from
securities
lending,
if
any,
is
invested
in
the
T.
Rowe
Price
Government
Reserve Fund. The
Price
Reserve
Funds
pay
no
investment
management
fees.
The
fund
may
also
invest
in
certain
other
T.
Rowe
Price
funds
(Price
Funds)
as
a
means
of
gaining
efficient
and
cost-effective
exposure
to
certain
markets.
The
fund
does
not
invest
for
the
purpose
of
exercising
management
or
control;
however,
investments
by
the
fund
may
represent
a
significant
portion
of
an
underlying
Price
Fund’s
net
assets.
Each
underlying
Price
Fund
is
an
open-
end
management
investment
company
managed
by
Price
Associates
and
is
considered
an
affiliate
of
the
fund.
To
ensure
that
the
fund
does
not
incur
duplicate
management
fees
(paid
by
the
underlying
Price
Fund(s)
and
the
fund),
Price
Associates
has
agreed
to
permanently
waive
a
portion
of
its
management
fee
charged
to
the
fund
in
an
amount
sufficient
to
fully
offset
that
portion
of
management
fees
paid
by
each
underlying
Price
Fund
related
to
the
fund’s
investment
therein.
Annual
management
fee
rates
and
amounts
waived
related
to
investments
in
the
underlying
Price
Fund(s)
for
the
year
ended
May
31,
2024,
are
as
follows:
($000s)
Effective
Management
Fee
Rate
Management
Fee
Waived
T.
Rowe
Price
Inflation
Protected
Bond
Fund
-
I
Class
0.17%
$
1
T.
Rowe
Price
Institutional
Emerging
Markets
Bond
Fund
0.70%
271
T.
Rowe
Price
Institutional
Emerging
Markets
Equity
Fund
1.00%
1,917
T.
Rowe
Price
Institutional
Floating
Rate
Fund
-
Institutional
Class
0.55%
85
T.
ROWE
PRICE
Spectrum
Moderate
Growth
Allocation
Fund
Total
management
fee
waived
was
allocated
ratably
in
the
amounts
of
$1,933,000
and
$2,502,000 for
the
Investor
Class
and
I
Class,
respectively,
for
the
year ended
May
31,
2024.
The fund may
participate
in
securities
purchase
and
sale
transactions
with
other
funds
or
accounts
advised
by
Price
Associates
(cross
trades),
in
accordance
with
procedures
adopted
by the
fund’s
Board
and
Securities
and
Exchange
Commission
rules,
which
require,
among
other
things,
that
such
purchase
and
sale
cross
trades
be
effected
at
the
independent
current
market
price
of
the
security.
During
the
year
ended
May
31,
2024,
the
fund
had
no
purchases
or
sales
cross
trades
with
other
funds
or
accounts
advised
by
Price
Associates.
Prior
to
January
1,
2024,
Price
Associates
had
voluntarily
agreed
to
reimburse
the
fund
from
its
own
resources
on
a
monthly
basis
for
the
cost
of
investment
research
embedded
in
the
cost
of
the
fund’s
securities
trades.
Price
Associates
has
also
voluntarily
agreed
to
reimburse
the
fund
from
its
own
resources
on
a
monthly
basis
for
the
cost
of
brokerage
commissions
embedded
in
the
cost
of
the
fund’s
foreign
currency
transactions. This
agreement
may
be
rescinded
at
any
time. For
the
year ended
May
31,
2024,
these
reimbursements
amounted
to
$24,000,
which
is
included
in
Net
realized
gain
(loss)
on
Securities
in
the
Statement
of
Operations.
($000s)
Effective
Management
Fee
Rate
Management
Fee
Waived
T.
Rowe
Price
Institutional
High
Yield
Fund
-
Institutional
Class
0.50%
$
200
T.
Rowe
Price
International
Bond
Fund
(USD
Hedged)
-
I
Class
0.49%
318
T.
Rowe
Price
Limited
Duration
Inflation
Focused
Bond
Fund
-
I
Class
0.25%
7
T.
Rowe
Price
Multi-Strategy
Total
Return
Fund
-
I
Class
1.00%
620
T.
Rowe
Price
Real
Assets
Fund
-
I
Class
0.64%
975
T.
Rowe
Price
U.S.
Treasury
Long-Term
Index
Fund
-
I
Class
0.06%
41
Total
Management
Fee
Waived
$
4,435
T.
ROWE
PRICE
Spectrum
Moderate
Growth
Allocation
Fund
NOTE
8
-
OTHER
MATTERS
Unpredictable environmental,
political,
social
and
economic
events,
including
but
not
limited
to,
environmental
or
natural
disasters,
war
and
conflict
(including
Russia’s
military
invasion
of
Ukraine
and
the
conflict
in
Israel,
Gaza
and
surrounding
areas),
terrorism,
geopolitical
developments
(including
trading
and
tariff
arrangements,
sanctions
and
cybersecurity
attacks),
and
public
health
epidemics
(including
the
global
outbreak
of
COVID-19)
and
similar
public
health
threats,
may
significantly
affect
the
economy
and
the
markets
and
issuers
in
which
a
fund
invests.
The
extent
and
duration
of
such
events
and
resulting
market
disruptions
cannot
be
predicted.
These
and
other
similar
events
may
cause
instability
across
global
markets,
including
reduced
liquidity
and
disruptions
in
trading
markets,
while
some
events
may
affect
certain
geographic
regions,
countries,
sectors,
and
industries
more
significantly
than
others,
and
exacerbate
other
pre-existing
political,
social,
and
economic
risks.
The
fund’s
performance
could
be
negatively
impacted
if
the
value
of
a
portfolio
holding
were
harmed
by
these
or
such
events.
Management
actively
monitors
the
risks
and
financial
impacts
arising
from
such
events.
T.
ROWE
PRICE
Spectrum
Moderate
Growth
Allocation
Fund
REPORT
OF
INDEPENDENT
REGISTERED
PUBLIC
ACCOUNTING
FIRM
To
the
Board
of
Directors
of
T.
Rowe
Price
Spectrum
Funds
II,
Inc.
and
Shareholders
of
T.
Rowe
Price
Spectrum
Moderate
Growth
Allocation
Fund
Opinion
on
the
Financial
Statements
We
have
audited
the
accompanying
statement
of
assets
and
liabilities,
including
the
portfolio
of
investments,
of
T.
Rowe
Price
Spectrum
Moderate
Growth
Allocation
Fund
(one
of
the
funds
constituting
T.
Rowe
Price
Spectrum
Funds
II,
Inc.,
referred
to
hereafter
as
the
"Fund")
as
of
May
31,
2024,
the
related
statement
of
operations
for
the
year
ended
May
31,
2024,
the
statement
of
changes
in
net
assets
for
each
of
the
two
years
in
the
period
ended
May
31,
2024,
including
the
related
notes,
and
the
financial
highlights
for
each
of
the
five
years
in
the
period
ended
May
31,
2024,
(collectively
referred
to
as
the
“financial
statements”).
In
our
opinion,
the
financial
statements
present
fairly,
in
all
material
respects,
the
financial
position
of
the
Fund
as
of
May
31,
2024,
the
results
of
its
operations
for
the
year
then
ended,
the
changes
in
its
net
assets
for
each
of
the
two
years
in
the
period
ended
May
31,
2024
and
the
financial
highlights
for
each
of
the
five
years
in
the
period
ended
May
31,
2024,
in
conformity
with
accounting
principles
generally
accepted
in
the
United
States
of
America.
Basis
for
Opinion
These
financial
statements
are
the
responsibility
of
the
Fund’s
management.
Our
responsibility
is
to
express
an
opinion
on
the
Fund’s
financial
statements
based
on
our
audits.
We
are
a
public
accounting
firm
registered
with
the
Public
Company
Accounting
Oversight
Board
(United
States)
(PCAOB)
and
are
required
to
be
independent
with
respect
to
the
Fund
in
accordance
with
the
U.S.
federal
securities
laws
and
the
applicable
rules
and
regulations
of
the
Securities
and
Exchange
Commission
and
the
PCAOB.
We
conducted
our
audits
of
these
financial
statements
in
accordance
with
the
standards
of
the
PCAOB.
Those
standards
require
that
we
plan
and
perform
the
audit
to
obtain
reasonable
assurance
about
whether
the
financial
statements
are
free
of
material
misstatement,
whether
due
to
error
or
fraud.
T.
ROWE
PRICE
Spectrum
Moderate
Growth
Allocation
Fund
Our
audits
included
performing
procedures
to
assess
the
risks
of
material
misstatement
of
the
financial
statements,
whether
due
to
error
or
fraud,
and
performing
procedures
that
respond
to
those
risks.
Such
procedures
included
examining,
on
a
test
basis,
evidence
regarding
the
amounts
and
disclosures
in
the
financial
statements.
Our
audits
also
included
evaluating
the
accounting
principles
used
and
significant
estimates
made
by
management,
as
well
as
evaluating
the
overall
presentation
of
the
financial
statements.
Our
procedures
included
confirmation
of
securities
owned
as
of
May
31,
2024
by
correspondence
with
the
custodians,
transfer
agent,
investment
manager
and
brokers;
when
replies
were
not
received
from
brokers,
we
performed
other
auditing
procedures.
We
believe
that
our
audits
provide
a
reasonable
basis
for
our
opinion.
/s/
PricewaterhouseCoopers
LLP
Baltimore,
Maryland
July
18,
2024
We
have
served
as
the
auditor
of
one
or
more
investment
companies
in
the
T.
Rowe
Price
group
of
investment
companies
since
1973.
REPORT
OF
INDEPENDENT
REGISTERED
PUBLIC
ACCOUNTING
FIRM
(continued)
T.
ROWE
PRICE
Spectrum
Moderate
Growth
Allocation
Fund
TAX
INFORMATION
(UNAUDITED)
FOR
THE
TAX
YEAR
ENDED 5/31/24
We
are
providing
this
information
as
required
by
the
Internal
Revenue
Code.
The
amounts
shown
may
differ
from
those
elsewhere
in
this
report
because
of
differences
between
tax
and
financial
reporting
requirements.
The
fund’s
distributions
to
shareholders
included
$2,762,000
from
long-term
capital
gains,
subject
to
a
long-term
capital
gains
tax
rate
of
not
greater
than
20%.
For
taxable
non-corporate
shareholders,
$39,471,000
of
the
fund's
income
represents
qualified
dividend
income
subject
to
a
long-term
capital
gains
tax
rate
of
not
greater
than
20%.
For
corporate
shareholders,
$18,753,000
of
the
fund's
income
qualifies
for
the
dividends-received
deduction.
For
shareholders
subject
to
interest
expense
deduction
limitation
under
Section
163(j),
$19,909,000
of
the
fund’s
income
qualifies
as
a
Section
163(j)
interest
dividend
and
can
be
treated
as
interest
income
for
purposes
of
Section
163(j),
subject
to
holding
period
requirements
and
other
limitations.
For
individuals
and
certain
trusts
and
estates
which
are
entitled
to
claim
a
deduction
of
up
to
20%
of
their
combined
qualified
real
estate
investment
trust
(REIT)
dividends,
$819,000
of
the
fund's
income
qualifies
as
qualified
real
estate
investment
trust
(REIT)
dividends.
T.
ROWE
PRICE
Spectrum
Moderate
Growth
Allocation
Fund
APPROVAL
OF
INVESTMENT
MANAGEMENT
AGREEMENT
AND
SUBADVISORY
AGREEMENTS
Each
year,
the
fund’s
Board
of
Directors
(Board)
considers
the
continuation
of
the
investment
management
agreement
(Advisory
Contract)
between
the
fund
and
its
investment
adviser,
T.
Rowe
Price
Associates,
Inc.
(Adviser),
as
well
as
the
investment
subadvisory
agreements
(Subadvisory
Contracts)
that
the
Adviser
has
entered
into
with
T.
Rowe
Price
Investment
Management,
Inc.
(TRPIM),
T.
Rowe
Price
International
Ltd,
and
T.
Rowe
Price
Hong
Kong
Limited
(collectively
the
Subadvisers)
on
behalf
of
the
fund.
In
that
regard,
at
a
meeting
held
on
March
11–12,
2024
(Meeting),
the
Board,
including
all
of
the
fund’s
independent
directors
present
in
person
at
the
Meeting,
approved
the
continuation
of
the
fund’s
Advisory
Contract
and
Subadvisory
Contracts.
At
the
Meeting,
the
Board
considered
the
factors
and
reached
the
conclusions
described
below
relating
to
the
selection
of
the
Adviser
and
Subadvisers
and
the
approval
of
the
Advisory
Contract
and
Subadvisory
Contracts.
The
independent
directors
were
assisted
in
their
evaluation
of
the
Advisory
Contract
and
Subadvisory
Contracts
by
independent
legal
counsel
from
whom
they
received
separate
legal
advice
and
with
whom
they
met
separately.
In
providing
information
to
the
Board,
the
Adviser
was
guided
by
a
detailed
set
of
requests
for
information
submitted
by
independent
legal
counsel
on
behalf
of
the
independent
directors.
In
considering
and
approving
the
continuation
of
the
Advisory
Contract
and
Subadvisory
Contracts,
the
Board
considered
the
information
it
believed
was
relevant,
including,
but
not
limited
to,
the
information
discussed
below.
The
Board
considered
not
only
the
specific
information
presented
in
connection
with
the
Meeting,
but
also
the
knowledge
gained
over
time
through
interaction
with
the
Adviser
and
Subadvisers
about
various
topics.
The
Board
also
considered
that
TRPIM
has
its
own
investment
platform
and
investment
management
leadership,
and
that
TRPIM
has
implemented
information
barriers
restricting
the
sharing
of
investment
information
and
voting
activity
with
the
Adviser
and
other
Subadvisers.
The
Board
meets
regularly
and,
at
each
of
its
meetings,
covers
an
extensive
agenda
of
topics
and
materials
and
considers
factors
that
are
relevant
to
its
annual
consideration
of
the
renewal
of
the
T.
Rowe
Price
funds’
advisory
contracts,
including
performance
and
the
services
and
support
provided
to
the
funds
and
their
shareholders.
Services
Provided
by
the
Adviser
and
Subadvisers
The
Board
considered
the
nature,
quality,
and
extent
of
the
services
provided
to
the
fund
by
the
Adviser
and
Subadvisers.
These
services
included,
but
were
not
limited
to,
directing
the
fund’s
investments
in
accordance
with
its
investment
program
and
the
overall
management
of
the
fund’s
portfolio,
as
well
as
a
variety
of
related
activities
such
as
financial,
investment
operations,
and
administrative
services;
compliance;
maintaining
the
fund’s
records
and
registrations;
and
shareholder
communications.
However,
the
Board
noted
that
there
are
information
T.
ROWE
PRICE
Spectrum
Moderate
Growth
Allocation
Fund
barriers
between
investment
personnel
of
TRPIM
and
the
Adviser
and
the
other
Subadvisers
that
restrict
the
sharing
of
certain
information,
such
as
investment
research,
trading,
and
proxy
voting.
The
Board
also
reviewed
the
background
and
experience
of
the
Adviser’s
and
Subadvisers’
senior
management
teams
and
investment
personnel
involved
in
the
management
of
the
fund,
as
well
as
the
Adviser’s
compliance
record.
The
Board
concluded
that
the
information
it
considered
with
respect
to
the
nature,
quality,
and
extent
of
the
services
provided
by
the
Adviser
and
Subadvisers,
as
well
as
the
other
factors
considered
at
the
Meeting,
supported
the
Board’s
approval
of
the
continuation
of
the
Advisory
Contract
and
Subadvisory
Contracts.
Investment
Performance
of
the
Fund
The
Board
took
into
account
discussions
with
the
Adviser
and
detailed
reports
that
it
regularly
receives
throughout
the
year
on
relative
and
absolute
performance
for
the
T.
Rowe
Price
funds.
In
connection
with
the
Meeting,
the
Board
reviewed
information
provided
by
the
Adviser
that
compared
the
fund’s
total
returns,
as
well
as
a
wide
variety
of
other
previously
agreed-upon
performance
measures
and
market
data,
against
relevant
benchmark
indexes
and
peer
groups
of
funds
with
similar
investment
programs
for
various
periods
through
December
31,
2023.
Additionally,
the
Board
reviewed
the
fund’s
relative
performance
information
as
of
September
30,
2023,
which
ranked
the
returns
of
the
fund’s
Investor
Class
for
various
periods
against
a
universe
of
funds
with
similar
investment
programs
selected
by
Broadridge,
an
independent
provider
of
mutual
fund
data.
In
the
course
of
its
deliberations,
the
Board
considered
performance
information
provided
throughout
the
year
and
in
connection
with
the
Advisory
Contract
review
at
the
Meeting,
as
well
as
information
provided
during
investment
review
meetings
conducted
with
portfolio
managers
and
senior
investment
personnel
during
the
course
of
the
year
regarding
the
fund’s
performance.
The
Board
also
considered
relevant
factors,
such
as
overall
market
conditions
and
trends
that
could
adversely
impact
the
fund’s
performance,
the
length
of
the
fund’s
performance
track
record,
and
how
closely
the
fund’s
strategies
align
with
its
benchmarks
and
peer
groups.
The
Board
concluded
that
the
information
it
considered
with
respect
to
the
fund’s
performance,
as
well
as
the
other
factors
considered
at
the
Meeting,
supported
the
Board’s
approval
of
the
continuation
of
the
Advisory
Contract
and
Subadvisory
Contracts.
APPROVAL
OF
INVESTMENT
MANAGEMENT
AGREEMENT
AND
SUBADVISORY
AGREEMENTS
(continued)
T.
ROWE
PRICE
Spectrum
Moderate
Growth
Allocation
Fund
Costs,
Benefits,
Profits,
and
Economies
of
Scale
The
Board
reviewed
detailed
information
regarding
the
revenues
received
by
the
Adviser
under
the
Advisory
Contract
and
other
direct
and
indirect
benefits
that
the
Adviser
(and
its
affiliates,
including
the
Subadvisers)
may
have
realized
from
its
relationship
with
the
fund.
In
considering
soft-dollar
arrangements
pursuant
to
which
research
may
be
received
from
broker-dealers
that
execute
the
fund’s
portfolio
transactions,
the
Board
noted
that
during
2023
the
Adviser
paid
the
costs
of
research
services
for
all
client
accounts
that
it
advises,
including
the
T.
Rowe
Price
funds.
However,
effective
January
1,
2024,
the
Adviser
will
begin
using
brokerage
commissions
in
connection
with
certain
T.
Rowe
Price
funds’
securities
transactions
to
pay
for
research
when
permissible.
The
Board
received
information
on
the
estimated
costs
incurred
and
profits
realized
by
the
Adviser
from
managing
the
T.
Rowe
Price
funds.
The
Board
also
reviewed
estimates
of
the
profits
realized
from
managing
the
fund
in
particular,
and
the
Board
concluded
that
the
Adviser’s
profits
were
reasonable
in
light
of
the
services
provided
to
the
fund.
The
Board
also
considered
whether
the
fund
benefits
under
the
fee
levels
set
forth
in
the
Advisory
Contract
or
otherwise
from
any
economies
of
scale
realized
by
the
Adviser.
Under
the
Advisory
Contract,
the
fund
pays
a
fee
to
the
Adviser
for
investment
management
services
composed
of
two
components—a
group
fee
rate
based
on
the
combined
average
net
assets
of
most
of
the
T.
Rowe
Price
funds
(including
the
fund)
that
declines
at
certain
asset
levels
and
an
individual
fund
fee
rate
based
on
the
fund’s
average
daily
net
assets—and
the
fund
pays
its
own
expenses
of
operations.
Under
each
Subadvisory
Contract,
the
Adviser
may
pay
each
Subadviser
up
to
60%
of
the
advisory
fees
that
the
Adviser
receives
from
the
fund.
The
group
fee
rate
decreases
as
total
T.
Rowe
Price
fund
assets
grow,
which
reduces
the
management
fee
rate
for
any
fund
that
has
a
group
fee
component
to
its
management
fee,
and
reflects
that
certain
resources
utilized
to
operate
the
fund
are
shared
with
other
T.
Rowe
Price
funds,
thus
allowing
shareholders
of
those
funds
to
share
potential
economies
of
scale.
The
fund’s
shareholders
also
benefit
from
potential
economies
of
scale
through
a
decline
in
certain
operating
expenses
as
the
fund
grows
in
size.
However,
the
fund
is
also
subject
to
contractual
expense
limitations
that
require
the
Adviser
to
waive
its
fees
and/or
bear
any
expenses
that
would
otherwise
cause
the
expenses
of
a
share
class
of
the
fund
to
exceed
a
certain
percentage
based
on
the
class’s
net
assets.
The
expense
limitations
mitigate
the
potential
for
an
increase
in
operating
expenses
above
a
certain
level
that
could
impact
shareholders.
APPROVAL
OF
INVESTMENT
MANAGEMENT
AGREEMENT
AND
SUBADVISORY
AGREEMENTS
(continued)
T.
ROWE
PRICE
Spectrum
Moderate
Growth
Allocation
Fund
In
addition,
the
Board
noted
that
the
fund
potentially
shares
in
indirect
economies
of
scale
through
the
Adviser’s
and
Subadvisers’
ongoing
investments
in
their
business
in
support
of
the
T.
Rowe
Price
funds,
including
investments
in
trading
systems,
technology,
and
regulatory
support
enhancements,
and
the
ability
to
possibly
negotiate
lower
fee
arrangements
with
third-party
service
providers.
The
Board
concluded
that
the
advisory
fee
structure
for
the
fund
provides
for
a
reasonable
sharing
of
benefits
from
any
economies
of
scale
with
the
fund’s
investors.
Fees
and
Expenses
The
Board
was
provided
with
information
regarding
industry
trends
in
management
fees
and
expenses.
Among
other
things,
the
Board
reviewed
data
for
peer
groups
that
were
compiled
by
Broadridge,
which
compared:
(i)
contractual
management
fees,
actual
management
fees,
nonmanagement
expenses,
and
total
expenses
of
the
Investor
Class
of
the
fund
with
a
group
of
competitor
funds
selected
by
Broadridge
(Expense
Group)
and
(ii)
actual
management
fees,
nonmanagement
expenses,
and
total
expenses
of
the
Investor
Class
of
the
fund
with
a
broader
set
of
funds
within
the
Lipper
investment
classification
(Expense
Universe).
The
Board
considered
the
fund’s
contractual
management
fee
rate,
actual
management
fee
rate
(which
reflects
the
management
fees
actually
received
from
the
fund
by
the
Adviser
after
any
applicable
waivers,
reductions,
or
reimbursements),
operating
expenses,
and
total
expenses
(which
reflect
the
net
total
expense
ratio
of
the
fund
after
any
waivers,
reductions,
or
reimbursements)
in
comparison
with
the
information
for
the
Broadridge
peer
groups.
Broadridge
generally
constructed
the
peer
groups
by
seeking
the
most
comparable
funds
based
on
similar
investment
classifications
and
objectives,
expense
structure,
asset
size,
and
operating
components
and
attributes
and
ranked
funds
into
quintiles,
with
the
first
quintile
representing
the
funds
with
the
lowest
relative
expenses
and
the
fifth
quintile
representing
the
funds
with
the
highest
relative
expenses.
The
information
provided
to
the
Board
indicated
that
the
fund’s
contractual
management
fee
ranked
in
the
first
quintile
(Expense
Group),
the
fund’s
actual
management
fee
rate
ranked
in
the
first
quintile
(Expense
Group)
and
second
quintile
(Expense
Universe),
and
the
fund’s
total
expenses
ranked
in
the
first
quintile
(Expense
Group
and
Expense
Universe).
The
Board
also
reviewed
the
fee
schedules
for
other
investment
portfolios
with
similar
mandates
that
are
advised
or
subadvised
by
the
Adviser
and
its
affiliates,
including
separately
managed
accounts
for
institutional
and
individual
investors;
subadvised
funds;
and
other
sponsored
investment
portfolios,
including
collective
investment
trusts
and
pooled
vehicles
organized
and
offered
to
investors
outside
the
United
States.
Management
provided
the
Board
with
information
about
the
Adviser’s
responsibilities
and
services
provided
to
subadvisory
and
other
institutional
account
clients,
including
information
about
how
the
requirements
and
APPROVAL
OF
INVESTMENT
MANAGEMENT
AGREEMENT
AND
SUBADVISORY
AGREEMENTS
(continued)
T.
ROWE
PRICE
Spectrum
Moderate
Growth
Allocation
Fund
economics
of
the
institutional
business
are
fundamentally
different
from
those
of
the
proprietary
mutual
fund
business.
The
Board
considered
information
showing
that
the
Adviser’s
mutual
fund
business
is
generally
more
complex
from
a
business
and
compliance
perspective
than
its
institutional
account
business
and
considered
various
relevant
factors,
such
as
the
broader
scope
of
operations
and
oversight,
more
extensive
shareholder
communication
infrastructure,
greater
asset
flows,
heightened
business
risks,
and
differences
in
applicable
laws
and
regulations
associated
with
the
Adviser’s
proprietary
mutual
fund
business.
In
assessing
the
reasonableness
of
the
fund’s
management
fee
rate,
the
Board
considered
the
differences
in
the
nature
of
the
services
required
for
the
Adviser
to
manage
its
mutual
fund
business
versus
managing
a
discrete
pool
of
assets
as
a
subadviser
to
another
institution’s
mutual
fund
or
for
an
institutional
account
and
that
the
Adviser
generally
performs
significant
additional
services
and
assumes
greater
risk
in
managing
the
fund
and
other
T.
Rowe
Price
funds
than
it
does
for
institutional
account
clients,
including
subadvised
funds.
On
the
basis
of
the
information
provided
and
the
factors
considered,
the
Board
concluded
that
the
fees
paid
by
the
fund
under
the
Advisory
Contract
are
reasonable.
Approval
of
the
Advisory
Contract
and
Subadvisory
Contracts
As
noted,
the
Board
approved
the
continuation
of
the
Advisory
Contract
and
Subadvisory
Contracts.
No
single
factor
was
considered
in
isolation
or
to
be
determinative
to
the
decision.
Rather,
the
Board
concluded,
in
light
of
a
weighting
and
balancing
of
all
factors
considered,
that
it
was
in
the
best
interests
of
the
fund
and
its
shareholders
for
the
Board
to
approve
the
continuation
of
the
Advisory
Contract
and
Subadvisory
Contracts
(including
the
fees
to
be
charged
for
services
thereunder).
APPROVAL
OF
INVESTMENT
MANAGEMENT
AGREEMENT
AND
SUBADVISORY
AGREEMENTS
(continued)
100
East
Pratt
Street
Baltimore,
MD
21202
T.
Rowe
Price
Investment
Services,
Inc.
Call
1-800-225-5132
to
request
a
prospectus
or
summary
prospectus;
each
includes
investment
objectives,
risks,
fees,
expenses,
and
other
information
that
you
should
read
and
consider
carefully
before
investing.
F103-050
7/24
Item 8. Changes in and Disagreements with Accountants for Open-End Management Investment Companies.
Not applicable.
Item 9. Proxy Disclosures for Open-End Management Investment Companies.
Not applicable.
Item 10. Remuneration Paid to Directors, Officers, and Others of Open-End Management Investment Companies.
Remuneration paid to Directors is included in Item 7 of this Form N-CSR.
Item 11. Statement Regarding Basis for Approval of Investment Advisory Contract.
If applicable, see Item 7.
Item 12. Disclosure of Proxy Voting Policies and Procedures for Closed-End Management Investment Companies.
Not applicable.
Item 13. Portfolio Managers of Closed-End Management Investment Companies.
Not applicable.
Item 14. Purchases of Equity Securities by Closed-End Management Investment Company and Affiliated Purchasers.
Not applicable.
Item 15. Submission of Matters to a Vote of Security Holders.
There has been no change to the procedures by which shareholders may recommend nominees to the registrant’s board of directors.
Item 16. Controls and Procedures.
(a) The registrant’s principal executive officer and principal financial officer have evaluated the registrant’s disclosure controls and procedures within 90 days of this filing and have concluded that the registrant’s disclosure controls and procedures were effective, as of that date, in ensuring that information required to be disclosed by the registrant in this Form N-CSR was recorded, processed, summarized, and reported timely.
(b) The registrant’s principal executive officer and principal financial officer are aware of no change in the registrant’s internal control over financial reporting that occurred during the period covered by this report that has materially affected, or is reasonably likely to materially affect, the registrant’s internal control over financial reporting.
Item 17. Disclosure of Securities Lending Activities for Closed-End Management Investment Companies.
Not applicable.
Item 18. Recovery of Erroneously Awarded Compensation.
Not applicable.
Item 19. Exhibits.
SIGNATURES
Pursuant to the requirements of the Securities Exchange Act of 1934 and the Investment Company Act of 1940, the registrant has duly caused this report to be signed on its behalf by the undersigned, thereunto duly authorized.
T. Rowe Price Spectrum Moderate Growth Allocation Fund
| | | | |
| | |
| By | | /s/ David Oestreicher | | |
| | David Oestreicher | | |
| | Principal Executive Officer | | |
| | |
| Date | | July 18, 2024 | | |
Pursuant to the requirements of the Securities Exchange Act of 1934 and the Investment Company Act of 1940, this report has been signed below by the following persons on behalf of the registrant and in the capacities and on the dates indicated.
| | | | |
| By | | /s/ David Oestreicher | | |
| | David Oestreicher | | |
| | Principal Executive Officer | | |
| | |
| Date | | July 18, 2024 | | |
| | |
| By | | /s/ Alan S. Dupski | | |
| | Alan S. Dupski | | |
| | Principal Financial Officer | | |
| | |
| Date | | July 18, 2024 | | |