- FFIC Dashboard
- Financials
- Filings
-
Holdings
- Transcripts
- ETFs
- Insider
- Institutional
- Shorts
-
FWP Filing
Flushing Financial (FFIC) FWPFree writing prospectus
Filed: 5 Dec 16, 12:00am
Subordinated Notes Offering December 2016 Free Writing Prospectus Dated December 5, 2016 Filed pursuant to Rule 433 Registration Statement No. 333-195182
Safe Harbor Statement This presentation has been prepared by Flushing Financial Corporation (“Flushing Financial” or the “Company”) solely for informational purposes based on information regarding its operations, as well as information from public sources. This presentation has been prepared to assist interested parties in making their own evaluation of Flushing Financial and does not purport to contain all of the information that may be relevant or material to an interested party’s investment decision. In all cases, interested parties should conduct their own investigation and analysis of Flushing Financial, the information set forth in this presentation, the information included in or incorporated by reference into the prospectus and the prospectus supplement, and other information provided by or on behalf of Flushing Financial. This presentation does not constitute an offer to sell, or a solicitation of an offer to buy, any securities of Flushing Financial by any person in any jurisdiction in which it is unlawful for such person to make such an offering or solicitation. Neither the Securities and Exchange Commission (“SEC”) nor any other regulatory body has approved or disapproved of the securities of Flushing Financial or passed upon the accuracy or adequacy of this presentation. Any representation to the contrary is a criminal offense. Securities of Flushing Financial are not deposits or insured by the FDIC or any other agency. Except where information is provided as of a specified date, this presentation speaks as of the date hereof. The delivery of this presentation shall not, under any circumstances, create any implication that there has been no change in the affairs of the Company after the date hereof. Certain of the information contained herein may be derived from information provided by industry sources. Flushing Financial believes that such information is accurate and that the sources from which it has been obtained are reliable. Flushing Financial cannot guarantee the accuracy of such information, however, and has not independently verified such information.
Safe Harbor Statement This presentation may contain forward-looking statements with respect to the financial condition, results of operations, plans, objectives, future performance or business of the Company. Forward-looking statements are generally identifiable by the use of words such as “believe,” “expect,” “anticipate,” “plan,” “intend,” “estimate,” “may,” “will,” “would,” “could,” “should” or other similar expressions. Forward-looking statements are not a guarantee of future performance or results, are based on information available at the time the statements are made and involve known and unknown risks, uncertainties and other factors that could cause actual results to differ materially from the information in the forward-looking statements. Factors that may cause such differences include: failures of or interruptions in the communications and information systems on which we rely to conduct our business; failure of our plans to grow our commercial real estate and commercial and industrial loan portfolios; competition with national, regional and community financial institutions; the loss of any key members of senior management; fluctuations in interest rates; general economic conditions; risks relating to the regulation of financial institutions; and other factors identified in reports we file with the SEC. All statements in this presentation, including forward-looking statements, speak only as of the date they are made, and the Company undertakes no obligation to update any statement in light of new information or future events. Flushing Financial has filed a registration statement (File No. 333-195182) (including a prospectus) and a prospectus supplement which is preliminary and subject to completion, with the SEC for the offering to which this communication relates. Before you invest, you should read the prospectus in that registration statement, the preliminary prospectus supplement and the other documents that Flushing Financial has filed with the SEC for more complete information about Flushing Financial and the offering. You may get these documents for free by visiting the SEC web site at www.sec.gov. Alternatively, the Company, any underwriter or any dealer participating in the offering will arrange to send you the prospectus if you request it by contacting; Sandler O’Neill + Partners, L.P. at toll-free 1-866-805-4128 or by emailing syndicate@sandleroneill.com.
Non-GAAP Measures Core Diluted EPS, Core ROAE, Core ROAA, tangible common stockholders’ equity and efficiency ratio are each non-GAAP financial measures used in this presentation. These non-GAAP financial measures adjust GAAP financial measures to exclude for net income, intangible assets, net gains/losses for financial assets and liabilities, gains/losses on sale of securities, prepayment penalties on borrowings, gain on sale of buildings and certain non-recurring items, which our management uses when evaluating net income from our business, capital utilization and adequacy. A reconciliation to the most directly comparable GAAP financial measures is set forth in the Appendix to this presentation on pages 32 - 34. The Company believes that these non-GAAP financial measures are useful for both investors and management to understand the effects of certain non-interest items and provide an alternative view of the Company's performance over time and in comparison to the Company's competitors. The Company believes these non-GAAP financial measures facilitate comparison of the quality and composition of the Company's earnings and capital over time and in comparison to its competitors. These measures should not be viewed as a substitute for their comparable GAAP financial measures. These non-GAAP financial measures have inherent limitations, are not required to be uniformly applied and are not audited. They should not be considered in isolation or as a substitute for analysis of results reported in our financial statements under GAAP. These non-GAAP financial measures may not be comparable to similarly titled measures reported by other companies.
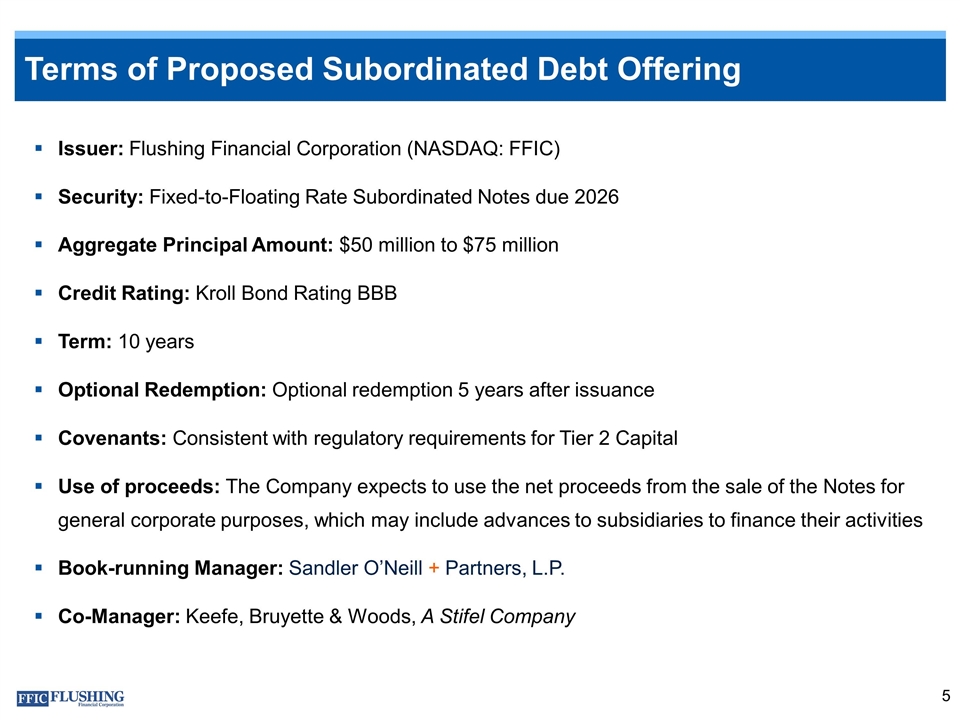
Terms of Proposed Subordinated Debt Offering Issuer: Flushing Financial Corporation (NASDAQ: FFIC) Security: Fixed-to-Floating Rate Subordinated Notes due 2026 Aggregate Principal Amount: $50 million to $75 million Credit Rating: Kroll Bond Rating BBB Term: 10 years Optional Redemption: Optional redemption 5 years after issuance Covenants: Consistent with regulatory requirements for Tier 2 Capital Use of proceeds: The Company expects to use the net proceeds from the sale of the Notes for general corporate purposes, which may include advances to subsidiaries to finance their activities Book-running Manager: Sandler O’Neill + Partners, L.P. Co-Manager: Keefe, Bruyette & Woods, A Stifel Company
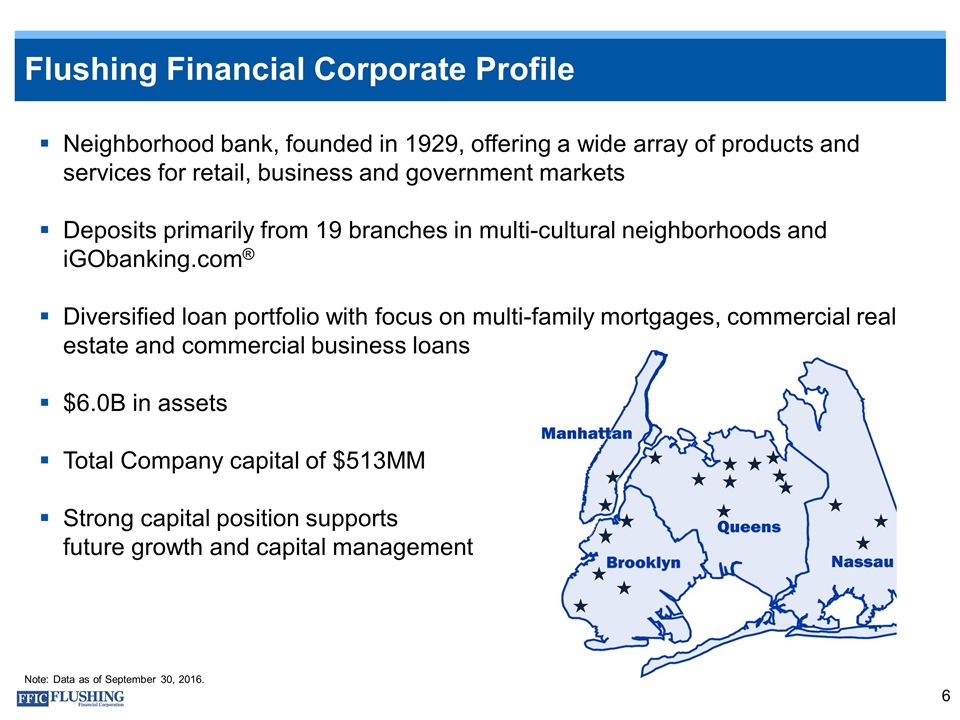
Flushing Financial Corporate Profile Neighborhood bank, founded in 1929, offering a wide array of products and services for retail, business and government markets Deposits primarily from 19 branches in multi-cultural neighborhoods and iGObanking.com® Diversified loan portfolio with focus on multi-family mortgages, commercial real estate and commercial business loans $6.0B in assets Total Company capital of $513MM Strong capital position supports future growth and capital management Note: Data as of September 30, 2016.
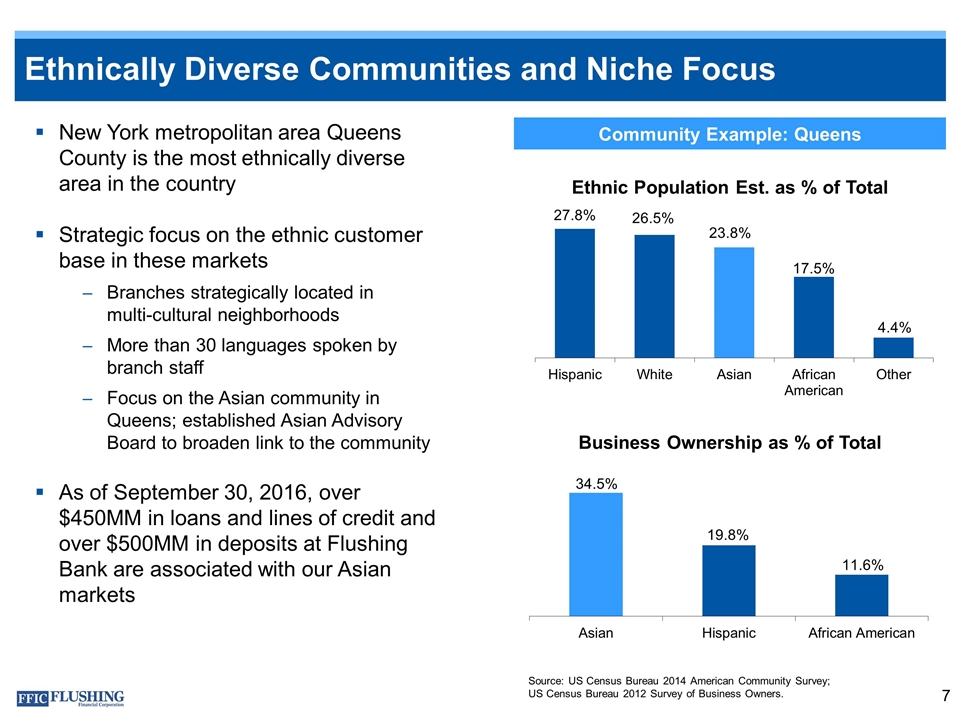
Ethnically Diverse Communities and Niche Focus Source: US Census Bureau 2014 American Community Survey; US Census Bureau 2012 Survey of Business Owners. Community Example: Queens New York metropolitan area Queens County is the most ethnically diverse area in the country Strategic focus on the ethnic customer base in these markets Branches strategically located in multi-cultural neighborhoods More than 30 languages spoken by branch staff Focus on the Asian community in Queens; established Asian Advisory Board to broaden link to the community As of September 30, 2016, over $450MM in loans and lines of credit and over $500MM in deposits at Flushing Bank are associated with our Asian markets
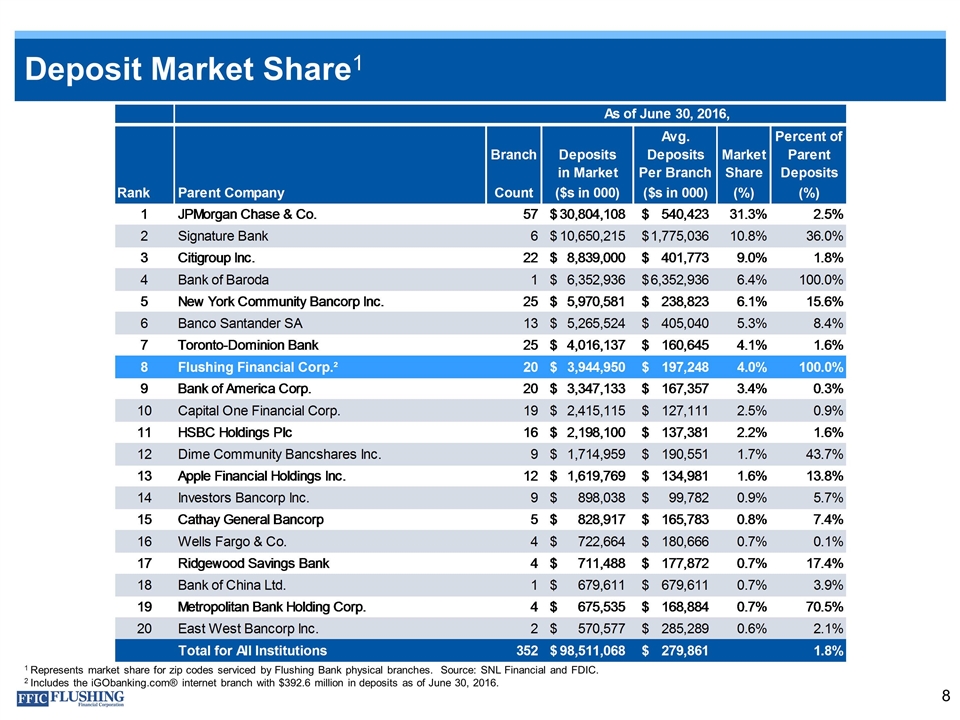
Deposit Market Share1 1 Represents market share for zip codes serviced by Flushing Bank physical branches. Source: SNL Financial and FDIC. 2 Includes the iGObanking.com® internet branch with $392.6 million in deposits as of June 30, 2016.
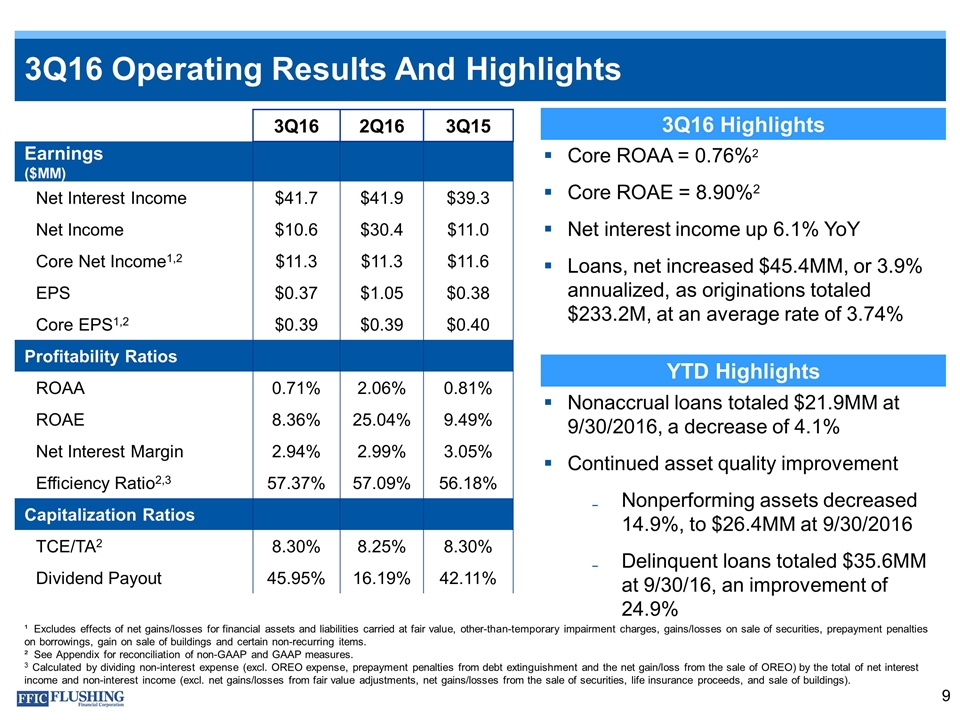
3Q16 Operating Results And Highlights ¹ Excludes effects of net gains/losses for financial assets and liabilities carried at fair value, other-than-temporary impairment charges, gains/losses on sale of securities, prepayment penalties on borrowings, gain on sale of buildings and certain non-recurring items. ² See Appendix for reconciliation of non-GAAP and GAAP measures. 3 Calculated by dividing non-interest expense (excl. OREO expense, prepayment penalties from debt extinguishment and the net gain/loss from the sale of OREO) by the total of net interest income and non-interest income (excl. net gains/losses from fair value adjustments, net gains/losses from the sale of securities, life insurance proceeds, and sale of buildings). Core ROAA = 0.76%2 Core ROAE = 8.90%2 Net interest income up 6.1% YoY Loans, net increased $45.4MM, or 3.9% annualized, as originations totaled $233.2M, at an average rate of 3.74% 3Q16 Highlights YTD Highlights Nonaccrual loans totaled $21.9MM at 9/30/2016, a decrease of 4.1% Continued asset quality improvement Nonperforming assets decreased 14.9%, to $26.4MM at 9/30/2016 Delinquent loans totaled $35.6MM at 9/30/16, an improvement of 24.9% 3Q16 2Q16 3Q15 Earnings ($MM) Net Interest Income $41.7 $41.9 $39.3 Net Income $10.6 $30.4 $11.0 Core Net Income1,2 $11.3 $11.3 $11.6 EPS $0.37 $1.05 $0.38 Core EPS1,2 $0.39 $0.39 $0.40 Profitability Ratios ROAA 0.71% 2.06% 0.81% ROAE 8.36% 25.04% 9.49% Net Interest Margin 2.94% 2.99% 3.05% Efficiency Ratio2,3 57.37% 57.09% 56.18% Capitalization Ratios TCE/TA2 8.30% 8.25% 8.30% Dividend Payout 45.95% 16.19% 42.11%
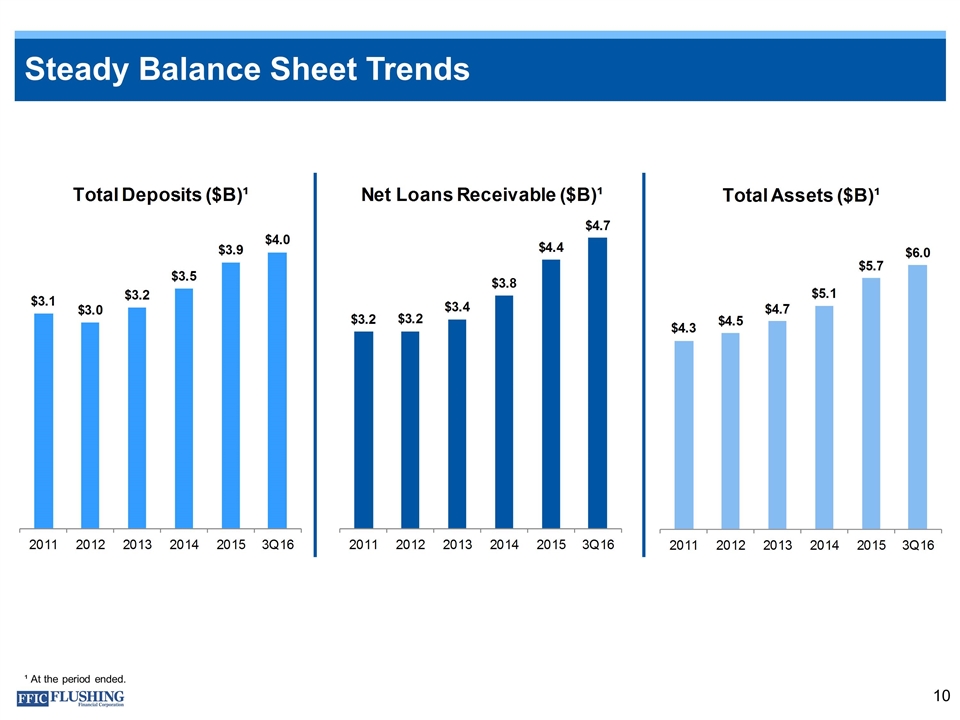
Steady Balance Sheet Trends ¹ At the period ended.
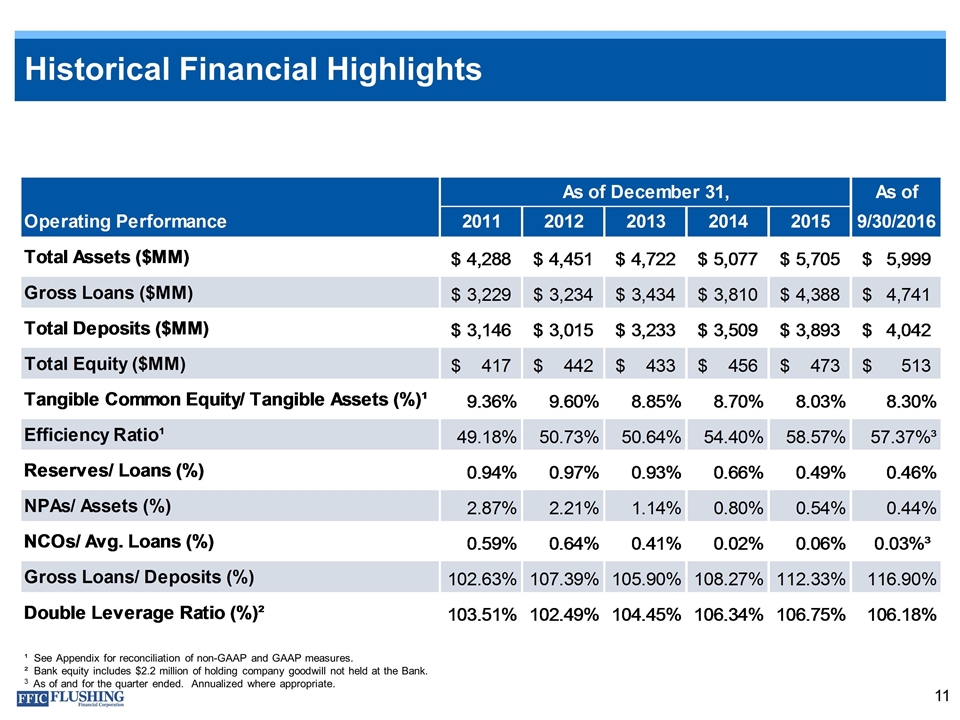
Historical Financial Highlights ¹ See Appendix for reconciliation of non-GAAP and GAAP measures. ² Bank equity includes $2.2 million of holding company goodwill not held at the Bank. 3 As of and for the quarter ended. Annualized where appropriate.
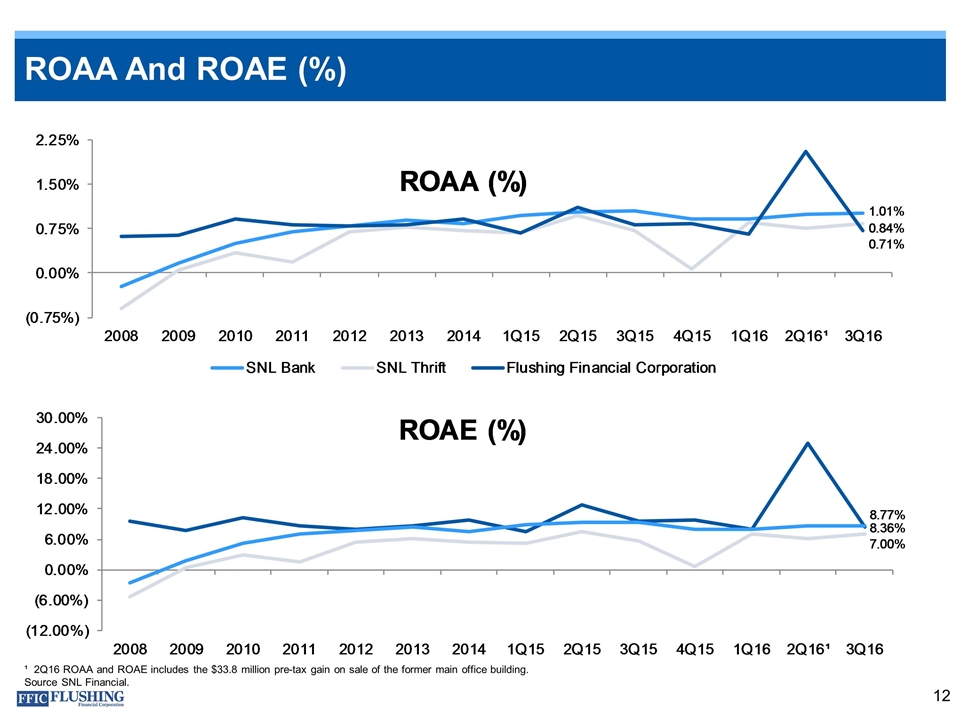
ROAA And ROAE (%) ¹ 2Q16 ROAA and ROAE includes the $33.8 million pre-tax gain on sale of the former main office building. Source SNL Financial.
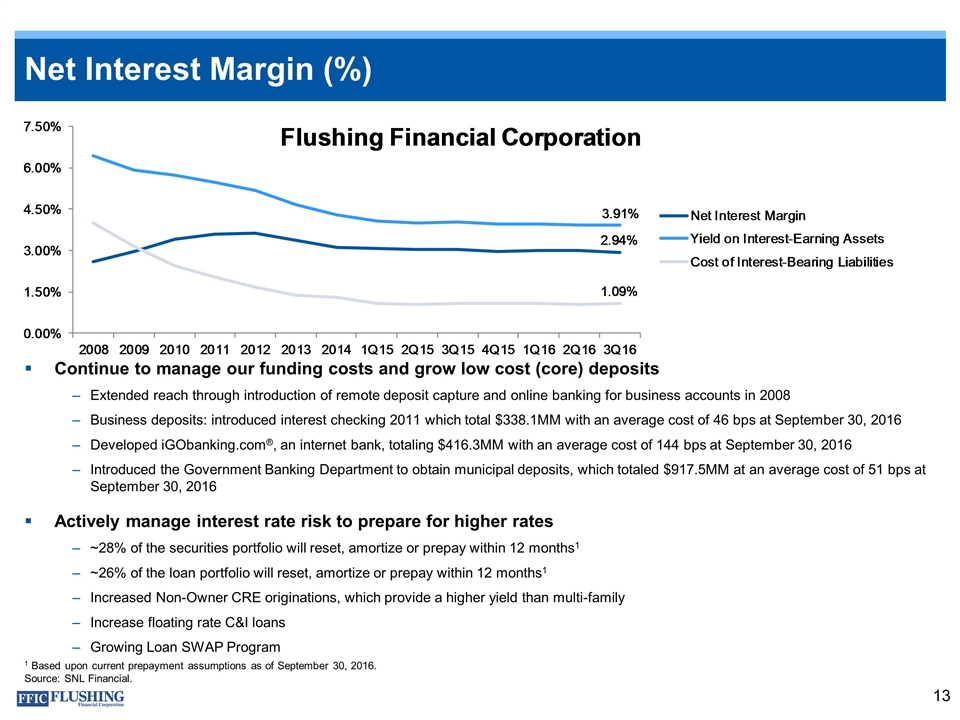
Net Interest Margin (%) 1 Based upon current prepayment assumptions as of September 30, 2016. Source: SNL Financial. Continue to manage our funding costs and grow low cost (core) deposits Extended reach through introduction of remote deposit capture and online banking for business accounts in 2008 Business deposits: introduced interest checking 2011 which total $338.1MM with an average cost of 46 bps at September 30, 2016 Developed iGObanking.com®, an internet bank, totaling $416.3MM with an average cost of 144 bps at September 30, 2016 Introduced the Government Banking Department to obtain municipal deposits, which totaled $917.5MM at an average cost of 51 bps at September 30, 2016 Actively manage interest rate risk to prepare for higher rates ~28% of the securities portfolio will reset, amortize or prepay within 12 months1 ~26% of the loan portfolio will reset, amortize or prepay within 12 months1 Increased Non-Owner CRE originations, which provide a higher yield than multi-family Increase floating rate C&I loans Growing Loan SWAP Program
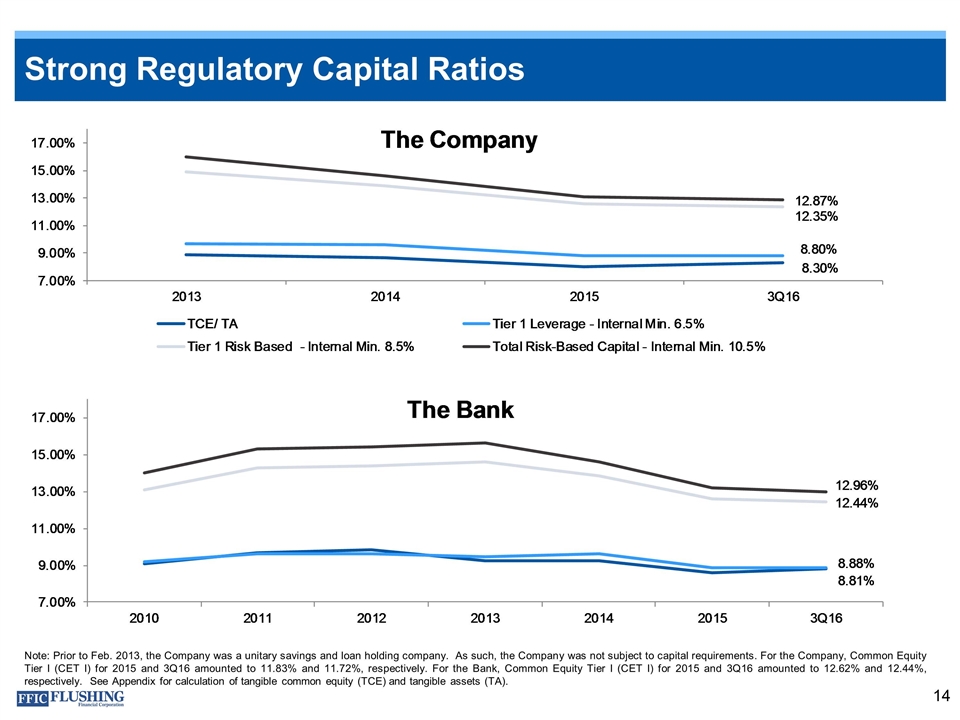
Strong Regulatory Capital Ratios Note: Prior to Feb. 2013, the Company was a unitary savings and loan holding company. As such, the Company was not subject to capital requirements. For the Company, Common Equity Tier I (CET I) for 2015 and 3Q16 amounted to 11.83% and 11.72%, respectively. For the Bank, Common Equity Tier I (CET I) for 2015 and 3Q16 amounted to 12.62% and 12.44%, respectively. See Appendix for calculation of tangible common equity (TCE) and tangible assets (TA).
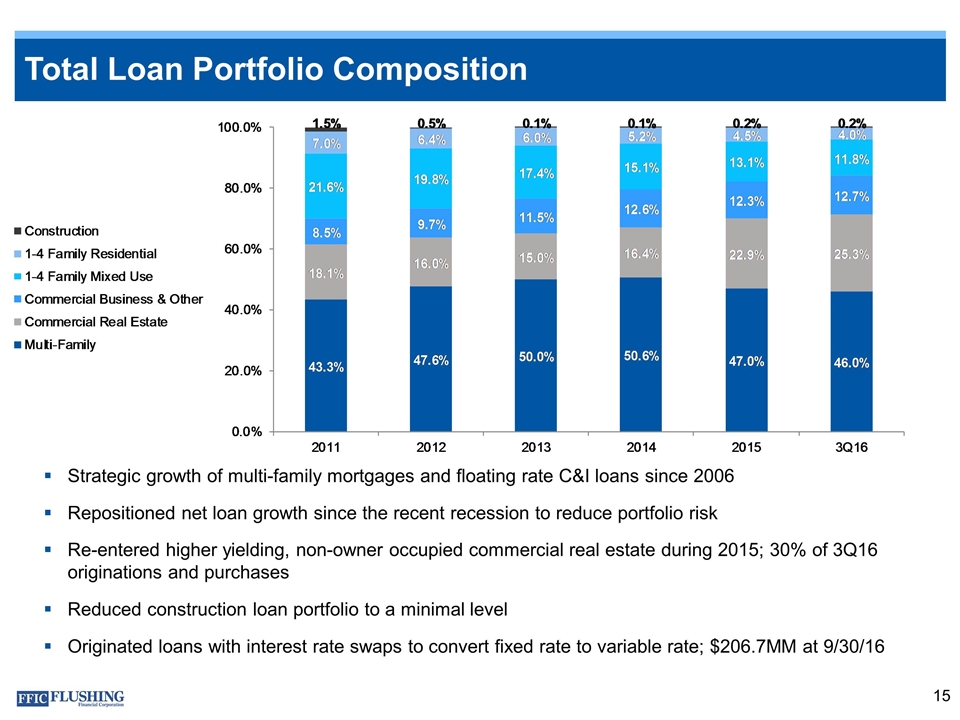
Total Loan Portfolio Composition Strategic growth of multi-family mortgages and floating rate C&I loans since 2006 Repositioned net loan growth since the recent recession to reduce portfolio risk Re-entered higher yielding, non-owner occupied commercial real estate during 2015; 30% of 3Q16 originations and purchases Reduced construction loan portfolio to a minimal level Originated loans with interest rate swaps to convert fixed rate to variable rate; $206.7MM at 9/30/16
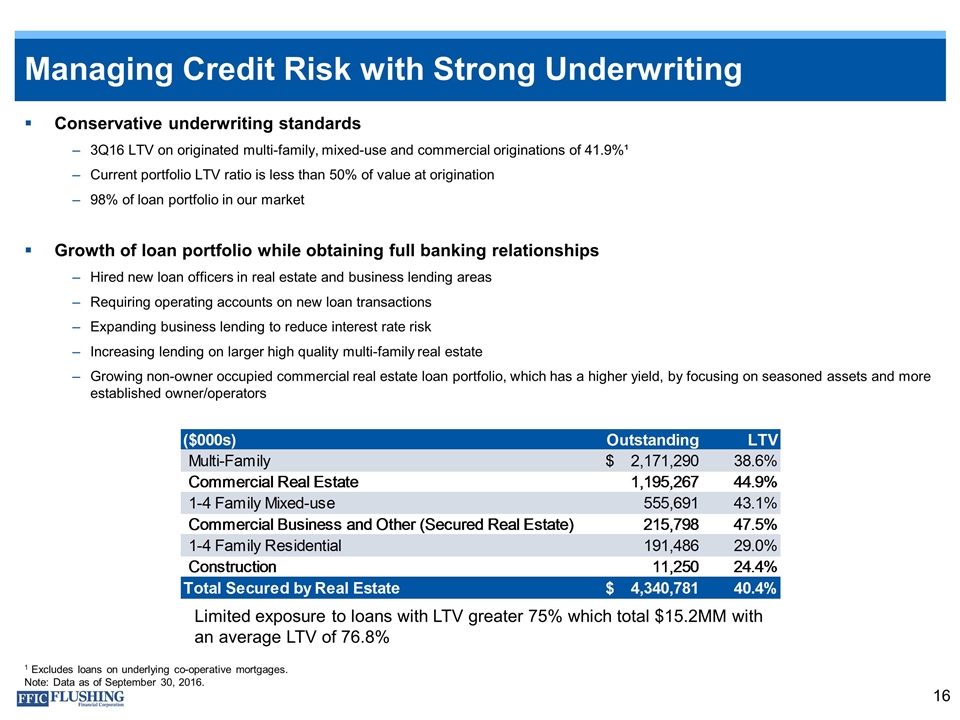
Managing Credit Risk with Strong Underwriting Limited exposure to loans with LTV greater 75% which total $15.2MM with an average LTV of 76.8% 1 Excludes loans on underlying co-operative mortgages. Note: Data as of September 30, 2016. Conservative underwriting standards 3Q16 LTV on originated multi-family, mixed-use and commercial originations of 41.9%¹ Current portfolio LTV ratio is less than 50% of value at origination 98% of loan portfolio in our market Growth of loan portfolio while obtaining full banking relationships Hired new loan officers in real estate and business lending areas Requiring operating accounts on new loan transactions Expanding business lending to reduce interest rate risk Increasing lending on larger high quality multi-family real estate Growing non-owner occupied commercial real estate loan portfolio, which has a higher yield, by focusing on seasoned assets and more established owner/operators
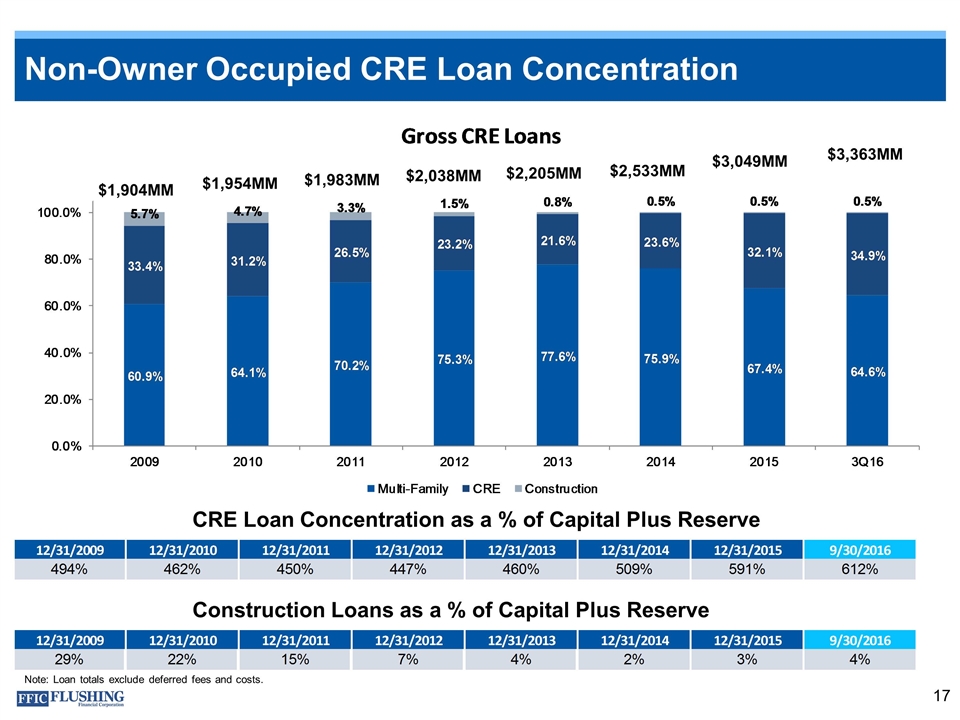
Non-Owner Occupied CRE Loan Concentration CRE Loan Concentration as a % of Capital Plus Reserve $1,904MM $1,983MM $2,038MM $2,205MM $2,533MM $3,049MM $3,363MM $1,954MM Construction Loans as a % of Capital Plus Reserve Note: Loan totals exclude deferred fees and costs.
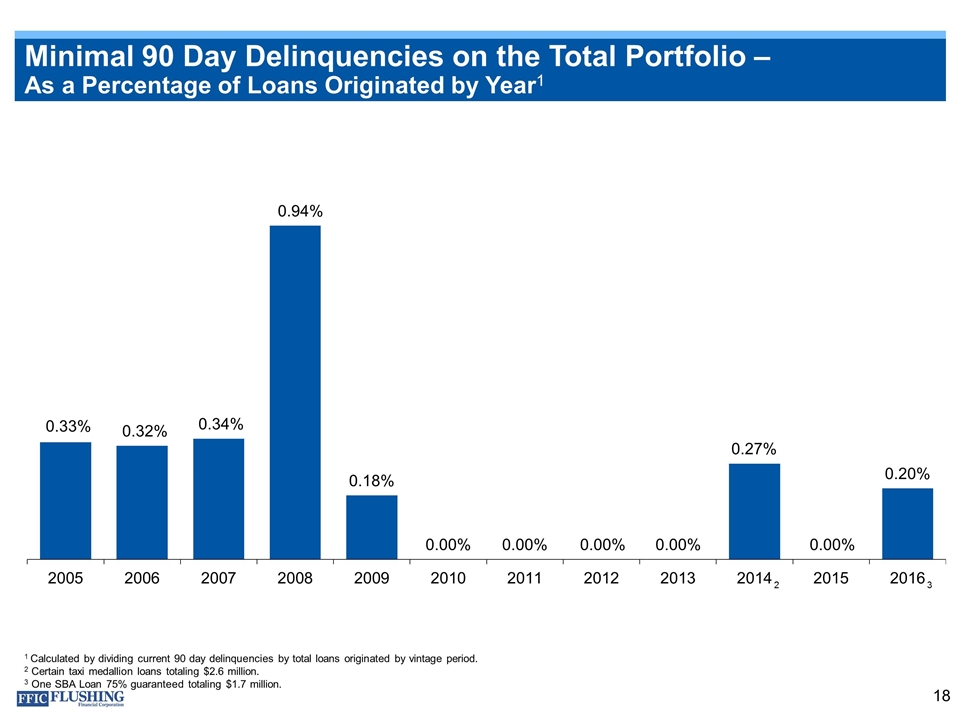
Minimal 90 Day Delinquencies on the Total Portfolio – As a Percentage of Loans Originated by Year1 1 Calculated by dividing current 90 day delinquencies by total loans originated by vintage period. 2 Certain taxi medallion loans totaling $2.6 million. 3 One SBA Loan 75% guaranteed totaling $1.7 million. 2 3
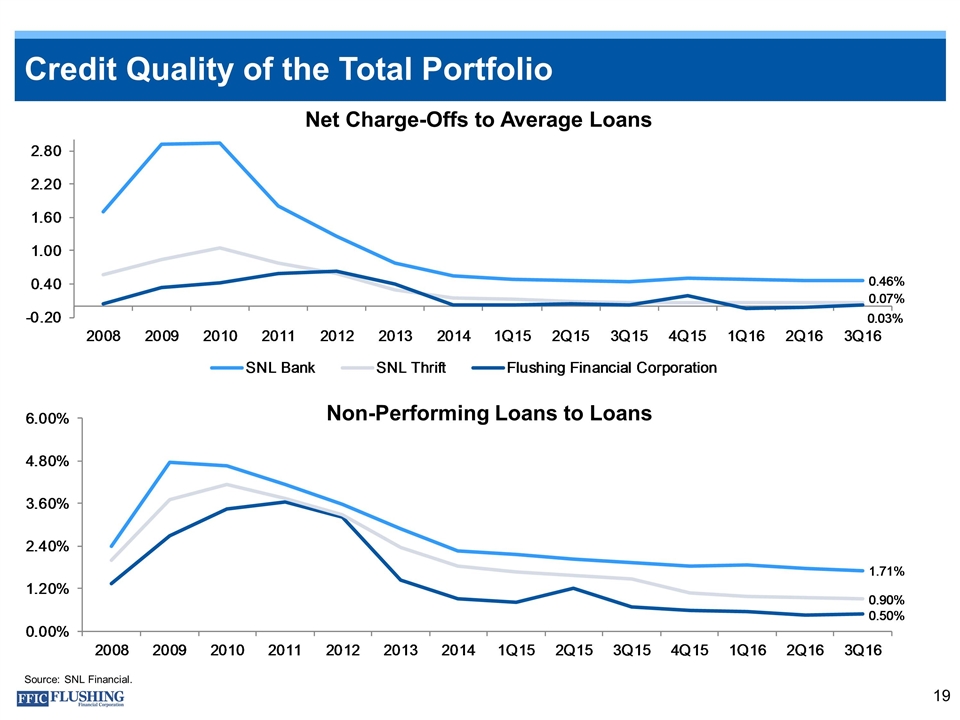
Credit Quality of the Total Portfolio Net Charge-Offs to Average Loans Non-Performing Loans to Loans Source: SNL Financial.
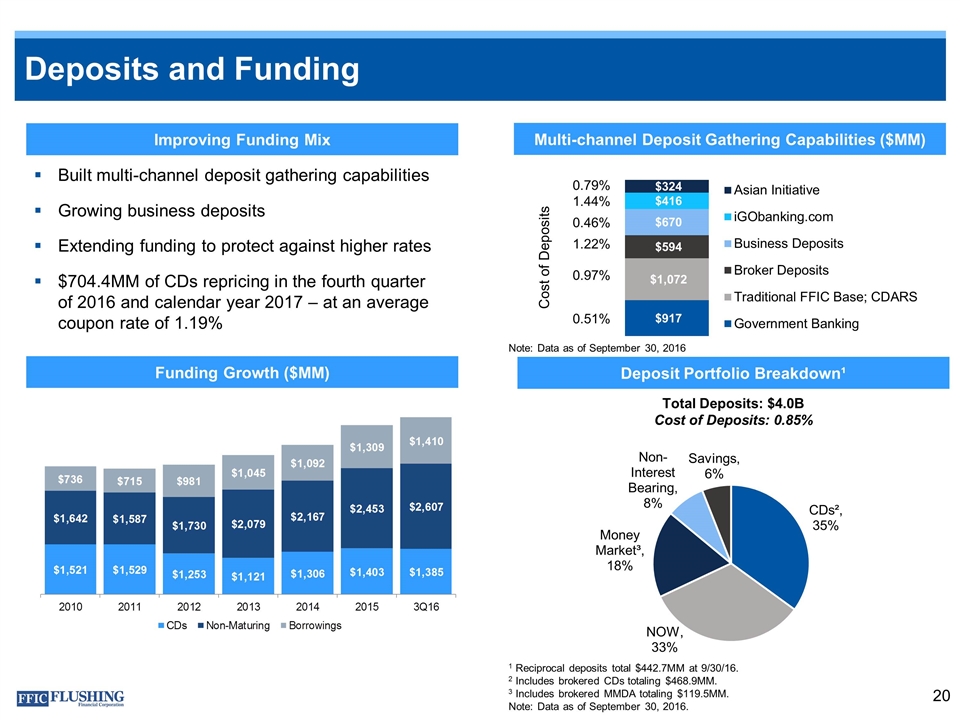
Deposits and Funding Built multi-channel deposit gathering capabilities Growing business deposits Extending funding to protect against higher rates $704.4MM of CDs repricing in the fourth quarter of 2016 and calendar year 2017 – at an average coupon rate of 1.19% Funding Growth ($MM) Improving Funding Mix Total Deposits: $4.0B Cost of Deposits: 0.85% Deposit Portfolio Breakdown¹ Cost of Deposits 0.79% 1.44% 0.46% 1.22% 0.97% 0.51% Multi-channel Deposit Gathering Capabilities ($MM) 1 Reciprocal deposits total $442.7MM at 9/30/16. 2 Includes brokered CDs totaling $468.9MM. 3 Includes brokered MMDA totaling $119.5MM. Note: Data as of September 30, 2016. Note: Data as of September 30, 2016
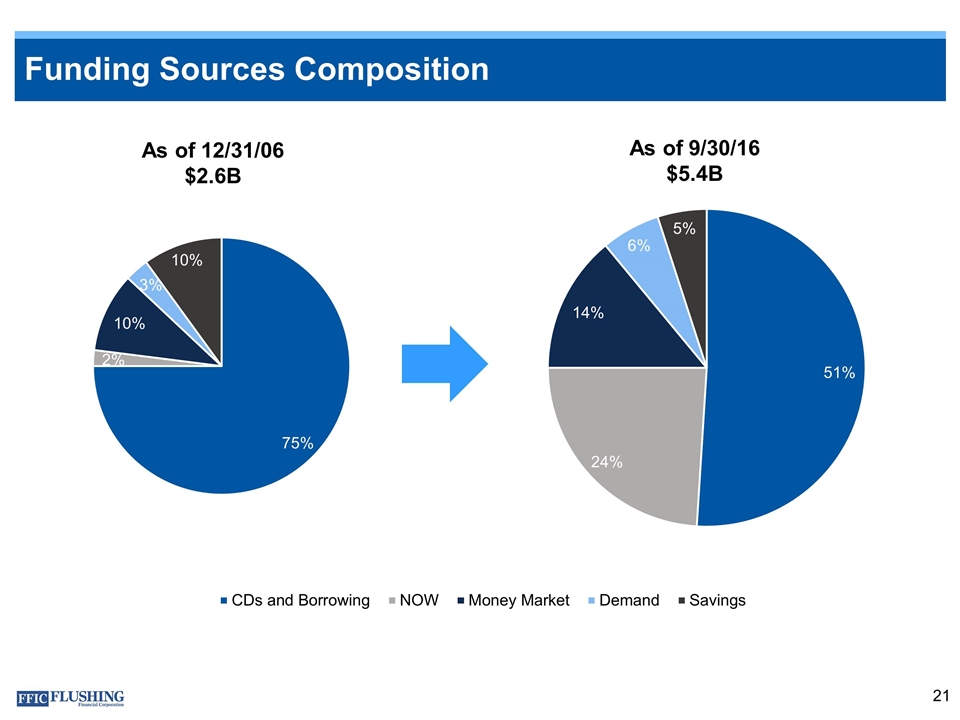
Funding Sources Composition As of 12/31/06 $2.6B As of 9/30/16 $5.4B
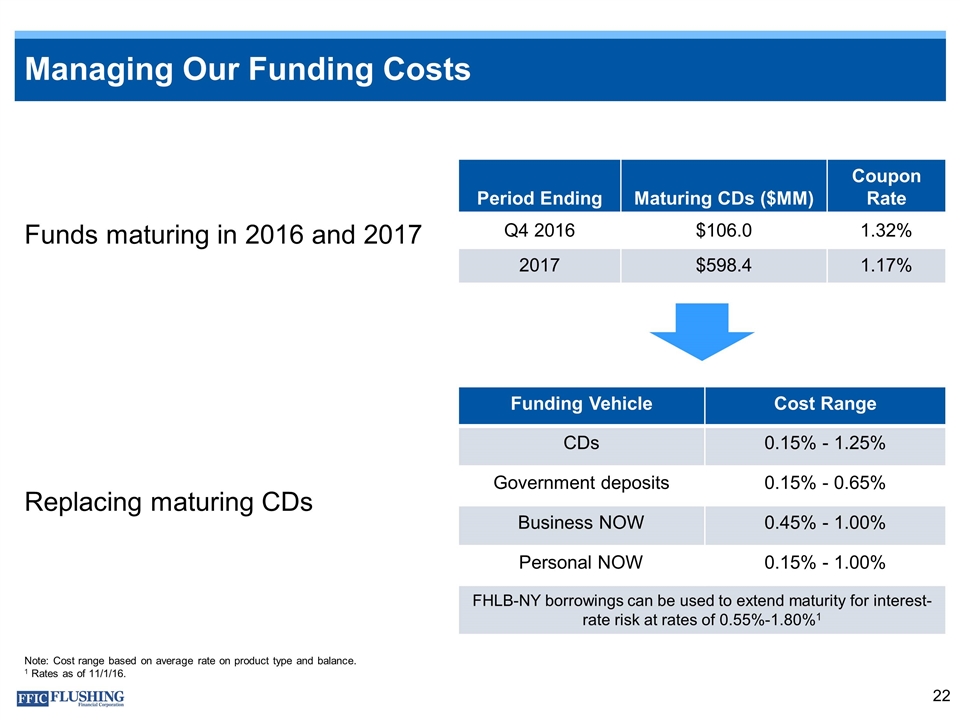
Managing Our Funding Costs Period Ending Maturing CDs ($MM) Coupon Rate Q4 2016 $106.0 1.32% 2017 $598.4 1.17% Funding Vehicle Cost Range CDs 0.15% - 1.25% Government deposits 0.15% - 0.65% Business NOW 0.45% - 1.00% Personal NOW 0.15% - 1.00% FHLB-NY borrowings can be used to extend maturity for interest-rate risk at rates of 0.55%-1.80%1 Funds maturing in 2016 and 2017 Replacing maturing CDs Note: Cost range based on average rate on product type and balance. 1 Rates as of 11/1/16.
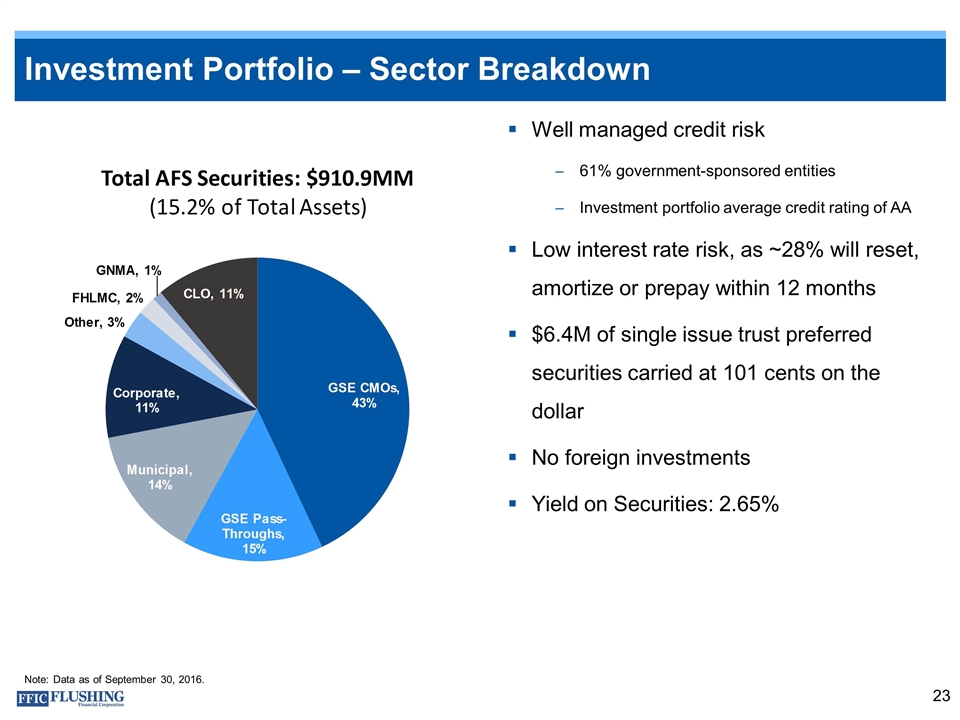
Investment Portfolio – Sector Breakdown Well managed credit risk 61% government-sponsored entities Investment portfolio average credit rating of AA Low interest rate risk, as ~28% will reset, amortize or prepay within 12 months $6.4M of single issue trust preferred securities carried at 101 cents on the dollar No foreign investments Yield on Securities: 2.65% Note: Data as of September 30, 2016.
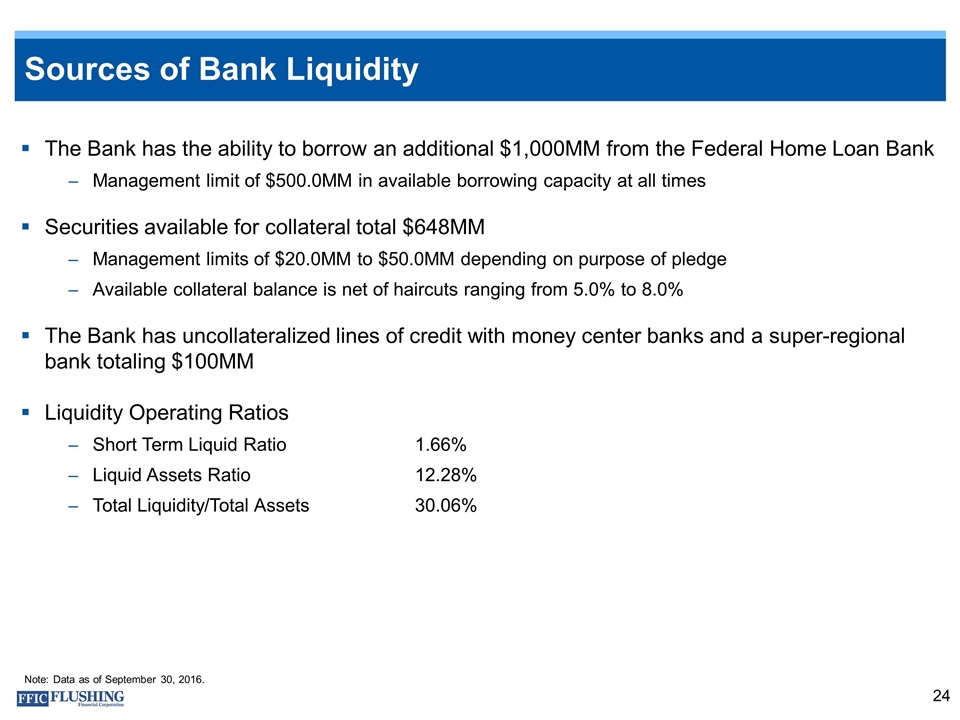
Sources of Bank Liquidity The Bank has the ability to borrow an additional $1,000MM from the Federal Home Loan Bank Management limit of $500.0MM in available borrowing capacity at all times Securities available for collateral total $648MM Management limits of $20.0MM to $50.0MM depending on purpose of pledge Available collateral balance is net of haircuts ranging from 5.0% to 8.0% The Bank has uncollateralized lines of credit with money center banks and a super-regional bank totaling $100MM Liquidity Operating Ratios Short Term Liquid Ratio 1.66% Liquid Assets Ratio 12.28% Total Liquidity/Total Assets 30.06% Note: Data as of September 30, 2016.
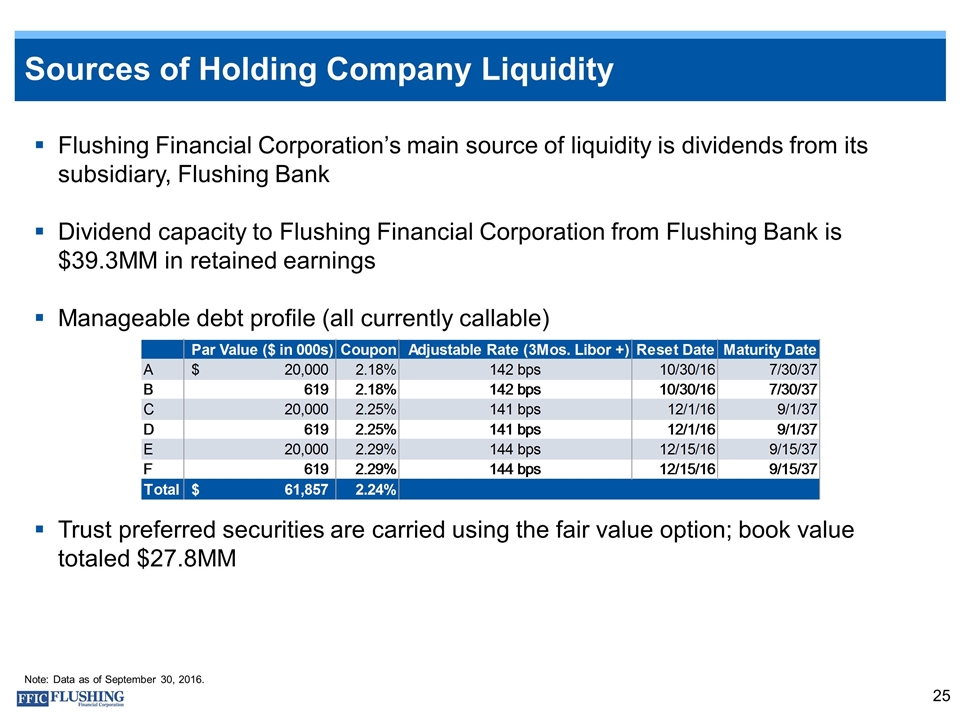
Sources of Holding Company Liquidity Flushing Financial Corporation’s main source of liquidity is dividends from its subsidiary, Flushing Bank Dividend capacity to Flushing Financial Corporation from Flushing Bank is $39.3MM in retained earnings Manageable debt profile (all currently callable) Trust preferred securities are carried using the fair value option; book value totaled $27.8MM Note: Data as of September 30, 2016. 2009 2010 2011 2012 2013 2014 2015 3Q16 40178 40543 40908 41274 41639 42004 42369 42643 Par Value ($ in 000s) Coupon Adjustable Rate (3Mos. Libor +) Reset Date Maturity Date Multi-Family 0.60850000000000004 0.64100000000000001 0.70150000000000001 0.753 0.77629999999999999 0.75929999999999997 0.67420000000000002 0.64600000000000002 4.95 4.62 4.5 4.47 4.5999999999999996 5.09 5.91 6.12 A $20,000 2.18E-2 142 bps 42673 50251 CRE 0.3337 0.31190000000000001 0.26540000000000002 0.23219999999999999 0.216 0.23619999999999999 0.3211 0.34899999999999998 B 619 2.18E-2 142 bps 42673 50251 Construction 5.7799999999999997E-2 4.7100000000000003E-2 3.3099999999999997E-2 1.4800000000000001E-2 7.6E-3 4.4000000000000003E-3 4.7999999999999996E-3 5.0000000000000001E-3 40178 40543 40908 41274 41639 42004 42369 42643 C 20,000 2.2499999999999999E-2 141 bps 42705 50284 0.28999999999999998 0.22 0.15 7.0000000000000007E-2 0.04 0.02 0.03 0.04 D 619 2.2499999999999999E-2 141 bps 42705 50284 E 20,000 2.29E-2 144 bps 42719 50298 F 619 2.29E-2 144 bps 42719 50298 Total $61,857 2.24E-2
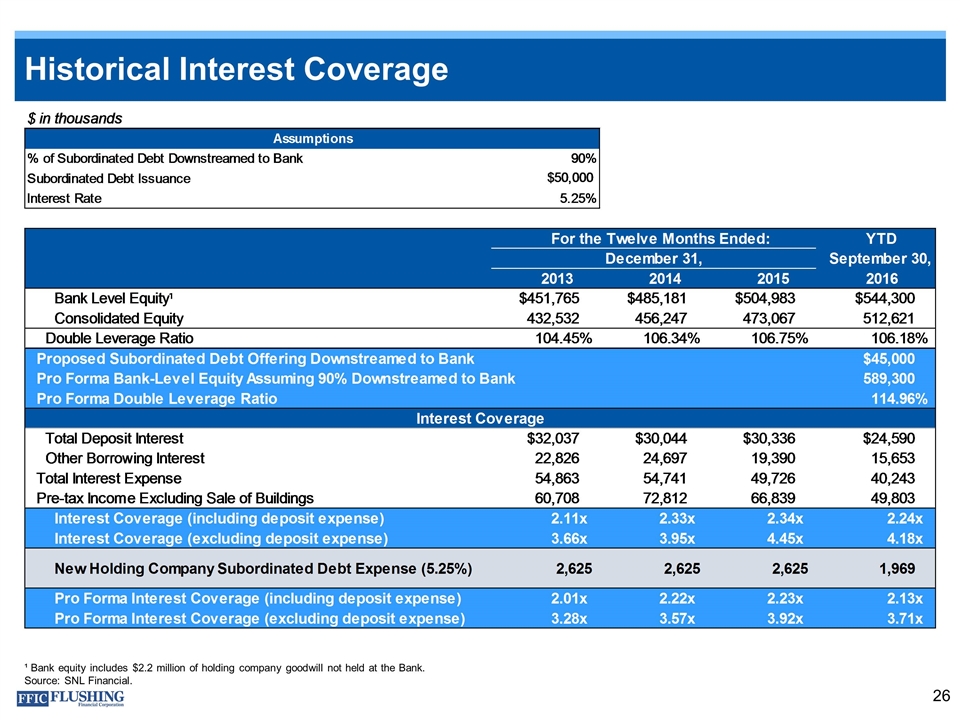
Historical Interest Coverage ¹ Bank equity includes $2.2 million of holding company goodwill not held at the Bank. Source: SNL Financial.
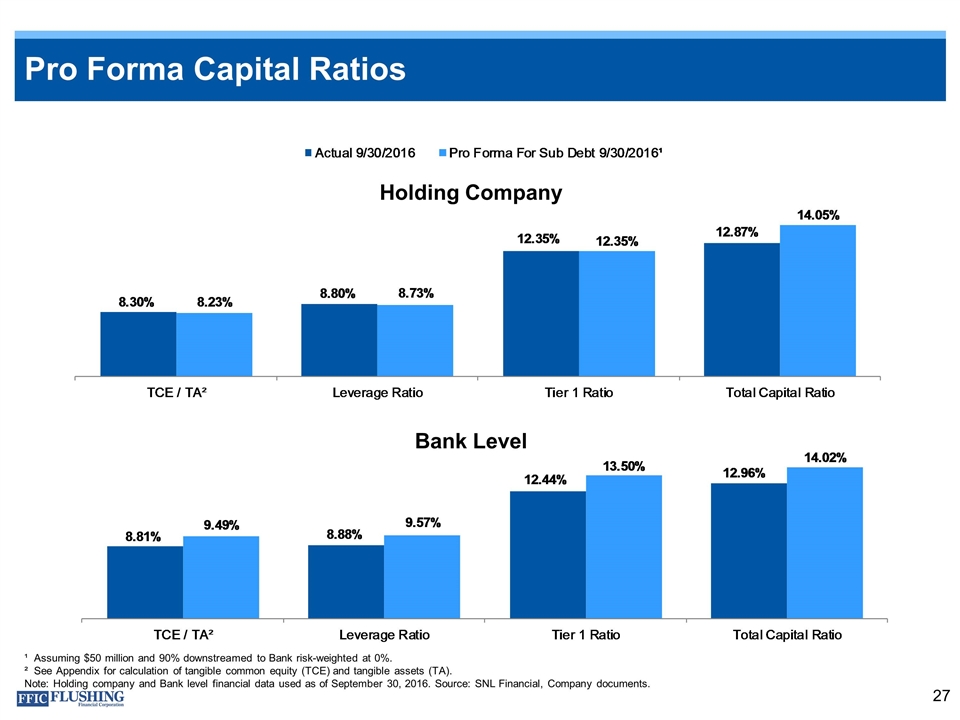
Pro Forma Capital Ratios ¹ Assuming $50 million and 90% downstreamed to Bank risk-weighted at 0%. ² See Appendix for calculation of tangible common equity (TCE) and tangible assets (TA). Note: Holding company and Bank level financial data used as of September 30, 2016. Source: SNL Financial, Company documents. Holding Company Bank Level
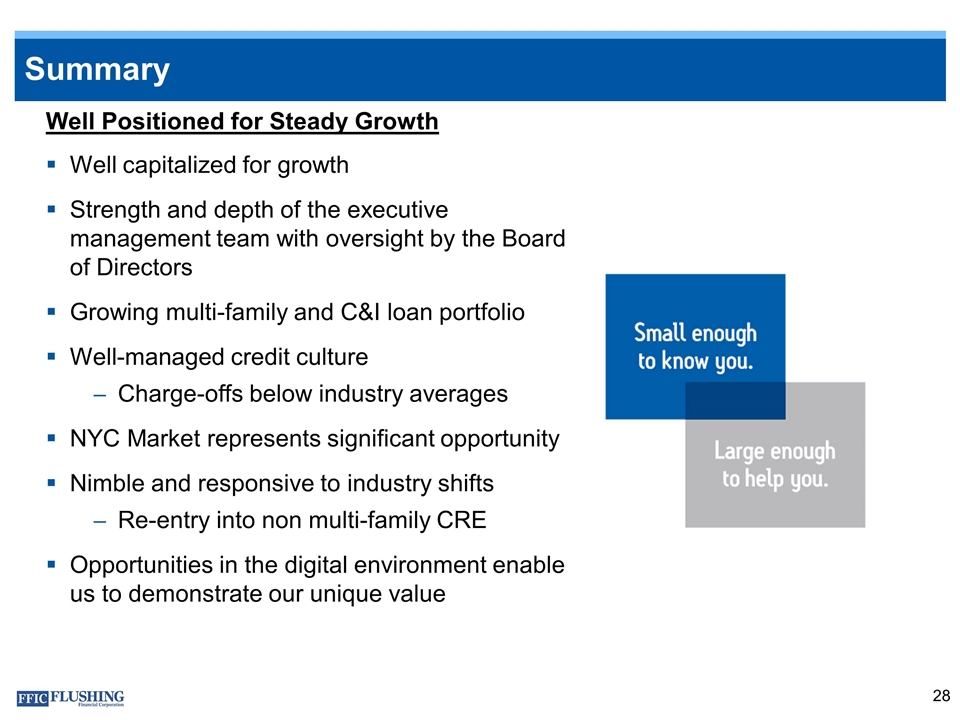
Summary Well Positioned for Steady Growth Well capitalized for growth Strength and depth of the executive management team with oversight by the Board of Directors Growing multi-family and C&I loan portfolio Well-managed credit culture Charge-offs below industry averages NYC Market represents significant opportunity Nimble and responsive to industry shifts Re-entry into non multi-family CRE Opportunities in the digital environment enable us to demonstrate our unique value
Appendix
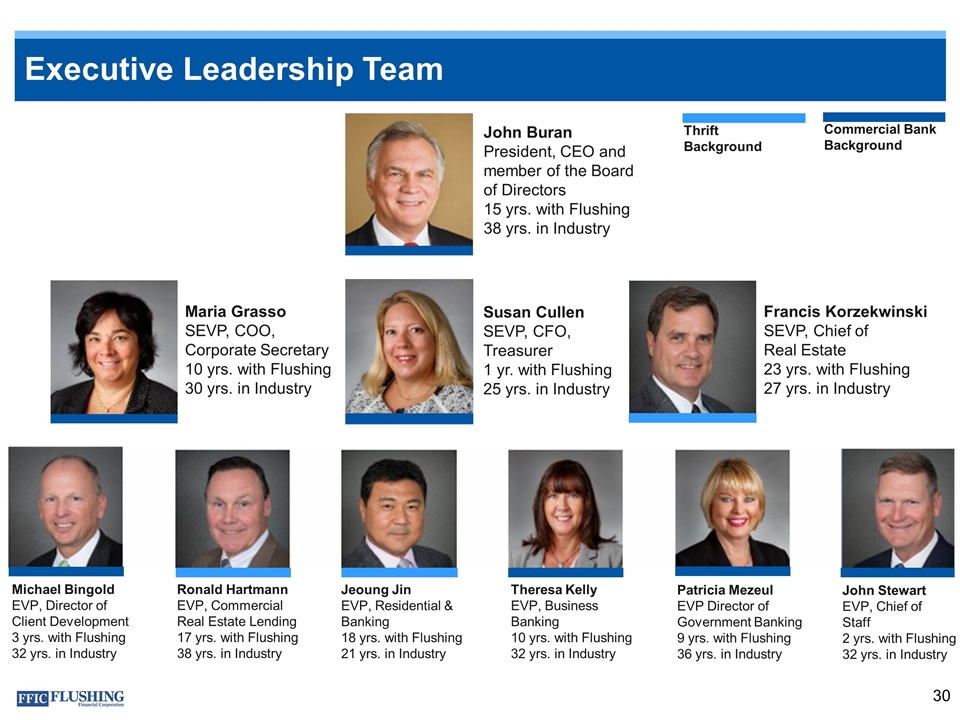
Executive Leadership Team Francis Korzekwinski SEVP, Chief of Real Estate 23 yrs. with Flushing 27 yrs. in Industry Maria Grasso SEVP, COO, Corporate Secretary 10 yrs. with Flushing 30 yrs. in Industry John Buran President, CEO and member of the Board of Directors 15 yrs. with Flushing 38 yrs. in Industry Michael Bingold EVP, Director of Client Development 3 yrs. with Flushing 32 yrs. in Industry Ronald Hartmann EVP, Commercial Real Estate Lending 17 yrs. with Flushing 38 yrs. in Industry Patricia Mezeul EVP Director of Government Banking 9 yrs. with Flushing 36 yrs. in Industry Theresa Kelly EVP, Business Banking 10 yrs. with Flushing 32 yrs. in Industry Jeoung Jin EVP, Residential & Banking 18 yrs. with Flushing 21 yrs. in Industry John Stewart EVP, Chief of Staff 2 yrs. with Flushing 32 yrs. in Industry Commercial Bank Background Thrift Background Susan Cullen SEVP, CFO, Treasurer 1 yr. with Flushing 25 yrs. in Industry
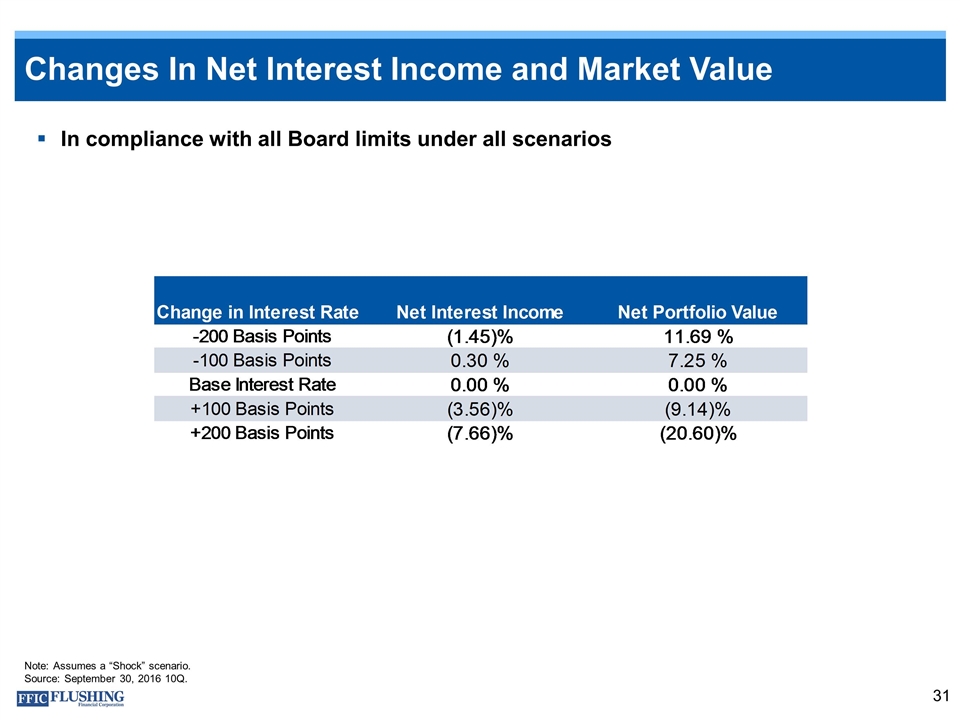
Changes In Net Interest Income and Market Value In compliance with all Board limits under all scenarios Note: Assumes a “Shock” scenario. Source: September 30, 2016 10Q.
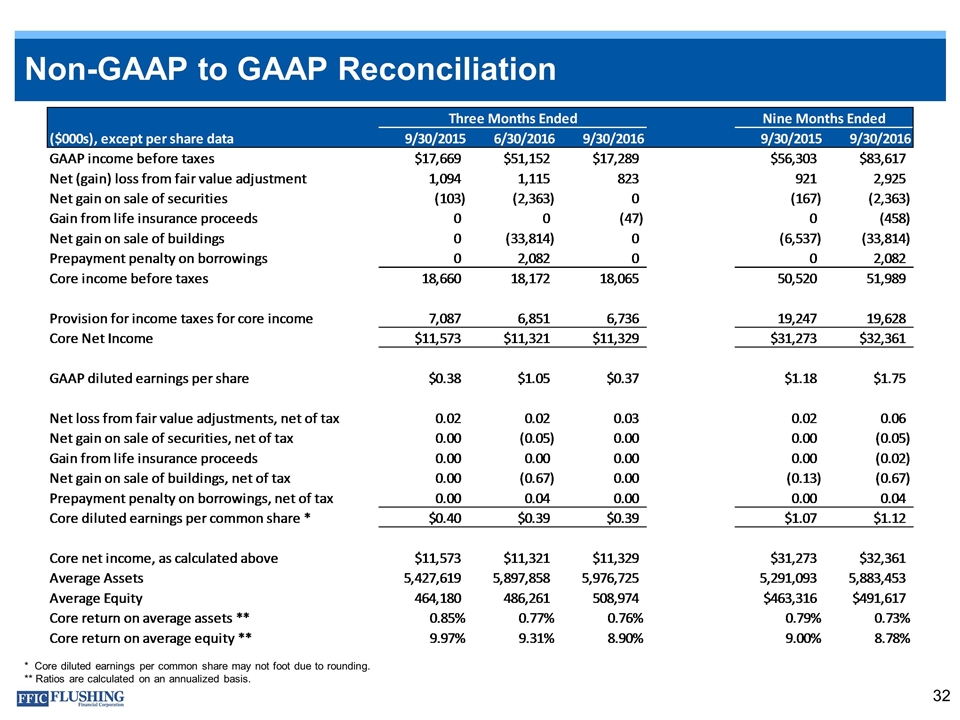
Non-GAAP to GAAP Reconciliation * Core diluted earnings per common share may not foot due to rounding. ** Ratios are calculated on an annualized basis.
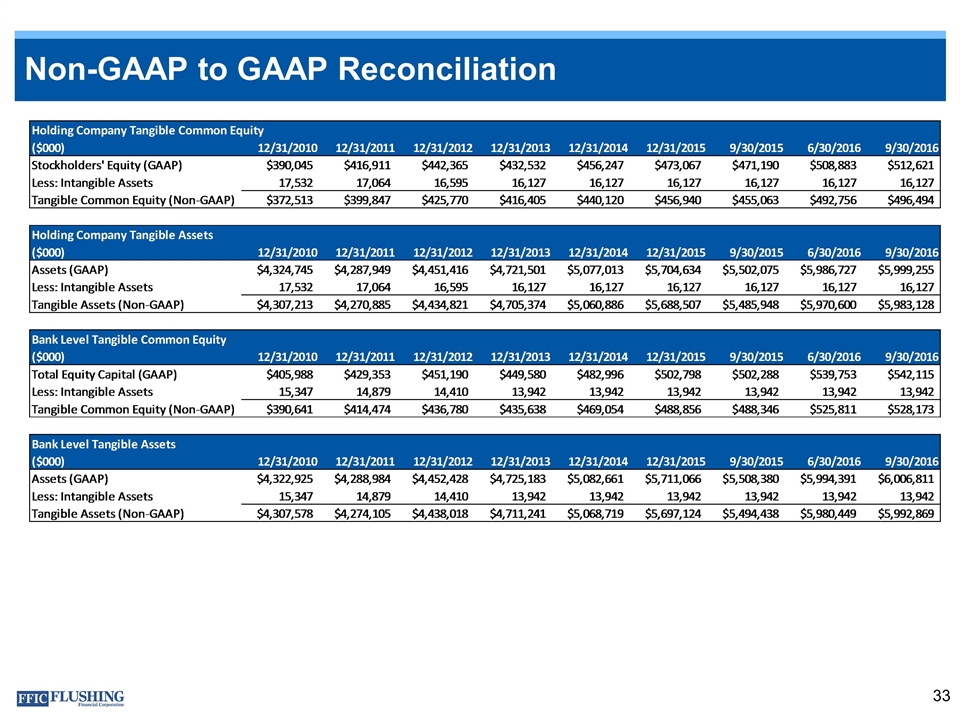
Non-GAAP to GAAP Reconciliation
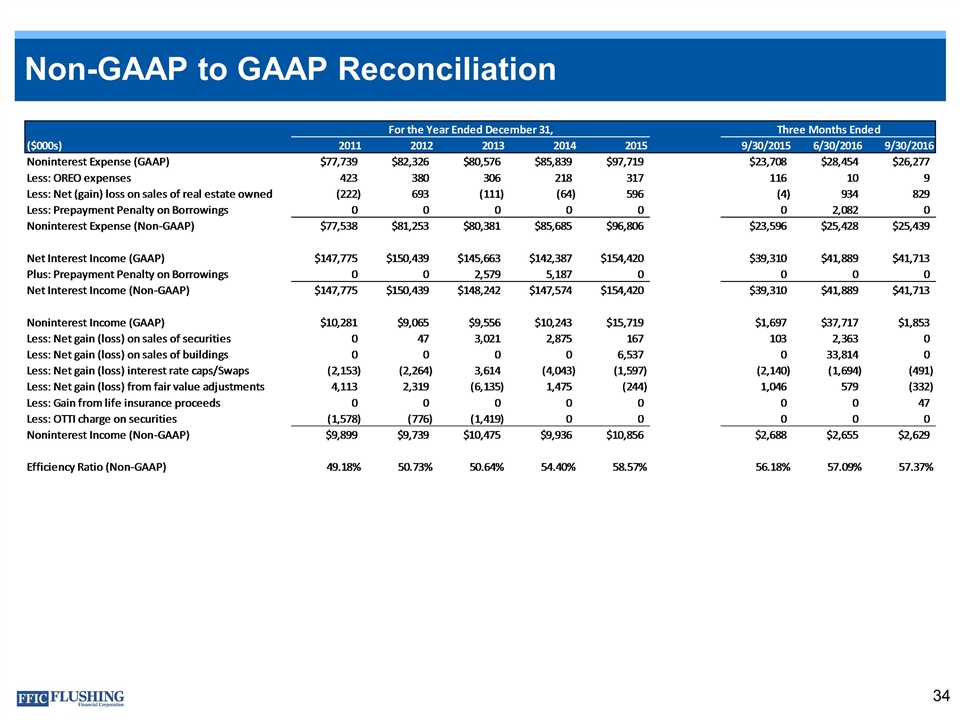
Non-GAAP to GAAP Reconciliation