UNITED STATES
SECURITIES AND EXCHANGE COMMISSION
Washington, D.C. 20549
FORM N-CSR
CERTIFIED SHAREHOLDER REPORT OF REGISTERED
MANAGEMENT INVESTMENT COMPANIES
Investment Company Act file number 811-08510
Matthews International Funds
(Exact name of registrant as specified in charter)
Four Embarcadero Center, Suite 550
San Francisco, CA 94111
(Address of principal executive offices) (Zip code)
James Cooper Abbott, President
Four Embarcadero Center, Suite 550
San Francisco, CA 94111
(Name and address of agent for service)
Registrant’s telephone number, including area code: 415-788-7553
Date of fiscal year end: December 31
Date of reporting period: June 30, 2023
Form N-CSR is to be used by management investment companies to file reports with the Commission not later than 10 days after the transmission to stockholders of any report that is required to be transmitted to stockholders under Rule 30e-1 under the Investment Company Act of 1940 (17 CFR 270.30e-1). The Commission may use the information provided on Form N-CSR in its regulatory, disclosure review, inspection, and policymaking roles.
A registrant is required to disclose the information specified by Form N-CSR, and the Commission will make this information public. A registrant is not required to respond to the collection of information contained in Form N-CSR unless the Form displays a currently valid Office of Management and Budget (“OMB”) control number. Please direct comments concerning the accuracy of the information collection burden estimate and any suggestions for reducing the burden to Secretary, Securities and Exchange Commission, 450 Fifth Street, NW, Washington, DC 20549-0609. The OMB has reviewed this collection of information under the clearance requirements of 44 U.S.C. § 3507.
Item 1. Reports to Stockholders.
| (a) | Include a copy of the report transmitted to stockholders pursuant to Rule 30e-1 under the Act (17 CFR 270.30e-1). |
The Report to Shareholders is attached herewith.
Matthews Asia Funds | Semi-Annual Report
June 30, 2023 | matthewsasia.com
GLOBAL EMERGING MARKETS STRATEGIES
Matthews Emerging Markets Equity Fund
Matthews Emerging Markets Sustainable Future Fund
Matthews Emerging Markets Small Companies Fund
ASIA GROWTH STRATEGIES
Matthews Asia Growth Fund
Matthews Pacific Tiger Fund
Matthews Asia Innovators Fund
Matthews China Fund
Matthews China Small Companies Fund
Matthews India Fund
Matthews Japan Fund
Matthews Korea Fund
ASIA GROWTH AND INCOME STRATEGIES
Matthews Asian Growth and Income Fund
Matthews Asia Dividend Fund
Matthews China Dividend Fund

Paper copies of the Funds’ annual and semi-annual shareholder reports are no longer being sent by mail, unless you specifically request paper copies of the reports. Instead, the reports will be made available on the Funds’ website matthewsasia.com, and you will be notified by mail each time a report is posted and provided with a website link to access the report. You may elect to receive paper copies of shareholder reports and other communications from the Funds anytime by contacting your financial intermediary (such as a broker-dealer or bank) or, if you are a direct investor, by calling 800.789.ASIA (2742).
Your election to receive reports in paper will apply to all Funds held in your account if you invest through your financial intermediary or all Funds held directly with Matthews Asia Funds.

Investor Class Performance and Expense Ratios (June 30, 2023) (unaudited)
| | | | | | | | | | | | | | | | | | | | | | | | | | | | |
| | | | | |
Average Annual Total Return† | | | Inception
Date | | | Prospectus
Expense
Ratios* | | | Prospectus
Expense
Ratios
after Fee
Waiver
and
Expense
Reim-
bursement* | |
| Investor Class | | 1 year | | | 5 years | | | 10 years | | | Since
Inception | |
GLOBAL EMERGING MARKETS STRATEGY | | | | | | | | | | | | | | | | | | | | | | | | | | | | |
| | | | | | | |
Emerging Markets Equity Fund (MEGMX) | | | 11.29% | | | | n.a. | | | | n.a. | | | | 9.76% | | | | 4/30/20 | | | | 1.58% | | | | 1.08% | 1 |
| | | | | | | |
Emerging Markets Sustainable Future Fund (MASGX)§ | | | 5.19% | | | | 8.95% | | | | n.a. | | | | 7.74% | | | | 4/30/15 | | | | 1.24% | | | | 1.24% | |
| | | | | | | |
Emerging Markets Small Companies Fund (MSMLX) | | | 16.06% | | | | 10.09% | | | | 7.97% | | | | 11.18% | | | | 9/15/08 | | | | 1.49% | | | | 1.37% | 1 |
ASIA GROWTH STRATEGIES | | | | | | | | | | | | | | | | | | | | | | | | | | | | |
| | | | | | | |
Asia Growth Fund (MPACX) | | | -3.65% | | | | -3.18% | | | | 2.99% | | | | 6.53% | | | | 10/31/03 | | | | 1.13% | | | | 1.13% | |
| | | | | | | |
Pacific Tiger Fund (MAPTX) | | | -5.73% | | | | 0.06% | | | | 4.43% | | | | 7.28% | | | | 9/12/94 | | | | 1.10% | | | | 1.09% | 2 |
| | | | | | | |
Asia Innovators Fund (MATFX) | | | -9.43% | | | | 4.41% | | | | 9.75% | | | | 4.27% | | | | 12/27/99 | | | | 1.18% | | | | 1.18% | |
| | | | | | | |
China Fund (MCHFX) | | | -23.98% | | | | -2.59% | | | | 4.32% | | | | 7.70% | | | | 2/19/98 | | | | 1.12% | | | | 1.12% | |
| | | | | | | |
China Small Companies Fund (MCSMX) | | | -22.55% | | | | 2.01% | | | | 8.21% | | | | 5.12% | | | | 5/31/11 | | | | 1.55% | | | | 1.41% | 1 |
| | | | | | | |
India Fund (MINDX) | | | 17.99% | | | | 5.31% | | | | 11.03% | | | | 9.97% | | | | 10/31/05 | | | | 1.15% | | | | 1.15% | |
| | | | | | | |
Japan Fund (MJFOX) | | | 15.51% | | | | 0.94% | | | | 6.20% | | | | 5.49% | | | | 12/31/98 | | | | 1.05% | | | | 1.05% | |
ASIA GROWTH AND INCOME STRATEGIES | | | | | | | | | | | | | | | | | | | | | | | | | | | | |
| | | | | | | |
Asian Growth and Income Fund (MACSX) | | | 0.16% | | | | 1.93% | | | | 2.22% | | | | 7.79% | | | | 9/12/94 | | | | 1.13% | | | | 1.13% | |
| | | | | | | |
Asia Dividend Fund (MAPIX) | | | -4.65% | | | | -1.46% | | | | 3.27% | | | | 6.17% | | | | 10/31/06 | | | | 1.10% | | | | 1.10% | |
| | | | | | | |
China Dividend Fund (MCDFX) | | | -11.93% | | | | -1.18% | | | | 5.92% | | | | 6.72% | | | | 11/30/09 | | | | 1.20% | | | | 1.20% | |
| † | Annualized performance for periods of at least one year, otherwise cumulative. |
| * | These figures are from the Funds’ prospectus dated as of April 28, 2023, and may differ from the actual expense ratios for fiscal year 2022, as shown in the financial highlights section of this report. |
| § | The Fund’s name changed from Matthews Asia ESG Fund to Matthews Emerging Markets Sustainable Future Fund on July 29, 2022. |
| 1 | Matthews has contractually agreed (i) to waive fees and reimburse expenses to the extent needed to limit Total Annual Fund Operating Expenses (excluding Rule 12b-1 fees, taxes, interest, brokerage commissions, short sale dividend expenses, expenses incurred in connection with any merger or reorganization or extraordinary expenses such as litigation) of the Institutional Class to 1.20% (except for the Matthews Emerging Markets Equity Fund, Matthews Emerging Markets Sustainable Future Fund and the Matthews Emerging Markets Small Companies Fund, which have expense limitations of 0.90%, 1.15% and 1.15%, respectively, for the Institutional Class) first by waiving class specific expenses (i.e., shareholder service fees specific to a particular class) of the Institutional Class and then, to the extent necessary, by waiving non-class specific expenses (e.g., custody fees) of the Institutional Class, and (ii) if any Fund-wide expenses (i.e., expenses that apply to both the Institutional Class and the Investor Class) are waived for the Institutional Class to maintain the 1.20% expense limitation (or 0.90% for the Matthews Emerging Markets Equity Fund, or 1.15% for the Matthews Emerging Markets Sustainable Future Fund and the Matthews Emerging Markets Small Companies Fund), to waive an equal amount (in annual percentage terms) of those same expenses for the Investor Class. The Total Annual Fund Operating Expenses After Fee Waiver and Expense Reimbursement for the Investor Class may vary from year to year and will in some years exceed 1.20% (or 0.90% for the Matthews Emerging Markets Equity Fund, or 1.15% for the Matthews Emerging Markets Sustainable Future Fund and the Matthews Emerging Markets Small Companies Fund). If the operating expenses fall below the expense limitation within three years after Matthews has made a waiver or reimbursement, the Fund may reimburse Matthews up to an amount that does not cause the expenses for that year to exceed the lesser of (i) the expense limitation applicable at the time of that fee waiver and/or expense reimbursement or (ii) the expense limitation in effect at the time of recoupment. This agreement will remain in place until April 30, 2024 and may be terminated at any time by the Board of Trustees on behalf of the Fund on 60 days’ written notice to Matthews. Matthews may decline to renew this agreement by written notice to the Trust at least 30 days before its annual expiration date. |
| 2 | Matthews has contractually agreed to waive a portion of its advisory fee and administrative and shareholder services fee if the Fund’s average daily net assets are over $3 billion, as follows: for every $2.5 billion average daily net assets of the Fund that are over $3 billion, the advisory fee rate and the administrative and shareholder services fee rate for the Fund with respect to such excess average daily net assets will be each reduced by 0.01%, in each case without reducing such fee rate below 0.00%. Any amount waived by Matthews pursuant to this agreement may not be recouped by Matthews. This agreement will remain in place until April 30, 2024 and may be terminated (i) at any time by the Board of Trustees upon 60 days’ prior written notice to Matthews; or (ii) by Matthews at the annual expiration date of the agreement upon 60 days’ prior written notice to the Trust, in each case without payment of any penalty. |
Institutional Class Performance and Expense Ratios (June 30, 2023) (unaudited)
| | | | | | | | | | | | | | | | | | | | | | | | | | | | |
| | | | | |
Average Annual Total Return† | | | Inception
Date | | | Prospectus
Expense
Ratios* | | | Prospectus
Expense
Ratios
after Fee
Waiver
and
Expense
Reim-
bursement* | |
| Institutional Class | | 1 year | | | 5 years | | | 10 years | | | Since
Inception | |
GLOBAL EMERGING MARKETS STRATEGY | | | | | | | | | | | | | | | | | | | | | | | | | | | | |
| | | | | | | |
Emerging Markets Equity Fund (MIEFX) | | | 11.37% | | | | n.a. | | | | n.a. | | | | 9.98% | | | | 4/30/20 | | | | 1.47% | | | | 0.90% | 1 |
| | | | | | | |
Emerging Markets Sustainable Future Fund (MISFX) | | | 5.26% | | | | 9.13% | | | | n.a. | | | | 7.96% | | | | 4/30/15 | | | | 1.11% | | | | 1.11% | |
| | | | | | | |
Emerging Markets Small Companies Fund (MISMX)§ | | | 16.27% | | | | 10.31% | | | | 8.20% | | | | 7.68% | | | | 4/30/13 | | | | 1.37% | | | | 1.15% | 1 |
ASIA GROWTH STRATEGIES | | | | | | | | | | | | | | | | | | | | | | | | | | | | |
| | | | | | | |
Asia Growth Fund (MIAPX) | | | -3.47% | | | | -3.03% | | | | 3.17% | | | | 3.81% | | | | 10/29/10 | | | | 0.98% | | | | 0.98% | |
| | | | | | | |
Pacific Tiger Fund (MIPTX) | | | -5.60% | | | | 0.20% | | | | 4.60% | | | | 4.12% | | | | 10/29/10 | | | | 0.97% | | | | 0.96% | 2 |
| | | | | | | |
Asia Innovators Fund (MITEX) | | | -9.30% | | | | 4.58% | | | | 9.94% | | | | 9.58% | | | | 4/30/13 | | | | 1.04% | | | | 1.04% | |
| | | | | | | |
China Fund (MICFX) | | | -23.87% | | | | -2.42% | | | | 4.49% | | | | 1.85% | | | | 10/29/10 | | | | 0.98% | | | | 0.98% | |
| | | | | | | |
China Small Companies Fund (MICHX) | | | -22.45% | | | | 2.23% | | | | n.a. | | | | 4.72% | | | | 11/30/17 | | | | 1.38% | | | | 1.20% | 1 |
| | | | | | | |
India Fund (MIDNX) | | | 18.15% | | | | 5.47% | | | | 11.22% | | | | 6.22% | | | | 10/29/10 | | | | 1.01% | | | | 1.01% | |
| | | | | | | |
Japan Fund (MIJFX) | | | 15.48% | | | | 0.99% | | | | 6.28% | | | | 7.44% | | | | 10/29/10 | | | | 0.97% | | | | 0.97% | |
| | | | | | | |
Korea Fund (MIKOX) | | | 8.64% | | | | 0.96% | | | | 5.68% | | | | 5.62% | | | | 10/29/10 | | | | 1.08% | | | | 1.08% | |
ASIA GROWTH AND INCOME STRATEGIES | | | | | | | | | | | | | | | | | | | | | | | | | | | | |
| | | | | | | |
Asian Growth and Income Fund (MICSX) | | | 0.26% | | | | 2.07% | | | | 2.37% | | | | 3.25% | | | | 10/29/10 | | | | 1.01% | | | | 1.01% | |
| | | | | | | |
Asia Dividend Fund (MIPIX) | | | -4.66% | | | | -1.37% | | | | 3.38% | | | | 4.05% | | | | 10/29/10 | | | | 0.99% | | | | 0.99% | |
| | | | | | | |
China Dividend Fund (MICDX) | | | -11.77% | | | | -1.03% | | | | 6.09% | | | | 5.86% | | | | 10/29/10 | | | | 1.06% | | | | 1.06% | |
| † | Annualized performance for periods of at least one year, otherwise cumulative. |
| * | These figures are from the Funds’ prospectus dated as of April 28, 2023, and may differ from the actual expense ratios for fiscal year 2022, as shown in the financial highlights section of this report. |
| § | The Fund’s name changed from Matthews Asia ESG Fund to Matthews Emerging Markets Sustainable Future Fund on July 29, 2022. |
| 1 | Matthews has contractually agreed to waive fees and reimburse expenses to the extent needed to limit Total Annual Fund Operating Expenses (excluding Rule 12b-1 fees, taxes, interest, brokerage commissions, short sale dividend expenses, expenses incurred in connection with any merger or reorganization or extraordinary expenses such as litigation) of the Institutional Class to 1.20% (except for the Matthews Emerging Markets Equity Fund, Matthews Emerging Markets Sustainable Future Fund and the Matthews Emerging Markets Small Companies Fund, which have expense limitations of 0.90%, 1.15% and 1.15%, respectively, for the Institutional Class). If the operating expenses fall below the expense limitation within three years after Matthews has made a waiver or reimbursement, the Fund may reimburse Matthews up to an amount that does not cause the expenses for that year to exceed the lesser of (i) the expense limitation applicable at the time of that fee waiver and/or expense reimbursement or (ii) the expense limitation in effect at the time of recoupment. This agreement will remain in place until April 30, 2024 and may be terminated at any time by the Board of Trustees on behalf of the Fund on 60 days’ written notice to Matthews. Matthews may decline to renew this agreement by written notice to the Trust at least 30 days before its annual expiration date. |
| 2 | Matthews has contractually agreed to waive a portion of its advisory fee and administrative and shareholder services fee if the Fund’s average daily net assets are over $3 billion, as follows: for every $2.5 billion average daily net assets of the Fund that are over $3 billion, the advisory fee rate and the administrative and shareholder services fee rate for the Fund with respect to such excess average daily net assets will be each reduced by 0.01%, in each case without reducing such fee rate below 0.00%. Any amount waived by Matthews pursuant to this agreement may not be recouped by Matthews. This agreement will remain in place until April 30, 2024 and may be terminated (i) at any time by the Board of Trustees upon 60 days’ prior written notice to Matthews; or (ii) by Matthews at the annual expiration date of the agreement upon 60 days’ prior written notice to the Trust, in each case without payment of any penalty. |
Past Performance: All performance quoted in this report is past performance and is no guarantee of future results. Investment return and principal value will fluctuate with changing market conditions so that when redeemed, shares may be worth more or less than their original cost. Current performance may be lower or higher than the returns quoted. If certain of the Funds’ fees and expenses had not been waived, returns would have been lower. For the Funds’ most recent month-end performance, please call 800.789.ASIA (2742) or visit matthewsasia.com.
| | | | |
| matthewsasia.com | 800.789.ASIA | | | 3 | |

Cover photo: Looking out to brighter and greener pastures (Chiang Mai, Thailand)
This report has been prepared for Matthews International Funds (d/b/a Matthews Asia Funds) shareholders. It is not authorized for distribution to prospective investors unless accompanied or preceded by a current Matthews Asia Funds prospectus, which contains more complete information about the Funds’ investment objectives, risks and expenses. Additional copies of the prospectus or summary prospectus may be obtained at matthewsasia.com. Please read the prospectus carefully before you invest or send money.
The views and opinions in this report were current as of June 30, 2023. They are not guarantees of performance or investment results and should not be taken as investment advice. Investment decisions reflect a variety of factors, and the managers reserve the right to change their views about individual stocks, sectors and the markets at any time. As a result, the views expressed should not be relied upon as a forecast of a Fund’s future investment intent. Current and future portfolio holdings are subject to risk.
Statements of fact are from sources considered reliable, but neither the Funds nor the Investment Advisor makes any representation or guarantee as to their completeness or accuracy.
Contents
* The Fund’s name changed from Matthews Asia ESG Fund to Matthews Emerging Markets Sustainable Future Fund on July 29, 2022.
Investment Risk: Mutual fund shares are not deposits or obligations of, or guaranteed by, any depositary institution. Shares are not insured by the FDIC, Federal Reserve Board or any government agency and are subject to investment risks, including possible loss of principal amount invested. Investing in international and emerging markets may involve additional risks, such as social and political instability, market illiquidity, exchange-rate fluctuations, a high level of volatility and limited regulation. Fixed income investments are subject to additional risks, including, but not limited to, interest rate, credit and inflation risks. In addition, single-country and sector funds may be subject to a higher degree of market risk than diversified funds because of a concentration in a specific industry, sector or geographic location. Investing in small and mid-size companies is more risky than investing in large companies as they may be more volatile and less liquid than larger companies. Please see the Funds’ Prospectuses and Statement of Additional Information for more risk disclosure.
| | | | |
| matthewsasia.com | 800.789.ASIA | | | 5 | |
Message to Shareholders from the
Investment Advisor
Interest rate cycles are driving changes in short-term sentiment these days and U.S.—China politics seem to be determining the longer-term mood. In the last quarter it was particularly apparent that neither seem to be working in favor of emerging markets. For many investors, it’s been a signal to sit it out on the sidelines.
Clearly, elevated global interest rates do pose a challenge to the outlook of a growth-orientated asset like emerging markets and geopolitics have weighed heavily on Chinese stocks and on companies in the semiconductor space. Underneath it all, Asia and emerging markets, particularly China, have simply struggled to produce the per-share earnings growth that their economic growth deserved. Meanwhile, markets like the U.S. have been outperforming consistently.
So you could be forgiven for questioning the rationale for staying invested in emerging markets, particularly as China labors in its recovery. Our economic theory and stock-picking patience have certainly been tested recently but we remain convinced of the long-term opportunities of this asset class. Here’s why.
Emerging markets and interest rates
First, let’s take a look at inflation and interest rates. After having obsessed over inflation and its permanence or transience for the past two years, I feel confident in saying two things: first, that two-thirds to three-quarters of the inflation spike we endured was transient and due to supply shocks that are now almost entirely behind us; second, the resulting permanent inflation is probably running at no more than about 3% in the U.S. and is still declining, in part due to interest rate rises that have already been made. So we can probably say with some confidence that interest rates have peaked. So where does this leave emerging market performance relative to developed markets? Typically it’s not been a favorable environment but only because falling rates are usually associated with cyclical economic weakness. However, I wouldn’t assume this to be the unfolding scenario. If the Fed has indeed pulled off the magic trick of a soft landing, a cycle more tilted to growth may play out—and I don’t see many in the market prepared for that. So that could be a tailwind at large for emerging markets.
Growth after a soft landing
The Fed’s rate moves are, of course, only half the story for emerging markets. What about their central banks? Here there are two plot lines in motion. In the rate hike camp, Brazil got a better start than the U.S. and Mexico, and it has brought a lot of credibility to macro management over the past few years. So the speed of the decline in interest rates in the U.S. are likely to be matched or even exceeded in these countries as inflation falls rapidly and at the same time the growth prospects of these economies look intact. The other plot line is in Asia, where inflation has been much less of an issue. Countries like Indonesia and India have done a lot to tame exposure to international rate cycles. As for Japan, I’ve always thought that it needed inflation so it’s not a surprise to see its equity markets doing quite well, particularly as the yen has strengthened.
India, Brazil, and Japan have been among the bright spots in emerging and international markets and there is no reason to suspect that any of them will hit harder times if the U.S. dollar remains weak and Fed rates come down.
And what about the elephant in the room, China? The world’s second biggest economy has no inflation. If anything inflation is too low. Core inflation, excluding food and energy, is at 0.4% year-on-year. The inflation rate is low partly due to the fact that China is emerging steadily but cautiously from COVID lockdown. It is emerging cautiously as the government doesn’t want to overstimulate the economy in the way that (arguably) some western nations did.
China’s challenges
So, China is in quite a different macro space and that brings opportunities and challenges. The trick for China is to get incomes (and with it consumer demand) onto a sustainably rising trend, at least in line with nominal gross domestic product growth. I think China understands this and there has been a renewed focus of late in promoting an environment favorable to private enterprise. The private sector is key for the government as it holds in its hands the fate of the vast majority of urban employment and therefore the fate of the China Communist’s Party’s urban popularity, which took a big hit in the later stages of the pandemic.
China may also have to be more aggressive in its attempts to spur quality growth, from the point of view of a balanced macroeconomic policy and return on investment. Just look at the concrete steps taken in India and Mexico, in particular on macroeconomic policy, and in places like Japan and South Korea, in terms of pressure on companies to improve corporate governance and shareholder returns. China has done better on these kind of things of late but it has achieved neither the fanfare nor the practical success that some of its neighbors have.
The other driver of global market sentiment is geopolitics, of course. As we have been at pains to point out, there seems little reason to expect things to improve any time soon. Indeed, further sanctions or trade controls seem to be pushing the U.S. and China into separate blocs with the result that economics and investment returns may become less correlated. As investors in emerging markets, I think we have to accept this truth and position portfolios and devise investment strategies that are more in tune with, and cognizant of, the growing importance of domestic policies.
Good businesses at good prices
Ultimately, investing in global and emerging markets is all down to finding companies. And the sluggishness of China’s economic growth and the skepticism towards it, belies the fact that there are still many good companies to be found. The sheer size of the market and the need for a bottom-up portfolio manager to find a tiny portion of good businesses means that short-term skepticism can often lead to good prices for good businesses. From our point of view, China still offers significant opportunities for the long-term investor. So, despite the better performance and perhaps superior short-term outlook in Japan and India, our regional portfolios will more often than not maintain a balance between the major markets.
In recent times, the bigger macro picture has determined, to large degrees, the trajectory of many equity markets regardless of the performance of their companies. In the falling rate cycle of the pandemic only growth was rewarded, profitable or otherwise. As rates rose, the environment favored more cyclical businesses. I suspect these unusually sharp style cycles are a symptom of the unusually severe and severely unusual inflation and growth cycles we’ve experienced. I think these will dampen down and the inflation cycle will normalize.
It has been a trial for quality growth stock picking and I expect the next few years will be a little easier. And it is quality growth that is shared across all we do. Yes, some of our portfolios are more exposed to emerging businesses and smaller companies. Some portfolios skew to income or established and predictable growth. But the core remains finding good businesses with sensible management, where we can be comfortable with the valuation we are paying. As strategic emerging market investors, we stand by our method, in both favorable times and trying times.

Robert Horrocks, PhD
Chief Investment Officer
Matthews International Capital Management, LLC
| | | | | | | | |
| | | | matthewsasia.com | 800.789.ASIA | | | 7 | |

| | | | |
| PORTFOLIO MANAGERS |
| |
| John Paul Lech | | Alex Zarechnak |
Lead Manager | | Lead Manager |
| |
| Andrew Mattock, CFA | | Peeyush Mittal, CFA |
Co-Manager | | Co-Manager |
| | | | |
|
| FUND FACTS |
| | |
| | | Investor | | Institutional |
Ticker | | MEGMX | | MIEFX |
CUSIP | | 577130651 | | 577130644 |
Inception | | 4/30/20 | | 4/30/20 |
NAV | | $11.81 | | $11.81 |
Initial Investment | | $2,500 | | $100,000 |
Gross Expense Ratio1 | | 1.58% | | 1.47% |
After fee waiver and Reimbursement2 | | 1.08% | | 0.90% |
Portfolio Statistics |
Total # of Positions | | 59 |
Net Assets | | $23.5 million |
Weighted Average Market Cap | | $109.9 billion |
Portfolio Turnover3 | | 63.3% |
Benchmark | | |
MSCI Emerging Markets Index |
OBJECTIVE
Long-term capital appreciation.
STRATEGY
Under normal circumstances, the Fund seeks to achieve its investment objective by investing at least 80% of its net assets, which include borrowings for investment purposes, in the common and preferred stocks of companies located in emerging market countries. Emerging market countries generally include every country in the world except the United States, Australia, Canada, Hong Kong, Israel, Japan, New Zealand, Singapore and most of the countries in Western Europe.
Matthews Emerging Markets Equity Fund
Portfolio Manager Commentary (unaudited)
Period ended June 30, 2023
For the first half of 2023, the Matthews Emerging Markets Equity Fund returned 6.02% (Investor Class) and 6.11% (Institutional Class), while its benchmark, the MSCI Emerging Markets Index, returned 5.10% over the same period. For the quarter ending June 30, 2023, the Fund returned 2.52% (Investor Class) and 2.61% (Institutional Class), while the benchmark returned 1.04%.
Market Environment
The first six months of the year saw a large divergence in equity markets. A strong recovery in China did not materialize while the tech-centric Nasdaq stock exchange posted large gains driven by a small subset of companies. Several emerging markets posted double-digit gains in dollar terms, notably Mexico and Brazil where the popular narrative of nearshoring and potential changes in monetary policy have resonated. At the sector level, IT led emerging markets, posting over 20% gains.
Performance Contributors and Detractors
At the country level, our cautious approach and underweight to China/Hong Kong was the biggest contributor to relative performance in the first half. Our overweight to Mexico was also a strong contributor. On the other hand, our underweight to Taiwan was the biggest detractor. We believe Taiwan’s equity market is overly concentrated in hardware which has historically been more cyclical and with lower barriers to entry.
From a sector perspective, stock selections in financials, real estate, consumer staples and materials were the top contributors to relative performance. In contrast, selections in energy and IT were the biggest detractors, the latter mitigated by our slightly overweight position.
At the holdings level, four of the top 10 performers—TSMC (Taiwan), Samsung Electronics (South Korea), Applied Materials (U.S.) and FPT (Vietnam)—are categorized in the IT sector yet are located in four different countries. It demonstrates the broader approach we take, focusing on structurally advantaged business models regardless of geography. On the flip side, JD.com and Innovent Biologics in China, and Excelerate Energy in the U.S. were among the biggest detractors. Ecommerce platform JD.com has generated concerns over its growth prospects and has been weighed down by China’s muted recovery.
Notable Portfolio Changes
We made several changes in the period. Among them, we exited three positions in Hong Kong in Techtronic Industries, Hong Kong Exchanges and ESR Group, finding better opportunities in their respective sectors of industrials, financials and real estate. Our energy holdings also became more concentrated in TotalEnergies and Woodside Energy as we exited Excelerate and Petrobras. We added Richemont, a watches and jewelry company that owns iconic brands like Cartier. The company, whose roots are in South Africa and largest market is in China, continues to demonstrate pricing in a consumer environment that is not strong. We also purchased a position in BYD, which is the market leader in electronic vehicles in
(continued)
| 1 | Prospectus expense ratios. |
| 2 | Matthews has contractually agreed (i) to waive fees and reimburse expenses to the extent needed to limit Total Annual Fund Operating Expenses (excluding Rule 12b-1 fees, taxes, interest, brokerage commissions, short sale dividend expenses, expenses incurred in connection with any merger or reorganization or extraordinary expenses such as litigation) of the Institutional Class to 0.90% first by waiving class specific expenses (i.e., shareholder service fees specific to a particular class) of the Institutional Class and then, to the extent necessary, by waiving non-class specific expenses (e.g., custody fees) of the Institutional Class, and (ii) if any Fund-wide expenses (i.e., expenses that apply to both the Institutional Class and the Investor Class) are waived for the Institutional Class to maintain the 0.90% expense limitation, to waive an equal amount (in annual percentage terms) of those same expenses for the Investor Class. The Total Annual Fund Operating Expenses After Fee Waiver and Expense Reimbursement for the Investor Class may vary from year to year and will in some years exceed 0.90%. If the operating expenses fall below the expense limitation within three years after Matthews has made a waiver or reimbursement, the Fund may reimburse Matthews up to an amount that does not cause the expenses for that year to exceed the lesser of (i) the expense limitation applicable at the time of that fee waiver and/or expense reimbursement or (ii) the expense limitation in effect at the time of recoupment. This agreement will remain in place until April 30, 2024 and may be terminated at any time by the Board of Trustees on behalf of the Fund on 60 days’ written notice to Matthews. Matthews may decline to renew this agreement by written notice to the Trust at least 30 days before its annual expiration date. |
| 3 | The lesser of fiscal year 2022 long-term purchase costs or sales proceeds divided by the average monthly market value of long-term securities. |
| | | | | | | | | | | | | | | | | | | | | | | | |
| |
| PERFORMANCE AS OF JUNE 30, 2023 | |
| | | 3 Months | | | YTD | | | 1 Year | | | 3 Years | | | Since
Inception | | | Inception
date | |
| Investor Class (MEGMX) | | | 2.52% | | | | 6.02% | | | | 11.29% | | | | 4.80% | | | | 9.76% | | | | 04/30/20 | |
| Institutional Class (MIEFX) | | | 2.61% | | | | 6.11% | | | | 11.37% | | | | 5.02% | | | | 9.98% | | | | 04/30/20 | |
| MSCI Emerging Markets Index4 | | | 1.04% | | | | 5.10% | | | | 2.22% | | | | 2.72% | | | | 5.17% | | | | | |
Performance assumes reinvestment of all dividends and/or distributions before taxes. All performance quoted represents past performance and is no guarantee of future results. Investment return and principal value will fluctuate with market conditions so that when redeemed, shares may be worth more or less than their original cost. Current performance may be lower or higher than the return figures quoted. Returns would have been lower if certain of the Fund’s fees and expenses had not been waived. For the Fund’s most recent month-end performance visit matthewsasia.com.
GROWTH OF A HYPOTHETICAL $10,000 INVESTMENT SINCE INCEPTION—INVESTOR CLASS
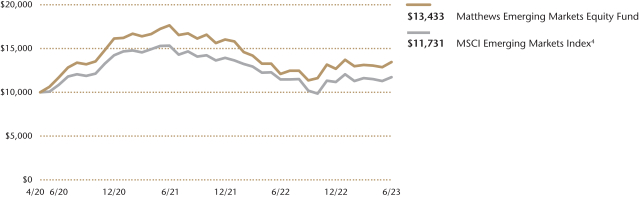
Plotted monthly. The performance data and graph do not reflect the deduction of taxes that a shareholder would pay on dividends, capital gains distributions or redemption of Fund shares. Values are in US$.
| | 4 | It is not possible to invest directly in an index. Source: Index data from Morgan Stanley Capital International and Bloomberg; total return calculations performed by BNY Mellon Investment Servicing (US) Inc. Please see page 76 for index definition. |
| | | | | | | | |
| | | | |
| TOP TEN HOLDINGS5 | | | | | | | |
| Name | | Sector | | Country | | % Net Assets | |
| Taiwan Semiconductor Manufacturing Co., Ltd. | | Information Technology | | Taiwan | | | 6.6% | |
| Samsung Electronics Co., Ltd., Pfd. | | Information Technology | | South Korea | | | 5.7% | |
| FPT Corp. | | Information Technology | | Vietnam | | | 4.1% | |
| Tencent Holdings, Ltd. | | Communication Services | | China/Hong Kong | | | 4.1% | |
| Prologis Property Mexico SA de CV REIT | | Real Estate | | Mexico | | | 3.5% | |
| HDFC Bank, Ltd. | | Financials | | India | | | 3.4% | |
| Prudential PLC | | Financials | | United Kingdom | | | 2.7% | |
| Woodside Energy Group, Ltd. | | Energy | | Australia | | | 2.6% | |
| ICICI Bank, Ltd. | | Financials | | India | | | 2.5% | |
| Banco BTD Pactual SA | | Financials | | Brazil | | | 2.5% | |
| TOTAL | | | | | | | 37.7% | |
| | 5 | Holdings may combine more than one security from same issuer and related depositary receipts. |
| | | | | | | | |
| | | | matthewsasia.com | 800.789.ASIA | | | 9 | |
| | | | |
| |
| COUNTRY ALLOCATION (%)6,7 | |
| India | | | 16.7 | |
| China/Hong Kong | | | 16.4 | |
| Mexico | | | 9.5 | |
| Brazil | | | 9.0 | |
| South Korea | | | 7.3 | |
| Taiwan | | | 6.6 | |
| Vietnam | | | 6.3 | |
| United States | | | 4.5 | |
| France | | | 3.6 | |
| United Kingdom | | | 2.7 | |
| Australia | | | 2.6 | |
| Indonesia | | | 2.2 | |
| Philippines | | | 2.2 | |
| Poland | | | 1.9 | |
| Singapore | | | 1.5 | |
| Switzerland | | | 1.4 | |
| Zambia | | | 1.3 | |
| Kazakhstan | | | 1.2 | |
| United Arab Emirates | | | 1.0 | |
| Thailand | | | 0.9 | |
| Cash and Other Assets, Less Liabilities | | | 1.1 | |
| | | | |
| |
| SECTOR ALLOCATION (%)7 | |
| Financials | | | 23.7 | |
| Information Technology | | | 22.1 | |
| Consumer Discretionary | | | 13.2 | |
| Materials | | | 10.5 | |
| Industrials | | | 6.3 | |
| Consumer Staples | | | 4.8 | |
| Energy | | | 4.8 | |
| Real Estate | | | 4.8 | |
| Health Care | | | 4.6 | |
| Communication Services | | | 4.1 | |
| Cash and Other Assets, Less Liabilities | | | 1.1 | |
| | | | |
| | |
| MARKET CAP EXPOSURE (%)7 | | | |
| Mega Cap (over $25B) | | | 55.7 | |
| Large Cap ($10B-$25B) | | | 15.4 | |
| Mid Cap ($3B-10B) | | | 20.0 | |
| Small Cap (under $3B) | | | 7.8 | |
| Cash and Other Assets, Less Liabilities | | | 1.1 | |
| 6 | Not all countries where the Fund may invest are included in the benchmark index. |
| 7 | Source: FactSet Research Systems. Percentage values in data are rounded to the nearest tenth of one percent, so the values may not sum to 100% due to rounding. Country allocations and percentage values may be derived from different data sources and may not be consistent with other Fund literature. |
Matthews Emerging Markets Equity Fund
Portfolio Manager Commentary (unaudited) (continued)
China with a nearly 40% market share. Our allocation to China/Hong Kong remains selective. Other notable additions were Indian Hotels and Divis Laboratories, a pharmaceutical company also in India.
Outlook
Our approach remains the same—we operate a framework that leads us to be biased towards high quality, profitable businesses that tend to exhibit some form of market leadership.
The backdrop for equity markets overall remains mixed. Higher interest rates both provide a return on cash and challenge consumers looking to make major purchases like homes or cars. The U.S. equity market had a strong start to 2023 but there are some clouds on the horizon. One example is the pending restart of student loan repayments which could impact consumer sentiment. In emerging markets, the news coming out of China is mostly negative both in terms of geopolitical tensions as well as the evolution of the domestic economy. We don’t expect any major pressure to the currency but do note the weakness in the renminbi year-to-date. Our approach in China remains highly selective and focused on individual businesses that in our assessment have strong go-forward fundamentals. India appears to have several structural tailwinds but remains a market that is expensive in aggregate.
Overall, we’re quite optimistic longer term. Near term, we see the high real interest rates in places like Brazil as portending an end to monetary tightening which may be beneficial for markets. Our process is company-by-company. Approaching the portfolio on fundamentals we think offers an attractive balance of growth and resiliency.
Matthews Emerging Markets Equity Fund
June 30, 2023
Schedule of Investmentsa (unaudited)
COMMON EQUITIES: 93.2%
| | | | | | | | |
| | | Shares | | | Value | |
| | |
| INDIA: 16.7% | | | | | | | | |
HDFC Bank, Ltd. ADR | | | 11,523 | | | | $803,153 | |
| | |
ICICI Bank, Ltd. ADR | | | 25,707 | | | | 593,318 | |
| | |
Infosys, Ltd. ADR | | | 31,436 | | | | 505,176 | |
| | |
Kotak Mahindra Bank, Ltd. | | | 16,022 | | | | 361,352 | |
| | |
PI Industries, Ltd. | | | 7,141 | | | | 341,895 | |
| | |
Dabur India, Ltd. | | | 48,390 | | | | 338,495 | |
| | |
Restaurant Brands Asia, Ltd.b | | | 234,016 | | | | 307,714 | |
| | |
UltraTech Cement, Ltd. | | | 2,990 | | | | 302,746 | |
| | |
Indian Hotels Co., Ltd. | | | 46,134 | | | | 221,201 | |
| | |
Divi’s Laboratories, Ltd. | | | 3,599 | | | | 157,488 | |
| | | | | | | | |
Total India | | | | | | | 3,932,538 | |
| | | | | | | | |
| | | | | | | | |
| | | |
| CHINA/HONG KONG: 16.4% | | | | | | | | |
Tencent Holdings, Ltd. | | | 22,500 | | | | 954,027 | |
| | |
AIA Group, Ltd. | | | 57,600 | | | | 585,014 | |
| | |
H World Group, Ltd. ADRb | | | 10,012 | | | | 388,265 | |
| | |
Yum China Holdings, Inc. | | | 6,562 | | | | 370,753 | |
| | |
Midea Group Co., Ltd. A Shares | | | 43,500 | | | | 353,599 | |
| | |
NARI Technology Co., Ltd. A Shares | | | 94,464 | | | | 300,567 | |
| | |
JD.com, Inc. Class A | | | 17,352 | | | | 295,931 | |
| | |
BYD Co., Ltd. A Shares | | | 6,800 | | | | 242,323 | |
| | |
CSPC Pharmaceutical Group, Ltd. | | | 270,000 | | | | 234,975 | |
| | |
Innovent Biologics, Inc.b,c,d | | | 36,000 | | | | 136,740 | |
| | | | | | | | |
Total China/Hong Kong | | | | | | | 3,862,194 | |
| | | | | | | | |
| | | | | | | | |
| | | |
| MEXICO: 9.5% | | | | | | | | |
Prologis Property Mexico SA de CV REIT | | | 221,898 | | | | 824,485 | |
| | |
GCC SAB de CV | | | 42,900 | | | | 367,571 | |
| | |
Grupo Financiero Banorte SAB de CV Class O | | | 44,200 | | | | 364,636 | |
| | |
Becle SAB de CV | | | 140,100 | | | | 342,945 | |
| | |
Grupo Aeroportuario del Sureste SAB de CV ADR | | | 1,214 | | | | 337,116 | |
| | | | | | | | |
Total Mexico | | | | | | | 2,236,753 | |
| | | | | | | | |
| | | | | | | | |
| | | |
| BRAZIL: 9.0% | | | | | | | | |
Banco BTG Pactual SA | | | 89,200 | | | | 585,886 | |
| | |
Vinci Partners Investments, Ltd. Class A | | | 36,170 | | | | 337,104 | |
| | |
Hapvida Participacoes e Investimentos SAb,c,d | | | 349,700 | | | | 319,888 | |
| | |
Armac Locacao Logistica E Servicos SA | | | 99,500 | | | | 311,288 | |
| | |
Vale SA ADR | | | 22,702 | | | | 304,661 | |
| | |
WEG SA | | | 31,700 | | | | 249,922 | |
| | | | | | | | |
Total Brazil | | | | | | | 2,108,749 | |
| | | | | | | | |
| | | | | | | | |
| | | |
| TAIWAN: 6.6% | | | | | | | | |
Taiwan Semiconductor Manufacturing Co., Ltd. | | | 84,000 | | | | 1,551,760 | |
| | | | | | | | |
Total Taiwan | | | | | | | 1,551,760 | |
| | | | | | | | |
| | | | | | | | |
| | | |
| VIETNAM: 6.3% | | | | | | | | |
FPT Corp. | | | 266,917 | | | | 974,977 | |
| | |
Military Commercial Joint Stock Bank | | | 389,876 | | | | 335,519 | |
| | |
HDBank | | | 220,875 | | | | 174,803 | |
| | | | | | | | |
Total Vietnam | | | | | | | 1,485,299 | |
| | | | | | | | |
| | | | | | | | |
| | | |
| UNITED STATES: 4.5% | | | | | | | | |
Applied Materials, Inc. | | | 3,035 | | | | 438,679 | |
| | |
Globant SAb | | | 2,195 | | | | 394,485 | |
| | |
Freeport-McMoRan, Inc. | | | 5,814 | | | | 232,560 | |
| | | | | | | | |
Total United States | | | | | | | 1,065,724 | |
| | | | | | | | |
| | | | | | | | |
| | | | | | | | |
| | | Shares | | | Value | |
| | |
| FRANCE: 3.6% | | | | | | | | |
TotalEnergies SE ADR | | | 8,788 | | | | $506,540 | |
| | |
LVMH Moet Hennessy Louis Vuitton SE | | | 359 | | | | 338,506 | |
| | | | | | | | |
Total France | | | | | | | 845,046 | |
| | | | | | | | |
| | | | | | | | |
| | | |
| UNITED KINGDOM: 2.7% | | | | | | | | |
Prudential PLC | | | 45,393 | | | | 641,103 | |
| | | | | | | | |
Total United Kingdom | | | | | | | 641,103 | |
| | | | | | | | |
| | | | | | | | |
| | | |
| AUSTRALIA: 2.6% | | | | | | | | |
Woodside Energy Group, Ltd. | | | 26,836 | | | | 620,759 | |
| | | | | | | | |
Total Australia | | | | | | | 620,759 | |
| | | | | | | | |
| | | | | | | | |
| | | |
| INDONESIA: 2.2% | | | | | | | | |
PT Bank Rakyat Indonesia Persero Tbk | | | 1,415,200 | | | | 516,678 | |
| | | | | | | | |
Total Indonesia | | | | | | | 516,678 | |
| | | | | | | | |
| | | | | | | | |
| | | |
| PHILIPPINES: 2.2% | | | | | | | | |
Wilcon Depot, Inc. | | | 620,500 | | | | 271,471 | |
| | |
Ayala Corp. | | | 21,090 | | | | 239,849 | |
| | | | | | | | |
Total Philippines | | | | | | | 511,320 | |
| | | | | | | | |
| | | | | | | | |
| | | |
| POLAND: 1.9% | | | | | | | | |
Dino Polska SAb,c,d | | | 3,743 | | | | 437,308 | |
| | | | | | | | |
Total Poland | | | | | | | 437,308 | |
| | | | | | | | |
| | | | | | | | |
| | | |
| SOUTH KOREA: 1.6% | | | | | | | | |
LG Chem, Ltd. | | | 754 | | | | 383,833 | |
| | | | | | | | |
Total South Korea | | | | | | | 383,833 | |
| | | | | | | | |
| | | | | | | | |
| | | |
| SINGAPORE: 1.5% | | | | | | | | |
CapitaLand Investment, Ltd. | | | 120,700 | | | | 296,553 | |
| | |
TDCX, Inc. ADRb | | | 6,751 | | | | 53,400 | |
| | |
CapitaLand Ascott Trust | | | 6,881 | | | | 5,515 | |
| | | | | | | | |
Total Singapore | | | | | | | 355,468 | |
| | | | | | | | |
| | | | | | | | |
| | | |
| SWITZERLAND: 1.4% | | | | | | | | |
Cie Financiere Richemont SA Class A | | | 1,903 | | | | 323,259 | |
| | | | | | | | |
Total Switzerland | | | | | | | 323,259 | |
| | | | | | | | |
| | | | | | | | |
| | | |
| ZAMBIA: 1.3% | | | | | | | | |
First Quantum Minerals, Ltd. | | | 12,700 | | | | 300,448 | |
| | | | | | | | |
Total Zambia | | | | | | | 300,448 | |
| | | | | | | | |
| | | | | | | | |
| | | |
| KAZAKHSTAN: 1.2% | | | | | | | | |
Kaspi.KZ JSC GDRd | | | 3,586 | | | | 286,061 | |
| | | | | | | | |
Total Kazakhstan | | | | | | | 286,061 | |
| | | | | | | | |
| | | | | | | | |
| | | |
| UNITED ARAB EMIRATES: 1.0% | | | | | | | | |
Fertiglobe PLC | | | 262,682 | | | | 238,318 | |
| | | | | | | | |
Total United Arab Emirates | | | | | | | 238,318 | |
| | | | | | | | |
| | | | | | | | |
| | | |
| THAILAND: 1.0% | | | | | | | | |
Bangkok Dusit Medical Services Public Co., Ltd. F Shares | | | 284,800 | | | | 223,333 | |
| | | | | | | | |
Total Thailand | | | | | | | 223,333 | |
| | | | | | | | |
| | | | | | | | |
| | | | | | | | |
| | | | matthewsasia.com | 800.789.ASIA | | | 11 | |
Matthews Emerging Markets Equity Fund
June 30, 2023
Schedule of Investmentsa (unaudited) (continued)
COMMON EQUITIES (continued)
| | | | | | | | |
| | | Shares | | | Value | |
| | |
| RUSSIA: 0.0% | | | | | | | | |
Sberbank of Russia PJSCb,e | | | 128,308 | | | | $1,434 | |
| | |
LUKOIL PJSC ADRb,e | | | 18,010 | | | | 360 | |
| | |
TCS Group Holding PLC GDRb,d,e | | | 3,865 | | | | 77 | |
| | | | | | | | |
Total Russia | | | | | | | 1,871 | |
| | | | | | | | |
| | | | | | | | |
| | | |
| TOTAL COMMON EQUITIES | | | | | | | 21,927,822 | |
| | | | | | | | |
(Cost $23,083,109) | | | | | | | | |
| | | | | | | | |
| | |
PREFERRED EQUITIES: 5.7% | | | | | | | | |
| | | |
| SOUTH KOREA: 5.7% | | | | | | | | |
Samsung Electronics Co., Ltd., Pfd. | | | 29,397 | | | | 1,334,016 | |
| | | | | | | | |
Total South Korea | | | | | | | 1,334,016 | |
| | | | | | | | |
| | | | | | | | |
| | | |
| TOTAL PREFERRED EQUITIES | | | | | | | 1,334,016 | |
| | | | | | | | |
(Cost $2,190,887) | | | | | | | | |
| | | | | | | | |
| | | |
| TOTAL INVESTMENTS: 98.9% | | | | | | | 23,261,838 | |
(Cost $25,273,996) | | | | | | | | |
| | | | | | | | |
| | |
CASH AND OTHER ASSETS,
LESS LIABILITIES: 1.1% | | | | | | | 262,220 | |
| | | | | | | | |
| | | | | | | | |
| | |
NET ASSETS: 100.0% | | | | | | | $23,524,058 | |
| | | | | | | | |
| a | Certain securities were fair valued under the valuation policies approved by the Board of Trustees (Note 2-A). |
| b | Non-income producing security. |
| c | Security exempt from registration under Rule 144A of the Securities Act of 1933, as amended. The security may be resold in transactions exempt from registration normally to qualified institutional buyers. The security has been determined to be liquid in accordance with procedures adopted by the Funds’ Board of Trustees. At June 30, 2023, the aggregate value is $893,936, which is 3.80% of net assets. |
| d | The securities may be resold to qualified foreign investors and foreign institutional buyers under Regulation S of the Securities Act of 1933. |
| e | Security is valued using significant unobservable inputs and is classified as Level 3 in the fair value hierarchy. The aggregate value of Level 3 security is $1,871 and 0.01% of net assets. |
| ADR | American Depositary Receipt |
| GDR | Global Depositary Receipt |
| PJSC | Public Joint Stock Co. |
| REIT | Real Estate Investment Trust |
See accompanying notes to financial statements.

| | | | |
| PORTFOLIO MANAGER |
| |
| Vivek Tanneeru | | |
Lead Manager | | |
| |
| Inbok Song | | |
Co-Manager | | |
|
| FUND FACTS |
| | |
| | | Investor | | Institutional |
Ticker | | MASGX | | MISFX |
CUSIP | | 577130727 | | 577130719 |
Inception | | 4/30/15 | | 4/30/15 |
NAV | | $13.54 | | $13.56 |
Initial Investment | | $2,500 | | $100,000 |
Gross Expense Ratio1 | | 1.24% | | 1.11% |
Portfolio Statistics | | | | |
Total # of Positions | | 56 |
Net Assets | | $245.9 million |
Weighted Average
Market Cap | | $20.5 billion |
Portfolio Turnover2 | | 31.5% |
Benchmark | | |
MSCI Emerging Markets Index |
OBJECTIVE
Long-term capital appreciation.
STRATEGY
Under normal circumstances, the Fund seeks to achieve its investment objective by investing at least 80% of its net assets, which include borrowings for investment purposes, in the common and preferred stocks of companies of any market capitalization located in emerging market countries that satisfy one or more of the Fund’s environmental, social and governance (“ESG”) standards. Emerging market countries generally include every country in the world except the United States, Australia, Canada, Hong Kong, Israel, Japan, New Zealand, Singapore and most of the countries in Western Europe.
Matthews Emerging Markets Sustainable Future Fund*
Portfolio Manager Commentary (unaudited)
Period ended June 30, 2023
For the first half of 2023, the Matthews Emerging Markets Sustainable Future Fund returned 8.23% (Investor Class) and 8.39% (Institutional Class), while its benchmark, the MSCI Emerging Markets Index, returned 5.10% over the same period. For the quarter ending June 30, 2023, the Fund returned 6.87% (Investor Class) and 6.94% (Institutional Class), while the benchmark returned 1.04%.
Market Environment
There were two key developments during the first six months of the year. Firstly, the market has been surprised by the persistence of higher inflation and, as a result, peak interest rate expectations in the western world have been steadily revised up. Secondly, there was the market’s excitement about the potential of artificial intelligence (AI), with the release of very successful, large language and stable diffusion models and blowout quarterly results and guidance from NVIDIA, a key player in the space, which together triggered a reassessment of the growth prospects of large tech companies. This led to a very top-heavy performance of equity markets, in the U.S. in particular.
During the period, the relative attractiveness of large emerging markets also came into focus as they were relatively well positioned from an inflation perspective, with either low inflation or high real interest rates. Latin American currencies like the Columbian peso, Mexican peso, Brazilian real, Chilean peso and Peruvian sol performed well against the U.S. dollar while currencies in inflation-hit countries like Turkey and Argentina performed poorly.
Brazil, after aggressively raising interest rates to fight inflation starting in early 2021, has seemingly reached the top of the rate cycle. With the potential moderation in inflation in sight, the market has taken a positive view on the trajectory of rates from here and the potential boost lower rates could provide the economy.
Poland, Hungary and Greece, alongside Brazil, were among the best-performing emerging markets in the MSCI Emerging Markets Index in the first half, while China, Turkey, Thailand and Malaysia were the worst performers. From a sector perspective, energy, IT and financials were the best performers while real estate and health care were among the weakest in emerging markets.
Performance Contributors and Detractors
From a country perspective, stock selection in South Korea, Brazil and India were the biggest contributors to the Fund’s relative performance in the first half. On the other hand, an overweight and stock selection in China was the biggest detractor amid negative sentiment over the country’s uneven recovery and geopolitical tensions with the U.S.
From a sector perspective, our underweight and stock selection in consumer discretionary was the biggest contributor. Stock selection in financials was also a top contributor. On the other hand, stock selection in consumer staples and communication services were the biggest detractors.
(continued)
| * | The Fund’s name changed from Matthews Asia ESG Fund to Matthews Emerging Markets Sustainable Future Fund on July 29, 2022. |
| 1 | Prospectus expense ratios. |
| 2 | The lesser of fiscal year 2022 long-term purchase costs or sales proceeds divided by the average monthly market value of long-term securities. |
| | | | | | | | |
| | | | matthewsasia.com | 800.789.ASIA | | | 13 | |
| | | | | | | | | | | | | | | | | | | | | | | | | | | | |
| | | | | | | | |
| PERFORMANCE AS OF JUNE 30, 2023 | | | | | | | | | | | | | | | | | | | | | |
| | | | | | | | | | | | Average Annual Total Returns | | | | |
| | | 3 Months | | | YTD | | | 1 Year | | | 3 years | | | 5 years | | | Since
Inception | | | Inception
Date | |
| Investor Class (MASGX)3 | | | 6.87% | | | | 8.23% | | | | 5.19% | | | | 13.71% | | | | 8.95% | | | | 7.74% | | | | 4/30/15 | |
| Institutional Class (MISFX)3 | | | 6.94% | | | | 8.39% | | | | 5.26% | | | | 13.91% | | | | 9.13% | | | | 7.96% | | | | 4/30/15 | |
| MSCI Emerging Markets Index4 | | | 1.04% | | | | 5.10% | | | | 2.22% | | | | 2.72% | | | | 1.32% | | | | 2.15% | | | | | |
| MSCI AC Asia ex Japan Index4 | | | -1.14% | | | | 3.19% | | | | -0.76% | | | | 1.49% | | | | 1.25% | | | | 2.61% | | | | | |
Performance assumes reinvestment of all dividends and/or distributions before taxes. All performance quoted represents past performance and is no guarantee of future results. Investment return and principal value will fluctuate with market conditions so that when redeemed, shares may be worth more or less than their original cost. Current performance may be lower or higher than the return figures quoted. Returns would have been lower if certain of the Fund’s fees and expenses had not been waived. For the Fund’s most recent month-end performance visit matthewsasia.com.
GROWTH OF A HYPOTHETICAL $10,000 INVESTMENT SINCE INCEPTION—INVESTOR CLASS
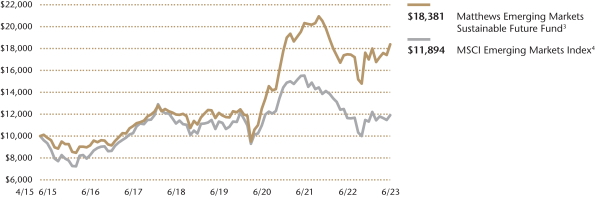
Plotted Monthly. The performance data and graph do not reflect the deduction of taxes that a shareholder would pay on dividends, capital gain distributions or redemption of Fund shares. Values are in US$.
| | 3 | Before July 29, 2022, the Fund was managed with a slightly different investment strategy and may have achieved different performance results under its current investment strategy from the performance shown for periods before that date. |
| | 4 | Effective July 29, 2022, in connection with changes to the Fund’s name and principal investment strategies, the primary benchmark changed from the MSCI All Country Asia ex Japan Index to the MSCI Emerging Markets Index. It is not possible to invest directly in an index. Source: Index data from Morgan Stanley Capital International; total return calculations performed by BNY Mellon Investment Servicing (US) Inc. Please see page 76 for index definition. |
| | | | | | | | |
| | | | |
| TOP TEN HOLDINGS5 | | | | | | | |
| Name | | Sector | | Country | | % Net Assets | |
| Bandhan Bank, Ltd. | | Financials | | India | | | 6.4% | |
| Shriram Finance, Ltd. | | Financials | | India | | | 6.0% | |
| Legend Biotech Corp. | | Health Care | | China/Hong Kong | | | 5.3% | |
| Full Truck Alliance Co., Ltd. | | Industrials | | China/Hong Kong | | | 4.8% | |
| JD Health International, Inc. | | Consumer Staples | | China/Hong Kong | | | 4.8% | |
| Meituan | | Consumer Discretionary | | China/Hong Kong | | | 4.7% | |
| Samsung SDI Co., Ltd., Pfd. | | Information Technology | | South Korea | | | 4.2% | |
| Ecopro BM Co., Ltd. | | Industrials | | South Korea | | | 3.7% | |
| YDUQS Participacoes SA | | Consumer Discretionary | | Brazil | | | 3.4% | |
| B3 SA-Brasil Bolsa Balcao | | Financials | | Brazil | | | 3.2% | |
| TOTAL | | | 46.5% | |
| | 5 | Holdings may combine more than one security from same issuer and related depositary receipts. |
Matthews Emerging Markets Sustainable Future Fund
Portfolio Manager Commentary (unaudited) (continued)
From a stock perspective, two Brazilian holdings, YDUQS and B3, were among top contributors. YDUQS, a leading on-campus and distance-learning education company, navigated the COVID-19 related-slowdown successfully and has positioned itself to benefit from improvements in household finances on account of expected lower interest rates, which will enable more low-mid income families to enroll students in their programs. The company could also see reduced interest payment burdens and potentially benefit from any increase in government-sponsored tuition support programs. B3, a stock market operator, is also seen as a beneficiary of potentially lower rates as the relative investment appeal of equities might go up in relation to fixed income in an easing environment, boosting its trading volumes.
On the flip side, our Chinese or China-exposed holdings such as Full Truck Alliance, a Chinese freight marketplace operator, and JD Health, a leading Chinese online pharmacy company, detracted as the market worried about the slow pace of the Chinese economic recovery. We remain positive about the long-term prospects of these companies and our base case remains a steady, not spectacular, recovery of China’s economy over the coming quarters.
Notable Portfolio Changes
We initiated a position in Aguas Andinas, a leading water utilities company in Chile, which provides services for water collection, and the production, transportation and distribution of drinking water as well as sewage collection, treatment and disposal. It operates under a unique regulatory environment in Chile that uses a model greenfield company method to set tariffs. This has incentivized strong investments into the water and sewage infrastructure and has enabled Chile to achieve drinking and sewage water treatment standards that are among the highest in the world. The company also offers steady growth and an attractive dividend yield. During the period, we exited a small residual position in Xinyi Glass, a China glass manufacturer.
Outlook
The U.S. Fed’s interest rate-strategy and the market’s expectation of its evolution have been the most important variables impacting the performance of emerging markets over the last few quarters. With the Fed seemingly coming close to the end of its rate-hiking cycle, the focus will now shift to assessing the cumulate impact of all the hikes on economic growth prospects over the coming quarters.
Like during the first half, our focus in the second half of 2023 will be on assessing how China’s economic recovery and growth prospects play out and how they might affect the dynamics of other emerging markets. Russia’s invasion of Ukraine and its effect on energy prices—alongside OPEC’s (Organization of the Petroleum Exporting Countries) persistent efforts to keep prices high—will also need ongoing, careful monitoring although to a lesser extent than in 2022.
Over the coming years, we expect the emerging markets gross domestic product (GDP) growth-differential with developed markets to improve from a 23-year low reached in 2022. This development, alongside relatively attractive valuations, should potentially lend support to better equity performance against developed markets compared with the last decade.
Finally, since our inception over eight years ago, we have viewed sustainability investing as a synonym for long-term investing. Our approach focuses on investing in companies that are well-positioned to embrace global, multidecadal trends, including addressing critical challenges like climate change and inclusive development. These companies also often tend to be good in identifying and proactively addressing long-terms risk to their businesses. Emerging markets, we believe, are key destination for sustainable investment themes that offer attractive opportunities for alpha generation.
| | | | |
| | |
| COUNTRY ALLOCATION (%)6,7 | | | |
| China/Hong Kong | | | 38.9 | |
| India | | | 18.8 | |
| South Korea | | | 11.2 | |
| Taiwan | | | 8.8 | |
| Brazil | | | 7.4 | |
| Poland | | | 3.2 | |
| United States | | | 2.7 | |
| Saudi Arabia | | | 1.7 | |
| Vietnam | | | 1.5 | |
| Jordan | | | 1.2 | |
| Romania | | | 1.1 | |
| Indonesia | | | 0.9 | |
| Estonia | | | 0.9 | |
| Chile | | | 0.8 | |
| Bangladesh | | | 0.7 | |
| Cash and Other Assets, Less Liabilities | | | 0.3 | |
| | | | |
| | |
| SECTOR ALLOCATION (%)7 | | | |
| Information Technology | | | 21.6 | |
| Financials | | | 20.7 | |
| Industrials | | | 19.5 | |
| Consumer Discretionary | | | 11.8 | |
| Health Care | | | 9.6 | |
| Consumer Staples | | | 7.6 | |
| Real Estate | | | 3.9 | |
| Communication Services | | | 3.4 | |
| Utilities | | | 1.7 | |
| Cash and Other Assets, Less Liabilities | | | 0.3 | |
| | | | |
| | |
| MARKET CAP EXPOSURE (%)7 | | | |
| Mega Cap (over $25B) | | | 18.7 | |
| Large Cap ($10B-$25B) | | | 22.3 | |
| Mid Cap ($3B-10B) | | | 34.5 | |
| Small Cap (under $3B) | | | 24.2 | |
| Cash and Other Assets, Less Liabilities | | | 0.3 | |
| 6 | Not all countries are included in the benchmark index. |
| 7 | Source: FactSet Research Systems. Percentage values in data are rounded to the nearest tenth of one percent, so the values may not sum to 100% due to rounding. Country allocations and percentage values may be derived from different data sources and may not be consistent with other Fund literature. |
| | | | | | | | |
| | | | matthewsasia.com | 800.789.ASIA | | | 15 | |
Matthews Emerging Markets Sustainable Future Fund
June 30, 2023
Schedule of Investmentsa (unaudited)
COMMON EQUITIES: 95.5%
| | | | | | | | |
| | | Shares | | | Value | |
| | |
| CHINA/HONG KONG: 38.9% | | | | | | | | |
Legend Biotech Corp. ADRb | | | 187,690 | | | | $12,956,241 | |
| | |
Full Truck Alliance Co., Ltd. ADRb | | | 1,910,620 | | | | 11,884,056 | |
| | |
JD Health International, Inc.b,c,d | | | 1,857,500 | | | | 11,798,548 | |
| | |
Meituan B Sharesb,c,d | | | 729,100 | | | | 11,432,957 | |
| | |
Contemporary Amperex Technology Co., Ltd. A Shares | | | 204,500 | | | | 6,456,321 | |
| | |
Airtac International Group | | | 178,000 | | | | 5,882,659 | |
| | |
Lam Research Corp. | | | 7,683 | | | | 4,939,093 | |
| | |
Flat Glass Group Co., Ltd. H Shares | | | 1,089,000 | | | | 3,733,908 | |
| | |
Ginlong Technologies Co., Ltd. A Sharesb | | | 246,600 | | | | 3,545,596 | |
| | |
Zhihu, Inc. ADRb | | | 2,945,436 | | | | 3,328,343 | |
| | |
Medlive Technology Co., Ltd.c,d | | | 3,200,000 | | | | 2,866,095 | |
| | |
Hong Kong Exchanges & Clearing, Ltd. | | | 70,300 | | | | 2,663,597 | |
| | |
OPT Machine Vision Tech Co., Ltd. A Shares | | | 83,485 | | | | 1,898,587 | |
| | |
China Conch Venture Holdings, Ltd. | | | 1,436,500 | | | | 1,876,888 | |
| | |
Silergy Corp. | | | 145,000 | | | | 1,806,293 | |
| | |
Centre Testing International Group Co., Ltd. A Shares | | | 655,100 | | | | 1,759,529 | |
| | |
Hangzhou Tigermed Consulting Co., Ltd. A Sharesb | | | 185,776 | | | | 1,652,084 | |
| | |
Wuxi Biologics Cayman, Inc.b,c,d | | | 319,000 | | | | 1,533,131 | |
| | |
Innovent Biologics, Inc.b,c,d | | | 378,500 | | | | 1,437,674 | |
| | |
Zhejiang HangKe Technology, Inc., Co. A Shares | | | 243,734 | | | | 1,026,825 | |
| | |
Morimatsu International Holdings Co., Ltd.b,d | | | 1,084,000 | | | | 894,017 | |
| | |
CSPC Pharmaceutical Group, Ltd. | | | 216,960 | | | | 188,816 | |
| | | | | | | | |
Total China/Hong Kong | | | | | | | 95,561,258 | |
| | | | | | | | |
| | | | | | | | |
| | | |
| INDIA: 18.8% | | | | | | | | |
Bandhan Bank, Ltd.b,c,d | | | 5,297,534 | | | | 15,674,692 | |
| | |
Shriram Finance, Ltd. | | | 698,597 | | | | 14,808,818 | |
| | |
Indus Towers, Ltd.b | | | 2,153,796 | | | | 4,321,814 | |
| | |
Phoenix Mills, Ltd. | | | 195,459 | | | | 3,728,680 | |
| | |
Mahindra & Mahindra, Ltd. | | | 203,091 | | | | 3,608,395 | |
| | |
Marico, Ltd. | | | 429,919 | | | | 2,786,554 | |
| | |
UNO Minda, Ltd. | | | 190,461 | | | | 1,352,774 | |
| | | | | | | | |
Total India | | | | | | | 46,281,727 | |
| | | | | | | | |
| | | | | | | | |
| | | |
| TAIWAN: 8.8% | | | | | | | | |
M31 Technology Corp. | | | 165,000 | | | | 5,164,178 | |
| | |
Andes Technology Corp. | | | 326,000 | | | | 5,008,241 | |
| | |
Poya International Co., Ltd. | | | 225,477 | | | | 4,298,823 | |
| | |
Elite Material Co., Ltd. | | | 444,000 | | | | 3,487,281 | |
| | |
Formosa Sumco Technology Corp. | | | 403,000 | | | | 2,179,636 | |
| | |
Sporton International, Inc. | | | 196,448 | | | | 1,606,008 | |
| | | | | | | | |
Total Taiwan | | | | | | | 21,744,167 | |
| | | | | | | | |
| | | | | | | | |
| | | |
| BRAZIL: 7.4% | | | | | | | | |
YDUQS Participacoes SAb | | | 2,031,400 | | | | 8,408,660 | |
| | |
B3 SA - Brasil Bolsa Balcao | | | 2,571,000 | | | | 7,844,766 | |
| | |
NU Holdings, Ltd. Class Ab | | | 237,640 | | | | 1,874,980 | |
| | | | | | | | |
Total Brazil | | | | | | | 18,128,406 | |
| | | | | | | | |
| | | | | | | | |
| | | | | | | | |
| | | Shares | | | Value | |
| | |
| SOUTH KOREA: 7.0% | | | | | | | | |
Ecopro BM Co., Ltd. | | | 47,722 | | | | $9,078,111 | |
| | |
Solus Advanced Materials Co., Ltd. | | | 115,014 | | | | 3,256,522 | |
| | |
Eugene Technology Co., Ltd. | | | 119,419 | | | | 3,103,166 | |
| | |
Samsung SDI Co., Ltd. | | | 3,079 | | | | 1,572,244 | |
| | |
LG Energy Solution, Ltd.b | | | 498 | | | | 209,953 | |
| | | | | | | | |
Total South Korea | | | | | | | 17,219,996 | |
| | | | | | | | |
| | | | | | | | |
| | | |
| POLAND: 3.1% | | | | | | | | |
Jeronimo Martins SGPS SA | | | 150,401 | | | | 4,143,334 | |
| | |
InPost SAb | | | 334,507 | | | | 3,630,293 | |
| | | | | | | | |
Total Poland | | | | | | | 7,773,627 | |
| | | | | | | | |
| | | | | | | | |
| | | |
| UNITED STATES: 2.7% | | | | | | | | |
Micron Technology, Inc. | | | 105,300 | | | | 6,645,483 | |
| | | | | | | | |
Total United States | | | | | | | 6,645,483 | |
| | | | | | | | |
| | | | | | | | |
| | | |
| SAUDI ARABIA: 1.7% | | | | | | | | |
Saudi Tadawul Group Holding Co. | | | 84,607 | | | | 4,259,080 | |
| | | | | | | | |
Total Saudi Arabia | | | | | | | 4,259,080 | |
| | | | | | | | |
| | | | | | | | |
| | | |
| VIETNAM: 1.5% | | | | | | | | |
Nam Long Investment Corp. | | | 2,565,039 | | | | 3,598,183 | |
| | | | | | | | |
Total Vietnam | | | | | | | 3,598,183 | |
| | | | | | | | |
| | | | | | | | |
| | | |
| JORDAN: 1.2% | | | | | | | | |
Hikma Pharmaceuticals PLC | | | 125,267 | | | | 3,014,522 | |
| | | | | | | | |
Total Jordan | | | | | | | 3,014,522 | |
| | | | | | | | |
| | | | | | | | |
| | | |
| ROMANIA: 1.1% | | | | | | | | |
Banca Transilvania SA | | | 573,157 | | | | 2,617,092 | |
| | | | | | | | |
Total Romania | | | | | | | 2,617,092 | |
| | | | | | | | |
| | | | | | | | |
| | | |
| ESTONIA: 0.9% | | | | | | | | |
Enefit Green AS | | | 474,035 | | | | 2,256,188 | |
| | | | | | | | |
Total Estonia | | | | | | | 2,256,188 | |
| | | | | | | | |
| | | | | | | | |
| | | |
| INDONESIA: 0.9% | | | | | | | | |
PT Summarecon Agung Tbk | | | 49,500,191 | | | | 2,181,721 | |
| | | | | | | | |
Total Indonesia | | | | | | | 2,181,721 | |
| | | | | | | | |
| | | | | | | | |
| | | |
| CHILE: 0.8% | | | | | | | | |
Aguas Andinas SA Class A | | | 5,423,989 | | | | 1,880,710 | |
| | | | | | | | |
Total Chile | | | | | | | 1,880,710 | |
| | | | | | | | |
| | | | | | | | |
| | | |
| BANGLADESH: 0.7% | | | | | | | | |
BRAC Bank, Ltd. | | | 3,657,902 | | | | 1,092,163 | |
| | |
GrameenPhone, Ltd. | | | 266,417 | | | | 644,248 | |
| | | | | | | | |
Total Bangladesh | | | | | | | 1,736,411 | |
| | | | | | | | |
| | | | | | | | |
| | | |
| TOTAL COMMON EQUITIES | | | | | | | 234,898,571 | |
| | | | | | | | |
(Cost $221,648,154) | | | | | | | | |
Matthews Emerging Markets Sustainable Future Fund
June 30, 2023
Schedule of Investmentsa (unaudited) (continued)
PREFERRED EQUITIES: 4.2%
| | | | | | | | |
| | | Shares | | | Value | |
| | |
| SOUTH KOREA: 4.2% | | | | | | | | |
Samsung SDI Co., Ltd., Pfd. | | | 41,656 | | | | $10,213,478 | |
| | | | | | | | |
Total South Korea | | | | | | | 10,213,478 | |
| | | | | | | | |
| | | | | | | | |
| | | |
| TOTAL PREFERRED EQUITIES | | | | | | | 10,213,478 | |
| | | | | | | | |
(Cost $ 11,238,090) | | | | | | | | |
| | | | | | | | |
| | | |
| TOTAL INVESTMENTS: 99.7% | | | | | | | 245,112,049 | |
(Cost $ 232,886,244) | | | | | | | | |
| | | | | | | | |
| | |
CASH AND OTHER ASSETS,
LESS LIABILITIES: 0.3% | | | | | | | 736,522 | |
| | | | | | | | |
| | |
NET ASSETS: 100.0% | | | | | | | $245,848,571 | |
| | | | | | | | |
| a | Certain securities were fair valued under the valuation policies approved by the Board of Trustees (Note 2-A). |
| b | Non-income producing security. |
| c | Security exempt from registration under Rule 144A of the Securities Act of 1933, as amended. The security may be resold in transactions exempt from registration normally to qualified institutional buyers. The security has been determined to be liquid in accordance with procedures adopted by the Funds’ Board of Trustees. At June 30, 2023, the aggregate value is $44,743,097, which is 18.20% of net assets. |
| d | The securities may be resold to qualified foreign investors and foreign institutional buyers under Regulation S of the Securities Act of 1933. |
| ADR | American Depositary Receipt |
See accompanying notes to financial statements.
| | | | | | | | |
| | | | matthewsasia.com | 800.789.ASIA | | | 17 | |
| | | | |
| PORTFOLIO MANAGERS |
| |
| Vivek Tanneeru | | |
| Lead Manager | | |
| |
| Jeremy Sutch, CFA | | Alex Zarechnak |
Co-Manager | | Co-Manager |
|
| FUND FACTS |
| | |
| | | Investor | | Institutional |
Ticker | | MSMLX | | MISMX |
CUSIP | | 577125206 | | 577125867 |
Inception | | 9/15/08 | | 4/30/13 |
NAV | | $26.31 | | $26.29 |
Initial Investment | | $2,500 | | $100,000 |
Gross Expense Ratio1 | | 1.49% | | 1.37% |
After Fee Waiver and Reimbursement2 | | 1.37% | | 1.15% |
Portfolio Statistics | | |
Total # of Positions | | 71 |
Net Assets | | $506.4 million |
Weighted Average
Market Cap | | $4.5 billion |
Portfolio Turnover3 | | 27.9% |
Benchmark | | |
MSCI Emerging Markets Small Cap Index |
OBJECTIVE
Long-term capital appreciation.
STRATEGY
Under normal market conditions, the Fund seeks to achieve its investment objective by investing at least 80% of its net assets, which include borrowings for investment purposes, in the common and preferred stocks of Small Companies located in emerging market countries. Emerging market countries generally include every country in the world except the United States, Australia, Canada, Hong Kong, Israel, Japan, New Zealand, Singapore and most of the countries in Western Europe. The Fund defines Small Companies as companies with market capitalization no higher than the greater of $5 billion or the market capitalization of the largest company included in the Fund’s primary benchmark, the MSCI Emerging Markets Small Cap Index.
Matthews Emerging Markets Small Companies Fund
Portfolio Manager Commentary (unaudited)
Period ended June 30, 2023
For the first half of 2023, the Matthews Emerging Markets Small Companies Fund returned 14.00% (Investor Class) and 14.11% (Institutional Class), while its benchmark, the MSCI Emerging Markets Small Cap Index, returned 10.73% over the same period. For the quarter ending June 30, 2023, the Fund returned 8.05% (Investor Class) and 8.10% (Institutional Class), while the benchmark returned 6.53%.
Market Environment
There were two key developments during the first six months of the year. Firstly, the market has been surprised by the persistence of higher inflation and as a result peak interest rate expectations in the western world have been steadily revised up. Secondly, there was the market’s excitement about the potential of artificial intelligence (AI), with the release of very successful, large language and stable diffusion models and blowout quarterly results and guidance from NVIDIA, a key player in the space, which together triggered a reassessment of the growth prospects of large tech companies. This led to a very top-heavy performance of equity markets, in the U.S. in particular.
During the period, the attractiveness of large emerging markets also came into focus as they were relatively well positioned from an inflation perspective, with either low inflation or high real interest rates. Latin American currencies like the Columbian peso, Mexican peso, Brazilian real, Chilean peso and Peruvian sol performed well against the U.S. dollar while currencies in inflation-hit countries like Turkey and Argentina performed poorly.
Brazil, after aggressively raising interest rates to fight inflation starting in early 2021, has seemingly reached the top of the rate cycle. With the potential moderation in inflation in sight, the market has taken a positive view on the trajectory of rates from here and the potential boost lower rates could provide the economy.
In the first half, Greece, Saudi Arabia and Hungary, alongside Brazil, were among the best performing markets in the MSCI Emerging Markets Small Cap Index, while China, Turkey, Thailand and South Africa were the worst performers. From a sector perspective, IT and industrials were the best performers while energy and real estate were the weakest.
Performance Contributors and Detractors
From a country perspective, our stock selections in South Korea, Brazil and India were the biggest contributors to relative performance in the first half of the year. Our underweight to Thailand and lack of exposure to South Africa also contributed. On the other hand, despite our positive stock selection, our overweight to China was the biggest detractor amid negative sentiment over the country’s uneven economy recovery and geopolitical tensions. Our underweight to Taiwan was also a detractor. At the sector level, stock selections in financials and consumer discretionary were the top contributors while our underweight to consumer staples also had a positive impact. On the flip side, selections in IT and an overweight and selections in health care were the biggest detractors.
(continued)
| 1 | Prospectus expense ratios. |
| 2 | Matthews has contractually agreed (i) to waive fees and reimburse expenses to the extent needed to limit Total Annual Fund Operating Expenses (excluding Rule 12b-1 fees, taxes, interest, brokerage commissions, short sale dividend expenses, expenses incurred in connection with any merger or reorganization or extraordinary expenses such as litigation) of the Institutional Class to 1.15% first by waiving class specific expenses (i.e., shareholder service fees specific to a particular class) of the Institutional Class and then, to the extent necessary, by waiving non-class specific expenses (e.g., custody fees) of the Institutional Class, and (ii) if any Fund-wide expenses (i.e., expenses that apply to both the Institutional Class and the Investor Class) are waived for the Institutional Class to maintain the 1.15% expense limitation, to waive an equal amount (in annual percentage terms) of those same expenses for the Investor Class. The Total Annual Fund Operating Expenses After Fee Waiver and Expense Reimbursement for the Investor Class may vary from year to year and will in some years exceed 1.15%. If the operating expenses fall below the expense limitation within three years after Matthews has made a waiver or reimbursement, the Fund may reimburse Matthews up to an amount that does not cause the expenses for that year to exceed the lesser of (i) the expense limitation applicable at the time of that fee waiver and/or expense reimbursement or (ii) the expense limitation in effect at the time of recoupment. This agreement will remain in place until April 30, 2024 and may be terminated at any time by the Board of Trustees on behalf of the Fund on 60 days’ written notice to Matthews. Matthews may decline to renew this agreement by written notice to the Trust at least 30 days before its annual expiration date. |
| 3 | The lesser of fiscal year 2022 long-term purchase costs or sales proceeds divided by the average monthly market value of long-term securities. |
| | | | | | | | | | | | | | | | | | | | | | | | | | | | | | | | |
| |
| PERFORMANCE AS OF JUNE 30, 2023 | |
| | | | | | | | | | | | Average Annual Total Returns | | | | |
| | | 3 Months | | | YTD | | | 1 Year | | | 3 Years | | | 5 Years | | | 10 Years | | | Since
Inception | | | Inception
Date | |
| Investor Class (MSMLX)4 | | | 8.05% | | | | 14.00% | | | | 16.06% | | | | 14.75% | | | | 10.09% | | | | 7.97% | | | | 11.18% | | | | 09/15/08 | |
| Institutional Class (MISMX)4 | | | 8.10% | | | | 14.11% | | | | 16.27% | | | | 14.98% | | | | 10.31% | | | | 8.20% | | | | 7.68% | | | | 04/30/13 | |
| MSCI Emerging Markets Small Cap Index5 | | | 6.53% | | | | 10.73% | | | | 13.93% | | | | 14.28% | | | | 5.40% | | | | 5.02% | | | | 6.64% | 6 | | | | |
Performance assumes reinvestment of all dividends and/or distributions before taxes. All performance quoted represents past performance and is no guarantee of future results. Investment return and principal value will fluctuate with market conditions so that when redeemed, shares may be worth more or less than their original cost. Current performance may be lower or higher than the return figures quoted. Returns would have been lower if certain of the Fund’s fees and expenses had not been waived. For the Fund’s most recent month-end performance, visit matthewsasia.com.
GROWTH OF A HYPOTHETICAL $10,000 INVESTMENT SINCE INCEPTION—INVESTOR CLASS
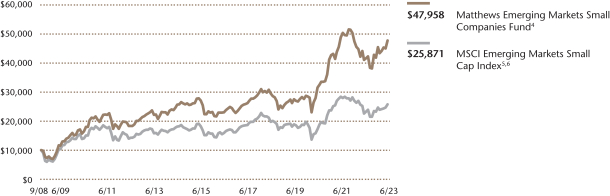
Plotted monthly. The performance data and graph do not reflect the deduction of taxes that a shareholder would pay on dividends, capital gains distributions or redemption of Fund shares. Values are in US$.
| | 4 | Before April 30, 2021, the Fund was managed with a different investment strategy and may have achieved different performance results for periods before that date with its current investment strategy. |
| | 5 | It is not possible to invest directly in an index. Source: Index data from Morgan Stanley Capital International and Bloomberg; total return calculations performed by BNY Mellon Investment Servicing (US) Inc. Please see page 76 for index definition. Effective April 30, 2021, in connection with changes to the Fund’s name and principal investment strategy, the primary benchmark changed from the MSCI All Country Asia ex Japan Small Cap Index to the MSCI Emerging Markets Small Cap Index. |
| | 6 | Calculated from 9/15/08. |
| | | | | | | | |
| | | | |
| TOP TEN HOLDINGS7 | | | | | | | |
| Name | | Sector | | Country | | % Net Assets | |
| Shriram Finance, Ltd. | | Financials | | India | | | 6.4% | |
| Bandhan Bank, Ltd. | | Financials | | India | | | 5.9% | |
| Legend Biotech Corp. | | Health Care | | China/Hong Kong | | | 5.1% | |
| Ecopro BM Co., Ltd. | | Industrials | | South Korea | | | 4.6% | |
| YDUQS Participacoes SA | | Consumer Discretionary | | Brazil | | | 3.5% | |
| Hugel, Inc. | | Health Care | | South Korea | | | 2.8% | |
| Full Truck Alliance Co., Ltd. | | Industrials | | China/Hong Kong | | | 2.8% | |
| M31 Technology Corp. | | Information Technology | | Taiwan | | | 2.5% | |
| Phoenix Mills, Ltd. | | Real Estate | | India | | | 2.5% | |
| Parque Arauco SA | | Real Estate | | Chile | | | 2.3% | |
| TOTAL | | | | | | | 38.4% | |
| | 7 | Holdings may combine more than one security from same issuer and related depositary receipts. |
| | | | | | | | |
| | | | matthewsasia.com | 800.789.ASIA | | | 19 | |
Matthews Emerging Markets Small Companies Fund
Portfolio Manager Commentary (unaudited) (continued)
At the holdings level, Brazilian company YDUQS was among the top contributors. YDUQS, a leading on-campus and distance-learning education company, navigated the COVID-19 related-slowdown successfully and has positioned itself to benefit from improvements in household finances on account of expected lower interest rates, which will enable more low-mid income families to enroll students in its programs. The company could also see reduced interest payment burdens and potentially benefit from any increase in government-sponsored tuition support programs. On the flip side, our Chinese or China-exposed holdings such as Silergy, a Taiwanese analog semiconductor company, Hugel, a South Korean botulin toxin maker, and Hainan Meilan International Airport, a Chinese airport operator, were among the biggest detractors as the market worried about the slow pace of the Chinese economic recovery. We remain positive about the long-term prospects of these companies and our base case remains a steady, not spectacular, recovery of the Chinese economy over the coming quarters.
Notable Portfolio Changes
We initiated a position in Aguas Andinas, a leading water utilities company in Chile, which provides services for water collection, and the production, transportation and distribution of drinking water as well as sewage collection, treatment and disposal. It operates under a unique regulatory environment in Chile that uses a model greenfield company method to set tariffs. This has incentivized strong investments into the water and sewage infrastructure and has enabled Chile to achieve drinking and sewage water treatment standards that are among the highest in the world. The company also offers steady growth and an attractive dividend yield. In the period we exited Lemon Tree, an Indian mid-market hotel chain operator, to take profits, and sold our position in Bank Tabungan Negara in Indonesia to deploy capital elsewhere.
Outlook
The U.S. Fed’s interest rate strategy and the market’s expectation of its evolution were the most important variables impacting the performance of emerging markets over the last few quarters. With the Fed seemingly coming close to the end of the interest rate hiking cycle, the focus will now shift to assessing the cumulate impact of all the rate hikes on economic growth prospects over the coming quarters.
Like during the first half, our focus in the second half of 2023 will be on assessing how China’s economic recovery and growth prospects play out and how they might affect the dynamics of other emerging markets. And Russia’s invasion of Ukraine and its effect on energy prices—alongside OPEC’s (Organization of the Petroleum Exporting Countries) persistent efforts to keep the prices high—will need ongoing, careful monitoring; although to a lesser extent than in 2022.
Over the coming years, we expect the emerging markets gross domestic product (GDP) growth-differential with developed markets to improve from a 23-year low reached in 2022. This development, alongside relatively attractive valuations, should potentially lend support to better equity performance against developed markets compared with the last decade.
As the global economy wades through a tricky 2023, we believe small companies in emerging markets offer long-term growth opportunities given their innovation and domestic consumption orientation. We continue to find quality businesses at attractive valuations in this asset class.
| | | | |
| |
| COUNTRY ALLOCATION (%)8,9 | |
| China/Hong Kong | | | 27.9 | |
| India | | | 21.0 | |
| Taiwan | | | 10.6 | |
| South Korea | | | 10.0 | |
| Brazil | | | 8.6 | |
| Vietnam | | | 5.3 | |
| Chile | | | 4.8 | |
| Philippines | | | 2.4 | |
| Indonesia | | | 2.3 | |
| United Arab Emirates | | | 1.7 | |
| Poland | | | 1.4 | |
| Mexico | | | 1.0 | |
| Turkey | | | 0.8 | |
| Thailand | | | 0.7 | |
| Bangladesh | | | 0.6 | |
| Russia | | | 0.0 | |
| Cash and Other Assets, Less Liabilities | | | 1.0 | |
| | | | |
| |
| SECTOR ALLOCATION (%)9 | |
| Industrials | | | 23.9 | |
| Financials | | | 20.3 | |
| Information Technology | | | 17.5 | |
| Consumer Discretionary | | | 13.7 | |
| Health Care | | | 11.7 | |
| Real Estate | | | 7.2 | |
| Communication Services | | | 1.8 | |
| Materials | | | 1.0 | |
| Consumer Staples | | | 0.9 | |
| Utilities | | | 0.9 | |
| Cash and Other Assets, Less Liabilities | | | 1.0 | |
| | | | |
| |
| MARKET CAP EXPOSURE (%)9,10 | |
| Mega Cap (over $25B) | | | 0.0 | |
| Large Cap ($10B-$25B) | | | 11.7 | |
| Mid Cap ($3B-10B) | | | 38.0 | |
| Small Cap (under $3B) | | | 49.3 | |
| Cash and Other Assets, Less Liabilities | | | 1.0 | |
| 8 | Not all countries where the Fund may invest are included in the benchmark index. |
| 9 | Source: FactSet Research Systems. Percentage values in data are rounded to the nearest tenth of one percent, so the values may not sum to 100% due to rounding. Country allocations and percentage values may be derived from different data sources and may not be consistent with other Fund literature. |
| 10 | The Fund defines Small Companies as companies with market capitalization no higher than the greater of $5 billion or the market capitalization of the largest company included in the Fund’s primary benchmark, the MSCI Emerging Markets Small Cap Index. |
Matthews Emerging Markets Small Companies Fund
June 30, 2023
Schedule of Investmentsa (unaudited)
COMMON EQUITIES: 96.8%
| | | | | | | | |
| | | Shares | | | Value | |
| | |
| CHINA/HONG KONG: 27.9% | | | | | | | | |
Legend Biotech Corp. ADRb | | | 373,276 | | | | $25,767,242 | |
| | |
Full Truck Alliance Co., Ltd. ADRb | | | 2,245,425 | | | | 13,966,543 | |
| | |
Silergy Corp. | | | 925,000 | | | | 11,522,905 | |
| | |
Airtac International Group | | | 284,431 | | | | 9,400,059 | |
| | |
Zhihu, Inc. ADRb | | | 8,191,572 | | | | 9,256,476 | |
| | |
Ginlong Technologies Co., Ltd. A Sharesb | | | 481,506 | | | | 6,923,057 | |
| | |
Flat Glass Group Co., Ltd. H Shares | | | 1,859,000 | | | | 6,374,045 | |
| | |
Xtep International Holdings, Ltd. | | | 6,155,000 | | | | 6,300,037 | |
| | |
Tongcheng Travel Holdings, Ltd.b,c | | | 2,562,400 | | | | 5,382,215 | |
| | |
Medlive Technology Co., Ltd.c,d | | | 5,452,000 | | | | 4,883,109 | |
| | |
Beijing Capital International Airport Co., Ltd. H Sharesb | | | 7,522,000 | | | | 4,881,766 | |
| | |
Peijia Medical, Ltd.b,c,d | | | 6,090,000 | | | | 4,802,374 | |
| | |
Hainan Meilan International Airport Co., Ltd. H Sharesb | | | 3,479,000 | | | | 4,330,027 | |
| | |
AK Medical Holdings, Ltd.c,d | | | 4,246,000 | | | | 3,699,919 | |
| | |
SITC International Holdings Co., Ltd. | | | 1,800,000 | | | | 3,296,107 | |
| | |
OPT Machine Vision Tech Co., Ltd. A Shares | | | 138,447 | | | | 3,148,513 | |
| | |
Innovent Biologics, Inc.b,c,d | | | 770,500 | | | | 2,926,626 | |
| | |
CIFI Ever Sunshine Services Group, Ltd.c,e | | | 8,858,000 | | | | 2,653,104 | |
| | |
Zhejiang HangKe Technology, Inc. Co. A Shares | | | 589,513 | | | | 2,481,591 | |
| | |
Morimatsu International Holdings Co., Ltd.b,c | | | 2,887,000 | | | | 2,381,020 | |
| | |
Ginlong Technologies Co., Ltd. A Sharesb | | | 163,310 | | | | 2,346,202 | |
| | |
Centre Testing International Group Co., Ltd. A Shares | | | 865,974 | | | | 2,324,075 | |
| | |
Centre Testing International Group Co., Ltd. A Shares | | | 585,338 | | | | 1,572,156 | |
| | |
Tam Jai International Co., Ltd. | | | 3,447,000 | | | | 794,091 | |
| | | | | | | | |
Total China/Hong Kong | | | | | | | 141,413,259 | |
| | | | | | | | |
| | | | | | | | |
| | | |
| INDIA: 21.0% | | | | | | | | |
Shriram Finance, Ltd. | | | 1,528,896 | | | | 32,409,447 | |
| | |
Bandhan Bank, Ltd.b,c,d | | | 10,170,281 | | | | 30,092,496 | |
| | |
Phoenix Mills, Ltd. | | | 652,201 | | | | 12,441,736 | |
| | |
Finolex Cables, Ltd. | | | 1,078,159 | | | | 11,306,864 | |
| | |
Barbeque Nation Hospitality, Ltd.b | | | 589,248 | | | | 4,751,852 | |
| | |
UNO Minda, Ltd. | | | 566,514 | | | | 4,023,739 | |
| | |
HEG, Ltd. | | | 177,008 | | | | 3,525,813 | |
| | |
Rainbow Children’s Medicare, Ltd. | | | 276,911 | | | | 3,253,027 | |
| | |
Radico Khaitan, Ltd. | | | 206,625 | | | | 3,047,992 | |
| | |
Marico, Ltd. | | | 254,966 | | | | 1,652,582 | |
| | | | | | | | |
Total India | | | | | | | 106,505,548 | |
| | | | | | | | |
| | | | | | | | |
| | | |
| TAIWAN: 10.6% | | | | | | | | |
M31 Technology Corp. | | | 407,000 | | | | 12,738,306 | |
| | |
Andes Technology Corp. | | | 634,000 | | | | 9,739,952 | |
| | |
Wiwynn Corp.e | | | 126,000 | | | | 5,859,731 | |
| | |
Elite Material Co., Ltd. | | | 731,000 | | | | 5,741,448 | |
| | |
Yageo Corp. | | | 350,124 | | | | 5,546,813 | |
| | |
Poya International Co., Ltd. | | | 289,610 | | | | 5,521,548 | |
| | |
ASPEED Technology, Inc. | | | 52,000 | | | | 4,789,448 | |
| | |
Formosa Sumco Technology Corp. | | | 731,000 | | | | 3,953,633 | |
| | | | | | | | |
Total Taiwan | | | | | | | 53,890,879 | |
| | | | | | | | |
| | | | | | | | |
| | | |
| SOUTH KOREA: 10.0% | | | | | | | | |
Ecopro BM Co., Ltd. | | | 121,948 | | | | 23,198,054 | |
| | |
Hugel, Inc.b | | | 168,202 | | | | 14,113,004 | |
| | |
Eugene Technology Co., Ltd. | | | 268,110 | | | | 6,966,980 | |
| | | | | | | | |
| | | Shares | | | Value | |
| | |
Solus Advanced Materials Co., Ltd. | | | 216,643 | | | | $6,134,059 | |
| | | | | | | | |
Total South Korea | | | | | | | 50,412,097 | |
| | | | | | | | |
| | | | | | | | |
| | | |
| BRAZIL: 6.3% | | | | | | | | |
YDUQS Participacoes SAb | | | 4,250,900 | | | | 17,595,931 | |
| | |
Vamos Locacao de Caminhoes Maquinas e Equipamentos SA | | | 3,942,200 | | | | 9,970,353 | |
| | |
Vivara Participacoes SA | | | 767,800 | | | | 4,566,840 | |
| | | | | | | | |
Total Brazil | | | | | | | 32,133,124 | |
| | | | | | | | |
| | | | | | | | |
| | | |
| VIETNAM: 5.3% | | | | | | | | |
Military Commercial Joint Stock Bank | | | 10,703,722 | | | | 9,211,389 | |
| | |
Mobile World Investment Corp. | | | 4,206,714 | | | | 7,752,043 | |
| | |
FPT Corp. | | | 1,721,238 | | | | 6,287,227 | |
| | |
Nam Long Investment Corp. | | | 2,386,132 | | | | 3,347,216 | |
| | | | | | | | |
Total Vietnam | | | | | | | 26,597,875 | |
| | | | | | | | |
| | | | | | | | |
| | | |
| CHILE: 4.8% | | | | | | | | |
Parque Arauco SA | | | 7,244,351 | | | | 11,646,910 | |
| | |
Lundin Mining Corp. | | | 663,000 | | | | 5,194,897 | |
| | |
Aguas Andinas SA Class A | | | 12,721,367 | | | | 4,410,998 | |
| | |
Banco de Credito e Inversiones SA | | | 101,620 | | | | 3,105,047 | |
| | | | | | | | |
Total Chile | | | | | | | 24,357,852 | |
| | | | | | | | |
| | | | | | | | |
| | | |
| PHILIPPINES: 2.4% | | | | | | | | |
Cebu Air, Inc.b | | | 10,386,400 | | | | 7,063,463 | |
| | |
GT Capital Holdings, Inc. | | | 533,000 | | | | 4,981,038 | |
| | | | | | | | |
Total Philippines | | | | | | | 12,044,501 | |
| | | | | | | | |
| | | | | | | | |
| | | |
| INDONESIA: 2.3% | | | | | | | | |
PT Summarecon Agung Tbk | | | 148,173,416 | | | | 6,530,742 | |
| | |
PT Mitra Adiperkasa Tbkb | | | 47,495,800 | | | | 5,360,402 | |
| | | | | | | | |
Total Indonesia | | | | | | | 11,891,144 | |
| | | | | | | | |
| | | | | | | | |
| | | |
| UNITED ARAB EMIRATES: 1.7% | | | | | | | | |
Network International Holdings PLCb,c,d | | | 1,755,334 | | | | 8,551,496 | |
| | | | | | | | |
Total United Arab Emirates | | | | | | | 8,551,496 | |
| | | | | | | | |
| | | | | | | | |
| | | |
| POLAND: 1.4% | | | | | | | | |
InPost SAb | | | 647,686 | | | | 7,029,120 | |
| | | | | | | | |
Total Poland | | | | | | | 7,029,120 | |
| | | | | | | | |
| | | | | | | | |
| | | |
| MEXICO: 1.0% | | | | | | | | |
Banco del Bajio SAc,d | | | 1,622,500 | | | | 4,930,914 | |
| | | | | | | | |
Total Mexico | | | | | | | 4,930,914 | |
| | | | | | | | |
| | | | | | | | |
| | | |
| TURKEY: 0.8% | | | | | | | | |
Ford Otomotiv Sanayi AS | | | 142,109 | | | | 4,128,839 | |
| | | | | | | | |
Total Turkey | | | | | | | 4,128,839 | |
| | | | | | | | |
| | | | | | | | |
| | | |
| THAILAND: 0.7% | | | | | | | | |
Siam Wellness Group Public Co., Ltd. F Sharesb | | | 10,109,900 | | | | 3,368,188 | |
| | | | | | | | |
Total Thailand | | | | | | | 3,368,188 | |
| | | | | | | | |
| | | | | | | | |
| | | | | | | | |
| | | | matthewsasia.com | 800.789.ASIA | | | 21 | |
Matthews Emerging Markets Small Companies Fund
June 30, 2023
Schedule of Investmentsa (unaudited) (continued)
COMMON EQUITIES (continued)
| | | | | | | | |
| | | Shares | | | Value | |
| | |
| BANGLADESH: 0.6% | | | | | | | | |
BRAC Bank, Ltd. | | | 9,498,906 | | | | $2,836,150 | |
| | | | | | | | |
Total Bangladesh | | | | | | | 2,836,150 | |
| | | | | | | | |
| | | | | | | | |
| | | |
| RUSSIA: 0.0% | | | | | | | | |
Moscow Exchange MICEX-RTS PJSCb,e | | | 2,101,250 | | | | 23,478 | |
| | |
TCS Group Holding PLC GDRb,c,e | | | 62,962 | | | | 1,259 | |
| | |
HeadHunter Group PLC ADRb,e | | | 15,800 | | | | 316 | |
| | | | | | | | |
Total Russia | | | | | | | 25,053 | |
| | | | | | | | |
| | | | | | | | |
| | | |
| TOTAL COMMON EQUITIES | | | | | | | 490,116,039 | |
| | | | | | | | |
(Cost $447,882,049) | | | | | | | | |
| | | | | | | | |
| | |
| PREFERRED EQUITIES: 2.2% | | | | | | | | |
| | | |
| BRAZIL: 2.2% | | | | | | | | |
Banco Pan SA, Pfd. | | | 5,972,500 | | | | 11,413,136 | |
| | | | | | | | |
Total Brazil | | | | | | | 11,413,136 | |
| | | | | | | | |
| | | | | | | | |
| | | |
| TOTAL PREFERRED EQUITIES | | | | | | | 11,413,136 | |
| | | | | | | | |
(Cost $9,168,254) | | | | | | | | |
| | | | | | | | |
| | | |
| TOTAL INVESTMENTS: 99.0% | | | | | | | 501,529,175 | |
(Cost $457,050,303) | | | | | | | | |
| | | | | | | | |
| | |
CASH AND OTHER ASSETS,
LESS LIABILITIES: 1.0% | | | | | | | 4,875,002 | |
| | | | | | | | |
| | | | | | | | |
| |
NET ASSETS: 100.0% | | | | $506,404,177 | |
| | | | | | | | |
| a | Certain securities were fair valued under the valuation policies approved by the Board of Trustees (Note 2-A). |
| b | Non-income producing security. |
| c | The securities may be resold to qualified foreign investors and foreign institutional buyers under Regulation S of the Securities Act of 1933. |
| d | Security exempt from registration under Rule 144A of the Securities Act of 1933, as amended. The security may be resold in transactions exempt from registration normally to qualified institutional buyers. The security has been determined to be liquid in accordance with procedures adopted by the Funds’ Board of Trustees. At June 30, 2023, the aggregate value is $59,886,934, which is 11.83% of net assets. |
| e | Security is valued using significant unobservable inputs and is classified as Level 3 in the fair value hierarchy. The aggregate value of Level 3 security is $8,537,888 and 1.69% of net assets. |
| ADR | American Depositary Receipt |
| GDR | Global Depositary Receipt |
| PJSC | Public Joint Stock Co. |
See accompanying notes to financial statements.

| | | | |
| PORTFOLIO MANAGERS |
| |
| Taizo Ishida | | |
Lead Manager | | |
| |
| Michael J. Oh, CFA | | Peeyush Mittal, CFA |
Co-Manager | | Co-Manager |
|
| FUND FACTS |
| | |
| | | Investor | | Institutional |
Ticker | | MPACX | | MIAPX |
CUSIP | | 577130867 | | 577130776 |
Inception | | 10/31/03 | | 10/29/10 |
NAV | | $20.63 | | $20.91 |
Initial Investment | | $2,500 | | $100,000 |
Gross Expense Ratio1 | | 1.13% | | 0.98% |
Portfolio Statistics | | | | |
Total # of Positions | | | | 47 |
Net Assets | | | | $575.0 million |
Weighted Average Market Cap | | $97.1 billion |
Portfolio Turnover2 | | 47.5% |
Benchmark |
MSCI AC Asia Pacific Index |
OBJECTIVE
Long-term capital appreciation.
STRATEGY
Under normal market conditions, the Fund seeks to achieve its investment objective by investing at least 80% of its net assets, which include borrowings for investment purposes, in the common and preferred stocks of companies located in Asia. Asia consists of all countries and markets in Asia, and includes developed, emerging and frontier countries and markets in the Asian region. The Fund may also invest in the convertible securities, of any duration or quality, of Asian companies.
Matthews Asia Growth Fund
Portfolio Manager Commentary (unaudited)
Period ended June 30, 2023
For the first half of 2023, the Matthews Asia Growth Fund returned –1.01% (Investor Class) and
–0.95% (Institutional Class), while its benchmark, the MSCI All Country Asia Pacific Index, returned 6.35% over the same period. For the quarter ending June 30, 2023, the Fund returned –3.69% (Investor Class) and –3.64% (Institutional Class), while the benchmark returned 1.43%.
Market Environment
The story of 2023’s first half has inarguably been about China. The year started on a positive note as markets anticipated that China’s lifting of zero-COVID would meaningfully boost economic activity—but the anticipation quickly faded as China’s economy struggled to regain its footing and domestic sentiment proved a meaningful drag. Consequently, China’s market returns have been negative year-to-date. Further weighing on China’s macro picture has been the property market, which has contributed to dour sentiment as many Chinese hold their wealth via real estate. Property market downturns make many Chinese citizens feel relatively poorer which decreases the likelihood they will spend money and help the economy.
Beyond China’s shores, the macroeconomic picture hasn’t been much better with much of the West (notably the U.S. and Europe) still battling inflation—an extended effort that has resulted in notably higher interest rates. If there is a bright spot, it may be Japan where the markets are improving thanks to fundamentals which appear to be turning for the first time in several decades. Spurred on by the Tokyo Stock Exchange, Japan-domiciled companies are finally working to improve their price-to-book ratios via share buybacks. Many Japanese companies have also increased their dividend payout ratios, improving their value to shareholders. In our view, these changes are meaningful and substantive and we believe Japan may be at the beginning of long-needed structural change. Another market offering encouragement has been India, which is benefiting in part from moves by some companies to make their supply chains less dependent on China.
Performance Contributors and Detractors
Regionally, our overweight and stock selection in China was the biggest detractor to relative performance in the first half of the year. Our underweight to Taiwan—a relative bright spot given ongoing geopolitical tensions around the semiconductor industry—was also a large detractor. Our holdings in Japan, while positive on an absolute basis, trailed the benchmark and detracted from performance. On the flip side, our stock selection in Indonesia and our overweight to India were strong contributors to performance.
At the sector level, relative weakness was concentrated in our health care exposure—which detracted from performance due to our overweight position and stock selections. Our selections in consumer discretionary and industrials, and our underweight in IT also detracted. Conversely, our stock selections in financials were a source of relative strength, as were our materials holdings.
At the individual holdings level, JD.com and InnoCare Pharma were among our bottom contributors in the first half. Chinese e-commerce giant JD.com suffered as Chinese consumers were slow to increase consumption in the wake of zero-COVID’s lifting. Though many investors have seemingly soured on the outlook, we maintain our conviction in the company’s quality and are attracted to its solid balance sheet with ample cash. Shares of China-based InnoCare Pharma declined sharply following the company’s announcement that its exclusive global
(continued)
| 1 | Prospectus expense ratios. |
| 2 | The lesser of fiscal year 2022 long-term purchase costs or sales proceeds divided by the average monthly market value of long-term securities. |
| | | | | | | | |
| | | | matthewsasia.com | 800.789.ASIA | | | 23 | |
| | | | | | | | | | | | | | | | | | | | | | | | | | | | | | | | |
| |
| PERFORMANCE AS OF JUNE 30, 2023 | |
| | | | | | | | | | | | Average Annual Total Returns | | | | |
| | | 3 Months | | | YTD | | | 1 Year | | | 3 Years | | | 5 Years | | | 10 Years | | | Since
Inception | | | Inception
Date | |
| Investor Class (MPACX) | | | -3.69% | | | | -1.01% | | | | -3.65% | | | | -8.55% | | | | -3.18% | | | | 2.99% | | | | 6.53% | | | | 10/31/03 | |
| Institutional Class (MIAPX) | | | -3.64% | | | | -0.95% | | | | -3.47% | | | | -8.41% | | | | -3.03% | | | | 3.17% | | | | 3.81% | | | | 10/29/10 | |
| MSCI AC Asia Pacific Index3 | | | 1.43% | | | | 6.35% | | | | 6.44% | | | | 3.81% | | | | 2.38% | | | | 5.04% | | | | 6.15% | 4 | | | | |
Performance assumes reinvestment of all dividends and/or distributions before taxes. All performance quoted represents past performance and is no guarantee of future results. Investment return and principal value will fluctuate with market conditions so that when redeemed, shares may be worth more or less than their original cost. Current performance may be lower or higher than the return figures quoted. For the Fund’s most recent month-end performance, visit matthewsasia.com.
GROWTH OF A HYPOTHETICAL $10,000 INVESTMENT SINCE INCEPTION—INVESTOR CLASS
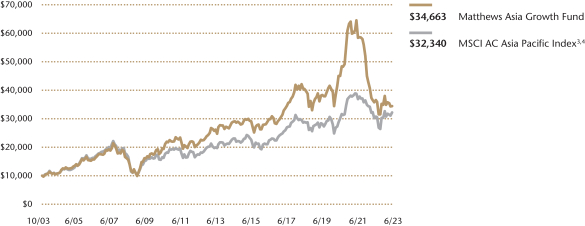
Plotted monthly. The performance data and graph do not reflect the deduction of taxes that a shareholder would pay on dividends, capital gains distributions or redemption of Fund shares. Values are in US$.
| | 3 | It is not possible to invest directly in an index. Source: Index data from Morgan Stanley Capital International and Bloomberg; total return calculations performed by BNY Mellon Investment Servicing (US) Inc. Please see page 76 for index definition. |
| | 4 | Calculated from 10/31/03. |
| | | | | | | | | | |
| | | | | |
| TOP TEN HOLDINGS5 | | | | | | | | | |
| Name | | Sector | | Country | | | | % Net Assets | |
| PT Bank Rakyat Indonesia Persero Tbk | | Financials | | Indonesia | | | | | 5.2% | |
| HDFC Bank, Ltd. | | Financials | | India | | | | | 5.0% | |
| Taiwan Semiconductor Manufacturing Co., Ltd. | | Information Technology | | Taiwan | | | | | 4.5% | |
| Sony Group Corp. | | Consumer Discretionary | | Japan | | | | | 4.1% | |
| Tencent Holdings, Ltd. | | Communication Services | | China/Hong Kong | | | | | 4.1% | |
| Hitachi, Ltd. | | Industrials | | Japan | | | | | 4.0% | |
| Keyence Corp. | | Information Technology | | Japan | | | | | 3.5% | |
| Innovent Biologics, Inc. | | Health Care | | China/Hong Kong | | | | | 3.4% | |
| Daiichi Sankyo Co., Ltd. | | Health Care | | Japan | | | | | 3.3% | |
| Alibaba Group Holding, Ltd. | | Consumer Discretionary | | China/Hong Kong | | | | | 3.0% | |
| TOTAL | | | | | | | | | 40.1% | |
| | 5 | Holdings may combine more than one security from same issuer and related depositary receipts. |
| | | | |
| |
| COUNTRY ALLOCATION (%)6,7 | |
| Japan | | | 43.7 | |
| China/Hong Kong | | | 25.1 | |
| India | | | 15.0 | |
| Indonesia | | | 5.2 | |
| Taiwan | | | 4.5 | |
| Australia | | | 3.6 | |
| Singapore | | | 1.2 | |
| Cash and Other Assets, Less Liabilities | | | 1.8 | |
| | | | |
| |
| SECTOR ALLOCATION (%)7 | |
| Consumer Discretionary | | | 22.8 | |
| Health Care | | | 18.6 | |
| Financials | | | 17.0 | |
| Information Technology | | | 12.4 | |
| Industrials | | | 9.0 | |
| Communication Services | | | 7.7 | |
| Consumer Staples | | | 4.1 | |
| Energy | | | 3.5 | |
| Materials | | | 3.3 | |
| Cash and Other Assets, Less Liabilities | | | 1.8 | |
| | | | |
| |
| MARKET CAP EXPOSURE (%)7 | |
| Mega Cap (over $25B) | | | 62.5 | |
| Large Cap ($10B-$25B) | | | 18.5 | |
| Mid Cap ($3B-10B) | | | 8.4 | |
| Small Cap (under $3B) | | | 8.9 | |
| Cash and Other Assets, Less Liabilities | | | 1.8 | |
| 6 | Not all countries where the Fund may invest are included in the benchmark index. |
| 7 | Source: FactSet Research Systems. Percentage values in data are rounded to the nearest tenth of one percent, so the values may not sum to 100% due to rounding. Country allocations and percentage values may be derived from different data sources and may not be consistent with other Fund literature. |
Matthews Asia Growth Fund
Portfolio Manager Commentary (unaudited) (continued)
licensing (ex-China) agreement with the U.S.’s Biogen to develop and market a BTK inhibitor for multiple sclerosis had been discontinued. As a result, we exited our position.
Among our top individual contributors were Legend Biotech and Shin-Etsu Chemical. China-based biopharmaceutical Legend Biotech has developed arguably a best-in-class CAR T-cell therapy for cancer—an area with few competitors. Given the company’s solid fundamentals, we like the outlook from here and its positioning in the space. Shares of Shin-Etsu Chemical, a premier Japanese semiconductor wafer company with large global market share, rose on the back of strength in semiconductor stocks. We favor the company’s solid fundamentals despite its exposure to the U.S. housing market as a dominant PVC maker.
Notable Portfolio Changes
During the last quarter, we initiated positions in Toyota and Mahindra & Mahindra. Japanese automaker Toyota has solid fundamentals, a long history as one of Japan’s premier companies and is exposed to the ongoing transition to electric vehicles (EVs). Similarly, Mahindra & Mahindra is an India-based automaker specializing in SUVs—a growing vehicle category in India which we expect to boost the company’s sales in the period ahead.
In addition to exiting InnoCare Pharma, we sold our positions in Taiwanese power management chip company Silergy and long-time holding Vietnam Dairy Products following conversations with both companies’ management teams which weakened our confidence in their outlooks. We opted to redeploy our capital into more compelling opportunities.
Outlook
We don’t have a crystal ball that can tell us what will happen in China, which continues to be the primary concern. Many have called a bottom several times in China’s market only to see it decline further. It’s hard to see much of a reason for sentiment in China to shift meaningfully in the near term. The likelihood the government can effect a quick turnaround seems low. We think, however, that an uptick in initial public offerings in the Hong Kong market should encourage global investors to participate in the market in the next three to six months.
Elsewhere, we are encouraged by the progress we’re seeing in Japan and expect it to continue along its current structural change path. Compounding our enthusiasm are valuations which, though certainly higher in the wake of the recent market rally, remain relatively cheap, in our view. By way of contrast, India, which also remains a relative bright spot, has much higher, and consequently less attractive, valuations. As we’ve gained confidence in Japan and its companies’ fundamentals, we’ve decreased our exposure to China while increasing our Japan holdings.
Over the next six months, we would like to think sentiment will gradually improve—and that perhaps the rate-hike cycle will conclude in the West and markets will find more reasons to continue climbing the proverbial wall of worry. We will certainly watch with interest and are prepared to position the portfolio accordingly as events unfold.
| | | | | | | | |
| | | | matthewsasia.com | 800.789.ASIA | | | 25 | |
Matthews Asia Growth Fund
June 30, 2023
Schedule of Investmentsa (unaudited)
COMMON EQUITIES: 98.2%
| | | | | | | | |
| | | Shares | | | Value | |
| | |
| JAPAN: 43.7% | | | | | | | | |
Sony Group Corp. | | | 263,900 | | | | $23,822,309 | |
| | |
Hitachi, Ltd. | | | 369,300 | | | | 22,961,784 | |
| | |
Keyence Corp. | | | 42,800 | | | | 20,336,707 | |
| | |
Daiichi Sankyo Co., Ltd. | | | 602,100 | | | | 19,131,292 | |
| | |
Shin-Etsu Chemical Co., Ltd. | | | 520,500 | | | | 17,394,046 | |
| | |
Toyota Motor Corp. | | | 1,064,300 | | | | 17,105,524 | |
| | |
Japan Elevator Service Holdings Co., Ltd. | | | 1,194,100 | | | | 15,710,262 | |
| | |
Sumitomo Mitsui Financial Group, Inc. | | | 312,100 | | | | 13,376,434 | |
| | |
Kyoritsu Maintenance Co., Ltd. | | | 306,500 | | | | 11,653,107 | |
| | |
ORIX Corp. | | | 597,000 | | | | 10,887,011 | |
| | |
SoftBank Group Corp. | | | 221,000 | | | | 10,422,275 | |
| | |
Unicharm Corp. | | | 274,900 | | | | 10,222,127 | |
| | |
SHIFT, Inc.b | | | 52,100 | | | | 9,550,378 | |
| | |
Sega Sammy Holdings, Inc. | | | 413,200 | | | | 8,851,896 | |
| | |
Disco Corp. | | | 54,800 | | | | 8,688,321 | |
| | |
Amvis Holdings, Inc. | | | 332,100 | | | | 7,559,887 | |
| | |
Asahi Intecc Co., Ltd. | | | 375,500 | | | | 7,392,829 | |
| | |
OBIC Business Consultants Co., Ltd. | | | 182,000 | | | | 6,668,669 | |
| | |
PeptiDream, Inc.b | | | 323,400 | | | | 4,854,783 | |
| | |
giftee, Inc.b | | | 229,300 | | | | 2,993,967 | |
| | |
Tokyo Ohka Kogyo Co., Ltd. | | | 25,800 | | | | 1,582,302 | |
| | | | | | | | |
Total Japan | | | | | | | 251,165,910 | |
| | | | | | | | |
| | | | | | | | |
| | | |
| CHINA/HONG KONG: 25.1% | | | | | | | | |
Tencent Holdings, Ltd. | | | 559,400 | | | | 23,719,220 | |
| | |
Innovent Biologics, Inc.b,c,d | | | 5,108,000 | | | | 19,401,951 | |
| | |
Alibaba Group Holding, Ltd.b | | | 1,682,900 | | | | 17,518,704 | |
| | |
BeiGene, Ltd. ADRb | | | 92,309 | | | | 16,458,695 | |
| | |
Legend Biotech Corp. ADRb | | | 197,969 | | | | 13,665,800 | |
| | |
Shenzhen Inovance Technology Co., Ltd. A Shares | | | 1,457,312 | | | | 12,906,868 | |
| | |
BYD Co., Ltd. H Shares | | | 200,000 | | | | 6,412,932 | |
| | |
Meituan B Sharesb,c,d | | | 379,660 | | | | 5,953,417 | |
| | |
JD.com, Inc. Class A | | | 338,135 | | | | 5,766,746 | |
| | |
H World Group, Ltd.b | | | 1,438,000 | | | | 5,572,780 | |
| | |
JD Health International, Inc.b,c,d | | | 803,350 | | | | 5,102,753 | |
| | |
PDD Holdings, Inc. ADRb | | | 65,408 | | | | 4,522,309 | |
| | |
Wuxi Biologics Cayman, Inc.b,c,d | | | 898,500 | | | | 4,318,240 | |
| | |
Hangzhou Tigermed Consulting Co., Ltd. H Sharesc,d | | | 510,600 | | | | 2,917,628 | |
| | | | | | | | |
Total China/Hong Kong | | | | | | | 144,238,043 | |
| | | | | | | | |
| | | | | | | | |
| | | |
| INDIA: 14.9% | | | | | | | | |
HDFC Bank, Ltd. | | | 1,372,120 | | | | 28,475,355 | |
| | |
Bajaj Finance, Ltd. | | | 169,997 | | | | 14,889,364 | |
| | |
Maruti Suzuki India, Ltd. | | | 109,176 | | | | 13,057,319 | |
| | |
Reliance Industries, Ltd. | | | 350,058 | | | | 10,911,689 | |
| | |
Mahindra & Mahindra, Ltd. | | | 599,040 | | | | 10,643,371 | |
| | |
Dabur India, Ltd. | | | 1,156,571 | | | | 8,090,372 | |
| | | | | | | | |
Total India | | | | | | | 86,067,470 | |
| | | | | | | | |
| | | | | | | | |
| | | | | | | | |
| | | Shares | | | Value | |
| | |
| INDONESIA: 5.2% | | | | | | | | |
PT Bank Rakyat Indonesia Persero Tbk | | | 81,846,800 | | | | $29,881,584 | |
| | | | | | | | |
Total Indonesia | | | | | | | 29,881,584 | |
| | | | | | | | |
| | | | | | | | |
| | | |
| TAIWAN: 4.5% | | | | | | | | |
Taiwan Semiconductor Manufacturing Co., Ltd. ADR | | | 140,119 | | | | 14,140,809 | |
| | |
Taiwan Semiconductor Manufacturing Co., Ltd. | | | 630,000 | | | | 11,638,200 | |
| | | | | | | | |
Total Taiwan | | | | | | | 25,779,009 | |
| | | | | | | | |
| | | | | | | | |
| | | |
| AUSTRALIA: 3.6% | | | | | | | | |
CSL, Ltd. | | | 62,155 | | | | 11,509,788 | |
| | |
Woodside Energy Group, Ltd. | | | 397,612 | | | | 9,197,393 | |
| | | | | | | | |
Total Australia | | | | | | | 20,707,181 | |
| | | | | | | | |
| | | | | | | | |
| | | |
| SINGAPORE: 1.2% | | | | | | | | |
Sea, Ltd. ADRb | | | 120,393 | | | | 6,987,610 | |
| | | | | | | | |
Total Singapore | | | | | | | 6,987,610 | |
| | | | | | | | |
| | | | | | | | |
| | | |
| TOTAL INVESTMENTS: 98.2% | | | | | | | 564,826,807 | |
| | | | | | | | |
(Cost $546,332,239) | | | | | | | | |
| | | | | | | | |
| | |
CASH AND OTHER ASSETS,
LESS LIABILITIES: 1.8% | | | | | | | 10,204,543 | |
| | | | | | | | |
| | | | | | | | |
| | |
NET ASSETS: 100.0% | | | | | | | $575,031,350 | |
| | | | | | | | |
| | | | | | | | |
| a | Certain securities were fair valued under the valuation policies approved by the Board of Trustees (Note 2-A). |
| b | Non-income producing security. |
| c | Security exempt from registration under Rule 144A of the Securities Act of 1933, as amended. The security may be resold in transactions exempt from registration normally to qualified institutional buyers. The security has been determined to be liquid in accordance with procedures adopted by the Funds’ Board of Trustees. At June 30, 2023, the aggregate value is $37,693,989, which is 6.56% of net assets. |
| d | The securities may be resold to qualified foreign investors and foreign institutional buyers under Regulation S of the Securities Act of 1933. |
| ADR | American Depositary Receipt |
See accompanying notes to financial statements.
| | | | |
| PORTFOLIO MANAGERS |
| |
| Sharat Shroff, CFA | | Inbok Song |
Lead Manager | | Lead Manager |
| |
| Winnie Chwang | | Andrew Mattock, CFA |
Co-Manager | | Co-Manager |
| | |
| FUND FACTS | | | | |
| | |
| | | Investor | | Institutional |
Ticker | | MAPTX | | MIPTX |
CUSIP | | 577130107 | | 577130834 |
Inception | | 9/12/94 | | 10/29/10 |
NAV | | $19.91 | | $19.92 |
Initial Investment | | $2,500 | | $100,000 |
Gross Expense Ratio1 | | 1.10% | | 0.97% |
After Fee Waiver and Reimbursement2 | | 1.09% | | 0.96% |
Portfolio Statistics | | |
Total # of Positions | | 51 |
Net Assets | | $3.6 billion |
Weighted Average Market Cap | | $126.2 billion |
Portfolio Turnover3 | | 5.6% |
Benchmark |
MSCI AC Asia ex Japan Index |
OBJECTIVE
Long-term capital appreciation.
STRATEGY
Under normal market conditions, the Fund seeks to achieve its investment objective by investing at least 80% of its net assets, which include borrowings for investment purposes, in the common and preferred stocks of companies located in Asia ex Japan, which consists of all countries and markets in Asia excluding Japan, but including all other developed, emerging and frontier countries and markets in the Asian region.
Matthews Pacific Tiger Fund
Portfolio Manager Commentary (unaudited)
Period ended June 30, 2023
For the first half of 2023, the Matthews Pacific Tiger Fund returned –1.24% (Investor Class) and –1.19% (Institutional Class), while its benchmark, the MSCI All Country Asia ex Japan Index, returned 3.19% over the same period. For the quarter ending June 30, 2023, the Fund returned –5.33% (Investor Class) and –5.32% (Institutional Class), while the benchmark returned –1.14%.
Market Environment
The Asian markets have been on a roller coaster largely because of the gyrations in Chinese equities as the post-COVID boost to the local economy is proving to be more gradual than previously expected. China lagged considerably as market participants remained underwhelmed with the pace of China’s recovery which has proven to be more ‘slow and steady’ than a ‘consumption led boom.’ As a result, Chinese equities were one of the worst performing during the quarter, and for the first half of the year. In addition, pessimistic sentiment in China has pushed the Chinese currency to its weakest level since October 2022, and close to its five-year low versus the U.S. dollar. Contrary to expectations earlier in the year, Taiwanese and South Korean equities outperformed the rest of the region on the back of hopes for a recovery in semiconductor demand, and benign valuations.
Property and consumer stocks were among the weaker sectors year-to-date, largely reflecting the tepid recovery in China. Small caps outperformed large caps as ongoing geopolitical risks continued to push up the embedded risk-premium in overseas listed Chinese American Depository Receipts (ADRs), many of which are larger sized stocks. Most of the Asian currencies weakened as rising interest rates spurred the U.S. dollar, while central banks in Asia have largely stopped raising rates.
Performance Contributors and Detractors
From a country perspective, stock selection in China was the biggest detractor to performance during the quarter and year-to-date period, as the portfolio’s consumer related holdings continued their underperformance amid overall macroeconomic concerns on the pace of consumption recovery. However, we believe these companies are well positioned to lead the economic recovery over time given their resilient earnings. Stock selection in the Philippines also detracted from relative performance during the first half. On the other hand, information technology companies in South Korea and Taiwan contributed positively. The positive performance was attributed to the combination of better-than-expected earnings and clear prospects in terms of demand as shown in the case of a Taiwan-based datacenter component manufacturer. Indian consumer discretionary companies also contributed positively with continued strong earning deliveries.
At the individual holdings level, the top detractors to both relative and absolute performance for the first half of the year came from China, including the leading Chinese duty free shop operator China Tourism Group. While the company went through the normalization process of operations after the pandemic, its earnings improvement was slower than sales as discounting and inventory management takes time. This could be a transitionary adjustment process rather than structural as the company’s market share is intact and management continues to make
(continued)
| 1 | Prospectus expense ratios. |
| 2 | Matthews has contractually agreed to waive a portion of its advisory fee and administrative and shareholder services fee if the Fund’s average daily net assets are over $3 billion, as follows: for every $2.5 billion average daily net assets of the Fund that are over $3 billion, the advisory fee rate and the administrative and shareholder services fee rate for the Fund with respect to such excess average daily net assets will be each reduced by 0.01%, in each case without reducing such fee rate below 0.00%. Any amount waived by Matthews pursuant to this agreement may not be recouped by Matthews. This agreement will remain in place until April 30, 2024 and may be terminated (i) at any time by the Board of Trustees upon 60 days’ prior written notice to Matthews; or (ii) by Matthews at the annual expiration date of the agreement upon 60 days’ prior written notice to the Trust, in each case without payment of any penalty. |
| 3 | The lesser of fiscal year 2022 long-term purchase costs or sales proceeds divided by the average monthly market value of long-term securities. |
| | | | | | | | |
| | | | matthewsasia.com | 800.789.ASIA | | | 27 | |
| | | | | | | | | | | | | | | | | | | | | | | | | | | | | | | | |
| | |
| PERFORMANCE AS OF JUNE 30, 2023 | | | | |
| | | | | | | | | | | | Average Annual Total Returns | | | | |
| | | 3 Months | | | YTD | | | 1 Year | | | 3 Years | | | 5 Years | | | 10 Years | | | Since
Inception | | | Inception
Date | |
Investor Class (MAPTX) | | | -5.33% | | | | -1.24% | | | | -5.73% | | | | 0.40% | | | | 0.06% | | | | 4.43% | | | | 7.28% | | | | 9/12/94 | |
Institutional Class (MIPTX) | | | -5.32% | | | | -1.19% | | | | -5.60% | | | | 0.53% | | | | 0.20% | | | | 4.60% | | | | 4.12% | | | | 10/29/10 | |
MSCI AC Asia ex Japan Index4 | | | -1.14% | | | | 3.19% | | | | -0.76% | | | | 1.49% | | | | 1.25% | | | | 4.80% | | | | 4.09% | 5 | | | | |
Performance assumes reinvestment of all dividends and/or distributions before taxes. All performance quoted represents past performance and is no guarantee of future results. Investment return and principal value will fluctuate with market conditions so that when redeemed, shares may be worth more or less than their original cost. Current performance may be lower or higher than the return figures quoted. Returns would have been lower if certain of the Fund’s fees and expenses had not been waived. For the Fund’s most recent month-end performance, visit matthewsasia.com.
GROWTH OF A HYPOTHETICAL $10,000 INVESTMENT SINCE INCEPTION—INVESTOR CLASS
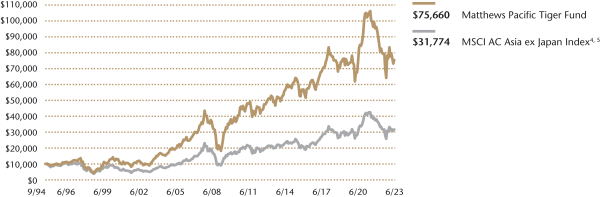
Plotted monthly. The performance data and graph do not reflect the deduction of taxes that a shareholder would pay on dividends, capital gains distributions or redemption of Fund shares. Values are in US$.
| | 4 | It is not possible to invest directly in an index. Source: Index data from Morgan Stanley Capital International and Bloomberg; total return calculations performed by BNY Mellon Investment Servicing (US) Inc. Please see page 76 for index definition. |
| | 5 | Calculated from 8/31/94. |
| | | | | | | | |
| | | | |
| TOP TEN HOLDINGS6 | | | | | | | |
| Name | | Sector | | Country | | % Net Assets | |
Taiwan Semiconductor Manufacturing Co., Ltd. | | Information Technology | | Taiwan | | | 7.3% | |
Samsung Electronics Co., Ltd. | | Information Technology | | South Korea | | | 6.2% | |
Tencent Holdings, Ltd. | | Communication Services | | China/Hong Kong | | | 4.7% | |
Alibaba Group Holding, Ltd. | | Consumer Discretionary | | China/Hong Kong | | | 3.8% | |
ICICI Bank, Ltd. | | Financials | | India | | | 3.6% | |
Meituan | | Consumer Discretionary | | China/Hong Kong | | | 3.4% | |
PT Bank Central Asia Tbk | | Financials | | Indonesia | | | 3.0% | |
Central Pattana Public Co., Ltd. | | Real Estate | | Thailand | | | 3.0% | |
China Resources Beer Holdings Co., Ltd. | | Consumer Staples | | China/Hong Kong | | | 2.6% | |
Yum China Holdings, Inc. | | Consumer Discretionary | | China/Hong Kong | | | 2.6% | |
TOTAL | | | 40.2% | |
| | 6 | Holdings may combine more than one security from same issuer and related depositary receipts. |
Matthews Pacific Tiger Fund
Portfolio Manager Commentary (unaudited) (continued)
efforts to improve the company’s product mix. Another notable detractor was the leading food delivery and local service company in China, Meituan. The company executed well during the pandemic and the reopening phase, accelerating its path towards profitability ahead of the management’s original target. However, negative sentiment around the China’s consumption recovery and potential competitive pressure has outweighed this progress, and Meituan’s share price did not react positively.
In contrast, one of the notable contributors was Taiwanese datacenter component manufacturer Accton Technology. As datacenter upgrades continue, especially from global cloud service providers, Accton has been a beneficiary of a secular demand in switches. As some of the supply chain bottlenecks that delayed the product delivery have been resolved, the company’s earning delivery has been robust. Another contributor during the period was India’s leading jeweler, Titan Company. The company delivered good results last year and, against the expectation of potential growth slowdown, Titan continued to deliver robust growth and brand value, helped by retail store expansion and continuous category expansion into watches and eyewear.
Notable Portfolio Changes
The second quarter was a relatively quiet quarter as no major directional shifts were made. We increased the portfolio’s relative concentration in high conviction China names by slowly decreasing the weightings of holdings with less certain growth prospects. With a broad valuation correction in China, we continue to assess new high-quality opportunities. Overall, the biggest active risk in the portfolio is from an overweight to domestic consumption in China. The portfolio remains underweight South Korea reflecting some concerns on the global growth outlook.
Outlook
Despite the divergence in Asia markets year-to-date performance, Asia equity markets are attractively positioned in terms of relative valuation especially with respect to earnings prospects. We expect double-digit earnings growth in China and India over the next two years. As post COVID activity continues to normalize in China, we believe there will be opportunities for domestically oriented growth. For Taiwan and South Korea, a mix of secular growth opportunities in the technology sector together with cyclicality continue to provide stock picking opportunities. With the U.S. Federal Reserve’s interest rate cycle coming into its final stages and a mixed backdrop on global demand, we expect that domestic demand in Asia should show resiliency.
| | | | |
| |
| COUNTRY ALLOCATION (%)7,8 | |
China/Hong Kong | | | 43.5 | |
Taiwan | | | 16.2 | |
India | | | 16.0 | |
South Korea | | | 10.6 | |
Indonesia | | | 3.0 | |
Thailand | | | 3.0 | |
Philippines | | | 2.5 | |
Vietnam | | | 1.7 | |
Singapore | | | 1.3 | |
Cash and Other Assets, Less Liabilities | | | 2.3 | |
| | | | |
| |
| SECTOR ALLOCATION (%)8 | |
Information Technology | | | 24.1 | |
Consumer Discretionary | | | 18.0 | |
Financials | | | 17.9 | |
Consumer Staples | | | 8.9 | |
Real Estate | | | 8.9 | |
Industrials | | | 7.7 | |
Communication Services | | | 5.7 | |
Materials | | | 3.4 | |
Utilities | | | 1.9 | |
Health Care | | | 1.3 | |
Cash and Other Assets, Less Liabilities | | | 2.3 | |
| | | | |
| |
| MARKET CAP EXPOSURE (%)8 | |
Mega Cap (over $25B) | | | 57.7 | |
Large Cap ($10B-$25B) | | | 22.2 | |
Mid Cap ($3B-10B) | | | 15.6 | |
Small Cap (under $3B) | | | 2.2 | |
Cash and Other Assets, Less Liabilities | | | 2.3 | |
| 7 | Not all countries where the Fund may invest are included in the benchmark index. |
| 8 | Source: FactSet Research Systems. Percentage values in data are rounded to the nearest tenth of one percent, so the values may not sum to 100% due to rounding. Country allocations and percentage values may be derived from different data sources and may not be consistent with other Fund literature. |
| | | | | | | | |
| | | | matthewsasia.com | 800.789.ASIA | | | 29 | |
Matthews Pacific Tiger Fund
June 30, 2023
Schedule of Investmentsa (unaudited)
COMMON EQUITIES: 97.7%
| | | | | | | | |
| | | Shares | | | Value | |
| | |
| CHINA/HONG KONG: 43.5% | | | | | | | | |
Tencent Holdings, Ltd. | | | 4,018,600 | | | | $170,393,379 | |
| | |
Meituan B Sharesb,c,d | | | 7,959,760 | | | | 124,816,336 | |
| | |
Alibaba Group Holding, Ltd.c | | | 11,916,000 | | | | 124,043,542 | |
| | |
China Resources Beer Holdings Co., Ltd. | | | 14,543,775 | | | | 96,108,506 | |
| | |
Yum China Holdings, Inc. | | | 1,698,548 | | | | 95,967,962 | |
| | |
Kweichow Moutai Co., Ltd. A Shares | | | 400,273 | | | | 93,231,514 | |
| | |
AIA Group, Ltd. | | | 9,161,000 | | | | 93,043,693 | |
| | |
Hong Kong Exchanges & Clearing, Ltd. | | | 2,411,400 | | | | 91,365,560 | |
| | |
CITIC Securities Co., Ltd. H Shares | | | 45,848,600 | | | | 83,367,090 | |
| | |
Shenzhen Inovance Technology Co., Ltd. A Shares | | | 8,608,385 | | | | 76,241,250 | |
| | |
China Resources Mixc Lifestyle Services, Ltd.b,d | | | 13,470,830 | | | | 67,100,331 | |
| | |
JD.com, Inc. Class A | | | 3,650,157 | | | | 62,251,851 | |
| | |
KE Holdings, Inc. ADRc | | | 3,935,772 | | | | 58,446,214 | |
| | |
China Tourism Group Duty Free Corp., Ltd. A Shares | | | 3,399,073 | | | | 51,839,053 | |
| | |
Shandong Sinocera Functional Material | | | | | | | | |
| | |
Co., Ltd. A Shares | | | 11,964,928 | | | | 45,184,672 | |
| | |
ENN Energy Holdings, Ltd. | | | 2,981,400 | | | | 37,291,624 | |
| | |
Will Semiconductor Co., Ltd. Shanghai A Shares | | | 2,585,272 | | | | 35,005,632 | |
| | |
StarPower Semiconductor, Ltd. A Shares | | | 1,079,889 | | | | 32,084,009 | |
| | |
Sany Heavy Industry Co., Ltd. A Shares | | | 13,120,461 | | | | 30,056,426 | |
| | |
Wuxi Biologics Cayman, Inc.b,c,d | | | 6,077,500 | | | | 29,208,793 | |
| | |
Contemporary Amperex Technology Co., Ltd. A Shares | | | 882,671 | | | | 27,867,028 | |
| | |
JD Logistics, Inc.b,c,d | | | 14,340,800 | | | | 22,454,307 | |
| | |
Shenzhen Mindray Bio-Medical Electronics Co., Ltd. A Shares | | | 449,920 | | | | 18,603,818 | |
| | |
Alibaba Group Holding, Ltd. ADRc | | | 160,220 | | | | 13,354,337 | |
| | |
China Lesso Group Holdings, Ltd. | | | 11,633,000 | | | | 7,666,346 | |
| | | | | | | | |
Total China/Hong Kong | | | | | | | 1,586,993,273 | |
| | | | | | | | |
| | | | | | | | |
| | | |
| TAIWAN: 16.2% | | | | | | | | |
Taiwan Semiconductor Manufacturing Co., Ltd. | | | 14,425,000 | | | | 266,477,832 | |
| | |
Chailease Holding Co., Ltd. | | | 10,886,257 | | | | 71,574,954 | |
| | |
Delta Electronics, Inc. | | | 5,162,182 | | | | 57,209,015 | |
| | |
E Ink Holdings, Inc. | | | 7,174,000 | | | | 52,185,978 | |
| | |
Accton Technology Corp. | | | 4,407,000 | | | | 49,570,843 | |
| | |
MediaTek, Inc. | | | 1,945,000 | | | | 43,054,237 | |
| | |
Uni-President Enterprises Corp. | | | 11,072,000 | | | | 27,146,555 | |
| | |
Eclat Textile Co., Ltd. | | | 1,549,000 | | | | 24,908,379 | |
| | | | | | | | |
Total Taiwan | | | | | | | 592,127,793 | |
| | | | | | | | |
| | | | | | | | |
| | | |
| INDIA: 16.0% | | | | | | | | |
ICICI Bank, Ltd. | | | 11,542,014 | | | | 132,144,370 | |
| | |
Titan Co., Ltd. | | | 2,353,563 | | | | 87,633,709 | |
| | |
Pidilite Industries, Ltd. | | | 2,523,498 | | | | 80,039,891 | |
| | |
Housing Development Finance Corp., Ltd. | | | 2,109,831 | | | | 72,789,768 | |
| | |
Ashok Leyland, Ltd. | | | 31,526,160 | | | | 64,484,364 | |
| | |
Tata Consultancy Services, Ltd. | | | 1,552,939 | | | | 62,750,145 | |
| | |
Dabur India, Ltd. | | | 7,494,091 | | | | 52,422,187 | |
| | |
Tata Power Co., Ltd. | | | 11,795,802 | | | | 31,983,189 | |
| | | | | | | | |
Total India | | | | | | | 584,247,623 | |
| | | | | | | | |
| | | | | | | | |
| | | | | | | | |
| | | Shares | | | Value | |
| | |
| SOUTH KOREA: 10.6% | | | | | | | | |
Samsung Electronics Co., Ltd. | | | 4,101,421 | | | | $225,837,702 | |
| | |
HL Mando Co., Ltd. | | | 1,732,314 | | | | 71,261,939 | |
| | |
Samsung Engineering Co., Ltd.c | | | 2,467,042 | | | | 53,202,438 | |
| | |
NAVER Corp. | | | 266,658 | | | | 37,328,090 | |
| | | | | | | | |
Total South Korea | | | | | | | 387,630,169 | |
| | | | | | | | |
| | | | | | | | |
| | | |
| INDONESIA: 3.0% | | | | | | | | |
PT Bank Central Asia Tbk | | | 176,061,600 | | | | 107,978,307 | |
| | | | | | | | |
Total Indonesia | | | | | | | 107,978,307 | |
| | | | | | | | |
| | | | | | | | |
| | | |
| THAILAND: 2.9% | | | | | | | | |
Central Pattana Public Co., Ltd. | | | 58,266,200 | | | | 107,880,417 | |
| | | | | | | | |
Total Thailand | | | | | | | 107,880,417 | |
| | | | | | | | |
| | | | | | | | |
| | | |
| PHILIPPINES: 2.5% | | | | | | | | |
SM Prime Holdings, Inc. | | | 150,947,171 | | | | 90,083,203 | |
| | | | | | | | |
Total Philippines | | | | | | | 90,083,203 | |
| | | | | | | | |
| | | | | | | | |
| | | |
| VIETNAM: 1.7% | | | | | | | | |
Vietnam Dairy Products JSC | | | 18,369,028 | | | | 55,362,317 | |
FPT Corp. | | | 1,935,254 | | | | 7,068,971 | |
| | | | | | | | |
Total Vietnam | | | | | | | 62,431,288 | |
| | | | | | | | |
| | | | | | | | |
| | | |
| SINGAPORE: 1.3% | | | | | | | | |
Venture Corp., Ltd. | | | 4,257,900 | | | | 46,486,864 | |
| | | | | | | | |
Total Singapore | | | | | | | 46,486,864 | |
| | | | | | | | |
| | | | | | | | |
| | | |
| TOTAL INVESTMENTS: 97.7% | | | | | | | 3,565,858,937 | |
(Cost $3,261,090,596) | | | | | | | | |
| | | | | | | | |
| | |
CASH AND OTHER ASSETS,
LESS LIABILITIES: 2.3% | | | | | | | 82,824,870 | |
| | | | | | | | |
| | |
NET ASSETS: 100.0% | | | | | | | $3,648,683,807 | |
| | | | | | | | |
| a | Certain securities were fair valued under the valuation policies approved by the Board of Trustees (Note 2-A). |
| b | Security exempt from registration under Rule 144A of the Securities Act of 1933, as amended. The security may be resold in transactions exempt from registration normally to qualified institutional buyers. The security has been determined to be liquid in accordance with procedures adopted by the Funds’ Board of Trustees. At June 30, 2023, the aggregate value is $243,579,767, which is 6.68% of net assets. |
| c | Non-income producing security. |
| d | The securities may be resold to qualified foreign investors and foreign institutional buyers under Regulation S of the Securities Act of 1933. |
| ADR | American Depositary Receipt |
See accompanying notes to financial statements.
| | | | |
| PORTFOLIO MANAGERS |
| |
| Michael J. Oh, CFA | | |
Lead Manager | | | | |
| |
| Taizo Ishida | | Inbok Song |
Co-Manager | | Co-Manager |
| | |
| FUND FACTS | | | | |
| | |
| | | Investor | | Institutional |
Ticker | | MATFX | | MITEX |
CUSIP | | 577130883 | | 577125859 |
Inception | | 12/27/99 | | 4/30/13 |
NAV | | $11.05 | | $11.24 |
Initial Investment | | $2,500 | | $100,000 |
Gross Expense Ratio1 | | 1.18% | | 1.04% |
Portfolio Statistics | | | | |
Total # of Positions | | | | 50 |
Net Assets | | | | $459.1 million |
Weighted Average Market Cap | | $193.5 billion |
Portfolio Turnover2 | | 118.1% |
Benchmark | | | | |
MSCI AC Asia ex Japan Index |
OBJECTIVE
Long-term capital appreciation.
STRATEGY
Under normal market conditions, the Fund seeks to achieve its investment objective by investing at least 80% of its net assets, which include borrowings for investment purposes, in the common and preferred stocks of companies located in Asia ex Japan that Matthews believes are innovators in their products, services, processes, business models, management, use of technology, or approach to creating, expanding or servicing their markets. Asia ex Japan consists of all countries and markets in Asia excluding Japan, but including developed, emerging, and frontier countries and markets in the Asian region.
Matthews Asia Innovators Fund
Portfolio Manager Commentary (unaudited)
Period ended June 30, 2023
For the first half of 2023, the Matthews Asia Innovators Fund returned –2.30% (Investor Class) and
–2.18% (Institutional Class), while its benchmark, the MSCI All Country Asia ex Japan Index, returned 3.19% over the same period. For the quarter ended June 30, 2023, the Fund returned –4.66% (Investor Class) and –4.58% (Institutional Class), while the benchmark returned –1.14%.
Market Environment
The big event of 2023’s first half was undoubtedly China’s reopening—and more specifically, an economic rebound that has been slower to materialize than many investors anticipated. This especially weighed on consumer sentiment which remains relatively dour. Despite having ample cash balances, many Chinese consumers seem reluctant to resume spending at pre-pandemic levels. This has further complicated the government’s ability to effect meaningful changes as much of any fiscal stimulus would probably wind up in consumer savings accounts. China’s property market also remains weak and is adding to consumers’ sense of uncertainty, given many people’s wealth is tied to real estate. In addition, ongoing tensions with the U.S. weighed on sentiment and amplified uncertainty. Elsewhere, India remains a bright spot in Asia as it faces far fewer challenges in the current environment than China. South Korea and Taiwan have also outperformed as they are (to varying degrees) benefiting from the nascent artificial intelligence (AI) boom, high U.S. chip demand and overall strength in the American technology industry.
Performance Contributors and Detractors
Regionally, our overweight and stock selection in China and Hong Kong were the biggest detractors to relative performance in the first half amid an environment of negative economic and consumer sentiment. Conversely, the Fund’s allocation to the U.S.—which consists primarily of technology companies—was the biggest contributor. These stocks benefited as investors sought exposure to Asia via non-China-domiciled companies in order to manage geopolitical concerns.
From a sector perspective, the Fund’s overweight and stock selection in consumer discretionary was the biggest detractor in the face of headwinds in China. Stock selection in communication services was also a big detractor though mitigated by our overweight allocation to the sector. Selections in health care, consumer staples and industrials were also detractors. Conversely, IT was the top contributor because of strength in hardware and digital services companies, and stock selection in real estate and our underweight and selection in financials also contributed to relative performance.
At the individual holdings level, sportswear giant Li Ning and e-commerce platform JD.com were among the weakest performers in the first half. JD.com has faced stiff pressure from rival platforms Alibaba and PDD Holdings (Pinduoduo), both of which are portfolio holdings. Given these dynamics, we chose to exit our position in JD.com. While Alibaba and PDD were bigger detractors in the period than JD.com we retained our positions in them because in our view they are more diversified and have higher potential growth than JD.com.
Conversely, U.S. tech giant NVIDIA, a leading beneficiary of the AI upswing, was the strongest contributor in the first half. Taiwanese technology companies Alchip Technologies and Taiwan Semiconductor Manufacturing Co. (TSMC) were also strong performers. Alchip has performed particularly well as the nascent AI trend
(continued)
| 1 | Prospectus expense ratios. |
| 2 | The lesser of fiscal year 2022 long-term purchase costs or sales proceeds divided by the average monthly market value of long-term securities. |
| | | | | | | | |
| | | | matthewsasia.com | 800.789.ASIA | | | 31 | |
| | | | | | | | | | | | | | | | | | | | | | | | | | | | | | | | |
| |
| PERFORMANCE AS OF JUNE 30, 2023 | |
| | | | | | | | | | | | Average Annual Total Returns | | | | |
| | | 3 Months | | | YTD | | | 1 Year | | | 3 Years | | | 5 Years | | | 10 Years | | | Since
Inception | | | Inception
Date | |
Investor Class (MATFX) | | | -4.66% | | | | -2.30% | | | | -9.43% | | | | -2.09% | | | | 4.41% | | | | 9.75% | | | | 4.27% | | | | 12/27/99 | |
Institutional Class (MITEX) | | | -4.58% | | | | -2.18% | | | | -9.30% | | | | -1.94% | | | | 4.58% | | | | 9.94% | | | | 9.58% | | | | 4/30/13 | |
MSCI AC Asia ex Japan Index 3 | | | -1.14% | | | | 3.19% | | | | -0.76% | | | | 1.49% | | | | 1.25% | | | | 4.80% | | | | 5.44% | 4 | | | | |
Performance assumes reinvestment of all dividends and/or distributions before taxes. All performance quoted represents past performance and is no guarantee of future results. Investment return and principal value will fluctuate with market conditions so that when redeemed, shares may be worth more or less than their original cost. Current performance may be lower or higher than the return figures quoted. For the Fund’s most recent month-end performance, visit matthewsasia.com.
GROWTH OF A HYPOTHETICAL $10,000 INVESTMENT SINCE INCEPTION—INVESTOR CLASS
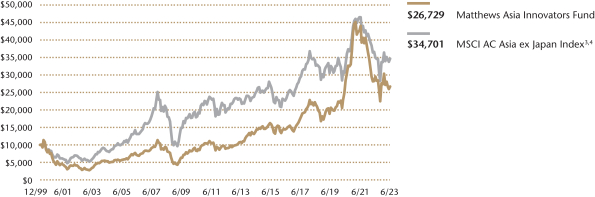
Plotted monthly. The performance data and graph do not reflect the deduction of taxes that a shareholder would pay on dividends, capital gains distributions or redemption of Fund shares. Values are in US$.
| | 3 | It is not possible to invest directly in an index. Source: Index data from Morgan Stanley Capital International and Bloomberg; total return calculations performed by BNY Mellon Investment Servicing (US) Inc. Please see page 76 for index definition. |
| | 4 | Calculated from 12/31/99. |
| | | | | | | | |
| | | | |
| TOP TEN HOLDINGS5 | | | | | | | |
| Name | | Sector | | Country | | % Net Assets | |
Taiwan Semiconductor Manufacturing Co., Ltd. | | Information Technology | | Taiwan | | | 8.0% | |
Samsung Electronics Co., Ltd. | | Information Technology | | South Korea | | | 6.3% | |
Tencent Holdings, Ltd. | | Communication Services | | China/Hong Kong | | | 4.4% | |
HDFC Bank, Ltd. | | Financials | | India | | | 4.3% | |
Alibaba Group Holding, Ltd. | | Consumer Discretionary | | China/Hong Kong | | | 3.9% | |
NVIDIA Corp. | | Information Technology | | United States | | | 3.3% | |
ICICI Bank, Ltd. | | Financials | | India | | | 3.1% | |
ASML Holding NV | | Information Technology | | Netherlands | | | 3.0% | |
Trip.com Group, Ltd. | | Consumer Discretionary | | China/Hong Kong | | | 3.0% | |
Meituan | | Consumer Discretionary | | China/Hong Kong | | | 2.9% | |
TOTAL | | | | | | | 42.2% | |
| | 5 | Holdings may combine more than one security from same issuer and related depositary receipts. |
| | | | |
| | |
| COUNTRY ALLOCATION (%)6,7 | | | |
| China/Hong Kong | | | 34.1 | |
| India | | | 18.3 | |
| United States | | | 11.5 | |
| South Korea | | | 11.1 | |
| Taiwan | | | 9.5 | |
| Netherlands | | | 3.0 | |
| Indonesia | | | 2.8 | |
| Japan | | | 2.5 | |
| France | | | 2.0 | |
| Singapore | | | 1.9 | |
| Vietnam | | | 1.1 | |
| Cash and Other Assets, Less Liabilities | | | 2.0 | |
| | | | |
| | |
| SECTOR ALLOCATION (%)7 | | | |
| Information Technology | | | 30.9 | |
| Consumer Discretionary | | | 26.7 | |
| Financials | | | 13.0 | |
| Communication Services | | | 10.7 | |
| Consumer Staples | | | 4.6 | |
| Industrials | | | 4.4 | |
| Health Care | | | 3.7 | |
| Energy | | | 2.1 | |
| Real Estate | | | 2.0 | |
| Cash and Other Assets, Less Liabilities | | | 2.0 | |
| | | | |
| | |
| MARKET CAP EXPOSURE (%)7 | | | |
| Mega Cap (over $25B) | | | 73.4 | |
| Large Cap ($10B-$25B) | | | 11.4 | |
| Mid Cap ($3B-10B) | | | 10.4 | |
| Small Cap (under $3B) | | | 2.7 | |
| Cash and Other Assets, Less Liabilities | | | 2.0 | |
| | 6 | Not all countries are included in the benchmark index. |
| | 7 | Source: FactSet Research Systems. Percentage values in data are rounded to the nearest tenth of one percent, so the values may not sum to 100% due to rounding. Country allocations and percentage values may be derived from different data sources and may not be consistent with other Fund literature. |
Matthews Asia Innovators Fund
Portfolio Manager Commentary (unaudited) (continued)
has picked up steam. TSMC has benefited from the ongoing semiconductor boom—particularly as geopolitical tensions with the U.S. have driven many companies to source chips outside of China. TSMC also manufactures chips for NVIDIA and so is well-positioned for the expanding AI market.
Notable Portfolio Changes
In the quarter, we initiated a new position in ASML Holding, a Netherlands-based semiconductor company. ASML derives most of its revenue from Asia where the majority of global chip manufacturing is located. It also has a very strong position in advanced chip-equipment production and is a beneficiary from some chip companies seeking to strengthen supply chains and move manufacturing away from China to the U.S. and Europe.
We also increased our exposure to PDD and Samsung Electronics. While the ongoing consumer malaise in China has challenged e-commerce companies and weighed on valuations, PDD is a company that is growing and taking share. We accordingly capitalized on its attractive valuation to add to our position. We increased our exposure to Samsung given the combination of its exposure to AI and its depressed valuation.
Conversely, we pared our exposure to Singapore-based Sea following a strong first-half performance in the stock. We trimmed our holding in H World Group given its higher valuation and as part of our ongoing reduction in our China exposure. We also hold Trip.com, which offers us similar exposure to H World though at a more attractive valuation and with, in our view, a better outlook. In addition to exiting JD.com in the period we also sold our holding in Li Ning.
Outlook
It seems clear to us that market movement in the second half will be heavily dependent on China’s performance. But China’s government has its work cut out. With the property market so depressed and consumers quite dour, it will be hard to kickstart the economy. That said, it also seems unlikely there is much room to the downside at this point—though we say that with caution as it seems many have called a bottom in China, only for it to sink further. Given the general sense of gloom surrounding China, it might not take much to spark a sentiment rally and turn things around. Time will naturally tell and we will continue monitoring how events develop in China.
Meanwhile, we remain positive on India. We are also positive on Indonesia in the long term but given there are currently relatively few innovative companies in Southeast Asia, our overall exposure to the region remains limited for now. We are also underweight in Taiwan. While fundamentals remain largely intact, strong performance has contributed to elevated valuations making Taiwan less attractive on a relative basis.
Uncertainty aside, we are finding innovative companies throughout Asia that are trading at attractive levels and will continue deploying our investment philosophy to uncover what we believe to be the next generation of companies able to innovate in business strategy, products and services, marketing and human capital.
| | | | | | | | |
| | | | matthewsasia.com | 800.789.ASIA | | | 33 | |
Matthews Asia Innovators Fund
June 30, 2023
Schedule of Investmentsa (unaudited)
COMMON EQUITIES: 97.3%
| | | | | | | | |
| | | Shares | | | Value | |
| | |
| CHINA/HONG KONG: 34.1% | | | | | | | | |
Tencent Holdings, Ltd. | | | 479,600 | | | | $20,335,606 | |
| | |
Alibaba Group Holding, Ltd. ADRb | | | 214,017 | | | | 17,838,317 | |
| | |
Trip.com Group, Ltd. ADRb | | | 397,255 | | | | 13,903,925 | |
| | |
Meituan B Sharesb,c,d | | | 852,730 | | | | 13,371,588 | |
| | |
PDD Holdings, Inc. ADRb | | | 167,960 | | | | 11,612,754 | |
| | |
KE Holdings, Inc. ADRb | | | 613,471 | | | | 9,110,044 | |
| | |
OPT Machine Vision Tech Co., Ltd. A Shares | | | 314,356 | | | | 7,148,974 | |
| | |
NARI Technology Co., Ltd. A Shares | | | 2,197,948 | | | | 6,993,465 | |
| | |
BYD Co., Ltd. A Shares | | | 173,220 | | | | 6,172,825 | |
| | |
Yum China Holdings, Inc. | | | 108,563 | | | | 6,133,810 | |
| | |
Contemporary Amperex Technology Co., Ltd. A Shares | | | 191,898 | | | | 6,058,460 | |
| | |
Baidu, Inc. ADRb | | | 43,346 | | | | 5,934,501 | |
| | |
Proya Cosmetics Co., Ltd. A Shares | | | 342,829 | | | | 5,307,729 | |
| | |
Hundsun Technologies, Inc. A Shares | | | 861,335 | | | | 5,257,645 | |
| | |
China Resources Beer Holdings Co., Ltd. | | | 734,000 | | | | 4,850,436 | |
| | |
BeiGene, Ltd. ADRb | | | 26,270 | | | | 4,683,941 | |
| | |
Kuaishou Technologyb,c,d | | | 675,100 | | | | 4,640,067 | |
| | |
Innovent Biologics, Inc.b,c,d | | | 997,000 | | | | 3,786,951 | |
| | |
Legend Biotech Corp. ADRb | | | 49,863 | | | | 3,442,043 | |
| | | | | | | | |
Total China/Hong Kong | | | | | | | 156,583,081 | |
| | | | | | | | |
| | | | | | | | |
| | | |
| INDIA: 18.3% | | | | | | | | |
HDFC Bank, Ltd. | | | 947,300 | | | | 19,659,143 | |
| | |
ICICI Bank, Ltd. | | | 1,234,245 | | | | 14,130,855 | |
| | |
Bajaj Finance, Ltd. | | | 142,632 | | | | 12,492,572 | |
| | |
Reliance Industries, Ltd. | | | 315,115 | | | | 9,822,477 | |
| | |
Mahindra & Mahindra, Ltd. | | | 525,029 | | | | 9,328,390 | |
| | |
Titan Co., Ltd. | | | 205,158 | | | | 7,638,953 | |
| | |
Indian Hotels Co., Ltd. | | | 1,179,966 | | | | 5,657,633 | |
| | |
Ashok Leyland, Ltd. | | | 2,605,640 | | | | 5,329,639 | |
| | | | | | | | |
Total India | | | | | | | 84,059,662 | |
| | | | | | | | |
| | | | | | | | |
| | | |
| SOUTH KOREA: 10.4% | | | | | | | | |
Samsung Electronics Co., Ltd. | | | 525,080 | | | | 28,912,628 | |
| | |
Samsung SDI Co., Ltd. | | | 13,732 | | | | 7,012,034 | |
| | |
Kia Corp. | | | 89,473 | | | | 6,026,994 | |
| | |
Orion Corp. | | | 61,460 | | | | 5,605,114 | |
| | | | | | | | |
Total South Korea | | | | | | | 47,556,770 | |
| | | | | | | | |
| | | | | | | | |
| | | |
| TAIWAN: 9.5% | | | | | | | | |
Taiwan Semiconductor Manufacturing Co., Ltd. | | | 1,986,000 | | | | 36,688,040 | |
| | |
Alchip Technologies, Ltd. | | | 122,000 | | | | 7,066,756 | |
| | | | | | | | |
Total Taiwan | | | | | | | 43,754,796 | |
| | | | | | | | |
| | | | | | | | |
| | | |
| UNITED STATES: 9.2% | | | | | | | | |
NVIDIA Corp. | | | 35,541 | | | | 15,034,554 | |
| | |
Netflix, Inc.b | | | 21,126 | | | | 9,305,792 | |
| | |
Visa, Inc. Class A | | | 32,697 | | | | 7,764,883 | |
| | |
Monolithic Power Systems, Inc. | | | 10,374 | | | | 5,604,346 | |
| | |
Lululemon Athletica, Inc.b | | | 12,220 | | | | 4,625,270 | |
| | | | | | | | |
Total United States | | | | | | | 42,334,845 | |
| | | | | | | | |
| | | | | | | | |
| | | | | | | | |
| | | Shares | | | Value | |
| | |
| JAPAN: 3.6% | | | | | | | | |
Keyence Corp. | | | 14,100 | | | | $6,699,710 | |
| | |
Asahi Intecc Co., Ltd. | | | 252,700 | | | | 4,975,147 | |
| | |
Allegro MicroSystems, Inc.b | | | 108,971 | | | | 4,918,951 | |
| | | | | | | | |
Total Japan | | | | | | | 16,593,808 | |
| | | | | | | | |
| | | | | | | | |
| | | |
| NETHERLANDS: 3.1% | | | | | | | | |
ASML Holding NV | | | 19,276 | | | | 13,970,281 | |
| | | | | | | | |
Total Netherlands | | | | | | | 13,970,281 | |
| | | | | | | | |
| | | | | | | | |
| | | |
| INDONESIA: 2.8% | | | | | | | | |
PT Bank Rakyat Indonesia Persero Tbk | | | 14,857,600 | | | | 5,424,386 | |
| | |
PT Indofood CBP Sukses Makmur Tbk | | | 6,942,900 | | | | 5,244,512 | |
| | |
PT Astra International Tbk | | | 4,381,400 | | | | 1,987,308 | |
| | | | | | | | |
Total Indonesia | | | | | | | 12,656,206 | |
| | | | | | | | |
| | | | | | | | |
| | | |
| FRANCE: 2.0% | | | | | | | | |
LVMH Moet Hennessy Louis Vuitton SE | | | 9,939 | | | | 9,371,605 | |
| | | | | | | | |
Total France | | | | | | | 9,371,605 | |
| | | | | | | | |
| | | | | | | | |
| | | |
| SINGAPORE: 1.9% | | | | | | | | |
Sea, Ltd. ADRb | | | 153,433 | | | | 8,905,251 | |
| | | | | | | | |
Total Singapore | | | | | | | 8,905,251 | |
| | | | | | | | |
| | | | | | | | |
| | | |
| BRAZIL: 1.2% | | | | | | | | |
MercadoLibre, Inc.b | | | 4,734 | | | | 5,607,897 | |
| | | | | | | | |
Total Brazil | | | | | | | 5,607,897 | |
| | | | | | | | |
| | | | | | | | |
| | | |
| VIETNAM: 1.2% | | | | | | | | |
Mobile World Investment Corp. | | | 2,861,648 | | | | 5,273,384 | |
| | | | | | | | |
Total Vietnam | | | | | | | 5,273,384 | |
| | | | | | | | |
| | | | | | | | |
| | | |
| TOTAL COMMON EQUITIES | | | | | | | 446,667,586 | |
| | | | | | | | |
(Cost $437,126,619) | | | | | | | | |
| | | | | | | | |
|
PREFERRED EQUITIES: 0.7% | |
| | | |
| SOUTH KOREA: 0.7% | | | | | | | | |
| | |
Samsung Electronics Co., Ltd., Pfd. | | | 74,486 | | | | 3,380,123 | |
| | | | | | | | |
Total South Korea | | | | | | | 3,380,123 | |
| | | | | | | | |
| | | | | | | | |
| | | |
| TOTAL PREFERRED EQUITIES | | | | | | | 3,380,123 | |
| | | | | | | | |
(Cost $3,411,265) | | | | | | | | |
| | | | | | | | |
| | | |
| TOTAL INVESTMENTS: 98.0% | | | | | | | 450,047,709 | |
(Cost $440,537,884) | | | | | | | | |
| | | | | | | | |
| | |
CASH AND OTHER ASSETS,
LESS LIABILITIES: 2.0% | | | | | | | 9,078,593 | |
| | | | | | | | |
| | |
NET ASSETS: 100.0% | | | | | | | $459,126,302 | |
| | | | | | | | |
Matthews Asia Innovators Fund
June 30, 2023
Schedule of Investmentsa (unaudited) (continued)
| a | Certain securities were fair valued under the valuation policies approved by the Board of Trustees (Note 2-A). |
| b | Non-income producing security. |
| c | Security exempt from registration under Rule 144A of the Securities Act of 1933, as amended. The security may be resold in transactions exempt from registration normally to qualified institutional buyers. The security has been determined to be liquid in accordance with procedures adopted by the Funds’ Board of Trustees. At June 30, 2023, the aggregate value is $21,798,606, which is 4.75% of net assets. |
| d | The securities may be resold to qualified foreign investors and foreign institutional buyers under Regulation S of the Securities Act of 1933. |
| ADR | American Depositary Receipt |
See accompanying notes to financial statements.
| | | | | | | | |
| | | | matthewsasia.com | 800.789.ASIA | | | 35 | |
| | | | |
| PORTFOLIO MANAGERS |
| |
| Andrew Mattock, CFA | | |
Lead Manager | | |
| |
| Winnie Chwang | | Sherwood Zhang, CFA |
Co-Manager | | Co-Manager |
| | |
| FUND FACTS | | | | |
| | |
| | | Investor | | Institutional |
Ticker | | MCHFX | | MICFX |
CUSIP | | 577130701 | | 577130818 |
Inception | | 2/19/98 | | 10/29/10 |
NAV | | $12.66 | | $12.65 |
Initial Investment | | $2,500 | | $100,000 |
Gross Expense Ratio1 | | 1.12% | | 0.98% |
Portfolio Statistics |
Total # of Positions | | 49 |
Net Assets | | $653.5 million |
Weighted Average
Market Cap | | $95.1 billion |
Portfolio Turnover2 | | 49.4% |
Benchmarks |
MSCI China Index |
MSCI China All Shares Index |
OBJECTIVE
Long-term capital appreciation.
STRATEGY
Under normal market conditions, the Fund seeks to achieve its investment objective by investing at least 80% of its net assets, which include borrowings for investment purposes, in the common and preferred stocks of companies located in China. China includes its administrative and other districts, such as Hong Kong.
Matthews China Fund
Portfolio Manager Commentary (unaudited)
Period ended June 30, 2023
For the first half of 2023, the Matthews China Fund returned –12.69% (Investor Class) and –12.64% (Institutional Class), while its benchmark, the MSCI China Index, returned –5.39% over the same period. For the quarter ending June 30, 2023, the Fund returned –13.05% (Investor Class) and –13.06% (Institutional Class), while the benchmark returned –9.65%.
Market Environment
The overall environment for China remained challenging during the first half of the year with continued negative headlines related to U.S.—China relations, Taiwan—China tensions and an overall bumpy corporate earnings growth story. Financial results in the first quarter were uneven with some sectors and industries recovering faster than others. Given the disruption experienced with much of the population contracting COVID, first quarter earnings were generally still on the weaker side. In areas of faster earnings recovery, many questioned if the growth trajectory would be sustainable, as a lack of supportive policies continued to weigh on market sentiment. Given this environment, investors continue to be in profit taking mode despite the fact that some companies have delivered on earnings estimates. At the same time, the property market recovery has been volatile with general market conditions remaining soft. This part of China’s economy continues to be important in determining the stability of the country’s recovery and more monitoring of on-the-ground conditions are required.
Performance Contributors and Detractors
From a sector perspective, the portfolio’s allocation and stock selection in information technology and an underweight to the materials sector contributed to relative performance during the first half of the year. On the other hand, an overweight allocation and stock selection within the consumer discretionary sector and an underweight and stock selection within communication services detracted from performance.
Among individual holdings, Petrochina and Midea Group were among the top contributors to performance. Petrochina is one of China’s largest state-owned oil and gas companies. State-own enterprises (SOEs) in China have seen re-ratings this year due to their defensive nature and cheap valuations. In addition, there has been increased government support to improve valuations of SOEs. Many SOEs are increasingly becoming more market-oriented, and profit driven. This positive change could help with cementing the corporate earnings story for these companies and drive valuation re-rating. Midea is a dominant white goods manufacturer in China. Shares of the company have been defensive year to date due to resilient recovery in the sales of Midea’s air conditioning units, buoyed by a low base, pent-up demand and increased appetite for premiumization. Both valuations and dividend yields of the company are attractive as well, and while Midea is no longer growing at a fast pace, its dominance in the market and strong execution offers investors a stable rate of return, which is appreciated in the more volatile market environment we are experiencing today.
On the other hand, JD.com, China’s leading e-commerce platform company known for its authentic products as well as fast and efficient product delivery, was the weakest contributor to performance. The company’s weaker-than-expected first quarter estimates and a conservative outlook caused market concerns in the first quarter. In addition, JD’s major shopping day, June 18, showed only moderate gross merchandise value (GMV) growth. However, shopping campaigns are
(continued)
| 1 | Prospectus expense ratios. |
| 2 | The lesser of fiscal year 2022 long-term purchase costs or sales proceeds divided by the average monthly market value of long-term securities. |
| | | | | | | | | | | | | | | | | | | | | | | | | | | | | | | | |
| | |
| PERFORMANCE AS OF JUNE 30, 2023 | | | | |
| | | | | | | | | | | | Average Annual Total Returns | | | | |
| | | 3 Months | | | YTD | | | 1 Year | | | 3 Years | | | 5 Years | | | 10 Years | | | Since
Inception | | | Inception
Date | |
Investor Class (MCHFX) | | | -13.05% | | | | -12.69% | | | | -23.98% | | | | -9.64% | | | | -2.59% | | | | 4.32% | | | | 7.70% | | | | 2/19/98 | |
Institutional Class (MICFX) | | | -13.06% | | | | -12.64% | | | | -23.87% | | | | -9.52% | | | | -2.42% | | | | 4.49% | | | | 1.85% | | | | 10/29/10 | |
MSCI China Index3 | | | -9.65% | | | | -5.39% | | | | -16.69% | | | | -10.13% | | | | -5.14% | | | | 3.22 | | | | 2.95% | 4 | | | | |
MSCI China All Shares Index3 | | | -9.79% | | | | -5.27% | | | | -17.90% | | | | -6.73% | | | | -2.18% | | | | n.a | 5 | | | n.a. | 5 | | | | |
Performance assumes reinvestment of all dividends and/or distributions before taxes. All performance quoted represents past performance and is no guarantee of future results. Investment return and principal value will fluctuate with market conditions so that when redeemed, shares may be worth more or less than their original cost. Current performance may be lower or higher than the return figures quoted. For the Fund’s most recent month-end performance, visit matthewsasia.com.
GROWTH OF A HYPOTHETICAL $10,000 INVESTMENT SINCE INCEPTION—INVESTOR CLASS
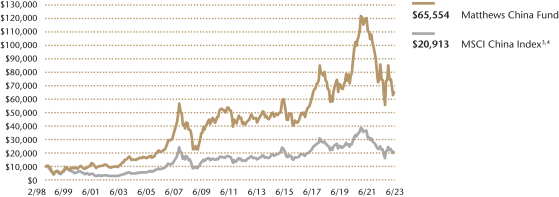
Plotted monthly. The performance data and graph do not reflect the deduction of taxes that a shareholder would pay on dividends, capital gains distributions or redemption of Fund shares. Values are in US$.
| | 3 | It is not possible to invest directly in an index. Source: Index data from Morgan Stanley Capital International and Bloomberg; total return calculations performed by BNY Mellon Investment Servicing (US) Inc. Please see page 76 for index definition. |
| | 4 | Calculated from 2/28/98. |
| | 5 | Index launched on 6/26/14. |
| | | | | | | | |
| | | | |
| TOP TEN HOLDINGS5 | | | | | | | |
| Name | | Sector | | | | % Net Assets | |
Alibaba Group Holding, Ltd. | | Consumer Discretionary | | | | | 7.7% | |
Tencent Holdings, Ltd. | | Communication Services | | | | | 7.6% | |
Meituan | | Consumer Discretionary | | | | | 5.5% | |
PDD Holdings, Inc. | | Consumer Discretionary | | | | | 5.4% | |
JD.com, Inc. | | Consumer Discretionary | | | | | 4.7% | |
China Merchants Bank Co., Ltd. | | Financials | | | | | 4.3% | |
China International Capital Corp., Ltd. | | Financials | | | | | 3.6% | |
KE Holdings, Inc. | | Real Estate | | | | | 3.3% | |
Contemporary Amperex Technology Co., Ltd. | | Industrials | | | | | 3.0% | |
CITIC Securities Co., Ltd. | | Financials | | | | | 2.6% | |
TOTAL | | | | | | | 47.7% | |
| | 5 | Holdings may combine more than one security from same issuer and related depositary receipts. |
| | | | | | | | |
| | | | matthewsasia.com | 800.789.ASIA | | | 37 | |
| | | | |
| |
| COUNTRY ALLOCATION (%)6 | |
| China/Hong Kong | | | 97.9 | |
| Macau | | | 1.8 | |
| Cash and Other Assets, Less Liabilities | | | 0.4 | |
| | | | |
| |
| SECTOR ALLOCATION (%)6 | |
| Consumer Discretionary | | | 32.6 | |
| Financials | | | 18.9 | |
| Communication Services | | | 13.7 | |
| Industrials | | | 9.0 | |
| Real Estate | | | 6.4 | |
| Information Technology | | | 6.2 | |
| Consumer Staples | | | 5.5 | |
| Health Care | | | 4.7 | |
| Energy | | | 1.8 | |
| Utilities | | | 0.9 | |
| Cash and Other Assets, Less Liabilities | | | 0.4 | |
| | | | |
| |
| MARKET CAP EXPOSURE (%)6 | |
| Mega Cap (over $25B) | | | 59.8 | |
| Large Cap ($10B-$25B) | | | 27.0 | |
| Mid Cap ($3B-10B) | | | 7.9 | |
| Small Cap (under $3B) | | | 5.0 | |
| Cash and Other Assets, Less Liabilities | | | 0.4 | |
| 6 | Source: FactSet Research Systems. Percentage values in data are rounded to the nearest tenth of one percent, so the values may not sum to 100% due to rounding. Country allocations and percentage values may be derived from different data sources and may not be consistent with other Fund literature. |
Matthews China Fund
Portfolio Manager Commentary (unaudited) (continued)
year-round and consumers are also shopping year-round. While the company’s GMV growth continues to moderate, we find JD’s approach to focusing on optimizing various business units and providing best everyday prices to consumers to be balanced with its profitability goals and targets. The JD e-commerce platform continues to be an important one in China and market worries about competition is likely overdone. Meituan, China’s largest food delivery platform, also detracted from performance during the first half of the year. Meituan also has businesses catering to the promotional and advertising needs of restaurants, and travel and hotel booking services. The company’s shares have been under a lot of pressure given concerns about competition with ByteDance’s Douyin in both food delivery and in-store services. Given Douyin is a strong competitor, there could be some market share loss, but we feel that will be generally manageable. At the same time, Meituan could see operational improvements post COVID as food delivery might see less disruptions as more restaurants are up and running, and in-store dining and travel related services could see recovery.
Notable Portfolio Changes
Overall, the number of names in the portfolio has decreased and there has generally been a consolidation of smaller, less than 1% positions in more expensive areas of the portfolio. Market correction has given us the opportunity to add to quality areas where valuations have come off meaningfully. The portfolio’s A-share exposure has trended down from the high thirties to low thirties percentage given more attractive valuations in the Hong Kong market and we have been adding to the portfolio’s Hong Kong-listed names.
During the year-to-date period, we added SOE names such as China Construction Bank and PetroChina as we believe good quality SOEs could be more defensive and see valuations re-rating. We also added Kuaishou Technology and JD Health over the first half of the year. Platform companies such as Kuaishou and JD Health have seen valuations correct meaningfully, but the nature of these business still benefit from economies of scale and as these platforms stand to gain as they get more sizable. Further, many platform companies continue to be on track to delivering better quality earnings and monetization.
Outlook
Looking ahead, the earnings story should benefit from easier comparables with the second half of 2022. We expect earnings to continue to be a catalyst. However, given weak sentiment, China needs to deliver a very strong set of earnings to re-rate in a meaningful way, and we remain more cautious on that front and expect only a gradual recovery ahead. Variables to be mindful of include whether there will be more stimulus ahead and whether China’s property market conditions continue to improve. Sentiment on the ground remains weak, which could call for more supportive policies. At the same time, we continue to see more companies delivering on monetization and increased room for shareholder return as more companies consider buybacks and dividends. Geopolitics remains a relevant concern, and unfortunately, does not offer much optimism at the moment, leading to continued volatile market conditions.
Gross Merchandise Value (GMV), also referred to as gross merchandise volume, is the total amount of sales a company makes over a specified period of time, typically measured quarterly or yearly.
Matthews China Fund
June 30, 2023
Schedule of Investmentsa (unaudited)
COMMON EQUITIES: 99.6%
| | | | | | | | |
| | | Shares | | | Value | |
|
| CONSUMER DISCRETIONARY: 32.5% | |
Broadline Retail: 17.8% | |
Alibaba Group Holding, Ltd.b | | | 4,842,200 | | | | $50,406,482 | |
| | |
PDD Holdings, Inc. ADRb | | | 511,016 | | | | 35,331,646 | |
| | |
JD.com, Inc. Class A | | | 1,810,513 | | | | 30,877,517 | |
| | | | | | | | |
| | | | | | | 116,615,645 | |
| | | | | | | | |
| | | | | | | | |
Hotels, Restaurants & Leisure: 8.4% | |
Meituan B Sharesb,c,d | | | 2,275,280 | | | | 35,678,477 | |
| | |
Galaxy Entertainment Group, Ltd.b | | | 1,803,000 | | | | 11,486,404 | |
| | |
H World Group, Ltd. ADRb | | | 204,333 | | | | 7,924,034 | |
| | | | | | | | |
| | | | | | | 55,088,915 | |
| | | | | | | | |
| | | | | | | | |
Household Durables: 2.9% | |
Midea Group Co., Ltd. A Shares | | | 1,346,052 | | | | 10,933,003 | |
| | |
Man Wah Holdings, Ltd. | | | 12,349,200 | | | | 8,267,268 | |
| | | | | | | | |
| | | | | | | 19,200,271 | |
| | | | | | | | |
| | | | | | | | |
Automobiles: 1.5% | |
Yadea Group Holdings, Ltd.c,d | | | 4,192,000 | | | | 9,562,674 | |
| | | | | | | | |
| | | | | | | | |
Diversified Consumer Services: 1.0% | |
China Education Group Holdings, Ltd.d | | | 8,327,000 | | | | 6,509,311 | |
| | | | | | | | |
| | | | | | | | |
Specialty Retail: 0.9% | |
China Tourism Group Duty Free Corp., Ltd. A Shares | | | 377,190 | | | | 5,752,502 | |
| | | | | | | | |
Total Consumer Discretionary | | | | | | | 212,729,318 | |
| | | | | | | | |
| | | | | | | | |
| |
| FINANCIALS: 18.9% | |
Capital Markets: 9.7% | |
China International Capital Corp., Ltd. H Sharesc,d | | | 13,172,400 | | | | 23,221,823 | |
| | |
CITIC Securities Co., Ltd. H Shares | | | 9,172,925 | | | | 16,679,246 | |
| | |
China Merchants Securities Co., Ltd. H Sharesc,d | | | 11,745,800 | | | | 11,090,059 | |
| | |
Hong Kong Exchanges & Clearing, Ltd. | | | 178,100 | | | | 6,748,033 | |
| | |
East Money Information Co., Ltd. A Shares | | | 2,866,920 | | | | 5,619,856 | |
| | | | | | | | |
| | | | | | | 63,359,017 | |
| | | | | | | | |
| | | | | | | | |
Banks: 6.7% | |
| | |
China Merchants Bank Co., Ltd. A Shares | | | 6,249,823 | | | | 28,232,208 | |
| | |
China Construction Bank Corp. H Shares | | | 24,043,000 | | | | 15,566,008 | |
| | | | | | | | |
| | | | | | | 43,798,216 | |
| | | | | | | | |
Insurance: 2.5% | |
| | |
PICC Property & Casualty Co., Ltd. H Shares | | | 9,082,000 | | | | 10,112,417 | |
| | |
Ping An Insurance Group Co. of China, Ltd. H Shares | | | 937,500 | | | | 5,987,735 | |
| | | | | | | | |
| | | | | | | 16,100,152 | |
| | | | | | | | |
Total Financials | | | | | | | 123,257,385 | |
| | | | | | | | |
| | | | | | | | |
| |
| COMMUNICATION SERVICES: 13.7% | |
Interactive Media & Services: 9.2% | |
Tencent Holdings, Ltd. | | | 1,172,700 | | | | 49,723,863 | |
| | |
Kuaishou Technologyb,c,d | | | 1,556,700 | | | | 10,699,440 | |
| | | | | | | | |
| | | | | | | 60,423,303 | |
| | | | | | | | |
| | | | | | | | |
| | | Shares | | | Value | |
Media: 2.9% | |
Focus Media Information Technology Co., Ltd. A Shares | | | 14,189,557 | | | | $13,296,080 | |
| | |
Three’s Co Media Group Co., Ltd. A Shares | | | 500,830 | | | | 5,921,745 | |
| | | | | | | | |
| | | | | | | 19,217,825 | |
| | | | | | | | |
| | | | | | | | |
Entertainment: 1.6% | |
Tencent Music Entertainment Group ADRb | | | 992,634 | | | | 7,325,639 | |
| | |
Bilibili, Inc. ADRb | | | 189,880 | | | | 2,867,188 | |
| | | | | | | | |
| | | | | | | 10,192,827 | |
| | | | | | | | |
Total Communication Services | | | | | | | 89,833,955 | |
| | | | | | | | |
| | | | | | | | |
| |
| INDUSTRIALS: 9.0% | |
Electrical Equipment: 5.0% | |
Contemporary Amperex Technology Co., Ltd. A Shares | | | 610,960 | | | | 19,288,772 | |
| | |
Sungrow Power Supply Co., Ltd. A Shares | | | 823,374 | | | | 13,252,596 | |
| | | | | | | | |
| | | | | | | 32,541,368 | |
| | | | | | | | |
| | | | | | | | |
Machinery: 2.6% | |
Shenzhen Inovance Technology Co., Ltd. A Shares | | | 1,103,207 | | | | 9,770,692 | |
| | |
Estun Automation Co., Ltd. A Shares | | | 1,944,344 | | | | 7,513,586 | |
| | | | | | | | |
| | | | | | | 17,284,278 | |
| | | | | | | | |
| | | | | | | | |
Transportation Infrastructure: 1.4% | |
Shanghai International Airport Co., Ltd. A Sharesb | | | 1,435,191 | | | | 8,984,639 | |
| | | | | | | | |
Total Industrials | | | | | | | 58,810,285 | |
| | | | | | | | |
| | | | | | | | |
| |
| REAL ESTATE: 6.4% | |
Real Estate Management & Development: 6.4% | |
KE Holdings, Inc. ADRb | | | 1,443,351 | | | | 21,433,762 | |
| | |
Country Garden Services Holdings Co., Ltd. | | | 6,795,000 | | | | 8,817,594 | |
| | |
CIFI Holdings Group Co., Ltd.e | | | 104,961,520 | | | | 7,833,269 | |
| | |
Times China Holdings, Ltd.b | | | 42,755,000 | | | | 3,899,943 | |
| | | | | | | | |
Total Real Estate | | | | | | | 41,984,568 | |
| | | | | | | | |
| | | | | | | | |
| |
| INFORMATION TECHNOLOGY: 6.2% | |
Electronic Equipment, Instruments & Components: 2.4% | |
Zhejiang Supcon Technology Co., Ltd. A Shares | | | 1,066,296 | | | | 9,239,562 | |
| | |
Wingtech Technology Co., Ltd. A Shares | | | 931,617 | | | | 6,288,477 | |
| | | | | | | | |
| | | | | | | 15,528,039 | |
| | | | | | | | |
| | | | | | | | |
Semiconductors & Semiconductor Equipment: 2.2% | |
NAURA Technology Group Co., Ltd. A Shares | | | 165,313 | | | | 7,252,316 | |
| | |
Zhejiang Jingsheng Mechanical & Electrical Co., Ltd. A Shares | | | 718,158 | | | | 7,029,213 | |
| | | | | | | | |
| | | | | | | 14,281,529 | |
| | | | | | | | |
| | | | | | | | |
Software: 1.6% | |
Shanghai Baosight Software Co., Ltd. A Shares | | | 1,485,334 | | | | 10,402,677 | |
| | | | | | | | |
Total Information Technology | | | | | | | 40,212,245 | |
| | | | | | | | |
| | | | | | | | |
| | | | | | | | |
| | | | matthewsasia.com | 800.789.ASIA | | | 39 | |
Matthews China Fund
June 30, 2023
Schedule of Investmentsa (unaudited) (continued)
COMMON EQUITIES (continued)
| | | | | | | | |
| | | Shares | | | Value | |
| | |
| CONSUMER STAPLES: 5.5% | | | | | | | | |
Beverages: 4.1% | |
Wuliangye Yibin Co., Ltd. A Shares | | | 505,729 | | | | $11,408,012 | |
Tsingtao Brewery Co., Ltd. H Shares | | | 1,024,000 | | | | $9,349,091 | |
| | |
Shanxi Xinghuacun Fen Wine Factory Co., Ltd. A Shares | | | 241,022 | | | | 6,143,517 | |
| | | | | | | | |
| | | | | | | 26,900,620 | |
| | | | | | | | |
| | | | | | | | |
Consumer Staples Distribution & Retail: 1.4% | |
JD Health International, Inc.b,c,d | | | 1,458,650 | | | | 9,265,116 | |
| | | | | | | | |
Total Consumer Staples | | | | | | | 36,165,736 | |
| | | | | | | | |
| | | | | | | | |
| |
| HEALTH CARE: 4.7% | |
Health Care Equipment & Supplies: 1.9% | |
Shenzhen Mindray Bio-Medical Electronics Co., Ltd. A Shares | | | 295,014 | | | | 12,198,584 | |
| | | | | | | | |
| | | | | | | | |
Life Sciences Tools & Services: 1.7% | |
Wuxi Biologics Cayman, Inc.b,c,d | | | 2,330,500 | | | | 11,200,509 | |
| | | | | | | | |
| | | | | | | | |
Health Care Providers & Services: 1.1% | |
Sinopharm Group Co., Ltd. H Shares | | | 2,377,600 | | | | 7,443,063 | |
| | | | | | | | |
Total Health Care | | | | | | | 30,842,156 | |
| | | | | | | | |
| | | | | | | | |
| |
| ENERGY: 1.8% | |
Oil, Gas & Consumable Fuels: 1.8% | |
PetroChina Co., Ltd. H Shares | | | 16,546,000 | | | | 11,488,845 | |
| | | | | | | | |
Total Energy | | | | | | | 11,488,845 | |
| | | | | | | | |
| | | | | | | | |
| |
| UTILITIES: 0.9% | |
Gas Utilities: 0.9% | |
ENN Energy Holdings, Ltd. | | | 472,300 | | | | 5,907,572 | |
| | | | | | | | |
Total Utilities | | | | | | | 5,907,572 | |
| | | | | | | | |
| | | | | | | | |
| | | |
| TOTAL INVESTMENTS: 99.6% | | | | | | | 651,232,065 | |
(Cost $862,429,012) | | | | | | | | |
| | | | | | | | |
| | |
CASH AND OTHER ASSETS,
LESS LIABILITIES: 0.4% | | | | | | | 2,305,325 | |
| | | | | | | | |
| | |
NET ASSETS: 100.0% | | | | | | | $653,537,390 | |
| | | | | | | | |
| a | Certain securities were fair valued under the valuation policies approved by the Board of Trustees (Note 2-A). |
| b | Non-income producing security. |
| c | Security exempt from registration under Rule 144A of the Securities Act of 1933, as amended. The security may be resold in transactions exempt from registration normally to qualified institutional buyers. The security has been determined to be liquid in accordance with procedures adopted by the Funds’ Board of Trustees. At June 30, 2023, the aggregate value is $110,718,098, which is 16.94% of net assets. |
| d | The securities may be resold to qualified foreign investors and foreign institutional buyers under Regulation S of the Securities Act of 1933. |
| e | Security is valued using significant unobservable inputs and is classified as Level 3 in the fair value hierarchy. The aggregate value of Level 3 security is $7,833,269 and 1.20% of net assets. |
| ADR | American Depositary Receipt |
See accompanying notes to financial statements.
| | | | |
| PORTFOLIO MANAGERS | | |
| |
| Winnie Chwang | | Andrew Mattock, CFA |
Lead Manager | | Lead Manager |
| |
| FUND FACTS | | |
| | |
| | | Investor | | Institutional |
Ticker | | MCSMX | | MICHX |
CUSIP | | 577125404 | | 577125842 |
Inception | | 5/31/11 | | 11/30/17 |
NAV | | $9.92 | | $9.93 |
Initial Investment | | $2,500 | | $100,000 |
Gross Expense Ratio1 | | 1.55% | | 1.38% |
After Fee Waiver and Reimbursement2 | | 1.41% | | 1.20% |
Portfolio Statistics | | |
Total # of Positions | | 47 |
Net Assets | | $127.5 million |
Weighted Average Market Cap | | $4.8 billion |
Portfolio Turnover3 | | 59.0% |
Benchmark | | |
MSCI China Small Cap Index |
OBJECTIVE
Long-term capital appreciation.
STRATEGY
Under normal market conditions, the Fund seeks to achieve its investment objective by investing at least 80% of its net assets, which include borrowings for investment purposes, in the common and preferred stocks of Small Companies located in China. China includes its administrative and other districts, such as Hong Kong. The Fund defines Small Companies as companies with market capitalization no higher than the greater of $5 billion or the market capitalization of the largest company included in the Fund’s primary benchmark, the MSCI China Small Cap Index.
Matthews China Small Companies Fund
Portfolio Manager Commentary (unaudited)
Period ended June 30, 2023
For the first half of 2023, the Matthews China Small Companies Fund returned –10.71% (Investor Class) and –10.70% (Institutional Class), while its benchmark, the MSCI China Small Cap Index, returned –17.55% over the same period. For the quarter ending June 30, 2023, the Fund returned
–10.95% (Investor Class) and –10.94% (Institutional Class), while the benchmark returned –14.02%.
Market Environment
The overall environment for China remained challenging during the first half of the year with continued negative headlines related to U.S.—China relations, Taiwan—China tensions and an overall bumpy corporate earnings growth story. Earnings in the first quarter were uneven with some sectors and industries recovering faster than others. Given the disruption experienced with much of the population contracting COVID, first quarter earnings were generally still on the weaker side. In areas of faster earnings recovery, many questioned if earnings growth would be sustainable, as a lack of supportive policies continued to weigh on market sentiment. Given this environment, the market continues to be in profit taking mode despite the fact that some companies have delivered on earnings estimates. At the same time, the property market recovery has been volatile with general market conditions being still soft. This part of China’s economy continues to be important in determining the stability of the country’s recovery and more monitoring of on-the-ground conditions are required.
Performance Contributors and Detractors
From a sector perspective, the portfolio’s stock selection in information technology and consumer discretionary contributed the most to the portfolio’s relative performance during the first half of the year. On the other hand, stock selection within industrials and an underweight and stock selection within communication services were the biggest detractors to performance.
Turning to individual holdings, Alchip, an integrated circuit (IC) backend design company, was the top contributor to performance. Alchip’s stock was severely impacted last year by geopolitical worries that it could no longer ship to its major Chinese super-computing customers. Since then, the company has diversified its customer base and has continued to execute well in shipment delivery to tier-one customers. At the same time, market exuberance around the prospect of artificial intelligence (AI) and the need for more customized, AI chips have driven a re-rating in Alchip’s share price. Another contributor to performance was Legend Biotech, a global, commercial-stage company with a pipeline of cell therapy platforms which include Chimeric antigen receptor (CAR) T-cell and non-gene editing CAR technologies. The company continues to publish promising data which further improves its prospects of being able to successfully commercialize.
On the other hand, Hainan Meilan Airport and Kanzhun were among the detractors to performance. Hainan Meilan is one of two airport operators on the island of Hainan. The stock has been under pressure due to profit taking in the tourism space given some concerns on a second wave of COVID in China, and also on worries of whether increased outbound travel in China would affect domestic duty-free purchases. Hainan remains China’s largest duty-free shopping region and
(continued)
| 1 | Prospectus expense ratios. |
| 2 | Matthews has contractually agreed (i) to waive fees and reimburse expenses to the extent needed to limit Total Annual Fund Operating Expenses (excluding Rule 12b-1 fees, taxes, interest, brokerage commissions, short sale dividend expenses, expenses incurred in connection with any merger or reorganization or extraordinary expenses such as litigation) of the Institutional Class to 1.20% first by waiving class specific expenses (i.e., shareholder service fees specific to a particular class) of the Institutional Class and then, to the extent necessary, by waiving non-class specific expenses (e.g., custody fees) of the Institutional Class, and (ii) if any Fund-wide expenses (i.e., expenses that apply to both the Institutional Class and the Investor Class) are waived for the Institutional Class to maintain the 1.20% expense limitation, to waive an equal amount (in annual percentage terms) of those same expenses for the Investor Class. The Total Annual Fund Operating Expenses After Fee Waiver and Expense Reimbursement for the Investor Class may vary from year to year and will in some years exceed 1.20%. If the operating expenses fall below the expense limitation within three years after Matthews has made a waiver or reimbursement, the Fund may reimburse Matthews up to an amount that does not cause the expenses for that year to exceed the lesser of (i) the expense limitation applicable at the time of that fee waiver and/or expense reimbursement or (ii) the expense limitation in effect at the time of recoupment. This agreement will remain in place until April 30, 2024 and may be terminated at any time by the Board of Trustees on behalf of the Fund on 60 days’ written notice to Matthews. Matthews may decline to renew this agreement by written notice to the Trust at least 30 days before its annual expiration date. |
| 3 | The lesser of fiscal year 2022 long-term purchase costs or sales proceeds divided by the average monthly market value of long-term securities. |
| | | | | | | | |
| | | | matthewsasia.com | 800.789.ASIA | | | 41 | |
| | | | | | | | | | | | | | | | | | | | | | | | | | | | | | | | |
| | |
| PERFORMANCE AS OF JUNE 30, 2023 | | | | |
| | | | | | | | | | | | Average Annual Total Returns | | | | | | | |
| | | 3 Months | | | YTD | | | 1 Year | | | 3 Years | | | 5 Years | | | 10 Years | | | Since
Inception | | | Inception
date | |
Investor Class (MCSMX) | | | -10.95% | | | | -10.71% | | | | -22.55% | | | | -11.84% | | | | 2.01% | | | | 8.21% | | | | 5.12% | | | | 05/31/11 | |
Institutional Class (MICHX) | | | -10.94% | | | | -10.70% | | | | -22.45% | | | | -11.64% | | | | 2.23% | | | | n.a. | | | | 4.72% | | | | 11/30/17 | |
MSCI China Small Cap Index4 | | | -14.02% | | | | -17.55% | | | | -25.81% | | | | -9.03% | | | | -8.86% | | | | -1.14% | | | | -2.60% | 5 | | | | |
Performance assumes reinvestment of all dividends and/or distributions before taxes. All performance quoted represents past performance and is no guarantee of future results. Investment return and principal value will fluctuate with market conditions so that when redeemed, shares may be worth more or less than their original cost. Current performance may be lower or higher than the return figures quoted. Returns would have been lower if certain of the Fund’s fees and expenses had not been waived. For the Fund’s most recent month-end performance, visit matthewsasia.com.
GROWTH OF A HYPOTHETICAL $10,000 INVESTMENT SINCE INCEPTION—INVESTOR CLASS
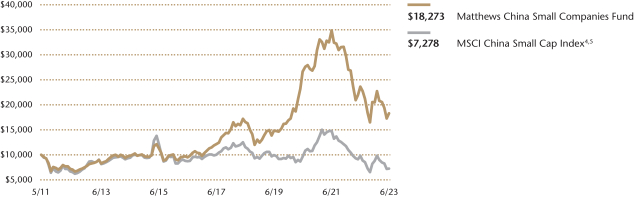
Plotted monthly. The performance data and graph do not reflect the deduction of taxes that a shareholder would pay on dividends, capital gains distributions or redemption of Fund shares. Values are in US$.
| | 4 | It is not possible to invest directly in an index. Source: Index data from Morgan Stanley Capital International and Bloomberg; total return calculations performed by BNY Mellon Investment Servicing (US) Inc. Please see page 76 for index definition. |
| | | | | | | | |
| | | | |
| TOP TEN HOLDINGS6 | | | | | | | |
| Name | | Sector | | | | % Net Assets | |
China Overseas Property Holdings, Ltd. | | Real Estate | | | | | 4.5% | |
Alchip Technologies, Ltd. | | Information Technology | | | | | 4.4% | |
Yangzijiang Shipbuilding Holdings, Ltd. | | Industrials | | | | | 3.9% | |
KE Holdings, Inc. | | Real Estate | | | | | 3.7% | |
Yadea Group Holdings, Ltd. | | Consumer Discretionary | | | | | 3.4% | |
Jason Furniture Hangzhou Co., Ltd. | | Consumer Discretionary | | | | | 3.2% | |
Zhejiang Shuanghuan Driveline Co., Ltd. | | Consumer Discretionary | | | | | 3.2% | |
ENN Natural Gas Co., Ltd. | | Utilities | | | | | 3.2% | |
Shenzhen Topband Co., Ltd. | | Information Technology | | | | | 3.1% | |
Elite Material Co., Ltd. | | Information Technology | | | | | 3.1% | |
TOTAL | | | | | | | 35.7% | |
| | 6 | Holdings may combine more than one security from same issuer and related depositary receipts. |
Matthews China Small Companies Fund
Portfolio Manager Commentary (unaudited) (continued)
increased talks about making the whole island of Hainan duty-free also gives rise to concerns about market share losses at Meilan Airport. We remain long-term believers of Hainan’s presence as China’s duty-free mecca. Even if there might be some market share losses, we think the pie will expand and as an asset owner in the duopoly airport market in Hainan, we think Meilan’s current valuations are attractive and remain invested in the name. Kanzhun is a leading recruitment platform company in China. The company’s shares have been under pressure as the overall economic recovery in China remains bumpy and uneven. Small businesses have generally been more cautious about hiring and are awaiting more stability in the economic recovery. However, Kanzhun continues to gain share as online penetration of recruiting increases and has seen a pickup across both blue and white collared jobs.
Notable Portfolio Changes
Overall, the number of names in the portfolio has decreased and there has generally been a consolidation of smaller, less than 1% positions in more expensive areas of the portfolio. The market correction has given us the opportunity to add to quality areas where valuations have come off meaningfully. The portfolio’s A-share exposure has trended down from the high thirties to the low thirties percentage given more attractive valuations in the Hong Kong market and we have been adding to the portfolio’s Hong Kong-listed names.
During the year-to-date period, we added names such as Elite Material, Centre Testing, OPT Machine. Elite Materials is a copper clad laminate producer with exposure to high-end server chips. The company is a beneficiary of the overall growth and penetration of high-performance server chips and traded at an attractive valuation. Centre Testing is the leading testing agency in China and saw shares pull back from high multiples to more reasonable levels. We continue to find that the testing and certification business is one that can deliver resilient and stable growth and we added to the position. OPT Machine provides factory automation solutions and uses its vision-related solutions to optimize operations in identifying product deficiencies. We believe the company has proven that its solutions can continue to penetrate new industries, and therefore enables the company to sustainably deliver on growth.
Outlook
Looking ahead, the earnings story should continue to benefit from easier comparables from the second half of 2022. We expect earnings to continue to be a catalyst. However, given weak sentiment, China needs to deliver a very strong set of earnings to re-rate in a meaningful way, and unfortunately, we remain more cautious on that front and expect only a gradual recovery ahead. Variables to be mindful of include whether there will be more stimulus ahead and whether China’s property market conditions continue to improve. Sentiment on the ground remains weak, which could call for more supportive policies. At the same time, we continue to see more companies delivering on monetization and increased room for shareholder return as more companies consider buybacks and dividends. Geopolitics remains a relevant concern, and unfortunately, does not offer much optimism at the moment, leading to a continued volatile market conditions.
| | | | |
| |
| COUNTRY ALLOCATION (%)7 | |
China/Hong Kong | | | 82.5 | |
Taiwan | | | 10.2 | |
United States | | | 6.4 | |
Cash and Other Assets, Less Liabilities | | | 0.9 | |
| | | | |
| |
| SECTOR ALLOCATION (%)7 | |
Industrials | | | 25.9 | |
Information Technology | | | 20.4 | |
Consumer Discretionary | | | 19.4 | |
Health Care | | | 9.6 | |
Real Estate | | | 8.7 | |
Consumer Staples | | | 5.1 | |
Financials | | | 3.6 | |
Utilities | | | 3.2 | |
Communication Services | | | 2.4 | |
Materials | | | 0.7 | |
Cash and Other Assets, Less Liabilities | | | 0.9 | |
| | | | |
| | |
| MARKET CAP EXPOSURE (%)7,8 | | | |
| Mega Cap (over $25B) | | | 0.0 | |
| Large Cap ($10B-$25B) | | | 10.0 | |
| Mid Cap ($3B-10B) | | | 51.7 | |
| Small Cap (under $3B) | | | 37.4 | |
| Cash and Other Assets, Less Liabilities | | | 0.9 | |
| 7 | Source: FactSet Research Systems. Percentage values in data are rounded to the nearest tenth of one percent, so the values may not sum to 100% due to rounding. Country allocations and percentage values may be derived from different data sources and may not be consistent with other Fund literature. |
| 8 | The Fund defines Small Companies as companies with market capitalization no higher than the greater of $5 billion or the market capitalization of the largest company included in the Fund’s primary benchmark, the MSCI China Small Cap Index. |
| | | | | | | | |
| | | | matthewsasia.com | 800.789.ASIA | | | 43 | |
Matthews China Small Companies Fund
June 30, 2023
Schedule of Investmentsa (unaudited)
COMMON EQUITIES: 99.1%
| | | | | | | | |
| | | Shares | | | Value | |
| | |
| INDUSTRIALS: 26.0% | | | | | | | | |
Machinery: 9.2% | | | | | |
Yangzijiang Shipbuilding Holdings, Ltd. | | | 4,518,200 | | | | $5,026,855 | |
| | |
Morimatsu International Holdings Co., Ltd.b,c | | | 3,835,000 | | | | 3,162,873 | |
| | |
Airtac International Group | | | 59,191 | | | | 1,956,182 | |
| | |
Zhuzhou CRRC Times Electric Co., Ltd. | | | 436,800 | | | | 1,631,580 | |
| | | | | | | | |
| | | | | | | 11,777,490 | |
| | | | | | | | |
| | | | | | | | |
Electrical Equipment: 4.2% | | | | | |
Hongfa Technology Co., Ltd. A Shares | | | 596,257 | | | | 2,618,483 | |
| | |
Zhejiang HangKe Technology, Inc., Co. A Shares | | | 351,710 | | | | 1,481,717 | |
| | |
Ginlong Technologies Co., Ltd. A Sharesb | | | 86,655 | | | | 1,245,919 | |
| | | | | | | | |
| | | | | | | 5,346,119 | |
| | | | | | | | |
| | | | | | | | |
Construction & Engineering: 2.7% | | | | | |
Greentown Management Holdings Co., Ltd.c,d | | | 3,009,000 | | | | 2,398,267 | |
| | |
China State Construction International Holdings, Ltd. | | | 950,000 | | | | 1,085,879 | |
| | | | | | | | |
| | | | | | | 3,484,146 | |
| | | | | | | | |
| | | | | | | | |
Transportation Infrastructure: 2.5% | | | | | |
Beijing Capital International Airport Co., Ltd. H Sharesb | | | 3,352,000 | | | | 2,175,442 | |
| | |
Hainan Meilan International Airport Co., Ltd. H Sharesb | | | 839,000 | | | | 1,044,235 | |
| | | | | | | | |
| | | | | | | 3,219,677 | |
| | | | | | | | |
| | | | | | | | |
Ground Transportation: 2.3% | | | | | |
Full Truck Alliance Co., Ltd. ADRb | | | 463,034 | | | | 2,880,072 | |
| | | | | | | | |
| | | | | | | | |
Professional Services: 2.2% | | | | | |
Centre Testing International Group Co., Ltd. A Shares | | | 1,037,500 | | | | 2,786,615 | |
| | | | | | | | |
| | | | | | | | |
Air Freight & Logistics: 1.9% | | | | | |
Milkyway Chemical Supply Chain Service Co., Ltd. A Shares | | | 193,530 | | | | 2,373,467 | |
| | | | | | | | |
| | | | | | | | |
Marine Transportation: 1.0% | | | | | |
SITC International Holdings Co., Ltd. | | | 659,500 | | | | 1,207,657 | |
| | | | | | | | |
Total Industrials | | | | | | | 33,075,243 | |
| | | | | | | | |
| | | | | | | | |
| | | |
| INFORMATION TECHNOLOGY: 20.4% | | | | | | | | |
Electronic Equipment, Instruments & Components: 10.4% | |
Shenzhen Topband Co., Ltd. A Shares | | | 2,230,300 | | | | 4,014,700 | |
| | |
Elite Material Co., Ltd. | | | 507,000 | | | | 3,982,098 | |
| | |
BOE Varitronix, Ltd. | | | 2,311,000 | | | | 3,337,837 | |
| | |
OPT Machine Vision Tech Co., Ltd. A Shares | | | 83,956 | | | | 1,909,298 | |
| | | | | | | | |
| | | | | | | 13,243,933 | |
| | | | | | | | |
| | | | | | | | |
Semiconductors & Semiconductor Equipment: 7.8% | |
Alchip Technologies, Ltd. | | | 96,000 | | | | 5,560,726 | |
| | |
ACM Research, Inc. Class Ab | | | 235,039 | | | | 3,074,310 | |
| | |
StarPower Semiconductor, Ltd. A Shares | | | 42,692 | | | | 1,268,400 | |
| | | | | | | | |
| | | | | | | 9,903,436 | |
| | | | | | | | |
Software: 2.2% | | | | | |
Longshine Technology Group Co., Ltd. A Shares | | | 898,644 | | | | 2,887,684 | |
| | | | | | | | |
Total Information Technology | | | | | | | 26,035,053 | |
| | | | | | | | |
| | | | | | | | |
| | | | | | | | |
| | | Shares | | | Value | |
| | |
| CONSUMER DISCRETIONARY: 19.4% | | | | | | | | |
Textiles, Apparel & Luxury Goods: 5.2% | | | | | |
Samsonite International SAb,c,d | | | 1,197,600 | | | | $3,386,566 | |
| | |
Xtep International Holdings, Ltd. | | | 3,182,000 | | | | 3,256,981 | |
| | | | | | | | |
| | | | | | | 6,643,547 | |
| | | | | | | | |
| | | | | | | | |
Automobiles: 3.4% | | | | | |
Yadea Group Holdings, Ltd.c,d | | | 1,878,000 | | | | 4,284,041 | |
| | | | | | | | |
| | | | | | | | |
Household Durables: 3.2% | | | | | |
Jason Furniture Hangzhou Co., Ltd. A Shares | | | 788,000 | | | | 4,138,356 | |
| | | | | | | | |
| | | | | | | | |
Automobile Components: 3.2% | | | | | |
Zhejiang Shuanghuan Driveline Co., Ltd. A Shares | | | 817,603 | | | | 4,092,263 | |
| | | | | | | | |
| | | | | | | | |
Hotels, Restaurants & Leisure: 2.7% | | | | | |
Melco International Development, Ltd.b | | | 3,656,000 | | | | 3,408,083 | |
| | | | | | | | |
| | | | | | | | |
Diversified Consumer Services: 1.7% | | | | | |
China Education Group Holdings, Ltd.c | | | 2,712,000 | | | | 2,120,001 | |
| | | | | | | | |
Total Consumer Discretionary | | | | | | | 24,686,291 | |
| | | | | | | | |
| | | | | | | | |
| | | |
| HEALTH CARE: 9.6% | | | | | | | | |
Health Care Equipment & Supplies: 4.1% | |
AK Medical Holdings, Ltd.c,d | | | 2,790,000 | | | | 2,431,176 | |
| | |
STAAR Surgical Co.b | | | 32,097 | | | | 1,687,339 | |
| | |
Peijia Medical, Ltd.b,c,d | | | 1,426,000 | | | | 1,124,497 | |
| | | | | | | | |
| | | | | | | 5,243,012 | |
| | | | | | | | |
| | | | | | | | |
Biotechnology: 2.7% | | | | | |
Legend Biotech Corp. ADRb | | | 49,612 | | | | 3,424,716 | |
| | | | | | | | |
| | | | | | | | |
Life Sciences Tools & Services: 1.8% | | | | | |
Joinn Laboratories China Co., Ltd. H Sharesc,d | | | 923,020 | | | | 2,328,836 | |
| | | | | | | | |
| | | | | | | | |
Health Care Technology: 1.0% | | | | | |
Medlive Technology Co., Ltd.c,d | | | 1,403,500 | | | | 1,257,051 | |
| | | | | | | | |
Total Health Care | | | | | | | 12,253,615 | |
| | | | | | | | |
| | | | | | | | |
| | | |
| REAL ESTATE: 8.7% | | | | | | | | |
Real Estate Management & Development: 8.7% | |
China Overseas Property Holdings, Ltd. | | | 5,650,000 | | | | 5,710,068 | |
| | |
KE Holdings, Inc. A Sharesb | | | 961,500 | | | | 4,749,320 | |
| | |
CIFI Ever Sunshine Services Group, Ltd.c,e | | | 2,258,000 | | | | 676,305 | |
| | | | | | | | |
Total Real Estate | | | | | | | 11,135,693 | |
| | | | | | | | |
| | | | | | | | |
| | | |
| CONSUMER STAPLES: 5.1% | | | | | | | | |
Food Products: 2.6% | |
Chacha Food Co., Ltd. A Shares | | | 330,400 | | | | 1,892,390 | |
| | |
Anjoy Foods Group Co., Ltd. A Shares | | | 71,047 | | | | 1,437,468 | |
| | | | | | | | |
| | | | | | | 3,329,858 | |
| | | | | | | | |
| | | | | | | | |
Beverages: 2.5% | | | | | |
Anhui Yingjia Distillery Co., Ltd. A Shares | | | 364,500 | | | | 3,205,031 | |
| | | | | | | | |
Total Consumer Staples | | | | | | | 6,534,889 | |
| | | | | | | | |
| | | | | | | | |
| | | |
| FINANCIALS: 3.6% | | | | | | | | |
Financial Services: 2.7% | | | | | | | | |
Chailease Holding Co., Ltd. | | | 519,712 | | | | 3,417,002 | |
| | | | | | | | |
| | | | | | | | |
Capital Markets: 0.9% | | | | | | | | |
Orient Securities Co., Ltd. H Sharesc,d | | | 2,177,600 | | | | 1,196,651 | |
| | | | | | | | |
Total Financials | | | | | | | 4,613,653 | |
| | | | | | | | |
| | | | | | | | |
Matthews China Small Companies Fund
June 30, 2023
Schedule of Investmentsa (unaudited) (continued)
COMMON EQUITIES (continued)
| | | | | | | | |
| | | Shares | | | Value | |
| | |
| UTILITIES: 3.2% | | | | | | | | |
Gas Utilities: 3.2% | | | | | | | | |
ENN Natural Gas Co., Ltd. A Shares | | | 1,552,742 | | | | $4,062,701 | |
| | | | | | | | |
Total Utilities | | | | | | | 4,062,701 | |
| | | | | | | | |
| | | | | | | | |
| | | |
| COMMUNICATION SERVICES: 2.4% | | | | | | | | |
Interactive Media & Services: 2.4% | | | | | | | | |
Kanzhun, Ltd. ADRb | | | 204,401 | | | | 3,076,235 | |
| | | | | | | | |
Total Communication Services | | | | | | | 3,076,235 | |
| | | | | | | | |
| | | | | | | | |
| | | |
| MATERIALS: 0.7% | | | | | | | | |
Chemicals: 0.7% | | | | | | | | |
Jiangsu Cnano Technology Co., Ltd. A Shares | | | 143,814 | | | | 907,244 | |
| | | | | | | | |
Total Materials | | | | | | | 907,244 | |
| | | | | | | | |
| | | | | | | | |
| | | |
| TOTAL INVESTMENTS: 99.1% | | | | | | | 126,380,617 | |
(Cost $143,468,418) | | | | | | | | |
| | | | | | | | |
| | |
CASH AND OTHER ASSETS,
LESS LIABILITIES: 0.9% | | | | | | | 1,162,071 | |
| | | | | | | | |
| | |
NET ASSETS: 100.0% | | | | | | | $127,542,688 | |
| | | | | | | | |
| a | Certain securities were fair valued under the valuation policies approved by the Board of Trustees (Note 2-A). |
| b | Non-income producing security. |
| c | The securities may be resold to qualified foreign investors and foreign institutional buyers under Regulation S of the Securities Act of 1933. |
| d | Security exempt from registration under Rule 144A of the Securities Act of 1933, as amended. The security may be resold in transactions exempt from registration normally to qualified institutional buyers. The security has been determined to be liquid in accordance with procedures adopted by the Funds’ Board of Trustees. At June 30, 2023, the aggregate value is $18,407,085, which is 14.43% of net assets. |
| e | Security is valued using significant unobservable inputs and is classified as Level 3 in the fair value hierarchy. The aggregate value of Level 3 security is $676,305 and 0.53% of net assets. |
| ADR | American Depositary Receipt |
See accompanying notes to financial statements.
| | | | | | | | |
| | | | matthewsasia.com | 800.789.ASIA | | | 45 | |
| | | | |
| PORTFOLIO MANAGERS |
| |
| Peeyush Mittal,CFA | | |
Lead Manager | | |
| |
| Sharat Shroff, CFA | | |
Co-Manager | | |
|
| FUND FACTS |
| | |
| | | Investor | | Institutional |
Ticker | | MINDX | | MIDNX |
CUSIP | | 577130859 | | 577130768 |
Inception | | 10/31/05 | | 10/29/10 |
NAV | | $24.64 | | $25.17 |
Initial Investment | | $2,500 | | $100,000 |
Gross Expense Ratio1 | | 1.15% | | 1.01% |
Portfolio Statistics | | | | |
Total # of Positions | | 50 |
Net Assets | | $652.0 million |
Weighted Average Market Cap | | $43.8 billion |
Portfolio Turnover2 | | 41.4% |
Benchmarks | | |
S&P Bombay Stock Exchange 100 Index |
MSCI India Index |
OBJECTIVE
Long-term capital appreciation.
STRATEGY
Under normal market conditions, the Fund seeks to achieve its investment objective by investing at least 80% of its net assets, which include borrowings for investment purposes, in publicly traded common stocks, preferred stocks and convertible securities of companies located in India.
Matthews India Fund
Portfolio Manager Commentary (unaudited)
Period ended June 30, 2023
For the first half of 2023, the Matthews India Fund returned 11.54% (Investor Class) and 11.67% (Institutional Class), while its benchmark, the S&P Bombay Stock Exchange 100 Index, returned 7.93% over the same period. For the quarter ending June 30, 2023, the Fund returned 13.13% (Investor Class) and 13.17% (Institutional Class), while the benchmark returned 11.94%.
Market Environment
Indian markets performed well in the first half of 2023 on the back of strong net equity flows from domestic and foreign portfolio investments (FPI). Foreign inflows are approaching US15 billion this year which isn’t far short of the total negative FPI outflow of 2022.
The turnaround in FPI has occurred amid the general consensus that global monetary tightening has either peaked or will be peaking soon. The Reserve Bank of India has held interest rates unchanged since April likely indicating an end to its rate hikes. The moderation in inflation data in the U.S. and India supports this view. In India, wholesale producer price inflation has turned negative and consumer price inflation (CPI) has trended within the RBI’s target zone of 2%-6% in last three months.
Despite what are elevated interest rates, India’s economy has continued to perform well. The 6.1% gross domestic product (GDP) growth reported for the first quarter exceeded consensus expectations of 5%. Expansion was largely led by government and private capital spending as consumption growth continued to be muted. Gross fixed capital formation delivered growth of 8.9% in the period while infrastructure development, along with revival in commercial and residential real estate, is driving a surge in construction activity in the country.
Performance Contributors and Detractors
At the sector level, strong stock selection in financials was the biggest contributor to relative performance in the first half. Our overweight and stock selection in health care and stock selection in materials and industrials were also positive contributors, as was our underweight to energy. On the flip side, stock selection in consumer staples was the biggest detractor. Selection in consumer discretionary also hurt relative performance, mitigated by our overweight position. Lack of exposure to utilities also detracted.
At the holdings level, the two biggest contributors to relative and absolute performance were Shriram Finance and Neuland Laboratories. Shriram Finance, an auto and consumer finance services provider, gained as the outlook for margins for non-banking financial companies continued to improve with the bulk of interest rate-hikes likely behind us. In the second quarter, long-standing issues related to stock ownership were also addressed which also helped drive stock performance. Neuland Laboratories continues to shift focus away from generic active pharmaceutical ingredients (API) manufacturing to working more closely with innovator pharma companies. This is not only helping the company grow predictably but also expand margins, in our view.
In contrast, Restaurant Brands Asia (RBA), a fast-food chain, was among the biggest detractors. RBA has continued to grow well on back of footprint expansion by opening more locations across the country, however its per-store-unit economics remain muted compared to peers as the company seems to be struggling to drive higher traffic through the same outlets.
(continued)
| 1 | Prospectus expense ratios. |
| 2 | The lesser of fiscal year 2022 long-term purchase costs or sales proceeds divided by the average monthly market value of long-term securities. |
| | | | | | | | | | | | | | | | | | | | | | | | | | | | | | | | |
| | | | | | | | | |
| PERFORMANCE AS OF JUNE 30, 2023 | | | | | | | | | | | | | | | | | | | | | | | | |
| | | | | | | | | | | | Average Annual Total Returns | | | | |
| | | 3 Months | | | YTD | | | 1 Year | | | 3 Years | | | 5 Years | | | 10 Years | | | Since
Inception | | | Inception
Date | |
Investor Class (MINDX) | | | 13.13% | | | | 11.54% | | | | 17.99% | | | | 19.68% | | | | 5.31% | | | | 11.03% | | | | 9.97% | | | | 10/31/05 | |
Institutional Class (MIDNX)* | | | 13.17% | | | | 11.67% | | | | 18.15% | | | | 19.86% | | | | 5.47% | | | | 11.22% | | | | 6.22% | | | | 10/29/10 | |
S&P Bombay Stock Exchange 100 Index3 | | | 11.94% | | | | 7.93% | | | | 19.23% | | | | 21.74% | | | | 9.69% | | | | 10.88% | | | | 10.31% | 5 | | | | |
MSCI India Index4 | | | 12.36% | | | | 5.30% | | | | 14.72% | | | | 19.84% | | | | 9.04% | | | | 9.02% | | | | 9.17% | 5 | | | | |
Performance assumes reinvestment of all dividends and/or distributions before taxes. All performance quoted represents past performance and is no guarantee of future results. Investment return and principal value will fluctuate with market conditions so that when redeemed, shares may be worth more or less than their original cost. Current performance may be lower or higher than the return figures quoted. For the Fund’s most recent month-end performance, visit matthewsasia.com.
| | * | Performance results include adjustments made for financial reporting purposes in accordance with U.S. generally accepted accounting principles. |
GROWTH OF A HYPOTHETICAL $10,000 INVESTMENT SINCE INCEPTION—INVESTOR CLASS
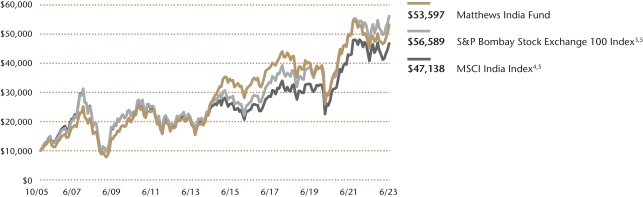
Plotted monthly. The performance data and graph do not reflect the deduction of taxes that a shareholder would pay on dividends, capital gains distributions or redemption of Fund shares. Values are in US$.
| | 3 | It is not possible to invest directly in an index. Source: Index data from S&P BSE 100 Index and Bloomberg; total return calculations performed by BNY Mellon Investment Servicing (US) Inc. Please see page 76 for index definition. |
| | 4 | It is not possible to invest directly in an index. Source: Index data from Morgan Stanley Capital International and Bloomberg; total return calculations performed by BNY Mellon Investment Servicing (US) Inc. Please see page 76 for index definition. |
| | 5 | Calculated from 10/31/05. |
| | | | | | | | |
| | | | |
| TOP TEN HOLDINGS6 | | | | | | | |
| Name | | Sector | | | | % Net Assets | |
| HDFC Bank, Ltd. | | Financials | | | | | 7.5% | |
| ICICI Bank, Ltd. | | Financials | | | | | 6.0% | |
| Shriram Finance, Ltd. | | Financials | | | | | 5.8% | |
| Reliance Industries, Ltd. | | Energy | | | | | 4.5% | |
| Infosys, Ltd. | | Information Technology | | | | | 4.1% | |
| Hindustan Unilever, Ltd. | | Consumer Staples | | | | | 3.8% | |
| Axis Bank, Ltd. | | Financials | | | | | 3.5% | |
| IndusInd Bank, Ltd. | | Financials | | | | | 3.0% | |
| Tata Consultancy Services, Ltd. | | Information Technology | | | | | 2.9% | |
| Maruti Suzuki India, Ltd. | | Consumer Discretionary | | | | | 2.8% | |
| TOTAL | | | | | | | 43.9% | |
| | 6 | Holdings may combine more than one security from same issuer and related depositary receipts. |
| | | | | | | | |
| | | | matthewsasia.com | 800.789.ASIA | | | 47 | |
| | | | |
| |
| COUNTRY ALLOCATION (%)7 | |
India | | | 99.8 | |
Cash and Other Assets, Less Liabilities | | | 0.2 | |
| | | | |
| |
| SECTOR ALLOCATION (%)7 | |
| Financials | | | 37.6 | |
| Consumer Discretionary | | | 12.9 | |
| Information Technology | | | 11.9 | |
| Health Care | | | 10.2 | |
| Consumer Staples | | | 9.2 | |
| Materials | | | 7.0 | |
| Industrials | | | 6.5 | |
| Energy | | | 4.5 | |
| Cash and Other Assets, Less Liabilities | | | 0.2 | |
| | | | |
| |
| MARKET CAP EXPOSURE (%)7 | |
Mega Cap (over $25B) | | | 47.9 | |
Large Cap ($10B-$25B) | | | 13.0 | |
Mid Cap ($3B-10B) | | | 26.6 | |
Small Cap (under $3B) | | | 12.4 | |
Cash and Other Assets, Less Liabilities | | | 0.2 | |
| 7 | Source: FactSet Research Systems. Percentage values in data are rounded to the nearest tenth of one percent, so the values may not sum to 100% due to rounding. Country allocations and percentage values may be derived from different data sources and may not be consistent with other Fund literature. |
Matthews India Fund
Portfolio Manager Commentary (unaudited) (continued)
Notable Portfolio Changes
We continued to shift the portfolio toward fast-growing business segments and away from end markets where we think competition seems to be ramping up. We exited Pidilite Industries, an adhesives manufacturing company, as growth has slowed down over the years and incremental return on capital is consistently going down. In our view, increasing competitive intensity will likely continue to negatively impact financial performance while the stock has continued to trade at a very lofty valuation.
Similarly we exited engineering company Greaves Cotton. While Greaves Cotton is operating in the electric vehicle (EV) space, an industry that will grow leaps and bounds in India, from its recent capital allocations, we believe the company is not taking the strategic steps it needs to make in order to be successful.
We initiated a new investment in Mahindra & Mahindra Financial Services. Following the turnaround of its flagship auto business, Mahindra & Mahindra seems to be taking the right steps to rejuvenate performance of its non-banking financial business. It has injected new talent and is addressing segments of the market where credit quality issues are less adverse and more predictable. We think the company will not just grow fast but also trade at a better valuation in the future compared to where it has been historically.
Outlook
Given the strong run in Indian equities in last few months it is time to be cautious and allow markets to consolidate for some time to come. Valuations have again gotten stretched and equity risk premium has dropped, indicating risk-reward is turning adverse from a near-term perspective. Indian equity markets at current valuations are also not discounting the risks that the economy faces in coming quarters. Among those is the risk to political stability. India is going to have general elections early next year and to assume that Prime Minister Narendra Modi will retain power would be foolhardy. We have seen how opposition parties are planning to present a united front against Modi and hence, we believe, the outcome of the election isn’t a forgone conclusion. India’s economy also depends on export-oriented growth and the slowdown in the developed world we think is going to have a negative impact. We also believe a steep commodity price-correction is likely and this, together with the elections, may inject caution and delays into decision-making as it relates to gross capital formation in the private sector.
Equity risk premium: the excess return that investing in the stock market provides over a risk-free rate.
Matthews India Fund
June 30, 2023
Schedule of Investmentsa (unaudited)
COMMON EQUITIES: 99.8%
| | | | | | | | |
| | | Shares | | | Value | |
|
| FINANCIALS: 37.6% | |
Banks: 24.6% | | | | | | | | |
HDFC Bank, Ltd. | | | 2,365,291 | | | | $49,086,451 | |
| | |
ICICI Bank, Ltd. | | | 3,397,020 | | | | 38,892,438 | |
| | |
Axis Bank, Ltd. | | | 1,903,879 | | | | 22,972,878 | |
| | |
IndusInd Bank, Ltd. | | | 1,150,993 | | | | 19,360,303 | |
| | |
Kotak Mahindra Bank, Ltd. | | | 682,976 | | | | 15,403,482 | |
| | |
Bandhan Bank, Ltd.b,c,d | | | 4,922,200 | | | | 14,564,129 | |
| | | | | | | | |
| | | | | | | 160,279,681 | |
| | | | | | | | |
| | | | | | | | |
Consumer Finance: 12.1% | | | | | | | | |
Shriram Finance, Ltd. | | | 1,784,781 | | | | 37,833,682 | |
| | |
Cholamandalam Investment and Finance Co., Ltd. | | | 1,158,600 | | | | 16,164,438 | |
| | |
Bajaj Finance, Ltd. | | | 170,376 | | | | 14,922,559 | |
| | |
Mahindra & Mahindra Financial Services, Ltd. | | | 2,413,176 | | | | 9,922,185 | |
| | | | | | | | |
| | | | | | | 78,842,864 | |
| | | | | | | | |
| | | | | | | | |
Insurance: 0.9% | | | | | | | | |
PB Fintech, Ltd.c | | | 706,417 | | | | 6,015,408 | |
| | | | | | | | |
Total Financials | | | | | | | 245,137,953 | |
| | | | | | | | |
| | | | | | | | |
| |
| CONSUMER DISCRETIONARY: 12.9% | |
Automobiles: 4.5% | | | | | | | | |
Maruti Suzuki India, Ltd. | | | 154,862 | | | | 18,521,310 | |
| | |
TVS Motor Co., Ltd. | | | 686,363 | | | | 11,121,691 | |
| | | | | | | | |
| | | | | | | 29,643,001 | |
| | | | | | | | |
| | | | | | | | |
Automobile Components: 3.3% | |
Bosch, Ltd. | | | 50,306 | | | | 11,696,655 | |
| | |
Sona Blw Precision Forgings, Ltd.b,d | | | 1,021,283 | | | | 6,439,444 | |
| | |
Divgi Torqtransfer Systems, Ltd.c | | | 327,748 | | | | 3,689,131 | |
| | | | | | | | |
| | | | | | | 21,825,230 | |
| | | | | | | | |
| | | | | | | | |
Hotels, Restaurants & Leisure: 2.4% | |
Restaurant Brands Asia, Ltd.c | | | 6,007,166 | | | | 7,898,999 | |
| | |
Lemon Tree Hotels, Ltd.b,c,d | | | 6,653,252 | | | | 7,620,690 | |
| | | | | | | | |
| | | | | | | 15,519,689 | |
| | | | | | | | |
| | | | | | | | |
Textiles, Apparel & Luxury Goods: 2.2% | |
Titan Co., Ltd. | | | 321,690 | | | | 11,977,962 | |
| | |
Page Industries, Ltd. | | | 4,531 | | | | 2,083,453 | |
| | | | | | | | |
| | | | | | | 14,061,415 | |
| | | | | | | | |
| | | | | | | | |
Specialty Retail: 0.5% | | | | | | | | |
Shankara Building Products, Ltd. | | | 363,880 | | | | 3,229,871 | |
| | | | | | | | |
Total Consumer Discretionary | | | | | | | 84,279,206 | |
| | | | | | | | |
| | | | | | | | |
| |
| INFORMATION TECHNOLOGY: 11.9% | |
IT Services: 11.9% | | | | | | | | |
Infosys, Ltd. | | | 1,631,506 | | | | 26,573,795 | |
| | |
Tata Consultancy Services, Ltd. | | | 469,622 | | | | 18,976,179 | |
| | |
LTIMindtree, Ltd.b,d | | | 165,134 | | | | 10,504,225 | |
| | |
HCL Technologies, Ltd. | | | 555,191 | | | | 8,071,118 | |
| | |
Persistent Systems, Ltd. | | | 118,456 | | | | 7,263,678 | |
| | |
Coforge, Ltd. | | | 106,963 | | | | 6,166,546 | |
| | | | | | | | |
Total Information Technology | | | | | | | 77,555,541 | |
| | | | | | | | |
| | | | | | | | |
| | | Shares | | | Value | |
| |
| HEALTH CARE: 10.2% | |
Pharmaceuticals: 4.3% | | | | | | | | |
Neuland Laboratories, Ltd. | | | 522,353 | | | | $18,050,988 | |
| | |
Sun Pharmaceutical Industries, Ltd. | | | 779,211 | | | | 9,997,263 | |
| | | | | | | | |
| | | | | | | 28,048,251 | |
| | | | | | | | |
| | | | | | | | |
Life Sciences Tools & Services: 3.5% | |
Syngene International, Ltd.b,d | | | 1,556,544 | | | | 14,539,135 | |
| | |
Divi’s Laboratories, Ltd. | | | 192,769 | | | | 8,435,346 | |
| | | | | | | | |
| | | | | | | 22,974,481 | |
| | | | | | | | |
| | | | | | | | |
Health Care Equipment & Supplies: 2.4% | |
Poly Medicure, Ltd. | | | 1,090,503 | | | | 15,297,198 | |
| | | | | | | | |
Total Health Care | | | | | | | 66,319,930 | |
| | | | | | | | |
| | | | | | | | |
| |
| CONSUMER STAPLES: 9.2% | |
Personal Care Products: 5.2% | |
Hindustan Unilever, Ltd. | | | 753,854 | | | | 24,647,254 | |
| | |
Dabur India, Ltd. | | | 1,288,984 | | | | 9,016,619 | |
| | | | | | | | |
| | | | | | | 33,663,873 | |
| | | | | | | | |
| | | | | | | | |
Food Products: 4.0% | |
Britannia Industries, Ltd. | | | 229,805 | | | | 14,091,086 | |
| | |
Nestle India, Ltd. | | | 44,360 | | | | 12,397,004 | |
| | | | | | | | |
| | | | | | | 26,488,090 | |
| | | | | | | | |
Total Consumer Staples | | | | | | | 60,151,963 | |
| | | | | | | | |
| | | | | | | | |
| |
| MATERIALS: 7.0% | |
Chemicals: 3.8% | |
PI Industries, Ltd. | | | 263,654 | | | | 12,623,174 | |
| | |
Asian Paints, Ltd. | | | 245,661 | | | | 10,087,791 | |
| | |
Carborundum Universal, Ltd. | | | 129,734 | | | | 1,897,784 | |
| | | | | | | | |
| | | | | | | 24,608,749 | |
| | | | | | | | |
| | | | | | | | |
Metals & Mining: 1.7% | | | | | | | | |
APL Apollo Tubes, Ltd. | | | 715,848 | | | | 11,409,085 | |
| | | | | | | | |
| | | | | | | | |
Construction Materials: 1.5% | |
Ramco Cements, Ltd. | | | 855,004 | | | | 9,654,466 | |
| | | | | | | | |
Total Materials | | | | | | | 45,672,300 | |
| | | | | | | | |
| | | | | | | | |
| |
| INDUSTRIALS: 6.5% | |
Machinery: 3.3% | |
Ashok Leyland, Ltd. | | | 6,374,760 | | | | 13,039,087 | |
| | |
Cummins India, Ltd. | | | 354,455 | | | | 8,413,588 | |
| | | | | | | | |
| | | | | | | 21,452,675 | |
| | | | | | | | |
| | | | | | | | |
Transportation Infrastructure: 1.4% | |
Gujarat Pipavav Port, Ltd. | | | 5,896,635 | | | | 8,849,317 | |
| | | | | | | | |
| | | | | | | | |
Industrial Conglomerates: 0.7% | | | | | | | | |
Siemens, Ltd. | | | 102,509 | | | | 4,714,588 | |
| | | | | | | | |
| | | | | | | | |
Electrical Equipment: 0.6% | | | | | | | | |
ABB India, Ltd. | | | 49,952 | | | | 2,698,079 | |
| | |
TD Power Systems, Ltd. | | | 382,626 | | | | 1,155,509 | |
| | | | | | | | |
| | | | | | | 3,853,588 | |
| | | | | | | | |
| | | | | | | | |
Professional Services: 0.5% | | | | | | | | |
Latent View Analytics, Ltd.c | | | 803,985 | | | | 3,460,447 | |
| | | | | | | | |
Total Industrials | | | | | | | 42,330,615 | |
| | | | | | | | |
| | | | | | | | |
| | | | matthewsasia.com | 800.789.ASIA | | | 49 | |
Matthews India Fund
June 30, 2023
Schedule of Investmentsa (unaudited) (continued)
COMMON EQUITIES (continued)
| | | | | | | | |
| | | Shares | | | Value | |
| |
| ENERGY: 4.5% | |
Oil, Gas & Consumable Fuels: 4.5% | |
Reliance Industries, Ltd. | | | 945,197 | | | | $29,462,818 | |
| | | | | | | | |
Total Energy | | | | | | | 29,462,818 | |
| | | | | | | | |
| | | | | | | | |
| | | |
| TOTAL COMMON EQUITIES | | | | | | | 650,910,326 | |
| | | | | | | | |
(Cost $509,997,853) | | | | | | | | |
| | | | | | | | |
|
NON-CONVERTIBLE CORPORATE BONDS: 0.0% | |
| | | Face Amount* | | | | |
| | |
| CONSUMER STAPLES: 0.0% | | | | | | | | |
Food Products: 0.0% | | | | | | | | |
Britannia Industries, Ltd., Series N3 5.500%, 06/03/2024 | | | INR 1,996,476 | | | | 23,852 | |
| | | | | | | | |
Total Consumer Staples | | | | | | | 23,852 | |
| | | | | | | | |
| | | | | | | | |
| | |
| TOTAL NON-CONVERTIBLE CORPORATE BONDS | | | | 23,852 | |
| | | | | | | | |
(Cost $27,435) | | | | | | | | |
| | | | | | | | |
| | | |
| TOTAL INVESTMENTS: 99.8% | | | | | | | 650,934,178 | |
(Cost $510,025,288) | | | | | | | | |
| | | | | | | | |
| | |
CASH AND OTHER ASSETS,
LESS LIABILITIES: 0.2% | | | | | | | 1,054,292 | |
| | | | | | | | |
| | |
NET ASSETS: 100.0% | | | | | | | $651,988,470 | |
| | | | | | | | |
| a | Certain securities were fair valued under the valuation policies approved by the Board of Trustees (Note 2-A). |
| b | Security exempt from registration under Rule 144A of the Securities Act of 1933, as amended. The security may be resold in transactions exempt from registration normally to qualified institutional buyers. The security has been determined to be liquid in accordance with procedures adopted by the Funds’ Board of Trustees. At June 30, 2023, the aggregate value is $53,667,623, which is 8.23% of net assets. |
| c | Non-income producing security. |
| d | The securities may be resold to qualified foreign investors and foreign institutional buyers under Regulation S of the Securities Act of 1933. |
| * | All Values in USD unless otherwise specified. |
See accompanying notes to financial statements.
| | | | |
PORTFOLIO MANAGERS |
| |
| Taizo Ishida | | Shuntaro Takeuchi |
Lead Manager | | Lead Manager |
| |
| Donghoon Han | | |
Co-Manager | | |
|
| FUND FACTS |
| | |
| | | Investor | | Institutional |
Ticker | | MJFOX | | MIJFX |
CUSIP | | 577130800 | | 577130792 |
Inception | | 12/31/98 | | 10/29/10 |
NAV | | $16.90 | | $16.94 |
Initial Investment | | $2,500 | | $100,000 |
Gross Expense Ratio1 | | 1.05% | | 0.97% |
Portfolio Statistics | | | | |
Total # of Positions | | 56 |
Net Assets | | $690.2 million |
Weighted Average Market Cap | | $42.5 billion |
Portfolio Turnover2 | | 83.4% |
Benchmark |
MSCI Japan Index |
OBJECTIVE
Long-term capital appreciation.
STRATEGY
Under normal market conditions, the Fund seeks to achieve its investment objective by investing at least 80% of its net assets, which include borrowings for investment purposes, in the common and preferred stocks of companies located in Japan.
Matthews Japan Fund
Portfolio Manager Commentary (unaudited)
Period ended June 30, 2023
For the first half of 2023, the Matthews Japan Fund returned 13.42% (Investor Class) and 13.46% (Institutional Class), while its benchmark, the MSCI Japan Index, returned 13.24% over the same period. For the quarter ending June 30, 2023, the Fund returned 4.90% (Investor Class) and 4.89% (Institutional Class), while the benchmark returned 6.45%.
Market Environment
Japan equity markets posted double digit returns for the first half of 2023, along with other developed markets, outpacing emerging markets. Japanese stocks continued their march higher during the second quarter as government policy and activist pressure pushed undervalued companies to increase their payout and buy-back ratios. Hopes over China’s reopening waned quickly but the U.S. Federal Reserve’s pace of rate hike slowing amid inflation rates starting to peak out spurred a general risk-on environment. The Japanese yen traded in a range bound for the first three months of the year but in the second quarter, as U.S. 10-year bond yield rose towards 4%, the yen weakened towards 145 yen against the U.S. dollar.
Japan enjoys several tailwinds for the first time in years including a positive earnings cycle driven by moderate inflation, meaningful wage gains and policy driven reforms which are pushing companies to increase their corporate value via capital efficiencies and shareholder payouts. In addition, the recovery in inbound tourism plus the fact that Japan lacks the geopolitical headwinds of China is creating positive foreign inflows into Japan.
Performance Contributors and Detractors
In the first half, strong stock selections were able to overcome the detraction from an allocation effect versus the benchmark index. From a sector perspective, our stock selection in information technology and consumer staples were the two largest contributors to relative performance year to date. On the other hand, the portfolio’s underweight and stock selection in industrials was the biggest detractor.
At the holdings level semiconductor company Renesas Electronics was the largest contributor to investment results. Shares reacted positively after earnings results in February, with progress being made in inventory adjustments showed the company’s solid execution during downturns. We continue to see Renesas constructively as its valuation level still remains compelling even after the strong performance year to date, and the potential for the company to improve shareholder returns. Electronic materials and chemical product company Shin-Etsu Chemical was another top contributor. The company continues to impress the market with solid execution capability during economic downturns and inventory adjustment periods related to both semiconductor wafers and polyvinyl chloride (PVC) demand. Over the long term, we remain bullish on the semiconductor market as well as the wafer market, where Shin-Etsu is a solid global leader with pricing power.
On the other hand, debt guarantor eGuarantee was the largest detractor year to date. The company’s shares weakened as small-cap growth companies faced unfavorable style movements in markets but eGuarantee is poised to benefit from a rise in bankruptcies as COVID-related relief funds have started to expire. eGuarantee is in the business of guaranteeing various types of credit that arise between companies doing business with each other. The credit guarantee business is a niche market, but it is a growing market in which eGuarantee is the leader. Furniture retailer Nitori was also a major detractor to investment results. The company has
(continued)
| 1 | Prospectus expense ratios. |
| 2 | The lesser of fiscal year 2022 long-term purchase costs or sales proceeds divided by the average monthly market value of long-term securities. |
| | | | | | | | |
| | | | matthewsasia.com | 800.789.ASIA | | | 51 | |
| | | | | | | | | | | | | | | | | | | | | | | | | | | | | | | | |
| | |
| PERFORMANCE AS OF JUNE 30, 2023 | | | | |
| | | | | | | | | | | | Average Annual Total Returns | | | | |
| | | 3 Months | | | YTD | | | 1 Year | | | 3 Years | | | 5 Years | | | 10 Years | | | Since
Inception | | | Inception
Date | |
| Investor Class (MJFOX) | | | 4.90% | | | | 13.42% | | | | 15.51% | | | | 1.36% | | | | 0.94% | | | | 6.20% | | | | 5.49% | | | | 12/31/98 | |
| Institutional Class (MIJFX) | | | 4.89% | | | | 13.46% | | | | 15.48% | | | | 1.42% | | | | 0.99% | | | | 6.28% | | | | 7.44% | | | | 10/29/10 | |
| MSCI Japan Index3 | | | 6.45% | | | | 13.24% | | | | 18.62% | | | | 6.09% | | | | 3.51% | | | | 5.59% | | | | 3.70% | 4 | | | | |
Performance assumes reinvestment of all dividends and/or distributions before taxes. All performance quoted represents past performance and is no guarantee of future results. Investment return and principal value will fluctuate with market conditions so that when redeemed, shares may be worth more or less than their original cost. Current performance may be lower or higher than the return figures quoted. For the Fund’s most recent month-end performance, visit matthewsasia.com.
GROWTH OF A HYPOTHETICAL $10,000 INVESTMENT SINCE INCEPTION—INVESTOR CLASS
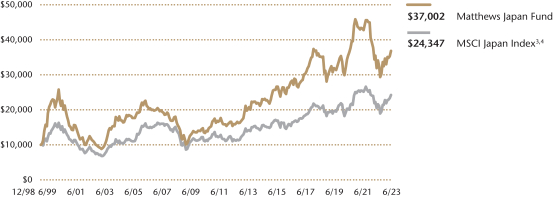
Plotted monthly. The performance data and graph do not reflect the deduction of taxes that a shareholder would pay on dividends, capital gains distributions or redemption of Fund shares. Values are in US$.
| �� | 3 | It is not possible to invest directly in an index. Source: Index data from Morgan Stanley Capital International and Bloomberg; total return calculations performed by BNY Mellon Investment Servicing (US) Inc. Please see page 76 for index definitions. |
| | 4 | Calculated from 12/31/98. |
| | | | | | | | | | |
| | | | |
| TOP TEN HOLDINGS5 | | | | | | | | |
| Name | | Sector | | | | | % Net Assets | |
Keyence Corp. | | Information Technology | | | | | | | 4.1% | |
Sony Group Corp. | | Consumer Discretionary | | | | | | | 4.0% | |
Shin-Etsu Chemical Co., Ltd. | | Materials | | | | | | | 4.0% | |
Tokio Marine Holdings, Inc | | Financials | | | | | | | 3.8% | |
Renesas Electronics Corp. | | Information Technology | | | | | | | 3.7% | |
ITOCHU Corp. | | Industrials | | | | | | | 3.3% | |
Ajinomoto Co., Inc. | | Consumer Staples | | | | | | | 3.1% | |
ORIX Corp. | | Financials | | | | | | | 3.1% | |
Hitatchi, Ltd. | | Industrials | | | | | | | 3.1% | |
Denso Coprp. | | Consumer Discretionary | | | | | | | 2.9% | |
TOTAL | | | | | | | | | 35.1% | |
| | 5 | Holdings may combine more than one security from same issuer and related depositary receipts. |
Matthews Japan Fund
Portfolio Manager Commentary (unaudited) (continued)
high exposure to currency rates, as it manufactures furniture overseas while the majority of its retail operations are in Japan. Yen weakness resumed especially in the second quarter, which pushed down the company’s own efforts to raise prices and introduce new products that can adapt to current currency environment.
Notable Portfolio Changes
During the second quarter, we initiated a position in credit card company Credit Saison. The company, in our view, could offer double digit profit growth coupled with increased shareholder return potential. While total card membership numbers are not growing, revolving loan total has turned positive year over year (YoY) post COVID and cashing loans has started to bottom out. Credit Saison’s India subsidiary (Kisetsu Saison Finance India) is growing above expectations and starting to contribute to earnings.
We have also re-initiated Toyota Motor after a year of hiatus. The stock has underperformed the overall market over the past year due to production constraints stemming from semiconductor shortage but the shortage has been largely resolved while the company has been quietly increasing its market share in Europe and Chinese markets with its hybrid vehicles.
To fund these positions, we exited Daikin Industries, IHI, Lasertec, Mitsubishi UFJ Financial Group, Nippon Telegraph & Telephone, and SMS Company.
Outlook
While the market seems ready for the Fed to pivot its interest-rate policy and for inflation to peak out, we believe the Fed is hesitant to prematurely remove its hawkish policies to contain inflation. With this backdrop, we don’t see a sudden reversal of growth underperformance in Japan anytime soon, although we also think that we have seen the worst in terms of style shift. We continue to prefer taking a more balanced approach towards multiple stages of growth and valuation levels. For the year of 2023, companies’ earnings growth and cash flow-generation ability will be ever more important as financial estimates for Japanese corporates have started to be revised down.
Over the long term, we continue to believe the earnings capability of Japanese companies has improved meaningfully over the past economic cycle. Last year, the Japanese equity market outperformed both developed markets (MSCI World) and emerging markets (MSCI Emerging Market) in U.S. dollar terms. With the yen at a near quarter-century-low to the dollar, Japanese companies are in good health and, importantly, the country is firmly open for tourism. We continue to believe this is the time for investors to add a long-term exposure to the market.
The MSCI World Index captures large and mid-cap representation across 23 Developed Markets (DM) countries. With 1,512 constituents, the index covers approximately 85% of the free float-adjusted market capitalization in each country.
| | | | |
| |
| COUNTRY ALLOCATION (%)6 | |
Japan | | | 95.9 | |
Cash and Other Assets, Less Liabilities | | | 4.1 | |
| | | | |
| | |
| SECTOR ALLOCATION (%)6 | | | |
Consumer Discretionary | | | 22.3 | |
Information Technology | | | 18.2 | |
Industrials | | | 18.1 | |
Financials | | | 10.9 | |
Health Care | | | 8.0 | |
Communication Services | | | 6.6 | |
Consumer Staples | | | 6.3 | |
Materials | | | 4.7 | |
Real Estate | | | 0.7 | |
Cash and Other Assets, Less Liabilities | | | 4.1 | |
| | | | |
| | |
| MARKET CAP EXPOSURE (%)6 | | | |
Mega Cap (over $25B) | | | 44.4 | |
Large Cap ($10B-$25B) | | | 26.4 | |
Mid Cap ($3B-10B) | | | 17.8 | |
Small Cap (under $3B) | | | 7.2 | |
Cash and Other Assets, Less Liabilities | | | 4.1 | |
| 6 | Source: FactSet Research Systems. Percentage values in data are rounded to the nearest tenth of one percent, so the values may not sum to 100% due to rounding. Country allocations and percentage values may be derived from different data sources and may not be consistent with other Fund literature. |
| | | | | | | | |
| | | | matthewsasia.com | 800.789.ASIA | | | 53 | |
Matthews Japan Fund
June 30, 2023
Schedule of Investmentsa (unaudited)
COMMON EQUITIES: 95.9%
| | | | | | | | |
| | | Shares | | | Value | |
| |
| CONSUMER DISCRETIONARY: 22.3% | | | | | |
Automobiles: 5.2% | | | | | | | | |
Toyota Motor Corp. | | | 1,174,700 | | | | $18,879,883 | |
| | |
Suzuki Motor Corp. | | | 465,200 | | | | 16,869,456 | |
| | | | | | | | |
| | | | | | | 35,749,339 | |
| | | | | | | | |
| | | | | | | | |
Household Durables: 4.0% | | | | | | | | |
Sony Group Corp. | | | 304,100 | | | | 27,451,171 | |
| | | | | | | | |
| | | | | | | | |
Specialty Retail: 3.5% | | | | | | | | |
Fast Retailing Co., Ltd. | | | 54,900 | | | | 14,080,467 | |
| | |
Nitori Holdings Co., Ltd. | | | 90,900 | | | | 10,207,550 | |
| | | | | | | | |
| | | | | | | 24,288,017 | |
| | | | | | | | |
| | | | | | | | |
Leisure Products: 3.1% | | | | | | | | |
Sega Sammy Holdings, Inc. | | | 616,000 | | | | 13,196,437 | |
| | |
Bandai Namco Holdings, Inc. | | | 348,100 | | | | 8,061,062 | |
| | | | | | | | |
| | | | | | | 21,257,499 | |
| | | | | | | | |
| | | | | | | | |
Automobile Components: 2.9% | | | | | | | | |
Denso Corp. | | | 299,900 | | | | 20,228,895 | |
| | | | | | | | |
| | | | | | | | |
Textiles, Apparel & Luxury Goods: 2.6% | | | | | |
Asics Corp. | | | 578,400 | | | | 17,899,185 | |
| | | | | | | | |
| | | | | | | | |
Hotels, Restaurants & Leisure: 1.0% | | | | | | | | |
Kyoritsu Maintenance Co., Ltd. | | | 182,100 | | | | 6,923,428 | |
| | | | | | | | |
Total Consumer Discretionary | | | | | | | 153,797,534 | |
| | | | | | | | |
| | | | | | | | |
| | | |
| INFORMATION TECHNOLOGY: 18.2% | | | | | | | | |
Semiconductors & Semiconductor Equipment: 5.3% | | | | | |
Renesas Electronics Corp.b | | | 1,338,700 | | | | 25,264,368 | |
| | |
Disco Corp. | | | 70,400 | | | | 11,161,638 | |
| | | | | | | | |
| | | | | | | 36,426,006 | |
| | | | | | | | |
| | | | | | | | |
Electronic Equipment, Instruments & Components: 5.2% | |
Keyence Corp. | | | 59,200 | | | | 28,129,277 | |
| | |
Taiyo Yuden Co., Ltd. | | | 266,700 | | | | 7,634,621 | |
| | | | | | | | |
| | | | | | | 35,763,898 | |
| | | | | | | | |
| | | | | | | | |
IT Services: 5.0% | | | | | | | | |
OBIC Co., Ltd. | | | 97,600 | | | | 15,665,621 | |
| | |
Nomura Research Institute, Ltd. | | | 447,800 | | | | 12,371,569 | |
| | |
SHIFT, Inc.b | | | 27,900 | | | | 5,114,310 | |
| | |
Simplex Holdings, Inc. | | | 75,800 | | | | 1,389,257 | |
| | | | | | | | |
| | | | | | | 34,540,757 | |
| | | | | | | | |
| | | | | | | | |
Technology Hardware, Storage & Peripherals: 1.9% | | | | | |
FUJIFILM Holdings Corp. | | | 227,300 | | | | 13,543,253 | |
| | | | | | | | |
| | | | | | | | |
Software: 0.8% | | | | | | | | |
Appier Group, Inc.b | | | 454,900 | | | | 5,580,736 | |
| | | | | | | | |
Total Information Technology | | | | | | | 125,854,650 | |
| | | | | | | | |
| | | | | | | | |
| | | |
| INDUSTRIALS: 18.1% | | | | | | | | |
Trading Companies & Distributors: 5.2% | | | | | |
ITOCHU Corp. | | | 571,300 | | | | 22,692,925 | |
| | |
Toyota Tsusho Corp. | | | 271,100 | | | | 13,548,522 | |
| | | | | | | | |
| | | | | | | 36,241,447 | |
| | | | | | | | |
| | | | | | | | |
Industrial Conglomerates: 4.9% | | | | | |
Hitachi, Ltd. | | | 338,600 | | | | 21,052,966 | |
| | |
Hikari Tsushin, Inc. | | | 87,600 | | | | 12,573,388 | |
| | | | | | | | |
| | | | | | | 33,626,354 | |
| | | | | | | | |
| | | | | | | | |
| | | | | | | | |
| | | Shares | | | Value | |
Electrical Equipment: 2.4% | | | | | |
Mitsubishi Electric Corp. | | | 1,186,500 | | | | $16,773,369 | |
| | | | | | | | |
| | | | | | | | |
Construction & Engineering: 1.8% | | | | | | | | |
Taisei Corp. | | | 191,600 | | | | 6,694,190 | |
| | |
JGC Holdings Corp. | | | 236,600 | | | | 3,076,376 | |
| | |
Kajima Corp. | | | 184,400 | | | | 2,784,186 | |
| | | | | | | | |
| | | | | | | 12,554,752 | |
| | | | | | | | |
| | | | | | | | |
Machinery: 1.8% | | | | | |
Miura Co., Ltd. | | | 335,500 | | | | 8,769,372 | |
| | |
NTN Corp. | | | 1,616,500 | | | | 3,424,052 | |
| | | | | | | | |
| | | | | | | 12,193,424 | |
| | | | | | | | |
| | | | | | | | |
Commercial Services & Supplies: 1.2% | | | | | |
TOPPAN, Inc. | | | 367,700 | | | | 7,946,614 | |
| | | | | | | | |
| | | | | | | | |
Professional Services: 0.8% | | | | | |
BayCurrent Consulting, Inc. | | | 155,400 | | | | 5,843,344 | |
| | | | | | | | |
Total Industrials | | | | | | | 125,179,304 | |
| | | | | | | | |
| | | | | | | | |
| | | |
| FINANCIALS: 10.9% | | | | | | | | |
Financial Services: 3.8% | | | | | |
ORIX Corp. | | | 1,172,800 | | | | 21,387,414 | |
| | |
eGuarantee, Inc. | | | 349,400 | | | | 4,661,572 | |
| | | | | | | | |
| | | | | | | 26,048,986 | |
| | | | | | | | |
| | | | | | | | |
Insurance: 3.7% | | | | | |
Tokio Marine Holdings, Inc. | | | 1,126,000 | | | | 25,958,318 | |
| | | | | | | | |
| | | | | | | | |
Consumer Finance: 1.9% | | | | | |
Credit Saison Co., Ltd. | | | 835,900 | | | | 12,854,978 | |
| | | | | | | | |
| | | | | | | | |
Banks: 1.5% | | | | | |
Sumitomo Mitsui Financial Group, Inc. | | | 238,300 | | | | 10,213,406 | |
| | | | | | | | |
Total Financials | | | | | | | 75,075,688 | |
| | | | | | | | |
| | | | | | | | |
| | | |
| HEALTH CARE: 8.0% | | | | | | | | |
Health Care Equipment & Supplies: 4.1% | | | | | |
Olympus Corp. | | | 809,200 | | | | 12,805,877 | |
| | |
Hoya Corp. | | | 84,200 | | | | 10,075,898 | |
| | |
Asahi Intecc Co., Ltd. | | | 276,100 | | | | 5,435,846 | |
| | | | | | | | |
| | | | | | | 28,317,621 | |
| | | | | | | | |
| | | | | | | | |
Pharmaceuticals: 2.7% | | | | | |
Daiichi Sankyo Co., Ltd. | | | 370,200 | | | | 11,762,838 | |
| | |
Takeda Pharmaceutical Co., Ltd. | | | 211,000 | | | | 6,630,160 | |
| | | | | | | | |
| | | | | | | 18,392,998 | |
| | | | | | | | |
| | | | | | | | |
Health Care Providers & Services: 0.8% | | | | | |
Amvis Holdings, Inc. | | | 236,700 | | | | 5,388,212 | |
| | | | | | | | |
Biotechnology: 0.4% | | | | | |
PeptiDream, Inc.b | | | 197,700 | | | | 2,967,813 | |
| | | | | | | | |
Total Health Care | | | | | | | 55,066,644 | |
| | | | | | | | |
| | | | | | | | |
| | |
| COMMUNICATION SERVICES: 6.6% | | | | | |
Entertainment: 3.2% | | | | | | | | |
Capcom Co., Ltd. | | | 328,200 | | | | 13,009,995 | |
| | |
Toho Co., Ltd. | | | 241,300 | | | | 9,190,996 | |
| | | | | | | | |
| | | | | | | 22,200,991 | |
| | | | | | | | |
| | | | | | | | |
Wireless Telecommunication Services: 2.9% | | | | | |
KDDI Corp. | | | 352,600 | | | | 10,889,388 | |
| | |
SoftBank Group Corp. | | | 197,000 | | | | 9,290,444 | |
| | | | | | | | |
| | | | | | | 20,179,832 | |
| | | | | | | | |
| | | | | | | | |
Matthews Japan Fund
June 30, 2023
Schedule of Investmentsa (unaudited) (continued)
COMMON EQUITIES (continued)
| | | | | | | | |
| | | Shares | | | Value | |
Diversified Telecommunication Services: 0.5% | | | | | |
Internet Initiative Japan, Inc. | | | 180,100 | | | | $3,394,926 | |
| | | | | | | | |
Total Communication Services | | | | | | | 45,775,749 | |
| | | | | | | | |
| | | | | | | | |
| | |
| CONSUMER STAPLES: 6.3% | | | | | |
Food Products: 4.6% | | | | | | | | |
Ajinomoto Co., Inc. | | | 542,500 | | | | 21,611,493 | |
| | |
Nissin Foods Holdings Co., Ltd. | | | 122,400 | | | | 10,120,652 | |
| | | | | | | | |
| | | | | | | 31,732,145 | |
| | | | | | | | |
| | | | | | | | |
Household Products: 1.7% | | | | | |
Unicharm Corp. | | | 323,900 | | | | 12,044,187 | |
| | | | | | | | |
Total Consumer Staples | | | | | | | 43,776,332 | |
| | | | | | | | |
| | | | | | | | |
| | | |
| MATERIALS: 4.8% | | | | | | | | |
Chemicals: 4.8% | | | | | | | | |
Shin-Etsu Chemical Co., Ltd. | | | 817,900 | | | | 27,332,546 | |
| | |
Mitsui Chemicals, Inc. | | | 115,700 | | | | 3,410,346 | |
| | |
Tokyo Ohka Kogyo Co., Ltd. | | | 32,500 | | | | 1,993,210 | |
| | | | | | | | |
Total Materials | | | | | | | 32,736,102 | |
| | | | | | | | |
| | | | | | | | |
| | | |
| REAL ESTATE: 0.7% | | | | | | | | |
Real Estate Management & Development: 0.7% | | | | | |
TKP Corp.b | | | 241,900 | | | | 4,620,249 | |
| | | | | | | | |
Total Real Estate | | | | | | | 4,620,249 | |
| | | | | | | | |
| | | | | | | | |
| | |
| TOTAL INVESTMENTS: 95.9% | | | | 661,882,252 | |
(Cost $583,404,372) | | | | | | | | |
| | | | | | | | |
| | |
CASH AND OTHER ASSETS,
LESS LIABILITIES: 4.1% | | | | | | | 28,357,271 | |
| | | | | | | | |
| | |
NET ASSETS: 100.0% | | | | | | | $690,239,523 | |
| | | | | | | | |
| a | Certain securities were fair valued under the valuation policies approved by the Board of Trustees (Note 2-A). |
| b | Non-income producing security. |
See accompanying notes to financial statements.
| | | | | | | | |
| | | | matthewsasia.com | 800.789.ASIA | | | 55 | |
| | | | |
| PORTFOLIO MANAGERS |
| |
| Michael J. Oh, CFA | | Elli Lee |
Lead Manager | | Lead Manager |
| | |
| Sojung Park | | | | |
Co-Manager | | | | |
| | | | |
|
| FUND FACTS† |
| | |
| | | | | Institutional |
Ticker | | | | MIKOX |
CUSIP | | | | 577130826 |
Inception | | | | 10/29/10 |
NAV | | | | $24.88 |
Initial Investment | | | | $100,000 |
Gross Expense Ratio1 | | | | 1.08% |
Portfolio Statistics |
Total # of Positions | | 36 |
Net Assets | | $65.0 million |
Weighted Average
Market Cap | | $93.1 billion |
Portfolio Turnover2 | | 56.9% |
Benchmarks |
Korea Composite Stock Price Index |
MSCI Korea Index |
OBJECTIVE
Long-term capital appreciation.
STRATEGY
Under normal market conditions, the Fund seeks to achieve its investment objective by investing at least 80% of its net assets, which include borrowings for investment purposes, in the common and preferred stocks of companies located in South Korea.
Matthews Korea Fund*
Portfolio Manager Commentary (unaudited)
Period ended June 30, 2023
For the first half of 2023, the Matthews Korea Fund returned 9.14% (Institutional Class), while its benchmark, the Korea Composite Stock Price Index (KOSPI), returned 10.10% over the same period. For the quarter ended June 30, 2023, the Fund returned 3.25% (Institutional Class), while the benchmark returned 2.43%.
Market Environment
Regionally, the first six months of the year were turbulent. 2023 started with expectations that China’s lifting of its zero-COVID policy would generate a reopening boost though that didn’t play out as many expected. China’s market has been volatile and negative and its challenges have had implications for macro-related stocks in Korea, especially the more commodities- and oil-oriented sectors. From a global perspective, the environment feels polarized, with the U.S. still in better economic shape than China and Europe—resulting in stronger performance for companies with U.S. exposure compared with those without. Within Korea, technology did quite well, as did automotive companies given their exposure to the U.S. market where auto demand has remained resilient and has generated healthy operating profits for businesses with exposure.
Performance Contributors and Detractors
At the sector level, the Fund’s underweight and stock selection to industrials was the biggest detractor to relative performance in the first half. This was primarily due to our lack of exposure to battery-cell maker LG Energy Solutions. We believe the company’s high valuation outweighs it positives. An overweight and stock selection in energy also detracted as did an overweight to consumer staples which weighed on relative returns as the sector consolidated gains following a positive 2022. Conversely, our underweight and stock selection in financials was the top contributor and our overweight in IT was the biggest single contributor. Korea has started building an ecosystem around semiconductor production equipment (SPE) and has made itself into a destination for memory and foundry manufacturing. We have accordingly been accumulating positions in companies that can take share among Korean and global customers alike. Stock selection in consumer discretionary also contributed.
At the individual holdings level, S-Oil, a refiner, and BGF Retail, an operator of convenience stories, were among the biggest detractors. We like S-Oil’s management and its shareholder returns policy but against a backdrop of deteriorating crude prices its earnings visibility remains low and has pressured shares. BGF benefited from stellar performance during COVID and into 2022, however, given higher earnings expectations and a higher valuation, the stock pared some of its gains in the period. Growing concerns around food inflation are pressuring the government to act on prices and there is increasing regulatory risk in the sector. These headwinds aside, BGF is taking share with superior merchandising capabilities.
On the flip side, SK Hynix and HPSP were the strongest contributors. Shares of semiconductor provider SK Hynix have appreciated as we increasingly see signs of a bottom in memory inventory levels and improvements in supply chain issues. The company is also getting AI-related orders from NVIDIA. HPSP makes high-pressure, heat treatment semiconductor equipment. The company’s specialized technology helps its customers produce the most advanced node migration in semiconductor manufacturing.
(continued)
| * | The Matthews Korea Fund reorganized into the Matthews Korea Active ETF on July 14, 2023. |
| † | Investor Class shares of the Fund were converted into Institutional Class shares on June 20, 2023. |
| 1 | Prospectus expense ratios. |
| 2 | The lesser of fiscal year 2022 long-term purchase costs or sales proceeds divided by the average monthly market value of long-term securities. |
| | | | | | | | | | | | | | | | | | | | | | | | | | | | | | | | |
| | | | | | | | | |
| PERFORMANCE AS OF JUNE 30, 2023 | | | | | | | | | | | | | | | | | | | | | | | | |
| | | | | | | | | | | | Average Annual Total Returns | | | | |
| | | 3 Months | | | YTD | | | 1 Year | | | 3 Years | | | 5 Years | | | 10 Years | | | Since
Inception | | | Inception
Date | |
Institutional Class (MIKOX) | | | 3.25% | | | | 9.14% | | | | 8.64% | | | | 6.14% | | | | 0.96% | | | | 5.68% | | | | 5.62% | | | | 10/29/10 | |
Korea Composite Stock Price Index3 | | | 2.43% | | | | 10.10% | | | | 9.63% | | | | 5.64% | | | | 0.69% | | | | 3.69% | | | | 3.00% | | | | | |
| MSCI Korea Index4 | | | 4.52% | | | | 14.61% | | | | 13.60% | | | | 5.46% | | | | 1.58% | | | | 4.69% | | | | 3.99% | | | | | |
Performance assumes reinvestment of all dividends and/or distributions before taxes. All performance quoted represents past performance and is no guarantee of future results. Investment return and principal value will fluctuate with market conditions so that when redeemed, shares may be worth more or less than their original cost. Current performance may be lower or higher than the return figures quoted. For the Fund’s most recent month-end performance, visit matthewsasia.com.
GROWTH OF A HYPOTHETICAL $10,000 INVESTMENT SINCE INCEPTION—INSTITUTIONAL CLASS
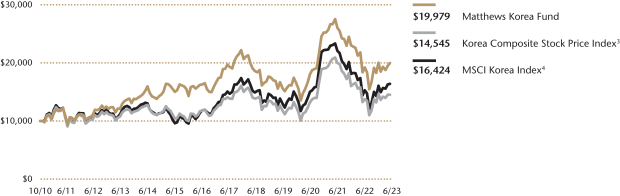
Plotted monthly. The performance data and graph do not reflect the deduction of taxes that a shareholder would pay on dividends, capital gains distributions or redemption of Fund shares. Values are in US$.
| | 3 | Korea Composite Stock Price Index performance data may be readjusted periodically by the Korea Exchange due to certain factors, including the declaration of dividends. It is not possible to invest directly in an index. Source: Index data from Korea Composite Stock Price Index and Bloomberg; total return calculations performed by BNY Mellon Investment Servicing (US) Inc. Please see page 76 for index definition. |
| | 4 | It is not possible to invest directly in an index. Source: Index data from Morgan Stanley Capital International and Bloomberg; total return calculations performed by BNY Mellon Investment Servicing (US) Inc. Please see page 76 for index definitions. |
| | | | | | | | |
| | | | |
| TOP TEN HOLDINGS5 | | | | | | | |
| Name | | Sector | | | | % Net Assets | |
| Samsung Electronics Co., Ltd., Pfd. | | Information Technology | | | | | 14.8% | |
| SK Hynix, Inc. | | Information Technology | | | | | 8.0% | |
| Samsung Electronics Co., Ltd. | | Information Technology | | | | | 6.0% | |
| Samsung SDI Co., Ltd. | | Information Technology | | | | | 4.1% | |
| Yuhan Corp. | | Health Care | | | | | 3.6% | |
| BGF Retail Co., Ltd. | | Consumer Staples | | | | | 3.6% | |
| S-Oil Corp. | | Energy | | | | | 3.1% | |
| Kia Corp. | | Consumer Discretionary | | | | | 2.8% | |
| KoMiCo., Ltd. | | Information Technology | | | | | 2.7% | |
| Hyundai Mobis Co., Ltd. | | Consumer Discretionary | | | | | 2.6% | |
| TOTAL | | | | | 51.3% | |
| | 5 | Holdings may combine more than one security from same issuer and related depositary receipts. |
| | | | | | | | |
| | | | matthewsasia.com | 800.789.ASIA | | | 57 | |
| | | | |
| | |
| COUNTRY ALLOCATION (%)6 | | | |
| South Korea | | | 95.7 | |
| Cash and Other Assets, Less Liabilities | | | 4.3 | |
| | | | |
| | |
| SECTOR ALLOCATION (%)6 | | | |
Information Technology | | | 42.3 | |
Consumer Discretionary | | | 11.3 | |
Consumer Staples | | | 8.2 | |
Health Care | | | 7.3 | |
Industrials | | | 6.9 | |
Materials | | | 6.0 | |
Communication Services | | | 5.7 | |
Financials | | | 4.9 | |
Energy | | | 3.1 | |
Cash and Other Assets, Less Liabilities | | | 4.3 | |
| | | | |
| | |
| MARKET CAP EXPOSURE (%)6 | | | |
Mega Cap (over $25B) | | | 44.5 | |
Large Cap ($10B-$25B) | | | 8.7 | |
Mid Cap ($3B-10B) | | | 20.5 | |
Small Cap (under $3B) | | | 22.0 | |
Cash and Other Assets, Less Liabilities | | | 4.3 | |
| 6 | Source: FactSet Research Systems. Percentage values in data are rounded to the nearest tenth of one percent, so the values may not sum to 100% due to rounding. Country allocations and percentage values may be derived from different data sources and may not be consistent with other Fund literature. |
Matthews Korea Fund
Portfolio Manager Commentary (unaudited) (continued)
Notable Portfolio Changes
In the last quarter, we capitalized on recent volatility to initiate a new position in Eugene Technology, a manufacturer of critical wafer components and semiconductor manufacturing equipment. Given the ongoing development of Korea’s SPE ecosystem, Eugene Technology is poised to benefit and take share from global competitors Samsung and SK Hynix. We anticipate local demand will only grow and that Eugene Technology’s product offering will gradually replace those of U.S. and Japanese players.
Conversely, we exited Leeno Industrial, a long-term holding and manufacturer of critical testing components for integrated circuit production. The last few years have been very positive for Leeno as key customers deployed ample R&D spending for new products, generating demand for Leeno’s test pins and sockets. Though we maintain our confidence in company management, the valuation is now elevated, and we chose to exit in favor of companies better positioned to take share as Korea’s SPE activity builds out. However, we will continue monitoring the company and should an opportunity present itself at an attractive valuation, we would consider reinitiating a position.
Outlook
We think a lot of the negative sentiment around China’s economic malaise is largely reflected in prices. Within the Fund, we own industrials, materials and energy names with strong capability for generating cash flow despite a difficult environment and that cater to global demand—many of which have been challenged year-to-date. But if we reach a bottom soon regarding negativity toward China, we anticipate these stocks will do better given their cash flow-generative capabilities and their fundamentals, which remain relatively intact.
In the interim, we will remain focused on what we do best, which is taking an active approach to security selection, focusing on innovative companies we believe are well-positioned to generate strong cash flows and capitalize on an improving global economic environment. We continue looking for businesses that can not only benefit from domestic consumption but can effectively compete and innovate in the global economy.
Matthews Korea Fund
June 30, 2023
Schedule of Investmentsa (unaudited)
COMMON EQUITIES: 81.0%
| | | | | | | | |
| | | Shares | | | Value | |
| | |
| INFORMATION TECHNOLOGY: 27.6% | | | | | | | | |
Semiconductors & Semiconductor Equipment: 14.3% | | | | | |
SK Hynix, Inc. | | | 58,997 | | | | $5,183,736 | |
| | |
KoMiCo., Ltd. | | | 36,712 | | | | 1,727,403 | |
| | |
HPSP Co., Ltd. | | | 59,124 | | | | 1,289,219 | |
| | |
Eugene Technology Co., Ltd. | | | 41,531 | | | | 1,079,205 | |
| | | | | | | | |
| | | | | | | 9,279,563 | |
| | | | | | | | |
| | | | | | | | |
Electronic Equipment, Instruments & Components: 7.3% | |
Samsung SDI Co., Ltd. | | | 5,269 | | | | 2,690,533 | |
| | |
Park Systems Corp. | | | 9,336 | | | | 1,338,263 | |
| | |
Samsung Electro-Mechanics Co., Ltd. | | | 6,702 | | | | 739,925 | |
| | | | | | | | |
| | | | | | | 4,768,721 | |
| | | | | | | | |
| | | | | | | | |
Technology Hardware, Storage & Peripherals: 6.0% | |
Samsung Electronics Co., Ltd. | | | 70,347 | | | | 3,873,537 | |
| | | | | | | | |
Total Information Technology | | | | | | | 17,921,821 | |
| | | | | | | | |
| | | | | | | | |
| | | |
| CONSUMER DISCRETIONARY: 11.3% | | | | | | | | |
Automobiles: 5.1% | | | | | | | | |
Kia Corp. | | | 27,092 | | | | 1,824,945 | |
| | |
Hyundai Motor Co. | | | 9,428 | | | | 1,482,971 | |
| | | | | | | | |
| | | | | | | 3,307,916 | |
| | | | | | | | |
| | | | | | | | |
Automobile Components: 3.9% | | | | | | | | |
Hyundai Mobis Co., Ltd. | | | 9,451 | | | | 1,673,272 | |
| | |
HL Mando Co., Ltd. | | | 20,863 | | | | 858,238 | |
| | | | | | | | |
| | | | | | | 2,531,510 | |
| | | | | | | | |
| | | | | | | | |
Broadline Retail: 2.3% | |
Coupang, Inc.b | | | 86,555 | | | | 1,506,057 | |
| | | | | | | | |
Total Consumer Discretionary | | | | | | | 7,345,483 | |
| | | | | | | | |
| | | | | | | | |
| | | |
| CONSUMER STAPLES: 8.2% | | | | | | | | |
Consumer Staples Distribution & Retail: 3.6% | | | | | |
BGF Retail Co., Ltd. | | | 17,433 | | | | 2,315,730 | |
| | | | | | | | |
| | | | | | | | |
Tobacco: 2.5% | | | | | |
KT&G Corp. | | | 25,799 | | | | 1,620,603 | |
| | | | | | | | |
| | | | | | | | |
Food Products: 2.1% | | | | | |
Orion Corp. | | | 15,140 | | | | 1,380,758 | |
| | | | | | | | |
Total Consumer Staples | | | | | | | 5,317,091 | |
| | | | | | | | |
| | | | | | | | |
| | | |
| HEALTH CARE: 7.3% | | | | | | | | |
Pharmaceuticals: 5.1% | | | | | | | | |
Yuhan Corp. | | | 51,216 | | | | 2,351,036 | |
| | |
DongKook Pharmaceutical Co., Ltd. | | | 90,730 | | | | 989,461 | |
| | | | | | | | |
| | | | | | | 3,340,497 | |
| | | | | | | | |
| | | | | | | | |
Life Sciences Tools & Services: 2.2% | | | | | |
Samsung Biologics Co., Ltd.b,c,d | | | 2,533 | | | | 1,434,128 | |
| | | | | | | | |
Total Health Care | | | | | | | 4,774,625 | |
| | | | | | | | |
| | | | | | | | |
| | | |
| INDUSTRIALS: 6.9% | | | | | | | | |
Marine Transportation: 2.5% | | | | | |
Pan Ocean Co., Ltd. | | | 403,728 | | | | 1,595,930 | |
| | | | | | | | |
| | | | | | | | |
Machinery: 2.4% | | | | | |
Hyundai Mipo Dockyard Co., Ltd.b | | | 24,440 | | | | 1,565,400 | |
| | | | | | | | |
| | | | | | | | |
| | | | | | | | |
| | | Shares | | | Value | |
Construction & Engineering: 2.0% | | | | | |
Samsung Engineering Co., Ltd.b | | | 61,010 | | | | $1,315,698 | |
| | | | | | | | |
Total Industrials | | | | | | | 4,477,028 | |
| | | | | | | | |
| | | | | | | | |
| | | |
| MATERIALS: 6.0% | | | | | | | | |
Chemicals: 3.2% | | | | | | | | |
LG Chem, Ltd. | | | 2,679 | | | | 1,363,777 | |
| | |
PI Advanced Materials Co., Ltd. | | | 23,665 | | | | 685,824 | |
| | | | | | | | |
| | | | | | | 2,049,601 | |
| | | | | | | | |
| | | | | | | | |
Metals & Mining: 2.8% | | | | | | | | |
POSCO Holdings, Inc. | | | 3,429 | | | | 1,014,819 | |
| | |
Korea Zinc Co., Ltd. | | | 2,205 | | | | 819,012 | |
| | | | | | | | |
| | | | | | | 1,833,831 | |
| | | | | | | | |
Total Materials | | | | | | | 3,883,432 | |
| | | | | | | | |
| | | | | | | | |
| | | |
| COMMUNICATION SERVICES: 5.7% | | | | | | | | |
Interactive Media & Services: 3.1% | | | | | | | | |
NAVER Corp. | | | 10,175 | | | | 1,424,346 | |
| | |
Kakao Corp. | | | 14,810 | | | | 556,263 | |
| | | | | | | | |
| | | | | | | 1,980,609 | |
| | | | | | | | |
| | | | | | | | |
Diversified Telecommunication Services: 1.3% | | | | | |
KINX, Inc. | | | 17,313 | | | | 859,798 | |
| | | | | | | | |
| | | | | | | | |
Wireless Telecommunication Services: 1.3% | | | | | |
SK Telecom Co., Ltd. | | | 23,698 | | | | 838,571 | |
| | | | | | | | |
Total Communication Services | | | | | | | 3,678,978 | |
| | | | | | | | |
| | | | | | | | |
| | | |
| FINANCIALS: 4.9% | | | | | | | | |
Insurance: 1.8% | | | | | |
Samsung Fire & Marine Insurance Co., Ltd. | | | 6,822 | | | | 1,190,476 | |
| | | | | | | | |
| | | | | | | | |
Capital Markets: 1.6% | | | | | |
Macquarie Korea Infrastructure Fund | | | 106,357 | | | | 1,026,557 | |
| | | | | | | | |
| | | | | | | | |
Banks: 1.5% | | | | | |
KB Financial Group, Inc. | | | 26,983 | | | | 979,340 | |
| | | | | | | | |
Total Financials | | | | | | | 3,196,373 | |
| | | | | | | | |
| | | | | | | | |
| | | |
| ENERGY: 3.1% | | | | | | | | |
Oil, Gas & Consumable Fuels: 3.1% | | | | | |
S-Oil Corp. | | | 39,893 | | | | 2,027,003 | |
| | | | | | | | |
Total Energy | | | | | | | 2,027,003 | |
| | | | | | | | |
| | | | | | | | |
| | |
| TOTAL COMMON EQUITIES | | | | 52,621,834 | |
| | | | | | | | |
(Cost $49,405,239) | | | | | | | | |
| | | | | | | | |
| | | | | | | | |
| | | | matthewsasia.com | 800.789.ASIA | | | 59 | |
Matthews Korea Fund
June 30, 2023
Schedule of Investmentsa (unaudited) (continued)
PREFERRED EQUITIES: 14.7%
| | | | | | | | |
| | | Shares | | | Value | |
| | |
| INFORMATION TECHNOLOGY: 14.7% | | | | | | | | |
Technology Hardware, Storage & Peripherals: 14.7% | |
Samsung Electronics Co., Ltd., Pfd. | | | 211,344 | | | | $9,590,644 | |
| | | | | | | | |
Total Information Technology | | | | | | | 9,590,644 | |
| | | | | | | | |
| | | | | | | | |
| | |
| TOTAL PREFERRED EQUITIES | | | | 9,590,644 | |
| | | | | | | | |
(Cost $6,695,847) | | | | | | | | |
| | | | | | | | |
| | |
RIGHTS: 0.0% | | | | | | | | |
| | | | | | | | |
| | | |
| FINANCIALS: 0.0% | | | | | | | | |
Capital Markets: 0.0% | | | | | | | | |
| | |
Macquarie Korea Infrastructure Fund, Rights, Expires 08/09/2023b | | | 8,127 | | | | 1,036 | |
| | | | | | | | |
Total Financials | | | | | | | 1,036 | |
| | | | | | | | |
| | | | | | | | |
| | |
| TOTAL RIGHTS | | | | 1,036 | |
| | | | | | | | |
(Cost $0) | | | | | | | | |
| | | | | | | | |
| | |
| TOTAL INVESTMENTS: 95.7% | | | | 62,213,514 | |
(Cost $56,101,086) | | | | | | | | |
| | | | | | | | |
| | |
CASH AND OTHER ASSETS,
LESS LIABILITIES: 4.3% | | | | | | | 2,777,613 | |
| | | | | | | | |
| | |
NET ASSETS: 100.0% | | | | | | | $64,991,127 | |
| | | | | | | | |
| a | Certain securities were fair valued under the valuation policies approved by the Board of Trustees (Note 2-A). |
| b | Non-income producing security. |
| c | Security exempt from registration under Rule 144A of the Securities Act of 1933, as amended. The security may be resold in transactions exempt from registration normally to qualified institutional buyers. The security has been determined to be liquid in accordance with procedures adopted by the Funds’ Board of Trustees. At June 30, 2023, the aggregate value is $1,434,128, which is 2.21% of net assets. |
| d | The securities may be resold to qualified foreign investors and foreign institutional buyers under Regulation S of the Securities Act of 1933. |
See accompanying notes to financial statements.

| | | | |
| PORTFOLIO MANAGERS |
| |
| Robert J. Horrocks, PhD | | Kenneth Lowe, CFA |
Lead Manager | | Lead Manager |
| |
| Siddarth Bhargava | | Elli Lee |
Co-Manager | | | | Co-Manager |
| | | | |
|
| FUND FACTS |
| | |
| | | Investor | | Institutional |
Ticker | | MACSX | | MICSX |
CUSIP | | 577130206 | | 577130842 |
Inception | | 9/12/94 | | 10/29/10 |
NAV | | $12.89 | | $12.86 |
Initial Investment | | $2,500 | | $100,000 |
Gross Expense Ratio1 | | 1.13% | | 1.01% |
Portfolio Statistics | | |
Total # of Positions | | 47 |
Net Assets | | $538.6 million |
Weighted Average Market Cap | | $111.9 billion |
Portfolio Turnover2 | | 13.2% |
Benchmark | | |
MSCI AC Asia ex Japan Index |
OBJECTIVE
Long-term capital appreciation. The Fund also seeks to provide some current income.
STRATEGY
Under normal market conditions, the Fund seeks to achieve its investment objective by investing at least 80% of its net assets, which include borrowings for investment purposes, in dividend-paying common stock, preferred stock and other equity securities, and convertible securities as well as fixed-income securities, of any duration or quality, including high yield securities, of companies located in Asia, which consists of all countries and markets in Asia, including developed, emerging and frontier countries and markets in the Asian region.
Matthews Asian Growth and Income Fund
Portfolio Manager Commentary (unaudited)
Period ended June 30, 2023
For the first half of 2023, the Matthews Asian Growth and Income Fund returned 4.44% (Investor Class) and 4.43% (Institutional Class), while its benchmark, the MSCI All Country Asia ex Japan Index, returned 3.19% over the same period. For the quarter ending June 30, 2023, the Fund returned –1.25% (Investor Class) and –1.27% (Institutional Class), while the benchmark returned –1.14%.
Market Environment
2023 began with a continuation of the rally in Asian markets but a rally that quickly petered out. For the rest of the six months up to mid-year, the MSCI AC Asia ex Japan Index, the portfolio’s benchmark, struggled. Much of the region’s relatively soft performance has focused on China where issues such as the continued U.S.—China political tensions and arguably underwhelming macroeconomic data have weighed on sentiment. It’s perhaps the market’s own disappointment at the pace of the recovery in China’s domestic demand that has contributed the most to lackluster returns. The government’s reluctance to aggressively stimulate the economy has further disappointed some.
The best performing countries over the period were Taiwan and South Korea, helped by both geographies having large information technology (IT) weights within their markets. IT was the strongest performing sector during the period helped by expectations of inventories clearing as well as the long-term potential presented by artificial intelligence (AI).
Performance Contributors and Detractors
At the country level, the portfolio’s stock selection in China and Hong Kong was the top contributor to relative performance over the past six months amid gains in gaming stocks, select energy/power-related companies and convertible bonds. Our overweight to U.S. and French companies with business activities in the region and our selections in Indonesia and the Philippines were also positive contributors. Indonesia has achieved much more monetary stability recently and this may have been beneficial for the financial sector.
Conversely, the portfolio’s underweight and stock selection in South Korea was the biggest detractor. Our underweight in Taiwan also detracted. In India, both stock selection and an underweight to what we deem to be an expensive market hurt relative performance.
From a sector perspective, stock selection in utilities and financials were among the top contributors to relative performance while both an underweight and stock selection in consumer discretionary also helped. In contrast, the biggest relative detractors included our slight underweight in IT and our overweight in real estate although this was almost entirely offset by good stock selection.
At the individual holdings level, the overall impact of the technology sector was significantly positive on an absolute basis because of our holdings in global industry leaders like Samsung, Advantech, TSMC and particularly Broadcom, recently buoyed by AI optimism. Bank Rakyat Indonesia was also a top performer in the period on the back of solid loan growth and stable margins and asset quality. Online gaming stocks, such as Tencent, and in particular NetEase, were also strong performers. China-based NetEase saw solid earnings delivery, a robust game pipeline and an aim to continue to grow its overseas business, all of which may have helped the stock.
(continued)
| 1 | Prospectus expense ratios. |
| 2 | The lesser of fiscal year 2022 long-term purchase costs or sales proceeds divided by the average monthly market value of long-term securities. |
| | | | | | | | |
| | | | matthewsasia.com | 800.789.ASIA | | | 61 | |
| | | | | | | | | | | | | | | | | | | | | | | | | | | | | | | | |
| | | | | | | | | |
| PERFORMANCE AS OF JUNE 30, 2023 | | | | | | | | | | | | | | | | | | | | | | | | |
| | | | | | | | | | | | Average Annual Total Returns | | | | |
| | | 3 Months | | | YTD | | | 1 Year | | | 3 Years | | | 5 Years | | | 10 Years | | | Since
Inception | | | Inception
Date | |
Investor Class (MACSX) | | | -1.25% | | | | 4.44% | | | | 0.16% | | | | 2.04% | | | | 1.93% | | | | 2.22% | | | | 7.79% | | | | 9/12/94 | |
Institutional Class (MICSX) | | | -1.27% | | | | 4.43% | | | | 0.26% | | | | 2.14% | | | | 2.07% | | | | 2.37% | | | | 3.25% | | | | 10/29/10 | |
MSCI AC Asia ex Japan Index3 | | | -1.14% | | | | 3.19% | | | | -0.76% | | | | 1.49% | | | | 1.25% | | | | 4.80% | | | | 4.09% | 4 | | | | |
Performance assumes reinvestment of all dividends and/or distributions before taxes. All performance quoted represents past performance and is no guarantee of future results. Investment return and principal value will fluctuate with market conditions so that when redeemed, shares may be worth more or less than their original cost. Current performance may be lower or higher than the return figures quoted. Returns would have been lower if certain of the Fund’s fees and expenses had not been waived. For the Fund’s most recent month-end performance, visit matthewsasia.com.
| | | | | | | | | | | | | | | | | | | | | | | | | | | | |
| | | | | | | | |
| INCOME DISTRIBUTION HISTORY | | | | | | | | | | | | | | | | | | | | | |
| | | 2023 | | | | | | 2022 | |
| | | June | | | December | | | Total | | | | | | June | | | December | | | Total | |
Investor (MACSX) | | $ | 0.17 | | | | n.a. | | | | n.a. | | | | | | | $ | 0.08 | | | $ | 0.13 | | | $ | 0.21 | |
Inst’l (MICSX) | | $ | 0.17 | | | | n.a. | | | | n.a. | | | | | | | $ | 0.09 | | | $ | 0.14 | | | $ | 0.23 | |
Note: This table does not include capital gains distributions. Totals may differ by $0.02 due to rounding. For income distribution history, visit matthewsasia.com.
| | | | |
| | | |
30-DAY YIELD: 2.55% (Investor Class); 2.72% (Institutional Class) The 30-Day Yield represents net investment income earned by the Fund over the 30-day period ended 6/30/23, expressed as an annual percentage rate based on the Fund’s share price at the end of the 30-day period. The 30-Day Yield should be regarded as an estimate of the Fund’s rate of investment income, and it may not equal the Fund’s actual income distribution rate. Source: BNY Mellon Investment Servicing (US) Inc. | | | | DIVIDEND YIELD: 3.29% The dividend yield (trailing) for the portfolio is the weighted average sum of the dividends paid by each equity security held by the Fund over the 12 months ended 6/30/23 divided by the current price of each equity as of 6/30/23. The annualized dividend yield for the Fund is for the equity-only portion of the portfolio. Please note that this is based on gross equity portfolio holdings and does not reflect the actual yield an investor in the Fund would receive. Past yields are no guarantee of future yields. Source: FactSet Research Systems, Bloomberg, MICM |
GROWTH OF A HYPOTHETICAL $10,000 INVESTMENT SINCE INCEPTION—INVESTOR CLASS
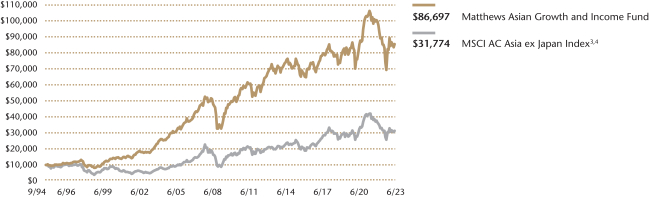
Plotted monthly. The performance data and graph do not reflect the deduction of taxes that a shareholder would pay on dividends, capital gains distributions or redemption of Fund shares. Values are in US$.
| | 3 | It is not possible to invest directly in an index. Source: Index data from Morgan Stanley Capital International and Bloomberg; total return calculations performed by BNY Mellon Investment Servicing (US) Inc. Please see page 76 for index definition. |
| | 4 | Calculated from 8/31/94. |
| | | | | | | | |
| | | | |
| TOP TEN HOLDINGS5 | | | | | | | |
| Name | | Sector | | Country | | % Net Assets | |
Taiwan Semiconductor Manufacturing Co., Ltd. | | Information Technology | | Taiwan | | | 8.1% | |
AIA Group, Ltd. | | Financials | | China/Hong Kong | | | 4.9% | |
Tencent Holdings, Ltd. | | Communication Services | | China/Hong Kong | | | 4.4% | |
Housing Development Finance Corp., Ltd. | | Financials | | India | | | 3.9% | |
Samsung Electronics Co., Ltd. | | Information Technology | | South Korea | | | 3.6% | |
ESR Group, Ltd., Cnv., 1.500%, 09/30/2025 | | Real Estate | | China/Hong Kong | | | 2.3% | |
PT Bank Rakyat Indonesia Persero Tbk | | Financials | | Indonesia | | | 2.3% | |
Macquarie Korea Infrastructure Fund | | Financials | | South Korea | | | 2.3% | |
HKT Trust & HKT, Ltd. | | Communication Services | | China/Hong Kong | | | 2.1% | |
Inner Mongolia Yili Industrial Group Co., Ltd. | | Consumer Staples | | China/Hong Kong | | | 2.1% | |
TOTAL | | | 36.0% | |
| | 5 | Holdings may combine more than one security from same issuer and related depositary receipts. |
Matthews Asian Growth and Income Fund
Portfolio Manager Commentary (unaudited) (continued)
In contrast, our exposure to JD.com, a direct competitor of Alibaba, was the biggest detractor to relative performance at the holdings level. Despite reasonable earnings delivery, the stock faltered as concerns remained around the competitive intensity of the industry as well as the strength of consumption in China. Fellow Chinese consumer stock Zhongsheng Group also fell. The auto dealer was impacted by weak sentiment and uncertainty over new car margins. Chinese health-care company Haier Biomedical also detracted from returns, as did Hong Kong-based life insurer AIA Group and Link REIT.
Notable Portfolio Changes
There was fairly limited activity in the portfolio during the quarter. We exited drug manufacturer Sanofi India as profitability may be structurally impacted with the inclusion of the company’s biggest diabetes treatment brand in the price-controlled National List of Essential Medicines. Combined with limited product launches and reasonably tepid performance from existing brands, we see better opportunities elsewhere.
Outlook
Fears of a global recession, geopolitics and an uneven recovery in China continue to weigh on earnings growth expectations and sentiment for some of the region. The markets await clarity from the government in China on how it can increase consumer confidence and stimulate private investment. However, this uncertainty may be being priced in as the MSCI China Index trades at a fairly low multiple of 9x price-to-earnings. Further, it should be remembered that a lack of inflationary pressure in China allows room for some policy easing. Elsewhere, countries like India and Indonesia continue to see healthy consumer demand while the former can benefit from the relocation of supply chains and benign inflation. At a portfolio level, we continue to prefer investing in companies that we believe can strike a balance for the portfolio between shareholder returns and sustainable growth, aiming to deliver solid total returns through the economic cycle. This is a strategy that we believe is reasonably placed against what is an uncertain macroeconomic backdrop.
| | | | |
| |
| COUNTRY ALLOCATION (%)6,7 | |
China/Hong Kong | | | 46.8 | |
Taiwan | | | 11.5 | |
India | | | 10.2 | |
South Korea | | | 9.3 | |
Singapore | | | 7.1 | |
France | | | 3.0 | |
Indonesia | | | 2.3 | |
Philippines | | | 1.8 | |
Thailand | | | 1.7 | |
United States | | | 1.6 | |
Australia | | | 1.5 | |
Cash and Other Assets, Less Liabilities | | | 3.1 | |
| | | | |
| |
| SECTOR ALLOCATION (%)7 | |
Financials | | | 20.5 | |
Information Technology | | | 20.1 | |
Communication Services | | | 12.2 | |
Industrials | | | 11.9 | |
Consumer Discretionary | | | 11.4 | |
Real Estate | | | 7.2 | |
Consumer Staples | | | 5.6 | |
Health Care | | | 5.2 | |
Utilities | | | 2.9 | |
Cash and Other Assets, Less Liabilities | | | 3.1 | |
| | | | |
| |
| MARKET CAP EXPOSURE (%)7 | |
Mega Cap (over $25B) | | | 48.8 | |
Large Cap ($10B-$25B) | | | 14.0 | |
Mid Cap ($3B-10B) | | | 26.9 | |
Small Cap (under $3B) | | | 7.3 | |
Cash and Other Assets, Less Liabilities | | | 3.1 | |
| | | | |
| |
| ASSET TYPE BREAKDOWN (%)7,8 | |
Common Equities and ADRs | | | 88.9 | |
Convertible Corporate Bonds | | | 8.1 | |
Preferred Equities | | | 0.0 | |
Cash and Other Assets, Less Liabilities | | | 3.1 | |
| 6 | Not all countries where the Fund may invest are included in the benchmark index. |
| 7 | Source: FactSet Research Systems. Percentage values in data are rounded to the nearest tenth of one percent, so the values may not sum to 100% due to rounding. Country allocations and percentage values may be derived from different data sources and may not be consistent with other Fund literature. |
| 8 | Bonds are not included in the MSCI All Country Asia ex Japan Index. |
| | | | | | | | |
| | | | matthewsasia.com | 800.789.ASIA | | | 63 | |
Matthews Asian Growth and Income Fund
June 30, 2023
Schedule of Investmentsa (unaudited)
COMMON EQUITIES: 88.8%
| | | | | | | | |
| | | Shares | | | Value | |
| | |
| CHINA/HONG KONG: 38.7% | | | | | | | | |
AIA Group, Ltd. | | | 2,580,400 | | | | $26,207,832 | |
| | |
Tencent Holdings, Ltd. | | | 564,600 | | | | 23,939,706 | |
| | |
HKT Trust & HKT, Ltd. | | | 9,901,000 | | | | 11,528,446 | |
| | |
Inner Mongolia Yili Industrial Group Co., Ltd. A Shares | | | 2,905,275 | | | | 11,327,582 | |
| | |
Midea Group Co., Ltd. A Shares | | | 1,384,430 | | | | 11,244,720 | |
| | |
NetEase, Inc. ADR | | | 115,749 | | | | 11,191,771 | |
| | |
JD.com, Inc. Class A | | | 652,102 | | | | 11,121,318 | |
| | |
Techtronic Industries Co., Ltd. | | | 964,000 | | | | 10,541,930 | |
| | |
NARI Technology Co., Ltd. A Shares | | | 2,996,190 | | | | 9,533,324 | |
| | |
Yum China Holdings, Inc. | | | 166,510 | | | | 9,407,815 | |
| | |
CK Hutchison Holdings, Ltd. | | | 1,501,172 | | | | 9,162,169 | |
| | |
BOC Hong Kong Holdings, Ltd. | | | 2,795,000 | | | | 8,562,000 | |
| | |
Zhongsheng Group Holdings, Ltd. | | | 2,192,000 | | | | 8,414,862 | |
| | |
Wuliangye Yibin Co., Ltd. A Shares | | | 367,674 | | | | 8,293,828 | |
| | |
Link REIT | | | 1,445,040 | | | | 8,044,715 | |
| | |
Jiangsu Expressway Co., Ltd. H Shares | | | 8,596,000 | | | | 7,927,255 | |
| | |
Guangdong Investment, Ltd. | | | 9,136,000 | | | | 7,891,089 | |
| | |
ENN Natural Gas Co., Ltd. A Shares | | | 2,864,177 | | | | 7,494,030 | |
| | |
Qingdao Haier Biomedical Co., Ltd. A Shares | | | 943,264 | | | | 6,680,533 | |
| | | | | | | | |
Total China/Hong Kong | | | | | | | 208,514,925 | |
| | | | | | | | |
| | | | | | | | |
| | | |
| TAIWAN: 11.6% | | | | | | | | |
Taiwan Semiconductor Manufacturing Co., Ltd. | | | 2,351,187 | | | | 43,434,261 | |
| | |
Advantech Co., Ltd. | | | 762,884 | | | | 10,043,906 | |
| | |
Chailease Holding Co., Ltd. | | | 1,327,160 | | | | 8,725,810 | |
| | | | | | | | |
Total Taiwan | | | | | | | 62,203,977 | |
| | | | | | | | |
| | | | | | | | |
| | | |
| INDIA: 10.2% | | | | | | | | |
Housing Development Finance Corp., Ltd. | | | 607,642 | | | | 20,963,821 | |
| | |
Tata Consultancy Services, Ltd. | | | 264,710 | | | | 10,696,229 | |
| | |
Computer Age Management Services, Ltd. | | | 303,611 | | | | 8,152,895 | |
| | |
Embassy Office Parks REIT | | | 2,177,183 | | | | 7,725,353 | |
| | |
Crompton Greaves Consumer Electricals, Ltd. | | | 2,094,413 | | | | 7,404,389 | |
| | | | | | | | |
Total India | | | | | | | 54,942,687 | |
| | | | | | | | |
| | | | | | | | |
| | | |
| SOUTH KOREA: 9.3% | | | | | | | | |
Samsung Electronics Co., Ltd. | | | 354,482 | | | | 19,518,942 | |
| | |
Macquarie Korea Infrastructure Fund | | | 1,291,597 | | | | 12,466,479 | |
| | |
SK Telecom Co., Ltd. | | | 285,610 | | | | 10,106,519 | |
| | |
LEENO Industrial, Inc. | | | 69,717 | | | | 7,833,841 | |
| | | | | | | | |
Total South Korea | | | | | | | 49,925,781 | |
| | | | | | | | |
| | | | | | | | |
| | | |
| SINGAPORE: 7.1% | | | | | | | | |
United Overseas Bank, Ltd. | | | 528,200 | | | | 10,960,815 | |
| | |
CapitaLand Ascendas REIT | | | 5,168,684 | | | | 10,432,337 | |
| | |
Singapore Technologies Engineering, Ltd. | | | 3,423,825 | | | | 9,342,485 | |
| | |
Venture Corp., Ltd. | | | 710,500 | | | | 7,757,091 | |
| | | | | | | | |
Total Singapore | | | | | | | 38,492,728 | |
| | | | | | | | |
| | | | | | | | |
| | | Shares | | | Value | |
| | | |
| FRANCE: 3.0% | | | | | | | | |
Pernod Ricard SA | | | 46,620 | | | | $10,301,841 | |
| | |
LVMH Moet Hennessy Louis Vuitton SE | | | 6,262 | | | | 5,904,517 | |
| | | | | | | | |
Total France | | | | | | | 16,206,358 | |
| | | | | | | | |
| | | | | | | | |
| | | |
| INDONESIA: 2.3% | | | | | | | | |
PT Bank Rakyat Indonesia Persero Tbk | | | 34,433,672 | | | | 12,571,447 | |
| | | | | | | | |
Total Indonesia | | | | | | | 12,571,447 | |
| | | | | | | | |
| | | | | | | | |
| | | |
| PHILIPPINES: 1.8% | | | | | | | | |
Bank of the Philippine Islands | | | 4,960,566 | | | | 9,795,198 | |
| | | | | | | | |
Total Philippines | | | | | | | 9,795,198 | |
| | | | | | | | |
| | | | | | | | |
| | | |
| THAILAND: 1.7% | | | | | | | | |
Digital Telecommunications Infrastructure Fund F Shares | | | 29,199,600 | | | | 9,141,604 | |
| | | | | | | | |
Total Thailand | | | | | | | 9,141,604 | |
| | | | | | | | |
| | | | | | | | |
| | | |
| UNITED STATES: 1.6% | | | | | | | | |
Broadcom, Inc. | | | 10,175 | | | | 8,826,100 | |
| | | | | | | | |
Total United States | | | | | | | 8,826,100 | |
| | | | | | | | |
| | | | | | | | |
| | | |
| AUSTRALIA: 1.5% | | | | | | | | |
Aristocrat Leisure, Ltd. | | | 308,358 | | | | 7,978,092 | |
| | | | | | | | |
Total Australia | | | | | | | 7,978,092 | |
| | | | | | | | |
| | | | | | | | |
| | | |
| TOTAL COMMON EQUITIES | | | | | | | 478,598,897 | |
| | | | | | | | |
(Cost $456,582,933) | | | | | | | | |
| | | | | | | | |
|
CONVERTIBLE CORPORATE BONDS: 8.1% | |
| | | Face Amount* | | | Value | |
|
| CHINA/HONG KONG: 8.1% | |
ESR Group, Ltd., Cnv.
1.500%, 09/30/25b | | | 12,866,000 | | | | 12,608,680 | |
| | |
Pharmaron Beijing Co., Ltd., Cnv.
0.000%, 06/18/26b | | | 12,100,000 | | | | 11,072,588 | |
| | |
Hansoh Pharmaceutical Group Co., Ltd., Cnv.
0.000%, 01/22/26b | | | 10,756,000 | | | | 10,331,138 | |
| | |
China Conch Venture Holdings International, Ltd., Cnv.
0.000%, 09/05/23b | | | HKD 66,000,000 | | | | 9,509,189 | |
| | | | | | | | |
Total China/Hong Kong | | | | | | | 43,521,595 | |
| | | | | | | | |
| | | | | | | | |
| | |
| TOTAL CONVERTIBLE CORPORATE BONDS | | | | 43,521,595 | |
| | | | | | | | |
(Cost $45,817,721) | | | | | | | | |
Matthews Asian Growth and Income Fund
June 30, 2023
Schedule of Investmentsa (unaudited) (continued)
RIGHTS: 0.0%
| | | | | | | | |
| | | Shares | | | Value | |
| | |
| SOUTH KOREA: 0.0% | | | | | | | | |
Macquarie Korea Infrastructure Fund, Rights, Expires 08/09/23c | | | 98,695 | | | | $12,579 | |
| | | | | | | | |
Total South Korea | | | | | | | 12,579 | |
| | | | | | | | |
| | | | | | | | |
| | | |
| TOTAL RIGHTS | | | | | | | 12,579 | |
| | | | | | | | |
(Cost $0) | | | | | | | | |
| | | | | | | | |
| | | |
| TOTAL INVESTMENTS: 96.9% | | | | | | | 522,133,071 | |
(Cost $502,400,654) | | | | | | | | |
| | | | | | | | |
| | |
CASH AND OTHER ASSETS,
LESS LIABILITIES: 3.1% | | | | | | | 16,449,514 | |
| | | | | | | | |
| | |
NET ASSETS: 100.0% | | | | | | | $538,582,585 | |
| | | | | | | | |
| a | Certain securities were fair valued under the valuation policies approved by the Board of Trustees (Note 2-A). |
| b | The securities may be resold to qualified foreign investors and foreign institutional buyers under Regulation S of the Securities Act of 1933. |
| c | Non-income producing security. |
| * | All Values in USD unless otherwise specified. |
| ADR | American Depositary Receipt |
| REIT | Real Estate Investment Trust |
See accompanying notes to financial statements.
| | | | | | | | |
| | | | matthewsasia.com | 800.789.ASIA | | | 65 | |
| | | | |
| PORTFOLIO MANAGERS |
| |
| Robert Horrocks, PhD | | Kenneth Lowe, CFA |
Lead Manager | | Lead Manager |
| | |
| Siddarth Bhargava | | | | Winnie Chwang |
Co-Manager | | | | Co-Manager |
| | |
| Elli Lee | | | | |
Co-Manager | | | | |
| | | | |
|
| FUND FACTS |
| | |
| | | Investor | | Institutional |
Ticker | | MAPIX | | MIPIX |
CUSIP | | 577125107 | | 577130750 |
Inception | | 10/31/06 | | 10/29/10 |
NAV | | $13.58 | | $13.57 |
Initial Investment | | $2,500 | | $100,000 |
Gross Expense Ratio1 | | 1.10% | | 0.99% |
Portfolio Statistics |
Total # of Positions | | 60 |
Net Assets | | $1.5 billion |
Weighted Average Market Cap | | $76.2 billion |
Portfolio Turnover2 | | 50.8% |
Benchmark | | | | |
MSCI AC Asia Pacific Index |
OBJECTIVE
Total return with an emphasis on providing current income.
STRATEGY
Under normal market conditions, the Fund seeks to achieve its investment objective by investing at least 80% of its net assets, which include borrowings for investment purposes, in dividend-paying equity securities of companies located in Asia. Asia consists of all countries and markets in Asia, and includes developed, emerging and frontier countries and markets in the Asian region. The Fund may also invest in convertible debt and equity securities of companies located in Asia.
Matthews Asia Dividend Fund
Portfolio Manager Commentary (unaudited)
Period ended June 30, 2023
For the first half of 2023, the Matthews Asia Dividend Fund returned 2.93% (Investor Class) and 2.97% (Institutional Class), while its benchmark, the MSCI All Country Asia Pacific Index, returned 6.35% over the same period. For the quarter ending June 30, 2023, the Fund returned 0.07% (Investor Class) and 0.07% (Institutional Class), while the benchmark returned 1.43%.
Market environment
2023 began with a continuation of the rally in Asian markets but a rally that quickly petered out. The remainder of the first half of the year saw a diverging performance across countries in the Asia Pacific region. Hopes for a rapid recovery in China post reopening were disappointed with relatively weak economic data and underwhelming stimulus measures. U.S.—China political tensions and the implementation of semiconductor trade sanctions by the U.S. also weighed on sentiment. This helped drive China/Hong Kong to be the third weakest performing market during the quarter ahead of only Thailand and Malaysia. Conversely, technology-focused stocks boosted the markets of South Korea and Taiwan, driven by expectations of inventories clearing through the rest of the year as well as the long-term potential presented by artificial intelligence. Stocks in Japan rallied on continued corporate reform with capital return policies improving.
Performance Contributors and Detractors
From a country perspective, the portfolio’s mild overweight and stock selection in China/Hong Kong was the biggest detractor to relative performance in the first half as slowing industrial output and disappointing retail sales, alongside disappointing stimulus and a prolonged property downturn, weighed on stocks. Stock selection was impacted particularly by weakness in select domestically focused businesses. In Japan, stock selection was also a large detractor as certain holdings in areas such as real estate fell. Turning to India, stock selection in what we deem to be a fairly expensive market hurt relative performance. On the flip side, stock selection in in Australia and Indonesia benefited performance, with gains in the commercial banking sector helping the latter.
From a sector perspective, stock selections within consumer discretionary, health care and industrials were big detractors from relative performance while selections in financials and IT were strong contributors.
At the individual holdings level, a number of the Fund’s largest detractors came from China. JD.com, a leading e-commerce player, China Tourism Group, a leading duty-free licensed operator, and Wuliangye Yibin, a prominent baijiu company, all slumped given an underwhelming consumer recovery post reopening. There are also concerns over increasing competition for JD.com and China Tourism in their respective sectors. Milkyway Chemical Supply Chain Service, a logistics and distribution company, fell on soft earnings as end markets were likely weaker than had been hoped. In contrast, some of the largest contributors to returns came from Japan, with semiconductor equipment manufacturer Disco benefiting from the strength in the broader IT sector and as certain end markets look to bottom out as well, with growth in areas such as power semiconductors. Trading company Itochu gained on robust earnings and an improving shareholder return policy.
(continued)
| 1 | Prospectus expense ratios. |
| 2 | The lesser of fiscal year 2022 long-term purchase costs or sales proceeds divided by the average monthly market value of long-term securities. |
| | | | | | | | | | | | | | | | | | | | | | | | | | | | | | | | |
| |
| PERFORMANCE AS OF JUNE 30, 2023 | |
| | | | | | | | | | | | Average Annual Total Returns | | | | |
| | | 3 Months | | | YTD | | | 1 Year | | | 3 Years | | | 5 Years | | | 10 Years | | | Since
Inception | | | Inception
Date | |
| Investor Class (MAPIX) | | | 0.07% | | | | 2.93% | | | | -4.65% | | | | -1.72% | | | | -1.46% | | | | 3.27% | | | | 6.17% | | | | 10/31/06 | |
| Institutional Class (MIPIX) | | | 0.07% | | | | 2.97% | | | | -4.66% | | | | -1.65% | | | | -1.37% | | | | 3.38% | | | | 4.05% | | | | 10/29/10 | |
| MSCI AC Asia Pacific Index3 | | | 1.43% | | | | 6.35% | | | | 6.44% | | | | 3.81% | | | | 2.38% | | | | 5.04% | | | | 3.99% | 4 | | | | |
Performance assumes reinvestment of all dividends and/or distributions before taxes. All performance quoted represents past performance and is no guarantee of future results. Investment return and principal value will fluctuate with market conditions so that when redeemed, shares may be worth more or less than their original cost. Current performance may be lower or higher than the return figures quoted. Returns would have been lower if certain of the Fund’s fees and expenses had not been waived. For the Fund’s most recent month-end performance, visit matthewsasia.com.
| | | | | | | | | | | | | | | | | | | | | | | | | | | | | | | | | | | | | | | | | | | | |
| | | | | | | | | | |
| INCOME DISTRIBUTION HISTORY | | | | | | | | | | | | | | | | | | | | | | | | | | | | |
| | | 2023 | | | | | | 2022 | |
| | | Q1 | | | Q2 | | | Q3 | | | Q4 | | | Total | | | | | | Q1 | | | Q2 | | | Q3 | | | Q4 | | | Total | |
| Investor (MAPIX) | | $ | 0.05 | | | $ | 0.00 | | | | n.a. | | | | n.a. | | | | n.a. | | | | | | | $ | 0.05 | | | $ | 0.04 | | | $ | 0.02 | | | $ | 0.01 | | | $ | 0.11 | |
| Inst’l (MIPIX) | | $ | 0.05 | | | $ | 0.00 | | | | n.a. | | | | n.a. | | | | n.a. | | | | | | | $ | 0.06 | | | $ | 0.04 | | | $ | 0.02 | | | $ | 0.01 | | | $ | 0.13 | |
Note: This table does not include capital gains distributions. Totals may differ by $0.02 due to rounding and a return of capital. For distribution history please visit matthewsasia.com.
| | | | |
| | | |
30-DAY YIELD: Investor Class 1.90% (1.90% excluding waivers) Institutional Class 2.06% (2.06% excluding waivers) The 30-Day Yield represents net investment income earned by the Fund over the 30-day period ended 6/30/23, expressed as an annual percentage rate based on the Fund’s share price at the end of the 30-day period. The 30-Day Yield should be regarded as an estimate of the Fund’s rate of investment income, and it may not equal the Fund’s actual income distribution rate. Source: BNY Mellon Investment Servicing (US) Inc. | | | | DIVIDEND YIELD: 2.73% The dividend yield (trailing) for the portfolio is the weighted average sum of the dividends paid by each equity security held by the Fund over the 12 months ended 6/30/23 divided by the current price of each equity as of 6/30/23. The annualized dividend yield for the Fund is for the equity-only portion of the portfolio. Please note that this is based on gross equity portfolio holdings and does not reflect the actual yield an investor in the Fund would receive. Past yields are no guarantee of future yields. Source: FactSet Research Systems, Bloomberg, MICM. |
GROWTH OF A HYPOTHETICAL $10,000 INVESTMENT SINCE INCEPTION—INVESTOR CLASS
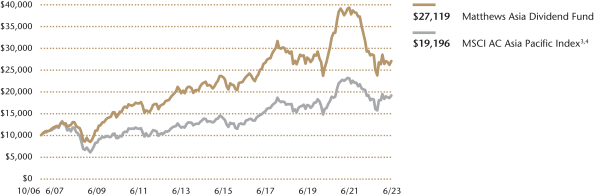
Plotted monthly. The performance data and graph do not reflect the deduction of taxes that a shareholder would pay on dividends, capital gains distributions or redemption of Fund shares. Values are in US$.
| | 3 | It is not possible to invest directly in an index. Source: Index data from Morgan Stanley Capital International and Bloomberg; total return calculations performed by BNY Mellon Investment Servicing (US) Inc. Please see page 76 for index definition. |
| | 4 | Calculated from 10/31/06. |
| | | | | | | | |
| | | | |
| TOP TEN HOLDINGS5 | | | | | | | |
| Name | | Sector | | Country | | % Net Assets | |
| Taiwan Semiconductor Manufacturing Co., Ltd. | | Information Technology | | Taiwan | | | 5.0% | |
| Tencent Holdings, Ltd. | | Communication Services | | China/Hong Kong | | | 2.5% | |
| ITOCHU Corp. | | Industrials | | Japan | | | 2.5% | |
| Samsung Electronics Co., Ltd. | | Information Technology | | South Korea | | | 2.4% | |
| Housing Development Finance Corp., Ltd. | | Financials | | India | | | 2.3% | |
| PT Bank Rakyat Indonesia Persero Tbk | | Financials | | Indonesia | | | 2.2% | |
| AIA Group, Ltd. | | Financials | | China/Hong Kong | | | 2.2% | |
| Power Grid Corp. of India, Ltd. | | Utilities | | India | | | 2.1% | |
| United Overseas Bank, Ltd. | | Financials | | Singapore | | | 2.0% | |
| Shin-Etsu Chemical Co., Ltd. | | Materials | | Japan | | | 2.0% | |
| TOTAL | | | 25.2% | |
| | 5 | Holdings may combine more than one security from same issuer and related depositary receipts. |
| | | | | | | | |
| | | | matthewsasia.com | 800.789.ASIA | | | 67 | |
| | | | |
| |
| COUNTRY ALLOCATION (%)6,7 | |
| Japan | | | 31.5 | |
| China/Hong Kong | | | 25.6 | |
| Australia | | | 9.7 | |
| Taiwan | | | 8.1 | |
| India | | | 7.6 | |
| South Korea | | | 6.0 | |
| Singapore | | | 3.5 | |
| Indonesia | | | 2.2 | |
| Vietnam | | | 1.7 | |
| Thailand | | | 1.5 | |
| Bangladesh | | | 0.6 | |
| Cash and Other Assets, Less Liabilities | | | 1.9 | |
| | | | |
| SECTOR ALLOCATION (%)7 | |
| Financials | | | 19.2 | |
| Information Technology | | | 17.1 | |
| Consumer Discretionary | | | 13.9 | |
| Communication Services | | | 11.7 | |
| Industrials | | | 10.0 | |
| Consumer Staples | | | 9.3 | |
| Real Estate | | | 4.7 | |
| Health Care | | | 4.3 | |
| Materials | | | 3.6 | |
| Utilities | | | 2.5 | |
| Energy | | | 1.9 | |
| Cash and Other Assets, Less Liabilities | | | 1.9 | |
| | | | |
| MARKET CAP EXPOSURE (%)7 | |
| Mega Cap (over $25B) | | | 45.8 | |
| Large Cap ($10B-$25B) | | | 24.4 | |
| Mid Cap ($3B-10B) | | | 19.0 | |
| Small Cap (under $3B) | | | 8.9 | |
| Cash and Other Assets, Less Liabilities | | | 1.9 | |
| 6 | Not all countries where the Fund may invest are included in the benchmark index. |
| 7 | Source: FactSet Research Systems. Percentage values in data are rounded to the nearest tenth of one percent, so the values may not sum to 100% due to rounding. Country allocations and percentage values may be derived from different data sources and may not be consistent with other Fund literature. |
Matthews Asia Dividend Fund
Portfolio Manager Commentary (unaudited) (continued)
Notable portfolio changes
The portfolio had several changes during the quarter with alterations in both Japanese and Chinese holdings. We exited our holding in the health care sector in China where life science-service company Pharmaron Beijing has faced earnings challenges. In Japan, we sold real estate-services provider Katitas as a changing mix in its business model and a tax dispute are expected to weigh on margins in the medium term. We also exited precision machinery parts-distributor Misumi Group amid heightened competition in overseas markets.
These exits funded new positions including in Japanese telecom provider KDDI. The stock offers meaningful share buybacks, a healthy dividend yield of over 3% and a multi-decade track record of dividend increases. We believe that it may also benefit from reduced competition. We also initiated a position in Guangdong Investment, a utility company that is a leading provider of water to Hong Kong, given its relatively stable cash generating ability and 9% dividend yield. Elsewhere in Japan, Suzuki Motor was added to the portfolio. The company derives significant value from its stake in India’s leading auto producer, Maruti Suzuki India, that has a reasonable new-model cycle as well as solid growth prospects in the medium term on rising volumes. We believe the stock is attractively valued at around 5x EV/EBITDA and offering over a 2% dividend yield.
Outlook
Fears of a global recession, geopolitics, and a spotty recovery in China continue to weigh on earnings growth expectations and sentiment for some of the Asian region. With a quick recovery delayed, markets await clarity from the government in China on how it can increase consumer confidence and stimulate private investment. However, this uncertainty may be being priced in as the MSCI China Index trades at a fairly low multiple of 9x forward P/E. Further, it should be remembered that a lack of inflationary pressure in China allows room for some policy easing. Elsewhere in the region, countries like India and Indonesia, continue to see consumer demand while the former can benefit from the relocation of supply chains. If China has been one of the more challenged markets in Asia then it is Japan that remains one of the brighter spots, supported by what may be a return in inflation and improving shareholder return policies that have attracted broader interest in equities.
At a micro level, valuations remain reasonable at around 13x 2023 earnings expectations for the Asia Pacific market, with growth anticipated to be somewhat muted this year before rebounding to double digit growth in 2024. We continue to prefer investing in companies that allow the portfolio to balance dividend yields with dividend growth, aiming to deliver solid total returns through the economic cycle. This is a strategy that we hope is reasonably placed against what remains an uncertain macroeconomic backdrop.
Dividend yield: A financial ratio that shows how much a company pays out in dividends each year relative to its share price.
Earnings growth: The change in a company’s reported net income over a period of time, such as from quarter to quarter or from year to year.
MSCI China Index: An index capturing large and mid cap representation across China A shares, H shares, B shares, Red chips, P chips and foreign listings, like ADRs. Currently the index includes Large Cap A and Mid Cap A shares represented at 20% of their free float-adjusted market capitalization.
Price-to-earnings (P/E) ratio: A valuation ratio of a company’s current share price compared to its per-share earnings.
Enterprise value to earnings before interest, taxes, depreciation and amortization (EV/EBITDA) ratio: A ratio used to determine the value of a company. The enterprise multiple looks at a firm as a potential acquirer would, because it takes debt into account - an item which other multiples like the P/E ratio do not include.
Matthews Asia Dividend Fund
June 30, 2023
Schedule of Investmentsa (unaudited)
COMMON EQUITIES: 98.1%
| | | | | | | | |
| | | Shares | | | Value | |
| | |
| JAPAN: 31.5% | | | | | | | | |
ITOCHU Corp. | | | 955,100 | | | | $37,938,058 | |
| | |
Shin-Etsu Chemical Co., Ltd. | | | 917,600 | | | | 30,664,316 | |
| | |
Tokio Marine Holdings, Inc. | | | 1,291,000 | | | | 29,762,157 | |
| | |
ORIX Corp. | | | 1,570,600 | | | | 28,641,774 | |
| | |
KDDI Corp. | | | 886,500 | | | | 27,377,886 | |
| | |
Disco Corp. | | | 165,900 | | | | 26,302,781 | |
| | |
Dai-ichi Life Holdings, Inc. | | | 1,318,700 | | | | 25,081,542 | |
| | |
Suzuki Motor Corp. | | | 674,500 | | | | 24,459,260 | |
| | |
Kakaku.com, Inc. | | | 1,692,900 | | | | 24,386,324 | |
| | |
Toray Industries, Inc. | | | 4,372,700 | | | | 24,379,613 | |
| | |
Nissin Foods Holdings Co., Ltd. | | | 294,700 | | | | 24,367,288 | |
| | |
Bandai Namco Holdings, Inc. | | | 1,047,800 | | | | 24,264,236 | |
| | |
Capcom Co., Ltd. | | | 603,100 | | | | 23,907,154 | |
| | |
GLP J-Reit | | | 23,991 | | | | 23,663,449 | |
| | |
Ajinomoto Co., Inc. | | | 592,900 | | | | 23,619,271 | |
| | |
Hikari Tsushin, Inc. | | | 162,300 | | | | 23,295,215 | |
| | |
Nomura Research Institute, Ltd. | | | 836,800 | | | | 23,118,646 | |
| | |
Keyence Corp. | | | 48,300 | | | | 22,950,069 | |
| | |
Olympus Corp. | | | 1,201,200 | | | | 19,009,416 | |
| | | | | | | | |
Total Japan | | | | | | | 487,188,455 | |
| | | | | | | | |
| | | | | | | | |
| | | |
| CHINA/HONG KONG: 25.6% | | | | | | | | |
Tencent Holdings, Ltd. | | | 912,400 | | | | 38,686,836 | |
| | |
AIA Group, Ltd. | | | 3,307,600 | | | | 33,593,638 | |
| | |
Midea Group Co., Ltd. A Shares | | | 3,630,641 | | | | 29,512,404 | |
| | |
NetEase, Inc. | | | 1,452,700 | | | | 28,137,222 | |
| | |
Inner Mongolia Yili Industrial Group Co., Ltd. A Shares | | | 7,147,643 | | | | 27,868,451 | |
| | |
NARI Technology Co., Ltd. A Shares | | | 8,632,368 | | | | 27,466,602 | |
| | |
Techtronic Industries Co., Ltd. | | | 2,506,000 | | | | 27,404,643 | |
| | |
Yum China Holdings, Inc. | | | 463,961 | | | | 26,213,797 | |
| | |
Link REIT | | | 4,523,120 | | | | 25,180,765 | |
| | |
JD.com, Inc. Class A | | | 1,406,433 | | | | 23,986,107 | |
| | |
Minth Group, Ltd. | | | 8,721,000 | | | | 23,978,676 | |
| | |
Wuliangye Yibin Co., Ltd. A Shares | | | 1,024,900 | | | | 23,119,244 | |
| | |
Yuexiu Transport Infrastructure, Ltd. | | | 44,930,000 | | | | 22,283,892 | |
| | |
Milkyway Chemical Supply Chain Service Co., Ltd. A Shares | | | 1,387,974 | | | | 17,022,223 | |
| | |
China Tourism Group Duty Free Corp., Ltd. A Shares | | | 978,424 | | | | 14,921,884 | |
| | |
Guangdong Investment, Ltd. | | | 7,230,000 | | | | 6,244,809 | |
| | | | | | | | |
Total China/Hong Kong | | | | | | | 395,621,193 | |
| | | | | | | | |
| | | | | | | | |
| | | |
| AUSTRALIA: 9.7% | | | | | | | | |
Ampol, Ltd. | | | 1,501,743 | | | | 29,999,485 | |
| | |
AUB Group, Ltd. | | | 1,376,897 | | | | 27,081,377 | |
| | |
Lottery Corp., Ltd. | | | 7,229,095 | | | | 24,783,230 | |
| | |
CSL, Ltd. | | | 130,215 | | | | 24,113,057 | |
| | |
Breville Group, Ltd. | | | 1,731,760 | | | | 23,147,867 | |
| | |
Treasury Wine Estates, Ltd. | | | 2,887,014 | | | | 21,650,175 | |
| | | | | | | | |
Total Australia | | | | | | | 150,775,191 | |
| | | | | | | | |
| | | | | | | | |
| | | Shares | | | Value | |
| | | |
| TAIWAN: 8.1% | | | | | | | | |
Taiwan Semiconductor Manufacturing Co., Ltd. ADR | | | 387,426 | | | | $39,099,032 | |
| | |
Taiwan Semiconductor Manufacturing Co., Ltd. | | | 2,044,469 | | | | 37,768,157 | |
| | |
Chailease Holding Co., Ltd. | | | 3,779,000 | | | | 24,846,166 | |
| | |
Delta Electronics, Inc. | | | 2,193,000 | | | | 24,303,554 | |
| | | | | | | | |
Total Taiwan | | | | | | | 126,016,909 | |
| | | | | | | | |
| | | | | | | | |
| | | |
| INDIA: 7.7% | | | | | | | | |
Housing Development Finance Corp., Ltd. | | | 1,033,497 | | | | 35,655,940 | |
| | |
Power Grid Corp. of India, Ltd. | | | 10,201,014 | | | | 31,801,057 | |
| | |
Tata Consultancy Services, Ltd. | | | 669,060 | | | | 27,034,940 | |
| | |
Hindustan Unilever, Ltd. | | | 729,314 | | | | 23,844,919 | |
| | | | | | | | |
Total India | | | | | | | 118,336,856 | |
| | | | | | | | |
| | | | | | | | |
| | | |
| SOUTH KOREA: 6.0% | | | | | | | | |
Samsung Electronics Co., Ltd. | | | 677,373 | | | | 37,298,381 | |
| | |
SK Telecom Co., Ltd. | | | 828,504 | | | | 29,317,219 | |
| | |
Macquarie Korea Infrastructure Fund | | | 2,734,972 | | | | 26,397,918 | |
| | | | | | | | |
Total South Korea | | | | | | | 93,013,518 | |
| | | | | | | | |
| | | | | | | | |
| | | |
| SINGAPORE: 3.5% | | | | | | | | |
United Overseas Bank, Ltd. | | | 1,516,600 | | | | 31,471,359 | |
| | |
Capitaland India Trust | | | 27,571,100 | | | | 23,288,650 | |
| | | | | | | | |
Total Singapore | | | | | | | 54,760,009 | |
| | | | | | | | |
| | | | | | | | |
| | | |
| INDONESIA: 2.2% | | | | | | | | |
PT Bank Rakyat Indonesia Persero Tbk | | | 94,237,384 | | | | 34,405,283 | |
| | | | | | | | |
Total Indonesia | | | | | | | 34,405,283 | |
| | | | | | | | |
| | | | | | | | |
| | | |
| VIETNAM: 1.7% | | | | | | | | |
FPT Corp. | | | 7,376,540 | | | | 26,944,548 | |
| | | | | | | | |
Total Vietnam | | | | | | | 26,944,548 | |
| | | | | | | | |
| | | | | | | | |
| | | |
| THAILAND: 1.5% | | | | | | | | |
Bangkok Dusit Medical Services Public Co., Ltd. F Shares | | | 29,008,800 | | | | 22,748,008 | |
| | | | | | | | |
Total Thailand | | | | | | | 22,748,008 | |
| | | | | | | | |
| | | | | | | | |
| | | |
| BANGLADESH: 0.6% | | | | | | | | |
GrameenPhone, Ltd. | | | 3,714,111 | | | | 8,981,433 | |
| | | | | | | | |
Total Bangladesh | | | | | | | 8,981,433 | |
| | | | | | | | |
| | | | | | | | |
| | | |
| TOTAL COMMON EQUITIES | | | | | | | 1,518,791,403 | |
| | | | | | | | |
(Cost $1,523,706,454) | | | | | | | | |
| | | | | | | | |
| | |
RIGHTS: 0.0% | | | | | | | | |
| | | |
| SINGAPORE: 0.0% | | | | | | | | |
Capitaland India Trust, Rights, Expires 07/17/23b | | | 3,280,960 | | | | 199,759 | |
| | | | | | | | |
Total Singapore | | | | | | | 199,759 | |
| | | | | | | | |
| | | | | | | | |
| | | | matthewsasia.com | 800.789.ASIA | | | 69 | |
Matthews Asia Dividend Fund
June 30, 2023
Schedule of Investmentsa (unaudited) (continued)
RIGHTS (continued)
| | | | | | | | |
| | | Shares | | | Value | |
| | | |
| SOUTH KOREA: 0.0% | | | | | | | | |
Macquarie Korea Infrastructure Fund, Rights, Expires 08/09/23b | | | 208,989 | | | | 26,637 | |
| | | | | | | | |
Total South Korea | | | | | | | 26,637 | |
| | | | | | | | |
| | | | | | | | |
| | | |
| TOTAL RIGHTS | | | | | | | 226,396 | |
| | | | | | | | |
(Cost $0) | | | | | | | | |
| | | | | | | | |
| | | |
| TOTAL INVESTMENTS: 98.1% | | | | | | | 1,519,017,799 | |
(Cost $1,523,706,454) | | | | | | | | |
| | | | | | | | |
| | |
CASH AND OTHER ASSETS,
LESS LIABILITIES: 1.9% | | | | | | | 29,157,520 | |
| | | | | | | | |
| | |
NET ASSETS: 100.0% | | | | | | | $1,548,175,319 | |
| | | | | | | | |
| a | Certain securities were fair valued under the valuation policies approved by the Board of Trustees (Note 2-A). |
| b | Non-income producing security. |
| ADR | American Depositary Receipt |
| REIT | Real Estate Investment Trust |
See accompanying notes to financial statements.
| | | | |
| PORTFOLIO MANAGERS |
| |
| Sherwood Zhang, CFA | | Winnie Chwang |
Lead Manager | | Lead manager |
| |
| Elli Lee | | Andrew Mattock, CFA |
Co-Manager | | Co-Manager |
| | | | |
| | |
| FUND FACTS | | | | |
| | |
| | | Investor | | Institutional |
Ticker | | MCDFX | | MICDX |
CUSIP | | 577125305 | | 577130735 |
Inception | | 11/30/09 | | 10/29/10 |
NAV | | $12.44 | | $12.44 |
Initial Investment | | $2,500 | | $100,000 |
Gross Expense Ratio1 | | 1.20% | | 1.06% |
Portfolio Statistics | | |
Total # of Positions | | 36 |
Net Assets | | $185.3 million |
Weighted Average Market Cap | | $86.0 billion |
Portfolio Turnover2 | | 67.1% |
Benchmark | | | | |
MSCI China Index |
OBJECTIVE
Total return with an emphasis on providing current income.
STRATEGY
Under normal market conditions, the Fund seeks to achieve its investment objective by investing at least 80% of its net assets, which include borrowings for investment purposes, in dividend-paying equity securities of companies located in China. China includes its administrative and other districts, such as Hong Kong. The Fund may also invest in convertible debt and equity securities of companies located in China.
Matthews China Dividend Fund
Portfolio Manager Commentary (unaudited)
Period ended June 30, 2023
For the first half of 2023, the Matthews China Dividend Fund returned –8.79% (Investor Class) and –8.70% (Institutional Class), while its benchmark, the MSCI China Index, returned -5.39% over the same period. For the quarter ending June 30, 2023, the Fund returned –11.33% (Investor Class) and –11.24% (Institutional Class), while the benchmark returned –9.65%.
Market Environment
Chinese equities performed sluggishly in the first half after the post-zero-COVID reopening rally fizzled out in February as consumption data in the period disappointed the market. During the second-quarter holiday festivals of Qing Ming in April, May Day and Duan Wu in June, there was surging demand for travel, and tourist numbers and hotel room rates recovered back to pre-COVID levels. However, spending during the periods remained below pre-COVID levels indicating that Chinese consumers lacked the confidence to spend.
The real estate market is also creating worries as new home sales shrank during the first six months of the year. This has generated calls for the government to further relax the cooling measures it put in place toward the end of the sector’s almost 20-year-long boom. Chinese equities rallied a number of times in the first half on speculation the government was considering certain stimulus policies. However, we think there is limited room to ease monetary policy as the U.S. economy continues to defy the risk of recession. China’s central bank cannot cut interest rates too aggressively as that could create further depreciation pressure on an already weakened Chinese renminbi. A cheap renminbi is good for China’s exports but not for encouraging inward capital flows.
In addition to China’s uneven recovery, the impact of geopolitical tensions was also present, as the U.S. further tightened restrictions on exports to China of key semiconductor manufacturing equipment and materials.
Performance Contributors and Detractors
At the sector level, stock selection in IT, communication services and consumer staples were the biggest contributors to relative performance. On the other hand, our overweight and stock selection in real estate was the biggest detractor and we are revaluating our positions and allocation in the sector. Our underweight and stock selection in financials and stock selection in industrials also detracted.
At the holdings level, CITIC Telecom was the top performer in the first half. The Macau telecom operator has a stable local business while the returning mainland tourists provide a rebound of roaming revenue. Yadea Group was the second-best performer. We have confidence in the prospects of the electric scooter manufacturer which is developing sodium-ion battery to help solidify its market leadership position. Tencent was the third-best performer. The internet platform reported better-than-expected earnings and management has said it is confident that all its units will recover strongly in 2023. The 50% increase in its annual dividend payment also shows confidence in its financial strength. However, Tencent’s largest shareholder’s plan to further divest shares will create more volatility for the stock.
In contrast, China’s largest duty-free shopping operator China Tourism Group Duty Free, and Hainan Meilan International Airport, which also has significant exposure to duty-free shopping revenue, were among the bottom performers in the period. As Chinese tourists can now go outside the border, Hainan has lost its
(continued)
| 1 | Prospectus expense ratios. |
| 2 | The lesser of fiscal year 2022 long-term purchase costs or sales proceeds divided by the average monthly market value of long-term securities. |
| | | | | | | | |
| | | | matthewsasia.com | 800.789.ASIA | | | 71 | |
| | | | | | | | | | | | | | | | | | | | | | | | | | | | | | | | |
| |
| PERFORMANCE AS OF JUNE 30, 2023 | |
| | | | | | | | | | | | Average Annual Total Returns | | | | |
| | | 3 Months | | | YTD | | | 1 Year | | | 3 Year | | | 5 Year | | | 10 Years | | | Since
Inception | | | Inception
Date | |
| Investor Class (MCDFX) | | | -11.33% | | | | -8.79% | | | | -11.93% | | | | -3.37% | | | | -1.18% | | | | 5.92% | | | | 6.72% | | | | 11/30/09 | |
| Institutional Class (MICDX) | | | -11.24% | | | | -8.70% | | | | -11.77% | | | | -3.22% | | | | -1.03% | | | | 6.09% | | | | 5.86% | | | | 10/29/10 | |
| MSCI China Index3 | | | -9.65% | | | | -5.39% | | | | -16.69% | | | | -10.13% | | | | -5.14% | | | | 3.22% | | | | 1.94% | 4 | | | | |
Performance assumes reinvestment of all dividends and/or distributions before taxes. All performance quoted represents past performance and is no guarantee of future results. Investment return and principal value will fluctuate with market conditions so that when redeemed, shares may be worth more or less than their original cost. Current performance may be lower or higher than the return figures quoted. For the Fund’s most recent month-end performance, visit matthewsasia.com.
| | | | | | | | | | | | | | | | | | | | | | | | | | | | |
| | | | | | | | |
| INCOME DISTRIBUTION HISTORY | | | | | | | | | | | | | | | | | | | | | |
| | | 2023 | | | | | | 2022 | |
| | | June | | | December | | | Total | | | | | | June | | | December | | | Total | |
| Investor (MCDFX) | | $ | 0.33 | | | | n.a. | | | | n.a. | | | | | | | $ | 0.42 | | | $ | 0.11 | | | $ | 0.52 | |
| Inst’l (MICDX) | | $ | 0.34 | | | | n.a. | | | | n.a. | | | | | | | $ | 0.43 | | | $ | 0.12 | | | $ | 0.54 | |
Note: This table does not include capital gains distributions. Totals may differ by $0.02 due to rounding. For income distribution history, visit matthewsasia.com.
| | | | |
| | | |
30 DAY YIELD: Investor Class 1.76% (1.76% excluding waivers) Institutional Class 1.96% (1.96% excluding waivers) The 30-Day Yield represents net investment income earned by the Fund over the 30-day period ended 6/30/23, expressed as an annual percentage rate based on the Fund’s share price at the end of the 30-day period. The 30-Day Yield should be regarded as an estimate of the Fund’s rate of investment income, and it may not equal the Fund’s actual income distribution rate. Source: BNY Mellon Investment Servicing (US) Inc. | | | | DIVIDEND YIELD: 3.32% The dividend yield (trailing) for the portfolio is the weighted average sum of the dividends paid by each equity security held by the Fund over the 12 months ended 6/30/23 divided by the current price of each equity as of 6/30/23. The annualized dividend yield for the Fund is for the equity-only portion of the portfolio. Please note that this is based on gross equity portfolio holdings and does not reflect the actual yield an investor in the Fund would receive. Past yields are no guarantee of future yields. Source: FactSet Research Systems, Bloomberg, MICM. |
GROWTH OF A HYPOTHETICAL $10,000 INVESTMENT SINCE INCEPTION—INVESTOR CLASS
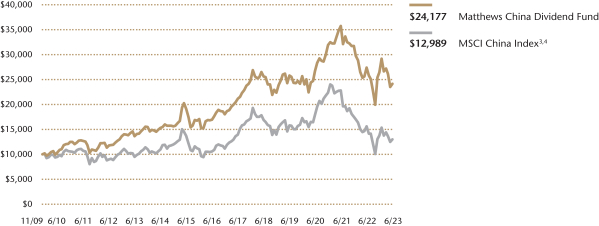
Plotted monthly. The performance data and graph do not reflect the deduction of taxes that a shareholder would pay on dividends, capital gains distributions or redemption of Fund shares. Values are in US$.
| | 3 | It is not possible to invest directly in an index. Source: Index data from Morgan Stanley Capital International and Bloomberg; total return calculations performed by BNY Mellon Investment Servicing (US) Inc. Please see page 76 for index definition. |
| | 4 | Calculated from 11/30/09. |
| | | | | | | | |
| | | | |
| TOP TEN HOLDINGS5 | | | | | | | |
| Name | | Sector | | | | % Net Assets | |
| Tencent Holdings, Ltd. | | Communication Services | | | | | 9.9% | |
| Alibaba Group Holding, Ltd. | | Consumer Discretionary | | | | | 7.7% | |
| CITIC Telecom International Holdings, Ltd. | | Communication Services | | | | | 6.1% | |
| Tsingtao Brewery Co., Ltd. | | Consumer Staples | | | | | 3.9% | |
| Postal Savings Bank of China Co., Ltd. | | Financials | | | | | 3.6% | |
| Yadea Group Holdings, Ltd. | | Consumer Discretionary | | | | | 3.4% | |
| Ping An Insurance Group Co. of China, Ltd. | | Financials | | | | | 3.3% | |
| China Merchants Bank Co., Ltd. | | Financials | | | | | 3.0% | |
| Wuliangye Yibin Co., Ltd. | | Consumer Staples | | | | | 3.0% | |
| Yangzijiang Shipbuilding Holdings, Ltd. | | Industrials | | | | | 2.6% | |
| TOTAL | | | | | | | 46.5% | |
| | 5 | Holdings may combine more than one security from same issuer and related depositary receipts. |
Matthews China Dividend Fund
Portfolio Manager Commentary (unaudited) (continued)
monopoly status in duty-free shopping. In addition, Chinese consumers are spending less on discretionary items such as cosmetics. We are evaluating the situation carefully.
Notable Portfolio Changes
During the second quarter, we initiated a new position in the Hong Kong shares of CSC Financial, a brokerage house and investment bank more commonly known as China Securities. The firm, which is less well-known among foreign investors, has been consistently ranked among the top three domestic brokers, especially in terms of securities underwriting. We believe it will benefit from new capital market reforms and its valuation on a price-to-earnings (P/E) ratio basis and discount to its mainland-listed A-shares are very attractive.
We have exited our position in Meituan as the company is facing new competition from ByteDance and is also entering new markets such as Hong Kong. These competitive threats and new investment will make Meituan less likely to achieve near-term profitability, which was our original expectation. In addition, we also exited Hainan Meilan International Airport, as the recovery of both of its traffic and duty-free business is proving challenging.
Outlook
While we share some near-term concern over the Chinese economy with many observers, such as unemployment of young people and private enterprises’ low appetite for expansion, we continue to believe the elements of the country’s economic success are still in place. And the current market valuation of Chinese equities is not reflecting an economic revival—many Chinese consumer company shares, for example, have plunged back to last October’s levels. We continue to believe therefore that holding high-quality Chinese companies has the potential to offer very attractive rewards for investors over the long term.
Price-to-earnings (P/E) ratio: Is a valuation ratio of a company’s current share price compared to its per-share earnings.
| | | | |
| |
| COUNTRY ALLOCATION (%)6,7 | |
| China/Hong Kong | | | 95.8 | |
| Taiwan | | | 2.3 | |
| Cash and Other Assets, Less Liabilities | | | 1.9 | |
| | | | |
| | |
| SECTOR ALLOCATION (%)7 | | | |
| Consumer Discretionary | | | 27.4 | |
| Communication Services | | | 16.0 | |
| Financials | | | 13.9 | |
| Consumer Staples | | | 8.8 | |
| Information Technology | | | 6.9 | |
| Industrials | | | 6.2 | |
| Health Care | | | 6.2 | |
| Real Estate | | | 5.9 | |
| Materials | | | 5.1 | |
| Energy | | | 1.9 | |
| Cash and Other Assets, Less Liabilities | | | 1.9 | |
| | | | |
| |
| MARKET CAP EXPOSURE (%)7 | |
| Mega Cap (over $25B) | | | 38.6 | |
| Large Cap ($10B-$25B) | | | 16.4 | |
| Mid Cap ($3B-10B) | | | 24.1 | |
| Small Cap (under $3B) | | | 19.0 | |
| Cash and Other Assets, Less Liabilities | | | 1.9 | |
| 6 | Not all countries where the Fund may invest are included in the benchmark index. |
| 7 | Source: FactSet Research Systems. Percentage values in data are rounded to the nearest tenth of one percent, so the values may not sum to 100% due to rounding. Country allocations and percentage values may be derived from different data sources and may not be consistent with other Fund literature. |
| | | | | | | | |
| | | | matthewsasia.com | 800.789.ASIA | | | 73 | |
Matthews China Dividend Fund
June 30, 2023
Schedule of Investmentsa (unaudited)
COMMON EQUITIES: 98.1%
| | | | | | | | |
| | | Shares | | | Value | |
| |
| CONSUMER DISCRETIONARY: 27.4% | |
Hotels, Restaurants & Leisure: 8.7% | |
Yum China Holdings, Inc. | | | 80,794 | | | | $4,564,861 | |
| | |
Melco Resorts & Entertainment, Ltd. ADRb | | | 327,330 | | | | 3,996,699 | |
| | |
Shanghai Jinjiang International Hotels Co., Ltd. B Shares | | | 2,091,400 | | | | 3,806,229 | |
| | |
Tam Jai International Co., Ltd. | | | 15,983,000 | | | | 3,682,030 | |
| | | | | | | | |
| | | | | | | 16,049,819 | |
| | | | | | | | |
| | | | | | | | |
Broadline Retail: 7.7% | |
Alibaba Group Holding, Ltd.b | | | 1,362,900 | | | | 14,187,558 | |
| | | | | | | | |
| | | | | | | | |
Automobiles: 3.4% | |
Yadea Group Holdings, Ltd.c,d | | | 2,758,000 | | | | 6,291,473 | |
| | | | | | | | |
| | | | | | | | |
Household Durables: 2.5% | |
Haier Smart Home Co., Ltd. D Shares | | | 3,713,926 | | | | 4,648,373 | |
| | | | | | | | |
| | | | | | | | |
Textiles, Apparel & Luxury Goods: 2.2% | |
Xtep International Holdings, Ltd. | | | 4,084,000 | | | | 4,180,236 | |
| | | | | | | | |
| | | | | | | | |
Diversified Consumer Services: 1.7% | |
China Education Group Holdings, Ltd.d | | | 4,055,000 | | | | 3,169,840 | |
| | | | | | | | |
| | | | | | | | |
Specialty Retail: 1.2% | |
China Tourism Group Duty Free Corp., Ltd. H Sharesb,c,d | | | 165,700 | | | | 2,248,209 | |
| | | | | | | | |
Total Consumer Discretionary | | | | | | | 50,775,508 | |
| | | | | | | | |
| | | | | | | | |
| |
| COMMUNICATION SERVICES: 15.9% | |
Interactive Media & Services: 9.8% | |
Tencent Holdings, Ltd. | | | 430,500 | | | | 18,253,708 | |
| | | | | | | | |
| | | | | | | | |
Diversified Telecommunication Services: 6.1% | |
CITIC Telecom International Holdings, Ltd. | | | 29,494,000 | | | | 11,306,014 | |
| | | | | | | | |
Total Communication Services | | | | | | | 29,559,722 | |
| | | | | | | | |
| | | | | | | | |
| |
| FINANCIALS: 13.9% | |
Banks: 6.6% | |
Postal Savings Bank of China Co., Ltd. H Sharesc,d | | | 10,745,000 | | | | 6,625,986 | |
| | |
China Merchants Bank Co., Ltd. A Shares | | | 1,241,884 | | | | 5,609,939 | |
| | | | | | | | |
| | | | | | | 12,235,925 | |
| | | | | | | | |
| | | | | | | | |
Capital Markets: 4.0% | | | | | | | | |
Hong Kong Exchanges & Clearing, Ltd. | | | 98,700 | | | | 3,739,645 | |
| | |
CSC Financial Co., Ltd. H Sharesc,d | | | 3,509,500 | | | | 3,630,735 | |
| | | | | | | | |
| | | | | | | 7,370,380 | |
| | | | | | | | |
| | | | | | | | |
Insurance: 3.3% | | | | | | | | |
Ping An Insurance Group Co. of China, Ltd. H Shares | | | 964,000 | | | | 6,156,988 | |
| | | | | | | | |
Total Financials | | | | | | | 25,763,293 | |
| | | | | | | | |
| | | | | | | | |
| | | |
| CONSUMER STAPLES: 8.8% | | | | | | | | |
Beverages: 6.9% | | | | | | | | |
Tsingtao Brewery Co., Ltd. H Shares | | | 796,000 | | | | 7,267,458 | |
| | |
Wuliangye Yibin Co., Ltd. A Shares | | | 246,600 | | | | 5,562,694 | |
| | | | | | | | |
| | | | | | | 12,830,152 | |
| | | | | | | | |
| | | | | | | | |
| | | | | | | | |
| | | Shares | | | Value | |
Food Products: 1.9% | | | | | | | | |
Inner Mongolia Yili Industrial Group Co., Ltd. A Shares | | | 885,600 | | | | $3,452,928 | |
| | | | | | | | |
Total Consumer Staples | | | | | | | 16,283,080 | |
| | | | | | | | |
| | | | | | | | |
| |
| INFORMATION TECHNOLOGY: 6.8% | |
Electronic Equipment, Instruments & Components: 4.6% | |
E Ink Holdings, Inc. | | | 598,000 | | | | 4,350,044 | |
| | |
OPT Machine Vision Tech Co., Ltd. A Shares | | | 185,055 | | | | 4,208,456 | |
| | | | | | | | |
| | | | | | | 8,558,500 | |
| | | | | | | | |
| | | | | | | | |
Software: 2.2% | | | | | | | | |
Longshine Technology Group Co., Ltd. A Shares | | | 1,289,600 | | | | 4,143,974 | |
| | | | | | | | |
Total Information Technology | | | | | | | 12,702,474 | |
| | | | | | | | |
| | | | | | | | |
| | | |
| INDUSTRIALS: 6.2% | | | | | | | | |
Machinery: 4.1% | | | | | | | | |
Yangzijiang Shipbuilding Holdings, Ltd. | | | 4,392,700 | | | | 4,887,226 | |
| | |
Zhuzhou CRRC Times Electric Co., Ltd. | | | 742,200 | | | | 2,772,342 | |
| | | | | | | | |
| | | | | | | 7,659,568 | |
| | | | | | | | |
| | | | | | | | |
Air Freight & Logistics: 2.1% | | | | | | | | |
ZTO Express Cayman, Inc. ADR | | | 155,269 | | | | 3,894,146 | |
| | | | | | | | |
Total Industrials | | | | | | | 11,553,714 | |
| | | | | | | | |
| | | | | | | | |
| | | |
| HEALTH CARE: 6.2% | | | | | | | | |
Pharmaceuticals: 4.6% | | | | | | | | |
Livzon Pharmaceutical Group, Inc. H Sharesb | | | 1,367,600 | | | | 4,716,773 | |
| | |
CSPC Pharmaceutical Group, Ltd. | | | 4,356,000 | | | | 3,790,935 | |
| | | | | | | | |
| | | | | | | 8,507,708 | |
| | | | | | | | |
| | | | | | | | |
Health Care Equipment & Supplies: 1.6% | |
AK Medical Holdings, Ltd.c,d | | | 3,396,000 | | | | 2,959,238 | |
| | | | | | | | |
Total Health Care | | | | | | | 11,466,946 | |
| | | | | | | | |
| | | | | | | | |
| | | |
| REAL ESTATE: 5.9% | | | | | | | | |
Real Estate Management & Development: 5.9% | |
Wharf Real Estate Investment Co., Ltd. | | | 906,000 | | | | 4,545,727 | |
| | |
China Vanke Co., Ltd. H Shares | | | 2,805,000 | | | | 3,778,635 | |
| | |
Onewo, Inc. H Shares | | | 782,730 | | | | 2,536,025 | |
| | | | | | | | |
Total Real Estate | | | | | | | 10,860,387 | |
| | | | | | | | |
| | | | | | | | |
| | | |
| MATERIALS: 5.1% | | | | | | | | |
Construction Materials: 3.8% | | | | | | | | |
China Jushi Co., Ltd. A Shares | | | 1,861,907 | | | | 3,632,528 | |
| | |
Huaxin Cement Co., Ltd. H Shares | | | 3,798,992 | | | | 3,298,350 | |
| | | | | | | | |
| | | | | | | 6,930,878 | |
| | | | | | | | |
| | | | | | | | |
Metals & Mining: 1.3% | | | | | | | | |
Tiangong International Co., Ltd. | | | 10,114,000 | | | | 2,459,233 | |
| | | | | | | | |
Total Materials | | | | | | | 9,390,111 | |
| | | | | | | | |
| | | | | | | | |
Matthews China Dividend Fund
June 30, 2023
Schedule of Investmentsa (unaudited) (continued)
COMMON EQUITIES (continued)
| | | | | | | | |
| | | Shares | | | Value | |
| | | |
| ENERGY: 1.9% | | | | | | | | |
Oil, Gas & Consumable Fuels: 1.9% | | | | | | | | |
China Suntien Green Energy Corp., Ltd. H Shares | | | 9,801,000 | | | | $3,525,136 | |
| | | | | | | | |
Total Energy | | | | | | | 3,525,136 | |
| | | | | | | | |
| | | | | | | | |
| | | |
| TOTAL INVESTMENTS: 98.1% | | | | | | | 181,880,371 | |
(Cost $204,476,841) | | | | | | | | |
| | | | | | | | |
| | |
CASH AND OTHER ASSETS,
LESS LIABILITIES: 1.9% | | | | | | | 3,435,268 | |
| | | | | | | | |
| | |
NET ASSETS: 100.0% | | | | | | | $185,315,639 | |
| | | | | | | | |
| a | Certain securities were fair valued under the valuation policies approved by the Board of Trustees (Note 2-A). |
| b | Non-income producing security. |
| c | Security exempt from registration under Rule 144A of the Securities Act of 1933, as amended. The security may be resold in transactions exempt from registration normally to qualified institutional buyers. The security has been determined to be liquid in accordance with procedures adopted by the Funds’ Board of Trustees. At June 30, 2023, the aggregate value is $21,755,641, which is 11.74% of net assets. |
| d | The securities may be resold to qualified foreign investors and foreign institutional buyers under Regulation S of the Securities Act of 1933. |
| ADR | American Depositary Receipt |
See accompanying notes to financial statements.
| | | | | | | | |
| | | | matthewsasia.com | 800.789.ASIA | | | 75 | |
Index Definitions
The MSCI Emerging Markets Index is a free float-adjusted market capitalization-weighted index of the stock markets of Argentina, Brazil, Chile, China, Colombia, Czech Republic, Egypt, Greece, Hungary, India, Indonesia, Kuwait, Malaysia, Mexico, Pakistan, Peru, Philippines, Poland, Qatar, Russia, Saudi Arabia, South Africa, South Korea, Taiwan, Thailand, Turkey and United Arab Emirates.
The MSCI Emerging Markets Small Cap Index is a free float-adjusted market capitalization-weighted small cap index of the stock markets of Argentina, Brazil, Chile, China, Colombia, Czech Republic, Egypt, Greece, Hungary, India, Indonesia, Kuwait, Malaysia, Mexico, Pakistan, Peru, Philippines, Poland, Qatar, Russia, Saudi Arabia, South Africa, South Korea, Taiwan, Thailand, Turkey and United Arab Emirates.
The MSCI All Country Asia ex Japan Small Cap Index is a free float–adjusted market capitalization-weighted small cap index of the stock markets of China, Hong Kong, India, Indonesia, Malaysia, Pakistan, Philippines, Singapore, South Korea, Taiwan and Thailand.
The MSCI All Country Asia Pacific Index is a free float–adjusted market capitalization–weighted index of the stock markets of Australia, China, Hong Kong, India, Indonesia, Japan, Malaysia, New Zealand, Pakistan, Philippines, Singapore, South Korea, Taiwan and Thailand.
The MSCI All Country Asia ex Japan Index is a free float–adjusted market capitalization–weighted index of the stock markets of China, Hong Kong, India, Indonesia, Malaysia, Pakistan, Philippines, Singapore, South Korea, Taiwan and Thailand.
The MSCI China Index is a free float–adjusted market capitalization-weighted index of Chinese equities that includes H shares listed on the Hong Kong exchange, B shares listed on the Shanghai and Shenzhen ex-exchanges, and Hong Kong-listed securities known as Red Chips (issued by entities owned by national or local governments in China) and P Chips (issued by
companies controlled by individuals in China and deriving substantial revenues in China), and foreign listings (e.g., ADRs).
The MSCI China All Shares Index captures large and mid-cap representation across China A shares, B shares, H shares, Red Chips (issued by entities owned by national or local governments in China), P Chips (issued by companies controlled by individuals in China and deriving substantial revenues in China), and foreign listings (e.g., ADRs). The index aims to reflect the opportunity set of China share classes listed in Hong Kong, Shanghai, Shenzhen and outside of China.
The MSCI China Small Cap Index is a free float–adjusted market capitalization-weighted small cap index of the Chinese equity securities markets, including H shares listed on the Hong Kong exchange, B shares listed on the Shanghai and Shenzhen exchanges, and Hong Kong-listed securities known as Red Chips (issued by entities owned by national or local governments in China) and P Chips (issued by companies controlled by individuals in China and deriving substantial revenues in China), and foreign listings (e.g., ADRs).
The S&P Bombay Stock Exchange (BSE) 100 Index is a free float–adjusted market capitalization-weighted index of the 100 stocks listed on the Bombay Stock Exchange.
MSCI India Index is a free float–adjusted market capitalization index that is designed to measure the performance of the large and mid -cap segments of the Indian market.
The MSCI Japan Index is a free float–adjusted market capitalization-weighted index of Japanese equities listed in Japan.
The Korea Composite Stock Price Index (KOSPI) is a market capitalization–weighted index of all common stocks listed on the Korea Stock Exchange.
The MSCI Korea Index is a free float-adjusted market capitalization-weighted index of Korean equities listed in Korea.
Disclosures
Fund Holdings: The Fund holdings shown in this report are as of June 30, 2023. Holdings are subject to change at any time, so holdings shown in this report may not reflect current Fund holdings. The Funds file complete schedules of portfolio holdings with the Securities and Exchange Commission (the “SEC”) for the first and third quarters of each fiscal year on Form N-PORT. The Funds’ Form N-PORTs are available on the SEC’s website at www.sec.gov. Complete schedules of investments are also available without charge, upon request, from the Funds by calling us at 800.789.ASIA (2742).
Proxy Voting Record: The Funds’ Statement of Additional Information containing a description of the policies and procedures that the Funds have used to vote proxies relating to portfolio securities, along with each Fund’s proxy voting record relating
to portfolio securities held during the most recent 12-month period ended June 30, is available upon request, at no charge, at the Funds’ website at matthewsasia.com or by calling 800.789.ASIA (2742), or on the SEC’s website at www.sec.gov.
Shareholder Reports and Prospectuses: To reduce the Funds’ expenses, we try to identify related shareholders in a household and send only one copy of the Funds’ prospectus and financial reports to that address. This process, called “householding,” will continue indefinitely unless you instruct us otherwise. At any time you may view the Funds’ current prospectus, summary prospectus and financial reports on our website. If you prefer to receive individual copies of the Funds’ prospectus or financial reports, please call us at 800.789.ASIA (2742).
| | | | | | | | |
| | | | matthewsasia.com | 800.789.ASIA | | | 77 | |
Disclosure of Fund Expenses (unaudited)
We believe it is important for you to understand the impact of fees regarding your investment. All mutual funds have operating expenses. As a shareholder of a mutual fund, you incur ongoing costs, which include costs for portfolio management, administrative services, and shareholder reports (like this one), among others. Operating expenses, which are deducted from a fund’s gross income, directly reduce the investment return of the fund. A fund’s operating expenses are expressed as a percentage of its average net assets. This figure is known as the expense ratio. The following examples are intended to help you understand the ongoing fees (in dollars) of investing in your fund and to compare these costs with those of other mutual funds. The examples are based on an investment of $1,000 made at the beginning of the period shown and held for the entire period.
This table illustrates your fund’s costs in two ways:
Actual Fund Return: This section helps you to estimate the actual operating expenses, after any applicable fee waivers, that you paid over the period. The “Ending Account Value” shown is derived from the fund’s actual return for the past six month period, the “Expense Ratio” column shows the period’s annualized expense ratio, and the “Operating Expenses Paid During Period” column shows the dollar amount that would have been paid by an investor who started with $1,000 in the fund at the beginning of the period. You may use the information here, together with your account value, to estimate the expenses that you paid over the period. To do so, simply divide your account value by $1,000 (for example, an
$8,600 account value divided by $1,000 = 8.6), then multiply the result by the number given for your fund in the first line under the heading entitled “Operating Expenses Paid During Period.”
Hypothetical 5% Return: This section is intended to help you compare your fund’s costs with those of other mutual funds. It assumes that the fund had an annual return of 5% before operating expenses, but that the expense ratio is unchanged. In this case, because the return used is not the fund’s actual return, the results do not apply to your investment. This example is useful in making comparisons to other mutual funds because the Securities and Exchange Commission requires all mutual funds to calculate expenses based on an assumed 5% annual return. You can assess your fund’s costs by comparing this hypothetical example with the hypothetical examples that appear in shareholder reports of other funds.
Please note that the operating expenses shown in the table are meant to highlight and help you compare your ongoing costs only and do not reflect any transactional costs such as sales charges (loads), redemption fees, or exchange fees.
Matthews Asia Funds does not charge any sales loads, exchange fees, or 12b-1 fees, but these may be present in other funds to which you compare this data. Therefore, the hypothetical portions of the table are useful in comparing ongoing costs only, and will not help you determine the relative total costs of owning different funds.
June 30, 2023
Disclosure of Fund Expenses (unaudited) (continued)
| | | | | | | | | | | | | | | | | | | | | | | | | | | | | | | | | | | | |
| | | Investor | | | | | | Institutional | |
| | | Beginning
Account Value 1/1/23 | | | Ending
Account Value 6/30/23 | | | Expense
Ratio | | | Operating
Expenses
Paid During
Period
1/1/23–
6/30/23 | | | | | | Beginning
Account Value 1/1/23 | | | Ending
Account Value 6/30/23 | | | Expense
Ratio | | | Operating
Expenses
Paid During
Period
1/1/23–
6/30/23 | |
| GLOBAL EMERGING MARKETS STRATEGIES | | | | | | | | | | | | | | | | | | | | | | | | | | | | | | | | | | | | |
Matthews Emerging Markets Equity Fund | | | | | | | | | | | | | | | | | | | | | | | | | | | | | | | | | | | | |
Actual Fund Return | | | $1,000.00 | | | | $1,060.20 | | | | 1.15% | | | | $5.87 | | | | | | | | $1,000.00 | | | | $1,061.10 | | | | 0.90% | | | | $4.60 | |
Hypothetical 5% Returns | | | $1,000.00 | | | | $1,019.09 | | | | 1.15% | | | | $5.76 | | | | | | | | $1,000.00 | | | | $1,020.33 | | | | 0.90% | | | | $4.51 | |
Matthews Emerging Markets Sustainable Future Fund | | | | | | | | | | | | | | | | | | | | | | | | | | | | | | | | | | | | |
Actual Fund Return | | | $1,000.00 | | | | $1,082.30 | | | | 1.20% | | | | $6.20 | | | | | | | | $1,000.00 | | | | $1,083.90 | | | | 1.04% | | | | $5.37 | |
Hypothetical 5% Returns | | | $1,000.00 | | | | $1,018.84 | | | | 1.20% | | | | $6.01 | | | | | | | | $1,000.00 | | | | $1,019.64 | | | | 1.04% | | | | $5.21 | |
Matthews Emerging Markets Small Companies Fund | | | | | | | | | | | | | | | | | | | | | | | | | | | | | | | | | | | | |
Actual Fund Return | | | $1,000.00 | | | | $1,140.00 | | | | 1.32% | | | | $7.00 | | | | | | | | $1,000.00 | | | | $1,141.10 | | | | 1.15% | | | | $6.11 | |
Hypothetical 5% Returns | | | $1,000.00 | | | | $1,018.25 | | | | 1.32% | | | | $6.61 | | | | | | | | $1,000.00 | | | | $1,019.09 | | | | 1.15% | | | | $5.76 | |
| | | | | | | | | |
| ASIA GROWTH STRATEGIES | | | | | | | | | | | | | | | | | | | | | | | | | | | | | | | | | | | | |
Matthews Asia Growth Fund | | | | | | | | | | | | | | | | | | | | | | | | | | | | | | | | | | | | |
Actual Fund Return | | | $1,000.00 | | | | $989.90 | | | | 1.17% | | | | $5.77 | | | | | | | | $1,000.00 | | | | $990.50 | | | | 1.00% | | | | $4.94 | |
Hypothetical 5% Returns | | | $1,000.00 | | | | $1,018.99 | | | | 1.17% | | | | $5.86 | | | | | | | | $1,000.00 | | | | $1,019.84 | | | | 1.00% | | | | $5.01 | |
Matthews Pacific Tiger Fund | | | | | | | | | | | | | | | | | | | | | | | | | | | | | | | | | | | | |
Actual Fund Return | | | $1,000.00 | | | | $987.60 | | | | 1.14% | | | | $5.62 | | | | | | | | $1,000.00 | | | | $988.10 | | | | 0.99% | | | | $4.88 | |
Hypothetical 5% Returns | | | $1,000.00 | | | | $1,019.14 | | | | 1.14% | | | | $5.71 | | | | | | | | $1,000.00 | | | | $1,019.89 | | | | 0.99% | | | | $4.96 | |
Matthews Asia Innovators Fund | | | | | | | | | | | | | | | | | | | | | | | | | | | | | | | | | | | | |
Actual Fund Return | | | $1,000.00 | | | | $977.00 | | | | 1.19% | | | | $5.83 | | | | | | | | $1,000.00 | | | | $978.20 | | | | 1.04% | | | | $5.10 | |
Hypothetical 5% Returns | | | $1,000.00 | | | | $1,018.89 | | | | 1.19% | | | | $5.96 | | | | | | | | $1,000.00 | | | | $1,019.64 | | | | 1.04% | | | | $5.21 | |
Matthews China Fund | | | | | | | | | | | | | | | | | | | | | | | | | | | | | | | | | | | | |
Actual Fund Return | | | $1,000.00 | | �� | | $873.10 | | | | 1.16% | | | | $5.39 | | | | | | | | $1,000.00 | | | | $873.60 | | | | 1.01% | | | | $4.69 | |
Hypothetical 5% Returns | | | $1,000.00 | | | | $1,019.04 | | | | 1.16% | | | | $5.81 | | | | | | | | $1,000.00 | | | | $1,019.79 | | | | 1.01% | | | | $5.06 | |
Matthews China Small Companies Fund | | | | | | | | | | | | | | | | | | | | | | | | | | | | | | | | | | | | |
Actual Fund Return | | | $1,000.00 | | | | $892.90 | | | | 1.45% | | | | $6.81 | | | | | | | | $1,000.00 | | | | $893.00 | | | | 1.20% | | | | $5.63 | |
Hypothetical 5% Returns | | | $1,000.00 | | | | $1,017.60 | | | | 1.45% | | | | $7.25 | | | | | | | | $1,000.00 | | | | $1,018.84 | | | | 1.20% | | | | $6.01 | |
Matthews India Fund | | | | | | | | | | | | | | | | | | | | | | | | | | | | | | | | | | | | |
Actual Fund Return | | | $1,000.00 | | | | $1,115.40 | | | | 1.16% | | | | $6.08 | | | | | | | | $1,000.00 | | | | $1,116.70 | | | | 1.01% | | | | $5.30 | |
Hypothetical 5% Returns | | | $1,000.00 | | | | $1,019.04 | | | | 1.16% | | | | $5.81 | | | | | | | | $1,000.00 | | | | $1,019.79 | | | | 1.01% | | | | $5.06 | |
Matthews Japan Fund | | | | | | | | | | | | | | | | | | | | | | | | | | | | | | | | | | | | |
Actual Fund Return | | | $1,000.00 | | | | $1,134.20 | | | | 1.09% | | | | $5.77 | | | | | | | | $1,000.00 | | | | $1,134.60 | | | | 1.02% | | | | $5.40 | |
Hypothetical 5% Returns | | | $1,000.00 | | | | $1,019.39 | | | | 1.09% | | | | $5.46 | | | | | | | | $1,000.00 | | | | $1,019.74 | | | | 1.02% | | | | $5.11 | |
Matthews Korea Fund | | | | | | | | | | | | | | | | | | | | | | | | | | | | | | | | | | | | |
Actual Fund Return | | | | | | | | | | | | | | | | | | | | | | | $1,000.00 | | | | $1,091.40 | | | | 1.54% | | | | $7.99 | |
Hypothetical 5% Returns | | | | | | | | | | | | | | | | | | | | | | | $1,000.00 | | | | $1,017.16 | | | | 1.54% | | | | $7.70 | |
| | | | | | | | | |
| ASIA GROWTH AND INCOME STRATEGIES | | | | | | | | | | | | | | | | | | | | | | | | | | | | | | | | | | | | |
Matthews Asian Growth and Income Fund | | | | | | | | | | | | | | | | | | | | | | | | | | | | | | | | | | | | |
Actual Fund Return | | | $1,000.00 | | | | $1,044.40 | | | | 1.18% | | | | $5.98 | | | | | | | | $1,000.00 | | | | $1,044.30 | | | | 1.05% | | | | $5.32 | |
Hypothetical 5% Returns | | | $1,000.00 | | | | $1,018.94 | | | | 1.18% | | | | $5.91 | | | | | | | | $1,000.00 | | | | $1,019.59 | | | | 1.05% | | | | $5.26 | |
Matthews Asia Dividend Fund | | | | | | | | | | | | | | | | | | | | | | | | | | | | | | | | | | | | |
Actual Fund Return | | | $1,000.00 | | | | $1,029.30 | | | | 1.18% | | | | $5.94 | | | | | | | | $1,000.00 | | | | $1,029.70 | | | | 1.04% | | | | $5.23 | |
Hypothetical 5% Returns | | | $1,000.00 | | | | $1,018.94 | | | | 1.18% | | | | $5.91 | | | | | | | | $1,000.00 | | | | $1,019.64 | | | | 1.04% | | | | $5.21 | |
Matthews China Dividend Fund | | | | | | | | | | | | | | | | | | | | | | | | | | | | | | | | | | | | |
Actual Fund Return | | | $1,000.00 | | | | $912.10 | | | | 1.18% | | | | $5.59 | | | | | | | | $1,000.00 | | | | $913.00 | | | | 1.01% | | | | $4.79 | |
Hypothetical 5% Returns | | | $1,000.00 | | | | $1,018.94 | | | | 1.18% | | | | $5.91 | | | | | | | | $1,000.00 | | | | $1,019.79 | | | | 1.01% | | | | $5.06 | |
| | | | | | | | |
| | | | matthewsasia.com | 800.789.ASIA | | | 79 | |
| | |
| Statements of Assets and Liabilities (unaudited) | | June 30, 2023 |
| | | | | | | | | | | | |
| | | Matthews Emerging Markets Equity Fund | | | Matthews Emerging Markets Sustainable
Future Fund | | | Matthews
Emerging Markets
Small Companies
Fund | |
| | | |
ASSETS: | | | | | | | | | | | | |
| | | |
Investments at value (A) (Note 2-A and 7): | | | | | | | | | | | | |
| | | |
Unaffiliated issuers | | | $23,261,838 | | | | $245,112,049 | | | | $501,529,175 | |
| | | |
Cash | | | 270,613 | | | | 1,318,776 | | | | 7,494,660 | |
| | | |
Segregated foreign currency at value | | | 525 | | | | 8,789 | | | | 580 | |
| | | |
Foreign currency at value (B) | | | 38,767 | | | | 62,023 | | | | 105,116 | |
| | | |
Dividends and interest receivable | | | 32,824 | | | | 354,559 | | | | 1,014,013 | |
| | | |
Receivable for securities sold | | | 26,401 | | | | — | | | | 16,901 | |
| | | |
Receivable for capital shares sold | | | 12,607 | | | | 441,338 | | | | 1,592,166 | |
| | | |
Other receivable | | | — | | | | 10,206 | | | | 61,817 | |
| | | |
Prepaid expenses | | | 38,415 | | | | 91,725 | | | | 36,861 | |
TOTAL ASSETS | | | 23,681,990 | | | | 247,399,465 | | | | 511,851,289 | |
| | | |
LIABILITIES: | | | | | | | | | | | | |
| | | |
Payable for securities purchased | | | 66,923 | | | | — | | | | — | |
| | | |
Payable for capital shares redeemed | | | 31,417 | | | | 41,767 | | | | 1,296,976 | |
| | | |
Deferred foreign capital gains tax liability (Note 2-E) | | | — | | | | 1,293,067 | | | | 3,572,511 | |
| | | |
Due to Advisor (Note 5) | | | 3,178 | | | | 134,282 | | | | 341,737 | |
| | | |
Administration and accounting fees payable (Note 5) | | | 465 | | | | 4,579 | | | | 8,999 | |
| | | |
Administration and shareholder servicing fees payable (Note 5) | | | 3,355 | | | | 34,155 | | | | 69,437 | |
| | | |
Custodian fees payable | | | 26,119 | | | | 20,721 | | | | 65,616 | |
| | | |
Intermediary service fees payable (Note 5) | | | 9,570 | | | | — | | | | 42,822 | |
| | | |
Professional fees payable | | | — | | | | 11,964 | | | | 10,125 | |
| | | |
Transfer agent fees payable | | | 260 | | | | — | | | | 1,509 | |
| | | |
Accrued other expenses payable | | | 16,645 | | | | 10,359 | | | | 37,380 | |
TOTAL LIABILITIES | | | 157,932 | | | | 1,550,894 | | | | 5,447,112 | |
| | | |
NET ASSETS | | | $23,524,058 | | | | $245,848,571 | | | | $506,404,177 | |
| | | |
NET ASSETS: | | | | | | | | | | | | |
| | | |
Investor Class | | | $10,408,822 | | | | $37,878,552 | | | | $209,043,375 | |
| | | |
Institutional Class | | | 13,115,236 | | | | 207,970,019 | | | | 297,360,802 | |
TOTAL | | | $23,524,058 | | | | $245,848,571 | | | | $506,404,177 | |
See accompanying notes to financial statements.
| | |
| Statements of Assets and Liabilities (unaudited) (continued) | | June 30, 2023 |
| | | | | | | | | | | | |
| | | Matthews Emerging Markets Equity Fund | | | Matthews Emerging Markets Sustainable
Future Fund | | | Matthews
Emerging Markets
Small Companies
Fund | |
SHARES OUTSTANDING: | | | | | | | | | | | | |
| | | |
(shares of beneficial interest issued and outstanding, respectively, unlimited number of shares authorized with a $0.001 par value) | | | | | | | | | | | | |
| | | |
Investor Class | | | 881,002 | | | | 2,797,464 | | | | 7,946,677 | |
| | | |
Institutional Class | | | 1,110,203 | | | | 15,337,068 | | | | 11,312,580 | |
TOTAL | | | 1,991,205 | | | | 18,134,532 | | | | 19,259,257 | |
| | | |
NET ASSET VALUE: | | | | | | | | | | | | |
Investor Class, offering price and redemption price | | | $11.81 | | | | $13.54 | | | | $26.31 | |
Institutional Class, offering price and redemption price | | | $11.81 | | | | $13.56 | | | | $26.29 | |
| | | |
NET ASSETS CONSISTS OF: | | | | | | | | | | | | |
| | | |
Capital paid-in | | | $31,509,724 | | | | $235,680,073 | | | | $524,323,237 | |
| | | |
Total distributable earnings/(accumulated loss) | | | (7,985,666 | ) | | | 10,168,498 | | | | (17,919,060 | ) |
NET ASSETS | | | $23,524,058 | | | | $245,848,571 | | | | $506,404,177 | |
| | | |
(A) Investments at cost: | | | | | | | | | | | | |
| | | |
Unaffiliated Issuers | | | $25,273,996 | | | | $232,886,244 | | | | $457,050,303 | |
| | | |
(B) Foreign Currency at Cost | | | $38,984 | | | | $62,654 | | | | $105,759 | |
See accompanying notes to financial statements.
| | | | | | | | |
| | | | matthewsasia.com | 800.789.ASIA | | | 81 | |
| | |
| Statements of Assets and Liabilities (unaudited) (continued) | | June 30, 2023 |
| | | | | | | | | | | | |
| | | Matthews Asia Growth Fund | | | Matthews Pacific Tiger Fund | | | Matthews Asia Innovators Fund | |
| | | |
ASSETS: | | | | | | | | | | | | |
| | | |
Investments at value (A) (Note 2-A and 7): | | | | | | | | | | | | |
| | | |
Unaffiliated issuers | | | $564,826,807 | | | | $3,565,858,937 | | | | $450,047,709 | |
| | | |
Cash | | | 2,516,112 | | | | 100,254,253 | | | | 3,926,318 | |
| | | |
Segregated foreign currency at value | | | — | | | | 23,317 | | | | 1,529 | |
| | | |
Foreign currency at value (B) | | | 445,207 | | | | 5,552,227 | | | | 3,950,312 | |
| | | |
Dividends and interest receivable | | | 567,046 | | | | 10,243,839 | | | | 535,494 | |
| | | |
Receivable for securities sold | | | 9,048,790 | | | | 50,512 | | | | 12,910,961 | |
| | | |
Receivable for capital shares sold | | | 164,183 | | | | 4,894,885 | | | | 366,400 | |
| | | |
Other receivable | | | 7,714 | | | | 1,054,368 | | | | — | |
| | | |
Prepaid expenses | | | 17,114 | | | | 44,372 | | | | 26,783 | |
TOTAL ASSETS | | | 577,592,973 | | | | 3,687,976,710 | | | | 471,765,506 | |
| | | |
LIABILITIES: | | | | | | | | | | | | |
| | | |
Payable for securities purchased | | | 16,413 | | | | 521,694 | | | | 9,166,515 | |
| | | |
Payable for capital shares redeemed | | | 538,771 | | | | 7,785,268 | | | | 1,638,606 | |
| | | |
Deferred foreign capital gains tax liability (Note 2-E) | | | 1,030,588 | | | | 25,782,237 | | | | 1,029,878 | |
| | | |
Due to Advisor (Note 5) | | | 333,920 | | | | 2,018,055 | | | | 261,620 | |
| | | |
Administration and accounting fees payable (Note 5) | | | 12,105 | | | | 75,413 | | | | 9,586 | |
| | | |
Administration and shareholder servicing fees payable (Note 5) | | | 84,235 | | | | 519,333 | | | | 65,807 | |
| | | |
Custodian fees payable | | | 118,560 | | | | 745,827 | | | | 136,563 | |
| | | |
Intermediary service fees payable (Note 5) | | | 149,440 | | | | 794,015 | | | | 129,979 | |
| | | |
Professional fees payable | | | 33,885 | | | | 76,820 | | | | 17,738 | |
| | | |
Transfer agent fees payable | | | 6,666 | | | | 8,789 | | | | 7,104 | |
| | | |
Accrued other expenses payable | | | 237,040 | | | | 965,452 | | | | 175,808 | |
TOTAL LIABILITIES | | | 2,561,623 | | | | 39,292,903 | | | | 12,639,204 | |
| | | |
NET ASSETS | | | $575,031,350 | | | | $3,648,683,807 | | | | $459,126,302 | |
| | | |
NET ASSETS: | | | | | | | | | | | | |
| | | |
Investor Class | | | $202,106,289 | | | | $985,087,025 | | | | $249,812,727 | |
| | | |
Institutional Class | | | 372,925,061 | | | | 2,663,596,782 | | | | 209,313,575 | |
TOTAL | | | $575,031,350 | | | | $3,648,683,807 | | | | $459,126,302 | |
See accompanying notes to financial statements.
| | |
| Statements of Assets and Liabilities (unaudited) (continued) | | June 30, 2023 |
| | | | | | | | | | | | |
| | | Matthews Asia Growth Fund | | | Matthews Pacific Tiger Fund | | | Matthews Asia Innovators Fund | |
SHARES OUTSTANDING: | | | | | | | | | | | | |
| | | |
(shares of beneficial interest issued and outstanding, respectively, unlimited number of shares authorized with a $0.001 par value) | | | | | | | | | | | | |
| | | |
Investor Class | | | 9,796,735 | | | | 49,484,501 | | | | 22,603,157 | |
| | | |
Institutional Class | | | 17,834,510 | | | | 133,701,959 | | | | 18,620,680 | |
TOTAL | | | 27,631,245 | | | | 183,186,460 | | | | 41,223,837 | |
| | | |
NET ASSET VALUE: | | | | | | | | | | | | |
Investor Class, offering price and redemption price | | | $20.63 | | | | $19.91 | | | | $11.05 | |
Institutional Class, offering price and redemption price | | | $20.91 | | | | $19.92 | | | | $11.24 | |
| | | |
NET ASSETS CONSISTS OF: | | | | | | | | | | | | |
| | | |
Capital paid-in | | | $754,783,019 | | | | $3,432,223,637 | | | | $843,417,217 | |
| | | |
Total distributable earnings/(accumulated loss) | | | (179,751,669 | ) | | | 216,460,170 | | | | (384,290,915 | ) |
NET ASSETS | | | $575,031,350 | | | | $3,648,683,807 | | | | $459,126,302 | |
| | | |
(A) Investments at cost: | | | | | | | | | | | | |
| | | |
Unaffiliated Issuers | | | $546,332,239 | | | | $3,261,090,596 | | | | $440,537,884 | |
| | | |
(B) Foreign Currency at Cost | | | $444,915 | | | | $5,557,266 | | | | $3,987,621 | |
See accompanying notes to financial statements.
| | | | | | | | |
| | | | matthewsasia.com | 800.789.ASIA | | | 83 | |
| | |
| Statements of Assets and Liabilities (unaudited) (continued) | | June 30, 2023 |
| | | | | | | | | | | | |
| | | Matthews
China Fund | | | Matthews China
Small Companies
Fund | | | Matthews
India Fund | |
| | | |
ASSETS: | | | | | | | | | | | | |
| | | |
Investments at value (A) (Note 2-A and 7): | | | | | | | | | | | | |
| | | |
Unaffiliated issuers | | | $651,232,065 | | | | $126,380,617 | | | | $650,934,178 | |
| | | |
Cash | | | 278,551 | | | | 364,845 | | | | 22,328,442 | |
| | | |
Segregated foreign currency at value | | | 18,981 | | | | 3,091 | | | | — | |
| | | |
Foreign currency at value (B) | | | 1,749 | | | | 1,132,662 | | | | 447,038 | |
| | | |
Dividends and interest receivable | | | 2,614,056 | | | | 373,606 | | | | 1,405,646 | |
| | | |
Receivable for securities sold | | | — | | | | — | | | | 151,641 | |
| | | |
Receivable for capital shares sold | | | 1,883,841 | | | | 39,934 | | | | 3,254,405 | |
| | | |
Other receivable | | | — | | | | 1,305 | | | | 13,529 | |
| | | |
Prepaid expenses | | | 31,872 | | | | 14,242 | | | | 6,808 | |
TOTAL ASSETS | | | 656,061,115 | | | | 128,310,302 | | | | 678,541,687 | |
| | | |
LIABILITIES: | | | | | | | | | | | | |
| | | |
Payable for securities purchased | | | — | | | | — | | | | 3,389,938 | |
| | | |
Payable for capital shares redeemed | | | 1,383,971 | | | | 469,291 | | | | 488,211 | |
| | | |
Deferred foreign capital gains tax liability (Note 2-E) | | | — | | | | — | | | | 21,706,083 | |
| | | |
Due to Advisor (Note 5) | | | 379,523 | | | | 95,017 | | | | 365,743 | |
| | | |
Administration and accounting fees payable (Note 5) | | | 14,308 | | | | 2,783 | | | | 11,986 | |
| | | |
Administration and shareholder servicing fees payable (Note 5) | | | 95,912 | | | | 18,156 | | | | 88,918 | |
| | | |
Custodian fees payable | | | 55,466 | | | | 42,964 | | | | 128,944 | |
| | | |
Foreign capital gains tax payable (Note 2-E) | | | — | | | | — | | | | 15,650 | |
| | | |
Intermediary service fees payable (Note 5) | | | 189,502 | | | | 50,678 | | | | 123,025 | |
| | | |
Professional fees payable | | | 22,957 | | | | 16,056 | | | | 44,805 | |
| | | |
Transfer agent fees payable | | | 11,901 | | | | 5,905 | | | | 9,632 | |
| | | |
Accrued other expenses payable | | | 370,185 | | | | 66,764 | | | | 180,282 | |
TOTAL LIABILITIES | | | 2,523,725 | | | | 767,614 | | | | 26,553,217 | |
| | | |
NET ASSETS | | | $653,537,390 | | | | $127,542,688 | | | | $651,988,470 | |
| | | |
NET ASSETS: | | | | | | | | | | | | |
| | | |
Investor Class | | | $375,664,099 | | | | $92,128,935 | | | | $542,421,501 | |
| | | |
Institutional Class | | | 277,873,291 | | | | 35,413,753 | | | | 109,566,969 | |
TOTAL | | | $653,537,390 | | | | $127,542,688 | | | | $651,988,470 | |
See accompanying notes to financial statements.
| | |
| Statements of Assets and Liabilities (unaudited) (continued) | | June 30, 2023 |
| | | | | | | | | | | | |
| | | Matthews
China Fund | | | Matthews China
Small Companies
Fund | | | Matthews
India Fund | |
SHARES OUTSTANDING: | | | | | | | | | | | | |
| | | |
(shares of beneficial interest issued and outstanding, respectively, unlimited number of shares authorized with a $0.001 par value) | | | | | | | | | | | | |
| | | |
Investor Class | | | 29,673,474 | | | | 9,289,236 | | | | 22,015,057 | |
| | | |
Institutional Class | | | 21,965,549 | | | | 3,565,180 | | | | 4,353,939 | |
TOTAL | | | 51,639,023 | | | | 12,854,416 | | | | 26,368,996 | |
| | | |
NET ASSET VALUE: | | | | | | | | | | | | |
Investor Class, offering price and redemption price | | | $12.66 | | | | $9.92 | | | | $24.64 | |
Institutional Class, offering price and redemption price | | | $12.65 | | | | $9.93 | | | | $25.17 | |
| | | |
NET ASSETS CONSISTS OF: | | | | | | | | | | | | |
| | | |
Capital paid-in | | | $1,112,057,613 | | | | $277,130,605 | | | | $545,722,272 | |
| | | |
Total distributable earnings/(accumulated loss) | | | (458,520,223 | ) | | | (149,587,917 | ) | | | 106,266,198 | |
NET ASSETS | | | $653,537,390 | | | | $127,542,688 | | | | $651,988,470 | |
| | | |
(A) Investments at cost: | | | | | | | | | | | | |
| | | |
Unaffiliated Issuers | | | $862,429,012 | | | | $143,468,418 | | | | $510,025,288 | |
| | | |
(B) Foreign Currency at Cost | | | $1,754 | | | | $1,161,664 | | | | $447,005 | |
See accompanying notes to financial statements.
| | | | | | | | |
| | | | matthewsasia.com | 800.789.ASIA | | | 85 | |
| | |
| Statements of Assets and Liabilities (unaudited) (continued) | | June 30, 2023 |
| | | | | | | | |
| | | Matthews
Japan Fund | | | Matthews
Korea Fund | |
| | |
ASSETS: | | | | | | | | |
| | |
Investments at value (A) (Note 2-A and 7): | | | | | | | | |
| | |
Unaffiliated issuers | | | $661,882,252 | | | | $62,213,514 | |
| | |
Cash | | | 26,526,148 | | | | 2,116,174 | |
| | |
Foreign currency at value (B) | | | 1,780,700 | | | | — | |
| | |
Dividends and interest receivable | | | 237,044 | | | | 222,647 | |
| | |
Receivable for securities sold | | | 6,466,837 | | | | 834,119 | |
| | |
Receivable for capital shares sold | | | 1,508,950 | | | | 651 | |
| | |
Prepaid expenses | | | 35,893 | | | | — | |
TOTAL ASSETS | | | 698,437,824 | | | | 65,387,105 | |
| | |
LIABILITIES: | | | | | | | | |
| | |
Payable for securities purchased | | | 6,640,739 | | | | 3,339 | |
| | |
Payable for capital shares redeemed | | | 614,494 | | | | 195,491 | |
| | |
Due to Advisor (Note 5) | | | 378,523 | | | | 38,381 | |
| | |
Administration and accounting fees payable (Note 5) | | | 13,002 | | | | 1,344 | |
| | |
Administration and shareholder servicing fees payable (Note 5) | | | 95,838 | | | | 9,725 | |
| | |
Custodian fees payable | | | 9,309 | | | | 23,040 | |
| | |
Intermediary service fees payable (Note 5) | | | 83,397 | | | | 40,844 | |
| | |
Professional fees payable | | | 17,690 | | | | 19,741 | |
| | |
Transfer agent fees payable | | | 13,222 | | | | 7,508 | |
| | |
Accrued other expenses payable | | | 332,087 | | | | 56,565 | |
TOTAL LIABILITIES | | | 8,198,301 | | | | 395,978 | |
| | |
NET ASSETS | | | $690,239,523 | | | | $64,991,127 | |
| | |
NET ASSETS: | | | | | | | | |
| | |
Investor Class | | | $238,490,580 | | | | $— | |
| | |
Institutional Class | | | 451,748,943 | | | | 64,991,127 | |
TOTAL | | | $690,239,523 | | | | $64,991,127 | |
See accompanying notes to financial statements.
| | |
| Statements of Assets and Liabilities (unaudited) (continued) | | June 30, 2023 |
| | | | | | | | |
| | | Matthews
Japan Fund | | | Matthews
Korea Fund | |
SHARES OUTSTANDING: | | | | | | | | |
| | |
(shares of beneficial interest issued and outstanding, respectively, unlimited number of shares authorized with a $0.001 par value) | | | | | | | | |
| | |
Investor Class | | | 14,113,329 | | | | — | |
| | |
Institutional Class | | | 26,662,862 | | | | 2,612,082 | |
TOTAL | | | 40,776,191 | | | | 2,612,082 | |
| | |
NET ASSET VALUE: | | | | | | | | |
Investor Class, offering price and redemption price | | | $16.90 | | | | $— | |
Institutional Class, offering price and redemption price | | | $16.94 | | | | $24.88 | |
| | |
NET ASSETS CONSISTS OF: | | | | | | | | |
| | |
Capital paid-in | | | $802,170,788 | | | | $58,999,936 | |
| | |
Total distributable earnings/(accumulated loss) | | | (111,931,265 | ) | | | 5,991,191 | |
NET ASSETS | | | $690,239,523 | | | | $64,991,127 | |
| | |
(A) Investments at cost: | | | | | | | | |
| | |
Unaffiliated Issuers | | | $583,404,372 | | | | $56,101,086 | |
| | |
(B) Foreign Currency at Cost | | | $1,776,637 | | | | $— | |
See accompanying notes to financial statements.
| | | | | | | | |
| | | | matthewsasia.com | 800.789.ASIA | | | 87 | |
| | |
| Statements of Assets and Liabilities (unaudited) (continued) | | June 30, 2023 |
| | | | | | | | | | | | |
| | | Matthews Asian
Growth and
Income Fund | | | Matthews Asia
Dividend Fund | | | Matthews China
Dividend Fund | |
| | | |
ASSETS: | | | | | | | | | | | | |
| | | |
Investments at value (A) (Note 2-A and 7): | | | | | | | | | | | | |
| | | |
Unaffiliated issuers | | | $522,133,071 | | | | $1,519,017,799 | | | | $181,880,371 | |
| | | |
Cash | | | 20,072,700 | | | | 38,205,720 | | | | 2,601,640 | |
| | | |
Segregated foreign currency at value | | | 12 | | | | 13,837 | | | | 4,461 | |
| | | |
Foreign currency at value (B) | | | 463 | | | | 4,784,380 | | | | 267,481 | |
| | | |
Dividends and interest receivable | | | 2,480,669 | | | | 3,480,548 | | | | 1,047,345 | |
| | | |
Receivable for securities sold | | | 531,212 | | | | 7,614,596 | | | | 88,208 | |
| | | |
Receivable for capital shares sold | | | 130,838 | | | | 672,130 | | | | 283,838 | |
| | | |
Other receivable | | | 20,830 | | | | 1,854,145 | | | | — | |
| | | |
Prepaid expenses | | | — | | | | 22,105 | | | | — | |
TOTAL ASSETS | | | 545,369,795 | | | | 1,575,665,260 | | | | 186,173,344 | |
| | | |
LIABILITIES: | | | | | | | | | | | | |
| | | |
Payable for securities purchased | | | 4,264,844 | | | | 19,525,931 | | | | — | |
| | | |
Payable for capital shares redeemed | | | 1,072,304 | | | | 3,831,749 | | | | 488,859 | |
| | | |
Deferred foreign capital gains tax liability (Note 2-E) | | | 392,330 | | | | 1,117,670 | | | | — | |
| | | |
Due to Advisor (Note 5) | | | 368,031 | | | | 876,120 | | | | 108,150 | |
| | | |
Administration and accounting fees payable (Note 5) | | | 11,468 | | | | 32,907 | | | | 4,188 | |
| | | |
Administration and shareholder servicing fees payable (Note 5) | | | 78,296 | | | | 224,310 | | | | 27,411 | |
| | | |
Custodian fees payable | | | 73,759 | | | | 589,275 | | | | 42,286 | |
| | | |
Intermediary service fees payable (Note 5) | | | 189,425 | | | | 498,230 | | | | 50,198 | |
| | | |
Professional fees payable | | | 26,575 | | | | 24,774 | | | | 15,317 | |
| | | |
Transfer agent fees payable | | | 6,909 | | | | 9,084 | | | | 1,660 | |
| | | |
Accrued other expenses payable | | | 303,269 | | | | 759,891 | | | | 119,636 | |
TOTAL LIABILITIES | | | 6,787,210 | | | | 27,489,941 | | | | 857,705 | |
| | | |
NET ASSETS | | | $538,582,585 | | | | $1,548,175,319 | | | | $185,315,639 | |
| | | |
NET ASSETS: | | | | | | | | | | | | |
| | | |
Investor Class | | | $303,026,588 | | | | $526,271,244 | | | | $118,887,269 | |
| | | |
Institutional Class | | | 235,555,997 | | | | 1,021,904,075 | | | | 66,428,370 | |
TOTAL | | | $538,582,585 | | | | $1,548,175,319 | | | | $185,315,639 | |
See accompanying notes to financial statements.
| | |
| Statements of Assets and Liabilities (unaudited) (continued) | | June 30, 2023 |
| | | | | | | | | | | | |
| | | Matthews Asian
Growth and
Income Fund | | | Matthews Asia
Dividend Fund | | | Matthews China
Dividend Fund | |
SHARES OUTSTANDING: | | | | | | | | | | | | |
| | | |
(shares of beneficial interest issued and outstanding, respectively, unlimited number of shares authorized with a $0.001 par value) | | | | | | | | | | | | |
| | | |
Investor Class | | | 23,502,482 | | | | 38,763,344 | | | | 9,557,080 | |
| | | |
Institutional Class | | | 18,310,160 | | | | 75,282,623 | | | | 5,341,694 | |
TOTAL | | | 41,812,642 | | | | 114,045,967 | | | | 14,898,774 | |
| | | |
NET ASSET VALUE: | | | | | | | | | | | | |
Investor Class, offering price and redemption price | | | $12.89 | | | | $13.58 | | | | $12.44 | |
Institutional Class, offering price and redemption price | | | $12.86 | | | | $13.57 | | | | $12.44 | |
| | | |
NET ASSETS CONSISTS OF: | | | | | | | | | | | | |
| | | |
Capital paid-in | | | $555,016,886 | | | | $1,905,414,173 | | | | $249,774,716 | |
| | | |
Total distributable earnings/(accumulated loss) | | | (16,434,301 | ) | | | (357,238,854 | ) | | | (64,459,077 | ) |
NET ASSETS | | | $538,582,585 | | | | $1,548,175,319 | | | | $185,315,639 | |
| | | |
(A) Investments at cost: | | | | | | | | | | | | |
| | | |
Unaffiliated Issuers | | | $502,400,654 | | | | $1,523,706,454 | | | | $204,476,841 | |
| | | |
(B) Foreign Currency at Cost | | | $460 | | | | $4,790,101 | | | | $267,524 | |
See accompanying notes to financial statements.
| | | | | | | | |
| | | | matthewsasia.com | 800.789.ASIA | | | 89 | |
| | |
| Statements of Operations (unaudited) | | Six-Month Period Ended June 30, 2023 |
| | | | | | | | | | | | |
| | | Matthews Emerging Markets Equity Fund | | | Matthews Emerging Markets Sustainable Future Fund | | | Matthews Emerging Markets
Small Companies
Fund | |
| | | |
INVESTMENT INCOME: | | | | | | | | | | | | |
| | | |
Dividends—Unaffiliated Issuers | | | $340,098 | | | | $1,077,668 | | | | $2,950,216 | |
| | | |
Interest | | | — | | | | 9 | | | | — | |
| | | |
Foreign withholding tax | | | (28,022 | ) | | | (114,629 | ) | | | (418,802 | ) |
TOTAL INVESTMENT INCOME | | | 312,076 | | | | 963,048 | | | | 2,531,414 | |
| | | |
EXPENSES: | | | | | | | | | | | | |
| | | |
Investment advisory fees (Note 5) | | | 87,509 | | | | 734,492 | | | | 2,131,709 | |
| | | |
Administration and accounting fees (Note 5) | | | 1,029 | | | | 8,636 | | | | 17,054 | |
| | | |
Administration and shareholder servicing fees (Note 5) | | | 22,030 | | | | 185,186 | | | | 365,729 | |
| | | |
Accounting out-of-pocket fees | | | 16,747 | | | | 16,674 | | | | 17,491 | |
| | | |
Custodian fees | | | 24,077 | | | | 42,064 | | | | 82,124 | |
| | | |
Printing fees | | | 7,761 | | | | 13,740 | | | | 18,037 | |
| | | |
Intermediary service fees (Note 5) | | | 21,035 | | | | 75,476 | | | | 220,845 | |
| | | |
Professional fees | | | 17,704 | | | | 20,081 | | | | 26,833 | |
| | | |
Registration fees | | | 9,178 | | | | 23,043 | | | | 20,965 | |
| | | |
Transfer agent fees | | | 2,343 | | | | 3,258 | | | | 13,114 | |
| | | |
Trustees fees | | | 1,985 | | | | 8,918 | | | | 21,268 | |
| | | |
Other expenses | | | 8,219 | | | | 19,822 | | | | 23,545 | |
TOTAL EXPENSES | | | 219,617 | | | | 1,151,390 | | | | 2,958,714 | |
| | | |
Advisory fees waived and expenses waived or reimbursed (Note 5) | | | (90,872 | ) | | | — | | | | (362,583 | ) |
NET EXPENSES | | | 128,745 | | | | 1,151,390 | | | | 2,596,131 | |
| | | |
NET INVESTMENT INCOME (LOSS) | | | 183,331 | | | | (188,342 | ) | | | (64,717 | ) |
| | | |
| REALIZED AND UNREALIZED GAIN (LOSS) ON INVESTMENTS, FOREIGN CURRENCY RELATED TRANSACTIONS, AND FOREIGN CAPITAL GAINS TAXES: | | | | | | | | | | | | |
| | | |
Net realized gain (loss) on investments—Unaffiliated Issuers | | | (1,056,118 | ) | | | 2,789,183 | | | | 13,684,032 | |
| | | |
Net realized foreign capital gains tax | | | — | | | | (378,024 | ) | | | (612,471 | ) |
| | | |
Net realized gain (loss) on foreign currency related transactions | | | (539 | ) | | | (21,800 | ) | | | (54,241 | ) |
| | | |
Net change in unrealized appreciation/depreciation on investments—Unaffiliated Issuers | | | 2,845,688 | | | | 13,497,563 | | | | 44,665,478 | |
| | | |
Net change in deferred foreign capital gains taxes on unrealized appreciation/depreciation | | | (1,759 | ) | | | (162,471 | ) | | | (1,032,678 | ) |
| | | |
Net change in unrealized appreciation/depreciation on foreign currency related translations | | | (387 | ) | | | (420 | ) | | | 823 | |
Net realized and unrealized gain (loss) on investments, foreign currency related transactions, and foreign capital gains taxes | | | 1,786,885 | | | | 15,724,031 | | | | 56,650,943 | |
| | | |
NET INCREASE (DECREASE) IN NET ASSETS FROM OPERATIONS | | | $1,970,216 | | | | $15,535,689 | | | | $56,586,226 | |
See accompanying notes to financial statements.
| | |
| Statements of Operations (unaudited) (continued) | | Six-Month Period Ended June 30, 2023 |
| | | | | | | | | | | | |
| | | Matthews Asia Growth Fund | | | Matthews Pacific Tiger Fund | | | Matthews Asia Innovators Fund | |
| | | |
INVESTMENT INCOME: | | | | | | | | | | | | |
| | | |
Dividends—Unaffiliated Issuers | | | $5,308,921 | | | | $37,061,052 | | | | $2,734,910 | |
| | | |
Foreign withholding tax | | | (574,468 | ) | | | (3,899,656 | ) | | | (336,795 | ) |
TOTAL INVESTMENT INCOME | | | 4,734,453 | | | | 33,161,396 | | | | 2,398,115 | |
| | | |
EXPENSES: | | | | | | | | | | | | |
| | | |
Investment advisory fees (Note 5) | | | 2,134,606 | | | | 13,092,021 | | | | 1,685,595 | |
| | | |
Administration and accounting fees (Note 5) | | | 25,103 | | | | 153,956 | | | | 19,822 | |
| | | |
Administration and shareholder servicing fees (Note 5) | | | 537,693 | | | | 3,298,259 | | | | 424,594 | |
| | | |
Accounting out-of-pocket fees | | | 17,453 | | | | 21,487 | | | | 16,276 | |
| | | |
Custodian fees | | | 21,665 | | | | 253,685 | | | | 53,774 | |
| | | |
Printing fees | | | 40,050 | | | | 130,188 | | | | 37,521 | |
| | | |
Intermediary service fees (Note 5) | | | 386,454 | | | | 2,283,447 | | | | 407,154 | |
| | | |
Professional fees | | | 35,047 | | | | 144,586 | | | | 31,990 | |
| | | |
Registration fees | | | 30,533 | | | | 46,662 | | | | 29,025 | |
| | | |
Transfer agent fees | | | 18,910 | | | | 53,688 | | | | 15,843 | |
| | | |
Trustees fees | | | 37,342 | | | | 227,998 | | | | 25,011 | |
| | | |
Other expenses | | | 46,507 | | | | 191,920 | | | | 42,149 | |
TOTAL EXPENSES | | | 3,331,363 | | | | 19,897,897 | | | | 2,788,754 | |
| | | |
Advisory fees waived and expenses waived or reimbursed (Note 5) | | | — | | | | (43,677 | ) | | | — | |
| | | |
Administration fees waived (Note 5) | | | — | | | | (43,677 | ) | | | — | |
NET EXPENSES | | | 3,331,363 | | | | 19,810,543 | | | | 2,788,754 | |
| | | |
NET INVESTMENT INCOME (LOSS) | | | 1,403,090 | | | | 13,350,853 | | | | (390,639 | ) |
| | | |
REALIZED AND UNREALIZED GAIN (LOSS) ON INVESTMENTS,
FOREIGN CURRENCY RELATED TRANSACTIONS, AND
FOREIGN CAPITAL GAINS TAXES: | | | | | | | | | | | | |
| | | |
Net realized gain (loss) on investments—Unaffiliated Issuers | | | (46,675,883 | ) | | | (46,514,593 | ) | | | (23,804,030 | ) |
| | | |
Net realized foreign capital gains tax | | | — | | | | (828,512 | ) | | | (327,549 | ) |
| | | |
Net realized gain (loss) on foreign currency related transactions | | | (97,985 | ) | | | (193,083 | ) | | | (341,242 | ) |
| | | |
Net change in unrealized appreciation/depreciation on investments—Unaffiliated Issuers | | | 40,627,663 | | | | (17,990,213 | ) | | | 11,122,052 | |
| | | |
Net change in deferred foreign capital gains taxes on unrealized appreciation/depreciation | | | (235,919 | ) | | | (3,042,945 | ) | | | 101,872 | |
| | | |
Net change in unrealized appreciation/depreciation on foreign currency related translations | | | 50,404 | | | | (31,403 | ) | | | (36,470 | ) |
Net realized and unrealized gain (loss) on investments, foreign currency related transactions, and foreign capital gains taxes | | | (6,331,720 | ) | | | (68,600,749 | ) | | | (13,285,367 | ) |
| | | |
NET INCREASE (DECREASE) IN NET ASSETS FROM OPERATIONS | | | ($4,928,630 | ) | | | ($55,249,896 | ) | | | ($13,676,006 | ) |
See accompanying notes to financial statements.
| | | | | | | | |
| | | | matthewsasia.com | 800.789.ASIA | | | 91 | |
| | |
| Statements of Operations (unaudited) (continued) | | Six-Month Period Ended June 30, 2023 |
| | | | | | | | | | | | |
| | | Matthews
China Fund | | | Matthews China Small Companies Fund | | | Matthews India Fund | |
| | | |
INVESTMENT INCOME: | | | | | | | | | | | | |
| | | |
Dividends—Unaffiliated Issuers | | | $6,437,532 | | | | $1,062,008 | | | | $4,569,287 | |
| | | |
Interest | | | — | | | | — | | | | 651 | |
| | | |
Foreign withholding tax | | | (388,612 | ) | | | (20,173 | ) | | | (975,876 | ) |
TOTAL INVESTMENT INCOME | | | 6,048,920 | | | | 1,041,835 | | | | 3,594,062 | |
| | | |
EXPENSES: | | | | | | | | | | | | |
| | | |
Investment advisory fees (Note 5) | | | 2,585,682 | | | | 759,906 | | | | 2,010,065 | |
| | | |
Administration and accounting fees (Note 5) | | | 30,409 | | | | 6,079 | | | | 23,635 | |
| | | |
Administration and shareholder servicing fees (Note 5) | | | 651,105 | | | | 130,141 | | | | 506,616 | |
| | | |
Accounting out-of-pocket fees | | | 17,990 | | | | 17,407 | | | | 17,332 | |
| | | |
Custodian fees | | | 43,364 | | | | 18,727 | | | | 52,434 | |
| | | |
Printing fees | | | 40,539 | | | | 16,543 | | | | 27,516 | |
| | | |
Intermediary service fees (Note 5) | | | 623,412 | | | | 157,577 | | | | 539,429 | |
| | | |
Professional fees | | | 31,406 | | | | 20,574 | | | | 61,064 | |
| | | |
Registration fees | | | 27,531 | | | | 19,855 | | | | 16,230 | |
| | | |
Transfer agent fees | | | 42,954 | | | | 9,253 | | | | 37,315 | |
| | | |
Trustees fees | | | 41,759 | | | | 9,813 | | | | 34,707 | |
| | | |
Other expenses | | | 37,079 | | | | 14,678 | | | | 30,873 | |
TOTAL EXPENSES | | | 4,173,230 | | | | 1,180,553 | | | | 3,357,216 | |
| | | |
Advisory fees waived and expenses waived or reimbursed (Note 5) | | | — | | | | (129,894 | ) | | | — | |
NET EXPENSES | | | 4,173,230 | | | | 1,050,659 | | | | 3,357,216 | |
| | | |
NET INVESTMENT INCOME (LOSS) | | | 1,875,690 | | | | (8,824 | ) | | | 236,846 | |
| | | |
REALIZED AND UNREALIZED GAIN (LOSS) ON INVESTMENTS,
FOREIGN CURRENCY RELATED TRANSACTIONS, AND
FOREIGN CAPITAL GAINS TAXES: | | | | | | | | | | | | |
| | | |
Net realized gain (loss) on investments—Unaffiliated Issuers | | | (68,151,958 | ) | | | (33,421,685 | ) | | | 10,414,445 | |
| | | |
Net realized foreign capital gains tax | | | — | | | | — | | | | (2,184,181 | ) |
| | | |
Net realized gain (loss) on foreign currency related transactions | | | (23,647 | ) | | | (57,340 | ) | | | (32,587 | ) |
| | | |
Net change in unrealized appreciation/depreciation on investments—Unaffiliated Issuers | | | (37,154,704 | ) | | | 16,568,195 | | | | 63,007,451 | |
| | | |
Net change in deferred foreign capital gains taxes on unrealized appreciation/depreciation | | | — | | | | — | | | | (4,818,385 | ) |
| | | |
Net change in unrealized appreciation/depreciation on foreign currency related translations | | | (13,167 | ) | | | (38,894 | ) | | | 3,513 | |
Net realized and unrealized gain (loss) on investments, foreign currency related transactions, and foreign capital gains taxes | | | (105,343,476 | ) | | | (16,949,724 | ) | | | 66,390,256 | |
| | | |
NET INCREASE (DECREASE) IN NET ASSETS FROM OPERATIONS | | | ($103,467,786 | ) | | | ($16,958,548 | ) | | | $66,627,102 | |
See accompanying notes to financial statements.
| | |
| Statements of Operations (unaudited) (continued) | | Six-Month Period Ended June 30, 2023 |
| | | | | | | | |
| | | Matthews
Japan Fund | | | Matthews
Korea Fund | |
| | |
INVESTMENT INCOME: | | | | | | | | |
| | |
Dividends—Unaffiliated Issuers | | | $6,429,265 | | | | $447,699 | |
| | |
Interest | | | 447 | | | | — | |
| | |
Foreign withholding tax | | | (618,865 | ) | | | (73,707 | ) |
TOTAL INVESTMENT INCOME | | | 5,810,847 | | | | 373,992 | |
| | |
EXPENSES: | | | | | | | | |
| | |
Investment advisory fees (Note 5) | | | 2,193,010 | | | | 246,290 | |
| | |
Administration and accounting fees (Note 5) | | | 25,787 | | | | 2,896 | |
| | |
Administration and shareholder servicing fees (Note 5) | | | 552,685 | | | | 62,022 | |
| | |
Accounting out-of-pocket fees | | | 17,590 | | | | 14,934 | |
| | |
Custodian fees | | | 15,537 | | | | 24,254 | |
| | |
Printing fees | | | 42,783 | | | | 16,331 | |
| | |
Intermediary service fees (Note 5) | | | 293,171 | | | | 89,217 | |
| | |
Professional fees | | | 33,187 | | | | 27,155 | |
| | |
Registration fees | | | 35,451 | | | | 34,500 | |
| | |
Transfer agent fees | | | 70,564 | | | | 16,429 | |
| | |
Trustees fees | | | 43,749 | | | | 6,727 | |
| | |
Other expenses | | | 37,836 | | | | 31,169 | |
TOTAL EXPENSES | | | 3,361,350 | | | | 571,924 | |
| | |
NET INVESTMENT INCOME (LOSS) | | | 2,449,497 | | | | (197,932 | ) |
| | |
REALIZED AND UNREALIZED GAIN (LOSS) ON INVESTMENTS
AND FOREIGN CURRENCY RELATED TRANSACTIONS: | | | | | | | | |
| | |
Net realized gain (loss) on investments—Unaffiliated Issuers | | | (14,604,711 | ) | | | 4,801,875 | |
| | |
Net realized gain (loss) on foreign currency related transactions | | | (576,378 | ) | | | (20,748 | ) |
| | |
Net change in unrealized appreciation/depreciation on investments—Unaffiliated Issuers | | | 94,181,828 | | | | 2,131,661 | |
| | |
Net change in unrealized appreciation/depreciation on foreign currency related translations | | | 258,253 | | | | (11,249 | ) |
Net realized and unrealized gain (loss) on investments and foreign currency related transactions | | | 79,258,992 | | | | 6,901,539 | |
| | |
NET INCREASE (DECREASE) IN NET ASSETS FROM OPERATIONS | | | $81,708,489 | | | | $6,703,607 | |
See accompanying notes to financial statements.
| | | | | | | | |
| | | | matthewsasia.com | 800.789.ASIA | | | 93 | |
| | |
| Statements of Operations (unaudited) (continued) | | Six-Month Period Ended June 30, 2023 |
| | | | | | | | | | | | |
| | | Matthews Asian Growth and Income Fund | | | Matthews Asia Dividend Fund | | | Matthews China Dividend Fund | |
| | | |
INVESTMENT INCOME: | | | | | | | | | | | | |
| | | |
Dividends—Unaffiliated Issuers | | | $10,452,814 | | | | $26,477,360 | | | | $3,499,614 | |
| | | |
Interest | | | 54,892 | | | | — | | | | — | |
| | | |
Foreign withholding tax | | | (857,412 | ) | | | (2,471,410 | ) | | | (151,014 | ) |
TOTAL INVESTMENT INCOME | | | 9,650,294 | | | | 24,005,950 | | | | 3,348,600 | |
| | | |
EXPENSES: | | | | | | | | | | | | |
| | | |
Investment advisory fees (Note 5) | | | 2,015,742 | | | | 5,883,227 | | | | 760,826 | |
| | | |
Administration and accounting fees (Note 5) | | | 23,705 | | | | 69,187 | | | | 8,948 | |
| | | |
Administration and shareholder servicing fees (Note 5) | | | 507,777 | | | | 1,481,774 | | | | 191,583 | |
| | | |
Accounting out-of-pocket fees | | | 17,875 | | | | 19,465 | | | | 15,473 | |
| | | |
Custodian fees | | | 53,026 | | | | 329,806 | | | | 10,022 | |
| | | |
Printing fees | | | 42,562 | | | | 112,053 | | | | 20,455 | |
| | | |
Intermediary service fees (Note 5) | | | 502,540 | | | | 1,127,241 | | | | 193,103 | |
| | | |
Professional fees | | | 34,209 | | | | 104,062 | | | | 20,880 | |
| | | |
Registration fees | | | 11,291 | | | | 31,000 | | | | — | |
| | | |
Transfer agent fees | | | 24,313 | | | | 33,929 | | | | 7,305 | |
| | | |
Trustees fees | | | 37,531 | | | | 123,430 | | | | 11,907 | |
| | | |
Other expenses | | | 36,845 | | | | 112,965 | | | | 12,126 | |
TOTAL EXPENSES | | | 3,307,416 | | | | 9,428,139 | | | | 1,252,628 | |
| | | |
NET INVESTMENT INCOME (LOSS) | | | 6,342,878 | | | | 14,577,811 | | | | 2,095,972 | |
| | | |
| REALIZED AND UNREALIZED GAIN (LOSS) ON INVESTMENTS, FOREIGN CURRENCY RELATED TRANSACTIONS, AND FOREIGN CAPITAL GAINS TAXES: | | | | | | | | | | | | |
| | | |
Net realized gain (loss) on investments—Unaffiliated Issuers | | | 20,622,418 | | | | 60,743,232 | | | | (5,704,958 | ) |
| | | |
Net realized foreign capital gains tax | | | (12 | ) | | | (9,083,047 | ) | | | — | |
| | | |
Net realized gain (loss) on foreign currency related transactions | | | (26,028 | ) | | | (2,742,040 | ) | | | (237 | ) |
| | | |
Net change in unrealized appreciation/depreciation on investments—Unaffiliated Issuers | | | (418,072 | ) | | | (14,296,780 | ) | | | (16,015,066 | ) |
| | | |
Net change in deferred foreign capital gains taxes on unrealized appreciation/depreciation | | | 227,406 | | | | 9,838,508 | | | | — | |
| | | |
Net change in unrealized appreciation/depreciation on foreign currency related translations | | | 286,538 | | | | (166,269 | ) | | | (11,690 | ) |
| | | |
Net realized and unrealized gain (loss) on investments, foreign currency related transactions, and foreign capital gains taxes | | | 20,692,250 | | | | 44,293,604 | | | | (21,731,951 | ) |
| | | |
NET INCREASE (DECREASE) IN NET ASSETS FROM OPERATIONS | | | $27,035,128 | | | | $58,871,415 | | | | ($19,635,979 | ) |
See accompanying notes to financial statements.
Statements of Changes in Net Assets
| | | | | | | | |
| MATTHEWS EMERGING MARKETS EQUITY FUND | | Six-Month Period Ended June 30, 2023 (Unaudited) | | | Year Ended December 31, 2022 | |
| | |
OPERATIONS: | | | | | | | | |
| | |
Net investment income (loss) | | | $183,331 | | | | $659,139 | |
| | |
Net realized gain (loss) on investments and foreign currency related transactions | | | (1,056,657 | ) | | | (4,261,238 | ) |
| | |
Net change in unrealized appreciation/depreciation on investments and foreign currency related translations | | | 2,845,301 | | | | (7,970,191 | ) |
| | |
Net change on foreign capital gains taxes on unrealized appreciation/depreciation | | | (1,759 | ) | | | 62,033 | |
Net increase (decrease) in net assets resulting from operations | | | 1,970,216 | | | | (11,510,257 | ) |
| | |
DISTRIBUTIONS TO SHAREHOLDERS: | | | | | | | | |
| | |
Investor Class | | | — | | | | (171,815 | ) |
| | |
Institutional Class | | | — | | | | (486,489 | ) |
Net decrease in net assets resulting from distributions | | | — | | | | (658,304 | ) |
CAPITAL SHARE TRANSACTIONS (net) (Note 4) | | | (11,910,926 | ) | | | (3,923,820 | ) |
Total increase (decrease) in net assets | | | (9,940,710 | ) | | | (16,092,381 | ) |
NET ASSETS: | | | | | | | | |
| | |
Beginning of period | | | 33,464,768 | | | | 49,557,149 | |
End of period | | | $23,524,058 | | | | $33,464,768 | |
| | |
| MATTHEWS EMERGING MARKETS SUSTAINABLE FUTURE FUND | | Six-Month Period Ended June 30, 2023 (Unaudited) | | | Year Ended December 31, 2022 | |
| | |
OPERATIONS: | | | | | | | | |
| | |
Net investment income (loss) | | | ($188,342 | ) | | | ($428,029 | ) |
| | |
Net realized gain (loss) on investments and foreign currency related transactions | | | 2,389,359 | | | | 3,676,316 | |
| | |
Net change in unrealized appreciation/depreciation on investments and foreign currency related translations | | | 13,497,143 | | | | (21,313,191 | ) |
| | |
Net change on foreign capital gains taxes on unrealized appreciation/depreciation | | | (162,471 | ) | | | (6,668 | ) |
Net increase (decrease) in net assets resulting from operations | | | 15,535,689 | | | | (18,071,572 | ) |
| | |
DISTRIBUTIONS TO SHAREHOLDERS: | | | | | | | | |
| | |
Investor Class | | | — | | | | (1,649,628 | ) |
| | |
Institutional Class | | | — | | | | (7,058,005 | ) |
Net decrease in net assets resulting from distributions | | | — | | | | (8,707,633 | ) |
CAPITAL SHARE TRANSACTIONS (net) (Note 4) | | | 58,004,890 | | | | 72,234,041 | |
Total increase (decrease) in net assets | | | 73,540,579 | | | | 45,454,836 | |
NET ASSETS: | | | | | | | | |
| | |
Beginning of period | | | 172,307,992 | | | | 126,853,156 | |
End of period | | | $245,848,571 | | | | $172,307,992 | |
See accompanying notes to financial statements.
| | | | | | | | |
| | | | matthewsasia.com | 800.789.ASIA | | | 95 | |
Statements of Changes in Net Assets (continued)
| | | | | | | | |
| MATTHEWS EMERGING MARKETS SMALL COMPANIES FUND | | Six-Month Period Ended June 30, 2023 (Unaudited) | | | Year Ended December 31, 2022 | |
| | |
OPERATIONS: | | | | | | | | |
| | |
Net investment income (loss) | | | ($64,717 | ) | | | ($348,674 | ) |
| | |
Net realized gain (loss) on investments and foreign currency related transactions | | | 13,017,320 | | | | 33,699,487 | |
| | |
Net change in unrealized appreciation/depreciation on investments and foreign currency related translations | | | 44,666,301 | | | | (103,113,237 | ) |
| | |
Net change on foreign capital gains taxes on unrealized appreciation/depreciation | | | (1,032,678 | ) | | | 862,730 | |
Net increase (decrease) in net assets resulting from operations | | | 56,586,226 | | | | (68,899,694 | ) |
| | |
DISTRIBUTIONS TO SHAREHOLDERS: | | | | | | | | |
| | |
Investor Class | | | — | | | | (10,642,526 | ) |
| | |
Institutional Class | | | — | | | | (17,586,490 | ) |
Net decrease in net assets resulting from distributions | | | — | | | | (28,229,016 | ) |
CAPITAL SHARE TRANSACTIONS (net) (Note 4) | | | 80,370,403 | | | | 68,567,370 | |
Total increase (decrease) in net assets | | | 136,956,629 | | | | (28,561,340 | ) |
NET ASSETS: | | | | | | | | |
| | |
Beginning of period | | | 369,447,548 | | | | 398,008,888 | |
End of period | | | $506,404,177 | | | | $369,447,548 | |
| | |
| MATTHEWS ASIA GROWTH FUND | | Six-Month Period Ended June 30, 2023 (Unaudited) | | | Year Ended December 31, 2022 | |
| | |
OPERATIONS: | | | | | | | | |
| | |
Net investment income (loss) | | | $1,403,090 | | | | ($2,079,983 | ) |
| | |
Net realized gain (loss) on investments and foreign currency related transactions | | | (46,773,868 | ) | | | (143,038,976 | ) |
| | |
Net change in unrealized appreciation/depreciation on investments and foreign currency related translations | | | 40,678,067 | | | | (406,306,763 | ) |
| | |
Net change on foreign capital gains taxes on unrealized appreciation/depreciation | | | (235,919 | ) | | | 5,625,551 | |
Net increase (decrease) in net assets resulting from operations | | | (4,928,630 | ) | | | (545,800,171 | ) |
| | |
DISTRIBUTIONS TO SHAREHOLDERS: | | | | | | | | |
| | |
Investor Class | | | — | | | | (6,372,932 | ) |
| | |
Institutional Class | | | — | | | | (11,696,816 | ) |
Net decrease in net assets resulting from distributions | | | — | | | | (18,069,748 | ) |
CAPITAL SHARE TRANSACTIONS (net) (Note 4) | | | (52,118,046 | ) | | | (558,821,991 | ) |
Total increase (decrease) in net assets | | | (57,046,676 | ) | | | (1,122,691,910 | ) |
NET ASSETS: | | | | | | | | |
| | |
Beginning of period | | | 632,078,026 | | | | 1,754,769,936 | |
End of period | | | $575,031,350 | | | | $632,078,026 | |
See accompanying notes to financial statements.
Statements of Changes in Net Assets (continued)
| | | | | | | | |
| MATTHEWS PACIFIC TIGER FUND | | Six-Month Period Ended June 30, 2023 (Unaudited) | | | Year Ended December 31, 2022 | |
| | |
OPERATIONS: | | | | | | | | |
| | |
Net investment income (loss) | | | $13,350,853 | | | | $24,615,390 | |
| | |
Net realized gain (loss) on investments and foreign currency related transactions | | | (47,536,188 | ) | | | (52,075,313 | ) |
| | |
Net change in unrealized appreciation/depreciation on investments and foreign currency related translations | | | (18,021,616 | ) | | | (1,497,234,871 | ) |
| | |
Net change on foreign capital gains taxes on unrealized appreciation/depreciation | | | (3,042,945 | ) | | | 16,309,323 | |
Net increase (decrease) in net assets resulting from operations | | | (55,249,896 | ) | | | (1,508,385,471 | ) |
| | |
DISTRIBUTIONS TO SHAREHOLDERS: | | | | | | | | |
| | |
Investor Class | | | — | | | | (88,898,319 | ) |
| | |
Institutional Class | | | — | | | | (213,752,096 | ) |
Net decrease in net assets resulting from distributions | | | — | | | | (302,650,415 | ) |
CAPITAL SHARE TRANSACTIONS (net) (Note 4) | | | 15,149,671 | | | | (1,692,644,474 | ) |
Total increase (decrease) in net assets | | | (40,100,225 | ) | | | (3,503,680,360 | ) |
NET ASSETS: | | | | | | | | |
| | |
Beginning of period | | | 3,688,784,032 | | | | 7,192,464,392 | |
End of period | | | $3,648,683,807 | | | | $3,688,784,032 | |
| | |
| MATTHEWS ASIA INNOVATORS FUND | | Six-Month Period Ended June 30, 2023 (Unaudited) | | | Year Ended December 31, 2022 | |
| | |
OPERATIONS: | | | | | | | | |
| | |
Net investment income (loss) | | | ($390,639 | ) | | | ($2,461,191 | ) |
| | |
Net realized gain (loss) on investments and foreign currency related transactions | | | (24,472,821 | ) | | | (296,415,093 | ) |
| | |
Net change in unrealized appreciation/depreciation on investments and foreign currency related translations | | | 11,085,582 | | | | (10,835,792 | ) |
| | |
Net change on foreign capital gains taxes on unrealized appreciation/depreciation | | | 101,872 | | | | 2,819,303 | |
Net increase (decrease) in net assets resulting from operations | | | (13,676,006 | ) | | | (306,892,773 | ) |
| | |
DISTRIBUTIONS TO SHAREHOLDERS: | | | | | | | | |
| | |
Investor Class | | | — | | | | (60,056,072 | ) |
| | |
Institutional Class | | | — | | | | (44,589,552 | ) |
Net decrease in net assets resulting from distributions | | | — | | | | (104,645,624 | ) |
CAPITAL SHARE TRANSACTIONS (net) (Note 4) | | | 484,552 | | | | (511,912,389 | ) |
Total increase (decrease) in net assets | | | (13,191,454 | ) | | | (923,450,786 | ) |
NET ASSETS: | | | | | | | | |
| | |
Beginning of period | | | 472,317,756 | | | | 1,395,768,542 | |
End of period | | | $459,126,302 | | | | $472,317,756 | |
See accompanying notes to financial statements.
| | | | | | | | |
| | | | matthewsasia.com | 800.789.ASIA | | | 97 | |
Statements of Changes in Net Assets (continued)
| | | | | | | | |
| MATTHEWS CHINA FUND | | Six-Month Period Ended June 30, 2023 (Unaudited) | | | Year Ended December 31, 2022 | |
| | |
OPERATIONS: | | | | | | | | |
| | |
Net investment income (loss) | | | $1,875,690 | | | | $217,849 | |
| | |
Net realized gain (loss) on investments and foreign currency related transactions | | | (68,175,605 | ) | | | (150,068,125 | ) |
| | |
Net change in unrealized appreciation/depreciation on investments and foreign currency related translations | | | (37,167,871 | ) | | | (197,123,046 | ) |
Net increase (decrease) in net assets resulting from operations | | | (103,467,786 | ) | | | (346,973,322 | ) |
| | |
DISTRIBUTIONS TO SHAREHOLDERS: | | | | | | | | |
| | |
Investor Class | | | — | | | | (32,362,149 | ) |
| | |
Institutional Class | | | — | | | | (21,837,281 | ) |
Net decrease in net assets resulting from distributions | | | — | | | | (54,199,430 | ) |
CAPITAL SHARE TRANSACTIONS (net) (Note 4) | | | 11,217,849 | | | | (194,850,178 | ) |
Total increase (decrease) in net assets | | | (92,249,937 | ) | | | (596,022,930 | ) |
NET ASSETS: | | | | | | | | |
| | |
Beginning of period | | | 745,787,327 | | | | 1,341,810,257 | |
End of period | | | $653,537,390 | | | | $745,787,327 | |
| | |
| MATTHEWS CHINA SMALL COMPANIES FUND | | Six-Month Period Ended June 30, 2023 (Unaudited) | | | Year Ended December 31, 2022 | |
| | |
OPERATIONS: | | | | | | | | |
| | |
Net investment income (loss) | | | ($8,824 | ) | | | $728,732 | |
| | |
Net realized gain (loss) on investments and foreign currency related transactions | | | (33,479,025 | ) | | | (88,967,075 | ) |
| | |
Net change in unrealized appreciation/depreciation on investments and foreign currency related translations | | | 16,529,301 | | | | (31,868,124 | ) |
Net increase (decrease) in net assets resulting from operations | | | (16,958,548 | ) | | | (120,106,467 | ) |
| | |
DISTRIBUTIONS TO SHAREHOLDERS: | | | | | | | | |
| | |
Investor Class | | | — | | | | (2,034,204 | ) |
| | |
Institutional Class | | | — | | | | (1,008,109 | ) |
Net decrease in net assets resulting from distributions | | | — | | | | (3,042,313 | ) |
CAPITAL SHARE TRANSACTIONS (net) (Note 4) | | | (10,260,477 | ) | | | (103,257,833 | ) |
Total increase (decrease) in net assets | | | (27,219,025 | ) | | | (226,406,613 | ) |
NET ASSETS: | | | | | | | | |
| | |
Beginning of period | | | 154,761,713 | | | | 381,168,326 | |
End of period | | | $127,542,688 | | | | $154,761,713 | |
See accompanying notes to financial statements.
Statements of Changes in Net Assets (continued)
| | | | | | | | |
| MATTHEWS INDIA FUND | | Six-Month Period Ended June 30, 2023 (Unaudited) | | | Year Ended December 31, 2022 | |
| | |
OPERATIONS: | | | | | | | | |
| | |
Net investment income (loss) | | | $236,846 | | | | ($2,826,201 | ) |
| | |
Net realized gain (loss) on investments and foreign currency related transactions | | | 8,197,677 | | | | 54,725,780 | |
| | |
Net change in unrealized appreciation/depreciation on investments and foreign currency related translations | | | 63,010,964 | | | | (138,570,199 | ) |
| | |
Net change on foreign capital gains taxes on unrealized appreciation/depreciation | | | (4,818,385 | ) | | | 12,032,808 | |
Net increase (decrease) in net assets resulting from operations | | | 66,627,102 | | | | (74,637,812 | ) |
| | |
DISTRIBUTIONS TO SHAREHOLDERS: | | | | | | | | |
| | |
Investor Class | | | — | | | | (69,440,851 | ) |
| | |
Institutional Class | | | — | | | | (13,509,415 | ) |
Net decrease in net assets resulting from distributions | | | — | | | | (82,950,266 | ) |
CAPITAL SHARE TRANSACTIONS (net) (Note 4) | | | (17,420,875 | ) | | | (3,405,239 | ) |
Total increase (decrease) in net assets | | | 49,206,227 | | | | (160,993,317 | ) |
NET ASSETS: | | | | | | | | |
| | |
Beginning of period | | | 602,782,243 | | | | 763,775,560 | |
End of period | | | $651,988,470 | | | | $602,782,243 | |
| | |
| MATTHEWS JAPAN FUND | | Six-Month Period Ended June 30, 2023 (Unaudited) | | | Year Ended December 31, 2022 | |
| | |
OPERATIONS: | | | | | | | | |
| | |
Net investment income (loss) | | | $2,449,497 | | | | $5,372,949 | |
| | |
Net realized gain (loss) on investments and foreign currency related transactions | | | (15,181,089 | ) | | | (169,997,728 | ) |
| | |
Net change in unrealized appreciation/depreciation on investments and foreign currency related translations | | | 94,440,081 | | | | (262,676,411 | ) |
Net increase (decrease) in net assets resulting from operations | | | 81,708,489 | | | | (427,301,190 | ) |
| | |
DISTRIBUTIONS TO SHAREHOLDERS: | | | | | | | | |
| | |
Investor Class | | | — | | | | (14,553,044 | ) |
| | |
Institutional Class | | | — | | | | (31,813,438 | ) |
Net decrease in net assets resulting from distributions | | | — | | | | (46,366,482 | ) |
CAPITAL SHARE TRANSACTIONS (net) (Note 4) | | | (13,605,051 | ) | | | (448,315,849 | ) |
Total increase (decrease) in net assets | | | 68,103,438 | | | | (921,983,521 | ) |
NET ASSETS: | | | | | | | | |
| | |
Beginning of period | | | 622,136,085 | | | | 1,544,119,606 | |
End of period | | | $690,239,523 | | | | $622,136,085 | |
See accompanying notes to financial statements.
| | | | | | | | |
| | | | matthewsasia.com | 800.789.ASIA | | | 99 | |
Statements of Changes in Net Assets (continued)
| | | | | | | | |
| MATTHEWS KOREA FUND | | Six-Month Period Ended June 30, 2023 (Unaudited) | | | Year Ended December 31, 2022 | |
| | |
OPERATIONS: | | | | | | | | |
| | |
Net investment income (loss) | | | ($197,932 | ) | | | $1,080,067 | |
| | |
Net realized gain (loss) on investments and foreign currency related transactions | | | 4,781,127 | | | | (3,280,646 | ) |
| | |
Net change in unrealized appreciation/depreciation on investments and foreign currency related translations | | | 2,120,412 | | | | (31,168,278 | ) |
Net increase (decrease) in net assets resulting from operations | | | 6,703,607 | | | | (33,368,857 | ) |
| | |
DISTRIBUTIONS TO SHAREHOLDERS: | | | | | | | | |
| | |
Investor Class | | | — | | | | (7,639,996 | ) |
| | |
Institutional Class | | | (1,077,132 | ) | | | (968,596 | ) |
Net decrease in net assets resulting from distributions | | | (1,077,132 | ) | | | (8,608,592 | ) |
CAPITAL SHARE TRANSACTIONS (net) (Note 4) | | | (20,658,104 | ) | | | (10,938,083 | ) |
Total increase (decrease) in net assets | | | (15,031,629 | ) | | | (52,915,532 | ) |
NET ASSETS: | | | | | | | | |
| | |
Beginning of period | | | 80,022,756 | | | | 132,938,288 | |
End of period | | | $64,991,127 | | | | $80,022,756 | |
| | |
| MATTHEWS ASIAN GROWTH AND INCOME FUND | | Six-Month Period Ended June 30, 2023 (Unaudited) | | | Year Ended December 31, 2022 | |
| | |
OPERATIONS: | | | | | | | | |
| | |
Net investment income (loss) | | | $6,342,878 | | | | $14,604,960 | |
| | |
Net realized gain (loss) on investments and foreign currency related transactions | | | 20,596,378 | | | | (48,439,576 | ) |
| | |
Net change in unrealized appreciation/depreciation on investments and foreign currency related translations | | | (131,534 | ) | | | (169,291,091 | ) |
| | |
Net change on foreign capital gains taxes on unrealized appreciation/depreciation | | | 227,406 | | | | 662,900 | |
Net increase (decrease) in net assets resulting from operations | | | 27,035,128 | | | | (202,462,807 | ) |
| | |
DISTRIBUTIONS TO SHAREHOLDERS: | | | | | | | | |
| | |
Investor Class | | | (3,838,104 | ) | | | (17,020,543 | ) |
| | |
Institutional Class | | | (3,156,375 | ) | | | (16,053,797 | ) |
Net decrease in net assets resulting from distributions | | | (6,994,479 | ) | | | (33,074,340 | ) |
CAPITAL SHARE TRANSACTIONS (net) (Note 4) | | | (91,472,970 | ) | | | (247,931,479 | ) |
Total increase (decrease) in net assets | | | (71,432,321 | ) | | | (483,468,626 | ) |
NET ASSETS: | | | | | | | | |
| | |
Beginning of period | | | 610,014,906 | | | | 1,093,483,532 | |
End of period | | | $538,582,585 | | | | $610,014,906 | |
See accompanying notes to financial statements.
Statements of Changes in Net Assets (continued)
| | | | | | | | |
| MATTHEWS ASIA DIVIDEND FUND | | Six-Month Period Ended June 30, 2023 (Unaudited) | | | Year Ended December 31, 2022 | |
| | |
OPERATIONS: | | | | | | | | |
| | |
Net investment income (loss) | | | $14,577,811 | | | | $28,888,532 | |
| | |
Net realized gain (loss) on investments and foreign currency related transactions | | | 48,918,145 | | | | (261,201,228 | ) |
| | |
Net change in unrealized appreciation/depreciation on investments and foreign currency related translations | | | (14,463,049 | ) | | | (1,103,989,848 | ) |
| | |
Net change on foreign capital gains taxes on unrealized appreciation/depreciation | | | 9,838,508 | | | | 595,392 | |
Net increase (decrease) in net assets resulting from operations | | | 58,871,415 | | | | (1,335,707,152 | ) |
| | |
DISTRIBUTIONS TO SHAREHOLDERS: | | | | | | | | |
| | |
Investor Class | | | (2,019,167 | ) | | | (7,812,204 | ) |
| | |
Institutional Class | | | (4,479,563 | ) | | | (18,595,761 | ) |
Net decrease in net assets resulting from distributions | | | (6,498,730 | ) | | | (26,407,965 | ) |
CAPITAL SHARE TRANSACTIONS (net) (Note 4) | | | (355,567,345 | ) | | | (1,527,382,129 | ) |
Total increase (decrease) in net assets | | | (303,194,660 | ) | | | (2,889,497,246 | ) |
NET ASSETS: | | | | | | | | |
| | |
Beginning of period | | | 1,851,369,979 | | | | 4,740,867,225 | |
End of period | | | $1,548,175,319 | | | | $1,851,369,979 | |
| | |
| MATTHEWS CHINA DIVIDEND FUND | | Six-Month Period Ended June 30, 2023 (Unaudited) | | | Year Ended December 31, 2022 | |
| | |
OPERATIONS: | | | | | | | | |
| | |
Net investment income (loss) | | | $2,095,972 | | | | $5,482,035 | |
| | |
Net realized gain (loss) on investments and foreign currency related transactions | | | (5,705,195 | ) | | | (29,326,490 | ) |
| | |
Net change in unrealized appreciation/depreciation on investments and foreign currency related translations | | | (16,026,756 | ) | | | (39,972,339 | ) |
Net increase (decrease) in net assets resulting from operations | | | (19,635,979 | ) | | | (63,816,794 | ) |
| | |
DISTRIBUTIONS TO SHAREHOLDERS: | | | | | | | | |
| | |
Investor Class | | | (3,080,890 | ) | | | (8,463,697 | ) |
| | |
Institutional Class | | | (1,797,481 | ) | | | (4,778,140 | ) |
Net decrease in net assets resulting from distributions | | | (4,878,371 | ) | | | (13,241,837 | ) |
CAPITAL SHARE TRANSACTIONS (net) (Note 4) | | | (11,455,678 | ) | | | (51,816,442 | ) |
Total increase (decrease) in net assets | | | (35,970,028 | ) | | | (128,875,073 | ) |
NET ASSETS: | | | | | | | | |
| | |
Beginning of period | | | 221,285,667 | | | | 350,160,740 | |
End of period | | | $185,315,639 | | | | $221,285,667 | |
See accompanying notes to financial statements.
| | | | | | | | |
| | | | matthewsasia.com | 800.789.ASIA | | | 101 | |
Financial Highlights
Matthews Emerging Markets Equity Fund
The tables below set forth financial data for a share of beneficial interest outstanding throughout each period presented.
| | | | | | | | | | | | | | | | |
| INVESTOR CLASS | | Six-Month Period Ended
June 30, 2023
(Unaudited) | | | Year Ended Dec. 31, | | | Period Ended
Dec. 31, 20201 | |
| | 2022 | | | 2021 | |
Net Asset Value, beginning of period | | | $11.14 | | | | $14.34 | | | | $15.76 | | | | $10.00 | |
INCOME (LOSS) FROM INVESTMENT OPERATIONS: | | | | | | | | | | | | | | | | |
Net investment income (loss)2 | | | 0.08 | | | | 0.20 | | | | 0.19 | | | | 0.04 | |
Net realized gain (loss) and unrealized appreciation/depreciation on investments, foreign currency related transactions and foreign capital gains taxes | | | 0.59 | | | | (3.20 | ) | | | (0.31 | ) | | | 6.08 | |
Total from investment operations | | | 0.67 | | | | (3.00 | ) | | | (0.12 | ) | | | 6.12 | |
LESS DISTRIBUTIONS FROM: | | | | | | | | | | | | | | | | |
Net investment income | | | — | | | | (0.20 | ) | | | (0.18 | ) | | | — | |
Net realized gains on investments | | | — | | | | — | | | | (1.12 | ) | | | (0.36 | ) |
Total distributions | | | — | | | | (0.20 | ) | | | (1.30 | ) | | | (0.36 | ) |
Net Asset Value, end of period | | | $11.81 | | | | $11.14 | | | | $14.34 | | | | $15.76 | |
TOTAL RETURN | | | 6.02% | 3 | | | (20.94% | ) | | | (0.60% | ) | | | 61.23% | 3 |
| | | | |
RATIOS/SUPPLEMENTAL DATA | | | | | | | | | | | | | | | | |
Net assets, end of period (in 000’s) | | | $10,409 | | | | $10,111 | | | | $13,317 | | | | $9,851 | |
Ratio of expenses to average net assets before any reimbursement, waiver or recapture of expenses by Advisor and Administrator (Note 5) | | | 1.80% | 4 | | | 1.58% | | | | 1.52% | | | | 2.76% | 4 |
Ratio of expenses to average net assets after any reimbursement, waiver or recapture of expenses by Advisor and Administrator | | | 1.15% | 4 | | | 1.08% | | | | 1.13% | | | | 1.08% | 4 |
Ratio of net investment income (loss) to average net assets | | | 1.41% | 4 | | | 1.46% | | | | 1.15% | | | | 0.45% | 4 |
Portfolio turnover5 | | | 14.07% | 3 | | | 63.08% | | | | 88.45% | | | | 62.30% | 3 |
| | | |
| INSTITUTIONAL CLASS | | Six-Month Period Ended
June 30, 2023
(Unaudited) | | | Year Ended Dec. 31, | | | Period Ended
Dec. 31, 20201 | |
| | 2022 | | | 2021 | |
Net Asset Value, beginning of period | | | $11.13 | | | | $14.34 | | | | $15.77 | | | | $10.00 | |
INCOME (LOSS) FROM INVESTMENT OPERATIONS: | | | | | | | | | | | | | | | | |
Net investment income (loss)2 | | | 0.08 | | | | 0.23 | | | | 0.22 | | | | 0.04 | |
Net realized gain (loss) and unrealized appreciation/depreciation on investments, foreign currency related transactions and foreign capital gains taxes | | | 0.60 | | | | (3.21 | ) | | | (0.31 | ) | | | 6.11 | |
Total from investment operations | | | 0.68 | | | | (2.98 | ) | | | (0.09 | ) | | | 6.15 | |
LESS DISTRIBUTIONS FROM: | | | | | | | | | | | | | | | | |
Net investment income | | | — | | | | (0.23 | ) | | | (0.22 | ) | | | (0.02 | ) |
Net realized gains on investments | | | — | | | | — | | | | (1.12 | ) | | | (0.36 | ) |
Total distributions | | | — | | | | (0.23 | ) | | | (1.34 | ) | | | (0.38 | ) |
Net Asset Value, end of period | | | $11.81 | | | | $11.13 | | | | $14.34 | | | | $15.77 | |
TOTAL RETURN | | | 6.11% | 3 | | | (20.81% | ) | | | (0.43% | ) | | | 61.55% | 3 |
| | | | |
RATIOS/SUPPLEMENTAL DATA | | | | | | | | | | | | | | | | |
Net assets, end of period (in 000’s) | | | $13,115 | | | | $23,353 | | | | $36,240 | | | | $34,941 | |
Ratio of expenses to average net assets before any reimbursement, waiver or recapture of expenses by Advisor and Administrator (Note 5) | | | 1.64% | 4 | | | 1.47% | | | | 1.38% | | | | 2.65% | 4 |
Ratio of expenses to average net assets after any reimbursement, waiver or recapture of expenses by Advisor and Administrator | | | 0.90% | 4 | | | 0.90% | | | | 0.90% | | | | 0.90% | 4 |
Ratio of net investment income (loss) to average net assets | | | 1.44% | 4 | | | 1.70% | | | | 1.33% | | | | 0.44% | 4 |
Portfolio turnover5 | | | 14.07% | 3 | | | 63.08% | | | | 88.45% | | | | 62.30% | 3 |
| 1 | The Fund commenced operations on April 29, 2020. |
| 2 | Calculated using the average daily shares method. |
| 5 | The portfolio turnover rate is calculated on the Fund as a whole without distinguishing between classes of shares issued. |
See accompanying notes to financial statements.
Financial Highlights (continued)
Matthews Emerging Markets Sustainable Future Fund
The tables below set forth financial data for a share of beneficial interest outstanding throughout each period presented.
| | | | | | | | | | | | | | | | | | | | | | | | |
| | | Six-Month
Period Ended
June 30, 2023 (Unaudited) | | | Year Ended Dec. 31, | |
| INVESTOR CLASS | | 2022 | | | 2021 | | | 2020 | | | 2019 | | | 2018 | |
Net Asset Value, beginning of period | | | $12.51 | | | | $15.37 | | | | $14.94 | | | | $11.08 | | | | $9.98 | | | | $11.56 | |
INCOME (LOSS) FROM INVESTMENT OPERATIONS: | | | | | | | | | | | | | | | | | | | | | | | | |
Net investment income (loss)1 | | | (0.02 | ) | | | (0.05 | ) | | | (0.07 | ) | | | (0.01 | ) | | | 0.04 | | | | 0.03 | |
Net realized gain (loss) and unrealized appreciation/depreciation on investments, foreign currency related transactions and foreign capital gains taxes | | | 1.05 | | | | (2.14 | ) | | | 1.85 | | | | 4.72 | | | | 1.21 | | | | (1.16 | ) |
Total from investment operations | | | 1.03 | | | | (2.19 | ) | | | 1.78 | | | | 4.71 | | | | 1.25 | | | | (1.13 | ) |
LESS DISTRIBUTIONS FROM: | | | | | | | | | | | | | | | | | | | | | | | | |
Net investment income | | | — | | | | (0.04 | ) | | | — | | | | (0.01 | ) | | | (0.03 | ) | | | (0.02 | ) |
Net realized gains on investments | | | — | | | | (0.63 | ) | | | (1.35 | ) | | | (0.84 | ) | | | (0.12 | ) | | | (0.43 | ) |
Total distributions | | | — | | | | (0.67 | ) | | | (1.35 | ) | | | (0.85 | ) | | | (0.15 | ) | | | (0.45 | ) |
Net Asset Value, end of period | | | $13.54 | | | | $12.51 | | | | $15.37 | | | | $14.94 | | | | $11.08 | | | | $9.98 | |
TOTAL RETURN | | | 8.23% | 2 | | | (14.38% | ) | | | 11.76% | | | | 42.87% | | | | 12.55% | | | | (9.73% | ) |
| | | | | | |
RATIOS/SUPPLEMENTAL DATA | | | | | | | | | | | | | | | | | | | | | | | | |
Net assets, end of period (in 000’s) | | | $37,879 | | | | $32,249 | | | | $39,612 | | | | $37,385 | | | | $19,291 | | | | $9,283 | |
Ratio of expenses to average net assets before any reimbursement, waiver or recapture of expenses by Advisor and Administrator (Note 5) | | | 1.20% | 3 | | | 1.24% | | | | 1.20% | | | | 1.42% | | | | 1.54% | | | | 2.20% | |
Ratio of expenses to average net assets after any reimbursement, waiver or recapture of expenses by Advisor and Administrator | | | 1.20% | 3 | | | 1.30% | | | | 1.40% | | | | 1.38% | | | | 1.42% | | | | 1.50% | |
Ratio of net investment income (loss) to average net assets | | | (0.31% | )3 | | | (0.41% | ) | | | (0.41% | ) | | | (0.08% | ) | | | 0.41% | | | | 0.27% | |
Portfolio turnover4 | | | 16.84% | 2 | | | 31.53% | | | | 65.56% | | | | 84.60% | | | | 29.67% | | | | 22.93% | |
| | |
| | | Six-Month Period Ended
June 30, 2023 (Unaudited) | | | Year Ended Dec. 31, | |
| INSTITUTIONAL CLASS | | 2022 | | | 2021 | | | 2020 | | | 2019 | | | 2018 | |
Net Asset Value, beginning of period | | | $12.51 | | | | $15.38 | | | | $14.92 | | | | $11.06 | | | | $9.96 | | | | $11.50 | |
INCOME (LOSS) FROM INVESTMENT OPERATIONS: | | | | | | | | | | | | | | | | | | | | | | | | |
Net investment income (loss)1 | | | (0.01 | ) | | | (0.04 | ) | | | (0.04 | ) | | | 0.01 | | | | 0.06 | | | | 0.06 | |
Net realized gain (loss) and unrealized appreciation/depreciation on investments, foreign currency related transactions and foreign capital gains taxes | | | 1.06 | | | | (2.14 | ) | | | 1.85 | | | | 4.72 | | | | 1.21 | | | | (1.16 | ) |
Total from investment operations | | | 1.05 | | | | (2.18 | ) | | | 1.81 | | | | 4.73 | | | | 1.27 | | | | (1.10 | ) |
LESS DISTRIBUTIONS FROM: | | | | | | | | | | | | | | | | | | | | | | | | |
Net investment income | | | — | | | | (0.06 | ) | | | — | | | | (0.03 | ) | | | (0.05 | ) | | | (0.01 | ) |
Net realized gains on investments | | | — | | | | (0.63 | ) | | | (1.35 | ) | | | (0.84 | ) | | | (0.12 | ) | | | (0.43 | ) |
Total distributions | | | — | | | | (0.69 | ) | | | (1.35 | ) | | | (0.87 | ) | | | (0.17 | ) | | | (0.44 | ) |
Net Asset Value, end of period | | | $13.56 | | | | $12.51 | | | | $15.38 | | | | $14.92 | | | | $11.06 | | | | $9.96 | |
TOTAL RETURN | | | 8.39% | 2 | | | (14.32% | ) | | | 11.98% | | | | 43.13% | | | | 12.74% | | | | (9.52% | ) |
| | | | | | |
RATIOS/SUPPLEMENTAL DATA | | | | | | | | | | | | | | | | | | | | | | | | |
Net assets, end of period (in 000’s) | | | $207,970 | | | | $140,059 | | | | $87,241 | | | | $50,642 | | | | $36,008 | | | | $23,249 | |
Ratio of expenses to average net assets before any reimbursement, waiver or recapture of expenses by Advisor and Administrator (Note 5) | | | 1.04% | 3 | | | 1.11% | | | | 1.07% | | | | 1.29% | | | | 1.41% | | | | 2.01% | |
Ratio of expenses to average net assets after any reimbursement, waiver or recapture of expenses by Advisor and Administrator | | | 1.04% | 3 | | | 1.17% | | | | 1.20% | | | | 1.20% | | | | 1.24% | | | | 1.25% | |
Ratio of net investment income (loss) to average net assets | | | (0.15% | )3 | | | (0.29% | ) | | | (0.25% | ) | | | 0.09% | | | | 0.54% | | | | 0.55% | |
Portfolio turnover4 | | | 16.84% | 2 | | | 31.53% | | | | 65.56% | | | | 84.60% | | | | 29.67% | | | | 22.93% | |
| 1 | Calculated using the average daily shares method. |
| 4 | The portfolio turnover rate is calculated on the Fund as a whole without distinguishing between classes of shares issued. |
See accompanying notes to financial statements.
| | | | | | | | |
| | | | matthewsasia.com | 800.789.ASIA | | | 103 | |
Financial Highlights (continued)
Matthews Emerging Markets Small Companies Fund
The tables below set forth financial data for a share of beneficial interest outstanding throughout each period presented.
| | | | | | | | | | | | | | | | | | | | | | | | |
| | | Six-Month
Period Ended
June 30, 2023 (Unaudited) | | | Year Ended Dec. 31, | |
| INVESTOR CLASS | | 2022 | | | 2021 | | | 2020 | | | 2019 | | | 2018 | |
Net Asset Value, beginning of period | | | $23.08 | | | | $29.92 | | | | $25.93 | | | | $18.10 | | | | $15.50 | | | | $22.89 | |
INCOME (LOSS) FROM INVESTMENT OPERATIONS: | | | | | | | | | | | | | | | | | | | | | | | | |
Net investment income (loss)1 | | | (0.01 | ) | | | (0.06 | ) | | | (0.17 | ) | | | (0.02 | ) | | | 0.12 | | | | 0.12 | |
Net realized gain (loss) and unrealized appreciation/depreciation on investments, foreign currency related transactions and foreign capital gains taxes | | | 3.24 | | | | (4.92 | ) | | | 5.90 | | | | 7.92 | | | | 2.57 | | | | (4.20 | ) |
Total from investment operations | | | 3.23 | | | | (4.98 | ) | | | 5.73 | | | | 7.90 | | | | 2.69 | | | | (4.08 | ) |
LESS DISTRIBUTIONS FROM: | | | | | | | | | | | | | | | | | | | | | | | | |
Net investment income | | | — | | | | (0.09 | ) | | | — | | | | (0.05 | ) | | | (0.09 | ) | | | (0.08 | ) |
Net realized gains on investments | | | — | | | | (1.77 | ) | | | (1.74 | ) | | | (0.02 | ) | | | — | | | | (3.23 | ) |
Total distributions | | | — | | | | (1.86 | ) | | | (1.74 | ) | | | (0.07 | ) | | | (0.09 | ) | | | (3.31 | ) |
Paid-in capital from redemption fees (Note 4) | | | — | | | | — | | | | — | | | | — | | | | — | 2 | | | — | 3 |
Net Asset Value, end of period | | | $26.31 | | | | $23.08 | | | | $29.92 | | | | $25.93 | | | | $18.10 | | | | $15.50 | |
TOTAL RETURN | | | 14.00% | 4 | | | (16.84% | ) | | | 22.14% | | | | 43.68% | | | | 17.38% | | | | (18.05% | ) |
| | | | | | |
RATIOS/SUPPLEMENTAL DATA | | | | | | | | | | | | | | | | | | | | | | | | |
Net assets, end of period (in 000’s) | | | $209,043 | | | | $141,254 | | | | $176,723 | | | | $99,573 | | | | $96,229 | | | | $111,456 | |
Ratio of expenses to average net assets before any reimbursement, waiver or recapture of expenses by Advisor and Administrator (Note 5) | | | 1.45% | 5 | | | 1.49% | | | | 1.51% | | | | 1.57% | | | | 1.60% | | | | 1.51% | |
Ratio of expenses to average net assets after any reimbursement, waiver or recapture of expenses by Advisor and Administrator | | | 1.32% | 5 | | | 1.37% | | | | 1.36% | | | | 1.39% | | | | 1.45% | | | | 1.46% | |
Ratio of net investment income (loss) to average net assets | | | (0.11% | )5 | | | (0.24% | ) | | | (0.55% | ) | | | (0.11% | ) | | | 0.72% | | | | 0.53% | |
Portfolio turnover6 | | | 10.99% | 4 | | | 27.85% | | | | 50.82% | | | | 111.87% | | | | 59.10% | | | | 69.79% | |
| | |
| | | Six-Month
Period Ended
June 30, 2023 (Unaudited) | | | Year Ended Dec. 31, | |
| INSTITUTIONAL CLASS | | 2022 | | | 2021 | | | 2020 | | | 2019 | | | 2018 | |
Net Asset Value, beginning of period | | | $23.04 | | | | $29.87 | | | | $25.87 | | | | $18.06 | | | | $15.46 | | | | $22.86 | |
INCOME (LOSS) FROM INVESTMENT OPERATIONS: | | | | | | | | | | | | | | | | | | | | | | | | |
Net investment income (loss)1 | | | — | 3 | | | — | 3 | | | (0.10 | ) | | | 0.01 | | | | 0.15 | | | | 0.16 | |
Net realized gain (loss) and unrealized appreciation/depreciation on investments, foreign currency related transactions and foreign capital gains taxes | | | 3.25 | | | | (4.92 | ) | | | 5.88 | | | | 7.91 | | | | 2.58 | | | | (4.19 | ) |
Total from investment operations | | | 3.25 | | | | (4.92 | ) | | | 5.78 | | | | 7.92 | | | | 2.73 | | | | (4.03 | ) |
LESS DISTRIBUTIONS FROM: | | | | | | | | | | | | | | | | | | | | | | | | |
Net investment income | | | — | | | | (0.14 | ) | | | (0.04 | ) | | | (0.09 | ) | | | (0.13 | ) | | | (0.14 | ) |
Net realized gains on investments | | | — | | | | (1.77 | ) | | | (1.74 | ) | | | (0.02 | ) | | | — | | | | (3.23 | ) |
Total distributions | | | — | | | | (1.91 | ) | | | (1.78 | ) | | | (0.11 | ) | | | (0.13 | ) | | | (3.37 | ) |
Paid-in capital from redemption fees (Note 4) | | | — | | | | — | | | | — | | | | — | | | | — | 2 | | | — | 3 |
Net Asset Value, end of period | | | $26.29 | | | | $23.04 | | | | $29.87 | | | | $25.87 | | | | $18.06 | | | | $15.46 | |
TOTAL RETURN | | | 14.11% | 4 | | | (16.66% | ) | | | 22.39% | | | | 43.90% | | | | 17.65% | | | | (17.86% | ) |
| | | | | | |
RATIOS/SUPPLEMENTAL DATA | | | | | | | | | | | | | | | | | | | | | | | | |
Net assets, end of period (in 000’s) | | | $297,361 | | | | $228,194 | | | | $221,286 | | | | $107,569 | | | | $85,006 | | | | $74,935 | |
Ratio of expenses to average net assets before any reimbursement, waiver or recapture of expenses by Advisor and Administrator (Note 5) | | | 1.34% | 5 | | | 1.37% | | | | 1.38% | | | | 1.47% | | | | 1.46% | | | | 1.37% | |
Ratio of expenses to average net assets after any reimbursement, waiver or recapture of expenses by Advisor and Administrator | | | 1.15% | 5 | | | 1.15% | | | | 1.16% | | | | 1.20% | | | | 1.24% | | | | 1.25% | |
Ratio of net investment income (loss) to average net assets | | | 0.03% | 5 | | | (0.01% | ) | | | (0.34% | ) | | | 0.08% | | | | 0.85% | | | | 0.73% | |
Portfolio turnover6 | | | 10.99% | 4 | | | 27.85% | | | | 50.82% | | | | 111.87% | | | | 59.10% | | | | 69.79% | |
| 1 | Calculated using the average daily shares method. |
| 2 | The Fund charged redemption fees through October 31, 2019. |
| 3 | Less than $0.01 per share. |
| 6 | The portfolio turnover rate is calculated on the Fund as a whole without distinguishing between classes of shares issued. |
See accompanying notes to financial statements.
Financial Highlights (continued)
Matthews Asia Growth Fund
The tables below set forth financial data for a share of beneficial interest outstanding throughout each period presented.
| | | | | | | | | | | | | | | | | | | | | | | | |
| | | Six-Month
Period Ended
June 30, 2023 (Unaudited) | | | Year Ended Dec. 31, | |
| INVESTOR CLASS | | 2022 | | | 2021 | | | 2020 | | | 2019 | | | 2018 | |
Net Asset Value, beginning of period | | | $20.84 | | | | $31.99 | | | | $39.44 | | | | $28.10 | | | | $22.49 | | | | $27.25 | |
INCOME (LOSS) FROM INVESTMENT OPERATIONS: | | | | | | | | | | | | | | | | | | | | | | | | |
Net investment income (loss)1 | | | 0.04 | | | | (0.08 | ) | | | (0.24 | ) | | | (0.11 | ) | | | (0.03 | ) | | | — | 2 |
Net realized gain (loss) and unrealized appreciation/depreciation on investments, foreign currency related transactions and foreign capital gains taxes | | | (0.25 | ) | | | (10.49 | ) | | | (5.56 | ) | | | 13.16 | | | | 5.91 | | | | (4.41 | ) |
Total from investment operations | | | (0.21 | ) | | | (10.57 | ) | | | (5.80 | ) | | | 13.05 | | | | 5.88 | | | | (4.41 | ) |
LESS DISTRIBUTIONS FROM: | | | | | | | | | | | | | | | | | | | | | | | | |
Net investment income | | | — | | | | — | | | | — | | | | (0.15 | ) | | | — | | | | (0.03 | ) |
Net realized gains on investments | | | — | | | | (0.58 | ) | | | (1.65 | ) | | | (1.56 | ) | | | (0.27 | ) | | | (0.32 | ) |
Total distributions | | | — | | | | (0.58 | ) | | | (1.65 | ) | | | (1.71 | ) | | | (0.27 | ) | | | (0.35 | ) |
Net Asset Value, end of period | | | $20.63 | | | | $20.84 | | | | $31.99 | | | | $39.44 | | | | $28.10 | | | | $22.49 | |
TOTAL RETURN | | | (1.01% | )3 | | | (33.12% | ) | | | (14.65% | ) | | | 46.76% | | | | 26.18% | | | | (16.25% | ) |
| | | | | | |
RATIOS/SUPPLEMENTAL DATA | | | | | | | | | | | | | | | | | | | | | | | | |
Net assets, end of period (in 000’s) | | | $202,106 | | | | $225,923 | | | | $568,001 | | | | $784,085 | | | | $504,538 | | | | $463,600 | |
Ratio of expenses to average net assets | | | 1.17% | 4 | | | 1.13% | | | | 1.07% | | | | 1.08% | | | | 1.09% | | | | 1.10% | |
Ratio of net investment income (loss) to average net assets | | | 0.34% | 4 | | | (0.32% | ) | | | (0.62% | ) | | | (0.35% | ) | | | (0.14% | ) | | | —% | 5 |
Portfolio turnover6 | | | 35.59% | 3 | | | 47.48% | | | | 42.37% | | | | 42.78% | | | | 38.05% | | | | 12.12% | |
| | |
| | | Six-Month
Period Ended
June 30, 2023 (Unaudited) | | | Year Ended Dec. 31, | |
| INSTITUTIONAL CLASS | | 2022 | | | 2021 | | | 2020 | | | 2019 | | | 2018 | |
Net Asset Value, beginning of period | | | $21.11 | | | | $32.33 | | | | $39.82 | | | | $28.34 | | | | $22.65 | | | | $27.45 | |
INCOME (LOSS) FROM INVESTMENT OPERATIONS: | | | | | | | | | | | | | | | | | | | | | | | | |
Net investment income (loss)1 | | | 0.06 | | | | (0.04 | ) | | | (0.19 | ) | | | (0.07 | ) | | | — | 2 | | | 0.05 | |
Net realized gain (loss) and unrealized appreciation/depreciation on investments, foreign currency related transactions and foreign capital gains taxes | | | (0.26 | ) | | | (10.60 | ) | | | (5.63 | ) | | | 13.30 | | | | 5.96 | | | | (4.45 | ) |
Total from investment operations | | | (0.20 | ) | | | (10.64 | ) | | | (5.82 | ) | | | 13.23 | | | | 5.96 | | | | (4.40 | ) |
LESS DISTRIBUTIONS FROM: | | | | | | | | | | | | | | | | | | | | | | | | |
Net investment income | | | — | | | | — | | | | (0.02 | ) | | | (0.19 | ) | | | — | | | | (0.08 | ) |
Net realized gains on investments | | | — | | | | (0.58 | ) | | | (1.65 | ) | | | (1.56 | ) | | | (0.27 | ) | | | (0.32 | ) |
Total distributions | | | — | | | | (0.58 | ) | | | (1.67 | ) | | | (1.75 | ) | | | (0.27 | ) | | | (0.40 | ) |
Net Asset Value, end of period | | | $20.91 | | | | $21.11 | | | | $32.33 | | | | $39.82 | | | | $28.34 | | | | $22.65 | |
TOTAL RETURN | | | (0.95% | )3 | | | (32.99% | ) | | | (14.55% | ) | | | 47.01% | | | | 26.34% | | | | (16.10% | ) |
| | | | | | |
RATIOS/SUPPLEMENTAL DATA | | | | | | | | | | | | | | | | | | | | | | | | |
Net assets, end of period (in 000’s) | | | $372,925 | | | | $406,155 | | | | $1,186,769 | | | | $1,269,702 | | | | $698,797 | | | | $466,733 | |
Ratio of expenses to average net assets | | | 1.00% | 4 | | | 0.98% | | | | 0.92% | | | | 0.95% | | | | 0.94% | | | | 0.93% | |
Ratio of net investment income (loss) to average net assets | | | 0.51% | 4 | | | (0.15% | ) | | | (0.47% | ) | | | (0.23% | ) | | | —% | 5 | | | 0.17% | |
Portfolio turnover6 | | | 35.59% | 3 | | | 47.48% | | | | 42.37% | | | | 42.78% | | | | 38.05% | | | | 12.12% | |
| 1 | Calculated using the average daily shares method. |
| 2 | Less than $0.01 per share. |
| 6 | The portfolio turnover rate is calculated on the Fund as a whole without distinguishing between classes of shares issued. |
See accompanying notes to financial statements.
| | | | | | | | |
| | | | matthewsasia.com | 800.789.ASIA | | | 105 | |
Financial Highlights (continued)
Matthews Pacific Tiger Fund
The tables below set forth financial data for a share of beneficial interest outstanding throughout each period presented.
| | | | | | | | | | | | | | | | | | | | | | | | |
| | | Six-Month Period Ended
June 30, 2023 (Unaudited) | | | Year Ended Dec. 31, | |
| INVESTOR CLASS | | 2022 | | | 2021 | | | 2020 | | | 2019 | | | 2018 | |
Net Asset Value, beginning of period | | | $20.16 | | | | $27.54 | | | | $34.94 | | | | $28.74 | | | | $26.86 | | | | $31.66 | |
INCOME (LOSS) FROM INVESTMENT OPERATIONS: | | | | | | | | | | | | | | | | | | | | | | | | |
Net investment income (loss)1 | | | 0.06 | | | | 0.09 | | | | 0.06 | | | | 0.10 | | | | 0.19 | | | | 0.24 | |
Net realized gain (loss) and unrealized appreciation/depreciation on investments, foreign currency related transactions and foreign capital gains taxes | | | (0.31 | ) | | | (5.75 | ) | | | (1.60 | ) | | | 8.10 | | | | 2.68 | | | | (3.75 | ) |
Total from investment operations | | | (0.25 | ) | | | (5.66 | ) | | | (1.54 | ) | | | 8.20 | | | | 2.87 | | | | (3.51 | ) |
LESS DISTRIBUTIONS FROM: | | | | | | | | | | | | | | | | | | | | | | | | |
Net investment income | | | — | | | | — | | | | — | | | | (0.08 | ) | | | (0.15 | ) | | | (0.21 | ) |
Net realized gains on investments | | | — | | | | (1.72 | ) | | | (5.86 | ) | | | (1.92 | ) | | | (0.84 | ) | | | (1.08 | ) |
Total distributions | | | — | | | | (1.72 | ) | | | (5.86 | ) | | | (2.00 | ) | | | (0.99 | ) | | | (1.29 | ) |
Paid-in capital from redemption fees (Note 4) | | | — | | | | — | | | | — | | | | — | | | | — | 2 | | | — | |
Net Asset Value, end of period | | | $19.91 | | | | $20.16 | | | | $27.54 | | | | $34.94 | | | | $28.74 | | | | $26.86 | |
TOTAL RETURN | | | (1.24% | )3 | | | (20.73% | ) | | | (4.41% | ) | | | 28.83% | | | | 10.72% | | | | (11.11% | ) |
| | | | | | |
RATIOS/SUPPLEMENTAL DATA | | | | | | | | | | | | | | | | | | | | | | | | |
Net assets, end of period (in 000’s) | | | $985,087 | | | | $1,081,347 | | | | $1,835,266 | | | | $2,585,654 | | | | $2,536,844 | | | | $2,618,155 | |
Ratio of expenses to average net assets before any reimbursement, waiver or recapture of expenses by Advisor and Administrator (Note 5) | | | 1.15% | 4 | | | 1.10% | | | | 1.06% | | | | 1.08% | | | | 1.08% | | | | 1.07% | |
Ratio of expenses to average net assets after any reimbursement, waiver or recapture of expenses by Advisor and Administrator | | | 1.14% | 4 | | | 1.09% | | | | 1.03% | | | | 1.06% | | | | 1.05% | | | | 1.04% | |
Ratio of net investment income (loss) to average net assets | | | 0.55% | 4 | | | 0.37% | | | | 0.17% | | | | 0.35% | | | | 0.66% | | | | 0.79% | |
Portfolio turnover5 | | | 4.72% | 3 | | | 5.61% | | | | 46.64% | | | | 38.11% | | | | 17.08% | | | | 11.48% | |
| | |
| | | Six-Month
Period Ended
June 30, 2023 (Unaudited) | | | Year Ended Dec. 31, | |
| INSTITUTIONAL CLASS | | 2022 | | | 2021 | | | 2020 | | | 2019 | | | 2018 | |
Net Asset Value, beginning of period | | | $20.16 | | | | $27.50 | | | | $34.90 | | | | $28.71 | | | | $26.83 | | | | $31.63 | |
INCOME (LOSS) FROM INVESTMENT OPERATIONS: | | | | | | | | | | | | | | | | | | | | | | | | |
Net investment income (loss)1 | | | 0.08 | | | | 0.11 | | | | 0.11 | | | | 0.13 | | | | 0.23 | | | | 0.28 | |
Net realized gain (loss) and unrealized appreciation/depreciation on investments, foreign currency related transactions and foreign capital gains taxes | | | (0.32 | ) | | | (5.73 | ) | | | (1.60 | ) | | | 8.11 | | | | 2.68 | | | | (3.74 | ) |
Total from investment operations | | | (0.24 | ) | | | (5.62 | ) | | | (1.49 | ) | | | 8.24 | | | | 2.91 | | | | (3.46 | ) |
LESS DISTRIBUTIONS FROM: | | | | | | | | | | | | | | | | | | | | | | | | |
Net investment income | | | — | | | | — | | | | (0.05 | ) | | | (0.13 | ) | | | (0.19 | ) | | | (0.26 | ) |
Net realized gains on investments | | | — | | | | (1.72 | ) | | | (5.86 | ) | | | (1.92 | ) | | | (0.84 | ) | | | (1.08 | ) |
Total distributions | | | — | | | | (1.72 | ) | | | (5.91 | ) | | | (2.05 | ) | | | (1.03 | ) | | | (1.34 | ) |
Paid-in capital from redemption fees (Note 4) | | | — | | | | — | | | | — | | | | — | | | | — | 2 | | | — | |
Net Asset Value, end of period | | | $19.92 | | | | $20.16 | | | | $27.50 | | | | $34.90 | | | | $28.71 | | | | $26.83 | |
TOTAL RETURN | | | (1.19% | )3 | | | (20.62% | ) | | | (4.29% | ) | | | 28.98% | | | | 10.90% | | | | (10.94% | ) |
| | | | | | |
RATIOS/SUPPLEMENTAL DATA | | | | | | | | | | | | | | | | | | | | | | | | |
Net assets, end of period (in 000’s) | | | $2,663,597 | | | | $2,607,437 | | | | $5,357,198 | | | | $6,172,995 | | | | $6,189,015 | | | | $5,689,079 | |
Ratio of expenses to average net assets before any reimbursement, waiver or recapture of expenses by Advisor and Administrator (Note 5) | | | 0.99% | 4 | | | 0.97% | | | | 0.92% | | | | 0.94% | | | | 0.93% | | | | 0.90% | |
Ratio of expenses to average net assets after any reimbursement, waiver or recapture of expenses by Advisor and Administrator | | | 0.99% | 4 | | | 0.96% | | | | 0.90% | | | | 0.92% | | | | 0.91% | | | | 0.88% | |
Ratio of net investment income (loss) to average net assets | | | 0.75% | 4 | | | 0.48% | | | | 0.30% | | | | 0.46% | | | | 0.80% | | | | 0.95% | |
Portfolio turnover5 | | | 4.72% | 3 | | | 5.61% | | | | 46.64% | | | | 38.11% | | | | 17.08% | | | | 11.48% | |
| 1 | Calculated using the average daily shares method. |
| 2 | Less than $0.01 per share. |
| 5 | The portfolio turnover rate is calculated on the Fund as a whole without distinguishing between classes of shares issued. |
See accompanying notes to financial statements.
Financial Highlights (continued)
Matthews Asia Innovators Fund
The tables below set forth financial data for a share of beneficial interest outstanding throughout each period presented.
| | | | | | | | | | | | | | | | | | | | | | | | |
| | | Six-Month
Period Ended
June 30, 2023 (Unaudited) | | | Year Ended Dec. 31, | |
| INVESTOR CLASS | | 2022 | | | 2021 | | | 2020 | | | 2019 | | | 2018 | |
Net Asset Value, beginning of period | | | $11.31 | | | | $18.86 | | | | $26.70 | | | | $14.55 | | | | $11.26 | | | | $14.19 | |
INCOME (LOSS) FROM INVESTMENT OPERATIONS: | | | | | | | | | | | | | | | | | | | | | | | | |
Net investment income (loss)1 | | | (0.01 | ) | | | (0.06 | ) | | | (0.16 | ) | | | (0.11 | ) | | | (0.01 | ) | | | (0.01 | ) |
Net realized gain (loss) and unrealized appreciation/depreciation on investments, foreign currency related transactions and foreign capital gains taxes | | | (0.25 | ) | | | (4.49 | ) | | | (3.34 | ) | | | 12.71 | | | | 3.34 | | | | (2.62 | ) |
Total from investment operations | | | (0.26 | ) | | | (4.55 | ) | | | (3.50 | ) | | | 12.60 | | | | 3.33 | | | | (2.63 | ) |
LESS DISTRIBUTIONS FROM: | | | | | | | | | | | | | | | | | | | | | | | | |
Net investment income | | | — | | | | — | | | | — | | | | — | | | | — | | | | (0.04 | ) |
Net realized gains on investments | | | — | | | | (3.00 | ) | | | (4.34 | ) | | | (0.45 | ) | | | (0.04 | ) | | | (0.26 | ) |
Total distributions | | | — | | | | (3.00 | ) | | | (4.34 | ) | | | (0.45 | ) | | | (0.04 | ) | | | (0.30 | ) |
Net Asset Value, end of period | | | $11.05 | | | | $11.31 | | | | $18.86 | | | | $26.70 | | | | $14.55 | | | | $11.26 | |
TOTAL RETURN | | | (2.30% | )3 | | | (24.80% | ) | | | (13.10% | ) | | | 86.72% | | | | 29.60% | | | | (18.62% | ) |
| | | | | | |
RATIOS/SUPPLEMENTAL DATA | | | | | | | | | | | | | | | | | | | | | | | | |
Net assets, end of period (in 000’s) | | | $249,813 | | | | $272,950 | | | | $465,207 | | | | $631,101 | | | | $177,639 | | | | $152,449 | |
Ratio of expenses to average net assets | | | 1.19% | 4 | | | 1.18% | | | | 1.09% | | | | 1.10% | | | | 1.19% | | | | 1.19% | |
Ratio of net investment income (loss) to average net assets | | | (0.25% | )4 | | | (0.40% | ) | | | (0.59% | ) | | | (0.60% | ) | | | (0.04% | ) | | | (0.07% | ) |
Portfolio turnover5 | | | 118.56% | 3 | | | 118.08% | | | | 220.45% | | | | 119.81% | | | | 80.10% | | | | 85.73% | |
| | |
| | | Six-Month
Period Ended
June 30, 2023 (Unaudited) | | | Year Ended Dec. 31, | |
| INSTITUTIONAL CLASS | | 2022 | | | 2021 | | | 2020 | | | 2019 | | | 2018 | |
Net Asset Value, beginning of period | | | $11.49 | | | | $19.08 | | | | $26.91 | | | | $14.64 | | | | $11.32 | | | | $14.26 | |
INCOME (LOSS) FROM INVESTMENT OPERATIONS: | | | | | | | | | | | | | | | | | | | | | | | | |
Net investment income (loss)1 | | | — | 2 | | | (0.04 | ) | | | (0.11 | ) | | | (0.09 | ) | | | 0.01 | | | | 0.01 | |
Net realized gain (loss) and unrealized appreciation/depreciation on investments, foreign currency related transactions and foreign capital gains taxes | | | (0.25 | ) | | | (4.55 | ) | | | (3.38 | ) | | | 12.81 | | | | 3.35 | | | | (2.62 | ) |
Total from investment operations | | | (0.25 | ) | | | (4.59 | ) | | | (3.49 | ) | | | 12.72 | | | | 3.36 | | | | (2.61 | ) |
LESS DISTRIBUTIONS FROM: | | | | | | | | | | | | | | | | | | | | | | | | |
Net investment income | | | — | | | | — | | | | — | | | | — | | | | — | | | | (0.07 | ) |
Net realized gains on investments | | | — | | | | (3.00 | ) | | | (4.34 | ) | | | (0.45 | ) | | | (0.04 | ) | | | (0.26 | ) |
Total distributions | | | — | | | | (3.00 | ) | | | (4.34 | ) | | | (0.45 | ) | | | (0.04 | ) | | | (0.33 | ) |
Net Asset Value, end of period | | | $11.24 | | | | $11.49 | | | | $19.08 | | | | $26.91 | | | | $14.64 | | | | $11.32 | |
TOTAL RETURN | | | (2.18% | )3 | | | (24.73% | ) | | | (12.97% | ) | | | 87.01% | | | | 29.71% | | | | (18.40% | ) |
| | | | | | |
RATIOS/SUPPLEMENTAL DATA | | | | | | | | | | | | | | | | | | | | | | | | |
Net assets, end of period (in 000’s) | | | $209,314 | | | | $199,368 | | | | $930,562 | | | | $1,094,356 | | | | $126,911 | | | | $91,769 | |
Ratio of expenses to average net assets | | | 1.04% | 4 | | | 1.04% | | | | 0.93% | | | | 0.95% | | | | 1.05% | | | | 1.02% | |
Ratio of net investment income (loss) to average net assets | | | (0.05% | )4 | | | (0.27% | ) | | | (0.43% | ) | | | (0.44% | ) | | | 0.10% | | | | 0.07% | |
Portfolio turnover5 | | | 118.56% | 3 | | | 118.08% | | | | 220.45% | | | | 119.81% | | | | 80.10% | | | | 85.73% | |
| 1 | Calculated using the average daily shares method. |
| 2 | Less than $0.01 per share. |
| 5 | The portfolio turnover rate is calculated on the Fund as a whole without distinguishing between classes of shares issued. |
See accompanying notes to financial statements.
| | | | | | | | |
| | | | matthewsasia.com | 800.789.ASIA | | | 107 | |
Financial Highlights (continued)
Matthews China Fund
The tables below set forth financial data for a share of beneficial interest outstanding throughout each period presented.
| | | | | | | | | | | | | | | | | | | | | | | | |
| | | Six-Month
Period Ended
June 30, 2023 (Unaudited) | | | Year Ended Dec. 31, | |
| INVESTOR CLASS | | 2022 | | | 2021 | | | 2020 | | | 2019 | | | 2018 | |
Net Asset Value, beginning of period | | | $14.50 | | | | $20.58 | | | | $27.00 | | | | $19.12 | | | | $14.37 | | | | $22.20 | |
INCOME (LOSS) FROM INVESTMENT OPERATIONS: | | | | | | | | | | | | | | | | | | | | | | | | |
Net investment income (loss)1 | | | 0.03 | | | | — | 2 | | | 0.03 | | | | 0.05 | | | | 0.16 | | | | 0.21 | |
Net realized gain (loss) and unrealized appreciation/depreciation on investments and foreign currency related transactions | | | (1.87 | ) | | | (4.99 | ) | | | (3.25 | ) | | | 8.17 | | | | 4 80 | | | | (4 84 | ) |
Total from investment operations | | | (1.84 | ) | | | (4.99 | ) | | | (3.22 | ) | | | 8.22 | | | | 4.96 | | | | (4.63 | ) |
LESS DISTRIBUTIONS FROM: | | | | | | | | | | | | | | | | | | | | | | | | |
Net investment income | | | — | | | | — | | | | (0.05 | ) | | | (0.06 | ) | | | (0.21 | ) | | | (0.29 | ) |
Net realized gains on investments | | | — | | | | (1.09 | ) | | | (3.15 | ) | | | (0.28 | ) | | | — | | | | (2.91 | ) |
Total distributions | | | — | | | | (1.09 | ) | | | (3.20 | ) | | | (0.34 | ) | | | (0.21 | ) | | | (3.20 | ) |
Net Asset Value, end of period | | | $12.66 | | | | $14.50 | | | | $20.58 | | | | $27.00 | | | | $19.12 | | | | $14.37 | |
TOTAL RETURN | | | (12.69% | )3 | | | (24.40% | ) | | | (12.26% | ) | | | 43.05% | | | | 34.56% | | | | (21.42% | ) |
| | | | | | |
RATIOS/SUPPLEMENTAL DATA | | | | | | | | | | | | | | | | | | | | | | | | |
Net assets, end of period (in 000’s) | | | $375,664 | | | | $448,623 | | | | $710,844 | | | | $962,714 | | | | $718,633 | | | | $566,456 | |
Ratio of expenses to average net assets | | | 1.16% | 4 | | | 1.12% | | | | 1.06% | | | | 1.09% | | | | 1.09% | | | | 1.10% | |
Ratio of net investment income (loss) to average net assets | | | 0.41% | 4 | | | (0.01% | ) | | | 0.13% | | | | 0.22% | | | | 0.96% | | | | 1.00% | |
Portfolio turnover5 | | | 33.24% | 3 | | | 49.38% | | | | 92.28% | | | | 52.64% | | | | 68.93% | | | | 96.98% | |
| | |
| | | Six-Month
Period Ended
June 30, 2023 (Unaudited) | | | Year Ended Dec. 31, | |
| INSTITUTIONAL CLASS | | 2022 | | | 2021 | | | 2020 | | | 2019 | | | 2018 | |
Net Asset Value, beginning of period | | | $14.48 | | | | $20.53 | | | | $26.94 | | | | $19.08 | | | | $14.33 | | | | $22.17 | |
INCOME (LOSS) FROM INVESTMENT OPERATIONS: | | | | | | | | | | | | | | | | | | | | | | | | |
Net investment income (loss)1 | | | 0.04 | | | | 0.01 | | | | 0.10 | | | | 0.09 | | | | 0.20 | | | | 0.33 | |
Net realized gain (loss) and unrealized appreciation/depreciation on investments and foreign currency related transactions | | | (1.87 | ) | | | (4.97 | ) | | | (3 26 | ) | | | 8.15 | | | | 4.80 | | | | (4 93 | ) |
Total from investment operations | | | (1.83 | ) | | | (4.96 | ) | | | (3.16 | ) | | | 8.24 | | | | 5.00 | | | | (4.60 | ) |
LESS DISTRIBUTIONS FROM: | | | | | | | | | | | | | | | | | | | | | | | | |
Net investment income | | | — | | | | — | | | | (0.10 | ) | | | (0.10 | ) | | | (0.25 | ) | | | (0.33 | ) |
Net realized gains on investments | | | — | | | | (1.09 | ) | | | (3.15 | ) | | | (0.28 | ) | | | — | | | | (2.91 | ) |
Total distributions | | | — | | | | (1.09 | ) | | | (3.25 | ) | | | (0.38 | ) | | | (0.25 | ) | | | (3.24 | ) |
Net Asset Value, end of period | | | $12.65 | | | | $14.48 | | | | $20.53 | | | | $26.94 | | | | $19.08 | | | | $14.33 | |
TOTAL RETURN | | | (12.64% | )3 | | | (24.31% | ) | | | (12.07% | ) | | | 43.23% | | | | 34.90% | | | | (21.32% | ) |
| | | | | | |
RATIOS/SUPPLEMENTAL DATA | | | | | | | | | | | | | | | | | | | | | | | | |
Net assets, end of period (in 000’s) | | | $277,873 | | | | $297,165 | | | | $630,966 | | | | $546,157 | | | | $183,762 | | | | $46,657 | |
Ratio of expenses to average net assets | | | 1.01% | 4 | | | 0.98% | | | | 0.91% | | | | 0.93% | | | | 0.91% | | | | 0.91% | |
Ratio of net investment income (loss) to average net assets | | | 0.60% | 4 | | | 0.07% | | | | 0.38% | | | | 0.40% | | | | 1.17% | | | | 1.53% | |
Portfolio turnover5 | | | 33.24% | 3 | | | 49.38% | | | | 92.28% | | | | 52.64% | | | | 68.93% | | | | 96.98% | |
| 1 | Calculated using the average daily shares method. |
| 2 | Less than $0.01 per share. |
| 5 | The portfolio turnover rate is calculated on the Fund as a whole without distinguishing between classes of shares issued. |
See accompanying notes to financial statements.
Financial Highlights (continued)
Matthews China Small Companies Fund
The tables below set forth financial data for a share of beneficial interest outstanding throughout each period presented.
| | | | | | | | | | | | | | | | | | | | | | | | |
| | | Six-Month
Period Ended
June 30, 2023 (Unaudited) | | | Year Ended Dec. 31, | |
| INVESTOR CLASS | | 2022 | | | 2021 | | | 2020 | | | 2019 | | | 2018 | |
Net Asset Value, beginning of period | | | $11.11 | | | | $16.44 | | | | $19.86 | | | | $12.84 | | | | $9.58 | | | | $11.89 | |
INCOME (LOSS) FROM INVESTMENT OPERATIONS: | | | | | | | | | | | | | | | | | | | | | | | | |
Net investment income (loss)1 | | | (0.01 | ) | | | 0.02 | | | | 0.09 | | | | (0.03 | ) | | | 0.14 | | | | 0.09 | |
Net realized gain (loss) and unrealized appreciation/depreciation on investments and foreign currency related transactions | | | (1.18 | ) | | | (5 15 | ) | | | (0.80 | ) | | | 10 42 | | | | 3.24 | | | | (2 23 | ) |
Total from investment operations | | | (1.19 | ) | | | (5.13 | ) | | | (0.71 | ) | | | 10.39 | | | | 3.38 | | | | (2.14 | ) |
LESS DISTRIBUTIONS FROM: | | | | | | | | | | | | | | | | | | | | | | | | |
Net investment income | | | — | | | | (0.20 | ) | | | (0.12 | ) | | | (0.13 | ) | | | (0.13 | ) | | | (0.05 | ) |
Net realized gains on investments | | | — | | | | — | | | | (2.59 | ) | | | (3.24 | ) | | | — | | | | (0.16 | ) |
Total distributions | | | — | | | | (0.20 | ) | | | (2.71 | ) | | | (3.37 | ) | | | (0.13 | ) | | | (0.21 | ) |
Paid-in capital from redemption fees (Note 4) | | | — | | | | — | | | | — | | | | — | | | | 0.01 | 2 | | | 0.04 | |
Net Asset Value, end of period | | | $9.92 | | | | $11.11 | | | | $16.44 | | | | $19.86 | | | | $12.84 | | | | $9.58 | |
TOTAL RETURN | | | (10.71% | )3 | | | (31.26% | ) | | | (3.59% | ) | | | 82.52% | | | | 35.41% | | | | (17.68% | ) |
| | | | | | |
RATIOS/SUPPLEMENTAL DATA | | | | | | | | | | | | | | | | | | | | | | | | |
Net assets, end of period (in 000’s) | | | $92,129 | | | | $114,440 | | | | $218,398 | | | | $285,717 | | | | $63,432 | | | | $41,740 | |
Ratio of expenses to average net assets before any reimbursement, waiver or recapture of expenses by Advisor and Administrator (Note 5) | | | 1.60% | 4 | | | 1.55% | | | | 1.48% | | | | 1.52% | | | | 1.62% | | | | 1.97% | |
Ratio of expenses to average net assets after any reimbursement, waiver or recapture of expenses by Advisor and Administrator | | | 1.45% | 4 | | | 1.41% | | | | 1.43% | | | | 1.43% | | | | 1.42% | | | | 1.50% | |
Ratio of net investment income (loss) to average net assets | | | (0.09% | )4 | | | 0.17% | | | | 0.44% | | | | (0.14% | ) | | | 1.25% | | | | 0.78% | |
Portfolio turnover5 | | | 33.49% | 3 | | | 59.00% | | | | 119.65% | | | | 152.86% | | | | 68.17% | | | | 76.67% | |
| | |
| | | Six-Month
Period Ended
June 30, 2023 (Unaudited) | | | Year Ended Dec. 31, | |
| INSTITUTIONAL CLASS | | 2022 | | | 2021 | | | 2020 | | | 2019 | | | 2018 | |
Net Asset Value, beginning of period | | | $11.12 | | | | $16.47 | | | | $19.90 | | | | $12.86 | | | | $9.59 | | | | $11.87 | |
INCOME (LOSS) FROM INVESTMENT OPERATIONS: | | | | | | | | | | | | | | | | | | | | | | | | |
Net investment income (loss)1 | | | 0.01 | | | | 0.06 | | | | 0.13 | | | | 0.04 | | | | 0.15 | | | | 0.11 | |
Net realized gain (loss) and unrealized appreciation/depreciation on investments and foreign currency related transactions | | | (1.20 | ) | | | (5.17 | ) | | | (0.80 | ) | | | 10.42 | | | | 3.26 | | | | (2 21 | ) |
Total from investment operations | | | (1.19 | ) | | | (5.11 | ) | | | (0.67 | ) | | | 10.46 | | | | 3.41 | | | | (2.10 | ) |
LESS DISTRIBUTIONS FROM: | | | | | | | | | | | | | | | | | | | | | | | | |
Net investment income | | | — | | | | (0.24 | ) | | | (0.17 | ) | | | (0.18 | ) | | | (0.15 | ) | | | (0.05 | ) |
Net realized gains on investments | | | — | | | | — | | | | (2.59 | ) | | | (3.24 | ) | | | — | | | | (0.16 | ) |
Total distributions | | | — | | | | (0.24 | ) | | | (2.76 | ) | | | (3.42 | ) | | | (0.15 | ) | | | (0.21 | ) |
Paid-in capital from redemption fees (Note 4) | | | — | | | | — | | | | — | | | | — | | | | 0.01 | 2 | | | 0.03 | |
Net Asset Value, end of period | | | $9.93 | | | | $11.12 | | | | $16.47 | | | | $19.90 | | | | $12.86 | | | | $9.59 | |
TOTAL RETURN | | | (10.70% | )3 | | | (31.08% | ) | | | (3.35% | ) | | | 82.89% | | | | 35.68% | | | | (17.48% | ) |
| | | | | | |
RATIOS/SUPPLEMENTAL DATA | | | | | | | | | | | | | | | | | | | | | | | | |
Net assets, end of period (in 000’s) | | | $35,414 | | | | $40,322 | | | | $162,770 | | | | $98,052 | | | | $32,376 | | | | $20,740 | |
Ratio of expenses to average net assets before any reimbursement, waiver or recapture of expenses by Advisor and Administrator (Note 5) | | | 1.44% | 4 | | | 1.38% | | | | 1.31% | | | | 1.37% | | | | 1.51% | | | | 1.79% | |
Ratio of expenses to average net assets after any reimbursement, waiver or recapture of expenses by Advisor and Administrator | | | 1.20% | 4 | | | 1.20% | | | | 1.20% | | | | 1.20% | | | | 1.24% | | | | 1.25% | |
Ratio of net investment income (loss) to average net assets | | | 0.20% | 4 | | | 0.47% | | | | 0.63% | | | | 0.20% | | | | 1.34% | | | | 1.05% | |
Portfolio turnover5 | | | 33.49% | 3 | | | 59.00% | | | | 119.65% | | �� | | 152.86% | | | | 68.17% | | | | 76.67% | |
| 1 | Calculated using the average daily shares method. |
| 2 | The Fund charged redemption fees through October 31, 2019. |
| 5 | The portfolio turnover rate is calculated on the Fund as a whole without distinguishing between classes of shares issued. |
See accompanying notes to financial statements.
| | | | | | | | |
| | | | matthewsasia.com | 800.789.ASIA | | | 109 | |
Financial Highlights (continued)
Matthews India Fund
The tables below set forth financial data for a share of beneficial interest outstanding throughout each period presented.
| | | | | | | | | | | | | | | | | | | | | | | | |
INVESTOR CLASS | | Six-Month Period Ended June 30, 2023 (Unaudited) | | | Year Ended Dec. 31, | |
| | 2022 | | | 2021 | | | 2020 | | | 2019 | | | 2018 | |
Net Asset Value, beginning of period | | | $22.09 | | | | $28.17 | | | | $26.29 | | | | $23.27 | | | | $26.32 | | | | $34.31 | |
INCOME (LOSS) FROM INVESTMENT OPERATIONS: | | | | | | | | | | | | | | | | | | | | | | | | |
Net investment income (loss)1 | | | 0.01 | | | | (0.12 | ) | | | (0.11 | ) | | | 0.01 | | | | (0.01 | ) | | | (0.05 | ) |
Net realized gain (loss) and unrealized appreciation/depreciation on investments, foreign currency related transactions and foreign capital gains taxes | | | 2.54 | | | | (2.58 | ) | | | 4.81 | | | | 3.81 | | | | (0.24 | ) | | | (3.60 | ) |
Total from investment operations | | | 2.55 | | | | (2.70 | ) | | | 4.70 | | | | 3.82 | | | | (0.25 | ) | | | (3.65 | ) |
LESS DISTRIBUTIONS FROM: | | | | | | | | | | | | | | | | | | | | | | | | |
Net realized gains on investments | | | — | | | | (3.38 | ) | | | (2.82 | ) | | | (0.80 | ) | | | (2.80 | ) | | | (4.34 | ) |
Net Asset Value, end of period | | | $24.64 | | | | $22.09 | | | | $28.17 | | | | $26.29 | | | | $23.27 | | | | $26.32 | |
TOTAL RETURN | | | 11.54% | 2 | | | (9.92% | ) | | | 18.11% | | | | 16.51% | | | | (0.88% | ) | | | (10.09% | ) |
| | | | | | |
RATIOS/SUPPLEMENTAL DATA | | | | | | | | | | | | | | | | | | | | | | | | |
Net assets, end of period (in 000’s) | | | $542,422 | | | | $505,764 | | | | $635,067 | | | | $617,908 | | | | $786,881 | | | | $1,077,990 | |
Ratio of expenses to average net assets | | | 1.16% | 3 | | | 1.15% | | | | 1.10% | | | | 1.15% | | | | 1.11% | | | | 1.09% | |
Ratio of net investment income (loss) to average net assets | | | 0.06% | 3 | | | (0.45% | ) | | | (0.38% | ) | | | 0.05% | | | | (0.03% | ) | | | (0.16% | ) |
Portfolio turnover4 | | | 19.16% | 2 | | | 41.35% | | | | 42.50% | | | | 57.38% | | | | 24.00% | | | | 20.87% | |
| | |
| INSTITUTIONAL CLASS | | Six-Month
Period Ended
June 30, 2023 (Unaudited) | | | Year Ended Dec. 31, | |
| | 2022 | | | 2021 | | | 2020 | | | 2019 | | | 2018 | |
Net Asset Value, beginning of period | | | $22.54 | | | | $28.64 | | | | $26.65 | | | | $23.55 | | | | $26.56 | | | | $34.51 | |
INCOME (LOSS) FROM INVESTMENT OPERATIONS: | | | | | | | | | | | | | | | | | | | | | | | | |
Net investment income (loss)1 | | | 0.02 | | | | (0.08 | ) | | | (0.06 | ) | | | 0.05 | | | | 0.02 | | | | 0.01 | |
Net realized gain (loss) and unrealized appreciation/depreciation on investments, foreign currency related transactions and foreign capital gains taxes | | | 2.61 | | | | (2.64 | ) | | | 4.87 | | | | 3.85 | | | | (0.23 | ) | | | (3.62 | ) |
Total from investment operations | | | 2.63 | | | | (2.72 | ) | | | 4.81 | | | | 3.90 | | | | (0.21 | ) | | | (3.61 | ) |
LESS DISTRIBUTIONS FROM: | | | | | | | | | | | | | | | | | | | | | | | | |
Net realized gains on investments | | | — | | | | (3.38 | ) | | | (2.82 | ) | | | (0.80 | ) | | | (2.80 | ) | | | (4.34 | ) |
Net Asset Value, end of period | | | $25.17 | | | | $22.54 | | | | $28.64 | | | | $26.65 | | | | $23.55 | | | | $26.56 | |
TOTAL RETURN | | | 11.67% | 2 | | | (9.83% | ) | | | 18.28% | | | | 16.65% | | | | (0.76% | ) | | | (9.92% | ) |
| | | | | | |
RATIOS/SUPPLEMENTAL DATA | | | | | | | | | | | | | | | | | | | | | | | | |
Net assets, end of period (in 000’s) | | | $109,567 | | | | $97,018 | | | | $128,708 | | | | $90,053 | | | | $177,526 | | | | $463,790 | |
Ratio of expenses to average net assets | | | 1.01% | 3 | | | 1.01% | | | | 0.96% | | | | 1.03% | | | | 0.94% | | | | 0.90% | |
Ratio of net investment income (loss) to average net assets | | | 0.20% | 3 | | | (0.31% | ) | | | (0.19% | ) | | | 0.24% | | | | 0.09% | | | | 0.02% | |
Portfolio turnover4 | | | 19.16% | 2 | | | 41.35% | | | | 42.50% | | | | 57.38% | | | | 24.00% | | | | 20.87% | |
| 1 | Calculated using the average daily shares method. |
| 4 | The portfolio turnover rate is calculated on the Fund as a whole without distinguishing between classes of shares issued. |
See accompanying notes to financial statements.
Financial Highlights (continued)
Matthews Japan Fund
The tables below set forth financial data for a share of beneficial interest outstanding throughout each period presented.
| | | | | | | | | | | | | | | | | | | | | | | | |
INVESTOR CLASS | | Six-Month Period Ended June 30, 2023 (Unaudited) | | | Year Ended Dec. 31, | |
| | 2022 | | | 2021 | | | 2020 | | | 2019 | | | 2018 | |
Net Asset Value, beginning of period | | | $14.90 | | | | $22.09 | | | | $25.27 | | | | $21.51 | | | | $18.53 | | | | $24.12 | |
INCOME (LOSS) FROM INVESTMENT OPERATIONS: | | | | | | | | | | | | | | | | | | | | | | | | |
Net investment income (loss)1 | | | 0.05 | | | | 0.07 | | | | 0.09 | | | | 0.07 | | | | 0.11 | | | | 0.09 | |
Net realized gain (loss) and unrealized appreciation/depreciation on investments and foreign currency related transactions | | | 1.95 | | | | (6 19 | ) | | | (0.52 | ) | | | 6.25 | | | | 4.73 | | | | (4 91 | ) |
Total from investment operations | | | 2.00 | | | | (6.12 | ) | | | (0.43 | ) | | | 6.32 | | | | 4.84 | | | | (4.82 | ) |
LESS DISTRIBUTIONS FROM: | | | | | | | | | | | | | | | | | | | | | | | | |
Net investment income | | | — | | | | — | | | | (0.24 | ) | | | (0.13 | ) | | | (0.12 | ) | | | (0.06 | ) |
Net realized gains on investments | | | — | | | | (1.07 | ) | | | (2.51 | ) | | | (2.43 | ) | | | (1.74 | ) | | | (0.71 | ) |
Total distributions | | | — | | | | (1.07 | ) | | | (2.75 | ) | | | (2.56 | ) | | | (1.86 | ) | | | (0.77 | ) |
Net Asset Value, end of period | | | $16.90 | | | | $14.90 | | | | $22.09 | | | | $25.27 | | | | $21.51 | | | | $18.53 | |
TOTAL RETURN | | | 13.42% | 2 | | | (27.85% | ) | | | (1.92% | ) | | | 29.82% | | | | 26.08% | | | | (20.18% | ) |
| | | | | | |
RATIOS/SUPPLEMENTAL DATA | | | | | | | | | | | | | | | | | | | | | | | | |
Net assets, end of period (in 000’s) | | | $238,491 | | | | $208,329 | | | | $373,739 | | | | $1,101,820 | | | | $1,466,194 | | | | $1,704,102 | |
Ratio of expenses to average net assets before any reimbursement, waiver or recapture of expenses by Advisor and Administrator (Note 5) | | | 1.09% | 3 | | | 1.05% | | | | 0.95% | | | | 0.95% | | | | 0.93% | | | | 0.91% | |
Ratio of expenses to average net assets after any reimbursement, waiver or recapture of expenses by Advisor and Administrator | | | 1.09% | 3 | | | 1.05% | | | | 0.95% | | | | 0.95% | | | | 0.93% | | | | 0.91% | |
Ratio of net investment income (loss) to average net assets | | | 0.68% | 3 | | | 0.41% | | | | 0.38% | | | | 0.31% | | | | 0.51% | | | | 0.40% | |
Portfolio turnover4 | | | 43.93% | 2 | | | 83.38% | | | | 70.30% | | | | 62.03% | | | | 25.42% | | | | 46.11% | |
| | |
INSTITUTIONAL CLASS | | Six-Month Period Ended June 30, 2023 (Unaudited) | | | Year Ended Dec. 31, | |
| | 2022 | | | 2021 | | | 2020 | | | 2019 | | | 2018 | |
Net Asset Value, beginning of period | | | $14.93 | | | | $22.13 | | | | $25.32 | | | | $21.55 | | | | $18.57 | | | | $24.16 | |
INCOME (LOSS) FROM INVESTMENT OPERATIONS: | | | | | | | | | | | | | | | | | | | | | | | | |
Net investment income (loss)1 | | | 0.06 | | | | 0.09 | | | | 0.05 | | | | 0.05 | | | | 0.11 | | | | 0.11 | |
Net realized gain (loss) and unrealized appreciation/depreciation on investments and foreign currency related transactions | | | 1.95 | | | | (6.22 | ) | | | (0.46 | ) | | | 6.29 | | | | 4 74 | | | | (4 91 | ) |
Total from investment operations | | | 2.01 | | | | (6.13 | ) | | | (0.41 | ) | | | 6.34 | | | | 4.85 | | | | (4.80 | ) |
LESS DISTRIBUTIONS FROM: | | | | | | | | | | | | | | | | | | | | | | | | |
Net investment income | | | — | | | | — | | | | (0.27 | ) | | | (0.14 | ) | | | (0.13 | ) | | | (0.08 | ) |
Net realized gains on investments | | | — | | | | (1.07 | ) | | | (2.51 | ) | | | (2.43 | ) | | | (1.74 | ) | | | (0.71 | ) |
Total distributions | | | — | | | | (1.07 | ) | | | (2.78 | ) | | | (2.57 | ) | | | (1.87 | ) | | | (0.79 | ) |
Net Asset Value, end of period | | | $16.94 | | | | $14.93 | | | | $22.13 | | | | $25.32 | | | | $21.55 | | | | $18.57 | |
TOTAL RETURN | | | 13.46% | 2 | | | (27.84% | ) | | | (1.83% | ) | | | 29.85% | | | | 26.10% | | | | (20.08% | ) |
| | | | | | |
RATIOS/SUPPLEMENTAL DATA | | | | | | | | | | | | | | | | | | | | | | | | |
Net assets, end of period (in 000’s) | | | $451,749 | | | | $413,807 | | | | $1,170,380 | | | | $548,968 | | | | $840,476 | | | | $1,167,472 | |
Ratio of expenses to average net assets before any reimbursement, waiver or recapture of expenses by Advisor and Administrator (Note 5) | | | 1.02% | 3 | | | 0.97% | | | | 0.89% | | | | 0.91% | | | | 0.88% | | | | 0.85% | |
Ratio of expenses to average net assets after any reimbursement, waiver or recapture of expenses by Advisor and Administrator | | | 1.02% | 3 | | | 0.97% | | | | 0.89% | | | | 0.91% | | | | 0.88% | | | | 0.84% | |
Ratio of net investment income (loss) to average net assets | | | 0.80% | 3 | | | 0.55% | | | | 0.22% | | | | 0.25% | | | | 0.53% | | | | 0.46% | |
Portfolio turnover4 | | | 43.93% | 2 | | | 83.38% | | | | 70.30% | | | | 62.03% | | | | 25.42% | | | | 46.11% | |
| 1 | Calculated using the average daily shares method. |
| 4 | The portfolio turnover rate is calculated on the Fund as a whole without distinguishing between classes of shares issued. |
See accompanying notes to financial statements.
| | | | | | | | |
| | | | matthewsasia.com | 800.789.ASIA | | | 111 | |
Financial Highlights (continued)
Matthews Korea Fund*
The table below set forth financial data for a share of beneficial interest outstanding throughout each period presented.
| | | | | | | | | | | | | | | | | | | | | | | | |
INSTITUTIONAL CLASS | | Six-Month
Period Ended
June 30, 2023 (Unaudited)1 | | | Year Ended Dec. 31, | |
| | 20221 | | | 20211 | | | 20201 | | | 20191 | | | 20181 | |
Net Asset Value, beginning of period | | | $23.18 | | | | $34.53 | | | | $37.05 | | | | $26.54 | | | | $27.68 | | | | $41.73 | |
INCOME (LOSS) FROM INVESTMENT OPERATIONS: | | | | | | | | | | | | | | | | | | | | | | | | |
Net investment income (loss)2 | | | 0.35 | | | | 0.36 | | | | 0.36 | | | | 0.06 | | | | 0.06 | | | | 0.24 | |
Net realized gain (loss) and unrealized appreciation/depreciation on investments and foreign currency related transactions | | | 1 77 | | | | (9.07 | ) | | | (0.42 | ) | | | 10 75 | | | | 1.02 | | | | (9 61 | ) |
Total from investment operations | | | 2.12 | | | | (8.71 | ) | | | (0.06 | ) | | | 10.81 | | | | 1.08 | | | | (9.37 | ) |
LESS DISTRIBUTIONS FROM: | | | | | | | | | | | | | | | | | | | | | | | | |
Net investment income | | | (0.42 | ) | | | — | | | | (0.66 | ) | | | (0.30 | ) | | | — | | | | (0.78 | ) |
Net realized gains on investments | | | — | | | | (2.64 | ) | | | (1.80 | ) | | | — | | | | (2.22 | ) | | | (3.90 | ) |
Total distributions | | | (0.42 | ) | | | (2.64 | ) | | | (2.46 | ) | | | (0.30 | ) | | | (2.22 | ) | | | (4.68 | ) |
Net Asset Value, end of period | | | $24.88 | | | | $23.18 | | | | $34.53 | | | | $37.05 | | | | $26.54 | | | | $27.68 | |
TOTAL RETURN | | | 9.14% | 3 | | | (25.39% | ) | | | (0.16% | ) | | | 40.76% | | | | 4.01% | | | | (22.15% | ) |
| | | | | | |
RATIOS/SUPPLEMENTAL DATA | | | | | | | | | | | | | | | | | | | | | | | | |
Net assets, end of period (in 000’s) | | | $64,991 | | | | $9,166 | | | | $14,998 | | | | $12,192 | | | | $23,426 | | | | $19,377 | |
Ratio of expenses to average net assets | | | 1.54% | 4 | | | 1.08% | | | | 0.98% | | | | 1.05% | | | | 1.05% | | | | 1.02% | |
Ratio of net investment income (loss) to average net assets | | | 2.97% | 4 | | | 1.20% | | | | 0.93% | | | | 0.28% | | | | 0.29% | | | | 0.67% | |
Portfolio turnover5 | | | 9.77% | 3 | | | 56.94% | | | | 40.18% | | | | 39.62% | | | | 36.63% | | | | 35.60% | |
| * | Investor Class shares of the Fund were converted into Institutional Class shares on June 20, 2023. |
| 1 | Share amounts have been adjusted for a reverse stock split effective after the close of business on June 23, 2023. See Note 1 of the Notes to Financial Statements. |
| 2 | Calculated using the average daily shares method. |
| 5 | The portfolio turnover rate is calculated on the Fund as a whole without distinguishing between classes of shares issued. |
See accompanying notes to financial statements.
Financial Highlights (continued)
Matthews Asian Growth And Income Fund
The tables below set forth financial data for a share of beneficial interest outstanding throughout each period presented.
| | | | | | | | | | | | | | | | | | | | | | | | |
INVESTOR CLASS | | Six-Month
Period Ended
June 30, 2023 (Unaudited) | | | Year Ended Dec. 31, | |
| | 2022 | | | 2021 | | | 2020 | | | 2019 | | | 2018 | |
Net Asset Value, beginning of period | | | $12.50 | | | | $16.07 | | | | $18.05 | | | | $15.73 | | | | $13.92 | | | | $17.46 | |
INCOME (LOSS) FROM INVESTMENT OPERATIONS: | | | | | | | | | | | | | | | | | | | | | | | | |
Net investment income (loss)1 | | | 0.14 | | | | 0.22 | | | | 0.17 | | | | 0.21 | | | | 0.25 | | | | 0.32 | |
Net realized gain (loss) and unrealized appreciation/depreciation on investments, foreign currency related transactions and foreign capital gains taxes | | | 0.42 | | | | (3.17 | ) | | | (0.17 | ) | | | 2.27 | | | | 2.13 | | | | (2.20 | ) |
Total from investment operations | | | 0.56 | | | | (2.95 | ) | | | — | | | | 2.48 | | | | 2.38 | | | | (1.88 | ) |
LESS DISTRIBUTIONS FROM: | | | | | | | | | | | | | | | | | | | | | | | | |
Net investment income | | | (0.17 | ) | | | (0.21 | ) | | | (0.20 | ) | | | (0.16 | ) | | | (0.35 | ) | | | (0.32 | ) |
Net realized gains on investments | | | — | | | | (0.41 | ) | | | (1.78 | ) | | | — | 2 | | | (0.22 | ) | | | (1.34 | ) |
Total distributions | | | (0.17 | ) | | | (0.62 | ) | | | (1.98 | ) | | | (0.16 | ) | | | (0.57 | ) | | | (1.66 | ) |
Net Asset Value, end of period | | | $12.89 | | | | $12.50 | | | | $16.07 | | | | $18.05 | | | | $15.73 | | | | $13.92 | |
TOTAL RETURN | | | 4.44% | 3 | | | (18.43% | ) | | | 0.04% | | | | 16.00% | | | | 17.26% | | | | (10.96% | ) |
| | | | | | |
RATIOS/SUPPLEMENTAL DATA | | | | | | | | | | | | | | | | | | | | | | | | |
Net assets, end of period (in 000’s) | | | $303,027 | | | | $339,756 | | | | $541,744 | | | | $673,576 | | | | $723,815 | | | | $799,328 | |
Ratio of expenses to average net assets before any reimbursement, waiver or recapture of expenses by Advisor and Administrator (Note 5) | | | 1.18% | 4 | | | 1.13% | | | | 1.07% | | | | 1.09% | | | | 1.08% | | | | 1.08% | |
Ratio of net investment income (loss) to average net assets | | | 2.15% | 4 | | | 1.58% | | | | 0.91% | | | | 1.38% | | | | 1.67% | | | | 1.95% | |
Portfolio turnover5 | | | 3.02% | 3 | | | 13.16% | | | | 37.85% | | | | 36.27% | | | | 21.89% | | | | 32.24% | |
| | |
INSTITUTIONAL CLASS | | Six-Month
Period Ended
June 30, 2023 (Unaudited) | | | Year Ended Dec. 31, | |
| | 2022 | | | 2021 | | | 2020 | | | 2019 | | | 2018 | |
Net Asset Value, beginning of period | | | $12.48 | | | | $16.04 | | | | $18.02 | | | | $15.70 | | | | $13.89 | | | | $17.43 | |
INCOME (LOSS) FROM INVESTMENT OPERATIONS: | | | | | | | | | | | | | | | | | | | | | | | | |
Net investment income (loss)1 | | | 0.14 | | | | 0.24 | | | | 0.20 | | | | 0.23 | | | | 0.27 | | | | 0.35 | |
Net realized gain (loss) and unrealized appreciation/depreciation on investments, foreign currency related transactions and foreign capital gains taxes | | | 0.41 | | | | (3.16 | ) | | | (0.17 | ) | | | 2.27 | | | | 2.14 | | | | (2.20 | ) |
Total from investment operations | | | 0.55 | | | | (2.92 | ) | | | 0.03 | | | | 2.50 | | | | 2.41 | | | | (1.85 | ) |
LESS DISTRIBUTIONS FROM: | | | | | | | | | | | | | | | | | | | | | | | | |
Net investment income | | | (0.17 | ) | | | (0.23 | ) | | | (0.23 | ) | | | (0.18 | ) | | | (0.38 | ) | | | (0.35 | ) |
Net realized gains on investments | | | — | | | | (0.41 | ) | | | (1.78 | ) | | | — | 2 | | | (0.22 | ) | | | (1.34 | ) |
Total distributions | | | (0.17 | ) | | | (0.64 | ) | | | (2.01 | ) | | | (0.18 | ) | | | (0.60 | ) | | | (1.69 | ) |
Net Asset Value, end of period | | | $12.86 | | | | $12.48 | | | | $16.04 | | | | $18.02 | | | | $15.70 | | | | $13.89 | |
TOTAL RETURN | | | 4.43% | 3 | | | (18.31% | ) | | | 0.18% | | | | 16.18% | | | | 17.46% | | | | (10.84% | ) |
| | | | | | |
RATIOS/SUPPLEMENTAL DATA | | | | | | | | | | | | | | | | | | | | | | | | |
Net assets, end of period (in 000’s) | | | $235,556 | | | | $270,259 | | | | $551,740 | | | | $822,179 | | | | $743,951 | | | | $596,364 | |
Ratio of expenses to average net assets before any reimbursement, waiver or recapture of expenses by Advisor and Administrator (Note 5) | | | 1.05% | 4 | | | 1.01% | | | | 0.94% | | | | 0.96% | | | | 0.94% | | | | 0.93% | |
Ratio of net investment income (loss) to average net assets | | | 2.13% | 4 | | | 1.71% | | | | 1.10% | | | | 1.51% | | | | 1.80% | | | | 2.14% | |
Portfolio turnover5 | | | 3.02% | 3 | | | 13.16% | | | | 37.85% | | | | 36.27% | | | | 21.89% | | | | 32.24% | |
| 1 | Calculated using the average daily shares method. |
| 2 | Less than $0.01 per share. |
| 5 | The portfolio turnover rate is calculated on the Fund as a whole without distinguishing between classes of shares issued. |
See accompanying notes to financial statements.
| | | | | | | | |
| | | | matthewsasia.com | 800.789.ASIA | | | 113 | |
Financial Highlights (continued)
Matthews Asia Dividend Fund
The tables below set forth financial data for a share of beneficial interest outstanding throughout each period presented.
| | | | | | | | | | | | | | | | | | | | | | | | |
INVESTOR CLASS | | Six-Month Period Ended June 30, 2023 (Unaudited) | | | Year Ended Dec. 31, | |
| | 2022 | | | 2021 | | | 2020 | | | 2019 | | | 2018 | |
Net Asset Value, beginning of period | | | $13.24 | | | | $18.94 | | | | $22.63 | | | | $17.47 | | | | $16.05 | | | | $19.74 | |
INCOME (LOSS) FROM INVESTMENT OPERATIONS: | | | | | | | | | | | | | | | | | | | | | | | | |
Net investment income (loss)1 | | | 0.11 | | | | 0.13 | | | | 0.18 | | | | 0.15 | | | | 0.28 | | | | 0.37 | |
Net realized gain (loss) and unrealized appreciation/depreciation on investments, foreign currency related transactions and foreign capital gains taxes | | | 0.28 | | | | (5.72 | ) | | | (0.81 | ) | | | 5.23 | | | | 1.50 | | | | (2.83 | ) |
Total from investment operations | | | 0.39 | | | | (5.59 | ) | | | (0.63 | ) | | | 5.38 | | | | 1.78 | | | | (2.46 | ) |
LESS DISTRIBUTIONS FROM: | | | | | | | | | | | | | | | | | | | | | | | | |
Net investment income | | | (0.05 | ) | | | (0.11 | ) | | | (0.19 | ) | | | (0.22 | ) | | | (0.36 | ) | | | (0.31 | ) |
Net realized gains on investments | | | — | | | | — | | | | (2.87 | ) | | | — | | | | — | | | | (0.92 | ) |
Total distributions | | | (0.05 | ) | | | (0.11 | ) | | | (3.06 | ) | | | (0.22 | ) | | | (0.36 | ) | | | (1.23 | ) |
Net Asset Value, end of period | | | $13.58 | | | | $13.24 | | | | $18.94 | | | | $22.63 | | | | $17.47 | | | | $16.05 | |
TOTAL RETURN | | | 2.93% | 2 | | | (29.57% | ) | | | (2.83% | ) | | | 31.25% | | | | 11.17% | | | | (12.72% | ) |
| | | | | | |
RATIOS/SUPPLEMENTAL DATA | | | | | | | | | | | | | | | | | | | | | | | | |
Net assets, end of period (in 000’s) | | | $526,271 | | | | $602,694 | | | | $1,586,460 | | | | $2,292,262 | | | | $2,312,560 | | | | $2,728,599 | |
Ratio of expenses to average net assets before any reimbursement, waiver or recapture of expenses by Advisor and Administrator (Note 5) | | | 1.18% | 3 | | | 1.10% | | | | 1.03% | | | | 1.03% | | | | 1.03% | | | | 1.02% | |
Ratio of expenses to average net assets after any reimbursement, waiver or recapture of expenses by Advisor and Administrator | | | 1.18% | 3 | | | 1.10% | | | | 1.02% | | | | 1.02% | | | | 1.02% | | | | 1.01% | |
Ratio of net investment income (loss) to average net assets | | | 1.61% | 3 | | | 0.84% | | | | 0.80% | | | | 0.85% | | | | 1.68% | | | | 1.97% | |
Portfolio turnover4 | | | 64.01% | 2 | | | 50.75% | | | | 47.41% | | | | 37.73% | | | | 30.32% | | | | 39.75% | |
| | |
| INSTITUTIONAL CLASS | | Six-Month Period Ended June 30, 2023 (Unaudited) | | | Year Ended Dec. 31, | |
| | 2022 | | | 2021 | | | 2020 | | | 2019 | | | 2018 | |
Net Asset Value, beginning of period | | | $13.23 | | | | $18.94 | | | | $22.62 | | | | $17.47 | | | | $16.04 | | | | $19.73 | |
INCOME (LOSS) FROM INVESTMENT OPERATIONS: | | | | | | | | | | | | | | | | | | | | | | | | |
Net investment income (loss)1 | | | 0.12 | | | | 0.14 | | | | 0.21 | | | | 0.16 | | | | 0.30 | | | | 0.39 | |
Net realized gain (loss) and unrealized appreciation/depreciation on investments, foreign currency related transactions and foreign capital gains taxes | | | 0.27 | | | | (5.72 | ) | | | (0.80 | ) | | | 5.22 | | | | 1.50 | | | | (2.83 | ) |
Total from investment operations | | | 0.39 | | | | (5.58 | ) | | | (0.59 | ) | | | 5.38 | | | | 1.80 | | | | (2.44 | ) |
LESS DISTRIBUTIONS FROM: | | | | | | | | | | | | | | | | | | | | | | | | |
Net investment income | | | (0.05 | ) | | | (0.13 | ) | | | (0.22 | ) | | | (0.23 | ) | | | (0.37 | ) | | | (0.33 | ) |
Net realized gains on investments | | | — | | | | — | | | | (2.87 | ) | | | — | | | | — | | | | (0.92 | ) |
Total distributions | | | (0.05 | ) | | | (0.13 | ) | | | (3.09 | ) | | | (0.23 | ) | | | (0.37 | ) | | | (1.25 | ) |
Net Asset Value, end of period | | | $13.57 | | | | $13.23 | | | | $18.94 | | | | $22.62 | | | | $17.47 | | | | $16.04 | |
TOTAL RETURN | | | 2.97% | 2 | | | (29.55% | ) | | | (2.67% | ) | | | 31.29% | | | | 11.35% | | | | (12.64% | ) |
| | | | | | |
RATIOS/SUPPLEMENTAL DATA | | | | | | | | | | | | | | | | | | | | | | | | |
Net assets, end of period (in 000’s) | | | $1,021,904 | | | | $1,248,676 | | | | $3,154,407 | | | | $2,908,674 | | | | $3,057,896 | | | | $3,039,226 | |
Ratio of expenses to average net assets before any reimbursement, waiver or recapture of expenses by Advisor and Administrator (Note 5) | | | 1.04% | 3 | | | 0.99% | | | | 0.92% | | | | 0.93% | | | | 0.93% | | | | 0.91% | |
Ratio of expenses to average net assets after any reimbursement, waiver or recapture of expenses by Advisor and Administrator | | | 1.04% | 3 | | | 0.99% | | | | 0.91% | | | | 0.93% | | | | 0.92% | | | | 0.90% | |
Ratio of net investment income (loss) to average net assets | | | 1.73% | 3 | | | 0.95% | | | | 0.93% | | | | 0.91% | | | | 1.80% | | | | 2.09% | |
Portfolio turnover4 | | | 64.01% | 2 | | | 50.75% | | | | 47.41% | | | | 37.73% | | | | 30.32% | | | | 39.75% | |
| 1 | Calculated using the average daily shares method. |
| 4 | The portfolio turnover rate is calculated on the Fund as a whole without distinguishing between classes of shares issued. |
See accompanying notes to financial statements.
Financial Highlights (continued)
Matthews China Dividend Fund
The tables below set forth financial data for a share of beneficial interest outstanding throughout each period presented.
| | | | | | | | | | | | | | | | | | | | | | | | |
| INVESTOR CLASS | | Six-Month Period Ended June 30, 2023 (Unaudited) | | | Year Ended Dec. 31, | |
| | 2022 | | | 2021 | | | 2020 | | | 2019 | | | 2018 | |
Net Asset Value, beginning of period | | | $14.00 | | | | $17.73 | | | | $19.64 | | | | $16.20 | | | | $14.32 | | | | $17.61 | |
INCOME (LOSS) FROM INVESTMENT OPERATIONS: | | | | | | | | | | | | | | | | | | | | | | | | |
Net investment income (loss)1 | | | 0.13 | | | | 0.31 | | | | 0.41 | | | | 0.30 | | | | 0.34 | | | | 0.41 | |
Net realized gain (loss) and unrealized appreciation/depreciation on investments and foreign currency related transactions | | | (1.36 | ) | | | (3.27 | ) | | | (0.48 | ) | | | 3.54 | | | | 1 80 | | | | (2 09 | ) |
Total from investment operations | | | (1.23 | ) | | | (2.96 | ) | | | (0.07 | ) | | | 3.84 | | | | 2.14 | | | | (1.68 | ) |
LESS DISTRIBUTIONS FROM: | | | | | | | | | | | | | | | | | | | | | | | | |
Net investment income | | | (0.33 | ) | | | (0.52 | ) | | | (0.49 | ) | | | (0.40 | ) | | | (0.26 | ) | | | (0.40 | ) |
Net realized gains on investments | | | — | | | | (0.25 | ) | | | (1.35 | ) | | | — | | | | — | | | | (1.21 | ) |
Total distributions | | | (0.33 | ) | | | (0.77 | ) | | | (1.84 | ) | | | (0.40 | ) | | | (0.26 | ) | | | (1.61 | ) |
Net Asset Value, end of period | | | $12.44 | | | | $14.00 | | | | $17.73 | | | | $19.64 | | | | $16.20 | | | | $14.32 | |
TOTAL RETURN | | | (8.79% | )2 | | | (16.75% | ) | | | (0.49% | ) | | | 24.22% | | | | 15.00% | | | | (9.98% | ) |
| | | | | | |
RATIOS/SUPPLEMENTAL DATA | | | | | | | | | | | | | | | | | | | | | | | | |
Net assets, end of period (in 000’s) | | | $118,887 | | | | $137,066 | | | | $218,766 | | | | $269,192 | | | | $258,111 | | | | $196,626 | |
Ratio of expenses to average net assets before any reimbursement, waiver or recapture of expenses by Advisor and Administrator (Note 5) | | | 1.18% | 3 | | | 1.20% | | | | 1.12% | | | | 1.15% | | | | 1.15% | | | | 1.15% | |
Ratio of net investment income (loss) to average net assets | | | 1.87% | 3 | | | 2.12% | | | | 2.05% | | | | 1.79% | | | | 2.14% | | | | 2.33% | |
Portfolio turnover4 | | | 13.88% | 2 | | | 67.08% | | | | 68.25% | | | | 81.79% | | | | 65.69% | | | | 66.47% | |
| | |
| INSTITUTIONAL CLASS | | Six-Month Period Ended June 30, 2023 (Unaudited) | | | Year Ended Dec. 31, | |
| | 2022 | | | 2021 | | | 2020 | | | 2019 | | | 2018 | |
Net Asset Value, beginning of period | | | $14.00 | | | | $17.72 | | | | $19.64 | | | | $16.20 | | | | $14.32 | | | | $17.61 | |
INCOME (LOSS) FROM INVESTMENT OPERATIONS: | | | | | | | | | | | | | | | | | | | | | | | | |
Net investment income (loss)1 | | | 0.13 | | | | 0.31 | | | | 0.53 | | | | 0.31 | | | | 0.35 | | | | 0.42 | |
Net realized gain (loss) and unrealized appreciation/depreciation on investments and foreign currency related transactions | | | (1.35 | ) | | | (3.24 | ) | | | (0.58 | ) | | | 3.55 | | | | 1.81 | | | | (2 07 | ) |
Total from investment operations | | | (1.22 | ) | | | (2.93 | ) | | | (0.05 | ) | | | 3.86 | | | | 2.16 | | | | (1.65 | ) |
LESS DISTRIBUTIONS FROM: | | | | | | | | | | | | | | | | | | | | | | | | |
Net investment income | | | (0.34 | ) | | | (0.54 | ) | | | (0.52 | ) | | | (0.42 | ) | | | (0.28 | ) | | | (0.43 | ) |
Net realized gains on investments | | | — | | | | (0.25 | ) | | | (1.35 | ) | | | — | | | | — | | | | (1.21 | ) |
Total distributions | | | (0.34 | ) | | | (0.79 | ) | | | (1.87 | ) | | | (0.42 | ) | | | (0.28 | ) | | | (1.64 | ) |
Net Asset Value, end of period | | | $12.44 | | | | $14.00 | | | | $17.72 | | | | $19.64 | | | | $16.20 | | | | $14.32 | |
TOTAL RETURN | | | (8.70% | )2 | | | (16.59% | ) | | | (0.38% | ) | | | 24.37% | | | | 15.16% | | | | (9.83% | ) |
| | | | | | |
RATIOS/SUPPLEMENTAL DATA | | | | | | | | | | | | | | | | | | | | | | | | |
Net assets, end of period (in 000’s) | | | $66,428 | | | | $84,220 | | | | $131,395 | | | | $115,451 | | | | $122,630 | | | | $73,033 | |
Ratio of expenses to average net assets before any reimbursement, waiver or recapture of expenses by Advisor and Administrator (Note 5) | | | 1.01% | 3 | | | 1.06% | | | | 0.97% | | | | 1.02% | | | | 1.01% | | | | 1.01% | |
Ratio of net investment income (loss) to average net assets | | | 1.87% | 3 | | | 2.12% | | | | 2.65% | | | | 1.85% | | | | 2.25% | | | | 2.44% | |
Portfolio turnover4 | | | 13.88% | 2 | | | 67.08% | | | | 68.25% | | | | 81.79% | | | | 65.69% | | | | 66.47% | |
| 1 | Calculated using the average daily shares method. |
| 4 | The portfolio turnover rate is calculated on the Fund as a whole without distinguishing between classes of shares issued. |
See accompanying notes to financial statements.
| | | | | | | | |
| | | | matthewsasia.com | 800.789.ASIA | | | 115 | |
Notes to Financial Statements (unaudited)
Matthews International Funds (d/b/a Matthews Asia Funds) (the “Trust”) is an open-end management investment company registered under the Investment Company Act of 1940, as amended (the “1940 Act”). As of June 30, 2023, the Trust issued eighteen separate series of shares. This shareholder report pertains to fourteen of those series (each a “Fund”, and collectively, the “Funds”): Matthews Emerging Markets Equity Fund, Matthews Emerging Markets Sustainable Future Fund (previously known as Matthews Asia ESG Fund), Matthews Emerging Markets Small Companies Fund, Matthews Asia Growth Fund, Matthews Pacific Tiger Fund, Matthews Asia Innovators Fund, Matthews China Fund, Matthews China Small Companies Fund, Matthews India Fund, Matthews Japan Fund, Matthews Korea Fund, Matthews Asian Growth and Income Fund, Matthews Asia Dividend Fund and Matthews China Dividend Fund. Each Fund, other than the Matthews Korea Fund, offers two classes of shares: Investor Class and Institutional Class. As of June 30, 2023, the Matthews Korea Fund offered only Institutional Class shares. Each class of shares has identical voting, dividend, liquidation and other rights and the same terms and conditions, except each class may be subject to different class expenses as outlined in the relevant prospectus and each class has exclusive voting rights with respect to matters solely affecting such class. The other four separate series of the Trust are Exchange Traded Funds and are covered in a separate shareholder report.
Effective June 20, 2023, as part of the reorganization of the Matthews Korea Fund into the Matthews Korea Active ETF, which occurred on July 14, 2023, the Investor Class shares of the Fund were converted to Institutional Class shares of the Fund. Each shareholder holding Investor Class shares of the Fund received Institutional Class shares with the same total net asset value as the shareholder previously held in the Investor Class shares.
Additionally, effective after the close of trading on June 23, 2023, Matthews Korea Fund shareholders owning Institutional Class shares of the Fund received a proportional number of Institutional Class shares of the Fund (the “Reverse Stock Split”). The total dollar value of a shareholder’s investment in the Fund was unchanged and each shareholder continued to own the same percentage (by value) of the Fund following the Reverse Stock Split as the shareholder did immediately prior to the Reverse Stock Split. The Reverse Stock Split ratio was 1 : 0.166538 (old to new).
| 2. | SIGNIFICANT ACCOUNTING POLICIES |
The following is a summary of significant accounting policies consistently followed by the Funds in preparation of their financial statements. Each Fund follows the investment company accounting and reporting guidance of the Financial Accounting Standards Board (FASB) Accounting Standard Codification Topic 946 Financial Services—Investment Companies. The accounting policies are in conformity with accounting principles generally accepted in the United States of America (“U.S. GAAP”).
| A. | SECURITY VALUATION: Pursuant to Rule 2a-5 under the 1940 Act, the Funds’ Board of Trustees (the “Board”) has designated authority to a Valuation Designee, Matthews International Capital Management, LLC (“Matthews”), the Funds’ investment adviser, to make fair valuation determinations under adopted procedures, subject to Board oversight. Matthews has formed a Valuation Committee (the “Valuation Committee”) to administer the pricing and valuation of portfolio securities and other assets and liabilities and to ensure that prices used for internal purposes or provided by third parties reasonably reflect fair value. The Valuation Designee may utilize independent pricing services, quotations from securities and financial instrument dealers and other market sources to determine fair value. The value of the Trust’s securities is based on market quotations for those securities, or on their fair value determined by the valuation policies approved by the Board. Market quotations and valuation information are provided by commercial pricing services or securities dealers that are independent of the Funds and Matthews in accordance with procedures established by the Valuation Designee. Foreign exchange-traded securities are valued as of the close of trading on the primary exchange on which they trade. Securities that trade in over-the-counter markets, including most debt securities (bonds), may be valued by other third-party vendors or by using indicative bid quotations from dealers or market makers, or other available market information. Market values for securities are determined based on quotations, market data or other information from the principal (or most advantageous) market on which the security is traded. Market quotations for equity securities used by the Funds include last reported sale prices, or, if such prices are not reported or available, bid and ask prices. Swap agreements are valued utilizing quotes received daily by the Funds’ pricing service or through brokers, which are derived using daily swap curves and models that incorporate a number of market data factors, such as discounted cash flows, trades and values of the underlying reference instruments. Foreign currency exchange contracts are valued at the mean between the bid and ask prices and are determined at the close of business on the New York Stock Exchange (“NYSE”). Interpolated values are derived when the settlement date of the contract is an interim date for which quotations are not available. The Funds may also utilize independent pricing services to assist them in determining a current market value for each security based on sources believed to be reliable. |
When fair value pricing is employed, the prices of securities used by a Fund to calculate its Net Asset Value (“NAV”) may differ from any quoted or published prices for the same securities for that day. Events affecting the value of foreign investments may occur between the time at which they are determined and when the Funds calculate their NAV, which is normally the close of trading on the NYSE. If such events render market quotations unreliable, and the impact of such events can be reasonably determined, the investments will be valued at their fair value in accordance with pricing policies. The fair value of a security held by the Funds may be determined using the services of third-party pricing services to assist in this process.
The books and records of the Funds are maintained in U.S. dollars. Transactions, portfolio securities, and assets and liabilities denominated in a foreign currency are translated and recorded in U.S. dollars at the prevailing exchange rate as of the close of trading on the NYSE. The Fund does not isolate the effect of changes in foreign exchange rates from changes in market prices on securities held. Accordingly, such changes are included within Change in net unrealized appreciation/depreciation on investments on the Statement of Operations. Translation gains or losses resulting from changes in the exchange rate during the reporting period and realized gains and losses on the settlement of foreign currency transactions are reported in the results of operations for the current period. The Funds isolate that portion of gains and losses on investments in fixed income securities that is due to changes in foreign exchange rate from that which is due to changes in market prices of securities.
Foreign securities held by the Funds may be traded on days and at times when the NYSE is closed. Accordingly, the value of the Funds may be significantly affected on days when shareholders have no access to the Funds.
| B. | FAIR VALUE MEASUREMENTS: The Funds follow a fair value hierarchy that distinguishes between market data obtained from independent sources (observable inputs) and the Funds’ own market assumptions (unobservable inputs). These inputs are used in determining the value of the Funds’ financial instruments and are summarized in the following fair value hierarchy: |
Level 1: Unadjusted quoted prices in active markets for identical securities (foreign securities that are valued based on market quotations).
Level 2: Other significant observable inputs. Certain foreign securities may be fair valued by Matthews using information such as quoted prices for similar securities, interest rates, prepayment speeds, credit risk, and foreign exchange. Additionally, external pricing services are used when the Funds determine that events affecting the value of foreign securities which occur between the time at which they are determined and the close of trading on the NYSE render market quotations unreliable.
Level 3: Significant unobservable inputs. Level 3 securities are valued based on significant unobservable inputs as determined under the direction of the Board. Characterization of such securities as Level 3 securities are not necessarily an indication of their liquidity or the risk associated with investing in these securities. A significant change in the unobservable inputs could result in a significantly lower or higher value in such Level 3 securities and could impact overall Fund performance.
The input levels are not necessarily an indication of the risk or liquidity associated with financial instruments at that level.
Notes to Financial Statements (unaudited) (continued)
Levels for Multi-Country Funds (1 of 2):
Summary of inputs used to determine the fair valuation of multi-country Funds’ investments as of June 30, 2023.
| | | | | | | | | | | | | | | | |
| | | Matthews
Emerging Markets
Equity Fund | | | Matthews
Emerging Markets
Sustainable Future
Fund | | | Matthews
Emerging Markets
Small Companies
Fund | | | Matthews Asia
Growth Fund | |
| Assets: | | | | | | | | | | | | | | | | |
| | | | |
| Investments: | | | | | | | | | | | | | | | | |
Level 1: Quoted Prices | | | | | | | | | | | | | | | | |
Common Equities: | | | | | | | | | | | | | | | | |
Brazil | | | $2,108,749 | | | | $18,128,406 | | | | $32,133,124 | | | | $— | |
Chile | | | — | | | | 1,880,710 | | | | 24,357,852 | | | | — | |
China/Hong Kong | | | 759,018 | | | | 33,107,733 | | | | 48,990,261 | | | | 34,646,804 | |
France | | | 506,540 | | | | — | | | | — | | | | — | |
India | | | 1,901,647 | | | | — | | | | — | | | | — | |
Mexico | | | 2,236,753 | | | | — | | �� | | 4,930,914 | | | | — | |
Philippines | | | 271,471 | | | | — | | | | — | | | | — | |
Singapore | | | 53,400 | | | | — | | | | — | | | | 6,987,610 | |
Taiwan | | | — | | | | — | | | | — | | | | 14,140,809 | |
United Arab Emirates | | | — | | | | — | | | | 8,551,496 | | | | — | |
United States | | | 1,065,724 | | | | 6,645,483 | | | | — | | | | — | |
Zambia | | | 300,448 | | | | — | | | | — | | | | — | |
Preferred Equities: | | | | | | | | | | | | | | | | |
Brazil | | | — | | | | — | | | | 11,413,136 | | | | — | |
Level 2: Other Significant Observable Inputs | | | | | | | | | | | | | | | | |
Common Equities: | | | | | | | | | | | | | | | | |
Australia | | | 620,759 | | | | — | | | | — | | | | 20,707,181 | |
Bangladesh | | | — | | | | 1,736,411 | | | | 2,836,150 | | | | — | |
China/Hong Kong | | | 3,103,176 | | | | 62,453,525 | | | | 89,769,894 | | | | 109,591,239 | |
Estonia | | | — | | | | 2,256,188 | | | | — | | | | — | |
France | | | 338,506 | | | | — | | | | — | | | | — | |
India | | | 2,030,891 | | | | 46,281,727 | | | | 106,505,548 | | | | 86,067,470 | |
Indonesia | | | 516,678 | | | | 2,181,721 | | | | 11,891,144 | | | | 29,881,584 | |
Kazakhstan | | | 286,061 | | | | — | | | | — | | | | — | |
Japan | | | — | | | | — | | | | — | | | | 251,165,910 | |
Jordan | | | — | | | | 3,014,522 | | | | — | | | | — | |
Philippines | | | 239,849 | | | | — | | | | 12,044,501 | | | | — | |
Poland | | | 437,308 | | | | 7,773,627 | | | | 7,029,120 | | | | — | |
Romania | | | — | | | | 2,617,092 | | | | — | | | | — | |
Saudi Arabia | | | — | | | | 4,259,080 | | | | — | | | | — | |
Singapore | | | 302,068 | | | | — | | | | — | | | | — | |
South Korea | | | 383,833 | | | | 17,219,996 | | | | 50,412,097 | | | | — | |
Switzerland | | | 323,259 | | | | — | | | | — | | | | — | |
Taiwan | | | 1,551,760 | | | | 21,744,167 | | | | 48,031,148 | | | | 11,638,200 | |
Thailand | | | 223,333 | | | | — | | | | 3,368,188 | | | | — | |
Turkey | | | — | | | | — | | | | 4,128,839 | | | | — | |
United Arab Emirates | | | 238,318 | | | | — | | | | — | | | | — | |
United Kingdom | | | 641,103 | | | | — | | | | — | | | | — | |
Vietnam | | | 1,485,299 | | | | 3,598,183 | | | | 26,597,875 | | | | — | |
Preferred Equities: | | | | | | | | | | | | | | | | |
South Korea | | | 1,334,016 | | | | 10,213,478 | | | | — | | | | — | |
Level 3: Significant Unobservable Inputs | | | | | | | | | | | | | | | | |
Common Equities: | | | | | | | | | | | | | | | | |
China/Hong Kong | | | — | | | | — | | | | 2,653,104 | | | | — | |
Russia | | | 1,871 | | | | — | | | | 25,053 | | | | — | |
Taiwan | | | — | | | | — | | | | 5,859,731 | | | | — | |
Total Market Value of Investments | | | $23,261,838 | | | | $245,112,049 | | | | $501,529,175 | | | | $564,826,807 | |
| | | | | | | | |
| | | | matthewsasia.com | 800.789.ASIA | | | 117 | |
Notes to Financial Statements (unaudited) (continued)
Levels for Multi-Country Funds (2 of 2):
Summary of inputs used to determine the fair valuation of multi-country Funds’ investments as of June 30, 2023.
| | | | | | | | | | | | | | | | |
| | | Matthews Pacific
Tiger Fund | | | Matthews Asia
Innovators Fund | | | Matthews Asian
Growth and
Income Fund | | | Matthews Asia
Dividend Fund | |
| Assets: | | | | | | | | | | | | | | | | |
| | | | |
| Investments: | | | | | | | | | | | | | | | | |
Level 1: Quoted Prices | | | | | | | | | | | | | | | | |
Common Equities: | | | | | | | | | | | | | | | | |
Brazil | | | $— | | | | $5,607,897 | | | | $— | | | | $— | |
Canada | | | — | | | | 72,659,335 | | | | — | | | | — | |
China/Hong Kong | | | 167,768,513 | | | | — | | | | 20,599,586 | | | | 26,213,797 | |
Indonesia | | | — | | | | 5,244,512 | | | | — | | | | — | |
Japan | | | — | | | | 4,918,951 | | | | — | | | | — | |
Netherlands | | | — | | | | 13,970,281 | | | | — | | | | — | |
Singapore | | | — | | | | 8,905,251 | | | | — | | | | — | |
Taiwan | | | — | | | | — | | | | — | | | | 39,099,032 | |
United States | | | — | | | | 42,334,845 | | | | 8,826,100 | | | | — | |
Level 2: Other Significant Observable Inputs | | | | | | | | | | | | | | | | |
Convertible Corporate Bondsa | | | — | | | | — | | | | 43,521,595 | | | | — | |
Common Equities: | | | | | | | | | | | | | | | | |
Australia | | | — | | | | — | | | | 7,978,092 | | | | 150,775,191 | |
Bangladesh | | | — | | | | — | | | | — | | | | 8,981,433 | |
China/Hong Kong | | | 1,419,224,760 | | | | 83,923,746 | | | | 187,915,339 | | | | 369,407,396 | |
France | | | — | | | | 9,371,605 | | | | 16,206,358 | | | | — | |
India | | | 584,247,623 | | | | 84,059,662 | | | | 54,942,687 | | | | 118,336,856 | |
Indonesia | | | 107,978,307 | | | | 7,411,694 | | | | 12,571,447 | | | | 34,405,283 | |
Japan | | | — | | | | 11,674,857 | | | | — | | | | 487,188,455 | |
Philippines | | | 90,083,203 | | | | — | | | | 9,795,198 | | | | — | |
Singapore | | | 46,486,864 | | | | — | | | | 38,492,728 | | | | 54,760,009 | |
South Korea | | | 387,630,169 | | | | 47,556,770 | | | | 49,925,781 | | | | 93,013,518 | |
Taiwan | | | 592,127,793 | | | | 43,754,796 | | | | 62,203,977 | | | | 86,917,877 | |
Thailand | | | 107,880,417 | | | | — | | | | 9,141,604 | | | | 22,748,008 | |
Vietnam | | | 62,431,288 | | | | 5,273,384 | | | | — | | | | 26,944,548 | |
Preferred Equities: | | | | | | | | | | | | | | | | |
South Korea | | | — | | | | 3,380,123 | | | | — | | | | — | |
Rights: | | | | | | | | | | | | | | | | |
Singapore | | | — | | | | — | | | | — | | | | 199,759 | |
South Korea | | | — | | | | — | | | | 12,579 | | | | 26,637 | |
Total Market Value of Investments | | | $3,565,858,937 | | | | $450,047,709 | | | | $522,133,071 | | | | $1,519,017,799 | |
| a | Industry, countries, or security types are disclosed on the Schedule of Investments. |
Notes to Financial Statements (unaudited) (continued)
Levels for Single Country Funds:
Summary of inputs used to determine the fair valuation of the single country Funds’ investments as of June 30, 2023.
| | | | | | | | | | | | | | | | | | | | | | | | |
| | | Matthews
China Fund | | | Matthews China Small Companies
Fund | | | Matthews
India Fund | | | Matthews
Japan Fund | | | Matthews
Korea Fund | | | Matthews China
Dividend Fund | |
| Assets: | | | | | | | | | | | | | | | | | | | | | | | | |
| | | | | | |
| Investments: | | | | | | | | | | | | | | | | | | | | | | | | |
Level 1: Quoted Prices | | | | | | | | | | | | | | | | | | | | | | | | |
Common Equities: | | | | | | | | | | | | | | | | | | | | | | | | |
Communication Services | | | $10,192,827 | | | | $3,076,235 | | | | $— | | | | $— | | | | $— | | | | $— | |
Consumer Discretionary | | | 43,255,680 | | | | — | | | | 3,689,131 | | | | — | | | | 1,506,057 | | | | 13,209,933 | |
Health Care | | | — | | | | 5,112,056 | | | | — | | | | — | | | | — | | | | — | |
Industrials | | | — | | | | 2,880,071 | | | | — | | | | — | | | | — | | | | 3,894,146 | |
Information Technology | | | — | | | | 3,074,310 | | | | — | | | | — | | | | — | | | | — | |
Real Estate | | | 21,433,762 | | | | — | | | | — | | | | — | | | | — | | | | — | |
Level 2: Other Significant Observable Inputs | | | | | | | | | | | | | | | | | | | | | | | | |
Common Equities: | | | | | | | | | | | | | | | | | | | | | | | | |
Communication Services | | | 79,641,128 | | | | — | | | | — | | | | 45,775,749 | | | | 3,678,978 | | | | 29,559,722 | |
Consumer Discretionary | | | 169,473,638 | | | | 24,686,291 | | | | 80,590,075 | | | | 153,797,534 | | | | 5,839,426 | | | | 37,565,575 | |
Consumer Staples | | | 36,165,736 | | | | 6,534,889 | | | | 60,151,963 | | | | 43,776,332 | | | | 5,317,091 | | | | 16,283,080 | |
Energy | | | 11,488,845 | | | | — | | | | 29,462,818 | | | | — | | | | 2,027,003 | | | | 3,525,136 | |
Financials | | | 123,257,385 | | | | 4,613,653 | | | | 245,137,953 | | | | 75,075,688 | | | | 3,196,373 | | | | 25,763,293 | |
Health Care | | | 30,842,156 | | | | 7,141,559 | | | | 66,319,930 | | | | 55,066,644 | | | | 4,774,625 | | | | 11,466,946 | |
Industrials | | | 58,810,285 | | | | 30,195,172 | | | | 42,330,615 | | | | 125,179,304 | | | | 4,477,028 | | | | 7,659,568 | |
Information Technology | | | 40,212,245 | | | | 22,960,743 | | | | 77,555,541 | | | | 125,854,650 | | | | 17,921,821 | | | | 12,702,474 | |
Materials | | | — | | | | 907,244 | | | | 45,672,300 | | | | 32,736,102 | | | | 3,883,432 | | | | 9,390,111 | |
Real Estate | | | 12,717,537 | | | | 10,459,388 | | | | — | | | | 4,620,249 | | | | — | | | | 10,860,387 | |
Utilities | | | 5,907,572 | | | | 4,062,701 | | | | — | | | | — | | | | — | | | | — | |
Preferred Equities: | | | | | | | | | | | | | | | | | | | | | | | | |
Information Technology | | | — | | | | — | | | | — | | | | — | | | | 9,590,644 | | | | — | |
Rights: | | | | | | | | | | | | | | | | | | | | | | | | |
Financials | | | — | | | | — | | | | — | | | | — | | | | 1,036 | | | | — | |
Non Convertible Corporate Bonds: | | | | | | | | | | | | | | | | | | | | | | | | |
Consumer Staples | | | — | | | | — | | | | 23,852 | | | | — | | | | — | | | | — | |
Level 3: Significant Unobservable Inputs | | | | | | | | | | | | | | | | | | | | | | | | |
Common Equities: | | | | | | | | | | | | | | | | | | | | | | | | |
Real Estate | | | 7,833,269 | | | | 676,305 | | | | — | | | | — | | | | — | | | | — | |
Total Market Value of Investments | | | $651,232,065 | | | | $126,380,617 | | | | $650,934,178 | | | | $661,882,252 | | | | $62,213,514 | | | | $181,880,371 | |
Changes in the Balances of Level 3 Securities:
The Funds’ policy is to recognize transfers in and transfers out of Level 3 as of the beginning of the reporting period.
| | | | | | | | | | | | | | | | | | | | | | | | |
| | | Matthews
Emerging Markets
Equity Fund | | | Matthews Emerging Markets Small
Companies Fund | | | Matthews China Fund | | | Matthews China Small Companies
Fund | |
| | | Common Equities — Russia | | | Common Equities — Russia | | | Common Equities — China/
Hong Kong | | | Common Equities — Taiwan | | | Common Equities — Real Estate | | | Common Equities — Real Estate | |
| Balance as of 12/31/22 (market value) | | | $2,177 | | | | $30,067 | | | | $— | | | | $— | | | | $— | | | | $250 | |
| | | | | | |
| Accrued discounts/premiums | | | — | | | | — | | | | — | | | | — | | | | — | | | | — | |
| | | | | | |
| Realized gain/(loss) | | | — | | | | — | | | | — | | | | — | | | | (12,583,162 | ) | | | (4,164,841 | ) |
| | | | | | |
| Change in unrealized appreciation/(depreciation) | | | (306 | ) | | | (5,014 | ) | | | (2,235,561 | ) | | | 2,282,041 | | | | 5,240,517 | | | | 3,039,605 | |
| | | | | | |
| Purchases | | | — | | | | — | | | | 550,940 | | | | 1,792,976 | | | | 1,792,214 | | | | — | |
| | | | | | |
| Sales | | | — | | | | — | | | | — | | | | — | | | | (1,629,852 | ) | | | (1,062,363 | ) |
| | | | | | |
| Transfers in to Level 3 | | | — | | | | — | | | | 4,337,725 | | | | 1,784,714 | | | | 15,013,552 | | | | 2,863,654 | |
| | | | | | |
| Transfer out of Level 3 | | | — | | | | — | | | | — | | | | — | | | | — | | | | — | |
| Balance as of 6/30/23 (market value) | | | $1,871 | | | | $25,053 | | | | $2,653,104 | | | | $5,859,731 | | | | $7,833,269 | | | | $676,305 | |
| Net change in unrealized appreciation/depreciation on Level 3 investments held as of 6/30/23* | | | ($306 | ) | | | ($5,014 | ) | | | ($2,235,561 | ) | | | $2,282,041 | | | | $5,240,517 | | | | $2,975,172 | |
| * | Included in the related amounts on the Statements of Operations. |
| | | | | | | | |
| | | | matthewsasia.com | 800.789.ASIA | | | 119 | |
Notes to Financial Statements (unaudited) (continued)
| C. | RISKS ASSOCIATED WITH NON-U.S. COMPANIES: Investments by the Funds in the securities of non-U.S. companies may involve investment risks not typically associated with investments in U.S. issuers. These risks include possible political, economic, social and religious instability, inadequate investor protection; changes in laws or regulations of countries within the Asia Pacific region (including in countries where the Funds may invest, as well as in the broader region); international relations with other nations; natural disasters; corruption; and military activity. Foreign securities may be subject to greater fluctuations in price than securities of domestic corporations or the U.S. government. Foreign investing may also include the risk of expropriation or confiscatory taxation, limitation on the removal of funds or other assets, currency crises and exchange controls, the imposition of foreign withholding tax on the interest income payable on such instruments, the possible seizure or nationalization of foreign deposits or assets, or the adoption of other foreign government restrictions that might adversely affect the foreign securities held by the Funds. Additionally, Asia Pacific countries may utilize formal or informal currency exchange controls or “capital controls” that may limit the ability to repatriate investments or income or adversely affect the value of portfolio investments. The economies of many Asia Pacific countries differ from the economies of more developed countries in many respects, such as their rate of growth, inflation, capital reinvestment, resource self-sufficiency and dependence on other economies, financial system stability, the national balance of payments position and sensitivity to changes in global trade. |
Certain Asia Pacific countries are highly dependent upon and may be affected by developments in the economies of other countries. Non-U.S. companies are subject to different accounting, auditing, and financial reporting standards, practices, and requirements than U.S. companies. There is generally less government regulation of stock exchanges, brokers, and listed companies abroad than in the United States, which may result in less transparency with respect to a company’s operations, and make obtaining information about them more difficult (or such information may be unavailable).
Among other risks of investing in foreign markets are the variable quality and reliability of financial information and related audits of companies. In some cases, financial information and related audits can be unreliable and not subject to verification. Auditing firms in some of these markets are not subject to independent inspection or oversight of audit quality. For example, China does not allow the Public Company Accounting Oversight Board to inspect the work that auditors perform in China for Chinese companies that sell stock into U.S. markets. This can result in investment decisions being made based on flawed or misleading information.
Foreign stock markets may not be as developed or efficient as those in the United States, and the absence of negotiated brokerage commissions in certain countries may result in higher brokerage fees. The time between the trade and settlement dates of securities transactions on foreign exchanges ranges from one day to four weeks or longer and may result in higher custody charges. Custodial arrangements may be less well developed than in the United States. Foreign securities are generally denominated and pay distributions in foreign currencies, exposing the Funds to changes in foreign currency exchange rates. Investing in any country in the Asia Pacific region will also entail risks specific and unique to that country, and these risks can be significant and change rapidly.
Changes in interest rates in each of the countries in which the Funds may invest, as well as interest rates in more-developed countries, may cause a decline in the market value of an investment. Generally, fixed income securities will decrease in value when interest rates rise and can be expected to rise in value when interest rates decline. As interest rates decline, debt issuers may repay or refinance their loans or obligations earlier than anticipated. The issuers of fixed income securities may, therefore, repay principal in advance. This would force the Funds to reinvest the proceeds from the principal prepayments at lower rates, which reduces the Funds’ income.
The Funds may invest in certain operating companies in China through legal structures known as variable interest entities (“VIEs”). In China, ownership of companies in certain sectors by foreign individuals and entities (including U.S. persons and entities such as the Fund) is prohibited. In order to facilitate foreign investment in these businesses, many Chinese companies have created VIEs. In such an arrangement, a China-based operating company typically establishes an offshore shell company in another jurisdiction, such as the Cayman Islands. That shell company enters into service and other contracts with the China-based operating company, then issues shares on a foreign exchange, such as the New York Stock Exchange. Foreign investors hold stock in the shell company rather than directly in the China-based operating company. This arrangement allows U.S. investors to obtain economic exposure to the China-based company through contractual means rather than through formal equity ownership.
VIEs are a longstanding industry practice and well known to officials and regulators in China; however, VIEs are not formally recognized under Chinese law. Recently, the government of China provided new guidance to and placed restrictions on China-based companies raising capital offshore, including through VIE structures. Investors face uncertainty about future actions by the government of China that could significantly affect an operating company’s financial performance and the enforceability of the shell company’s contractual arrangements. It is uncertain whether Chinese officials or regulators will withdraw their implicit acceptance of the VIE structure, or whether any new laws, rules or regulations relating to VIE structures will be adopted or, if adopted, what impact they would have on the interests of foreign shareholders. Under extreme circumstances, China might prohibit the existence of VIEs, or sever their ability to transmit economic and governance rights to foreign individuals and entities; if so, the market value of the Funds’ associated portfolio holdings would likely suffer significant, detrimental, and possibly permanent effects, which could result in substantial investment losses.
In February 2022, Russian forces entered Ukraine and commenced an armed conflict. Economic sanctions have since been imposed on Russia and certain of its citizens, including the exclusion of Russia from the SWIFT global payments network. As a result, Russian-related stocks and debt have since suffered significant declines in value. The ongoing conflict, together with growing turmoil from fluctuations in commodity prices and foreign exchange rates, has the potential to impact adversely global economies and has driven a sharp increase in volatility across markets. The duration of the Russian-Ukraine conflict and its effect on financial markets cannot be determined with certainty. The Funds’ performance could be negatively impacted if the value of a portfolio holding were harmed by these and such other events. Management is actively monitoring these events. As of June 30, 2023, the Russian positions held across the Matthews Asia Funds were valued near zero.
| D. | DISTRIBUTIONS TO SHAREHOLDERS: It is the policy of Matthews Asian Growth and Income Fund and Matthews China Dividend Fund to distribute net investment income on a semi-annual basis and capital gains, if any, annually. It is the policy of Matthews Asia Dividend Fund to distribute net investment income on a quarterly basis and capital gains, if any, annually. Each of the other Funds distributes a net investment income and capital gains, if any, annually. Distributions to shareholders are recorded on the ex-dividend date. Income and capital gain distributions are determined in accordance with income tax regulations which may differ from U.S. GAAP. |
Notes to Financial Statements (unaudited) (continued)
The tax character of distributions paid for the fiscal year ended December 31, 2022 was as follows:
| | | | | | | | | | | | |
| YEAR ENDED DECEMBER 31, 2022 | | Ordinary
Income | | | Net Long-Term
Capital Gains | | | Total Taxable
Distributions | |
| Matthews Emerging Markets Equity Fund | | | $658,304 | | | | $— | | | | $658,304 | |
| Matthews Emerging Markets Sustainable Future Fund | | | 1,492,800 | | | | 7,214,833 | | | | 8,707,633 | |
| Matthews Emerging Markets Small Companies Fund | | | 3,923,578 | | | | 24,305,438 | | | | 28,229,016 | |
| Matthews Asia Growth Fund | | | 5 | | | | 18,069,743 | | | | 18,069,748 | |
| Matthews Pacific Tiger Fund | | | 16,179,343 | | | | 286,471,072 | | | | 302,650,415 | |
| Matthews Asia Innovators Fund | | | — | | | | 104,645,624 | | | | 104,645,624 | |
| Matthews China Fund | | | 240 | | | | 54,199,190 | | | | 54,199,430 | |
| Matthews China Small Companies Fund | | | 3,042,313 | | | | — | | | | 3,042,313 | |
| Matthews India Fund | | | 708,348 | | | | 82,241,918 | | | | 82,950,266 | |
| Matthews Japan Fund | | | — | | | | 46,366,482 | | | | 46,366,482 | |
| Matthews Korea Fund | | | 49 | | | | 8,608,543 | | | | 8,608,592 | |
| Matthews Asian Growth and Income Fund | | | 12,257,793 | | | | 20,816,547 | | | | 33,074,340 | |
| Matthews Asia Dividend Fund | | | 26,407,965 | | | | — | | | | 26,407,965 | |
| Matthews China Dividend Fund | | | 9,296,913 | | | | 3,944,924 | | | | 13,241,837 | |
| E. | INVESTMENT TRANSACTIONS AND INCOME: Securities transactions are accounted for on the date the securities are purchased or sold or on the following business day. Financial statements reflect security transactions on trade date. Gains or losses on the sale of securities are determined on the identified cost basis. Interest income is recorded on the accrual basis. Interest income, including amortization and accretion of premiums and discounts on debt securities, is recognized daily on an accrual basis. Dividend income is generally recorded on the ex-dividend date net of any foreign taxes withheld at the source. Dividend income for certain issuers headquartered in countries which the Funds invest may not be recorded until approved by the shareholders (which may occur after the ex-dividend date) if, in the judgment of management, such dividends are not reasonably determined as of the ex-dividend date. Income and realized and unrealized gains or losses on investments are allocated to each class of shares based on its relative net assets. |
The Funds may be subject to foreign taxation related to income received, capital gains on the sale of securities and certain foreign currency transactions in the foreign jurisdictions in which they invest. Foreign taxes, if any, are recorded based on the tax regulations and rates that exist in the foreign markets in which the Funds invest. When a capital gain tax is determined to apply, the Funds record an estimated deferred tax liability in an amount that may be payable if the securities were disposed of on the valuation date.
| F. | FUND EXPENSE ALLOCATIONS: The Funds account separately for the assets, liabilities and operations of each Fund. Estimated expenses are accrued daily. Direct expenses of each Fund or class are charged to that Fund or class while general expenses are allocated pro-rata among the Funds based on net assets or other appropriate methods. |
| G. | CASH, CASH OVERDRAFTS, AND FOREIGN CURRENCY: QFI accounts (i.e., the accounts through which the QFI quota is accessed) are required by the local market to maintain a cash reserve. The cash reserve is based upon a fixed ratio of the QFI’s approved investment quota, which is defined as the amount remitted into its special Renminbi (RMB) cash account. These amounts, if any, are included in “Segregated foreign currency at value” on the Statements of Assets and Liabilities. The fixed ratio is set at 0.08 percent for the Shanghai and 0.06 percent for the Shenzhen market. When any of the Funds’ cash balances are overdrawn, a Fund is charged an overdraft fee by the custodian of 1.00% above the 30-day LIBOR rate on outstanding balances. These amounts, if any, are included in “Other expenses” on the Statements of Operations. |
| H. | USE OF ESTIMATES: The preparation of financial statements in conformity with U.S. GAAP requires management to make estimates and assumptions that affect the amounts reported in the financial statements and accompanying notes. Actual results may differ from those estimates. |
| I. | RECENT ACCOUNTING GUIDANCE: The FASB issued Accounting Standards Update (ASU), ASU 2020-04, Reference Rate Reform (Topic 848)—Facilitation of the Effects of Reference Rate Reform on Financial Reporting in March 2020 and ASU 2021-01 in January 2021 which provided further amendments and clarifications to Topic 848. These ASUs provide optional, temporary relief with respect to the financial reporting of contracts subject to certain types of modifications due to the planned discontinuation of the London Interbank Offered Rate (LIBOR), and other interbank-offered based reference rates, through December 31, 2022. In December, 2022, FASB issued ASU 2022-06 which defers the sunset date of Topic 848 from December 31, 2022, to December 31, 2024, after which entities will no longer be permitted to apply the relief in Topic 848. Management intends to rely upon the relief provided under Topic 848, which is not expected to have a material impact on the fund’s financial statements. |
In June 2022, the FASB issued Accounting Standards Update (ASU), ASU 2022-03, Fair Value Measurement (Topic 820)—Fair Value Measurement of Equity Securities Subject to Contractual Sale Restrictions, which clarifies that a contractual restriction on the sale of an equity security is not considered part of the unit of account of the equity security and, therefore, is not considered in measuring fair value. The amendments under this ASU are effective for fiscal years beginning after December 15, 2023; however, early adoption is permitted. Management is currently evaluating the impact, if any, of applying this ASU.
| | | | | | | | |
| | | | matthewsasia.com | 800.789.ASIA | | | 121 | |
Notes to Financial Statements (unaudited) (continued)
| 3. | CAPITAL SHARE TRANSACTIONS |
| | | | | | | | | | | | | | | | |
| | | Six-Month Period Ended June 30, 2023 (Unaudited) | | | Year Ended December 31, 2022 | |
| | | Shares | | | Amount | | | Shares | | | Amount | |
MATTHEWS EMERGING MARKETS EQUITY FUND | | | | | | | | | | | | | | | | |
| | | | |
Investor Class | | | | | | | | | | | | | | | | |
| | | | |
Shares sold | | | 70,548 | | | | $827,699 | | | | 543,935 | | | | $6,760,608 | |
| | | | |
Shares issued through reinvestment of distributions | | | — | | | | — | | | | 14,921 | | | | 169,949 | |
| | | | |
Shares redeemed | | | (96,896 | ) | | | (1,134,472 | ) | | | (580,296 | ) | | | (6,968,303 | ) |
Net (decrease) | | | (26,348 | ) | | | ($306,773 | ) | | | (21,440 | ) | | | ($37,746 | ) |
Institutional Class | | | | | | | | | | | | | | | | |
| | | | |
Shares sold | | | 91,431 | | | | $1,059,320 | | | | 538,021 | | | | $6,550,963 | |
| | | | |
Shares issued through reinvestment of distributions | | | — | | | | — | | | | 32,061 | | | | 364,856 | |
| | | | |
Shares redeemed | | | (1,078,680 | ) | | | (12,663,473 | ) | | | (999,790 | ) | | | (10,801,893 | ) |
Net (decrease) | | | (987,249 | ) | | | ($11,604,153 | ) | | | (429,708 | ) | | | ($3,886,074 | ) |
MATTHEWS EMERGING MARKETS SUSTAINABLE FUTURE FUND | | | | | | | | | | | | | | | | |
| | | | |
Investor Class | | | | | | | | | | | | | | | | |
| | | | |
Shares sold | | | 601,624 | | | | $7,766,459 | | | | 1,098,927 | | | | $14,356,992 | |
| | | | |
Shares issued through reinvestment of distributions | | | — | | | | — | | | | 126,489 | | | | 1,643,095 | |
| | | | |
Shares redeemed | | | (382,907 | ) | | | (4,951,758 | ) | | | (1,223,916 | ) | | | (16,262,366 | ) |
Net increase (decrease) | | | 218,717 | | | | $2,814,701 | | | | 1,500 | | | | ($262,279 | ) |
Institutional Class | | | | | | | | | | | | | | | | |
| | | | |
Shares sold | | | 6,199,077 | | | | $81,437,122 | | | | 8,359,951 | | | | $109,214,942 | |
| | | | |
Shares issued through reinvestment of distributions | | | — | | | | — | | | | 520,431 | | | | 6,765,600 | |
| | | | |
Shares redeemed | | | (2,054,381 | ) | | | (26,246,933 | ) | | | (3,359,345 | ) | | | (43,484,222 | ) |
Net increase | | | 4,144,696 | | | | $55,190,189 | | | | 5,521,037 | | | | $72,496,320 | |
MATTHEWS EMERGING MARKETS SMALL COMPANIES FUND | | | | | | | | | | | | | | | | |
| | | | |
Investor Class | | | | | | | | | | | | | | | | |
| | | | |
Shares sold | | | 2,723,298 | | | | $67,179,127 | | | | 1,463,829 | | | | $36,219,282 | |
| | | | |
Shares issued through reinvestment of distributions | | | — | | | | — | | | | 435,633 | | | | 10,354,992 | |
| | | | |
Shares redeemed | | | (896,844 | ) | | | (22,158,167 | ) | | | (1,685,415 | ) | | | (43,078,500 | ) |
Net increase | | | 1,826,454 | | | | $45,020,960 | | | | 214,047 | | | | $3,495,774 | |
Institutional Class | | | | | | | | | | | | | | | | |
| | | | |
Shares sold | | | 2,803,196 | | | | $69,827,822 | | | | 4,719,237 | | | | $119,349,047 | |
| | | | |
Shares issued through reinvestment of distributions | | | — | | | | — | | | | 709,335 | | | | 16,832,529 | |
| | | | |
Shares redeemed | | | (1,393,206 | ) | | | (34,478,379 | ) | | | (2,933,352 | ) | | | (71,109,980 | ) |
Net increase | | | 1,409,990 | | | | $35,349,443 | | | | 2,495,220 | | | | $65,071,596 | |
MATTHEWS ASIA GROWTH FUND | | | | | | | | | | | | | | | | |
| | | | |
Investor Class | | | | | | | | | | | | | | | | |
| | | | |
Shares sold | | | 502,069 | | | | $10,967,934 | | | | 2,196,500 | | | | $53,440,225 | |
| | | | |
Shares issued through reinvestment of distributions | | | — | | | | — | | | | 280,586 | | | | 6,105,563 | |
| | | | |
Shares redeemed | | | (1,546,071 | ) | | | (33,140,895 | ) | | | (9,394,517 | ) | | | (217,632,827 | ) |
Net (decrease) | | | (1,044,002 | ) | | | ($22,172,961 | ) | | | (6,917,431 | ) | | | ($158,087,039 | ) |
Institutional Class | | | | | | | | | | | | | | | | |
| | | | |
Shares sold | | | 1,334,900 | | | | $29,482,214 | | | | 8,636,741 | | | | $205,709,835 | |
| | | | |
Shares issued through reinvestment of distributions | | | — | | | | — | | | | 461,447 | | | | 10,165,668 | |
| | | | |
Shares redeemed | | | (2,744,705 | ) | | | (59,427,299 | ) | | | (26,559,936 | ) | | | (616,610,455 | ) |
Net (decrease) | | | (1,409,805 | ) | | | ($29,945,085 | ) | | | (17,461,748 | ) | | | ($400,734,952 | ) |
Notes to Financial Statements (unaudited) (continued)
| | | | | | | | | | | | | | | | |
| | | Six-Month Period Ended June 30, 2023 (Unaudited) | | | Year Ended December 31, 2022 | |
| | | Shares | | | Amount | | | Shares | | | Amount | |
MATTHEWS PACIFIC TIGER FUND | | | | | | | | | | | | | | | | |
| | | | |
Investor Class | | | | | | | | | | | | | | | | |
| | | | |
Shares sold | | | 1,563,341 | | | | $33,191,484 | | | | 6,112,939 | | | | $142,892,124 | |
| | | | |
Shares issued through reinvestment of distributions | | | 2,040 | | | | 42,290 | | | | 4,149,003 | | | | 86,008,839 | |
| | | | |
Shares redeemed | | | (5,715,591 | ) | | | (117,636,651 | ) | | | (23,272,445 | ) | | | (523,023,023 | ) |
Net (decrease) | | | (4,150,210 | ) | | | ($84,402,877 | ) | | | (13,010,503 | ) | | | ($294,122,060 | ) |
Institutional Class | | | | | | | | | | | | | | | | |
| | | | |
Shares sold | | | 22,483,583 | | | | $471,754,548 | | | | 62,395,908 | | | | $1,443,573,678 | |
| | | | |
Shares issued through reinvestment of distributions | | | — | | | | — | | | | 9,622,597 | | | | 199,476,439 | |
| | | | |
Shares redeemed | | | (18,114,117 | ) | | | (372,202,000 | ) | | | (137,484,729 | ) | | | (3,041,572,531 | ) |
Net increase (decrease) | | | 4,369,466 | | | | $99,552,548 | | | | (65,466,224 | ) | | | ($1,398,522,414 | ) |
MATTHEWS ASIA INNOVATORS FUND | | | | | | | | | | | | | | | | |
| | | | |
Investor Class | | | | | | | | | | | | | | | | |
| | | | |
Shares sold | | | 2,579,502 | | | | $30,835,708 | | | | 7,678,394 | | | | $115,859,588 | |
| | | | |
Shares issued through reinvestment of distributions | | | — | | | | — | | | | 4,958,740 | | | | 58,612,306 | |
| | | | |
Shares redeemed | | | (4,111,924 | ) | | | (47,112,174 | ) | | | (13,166,923 | ) | | | (190,724,602 | ) |
Net (decrease) | | | (1,532,422 | ) | | | ($16,276,466 | ) | | | (529,789 | ) | | | ($16,252,708 | ) |
Institutional Class | | | | | | | | | | | | | | | | |
| | | | |
Shares sold | | | 5,015,716 | | | | $59,711,685 | | | | 9,489,396 | | | | $148,205,928 | |
| | | | |
Shares issued through reinvestment of distributions | | | — | | | | — | | | | 3,693,765 | | | | 44,362,122 | |
| | | | |
Shares redeemed | | | (3,740,667 | ) | | | (42,950,667 | ) | | | (44,606,226 | ) | | | (688,227,731 | ) |
Net increase (decrease) | | | 1,275,049 | | | | $16,761,018 | | | | (31,423,065 | ) | | | ($495,659,681 | ) |
MATTHEWS CHINA FUND | | | | | | | | | | | | | | | | |
| | | | |
Investor Class | | | | | | | | | | | | | | | | |
| | | | |
Shares sold | | | 3,134,855 | | | | $48,052,312 | | | | 6,751,257 | | | | $111,112,645 | |
| | | | |
Shares issued through reinvestment of distributions | | | — | | | | — | | | | 2,084,117 | | | | 31,178,384 | |
| | | | |
Shares redeemed | | | (4,400,994 | ) | | | (63,958,039 | ) | | | (12,430,268 | ) | | | (194,631,328 | ) |
Net (decrease) | | | (1,266,139 | ) | | | ($15,905,727 | ) | | | (3,594,894 | ) | | | ($52,340,299 | ) |
Institutional Class | | | | | | | | | | | | | | | | |
| | | | |
Shares sold | | | 6,662,023 | | | | $98,346,142 | | | | 15,868,949 | | | | $265,191,549 | |
| | | | |
Shares issued through reinvestment of distributions | | | — | | | | — | | | | 1,343,972 | | | | 20,078,939 | |
| | | | |
Shares redeemed | | | (5,222,137 | ) | | | (71,222,566 | ) | | | (27,424,340 | ) | | | (427,780,367 | ) |
Net increase (decrease) | | | 1,439,886 | | | | $27,123,576 | | | | (10,211,419 | ) | | | ($142,509,879 | ) |
MATTHEWS CHINA SMALL COMPANIES FUND | | | | | | | | | | | | | | | | |
| | | | |
Investor Class | | | | | | | | | | | | | | | | |
| | | | |
Shares sold | | | 959,768 | | | | $11,182,611 | | | | 3,436,963 | | | | $44,992,214 | |
| | | | |
Shares issued through reinvestment of distributions | | | — | | | | — | | | | 173,336 | | | | 1,984,698 | |
| | | | |
Shares redeemed | | | (1,968,656 | ) | | | (21,298,489 | ) | | | (6,599,506 | ) | | | (82,835,265 | ) |
Net (decrease) | | | (1,008,888 | ) | | | ($10,115,878 | ) | | | (2,989,207 | ) | | | ($35,858,353 | ) |
Institutional Class | | | | | | | | | | | | | | | | |
| | | | |
Shares sold | | | 667,686 | | | | $7,774,212 | | | | 2,927,129 | | | | $38,281,777 | |
| | | | |
Shares issued through reinvestment of distributions | | | — | | | | — | | | | 78,949 | | | | 904,757 | |
| | | | |
Shares redeemed | | | (729,969 | ) | | | (7,918,811 | ) | | | (9,263,348 | ) | | | (106,586,014 | ) |
Net (decrease) | | | (62,283 | ) | | | ($144,599 | ) | | | (6,257,270 | ) | | | ($67,399,480 | ) |
| | | | | | | | |
| | | | matthewsasia.com | 800.789.ASIA | | | 123 | |
Notes to Financial Statements (unaudited) (continued)
| | | | | | | | | | | | | | | | |
| | | Six-Month Period Ended June 30, 2023 (Unaudited) | | | Year Ended December 31, 2022 | |
| | | Shares | | | Amount | | | Shares | | | Amount | |
MATTHEWS INDIA FUND | | | | | | | | | | | | | | | | |
| | | | |
Investor Class | | | | | | | | | | | | | | | | |
| | | | |
Shares sold | | | 1,369,616 | | | | $31,338,632 | | | | 1,593,397 | | | | $42,087,227 | |
| | | | |
Shares issued through reinvestment of distributions | | | — | | | | — | | | | 2,952,961 | | | | 67,091,273 | |
| | | | |
Shares redeemed | | | (2,253,595 | ) | | | (50,065,507 | ) | | | (4,188,976 | ) | | | (106,860,935 | ) |
Net increase (decrease) | | | (883,979 | ) | | | ($18,726,875 | ) | | | 357,382 | | | | $2,317,565 | |
Institutional Class | | | | | | | | | | | | | | | | |
| | | | |
Shares sold | | | 579,402 | | | | $13,404,899 | | | | 894,519 | | | | $22,947,980 | |
| | | | |
Shares issued through reinvestment of distributions | | | — | | | | — | | | | 456,719 | | | | 10,591,311 | |
| | | | |
Shares redeemed | | | (529,451 | ) | | | (12,098,899 | ) | | | (1,541,629 | ) | | | (39,262,095 | ) |
Net increase (decrease) | | | 49,951 | | | | $1,306,000 | | | | (190,391 | ) | | | ($5,722,804 | ) |
MATTHEWS JAPAN FUND | | | | | | | | | | | | | | | | |
| | | | |
Investor Class | | | | | | | | | | | | | | | | |
| | | | |
Shares sold | | | 1,260,068 | | | | $20,265,954 | | | | 1,890,537 | | | | $31,931,773 | |
| | | | |
Shares issued through reinvestment of distributions | | | — | | | | — | | | | 877,175 | | | | 13,482,177 | |
| | | | |
Shares redeemed | | | (1,132,558 | ) | | | (17,947,725 | ) | | | (5,698,655 | ) | | | (100,302,819 | ) |
Net increase (decrease) | | | 127,510 | | | | $2,318,229 | | | | (2,930,943 | ) | | | ($54,888,869 | ) |
Institutional Class | | | | | | | | | | | | | | | | |
| | | | |
Shares sold | | | 6,097,493 | | | | $97,849,281 | | | | 20,568,891 | | | | $361,445,980 | |
| | | | |
Shares issued through reinvestment of distributions | | | — | | | | — | | | | 1,915,282 | | | | 29,495,342 | |
| | | | |
Shares redeemed | | | (7,150,611 | ) | | | (113,772,561 | ) | | | (47,662,766 | ) | | | (784,368,302 | ) |
Net (decrease) | | | (1,053,118 | ) | | | ($15,923,280 | ) | | | (25,178,593 | ) | | | ($393,426,980 | ) |
MATTHEWS KOREA FUND | | | | | | | | | | | | | | | | |
| | | | |
Investor Class† | | | | | | | | | | | | | | | | |
| | | | |
Shares sold | | | 318,248 | | | | $1,279,757 | | | | 1,794,314 | | | | $7,344,868 | |
| | | | |
Shares issued through reinvestment of distributions | | | — | | | | — | | | | 1,920,486 | | | | 7,451,487 | |
| | | | |
Shares redeemed | | | (18,877,339 | ) | | | (79,650,512 | ) | | | (5,847,971 | ) | | | (24,651,834 | ) |
Net (decrease) | | | (18,559,091 | ) | | | ($78,370,755 | ) | | | (2,133,171 | ) | | | ($9,855,479 | ) |
Institutional Class‡ | | | | | | | | | | | | | | | | |
| | | | |
Shares sold | | | 2,457,586 | | | | $63,757,145 | | | | 81,837 | | | | $2,268,597 | |
| | | | |
Shares issued through reinvestment of distributions | | | 42,186 | | | | 1,051,693 | | | | 40,393 | | | | 953,194 | |
| | | | |
Shares redeemed | | | (283,065 | ) | | | (7,096,187 | ) | | | (161,336 | ) | | | (4,304,395 | ) |
Net increase (decrease) | | | 2,216,707 | | | | $57,712,651 | | | | (39,106 | ) | | | ($1,082,604 | ) |
MATTHEWS ASIAN GROWTH AND INCOME FUND | | | | | | | | | | | | | | | | |
| | | | |
Investor Class | | | | | | | | | | | | | | | | |
| | | | |
Shares sold | | | 652,128 | | | | $8,621,368 | | | | 2,072,697 | | | | $28,836,381 | |
| | | | |
Shares issued through reinvestment of distributions | | | 291,454 | | | | 3,756,844 | | | | 1,292,489 | | | | 16,634,895 | |
| | | | |
Shares redeemed | | | (4,612,605 | ) | | | (60,723,650 | ) | | | (9,901,120 | ) | | | (135,266,079 | ) |
Net (decrease) | | | (3,669,023 | ) | | | ($48,345,438 | ) | | | (6,535,934 | ) | | | ($89,794,803 | ) |
Institutional Class | | | | | | | | | | | | | | | | |
| | | | |
Shares sold | | | 2,374,729 | | | | $31,485,765 | | | | 9,508,243 | | | | $131,777,583 | |
| | | | |
Shares issued through reinvestment of distributions | | | 230,653 | | | | 2,966,198 | | | | 1,200,111 | | | | 15,469,643 | |
| | | | |
Shares redeemed | | | (5,956,507 | ) | | | (77,579,495 | ) | | | (23,448,483 | ) | | | (305,383,902 | ) |
Net (decrease) | | | (3,351,125 | ) | | | ($43,127,532 | ) | | | (12,740,129 | ) | | | ($158,136,676 | ) |
| † | Investor Class shares of the Fund were converted into Institutional Class shares on June 20, 2023. |
| ‡ | Share amounts have been adjusted for a reverse stock split effective after the close of business on June 23, 2023. See Note 1 of the Notes to Financial Statements. |
Notes to Financial Statements (unaudited) (continued)
| | | | | | | | | | | | | | | | |
| | | Six-Month Period Ended June 30, 2023 (Unaudited) | | | Year Ended December 31, 2022 | |
| | | Shares | | | Amount | | | Shares | | | Amount | |
MATTHEWS ASIA DIVIDEND FUND | | | | | | | | | | | | | | | | |
| | | | |
Investor Class | | | | | | | | | | | | | | | | |
| | | | |
Shares sold | | | 1,559,915 | | | | $21,431,207 | | | | 7,514,453 | | | | $115,243,327 | |
| | | | |
Shares issued through reinvestment of distributions | | | 145,957 | | | | 1,966,041 | | | | 505,887 | | | | 7,582,603 | |
| | | | |
Shares redeemed | | | (8,469,506 | ) | | | (115,510,382 | ) | | | (46,253,275 | ) | | | (662,868,059 | ) |
Net (decrease) | | | (6,763,634 | ) | | | ($92,113,134 | ) | | | (38,232,935 | ) | | | ($540,042,129 | ) |
Institutional Class | | | | | | | | | | | | | | | | |
| | | | |
Shares sold | | | 6,115,821 | | | | $84,369,225 | | | | 39,426,296 | | | | $582,376,055 | |
| | | | |
Shares issued through reinvestment of distributions | | | 300,831 | | | | 4,049,180 | | | | 1,155,172 | | | | 17,289,211 | |
| | | | |
Shares redeemed | | | (25,503,594 | ) | | | (351,872,616 | ) | | | (112,802,946 | ) | | | (1,587,005,266 | ) |
Net (decrease) | | | (19,086,942 | ) | | | ($263,454,211 | ) | | | (72,221,478 | ) | | | ($987,340,000 | ) |
MATTHEWS CHINA DIVIDEND FUND | | | | | | | | | | | | | | | | |
| | | | |
Investor Class | | | | | | | | | | | | | | | | |
| | | | |
Shares sold | | | 959,347 | | | | $14,152,657 | | | | 2,997,704 | | | | $43,780,103 | |
| | | | |
Shares issued through reinvestment of distributions | | | 238,818 | | | | 2,970,892 | | | | 563,832 | | | | 8,208,582 | |
| | | | |
Shares redeemed | | | (1,431,149 | ) | | | (19,843,134 | ) | | | (6,111,791 | ) | | | (84,105,056 | ) |
Net (decrease) | | | (232,984 | ) | | | ($2,719,585 | ) | | | (2,550,255 | ) | | | ($32,116,371 | ) |
Institutional Class | | | | | | | | | | | | | | | | |
| | | | |
Shares sold | | | 1,336,740 | | | | $18,988,623 | | | | 2,658,451 | | | | $38,472,050 | |
| | | | |
Shares issued through reinvestment of distributions | | | 138,441 | | | | 1,720,824 | | | | 320,617 | | | | 4,657,289 | |
| | | | |
Shares redeemed | | | (2,150,312 | ) | | | (29,445,540 | ) | | | (4,375,736 | ) | | | (62,829,410 | ) |
Net (decrease) | | | (675,131 | ) | | | ($8,736,093 | ) | | | (1,396,668 | ) | | | ($19,700,071 | ) |
| 4. | INVESTMENT ADVISORY FEES AND OTHER TRANSACTIONS WITH AFFILIATES |
Matthews, a registered investment advisor under the 1940 Act, provides the Funds with investment management services. Pursuant to the prior Investment Advisory Agreement dated August 13, 2004, as amended (the “Prior Advisory Agreement”) and the current Investment Advisory Agreement dated February 1, 2016, as amended (the “Current Advisory Agreement,” and together with the Prior Advisory Agreement, the “Advisory Agreement”), the Funds pay Matthews (i) for management and advisory services; and (ii) for certain administrative services, an annual fee as a percentage of average daily net assets. Under the Advisory Agreement each of the Funds, other than Matthews Emerging Markets Small Companies Fund and Matthews China Small Companies Fund (the “Family-Priced Funds”), pays Matthews 0.75% of their aggregate average daily net assets up to $2 billion, 0.6834% of their aggregate average daily net assets over $2 billion up to $5 billion, 0.65% of their aggregate average daily net assets over $5 billion up to $25 billion, 0.64% of their aggregate average daily net assets over $25 billion up to $30 billion, 0.63% of their aggregate average daily net assets over $30 billion up to $35 billion, 0.62% of their aggregate average daily net assets over $35 billion up to $40 billion, 0.61% of their aggregate average daily net assets over $40 billion up to $45 billion, and 0.60% of their aggregate average daily net assets over $45 billion. Each of the Matthews Emerging Markets Small Companies Fund and the Matthews China Small Companies Fund pays Matthews an annual fee of 1.00% of the average daily net assets of such Fund up to $1 billion and 0.95% of the average daily net assets of such Fund over $1 billion pursuant to the Advisory Agreement. Each Fund pays Matthews a monthly fee at the annual rate using the applicable management fee calculated based on the actual number of days of that month and based on the Fund’s average daily net asset value for the month.
Pursuant to a fee waiver letter agreement, effective as of September 1, 2014, between the Trust, on behalf of the Family-Priced Funds, and Matthews (as amended from time to time, the “Fee Waiver Agreement”), for each Family-Priced Fund, Matthews has agreed to waive a portion of the fee payable under the Advisory Agreement and a portion of the fee payable under the Administration and Shareholder Services Agreement, if any Family-Priced Fund’s average daily net assets are over $3 billion, as follows: for every $2.5 billion average daily net assets of a Family-Priced Fund that are over $3 billion, the fee rates that otherwise would be applied for calculating fees payable under the Advisory Agreement and the Administration and Shareholder Services Agreement for such Family-Priced Fund with respect to such excess average daily net assets will be each reduced by 0.01%, in each case without reducing such fee rate below 0.00%.
| | | | | | | | |
| | | | matthewsasia.com | 800.789.ASIA | | | 125 | |
Notes to Financial Statements (unaudited) (continued)
Investment advisory fees charged, waived fees and reimbursed additional expenses for the six-month period ended June 30, 2023, were as follows:
| | | | | | | | | | | | |
| | | Gross Advisory Fees | | | Advisory Fees
Waived and
Expenses Waived or
Reimbursed in
Excess of the
Expense Limitation | | | Net Advisory Fee/
(Net Reimbursement) | |
| Matthews Emerging Markets Equity Fund | | | $87,509 | | | | ($90,872 | ) | | | ($3,363 | ) |
| Matthews Emerging Markets Sustainable Future Fund | | | 734,492 | | | | — | | | | 734,492 | |
| Matthews Emerging Markets Small Companies Fund | | | 2,131,709 | | | | (362,583 | ) | | | 1,769,126 | |
| Matthews Asia Growth Fund | | | 2,134,606 | | | | — | | | | 2,134,606 | |
| Matthews Pacific Tiger Fund | | | 13,092,021 | | | | (43,677 | ) | | | 13,048,344 | |
| Matthews Asia Innovators Fund | | | 1,685,595 | | | | — | | | | 1,685,595 | |
| Matthews China Fund | | | 2,585,682 | | | | — | | | | 2,585,682 | |
| Matthews China Small Companies Fund | | | 759,906 | | | | (129,894 | ) | | | 630,012 | |
| Matthews India Fund | | | 2,010,065 | | | | — | | | | 2,010,065 | |
| Matthews Japan Fund | | | 2,193,010 | | | | — | | | | 2,193,010 | |
| Matthews Korea Fund | | | 246,290 | | | | — | | | | 246,290 | |
| Matthews Asian Growth and Income Fund | | | 2,015,742 | | | | — | | | | 2,015,742 | |
| Matthews Asia Dividend Fund | | | 5,883,227 | | | | — | | | | 5,883,227 | |
| Matthews China Dividend Fund | | | 760,826 | | | | — | | | | 760,826 | |
Under a written agreement between the Funds and Matthews (the “Operating Expense Agreement”), Matthews agrees to waive fees and reimburse expenses to a Fund if its expense ratio exceeds a certain percentage level. For all Funds, except the Matthews Emerging Markets Equity Fund, the Matthews Emerging Markets Sustainable Future Fund and the Matthews Emerging Markets Small Companies Fund, this level is 1.20% for the Institutional Class. For the Matthews Emerging Markets Equity Fund, this level is 0.90% for the Institutional Class. For the Matthews Emerging Markets Sustainable Future Fund and the Matthews Emerging Markets Small Companies Fund, this level is 1.15% for the Institutional Class. Matthews agrees to reduce the expense ratio for the Investor Class by waiving an equal amount of non-class specific expenses (e.g., custody fees) as the Institutional Class. Because certain expenses of the Investor Class may be higher than those of the Institutional Class and because class specific expenses may be waived solely for the Institutional Class, total annual Fund expenses for the Investor Class may exceed 1.20% (or 0.90% for the Matthews Emerging Markets Equity Fund, or 1.15% for the Matthews Emerging Markets Sustainable Future Fund and Matthews Emerging Markets Small Companies Fund). In turn, if the expenses of a Fund, fall below the level noted within three years after Matthews has made such a reimbursement, the Fund may reimburse Matthews up to an amount of the recoupment available not to exceed the lesser of (i) the expense limitation applicable at the time of that fee waiver and/or expense reimbursement or (ii) the expense limitation in effect at the time of recoupment. This agreement will continue through April 30, 2024, may be extended for additional periods not exceeding one year, and may be terminated at any time by the Board of Trustees on behalf of the Fund on 60 days’ written notice to Matthews. Matthews may decline to renew this agreement by written notice to the Trust at least 30 days before its annual expiration date.
Waived Fees Subject to Possible Future Recoupment:
On June 30, 2023, the amounts subject to possible future recoupment under the expense limitation agreement are as follows:
| | | | | | | | | | | | | | | | |
| | | Expiring December 31, | |
| | | 2023 | | | 2024 | | | 2025 | | | 2026 | |
| Matthews Emerging Markets Equity Fund | | | $231,409 | | | | $248,206 | | | | $263,291 | | | | $90,872 | |
| Matthews Emerging Markets Small Companies Fund | | | 378,868 | | | | 638,812 | | | | 647,978 | | | | 362,583 | |
| Matthews China Small Companies Fund | | | 362,019 | | | | 309,590 | | | | 388,736 | | | | 129,894 | |
The Funds have an Administration and Shareholder Services Agreement dated August 13, 2004, as amended (the “Shareholder Services Agreement” or “Services Agreement”), in which the Funds pay an annual administration and shareholder servicing fee to Matthews, as a percentage of the average daily net assets of each Fund in aggregate, computed and prorated on a daily basis. Under the Shareholder Services Agreement, the Funds in the aggregate pay Matthews 0.25% of their aggregate average daily net assets up to $2 billion, 0.1834% of their aggregate average daily net assets over $2 billion up to $5 billion, 0.15% of their aggregate average daily net assets over $5 billion up to $7.5 billion, 0.125% of their aggregate average daily net assets over $7.5 billion up to $15 billion, 0.11% of their aggregate average daily net assets over $15 billion up to $22.5 billion, 0.10% of their aggregate average daily net assets over $22.5 billion up to $25 billion, 0.09% of their aggregate average daily net assets over $25 billion up to $30 billion, 0.08% of their aggregate average daily net assets over $30 billion up to $35 billion, 0.07% of their aggregate average daily net assets over $35 billion up to $40 billion, 0.06% of their aggregate average daily net assets over $40 billion up to $45 billion, and 0.05% of their aggregate average daily net assets over $45 billion.
Notes to Financial Statements (unaudited) (continued)
Administration and shareholder servicing fees charged, for the six-month period ended June 30, 2023, were as follows:
| | | | | | | | | | | | |
| | | Gross
Administration and
Shareholder
Servicing Fees | | | Administration and
Shareholder
Servicing Fees
Waived in Excess of
Expense Limitation | | | Net
Administration and
Shareholder
Servicing Fees | |
| Matthews Emerging Markets Equity Fund | | | $22,030 | | | | $— | | | | $22,030 | |
| Matthews Emerging Markets Sustainable Future Fund | | | 185,186 | | | | — | | | | 185,186 | |
| Matthews Emerging Markets Small Companies Fund | | | 365,729 | | | | — | | | | 365,729 | |
| Matthews Asia Growth Fund | | | 537,693 | | | | — | | | | 537,693 | |
| Matthews Pacific Tiger Fund | | | 3,298,259 | | | | (43,677 | ) | | | 3,254,582 | |
| Matthews Asia Innovators Fund | | | 424,594 | | | | — | | | | 424,594 | |
| Matthews China Fund | | | 651,105 | | | | — | | | | 651,105 | |
| Matthews China Small Companies Fund | | | 130,141 | | | | — | | | | 130,141 | |
| Matthews India Fund | | | 506,616 | | | | — | | | | 506,616 | |
| Matthews Japan Fund | | | 552,685 | | | | — | | | | 552,685 | |
| Matthews Korea Fund | | | 62,022 | | | | — | | | | 62,022 | |
| Matthews Asian Growth and Income Fund | | | 507,777 | | | | — | | | | 507,777 | |
| Matthews Asia Dividend Fund | | | 1,481,774 | | | | — | | | | 1,481,774 | |
| Matthews China Dividend Fund | | | 191,583 | | | | — | | | | 191,583 | |
In addition to the fees paid to the Funds’ transfer agent, the Funds bear the cost of fees paid to certain service providers or intermediaries, including supermarkets, which provide transfer agency, record-keeping and shareholder servicing to certain shareholders. These fees are referred to as intermediary service fees on the Statements of Assets and Liabilities as well as the Statements of Operations. Additional information concerning these services and fees is contained in the Funds’ prospectuses.
BNY Mellon Investment Servicing (US) Inc. (“BNY Mellon”), an indirect wholly owned subsidiary of The Bank of New York Mellon Corporation, serves as the Funds’ administrator, and in that capacity, performs various administrative and accounting services for each Fund. BNY Mellon also serves as the Funds’ transfer agent, dividend disbursing agent and registrar. An officer of BNY Mellon serves as Assistant Treasurer to the Funds. Total fees accrued by the Funds for administration and accounting services for the six-month period ended June 30, 2023 were as follows:
| | | | |
| | | Administration and
Accounting fees | |
| Matthews Emerging Markets Equity Fund | | | $1,029 | |
| Matthews Emerging Markets Sustainable Future Fund | | | 8,636 | |
| Matthews Emerging Markets Small Companies Fund | | | 17,054 | |
| Matthews Asia Growth Fund | | | 25,103 | |
| Matthews Pacific Tiger Fund | | | 153,956 | |
| Matthews Asia Innovators Fund | | | 19,822 | |
| Matthews China Fund | | | 30,409 | |
| Matthews China Small Companies Fund | | | 6,079 | |
| Matthews India Fund | | | 23,635 | |
| Matthews Japan Fund | | | 25,787 | |
| Matthews Korea Fund | | | 2,896 | |
| Matthews Asian Growth and Income Fund | | | 23,705 | |
| Matthews Asia Dividend Fund | | | 69,187 | |
| Matthews China Dividend Fund | | | 8,948 | |
As of June 30, 2023, Matthews and its affiliates held significant shares in the Funds as follows:
| | | | | | | | |
| | | Shares held by Matthews
and its Affiliates | | | Percentage of
Outstanding Shares | |
| Matthews Emerging Markets Equity Fund | | | 619,543 | | | | 31% | |
Certain officers and Trustees of the Funds are also officers and directors of Matthews. All officers serve without compensation from the Funds. The Funds paid the Independent Trustees $580,405 in aggregate for regular compensation during the six-month period ended June 30, 2023.
| | | | | | | | |
| | | | matthewsasia.com | 800.789.ASIA | | | 127 | |
Notes to Financial Statements (unaudited) (continued)
The value of investment transactions made for affiliated and unaffiliated holdings for the six-month period ended June 30, 2023 were as follows:
| | | | | | | | | | | | | | | | |
| | | Affiliated Purchases | | | Proceeds from
Affiliated Sales | | | Unaffiliated Purchases | | | Proceeds from
Unaffiliated Sales | |
| Matthews Emerging Markets Equity Fund | | | $— | | | | $— | | | | $3,643,282 | | | | $15,094,231 | |
| Matthews Emerging Markets Sustainable Future Fund | | | — | | | | — | | | | 94,567,489 | | | | 36,326,696 | |
| Matthews Emerging Markets Small Companies Fund | | | — | | | | — | | | | 118,879,403 | | | | 47,164,100 | |
| Matthews Asia Growth Fund | | | — | | | | — | | | | 216,892,273 | | | | 276,342,750 | |
| Matthews Pacific Tiger Fund | | | — | | | | — | | | | 174,334,125 | | | | 215,015,198 | |
| Matthews Asia Innovators Fund | | | — | | | | — | | | | 570,611,128 | | | | 575,605,259 | |
| Matthews China Fund | | | — | | | | — | | | | 260,162,164 | | | | 244,999,202 | |
| Matthews China Small Companies Fund | | | — | | | | — | | | | 49,565,332 | | | | 61,331,734 | |
| Matthews India Fund | | | — | | | | — | | | | 112,596,102 | | | | 128,625,776 | |
| Matthews Japan Fund | | | — | | | | — | | | | 278,083,471 | | | | 306,846,590 | |
| Matthews Korea Fund | | | — | | | | — | | | | 6,966,946 | | | | 30,229,023 | |
| Matthews Asian Growth and Income Fund | | | — | | | | — | | | | 17,323,531 | | | | 116,035,968 | |
| Matthews Asia Dividend Fund | | | — | | | | — | | | | 1,072,129,326 | | | | 1,452,895,669 | |
| Matthews China Dividend Fund | | | — | | | | — | | | | 29,787,480 | | | | 43,810,453 | |
It is the policy of the Funds to comply with all requirements of the Internal Revenue Code of 1986, as amended (“the Code”), applicable to regulated investment companies and to distribute substantially all of their taxable income to their shareholders. The Funds have met the requirements of the Code applicable to regulated investment companies for the six-month period ended June 30, 2023. Therefore, no federal income tax provision is required.
Management has analyzed the Funds’ tax positions taken on federal income tax returns for all open tax years (current and prior three tax years), and has concluded that no provision for federal income tax is required in the Funds’ financial statements. The Funds’ federal and state income and federal excise tax returns for tax years for which the applicable statutes of limitations have not expired are subject to examination by the Internal Revenue Service and state departments of revenue.
Under current tax law, the Funds have elected to defer certain qualified late-year losses and recognize such losses in the year ending December 31, 2022:
| | | | |
| | | Late Year
Losses* | |
| Matthews Asia Innovators Fund | | | ($1,695,641 | ) |
| Matthews India Fund | | | (4,306,898 | ) |
| * | As permitted by the Internal Revenue Service, the Funds have elected to defer certain qualified late-year losses and recognize such losses in the next fiscal year. |
As of December 31, 2022, the Funds have capital loss carryforwards available to offset future realized capital gains through the indicated expiration dates as follows:
| | | | | | | | | | | | |
| | | Amount With No Expiration | | | | |
| | | Short-term
Losses | | | Long-term
Losses | | | Total | |
| Matthews Emerging Markets Equity Fund | | | $3,392,560 | | | | $989,581 | | | | $4,382,141 | |
| Matthews Emerging Markets Small Companies Fund | | | — | | | | 83,618,354 | | | | 83,618,354 | |
| Matthews Asia Growth Fund | | | 124,610,849 | | | | 22,738,539 | | | | 147,349,388 | |
| Matthews Pacific Tiger Fund | | | 33,908,360 | | | | — | | | | 33,908,360 | |
| Matthews Asia Innovators Fund | | | 179,655,785 | | | | 91,870,463 | | | | 271,526,248 | |
| Matthews China Fund | | | 102,659,675 | | | | 46,640,649 | | | | 149,300,324 | |
| Matthews China Small Companies Fund | | | 41,071,139 | | | | 55,238,491 | | | | 96,309,630 | |
| Matthews Japan Fund | | | 152,505,812 | | | | 15,879,969 | | | | 168,385,781 | |
| Matthews Korea Fund | | | 3,269,836 | | | | 953,240 | | | | 4,223,076 | |
| Matthews Asian Growth and Income Fund | | | 11,747,132 | | | | 38,811,432 | | | | 50,558,564 | |
| Matthews Asia Dividend Fund | | | 351,455,897 | | | | — | | | | 351,455,897 | |
| Matthews China Dividend Fund | | | 22,983,416 | | | | 8,879,325 | | | | 31,862,741 | |
Notes to Financial Statements (unaudited) (continued)
Under the Regulated Investment Company Modernization Act of 2010, the Funds are permitted to carry forward capital losses incurred in taxable years beginning after December 22, 2010 for an unlimited period. However, any losses incurred during those future taxable years will be required to be utilized prior to any losses incurred in pre-enactment taxable years, which generally expire after eight years from when they are incurred. Additionally, post-enactment capital losses that are carried forward will retain their character as either short-term or long-term capital losses rather than being considered all short-term as under previous law.
As of June 30, 2023, the tax cost of investments, including derivatives, and the related net unrealized appreciation and depreciation were as follows:
| | | | | | | | | | | | | | | | |
| | | Tax Cost | | | Gross
Unrealized
Appreciation | | | Gross
Unrealized
Depreciation | | | Net Unrealized
Appreciation
(Depreciation) | |
| Matthews Emerging Markets Equity Fund | | | $26,010,985 | | | | $2,122,255 | | | | ($4,871,402 | ) | | | ($2,749,147 | ) |
| Matthews Emerging Markets Sustainable Future Fund | | | 237,926,483 | | | | 36,344,855 | | | | (29,159,289 | ) | | | 7,185,566 | |
| Matthews Emerging Markets Small Companies Fund | | | 458,310,058 | | | | 108,366,476 | | | | (65,147,359 | ) | | | 43,219,117 | |
| Matthews Asia Growth Fund | | | 560,461,341 | | | | 69,798,811 | | | | (65,433,345 | ) | | | 4,365,466 | |
| Matthews Pacific Tiger Fund | | | 3,313,603,561 | | | | 842,021,794 | | | | (589,766,418 | ) | | | 252,255,376 | |
| Matthews Asia Innovators Fund | | | 498,752,336 | | | | 27,357,203 | | | | (76,061,830 | ) | | | (48,704,627 | ) |
| Matthews China Fund | | | 904,795,831 | | | | 23,556,238 | | | | (277,120,004 | ) | | | (253,563,766 | ) |
| Matthews China Small Companies Fund | | | 144,087,267 | | | | 11,749,797 | | | | (29,456,447 | ) | | | (17,706,650 | ) |
| Matthews India Fund | | | 521,526,284 | | | | 150,708,350 | | | | (21,300,456 | ) | | | 129,407,894 | |
| Matthews Japan Fund | | | 589,155,925 | | | | 90,067,108 | | | | (17,340,781 | ) | | | 72,726,327 | |
| Matthews Korea Fund | | | 56,644,823 | | | | 9,841,374 | | | | (4,272,683 | ) | | | 5,568,691 | |
| Matthews Asian Growth and Income Fund | | | 514,010,826 | | | | 88,672,699 | | | | (80,550,454 | ) | | | 8,122,245 | |
| Matthews Asia Dividend Fund | | | 1,553,608,168 | | | | 123,555,522 | | | | (158,145,891 | ) | | | (34,590,369 | ) |
| Matthews China Dividend Fund | | | 207,163,826 | | | | 14,705,336 | | | | (39,988,791 | ) | | | (25,283,455 | ) |
| 7. | PUBLIC HEALTH EMERGENCY RISKS |
Pandemics and other public health emergencies, including outbreaks of infectious diseases such as the current outbreak of the novel coronavirus (“COVID-19”), can result, and in the case of COVID-19 is resulting, in market volatility and disruption, and materially and adversely impact economic conditions in ways that cannot be predicted, all of which could result in substantial investment losses. Containment efforts and related restrictive actions by governments and businesses have significantly diminished and disrupted global economic activity across many industries. Less developed countries and their health systems may be more vulnerable to these impacts. The ultimate impact of COVID-19 or other health emergencies on global economic conditions and businesses is impossible to predict accurately. Ongoing and potential additional material adverse economic effects of indeterminate duration and severity are possible. The resulting adverse impact on the value of investment in the Funds could be significant and prolonged.
Effective July 14, 2023, the Matthews Korea Fund reorganized into the Matthews Korea Active ETF, a new series of the Trust.
| | | | | | | | |
| | | | matthewsasia.com | 800.789.ASIA | | | 129 | |


| | | | |
| Matthews Asia Funds | | | | |
| | |
INVESTMENT ADVISOR Matthews International Capital Management, LLC Four Embarcadero Center, Suite 550 San Francisco, CA 94111 800.789.ASIA CUSTODIAN Brown Brothers Harriman & Co. 50 Post Office Square Boston, MA 02110 | | ACCOUNT SERVICES Matthews Asia Funds P.O. Box 534475 Pittsburgh, PA 15253-4475 800.789.ASIA LEGAL COUNSEL Paul Hastings LLP 101 California Street, 48th Floor San Francisco, CA 94111 | | ADMINISTRATOR & TRANSFER AGENT BNY Mellon 301 Bellevue Parkway Wilmington, DE 19809 |

P.O. Box 534475 | Pittsburgh, PA 15253-4475 | matthewsasia.com | 800.789.ASIA (2742)
Matthews Asia Funds are distributed in the United States by Foreside Funds Distributors LLC, Portland, Maine
Matthews Asia Funds are distributed in Latin America by Picton S. A.

SAR-0623
Matthews Asia Active ETFs | Semi-Annual Report
June 30, 2023 | matthewsasia.com
GLOBAL EMERGING MARKETS STRATEGIES
Matthews Emerging Markets Equity Active ETF (MEM)
Matthews Emerging Markets ex China Active ETF (MEMX)
ASIA GROWTH STRATEGIES
Matthews Asia Innovators Active ETF (MINV)
Matthews China Active ETF (MCH)
Listed on the NYSE Arca


Matthews Asia Active Exchange-Traded Funds (ETFs) are actively managed and do not seek to replicate a specific index. ETFs are bought and sold through an exchange at the then current market price, not net asset value (NAV), and are not individually redeemed from the fund. Shares may trade at a premium or discount to their NAV when traded on an exchange. Brokerage commissions will reduce returns. There can be no guarantee that an active market for ETFs will develop or be maintained, or that the ETF’s listing will continue or remain unchanged.
ETF market price returns since inception are calculated using NAV for the period until market price becomes available (generally a few days after inception).
Investments are not FDIC-insured, nor are they deposits of, or guaranteed by, a bank or any other entity, so they may lose value.
Cover photo: Looking out to brighter and greener pastures (Chiang Mai, Thailand)
This report has been prepared for Matthews International Funds (d/b/a Matthews Asia Funds) shareholders. It is not authorized for distribution to prospective investors unless accompanied or preceded by a current Matthews Asia Funds prospectus, which contains more complete information about the Funds’ investment objectives, risks and expenses. Additional copies of the prospectus or summary prospectus may be obtained at matthewsasia.com. Please read the prospectus carefully before you invest or send money.
The views and opinions in this report were current as of June 30, 2023. They are not guarantees of performance or investment results and should not be taken as investment advice. Investment decisions reflect a variety of factors, and the managers reserve the right to change their views about individual stocks, sectors and the markets at any time. As a result, the views expressed should not be relied upon as a forecast of a Fund’s future investment intent. Current and future portfolio holdings are subject to risk.
Statements of fact are from sources considered reliable, but neither the Funds nor the Investment Advisor makes any representation or guarantee as to their completeness or accuracy.
Contents
Investment Risk: Exchange-Traded Fund shares are not deposits or obligations of, or guaranteed by, any depositary institution. Shares are not insured by the FDIC, Federal Reserve Board or any government agency and are subject to investment risks, including possible loss of principal amount invested. Investing in international and emerging markets may involve additional risks, such as social and political instability, market illiquidity, exchange-rate fluctuations, a high level of volatility and limited regulation. Fixed income investments are subject to additional risks, including, but not limited to, interest rate, credit and inflation risks. In addition, single-country and sector funds may be subject to a higher degree of market risk than diversified funds because of a concentration in a specific industry, sector or geographic location. Investing in small and mid-size companies is more risky than investing in large companies as they may be more volatile and less liquid than larger companies. Please see the Funds’ Prospectus and Statement of Additional Information for more risk disclosure.
| | | | | | | | |
| | | | matthewsasia.com | 833.228.5605 | | | 3 | |
Message to Shareholders from the
Investment Advisor
Investment Manager Letter
Interest rate cycles are driving changes in short-term sentiment these days and U.S.—China politics seem to be determining the longer-term mood. In the last quarter it was particularly apparent that neither seem to be working in favor of emerging markets. For many investors, it’s been a signal to sit it out on the sidelines.
Clearly, elevated global interest rates do pose a challenge to the outlook of a growth-orientated asset like emerging markets and geopolitics have weighed heavily on Chinese stocks and on companies in the semiconductor space. Underneath it all, Asia and emerging markets, particularly China, have simply struggled to produce the per-share earnings growth that their economic growth deserved. Meanwhile, markets like the U.S. have been outperforming consistently.
So you could be forgiven for questioning the rationale for staying invested in emerging markets, particularly as China labors in its recovery. Our economic theory and stock-picking patience have certainly been tested recently but we remain convinced of the long-term opportunities of this asset class. Here’s why.
Emerging markets and interest rates
First, let’s take a look at inflation and interest rates. After having obsessed over inflation and its permanence or transience for the past two years I feel confident in saying two things: first, that two-thirds to three-quarters of the inflation spike we endured was transient and due to supply shocks that are now almost entirely behind us. Second, the resulting permanent inflation is probably running at no more than about 3% in the U.S. and is still declining, in part due to interest rate rises that have already been made. So we can probably say with some confidence that interest rates have peaked. So where does this leave emerging market performance relative to developed markets? Typically it’s not been a favorable environment but only because falling rates are usually associated with cyclical economic weakness. However, I wouldn’t assume this to be the unfolding scenario. If the Fed has indeed pulled off the magic trick of a soft landing, a cycle more tilted to growth may play out—and I don’t see many in the market prepared for that. So that could be a tailwind at large for emerging markets.
Growth after a soft landing
The Fed’s rate moves are, of course, are only half the story for emerging markets. What about their central banks? Here there are two plot lines in motion. In the rate hike camp, Brazil got a better start even than the U.S. and Mexico, too, has brought a lot of credibility to macro management over the past few years. So the speed of the decline in interest rates in the U.S. is likely to be matched or even exceeded in these countries as inflation falls rapidly and at the same time the growth prospects of these economies look intact. The other plot line is in Asia, where inflation has been much less of an issue. Countries like Indonesia and India have done a lot to tame exposure to international rate cycles. As for Japan, I’ve always thought that it needed inflation so it’s not a surprise to see its equity markets doing quite well, particularly as the yen has strengthened.
India, Brazil, and Japan have been among the bright spots in emerging and international markets and there is no reason to suspect that any of them will hit harder times if the U.S. dollar remains weak and Fed rates come down.
And what about the elephant in the room, China. The world’s second biggest economy has no inflation. If anything inflation is too low. Core inflation, excluding food and energy, is at 0.4% year-on-year. The inflation rate is low partly due to the fact that China is emerging steadily but cautiously from COVID lockdown. It is emerging cautiously as the government doesn’t want to overstimulate the economy in the way that (arguably) some western nations did.
China’s challenges
So China is in quite a different macro space and that brings opportunities and challenges. The trick for China is to get incomes (and with it consumer demand) onto a sustainably rising trend, at least in line with nominal gross domestic product growth. I think China understands this and there has been a renewed focus of late in promoting an environment favorable to private enterprise. The private sector is key for the government as it holds in its hands the fate of the vast majority of urban employment and therefore the fate of the China Communist’s Party’s urban popularity, which took a big hit in the later stages of the pandemic.
China may also have to be more aggressive in its attempts to spur quality growth, from the point of view of a balanced macroeconomic policy and return on investment. Just look at the concrete steps taken in India and Mexico, in particular on macroeconomic policy, and in places like Japan and South Korea, in terms of pressure on companies to improve corporate governance and shareholder returns. China has done better on these kind of things of late but it has achieved neither the fanfare nor the practical success that some of its neighbors have.
The other driver of global market sentiment is geopolitics, of course. As we have been at pains to point out there seems little reason to expect things to improve any time soon. Indeed, further sanctions or trade controls seem to be pushing the U.S. and China into separate blocs with the result that economics and investment returns may become less correlated. As investors in emerging markets, I think we have to accept this truth and position portfolios and devise investment strategies that are more in tune with, and cognizant of, the growing importance of domestic policies.
Good businesses at good prices
Ultimately, investing in global and emerging markets is all down to finding companies. And the sluggishness of China’s economic growth and the skepticism towards it, belies the fact that there are still many good companies to be found. The sheer size of the market and the need for a bottom-up portfolio manager to find a tiny portion of good businesses means that short-term skepticism can often lead to good prices for good businesses. From our point of view, China still offers significant opportunities for the long-term investor. So, despite the better performance and perhaps superior short-term outlook in Japan and India, our regional portfolios will more often than not maintain a balance between the major markets.
In recent times, the bigger macro picture has determined to large degrees the trajectory of many equity markets regardless of the performance of their companies. In the falling rate cycle of the pandemic only growth was rewarded, profitable or otherwise. As rates rose, the environment favored more cyclical businesses. I suspect these unusually sharp style cycles are a symptom of the unusually severe and severely unusual inflation and growth cycles we’ve experienced. I think these will dampen down and the inflation cycle will normalize.
It has been a trial for quality growth stock picking and I expect the next few years will be a little easier. And it is quality growth that is shared across all we do. Yes, some of our portfolios are more exposed to emerging businesses and smaller companies. Some portfolios skew to income or established and predictable growth. But the core remains finding good businesses with sensible management, where we can be comfortable with the valuation we are paying. As strategic emerging market investors, we stand by our method, in both favorable times and trying times.

Robert Horrocks, PhD
Chief Investment Officer
Matthews International Capital Management, LLC
| | | | | | | | |
| | | | matthewsasia.com | 833.228.5605 | | | 5 | |

| | |
| PORTFOLIO MANAGERS |
| |
| John Paul Lech | | Alex Zarechnak |
Lead Manager | | Lead Manager |
| |
| Andrew Mattock, CFA | | Peeyush Mittal, CFA |
Co-Manager | | Co-Manager |
|
| FUND FACTS |
| |
| Ticker | | MEM |
CUSIP | | 577125818 |
Inception Date | | 07/13/22 |
Gross Expense Ratio | | 0.79% |
# of Positions | | 57 |
Net Assets | | $57.5 million |
Portfolio Turnover | | 15.5% |
Weight Average Market Cap | | $111.5 billion |
Benchmark |
MSCI Emerging Markets Index |
OBJECTIVE
Long-term capital appreciation.
STRATEGY
Under normal circumstances, the Fund seeks to achieve its investment objective by investing at least 80% of its net assets, which include borrowings for investment purposes, in the common and preferred stocks of companies located in emerging market countries. Emerging market countries generally include every country in the world except the United States, Australia, Canada, Hong Kong, Israel, Japan, New Zealand, Singapore and most of the countries in Western Europe.
| 3 | Holdings may combine more than one security from same issuer and related depositary receipts. |
| 4 | Not all countries where the Fund may invest are included in the benchmark index. |
| 5 | Source: FactSet Research Systems. Percentage values in data are rounded to the nearest tenth of one percent, so the values may not sum to 100% due to rounding. Country allocations and percentage values may be derived from different data sources and may not be consistent with other Fund literature. |
Matthews Emerging Markets Equity Active ETF (unaudited)
| | | | | | | | | | | | | | | | | | | | |
| |
| PERFORMANCE AS OF JUNE 30, 2023 | |
| | | | | | | | | | | | Actual Return,
Not Annualized | |
| | | 3 Months | | | YTD | | | 1 Year | | | Since
Inception | | | Inception
date | |
| Emerging Markets Equity Active ETF (NAV)1 | | | 2.18% | | | | 5.14% | | | | n.a. | | | | 11.06% | | | | 07/13/22 | |
| Emerging Markets Equity Active ETF (market price) | | | 3.11% | | | | 5.41% | | | | n.a. | | | | 12.06% | | | | | |
| MSCI Emerging Markets Index2 | | | 1.04% | | | | 5.10% | | | | n.a. | | | | 5.02% | | | | | |
| | 1 | The returns shown are based on net asset values calculated for shareholder transactions and may differ from the returns shown in the financial highlights, which reflect adjustments made to the net asset values in accordance with accounting principles generally accepted in the United States of America. |
| | 2 | It is not possible to invest directly in an index. Source: Index data from Morgan Stanley Capital International and Bloomberg; total return calculations performed by BNY Mellon Investment Servicing (US) Inc. Please see page 18 for index definition. |
Performance assumes reinvestment of all dividends and/or distributions before taxes. All performance quoted represents past performance and is no guarantee of future results. Investment return and principal value will fluctuate with market conditions so that when sold, shares may be worth more or less than their original cost. For the Fund’s most recent month-end performance visit matthewsasia.com.
| | | | | | |
| | | |
| TOP TEN HOLDINGS3 | | | | | |
| | | Country | | % of Net Assets | |
| Samsung Electronics Co., Ltd., Pfd. | | South Korea | | | 6.6% | |
| Taiwan Semiconductor Manufacturing Co., Ltd. | | Taiwan | | | 5.6% | |
| Tencent Holdings, Ltd. | | China | | | 4.1% | |
| Prologis Property Mexico SA de CV REIT | | Mexico | | | 3.5% | |
| HDFC Bank, Ltd. ADR | | India | | | 3.4% | |
| FPT Corp. | | Vietnam | | | 2.9% | |
| Prudential PLC | | United Kingdom | | | 2.8% | |
| Woodside Energy Group, Ltd. | | Australia | | | 2.6% | |
| AIA Group, Ltd. | | Hong Kong | | | 2.5% | |
| ICICI Bank, Ltd. ADR | | India | | | 2.5% | |
| Total | | | | | 36.5% | |
| | | | |
| | |
| COUNTRY ALLOCATION (%)4.5 | | | |
| India | | | 16.6 | |
| China/Hong Kong | | | 16.4 | |
| Mexico | | | 9.4 | |
| Brazil | | | 8.8 | |
| South Korea | | | 7.2 | |
| Taiwan | | | 6.6 | |
| Vietnam | | | 5.1 | |
| United States | | | 4.5 | |
| France | | | 3.6 | |
| United Kingdom | | | 2.8 | |
| Australia | | | 2.6 | |
| Philippines | | | 2.2 | |
| Indonesia | | | 2.1 | |
| Poland | | | 1.9 | |
| Singapore | | | 1.7 | |
| Switzerland | | | 1.4 | |
| Zambia | | | 1.3 | |
| Kazakhstan | | | 1.2 | |
| United Arab Emirates | | | 1.0 | |
| Thailand | | | 0.9 | |
| Cash and Other Assets, Less Liabilities | | | 2.8 | |
| | | | |
| | |
| SECTOR ALLOCATION (%)5 | | | |
| Financials | | | 23.7 | |
| Information Technology | | | 20.7 | |
| Consumer Discretionary | | | 13.1 | |
| Materials | | | 10.4 | |
| Industrials | | | 6.4 | |
| Energy | | | 4.8 | |
| Real Estate | | | 4.8 | |
| Consumer Staples | | | 4.7 | |
| Health Care | | | 4.6 | |
| Communication Services | | | 4.1 | |
| Cash and Other Assets, Less Liabilities | | | 2.8 | |
| | | | |
| | |
| MARKET CAP EXPOSURE (%)5 | | | |
| Mega Cap (over $25B) | | | 55.4 | |
| Large Cap ($10B-$25B) | | | 15.2 | |
| Mid Cap ($3B-10B) | | | 18.4 | |
| Small Cap (under $3B) | | | 8.2 | |
| Cash and Other Assets, Less Liabilities | | | 2.8 | |
| | | | | | |
| 6 | | Matthews Emerging Markets Equity Active ETF | | | | |
Matthews Emerging Markets Equity Active ETF
June 30, 2023
Schedule of Investmentsa (unaudited)
COMMON EQUITIES: 91.6%
| | | | | | | | |
| | | Shares | | | Value | |
| | |
| INDIA: 16.6% | | | | | | | | |
HDFC Bank, Ltd. ADR | | | 27,933 | | | | $1,946,930 | |
ICICI Bank, Ltd. ADR | | | 62,411 | | | | 1,440,446 | |
Infosys, Ltd. ADR | | | 75,827 | | | | 1,218,540 | |
Kotak Mahindra Bank, Ltd. | | | 38,897 | | | | 875,531 | |
PI Industries, Ltd. | | | 17,357 | | | | 829,753 | |
Dabur India, Ltd. | | | 118,484 | | | | 827,505 | |
Restaurant Brands Asia, Ltd.b | | | 563,905 | | | | 740,314 | |
UltraTech Cement, Ltd. | | | 7,312 | | | | 739,322 | |
Indian Hotels Co., Ltd. | | | 112,792 | | | | 539,650 | |
Divi’s Laboratories, Ltd. | | | 8,760 | | | | 382,664 | |
| | | | | | | | |
Total India | | | | | | | 9,540,655 | |
| | | | | | | | |
| | | | | | | | |
| | | |
| CHINA/HONG KONG: 16.4% | | | | | | | | |
Tencent Holdings, Ltd. | | | 55,000 | | | | 2,327,285 | |
AIA Group, Ltd. | | | 143,000 | | | | 1,443,394 | |
H World Group, Ltd. ADRb | | | 24,485 | | | | 949,528 | |
Yum China Holdings, Inc. | | | 15,709 | | | | 887,558 | |
Midea Group Co., Ltd. A Shares | | | 104,400 | | | | 846,807 | |
JD.com, Inc. Class A | | | 42,400 | | | | 716,351 | |
NARI Technology Co., Ltd. A Shares | | | 224,640 | | | | 713,310 | |
BYD Co., Ltd. A Shares | | | 16,500 | | | | 585,783 | |
CSPC Pharmaceutical Group, Ltd. | | | 652,000 | | | | 566,588 | |
Innovent Biologics, Inc.b,c,d | | | 97,000 | | | | 366,383 | |
| | | | | | | | |
Total China/Hong Kong | | | | | | | 9,402,987 | |
| | | | | | | | |
| | | | | | | | |
| | | |
| MEXICO: 9.4% | | | | | | | | |
Prologis Property Mexico SA de CV REIT | | | 543,000 | | | | 2,013,632 | |
GCC SAB de CV | | | 104,000 | | | | 889,341 | |
Grupo Financiero Banorte SAB de CV Class O | | | 104,700 | | | | 862,056 | |
Becle SAB de CV | | | 332,700 | | | | 812,812 | |
Grupo Aeroportuario del Sureste SAB de CV ADR | | | 2,912 | | | | 808,633 | |
| | | | | | | | |
Total Mexico | | | | | | | 5,386,474 | |
| | | | | | | | |
| | | | | | | | |
| | | |
| BRAZIL: 8.8% | | | | | | | | |
Banco BTG Pactual SA | | | 216,600 | | | | 1,412,120 | |
Vinci Partners Investments, Ltd. Class A | | | 87,949 | | | | 819,685 | |
Hapvida Participacoes e Investimentos SAb,c,d | | | 849,100 | | | | 770,949 | |
Armac Locacao Logistica E Servicos SA | | | 238,900 | | | | 741,858 | |
Vale SA ADR | | | 54,388 | | | | 729,887 | |
WEG SA | | | 77,200 | | | | 604,125 | |
| | | | | | | | |
Total Brazil | | | | | | | 5,078,624 | |
| | | | | | | | |
| | | | | | | | |
| | | |
| TAIWAN: 6.6% | | | | | | | | |
Taiwan Semiconductor Manufacturing Co., Ltd. | | | 167,000 | | | | 3,088,571 | |
Taiwan Semiconductor Manufacturing Co., Ltd. ADR | | | 7,200 | | | | 726,624 | |
| | | | | | | | |
Total Taiwan | | | | | | | 3,815,195 | |
| | | | | | | | |
| | | | | | | | |
| | | |
| VIETNAM: 5.1% | | | | | | | | |
FPT Corp. | | | 450,700 | | | | 1,643,426 | |
Military Commercial Joint Stock Bank | | | 818,700 | | | | 701,197 | |
HDBank | | | 766,625 | | | | 604,589 | |
| | | | | | | | |
Total Vietnam | | | | | | | 2,949,212 | |
| | | | | | | | |
| | | | | | | | |
| | | |
| UNITED STATES: 4.5% | | | | | | | | |
Applied Materials, Inc. | | | 7,368 | | | | 1,064,971 | |
Globant SAb | | | 5,216 | | | | 937,419 | |
Freeport-McMoRan, Inc. | | | 14,136 | | | | 565,440 | |
| | | | | | | | |
Total United States | | | | | | | 2,567,830 | |
| | | | | | | | |
| | | | | | | | |
| | | | | | | | |
| | | Shares | | | Value | |
| | | |
| FRANCE: 3.6% | | | | | | | | |
TotalEnergies SE ADR | | | 21,409 | | | | $1,234,015 | |
LVMH Moet Hennessy Louis Vuitton SE | | | 896 | | | | 843,614 | |
| | | | | | | | |
Total France | | | | | | | 2,077,629 | |
| | | | | | | | |
| | | | | | | | |
| | | |
| UNITED KINGDOM: 2.8% | | | | | | | | |
Prudential PLC | | | 112,223 | | | | 1,581,550 | |
| | | | | | | | |
Total United Kingdom | | | | | | | 1,581,550 | |
| | | | | | | | |
| | | | | | | | |
| | | |
| AUSTRALIA: 2.6% | | | | | | | | |
Woodside Energy Group, Ltd. | | | 65,762 | | | | 1,507,593 | |
| | | | | | | | |
Total Australia | | | | | | | 1,507,593 | |
| | | | | | | | |
| | | | | | | | |
| | | |
| PHILIPPINES: 2.2% | | | | | | | | |
Wilcon Depot, Inc. | | | 1,511,800 | | | | 661,419 | |
Ayala Corp. | | | 50,880 | | | | 576,092 | |
| | | | | | | | |
Total Philippines | | | | | | | 1,237,511 | |
| | | | | | | | |
| | | | | | | | |
| | | |
| INDONESIA: 2.1% | | | | | | | | |
PT Bank Rakyat Indonesia Persero Tbk | | | 3,380,000 | | | | 1,223,045 | |
| | | | | | | | |
Total Indonesia | | | | | | | 1,223,045 | |
| | | | | | | | |
| | | | | | | | |
| | | |
| POLAND: 1.8% | | | | | | | | |
Dino Polska SAb,c,d | | | 9,103 | | | | 1,063,785 | |
| | | | | | | | |
Total Poland | | | | | | | 1,063,785 | |
| | | | | | | | |
| | | | | | | | |
| | | |
| SINGAPORE: 1.7% | | | | | | | | |
CapitaLand Investment, Ltd. | | | 291,700 | | | | 713,435 | |
TDCX, Inc. ADRb | | | 32,319 | | | | 255,643 | |
CapitaLand Ascott Trust | | | 19,254 | | | | 15,365 | |
| | | | | | | | |
Total Singapore | | | | | | | 984,443 | |
| | | | | | | | |
| | | | | | | | |
| | | |
| SOUTH KOREA: 1.6% | | | | | | | | |
LG Chem, Ltd. | | | 1,780 | | | | 901,044 | |
| | | | | | | | |
Total South Korea | | | | | | | 901,044 | |
| | | | | | | | |
| | | | | | | | |
| | | |
| SWITZERLAND: 1.4% | | | | | | | | |
Cie Financiere Richemont SA Class A | | | 4,625 | | | | 783,973 | |
| | | | | | | | |
Total Switzerland | | | | | | | 783,973 | |
| | | | | | | | |
| | | | | | | | |
| | | |
| ZAMBIA: 1.3% | | | | | | | | |
First Quantum Minerals, Ltd. | | | 30,500 | | | | 722,365 | |
| | | | | | | | |
Total Zambia | | | | | | | 722,365 | |
| | | | | | | | |
| | | | | | | | |
| | | |
| KAZAKHSTAN: 1.2% | | | | | | | | |
Kaspi.KZ JSC GDRd | | | 8,639 | | | | 687,664 | |
| | | | | | | | |
Total Kazakhstan | | | | | | | 687,664 | |
| | | | | | | | |
| | | | | | | | |
| | | |
| UNITED ARAB EMIRATES: 1.0% | | | | | | | | |
Fertiglobe PLC | | | 638,793 | | | | 577,393 | |
| | | | | | | | |
Total United Arab Emirates | | | | | | | 577,393 | |
| | | | | | | | |
| | | | | | | | |
| | | | | | | | |
| | | | matthewsasia.com | 833.228.5605 | | | 7 | |
Matthews Emerging Markets Equity Active ETF
June 30, 2023
Schedule of Investmentsa (unaudited) (continued)
COMMON EQUITIES (continued)
| | | | | | | | |
| | | Shares | | | Value | |
| | |
| THAILAND: 0.9% | | | | | | | | |
Bangkok Dusit Medical Services Public Co., Ltd. F Shares | | | 690,200 | | | | $540,207 | |
| | | | | | | | |
Total Thailand | | | | | | | 540,207 | |
| | | | | | | | |
| | | | | | | | |
| | | |
| TOTAL COMMON EQUITIES | | | | | | | 52,629,179 | |
| | | | | | | | |
(Cost $51,739,270) | | | | | | | | |
| | | | | | | | |
| |
PREFERRED EQUITIES: 5.6% | | | | | |
| | | |
| SOUTH KOREA: 5.6% | | | | | | | | |
Samsung Electronics Co., Ltd., Pfd. | | | 71,480 | | | | 3,227,762 | |
| | | | | | | | |
Total South Korea | | | | | | | 3,227,762 | |
| | | | | | | | |
| | | | | | | | |
| | | |
| TOTAL PREFERRED EQUITIES | | | | | | | 3,227,762 | |
| | | | | | | | |
(Cost $3,109,384) | | | | | | | | |
| | | | | | | | |
| |
SHORT-TERM INVESTMENTS: 1.5% | | | | | |
| | | |
| MONEY MARKET FUNDS: 1.5% | | | | | | | | |
JPMorgan U.S. Government Money Market
Fund, Capital Shares, 5.01%e | | | 837,126 | | | | 837,126 | |
| | | | | | | | |
(Cost $837,126) | | | | | | | | |
| | | | | | | | |
| | | |
| TOTAL INVESTMENTS: 98.7% | | | | | | | 56,694,067 | |
(Cost $55,685,780) | | | | | | | | |
| | | | | | | | |
| | |
CASH AND OTHER ASSETS,
LESS LIABILITIES: 1.3% | | | | | | | 767,781 | |
| | | | | | | | |
| | |
NET ASSETS: 100.0% | | | | | | | $57,461,848 | |
| | | | | | | | |
| a | Certain securities were fair valued under the valuation policies approved by the Board of Trustees (Note 2-A). |
| b | Non-income producing security. |
| c | Security exempt from registration under Rule 144A of the Securities Act of 1933, as amended. The security may be resold in transactions exempt from registration normally to qualified institutional buyers. The security has been determined to be liquid in accordance with procedures adopted by the Funds’ Board of Trustees. At June 30, 2023, the aggregate value is $2,201,117, which is 3.83% of net assets. |
| d | The securities may be resold to qualified foreign investors and foreign institutional buyers under Regulation S of the Securities Act of 1933. |
| e | Rate shown is the current yield as of June 30, 2023. |
| ADR | American Depositary Receipt |
| GDR | Global Depositary Receipt |
| REIT | Real Estate Investment Trust |
See accompanying notes to financial statements.
| | | | | | |
| 8 | | Matthews Emerging Markets Equity Active ETF | | | | |
| | |
| PORTFOLIO MANAGERS |
| |
| John Paul Lech | | Alex Zarechnak |
Lead Manager | | Lead Manager |
| |
| Peeyush Mittal, CFA | | |
Co-Manager | | |
|
| FUND FACTS |
| |
| Ticker | | MEMX |
CUSIP | | 577125792 |
Inception Date | | 01/10/23 |
Gross Expense Ratio | | 0.79% |
# of Positions | | 50 |
Net Assets | | $5.3 million |
Portfolio Turnover | | n.a. |
Weight Average Market Cap | | $108.4 billion |
Benchmark |
MSCI Emerging Markets ex China Index |
OBJECTIVE
Long-term capital appreciation.
STRATEGY
Under normal circumstances, the Fund seeks to achieve its investment objective by investing at least 80% of its net assets, which include borrowings for investment purposes, in the common and preferred stocks of companies located in emerging market countries excluding China. Emerging market countries generally include every country in the world except the United States, Australia, Canada, Hong Kong, Israel, Japan, New Zealand, Singapore and most of the countries in Western Europe.
| 2 | Holdings may combine more than one security from same issuer and related depositary receipts. |
| 3 | Not all countries where the Fund may invest are included in the benchmark index. |
| 4 | Source: FactSet Research Systems. Percentage values in data are rounded to the nearest tenth of one percent, so the values may not sum to 100% due to rounding. Country allocations and percentage values may be derived from different data sources and may not be consistent with other Fund literature. |
Matthews Emerging Markets ex China Active ETF
(unaudited)
| | | | | | | | | | | | | | | | |
| |
| PERFORMANCE AS OF JUNE 30, 2023 | |
| | | | | | | | | Actual Return,
Not Annualized | |
| | | 3 Months | | | 1 Year | | | Since
Inception | | | Inception
date | |
| Emerging Markets ex China Active ETF (NAV) | | | 6.38% | | | | n.a. | | | | 6.04% | | | | 01/10/23 | |
| Emerging Markets ex China Active ETF (market price) | | | 6.74% | | | | n.a. | | | | 7.08% | | | | | |
| MSCI Emerging Markets ex China Index1 | | | 6.23% | | | | n.a. | | | | 5.67% | | | | | |
| | 1 | It is not possible to invest directly in an index. Source: Index data from Morgan Stanley Capital International and Bloomberg; total return calculations performed by BNY Mellon Investment Servicing (US) Inc. Please see page 18 for index definition. |
Performance assumes reinvestment of all dividends and/or distributions before taxes. All performance quoted represents past performance and is no guarantee of future results. Investment return and principal value will fluctuate with market conditions so that when sold, shares may be worth more or less than their original cost. For the Fund’s most recent month-end performance visit matthewsasia.com.
| | | | | | |
| | | |
| TOP TEN HOLDINGS2 | | | | | |
| | | Country | | % of Net Assets | |
| Taiwan Semiconductor Manufacturing Co., Ltd. ADR | | Taiwan | | | 9.9% | |
| Samsung Electronics Co., Ltd., Pfd. | | South Korea | | | 6.1% | |
| HDFC Bank, Ltd. ADR | | India | | | 4.0% | |
| Prologis Property Mexico SA de CV REIT | | Mexico | | | 3.6% | |
| FPT Corp. | | Vietnam | | | 3.4% | |
| Prudential PLC | | United Kingdom | | | 3.0% | |
| Banco BTG Pactual SA | | Brazil | | | 3.0% | |
| Woodside Energy Group, Ltd. | | Australia | | | 2.9% | |
| Infosys, Ltd. ADR | | India | | | 2.8% | |
| ICICI Bank, Ltd. ADR | | India | | | 2.7% | |
| Total | | | | | 41.4% | |
| | | | |
| | |
| COUNTRY ALLOCATION (%)3,4 | | | |
| India | | | 20.9 | |
| Brazil | | | 10.3 | |
| Mexico | | | 10.0 | |
| Taiwan | | | 9.9 | |
| South Korea | | | 8.7 | |
| Vietnam | | | 5.9 | |
| United States | | | 5.0 | |
| France | | | 4.0 | |
| United Kingdom | | | 3.7 | |
| Australia | | | 2.9 | |
| Philippines | | | 2.6 | |
| Indonesia | | | 2.4 | |
| United Arab Emirates | | | 2.4 | |
| Poland | | | 2.1 | |
| Switzerland | | | 1.7 | |
| Zambia | | | 1.3 | |
| Kazakhstan | | | 1.3 | |
| Singapore | | | 1.2 | |
| Thailand | | | 1.0 | |
| Turkey | | | 0.2 | |
| Cash and Other Assets, Less Liabilities | | | 2.4 | |
| | | | |
| | |
| SECTOR ALLOCATION (%)4 | | | |
| Information Technology | | | 26.1 | |
| Financials | | | 24.2 | |
| Materials | | | 12.6 | |
| Consumer Discretionary | | | 9.6 | |
| Consumer Staples | | | 6.1 | |
| Energy | | | 5.3 | |
| Industrials | | | 5.1 | |
| Real Estate | | | 4.9 | |
| Health Care | | | 3.8 | |
| Cash and Other Assets, Less Liabilities | | | 2.4 | |
| | | | |
| | |
| MARKET CAP EXPOSURE (%)4 | | | |
| Mega Cap (over $25B) | | | 52.3 | |
| Large Cap ($10B-$25B) | | | 15.0 | |
| Mid Cap ($3B-10B) | | | 21.4 | |
| Small Cap (under $3B) | | | 8.8 | |
| Cash and Other Assets, Less Liabilities | | | 2.4 | |
| | | | | | | | |
| | | | matthewsasia.com | 833.228.5605 | | | 9 | |
Matthews Emerging Markets ex China Active ETF
June 30, 2023
Schedule of Investmentsa (unaudited)
COMMON EQUITIES: 91.5%
| | | | | | | | |
| | | Shares | | | Value | |
| | |
| INDIA: 20.9% | | | | | | | | |
HDFC Bank, Ltd. ADR | | | 3,027 | | | | $210,982 | |
Infosys, Ltd. ADR | | | 9,133 | | | | 146,767 | |
ICICI Bank, Ltd. ADR | | | 6,277 | | | | 144,873 | |
Kotak Mahindra Bank, Ltd. | | | 4,454 | | | | 100,255 | |
PI Industries, Ltd. | | | 1,867 | | | | 89,252 | |
UltraTech Cement, Ltd. | | | 872 | | | | 88,169 | |
Restaurant Brands Asia, Ltd.b | | | 62,641 | | | | 82,237 | |
Dabur India, Ltd. | | | 11,707 | | | | 81,763 | |
Divi’s Laboratories, Ltd. | | | 1,446 | | | | 63,166 | |
Indian Hotels Co., Ltd. | | | 13,109 | | | | 62,720 | |
Hindustan Unilever, Ltd. | | | 1,121 | | | | 36,596 | |
| | | | | | | | |
Total India | | | | | | | 1,106,780 | |
| | | | | | | | |
| | | | | | | | |
| | | |
| BRAZIL: 10.3% | | | | | | | | |
Banco BTG Pactual SA | | | 24,200 | | | | 157,772 | |
Vinci Partners Investments, Ltd. Class A | | | 9,590 | | | | 89,379 | |
Vale SA ADR | | | 6,420 | | | | 86,156 | |
Hapvida Participacoes e Investimentos SAb,c,d | | | 90,100 | | | | 81,807 | |
Armac Locacao Logistica E Servicos SA | | | 21,700 | | | | 67,385 | |
WEG SA | | | 8,300 | | | | 64,951 | |
| | | | | | | | |
Total Brazil | | | | | | | 547,450 | |
| | | | | | | | |
| | | | | | | | |
| | | |
| MEXICO: 10.0% | | | | | | | | |
Prologis Property Mexico SA de CV REIT | | | 52,100 | | | | 193,205 | |
GCC SAB de CV | | | 10,800 | | | | 92,354 | |
Grupo Financiero Banorte SAB de CV Class O | | | 11,100 | | | | 91,393 | |
Becle SAB de CV | | | 33,000 | | | | 80,621 | |
Grupo Aeroportuario del Sureste SAB de CV ADR | | | 259 | | | | 71,922 | |
| | | | | | | | |
Total Mexico | | | | | | | 529,495 | |
| | | | | | | | |
| | | | | | | | |
| | | |
| TAIWAN: 9.9% | | | | | | | | |
Taiwan Semiconductor Manufacturing Co., Ltd. ADR | | | 5,196 | | | | 524,380 | |
| | | | | | | | |
Total Taiwan | | | | | | | 524,380 | |
| | | | | | | | |
| | | | | | | | |
| | | |
| VIETNAM: 5.9% | | | | | | | | |
FPT Corp. | | | 48,800 | | | | 177,944 | |
Military Commercial Joint Stock Bank | | | 79,200 | | | | 67,833 | |
HDBank | | | 84,000 | | | | 66,245 | |
| | | | | | | | |
Total Vietnam | | | | | | | 312,022 | |
| | | | | | | | |
| | | | | | | | |
| | | |
| UNITED STATES: 5.0% | | | | | | | | |
Globant SAb | | | 591 | | | | 106,215 | |
Applied Materials, Inc. | | | 732 | | | | 105,803 | |
Freeport-McMoRan, Inc. | | | 1,371 | | | | 54,840 | |
| | | | | | | | |
Total United States | | | | | | | 266,858 | |
| | | | | | | | |
| | | | | | | | |
| | | |
| FRANCE: 4.0% | | | | | | | | |
TotalEnergies SE ADR | | | 2,188 | | | | 126,116 | |
LVMH Moet Hennessy Louis Vuitton SE | | | 91 | | | | 85,680 | |
| | | | | | | | |
Total France | | | | | | | 211,796 | |
| | | | | | | | |
| | | | | | | | |
| | | |
| UNITED KINGDOM: 3.0% | | | | | | | | |
Prudential PLC | | | 11,312 | | | | 159,419 | |
| | | | | | | | |
Total United Kingdom | | | | | | | 159,419 | |
| | | | | | | | |
| | | | | | | | |
| | | | | | | | |
| | | Shares | | | Value | |
| | |
| AUSTRALIA: 2.9% | | | | | | | | |
Woodside Energy Group, Ltd. | | | 6,749 | | | | $154,721 | |
| | | | | | | | |
Total Australia | | | | | | | 154,721 | |
| | | | | | | | |
| | | | | | | | |
| | | |
| SOUTH KOREA: 2.6% | | | | | | | | |
LG Chem, Ltd. | | | 177 | | | | 89,598 | |
Kia Corp. | | | 748 | | | | 50,240 | |
| | | | | | | | |
Total South Korea | | | | | | | 139,838 | |
| | | | | | | | |
| | | | | | | | |
| | | |
| PHILIPPINES: 2.6% | | | | | | | | |
Wilcon Depot, Inc. | | | 157,000 | | | | 68,688 | |
Ayala Corp. | | | 5,970 | | | | 67,596 | |
| | | | | | | | |
Total Philippines | | | | | | | 136,284 | |
| | | | | | | | |
| | | | | | | | |
| | | |
| INDONESIA: 2.4% | | | | | | | | |
PT Bank Rakyat Indonesia Persero Tbk | | | 353,900 | | | | 128,058 | |
| | | | | | | | |
Total Indonesia | | | | | | | 128,058 | |
| | | | | | | | |
| | | | | | | | |
| | | |
| UNITED ARAB EMIRATES: 2.4% | | | | | | | | |
Americana Restaurants International PLC | | | 57,390 | | | | 66,092 | |
Fertiglobe PLC | | | 65,529 | | | | 59,230 | |
| | | | | | | | |
Total United Arab Emirates | | | | | | | 125,322 | |
| | | | | | | | |
| | | | | | | | |
| | | |
| POLAND: 2.1% | | | | | | | | |
Dino Polska SAb,c,d | | | 951 | | | | 111,135 | |
| | | | | | | | |
Total Poland | | | | | | | 111,135 | |
| | | | | | | | |
| | | | | | | | |
| | | |
| SWITZERLAND: 1.7% | | | | | | | | |
Cie Financiere Richemont SA Class A | | | 538 | | | | 91,195 | |
| | | | | | | | |
Total Switzerland | | | | | | | 91,195 | |
| | | | | | | | |
| | | | | | | | |
| | | |
| ZAMBIA: 1.3% | | | | | | | | |
First Quantum Minerals, Ltd. | | | 2,900 | | | | 68,684 | |
| | | | | | | | |
Total Zambia | | | | | | | 68,684 | |
| | | | | | | | |
| | | | | | | | |
| | | |
| KAZAKHSTAN: 1.3% | | | | | | | | |
Kaspi.KZ JSC GDRd | | | 849 | | | | 67,580 | |
| | | | | | | | |
Total Kazakhstan | | | | | | | 67,580 | |
| | | | | | | | |
| | | | | | | | |
| | | |
| SINGAPORE: 1.2% | | | | | | | | |
CapitaLand Investment, Ltd. | | | 26,000 | | | | 63,590 | |
CapitaLand Ascott Trust | | | 1,819 | | | | 1,452 | |
| | | | | | | | |
Total Singapore | | | | | | | 65,042 | |
| | | | | | | | |
| | | | | | | | |
| | | |
| THAILAND: 1.1% | | | | | | | | |
Bangkok Dusit Medical Services Public Co., Ltd. F Shares | | | 70,300 | | | | 55,023 | |
| | | | | | | | |
Total Thailand | | | | | | | 55,023 | |
| | | | | | | | |
| | | | | | | | |
| | | |
| CHILE: 0.7% | | | | | | | | |
Antofagasta PLC | | | 2,037 | | | | 37,836 | |
| | | | | | | | |
Total Chile | | | | | | | 37,836 | |
| | | | | | | | |
| | | | | | | | |
| | | | | | |
| 10 | | Matthews Emerging Markets ex China Active ETF | | | | |
Matthews Emerging Markets ex China Active ETF
June 30, 2023
Schedule of Investmentsa (unaudited) (continued)
COMMON EQUITIES (continued)
| | | | | | | | |
| | | Shares | | | Value | |
| | |
| TURKEY: 0.2% | | | | | | | | |
BIM Birlesik Magazalar ASb | | | 1,900 | | | | $12,426 | |
| | | | | | | | |
Total Turkey | | | | | | | 12,426 | |
| | | | | | | | |
| | | | | | | | |
| | | |
| TOTAL COMMON EQUITIES | | | | | | | 4,851,344 | |
| | | | | | | | |
(Cost $4,590,695) | | | | | | | | |
| | | | | | | | |
| | |
PREFERRED EQUITIES: 6.1% | | | | | | | | |
| | | |
| SOUTH KOREA: 6.1% | | | | | | | | |
Samsung Electronics Co., Ltd., Pfd. | | | 7,162 | | | | 323,409 | |
| | | | | | | | |
Total South Korea | | | | | | | 323,409 | |
| | | | | | | | |
| | | | | | | | |
| | | |
| TOTAL PREFERRED EQUITIES | | | | | | | 323,409 | |
| | | | | | | | |
(Cost $312,952) | | | | | | | | |
| | | | | | | | |
| | |
SHORT-TERM INVESTMENTS: 1.8% | | | | | | | | |
| | | |
| MONEY MARKET FUNDS: 1.8% | | | | | | | | |
JPMorgan U.S. Government Money Market Fund,
Capital Shares, 5.01%e | | | 96,693 | | | | 96,693 | |
| | | | | | | | |
(Cost $96,693) | | | | | | | | |
| | | | | | | | |
| | | |
| TOTAL INVESTMENTS: 99.4% | | | | | | | 5,271,446 | |
(Cost $5,000,340) | | | | | | | | |
| | | | | | | | |
| | |
CASH AND OTHER ASSETS,
LESS LIABILITIES: 0.6% | | | | | | | 30,681 | |
| | | | | | | | |
| | |
NET ASSETS: 100.0% | | | | | | | $5,302,127 | |
| | | | | | | | |
| a | Certain securities were fair valued under the valuation policies approved by the Board of Trustees (Note 2-A). |
| b | Non-income producing security. |
| c | Security exempt from registration under Rule 144A of the Securities Act of 1933, as amended. The security may be resold in transactions exempt from registration normally to qualified institutional buyers. The security has been determined to be liquid in accordance with procedures adopted by the Funds’ Board of Trustees. At June 30, 2023, the aggregate value is $192,942, which is 3.64% of net assets. |
| d | The securities may be resold to qualified foreign investors and foreign institutional buyers under Regulation S of the Securities Act of 1933. |
| e | Rate shown is the current yield as of June 30, 2023. |
| ADR | American Depositary Receipt |
| GDR | Global Depositary Receipt |
| REIT | Real Estate Investment Trust |
See accompanying notes to financial statements.
| | | | | | | | |
| | | | matthewsasia.com | 833.228.5605 | | | 11 | |

| | |
| PORTFOLIO MANAGERS |
| |
| Michael J. Oh, CFA | | |
Lead Manager | | |
| |
| Taizo Ishida | | Inbok Song |
Co-Manager | | Co-Manager |
|
| FUND FACTS |
| |
| Ticker | | MINV |
CUSIP | | 577125826 |
Inception Date | | 07/13/22 |
Gross Expense Ratio | | 0.79% |
# of Positions | | 50 |
Net Assets | | $135.4 million |
Portfolio Turnover | | 72.6% |
Weight Average Market Cap | | $193.6 billion |
Benchmark |
MSCI AC Asia ex Japan Index |
OBJECTIVE
Long-term capital appreciation.
STRATEGY
Under normal circumstances, the Fund seeks to achieve its investment objective by investing at least 80% of its net assets, which include borrowings for investment purposes, in the common and preferred stocks of companies located in Asia ex Japan that Matthews believes are innovators in their products, services, processes, business models, management, use of technology, or approach to creating, expanding or servicing their markets. Asia ex Japan consists of all countries and markets in Asia excluding Japan, including developed, emerging, and frontier countries and markets in the Asia region.
| 2 | Holdings may combine more than one security from same issuer and related depositary receipts. |
| 3 | Not all countries where the Fund may invest are included in the benchmark index. |
| 4 | Source: FactSet Research Systems. Percentage values in data are rounded to the nearest tenth of one percent, so the values may not sum to 100% due to rounding. Country allocations and percentage values may be derived from different data sources and may not be consistent with other Fund literature. |
Matthews Asia Innovators Active ETF (unaudited)
| | | | | | | | | | | | | | | | | | | | |
| |
| PERFORMANCE AS OF JUNE 30, 2023 | |
| | | | | | | | | | | | Actual Return,
Not Annualized | |
| | | 3 Months | | | YTD | | | 1 Year | | | Since
Inception | | | Inception
date | |
| Asia Innovators Active ETF (NAV) | | | -4.66% | | | | -2.85% | | | | n.a. | | | | -5.80% | | | | 07/13/22 | |
| Asia Innovators Active ETF (market price) | | | -4.16% | | | | -2.35% | | | | n.a. | | | | -5.12% | | | | | |
| MSCI AC Asia ex Japan Index1 | | | -1.14% | | | | 3.19% | | | | n.a. | | | | 1.71% | | | | | |
| | 1 | It is not possible to invest directly in an index. Source: Index data from Morgan Stanley Capital International and Bloomberg; total return calculations performed by BNY Mellon Investment Servicing (US) Inc. Please see page 18 for index definition. |
Performance assumes reinvestment of all dividends and/or distributions before taxes. All performance quoted represents past performance and is no guarantee of future results. Investment return and principal value will fluctuate with market conditions so that when sold, shares may be worth more or less than their original cost. For the Fund’s most recent month-end performance visit matthewsasia.com.
| | | | | | |
| | | |
| TOP TEN HOLDINGS2 | | | | | |
| Name | | Country | | % Net Assets | |
| Taiwan Semiconductor Manufacturing Co., Ltd. | | Taiwan | | | 8.0% | |
| Samsung Electronics Co., Ltd. | | South Korea | | | 6.2% | |
| Tencent Holdings, Ltd. | | China | | | 4.4% | |
| HDFC Bank, Ltd. | | India | | | 4.3% | |
| Alibaba Group Holding, Ltd. ADR | | China | | | 3.9% | |
| NVIDIA Corp. | | United States | | | 3.2% | |
| Trip.com Group, Ltd. ADR | | China | | | 3.0% | |
| ICICI Bank, Ltd. | | India | | | 3.0% | |
| ASML Holding NV | | Netherlands | | | 3.0% | |
| Meituan B Shares | | China | | | 2.9% | |
| Total | | | | | 41.9% | |
| | | | |
| | |
| COUNTRY ALLOCATION (%)3,4 | | | |
| China | | | 33.7 | |
| India | | | 18.1 | |
| United States | | | 11.3 | |
| South Korea | | | 11.0 | |
| Taiwan | | | 9.5 | |
| Netherlands | | | 3.0 | |
| Indonesia | | | 2.7 | |
| Japan | | | 2.4 | |
| France | | | 2.0 | |
| Singapore | | | 1.9 | |
| Vietnam | | | 1.1 | |
| Cash and Other Assets, Less Liabilities | | | 3.1 | |
| | | | |
| | |
| SECTOR ALLOCATION (%)4 | | | |
| Information Technology | | | 30.5 | |
| Consumer Discretionary | | | 26.5 | |
| Financials | | | 12.8 | |
| Communication Services | | | 10.5 | |
| Consumer Staples | | | 4.5 | |
| Industrials | | | 4.4 | |
| Health Care | | | 3.6 | |
| Energy | | | 2.1 | |
| Real Estate | | | 2.0 | |
| Cash and Other Assets, Less Liabilities | | | 3.1 | |
| | | | |
| | |
| MARKET CAP EXPOSURE (%)4 | | | |
| Mega Cap (over $25B) | | | 72.6 | |
| Large Cap ($10B-$25B) | | | 11.4 | |
| Mid Cap ($3B-10B) | | | 10.3 | |
| Small Cap (under $3B) | | | 2.6 | |
| Cash and Other Assets, Less Liabilities | | | 3.1 | |
| | | | | | |
| 12 | | Matthews Asia Innovators Active ETF | | | | |
Matthews Asia Innovators Active ETF
June 30, 2023
Schedule of Investmentsa (unaudited)
COMMON EQUITIES: 96.2%
| | | | | | | | |
| | | Shares | | | Value | |
| | |
| CHINA/HONG KONG: 33.7% | | | | | | | | |
Tencent Holdings, Ltd. | | | 139,800 | | | | $5,915,535 | |
| | |
Alibaba Group Holding, Ltd. ADRb | | | 62,942 | | | | 5,246,216 | |
| | |
Trip.com Group, Ltd. ADRb | | | 116,920 | | | | 4,092,200 | |
| | |
Meituan B Sharesb,c,d | | | 251,020 | | | | 3,917,483 | |
| | |
PDD Holdings, Inc. ADRb | | | 49,292 | | | | 3,408,049 | |
| | |
KE Holdings, Inc. ADRb | | | 180,619 | | | | 2,682,192 | |
| | |
NARI Technology Co., Ltd. A Shares | | | 637,080 | | | | 2,022,949 | |
| | |
OPT Machine Vision Tech Co., Ltd. A Shares | | | 88,974 | | | | 2,014,640 | |
| | |
Yum China Holdings, Inc. | | | 31,775 | | | | 1,795,287 | |
| | |
BYD Co., Ltd. A Shares | | | 50,500 | | | | 1,792,851 | |
| | |
Contemporary Amperex Technology Co., Ltd. A Shares | | | 56,000 | | | | 1,761,181 | |
| | |
Baidu, Inc. ADRb | | | 12,448 | | | | 1,704,256 | |
| | |
Proya Cosmetics Co., Ltd. A Shares | | | 100,780 | | | | 1,557,111 | |
| | |
Hundsun Technologies, Inc. A Shares | | | 253,900 | | | | 1,545,779 | |
| | |
China Resources Beer Holdings Co., Ltd. | | | 212,000 | | | | 1,395,911 | |
| | |
BeiGene, Ltd. ADRb | | | 7,656 | | | | 1,365,065 | |
| | |
Kuaishou Technologyb,c,d | | | 195,700 | | | | 1,337,281 | |
| | |
Innovent Biologics, Inc.b,c,d | | | 290,500 | | | | 1,097,262 | |
| | |
Legend Biotech Corp. ADRb | | | 14,582 | | | | 1,006,595 | |
| | | | | | | | |
Total China/Hong Kong | | | | | | | 45,657,843 | |
| | | | | | | | |
| | | | | | | | |
| | | |
| INDIA: 18.1% | | | | | | | | |
HDFC Bank, Ltd. | | | 278,885 | | | | 5,783,967 | |
| | |
ICICI Bank, Ltd. | | | 357,618 | | | | 4,074,172 | |
| | |
Bajaj Finance, Ltd. | | | 41,912 | | | | 3,658,323 | |
| | |
Reliance Industries, Ltd. | | | 91,582 | | | | 2,846,997 | |
| | |
Mahindra & Mahindra, Ltd. | | | 153,185 | | | | 2,714,284 | |
| | |
Titan Co., Ltd. | | | 59,487 | | | | 2,209,944 | |
| | |
Indian Hotels Co., Ltd. | | | 348,116 | | | | 1,665,551 | |
| | |
Ashok Leyland, Ltd. | | | 756,971 | | | | 1,544,646 | |
| | | | | | | | |
Total India | | | | | | | 24,497,884 | |
| | | | | | | | |
| | | | | | | | |
| | | |
| SOUTH KOREA: 10.3% | | | | | | | | |
Samsung Electronics Co., Ltd. | | | 154,272 | | | | 8,453,260 | |
| | |
Samsung SDI Co., Ltd. | | | 4,043 | | | | 2,052,720 | |
| | |
Kia Corp. | | | 26,181 | | | | 1,758,448 | |
| | |
Orion Corp. | | | 18,022 | | | | 1,641,286 | |
| | | | | | | | |
Total South Korea | | | | | | | 13,905,714 | |
| | | | | | | | |
| | | | | | | | |
| | | |
| TAIWAN: 9.5% | | | | | | | | |
Taiwan Semiconductor Manufacturing Co., Ltd. | | | 585,000 | | | | 10,819,246 | |
| | |
Alchip Technologies, Ltd. | | | 36,000 | | | | 2,074,844 | |
| | | | | | | | |
Total Taiwan | | | | | | | 12,894,090 | |
| | | | | | | | |
| | | | | | | | |
| | | |
| UNITED STATES: 9.1% | | | | | | | | |
NVIDIA Corp. | | | 10,349 | | | | 4,377,834 | |
| | |
Netflix, Inc.b | | | 6,025 | | | | 2,653,952 | |
| | |
Visa, Inc. Class A | | | 9,392 | | | | 2,230,412 | |
| | |
Monolithic Power Systems, Inc. | | | 3,016 | | | | 1,629,334 | |
| | |
Lululemon Athletica, Inc.b | | | 3,598 | | | | 1,361,843 | |
| | | | | | | | |
Total United States | | | | | | | 12,253,375 | |
| | | | | | | | |
| | | | | | | | |
| | | |
| JAPAN: 3.5% | | | | | | | | |
Keyence Corp. | | | 4,000 | | | | 1,877,746 | |
| | |
Allegro MicroSystems, Inc.b | | | 32,107 | | | | 1,449,310 | |
| | |
Asahi Intecc Co., Ltd. | | | 73,400 | | | | 1,427,525 | |
| | | | | | | | |
Total Japan | | | | | | | 4,754,581 | |
| | | | | | | | |
| | | | | | | | |
| | | | | | | | |
| | | Shares | | | Value | |
| | |
| NETHERLANDS: 3.0% | | | | | | | | |
ASML Holding NV | | | 5,614 | | | | $4,068,747 | |
| | | | | | | | |
Total Netherlands | | | | | | | 4,068,747 | |
| | | | | | | | |
| | | | | | | | |
| | | |
| INDONESIA: 2.7% | | | | | | | | |
PT Bank Rakyat Indonesia Persero Tbk | | | 4,353,100 | | | | 1,575,159 | |
| | |
PT Indofood CBP Sukses Makmur Tbk | | | 2,030,500 | | | | 1,533,794 | |
| | |
PT Astra International Tbk | | | 1,280,000 | | | | 578,423 | |
| | | | | | | | |
Total Indonesia | | | | | | | 3,687,376 | |
| | | | | | | | |
| | | | | | | | |
| | | |
| FRANCE: 2.0% | | | | | | | | |
LVMH Moet Hennessy Louis Vuitton SE | | | 2,843 | | | | 2,676,779 | |
| | | | | | | | |
Total France | | | | | | | 2,676,779 | |
| | | | | | | | |
| | | | | | | | |
| | | |
| SINGAPORE: 1.9% | | | | | | | | |
Sea, Ltd. ADRb | | | 45,034 | | | | 2,613,773 | |
| | | | | | | | |
Total Singapore | | | | | | | 2,613,773 | |
| | | | | | | | |
| | | | | | | | |
| | | |
| BRAZIL: 1.2% | | | | | | | | |
MercadoLibre, Inc.b | | | 1,392 | | | | 1,648,963 | |
| | | | | | | | |
Total Brazil | | | | | | | 1,648,963 | |
| | | | | | | | |
| | | | | | | | |
| | | |
| VIETNAM: 1.2% | | | | | | | | |
Mobile World Investment Corp. | | | 837,800 | | | | 1,538,128 | |
| | | | | | | | |
Total Vietnam | | | | | | | 1,538,128 | |
| | | | | | | | |
| | | | | | | | |
| | | |
| TOTAL COMMON EQUITIES | | | | | | | 130,197,253 | |
| | | | | | | | |
(Cost $121,988,712) | | | | | | | | |
| | | | | | | | |
| | |
PREFERRED EQUITIES: 0.7% | | | | | | | | |
| | | |
| SOUTH KOREA: 0.7% | | | | | | | | |
Samsung Electronics Co., Ltd., Pfd. | | | 21,930 | | | | 990,274 | |
| | | | | | | | |
Total South Korea | | | | | | | 990,274 | |
| | | | | | | | |
| | | | | | | | |
| | | |
| TOTAL PREFERRED EQUITIES | | | | | | | 990,274 | |
| | | | | | | | |
(Cost $1,004,337) | | | | | | | | |
| | | | | | | | |
| | |
SHORT-TERM INVESTMENTS: 1.5% | | | | | | | | |
| | | | | | | | |
| | | |
| MONEY MARKET FUNDS: 1.5% | | | | | | | | |
JPMorgan U.S. Government Money Market Fund, Capital Shares, 5.01%e | | | 2,052,458 | | | | 2,052,458 | |
| | | | | | | | |
| | |
(Cost $2,052,458) | | | | | | | | |
| | | |
| TOTAL INVESTMENTS: 98.4% | | | | | | | 133,239,985 | |
(Cost $125,045,507) | | | | | | | | |
| | | | | | | | |
| | |
CASH AND OTHER ASSETS,
LESS LIABILITIES: 1.6% | | | | | | | 2,179,065 | |
| | | | | | | | |
| | |
NET ASSETS: 100.0% | | | | | | | $135,419,050 | |
| | | | | | | | |
| | | | | | | | |
| | | | matthewsasia.com | 833.228.5605 | | | 13 | |
Matthews Asia Innovators Active ETF
June 30, 2023
Schedule of Investmentsa (unaudited) (continued)
COMMON EQUITIES (continued)
| a | Certain securities were fair valued under the valuation policies approved by the Board of Trustees (Note 2-A). |
| b | Non-income producing security. |
| c | Security exempt from registration under Rule 144A of the Securities Act of 1933, as amended. The security may be resold in transactions exempt from registration normally to qualified institutional buyers. The security has been determined to be liquid in accordance with procedures adopted by the Funds’ Board of Trustees. At June 30, 2023, the aggregate value is $6,352,026, which is 4.69% of net assets. |
| d | The securities may be resold to qualified foreign investors and foreign institutional buyers under Regulation S of the Securities Act of 1933. |
| e | Rate shown is the current yield as of June 30, 2023. |
| ADR | American Depositary Receipt |
See accompanying notes to financial statements.
| | | | | | |
| 14 | | Matthews Asia Innovators Active ETF | | | | |
| | | | |
| PORTFOLIO MANAGERS |
| |
| Andrew Mattock, CFA | | |
Lead Manager | | |
| | |
| Winnie Chwang | | Sherwood Zhang, CFA | | |
Co-Manager | | Co-Manager |
| | | | |
| | |
| FUND FACTS | | | | |
| | |
| Ticker | | | | MCH |
CUSIP | | | | 577125834 |
Inception Date | | | | 07/13/22 |
Gross Expense Ratio | | | | 0.79% |
# of Positions | | | | 48 |
Net Assets | | | | $29.9 million |
Portfolio Turnover | | | | 12.5% |
Weight Average Market Cap | | | | $97.4 billion |
Benchmark | | |
MSCI China Index |
MSCI China All Shares Index |
OBJECTIVE
Long-term capital appreciation.
STRATEGY
Under normal circumstances, the Fund seeks to achieve its investment objective by investing at least 80% of its net assets, which include borrowings for investment purposes, in the common and preferred stocks of companies located in China. China includes its administrative and other districts, such as Hong Kong.
| 2 | Holdings may combine more than one security from same issuer and related depositary receipts. |
| 3 | Not all countries where the Fund may invest are included in the benchmark index. |
| 4 | Source: FactSet Research Systems. Percentage values in data are rounded to the nearest tenth of one percent, so the values may not sum to 100% due to rounding. Country allocations and percentage values may be derived from different data sources and may not be consistent with other Fund literature. |
Matthews China Active ETF (unaudited)
| | | | | | | | | | | | | | | | | | | | |
| |
| PERFORMANCE AS OF JUNE 30, 2023 | |
| | | | | | | | | | | | Actual Return,
Not Annualized | |
| | | 3 Months | | | YTD | | | 1 Year | | | Since
Inception | | | Inception
date | |
| China Active ETF (NAV) | | | -13.80% | | | | -13.73% | | | | n.a. | | | | -17.04% | | | | 07/13/22 | |
| China Active ETF (market price) | | | -13.25% | | | | -13.57% | | | | n.a. | | | | -16.44% | | | | | |
| MSCI China Index1 | | | -9.65% | | | | -5.39% | | | | n.a. | | | | -12.59% | | | | | |
| MSCI China All Shares Index1 | | | -9.79% | | | | -5.27% | | | | n.a. | | | | -14.24% | | | | | |
| | 1 | It is not possible to invest directly in an index. Source: Index data from Morgan Stanley Capital International and Bloomberg; total return calculations performed by BNY Mellon Investment Servicing (US) Inc. Please see page 18 for index definition. |
Performance assumes reinvestment of all dividends and/or distributions before taxes. All performance quoted represents past performance and is no guarantee of future results. Investment return and principal value will fluctuate with market conditions so that when sold, shares may be worth more or less than their original cost. For the Fund’s most recent month-end performance visit matthewsasia.com.
| | | | | | |
| | | |
| TOP TEN HOLDINGS2 | | | | | |
| Name | | Country | | % Net Assets | |
| Alibaba Group Holding, Ltd. | | Consumer Discretionary | | | 8.0% | |
| Tencent Holdings, Ltd. | | Communication Services | | | 7.8% | |
| PDD Holdings, Inc. ADR | | Consumer Discretionary | | | 5.3% | |
| Meituan B Shares | | Consumer Discretionary | | | 5.3% | |
| JD.com, Inc. Class A | | Consumer Discretionary | | | 4.6% | |
| China Merchants Bank Co., Ltd. A Shares | | Financials | | | 4.4% | |
| CITIC Securities Co., Ltd. H Shares | | Financials | | | 3.7% | |
| China International Capital Corp., Ltd. H Shares | | Financials | | | 3.6% | |
| KE Holdings, Inc. ADR | | Real Estate | | | 3.4% | |
| Contemporary Amperex Technology Co., Ltd. A Shares | | Industrials | | | 2.9% | |
| Total | | | | | 49.0% | |
| | | | |
| |
| COUNTRY ALLOCATION (%)3,4 | |
| China/Hong Kong | | | 98.3 | |
| Cash and Other Assets, Less Liabilities | | | 1.7 | |
| | | | |
| | |
| SECTOR ALLOCATION (%)4 | | | |
| Consumer Discretionary | | | 31.1 | |
| Financials | | | 18.6 | |
| Communication Services | | | 13.9 | |
| Industrials | | | 8.8 | |
| Real Estate | | | 6.5 | |
| Information Technology | | | 6.1 | |
| Consumer Staples | | | 5.7 | |
| Health Care | | | 4.6 | |
| Energy | | | 1.8 | |
| Utilities | | | 1.2 | |
| Cash and Other Assets, Less Liabilities | | | 1.7 | |
| | | | |
| | |
| MARKET CAP EXPOSURE��(%)4 | | | |
| Mega Cap (over $25B) | | | 59.9 | |
| Large Cap ($10B-$25B) | | | 25.7 | |
| Mid Cap ($3B-10B) | | | 7.8 | |
| Small Cap (under $3B) | | | 4.9 | |
| Cash and Other Assets, Less Liabilities | | | 1.7 | |
| | | | | | | | |
| | | | matthewsasia.com | 833.228.5605 | | | 15 | |
Matthews China Active ETF
June 30, 2023
Schedule of Investmentsa (unaudited)
COMMON EQUITIES: 98.4%
| | | | | | | | |
| | | Shares | | | Value | |
| | |
| CONSUMER DISCRETIONARY: 31.1% | | | | | | | | |
Broadline Retail: 17.9% | | | | | | | | |
| | |
Alibaba Group Holding, Ltd.b | | | 231,300 | | | | $2,396,647 | |
| | |
PDD Holdings, Inc. ADRb | | | 22,846 | | | | 1,579,572 | |
| | |
JD.com, Inc. Class A | | | 81,200 | | | | 1,371,881 | |
| | | | | | | | |
| | | | | | | 5,348,100 | |
| | | | | | | | |
| | | | | | | | |
Hotels, Restaurants & Leisure: 8.2% | | | | | | | | |
| | |
Meituan B Sharesb,c,d | | | 100,910 | | | | 1,574,828 | |
| | |
Galaxy Entertainment Group, Ltd.b | | | 82,000 | | | | 520,047 | |
| | |
H World Group, Ltd. ADRb | | | 9,090 | | | | 352,510 | |
| | | | | | | | |
| | | | | | | 2,447,385 | |
| | | | | | | | |
| | | | | | | | |
Household Durables: 1.7% | | | | | | | | |
| | |
Man Wah Holdings, Ltd. | | | 550,000 | | | | 367,060 | |
| | |
Midea Group Co., Ltd. A Shares | | | 18,800 | | | | 152,265 | |
| | | | | | | | |
| | | | | | | 519,325 | |
| | | | | | | | |
| | | | | | | | |
Automobiles: 1.5% | | | | | | | | |
| | |
Yadea Group Holdings, Ltd.c,d | | | 196,000 | | | | 445,693 | |
| | | | | | | | |
| | | | | | | | |
Diversified Consumer Services: 1.0% | | | | | | | | |
| | |
China Education Group Holdings, Ltd.d | | | 367,000 | | | | 285,672 | |
| | | | | | | | |
| | | | | | | | |
Specialty Retail: 0.8% | | | | | | | | |
China Tourism Group Duty Free Corp., Ltd. A Shares | | | 16,300 | | | | 247,655 | |
| | | | | | | | |
Total Consumer Discretionary | | | | | | | 9,293,830 | |
| | | | | | | | |
| | | | | | | | |
| | | |
| FINANCIALS: 18.6% | | | | | | | | |
Capital Markets: 9.1% | | | | | | | | |
| | |
CITIC Securities Co., Ltd. H Shares | | | 613,000 | | | | 1,110,762 | |
China International Capital Corp., Ltd. H
Sharesc,d | | | 609,600 | | | | 1,068,819 | |
| | |
Hong Kong Exchanges & Clearing, Ltd. | | | 7,800 | | | | 293,821 | |
| | |
East Money Information Co., Ltd. A Shares | | | 122,640 | | | | 239,387 | |
| | | | | | | | |
| | | | | | | 2,712,789 | |
| | | | | | | | |
| | | | | | | | |
Banks: 6.9% | | | | | | | | |
| | |
China Merchants Bank Co., Ltd. A Shares | | | 290,800 | | | | 1,309,535 | |
| | |
China Construction Bank Corp. H Shares | | | 1,171,000 | | | | 757,595 | |
| | | | | | | | |
| | | | | | | 2,067,130 | |
| | | | | | | | |
| | | | | | | | |
Insurance: 2.6% | | | | | | | | |
| | |
PICC Property & Casualty Co., Ltd. H Shares | | | 428,000 | | | | 475,701 | |
Ping An Insurance Group Co. of China, Ltd. H
Shares | | | 46,500 | | | | 295,795 | |
| | | | | | | | |
| | | | | | | 771,496 | |
| | | | | | | | |
Total Financials | | | | | | | 5,551,415 | |
| | | | | | | | |
| | | | | | | | |
| | | |
| COMMUNICATION SERVICES: 13.9% | | | | | | | | |
Interactive Media & Services: 9.4% | | | | | | | | |
| | |
Tencent Holdings, Ltd. | | | 54,800 | | | | 2,318,822 | |
| | |
Kuaishou Technologyb,c,d | | | 71,600 | | | | 489,266 | |
| | | | | | | | |
| | | | | | | 2,808,088 | |
| | | | | | | | |
| | | | | | | | |
| | | | | | | | |
| | | Shares | | | Value | |
Media: 2.9% | | | | | | | | |
Focus Media Information Technology Co., Ltd. A Shares | | | 657,811 | | | | 615,782 | |
| | |
Three’s Co Media Group Co., Ltd. A Shares | | | 21,895 | | | | $258,654 | |
| | | | | | | | |
| | | | | | | 874,436 | |
| | | | | | | | |
| | | | | | | | |
Entertainment: 1.6% | | | | | | | | |
| | |
Tencent Music Entertainment Group ADRb | | | 43,695 | | | | 322,469 | |
| | |
Bilibili, Inc. ADRb | | | 9,920 | | | | 149,792 | |
| | | | | | | 472,261 | |
| | | | | | | | |
Total Communication Services | | | | | | | 4,154,785 | |
| | | | | | | | |
| | | | | | | | |
| | | |
| INDUSTRIALS: 8.8% | | | | | | | | |
Electrical Equipment: 4.9% | | | | | | | | |
Contemporary Amperex Technology Co., Ltd. A
Shares | | | 27,900 | | | | 877,445 | |
| | |
Sungrow Power Supply Co., Ltd. A Shares | | | 36,300 | | | | 581,964 | |
| | | | | | | | |
| | | | | | | 1,459,409 | |
| | | | | | | | |
| | | | | | | | |
Machinery: 2.6% | | | | | | | | |
Shenzhen Inovance Technology Co., Ltd. A Shares | | | 50,400 | | | | 444,848 | |
| | |
Estun Automation Co., Ltd. A Shares | | | 86,600 | | | | 333,315 | |
| | | | | | | | |
| | | | | | | 778,163 | |
| | | | | | | | |
| | | | | | | | |
Transportation Infrastructure: 1.3% | | | | | | | | |
Shanghai International Airport Co., Ltd. A Sharesb | | | 62,552 | | | | 390,542 | |
| | | | | | | | |
Total Industrials | | | | | | | 2,628,114 | |
| | | | | | | | |
| | | | | | | | |
| | | |
| REAL ESTATE: 6.5% | | | | | | | | |
Real Estate Management & Development: 6.5% | | | | | | | | |
| | |
KE Holdings, Inc. ADRb | | | 69,011 | | | | 1,024,813 | |
| | |
Country Garden Services Holdings Co., Ltd. | | | 284,000 | | | | 366,751 | |
| | |
CIFI Holdings Group Co., Ltd.e | | | 4,668,000 | | | | 348,346 | |
| | |
Times China Holdings, Ltd.b | | | 2,255,000 | | | | 204,304 | |
| | | | | | | | |
Total Real Estate | | | | | | | 1,944,214 | |
| | | | | | | | |
| | | | | | | | |
| | | |
| INFORMATION TECHNOLOGY: 6.1% | | | | | | | | |
Electronic Equipment, Instruments & Components: 2.4% | | | | | | | | |
| | |
Zhejiang Supcon Technology Co., Ltd. A Shares | | | 49,817 | | | | 429,911 | |
| | |
Wingtech Technology Co., Ltd. A Shares | | | 43,200 | | | | 290,383 | |
| | | | | | | | |
| | | | | | | 720,294 | |
| | | | | | | | |
| | | | | | | | |
Semiconductors & Semiconductor Equipment: 2.1% | | | | | |
| | |
NAURA Technology Group Co., Ltd. A Shares | | | 7,387 | | | | 322,549 | |
Zhejiang Jingsheng Mechanical & Electrical Co., Ltd. A Shares | | | 31,603 | | | | 308,002 | |
| | | | | | | | |
| | | | | | | 630,551 | |
| | | | | | | | |
| | | | | | | | |
Software: 1.6% | | | | | | | | |
| | |
Shanghai Baosight Software Co., Ltd. A Shares | | | 68,256 | | | | 476,726 | |
| | | | | | | | |
Total Information Technology | | | | | | | 1,827,571 | |
| | | | | | | | |
| | | | | | | | |
| | |
| CONSUMER STAPLES: 5.7% | | | | | | | | |
Beverages: 4.1% | | | | | | | | |
| | |
Wuliangye Yibin Co., Ltd. A Shares | | | 23,200 | | | | 521,640 | |
| | |
Tsingtao Brewery Co., Ltd. H Shares | | | 46,000 | | | | 417,936 | |
Shanxi Xinghuacun Fen Wine Factory Co., Ltd. A Shares | | | 11,600 | | | | 295,102 | |
| | | | | | | | |
| | | | | | | 1,234,678 | |
| | | | | | | | |
| | | | | | | | |
| | | | | | |
| 16 | | Matthews China Active ETF | | | | |
Matthews China Active ETF
June 30, 2023
Schedule of Investmentsa (unaudited) (continued)
COMMON EQUITIES (continued)
| | | | | | | | |
| | | Shares | | | Value | |
Consumer Staples Distribution & Retail: 1.6% | | | | | | | | |
JD Health International, Inc.b,c,d | | | 73,200 | | | | $461,902 | |
| | | | | | | | |
Total Consumer Staples | | | | | | | 1,696,580 | |
| | | | | | | | |
| | | | | | | | |
| | | |
| HEALTH CARE: 4.6% | | | | | | | | |
Health Care Equipment & Supplies: 1.8% | | | | | | | | |
Shenzhen Mindray Bio-Medical Electronics Co., Ltd. A Shares | | | 13,000 | | | | 535,740 | |
| | | | | | | | |
| | | | | | | | |
Life Sciences Tools & Services: 1.7% | | | | | | | | |
Wuxi Biologics Cayman, Inc.b,c,d | | | 108,000 | | | | 517,495 | |
| | | | | | | | |
| | | | | | | | |
Health Care Providers & Services: 1.1% | | | | | | | | |
Sinopharm Group Co., Ltd. H Shares | | | 104,000 | | | | 325,141 | |
| | | | | | | | |
Total Health Care | | | | | | | 1,378,376 | |
| | | | | | | | |
| | | | | | | | |
| | | |
| ENERGY: 1.9% | | | | | | | | |
Oil, Gas & Consumable Fuels: 1.9% | | | | | | | | |
PetroChina Co., Ltd. H Shares | | | 786,000 | | | | 543,618 | |
| | | | | | | | |
Total Energy | | | | | | | 543,618 | |
| | | | | | | | |
| | | | | | | | |
| | | |
| UTILITIES: 1.2% | | | | | | | | |
Gas Utilities: 1.2% | | | | | | | | |
ENN Energy Holdings, Ltd. | | | 28,700 | | | | 357,441 | |
| | | | | | | | |
Total Utilities | | | | | | | 357,441 | |
| | | | | | | | |
| | | | | | | | |
| | | |
| TOTAL COMMON EQUITIES | | | | | | | 29,375,944 | |
| | | | | | | | |
(Cost $35,621,036) | | | | | | | | |
| | | | | | | | |
| | |
SHORT-TERM INVESTMENTS: 1.3% | | | | | | | | |
| | | |
| MONEY MARKET FUNDS: 1.3% | | | | | | | | |
JPMorgan U.S. Government Money Market
Fund, Capital Shares, 5.01%f | | | 395,006 | | | | 395,006 | |
| | | | | | | | |
(Cost $395,006) | | | | | | | | |
| | | | | | | | |
| | | |
| TOTAL INVESTMENTS: 99.7% | | | | | | | 29,770,950 | |
(Cost $36,016,042) | | | | | | | | |
| | | | | | | | |
| | |
CASH AND OTHER ASSETS,
LESS LIABILITIES: 0.3% | | | | | | | 100,972 | |
| | | | | | | | |
| | |
NET ASSETS: 100.0% | | | | | | | $29,871,922 | |
| | | | | | | | |
| a | Certain securities were fair valued under the valuation policies approved by the Board of Trustees (Note 2-A). |
| b | Non-income producing security. |
| c | Security exempt from registration under Rule 144A of the Securities Act of 1933, as amended. The security may be resold in transactions exempt from registration normally to qualified institutional buyers. The security has been determined to be liquid in accordance with procedures adopted by the Funds’ Board of Trustees. At June 30, 2023, the aggregate value is $4,558,003, which is 15.26% of net assets. |
| d | The securities may be resold to qualified foreign investors and foreign institutional buyers under Regulation S of the Securities Act of 1933. |
| e | Security is valued using significant unobservable inputs and is classified as Level 3 in the fair value hierarchy. The aggregate value of Level 3 security is $348,346 and 1.17% of net assets. |
| f | Rate shown is the current yield as of June 30, 2023. |
| ADR | American Depositary Receipt |
See accompanying notes to financial statements.
| | | | | | | | |
| | | | matthewsasia.com | 833.228.5605 | | | 17 | |
Index Definitions
The MSCI Emerging Markets Index is a free float-adjusted market capitalization-weighted index of the stock markets of Brazil, Chile, China, Colombia, Czech Republic, Egypt, Greece, Hungary, India, Indonesia, Kuwait, Malaysia, Mexico, Peru, Philippines, Poland, Qatar, Saudi Arabia, South Africa, South Korea, Taiwan, Thailand, Turkey and United Arab Emirates.
The MSCI All Country Asia ex Japan Index is a free float–adjusted market capitalization-weighted index of the stock markets of China, Hong Kong, India, Indonesia, Malaysia, Philippines, Singapore, South Korea, Taiwan and Thailand.
The MSCI China Index is a free float–adjusted market capitalization-weighted index of Chinese equities that includes H
shares listed on the Hong Kong exchange, B shares listed on the Shanghai and Shenzhen ex-exchanges, and Hong Kong-listed securities known as Red Chips (issued by entities owned by national or local governments in China) and P Chips (issued by companies controlled by individuals in China and deriving substantial revenues in China), and foreign listings (e.g., ADRs).
The MSCI China All Shares Index captures large and mid-cap representation across China A shares, B shares, H shares, Red Chips (issued by entities owned by national or local governments in China), P Chips (issued by companies controlled by individuals in China and deriving substantial revenues in China), and foreign listings (e.g., ADRs). The index aims to reflect the opportunity set of China share classes listed in Hong Kong, Shanghai, Shenzhen and outside of China.
Disclosures
Fund Holdings: The Fund holdings shown in this report are as of June 30, 2023. Holdings are subject to change at any time, so holdings shown in this report may not reflect current Fund holdings. The Funds file complete schedules of portfolio holdings with the Securities and Exchange Commission (the “SEC”) for the first and third quarters of each fiscal year on Form N-PORT. The Funds’ Form N-PORTs are available on the SEC’s website at www.sec.gov. Complete schedules of investments are also available without charge, upon request, from the Funds by calling us at 833.228.5605.
Proxy Voting Record: The Funds’ Statement of Additional Information containing a description of the policies and procedures that the Funds have used to vote proxies relating to portfolio securities, along with each Fund’s proxy voting record relating
to portfolio securities held during the most recent 12-month period ended June 30, is available upon request, at no charge, at the Funds’ website at matthewsasia.com or by calling 833.228.5605, or on the SEC’s website at www.sec.gov.
Shareholder Reports and Prospectuses: To reduce the Funds’ expenses, we try to identify related shareholders in a household and send only one copy of the Funds’ prospectus and financial reports to that address. This process, called “householding,” will continue indefinitely unless you instruct us otherwise. At any time you may view the Funds’ current prospectus, summary prospectus and financial reports on our website. If you prefer to receive individual copies of the Funds’ prospectus or financial reports, please call us at 833.228.5605.
Disclosure of Fund Expenses (unaudited)
We believe it is important for you to understand the impact of fees regarding your investment. All ETFs have operating expenses. As a shareholder of an ETF, you incur ongoing costs, which include costs for portfolio management, administrative services, and shareholder reports (like this one), among others. Operating expenses, which are deducted from a fund’s gross income, directly reduce the investment return of the fund. A fund’s operating expenses are expressed as a percentage of its average net assets. This figure is known as the expense ratio. The following examples are intended to help you understand the ongoing fees (in dollars) of investing in your fund and to compare these costs with those of other ETFs. The examples are based on an investment of $1,000 made at the beginning of the period shown and held for the entire period.
This table illustrates your fund’s costs in two ways:
Actual Fund Return: This section helps you to estimate the actual operating expenses, after any applicable fee waivers, that you paid over the period. The “Ending Account Value” shown is derived from the fund’s actual return for the past six month period, the “Expense Ratio” column shows the period’s annualized expense ratio, and the “Operating Expenses Paid During Period” column shows the dollar amount that would have been paid by an investor who started with $1,000 in the fund at the beginning of the period. You may use the information here, together with your account value, to estimate the expenses that you paid over the period. To do so, simply divide your account value by $1,000 (for example, an
$8,600 account value divided by $1,000 = 8.6), then multiply the result by the number given for your fund in the first line under the heading entitled “Operating Expenses Paid During Period.”
Hypothetical 5% Return: This section is intended to help you compare your fund’s costs with those of other ETFs. It assumes that the fund had an annual return of 5% before operating expenses, but that the expense ratio is unchanged. In this case, because the return used is not the fund’s actual return, the results do not apply to your investment. This example is useful in making comparisons to other ETFs because the Securities and Exchange Commission requires all registered funds to calculate expenses based on an assumed 5% annual return. You can assess your fund’s costs by comparing this hypothetical example with the hypothetical examples that appear in shareholder reports of other funds.
Please note that the operating expenses shown in the table are meant to highlight and help you compare your ongoing costs only and do not reflect any transactional costs. You may pay brokerage commissions on your purchases and sales of fund shares, which are not reflected in the table.
Matthews Asia Funds does not charge any sales loads, exchange fees, or 12b-1 fees, but these may be present in other funds to which you compare this data. Therefore, the hypothetical portions of the table are useful in comparing ongoing costs only, and will not help you determine the relative total costs of owning different funds.
| | | | | | | | |
| | | | matthewsasia.com | 833.228.5605 | | | 19 | |
June 30, 2023
Disclosure of Fund Expenses (unaudited) (continued)
| | | | | | | | | | | | | | | | |
| | | | |
| | | Beginning
Account
Value
1/1/23 | | | Ending
Account
Value
6/30/23 | | | Expense
Ratio | | | Operating
Expenses
Paid During
Period
1/1/23–
6/30/23 | |
| | | | | | | | | | | | | | | | | |
Matthews Emerging Markets Equity Active ETF | | | | | | | | | | | | | | | | |
Actual Fund Return | | | $1,000.00 | | | | $1,054.10 | | | | 0.79% | | | | $4.02 | |
Hypothetical 5% Returns | | | $1,000.00 | | | | $1,020.88 | | | | 0.79% | | | | $3.96 | |
Matthews Emerging Markets ex China Active ETF1,2 | | | | | | | | | | | | | | | | |
Actual Fund Return | | | $1,000.00 | | | | $1,070.80 | | | | 0.79% | | | | $4.06 | |
Hypothetical 5% Returns | | | $1,000.00 | | | | $1,020.88 | | | | 0.79% | | | | $3.96 | |
Matthews Asia Innovators Active ETF | | | | | | | | | | | | | | | | |
Actual Fund Return | | | $1,000.00 | | | | $976.50 | | | | 0.79% | | | | $3.87 | |
Hypothetical 5% Returns | | | $1,000.00 | | | | $1,020.88 | | | | 0.79% | | | | $3.96 | |
Matthews China Active ETF | | | | | | | | | | | | | | | | |
Actual Fund Return | | | $1,000.00 | | | | $864.30 | | | | 0.79% | | | | $3.65 | |
Hypothetical 5% Returns | | | $1,000.00 | | | | $1,020.88 | | | | 0.79% | | | | $3.96 | |
| 1 | Annualized from Fund’s inception, January 10, 2023. |
| 2 | The Fund commenced operations on January 10, 2023. Operating expenses are equal to the Fund’s annualized expense ratio multiplied by the average account value over the period, multiplied by 171 days, then divided by 365. The hypothetical expense example is based on the half-year period beginning January 1, 2023, as required by the SEC. |
Statements of Assets and Liabilities (unaudited)
June 30, 2023
| | | | | | | | | | | | | | | | |
| | | Matthews Emerging
Markets Equity
Active ETF | | | Matthews Emerging
Markets ex China
Active ETF | | | Matthews Asia
Innovators Active ETF | | | Matthews China
Active ETF | |
| | | | |
ASSETS: | | | | | | | | | | | | | | | | |
| | | | |
Investments at value (A) (Note 2-A): | | | | | | | | | | | | | | | | |
| | | | |
Unaffiliated issuers | | | $56,694,067 | | | | $5,271,446 | | | | $133,239,985 | | | | $29,770,950 | |
| | | | |
Cash | | | 1,584,562 | | | | 22,891 | | | | 290,907 | | | | 4,142 | |
| | | | |
Segregated foreign currency at value | | | 80,028 | | | | — | | | | 37,214 | | | | 47 | |
| | | | |
Foreign currency at value (B) | | | 28 | | | | 3 | | | | 966,078 | | | | — | |
| | | | |
Dividends and interest receivable | | | 81,715 | | | | 9,096 | | | | 183,598 | | | | 120,839 | |
| | | | |
Receivable for securities sold | | | 129,074 | | | | 13,131 | | | | 7,698,285 | | | | — | |
| | | | |
Other receivable | | | 449 | | | | — | | | | 370 | | | | — | |
TOTAL ASSETS | | | 58,569,923 | | | | 5,316,567 | | | | 142,416,437 | | | | 29,895,978 | |
| | | | |
LIABILITIES: | | | | | | | | | | | | | | | | |
| | | | |
Payable for securities purchased | | | 1,043,245 | | | | 4,899 | | | | 6,852,306 | | | | 4,118 | |
| | | | |
Deferred foreign capital gains tax liability (Note 2-C) | | | 29,138 | | | | 6,341 | | | | 56,510 | | | | — | |
| | | | |
Due to Advisor (Note 4) | | | 35,692 | | | | 3,200 | | | | 88,571 | | | | 19,938 | |
TOTAL LIABILITIES | | | 1,108,075 | | | | 14,440 | | | | 6,997,387 | | | | 24,056 | |
| | | | |
NET ASSETS | | | $57,461,848 | | | | $5,302,127 | | | | $135,419,050 | | | | $29,871,922 | |
| | | | |
SHARES OUTSTANDING: | | | | | | | | | | | | | | | | |
| | | | |
(shares of beneficial interest issued and outstanding, respectively, unlimited number of shares authorized with a $0.001 par value) | | | 2,080,000 | | | | 200,000 | | | | 5,750,000 | | | | 1,440,000 | |
| | | | |
Net asset value, offering price and redemption price | | | 27.63 | | | | 26.51 | | | | 23.55 | | | | 20.74 | |
| | | | |
NET ASSETS CONSISTS OF: | | | | | | | | | | | | | | | | |
| | | | |
Capital paid-in | | | $56,884,532 | | | | $5,049,714 | | | | $140,979,727 | | | | $37,066,091 | |
| | | | |
Total distributable earnings/(accumulated loss) | | | 577,316 | | | | 252,413 | | | | (5,560,677 | ) | | | (7,194,169 | ) |
| | | | |
NET ASSETS | | | $57,461,848 | | | | $5,302,127 | | | | $135,419,050 | | | | $29,871,922 | |
| | | | |
(A) Investments at cost: Unaffiliated Issuers | | | $55,685,780 | | | | $5,000,340 | | | | $125,045,507 | | | | $36,016,042 | |
| | | | |
(B) Foreign Currency at Cost | | | $28 | | | | $3 | | | | $966,078 | | | | $— | |
See accompanying notes to financial statements.
| | | | | | | | |
| | | | matthewsasia.com | 833.228.5605 | | | 21 | |
Statements of Operations (unaudited)
Period Ended June 30, 2023
| | | | | | | | | | | | | | | | |
| | | Matthews Emerging
Markets Equity
Active ETF | | | Matthews Emerging
Markets ex China
Active ETF | | | Matthews Asia
Innovators
Active ETF | | | Matthews China
Active ETF | |
| | | | |
INVESTMENT INCOME: | | | | | | | | | | | | | | | | |
| | | | |
Dividends—Unaffiliated Issuers | | | $489,399 | | | | $54,695 | | | | $702,612 | | | | $268,084 | |
| | | | |
Interest | | | 10,289 | | | | 886 | | | | 58,927 | | | | 16,381 | |
| | | | |
Foreign withholding tax | | | (39,414 | ) | | | (4,882 | ) | | | (88,543 | ) | | | (16,042 | ) |
TOTAL INVESTMENT INCOME | | | 460,274 | | | | 50,699 | | | | 672,996 | | | | 268,423 | |
| | | | |
EXPENSES: | | | | | | | | | | | | | | | | |
| | | | |
Investment advisory fees (Note 4) | | | 119,015 | | | | 13,757 | | | | 522,775 | | | | 124,453 | |
| | | | |
NET INVESTMENT INCOME (LOSS) | | | 341,259 | | | | 36,942 | | | | 150,221 | | | | 143,970 | |
| | | | |
| REALIZED AND UNREALIZED GAIN (LOSS) ON INVESTMENTS, FOREIGN CURRENCY RELATED TRANSACTIONS, AND FOREIGN CAPITAL GAINS TAXES: | | | | | | | | | | | | | | | | |
| | | | |
Net realized gain (loss) on investments—Unaffiliated Issuers | | | (912,571 | ) | | | (44,292 | ) | | | (12,333,495 | ) | | | (1,039,498 | ) |
| | | | |
Net realized gain (loss) on in-kind redemptions—Unaffiliated Issuers | | | 229,519 | | | | — | | | | — | | | | — | |
| | | | |
Net realized gain (loss) on foreign currency related transactions | | | (15,750 | ) | | | (5,020 | ) | | | (141,854 | ) | | | (6,116 | ) |
| | | | |
Net change in unrealized appreciation/depreciation on investments—Unaffiliated Issuers | | | 984,319 | | | | 271,106 | | | | 5,900,912 | | | | (6,691,096 | ) |
| | | | |
Net change in deferred foreign capital gains taxes on unrealized appreciation/depreciation | | | (28,965 | ) | | | (6,341 | ) | | | (60,495 | ) | | | — | |
| | | | |
Net change in unrealized appreciation/depreciation on foreign currency related translations | | | (465 | ) | | | 18 | | | | 1,750 | | | | (775 | ) |
Net realized and unrealized gain (loss) on investments, foreign currency related transactions, and foreign capital gains taxes | | | 256,087 | | | | 215,471 | | | | (6,633,182 | ) | | | (7,737,485 | ) |
| | | | |
NET INCREASE (DECREASE) IN NET ASSETS FROM OPERATIONS | | | $597,346 | | | | $252,413 | | | | ($6,482,961 | ) | | | ($7,593,515 | ) |
See accompanying notes to financial statements.
Statements of Changes in Net Assets (unaudited)
| | | | | | | | |
| MATTHEWS EMERGING MARKETS EQUITY ACTIVE ETF | | Six-Month Period
Ended June 30, 2023
(Unaudited) | | | For the Period Ended
December 31, 20221 | |
| | |
OPERATIONS: | | | | | | | | |
| | |
Net investment income (loss) | | | $341,259 | | | | $31,792 | |
| | |
Net realized gain (loss) on investments, in-kind redemptions and foreign currency related transactions | | | (698,802 | ) | | | (47,523 | ) |
| | |
Net change in unrealized appreciation/depreciation on investments and foreign currency related translations | | | 983,854 | | | | 23,964 | |
| | |
Net change on foreign capital gains taxes on unrealized appreciation/depreciation | | | (28,965 | ) | | | (173 | ) |
| | |
Net increase (decrease) in net assets resulting from operations | | | 597,346 | | | | 8,060 | |
DISTRIBUTIONS TO SHAREHOLDERS: | | | | | | | | |
| | |
Net decrease in net assets resulting from distributions | | | — | | | | (28,090 | ) |
CAPITAL SHARE TRANSACTIONS (net) (Note 4) | | | 50,560,616 | | | | 6,323,916 | |
| | |
Total increase (decrease) in net assets | | | 51,157,962 | | | | 6,303,886 | |
NET ASSETS: | | | | | | | | |
| | |
Beginning of period | | | 6,303,886 | | | | — | |
End of period | | | $57,461,848 | | | | $6,303,886 | |
|
1 The Fund commenced operations on July 13, 2022. | |
| | | | | | | | |
| MATTHEWS EMERGING MARKETS EX CHINA ACTIVE ETF | | For the Period Ended
June 30, 20231
(Unaudited) | | | | |
| | |
OPERATIONS: | | | | | | | | |
| | |
Net investment income (loss) | | | $36,942 | | | | | |
| | |
Net realized gain (loss) on investments and foreign currency related transactions | | | (49,312 | ) | | | | |
| | |
Net change in unrealized appreciation/depreciation on investments and foreign currency related translations | | | 271,124 | | | | | |
| | |
Net change on foreign capital gains taxes on unrealized appreciation/depreciation | | | (6,341 | ) | | | | |
Net increase (decrease) in net assets resulting from operations | | | 252,413 | | | | | |
CAPITAL SHARE TRANSACTIONS (net) (Note 4) | | | 5,049,714 | | | | | |
Total increase (decrease) in net assets | | | 5,302,127 | | | | | |
NET ASSETS: | | | | | | | | |
| | |
Beginning of period | | | — | | | | | |
End of period | | | $5,302,127 | | | | | |
| |
1 The Fund commenced operations on January 10, 2023. | | | | | |
See accompanying notes to financial statements.
| | | | | | | | |
| | | | matthewsasia.com | 833.228.5605 | | | 23 | |
Statements of Changes in Net Assets (unaudited) (continued)
| | | | | | | | |
| MATTHEWS ASIA INNOVATORS ACTIVE ETF | | Six-Month Period
Ended June 30, 2023
(Unaudited) | | | For the Period Ended
December 31, 20221 | |
| | |
OPERATIONS: | | | | | | | | |
| | |
Net investment income (loss) | | | $150,221 | | | | ($34,351 | ) |
| | |
Net realized gain (loss) on investments and foreign currency related transactions | | | (12,475,349 | ) | | | (1,392,598 | ) |
| | |
Net change in unrealized appreciation/depreciation on investments and foreign currency related translations | | | 5,902,662 | | | | 2,293,574 | |
Net change on foreign capital gains taxes on unrealized appreciation/depreciation | | | (60,495 | ) | | | — | |
Net increase (decrease) in net assets resulting from operations | | | (6,482,961 | ) | | | 866,625 | |
CAPITAL SHARE TRANSACTIONS (net) (Note 4) | | | 36,462,984 | | | | 104,572,402 | |
Total increase (decrease) in net assets | | | 29,980,023 | | | | 105,439,027 | |
NET ASSETS: | | | | | | | | |
| | |
Beginning of period | | | 105,439,027 | | | | — | |
End of period | | | $135,419,050 | | | | $105,439,027 | |
|
1 The Fund commenced operations on July 13, 2022. | |
| | | | | | | | |
| MATTHEWS CHINA ACTIVE ETF | | Six-Month Period
Ended June 30, 2023
(Unaudited) | | | For the Period Ended
December 31, 20221 | |
| | |
OPERATIONS: | | | | | | | | |
| | |
Net investment income (loss) | | | $143,970 | | | | ($4,643 | ) |
| | |
Net realized gain (loss) on investments and foreign currency related transactions | | | (1,045,614 | ) | | | (47,731 | ) |
| | |
Net change in unrealized appreciation/depreciation on investments and foreign currency related translations | | | (6,691,871 | ) | | | 446,556 | |
Net increase (decrease) in net assets resulting from operations | | | (7,593,515 | ) | | | 394,182 | |
CAPITAL SHARE TRANSACTIONS (net) (Note 4) | | | 27,366,557 | | | | 9,704,698 | |
Total increase (decrease) in net assets | | | 19,773,042 | | | | 10,098,880 | |
NET ASSETS: | | | | | | | | |
| | |
Beginning of period | | | 10,098,880 | | | | — | |
End of period | | | $29,871,922 | | | | $10,098,880 | |
|
1 The Fund commenced operations on July 13, 2022. | |
See accompanying notes to financial statements.
Financial Highlights
Matthews Emerging Markets Equity Active ETF
The tables below set forth financial data for a share of beneficial interest outstanding throughout each period presented.
| | | | | | | | |
| | | Six-Month
Period Ended
June 30, 2023
(Unaudited) | | | Period Ended
Dec. 31, 20221 | |
Net Asset Value, beginning of Period | | | $26.27 | | | | $25.00 | |
INCOME (LOSS) FROM INVESTMENT OPERATIONS: | | | | | | | | |
Net investment income (loss)2 | | | 0.30 | | | | 0.23 | |
Net realized gain (loss) and unrealized appreciation/depreciation on investments, foreign currency related transactions and foreign capital gains taxes | | | 1.06 | | | | 1.18 | |
Total from investment operations | | | 1.36 | | | | 1.41 | |
LESS DISTRIBUTIONS FROM: | | | | | | | | |
Net investment income | | | — | | | | (0.14 | ) |
Net Asset Value, end of Period | | | $27.63 | | | | $26.27 | |
TOTAL RETURN | | | 5.18% | 3 | | | 5.63% | 3 |
| | |
RATIOS/SUPPLEMENTAL DATA | | | | | | | | |
Net assets, end of Period (in 000’s) | | | $57,462 | | | | $6,304 | |
Ratio of expenses to average net assets (Note 5) | | | 0.79% | 4 | | | 0.79% | 4 |
Ratio of net investment income (loss) to average net assets | | | 2.27% | 4 | | | 1.93% | 4 |
Portfolio turnover | | | 37.64% | 3 | | | 15.47% | 3 |
| 1 | The Fund commenced operations on July 13, 2022. |
| 2 | Calculated using the average daily shares method. |
See accompanying notes to financial statements.
| | | | | | | | |
| | | | matthewsasia.com | 833.228.5605 | | | 25 | |
Financial Highlights (continued)
Matthews Emerging Markets ex China Active ETF
The tables below set forth financial data for a share of beneficial interest outstanding throughout each period presented.
| | | | |
| | | Period Ended
June 30, 2023
(Unaudited)1 | |
Net Asset Value, beginning of Period | | | $25.00 | |
INCOME (LOSS) FROM INVESTMENT OPERATIONS: | | | | |
Net investment income (loss)2 | | | 0.25 | |
Net realized gain (loss) and unrealized appreciation/depreciation on investments and foreign currency related transactions | | | 1.26 | |
Total from investment operations | | | 1.51 | |
LESS DISTRIBUTIONS FROM: | | | | |
Net Asset Value, end of Period | | | $26.51 | |
TOTAL RETURN | | | 6.04% | 3 |
| |
RATIOS/SUPPLEMENTAL DATA | | | | |
Net assets, end of Period (in 000’s) | | | $5,302 | |
Ratio of expenses to average net assets (Note 5) | | | 0.79% | 4 |
Ratio of net investment income (loss) to average net assets | | | 2.12% | 4 |
Portfolio turnover | | | 15.00% | 3 |
| 1 | The Fund commenced operations on January 10, 2023. |
| 2 | Calculated using the average daily shares method. |
See accompanying notes to financial statements.
Financial Highlights (continued)
Matthews Asia Innovators Active ETF
The tables below set forth financial data for a share of beneficial interest outstanding throughout each period presented.
| | | | | | | | |
| | | Six-Month
Period Ended
June 30, 2023
(Unaudited) | | | Period Ended
Dec. 31, 20221 | |
Net Asset Value, beginning of Period | | | $24.24 | | | | $25.00 | |
INCOME (LOSS) FROM INVESTMENT OPERATIONS: | | | | | | | | |
Net investment income (loss)2 | | | 0.03 | | | | (0.04 | ) |
Net realized gain (loss) and unrealized appreciation/depreciation on investments and foreign currency related transactions | | | (0.72 | ) | | | (0 72 | ) |
Total from investment operations | | | (0.69 | ) | | | (0.76 | ) |
Net Asset Value, end of Period | | | $23.55 | | | | $24.24 | |
TOTAL RETURN | | | (2.85% | )3 | | | (3.04% | )3 |
| | |
RATIOS/SUPPLEMENTAL DATA | | | | | | | | |
Net assets, end of Period (in 000’s) | | | $135,419 | | | | $105,439 | |
Ratio of expenses to average net assets (Note 5) | | | 0.79% | 4 | | | 0.79% | 4 |
Ratio of net investment income (loss) to average net assets | | | 0.23% | 4 | | | (0.33% | )4 |
Portfolio turnover | | | 117.21% | 3 | | | 72.56% | 3 |
| 1 | The Fund commenced operations on July 13, 2022. |
| 2 | Calculated using the average daily shares method. |
See accompanying notes to financial statements.
| | | | | | | | |
| | | | matthewsasia.com | 833.228.5605 | | | 27 | |
Financial Highlights (continued)
Matthews China Active ETF
The tables below set forth financial data for a share of beneficial interest outstanding throughout each period presented.
| | | | | | | | |
| | | Six-Month
Period Ended
June 30, 2023
(Unaudited) | | | Period Ended
Dec. 31, 20221 | |
Net Asset Value, beginning of Period | | | $24.04 | | | | $25.00 | |
INCOME (LOSS) FROM INVESTMENT OPERATIONS: | | | | | | | | |
Net investment income (loss)2 | | | 0.11 | | | | (0.03 | ) |
Net realized gain (loss) and unrealized appreciation/depreciation on investments and foreign currency related transactions | | | (3.41 | ) | | | (0 93 | ) |
Total from investment operations | | | (3.30 | ) | | | (0.96 | ) |
Net Asset Value, end of Period | | | $20.74 | | | | $24.04 | |
TOTAL RETURN | | | (13.73% | )3 | | | (3.84% | )3 |
| | |
RATIOS/SUPPLEMENTAL DATA | | | | | | | | |
Net assets, end of Period (in 000’s) | | | $29,872 | | | | $10,099 | |
Ratio of expenses to average net assets (Note 5) | | | 0.79% | 4 | | | 0.79% | 4 |
Ratio of net investment income (loss) to average net assets | | | 0.91% | 4 | | | (0.24% | )4 |
Portfolio turnover | | | 36.32% | 3 | | | 12.48% | 3 |
| 1 | The Fund commenced operations on July 13, 2022. |
| 2 | Calculated using the average daily shares method. |
See accompanying notes to financial statements.
Notes to Financial Statements (unaudited)
Matthews International Funds (d/b/a Matthews Asia Funds) (the “Trust”) is an open-end management investment company registered under the Investment Company Act of 1940, as amended (the “1940 Act”). As of June 30, 2023, the Trust issued eighteen separate series of shares. This shareholder report pertains to four of those series (each a “Fund”, and collectively, the “Funds”): Matthews Emerging Markets Equity Active ETF, Matthews Emerging Markets ex China Active ETF, Matthews Innovators Active ETF and Matthews China Active ETF. All four Funds are considered diversified. The other fourteen separate series of the Trust are mutual funds and are covered in a separate shareholder report.
The Funds issue and redeem shares at their net asset value per share (NAV) only in large blocks of shares (Creation Units). These transactions are usually in exchange for a basket of securities and/or an amount of cash. As a practical matter, only institutional investors who have entered into an authorized participant agreement may purchase or redeem Creation Units. Except when aggregated in Creation Units, shares of the Funds are not redeemable securities.
Individual shares of the Funds trade on national securities exchanges and elsewhere during the trading day and can only be bought and sold at market prices throughout the trading day through a broker-dealer. Because Fund shares trade at market prices rather than NAV, shares may trade at a price greater than NAV (premium) or less than NAV (discount). A chart showing the frequency at which each fund’s daily closing market price was at a discount or premium to each fund’s NAV can be found at www.matthewsasia.com.
| 2. | SIGNIFICANT ACCOUNTING POLICIES |
The following is a summary of significant accounting policies consistently followed by the Funds in preparation of their financial statements. Each Fund follows the investment company accounting and reporting guidance of the Financial Accounting Standards Board (FASB) Accounting Standard Codification Topic 946 Financial Services—Investment Companies. The accounting policies are in conformity with accounting principles generally accepted in the United States of America (“U.S. GAAP”).
| A. | SECURITY VALUATION: Pursuant to Rule 2a-5 under the 1940 Act, the Funds’ Board of Trustees (the “Board”) has designated authority to a Valuation Designee, Matthews International Capital Management, LLC (“Matthews”), the Funds’ investment adviser, to make fair valuation determinations under adopted procedures subject to Board oversight. Matthews has formed a Valuation Committee (the “Valuation Committee”) to administer the pricing and valuation of portfolio securities and other assets and liabilities and to ensure that prices used for internal purposes or provided by third parties reasonably reflect fair value. The Valuation Designee may utilize independent pricing services, quotations from securities and financial instrument dealers and other market sources to determine fair value. The value of the Trust’s securities is based on market quotations for those securities, or on their fair value determined by the valuation policies approved by the Board. Market quotations and valuation information are provided by commercial pricing services or securities dealers that are independent of the Funds and Matthews, in accordance with procedures established by the Valuation Designee. Foreign exchange-traded securities are valued as of the close of trading on the primary exchange on which they trade. Securities that trade in over-the-counter markets, including most debt securities (bonds), may be valued by other third-party vendors or by using indicative bid quotations from dealers or market makers, or other available market information. Market values for securities are determined based on quotations, market data or other information from the principal (or most advantageous) market on which the security is traded. Market quotations for equity securities used by the Funds include last reported sale prices, or, if such prices are not reported or available, bid and ask prices. Foreign currency exchange contracts are valued at the mean between the bid and ask prices and are determined at the close of business on the New York Stock Exchange (“NYSE”). Interpolated values are derived when the settlement date of the contract is an interim date for which quotations are not available. The Funds may also utilize independent pricing services to assist them in determining a current market value for each security based on sources believed to be reliable. When fair value pricing is employed, the prices of securities used by a Fund to calculate its Net Asset Value (“NAV”) may differ from any quoted or published prices for the same securities for that day. |
The books and records of the Funds are maintained in U.S. dollars. Transactions, portfolio securities, and assets and liabilities denominated in a foreign currency are translated and recorded in U.S. dollars at the prevailing exchange rate as of the close of trading on the NYSE. The Fund does not isolate the effect of changes in foreign exchange rates from changes in market prices on securities held. Accordingly, such changes are included within Change in net unrealized appreciation/depreciation on investments on the Statement of Operations. Translation gains or losses resulting from changes in the exchange rate during the reporting period and realized gains and losses on the settlement of foreign currency transactions are reported in the results of operations for the current period. The Funds isolate that portion of gains and losses on investments in fixed income securities that is due to changes in foreign exchange rate from that which is due to changes in market prices of securities.
Foreign securities held by the Funds may be traded on days and at times when the NYSE is closed. Accordingly, the value of the Funds may be significantly affected on days when shareholders have no access to the Funds.
| B. | FAIR VALUE MEASUREMENTS: The Funds follow a fair value hierarchy that distinguishes between market data obtained from independent sources (observable inputs) and the Funds’ own market assumptions (unobservable inputs). These inputs are used in determining the value of the Funds’ financial instruments and are summarized in the following fair value hierarchy: |
Level 1: Unadjusted quoted prices in active markets for identical securities (foreign securities that are valued based on market quotations).
Level 2: Other significant observable inputs. Certain foreign securities may be fair valued by Matthews using information such as quoted prices for similar securities, interest rates, prepayment speeds, credit risk, and foreign exchange.
Level 3: Significant unobservable inputs. Level 3 securities are valued based on significant unobservable inputs as determined under the direction of the Board. Characterization of such securities as Level 3 securities are not necessarily an indication of their liquidity or the risk associated with investing in these securities. A significant change in the unobservable inputs could result in a significantly lower or higher value in such Level 3 securities and could impact overall Fund performance.
The input levels are not necessarily an indication of the risk or liquidity associated with financial instruments at that level.
| | | | | | | | |
| | | | matthewsasia.com | 833.228.5605 | | | 29 | |
Notes to Financial Statements (unaudited) (continued)
Levels for Multi-Country Funds:
Summary of inputs used to determine the fair valuation of multi-country Funds’ investments as of June 30, 2023.
| | | | | | | | | | | | |
| | | Matthews Emerging Markets Equity
Active ETF | | | Matthews Emerging Markets ex China
Active ETF | | | Matthews Asia Innovators
Active ETF | |
| Assets: | | | | | | | | | | | | |
| | | |
| Investments: | | | | | | | | | | | | |
Level 1: Quoted Prices | | | | | | | | | | | | |
Common Equities: | | | | | | | | | | | | |
Australia | | | $1,507,593 | | | | $154,721 | | | | $— | |
Brazil | | | 5,078,624 | | | | 547,450 | | | | 1,648,963 | |
Chile | | | — | | | | 37,836 | | | | — | |
China/Hong Kong | | | 9,402,987 | | | | — | | | | 45,657,843 | |
France | | | 2,077,629 | | | | 211,796 | | | | 2,676,779 | |
India | | | 9,540,655 | | | | 1,106,780 | | | | 24,497,884 | |
Indonesia | | | 1,223,045 | | | | 128,058 | | | | 3,687,376 | |
Japan | | | — | | | | — | | | | 4,754,581 | |
Kazakhstan | | | 687,664 | | | | 67,580 | | | | — | |
Mexico | | | 5,386,474 | | | | 529,495 | | | | — | |
Netherlands | | | — | | | | — | | | | 4,068,747 | |
Philippines | | | 1,237,511 | | | | 136,284 | | | | — | |
Poland | | | 1,063,785 | | | | 111,135 | | | | — | |
Singapore | | | 984,443 | | | | 65,042 | | | | 2,613,773 | |
South Korea | | | 901,044 | | | | 139,838 | | | | 13,905,714 | |
Switzerland | | | 783,973 | | | | 91,195 | | | | — | |
Taiwan | | | 3,815,195 | | | | 524,380 | | | | 12,894,090 | |
Turkey | | | — | | | | 12,426 | | | | — | |
United Arab Emirates | | | 577,393 | | | | 125,322 | | | | — | |
United Kingdom | | | 1,581,550 | | | | 159,419 | | | | — | |
United States | | | 2,567,830 | | | | 266,858 | | | | 12,253,375 | |
Vietnam | | | 2,949,212 | | | | 312,022 | | | | 1,538,128 | |
Zambia | | | 722,365 | | | | 68,684 | | | | — | |
Preferred Equities: | | | | | | | | | | | | |
South Korea | | | 3,227,762 | | | | 323,409 | | | | 990,274 | |
Short-Term Investments | | | 837,126 | | | | 96,693 | | | | 2,052,458 | |
Level 2: Other Significant Observable Inputs | | | | | | | | | | | | |
Common Equities: | | | | | | | | | | | | |
Thailand | | | 540,207 | | | | 55,023 | | | | — | |
Total Market Value of Investments | | | $56,694,067 | | | | $5,271,446 | | | | $133,239,985 | |
Notes to Financial Statements (unaudited) (continued)
Levels for Single Country Funds:
Summary of inputs used to determine the fair valuation of the single country Fund’s investments as of June 30, 2023.
| | | | |
| | | Matthews China
Active ETF | |
| Assets: | | | | |
| |
| Investments: | | | | |
Level 1: Quoted Prices | | | | |
Common Equities: | | | | |
Communication Services | | | $4,154,785 | |
Consumer Discretionary | | | 9,293,829 | |
Consumer Staples | | | 1,696,581 | |
Energy | | | 543,618 | |
Financials | | | 5,551,414 | |
Health Care | | | 1,378,376 | |
Industrials | | | 2,628,116 | |
Information Technology | | | 1,827,570 | |
Real Estate | | | 1,595,868 | |
Utilities | | | 357,441 | |
Short-Term Investments | | | 395,006 | |
Level 3: Significant Unobservable Inputs | | | | |
Common Equities: | | | | |
Real Estate | | | 348,346 | |
Total Market Value of Investments | | | $29,770,950 | |
Changes in the Balances of Level 3 Securities:
The Funds’ policy is to recognize transfers in and transfers out of Level 3 as of the beginning of the reporting period.
| | | | |
| | | Matthews China
Active ETF | |
| | | Common Equities—
Real Estate | |
| Balance as of 12/31/22 (market value) | | | $— | |
| |
| Accrued discounts/premiums | | | — | |
| |
| Realized gain/(loss) | | | (91,419 | ) |
| |
| Change in unrealized appreciation/(depreciation) | | | (308,428 | ) |
| |
| Purchases | | | 632,333 | |
| |
| Sales | | | (71,867 | ) |
| |
| Transfers in to Level 3 | | | 187,727 | |
| |
| Transfer out of Level 3 | | | — | |
| Balance as of 6/30/23 (market value) | | | $348,346 | |
| Net change in unrealized appreciation/depreciation on Level 3 investments held as of 6/30/23 | | | ($308,428 | ) |
| C. | RISKS ASSOCIATED WITH NON-U.S. COMPANIES: Investments by the Funds in the securities of non-U.S. companies may involve investment risks not typically associated with investments in U.S. issuers. These risks include possible political, economic, social and religious instability, inadequate investor protection; changes in laws or regulations of countries within the Asia Pacific region (including in countries where the Funds may invest, as well as in the broader region); international relations with other nations; natural disasters; corruption; and military activity. Foreign securities may be subject to greater fluctuations in price than securities of domestic corporations or the U.S. government. Foreign investing may also include the risk of expropriation or confiscatory taxation, limitation on the removal of funds or other assets, currency crises and exchange controls, the imposition of foreign withholding tax on the interest income payable on such instruments, the possible seizure or nationalization of foreign deposits or assets, or the adoption of other foreign government restrictions that might adversely affect the foreign securities held by the Funds. Additionally, Asia Pacific countries may utilize formal or informal currency exchange controls or “capital controls” that may limit the ability to repatriate investments or income or adversely affect the value of portfolio investments. The economies of many Asia Pacific countries differ from the economies of more developed countries in many respects, such as their rate of growth, inflation, capital reinvestment, resource self-sufficiency and dependence on other economies, financial system stability, the national balance of payments position and sensitivity to changes in global trade. |
Certain Asia Pacific countries are highly dependent upon and may be affected by developments in the economies of other countries. There is generally less government regulation of stock exchanges, brokers, and listed companies abroad than in the United States, which may result in less transparency with respect to a company’s operations, and make obtaining information about them more difficult (or such information may be unavailable).
Among other risks of investing in foreign markets are the variable quality and reliability of financial information and related audits of companies. Non-U.S. companies are subject to different accounting, auditing, and financial reporting standards, practices, and requirements than U.S. companies. In some cases, financial information and related audits can be unreliable and not subject to verification. Auditing firms in some of these markets are not subject to independent inspection or oversight of audit quality.
| | | | | | | | |
| | | | matthewsasia.com | 833.228.5605 | | | 31 | |
Notes to Financial Statements (unaudited) (continued)
Foreign stock markets may not be as developed or efficient as those in the United States, and the absence of negotiated brokerage commissions in certain countries may result in higher brokerage fees. The time between the trade and settlement dates of securities transactions on foreign exchanges ranges from one day to four weeks or longer and may result in higher custody charges. Custodial arrangements may be less well developed than in the United States. Foreign securities are generally denominated and pay distributions in foreign currencies, exposing the Funds to changes in foreign currency exchange rates. Investing in any country in the Asia Pacific region will also entail risks specific and unique to that country, and these risks can be significant and change rapidly.
Changes in interest rates in each of the countries in which the Funds may invest, as well as interest rates in more-developed countries, may cause a decline in the market value of an investment. Generally, fixed income securities will decrease in value when interest rates rise and can be expected to rise in value when interest rates decline. As interest rates decline, debt issuers may repay or refinance their loans or obligations earlier than anticipated. The issuers of fixed income securities may, therefore, repay principal in advance. This would force the Funds to reinvest the proceeds from the principal prepayments at lower rates, which reduces the Funds’ income.
The Funds may invest in certain operating companies in China through legal structures known as variable interest entities (“VIEs”). In China, ownership of companies in certain sectors by foreign individuals and entities (including U.S. persons and entities such as the Fund) is prohibited. In order to facilitate foreign investment in these businesses, many Chinese companies have created VIEs. In such an arrangement, a China-based operating company typically establishes an offshore shell company in another jurisdiction, such as the Cayman Islands. That shell company enters into service and other contracts with the China-based operating company, then issues shares on a foreign exchange, such as the New York Stock Exchange. Foreign investors hold stock in the shell company rather than directly in the China-based operating company. This arrangement allows U.S. investors to obtain economic exposure to the China-based company through contractual means rather than through formal equity ownership.
VIEs are a longstanding industry practice and well known to officials and regulators in China; however, VIEs are not formally recognized under Chinese law. Recently, the government of China provided new guidance to and placed restrictions on China-based companies raising capital offshore, including through VIE structures. Investors face uncertainty about future actions by the government of China that could significantly affect an operating company’s financial performance and the enforceability of the shell company’s contractual arrangements. It is uncertain whether Chinese officials or regulators will withdraw their implicit acceptance of the VIE structure, or whether any new laws, rules or regulations relating to VIE structures will be adopted or, if adopted, what impact they would have on the interests of foreign shareholders. Under extreme circumstances, China might prohibit the existence of VIEs, or sever their ability to transmit economic and governance rights to foreign individuals and entities; if so, the market value of the Funds’ associated portfolio holdings would likely suffer significant, detrimental, and possibly permanent effects, which could result in substantial investment losses.
In February 2022, Russian forces entered Ukraine and commenced an armed conflict. Economic sanctions have since been imposed on Russia and certain of its citizens, including the exclusion of Russia from the SWIFT global payments network. As a result, Russian-related stocks and debt have since suffered significant declines in value. The ongoing conflict, together with growing turmoil from fluctuations in commodity prices and foreign exchange rates, has the potential to impact adversely global economies and has driven a sharp increase in volatility across markets. The duration of the Russian-Ukraine conflict and its effect on financial markets cannot be determined with certainty. The Funds’ performance could be negatively impacted if the value of a portfolio holding were harmed by these and such other events. Management is actively monitoring these events. As of June 30, 2023, the Funds did not hold any Russian securities.
| D. | DISTRIBUTIONS TO SHAREHOLDERS: |
The Funds generally distribute their net investment income once annually in December. Any net realized gain from the sale of portfolio securities and net realized gains from foreign currency transactions are distributed at least once each year unless they are used to offset losses carried forward from prior years. The Funds will declare and pay income and capital gain distributions in cash. Distributions in cash may be reinvested automatically in additional whole shares of the Funds only if the broker through whom you purchased your shares makes such option available. Your broker is responsible for distributing the income and capital gain distributions to you. Distributions are treated the same for tax purposes whether received in cash or reinvested. If you buy shares when a Fund has realized but not yet distributed ordinary income or capital gains, you will be “buying a dividend” by paying the full price of the shares and then receiving a portion of the price back in the form of a taxable dividend.
The tax character of distributions paid for the period ended December 31, 2022 were as follows:
| | | | |
| | | Ordinary Income | |
| Matthews Emerging Markets Equity Active ETF | | | $28,090 | |
| E. | INVESTMENT TRANSACTIONS AND INCOME: Securities transactions are accounted for on the date the securities are purchased or sold or on the following business day. Financial statements reflect security transactions on trade date. Gains or losses on the sale of securities are determined on the identified cost basis. Interest income is recorded on the accrual basis. Interest income, including amortization and accretion of premiums and discounts on debt securities, is recognized daily on an accrual basis. Dividend income is generally recorded on the ex-dividend date net of any foreign taxes withheld at the source. Dividend income for certain issuers headquartered in countries which the Funds invest may not be recorded until approved by the shareholders (which may occur after the ex-dividend date) if, in the judgment of management, such dividends are not reasonably determined as of the ex-dividend date. Income and realized and unrealized gains or losses on investments are allocated to each class of shares based on its relative net assets. |
The Funds may be subject to foreign taxation related to income received, capital gains on the sale of securities and certain foreign currency transactions in the foreign jurisdictions in which they invest. Foreign taxes, if any, are recorded based on the tax regulations and rates that exist in the foreign markets in which the Funds invest. When a capital gain tax is determined to apply, the Funds record an estimated deferred tax liability in an amount that may be payable if the securities were disposed of on the valuation date.
| F. | CASH, CASH OVERDRAFTS, AND FOREIGN CURRENCY: QFI accounts (i.e., the accounts through which the QFI quota is accessed) are required by the local market to maintain a cash reserve. The cash reserve is based upon a fixed ratio of the QFI’s approved investment quota, which is defined as the amount remitted into its special Renminbi (RMB) cash account. These amounts, if any, are included in “Segregated foreign currency at value” on the Statements of Assets and Liabilities. The fixed ratio is set at 0.08 percent for the Shanghai and 0.06 percent for the Shenzhen market. When any of the Funds’ cash balances are overdrawn, a Fund is charged an overdraft fee by the custodian of 1.00% above the 30-day LIBOR rate on outstanding balances. These amounts, if any, are included in “Other expenses” on the Statements of Operations. |
Notes to Financial Statements (unaudited) (continued)
| G. | USE OF ESTIMATES: The preparation of financial statements in conformity with U.S. GAAP requires management to make estimates and assumptions that affect the amounts reported in the financial statements and accompanying notes. Actual results may differ from those estimates. |
| H. | RECENT ACCOUNTING GUIDANCE: The FASB issued Accounting Standards Update (ASU), ASU 2020-04, Reference Rate Reform (Topic 848)—Facilitation of the Effects of Reference Rate Reform on Financial Reporting in March 2020 and ASU 2021-01 in January 2021 which provided further amendments and clarifications to Topic 848. These ASUs provide optional, temporary relief with respect to the financial reporting of contracts subject to certain types of modifications due to the planned discontinuation of the London Interbank Offered Rate (LIBOR), and other interbank-offered based reference rates, through December 31, 2022. In December, 2022, FASB issued ASU 2022-06 which defers the sunset date of Topic 848 from December 31, 2022, to December 31, 2024, after which entities will no longer be permitted to apply the relief in Topic 848. Management intends to rely upon the relief provided under Topic 848, which is not expected to have a material impact on the fund’s financial statements. |
In June 2022, the FASB issued Accounting Standards Update (ASU), ASU 2022-03, Fair Value Measurement (Topic 820)—Fair Value Measurement of Equity Securities Subject to Contractual Sale Restrictions, which clarifies that a contractual restriction on the sale of an equity security is not considered part of the unit of account of the equity security and, therefore, is not considered in measuring fair value. The amendments under this ASU are effective for fiscal years beginning after December 15, 2023; however, early adoption is permitted.
Management is currently evaluating the impact, if any, of applying this ASU.
| | In June 2022, the FASB issued Accounting Standards Update (ASU), ASU 2022-03, Fair Value Measurement (Topic 820)—Fair Value Measurement of Equity Securities Subject to Contractual Sale Restrictions, which clarifies that a contractual restriction on the sale of an equity security is not considered part of the unit of account of the equity security and, therefore, is not considered in measuring fair value. The amendments under this ASU are effective for fiscal years beginning after December 15, 2023; however, early adoption is permitted. Management is currently evaluating the impact, if any, of applying this ASU. |
| 3. | CAPITAL SHARE TRANSACTIONS |
Capital shares are issued and redeemed by the Fund only in aggregations of a specified number of shares or multiples thereof (Creation Units) at NAV, in return for securities, other instruments, and/or cash (the Basket). Except when aggregated in Creation Units, shares of the Fund are not redeemable. Transactions in capital shares for the Fund are disclosed in detail in the Statement of Changes in Net Assets. Purchasers and redeemers of Creation Units are charged a transaction fee to cover the estimated cost to the Fund of processing the purchase or redemption, including costs charged to it by the NSCC (National Securities Clearing Corporation) or DTC (Depository Trust Company), and the estimated transaction costs, e.g., brokerage commissions, bid-ask spread, and market impact trading costs, incurred in converting the Basket to or from the desired portfolio composition. The transaction fee is determined daily and will be limited to amounts approved by the Board and determined by the Adviser to be appropriate to defray the expenses that the Fund incurs in connection with the purchase or redemption. The purpose of transaction fees is to protect the Fund’s existing shareholders from the dilutive costs associated with the purchase and redemption of Creation Units. The amount of transaction fees will differ depending on the estimated trading costs for portfolio positions and Basket processing costs and other considerations. Transaction fees may include fixed amounts per creation or redemption transactions, amounts varying with the number of Creation Units purchased or redeemed, and varying amounts based on the time an order is placed. The Fund may impose higher transaction fees when cash is substituted for Basket instruments. Higher transaction fees may apply to purchases and redemptions through the DTC than through the NSCC.
| | | | | | | | | | | | | | | | |
| | | Six-Month Period Ended June 30, 2023 (Unaudited) | | | For the Period Ended December 31, 20221 | |
| | | Shares | | | Amount | | | Shares | | | Amount | |
MATTHEWS EMERGING MARKETS EQUITY ACTIVE ETF | | | | | | | | | | | | | | | | |
| | | | |
Shares sold | | | 2,460,000 | | | | $67,006,002 | | | | 240,000 | | | | $6,323,916 | |
| | | | |
Shares redeemed | | | (620,000 | ) | | | (16,445,386 | ) | | | — | | | | — | |
Net increase | | | 1,840,000 | | | | $50,560,616 | | | | 240,000 | | | | $6,323,916 | |
MATTHEWS ASIA INNOVATORS ACTIVE ETF | | | | | | | | | | | | | | | | |
| | | | |
Shares sold | | | 5,750,000 | | | | $36,462,984 | | | | 4,350,000 | | | | $104,572,402 | |
| | | | |
Shares redeemed | | | — | | | | — | | | | — | | | | — | |
Net increase | | | 5,750,000 | | | | $36,462,984 | | | | 4,350,000 | | | | $104,572,402 | |
MATTHEWS CHINA ACTIVE ETF | | | | | | | | | | | | | | | | |
| | | | |
Shares sold | | | 1,440,000 | | | | $27,366,557 | | | | 420,000 | | | | $9,704,698 | |
| | | | |
Shares redeemed | | | — | | | | — | | | | — | | | | — | |
Net increase | | | 1,440,000 | | | | $27,366,557 | | | | 420,000 | | | | $9,704,698 | |
| | | | | | | | |
| | | For the Period Ended June 30, 20232 | |
| | | Shares | | | Amount | |
MATTHEWS EMERGING MARKETS EX CHINA ACTIVE ETF | | | | | | | | |
| | |
Shares sold | | | 200,000 | | | | $5,049,714 | |
| | |
Shares redeemed | | | — | | | | — | |
Net increase | | | 200,000 | | | | $5,049,714 | |
| 1 | The Fund commenced operations on July 13, 2022. |
| 2 | The Fund commenced operations on January 10, 2023. |
| | | | | | | | |
| | | | matthewsasia.com | 833.228.5605 | | | 33 | |
Notes to Financial Statements (unaudited) (continued)
| 4. | INVESTMENT MANAGEMENT FEES |
Pursuant to the Investment Management Agreement, as amended, between Matthews and the Trust, Matthews will pay substantially all the expenses of each Fund excluding management fees, interest expenses, taxes, brokerage fees, securities lending fees, payments under a Fund’s 12b-1 plan (if any), acquired fund fees, litigation expenses and any extraordinary expenses. The investment management fee, accrued daily and paid monthly by the Funds based on the average daily net assets of each Fund, are as follows:
| | | | |
| Matthews Emerging Markets Equity Active ETF | | | 0.79 | % |
| Matthews Emerging Markets ex China Active ETF | | | 0.79 | % |
| Matthews Asia Innovators Active ETF | | | 0.79 | % |
| Matthews China Active ETF | | | 0.79 | % |
For the period ended June 30, 2023, the cost of investments purchased and proceeds from sale of investments (excluding in-kind transactions and short-term investments) were as follows:
| | | | | | | | |
| | | Purchases | | | Proceeds from
Sales | |
| Matthews Emerging Markets Equity Active ETF | | | $36,115,604 | | | | $11,392,843 | |
| Matthews Emerging Markets ex China Active ETF | | | 3,257,645 | | | | 571,475 | |
| Matthews Asia Innovators Active ETF | | | 170,643,343 | | | | 149,179,476 | |
For the period ended June 30. 2023, the cost of in-kind purchases and proceeds from in-kind sales were as follows:
| | | | | | | | |
| | | | | | | | |
| | | Purchases | | | Proceeds from
Sales | |
| Matthews Emerging Markets Equity Active ETF | | | $34,725,733 | | | | $10,010,386 | |
| Matthews Emerging Markets ex China Active ETF | | | 2,262,927 | | | | — | |
| Matthews Asia Innovators Active ETF | | | 13,930,518 | | | | — | |
| Matthews China Active ETF | | | 1,952,750 | | | | — | |
It is the policy of the Funds to comply with all requirements of the Internal Revenue Code of 1986, as amended (“the Code”), applicable to regulated investment companies and to distribute substantially all of their taxable income to their shareholders. The Funds have met the requirements of the Code applicable to regulated investment companies for the six-month period ended June 30, 2023. Therefore, no federal income tax provision is required.
Management has analyzed the Funds’ tax positions taken on federal income tax returns for all open tax years (current and prior three tax years), and has concluded that no provision for federal income tax is required in the Funds’ financial statements. The Funds’ federal and state income and federal excise tax returns for tax years for which the applicable statutes of limitations have not expired are subject to examination by the Internal Revenue Service and state departments of revenue.
Under current tax law, the Funds have elected to defer certain qualified late-year losses and recognize such losses in the year ending December 31, 2022:
| | | | |
| | | Late Year Losses* | |
| Matthews Asia Innovators Active ETF | | | ($101,402 | ) |
| * | As permitted by the Internal Revenue Service, the Funds have elected to defer certain qualified late-year losses and recognize such losses in the next fiscal year. |
As of December 31, 2022, the Funds have capital loss carryforwards available to offset future realized capital gains through the indicated expiration dates as follows:
| | | | |
| | | Amount With
No Expiration | |
| | | Short-term Losses | |
| Matthews Emerging Markets Equity Active ETF | | | $43,128 | |
| Matthews Asia Innovators Active ETF | | | 549,621 | |
| Matthews China Active ETF | | | 3,277 | |
Under the Regulated Investment Company Modernization Act of 2010, the Funds are permitted to carry forward capital losses incurred in taxable years beginning after December 22, 2010 for an unlimited period. However, any losses incurred during those future taxable years will be required to be utilized prior to any losses incurred in pre-enactment taxable years, which generally expire after eight years from when they are incurred. Additionally, post-enactment capital losses that are carried forward will retain their character as either short-term or long-term capital losses rather than being considered all short-term as under previous law.
Notes to Financial Statements (unaudited) (continued)
As of June 30, 2023, the tax cost of investments and the related net unrealized appreciation and depreciation were as follows:
| | | | | | | | | | | | | | | | |
| | | Tax Cost | | | Gross Unrealized Appreciation | | | Gross Unrealized Depreciation | | | Net Unrealized Appreciation (Depreciation) | |
| Matthews Emerging Markets Equity Active ETF | | | $56,019,088 | | | | $2,501,150 | | | | ($1,826,171 | ) | | | $674,979 | |
| Matthews Emerging Markets ex China Active ETF | | | 5,002,131 | | | | 379,621 | | | | (110,306 | ) | | | 269,315 | |
| Matthews Asia Innovators Active ETF | | | 128,949,871 | | | | 10,203,445 | | | | (5,913,331 | ) | | | 4,290,114 | |
| Matthews China Active ETF | | | 36,176,733 | | | | 337,525 | | | | (6,743,308 | ) | | | (6,405,783 | ) |
| 7. | PUBLIC HEALTH EMERGENCY RISKS |
Pandemics and other public health emergencies, including outbreaks of infectious diseases such as the current outbreak of the novel coronavirus (“COVID-19”), can result, and in the case of COVID-19 is resulting, in market volatility and disruption, and materially and adversely impact economic conditions in ways that cannot be predicted, all of which could result in substantial investment losses. Containment efforts and related restrictive actions by governments and businesses have significantly diminished and disrupted global economic activity across many industries. Less developed countries and their health systems may be more vulnerable to these impacts. The ultimate impact of COVID-19 or other health emergencies on global economic conditions and businesses is impossible to predict accurately. Ongoing and potential additional material adverse economic effects of indeterminate duration and severity are possible. The resulting adverse impact on the value of investment in the Funds could be significant and prolonged.
| | | | | | | | |
| | | | matthewsasia.com | 833.228.5605 | | | 35 | |
| | | | |
| Matthews Asia Funds | | | | |
| | |
INVESTMENT ADVISOR Matthews International Capital Management, LLC Four Embarcadero Center, Suite 550 San Francisco, CA 94111 833.228.5605 | | ADMINISTRATOR, CUSTODIAN & TRANSFER AGENT BNY Mellon 240 Greenwich St. New York, NY 10007 | | LEGAL COUNSEL Paul Hastings LLP 101 California Street, 48th Floor San Francisco, CA 94111 |

P.O. Box 9791 | Providence, RI 02940 | matthewsasia.com | 833.228.5605
Matthews Asia Funds are distributed in the United States by Foreside Funds Distributors LLC, Portland, Maine
Matthews Asia Funds are distributed in Latin America by Picton S. A.

SAR-ETF-0623
Item 2. Code of Ethics.
Not applicable.
Item 3. Audit Committee Financial Expert.
Not applicable.
Item 4. Principal Accountant Fees and Services.
Not applicable.
Item 5. Audit Committee of Listed Registrants.
Not applicable.
Item 6. Investments.
| (a) | Schedule of Investments in securities of unaffiliated issuers as of the close of the reporting period is included as part of the report to shareholders filed under Item 1(a) of this form. |
Item 7. Disclosure of Proxy Voting Policies and Procedures for Closed-End Management Investment Companies.
Not applicable.
Item 8. Portfolio Managers of Closed-End Management Investment Companies.
Not applicable.
Item 9. Purchases of Equity Securities by Closed-End Management Investment Company and Affiliated Purchasers.
Not applicable.
Item 10. Submission of Matters to a Vote of Security Holders.
There have been no material changes to the procedures by which the shareholders may recommend nominees to the registrant’s board of directors, where those changes were implemented after the registrant last provided disclosure in response to the requirements of Item 407(c)(2)(iv) of Regulation S-K (17 CFR 229.407) (as required by Item 22(b)(15) of Schedule 14A (17 CFR 240.14a-101)), or this Item.
Item 11. Controls and Procedures.
| (a) | The registrant’s principal executive and principal financial officers, or persons performing similar functions, have concluded that the registrant’s disclosure controls and procedures (as defined in Rule 30a-3(c) under the Investment Company Act of 1940, as amended (the “1940 Act”) (17 CFR 270.30a-3(c))) are effective, as of a date within 90 days of the filing date of the report that includes the disclosure required by this paragraph, based on their evaluation of these controls and procedures required by Rule 30a-3(b) under the 1940 Act (17 CFR 270.30a-3(b)) and Rules 13a-15(b) or 15d-15(b) under the Securities Exchange Act of 1934, as amended (17 CFR 240.13a-15(b) or 240.15d-15(b)). |
| (b) | There was no change in the registrant’s internal control over financial reporting (as defined in Rule 30a-3(d) under the 1940 Act (17 CFR 270.30a-3(d))) that occurred during the period covered by this report that has materially affected, or is reasonably likely to materially affect, the registrant’s internal control over financial reporting. |
Item 12. Disclosure of Securities Lending Activities for Closed-End Management Investment Companies.
Not applicable.
Item 13. Exhibits.
SIGNATURES
Pursuant to the requirements of the Securities Exchange Act of 1934 and the Investment Company Act of 1940, the registrant has duly caused this report to be signed on its behalf by the undersigned, thereunto duly authorized.
| | |
| (Registrant) | | Matthews International Funds |
| |
| By (Signature and Title)* | | /s/ James Cooper Abbott |
| | James Cooper Abbott, President |
| | (principal executive officer) |
|
| Date September 8, 2023 |
Pursuant to the requirements of the Securities Exchange Act of 1934 and the Investment Company Act of 1940, this report has been signed below by the following persons on behalf of the registrant and in the capacities and on the dates indicated.
| | |
| By (Signature and Title)* | | /s/ James Cooper Abbott |
| | James Cooper Abbott, President |
| | (principal executive officer) |
|
| Date September 8, 2023 |
| |
| By (Signature and Title)* | | /s/ Shai Malka |
| | Shai Malka, Treasurer |
| | (principal financial officer) |
| Date September 8, 2023 |
| * | Print the name and title of each signing officer under his or her signature. |