UNITED STATES
SECURITIES AND EXCHANGE COMMISSION
Washington, D.C. 20549
FORM N-CSR
CERTIFIED SHAREHOLDER REPORT OF REGISTERED
MANAGEMENT INVESTMENT COMPANIES
Investment Company Act file number 811-08510
Matthews International Funds
(Exact name of registrant as specified in charter)
Four Embarcadero Center, Suite 550
San Francisco, CA 94111
(Address of principal executive offices) (Zip code)
Robert Horrocks, President
Four Embarcadero Center, Suite 550
San Francisco, CA 94111
(Name and address of agent for service)
Registrant’s telephone number, including area code: 415-788-7553
Date of fiscal year end: December 31
Date of reporting period: June 30, 2022
Form N-CSR is to be used by management investment companies to file reports with the Commission not later than 10 days after the transmission to stockholders of any report that is required to be transmitted to stockholders under Rule 30e-1 under the Investment Company Act of 1940 (17 CFR 270.30e-1). The Commission may use the information provided on Form N-CSR in its regulatory, disclosure review, inspection, and policymaking roles.
A registrant is required to disclose the information specified by Form N-CSR, and the Commission will make this information public. A registrant is not required to respond to the collection of information contained in Form N-CSR unless the Form displays a currently valid Office of Management and Budget (“OMB”) control number. Please direct comments concerning the accuracy of the information collection burden estimate and any suggestions for reducing the burden to Secretary, Securities and Exchange Commission, 450 Fifth Street, NW, Washington, DC 20549-0609. The OMB has reviewed this collection of information under the clearance requirements of 44 U.S.C. § 3507.
| Item 1. | Reports to Stockholders. |
| | (a) | Include a copy of the report transmitted to stockholders pursuant to Rule 30e-1 under the Act (17 CFR 270.30e-1). |
The Report to Shareholders is attached herewith.
Matthews Asia Funds | Semi-Annual Report
June 30, 2022 | matthewsasia.com
GLOBAL EMERGING MARKETS STRATEGIES
Matthews Emerging Markets Equity Fund
Matthews Emerging Markets Small Companies Fund
ASIA GROWTH STRATEGIES
Matthews Asia Growth Fund
Matthews Pacific Tiger Fund
Matthews Asia ESG Fund
Matthews Asia Innovators Fund
Matthews China Fund
Matthews China Small Companies Fund
Matthews India Fund
Matthews Japan Fund
Matthews Korea Fund
ASIA GROWTH AND INCOME STRATEGIES
Matthews Asian Growth and Income Fund
Matthews Asia Dividend Fund
Matthews China Dividend Fund
ASIA FIXED INCOME STRATEGIES
Matthews Asia Total Return Bond Fund
Matthews Asia Credit Opportunities Fund

Paper copies of the Funds’ annual and semi-annual shareholder reports are no longer being sent by mail, unless you specifically request paper copies of the reports. Instead, the reports will be made available on the Funds’ website matthewsasia.com, and you will be notified by mail each time a report is posted and provided with a website link to access the report. You may elect to receive paper copies of shareholder reports and other communications from the Funds anytime by contacting your financial intermediary (such as a broker-dealer or bank) or, if you are a direct investor, by calling 800.789.ASIA (2742).
Your election to receive reports in paper will apply to all Funds held in your account if you invest through your financial intermediary or all Funds held directly with Matthews Asia Funds.

Investor Class Performance and Expense Ratios (June 30, 2022) (unaudited)
| | | | | | | | | | | | | | | | | | | | | | | | | | | | |
| | | | | |
Average Annual Total Return† | | | Inception
Date | | | Prospectus
Expense
Ratios* | | | Prospectus
Expense
Ratios
after Fee
Waiver
and
Expense
Reim- bursement* | |
| Investor Class | | 1 year | | | 5 years | | | 10 years | | | Since
Inception | |
GLOBAL EMERGING MARKETS STRATEGY | | | | | | | | | | | | | | | | | | | | | | | | | | | | |
| | | | | | | |
Emerging Markets Equity Fund (MEGMX) | | | -31.53% | | | | n.a. | | | | n.a. | | | | 9.07% | | | | 4/30/20 | | | | 1.52% | | | | 1.13% | 1 |
| | | | | | | |
Emerging Markets Small Companies Fund (MSMLX) | | | -15.79% | | | | 9.48% | | | | 8.39% | | | | 10.84% | | | | 9/15/08 | | | | 1.51% | | | | 1.35% | 3 |
ASIA GROWTH STRATEGIES | | | | | | | | | | | | | | | | | | | | | | | | | | | | |
| | | | | | | |
Asia Growth Fund (MPACX) | | | -44.60% | | | | 1.27% | | | | 5.60% | | | | 7.10% | | | | 10/31/03 | | | | 1.07% | | | | 1.07% | |
| | | | | | | |
Pacific Tiger Fund (MAPTX) | | | -24.82% | | | | 3.22% | | | | 6.19% | | | | 7.78% | | | | 9/12/94 | | | | 1.06% | | | | 1.03% | 2 |
| | | | | | | |
Asia ESG Fund (MASGX)§ | | | -13.98% | | | | 9.91% | | | | n.a. | | | | 8.10% | | | | 4/30/15 | | | | 1.35% | | | | 1.35% | 3,4 |
| | | | | | | |
Asia Innovators Fund (MATFX) | | | -32.88% | | | | 10.28% | | | | 12.42% | | | | 4.93% | | | | 12/27/99 | | | | 1.09% | | | | 1.09% | |
| | | | | | | |
China Fund (MCHFX) | | | -28.80% | | | | 7.14% | | | | 7.17% | | | | 9.25% | | | | 2/19/98 | | | | 1.06% | | | | 1.06% | |
| | | | | | | |
China Small Companies Fund (MCSMX) | | | -32.25% | | | | 14.21% | | | | 12.78% | | | | 8.05% | | | | 5/31/11 | | | | 1.48% | | | | 1.43% | 3 |
| | | | | | | |
India Fund (MINDX) | | | -9.41% | | | | 3.02% | | | | 9.62% | | | | 9.51% | | | | 10/31/05 | | | | 1.10% | | | | 1.10% | |
| | | | | | | |
Japan Fund (MJFOX) | | | -26.32% | | | | 1.07% | | | | 7.22% | | | | 5.08% | | | | 12/31/98 | | | | 0.95% | | | | 0.95% | |
| | | | | | | |
Korea Fund (MAKOX) | | | -33.39% | | | | -0.79% | | | | 5.55% | | | | 5.28% | | | | 1/3/95 | | | | 1.13% | | | | 1.13% | |
ASIA GROWTH AND INCOME STRATEGIES | | | | | | | | | | | | | | | | | | | | | | | | | | | | |
| | | | | | | |
Asian Growth and Income Fund (MACSX) | | | -18.41% | | | | 1.80% | | | | 3.90% | | | | 8.07% | | | | 9/12/94 | | | | 1.07% | | | | 1.07% | |
| | | | | | | |
Asia Dividend Fund (MAPIX) | | | -27.97% | | | | 1.26% | | | | 5.45% | | | | 6.90% | | | | 10/31/06 | | | | 1.03% | | | | 1.02% | 2 |
| | | | | | | |
China Dividend Fund (MCDFX) | | | -23.47% | | | | 5.34% | | | | 8.84% | | | | 8.36% | | | | 11/30/09 | | | | 1.12% | | | | 1.12% | |
ASIA FIXED INCOME STRATEGIES | | | | | | | | | | | | | | | | | | | | | | | | | | | | |
| | | | | | | |
Asia Total Return Bond Fund (MAINX) | | | -21.15% | | | | -1.71% | | | | 1.56% | | | | 1.82% | | | | 11/30/11 | | | | 1.05% | | | | 1.05% | 1 |
| | | | | | | |
Asia Credit Opportunities Fund (MCRDX) | | | -21.29% | | | | -2.44% | | | | n.a. | | | | -0.42% | | | | 4/29/16 | | | | 1.07% | | | | 1.07% | 1 |
| † | Annualized performance for periods of at least one year, otherwise cumulative. |
| * | These figures are from the Funds’ prospectus dated as of April 28, 2022, and may differ from the actual expense ratios for fiscal year 2021, as shown in the financial highlights section of this report. |
| § | The Fund’s name changed from Matthews Asia ESG Fund to Matthews Emerging Markets Sustainable Future Fund on July 29, 2022. |
| 1 | Matthews has contractually agreed (i) to waive fees and reimburse expenses to the extent needed to limit Total Annual Fund Operating Expenses (excluding Rule 12b-1 fees, taxes, interest, brokerage commissions, short sale dividend expenses, expenses incurred in connection with any merger or reorganization or extraordinary expenses such as litigation) of the Institutional Class to 0.90% first by waiving class specific expenses (i.e., shareholder service fees specific to a particular class) of the Institutional Class and then, to the extent necessary, by waiving non-class specific expenses (e.g., custody fees) of the Institutional Class, and (ii) if any Fund-wide expenses (i.e., expenses that apply to both the Institutional Class and the Investor Class) are waived for the Institutional Class to maintain the 0.90% expense limitation, to waive an equal amount (in annual percentage terms) of those same expenses for the Investor Class. The Total Annual Fund Operating Expenses After Fee Waiver and Expense Reimbursement for the Investor Class may vary from year to year and will in some years exceed 0.90%. Pursuant to this agreement, any amount waived for prior fiscal years with respect to the Matthews Asia Total Return Bond Fund and the Matthews Asia Credit Opportunities Fund is not subject to recoupment. For the Matthews Emerging Markets Equity Fund, if the operating expenses fall below the expense limitation within three years after Matthews has made a waiver or reimbursement, the Fund may reimburse Matthews up to an amount that does not cause the expenses for that year to exceed the lesser of (i) the expense limitation applicable at the time of that fee waiver and/or expense reimbursement or (ii) the expense limitation in effect at the time of recoupment. This agreement will remain in place until April 30, 2023 and may be terminated at any time by the Board of Trustees on behalf of the Fund on 60 days’ written notice to Matthews. Matthews may decline to renew this agreement by written notice to the Trust at least 30 days before its annual expiration date. |
| 2 | Matthews has contractually agreed to waive a portion of its advisory fee and administrative and shareholder services fee if the Fund’s average daily net assets are over $3 billion, as follows: for every $2.5 billion average daily net assets of the Fund that are over $3 billion, the advisory fee rate and the administrative and shareholder services fee rate for the Fund with respect to such excess average daily net assets will be each reduced by 0.01%, in each case without reducing such fee rate below 0.00%. Any amount waived by Matthews pursuant to this agreement may not be recouped by Matthews. This agreement will remain in place until April 30, 2023 and may be terminated (i) at any time by the Board of Trustees upon 60 days’ prior written notice to Matthews; or (ii) by Matthews at the annual expiration date of the agreement upon 60 days’ prior written notice to the Trust, in each case without payment of any penalty. |
| 3 | Matthews has contractually agreed (i) to waive fees and reimburse expenses to the extent needed to limit Total Annual Fund Operating Expenses (excluding Rule 12b-1 fees, taxes, interest, brokerage commissions, short sale dividend expenses, expenses incurred in connection with any merger or reorganization or extraordinary expenses such as litigation) of the Institutional Class to 1.20% (except for the Matthews Emerging Markets Small Companies Fund, which has an expense limitation of 1.15% for the Institutional Class) first by waiving class specific expenses (i.e., shareholder service fees specific to a particular class) of the Institutional Class and then, to the extent necessary, by waiving non-class specific expenses (e.g., custody fees) of the Institutional Class, and (ii) if any Fund-wide expenses (i.e., expenses that apply to both the Institutional Class and the Investor Class) are waived for the Institutional Class to maintain the 1.20% expense limitation (or 1.15% for the Matthews Emerging Markets Small Companies Fund), to waive an equal amount (in annual percentage terms) of those same expenses for the Investor Class. Effective July 29, 2022, for the Matthews Emerging Markets Sustainable Future Fund (formerly the Matthews Asia ESG Fund), Matthews reduced this expense limitation to 1.15% for the Institutional Class and waived a corresponding amount (in annual percentage terms) for the Investor Class. The Total Annual Fund Operating Expenses After Fee Waiver and Expense Reimbursement for the Investor Class may vary from year to year and will in some years exceed 1.20% (or 1.15% for the Matthews Emerging Markets Small Companies Fund). If the operating expenses fall below the expense limitation within three years after Matthews has made a waiver or reimbursement, the Fund may reimburse Matthews up to an amount that does not cause the expenses for that year to exceed the lesser of (i) the expense limitation applicable at the time of that fee waiver and/or expense reimbursement or (ii) the expense limitation in effect at the time of recoupment. This agreement will remain in place until April 30, 2023 and may be terminated at any time by the Board of Trustees on behalf of the Fund on 60 days’ written notice to Matthews. Matthews may decline to renew this agreement by written notice to the Trust at least 30 days before its annual expiration date. |
| 4 | Expense ratios are from the Fund’s prospectus dated as of July 29, 2022. |
Institutional Class Performance and Expense Ratios (June 30, 2022) (unaudited)
| | | | | | | | | | | | | | | | | | | | | | | | | | | | |
| | | | | |
Average Annual Total Return† | | | | | | Prospectus
Expense
Ratios* | | | Prospectus
Expense
Ratios
after Fee
Waiver
and
Expense
Reim- bursement* | |
| Institutional Class | | 1 year | | | 5 years | | | 10 years | | | Since
Inception | | | Inception
Date | |
GLOBAL EMERGING MARKETS STRATEGY | | | | | | | | | | | | | | | | | | | | | | | | | | | | |
| | | | | | | |
Emerging Markets Equity Fund (MIEFX) | | | -31.28% | | | | n.a. | | | | n.a. | | | | 9.35% | | | | 4/30/20 | | | | 1.38% | | | | 0.90% | 1 |
| | | | | | | |
Emerging Markets Small Companies Fund (MISMX) | | | -15.59% | | | | 9.70% | | | | n.a. | | | | 6.79% | | | | 4/30/13 | | | | 1.38% | | | | 1.15% | 3 |
ASIA GROWTH STRATEGIES | | | | | | | | | | | | | | | | | | | | | | | | | | | | |
| | | | | | | |
Asia Growth Fund (MIAPX) | | | -44.52% | | | | 1.43% | | | | 5.78% | | | | 4.46% | | | | 10/29/10 | | | | 0.92% | | | | 0.92% | |
| | | | | | | |
Pacific Tiger Fund (MIPTX) | | | -24.73% | | | | 3.37% | | | | 6.36% | | | | 5.00% | | | | 10/29/10 | | | | 0.92% | | | | 0.90% | 2 |
| | | | | | | |
Asia ESG Fund (MISFX)§ | | | -13.74% | | | | 10.15% | | | | n.a. | | | | 8.34% | | | | 4/30/15 | | | | 1.15% | | | | 1.15% | 3,4 |
| | | | | | | |
Asia Innovators Fund (MITEX) | | | -32.76% | | | | 10.46% | | | | n.a. | | | | 11.87% | | | | 4/30/13 | | | | 0.93% | | | | 0.93% | |
| | | | | | | |
China Fund (MICFX) | | | -28.71% | | | | 7.33% | | | | 7.34% | | | | 4.42% | | | | 10/29/10 | | | | 0.91% | | | | 0.91% | |
| | | | | | | |
China Small Companies Fund (MICHX) | | | -32.08% | | | | n.a. | | | | n.a. | | | | 11.81% | | | | 11/30/17 | | | | 1.31% | | | | 1.20% | 3 |
| | | | | | | |
India Fund (MIDNX)# | | | -9.27% | | | | 3.17% | | | | 9.81% | | | | 5.25% | | | | 10/29/10 | | | | 0.96% | | | | 0.96% | |
| | | | | | | |
Japan Fund (MIJFX) | | | -26.23% | | | | 1.14% | | | | 7.32% | | | | 6.78% | | | | 10/29/10 | | | | 0.89% | | | | 0.89% | |
| | | | | | | |
Korea Fund (MIKOX) | | | -33.28% | | | | -0.67% | | | | 5.67% | | | | 5.36% | | | | 10/29/10 | | | | 0.98% | | | | 0.98% | |
ASIA GROWTH AND INCOME STRATEGIES | | | | | | | | | | | | | | | | | | | | | | | | | | | | |
| | | | | | | |
Asian Growth and Income Fund (MICSX) | | | -18.32% | | | | 1.93% | | | | 4.05% | | | | 3.51% | | | | 10/29/10 | | | | 0.94% | | | | 0.94% | |
| | | | | | | |
Asia Dividend Fund (MIPIX) | | | -27.86% | | | | 1.38% | | | | 5.58% | | | | 4.84% | | | | 10/29/10 | | | | 0.92% | | | | 0.91% | 2 |
| | | | | | | |
China Dividend Fund (MICDX) | | | -23.32% | | | | 5.49% | | | | 9.03% | | | | 7.53% | | | | 10/29/10 | | | | 0.97% | | | | 0.97% | |
ASIA FIXED INCOME STRATEGIES | | | | | | | | | | | | | | | | | | | | | | | | | | | | |
| | | | | | | |
Asia Total Return Bond Fund (MINCX) | | | -20.98% | | | | -1.50% | | | | 1.77% | | | | 2.03% | | | | 11/30/11 | | | | 0.91% | | | | 0.90% | 1 |
| | | | | | | |
Asia Credit Opportunities Fund (MICPX) | | | -21.08% | | | | -2.21% | | | | n.a. | | | | -0.19% | | | | 4/29/16 | | | | 0.93% | | | | 0.90% | 1 |
| † | Annualized performance for periods of at least one year, otherwise cumulative. |
| * | These figures are from the Funds’ prospectus dated as of April 28, 2022, and may differ from the actual expense ratios for fiscal year 2021, as shown in the financial highlights section of this report. |
| § | The Fund’s name changed from Matthews Asia ESG Fund to Matthews Emerging Markets Sustainable Future Fund on July 29, 2022. |
| # | Performance results include adjustments made for financial reporting purposes in accordance with U.S. generally accepted accounting principles. |
| 1 | Matthews has contractually agreed to waive fees and reimburse expenses to the extent needed to limit Total Annual Fund Operating Expenses (excluding Rule 12b-1 fees, taxes, interest, brokerage commissions, short sale dividend expenses, expenses incurred in connection with any merger or reorganization or extraordinary expenses such as litigation) of the Institutional Class to 0.90%. Pursuant to this agreement, any amount waived for prior fiscal years with respect to the Matthews Asia Total Return Bond Fund and the Matthews Asia Credit Opportunities Fund is not subject to recoupment. For the Matthews Emerging Markets Equity Fund, if the operating expenses fall below the expense limitation within three years after Matthews has made a waiver or reimbursement, the Fund may reimburse Matthews up to an amount that does not cause the expenses for that year to exceed the lesser of (i) the expense limitation applicable at the time of that fee waiver and/or expense reimbursement or (ii) the expense limitation in effect at the time of recoupment. This agreement will remain in place until April 30, 2023 and may be terminated at any time by the Board of Trustees on behalf of the Fund on 60 days’ written notice to Matthews. Matthews may decline to renew this agreement by written notice to the Trust at least 30 days before its annual expiration date. |
| 2 | Matthews has contractually agreed to waive a portion of its advisory fee and administrative and shareholder services fee if the Fund’s average daily net assets are over $3 billion, as follows: for every $2.5 billion average daily net assets of the Fund that are over $3 billion, the advisory fee rate and the administrative and shareholder services fee rate for the Fund with respect to such excess average daily net assets will be each reduced by 0.01%, in each case without reducing such fee rate below 0.00%. Any amount waived by Matthews pursuant to this agreement may not be recouped by Matthews. This agreement will remain in place until April 30, 2023 and may be terminated (i) at any time by the Board of Trustees upon 60 days’ prior written notice to Matthews; or (ii) by Matthews at the annual expiration date of the agreement upon 60 days’ prior written notice to the Trust, in each case without payment of any penalty. |
| 3 | Matthews has contractually agreed to waive fees and reimburse expenses to the extent needed to limit Total Annual Fund Operating Expenses (excluding Rule 12b-1 fees, taxes, interest, brokerage commissions, short sale dividend expenses, expenses incurred in connection with any merger or reorganization or extraordinary expenses such as litigation) of the Institutional Class to 1.20% (except for the Matthews Emerging Markets Small Companies Fund, which has an expense limitation of 1.15% for the Institutional Class). Effective July 29, 2022, for the Matthews Emerging Markets Sustainable Future Fund (formerly the Matthews Asia ESG Fund), Matthews reduced this expense limitation to 1.15% for the Institutional Class. If the operating expenses fall below the expense limitation within three years after Matthews has made a waiver or reimbursement, the Fund may reimburse Matthews up to an amount that does not cause the expenses for that year to exceed the lesser of (i) the expense limitation applicable at the time of that fee waiver and/or expense reimbursement or (ii) the expense limitation in effect at the time of recoupment. This agreement will remain in place until April 30, 2023 and may be terminated at any time by the Board of Trustees on behalf of the Fund on 60 days’ written notice to Matthews. Matthews may decline to renew this agreement by written notice to the Trust at least 30 days before its annual expiration date. |
| 4 | Expense ratios are from the Fund’s prospectus dated as of July 29, 2022. |
Past Performance: All performance quoted in this report is past performance and is no guarantee of future results. Investment return and principal value will fluctuate with changing market conditions so that when redeemed, shares may be worth more or less than their original cost. Current performance may be lower or higher than the returns quoted. If certain of the Funds’ fees and expenses had not been waived, returns would have been lower. For the Funds’ most recent month-end performance, please call 800.789.ASIA (2742) or visit matthewsasia.com.
| | | | |
| matthewsasia.com | 800.789.ASIA | | | 3 | |

Cover photo: Tea plantations in Xijian, China
This report has been prepared for Matthews International Funds (d/b/a Matthews Asia Funds) shareholders. It is not authorized for distribution to prospective investors unless accompanied or preceded by a current Matthews Asia Funds prospectus, which contains more complete information about the Funds’ investment objectives, risks and expenses. Additional copies of the prospectus or summary prospectus may be obtained at matthewsasia.com. Please read the prospectus carefully before you invest or send money.
The views and opinions in this report were current as of June 30, 2022. They are not guarantees of performance or investment results and should not be taken as investment advice. Investment decisions reflect a variety of factors, and the managers reserve the right to change their views about individual stocks, sectors and the markets at any time. As a result, the views expressed should not be relied upon as a forecast of a Fund’s future investment intent. Current and future portfolio holdings are subject to risk.
Statements of fact are from sources considered reliable, but neither the Funds nor the Investment Advisor makes any representation or guarantee as to their completeness or accuracy.
Contents
* The Fund’s name changed from Matthews Asia ESG Fund to Matthews Emerging Markets Sustainable Future Fund on July 29, 2022.
Investment Risk: Mutual fund shares are not deposits or obligations of, or guaranteed by, any depositary institution. Shares are not insured by the FDIC, Federal Reserve Board or any government agency and are subject to investment risks, including possible loss of principal amount invested. Investing in international and emerging markets may involve additional risks, such as social and political instability, market illiquidity, exchange-rate fluctuations, a high level of volatility and limited regulation. Fixed income investments are subject to additional risks, including, but not limited to, interest rate, credit and inflation risks. In addition, single-country and sector funds may be subject to a higher degree of market risk than diversified funds because of a concentration in a specific industry, sector or geographic location. Investing in small and mid-size companies is more risky than investing in large companies as they may be more volatile and less liquid than larger companies. Please see the Funds’ Prospectuses and Statement of Additional Information for more risk disclosure.
| | | | |
| matthewsasia.com | 800.789.ASIA | | | 5 | |
Message to Shareholders from the
Investment Advisor
Dear Valued Shareholders,
In the end, long-term investing is not really about timing economic cycles. Why? Well, for one thing, it’s hard to do. Our macroeconomic discussions also tend to focus less on the general environment. Gross domestic product (GDP), inflation and interest-rate cycles are not front and center of our considerations.
The issues we chew over are more tied to the prospects of companies themselves. Are we investing in countries which have policies supporting markets and the promotion of high-quality businesses? Are we able to find businesses with market power? Can they raise prices when the environment allows and maintain prices when the environment moves against them? Are they in a strong bargaining position with suppliers? Do they have a good or service that their clients will prioritize over other spending? Are they free from competition in providing these goods? And, finally, can we make a decent estimate of valuation?
A lot of this is about understanding companies and their management but also having the discipline to back up the analysis with some kind of fundamental assessment and metric. We don’t invest in fads, fashions and stories. That’s speculation. Growth investing is more concrete. We try to understand the economic environment as it relates to industrial ecosystems. So it’s in this sense that the macro most often enters our calculations.
Look beyond sentiment
It’s undoubtedly been the case that there have been some significant factors playing out within the economic environments and industrial ecosystems of certain markets recently. Take the regulatory initiatives in China, which triggered such a shock on the markets. Here was a government prepared to stand up to the monopolistic power of companies in the online retail trade. That seemed like a foreign concept to many Western investors and yet, we ourselves have the same issues around market power in some industries. Our governments also espouse the same ideals of intervention in the market, rhetorically at least.
But despite the adverse sentiment these policies caused, they did not render China “uninvestable’’ as some have claimed. It simply required an understanding of the motivations behind the government’s actions and a realization that there were other companies that might benefit from having a more level playing field or open architecture in the online retail space.
Similarly, the approach to regulation in the educational and health-care sectors in China was around trying to provide broader access for lower income families. Although there may have been some missteps and misunderstanding about how the price system would react to regulation, we have emerged with a rational market where low-cost providers will grab market share and highly innovative businesses will be allowed a certain amount of time to reap quasi-monopolistic profits in order to encourage continued research and development.
Staying with Asia, while China is a managed, growth economy with developed regulatory oversight, there are other markets that are struggling with the earlier stages of development and have very different environments and ecosystems. They’re figuring out how to build the appropriate infrastructure, and how to meet the challenge of creating a strong manufacturing base and if in fact that is still the best way to raise wages and living standards. Some have been more successful than others. We’ve always been complimentary about the advances Vietnam has made, for instance. On the other hand, we’ve tended to be skeptical that India could achieve the kind of progress in these areas that other less democratic regimes have achieved—at least at the pace they have achieved them. Now, however, India appears to be moving in the right direction.
And then there are the developed economies of North Asia. They are at another level of development stage having bred their own global champions, most notably in electronics and technology hardware. Their economies are more export-led and right now
more exposed to the adverse sentiment building over slowing growth and the prospect of recession in the West.
Added value in Latin America
Looking across to Latin America, commodity price-inflation is usually seen to be a boon. It’s often a big reason for speculators to trade these markets. But while these countries are indeed resource rich, this strength can be a vulnerability and at times like these they can become caricatures. A rise in commodity prices will lift stocks but the subsequent fall in commodities will usually see these markets relegated to the sidelines once more.
But these caricatures are just that. The economies of Latin America are much more varied than this. One way to access their growth—and this apples to other areas of emerging markets too—is through investment in local banks. Their banking systems are often much more commercially run than one sees in Asia, particularly North Asia. It’s probably true that emerging market banks have benefitted perhaps even more than commodity producers in this inflationary episode and period of steepening of global yield curves.
Additionally, the opening up of Latin American economies to tourism as the pandemic subsides should be a further boost. We can access this growth directly through consumer businesses but also through travel infrastructures such as airports, which are often interesting businesses in that they are mini monopolies! And beyond the immediate beneficiaries of the return to normalcy, there are interesting franchises in the health-care sector, where we can invest for secular growth as societies both age and get wealthier.
So it would be wrong to buy into the caricature of emerging markets as inflationary trades. Even if inflation does subside quickly, there is much value to be had in Latin America, value that has only been increased by the recent strength of the U.S. dollar.
Business not inflation
If we stand back for a moment—while markets continue to fixate on the pressing problem of inflation in the U.S. economy and how the central banks will respond—we see that many emerging market economies are treading a relatively normal path. There’s no reason why these economies shouldn’t keep making advances in their own ways in terms of productivity, innovation and growth. Granted, some central banks around the world are hiking but not at the magnitude of the Fed. And those markets with large, strong domestic economies can mitigate slowing overseas consumer demand and the prospect of recession in Europe and the U.S. China’s counter-cyclical monetary stance even puts it in a position to inject stimulus and demand into its economy.
There are headwinds to be sure. China’s zero-COVID policy has hit the economy and sentiment much harder than I would have thought. And dollar strength has always been a problem for emerging markets. But at some point a strong dollar starts to make foreign purchases attractive and emerging market valuations are already relatively low compared to global peers.
We would contend that much like the magician’s sleight of hand that deceives the audience, investors in the West have been focused on inflation just as emerging markets companies have been focused on their businesses. And it is companies that we have been focused on—not rising prices. For what it is worth, I think inflation is peaking and the Fed is likely too tight than too loose. But in any case, we try to find the companies that can best navigate the future whatever the rate of increase in prices or whether or not the West enters recession.

Robert Horrocks, PhD
Chief Investment Officer
Matthews International Capital Management, LLC
| | | | | | | | |
| | | | matthewsasia.com | 800.789.ASIA | | | 7 | |

| | | | |
| PORTFOLIO MANAGERS |
| |
| John Paul Lech | | |
Lead Manager | | |
| |
| Alex Zarechnak | | |
Co-Manager | | |
|
| FUND FACTS |
| | |
| | | Investor | | Institutional |
Ticker | | MEGMX | | MIEFX |
CUSIP | | 577130651 | | 577130644 |
Inception | | 4/30/20 | | 4/30/20 |
NAV | | $10.80 | | $10.82 |
Initial Investment | | $2,500 | | $100,000 |
Gross Expense Ratio1 | | 1.52% | | 1.38% |
After fee waiver and Reimbursement2 | | 1.13% | | 0.90% |
Portfolio Statistics |
Total # of Positions | | 57 |
Net Assets | | $38.2 million |
Weighted Average Market Cap | | $93.4 billion |
Portfolio Turnover3 | | 88.5% |
Benchmark | | |
MSCI Emerging Markets Index |
OBJECTIVE
Long-term capital appreciation.
STRATEGY
Under normal circumstances, the Fund seeks to achieve its investment objective by investing at least 80% of its net assets, which include borrowings for investment purposes, in the common and preferred stocks of companies located in emerging market countries. Emerging market countries generally include every country in the world except the United States, Australia, Canada, Hong Kong, Israel, Japan, New Zealand, Singapore and most of the countries in Western Europe.
Matthews Emerging Markets Equity Fund
Portfolio Manager Commentary (unaudited)
For the first half of 2022, the Matthews Emerging Markets Equity Fund returned –24.69% (Investor Class) and –24.55% (Institutional Class), while its benchmark, the MSCI Emerging Markets Index, returned –17.47% over the same period. For the quarter ending June 30, 2022, the Fund returned
–14.96% (Investor Class) and –14.80% (Institutional Class), while the benchmark returned –11.34%.
Market Environment:
The first half of 2022 was the weakest start for the S&P 500 since World War II with the exception of 1962 when markets were upended in the months leading up to the Cuban Missile Crisis. The NASDAQ Composite Index is down around 30% for the first half of the year. Elsewhere, bonds, crypto assets and cash provided little succor making the year thus far one of the most confounding of my career.
There have been some bright spots. Broadly, U.S.-listed Chinese American Depositary Receipts (ADRs) had their best month in June in three years after regaining from some of the underperformance of recent quarters. But while there are exceptions at the company level, index estimates indicate investors are still paying a hefty price-to-earnings ratio* (P/E) premium for U.S.-listed China exposure, with the NASDAQ Composite Index trading on 23-24x 2022 earnings and the NASDAQ Golden Dragon China Index trading on 33-34x earnings.
With U.S. Federal Reserve rates likely to move higher and little abatement in geopolitical tensions, the prospect of pandemic stocks roaring back and China internet stocks rebounding meaningfully is not a given. There is still very much a case for selectivity—and balance, ballast and income are worth considering too.
Performance Contributors and Detractors:
From a regional perspective most of our relative underperformance in the first half of the year was tied to Russia, which is nominally marked at close to zero. The pain has been taken. Geopolitical events on the magnitude of the invasion of Ukraine are rare, hard to predict ex-ante but easy to Monday morning quarterback. Our overall construction held up well in what was a major geopolitical event. That’s in stark contrast to strategies that underperformed as a result of an inability to pivot from early-stage companies with little profits that were en vogue during the pandemic and now face material headwinds in the current market backdrop. On the other hand, our allocation to Vietnam contributed the most to relative performance in the first half.
At the sector level, our overweight and stock allocation in real estate contributed the most to performance over the past six months while stock selection in materials was a positive contributor. In contrast, our stock selections in energy and financials detracted the most.
At the holdings level, real estate company CapitaLand Investment in Singapore was a top contributor in the first half, as was energy giant Petroleo Brasileiro SA in Brazil and financial services company AIA Group in Hong Kong. Two information technology (IT) stocks: Samsung Electronics Co. Ltd Pfd and Taiwan Semiconductor Manufacturing Co. (TSMC) were among the biggest detractors. The
(continued)
| 1 | Prospectus expense ratios. |
| 2 | Matthews has contractually agreed (i) to waive fees and reimburse expenses to the extent needed to limit Total Annual Fund Operating Expenses (excluding Rule 12b-1 fees, taxes, interest, brokerage commissions, short sale dividend expenses, expenses incurred in connection with any merger or reorganization or extraordinary expenses such as litigation) of the Institutional Class to 0.90% first by waiving class specific expenses (i.e., shareholder service fees specific to a particular class) of the Institutional Class and then, to the extent necessary, by waiving non-class specific expenses (e.g., custody fees) of the Institutional Class, and (ii) if any Fund-wide expenses (i.e., expenses that apply to both the Institutional Class and the Investor Class) are waived for the Institutional Class to maintain the 0.90% expense limitation, to waive an equal amount (in annual percentage terms) of those same expenses for the Investor Class. The Total Annual Fund Operating Expenses After Fee Waiver and Expense Reimbursement for the Investor Class may vary from year to year and will in some years exceed 0.90%. If the operating expenses fall below the expense limitation within three years after Matthews has made a waiver or reimbursement, the Fund may reimburse Matthews up to an amount that does not cause the expenses for that year to exceed the lesser of (i) the expense limitation applicable at the time of that fee waiver and/or expense reimbursement or (ii) the expense limitation in effect at the time of recoupment. This agreement will remain in place until April 30, 2023 and may be terminated at any time by the Board of Trustees on behalf of the Fund on 60 days’ written notice to Matthews. Matthews may decline to renew this agreement by written notice to the Trust at least 30 days before its annual expiration date. |
| 3 | The lesser of fiscal year 2021 long-term purchase costs or sales proceeds divided by the average monthly market value of long-term securities. |
| | | | | | | | | | | | | | | | | | | | |
| |
| PERFORMANCE AS OF JUNE 30, 2022 | |
| | | 3 Months | | | YTD | | | 1 Year | | | Since
Inception | | | Inception
date | |
| Investor Class (MEGMX) | | | -14.96% | | | | -24.69% | | | | -31.53% | | | | 9.07% | | | | 04/30/20 | |
| Institutional Class (MIEFX) | | | -14.80% | | | | -24.55% | | | | -31.28% | | | | 9.35% | | | | 04/30/20 | |
| MSCI Emerging Markets Index4 | | | -11.34% | | | | -17.47% | | | | -25.00% | | | | 6.56% | | | | | |
Performance assumes reinvestment of all dividends and/or distributions before taxes. All performance quoted represents past performance and is no guarantee of future results. Investment return and principal value will fluctuate with market conditions so that when redeemed, shares may be worth more or less than their original cost. Current performance may be lower or higher than the return figures quoted. Returns would have been lower if certain of the Fund’s fees and expenses had not been waived. For the Fund’s most recent month-end performance visit matthewsasia.com.
GROWTH OF A HYPOTHETICAL $10,000 INVESTMENT SINCE INCEPTION—INVESTOR CLASS
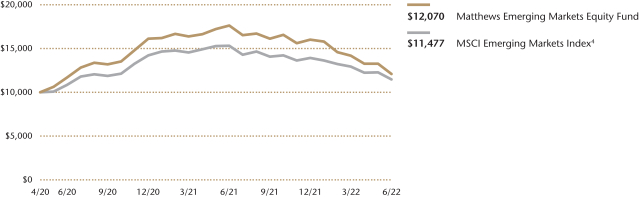
Plotted monthly. The performance data and graph do not reflect the deduction of taxes that a shareholder would pay on dividends, capital gains distributions or redemption of Fund shares. Values are in US$.
| | 4 | It is not possible to invest directly in an index. Source: Index data from Morgan Stanley Capital International and Bloomberg; total return calculations performed by BNY Mellon Investment Servicing (US) Inc. Please see page 84 for index definition. |
| | | | | | | | |
| | | | |
| TOP TEN HOLDINGS5 | | | | | | | |
Name | | Sector | | Country | | % Net Assets | |
| Taiwan Semiconductor Manufacturing Co., Ltd. | | Information Technology | | Taiwan | | | 6.6% | |
| Samsung Electronics Co., Ltd., Pfd. | | Information Technology | | South Korea | | | 5.5% | |
| FPT Corp. | | Information Technology | | Vietnam | | | 4.8% | |
| Tencent Holdings, Ltd. | | Communication Services | | China/Hong Kong | | | 4.1% | |
| Capitaland Investment, Ltd. | | Real Estate | | Singapore | | | 3.5% | |
| Infosys, Ltd. | | Information Technology | | India | | | 2.9% | |
| HDFC Bank, Ltd. | | Financials | | India | | | 2.8% | |
| Woodside Energy Group, Ltd. | | Energy | | Australia | | | 2.8% | |
| First Quantum Minerals, Ltd. | | Materials | | Zambia | | | 2.8% | |
| Prologis Property Mexico SA de CV, REIT | | Real Estate | | Mexico | | | 2.7% | |
| % OF ASSETS IN TOP 10 | | | | | | | 38.5% | |
| | 5 | Holdings may combine more than one security from same issuer and related depositary receipts. |
| | | | | | | | |
| | | | matthewsasia.com | 800.789.ASIA | | | 9 | |
| | | | |
| |
| COUNTRY ALLOCATION (%)6,7 | |
| China/Hong Kong | | | 16.5 | |
| India | | | 12.6 | |
| Mexico | | | 9.0 | |
| Brazil | | | 7.9 | |
| Taiwan | | | 7.4 | |
| South Korea | | | 7.2 | |
| Vietnam | | | 7.0 | |
| Singapore | | | 4.9 | |
| Canada | | | 3.4 | |
| Indonesia | | | 2.9 | |
| Australia | | | 2.8 | |
| Philippines | | | 2.5 | |
| United States | | | 2.5 | |
| United Kingdom | | | 2.5 | |
| France | | | 1.7 | |
| Qatar | | | 1.6 | |
| Israel | | | 1.5 | |
| Netherlands | | | 1.2 | |
| Argentina | | | 0.9 | |
| Poland | | | 0.8 | |
| Cash and Other Assets, Less Liabilities | | | 3.4 | |
| | | | |
| |
| SECTOR ALLOCATION (%)7 | |
| Information Technology | | | 25.1 | |
| Financials | | | 22.2 | |
| Consumer Discretionary | | | 10.3 | |
| Real Estate | | | 9.2 | |
| Materials | | | 8.9 | |
| Energy | | | 6.5 | |
| Industrials | | | 4.9 | |
| Consumer Staples | | | 4.5 | |
| Communication Services | | | 4.1 | |
| Health Care | | | 0.9 | |
| Cash and Other Assets, Less Liabilities | | | 3.4 | |
| | | | |
| | |
| MARKET CAP EXPOSURE (%)7 | | | |
| Mega Cap (over $25B) | | | 50.7 | |
| Large Cap ($10B-$25B) | | | 18.5 | |
| Mid Cap ($3B-10B) | | | 14.8 | |
| Small Cap (under $3B) | | | 12.6 | |
| Cash and Other Assets, Less Liabilities | | | 3.4 | |
| 6 | Not all countries where the Fund may invest are included in the benchmark index. |
| 7 | Source: FactSet Research Systems. Percentage values in data are rounded to the nearest tenth of one percent, so the values may not sum to 100% due to rounding. Country allocations and percentage values may be derived from different data sources and may not be consistent with other Fund literature. |
Matthews Emerging Markets Equity Fund
Portfolio Manager Commentary (unaudited) (continued)
semiconductor space has been weak as fears of a recession or global slowdown weigh on sentiment. Samsung and TSMC fit our framework well as both have exceptional competitive positions, strong cash generation, and balance sheets that allow for funding of expansion from internal resources. These companies should continue to benefit long term from more chips in more things as well as from an expansion of semiconductor fabs in different geographies.
Notable Portfolio Changes:
Among the holdings we closed in the second quarter was our position in Alibaba Group Holding Ltd. The business is cheap, but we are unsure of the go-forward prospects in both its core e-commerce business and its capital allocation outside of it. Among the positions we added are Prudential Plc, which has a large, successful Asian life insurance business that is growing new business volumes in most of its markets now and should benefit meaningfully from re-opening in Hong Kong and China, the timing of which remains uncertain.
Outlook:
We’ve attempted to re-evaluate each of our holdings to understand resiliency against a backdrop of persistent (but perhaps peaked) inflation, geopolitical tension, and bias toward higher U.S. rates, which puts comparatively more pressure on cashless narratives compared with cash-generating ones. A strong dollar is a topic we’ve touched on in the past. The depth of asset price declines appears indiscriminate at times. When the dust settles, we believe elements of our framework including capital allocation, cash flow and capital structure, combined with solid company character, will eventually gain traction.
Good things tend to take care of themselves so investors need to ask hard questions about how companies will perform if the backdrop remains challenging. A U.S. recession or general decline in economic activity is increasingly a topic of concern. We don’t have any unique insight on the probability or depth of a slowdown, which is why the Matthews Emerging Markets Equity Fund remains more cautiously positioned than in past quarters. We believe investors need to think beyond consumer-driven trends that dominated during the height of the pandemic and embrace a broader set of companies going forward.
Definitions:
NASDAQ Composite Index: A market capitalization-weighted index of over 3,700 stocks listed on the Nasdaq stock exchange, heavily weighted toward the technology sector.
NASDAQ Golden Dragon China Index: A modified market capitalization-weighted index featuring companies whose common stock is publicly traded in the U.S. while the bulk of their business is conducted in China.
Price to earnings ratio: A valuation ratio of a company’s current share price compared to its per-share earnings.
Matthews Emerging Markets Equity Fund
June 30, 2022
Schedule of Investmentsa (unaudited)
COMMON EQUITIES: 91.1%
| | | | | | | | |
| | | Shares | | | Value | |
| | |
| CHINA/HONG KONG: 16.5% | | | | | | | | |
| | |
Tencent Holdings, Ltd. | | | 34,900 | | | | $1,579,754 | |
| | |
AIA Group, Ltd. | | | 86,400 | | | | 944,056 | |
| | |
Huazhu Group, Ltd. ADR | | | 17,400 | | | | 662,940 | |
| | |
ESR Group, Ltd.b,c,d | | | 225,800 | | | | 612,291 | |
| | |
JD.com, Inc. A Shares | | | 18,502 | | | | 596,191 | |
| | |
Yum China Holdings, Inc. | | | 11,400 | | | | 552,900 | |
| | |
Midea Group Co., Ltd. A Shares | | | 54,300 | | | | 491,472 | |
| | |
NARI Technology Co., Ltd. A Shares | | | 121,320 | | | | 491,043 | |
| | |
Techtronic Industries Co., Ltd. | | | 35,000 | | | | 365,475 | |
| | | | | | | | |
Total China/Hong Kong | | | | | | | 6,296,122 | |
| | | | | | | | |
| | | | | | | | |
| | | |
| INDIA: 12.6% | | | | | | | | |
| | |
Infosys, Ltd. ADR | | | 59,100 | | | | 1,093,941 | |
| | |
HDFC Bank, Ltd. ADR | | | 19,700 | | | | 1,082,712 | |
| | |
ICICI Bank, Ltd. ADR | | | 41,600 | | | | 737,984 | |
| | |
Kotak Mahindra Bank, Ltd. | | | 29,273 | | | | 619,117 | |
| | |
Restaurant Brands Asia, Ltd.c | | | 366,466 | | | | 517,320 | |
| | |
Dabur India, Ltd. | | | 73,145 | | | | 460,152 | |
| | |
Bandhan Bank, Ltd.b,d | | | 90,944 | | | | 305,140 | |
| | | | | | | | |
Total India | | | | | | | 4,816,366 | |
| | | | | | | | |
| | | | | | | | |
| | | |
| MEXICO: 9.0% | | | | | | | | |
| | |
Prologis Property Mexico SA de CV, REIT | | | 392,998 | | | | 1,030,693 | |
| | |
Grupo Financiero Banorte SAB de CV Class O | | | 119,900 | | | | 668,797 | |
| | |
GCC SAB de CV | | | 101,400 | | | | 633,879 | |
| | |
Grupo Aeroportuario del Sureste SAB de CV ADR | | | 3,200 | | | | 628,448 | |
| | |
Becle SAB de CV | | | 218,800 | | | | 473,299 | |
| | | | | | | | |
Total Mexico | | | | | | | 3,435,116 | |
| | | | | | | | |
| | | | | | | | |
| | | |
| BRAZIL: 7.9% | | | | | | | | |
| | |
Banco BTG Pactual SA | | | 183,200 | | | | 780,975 | |
| | |
Vale SA ADR | | | 45,400 | | | | 664,202 | |
| | |
Petroleo Brasileiro SA ADR | | | 50,200 | | | | 586,336 | |
| | |
Vinci Partners Investments, Ltd. Class A | | | 38,500 | | | | 411,950 | |
| | |
Hapvida Participacoes e Investimentos SAb,d | | | 344,100 | | | | 359,653 | |
| | |
Itau Unibanco Holding SA ADR | | | 50,400 | | | | 215,712 | |
| | | | | | | | |
Total Brazil | | | | | | | 3,018,828 | |
| | | | | | | | |
| | | | | | | | |
| | | |
| TAIWAN: 7.3% | | | | | | | | |
| | |
Taiwan Semiconductor Manufacturing Co., Ltd. | | | 157,000 | | | | 2,516,137 | |
| | |
Gogoro, Inc.c | | | 38,100 | | | | 291,465 | |
| | | | | | | | |
Total Taiwan | | | | | | | 2,807,602 | |
| | | | | | | | |
| | | | | | | | |
| | | |
| VIETNAM: 7.0% | | | | | | | | |
| | |
FPT Corp. | | | 491,217 | | | | 1,822,163 | |
| | |
Military Commercial Joint Stock Bankc | | | 456,980 | | | | 476,082 | |
| | |
Sai Gon Cargo Service Corp. | | | 56,700 | | | | 386,613 | |
| | | | | | | | |
Total Vietnam | | | | | | | 2,684,858 | |
| | | | | | | | |
| | | | | | | | |
| | | |
| SINGAPORE: 4.9% | | | | | | | | |
| | |
Capitaland Investment, Ltd. | | | 484,000 | | | | 1,332,123 | |
| | |
TDCX, Inc. ADRc | | | 57,800 | | | | 534,650 | |
| | | | | | | | |
Total Singapore | | | | | | | 1,866,773 | |
| | | | | | | | |
| | | | | | | | |
| | | Shares | | | Value | |
| | |
| UNITED STATES: 3.4% | | | | | | | | |
| | |
Lam Research Corp. | | | 1,400 | | | | $596,610 | |
| | |
Globant SAc | | | 2,000 | | | | 348,000 | |
| | |
Excelerate Energy, Inc. Class Ac | | | 17,400 | | | | 346,608 | |
| | | | | | | | |
Total United States | | | | | | | 1,291,218 | |
| | | | | | | | |
| | | | | | | | |
| | | |
| INDONESIA: 2.9% | | | | | | | | |
| | |
PT Bank Rakyat Indonesia Persero | | | 2,414,500 | | | | 674,287 | |
| | |
PT Avia Avian Tbk | | | 7,795,900 | | | | 426,492 | |
| | | | | | | | |
Total Indonesia | | | | | | | 1,100,779 | |
| | | | | | | | |
| | | | | | | | |
| | | |
| AUSTRALIA: 2.8% | | | | | | | | |
| | |
Woodside Energy Group, Ltd. | | | 48,559 | | | | 1,067,255 | |
| | | | | | | | |
Total Australia | | | | | | | 1,067,255 | |
| | | | | | | | |
| | | | | | | | |
| | | |
| ZAMBIA: 2.8% | | | | | | | | |
| | |
First Quantum Minerals, Ltd. | | | 55,500 | | | | 1,052,913 | |
| | | | | | | | |
Total Zambia | | | | | | | 1,052,913 | |
| | | | | | | | |
| | | | | | | | |
| | | |
| UNITED KINGDOM: 2.5% | | | | | | | | |
| | |
Prudential PLC | | | 76,538 | | | | 952,074 | |
| | | | | | | | |
Total United Kingdom | | | | | | | 952,074 | |
| | | | | | | | |
| | | | | | | | |
| | | |
| PHILIPPINES: 2.5% | | | | | | | | |
| | |
Ayala Land, Inc. | | | 1,114,400 | | | | 517,992 | |
| | |
Wilcon Depot, Inc. | | | 988,100 | | | | 427,695 | |
| | | | | | | | |
Total Philippines | | | | | | | 945,687 | |
| | | | | | | | |
| | | | | | | | |
| | | |
| FRANCE: 1.7% | | | | | | | | |
| | |
LVMH Moet Hennessy Louis Vuitton SE | | | 615 | | | | 376,920 | |
| | |
TotalEnergies SE ADR | | | 4,900 | | | | 257,936 | |
| | | | | | | | |
Total France | | | | | | | 634,856 | |
| | | | | | | | |
| | | | | | | | |
| | | |
| SOUTH KOREA: 1.6% | | | | | | | | |
| | |
LG Chem Ltd. | | | 1,579 | | | | 627,308 | |
| | | | | | | | |
Total South Korea | | | | | | | 627,308 | |
| | | | | | | | |
| | | | | | | | |
| | | |
| QATAR: 1.6% | | | | | | | | |
| | |
Qatar National Bank QPSC | | | 112,729 | | | | 618,842 | |
| | | | | | | | |
Total Qatar | | | | | | | 618,842 | |
| | | | | | | | |
| | | | | | | | |
| | | |
| ISRAEL: 1.5% | | | | | | | | |
| | |
Nice, Ltd. ADRc | | | 2,900 | | | | 558,105 | |
| | | | | | | | |
Total Israel | | | | | | | 558,105 | |
| | | | | | | | |
| | | | | | | | |
| | | |
| NETHERLANDS: 1.2% | | | | | | | | |
| | |
Heineken NV | | | 5,168 | | | | 470,400 | |
| | | | | | | | |
Total Netherlands | | | | | | | 470,400 | |
| | | | | | | | |
| | | | | | | | |
| | | |
| POLAND: 0.8% | | | | | | | | |
| | |
Dino Polska SAb,c,d | | | 4,353 | | | | 310,486 | |
| | | | | | | | |
Total Poland | | | | | | | 310,486 | |
| | | | | | | | |
| | | | | | | | |
| | | | matthewsasia.com | 800.789.ASIA | | | 11 | |
Matthews Emerging Markets Equity Fund
June 30, 2022
Schedule of Investmentsa (unaudited) (continued)
COMMON EQUITIES (continued)
| | | | | | | | |
| | | Shares | | | Value | |
| | |
| CANADA: 0.6% | | | | | | | | |
| | |
Parex Resources, Inc. | | | 13,400 | | | | $226,942 | |
| | | | | | | | |
Total Canada | | | | | | | 226,942 | |
| | | | | | | | |
| | | | | | | | |
| | | |
| RUSSIA: 0.0% | | | | | | | | |
| | |
Sberbank of Russia PJSCc,e | | | 128,308 | | | | 2,333 | |
| | |
LUKOIL PJSC ADRe | | | 18,010 | | | | 360 | |
| | |
Novatek PJSC GDRd,e | | | 6,184 | | | | 124 | |
| | |
TCS Group Holding PLC GDRc,d,e | | | 3,865 | | | | 77 | |
| | | | | | | | |
Total Russia | | | | | | | 2,894 | |
| | | | | | | | |
| | | | | | | | |
| | | |
| TOTAL COMMON EQUITIES | | | | | | | 34,785,424 | |
| | | | | | | | |
(Cost $42,383,277) | | | | | | | | |
| | | | | | | | |
| | |
PREFERRED EQUITIES: 5.5% | | | | | | | | |
| | | |
| SOUTH KOREA: 5.5% | | | | | | | | |
| | |
Samsung Electronics Co., Ltd., Pfd. | | | 52,370 | | | | 2,105,033 | |
| | | | | | | | |
Total South Korea | | | | | | | 2,105,033 | |
| | | | | | | | |
| | | | | | | | |
| | | |
| TOTAL PREFERRED EQUITIES | | | | | | | 2,105,033 | |
| | | | | | | | |
(Cost $2,893,786) | | | | | | | | |
| | | | | | | | |
| | |
| TOTAL INVESTMENTS: 96.6% | | | | 36,890,457 | |
(Cost $45,277,063) | | | | | | | | |
| | | | | | | | |
| | |
CASH AND OTHER ASSETS,
LESS LIABILITIES: 3.4% | | | | | | | 1,281,794 | |
| | | | | | | | |
| | | | | | | | |
| |
NET ASSETS: 100.0% | | | | $38,172,251 | |
| | | | | | | | |
| a | Certain securities were fair valued under the valuation policies approved by the Board of Trustees (Note 2-A). |
| b | Security exempt from registration under Rule 144A of the Securities Act of 1933, as amended. The security may be resold in transactions exempt from registration normally to qualified institutional buyers. The security has been determined to be liquid in accordance with procedures adopted by the Funds’ Board of Trustees. At June 30, 2022, the aggregate value is $1,587,570, which is 4.16% of net assets. |
| c | Non-income producing security. |
| d | The securities may be resold to qualified foreign investors and foreign institutional buyers under Regulation S of the Securities Act of 1933. |
| e | Security is valued using significant unobservable inputs and is classified as Level 3 in the fair value hierarchy. The aggregate value of Level 3 security is $2,894 and 0.01% of net assets. |
| ADR | American Depositary Receipt |
| GDR | Global Depositary Receipt |
| PJSC | Public Joint Stock Co. |
| QPSC | Qatari Public Shareholding Co. |
| REIT | Real Estate Investment Trust |
See accompanying notes to financial statements.

| | | | |
| PORTFOLIO MANAGERS |
| |
| Vivek Tanneeru | | |
| Lead Manager | | |
| |
| Jeremy Sutch, CFA | | |
Co-Manager | | |
|
| FUND FACTS |
| | |
| | | Investor | | Institutional |
Ticker | | MSMLX | | MISMX |
CUSIP | | 577125206 | | 577125867 |
Inception | | 9/15/08 | | 4/30/13 |
NAV | | $24.44 | | $24.43 |
Initial Investment | | $2,500 | | $100,000 |
Gross Expense Ratio1 | | 1.51% | | 1.38% |
After Fee Waiver and Reimbursement2 | | 1.35% | | 1.15% |
Portfolio Statistics | | |
Total # of Positions | | 60 |
Net Assets | | $347.8 million |
Weighted Average
Market Cap | | $4.3 billion |
Portfolio Turnover3 | | 50.8% |
Benchmark | | |
MSCI Emerging Markets Small Cap Index |
OBJECTIVE
Long-term capital appreciation.
STRATEGY
Under normal market conditions, the Fund seeks to achieve its investment objective by investing at least 80% of its net assets, which include borrowings for investment purposes, in the common and preferred stocks of Small Companies located in emerging market countries. Emerging market countries generally include every country in the world except the United States, Australia, Canada, Hong Kong, Israel, Japan, New Zealand, Singapore and most of the countries in Western Europe. The Fund defines Small Companies as companies with market capitalization no higher than the greater of $5 billion or the market capitalization of the largest company included in the Fund’s primary benchmark, the MSCI Emerging Markets Small Cap Index.
Matthews Emerging Markets Small Companies Fund
Portfolio Manager Commentary (unaudited)
For the first half of 2022, the Matthews Emerging Markets Small Companies Fund returned –18.32% (Investor Class) and –18.21% (Institutional Class), while its benchmark, the MSCI Emerging Markets Small Cap Index, returned –19.85% over the same period. For the quarter ending June 30, 2022, the Fund returned –8.09% (Investor Class) and –8.02% (Institutional Class), while the benchmark returned –16.28%.
Market Environment:
There were mixed fortunes for emerging markets in the first half of the year. Higher-than-expected inflation reads in the U.S. and European Union led the market to anticipate a steeper rate hike cycle. The Fed hiked its rate by 75 basis points (0.75%) in its June meeting, the first such move in almost three decades. Also attendant was the view that the steeper pace of tightening may lead to recession. With no end in sight to the Russian invasion of Ukraine, prices in the oil and gas markets remained elevated notwithstanding periodic pullbacks over recessionary concerns.
Still, in China, after several quarters, sentiment has turned a corner with the expectation that regulatory risk has peaked and the Chinese government is taking a more pragmatic approach to its zero COVID policy and aiding economic activity through a stimulus package. In Latin America, Colombia elected its first ever left-leaning president, solidifying gains for the left in the region following victories for left-leaning candidates in Chile and Peru.
Turkey and Kuwait were the strongest performing markets in the first six months of the year, while Egypt and Hungary were the worst. During the second quarter, Turkey and United Arab Emirates were the strongest while Hungary and Brazil were the biggest laggards.
In the second quarter, all major investable emerging market currencies weakened against a surging U.S. dollar. Currencies of commodity-exporting countries such as Chile, South Africa and Brazil that appreciated strongly in the first quarter gave up some of those gains during the second quarter. During the second quarter the Chilean peso depreciated the most followed by the Hungarian forint and the Turkish lira.
Performance Contributors and Detractors:
India, Vietnam and South Korea were major contributors to relative performance during the first half of the year. India’s contribution was driven by stock selection while the portfolio benefited from being overweight Vietnam and underweight South Korea. On the other hand, our underweight and stock selection in Taiwan was the biggest detractor.
From a sector perspective, stock selection in industrials and consumer discretionary were the biggest drivers of performance in the first half, while stock selection in information technology and financials detracted from performance.
(continued)
| 1 | Prospectus expense ratios. |
| 2 | Matthews has contractually agreed (i) to waive fees and reimburse expenses to the extent needed to limit Total Annual Fund Operating Expenses (excluding Rule 12b-1 fees, taxes, interest, brokerage commissions, short sale dividend expenses, expenses incurred in connection with any merger or reorganization or extraordinary expenses such as litigation) of the Institutional Class to 1.15% first by waiving class specific expenses (i.e., shareholder service fees specific to a particular class) of the Institutional Class and then, to the extent necessary, by waiving non-class specific expenses (e.g., custody fees) of the Institutional Class, and (ii) if any Fund-wide expenses (i.e., expenses that apply to both the Institutional Class and the Investor Class) are waived for the Institutional Class to maintain the 1.15% expense limitation, to waive an equal amount (in annual percentage terms) of those same expenses for the Investor Class. The Total Annual Fund Operating Expenses After Fee Waiver and Expense Reimbursement for the Investor Class may vary from year to year and will in some years exceed 1.15%. If the operating expenses fall below the expense limitation within three years after Matthews has made a waiver or reimbursement, the Fund may reimburse Matthews up to an amount that does not cause the expenses for that year to exceed the lesser of (i) the expense limitation applicable at the time of that fee waiver and/or expense reimbursement or (ii) the expense limitation in effect at the time of recoupment. This agreement will remain in place until April 30, 2023 and may be terminated at any time by the Board of Trustees on behalf of the Fund on 60 days’ written notice to Matthews. Matthews may decline to renew this agreement by written notice to the Trust at least 30 days before its annual expiration date. |
| 3 | The lesser of fiscal year 2021 long-term purchase costs or sales proceeds divided by the average monthly market value of long-term securities. |
| | | | | | | | |
| | | | matthewsasia.com | 800.789.ASIA | | | 13 | |
| | | | | | | | | | | | | | | | | | | | | | | | | | | | | | | | |
| |
| PERFORMANCE AS OF JUNE 30, 2022 | |
| | | | | | | | | | | | Average Annual Total Returns | | | | |
| | | 3 Months | | | YTD | | | 1 Year | | | 3 Years | | | 5 Years | | | 10 Years | | | Since
Inception | | | Inception
Date | |
| Investor Class (MSMLX) | | | -8.09% | | | | -18.32% | | | | -15.79% | | | | 14.31% | | | | 9.48% | | | | 8.39% | | | | 10.84% | | | | 09/15/08 | |
| Institutional Class (MISMX) | | | -8.02% | | | | -18.21% | | | | -15.59% | | | | 14.55% | | | | 9.70% | | | | n.a. | | | | 6.79% | | | | 04/30/13 | |
| MSCI Emerging Markets Small Cap Index4 | | | -16.28% | | | | -19.85% | | | | -20.29% | | | | 6.24% | | | | 3.89% | | | | 4.67% | | | | 6.13% | 5 | | | | |
Performance assumes reinvestment of all dividends and/or distributions before taxes. All performance quoted represents past performance and is no guarantee of future results. Investment return and principal value will fluctuate with market conditions so that when redeemed, shares may be worth more or less than their original cost. Current performance may be lower or higher than the return figures quoted. Returns would have been lower if certain of the Fund’s fees and expenses had not been waived. For the Fund’s most recent month-end performance, visit matthewsasia.com.
GROWTH OF A HYPOTHETICAL $10,000 INVESTMENT SINCE INCEPTION—INVESTOR CLASS
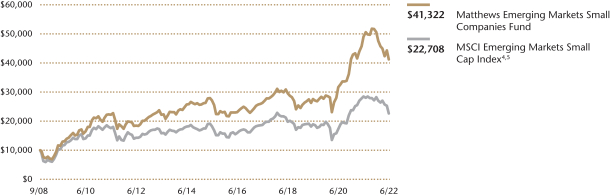
Plotted monthly. The performance data and graph do not reflect the deduction of taxes that a shareholder would pay on dividends, capital gains distributions or redemption of Fund shares. Values are in US$.
| | 4 | It is not possible to invest directly in an index. Source: Index data from Morgan Stanley Capital International and Bloomberg; total return calculations performed by BNY Mellon Investment Servicing (US) Inc. Please see page 84 for index definition. Effective April 30, 2021, in connection with changes to the Fund’s name and principal investment strategy, the primary benchmark changed from the MSCI All Country Asia ex Japan Small Cap Index to the MSCI Emerging Markets Small Cap Index. Before April 30, 2021, the Fund was managed with a different investment strategy and may have achieved different performance results for periods before that date with its current investment strategy. |
| | 5 | Calculated from 9/15/08. |
| | | | | | | | |
| | | | |
| TOP TEN HOLDINGS6 | | | | | | | |
| Name | | Sector | | Country | | % Net Assets | |
| Ginlong Technologies Co., Ltd. | | Industrials | | China/Hong Kong | | | 7.2% | |
| Shriram City Union Finance, Ltd. | | Financials | | India | | | 5.9% | |
| Ecopro BM Co., Ltd. | | Industrials | | South Korea | | | 5.1% | |
| Bandhan Bank, Ltd. | | Financials | | India | | | 4.8% | |
| Legend Biotech Corp. | | Health Care | | United States | | | 4.5% | |
| Phoenix Mills, Ltd. | | Real Estate | | India | | | 4.5% | |
| Silergy Corp. | | Information Technology | | China/Hong Kong | | | 4.2% | |
| Mobile World Investment Corp. | | Consumer Discretionary | | Vietnam | | | 3.6% | |
| Lemon Tree Hotels, Ltd. | | Consumer Discretionary | | India | | | 3.3% | |
| Vamos Locacao de Caminhoes Maquinas e Equipamentos SA | | Industrials | | Brazil | | | 2.8% | |
| % OF ASSETS IN TOP 10 | | | | | | | 45.9% | |
| | 6 | Holdings may combine more than one security from same issuer and related depositary receipts. |
Matthews Emerging Markets Small Companies Fund
Portfolio Manager Commentary (unaudited) (continued)
Turning to individual stocks, Ginlong Technologies, a Chinese solar inverter manufacturer, was the biggest contributor to the Fund’s absolute and relative performance in the first six months. Ginlong continues to benefit from the strong growth in the underlying demand for solar power globally and from distributed solar power in particular. The company’s strong performance stemmed from both domestic and overseas markets and it gained further market share. Looking ahead we see strong demand prospects for solar power on the back of reduced raw material pricing pressures in the supply chain compared to last year. This should benefit the company alongside the progress it is making in the commercial and industrial space as well as with utility projects and storage inverters. On the other hand, technology holdings such as Silergy, Formosa Sumco Technology, and Andes Technology detracted from performance due to rotation away from companies that derive a significant part of their value from growth in the long term. Such stocks face a headwind in a sharply rising interest-rate environment and near-term concerns about the semiconductor demand outlook in light of growing worries about softness in economic growth.
Notable Portfolio Changes:
During the second quarter we initiated positions including Hainan Meilan International Airport, a leading operator that serves Haikou, the capital city of Hainan island province in China. Hainan island is a major tourist destination in China and Haikou airport is a major gateway to the island. We expect the pent-up domestic tourism demand to be strong as China’s government takes a more pragmatic approach to implementing its zero COVID policy while outbound international tourism take off might be a few quarters away pending large-scale mRNA vaccination rollout in China. Meilan Airport has a strong duty-free revenue exposure given it has China’s largest duty-free store area and is expected to benefit from the opening of a new terminal that doubled the airport’s passenger handling capacity both from aeronautical and non-aeronautical revenue lines. The stock was available at very attractive valuations amid COVID-19 related lockdowns in Shanghai and Beijing during the quarter.
We exited positions such as Hua Hong Semiconductor—which was a source of cash to fund other promising ideas—and GMR Power and Urban Infra, a stub holding as a result of a de-merger from an airport operator.
Outlook:
The pace and scope of the Fed’s interest-rate hikes and quantitative tightening and the market’s expectation of its evolution remain the most important variables to watch and will have near-term implications for regional, sector and style performance. Russia’s invasion of Ukraine and its impact on energy prices also needs careful monitoring.
Overall, the impact of weak external balances and strongly depreciating currencies in addition to rampant inflation in soft and industrial commodities and energy have led to severe stress in frontier countries like Sri Lanka. But generally, larger emerging markets seem to be reasonably well placed to weather the storm. We believe there is sufficient liquidity in emerging markets in general and that there are early signs of the rate hiking cycle coming to a potential close in commodity-orientated markets like Brazil. In many parts of the emerging markets, the COVID-19 vaccination is progressing well and provides hope for economic activity normalization in the coming quarters led by a pickup in the services sector.
From a portfolio standpoint, we will look to maintain a balance between growth and value exposure while staying broadly diversified across sectors and countries. We remain watchful about the impact of input inflation and potentially slower economic growth on corporate earnings for the rest of the year and into 2023. Barring another serious pandemic wave or a major recession, we believe small companies are poised to grow and are available at attractive valuations.
| | | | |
| |
| COUNTRY ALLOCATION (%)7,8 | |
| China/Hong Kong | | | 29.2 | |
| India | | | 24.8 | |
| South Korea | | | 8.8 | |
| Vietnam | | | 7.8 | |
| Indonesia | | | 6.1 | |
| Taiwan | | | 4.9 | |
| United States | | | 4.5 | |
| Brazil | | | 4.4 | |
| Chile | | | 2.6 | |
| Philippines | | | 2.2 | |
| Mexico | | | 1.3 | |
| United Kingdom | | | 1.3 | |
| Bangladesh | | | 1.1 | |
| Canada | | | 1.1 | |
| Turkey | | | 0.5 | |
| Liabilities in Excess of Cash and Other Assets | | | -0.5 | |
| | | | |
| |
| SECTOR ALLOCATION (%)8 | |
| Industrials | | | 31.2 | |
| Financials | | | 18.9 | |
| Information Technology | | | 15.2 | |
| Consumer Discretionary | | | 12.9 | |
| Health Care | | | 10.8 | |
| Real Estate | | | 8.9 | |
| Materials | | | 1.1 | |
| Communication Services | | | 1.1 | |
| Consumer Staples | | | 0.5 | |
| Liabilities in Excess of Cash and Other Assets | | | -0.5 | |
| | | | |
| |
| MARKET CAP EXPOSURE (%)8,9 | |
| Mega Cap (over $25B) | | | 0.0 | |
| Large Cap ($10B-$25B) | | | 9.7 | |
| Mid Cap ($3B-10B) | | | 40.6 | |
| Small Cap (under $3B) | | | 50.2 | |
| Liabilities in Excess of Cash and Other Assets | | | -0.5 | |
| 7 | Not all countries where the Fund may invest are included in the benchmark index. |
| 8 | Source: FactSet Research Systems. Percentage values in data are rounded to the nearest tenth of one percent, so the values may not sum to 100% due to rounding. Country allocations and percentage values may be derived from different data sources and may not be consistent with other Fund literature. |
| 9 | The Fund defines Small Companies as companies with market capitalization no higher than the greater of $5 billion or the market capitalization of the largest company included in the Fund’s primary benchmark, the MSCI Emerging Markets Small Cap Index. |
| | | | | | | | |
| | | | matthewsasia.com | 800.789.ASIA | | | 15 | |
Matthews Emerging Markets Small Companies Fund
June 30, 2022
Schedule of Investmentsa (unaudited)
COMMON EQUITIES: 99.8%
| | | | | | | | |
| | | Shares | | | Value | |
| | |
| CHINA/HONG KONG: 29.1% | | | | | | | | |
| | |
Silergy Corp. | | | 180,000 | | | | $14,554,688 | |
| | |
Ginlong Technologies Co., Ltd. A Shares | | | 441,706 | | | | 14,119,212 | |
| | |
Ginlong Technologies Co., Ltd. A Shares | | | 344,241 | | | | 11,006,413 | |
| | |
Airtac International Group | | | 285,431 | | | | 9,527,074 | |
| | |
Hainan Meilan International Airport Co., Ltd. H Sharesb | | | 1,673,000 | | | | 4,930,229 | |
| | |
SITC International Holdings Co., Ltd. | | | 1,555,000 | | | | 4,422,699 | |
| | |
Flat Glass Group Co., Ltd. H Sharesb | | | 1,229,000 | | | | 4,326,510 | |
| | |
Full Truck Alliance Co., Ltd. ADRb | | | 472,200 | | | | 4,278,132 | |
| | |
Xtep International Holdings, Ltd. | | | 2,315,500 | | | | 4,195,526 | |
| | |
Innovent Biologics, Inc.b,c,d | | | 885,500 | | | | 3,961,782 | |
| | |
Centre Testing International Group Co., Ltd. A Shares | | | 1,120,674 | | | | 3,894,530 | |
| | |
Zhihu, Inc. ADRb | | | 2,158,300 | | | | 3,863,357 | |
| | |
Medlive Technology Co., Ltd.c,d | | | 2,176,000 | | | | 3,211,041 | |
| | |
Peijia Medical, Ltd.b,c,d | | | 3,137,000 | | | | 3,104,564 | |
| | |
OPT Machine Vision Tech Co., Ltd. A Shares | | | 79,118 | | | | 3,057,047 | |
| | |
AK Medical Holdings, Ltd.c,d | | | 3,364,000 | | | | 2,519,272 | |
| | |
Morimatsu International Holdings Co., Ltd.b,d | | | 2,341,000 | | | | 2,212,436 | |
| | |
CIFI Ever Sunshine Services Group, Ltd.d | | | 1,662,000 | | | | 2,130,550 | |
| | |
Centre Testing International Group Co., Ltd. A Shares | | | 585,338 | | | | 2,033,616 | |
| | | | | | | | |
Total China/Hong Kong | | | | | | | 101,348,678 | |
| | | | | | | | |
| | | | | | | | |
| | | |
| INDIA: 24.8% | | | | | | | | |
| | |
Shriram City Union Finance, Ltd. | | | 975,026 | | | | 20,521,490 | |
| | |
Bandhan Bank, Ltd.c,d | | | 4,973,475 | | | | 16,687,239 | |
| | |
Phoenix Mills, Ltd. | | | 1,031,247 | | | | 15,505,999 | |
| | |
Lemon Tree Hotels, Ltd.b,c,d | | | 14,664,074 | | | | 11,408,907 | |
| | |
Ashok Leyland, Ltd. | | | 3,350,560 | | | | 6,286,808 | |
| | |
Finolex Cables, Ltd. | | | 1,112,319 | | | | 5,312,253 | |
| | |
GMR Infrastructure, Ltd.b | | | 7,823,651 | | | | 3,389,984 | |
| | |
Barbeque Nation Hospitality, Ltd.b | | | 167,508 | | | | 2,306,320 | |
| | |
HEG, Ltd. | | | 169,638 | | | | 2,153,517 | |
| | |
Marico, Ltd. | | | 264,237 | | | | 1,602,516 | |
| | |
Rainbow Children’s Medicare, Ltd.b | | | 184,518 | | | | 1,088,685 | |
| | | | | | | | |
Total India | | | | | | | 86,263,718 | |
| | | | | | | | |
| | | | | | | | |
| | | |
| SOUTH KOREA: 8.8% | | | | | | | | |
| | |
Ecopro BM Co., Ltd. | | | 200,220 | | | | 17,644,093 | |
| | |
Hugel, Inc.b | | | 99,317 | | | | 8,053,733 | |
| | |
Solus Advanced Materials Co., Ltd. | | | 139,346 | | | | 4,879,955 | |
| | | | | | | | |
Total South Korea | | | | | | | 30,577,781 | |
| | | | | | | | |
| | | | | | | | |
| | | |
| VIETNAM: 7.8% | | | | | | | | |
| | |
Mobile World Investment Corp. | | | 4,032,014 | | | | 12,401,827 | |
| | |
Military Commercial Joint Stock Bankb | | | 8,012,269 | | | | 8,347,192 | |
| | |
FPT Corp. | | | 1,449,888 | | | | 5,378,339 | |
| | |
Nam Long Investment Corp. | | | 698,232 | | | | 1,076,966 | |
| | | | | | | | |
Total Vietnam | | | | | | | 27,204,324 | |
| | | | | | | | |
| | | | | | | | |
| | | |
| INDONESIA: 6.1% | | | | | | | | |
| | |
PT Mitra Adiperkasab | | | 136,713,400 | | | | 9,004,455 | |
| | |
PT Bank Tabungan Negara Persero | | | 66,124,500 | | | | 6,470,192 | |
| | | | | | | | |
| | | Shares | | | Value | |
| | |
PT Summarecon Agungb | | | 150,243,216 | | | | $5,763,257 | |
| | | | | | | | |
Total Indonesia | | | | | | | 21,237,904 | |
| | | | | | | | |
| | | | | | | | |
| | | |
| TAIWAN: 4.9% | | | | | | | | |
| | |
Andes Technology Corp. | | | 568,000 | | | | 4,824,834 | |
| | |
Formosa Sumco Technology Corp. | | | 714,000 | | | | 4,256,507 | |
| | |
Yageo Corp. | | | 362,000 | | | | 3,754,270 | |
| | |
M31 Technology Corp. | | | 407,000 | | | | 3,229,450 | |
| | |
Poya International Co., Ltd. | | | 78,000 | | | | 830,275 | |
| | | | | | | | |
Total Taiwan | | | | | | | 16,895,336 | |
| | | | | | | | |
| | | | | | | | |
| | | |
| UNITED STATES: 4.5% | | | | | | | | |
| | |
Legend Biotech Corp. ADRb | | | 284,159 | | | | 15,628,745 | |
| | | | | | | | |
Total United States | | | | | | | 15,628,745 | |
| | | | | | | | |
| | | | | | | | |
| | | |
| CHILE: 3.7% | | | | | | | | |
| | |
Parque Arauco SA | | | 8,448,535 | | | | 6,587,399 | |
| | |
Lundin Mining Corp. | | | 589,400 | | | | 3,736,408 | |
| | |
Banco de Credito e Inversiones SA | | | 89,121 | | | | 2,608,803 | |
| | | | | | | | |
Total Chile | | | | | | | 12,932,610 | |
| | | | | | | | |
| | | | | | | | |
| | | |
| BRAZIL: 3.7% | | | | | | | | |
| | |
Vamos Locacao de Caminhoes Maquinase | | | | | | | | |
| | |
Equipamentos SA | | | 4,335,000 | | | | 9,699,692 | |
| | |
YDUQS Participacoes SA | | | 1,224,100 | | | | 3,057,063 | |
| | | | | | | | |
Total Brazil | | | | | | | 12,756,755 | |
| | | | | | | | |
| | | | | | | | |
| | | |
| PHILIPPINES: 2.2% | | | | | | | | |
| | |
Cebu Air, Inc.b | | | 9,993,800 | | | | 7,563,255 | |
| | | | | | | | |
Total Philippines | | | | | | | 7,563,255 | |
| | | | | | | | |
| | | | | | | | |
| | | |
| UNITED ARAB EMIRATES: 1.3% | | | | | | | | |
| | |
Network International Holdings PLCb,c,d | | | 2,005,515 | | | | 4,609,200 | |
| | | | | | | | |
Total United Arab Emirates | | | | | | | 4,609,200 | |
| | | | | | | | |
| | | | | | | | |
| | | |
| MEXICO: 1.3% | | | | | | | | |
| | |
Banco del Bajio SAc,d | | | 2,199,400 | | | | 4,408,753 | |
| | | | | | | | |
Total Mexico | | | | | | | 4,408,753 | |
| | | | | | | | |
| | | | | | | | |
| | | |
| BANGLADESH: 1.1% | | | | | | | | |
| | |
BRAC Bank, Ltd. | | | 8,836,192 | | | | 3,922,995 | |
| | | | | | | | |
Total Bangladesh | | | | | | | 3,922,995 | |
| | | | | | | | |
| | | | | | | | |
| | | |
| TURKEY: 0.5% | | | | | | | | |
| | |
Ford Otomotiv Sanayi AS | | | 97,236 | | | | 1,567,161 | |
| | | | | | | | |
Total Turkey | | | | | | | 1,567,161 | |
| | | | | | | | |
| | | | | | | | |
| | | |
| RUSSIA: 0.0% | | | | | | | | |
| | |
Moscow Exchange MICEX-RTS PJSCb,e | | | 2,101,250 | | | | 38,205 | |
| | |
TCS Group Holding PLC GDRb,d,e | | | 62,962 | | | | 1,259 | |
| | |
HeadHunter Group PLC ADRe | | | 15,800 | | | | 316 | |
| | | | | | | | |
Total Russia | | | | | | | 39,780 | |
| | | | | | | | |
| | | | | | | | |
| | | |
| TOTAL COMMON EQUITIES | | | | | | | 346,956,995 | |
| | | | | | | | |
(Cost $327,003,147) | | | | | | | | |
Matthews Emerging Markets Small Companies Fund
June 30, 2022
Schedule of Investmentsa (unaudited) (continued)
PREFERRED EQUITIES: 0.7%
| | | | | | | | |
| | | Shares | | | Value | |
| | |
| BRAZIL: 0.7% | | | | | | | | |
| | |
Banco Pan SA, Pfd. | | | 2,195,900 | | | | $2,563,691 | |
| | | | | | | | |
Total Brazil | | | | | | | 2,563,691 | |
| | | | | | | | |
| | | | | | | | |
| | | |
| TOTAL PREFERRED EQUITIES | | | | | | | 2,563,691 | |
| | | | | | | | |
(Cost $4,462,782) | | | | | | | | |
| | | | | | | | |
| | | |
| TOTAL INVESTMENTS: 100.5% | | | | | | | 349,520,686 | |
(Cost $331,465,929) | | | | | | | | |
| | | | | | | | |
| | |
LIABILITIES IN EXCESS OF CASH
AND OTHER ASSETS: (0.5%) | | | | | | | (1,713,033 | ) |
| | | | | | | | |
| | | | | | | | |
| |
NET ASSETS: 100.0% | | | | $347,807,653 | |
| | | | | | | | |
| a | Certain securities were fair valued under the valuation policies approved by the Board of Trustees (Note 2-A). |
| b | Non-income producing security. |
| c | Security exempt from registration under Rule 144A of the Securities Act of 1933, as amended. The security may be resold in transactions exempt from registration normally to qualified institutional buyers. The security has been determined to be liquid in accordance with procedures adopted by the Funds’ Board of Trustees. At June 30, 2022, the aggregate value is $49,910,758, which is 14.35% of net assets. |
| d | The securities may be resold to qualified foreign investors and foreign institutional buyers under Regulation S of the Securities Act of 1933. |
| e | Security is valued using significant unobservable inputs and is classified as Level 3 in the fair value hierarchy. The aggregate value of Level 3 security is $39,780 and 0.01% of net assets. |
| ADR | American Depositary Receipt |
| GDR | Global Depositary Receipt |
| PJSC | Public Joint Stock Co. |
See accompanying notes to financial statements.
| | | | | | | | |
| | | | matthewsasia.com | 800.789.ASIA | | | 17 | |

| | | | |
| PORTFOLIO MANAGERS |
| |
| Taizo Ishida | | |
Lead Manager | | |
| |
| Michael J. Oh, CFA | | |
Co-Manager | | |
|
| FUND FACTS |
| | |
| | | Investor | | Institutional |
Ticker | | MPACX | | MIAPX |
CUSIP | | 577130867 | | 577130776 |
Inception | | 10/31/03 | | 10/29/10 |
NAV | | $21.98 | | $22.23 |
Initial Investment | | $2,500 | | $100,000 |
Gross Expense Ratio1 | | 1.07% | | 0.92% |
Portfolio Statistics | | | | |
Total # of Positions | | | | 53 |
Net Assets | | | | $913.5 million |
Weighted Average Market Cap | | $63.8 billion |
Portfolio Turnover2 | | 42.4% |
Benchmark |
MSCI AC Asia Pacific Index |
OBJECTIVE
Long-term capital appreciation.
STRATEGY
Under normal market conditions, the Fund seeks to achieve its investment objective by investing at least 80% of its net assets, which include borrowings for investment purposes, in the common and preferred stocks of companies located in Asia. Asia consists of all countries and markets in Asia, and includes developed, emerging and frontier countries and markets in the Asian region. The Fund may also invest in the convertible securities, of any duration or quality, of Asian companies.
Matthews Asia Growth Fund
Portfolio Manager Commentary (unaudited)
For the first half of 2022, the Matthews Asia Growth Fund returned –31.29% (Investor Class) and
–31.24% (Institutional Class), while its benchmark, the MSCI All Country Asia Pacific Index, returned –16.99% over the same period. For the quarter ending June 30, 2022, the Fund returned –12.39% (Investor Class) and –12.38% (Institutional Class), while the benchmark returned –11.78%.
Market Environment:
The first half of the year was a challenging period. Elevated inflation data and diminishing consumer spending in many regions dampened global sentiment and sparked recessionary fears. While Asian equity markets endured choppy waters they performed well in the second quarter, experiencing less downside than commodity heavy, weak-performing EMEA (Europe, Middle East, Africa) and LatAm regions. In particular, Chinese equities saw a strong rebound—in both Hong Kong-listed stocks and local A-Shares. Chinese fiscal and monetary support, combined with more lenient zero-COVID policy implementation, a reduction of regulatory pressure on internet and platform monopolies and progress on real estate re-financing roadblocks enabled a rebound in sentiment and economic activity. Conversely, South Korea was a major market laggard followed by Taiwan, Japan and India. In terms of investing styles, Asian growth stocks continued to trail value stocks, especially in Japan, and small caps suffered more than their larger cap regional peers.
Performance Contributors and Detractors:
From a regional perspective, China/Hong Kong and Japan detracted the most from relative performance during the first half of the year. Once again, the returns from our Japanese holdings were impacted by the weakening of the yen against the U.S. dollar as Japan maintains a loose monetary policy and the Federal Reserve aggressively tightens and hikes rates to combat inflation. On the other hand, our underweight in South Korea and Taiwan contributed positively to performance.
From a sector perspective, our overweight and stock selection within health care and our stock selection within information technology (IT) detracted from performance while our underweight in the industrials sector contributed the most to relative performance for the first half.
Turning to individual securities, Japanese IT names Tokyo Electron and GMO Payment Gateway were among the largest detractors to absolute performance over the period. Tokyo Electron is one of the largest semiconductor equipment companies in the world and a sudden change in investor mindset toward the industry in early June drove stock prices down. The concern may be that the risk of recession will lower end-demand for semiconductors over the next few quarters. GMO Payment is a high valuation stock in Japan when the market is still favoring low P/E* value names. We still think that company has a steady 20-25% growth rate on solid fundamentals.
On the positive side, Chinese health care holding Legend Biotech Corp. and Japanese health care holding Daiichi Sankyo contributed the most to relative performance during the first half of the year. These companies were the exceptions from the onslaught of the entire health care sector in the first half and bucked the trend by announcing positive clinical data at the annual American Society of Clinical Oncology (ASCO) meeting in early June. Investors appear to give extra credit to
(continued)
| 1 | Prospectus expense ratios. |
| 2 | The lesser of fiscal year 2021 long-term purchase costs or sales proceeds divided by the average monthly market value of long-term securities. |
| | | | | | | | | | | | | | | | | | | | | | | | | | | | | | | | |
| |
| PERFORMANCE AS OF JUNE 30, 2022 | |
| | | | | | | | | | | | Average Annual Total Returns | | | | |
| | | 3 Months | | | YTD | | | 1 Year | | | 3 Years | | | 5 Years | | | 10 Years | | | Since
Inception | | | Inception
Date | |
| Investor Class (MPACX) | | | -12.39% | | | | -31.29% | | | | -44.60% | | | | -2.11% | | | | 1.27% | | | | 5.60% | | | | 7.10% | | | | 10/31/03 | |
| Institutional Class (MIAPX) | | | -12.38% | | | | -31.24% | | | | -44.52% | | | | -1.99% | | | | 1.43% | | | | 5.78% | | | | 4.46% | | | | 10/29/10 | |
| MSCI AC Asia Pacific Index3 | | | -11.78% | | | | -16.99% | | | | -21.99% | | | | 2.13% | | | | 3.11% | | | | 5.81% | | | | 6.13% | 4 | | | | |
Performance assumes reinvestment of all dividends and/or distributions before taxes. All performance quoted represents past performance and is no guarantee of future results. Investment return and principal value will fluctuate with market conditions so that when redeemed, shares may be worth more or less than their original cost. Current performance may be lower or higher than the return figures quoted. For the Fund’s most recent month-end performance, visit matthewsasia.com.
GROWTH OF A HYPOTHETICAL $10,000 INVESTMENT SINCE INCEPTION—INVESTOR CLASS
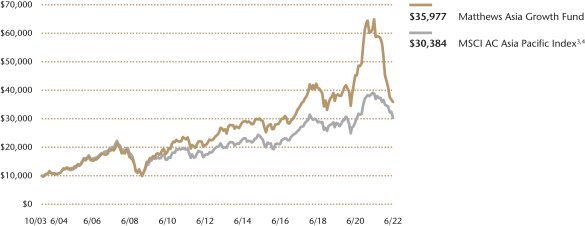
Plotted monthly. The performance data and graph do not reflect the deduction of taxes that a shareholder would pay on dividends, capital gains distributions or redemption of Fund shares. Values are in US$.
| | 3 | It is not possible to invest directly in an index. Source: Index data from Morgan Stanley Capital International and Bloomberg; total return calculations performed by BNY Mellon Investment Servicing (US) Inc. Please see page 84 for index definition. |
| | 4 | Calculated from 10/31/03. |
| | | | | | | | | | |
| | | | | |
| TOP TEN HOLDINGS5 | | | | | | | | | |
| Name | | Sector | | Country | | | | % Net Assets | |
| PT Bank Rakyat Indonesia Persero | | Financials | | Indonesia | | | | | 4.4% | |
| HDFC Bank, Ltd. | | Financials | | India | | | | | 4.2% | |
| CSL, Ltd. | | Health Care | | Australia | | | | | 4.2% | |
| XPeng, Inc. | | Consumer Discretionary | | China/Hong Kong | | | | | 4.2% | |
| Shenzhen Inovance Technology Co., Ltd. | | Industrials | | China/Hong Kong | | | | | 3.9% | |
| Dabur India, Ltd. | | Consumer Staples | | India | | | | | 3.8% | |
| Sony Group Corp. | | Consumer Discretionary | | Japan | | | | | 3.8% | |
| Toyota Motor Corp. | | Consumer Discretionary | | Japan | | | | | 3.5% | |
| Reliance Industries, Ltd. | | Energy | | India | | | | | 3.2% | |
| Daiichi Sankyo Co., Ltd. | | Health Care | | Japan | | | | | 3.1% | |
| % OF ASSETS IN TOP 10 | | | | | | | | | 38.3% | |
| | 5 | Holdings may combine more than one security from same issuer and related depositary receipts. |
| | | | | | | | |
| | | | matthewsasia.com | 800.789.ASIA | | | 19 | |
| | | | |
| |
| COUNTRY ALLOCATION (%)6,7 | |
| China/Hong Kong | | | 32.6 | |
| Japan | | | 30.5 | |
| India | | | 18.9 | |
| Australia | | | 6.8 | |
| Indonesia | | | 4.9 | |
| United States | | | 2.8 | |
| Vietnam | | | 1.3 | |
| Singapore | | | 1.0 | |
| Taiwan | | | 0.9 | |
| Cash and Other Assets, Less Liabilities | | | 0.2 | |
| | | | |
| |
| SECTOR ALLOCATION (%)7 | |
| Health Care | | | 26.1 | |
| Consumer Discretionary | | | 21.0 | |
| Information Technology | | | 14.1 | |
| Financials | | | 11.4 | |
| Communication Services | | | 8.6 | |
| Consumer Staples | | | 7.0 | |
| Industrials | | | 6.5 | |
| Energy | | | 3.2 | |
| Materials | | | 1.8 | |
| Cash and Other Assets, Less Liabilities | | | 0.2 | |
| | | | |
| |
| MARKET CAP EXPOSURE (%)7 | |
| Mega Cap (over $25B) | | | 54.1 | |
| Large Cap ($10B-$25B) | | | 15.3 | |
| Mid Cap ($3B-10B) | | | 21.3 | |
| Small Cap (under $3B) | | | 9.1 | |
| Cash and Other Assets, Less Liabilities | | | 0.2 | |
| 6 | Not all countries where the Fund may invest are included in the benchmark index. |
| 7 | Source: FactSet Research Systems. Percentage values in data are rounded to the nearest tenth of one percent, so the values may not sum to 100% due to rounding. Country allocations and percentage values may be derived from different data sources and may not be consistent with other Fund literature. |
Matthews Asia Growth Fund
Portfolio Manager Commentary (unaudited) (continued)
“first-in-class” innovative drug development close to commercialization. Both Legend’s CATR-T therapy and Daiichi’s antibody-drug conjugate (ADC) would be competing against the global giants in the cancer treatment in the U.S. and elsewhere.
Notable Portfolio Changes:
During the second quarter, we took the opportunity to close out of several smaller positions including Wuxi Apptec, a Chinese biologics company and Sansan Inc, a Japanese mobile software solutions company. We also initiated positions in Huazhu Hotel Group, a leading hotel chain in China that we believe should benefit from increased travel, and Hitachi, a Japanese multinational conglomerate focused primarily on digital systems and services as well as green energy solutions. Both companies are quality growth names in our view which should be well suited for the uncertain investment environment we are in right now.
Outlook:
Looking ahead, we believe markets may see more volatility as they come to terms with the severity of Fed hikes, tighter global liquidity and protracted inflation. That said, we believe that markets have priced in a substantial amount of uncertainty, especially within Asia and China, and not withstanding a sudden and severe downturn of global economic activity or a geopolitical shift, we believe there may be plenty of upside to come.
In particular, China should be positioned well for a pickup in domestic activity as the government is starting to support consumers and small and medium enterprises (SMEs) through gradual release of stimulus programs. Unlike the interest rate cycle in the West, interest rates are easing in China which may help lower the cost of capital for companies. In other parts of Asia, shopping mall operators in Southeast Asia stand to benefit from resumption of tourism activities.
| * | Price to earnings ratio is a valuation ratio of a company’s current share price compared to its per-share earnings. |
Matthews Asia Growth Fund
June 30, 2022
Schedule of Investmentsa (unaudited)
COMMON EQUITIES: 99.8%
| | | | | | | | |
| | | Shares | | | Value | |
| | |
| CHINA/HONG KONG: 32.6% | | | | | | | | |
| | |
XPeng, Inc. A Sharesb | | | 2,390,250 | | | | $38,088,915 | |
| | |
Shenzhen Inovance Technology Co., Ltd. A Shares | | | 3,599,012 | | | | 35,515,406 | |
| | |
BeiGene, Ltd. ADRb | | | 162,500 | | | | 26,300,625 | |
| | |
Innovent Biologics, Inc.b,c,d | | | 5,835,500 | | | | 26,108,390 | |
| | |
Silergy Corp. | | | 304,000 | | | | 24,581,250 | |
| | |
InnoCare Pharma, Ltd.b,c,d | | | 13,446,000 | | | | 23,092,420 | |
| | |
Alibaba Group Holding, Ltd.b | | | 1,399,700 | | | | 19,967,271 | |
| | |
Hangzhou Tigermed Consulting Co., Ltd. H Sharesc,d | | | 1,572,100 | | | | 18,232,436 | |
| | |
Tencent Holdings, Ltd. | | | 380,300 | | | | 17,214,335 | |
| | |
Bilibili, Inc. Class Zb | | | 632,900 | | | | 16,225,133 | |
| | |
RemeGen Co., Ltd. H Sharesb,c,d | | | 1,990,000 | | | | 11,139,179 | |
| | |
Medlive Technology Co., Ltd.c,d | | | 6,873,500 | | | | 10,142,964 | |
| | |
Shenzhou International Group Holdings, Ltd. | | | 750,500 | | | | 9,160,311 | |
| | |
JD Health International, Inc.b,c,d | | | 1,093,400 | | | | 8,655,267 | |
| | |
Huazhu Group, Ltd. | | | 1,705,800 | | | | 6,623,633 | |
| | |
Zhaoke Ophthalmology, Ltd.b,c,d | | | 5,683,633 | | | | 2,900,610 | |
| | |
Kindstar Globalgene Technology, Inc.b,c,d | | | 7,212,500 | | | | 1,992,600 | |
| | |
Jacobio Pharmaceuticals Group Co., Ltd.b,c,d | | | 1,023,300 | | | | 800,550 | |
| | |
Adagene, Inc. ADRb | | | 364,955 | | | | 733,560 | |
| | |
JD.com, Inc. A Shares | | | 13,985 | | | | 450,639 | |
| | | | | | | | |
Total China/Hong Kong | | | | | | | 297,925,494 | |
| | | | | | | | |
| | | | | | | | |
| | | |
| JAPAN: 30.5% | | | | | | | | |
| | |
Sony Group Corp. | | | 426,100 | | | | 34,751,344 | |
| | |
Toyota Motor Corp. | | | 2,083,100 | | | | 32,140,787 | |
| | |
Daiichi Sankyo Co., Ltd. | | | 1,096,600 | | | | 27,889,266 | |
| | |
GMO Payment Gateway, Inc. | | | 373,500 | | | | 26,604,773 | |
| | |
CyberAgent, Inc. | | | 2,001,900 | | | | 20,056,122 | |
| | |
Terumo Corp. | | | 643,600 | | | | 19,469,577 | |
| | |
Keyence Corp. | | | 55,500 | | | | 19,033,072 | |
| | |
OBIC Business Consultants Co., Ltd. | | | 518,100 | | | | 17,865,402 | |
| | |
Shimano, Inc. | | | 97,500 | | | | 16,424,544 | |
| | |
Shin-Etsu Chemical Co., Ltd. | | | 142,300 | | | | 15,996,082 | |
| | |
SoftBank Group Corp. | | | 398,900 | | | | 15,460,767 | |
| | |
Japan Elevator Service Holdings Co., Ltd. | | | 1,194,100 | | | | 12,489,928 | |
| | |
Hitachi, Ltd. | | | 233,100 | | | | 11,088,583 | |
| | |
Tokyo Electron, Ltd. | | | 26,100 | | | | 8,518,866 | |
| | |
HEALIOS KKb | | | 174,300 | | | | 456,732 | |
| | | | | | | | |
Total Japan | | | | | | | 278,245,845 | |
| | | | | | | | |
| | | | | | | | |
| | | |
| INDIA: 18.9% | | | | | | | | |
| | |
HDFC Bank, Ltd. | | | 2,237,334 | | | | 38,323,544 | |
| | |
Dabur India, Ltd. | | | 5,549,055 | | | | 34,908,860 | |
| | |
Reliance Industries, Ltd. | | | 895,148 | | | | 29,557,228 | |
| | |
Bajaj Finance, Ltd. | | | 372,236 | | | | 25,612,505 | |
| | |
FSN E-Commerce Ventures, Ltd.b | | | 1,309,523 | | | | 23,454,522 | |
| | |
Avenue Supermarts, Ltd.b,c,d | | | 318,181 | | | | 13,773,755 | |
| | |
Dr. Lal PathLabs, Ltd.c,d | | | 176,411 | | | | 4,842,610 | |
| | |
Crompton Greaves Consumer Electricals, Ltd. | | | 551,508 | | | | 2,378,126 | |
| | | | | | | | |
Total India | | | | | | | 172,851,150 | |
| | | | | | | | |
| | | | | | | | |
| | | | | | | | |
| | | Shares | | | Value | |
| | |
| INDONESIA: 4.9% | | | | | | | | |
| | |
PT Bank Rakyat Indonesia Persero | | | 145,246,700 | | | | $40,562,435 | |
| | |
PT Mayora Indah | | | 28,901,100 | | | | 4,054,593 | |
| | | | | | | | |
Total Indonesia | | | | | | | 44,617,028 | |
| | | | | | | | |
| | | | | | | | |
| | | |
| UNITED STATES: 4.4% | | | | | | | | |
| | |
Legend Biotech Corp. ADRb | | | 373,038 | | | | 20,517,090 | |
| | |
Atlassian Corp. PLC Class Ab | | | 75,000 | | | | 14,055,000 | |
| | |
Schrodinger, Inc.b | | | 203,700 | | | | 5,379,717 | |
| | | | | | | | |
Total United States | | | | | | | 39,951,807 | |
| | | | | | | | |
| | | | | | | | |
| | | |
| AUSTRALIA: 4.2% | | | | | | | | |
| | |
CSL, Ltd. | | | 206,045 | | | | 38,257,371 | |
| | | | | | | | |
Total Australia | | | | | | | 38,257,371 | |
| | | | | | | | |
| | | | | | | | |
| | | |
| VIETNAM: 1.3% | | | | | | | | |
| | |
Vietnam Dairy Products JSC | | | 3,739,910 | | | | 11,611,019 | |
| | | | | | | | |
Total Vietnam | | | | | | | 11,611,019 | |
| | | | | | | | |
| | | | | | | | |
| | | |
| NEW ZEALAND: 1.1% | | | | | | | | |
| | |
Xero, Ltd.b | | | 184,469 | | | | 9,839,695 | |
| | | | | | | | |
Total New Zealand | | | | | | | 9,839,695 | |
| | | | | | | | |
| | | | | | | | |
| | | |
| SINGAPORE: 1.0% | | | | | | | | |
| | |
Sea, Ltd. ADRb | | | 140,200 | | | | 9,373,772 | |
| | | | | | | | |
Total Singapore | | | | | | | 9,373,772 | |
| | | | | | | | |
| | | | | | | | |
| | | |
| TAIWAN: 0.9% | | | | | | | | |
| | |
Taiwan Semiconductor Manufacturing Co., Ltd. ADR | | | 105,400 | | | | 8,616,450 | |
| | | | | | | | |
Total Taiwan | | | | | | | 8,616,450 | |
| | | | | | | | |
| | | | | | | | |
| | | |
| TOTAL INVESTMENTS: 99.8% | | | | | | | 911,289,631 | |
(Cost $1,030,669,122) | | | | | | | | |
| | | | | | | | |
| | |
CASH AND OTHER ASSETS,
LESS LIABILITIES: 0.2% | | | | | | | 2,184,596 | |
| | | | | | | | |
| | | | | | | | |
| | |
NET ASSETS: 100.0% | | | | | | | $913,474,227 | |
| | | | | | | | |
| | | | | | | | |
| a | Certain securities were fair valued under the valuation policies approved by the Board of Trustees (Note 2-A). |
| b | Non-income producing security. |
| c | Security exempt from registration under Rule 144A of the Securities Act of 1933, as amended. The security may be resold in transactions exempt from registration normally to qualified institutional buyers. The security has been determined to be liquid in accordance with procedures adopted by the Funds’ Board of Trustees. At June 30, 2022, the aggregate value is $121,680,781, which is 13.32% of net assets. |
| d | The securities may be resold to qualified foreign investors and foreign institutional buyers under Regulation S of the Securities Act of 1933. |
| ADR | American Depositary Receipt |
See accompanying notes to financial statements.
| | | | | | | | |
| | | | matthewsasia.com | 800.789.ASIA | | | 21 | |
| | | | |
| PORTFOLIO MANAGERS |
| |
| Sharat Shroff, CFA | | Inbok Song |
Lead Manager | | Lead Manager |
| |
| Winnie Chwang | | Andrew Mattock, CFA |
Co-Manager | | Co-Manager |
| | |
| FUND FACTS | | | | |
| | |
| | | Investor | | Institutional |
Ticker | | MAPTX | | MIPTX |
CUSIP | | 577130107 | | 577130834 |
Inception | | 9/12/94 | | 10/29/10 |
NAV | | $22.87 | | $22.85 |
Initial Investment | | $2,500 | | $100,000 |
Gross Expense Ratio1 | | 1.06% | | 0.92% |
After Fee Waiver and Reimbursement2 | | 1.03% | | 0.90% |
Portfolio Statistics | | |
Total # of Positions | | 59 |
Net Assets | | $5.3 billion |
Weighted Average Market Cap | | $104.8 billion |
Portfolio Turnover3 | | 46.6% |
Benchmark |
MSCI AC Asia ex Japan Index |
OBJECTIVE
Long-term capital appreciation.
STRATEGY
Under normal market conditions, the Fund seeks to achieve its investment objective by investing at least 80% of its net assets, which include borrowings for investment purposes, in the common and preferred stocks of companies located in Asia ex Japan, which consists of all countries and markets in Asia excluding Japan, but including all other developed, emerging and frontier countries and markets in the Asian region.
Matthews Pacific Tiger Fund
Portfolio Manager Commentary (unaudited)
For the first half of 2022, the Matthews Pacific Tiger Fund returned –16.96% (Investor Class) and
–16.91% (Institutional Class), while its benchmark, the MSCI All Country Asia ex Japan Index, returned –16.14% over the same period. For the quarter ending June 30, 2022, the Fund returned
–6.12% (Investor Class) and –6.12% (Institutional Class), while the benchmark returned –8.90%.
Market Environment:
The first half of the year was a challenging period. The Asia ex Japan region experienced a largely similar rate of decline in the first and second quarters but the factors influencing the decline were quite different. In the first quarter, Chinese equities and the consumer discretionary sector were among the worst performing but recovered nicely to be the best performing in the second quarter. On the flip side, some of the ASEAN (Association of Southeast Asian Nations) equities went from being the best performing in the first quarter to the worst detractors in the second quarter. The biggest driver of this change is ongoing evolution of investor perception of China, and the uncertainty around its zero-COVID policy which is curbing domestic consumption. High energy prices are an additional tax for consumers and companies in South Asia and has weighed on equity returns particularly in the second quarter. In addition, small caps have continuously underperformed this year reflecting concerns around rising cost of capital and weak domestic demand in many parts of Asia, but this follows past few years of outsized returns.
Foreign exchange trends have remained consistent through the first half reflecting some depreciation for Southeast Asia currencies and the Indian rupee. However, there was a sharp change in the trend for the Chinese renminbi which depreciated by about 3% late in April—in spite of that move, the renminbi trades at roughly the same level compared to three years ago.
Performance Contributors and Detractors:
For the first half of 2022, stock selections in the Philippines, Indonesia and India contributed the most to the Fund’s relative performance. Southeast Asian countries and India have shown late but sustained economic recovery from the pandemic. On the other hand, stock selection within China and South Korea detracted the most from relative performance as a resurgence of COVID in China and global macro concern with interest rate hiking cycle negatively affected South Korea. It is notable that underperformance within China was more concentrated in the first quarter. Some of that relative underperformance was recovered during the second quarter, given the emergence of supporting policies during the quarter from the Chinese government. Thus, during the second quarter, the Fund’s holdings such as China Tourism Group, a China-based company principally engaged in the travel agency and duty-free businesses and Kweichow Moutai, China’s premier white liquor business, contributed positively. Expectation for the travel resumption for China Tourism Group and resilient operation for Kweichow Moutai with relatively attractive valuations supported performance of these companies. On the other hand, continuous concern on the macro environment further dragged down South Korea holdings into the second quarter. For example, industrial holdings such as Doosan Bobcat, a construction machinery manufacturer, underperformed with a concern on upcoming headwinds though current earnings have been resilient.
(continued)
| 1 | Prospectus expense ratios. |
| 2 | Matthews has contractually agreed to waive a portion of its advisory fee and administrative and shareholder services fee if the Fund’s average daily net assets are over $3 billion, as follows: for every $2.5 billion average daily net assets of the Fund that are over $3 billion, the advisory fee rate and the administrative and shareholder services fee rate for the Fund with respect to such excess average daily net assets will be each reduced by 0.01%, in each case without reducing such fee rate below 0.00%. Any amount waived by Matthews pursuant to this agreement may not be recouped by Matthews. This agreement will remain in place until April 30, 2023 and may be terminated (i) at any time by the Board of Trustees upon 60 days’ prior written notice to Matthews; or (ii) by Matthews at the annual expiration date of the agreement upon 60 days’ prior written notice to the Trust, in each case without payment of any penalty. |
| 3 | The lesser of fiscal year 2021 long-term purchase costs or sales proceeds divided by the average monthly market value of long-term securities. |
| | | | | | | | | | | | | | | | | | | | | | | | | | | | | | | | |
| |
| PERFORMANCE AS OF JUNE 30, 2022 | |
| | | | | | | | | | | | Average Annual Total Returns | | | | |
| | | 3 Months | | | YTD | | | 1 Year | | | 3 Years | | | 5 Years | | | 10 Years | | | Since
Inception | | | Inception
Date | |
| Investor Class (MAPTX) | | | -6.12% | | | | -16.96% | | | | -24.82% | | | | 1.70% | | | | 3.22% | | | | 6.19% | | | | 7.78% | | | | 9/12/94 | |
| Institutional Class (MIPTX) | | | -6.12% | | | | -16.91% | | | | -24.73% | | | | 1.83% | | | | 3.37% | | | | 6.36% | | | | 5.00% | | | | 10/29/10 | |
| MSCI AC Asia ex Japan Index4 | | | -8.90% | | | | -16.14% | | | | -24.78% | | | | 2.41% | | | | 3.39% | | | | 5.80% | | | | 4.27% | 5 | | | | |
Performance assumes reinvestment of all dividends and/or distributions before taxes. All performance quoted represents past performance and is no guarantee of future results. Investment return and principal value will fluctuate with market conditions so that when redeemed, shares may be worth more or less than their original cost. Current performance may be lower or higher than the return figures quoted. Returns would have been lower if certain of the Fund’s fees and expenses had not been waived. For the Fund’s most recent month-end performance, visit matthewsasia.com.
GROWTH OF A HYPOTHETICAL $10,000 INVESTMENT SINCE INCEPTION—INVESTOR CLASS
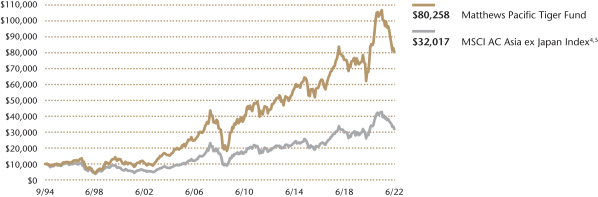
Plotted monthly. The performance data and graph do not reflect the deduction of taxes that a shareholder would pay on dividends, capital gains distributions or redemption of Fund shares. Values are in US$.
| | 4 | It is not possible to invest directly in an index. Source: Index data from Morgan Stanley Capital International and Bloomberg; total return calculations performed by BNY Mellon Investment Servicing (US) Inc. Please see page 84 for index definition. |
| | 5 | Calculated from 8/31/94. |
| | | | | | | | |
| | | | |
| TOP TEN HOLDINGS6 | | | | | | | |
| Name | | Sector | | Country | | % Net Assets | |
| Taiwan Semiconductor Manufacturing Co., Ltd. | | Information Technology | | Taiwan | | | 6.5% | |
| Tencent Holdings, Ltd. | | Communication Services | | China/Hong Kong | | | 4.2% | |
| Alibaba Group Holding, Ltd. | | Consumer Discretionary | | China/Hong Kong | | | 3.5% | |
| Samsung Electronics Co., Ltd. | | Information Technology | | South Korea | | | 3.3% | |
| Meituan | | Consumer Discretionary | | China/Hong Kong | | | 2.9% | |
| Kweichow Moutai Co., Ltd. | | Consumer Staples | | China/Hong Kong | | | 2.8% | |
| Central Pattana Public Co., Ltd. | | Real Estate | | Thailand | | | 2.8% | |
| SM Prime Holdings, Inc. | | Real Estate | | Philippines | | | 2.8% | |
| ICICI Bank, Ltd. | | Financials | | India | | | 2.6% | |
| AIA Group, Ltd. | | Financials | | China/Hong Kong | | | 2.5% | |
| % OF ASSETS IN TOP 10 | | | 33.9% | |
| | 6 | Holdings may combine more than one security from same issuer and related depositary receipts. |
| | | | | | | | |
| | | | matthewsasia.com | 800.789.ASIA | | | 23 | |
Matthews Pacific Tiger Fund
Portfolio Manager Commentary (unaudited) (continued)
From a sector perspective, real estate and industrials were positive contributors during the first half, helped by our holdings in shopping mall companies in the Philippines and Thailand with improved foot traffic, and a commercial vehicle manufacturer in India as vehicle sales have been improving. Meanwhile, communication services was the major detractor. The Fund’s holdings in South Korea’s communication service sector such as Naver Corp., a search engine and internet content provider and Hybe Co., an artist management company, underperformed with potentially weakening demand, increased cost burden together with relatively high valuation to begin with.
Notable Portfolio Changes:
We increased the portfolio’s weight in China added to existing holdings such as China Tourism Group and Meituan, a web-based shopping platform company, as valuations became more attractive while long-term earning generation capability are intact. We believe these companies are likely to benefit from a recovery in domestic consumption. This was funded by trimming positions in the IT sector in South Korea and Taiwan. Though these IT companies have strong fundamentals, near-term earnings uncertainty risk has increased as these companies are exposed to the global demand environment.
We also exited positions with demanding valuation with deteriorating earning visibility. This is a part of efforts to manage the downside risk and reallocate capital into the areas where we see better earning visibility with certain valuation supports. SEA, an internet gaming and e-commerce company in Singapore, is an example. While the company has achieved impressive track record in establishing sizable market share across different countries, an increased uncertainty around their internet gaming as a “cash cow” may delay the expected profitability goal amid continuous needs for e-commerce investment.
Although the portfolio’s number of holdings has decreased to a near-term low, especially in China, it is quite likely that the position count may increase into the second half of 2022 as we look to benefit from cheaper valuations.
Outlook:
Looking ahead, the Asia ex Japan region is in a relatively better situation from a macroeconomic standpoint as the inflationary pressures are not as severe as in the West, and several countries are still in the process of recovering fully from COVID-19 related disruptions. In particular, China is positioned well for a pickup in domestic activity as the government is starting to support consumers and small and medium-sized enterprises (SMEs) through gradual release of stimulus programs. Unlike the interest rate cycle in the West, interest rates are easing in China which may help lower the cost of capital for companies. In other parts of Asia, shopping mall operators like in Southeast Asia stand to benefit from resumption of tourism activities.
The earnings picture looks a bit mixed largely because of downgrades earlier in the year in China as several key cities were locked down, but that is changing for the better. Valuations have eased to low-teens P/E* ratio while the projected earning growth (average) over the next two years for the MSCI Asia ex Japan Index is in the high single digits. We are sanguine about the potential economic recovery in parts of Asia and are looking to position the portfolio to participate in that growth.
| * | Price to earnings ratio is a valuation ratio of a company’s current share price compared to its per-share earnings. |
| | | | |
| |
| COUNTRY ALLOCATION (%)7,8 | |
| China/Hong Kong | | | 46.2 | |
| Taiwan | | | 15.1 | |
| India | | | 13.9 | |
| South Korea | | | 9.8 | |
| Indonesia | | | 3.5 | |
| Singapore | | | 3.3 | |
| Thailand | | | 3.3 | |
| Philippines | | | 2.8 | |
| Vietnam | | | 1.1 | |
| Cash and Other Assets, Less Liabilities | | | 0.8 | |
| | | | |
| |
| SECTOR ALLOCATION (%)8 | |
| Information Technology | | | 20.7 | |
| Consumer Discretionary | | | 19.3 | |
| Financials | | | 14.8 | |
| Industrials | | | 11.2 | |
| Consumer Staples | | | 9.1 | |
| Real Estate | | | 7.5 | |
| Communication Services | | | 7.2 | |
| Materials | | | 4.0 | |
| Health Care | | | 2.7 | |
| Utilities | | | 2.7 | |
| Cash and Other Assets, Less Liabilities | | | 0.8 | |
| | | | |
| |
| MARKET CAP EXPOSURE (%)8 | |
| Mega Cap (over $25B) | | | 48.4 | |
| Large Cap ($10B-$25B) | | | 24.4 | |
| Mid Cap ($3B-10B) | | | 23.0 | |
| Small Cap (under $3B) | | | 3.4 | |
| Cash and Other Assets, Less Liabilities | | | 0.8 | |
| 7 | Not all countries where the Fund may invest are included in the benchmark index. |
| 8 | Source: FactSet Research Systems. Percentage values in data are rounded to the nearest tenth of one percent, so the values may not sum to 100% due to rounding. Country allocations and percentage values may be derived from different data sources and may not be consistent with other Fund literature. |
Matthews Pacific Tiger Fund
June 30, 2022
Schedule of Investmentsa (unaudited)
COMMON EQUITIES: 99.2%
| | | | | | | | |
| | | Shares | | | Value | |
| | |
| CHINA/HONG KONG: 46.1% | | | | | | | | |
| | |
Tencent Holdings, Ltd. | | | 4,968,600 | | | | $224,904,409 | |
| | |
Alibaba Group Holding, Ltd.b | | | 11,916,000 | | | | 169,986,426 | |
| | |
Meituan B Sharesb,c,d | | | 6,194,700 | | | | 154,584,335 | |
| | |
Kweichow Moutai Co., Ltd. A Shares | | | 494,373 | | | | 151,244,735 | |
| | |
AIA Group, Ltd. | | | 12,344,400 | | | | 134,881,947 | |
| | |
CITIC Securities Co., Ltd. H Shares | | | 59,885,100 | | | | 134,237,373 | |
| | |
Hong Kong Exchanges & Clearing, Ltd. | | | 2,411,400 | | | | 119,258,843 | |
| | |
China Tourism Group Duty Free Corp., Ltd. A Shares | | | 3,399,073 | | | | 118,531,943 | |
| | |
Shenzhen Inovance Technology Co., Ltd. A Shares | | | 11,245,585 | | | | 110,972,543 | |
| | |
China Resources Beer Holdings Co., Ltd. | | | 14,543,775 | | | | 108,685,263 | |
| | |
Yum China Holdings, Inc. | | | 2,221,901 | | | | 107,762,198 | |
| | |
CSPC Pharmaceutical Group, Ltd. | | | 99,886,000 | | | | 99,838,532 | |
| | |
China Resources Mixc Lifestyle Services, Ltd.c,d | | | 19,936,630 | | | | 99,043,126 | |
| | |
China Lesso Group Holdings, Ltd. | | | 51,297,000 | | | | 77,647,836 | |
| | |
StarPower Semiconductor, Ltd. A Shares | | | 1,279,323 | | | | 73,950,129 | |
| | |
ENN Energy Holdings, Ltd. | | | 4,404,800 | | | | 72,805,711 | |
| | |
Baidu, Inc. A Sharesb | | | 3,701,200 | | | | 70,112,548 | |
| | |
Topsports International Holdings, Ltd.c,d | | | 67,131,000 | | | | 61,137,230 | |
| | |
Shandong Sinocera Functional Material Co., Ltd. A Shares | | | 10,992,028 | | | | 59,086,931 | |
| | |
JD.com, Inc. ADR | | | 895,800 | | | | 57,528,276 | |
| | |
Will Semiconductor Co., Ltd. Shanghai A Shares | | | 2,090,139 | | | | 54,258,310 | |
| | |
JD.com, Inc. A Shares | | | 1,678,307 | | | | 54,080,154 | |
| | |
Wuxi Biologics Cayman, Inc.b,c,d | | | 4,857,500 | | | | 45,006,791 | |
| | |
Sany Heavy Industry Co., Ltd. A Shares | | | 13,120,461 | | | | 37,452,497 | |
| | |
JD Logistics, Inc.b,c,d | | | 16,340,800 | | | | 35,805,242 | |
| | |
Alibaba Group Holding, Ltd. ADRb | | | 160,220 | | | | 18,213,810 | |
| | | | | | | | |
Total China/Hong Kong | | | | | | | 2,451,017,138 | |
| | | | | | | | |
| | | | | | | | |
| | | |
| TAIWAN: 15.2% | | | | | | | | |
| | |
Taiwan Semiconductor Manufacturing Co., Ltd. | | | 21,382,000 | | | | 342,675,470 | |
| | |
Chailease Holding Co., Ltd.e | | | 11,531,257 | | | | 76,012,793 | |
| | |
E Ink Holdings, Inc.e | | | 11,818,000 | | | | 73,423,550 | |
| | |
Uni-President Enterprises Corp. | | | 27,526,000 | | | | 62,063,124 | |
| | |
Accton Technology Corp. | | | 7,311,000 | | | | 58,809,747 | |
| | |
Delta Electronics, Inc. | | | 7,013,182 | | | | 52,292,076 | |
| | |
MediaTek, Inc. | | | 2,295,000 | | | | 50,377,960 | |
| | |
Eclat Textile Co., Ltd. | | | 3,223,000 | | | | 45,144,349 | |
| | |
Yageo Corp. | | | 4,243,000 | | | | 44,003,774 | |
| | | | | | | | |
Total Taiwan | | | | | | | 804,802,843 | |
| | | | | | | | |
| | | | | | | | |
| | | |
| INDIA: 14.0% | | | | | | | | |
| | |
ICICI Bank, Ltd. | | | 15,592,014 | | | | 140,077,450 | |
| | |
Ashok Leyland, Ltd. | | | 68,826,160 | | | | 129,141,658 | |
| | |
Dabur India, Ltd. | | | 15,806,924 | | | | 99,440,660 | |
| | |
Titan Co., Ltd. | | | 3,203,563 | | | | 78,963,118 | |
| | |
Pidilite Industries, Ltd. | | | 2,941,049 | | | | 77,981,931 | |
| | |
Housing Development Finance Corp., Ltd. | | | 2,736,193 | | | | 75,701,467 | |
| | |
Tata Power Co., Ltd. | | | 27,167,391 | | | | 69,869,887 | |
| | |
Tata Consultancy Services, Ltd. | | | 1,675,820 | | | | 69,591,613 | |
| | | | | | | | |
Total India | | | | | | | 740,767,784 | |
| | | | | | | | |
| | | | | | | | |
| | | | | | | | |
| | | Shares | | | Value | |
| | |
| SOUTH KOREA: 9.8% | | | | | | | | |
| | |
Samsung Electronics Co., Ltd. | | | 4,028,966 | | | | $177,707,048 | |
| | |
Mando Corp. | | | 2,114,094 | | | | 77,651,513 | |
| | |
Samsung Engineering Co., Ltd.b | | | 3,670,580 | | | | 61,007,833 | |
| | |
NAVER Corp. | | | 266,658 | | | | 49,738,815 | |
| | |
SK IE Technology Co., Ltd.b,c,d | | | 588,281 | | | | 44,709,706 | |
| | |
Doosan Bobcat, Inc. | | | 1,929,362 | | | | 43,172,166 | |
| | |
HYBE Co., Ltd.b | | | 314,643 | | | | 35,339,314 | |
| | |
Hyosung Advanced Materials Corp. | | | 113,218 | | | | 33,231,176 | |
| | | | | | | | |
Total South Korea | | | | | | | 522,557,571 | |
| | | | | | | | |
| | | | | | | | |
| | | |
| INDONESIA: 3.5% | | | | | | | | |
| | |
PT Bank Central Asia | | | 213,517,800 | | | | 103,970,343 | |
| | |
PT Astra International | | | 187,821,300 | | | | 83,705,677 | |
| | | | | | | | |
Total Indonesia | | | | | | | 187,676,020 | |
| | | | | | | | |
| | | | | | | | |
| | | |
| THAILAND: 3.3% | | | | | | | | |
| | |
Central Pattana Public Co., Ltd. | | | 87,288,500 | | | | 150,855,161 | |
| | |
Hana Microelectronics Public Co., Ltd. | | | 22,977,600 | | | | 26,617,099 | |
| | | | | | | | |
Total Thailand | | | | | | | 177,472,260 | |
| | | | | | | | |
| | | | | | | | |
| | | |
| SINGAPORE: 3.3% | | | | | | | | |
| | |
SATS, Ltd.b | | | 35,963,700 | | | | 100,902,835 | |
| | |
Venture Corp., Ltd. | | | 6,271,900 | | | | 75,127,904 | |
| | | | | | | | |
Total Singapore | | | | | | | 176,030,739 | |
| | | | | | | | |
| | | | | | | | |
| | | |
| PHILIPPINES: 2.8% | | | | | | | | |
| | |
SM Prime Holdings, Inc. | | | 224,061,771 | | | | 149,106,546 | |
| | | | | | | | |
Total Philippines | | | | | | | 149,106,546 | |
| | | | | | | | |
| | | | | | | | |
| | | |
| VIETNAM: 1.2% | | | | | | | | |
| | |
Vietnam Dairy Products JSC | | | 19,619,028 | | | | 60,909,728 | |
| | | | | | | | |
Total Vietnam | | | | | | | 60,909,728 | |
| | | | | | | | |
| | | | | | | | |
| | | |
| TOTAL INVESTMENTS: 99.2% | | | | | | | 5,270,340,629 | |
(Cost $4,821,056,322) | | | | | | | | |
| | | | | | | | |
| | |
CASH AND OTHER ASSETS,
LESS LIABILITIES: 0.8% | | | | | | | 42,278,086 | |
| | | | | | | | |
| | |
NET ASSETS: 100.0% | | | | | | | $5,312,618,715 | |
| | | | | | | | |
| a | Certain securities were fair valued under the valuation policies approved by the Board of Trustees (Note 2-A). |
| b | Non-income producing security. |
| c | Security exempt from registration under Rule 144A of the Securities Act of 1933, as amended. The security may be resold in transactions exempt from registration normally to qualified institutional buyers. The security has been determined to be liquid in accordance with procedures adopted by the Funds’ Board of Trustees. At June 30, 2022, the aggregate value is $440,286,430, which is 8.29% of net assets. |
| d | The securities may be resold to qualified foreign investors and foreign institutional buyers under Regulation S of the Securities Act of 1933. |
| e | Security is valued using significant unobservable inputs and is classified as Level 3 in the fair value hierarchy. The aggregate value of Level 3 security is $149,436,343 and 2.81% of net assets. |
| ADR | American Depositary Receipt |
See accompanying notes to financial statements.
| | | | | | | | |
| | | | matthewsasia.com | 800.789.ASIA | | | 25 | |
| | | | |
| PORTFOLIO MANAGER |
| |
| Vivek Tanneeru | | |
Lead Manager | | |
|
| FUND FACTS |
| | |
| | | Investor | | Institutional |
Ticker | | MASGX | | MISFX |
CUSIP | | 577130727 | | 577130719 |
Inception | | 4/30/15 | | 4/30/15 |
NAV | | $13.54 | | $13.57 |
Initial Investment | | $2,500 | | $100,000 |
Gross Expense Ratio1 | | 1.35% | | 1.15% |
After Fee Waiver and Reimbursement2 | | 1.35% | | 1.15% |
Portfolio Statistics | | | | |
Total # of Positions | | 53 |
Net Assets | | $128.6 million |
Weighted Average
Market Cap | | $24.3 billion |
Portfolio Turnover3 | | 65.6% |
Benchmark | | |
MSCI AC Asia ex Japan Index |
OBJECTIVE
Long-term capital appreciation.
STRATEGY
Under normal market conditions, the Fund seeks to achieve its investment objective by investing at least 80% of its net assets, which include borrowings for investment purposes, in the common and preferred stocks of companies of any market capitalization located in Asia that Matthews believes satisfy one or more of its environmental, social and governance (“ESG”) standards. Asia consists of all countries and markets in Asia and includes developed, emerging, and frontier countries and markets in the Asia region. The Fund may also invest in convertible securities and fixed-income securities, of any duration or quality, including high yield securities, of Asian companies.
The Fund’s consideration of ESG factors may impact its relative investment performance—positively or negatively—depending on whether such investments are in or out of favor in the market. The ESG factors used in the Fund’s investment process will likely make it perform differently from a fund that relies solely or primarily on financial metrics.
Matthews Asia ESG Fund*
Portfolio Manager Commentary (unaudited)
For the first half of 2022, the Matthews Asia ESG Fund returned –11.91% (Investor Class) and
–11.77% (Institutional Class), while its benchmark, the MSCI All Country Asia ex Japan Index, returned –16.14% over the same period. For the quarter ending June 30, 2022, the Fund returned 0.74% (Investor Class) and 0.89% (Institutional Class), while the benchmark returned –8.90%.
Market Environment:
The continually higher-than-expected inflation reads both in the U.S. and European Union have led the market to increasingly expect a steeper rate-hike cycle. The U.S. Federal Reserve hiked its rate by 75 basis points (0.75%) at its June meeting, the first such move in almost three decades. Also attendant was the view that this steeper pace of tightening may lead to a recession down the road. With no end in sight for the Russian invasion of Ukraine, the prices in the oil and gas markets remain elevated notwithstanding periodic pullbacks predicated on worries of recession.
That said, in China, after several quarters, sentiment has turned a corner with an expectation that the regulatory risk has peaked and the Chinese government is taking a more pragmatic approach to implementing its zero COVID policy and aiding economic activity through a stimulus package.
Indonesia was the strongest performing market in the first six months and the only major market to deliver positive returns, while South Korea and Taiwan were the worst performing markets. In the second quarter, China/Hong Kong was the top performer and South Korea and Taiwan were again the bottom performers.
Asian currencies weakened against a surging U.S. dollar during the second quarter but have held up relatively well compared to other developed market currencies. The South Korean won depreciated the most followed by the Thai baht, while the Singapore dollar and the Indonesian rupiah did relatively better.
Performance Contributors and Detractors:
On a country basis, China, India and South Korea were major contributors to relative performance during the first half of 2022 primarily driven by stock selection. On the other hand, our underweight and stock selection within Taiwan and stock selection within Indonesia detracted from relative performance.
From a sector perspective, good stock selection in industrials and health care were the biggest drivers of relative performance, while poor stock selection in information technology and financials detracted performance.
Turning to individual holdings, Full Truck Alliance was a top contributor to the Fund’s relative performance in the first half of the year. The company is a leading digital-freight platform in China and the world connecting shippers with truckers online, enabling faster, more efficient order listing and matching and creating broader access while at the same time lowering shipping costs and carbon emissions by reducing empty miles. During the period, a key part of the Cyberspace Administration of China (CAC) cybersecurity review that started in July 2021, during which time Full Truck was not allowed to register new users, was resolved.
(continued)
| * | The Fund’s name changed from Matthews Asia ESG Fund to Matthews Emerging Markets Sustainable Future Fund on July 29, 2022. |
| 1 | Expense ratios are from the Fund’s prospectus dated as of July 29, 2022. |
| 2 | Matthews has contractually agreed (i) to waive fees and reimburse expenses to the extent needed to limit Total Annual Fund Operating Expenses (excluding Rule 12b-1 fees, taxes, interest, brokerage commissions, short sale dividend expenses, expenses incurred in connection with any merger or reorganization or extraordinary expenses such as litigation) of the Institutional Class to 1.20% first by waiving class specific expenses (i.e., shareholder service fees specific to a particular class) of the Institutional Class and then, to the extent necessary, by waiving non-class specific expenses (e.g., custody fees) of the Institutional Class, and (ii) if any Fund-wide expenses (i.e., expenses that apply to both the Institutional Class and the Investor Class) are waived for the Institutional Class to maintain the 1.20% expense limitation, to waive an equal amount (in annual percentage terms) of those same expenses for the Investor Class. Effective July 29, 2022, for the Matthews Emerging Markets Sustainable Future Fund (formerly the Matthews Asia ESG Fund), Matthews reduced this expense limitation to 1.15% for the Institutional Class and waived a corresponding amount (in annual percentage terms) for the Investor Class. The Total Annual Fund Operating Expenses After Fee Waiver and Expense Reimbursement for the Investor Class may vary from year to year and will in some years exceed 1.20%. If the operating expenses fall below the expense limitation within three years after Matthews has made a waiver or reimbursement, the Fund may reimburse Matthews up to an amount that does not cause the expenses for that year to exceed the lesser of (i) the expense limitation applicable at the time of that fee waiver and/or expense reimbursement or (ii) the expense limitation in effect at the time of recoupment. This agreement will remain in place until April 30, 2023 and may be terminated at any time by the Board of Trustees on behalf of the Fund on 60 days’ written notice to Matthews. Matthews may decline to renew this agreement by written notice to the Trust at least 30 days before its annual expiration date. |
| 3 | The lesser of fiscal year 2021 long-term purchase costs or sales proceeds divided by the average monthly market value of long-term securities. |
| | | | | | | | | | | | | | | | | | | | | | | | | | | | |
| | | | | | | | |
| PERFORMANCE AS OF JUNE 30, 2022 | | | | | | | | | | | | | | | | | | | | | |
| | | | | | | | | | | | Average Annual Total Returns | | | | |
| | | 3 Months | | | YTD | | | 1 Year | | | 3 years | | | 5 years | | | Since
Inception | | | Inception
Date | |
| Investor Class (MASGX) | | | 0.74% | | | | -11.91% | | | | -13.98% | | | | 13.03% | | | | 9.91% | | | | 8.10% | | | | 4/30/15 | |
| Institutional Class (MISFX) | | | 0.89% | | | | -11.77% | | | | -13.74% | | | | 13.26% | | | | 10.15% | | | | 8.34% | | | | 4/30/15 | |
| MSCI AC Asia ex Japan Index4 | | | -8.90% | | | | -16.14% | | | | -24.78% | | | | 2.41% | | | | 3.39% | | | | 3.09% | | | | | |
Performance assumes reinvestment of all dividends and/or distributions before taxes. All performance quoted represents past performance and is no guarantee of future results. Investment return and principal value will fluctuate with market conditions so that when redeemed, shares may be worth more or less than their original cost. Current performance may be lower or higher than the return figures quoted. Returns would have been lower if certain of the Fund’s fees and expenses had not been waived. For the Fund’s most recent month-end performance visit matthewsasia.com.
GROWTH OF A HYPOTHETICAL $10,000 INVESTMENT SINCE INCEPTION—INVESTOR CLASS
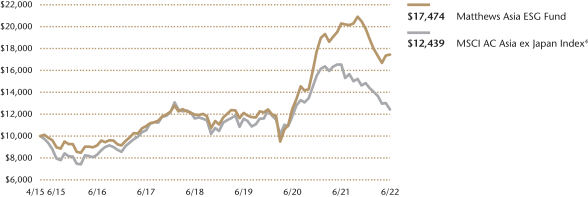
Plotted Monthly. The performance data and graph do not reflect the deduction of taxes that a shareholder would pay on dividends, capital gain distributions or redemption of Fund shares. Values are in US$.
| | 4 | It is not possible to invest directly in an index. Source: Index data from Morgan Stanley Capital International; total return calculations performed by BNY Mellon Investment Servicing (US) Inc. Please see page 84 for index definition. |
| | | | | | | | |
| | | | |
| TOP TEN HOLDINGS5 | | | | | | | |
| Name | | Sector | | Country | | % Net Assets | |
| Full Truck Alliance Co., Ltd. | | Industrials | | China/Hong Kong | | | 7.3% | |
| Legend Biotech Corp. | | Health Care | | United States | | | 6.6% | |
| Hong Kong Exchanges & Clearing, Ltd. | | Financials | | China/Hong Kong | | | 6.4% | |
| Shriram City Union Finance, Ltd. | | Financials | | India | | | 5.4% | |
| JD Health International, Inc. | | Consumer Discretionary | | China/Hong Kong | | | 5.0% | |
| Samsung SDI Co., Ltd., Pfd. | | Information Technology | | South Korea | | | 4.9% | |
| Bandhan Bank, Ltd. | | Financials | | India | | | 4.8% | |
| Phoenix Mills, Ltd. | | Real Estate | | India | | | 3.9% | |
| Ginlong Technologies Co., Ltd. | | Industrials | | China/Hong Kong | | | 3.8% | |
| Ecopro BM Co., Ltd. | | Industrials | | South Korea | | | 3.5% | |
| % OF ASSETS IN TOP 10 | | | | | | | 51.6% | |
| | 5 | Holdings may combine more than one security from same issuer and related depositary receipts. |
| | | | | | | | |
| | | | matthewsasia.com | 800.789.ASIA | | | 27 | |
Matthews Asia ESG Fund
Portfolio Manager Commentary (unaudited) (continued)
The company was again allowed to register new users thereby lifting a major overhang on stock price performance. We continue to take a constructive view of Full Truck’s market positioning, growth prospects, social and environmental value-add.
On the other hand, semiconductor companies Andes Technology and Micron Technology were among the top detractors to relative performance due to rotation away from companies that derive a significant part of their value from long-term growth amid a sharply rising interest rate environment and near-term concerns about memory demand outlook, respectively.
Notable Portfolio Changes:
There were no meaningful additions to the portfolio during the second quarter but we initiated a small position in Zhejiang Hangke, a leading Chinese battery cell-making equipment manufacturer. The company has a diversified customer base and is expected to benefit from fast-growing battery cell manufacturing capabilities globally. There were no exits during the quarter.
Outlook:
Looking ahead, the Fed’s pace and scope of interest rate hikes and quantitative tightening and the market’s expectation of its evolution remain the most important variables to watch and will have near-term implications for regional, sector and style performance. Russia’s invasion of Ukraine and the attendant impact on energy prices also needs careful watching.
We expect corporate earnings to moderate in 2022 and remain watchful about the impact of inflation on financial results. Across the region we see sufficient liquidity, and while we have not seen as much uptake in credit, any meaningful pick up in credit issuance should further support economic growth. In many parts of Asia, COVID-19 vaccination is progressing well and provides hope for economic activity normalization in the coming quarters but China’s zero-COVID policy and its variants need monitoring.
Over the mid-to-long term, we continue to believe that companies that address critical challenges such as climate change and inclusive development will continue to thrive. And for investors interested in sustainability themes, including reducing carbon emissions, alleviating poverty and creating greater financial inclusion in the developing world, Asia remains a key investment destination, in our view. To tackle sustainable themes globally, we believe we need to include the world’s most populous economies, many of which lie in Asia.
As the global economy embarks on a post-pandemic recovery path and markets contend with macro headwinds and volatility, we believe there are attractive opportunities for alpha* generation throughout our large, diverse, sustainable investment universe.
| * | Alpha is defined as the excess return on an investment relative to the return on a benchmark index. |
| | | | |
| | |
| COUNTRY ALLOCATION (%)6,7 | | | |
| China/Hong Kong | | | 44.6 | |
| India | | | 23.2 | |
| South Korea | | | 11.3 | |
| United States | | | 8.5 | |
| Taiwan | | | 4.5 | |
| Indonesia | | | 3.2 | |
| Bangladesh | | | 1.8 | |
| Vietnam | | | 0.9 | |
| Singapore | | | 0.4 | |
| Japan | | | 0.0 | |
| Cash and Other Assets, Less Liabilities | | | 1.6 | |
| | | | |
| | |
| SECTOR ALLOCATION (%)7 | | | |
| Industrials | | | 28.9 | |
| Financials | | | 20.4 | |
| Consumer Discretionary | | | 14.3 | |
| Information Technology | | | 13.2 | |
| Health Care | | | 11.4 | |
| Real Estate | | | 6.6 | |
| Communication Services | | | 2.5 | |
| Consumer Staples | | | 1.2 | |
| Cash and Other Assets, Less Liabilities | | | 1.6 | |
| | | | |
| | |
| MARKET CAP EXPOSURE (%)7 | | | |
| Mega Cap (over $25B) | | | 21.7 | |
| Large Cap ($10B-$25B) | | | 21.2 | |
| Mid Cap ($3B-10B) | | | 28.8 | |
| Small Cap (under $3B) | | | 26.7 | |
| Cash and Other Assets, Less Liabilities | | | 1.6 | |
| 6 | Not all countries are included in the benchmark index. |
| 7 | Source: FactSet Research Systems. Percentage values in data are rounded to the nearest tenth of one percent, so the values may not sum to 100% due to rounding. Country allocations and percentage values may be derived from different data sources and may not be consistent with other Fund literature. |
Matthews Asia ESG Fund
June 30, 2022
Schedule of Investmentsa (unaudited)
COMMON EQUITIES: 93.5%
| | | | | | | | |
| | | Shares | | | Value | |
| | |
| CHINA/HONG KONG: 44.6% | | | | | | | | |
| | |
Full Truck Alliance Co., Ltd. ADRb | | | 1,036,963 | | | | $9,394,885 | |
| | |
Hong Kong Exchanges & Clearing, Ltd. | | | 166,900 | | | | 8,254,251 | |
| | |
JD Health International, Inc.b,c,d | | | 819,100 | | | | 6,483,930 | |
| | |
Ginlong Technologies Co., Ltd. A Shares | | | 154,600 | | | | 4,941,817 | |
| | |
Contemporary Amperex Technology Co., Ltd. A Shares | | | 53,100 | | | | 4,255,083 | |
| | |
Meituan B Sharesb,c,d | | | 153,600 | | | | 3,832,979 | |
| | |
Airtac International Group | | | 85,000 | | | | 2,837,117 | |
| | |
Xinyi Glass Holdings, Ltd. | | | 780,000 | | | | 1,881,958 | |
| | |
China Conch Venture Holdings, Ltd. | | | 790,000 | | | | 1,723,125 | |
| | |
Medlive Technology Co., Ltd.c,d | | | 1,151,000 | | | | 1,698,487 | |
| | |
Innovent Biologics, Inc.b,c,d | | | 378,500 | | | | 1,693,432 | |
| | |
Centre Testing International Group Co., Ltd. A Shares | | | 448,400 | | | | 1,557,858 | |
| | |
MTR Corp., Ltd. | | | 248,000 | | | | 1,300,199 | |
| | |
Flat Glass Group Co., Ltd. H Sharesb | | | 369,000 | | | | 1,299,009 | |
| | |
OPT Machine Vision Tech Co., Ltd. A Shares | | | 32,894 | | | | 1,270,994 | |
| | |
CSPC Pharmaceutical Group, Ltd. | | | 1,054,960 | | | | 1,054,459 | |
| | |
Hangzhou Tigermed Consulting Co., Ltd. A Shares | | | 53,976 | | | | 925,275 | |
| | |
Zhejiang HangKe Technology, Inc., Co. A Shares | | | 86,357 | | | | 906,991 | |
| | |
Wuxi Biologics Cayman, Inc.b,c,d | | | 84,500 | | | | 782,928 | |
| | |
Morimatsu International Holdings Co., Ltd.b,d | | | 661,000 | | | | 624,699 | |
| | |
China Conch Environment Protection Holdings, Ltd.b | | | 733,500 | | | | 510,388 | |
| | |
Link REIT | | | 13,400 | | | | 109,496 | |
| | | | | | | | |
Total China/Hong Kong | | | | | | | 57,339,360 | |
| | | | | | | | |
| | | | | | | | |
| | | |
| INDIA: 23.2% | | | | | | | | |
| | |
Shriram City Union Finance, Ltd. | | | 332,554 | | | | 6,999,305 | |
| | |
Bandhan Bank, Ltd.c,d | | | 1,832,048 | | | | 6,146,974 | |
| | |
Phoenix Mills, Ltd. | | | 331,115 | | | | 4,978,699 | |
| | |
Lemon Tree Hotels, Ltd.b,c,d | | | 4,019,898 | | | | 3,127,551 | |
| | |
Mahindra & Mahindra, Ltd. | | | 217,026 | | | | 3,018,389 | |
| | |
Indus Towers, Ltd. | | | 875,637 | | | | 2,327,537 | |
| | |
Marico, Ltd. | | | 263,146 | | | | 1,595,899 | |
| | |
NBCC India, Ltd. | | | 2,251,753 | | | | 813,247 | |
| | |
Minda Industries, Ltd. | | | 68,078 | | | | 799,010 | |
| | | | | | | | |
Total India | | | | | | | 29,806,611 | |
| | | | | | | | |
| | | | | | | | |
| | | |
| UNITED STATES: 8.5% | | | | | | | | |
| | |
Legend Biotech Corp. ADRb | | | 154,188 | | | | 8,480,340 | |
| | |
Micron Technology, Inc. | | | 43,500 | | | | 2,404,680 | |
| | | | | | | | |
Total United States | | | | | | | 10,885,020 | |
| | | | | | | | |
| | | | | | | | |
| | | |
| SOUTH KOREA: 6.3% | | | | | | | | |
| | |
Ecopro BM Co., Ltd. | | | 51,493 | | | | 4,537,745 | |
| | |
Solus Advanced Materials Co., Ltd. | | | 48,107 | | | | 1,684,727 | |
| | |
BNK Financial Group, Inc. | | | 132,258 | | | | 686,176 | |
| | |
DGB Financial Group, Inc. | | | 113,758 | | | | 667,872 | |
| | |
LG Energy Solution, Ltd.b | | | 1,476 | | | | 425,734 | |
| | |
Samsung SDI Co., Ltd. | | | 370 | | | | 152,582 | |
| | | | | | | | |
Total South Korea | | | | | | | 8,154,836 | |
| | | | | | | | |
| | | | | | | | |
| | | |
| TAIWAN: 4.5% | | | | | | | | |
| | |
Andes Technology Corp. | | | 212,000 | | | | 1,800,818 | |
| | |
Poya International Co., Ltd. | | | 111,760 | | | | 1,189,636 | |
| | |
M31 Technology Corp. | | | 135,000 | | | | 1,071,194 | |
| | |
Sporton International, Inc. | | | 161,448 | | | | 950,951 | |
| | |
Formosa Sumco Technology Corp. | | | 121,000 | | | | 721,341 | |
| | |
Taiwan Semiconductor Manufacturing Co., Ltd. | | | 7,000 | | | | 112,184 | |
| | | | | | | | |
Total Taiwan | | | | | | | 5,846,124 | |
| | | | | | | | |
| | | | | | | | |
| | | | | | | | |
| | | Shares | | | Value | |
| | |
| INDONESIA: 3.2% | | | | | | | | |
| | |
PT Summarecon Agungb | | | 56,797,291 | | | | $2,178,717 | |
| | |
PT Bank Tabungan Negara Persero | | | 19,497,100 | | | | 1,907,764 | |
| | | | | | | | |
Total Indonesia | | | | | | | 4,086,481 | |
| | | | | | | | |
| | | | | | | | |
| | | |
| BANGLADESH: 1.8% | | | | | | | | |
| | |
BRAC Bank, Ltd. | | | 3,402,700 | | | | 1,510,693 | |
| | |
GrameenPhone, Ltd. | | | 266,417 | | | | 838,227 | |
| | | | | | | | |
Total Bangladesh | | | | | | | 2,348,920 | |
| | | | | | | | |
| | | | | | | | |
| | | |
| VIETNAM: 0.9% | | | | | | | | |
| | |
Nam Long Investment Corp. | | | 778,139 | | | | 1,200,215 | |
| | | | | | | | |
Total Vietnam | | | | | | | 1,200,215 | |
| | | | | | | | |
| | | | | | | | |
| | | |
| SINGAPORE: 0.4% | | | | | | | | |
| | |
SATS, Ltd.b | | | 170,700 | | | | 478,931 | |
| | | | | | | | |
Total Singapore | | | | | | | 478,931 | |
| | | | | | | | |
| | | | | | | | |
| | | |
| JAPAN: 0.1% | | | | | | | | |
| | |
Koa Corp. | | | 5,000 | | | | 59,607 | |
| | | | | | | | |
Total Japan | | | | | | | 59,607 | |
| | | | | | | | |
| | | | | | | | |
| | | |
| TOTAL COMMON EQUITIES | | | | | | | 120,206,105 | |
| | | | | | | | |
(Cost $114,647,438) | | | | | | | | |
| | | | | | | | |
| | |
PREFERRED EQUITIES: 4.9% | | | | | | | | |
| | | |
| SOUTH KOREA: 4.9% | | | | | | | | |
| | |
Samsung SDI Co., Ltd., Pfd. | | | 30,431 | | | | 6,358,980 | |
| | | | | | | | |
Total South Korea | | | | | | | 6,358,980 | |
| | | | | | | | |
| | | | | | | | |
| | |
| TOTAL PREFERRED EQUITIES | | | | 6,358,980 | |
| | | | | | | | |
(Cost $8,175,799) | | | | | | | | |
| | | | | | | | |
| | |
| TOTAL INVESTMENTS: 98.4% | | | | 126,565,085 | |
(Cost $122,823,237) | | | | | | | | |
| | | | | | | | |
| | |
CASH AND OTHER ASSETS,
LESS LIABILITIES: 1.6% | | | | | | | 2,030,712 | |
| | | | | | | | |
| | |
NET ASSETS: 100.0% | | | | | | | $128,595,797 | |
| | | | | | | | |
| a | Certain securities were fair valued under the valuation policies approved by the Board of Trustees (Note 2-A). |
| b | Non-income producing security. |
| c | Security exempt from registration under Rule 144A of the Securities Act of 1933, as amended. The security may be resold in transactions exempt from registration normally to qualified institutional buyers. The security has been determined to be liquid in accordance with procedures adopted by the Funds’ Board of Trustees. At June 30, 2022, the aggregate value is $23,766,281, which is 18.48% of net assets. |
| d | The securities may be resold to qualified foreign investors and foreign institutional buyers under Regulation S of the Securities Act of 1933. |
| ADR | American Depositary Receipt |
| REIT | Real Estate Investment Trust |
See accompanying notes to financial statements.
| | | | | | | | |
| | | | matthewsasia.com | 800.789.ASIA | | | 29 | |
| | | | |
| PORTFOLIO MANAGERS |
| |
| Michael J. Oh, CFA | | |
Lead Manager | | | | |
| |
| Taizo Ishida | | |
Co-Manager | | | | |
| | |
| FUND FACTS | | | | |
| | |
| | | Investor | | Institutional |
Ticker | | MATFX | | MITEX |
CUSIP | | 577130883 | | 577125859 |
Inception | | 12/27/99 | | 4/30/13 |
NAV | | $15.30 | | $15.49 |
Initial Investment | | $2,500 | | $100,000 |
Gross Expense Ratio1 | | 1.09% | | 0.93% |
Portfolio Statistics | | | | |
Total # of Positions | | | | 40 |
Net Assets | | | | $668.1 million |
Weighted Average Market Cap | | $98.1 billion |
Portfolio Turnover2 | | 220.5% |
Benchmark | | | | |
MSCI AC Asia ex Japan Index |
OBJECTIVE
Long-term capital appreciation.
STRATEGY
Under normal market conditions, the Fund seeks to achieve its investment objective by investing at least 80% of its net assets, which include borrowings for investment purposes, in the common and preferred stocks of companies located in Asia that Matthews believes are innovators in their products, services, processes, business models, management, use of technology, or approach to creating, expanding or servicing their markets. Asia consists of all countries and markets in Asia, including developed, emerging, and frontier countries and markets in the Asian region.
Matthews Asia Innovators Fund
Portfolio Manager Commentary (unaudited)
For the first half of 2022, the Matthews Asia Innovators Fund returned –18.88% (Investor Class) and
–18.82% (Institutional Class), while its benchmark, the MSCI All Country Asia ex Japan Index, returned –16.14% over the same period. For the quarter ending June 30, 2022, the Fund returned 0.07% (Investor Class) and 0.13% (Institutional Class), while the benchmark returned –8.90%.
Market Environment:
The first half of the year was a challenging period. Elevated inflation data and diminishing consumer spending in many regions dampened global sentiment and sparked recessionary fears. While Asian equity markets endured choppy waters they performed well in the second quarter, experiencing less downside than commodity heavy, weak-performing EMEA (Europe, Middle East, Africa) and LatAm regions. In particular, Chinese equities saw a strong rebound—in both Hong Kong-listed stocks and local A-Shares. Chinese fiscal and monetary support, combined with more lenient zero-COVID policy implementation, a reduction of regulatory pressure on internet and platform monopolies and progress on real estate re-financing roadblocks enabled a rebound in sentiment and economic activity. Conversely, South Korea was a major market laggard followed by Taiwan, Japan and India. In terms of investing styles, Asian growth stocks continued to trail value stocks, especially in Japan, and small caps suffered more than their larger cap regional peers.
Performance Contributors and Detractors:
From a regional perspective, the Fund’s stock selection within China/Hong Kong and Singapore detracted the most to relative performance for the first half of the year. On the other hand, the Fund’s underweight to and stock selection within South Korea contributed the most to relative performance. From a sector perspective, the Fund’s overweight and stock selection to higher growth communication services names detracted the most from relative performance for the period. Consumer discretionary is the biggest sector allocation and the top contributor to performance. It is also where we believe innovation can flourish.
Turning to individual securities, Chinese consumer discretionary holdings H World Group, which is mainly engaged in multi-brand hotel operations, and Trip.com Group, a Chinese multinational online travel company, were the largest contributors to performance. Both companies performed well based on the expectation that China’s zero COVID policy will ease and travel activities will pick up in the country. On the other hand, communications services holdings Sea and Bilibili were among the largest detractors to performance. While Sea, an internet gaming and e-commerce company in Singapore, has achieved impressive track record in establishing sizable market share across different countries, increased uncertainty around their internet gaming revenue trends contributed to poor performance.
Bilibili, a Chinese video content company, continued to suffer from China’s policies to regulate the health and development of the country’s internet industry. However, the company’s operational metrics from user acquisition and engagement still trend positively and while we remain cautious about the ongoing regulations, we continue to hold Bilibili as the fundamentals of the company remain healthy and its position as one of the dominant players in its field has strengthened as a result of more regulatory scrutiny.
(continued)
| 1 | Prospectus expense ratios. |
| 2 | The lesser of fiscal year 2021 long-term purchase costs or sales proceeds divided by the average monthly market value of long-term securities. |
| | | | | | | | | | | | | | | | | | | | | | | | | | | | | | | | | | | | |
| |
| PERFORMANCE AS OF JUNE 30, 2022 | |
| | | | | | | | | | | | | | | Average Annual Total Returns | | | | | | | |
| | | | | | 3 Months | | | YTD | | | 1 Year | | | 3 Years | | | 5 Years | | | 10 Years | | | Since
Inception | | | Inception
Date | |
| Investor Class (MATFX) | | | | | | | 0.07% | | | | -18.88% | | | | -32.88% | | | | 12.73% | | | | 10.28% | | | | 12.42% | | | | 4.93% | | | | 12/27/99 | |
| Institutional Class (MITEX) | | | | | | | 0.13% | | | | -18.82% | | | | -32.76% | | | | 12.88% | | | | 10.46% | | | | n.a. | | | | 11.87% | | | | 4/30/13 | |
| MSCI AC Asia ex Japan Index3 | | | | | | | -8.90% | | | | -16.14% | | | | -24.78% | | | | 2.41% | | | | 3.39% | | | | 5.80% | | | | 5.72% | 4 | | | | |
Performance assumes reinvestment of all dividends and/or distributions before taxes. All performance quoted represents past performance and is no guarantee of future results. Investment return and principal value will fluctuate with market conditions so that when redeemed, shares may be worth more or less than their original cost. Current performance may be lower or higher than the return figures quoted. For the Fund’s most recent month-end performance, visit matthewsasia.com.
GROWTH OF A HYPOTHETICAL $10,000 INVESTMENT SINCE INCEPTION—INVESTOR CLASS
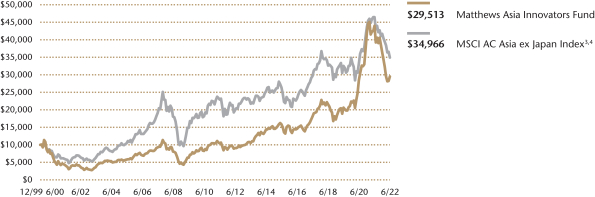
Plotted monthly. The performance data and graph do not reflect the deduction of taxes that a shareholder would pay on dividends, capital gains distributions or redemption of Fund shares. Values are in US$.
| | 3 | It is not possible to invest directly in an index. Source: Index data from Morgan Stanley Capital International and Bloomberg; total return calculations performed by BNY Mellon Investment Servicing (US) Inc. Please see page 84 for index definition. |
| | 4 | Calculated from 12/31/99. |
| | | | | | | | |
| | | | |
| TOP TEN HOLDINGS5 | | | | | | | |
| Name | | Sector | | Country | | % Net Assets | |
| ICICI Bank, Ltd. | | Financials | | India | | | 6.4% | |
| Meituan | | Consumer Discretionary | | China/Hong Kong | | | 6.0% | |
| Alibaba Group Holding, Ltd. | | Consumer Discretionary | | China/Hong Kong | | | 5.9% | |
| JD.com, Inc. | | Consumer Discretionary | | China/Hong Kong | | | 5.8% | |
| Tencent Holdings, Ltd. | | Communication Services | | China/Hong Kong | | | 5.2% | |
| XPeng, Inc. | | Consumer Discretionary | | China/Hong Kong | | | 4.8% | |
| Huazhu Group, Ltd. | | Consumer Discretionary | | China/Hong Kong | | | 4.4% | |
| Trip.com Group, Ltd. | | Consumer Discretionary | | China/Hong Kong | | | 4.3% | |
| Reliance Industries, Ltd. | | Energy | | India | | | 3.9% | |
| Bilibili, Inc. | | Communication Services | | China/Hong Kong | | | 3.0% | |
| % OF ASSETS IN TOP 10 | | | | | | | 49.7% | |
| | 5 | Holdings may combine more than one security from same issuer and related depositary receipts. |
| | | | | | | | |
| | | | matthewsasia.com | 800.789.ASIA | | | 31 | |
| | | | |
| | |
| COUNTRY ALLOCATION (%)6,7 | | | |
| China/Hong Kong | | | 64.7 | |
| India | | | 18.1 | |
| Indonesia | | | 4.3 | |
| Taiwan | | | 3.5 | |
| South Korea | | | 3.4 | |
| Vietnam | | | 2.2 | |
| Singapore | | | 1.4 | |
| Thailand | | | 0.9 | |
| Philippines | | | 0.8 | |
| Cash and Other Assets, Less Liabilities | | | 0.7 | |
| | | | |
| | |
| SECTOR ALLOCATION (%)7 | | | |
| Consumer Discretionary | | | 36.8 | |
| Financials | | | 20.2 | |
| Communication Services | | | 12.5 | |
| Consumer Staples | | | 7.7 | |
| Information Technology | | | 5.0 | |
| Real Estate | | | 4.5 | |
| Health Care | | | 3.9 | |
| Energy | | | 3.9 | |
| Industrials | | | 3.7 | |
| Materials | | | 1.1 | |
| Cash and Other Assets, Less Liabilities | | | 0.7 | |
| | | | |
| | |
| MARKET CAP EXPOSURE (%)7 | | | |
| Mega Cap (over $25B) | | | 62.1 | |
| Large Cap ($10B-$25B) | | | 24.0 | |
| Mid Cap ($3B-10B) | | | 11.7 | |
| Small Cap (under $3B) | | | 1.4 | |
| Cash and Other Assets, Less Liabilities | | | 0.7 | |
| | 6 | Not all countries are included in the benchmark index. |
| | 7 | Source: FactSet Research Systems. Percentage values in data are rounded to the nearest tenth of one percent, so the values may not sum to 100% due to rounding. Country allocations and percentage values may be derived from different data sources and may not be consistent with other Fund literature. |
Matthews Asia Innovators Fund
Portfolio Manager Commentary (unaudited) (continued)
Notable Portfolio Changes:
During the second quarter, we initiated a position in Chinese health care company Innovent Biologics. Innovent, which develops and manufactures high-quality medicines for the treatment of major diseases such as cancer, rallied on positive sentiment around the likelihood it will get FDA approval for new therapy trials. Additionally, we initiated a position in Pinduoduo, a Chinese e-commerce platform offering a wide range of products including groceries, fashion, beauty and electronics. While Pinduoduo has been a loss-making company for most of its existence, it is now profitable and recent earnings results show improvement in its margin profile.
During the quarter we also exited a few positions including two Chinese stocks, Flat Glass Group which is principally involved in the research, development and sales of glass products, and Contemporary Amperex Technology, a lithium-ion battery manufacturer. In both cases we took the opportunity to take some profits and invest in other attractive Chinese companies.
Outlook:
Looking ahead, we believe markets may see more volatility as they come to terms with the severity of Fed hikes, tighter global liquidity and protracted inflation. That said, we believe that markets have priced in a substantial amount of uncertainty, especially within Asia and China, and not withstanding a sudden and severe downturn of global economic activity or a geopolitical shift, we believe there may be upside to come.
In particular, China should be positioned well for a pickup in domestic activity as the government is starting to support consumers and small and medium enterprises (SMEs) through gradual release of stimulus programs. Unlike the interest rate cycle in the West, interest rates are easing in China which may help lower the cost of capital for companies. In other parts of Asia, shopping mall operators in Southeast Asia stand to benefit from resumption of tourism activities.
We continue to find many innovative companies in Asia at appealing levels today and the current levels continue to provide fertile hunting ground for companies that are innovating in areas such as business strategy, products and services, marketing and human capital.
Matthews Asia Innovators Fund
June 30, 2022
Schedule of Investmentsa (unaudited)
COMMON EQUITIES: 99.3%
| | | | | | | | |
| | | Shares | | | Value | |
| | |
| CHINA/HONG KONG: 65.8% | | | | | | | | |
| | |
Meituan B Sharesb,c,d | | | 1,606,200 | | | | $40,081,579 | |
| | |
Alibaba Group Holding, Ltd.c | | | 2,760,300 | | | | 39,376,765 | |
| | |
JD.com, Inc. A Shares | | | 1,194,423 | | | | 38,487,941 | |
| | |
Tencent Holdings, Ltd. | | | 769,800 | | | | 34,845,110 | |
| | |
XPeng, Inc. A Sharesc | | | 1,998,200 | | | | 31,841,553 | |
| | |
Huazhu Group, Ltd. | | | 7,520,500 | | | | 29,202,153 | |
| | |
Trip.com Group, Ltd.c | | | 1,033,750 | | | | 28,604,332 | |
| | |
Bilibili, Inc. Class Zc | | | 773,871 | | | | 19,839,089 | |
| | |
AIA Group, Ltd. | | | 1,806,800 | | | | 19,742,126 | |
| | |
China Resources Beer Holdings Co., Ltd. | | | 2,636,000 | | | | 19,698,761 | |
| | |
Wuxi Biologics Cayman, Inc.b,c,d | | | 1,826,500 | | | | 16,923,295 | |
| | |
Inner Mongolia Yili Industrial Group Co., Ltd. A Shares | | | 2,615,230 | | | | 15,239,071 | |
| | |
KE Holdings, Inc. A Sharesc | | | 2,343,300 | | | | 13,841,560 | |
| | |
Shenzhen Inovance Technology Co., Ltd. A Shares | | | 1,247,097 | | | | 12,306,476 | |
| | |
Sungrow Power Supply Co., Ltd. A Shares | | | 835,000 | | | | 12,297,502 | |
| | |
East Money Information Co., Ltd. A Shares | | | 2,810,180 | | | | 10,706,222 | |
| | |
Kanzhun, Ltd. ADRc | | | 406,200 | | | | 10,674,936 | |
| | |
China Resources Mixc Lifestyle Services, Ltd.b,d | | | 2,052,400 | | | | 10,196,112 | |
| | |
Silergy Corp. | | | 125,000 | | | | 10,107,422 | |
| | |
Pinduoduo, Inc. ADRc | | | 142,400 | | | | 8,800,320 | |
| | |
Alchip Technologies, Ltd. | | | 330,000 | | | | 7,744,253 | |
| | |
Innovent Biologics, Inc.b,c,d | | | 1,579,500 | | | | 7,066,781 | |
| | |
MicroTech Medical Hangzhou Co., Ltd. H Sharesb,c,d | | | 1,393,100 | | | | 1,765,409 | |
| | | | | | | | |
Total China/Hong Kong | | | | | | | 439,388,768 | |
| | | | | | | | |
| | | | | | | | |
| | | |
| INDIA: 18.2% | | | | | | | | |
| | |
ICICI Bank, Ltd. | | | 4,793,968 | | | | 43,068,638 | |
| | |
Reliance Industries, Ltd. | | | 781,333 | | | | 25,799,128 | |
| | |
HDFC Bank, Ltd. | | | 1,140,655 | | | | 19,538,407 | |
| | |
Bajaj Finance, Ltd. | | | 251,291 | | | | 17,290,622 | |
| | |
Dabur India, Ltd. | | | 1,372,283 | | | | 8,632,972 | |
| | |
Bandhan Bank, Ltd.b,d | | | 2,035,495 | | | | 6,829,590 | |
| | | | | | | | |
Total India | | | | | | | 121,159,357 | |
| | | | | | | | |
| | | | | | | | |
| | | |
| INDONESIA: 4.3% | | | | | | | | |
| | |
PT Bank Mandiri Persero | | | 23,043,300 | | | | 12,305,488 | |
| | |
PT Indofood CBP Sukses Makmur Tbk | | | 12,750,100 | | | | 8,180,523 | |
| | |
PT Astra International | | | 18,263,900 | | | | 8,139,610 | |
| | | | | | | | |
Total Indonesia | | | | | | | 28,625,621 | |
| | | | | | | | |
| | | | | | | | |
| | | |
| SOUTH KOREA: 3.4% | | | | | | | | |
| | |
NAVER Corp. | | | 48,543 | | | | 9,054,561 | |
| | |
LG Chem Ltd. | | | 18,384 | | | | 7,303,632 | |
| | |
Kia Corp. | | | 109,196 | | | | 6,517,423 | |
| | | | | | | | |
Total South Korea | | | | | | | 22,875,616 | |
| | | | | | | | |
| | | | | | | | |
| | | |
| TAIWAN: 2.3% | | | | | | | | |
| | |
Taiwan Semiconductor Manufacturing Co., Ltd. | | | 967,000 | | | | 15,497,483 | |
| | | | | | | | |
Total Taiwan | | | | | | | 15,497,483 | |
| | | | | | | | |
| | | | | | | | |
| | | | | | | | |
| | | Shares | | | Value | |
| | |
| VIETNAM: 2.2% | | | | | | | | |
| | |
Mobile World Investment Corp. | | | 4,800,748 | | | | $14,766,330 | |
| | | | | | | | |
Total Vietnam | | | | | | | 14,766,330 | |
| | | | | | | | |
| | | | | | | | |
| | | |
| SINGAPORE: 1.4% | | | | | | | | |
| | |
Sea, Ltd. ADRc | | | 136,806 | | | | 9,146,849 | |
| | | | | | | | |
Total Singapore | | | | | | | 9,146,849 | |
| | | | | | | | |
| | | | | | | | |
| | | |
| THAILAND: 0.9% | | | | | | | | |
| | |
Central Pattana Public Co., Ltd. | | | 3,613,600 | | | | 6,245,155 | |
| | | | | | | | |
Total Thailand | | | | | | | 6,245,155 | |
| | | | | | | | |
| | | | | | | | |
| | | |
| PHILIPPINES: 0.8% | | | | | | | | |
| | |
Bank of the Philippine Islands | | | 3,534,660 | | | | 5,451,696 | |
| | | | | | | | |
Total Philippines | | | | | | | 5,451,696 | |
| | | | | | | | |
| | | | | | | | |
| | | |
| TOTAL INVESTMENTS: 99.3% | | | | | | | 663,156,875 | |
(Cost $738,185,129) | | | | | | | | |
| | | | | | | | |
| | |
CASH AND OTHER ASSETS,
LESS LIABILITIES: 0.7% | | | | | | | 4,947,332 | |
| | | | | | | | |
| | |
NET ASSETS: 100.0% | | | | | | | $668,104,207 | |
| | | | | | | | |
| a | Certain securities were fair valued under the valuation policies approved by the Board of Trustees (Note 2-A). |
| b | Security exempt from registration under Rule 144A of the Securities Act of 1933, as amended. The security may be resold in transactions exempt from registration normally to qualified institutional buyers. The security has been determined to be liquid in accordance with procedures adopted by the Funds’ Board of Trustees. At June 30, 2022, the aggregate value is $82,862,766, which is 12.40% of net assets. |
| c | Non-income producing security. |
| d | The securities may be resold to qualified foreign investors and foreign institutional buyers under Regulation S of the Securities Act of 1933. |
| ADR | American Depositary Receipt |
See accompanying notes to financial statements.
| | | | | | | | |
| | | | matthewsasia.com | 800.789.ASIA | | | 33 | |
| | | | |
| PORTFOLIO MANAGERS |
| |
| Andrew Mattock, CFA | | |
Lead Manager | | |
| |
| Winnie Chwang | | Sherwood Zhang, CFA |
Co-Manager | | Co-Manager |
| | |
| FUND FACTS | | | | |
| | |
| | | Investor | | Institutional |
Ticker | | MCHFX | | MICFX |
CUSIP | | 577130701 | | 577130818 |
Inception | | 2/19/98 | | 10/29/10 |
NAV | | $17.87 | | $17.83 |
Initial Investment | | $2,500 | | $100,000 |
Gross Expense Ratio1 | | 1.06% | | 0.91% |
Portfolio Statistics |
Total # of Positions | | 65 |
Net Assets | | $1.1 billion |
Weighted Average
Market Cap | | $85.5 billion |
Portfolio Turnover2 | | 92.3% |
Benchmarks |
MSCI China Index |
MSCI China All Shares Index |
OBJECTIVE
Long-term capital appreciation.
STRATEGY
Under normal market conditions, the Fund seeks to achieve its investment objective by investing at least 80% of its net assets, which include borrowings for investment purposes, in the common and preferred stocks of companies located in China. China includes its administrative and other districts, such as Hong Kong.
Matthews China Fund
Portfolio Manager Commentary (unaudited)
For the first half of 2022, the Matthews China Fund returned –13.17% (Investor Class) and –13.15% (Institutional Class), while its benchmark, the MSCI China Index, returned –11.19% over the same period. For the quarter ending June 30, 2022, the Fund returned 8.90% (Investor Class) and 8.92% (Institutional Class), while the benchmark returned 3.50%.
Market Environment:
The first half of the year was negative and choppy for Chinese markets led down by the confluence of COVID-19 case spikes resulting in policy-enforced lockdowns in tier one cities, ADR delisting pricing pressures and investor worries that Russia-like sanctions could be implemented upon select Chinese companies. However, Chinese equities rebounded in the second quarter of the year following three consecutive negative quarters amid less restrictive regulatory pressure on Chinese platforms and internet giants, accommodative monetary and fiscal policy combined with positive changes to COVID lock-down protocols.
Quarantine restrictions for in-bound foreign visitors were reduced and late quarter weakness in imported commodity prices could support China’s current account while reducing inflationary pressures. Although the government’s announced 2022 GDP growth-rate target of “around 5.5%” may not be fully achieved, we believe the government will largely succeed in supporting its economy and that corporate earnings will remain some of the highest globally in 2022-23.
Performance Contributors and Detractors:
From a sector perspective, stock selection and allocation within consumer discretionary, real estate and consumer staples contributed to relative performance during the first half of the year. Among the portfolio’s consumer discretionary holdings, Pinduoduo, China’s largest agriculture-focused technology platform that connects farmers and distributors with consumers directly through its interactive shopping experience, contributed the most to the Fund’s absolute and relative performance. In light of the regulatory impact seen in the second half of 2021, more internet platform companies in China have begun to adapt to new regulations, including trying to set a path to profitability. We see more encouraging signs of monetization efforts and this, coupled with attractive valuations can potentially help the stocks to continue to recover.
On the other hand, the portfolio’s overweight in information technology and stock selection in industrials and financials sectors detracted from relative performance. Sungrow Power Supply Co., a solar component manufacturer, detracted from performance. The A-Shares market experienced a sharp correction in growth sectors including that of the renewable sector given a general risk off appetite, coupled with COVID concerns. We continue to believe that the solar industry will continue to be a secular opportunity. Most recently, the industry is seeing strong demand from Europe given escalating energy prices in the region. Valuations for Sungrow have also corrected down to more reasonable levels and thus we remain comfortable in holding this stock in the portfolio.
(continued)
| 1 | Prospectus expense ratios. |
| 2 | The lesser of fiscal year 2021 long-term purchase costs or sales proceeds divided by the average monthly market value of long-term securities. |
| | | | | | | | | | | | | | | | | | | | | | | | | | | | | | | | |
| |
| PERFORMANCE AS OF JUNE 30, 2022 | |
| | | | | | | | | | | | Average Annual Total Returns | | | | |
| | | 3 Months | | | YTD | | | 1 Year | | | 3 Years | | | 5 Years | | | 10 Years | | | Since
Inception | | | Inception
Date | |
| Investor Class (MCHFX) | | | 8.90% | | | | -13.17% | | | | -28.80% | | | | 6.25% | | | | 7.14% | | | | 7.17% | | | | 9.25% | | | | 2/19/98 | |
| Institutional Class (MICFX) | | | 8.92% | | | | -13.15% | | | | -28.71% | | | | 6.41% | | | | 7.33% | | | | 7.34% | | | | 4.42% | | | | 10/29/10 | |
| MSCI China Index3 | | | 3.50% | | | | -11.19% | | | | -31.70% | | | | -0.44% | | | | 2.29% | | | | 5.69% | | | | 3.85% | 4 | | | | |
| MSCI China All Shares Index3 | | | 2.99% | | | | -11.70% | | | | -25.36% | | | | 3.78% | | | | 3.67% | | | | 6.30% | | | | n.a. | 5 | | | | |
Performance assumes reinvestment of all dividends and/or distributions before taxes. All performance quoted represents past performance and is no guarantee of future results. Investment return and principal value will fluctuate with market conditions so that when redeemed, shares may be worth more or less than their original cost. Current performance may be lower or higher than the return figures quoted. For the Fund’s most recent month-end performance, visit matthewsasia.com.
GROWTH OF A HYPOTHETICAL $10,000 INVESTMENT SINCE INCEPTION—INVESTOR CLASS
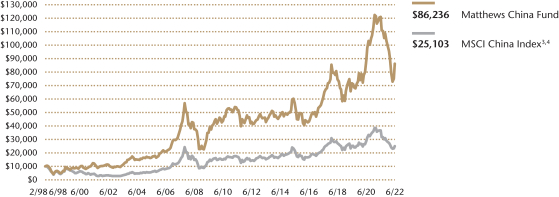
Plotted monthly. The performance data and graph do not reflect the deduction of taxes that a shareholder would pay on dividends, capital gains distributions or redemption of Fund shares. Values are in US$.
| | 3 | It is not possible to invest directly in an index. Source: Index data from Morgan Stanley Capital International and Bloomberg; total return calculations performed by BNY Mellon Investment Servicing (US) Inc. Please see page 84 for index definition. |
| | 4 | Calculated from 2/28/98. |
| | 5 | Index performance data prior to 11/25/08 is not available. |
| | | | | | | | |
| | | | |
| TOP TEN HOLDINGS5 | | | | | | | |
| Name | | Sector | | | | % Net Assets | |
| Alibaba Group Holding, Ltd. | | Consumer Discretionary | | | | | 7.9% | |
| Pinduoduo, Inc. | | Consumer Discretionary | | | | | 5.7% | |
| Meituan | | Consumer Discretionary | | | | | 5.4% | |
| JD.com, Inc. | | Consumer Discretionary | | | | | 4.8% | |
| China Merchants Bank Co., Ltd. | | Financials | | | | | 4.0% | |
| Tencent Holdings, Ltd. | | Communication Services | | | | | 3.9% | |
| China International Capital Corp., Ltd. | | Financials | | | | | 3.8% | |
| CITIC Securities Co., Ltd. | | Financials | | | | | 2.9% | |
| China Tourism Group Duty Free Corp., Ltd. | | Consumer Discretionary | | | | | 2.4% | |
| Wuliangye Yibin Co., Ltd. | | Consumer Staples | | | | | 2.2% | |
| % OF ASSETS IN TOP 10 | | | | | | | 43.0% | |
| | 5 | Holdings may combine more than one security from same issuer and related depositary receipts. |
| | | | | | | | |
| | | | matthewsasia.com | 800.789.ASIA | | | 35 | |
| | | | |
| |
| COUNTRY ALLOCATION (%)6 | |
| China | | | 99.3 | |
| Cash and Other Assets, Less Liabilities | | | 0.7 | |
| | | | |
| |
| SECTOR ALLOCATION (%)6 | |
| Consumer Discretionary | | | 32.2 | |
| Information Technology | | | 15.2 | |
| Financials | | | 13.8 | |
| Industrials | | | 11.5 | |
| Communication Services | | | 7.1 | |
| Real Estate | | | 5.9 | |
| Health Care | | | 5.5 | |
| Consumer Staples | | | 4.1 | |
| Materials | | | 4.0 | |
| Cash and Other Assets, Less Liabilities | | | 0.7 | |
| | | | |
| |
| MARKET CAP EXPOSURE (%)6 | |
| Mega Cap (over $25B) | | | 50.5 | |
| Large Cap ($10B-$25B) | | | 30.6 | |
| Mid Cap ($3B-10B) | | | 15.8 | |
| Small Cap (under $3B) | | | 2.5 | |
| Cash and Other Assets, Less Liabilities | | | 0.7 | |
| 6 | Source: FactSet Research Systems. Percentage values in data are rounded to the nearest tenth of one percent, so the values may not sum to 100% due to rounding. Country allocations and percentage values may be derived from different data sources and may not be consistent with other Fund literature. |
Matthews China Fund
Portfolio Manager Commentary (unaudited) (continued)
Notable Portfolio Changes:
During the second quarter, we increased our exposure to the real estate sector given overall policy improvements in the sector, including progress on re-financing roadblocks and lower mortgage rates. We believe that these eased measures will start to drive contracted sales growth when COVID lockdown restrictions are eased. Property developers and management companies still trade at attractive valuations and there remains an opportunity for market consolidation for the larger and better run players. We also reduced some exposure from holdings in the communication services sector, including Tencent. Tencent continues to be one of China’s most dominant internet platforms and gaming remains the largest part of its exposure. However, with a broad-base revenue moderation in gaming, coupled with weaker outlook on its advertising business, we have trimmed from this exposure to fund other opportunities.
Outlook:
The A-Shares market has recovered meaningfully since the end of April lows. It is uncertain if second quarter results (which will be weak given it will bake in the worst of the COVID lockdowns) might derail this recovery. However, we are cautiously optimistic that in the second half of this year, the conditions in China will continue to improve.
Large scale lockdowns seem a lot less probable as the government continues to become more pragmatic. Further, the party will likely do what they can to improve economic conditions ahead of the party meeting at the end of the year which may make it more likely that monetary and fiscal stimulus will be unleashed in the second half. Sentiment towards growth globally remains tepid but we believe the significantly lower valuations might warrant a re-interest in this category as well.
Matthews China Fund
June 30, 2022
Schedule of Investmentsa (unaudited)
COMMON EQUITIES: 99.3%
| | | | | | | | |
| | | Shares | | | Value | |
|
| CONSUMER DISCRETIONARY: 32.2% | |
Internet & Direct Marketing Retail: 23.9% | |
| | |
Alibaba Group Holding, Ltd.b | | | 6,014,600 | | | | $85,800,634 | |
| | |
Pinduoduo, Inc. ADRb | | | 999,550 | | | | 61,772,190 | |
| | |
Meituan B Sharesb,c,d | | | 2,359,200 | | | | 58,872,159 | |
| | |
JD.com, Inc. A Shares | | | 1,625,463 | | | | 52,377,360 | |
| | | | | | | | |
| | | | | | | 258,822,343 | |
| | | | | | | | |
| | | | | | | | |
Specialty Retail: 3.7% | | | | | | | | |
| | |
China Tourism Group Duty Free Corp., Ltd. A Shares | | | 732,990 | | | | 25,560,713 | |
| | |
Zhongsheng Group Holdings, Ltd. | | | 2,143,500 | | | | 15,145,034 | |
| | | | | | | | |
| | | | | | | 40,705,747 | |
| | | | | | | | |
| | | | | | | | |
Household Durables: 2.4% | | | | | | | | |
| | |
Midea Group Co., Ltd. A Shares | | | 1,742,552 | | | | 15,776,064 | |
| | |
Man Wah Holdings, Ltd. | | | 9,508,400 | | | | 10,267,182 | |
| | | | | | | | |
| | | | | | | 26,043,246 | |
| | | | | | | | |
| | | | | | | | |
Hotels, Restaurants & Leisure: 1.1% | | | | | | | | |
| | |
Huazhu Group, Ltd. ADR | | | 305,300 | | | | 11,631,930 | |
| | | | | | | | |
| | | | | | | | |
Auto Components: 1.1% | | | | | | | | |
| | |
Zhejiang Shuanghuan Driveline Co., Ltd. A Shares | | | 2,423,017 | | | | 11,546,592 | |
| | | | | | | | |
Total Consumer Discretionary | | | | | | | 348,749,858 | |
| | | | | | | | |
| | | | | | | | |
| | | |
| INFORMATION TECHNOLOGY: 15.2% | | | | | | | | |
Semiconductors & Semiconductor Equipment: 8.0% | | | | | |
| | |
LONGi Green Energy Technology Co., Ltd. A Shares | | | 1,405,612 | | | | 14,062,142 | |
| | |
Gigadevice Semiconductor Beijing, Inc. A Shares | | | 590,380 | | | | 12,608,591 | |
| | |
Zhejiang Jingsheng Mechanical & Electrical Co., Ltd. A Shares | | | 1,113,489 | | | | 11,286,639 | |
| | |
Will Semiconductor Co., Ltd. Shanghai A Shares | | | 397,119 | | | | 10,308,886 | |
| | |
Hangzhou Silan Microelectronics Co., Ltd. A Shares | | | 1,319,209 | | | | 10,293,837 | |
| | |
All Winner Technology Co., Ltd. A Shares | | | 2,073,150 | | | | 9,369,979 | |
| | |
Beijing Huafeng Test & Control Technology Co., Ltd. A Shares | | | 166,111 | | | | 8,879,327 | |
| | |
NAURA Technology Group Co., Ltd. A Shares | | | 173,841 | | | | 7,228,078 | |
| | |
Cambricon Technologies Corp., Ltd. A Sharesb | | | 221,151 | | | | 2,140,888 | |
| | | | | | | | |
| | | | | | | 86,178,367 | |
| | | | | | | | |
| | | | | | | | |
Software: 5.0% | | | | | | | | |
| | |
Shanghai Baosight Software Co., Ltd. A Shares | | | 2,426,496 | | | | 19,857,981 | |
| | |
Thunder Software Technology Co., Ltd. A Shares | | | 883,666 | | | | 17,290,881 | |
| | |
Beijing Kingsoft Office Software, Inc. A Shares | | | 319,574 | | | | 9,431,977 | |
| | |
Kingdee International Software Group Co., Ltd.b | | | 2,048,000 | | | | 4,825,111 | |
| | |
Sangfor Technologies, Inc. A Shares | | | 139,049 | | | | 2,161,337 | |
| | | | | | | | |
| | | | | | | 53,567,287 | |
| | | | | | | | |
| | | | | | | | |
Electronic Equipment, Instruments & Components: 2.2% | |
| | |
Wingtech Technology Co., Ltd. A Shares | | | 1,273,417 | | | | 16,264,566 | |
| | |
Xiamen Faratronic Co., Ltd. A Shares | | | 257,209 | | | | 7,900,269 | |
| | | | | | | | |
| | | | | | | 24,164,835 | |
| | | | | | | | |
Total Information Technology | | | | | | | 163,910,489 | |
| | | | | | | | |
| | | | | | | | |
| | | Shares | | | Value | |
| | |
| FINANCIALS: 13.8% | | | | | | | | |
Capital Markets: 9.8% | | | | | | | | |
| | |
China International Capital Corp., Ltd. H Sharesc,d | | | 19,237,600 | | | | $41,076,836 | |
| | |
CITIC Securities Co., Ltd. H Shares | | | 14,137,425 | | | | 31,690,200 | |
| | |
China Merchants Securities Co., Ltd. H Sharesc,d | | | 14,579,800 | | | | 15,835,516 | |
| | |
East Money Information Co., Ltd. A Shares | | | 2,809,700 | | | | 10,704,393 | |
| | |
Hong Kong Exchanges & Clearing, Ltd. | | | 143,200 | | | | 7,082,137 | |
| | | | | | | | |
| | | | | | | 106,389,082 | |
| | | | | | | | |
| | | | | | | | |
Banks: 4.0% | | | | | | | | |
| | |
China Merchants Bank Co., Ltd. A Shares | | | 6,800,323 | | | | 43,016,766 | |
| | | | | | | | |
Total Financials | | | | | | | 149,405,848 | |
| | | | | | | | |
| | | | | | | | |
| | | |
| INDUSTRIALS: 11.5% | | | | | | | | |
Machinery: 7.2% | | | | | | | | |
| | |
Shenzhen Inovance Technology Co., Ltd. A Shares | | | 2,355,107 | | | | 23,240,428 | |
| | |
Estun Automation Co., Ltd. A Shares | | | 5,553,544 | | | | 20,396,846 | |
| | |
Wuxi Lead Intelligent Equipment Co., Ltd. A Shares | | | 1,859,116 | | | | 17,586,310 | |
| | |
Jiangsu Hengli Hydraulic Co., Ltd. A Shares | | | 976,200 | | | | 9,014,260 | |
| | |
Weichai Power Co., Ltd. A Shares | | | 4,277,461 | | | | 7,992,742 | |
| | | | | | | | |
| | | | | | | 78,230,586 | |
| | | | | | | | |
| | | | | | | | |
Electrical Equipment: 2.9% | | | | | | | | |
| | |
Sungrow Power Supply Co., Ltd. A Shares | | | 1,010,974 | | | | 14,889,167 | |
| | |
Gotion High-tech Co., Ltd. A Shares | | | 1,353,583 | | | | 9,255,147 | |
| | |
Contemporary Amperex Technology Co., Ltd. A Shares | | | 71,700 | | | | 5,745,563 | |
| | |
NARI Technology Co., Ltd. A Shares | | | 420,436 | | | | 1,701,715 | |
| | | | | | | | |
| | | | | | | 31,591,592 | |
| | | | | | | | |
| | | | | | | | |
Transportation Infrastructure: 1.4% | | | | | | | | |
| | |
Shanghai International Airport Co., Ltd. A Sharesb | | | 1,696,141 | | | | 14,404,406 | |
| | | | | | | | |
Total Industrials | | | | | | | 124,226,584 | |
| | | | | | | | |
| | | | | | | | |
| | | |
| COMMUNICATION SERVICES: 7.1% | | | | | | | | |
Interactive Media & Services: 3.9% | | | | | | | | |
| | |
Tencent Holdings, Ltd. | | | 937,000 | | | | 42,413,443 | |
| | | | | | | | |
| | | | | | | | |
Media: 1.7% | | | | | | | | |
| | |
Focus Media Information Technology Co., Ltd. A Shares | | | 17,728,457 | | | | 17,871,862 | |
| | | | | | | | |
| | | | | | | | |
Entertainment: 1.5% | | | | | | | | |
| | |
Bilibili, Inc. ADRb | | | 654,500 | | | | 16,755,200 | |
| | | | | | | | |
Total Communication Services | | | | | | | 77,040,505 | |
| | | | | | | | |
| | | | | | | | |
| | | |
| REAL ESTATE: 5.9% | | | | | | | | |
Real Estate Management & Development: 5.9% | | | | | |
| | |
CIFI Holdings Group Co., Ltd. | | | 37,739,520 | | | | 19,023,704 | |
| | |
KE Holdings, Inc. ADRb | | | 884,700 | | | | 15,880,365 | |
| | |
Country Garden Services Holdings Co., Ltd. | | | 2,525,000 | | | | 11,331,873 | |
| | |
Times China Holdings, Ltd. | | | 31,604,000 | | | | 10,522,713 | |
| | |
KWG Living Group Holdings, Ltd.d | | | 21,754,000 | | | | 6,818,990 | |
| | | | | | | | |
Total Real Estate | | | | | | | 63,577,645 | |
| | | | | | | | |
| | | | | | | | |
| | | | matthewsasia.com | 800.789.ASIA | | | 37 | |
Matthews China Fund
June 30, 2022
Schedule of Investmentsa (unaudited) (continued)
COMMON EQUITIES (continued)
| | | | | | | | |
| | | Shares | | | Value | |
| | |
| HEALTH CARE: 5.5% | | | | | | | | |
Life Sciences Tools & Services: 3.1% | | | | | | | | |
| | |
Pharmaron Beijing Co., Ltd. H Sharesc,d | | | 1,766,100 | | | | $17,739,435 | |
| | |
Hangzhou Tigermed Consulting Co., Ltd. A Shares | | | 706,681 | | | | 12,114,169 | |
| | |
Wuxi Biologics Cayman, Inc.b,c,d | | | 379,500 | | | | 3,516,228 | |
| | | | | | | | |
| | | | | | | 33,369,832 | |
| | | | | | | | |
| | | | | | | | |
Health Care Equipment & Supplies: 1.8% | | | | | | | | |
| | |
Shenzhen New Industries Biomedical Engineering Co., Ltd. A Shares | | | 1,649,057 | | | | 11,136,881 | |
| | |
Shenzhen Mindray Bio-Medical Electronics Co., Ltd. A Shares | | | 193,873 | | | | 9,093,150 | |
| | | | | | | | |
| | | | | | | 20,230,031 | |
| | | | | | | | |
| | | | | | | | |
Health Care Providers & Services: 0.5% | | | | | | | | |
| | |
Topchoice Medical Corp. A Sharesb | | | 200,391 | | | | 5,237,842 | |
| | | | | | | | |
| | | | | | | | |
Pharmaceuticals: 0.1% | | | | | | | | |
| | |
Jiangsu Hengrui Medicine Co., Ltd. A Shares | | | 204,933 | | | | 1,137,724 | |
| | | | | | | | |
Total Health Care | | | | | | | 59,975,429 | |
| | | | | | | | |
| | | | | | | | |
| | | |
| CONSUMER STAPLES: 4.1% | | | | | | | | |
Beverages: 2.7% | | | | | | | | |
| | |
Wuliangye Yibin Co., Ltd. A Shares | | | 775,319 | | | | 23,447,176 | |
| | |
Shanxi Xinghuacun Fen Wine Factory Co., Ltd. A Shares | | | 119,022 | | | | 5,788,733 | |
| | | | | | | | |
| | | | | | | 29,235,909 | |
| | | | | | | | |
| | | | | | | | |
Food Products: 1.4% | | | | | | | | |
| | |
Anjoy Foods Group Co., Ltd. A Shares | | | 596,523 | | | | 14,983,702 | |
| | | | | | | | |
Total Consumer Staples | | | | | | | 44,219,611 | |
| | | | | | | | |
| | | | | | | | |
| | | |
| MATERIALS: 4.0% | | | | | | | | |
Chemicals: 3.9% | | | | | | | | |
| | |
Shanghai Putailai New Energy Technology Co., Ltd. A Shares | | | 1,662,486 | | | | 21,068,613 | |
| | |
Shandong Sinocera Functional Material Co., Ltd. A Shares | | | 2,119,924 | | | | 11,395,514 | |
| | |
Skshu Paint Co., Ltd. A Sharesb | | | 335,626 | | | | 6,500,866 | |
| | |
Wanhua Chemical Group Co., Ltd. A Shares | | | 217,718 | | | | 3,162,178 | |
| | | | | | | | |
| | | | | | | 42,127,171 | |
| | | | | | | | |
| | | | | | | | |
Construction Materials: 0.1% | | | | | | | | |
| | |
China Jushi Co., Ltd. A Shares | | | 423,389 | | | | 1,102,467 | |
| | | | | | | | |
Total Materials | | | | | | | 43,229,638 | |
| | | | | | | | |
| | | | | | | | |
| | | |
| TOTAL INVESTMENTS: 99.3% | | | | | | | 1,074,335,607 | |
(Cost $1,192,585,936) | | | | | | | | |
| | | | | | | | |
| | |
| CASH AND OTHER ASSETS, LESS LIABILITIES: 0.7% | | | | | | | 7,504,828 | |
| | | | | | | | |
| | |
NET ASSETS: 100.0% | | | | | | | $1,081,840,435 | |
| | | | | | | | |
| a | Certain securities were fair valued under the valuation policies approved by the Board of Trustees (Note 2-A). |
| b | Non-income producing security. |
| c | Security exempt from registration under Rule 144A of the Securities Act of 1933, as amended. The security may be resold in transactions exempt from registration normally to qualified institutional buyers. The security has been determined to be liquid in accordance with procedures adopted by the Funds’ Board of Trustees. At June 30, 2022, the aggregate value is $137,040,174, which is 12.67% of net assets. |
| d | The securities may be resold to qualified foreign investors and foreign institutional buyers under Regulation S of the Securities Act of 1933. |
| ADR | American Depositary Receipt |
See accompanying notes to financial statements.
| | | | |
| PORTFOLIO MANAGERS | | |
| |
| Winnie Chwang | | Andrew Mattock, CFA |
Lead Manager | | Lead Manager |
| |
| FUND FACTS | | |
| | |
| | | Investor | | Institutional |
Ticker | | MCSMX | | MICHX |
CUSIP | | 577125404 | | 577125842 |
Inception | | 5/31/11 | | 11/30/17 |
NAV | | $13.03 | | $13.07 |
Initial Investment | | $2,500 | | $100,000 |
Gross Expense Ratio1 | | 1.48% | | 1.31% |
After Fee Waiver and Reimbursement2 | | 1.43% | | 1.20% |
Portfolio Statistics | | |
Total # of Positions | | 61 |
Net Assets | | $270.2 million |
Weighted Average Market Cap | | $4.8 billion |
Portfolio Turnover3 | | 119.7% |
Benchmark | | |
MSCI China Small Cap Index |
OBJECTIVE
Long-term capital appreciation.
STRATEGY
Under normal market conditions, the Fund seeks to achieve its investment objective by investing at least 80% of its net assets, which include borrowings for investment purposes, in the common and preferred stocks of Small Companies located in China. China includes its administrative and other districts, such as Hong Kong. The Fund defines Small Companies as companies with market capitalization no higher than the greater of $5 billion or the market capitalization of the largest company included in the Fund’s primary benchmark, the MSCI China Small Cap Index.
Matthews China Small Companies Fund
Portfolio Manager Commentary (unaudited)
For the first half of 2022, the Matthews China Small Companies Fund returned –20.74% (Investor Class) and –20.64% (Institutional Class), while its benchmark, the MSCI China Small Cap Index, returned –16.39% over the same period. For the quarter ending June 30, 2022, the Fund returned
–0.99% (Investor Class) and –0.98% (Institutional Class), while the benchmark returned –0.08%.
Market Environment:
The first half of the year was negative and choppy for Chinese markets led down by the confluence of COVID-19 case spikes resulting in policy-enforced lockdowns in tier one cities, ADR delisting pricing pressures and investor worries that Russia-like sanctions could be implemented upon select Chinese companies. However, Chinese equities rebounded in the second quarter of the year following three consecutive negative quarters amid less restrictive regulatory pressure on Chinese platforms and internet giants, accommodative monetary and fiscal policy combined with positive changes to COVID lockdown protocols.
Quarantine restrictions for in-bound foreign visitors were reduced and late quarter weakness in imported commodity prices could support China’s current account while reducing inflationary pressures. Although the government’s announced 2022 GDP growth-rate target of “around 5.5%” may not be fully achieved, we believe the government will largely succeed in supporting its economy and that corporate earnings will remain some of the highest globally in 2022-23.
Performance Contributors and Detractors:
During the first half of the year, our stock selection within industrials and our underweight and stock selection within the utilities and communications services sectors contributed to the Fund’s relative performance. On the other hand, stock selection within information technology (IT) and materials sector detracted from performance.
Among individual securities, Zhejiang Shuanhuan Driveline, which makes both auto parts (electric drives) and robotics components (RV reducers), was the top contributor to the Fund’s absolute performance during the first half. The company benefited from increased content expansion in the autos space, and market share gains and increased robotics penetration in the robotics space. Zhejiang has done well on the back of a sentiment recovery in China’s industrials sector which was subject to a lot of profit taking in the earlier months of 2022. Conversely, Taiwanese chip-related companies such as Alchip Technologies and Pan Jit International were among the top detractors to the portfolio’s absolute and relative performance during the period. While the fundamentals of Alchip and Pan Jit remain resilient, with both companies benefiting from the semi-localization efforts in China, they have been affected by a negative sentiment towards semiconductor stocks globally and have thus de-rated meaningfully. It is difficult to gauge if sentiment can turn meaningfully in the short run but we still remain positive about the long-term secular growth opportunities for Alchip and Pan Jit.
(continued)
| 1 | Prospectus expense ratios. |
| 2 | Matthews has contractually agreed (i) to waive fees and reimburse expenses to the extent needed to limit Total Annual Fund Operating Expenses (excluding Rule 12b-1 fees, taxes, interest, brokerage commissions, short sale dividend expenses, expenses incurred in connection with any merger or reorganization or extraordinary expenses such as litigation) of the Institutional Class to 1.20% first by waiving class specific expenses (i.e., shareholder service fees specific to a particular class) of the Institutional Class and then, to the extent necessary, by waiving non-class specific expenses (e.g., custody fees) of the Institutional Class, and (ii) if any Fund-wide expenses (i.e., expenses that apply to both the Institutional Class and the Investor Class) are waived for the Institutional Class to maintain the 1.20% expense limitation, to waive an equal amount (in annual percentage terms) of those same expenses for the Investor Class. The Total Annual Fund Operating Expenses After Fee Waiver and Expense Reimbursement for the Investor Class may vary from year to year and will in some years exceed 1.20%. If the operating expenses fall below the expense limitation within three years after Matthews has made a waiver or reimbursement, the Fund may reimburse Matthews up to an amount that does not cause the expenses for that year to exceed the lesser of (i) the expense limitation applicable at the time of that fee waiver and/or expense reimbursement or (ii) the expense limitation in effect at the time of recoupment. This agreement will remain in place until April 30, 2023 and may be terminated at any time by the Board of Trustees on behalf of the Fund on 60 days’ written notice to Matthews. Matthews may decline to renew this agreement by written notice to the Trust at least 30 days before its annual expiration date. |
| 3 | The lesser of fiscal year 2021 long-term purchase costs or sales proceeds divided by the average monthly market value of long-term securities. |
| | | | | | | | |
| | | | matthewsasia.com | 800.789.ASIA | | | 39 | |
| | | | | | | | | | | | | | | | | | | | | | | | | | | | | | | | |
| |
| PERFORMANCE AS OF JUNE 30, 2022 | |
| | | | | | | | | | | | Average Annual Total Returns | | | | |
| | | 3 Months | | | YTD | | | 1 Year | | | 3 Years | | | 5 Years | | | 10 Years | | | Since
Inception | | | Inception
date | |
| Investor Class (MCSMX) | | | -0.99% | | | | -20.74% | | | | -32.25% | | | | 16.75% | | | | 14.21% | | | | 12.78% | | | | 8.05% | | | | 05/31/11 | |
| Institutional Class (MICHX) | | | -0.98% | | | | -20.64% | | | | -32.08% | | | | 16.98% | | | | n.a. | | | | n.a. | | | | 11.81% | | | | 11/30/17 | |
| MSCI China Small Cap Index4 | | | -0.08% | | | | -16.39% | | | | -33.53% | | | | -0.52% | | | | -0.40% | | | | 4.07% | | | | -0.17% | 5 | | | | |
Performance assumes reinvestment of all dividends and/or distributions before taxes. All performance quoted represents past performance and is no guarantee of future results. Investment return and principal value will fluctuate with market conditions so that when redeemed, shares may be worth more or less than their original cost. Current performance may be lower or higher than the return figures quoted. Returns would have been lower if certain of the Fund’s fees and expenses had not been waived. For the Fund’s most recent month-end performance, visit matthewsasia.com.
GROWTH OF A HYPOTHETICAL $10,000 INVESTMENT SINCE INCEPTION—INVESTOR CLASS

Plotted monthly. The performance data and graph do not reflect the deduction of taxes that a shareholder would pay on dividends, capital gains distributions or redemption of Fund shares. Values are in US$.
| | 4 | It is not possible to invest directly in an index. Source: Index data from Morgan Stanley Capital International and Bloomberg; total return calculations performed by BNY Mellon Investment Servicing (US) Inc. Please see page 84 for index definition. |
| | | | | | | | |
| | | | |
| TOP TEN HOLDINGS6 | | | | | | | |
| Name | | Sector | | | | % Net Assets | |
| Zhejiang Shuanghuan Driveline Co., Ltd. | | Consumer Discretionary | | | | | 3.5% | |
| China Overseas Property Holdings, Ltd. | | Real Estate | | | | | 3.4% | |
| Airtac International Group | | Industrials | | | | | 2.9% | |
| Hainan Meilan International Airport Co., Ltd. | | Industrials | | | | | 2.9% | |
| Pharmaron Beijing Co., Ltd. | | Health Care | | | | | 2.7% | |
| Zhejiang HangKe Technology, Inc., Co. | | Industrials | | | | | 2.7% | |
| ENN Natural Gas Co., Ltd. | | Utilities | | | | | 2.5% | |
| Morimatsu International Holdings Co., Ltd. | | Industrials | | | | | 2.4% | |
| Longshine Technology Group Co., Ltd. | | Information Technology | | | | | 2.3% | |
| Xtep International Holdings, Ltd. | | Consumer Discretionary | | | | | 2.3% | |
| % OF ASSETS IN TOP 10 | | | | | | | 27.6% | |
| | 6 | Holdings may combine more than one security from same issuer and related depositary receipts. |
Matthews China Small Companies Fund
Portfolio Manager Commentary (unaudited) (continued)
Notable Portfolio Changes:
During the second quarter, we increased the portfolio’s exposure to the industrials sector. Most of our exposure in the sector are in A-Shares and with the market correction, we added to names that we have been following at much cheaper valuations. We also decreased our exposure to the IT sector. As noted earlier, market conditions resulted in a de-rating of many of the technology names we hold. Given Taiwan’s strong performance in 2021 and continued concerns about the global semi cycle, we have adjusted exposure down slightly. However, we continue to hold a long-term view of the sector with a refocused view on onshore A-Share tech opportunities, given the A-share correction seen in the earlier months of 2022.
Both the industrial and IT sectors continue to account for the most sizable exposures of the portfolio, amounting to close to half of the Fund’s sector allocations.
Outlook:
The A-Shares market has recovered meaningfully since the end of April lows. It is uncertain if second quarter results (which will be weak given it will bake in the worst of the COVID lockdowns) might derail this recovery. However, we are cautiously optimistic that in the second half of this year, the conditions in China will continue to improve.
Large scale lockdowns seem a lot less probable as the government continues to become more pragmatic. Further, the party will likely do what they can to improve economic conditions ahead of the party meeting at the end of the year which may make it more likely that monetary and fiscal stimulus will be unleashed in the second half. Sentiment toward growth globally remains tepid but we believe the significantly lower valuations might warrant a re-interest in this category as well as the fundamentals of the many promising small cap growth companies in China that remain. While China won’t be immune to rising costs and a slowing world economy, its government is all in on a commitment to deliver strong and steady growth for its citizens.
| | | | |
| |
| COUNTRY ALLOCATION (%)7 | |
| China/Hong Kong | | | 88.4 | |
| Taiwan | | | 6.2 | |
| United States | | | 4.2 | |
Cash and Other Assets, Less Liabilities | | | 1.2 | |
| | | | |
| |
| SECTOR ALLOCATION (%)7 | |
| Industrials | | | 28.2 | |
| Information Technology | | | 17.6 | |
| Consumer Discretionary | | | 13.8 | |
| Health Care | | | 10.2 | |
| Real Estate | | | 7.9 | |
| Materials | | | 5.6 | |
| Financials | | | 5.4 | |
| Consumer Staples | | | 4.5 | |
| Communication Services | | | 3.0 | |
| Utilities | | | 2.5 | |
| Cash and Other Assets, Less Liabilities | | | 1.2 | |
| | | | |
| | |
| MARKET CAP EXPOSURE (%)7,8 | | | |
| Mega Cap (over $25B) | | | 0.0 | |
| Large Cap ($10B-$25B) | | | 9.4 | |
| Mid Cap ($3B-10B) | | | 53.3 | |
| Small Cap (under $3B) | | | 36.1 | |
| Cash and Other Assets, Less Liabilities | | | 1.2 | |
| 7 | Source: FactSet Research Systems. Percentage values in data are rounded to the nearest tenth of one percent, so the values may not sum to 100% due to rounding. Country allocations and percentage values may be derived from different data sources and may not be consistent with other Fund literature. |
| 8 | The Fund defines Small Companies as companies with market capitalization no higher than the greater of $5 billion or the market capitalization of the largest company included in the Fund’s primary benchmark, the MSCI China Small Cap Index. |
| | | | | | | | |
| | | | matthewsasia.com | 800.789.ASIA | | | 41 | |
Matthews China Small Companies Fund
June 30, 2022
Schedule of Investmentsa (unaudited)
COMMON EQUITIES: 98.8%
| | | | | | | | |
| | | Shares | | | Value | |
|
| INDUSTRIALS: 28.2% | |
Machinery: 12.2% | | | | | |
| | |
Airtac International Group | | | 233,191 | | | | $7,783,415 | |
| | |
Morimatsu International Holdings Co., Ltd.b,c | | | 6,776,000 | | | | 6,403,873 | |
| | |
Leader Harmonious Drive Systems Co., Ltd. A Shares | | | 297,205 | | | | 5,305,609 | |
| | |
Yangzijiang Shipbuilding Holdings, Ltd. | | | 7,280,800 | | | | 4,875,432 | |
| | |
Zhuzhou Huarui Precision Cutting Tools Co., Ltd. A Shares | | | 210,653 | | | | 4,347,167 | |
| | |
Estun Automation Co., Ltd. A Shares | | | 1,129,400 | | | | 4,148,017 | |
| | | | | | | | |
| | | | | | | 32,863,513 | |
| | | | | | | | |
| | | | | | | | |
Electrical Equipment: 6.0% | | | | | |
| | |
Zhejiang HangKe Technology, Inc., Co. A Shares | | | 686,683 | | | | 7,212,096 | |
| | |
Ginlong Technologies Co., Ltd. A Shares | | | 166,255 | | | | 5,314,371 | |
| | |
Hongfa Technology Co., Ltd. A Shares | | | 582,057 | | | | 3,646,747 | |
| | | | | | | | |
| | | | | | | 16,173,214 | |
| | | | | | | | |
| | | | | | | | |
Transportation Infrastructure: 4.2% | | | | | |
| | |
Hainan Meilan International Airport Co., Ltd. H Sharesb | | | 2,626,000 | | | | 7,738,662 | |
| | |
Yuexiu Transport Infrastructure, Ltd. | | | 6,024,000 | | | | 3,482,775 | |
| | | | | | | | |
| | | | | | | 11,221,437 | |
| | | | | | | | |
| | | | | | | | |
Construction & Engineering: 2.2% | | | | | |
China State Construction International Holdings, Ltd. | | | 5,488,000 | | | | 6,073,313 | |
| | | | | | | | |
| | | | | | | | |
Professional Services: 1.3% | | | | | |
China Testing & Certification International Group Co., Ltd. A Shares | | | 1,969,722 | | | | 3,555,393 | |
| | | | | | | | |
| | | | | | | | |
Air Freight & Logistics: 1.2% | | | | | |
Milkyway Chemical Supply Chain Service Co., Ltd. A Shares | | | 163,230 | | | | 3,332,835 | |
| | | | | | | | |
| | | | | | | | |
Marine: 1.1% | |
SITC International Holdings Co., Ltd. | | | 1,028,500 | | | | 2,925,239 | |
| | | | | | | | |
Total Industrials | | | | | | | 76,144,944 | |
| | | | | | | | |
| | | | | | | | |
| | | |
| INFORMATION TECHNOLOGY: 17.6% | | | | | | | | |
Semiconductors & Semiconductor Equipment: 13.6% | | | | | |
| | |
ACM Research, Inc. Class Ab | | | 331,200 | | | | 5,574,096 | |
| | |
Alchip Technologies, Ltd. | | | 221,000 | | | | 5,186,303 | |
| | |
Sino Wealth Electronic, Ltd. A Shares | | | 689,739 | | | | 5,147,270 | |
| | |
Flat Glass Group Co., Ltd. H Sharesb | | | 1,247,000 | | | | 4,389,877 | |
| | |
Pan Jit International, Inc. | | | 1,896,000 | | | | 4,024,974 | |
| | |
Beijing Huafeng Test & Control Technology Co., Ltd. A Shares | | | 74,314 | | | | 3,972,394 | |
| | |
StarPower Semiconductor, Ltd. A Shares | | | 65,992 | | | | 3,814,609 | |
| | |
BOE Varitronix, Ltd. | | | 1,318,000 | | | | 2,657,353 | |
| | |
Silergy Corp. | | | 25,000 | | | | 2,021,484 | |
| | | | | | | | |
| | | | | | | 36,788,360 | |
| | | | | | | | |
| | | | | | | | |
Software: 4.0% | | | | | |
| | |
Longshine Technology Group Co., Ltd. A Shares | | | 1,672,244 | | | | 6,311,101 | |
| | |
Kingdee International Software Group Co., Ltd.b | | | 1,894,000 | | | | 4,462,285 | |
| | | | | | | | |
| | | | | | | 10,773,386 | |
| | | | | | | | |
| | | | | | | | |
| | | | | | | | |
| | | Shares | | | Value | |
Electronic Equipment, Instruments & Components: 0.0% | |
China High Precision Automation Group, Ltd.b,d | | | 195,000 | | | | $249 | |
| | | | | | | | |
Total Information Technology | | | | | | | 47,561,995 | |
| | | | | | | | |
| | | | | | | | |
| |
| CONSUMER DISCRETIONARY: 13.8% | |
Hotels, Restaurants & Leisure: 3.5% | | | | | |
| | |
BTG Hotels Group Co., Ltd. A Shares | | | 1,431,900 | | | | 5,316,223 | |
| | |
Helens International Holdings Co., Ltd.b | | | 1,781,500 | | | | 4,115,757 | |
| | | | | | | | |
| | | | | | | 9,431,980 | |
| | | | | | | | |
| | | | | | | | |
Auto Components: 3.5% | | | | | |
Zhejiang Shuanghuan Driveline Co., Ltd. A Shares | | | 1,970,003 | | | | 9,381,566 | |
| | | | | | | | |
| | | | | | | | |
Textiles, Apparel & Luxury Goods: 2.3% | | | | | |
Xtep International Holdings, Ltd. | | | 3,382,500 | | | | 6,128,856 | |
| | | | | | | | |
| | | | | | | | |
Specialty Retail: 2.1% | |
| | |
China Yongda Automobiles Services Holdings, Ltd. | | | 3,944,500 | | | | 3,739,674 | |
| | |
China Meidong Auto Holdings, Ltd. | | | 628,000 | | | | 1,995,592 | |
| | | | | | | | |
| | | | | | | 5,735,266 | |
| | | | | | | | |
| | | | | | | | |
Automobiles: 1.5% | | | | | |
Yadea Group Holdings, Ltd.c,e | | | 2,132,000 | | | | 4,181,307 | |
| | | | | | | | |
| | | | | | | | |
Diversified Consumer Services: 0.9% | | | | | | | | |
China Yuhua Education Corp., Ltd.c,e | | | 13,530,000 | | | | 2,396,885 | |
| | | | | | | | |
Total Consumer Discretionary | | | | | | | 37,255,860 | |
| | | | | | | | |
| | | | | | | | |
| |
| HEALTH CARE: 10.2% | |
Health Care Equipment & Supplies: 4.4% | | | | | |
| | |
Shenzhen New Industries Biomedical Engineering Co., Ltd. A Shares | | | 722,565 | | | | 4,879,832 | |
| | |
Qingdao Haier Biomedical Co., Ltd. A Shares | | | 340,166 | | | | 3,705,718 | |
| | |
Brighten Optix Corp. | | | 434,000 | | | | 3,263,250 | |
| | | | | | | | |
| | | | | | | 11,848,800 | |
| | | | | | | | |
| | | | | | | | |
Biotechnology: 3.1% | | | | | |
| | |
Legend Biotech Corp. ADRb | | | 102,900 | | | | 5,659,500 | |
| | |
Zai Lab, Ltd.b | | | 799,800 | | | | 2,765,331 | |
| | | | | | | | |
| | | | | | | 8,424,831 | |
| | | | | | | | |
| | | | | | | | |
Life Sciences Tools & Services: 2.7% | | | | | |
Pharmaron Beijing Co., Ltd. H Sharesc,e | | | 725,400 | | | | 7,286,216 | |
| | | | | | | | |
Total Health Care | | | | | | | 27,559,847 | |
| | | | | | | | |
| | | | | | | | |
| | | |
| REAL ESTATE: 7.9% | | | | | | | | |
Real Estate Management & Development: 7.9% | | | | | |
| | |
China Overseas Property Holdings, Ltd. | | | 8,510,000 | | | | 9,173,125 | |
| | |
CIFI Ever Sunshine Services Group, Ltd.c | | | 3,098,000 | | | | 3,971,386 | |
| | |
China Jinmao Holdings Group, Ltd. | | | 9,826,000 | | | | 2,648,382 | |
| | |
KWG Living Group Holdings, Ltd.c | | | 7,064,000 | | | | 2,214,275 | |
| | |
Times China Holdings, Ltd. | | | 6,397,000 | | | | 2,129,914 | |
KWG Group Holdings, Ltd. | | | 3,879,500 | | | | 1,240,298 | |
| | | | | | | | |
Total Real Estate | | | | | | | 21,377,380 | |
| | | | | | | | |
| | | | | | | | |
Matthews China Small Companies Fund
June 30, 2022
Schedule of Investmentsa (unaudited) (continued)
COMMON EQUITIES (continued)
| | | | | | | | |
| | | Shares | | | Value | |
| | |
| MATERIALS: 5.7% | | | | | | | | |
Chemicals: 4.0% | | | | | |
| | |
Jiangsu Cnano Technology Co., Ltd. A Shares | | | 204,113 | | | | $5,191,179 | |
| | |
Sinoma Science & Technology Co., Ltd. A Shares | | | 884,100 | | | | 3,640,059 | |
| | |
Asia Cuanon Technology Shanghai Co., Ltd. A Shares | | | 1,147,385 | | | | 2,002,391 | |
| | | | | | | | |
| | | | | | | 10,833,629 | |
| | | | | | | | |
| | | | | | | | |
Construction Materials: 1.7% | | | | | |
Keshun Waterproof Technologies Co., Ltd. A Shares | | | 2,244,580 | | | | 4,428,625 | |
| | | | | | | | |
Total Materials | | | | | | | 15,262,254 | |
| | | | | | | | |
| | | | | | | | |
| | | |
| FINANCIALS: 5.4% | | | | | | | | |
Capital Markets: 3.8% | | | | | |
| | |
China Merchants Securities Co., Ltd. H Sharesc,e | | | 3,752,000 | | | | 4,075,149 | |
| | |
Haitong International Securities Group, Ltd. | | | 24,073,800 | | | | 3,438,107 | |
| | |
China Renaissance Holdings, Ltd.c,e | | | 2,174,000 | | | | 2,730,009 | |
| | | | | | | | |
| | | | | | | 10,243,265 | |
| | | | | | | | |
| | | | | | | | |
Diversified Financial Services: 1.6% | | | | | |
Chailease Holding Co., Ltd.d | | | 660,712 | | | | 4,355,342 | |
| | | | | | | | |
Total Financials | | | | | | | 14,598,607 | |
| | | | | | | | |
| | | | | | | | |
| | | |
| CONSUMER STAPLES: 4.5% | | | | | | | | |
Food Products: 4.5% | | | | | |
| | |
Anjoy Foods Group Co., Ltd. A Shares | | | 192,247 | | | | 4,828,936 | |
| | |
Jonjee Hi-Tech Industrial And Commercial Holding Co., Ltd. A Sharesb | | | 734,332 | | | | 3,800,060 | |
| | |
Yantai China Pet Foods Co., Ltd. A Shares | | | 918,048 | | | | 3,495,867 | |
| | | | | | | | |
Total Consumer Staples | | | | | | | 12,124,863 | |
| | | | | | | | |
| | | | | | | | |
| | | |
| COMMUNICATION SERVICES: 3.0% | | | | | | | | |
Entertainment: 3.0% | | | | | |
| | |
Kingsoft Corp., Ltd. | | | 1,061,600 | | | | 4,148,077 | |
| | |
Bilibili, Inc. Class Zb | | | 152,960 | | | | 3,921,309 | |
| | | | | | | | |
Total Communication Services | | | | | | | 8,069,386 | |
| | | | | | | | |
| | | | | | | | |
| | |
| UTILITIES: 2.5% | | | | | | | | |
Gas Utilities: 2.5% | | | | | |
ENN Natural Gas Co., Ltd. A Shares | | | 2,469,742 | | | | 6,870,432 | |
| | | | | | | | |
Total Utilities | | | | | | | 6,870,432 | |
| | | | | | | | |
| | | | | | | | |
| | | |
| TOTAL INVESTMENTS: 98.8% | | | | | | | 266,825,568 | |
(Cost $309,217,074) | | | | | | | | |
| | | | | | | | |
| | |
CASH AND OTHER ASSETS,
LESS LIABILITIES: 1.2% | | | | | | | 3,341,201 | |
| | | | | | | | |
| | |
NET ASSETS: 100.0% | | | | | | | $270,166,769 | |
| | | | | | | | |
| a | Certain securities were fair valued under the valuation policies approved by the Board of Trustees (Note 2-A). |
| b | Non-income producing security. |
| c | The securities may be resold to qualified foreign investors and foreign institutional buyers under Regulation S of the Securities Act of 1933. |
| d | Security is valued using significant unobservable inputs and is classified as Level 3 in the fair value hierarchy. The aggregate value of Level 3 security is $4,355,591 and 1.61% of net assets. |
| e | Security exempt from registration under Rule 144A of the Securities Act of 1933, as amended. The security may be resold in transactions exempt from registration normally to qualified institutional buyers. The security has been determined to be liquid in accordance with procedures adopted by the Funds’ Board of Trustees. At June 30, 2022, the aggregate value is $20,669,566, which is 7.65% of net assets. |
| ADR | American Depositary Receipt |
See accompanying notes to financial statements.
| | | | | | | | |
| | | | matthewsasia.com | 800.789.ASIA | | | 43 | |
| | | | |
| PORTFOLIO MANAGERS |
| |
| Peeyush Mittal,CFA | | |
Lead Manager | | |
| |
| Sharat Shroff, CFA | | |
Co-Manager | | |
|
| FUND FACTS |
| | |
| | | Investor | | Institutional |
Ticker | | MINDX | | MIDNX |
CUSIP | | 577130859 | | 577130768 |
Inception | | 10/31/05 | | 10/29/10 |
NAV | | $23.99 | | $24.40 |
Initial Investment | �� | $2,500 | | $100,000 |
Gross Expense Ratio1 | | 1.10% | | 0.96% |
Portfolio Statistics | | | | |
Total # of Positions | | 52 |
Net Assets | | $604.5 million |
Weighted Average Market Cap | | $46.2 billion |
Portfolio Turnover2 | | 42.5% |
Benchmark | | |
S&P Bombay Stock Exchange 100 Index |
OBJECTIVE
Long-term capital appreciation.
STRATEGY
Under normal market conditions, the Fund seeks to achieve its investment objective by investing at least 80% of its net assets, which include borrowings for investment purposes, in publicly traded common stocks, preferred stocks and convertible securities of companies located in India.
Matthews India Fund
Portfolio Manager Commentary (unaudited)
For the first half of 2022, the Matthews India Fund returned –14.84% (Investor Class) and –14.81% (Institutional Class), while its benchmark, the S&P Bombay Stock Exchange 100 Index, returned
–13.58% over the same period. For the quarter ending June 30, 2022, the Fund returned –10.25% (Investor Class) and –10.23% (Institutional Class), while the benchmark returned –12.62%.
Market Environment:
Rising inflation in developed markets continues to impact investor sentiment negatively while monetary policy tightening is posing a substantial challenge for equity markets globally, India included. Given the aggression the U.S. Federal Reserve has shown toward containing inflation, the Reserve Bank of India has reversed its accommodative stance by hiking policy rates by a cumulative 90 basis points (0.90%) in two separate moves so far this year.
Russia’s war in Ukraine has gone on longer than anyone anticipated. Europe’s dependence on Ukraine for food grain and on Russia for energy implies that the future is going to be challenging from the perspective of securing food and energy supplies. Lack of energy supply-security along with high oil and gas prices has sent power costs soaring in some of the largest European economies and the risk of prolonged recession in the region is increasing with every passing day. Developments in Europe at the very least have negative growth repercussions for global growth.
Against this backdrop India seems to be faring reasonably well though it has its own challenges. The rural economy continues to be weak and thus far has not shown any signs of reversal. High prices of thermal coal along with supply chain issues are beginning to have a negative impact on the financial health of power distribution companies which will have an adverse impact on fiscal math at the state level.
Amid these challenges, discretionary consumption continues to normalize despite rising interest rates. Automotive production in India has improved month-over-month and is helping to boost manufacturing gross domestic product (GDP). Automakers couldn’t produce enough vehicles over the last two years due to chip shortages and that has created a lot of pent-up demand. We expect this trend to sustain in the coming quarters.
Performance Contributors and Detractors:
Our lack of ownership in commodity-led sectors like utilities and underweight in energy detracted from relative performance in the first half. We have historically not focused on these sectors due to our inability to predict underlying commodity prices. On the other hand, our stock selection in financials and industrials were the biggest contributors to relative performance. In the second quarter, Fund performance improved. A reversal in prices of many hard commodities meant that the negative drag we experienced in the first quarter due to lack of ownership in commodity-related sectors switched positively.
At the stock level, industrials and consumer discretionary holdings were among the top performers in the first half. Ashok Leyland, a commercial vehicle manufacturer, was the best performer. Commercial vehicle production in India is expected to see robust growth in fiscal year (FY) 2023 after seeing some stabilization of production in FY2022. Ashok Leyland is a leading manufacturer in the space and is expected to benefit tremendously from improvements in the sector’s production rate. Further, a reduction in the price of copper, aluminum and steel
(continued)
| 1 | Prospectus expense ratios. |
| 2 | The lesser of fiscal year 2021 long-term purchase costs or sales proceeds divided by the average monthly market value of long-term securities. |
| | | | | | | | | | | | | | | | | | | | | | | | | | | | | | | | |
| | | | | | | | | |
| PERFORMANCE AS OF JUNE 30, 2022 | | | | | | | | | | | | | | | | | | | | | | | | |
| | | | | | | | | | | | Average Annual Total Returns | | | | |
| | | 3 Months | | | YTD | | | 1 Year | | | 3 Years | | | 5 Years | | | 10 Years | | | Since
Inception | | | Inception
Date | |
| Investor Class (MINDX) | | | -10.25% | | | | -14.84% | | | | -9.41% | | | | 4.32% | | | | 3.02% | | | | 9.62% | | | | 9.51% | | | | 10/31/05 | |
| Institutional Class (MIDNX)* | | | -10.23% | | | | -14.81% | | | | -9.27% | | | | 4.46% | | | | 3.17% | | | | 9.81% | | | | 5.25% | | | | 10/29/10 | |
| S&P Bombay Stock Exchange 100 Index3 | | | -12.62% | | | | -13.58% | | | | -4.50% | | | | 6.90% | | | | 7.26% | | | | 9.37% | | | | 9.80% | 4 | | | | |
Performance assumes reinvestment of all dividends and/or distributions before taxes. All performance quoted represents past performance and is no guarantee of future results. Investment return and principal value will fluctuate with market conditions so that when redeemed, shares may be worth more or less than their original cost. Current performance may be lower or higher than the return figures quoted. For the Fund’s most recent month-end performance, visit matthewsasia.com.
| | * | Performance results include adjustments made for financial reporting purposes in accordance with U.S. generally accepted accounting principles. |
GROWTH OF A HYPOTHETICAL $10,000 INVESTMENT SINCE INCEPTION—INVESTOR CLASS
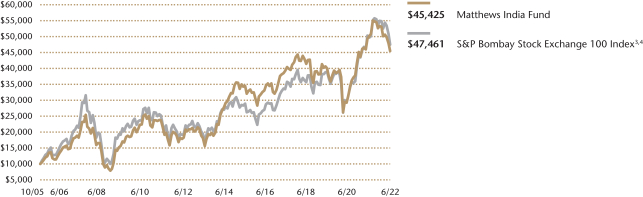
Plotted monthly. The performance data and graph do not reflect the deduction of taxes that a shareholder would pay on dividends, capital gains distributions or redemption of Fund shares. Values are in US$.
| | 3 | It is not possible to invest directly in an index. Source: Index data from S&P BSE 100 Index and Bloomberg; total return calculations performed by BNY Mellon Investment Servicing (US) Inc. Please see page 84 for index definition. |
| | 4 | Calculated from 10/31/05. |
| | | | | | | | |
| | | | |
| TOP TEN HOLDINGS5 | | | | | | | |
| Name | | Sector | | | | % Net Assets | |
| HDFC Bank, Ltd. | | Financials | | | | | 7.1% | |
| ICICI Bank, Ltd. | | Financials | | | | | 6.0% | |
| Infosys, Ltd. | | Information Technology | | | | | 6.0% | |
| Reliance Industries, Ltd. | | Energy | | | | | 5.0% | |
| Tata Consultancy Services, Ltd. | | Information Technology | | | | | 4.8% | |
| Shriram City Union Finance, Ltd. | | Financials | | | | | 3.8% | |
| Kotak Mahindra Bank, Ltd. | | Financials | | | | | 3.6% | |
| Maruti Suzuki India, Ltd. | | Consumer Discretionary | | | | | 3.4% | |
| Hindustan Unilever, Ltd. | | Consumer Staples | | | | | 3.4% | |
| Bandhan Bank, Ltd. | | Financials | | | | | 3.1% | |
| % OF ASSETS IN TOP 10 | | | | | | | 46.6% | |
| | 5 | Holdings may combine more than one security from same issuer and related depositary receipts. |
| | | | | | | | |
| | | | matthewsasia.com | 800.789.ASIA | | | 45 | |
| | | | |
| |
| COUNTRY ALLOCATION (%)6 | |
| India | | | 97.3 | |
Cash and Other Assets, Less Liabilities | | | 2.7 | |
| | | | |
| |
| SECTOR ALLOCATION (%)6 | |
| Financials | | | 36.1 | |
| Information Technology | | | 14.9 | |
| Consumer Discretionary | | | 12.2 | |
| Industrials | | | 8.7 | |
| Consumer Staples | | | 8.5 | |
| Health Care | | | 5.9 | |
| Energy | | | 5.0 | |
| Materials | | | 4.9 | |
| Communication Services | | | 1.1 | |
| Cash and Other Assets, Less Liabilities | | | 2.7 | |
| | | | |
| |
| MARKET CAP EXPOSURE (%)6 | |
| Mega Cap (over $25B) | | | 49.0 | |
| Large Cap ($10B-$25B) | | | 9.2 | |
| Mid Cap ($3B-10B) | | | 22.2 | |
| Small Cap (under $3B) | | | 16.8 | |
| Cash and Other Assets, Less Liabilities | | | 2.7 | |
| 6 | Source: FactSet Research Systems. Percentage values in data are rounded to the nearest tenth of one percent, so the values may not sum to 100% due to rounding. Country allocations and percentage values may be derived from different data sources and may not be consistent with other Fund literature. |
Matthews India Fund
Portfolio Manager Commentary (unaudited) (continued)
implies that margins are likely going to be better than what investors were anticipating at the start of the fiscal year. Both these developments bode well for continued positive investor sentiment toward Ashok Leyland. On the flip side, information technology (IT) companies were among the biggest detractors in the first six months. Most IT stocks including Infosys didn’t perform well as investors worried about prospects for these businesses given that rampant employee-wage inflation is pressuring their margins and fears are growing of recession in developed markets.
Notable Portfolio Changes:
In the second quarter, we reduced our holdings in IT stocks like Tech Mahindra. Companies in the sector have benefited from mass adoption of digitization globally and from being insulated from supply chain challenges faced by other sectors. However, the emergence of recession concerns in the U.S. and Europe is going to have a negative impact on the growth outlook for all large Indian IT services firms which derive meaningful revenues from these markets. Supply-side constraints are also forcing IT services firms to give higher-than-anticipated wage increases to retain employees and that is leading to lower margins compared to long-run averages and investor expectations.
In the quarter we increased our exposure to the auto sector. We initiated a position in TVS Motor which is a leading domestic manufacturer of motorcycles in India. TVS Motor has demonstrated an ability to launch successful new products in both scooter and motorcycle categories and we expect the company to use electrification-related disruption to gain market share in the country. Further, motorcycle demand has been subdued in India for a long time. We expect to see a cyclical recovery in FY2023 from the bottom which would bode well for TVS Motor’s financial performance.
Outlook:
We are beginning to see some light at the end of tunnel as it relates to inflationary pressures around the world. Notwithstanding the efforts central banks are making to tighten monetary policy we have also seen supply chain-led price disruptions for many products and commodities ease in the last few months and that is having a cooling-off effect on commodity prices globally. Two very important industrial commodities—copper and aluminum—are down substantially from recent highs and the same is true for crude oil too. That bodes well from the perspective of an impending reduction in inflation.
We think monetary policy tightening globally has some way to go before it stabilizes. We expect the Reserve Bank of India to follow this path though the impact of the higher rates in the country is unlikely to be as adverse as it may be in developed markets. Interest rates are likely going to normalize back to pre-COVID levels in India and hence we think that the adverse impact of higher rates is likely going to be only marginal.
We continue to be optimistic in our outlook for India. We think there will be a further revival in domestic consumption and we think easing of inflation is going to support that further. We also think discretionary consumption is going to surprise positively given the pent-up demand from last two years. Easing hard commodity prices bodes well for profitability in the consumer discretionary sector and we think it is a good hunting ground for investors to evaluate and invest.
Matthews India Fund
June 30, 2022
Schedule of Investmentsa (unaudited)
COMMON EQUITIES: 97.3%
| | | | | | | | |
| | | Shares | | | Value | |
| | |
| FINANCIALS: 36.1% | | | | | | | | |
Banks: 24.5% | | | | | | | | |
HDFC Bank, Ltd. | | | 2,514,826 | | | | $43,076,736 | |
| | |
ICICI Bank, Ltd. | | | 4,055,302 | | | | 36,432,520 | |
| | |
Kotak Mahindra Bank, Ltd. | | | 1,037,045 | | | | 21,933,245 | |
| | |
Bandhan Bank, Ltd.b,c | | | 5,534,868 | | | | 18,570,852 | |
| | |
Axis Bank, Ltd.d | | | 2,116,255 | | | | 17,141,817 | |
| | |
IndusInd Bank, Ltd. | | | 1,099,722 | | | | 11,126,610 | |
| | | | | | | | |
| | | | | | | 148,281,780 | |
| | | | | | | | |
| | | | | | | | |
Consumer Finance: 8.9% | | | | | | | | |
Shriram City Union Finance, Ltd. | | | 1,100,949 | | | | 23,171,807 | |
| | |
Bajaj Finance, Ltd. | | | 237,998 | | | | 16,375,968 | |
| | |
Cholamandalam Investment and Finance Co., Ltd. | | | 1,271,933 | | | | 10,019,444 | |
| | |
Shriram Transport Finance Co., Ltd. | | | 268,201 | | | | 4,379,316 | |
| | | | | | | | |
| | | | | | | 53,946,535 | |
| | | | | | | | |
| | | | | | | | |
Thrifts & Mortgage Finance: 2.7% | | | | | | | | |
Housing Development Finance Corp., Ltd. | | | 580,755 | | | | 16,067,582 | |
| | | | | | | | |
Total Financials | | | | | | | 218,295,897 | |
| | | | | | | | |
| | | | | | | | |
| | | |
| INFORMATION TECHNOLOGY: 14.9% | | | | | | | | |
IT Services: 14.3% | | | | | | | | |
Infosys, Ltd. | | | 1,949,892 | | | | 36,241,727 | |
| | |
Tata Consultancy Services, Ltd. | | | 698,410 | | | | 29,002,804 | |
| | |
HCL Technologies, Ltd. | | | 955,949 | | | | 11,836,489 | |
| | |
Tech Mahindra, Ltd. | | | 399,800 | | | | 5,085,880 | |
| | |
Larsen & Toubro Infotech, Ltd.b,c | | | 91,221 | | | | 4,615,484 | |
| | | | | | | | |
| | | | | | | 86,782,384 | |
| | | | | | | | |
| | | | | | | | |
Software: 0.6% | | | | | | | | |
Birlasoft, Ltd. | | | 770,186 | | | | 3,465,449 | |
| | | | | | | | |
Total Information Technology | | | | | | | 90,247,833 | |
| | | | | | | | |
| | | | | | | | |
| | | |
| CONSUMER DISCRETIONARY: 12.2% | | | | | | | | |
Automobiles: 4.6% | | | | | | | | |
Maruti Suzuki India, Ltd. | | | 189,585 | | | | 20,434,980 | |
| | |
TVS Motor Co., Ltd. | | | 727,513 | | | | 7,788,471 | |
| | | | | | | | |
| | | | | | | 28,223,451 | |
| | | | | | | | |
| | | | | | | | |
Hotels, Restaurants & Leisure: 3.3% | | | | | | | | |
Lemon Tree Hotels, Ltd.b,c,d | | | 17,468,955 | | | | 13,591,154 | |
| | |
Restaurant Brands Asia, Ltd.d | | | 4,539,363 | | | | 6,407,973 | |
| | | | | | | | |
| | | | | | | 19,999,127 | |
| | | | | | | | |
| | | | | | | | |
Auto Components: 1.7% | | | | | | | | |
Bosch, Ltd. | | | 35,000 | | | | 6,775,303 | |
| | |
Varroc Engineering, Ltd.b,c,d | | | 878,107 | | | | 3,353,994 | |
| | | | | | | | |
| | | | | | | 10,129,297 | |
| | | | | | | | |
| | | | | | | | |
Household Durables: 1.1% | | | | | | | | |
Crompton Greaves Consumer Electricals, Ltd. | | | 1,507,466 | | | | 6,500,257 | |
| | | | | | | | |
| | | | | | | | |
Internet & Direct Marketing Retail: 1.0% | | | | | | | | |
FSN E-Commerce Ventures, Ltd.d | | | 344,746 | | | | 6,174,655 | |
| | | | | | | | |
| | | | | | | | |
Textiles, Apparel & Luxury Goods: 0.5% | | | | | | | | |
Page Industries, Ltd. | | | 5,701 | | | | 2,906,058 | |
| | | | | | | | |
Total Consumer Discretionary | | | | | | | 73,932,845 | |
| | | | | | | | |
| | | | | | | | |
| | | | | | | | |
| | | Shares | | | Value | |
| | |
| INDUSTRIALS: 8.7% | | | | | | | | |
Machinery: 5.5% | | | | | | | | |
Ashok Leyland, Ltd. | | | 9,698,506 | | | | $18,197,748 | |
| | |
Cummins India, Ltd. | | | 849,820 | | | | 11,053,950 | |
| | |
Greaves Cotton, Ltd. | | | 2,011,962 | | | | 3,799,320 | |
| | | | | | | | |
| | | | | | | 33,051,018 | |
| | | | | | | | |
| | | | | | | | |
Transportation Infrastructure: 0.9% | | | | | | | | |
Gujarat Pipavav Port, Ltd. | | | 5,896,635 | | | | 5,754,013 | |
| | | | | | | | |
| | | | | | | | |
Electrical Equipment: 0.9% | | | | | | | | |
ABB India, Ltd. | | | 191,822 | | | | 5,596,773 | |
| | | | | | | | |
| | | | | | | | |
Industrial Conglomerates: 0.9% | | | | | | | | |
Siemens, Ltd. | | | 173,203 | | | | 5,277,769 | |
| | | | | | | | |
| | | | | | | | |
Professional Services: 0.5% | |
Quess Corp., Ltd.b,c | | | 386,246 | | | | 3,017,588 | |
| | | | | | | | |
Total Industrials | | | | | | | 52,697,161 | |
| | | | | | | | |
| | | | | | | | |
| | | |
| CONSUMER STAPLES: 8.5% | | | | | | | | |
Personal Products: 6.0% | | | | | | | | |
Hindustan Unilever, Ltd. | | | 717,814 | | | | 20,352,555 | |
| | |
Dabur India, Ltd. | | | 2,536,695 | | | | 15,958,236 | |
| | | | | | | | |
| | | | | | | 36,310,791 | |
| | | | | | | | |
| | | | | | | | |
Food Products: 1.5% | | | | | | | | |
| | |
Zydus Wellness, Ltd. | | | 226,526 | | | | 4,706,020 | |
| | |
Britannia Industries, Ltd. | | | 103,722 | | | | 4,566,343 | |
| | | | | | | | |
| | | | | | | 9,272,363 | |
| | | | | | | | |
| | | | | | | | |
Tobacco: 1.0% | | | | | | | | |
VST Industries, Ltd. | | | 146,276 | | | | 5,663,621 | |
| | | | | | | | |
Total Consumer Staples | | | | | | | 51,246,775 | |
| | | | | | | | |
| | | | | | | | |
| | | |
| HEALTH CARE: 5.9% | | | | | | | | |
Pharmaceuticals: 4.6% | | | | | | | | |
Laurus Labs, Ltd.b,c | | | 1,975,425 | | | | 11,660,854 | |
| | |
Sun Pharmaceutical Industries, Ltd. | | | 877,748 | | | | 9,245,013 | |
| | |
Neuland Laboratories, Ltd. | | | 446,230 | | | | 6,682,193 | |
| | | | | | | | |
| | | | | | | 27,588,060 | |
| | | | | | | | |
| | | | | | | | |
Health Care Equipment & Supplies: 0.7% | | | | | | | | |
Poly Medicure, Ltd. | | | 420,976 | | | | 4,011,446 | |
| | | | | | | | |
| | | | | | | | |
Life Sciences Tools & Services: 0.6% | |
Divi’s Laboratories, Ltd. | | | 82,912 | | | | 3,821,714 | |
| | | | | | | | |
Total Health Care | | | | | | | 35,421,220 | |
| | | | | | | | |
| | | | | | | | |
| | | |
| ENERGY: 5.0% | | | | | | | | |
Oil, Gas & Consumable Fuels: 5.0% | | | | | | | | |
Reliance Industries, Ltd. | | | 908,794 | | | | 30,007,811 | |
| | | | | | | | |
Total Energy | | | | | | | 30,007,811 | |
| | | | | | | | |
| | | | | | | | |
| | | |
| MATERIALS: 4.9% | | | | | | | | |
Chemicals: 3.2% | | | | | | | | |
Carborundum Universal, Ltd. | | | 642,449 | | | | 5,858,294 | |
| | |
Asian Paints, Ltd. | | | 154,637 | | | | 5,294,118 | |
| | |
Gujarat Fluorochemicals, Ltd. | | | 115,247 | | | | 4,067,036 | |
| | |
Pidilite Industries, Ltd. | | | 145,833 | | | | 3,866,763 | |
| | | | | | | | |
| | | | | | | 19,086,211 | |
| | | | | | | | |
| | | | | | | | |
| | | | | | | | |
| | | | matthewsasia.com | 800.789.ASIA | | | 47 | |
Matthews India Fund
June 30, 2022
Schedule of Investmentsa (unaudited) (continued)
COMMON EQUITIES (continued)
| | | | | | | | |
| | | Shares | | | Value | |
Construction Materials: 1.7% | | | | | | | | |
Ramco Cements, Ltd.d | | | 721,204 | | | | $5,836,404 | |
| | |
Ambuja Cements, Ltd. | | | 956,187 | | | | 4,409,461 | |
| | | | | | | | |
| | | | | | | 10,245,865 | |
| | | | | | | | |
Total Materials | | | | | | | 29,332,076 | |
| | | | | | | | |
| | | | | | | | |
| | | |
| COMMUNICATION SERVICES: 1.1% | | | | | | | | |
Interactive Media & Services: 1.1% | | | | | | | | |
Info Edge India, Ltd. | | | 140,283 | | | | 6,698,783 | |
| | | | | | | | |
Total Communication Services | | | | | | | 6,698,783 | |
| | | | | | | | |
| | | | | | | | |
| | | |
| TOTAL COMMON EQUITIES | | | | | | | 587,880,401 | |
| | | | | | | | |
(Cost $546,303,874) | | | | | | | | |
| | | | | | | | |
| NON-CONVERTIBLE CORPORATE BONDS: 0.0% | | | | | |
| | | Face Amount | | | Value | |
| | |
| CONSUMER STAPLES: 0.0% | | | | | | | | |
Food Products: 0.0% | | | | | | | | |
Britannia Industries, Ltd. 5.500%, 06/03/2024 | | | INR 1,996,476 | | | | 24,623 | |
| | | | | | | | |
Total Consumer Staples | | | | | | | 24,623 | |
| | | | | | | | |
| | | | | | | | |
| | |
| TOTAL NON-CONVERTIBLE CORPORATE BONDS | | | | 24,623 | |
| | | | | | | | |
(Cost $27,435) | | | | | | | | |
| | | | | | | | |
| | | |
| TOTAL INVESTMENTS: 97.3% | | | | | | | 587,905,024 | |
(Cost $546,331,309) | | | | | | | | |
| | | | | | | | |
| | |
CASH AND OTHER ASSETS, LESS LIABILITIES: 2.7% | | | | | | | 16,618,083 | |
| | | | | | | | |
| | |
NET ASSETS: 100.0% | | | | | | | $604,523,107 | |
| | | | | | | | |
| a | Certain securities were fair valued under the valuation policies approved by the Board of Trustees (Note 2-A). |
| b | Security exempt from registration under Rule 144A of the Securities Act of 1933, as amended. The security may be resold in transactions exempt from registration normally to qualified institutional buyers. The security has been determined to be liquid in accordance with procedures adopted by the Funds’ Board of Trustees. At June 30, 2022, the aggregate value is $54,809,926, which is 9.07% of net assets. |
| c | The securities may be resold to qualified foreign investors and foreign institutional buyers under Regulation S of the Securities Act of 1933. |
| d | Non-income producing security. |
See accompanying notes to financial statements.
| | | | |
PORTFOLIO MANAGERS |
| |
| Taizo Ishida | | Shuntaro Takeuchi |
Lead Manager | | Lead Manager |
|
| FUND FACTS |
| | |
| | | Investor | | Institutional |
Ticker | | MJFOX | | MIJFX |
CUSIP | | 577130800 | | 577130792 |
Inception | | 12/31/98 | | 10/29/10 |
NAV | | $15.65 | | $15.69 |
Initial Investment | | $2,500 | | $100,000 |
Gross Expense Ratio1 | | 0.95% | | 0.89% |
Portfolio Statistics | | | | |
Total # of Positions | | 50 |
Net Assets | | $963.1 million |
Weighted Average Market Cap | | $36.3 billion |
Portfolio Turnover2 | | 70.3% |
Benchmark |
MSCI Japan Index |
OBJECTIVE
Long-term capital appreciation.
STRATEGY
Under normal market conditions, the Fund seeks to achieve its investment objective by investing at least 80% of its net assets, which include borrowings for investment purposes, in the common and preferred stocks of companies located in Japan.
Matthews Japan Fund
Portfolio Manager Commentary (unaudited)
For the first half of 2022, the Matthews Japan Fund returned –29.15% (Investor Class) and –29.10% (Institutional Class), while its benchmark, the MSCI Japan Index, returned –20.10% over the same period. For the quarter ending June 30, 2022, the Fund returned –15.50% (Investor Class) and –15.46% (Institutional Class), while the benchmark returned –14.60%.
Market Environment:
Japanese equity markets for the first half of 2022 were dominated by two of the largest moves in decades. Japan’s currency hit 135 yen to the U.S. dollar toward the end of the second quarter, a level last seen in early 2002, and the biggest move between the currencies since the early nineties. Multiple rate hikes by the U.S. Federal Reserve and the accommodative stance of the Bank of Japan is resulting in a widening of the U.S.-Japan bond yield spread. Ongoing high energy prices are also adding pressure on the yen as Japan’s energy self-sufficiency ratio remains one of the lowest among Organisation for Economic Co-operation and Development (OECD) countries. As a result of the weakening yen, Japanese equity markets traded in-line with global developed market peers in U.S. dollar terms despite outperforming in local currency terms.
Secondly, the velocity of the widening of the spread between the performance of value stocks and growth stocks was the fastest in two decades. In the first quarter the spread was 1,556 basis points (15.56%), and in the second quarter it widened by another 730 basis points (7.30%). While this performance gap between value and growth can be seen across the world, it is especially large in Japan. In the first quarter it was more about rising rates resulting in equity multiple-compression of growth names while the second quarter was dominated by fears that multiple rate hikes to contain inflation will result in the world economy falling into a recession.
Performance Contributors and Detractors:
The first six months of the year were an amplified version of first three months of 2021 as our focus on high-quality growth continued to endure a surge in U.S. 10-year bond yields. From a sector perspective, stock selections in the key areas of information technology and industrials were the largest detractors to the relative performance of the portfolio in the first half. Industrials was notably impacted due to its inclusion of commodity price-sensitive trading companies and cyclical-transport enterprises—businesses that have been challenged by surging fuel costs and supply-chain disruption. On the other hand, our overweight and stock selection in consumer staples was the largest contributor to relative performance in the first six months.
From a market cap point of view, our overweight in small cap stocks—those under $3 billion—was also a detractor to performance in the first half. Our underweight and stock selection in mega cap, and overweight and stock selection in mid-cap stocks were also large detractors.
Turning to individual securities, Shin-Etsu Chemical and Tokyo Electron were among the biggest detractors in the first six months. Shin-Etsu Chemical is a top global provider of electronic materials (Silicon Wafers) and PVC (Polyvinyl Chloride) but its trading multiple has compressed sharply amid signs of a slowdown in U.S. housing starts. Tokyo Electron, the largest semiconductor production equipment provider in Japan, has been impacted over concerns over declining demand in consumer electronics and increasing semiconductor inventory.
On the positive side, pharmaceutical company Daiichi Sankyo was a top contributor, after posting a positive outcome of the DESTINY-Breast04 (DB04) trial for anticancer agent Enhertu, as announced by the American Society of Clinical Oncology (ASCO) in June. P&C insurance company Tokio Marine Holdings was also a top contributor in the period. March 2022 full-year results and March 2023 guidance delivered on our
(continued)
| 1 | Prospectus expense ratios. |
| 2 | The lesser of fiscal year 2021 long-term purchase costs or sales proceeds divided by the average monthly market value of long-term securities. |
| | | | | | | | |
| | | | matthewsasia.com | 800.789.ASIA | | | 49 | |
| | | | | | | | | | | | | | | | | | | | | | | | | | | | | | | | |
| |
| PERFORMANCE AS OF JUNE 30, 2022 | |
| | | | | | | | | | | | Average Annual Total Returns | | | | |
| | | 3 Months | | | YTD | | | 1 Year | | | 3 Years | | | 5 Years | | | 10 Years | | | Since
Inception | | | Inception
Date | |
| Investor Class (MJFOX) | | | -15.50% | | | | -29.15% | | | | -26.32% | | | | -0.01% | | | | 1.07% | | | | 7.22% | | | | 5.08% | | | | 12/31/98 | |
| Institutional Class (MIJFX) | | | -15.46% | | | | -29.10% | | | | -26.23% | | | | 0.07% | | | | 1.14% | | | | 7.32% | | | | 6.78% | | | | 10/29/10 | |
| MSCI Japan Index3 | | | -14.60% | | | | -20.10% | | | | -19.64% | | | | 1.38% | | | | 2.13% | | | | 5.92% | | | | 3.11% | 4 | | | | |
Performance assumes reinvestment of all dividends and/or distributions before taxes. All performance quoted represents past performance and is no guarantee of future results. Investment return and principal value will fluctuate with market conditions so that when redeemed, shares may be worth more or less than their original cost. Current performance may be lower or higher than the return figures quoted. For the Fund’s most recent month-end performance, visit matthewsasia.com.
GROWTH OF A HYPOTHETICAL $10,000 INVESTMENT SINCE INCEPTION—INVESTOR CLASS
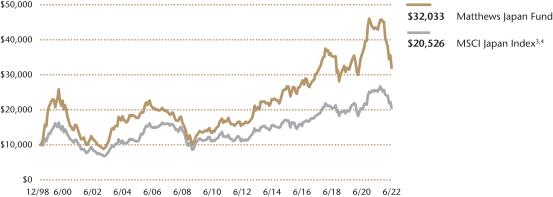
Plotted monthly. The performance data and graph do not reflect the deduction of taxes that a shareholder would pay on dividends, capital gains distributions or redemption of Fund shares. Values are in US$.
| | 3 | It is not possible to invest directly in an index. Source: Index data from Morgan Stanley Capital International and Bloomberg; total return calculations performed by BNY Mellon Investment Servicing (US) Inc. Please see page 84 for index definitions. |
| | 4 | Calculated from 12/31/98. |
| | | | | | | | | | |
| | | | |
| TOP TEN HOLDINGS5 | | | | | | | | |
| Name | | Sector | | | | | % Net Assets | |
| Sony Group Corp. | | Consumer Discretionary | | | | | | | 4.7% | |
| Olympus Corp. | | Health Care | | | | | | | 4.0% | |
| ORIX Corp. | | Financials | | | | | | | 3.7% | |
| Daiichi Sankyo Co., Ltd. | | Health Care | | | | | | | 3.7% | |
| Tokio Marine Holdings, Inc. | | Financials | | | | | | | 3.6% | |
| Shin-Etsu Chemical Co., Ltd. | | Materials | | | | | | | 3.0% | |
| Toyota Motor Corp. | | Consumer Discretionary | | | | | | | 2.9% | |
| JSR Corp. | | Materials | | | | | | | 2.8% | |
| Keyence Corp. | | Information Technology | | | | | | | 2.8% | |
| Hitachi, Ltd. | | Industrials | | | | | | | 2.7% | |
| % OF ASSETS IN TOP 10 | | | | | | | | | 33.9% | |
| | 5 | Holdings may combine more than one security from same issuer and related depositary receipts. |
Matthews Japan Fund
Portfolio Manager Commentary (unaudited) (continued)
investment thesis. We view the stock as offering a mid-teens dividend compound annual growth rate (CAGR) coupled with earnings-per-share (EPS) growth driven by both earnings and buybacks.
Notable Portfolio Changes:
One significant adjustment within our portfolio is the increase in defensive sectors such as consumer staples. While we still see economic growth recovery as the world reopens from the pandemic, ongoing uncertainty over the war in Ukraine, coupled with inflation risks and a rising interest-rate environment warrant a more balanced approach towards growth in our view. We have also taken down our portfolio weighting in cyclical growth areas as the Global Manufacturing Purchasing Managers’ Index is starting to peak out and rate hikes to manage inflation pose risks for a recession.
In the second quarter, we re-initiated a position in Tokio Marine Holdings. We have always viewed the company as a prudent capital allocator, with its lucrative domestic P&C business among the three top players that control 90% of the car insurance market. The company is also expanding its footprint to overseas specialty mergers and acquisitions insurance.
We initiated a position in Mazda Motor as our research suggests that 2022 is a key launch year for firm’s new generation products and the company is at a turning point in profitability.
We also added Toho, a producer and distributor of motion pictures in Japan, as we remain optimistic about earnings recovery of its movie theater division and in the longer term, we highly rate Toho’s untapped potential in monetizing its key IP assets.
In order to make positions for new names we exited AGC, Kadokawa, Koito Manufacturing, Morinaga Milk Industry, NTT Data, Persol Holdings, Raksul, Sumitomo Bakelite and Tokyo Electron.
Outlook:
The first half of 2022 turned out to be a much worse external environment for high-quality growth strategies even compared to first three months of 2021. The velocity of the widening of growth-value spreads has made it challenging to adapt our strategy quickly. While extremely loose monetary policy from all major central banks has come to an end and the Federal Reserve has officially started to tighten, the long-value/short-growth trade has now fully unwound back to pre-pandemic levels and some growth names valuations are well below pre-pandemic levels. That said, full-year earnings results in May showed Japanese growth stocks continued to improve their margins and strengthen cashflow generation abilities.
So while we are taking a more balanced approach towards stages of growth and valuation levels we believe the earnings capability of Japanese companies has improved meaningfully over the past economic cycle. This has been helped by productivity improvements, better corporate governance, innovation and a higher focus on capital efficiency.
Japan has yet to open up its borders like other developed countries have as they emerged from the pandemic but once it does that will provide a tailwind for the economy. As the Federal Reserve continues to tighten and tries to engineer a soft landing for the world’s biggest economy there will be challenging times ahead. But we believe Japan’s own loose domestic monetary environment, together with the strong fundamentals and profitability of its corporates, will provide healthy investment opportunities.
| | | | |
| |
| COUNTRY ALLOCATION (%)6 | |
| Japan | | | 98.2 | |
| Cash and Other Assets, Less Liabilities | | | 1.8 | |
| | | | |
| | |
| SECTOR ALLOCATION (%)6 | | | |
| Industrials | | | 24.2 | |
| Consumer Discretionary | | | 15.1 | |
| Health Care | | | 11.6 | |
| Information Technology | | | 11.1 | |
| Financials | | | 11.1 | |
| Communication Services | | | 8.9 | |
| Consumer Staples | | | 8.2 | |
| Materials | | | 8.1 | |
| Cash and Other Assets, Less Liabilities | | | 1.8 | |
| | | | |
| | |
| MARKET CAP EXPOSURE (%)6 | | | |
| Mega Cap (over $25B) | | | 46.3 | |
| Large Cap ($10B-$25B) | | | 24.0 | |
| Mid Cap ($3B-10B) | | | 16.6 | |
| Small Cap (under $3B) | | | 11.3 | |
| Cash and Other Assets, Less Liabilities | | | 1.8 | |
| 6 | Source: FactSet Research Systems. Percentage values in data are rounded to the nearest tenth of one percent, so the values may not sum to 100% due to rounding. Country allocations and percentage values may be derived from different data sources and may not be consistent with other Fund literature. |
| | | | | | | | |
| | | | matthewsasia.com | 800.789.ASIA | | | 51 | |
Matthews Japan Fund
June 30, 2022
Schedule of Investmentsa (unaudited)
COMMON EQUITIES: 98.2%
| | | | | | | | |
| | | Shares | | | Value | |
| | |
| INDUSTRIALS: 24.2% | | | | | | | | |
Machinery: 8.7% | | | | | | | | |
| | |
SMC Corp. | | | 55,700 | | | | $24,794,273 | |
| | |
Toyota Industries Corp. | | | 387,100 | | | | 24,003,013 | |
| | |
IHI Corp. | | | 895,000 | | | | 23,909,302 | |
| | |
Japan Steel Works, Ltd. | | | 485,900 | | | | 10,582,371 | |
| | | | | | | | |
| | | | | | | 83,288,959 | |
| | | | | | | | |
| | | | | | | | |
Trading Companies & Distributors: 3.3% | | | | | | | | |
| | |
ITOCHU Corp. | | | 628,300 | | | | 16,950,258 | |
| | |
Mitsubishi Corp. | | | 502,100 | | | | 14,953,128 | |
| | | | | | | | |
| | | | | | | 31,903,386 | |
| | | | | | | | |
| | | | | | | | |
Professional Services: 3.0% | | | | | | | | |
| | |
Recruit Holdings Co., Ltd. | | | 707,600 | | | | 20,839,134 | |
| | |
SMS Co., Ltd. | | | 419,600 | | | | 8,323,549 | |
| | | | | | | | |
| | | | | | | 29,162,683 | |
| | | | | | | | |
| | | | | | | | |
Industrial Conglomerates: 2.7% | | | | | | | | |
Hitachi, Ltd. | | | 552,200 | | | | 26,268,192 | |
| | | | | | | | |
| | | | | | | | |
Electrical Equipment: 2.1% | | | | | | | | |
Ushio, Inc. | | | 1,608,900 | | | | 19,926,189 | |
| | | | | | | | |
| | | | | | | | |
Commercial Services & Supplies: 1.8% | | | | | | | | |
TOPPAN, Inc. | | | 1,053,200 | | | | 17,571,507 | |
| | | | | | | | |
| | | | | | | | |
Building Products: 1.4% | | | | | | | | |
Daikin Industries, Ltd. | | | 85,000 | | | | 13,647,526 | |
| | | | | | | | |
| | | | | | | | |
Air Freight & Logistics: 1.2% | | | | | | | | |
Yamato Holdings Co., Ltd. | | | 689,900 | | | | 11,040,582 | |
| | | | | | | | |
Total Industrials | | | | | | | 232,809,024 | |
| | | | | | | | |
| | | | | | | | |
| | | |
| CONSUMER DISCRETIONARY: 15.0% | | | | | | | | |
Household Durables: 4.7% | |
Sony Group Corp. | | | 555,500 | | | | 45,304,791 | |
| | | | | | | | |
| | | | | | | | |
Leisure Products: 4.5% | | | | | | | | |
| | |
Bandai Namco Holdings, Inc. | | | 252,500 | | | | 17,824,725 | |
| | |
Shimano, Inc. | | | 86,500 | | | | 14,571,519 | |
| | |
Roland Corp. | | | 379,500 | | | | 11,274,074 | |
| | | | | | | | |
| | | | | | | 43,670,318 | |
| | | | | | | | |
| | | | | | | | |
Automobiles: 4.4% | | | | | | | | |
| | |
Toyota Motor Corp. | | | 1,786,100 | | | | 27,558,283 | |
| | |
Mazda Motor Corp. | | | 1,787,400 | | | | 14,589,629 | |
| | | | | | | | |
| | | | | | | 42,147,912 | |
| | | | | | | | |
| | | | | | | | |
Hotels, Restaurants & Leisure: 1.4% | | | | | | | | |
Food & Life Cos., Ltd. | | | 654,300 | | | | 14,037,411 | |
| | | | | | | | |
Total Consumer Discretionary | | | | | | | 145,160,432 | |
| | | | | | | | |
| | | | | | | | |
| | | |
| HEALTH CARE: 11.6% | | | | | | | | |
Health Care Equipment & Supplies: 7.9% | |
| | |
Olympus Corp. | | | 1,912,100 | | | | 38,749,076 | |
| | |
Hoya Corp. | | | 252,500 | | | | 21,609,693 | |
| | |
Terumo Corp. | | | 518,000 | | | | 15,670,045 | |
| | | | | | | | |
| | | | | | | 76,028,814 | |
| | | | | | | | |
| | | | | | | | |
| | | | | | | | |
| | | Shares | | | Value | |
Pharmaceuticals: 3.7% | | | | | | | | |
Daiichi Sankyo Co., Ltd. | | | 1,397,300 | | | | $35,536,815 | |
| | | | | | | | |
Total Health Care | | | | | | | 111,565,629 | |
| | | | | | | | |
| | | | | | | | |
| | | |
| FINANCIALS: 11.1% | | | | | | | | |
Insurance: 5.6% | | | | | | | | |
| | |
Tokio Marine Holdings, Inc. | | | 589,200 | | | | 34,357,404 | |
| | |
Dai-ichi Life Holdings, Inc. | | | 1,047,000 | | | | 19,364,674 | |
| | | | | | | | |
| | | | | | | 53,722,078 | |
| | | | | | | | |
| | | | | | | | |
Diversified Financial Services: 5.5% | | | | | | | | |
| | |
ORIX Corp. | | | 2,125,100 | | | | 35,616,357 | |
| | |
eGuarantee, Inc. | | | 1,105,600 | | | | 17,567,568 | |
| | | | | | | | |
| | | | | | | 53,183,925 | |
| | | | | | | | |
Total Financials | | | | | | | 106,906,003 | |
| | | | | | | | |
| | | | | | | | |
| | | |
| INFORMATION TECHNOLOGY: 11.1% | | | | | | | | |
IT Services: 4.3% | | | | | | | | |
| | |
OBIC Co., Ltd. | | | 165,300 | | | | 23,506,690 | |
| | |
GMO Payment Gateway, Inc. | | | 182,200 | | | | 12,978,285 | |
| | |
Simplex Holdings, Inc. | | | 394,400 | | | | 5,083,361 | |
| | | | | | | | |
| | | | | | | 41,568,336 | |
| | | | | | | | |
| | | | | | | | |
Electronic Equipment, Instruments & Components: 3.9% | |
| | |
Keyence Corp. | | | 78,700 | | | | 26,989,238 | |
| | |
TDK Corp. | | | 341,600 | | | | 10,561,684 | |
| | | | | | | | |
| | | | | | | 37,550,922 | |
| | | | | | | | |
| | | | | | | | |
Semiconductors & Semiconductor Equipment: 2.5% | | | | | |
| | |
Renesas Electronics Corp.b | | | 1,676,800 | | | | 15,173,963 | |
| | |
Tokyo Electron, Ltd. | | | 28,100 | | | | 9,171,653 | |
| | | | | | | | |
| | | | | | | 24,345,616 | |
| | | | | | | | |
| | | | | | | | |
Software: 0.4% | | | | | | | | |
| | |
Appier Group, Inc.b | | | 509,100 | | | | 3,250,240 | |
| | | | | | | | |
Total Information Technology | | | | | | | 106,715,114 | |
| | | | | | | | |
| | | | | | | | |
| | | |
| COMMUNICATION SERVICES: 8.9% | | | | | | | | |
Entertainment: 2.9% | | | | | | | | |
| | |
Toho Co., Ltd. | | | 500,800 | | | | 18,141,555 | |
| | |
Capcom Co., Ltd. | | | 416,000 | | | | 10,119,596 | |
| | | | | | | | |
| | | | | | | 28,261,151 | |
| | | | | | | | |
| | | | | | | | |
Media: 2.2% | | | | | | | | |
| | |
Direct Marketing MiX, Inc. | | | 824,100 | | | | 10,498,959 | |
| | |
Septeni Holdings Co., Ltd. | | | 2,070,100 | | | | 7,995,576 | |
| | |
CyberAgent, Inc. | | | 243,400 | | | | 2,438,514 | |
| | | | | | | | |
| | | | | | | 20,933,049 | |
| | | | | | | | |
| | | | | | | | |
Diversified Telecommunication Services: 2.0% | | | | | |
Nippon Telegraph & Telephone Corp. | | | 678,900 | | | | 19,506,949 | |
| | | | | | | | |
| | | | | | | | |
Wireless Telecommunication Services: 1.8% | | | | | | | | |
| | |
SoftBank Group Corp. | | | 437,400 | | | | 16,952,969 | |
| | | | | | | | |
Total Communication Services | | | | | | | 85,654,118 | |
| | | | | | | | |
| | | | | | | | |
| | | |
| CONSUMER STAPLES: 8.2% | | | | | | | | |
Food Products: 3.9% | | | | | | | | |
| | |
Ajinomoto Co., Inc. | | | 954,400 | | | | 23,273,627 | |
| | |
Kikkoman Corp. | | | 267,900 | | | | 14,256,802 | |
| | | | | | | | |
| | | | | | | 37,530,429 | |
| | | | | | | | |
| | | | | | | | |
Matthews Japan Fund
June 30, 2022
Schedule of Investmentsa (unaudited) (continued)
COMMON EQUITIES (continued)
| | | | | | | | |
| | | Shares | | | Value | |
Food & Staples Retailing: 2.5% | | | | | | | | |
Seven & i Holdings Co., Ltd. | | | 618,500 | | | | $23,998,049 | |
| | | | | | | | |
| | | | | | | | |
Beverages: 1.8% | | | | | | | | |
Suntory Beverage & Food, Ltd. | | | 460,400 | | | | 17,386,084 | |
| | | | | | | | |
Total Consumer Staples | | | | | | | 78,914,562 | |
| | | | | | | | |
| | | | | | | | |
| | | | | | | | |
| | | |
| MATERIALS: 8.1% | | | | | | | | |
Chemicals: 8.1% | |
Shin-Etsu Chemical Co., Ltd. | | | 257,200 | | | | 28,912,103 | |
JSR Corp. | | | 1,041,600 | | | | 27,067,224 | |
Nissan Chemical Corp. | | | 483,700 | | | | 22,326,337 | |
| | | | | | | | |
Total Materials | | | | | | | 78,305,664 | |
| | | | | | | | |
| | | | | | | | |
| | | |
| TOTAL INVESTMENTS: 98.2% | | | | | | | 946,030,546 | |
(Cost $1,083,436,375) | | | | | | | | |
| | | | | | | | |
| | |
CASH AND OTHER ASSETS,
LESS LIABILITIES: 1.8% | | | | | | | 17,115,533 | |
| | | | | | | | |
| | |
NET ASSETS: 100.0% | | | | | | | $963,146,079 | |
| | | | | | | | |
| a | Certain securities were fair valued under the valuation policies approved by the Board of Trustees (Note 2-A). |
| b | Non-income producing security. |
See accompanying notes to financial statements.
| | | | | | | | |
| | | | matthewsasia.com | 800.789.ASIA | | | 53 | |
| | | | |
| PORTFOLIO MANAGERS |
| |
| Michael J. Oh, CFA | | Elli Lee |
Lead Manager | | Lead Manager |
| |
| Sojung Park | | |
Co-Manager | | | | |
|
| FUND FACTS |
| | |
| | | Investor | | Institutional |
Ticker | | MAKOX | | MIKOX |
CUSIP | | 577130305 | | 577130826 |
Inception | | 1/3/95 | | 10/29/10 |
NAV | | $4.27 | | $4.31 |
Initial Investment | | $2,500 | | $100,000 |
Gross Expense Ratio1 | | 1.13% | | 0.98% |
Portfolio Statistics |
Total # of Positions | | 32 |
Net Assets | | $95.4 million |
Weighted Average
Market Cap | | $83.4 billion |
Portfolio Turnover2 | | 40.2% |
Benchmark |
Korea Composite Stock Price Index |
OBJECTIVE
Long-term capital appreciation.
STRATEGY
Under normal market conditions, the Fund seeks to achieve its investment objective by investing at least 80% of its net assets, which include borrowings for investment purposes, in the common and preferred stocks of companies located in South Korea.
Matthews Korea Fund
Portfolio Manager Commentary (unaudited)
For the first half of 2022, the Matthews Korea Fund returned –25.09% (Investor Class) and –25.04% (Institutional Class), while its benchmark, the Korea Composite Stock Price Index (KOSPI), returned
–27.43% over the same period. For the quarter ending June 30, 2022, the Fund returned –18.67% (Investor Class) and –18.68% (Institutional Class), while the benchmark returned –20.28%.
Market Environment:
The first half of the year was a challenging period. Elevated inflation data and diminishing consumer spending in many regions dampened global sentiment and sparked recessionary fears. While Asian equity markets endured choppy waters, they performed well in the second quarter, experiencing less downside than commodity heavy, weak-performing EMEA (Europe, Middle East, Africa) and LatAm regions. In particular, Chinese equities saw a strong rebound—in both Hong Kong-listed stocks and local A-Shares, and Indonesia was the strongest performing market in the first six months. Conversely, South Korea was a major market laggard followed by Taiwan, Japan and India.
Global macro concern with the interest rate hiking cycle negatively affected South Korea and foreign investors have been net sellers of Korean stocks, especially late in the second quarter as global recessionary fears caused speculation that demand for Korean exports would fall. South Korea’s tech heavy industries also underperformed as the technology cycle appears to be passing its peak with easing supply constraints and waning demand from already high levels. In aggregate, South Korean equities are now one of the cheapest in Asia.
Performance Contributors and Detractors:
The Fund’s allocation and stock selection within the consumer staples and materials sectors and allocation within information technology (IT) detracted the most to relative performance for the first half of the year. Among the portfolio’s IT holdings, Leeno Industrial, maker of pins and test sockets for the chip industry, declined on market concerns of research and development (R&D) spending by global innovation companies to come down on recession fears. However, we believe R&D spending on innovation is a structural direction. Global memory players such as Hynix and Samsung Electronics were also detractors on growing concerns over average selling price cuts in the second half of the year, with heightened inventory levels in the channel with weakening end demand. However, we see clear signs of better supply management in DRAM (dynamic random-access memory) that we believe will allow the companies to sustain margins in the long term which should be a differentiating factor versus the previous downturn.
On the other hand, the portfolio’s overweight allocation and stock selection within financials and consumer discretionary sectors contributed the most to the Fund’s relative performance for the first half. South Korea’s largest e-commerce player Coupang’s share price reacted positively to signs of the company meeting its mid-term earnings milestones by narrowing losses while continuing to deliver solid top line growth.
Notable Portfolio Changes:
During the second quarter, we initiated several positions including BGF Retail which is principally engaged in the operation of convenience stores. We previously held the name and have been monitoring the industry closely. During the COVID
(continued)
| 1 | Prospectus expense ratios. |
| 2 | The lesser of fiscal year 2021 long-term purchase costs or sales proceeds divided by the average monthly market value of long-term securities. |
| | | | | | | | | | | | | | | | | | | | | | | | | | | | | | | | |
| | | | | | | | | |
| PERFORMANCE AS OF JUNE 30, 2022 | | | | | | | | | | | | | | | | | | | | | | | | |
| | | | | | | | | | | | Average Annual Total Returns | | | | |
| | | 3 Months | | | YTD | | | 1 Year | | | 3 Years | | | 5 Years | | | 10 Years | | | Since
Inception | | | Inception
Date | |
| Investor Class (MAKOX) | | | -18.67% | | | | -25.09% | | | | -33.39% | | | | 3.25% | | | | -0.79% | | | | 5.55% | | | | 5.28% | | | | 01/03/95 | |
| Institutional Class (MIKOX) | | | -18.68% | | | | -25.04% | | | | -33.28% | | | | 3.32% | | | | -0.67% | | | | 5.67% | | | | 5.36% | | | | 10/29/10 | |
| Korea Composite Stock Price Index3 | | | -20.28% | | | | -27.43% | | | | -36.83% | | | | 1.48% | | | | -0.84% | | | | 2.88% | | | | 2.84% | 4 | | | | |
Performance assumes reinvestment of all dividends and/or distributions before taxes. All performance quoted represents past performance and is no guarantee of future results. Investment return and principal value will fluctuate with market conditions so that when redeemed, shares may be worth more or less than their original cost. Current performance may be lower or higher than the return figures quoted. For the Fund’s most recent month-end performance, visit matthewsasia.com.
GROWTH OF A HYPOTHETICAL $10,000 INVESTMENT SINCE INCEPTION—INVESTOR CLASS
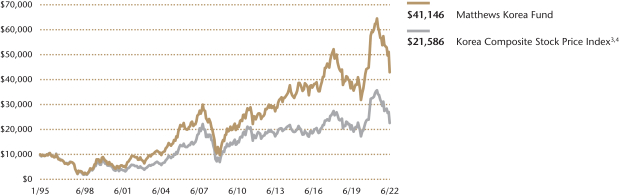
Plotted monthly. The performance data and graph do not reflect the deduction of taxes that a shareholder would pay on dividends, capital gains distributions or redemption of Fund shares. Values are in US$.
| | 3 | Korea Composite Stock Price Index performance data may be readjusted periodically by the Korea Exchange due to certain factors, including the declaration of dividends. It is not possible to invest directly in an index. Source: Index data from Korea Composite Stock Price Index and Bloomberg; total return calculations performed by BNY Mellon Investment Servicing (US) Inc. Please see page 84 for index definition. |
| | | | | | | | |
| | | | |
| TOP TEN HOLDINGS5 | | | | | | | |
| Name | | Sector | | | | % Net Assets | |
| Samsung Electronics Co., Ltd., Pfd. | | Information Technology | | | | | 16.3% | |
| Samsung Electronics Co., Ltd. | | Information Technology | | | | | 6.2% | |
| SK Hynix, Inc. | | Information Technology | | | | | 4.8% | |
| KB Financial Group, Inc. | | Financials | | | | | 3.8% | |
| Yuhan Corp. | | Health Care | | | | | 3.6% | |
| Kia Corp. | | Consumer Discretionary | | | | | 3.5% | |
| Shinhan Financial Group Co., Ltd. | | Financials | | | | | 3.3% | |
| NAVER Corp. | | Communication Services | | | | | 3.2% | |
| SK Innovation Co., Ltd. | | Energy | | | | | 3.2% | |
| DongKook Pharmaceutical Co., Ltd. | | Health Care | | | | | 3.1% | |
| % OF ASSETS IN TOP 10 | | | | | 51.0% | |
| | 5 | Holdings may combine more than one security from same issuer and related depositary receipts. |
| | | | | | | | |
| | | | matthewsasia.com | 800.789.ASIA | | | 55 | |
| | | | |
| | |
| COUNTRY ALLOCATION (%)6 | | | |
| South Korea | | | 94.2 | |
| Cash and Other Assets, Less Liabilities | | | 5.8 | |
| | | | |
| | |
| SECTOR ALLOCATION (%)6 | | | |
| Information Technology | | | 35.3 | |
| Consumer Discretionary | | | 13.4 | |
| Financials | | | 9.6 | |
| Health Care | | | 9.2 | |
| Communication Services | | | 8.2 | |
| Energy | | | 6.0 | |
| Industrials | | | 4.7 | |
| Materials | | | 4.1 | |
| Consumer Staples | | | 3.8 | |
| Cash and Other Assets, Less Liabilities | | | 5.8 | |
| | | | |
| | |
| MARKET CAP EXPOSURE (%)6 | | | |
| Mega Cap (over $25B) | | | 41.3 | |
| Large Cap ($10B-$25B) | | | 20.3 | |
| Mid Cap ($3B-10B) | | | 15.1 | |
| Small Cap (under $3B) | | | 17.5 | |
| Cash and Other Assets, Less Liabilities | | | 5.8 | |
| 6 | Source: FactSet Research Systems. Percentage values in data are rounded to the nearest tenth of one percent, so the values may not sum to 100% due to rounding. Country allocations and percentage values may be derived from different data sources and may not be consistent with other Fund literature. |
Matthews Korea Fund
Portfolio Manager Commentary (unaudited) (continued)
pandemic, the convenient stores industry suffered from declining traffic. However, BGF successfully improved efficiency and gained market share to benefit from the reopening.
We also exited a few positions, including Koh Young Technology. We had been a long-term shareholder of the 3D inspection and measurement equipment manufacturer as we liked the management’s approach focusing on R&D for robotic technology. However, we were disappointed in the company’s capability to improve R&D efficiency and broaden the industry. While we have existed our position, we will continue to monitor the stock.
Outlook:
South Korea has yet to see a boom in consumption, but looking ahead, we anticipate it will gradually improve during the coming year. Newly elected President Yoon Suk-Yeol is known for his preference and support for the private sector in the form of more lenient regulatory policies, and if global recessionary fears diminish, we envision that Korean stocks should stabilize.
We remain focused on active security selection, concentrating on groundbreaking companies we believe are positioned to benefit from strong cash flows and the global recovery. We continue to look for companies that can benefit from domestic consumption, as well as South Korean companies effectively competing and innovating in global markets. We are confident the pioneering companies we’ve invested in will continue to show improved cash flows and long-term growth potential.
Matthews Korea Fund
June 30, 2022
Schedule of Investmentsa (unaudited)
COMMON EQUITIES: 76.8%
| | | | | | | | |
| | | Shares | | | Value | |
| | |
| INFORMATION TECHNOLOGY: 19.0% | | | | | | | | |
Semiconductors & Semiconductor Equipment: 7.9% | | | | | |
| | |
SK Hynix, Inc. | | | 64,641 | | | | $4,564,567 | |
| | |
LEENO Industrial, Inc. | | | 20,880 | | | | 2,094,595 | |
| | |
Hana Materials, Inc. | | | 24,257 | | | | 898,636 | |
| | | | | | | | |
| | | | | | | 7,557,798 | |
| | | | | | | | |
| | | | | | | | |
Technology Hardware, Storage & Peripherals: 6.2% | | | | | |
Samsung Electronics Co., Ltd. | | | 134,635 | | | | 5,938,394 | |
| | | | | | | | |
| | | | | | | | |
Electronic Equipment, Instruments & Components: 4.9% | | | | | |
| | |
Park Systems Corp. | | | 32,137 | | | | 2,395,968 | |
| | |
Samsung SDI Co., Ltd. | | | 5,355 | | | | 2,208,322 | |
| | | | | | | | |
| | | | | | | 4,604,290 | |
| | | | | | | | |
Total Information Technology | | | | | | | 18,100,482 | |
| | | | | | | | |
| | | | | | | | |
| | | |
| CONSUMER DISCRETIONARY: 12.2% | | | | | | | | |
Automobiles: 6.0% | | | | | | | | |
| | |
Kia Corp. | | | 56,554 | | | | 3,375,456 | |
| | |
Hyundai Motor Co. | | | 17,300 | | | | 2,417,634 | |
| | | | | | | | |
| | | | | | | 5,793,090 | |
| | | | | | | | |
| | | | | | | | |
Internet & Direct Marketing Retail: 2.7% | | | | | |
Coupang, Inc.b | | | 202,200 | | | | 2,578,050 | |
| | | | | | | | |
| | | | | | | | |
Auto Components: 2.0% | | | | | |
Mando Corp. | | | 51,712 | | | | 1,899,402 | |
| | | | | | | | |
| | | | | | | | |
Multiline Retail: 1.5% | | | | | |
Shinsegae, Inc. | | | 8,349 | | | | 1,405,484 | |
| | | | | | | | |
Total Consumer Discretionary | | | | | | | 11,676,026 | |
| | | | | | | | |
| | | | | | | | |
| | | |
| FINANCIALS: 9.6% | | | | | | | | |
Banks: 7.1% | | | | | | | | |
| | |
KB Financial Group, Inc. | | | 96,568 | | | | 3,606,170 | |
| | |
Shinhan Financial Group Co., Ltd. | | | 110,646 | | | | 3,172,716 | |
| | | | | | | | |
| | | | | | | 6,778,886 | |
| | | | | | | | |
| | | | | | | | |
Insurance: 2.5% | | | | | |
Samsung Fire & Marine Insurance Co., Ltd. | | | 15,508 | | | | 2,409,379 | |
| | | | | | | | |
Total Financials | | | | | | | 9,188,265 | |
| | | | | | | | |
| | | | | | | | |
| | | |
| HEALTH CARE: 9.2% | | | | | | | | |
Pharmaceuticals: 6.7% | | | | | | | | |
| | |
Yuhan Corp. | | | 78,904 | | | | 3,412,937 | |
| | |
DongKook Pharmaceutical Co., Ltd. | | | 199,345 | | | | 2,995,727 | |
| | | | | | | | |
| | | | | | | 6,408,664 | |
| | | | | | | | |
| | | | | | | | |
Life Sciences Tools & Services: 2.5% | | | | | |
Samsung Biologics Co., Ltd.b,c,d | | | 3,808 | | | | 2,328,086 | |
| | | | | | | | |
Total Health Care | | | | | | | 8,736,750 | |
| | | | | | | | |
| | | | | | | | |
| | | |
| COMMUNICATION SERVICES: 8.2% | | | | | | | | |
Interactive Media & Services: 5.2% | | | | | | | | |
| | |
NAVER Corp. | | | 16,393 | | | | 3,057,731 | |
| | |
Kakao Corp. | | | 34,448 | | | | 1,866,569 | |
| | | | | | | | |
| | | | | | | 4,924,300 | |
| | | | | | | | |
| | | | | | | | |
Wireless Telecommunication Services: 2.5% | | | | | |
SK Telecom Co., Ltd. | | | 59,351 | | | | 2,381,821 | |
| | | | | | | | |
| | | | | | | | |
| | | | | | | | |
| | | Shares | | | Value | |
Entertainment: 0.5% | | | | | |
HYBE Co., Ltd.b | | | 4,348 | | | | $488,348 | |
| | | | | | | | |
Total Communication Services | | | | | | | 7,794,469 | |
| | | | | | | | |
| | | | | | | | |
| | | |
| ENERGY: 6.0% | | | | | | | | |
Oil, Gas & Consumable Fuels: 6.0% | | | | | | | | |
| | |
SK Innovation Co., Ltd.b | | | 20,528 | | | | 3,047,533 | |
| | |
S-Oil Corp. | | | 33,033 | | | | 2,632,871 | |
| | | | | | | | |
Total Energy | | | | | | | 5,680,404 | |
| | | | | | | | |
| | | | | | | | |
| | | |
| INDUSTRIALS: 4.7% | | | | | | | | |
Machinery: 1.7% | | | | | | | | |
Hyundai Mipo Dockyard Co., Ltd.b | | | 22,429 | | | | 1,577,923 | |
| | | | | | | | |
| | | | | | | | |
Construction & Engineering: 1.6% | | | | | |
Samsung Engineering Co., Ltd.b | | | 92,597 | | | | 1,539,033 | |
| | | | | | | | |
| | | | | | | | |
Marine: 1.4% | | | | | |
Pan Ocean Co., Ltd. | | | 291,036 | | | | 1,337,211 | |
| | | | | | | | |
Total Industrials | | | | | | | 4,454,167 | |
| | | | | | | | |
| | | | | | | | |
| | | |
| MATERIALS: 4.1% | | | | | | | | |
Chemicals: 2.3% | | | | | | | | |
LG Chem Ltd. | | | 5,580 | | | | 2,216,833 | |
| | | | | | | | |
| | | | | | | | |
Metals & Mining: 1.8% | | | | | |
POSCO Holdings, Inc. | | | 9,621 | | | | 1,715,782 | |
| | | | | | | | |
Total Materials | | | | | | | 3,932,615 | |
| | | | | | | | |
| | | | | | | | |
| | | |
| CONSUMER STAPLES: 3.8% | | | | | | | | |
Food & Staples Retailing: 2.2% | | | | | | | | |
BGF Retail Co., Ltd. | | | 14,290 | | | | 2,085,428 | |
| | | | | | | | |
| | | | | | | | |
Personal Products: 1.6% | | | | | |
| | |
LG H&H Co., Ltd. | | | 2,991 | | | | 1,571,461 | |
| | | | | | | | |
Total Consumer Staples | | | | | | | 3,656,889 | |
| | | | | | | | |
| | | | | | | | |
| | |
| TOTAL COMMON EQUITIES | | | | 73,220,067 | |
| | | | | | | | |
(Cost $77,336,802) | | | | | | | | |
| | | | | | | | |
| | |
PREFERRED EQUITIES: 17.4% | | | | | | | | |
| | | |
| INFORMATION TECHNOLOGY: 16.3% | | | | | | | | |
Technology Hardware, Storage & Peripherals: 16.3% | | | | | |
Samsung Electronics Co., Ltd., Pfd. | | | 387,535 | | | | 15,577,125 | |
| | | | | | | | |
Total Information Technology | | | | | | | 15,577,125 | |
| | | | | | | | |
| | | | | | | | |
| | | | | | | | |
| | | | matthewsasia.com | 800.789.ASIA | | | 57 | |
Matthews Korea Fund
June 30, 2022
Schedule of Investmentsa (unaudited) (continued)
PREFERRED EQUITIES (continued)
| | | | | | | | |
| | | Shares | | | Value | |
| | |
| CONSUMER DISCRETIONARY: 1.1% | | | | | | | | |
Automobiles: 1.1% | | | | | | | | |
Hyundai Motor Co., Ltd., Pfd. | | | 15,983 | | | | $1,073,021 | |
| | | | | | | | |
Total Consumer Discretionary | | | | | | | 1,073,021 | |
| | | | | | | | |
| | | | | | | | |
| | |
| TOTAL PREFERRED EQUITIES | | | | 16,650,146 | |
| | | | | | | | |
(Cost $11,571,285) | | | | | | | | |
| | | | | | | | |
| | |
| TOTAL INVESTMENTS: 94.2% | | | | 89,870,213 | |
(Cost $88,908,087) | | | | | | | | |
| | | | | | | | |
| | |
CASH AND OTHER ASSETS,
LESS LIABILITIES: 5.8% | | | | | | | 5,516,606 | |
| | | | | | | | |
| | |
NET ASSETS: 100.0% | | | | | | | $95,386,819 | |
| | | | | | | | |
| a | Certain securities were fair valued under the valuation policies approved by the Board of Trustees (Note 2-A). |
| b | Non-income producing security. |
| c | Security exempt from registration under Rule 144A of the Securities Act of 1933, as amended. The security may be resold in transactions exempt from registration normally to qualified institutional buyers. The security has been determined to be liquid in accordance with procedures adopted by the Funds’ Board of Trustees. At June 30, 2022, the aggregate value is $2,328,086, which is 2.44% of net assets. |
| d | The securities may be resold to qualified foreign investors and foreign institutional buyers under Regulation S of the Securities Act of 1933. |
See accompanying notes to financial statements.

| | | | |
| PORTFOLIO MANAGERS |
| |
| Robert J. Horrocks, PhD | | Kenneth Lowe, CFA |
Lead Manager | | Lead Manager |
| |
| Satya Patel | | Siddarth Bhargava |
Co-Manager | | | | Co-Manager |
| | | | |
|
| FUND FACTS |
| | |
| | | Investor | | Institutional |
Ticker | | MACSX | | MICSX |
CUSIP | | 577130206 | | 577130842 |
Inception | | 9/12/94 | | 10/29/10 |
NAV | | $13.59 | | $13.56 |
Initial Investment | | $2,500 | | $100,000 |
Gross Expense Ratio1 | | 1.07% | | 0.94% |
Portfolio Statistics | | |
Total # of Positions | | 51 |
Net Assets | | $892.2 million |
Weighted Average Market Cap | | $97.4 billion |
Portfolio Turnover2 | | 37.9% |
Benchmark | | |
MSCI AC Asia ex Japan Index |
OBJECTIVE
Long-term capital appreciation. The Fund also seeks to provide some current income.
STRATEGY
Under normal market conditions, the Fund seeks to achieve its investment objective by investing at least 80% of its net assets, which include borrowings for investment purposes, in dividend-paying common stock, preferred stock and other equity securities, and convertible securities as well as fixed-income securities, of any duration or quality, including high yield securities, of companies located in Asia, which consists of all countries and markets in Asia, including developed, emerging and frontier countries and markets in the Asian region.
Matthews Asian Growth and Income Fund
Portfolio Manager Commentary (unaudited)
For the first half of 2022, the Matthews Asian Growth and Income Fund returned –14.95% (Investor Class) and –14.91% (Institutional Class), while its benchmark, the MSCI All Country Asia ex Japan Index, returned –16.14% over the same period. For the quarter ending June 30, 2022, the Fund returned –8.02% (Investor Class) and –8.03% (Institutional Class), while the benchmark returned –8.90%.
Market Environment:
The first half of the year has been a challenging one for risk assets and even for many safe havens with numerous concerns weighing on values as tighter policy and weaker growth appear likely. Recent months have seen further confirmation of how embedded inflation has become and how far behind the curve many central banks have been in lifting interest rates and undergoing quantitative tightening. Supply chain disruptions from semiconductor chip shortages to the war in Ukraine have clearly played a significant role and are challenging to offset but demand has also been key. An aggressive fiscal stimulus through the pandemic now looks overly large with high growth in monetary aggregates while labor markets are also notably tight.
In Asia, spotty growth, an increase in the cost of capital and a strengthening dollar have hit returns. The Southeast Asian markets of Thailand and Indonesia were among the most resilient during the half as reopening hopes and broadly higher commodity prices helped. China also held up better than the broader regional index. Despite weak consumer growth due to strict COVID-related lockdowns, tighter regulations that have weighed on sentiment eased and the potential for stimulus rose. South Korea and Taiwan underperformed as the technology cycle appears to be passing its peak with easing supply constraints and waning demand from already high levels.
Performance Contributors and Detractors:
AIA Group was the largest contributor to returns over the first half of the year as it is hoped that easing restrictions will allow more face-to-face interactions between the regional life insurance leader’s agents and customers. This should help to boost growth in premiums and margins. The company also had its China expansion plans boosted through regulatory approval for its Henan province branch during the period. Further, rising interest rates may help AIA’s International Financial Reporting Standards (IFRS) earnings growth. Staying with the financial sector, Bank of China (Hong Kong) also rallied as the attractively valued lender is expected to deliver solid earnings growth this year. Rising rates should help to drive net interest margin expansion, accompanied by mid to high single-digit loan growth and robust asset quality. Fellow Hong Kong stock CK Hutchison ended the half in positive territory as merger discussions were reported between its U.K. telecom operations and Vodafone. This may unlock value for the firm. A broader reopening could also help its retail business and higher commodity prices have benefited its holding in Cenovus Energy.
Elsewhere, national defense, commercial aerospace and urban solutions provider ST Engineering gained given a solid order book and relatively visible earnings. The Singapore-based company is expected to benefit in aerospace through more maintenance, repair and overhaul operations due to improving global mobility as well as through strong demand for its passenger-to-freighter aircraft conversions. Defense spending remains elevated due to geopolitical tensions and the urban solutions business is well positioned for continued smart city investments. An underweight to information technology (IT) as well as broadly more defensive positioning in the sector contributed to relative returns as the technology cycle appears to be peaking. Many of these businesses are shorter cycle in nature and do not fit our long-term investment approach.
(continued)
| 1 | Prospectus expense ratios. |
| 2 | The lesser of fiscal year 2021 long-term purchase costs or sales proceeds divided by the average monthly market value of long-term securities. |
| | | | | | | | |
| | | | matthewsasia.com | 800.789.ASIA | | | 59 | |
| | | | | | | | | | | | | | | | | | | | | | | | | | | | | | | | |
| | | | | | | | | |
| PERFORMANCE AS OF JUNE 30, 2022 | | | | | | | | | | | | | | | | | | | | | | | | |
| | | | | | | | | | | | Average Annual Total Returns | | | | |
| | | 3 Months | | | YTD | | | 1 Year | | | 3 Years | | | 5 Years | | | 10 Years | | | Since
Inception | | | Inception
Date | |
| Investor Class (MACSX) | | | -8.02% | | | | -14.95% | | | | -18.41% | | | | 0.82% | | | | 1.80% | | | | 3.90% | | | | 8.07% | | | | 9/12/94 | |
| Institutional Class (MICSX) | | | -8.03% | | | | -14.91% | | | | -18.32% | | | | 0.97% | | | | 1.93% | | | | 4.05% | | | | 3.51% | | | | 10/29/10 | |
| MSCI AC Asia ex Japan Index3 | | | -8.90% | | | | -16.14% | | | | -24.78% | | | | 2.41% | | | | 3.39% | | | | 5.80% | | | | 4.27% | 4 | | | | |
Performance assumes reinvestment of all dividends and/or distributions before taxes. All performance quoted represents past performance and is no guarantee of future results. Investment return and principal value will fluctuate with market conditions so that when redeemed, shares may be worth more or less than their original cost. Current performance may be lower or higher than the return figures quoted. Returns would have been lower if certain of the Fund’s fees and expenses had not been waived. For the Fund’s most recent month-end performance, visit matthewsasia.com.
| | | | | | | | | | | | | | | | | | | | | | | | | | | | |
| | | | | | | | |
| INCOME DISTRIBUTION HISTORY | | | | | | | | | | | | | | | | | | | | | |
| | | 2022 | | | | | | 2021 | |
| | | June | | | December | | | Total | | | | | | June | | | December | | | Total | |
| Investor (MACSX) | | $ | 0.08 | | | | n.a. | | | | n.a. | | | | | | | $ | 0.12 | | | $ | 0.08 | | | $ | 0.20 | |
| Inst’l (MICSX) | | $ | 0.09 | | | | n.a. | | | | n.a. | | | | | | | $ | 0.14 | | | $ | 0.09 | | | $ | 0.23 | |
Note: This table does not include capital gains distributions. Totals may differ by $0.02 due to rounding. For income distribution history, visit matthewsasia.com.
| | | | |
| | | |
30-DAY YIELD: 1.79% (Investor Class); 1.79% (Institutional Class) The 30-Day Yield represents net investment income earned by the Fund over the 30-day period ended 6/30/22, expressed as an annual percentage rate based on the Fund’s share price at the end of the 30-day period. The 30-Day Yield should be regarded as an estimate of the Fund’s rate of investment income, and it may not equal the Fund’s actual income distribution rate. Source: BNY Mellon Investment Servicing (US) Inc. | | | | DIVIDEND YIELD: 2.72% The dividend yield (trailing) for the portfolio is the weighted average sum of the dividends paid by each equity security held by the Fund over the 12 months ended 6/30/22 divided by the current price of each equity as of 6/30/22. The annualized dividend yield for the Fund is for the equity-only portion of the portfolio. Please note that this is based on gross equity portfolio holdings and does not reflect the actual yield an investor in the Fund would receive. Past yields are no guarantee of future yields. Source: FactSet Research Systems, Bloomberg, MICM |
GROWTH OF A HYPOTHETICAL $10,000 INVESTMENT SINCE INCEPTION—INVESTOR CLASS
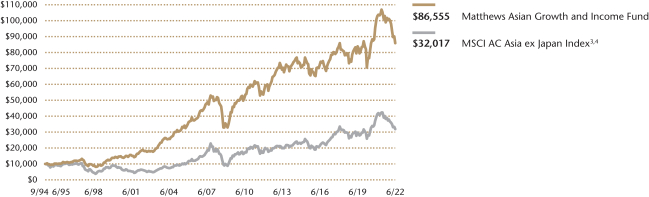
Plotted monthly. The performance data and graph do not reflect the deduction of taxes that a shareholder would pay on dividends, capital gains distributions or redemption of Fund shares. Values are in US$.
| | 3 | It is not possible to invest directly in an index. Source: Index data from Morgan Stanley Capital International and Bloomberg; total return calculations performed by BNY Mellon Investment Servicing (US) Inc. Please see page 84 for index definition. |
| | 4 | Calculated from 8/31/94. |
| | | | | | | | |
| | | | |
| TOP TEN HOLDINGS5 | | | | | | | |
| Name | | Sector | | Country | | % Net Assets | |
| Taiwan Semiconductor Manufacturing Co., Ltd. | | Information Technology | | Taiwan | | | 7.1% | |
| Tencent Holdings, Ltd. | | Communication Services | | China/Hong Kong | | | 5.1% | |
| AIA Group, Ltd. | | Financials | | China/Hong Kong | | | 4.7% | |
| Samsung Electronics Co., Ltd. | | Information Technology | | South Korea | | | 3.2% | |
| JD.com, Inc. | | Consumer Discretionary | | China/Hong Kong | | | 3.1% | |
| Housing Development Finance Corp., Ltd. | | Financials | | India | | | 2.5% | |
| Macquarie Korea Infrastructure Fund | | Financials | | South Korea | | | 2.2% | |
| Inner Mongolia Yili Industrial Group Co., Ltd. | | Consumer Staples | | China/Hong Kong | | | 2.2% | |
| HKT Trust & HKT, Ltd. | | Communication Services | | China/Hong Kong | | | 2.0% | |
| NetEase, Inc. | | Communication Services | | China/Hong Kong | | | 2.0% | |
| % OF ASSETS IN TOP 10 | | | 34.1% | |
| | 5 | Holdings may combine more than one security from same issuer and related depositary receipts. |
Matthews Asian Growth and Income Fund
Portfolio Manager Commentary (unaudited) (continued)
Despite this more defensive posture, the Fund was not left unscathed in the IT sell-off. Taiwan Semiconductor Manufacturing Co. (TSMC) and Samsung Electronics were some of the largest detractors to returns during the half. Both fell on concerns that supply constraints are easing at the same time that demand is softening after the boost in electronics spending following the move to work from home during the pandemic. Fellow semiconductor-related player Leeno Industrial also fell. The South Korean maker of pins and test sockets for the chip industry declined partially as it entered the year at elevated valuations following excellent 2021 results. Additionally, slowing smartphone sales in China are likely to impact demand and cause lower sequential growth in 2022, while higher input costs could hurt margins.
Outside of technology, the greatest detractor to returns came from one of last year’s strongest performers for the Fund, Techtronic Industries. The power tool company experienced concerns that its previously impressive growth numbers would not be sustainable. Higher input costs may hurt margins, floor care demand is weak and rising mortgage costs alongside reopening may hurt DIY demand in the U.S., which is the company’s largest market. We believe that these issues are overstated.
Notable Portfolio Changes:
We added two new positions during the second quarter. The first of these was an investment in a Hansoh Pharmaceutical Group convertible bond. The company is one of the largest pharmaceutical businesses in China with solid positions in multiple therapeutic areas such as central nervous system and oncology. Management has done a robust job in increasingly focusing on innovative drugs and these factors provide it with reasonable cash flow generation to accompany its net cash balance sheet. Despite being a strong credit, the bond offered us an attractive 6.4% yield to put. We also initiated a position in Computer Age Management Services in India. The company is the largest registrar and transfer agent for mutual funds in the country with a strong moat given good relationships with clients demonstrated by a 65% market share domestically. We expect the company to deliver sustainable double-digit growth as mutual fund assets under management grow, supplemented by growth in its non-mutual fund business in alternative investment funds, account aggregation and central recordkeeping. The stock is attractively valued in an Indian context at 35x P/E* and a 1.9% dividend yield.
These were partially funded through exiting a position in LG H&H in South Korea following disappointing earnings results. We remain concerned that the company has an over-reliance on its “Whoo” brand.
Outlook:
A considerable risk remains that the current inflationary shocks get embedded in wage demands, further compounding what some argue to be structural inflation drivers such as energy transition and deglobalization. Walking the tightrope of reducing these inflationary concerns through tighter policy whilst also maintaining full employment is likely to prove challenging and, with this, the probability of a recession or stagflation in the West has grown. This has also set the cost of capital higher across the globe. That said, recent negative price action in commodities given weaker expected demand may ease this path.
For Asia, recession risks are lesser given where most economies are in their business cycles having been relatively slower to recover after reopening, albeit none are immune to the potential of a weakening external demand environment. In China’s case, it is likely better positioned given policy flexibility as inflation is less of an issue. It is expected that some form of stimulus will take place there in order to provide an offset to soft consumption caused by the stop-start nature of a zero-COVID policy and a struggling property market.
At a micro level, valuations for the Asia region are reasonable although not especially cheap at 12.5x P/E* with expectations that are likely to decline from the 11% growth that is currently anticipated. It is our belief that the strategy is well positioned for this potentially volatile macroeconomic backdrop that may exhibit uneven growth. In environments such as this, quality companies with strong cash flow generation, relatively visible earnings growth and some form of income look appealing. The portfolio’s focus on buying such names at reasonable valuations should enable the fund to navigate such choppy waters.
| * | Price to earnings ratio is a valuation ratio of a company’s current share price compared to its per-share earnings. |
| | | | |
| |
| COUNTRY ALLOCATION (%)6,7 | |
| China/Hong Kong | | | 51.5 | |
| Taiwan | | | 10.6 | |
| India | | | 9.5 | |
| South Korea | | | 8.0 | |
| Singapore | | | 6.6 | |
| France | | | 3.3 | |
| Australia | | | 2.4 | |
| Indonesia | | | 1.7 | |
| United States | | | 1.7 | |
| Thailand | | | 1.5 | |
| Philippines | | | 1.3 | |
| Cash and Other Assets, Less Liabilities | | | 2.0 | |
| | | | |
| |
| SECTOR ALLOCATION (%)7 | |
| Information Technology | | | 19.1 | |
| Financials | | | 17.7 | |
| Consumer Discretionary | | | 17.0 | |
| Communication Services | | | 10.5 | |
| Industrials | | | 9.8 | |
| Real Estate | | | 7.8 | |
| Health Care | | | 6.5 | |
| Consumer Staples | | | 5.6 | |
| Utilities | | | 3.1 | |
| Materials | | | 0.8 | |
| Cash and Other Assets, Less Liabilities | | | 2.0 | |
| | | | |
| |
| MARKET CAP EXPOSURE (%)7 | |
| Mega Cap (over $25B) | | | 48.6 | |
| Large Cap ($10B-$25B) | | | 17.2 | |
| Mid Cap ($3B-10B) | | | 23.7 | |
| Small Cap (under $3B) | | | 8.4 | |
| Cash and Other Assets, Less Liabilities | | | 2.0 | |
| | | | |
| |
| ASSET TYPE BREAKDOWN (%)7,8 | |
| Common Equities and ADRs | | | 89.8 | |
| Convertible Corporate Bonds | | | 8.2 | |
| Preferred Equities | | | 0.0 | |
| Cash and Other Assets, Less Liabilities | | | 2.0 | |
| 6 | Not all countries where the Fund may invest are included in the benchmark index. |
| 7 | Source: FactSet Research Systems. Percentage values in data are rounded to the nearest tenth of one percent, so the values may not sum to 100% due to rounding. Country allocations and percentage values may be derived from different data sources and may not be consistent with other Fund literature. |
| 8 | Bonds are not included in the MSCI All Country Asia ex Japan Index. |
| | | | | | | | |
| | | | matthewsasia.com | 800.789.ASIA | | | 61 | |
Matthews Asian Growth and Income Fund
June 30, 2022
Schedule of Investmentsa (unaudited)
COMMON EQUITIES: 89.8%
| | | | | | | | |
| | | Shares | | | Value | |
| | |
| CHINA/HONG KONG: 43.3% | | | | | | | | |
| | |
Tencent Holdings, Ltd. | | | 996,500 | | | | $45,106,719 | |
| | |
AIA Group, Ltd. | | | 3,867,800 | | | | 42,261,786 | |
| | |
JD.com, Inc. A Shares | | | 857,702 | | | | 27,637,766 | |
| | |
Inner Mongolia Yili Industrial Group Co., Ltd. A Shares | | | 3,311,375 | | | | 19,295,542 | |
| | |
HKT Trust & HKT, Ltd. | | | 13,191,000 | | | | 17,716,084 | |
| | |
NetEase, Inc. ADR | | | 189,700 | | | | 17,710,392 | |
| | |
Yum China Holdings, Inc. | | | 355,300 | | | | 17,232,050 | |
| | |
Techtronic Industries Co., Ltd. | | | 1,576,000 | | | | 16,456,834 | |
| | |
Jiangsu Expressway Co., Ltd. H Shares | | | 15,970,000 | | | | 16,110,589 | |
| | |
Wuliangye Yibin Co., Ltd. A Shares | | | 522,874 | | | | 15,812,741 | |
| | |
Midea Group Co., Ltd. A Shares | | | 1,742,930 | | | | 15,779,487 | |
| | |
Link REIT | | | 1,878,800 | | | | 15,352,368 | |
| | |
Zhongsheng Group Holdings, Ltd. | | | 2,122,500 | | | | 14,996,657 | |
| | |
BOC Hong Kong Holdings, Ltd. | | | 3,724,500 | | | | 14,789,903 | |
| | |
NARI Technology Co., Ltd. A Shares | | | 3,641,109 | | | | 14,737,394 | |
| | |
ENN Natural Gas Co., Ltd. A Shares | | | 5,146,377 | | | | 14,316,408 | |
| | |
CK Hutchison Holdings, Ltd. | | | 2,044,172 | | | | 13,867,665 | |
| | |
Topsports International Holdings, Ltd.b,c | | | 14,911,000 | | | | 13,579,676 | |
| | |
Guangdong Investment, Ltd. | | | 12,798,000 | | | | 13,527,896 | |
| | |
CIFI Ever Sunshine Services Group, Ltd.c | | | 8,454,000 | | | | 10,837,345 | |
| | |
Minth Group, Ltd. | | | 3,254,000 | | | | 8,915,588 | |
| | | | | | | | |
Total China/Hong Kong | | | | | | | 386,040,890 | |
| | | | | | | | |
| | | | | | | | |
| | | |
| TAIWAN: 10.5% | | | | | | | | |
| | |
Taiwan Semiconductor Manufacturing Co., Ltd. | | | 3,950,187 | | | | 63,307,090 | |
| | |
Advantech Co., Ltd. | | | 1,369,884 | | | | 15,941,760 | |
| | |
Chailease Holding Co., Ltd.d | | | 2,267,160 | | | | 14,944,872 | |
| | | | | | | | |
Total Taiwan | | | | | | | 94,193,722 | |
| | | | | | | | |
| | | | | | | | |
| | | |
| INDIA: 9.5% | | | | | | | | |
| | |
Housing Development Finance Corp., Ltd. | | | 804,587 | | | | 22,260,278 | |
| | |
Tata Consultancy Services, Ltd. | | | 386,051 | | | | 16,031,502 | |
| | |
Sanofi India, Ltd. | | | 162,854 | | | | 13,293,762 | |
| | |
Crompton Greaves Consumer Electricals, Ltd. | | | 3,057,055 | | | | 13,182,151 | |
| | |
Computer Age Management Services, Ltd. | | | 377,708 | | | | 10,839,196 | |
| | |
Embassy Office Parks, REIT | | | 1,990,600 | | | | 9,443,756 | |
| | | | | | | | |
Total India | | | | | | | 85,050,645 | |
| | | | | | | | |
| | | | | | | | |
| | | |
| SOUTH KOREA: 8.0% | | | | | | | | |
| | |
Samsung Electronics Co., Ltd. | | | 641,948 | | | | 28,314,631 | |
| | |
Macquarie Korea Infrastructure Fund | | | 2,054,184 | | | | 19,774,048 | |
| | |
Coway Co., Ltd. | | | 241,563 | | | | 11,951,816 | |
| | |
LEENO Industrial, Inc. | | | 112,250 | | | | 11,260,454 | |
| | | | | | | | |
Total South Korea | | | | | | | 71,300,949 | |
| | | | | | | | |
| | | | | | | | |
| | | |
| SINGAPORE: 6.6% | | | | | | | | |
| | |
Ascendas, REIT | | | 8,439,884 | | | | 17,321,579 | |
| | |
United Overseas Bank, Ltd. | | | 902,200 | | | | 17,044,483 | |
| | |
Singapore Technologies Engineering, Ltd. | | | 4,889,725 | | | | 14,394,456 | |
| | |
Venture Corp., Ltd. | | | 825,500 | | | | 9,888,245 | |
| | | | | | | | |
Total Singapore | | | | | | | 58,648,763 | |
| | | | | | | | |
| | | | | | | | |
| | | | | | | | |
| | | Shares | | | Value | |
| | |
| FRANCE: 3.3% | | | | | | | | |
| | |
LVMH Moet Hennessy Louis Vuitton SE | | | 24,172 | | | | $14,814,488 | |
| | |
Pernod Ricard SA | | | 79,688 | | | | 14,732,303 | |
| | | | | | | | |
Total France | | | | | | | 29,546,791 | |
| | | | | | | | |
| | | | | | | | |
| | | |
| AUSTRALIA: 2.4% | | | | | | | | |
| | |
Aristocrat Leisure, Ltd. | | | 579,666 | | | | 13,787,953 | |
| | |
Northern Star Resources, Ltd. | | | 1,580,128 | | | | 7,411,918 | |
| | | | | | | | |
Total Australia | | | | | | | 21,199,871 | |
| | | | | | | | |
| | | | | | | | |
| | | |
| INDONESIA: 1.7% | | | | | | | | |
| | |
PT Bank Rakyat Indonesia Persero | | | 55,682,872 | | | | 15,550,321 | |
| | | | | | | | |
Total Indonesia | | | | | | | 15,550,321 | |
| | | | | | | | |
| | | | | | | | |
| | | |
| UNITED STATES: 1.7% | | | | | | | | |
| | |
Broadcom, Inc. | | | 30,800 | | | | 14,962,948 | |
| | | | | | | | |
Total United States | | | | | | | 14,962,948 | |
| | | | | | | | |
| | | | | | | | |
| | | |
| THAILAND: 1.5% | | | | | | | | |
| | |
Digital Telecommunications Infrastructure Fund F Shares | | | 35,055,000 | | | | 13,286,296 | |
| | | | | | | | |
Total Thailand | | | | | | | 13,286,296 | |
| | | | | | | | |
| | | | | | | | |
| | | |
| PHILIPPINES: 1.3% | | | | | | | | |
| | |
Bank of the Philippine Islands | | | 7,495,594 | | | | 11,560,858 | |
| | | | | | | | |
Total Philippines | | | | | | | 11,560,858 | |
| | | | | | | | |
| | | | | | | | |
| | | |
| TOTAL COMMON EQUITIES | | | | | | | 801,342,054 | |
| | | | | | | | |
(Cost $752,877,383) | | | | | | | | |
| | | | | | | | |
| | | | | | | | |
| |
CONVERTIBLE CORPORATE BONDS: 8.2% | | | | | |
| | | Face Amount* | | | Value | |
| | | |
| CHINA/HONG KONG: 8.2% | | | | | | | | |
ESR Group, Ltd., Cnv.
1.500%, 09/30/25c | | | 17,657,000 | | | | 16,721,179 | |
Pharmaron Beijing Co., Ltd., Cnv.
0.000%, 06/18/26c | | | 18,800,000 | | | | 16,647,400 | |
Luye Pharma Group, Ltd., Cnv.
1.500%, 07/09/24c | | | 15,770,000 | | | | 15,737,672 | |
Hansoh Pharmaceutical Group Co., Ltd., Cnv. 0.000%, 01/22/26c | | | 13,654,000 | | | | 12,329,562 | |
| |
China Conch Venture Holdings International, Ltd., Cnv. | | | | | |
0.000%, 09/05/23c | | HKD | 88,000,000 | | | | 11,887,648 | |
| | | | | | | | |
Total China/Hong Kong | | | | | | | 73,323,461 | |
| | | | | | | | |
| | | | | | | | |
| | |
| TOTAL CONVERTIBLE CORPORATE BONDS | | | | 73,323,461 | |
| | | | | | | | |
(Cost $79,755,332) | | | | | | | | |
| | | | | | | | |
| | | |
| TOTAL INVESTMENTS: 98.0% | | | | | | | 874,665,515 | |
(Cost $832,632,715) | | | | | | | | |
| | | | | | | | |
| | |
CASH AND OTHER ASSETS,
LESS LIABILITIES: 2.0% | | | | | | | 17,576,853 | |
| | | | | | | | |
| | |
NET ASSETS: 100.0% | | | | | | | $892,242,368 | |
| | | | | | | | |
Matthews Asian Growth and Income Fund
June 30, 2022
Schedule of Investmentsa (unaudited) (continued)
| a | Certain securities were fair valued under the valuation policies approved by the Board of Trustees (Note 2-A). |
| b | Security exempt from registration under Rule 144A of the Securities Act of 1933, as amended. The security may be resold in transactions exempt from registration normally to qualified institutional buyers. The security has been determined to be liquid in accordance with procedures adopted by the Funds’ Board of Trustees. At June 30, 2022, the aggregate value is $13,579,676, which is 1.52% of net assets. |
| c | The securities may be resold to qualified foreign investors and foreign institutional buyers under Regulation S of the Securities Act of 1933. |
| d | Security is valued using significant unobservable inputs and is classified as Level 3 in the fair value hierarchy. The aggregate value of Level 3 security is $14,944,872 and 1.67% of net assets. |
| * | All Values in USD unless otherwise specified. |
| ADR | American Depositary Receipt |
| REIT | Real Estate Investment Trust |
See accompanying notes to financial statements.
| | | | | | | | |
| | | | matthewsasia.com | 800.789.ASIA | | | 63 | |
| | | | |
| PORTFOLIO MANAGERS |
| | |
| Yu Zhang, CFA | | | | S. Joyce Li, CFA |
Lead Manager | | | | Lead Manager |
| |
| Robert Horrocks, PhD | | Sherwood Zhang, CFA |
Co-Manager | | Co-Manager |
| | | | |
|
| FUND FACTS |
| | |
| | | Investor | | Institutional |
Ticker | | MAPIX | | MIPIX |
CUSIP | | 577125107 | | 577130750 |
Inception | | 10/31/06 | | 10/29/10 |
NAV | | $14.32 | | $14.32 |
Initial Investment | | $2,500 | | $100,000 |
Gross Expense Ratio1 | | 1.03% | | 0.92% |
After Fee Waiver and Reimbursement2 | | 1.02% | | 0.91% |
Portfolio Statistics |
Total # of Positions | | 56 |
Net Assets | | $2.9 billion |
Weighted Average Market Cap | | $61.5 billion |
Portfolio Turnover3 | | 47.4% |
Benchmark | | | | |
MSCI AC Asia Pacific Index |
OBJECTIVE
Total return with an emphasis on providing current income.
STRATEGY
Under normal market conditions, the Fund seeks to achieve its investment objective by investing at least 80% of its net assets, which include borrowings for investment purposes, in dividend-paying equity securities of companies located in Asia. Asia consists of all countries and markets in Asia, and includes developed, emerging and frontier countries and markets in the Asian region. The Fund may also invest in convertible debt and equity securities of companies located in Asia.
Matthews Asia Dividend Fund
Portfolio Manager Commentary (unaudited)
For the first half of 2022, the Matthews Asia Dividend Fund returned –23.97% (Investor Class) and
–23.92% (Institutional Class), while its benchmark, the MSCI All Country Asia Pacific Index, returned –16.99% over the same period. For the quarter ending June 30, 2022, the Fund returned –10.11% (Investor Class) and –10.09% (Institutional Class), while the benchmark returned –11.78%.
Market Environment:
During the first half of 2022, a more hawkish policy stance adopted by the U.S. Fed and the European Central Bank has raise the specter of a potential hard landing, and global equity markets including Asia have reacted negatively. MSCI AC Asia Pacific Index returned –17%, with the worst performance coming from markets with higher sensitivity to U.S. and Europe economies, including Japan, South Korea and Taiwan. Indonesia was the only market in the Index that managed to stay flattish during the six months. The country enjoys fiscal and economic tailwinds from robust commodity prices and reopening of its economy from COVID lockdowns.
After a decline of 14% in the first quarter due to the Shanghai lockdown and perceived risk contagion from the Russia/Ukraine conflict, China outperformed global equity markets and gained 2.3% in the second quarter. Market confidence on corporate earnings and consumption growth in the medium term was boosted by a series of economic stimulus announcements and the government’s pivot towards a more pragmatic approach with its COVID measures.
Performance Contributors and Detractors:
From a country perspective, our stock selection in Japan and China detracted from relative performance during the first half of 2022. Dividend growth holdings in Japan were hurt by worries that inflation and potential economic recession in developed countries might impact the medium-term growth outlook. Our holdings in China rebounded in the second quarter from their steep sell-off earlier in the year, after China reoriented its policies towards restoring growth, by fine tuning its COVID measures and announcing a series of stimulus. On the other hand, our stock selection in South Korea and Singapore contributed positively in the first half.
From a sector perspective, poor stock selection in the consumer discretionary sector detracted the most from relative performance. Our portfolio’s holdings exposed to discretionary consumer goods sold in developed countries were hurt by weak consumer sentiment. Additionally, holdings in auto parts companies were weighed down by the supply chain disruptions and sharp commodity price spike since the Russia/Ukraine conflict. Conversely, an underweight allocation and stock selection within information technology contributed the most to the relative performance.
Turning to individual stocks, Breville Group, a premium household appliance manufacturer headquartered in Australia, was one of the largest detractors to performance in the period. The company experienced a sharp pull-back in share performance recently due to concerns on weakening consumption outlook in North America and Europe. We believe the company is now attractively priced at below 14x forward EV/EBITDA (Enterprise Value over Earnings Before Interest, Taxes, Depreciation and Amortization) with its motivated management team, attractive product innovation and continued market share gains over the long term. On the positive side, our holding in BOC Aviation, a leading player in the global aircraft
(continued)
| 1 | Prospectus expense ratios. |
| 2 | Matthews has contractually agreed to waive a portion of its advisory fee and administrative and shareholder services fee if the Fund’s average daily net assets are over $3 billion, as follows: for every $2.5 billion average daily net assets of the Fund that are over $3 billion, the advisory fee rate and the administrative and shareholder services fee rate for the Fund with respect to such excess average daily net assets will be each reduced by 0.01%, in each case without reducing such fee rate below 0.00%. Any amount waived by Matthews pursuant to this agreement may not be recouped by Matthews. This agreement will remain in place until April 30, 2023 and may be terminated (i) at any time by the Board of Trustees upon 60 days’ prior written notice to Matthews; or (ii) by Matthews at the annual expiration date of the agreement upon 60 days’ prior written notice to the Trust, in each case without payment of any penalty. |
| 3 | The lesser of fiscal year 2021 long-term purchase costs or sales proceeds divided by the average monthly market value of long-term securities. |
| | | | | | | | | | | | | | | | | | | | | | | | | | | | | | | | |
| |
| PERFORMANCE AS OF JUNE 30, 2022 | |
| | | | | | | | | | | | Average Annual Total Returns | | | | |
| | | 3 Months | | | YTD | | | 1 Year | | | 3 Years | | | 5 Years | | | 10 Years | | | Since
Inception | | | Inception
Date | |
| Investor Class (MAPIX) | | | -10.11% | | | | -23.97% | | | | -27.97% | | | | 0.62% | | | | 1.26% | | | | 5.45% | | | | 6.90% | | | | 10/31/06 | |
| Institutional Class (MIPIX) | | | -10.09% | | | | -23.92% | | | | -27.86% | | | | 0.75% | | | | 1.38% | | | | 5.58% | | | | 4.84% | | | | 10/29/10 | |
| MSCI AC Asia Pacific Index4 | | | -11.78% | | | | -16.99% | | | | -21.99% | | | | 2.13% | | | | 3.11% | | | | 5.81% | | | | 3.84% | 5 | | | | |
Performance assumes reinvestment of all dividends and/or distributions before taxes. All performance quoted represents past performance and is no guarantee of future results. Investment return and principal value will fluctuate with market conditions so that when redeemed, shares may be worth more or less than their original cost. Current performance may be lower or higher than the return figures quoted. Returns would have been lower if certain of the Fund’s fees and expenses had not been waived. For the Fund’s most recent month-end performance, visit matthewsasia.com.
| | | | | | | | | | | | | | | | | | | | | | | | | | | | | | | | | | | | | | | | | | | | |
| | | | | | | | | | |
| INCOME DISTRIBUTION HISTORY | | | | | | | | | | | | | | | | | | | | | | | | | | | | |
| | | 2022 | | | | | | 2021 | |
| | | Q1 | | | Q2 | | | Q3 | | | Q4 | | | Total | | | | | | Q1 | | | Q2 | | | Q3 | | | Q4 | | | Total | |
| Investor (MAPIX) | | $ | 0.05 | | | $ | 0.04 | | | | n.a. | | | | n.a. | | | | n.a. | | | | | | | $ | 0.08 | | | $ | 0.04 | | | $ | 0.05 | | | $ | 0.02 | | | $ | 0.19 | |
| Inst’l (MIPIX) | | $ | 0.06 | | | $ | 0.04 | | | | n.a. | | | | n.a. | | | | n.a. | | | | | | | $ | 0.08 | | | $ | 0.05 | | | $ | 0.06 | | | $ | 0.02 | | | $ | 0.22 | |
Note: This table does not include capital gains distributions. Totals may differ by $0.02 due to rounding and a return of capital. For distribution history please visit matthewsasia.com.
| | | | |
| | | |
30-DAY YIELD: Investor Class: 1.06% (1.06% excluding waivers) Institutional Class: 1.14% (1.14% excluding waivers) The 30-Day Yield represents net investment income earned by the Fund over the 30-day period ended 6/30/22, expressed as an annual percentage rate based on the Fund’s share price at the end of the 30-day period. The 30-Day Yield should be regarded as an estimate of the Fund’s rate of investment income, and it may not equal the Fund’s actual income distribution rate. Source: BNY Mellon Investment Servicing (US) Inc. | | | | DIVIDEND YIELD: 2.17% The dividend yield (trailing) for the portfolio is the weighted average sum of the dividends paid by each equity security held by the Fund over the 12 months ended 6/30/22 divided by the current price of each equity as of 6/30/22. The annualized dividend yield for the Fund is for the equity-only portion of the portfolio. Please note that this is based on gross equity portfolio holdings and does not reflect the actual yield an investor in the Fund would receive. Past yields are no guarantee of future yields. Source: FactSet Research Systems, Bloomberg, MICM. |
GROWTH OF A HYPOTHETICAL $10,000 INVESTMENT SINCE INCEPTION—INVESTOR CLASS

Plotted monthly. The performance data and graph do not reflect the deduction of taxes that a shareholder would pay on dividends, capital gains distributions or redemption of Fund shares. Values are in US$.
| | 4 | It is not possible to invest directly in an index. Source: Index data from Morgan Stanley Capital International and Bloomberg; total return calculations performed by BNY Mellon Investment Servicing (US) Inc. Please see page 84 for index definition. |
| | 5 | Calculated from 10/31/06. |
| | | | | | | | |
| | | | |
| TOP TEN HOLDINGS6 | | | | | | | |
| Name | | Sector | | Country | | % Net Assets | |
| Minth Group, Ltd. | | Consumer Discretionary | | China/Hong Kong | | | 5.1% | |
| Minda Industries, Ltd. | | Consumer Discretionary | | India | | | 4.3% | |
| Tencent Holdings, Ltd. | | Communication Services | | China/Hong Kong | | | 4.0% | |
| Taiwan Semiconductor Manufacturing Co., Ltd. | | Information Technology | | Taiwan | | | 3.2% | |
| Pharmaron Beijing Co., Ltd. | | Health Care | | China/Hong Kong | | | 2.9% | |
| Baidu, Inc. | | Communication Services | | China/Hong Kong | | | 2.6% | |
| KATITAS Co., Ltd. | | Real Estate | | Japan | | | 2.6% | |
| FPT Corp. | | Information Technology | | Vietnam | | | 2.4% | |
| Breville Group, Ltd. | | Consumer Discretionary | | Australia | | | 2.4% | |
| Asia Commercial Bank JSC | | Financials | | Vietnam | | | 2.4% | |
| % OF ASSETS IN TOP 10 | | | 31.9% | |
| | 6 | Holdings may combine more than one security from same issuer and related depositary receipts. |
| | | | | | | | |
| | | | matthewsasia.com | 800.789.ASIA | | | 65 | |
| | | | |
| |
| COUNTRY ALLOCATION (%)7,8 | |
| China/Hong Kong | | | 31.1 | |
| Japan | | | 23.1 | |
| Vietnam | | | 10.5 | |
| Australia | | | 7.8 | |
| Singapore | | | 4.7 | |
| India | | | 4.5 | |
| Taiwan | | | 4.2 | |
| Indonesia | | | 2.1 | |
| Thailand | | | 1.8 | |
| Philippines | | | 1.8 | |
| South Korea | | | 1.5 | |
| Bangladesh | | | 1.4 | |
| Cash and Other Assets, Less Liabilities | | | 5.6 | |
| | | | |
| SECTOR ALLOCATION (%)8 | |
| Consumer Discretionary | | | 27.3 | |
| Communication Services | | | 12.4 | |
| Financials | | | 11.6 | |
| Industrials | | | 10.5 | |
| Information Technology | | | 9.0 | |
| Health Care | | | 7.5 | |
| Real Estate | | | 7.1 | |
| Consumer Staples | | | 4.8 | |
| Materials | | | 3.1 | |
| Energy | | | 1.0 | |
| Cash and Other Assets, Less Liabilities | | | 5.6 | |
| | | | |
| MARKET CAP EXPOSURE (%)8 | |
| Mega Cap (over $25B) | | | 35.9 | |
| Large Cap ($10B-$25B) | | | 14.4 | |
| Mid Cap ($3B-10B) | | | 33.2 | |
| Small Cap (under $3B) | | | 10.9 | |
| Cash and Other Assets, Less Liabilities | | | 5.6 | |
| 7 | Not all countries where the Fund may invest are included in the benchmark index. |
| 8 | Source: FactSet Research Systems. Percentage values in data are rounded to the nearest tenth of one percent, so the values may not sum to 100% due to rounding. Country allocations and percentage values may be derived from different data sources and may not be consistent with other Fund literature. |
Matthews Asia Dividend Fund
Portfolio Manager Commentary (unaudited) (continued)
operating leasing market, was the top contributor to performance. The company demonstrated its top-tier management quality and capital resilience over the past few years and is well positioned for the industry recovery ahead.
Notable Portfolio Changes:
During the reporting period, we increased our allocation to companies that benefited from the change in interest rate regime and companies with exposure to re-opening in most Asian economies. We took advantage of the sell-off in China to add to high-quality growth holdings with attractive valuation. For instance, we initiated positions in a few Chinese internet stocks, namely Netease (a global mobile and PC gaming franchise), JD.com (a leading Chinese e-commerce player) and Alibaba Group (the largest e-commerce platform in China with enterprise services such as cloud computing). We observed major headwinds including regulations and excessive earnings expectation that caused the severe de-rating on these stocks started to abate. With more disciplined investment plans compared to the past, the large Chinese internet companies are increasingly generating abundant positive free cash flow, and their balance sheet is flushed with high level of net cash. A few of them started conducting large share buybacks and/or paying dividends for the first time, sending an interesting signal underscoring the value in those businesses. We believe the risk/reward profile on Chinese internet stocks now looks attractive.
On the flip side, as the impact from an aggressive U.S. monetary tightening on the global economy remains quite uncertain, the portfolio exited several positions whose underlying businesses are more sensitive towards the global consumer demand situation and commodity prices. Those included Shiseido (a cosmetics company in Japan), Posco (a steel maker in South Korea), and Anritsu (a mobile device-testing equipment maker in Japan).
Outlook:
The overall global growth outlook remains murky with risks of protracted inflation and tight global liquidity amid weak economic growth. However, it is worth noting that wage inflation in most Asian countries remains quite moderate and commodity cost pressure has started to soften as well, allowing more accommodative monetary policies in these Asian countries than their developed market counterparts.
In particular, Chinese fiscal and monetary support combined with more lenient zero-COVID policy implementation recently provided a positive catalyst for investors to refocus on long-term bottom-up corporate fundamentals for investment opportunities in the market. Admittedly, any major resurgence of COVID and resulting economic weakness in China will prolong the restoration of consumer confidence and delay corporate capital investments.
In this environment, the Fund’s focus remains steadfast—looking for businesses with a strong ability to fend off inflation cost pressures and maintain their earnings and dividend growth outlook.
Matthews Asia Dividend Fund
June 30, 2022
Schedule of Investmentsa (unaudited)
COMMON EQUITIES: 92.9%
| | | | | | | | |
| | | Shares | | | Value | |
| | | |
| CHINA/HONG KONG: 31.0% | | | | | | | | |
Minth Group, Ltd. | | | 54,275,000 | | | | $148,707,295 | |
| | |
Tencent Holdings, Ltd. | | | 2,608,300 | | | | 118,065,083 | |
| | |
Baidu, Inc. A Sharesb | | | 4,043,050 | | | | 76,588,279 | |
| | |
Pharmaron Beijing Co., Ltd. A Shares | | | 4,613,396 | | | | 65,678,123 | |
| | |
China Tourism Group Duty Free Corp., Ltd. A Shares | | | 1,759,105 | | | | 61,343,235 | |
| | |
JD.com, Inc. A Shares | | | 1,623,033 | | | | 52,299,058 | |
| | |
Beijing-Shanghai High Speed Railway Co., Ltd. A Shares | | | 68,208,970 | | | | 51,224,926 | |
| | |
Alibaba Group Holding, Ltd.b | | | 3,455,400 | | | | 49,292,640 | |
| | |
OPT Machine Vision Tech Co., Ltd. A Shares | | | 1,274,340 | | | | 49,239,339 | |
| | |
AIA Group, Ltd. | | | 4,491,200 | | | | 49,073,410 | |
| | |
Inner Mongolia Yili Industrial Group Co., Ltd. A Shares | | | 7,765,022 | | | | 45,247,157 | |
| | |
NetEase, Inc. | | | 2,304,900 | | | | 43,423,175 | |
| | |
Yuexiu Transport Infrastructure, Ltd. | | | 71,340,000 | | | | 41,245,217 | |
| | |
Link REIT | | | 4,626,100 | | | | 37,801,570 | |
| | |
Pharmaron Beijing Co., Ltd. H Sharesc,d | | | 2,005,500 | | | | 20,144,067 | |
| | | | | | | | |
Total China/Hong Kong | | | | | | | 909,372,574 | |
| | | | | | | | |
| | | | | | | | |
| | | |
| JAPAN: 23.1% | | | | | | | | |
| | |
KATITAS Co., Ltd. | | | 3,539,200 | | | | 76,525,043 | |
| | |
Olympus Corp. | | | 2,916,500 | | | | 59,103,437 | |
| | |
Oriental Land Co., Ltd. | | | 396,900 | | | | 55,427,855 | |
| | |
Toyota Motor Corp. | | | 3,533,000 | | | | 54,511,737 | |
| | |
Dai-ichi Life Holdings, Inc. | | | 2,861,800 | | | | 52,930,108 | |
| | |
MISUMI Group, Inc. | | | 2,083,300 | | | | 43,998,215 | |
| | |
Food & Life Cos., Ltd. | | | 1,873,200 | | | | 40,187,802 | |
| | |
Bandai Namco Holdings, Inc. | | | 552,100 | | | | 38,974,380 | |
| | |
AGC, Inc. | | | 1,094,600 | | | | 38,461,709 | |
| | |
Ajinomoto Co., Inc. | | | 1,498,500 | | | | 36,541,838 | |
| | |
Recruit Holdings Co., Ltd. | | | 1,174,200 | | | | 34,580,711 | |
| | |
Nintendo Co., Ltd. | | | 75,200 | | | | 32,340,246 | |
| | |
Japan Steel Works, Ltd. | | | 1,305,300 | | | | 28,428,006 | |
| | |
Rakus Co., Ltd. | | | 2,240,600 | | | | 26,745,940 | |
| | |
Disco Corp. | | | 110,100 | | | | 26,199,599 | |
| | |
Hoya Corp. | | | 273,900 | | | | 23,441,168 | |
| | |
IHI Corp. | | | 322,900 | | | | 8,626,049 | |
| | | | | | | | |
Total Japan | | | | | | | 677,023,843 | |
| | | | | | | | |
| | | | | | | | |
| | | |
| VIETNAM: 10.5% | | | | | | | | |
| | |
FPT Corp. | | | 18,817,540 | | | | 69,803,400 | |
| | |
Asia Commercial Bank JSCb | | | 67,132,287 | | | | 69,355,016 | |
| | |
Vinhomes JSCc,d | | | 21,913,710 | | | | 58,567,145 | |
| | |
Hoa Phat Group JSC | | | 49,904,367 | | | | 47,830,136 | |
| | |
Mobile World Investment Corp. | | | 14,459,800 | | | | 44,476,022 | |
| | |
Vietnam Dairy Products JSC | | | 5,657,700 | | | | 17,565,037 | |
| | | | | | | | |
Total Vietnam | | | | | | | 307,596,756 | |
| | | | | | | | |
| | | | | | | | |
| | | |
| AUSTRALIA: 7.8% | | | | | | | | |
| | |
Breville Group, Ltd. | | | 5,610,152 | | | | 69,623,682 | |
| | |
IDP Education, Ltd. | | | 3,682,140 | | | | 60,295,521 | |
| | |
Treasury Wine Estates, Ltd. | | | 5,121,354 | | | | 40,162,708 | |
| | |
Worley, Ltd. | | | 3,086,152 | | | | 30,429,447 | |
| | |
QBE Insurance Group, Ltd. | | | 3,509,255 | | | | 29,487,829 | |
| | | | | | | | |
Total Australia | | | | | | | 229,999,187 | |
| | | | | | | | |
| | | | | | | | |
| | | | | | | | |
| | | Shares | | | Value | |
| | | |
| SINGAPORE: 4.7% | | | | | | | | |
| | |
BOC Aviation, Ltd.c,d | | | 7,182,700 | | | | $60,726,985 | |
| | |
United Overseas Bank, Ltd. | | | 2,171,300 | | | | 41,020,491 | |
| | |
Ascendas India Trust | | | 42,499,300 | | | | 35,815,136 | |
| | | | | | | | |
Total Singapore | | | | | | | 137,562,612 | |
| | | | | | | | |
| | | | | | | | |
| | | |
| INDIA: 4.5% | | | | | | | | |
| | |
Minda Industries, Ltd. | | | 10,678,217 | | | | 125,326,896 | |
| | |
ICICI Bank, Ltd. | | | 889,646 | | | | 7,992,511 | |
| | | | | | | | |
Total India | | | | | | | 133,319,407 | |
| | | | | | | | |
| | | | | | | | |
| | | |
| TAIWAN: 4.2% | | | | | | | | |
| | |
Taiwan Semiconductor Manufacturing Co., Ltd. | | | 3,146,469 | | | | 50,426,421 | |
| | |
Taiwan Semiconductor Manufacturing Co., Ltd. ADR | | | 513,640 | | | | 41,990,070 | |
| | |
CTBC Financial Holding Co., Ltd. | | | 35,704,000 | | | | 30,200,272 | |
| | | | | | | | |
Total Taiwan | | | | | | | 122,616,763 | |
| | | | | | | | |
| | | | | | | | |
| | | |
| INDONESIA: 2.1% | | | | | | | | |
| | |
PT Bank Rakyat Indonesia Persero | | | 219,999,584 | | | | 61,438,358 | |
| | | | | | | | |
Total Indonesia | | | | | | | 61,438,358 | |
| | | | | | | | |
| | | | | | | | |
| | | |
| PHILIPPINES: 1.8% | | | | | | | | |
| | |
Globe Telecom, Inc. | | | 1,276,215 | | | | 52,669,991 | |
| | | | | | | | |
Total Philippines | | | | | | | 52,669,991 | |
| | | | | | | | |
| | | | | | | | |
| | | |
| THAILAND: 1.8% | | | | | | | | |
| | |
Bangkok Dusit Medical Services Public Co., Ltd. F Shares | | | 73,384,700 | | | | 51,941,755 | |
| | | | | | | | |
Total Thailand | | | | | | | 51,941,755 | |
| | | | | | | | |
| | | | | | | | |
| | | |
| BANGLADESH: 1.4% | | | | | | | | |
| | |
GrameenPhone, Ltd. | | | 12,893,915 | | | | 40,568,070 | |
| | | | | | | | |
Total Bangladesh | | | | | | | 40,568,070 | |
| | | | | | | | |
| | | | | | | | |
| | | |
| TOTAL COMMON EQUITIES | | | | | | | 2,724,109,316 | |
| | | | | | | | |
(Cost $2,765,724,331) | | | | | | | | |
| | | | | | | | |
| | |
PREFERRED EQUITIES: 1.5% | | | | | | | | |
| | | |
| SOUTH KOREA: 1.5% | | | | | | | | |
LG Chem, Ltd., Pfd. | | | 230,575 | | | | 42,699,245 | |
| | | | | | | | |
Total South Korea | | | | | | | 42,699,245 | |
| | | | | | | | |
| | | | | | | | |
| | | |
| TOTAL PREFERRED EQUITIES | | | | | | | 42,699,245 | |
| | | | | | | | |
(Cost $28,739,064) | | | | | | | | |
| | | | | | | | |
| | | |
| TOTAL INVESTMENTS: 94.4% | | | | | | | 2,766,808,561 | |
(Cost $2,794,463,395) | | | | | | | | |
| | | | | | | | |
| | |
CASH AND OTHER ASSETS,
LESS LIABILITIES: 5.6% | | | | | | | 164,569,837 | |
| | | | | | | | |
| | |
NET ASSETS: 100.0% | | | | | | | $2,931,378,398 | |
| | | | | | | | |
| | | | | | | | |
| | | | matthewsasia.com | 800.789.ASIA | | | 67 | |
Matthews Asia Dividend Fund
June 30, 2022
Schedule of Investmentsa (unaudited) (continued)
| a | Certain securities were fair valued under the valuation policies approved by the Board of Trustees (Note 2-A). |
| b | Non-income producing security. |
| c | Security exempt from registration under Rule 144A of the Securities Act of 1933, as amended. The security may be resold in transactions exempt from registration normally to qualified institutional buyers. The security has been determined to be liquid in accordance with procedures adopted by the Funds’ Board of Trustees. At June 30, 2022, the aggregate value is $139,438,197, which is 4.76% of net assets. |
| d | The securities may be resold to qualified foreign investors and foreign institutional buyers under Regulation S of the Securities Act of 1933. |
| ADR | American Depositary Receipt |
| REIT | Real Estate Investment Trust |
See accompanying notes to financial statements.
| | | | |
| PORTFOLIO MANAGERS |
| |
| Sherwood Zhang, CFA | | |
Lead Manager | | | | |
| |
| Yu Zhang, CFA | | S. Joyce Li, CFA |
Co-Manager | | Co-Manager |
| | |
| FUND FACTS | | | | |
| | |
| | | Investor | | Institutional |
Ticker | | MCDFX | | MICDX |
CUSIP | | 577125305 | | 577130735 |
Inception | | 11/30/09 | | 10/29/10 |
NAV | | $14.87 | | $14.87 |
Initial Investment | | $2,500 | | $100,000 |
Gross Expense Ratio1 | | 1.12% | | 0.97% |
Portfolio Statistics | | |
Total # of Positions | | 39 |
Net Assets | | $273.4 million |
Weighted Average Market Cap | | $70.0 billion |
Portfolio Turnover2 | | 68.3% |
Benchmark | | | | |
MSCI China Index |
OBJECTIVE
Total return with an emphasis on providing current income.
STRATEGY
Under normal market conditions, the Fund seeks to achieve its investment objective by investing at least 80% of its net assets, which include borrowings for investment purposes, in dividend-paying equity securities of companies located in China. China includes its administrative and other districts, such as Hong Kong. The Fund may also invest in convertible debt and equity securities of companies located in China.
Matthews China Dividend Fund
Portfolio Manager Commentary (unaudited)
For the first half of 2022, the Matthews China Dividend Fund returned –13.78% (Investor Class) and
–13.68% (Institutional Class), while its benchmark, the MSCI China Index, returned –11.19% over the same period. For the quarter ending June 30, 2022, the Fund returned 3.22% (Investor Class) and 3.28% (Institutional Class), while the benchmark returned 3.50%.
Market Environment:
Many events have shaped the global equity markets in the first half of the year: the Russia-Ukraine war and the resulting higher oil price; higher inflation globally; and the interest rate decisions of the U.S. Federal Reserve. Chinese equities markets, however, both onshore and offshore, have traded very much in tandem with China’s approach to managing the COVID virus. Earlier in the year, when investors had the impression that China might gradually phase out its strict COVID policy, Chinese equities enjoyed a small rally. Then Shanghai entered a prolonged, strict lockdown and that drove markets into free fall.
When President Xi Jinping reiterated China’s economic growth target at the BRICS Summit in late June, Chinese equities staged a strong rally from the bottom. In addition, there was speculation that the Chinese government might push more favorable policies toward the Hong Kong market in celebration of the island’s 25th anniversary of returning to China.
Outside of China, the Fed aggressively raised rates by 75 basis points (0.75%) in June due to persistent inflation pressure and many Asian currencies have depreciated as a result, particularly the Japanese yen. While the Chinese yuan also saw depreciation against the U.S. dollar, it has remained very strong against other currencies. These currency dynamics could become a headwind for China’s exports down the road.
Performance Contributors and Detractors:
During the first half of the year, the Fund’s underweight in the consumer discretionary sector and our stock selection was the biggest detractor to relative performance. Our stock selection in the energy sector was the second-largest detractor. Many oil and coal companies performed well during the first half while our single energy holding, China Suntien Green Energy, a gas pipeline and wind power operator, suffered from low utilization rates due to reduced industrial activities. On the flip side, our stock selection in the information technology (IT) sector was the biggest contributor to performance in the first half.
At the individual stock level, Yangzijiang Shipbuilding was the biggest contributor to performance during the first six months of 2022. The company has fulfilled its promise to investors to separately list its financial investments business and continues to win new vessel orders with more complex technical requirements and higher margins. Yadea Group, a leading e-motorcycle maker, was the second-largest contributor as the company bounced back after giving the market fairly bullish guidance as it seeks to invest and take share in overseas markets. Bank of China (Hong Kong) was also a top contributor as the market expects the lender to benefit from Hong Kong’s rising interest rate, which is tied closely to the Fed’s, and from better credit demand due to post-pandemic recovery.
(continued)
| 1 | Prospectus expense ratios. |
| 2 | The lesser of fiscal year 2021 long-term purchase costs or sales proceeds divided by the average monthly market value of long-term securities. |
| | | | | | | | |
| | | | matthewsasia.com | 800.789.ASIA | | | 69 | |
| | | | | | | | | | | | | | | | | | | | | | | | | | | | | | | | |
| |
| PERFORMANCE AS OF JUNE 30, 2022 | |
| | | | | | | | | | | | Average Annual Total Returns | | | | |
| | | 3 Months | | | YTD | | | 1 Year | | | 3 Year | | | 5 Year | | | 10 Years | | | Since
Inception | | | Inception
Date | |
| Investor Class (MCDFX) | | | 3.22% | | | | -13.78% | | | | -23.47% | | | | 2.00% | | | | 5.34% | | | | 8.84% | | | | 8.36% | | | | 11/30/09 | |
| Institutional Class (MICDX) | | | 3.28% | | | | -13.68% | | | | -23.32% | | | | 2.14% | | | | 5.49% | | | | 9.03% | | | | 7.53% | | | | 10/29/10 | |
| MSCI China Index3 | | | 3.50% | | | | -11.19% | | | | -31.70% | | | | -0.44% | | | | 2.29% | | | | 5.69% | | | | 3.59% | 4 | | | | |
Performance assumes reinvestment of all dividends and/or distributions before taxes. All performance quoted represents past performance and is no guarantee of future results. Investment return and principal value will fluctuate with market conditions so that when redeemed, shares may be worth more or less than their original cost. Current performance may be lower or higher than the return figures quoted. For the Fund’s most recent month-end performance, visit matthewsasia.com.
| | | | | | | | | | | | | | | | | | | | | | | | | | | | |
| | | | | | | | |
| INCOME DISTRIBUTION HISTORY | | | | | | | | | | | | | | | | | | | | | |
| | | 2022 | | | | | | 2021 | |
| | | June | | | December | | | Total | | | | | | June | | | December | | | Total | |
| Investor (MCDFX) | | $ | 0.42 | | | | n.a. | | | | n.a. | | | | | | | $ | 0.38 | | | $ | 0.11 | | | $ | 0.49 | |
| Inst’l (MICDX) | | $ | 0.43 | | | | n.a. | | | | n.a. | | | | | | | $ | 0.39 | | | $ | 0.12 | | | $ | 0.52 | |
Note: This table does not include capital gains distributions. Totals may differ by $0.02 due to rounding. For income distribution history, visit matthewsasia.com.
| | | | |
| | | |
30 DAY YIELD: Investor Class: 1.47% (1.47% excluding waivers) Institutional Class: 1.56% (1.56% excluding waivers) The 30-Day Yield represents net investment income earned by the Fund over the 30-day period ended 6/30/22, expressed as an annual percentage rate based on the Fund’s share price at the end of the 30-day period. The 30-Day Yield should be regarded as an estimate of the Fund’s rate of investment income, and it may not equal the Fund’s actual income distribution rate. Source: BNY Mellon Investment Servicing (US) Inc. | | | | DIVIDEND YIELD: 2.93% The dividend yield (trailing) for the portfolio is the weighted average sum of the dividends paid by each equity security held by the Fund over the 12 months ended 6/30/22 divided by the current price of each equity as of 6/30/22. The annualized dividend yield for the Fund is for the equity-only portion of the portfolio. Please note that this is based on gross equity portfolio holdings and does not reflect the actual yield an investor in the Fund would receive. Past yields are no guarantee of future yields. Source: FactSet Research Systems, Bloomberg, MICM. |
GROWTH OF A HYPOTHETICAL $10,000 INVESTMENT SINCE INCEPTION—INVESTOR CLASS
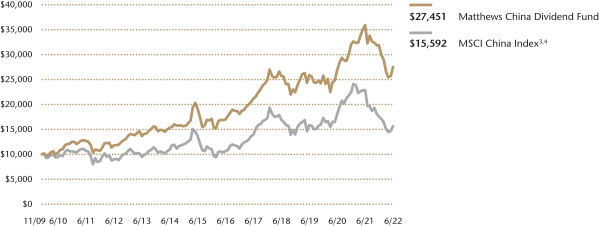
Plotted monthly. The performance data and graph do not reflect the deduction of taxes that a shareholder would pay on dividends, capital gains distributions or redemption of Fund shares. Values are in US$.
| | 3 | It is not possible to invest directly in an index. Source: Index data from Morgan Stanley Capital International and Bloomberg; total return calculations performed by BNY Mellon Investment Servicing (US) Inc. Please see page 84 for index definition. |
| | 4 | Calculated from 11/30/09. |
| | | | | | | | |
| | | | |
| TOP TEN HOLDINGS5 | | | | | | | |
| Name | | Sector | | | | % Net Assets | |
| Tencent Holdings, Ltd. | | Communication Services | | | | | 9.0% | |
| Postal Savings Bank of China Co., Ltd. | | Financials | | | | | 4.6% | |
| CITIC Telecom International Holdings, Ltd. | | Communication Services | | | | | 4.2% | |
| BOC Hong Kong Holdings, Ltd. | | Financials | | | | | 3.4% | |
| Yadea Group Holdings, Ltd. | | Consumer Discretionary | | | | | 2.8% | |
| CSPC Pharmaceutical Group, Ltd. | | Health Care | | | | | 2.7% | |
| Tsingtao Brewery Co., Ltd. | | Consumer Staples | | | | | 2.7% | |
| China Everbright International, Ltd. | | Industrials | | | | | 2.7% | |
| China Education Group Holdings, Ltd. | | Consumer Discretionary | | | | | 2.7% | |
| Yangzijiang Shipbuilding Holdings, Ltd. | | Industrials | | | | | 2.6% | |
| % OF ASSETS IN TOP 10 | | | | | | | 37.4% | |
| | 5 | Holdings may combine more than one security from same issuer and related depositary receipts. |
Matthews China Dividend Fund
Portfolio Manager Commentary (unaudited) (continued)
On the other hand, Tencent, the internet giant, was the biggest detractor from performance as it continues to be haunted by weak first-quarter results and an uncertain regulatory environment. It experienced more negative sentiment when Naspers, its largest shareholder, announced it will gradually sell its stake. China Suntien was a big detractor as was China Education Group, a leading private higher-education operator, and we continue to closely monitor its performance and the regulatory environment.
Notable Portfolio Changes:
We made a switch among Chinese banks during the second quarter. As China Merchants Bank’s former president was placed under investigation by China’s anti-corruption watchdog, the bank’s stock price suffered a heavy sell-off. We believe the probe is not directly related to tenure at China Merchants Bank and the lender’s new president was internally selected which in our view signals the regulator and large shareholders remain confident in the bank’s controls. As China Merchants Bank’s valuation premium in relation to other Chinese lenders fell, we decided to take a position in the stock and sell our holding in PingAn Bank.
We also added Meituan to the portfolio as the food delivery platform continues to show its importance in China’s service economy amid the ongoing pandemic and related lockdowns. We also believe the company’s heavy losses in new businesses will narrow as the sector starts to focus more on profit and less on growth at all costs.
We exited our position in Uni-President China as the company’s food business is likely to suffer from higher soft-commodities prices because of the Russia-Ukraine war.
Outlook:
Although the Chinese economy has recovered some ground after the lifting of the mass lockdown in Shanghai, its growth is still way below full potential. However, there is a glimpse of hope that the Chinese government may turn more pragmatic in terms of its COVID policies and place more importance on economic growth especially after it halved its travel-quarantine days requirement. In addition, the People’s Bank of China is the only major central bank in the world that has the capacity and the willingness to loosen its monetary policy. It is on a different trajectory to the Fed. Thus, we continue to be optimistic that the Chinese economy can swiftly shift back to growth mode if the policy tailwinds are in place. In the meantime, the stringent COVID policy poses major risks to a sustainable market rally.
| | | | |
| |
| COUNTRY ALLOCATION (%)6,7 | |
| China/Hong Kong | | | 96.3 | |
| Cash and Other Assets, Less Liabilities | | | 3.8 | |
| | | | |
| | |
| SECTOR ALLOCATION (%)7 | | | |
| Consumer Discretionary | | | 23.3 | |
| Communication Services | | | 13.3 | |
| Industrials | | | 12.1 | |
| Financials | | | 11.8 | |
| Health Care | | | 10.4 | |
| Consumer Staples | | | 9.1 | |
| Materials | | | 5.8 | |
| Information Technology | | | 5.6 | |
| Energy | | | 2.6 | |
| Real Estate | | | 2.2 | |
| Cash and Other Assets, Less Liabilities | | | 3.8 | |
| | | | |
| |
| MARKET CAP EXPOSURE (%)7 | |
| Mega Cap (over $25B) | | | 38.2 | |
| Large Cap ($10B-$25B) | | | 18.5 | |
| Mid Cap ($3B-10B) | | | 19.1 | |
| Small Cap (under $3B) | | | 20.5 | |
| Cash and Other Assets, Less Liabilities | | | 3.8 | |
| 6 | Not all countries where the Fund may invest are included in the benchmark index. |
| 7 | Source: FactSet Research Systems. Percentage values in data are rounded to the nearest tenth of one percent, so the values may not sum to 100% due to rounding. Country allocations and percentage values may be derived from different data sources and may not be consistent with other Fund literature. |
| | | | | | | | |
| | | | matthewsasia.com | 800.789.ASIA | | | 71 | |
Matthews China Dividend Fund
June 30, 2022
Schedule of Investmentsa (unaudited)
COMMON EQUITIES: 96.2%
| | | | | | | | |
| | | Shares | | | Value | |
| | |
| CONSUMER DISCRETIONARY: 23.3% | | | | | | | | |
Hotels, Restaurants & Leisure: 7.3% | | | | | | | | |
| | |
Yum China Holdings, Inc. | | | 148,500 | | | | $7,202,250 | |
| | |
Tam Jai International Co., Ltd.b | | | 16,628,000 | | | | 6,024,823 | |
| | |
Helens International Holdings Co., Ltd.b | | | 1,588,500 | | | | 3,669,874 | |
| | |
Shanghai Jinjiang International Hotels Co., Ltd. B Shares | | | 1,519,631 | | | | 2,971,126 | |
| | | | | | | | |
| | | | | | | 19,868,073 | |
| | | | | | | | |
| | | | | | | | |
Automobiles: 5.2% | | | | | | | | |
| | |
Yadea Group Holdings, Ltd.c,d | | | 3,918,000 | | | | 7,684,034 | |
| | |
Chongqing Changan Automobile Co., Ltd. B Shares | | | 12,921,458 | | | | 6,421,854 | |
| | | | | | | | |
| | | | | | | 14,105,888 | |
| | | | | | | | |
| | | | | | | | |
Internet & Direct Marketing Retail: 3.7% | | | | | | | | |
| | |
Meituan B Sharesb,c,d | | | 201,200 | | | | 5,020,803 | |
| | |
Pinduoduo, Inc. ADRb | | | 81,100 | | | | 5,011,980 | |
| | | | | | | | |
| | | | | | | 10,032,783 | |
| | | | | | | | |
| | | | | | | | |
Diversified Consumer Services: 2.7% | | | | | | | | |
China Education Group Holdings, Ltd.d | | | 7,498,000 | | | | 7,421,882 | |
| | | | | | | | |
| | | | | | | | |
Specialty Retail: 2.4% | | | | | | | | |
China Tourism Group Duty Free Corp., Ltd. A Shares | | | 192,769 | | | | 6,722,210 | |
| | | | | | | | |
| | | | | | | | |
Household Durables: 2.0% | | | | | | | | |
Haier Smart Home Co., Ltd. D Shares | | | 4,520,762 | | | | 5,478,606 | |
| | | | | | | | |
| | | | | | | | |
Total Consumer Discretionary | | | | | | | 63,629,442 | |
| | | | | | | | |
| | | | | | | | |
| | | |
| COMMUNICATION SERVICES: 13.3% | | | | | | | | |
Interactive Media & Services: 9.0% | | | | | | | | |
Tencent Holdings, Ltd. | | | 544,400 | | | | 24,642,346 | |
| | | | | | | | |
| | | | | | | | |
Diversified Telecommunication Services: 4.3% | |
CITIC Telecom International Holdings, Ltd. | | | 35,007,000 | | | | 11,593,207 | |
| | | | | | | | |
Total Communication Services | | | | | | | 36,235,553 | |
| | | | | | | | |
| | | | | | | | |
| | | |
| INDUSTRIALS: 12.1% | | | | | | | | |
Commercial Services & Supplies: 2.7% | | | | | | | | |
China Everbright International, Ltd. | | | 12,552,000 | | | | 7,422,243 | |
| | | | | | | | |
| | | | | | | | |
Machinery: 2.6% | | | | | | | | |
Yangzijiang Shipbuilding Holdings, Ltd. | | | 10,773,000 | | | | 7,213,909 | |
| | | | | | | | |
| | | | | | | | |
Industrial Conglomerates: 2.6% | | | | | | | | |
CK Hutchison Holdings, Ltd. | | | 1,051,500 | | | | 7,133,377 | |
| | | | | | | | |
| | | | | | | | |
Transportation Infrastructure: 2.5% | | | | | | | | |
Hainan Meilan International Airport Co., Ltd. H Sharesb | | | 2,267,000 | | | | 6,680,711 | |
| | | | | | | | |
| | | | | | | | |
Electrical Equipment: 1.7% | | | | | | | | |
| | |
Zhejiang HangKe Technology, Inc. Co. A Shares | | | 449,902 | | | | 4,729,329 | |
| | | | | | | | |
Total Industrials | | | | | | | 33,179,569 | |
| | | | | | | | |
| | | | | | | | |
| | | | | | | | |
| | | Shares | | | Value | |
| | |
| FINANCIALS: 11.8% | | | | | | | | |
Banks: 10.0% | |
| | |
Postal Savings Bank of China Co., Ltd. H Sharesc,d | | | 15,784,000 | | | | $12,578,571 | |
| | |
BOC Hong Kong Holdings, Ltd. | | | 2,347,000 | | | | 9,319,883 | |
| | |
China Merchants Bank Co., Ltd. A Shares | | | 889,937 | | | | 5,629,470 | |
| | | | | | | | |
| | | | | | | 27,527,924 | |
| | | | | | | | |
| | | | | | | | |
Capital Markets: 1.8% | | | | | | | | |
| | |
GF Securities Co., Ltd. H Shares | | | 3,669,600 | | | | 4,862,056 | |
| | | | | | | | |
Total Financials | | | | | | | 32,389,980 | |
| | | | | | | | |
| | | | | | | | |
| | | |
| HEALTH CARE: 10.4% | | | | | | | | |
Pharmaceuticals: 6.7% | |
| | |
CSPC Pharmaceutical Group, Ltd. | | | 7,464,000 | | | | 7,460,453 | |
| | |
Livzon Pharmaceutical Group, Inc. H Shares | | | 1,881,800 | | | | 6,540,128 | |
| | |
Asymchem Laboratories Tianjin Co., Ltd. H Sharesc,d | | | 182,200 | | | | 4,297,280 | |
| | | | | | | | |
| | | | | | | 18,297,861 | |
| | | | | | | | |
| | | | | | | | |
Life Sciences Tools & Services: 2.4% | | | | | | | | |
Pharmaron Beijing Co., Ltd. H Sharesc,d | | | 669,750 | | | | 6,727,245 | |
| | | | | | | | |
| | | | | | | | |
Health Care Equipment & Supplies: 1.3% | | | | | | | | |
| | |
AK Medical Holdings, Ltd.c,d | | | 4,666,000 | | | | 3,494,329 | |
| | | | | | | | |
Total Health Care | | | | | | | 28,519,435 | |
| | | | | | | | |
| | | | | | | | |
| | | |
| CONSUMER STAPLES: 9.1% | | | | | | | | |
Beverages: 7.2% | |
| | |
Tsingtao Brewery Co., Ltd. H Shares | | | 714,000 | | | | 7,432,417 | |
| | |
Wuliangye Yibin Co., Ltd. A Shares | | | 208,600 | | | | 6,308,475 | |
| | |
Yantai Changyu Pioneer Wine Co., Ltd. B Shares | | | 3,792,176 | | | | 6,084,131 | |
| | | | | | | | |
| | | | | | | 19,825,023 | |
| | | | | | | | |
| | | | | | | | |
Food Products: 1.9% | | | | | | | | |
| | |
Inner Mongolia Yili Industrial Group Co., Ltd. A Shares | | | 885,600 | | | | 5,160,434 | |
| | | | | | | | |
Total Consumer Staples | | | | | | | 24,985,457 | |
| | | | | | | | |
| | | | | | | | |
| | | |
| MATERIALS: 5.8% | | | | | | | | |
Construction Materials: 4.4% | |
| | |
China Jushi Co., Ltd. A Shares | | | 2,347,207 | | | | 6,111,920 | |
| | |
Huaxin Cement Co., Ltd. H Shares | | | 4,143,292 | | | | 5,987,782 | |
| | | | | | | | |
| | | | | | | 12,099,702 | |
| | | | | | | | |
| | | | | | | | |
Metals & Mining: 1.4% | | | | | | | | |
| | |
Tiangong International Co., Ltd. | | | 10,616,000 | | | | 3,830,166 | |
| | | | | | | | |
Total Materials | | | | | | | 15,929,868 | |
| | | | | | | | |
| | | | | | | | |
| | | |
| INFORMATION TECHNOLOGY: 5.6% | | | | | | | | |
Software: 3.8% | |
| | |
Shanghai Baosight Software Co., Ltd. B Shares | | | 1,313,664 | | | | 5,550,182 | |
| | |
Longshine Technology Group Co., Ltd. A Shares | | | 1,289,600 | | | | 4,866,990 | |
| | | | | | | | |
| | | | | | | 10,417,172 | |
| | | | | | | | |
| | | | | | | | |
Matthews China Dividend Fund
June 30, 2022
Schedule of Investmentsa (unaudited) (continued)
COMMON EQUITIES (continued)
| | | | | | | | |
| | | Shares | | | Value | |
Electronic Equipment, Instruments & Components: 1.8% | |
| | |
OPT Machine Vision Tech Co., Ltd. A Shares | | | 125,037 | | | | $4,831,316 | |
| | | | | | | | |
Total Information Technology | | | | | | | 15,248,488 | |
| | | | | | | | |
| | | | | | | | |
| | | |
| ENERGY: 2.6% | | | | | | | | |
Oil, Gas & Consumable Fuels: 2.6% | | | | | |
| | |
China Suntien Green Energy Corp., Ltd. H Shares | | | 13,985,000 | | | | 7,123,617 | |
| | | | | | | | |
Total Energy | | | | | | | 7,123,617 | |
| | | | | | | | |
| | | | | | | | |
| | | |
| REAL ESTATE: 2.2% | | | | | | | | |
Real Estate Management & Development: 2.2% | | | | | |
| | |
China Vanke Co., Ltd. H Shares | | | 2,350,200 | | | | 5,917,281 | |
| | | | | | | | |
Total Real Estate | | | | | | | 5,917,281 | |
| | | | | | | | |
| | | | | | | | |
| | | |
| TOTAL INVESTMENTS: 96.2% | | | | | | | 263,158,690 | |
(Cost $271,839,157) | | | | | | | | |
| | | | | | | | |
| | |
CASH AND OTHER ASSETS,
LESS LIABILITIES: 3.8% | | | | | | | 10,280,125 | |
| | | | | | | | |
| | |
NET ASSETS: 100.0% | | | | | | | $273,438,815 | |
| | | | | | | | |
| a | Certain securities were fair valued under the valuation policies approved by the Board of Trustees (Note 2-A). |
| b | Non-income producing security. |
| c | Security exempt from registration under Rule 144A of the Securities Act of 1933, as amended. The security may be resold in transactions exempt from registration normally to qualified institutional buyers. The security has been determined to be liquid in accordance with procedures adopted by the Funds’ Board of Trustees. At June 30, 2022, the aggregate value is $39,802,262, which is 14.56% of net assets. |
| d | The securities may be resold to qualified foreign investors and foreign institutional buyers under Regulation S of the Securities Act of 1933. |
| ADR | American Depositary Receipt |
See accompanying notes to financial statements.
| | | | | | | | |
| | | | matthewsasia.com | 800.789.ASIA | | | 73 | |

| | | | |
| PORTFOLIO MANAGERS |
| |
| Satya Patel* | | |
Lead Manager | | |
| |
Wei Zhang | | |
Co-Manager | | |
|
| FUND FACTS |
| | |
| | | Investor | | Institutional |
Ticker | | MAINX | | MINCX |
CUSIP | | 577125503 | | 577125602 |
Inception | | 11/30/11 | | 11/30/11 |
NAV | | $8.17 | | $8.17 |
Initial Investment | | $2,500 | | $100,000 |
Gross Expense Ratio1 | | 1.05% | | 0.91% |
After Fee Waiver and Reimbursement2 | | 1.05% | | 0.90% |
Portfolio Statistics | | | | |
Total # of Positions | | 38 |
Net Assets | | $73.6 million |
Modified Duration3 | | 3.1 |
Portfolio Turnover4 | | 62.2% |
Benchmark | | |
| 50% Markit iBoxx Asian Local Bond Index, 50% J.P. Morgan Asia Credit Index |
OBJECTIVE
Total return over the long term with an emphasis on income.
STRATEGY
Under normal market conditions, the Fund seeks to achieve its investment objective by investing at least 80% of its net assets, which include borrowings for investment purposes, in debt and debt-related instruments issued by governments, quasi-governmental entities, supra-national institutions, and companies in Asia. Asia consists of all countries and markets in Asia, such as China and India, and includes developed, emerging, and frontier countries and markets in the Asian region. The Fund’s investments in debt securities may be denominated in any currency, may be of any quality or may be unrated, and may have no stated maturity or duration target.
Matthews Asia Total Return Bond Fund
Portfolio Manager Commentary (unaudited)
For the first half of 2022, the Matthews Asia Total Return Bond Fund returned –19.07% (Investor Class) and –19.06% (Institutional Class), while its benchmark, the 50% Markit iBoxx Asian Local Bond Index, 50% J.P. Morgan Asia Credit Index, returned –9.90% over the same period. For the quarter ending June 30, 2022, the Fund returned –10.29% (Investor Class) and –10.25% (Institutional Class), while the benchmark returned –5.70%.
Market Environment:
The first half of the year was a challenging one for risk assets globally, and Asia fixed income was no exception. For Asian corporate bonds, the half of the year was primarily driven by the China high yield real estate sector. The resurgence of COVID-19 in April and May severely limited economic activity in China and the real estate sector saw a significant decline in sales. As COVID quarantine measures were gradually lifted in June, real estate sales recovered from the trough in April although it is relatively early to say if the recovery trend in June can be sustained in the second half of the year. Asian high yield bond performance has been volatile in recent months. Sentiment deteriorated gradually over the quarter with the average spread for Asia high yield 148 basis points (1.48%) wider on the quarter, driven mostly by changes in the China high yield real estate sector. The deterioration in the China high yield real estate sector is mainly driven by continued defaults of high yield issuers and ratings downgrade of select investment grade issuers. While we have seen macro policies on real estate continue to ease and contracted sales trough in April, the recovery has been slowed by COVID outbreaks in key major cities such as Shanghai and Beijing. We have also seen a lack of demand as buyers struggle to build confidence in the ability of many private developers to complete construction projects. The refinancing ability of issuers in the real estate sector dominate the market’s list of worries and continues to weigh on sentiment.
On interest rate and currency, the key theme has been inflation. Asia interest rates were broadly higher during the quarter along with U.S. interest rates. During the second quarter, inflation expectations were further exacerbated by high energy prices. Supply disruptions due to COVID quarantines in China also contributed to the inflationary pressure during the quarter. The latest development has caused the U.S. Federal Reserve to quicken its path of rate hikes. Higher U.S. interest rates also provided strength to the U.S. dollar, which appreciated against all Asian currencies.
Performance Contributors and Detractors:
For the first half of the year, the return for the corporate bond portion of the portfolio was driven primarily by the China high yield real estate sector. The Fund’s China portion of corporate bonds underperformed our benchmark due to overweight in China real estate and selection effect. South Korea, Thailand and Indonesia outperformed the benchmark on the back of both selection and underweight relative to the benchmark. For the first half of the year, the top two contributors in corporate bonds were China-based financial leasing company Far East Horizon and International Container Terminal Services, which develops, manages and operates container ports and terminals in Asia. For the first half of
(continued)
| * | Effective July 31, 2022. |
| 1 | Prospectus expense ratios. |
| 2 | Matthews has contractually agreed (i) to waive fees and reimburse expenses to the extent needed to limit Total Annual Fund Operating Expenses (excluding Rule 12b-1 fees, taxes, interest, brokerage commissions, short sale dividend expenses, expenses incurred in connection with any merger or reorganization or extraordinary expenses such as litigation) of the Institutional Class to 0.90% first by waiving class specific expenses (i.e., shareholder service fees specific to a particular class) of the Institutional Class and then, to the extent necessary, by waiving non-class specific expenses (e.g. custody fees) of the Institutional Class, and (ii) if any Fund-wide expenses (i.e., expenses that apply to both the Institutional Class and the Investor Class) are waived for the Institutional Class to maintain the 0.90% expense limitation, to waive an equal amount (in annual percentage terms) of those same expenses for the Investor Class. The Total Annual Fund Operating Expenses After Fee Waiver and Expense Reimbursement for the Investor Class may vary from year to year and will in some years exceed 0.90%. Pursuant to this agreement, any amount waived for prior fiscal years with respect to the Fund is not subject to recoupment. This agreement will remain in place until April 30, 2023 and may be terminated at any time by the Board of Trustees on behalf of the Fund on 60 days’ written notice to Matthews. Matthews may decline to renew this agreement by written notice to the Trust at least 30 days before its annual expiration date. |
| 3 | Modified duration measures the percent change in value of the fixed income portion of the portfolio in response to a 1% change in interest rates. In a multi-currency denominated portfolio with sensitivities to different interest rate regimes, modified duration will not accurately reflect the change in value of the overall portfolio from a change in any one interest rate regime. |
| 4 | The lesser of fiscal year 2021 long-term purchase costs or sales proceeds divided by the average monthly market value of long-term securities. |
| | | | | | | | | | | | | | | | | | | | | | | | | | | | | | | | |
| |
| PERFORMANCE AS OF JUNE 30, 2022 | |
| | | | | | | | | | | | Average Annual Total Returns | | | | | | | |
| | | 3 Months | | | YTD | | | 1 Year | | | 3 Years | | | 5 Years | | | 10 Years | | | Since
Inception | | | Inception
Date | |
| Investor Class (MAINX) | | | -10.29% | | | | -19.07% | | | | -21.15% | | | | -5.20% | | | | -1.71% | | | | 1.56% | | | | 1.82% | | | | 11/30/11 | |
| Institutional Class (MINCX) | | | -10.25% | | | | -19.06% | | | | -20.98% | | | | -5.05% | | | | -1.50% | | | | 1.77% | | | | 2.03% | | | | 11/30/11 | |
| 50% Markit iBoxx Asian Local Bond Index, 50% J.P. Morgan Asia Credit Index5 | | | -5.70% | | | | -9.90% | | | | -10.99% | | | | -0.79% | | | | 1.32% | | | | 2.42% | | | | 2.80% | | | | | |
Performance assumes reinvestment of all dividends and/or distributions before taxes. All performance quoted represents past performance and is no guarantee of future results. Investment return and principal value will fluctuate with market conditions so that when redeemed, shares may be worth more or less than their original cost. Current performance may be lower or higher than the return figures quoted. Returns would have been lower if certain of the Fund’s fees and expenses had not been waived. For the Fund’s most recent month-end performance visit matthewsasia.com.
| | | | | | | | | | | | | | | | | | | | | | | | | | | | | | | | | | | | | | | | | | | | | | | | | | | | |
| |
| INCOME DISTRIBUTION HISTORY | |
| 2022 | | Jan. | | | Feb. | | | Mar. | | | Apr. | | | May | | | June | | | July | | | Aug. | | | Sept. | | | Oct. | | | Nov. | | | Dec. | | | Total | |
| Investor (MAINX) | | $ | 0.02 | | | $ | 0.04 | | | $ | 0.03 | | | $ | 0.04 | | | $ | 0.03 | | | $ | 0.04 | | | | n.a. | | | | n.a. | | | | n.a. | | | | n.a. | | | | n.a. | | | | n.a. | | | | n.a. | |
| Inst’l (MINCX) | | $ | 0.02 | | | $ | 0.04 | | | $ | 0.04 | | | $ | 0.04 | | | $ | 0.04 | | | $ | 0.04 | | | | n.a. | | | | n.a. | | �� | | n.a. | | | | n.a. | | | | n.a. | | | | n.a. | | | | n.a. | |
| | | | | | | | | | | | | |
| 2021 | | | | | | | | | | | | | | | | | | | | | | | | | | | | | | | | | | | | | | | |
| Investor (MAINX) | | $ | 0.03 | | | $ | 0.02 | | | $ | 0.03 | | | $ | 0.04 | | | $ | 0.03 | | | $ | 0.04 | | | $ | 0.03 | | | $ | 0.03 | | | $ | 0.03 | | | $ | 0.04 | | | $ | 0.05 | | | $ | 0.08 | | | $ | 0.46 | |
| Inst’l (MINCX) | | $ | 0.03 | | | $ | 0.02 | | | $ | 0.03 | | | $ | 0.04 | | | $ | 0.04 | | | $ | 0.04 | | | $ | 0.03 | | | $ | 0.04 | | | $ | 0.03 | | | $ | 0.04 | | | $ | 0.05 | | | $ | 0.08 | | | $ | 0.47 | |
Note: This table does not include capital gains distributions. Totals may differ by $0.02 due to rounding. For income distribution history, visit matthewsasia.com.
| | | | |
| | | |
30-DAY YIELD: Investor Class: 10.44% (10.34% excluding waivers) Institutional Class: 10.58% (10.41% excluding waivers) The 30-Day Yield represents net investment income earned by the Fund over the 30-day period ended 6/30/22, expressed as an annual percentage rate based on the Fund’s share price at the end of the 30-day period. The 30 Day Yield excludes securities that trade without accrued interest. The 30-Day Yield should be regarded as an estimate of the Fund’s rate of investment income, and it may not equal the Fund’s actual income distribution rate. Source: BNY Mellon Investment Servicing (US) Inc. | | | | YIELD TO WORST: 13.63% Yield to worst is the lowest yield that can be received on a bond assuming that the issuer does not default. It is calculated by utilizing the worst case assumptions for a bond with respect to certain income-reducing factors, including prepayment, call or sinking fund provisions. The yield to worst excludes securities that trade without accrued interest. It does not represent the yield that an investor should expect to receive. Past yields are no guarantee of future yields. Source: FactSet Research Systems |
GROWTH OF A HYPOTHETICAL $10,000 INVESTMENT SINCE INCEPTION—INVESTOR CLASS
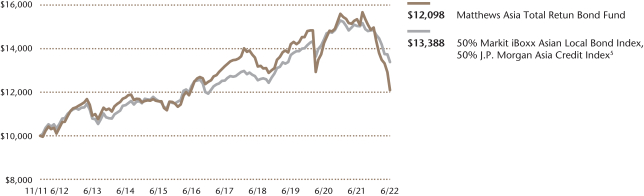
Plotted monthly. The performance data and graph do not reflect the deduction of taxes that a shareholder would pay on dividends, capital gains distributions or redemption of Fund shares. Values are in US$.
| | 5 | It is not possible to invest directly in an index. Source: Index data from HSBC, Markit iBoxx and Bloomberg; total return calculations performed by BNY Mellon Investment Servicing (US) Inc. Please see page 84 for index definitions. The Markit iBoxx Asian Local Bond Index performance reflects the returns of the discontinued predecessor HSBC Asian Local Bond Index up to December 31, 2012 and the returns of the successor Markit iBoxx Asian Local Bond Index thereafter. |
| | | | | | | | |
| | | | |
| TOP TEN HOLDINGS | | | | | | | |
| Name | | Sector | | Currency | | % Net Assets | |
| China Development Bank, 3.800%, 01/25/2036 | | Agency | | China Renminbi | | | 6.4% | |
| Franshion Brilliant, Ltd., 6.000%, 02/08/2026 | | Financial Institutions | | U.S. Dollar | | | 6.0% | |
| Wanda Properties International Co., Ltd., 7.250%, 01/29/2024 | | Financial Institutions | | U.S. Dollar | | | 5.3% | |
| ESR Group, Ltd., 5.650%, 09/02/2068 | | Industrial | | Singapore Dollar | | | 5.1% | |
| Luye Pharma Group, Ltd., Cnv., 1.500%, 07/09/2024 | | Industrial | | U.S. Dollar | | | 4.7% | |
| Periama Holdings LLC, 5.950%, 04/19/2026 | | Industrial | | U.S. Dollar | | | 4.4% | |
| Indika Energy Capital III Pte, Ltd., 5.875%, 11/09/2024 | | Industrial | | U.S. Dollar | | | 4.3% | |
| ESR Group, Ltd., Cnv., 1.500%, 09/30/2025 | | Industrial | | U.S. Dollar | | | 3.1% | |
| PB International BV, 7.625%, 12/31/2025 | | Industrial | | U.S. Dollar | | | 3.0% | |
| Standard Chartered PLC, 4.300%, 02/19/2068 | | Financial Institutions | | U.S. Dollar | | | 3.0% | |
| % OF ASSETS IN TOP 10 | | | 45.3% | |
| | | | | | | | |
| | | | matthewsasia.com | 800.789.ASIA | | | 75 | |
| | | | |
| |
| CURRENCY ALLOCATION (%)6,7 | |
| US Dollar | | | 72.6 | |
| China Renminbi | | | 8.0 | |
| Singapore Dollar | | | 6.9 | |
| South Korean Won | | | 5.0 | |
| Malaysian Ringgit | | | 4.0 | |
| Indonesian Rupiah | | | 3.4 | |
| | | | |
| | |
| COUNTRY ALLOCATION (%)6,7,8 | | | |
| China/Hong Kong | | | 60.2 | |
| Indonesia | | | 10.7 | |
| India | | | 8.4 | |
| Malaysia | | | 4.0 | |
| New Zealand | | | 2.1 | |
| Singapore | | | 1.8 | |
| Thailand | | | 1.1 | |
| Taiwan | | | 0.7 | |
| Cash and Other Assets, Less Liabilities | | | 11.1 | |
| | | | |
| | |
| SECTOR ALLOCATION (%)6,7 | | | |
| Industrial | | | 41.0 | |
| Financial Institutions | | | 25.1 | |
| Agency | | | 15.5 | |
| Treasury | | | 7.3 | |
| Cash and Other Assets, Less Liabilities | | | 11.1 | |
Please note: Foreign Government Bonds category includes Supranationals.
| | | | |
| | |
| ASSET TYPE BREAKDOWN (%)6,7 | | | |
| Non-Convertible Corporate Bonds | | | 59.7 | |
| Convertible Corporate Bonds | | | 21.9 | |
| Government Bonds | | | 7.3 | |
| Cash and Other Assets, Less Liabilities | | | 11.1 | |
| 6 | Source: FactSet Research Systems. Percentage values in data are rounded to the nearest tenth of one percent, so the values may not sum to 100% due to rounding. Country allocations and percentage values may be derived from different data sources and may not be consistent with other Fund literature. |
| 7 | Cash and other assets may include forward currency exchange contracts and certain derivative instruments that have been marked-to-market. |
| 8 | Not all countries where the Fund may invest are included in the benchmark index. |
Matthews Asia Total Return Bond Fund
Portfolio Manager Commentary (unaudited) (continued)
the year, the top three negative contributors were Times China Holding, Powerlong Real Estate Holdings, and KWG Group Holding. All three are China real estate developers impacted by the overall China real estate tight funding conditions.
For the first half of the year, the convertible bond portion of the portfolio was a slight detractor to performance. Among individual contributors were Baozun Inc., a Chinese online e-commerce platform primarily serving oversea clients; iQIYI Inc., a video content maker and video platform operator in China; and Luye Pharma Group, a China-based pharmaceutical company focused on orthopedics, neurology, and gastroenterology. Among negative contributors were: Kakao Corp., a South Korean operator of cross platform mobile messaging application; Nio Inc., a Chinese electric vehicle manufacturer; and Weimob Inc., a China based e-commerce solutions provider to small and medium business in China.
Notable Portfolio Changes:
During the second quarter, we exited positions that have reached our price targets or potential risks were no longer justified by the expected returns, including Kakao Corp., the dominant South Korean internet messaging company. We also exited Baozun Inc. as the bond reached its put date and we were able to put the bond back to the issuer.
We also adjusted the portfolio’s currency exposure to be more overweight U.S. dollar and underweight local currencies, including exiting local currency Thailand Government Bond. We believe the recent uncertainties around inflation and geopolitical risk will continue to support a strong U.S. dollar view.
Lastly, we added to convertible bond positions outside of China, including Australian accounting software company Xero Investments and Singapore-based Sea Ltd., a provider of online and mobile digital content, e-commerce, and payment platforms.
Outlook:
With COVID-19 brought under control and China exiting some of its strict quarantine measures, economic activity has started to see a significant rebound during the second half of the quarter. Additional macro policy easing has continued to be rolled out. We expect the economic recovery in China to continue in the second half of the year, but a key risk would be a renewed surge in COVID-19 cases which could prompt strict lockdown measures again, severely limiting economic activity.
In the U.S., the Fed responded to the persistent high inflation with a 75 basis points (0.75%) rate hike in June. The discussion is starting to shift from containing inflation to potential policy induced recession. While supply chain disruptions are normalizing, inflation remains stubbornly high. While the Fed has expressed some confidence in bring down inflation without causing a recession, the market remains very much concerned about a recession scenario. The Fed would have a very thin margin of error in achieving the “soft landing” scenario.
With the U.S. Fed still on a rate hike path and high energy prices, we do not believe the next few quarters to be favorable to Asian local currencies and have taken additional steps to reduce the portfolio’s local currency exposure. With inflation rising in most Asian economies, we also expect most Asian central banks to raise interest rates in response. We have also adjusted the portfolio to be underweight in Asia local currency bonds.
Matthews Asia Total Return Bond Fund
June 30, 2022
Schedule of Investmentsa (unaudited)
NON-CONVERTIBLE CORPORATE BONDS: 53.3%
| | | | | | | | |
| | | Face Amount* | | | Value | |
| | |
| CHINA/HONG KONG: 36.5% | | | | | | | | |
| | |
Franshion Brilliant, Ltd.
6.000%b, 02/08/26c,d | | | 4,700,000 | | | | $4,423,875 | |
| | |
Wanda Properties International Co., Ltd.
7.250%, 01/29/24d | | | 5,300,000 | | | | 3,922,795 | |
| | |
ESR Group, Ltd.
5.650%b, 03/02/26c,d | | | SGD 5,250,000 | | | | 3,759,949 | |
| | |
Standard Chartered PLC
4.300%b, 08/19/28c,d | | | 3,000,000 | | | | 2,192,744 | |
| | |
Sino-Ocean Land Treasure III, Ltd.
4.900%b, 09/21/22c,d | | | 5,000,000 | | | | 2,035,026 | |
| | |
China Cinda Asset Management Co., Ltd.
5.500%, 03/14/28 | | | CNY 10,000,000 | | | | 1,645,412 | |
| | |
Agricultural Bank of China, Ltd.
4.300%, 04/11/29d | | | CNY 10,000,000 | | | | 1,533,044 | |
| | |
China Cinda Asset Management Co., Ltd.
3.900%, 03/05/30 | | | CNY 10,000,000 | | | | 1,507,950 | |
| | |
CIFI Holdings Group Co., Ltd.
4.800%, 05/17/28d | | | 2,200,000 | | | | 1,163,250 | |
| | |
China SCE Group Holdings, Ltd.
7.000%, 05/02/25d | | | 4,000,000 | | | | 1,160,000 | |
| | |
KWG Group Holdings, Ltd.
7.400%, 01/13/27d | | | 5,000,000 | | | | 941,224 | |
| | |
King Talent Management, Ltd.
5.600%b, 12/04/22c,d | | | 850,000 | | | | 808,520 | |
| | |
Times China Holdings, Ltd.
6.200%, 03/22/26d | | | 3,900,000 | | | | 507,000 | |
| | |
Logan Group Co., Ltd.
4.500%, 01/13/28d | | | 2,376,000 | | | | 493,024 | |
| | |
Sunac China Holdings, Ltd.
6.500%, 01/26/26d | | | 2,200,000 | | | | 309,745 | |
| | |
Powerlong Real Estate Holdings, Ltd.
4.900%, 05/13/26d | | | 1,500,000 | | | | 225,000 | |
| | |
Times China Holdings, Ltd.
6.750%, 07/08/25d | | | 1,100,000 | | | | 147,125 | |
| | |
Times China Holdings, Ltd.
5.750%, 01/14/27d | | | 800,000 | | | | 104,093 | |
| | | | | | | | |
Total China/Hong Kong | | | | | | | 26,879,776 | |
| | | | | | | | |
| | | | | | | | |
| | | |
| INDIA: 8.4% | | | | | | | | |
| | |
Periama Holdings LLC
5.950%, 04/19/26d | | | 3,600,000 | | | | 3,222,000 | |
| | |
Network i2i, Ltd.
5.650%b, 01/15/25c,e | | | 1,800,000 | | | | 1,669,500 | |
| | |
ICICI Bank UK PLC
5.375%b, 09/26/28d | | | SGD 1,750,000 | | | | 1,251,654 | |
| | | | | | | | |
Total India | | | | | | | 6,143,154 | |
| | | | | | | | |
| | | | | | | | |
| | | |
| INDONESIA: 7.3% | | | | | | | | |
| | |
Indika Energy Capital III Pte, Ltd.
5.875%, 11/09/24d | | | 3,300,000 | | | | 3,200,101 | |
| | |
PB International BV
7.625%, 12/31/25d | | | 5,100,000 | | | | 2,193,000 | |
| | | | | | | | |
Total Indonesia | | | | | | | 5,393,101 | |
| | | | | | | | |
| | | | | | | | |
| | | | | | | | |
| | | Face Amount* | | | Value | |
| | |
| THAILAND: 1.1% | | | | | | | | |
| | |
Bangkok Bank Public Co., Ltd.
5.000%b, 09/23/25c,d | | | 900,000 | | | | $827,388 | |
| | | | | | | | |
Total Thailand | | | | | | | 827,388 | |
| | | | | | | | |
| | | | | | | | |
| | |
| TOTAL NON-CONVERTIBLE CORPORATE BONDS | | | | 39,243,419 | |
| | | | | | | | |
(Cost $64,778,789) | | | | | | | | |
| | | | | | | | |
| |
CONVERTIBLE CORPORATE BONDS: 21.9% | | | | | |
| |
| CHINA/HONG KONG: 17.3% | |
| | |
Luye Pharma Group, Ltd., Cnv.
1.500%, 07/09/24d | | | 3,500,000 | | | | 3,492,825 | |
| | |
ESR Group, Ltd., Cnv.
1.500%, 09/30/25d | | | 2,400,000 | | | | 2,272,800 | |
| | |
NIO, Inc., Cnv.
0.500%, 02/01/27 | | | 2,200,000 | | | | 1,648,900 | |
| | |
iQIYI, Inc., Cnv.
2.000%, 04/01/25 | | | 1,800,000 | | | | 1,449,000 | |
| | |
Weimob Investment, Ltd., Cnv.
0.000%, 06/07/26d | | | 2,000,000 | | | | 1,353,000 | |
| | |
Meituan, Cnv.
0.000%, 04/27/28d | | | 1,600,000 | | | | 1,338,400 | |
| | |
Pinduoduo, Inc., Cnv.
0.000%, 12/01/25 | | | 1,300,000 | | | | 1,145,300 | |
| | | | | | | | |
Total China/Hong Kong | | | | | | | 12,700,225 | |
| | | | | | | | |
| | | | | | | | |
| |
| NEW ZEALAND: 2.1% | |
| | |
Xero Investments, Ltd., Cnv.
0.000%, 12/02/25d | | | 2,000,000 | | | | 1,569,600 | |
| | | | | | | | |
Total New Zealand | | | | | | | 1,569,600 | |
| | | | | | | | |
| | | | | | | | |
| |
| SINGAPORE: 1.8% | |
| | |
Sea, Ltd., Cnv.
0.250%, 09/15/26 | | | 1,800,000 | | | | 1,314,000 | |
| | | | | | | | |
Total Singapore | | | | | | | 1,314,000 | |
| | | | | | | | |
| | | | | | | | |
| |
| TAIWAN: 0.7% | |
| | |
United Microelectronics Corp., Cnv.
0.000%, 07/07/26d | | | 600,000 | | | | 531,900 | |
| | | | | | | | |
Total Taiwan | | | | | | | 531,900 | |
| | | | | | | | |
| | | | | | | | |
| | |
| TOTAL CONVERTIBLE CORPORATE BONDS | | | | 16,115,725 | |
| | | | | | | | |
(Cost $18,458,031) | | | | | | | | |
| | | | | | | | |
| |
FOREIGN GOVERNMENT OBLIGATIONS: 13.7% | | | | | |
| | | |
| CHINA/HONG KONG: 6.4% | | | | | | | | |
| | |
China Development Bank
3.800%, 01/25/36 | | | CNY 30,000,000 | | | | 4,730,188 | |
| | | | | | | | |
Total China/Hong Kong | | | | | | | 4,730,188 | |
| | | | | | | | |
| | | | | | | | |
| | | | | | | | |
| | | | matthewsasia.com | 800.789.ASIA | | | 77 | |
Matthews Asia Total Return Bond Fund
June 30, 2022
Schedule of Investmentsa (unaudited) (continued)
FOREIGN GOVERNMENT OBLIGATIONS (continued)
| | | | | | | | |
| | | Face Amount* | | | Value | |
| | |
| MALAYSIA: 4.0% | | | | | | | | |
| | |
Malaysia Government Bond
4.642%, 11/07/33 | | | MYR 9,000,000 | | | | $2,048,772 | |
| | |
Malaysia Government Investment Issue
3.422%, 09/30/27 | | | MYR 4,000,000 | | | | 880,002 | |
| | | | | | | | |
Total Malaysia | | | | | | | 2,928,774 | |
| | | | | | | | |
| | | | | | | | |
| | | |
| INDONESIA: 3.3% | | | | | | | | |
| | |
Indonesia Government Bond
8.250%, 05/15/29 | | | IDR 30,550,000,000 | | | | 2,178,847 | |
| | |
Indonesia Government Bond
9.000%, 03/15/29 | | | IDR 4,000,000,000 | | | | 295,352 | |
| | | | | | | | |
Total Indonesia | | | | | | | 2,474,199 | |
| | | | | | | | |
| | | | | | | | |
| | |
| TOTAL FOREIGN GOVERNMENT OBLIGATIONS | | | | 10,133,161 | |
| | | | | | | | |
(Cost $10,426,495) | | | | | | | | |
| | | | | | | | |
| | | |
| TOTAL INVESTMENTS: 88.9% | | | | | | | 65,492,305 | |
(Cost $93,663,315) | | | | | | | | |
| | | | | | | | |
| |
CASH AND OTHER ASSETS,
LESS LIABILITIES: 11.1% | | | | 8,146,144 | |
| | | | | | | | |
| | |
NET ASSETS: 100.0% | | | | | | | $73,638,449 | |
| | | | | | | | |
| a | Certain securities were fair valued under the valuation policies approved by the Board of Trustees (Note 2-A). |
| b | Security is a fix-to-float security, which carries a fixed coupon until a certain date, upon which it switches to a floating rate. Reference rate and spread are provided if the rate is currently floating. |
| c | Perpetual security with no stated maturity date. First call date is disclosed. |
| d | The securities may be resold to qualified foreign investors and foreign institutional buyers under Regulation S of the Securities Act of 1933. |
| e | Security exempt from registration under Rule 144A of the Securities Act of 1933, as amended. The security may be resold in transactions exempt from registration normally to qualified institutional buyers. The security has been determined to be liquid in accordance with procedures adopted by the Funds’ Board of Trustees. At June 30, 2022, the aggregate value is $1,669,500, which is 2.27% of net assets. |
| * | All Values in USD unless otherwise specified. |
| CNY | Chinese Renminbi (Yuan) |
FORWARD FOREIGN CURRENCY EXCHANGE CONTRACTS
| | | | | | | | | | | | |
| Currency Purchased | | Currency Sold | | Counterparty | | Settlement
Date | | | Unrealized
Appreciation | |
| KRW 4,785,036,000 | | USD 3,720,000 | | Bank of America, N.A. | | | 12/22/22 | | | | $13,198 | |
| USD 3,650,000 | | CNY 24,418,500 | | Bank of America, N.A. | | | 12/22/22 | | | | 1,357 | |
| | | | | | | | | | | | |
Net Unrealized Appreciation | | | | | | | | | $14,555 | |
| | | | | | | | | | | | |
See accompanying notes to financial statements.
| | | | |
| PORTFOLIO MANAGERS |
| |
Satya Patel | | |
Lead Manager | | |
| |
Wei Zhang* | | |
Co-Manager | | |
| | |
| FUND FACTS | | | | |
| | |
| | | Investor | | Institutional |
Ticker | | MCRDX | | MICPX |
CUSIP | | 577130677 | | 577130669 |
Inception | | 4/29/16 | | 4/29/16 |
NAV | | $7.35 | | $7.35 |
Initial Investment | | $2,500 | | $100,000 |
Gross Expense Ratio1 | | 1.07% | | 0.93% |
After Fee Waiver and Reimbursement2 | | 1.07% | | 0.90% |
Portfolio Statistics | | |
Total # of Positions | | | | 34 |
Net Assets | | | | $25.6 million |
Modified Duration3 | | | | 2.5 |
Portfolio Turnover4 | | | | 79.8% |
Benchmark | | | | |
J.P. Morgan Asia Credit Index |
OBJECTIVE
Total return over the long term.
STRATEGY
Under normal market conditions, the Fund seeks to achieve its investment objective by investing at least 80% of its net assets, which include borrowings for investment purposes, in debt and debt-related instruments issued by companies as well as governments, quasi-governmental entities, and supra-national institutions in Asia. Debt and debt-related instruments typically include bonds, debentures, bills, securitized instruments (which are vehicles backed by pools of assets such as loans or other receivables), notes, certificates of deposit and other bank obligations, bank loans, senior secured bank debt, convertible debt securities, exchangeable bonds, credit-linked notes, inflation-linked instruments, repurchase agreements, payment-in-kind securities and derivative instruments with fixed income characteristics. Asia consists of all countries and markets in Asia, such as China and Indonesia, in addition to the developed, emerging, and frontier countries and markets in the Asian region.
Matthews Asia Credit Opportunities Fund
Portfolio Manager Commentary (unaudited)
For the first half of 2022, the Matthews Asia Credit Opportunities Fund returned –17.75% (Investor Class) and –17.57% (Institutional Class), while its benchmark, the J.P. Morgan Asia Credit Index, returned –10.74% over the same period. For the quarter ending June 30, 2022, the Fund returned
–9.14% (Investor Class) and –9.08% (Institutional Class), while the benchmark returned –4.74%.
Market Environment:
Asia credit, along with just about every other asset class with the exception of commodities saw material declines in the first half of 2022. It has been a tough market, marked by price declines driven by both credit spread widening and rising U.S. interest rates.
The U.S. dollar-denominated Asia credit market continues to grapple with rising defaults and ongoing uncertainly. Asia high yield default rates hit a multi-year high of 14.24% in the first half of this year that includes the default of 11 issuers on US$35 billion notional of debt outstanding. Asia high yield spreads ended the first half close to the highs experienced at the peak of the pandemic at 965 basis points (9.65%). Asia investment grade spreads widened to 206 basis points (2.06%) at the end of June, though the spread widening reflected a repricing of relative value in comparison to sub-investment grade credit rather than a material rise in risk.
The Asia credit market in the first half was dominated by China’s zero-COVID policy and its consequences on the economy. The start-and-stop quarantines that paralyzed mobility in much of the country sterilized much of the macro policy easing designed to ease credit conditions and reaccelerate the economy. Within this macro backdrop, several sub investment grade property developers in China were unable to refinance their maturities as there was no marginal buyer willing to lend. With the lack of credit, liquidity and workers, construction remains at a standstill, resulting in continued deterioration in the sector. In the U.S., inflation continues to run significantly above the Federal Reserve’s mandate, with investors pricing in a higher likelihood of the Fed having to slam the brakes to slay the inflation dragon at the expense of economy. Oil and food prices remain elevated given the ongoing conflict in Ukraine, though several commodities had fallen off their peaks by the end of June.
Performance Contributors and Detractors:
Overall, the top contributors to performance came from Chinese corporates that bounced off of the bottoms. These included Baozun, an e-commerce provider; Dalian Wanda, one of the largest developers of integrated malls; and iQIYI, an online video platform company.
The biggest detractors to returns include Sino Ocean, Times China and KWG Holdings, all of which are Chinese property developers that have not been able to refinance in the USD market because of the lack of appetite for any China real estate exposure.
(continued)
| * | Effective July 31, 2022. |
| 1 | Prospectus expense ratios. |
| 2 | Matthews has contractually agreed (i) to waive fees and reimburse expenses to the extent needed to limit Total Annual Fund Operating Expenses (excluding Rule 12b-1 fees, taxes, interest, brokerage commissions, short sale dividend expenses, expenses incurred in connection with any merger or reorganization or extraordinary expenses such as litigation) of the Institutional Class to 0.90% first by waiving class specific expenses (i.e., shareholder service fees specific to a particular class) of the Institutional Class and then, to the extent necessary, by waiving non-class specific expenses (e.g., custody fees) of the Institutional Class, and (ii) if any Fund-wide expenses (i.e., expenses that apply to both the Institutional Class and the Investor Class) are waived for the Institutional Class to maintain the 0.90% expense limitation, to waive an equal amount (in annual percentage terms) of those same expenses for the Investor Class. The Total Annual Fund Operating Expenses After Fee Waiver and Expense Reimbursement for the Investor Class may vary from year to year and will in some years exceed 0.90%. Pursuant to this agreement, any amount waived for prior fiscal years with respect to the Fund is not subject to recoupment. This agreement will remain in place until April 30, 2023 and may be terminated at any time by the Board of Trustees on behalf of the Fund on 60 days’ written notice to Matthews. Matthews may decline to renew this agreement by written notice to the Trust at least 30 days before its annual expiration date. |
| 3 | Modified duration measures the percent change in value of the fixed income portion of the portfolio in response to a 1% change in interest rates. In a multi-currency denominated portfolio with sensitivities to different interest rate regimes, modified duration will not accurately reflect the change in value of the overall portfolio from a change in any one interest rate regime. |
| 4 | The lesser of fiscal year 2021 long-term purchase costs or sales proceeds divided by the average monthly market value of long-term securities. |
| | | | | | | | |
| | | | matthewsasia.com | 800.789.ASIA | | | 79 | |
| | | | | | | | | | | | | | | | | | | | | | | | | | | | |
| | | | | | | | |
| PERFORMANCE AS OF JUNE 30, 2022 | | | | | | | | | | | | | | | | | | | | | |
| | | | | | | | | | | | Average Annual
Total Retuns | | | | | | | |
| | | 3 Months | | | YTD | | | 1 Year | | | 3 Years | | | 5 Years | | | Since
Inception | | | Inception
Date | |
| Investor Class (MCRDX) | | | -9.14% | | | | -17.75% | | | | -21.29% | | | | -6.69% | | | | -2.44% | | | | -0.42% | | | | 4/29/16 | |
| Institutional Class (MICPX) | | | -9.08% | | | | -17.57% | | | | -21.08% | | | | -6.48% | | | | -2.21% | | | | -0.19% | | | | 4/29/16 | |
| J.P. Morgan Asia Credit Index5 | | | -4.74% | | | | -10.74% | | | | -12.81% | | | | -1.55% | | | | 0.84% | | | | 1.52% | | | | | |
Performance assumes reinvestment of all dividends and/or distributions before taxes. All performance quoted represents past performance and is no guarantee of future results. Investment return and principal value will fluctuate with market conditions so that when redeemed, shares may be worth more or less than their original cost. Current performance may be lower or higher than the return figures quoted. Returns would have been lower if certain of the Fund’s fees and expenses had not been waived. For the Fund’s most recent month-end performance, visit matthewsasia.com.
| | | | | | | | | | | | | | | | | | | | | | | | | | | | | | | | | | | | | | | | | | | | | | | | | | | | |
| |
| INCOME DISTRIBUTION HISTORY | |
| 2022 | | Jan. | | | Feb. | | | Mar. | | | Apr. | | | May | | | June | | | July | | | Aug. | | | Sept. | | | Oct. | | | Nov. | | | Dec. | | | Total | |
| Investor (MCRDX) | | $ | 0.02 | | | $ | 0.03 | | | $ | 0.03 | | | $ | 0.04 | | | $ | 0.04 | | | $ | 0.04 | | | | n.a. | | | | n.a. | | | | n.a. | | | | n.a. | | | | n.a. | | | | n.a. | | | | n.a. | |
| Inst’l (MICPX) | | $ | 0.02 | | | $ | 0.03 | | | $ | 0.03 | | | $ | 0.04 | | | $ | 0.04 | | | $ | 0.04 | | | | n.a. | | | | n.a. | | | | n.a. | | | | n.a. | | | | n.a. | | | | n.a. | | | | n.a. | |
| | | | | | | | | | | | | |
| 2021 | | | | | | | | | | | | | | | | | | | | | | | | | | | | | | | | | | | | | | | |
| Investor (MCRDX) | | $ | 0.05 | | | $ | 0.03 | | | $ | 0.04 | | | $ | 0.04 | | | $ | 0.03 | | | $ | 0.03 | | | $ | 0.03 | | | $ | 0.03 | | | $ | 0.03 | | | $ | 0.03 | | | $ | 0.07 | | | $ | 0.07 | | | $ | 0.47 | |
| Inst’l (MICPX) | | $ | 0.05 | | | $ | 0.03 | | | $ | 0.04 | | | $ | 0.04 | | | $ | 0.03 | | | $ | 0.03 | | | $ | 0.03 | | | $ | 0.03 | | | $ | 0.03 | | | $ | 0.04 | | | $ | 0.07 | | | $ | 0.07 | | | $ | 0.50 | |
Note: This table does not include capital gains distributions. Totals may differ by $0.02 due to rounding. For income distribution history, visit matthewsasia.com.
| | | | |
| | | |
30 DAY YIELD: Investor Class: 9.74% (9.33% excluding waivers) Institutional Class: 9.95% (9.46% excluding waivers) The 30-Day Yield represents net investment income earned by the Fund over the 30-day period ended 6/30/22, expressed as an annual percentage rate based on the Fund’s share price at the end of the 30-day period. The 30 Day Yield excludes securities that trade without accrued interest. The 30-Day Yield should be regarded as an estimate of the Fund’s rate of investment income, and it may not equal the Fund’s actual income distribution rate. Source: BNY Mellon Investment Servicing (US) Inc. | | | | YIELD TO WORST: 15.12% Yield to worst is the lowest yield that can be received on a bond assuming that the issuer does not default. It is calculated by utilizing the worst case assumptions for a bond with respect to certain income-reducing factors, including prepayment, call or sinking fund provisions. The yield to worst excludes securities that trade without accrued interest. It does not represent the yield that an investor should expect to receive. Past yields are no guarantee of future yields. Source: FactSet Research Systems |
GROWTH OF A HYPOTHETICAL $10,000 INVESTMENT SINCE INCEPTION—INVESTOR CLASS
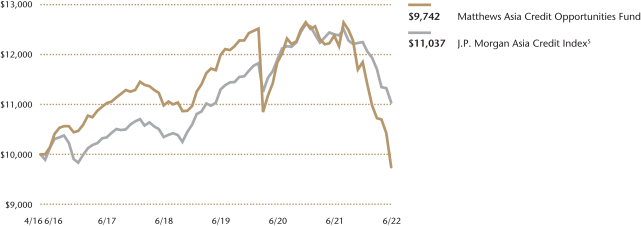
Plotted monthly. The performance data and graph do not reflect the deduction of taxes that a shareholder would pay on dividends, capital gains distributions, or redemption of Fund shares. Values are in US$.
| | 5 | It is not possible to invest directly in an index. Source: Index data from J.P. Morgan and Bloomberg; total return calculations performed by BNY Mellon Investment Servicing (US) Inc. Please see page 84 for index definition. |
| | | | | | | | |
| | | | |
| TOP TEN HOLDINGS | | | | | | | |
| Name | | Sector | | Currency | | % Net Assets | |
| PB International BV, 7.625%, 12/31/2025 | | Industrial | | U.S. Dollar | | | 8.9% | |
| Luye Pharma Group, Ltd., Cnv., 1.500%, 07/09/2024 | | Industrial | | U.S. Dollar | | | 7.0% | |
| Indika Energy Capital III Pte, Ltd., 5.875%, 11/09/2024 | | Industrial | | U.S. Dollar | | | 4.9% | |
| Socialist Republic of Vietnam, 5.500%, 03/12/2028 | | Sovereign | | U.S. Dollar | | | 4.8% | |
| Network i2i, Ltd., 5.650%, 04/15/2068 | | Industrial | | U.S. Dollar | | | 4.7% | |
| Shriram Transport Finance Co., Ltd., 4.400%, 03/13/2024 | | Financial Institutions | | U.S. Dollar | | | 4.7% | |
| Axis Bank, Ltd./Gift City, 4.100%, 09/08/2026 | | Financial Institutions | | U.S. Dollar | | | 4.4% | |
| Kasikornbank Public Co., Ltd., 5.275%, 04/14/2068 | | Financial Institutions | | U.S. Dollar | | | 4.4% | |
| Periama Holdings LLC, 5.950%, 04/19/2026 | | Industrial | | U.S. Dollar | | | 4.2% | |
| Bank of East Asia, Ltd., 5.825%, 04/21/2069 | | Financial Institutions | | U.S. Dollar | | | 4.2% | |
| % OF ASSETS IN TOP 10 | | | 52.2% | |
| | | | |
| |
| CURRENCY ALLOCATION (%)6,7 | |
| US Dollar | | | 100.0 | |
| | | | |
| |
| COUNTRY ALLOCATION (%)6,7,8 | |
| China/Hong Kong | | | 43.8 | |
| India | | | 23.9 | |
| Indonesia | | | 18.0 | |
| Vietnam | | | 4.8 | |
| Thailand | | | 4.4 | |
| New Zealand | | | 2.5 | |
| Singapore | | | 2.0 | |
| Cash and Other Assets, Less Liabilities | | | 0.8 | |
| | | | |
| |
| SECTOR ALLOCATION (%)6,7 | |
| Industrial | | | 46.0 | |
| Financial Institutions | | | 41.8 | |
| Agency | | | 6.7 | |
| Sovereign | | | 4.8 | |
| Cash and Other Assets, Less Liabilities | | | 0.8 | |
| | | | |
| |
| ASSET TYPE BREAKDOWN (%)6,7 | |
| Non-Convertible Corporate Bonds | | | 74.0 | |
| Convertible Corporate Bonds | | | 20.5 | |
| Government Bonds | | | 4.8 | |
| Cash and Other Assets, Less Liabilities | | | 0.8 | |
| 6 | Source: FactSet Research Systems. Percentage values in data are rounded to the nearest tenth of one percent, so the values may not sum to 100% due to rounding. Country allocations and percentage values may be derived from different data sources and may not be consistent with other Fund literature. |
| 7 | Cash and other assets may include forward currency exchange contracts and certain derivative instruments that have been marked-to-market. |
| 8 | Not all countries where the Fund may invest are included in the benchmark index. |
Matthews Asia Credit Opportunities Fund
Portfolio Manager Commentary (unaudited) (continued)
In terms of sectors, sovereigns were the best performing sector as our holdings in the Viet Nam Debt and Asset Trading Corp remained solid while other financials, which include real estate developers, were the biggest detractor from performance.
Notable Portfolio Changes:
We made limited changes to the portfolio in the first quarter and did not initiate any new holdings in the second quarter. During the second quarter, we exited a number of positions as we deemed their prices to offer limited upside, including bonds issued by Baozun; Dalian Wanda; Kakao, the dominant South Korean internet messaging company; Khazanah Investment, a Malaysian sovereign wealth fund (Cerah), Meituan, one of the largest internet retailers in China; Abja Investment Company, the financing vehicle for Tata Steel, one of the largest steel producers headquartered in India; and United Microelectronics Corp., a Taiwanese semiconductor company.
Outlook:
There is an ancient saying, “As things tend to their extremes, they give way to their opposites.” By all measures, Asia credit has priced in much of the risks and uncertainties in the market today. With credit spreads again close to historic highs, they have already baked in expected defaults across much of the sub-investment grade real estate sector. While we believe defaults are likely to continue, we expect the overwhelming number of restructurings to be amended and extended exercises which should result in an extension of the maturity, but no haircut in principal so that bondholders should ultimately see a recovery of 100% in principal. The other component to Asia credit returns is U.S. interest rates, which unfortunately have more risks of rising than falling. We have seen high volatility driven by waning or waxing inflation and the market’s expectation of the Fed’s ability to tame the U.S.’s stubborn and persistent inflation. With the yield curve pricing in at least a 50 basis points (0.50%) rate hike at the upcoming July Fed meeting, the market is increasingly pricing in a challenging inflation picture that would likely land the U.S. into a recession in the coming year. With the persistence of inflation and defaults, buyers have been waiting on the sidelines, reluctant to catch a falling knife. However, as any of the storm clouds we outline dissipate, we expect the patient marginal buyer to finally step in to take advantage of depressed valuations to reap price appreciation and potential outsized returns in the coming years.
| | | | | | | | |
| | | | matthewsasia.com | 800.789.ASIA | | | 81 | |
Matthews Asia Credit Opportunities Fund
June 30, 2022
Schedule of Investmentsa (unaudited)
NON-CONVERTIBLE CORPORATE BONDS: 74.0%
| | | | | | | | |
| | | Face Amount* | | | Value | |
| | |
| CHINA/HONG KONG: 27.7% | | | | | | | | |
| | |
Bank of East Asia, Ltd.
5.825%b, 10/21/25c,d | | | 1,100,000 | | | | $1,072,500 | |
| | |
Sino-Ocean Land Treasure III, Ltd.
4.900%b, 09/21/22c,d | | | 2,500,000 | | | | 1,017,513 | |
| | |
Wanda Properties International Co., Ltd.
7.250%, 01/29/24d | | | 1,100,000 | | | | 814,165 | |
| | |
Franshion Brilliant, Ltd.
6.000%b, 02/08/26c,d | | | 800,000 | | | | 753,000 | |
| | |
Standard Chartered PLC
4.300%b, 08/19/28c,d | | | 1,000,000 | | | | 730,915 | |
| | |
Huarong Finance 2019 Co., Ltd.
4.250%b, 09/30/25c,d | | | 800,000 | | | | 704,000 | |
| | |
King Talent Management, Ltd.
5.600%b, 12/04/22c,d | | | 600,000 | | | | 570,720 | |
| | |
China SCE Group Holdings, Ltd.
7.000%, 05/02/25d | | | 1,200,000 | | | | 348,000 | |
| | |
KWG Group Holdings, Ltd.
7.400%, 01/13/27d | | | 1,800,000 | | | | 338,840 | |
| | |
Logan Group Co., Ltd.
4.500%, 01/13/28d | | | 1,020,000 | | | | 211,652 | |
| | |
Times China Holdings, Ltd.
6.200%, 03/22/26d | | | 1,500,000 | | | | 195,000 | |
| | |
CIFI Holdings Group Co., Ltd.
4.800%, 05/17/28d | | | 200,000 | | | | 105,750 | |
| | |
Sunac China Holdings, Ltd.
6.500%, 01/26/26d | | | 700,000 | | | | 98,555 | |
| | |
Powerlong Real Estate Holdings, Ltd.
4.900%, 05/13/26d | | | 500,000 | | | | 75,000 | |
| | |
Times China Holdings, Ltd.
5.750%, 01/14/27d | | | 250,000 | | | | 32,529 | |
| | | | | | | | |
Total China/Hong Kong | | | | | | | 7,068,139 | |
| | | | | | | | |
| | | | | | | | |
| | | |
| INDIA: 23.9% | | | | | | | | |
| | |
Network i2i, Ltd.
5.650%b, 01/15/25c,e | | | 1,300,000 | | | | 1,205,750 | |
| | |
Shriram Transport Finance Co., Ltd.
4.400%, 03/13/24d | | | 1,300,000 | | | | 1,198,032 | |
| | |
Axis Bank, Ltd./Gift City,
4.100%b, 09/08/26c,d | | | 1,300,000 | | | | 1,115,323 | |
| | |
Periama Holdings LLC
5.950%, 04/19/26d | | | 1,200,000 | | | | 1,074,000 | |
| | |
HDFC Bank, Ltd.
3.700%b, 08/25/26c,e | | | 1,000,000 | | | | 830,000 | |
| | |
Tata Motors, Ltd.
5.875%, 05/20/25d | | | 700,000 | | | | 689,493 | |
| | | | | | | | |
Total India | | | | | | | 6,112,598 | |
| | | | | | | | |
| | | | | | | | |
| | | |
| INDONESIA: 18.0% | | | | | | | | |
| | |
PB International BV
7.625%, 12/31/25d | | | 5,300,000 | | | | 2,279,000 | |
| | |
Indika Energy Capital III Pte, Ltd.
5.875%, 11/09/24d | | | 1,300,000 | | | | 1,260,646 | |
| | |
Theta Capital Pte, Ltd.
6.750%, 10/31/26d | | | 1,400,000 | | | | 1,069,250 | |
| | | | | | | | |
Total Indonesia | | | | | | | 4,608,896 | |
| | | | | | | | |
| | | | | | | | |
| | | | | | | | |
| | | Face Amount* | | | Value | |
| | |
| THAILAND: 4.4% | | | | | | | | |
| | |
Kasikornbank Public Co., Ltd.
5.275%b, 10/14/25c,d | | | 1,200,000 | | | | $1,113,000 | |
| | | | | | | | |
Total Thailand | | | | | | | 1,113,000 | |
| | | | | | | | |
| | | | | | | | |
| | |
| TOTAL NON-CONVERTIBLE CORPORATE BONDS | | | | 18,902,633 | |
| | | | | | | | |
(Cost $30,196,070) | | | | | | | | |
| | | | | | | | |
| |
CONVERTIBLE CORPORATE BONDS: 20.5% | | | | | |
| |
| CHINA/HONG KONG: 16.1% | |
| | |
Luye Pharma Group, Ltd., Cnv.
1.500%, 07/09/24d | | | 1,800,000 | | | | 1,796,310 | |
| | |
NIO, Inc., Cnv.
0.500%, 02/01/27 | | | 800,000 | | | | 599,600 | |
| | |
iQIYI, Inc., Cnv.
2.000%, 04/01/25 | | | 600,000 | | | | 483,000 | |
| | |
Pinduoduo, Inc., Cnv.
0.000%, 12/01/25 | | | 500,000 | | | | 440,500 | |
| | |
Weimob Investment, Ltd., Cnv.
0.000%, 06/07/26d | | | 600,000 | | | | 405,900 | |
| | |
ESR Group, Ltd., Cnv.
1.500%, 09/30/25d | | | 400,000 | | | | 378,800 | |
| | | | | | | | |
Total China/Hong Kong | | | | | | | 4,104,110 | |
| | | | | | | | |
| | | | | | | | |
| | | |
| NEW ZEALAND: 2.4% | | | | | | | | |
| | |
Xero Investments, Ltd., Cnv.
0.000%, 12/02/25d | | | 800,000 | | | | 627,840 | |
| | | | | | | | |
Total New Zealand | | | | | | | 627,840 | |
| | | | | | | | |
| | | | | | | | |
| | | |
| SINGAPORE: 2.0% | | | | | | | | |
| | |
Sea, Ltd., Cnv.
0.250%, 09/15/26 | | | 700,000 | | | | 511,000 | |
| | | | | | | | |
Total Singapore | | | | | | | 511,000 | |
| | | | | | | | |
| | | | | | | | |
| | |
| TOTAL CONVERTIBLE CORPORATE BONDS | | | | 5,242,950 | |
| | | | | | | | |
(Cost $5,838,606) | | | | | | | | |
| | | | | | | | |
| |
FOREIGN GOVERNMENT OBLIGATIONS: 4.7% | | | | | |
| | | |
| VIETNAM: 4.7% | | | | | | | | |
| | |
Socialist Republic of Vietnam
5.500%, 03/12/28 | | | 1,230,000 | | | | 1,215,793 | |
| | | | | | | | |
Total Vietnam | | | | | | | 1,215,793 | |
| | | | | | | | |
| | | | | | | | |
| | |
| TOTAL FOREIGN GOVERNMENT OBLIGATIONS | | | | 1,215,793 | |
| | | | | | | | |
(Cost $1,230,000) | | | | | | | | |
| | | | | | | | |
| | |
| TOTAL INVESTMENTS: 99.2% | | | | 25,361,376 | |
(Cost $37,264,676) | | | | | | | | |
| | | | | | | | |
| |
CASH AND OTHER ASSETS,
LESS LIABILITIES: 0.8% | | | | 196,417 | |
| | | | | | | | |
| |
NET ASSETS: 100.0% | | | | $25,557,793 | |
| | | | | | | | |
Matthews Asia Credit Opportunities Fund
June 30, 2022
Schedule of Investmentsa (unaudited) (continued)
| a | Certain securities were fair valued under the valuation policies approved by the Board of Trustees (Note 2-A). |
| b | Security is a fix-to-float security, which carries a fixed coupon until a certain date, upon which it switches to a floating rate. Reference rate and spread are provided if the rate is currently floating. |
| c | Perpetual security with no stated maturity date. First call date is disclosed. |
| d | The securities may be resold to qualified foreign investors and foreign institutional buyers under Regulation S of the Securities Act of 1933. |
| e | Security exempt from registration under Rule 144A of the Securities Act of 1933, as amended. The security may be resold in transactions exempt from registration normally to qualified institutional buyers. The security has been determined to be liquid in accordance with procedures adopted by the Funds’ Board of Trustees. At June 30, 2022, the aggregate value is $2,035,750, which is 7.97% of net assets. |
| * | All Values in USD unless otherwise specified. |
See accompanying notes to financial statements.
| | | | | | | | |
| | | | matthewsasia.com | 800.789.ASIA | | | 83 | |
Index Definitions
The MSCI Emerging Markets Index is a free float-adjusted market capitalization-weighted index of the stock markets of Argentina, Brazil, Chile, China, Colombia, Czech Republic, Egypt, Greece, Hungary, India, Indonesia, Kuwait, Malaysia, Mexico, Pakistan, Peru, Philippines, Poland, Qatar, Russia, Saudi Arabia, South Africa, South Korea, Taiwan, Thailand, Turkey and United Arab Emirates.
The MSCI Emerging Markets Small Cap Index is a free float-adjusted market capitalization-weighted small cap index of the stock markets of Argentina, Brazil, Chile, China, Colombia, Czech Republic, Egypt, Greece, Hungary, India, Indonesia, Kuwait, Malaysia, Mexico, Pakistan, Peru, Philippines, Poland, Qatar, Russia, Saudi Arabia, South Africa, South Korea, Taiwan, Thailand, Turkey and United Arab Emirates.
The MSCI All Country Asia Pacific Index is a free float–adjusted market capitalization–weighted index of the stock markets of Australia, China, Hong Kong, India, Indonesia, Japan, Malaysia, New Zealand, Pakistan, Philippines, Singapore, South Korea, Taiwan and Thailand.
The MSCI All Country Asia ex Japan Index is a free float–adjusted market capitalization–weighted index of the stock markets of China, Hong Kong, India, Indonesia, Malaysia, Pakistan, Philippines, Singapore, South Korea, Taiwan and Thailand.
The MSCI China Index is a free float–adjusted market capitalization-weighted index of Chinese equities that includes H shares listed on the Hong Kong exchange, B shares listed on the Shanghai and Shenzhen ex-exchanges, and Hong Kong-listed securities known as Red Chips (issued by entities owned by national or local governments in China) and P Chips (issued by companies controlled by individuals in China and deriving substantial revenues in China), and foreign listings (e.g., ADRs).
The MSCI China All Shares Index captures large and mid-cap representation across China A shares, B shares, H shares, Red Chips (issued by entities owned by national or local governments in China), P Chips (issued by companies controlled by
individuals in China and deriving substantial revenues in China), and foreign listings (e.g., ADRs). The index aims to reflect the opportunity set of China share classes listed in Hong Kong, Shanghai, Shenzhen and outside of China.
The MSCI China Small Cap Index is a free float–adjusted market capitalization-weighted small cap index of the Chinese equity securities markets, including H shares listed on the Hong Kong exchange, B shares listed on the Shanghai and Shenzhen exchanges, and Hong Kong-listed securities known as Red Chips (issued by entities owned by national or local governments in China) and P Chips (issued by companies controlled by individuals in China and deriving substantial revenues in China), and foreign listings (e.g., ADRs).
The S&P Bombay Stock Exchange (BSE) 100 Index is a free float–adjusted market capitalization-weighted index of the 100 stocks listed on the Bombay Stock Exchange.
The MSCI Japan Index is a free float–adjusted market capitalization-weighted index of Japanese equities listed in Japan.
The Korea Composite Stock Price Index (KOSPI) is a market capitalization–weighted index of all common stocks listed on the Korea Stock Exchange.
The Markit iBoxx Asian Local Bond Index (ALBI) tracks the total return performance of a bond portfolio consisting of local currency denominated, high quality and liquid bonds in Asia ex Japan. The ALBI includes bonds from the following countries: China, Hong Kong, India, Indonesia, Hong Kong, Malaysia, Philippines, Singapore, South Korea, Taiwan and Thailand.
The J.P. Morgan Asia Credit Index (JACI) tracks the total return performance of the Asia fixed-rate dollar bond market. JACI is a market capitalization-weighted index comprising sovereign, quasi-sovereign and corporate bonds and is partitioned by country, sector and credit rating. JACI includes bonds from the following countries: China, Hong Kong, India, Indonesia, Malaysia, Philippines, Singapore, South Korea and Thailand.
Disclosures
Fund Holdings: The Fund holdings shown in this report are as of June 30, 2022. Holdings are subject to change at any time, so holdings shown in this report may not reflect current Fund holdings. The Funds file complete schedules of portfolio holdings with the Securities and Exchange Commission (the “SEC”) for the first and third quarters of each fiscal year on Form N-PORT. The Funds’ Form N-PORTs are available on the SEC’s website at www.sec.gov. Complete schedules of investments are also available without charge, upon request, from the Funds by calling us at 800.789.ASIA (2742).
Proxy Voting Record: The Funds’ Statement of Additional Information containing a description of the policies and procedures that the Funds have used to vote proxies relating to portfolio securities, along with each Fund’s proxy voting record relating
to portfolio securities held during the most recent 12-month period ended June 30, is available upon request, at no charge, at the Funds’ website at matthewsasia.com or by calling 800.789.ASIA (2742), or on the SEC’s website at www.sec.gov.
Shareholder Reports and Prospectuses: To reduce the Funds’ expenses, we try to identify related shareholders in a household and send only one copy of the Funds’ prospectus and financial reports to that address. This process, called “householding,” will continue indefinitely unless you instruct us otherwise. At any time you may view the Funds’ current prospectus, summary prospectus and financial reports on our website. If you prefer to receive individual copies of the Funds’ prospectus or financial reports, please call us at 800.789.ASIA (2742).
| | | | | | | | |
| | | | matthewsasia.com | 800.789.ASIA | | | 85 | |
Disclosure of Fund Expenses (unaudited)
We believe it is important for you to understand the impact of fees regarding your investment. All mutual funds have operating expenses. As a shareholder of a mutual fund, you incur ongoing costs, which include costs for portfolio management, administrative services, and shareholder reports (like this one), among others. Operating expenses, which are deducted from a fund’s gross income, directly reduce the investment return of the fund. A fund’s operating expenses are expressed as a percentage of its average net assets. This figure is known as the expense ratio. The following examples are intended to help you understand the ongoing fees (in dollars) of investing in your fund and to compare these costs with those of other mutual funds. The examples are based on an investment of $1,000 made at the beginning of the period shown and held for the entire period.
This table illustrates your fund’s costs in two ways:
Actual Fund Return: This section helps you to estimate the actual operating expenses, after any applicable fee waivers, that you paid over the period. The “Ending Account Value” shown is derived from the fund’s actual return for the past six month period, the “Expense Ratio” column shows the period’s annualized expense ratio, and the “Operating Expenses Paid During Period” column shows the dollar amount that would have been paid by an investor who started with $1,000 in the fund at the beginning of the period. You may use the information here, together with your account value, to estimate the expenses that you paid over the period. To do so, simply divide your account value
by $1,000 (for example, an $8,600 account value divided by $1,000 = 8.6), then multiply the result by the number given for your fund in the first line under the heading entitled “Operating Expenses Paid During Period.”
Hypothetical 5% Return: This section is intended to help you compare your fund’s costs with those of other mutual funds. It assumes that the fund had an annual return of 5% before operating expenses, but that the expense ratio is unchanged. In this case, because the return used is not the fund’s actual return, the results do not apply to your investment. This example is useful in making comparisons to other mutual funds because the Securities and Exchange Commission requires all mutual funds to calculate expenses based on an assumed 5% annual return. You can assess your fund’s costs by comparing this hypothetical example with the hypothetical examples that appear in shareholder reports of other funds.
Please note that the operating expenses shown in the table are meant to highlight and help you compare your ongoing costs only and do not reflect any transactional costs such as sales charges (loads), redemption fees, or exchange fees.
Matthews Asia Funds does not charge any sales loads, exchange fees, or 12b-1 fees, but these may be present in other funds to which you compare this data. Therefore, the hypothetical portions of the table are useful in comparing ongoing costs only, and will not help you determine the relative total costs of owning different funds.
June 30, 2022
Disclosure of Fund Expenses (unaudited) (continued)
| | | | | | | | | | | | | | | | | | | | | | | | | | | | | | | | | | | | |
| | | INVESTOR | | | | | | INSTITUTIONAL | |
| | | Beginning
Account
Value
1/1/22 | | | Ending
Account
Value
6/30/22 | | | Expense
Ratio1 | | | Operating
Expenses
Paid During
Period
1/1/22–
6/30/222 | | | | | | Beginning
Account
Value
1/1/22 | | | Ending
Account
Value
6/30/22 | | | Expense
Ratio1 | | | Operating
Expenses
Paid During
Period
1/1/22–
6/30/222 | |
| GLOBAL EMERGING MARKETS STRATEGIES | | | | | | | | | | | | | | | | | | | | | | | | | | | | | | | | | | | | |
Matthews Emerging Markets Equity Fund | | | | | | | | | | | | | | | | | | | | | | | | | | | | | | | | | | | | |
Actual Fund Return | | | $1,000.00 | | | | $753.10 | | | | 1.14% | | | | $4.96 | | | | | | | | $1,000.00 | | | | $754.50 | | | | 0.90% | | | | $3.92 | |
Hypothetical 5% Returns | | | $1,000.00 | | | | $1,019.14 | | | | 1.14% | | | | $5.71 | | | | | | | | $1,000.00 | | | | $1,020.33 | | | | 0.90% | | | | $4.51 | |
Matthews Emerging Markets Small Companies Fund | | | | | | | | | | | | | | | | | | | | | | | | | |
Actual Fund Return | | | $1,000.00 | | | | $816.80 | | | | 1.40% | | | | $6.31 | | | | | | | | $1,000.00 | | | | $817.90 | | | | 1.15% | | | | $5.18 | |
Hypothetical 5% Returns | | | $1,000.00 | | | | $1,017.85 | | | | 1.40% | | | | $7.00 | | | | | | | | $1,000.00 | | | | $1,019.09 | | | | 1.15% | | | | $5.76 | |
| | | | | | | | | |
| ASIA GROWTH STRATEGIES | | | | | | | | | | | | | | | | | | | | | | | | | | | | | | | | | | | | |
Matthews Asia Growth Fund | | | | | | | | | | | | | | | | | | | | | | | | | | | | | | | | | | | | |
Actual Fund Return | | | $1,000.00 | | | | $687.10 | | | | 1.14% | | | | $4.77 | | | | | | | | $1,000.00 | | | | $687.60 | | | | 1.01% | | | | $4.23 | |
Hypothetical 5% Returns | | | $1,000.00 | | | | $1,019.14 | | | | 1.14% | | | | $5.71 | | | | | | | | $1,000.00 | | | | $1,019.79 | | | | 1.01% | | | | $5.06 | |
Matthews Pacific Tiger Fund | | | | | | | | | | | | | | | | | | | | | | | | | | | | | | | | | | | | |
Actual Fund Return | | | $1,000.00 | | | | $830.40 | | | | 1.11% | | | | $5.04 | | | | | | | | $1,000.00 | | | | $830.90 | | | | 0.98% | | | | $4.45 | |
Hypothetical 5% Returns | | | $1,000.00 | | | | $1,019.29 | | | | 1.11% | | | | $5.56 | | | | | | | | $1,000.00 | | | | $1,019.93 | | | | 0.98% | | | | $4.91 | |
Matthews Asia ESG Fund | | | | | | | | | | | | | | | | | | | | | | | | | | | | | | | | | | | | |
Actual Fund Return | | | $1,000.00 | | | | $880.90 | | | | 1.39% | | | | $6.48 | | | | | | | | $1,000.00 | | | | $882.30 | | | | 1.20% | | | | $5.60 | |
Hypothetical 5% Returns | | | $1,000.00 | | | | $1,017.90 | | | | 1.39% | | | | $6.95 | | | | | | | | $1,000.00 | | | | $1,018.84 | | | | 1.20% | | | | $6.01 | |
Matthews Asia Innovators Fund | | | | | | | | | | | | | | | | | | | | | | | | | | | | | | | | | | | | |
Actual Fund Return | | | $1,000.00 | | | | $811.20 | | | | 1.20% | | | | $5.39 | | | | | | | | $1,000.00 | | | | $811.80 | | | | 1.09% | | | | $4.90 | |
Hypothetical 5% Returns | | | $1,000.00 | | | | $1,018.84 | | | | 1.20% | | | | $6.01 | | | | | | | | $1,000.00 | | | | $1,019.39 | | | | 1.09% | | | | $5.46 | |
Matthews China Fund | | | | | | | | | | | | | | | | | | | | | | | | | | | | | | | | | | | | |
Actual Fund Return | | | $1,000.00 | | | | $868.30 | | | | 1.13% | | | | $5.23 | | | | | | | | $1,000.00 | | | | $868.50 | | | | 0.97% | | | | $4.49 | |
Hypothetical 5% Returns | | | $1,000.00 | | | | $1,019.19 | | | | 1.13% | | | | $5.66 | | | | | | | | $1,000.00 | | | | $1,019.98 | | | | 0.97% | | | | $4.86 | |
Matthews China Small Companies Fund | | | | | | | | | | | | | | | | | | | | | | | | | | | | | | | | | | | | |
Actual Fund Return | | | $1,000.00 | | | | $792.60 | | | | 1.44% | | | | $6.40 | | | | | | | | $1,000.00 | | | | $793.60 | | | | 1.20% | | | | $5.34 | |
Hypothetical 5% Returns | | | $1,000.00 | | | | $1,017.65 | | | | 1.44% | | | | $7.20 | | | | | | | | $1,000.00 | | | | $1,018.84 | | | | 1.20% | | | | $6.01 | |
Matthews India Fund | | | | | | | | | | | | | | | | | | | | | | | | | | | | | | | | | | | | |
Actual Fund Return | | | $1,000.00 | | | | $851.60 | | | | 1.17% | | | | $5.37 | | | | | | | | $1,000.00 | | | | $851.90 | | | | 1.00% | | | | $4.59 | |
Hypothetical 5% Returns | | | $1,000.00 | | | | $1,018.99 | | | | 1.17% | | | | $5.86 | | | | | | | | $1,000.00 | | | | $1,019.84 | | | | 1.00% | | | | $5.01 | |
Matthews Japan Fund | | | | | | | | | | | | | | | | | | | | | | | | | | | | | | | | | | | | |
Actual Fund Return | | | $1,000.00 | | | | $708.50 | | | | 1.07% | | | | $4.53 | | | | | | | | $1,000.00 | | | | $709.00 | | | | 0.93% | | | | $3.94 | |
Hypothetical 5% Returns | | | $1,000.00 | | | | $1,019.49 | | | | 1.07% | | | | $5.36 | | | | | | | | $1,000.00 | | | | $1,020.18 | | | | 0.93% | | | | $4.66 | |
Matthews Korea Fund | | | | | | | | | | | | | | | | | | | | | | | | | | | | | | | | | | | | |
Actual Fund Return | | | $1,000.00 | | | | $749.10 | | | | 1.24% | | | | $5.38 | | | | | | | | $1,000.00 | | | | $749.60 | | | | 1.06% | | | | $4.60 | |
Hypothetical 5% Returns | | | $1,000.00 | | | | $1,018.65 | | | | 1.24% | | | | $6.21 | | | | | | | | $1,000.00 | | | | $1,019.54 | | | | 1.06% | | | | $5.31 | |
| | | | | | | | | |
| ASIA GROWTH AND INCOME STRATEGIES | | | | | | | | | | | | | | | | | | | | | | | | | | | | | | | | | | | | |
Matthews Asian Growth and Income Fund | | | | | | | | | | | | | | | | | | | | | | | | | | | | | | | | | | | | |
Actual Fund Return | | | $1,000.00 | | | | $850.50 | | | | 1.14% | | | | $5.23 | | | | | | | | $1,000.00 | | | | $850.90 | | | | 1.00% | | | | $4.59 | |
Hypothetical 5% Returns | | | $1,000.00 | | | | $1,019.14 | | | | 1.14% | | | | $5.71 | | | | | | | | $1,000.00 | | | | $1,019.84 | | | | 1.00% | | | | $5.01 | |
Matthews Asia Dividend Fund | | | | | | | | | | | | | | | | | | | | | | | | | | | | | | | | | | | | |
Actual Fund Return | | | $1,000.00 | | | | $760.30 | | | | 1.13% | | | | $4.93 | | | | | | | | $1,000.00 | | | | $760.80 | | | | 0.99% | | | | $4.32 | |
Hypothetical 5% Returns | | | $1,000.00 | | | | $1,019.19 | | | | 1.13% | | | | $5.66 | | | | | | | | $1,000.00 | | | | $1,019.89 | | | | 0.99% | | | | $4.96 | |
Matthews China Dividend Fund | | | | | | | | | | | | | | | | | | | | | | | | | | | | | | | | | | | | |
Actual Fund Return | | | $1,000.00 | | | | $862.20 | | | | 1.20% | | | | $5.54 | | | | | | | | $1,000.00 | | | | $863.20 | | | | 1.07% | | | | $4.94 | |
Hypothetical 5% Returns | | | $1,000.00 | | | | $1,018.84 | | | | 1.20% | | | | $6.01 | | | | | | | | $1,000.00 | | | | $1,019.49 | | | | 1.07% | | | | $5.36 | |
| | | | | | | | | |
| ASIA FIXED INCOME STRATEGIES | | | | | | | | | | | | | | | | | | | | | | | | | | | | | | | | | | | | |
Matthews Asia Total Return Bond Fund | | | | | | | | | | | | | | | | | | | | | | | | | | | | | | | | | | | | |
Actual Fund Return | | | $1,000.00 | | | | $808.50 | | | | 1.14% | | | | $5.11 | | | | | | | | $1,000.00 | | | | $809.40 | | | | 0.90% | | | | $4.04 | |
Hypothetical 5% Returns | | | $1,000.00 | | | | $1,019.14 | | | | 1.14% | | | | $5.71 | | | | | | | | $1,000.00 | | | | $1,020.33 | | | | 0.90% | | | | $4.51 | |
Matthews Asia Credit Opportunities Fund | | | | | | | | | | | | | | | | | | | | | | | | | | | | | | | | | | | | |
Actual Fund Return | | | $1,000.00 | | | | $822.50 | | | | 1.14% | | | | $5.15 | | | | | | | | $1,000.00 | | | | $824.30 | | | | 0.90% | | | | $4.07 | |
Hypothetical 5% Returns | | | $1,000.00 | | | | $1,019.14 | | | | 1.14% | | | | $5.71 | | | | | | | | $1,000.00 | | | | $1,020.33 | | | | 0.90% | | | | $4.51 | |
| 1 | Annualized, based on the Fund’s most recent fiscal half-year expenses. |
| 2 | Operating expenses are equal to the Fund’s annualized expense ratio multiplied by the average account value over the period, multiplied by 181 days, then divided by 365. |
| | | | | | | | |
| | | | matthewsasia.com | 800.789.ASIA | | | 87 | |
| | |
| Statements of Assets and Liabilities (unaudited) | | June 30, 2022 |
| | | | | | | | | | | | |
| | | Matthews Emerging
Markets Equity Fund | | | Matthews
Emerging Markets
Small Companies
Fund | | | Matthews Asia
Growth Fund | |
| | | |
ASSETS: | | | | | | | | | | | | |
| | | |
Investments at value (A) (Note 2-A and 7): | | | | | | | | | | | | |
| | | |
Unaffiliated issuers | | | $36,890,457 | | | | $349,520,686 | | | | $911,289,631 | |
| | | |
Cash | | | 1,115,195 | | | | — | | | | — | |
| | | |
Segregated foreign currency at value | | | 896 | | | | 1,927 | | | | — | |
| | | |
Foreign currency at value (B) | | | 53,614 | | | | 728,483 | | | | 7,075,257 | |
| | | |
Dividends and interest receivable | | | 73,536 | | | | 157,168 | | | | 549,212 | |
| | | |
Receivable for securities sold | | | — | | | | 1,161,562 | | | | 9,192,519 | |
| | | |
Receivable for capital shares sold | | | 150,825 | | | | 375,960 | | | | 1,490,833 | |
| | | |
Other receivable | | | — | | | | 57,636 | | | | 236,645 | |
| | | |
Prepaid expenses | | | 8,180 | | | | 5,613 | | | | 31,268 | |
TOTAL ASSETS | | | 38,292,703 | | | | 352,009,035 | | | | 929,865,365 | |
| | | |
LIABILITIES: | | | | | | | | | | | | |
| | | |
Cash overdraft | | | — | | | | 82,317 | | | | 1,749,799 | |
| | | |
Payable for securities purchased | | | 14,332 | | | | 772,355 | | | | 6,753,312 | |
| | | |
Payable for capital shares redeemed | | | 29,373 | | | | 475,252 | | | | 5,590,269 | |
| | | |
Deferred foreign capital gains tax liability (Note 2-E) | | | 5,876 | | | | 2,360,391 | | | | 1,067,742 | |
| | | |
Due to Advisor (Note 5) | | | 808 | | | | 243,255 | | | | 521,619 | |
| | | |
Administration and accounting fees payable (Note 5) | | | 835 | | | | 6,949 | | | | 20,607 | |
| | | |
Administration and shareholder servicing fees payable (Note 5) | | | 5,164 | | | | 46,107 | | | | 121,879 | |
| | | |
Custodian fees payable | | | 21,106 | | | | 91,381 | | | | 82,058 | |
| | | |
Intermediary service fees payable (Note 5) | | | 12,411 | | | | 72,478 | | | | 387,829 | |
| | | |
Professional fees payable | | | — | | | | 20,273 | | | | 32,141 | |
| | | |
Transfer agent fees payable | | | 386 | | | | 3,235 | | | | 4,908 | |
| | | |
Accrued other expenses payable | | | 30,161 | | | | 27,389 | | | | 58,975 | |
TOTAL LIABILITIES | | | 120,452 | | | | 4,201,382 | | | | 16,391,138 | |
| | | |
NET ASSETS | | | $38,172,251 | | | | $347,807,653 | | | | $913,474,227 | |
| | | |
NET ASSETS: | | | | | | | | | | | | |
| | | |
Investor Class | | | $9,313,127 | | | | $130,929,518 | | | | $309,883,611 | |
| | | |
Institutional Class | | | 28,859,124 | | | | 216,878,135 | | | | 603,590,616 | |
TOTAL | | | $38,172,251 | | | | $347,807,653 | | | | $913,474,227 | |
See accompanying notes to financial statements.
| | |
| Statements of Assets and Liabilities (unaudited) (continued) | | June 30, 2022 |
| | | | | | | | | | | | |
| | | Matthews Emerging
Markets Equity Fund | | | Matthews
Emerging Markets
Small Companies
Fund | | | Matthews Asia
Growth Fund | |
| | | |
SHARES OUTSTANDING: | | | | | | | | | | | | |
| | | |
(shares of beneficial interest issued and outstanding, respectively, unlimited number of shares authorized with a $0.001 par value) | | | | | | | | | | | | |
| | | |
Investor Class | | | 862,204 | | | | 5,356,677 | | | | 14,097,336 | |
| | | |
Institutional Class | | | 2,668,204 | | | | 8,876,309 | | | | 27,149,275 | |
TOTAL | | | 3,530,408 | | | | 14,232,986 | | | | 41,246,611 | |
| | | |
NET ASSET VALUE: | | | | | | | | | | | | |
Investor Class, offering price and redemption price | | | $10.80 | | | | $24.44 | | | | $21.98 | |
Institutional Class, offering price and redemption price | | | $10.82 | | | | $24.43 | | | | $22.23 | |
| | | |
NET ASSETS CONSISTS OF: | | | | | | | | | | | | |
| | | |
Capital paid-in | | | $48,711,954 | | | | $397,971,815 | | | | $1,038,905,769 | |
| | | |
Total distributable earnings/(accumulated loss) | | | (10,539,703 | ) | | | (50,164,162 | ) | | | (125,431,542 | ) |
NET ASSETS | | | $38,172,251 | | | | $347,807,653 | | | | $913,474,227 | |
| | | |
(A) Investments at cost: | | | | | | | | | | | | |
| | | |
Unaffiliated Issuers | | | $45,277,063 | | | | $331,465,929 | | | | $1,030,669,122 | |
| | | |
(B) Foreign Currency at Cost | | | $53,448 | | | | $729,257 | | | | $7,075,146 | |
See accompanying notes to financial statements.
| | | | | | | | |
| | | | matthewsasia.com | 800.789.ASIA | | | 89 | |
| | |
| Statements of Assets and Liabilities (unaudited) (continued) | | June 30, 2022 |
| | | | | | | | | | | | |
| | | Matthews Pacific
Tiger Fund | | | Matthews Asia
ESG Fund | | | Matthews Asia
Innovators
Fund | |
| | | |
ASSETS: | | | | | | | | | | | | |
| | | |
Investments at value (A) (Note 2-A and 7): | | | | | | | | | | | | |
| | | |
Unaffiliated issuers | | | $5,270,340,629 | | | | $126,565,085 | | | | $663,156,875 | |
| | | |
Cash | | | 39,287,410 | | | | — | | | | 5,222,977 | |
| | | |
Segregated foreign currency at value | | | 15,933 | | | | 5,112 | | | | 1,659 | |
| | | |
Foreign currency at value (B) | | | 3,294,085 | | | | 890,449 | | | | 96,118 | |
| | | |
Dividends and interest receivable | | | 19,649,205 | | | | 273,836 | | | | 511,560 | |
| | | |
Receivable for securities sold | | | 9,971,613 | | | | 1,266,090 | | | | 31,840 | |
| | | |
Receivable for capital shares sold | | | 18,538,411 | | | | 2,006,084 | | | | 1,500,237 | |
| | | |
Other receivable | | | 2,467,788 | | | | 3,111 | | | | 21,530 | |
| | | |
Prepaid expenses | | | 59,722 | | | | 37,250 | | | | 37,113 | |
TOTAL ASSETS | | | 5,363,624,796 | | | | 131,047,017 | | | | 670,579,909 | |
| | | |
LIABILITIES: | | | | | | | | | | | | |
| | | |
Cash overdraft | | | — | | | | 1,341,434 | | | | — | |
| | | |
Payable for capital shares redeemed | | | 22,555,937 | | | | 100,767 | | | | 731,877 | |
| | | |
Deferred foreign capital gains tax liability (Note 2-E) | | | 21,847,896 | | | | 868,955 | | | | 745,431 | |
| | | |
Due to Advisor (Note 5) | | | 2,899,940 | | | | 80,797 | | | | 360,911 | |
| | | |
Administration and accounting fees payable (Note 5) | | | 112,708 | | | | 2,504 | | | | 13,781 | |
| | | |
Administration and shareholder servicing fees payable (Note 5) | | | 675,867 | | | | 16,795 | | | | 84,120 | |
| | | |
Custodian fees payable | | | 499,286 | | | | 16,054 | | | | 98,065 | |
| | | |
Foreign capital gains tax payable (Note 2-E) | | | 68,788 | | | | 6,957 | | | | — | |
| | | |
Intermediary service fees payable (Note 5) | | | 1,966,430 | | | | 2,374 | | | | 384,211 | |
| | | |
Professional fees payable | | | 60,701 | | | | 6,854 | | | | 22,627 | |
| | | |
Transfer agent fees payable | | | 6,875 | | | | — | | | | 6,301 | |
| | | |
Accrued other expenses payable | | | 311,653 | | | | 7,729 | | | | 28,378 | |
TOTAL LIABILITIES | | | 51,006,081 | | | | 2,451,220 | | | | 2,475,702 | |
| | | |
NET ASSETS | | | $5,312,618,715 | | | | $128,595,797 | | | | $668,104,207 | |
| | | |
NET ASSETS: | | | | | | | | | | | | |
| | | |
Investor Class | | | $1,386,781,204 | | | | $31,176,185 | | | | $317,768,552 | |
| | | |
Institutional Class | | | 3,925,837,511 | | | | 97,419,612 | | | | 350,335,655 | |
TOTAL | | | $5,312,618,715 | | | | $128,595,797 | | | | $668,104,207 | |
See accompanying notes to financial statements.
| | |
| Statements of Assets and Liabilities (unaudited) (continued) | | June 30, 2022 |
| | | | | | | | | | | | |
| | | Matthews Pacific
Tiger Fund | | | Matthews Asia
ESG Fund | | | Matthews Asia
Innovators Fund | |
| | | |
SHARES OUTSTANDING: | | | | | | | | | | | | |
| | | |
(shares of beneficial interest issued and outstanding, respectively, unlimited number of shares authorized with a $0.001 par value) | | | | | | | | | | | | |
| | | |
Investor Class | | | 60,647,973 | | | | 2,302,089 | | | | 20,764,282 | |
| | | |
Institutional Class | | | 171,805,454 | | | | 7,180,508 | | | | 22,621,253 | |
TOTAL | | | 232,453,427 | | | | 9,482,597 | | | | 43,385,535 | |
| | | |
NET ASSET VALUE: | | | | | | | | | | | | |
Investor Class, offering price and redemption price | | | $22.87 | | | | $13.54 | | | | $15.30 | |
Institutional Class, offering price and redemption price | | | $22.85 | | | | $13.57 | | | | $15.49 | |
| | | |
NET ASSETS CONSISTS OF: | | | | | | | | | | | | |
| | | |
Capital paid-in | | | $4,448,032,379 | | | | $122,544,694 | | | | $876,014,421 | |
| | | |
Total distributable earnings/(accumulated loss) | | | 864,586,336 | | | | 6,051,103 | | | | (207,910,214 | ) |
NET ASSETS | | | $5,312,618,715 | | | | $128,595,797 | | | | $668,104,207 | |
| | | |
(A) Investments at cost: | | | | | | | | | | | | |
| | | |
Unaffiliated Issuers | | | $4,821,056,322 | | | | $122,823,237 | | | | $738,185,129 | |
| | | |
(B) Foreign Currency at Cost | | | $3,294,189 | | | | $892,951 | | | | $96,188 | |
See accompanying notes to financial statements.
| | | | | | | | |
| | | | matthewsasia.com | 800.789.ASIA | | | 91 | |
| | |
| Statements of Assets and Liabilities (unaudited) (continued) | | June 30, 2022 |
| | | | | | | | | | | | |
| | | Matthews
China Fund | | | Matthews
China Small
Companies Fund | | | Matthews
India Fund | |
| | | |
ASSETS: | | | | | | | | | | | | |
| | | |
Investments at value (A) (Note 2-A and 7): | | | | | | | | | | | | |
| | | |
Unaffiliated issuers | | | $1,074,335,607 | | | | $266,825,568 | | | | $587,905,024 | |
| | | |
Cash | | | — | | | | 410,499 | | | | 30,574,083 | |
| | | |
Segregated foreign currency at value | | | 38,723 | | | | 3,165 | | | | — | |
| | | |
Foreign currency at value (B) | | | 466,152 | | | | 1,517,386 | | | | 205,795 | |
| | | |
Dividends and interest receivable | | | 3,190,515 | | | | 870,367 | | | | 639,177 | |
| | | |
Receivable for securities sold | | | 5,072,715 | | | | 1,332,663 | | | | 933,032 | |
| | | |
Receivable for capital shares sold | | | 6,489,120 | | | | 718,695 | | | | 91,930 | |
| | | |
Other receivable | | | — | | | | 1,223 | | | | 16,066 | |
| | | |
Prepaid expenses | | | 25,139 | | | | 27,278 | | | | 7,921 | |
TOTAL ASSETS | | | 1,089,617,971 | | | | 271,706,844 | | | | 620,373,028 | |
| | | |
LIABILITIES: | | | | | | | | | | | | |
| | | |
Cash overdraft | | | 3,084,934 | | | | — | | | | — | |
| | | |
Payable for securities purchased | | | 1,811,180 | | | | 817,581 | | | | 789,709 | |
| | | |
Payable for capital shares redeemed | | | 1,568,119 | | | | 302,947 | | | | 558,880 | |
| | | |
Deferred foreign capital gains tax liability (Note 2-E) | | | — | | | | — | | | | 13,601,520 | |
| | | |
Due to Advisor (Note 5) | | | 548,257 | | | | 179,512 | | | | 356,790 | |
| | | |
Administration and accounting fees payable (Note 5) | | | 18,917 | | | | 5,096 | | | | 12,999 | |
| | | |
Administration and shareholder servicing fees payable (Note 5) | | | 128,301 | | | | 33,155 | | | | 79,919 | |
| | | |
Custodian fees payable | | | 37,842 | | | | 34,443 | | | | 91,458 | |
| | | |
Foreign capital gains tax payable (Note 2-E) | | | — | | | | — | | | | 36,406 | |
| | | |
Intermediary service fees payable (Note 5) | | | 302,659 | | | | 104,255 | | | | 163,519 | |
| | | |
Professional fees payable | | | 21,916 | | | | 19,448 | | | | 34,712 | |
| | | |
Transfer agent fees payable | | | 12,169 | | | | 5,407 | | | | 10,334 | |
| | | |
Accrued other expenses payable | | | 243,242 | | | | 38,231 | | | | 113,675 | |
TOTAL LIABILITIES | | | 7,777,536 | | | | 1,540,075 | | | | 15,849,921 | |
| | | |
NET ASSETS | | | $1,081,840,435 | | | | $270,166,769 | | | | $604,523,107 | |
| | | |
NET ASSETS: | | | | | | | | | | | | |
| | | |
Investor Class | | | $609,176,843 | | | | $155,975,229 | | | | $505,423,716 | |
| | | |
Institutional Class | | | 472,663,592 | | | | 114,191,540 | | | | 99,099,391 | |
TOTAL | | | $1,081,840,435 | | | | $270,166,769 | | | | $604,523,107 | |
See accompanying notes to financial statements.
| | |
| Statements of Assets and Liabilities (unaudited) (continued) | | June 30, 2022 |
| | | | | | | | | | | | |
| | | Matthews
China Fund | | | Matthews
China Small
Companies Fund | | | Matthews
India Fund | |
| | | |
SHARES OUTSTANDING: | | | | | | | | | | | | |
| | | |
(shares of beneficial interest issued and outstanding, respectively, unlimited number of shares authorized with a $0.001 par value) | | | | | | | | | | | | |
| | | |
Investor Class | | | 34,089,965 | | | | 11,973,467 | | | | 21,069,758 | |
| | | |
Institutional Class | | | 26,503,138 | | | | 8,740,147 | | | | 4,060,732 | |
TOTAL | | | 60,593,103 | | | | 20,713,614 | | | | 25,130,490 | |
| | | |
NET ASSET VALUE: | | | | | | | | | | | | |
Investor Class, offering price and redemption price | | | $17.87 | | | | $13.03 | | | | $23.99 | |
Institutional Class, offering price and redemption price | | | $17.83 | | | | $13.07 | | | | $24.40 | |
| | | |
NET ASSETS CONSISTS OF: | | | | | | | | | | | | |
| | | |
Capital paid-in | | | $1,227,917,600 | | | | $359,855,499 | | | | $522,462,956 | |
| | | |
Total distributable earnings/(accumulated loss) | | | (146,077,165 | ) | | | (89,688,730 | ) | | | 82,060,151 | |
NET ASSETS | | | $1,081,840,435 | | | | $270,166,769 | | | | $604,523,107 | |
| | | |
(A) Investments at cost: | | | | | | | | | | | | |
| | | |
Unaffiliated Issuers | | | $1,192,585,936 | | | | $309,217,074 | | | | $546,331,309 | |
| | | |
(B) Foreign Currency at Cost | | | $465,968 | | | | $1,517,424 | | | | $205,795 | |
See accompanying notes to financial statements.
| | | | | | | | |
| | | | matthewsasia.com | 800.789.ASIA | | | 93 | |
| | |
| Statements of Assets and Liabilities (unaudited) (continued) | | June 30, 2022 |
| | | | | | | | |
| | | Matthews
Japan Fund | | | Matthews
Korea Fund | |
| | |
ASSETS: | | | | | | | | |
| | |
Investments at value (A) (Note 2-A and 7): | | | | | | | | |
| | |
Unaffiliated issuers | | | $946,030,546 | | | | $89,870,213 | |
| | |
Cash | | | 12,240,693 | | | | 4,481,549 | |
| | |
Foreign currency at value (B) | | | 2,179,672 | | | | — | |
| | |
Dividends and interest receivable | | | 465,810 | | | | 321,851 | |
| | |
Receivable for securities sold | | | 7,752,502 | | | | 3,460,566 | |
| | |
Receivable for capital shares sold | | | 1,646,929 | | | | 9,978 | |
| | |
Other receivable | | | 986,718 | | | | — | |
| | |
Prepaid expenses | | | 41,697 | | | | 20,092 | |
TOTAL ASSETS | | | 971,344,567 | | | | 98,164,249 | |
| | |
LIABILITIES: | | | | | | | | |
| | |
Payable for securities purchased | | | — | | | | 2,556,090 | |
| | |
Payable for capital shares redeemed | | | 7,194,852 | | | | 66,929 | |
| | |
Due to Advisor (Note 5) | | | 581,940 | | | | 57,438 | |
| | |
Administration and accounting fees payable (Note 5) | | | 22,958 | | | | 2,215 | |
| | |
Administration and shareholder servicing fees payable (Note 5) | | | 136,314 | | | | 13,463 | |
| | |
Custodian fees payable | | | 29,921 | | | | 3,724 | |
| | |
Intermediary service fees payable (Note 5) | | | 33,231 | | | | 43,804 | |
| | |
Professional fees payable | | | 18,257 | | | | 13,737 | |
| | |
Transfer agent fees payable | | | 14,650 | | | | 3,311 | |
| | |
Accrued other expenses payable | | | 166,365 | | | | 16,719 | |
TOTAL LIABILITIES | | | 8,198,488 | | | | 2,777,430 | |
| | |
NET ASSETS | | | $963,146,079 | | | | $95,386,819 | |
| | |
NET ASSETS: | | | | | | | | |
| | |
Investor Class | | | $232,508,157 | | | | $85,097,574 | |
| | |
Institutional Class | | | 730,637,922 | | | | 10,289,245 | |
TOTAL | | | $963,146,079 | | | | $95,386,819 | |
See accompanying notes to financial statements.
| | |
| Statements of Assets and Liabilities (unaudited) (continued) | | June 30, 2022 |
| | | | | | | | |
| | | Matthews
Japan Fund | | | Matthews
Korea Fund | |
| | |
SHARES OUTSTANDING: | | | | | | | | |
| | |
(shares of beneficial interest issued and outstanding, respectively, unlimited number of shares authorized with a $0.001 par value) | | | | | | | | |
| | |
Investor Class | | | 14,856,016 | | | | 19,938,570 | |
| | |
Institutional Class | | | 46,579,652 | | | | 2,388,120 | |
TOTAL | | | 61,435,668 | | | | 22,326,690 | |
| | |
NET ASSET VALUE: | | | | | | | | |
Investor Class, offering price and redemption price | | | $15.65 | | | | $4.27 | |
Institutional Class, offering price and redemption price | | | $15.69 | | | | $4.31 | |
| | |
NET ASSETS CONSISTS OF: | | | | | | | | |
| | |
Capital paid-in | | | $1,132,227,198 | | | | $85,868,216 | |
| | |
Total distributable earnings/(accumulated loss) | | | (169,081,119 | ) | | | 9,518,603 | |
NET ASSETS | | | $963,146,079 | | | | $95,386,819 | |
| | |
(A) Investments at cost: | | | | | | | | |
| | |
Unaffiliated Issuers | | | $1,083,436,375 | | | | $88,908,087 | |
| | |
(B) Foreign Currency at Cost | | | $2,171,478 | | | | $— | |
See accompanying notes to financial statements.
| | | | | | | | |
| | | | matthewsasia.com | 800.789.ASIA | | | 95 | |
| | |
| Statements of Assets and Liabilities (unaudited) (continued) | | June 30, 2022 |
| | | | | | | | | | | | |
| | | Matthews Asian
Growth and
Income Fund | | | Matthews Asia
Dividend Fund | | | Matthews China
Dividend Fund | |
| | | |
ASSETS: | | | | | | | | | | | | |
| | | |
Investments at value (A) (Note 2-A and 7): | | | | | | | | | | | | |
| | | |
Unaffiliated issuers | | | $874,665,515 | | | | $2,766,808,561 | | | | $263,158,690 | |
| | | |
Cash | | | 14,662,147 | | | | 81,616,554 | | | | 7,066,430 | |
| | | |
Segregated foreign currency at value | | | — | | | | 64,391 | | | | 6,883 | |
| | | |
Foreign currency at value (B) | | | 212,605 | | | | 71,720,302 | | | | 2,242,329 | |
| | | |
Dividends and interest receivable | | | 3,187,092 | | | | 3,065,482 | | | | 1,466,425 | |
| | | |
Receivable for securities sold | | | 2,282,840 | | | | 26,679,198 | | | | 405,388 | |
| | | |
Receivable for capital shares sold | | | 2,778,847 | | | | 10,171,700 | | | | 122,962 | |
| | | |
Other receivable | | | 16,612 | | | | 1,106,455 | | | | — | |
| | | |
Prepaid expenses | | | — | | | | 29,137 | | | | — | |
TOTAL ASSETS | | | 897,805,658 | | | | 2,961,261,780 | | | | 274,469,107 | |
| | | |
LIABILITIES: | | | | | | | | | | | | |
| | | |
Payable for securities purchased | | | 207 | | | | 10,771,260 | | | | 286,784 | |
| | | |
Payable for capital shares redeemed | | | 4,045,330 | | | | 9,415,192 | | | | 328,360 | |
| | | |
Deferred foreign capital gains tax liability (Note 2-E) | | | 300,304 | | | | 5,827,181 | | | | — | |
| | | |
Due to Advisor (Note 5) | | | 562,678 | | | | 1,650,179 | | | | 141,430 | |
| | | |
Administration and accounting fees payable (Note 5) | | | 18,632 | | | | 66,234 | | | | 5,149 | |
| | | |
Administration and shareholder servicing fees payable (Note 5) | | | 118,059 | | | | 388,843 | | | | 33,129 | |
| | | |
Custodian fees payable | | | 49,571 | | | | 302,782 | | | | 31,099 | |
| | | |
Intermediary service fees payable (Note 5) | | | 261,917 | | | | 1,140,004 | | | | 86,444 | |
| | | |
Professional fees payable | | | 29,880 | | | | 8,744 | | | | 18,239 | |
| | | |
Transfer agent fees payable | | | 6,267 | | | | 4,993 | | | | 1,825 | |
| | | |
Accrued other expenses payable | | | 170,445 | | | | 307,970 | | | | 97,833 | |
TOTAL LIABILITIES | | | 5,563,290 | | | | 29,883,382 | | | | 1,030,292 | |
| | | |
NET ASSETS | | | $892,242,368 | | | | $2,931,378,398 | | | | $273,438,815 | |
| | | |
NET ASSETS: | | | | | | | | | | | | |
| | | |
Investor Class | | | $415,212,552 | | | | $962,407,008 | | | | $180,398,950 | |
| | | |
Institutional Class | | | 477,029,816 | | | | 1,968,971,390 | | | | 93,039,865 | |
TOTAL | | | $892,242,368 | | | | $2,931,378,398 | | | | $273,438,815 | |
See accompanying notes to financial statements.
| | |
| Statements of Assets and Liabilities (unaudited) (continued) | | June 30, 2022 |
| | | | | | | | | | | | |
| | | Matthews Asian
Growth and
Income Fund | | | Matthews Asia
Dividend Fund | | | Matthews China
Dividend Fund | |
| | | |
SHARES OUTSTANDING: | | | | | | | | | | | | |
| | | |
(shares of beneficial interest issued and outstanding, respectively, unlimited number of shares authorized with a $0.001 par value) | | | | | | | | | | | | |
| | | |
Investor Class | | | 30,543,869 | | | | 67,196,668 | | | | 12,133,367 | |
| | | |
Institutional Class | | | 35,169,174 | | | | 137,525,995 | | | | 6,258,616 | |
TOTAL | | | 65,713,043 | | | | 204,722,663 | | | | 18,391,983 | |
| | | |
NET ASSET VALUE: | | | | | | | | | | | | |
Investor Class, offering price and redemption price | | | $13.59 | | | | $14.32 | | | | $14.87 | |
Institutional Class, offering price and redemption price | | | $13.56 | | | | $14.32 | | | | $14.87 | |
| | | |
NET ASSETS CONSISTS OF: | | | | | | | | | | | | |
| | | |
Capital paid-in | | | $859,646,484 | | | | $3,118,227,731 | | | | $293,480,949 | |
| | | |
Total distributable earnings/(accumulated loss) | | | 32,595,884 | | | | (186,849,333 | ) | | | (20,042,134 | ) |
NET ASSETS | | | $892,242,368 | | | | $2,931,378,398 | | | | $273,438,815 | |
| | | |
(A) Investments at cost: | | | | | | | | | | | | |
| | | |
Unaffiliated Issuers | | | $832,632,715 | | | | $2,794,463,395 | | | | $271,839,157 | |
| | | |
(B) Foreign Currency at Cost | | | $212,522 | | | | $72,376,640 | | | | $2,260,870 | |
See accompanying notes to financial statements.
| | | | | | | | |
| | | | matthewsasia.com | 800.789.ASIA | | | 97 | |
| | |
| Statements of Assets and Liabilities (unaudited) (continued) | | June 30, 2022 |
| | | | | | | | |
| | | Matthews Asia
Total Return
Bond Fund | | | Matthews Asia
Credit
Opportunities Fund | |
| | |
ASSETS: | | | | | | | | |
| | |
Investments at value (A) (Note 2-A and 7): | | | | | | | | |
| | |
Unaffiliated issuers | | | $65,492,305 | | | | $25,361,376 | |
| | |
Cash | | | 6,675,483 | | | | 163,346 | |
| | |
Cash pledged collateral for forward foreign currency exchange contracts | | | 10,000 | | | | — | |
| | |
Segregated foreign currency at value | | | 10,369 | | | | 3,561 | |
| | |
Foreign currency at value (B) | | | 276 | | | | 4,414 | |
| | |
Dividends and interest receivable | | | 1,446,554 | | | | 614,915 | |
| | |
Receivable for capital shares sold | | | 263,466 | | | | 60,047 | |
| | |
Unrealized appreciation on forward foreign currency exchange contracts | | | 14,555 | | | | — | |
| | |
Prepaid expenses | | | 42,372 | | | | 23,158 | |
TOTAL ASSETS | | | 73,955,380 | | | | 26,230,817 | |
| | |
LIABILITIES: | | | | | | | | |
| | |
Payable for capital shares redeemed | | | 203,647 | | | | 602,294 | |
| | |
Deferred foreign capital gains tax liability (Note 2-E) | | | 8,893 | | | | — | |
| | |
Due to Advisor (Note 5) | | | 25,477 | | | | 2,772 | |
| | |
Administration and accounting fees payable (Note 5) | | | 1,656 | | | | 652 | |
| | |
Administration and shareholder servicing fees payable (Note 5) | | | 9,946 | | | | 3,769 | |
| | |
Custodian fees payable | | | 7,723 | | | | 1,289 | |
| | |
Intermediary service fees payable (Note 5) | | | 38,455 | | | | 34,325 | |
| | |
Professional fees payable | | | 13,738 | | | | 13,506 | |
| | |
Transfer agent fees payable | | | 598 | | | | 137 | |
| | |
Accrued other expenses payable | | | 6,798 | | | | 14,280 | |
TOTAL LIABILITIES | | | 316,931 | | | | 673,024 | |
| | |
NET ASSETS | | | $73,638,449 | | | | $25,557,793 | |
| | |
NET ASSETS: | | | | | | | | |
| | |
Investor Class | | | $17,156,768 | | | | $4,596,876 | |
| | |
Institutional Class | | | 56,481,681 | | | | 20,960,917 | |
TOTAL | | | $73,638,449 | | | | $25,557,793 | |
See accompanying notes to financial statements.
| | |
| Statements of Assets and Liabilities (unaudited) (continued) | | June 30, 2022 |
| | | | | | | | |
| | | Matthews Asia
Total Return
Bond Fund | | | Matthews Asia
Credit
Opportunities Fund | |
| | |
SHARES OUTSTANDING: | | | | | | | | |
| | |
(shares of beneficial interest issued and outstanding, respectively, unlimited number of shares authorized with a $0.001 par value) | | | | | | | | |
| | |
Investor Class | | | 2,099,464 | | | | 625,498 | |
| | |
Institutional Class | | | 6,913,561 | | | | 2,853,588 | |
TOTAL | | | 9,013,025 | | | | 3,479,086 | |
| | |
NET ASSET VALUE: | | | | | | | | |
Investor Class, offering price and redemption price | | | $8.17 | | | | $7.35 | |
Institutional Class, offering price and redemption price | | | $8.17 | | | | $7.35 | |
| | |
NET ASSETS CONSISTS OF: | | | | | | | | |
| | |
Capital paid-in | | | $103,260,091 | | | | $45,945,849 | |
| | |
Total distributable earnings/(accumulated loss) | | | (29,621,642 | ) | | | (20,388,056 | ) |
NET ASSETS | | | $73,638,449 | | | | $25,557,793 | |
| | |
(A) Investments at cost: | | | | | | | | |
| | |
Unaffiliated Issuers | | | $93,663,315 | | | | $37,264,676 | |
| | |
(B) Foreign Currency at Cost | | | $281 | | | | $4,569 | |
See accompanying notes to financial statements.
| | | | | | | | |
| | | | matthewsasia.com | 800.789.ASIA | | | 99 | |
| | |
| Statements of Operations (unaudited) | | Six-Month Period Ended June 30, 2022 |
| | | | | | | | | | | | |
| | | Matthews Emerging
Markets Equity Fund | | | Matthews Emerging Markets Small
Companies Fund | | | Matthews Asia
Growth Fund | |
| | | |
INVESTMENT INCOME: | | | | | | | | | | | | |
| | | |
Dividends—Unaffiliated Issuers | | | $592,989 | | | | $2,428,395 | | | | $6,009,602 | |
| | | |
Foreign withholding tax | | | (43,532 | ) | | | (330,257 | ) | | | (892,651 | ) |
TOTAL INVESTMENT INCOME | | | 549,457 | | | | 2,098,138 | | | | 5,116,951 | |
| | | |
EXPENSES: | | | | | | | | | | | | |
| | | |
Investment advisory fees (Note 5) | | | 149,561 | | | | 1,798,596 | | | | 4,028,766 | |
| | | |
Administration and accounting fees (Note 5) | | | 1,791 | | | | 14,389 | | | | 48,268 | |
| | | |
Administration and shareholder servicing fees (Note 5) | | | 33,737 | | | | 271,464 | | | | 906,063 | |
| | | |
Accounting out-of-pocket fees | | | 20,877 | | | | 19,295 | | | | 22,189 | |
| | | |
Custodian fees | | | 32,202 | | | | 74,283 | | | | 198,987 | |
| | | |
Printing fees | | | 5,683 | | | | 13,209 | | | | 76,087 | |
| | | |
Intermediary service fees (Note 5) | | | 32,126 | | | | 263,893 | | | | 880,416 | |
| | | |
Professional fees | | | 23,318 | | | | 37,494 | | | | 48,323 | |
| | | |
Registration fees | | | 15,452 | | | | 19,334 | | | | 33,118 | |
| | | |
Transfer agent fees | | | 1,586 | | | | 7,805 | | | | 18,614 | |
| | | |
Trustees fees | | | 1,108 | | | | 6,534 | | | | 47,750 | |
| | | |
Other expenses | | | 33,805 | | | | 13,125 | | | | 36,221 | |
TOTAL EXPENSES | | | 351,246 | | | | 2,539,421 | | | | 6,344,802 | |
| | | |
Advisory fees waived and expenses waived or reimbursed (Note 5) | | | (135,192 | ) | | | (291,964 | ) | | | — | |
NET EXPENSES | | | 216,054 | | | | 2,247,457 | | | | 6,344,802 | |
| | | |
NET INVESTMENT INCOME (LOSS) | | | 333,403 | | | | (149,319 | ) | | | (1,227,851 | ) |
| | | |
REALIZED AND UNREALIZED GAIN (LOSS) ON INVESTMENTS, FOREIGN CURRENCY RELATED TRANSACTIONS, AND FOREIGN CAPITAL GAINS TAXES: | | | | | | | | | | | | |
| | | |
Net realized gain (loss) on investments—Unaffiliated Issuers | | | (1,598,758 | ) | | | 9,189,418 | | | | (13,135,135 | ) |
| | | |
Net realized foreign capital gains tax | | | (24,223 | ) | | | (624,031 | ) | | | (928,984 | ) |
| | | |
Net realized gain (loss) on foreign currency related transactions | | | (15,183 | ) | | | (45,509 | ) | | | (963,026 | ) |
| | | |
Net change in unrealized appreciation/depreciation on investments—Unaffiliated Issuers | | | (11,498,771 | ) | | | (84,861,953 | ) | | | (503,513,909 | ) |
| | | |
Net change in deferred foreign capital gains taxes on unrealized appreciation/depreciation | | | 51,302 | | | | 1,042,172 | | | | 5,352,478 | |
| | | |
Net change in unrealized appreciation/depreciation on foreign currency related translations | | | (152 | ) | | | (3,296 | ) | | | (61,995 | ) |
Net realized and unrealized gain (loss) on investments, foreign currency related transactions, and foreign capital gains taxes | | | (13,085,785 | ) | | | (75,303,199 | ) | | | (513,250,571 | ) |
| | | |
NET INCREASE (DECREASE) IN NET ASSETS FROM OPERATIONS | | | ($12,752,382 | ) | | | ($75,452,518 | ) | | | ($514,478,422 | ) |
See accompanying notes to financial statements.
| | |
| Statements of Operations (unaudited) (continued) | | Six-Month Period Ended June 30, 2022 |
| | | | | | | | | | | | |
| | | Matthews Pacific
Tiger Fund | | | Matthews Asia
ESG Fund | | | Matthews Asia
Innovators Fund | |
| | | |
INVESTMENT INCOME: | | | | | | | | | | | | |
| | | |
Dividends—Unaffiliated Issuers | | | $52,604,157 | | | | $846,459 | | | | $4,982,704 | |
| | | |
Foreign withholding tax | | | (5,586,976 | ) | | | (116,889 | ) | | | (561,949 | ) |
TOTAL INVESTMENT INCOME | | | 47,017,181 | | | | 729,570 | | | | 4,420,755 | |
| | | |
EXPENSES: | | | | | | | | | | | | |
| | | |
Investment advisory fees (Note 5) | | | 20,720,336 | | | | 416,016 | | | | 2,944,061 | |
| | | |
Administration and accounting fees (Note 5) | | | 248,183 | | | | 4,981 | | | | 35,281 | |
| | | |
Administration and shareholder servicing fees (Note 5) | | | 4,670,618 | | | | 94,097 | | | | 660,660 | |
| | | |
Accounting out-of-pocket fees | | | 19,092 | | | | 14,981 | | | | 19,501 | |
| | | |
Custodian fees | | | 1,046,861 | | | | 50,287 | | | | 310,020 | |
| | | |
Printing fees | | | 252,363 | | | | 9,448 | | | | 65,823 | |
| | | |
Intermediary service fees (Note 5) | | | 4,284,831 | | | | 64,441 | | | | 787,309 | |
| | | |
Professional fees | | | 98,440 | | | | 26,870 | | | | 45,141 | |
| | | |
Registration fees | | | 48,399 | | | | 16,668 | | | | 28,500 | |
| | | |
Transfer agent fees | | | 42,012 | | | | 1,119 | | | | 17,407 | |
| | | |
Trustees fees | | | 198,465 | | | | 2,315 | | | | 41,782 | |
| | | |
Other expenses | | | 134,643 | | | | 11,032 | | | | 54,784 | |
TOTAL EXPENSES | | | 31,764,243 | | | | 712,255 | | | | 5,010,269 | |
| | | |
Advisory fees waived and expenses waived or reimbursed/repaid (Note 5) | | | (200,392 | ) | | | 64,885 | | | | — | |
| | | |
Administration fees waived (Note 5) | | | (200,392 | ) | | | — | | | | — | |
NET EXPENSES | | | 31,363,459 | | | | 777,140 | | | | 5,010,269 | |
| | | |
NET INVESTMENT INCOME (LOSS) | | | 15,653,722 | | | | (47,570 | ) | | | (589,514 | ) |
| | | |
| REALIZED AND UNREALIZED GAIN (LOSS) ON INVESTMENTS, FOREIGN CURRENCY RELATED TRANSACTIONS, AND FOREIGN CAPITAL GAINS TAXES: | | | | | | | | | | | | |
| | | |
Net realized gain (loss) on investments—Unaffiliated Issuers | | | 127,967,865 | | | | 595,044 | | | | (158,220,926 | ) |
| | | |
Net realized gain (loss) on investments—Affiliated Issuers | | | — | | | | — | | | | (7,383,204 | ) |
| | | |
Net realized foreign capital gains tax | | | (6,591,350 | ) | | | (262,558 | ) | | | (240,359 | ) |
| | | |
Net realized gain (loss) on foreign currency related transactions | | | (1,666,189 | ) | | | (28,224 | ) | | | (266,220 | ) |
| | | |
Net change in unrealized appreciation/depreciation on investments—Unaffiliated Issuers | | | (1,370,540,349 | ) | | | (16,299,082 | ) | | | (83,889,896 | ) |
| | | |
Net change in unrealized appreciation/depreciation on investments—Affiliated Issuers | | | — | | | | — | | | | (371,266 | ) |
| | | |
Net change in deferred foreign capital gains taxes on unrealized appreciation/depreciation | | | 17,200,719 | | | | 254,973 | | | | 3,205,622 | |
| | | |
Net change in unrealized appreciation/depreciation on foreign currency related translations | | | (184,034 | ) | | | (3,819 | ) | | | (503 | ) |
Net realized and unrealized gain (loss) on investments, foreign currency related transactions, and foreign capital gains taxes | | | (1,233,813,338 | ) | | | (15,743,666 | ) | | | (247,166,752 | ) |
| | | |
NET INCREASE (DECREASE) IN NET ASSETS FROM OPERATIONS | | | ($1,218,159,616 | ) | | | ($15,791,236 | ) | | | ($247,756,266 | ) |
See accompanying notes to financial statements.
| | | | | | | | |
| | | | matthewsasia.com | 800.789.ASIA | | | 101 | |
| | |
| Statements of Operations (unaudited) (continued) | | Six-Month Period Ended June 30, 2022 |
| | | | | | | | | | | | |
| | | Matthews
China Fund | | | Matthews China
Small Companies
Fund | | | Matthews India Fund | |
| | | |
INVESTMENT INCOME: | | | | | | | | | | | | |
| | | |
Dividends—Unaffiliated Issuers | | | $7,287,389 | | | | $2,529,349 | | | | $2,749,800 | |
| | | |
Interest | | | — | | | | — | | | | 714 | |
| | | |
Foreign withholding tax | | | (457,799 | ) | | | (58,676 | ) | | | (685,906 | ) |
TOTAL INVESTMENT INCOME | | | 6,829,590 | | | | 2,470,673 | | | | 2,064,608 | |
| | | |
EXPENSES: | | | | | | | | | | | | |
| | | |
Investment advisory fees (Note 5) | | | 3,635,242 | | | | 1,465,621 | | | | 2,289,723 | |
| | | |
Administration and accounting fees (Note 5) | | | 43,548 | | | | 11,725 | | | | 27,422 | |
| | | |
Administration and shareholder servicing fees (Note 5) | | | 818,426 | | | | 220,346 | | | | 516,691 | |
| | | |
Accounting out-of-pocket fees | | | 21,398 | | | | 20,493 | | | | 22,395 | |
| | | |
Custodian fees | | | 142,490 | | | | 76,743 | | | | 145,314 | |
| | | |
Printing fees | | | 57,699 | | | | 27,025 | | | | 36,184 | |
| | | |
Intermediary service fees (Note 5) | | | 867,673 | | | | 256,309 | | | | 712,085 | |
| | | |
Professional fees | | | 37,498 | | | | 30,625 | | | | 69,281 | |
| | | |
Registration fees | | | 31,823 | | | | 28,370 | | | | 25,063 | |
| | | |
Transfer agent fees | | | 35,212 | | | | 10,382 | | | | 29,546 | |
| | | |
Trustees fees | | | 35,668 | | | | 9,683 | | | | 16,321 | |
| | | |
Other expenses | | | 36,039 | | | | 8,745 | | | | 17,133 | |
TOTAL EXPENSES | | | 5,762,716 | | | | 2,166,067 | | | | 3,907,158 | |
| | | |
Advisory fees waived and expenses waived or reimbursed (Note 5) | | | — | | | | (209,322 | ) | | | — | |
NET EXPENSES | | | 5,762,716 | | | | 1,956,745 | | | | 3,907,158 | |
| | | |
NET INVESTMENT INCOME (LOSS) | | | 1,066,874 | | | | 513,928 | | | | (1,842,550 | ) |
| | | |
| REALIZED AND UNREALIZED GAIN (LOSS) ON INVESTMENTS, FOREIGN CURRENCY RELATED TRANSACTIONS, AND FOREIGN CAPITAL GAINS TAXES: | | | | | | | | | | | | |
| | | |
Net realized gain (loss) on investments—Unaffiliated Issuers | | | (51,941,188 | ) | | | (40,146,249 | ) | | | 58,718,636 | |
| | | |
Net realized foreign capital gains tax | | | — | | | | — | | | | (6,946,076 | ) |
| | | |
Net realized gain (loss) on foreign currency related transactions | | | 9,462 | | | | 37,989 | | | | (444,186 | ) |
| | | |
Net change in unrealized appreciation/depreciation on investments—Unaffiliated Issuers | | | (141,325,797 | ) | | | (40,608,172 | ) | | | (175,055,049 | ) |
| | | |
Net change in deferred foreign capital gains taxes on unrealized appreciation/depreciation | | | — | | | | — | | | | 15,318,986 | |
| | | |
Net change in unrealized appreciation/depreciation on foreign currency related translations | | | (6,831 | ) | | | (5,637 | ) | | | 145,095 | |
Net realized and unrealized gain (loss) on investments, foreign currency related transactions, and foreign capital gains taxes | | | (193,264,354 | ) | | | (80,722,069 | ) | | | (108,262,594 | ) |
| | | |
NET INCREASE (DECREASE) IN NET ASSETS FROM OPERATIONS | | | ($192,197,480 | ) | | | ($80,208,141 | ) | | | ($110,105,144 | ) |
See accompanying notes to financial statements.
| | |
| Statements of Operations (unaudited) (continued) | | Six-Month Period Ended June 30, 2022 |
| | | | | | | | |
| | | Matthews
Japan Fund | | | Matthews
Korea Fund | |
| | |
INVESTMENT INCOME: | | | | | | | | |
| | |
Dividends—Unaffiliated Issuers | | | $11,434,828 | | | | $1,344,569 | |
| | |
Foreign withholding tax | | | (1,638,665 | ) | | | (225,753 | ) |
TOTAL INVESTMENT INCOME | | | 9,796,163 | | | | 1,118,816 | |
| | |
EXPENSES: | | | | | | | | |
| | |
Investment advisory fees (Note 5) | | | 4,164,977 | | | | 390,154 | |
| | |
Administration and accounting fees (Note 5) | | | 49,886 | | | | 4,672 | |
| | |
Administration and shareholder servicing fees (Note 5) | | | 939,035 | | | | 88,052 | |
| | |
Accounting out-of-pocket fees | | | 21,365 | | | | 20,084 | |
| | |
Custodian fees | | | 60,951 | | | | 13,713 | |
| | |
Printing fees | | | 90,636 | | | | 11,629 | |
| | |
Intermediary service fees (Note 5) | | | 502,373 | | | | 121,908 | |
| | |
Professional fees | | | 37,043 | | | | 26,846 | |
| | |
Registration fees | | | 24,511 | | | | 17,340 | |
| | |
Transfer agent fees | | | 52,914 | | | | 9,470 | |
| | |
Trustees fees | | | 36,846 | | | | 3,254 | |
| | |
Other expenses | | | 27,153 | | | | 3,170 | |
TOTAL EXPENSES | | | 6,007,690 | | | | 710,292 | |
| | |
NET INVESTMENT INCOME (LOSS) | | | 3,788,473 | | | | 408,524 | |
| | |
| REALIZED AND UNREALIZED GAIN (LOSS) ON INVESTMENTS AND FOREIGN CURRENCY RELATED TRANSACTIONS: | | | | | | | | |
| | |
Net realized gain (loss) on investments—Unaffiliated Issuers | | | (60,911,322 | ) | | | 1,048,675 | |
| | |
Net realized gain (loss) on foreign currency related transactions | | | (715,640 | ) | | | (81,989 | ) |
| | |
Net change in unrealized appreciation/depreciation on investments—Unaffiliated Issuers | | | (384,172,008 | ) | | | (34,194,815 | ) |
| | |
Net change in unrealized appreciation/depreciation on foreign currency related translations | | | (180,216 | ) | | | (3,957 | ) |
Net realized and unrealized gain (loss) on investments and foreign currency related transactions | | | (445,979,186 | ) | | | (33,232,086 | ) |
| | |
NET INCREASE (DECREASE) IN NET ASSETS FROM OPERATIONS | | | ($442,190,713 | ) | | | ($32,823,562 | ) |
See accompanying notes to financial statements.
| | | | | | | | |
| | | | matthewsasia.com | 800.789.ASIA | | | 103 | |
| | |
| Statements of Operations (unaudited) (continued) | | Six-Month Period Ended June 30, 2022 |
| | | | | | | | | | | | |
| | | Matthews Asian
Growth and
Income Fund | | | Matthews Asia
Dividend Fund | | | Matthews China
Dividend Fund | |
| | | |
INVESTMENT INCOME: | | | | | | | | | | | | |
| | | |
Dividends—Unaffiliated Issuers | | | $15,812,540 | | | | $37,973,098 | | | | $5,617,746 | |
| | | |
Dividends—Affiliated Issuers (Note 7) | | | — | | | | 9,240,160 | | | | — | |
| | | |
Interest | | | (567,571 | ) | | | — | | | | — | |
| | | |
Foreign withholding tax | | | (1,168,176 | ) | | | (3,861,306 | ) | | | (250,166 | ) |
TOTAL INVESTMENT INCOME | | | 14,076,793 | | | | 43,351,952 | | | | 5,367,580 | |
| | | |
EXPENSES: | | | | | | | | | | | | |
| | | |
Investment advisory fees (Note 5) | | | 3,296,526 | | | | 12,683,749 | | | | 954,071 | |
| | | |
Administration and accounting fees (Note 5) | | | 39,480 | | | | 151,947 | | | | 11,428 | |
| | | |
Administration and shareholder servicing fees (Note 5) | | | 743,977 | | | | 2,855,163 | | | | 214,997 | |
| | | |
Accounting out-of-pocket fees | | | 20,312 | | | | 20,370 | | | | 20,815 | |
| | | |
Custodian fees | | | 108,596 | | | | 784,905 | | | | 64,438 | |
| | | |
Printing fees | | | 83,249 | | | | 217,571 | | | | 16,093 | |
| | | |
Intermediary service fees (Note 5) | | | 802,246 | | | | 2,709,458 | | | | 270,872 | |
| | | |
Professional fees | | | 43,693 | | | | 68,746 | | | | 29,823 | |
| | | |
Registration fees | | | 42,942 | | | | 33,679 | | | | 38,897 | |
| | | |
Transfer agent fees | | | 20,779 | | | | 32,969 | | | | 5,685 | |
| | | |
Trustees fees | | | 31,168 | | | | 119,333 | | | | 8,826 | |
| | | |
Other expenses | | | 23,224 | | | | 78,252 | | | | 6,989 | |
TOTAL EXPENSES | | | 5,256,192 | | | | 19,756,142 | | | | 1,642,934 | |
| | | |
Advisory fees waived and expenses waived or reimbursed (Note 5) | | | — | | | | (41,494 | ) | | | — | |
| | | |
Administration fees waived (Note 5) | | | — | | | | (41,494 | ) | | | — | |
NET EXPENSES | | | 5,256,192 | | | | 19,673,154 | | | | 1,642,934 | |
| | | |
NET INVESTMENT INCOME (LOSS) | | | 8,820,601 | | | | 23,678,798 | | | | 3,724,646 | |
| | | |
| REALIZED AND UNREALIZED GAIN (LOSS) ON INVESTMENTS, FOREIGN CURRENCY RELATED TRANSACTIONS, AND FOREIGN CAPITAL GAINS TAXES: | | | | | | | | | | | | |
| | | |
Net realized gain (loss) on investments—Unaffiliated Issuers | | | (23,155,402 | ) | | | (19,485,123 | ) | | | (11,098,167 | ) |
| | | |
Net realized gain (loss) on investments—Affiliated Issuers | | | — | | | | 15,626,737 | | | | — | |
| | | |
Net realized gain (loss) on foreign currency related transactions | | | (158,627 | ) | | | (1,714,028 | ) | | | (129,481 | ) |
| | | |
Net change in unrealized appreciation/depreciation on investments—Unaffiliated Issuers | | | (147,411,589 | ) | | | (950,890,368 | ) | | | (42,055,467 | ) |
| | | |
Net change in unrealized appreciation/depreciation on investments—Affiliated Issuers | | | — | | | | (190,136,254 | ) | | | — | |
| | | |
Net change in deferred foreign capital gains taxes on unrealized appreciation/depreciation | | | 982,332 | | | | 5,724,389 | | | | — | |
| | | |
Net change in unrealized appreciation/depreciation on foreign currency related translations | | | (16,704 | ) | | | (868,091 | ) | | | (36,790 | ) |
Net realized and unrealized gain (loss) on investments, foreign currency related transactions, and foreign capital gains taxes | | | (169,759,990 | ) | | | (1,141,742,738 | ) | | | (53,319,905 | ) |
| | | |
NET INCREASE (DECREASE) IN NET ASSETS FROM OPERATIONS | | | ($160,939,389 | ) | | | ($1,118,063,940 | ) | | | ($49,595,259 | ) |
See accompanying notes to financial statements.
| | |
| Statements of Operations (unaudited) (continued) | | Six-Month Period Ended June 30, 2022 |
| | | | | | | | |
| | | Matthews
Asia Total
Return Bond
Fund | | | Matthews Asia
Credit
Opportunities Fund | |
| | |
INVESTMENT INCOME: | | | | | | | | |
| | |
Dividends—Unaffiliated Issuers | | | $2,401 | | | | $286 | |
| | |
Interest | | | 2,647,001 | | | | 1,116,655 | |
| | |
Foreign withholding tax | | | (23,200 | ) | | | — | |
TOTAL INVESTMENT INCOME | | | 2,626,202 | | | | 1,116,941 | |
| | |
EXPENSES: | | | | | | | | |
| | |
Investment advisory fees (Note 5) | | | 245,105 | | | | 96,725 | |
| | |
Administration and accounting fees (Note 5) | | | 3,565 | | | | 1,407 | |
| | |
Administration and shareholder servicing fees (Note 5) | | | 67,123 | | | | 26,487 | |
| | |
Accounting out-of-pocket fees | | | 20,162 | | | | 15,229 | |
| | |
Custodian fees | | | 17,658 | | | | 3,823 | |
| | |
Printing fees | | | 15,548 | | | | 13,217 | |
| | |
Intermediary service fees (Note 5) | | | 68,685 | | | | 43,325 | |
| | |
Professional fees | | | 25,573 | | | | 26,145 | |
| | |
Registration fees | | | 20,046 | | | | 18,893 | |
| | |
Transfer agent fees | | | 2,331 | | | | 869 | |
| | |
Trustees fees | | | 2,825 | | | | 2,016 | |
| | |
Other expenses | | | 3,575 | | | | 2,616 | |
TOTAL EXPENSES | | | 492,196 | | | | 250,752 | |
| | |
Advisory fees waived and expenses waived or reimbursed (Note 5) | | | (65,024 | ) | | | (83,359 | ) |
NET EXPENSES | | | 427,172 | | | | 167,393 | |
| | |
NET INVESTMENT INCOME (LOSS) | | | 2,199,030 | | | | 949,548 | |
| | |
| REALIZED AND UNREALIZED GAIN (LOSS) ON INVESTMENTS, FORWARD FOREIGN CURRENCY EXCHANGE CONTRACTS, FOREIGN CURRENCY RELATED TRANSACTIONS, SWAPS, AND FOREIGN CAPITAL GAINS TAXES: | | | | | | | | |
| | |
Net realized gain (loss) on investments—Unaffiliated Issuers | | | (946,918 | ) | | | (369,667 | ) |
| | |
Net realized gain (loss) on forward foreign currency exchange contracts | | | (1,162,907 | ) | | | — | |
| | |
Net realized gain (loss) on swaps | | | (4,480 | ) | | | — | |
| | |
Net realized gain (loss) on foreign currency related transactions | | | (2,173 | ) | | | — | |
| | |
Net change in unrealized appreciation/depreciation on investments—Unaffiliated Issuers | | | (19,923,480 | ) | | | (7,414,821 | ) |
| | |
Net change in unrealized appreciation/depreciation forward foreign currency exchange contracts | | | 628,814 | | | | — | |
| | |
Net change in unrealized appreciation/depreciation on swaps | | | (81,339 | ) | | | — | |
| | |
Net change in deferred foreign capital gains taxes on unrealized appreciation/depreciation | | | 32,176 | | | | — | |
| | |
Net change in unrealized appreciation/depreciation on foreign currency related translations | | | 10,924 | | | | 202 | |
Net realized and unrealized gain (loss) on investments, forward foreign currency exchange contracts, foreign currency related transactions, swaps, and foreign capital gains taxes | | | (21,449,383 | ) | | | (7,784,286 | ) |
| | |
NET INCREASE (DECREASE) IN NET ASSETS FROM OPERATIONS | | | ($19,250,353 | ) | | | ($6,834,738 | ) |
See accompanying notes to financial statements.
| | | | | | | | |
| | | | matthewsasia.com | 800.789.ASIA | | | 105 | |
Statements of Changes in Net Assets
| | | | | | | | |
| MATTHEWS EMERGING MARKETS EQUITY FUND | | Six-Month Period
Ended June 30, 2022
(Unaudited) | | | Year Ended
December 31, 2021 | |
| | |
OPERATIONS: | | | | | | | | |
| | |
Net investment income (loss) | | | $333,403 | | | | $700,658 | |
| | |
Net realized gain (loss) on investments and foreign currency related transactions | | | (1,638,164 | ) | | | 2,342,740 | |
| | |
Net change in unrealized appreciation/depreciation on investments and foreign currency related translations | | | (11,498,923 | ) | | | (3,861,061 | ) |
| | |
Net change on foreign capital gains taxes on unrealized appreciation/depreciation | | | 51,302 | | | | 11,495 | |
Net increase (decrease) in net assets resulting from operations | | | (12,752,382 | ) | | | (806,168 | ) |
| | |
DISTRIBUTIONS TO SHAREHOLDERS: | | | | | | | | |
| | |
Investor Class | | | — | | | | (1,083,017 | ) |
| | |
Institutional Class | | | — | | | | (3,260,692 | ) |
Net decrease in net assets resulting from distributions | | | — | | | | (4,343,709 | ) |
CAPITAL SHARE TRANSACTIONS (net) (Note 4) | | | 1,367,484 | | | | 9,914,929 | |
Total increase (decrease) in net assets | | | (11,384,898 | ) | | | 4,765,052 | |
NET ASSETS: | | | | | | | | |
| | |
Beginning of period | | | 49,557,149 | | | | 44,792,097 | |
End of period | | | $38,172,251 | | | | $49,557,149 | |
| | |
| MATTHEWS EMERGING MARKETS SMALL COMPANIES FUND | | Six-Month Period
Ended June 30, 2022
(Unaudited) | | | Year Ended
December 31, 2021 | |
| | |
OPERATIONS: | | | | | | | | |
| | |
Net investment income (loss) | | | ($149,319) | | | | ($1,478,959) | |
| | |
Net realized gain (loss) on investments and foreign currency related transactions | | | 8,519,878 | | | | 46,739,287 | |
| | |
Net change in unrealized appreciation/depreciation on investments and foreign currency related translations | | | (84,865,249 | ) | | | 20,513,242 | |
| | |
Net change on foreign capital gains taxes on unrealized appreciation/depreciation | | | 1,042,172 | | | | (2,166,702 | ) |
Net increase (decrease) in net assets resulting from operations | | | (75,452,518 | ) | | | 63,606,868 | |
| | |
DISTRIBUTIONS TO SHAREHOLDERS: | | | | | | | | |
| | |
Investor Class | | | — | | | | (9,801,473 | ) |
| | |
Institutional Class | | | — | | | | (12,694,236 | ) |
Net decrease in net assets resulting from distributions | | | — | | | | (22,495,709 | ) |
CAPITAL SHARE TRANSACTIONS (net) (Note 4) | | | 25,251,283 | | | | 149,755,453 | |
Total increase (decrease) in net assets | | | (50,201,235 | ) | | | 190,866,612 | |
NET ASSETS: | | | | | | | | |
| | |
Beginning of period | | | 398,008,888 | | | | 207,142,276 | |
End of period | | | $347,807,653 | | | | $398,008,888 | |
See accompanying notes to financial statements.
Statements of Changes in Net Assets (continued)
| | | | | | | | |
| MATTHEWS ASIA GROWTH FUND | | Six-Month Period
Ended June 30, 2022
(Unaudited) | | | Year Ended
December 31, 2021 | |
| | |
OPERATIONS: | | | | | | | | |
| | |
Net investment income (loss) | | | ($1,227,851 | ) | | | ($11,511,247 | ) |
| | |
Net realized gain (loss) on investments and foreign currency related transactions | | | (15,027,145 | ) | | | 85,502,548 | |
| | |
Net change in unrealized appreciation/depreciation on investments and foreign currency related translations | | | (503,575,904 | ) | | | (413,024,484 | ) |
| | |
Net change on foreign capital gains taxes on unrealized appreciation/depreciation | | | 5,352,478 | | | | (5,345,430 | ) |
Net increase (decrease) in net assets resulting from operations | | | (514,478,422 | ) | | | (344,378,613 | ) |
| | |
DISTRIBUTIONS TO SHAREHOLDERS: | | | | | | | | |
| | |
Investor Class | | | — | | | | (28,626,230 | ) |
| | |
Institutional Class | | | — | | | | (61,109,835 | ) |
Net decrease in net assets resulting from distributions | | | — | | | | (89,736,065 | ) |
CAPITAL SHARE TRANSACTIONS (net) (Note 4) | | | (326,817,287 | ) | | | 135,096,963 | |
Total increase (decrease) in net assets | | | (841,295,709 | ) | | | (299,017,715 | ) |
NET ASSETS: | | | | | | | | |
| | |
Beginning of period | | | 1,754,769,936 | | | | 2,053,787,651 | |
End of period | | | $913,474,227 | | | | $1,754,769,936 | |
| | |
| MATTHEWS PACIFIC TIGER FUND | | Six-Month Period
Ended June 30, 2022
(Unaudited) | | | Year Ended
December 31, 2021 | |
| | |
OPERATIONS: | | | | | | | | |
| | |
Net investment income (loss) | | | $15,653,722 | | | | $24,387,817 | |
| | |
Net realized gain (loss) on investments and foreign currency related transactions | | | 119,710,326 | | | | 1,488,400,469 | |
| | |
Net change in unrealized appreciation/depreciation on investments and foreign currency related translations | | | (1,370,724,383 | ) | | | (1,906,988,327 | ) |
| | |
Net change on foreign capital gains taxes on unrealized appreciation/depreciation | | | 17,200,719 | | | | (11,587,560 | ) |
Net increase (decrease) in net assets resulting from operations | | | (1,218,159,616 | ) | | | (405,787,601 | ) |
| | |
DISTRIBUTIONS TO SHAREHOLDERS: | | | | | | | | |
| | |
Investor Class | | | — | | | | (343,295,997 | ) |
| | |
Institutional Class | | | — | | | | (1,049,525,838 | ) |
Net decrease in net assets resulting from distributions | | | — | | | | (1,392,821,835 | ) |
CAPITAL SHARE TRANSACTIONS (net) (Note 4) | | | (661,686,061 | ) | | | 232,424,290 | |
Total increase (decrease) in net assets | | | (1,879,845,677 | ) | | | (1,566,185,146 | ) |
NET ASSETS: | | | | | | | | |
| | |
Beginning of period | | | 7,192,464,392 | | | | 8,758,649,538 | |
End of period | | | $5,312,618,715 | | | | $7,192,464,392 | |
See accompanying notes to financial statements.
| | | | | | | | |
| | | | matthewsasia.com | 800.789.ASIA | | | 107 | |
Statements of Changes in Net Assets (continued)
| | | | | | | | |
| MATTHEWS ASIA ESG FUND | | Six-Month Period
Ended June 30, 2022
(Unaudited) | | | Year Ended
December 31, 2021 | |
| | |
OPERATIONS: | | | | | | | | |
| | |
Net investment income (loss) | | | ($47,570 | ) | | | ($367,490 | ) |
| | |
Net realized gain (loss) on investments and foreign currency related transactions | | | 304,262 | | | | 16,498,506 | |
| | |
Net change in unrealized appreciation/depreciation on investments and foreign currency related translations | | | (16,302,901 | ) | | | (5,061,936 | ) |
| | |
Net change on foreign capital gains taxes on unrealized appreciation/depreciation | | | 254,973 | | | | (654,383 | ) |
Net increase (decrease) in net assets resulting from operations | | | (15,791,236 | ) | | | 10,414,697 | |
| | |
DISTRIBUTIONS TO SHAREHOLDERS: | | | | | | | | |
| | |
Investor Class | | | — | | | | (3,181,901 | ) |
| | |
Institutional Class | | | — | | | | (7,036,599 | ) |
Net decrease in net assets resulting from distributions | | | — | | | | (10,218,500 | ) |
CAPITAL SHARE TRANSACTIONS (net) (Note 4) | | | 17,533,877 | | | | 38,630,119 | |
Total increase (decrease) in net assets | | | 1,742,641 | | | | 38,826,316 | |
NET ASSETS: | | | | | | | | |
| | |
Beginning of period | | | 126,853,156 | | | | 88,026,840 | |
End of period | | | $128,595,797 | | | | $126,853,156 | |
| | |
| MATTHEWS ASIA INNOVATORS FUND | | Six-Month Period Ended June 30, 2022
(Unaudited) | | | Year Ended
December 31, 2021 | |
| | |
OPERATIONS: | | | | | | | | |
| | |
Net investment income (loss) | | | ($589,514) | | | | ($9,357,135) | |
| | |
Net realized gain (loss) on investments and foreign currency related transactions | | | (166,110,709 | ) | | | 294,063,267 | |
| | |
Net change in unrealized appreciation/depreciation on investments and foreign currency related translations | | | (84,261,665 | ) | | | (580,855,771 | ) |
| | |
Net change on foreign capital gains taxes on unrealized appreciation/depreciation | | | 3,205,622 | | | | 2,164,474 | |
Net increase (decrease) in net assets resulting from operations | | | (247,756,266 | ) | | | (293,985,165 | ) |
| | |
DISTRIBUTIONS TO SHAREHOLDERS: | | | | | | | | |
| | |
Investor Class | | | — | | | | (88,802,778 | ) |
| | |
Institutional Class | | | — | | | | (187,598,026 | ) |
Net decrease in net assets resulting from distributions | | | — | | | | (276,400,804 | ) |
CAPITAL SHARE TRANSACTIONS (net) (Note 4) | | | (479,908,069 | ) | | | 240,697,526 | |
Total increase (decrease) in net assets | | | (727,664,335 | ) | | | (329,688,443 | ) |
NET ASSETS: | | | | | | | | |
| | |
Beginning of period | | | 1,395,768,542 | | | | 1,725,456,985 | |
End of period | | | $668,104,207 | | | | $1,395,768,542 | |
See accompanying notes to financial statements.
Statements of Changes in Net Assets (continued)
| | | | | | | | |
| MATTHEWS CHINA FUND | | Six-Month Period Ended June 30, 2022
(Unaudited) | | | Year Ended
December 31, 2021 | |
| | |
OPERATIONS: | | | | | | | | |
| | |
Net investment income (loss) | | | $1,066,874 | | | | $3,844,991 | |
| | |
Net realized gain (loss) on investments and foreign currency related transactions | | | (51,931,726 | ) | | | 204,568,096 | |
Net change in unrealized appreciation/depreciation on investments and foreign currency related translations | | | (141,332,628 | ) | | | (415,651,012 | ) |
Net increase (decrease) in net assets resulting from operations | | | (192,197,480 | ) | | | (207,237,925 | ) |
| | |
DISTRIBUTIONS TO SHAREHOLDERS: | | | | | | | | |
| | |
Investor Class | | | — | | | | (99,354,820 | ) |
| | |
Institutional Class | | | — | | | | (84,823,673 | ) |
Net decrease in net assets resulting from distributions | | | — | | | | (184,178,493 | ) |
CAPITAL SHARE TRANSACTIONS (net) (Note 4) | | | (67,772,342 | ) | | | 224,355,518 | |
Total increase (decrease) in net assets | | | (259,969,822 | ) | | | (167,060,900 | ) |
NET ASSETS: | | | | | | | | |
| | |
Beginning of period | | | 1,341,810,257 | | | | 1,508,871,157 | |
End of period | | | $1,081,840,435 | | | | $1,341,810,257 | |
| | |
| MATTHEWS CHINA SMALL COMPANIES FUND | | Six-Month Period
Ended June 30, 2022
(Unaudited) | | | Year Ended
December 31, 2021 | |
| | |
OPERATIONS: | | | | | | | | |
| | |
Net investment income (loss) | | | $513,928 | | | | $2,295,512 | |
| | |
Net realized gain (loss) on investments and foreign currency related transactions | | | (40,108,260 | ) | | | 62,613,741 | |
Net change in unrealized appreciation/depreciation on investments and foreign currency related translations | | | (40,613,809 | ) | | | (90,887,223 | ) |
Net increase (decrease) in net assets resulting from operations | | | (80,208,141 | ) | | | (25,977,970 | ) |
| | |
DISTRIBUTIONS TO SHAREHOLDERS: | | | | | | | | |
| | |
Investor Class | | | — | | | | (33,393,779 | ) |
| | |
Institutional Class | | | — | | | | (24,008,699 | ) |
Net decrease in net assets resulting from distributions | | | — | | | | (57,402,478 | ) |
CAPITAL SHARE TRANSACTIONS (net) (Note 4) | | | (30,793,416 | ) | | | 80,779,555 | |
Total increase (decrease) in net assets | | | (111,001,557 | ) | | | (2,600,893 | ) |
NET ASSETS: | | | | | | | | |
| | |
Beginning of period | | | 381,168,326 | | | | 383,769,219 | |
End of period | | | $270,166,769 | | | | $381,168,326 | |
See accompanying notes to financial statements.
| | | | | | | | |
| | | | matthewsasia.com | 800.789.ASIA | | | 109 | |
Statements of Changes in Net Assets (continued)
| | | | | | | | |
| MATTHEWS INDIA FUND | | Six-Month Period Ended June 30, 2022
(Unaudited) | | | Year Ended
December 31, 2021 | |
| | |
OPERATIONS: | | | | | | | | |
| | |
Net investment income (loss) | | | ($1,842,550 | ) | | | ($2,671,741 | ) |
| | |
Net realized gain (loss) on investments and foreign currency related transactions | | | 51,328,374 | | | | 111,630,393 | |
Net change in unrealized appreciation/depreciation on investments and foreign currency related translations | | | (174,909,954 | ) | | | 22,196,110 | |
| | |
Net change on foreign capital gains taxes on unrealized appreciation/depreciation | | | 15,318,986 | | | | (7,346,295 | ) |
Net increase (decrease) in net assets resulting from operations | | | (110,105,144 | ) | | | 123,808,467 | |
| | |
DISTRIBUTIONS TO SHAREHOLDERS: | | | | | | | | |
| | |
Investor Class | | | — | | | | (58,881,696 | ) |
| | |
Institutional Class | | | — | | | | (11,871,666 | ) |
Net decrease in net assets resulting from distributions | | | — | | | | (70,753,362 | ) |
CAPITAL SHARE TRANSACTIONS (net) (Note 4) | | | (49,147,309 | ) | | | 2,759,175 | |
Total increase (decrease) in net assets | | | (159,252,453 | ) | | | 55,814,280 | |
NET ASSETS: | | | | | | | | |
| | |
Beginning of period | | | 763,775,560 | | | | 707,961,280 | |
End of period | | | $604,523,107 | | | | $763,775,560 | |
| | |
| MATTHEWS JAPAN FUND | | Six-Month Period Ended June 30, 2022
(Unaudited) | | | Year Ended
December 31, 2021 | |
| | |
OPERATIONS: | | | | | | | | |
| | |
Net investment income (loss) | | | $3,788,473 | | | | $4,627,985 | |
| | |
Net realized gain (loss) on investments and foreign currency related transactions | | | (61,626,962 | ) | | | 208,077,658 | |
Net change in unrealized appreciation/depreciation on investments and foreign currency related translations | | | (384,352,224 | ) | | | (244,902,428 | ) |
Net increase (decrease) in net assets resulting from operations | | | (442,190,713 | ) | | | (32,196,785 | ) |
| | |
DISTRIBUTIONS TO SHAREHOLDERS: | | | | | | | | |
| | |
Investor Class | | | — | | | | (42,947,580 | ) |
| | |
Institutional Class | | | — | | | | (137,877,438 | ) |
Net decrease in net assets resulting from distributions | | | — | | | | (180,825,018 | ) |
CAPITAL SHARE TRANSACTIONS (net) (Note 4) | | | (138,782,814 | ) | | | 106,353,598 | |
Total increase (decrease) in net assets | | | (580,973,527 | ) | | | (106,668,205 | ) |
NET ASSETS: | | | | | | | | |
| | |
Beginning of period | | | 1,544,119,606 | | | | 1,650,787,811 | |
End of period | | | $963,146,079 | | | | $1,544,119,606 | |
See accompanying notes to financial statements.
Statements of Changes in Net Assets (continued)
| | | | | | | | |
| MATTHEWS KOREA FUND | | Six-Month Period Ended June 30, 2022
(Unaudited) | | | Year Ended
December 31, 2021 | |
| | |
OPERATIONS: | | | | | | | | |
| | |
Net investment income (loss) | | | $408,524 | | | | $1,076,847 | |
| | |
Net realized gain (loss) on investments and foreign currency related transactions | | | 966,686 | | | | 24,299,609 | |
| | |
Net change in unrealized appreciation/depreciation on investments and foreign currency related translations | | | (34,198,772 | ) | | | (25,128,460 | ) |
Net increase (decrease) in net assets resulting from operations | | | (32,823,562 | ) | | | 247,996 | |
| | |
DISTRIBUTIONS TO SHAREHOLDERS: | | | | | | | | |
| | |
Investor Class | | | — | | | | (7,903,643 | ) |
| | |
Institutional Class | | | — | | | | (965,714 | ) |
Net decrease in net assets resulting from distributions | | | — | | | | (8,869,357 | ) |
CAPITAL SHARE TRANSACTIONS (net) (Note 4) | | | (4,727,907 | ) | | | (12,563,088 | ) |
Total increase (decrease) in net assets | | | (37,551,469 | ) | | | (21,184,449 | ) |
NET ASSETS: | | | | | | | | |
| | |
Beginning of period | | | 132,938,288 | | | | 154,122,737 | |
End of period | | | $95,386,819 | | | | $132,938,288 | |
| | |
| MATTHEWS ASIAN GROWTH AND INCOME FUND | | Six-Month Period Ended June 30, 2022
(Unaudited) | | | Year Ended
December 31, 2021 | |
| | |
OPERATIONS: | | | | | | | | |
| | |
Net investment income (loss) | | | $8,820,601 | | | | $13,961,338 | |
| | |
Net realized gain (loss) on investments and foreign currency related transactions | | | (23,314,029 | ) | | | 180,269,695 | |
| | |
Net change in unrealized appreciation/depreciation on investments and foreign currency related translations | | | (147,428,293 | ) | | | (193,065,395 | ) |
| | |
Net change on foreign capital gains taxes on unrealized appreciation/depreciation | | | 982,332 | | | | 551,992 | |
Net increase (decrease) in net assets resulting from operations | | | (160,939,389 | ) | | | 1,717,630 | |
| | |
DISTRIBUTIONS TO SHAREHOLDERS: | | | | | | | | |
| | |
Investor Class | | | (2,386,367 | ) | | | (63,324,581 | ) |
| | |
Institutional Class | | | (3,140,557 | ) | | | (67,936,667 | ) |
Net decrease in net assets resulting from distributions | | | (5,526,924 | ) | | | (131,261,248 | ) |
CAPITAL SHARE TRANSACTIONS (net) (Note 4) | | | (34,774,851 | ) | | | (272,727,754 | ) |
Total increase (decrease) in net assets | | | (201,241,164 | ) | | | (402,271,372 | ) |
NET ASSETS: | | | | | | | | |
| | |
Beginning of period | | | 1,093,483,532 | | | | 1,495,754,904 | |
End of period | | | $892,242,368 | | | | $1,093,483,532 | |
See accompanying notes to financial statements.
| | | | | | | | |
| | | | matthewsasia.com | 800.789.ASIA | | | 111 | |
Statements of Changes in Net Assets (continued)
| | | | | | | | |
| MATTHEWS ASIA DIVIDEND FUND | | Six-Month Period Ended June 30, 2022
(Unaudited) | | | Year Ended
December 31, 2021 | |
| | |
OPERATIONS: | | | | | | | | |
| | |
Net investment income (loss) | | | $23,678,798 | | | | $47,989,553 | |
| | |
Net realized gain (loss) on investments and foreign currency related transactions | | | (5,572,414 | ) | | | 590,052,083 | |
| | |
Net change in unrealized appreciation/depreciation on investments and foreign currency related translations | | | (1,141,894,713 | ) | | | (778,480,857 | ) |
| | |
Net change on foreign capital gains taxes on unrealized appreciation/depreciation | | | 5,724,389 | | | | (11,499,323 | ) |
Net increase (decrease) in net assets resulting from operations | | | (1,118,063,940 | ) | | | (151,938,544 | ) |
| | |
DISTRIBUTIONS TO SHAREHOLDERS: | | | | | | | | |
| | |
Investor Class | | | (6,349,828 | ) | | | (236,307,308 | ) |
| | |
Institutional Class | | | (14,939,143 | ) | | | (467,698,670 | ) |
Net decrease in net assets resulting from distributions | | | (21,288,971 | ) | | | (704,005,978 | ) |
CAPITAL SHARE TRANSACTIONS (net) (Note 4) | | | (670,135,916 | ) | | | 395,875,826 | |
Total increase (decrease) in net assets | | | (1,809,488,827 | ) | | | (460,068,696 | ) |
NET ASSETS: | | | | | | | | |
| | |
Beginning of period | | | 4,740,867,225 | | | | 5,200,935,921 | |
End of period | | | $2,931,378,398 | | | | $4,740,867,225 | |
| | |
| MATTHEWS CHINA DIVIDEND FUND | | Six-Month Period Ended June 30, 2022
(Unaudited) | | | Year Ended
December 31, 2021 | |
| | |
OPERATIONS: | | | | | | | | |
| | |
Net investment income (loss) | | | $3,724,646 | | | | $9,178,392 | |
| | |
Net realized gain (loss) on investments and foreign currency related transactions | | | (11,227,648 | ) | | | 38,504,136 | |
| | |
Net change in unrealized appreciation/depreciation on investments and foreign currency related translations | | | (42,092,257 | ) | | | (49,851,545 | ) |
Net increase (decrease) in net assets resulting from operations | | | (49,595,259 | ) | | | (2,169,017 | ) |
| | |
DISTRIBUTIONS TO SHAREHOLDERS: | | | | | | | | |
| | |
Investor Class | | | (4,945,510 | ) | | | (21,726,106 | ) |
| | |
Institutional Class | | | (2,615,269 | ) | | | (13,662,250 | ) |
Net decrease in net assets resulting from distributions | | | (7,560,779 | ) | | | (35,388,356 | ) |
CAPITAL SHARE TRANSACTIONS (net) (Note 4) | | | (19,565,887 | ) | | | 3,075,154 | |
Total increase (decrease) in net assets | | | (76,721,925 | ) | | | (34,482,219 | ) |
NET ASSETS: | | | | | | | | |
| | |
Beginning of period | | | 350,160,740 | | | | 384,642,959 | |
End of period | | | $273,438,815 | | | | $350,160,740 | |
See accompanying notes to financial statements.
Statements of Changes in Net Assets (continued)
| | | | | | | | |
| MATTHEWS ASIA TOTAL RETURN BOND FUND | | Six-Month Period Ended June 30, 2022
(Unaudited) | | | Year Ended
December 31, 2021 | |
| | |
OPERATIONS: | | | | | | | | |
| | |
Net investment income (loss) | | | $2,199,030 | | | | $5,083,424 | |
| | |
Net realized gain (loss) on investments, forward foreign currency exchange contracts, swaps and foreign currency related transactions | | | (2,116,478 | ) | | | 4,828,235 | |
| | |
Net change in unrealized appreciation/depreciation on investments, forward foreign currency exchange contracts and foreign currency related translations | | | (19,283,742 | ) | | | (14,620,240 | ) |
| | |
Net change on foreign capital gains taxes on unrealized appreciation/depreciation | | | 32,176 | | | | 34,300 | |
| | |
Net change in unrealized appreciation/depreciation on swaps | | | (81,339 | ) | | | (623,558 | ) |
Net increase (decrease) in net assets resulting from operations | | | (19,250,353 | ) | | | (5,297,839 | ) |
| | |
DISTRIBUTIONS TO SHAREHOLDERS: | | | | | | | | |
| | |
Investor Class | | | (462,668 | ) | | | (1,530,622 | ) |
| | |
Institutional Class | | | (1,512,292 | ) | | | (4,316,780 | ) |
Net decrease in net assets resulting from distributions | | | (1,974,960 | ) | | | (5,847,402 | ) |
CAPITAL SHARE TRANSACTIONS (net) (Note 4) | | | (18,996,378 | ) | | | 10,157,141 | |
Total increase (decrease) in net assets | | | (40,221,691 | ) | | | (988,100 | ) |
NET ASSETS: | | | | | | | | |
| | |
Beginning of period | | | 113,860,140 | | | | 114,848,240 | |
End of period | | | $73,638,449 | | | | $113,860,140 | |
| | |
| MATTHEWS ASIA CREDIT OPPORTUNITIES FUND | | Six-Month Period
Ended June 30, 2022
(Unaudited) | | | Year Ended
December 31, 2021 | |
| | |
OPERATIONS: | | | | | | | | |
| | |
Net investment income (loss) | | | $949,548 | | | | $3,707,314 | |
| | |
Net realized gain (loss) on investments and foreign currency related transactions | | | (369,667 | ) | | | (5,615,978 | ) |
| | |
Net change in unrealized appreciation/depreciation on investments and foreign currency related translations | | | (7,414,619 | ) | | | (5,166,380 | ) |
Net increase (decrease) in net assets resulting from operations | | | (6,834,738 | ) | | | (7,075,044 | ) |
| | |
DISTRIBUTIONS TO SHAREHOLDERS: | | | | | | | | |
| | |
Investor Class | | | (176,016 | ) | | | (421,926 | ) |
| | |
Institutional Class | | | (678,037 | ) | | | (3,602,496 | ) |
Net decrease in net assets resulting from distributions | | | (854,053 | ) | | | (4,024,422 | ) |
CAPITAL SHARE TRANSACTIONS (net) (Note 4) | | | (8,181,167 | ) | | | (38,580,219 | ) |
Total increase (decrease) in net assets | | | (15,869,958 | ) | | | (49,679,685 | ) |
NET ASSETS: | | | | | | | | |
| | |
Beginning of period | | | 41,427,751 | | | | 91,107,436 | |
End of period | | | $25,557,793 | | | | $41,427,751 | |
See accompanying notes to financial statements.
| | | | | | | | |
| | | | matthewsasia.com | 800.789.ASIA | | | 113 | |
Financial Highlights
Matthews Emerging Markets Equity Fund
The tables below set forth financial data for a share of beneficial interest outstanding throughout each period presented.
| | | | | | | | | | | | |
| INVESTOR CLASS | | Six-Month Period Ended June 30, 2022 (Unaudited) | | | Year Ended
Dec. 31, 2021 | | | Period Ended
Dec. 31, 20201 | |
Net Asset Value, beginning of period | | | $14.34 | | | | $15.76 | | | | $10.00 | |
INCOME (LOSS) FROM INVESTMENT OPERATIONS: | | | | | | | | | | | | |
Net investment income (loss)2 | | | 0.08 | | | | 0.19 | | | | 0.04 | |
Net realized gain (loss) and unrealized appreciation/depreciation on investments, foreign currency related transactions and foreign capital gains taxes | | | (3.62 | ) | | | (0.31 | ) | | | 6.08 | |
Total from investment operations | | | (3.54 | ) | | | (0.12 | ) | | | 6.12 | |
LESS DISTRIBUTIONS FROM: | | | | | | | | | | | | |
Net investment income | | | — | | | | (0.18 | ) | | | — | |
Net realized gains on investments | | | — | | | | (1.12 | ) | | | (0.36 | ) |
Total distributions | | | — | | | | (1.30 | ) | | | (0.36 | ) |
Net Asset Value, end of period | | | $10.80 | | | | $14.34 | | | | $15.76 | |
TOTAL RETURN | | | (24.69% | )3 | | | (0.60% | ) | | | 61.23% | 3 |
| | | |
RATIOS/SUPPLEMENTAL DATA | | | | | | | | | | | | |
Net assets, end of period (in 000’s) | | | $9,313 | | | | $13,317 | | | | $9,851 | |
Ratio of expenses to average net assets before any reimbursement, waiver or recapture of expenses by Advisor and Administrator (Note 5) | | | 1.67% | 4 | | | 1.52% | | | | 2.76% | 4 |
Ratio of expenses to average net assets after any reimbursement, waiver or recapture of expenses by Advisor and Administrator | | | 1.14% | 4 | | | 1.13% | | | | 1.08% | 4 |
Ratio of net investment income (loss) to average net assets | | | 1.30% | 4 | | | 1.15% | | | | 0.45% | 4 |
Portfolio turnover5 | | | 35.50% | 3 | | | 88.45% | | | | 62.30% | 3 |
| | | |
| INSTITUTIONAL CLASS | | Six-Month Period Ended June 30, 2022 (Unaudited) | | | Year Ended
Dec. 31, 2021 | | | Period Ended
Dec. 31, 20201 | |
Net Asset Value, beginning of period | | | $14.34 | | | | $15.77 | | | | $10.00 | |
INCOME (LOSS) FROM INVESTMENT OPERATIONS: | | | | | | | | | | | | |
Net investment income (loss)2 | | | 0.10 | | | | 0.22 | | | | 0.04 | |
Net realized gain (loss) and unrealized appreciation/depreciation on investments, foreign currency related transactions and foreign capital gains taxes | | | (3.62 | ) | | | (0.31 | ) | | | 6.11 | |
Total from investment operations | | | (3.52 | ) | | | (0.09 | ) | | | 6.15 | |
LESS DISTRIBUTIONS FROM: | | | | | | | | | | | | |
Net investment income | | | — | | | | (0.22) | | | | (0.02) | |
Net realized gains on investments | | | — | | | | (1.12) | | | | (0.36) | |
Total distributions | | | — | | | | (1.34) | | | | (0.38) | |
Net Asset Value, end of period | | | $10.82 | | | | $14.34 | | | | $15.77 | |
TOTAL RETURN | | | (24.55% | )3 | | | (0.43% | ) | | | 61.55% | 3 |
| | | |
RATIOS/SUPPLEMENTAL DATA | | | | | | | | | | | | |
Net assets, end of period (in 000’s) | | | $28,859 | | | | $36,240 | | | | $34,941 | |
Ratio of expenses to average net assets before any reimbursement, waiver or recapture of expenses by Advisor and Administrator (Note 5) | | | 1.53% | 4 | | | 1.38% | | | | 2.65% | 4 |
Ratio of expenses to average net assets after any reimbursement, waiver or recapture of expenses by Advisor and Administrator | | | 0.90% | 4 | | | 0.90% | | | | 0.90% | 4 |
Ratio of net investment income (loss) to average net assets | | | 1.56% | 4 | | | 1.33% | | | | 0.44% | 4 |
Portfolio turnover5 | | | 35.50% | 3 | | | 88.45% | | | | 62.30% | 3 |
| 1 | The Fund commenced operations on April 30, 2020. |
| 2 | Calculated using the average daily shares method. |
| 5 | The portfolio turnover rate is calculated on the Fund as a whole without distinguishing between classes of shares issued. |
See accompanying notes to financial statements.
Financial Highlights (continued)
Matthews Emerging Markets Small Companies Fund
The tables below set forth financial data for a share of beneficial interest outstanding throughout each period presented.
| | | | | | | | | | | | | | | | | | | | | | | | |
| INVESTOR CLASS | | Six-Month
Period Ended
June 30, 2022
(Unaudited) | | | Year Ended Dec. 31 | |
| | 2021 | | | 2020 | | | 2019 | | | 2018 | | | 2017 | |
Net Asset Value, beginning of period | | | $29.92 | | | | $25.93 | | | | $18.10 | | | | $15.50 | | | | $22.89 | | | | $19.05 | |
INCOME (LOSS) FROM INVESTMENT OPERATIONS: | | | | | | | | | | | | | | | | | | | | | | | | |
Net investment income (loss)1 | | | (0.03 | ) | | | (0.17 | ) | | | (0.02 | ) | | | 0.12 | | | | 0.12 | | | | 0.02 | |
Net realized gain (loss) and unrealized appreciation/depreciation on investments, foreign currency related transactions and foreign capital gains taxes | | | (5.45 | ) | | | 5.90 | | | | 7.92 | | | | 2.57 | | | | (4.20 | ) | | | 5.68 | |
Total from investment operations | | | (5.48 | ) | | | 5.73 | | | | 7.90 | | | | 2.69 | | | | (4.08 | ) | | | 5.70 | |
LESS DISTRIBUTIONS FROM: | | | | | | | | | | | | | | | | | | | | | | | | |
Net investment income | | | — | | | | — | | | | (0.05 | ) | | | (0.09 | ) | | | (0.08 | ) | | | (0.10 | ) |
Net realized gains on investments | | | — | | | | (1.74 | ) | | | (0.02 | ) | | | — | | | | (3.23 | ) | | | (1.76 | ) |
Total distributions | | | — | | | | (1.74 | ) | | | (0.07 | ) | | | (0.09 | ) | | | (3.31 | ) | | | (1.86 | ) |
Paid-in capital from redemption fees (Note 4) | | | — | | | | — | | | | — | | | | — | 2 | | | — | 3 | | | — | 3 |
Net Asset Value, end of period | | | $24.44 | | | | $29.92 | | | | $25.93 | | | | $18.10 | | | | $15.50 | | | | $22.89 | |
TOTAL RETURN | | | (18.32% | )4 | | | 22.14% | | | | 43.68% | | | | 17.38% | | | | (18.05% | ) | | | 30.59% | |
| | | | | | |
RATIOS/SUPPLEMENTAL DATA | | | | | | | | | | | | | | | | | | | | | | | | |
Net assets, end of period (in 000’s) | | | $130,930 | | | | $176,723 | | | | $99,573 | | | | $96,229 | | | | $111,456 | | | | $208,339 | |
Ratio of expenses to average net assets before any reimbursement, waiver or recapture of expenses by Advisor and Administrator (Note 5) | | | 1.51% | 5 | | | 1.51% | | | | 1.57% | | | | 1.60% | | | | 1.51% | | | | 1.49% | |
Ratio of expenses to average net assets after any reimbursement, waiver or recapture of expenses by Advisor and Administrator | | | 1.40% | 5 | | | 1.36% | | | | 1.39% | | | | 1.45% | | | | 1.46% | | | | 1.46% | |
Ratio of net investment income (loss) to average net assets | | | (0.25% | )5 | | | (0.55% | ) | | | (0.11% | ) | | | 0.72% | | | | 0.53% | | | | 0.09% | |
Portfolio turnover6 | | | 12.70% | 4 | | | 50.82% | | | | 111.87% | | | | 59.10% | | | | 69.79% | | | | 67.13% | |
| | |
| INSTITUTIONAL CLASS | | Six-Month
Period Ended
June 30, 2022
(Unaudited) | | | Year Ended Dec. 31 | |
| | 2021 | | | 2020 | | | 2019 | | | 2018 | | | 2017 | |
Net Asset Value, beginning of period | | | $29.87 | | | | $25.87 | | | | $18.06 | | | | $15.46 | | | | $22.86 | | | | $19.03 | |
INCOME (LOSS) FROM INVESTMENT OPERATIONS: | | | | | | | | | | | | | | | | | | | | | | | | |
Net investment income (loss)1 | | | — | 3 | | | (0.10 | ) | | | 0.01 | | | | 0.15 | | | | 0.16 | | | | 0.07 | |
Net realized gain (loss) and unrealized appreciation/depreciation on investments, foreign currency related transactions and foreign capital gains taxes | | | (5.44 | ) | | | 5.88 | | | | 7.91 | | | | 2.58 | | | | (4.19 | ) | | | 5.67 | |
Total from investment operations | | | (5.44 | ) | | | 5.78 | | | | 7.92 | | | | 2.73 | | | | (4.03 | ) | | | 5.74 | |
LESS DISTRIBUTIONS FROM: | | | | | | | | | | | | | | | | | | | | | | | | |
Net investment income | | | — | | | | (0.04 | ) | | | (0.09 | ) | | | (0.13 | ) | | | (0.14 | ) | | | (0.15 | ) |
Net realized gains on investments | | | — | | | | (1.74 | ) | | | (0.02 | ) | | | — | | | | (3.23 | ) | | | (1.76 | ) |
Total distributions | | | — | | | | (1.78 | ) | | | (0.11 | ) | | | (0.13 | ) | | | (3.37 | ) | | | (1.91 | ) |
Paid-in capital from redemption fees (Note 4) | | | — | | | | — | | | | — | | | | — | 2 | | | — | 3 | | | — | 3 |
Net Asset Value, end of period | | | $24.43 | | | | $29.87 | | | | $25.87 | | | | $18.06 | | | | $15.46 | | | | $22.86 | |
TOTAL RETURN | | | (18.21% | )4 | | | 22.39% | | | | 43.90% | | | | 17.65% | | | | (17.86% | ) | | | 30.85% | |
| | | | | | |
RATIOS/SUPPLEMENTAL DATA | | | | | | | | | | | | | | | | | | | | | | | | |
Net assets, end of period (in 000’s) | | | $216,878 | | | | $221,286 | | | | $107,569 | | | | $85,006 | | | | $74,935 | | | | $232,954 | |
Ratio of expenses to average net assets before any reimbursement, waiver or recapture of expenses by Advisor and Administrator (Note 5) | | | 1.35% | 5 | | | 1.38% | | | | 1.47% | | | | 1.46% | | | | 1.37% | | | | 1.35% | |
Ratio of expenses to average net assets after any reimbursement, waiver or recapture of expenses by Advisor and Administrator | | | 1.15% | 5 | | | 1.16% | | | | 1.20% | | | | 1.24% | | | | 1.25% | | | | 1.25% | |
Ratio of net investment income (loss) to average net assets | | | 0.03% | 5 | | | (0.34% | ) | | | 0.08% | | | | 0.85% | | | | 0.73% | | | | 0.34% | |
Portfolio turnover6 | | | 12.70% | 4 | | | 50.82% | | | | 111.87% | | | | 59.10% | | | | 69.79% | | | | 67.13% | |
| 1 | Calculated using the average daily shares method. |
| 2 | The Fund charged redemption fees through October 31, 2019. |
| 3 | Less than $0.01 per share. |
| 6 | The portfolio turnover rate is calculated on the Fund as a whole without distinguishing between classes of shares issued. |
See accompanying notes to financial statements.
| | | | | | | | |
| | | | matthewsasia.com | 800.789.ASIA | | | 115 | |
Financial Highlights (continued)
Matthews Asia Growth Fund
The tables below set forth financial data for a share of beneficial interest outstanding throughout each period presented.
| | | | | | | | | | | | | | | | | | | | | | | | |
| INVESTOR CLASS | | Six-Month
Period Ended
June 30, 2022 (Unaudited) | | | Year Ended Dec. 31 | |
| | 2021 | | | 2020 | | | 2019 | | | 2018 | | | 2017 | |
Net Asset Value, beginning of period | | | $31.99 | | | | $39.44 | | | | $28.10 | | | | $22.49 | | | | $27.25 | | | | $21.05 | |
INCOME (LOSS) FROM INVESTMENT OPERATIONS: | | | | | | | | | | | | | | | | | | | | | | | | |
Net investment income (loss)1 | | | (0.04 | ) | | | (0.24 | ) | | | (0.11 | ) | | | (0.03 | ) | | | — | 2 | | | 0.04 | |
Net realized gain (loss) and unrealized appreciation/depreciation on investments, foreign currency related transactions and foreign capital gains taxes | | | (9.97 | ) | | | (5.56 | ) | | | 13.16 | | | | 5.91 | | | | (4.41 | ) | | | 8.14 | |
Total from investment operations | | | (10.01 | ) | | | (5.80 | ) | | | 13.05 | | | | 5.88 | | | | (4.41 | ) | | | 8.18 | |
LESS DISTRIBUTIONS FROM: | | | | | | | | | | | | | | | | | | | | | | | | |
Net investment income | | | — | | | | — | | | | (0.15 | ) | | | — | | | | (0.03 | ) | | | (0.16 | ) |
Net realized gains on investments | | | — | | | | (1.65 | ) | | | (1.56 | ) | | | (0.27 | ) | | | (0.32 | ) | | | (1.82 | ) |
Total distributions | | | — | | | | (1.65 | ) | | | (1.71 | ) | | | (0.27 | ) | | | (0.35 | ) | | | (1.98 | ) |
Net Asset Value, end of period | | | $21.98 | | | | $31.99 | | | | $39.44 | | | | $28.10 | | | | $22.49 | | | | $27.25 | |
TOTAL RETURN | | | (31.29% | )3 | | | (14.65% | ) | | | 46.76% | | | | 26.18% | | | | (16.25% | ) | | | 39.39% | |
| | | | | | |
RATIOS/SUPPLEMENTAL DATA | | | | | | | | | | | | | | | | | | | | | | | | |
Net assets, end of period (in 000’s) | | | $309,884 | | | | $568,001 | | | | $784,085 | | | | $504,538 | | | | $463,600 | | | | $554,309 | |
Ratio of expenses to average net assets | | | 1.14% | 4 | | | 1.07% | | | | 1.08% | | | | 1.09% | | | | 1.10% | | | | 1.12% | |
Ratio of net investment income (loss) to average net assets | | | (0.31% | )4 | | | (0.62% | ) | | | (0.35% | ) | | | (0.14% | ) | | | —% | 5 | | | 0.16% | |
Portfolio turnover6 | | | 23.46% | 3 | | | 42.37% | | | | 42.78% | | | | 38.05% | | | | 12.12% | | | | 23.19% | |
| | |
| INSTITUTIONAL CLASS | | Six-Month
Period Ended
June 30, 2022 (Unaudited) | | | Year Ended Dec. 31 | |
| | 2021 | | | 2020 | | | 2019 | | | 2018 | | | 2017 | |
Net Asset Value, beginning of period | | | $32.33 | | | | $39.82 | | | | $28.34 | | | | $22.65 | | | | $27.45 | | | | $21.19 | |
INCOME (LOSS) FROM INVESTMENT OPERATIONS: | | | | | | | | | | | | | | | | | | | | | | | | |
Net investment income (loss)1 | | | (0.02 | ) | | | (0.19 | ) | | | (0.07 | ) | | | — | 2 | | | 0.05 | | | | 0.09 | |
Net realized gain (loss) and unrealized appreciation/depreciation on investments, foreign currency related transactions and foreign capital gains taxes | | | (10.08 | ) | | | (5.63 | ) | | | 13.30 | | | | 5.96 | | | | (4.45 | ) | | | 8.20 | |
Total from investment operations | | | (10.10 | ) | | | (5.82 | ) | | | 13.23 | | | | 5.96 | | | | (4.40 | ) | | | 8.29 | |
LESS DISTRIBUTIONS FROM: | | | | | | | | | | | | | | | | | | | | | | | | |
Net investment income | | | — | | | | (0.02 | ) | | | (0.19 | ) | | | — | | | | (0.08 | ) | | | (0.21 | ) |
Net realized gains on investments | | | — | | | | (1.65 | ) | | | (1.56 | ) | | | (0.27 | ) | | | (0.32 | ) | | | (1.82 | ) |
Total distributions | | | — | | | | (1.67 | ) | | | (1.75 | ) | | | (0.27 | ) | | | (0.40 | ) | | | (2.03 | ) |
Net Asset Value, end of period | | | $22.23 | | | | $32.33 | | | | $39.82 | | | | $28.34 | | | | $22.65 | | | | $27.45 | |
TOTAL RETURN | | | (31.24% | )3 | | | (14.55% | ) | | | 47.01% | | | | 26.34% | | | | (16.10% | ) | | | 39.64% | |
| | | | | | |
RATIOS/SUPPLEMENTAL DATA | | | | | | | | | | | | | | | | | | | | | | | | |
Net assets, end of period (in 000’s) | | | $603,591 | | | | $1,186,769 | | | | $1,269,702 | | | | $698,797 | | | | $466,733 | | | | $296,253 | |
Ratio of expenses to average net assets | | | 1.01% | 4 | | | 0.92% | | | | 0.95% | | | | 0.94% | | | | 0.93% | | | | 0.93% | |
Ratio of net investment income (loss) to average net assets | | | (0.15% | )4 | | | (0.47% | ) | | | (0.23% | ) | | | —% | 5 | | | 0.17% | | | | 0.35% | |
Portfolio turnover6 | | | 23.46% | 3 | | | 42.37% | | | | 42.78% | | | | 38.05% | | | | 12.12% | | | | 23.19% | |
| 1 | Calculated using the average daily shares method. |
| 2 | Less than $0.01 per share. |
| 6 | The portfolio turnover rate is calculated on the Fund as a whole without distinguishing between classes of shares issued. |
See accompanying notes to financial statements.
Financial Highlights (continued)
Matthews Pacific Tiger Fund
The tables below set forth financial data for a share of beneficial interest outstanding throughout each period presented.
| | | | | | | | | | | | | | | | | | | | | | | | |
| INVESTOR CLASS | | Six-Month
Period Ended
June 30, 2022 (Unaudited) | | | Year Ended Dec. 31 | |
| | 2021 | | | 2020 | | | 2019 | | | 2018 | | | 2017 | |
Net Asset Value, beginning of period | | | $27.54 | | | | $34.94 | | | | $28.74 | | | | $26.86 | | | | $31.66 | | | | $22.92 | |
INCOME (LOSS) FROM INVESTMENT OPERATIONS: | | | | | | | | | | | | | | | | | | | | | | | | |
Net investment income (loss)1 | | | 0.05 | | | | 0.06 | | | | 0.10 | | | | 0.19 | | | | 0.24 | | | | 0.17 | |
Net realized gain (loss) and unrealized appreciation/depreciation on investments, foreign currency related transactions and foreign capital gains taxes | | | (4.72 | ) | | | (1.60 | ) | | | 8.10 | | | | 2.68 | | | | (3.75 | ) | | | 8.96 | |
Total from investment operations | | | (4.67 | ) | | | (1.54 | ) | | | 8.20 | | | | 2.87 | | | | (3.51 | ) | | | 9.13 | |
LESS DISTRIBUTIONS FROM: | | | | | | | | | | | | | | | | | | | | | | | | |
Net investment income | | | — | | | | — | | | | (0.08 | ) | | | (0.15 | ) | | | (0.21 | ) | | | (0.17 | ) |
Net realized gains on investments | | | — | | | | (5.86 | ) | | | (1.92 | ) | | | (0.84 | ) | | | (1.08 | ) | | | (0.22 | ) |
Total distributions | | | — | | | | (5.86 | ) | | | (2.00 | ) | | | (0.99 | ) | | | (1.29 | ) | | | (0.39 | ) |
Paid-in capital from redemption fees (Note 4) | | | — | | | | — | | | | — | | | | — | 2 | | | — | | | | — | 2 |
Net Asset Value, end of period | | | $22.87 | | | | $27.54 | | | | $34.94 | | | | $28.74 | | | | $26.86 | | | | $31.66 | |
TOTAL RETURN | | | (16.96% | )3 | | | (4.41% | ) | | | 28.83% | | | | 10.72% | | | | (11.11% | ) | | | 39.96% | |
| | | | | | |
RATIOS/SUPPLEMENTAL DATA | | | | | | | | | | | | | | | | | | | | | | | | |
Net assets, end of period (in 000’s) | | | $1,386,781 | | | | $1,835,266 | | | | $2,585,654 | | | | $2,536,844 | | | | $2,618,155 | | | | $3,335,795 | |
Ratio of expenses to average net assets before any reimbursement, waiver or recapture of expenses by Advisor and Administrator (Note 5) | | | 1.12% | 4 | | | 1.06% | | | | 1.08% | | | | 1.08% | | | | 1.07% | | | | 1.08% | |
Ratio of expenses to average net assets after any reimbursement, waiver or recapture of expenses by Advisor and Administrator | | | 1.11% | 4 | | | 1.03% | | | | 1.06% | | | | 1.05% | | | | 1.04% | | | | 1.06% | |
Ratio of net investment income (loss) to average net assets | | | 0.43% | 4 | | | 0.17% | | | | 0.35% | | | | 0.66% | | | | 0.79% | | | | 0.63% | |
Portfolio turnover5 | | | 3.63% | 3 | | | 46.64% | | | | 38.11% | | | | 17.08% | | | | 11.48% | | | | 9.18% | |
| | |
| INSTITUTIONAL CLASS | | Six-Month
Period Ended
June 30, 2022 (Unaudited) | | | Year Ended Dec. 31 | |
| | 2021 | | | 2020 | | | 2019 | | | 2018 | | | 2017 | |
Net Asset Value, beginning of period | | | $27.50 | | | | $34.90 | | | | $28.71 | | | | $26.83 | | | | $31.63 | | | | $22.90 | |
INCOME (LOSS) FROM INVESTMENT OPERATIONS: | | | | | | | | | | | | | | | | | | | | | | | | |
Net investment income (loss)1 | | | 0.06 | | | | 0.11 | | | | 0.13 | | | | 0.23 | | | | 0.28 | | | | 0.22 | |
Net realized gain (loss) and unrealized appreciation/depreciation on investments, foreign currency related transactions and foreign capital gains taxes | | | (4.71 | ) | | | (1.60 | ) | | | 8.11 | | | | 2.68 | | | | (3.74 | ) | | | 8.95 | |
Total from investment operations | | | (4.65 | ) | | | (1.49 | ) | | | 8.24 | | | | 2.91 | | | | (3.46 | ) | | | 9.17 | |
LESS DISTRIBUTIONS FROM: | | | | | | | | | | | | | | | | | | | | | | | | |
Net investment income | | | — | | | | (0.05 | ) | | | (0.13 | ) | | | (0.19 | ) | | | (0.26 | ) | | | (0.22 | ) |
Net realized gains on investments | | | — | | | | (5.86 | ) | | | (1.92 | ) | | | (0.84 | ) | | | (1.08 | ) | | | (0.22 | ) |
Total distributions | | | — | | | | (5.91 | ) | | | (2.05 | ) | | | (1.03 | ) | | | (1.34 | ) | | | (0.44 | ) |
Paid-in capital from redemption fees (Note 4) | | | — | | | | — | | | | — | | | | — | 2 | | | — | | | | — | 2 |
Net Asset Value, end of period | | | $22.85 | | | | $27.50 | | | | $34.90 | | | | $28.71 | | | | $26.83 | | | | $31.63 | |
TOTAL RETURN | | | (16.91% | )3 | | | (4.29% | ) | | | 28.98% | | | | 10.90% | | | | (10.94% | ) | | | 40.17% | |
| | | | | | |
RATIOS/SUPPLEMENTAL DATA | | | | | | | | | | | | | | | | | | | | | | | | |
Net assets, end of period (in 000’s) | | | $3,925,838 | | | | $5,357,198 | | | | $6,172,995 | | | | $6,189,015 | | | | $5,689,079 | | | | $6,389,242 | |
Ratio of expenses to average net assets before any reimbursement, waiver or recapture of expenses by Advisor and Administrator (Note 5) | | | 0.99% | 4 | | | 0.92% | | | | 0.94% | | | | 0.93% | | | | 0.90% | | | | 0.91% | |
Ratio of expenses to average net assets after any reimbursement, waiver or recapture of expenses by Advisor and Administrator | | | 0.98% | 4 | | | 0.90% | | | | 0.92% | | | | 0.91% | | | | 0.88% | | | | 0.89% | |
Ratio of net investment income (loss) to average net assets | | | 0.53% | 4 | | | 0.30% | | | | 0.46% | | | | 0.80% | | | | 0.95% | | | | 0.80% | |
Portfolio turnover5 | | | 3.63% | 3 | | | 46.64% | | | | 38.11% | | | | 17.08% | | | | 11.48% | | | | 9.18% | |
| 1 | Calculated using the average daily shares method. |
| 2 | Less than $0.01 per share. |
| 5 | The portfolio turnover rate is calculated on the Fund as a whole without distinguishing between classes of shares issued. |
See accompanying notes to financial statements.
| | | | | | | | |
| | | | matthewsasia.com | 800.789.ASIA | | | 117 | |
Financial Highlights (continued)
Matthews Asia ESG Fund
The tables below set forth financial data for a share of beneficial interest outstanding throughout each period presented.
| | | | | | | | | | | | | | | | | | | | | | | | |
| INVESTOR CLASS | | Six-Month
Period Ended
June 30, 2022 (Unaudited) | | | Year Ended Dec. 31 | |
| | 2021 | | | 2020 | | | 2019 | | | 2018 | | | 2017 | |
Net Asset Value, beginning of period | | | $15.37 | | | | $14.94 | | | | $11.08 | | | | $9.98 | | | | $11.56 | | | | $8.97 | |
INCOME (LOSS) FROM INVESTMENT OPERATIONS: | | | | | | | | | | | | | | | | | | | | | | | | |
Net investment income (loss)1 | | | (0.02 | ) | | | (0.07 | ) | | | (0.01 | ) | | | 0.04 | | | | 0.03 | | | | 0.05 | |
Net realized gain (loss) and unrealized appreciation/depreciation on investments, foreign currency related transactions and foreign capital gains taxes | | | (1.81 | ) | | | 1.85 | | | | 4.72 | | | | 1.21 | | | | (1.16 | ) | | | 2.97 | |
Total from investment operations | | | (1.83 | ) | | | 1.78 | | | | 4.71 | | | | 1.25 | | | | (1.13 | ) | | | 3.02 | |
LESS DISTRIBUTIONS FROM: | | | | | | | | | | | | | | | | | | | | | | | | |
Net investment income | | | — | | | | — | | | | (0.01 | ) | | | (0.03 | ) | | | (0.02 | ) | | | (0.27 | ) |
Net realized gains on investments | | | — | | | | (1.35 | ) | | | (0.84 | ) | | | (0.12 | ) | | | (0.43 | ) | | | (0.16 | ) |
Total distributions | | | — | | | | (1.35 | ) | | | (0.85 | ) | | | (0.15 | ) | | | (0.45 | ) | | | (0.43 | ) |
Net Asset Value, end of period | | | $13.54 | | | | $15.37 | | | | $14.94 | | | | $11.08 | | | | $9.98 | | | | $11.56 | |
TOTAL RETURN | | | (11.91% | )2 | | | 11.76% | | | | 42.87% | | | | 12.55% | | | | (9.73% | ) | | | 33.79% | |
| | | | | | |
RATIOS/SUPPLEMENTAL DATA | | | | | | | | | | | | | | | | | | | | | | | | |
Net assets, end of period (in 000’s) | | | $31,176 | | | | $39,612 | | | | $37,385 | | | | $19,291 | | | | $9,283 | | | | $10,695 | |
Ratio of expenses to average net assets before any reimbursement, waiver or recapture of expenses by Advisor and Administrator (Note 5) | | | 1.27% | 3 | | | 1.20% | | | | 1.42% | | | | 1.54% | | | | 2.20% | | | | 2.65% | |
Ratio of expenses to average net assets after any reimbursement, waiver or recapture of expenses by Advisor and Administrator | | | 1.39% | 3 | | | 1.40% | | | | 1.38% | | | | 1.42% | | | | 1.50% | | | | 1.50% | |
Ratio of net investment income (loss) to average net assets | | | (0.28% | )3 | | | (0.41% | ) | | | (0.08% | ) | | | 0.41% | | | | 0.27% | | | | 0.45% | |
Portfolio turnover4 | | | 25.69% | 2 | | | 65.56% | | | | 84.60% | | | | 29.67% | | | | 22.93% | | | | 28.82% | |
| | |
| INSTITUTIONAL CLASS | | Six-Month
Period Ended
June 30, 2022 (Unaudited) | | | Year Ended Dec. 31 | |
| | 2021 | | | 2020 | | | 2019 | | | 2018 | | | 2017 | |
Net Asset Value, beginning of period | | | $15.38 | | | | $14.92 | | | | $11.06 | | | | $9.96 | | | | $11.50 | | | | $8.92 | |
INCOME (LOSS) FROM INVESTMENT OPERATIONS: | | | | | | | | | | | | | | | | | | | | | | | | |
Net investment income (loss)1 | | | — | 5 | | | (0.04 | ) | | | 0.01 | | | | 0.06 | | | | 0.06 | | | | 0.08 | |
Net realized gain (loss) and unrealized appreciation/depreciation on investments, foreign currency related transactions and foreign capital gains taxes | | | (1.81 | ) | | | 1.85 | | | | 4.72 | | | | 1.21 | | | | (1.16 | ) | | | 2.95 | |
Total from investment operations | | | (1.81 | ) | | | 1.81 | | | | 4.73 | | | | 1.27 | | | | (1.10 | ) | | | 3.03 | |
LESS DISTRIBUTIONS FROM: | | | | | | | | | | | | | | | | | | | | | | | | |
Net investment income | | | — | | | | — | | | | (0.03 | ) | | | (0.05 | ) | | | (0.01 | ) | | | (0.29 | ) |
Net realized gains on investments | | | — | | | | (1.35 | ) | | | (0.84 | ) | | | (0.12 | ) | | | (0.43 | ) | | | (0.16 | ) |
Total distributions | | | — | | | | (1.35 | ) | | | (0.87 | ) | | | (0.17 | ) | | | (0.44 | ) | | | (0.45 | ) |
Net Asset Value, end of period | | | $13.57 | | | | $15.38 | | | | $14.92 | | | | $11.06 | | | | $9.96 | | | | $11.50 | |
TOTAL RETURN | | | (11.77% | )2 | | | 11.98% | | | | 43.13% | | | | 12.74% | | | | (9.52% | ) | | | 34.11% | |
| | | | | | |
RATIOS/SUPPLEMENTAL DATA | | | | | | | | | | | | | | | | | | | | | | | | |
Net assets, end of period (in 000’s) | | | $97,420 | | | | $87,241 | | | | $50,642 | | | | $36,008 | | | | $23,249 | | | | $7,359 | |
Ratio of expenses to average net assets before any reimbursement, waiver or recapture of expenses by Advisor and Administrator (Note 5) | | | 1.10% | 3 | | | 1.07% | | | | 1.29% | | | | 1.41% | | | | 2.01% | | | | 2.46% | |
Ratio of expenses to average net assets after any reimbursement, waiver or recapture of expenses by Advisor and Administrator | | | 1.20% | 3 | | | 1.20% | | | | 1.20% | | | | 1.24% | | | | 1.25% | | | | 1.25% | |
Ratio of net investment income (loss) to average net assets | | | (0.01% | )3 | | | (0.25% | ) | | | 0.09% | | | | 0.54% | | | | 0.55% | | | | 0.71% | |
Portfolio turnover4 | | | 25.69% | 2 | | | 65.56% | | | | 84.60% | | | | 29.67% | | | | 22.93% | | | | 28.82% | |
| 1 | Calculated using the average daily shares method. |
| 4 | The portfolio turnover rate is calculated on the Fund as a whole without distinguishing between classes of shares issued. |
| 5. | Less than $0.01 per share. |
See accompanying notes to financial statements.
Financial Highlights (continued)
Matthews Asia Innovators Fund
The tables below set forth financial data for a share of beneficial interest outstanding throughout each period presented.
| | | | | | | | | | | | | | | | | | | | | | | | |
| INVESTOR CLASS | | Six-Month
Period Ended
June 30, 2022 (Unaudited) | | | Year Ended Dec. 31 | |
| | 2021 | | | 2020 | | | 2019 | | | 2018 | | | 2017 | |
Net Asset Value, beginning of period | | | $18.86 | | | | $26.70 | | | | $14.55 | | | | $11.26 | | | | $14.19 | | | | $10.10 | |
INCOME (LOSS) FROM INVESTMENT OPERATIONS: | | | | | | | | | | | | | | | | | | | | | | | | |
Net investment income (loss)1 | | | (0.01 | ) | | | (0.16 | ) | | | (0.11 | ) | | | (0.01 | ) | | | (0.01 | ) | | | (0.02 | ) |
Net realized gain (loss) and unrealized appreciation/depreciation on investments, foreign currency related transactions and foreign capital gains taxes | | | (3.55 | ) | | | (3.34 | ) | | | 12.71 | | | | 3.34 | | | | (2.62 | ) | | | 5.31 | |
Total from investment operations | | | (3.56 | ) | | | (3.50 | ) | | | 12.60 | | | | 3.33 | | | | (2.63 | ) | | | 5.29 | |
LESS DISTRIBUTIONS FROM: | | | | | | | | | | | | | | | | | | | | | | | | |
Net investment income | | | — | | | | — | | | | — | | | | — | | | | (0.04 | ) | | | (0.24 | ) |
Net realized gains on investments | | | — | | | | (4.34 | ) | | | (0.45 | ) | | | (0.04 | ) | | | (0.26 | ) | | | (0.96 | ) |
Total distributions | | | — | | | | (4.34 | ) | | | (0.45 | ) | | | (0.04 | ) | | | (0.30 | ) | | | (1.20 | ) |
Net Asset Value, end of period | | | $15.30 | | | | $18.86 | | | | $26.70 | | | | $14.55 | | | | $11.26 | | | | $14.19 | |
TOTAL RETURN | | | (18.88% | )2 | | | (13.10% | ) | | | 86.72% | | | | 29.60% | | | | (18.62% | ) | | | 52.88% | |
| | | | | | |
RATIOS/SUPPLEMENTAL DATA | | | | | | | | | | | | | | | | | | | | | | | | |
Net assets, end of period (in 000’s) | | | $317,769 | | | | $465,207 | | | | $631,101 | | | | $177,639 | | | | $152,449 | | | | $175,331 | |
Ratio of expenses to average net assets | | | 1.20% | 3 | | | 1.09% | | | | 1.10% | | | | 1.19% | | | | 1.19% | | | | 1.24% | |
Ratio of net investment income (loss) to average net assets | | | (0.13% | )3 | | | (0.59% | ) | | | (0.60% | ) | | | (0.04% | ) | | | (0.07% | ) | | | (0.18% | ) |
Portfolio turnover4 | | | 54.40% | 2 | | | 220.45% | | | | 119.81% | | | | 80.10% | | | | 85.73% | | | | 66.51% | |
| | |
| INSTITUTIONAL CLASS | | Six-Month
Period Ended
June 30, 2022 (Unaudited) | | | Year Ended Dec. 31 | |
| | 2021 | | | 2020 | | | 2019 | | | 2018 | | | 2017 | |
Net Asset Value, beginning of period | | | $19.08 | | | | $26.91 | | | | $14.64 | | | | $11.32 | | | | $14.26 | | | | $10.14 | |
INCOME (LOSS) FROM INVESTMENT OPERATIONS: | | | | | | | | | | | | | | | | | | | | | | | | |
Net investment income (loss)1 | | | (0.01 | ) | | | (0.11 | ) | | | (0.09 | ) | | | 0.01 | | | | 0.01 | | | | 0.01 | |
Net realized gain (loss) and unrealized appreciation/depreciation on investments, foreign currency related transactions and foreign capital gains taxes | | | (3.58 | ) | | | (3.38 | ) | | | 12.81 | | | | 3.35 | | | | (2.62 | ) | | | 5.33 | |
Total from investment operations | | | (3.59 | ) | | | (3.49 | ) | | | 12.72 | | | | 3.36 | | | | (2.61 | ) | | | 5.34 | |
LESS DISTRIBUTIONS FROM: | | | | | | | | | | | | | | | | | | | | | | | | |
Net investment income | | | — | | | | — | | | | — | | | | — | | | | (0.07 | ) | | | (0.26 | ) |
Net realized gains on investments | | | — | | | | (4.34 | ) | | | (0.45 | ) | | | (0.04 | ) | | | (0.26 | ) | | | (0.96 | ) |
Total distributions | | | — | | | | (4.34 | ) | | | (0.45 | ) | | | (0.04 | ) | | | (0.33 | ) | | | (1.22 | ) |
Net Asset Value, end of period | | | $15.49 | | | | $19.08 | | | | $26.91 | | | | $14.64 | | | | $11.32 | | | | $14.26 | |
TOTAL RETURN | | | (18.82% | )2 | | | (12.97% | ) | | | 87.01% | | | | 29.71% | | | | (18.40% | ) | | | 53.18% | |
| | | | | | |
RATIOS/SUPPLEMENTAL DATA | | | | | | | | | | | | | | | | | | | | | | | | |
Net assets, end of period (in 000’s) | | | $350,336 | | | | $930,562 | | | | $1,094,356 | | | | $126,911 | | | | $91,769 | | | | $30,957 | |
Ratio of expenses to average net assets | | | 1.09% | 3 | | | 0.93% | | | | 0.95% | | | | 1.05% | | | | 1.02% | | | | 1.05% | |
Ratio of net investment income (loss) to average net assets | | | (0.13% | )3 | | | (0.43% | ) | | | (0.44% | ) | | | 0.10% | | | | 0.07% | | | | 0.06% | |
Portfolio turnover4 | | | 54.40% | 2 | | | 220.45% | | | | 119.81% | | | | 80.10% | | | | 85.73% | | | | 66.51% | |
| 1 | Calculated using the average daily shares method. |
| 4 | The portfolio turnover rate is calculated on the Fund as a whole without distinguishing between classes of shares issued. |
See accompanying notes to financial statements.
| | | | | | | | |
| | | | matthewsasia.com | 800.789.ASIA | | | 119 | |
Financial Highlights (continued)
Matthews China Fund
The tables below set forth financial data for a share of beneficial interest outstanding throughout each period presented.
| | | | | | | | | | | | | | | | | | | | | | | | |
| INVESTOR CLASS | | Six-Month
Period Ended
June 30, 2022 (Unaudited) | | | Year Ended Dec. 31 | |
| | 2021 | | | 2020 | | | 2019 | | | 2018 | | | 2017 | |
Net Asset Value, beginning of period | | | $20.58 | | | | $27.00 | | | | $19.12 | | | | $14.37 | | | | $22.20 | | | | $15.47 | |
INCOME (LOSS) FROM INVESTMENT OPERATIONS: | | | | | | | | | | | | | | | | | | | | | | | | |
Net investment income (loss)1 | | | 0.02 | | | | 0.03 | | | | 0.05 | | | | 0.16 | | | | 0.21 | | | | 0.16 | |
Net realized gain (loss) and unrealized appreciation/depreciation on investments and foreign currency related transactions | | | (2.73 | ) | | | (3.25 | ) | | | 8.17 | | | | 4.80 | | | | (4.84 | ) | | | 8.86 | |
Total from investment operations | | | (2.71 | ) | | | (3.22 | ) | | | 8.22 | | | | 4.96 | | | | (4.63 | ) | | | 9.02 | |
LESS DISTRIBUTIONS FROM: | | | | | | | | | | | | | | | | | | | | | | | | |
Net investment income | | | — | | | | (0.05 | ) | | | (0.06 | ) | | | (0.21 | ) | | | (0.29 | ) | | | (0.37 | ) |
Net realized gains on investments | | | — | | | | (3.15 | ) | | | (0.28 | ) | | | — | | | | (2.91 | ) | | | (1.92 | ) |
Total distributions | | | — | | | | (3.20 | ) | | | (0.34 | ) | | | (0.21 | ) | | | (3.20 | ) | | | (2.29 | ) |
Net Asset Value, end of period | | | $17.87 | | | | $20.58 | | | | $27.00 | | | | $19.12 | | | | $14.37 | | | | $22.20 | |
TOTAL RETURN | | | (13.17% | )2 | | | (12.26% | ) | | | 43.05% | | | | 34.56% | | | | (21.42% | ) | | | 59.37% | |
| | | | | | |
RATIOS/SUPPLEMENTAL DATA | | | | | | | | | | | | | | | | | | | | | | | | |
Net assets, end of period (in 000’s) | | | $609,177 | | | | $710,844 | | | | $962,714 | | | | $718,633 | | | | $566,456 | | | | $843,508 | |
Ratio of expenses to average net assets | | | 1.13% | 3 | | | 1.06% | | | | 1.09% | | | | 1.09% | | | | 1.10% | | | | 1.09% | |
Ratio of net investment income (loss) to average net assets | | | 0.18% | 3 | | | 0.13% | | | | 0.22% | | | | 0.96% | | | | 1.00% | | | | 0.78% | |
Portfolio turnover4 | | | 33.50% | 2 | | | 92.28% | | | | 52.64% | | | | 68.93% | | | | 96.98% | | | | 78.74% | |
| | |
| INSTITUTIONAL CLASS | | Six-Month
Period Ended
June 30, 2022 (Unaudited) | | | Year Ended Dec. 31 | |
| | 2021 | | | 2020 | | | 2019 | | | 2018 | | | 2017 | |
Net Asset Value, beginning of period | | | $20.53 | | | | $26.94 | | | | $19.08 | | | | $14.33 | | | | $22.17 | | | | $15.44 | |
INCOME (LOSS) FROM INVESTMENT OPERATIONS: | | | | | | | | | | | | | | | | | | | | | | | | |
Net investment income (loss)1 | | | 0.02 | | | | 0.10 | | | | 0.09 | | | | 0.20 | | | | 0.33 | | | | 0.21 | |
Net realized gain (loss) and unrealized appreciation/depreciation on investments and foreign currency related transactions | | | (2.72 | ) | | | (3.26 | ) | | | 8.15 | | | | 4.80 | | | | (4.93 | ) | | | 8.84 | |
Total from investment operations | | | (2.70 | ) | | | (3.16 | ) | | | 8.24 | | | | 5.00 | | | | (4.60 | ) | | | 9.05 | |
LESS DISTRIBUTIONS FROM: | | | | | | | | | | | | | | | | | | | | | | | | |
Net investment income | | | — | | | | (0.10 | ) | | | (0.10 | ) | | | (0.25 | ) | | | (0.33 | ) | | | (0.40 | ) |
Net realized gains on investments | | | — | | | | (3.15 | ) | | | (0.28 | ) | | | — | | | | (2.91 | ) | | | (1.92 | ) |
Total distributions | | | — | | | | (3.25 | ) | | | (0.38 | ) | | | (0.25 | ) | | | (3.24 | ) | | | (2.32 | ) |
Net Asset Value, end of period | | | $17.83 | | | | $20.53 | | | | $26.94 | | | | $19.08 | | | | $14.33 | | | | $22.17 | |
TOTAL RETURN | | | (13.15% | )2 | | | (12.07% | ) | | | 43.23% | | | | 34.90% | | | | (21.32% | ) | | | 59.71% | |
| | | | | | |
RATIOS/SUPPLEMENTAL DATA | | | | | | | | | | | | | | | | | | | | | | | | |
Net assets, end of period (in 000’s) | | | $472,664 | | | | $630,966 | | | | $546,157 | | | | $183,762 | | | | $46,657 | | | | $61,975 | |
Ratio of expenses to average net assets | | | 0.97% | 3 | | | 0.91% | | | | 0.93% | | | | 0.91% | | | | 0.91% | | | | 0.93% | |
Ratio of net investment income (loss) to average net assets | | | 0.21% | 3 | | | 0.38% | | | | 0.40% | | | | 1.17% | | | | 1.53% | | | | 0.99% | |
Portfolio turnover4 | | | 33.50% | 2 | | | 92.28% | | | | 52.64% | | | | 68.93% | | | | 96.98% | | | | 78.74% | |
| 1 | Calculated using the average daily shares method. |
| 4 | The portfolio turnover rate is calculated on the Fund as a whole without distinguishing between classes of shares issued. |
See accompanying notes to financial statements.
Financial Highlights (continued)
Matthews China Small Companies Fund
The tables below set forth financial data for a share of beneficial interest outstanding throughout each period presented.
| | | | | | | | | | | | | | | | | | | | | | | | |
| INVESTOR CLASS | | Six-Month
Period Ended
June 30, 2022 (Unaudited) | | | Year Ended Dec. 31 | |
| | 2021 | | | 2020 | | | 2019 | | | 2018 | | | 2017 | |
Net Asset Value, beginning of period | | | $16.44 | | | | $19.86 | | | | $12.84 | | | | $9.58 | | | | $11.89 | | | | $8.21 | |
INCOME (LOSS) FROM INVESTMENT OPERATIONS: | | | | | | | | | | | | | | | | | | | | | | | | |
Net investment income (loss)1 | | | 0.02 | | | | 0.09 | | | | (0.03 | ) | | | 0.14 | | | | 0.09 | | | | 0.07 | |
Net realized gain (loss) and unrealized appreciation/depreciation on investments and foreign currency related transactions | | | (3.43 | ) | | | (0.80 | ) | | | 10.42 | | | | 3.24 | | | | (2.23 | ) | | | 4.27 | |
Total from investment operations | | | (3.41 | ) | | | (0.71 | ) | | | 10.39 | | | | 3.38 | | | | (2.14 | ) | | | 4.34 | |
LESS DISTRIBUTIONS FROM: | | | | | | | | | | | | | | | | | | | | | | | | |
Net investment income | | | — | | | | (0.12 | ) | | | (0.13 | ) | | | (0.13 | ) | | | (0.05 | ) | | | (0.11 | ) |
Net realized gains on investments | | | — | | | | (2.59 | ) | | | (3.24 | ) | | | — | | | | (0.16 | ) | | | (0.56 | ) |
Total distributions | | | — | | | | (2.71 | ) | | | (3.37 | ) | | | (0.13 | ) | | | (0.21 | ) | | | (0.67 | ) |
Paid-in capital from redemption fees (Note 4) | | | — | | | | — | | | | — | | | | 0.01 | 2 | | | 0.04 | | | | 0.01 | |
Net Asset Value, end of period | | | $13.03 | | | | $16.44 | | | | $19.86 | | | | $12.84 | | | | $9.58 | | | | $11.89 | |
TOTAL RETURN | | | (20.74% | )3 | | | (3.59% | ) | | | 82.52% | | | | 35.41% | | | | (17.68% | ) | | | 53.88% | |
| | | | | | |
RATIOS/SUPPLEMENTAL DATA | | | | | | | | | | | | | | | | | | | | | | | | |
Net assets, end of period (in 000’s) | | | $155,975 | | | | $218,398 | | | | $285,717 | | | | $63,432 | | | | $41,740 | | | | $35,209 | |
Ratio of expenses to average net assets before any reimbursement, waiver or recapture of expenses by Advisor and Administrator (Note 5) | | | 1.54% | 4 | | | 1.48% | | | | 1.52% | | | | 1.62% | | | | 1.97% | | | | 2.34% | |
Ratio of expenses to average net assets after any reimbursement, waiver or recapture of expenses by Advisor and Administrator | | | 1.44% | 4 | | | 1.43% | | | | 1.43% | | | | 1.42% | | | | 1.50% | | | | 1.50% | |
Ratio of net investment income (loss) to average net assets | | | 0.27% | 4 | | | 0.44% | | | | (0.14% | ) | | | 1.25% | | | | 0.78% | | | | 0.66% | |
Portfolio turnover5 | | | 29.47% | 3 | | | 119.65% | | | | 152.86% | | | | 68.17% | | | | 76.67% | | | | 67.22% | |
| | | |
| INSTITUTIONAL CLASS | | Six-Month
Period Ended
June 30, 2022 (Unaudited) | | | Year Ended Dec. 31 | | | Period Ended
Dec. 31, 20176 | |
| | 2021 | | | 2020 | | | 2019 | | | 2018 | |
Net Asset Value, beginning of period | | | $16.47 | | | | $19.90 | | | | $12.86 | | | | $9.59 | | | | $11.87 | | | | $11.90 | |
INCOME (LOSS) FROM INVESTMENT OPERATIONS: | | | | | | | | | | | | | | | | | | | | | | | | |
Net investment income (loss)1 | | | 0.03 | | | | 0.13 | | | | 0.04 | | | | 0.15 | | | | 0.11 | | | | (0.01 | ) |
Net realized gain (loss) and unrealized appreciation/depreciation on investments and foreign currency related transactions | | | (3.43 | ) | | | (0.80 | ) | | | 10.42 | | | | 3.26 | | | | (2.21 | ) | | | 0.67 | |
Total from investment operations | | | (3.40 | ) | | | (0.67 | ) | | | 10.46 | | | | 3.41 | | | | (2.10 | ) | | | 0.66 | |
LESS DISTRIBUTIONS FROM: | | | | | | | | | | | | | | | | | | | | | | | | |
Net investment income | | | — | | | | (0.17 | ) | | | (0.18 | ) | | | (0.15 | ) | | | (0.05 | ) | | | (0.13 | ) |
Net realized gains on investments | | | — | | | | (2.59 | ) | | | (3.24 | ) | | | — | | | | (0.16 | ) | | | (0.56 | ) |
Total distributions | | | — | | | | (2.76 | ) | | | (3.42 | ) | | | (0.15 | ) | | | (0.21 | ) | | | (0.69 | ) |
Paid-in capital from redemption fees (Note 4) | | | — | | | | — | | | | — | | | | 0.01 | 2 | | | 0.03 | | | | — | |
Net Asset Value, end of period | | | $13.07 | | | | $16.47 | | | | $19.90 | | | | $12.86 | | | | $9.59 | | | | $11.87 | |
TOTAL RETURN | | | (20.64% | )3 | | | (3.35% | ) | | | 82.89% | | | | 35.68% | | | | (17.48% | ) | | | 6.19% | 3 |
| | | | | | |
RATIOS/SUPPLEMENTAL DATA | | | | | | | | | | | | | | | | | | | | | | | | |
Net assets, end of period (in 000’s) | | | $114,192 | | | | $162,770 | | | | $98,052 | | | | $32,376 | | | | $20,740 | | | | $476 | |
Ratio of expenses to average net assets before any reimbursement, waiver or recapture of expenses by Advisor and Administrator (Note 5) | | | 1.40% | 4 | | | 1.31% | | | | 1.37% | | | | 1.51% | | | | 1.79% | | | | 2.09% | 4 |
Ratio of expenses to average net assets after any reimbursement, waiver or recapture of expenses by Advisor and Administrator | | | 1.20% | 4 | | | 1.20% | | | | 1.20% | | | | 1.24% | | | | 1.25% | | | | 1.25% | 4 |
Ratio of net investment income (loss) to average net assets | | | 0.46% | 4 | | | 0.63% | | | | 0.20% | | | | 1.34% | | | | 1.05% | | | | (1.20% | )4 |
Portfolio turnover5 | | | 29.47% | 3 | | | 119.65% | | | | 152.86% | | | | 68.17% | | | | 76.67% | | | | 67.22% | 3 |
| 1 | Calculated using the average daily shares method. |
| 2 | The Fund charged redemption fees through October 31, 2019. |
| 5 | The portfolio turnover rate is calculated on the Fund as a whole without distinguishing between classes of shares issued. |
| 6 | Commenced operations on November 30, 2017. |
See accompanying notes to financial statements.
| | | | | | | | |
| | | | matthewsasia.com | 800.789.ASIA | | | 121 | |
Financial Highlights (continued)
Matthews India Fund
The tables below set forth financial data for a share of beneficial interest outstanding throughout each period presented.
| | | | | | | | | | | | | | | | | | | | | | | | |
| INVESTOR CLASS | | Six-Month
Period Ended
June 30, 2022 (Unaudited) | | | Year Ended Dec. 31 | |
| | 2021 | | | 2020 | | | 2019 | | | 2018 | | | 2017 | |
Net Asset Value, beginning of period | | | $28.17 | | | | $26.29 | | | | $23.27 | | | | $26.32 | | | | $34.31 | | | | $25.65 | |
INCOME (LOSS) FROM INVESTMENT OPERATIONS: | | | | | | | | | | | | | | | | | | | | | | | | |
Net investment income (loss)1 | | | (0.07 | ) | | | (0.11 | ) | | | 0.01 | | | | (0.01 | ) | | | (0.05 | ) | | | (0.09 | ) |
Net realized gain (loss) and unrealized appreciation/depreciation on investments, foreign currency related transactions and foreign capital gains taxes | | | (4.11 | ) | | | 4.81 | | | | 3.81 | | | | (0.24 | ) | | | (3.60 | ) | | | 9.24 | |
Total from investment operations | | | (4.18 | ) | | | 4.70 | | | | 3.82 | | | | (0.25 | ) | | | (3.65 | ) | | | 9.15 | |
LESS DISTRIBUTIONS FROM: | | | | | | | | | | | | | | | | | | | | | | | | |
Net realized gains on investments | | | — | | | | (2.82 | ) | | | (0.80 | ) | | | (2.80 | ) | | | (4.34 | ) | | | (0.49 | ) |
Net Asset Value, end of period | | | $23.99 | | | | $28.17 | | | | $26.29 | | | | $23.27 | | | | $26.32 | | | | $34.31 | |
TOTAL RETURN | | | (14.84% | )2 | | | 18.11% | | | | 16.51% | | | | (0.88% | ) | | | (10.09% | ) | | | 35.79% | |
| | | | | | |
RATIOS/SUPPLEMENTAL DATA | | | | | | | | | | | | | | | | | | | | | | | | |
Net assets, end of period (in 000’s) | | | $505,424 | | | | $635,067 | | | | $617,908 | | | | $786,881 | | | | $1,077,990 | | | | $1,484,045 | |
Ratio of expenses to average net assets | | | 1.17% | 3 | | | 1.10% | | | | 1.15% | | | | 1.11% | | | | 1.09% | | | | 1.09% | |
Ratio of net investment income (loss) to average net assets | | | (0.56% | )3 | | | (0.38% | ) | | | 0.05% | | | | (0.03% | ) | | | (0.16% | ) | | | (0.30% | ) |
Portfolio turnover4 | | | 21.78% | 2 | | | 42.50% | | | | 57.38% | | | | 24.00% | | | | 20.87% | | | | 16.81% | |
| | |
| INSTITUTIONAL CLASS | | Six-Month
Period Ended
June 30, 2022 (Unaudited) | | | Year Ended Dec. 31 | |
| | 2021 | | | 2020 | | | 2019 | | | 2018 | | | 2017 | |
Net Asset Value, beginning of period | | | $28.64 | | | | $26.65 | | | | $23.55 | | | | $26.56 | | | | $34.51 | | | | $25.77 | |
INCOME (LOSS) FROM INVESTMENT OPERATIONS: | | | | | | | | | | | | | | | | | | | | | | | | |
Net investment income (loss)1 | | | (0.05 | ) | | | (0.06 | ) | | | 0.05 | | | | 0.02 | | | | 0.01 | | | | (0.03 | ) |
Net realized gain (loss) and unrealized appreciation/depreciation on investments, foreign currency related transactions and foreign capital gains taxes | | | (4.19 | ) | | | 4.87 | | | | 3.85 | | | | (0.23 | ) | | | (3.62 | ) | | | 9.29 | |
Total from investment operations | | | (4.24 | ) | | | 4.81 | | | | 3.90 | | | | (0.21 | ) | | | (3.61 | ) | | | 9.26 | |
LESS DISTRIBUTIONS FROM: | | | | | | | | | | | | | | | | | | | | | | | | |
Net investment income | | | — | | | | — | | | | — | | | | — | | | | — | | | | (0.03 | ) |
Net realized gains on investments | | | — | | | | (2.82 | ) | | | (0.80 | ) | | | (2.80 | ) | | | (4.34 | ) | | | (0.49 | ) |
Total distributions | | | — | | | | (2.82 | ) | | | (0.80 | ) | | | (2.80 | ) | | | (4.34 | ) | | | (0.52 | ) |
Net Asset Value, end of period | | | $24.40 | | | | $28.64 | | | | $26.65 | | | | $23.55 | | | | $26.56 | | | | $34.51 | |
TOTAL RETURN | | | (14.81% | )2 | | | 18.28% | | | | 16.65% | | | | (0.76% | ) | | | (9.92% | ) | | | 36.05% | |
| | | | | | |
RATIOS/SUPPLEMENTAL DATA | | | | | | | | | | | | | | | | | | | | | | | | |
Net assets, end of period (in 000’s) | | | $99,099 | | | | $128,708 | | | | $90,053 | | | | $177,526 | | | | $463,790 | | | | $788,388 | |
Ratio of expenses to average net assets | | | 1.00% | 3 | | | 0.96% | | | | 1.03% | | | | 0.94% | | | | 0.90% | | | | 0.89% | |
Ratio of net investment income (loss) to average net assets | | | (0.41% | )3 | | | (0.19% | ) | | | 0.24% | | | | 0.09% | | | | 0.02% | | | | (0.08% | ) |
Portfolio turnover4 | | | 21.78% | 2 | | | 42.50% | | | | 57.38% | | | | 24.00% | | | | 20.87% | | | | 16.81% | |
| 1 | Calculated using the average daily shares method. |
| 4 | The portfolio turnover rate is calculated on the Fund as a whole without distinguishing between classes of shares issued. |
See accompanying notes to financial statements.
Financial Highlights (continued)
Matthews Japan Fund
The tables below set forth financial data for a share of beneficial interest outstanding throughout each period presented.
| | | | | | | | | | | | | | | | | | | | | | | | |
| INVESTOR CLASS | | Six-Month
Period Ended
June 30, 2022 (Unaudited) | | | Year Ended Dec. 31 | |
| | 2021 | | | 2020 | | | 2019 | | | 2018 | | | 2017 | |
Net Asset Value, beginning of period | | | $22.09 | | | | $25.27 | | | | $21.51 | | | | $18.53 | | | | $24.12 | | | | $18.83 | |
INCOME (LOSS) FROM INVESTMENT OPERATIONS: | | | | | | | | | | | | | | | | | | | | | | | | |
Net investment income (loss)1 | | | 0.04 | | | | 0.09 | | | | 0.07 | | | | 0.11 | | | | 0.09 | | | | 0.09 | |
Net realized gain (loss) and unrealized appreciation/depreciation on investments and foreign currency related transactions | | | (6.48 | ) | | | (0.52 | ) | | | 6.25 | | | | 4.73 | | | | (4.91 | ) | | | 6.13 | |
Total from investment operations | | | (6.44 | ) | | | (0.43 | ) | | | 6.32 | | | | 4.84 | | | | (4.82 | ) | | | 6.22 | |
LESS DISTRIBUTIONS FROM: | | | | | | | | | | | | | | | | | | | | | | | | |
Net investment income | | | — | | | | (0.24 | ) | | | (0.13 | ) | | | (0.12 | ) | | | (0.06 | ) | | | (0.20 | ) |
Net realized gains on investments | | | — | | | | (2.51 | ) | | | (2.43 | ) | | | (1.74 | ) | | | (0.71 | ) | | | (0.73 | ) |
Total distributions | | | — | | | | (2.75 | ) | | | (2.56 | ) | | | (1.86 | ) | | | (0.77 | ) | | | (0.93 | ) |
Net Asset Value, end of period | | | $15.65 | | | | $22.09 | | | | $25.27 | | | | $21.51 | | | | $18.53 | | | | $24.12 | |
TOTAL RETURN | | | (29.15% | )2 | | | (1.92% | ) | | | 29.82% | | | | 26.08% | | | | (20.18% | ) | | | 33.14% | |
| | | | | | |
RATIOS/SUPPLEMENTAL DATA | | | | | | | | | | | | | | | | | | | | | | | | |
Net assets, end of period (in 000’s) | | | $232,508 | | | | $373,739 | | | | $1,101,820 | | | | $1,466,194 | | | | $1,704,102 | | | | $2,155,280 | |
Ratio of expenses to average net assets before any reimbursement, waiver or recapture of expenses by Advisor and Administrator (Note 5) | | | 1.07% | 3 | | | 0.95% | | | | 0.95% | | | | 0.93% | | | | 0.91% | | | | 0.95% | |
Ratio of expenses to average net assets after any reimbursement, waiver or recapture of expenses by Advisor and Administrator | | | 1.07% | 3 | | | 0.95% | | | | 0.95% | | | | 0.93% | | | | 0.91% | | | | 0.94% | |
Ratio of net investment income (loss) to average net assets | | | 0.46% | 3 | | | 0.38% | | | | 0.31% | | | | 0.51% | | | | 0.40% | | | | 0.40% | |
Portfolio turnover4 | | | 46.71% | 2 | | | 70.30% | | | | 62.03% | | | | 25.42% | | | | 46.11% | | | | 44.34% | |
| | |
| INSTITUTIONAL CLASS | | Six-Month
Period Ended
June 30, 2022 (Unaudited) | | | Year Ended Dec. 31 | |
| | 2021 | | | 2020 | | | 2019 | | | 2018 | | | 2017 | |
Net Asset Value, beginning of period | | | $22.13 | | | | $25.32 | | | | $21.55 | | | | $18.57 | | | | $24.16 | | | | $18.86 | |
INCOME (LOSS) FROM INVESTMENT OPERATIONS: | | | | | | | | | | | | | | | | | | | | | | | | |
Net investment income (loss)1 | | | 0.06 | | | | 0.05 | | | | 0.05 | | | | 0.11 | | | | 0.11 | | | | 0.10 | |
Net realized gain (loss) and unrealized appreciation/depreciation on investments and foreign currency related transactions | | | (6.50 | ) | | | (0.46 | ) | | | 6.29 | | | | 4.74 | | | | (4.91 | ) | | | 6.14 | |
Total from investment operations | | | (6.44 | ) | | | (0.41 | ) | | | 6.34 | | | | 4.85 | | | | (4.80 | ) | | | 6.24 | |
LESS DISTRIBUTIONS FROM: | | | | | | | | | | | | | | | | | | | | | | | | |
Net investment income | | | — | | | | (0.27 | ) | | | (0.14 | ) | | | (0.13 | ) | | | (0.08 | ) | | | (0.21 | ) |
Net realized gains on investments | | | — | | | | (2.51 | ) | | | (2.43 | ) | | | (1.74 | ) | | | (0.71 | ) | | | (0.73 | ) |
Total distributions | | | — | | | | (2.78 | ) | | | (2.57 | ) | | | (1.87 | ) | | | (0.79 | ) | | | (0.94 | ) |
Net Asset Value, end of period | | | $15.69 | | | | $22.13 | | | | $25.32 | | | | $21.55 | | | | $18.57 | | | | $24.16 | |
TOTAL RETURN | | | (29.10% | )2 | | | (1.83% | ) | | | 29.85% | | | | 26.10% | | | | (20.08% | ) | | | 33.23% | |
| | | | | | |
RATIOS/SUPPLEMENTAL DATA | | | | | | | | | | | | | | | | | | | | | | | | |
Net assets, end of period (in 000’s) | | | $730,638 | | | | $1,170,380 | | | | $548,968 | | | | $840,476 | | | | $1,167,472 | | | | $1,957,214 | |
Ratio of expenses to average net assets before any reimbursement, waiver or recapture of expenses by Advisor and Administrator (Note 5) | | | 0.93% | 3 | | | 0.89% | | | | 0.91% | | | | 0.88% | | | | 0.85% | | | | 0.87% | |
Ratio of expenses to average net assets after any reimbursement, waiver or recapture of expenses by Advisor and Administrator | | | 0.93% | 3 | | | 0.89% | | | | 0.91% | | | | 0.88% | | | | 0.84% | | | | 0.86% | |
Ratio of net investment income (loss) to average net assets | | | 0.65% | 3 | | | 0.22% | | | | 0.25% | | | | 0.53% | | | | 0.46% | | | | 0.46% | |
Portfolio turnover4 | | | 46.71% | 2 | | | 70.30% | | | | 62.03% | | | | 25.42% | | | | 46.11% | | | | 44.34% | |
| 1 | Calculated using the average daily shares method. |
| 4 | The portfolio turnover rate is calculated on the Fund as a whole without distinguishing between classes of shares issued. |
See accompanying notes to financial statements.
| | | | | | | | |
| | | | matthewsasia.com | 800.789.ASIA | | | 123 | |
Financial Highlights (continued)
Matthews Korea Fund
The tables below set forth financial data for a share of beneficial interest outstanding throughout each period presented.
| | | | | | | | | | | | | | | | | | | | | | | | |
| INVESTOR CLASS | | Six-Month
Period Ended
June 30, 2022 (Unaudited) | | | Year Ended Dec. 31 | |
| | 2021 | | | 2020 | | | 2019 | | | 2018 | | | 2017 | |
Net Asset Value, beginning of period | | | $5.70 | | | | $6.12 | | | | $4.38 | | | | $4.58 | | | | $6.91 | | | | $5.25 | |
INCOME (LOSS) FROM INVESTMENT OPERATIONS: | | | | | | | | | | | | | | | | | | | | | | | | |
Net investment income (loss)1 | | | 0.02 | | | | 0.04 | | | | 0.02 | | | | 0.01 | | | | 0.06 | | | | 0.06 | |
Net realized gain (loss) and unrealized appreciation/depreciation on investments and foreign currency related transactions | | | (1.45 | ) | | | (0.06 | ) | | | 1.76 | | | | 0.16 | | | | (1.61 | ) | | | 2.22 | |
Total from investment operations | | | (1.43 | ) | | | (0.02 | ) | | | 1.78 | | | | 0.17 | | | | (1.55 | ) | | | 2.28 | |
LESS DISTRIBUTIONS FROM: | | | | | | | | | | | | | | | | | | | | | | | | |
Net investment income | | | — | | | | (0.10 | ) | | | (0.04 | ) | | | — | | | | (0.13 | ) | | | (0.29 | ) |
Net realized gains on investments | | | — | | | | (0.30 | ) | | | — | | | | (0.37 | ) | | | (0.65 | ) | | | (0.33 | ) |
Total distributions | | | — | | | | (0.40 | ) | | | (0.04 | ) | | | (0.37 | ) | | | (0.78 | ) | | | (0.62 | ) |
Net Asset Value, end of period | | | $4.27 | | | | $5.70 | | | | $6.12 | | | | $4.38 | | | | $4.58 | | | | $6.91 | |
TOTAL RETURN | | | (25.09% | )2 | | | (0.33% | ) | | | 40.77% | | | | 3.80% | | | | (22.21% | ) | | | 43.70% | |
| | | | | | |
RATIOS/SUPPLEMENTAL DATA | | | | | | | | | | | | | | | | | | | | | | | | |
Net assets, end of period (in 000’s) | | | $85,098 | | | | $117,940 | | | | $141,931 | | | | $113,388 | | | | $127,080 | | | | $192,431 | |
Ratio of expenses to average net assets | | | 1.24% | 3 | | | 1.13% | | | | 1.19% | | | | 1.15% | | | | 1.14% | | | | 1.15% | |
Ratio of net investment income (loss) to average net assets | | | 0.68% | 3 | | | 0.70% | | | | 0.50% | | | | 0.28% | | | | 1.01% | | | | 0.90% | |
Portfolio turnover4 | | | 25.40% | 2 | | | 40.18% | | | | 39.62% | | | | 36.63% | | | | 35.60% | | | | 25.37% | |
| | |
| INSTITUTIONAL CLASS | | Six-Month
Period Ended
June 30, 2022 (Unaudited) | | | Year Ended Dec. 31 | |
| | 2021 | | | 2020 | | | 2019 | | | 2018 | | | 2017 | |
Net Asset Value, beginning of period | | | $5.75 | | | | $6.17 | | | | $4.42 | | | | $4.61 | | | | $6.95 | | | | $5.27 | |
INCOME (LOSS) FROM INVESTMENT OPERATIONS: | | | | | | | | | | | | | | | | | | | | | | | | |
Net investment income (loss)1 | | | 0.02 | | | | 0.06 | | | | 0.01 | | | | 0.01 | | | | 0.04 | | | | 0.10 | |
Net realized gain (loss) and unrealized appreciation/depreciation on investments and foreign currency related transactions | | | (1.46 | ) | | | (0.07 | ) | | | 1.79 | | | | 0.17 | | | | (1.60 | ) | | | 2.21 | |
Total from investment operations | | | (1.44 | ) | | | (0.01 | ) | | | 1.80 | | | | 0.18 | | | | (1.56 | ) | | | 2.31 | |
LESS DISTRIBUTIONS FROM: | | | | | | | | | | | | | | | | | | | | | | | | |
Net investment income | | | — | | | | (0.11 | ) | | | (0.05 | ) | | | — | | | | (0.13 | ) | | | (0.30 | ) |
Net realized gains on investments | | | — | | | | (0.30 | ) | | | — | | | | (0.37 | ) | | | (0.65 | ) | | | (0.33 | ) |
Total distributions | | | — | | | | (0.41 | ) | | | (0.05 | ) | | | (0.37 | ) | | | (0.78 | ) | | | (0.63 | ) |
Net Asset Value, end of period | | | $4.31 | | | | $5.75 | | | | $6.17 | | | | $4.42 | | | | $4.61 | | | | $6.95 | |
TOTAL RETURN | | | (25.04% | )2 | | | (0.16% | ) | | | 40.76% | | | | 4.01% | | | | (22.15% | ) | | | 44.11% | |
| | | | | | |
RATIOS/SUPPLEMENTAL DATA | | | | | | | | | | | | | | | | | | | | | | | | |
Net assets, end of period (in 000’s) | | | $10,289 | | | | $14,998 | | | | $12,192 | | | | $23,426 | | | | $19,377 | | | | $32,587 | |
Ratio of expenses to average net assets | | | 1.06% | 3 | | | 0.98% | | | | 1.05% | | | | 1.05% | | | | 1.02% | | | | 1.01% | |
Ratio of net investment income (loss) to average net assets | | | 0.84% | 3 | | | 0.93% | | | | 0.28% | | | | 0.29% | | | | 0.67% | | | | 1.51% | |
Portfolio turnover4 | | | 25.40% | 2 | | | 40.18% | | | | 39.62% | | | | 36.63% | | | | 35.60% | | | | 25.37% | |
| 1 | Calculated using the average daily shares method. |
| 4 | The portfolio turnover rate is calculated on the Fund as a whole without distinguishing between classes of shares issued. |
See accompanying notes to financial statements.
Financial Highlights (continued)
Matthews Asian Growth and Income Fund
The tables below set forth financial data for a share of beneficial interest outstanding throughout each period presented.
| | | | | | | | | | | | | | | | | | | | | | | | |
| INVESTOR CLASS | | Six-Month
Period Ended
June 30, 2022 (Unaudited) | | | Year Ended Dec. 31 | |
| | 2021 | | | 2020 | | | 2019 | | | 2018 | | | 2017 | |
Net Asset Value, beginning of period | | | $16.07 | | | | $18.05 | | | | $15.73 | | | | $13.92 | | | | $17.46 | | | | $14.94 | |
INCOME (LOSS) FROM INVESTMENT OPERATIONS: | | | | | | | | | | | | | | | | | | | | | | | | |
Net investment income (loss)1 | | | 0.12 | | | | 0.17 | | | | 0.21 | | | | 0.25 | | | | 0.32 | | | | 0.33 | |
Net realized gain (loss) and unrealized appreciation/depreciation on investments, foreign currency related transactions and foreign capital gains taxes | | | (2.52 | ) | | | (0.17 | ) | | | 2.27 | | | | 2.13 | | | | (2.20 | ) | | | 2.92 | |
Total from investment operations | | | (2.40 | ) | | | — | | | | 2.48 | | | | 2.38 | | | | (1.88 | ) | | | 3.25 | |
LESS DISTRIBUTIONS FROM: | | | | | | | | | | | | | | | | | | | | | | | | |
Net investment income | | | (0.08 | ) | | | (0.20 | ) | | | (0.16 | ) | | | (0.35 | ) | | | (0.32 | ) | | | (0.46 | ) |
Net realized gains on investments | | | — | | | | (1.78 | ) | | | — | 2 | | | (0.22 | ) | | | (1.34 | ) | | | (0.27 | ) |
Total distributions | | | (0.08 | ) | | | (1.98 | ) | | | (0.16 | ) | | | (0.57 | ) | | | (1.66 | ) | | | (0.73 | ) |
Paid-in capital from redemption fees (Note 4) | | | — | | | | — | | | | — | | | | — | | | | — | | | | — | 2 |
Net Asset Value, end of period | | | $13.59 | | | | $16.07 | | | | $18.05 | | | | $15.73 | | | | $13.92 | | | | $17.46 | |
TOTAL RETURN | | | (14.95% | )3 | | | 0.04% | | | | 16.00% | | | | 17.26% | | | | (10.96% | ) | | | 21.85% | |
| | | | | | |
RATIOS/SUPPLEMENTAL DATA | | | | | | | | | | | | | | | | | | | | | | | | |
Net assets, end of period (in 000’s) | | | $415,213 | | | | $541,744 | | | | $673,576 | | | | $723,815 | | | | $799,328 | | | | $1,535,746 | |
Ratio of expenses to average net assets before any reimbursement, waiver or recapture of expenses by Advisor and Administrator (Note 5) | | | 1.14% | 4 | | | 1.07% | | | | 1.09% | | | | 1.08% | | | | 1.08% | | | | 1.07% | |
Ratio of net investment income (loss) to average net assets | | | 1.68% | 4 | | | 0.91% | | | | 1.38% | | | | 1.67% | | | | 1.95% | | | | 1.95% | |
Portfolio turnover5 | | | 7.14% | 3 | | | 37.85% | | | | 36.27% | | | | 21.89% | | | | 32.24% | | | | 23.23% | |
| | |
| INSTITUTIONAL CLASS | | Six-Month
Period Ended
June 30, 2022 (Unaudited) | | | Year Ended Dec. 31 | |
| | 2021 | | | 2020 | | | 2019 | | | 2018 | | | 2017 | |
Net Asset Value, beginning of period | | | $16.04 | | | | $18.02 | | | | $15.70 | | | | $13.89 | | | | $17.43 | | | | $14.92 | |
INCOME (LOSS) FROM INVESTMENT OPERATIONS: | | | | | | | | | | | | | | | | | | | | | | | | |
Net investment income (loss)1 | | | 0.14 | | | | 0.20 | | | | 0.23 | | | | 0.27 | | | | 0.35 | | | | 0.36 | |
Net realized gain (loss) and unrealized appreciation/depreciation on investments, foreign currency related transactions and foreign capital gains taxes | | | (2.53 | ) | | | (0.17 | ) | | | 2.27 | | | | 2.14 | | | | (2.20 | ) | | | 2.91 | |
Total from investment operations | | | (2.39 | ) | | | 0.03 | | | | 2.50 | | | | 2.41 | | | | (1.85 | ) | | | 3.27 | |
LESS DISTRIBUTIONS FROM: | | | | | | | | | | | | | | | | | | | | | | | | |
Net investment income | | | (0.09 | ) | | | (0.23 | ) | | | (0.18 | ) | | | (0.38 | ) | | | (0.35 | ) | | | (0.49 | ) |
Net realized gains on investments | | | — | | | | (1.78 | ) | | | — | 2 | | | (0.22 | ) | | | (1.34 | ) | | | (0.27 | ) |
Total distributions | | | (0.09 | ) | | | (2.01 | ) | | | (0.18 | ) | | | (0.60 | ) | | | (1.69 | ) | | | (0.76 | ) |
Paid-in capital from redemption fees (Note 4) | | | — | | | | — | | | | — | | | | — | | | | — | | | | — | 2 |
Net Asset Value, end of period | | | $13.56 | | | | $16.04 | | | | $18.02 | | | | $15.70 | | | | $13.89 | | | | $17.43 | |
TOTAL RETURN | | | (14.91% | )3 | | | 0.18% | | | | 16.18% | | | | 17.46% | | | | (10.84% | ) | | | 22.00% | |
| | | | | | |
RATIOS/SUPPLEMENTAL DATA | | | | | | | | | | | | | | | | | | | | | | | | |
Net assets, end of period (in 000’s) | | | $477,030 | | | | $551,740 | | | | $822,179 | | | | $743,951 | | | | $596,364 | | | | $1,310,168 | |
Ratio of expenses to average net assets before any reimbursement, waiver or recapture of expenses by Advisor and Administrator (Note 5) | | | 1.00% | 4 | | | 0.94% | | | | 0.96% | | | | 0.94% | | | | 0.93% | | | | 0.93% | |
Ratio of net investment income (loss) to average net assets | | | 1.89% | 4 | | | 1.10% | | | | 1.51% | | | | 1.80% | | | | 2.14% | | | | 2.16% | |
Portfolio turnover5 | | | 7.14% | 3 | | | 37.85% | | | | 36.27% | | | | 21.89% | | | | 32.24% | | | | 23.23% | |
| 1 | Calculated using the average daily shares method. |
| 2 | Less than $0.01 per share. |
| 5 | The portfolio turnover rate is calculated on the Fund as a whole without distinguishing between classes of shares issued. |
See accompanying notes to financial statements.
| | | | | | | | |
| | | | matthewsasia.com | 800.789.ASIA | | | 125 | |
Financial Highlights (continued)
Matthews Asia Dividend Fund
The tables below set forth financial data for a share of beneficial interest outstanding throughout each period presented.
| | | | | | | | | | | | | | | | | | | | | | | | |
| INVESTOR CLASS | | Six-Month
Period Ended
June 30, 2022
(Unaudited) | | | Year Ended Dec. 31 | |
| | 2021 | | | 2020 | | | 2019 | | | 2018 | | | 2017 | |
Net Asset Value, beginning of period | | | $18.94 | | | | $22.63 | | | | $17.47 | | | | $16.05 | | | | $19.74 | | | | $15.52 | |
INCOME (LOSS) FROM INVESTMENT OPERATIONS: | | | | | | | | | | | | | | | | | | | | | | | | |
Net investment income (loss)1 | | | 0.09 | | | | 0.18 | | | | 0.15 | | | | 0.28 | | | | 0.37 | | | | 0.31 | |
Net realized gain (loss) and unrealized appreciation/depreciation on investments, foreign currency related transactions and foreign capital gains taxes | | | (4.62 | ) | | | (0.81 | ) | | | 5.23 | | | | 1.50 | | | | (2.83 | ) | | | 5.02 | |
Total from investment operations | | | (4.53 | ) | | | (0.63 | ) | | | 5.38 | | | | 1.78 | | | | (2.46 | ) | | | 5.33 | |
LESS DISTRIBUTIONS FROM: | | | | | | | | | | | | | | | | | | | | | | | | |
Net investment income | | | (0.09 | ) | | | (0.19 | ) | | | (0.22 | ) | | | (0.36 | ) | | | (0.31 | ) | | | (0.69 | ) |
Net realized gains on investments | | | — | | | | (2.87 | ) | | | — | | | | — | | | | (0.92 | ) | | | (0.42 | ) |
Total distributions | | | (0.09 | ) | | | (3.06 | ) | | | (0.22 | ) | | | (0.36 | ) | | | (1.23 | ) | | | (1.11 | ) |
Paid-in capital from redemption fees (Note 4) | | | — | | | | — | | | | — | | | | — | | | | — | | | | — | 2 |
Net Asset Value, end of period | | | $14.32 | | | | $18.94 | | | | $22.63 | | | | $17.47 | | | | $16.05 | | | | $19.74 | |
TOTAL RETURN | | | (23.97% | )3 | | | (2.83% | ) | | | 31.25% | | | | 11.17% | | | | (12.72% | ) | | | 34.69% | |
| | | | | | |
RATIOS/SUPPLEMENTAL DATA | | | | | | | | | | | | | | | | | | | | | | | | |
Net assets, end of period (in 000’s) | | | $962,407 | | | | $1,586,460 | | | | $2,292,262 | | | | $2,312,560 | | | | $2,728,599 | | | | $3,713,276 | |
Ratio of expenses to average net assets before any reimbursement, waiver or recapture of expenses by Advisor and Administrator (Note 5) | | | 1.14% | 4 | | | 1.03% | | | | 1.03% | | | | 1.03% | | | | 1.02% | | | | 1.03% | |
Ratio of expenses to average net assets after any reimbursement, waiver or recapture of expenses by Advisor and Administrator | | | 1.13% | 4 | | | 1.02% | | | | 1.02% | | | | 1.02% | | | | 1.01% | | | | 1.02% | |
Ratio of net investment income (loss) to average net assets | | | 1.14% | 4 | | | 0.80% | | | | 0.85% | | | | 1.68% | | | | 1.97% | | | | 1.67% | |
Portfolio turnover5 | | | 29.29% | 3 | | | 47.41% | | | | 37.73% | | | | 30.32% | | | | 39.75% | | | | 28.11% | |
| | |
| INSTITUTIONAL CLASS | | Six-Month
Period Ended
June 30, 2022
(Unaudited) | | | Year Ended Dec. 31 | |
| | 2021 | | | 2020 | | | 2019 | | | 2018 | | | 2017 | |
Net Asset Value, beginning of period | | | $18.94 | | | | $22.62 | | | | $17.47 | | | | $16.04 | | | | $19.73 | | | | $15.52 | |
INCOME (LOSS) FROM INVESTMENT OPERATIONS: | | | | | | | | | | | | | | | | | | | | | | | | |
Net investment income (loss)1 | | | 0.10 | | | | 0.21 | | | | 0.16 | | | | 0.30 | | | | 0.39 | | | | 0.33 | |
Net realized gain (loss) and unrealized appreciation/depreciation on investments, foreign currency related transactions and foreign capital gains taxes | | | (4.62 | ) | | | (0.80 | ) | | | 5.22 | | | | 1.50 | | | | (2.83 | ) | | | 5.01 | |
Total from investment operations | | | (4.52 | ) | | | (0.59 | ) | | | 5.38 | | | | 1.80 | | | | (2.44 | ) | | | 5.34 | |
LESS DISTRIBUTIONS FROM: | | | | | | | | | | | | | | | | | | | | | | | | |
Net investment income | | | (0.10 | ) | | | (0.22 | ) | | | (0.23 | ) | | | (0.37 | ) | | | (0.33 | ) | | | (0.71 | ) |
Net realized gains on investments | | | — | | | | (2.87 | ) | | | — | | | | — | | | | (0.92 | ) | | | (0.42 | ) |
Total distributions | | | (0.10 | ) | | | (3.09 | ) | | | (0.23 | ) | | | (0.37 | ) | | | (1.25 | ) | | | (1.13 | ) |
Paid-in capital from redemption fees (Note 4) | | | — | | | | — | | | | — | | | | — | | | | — | | | | — | 2 |
Net Asset Value, end of period | | | $14.32 | | | | $18.94 | | | | $22.62 | | | | $17.47 | | | | $16.04 | | | | $19.73 | |
TOTAL RETURN | | | (23.92% | )3 | | | (2.67% | ) | | | 31.29% | | | | 11.35% | | | | (12.64% | ) | | | 34.77% | |
| | | | | | |
RATIOS/SUPPLEMENTAL DATA | | | | | | | | | | | | | | | | | | | | | | | | |
Net assets, end of period (in 000’s) | | | $1,968,971 | | | | $3,154,407 | | | | $2,908,674 | | | | $3,057,896 | | | | $3,039,226 | | | | $3,284,070 | |
Ratio of expenses to average net assets before any reimbursement, waiver or recapture of expenses by Advisor and Administrator (Note 5) | | | 0.99% | 4 | | | 0.92% | | | | 0.93% | | | | 0.93% | | | | 0.91% | | | | 0.92% | |
Ratio of expenses to average net assets after any reimbursement, waiver or recapture of expenses by Advisor and Administrator | | | 0.99% | 4 | | | 0.91% | | | | 0.93% | | | | 0.92% | | | | 0.90% | | | | 0.91% | |
Ratio of net investment income (loss) to average net assets | | | 1.30% | 4 | | | 0.93% | | | | 0.91% | | | | 1.80% | | | | 2.09% | | | | 1.81% | |
Portfolio turnover5 | | | 29.29% | 3 | | | 47.41% | | | | 37.73% | | | | 30.32% | | | | 39.75% | | | | 28.11% | |
| 1 | Calculated using the average daily shares method. |
| 2 | Less than $0.01 per share. |
| 5 | The portfolio turnover rate is calculated on the Fund as a whole without distinguishing between classes of shares issued. |
See accompanying notes to financial statements.
Financial Highlights (continued)
Matthews China Dividend Fund
The tables below set forth financial data for a share of beneficial interest outstanding throughout each period presented.
| | | | | | | | | | | | | | | | | | | | | | | | |
| INVESTOR CLASS | | Six-Month
Period Ended
June 30, 2022 (Unaudited) | | | Year Ended Dec. 31 | |
| | 2021 | | | 2020 | | | 2019 | | | 2018 | | | 2017 | |
Net Asset Value, beginning of period | | | $17.73 | | | | $19.64 | | | | $16.20 | | | | $14.32 | | | | $17.61 | | | | $14.09 | |
INCOME (LOSS) FROM INVESTMENT OPERATIONS: | | | | | | | | | | | | | | | | | | | | | | | | |
Net investment income (loss)1 | | | 0.20 | | | | 0.41 | | | | 0.30 | | | | 0.34 | | | | 0.41 | | | | 0.35 | |
Net realized gain (loss) and unrealized appreciation/depreciation on investments and foreign currency related transactions | | | (2.64 | ) | | | (0.48 | ) | | | 3.54 | | | | 1.80 | | | | (2.09 | ) | | | 4.85 | |
Total from investment operations | | | (2.44 | ) | | | (0.07 | ) | | | 3.84 | | | | 2.14 | | | | (1.68 | ) | | | 5.20 | |
LESS DISTRIBUTIONS FROM: | | | | | | | | | | | | | | | | | | | | | | | | |
Net investment income | | | (0.42 | ) | | | (0.49 | ) | | | (0.40 | ) | | | (0.26 | ) | | | (0.40 | ) | | | (0.49 | ) |
Net realized gains on investments | | | — | | | | (1.35 | ) | | | — | | | | — | | | | (1.21 | ) | | | (1.19 | ) |
Total distributions | | | (0.42 | ) | | | (1.84 | ) | | | (0.40 | ) | | | (0.26 | ) | | | (1.61 | ) | | | (1.68 | ) |
Net Asset Value, end of period | | | $14.87 | | | | $17.73 | | | | $19.64 | | | | $16.20 | | | | $14.32 | | | | $17.61 | |
TOTAL RETURN | | | (13.78% | )2 | | | (0.49% | ) | | | 24.22% | | | | 15.00% | | | | (9.98% | ) | | | 37.69% | |
| | | | | | |
RATIOS/SUPPLEMENTAL DATA | | | | | | | | | | | | | | | | | | | | | | | | |
Net assets, end of period (in 000’s) | | | $180,399 | | | | $218,766 | | | | $269,192 | | | | $258,111 | | | | $196,626 | | | | $260,593 | |
Ratio of expenses to average net assets before any reimbursement, waiver or recapture of expenses by Advisor and Administrator (Note 5) | | | 1.20% | 3 | | | 1.12% | | | | 1.15% | | | | 1.15% | | | | 1.15% | | | | 1.19% | |
Ratio of net investment income (loss) to average net assets | | | 2.62% | 3 | | | 2.05% | | | | 1.79% | | | | 2.14% | | | | 2.33% | | | | 2.12% | |
Portfolio turnover4 | | | 37.29% | 2 | | | 68.25% | | | | 81.79% | | | | 65.69% | | | | 66.47% | | | | 69.14% | |
| | |
| INSTITUTIONAL CLASS | | Six-Month
Period Ended
June 30, 2022 (Unaudited) | | | Year Ended Dec. 31 | |
| | 2021 | | �� | 2020 | | | 2019 | | | 2018 | | | 2017 | |
Net Asset Value, beginning of period | | | $17.72 | | | | $19.64 | | | | $16.20 | | | | $14.32 | | | | $17.61 | | | | $14.09 | |
INCOME (LOSS) FROM INVESTMENT OPERATIONS: | | | | | | | | | | | | | | | | | | | | | | | | |
Net investment income (loss)1 | | | 0.20 | | | | 0.53 | | | | 0.31 | | | | 0.35 | | | | 0.42 | | | | 0.37 | |
Net realized gain (loss) and unrealized appreciation/depreciation on investments and foreign currency related transactions | | | (2.62 | ) | | | (0.58 | ) | | | 3.55 | | | | 1.81 | | | | (2.07 | ) | | | 4.85 | |
Total from investment operations | | | (2.42 | ) | | | (0.05 | ) | | | 3.86 | | | | 2.16 | | | | (1.65 | ) | | | 5.22 | |
LESS DISTRIBUTIONS FROM: | | | | | | | | | | | | | | | | | | | | | | | | |
Net investment income | | | (0.43 | ) | | | (0.52 | ) | | | (0.42 | ) | | | (0.28 | ) | | | (0.43 | ) | | | (0.51 | ) |
Net realized gains on investments | | | — | | | | (1.35 | ) | | | — | | | | — | | | | (1.21 | ) | | | (1.19 | ) |
Total distributions | | | (0.43 | ) | | | (1.87 | ) | | | (0.42 | ) | | | (0.28 | ) | | | (1.64 | ) | | | (1.70 | ) |
Net Asset Value, end of period | | | $14.87 | | | | $17.72 | | | | $19.64 | | | | $16.20 | | | | $14.32 | | | | $17.61 | |
TOTAL RETURN | | | (13.68% | )2 | | | (0.38% | ) | | | 24.37% | | | | 15.16% | | | | (9.83% | ) | | | 37.88% | |
| | | | | | |
RATIOS/SUPPLEMENTAL DATA | | | | | | | | | | | | | | | | | | | | | | | | |
Net assets, end of period (in 000’s) | | | $93,040 | | | | $131,395 | | | | $115,451 | | | | $122,630 | | | | $73,033 | | | | $54,147 | |
Ratio of expenses to average net assets before any reimbursement, waiver or recapture of expenses by Advisor and Administrator (Note 5) | | | 1.07% | 3 | | | 0.97% | | | | 1.02% | | | | 1.01% | | | | 1.01% | | | | 1.04% | |
Ratio of net investment income (loss) to average net assets | | | 2.59% | 3 | | | 2.65% | | | | 1.85% | | | | 2.25% | | | | 2.44% | | | | 2.25% | |
Portfolio turnover4 | | | 37.29% | 2 | | | 68.25% | | | | 81.79% | | | | 65.69% | | | | 66.47% | | | | 69.14% | |
| 1 | Calculated using the average daily shares method. |
| 4 | The portfolio turnover rate is calculated on the Fund as a whole without distinguishing between classes of shares issued. |
See accompanying notes to financial statements.
| | | | | | | | |
| | | | matthewsasia.com | 800.789.ASIA | | | 127 | |
Financial Highlights (continued)
Matthews Asia Total Return Bond Fund
The tables below set forth financial data for a share of beneficial interest outstanding throughout each period presented.
| | | | | | | | | | | | | | | | | | | | | | | | |
| INVESTOR CLASS | | Six-Month
Period Ended
June 30, 2022 (Unaudited) | | | Year Ended Dec. 31 | |
| | 2021 | | | 2020 | | | 2019 | | | 2018 | | | 2017 | |
Net Asset Value, beginning of period | | | $10.33 | | | | $11.25 | | | | $11.12 | | | | $10.25 | | | | $10.98 | | | | $10.43 | |
INCOME (LOSS) FROM INVESTMENT OPERATIONS: | | | | | | | | | | | | | | | | | | | | | | | | |
Net investment income (loss)1 | | | 0.22 | | | | 0.41 | | | | 0.46 | | | | 0.50 | | | | 0.40 | | | | 0.51 | |
Net realized gain (loss) and unrealized appreciation/depreciation on investments, forward foreign currency exchange contracts, swaps, foreign currency related transactions, and foreign capital gains taxes | | | (2.18 | ) | | | (0.85 | ) | | | 0.11 | | | | 0.81 | | | | (0.84 | ) | | | 0.46 | |
Total from investment operations | | | (1.96 | ) | | | (0.44 | ) | | | 0.57 | | | | 1.31 | | | | (0.44 | ) | | | 0.97 | |
LESS DISTRIBUTIONS FROM: | | | | | | | | | | | | | | | | | | | | | | | | |
Net investment income | | | (0.20 | ) | | | (0.46 | ) | | | (0.44 | ) | | | (0.44 | ) | | | (0.25 | ) | | | (0.42 | ) |
Net realized gains on investments | | | — | | | | (0.02 | ) | | | — | | | | — | | | | — | | | | — | |
Return of capital | | | — | | | | — | | | | — | | | | — | | | | (0.04 | ) | | | — | |
Total distributions | | | (0.20 | ) | | | (0.48 | ) | | | (0.44 | ) | | | (0.44 | ) | | | (0.29 | ) | | | (0.42 | ) |
Net Asset Value, end of period | | | $8.17 | | | | $10.33 | | | | $11.25 | | | | $11.12 | | | | $10.25 | | | | $10.98 | |
TOTAL RETURN | | | (19.15% | )2 | | | (4.06% | ) | | | 5.36% | | | | 13.00% | | | | (4.05% | ) | | | 9.40% | |
| | | | | | |
RATIOS/SUPPLEMENTAL DATA | | | | | | | | | | | | | | | | | | | | | | | | |
Net assets, end of period (in 000’s) | | | $17,157 | | | | $28,166 | | | | $40,422 | | | | $39,485 | | | | $40,698 | | | | $63,437 | |
Ratio of expenses to average net assets before any reimbursement, waiver or recapture of expenses by Advisor and Administrator (Note 5) | | | 1.19% | 3 | | | 1.05% | | | | 1.15% | | | | 1.08% | | | | 1.23% | | | | 1.29% | |
Ratio of expenses to average net assets after any reimbursement, waiver or recapture of expenses by Advisor and Administrator | | | 1.14% | 3 | | | 1.05% | | | | 1.12% | | | | 1.07% | | | | 1.15% | | | | 1.15% | |
Ratio of net investment income (loss) to average net assets | | | 4.74% | 3 | | | 3.76% | | | | 4.32% | | | | 4.61% | | | | 3.76% | | | | 4.70% | |
Portfolio turnover4 | | | 3.92% | 2 | | | 62.17% | | | | 39.71% | | | | 84.38% | | | | 82.32% | | | | 36.58% | |
| | |
| INSTITUTIONAL CLASS | | Six-Month
Period Ended
June 30, 2022 (Unaudited) | | | Year Ended Dec. 31 | |
| | 2021 | | | 2020 | | | 2019 | | | 2018 | | | 2017 | |
Net Asset Value, beginning of period | | | $10.33 | | | | $11.25 | | | | $11.12 | | | | $10.25 | | | | $10.97 | | | | $10.42 | |
INCOME (LOSS) FROM INVESTMENT OPERATIONS: | | | | | | | | | | | | | | | | | | | | | | | | |
Net investment income (loss)1 | | | 0.23 | | | | 0.42 | | | | 0.49 | | | | 0.52 | | | | 0.42 | | | | 0.53 | |
Net realized gain (loss) and unrealized appreciation/depreciation on investments, forward foreign currency exchange contracts, swaps, foreign currency related transactions, and foreign capital gains taxes | | | (2.18 | ) | | | (0.85 | ) | | | 0.10 | | | | 0.81 | | | | (0.83 | ) | | | 0.47 | |
Total from investment operations | | | (1.95 | ) | | | (0.43 | ) | | | 0.59 | | | | 1.33 | | | | (0.41 | ) | | | 1.00 | |
LESS DISTRIBUTIONS FROM: | | | | | | | | | | | | | | | | | | | | | | | | |
Net investment income | | | (0.21 | ) | | | (0.47 | ) | | | (0.46 | ) | | | (0.46 | ) | | | (0.27 | ) | | | (0.45 | ) |
Net realized gains on investments | | | — | | | | (0.02 | ) | | | — | | | | — | | | | — | | | | — | |
Return of capital | | | — | | | | — | | | | — | | | | — | | | | (0.04 | ) | | | — | |
Total distributions | | | (0.21 | ) | | | (0.49 | ) | | | (0.46 | ) | | | (0.46 | ) | | | (0.31 | ) | | | (0.45 | ) |
Net Asset Value, end of period | | | $8.17 | | | | $10.33 | | | | $11.25 | | | | $11.12 | | | | $10.25 | | | | $10.97 | |
TOTAL RETURN | | | (19.06% | )2 | | | (3.89% | ) | | | 5.60% | | | | 13.20% | | | | (3.78% | ) | | | 9.67% | |
| | | | | | |
RATIOS/SUPPLEMENTAL DATA | | | | | | | | | | | | | | | | | | | | | | | | |
Net assets, end of period (in 000’s) | | | $56,482 | | | | $85,694 | | | | $74,426 | | | | $77,228 | | | | $60,017 | | | | $31,155 | |
Ratio of expenses to average net assets before any reimbursement, waiver or recapture of expenses by Advisor and Administrator (Note 5) | | | 1.08% | 3 | | | 0.91% | | | | 1.00% | | | | 0.97% | | | | 1.04% | | | | 1.08% | |
Ratio of expenses to average net assets after any reimbursement, waiver or recapture of expenses by Advisor and Administrator | | | 0.90% | 3 | | | 0.90% | | | | 0.90% | | | | 0.90% | | | | 0.90% | | | | 0.90% | |
Ratio of net investment income (loss) to average net assets | | | 5.00% | 3 | | | 3.93% | | | | 4.56% | | | | 4.81% | | | | 4.03% | | | | 4.93% | |
Portfolio turnover4 | | | 3.92% | 2 | | | 62.17% | | | | 39.71% | | | | 84.38% | | | | 82.32% | | | | 36.58% | |
| 1 | Calculated using the average daily shares method. |
| 4 | The portfolio turnover rate is calculated on the Fund as a whole without distinguishing between classes of shares issued. |
See accompanying notes to financial statements.
Financial Highlights (continued)
Matthews Asia Credit Opportunities Fund
The tables below set forth financial data for a share of beneficial interest outstanding throughout each period presented.
| | | | | | | | | | | | | | | | | | | | | | | | |
| INVESTOR CLASS | | Six-Month
Period Ended
June 30, 2022 (Unaudited) | | | Year Ended Dec. 31 | |
| | 2021 | | | 2020 | | | 2019 | | | 2018 | | | 2017 | |
Net Asset Value, beginning of period | | | $9.16 | | | | $10.27 | | | | $10.57 | | | | $9.76 | | | | $10.39 | | | | $10.13 | |
INCOME (LOSS) FROM INVESTMENT OPERATIONS: | | | | | | | | | | | | | | | | | | | | | | | | |
Net investment income (loss)1 | | | 0.22 | | | | 0.40 | | | | 0.46 | | | | 0.47 | | | | 0.37 | | | | 0.44 | |
Net realized gain (loss) and unrealized appreciation/depreciation on investments, swaps, and foreign currency related transactions | | | (1.83 | ) | | | (1.04 | ) | | | (0.29 | ) | | | 0.82 | | | | (0.67 | ) | | | 0.35 | |
Total from investment operations | | | (1.61 | ) | | | (0.64 | ) | | | 0.17 | | | | 1.29 | | | | (0.30 | ) | | | 0.79 | |
LESS DISTRIBUTIONS FROM: | | | | | | | | | | | | | | | | | | | | | | | | |
Net investment income | | | (0.20 | ) | | | (0.47 | ) | | | (0.44 | ) | | | (0.44 | ) | | | (0.33 | ) | | | (0.43 | ) |
Net realized gains on investments | | | — | | | | — | | | | (0.03 | ) | | | (0.04 | ) | | | — | | | | (0.10 | ) |
Total distributions | | | (0.20 | ) | | | (0.47 | ) | | | (0.47 | ) | | | (0.48 | ) | | | (0.33 | ) | | | (0.53 | ) |
Net Asset Value, end of period | | | $7.35 | | | | $9.16 | | | | $10.27 | | | | $10.57 | | | | $9.76 | | | | $10.39 | |
TOTAL RETURN | | | (17.75% | )2 | | | (6.35% | ) | | | 1.80% | | | | 13.34% | | | | (2.88% | ) | | | 7.86% | |
| | | | | | |
RATIOS/SUPPLEMENTAL DATA | | | | | | | | | | | | | | | | | | | | | | | | |
Net assets, end of period (in 000’s) | | | $4,597 | | | | $7,966 | | | | $8,856 | | | | $12,997 | | | | $8,668 | | | | $10,201 | |
Ratio of expenses to average net assets before any reimbursement, waiver or recapture of expenses by Advisor and Administrator (Note 5) | | | 1.42% | 3 | | | 1.07% | | | | 1.14% | | | | 1.24% | | | | 1.44% | | | | 1.86% | |
Ratio of expenses to average net assets after any reimbursement, waiver or recapture of expenses by Advisor and Administrator | | | 1.14% | 3 | | | 1.07% | | | | 1.14% | | | | 1.12% | | | | 1.15% | | | | 1.15% | |
Ratio of net investment income (loss) to average net assets | | | 5.24% | 3 | | | 4.13% | | | | 4.53% | | | | 4.55% | | | | 3.62% | | | | 4.17% | |
Portfolio turnover4 | | | 3.05% | 2 | | | 79.83% | | | | 48.46% | | | | 81.08% | | | | 49.06% | | | | 27.86% | |
| | |
| INSTITUTIONAL CLASS | | Six-Month
Period Ended
June 30, 2022 (Unaudited) | | | Year Ended Dec. 31 | |
| | 2021 | | | 2020 | | | 2019 | | | 2018 | | | 2017 | |
Net Asset Value, beginning of period | | | $9.15 | | | | $10.27 | | | | $10.57 | | | | $9.75 | | | | $10.39 | | | | $10.13 | |
INCOME (LOSS) FROM INVESTMENT OPERATIONS: | | | | | | | | | | | | | | | | | | | | | | | | |
Net investment income (loss)1 | | | 0.22 | | | | 0.42 | | | | 0.48 | | | | 0.50 | | | | 0.39 | | | | 0.46 | |
Net realized gain (loss) and unrealized appreciation/depreciation on investments, swaps, and foreign currency related transactions | | | (1.81 | ) | | | (1.04 | ) | | | (0.29 | ) | | | 0.82 | | | | (0.67 | ) | | | 0.36 | |
Total from investment operations | | | (1.59 | ) | | | (0.62 | ) | | | 0.19 | | | | 1.32 | | | | (0.28 | ) | | | 0.82 | |
LESS DISTRIBUTIONS FROM: | | | | | | | | | | | | | | | | | | | | | | | | |
Net investment income | | | (0.21 | ) | | | (0.50 | ) | | | (0.46 | ) | | | (0.46 | ) | | | (0.36 | ) | | | (0.46 | ) |
Net realized gains on investments | | | — | | | | — | | | | (0.03 | ) | | | (0.04 | ) | | | — | | | | (0.10 | ) |
Total distributions | | | (0.21 | ) | | | (0.50 | ) | | | (0.49 | ) | | | (0.50 | ) | | | (0.36 | ) | | | (0.56 | ) |
Net Asset Value, end of period | | | $7.35 | | | | $9.15 | | | | $10.27 | | | | $10.57 | | | | $9.75 | | | | $10.39 | |
TOTAL RETURN | | | (17.57% | )2 | | | (6.24% | ) | | | 2.05% | | | | 13.69% | | | | (2.75% | ) | | | 8.13% | |
| | | | | | |
RATIOS/SUPPLEMENTAL DATA | | | | | | | | | | | | | | | | | | | | | | | | |
Net assets, end of period (in 000’s) | | | $20,961 | | | | $33,462 | | | | $82,252 | | | | $79,438 | | | | $31,085 | | | | $21,491 | |
Ratio of expenses to average net assets before any reimbursement, waiver or recapture of expenses by Advisor and Administrator (Note 5) | | | 1.43% | 3 | | | 0.93% | | | | 0.98% | | | | 1.07% | | | | 1.25% | | | | 1.62% | |
Ratio of expenses to average net assets after any reimbursement, waiver or recapture of expenses by Advisor and Administrator | | | 0.90% | 3 | | | 0.90% | | | | 0.90% | | | | 0.90% | | | | 0.90% | | | | 0.90% | |
Ratio of net investment income (loss) to average net assets | | | 5.44% | 3 | | | 4.25% | | | | 4.79% | | | | 4.79% | | | | 3.90% | | | | 4.45% | |
Portfolio turnover4 | | | 3.05% | 2 | | | 79.83% | | | | 48.46% | | | | 81.08% | | | | 49.06% | | | | 27.86% | |
| 1 | Calculated using the average daily shares method. |
| 4 | The portfolio turnover rate is calculated on the Fund as a whole without distinguishing between classes of shares issued. |
See accompanying notes to financial statements.
| | | | | | | | |
| | | | matthewsasia.com | 800.789.ASIA | | | 129 | |
Notes to Financial Statements (unaudited)
Matthews Asia Funds (the “Trust”) is an open-end management investment company registered under the Investment Company Act of 1940, as amended (the “1940 Act”). As of June 30, 2022, the Trust issued sixteen separate series of shares (each a “Fund”, and collectively, the “Funds”): Matthews Emerging Markets Equity Fund, Matthews Emerging Markets Small Companies Fund, Matthews Asia Growth Fund, Matthews Pacific Tiger Fund, Matthews Asia ESG Fund, Matthews Asia Innovators Fund, Matthews China Fund, Matthews China Small Companies Fund, Matthews India Fund, Matthews Japan Fund, Matthews Korea Fund, Matthews Asian Growth and Income Fund, Matthews Asia Dividend Fund, Matthews China Dividend Fund, Matthews Asia Total Return Bond Fund and Matthews Asia Credit Opportunities Fund. Each Fund currently offers two classes of shares: Investor Class and Institutional Class. Each class of shares has identical voting, dividend, liquidation and other rights and the same terms and conditions, except each class may be subject to different class expenses as outlined in the relevant prospectus and each class has exclusive voting rights with respect to matters solely affecting such class.
| A. | Reorganization of Matthews Emerging Asia Fund into Matthews Asia Small Companies Fund and renaming of the combined Fund as Matthews Emerging Markets Small Companies Fund |
The Trust approved the reorganization of Matthews Emerging Asia Fund into Matthews Asia Small Companies Fund effective April 29, 2021, and the renaming of the combined Fund as Matthews Emerging Markets Small Companies Fund effective April 30, 2021. The Board of Trustees of the Trust had determined that the reorganization was in the best interests of each Fund given the factors referenced in the Combined Prospectus/Information Statement filed on March 31, 2021, that included the recognition that approximately 75% of the companies comprising the emerging markets small capitalization investment universe are located in Asia, the significant overlap in the investment mandates of the Matthews Emerging Asia Fund and the Matthews Asia Small Companies Fund, an additional 0.05% reduction from each Fund’s contractual expense cap to the contractual expense cap of the combined Matthews Emerging Markets Small Companies Fund’s Institutional Class shares (which would also result in a reduction in the expense cap for the Investor Class shares), and the benefit to the shareholders of each Fund from the exposure to a broader investment universe as well as from potential operating efficiencies and economies of scale that may be achieved by combining the two Funds’ assets through the reorganization.
For U.S. GAAP purposes, the transaction was treated as a merger. The merger took place after the close of business on April 29, 2021. For accounting and performance reporting purposes, the Matthews Emerging Markets Small Companies Fund is the survivor. The reorganization was accomplished by a tax-free exchange of shares of Matthews Emerging Markets Small Companies Fund in the following amount and at the following conversion ratio:
| | | | | | | | | | | | | | | | | | | | |
| Fund | | Fund Share Class | | | Shares Prior to Reorganization | | | Conversion Ratio | | | Matthews Emerging Markets Small Companies Fund’s Share Class | | | Shares of Matthews Emerging Markets Small Companies Fund | |
| Matthews Emerging Asia Fund | | | Investor | | | | 4,222,800 | | | | 0.418762136 | | | | Investor | | | | 1,768,348 | |
| Matthews Emerging Asia Fund | | | Institutional | | | | 5,778,167 | | | | 0.421592128 | | | | Institutional | | | | 2,436,030 | |
The exchange was based on values at the close of the New York Stock Exchange on the immediately preceding business day, April 29, 2021. The net assets of the acquired Fund at that date included unrealized appreciation of $15,929,918, securities of $58,327,177, cash of $36,124,254, foreign currency of $17,857,911, receivables and other assets of $5,309,401, payables of $944,907, unrealized foreign capital gains tax accrued of $91,283, capital paid-in of $191,310,932, total distributable earnings of ($74,728,379), and net assets of $116,582,553 that were combined with those of the acquiring Fund, resulting in aggregate net assets of $353,643,657 immediately after the acquisition. The assets and liabilities of Matthews Emerging Asia Fund were recorded at fair value; however, the cost basis of the investments received from the Matthews Emerging Asia Fund was carried forward to align ongoing reporting of the Matthews Emerging Markets Small Companies Fund’s realized and unrealized gains and losses with amounts distributable to shareholders for tax purposes. Pro forma results of operations of the combined entity for the year ended December 31, 2021, as though the acquisition had occurred as of the beginning of the year (rather that on the actual acquisition date), are as follows:
| | * | Net investment loss: ($1,121,605) |
| | * | Net realized gain on investments: $48,010,992 |
| | * | Net change in unrealized gain/loss on investments: $20,080,367 |
| | * | Net increase in the net assets resulting from operations: $66,969,754 |
| 2. | SIGNIFICANT ACCOUNTING POLICIES |
The following is a summary of significant accounting policies consistently followed by the Funds in preparation of their financial statements. Each Fund follows the investment company accounting and reporting guidance of the Financial Accounting Standards Board (FASB) Accounting Standard Codification Topic 946 Financial Services—Investment Companies. The accounting policies are in conformity with accounting principles generally accepted in the United States of America (“U.S. GAAP”).
| A. | SECURITY VALUATION: The value of the Trust’s securities is based on market quotations for those securities, or on their fair value determined by the valuation policies approved by the Funds’ Board of Trustees (the “Board”). Market quotations and valuation information are provided by commercial pricing services or securities dealers that are independent of the Funds and Matthews International Capital Management, LLC (“Matthews”), in accordance with procedures established by the Funds’ Board. Foreign exchange-traded securities are valued as of the close of trading on the primary exchange on which they trade. Securities that trade in over-the-counter markets, including most debt securities (bonds), may be valued by other third-party vendors or by using indicative bid quotations from dealers or market makers, or other available market information. Market values for securities are determined based on quotations, market data or other information from the principal (or most advantageous) market on which the security is traded. Market quotations for equity securities used by the Funds include last reported sale prices, or, if such prices are not reported or available, bid and ask prices. Swap agreements are valued utilizing quotes received daily by the Funds’ pricing service or through brokers, which are derived using daily swap curves and models that incorporate a number of market data factors, such as discounted cash flows, trades and values of the underlying reference instruments. Foreign currency exchange contracts are valued at the mean between the bid and ask prices and are determined at the close of business on the New York Stock Exchange (“NYSE”). Interpolated values are derived when the settlement date of the contract is an interim date for which quotations are not available. The Funds may also utilize independent pricing services to assist them in determining a current market value for each security based on sources believed to be reliable. |
The Board has delegated to the Board’s Valuation Committee the responsibility for oversight of the fair valuation process under the Trust’s Pricing and Valuation Policy. The Board’s Valuation Committee, in turn, has delegated the determination of fair value prices under Matthews’ Pricing and Valuation Procedures to Matthews’ Valuation Committee (the “Valuation Committee”). The Board’s Valuation Committee will review and approve fair value determinations by Matthews’ Valuation Committee in accordance with the Pricing and Valuation Policy. When fair value pricing is employed, the prices of securities used by a Fund to calculate its Net Asset Value (“NAV”) may differ from any quoted or published prices for the
Notes to Financial Statements (unaudited) (continued)
same securities for that day. All fair value determinations are made subject to the Board’s oversight. Events affecting the value of foreign investments may occur between the time at which they are determined and when the Funds calculate their NAV, which is normally the close of trading on the NYSE. If such events render market quotations unreliable, and the impact of such events can be reasonably determined, the investments will be valu ed at their fair value in accordance with pricing policies. The fair value of a security held by the Funds may be determined using the services of third-party pricing services to assist in this process.
The books and records of the Funds are maintained in U.S. dollars. Transactions, portfolio securities, and assets and liabilities denominated in a fore ign currency are translated and recorded in U.S. dollars at the prevailing exchange rate as of the close of trading on the NYSE. The Fund does not isolate the effect of changes in foreign exchange rates from changes in market prices on securities held. Accordingly, such changes are included within Change in net unrealized appreciation/depreciation on investments on the Statement of Operations. Translation gains or losses resulting from changes in the exchange rate during the reporting period and realized gains and losses on the settlement of foreign currency transactions are reported in the results of operations for the current period. The Funds isolate that portion of gains and losses on investments in fixed income secur ities that is due to changes in foreign exchange rate from that which is due to changes in market prices of securities.
Foreign securities held by the Funds may be traded on days and at times when the NYSE is closed. Accordingly, the value of the Funds may be sign ificantly affected on days when shareholders have no access to the Funds.
| B. | FAIR VALUE MEASUREMENTS: The Funds follow a fair value hierarchy that distinguishes between market data obtained from independent sources (observable inputs) and the Funds’ own market assumptions (unobservable inputs). These inputs are used in determining the value of the Funds’ financial instruments and are summarized in the following fair value hierarchy: |
Level 1: Unadjusted quoted prices in active markets for identical securities (foreign securities that are valued based on market quotations).
Level 2: Other significant observable inputs. Certain foreign securities may be fair valued by Matthews using information such as quoted prices for similar securities, interest rates, prepayment speeds, credit risk, and foreign exchange. Additionally, external pricing services are used when the Funds determine that events affecting the value of foreign securities which occur between the time at which they are determined and the close of trading on the NYSE render market quotations unreliable.
Level 3: Significant unobservable inputs. Level 3 securities are valued based on significant unobservable inputs as determined under the direction of the Board. Characterization of such securities as Level 3 securities are not necessarily an indication of their liquidity or the risk associated with investing in these securities. A significant change in the unobservable inputs could result in a significantly lower or higher value in such Level 3 securities and could impact overall Fund performance.
The input levels are not necessarily an indication of the risk or liquidity associated with financial instruments at that level.
| | | | | | | | |
| | | | matthewsasia.com | 800.789.ASIA | | | 131 | |
Notes to Financial Statements (unaudited) (continued)
Levels for Multi-Country Funds (1 of 2):
Summary of inputs used to determine the fair valuation of multi-country Funds’ investments as of June 30, 2022.
| | | | | | | | | | | | | | | | | | | | | | | | |
| | | Matthews
Emerging Markets
Equity Fund | | | Matthews
Emerging Markets
Small Companies
Fund | | | Matthews Asian
Growth Fund | | | Matthews Pacific
Tiger Fund | | | Matthews Asia
ESG Fund | | | Matthews Asia
Innovators Fund | |
| Assets: | | | | | | | | | | | | | | | | | | | | | | | | |
| | | | | | |
| Investments: | | | | | | | | | | | | | | | | | | | | | | | | |
Level 1: Quoted Prices | | | | | | | | | | | | | | | | | | | | | | | | |
Common Equities: | | | | | | | | | | | | | | | | | | | | | | | | |
Bangladesh | | | $— | | | | $3,922,995 | | | | $— | | | | $— | | | | $2,348,920 | | | | $— | |
Brazil | | | 3,018,828 | | | | 12,756,755 | | | | — | | | | — | | | | — | | | | — | |
Canada | | | 226,942 | | | | — | | | | — | | | | — | | | | — | | | | — | |
Chile | | | — | | | | 12,932,610 | | | | — | | | | — | | | | — | | | | — | |
China/Hong Kong | | | 1,215,840 | | | | 8,141,489 | | | | 27,034,185 | | | | 183,504,284 | | | | 9,905,273 | | | | 33,316,816 | |
France | | | 257,936 | | | | — | | | | — | | | | — | | | | — | | | | — | |
India | | | 2,914,637 | | | | 1,088,685 | | | | — | | | | — | | | | — | | | | — | |
Indonesia | | | 426,492 | | | | — | | | | 4,054,593 | | | | — | | | | — | | | | — | |
Israel | | | 558,105 | | | | — | | | | — | | | | — | | | | — | | | | — | |
Mexico | | | 3,435,116 | | | | 4,408,753 | | | | — | | | | — | | | | — | | | | — | |
Philippines | | | 427,695 | | | | — | | | | — | | | | — | | | | — | | | | — | |
Singapore | | | 534,650 | | | | — | | | | 9,373,772 | | | | — | | | | — | | | | 9,146,849 | |
Taiwan | | | 291,465 | | | | — | | | | 8,616,450 | | | | — | | | | — | | | | — | |
United Arab Emirates | | | — | | | | 4,609,200 | | | | — | | | | — | | | | — | | | | — | |
United States | | | 1,291,218 | | | | 15,628,745 | | | | 39,951,807 | | | | — | | | | 10,885,020 | | | | — | |
Zambia | | | 1,052,913 | | | | — | | | | — | | | | — | | | | — | | | | — | |
Preferred Equities: | | | | | | | | | | | | | | | | | | | | | | | | |
Brazil | | | — | | | | 2,563,691 | | | | — | | | | — | | | | — | | | | — | |
Level 2: Other Significant Observable Inputs | | | | | | | | | | | | | | | | | | | | | | | | |
Common Equities: | | | | | | | | | | | | | | | | | | | | | | | | |
Australia | | | 1,067,255 | | | | — | | | | 38,257,371 | | | | — | | | | — | | | | — | |
China/Hong Kong | | | 5,080,282 | | | | 93,207,189 | | | | 270,891,309 | | | | 2,267,512,854 | | | | 47,434,087 | | | | 406,071,952 | |
France | | | 376,920 | | | | — | | | | — | | | | — | | | | — | | | | — | |
India | | | 1,901,729 | | | | 85,175,033 | | | | 172,851,150 | | | | 740,767,784 | | | | 29,806,611 | | | | 121,159,357 | |
Indonesia | | | 674,287 | | | | 21,237,904 | | | | 40,562,435 | | | | 187,676,020 | | | | 4,086,481 | | | | 28,625,621 | |
Japan | | | — | | | | — | | | | 278,245,845 | | | | — | | | | 59,607 | | | | — | |
Netherlands | | | 470,400 | | | | — | | | | — | | | | — | | | | — | | | | — | |
New Zealand | | | — | | | | — | | | | 9,839,695 | | | | — | | | | — | | | | — | |
Philippines | | | 517,992 | | | | 7,563,255 | | | | — | | | | 149,106,546 | | | | — | | | | 5,451,696 | |
Poland | | | 310,486 | | | | — | | | | — | | | | — | | | | — | | | | — | |
Qatar | | | 618,842 | | | | — | | | | — | | | | — | | | | — | | | | — | |
Singapore | | | 1,332,123 | | | | — | | | | — | | | | 176,030,739 | | | | 478,931 | | | | — | |
South Korea | | | 627,308 | | | | 30,577,781 | | | | — | | | | 522,557,571 | | | | 8,154,836 | | | | 22,875,616 | |
Taiwan | | | 2,516,137 | | | | 16,895,336 | | | | — | | | | 655,366,500 | | | | 5,846,124 | | | | 15,497,483 | |
Thailand | | | — | | | | — | | | | — | | | | 177,472,260 | | | | — | | | | 6,245,155 | |
Turkey | | | — | | | | 1,567,161 | | | | — | | | | — | | | | — | | | | — | |
United Kingdom | | | 952,074 | | | | — | | | | — | | | | — | | | | — | | | | — | |
Vietnam | | | 2,684,858 | | | | 27,204,324 | | | | 11,611,019 | | | | 60,909,728 | | | | 1,200,215 | | | | 14,766,330 | |
Preferred Equities: | | | | | | | | | | | | | | | | | | | | | | | | |
South Korea | | | 2,105,033 | | | | — | | | | — | | | | — | | | | 6,358,980 | | | | — | |
Level 3: Significant Unobservable Inputs | | | | | | | | | | | | | | | | | | | | | | | | |
Common Equities: | | | | | | | | | | | | | | | | | | | | | | | | |
Russia | | | 2,894 | | | | 39,780 | | | | — | | | | — | | | | — | | | | — | |
Taiwan | | | — | | | | — | | | | — | | | | 149,436,343 | | | | — | | | | — | |
Total Market Value of Investments | | | $36,890,457 | | | | $349,520,686 | | | | $911,289,631 | | | | $5,270,340,629 | | | | $126,565,085 | | | | $663,156,875 | |
Notes to Financial Statements (unaudited) (continued)
Levels for Multi-Country Funds (2 of 2):
Summary of inputs used to determine the fair valuation of multi-country Funds’ investments as of June 30, 2022.
| | | | | | | | | | | | | | | | |
| | | Matthews Asian
Growth and
Income Fund | | | Matthews Asia
Dividend Fund | | | Matthews Asia
Total Return
Bond Fund | | | Matthews
Asia Credit
Opportunities
Fund | |
| Assets: | | | | | | | | | | | | | | | | |
| | | | |
| Investments: | | | | | | | | | | | | | | | | |
Level 1: Quoted Prices | | | | | | | | | | | | | | | | |
Common Equities: | | | | | | | | | | | | | | | | |
Bangladesh | | | $— | | | | $40,568,070 | | | | $— | | | | $— | |
China/Hong Kong | | | 34,942,442 | | | | — | | | | — | | | | — | |
Taiwan | | | — | | | | 41,990,070 | | | | — | | | | — | |
United States | | | 14,962,948 | | | | — | | | | — | | | | — | |
Level 2: Other Significant Observable Inputs | | | | | | | | | | | | | | | | |
Foreign Government Obligationsa | | | — | | | | — | | | | 10,133,161 | | | | 1,215,793 | |
Non-Convertible Corporate Bondsa | | | — | | | | — | | | | 39,243,419 | | | | 18,902,633 | |
Convertible Corporate Bondsa | | | 73,323,461 | | | | — | | | | 16,115,725 | | | | 5,242,950 | |
Common Equities: | | | | | | | | | | | | | | | | |
Australia | | | 21,199,871 | | | | 229,999,187 | | | | — | | | | — | |
China/Hong Kong | | | 351,098,448 | | | | 909,372,574 | | | | — | | | | — | |
France | | | 29,546,791 | | | | — | | | | — | | | | — | |
India | | | 85,050,645 | | | | 133,319,407 | | | | — | | | | — | |
Indonesia | | | 15,550,321 | | | | 61,438,358 | | | | — | | | | — | |
Japan | | | — | | | | 677,023,843 | | | | — | | | | — | |
Philippines | | | 11,560,858 | | | | 52,669,991 | | | | — | | | | — | |
Singapore | | | 58,648,763 | | | | 137,562,612 | | | | — | | | | — | |
South Korea | | | 71,300,949 | | | | — | | | | — | | | | — | |
Taiwan | | | 79,248,850 | | | | 80,626,693 | | | | — | | | | — | |
Thailand | | | 13,286,296 | | | | 51,941,755 | | | | — | | | | — | |
Vietnam | | | — | | | | 307,596,756 | | | | — | | | | — | |
Preferred Equities: | | | | | | | | | | | | | | | | |
South Korea | | | — | | | | 42,699,245 | | | | — | | | | — | |
Level 3: Significant Unobservable Inputs | | | | | | | | | | | | | | | | |
Common Equities: | | | | | | | | | | | | | | | | |
Taiwan | | | 14,944,872 | | | | — | | | | — | | | | — | |
Total Market Value of Investments | | | $874,665,515 | | | | $2,766,808,561 | | | | $65,492,305 | | | | $25,361,376 | |
| a | Industry, countries, or security types are disclosed on the Schedule of Investments. |
| | | | | | | | |
| | | | matthewsasia.com | 800.789.ASIA | | | 133 | |
Notes to Financial Statements (unaudited) (continued)
Levels for Single Country Funds:
Summary of inputs used to determine the fair valuation of the single country Funds’ investments as of June 30, 2022.
| | | | | | | | | | | | | | | | | | | | | | | | |
| | | Matthews
China Fund | | | Matthews
China Small
Companies
Fund | | | Matthews
India Fund | | | Matthews
Japan Fund | | | Matthews
Korea Fund | | | Matthews
China Dividend
Fund | |
| Assets: | | | | | | | | | | | | | | | | | | | | | | | | |
| | | | | | |
| Investments: | | | | | | | | | | | | | | | | | | | | | | | | |
Level 1: Quoted Prices | | | | | | | | | | | | | | | | | | | | | | | | |
Common Equities: | | | | | | | | | | | | | | | | | | | | | | | | |
Communication Services | | | $16,755,200 | | | | $— | | | | $— | | | | $— | | | | $— | | | | $— | |
Consumer Discretionary | | | 73,404,120 | | | | — | | | | — | | | | — | | | | 2,578,050 | | | | 12,214,230 | |
Health Care | | | — | | | | 5,659,500 | | | | — | | | | — | | | | — | | | | — | |
Information Technology | | | — | | | | 5,574,096 | | | | — | | | | — | | | | — | | | | — | |
Materials | | | — | | | | — | | | | — | | | | — | | | | — | | | | 5,987,782 | |
Real Estate | | | 15,880,365 | | | | — | | | | — | | | | — | | | | — | | | | — | |
Level 2: Other Significant Observable Inputs | | | | | | | | | | | | | | | | | | | | | | | | |
Common Equities: | | | | | | | | | | | | | | | | | | | | | | | | |
Communication Services | | | 60,285,305 | | | | 8,069,386 | | | | 6,698,783 | | | | 85,654,118 | | | | 7,794,469 | | | | 36,235,553 | |
Consumer Discretionary | | | 275,345,738 | | | | 37,255,860 | | | | 73,932,845 | | | | 145,160,432 | | | | 9,097,976 | | | | 51,415,212 | |
Consumer Staples | | | 44,219,611 | | | | 12,124,863 | | | | 51,246,775 | | | | 78,914,562 | | | | 3,656,889 | | | | 24,985,457 | |
Energy | | | — | | | | — | | | | 30,007,811 | | | | — | | | | 5,680,404 | | | | 7,123,617 | |
Financials | | | 149,405,848 | | | | 10,243,265 | | | | 218,295,897 | | | | 106,906,003 | | | | 9,188,265 | | | | 32,389,980 | |
Health Care | | | 59,975,429 | | | | 21,900,347 | | | | 35,421,220 | | | | 111,565,629 | | | | 8,736,750 | | | | 28,519,435 | |
Industrials | | | 124,226,584 | | | | 76,144,944 | | | | 52,697,161 | | | | 232,809,024 | | | | 4,454,167 | | | | 33,179,569 | |
Information Technology | | | 163,910,489 | | | | 41,987,650 | | | | 90,247,833 | | | | 106,715,114 | | | | 18,100,482 | | | | 15,248,488 | |
Materials | | | 43,229,638 | | | | 15,262,254 | | | | 29,332,076 | | | | 78,305,664 | | | | 3,932,615 | | | | 9,942,086 | |
Real Estate | | | 47,697,280 | | | | 21,377,380 | | | | — | | | | — | | | | — | | | | 5,917,281 | |
Utilities | | | — | | | | 6,870,432 | | | | — | | | | — | | | | — | | | | — | |
Preferred Equities: | | | | | | | | | | | | | | | | | | | | | | | | |
Consumer Discretionary | | | — | | | | — | | | | — | | | | — | | | | 1,073,021 | | | | — | |
Information Technology | | | — | | | | — | | | | — | | | | — | | | | 15,577,125 | | | | — | |
Non Convertible Corporate Bonds: | | | | | | | | | | | | | | | | | | | | | | | | |
Consumer Staples | | | — | | | | — | | | | 24,623 | | | | — | | | | — | | | | — | |
Level 3: Significant Unobservable Inputs | | | | | | | | | | | | | | | | | | | | | | | | |
Common Equities: | | | | | | | | | | | | | | | | | | | | | | | | |
Financials | | | — | | | | 4,355,342 | | | | — | | | | — | | | | — | | | | — | |
Information Technology | | | — | | | | 249 | | | | — | | | | — | | | | — | | | | — | |
Total Market Value of Investments | | | $1,074,335,607 | | | | $266,825,568 | | | | $587,905,024 | | | | $946,030,546 | | | | $89,870,213 | | | | $263,158,690 | |
Levels for Derivatives Financial Instruments:
Summary of inputs used to determine the fair valuation of the Funds’ derivative financial instruments as of June 30, 2022.
| | | | |
| | | Matthews Asia
Total Return
Bond Fund | |
Derivative Financial Instruments1 | | | | |
Assets | | | | |
| Level 2: Other Significant Observable Inputs | | | | |
| |
Forward Foreign Currency Exchange Contracts | | | $14,555 | |
| | | | |
| 1 | Derivative financial instruments are forward foreign currency exchange contracts. Forward foreign currency exchange contracts are valued at the unrealized appreciation/depreciation on the instrument. |
Notes to Financial Statements (unaudited) (continued)
Changes in the Balances of Level 3 Securities:
The Funds’ policy is to recognize transfers in and transfers out of Level 3 as of the beginning of the reporting period.
| | | | | | | | | | | | | | | | | | | | | | | | |
| | | Matthews Emerging
Markets Equity
Fund | | | Matthews Emerging
Markets Small
Companies Fund | | | Matthews Pacific
Tiger Fund | | | Matthews China Small Companies Fund | | | Matthews Asian
Growth and Income
Fund | |
| | | Common Equities —
Russia | | | Common Equities —
Russia | | | Common Equities —
Taiwan | | | Common Equities —
Financials | | | Common Equities —
Information Technology | | | Common Equities —
Taiwan | |
| Balance as of 12/31/21 (market value) | | | $— | | | | $— | | | | $— | | | | $— | | | | $250 | | | | $— | |
| | | | | | |
| Accrued discounts/premiums | | | — | | | | — | | | | — | | | | — | | | | — | | | | — | |
| | | | | | |
| Realized gain/(loss) | | | (51,561 | ) | | | 82,479 | | | | 33,308,865 | | | | 975,565 | | | | — | | | | 1,082,682 | |
| | | | | | |
| Change in unrealized appreciation/ (depreciation) | | | (3,743,753 | ) | | | (10,102,137 | ) | | | (50,226,102 | ) | | | (4,270,798 | ) | | | (1 | ) | | | (5,610,112 | ) |
| | | | | | |
| Purchases | | | 876,913 | | | | 3,422,384 | | | | — | | | | — | | | | — | | | | 3,240,444 | |
| | | | | | |
| Sales | | | (129,793 | ) | | | (1,376,811 | ) | | | (65,458,041 | ) | | | (3,585,263 | ) | | | — | | | | (3,792,426 | ) |
| | | | | | |
| Transfers in to Level 3 | | | 3,051,088 | | | | 8,013,865 | | | | 231,811,621 | | | | 11,235,838 | | | | — | | | | 20,024,284 | |
| | | | | | |
| Transfer out of Level 3 | | | — | | | | — | | | | — | | | | — | | | | — | | | | — | |
| Balance as of 6/30/22 (market value) | | | $2,894 | | | | $39,780 | | | | $149,436,343 | | | | $4,355,342 | | | | $249 | | | | $14,944,872 | |
| Net change in unrealized appreciation/depreciation on Level 3 investments held as of 6/30/22* | | | ($3,743,753 | ) | | | ($10,102,137 | ) | | | ($50,226,102 | ) | | | ($4,270,798 | ) | | | ($1 | ) | | | ($5,610,112 | ) |
| * | Included in the related amounts on the Statements of Operations. |
| C. | RISKS ASSOCIATED WITH NON-U.S. COMPANIES: Investments by the Funds in the securities of non-U.S. companies may involve investment risks not typically associated with investments in U.S. issuers. These risks include possible political, economic, social and religious instability, inadequate investor protection; changes in laws or regulations of countries within the Asia Pacific region (including in countries where the Funds may invest, as well as in the broader region); international relations with other nations; natural disasters; corruption; and military activity. Foreign securities may be subject to greater fluctuations in price than securities of domestic corporations or the U.S. government. Foreign investing may also include the risk of expropriation or confiscatory taxation, limitation on the removal of funds or other assets, currency crises and exchange controls, the imposition of foreign withholding tax on the interest income payable on such instruments, the possible seizure or nationalization of foreign deposits or assets, or the adoption of other foreign government restrictions that might adversely affect the foreign securities held by the Funds. Additionally, Asia Pacific countries may utilize formal or informal currency exchange controls or “capital controls” that may limit the ability to repatriate investments or income or adversely affect the value of portfolio investments. The economies of many Asia Pacific countries differ from the economies of more developed countries in many respects, such as their rate of growth, inflation, capital reinvestment, resource self-sufficiency and dependence on other economies, financial system stability, the national balance of payments position and sensitivity to changes in global trade. |
Certain Asia Pacific countries are highly dependent upon and may be affected by developments in the economies of other countries. Non-U.S. companies are subject to different accounting, auditing, and financial reporting standards, practices, and requirements than U.S. companies. There is generally less government regulation of stock exchanges, brokers, and listed companies abroad than in the United States, which may result in less transparency with respect to a company’s operations, and make obtaining information about them more difficult (or such information may be unavailable).
Among other risks of investing in foreign markets are the variable quality and reliability of financial information and related audits of companies. In some cases, financial information and related audits can be unreliable and not subject to verification. Auditing firms in some of these markets are not subject to independent inspection or oversight of audit quality. For example, China does not allow the Public Company Accounting Oversight Board to inspect the work that auditors perform in China for Chinese companies that sell stock into U.S. markets. This can result in investment decisions being made based on flawed or misleading information.
Foreign stock markets may not be as developed or efficient as those in the United States, and the absence of negotiated brokerage commissions in certain countries may result in higher brokerage fees. The time between the trade and settlement dates of securities transactions on foreign exchanges ranges from one day to four weeks or longer and may result in higher custody charges. Custodial arrangements may be less well developed than in the United States. Foreign securities are generally denominated and pay distributions in foreign currencies, exposing the Funds to changes in foreign currency exchange rates. Investing in any country in the Asia Pacific region will also entail risks specific and unique to that country, and these risks can be significant and change rapidly.
Changes in interest rates in each of the countries in which the Funds may invest, as well as interest rates in more-developed countries, may cause a decline in the market value of an investment. Generally, fixed income securities will decrease in value when interest rates rise and can be expected to rise in value when interest rates decline. As interest rates decline, debt issuers may repay or refinance their loans or obligations earlier than anticipated. The issuers of fixed income securities may, therefore, repay principal in advance. This would force the Funds to reinvest the proceeds from the principal prepayments at lower rates, which reduces the Funds’ income.
The Funds may invest in certain operating companies in China through legal structures known as variable interest entities (“VIEs”). In China, ownership of companies in certain sectors by foreign individuals and entities (including U.S. persons and entities such as the Fund) is prohibited. In order to facilitate foreign investment in these businesses, many Chinese companies have created VIEs. In such an arrangement, a China-based operating company typically establishes an offshore shell company in another jurisdiction, such as the Cayman Islands. That shell company enters into service
| | | | | | | | |
| | | | matthewsasia.com | 800.789.ASIA | | | 135 | |
Notes to Financial Statements (unaudited) (continued)
and other contracts with the China-based operating company, then issues shares on a foreign exchange, such as the New York Stock Exchange. Foreign investors hold stock in the shell company rather than directly in the China-based operating company. This arrangement allows U.S. investors to obtain economic exposure to the China-based company through contractual means rather than through formal equity ownership.
VIEs are a longstanding industry practice and well known to officials and regulators in China; however, VIEs are not formally recognized under Chinese law. Recently, the government of China provided new guidance to and placed restrictions on China-based companies raising capital offshore, including through VIE structures. Investors face uncertainty about future actions by the government of China that could significantly affect an operating company’s financial performance and the enforceability of the shell company’s contractual arrangements. It is uncertain whether Chinese officials or regulators will withdraw their implicit acceptance of the VIE structure, or whether any new laws, rules or regulations relating to VIE structures will be adopted or, if adopted, what impact they would have on the interests of foreign shareholders. Under extreme circumstances, China might prohibit the existence of VIEs, or sever their ability to transmit economic and governance rights to foreign individuals and entities; if so, the market value of the Funds’ associated portfolio holdings would likely suffer significant, detrimental, and possibly permanent effects, which could result in substantial investment losses.
In February 2022, Russian forces entered Ukraine and commenced an armed conflict. Economic sanctions have since been imposed on Russia and certain of its citizens, including the exclusion of Russia from the SWIFT global payments network. As a result, Russian-related stocks and debt have since suffered significant declines in value. The ongoing conflict, together with growing turmoil from fluctuations in commodity prices and foreign exchange rates, has the potential to impact adversely global economies and has driven a sharp increase in volatility across markets. The duration of the Russian-Ukraine conflict and its effect on financial markets cannot be determined with certainty. The Funds’ performance could be negatively impacted if the value of a portfolio holding were harmed by these and such other events. Management is actively monitoring these events. As of June 30, 2022, the Russian positions held across the Matthews Asia Funds were valued near zero.
| D. | DISTRIBUTIONS TO SHAREHOLDERS: It is the policy of Matthews Asian Growth and Income Fund and Matthews China Dividend Fund to distribute net investment income on a semi-annual basis and capital gains, if any, annually. It is the policy of Matthews Asia Dividend Fund to distribute net investment income on a quarterly basis and capital gains, if any, annually. It is the policy of Matthews Asia Total Return Bond Fund and Matthews Asia Credit Opportunities Fund to distribute net investment income on a monthly basis and capital gains, if any, annually. Each of the other Funds distributes a net investment income and capital gains, if any, annually. Distributions to shareholders are recorded on the ex-dividend date. Income and capital gain distributions are determined in accordance with income tax regulations which may differ from U.S. GAAP. |
The tax character of distributions paid for the fiscal year ended December 31, 2021 was as follows:
| | | | | | | | | | | | |
| YEAR ENDED DECEMBER 31, 2021 | | Ordinary
Income | | | Net Long-Term
Capital Gains | | | Total Taxable
Distributions | |
| Matthews Emerging Markets Equity Fund | | | $2,926,053 | | | | $1,417,656 | | | | $4,343,709 | |
| Matthews Emerging Markets Small Companies Fund | | | 19,110,774 | | | | 3,384,935 | | | | 22,495,709 | |
| Matthews Asia Growth Fund | | | 26,665,170 | | | | 63,070,895 | | | | 89,736,065 | |
| Matthews Pacific Tiger Fund | | | 126,545,111 | | | | 1,266,276,724 | | | | 1,392,821,835 | |
| Matthews Asia ESG Fund | | | 5,343,494 | | | | 4,875,006 | | | | 10,218,500 | |
| Matthews Asia Innovators Fund | | | 70,648,640 | | | | 205,752,164 | | | | 276,400,804 | |
| Matthews China Fund | | | 91,374,118 | | | | 92,804,375 | | | | 184,178,493 | |
| Matthews China Small Companies Fund | | | 40,331,721 | | | | 17,070,757 | | | | 57,402,478 | |
| Matthews India Fund | | | 6,626,844 | | | | 64,126,518 | | | | 70,753,362 | |
| Matthews Japan Fund | | | 36,167,888 | | | | 144,657,130 | | | | 180,825,018 | |
| Matthews Korea Fund | | | 3,049,995 | | | | 5,819,362 | | | | 8,869,357 | |
| Matthews Asian Growth and Income Fund | | | 42,341,878 | | | | 88,919,370 | | | | 131,261,248 | |
| Matthews Asia Dividend Fund | | | 176,600,715 | | | | 527,405,263 | | | | 704,005,978 | |
| Matthews China Dividend Fund | | | 12,319,487 | | | | 23,068,869 | | | | 35,388,356 | |
| Matthews Asia Total Return Bond Fund | | | 5,670,055 | | | | 177,347 | | | | 5,847,402 | |
| Matthews Asia Credit Opportunities Fund | | | 4,024,422 | | | | — | | | | 4,024,422 | |
| E. | INVESTMENT TRANSACTIONS AND INCOME: Securities transactions are accounted for on the date the securities are purchased or sold or on the following business day. Financial statements reflect security transactions on trade date. Gains or losses on the sale of securities are determined on the identified cost basis. Interest income is recorded on the accrual basis. Interest income, including amortization and accretion of premiums and discounts on debt securities, is recognized daily on an accrual basis. Dividend income is generally recorded on the ex-dividend date net of any foreign taxes withheld at the source. Dividend income for certain issuers headquartered in countries which the Funds invest may not be recorded until approved by the shareholders (which may occur after the ex-dividend date) if, in the judgment of management, such dividends are not reasonably determined as of the ex-dividend date. Income and realized and unrealized gains or losses on investments are allocated to each class of shares based on its relative net assets. |
The Funds may be subject to foreign taxation related to income received, capital gains on the sale of securities and certain foreign currency trans- actions in the foreign jurisdictions in which they invest. Foreign taxes, if any, are recorded based on the tax regulations and rates that exist in the foreign markets in which the Funds invest. When a capital gain tax is determined to apply, the Funds record an estimated deferred tax liability in an amount that may be payable if the securities were disposed of on the valuation date.
| F. | FUND EXPENSE ALLOCATIONS: The Funds account separately for the assets, liabilities and operations of each Fund. Estimated expenses are accrued daily. Direct expenses of each Fund or class are charged to that Fund or class while general expenses are allocated pro-rata among the Funds based on net assets or other appropriate methods. |
| G. | CASH, CASH OVERDRAFTS, AND FOREIGN CURRENCY: QFI accounts (i.e., the accounts through which the QFI quota is accessed) are required by the local market to maintain a cash reserve. The cash reserve is based upon a fixed ratio of the QFI’s approved investment quota, which is defined as the amount remitted into its special Renminbi (RMB) cash account. These amounts, if any, are included in “Segregated foreign currency at value” on the Statements of Assets and Liabilities. The fixed ratio is set at 0.08 percent for the Shanghai and 0.06 percent for the Shenzhen market. When any of the Funds’ cash balances are overdrawn, a Fund is charged an overdraft fee by the custodian of 1.00% above the 30-day LIBOR rate on outstanding balances. These amounts, if any, are included in “Other expenses” on the Statements of Operations. |
Notes to Financial Statements (unaudited) (continued)
| H. | USE OF ESTIMATES: The preparation of financial statements in conformity with U.S. GAAP requires management to make estimates and assumptions that affect the amounts reported in the financial statements and accompanying notes. Actual results may differ from those estimates. |
| I. | RECENT ACCOUNTING GUIDANCE: In March 2020, the Financial Accounting Standards Board (FASB) issued Accounting Standards Update (ASU) No. 2020-04, Reference Rate Reform (Topic 848)—Facilitation of the Effects of Reference Rate Reform on Financial Reporting. The amendments in the ASU provide optional temporary financial reporting relief from the effect of certain types of contract modifications due to the planned discontinuation of the London Interbank Offered Rate (LIBOR) and other interbank-offered based reference rates as of the end of 2021. The ASU is effective for certain reference rate-related contract modifications that occur during the period March 12, 2020 through December 31, 2022. |
Management is currently evaluating the impact, if any, of applying this ASU.
| 3. | DERIVATIVE FINANCIAL INSTRUMENTS |
Each of the Matthews Asia Total Return Bond Fund and the Matthews Asia Credit Opportunities Fund may engage in derivative transactions for a variety of purposes, including managing interest rate, currency and credit exposure. Derivative transactions in which each Fund may engage include financial futures contracts, swaps and/or forward foreign currency exchange contracts.
Certain derivative transactions may result in each Fund’s exposure to a currency to exceed the value of the Fund’s assets and the Fund could be exposed to currency risk whether or not it holds a bond or other instrument denominated in that currency. The gross notional value of derivative financial instruments and transactions could exceed the value of the Fund’s net assets, although the net market value of these instruments and transactions, on a marked-to-market basis, at most times, is expected to be substantially lower.
The primary risks associated with the use of derivative financial instruments are: (i) Matthews may not correctly predict the direction of currency exchange rates, interest rates, security prices, or other economic factors; (ii) Matthews may not correctly predict changes in the value of derivative financial instruments and related underlying instruments or assets, which may result in disproportionately increased losses and/or reduced opportunities for gains; (iii) imperfect correlation between the change in market value of the securities held by a Fund and the price of financial futures contracts and credit default swaps contracts; (iv) the lack of, or a reduction in the liquidity of, any secondary market for the instrument, and the resulting inability to close the position (or exit the position) when desired; (v) losses, which are potentially unlimited, due to unanticipated market movements; (vi) the value of the instrument may change unfavorably due to movements in the value of the referenced foreign currencies; (vii) a Fund may suffer disproportionately heavy losses relative to the amount invested; (viii) changes in the value of the derivatives may not match or fully offset changes in the value of hedged or related portfolio securities, thereby failing to achieve the hedging or investment purpose for the derivative transaction; and (ix) the other party to the instrument may fail to fulfill its obligation.
Forward Foreign Currency Exchange Contracts: The Matthews Asia Total Return Bond Fund and the Matthews Asia Credit Opportunities Fund may enter into forward foreign currency exchange contracts to gain or reduce exposure to foreign currency exchange rate risk. A forward foreign currency exchange contract is an agreement between two parties to buy and sell a currency at a set exchange rate on a future date. The contract is marked-to-market daily and the change in market value is recorded by the Fund as an unrealized gain or loss. When the contract is closed, the Fund records a realized gain or loss equal to the difference between the value at the time it was opened and the value at the time it was closed.
Swaps: The Matthews Asia Total Return Bond Fund and the Matthews Asia Credit Opportunities Fund may enter into swap contracts to manage exposure to issuers, markets and securities to reduce their risk exposure to defaults of corporate and/or sovereign issuers or to create exposure to corporate and/or sovereign issuers to which they are not otherwise exposed (credit risk). Such contracts are agreements between the Funds and a counterparty to make periodic net payments on a specified notional amount or a net payment upon termination. Swap agreements are privately negotiated in the OTC market and may be entered into as a bilateral contract (“OTC Swaps”) or centrally cleared (“centrally cleared swaps”).
For OTC swaps, any upfront premiums paid and any upfront fees received are shown as swap premiums paid and swap premiums received, respectively, in the Statements of Assets and Liabilities and amortized over the term of the contract. The daily fluctuation in market value is recorded as unrealized appreciation (depreciation) on OTC Swaps in the Statements of Assets and Liabilities. Payments received or paid are recorded in the Statements of Operations as realized gains or losses, respectively. When an OTC swap is terminated, a realized gain or loss is recorded in the Statements of Operations equal to the difference between the proceeds from (or cost of) the closing transaction and the Funds’ basis in the contract, if any. Generally, the basis of the contract is the amortized premium received or paid.
The Funds may buy credit default swaps on single-name issuers (corporate or sovereign), a combination or basket of single-name issuers or traded indexes. Credit default swaps are agreements in which the protection buyer pays fixed periodic payments to the seller in consideration for a promise from the protection seller to make a specific payment should a negative credit event take place with respect to the referenced entity (e.g., bankruptcy, failure to pay, obligation acceleration, repudiation, moratorium or restructuring). As a buyer, if an underlying credit event occurs, the Funds will either (i) receive from the seller an amount equal to the notional amount of the swap and deliver the referenced security or underlying securities comprising the index, or (ii) receive a net settlement of cash equal to the notional amount of the swap less the recovery value of the security or underlying securities comprising the index.
The Funds may enter into interest rate swaps to gain or reduce exposure to interest rates or to manage duration, the yield curve or interest rate (interest rate risk).
Interest rate swaps are agreements to exchange cash flows based on the difference between specified interest rates applied to a notional principal amount for a specified period of time. Risks related to the use of interest rate swaps include the potential for unanticipated movements in interest or currency rates, the possible failure of a counterparty to perform in accordance with the terms of the swap agreements and potential government regulation that could adversely affect the Funds’ swap investments.
Counterparty Credit Risk: A derivative contract may suffer a mark to market loss if the value of the contract decreases due to an unfavorable change in the market rates or values of the underlying instrument. Losses can also occur if the counterparty does not perform under the contract.
A Fund’s risk of loss from counterparty credit risk on OTC derivatives is generally limited to the aggregate unrealized gain netted against any collateral held by such Fund.
With exchange traded futures and centrally cleared swaps, there is less counterparty credit risk to the Funds since the exchange or clearinghouse, as counterparty to such instruments, guarantees against a possible default. The clearinghouse stands between the buyer and the seller of the contract; therefore, the credit risk is limited to failure of the clearinghouse. While offset rights may exist under applicable law, a Fund does not have a contractual right of offset against a clearing broker or clearinghouse in the event of a default (including the bankruptcy or insolvency) of the clearing broker or clearinghouse. Additionally, credit risk exists in exchange traded futures and centrally cleared swaps with respect to initial and variation margin that is held in a clearing broker’s customer accounts. While clearing brokers are required to segregate customer margin from their own assets, in the event that a clearing broker becomes insolvent or goes into bankruptcy and at that time there is a shortfall in the aggregate amount of margin
| | | | | | | | |
| | | | matthewsasia.com | 800.789.ASIA | | | 137 | |
Notes to Financial Statements (unaudited) (continued)
held by the clearing broker for all its clients, typically the shortfall would be allocated on a pro rata basis across all the clearing broker’s customers, potentially resulting in losses to the Funds.
In order to better define its contractual rights and to secure rights that will help the Funds mitigate their counterparty risk, a Fund may enter into an International Swaps and Derivatives Association, Inc. Master Agreement (“ISDA Master Agreement”) or similar agreement with its derivative contract counterparties. An ISDA Master Agreement is a bilateral agreement between each Fund and a counterparty that governs OTC derivatives and typically contains, among other things, collateral posting terms and netting provisions in the event of a default and/or termination event. Under an ISDA Master Agreement, each Fund may, under certain circumstances, offset with the counterparty certain derivative financial instruments’ payables and/or receivables with collateral held and/or posted and create one single net payment. The provisions of the ISDA Master Agreement typically permit a single net payment in the event of default including the bankruptcy or insolvency of the counterparty. However, bankruptcy or insolvency laws of a particular jurisdiction may impose restrictions on or prohibitions against the right of offset in bankruptcy, insolvency or other events. In addition, certain ISDA Master Agreements allow counterparties to OTC derivatives to terminate derivative contracts prior to maturity in the event a Fund’s net assets decline by a stated percentage or the Fund fails to meet the terms of its ISDA Master Agreements, which would cause the Fund to accelerate payment of any net liability owed to the counterparty.
Collateral requirements: For derivatives traded under an ISDA Master Agreement, the collateral requirements are typically calculated by netting the mark to market amount for each transaction under such agreement and comparing that amount to the value of any collateral currently pledged by a Fund and the counterparty. Cash collateral that has been pledged to cover obligations of a Fund, if any, is reported separately on the Statements of Assets and Liabilities as cash pledged as collateral. Non-cash collateral pledged by a Fund, if any, is noted in the Schedules of Investments.
For financial reporting purposes, the Funds do not offset derivative assets and derivative liabilities that are subject to netting arrangements in the Statements of Assets and Liabilities.
The Funds have implemented the disclosure requirements pursuant to FASB Accounting Standards update No. 2011-11, Disclosures about Offsetting Assets and Liabilities, that requires disclosures to make financial statements that are prepared under U.S. GAAP more comparable to those prepared under International Financial Reporting Standards. Under this guidance the Funds disclose in the Statements of Assets and Liabilities both gross and net information about instruments and transactions eligible for offset such as instruments and transactions subject to an agreement similar to a master netting arrangement. In addition, the Funds disclose collateral received and posted in connection with master netting agreements or similar arrangements.
The following table presents the Matthews Asia Total Return Bond Fund’s net exposure to each counterparty for derivatives that are subject to enforceable master netting arrangements as of June 30, 2022.
| | | | | | | | | | | | | | | | |
| | | Gross Value on
Statments of Assets
and Liabilities | | | | | | | |
| Counterparty | | Assets | | | Liablities | | | Cash Collateral
Pledged/(Receivable)1 | | | Net Amount2 | |
Bank of America, N.A. | | | $14,555 | | | | $— | | | | $10,000 | | | | $24,555 | |
| 1 | Cash collateral pledged/(received) in excess of derivative assets/liabilities is not presented in this table. The total cash collateral is presented on the Fund’s Statement of Assets and Liabilities. |
| 2 | Represents the net amount receivable from (payable to) the counterparty in the event of a default. |
For the six-month period ended June 30, 2022, the effects of derivative financial instruments on the statement of Assets and Liabilities were as follows:
| | | | | | | | | | |
| | | Statements of Assets and Liabilities Location | | | | | Matthews
Asia Total Return Bond
Fund | |
| | Asset Derivatives | | | | | | | | |
| | Unrealized appreciation on forward foreign | | | | | | | | |
| Forward foreign currency exchange contracts | | currency exchange contracts | | | | | | | $14,555 | |
| | | | | | | | | | |
For the six-month period ended June 30, 2022, the effects of derivative financial instruments on the Statements of Operations were as follows:
| | | | | | | | | | |
| Derivative type | | Statements of Operations Location | | | | | Matthews
Asia Total Return Bond
Fund | |
Net Realized Gain (Loss) | | | | | | | | | | |
| Foreign currency contracts: | | | | | | | | | | |
| | | |
Forward foreign currency exchange contracts | | Net realized gain (loss) on forward foreign | | | | | | | | |
| | currency exchange contracts | | | | | | | ($1,162,907 | ) |
| Interest rate swaps: | | | | | | | | | | |
| | | |
Interest rate contracts | | Net realized gain (loss) on swaps | | | | | | | (4,480 | ) |
| | | | | | | | | | |
| | Total | | | | | | | ($1,167,387 | ) |
| | | | | | | | | | |
Net Change In Unrealized Appreciation (Depreciation) | | | | | | | | | | |
| Foreign currency contracts: | | | | | | | | | | |
| | | |
Forward foreign currency exchange contracts | | Net change in unrealized appreciation/ | | | | | | | | |
| | depreciation on forward foreign currency | | | | | | | | |
| | exchange contracts | | | | | | | $628,814 | |
| Interest rate swaps: | | | | | | | | | | |
| | | |
Interest rate contracts | | Net change in unrealized appreciation/ | | | | | | | | |
| | depreciation on swaps | | | | | | | (81,339 | ) |
| | | | | | | | | | |
| | Total | | | | | | | $547,475 | |
| | | | | | | | | | |
Notes to Financial Statements (unaudited) (continued)
In regards to the forward foreign currency exchange contracts entered into by the Matthews Asia Total Return Bond Fund, the average notional ending quarterly amounts purchased in USD were $6,743,583 and the average notional ending quarterly amounts sold in USD were $9,740,000. In regards to the interest rate swap contracts entered into by the Matthews Asia Total Return Bond Fund, where the Fund receives the fixed rate and pays the floating rate, the average notional ending quarterly amounts in USD was $3,157,895.
| 4. | CAPITAL SHARE TRANSACTIONS |
| | | | | | | | | | | | | | | | |
| | | Six-Month Period Ended
June 30, 2022 (Unaudited) | | | Year Ended December 31, 2021 | |
| | | Shares | | | Amount | | | Shares | | | Amount | |
MATTHEWS EMERGING MARKETS EQUITY FUND | | | | | | | | | | | | | | | | |
| | | | |
Investor Class | | | | | | | | | | | | | | | | |
| | | | |
Shares sold | | | 347,384 | | | | $4,608,460 | | | | 709,531 | | | | $11,546,227 | |
| | | | |
Shares issued through reinvestment of distributions | | | — | | | | — | | | | 76,220 | | | | 1,071,651 | |
| | | | |
Shares redeemed | | | (413,970 | ) | | | (5,135,561 | ) | | | (481,860 | ) | | | (7,728,667 | ) |
Net increase (decrease) | | | (66,586 | ) | | | ($527,101 | ) | | | 303,891 | | | | $4,889,211 | |
Institutional Class | | | | | | | | | | | | | | | | |
| | | | |
Shares sold | | | 382,710 | | | | $4,850,141 | | | | 497,556 | | | | $8,187,275 | |
| | | | |
Shares issued through reinvestment of distributions | | | — | | | | — | | | | 184,073 | | | | 2,588,076 | |
| | | | |
Shares redeemed | | | (241,666 | ) | | | (2,955,556 | ) | | | (370,525 | ) | | | (5,749,633 | ) |
Net increase | | | 141,044 | | | | $1,894,585 | | | | 311,104 | | | | $5,025,718 | |
MATTHEWS EMERGING MARKETS SMALL COMPANIES FUND | | | | | | | | | | | | | | | | |
| | | | |
Investor Class | | | | | | | | | | | | | | | | |
| | | | |
Shares sold | | | 437,051 | | | | $11,725,420 | | | | 1,617,341 | | | | $47,891,984 | |
| | | | |
Shares issued in reorganization1 | | | — | | | | — | | | | 1,768,348 | | | | 49,082,409 | |
| | | | |
Shares issued through reinvestment of distributions | | | — | | | | — | | | | 320,642 | | | | 9,555,131 | |
| | | | |
Shares redeemed | | | (986,550 | ) | | | (26,311,823 | ) | | | (1,640,812 | ) | | | (48,081,821 | ) |
Net increase (decrease) | | | (549,499 | ) | | | ($14,586,403 | ) | | | 2,065,519 | | | | $58,447,703 | |
Institutional Class | | | | | | | | | | | | | | | | |
| | | | |
Shares sold | | | 2,302,840 | | | | $61,147,959 | | | | 2,286,207 | | | | $65,576,613 | |
| | | | |
Shares issued in reorganization1 | | | — | | | | — | | | | 2,436,030 | | | | 67,500,144 | |
| | | | |
Shares issued through reinvestment of distributions | | | — | | | | — | | | | 397,521 | | | | 11,822,265 | |
| | | | |
Shares redeemed | | | (833,901 | ) | | | (21,310,273 | ) | | | (1,870,741 | ) | | | (53,591,272 | ) |
Net increase | | | 1,468,939 | | | | $39,837,686 | | | | 3,249,017 | | | | $91,307,750 | |
MATTHEWS ASIA GROWTH FUND | | | | | | | | | | | | | | | | |
| | | | |
Investor Class | | | | | | | | | | | | | | | | |
| | | | |
Shares sold | | | 1,608,165 | | | | $40,967,291 | | | | 7,423,313 | | | | $304,032,957 | |
| | | | |
Shares issued through reinvestment of distributions | | | — | | | | — | | | | 874,009 | | | | 27,662,376 | |
| | | | |
Shares redeemed | | | (5,268,997 | ) | | | (131,658,114 | ) | | | (10,417,644 | ) | | | (396,564,020 | ) |
Net (decrease) | | | (3,660,832 | ) | | | ($90,690,823 | ) | | | (2,120,322 | ) | | | ($64,868,687 | ) |
Institutional Class | | | | | | | | | | | | | | | | |
| | | | |
Shares sold | | | 4,710,395 | | | | $120,793,426 | | | | 14,166,492 | | | | $560,286,297 | |
| | | | |
Shares issued through reinvestment of distributions | | | — | | | | — | | | | 1,549,232 | | | | 49,575,432 | |
| | | | |
Shares redeemed | | | (14,267,184 | ) | | | (356,919,890 | ) | | | (10,898,197 | ) | | | (409,896,079 | ) |
Net increase (decrease) | | | (9,556,789 | ) | | | ($236,126,464 | ) | | | 4,817,527 | | | | $199,965,650 | |
MATTHEWS PACIFIC TIGER FUND | | | | | | | | | | | | | | | | |
| | | | |
Investor Class | | | | | | | | | | | | | | | | |
| | | | |
Shares sold | | | 4,553,042 | | | | $110,034,054 | | | | 8,893,329 | | | | $321,350,881 | |
| | | | |
Shares issued through reinvestment of distributions | | | — | | | | — | | | | 11,959,980 | | | | 329,497,448 | |
| | | | |
Shares redeemed | | | (10,550,283 | ) | | | (255,451,103 | ) | | | (28,205,661 | ) | | | (969,424,207 | ) |
Net (decrease) | | | (5,997,241 | ) | | | ($145,417,049 | ) | | | (7,352,352 | ) | | | ($318,575,878 | ) |
Institutional Class | | | | | | | | | | | | | | | | |
| | | | |
Shares sold | | | 33,312,663 | | | | $826,675,713 | | | | 47,973,599 | | | | $1,692,522,684 | |
| | | | |
Shares issued through reinvestment of distributions | | | — | | | | — | | | | 34,730,797 | | | | 955,791,557 | |
| | | | |
Shares redeemed | | | (56,305,926 | ) | | | (1,342,944,725 | ) | | | (64,771,287 | ) | | | (2,097,314,073 | ) |
Net increase (decrease) | | | (22,993,263 | ) | | | ($516,269,012 | ) | | | 17,933,109 | | | | $551,000,168 | |
| | | | | | | | |
| | | | matthewsasia.com | 800.789.ASIA | | | 139 | |
Notes to Financial Statements (unaudited) (continued)
| | | | | | | | | | | | | | | | |
| | | Six-Month Period Ended
June 30, 2022 (Unaudited) | | | Year Ended December 31, 2021 | |
| | | Shares | | | Amount | | | Shares | | | Amount | |
MATTHEWS ASIA ESG FUND | | | | | | | | | | | | | | | | |
| | | | |
Investor Class | | | | | | | | | | | | | | | | |
| | | | |
Shares sold | | | 384,337 | | | | $5,206,409 | | | | 1,249,460 | | | | $20,652,739 | |
| | | | |
Shares issued through reinvestment of distributions | | | — | | | | — | | | | 204,051 | | | | 3,179,112 | |
| | | | |
Shares redeemed | | | (659,495 | ) | | | (9,196,063 | ) | | | (1,378,374 | ) | | | (23,248,889 | ) |
Net increase (decrease) | | | (275,158 | ) | | | ($3,989,654 | ) | | | 75,137 | | | | $582,962 | |
Institutional Class | | | | | | | | | | | | | | | | |
| | | | |
Shares sold | | | 3,031,324 | | | | $41,943,388 | | | | 2,938,670 | | | | $49,371,326 | |
| | | | |
Shares issued through reinvestment of distributions | | | — | | | | — | | | | 427,487 | | | | 6,664,516 | |
| | | | |
Shares redeemed | | | (1,522,151 | ) | | | (20,419,857 | ) | | | (1,088,483 | ) | | | (17,988,685 | ) |
Net increase | | | 1,509,173 | | | | $21,523,531 | | | | 2,277,674 | | | | $38,047,157 | |
MATTHEWS ASIA INNOVATORS FUND | | | | | | | | | | | | | | | | |
| | | | |
Investor Class | | | | | | | | | | | | | | | | |
| | | | |
Shares sold | | | 4,158,161 | | | | $66,272,756 | | | | 15,900,681 | | | | $439,497,187 | |
| | | | |
Shares issued through reinvestment of distributions | | | — | | | | — | | | | 4,617,381 | | | | 86,991,462 | |
| | | | |
Shares redeemed | | | (8,059,247 | ) | | | (123,654,724 | ) | | | (19,490,967 | ) | | | (507,912,649 | ) |
Net increase (decrease) | | | (3,901,086 | ) | | | ($57,381,968 | ) | | | 1,027,095 | | | | $18,576,000 | |
Institutional Class | | | | | | | | | | | | | | | | |
| | | | |
Shares sold | | | 5,787,275 | | | | $94,337,644 | | | | 24,802,456 | | | | $692,154,752 | |
| | | | |
Shares issued through reinvestment of distributions | | | — | | | | — | | | | 7,868,062 | | | | 149,965,265 | |
| | | | |
Shares redeemed | | | (31,934,719 | ) | | | (516,863,745 | ) | | | (24,573,373 | ) | | | (619,998,491 | ) |
Net increase (decrease) | | | (26,147,444 | ) | | | ($422,526,101 | ) | | | 8,097,145 | | | | $222,121,526 | |
MATTHEWS CHINA FUND | | | | | | | | | | | | | | | | |
| | | | |
Investor Class | | | | | | | | | | | | | | | | |
| | | | |
Shares sold | | | 4,291,861 | | | | $73,156,494 | | | | 8,883,802 | | | | $247,820,469 | |
| | | | |
Shares issued through reinvestment of distributions | | | — | | | | — | | | | 4,527,322 | | | | 95,933,945 | |
| | | | |
Shares redeemed | | | (4,736,403 | ) | | | (80,405,808 | ) | | | (14,536,851 | ) | | | (384,500,174 | ) |
Net (decrease) | | | (444,542 | ) | | | ($7,249,314 | ) | | | (1,125,727 | ) | | | ($40,745,760 | ) |
Institutional Class | | | | | | | | | | | | | | | | |
| | | | |
Shares sold | | | 10,400,864 | | | | $185,926,032 | | | | 20,456,030 | | | | $528,285,590 | |
| | | | |
Shares issued through reinvestment of distributions | | | — | | | | — | | | | 3,583,944 | | | | 75,728,747 | |
| | | | |
Shares redeemed | | | (14,634,808 | ) | | | (246,449,060 | ) | | | (13,572,392 | ) | | | (338,913,059 | ) |
Net increase (decrease) | | | (4,233,944 | ) | | | ($60,523,028 | ) | | | 10,467,582 | | | | $265,101,278 | |
MATTHEWS CHINA SMALL COMPANIES FUND | | | | | | | | | | | | | | | | |
| | | | |
Investor Class | | | | | | | | | | | | | | | | |
| | | | |
Shares sold | | | 2,485,045 | | | | $34,382,001 | | | | 8,959,506 | | | | $189,717,563 | |
| | | | |
Shares issued through reinvestment of distributions | | | — | | | | — | | | | 1,975,948 | | | | 32,484,582 | |
| | | | |
Shares redeemed | | | (3,798,909 | ) | | | (51,484,261 | ) | | | (12,033,641 | ) | | | (241,573,249 | ) |
Net (decrease) | | | (1,313,864 | ) | | | ($17,102,260 | ) | | | (1,098,187 | ) | | | ($19,371,104 | ) |
Institutional Class | | | | | | | | | | | | | | | | |
| | | | |
Shares sold | | | 1,922,702 | | | | $26,033,309 | | | | 6,605,771 | | | | $137,241,251 | |
| | | | |
Shares issued through reinvestment of distributions | | | — | | | | — | | | | 1,402,207 | | | | 23,094,348 | |
| | | | |
Shares redeemed | | | (3,067,288 | ) | | | (39,724,465 | ) | | | (3,049,880 | ) | | | (60,184,940 | ) |
Net increase (decrease) | | | (1,144,586 | ) | | | ($13,691,156 | ) | | | 4,958,098 | | | | $100,150,659 | |
MATTHEWS INDIA FUND | | | | | | | | | | | | | | | | |
| | | | |
Investor Class | | | | | | | | | | | | | | | | |
| | | | |
Shares sold | | | 793,713 | | | | $21,736,553 | | | | 2,813,109 | | | | $80,696,081 | |
| | | | |
Shares issued through reinvestment of distributions | | | — | | | | — | | | | 2,067,362 | | | | 57,059,198 | |
| | | | |
Shares redeemed | | | (2,265,609 | ) | | | (59,689,723 | ) | | | (5,842,428 | ) | | | (166,461,095 | ) |
Net (decrease) | | | (1,471,896 | ) | | | ($37,953,170 | ) | | | (961,957 | ) | | | ($28,705,816 | ) |
Institutional Class | | | | | | | | | | | | | | | | |
| | | | |
Shares sold | | | 413,320 | | | | $10,861,828 | | | | 1,816,167 | | | | $52,199,270 | |
| | | | |
Shares issued through reinvestment of distributions | | | — | | | | — | | | | 314,464 | | | | 8,820,713 | |
| | | | |
Shares redeemed | | | (846,966 | ) | | | (22,055,967 | ) | | | (1,015,833 | ) | | | (29,554,992 | ) |
Net increase (decrease) | | | (433,646 | ) | | | ($11,194,139 | ) | | | 1,114,798 | | | | $31,464,991 | |
Notes to Financial Statements (unaudited) (continued)
| | | | | | | | | | | | | | | | |
| | | Six-Month Period Ended
June 30, 2022 (Unaudited) | | | Year Ended December 31, 2021 | |
| | | Shares | | | Amount | | | Shares | | | Amount | |
MATTHEWS JAPAN FUND | | | | | | | | | | | | | | | | |
| | | | |
Investor Class | | | | | | | | | | | | | | | | |
| | | | |
Shares sold | | | 871,670 | | | | $16,142,854 | | | | 6,743,366 | | | | $166,680,993 | |
| | | | |
Shares issued through reinvestment of distributions | | | — | | | | — | | | | 1,755,976 | | | | 39,527,030 | |
| | | | |
Shares redeemed | | | (2,932,416 | ) | | | (56,847,555 | ) | | | (35,183,485 | ) | | | (842,316,315 | ) |
Net (decrease) | | | (2,060,746 | ) | | | ($40,704,701 | ) | | | (26,684,143 | ) | | | ($636,108,292 | ) |
Institutional Class | | | | | | | | | | | | | | | | |
| | | | |
Shares sold | | | 15,178,869 | | | | $277,524,277 | | | | 39,272,380 | | | | $945,798,673 | |
| | | | |
Shares issued through reinvestment of distributions | | | — | | | | — | | | | 5,389,914 | | | | 121,542,567 | |
| | | | |
Shares redeemed | | | (21,493,790 | ) | | | (375,602,390 | ) | | | (13,446,544 | ) | | | (324,879,350 | ) |
Net increase (decrease) | | | (6,314,921 | ) | | | ($98,078,113 | ) | | | 31,215,750 | | | | $742,461,890 | |
MATTHEWS KOREA FUND | | | | | | | | | | | | | | | | |
| | | | |
Investor Class | | | | | | | | | | | | | | | | |
| | | | |
Shares sold | | | 298,996 | | | | $1,520,380 | | | | 2,166,787 | | | | $14,093,494 | |
| | | | |
Shares issued through reinvestment of distributions | | | — | | | | — | | | | 1,365,820 | | | | 7,771,518 | |
| | | | |
Shares redeemed | | | (1,052,688 | ) | | | (5,266,518 | ) | | | (6,041,095 | ) | | | (38,538,375 | ) |
Net (decrease) | | | (753,692 | ) | | | ($3,746,138 | ) | | | (2,508,488 | ) | | | ($16,673,363 | ) |
Institutional Class | | | | | | | | | | | | | | | | |
| | | | |
Shares sold | | | 244,932 | | | | $1,303,003 | | | | 1,069,910 | | | | $7,020,298 | |
| | | | |
Shares issued through reinvestment of distributions | | | — | | | | — | | | | 164,505 | | | | 944,259 | |
| | | | |
Shares redeemed | | | (465,715 | ) | | | (2,284,772 | ) | | | (602,319 | ) | | | (3,854,282 | ) |
Net increase (decrease) | | | (220,783 | ) | | | ($981,769 | ) | | | 632,096 | | | | $4,110,275 | |
MATTHEWS ASIAN GROWTH AND INCOME FUND | | | | | | | | | | | | | | | | |
| | | | |
Investor Class | | | | | | | | | | | | | | | | |
| | | | |
Shares sold | | | 1,066,562 | | | | $16,160,652 | | | | 2,726,234 | | | | $50,277,256 | |
| | | | |
Shares issued through reinvestment of distributions | | | 170,289 | | | | 2,338,065 | | | | 3,842,976 | | | | 62,138,570 | |
| | | | |
Shares redeemed | | | (4,400,421 | ) | | | (65,954,484 | ) | | | (10,174,874 | ) | | | (183,241,744 | ) |
Net (decrease) | | | (3,163,570 | ) | | | ($47,455,767 | ) | | | (3,605,664 | ) | | | ($70,825,918 | ) |
Institutional Class | | | | | | | | | | | | | | | | |
| | | | |
Shares sold | | | 5,405,472 | | | | $79,764,571 | | | | 9,687,951 | | | | $178,195,373 | |
| | | | |
Shares issued through reinvestment of distributions | | | 220,652 | | | | 3,020,729 | | | | 4,074,854 | | | | 65,968,954 | |
| | | | |
Shares redeemed | | | (4,858,364 | ) | | | (70,104,384 | ) | | | (24,989,912 | ) | | | (446,066,163 | ) |
Net increase (decrease) | | | 767,760 | | | | $12,680,916 | | | | (11,227,107 | ) | | | ($201,901,836 | ) |
MATTHEWS ASIA DIVIDEND FUND | | | | | | | | | | | | | | | | |
| | | | |
Investor Class | | | | | | | | | | | | | | | | |
| | | | |
Shares sold | | | 4,196,393 | | | | $69,566,852 | | | | 12,057,493 | | | | $274,397,893 | |
| | | | |
Shares issued through reinvestment of distributions | | | 398,308 | | | | 6,176,793 | | | | 12,044,142 | | | | 231,202,200 | |
| | | | |
Shares redeemed | | | (21,157,946 | ) | | | (330,906,388 | ) | | | (41,646,108 | ) | | | (927,390,236 | ) |
Net (decrease) | | | (16,563,245 | ) | | | ($255,162,743 | ) | | | (17,544,473 | ) | | | ($421,790,143 | ) |
Institutional Class | | | | | | | | | | | | | | | | |
| | | | |
Shares sold | | | 19,433,025 | | | | $318,150,275 | | | | 53,859,272 | | | | $1,217,283,482 | |
| | | | |
Shares issued through reinvestment of distributions | | | 895,211 | | | | 13,902,364 | | | | 22,772,158 | | | | 436,803,502 | |
| | | | |
Shares redeemed | | | (49,393,284 | ) | | | (747,025,812 | ) | | | (38,600,689 | ) | | | (836,421,015 | ) |
Net increase (decrease) | | | (29,065,048 | ) | | | ($414,973,173 | ) | | | 38,030,741 | | | | $817,665,969 | |
MATTHEWS CHINA DIVIDEND FUND | | | | | | | | | | | | | | | | |
| | | | |
Investor Class | | | | | | | | | | | | | | | | |
| | | | |
Shares sold | | | 1,793,933 | | | | $27,808,830 | | | | 3,142,125 | | | | $63,677,062 | |
| | | | |
Shares issued through reinvestment of distributions | | | 323,283 | | | | 4,807,211 | | | | 1,155,183 | | | | 21,089,762 | |
| | | | |
Shares redeemed | | | (2,324,168 | ) | | | (35,327,037 | ) | | | (5,663,768 | ) | | | (114,181,841 | ) |
Net (decrease) | | | (206,952 | ) | | | ($2,710,996 | ) | | | (1,366,460 | ) | | | ($29,415,017 | ) |
Institutional Class | | | | | | | | | | | | | | | | |
| | | | |
Shares sold | | | 1,179,541 | | | | $18,520,304 | | | | 3,631,851 | | | | $74,478,535 | |
| | | | |
Shares issued through reinvestment of distributions | | | 171,587 | | | | 2,551,492 | | | | 730,061 | | | | 13,362,860 | |
| | | | |
Shares redeemed | | | (2,506,005 | ) | | | (37,926,687 | ) | | | (2,827,086 | ) | | | (55,351,224 | ) |
Net increase (decrease) | | | (1,154,877 | ) | | | ($16,854,891 | ) | | | 1,534,826 | | | | $32,490,171 | |
| | | | | | | | |
| | | | matthewsasia.com | 800.789.ASIA | | | 141 | |
Notes to Financial Statements (unaudited) (continued)
| | | | | | | | | | | | | | | | |
| | | Six-Month Period Ended
June 30, 2022 (Unaudited) | | | Year Ended December 31, 2021 | |
| | | Shares | | | Amount | | | Shares | | | Amount | |
MATTHEWS ASIA TOTAL RETURN BOND FUND | | | | | | | | | | | | | | | | |
| | | | |
Investor Class | | | | | | | | | | | | | | | | |
| | | | |
Shares sold | | | 79,196 | | | | $736,350 | | | | 1,180,628 | | | | $12,970,119 | |
| | | | |
Shares issued through reinvestment of distributions | | | 50,358 | | | | 456,023 | | | | 140,376 | | | | 1,506,992 | |
| | | | |
Shares redeemed | | | (757,071 | ) | | | (7,014,884 | ) | | | (2,187,511 | ) | | | (23,638,876 | ) |
Net (decrease) | | | (627,517 | ) | | | ($5,822,511 | ) | | | (866,507 | ) | | | ($9,161,765 | ) |
Institutional Class | | | | | | | | | | | | | | | | |
| | | | |
Shares sold | | | 395,988 | | | | $3,730,453 | | | | 3,754,829 | | | | $41,266,970 | |
| | | | |
Shares issued through reinvestment of distributions | | | 167,157 | | | | 1,511,580 | | | | 401,205 | | | | 4,298,763 | |
| | | | |
Shares redeemed | | | (1,947,460 | ) | | | (18,415,900 | ) | | | (2,473,473 | ) | | | (26,246,827 | ) |
Net increase (decrease) | | | (1,384,315 | ) | | | ($13,173,867 | ) | | | 1,682,561 | | | | $19,318,906 | |
MATTHEWS ASIA CREDIT OPPORTUNITIES FUND | | | | | | | | | | | | | | | | |
| | | | |
Investor Class | | | | | | | | | | | | | | | | |
| | | | |
Shares sold | | | 177,851 | | | | $1,527,997 | | | | 430,191 | | | | $4,182,400 | |
| | | | |
Shares issued through reinvestment of distributions | | | 21,692 | | | | 175,407 | | | | 42,926 | | | | 415,208 | |
| | | | |
Shares redeemed | | | (443,649 | ) | | | (3,451,497 | ) | | | (465,891 | ) | | | (4,464,027 | ) |
Net increase (decrease) | | | (244,106 | ) | | | ($1,748,093 | ) | | | 7,226 | | | | $133,581 | |
Institutional Class | | | | | | | | | | | | | | | | |
| | | | |
Shares sold | | | 323,554 | | | | $2,686,388 | | | | 2,341,111 | | | | $22,982,610 | |
| | | | |
Shares issued through reinvestment of distributions | | | 81,887 | | | | 662,085 | | | | 349,347 | | | | 3,411,004 | |
| | | | |
Shares redeemed | | | (1,207,303 | ) | | | (9,781,547 | ) | | | (7,045,662 | ) | | | (65,107,414 | ) |
Net (decrease) | | | (801,862 | ) | | | ($6,433,074 | ) | | | (4,355,204 | ) | | | ($38,713,800 | ) |
| 1 | See Note 1-A regarding the reorganization. |
| 5. | INVESTMENT ADVISORY FEES AND OTHER TRANSACTIONS WITH AFFILIATES |
Matthews, a registered investment advisor under the 1940 Act, provides the Funds with investment management services. Pursuant to the prior Investment Advisory Agreement dated August 13, 2004, as amended (the “Prior Advisory Agreement”) and the current Investment Advisory Agree- ment dated February 1, 2016, as amended (the “Current Advisory Agreement,” and together with the Prior Advisory Agreement, the “Advisory Agreement”), the Funds pay Matthews (i) for management and advisory services; and (ii) for certain administrative services, an annual fee as a percentage of average daily net assets. Under the Advisory Agreement each of the Funds, other than Matthews Emerging Markets Small Companies Fund, Matthews China Small Companies Fund, Matthews Asia Total Return Bond Fund and Matthews Asia Credit Opportunities Fund (the “Family-Priced Funds”), pays Matthews 0.75% of their aggregate average daily net assets up to $2 billion, 0.6834% of their aggregate average daily net assets over $2 billion up to $5 billion, 0.65% of their aggregate average daily net assets over $5 billion up to $25 billion, 0.64% of their aggregate average daily net assets over $25 billion up to $30 billion, 0.63% of their aggregate average daily net assets over $30 billion up to $35 billion, 0.62% of their aggregate average daily net assets over $35 billion up to $40 billion, 0.61% of their aggregate average daily net assets over $40 billion up to $45 billion, and 0.60% of their aggregate average daily net assets over $45 billion. Each of the Matthews Asia Total Return Bond Fund and Matthews Asia Credit Opportunities Fund pays Matthews an annual fee of 0.55% of such Fund’s annual average daily net assets pursuant to the Advisory Agreement. Each of the Matthews Emerging Markets Small Companies Fund and the Matthews China Small Companies Fund pays Matthews an annual fee of 1.00% of the average daily net assets of such Fund up to $1 billion and 0.95% of the average daily net assets of such Fund over $1 billion pursuant to the Advisory Agreement. Each Fund pays Matthews a monthly fee at the annual rate using the applicable management fee calculated based on the actual number of days of that month and based on the Fund’s average daily net asset value for the month.
Pursuant to a fee waiver letter agreement, effective as of September 1, 2014, between the Trust, on behalf of the Family-Priced Funds, and Matthews (as amended from time to time, the “Fee Waiver Agreement”), for each Family-Priced Fund, Matthews has agreed to waive a portion of the fee payable under the Advisory Agreement and a portion of the fee payable under the Administration and Shareholder Services Agreement, if any Family-Priced Fund’s average daily net assets are over $3 billion, as follows: for every $2.5 billion average daily net assets of a Family-Priced Fund that are over $3 billion, the fee rates that otherwise would be applied for calculating fees payable under the Advisory Agreement and the Administration and Shareholder Services Agreement for such Family-Priced Fund with respect to such excess average daily net assets will be each reduced by 0.01%, in each case without reducing such fee rate below 0.00%.
Notes to Financial Statements (unaudited) (continued)
Investment advisory fees charged, waived fees and reimbursed additional expenses for the six-month period ended June 30, 2022, were as follows:
| | | | | | | | | | | | |
| | | Gross Advisory Fees | | | Advisory Fees
Waived and
Expenses Waived or
Reimbursed in
Excess of the
Expense Limitation | | | Net Advisory Fee/
(Net Reimbursement) | |
| Matthews Emerging Markets Equity Fund | | | $149,561 | | | | ($135,192 | ) | | | $14,369 | |
| Matthews Emerging Markets Small Companies Fund | | | 1,798,596 | | | | (291,964 | ) | | | 1,506,632 | |
| Matthews Asia Growth Fund | | | 4,028,766 | | | | — | | | | 4,028,766 | |
| Matthews Pacific Tiger Fund | | | 20,720,336 | | | | (200,392 | ) | | | 20,519,944 | |
| Matthews Asia ESG Fund | | | 416,016 | | | | 64,885 | | | | 480,901 | |
| Matthews Asia Innovators Fund | | | 2,944,061 | | | | — | | | | 2,944,061 | |
| Matthews China Fund | | | 3,635,242 | | | | — | | | | 3,635,242 | |
| Matthews China Small Companies Fund | | | 1,465,621 | | | | (209,322 | ) | | | 1,256,299 | |
| Matthews India Fund | | | 2,289,723 | | | | — | | | | 2,289,723 | |
| Matthews Japan Fund | | | 4,164,977 | | | | — | | | | 4,164,977 | |
| Matthews Korea Fund | | | 390,154 | | | | — | | | | 390,154 | |
| Matthews Asian Growth and Income Fund | | | 3,296,526 | | | | — | | | | 3,296,526 | |
| Matthews Asia Dividend Fund | | | 12,683,749 | | | | (41,494 | ) | | | 12,642,255 | |
| Matthews China Dividend Fund | | | 954,071 | | | | — | | | | 954,071 | |
| Matthews Asia Total Return Bond Fund | | | 245,105 | | | | (65,024 | ) | | | 180,081 | |
| Matthews Asia Credit Opportunities Fund | | | 96,725 | | | | (83,359 | ) | | | 13,366 | |
Under a written agreement between the Funds and Matthews (the “Operating Expenses Agreement”), Matthews agrees to waive fees and reimburse expenses to a Fund if its expense ratio exceeds a certain percentage level. As of June 30, 2022, for all Funds except the Matthews Emerging Markets Equity Fund, the Matthews Emerging Markets Small Companies Fund, the Matthews Asia Total Return Bond Fund and the Matthews Asia Credit Opportunities Fund, this level is 1.20% for the Institutional Class. For the Matthews Emerging Markets Equity Fund, the Matthews Total Return Bond Fund and the Matthews Asia Credit Opportunities Fund, this level is 0.90% for the Institutional Class. For the Matthews Emerging Markets Small Companies Fund, this level is 1.15% for the Institutional Class. Matthews agrees to reduce the expense ratio by waiving an equal amount of non-class specific expenses (e.g., custody fees) for the Investor Class. Because certain expenses of the Investor Class may be higher than those of the Institutional Class and because class specific expenses may be waived solely for the Institutional Class, total annual Fund expenses for the Investor Class may exceed 1.20% (or 0.90% for the Matthews Emerging Markets Equity Fund, the Matthews Total Return Bond Fund and the Matthews Asia Credit Opportunities Fund, or 1.15% for the Matthews Emerging Markets Small Companies Fund). In turn, if the expenses of a Fund, other than the Matthews Asia Total Return Bond Fund and the Matthews Asia Credit Opportunities Fund, fall below the level noted within three years after Matthews has made such a reimbursement, the Fund may reimburse Matthews up to an amount of the recoupment available not to exceed the lesser of (i) the expense limitation applicable at the time of that fee waiver and/or expense reimbursement or (ii) the expense limitation in effect at the time of recoupment. For the Matthews Asia Total Return Bond Fund and the Matthews Asia Credit Opportunities Fund, any amount waived for prior fiscal years is not subject to recoupment. This agreement will continue through April 30, 2023, may be extended for additional periods not exceeding one year, and may be terminated at any time by the Board of Trustees on behalf of the Fund on 60 days’ written notice to Matthews. Matthews may decline to renew this agreement by written notice to the Trust at least 30 days before its annual expiration date.
Waived Fees Subject to Possible Future Recoupment:
On June 30, 2022, the amounts subject to possible future recoupment under the expense limitation agreement are as follows:
| | | | | | | | | | | | | | | | |
| | | Expiring December 31, | |
| | | 2022 | | | 2023 | | | 2024 | | | 2025 | |
| Matthews Emerging Markets Equity Fund | | | $— | | | | $231,409 | | | | $248,206 | | | | $135,192 | |
| Matthews Emerging Markets Small Companies Fund | | | 336,966 | | | | 378,868 | | | | 638,812 | | | | 291,964 | |
| Matthews Asia ESG Fund | | | — | | | | 16,535 | | | | — | | | | — | |
| Matthews China Small Companies Fund | | | 167,178 | | | | 362,019 | | | | 309,590 | | | | 209,322 | |
The Funds have an Administration and Shareholder Services Agreement dated August 13, 2004, as amended (the “Shareholder Services Agreement” or “Services Agreement”), in which the Funds pay an annual administration and shareholder servicing fee to Matthews, as a percentage of the average daily net assets of each Fund in aggregate, computed and prorated on a daily basis. Under the Shareholder Services Agreement, the Funds in the aggregate pay Matthews 0.25% of their aggregate average daily net assets up to $2 billion, 0.1834% of their aggregate average daily net assets over $2 billion up to $5 billion, 0.15% of their aggregate average daily net assets over $5 billion up to $7.5 billion, 0.125% of their aggregate average daily net assets over $7.5 billion up to $15 billion, 0.11% of their aggregate average daily net assets over $15 billion up to $22.5 billion, 0.10% of their aggregate average daily net assets over $22.5 billion up to $25 billion, 0.09% of their aggregate average daily net assets over $25 billion up to $30 billion, 0.08% of their aggregate average daily net assets over $30 billion up to $35 billion, 0.07% of their aggregate average daily net assets over $35 billion up to $40 billion, 0.06% of their aggregate average daily net assets over $40 billion up to $45 billion, and 0.05% of their aggregate average daily net assets over $45 billion.
| | | | | | | | |
| | | | matthewsasia.com | 800.789.ASIA | | | 143 | |
Notes to Financial Statements (unaudited) (continued)
Administration and shareholder servicing fees charged, for the six-month period ended June 30, 2022, were as follows:
| | | | | | | | | | | | |
| | | Gross
Administration and
Shareholder
Servicing Fees | | | Administration and
Shareholder
Servicing Fees
Waived in Excess of
Expense Limitation | | | Net
Administration and
Shareholder
Servicing Fees | |
| Matthews Emerging Markets Equity Fund | | | $33,737 | | | | $— | | | | $33,737 | |
| Matthews Emerging Markets Small Companies Fund | | | 271,464 | | | | — | | | | 271,464 | |
| Matthews Asia Growth Fund | | | 906,063 | | | | — | | | | 906,063 | |
| Matthews Pacific Tiger Fund | | | 4,670,618 | | | | (200,392 | ) | | | 4,470,226 | |
| Matthews Asia ESG Fund | | | 94,097 | | | | — | | | | 94,097 | |
| Matthews Asia Innovators Fund | | | 660,660 | | | | — | | | | 660,660 | |
| Matthews China Fund | | | 818,426 | | | | — | | | | 818,426 | |
| Matthews China Small Companies Fund | | | 220,346 | | | | — | | | | 220,346 | |
| Matthews India Fund | | | 516,691 | | | | — | | | | 516,691 | |
| Matthews Japan Fund | | | 939,035 | | | | — | | | | 939,035 | |
| Matthews Korea Fund | | | 88,052 | | | | — | | | | 88,052 | |
| Matthews Asian Growth and Income Fund | | | 743,977 | | | | — | | | | 743,977 | |
| Matthews Asia Dividend Fund | | | 2,855,163 | | | | (41,494 | ) | | | 2,813,669 | |
| Matthews China Dividend Fund | | | 214,997 | | | | — | | | | 214,997 | |
| Matthews Asia Total Return Bond Fund | | | 67,123 | | | | — | | | | 67,123 | |
| Matthews Asia Credit Opportunities Fund | | | 26,487 | | | | — | | | | 26,487 | |
In addition to the fees paid to the Funds’ transfer agent, the Funds bear the cost of fees paid to certain service providers or intermediaries, including supermarkets, which provide transfer agency, record-keeping and shareholder servicing to certain shareholders. These fees are referred to as intermediary service fees on the Statements of Assets and Liabilities as well as the Statements of Operations. Additional information concerning these services and fees is contained in the Funds’ prospectuses.
BNY Mellon Investment Servicing (US) Inc. (“BNY Mellon”), an indirect wholly owned subsidiary of The Bank of New York Mellon Corporation, serves as the Funds’ administrator, and in that capacity, performs various administrative and accounting services for each Fund. BNY Mellon also serves as the Funds’ transfer agent, dividend disbursing agent and registrar. An officer of BNY Mellon serves as Assistant Treasurer to the Funds. Total fees accrued by the Funds for administration and accounting services for the six-month period ended June 30, 2022 were as follows:
| | | | |
| | | Administration and
Accounting fees | |
| Matthews Emerging Markets Equity Fund | | | $1,791 | |
| Matthews Emerging Markets Small Companies Fund | | | 14,389 | |
| Matthews Asia Growth Fund | | | 48,268 | |
| Matthews Pacific Tiger Fund | | | 248,183 | |
| Matthews Asia ESG Fund | | | 4,981 | |
| Matthews Asia Innovators Fund | | | 35,281 | |
| Matthews China Fund | | | 43,548 | |
| Matthews China Small Companies Fund | | | 11,725 | |
| Matthews India Fund | | | 27,422 | |
| Matthews Japan Fund | | | 49,886 | |
| Matthews Korea Fund | | | 4,672 | |
| Matthews Asian Growth and Income Fund | | | 39,480 | |
| Matthews Asia Dividend Fund | | | 151,947 | |
| Matthews China Dividend Fund | | | 11,428 | |
| Matthews Asia Total Return Bond Fund | | | 3,565 | |
| Matthews Asia Credit Opportunities Fund | | | 1,407 | |
As of June 30, 2022, Matthews and its affiliates held significant shares in the Funds as follows:
| | | | | | | | |
| | | Shares held by Matthews
and its Affiliates | | | Percentage of
Outstanding Shares | |
| Matthews Emerging Markets Equity Fund | | | 655,294 | | | | 19% | |
| Matthews Asia Credit Opportunities Fund | | | 705,579 | | | | 20% | |
Certain officers and Trustees of the Funds are also officers and directors of Matthews. All officers serve without compensation from the Funds. The Funds paid the Independent Trustees $589,350 in aggregate for regular compensation during the six-month period ended June 30, 2022.
Notes to Financial Statements (unaudited) (continued)
The value of investment transactions made for affiliated and unaffiliated holdings for the six-month period ended June 30, 2022 were as follows:
| | | | | | | | | | | | | | | | |
| | | Affiliated Purchases | | | Proceeds from
Affiliated Sales | | | Unaffiliated Purchases | | | Proceeds from
Unaffiliated Sales | |
| Matthews Emerging Markets Equity Fund | | | $— | | | | $— | | | | $17,965,283 | | | | $15,448,267 | |
| Matthews Emerging Markets Small Companies Fund | | | — | | | | — | | | | 75,103,007 | | | | 46,846,557 | |
| Matthews Asia Growth Fund | | | — | | | | — | | | | 289,412,579 | | | | 616,266,670 | |
| Matthews Pacific Tiger Fund | | | — | | | | — | | | | 225,553,600 | | | | 950,239,277 | |
| Matthews Asia ESG Fund | | | — | | | | — | | | | 47,825,371 | | | | 32,497,091 | |
| Matthews Asia Innovators Fund | | | — | | | | 6,160,428 | | | | 500,499,708 | | | | 973,044,110 | |
| Matthews China Fund | | | — | | | | — | | | | 373,953,745 | | | | 427,292,537 | |
| Matthews China Small Companies Fund | | | — | | | | — | | | | 87,344,806 | | | | 121,786,918 | |
| Matthews India Fund | | | — | | | | — | | | | 147,710,577 | | | | 211,973,861 | |
| Matthews Japan Fund | | | — | | | | — | | | | 577,953,169 | | | | 730,181,158 | |
| Matthews Korea Fund | | | — | | | | — | | | | 28,828,149 | | | | 36,330,192 | |
| Matthews Asian Growth and Income Fund | | | — | | | | — | | | | 69,855,125 | | | | 104,014,596 | |
| Matthews Asia Dividend Fund | | | — | | | | 48,137,656 | | | | 1,087,621,494 | | | | 1,767,704,647 | |
| Matthews China Dividend Fund | | | — | | | | — | | | | 105,355,498 | | | | 127,675,830 | |
| Matthews Asia Total Return Bond Fund | | | — | | | | — | | | | 3,462,982 | | | | 28,647,049 | |
| Matthews Asia Credit Opportunities Fund | | | — | | | | — | | | | 1,041,090 | | | | 8,590,705 | |
| 7. | HOLDINGS OF 5% VOTING SHARES OF PORTFOLIO COMPANIES |
The 1940 Act defines “affiliated companies” to include investments in portfolio companies in which a fund owns 5% or more of the outstanding voting shares. During the six-month period ended June 30, 2022, the Funds below held 5% or more of the outstanding voting shares of the noted portfolio companies. During this period, other Funds in the Trust may also have held voting shares of the issuers at levels below 5%.
Investments in affiliates:
A summary of transactions in securities of issuers affiliated with a Fund for the six-month period ended June 30, 2022 is as follows:
| | | | | | | | | | | | | | | | | | | | | | | | | | | | | | | | |
| | | Value at
Dec. 31, 2021 | | | Purchases | | | Sales | | | Net Realized
Gain (Loss)
Jan. 1, 2022-
June 30, 2022 | | | Net Change in
Unrealized
Appreciation
(Depreciation) | | | Value at
June 30, 2022 | | | Shares
June 30, 2022 | | | Dividend
Income
Jan. 1, 2022-
June 30,
2022 | |
| | | | | | | |
| MATTHEWS ASIA INNOVATORS FUND | | | | | | | | | | | | | | | | | | | | | | | | | | | | | |
| | | | | | | | |
| Name of Issuer: | | | | | | | | | | | | | | | | | | | | | | | | | | | | | | | | |
MicroTech Medical Hangzhou Co., Ltd.† | | | $15,680,307 | | | | $— | | | | $6,160,428 | | | | ($7,383,204 | ) | | | ($371,266 | ) | | | $— | | | | — | | | | $— | |
| | | | | | |
| MATTHEWS ASIA DIVIDEND FUND | | | | | | | | | | | | | | | | | | | | | | | | | |
| | | | | | | | |
| Name of Issuer: | | | | | | | | | | | | | | | | | | | | | | | | | | | | | | | | |
KATITAS Co., Ltd.† | | | $161,151,617 | | | | $— | | | | $15,034,903 | | | | $4,967,453 | | | | ($74,559,124 | ) | | | $— | | | | — | | | | $585,188 | |
Minth Group, Ltd.† | | | 272,336,759 | | | | — | | | | 18,991,473 | | | | 8,997,436 | | | | (113,635,427 | ) | | | — | | | | — | | | | 4,669,744 | |
Yuexiu Transport Infrastructure, Ltd.† | | | 55,636,352 | | | | — | | | | 14,111,280 | | | | 1,661,848 | | | | (1,941,703 | ) | | | — | | | | — | | | | 3,985,228 | |
| | | | | | | | | | | | | | | | | | | | | | | | |
Total Affiliates | | | | | | | | | | | | | | | $15,626,737 | | | | ($190,136,254 | ) | | | $— | | | | | | | | $9,240,160 | |
| | | | | | | | | | | | | | | | | | | | | | | | |
| † | Issuer was not an affiliated company as of June 30, 2022. |
It is the policy of the Funds to comply with all requirements of the Internal Revenue Code of 1986, as amended (“the Code”), applicable to regulated investment companies and to distribute substantially all of their taxable income to their shareholders. The Funds have met the requirements of the Code applicable to regulated investment companies for the six-month period ended June 30, 2022. Therefore, no federal income tax provision is required.
Management has analyzed the Funds’ tax positions taken on federal income tax returns for all open tax years (current and prior three tax years), and has concluded that no provision for federal income tax is required in the Funds’ financial statements. The Funds’ federal and state income and federal excise tax returns for tax years for which the applicable statutes of limitations have not expired are subject to examination by the Internal Revenue Service and state departments of revenue.
| | | | | | | | |
| | | | matthewsasia.com | 800.789.ASIA | | | 145 | |
Notes to Financial Statements (unaudited) (continued)
Under current tax law, the Funds have elected to defer certain qualified late-year losses and recognize such losses in the year ending December 31, 2021:
| | | | |
| | | Late Year
Losses* | |
| Matthews Emerging Markets Equity Fund | | | ($70,980 | ) |
| Matthews Emerging Markets Small Companies Fund | | | (200,393 | ) |
| Matthews Asia Growth Fund | | | (655,318 | ) |
| Matthews Asia ESG Fund | | | (232,007 | ) |
| Matthews Asia Innovators Fund | | | (3,327,545 | ) |
| Matthews China Fund | | | (13,614,360 | ) |
| Matthews China Small Companies Fund | | | (5,264,748 | ) |
| Matthews India Fund | | | (2,802,871 | ) |
| Matthews Japan Fund | | | (2,929,671 | ) |
| Matthews Asia Dividend Fund | | | (137,455,546 | ) |
| Matthews China Dividend Fund | | | (550,929 | ) |
| * | As permitted by the Internal Revenue Service, the Funds have elected to defer certain qualified late-year losses and recognize such losses in the next fiscal year. |
As of December 31, 2021, the Funds have capital loss carryforwards available to offset future realized capital gains through the indicated expiration dates as follows:
| | | | | | | | | | | | |
| | | Amount With No Expiration | | | | |
| | | Short-term
Losses | | | Long-term
Losses | | | Total | |
| Matthews Emerging Markets Small Companies Fund | | | $— | | | | $85,378,751 | | | | $85,378,751 | |
| Matthews Asia Credit Opportunities Fund | | | 6,601,763 | | | | 856,586 | | | | 7,458,349 | |
Under the Regulated Investment Company Modernization Act of 2010, the Funds are permitted to carry forward capital losses incurred in taxable years beginning after December 22, 2010 for an unlimited period. However, any losses incurred during those future taxable years will be required to be utilized prior to any losses incurred in pre-enactment taxable years, which generally expire after eight years from when they are incurred. Additionally, post-enactment capital losses that are carried forward will retain their character as either short-term or long-term capital losses rather than being considered all short-term as under previous law.
As of June 30, 2022, the tax cost of investments, including derivatives, and the related net unrealized appreciation and depreciation were as follows:
| | | | | | | | | | | | | | | | |
| | | Tax Cost | | | Gross
Unrealized
Appreciation | | | Gross
Unrealized
Depreciation | | | Net Unrealized
Appreciation
(Depreciation) | |
| Matthews Emerging Markets Equity Fund | | | $45,707,047 | | | | $1,760,992 | | | | ($10,577,582) | | | | ($8,816,590 | ) |
| Matthews Emerging Markets Small Companies Fund | | | 331,675,093 | | | | 81,863,751 | | | | (64,018,158 | ) | | | 17,845,593 | |
| Matthews Asia Growth Fund | | | 1,032,366,512 | | | | 92,002,773 | | | | (213,079,654) | | | | (121,076,881 | ) |
| Matthews Pacific Tiger Fund | | | 4,821,944,946 | | | | 1,181,763,699 | | | | (733,368,016 | ) | | | 448,395,683 | |
| Matthews Asia ESG Fund | | | 126,305,097 | | | | 16,340,060 | | | | (16,080,072) | | | | 259,988 | |
| Matthews Asia Innovators Fund | | | 836,483,383 | | | | 28,056,178 | | | | (201,382,686 | ) | | | (173,326,508 | ) |
| Matthews China Fund | | | 1,216,852,123 | | | | 67,139,725 | | | | (209,656,241) | | | | (142,516,516 | ) |
| Matthews China Small Companies Fund | | | 310,589,209 | | | | 30,649,563 | | | | (74,413,204 | ) | | | (43,763,641 | ) |
| Matthews India Fund | | | 560,013,529 | | | | 90,187,152 | | | | (62,295,657) | | | | 27,891,495 | |
| Matthews Japan Fund | | | 1,092,275,986 | | | | 21,084,039 | | | | (167,329,479 | ) | | | (146,245,440 | ) |
| Matthews Korea Fund | | | 89,354,571 | | | | 10,137,072 | | | | (9,621,430) | | | | 515,642 | |
| Matthews Asian Growth and Income Fund | | | 836,879,982 | | | | 136,144,803 | | | | (98,359,270 | ) | | | 37,785,533 | |
| Matthews Asia Dividend Fund | | | 2,818,108,836 | | | | 316,659,617 | | | | (367,959,892) | | | | (51,300,275 | ) |
| Matthews China Dividend Fund | | | 271,965,535 | | | | 26,382,425 | | �� | | (35,189,270 | ) | | | (8,806,845 | ) |
| Matthews Asia Total Return Bond Fund | | | 93,663,315 | | | | 481,935 | | | | (28,652,945) | | | | (28,171,010 | ) |
| Matthews Asia Credit Opportunities Fund | | | 37,894,669 | | | | 107,486 | | | | (12,640,779 | ) | | | (12,533,293 | ) |
| 9. | PUBLIC HEALTH EMERGENCY RISKS |
Pandemics and other public health emergencies, including outbreaks of infectious diseases such as the current outbreak of the novel coronavirus (“COVID-19”), can result, and in the case of COVID-19 is resulting, in market volatility and disruption, and materially and adversely impact economic conditions in ways that cannot be predicted, all of which could result in substantial investment losses. Containment efforts and related restrictive actions by governments and businesses have significantly diminished and disrupted global economic activity across many industries. Less developed countries and their health systems may be more vulnerable to these impacts. The ultimate impact of COVID-19 or other health emergencies on global economic conditions and businesses is impossible to predict accurately. Ongoing and potential additional material adverse economic effects of indeterminate duration and severity are possible. The resulting adverse impact on the value of investment in the Funds could be significant and prolonged.
Effective July 14, 2022, Matthews launched three exchange traded funds as new series of the Trust, the Matthews Emerging Markets Equity Active ETF, the Matthews China Active ETF, and the Matthews Asia Innovators Active ETF.
Effective July 29, 2022, the Matthews Asia ESG Fund was renamed the Matthews Emerging Markets Sustainable Future Fund.
| | | | |
| Matthews Asia Funds | | | | |
| | |
INVESTMENT ADVISOR Matthews International Capital Management, LLC Four Embarcadero Center, Suite 550 San Francisco, CA 94111 800.789.ASIA CUSTODIAN Brown Brothers Harriman & Co. 50 Post Office Square Boston, MA 02110 | | ACCOUNT SERVICES Matthews Asia Funds P.O. Box 9791 Providence, RI 02940 800.789.ASIA LEGAL COUNSEL Paul Hastings LLP 101 California Street, 48th Floor San Francisco, CA 94111 | | ADMINISTRATOR & TRANSFER AGENT BNY Mellon 301 Bellevue Parkway Wilmington, DE 19809 |

P.O. Box 9791 | Providence, RI 02940 | matthewsasia.com | 800.789.ASIA (2742)
Matthews Asia Funds are distributed in the United States by Foreside Funds Distributors LLC, Portland, Maine
Matthews Asia Funds are distributed in Latin America by Picton S. A.

SAR-0622
Not applicable.
| Item 3. | Audit Committee Financial Expert. |
Not applicable.
| Item 4. | Principal Accountant Fees and Services. |
Not applicable.
| Item 5. | Audit Committee of Listed Registrants. |
Not applicable.
| (a) | Schedule of Investments in securities of unaffiliated issuers as of the close of the reporting period is included as part of the report to shareholders filed under Item 1 of this form. |
| Item 7. | Disclosure of Proxy Voting Policies and Procedures for Closed-End Management Investment Companies. |
Not applicable.
| Item 8. | Portfolio Managers of Closed-End Management Investment Companies. |
Not applicable.
| Item 9. | Purchases of Equity Securities by Closed-End Management Investment Company and Affiliated Purchasers. |
Not applicable.
| Item 10. | Submission of Matters to a Vote of Security Holders. |
There have been no material changes to the procedures by which the shareholders may recommend nominees to the registrant’s board of directors, where those changes were implemented after the registrant last provided disclosure in response to the requirements of Item 407(c)(2)(iv) of Regulation S-K (17 CFR 229.407) (as required by Item 22(b)(15) of Schedule 14A (17 CFR 240.14a-101)), or this Item.
| Item 11. | Controls and Procedures. |
| | (a) | The registrant’s principal executive and principal financial officers, or persons performing similar functions, have concluded that the registrant’s disclosure controls and procedures (as defined in Rule 30a-3(c) under the Investment Company Act of 1940, as amended (the “1940 Act”) (17 CFR 270.30a-3(c))) are effective, as of a date within 90 days of the filing date of the report that includes the disclosure required by this paragraph, based on their evaluation of these controls and procedures required by Rule 30a-3(b) under the 1940 Act (17 CFR 270.30a-3(b)) and Rules 13a-15(b) or 15d-15(b) under the Securities Exchange Act of 1934, as amended (17 CFR 240.13a-15(b) or 24l0.15d-15(b)). |
| | (b) | There was no change in the registrant’s internal control over financial reporting (as defined in Rule 30a-3(d) under the 1940 Act (17 CFR 270.30a-3(d))) that occurred during the period covered by this report that has materially affected, or is reasonably likely to materially affect, the registrant’s internal control over financial reporting. |
| Item 12. | Disclosure of Securities Lending Activities for Closed-End Management Investment Companies. |
Not applicable.
SIGNATURES
Pursuant to the requirements of the Securities Exchange Act of 1934 and the Investment Company Act of 1940, the registrant has duly caused this report to be signed on its behalf by the undersigned, thereunto duly authorized.
| | |
| (Registrant) | | Matthews International Funds |
| |
| By (Signature and Title)* | | /s/ Robert Horrocks |
| | Robert Horrocks, President |
| | (principal executive officer) |
| |
| Date | | September 7, 2022 |
Pursuant to the requirements of the Securities Exchange Act of 1934 and the Investment Company Act of 1940, this report has been signed below by the following persons on behalf of the registrant and in the capacities and on the dates indicated.
| | |
| By (Signature and Title)* | | /s/ Robert Horrocks |
| | Robert Horrocks, President |
| | (principal executive officer) |
| |
| Date | | September 7, 2022 |
| |
| By (Signature and Title)* | | /s/ Shai Malka |
| | Shai Malka, Treasurer |
| | (principal financial officer) |
| |
| Date | | September 7, 2022 |
| * | Print the name and title of each signing officer under his or her signature. |