UNITED STATES
SECURITIES AND EXCHANGE COMMISSION
Washington, D.C. 20549
FORM N-CSR
CERTIFIED SHAREHOLDER REPORT OF REGISTERED
MANAGEMENT INVESTMENT COMPANIES
Investment Company Act file number 811-08510
Matthews International Funds
(Exact name of registrant as specified in charter)
Four Embarcadero Center, Suite 550
San Francisco, CA 94111
(Address of principal executive offices) (Zip code)
William J. Hackett, President
Four Embarcadero Center, Suite 550
San Francisco, CA 94111
(Name and address of agent for service)
Registrant’s telephone number, including area code: 415-788-7553
Date of fiscal year end: December 31
Date of reporting period: June 30, 2020
Form N-CSR is to be used by management investment companies to file reports with the Commission not later than 10 days after the transmission to stockholders of any report that is required to be transmitted to stockholders under Rule 30e-1 under the Investment Company Act of 1940 (17 CFR 270.30e-1). The Commission may use the information provided on Form N-CSR in its regulatory, disclosure review, inspection, and policymaking roles.
A registrant is required to disclose the information specified by Form N-CSR, and the Commission will make this information public. A registrant is not required to respond to the collection of information contained in Form N-CSR unless the Form displays a currently valid Office of Management and Budget (“OMB”) control number. Please direct comments concerning the accuracy of the information collection burden estimate and any suggestions for reducing the burden to Secretary, Securities and Exchange Commission, 450 Fifth Street, NW, Washington, DC 20549-0609. The OMB has reviewed this collection of information under the clearance requirements of 44 U.S.C. § 3507.
| Item 1. | Reports to Stockholders. |
The Report to Shareholders is attached herewith.
Matthews Asia Funds | Semi-Annual Report
June 30, 2020 | matthewsasia.com
GLOBAL EMERGING MARKETS STRATEGY
Matthews Emerging Markets Equity Fund
ASIA FIXED INCOME STRATEGIES
Matthews Asia Total Return Bond Fund
Matthews Asia Credit Opportunities Fund
ASIA GROWTH AND INCOME STRATEGIES
Matthews Asian Growth and Income Fund
Matthews Asia Dividend Fund
Matthews China Dividend Fund
ASIA VALUE STRATEGY
Matthews Asia Value Fund
ASIA GROWTH STRATEGIES
Matthews Asia Growth Fund
Matthews Pacific Tiger Fund
Matthews Asia ESG Fund
Matthews Emerging Asia Fund
Matthews Asia Innovators Fund
Matthews China Fund
Matthews India Fund
Matthews Japan Fund
Matthews Korea Fund
ASIA SMALL COMPANY STRATEGIES
Matthews Asia Small Companies Fund
Matthews China Small Companies Fund

Beginning on January 1, 2021, as permitted by regulations adopted by the Securities and Exchange Commission, paper copies of the Funds’ annual and semi-annual shareholder reports will no longer be sent by mail, unless you specifically request paper copies of the reports. Instead, the reports will be made available on the Funds’ website matthewsasia.com, and you will be notified by mail each time a report is posted and provided with a website link to access the report. If you already elected to receive shareholder reports electronically, you will not be affected by this change and you need not take any action. You may elect to receive shareholder reports and other communications from the Funds electronically anytime by contacting your financial intermediary (such as a broker-dealer or bank) or, if you are a direct investor, by calling 800.789.ASIA (2742).
You may elect to receive all future reports in paper free of charge. If you invest through a financial intermediary, you can contact your financial intermediary to request that you continue to receive paper copies of your shareholder reports. If you invest directly with a Fund, you can call 800.789.ASIA (2742) to let the Fund know you wish to continue receiving paper copies of your shareholder reports. Your election to receive reports in paper will apply to all Funds held in your account if you invest through your financial intermediary or all Funds held directly with Matthews Asia Funds.

Investor Class Performance and Expenses (June 30, 2020)
| | | | | | | | | | | | | | | | | | | | | | | | | | | | |
| Investor Class | | | | | Average Annual Total Return† | | | Inception
Date | | | Prospectus
Expense
Ratios* | | | Prospectus
Expense Ratios
after Fee Waiver and Expense
Reimbursement* | |
| | 1 year | | | 5 years | | | 10 years | | | Since
Inception | |
GLOBAL EMERGING MARKETS STRATEGY | | | | | | | | | | | | | | | | | | | | | | | | | | | | |
| | | | | | | |
Emerging Markets Equity Fund (MEGMX) | | | n.a. | | | | n.a. | | | | n.a. | | | | 16.70% | | | | 4/30/20 | | | | 2.77% | | | | 1.15% | 1 |
ASIA FIXED INCOME STRATEGIES | | | | | | | | | | | | | | | | | | | | | | | | | | | | |
| | | | | | | |
Asia Total Return Bond Fund (MAINX)** | | | 0.45% | | | | 4.26% | | | | n.a. | | | | 4.22% | | | | 11/30/11 | | | | 1.08% | | | | 1.07% | 1 |
| | | | | | | |
Asia Credit Opportunities Fund (MCRDX) | | | -1.30% | | | | n.a. | | | | n.a. | | | | 4.13% | | | | 4/29/16 | | | | 1.24% | | | | 1.12% | 1 |
ASIA GROWTH AND INCOME STRATEGIES | | | | | | | | | | | | | | | | | | | | | | | | | | | | |
| | | | | | | |
Asian Growth and Income Fund (MACSX) | | | -3.38% | | | | 2.06% | | | | 4.74% | | | | 8.48% | | | | 9/12/94 | | | | 1.08% | | | | 1.08% | |
| | | | | | | |
Asia Dividend Fund (MAPIX) | | | 2.31% | | | | 4.09% | | | | 6.95% | | | | 7.98% | | | | 10/31/06 | | | | 1.03% | | | | 1.02% | 2 |
| | | | | | | |
China Dividend Fund (MCDFX) | | | 3.56% | | | | 6.94% | | | | 9.99% | | | | 9.76% | | | | 11/30/09 | | | | 1.15% | | | | 1.15% | |
ASIA VALUE STRATEGY | | | | | | | | | | | | | | | | | | | | | | | | | | | | |
| | | | | | | |
Asia Value Fund (MAVRX) | | | -3.33% | | | | n.a. | | | | n.a. | | | | 6.40% | | | | 11/30/15 | | | | 1.85% | | | | 1.37% | 3 |
ASIA GROWTH STRATEGIES | | | | | | | | | | | | | | | | | | | | | | | | | | | | |
| | | | | | | |
Asia Growth Fund (MPACX) | | | 18.17% | | | | 9.04% | | | | 9.53% | | | | 9.49% | | | | 10/31/03 | | | | 1.09% | | | | 1.09% | |
| | | | | | | |
Pacific Tiger Fund (MAPTX) | | | -2.00% | | | | 3.64% | | | | 7.01% | | | | 8.11% | | | | 9/12/94 | | | | 1.08% | | | | 1.05% | 2 |
| | | | | | | |
Asia ESG Fund (MASGX) | | | 3.32% | | | | 4.90% | | | | n.a. | | | | 4.42% | | | | 4/30/15 | | | | 1.54% | | | | 1.38% | 3 |
| | | | | | | |
Emerging Asia Fund (MEASX) | | | -24.51% | | | | -3.34% | | | | n.a. | | | | -0.25% | | | | 4/30/13 | | | | 1.65% | | | | 1.42% | 3 |
| | | | | | | |
Asia Innovators Fund (MATFX) | | | 38.22% | | | | 12.33% | | | | 13.19% | | | | 5.24% | | | | 12/27/99 | | | | 1.19% | | | | 1.19% | |
| | | | | | | |
China Fund (MCHFX) | | | 23.58% | | | | 9.21% | | | | 7.30% | | | | 10.26% | | | | 2/19/98 | | | | 1.09% | | | | 1.09% | |
| | | | | | | |
India Fund (MINDX) | | | -21.86% | | | | -1.80% | | | | 4.06% | | | | 8.08% | | | | 10/31/05 | | | | 1.11% | | | | 1.11% | |
| | | | | | | |
Japan Fund (MJFOX) | | | 10.88% | | | | 5.86% | | | | 10.27% | | | | 6.07% | | | | 12/31/98 | | | | 0.93% | | | | 0.93% | |
| | | | | | | |
Korea Fund (MAKOX) | | | 0.41% | | | | 0.73% | | | | 6.83% | | | | 5.33% | | | | 1/3/95 | | | | 1.15% | | | | 1.15% | |
ASIA SMALL COMPANY STRATEGIES | | | | | | | | | | | | | | | | | | | | | | | | | | | | |
| | | | | | | |
Asia Small Companies Fund (MSMLX) | | | 14.74% | | | | 3.10% | | | | 6.72% | | | | 10.29% | | | | 9/15/08 | | | | 1.60% | | | | 1.41% | 3 |
| | | | | | | |
China Small Companies Fund (MCSMX) | | | 79.85% | | | | 18.72% | | | | n.a. | | | | 11.40% | | | | 5/31/11 | | | | 1.62% | | | | 1.38% | 3 |
| † | Annualized performance for periods of at least one year, otherwise cumulative. |
| * | These figures are from the Funds’ prospectus dated as of April 29, 2020, and may differ from the actual expense ratios for fiscal year 2020, as shown in the financial highlights section of this report. |
| ** | The Fund’s name changed from Matthews Asia Strategic Income Fund to Matthews Asia Total Return Bond Fund on January 31, 2020. |
| 1 | Matthews has contractually agreed (i) to waive fees and reimburse expenses to the extent needed to limit Total Annual Fund Operating Expenses (excluding Rule 12b-1 fees, taxes, interest, brokerage commissions, short sale dividend expenses, expenses incurred in connection with any merger or reorganization or extraordinary expenses such as litigation) of the Institutional Class to 0.90% first by waiving class specific expenses (i.e., shareholder service fees specific to a particular class) of the Institutional Class and then, to the extent necessary, by waiving non-class specific expenses (e.g., custody fees) of the Institutional Class, and (ii) if any Fund-wide expenses (i.e., expenses that apply to both the Institutional Class and the Investor Class) are waived for the Institutional Class to maintain the 0.90% expense limitation, to waive an equal amount (in annual percentage terms) of those same expenses for the Investor Class. The Total Annual Fund Operating Expenses After Fee Waiver and Expense Reimbursement for the Investor Class may vary from year to year and will in some years exceed 0.90%. Pursuant to this agreement, any amount waived for prior fiscal years with respect to the Matthews Asia Total Return Bond Fund and the Matthews Asia Credit Opportunities Fund is not subject to recoupment. For the Matthews Emerging Markets Equity Fund, if the operating expenses fall below the expense limitation in a year within three years after Matthews has made a waiver or reimbursement, the Fund may reimburse Matthews up to an amount that does not cause the expenses for that year to exceed the lesser of (i) the expense limitation applicable at the time of that fee waiver and/or expense reimbursement or (ii) the expense limitation in effect at the time of recoupment. This agreement will remain in place until April 30, 2021 and may be terminated at any time by the Board of Trustees on behalf of the Fund on 60 days’ written notice to Matthews. Matthews may decline to renew this agreement by written notice to the Trust at least 30 days before its annual expiration date. |
| 2 | Matthews has contractually agreed to waive a portion of its advisory fee and administrative and shareholder services fee if the Fund’s average daily net assets are over $3 billion, as follows: for every $2.5 billion average daily net assets of the Fund that are over $3 billion, the advisory fee rate and the administrative and shareholder services fee rate for the Fund with respect to such excess average daily net assets will be each reduced by 0.01%, in each case without reducing such fee rate below 0.00%. Any amount waived by Matthews pursuant to this agreement may not be recouped by Matthews. This agreement will remain in place until April 30, 2021 and may be terminated (i) at any time by the Board of Trustees upon 60 days’ prior written notice to Matthews; or (ii) by Matthews at the annual expiration date of the agreement upon 60 days’ prior written notice to the Trust, in each case without payment of any penalty. |
| 3 | Matthews has contractually agreed (i) to waive fees and reimburse expenses to the extent needed to limit Total Annual Fund Operating Expenses (excluding Rule 12b-1 fees, taxes, interest, brokerage commissions, short sale dividend expenses, expenses incurred in connection with any merger or reorganization or extraordinary expenses such as litigation) of the Institutional Class to 1.20% first by waiving class specific expenses (i.e., shareholder service fees specific to a particular class) of the Institutional Class and then, to the extent necessary, by waiving non-class specific expenses (e.g., custody fees) of the Institutional Class, and (ii) if any Fund-wide expenses (i.e., expenses that apply to both the Institutional Class and the Investor Class) are waived for the Institutional Class to maintain the 1.20% expense limitation, to waive an equal amount (in annual percentage terms) of those same expenses for the Investor Class. The Total Annual Fund Operating Expenses After Fee Waiver and Expense Reimbursement for the Investor Class may vary from year to year and will in some years exceed 1.20%. If the operating expenses fall below the expense limitation in a year within three years after Matthews has made a waiver or reimbursement, the Fund may reimburse Matthews up to an amount that does not cause the expenses for that year to exceed the lesser of (i) the expense limitation applicable at the time of that fee waiver and/or expense reimbursement or (ii) the expense limitation in effect at the time of recoupment. This agreement will remain in place until April 30, 2021 and may be terminated at any time by the Board of Trustees on behalf of the Fund on 60 days’ written notice to Matthews. Matthews may decline to renew this agreement by written notice to the Trust at least 30 days before its annual expiration date. |
Institutional Class Performance and Expenses (June 30, 2020)
| | | | | | | | | | | | | | | | | | | | | | | | | | | | |
| Institutional Class | | | | | Average Annual Total Return† | | | Inception
Date | | | Prospectus
Expense
Ratios* | | | Prospectus
Expense Ratios
after Fee Waiver
and Expense
Reimbursement* | |
| | 1 year | | | 5 years | | | 10 years | | | Since
Inception | |
GLOBAL EMERGING MARKETS STRATEGY | | | | | | | | | | | | | | | | | | | | | | | | | | | | |
| | | | | | | |
Emerging Markets Equity Fund (MIEFX) | | | n.a. | | | | n.a. | | | | n.a. | | | | 16.70% | | | | 4/30/20 | | | | 2.57% | | | | 0.90% | 1 |
ASIA FIXED INCOME STRATEGIES | | | | | | | | | | | | | | | | | | | | | | | | | | | | |
| | | | | | | |
Asia Total Return Bond Fund (MINCX)** | | | 0.51% | | | | 4.51% | | | | n.a. | | | | 4.44% | | | | 11/30/11 | | | | 0.97% | | | | 0.90% | 1 |
| | | | | | | |
Asia Credit Opportunities Fund (MICPX) | | | -1.09% | | | | n.a. | | | | n.a. | | | | 4.37% | | | | 4/29/16 | | | | 1.07% | | | | 0.90% | 1 |
ASIA GROWTH AND INCOME STRATEGIES | | | | | | | | | | | | | | | | | | | | | | | | | | | | |
| | | | | | | |
Asian Growth and Income Fund (MICSX) | | | -3.17% | | | | 2.22% | | | | n.a. | | | | 3.60% | | | | 10/29/10 | | | | 0.94% | | | | 0.94% | |
| | | | | | | |
Asia Dividend Fund (MIPIX) | | | 2.48% | | | | 4.21% | | | | n.a. | | | | 5.89% | | | | 10/29/10 | | | | 0.93% | | | | 0.92% | 2 |
| | | | | | | |
China Dividend Fund (MICDX) | | | 3.72% | | | | 7.12% | | | | n.a. | | | | 8.85% | | | | 10/29/10 | | | | 1.01% | | | | 1.01% | |
ASIA VALUE STRATEGY | | | | | | | | | | | | | | | | | | | | | | | | | | | | |
| | | | | | | |
Asia Value Fund (MAVAX) | | | -3.21% | | | | n.a. | | | | n.a. | | | | 6.65% | | | | 11/30/15 | | | | 1.74% | | | | 1.20% | 3 |
ASIA GROWTH STRATEGIES | | | | | | | | | | | | | | | | | | | | | | | | | | | | |
| | | | | | | |
Asia Growth Fund (MIAPX) | | | 18.29% | | | | 9.23% | | | | n.a. | | | | 7.92% | | | | 10/29/10 | | | | 0.94% | | | | 0.94% | |
| | | | | | | |
Pacific Tiger Fund (MIPTX) | | | -1.88% | | | | 3.82% | | | | n.a. | | | | 5.26% | | | | 10/29/10 | | | | 0.93% | | | | 0.91% | 2 |
| | | | | | | |
Asia ESG Fund (MISFX) | | | 3.48% | | | | 5.15% | | | | n.a. | | | | 4.65% | | | | 4/30/15 | | | | 1.41% | | | | 1.20% | 3 |
| | | | | | | |
Emerging Asia Fund (MIASX) | | | -24.39% | | | | -3.12% | | | | n.a. | | | | -0.03% | | | | 4/30/13 | | | | 1.51% | | | | 1.20% | 3 |
| | | | | | | |
Asia Innovators Fund (MITEX) | | | 38.36% | | | | 12.53% | | | | n.a. | | | | 14.80% | | | | 4/30/13 | | | | 1.05% | | | | 1.05% | |
| | | | | | | |
China Fund (MICFX) | | | 23.83% | | | | 9.40% | | | | n.a. | | | | 5.66% | | | | 10/29/10 | | | | 0.91% | | | | 0.91% | |
| | | | | | | |
India Fund (MIDNX) | | | -21.76% | | | | -1.62% | | | | n.a. | | | | 2.31% | | | | 10/29/10 | | | | 0.94% | | | | 0.94% | |
| | | | | | | |
Japan Fund (MIJFX) | | | 10.92% | | | | 5.94% | | | | n.a. | | | | 9.38% | | | | 10/29/10 | | | | 0.88% | | | | 0.88% | |
| | | | | | | |
Korea Fund (MIKOX) | | | 0.19% | | | | 0.81% | | | | n.a. | | | | 5.45% | | | | 10/29/10 | | | | 1.05% | | | | 1.05% | |
ASIA SMALL COMPANY STRATEGIES | | | | | | | | | | | | | | | | | | | | | | | | | | | | |
| | | | | | | |
Asia Small Companies Fund (MISMX) | | | 14.99% | | | | 3.33% | | | | n.a. | | | | 4.77% | | | | 4/30/13 | | | | 1.46% | | | | 1.20% | 3 |
| | | | | | | |
China Small Companies Fund (MICHX) | | | 79.99% | | | | n.a. | | | | n.a. | | | | 27.58% | | | | 11/30/17 | | | | 1.51% | | | | 1.20% | 3 |
| † | Annualized performance for periods of at least one year, otherwise cumulative. |
| * | These figures are from the Funds’ prospectus dated as of April 29, 2020, and may differ from the actual expense ratios for fiscal year 2020, as shown in the financial highlights section of this report. |
| ** | The Fund’s name changed from Matthews Asia Strategic Income Fund to Matthews Asia Total Return Bond Fund on January 31, 2020. |
| 1 | Matthews has contractually agreed to waive fees and reimburse expenses to the extent needed to limit Total Annual Fund Operating Expenses (excluding Rule 12b-1 fees, taxes, interest, brokerage commissions, short sale dividend expenses, expenses incurred in connection with any merger or reorganization or extraordinary expenses such as litigation) of the Institutional Class to 0.90%. Pursuant to this agreement, any amount waived for prior fiscal years with respect to the Matthews Asia Total Return Bond Fund and the Matthews Asia Credit Opportunities Fund is not subject to recoupment. For the Matthews Emerging Markets Equity Fund, if the operating expenses fall below the expense limitation in a year within three years after Matthews has made a waiver or reimbursement, the Fund may reimburse Matthews up to an amount that does not cause the expenses for that year to exceed the lesser of (i) the expense limitation applicable at the time of that fee waiver and/or expense reimbursement or (ii) the expense limitation in effect at the time of recoupment. This agreement will remain in place until April 30, 2021 and may be terminated at any time by the Board of Trustees on behalf of the Fund on 60 days’ written notice to Matthews. Matthews may decline to renew this agreement by written notice to the Trust at least 30 days before its annual expiration date. |
| 2 | Matthews has contractually agreed to waive a portion of its advisory fee and administrative and shareholder services fee if the Fund’s average daily net assets are over $3 billion, as follows: for every $2.5 billion average daily net assets of the Fund that are over $3 billion, the advisory fee rate and the administrative and shareholder services fee rate for the Fund with respect to such excess average daily net assets will be each reduced by 0.01%, in each case without reducing such fee rate below 0.00%. Any amount waived by Matthews pursuant to this agreement may not be recouped by Matthews. This agreement will remain in place until April 30, 2021 and may be terminated (i) at any time by the Board of Trustees upon 60 days’ prior written notice to Matthews; or (ii) by Matthews at the annual expiration date of the agreement upon 60 days’ prior written notice to the Trust, in each case without payment of any penalty. |
| 3 | Matthews has contractually agreed to waive fees and reimburse expenses to the extent needed to limit Total Annual Fund Operating Expenses (excluding Rule 12b-1 fees, taxes, interest, brokerage commissions, short sale dividend expenses, expenses incurred in connection with any merger or reorganization or extraordinary expenses such as litigation) of the Institutional Class to 1.20%. If the operating expenses fall below the expense limitation in a year within three years after Matthews has made a waiver or reimbursement, the Fund may reimburse Matthews up to an amount that does not cause the expenses for that year to exceed the lesser of (i) the expense limitation applicable at the time of that fee waiver and/or expense reimbursement or (ii) the expense limitation in effect at the time of recoupment. This agreement will remain in place until April 30, 2021 and may be terminated at any time by the Board of Trustees on behalf of the Fund on 60 days’ written notice to Matthews. Matthews may decline to renew this agreement by written notice to the Trust at least 30 days before its annual expiration date. |
Past Performance: All performance quoted in this report is past performance and is no guarantee of future results. Investment return and principal value will fluctuate with changing market conditions so that when redeemed, shares may be worth more or less than their original cost. Current performance may be lower or higher than the returns quoted. If certain of the Funds’ fees and expenses had not been waived, returns would have been lower. For the Funds’ most recent month-end performance, please call 800.789.ASIA (2742) or visit matthewsasia.com.
| | | | |
| matthewsasia.com | 800.789.ASIA | | | | |

Cover photo: Asian Palace
This report has been prepared for Matthews International Funds (d/b/a Matthews Asia Funds) shareholders. It is not authorized for distribution to prospective investors unless accompanied or preceded by a current Matthews Asia Funds prospectus, which contains more complete information about the Funds’ investment objectives, risks and expenses. Additional copies of the prospectus or summary prospectus may be obtained at matthewsasia.com. Please read the prospectus carefully before you invest or send money.
The views and opinions in this report were current as of June 30, 2020. They are not guarantees of performance or investment results and should not be taken as investment advice. Investment decisions reflect a variety of factors, and the managers reserve the right to change their views about individual stocks, sectors and the markets at any time. As a result, the views expressed should not be relied upon as a forecast of a Fund’s future investment intent. Current and future portfolio holdings are subject to risk.
Statements of fact are from sources considered reliable, but neither the Funds nor the Investment Advisor makes any representation or guarantee as to their completeness or accuracy.
Contents
*The Fund’s name changed from Matthews Asia Strategic Income Fund to Matthews Asia Total Return Bond Fund on January 31, 2020.
Investment Risk: Mutual fund shares are not deposits or obligations of, or guaranteed by, any depositary institution. Shares are not insured by the FDIC, Federal Reserve Board or any government agency and are subject to investment risks, including possible loss of principal amount invested. Investing in international and emerging markets may involve additional risks, such as social and political instability, market illiquidity, exchange-rate fluctuations, a high level of volatility and limited regulation. Fixed income investments are subject to additional risks, including, but not limited to, interest rate, credit and inflation risks. In addition, single-country and sector funds may be subject to a higher degree of market risk than diversified funds because of a concentration in a specific industry, sector or geographic location. Investing in small and mid-size companies is more risky than investing in large companies as they may be more volatile and less liquid than larger companies. Please see the Funds’ Prospectuses and Statement of Additional Information for more risk disclosure.
Message to Shareholders from the
Investment Advisor
Dear Valued Investors,
I feel like saying something like “It’s a funny old world.” That’s the kind of cliché that the editors normally strike out of the first draft. But not this time. For the developments in the fight against COVID-19, the increased tensions between the U.S. and China and the performance of the markets appear to be completely out of step. It is, after all, a funny old world.
The virus seems to be spiking again—the hopes that warm weather would slow its progress appear to be unfounded. The rhetoric between the Trump administration and China has picked up—“The China virus” is a common catchphrase. Changes in visa processing in the U.S. and potentially more stringent moves on both the movement of people and goods, as well as measures that may harm Hong Kong’s special treatment by the U.S. would all seem to argue for caution. And yet the markets have been climbing ever higher—for Asia ex Japan, we are very close to the high point for the year. It has also been gratifying to see the performance of many of the Matthews Asia portfolios outperforming their benchmarks and even in positive territory for the year. The portfolio managers and analysts have been able to keep in close contact with holdings as well as keep up the steady flow of new ideas to which we are accustomed during more normal times.
However, it is undeniably strange to me that markets should have reacted this strongly. Clearly investors believe that governments have done enough to battle the virus and to support the economies for the moment. They also appear to believe that governments stand prepared and able to deliver the necessary economic medicine for a long-term recovery. I can understand this kind of optimism when it comes to the Chinese market—where China’s authorities have the will to close down the economy and its citizens will cooperate with a strict enforcement. The mildness of the second wave also gives some hope; earnings reports and economic data suggest China is functioning quite like normal.
In the U.S., I am less sure of the response to the virus—the second wave seems more acute. And I am troubled by some of the Trump administration’s moves on trade and visas. Although one can concoct short-term arguments for protectionism at times like this, my suspicion is the moves are meant to be for the foreseeable future. However, the Federal Reserve has shown itself capable and willing to do what is necessary not only for the U.S. economy but also for the global financial system. In that sense they are worthy of the market’s optimism. Europe, on the other hand, may be most at odds with the market’s optimism about recovery and the authorities’ willingness and ability to stimulate economies and support business. For the initial European stimulus has been small relative to other parts of the world and the European Central Bank (ECB) has not been as successful as other central banks in creating accelerated growth in monetary aggregates.
Should we worry too much about Europe? In one sense, no. Our portfolios are built around the growth in Asia’s domestic demand and other emerging economies. On the other hand, Europe is a significant part of the world economy, and how successful it is in reflating will have an impact on the world and the attractiveness of various markets. My main concern is that if the U.S. is able to successfully support its own economy while Europe continues to be weak, this may raise U.S. yields relative to Europe. The U.S. long bond would re-emerge as an attractive investment for Europeans trying to shelter from domestic weakness. In so doing, they are likely to prevent the dollar from weakening and may even push it higher—something that is likely to be a headwind for Asia stock markets and particularly for the non-Asia parts of the emerging market asset class. In such an atmosphere, it is likely to be the economies of North Asia, with their
significant current account surpluses that are best placed to perform. However, there is one aspect where Europe does seem increasingly better placed than the U.S.: Europe still seems (for the moment) to be reaching out to Asia, both central and eastern Asia, in terms of building trade routes. This is all part of China’s One Belt One Road initiative, of course, which will have the added benefit of some potential infrastructure and stimulus spending in Europe. In this sense, Europe seems committed to the ideas of global economic cooperation that the U.S. finds so troubling.
It is in this relationship that I see the best prospects for the continued growth in world trade. It would be a realignment of diplomatic influence away from the U.S. and towards China. A world split between two poles. In this scenario, China’s attempts to build trust in its capital markets, and its bond markets in particular, start to play a very significant role. Are we moving to a stage where China enjoys perpetual current account deficits financed by foreign purchases of its government bonds and the increased internationalization of its currency? That seems an increasingly likely scenario and one that is likely to raise the profile of Chinese assets in the minds of international asset allocators. Just as China increases its significance in the global economy and global politics, so, too it is increasing its significance in global benchmarks. But there is one caveat—the Chinese have made some missteps. The new security law in Hong Kong raises questions about their ability to manage an international financial center and creates mistrust between China and Europe and may yet get in the way of improved economic relations. Certainly, there have been increased signs of nervousness towards China in parts of core Europe.
At Matthews Asia, we stand in the middle of this, trying to monitor the developments that seem to be occurring on a daily basis. Yet, we remain mindful of the longer-term trends and committed to helping our shareholders protect and grow their investments in countries that seemed destined to still have the fastest-growing economies and growing domestic markets that will be the breeding ground for their own corporate champions. Ultimately, it is those businesses that we try to identify and to hold for many years.

Robert Horrocks, PhD
Chief Investment Officer
Matthews International Capital Management, LLC
| | | | |
| matthewsasia.com | 800.789.ASIA | | | 5 | |

| | | | |
| PORTFOLIO MANAGERS* |
| |
| John Paul Lech | | |
Lead Manager | | |
* As of August 31, 2020 | | |
|
| FUND FACTS |
| | |
| | | Investor | | Institutional |
Ticker | | MEGMX | | MIEFX |
CUSIP | | 577130651 | | 577130644 |
Inception | | 4/30/20 | | 4/30/20 |
NAV | | $11.67 | | $11.67 |
Initial Investment | | $2,500 | | $100,000 |
Gross Expense Ratio1 | | 2.77% | | 2.57% |
After fee waiver and Reimbursement2 | | 1.15% | | 0.90% |
Portfolio Statistics |
Total # of Positions | | | | 53 |
Net Assets | | | | $9.2 million |
Weighted Average Market Cap | | $125.8 billion |
Portfolio Turnover3 | | | | N/A |
Benchmark | | |
MSCI Emerging Markets Index |
OBJECTIVE
Long-term capital appreciation.
STRATEGY
Under normal circumstances, the Matthews Emerging Markets Equity Fund seeks to achieve its investment objective by investing at least 80% of its net assets, which include borrowings for investment purposes, in the common and preferred stocks of companies located in emerging market countries. Emerging market countries generally include every country in the world except the United States, Australia, Canada, Hong Kong, Israel, Japan, New Zealand, Singapore and most of the countries in Western Europe. Certain emerging market countries may also be classified as “frontier” market countries, which are a subset of emerging market countries with newer or even less developed economies and markets, such as Sri Lanka and Vietnam. The list of emerging market countries and frontier market countries may change from time to time. The Fund may also invest in companies located in developed countries; however, the Fund may not invest in any company located in a developed country if, at the time of purchase, more than 20% of the Fund’s assets are invested in developed market companies.
Matthews Emerging Markets Equity Fund
Portfolio Manager Commentary (unaudited)
The Matthews Emerging Markets Equity Fund was launched on April 30, 2020. Since inception, the Fund returned 16.70% (Investor Class) and 16.70% (Institutional Class), while its benchmark, the MSCI Emerging Markets Index, returned 8.25% over the same period. This is the first commentary for the Matthews Emerging Markets Equity Fund.
Market Environment:
The first half of 2020 has been like no other. The expansion of the COVID-19 around the world led to a dramatic selloff across most asset classes in March and a dash into USD cash. Market volatility exceeded the levels seen during the 2008 Global Financial Crisis. Emerging markets were no different as many currencies, country indices and individual company stock prices moved up over the course of the second quarter. As investors gained confidence that the plumbing would not break, the selloff abated and markets began to recover from their March lows. Within emerging markets, the first part of the year saw very strong relative performance from China, but the rebound since the bottom has been led by other markets that were particularly hard hit. While volatility—as measured by the Chicago Board Options Exchange’s CBOE Volatility Index—has come down, we remain quite cautious as asset prices remain high and the duration and economic damage of the pandemic remain hard to dimension.
Year-to-date, the Shanghai Composite Index led most major emerging market country indices, followed by Taiwan. While the aforementioned were slightly negative year-to-date, the return was roughly in line with the S&P 500 Index. Russia, Mexico, Brazil, India and much of Southeast Asia remain down more than 10% in U.S. dollar terms year-to-date.
Market dislocations allowed us to invest in high conviction companies at what we believe are compelling valuations as we built the portfolio. We believe constructing an emerging markets portfolio designed for sustainable growth requires identifying companies that have higher growth metrics, as well as higher quality metrics, than the broader market. Good companies worldwide share common traits. They require a strong competitive position and the ability to allocate capital well. We tend to focus on companies that can serve the needs of domestic consumer within their markets, although we may invest in commodities and companies that serve a global marketplace. We also tend to look for companies that can withstand economic cycles. In addition, the Fund’s portfolio management team takes an all-cap approach, believing that smaller cap companies may offer attractive potential for generating alpha.
Contributors and Detractors:
The Fund outperformed its benchmark since its inception on April 30, 2020 through June 30, 2020 driven by strong stock selection. During the reporting period, our largest positive attribution came from China/HK, followed by Brazil and Russia.
From a sector standpoint, consumer staples and discretionary sectors were contributors to absolute performance but slight detractors from relative performance.
(continued)
| 1 | Prospectus expense ratios. |
| 2 | Matthews has contractually agreed (i) to waive fees and reimburse expenses to the extent needed to limit Total Annual Fund Operating Expenses (excluding Rule 12b-1 fees, taxes, interest, brokerage commissions, short sale dividend expenses, expenses incurred in connection with any merger or reorganization or extraordinary expenses such as litigation) of the Institutional Class to 0.90% first by waiving class specific expenses (i.e., shareholder service fees specific to a particular class) of the Institutional Class and then, to the extent necessary, by waiving non-class specific expenses (e.g., custody fees) of the Institutional Class, and (ii) if any Fund-wide expenses (i.e., expenses that apply to both the Institutional Class and the Investor Class) are waived for the Institutional Class to maintain the 0.90% expense limitation, to waive an equal amount (in annual percentage terms) of those same expenses for the Investor Class. The Total Annual Fund Operating Expenses After Fee Waiver and Expense Reimbursement for the Investor Class may vary from year to year and will in some years exceed 0.90%. If the operating expenses fall below the expense limitation in a year within three years after Matthews has made a waiver or reimbursement, the Fund may reimburse Matthews up to an amount that does not cause the expenses for that year to exceed the lesser of (i) the expense limitation applicable at the time of that fee waiver and/or expense reimbursement or (ii) the expense limitation in effect at the time of recoupment. This agreement will remain in place until April 30, 2021 and may be terminated at any time by the Board of Trustees on behalf of the Fund on 60 days’ written notice to Matthews. Matthews may decline to renew this agreement by written notice to the Trust at least 30 days before its annual expiration date. |
| 3 | The Fund commenced operations on April 30, 2020. |
| | | | | | | | |
| | | |
| PERFORMANCE AS OF JUNE 30, 2020 | | | | | | |
| | | Actual Return, Not Annualized | |
| | | Since
Inception | | | Inception
Date | |
| Investor Class (MEGMX) | | | 16.70% | | | | 4/30/20 | |
| Institutional Class (MIEFX) | | | 16.70% | | | | 4/30/20 | |
| MSCI Emerging Markets Index4 | | | 8.25% | | | | | |
| | 4 | It is not possible to invest directly in an index. Source: Index data from Morgan Stanley Capital International and Bloomberg; total return calculations performed by BNY Mellon Investment Servicing (US) Inc. Please see page 90 for index definition. |
| | | | | | | | |
| | | | |
| TOP TEN HOLDINGS5 | | | | | | | |
| | | Sector | | Country | | % of Net Assets | |
| Alibaba Group Holding, Ltd. | | Consumer Discretionary | | China/Hong Kong | | | 6.8% | |
| Taiwan Semiconductor Manufacturing Co., Ltd. | | Information Technology | | Taiwan | | | 4.6% | |
| Tencent Holdings, Ltd. | | Communication Services | | China/Hong Kong | | | 4.3% | |
| Samsung Electronics Co., Ltd., Pfd. | | Information Technology | | South Korea | | | 3.6% | |
| AIA Group, Ltd. | | Financials | | China/Hong Kong | | | 3.3% | |
| Wuxi Biologics Cayman, Inc. | | Health Care | | China/Hong Kong | | | 2.2% | |
| LVMH Moet Hennessy Louis Vuitton SE | | Consumer Discretionary | | France | | | 2.2% | |
| NAVER Corp. | | Communication Services | | South Korea | | | 2.2% | |
| Kotak Mahindra Bank, Ltd. | | Financials | | India | | | 2.2% | |
| Banco BTG Pactual SA | | Financials | | Brazil | | | 2.2% | |
| Total | | | | | | | 33.6% | |
| | 5 | Holdings may combine more than one security from same issuer and related depositary receipts. |
| | | | |
| matthewsasia.com | 800.789.ASIA | | | 7 | |
| | | | |
| |
| COUNTRY ALLOCATION (%)6,7 | |
| China/Hong Kong | | | 32.2 | |
| South Korea | | | 9.9 | |
| India | | | 7.7 | |
| Brazil | | | 7.1 | |
| Russia | | | 7.0 | |
| Taiwan | | | 5.9 | |
| Mexico | | | 3.9 | |
| France | | | 3.8 | |
| Singapore | | | 3.1 | |
| Philippines | | | 3.0 | |
| Poland | | | 2.0 | |
| United Kingdom | | | 1.7 | |
| Indonesia | | | 1.6 | |
| Argentina | | | 1.6 | |
| United States | | | 1.3 | |
| Canada | | | 1.1 | |
| Vietnam | | | 1.0 | |
| | | | |
| |
| SECTOR ALLOCATION (%)7 | |
| Information Technology | | | 17.5 | |
| Consumer Discretionary | | | 15.0 | |
| Financials | | | 13.9 | |
| Communication Services | | | 13.5 | |
| Health Care | | | 9.0 | |
| Consumer Staples | | | 8.8 | |
| Energy | | | 5.9 | |
| Materials | | | 3.7 | |
| Real Estate | | | 3.4 | |
| Industrials | | | 3.2 | |
| Cash and Other Assets, Less Lliabilities | | | 6.1 | |
| Total | | | 100.0 | |
| | | | |
| |
| MARKET CAP EXPOSURE (%)7 | |
| Mega Cap (over $25B) | | | 49.4 | |
| Large Cap ($10B–$25B) | | | 18.6 | |
| Mid Cap ($3B–$10B) | | | 17.7 | |
| Small Cap (under $3B) | | | 8.2 | |
| Cash and Other Assets, Less Lliabilities | | | 6.1 | |
| Total | | | 100.0 | |
| 6 | Not all countries where the Fund may invest are included in the benchmark index. |
| 7 | Source: FactSet Research Systems. Percentage values in data are rounded to the nearest tenth of one percent, so the values may not sum to 100% due to rounding. Percentage values may be derived from different data sources and may not be consistent with other Fund literature. |
Matthews Emerging Markets Equity Fund
Portfolio Manager Commentary (unaudited) (continued)
However, this was more than offset by very strong relative attribution in other consumer facing sectors like communication services, where our holdings tend to be concentrated in media and entertainment. The Fund takes a holistic approach to considering consumer behavior and increasingly digitally driven behavior. Companies that do similar things can often be classified differently. Alibaba and Sea Ltd, for example, are both e-commerce companies yet one is classified as consumer discretionary and the other as communication services. We focus less on classifications and more on how and where companies make money. Our holdings are the natural outcome of our bottom-up stock selection process.
Notable Portfolio Changes:
The Fund added to its overweight in software over the reporting period by increasing position sizes in existing holdings and starting a position in Livechat, a Polish software company. Health care has been an increasing focus for the Fund, and we currently maintain seven positions in the sector—three in China/HK, one in South Korea, one in India, one in Brazil and a company listed in the U.S. whose largest market is China. While we are (or have been) cautious in the financials sector, we have increased our exposure during the reporting period.
Outlook:
Media coverage of the ongoing health pandemic of COVID-19 has been intense. Very few people alive have lived through something similar, and the scope of every economy being impacted is without recent precedent. All companies, too, have been impacted. For some, this has been an acceleration of trends that were in place and the pandemic appears to have improved their long term business prospects. For others, the pandemic has decreased line of sight on strategy or end demand. It is far too early to predict with certainty the near-term or long term impacts of a global event like the one we’re all living through.
Experiences both at the company and country level have been highly heterodox. In China, the disease hit before the economic lockdown and we’re seeing some green shoots. In much of emerging markets, the lockdown hit before the disease. Some, like South Korea, appear to have managed the pandemic well. Others, like Brazil, are still seeing increases in cases. Similarly, fiscal budgets and monetary responses have varying amounts of firepower across emerging markets. Many of the EM geographies are quite constrained versus the G3 (U.S., Europe, and Japan) in terms of the fiscal or monetary expansions that they can proffer without detrimental impact to currencies or local market conditions. Political tensions, too, remain elevated. China’s relationship with the U.S. is a focus for many investors, as is China’s engagement with other emerging markets geographies like India.
We do not pretend to have more clarity on such macro events. For the Matthews Emerging Markets Equity Fund, our philosophy starts at the company level and we believe the attributes of great companies are similar across geographies. The heightened uncertainty of the pandemic has accentuated our focus on quality balance sheets and business model. We remain cautious on banks in a world of low rates and loose government balance sheets. History has often shown that the best time to pick up great assets may be in times of great stress. While we are very concerned about the global pandemic and its social and economic impacts, we are optimistic about the long-term prospects of our holdings.
Matthews Emerging Markets Equity Fund
June 30, 2020
Schedule of Investmentsa (unaudited)
COMMON EQUITIES: 90.3%
| | | | | | | | |
| | | Shares | | | Value | |
| | | | | | | | |
| | |
| CHINA/HONG KONG: 32.2% | | | | | | | | |
Alibaba Group Holding, Ltd. ADRb | | | 2,900 | | | | $625,530 | |
| | |
Tencent Holdings, Ltd. | | | 6,200 | | | | 397,283 | |
| | |
AIA Group, Ltd. | | | 32,600 | | | | 305,058 | |
| | |
Wuxi Biologics Cayman, Inc.b,c,d | | | 11,000 | | | | 201,912 | |
| | |
Midea Group Co., Ltd. A Shares | | | 21,400 | | | | 181,421 | |
| | |
Bilibili, Inc. ADRb | | | 3,600 | | | | 166,752 | |
| | |
Wuliangye Yibin Co., Ltd. A Shares | | | 6,100 | | | | 148,284 | |
| | |
Yum China Holdings, Inc. | | | 3,000 | | | | 144,210 | |
| | |
Techtronic Industries Co., Ltd. | | | 13,500 | | | | 133,576 | |
| | |
Ping An Insurance Group Co. of China, Ltd. A Shares | | | 12,800 | | | | 129,612 | |
| | |
Anhui Conch Cement Co., Ltd. A Shares | | | 16,500 | | | | 124,172 | |
| | |
China East Education Holdings, Ltd.c,d | | | 62,500 | | | | 113,613 | |
| | |
Shandong Weigao Group Medical Polymer Co., Ltd. H Shares | | | 44,000 | | | | 98,245 | |
| | |
Lepu Medical Technology Beijing Co., Ltd. A Shares | | | 18,500 | | | | 95,630 | |
| | |
China International Capital Corp., Ltd. H Sharesb,c,d | | | 46,800 | | | | 92,596 | |
| | | | | | | | |
Total China/Hong Kong | | | | | | | 2,957,894 | |
| | | | | | | | |
| | | | | | | | |
| | | |
| INDIA: 7.7% | | | | | | | | |
| | |
Kotak Mahindra Bank, Ltd. | | | 11,004 | | | | 198,622 | |
| | |
Reliance Industries, Ltd. | | | 7,368 | | | | 167,596 | |
| | |
Colgate-Palmolive India, Ltd. | | | 6,830 | | | | 127,407 | |
| | |
HDFC Bank, Ltd. ADR | | | 2,400 | | | | 109,104 | |
| | |
Dr. Reddy’s Laboratories, Ltd. ADR | | | 2,000 | | | | 106,020 | |
| | | | | | | | |
Total India | | | | | | | 708,749 | |
| | | | | | | | |
| | | | | | | | |
| | | |
| BRAZIL: 7.1% | | | | | | | | |
| | |
Banco BTG Pactual SA | | | 11,400 | | | | 160,368 | |
| | |
Pagseguro Digital, Ltd. Class Ab | | | 4,200 | | | | 148,428 | |
| | |
Vale SA ADR | | | 11,200 | | | | 115,472 | |
| | |
Hapvida Participacoes e Investimentos SAc,d | | | 8,500 | | | | 98,316 | |
| | |
Raia Drogasil SA | | | 4,600 | | | | 94,451 | |
| | |
Banco BTG Pactual SAb | | | 2,700 | | | | 37,982 | |
| | | | | | | | |
Total Brazil | | | | | | | 655,017 | |
| | | | | | | | |
| | | | | | | | |
| | | |
| RUSSIA: 7.0% | | | | | | | | |
| | |
LUKOIL PJSC ADR | | | 2,556 | | | | 189,998 | |
| | |
Novatek PJSC GDRd | | | 1,310 | | | | 185,683 | |
| | |
Yandex N.V. Class Ab | | | 3,100 | | | | 155,062 | |
| | |
Mail.Ru Group, Ltd. GDRb,d | | | 5,058 | | | | 114,091 | |
| | | | | | | | |
Total Russia | | | | | | | 644,834 | |
| | | | | | | | |
| | | | | | | | |
| | | |
| SOUTH KOREA: 6.2% | | | | | | | | |
| | |
NAVER Corp. | | | 888 | | | | 199,785 | |
| | |
LG Household & Health Care, Ltd. | | | 150 | | | | 168,122 | |
| | |
Hugel, Inc.b | | | 271 | | | | 106,668 | |
| | |
Macquarie Korea Infrastructure Fund | | | 10,283 | | | | 97,774 | |
| | | | | | | | |
Total South Korea | | | | | | | 572,349 | |
| | | | | | | | |
| | | | | | | | |
| | | |
| TAIWAN: 5.9% | | | | | | | | |
| | |
Taiwan Semiconductor Manufacturing Co., Ltd. ADR | | | 7,400 | | | | 420,098 | |
| | |
Advantech Co., Ltd. | | | 12,000 | | | | 120,765 | |
| | | | | | | | |
Total Taiwan | | | | | | | 540,863 | |
| | | | | | | | |
| | | | | | | | |
| | | | | | | | |
| | | Shares | | | Value | |
| | | | | | | | |
| | |
| MEXICO: 3.9% | | | | | | | | |
| | |
Prologis Property Mexico SA de CV, REIT | | | 77,300 | | | | $138,259 | |
| | |
Fomento Economico Mexicano SAB de CV ADR | | | 1,900 | | | | 117,819 | |
| | |
America Movil SAB de CV ADR | | | 7,900 | | | | 100,251 | |
| | | | | | | | |
Total Mexico | | | | | | | 356,329 | |
| | | | | | | | |
| | | | | | | | |
| | | |
| FRANCE: 3.8% | | | | | | | | |
| | |
LVMH Moet Hennessy Louis Vuitton SE | | | 455 | | | | 200,880 | |
| | |
Pernod Ricard SA | | | 956 | | | | 150,537 | |
| | | | | | | | |
Total France | | | | | | | 351,417 | |
| | | | | | | | |
| | | | | | | | |
| | | |
| SINGAPORE: 3.1% | | | | | | | | |
| | |
CapitaLand, Ltd.b | | | 82,300 | | | | 173,871 | |
| | |
Sea, Ltd. ADRb | | | 1,000 | | | | 107,240 | |
| | | | | | | | |
Total Singapore | | | | | | | 281,111 | |
| | | | | | | | |
| | | | | | | | |
| | | |
| PHILIPPINES: 3.0% | | | | | | | | |
| | |
Ayala Corp. | | | 10,070 | | | | 158,064 | |
| | |
Wilcon Depot, Inc. | | | 373,600 | | | | 116,083 | |
| | | | | | | | |
Total Philippines | | | | | | | 274,147 | |
| | | | | | | | |
| | | | | | | | |
| | | |
| POLAND: 2.0% | | | | | | | | |
| | |
LiveChat Software SA | | | 11,545 | | | | 186,318 | |
| | | | | | | | |
Total Poland | | | | | | | 186,318 | |
| | | | | | | | |
| | | | | | | | |
| | | |
| UNITED KINGDOM: 1.8% | | | | | | | | |
| | |
Avast PLCc,d | | | 24,354 | | | | 159,174 | |
| | | | | | | | |
Total United Kingdom | | | | | | | 159,174 | |
| | | | | | | | |
| | | | | | | | |
| | | |
| ARGENTINA: 1.6% | | | | | | | | |
| | |
Globant SAb | | | 1,000 | | | | 149,850 | |
| | | | | | | | |
Total Argentina | | | | | | | 149,850 | |
| | | | | | | | |
| | | | | | | | |
| | | |
| INDONESIA: 1.6% | | | | | | | | |
| | |
PT Bank Rakyat Indonesia Persero | | | 690,600 | | | | 147,404 | |
| | | | | | | | |
Total Indonesia | | | | | | | 147,404 | |
| | | | | | | | |
| | | | | | | | |
| | | |
| UNITED STATES: 1.3% | | | | | | | | |
| | |
STAAR Surgical Co.b | | | 1,900 | | | | 116,926 | |
| | | | | | | | |
Total United States | | | | | | | 116,926 | |
| | | | | | | | |
| | | | | | | | |
| | | |
| ZAMBIA: 1.1% | | | | | | | | |
| | |
First Quantum Minerals, Ltd. | | | 12,500 | | | | 99,624 | |
| | | | | | | | |
Total Zambia | | | | | | | 99,624 | |
| | | | | | | | |
| | | | | | | | |
| | | |
| VIETNAM: 1.0% | | | | | | | | |
| | |
FPT Corp. | | | 46,044 | | | | 91,213 | |
| | | | | | | | |
Total Vietnam | | | | | | | 91,213 | |
| | | | | | | | |
| | | | | | | | |
| | | |
| TOTAL COMMON EQUITIES | | | | | | | 8,293,219 | |
| | | | | | | | |
(Cost $7,327,711) | | | | | | | | |
| | | | |
| matthewsasia.com | 800.789.ASIA | | | 9 | |
Matthews Emerging Markets Equity Fund
June 30, 2020
Schedule of Investmentsa (unaudited) (continued)
PREFERRED EQUITIES: 3.6%
| | | | | | | | |
| | | Shares | | | Value | |
| | | | | | | | |
| |
| SOUTH KOREA: 3.6% | | | | | |
Samsung Electronics Co., Ltd., Pfd. | | | 8,594 | | | | $334,773 | |
| | | | | | | | |
Total South Korea | | | | 334,773 | |
| | | | | | | | |
| | | | | | | | |
| | |
| TOTAL PREFERRED EQUITIES | | | | 334,773 | |
| | | | | | | | |
(Cost $306,070) | | | | | |
| | | | | | | | |
| | |
| TOTAL INVESTMENTS: 93.9% | | | | 8,627,992 | |
(Cost $7,633,781) | | | | | |
| | | | | | | | |
| |
CASH AND OTHER ASSETS,
LESS LIABILITIES: 6.1% | | | | 556,390 | |
| | | | | | | | |
| |
NET ASSETS: 100.0% | | | | $9,184,382 | |
| | | | | | | | |
| a | Certain securities were fair valued under the valuation policies approved by the Board of Trustees (Note 2-A). |
| b | Non-income producing security. |
| c | Security exempt from registration under Rule 144A of the Securities Act of 1933, as amended. The security may be resold in transactions exempt from registration normally to qualified institutional buyers. The security has been determined to be liquid in accordance with procedures adopted by the Funds’ Board of Trustees. At June 30, 2020, the aggregate value is $665,611, which is 7.25% of net assets. |
| d | The securities may be resold to qualified foreign investors and foreign institutional buyers under Regulation S of the Securities Act of 1933. |
| ADR | American Depositary Receipt |
| GDR | Global Depositary Receipt |
| REIT | Real Estate Investment Trust |
See accompanying notes to financial statements.

| | | | |
| PORTFOLIO MANAGERS |
| |
| Teresa Kong, CFA | | |
Lead Manager | | |
| |
| Satya Patel | | Wei Zhang |
Co-Manager | | Co-Manager |
|
| FUND FACTS |
| | |
| | | Investor | | Institutional |
Ticker | | MAINX | | MINCX |
CUSIP | | 577125503 | | 577125602 |
Inception | | 11/30/11 | | 11/30/11 |
NAV | | $10.54 | | $10.54 |
Initial Investment | | $2,500 | | $100,000 |
Gross Expense Ratio1 | | 1.08% | | 0.97% |
After Fee Waiver and Reimbursement2 | | 1.07% | | 0.90% |
Portfolio Statistics | | | | |
Total # of Positions | | 41 | | |
Net Assets | | $102.1
million | |
|
Modified Duration3 | | 5.0 | | |
Portfolio Turnover4 | | 84.38% | | |
Benchmark | | |
| 50% Markit iBoxx Asian Local Bond Index, 50% J.P. Morgan Asia Credit Index* |
OBJECTIVE
Total return over the long term with an emphasis on income.
STRATEGY
Under normal market conditions, the Fund seeks to achieve its investment objective by investing at least 80% of its net assets, which include borrowings for investment purposes, in debt and debt-related instruments issued by governments, quasi-governmental entities, supra-national institutions, and companies in Asia. Asia consists of all countries and markets in Asia, such as China and India, and includes developed, emerging, and frontier countries and markets in the Asian region. The Fund’s investments in debt securities may be denominated in any currency, may be of any quality or may be unrated, and may have no stated maturity or duration target.
Matthews Asia Total Return Bond Fund†
Portfolio Manager Commentary (unaudited)
For the first half of 2020, the Matthews Asia Total Return Bond Fund returned –3.65% (Investor Class) and –3.55% (Institutional Class) while its benchmark, the 50% Markit iBoxx Asian Local Bond Index/50% J.P. Morgan Asia Credit Index (JACI), returned 1.87%. For the quarter ending June 30, 2020, the Fund returned 10.32% (Investor Class) and 10.39% (Institutional Class) compared to the benchmark return of 5.75%.
Market Environment:
Just as the recovery from Covid-19 has been uneven globally, the recovery in markets has also been uneven. For some asset classes, it’s as if the virus never happened, posting positive gains for the year. These are generally the less risky parts of the market, such as developed market government bonds, investment grade corporates and gold. The riskier parts of the market have also rebounded from March lows but given the lingering uncertainty to economic activity and corporate fundamentals due to the coronavirus, these markets still faced losses year to date.
For Asia fixed income, this means that investment-grade corporates and rates performed the best in the first half of the year, followed by high yield. Within credit, issuers from more developed countries such as China have outperformed issuers from emerging countries such as Indonesia and India. Within Asian currencies, the most punished in the first quarter rebounded the most in the second quarter, including the Indonesian rupiah and the Thai baht.
Global central banks continue to provide ample liquidity, which we believe undergirds a lot of the markets’ return to normalcy. The U.S. Federal Reserve continues to signal it will do “whatever it takes” to remain accommodative and to support the smooth functioning of financial markets. Meanwhile, the European Central Bank increased the size of its bond buying program by 600 billion euros in June. Many Asian countries are also in the enviable position of having ample fiscal flexibility to boost spending. For instance, Thailand and Singapore have already started disbursing fiscal stimulus packages.
We also see increased experimentation with support from emerging markets central banks. For instance, the Indonesian central bank has announced a program to buy government bonds in both the primary and secondary markets. For now, it looks like the Indonesian central bank’s goal is to act as a buyer of last resort and cap government bond yields, rather than monetizing the debt. As such, this alleviates pressure on the government without debasing the currency. However, we are watching carefully as emerging market countries tread the narrow path between fiscal prudence to provide the needed social support for a health crisis and fiscal largess that could lead to a financial crisis.
Performance Contributors and Detractors:
A key driver of positive performance was the Fund’s exposure to U.S. dollar high yield issuers, which recouped much of their first quarter losses. In general, lower-rated bonds outperformed higher-rated bonds. The top contributors were our positions in Chinese property developer Dalian Wanda, Tata Steel, a top three global steel producer, and Bharti Airtel, one the three largest wireless companies in India. These large blue chip companies recovered most quickly as their probability of survival, even in a protracted economic downturn, is materially higher than their peers. Top detractors were Modernland Reality, Franshion Brilliant and Sino-Ocean. As a real estate developer in Indonesia, Modernland faced both a revenue shortfall as well as potential liquidity issues due to the economic lockdown in response to Covid-19. Both Franshion Brilliant and Sino-Ocean are fundamentally sound, with their long-dated perpetual bonds slower to recover than their shorter dated ones.
(continued)
| † | The Fund’s name changed from Matthews Asia Strategic Income Fund to Matthews Asia Total Return Bond Fund on January 31, 2020. |
| * | Effective January 31, 2020, the Fund changed its benchmark to a blended benchmark comprised of 50% Markit iBoxx Asian Local Bond Index and 50% J.P. Morgan Asia Credit Index. Prior to January 31, 2020, the Fund’s benchmark was the Markit iBoxx Asian Local Bond Index. Matthews believes that the blended benchmark is more appropriate in light of the Fund’s current investment strategy. The Markit iBoxx Local Bond Index performance reflects the returns of the discontinued predecessor HSBC Asia Local Bond Index up to December 31, 2012 and the returns of the successor Markit iBoxx Local Bond Index thereafter. |
| 1 | Prospectus expense ratios. |
| 2 | Matthews has contractually agreed (i) to waive fees and reimburse expenses to the extent needed to limit Total Annual Fund Operating Expenses (excluding Rule 12b-1 fees, taxes, interest, brokerage commissions, short sale dividend expenses, expenses incurred in connection with any merger or reorganization or extraordinary expenses such as litigation) of the Institutional Class to 0.90% first by waiving class specific expenses (i.e., shareholder service fees specific to a particular class) of the Institutional Class and then, to the extent necessary, by waiving non-class specific expenses (e.g. custody fees) of the Institutional Class, and (ii) if any Fund-wide expenses (i.e., expenses that apply to both the Institutional Class and the Investor Class) are waived for the Institutional Class to maintain the 0.90% expense limitation, to waive an equal amount (in annual percentage terms) of those same expenses for the Investor Class. The Total Annual Fund Operating Expenses After Fee Waiver and Expense Reimbursement for the Investor Class may vary from year to year and will in some years exceed 0.90%. Pursuant to this agreement, any amount waived for prior fiscal years with respect to the Fund is not subject to recoupment. This agreement will remain in place until April 30, 2021 and may be terminated at any time by the Board of Trustees on behalf of the Fund on 60 days’ written notice to Matthews. Matthews may decline to renew this agreement by written notice to the Trust at least 30 days before its annual expiration date. |
| 3 | Modified duration measures the percent change in value of the fixed income portion of the portfolio in response to a 1% change in interest rates. In a multi-currency denominated portfolio with sensitivities to different interest rate regimes, modified duration will not accurately reflect the change in value of the overall portfolio from a change in any one interest rate regime. |
| 4 | The lesser of fiscal year 2019 long-term purchase costs or sales proceeds divided by the average monthly market value of long-term securities. |
| | | | |
| matthewsasia.com | 800.789.ASIA | | | 11 | |
| | | | | | | | | | | | | | | | | | | | | | | | | | | | |
| | | | | | | | |
| PERFORMANCE AS OF JUNE 30, 2020 | | | | | | | | | | | | | | | | | | | | | |
| | | | | | | | | Average Annual Total Returns | | | | |
| | | 3 Months | | | YTD | | | 1 Year | | | 3 Years | | | 5 Years | | | Since
Inception | | | Inception
Date | |
| Investor Class (MAINX) | | | 10.32% | | | | -3.65% | | | | 0.45% | | | | 2.64% | | | | 4.26% | | | | 4.22% | | | | 11/30/11 | |
| Institutional Class (MINCX) | | | 10.39% | | | | -3.55% | | | | 0.51% | | | | 2.88% | | | | 4.51% | | | | 4.44% | | | | 11/30/11 | |
| 50% Markit iBoxx Asian Local Bond Index, 50% J.P. Morgan Asia Credit Index5 | | | 5.75% | | | | 1.87% | | | | 5.22% | | | | 4.79% | | | | 4.77% | | | | 4.36% | | | | | |
Performance assumes reinvestment of all dividends and/or distributions before taxes. All performance quoted represents past performance and is no guarantee of future results. Investment return and principal value will fluctuate with market conditions so that when redeemed, shares may be worth more or less than their original cost. Current performance may be lower or higher than the return figures quoted. Returns would have been lower if certain of the Fund’s fees and expenses had not been waived. For the Fund’s most recent month-end performance visit matthewsasia.com.
| | | | | | | | | | | | | | | | | | | | | | | | | | | | | | | | | | | | | | | | | | | | | | | | | | | | | | | | | | | | | | | | | | | | | | | | | | | | |
| |
| INCOME DISTRIBUTION HISTORY | |
| | | 2020 | | | | | | 2019 | |
| | Jan. | | | Feb. | | | Mar. | | | Apr. | | | May | | | June | | | July | | | Aug. | | | Sept. | | | Oct. | | | Nov. | | | Dec. | | | Total | | | | | | Q1 | | | Q2 | | | Q3 | | | Q4 | | | Total | |
| Investor (MAINX) | | | n.a. | | | $ | 0.06 | | | $ | 0.04 | | | $ | 0.00 | | | $ | 0.03 | | | $ | 0.04 | | | | n.a. | | | | n.a. | | | | n.a. | | | | n.a. | | | | n.a. | | | | n.a. | | | $ | 0.17 | | | | | | | $ | 0.08 | | | $ | 0.10 | | | $ | 0.14 | | | $ | 0.12 | | | $ | 0.44 | |
| Inst’l (MINCX) | | | n.a. | | | $ | 0.07 | | | $ | 0.04 | | | $ | 0.01 | | | $ | 0.03 | | | $ | 0.04 | | | | n.a. | | | | n.a. | | | | n.a. | | | | n.a. | | | | n.a. | | | | n.a. | | | $ | 0.19 | | | | | | | $ | 0.09 | | | $ | 0.11 | | | $ | 0.14 | | | $ | 0.12 | | | $ | 0.46 | |
Note: This table does not include capital gains distributions. Totals may differ by $0.02 due to rounding. For income distribution history, visit matthewsasia.com.
| | | | |
| | | |
30-DAY YIELD: Investor Class: 5.65% (5.63% excluding waivers) Institutional Class: 5.89% (5.80% excluding waivers) The 30-Day Yield represents net investment income earned by the Fund over the 30-day period ended 6/30/20, expressed as an annual percentage rate based on the Fund’s share price at the end of the 30-day period. The 30-Day Yield should be regarded as an estimate of the Fund’s rate of investment income, and it may not equal the Fund’s actual income distribution rate. Source: BNY Mellon Investment Servicing (US) Inc. | | | | YIELD TO WORST: 6.24% Yield to worst is the lowest yield that can be received on a bond assuming that the issuer does not default. It is calculated by utilizing the worst case assumptions for a bond with respect to certain income-reducing factors, including prepayment, call or sinking fund provisions. It does not represent the yield that an investor should expect to receive. Past yields are no guarantee of future yields. Source: FactSet Research Systems |
GROWTH OF A HYPOTHETICAL $10,000 INVESTMENT SINCE INCEPTION—INVESTOR CLASS
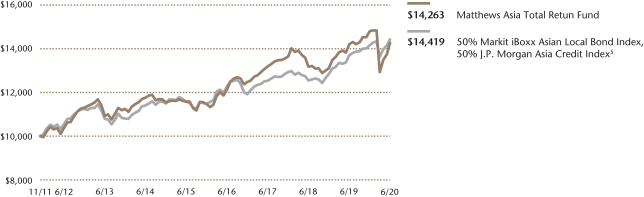
Plotted monthly. The performance data and graph do not reflect the deduction of taxes that a shareholder would pay on dividends, capital gains distributions or redemption of Fund shares. Values are in US$.
| | 5 | It is not possible to invest directly in an index. Source: Index data from HSBC, Markit iBoxx and Bloomberg; total return calculations performed by BNY Mellon Investment Servicing (US) Inc. Please see page 90 for index definitions. Effective January 31, 2020, the Fund changed its benchmark to a blended benchmark comprised of 50% Markit iBoxx Asian Local Bond Index and 50% J.P. Morgan Asia Credit Index. Prior to January 31, 2020, the Fund’s benchmark was the Markit iBoxx Asian Local Bond Index. Matthews believes that the blended benchmark is more appropriate in light of the Fund’s current investment strategy. The Markit iBoxx Asian Local Bond Index performance reflects the returns of the discontinued predecessor HSBC Asian Local Bond Index up to December 31, 2012 and the returns of the successor Markit iBoxx Asian Local Bond Index thereafter. |
| | | | | | | | |
| | | | |
| TOP TEN HOLDINGS | | | | | | | |
| | | Sector | | Currency | | % of Net Assets | |
| Wanda Properties International Co., Ltd., 7.250%, 01/29/2024 | | Real Estate | | U.S. Dollar | | | 4.9% | |
| Network i2i, Ltd., 5.650%, 04/15/2068 | | Communication Services | | U.S. Dollar | | | 4.7% | |
| Viet Nam Debt & Asset Trading Corp., 1.000%, 10/10/2025 | | Financials | | U.S. Dollar | | | 4.6% | |
| CIFI Holdings Group Co., Ltd., 6.550%, 03/28/2024 | | Real Estate | | U.S. Dollar | | | 4.5% | |
| Luye Pharma Group, Ltd., Cnv., 1.500%, 07/09/2024 | | Health Care | | U.S. Dollar | | | 4.4% | |
| PB International BV, 7.625%, 01/26/2022 | | Consumer Discretionary | | U.S. Dollar | | | 4.4% | |
| Bosideng International Holdings, Ltd., Cnv., 1.000%, 12/17/2024 | | Consumer Discretionary | | U.S. Dollar | | | 4.1% | |
| ABJA Investment Co. Pte, Ltd., 5.450%, 01/24/2028 | | Materials | | U.S. Dollar | | | 4.0% | |
| Logan Group Co., Ltd., 5.250%, 02/23/2023 | | Real Estate | | U.S. Dollar | | | 3.8% | |
| Malaysia Government Bond, 4.642%, 11/07/2033 | | Foreign Government Bonds | | Malaysian Ringgit | | | 3.4% | |
| % OF ASSETS IN TOP TEN | | | | | | | 42.8% | |
Matthews Asia Total Return Bond Fund
Portfolio Manager Commentary (unaudited) (continued)
Local currency bond exposures also added to performance as most Asian currencies appreciated relative to the U.S. dollar, and interest rates across Asia fell in the quarter. Relative to our benchmark, overweights to Indonesia, Malaysia and Thailand were the top rate contributors while underweights to the Philippines and Singapore detracted, even though these positions still posted positive total returns. Our exposure to local currency-denominated bonds of Indonesia contributed most in our local currency positions as the rupiah was one of the best performing currencies globally, appreciating 14% in the second quarter.
Notable Portfolio Changes:
During the second quarter, we exited our position in Sri Lanka sovereign bonds. We believe these bonds have limited upside after the pandemic-driven sell-off. We expect developing countries across the world to seek external assistance in the coming quarters and think that will weigh on performance in Sri Lanka. We also exited Chinese auto manufacture Geely perpetual bonds, and Huaneng, a state owned Chinese utility company. Both of these bonds carry investment-grade level risk and had reached our price targets after the pandemic-induced sell-off. We decided to take profit and re-deploy into bonds with more upside. Finally, we exited the bonds of Modernland Realty as the company seemed less willing and able to refinance its maturities.
In the second quarter, we initiated new positions in a handful of high-quality bonds where we see the potential for upside. These include the bonds of JD.com, a Chinese e-commerce company, and Sygenta, a global chemicals company headquartered in Switzerland and wholly owned by ChemChina, a state owned enterprise.
In terms of currencies, we slightly reduced our overweight to the Indonesian rupiah after its strong performance in the quarter via a currency hedge.
Outlook:
We expect the Asia credit, currency and interest rate markets to continue to be driven by policy makers’ response to the coronavirus in the coming quarters. Countries that have been the most effective in stopping the spread of the coronavirus have also had the fastest economic rebounds. Given this view, we remain most concerned about the spread of coronavirus in the U.S. and emerging market countries. While the U.S. remains behind the curve in terms of curtailing the spread of the coronavirus, it has been ahead of the curve in terms of stimulus, which has been supportive for its asset prices. Emerging markets are in a tough spot since many countries lack the resources to control the virus as well as the monetary and fiscal space to stimulate their markets.
Our strategy is to hold issuers that we believe have the best fundamentals to survive the coronavirus and its related economic challenges. Taken altogether, we believe Asia to be well positioned in this crisis, given their early control of the virus and space for economic stimulus. We continue to be overweight to Asia high yield, especially to credits which have a positive skew in price. In terms of Asia currencies, we have positioned the portfolio to be slightly long U.S. dollar given our expectations of continued volatility which still favors safe haven currencies such as the U.S. dollar. Among rates, we continue to be overweight countries like Thailand, Malaysia and Indonesia where we think rates are stable and provide attractive carry. Our biggest overweight in interest rates remains in the U.S., where the U.S. Fed has effectively signaled structurally lower rates for the coming quarters to buoy the markets. As the market recovers, we expect the credit spread compression to more than compensate for a mild rise and steepening of the U.S. yield curve.
| | | | |
| |
| CURRENCY ALLOCATION (%)6,7 | |
| US Dollar | | | 53.5 | |
South Korean Won | | | 9.7 | |
China Renminbi | | | 7.0 | |
Thailand Baht | | | 5.9 | |
Malaysian Ringgit | | | 5.8 | |
Singapore Dollar | | | 5.7 | |
Indonesian Rupiah | | | 5.5 | |
| Philippines Peso | | | 4.2 | |
China Renminbi Offshore | | | 2.7 | |
Total | | | 100.0 | |
| | | | |
| |
| COUNTRY ALLOCATION (%)6,7,8 | |
| China/Hong Kong | | | 48.8 | |
| Indonesia | | | 13.8 | |
| India | | | 11.1 | |
| Philippines | | | 6.7 | |
| Malaysia | | | 5.6 | |
| Vietnam | | | 4.6 | |
| Switzerland | | | 3.1 | |
| Thailand | | | 2.4 | |
| Cash and Other Assets, Less Liabilities | | | 4.0 | |
| Total | | | 100.1 | |
| | | | |
| |
| SECTOR ALLOCATION (%)6,7 | |
| Real Estate | | | 24.1 | |
| Foreign Government Bonds | | | 18.7 | |
Consumer Discretionary | | | 14.2 | |
Financials | | | 14.0 | |
Communication Services | | | 8.7 | |
| Materials | | | 7.1 | |
Health Care | | | 4.4 | |
Energy | | | 3.9 | |
| Industrials | | | 1.0 | |
| Cash and Other Assets, Less Liabilities | | | 4.0 | |
| Total | | | 100.1 | |
Please note: Foreign Government Bonds category includes Supranationals.
| | | | |
| |
| ASSET TYPE BREAKDOWN (%)6,7 | |
| Non-Convertible Corporate Bonds | | | 61.3 | |
Government Bonds | | | 23.3 | |
Convertible Corporate Bonds | | | 11.5 | |
Cash and Other Assets, Less Liabilities | | | 4.0 | |
| 6 | Source: FactSet Research Systems. Percentage values in data are rounded to the nearest tenth of one percent, so the values may not sum to 100% due to rounding. Percentage values may be derived from different data sources and may not be consistent with other Fund literature. |
| 7 | Cash and other assets may include forward currency exchange contracts and certain derivative instruments that have been marked-to-market. |
| 8 | Not all countries where the Fund may invest are included in the benchmark index. |
| | | | |
| matthewsasia.com | 800.789.ASIA | | | 13 | |
Matthews Asia Total Return Bond Fund
June 30, 2020
Schedule of Investmentsa (unaudited)
NON-CONVERTIBLE CORPORATE BONDS: 61.3%
| | | | | | | | |
| | | Face Amount* | | | Value | |
| | | | | | | | |
|
| CHINA/HONG KONG: 37.2% | |
Wanda Properties International Co., Ltd.
7.250%, 01/29/24b | | | 5,300,000 | | | | $4,975,375 | |
| | |
CIFI Holdings Group Co., Ltd.
6.550%, 03/28/24b | | | 4,500,000 | | | | 4,611,977 | |
| | |
Logan Group Co., Ltd.
5.250%, 02/23/23b | | | 3,900,000 | | | | 3,870,521 | |
| | |
KWG Group Holdings, Ltd.
5.875%, 11/10/24b | | | 3,400,000 | | | | 3,238,003 | |
| | |
King Talent Management, Ltd.
5.600%c, 12/04/22b,d | | | 3,500,000 | | | | 3,011,641 | |
| | |
Franshion Brilliant, Ltd.
5.750%c, 01/17/22b,d | | | 3,400,000 | | | | 2,928,420 | |
| | |
JD.com, Inc.
4.125%, 01/14/50 | | | 2,200,000 | | | | 2,327,291 | |
| | |
KWG Group Holdings, Ltd.
7.875%, 09/01/23b | | | 2,050,000 | | | | 2,121,724 | |
| | |
HSBC Holdings PLC
6.375%c, 03/30/25d | | | 2,000,000 | | | | 2,053,760 | |
| | |
CIFI Holdings Group Co., Ltd.
7.750%, 09/20/20b | | | CNY 12,000,000 | | | | 1,715,963 | |
| | |
CITIC Telecom International Finance, Ltd.
6.100%, 03/05/25b | | | 1,631,000 | | | | 1,687,784 | |
| | |
China Cinda Asset Management Co., Ltd.
5.500%, 03/14/28 | | | CNY 10,000,000 | | | | 1,555,585 | |
| | |
Agricultural Bank of China, Ltd.
4.300%, 04/11/29b | | | CNY 10,000,000 | | | | 1,445,405 | |
| | |
Sino-Ocean Land Treasure III, Ltd.
4.900%c, 09/21/22b,d | | | 1,400,000 | | | | 1,162,658 | |
| | |
Honghua Group, Ltd.
6.375%, 08/01/22b | | | 1,100,000 | | | | 1,075,208 | |
| | |
Deutsche Bank AG
3.670%c, 04/10/25b,e | | | CNY 2,000,000 | | | | 256,695 | |
| | | | | | | | |
Total China/Hong Kong | | | | | | | 38,038,010 | |
| | | | | | | | |
| | | | | | | | |
| |
| INDIA: 11.1% | |
Network i2i, Ltd.
5.650%c, 01/15/25d,f | | | 5,000,000 | | | | 4,840,000 | |
| | |
ABJA Investment Co. Pte, Ltd.
5.450%, 01/24/28b | | | 4,440,000 | | | | 4,098,079 | |
| | |
ICICI Bank UK PLC
5.375%c, 09/26/28b | | | SGD 1,750,000 | | | | 1,248,219 | |
| | |
Network i2i, Ltd.
5.650%c, 01/15/25b,d | | | 1,200,000 | | | | 1,161,600 | |
| | | | | | | | |
Total India | | | | | | | 11,347,898 | |
| | | | | | | | |
| | | | | | | | |
| |
| INDONESIA: 7.3% | |
PB International BV
7.625%, 01/26/22b | | | 5,100,000 | | | | 4,475,154 | |
| | |
Indika Energy Capital III Pte, Ltd.
5.875%, 11/09/24b | | | 3,300,000 | | | | 2,938,487 | |
| | | | | | | | |
Total Indonesia | | | | | | | 7,413,641 | |
| | | | | | | | |
| | | | | | | | |
| |
| SWITZERLAND: 3.1% | |
Syngenta Finance N.V.
5.182%, 04/24/28b | | | 2,400,000 | | | | 2,560,072 | |
| | |
Syngenta Finance N.V.
4.892%, 04/24/25f | | | 300,000 | | | | 315,394 | |
| | |
Syngenta Finance N.V.
5.676%, 04/24/48b | | | 300,000 | | | | 303,709 | |
| | | | | | | | |
Total Switzerland | | | | | | | 3,179,175 | |
| | | | | | | | |
| | | | | | | | |
| | | Face Amount* | | | Value | |
| | | | | | | | |
|
| PHILIPPINES: 2.6% | |
Jollibee Worldwide Pte, Ltd.
3.900%c, 01/23/25b,d | | | 1,729,000 | | | | $1,613,157 | |
| | |
Royal Capital BV
4.875%c, 05/05/24b,d | | | 1,041,000 | | | | 1,014,975 | |
| | | | | | | | |
Total Philippines | | | | | | | 2,628,132 | |
| | | | | | | | |
| | | | | | | | |
| | |
| TOTAL NON-CONVERTIBLE CORPORATE BONDS | | | | 62,606,856 | |
| | | | | | | | |
(Cost $63,336,665) | | | | | | | | |
| | | | | | | | |
| |
FOREIGN GOVERNMENT OBLIGATIONS: 23.2% | | | | | |
| |
| INDONESIA: 6.5% | |
Indonesia Government Bond
9.000%, 03/15/29 | | | IDR 38,000,000,000 | | | | 2,945,299 | |
| | |
Indonesia Government Bond
8.250%, 05/15/29 | | | IDR 34,550,000,000 | | | | 2,574,138 | |
| | |
Indonesia Government Bond
8.375%, 04/15/39 | | | IDR 15,000,000,000 | | | | 1,102,660 | |
| | | | | | | | |
Total Indonesia | | | | | | | 6,622,097 | |
| | | | | | | | |
| | | | | | | | |
| |
| MALAYSIA: 5.6% | |
Malaysia Government Bond
4.642%, 11/07/33 | | | MYR 13,000,000 | | | | 3,454,790 | |
| | |
Malaysia Government Bond
3.478%, 06/14/24 | | | MYR 4,800,000 | | | | 1,163,717 | |
| | |
Malaysia Government Investment Issue
4.119%, 11/30/34 | | | MYR 4,500,000 | | | | 1,131,887 | |
| | | | | | | | |
Total Malaysia | | | | | | | 5,750,394 | |
| | | | | | | | |
| | | | | | | | |
| |
| VIETNAM: 4.6% | |
Viet Nam Debt & Asset Trading Corp.
1.000%, 10/10/25b | | | 6,219,000 | | | | 4,726,440 | |
| | | | | | | | |
Total Vietnam | | | | | | | 4,726,440 | |
| | | | | | | | |
| | | | | | | | |
| |
| PHILIPPINES: 4.1% | |
Republic of Philippines
3.900%, 11/26/22 | | | PHP 123,000,000 | | | | 2,493,778 | |
| | |
Republic of Philippines
6.250%, 01/14/36 | | | PHP 70,000,000 | | | | 1,731,945 | |
| | | | | | | | |
Total Philippines | | | | | | | 4,225,723 | |
| | | | | | | | |
| | | | | | | | |
| |
| THAILAND: 2.4% | |
Thailand Government Bond
1.600%, 12/17/29 | | | THB 72,000,000 | | | | 2,411,962 | |
| | | | | | | | |
Total Thailand | | | | | | | 2,411,962 | |
| | | | | | | | |
| | | | | | | | |
| | |
| TOTAL FOREIGN GOVERNMENT OBLIGATIONS | | | | 23,736,616 | |
| | | | | | | | |
(Cost $22,877,543) | | | | | | | | |
| | | | | | | | |
Matthews Asia Total Return Bond Fund
June 30, 2020
Schedule of Investmentsa (unaudited) (continued)
CONVERTIBLE CORPORATE BONDS: 11.5%
| | | | | | | | |
| | | Face Amount* | | | Value | |
| | | | | | | | |
|
| CHINA/HONG KONG: 11.5% | |
Luye Pharma Group, Ltd., Cnv.
1.500%, 07/09/24b | | | 4,700,000 | | | | $4,478,395 | |
| | |
Bosideng International Holdings, Ltd., Cnv. | | | | | | | | |
1.000%, 12/17/24b | | | 5,000,000 | | | | 4,225,000 | |
| | |
Baozun, Inc., Cnv.
1.625%, 05/01/24 | | | 1,900,000 | | | | 1,832,096 | |
| | |
Weibo Corp., Cnv.
1.250%, 11/15/22 | | | 1,268,000 | | | | 1,179,171 | |
| | | | | | | | |
Total China/Hong Kong | | | | 11,714,662 | |
| | | | | | | | |
| | | | | | | | |
| | |
| TOTAL CONVERTIBLE CORPORATE BONDS | | | | 11,714,662 | |
| | | | | | | | |
(Cost $12,519,515) | | | | | | | | |
| | | | | | | | |
| | |
| TOTAL INVESTMENTS: 96.0% | | | | 98,058,134 | |
(Cost $98,733,723) | | | | | | | | |
| | | | | | | | |
| |
CASH AND OTHER ASSETS,
LESS LIABILITIES: 4.0% | | | | 4,047,106 | |
| | | | | | | | |
| |
NET ASSETS: 100.0% | | | | $102,105,240 | |
| | | | | | | | |
| a | Certain securities were fair valued under the valuation policies approved by the Board of Trustees (Note 2-A). |
| b | The securities may be resold to qualified foreign investors and foreign institutional buyers under Regulation S of the Securities Act of 1933. |
| c | Security is a fix-to-float security, which carries a fixed coupon until a certain date, upon which it switches to a floating rate. Reference rate and spread are provided if the rate is currently floating. |
| d | Perpetual security with no stated maturity date. First call date is disclosed. |
| e | Security is valued using significant unobservable inputs and is classified as Level 3 in the fair value hierarchy. The aggregate value of Level 3 security is $256,695 and 0.25% of net assets. |
| f | Security exempt from registration under Rule 144A of the Securities Act of 1933, as amended. The security may be resold in transactions exempt from registration normally to qualified institutional buyers. The security has been determined to be liquid in accordance with procedures adopted by the Funds’ Board of Trustees. At June 30, 2020, the aggregate value is $5,155,394, which is 5.05% of net assets. |
| * | All Values in USD unless otherwise specified |
| 3M MYR-KLIBOR | Three Month Kuala Lumpur Interbank Offered Rate |
| 6M THB-THBFIX | Six Month Thai Baht Interest Rate Fixing |
| CNY | Chinese Renminbi (Yuan) |
FORWARD FOREIGN CURRENCY EXCHANGE CONTRACTS
| | | | | | | | | | | | | | |
Currency
Purchased | | Currency Sold | | | Counterparty | | Settlement
Date | | | Unrealized
Appreciation
(Depreciation) | |
| CNY 14,368,260 | | | USD 2,020,000 | | | Bank of America, N.A. | | | 09/21/20 | | | | $3,528 | |
| | | | | | | | | | | | | | |
| | | | |
| USD 1,000,000 | | | IDR 16,495,000,000 | | | Bank of America, N.A. | | | 07/09/20 | | | | (147,259 | ) |
| KRW 5,270,220,000 | | | USD 4,600,000 | | | JPMorgan Chase & Co. | | | 07/16/20 | | | | (211,777 | ) |
| THB 90,630,000 | | | USD 3,000,000 | | | Bank of America, N.A. | | | 07/21/20 | | | | (67,895 | ) |
| KRW 6,677,976,000 | | | USD 5,756,876 | | | Bank of America, N.A. | | | 07/29/20 | | | | (189,494 | ) |
| SGD 6,374,892 | | | USD 4,700,000 | | | Bank of America, N.A. | | | 07/30/20 | | | | (125,299 | ) |
| CNY 19,250,000 | | | USD 2,750,000 | | | Bank of America, N.A. | | | 08/04/20 | | | | (32,550 | ) |
| | | | | | | | | | | | | | |
| | | | | | | | | | | | | (774,274 | ) |
| | | | | | | | | | | | | | |
| Net Unrealized Depreciation | | | | | | | | | | ($770,746 | ) |
| | | | | | | | | | | | | | |
OTC INTEREST RATE SWAPS*
| | | | | | | | | | | | | | | | | | | | | | | | | | | | |
Floating Rate
Paid by Fund | | Fixed Rate Received by Fund | | Counterparty | | Termination Date | | | Notional
Amount (000) | | | Value | | | Upfront
Premium
Paid (Received) | | | Unrealized Appreciation | |
| Rate | | Frequency | | Rate | | Frequency |
3M MYR-KLIBOR, 2.280% | | Quarterly | | 3.300% | | Quarterly | | Bank of America, N.A. | | | 06/19/2024 | | | | MYR 13,000 | | | $ | 143,964 | | | | — | | | $ | 143,964 | |
6M THB-THBFIX, 0.526% | | Semi-annual | | 1.610% | | Semi-annual | | Bank of America, N.A. | | | 06/21/2024 | | | | THB 281,000 | | | | 324,763 | | | | — | | | | 324,763 | |
6M THB-THBFIX, 0.914% | | Semi-annual | | 1.265% | | Semi-annual | | Bank of America, N.A. | | | 09/04/2024 | | | | THB 210,000 | | | | 160,092 | | | | — | | | | 160,092 | |
| | | | | | | | | | | | | | | | | | | | |
Total | | | | | | | | | | | | | | | | | | $ | 628,819 | | | | — | | | $ | 628,819 | |
| | | | | | | | | | | | | | | | | | | | |
| * | Swaps are not centrally cleared. |
See accompanying notes to financial statements.
| | | | |
| matthewsasia.com | 800.789.ASIA | | | 15 | |
| | | | |
| PORTFOLIO MANAGERS |
| |
| Teresa Kong, CFA | | Satya Patel |
Lead Manager | | Lead Manager |
| | |
| FUND FACTS | | | | |
| | |
| | | Investor | | Institutional |
Ticker | | MCRDX | | MICPX |
CUSIP | | 577130677 | | 577130669 |
Inception | | 4/29/16 | | 4/29/16 |
NAV | | $9.88 | | $9.88 |
Initial Investment | | $2,500 | | $100,000 |
Gross Expense Ratio1 | | 1.24% | | 1.07% |
After Fee Waiver and Reimbursement2 | | 1.12% | | 0.90% |
Portfolio Statistics | | |
Total # of Positions | | 35 |
Net Assets | | $92.0 million |
Modified Duration3 | | 3.3 |
Portfolio Turnover4 | | 81.08% |
Benchmark | | | | |
J.P. Morgan Asia Credit Index |
OBJECTIVE
Total return over the long term.
STRATEGY
Under normal market conditions, the Fund seeks to achieve its investment objective by investing at least 80% of its net assets, which include borrowings for investment purposes, in debt and debt-related instruments issued by companies as well as governments, quasi-governmental entities, and supra-national institutions in Asia. Debt and debt-related instruments typically include bonds, debentures, bills, securitized instruments (which are vehicles backed by pools of assets such as loans or other receivables), notes, certificates of deposit and other bank obligations, bank loans, senior secured bank debt, convertible debt securities, exchangeable bonds, credit-linked notes, inflation-linked instruments, repurchase agreements, payment-in-kind securities and derivative instruments with fixed income characteristics. Asia consists of all countries and markets in Asia, such as China and Indonesia, in addition to the developed, emerging, and frontier countries and markets in the Asian region.
Matthews Asia Credit Opportunities Fund
Portfolio Manager Commentary (unaudited)
For the first half of 2020, the Matthews Asia Credit Opportunities Fund returned –4.74 (Investor Class) and –4.62% (Institutional Class) while its benchmark, the J.P. Morgan Asia Credit Index, returned 2.26%. For the quarter ending June 30, the Fund returned 9.15% (Investor Class) and 9.23% (Institutional Class) compared to the benchmark return of 6.08% over the same period.
Market Discussion:
We have now witnessed the end of a credit cycle in Asia after an unusually long run of 11 years. The old adage in credit analysis that “cash is king but liquidity rules” is important in this part of the cycle as credit markets begin their recovery. Differentials in access to liquidity across companies, industries, countries and regions are dictating the recovery for issuers.
For the most credit-worthy issuers, liquidity is ample. In fact, issuance in U.S. investment grade hit all-time highs in the first half. Asian investment grade issuance has also recovered reasonably well in recent months. The combination of central bank buying and investors’ demand for safety means that recovery in the investment grade market has been broad, having a positive spillover to Asia bonds through relative value. Asian investment-grade credit spreads narrowed 40 basis points (0.40%) in the second quarter, after rising by 123 basis points (1.23%) in the first quarter.
For high yield issuers, liquidity is more segmented, leading to an uneven recovery. Issuance within Asian high yield is down significantly year-on-year. Issuers from countries like China and in industries like its domestic property sector have been able to borrow in the international capital markets, albeit at a higher cost than earlier in the year. But other countries across emerging and frontier Asia have yet to see meaningful new high yield issuance from their corporates. The biggest uncertainty in the Asian high yield market is whether companies with imminent maturities will be able to refinance their debt. This has led to some parts of the Asian high yield market to be bifurcated between issuers with no refinancing risk, where spreads have tightened substantially, and issuers with refinancing risk, where spreads have tightened much less or even widened since the first quarter.
Performance Contributors and Detractors:
The primary driver of the Fund’s outperformance during the second quarter has been the portfolio’s exposure to high yield, which outpaced gains in investment grade issuers. In terms of sectors, exposures in basic industry and consumer discretionary were the top contributors. Within these sectors, issuers such as Indika, an Indonesian coal miner, Tata Steel, an Indian steel producer, and PB International, an Indonesia textile manufacturer, were the top contributors. These names had been among the most punished within the portfolio in the first quarter and therefore, had substantial room to rebound.
Amongst the biggest detractors to performance were the perpetual bonds. Within these, China Jinmao and Sino-Ocean perpetual bonds were the top detractors. Perpetual bonds suffered from poor liquidity and wide bid-offer spreads during the crisis and therefore, recovery was much slower in the second quarter due to these liquidity risks. Vietnam Debt and Asset Trading Corporation bonds have been
(continued)
| 1 | Prospectus expense ratios. |
| 2 | Matthews has contractually agreed (i) to waive fees and reimburse expenses to the extent needed to limit Total Annual Fund Operating Expenses (excluding Rule 12b-1 fees, taxes, interest, brokerage commissions, short sale dividend expenses, expenses incurred in connection with any merger or reorganization or extraordinary expenses such as litigation) of the Institutional Class to 0.90% first by waiving class specific expenses (i.e., shareholder service fees specific to a particular class) of the Institutional Class and then, to the extent necessary, by waiving non-class specific expenses (e.g., custody fees) of the Institutional Class, and (ii) if any Fund-wide expenses (i.e., expenses that apply to both the Institutional Class and the Investor Class) are waived for the Institutional Class to maintain the 0.90% expense limitation, to waive an equal amount (in annual percentage terms) of those same expenses for the Investor Class. The Total Annual Fund Operating Expenses After Fee Waiver and Expense Reimbursement for the Investor Class may vary from year to year and will in some years exceed 0.90%. Pursuant to this agreement, any amount waived for prior fiscal years with respect to the Fund is not subject to recoupment. This agreement will remain in place until April 30, 2021 and may be terminated at any time by the Board of Trustees on behalf of the Fund on 60 days’ written notice to Matthews. Matthews may decline to renew this agreement by written notice to the Trust at least 30 days before its annual expiration date. |
| 3 | Modified duration measures the percent change in value of the fixed income portion of the portfolio in response to a 1% change in interest rates. In a multi-currency denominated portfolio with sensitivities to different interest rate regimes, modified duration will not accurately reflect the change in value of the overall portfolio from a change in any one interest rate regime. |
| 4 | The lesser of fiscal year 2019 long-term purchase costs or sales proceeds divided by the average monthly market value of long-term securities. |
| | | | | | | | | | | | | | | | | | | | | | | | |
| | | | | | | |
| PERFORMANCE AS OF JUNE 30, 2020 | | | | | | | | | | | | | | | | | | |
| | | | | | | | | Average Annual Total Retuns | | | | |
| | | 3 Months | | | YTD | | | 1 Year | | | 3 Years | | | Since Inception | | | Inception Date | |
| Investor Class (MCRDX) | | | 9.15% | | | | -4.74% | | | | -1.30% | | | | 2.39% | | | | 4.13% | | | | 4/29/16 | |
| Institutional Class (MICPX) | | | 9.23% | | | | -4.62% | | | | -1.09% | | | | 2.65% | | | | 4.37% | | | | 4/29/16 | |
| J.P. Morgan Asia Credit Index5 | | | 6.08% | | | | 2.26% | | | | 5.39% | | | | 4.81% | | | | 4.72% | | | | | |
Performance assumes reinvestment of all dividends and/or distributions before taxes. All performance quoted represents past performance and is no guarantee of future results. Investment return and principal value will fluctuate with market conditions so that when redeemed, shares may be worth more or less than their original cost. Current performance may be lower or higher than the return figures quoted. Returns would have been lower if certain of the Fund’s fees and expenses had not been waived. For the Fund’s most recent month-end performance, visit matthewsasia.com.
| | | | | | | | | | | | | | | | | | | | | | | | | | | | | | | | | | | | | | | | | | | | | | | | | | | | | | | | | | | | | | | | | | | | | | | | | | | | |
| |
| INCOME DISTRIBUTION HISTORY | |
| | | 2020 | | | | | | 2019 | |
| | Jan. | | | Feb. | | | Mar. | | | Apr. | | | May | | | June | | | July | | | Aug. | | | Sept. | | | Oct. | | | Nov. | | | Dec. | | | Total | | | | | | Q1 | | | Q2 | | | Q3 | | | Q4 | | | Total | |
| Investor (MCRDX) | | | n.a. | | | $ | 0.04 | | | $ | 0.03 | | | $ | 0.04 | | | $ | 0.04 | | | $ | 0.04 | | | | n.a. | | | | n.a. | | | | n.a. | | | | n.a. | | | | n.a. | | | | n.a. | | | $ | 0.18 | | | | | | | $ | 0.10 | | | $ | 0.10 | | | $ | 0.13 | | | $ | 0.11 | | | $ | 0.44 | |
| Inst’l (MICPX) | | | n.a. | | | $ | 0.04 | | | $ | 0.03 | | | $ | 0.04 | | | $ | 0.04 | | | $ | 0.04 | | | | n.a. | | | | n.a. | | | | n.a. | | | | n.a. | | | | n.a. | | | | n.a. | | | $ | 0.20 | | | | | | | $ | 0.10 | | | $ | 0.11 | | | $ | 0.14 | | | $ | 0.11 | | | $ | 0.46 | |
Note: This table does not include capital gains distributions. Totals may differ by $0.02 due to rounding. For income distribution history, visit matthewsasia.com.
| | | | |
| | | |
30-DAY YIELD: Investor Class: 6.14% (6.14% excluding waivers) Institutional Class: 6.38% (6.33% excluding waivers) The 30-Day Yield represents net investment income earned by the Fund over the 30-day period ended 6/30/20, expressed as an annual percentage rate based on the Fund’s share price at the end of the 30-day period. The 30-Day Yield should be regarded as an estimate of the Fund’s rate of investment income, and it may not equal the Fund’s actual income distribution rate. Source: BNY Mellon Investment Servicing (US) Inc. | | | | YIELD TO WORST: 7.07% Yield to worst is the lowest yield that can be received on a bond assuming that the issuer does not default. It is calculated by utilizing the worst case assumptions for a bond with respect to certain income-reducing factors, including prepayment, call or sinking fund provisions. It does not represent the yield that an investor should expect to receive. Past yields are no guarantee of future yields. Source: FactSet Research Systems |
GROWTH OF A HYPOTHETICAL $10,000 INVESTMENT SINCE INCEPTION—INVESTOR CLASS
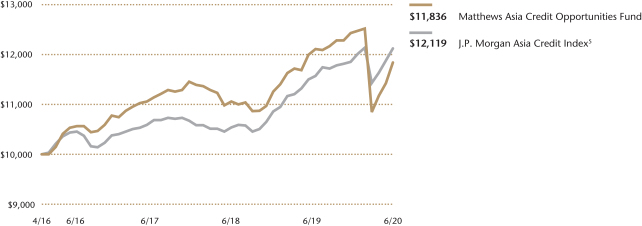
Plotted monthly. The performance data and graph do not reflect the deduction of taxes that a shareholder would pay on dividends, capital gains distributions, or redemption of Fund shares. Values are in US$.
| | 5 | It is not possible to invest directly in an index. Source: Index data from J.P. Morgan and Bloomberg; total return calculations performed by BNY Mellon Investment Servicing (US) Inc. Please see page 90 for index definition. |
| | | | | | | | |
| | | | |
| TOP TEN HOLDINGS | | | | | | | |
| | | Sector | | Currency | | % of Net Assets | |
| Network i2i, Ltd., 5.650%, 04/15/2068 | | Communication Services | | U.S. Dollar | | | 5.5% | |
| Honghua Group, Ltd., 6.375%, 08/01/2022 | | Energy | | U.S. Dollar | | | 5.1% | |
| PB International BV, 7.625%, 01/26/2022 | | Consumer Discretionary | | U.S. Dollar | | | 5.1% | |
| Sino-Ocean Land Treasure III, Ltd., 4.900%, 03/21/2068 | | Real Estate | | U.S. Dollar | | | 5.1% | |
| King Talent Management, Ltd., 5.600%, 06/04/2068 | | Financials | | U.S. Dollar | | | 5.0% | |
| Indika Energy Capital III Pte, Ltd., 5.875%, 11/09/2024 | | Energy | | U.S. Dollar | | | 4.8% | |
| Viet Nam Debt & Asset Trading Corp., 1.000%, 10/10/2025 | | Financials | | U.S. Dollar | | | 4.7% | |
| Bosideng International Holdings, Ltd., Cnv., 1.000%, 12/17/2024 | | Consumer Discretionary | | U.S. Dollar | | | 4.5% | |
| Franshion Brilliant, Ltd., 5.750%, 07/17/2067 | | Real Estate | | U.S. Dollar | | | 4.4% | |
| Luye Pharma Group, Ltd., Cnv., 1.500%, 07/09/2024 | | Health Care | | U.S. Dollar | | | 4.2% | |
| % OF ASSETS IN TOP TEN | | | | | | | 48.4% | |
| | | | |
| matthewsasia.com | 800.789.ASIA | | | 17 | |
| | | | |
| |
| CURRENCY ALLOCATION (%)6,7 | |
| US Dollar | | | 100.0 | |
| | | | |
| |
| COUNTRY ALLOCATION (%)6,7,8 | |
| China/Hong Kong | | | 53.8 | |
| Indonesia | | | 20.4 | |
| India | | | 8.4 | |
| Vietnam | | | 6.2 | |
| Australia | | | 2.4 | |
| Philippines | | | 2.4 | |
| Switzerland | | | 2.1 | |
Cash and Other Assets, Less Liabilities | | | 4.3 | |
| Total | | | 100.0 | |
| | | | |
| |
| SECTOR ALLOCATION (%)6,7 | |
| Real Estate | | | 27.5 | |
| Financials | | | 18.0 | |
| Consumer Discretionary | | | 15.7 | |
| Energy | | | 12.6 | |
| Materials | | | 7.5 | |
| Communication Services | | | 5.5 | |
| Health Care | | | 4.2 | |
| Utilities | | | 2.4 | |
| Foreign Government Bonds | | | 1.5 | |
| Industrials | | | 0.8 | |
Cash and Other Assets, Less Liabilities | | | 4.3 | |
| Total | | | 100.0 | |
| | | | |
| |
| ASSET TYPE BREAKDOWN (%)6,7 | |
| Non-Convertible Corporate Bonds | | | 77.8 | |
| Government Bonds | | | 11.7 | |
| Convertible Corporate Bonds | | | 6.2 | |
| Cash and Other Assets, Less Liabilities | | | 4.3 | |
| 6 | Source: FactSet Research Systems. Percentage values in data are rounded to the nearest tenth of one percent, so the values may not sum to 100% due to rounding. Percentage values may be derived from different data sources and may not be consistent with other Fund literature. |
| 7 | Cash and other assets may include forward currency exchange contracts and certain derivative instruments that have been marked-to-market. |
| 8 | Not all countries where the Fund may invest are included in the benchmark index. |
Matthews Asia Credit Opportunities Fund
Portfolio Manager Commentary (unaudited) (continued)
remarkably stable this year and were among the top performers in the crisis, but they were marked marginally lower in the second quarter, leading to a small loss in the position.
Notable Portfolio Changes:
We made a number of changes to the portfolio in the second quarter. We exited our positions in sovereign U.S. dollar bonds of the Pakistan and Sri Lanka sovereigns. Given the heavy fiscal burden to be borne by these frontier markets and the limited assistance available from multi-lateral and bilateral institutions, we believe the upside in these bonds were limited. We also exited China’s Weibo and Citic Telecom bonds. These bonds carry investment-grade level risk and had performed well during the sell-off. We decided to take profits and redeploy into bonds with a more positive skew. Finally, we exited the bonds of Modernland Realty, an Indonesian property developer because we became less convinced on the company’s willingness and ability to refinance its upcoming maturities.
We also added a number of bonds in which we saw potential upside in the coming quarters and years. We added Sritex, an Indonesia textile manufacturer, Adaro, an Indonesian energy producer, and Syngenta, a chemicals company based in Switzerland wholly owned by ChemChina, a state owned enterprise. These bonds had a slower pace of recovery since the first quarter sell-offs, but we felt that their fundamentals warrant further recovery.
Outlook:
Many Asian high yield companies are asset-rich and have little solvency risk. In fact, in terms of economic fundamentals, Asia in many ways actually looks better than the U.S. The economic reopening in Asia is further along than that in the U.S., giving companies in Asia a better environment to operate in. For instance, for China real estate developers, which represent the biggest overweight in the portfolio, many are seeing sales match or surpass levels from a year ago and they’ve seem to be experiencing a V-shaped recovery. As such, we expect Asia high yield default rates to be lower than that of U.S. and global high yields. However, companies typically do not default because of solvency, but because of lack of liquidity. As such, we see liquidity as both a near-term challenge and a long-term opportunity. Our top priority is a careful evaluation of each company’s capital structure, liquidity profile and refinancing channel to help us navigate the recovery and uncover opportunities.
For long-term investors, we believe it is currently an attractive entry opportunity because yields are elevated due to continued financing risk. As the new issue market normalizes in the coming quarters, we believe the liquidity premium in Asia high yield will continue to go down, driving bond price appreciation.
Matthews Asia Credit Opportunities Fund
June 30, 2020
Schedule of Investmentsa (unaudited)
| | |
| NON-CONVERTIBLE CORPORATE BONDS: 77.8% | | |
| | | | | | | | |
| | | Face Amount* | | | Value | |
| | |
| CHINA/HONG KONG: 42.1% | | | | | | | | |
Honghua Group, Ltd. 6.375%, 08/01/22b | | | 4,800,000 | | | | $4,691,819 | |
| | |
Sino-Ocean Land Treasure III, Ltd. 4.900%c, 09/21/22b,d | | | 5,600,000 | | | | 4,650,633 | |
| | |
King Talent Management, Ltd. 5.600%c, 12/04/22b,d | | | 5,300,000 | | | | 4,560,485 | |
| | |
Franshion Brilliant, Ltd. 5.750%c, 01/17/22b,d | | | 4,700,000 | | | | 4,048,110 | |
| | |
KWG Group Holdings, Ltd. 5.875%, 11/10/24b | | | 3,200,000 | | | | 3,047,532 | |
| | |
Standard Chartered PLC 7.750%c, 04/02/23b,d | | | 2,850,000 | | | | 2,974,687 | |
| | |
CIFI Holdings Group Co., Ltd. 6.550%, 03/28/24b | | | 2,600,000 | | | | 2,664,698 | |
| | |
HSBC Holdings PLC 6.375%c, 03/30/25d | | | 2,400,000 | | | | 2,464,512 | |
| | |
Wanda Group Overseas, Ltd. 7.500%, 07/24/22b | | | 2,500,000 | | | | 2,325,289 | |
| | |
Wanda Properties International Co., Ltd. 7.250%, 01/29/24b | | | 2,400,000 | | | | 2,253,000 | |
| | |
CIFI Holdings Group Co., Ltd. 5.375%c, 08/24/22b,d | | | 2,000,000 | | | | 1,947,420 | |
| | |
Logan Group Co., Ltd. 5.250%, 02/23/23b | | | 1,500,000 | | | | 1,488,662 | |
| | |
KWG Group Holdings, Ltd. 7.875%, 09/01/23b | | | 1,300,000 | | | | 1,345,483 | |
| | |
KWG Group Holdings, Ltd. 7.400%, 03/05/24b | | | 300,000 | | | | 306,342 | |
| | | | | | | | |
Total China/Hong Kong | | | | | | | 38,768,672 | |
| | | | | | | | |
| | | | | | | | |
| | | |
| INDONESIA: 20.4% | | | | | | | | |
PB International BV 7.625%, 01/26/22b | | | 5,300,000 | | | | 4,650,651 | |
| | |
Indika Energy Capital III Pte, Ltd. 5.875%, 11/09/24b | | | 5,000,000 | | | | 4,452,253 | |
| | |
PT Adaro Indonesia 4.250%, 10/31/24b | | | 2,600,000 | | | | 2,453,750 | |
| | |
PT Indonesia Asahan Aluminium Perser 6.757%, 11/15/48b | | | 1,900,000 | | | | 2,308,811 | |
| | |
Listrindo Capital BV 4.950%, 09/14/26b | | | 2,200,000 | | | | 2,211,000 | |
| | |
PT Sri Rejeki Isman 7.250%, 01/16/25b | | | 1,600,000 | | | | 1,491,085 | |
| | |
Theta Capital Pte, Ltd. 6.750%, 10/31/26b | | | 1,500,000 | | | | 1,191,522 | |
| | | | | | | | |
Total Indonesia | | | | | | | 18,759,072 | |
| | | | | | | | |
| | | | | | | | |
| | | |
| INDIA: 8.4% | | | | | | | | |
| | |
Network i2i, Ltd. 5.650%c, 01/15/25d,e | | | 3,000,000 | | | | 2,904,000 | |
| | |
ABJA Investment Co. Pte, Ltd. 5.450%, 01/24/28b | | | 2,900,000 | | | | 2,676,674 | |
| | |
Network i2i, Ltd. 5.650%c, 01/15/25b,d | | | 2,200,000 | | | | 2,129,600 | |
| | | | | | | | |
Total India | | | | | | | 7,710,274 | |
| | | | | | | | |
| | | | | | | | |
| | | |
| AUSTRALIA: 2.4% | | | | | | | | |
| | |
Australia & New Zealand Banking Group, Ltd. 6.750%c, 06/15/26b,d | | | 2,000,000 | | | | 2,218,760 | |
| | | | | | | | |
Total Australia | | | | | | | 2,218,760 | |
| | | | | | | | |
| | | | | | | | |
| | | |
| PHILIPPINES: 2.4% | | | | | | | | |
| | |
Jollibee Worldwide Pte, Ltd. 3.900%c, 01/23/25b,d | | | 1,556,000 | | | | 1,451,748 | |
| | |
Royal Capital BV 4.875%c, 05/05/24b,d | | | 782,000 | | | | 762,450 | |
| | | | | | | | |
Total Philippines | | | | | | | 2,214,198 | |
| | | | | | | | |
| | | | | | | | |
| | | | | | | | |
| | | Face Amount* | | | Value | |
| | |
| SWITZERLAND: 2.1% | | | | | | | | |
| | |
Syngenta Finance N.V. 5.182%, 04/24/28b | | | 1,400,000 | | | | $1,493,375 | |
| | |
Syngenta Finance N.V. 4.892%, 04/24/25e | | | 200,000 | | | | 210,262 | |
| | |
Syngenta Finance N.V. 5.676%, 04/24/48b | | | 200,000 | | | | 202,473 | |
| | | | | | | | |
Total Switzerland | | | | | | | 1,906,110 | |
| | | | | | | | |
| | | | | | | | |
| | |
| TOTAL NON-CONVERTIBLE CORPORATE BONDS | | | | 71,577,086 | |
| | | | | | | | |
(Cost $73,265,838) | | | | | | | | |
| | | | | | | | |
| |
CONVERTIBLE CORPORATE BONDS: 11.7% | | | | | |
| | | |
| CHINA/HONG KONG: 11.7% | | | | | | | | |
| | |
Bosideng International Holdings, Ltd., Cnv. 1.000%, 12/17/24b | | | 4,900,000 | | | | 4,140,500 | |
| | |
Luye Pharma Group, Ltd., Cnv. 1.500%, 07/09/24b | | | 4,100,000 | | | | 3,906,685 | |
| | |
Baozun, Inc., Cnv. 1.625%, 05/01/24 | | | 2,800,000 | | | | 2,699,931 | |
| | | | | | | | |
Total China/Hong Kong | | | | | | | 10,747,116 | |
| | | | | | | | |
| | | | | | | | |
| | |
| TOTAL CONVERTIBLE CORPORATE BONDS | | | | 10,747,116 | |
| | | | | | | | |
(Cost $11,528,829) | | | | | | | | |
| | | | | | | | |
| |
FOREIGN GOVERNMENT OBLIGATIONS: 6.2% | | | | | |
| | | |
| VIETNAM: 6.2% | | | | | | | | |
| | |
Viet Nam Debt & Asset Trading Corp. 1.000%, 10/10/25b | | | 5,689,000 | | | | 4,323,640 | |
| | |
Socialist Republic of Vietnam 5.500%, 03/12/28 | | | 1,350,000 | | | | 1,356,750 | |
| | | | | | | | |
Total Vietnam | | | | | | | 5,680,390 | |
| | | | | | | | |
| | | | | | | | |
| | |
| TOTAL FOREIGN GOVERNMENT OBLIGATIONS | | | | 5,680,390 | |
| | | | | | | | |
(Cost $5,805,057) | | | | | | | | |
| | | | | | | | |
| | | |
| TOTAL INVESTMENTS: 95.7% | | | | | | | $88,004,592 | |
(Cost $90,534,789) | | | | | | | | |
| | | | | | | | |
| |
CASH AND OTHER ASSETS,
LESS LIABILITIES: 4.3% | | | | 3,994,508 | |
| | | | | | | | |
| | |
NET ASSETS: 100.0% | | | | | | | $91,999,100 | |
| | | | | | | | |
| a | Certain securities were fair valued under the valuation policies approved by the Board of Trustees (Note 2-A). |
| b | The securities may be resold to qualified foreign investors and foreign institutional buyers under Regulation S of the Securities Act of 1933. |
| c | Security is a fix-to-float security, which carries a fixed coupon until a certain date, upon which it switches to a floating rate. Reference rate and spread are provided if the rate is currently floating. |
| d | Perpetual security with no stated maturity date. First call date is disclosed. |
| e | Security exempt from registration under Rule 144A of the Securities Act of 1933, as amended. The security may be resold in transactions exempt from registration normally to qualified institutional buyers. The security has been determined to be liquid in accordance with procedures adopted by the Funds’ Board of Trustees. At June 30, 2020, the aggregate value is $3,114,262, which is 3.39% of net assets. |
| * | All Values in USD unless otherwise specified |
See accompanying notes to financial statements.
| | | | |
| matthewsasia.com | 800.789.ASIA | | | 19 | |

| | | | |
| PORTFOLIO MANAGERS* |
| |
| Robert J. Horrocks, PhD | | Kenneth Lowe, CFA |
Lead Manager | | Lead Manager |
| |
| Satya Patel | | |
Co-Manager | | | | |
|
* As of August 31, 2020 |
| | | | |
|
| FUND FACTS |
| | |
| | | Investor | | Institutional |
Ticker | | MACSX | | MICSX |
CUSIP | | 577130206 | | 577130842 |
Inception | | 9/12/94 | | 10/29/10 |
NAV | | $14.53 | | $14.51 |
Initial Investment | | $2,500 | | $100,000 |
Gross Expense Ratio1 | | 1.08% | | 0.94% |
Portfolio Statistics | | |
Total # of Positions | | 60 |
Net Assets | | $1.3 billion |
Weighted Average Market Cap | | $84.6 billion |
Portfolio Turnover2 | | 21.89% |
Benchmark | | |
MSCI AC Asia ex Japan Index |
OBJECTIVE
Long-term capital appreciation. The Fund also seeks to provide some current income.
STRATEGY
Under normal market conditions, the Fund seeks to achieve its investment objective by investing at least 80% of its net assets, which include borrowings for investment purposes, in dividend-paying common stock, preferred stock and other equity securities, and convertible securities as well as fixed-income securities, of any duration or quality, including high yield securities, of companies located in Asia, which consists of all countries and markets in Asia, including developed, emerging and frontier countries and markets in the Asian region.
Matthews Asian Growth and Income Fund
Portfolio Manager Commentary (unaudited)
For the first half of 2020, the Matthews Asian Growth and Income Fund returned –6.95% (Investor Class) and –6.83% (Institutional Class), while its benchmark, the MSCI All Country Asia ex Japan Index returned –4.65% over the same period. For the quarter ending June 30, 2020, the Fund returned 14.71% (Investor Class) and 14.82% (Institutional Class), while the benchmark returned 16.79%.
Market Environment:
The deep drops suffered across risk assets during the first quarter were almost entirely reversed over the last three months, a move that was far swifter than most would have anticipated. Although meant to be strong discounting mechanisms, one can’t help but view the more recent recovery in markets as being driven by other forces to some extent. Those include the ongoing tinkering by central banks and governments in underpinning market prices, as well as the increase in retail investor participation across the globe, which has added yet more liquidity. Despite the continued uncertain outlook, the recent recovery in equities has been one of the quickest on record.
For Asia, these moves have been equally fierce. However, it could be argued that they are more justified than elsewhere, particularly in the case of China where the recovery appeared to be ahead of the curve and V-shaped in nature. The rebound in areas such as auto and property sales, fixed asset investment and Purchasing Managers Index data (a measure of the prevailing direction of economic trends in manufacturing) suggests an impressive return to normalcy. This confluence of improving sentiment globally, solid Chinese economic data and a gradually weakening U.S. dollar helped all Asian markets to double digit returns for the quarter.
Performance Contributors and Detractors:
Although trailing the market rebound, the Fund had a respectable 90% upside capture during the quarter. This was despite our more conservative investment approach and growth stocks leading the charge. The largest contributors to performance came from China, where stay-at-home economy stocks including Tencent and Netease gained significantly. Tencent, the country’s dominant social network rose on continued growth in games through its key titles and ongoing updates as well as via e-commerce advertising and payments. Games company Netease rose partly as it successfully launched a second listing in Hong Kong, and as its games pipeline looks strong with additional growth expected to come from overseas. Further Netease’s online education business Youdao and its cloud music operations also appear to be performing well. Elsewhere in China leading white goods company Midea gained as China’s consumption recovery continues and due to further market share wins. Leading baijiu producer Jiangsu Yanghe also performed strongly as its ongoing sales channel restructure bears fruit.
In Hong Kong, Techtronic Industries delivered solid performance again as the pandemic is causing a surge in DIY activity. The firm is also using the environment to invest in the business when others are cutting costs. The largest detractor over the quarter also came from the city state. Conglomerate Jardine Matheson dropped as its consumer facing businesses in areas like auto, retail and property are struggling and caused the company to profit warn. HSBC also fell following a worsened outlook for global trade, questions over Hong Kong’s role in international finance and a suspension of its dividend. We exited our position during the quarter. China Mobile sputtered as its first quarter results saw weaker users and decreased roaming fees whilst domestic Hong Kong REITs Fortune and LINK REIT dropped on concerns of weak sales amongst their tenants.
(continued)
| 1 | Prospectus expense ratios. |
| 2 | The lesser of fiscal year 2019 long-term purchase costs or sales proceeds divided by the average monthly market value of long-term securities. |
| | | | | | | | | | | | | | | | | | | | | | | | | | | | | | | | |
| | | | | | | | | |
| PERFORMANCE AS OF JUNE 30, 2020 | | | | | | | | | | | | | | | | | | | | | | | | |
| | | | | | | | | Average Annual Total Returns | | | | |
| | | 3 Months | | | YTD | | | 1 Year | | | 3 Years | | | 5 Years | | | 10 Years | | | Since
Inception | | | Inception
Date | |
| Investor Class (MACSX) | | | 14.71% | | | | -6.95% | | | | -3.38% | | | | 1.01% | | | | 2.06% | | | | 4.74% | | | | 8.48% | | | | 9/12/94 | |
| Institutional Class (MICSX) | | | 14.82% | | | | -6.83% | | | | -3.17% | | | | 1.16% | | | | 2.22% | | | | n.a. | | | | 3.60% | | | | 10/29/10 | |
| MSCI AC Asia ex Japan Index3 | | | 16.79% | | | | -4.65% | | | | 1.97% | | | | 3.80% | | | | 4.70% | | | | 6.21% | | | | 4.40% | 4 | | | | |
Performance assumes reinvestment of all dividends and/or distributions before taxes. All performance quoted represents past performance and is no guarantee of future results. Investment return and principal value will fluctuate with market conditions so that when redeemed, shares may be worth more or less than their original cost. Current performance may be lower or higher than the return figures quoted. Returns would have been lower if certain of the Fund’s fees and expenses had not been waived. For the Fund’s most recent month-end performance, visit matthewsasia.com.
| | | | | | | | | | | | | | | | | | | | | | | | | | | | |
| | | | | | | | |
| INCOME DISTRIBUTION HISTORY | | | | | | | | | | | | | | | | | | | | | |
| | | 2020 | | | | | | 2019 | |
| | | June | | | December | | | Total | | | | | | June | | | December | | | Total | |
| Investor (MACSX) | | $ | 0.11 | | | | n.a. | | | $ | 0.11 | | | | | | | $ | 0.17 | | | $ | 0.18 | | | $ | 0.35 | |
| Inst’l (MICSX) | | $ | 0.12 | | | | n.a. | | | $ | 0.12 | | | | | | | $ | 0.18 | | | $ | 0.19 | | | $ | 0.38 | |
Note: This table does not include capital gains distributions. Totals may differ by $0.02 due to rounding. For income distribution history, visit matthewsasia.com.
| | | | |
| | | |
30-DAY YIELD: 3.78% (Investor Class) 3.92% (Institutional Class) The 30-Day Yield represents net investment income earned by the Fund over the 30-day period ended 6/30/20, expressed as an annual percentage rate based on the Fund’s share price at the end of the 30-day period. The 30-Day Yield should be regarded as an estimate of the Fund’s rate of investment income, and it may not equal the Fund’s actual income distribution rate. Source: BNY Mellon Investment Servicing (US) Inc. | | | | DIVIDEND YIELD: 3.16% The dividend yield (trailing) for the portfolio is the weighted average sum of the dividends paid by each equity security held by the Fund over the 12 months ended 6/30/20 divided by the current price of each equity as of 6/30/20. The annualized dividend yield for the Fund is for the equity-only portion of the portfolio. Please note that this is based on gross equity portfolio holdings and does not reflect the actual yield an investor in the Fund would receive. Past yields are no guarantee of future yields. Source: FactSet Research Systems, Bloomberg, MICM |
GROWTH OF A HYPOTHETICAL $10,000 INVESTMENT SINCE INCEPTION—INVESTOR CLASS
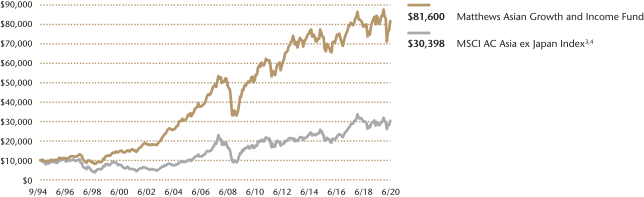
Plotted monthly. The performance data and graph do not reflect the deduction of taxes that a shareholder would pay on dividends, capital gains distributions or redemption of Fund shares. Values are in US$.
| | 3 | It is not possible to invest directly in an index. Source: Index data from Morgan Stanley Capital International and Bloomberg; total return calculations performed by BNY Mellon Investment Servicing (US) Inc. Please see page 90 for index definition. |
| | 4 | Calculated from 8/31/94. |
| | | | | | | | |
| | | | |
| TOP TEN HOLDINGS5 | | | | | | | |
| | | Sector | | Country | | % of Net Assets | |
| Tencent Holdings, Ltd. | | Communication Services | | China/Hong Kong | | | 5.2% | |
| Taiwan Semiconductor Manufacturing Co., Ltd. | | Information Technology | | Taiwan | | | 4.9% | |
| AIA Group, Ltd. | | Financials | | China/Hong Kong | | | 3.7% | |
| Samsung Electronics Co., Ltd. | | Information Technology | | South Korea | | | 2.9% | |
| Techtronic Industries Co., Ltd. | | Industrials | | China/Hong Kong | | | 2.1% | |
| Macquarie Korea Infrastructure Fund | | Financials | | South Korea | | | 2.1% | |
| LG Household & Health Care, Ltd., Pfd. | | Consumer Staples | | South Korea | | | 2.0% | |
| Ascendas, REIT | | Real Estate | | Singapore | | | 1.9% | |
| Advantech Co., Ltd. | | Information Technology | | Taiwan | | | 1.9% | |
| NetEase, Inc. | | Communication Services | | China/Hong Kong | | | 1.8% | |
| % OF ASSETS IN TOP TEN | | | | | | | 28.5% | |
| | 5 | Holdings may combine more than one security from same issuer and related depositary receipts. |
| | | | |
| matthewsasia.com | 800.789.ASIA | | | 21 | |
| | | | |
| |
| COUNTRY ALLOCATION (%)6,7 | |
| China/Hong Kong | | | 45.4 | |
| Singapore | | | 10.3 | |
| South Korea | | | 9.8 | |
| Taiwan | | | 8.4 | |
| India | | | 6.5 | |
| France | | | 3.2 | |
| Indonesia | | | 2.8 | |
| United States | | | 1.9 | |
| Japan | | | 1.5 | |
| Philippines | | | 1.4 | |
| Vietnam | | | 1.4 | |
| United Kingdom | | | 1.4 | |
| Australia | | | 1.3 | |
| Thailand | | | 1.0 | |
| Cash and Other Assets, Less Liabilities | | | 3.8 | |
| Total | | | 100.1 | |
| | | | |
| |
| SECTOR ALLOCATION (%)7 | |
| Consumer Discretionary | | | 17.2 | |
| Financials | | | 15.7 | |
| Information Technology | | | 14.3 | |
| Communication Services | | | 13.5 | |
| Industrials | | | 10.8 | |
| Consumer Staples | | | 9.5 | |
| Real Estate | | | 7.4 | |
| Utilities | | | 4.2 | |
| Health Care | | | 3.6 | |
| Cash and Other Assets, Less Liabilities | | | 3.8 | |
| Total | | | 100.0 | |
| | | | |
| |
| MARKET CAP EXPOSURE (%)7 | |
| Mega Cap (over $25B) | | | 42.9 | |
| Large Cap ($10B-$25B) | | | 23.2 | |
| Mid Cap ($3B-10B) | | | 23.9 | |
| Small Cap (under $3B) | | | 6.2 | |
| Cash and Other Assets, Less Liabilities | | | 3.8 | |
| | | | |
| |
| ASSET TYPE BREAKDOWN (%)7,8 | |
| Common Equities and ADRs | | | 86.0 | |
| Convertible Corporate Bonds | | | 8.2 | |
| Preferred Equities | | | 2.0 | |
| Cash and Other Assets, Less Liabilities | | | 3.8 | |
| 6 | Not all countries where the Fund may invest are included in the benchmark index. |
| 7 | Source: FactSet Research Systems. Percentage values in data are rounded to the nearest tenth of one percent, so the values may not sum to 100% due to rounding. Percentage values may be derived from different data sources and may not be consistent with other Fund literature. |
| 8 | Bonds are not included in the MSCI All Country Asia ex Japan Index. |
Matthews Asian Growth and Income Fund
Portfolio Manager Commentary (unaudited) (continued)
Notable Portfolio Changes:
During the second quarter, we added seven new holdings and exited eight holdings amidst an environment where the outlook for companies is changing rapidly. In general terms, this has caused an increase to our weighting within mainland China and a decrease in Hong Kong as we remain concerned about the impacts of the new security law. Within equities, we added new positions in Lepu Medical, China Yangtze Power, LINK REIT, Digital Telecom Infrastructure Fund in Thailand and TCS in India. To fund these, we exited Pacific Textiles, Fortune REIT, HSBC, Cognizant in the U.S. and Kasikornbank in Thailand.
This is significant change for the portfolio. We had noted in the first quarter that part of our process during periods of volatility was to look to upgrade our holdings. Many of these transitions are a manifestation of this. As an example, we believe that LINK REIT is better positioned in Hong Kong than Fortune REIT, in our view, due to its superior diversity, quality of assets and asset enhancement history. Recent weakness allowed this switch. We have also purposefully cut our weightings in commercial banks given stress on asset quality, margins, capital and dividends.
There has also been some change in our convertible bonds, with Chinese sportswear company Anta being added after exiting bonds in China Mengniu, Zhongsheng and Top Glove. This followed strong performance in the latter two.
Outlook:
After what has been an unprecedented first half of the year in 2020, the second half and beyond requires continued caution. It appears that Asia, and China in particular, is well placed in our view, relative to the rest of the globe in the speed at which it may be able to return to 2019 levels of economic activity. However, it remains unclear what the ramifications of the coronavirus pandemic will have upon consumer behavior as well as the attitude that corporate management teams will have toward risk taking. This could impinge upon consumer spending, capital expenditure budgets, dividend policies and views around what appropriate capital structures are in an era of outlandish debt levels. Further, market performance may also be dictated by the forces of an impending U.S. election and once again rising geopolitical tensions between the globe’s two largest economies. Not only is there a risk of increasing barriers to trade, but a move away from just in time toward just in case supply chains and a potential technological divide between the two countries could hamper global growth and productivity.
At a fundamental level, it will be some time before companies are able to recover prior levels of profitability. Ongoing stimulus measures should help smooth this path, but it remains bumpy. Despite this, markets have priced in an imminent resumption of growth with Asia ex. Japan earnings expected to rise over 20% in 2021, and the benchmark trading at 13.9x those earnings estimates.
For the Fund, we remain constructive. Asia’s relative economic standing is solid, but volatility is likely to persist and growth across the globe weaker. We believe that a focus on quality investing that incorporates both a keen eye on mitigating volatility and producing total returns through the steadier means of balancing growth and income should be well placed to deliver for clients.
Matthews Asian Growth and Income Fund
June 30, 2020
Schedule of Investmentsa (unaudited)
COMMON EQUITIES: 86.0%
| | | | | | | | |
| | | Shares | | | Value | |
| | |
| CHINA/HONG KONG: 39.0% | | | | | | | | |
Tencent Holdings, Ltd. | | | 1,014,400 | | | | $65,000,635 | |
| | |
AIA Group, Ltd. | | | 4,998,400 | | | | 46,773,053 | |
| | |
Techtronic Industries Co., Ltd. | | | 2,632,000 | | | | 26,042,471 | |
| | |
NetEase, Inc. ADR | | | 53,200 | | | | 22,843,016 | |
| | |
Jiangsu Yanghe Brewery Joint-Stock Co., Ltd. A Shares | | | 1,513,444 | | | | 22,600,173 | |
| | |
Yum China Holdings, Inc. | | | 449,300 | | | | 21,597,851 | |
| | |
Midea Group Co., Ltd. A Shares | | | 2,372,079 | | | | 20,119,418 | |
| | |
Jiangsu Expressway Co., Ltd. H Shares | | | 16,770,000 | | | | 19,710,180 | |
| | |
China Yangtze Power Co., Ltd. A Shares | | | 7,295,600 | | | | 19,598,899 | |
| | |
HKT Trust & HKT, Ltd. | | | 13,284,000 | | | | 19,493,852 | |
| | |
Inner Mongolia Yili Industrial Group Co., Ltd. A Shares | | | 4,376,775 | | | | 19,335,196 | |
| | |
Shanghai International Airport Co., Ltd. A Shares | | | 1,834,462 | | | | 18,740,098 | |
| | |
Zhejiang Supor Co., Ltd. A Shares | | | 1,809,028 | | | | 18,229,917 | |
| | |
CLP Holdings, Ltd. | | | 1,726,200 | | | | 16,953,427 | |
| | |
CK Asset Holdings, Ltd. | | | 2,810,172 | | | | 16,852,024 | |
| | |
Guangdong Investment, Ltd. | | | 9,648,000 | | | | 16,641,726 | |
| | |
CK Hutchison Holdings, Ltd. | | | 2,540,172 | | | | 16,449,105 | |
| | |
Link REIT | | | 1,827,400 | | | | 15,003,259 | |
| | |
Minth Group, Ltd. | | | 5,196,000 | | | | 14,915,133 | |
| | |
BOC Hong Kong Holdings, Ltd. | | | 4,545,000 | | | | 14,552,611 | |
| | |
Lepu Medical Technology Beijing Co., Ltd. | | | | | | | | |
A Shares | | | 2,661,573 | | | | 13,758,148 | |
| | |
Jardine Matheson Holdings, Ltd. | | | 289,300 | | | | 12,095,875 | |
| | |
China Mobile, Ltd. ADR | | | 334,100 | | | | 11,239,124 | |
| | | | | | | | |
Total China/Hong Kong | | | | | | | 488,545,191 | |
| | | | | | | | |
| | | | | | | | |
| | | |
| SINGAPORE: 8.6% | | | | | | | | |
Ascendas, REIT | | | 10,266,184 | | | | 23,554,859 | |
| | |
Singapore Technologies Engineering, Ltd. | | | 8,765,425 | | | | 20,920,854 | |
| | |
Venture Corp., Ltd. | | | 1,614,300 | | | | 18,865,847 | |
| | |
Singapore Telecommunications, Ltd. | | | 10,515,700 | | | | 18,706,356 | |
| | |
United Overseas Bank, Ltd. | | | 1,193,000 | | | | 17,431,958 | |
| | |
Ascendas India Trust | | | 8,946,700 | | | | 8,675,461 | |
| | | | | | | | |
Total Singapore | | | | | | | 108,155,335 | |
| | | | | | | | |
| | | | | | | | |
| | | |
| TAIWAN: 8.4% | | | | | | | | |
Taiwan Semiconductor Manufacturing Co., Ltd. | | | 5,754,187 | | | | 61,451,957 | |
| | |
Advantech Co., Ltd. | | | 2,302,000 | | | | 23,166,740 | |
| | |
Taiwan Secom Co., Ltd. | | | 7,112,000 | | | | 21,049,990 | |
| | | | | | | | |
Total Taiwan | | | | | | | 105,668,687 | |
| | | | | | | | |
| | | | | | | | |
| | | |
| SOUTH KOREA: 7.8% | | | | | | | | |
Samsung Electronics Co., Ltd. | | | 823,968 | | | | 36,475,113 | |
| | |
Macquarie Korea Infrastructure Fund | | | 2,708,261 | | | | 25,750,987 | |
| | |
Coway Co., Ltd. | | | 330,466 | | | | 19,978,153 | |
| | |
Hanon Systems | | | 2,016,529 | | | | 15,282,684 | |
| | | | | | | | |
Total South Korea | | | | | | | 97,486,937 | |
| | | | | | | | |
| | | | | | | | |
| | | | | | | | |
| | | Shares | | | Value | |
| | | |
| INDIA: 6.5% | | | | | | | | |
Housing Development Finance Corp., Ltd. | | | 979,513 | | | | $22,775,756 | |
| | |
Sanofi India, Ltd. | | | 165,908 | | | | 17,307,445 | |
| | |
Tata Consultancy Services, Ltd. | | | 628,279 | | | | 17,294,967 | |
| | |
ITC, Ltd.b | | | 6,217,860 | | | | 16,055,088 | |
| | |
Embassy Office Parks, REIT | | | 1,644,000 | | | | 7,481,180 | |
| | | | | | | | |
Total India | | | | | | | 80,914,436 | |
| | | | | | | | |
| | | | | | | | |
| | | |
| FRANCE: 3.2% | | | | | | | | |
LVMH Moet Hennessy Louis Vuitton SE | | | 46,973 | | | | 20,738,257 | |
| | |
Pernod Ricard SA | | | 121,618 | | | | 19,150,657 | |
| | | | | | | | |
Total France | | | | | | | 39,888,914 | |
| | | | | | | | |
| | | | | | | | |
| | | |
| INDONESIA: 2.8% | | | | | | | | |
PT Ace Hardware Indonesiab | | | 167,711,400 | | | | 17,760,287 | |
| | |
PT Bank Rakyat Indonesia Persero | | | 78,744,300 | | | | 16,807,430 | |
| | | | | | | | |
Total Indonesia | | | | | | | 34,567,717 | |
| | | | | | | | |
| | | | | | | | |
| | | |
| UNITED STATES: 1.8% | | | | | | | | |
Broadcom, Inc. | | | 70,600 | | | | 22,282,066 | |
| | | | | | | | |
Total United States | | | | | | | 22,282,066 | |
| | | | | | | | |
| | | | | | | | |
| | | |
| JAPAN: 1.5% | | | | | | | | |
KDDI Corp. | | | 624,900 | | | | 18,645,233 | |
| | | | | | | | |
Total Japan | | | | | | | 18,645,233 | |
| | | | | | | | |
| | | | | | | | |
| | | |
| PHILIPPINES: 1.4% | | | | | | | | |
Bank of the Philippine Islands | | | 12,247,404 | | | | 17,746,490 | |
| | | | | | | | |
Total Philippines | | | | | | | 17,746,490 | |
| | | | | | | | |
| | | | | | | | |
| | | |
| VIETNAM: 1.4% | | | | | | | | |
Vietnam Dairy Products JSC | | | 3,596,093 | | | | 17,578,658 | |
| | | | | | | | |
Total Vietnam | | | | | | | 17,578,658 | |
| | | | | | | | |
| | | | | | | | |
| | | |
| UNITED KINGDOM: 1.3% | | | | | | | | |
Prudential PLC | | | 1,125,099 | | | | 16,953,010 | |
| | | | | | | | |
Total United Kingdom | | | | | | | 16,953,010 | |
| | | | | | | | |
| | | | | | | | |
| | | |
| AUSTRALIA: 1.3% | | | | | | | | |
Macquarie Group, Ltd. | | | 197,166 | | | | 16,363,176 | |
| | | | | | | | |
Total Australia | | | | | | | 16,363,176 | |
| | | | | | | | |
| | | | | | | | |
| | | |
| THAILAND: 1.0% | | | | | | | | |
Digital Telecommunications Infrastructure Fund F Shares | | | 25,577,000 | | | | 12,539,899 | |
| | | | | | | | |
Total Thailand | | | | | | | 12,539,899 | |
| | | | | | | | |
| | | | | | | | |
| | | |
| TOTAL COMMON EQUITIES | | | | | | | 1,077,335,749 | |
| | | | | | | | |
(Cost $968,561,957) | | | | | | | | |
| | | | |
| matthewsasia.com | 800.789.ASIA | | | 23 | |
Matthews Asian Growth and Income Fund
June 30, 2020
Schedule of Investmentsa (unaudited) (continued)
| | |
| CONVERTIBLE CORPORATE BONDS: 8.2% | | PREFERRED EQUITIES: 2.0% |
| | | | | | | | |
| | | Face Amount* | | | Value | |
| | | | | | | | |
| | |
| CHINA/HONG KONG: 6.4% | | | | | | | | |
|
Bosideng International Holdings, Ltd., Cnv. | |
1.000%, 12/17/24c | | | 24,700,000 | | | | $20,871,500 | |
| | |
ANLLIAN Capital, Ltd., Cnv. 0.000%, 02/05/25c | | | EUR 14,800,000 | | | | 15,439,375 | |
| |
China Education Group Holdings, Ltd., Cnv. | | | | | |
2.000%, 03/28/24c | | | HKD 111,000,000 | | | | 15,218,773 | |
| | |
Harvest International Co., Cnv.
0.000%, 11/21/22c | | | HKD 111,000,000 | | | | 14,658,090 | |
| | |
Luye Pharma Group, Ltd., Cnv.
1.500%, 07/09/24c | | | 14,101,000 | | | | 13,436,138 | |
| | | | | | | | |
Total China/Hong Kong | | | | | | | 79,623,876 | |
| | | | | | | | |
| | | | | | | | |
| | | |
| SINGAPORE: 1.7% | | | | | | | | |
CapitaLand, Ltd., Cnv.
1.950%, 10/17/23c | | | SGD 31,250,000 | | | | 21,448,497 | |
| | | | | | | | |
Total Singapore | | | | | | | 21,448,497 | |
| | | | | | | | |
| | | | | | | | |
| | | |
| UNITED STATES: 0.1% | | | | | | | | |
JPMorgan Chase Bank NA, Cnv.
0.125%, 01/01/23d | | | 1,539,000 | | | | 1,623,645 | |
| | | | | | | | |
Total United States | | | | | | | 1,623,645 | |
| | | | | | | | |
| | | | | | | | |
| | |
| TOTAL CONVERTIBLE CORPORATE BONDS | | | | 102,696,018 | |
| | | | | | | | |
(Cost $109,688,509) | | | | | | | | |
| | | | | | | | |
| | | Shares | | | Value | |
| | | | | | | | |
| | |
| SOUTH KOREA: 2.0% | | | | | | | | |
LG Household & Health Care, Ltd., Pfd. | | | 41,042 | | | | $24,863,573 | |
| | | | | | | | |
Total South Korea | | | | | | | 24,863,573 | |
| | | | | | | | |
| | | | | | | | |
| | | |
| TOTAL PREFERRED EQUITIES | | | | | | | 24,863,573 | |
| | | | | | | | |
(Cost $11,577,044) | | | | | | | | |
| | | | | | | | |
| | | |
| TOTAL INVESTMENTS: 96.2% | | | | | | | 1,204,895,340 | |
(Cost $1,089,827,510) | | | | | | | | |
| | | | | | | | |
| | |
CASH AND OTHER ASSETS,
LESS LIABILITIES: 3.8% | | | | | | | 47,338,340 | |
| | | | | | | | |
| | |
NET ASSETS: 100.0% | | | | | | | $1,252,233,680 | |
| | | | | | | | |
| a | Certain securities were fair valued under the valuation policies approved by the Board of Trustees (Note 2-A). |
| b | Non-income producing security. |
| c | The securities may be resold to qualified foreign investors and foreign institutional buyers under Regulation S of the Securities Act of 1933. |
| d | Security exempt from registration under Rule 144A of the Securities Act of 1933, as amended. The security may be resold in transactions exempt from registration normally to qualified institutional buyers. The security has been determined to be liquid in accordance with procedures adopted by the Funds’ Board of Trustees. At June 30, 2020, the aggregate value is $1,623,645, which is 0.13% of net assets. |
| * | All Values in USD unless otherwise specified |
| ADR | American Depositary Receipt |
| REIT | Real Estate Investment Trust |
See accompanying notes to financial statements.
| | | | |
| PORTFOLIO MANAGERS |
| |
| Yu Zhang, CFA | | |
Lead Manager | | |
| |
| Robert Horrocks, PhD | | S. Joyce Li, CFA |
Co-Manager | | Co-Manager |
| |
| Sherwood Zhang, CFA | | |
Co-Manager | | |
|
| FUND FACTS |
| | |
| | | Investor | | Institutional |
Ticker | | MAPIX | | MIPIX |
CUSIP | | 577125107 | | 577130750 |
Inception | | 10/31/06 | | 10/29/10 |
NAV | | $16.84 | | $16.84 |
Initial Investment | | $2,500 | | $100,000 |
Gross Expense Ratio1 | | 1.03% | | 0.93% |
After Fee Waiver and Reimbursement2 | | 1.02% | | 0.92% |
Portfolio Statistics |
Total # of Positions | | 57 |
Net Assets | | $3.8 billion |
Weighted Average Market Cap | | $45.5 billion |
Portfolio Turnover3 | | 30.32% |
Benchmark | | | | |
MSCI AC Asia Pacific Index |
OBJECTIVE
Total return with an emphasis on providing current income.
STRATEGY
Under normal market conditions, the Fund seeks to achieve its investment objective by investing at least 80% of its net assets, which include borrowings for investment purposes, in dividend-paying equity securities of companies located in Asia. Asia consists of all countries and markets in Asia, and includes developed, emerging and frontier countries and markets in the Asian region. The Fund may also invest in convertible debt and equity securities of companies located in Asia.
Matthews Asia Dividend Fund
Portfolio Manager Commentary (unaudited)
For the first half of 2020, the Matthews Asia Dividend Fund returned –2.62% (Investor Class) and –2.57% (Institutional Class), while its benchmark, the MSCI All Country Asia Pacific Index, returned –6.29% over the same period. For the quarter ending June 30, the Fund returned 20.37% (Investor Class) and 20.40% (Institutional Class), while the benchmark returned 15.99%.
Market Environment:
Asian equities staged a sharp rally during the second quarter of 2020, recovering a significant portion of the steep losses incurred during the first quarter. Having learned from previous crisis moments, central banks and governments in Asia responded very quickly with an unprecedented liquidity injection and fiscal stimulus measures, providing a much-needed backstop to the real economy and to the capital market. As the Asian region, led by North Asia, effectively flattened the COVID-19 curve and started shifting focus towards economic recovery, equity investors also looked beyond the near-term corporate earnings headwind. Instead, investors were positioning for an economic rebound by bidding up equity prices.
Performance Contributors and Detractors:
The Fund performed well during the current market rally. Using a barbell approach, which invests in both higher-yielding dividend paying stocks together with faster-growing dividend growth stocks, we steadily increased the portfolio’s overall exposure towards dividend growth stocks amid the first quarter market volatility. The “dividend growth” bucket of the portfolio delivered strong returns during the second quarter. Among some of the top-performing dividend growth stocks during the quarter was China Int’l Travel Service (CITS), a Chinese duty-free store operator listed in the mainland A-share market. While travel retail industry is going through a very challenging operating environment globally, CITS saw its underlying duty-free store business in Hainan Island—a famous tourist spot for Chinese consumers, recover swiftly thanks to a favorable policy change which increased the duty-free allowance from RMB 30,000 per annum to RMB 100,000 per annum for Chinese visitors to the island. The market responded very favorably towards this latest change, and CITS’s share price more than doubled during the quarter (the company recently changed its corporate name from CITS to China Tourism Duty Free Corp, a better reflection of its underlying duty-free shopping business).
On the other hand, stocks with defensive earnings streams but with more moderated growth profiles became the relative laggards during the quarter. Top detractors to performance included Japanese wireless telecom carrier NTT DoCoMo and Japanese small-cap medical device manufacturer Eiken Chemical. Both DoCoMo and Eiken outperformed during the first quarter, as the underlying business was either minimally affected, in the case of DoCoMo’s telecom business, or was benefiting from new demand due to the pandemic (Eiken introduced a COVID-19 testing kit). However, as the market moved from a defensive posture into more of a “risk-on” mode, these defensive businesses became less of a focus area for the market.
Notable Portfolio Changes:
During the second quarter, we initiated several new positions, focusing on firstly finding new dividend growth stocks whose underlying business is
(continued)
| 1 | Prospectus expense ratios. |
| 2 | Matthews has contractually agreed to waive a portion of its advisory fee and administrative and shareholder services fee if the Fund’s average daily net assets are over $3 billion, as follows: for every $2.5 billion average daily net assets of the Fund that are over $3 billion, the advisory fee rate and the administrative and shareholder services fee rate for the Fund with respect to such excess average daily net assets will be each reduced by 0.01%, in each case without reducing such fee rate below 0.00%. Any amount waived by Matthews pursuant to this agreement may not be recouped by Matthews. This agreement will remain in place until April 30, 2021 and may be terminated (i) at any time by the Board of Trustees upon 60 days’ prior written notice to Matthews; or (ii) by Matthews at the annual expiration date of the agreement upon 60 days’ prior written notice to the Trust, in each case without payment of any penalty. |
| 3 | The lesser of fiscal year 2019 long-term purchase costs or sales proceeds divided by the average monthly market value of long-term securities. |
| | | | |
| matthewsasia.com | 800.789.ASIA | | | 25 | |
| | | | | | | | | | | | | | | | | | | | | | | | | | | | | | | | |
| |
| PERFORMANCE AS OF JUNE 30, 2020 | |
| | | | | | | | | | | | Average Annual Total Returns | | | | |
| | | 3 Months | | | YTD | | | 1 Year | | | 3 Years | | | 5 Years | | | 10 Years | | | Since
Inception | | | Inception
Date | |
| Investor Class (MAPIX) | | | 20.37% | | | | -2.62% | | | | 2.31% | | | | 2.26% | | | | 4.09% | | | | 6.95% | | | | 7.98% | | | | 10/31/06 | |
| Institutional Class (MIPIX) | | | 20.40% | | | | -2.57% | | | | 2.48% | | | | 2.39% | | | | 4.21% | | | | n.a. | | | | 5.89% | | | | 10/29/10 | |
| MSCI AC Asia Pacific Index4 | | | 15.99% | | | | -6.29% | | | | 1.35% | | | | 3.50% | | | | 4.33% | | | | 6.30% | | | | 4.03% | 5 | | | | |
Performance assumes reinvestment of all dividends and/or distributions before taxes. All performance quoted represents past performance and is no guarantee of future results. Investment return and principal value will fluctuate with market conditions so that when redeemed, shares may be worth more or less than their original cost. Current performance may be lower or higher than the return figures quoted. Returns would have been lower if certain of the Fund’s fees and expenses had not been waived. For the Fund’s most recent month-end performance, visit matthewsasia.com.
| | | | | | | | | | | | | | | | | | | | | | | | | | | | | | | | | | | | | | | | | | | | |
| | | | | | | | | | |
| INCOME DISTRIBUTION HISTORY | | | | | | | | | | | | | | | | | | | | | | | | | | | | |
| | | 2020 | | | | | | 2019 | |
| | | Q1 | | | Q2 | | | Q3 | | | Q4 | | | Total | | | | | | Q1 | | | Q2 | | | Q3 | | | Q4 | | | Total | |
| Investor (MAPIX) | | $ | 0.04 | | | $ | 0.12 | | | | n.a. | | | | n.a. | | | $ | 0.16 | | | | | | | $ | 0.03 | | | $ | 0.12 | | | $ | 0.11 | | | $ | 0.09 | | | $ | 0.36 | |
| Inst’l (MIPIX) | | $ | 0.05 | | | $ | 0.12 | | | | n.a. | | | | n.a. | | | $ | 0.17 | | | | | | | $ | 0.04 | | | $ | 0.12 | | | $ | 0.12 | | | $ | 0.10 | | | $ | 0.37 | |
Note: This table does not include capital gains distributions. Totals may differ by $0.02 due to rounding and a return of capital. For distribution history please visit matthewsasia.com.
| | | | |
| | | |
30-DAY YIELD: Investor Class: 1.18% (1.17% excluding waivers) Institutional Class: 1.27% (1.26% excluding waivers) The 30-Day Yield represents net investment income earned by the Fund over the 30-day period ended 6/30/20, expressed as an annual percentage rate based on the Fund’s share price at the end of the 30-day period. The 30-Day Yield should be regarded as an estimate of the Fund’s rate of investment income, and it may not equal the Fund’s actual income distribution rate. Source: BNY Mellon Investment Servicing (US) Inc. | | | | DIVIDEND YIELD: 2.35% The dividend yield (trailing) for the portfolio is the weighted average sum of the dividends paid by each equity security held by the Fund over the 12 months ended 6/30/20 divided by the current price of each equity as of 6/30/20. The annualized dividend yield for the Fund is for the equity-only portion of the portfolio. Please note that this is based on gross equity portfolio holdings and does not reflect the actual yield an investor in the Fund would receive. Past yields are no guarantee of future yields. Source: FactSet Research Systems, Bloomberg, MICM. |
GROWTH OF A HYPOTHETICAL $10,000 INVESTMENT SINCE INCEPTION—INVESTOR CLASS
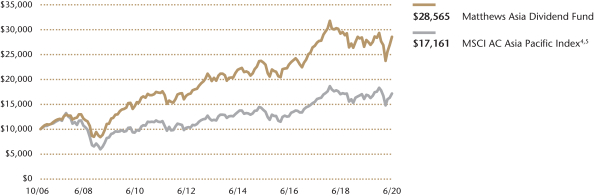
Plotted monthly. The performance data and graph do not reflect the deduction of taxes that a shareholder would pay on dividends, capital gains distributions or redemption of Fund shares. Values are in US$.
| | 4 | It is not possible to invest directly in an index. Source: Index data from Morgan Stanley Capital International and Bloomberg; total return calculations performed by BNY Mellon Investment Servicing (US) Inc. Please see page 90 for index definition. |
| | 5 | Calculated from 10/31/06. |
| | | | | | | | |
| | | | |
| TOP TEN HOLDINGS6 | | | | | | | |
| | | Sector | | Country | | % of Net Assets | |
| Minth Group, Ltd. | | Consumer Discretionary | | China/Hong Kong | | | 4.9% | |
| China Tourism Group Duty Free Corp., Ltd. | | Consumer Discretionary | | China/Hong Kong | | | 3.8% | |
| Anritsu Corp. | | Information Technology | | Japan | | | 3.8% | |
| Chongqing Brewery Co., Ltd. | | Consumer Staples | | China/Hong Kong | | | 3.3% | |
| Taiwan Semiconductor Manufacturing Co., Ltd. | | Information Technology | | Taiwan | | | 3.2% | |
| Breville Group, Ltd. | | Consumer Discretionary | | Australia | | | 3.1% | |
| Hoya Corp. | | Health Care | | Japan | | | 3.0% | |
| LG Chem, Ltd., Pfd. | | Materials | | South Korea | | | 3.0% | |
| MISUMI Group, Inc. | | Industrials | | Japan | | | 3.0% | |
| Shenzhou International Group Holdings, Ltd. | | Consumer Discretionary | | China/Hong Kong | | | 2.7% | |
| % OF ASSETS IN TOP TEN | | | | | | | 33.8% | |
| | 6 | Holdings may combine more than one security from same issuer and related depositary receipts. |
Matthews Asia Dividend Fund
Portfolio Manager Commentary (unaudited) (continued)
positively exposed to more secular growth trends. Secondly, we also added certain cyclical businesses whose fundamentals are negatively affected by the virus outbreak to pair with the dividend growers. The valuation discount on these cyclical businesses is very significant, but we believe the long-term strength of these companies remains intact and have the potential to rebound back from the current downturn. Among the new dividend growth names is Pharmaron Beijing, a Chinese contract-research-organization (CRO) company providing research and development outsourcing services to global pharmaceutical firms. The company is in a rapid growth phase. With rising scale, Pharmaron has seen a meaningful expansion of its profit margin and has turned free-cash-flow positive. Dividend payment was also initiated and has been growing rapidly.
Among the cyclical recovery names is our new position in BOC Aviation, an aircraft leasing company based in Singapore. BOC Aviation’s stock was heavily punished by the market, down about 35% as of the end of the second quarter because of the deep disruption to the global aviation industry. While we share the market’s concern on the aviation industry headwind, from a bottom-up perspective we consider BOC Aviation to be one of the higher-quality aircraft financing vendors globally. The company is run by a well-seasoned management team who has been through multiple industry cycles. Owning one of the newer aircraft fleet assets with long-term leasing contracts, the company is also receiving a strong financial backing from its parent company Bank of China. With these relative competitive advantages, the company is adopting a counter-cycle strategy, actively expanding its aircraft leasing business during the current industry downturn. Trading at 0.8 times price-to-book against a normalized mid-teen ROE, and with a 6% trailing dividend yield, we think the risk-reward profile on the stock is quite attractive.
Outlook:
Looking ahead we see two potential risks that could have major market implications. First, the risk of the coronavirus resurgence and its impact on the re-opening of global economy could continue to dictate short-term market volatility. While the Asian economy as a whole is better positioned for a strong revival due to more effective virus suppression, individual countries, such as India, are still struggling with its virus control efforts and economic recovery is being pushed out. Second, the downward spiral of U.S.—China relations has the potential of upending the decades’-long geopolitical stability, a crucial factor behind the booming of Asia’s economy. Notwithstanding, improving signs of economic recovery, led by China, are building a solid fundamental foundation to sustain the current equity rally. In the current environment, we believe our dividend investment approach of balancing stable dividend payers with fast-growing dividend growers continues to offer a sensible way of tapping Asian-regional’s long-term growth potential.
| | | | |
| |
| COUNTRY ALLOCATION (%)7,8 | |
| China/Hong Kong | | | 35.5 | |
| Japan | | | 31.9 | |
| South Korea | | | 8.6 | |
| Singapore | | | 7.5 | |
| Australia | | | 6.2 | |
| Taiwan | | | 3.7 | |
| Philippines | | | 2.0 | |
| India | | | 1.6 | |
| Thailand | | | 1.6 | |
| Bangladesh | | | 1.2 | |
Cash and Other Assets, Less Liabilities | | | 0.1 | |
| Total | | | 99.9 | |
| | | | |
| SECTOR ALLOCATION (%)8 | |
| Consumer Discretionary | | | 29.2 | |
| Consumer Staples | | | 13.4 | |
| Information Technology | | | 13.0 | |
| Industrials | | | 11.8 | |
| Communication Services | | | 11.5 | |
| Real Estate | | | 8.8 | |
| Health Care | | | 6.6 | |
| Materials | | | 3.5 | |
Financials | | | 2.0 | |
Cash and Other Assets, Less Liabilities | | | 0.1 | |
| Total | | | 99.9 | |
| | | | |
| MARKET CAP EXPOSURE (%)8 | |
| Mega Cap (over $25B) | | | 31.6 | |
| Large Cap ($10B–$25B) | | | 15.8 | |
| Mid Cap ($3B–10B) | | | 29.8 | |
| Small Cap (under $3B) | | | 22.7 | |
| Cash and Other Assets, Less Liabilities | | | 0.1 | |
| 7 | Not all countries where the Fund may invest are included in the benchmark index. |
| 8 | Source: FactSet Research Systems. Percentage values in data are rounded to the nearest tenth of one percent, so the values may not sum to 100% due to rounding. Percentage values may be derived from different data sources and may not be consistent with other Fund literature. |
| | | | |
| matthewsasia.com | 800.789.ASIA | | | 27 | |
Matthews Asia Dividend Fund
June 30, 2020
Schedule of Investmentsa (unaudited)
COMMON EQUITIES: 95.1%
| | | | | | | | |
| | | Shares | | | Value | |
|
| CHINA/HONG KONG: 35.5% | |
Minth Group, Ltd.† | | | 64,635,000 | | | | $185,534,957 | |
| | |
China Tourism Group Duty Free Corp., Ltd. A Shares | | | 6,576,311 | | | | 144,198,885 | |
| | |
Chongqing Brewery Co., Ltd. A Shares | | | 12,305,570 | | | | 127,394,420 | |
| | |
Shenzhou International Group Holdings, Ltd. | | | 8,406,100 | | | | 102,194,759 | |
| | |
Zhongsheng Group Holdings, Ltd. | | | 17,974,000 | | | | 100,523,713 | |
| | |
Tencent Holdings, Ltd. | | | 1,392,900 | | | | 89,254,125 | |
| | |
Gree Electric Appliances, Inc. of Zhuhai A Shares | | | 10,169,803 | | | | 81,719,079 | |
| | |
HKBN, Ltd. | | | 46,034,623 | | | | 80,724,641 | |
| | |
China Education Group Holdings, Ltd.b | | | 45,563,000 | | | | 73,477,679 | |
| | |
Yuexiu Transport Infrastructure, Ltd.† | | | 93,902,000 | | | | 65,871,323 | |
| | |
China Resources Land, Ltd. | | | 16,316,000 | | | | 62,362,937 | |
| | |
Pharmaron Beijing Co., Ltd. A Shares | | | 4,327,964 | | | | 60,222,510 | |
| | |
Wuliangye Yibin Co., Ltd. A Shares | | | 2,427,344 | | | | 59,005,809 | |
| | |
China East Education Holdings, Ltd.b,c | | | 31,845,000 | | | | 57,887,928 | |
| | |
Sun Art Retail Group, Ltd. | | | 27,221,500 | | | | 46,701,821 | |
| | |
Pharmaron Beijing Co., Ltd. H Sharesb,c | | | 1,609,500 | | | | 16,668,620 | |
| | |
WH Group, Ltd.b,c | | | 2,255,000 | | | | 1,948,758 | |
| | |
Crystal International Group, Ltd.b,c | | | 6,860,000 | | | | 1,496,529 | |
| | | | | | | | |
Total China/Hong Kong | | | | | | | 1,357,188,493 | |
| | | | | | | | |
| | | | | | | | |
| |
| JAPAN: 31.9% | |
Anritsu Corp. | | | 6,038,300 | | | | 143,453,217 | |
| | |
Hoya Corp. | | | 1,206,400 | | | | 115,523,653 | |
| | |
MISUMI Group, Inc. | | | 4,559,400 | | | | 114,479,202 | |
| | |
KATITAS Co., Ltd.† | | | 4,210,800 | | | | 97,964,485 | |
| | |
Pigeon Corp. | | | 2,198,400 | | | | 85,089,258 | |
| | |
Nintendo Co., Ltd. | | | 173,000 | | | | 77,342,911 | |
| | |
Bandai Namco Holdings, Inc. | | | 1,376,500 | | | | 72,456,306 | |
| | |
BELLSYSTEM24 Holdings, Inc.† | | | 5,137,700 | | | | 66,858,350 | |
| | |
LIXIL Group Corp. | | | 4,632,900 | | | | 65,065,720 | |
| | |
Disco Corp. | | | 263,600 | | | | 64,289,053 | |
| | |
TDK Corp. | | | 598,500 | | | | 59,581,529 | |
| | |
Kao Corp. | | | 718,700 | | | | 57,034,463 | |
| | |
Oriental Land Co., Ltd. | | | 428,600 | | | | 56,637,832 | |
| | |
MANI, INC. | | | 2,038,000 | | | | 54,103,758 | |
| | |
Shiseido Co., Ltd. | | | 678,200 | | | | 43,215,334 | |
| | |
Mitsubishi Pencil Co., Ltd. | | | 2,403,000 | | | | 30,145,767 | |
| | |
Daifuku Co., Ltd. | | | 129,800 | | | | 11,374,646 | |
| | |
Eiken Chemical Co., Ltd. | | | 403,000 | | | | 6,450,892 | |
| | | | | | | | |
Total Japan | | | | | | | 1,221,066,376 | |
| | | | | | | | |
| | | | | | | | |
| |
| SINGAPORE: 7.5% | |
Keppel DC, REIT | | | 39,365,580 | | | | 72,091,241 | |
| | |
NetLink NBN Trustb | | | 98,664,300 | | | | 68,918,175 | |
| | |
Ascendas India Trust | | | 57,288,600 | | | | 55,551,772 | |
| | |
CapitaLand Retail China Trust, REIT | | | 51,969,100 | | | | 47,424,750 | |
| | |
BOC Aviation, Ltd.b,c | | | 6,857,300 | | | | 44,144,186 | |
| | | | | | | | |
Total Singapore | | | | | | | 288,130,124 | |
| | | | | | | | |
| | | | | | | | |
| |
| AUSTRALIA: 6.2% | |
Breville Group, Ltd.† | | | 7,564,257 | | | | 119,567,691 | |
| | |
Macquarie Group, Ltd. | | | 765,538 | | | | 63,533,436 | |
| | |
Sydney Airport | | | 13,935,221 | | | | 54,996,429 | |
| | | | | | | | |
Total Australia | | | | | | | 238,097,556 | |
| | | | | | | | |
| | | | | | | | |
| | | Shares | | | Value | |
|
| SOUTH KOREA: 3.9% | |
Hyundai Mobis Co., Ltd. | | | 457,734 | | | | $73,475,102 | |
| | |
Samsung Electronics Co., Ltd. | | | 914,230 | | | | 40,470,797 | |
| | |
BGF Retail Co., Ltd. | | | 287,799 | | | | 33,361,026 | |
| | | | | | | | |
Total South Korea | | | | | | | 147,306,925 | |
| | | | | | | | |
| | | | | | | | |
| |
| TAIWAN: 3.7% | |
Taiwan Semiconductor Manufacturing Co., Ltd. ADR | | | 1,210,140 | | | | 68,699,648 | |
| | |
Taiwan Semiconductor Manufacturing Co., Ltd. | | | 4,934,469 | | | | 52,697,762 | |
| | |
China Steel Chemical Corp. | | | 5,272,000 | | | | 18,818,417 | |
| | | | | | | | |
Total Taiwan | | | | | | | 140,215,827 | |
| | | | | | | | |
| | | | | | | | |
| |
| PHILIPPINES: 2.0% | |
Globe Telecom, Inc. | | | 1,872,220 | | | | 77,816,261 | |
| | | | | | | | |
Total Philippines | | | | | | | 77,816,261 | |
| | | | | | | | |
| | | | | | | | |
| |
| INDIA: 1.6% | |
Minda Industries, Ltd.† | | | 13,532,234 | | | | 49,285,693 | |
| | |
HDFC Bank, Ltd. | | | 965,013 | | | | 13,563,762 | |
| | | | | | | | |
Total India | | | | | | | 62,849,455 | |
| | | | | | | | |
| | | | | | | | |
| |
| THAILAND: 1.6% | |
Thai Beverage Public Co., Ltd. | | | 123,128,000 | | | | 60,106,538 | |
| | | | | | | | |
Total Thailand | | | | | | | 60,106,538 | |
| | | | | | | | |
| | | | | | | | |
| |
| BANGLADESH: 1.2% | |
GrameenPhone, Ltd. | | | 16,665,233 | | | | 45,173,878 | |
| | | | | | | | |
Total Bangladesh | | | | | | | 45,173,878 | |
| | | | | | | | |
| | | | | | | | |
| | |
| TOTAL COMMON EQUITIES | | | | 3,637,951,433 | |
| | | | | | | | |
(Cost $2,868,519,144) | | | | | | | | |
| | | | | | | | |
| | |
PREFERRED EQUITIES: 4.8% | | | | | | | | |
| |
| SOUTH KOREA: 4.8% | |
LG Chem, Ltd., Pfd. | | | 545,384 | | | | 114,740,796 | |
| | |
Samsung Electronics Co., Ltd., Pfd. | | | 1,733,915 | | | | 67,543,453 | |
| | | | | | | | |
Total South Korea | | | | | | | 182,284,249 | |
| | | | | | | | |
| | | | | | | | |
| | |
| TOTAL PREFERRED EQUITIES | | | | 182,284,249 | |
| | | | | | | | |
(Cost $112,743,798) | | | | | | | | |
| | | | | | | | |
| | |
| TOTAL INVESTMENTS: 99.9% | | | | 3,820,235,682 | |
(Cost $2,981,262,942) | | | | | | | | |
| | | | | | | | |
| | |
CASH AND OTHER ASSETS,
LESS LIABILITIES: 0.1% | | | | | | | 3,980,374 | |
| | | | | | | | |
| | |
NET ASSETS: 100.0% | | | | | | | $3,824,216,056 | |
| | | | | | | | |
Matthews Asia Dividend Fund
June 30, 2020
Schedule of Investmentsa (unaudited) (continued)
| a | Certain securities were fair valued under the valuation policies approved by the Board of Trustees (Note 2-A). |
| b | The securities may be resold to qualified foreign investors and foreign institutional buyers under Regulation S of the Securities Act of 1933. |
| c | Security exempt from registration under Rule 144A of the Securities Act of 1933, as amended. The security may be resold in transactions exempt from registration normally to qualified institutional buyers. The security has been determined to be liquid in accordance with procedures adopted by the Funds’ Board of Trustees. At June 30, 2020, the aggregate value is $122,146,021, which is 3.19% of net assets. |
| † | Affiliated Issuer, as defined under the Investment Company Act of 1940 (ownership of 5% or more of the outstanding voting securities of this issuer) |
| ADR | American Depositary Receipt |
| REIT | Real Estate Investment Trust |
See accompanying notes to financial statements.
| | | | |
| matthewsasia.com | 800.789.ASIA | | | 29 | |
| | | | |
| PORTFOLIO MANAGERS |
| |
| Sherwood Zhang, CFA | | |
Lead Manager | | | | |
| |
| Yu Zhang, CFA | | S. Joyce Li, CFA |
Co-Manager | | Co-Manager |
| | |
| FUND FACTS | | | | |
| | |
| | | Investor | | Institutional |
Ticker | | MCDFX | | MICDX |
CUSIP | | 577125305 | | 577130735 |
Inception | | 11/30/09 | | 10/29/10 |
NAV | | $16.48 | | $16.48 |
Initial Investment | | $2,500 | | $100,000 |
Gross Expense Ratio1 | | 1.15% | | 1.01% |
Portfolio Statistics | | |
Total # of Positions | | 46 |
Net Assets | | $321.8 million |
Weighted Average Market Cap | | $62.8 billion |
Portfolio Turnover2 | | 65.69% |
Benchmark | | | | |
MSCI China Index |
OBJECTIVE
Total return with an emphasis on providing current income.
STRATEGY
Under normal market conditions, the Fund seeks to achieve its investment objective by investing at least 80% of its net assets, which include borrowings for investment purposes, in dividend-paying equity securities of companies located in China. China includes its administrative and other districts, such as Hong Kong. The Fund may also invest in convertible debt and equity securities of companies located in China.
Matthews China Dividend Fund
Portfolio Manager Commentary (unaudited)
For the first half of 2020, the Matthews China Dividend Fund returned 4.02% (Investor Class) and 4.09% (Institutional Class), while its benchmark, the MSCI China Index, returned 3.58%. For the quarter ending June 30, 2020, the Matthews China Dividend Fund returned 19.18% (Investor Class) and 19.26% (Institutional Class), while its benchmark, the MSCI China Index, returned 15.37%.
Market Environment:
Asia’s markets experienced considerable volatility related the global COVID-19 pandemic, but Chinese equities generated the strongest returns in the region, as domestic Chinese sentiment gained strength on the back of a quick resumption of economic activity. China, along with South Korea and Taiwan, made considerable progress in flattening its curve of new virus infections in the reporting period. Amid strong returns, we also saw some volatility related to the Chinese government’s amendment of national security laws in Hong Kong during China’s annual gathering of its top legislative body, the People’s Congress. Although the nature and legislative process of this law is arguably controversial, it was passed and became effective in Hong Kong on July 1, which attracted international attention and protests from Hong Kong citizens.
On the economic polices front, China’s central bank refrained from adopting unconventional monetary policy tools such as Quantitative Easing and a zero interest rate. It only guided down the benchmark lending rate by 10 to 20 basis points (0.10% to 0.20%) during April, while cutting the required reserve ratio to release liquidity from the banking system. In terms of fiscal policy, the People’s Congress adopted a budget with historical high fiscal deficit of 3.76 trillion renminbi, and for the first time, it breached 3% of China’s GDP.
Performance Contributors and Detractors:
Stock selection made a significant contribution to relative performance in the first half of the year, with Hope Education Group, Tencent Holdings and Sun Art Retail Group contributing the most. Hope Education, a provider of educational services including training and knowledge point sharing, had very limited revenue impact from the COVID-19 outbreak, and the company also reported strong earnings. Tencent Holdings, the leading social media company in China has a wide range of product offerings including online games, mobile messaging and mobile payment. These offerings significantly gained their popularity during lock down and social distancing period in China. The Fund’s third largest contributor was Sun Art Retail Group, China’s largest hypermarket operator. Sun Art Retail benefited significantly from consumers stocking up on food and groceries and spending less time eating out. From a sector perspective, the Fund’s significant underweight allocation to financials and security selection in real estate contributed most to the Fund’s outperformance during the first half of the year.
On the other hand, Geely Automobile was the largest performance detractor as passenger car sales plunged due to the pandemic. However, we believe the company will continue to be a leader among China’s domestic branded passenger car makers. However, the planned merger with its parent controlled Volvo Cars could impair its ability to pay dividends in the near future, thus we decided to exit the position. Security selection in communication services and industrials sectors also caused a significant drag to Fund performance during the first half of the year. Two of the top three detractors were China B share market listed industrial companies, Shanghai Mechanical & Electrical Industry, a leading elevator maker in China, and Guangdong Provincial Expressway Development, a regional toll road operator in
(continued)
| 1 | Prospectus expense ratios. |
| 2 | The lesser of fiscal year 2019 long-term purchase costs or sales proceeds divided by the average monthly market value of long-term securities. |
| | | | | | | | | | | | | | | | | | | | | | | | | | | | | | | | |
| | |
| PERFORMANCE AS OF JUNE 30, 2020 | | | | |
| | | | | | | | | | | | Average Annual Total Returns | | | | |
| | | 3 Months | | | YTD | | | 1 Year | | | 3 Year | | | 5 Year | | | 10 Years | | | Since
Inception | | | Inception
Date | |
| Investor Class (MCDFX) | | | 19.18% | | | | 4.02% | | | | 3.56% | | | | 8.18% | | | | 6.94% | | | | 9.99% | | | | 9.76% | | | | 11/30/09 | |
| Institutional Class (MICDX) | | | 19.26% | | | | 4.09% | | | | 3.72% | | | | 8.34% | | | | 7.12% | | | | n.a. | | | | 8.85% | | | | 10/29/10 | |
| MSCI China Index3 | | | 15.37% | | | | 3.58% | | | | 13.28% | | | | 8.73% | | | | 5.49% | | | | 6.60% | | | | 5.66% | 4 | | | | |
Performance assumes reinvestment of all dividends and/or distributions before taxes. All performance quoted represents past performance and is no guarantee of future results. Investment return and principal value will fluctuate with market conditions so that when redeemed, shares may be worth more or less than their original cost. Current performance may be lower or higher than the return figures quoted. For the Fund’s most recent month-end performance, visit matthewsasia.com.
| | | | | | | | | | | | | | | | | | | | | | | | | | | | |
| | | | | | | | |
| INCOME DISTRIBUTION HISTORY | | | | | | | | | | | | | | | | | | | | | |
| | | 2020 | | | | | | 2019 | |
| | | June | | | December | | | Total | | | | | | June | | | December | | | Total | |
| Investor (MCDFX) | | $ | 0.36 | | | | n.a. | | | $ | 0.36 | | | | | | | $ | 0.24 | | | $ | 0.02 | | | $ | 0.26 | |
| Inst’l (MICDX) | | $ | 0.38 | | | | n.a. | | | $ | 0.38 | | | | | | | $ | 0.25 | | | $ | 0.03 | | | $ | 0.28 | |
Note: This table does not include capital gains distributions. Totals may differ by $0.02 due to rounding. For income distribution history, visit matthewsasia.com.
| | | | |
| | | |
30-DAY YIELD: 1.64% (Investor Class) 1.77% (Institutional Class) The 30-Day Yield represents net investment income earned by the Fund over the 30-day period ended 6/30/20, expressed as an annual percentage rate based on the Fund’s share price at the end of the 30-day period. The 30-Day Yield should be regarded as an estimate of the Fund’s rate of investment income, and it may not equal the Fund’s actual income distribution rate. Source: BNY Mellon Investment Servicing (US) Inc. | | | | DIVIDEND YIELD: 3.23% The dividend yield (trailing) for the portfolio is the weighted average sum of the dividends paid by each equity security held by the Fund over the 12 months ended 6/30/20 divided by the current price of each equity as of 6/30/20. The annualized dividend yield for the Fund is for the equity-only portion of the portfolio. Please note that this is based on gross equity portfolio holdings and does not reflect the actual yield an investor in the Fund would receive. Past yields are no guarantee of future yields. Source: FactSet Research Systems, Bloomberg, MICM. |
GROWTH OF A HYPOTHETICAL $10,000 INVESTMENT SINCE INCEPTION—INVESTOR CLASS
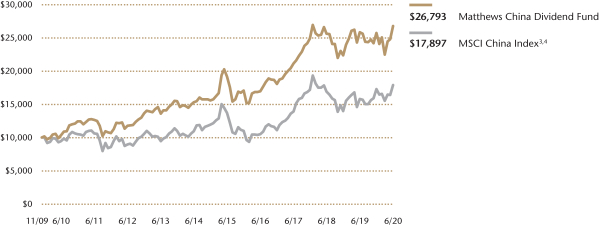
Plotted monthly. The performance data and graph do not reflect the deduction of taxes that a shareholder would pay on dividends, capital gains distributions or redemption of Fund shares. Values are in US$.
| | 3 | It is not possible to invest directly in an index. Source: Index data from Morgan Stanley Capital International and Bloomberg; total return calculations performed by BNY Mellon Investment Servicing (US) Inc. Please see page 90 for index definition. |
| | 4 | Calculated from 11/30/09. |
| | | | | | | | |
| | | | |
| TOP TEN HOLDINGS5 | | | | | | | |
| | | Sector | | | | % of Net Assets | |
| Tencent Holdings, Ltd. | | Communication Services | | | | | 7.6% | |
| Livzon Pharmaceutical Group, Inc. | | Health Care | | | | | 3.4% | |
| Hope Education Group Co., Ltd. | | Consumer Discretionary | | | | | 3.0% | |
| China International Capital Corp., Ltd. | | Financials | | | | | 3.0% | |
| Chengdu Hongqi Chain Co., Ltd. | | Consumer Staples | | | | | 3.0% | |
| Shanghai Baosight Software Co., Ltd. | | Information Technology | | | | | 3.0% | |
| KWG Group Holdings, Ltd. | | Real Estate | | | | | 2.8% | |
| Gree Electric Appliances, Inc. of Zhuhai | | Consumer Discretionary | | | | | 2.8% | |
| CITIC Telecom International Holdings, Ltd. | | Communication Services | | | | | 2.8% | |
| WH Group, Ltd. | | Consumer Staples | | | | | 2.8% | |
| % OF ASSETS IN TOP TEN | | | | | | | 34.2% | |
| | 5 | Holdings may combine more than one security from same issuer and related depositary receipts. |
| | | | |
| matthewsasia.com | 800.789.ASIA | | | 31 | |
| | | | |
| |
COUNTRY ALLOCATION (%)6,7 | |
| China/Hong Kong | | | 88.7 | |
| Taiwan | | | 5.5 | |
| Singapore | | | 3.1 | |
| Cash and Other Assets, Less Liabilities | | | 2.6 | |
| Total | | | 99.9 | |
| | | | |
| | |
SECTOR ALLOCATION (%)7 | | | |
| Consumer Discretionary | | | 20.1 | |
| Communication Services | | | 18.3 | |
| Consumer Staples | | | 12.2 | |
| Information Technology | | | 9.9 | |
| Industrials | | | 8.5 | |
| Health Care | | | 7.4 | |
| Financials | | | 6.9 | |
| Real Estate | | | 6.1 | |
| Energy | | | 4.1 | |
| Materials | | | 3.9 | |
| Cash and Other Assets, Less Liabilities | | | 2.6 | |
| Total | | | 100.0 | |
| | | | |
| |
MARKET CAP EXPOSURE (%)7 | |
| Mega Cap (over $25B) | | | 24.0 | |
| Large Cap ($10B-$25B) | | | 12.5 | |
| Mid Cap ($3B-10B) | | | 28.7 | |
| Small Cap (under $3B) | | | 32.1 | |
| Cash and Other Assets, Less Liabilities | | | 2.6 | |
| 6 | Not all countries where the Fund may invest are included in the benchmark index. |
| 7 | Source: FactSet Research Systems. Percentage values in data are rounded to the nearest tenth of one percent, so the values may not sum to 100% due to rounding. Percentage values may be derived from different data sources and may not be consistent with other Fund literature. |
Matthews China Dividend Fund
Portfolio Manager Commentary (unaudited) (continued)
Guangdong province. China’s B share market, originally designed for only foreign investors, has been gradually marginalized as A shares are now accessible to global investors. However, there are still companies listed as B shares on the Shanghai and Shenzhen exchanges in foreign currency with sound fundamental while offering attractive dividend yields and valuations. But, due to the less liquid nature of the B share market, they could underperform further in a severe sell off.
Notable Portfolio Changes:
During the second quarter, we initiated a new position in Tsingtao Brewery, one of the oldest Chinese companies listed in Hong Kong. We believe the Chinese beer industry is entering into a market share consolidation phase with top four market share leaders all focusing on premium products and profitability. In addition, for the first time of its history, Tsingtao Brewery launched a share based management incentive program to align management’s interest with minority shareholders. We believe the positive industry dynamics and management incentive could revitalize one of the best known consumer brands in China. We also initiated a position in Zhongsheng Group Holdings, a large premium car dealership network operator in China to replace Geely Automobile.
During the quarter, we exited our position in Hua Hong Semiconductor as the company decided to cut its dividend to maintain financial flexibility. We also exited China Merchants Bank as we expect the liquidity injection by central banks both domestic and globally will impact commercial banks’ ability to keep their profitability.
Outlook:
As China has started to recover its economic activity, its leaders have also been cautioning that the country is increasingly likely to be isolated politically and economically due to potential sanctions and diversification of global supply chain. “Internal Circulation” strategy of domestic consumption and home grown technology—key investment themes for us—has been proposed as a potential solution. We believe these themes will become even more attractive investment areas.
In the meantime, we are encouraged to see China has not given up its effort to open further to the world. In June, the Chinese government announced some major policy initiatives to make Hainan Island a free trade port benchmarked to Dubai and Singapore. These include significantly increasing Chinese tourists’ duty free spending limit, lowering corporate and personal income tax on the island to a low rate comparable to Hong Kong and Singapore and allowing more business areas for foreign investors to invest. These efforts could sow early seeds of a much freer open economy very much like China launching a few special economic zones along its coast 40 years ago.
Matthews China Dividend Fund
June 30, 2020
Schedule of Investmentsa (unaudited)
COMMON EQUITIES: 97.4%
| | | | | | | | |
| | | Shares | | | Value | |
| | |
| CONSUMER DISCRETIONARY: 20.1% | | | | | | | | |
Specialty Retail: 7.1% | | | | | | | | |
| | |
China Tourism Group Duty Free Corp., Ltd. A Shares | | | 402,396 | | | | $8,823,344 | |
| | |
Zhongsheng Group Holdings, Ltd. | | | 1,439,000 | | | | 8,047,937 | |
| | |
Topsports International Holdings, Ltd.b,c | | | 4,620,000 | | | | 5,943,923 | |
| | | | | | | | |
| | | | | | | 22,815,204 | |
| | | | | | | | |
| | | | | | | | |
Diversified Consumer Services: 5.2% | | | | | | | | |
| | |
Hope Education Group Co., Ltd.b,c | | | 28,296,000 | | | | 9,746,569 | |
| | |
China Education Group Holdings, Ltd.c | | | 4,251,000 | | | | 6,855,423 | |
| | | | | | | | |
| | | | | | | 16,601,992 | |
| | | | | | | | |
| | | | | | | | |
Household Durables: 2.8% | | | | | | | | |
Gree Electric Appliances, Inc. of Zhuhai A Shares | | | 1,137,104 | | | | 9,137,158 | |
| | | | | | | | |
| | | | | | | | |
Auto Components: 2.0% | | | | | | | | |
Minth Group, Ltd. | | | 2,272,000 | | | | 6,521,783 | |
| | | | | | | | |
| | | | | | | | |
Textiles, Apparel & Luxury Goods: 1.7% | |
Nan Liu Enterprise Co., Ltd. | | | 612,000 | | | | 5,455,303 | |
| | | | | | | | |
| | | | | | | | |
Hotels, Restaurants & Leisure: 1.3% | | | | | | | | |
Shanghai Jin Jiang Capital Co., Ltd. H Shares | | | 23,872,000 | | | | 4,235,728 | |
| | | | | | | | |
Total Consumer Discretionary | | | | | | | 64,767,168 | |
| | | | | | | | |
| | | | | | | | |
| | | |
| COMMUNICATION SERVICES: 18.3% | | | | | | | | |
Diversified Telecommunication Services: 7.9% | |
| | |
CITIC Telecom International Holdings, Ltd. | | | 28,155,000 | | | | 8,969,837 | |
| | |
HKBN, Ltd. | | | 5,069,957 | | | | 8,890,492 | |
| | |
China Tower Corp., Ltd. H Sharesb,c | | | 41,965,136 | | | | 7,457,454 | |
| | | | | | | | |
| | | | | | | 25,317,783 | |
| | | | | | | | |
| | | | | | | | |
Interactive Media & Services: 7.6% | | | | | | | | |
Tencent Holdings, Ltd. | | | 382,300 | | | | 24,496,986 | |
| | | | | | | | |
| | | | | | | | |
Entertainment: 2.8% | | | | | | | | |
NetEase, Inc. ADR | | | 20,800 | | | | 8,931,104 | |
| | | | | | | | |
Total Communication Services | | | | | | | 58,745,873 | |
| | | | | | | | |
| | | | | | | | |
| | | |
| CONSUMER STAPLES: 12.2% | | | | | | | | |
Food & Staples Retailing: 5.2% | | | | | | | | |
| | |
Chengdu Hongqi Chain Co., Ltd. A Shares | | | 6,163,641 | | | | 9,561,648 | |
| | |
Sun Art Retail Group, Ltd. | | | 4,219,000 | | | | 7,238,212 | |
| | | | | | | | |
| | | | | | | 16,799,860 | |
| | | | | | | | |
| | | | | | | | |
Food Products: 2.8% | | | | | | | | |
WH Group, Ltd.b,c | | | 10,357,000 | | | | 8,950,462 | |
| | | | | | | | |
| | | | | | | | |
Beverages: 2.5% | | | | | | | | |
Tsingtao Brewery Co., Ltd. H Shares | | | 1,100,000 | | | | 8,209,482 | |
| | | | | | | | |
| | | | | | | | |
Household Products: 1.7% | | | | | | | | |
Vinda International Holdings, Ltd. | | | 1,507,000 | | | | 5,413,573 | |
| | | | | | | | |
Total Consumer Staples | | | | | | | 39,373,377 | |
| | | | | | | | |
| | | | | | | | |
| | | |
| INFORMATION TECHNOLOGY: 9.9% | | | | | | | | |
Software: 4.2% | | | | | | | | |
| | |
Shanghai Baosight Software Co., Ltd. B Shares | | | 4,090,073 | | | | 9,504,172 | |
| | |
Kingdee International Software Group Co., Ltd. | | | 1,668,000 | | | | 3,902,926 | |
| | | | | | | | |
| | | | | | | 13,407,098 | |
| | | | | | | | |
| | | | | | | | |
| | | Shares | | | Value | |
Semiconductors & Semiconductor Equipment: 2.0% | | | | | |
MediaTek, Inc. | | | 326,000 | | | | $6,445,225 | |
| | | | | | | | |
| | | | | | | | |
IT Services: 2.0% | | | | | | | | |
SUNeVision Holdings, Ltd. | | | 8,162,000 | | | | 6,426,432 | |
| | | | | | | | |
| | | | | | | | |
Communications Equipment: 1.7% | | | | | | | | |
Accton Technology Corp. | | | 728,000 | | | | 5,653,359 | |
| | | | | | | | |
Total Information Technology | | | | | | | 31,932,114 | |
| | | | | | | | |
| | | | | | | | |
| | | |
| INDUSTRIALS: 8.5% | | | | | | | | |
Machinery: 2.4% | | | | | | | | |
| | |
Shanghai Mechanical and Electrical Industry Co., Ltd. B Shares | | | 4,976,114 | | | | 5,055,264 | |
| | |
Guangzhou Guangri Stock Co., Ltd. A Shares | | | 2,703,110 | | | | 2,633,413 | |
| | | | | | | | |
| | | | | | | 7,688,677 | |
| | | | | | | | |
| | | | | | | | |
Marine: 2.2% | | | | | | | | |
SITC International Holdings Co., Ltd. | | | 6,550,000 | | | | 7,013,350 | |
| | | | | | | | |
| | | | | | | | |
Trading Companies & Distributors: 2.0% | | | | | | | | |
BOC Aviation, Ltd.b,c | | | 993,100 | | | | 6,393,127 | |
| | | | | | | | |
| | | | | | | | |
Transportation Infrastructure: 1.9% | | | | | | | | |
Guangdong Provincial Expressway Development Co., Ltd. B Shares | | | 10,498,218 | | | | 6,136,721 | |
| | | | | | | | |
| | | | | | | | |
Road & Rail: 0.0% | | | | | | | | |
Beijing-Shanghai High Speed Railway Co., Ltd. A Sharesd | | | 6,000 | | | | 5,308 | |
| | | | | | | | |
Total Industrials | | | | | | | 27,237,183 | |
| | | | | | | | |
| | | | | | | | |
| | | |
| HEALTH CARE: 7.4% | | | | | | | | |
Pharmaceuticals: 3.5% | | | | | | | | |
Livzon Pharmaceutical Group, Inc. H Shares | | | 2,180,800 | | | | 11,069,299 | |
| | | | | | | | |
| | | | | | | | |
Life Sciences Tools & Services: 3.4% | | | | | | | | |
| | |
Pharmaron Beijing Co., Ltd. H Sharesb,c | | | 761,900 | | | | 7,890,538 | |
| | |
Genscript Biotech Corp.d | | | 1,484,000 | | | | 3,069,044 | |
| | | | | | | | |
| | | | | | | 10,959,582 | |
| | | | | | | | |
| | | | | | | | |
Health Care Equipment & Supplies: 0.4% | | | | | | | | |
Kangji Medical Holdings, Ltd.d | | | 342,000 | | | | 1,314,960 | |
| | | | | | | | |
| | | | | | | | |
Health Care Providers & Services: 0.1% | | | | | | | | |
Hygeia Healthcare Holdings Co., Ltd.b,c,d | | | 103,600 | | | | 356,896 | |
| | | | | | | | |
| | | | | | | | |
Biotechnology: 0.0% | | | | | | | | |
Legend Biotech Corp. ADRd | | | 503 | | | | 21,408 | |
| | | | | | | | |
Total Health Care | | | | | | | 23,722,145 | |
| | | | | | | | |
| | | | | | | | |
| | | |
| FINANCIALS: 6.9% | | | | | | | | |
Capital Markets: 5.1% | | | | | | | | |
| | |
China International Capital Corp., Ltd. H Sharesb,c,d | | | 4,848,400 | | | | 9,592,823 | |
| | |
China Everbright, Ltd. | | | 4,622,000 | | | | 6,733,662 | |
| | | | | | | | |
| | | | | | | 16,326,485 | |
| | | | | | | | |
| | | | | | | | |
Insurance: 1.8% | | | | | | | | |
Ping An Insurance Group Co. of China, Ltd. H Shares | | | 597,000 | | | | 5,951,488 | |
| | | | | | | | |
Total Financials | | | | | | | 22,277,973 | |
| | | | | | | | |
| | | | | | | | |
| | | | |
| matthewsasia.com | 800.789.ASIA | | | 33 | |
Matthews China Dividend Fund
June 30, 2020
Schedule of Investmentsa (unaudited) (continued)
| | |
| COMMON EQUITIES (continued) | | |
| | | | | | | | |
| | | Shares | | | Value | |
| | |
| REAL ESTATE: 6.1% | | | | | | | | |
Real Estate Management & Development: 5.0% | | | | | |
| | |
KWG Group Holdings, Ltd. | | | 5,391,500 | | | | $9,160,479 | |
| | |
Powerlong Commercial Management Holdings, Ltd.c | | | 2,918,500 | | | | 6,793,533 | |
| | | | | | | | |
| | | | | | | 15,954,012 | |
| | | | | | | | |
| | | | | | | | |
Equity REITs: 1.1% | | | | | | | | |
CapitaLand Retail China Trust, REIT | | | 3,948,961 | | | | 3,603,651 | |
| | | | | | | | |
Total Real Estate | | | | | | | 19,557,663 | |
| | | | | | | | |
| | | | | | | | |
| | | |
| ENERGY: 4.1% | | | | | | | | |
Oil, Gas & Consumable Fuels: 4.1% | | | | | | | | |
| | |
China Suntien Green Energy Corp., Ltd. H Sharesd | | | 31,235,000 | | | | 7,187,855 | |
| | |
China Petroleum & Chemical Corp. H Shares | | | 14,440,000 | | | | 6,039,659 | |
| | | | | | | | |
Total Energy | | | | | | | 13,227,514 | |
| | | | | | | | |
| | | | | | | | |
| | | |
| MATERIALS: 3.9% | | | | | | | | |
Construction Materials: 2.5% | | | | | | | | |
Huaxin Cement Co., Ltd. B Shares | | | 4,276,992 | | | | 7,811,575 | |
| | | | | | | | |
| | | | | | | | |
Containers & Packaging: 1.4% | | | | | | | | |
Greatview Aseptic Packaging Co., Ltd. | | | 12,919,000 | | | | 4,578,640 | |
| | | | | | | | |
Total Materials | | | | | | | 12,390,215 | |
| | | | | | | | |
| | | | | | | | |
| | | |
| TOTAL INVESTMENTS: 97.4% | | | | | | | 313,231,225 | |
(Cost $271,310,193) | | | | | | | | |
| | | | | | | | |
| | |
CASH AND OTHER ASSETS,
LESS LIABILITIES: 2.6% | | | | | | | 8,523,927 | |
| | | | | | | | |
| | |
NET ASSETS: 100.0% | | | | | | | $321,755,152 | |
| | | | | | | | |
| a | Certain securities were fair valued under the valuation policies approved by the Board of Trustees (Note 2-A). |
| b | Security exempt from registration under Rule 144A of the Securities Act of 1933, as amended. The security may be resold in transactions exempt from registration normally to qualified institutional buyers. The security has been determined to be liquid in accordance with procedures adopted by the Funds’ Board of Trustees. At June 30, 2020, the aggregate value is $56,331,792, which is 17.51% of net assets. |
| c | The securities may be resold to qualified foreign investors and foreign institutional buyers under Regulation S of the Securities Act of 1933. |
| d | Non-income producing security. |
| ADR | American Depositary Receipt |
| REIT | Real Estate Investment Trust |
See accompanying notes to financial statements.

| | | | |
| PORTFOLIO MANAGER* |
|
| Robert Horrocks, PhD |
Lead Manager |
* As of August 31, 2020 | | | | |
| | |
| FUND FACTS | | | | |
| | |
| | | Investor | | Institutional |
Ticker | | MAVRX | | MAVAX |
CUSIP | | 577130693 | | 577130685 |
Inception | | 11/30/15 | | 11/30/15 |
NAV | | $10.57 | | $10.50 |
Initial Investment | | $2,500 | | $100,000 |
Gross Expense Ratio1 | | 1.85% | | 1.74% |
After Fee Waiver and Reimbursement2 | | 1.37% | | 1.20% |
Portfolio Statistics | | | | |
Total # of Positions | | 27 |
Net Assets | | $13.4 million |
Weighted Average Market Cap | | $53.1 billion |
Portfolio Turnover3 | | 32.03% |
Benchmark | | | | |
MSCI AC Asia ex Japan Index |
OBJECTIVE
Long-term capital appreciation.
STRATEGY
Under normal market conditions, the Fund seeks to achieve its investment objective by investing at least 80% of its net assets, which include borrowings for investment purposes, in common stock, preferred stock and other equity securities, and convertible securities of companies located in Asia. The Fund seeks to create an investable universe of value companies that it believes trade at market values with discounts to their intrinsic value, have strong financial and market positions, have strong management and are oriented to creating value for their shareholders. Matthews assesses companies within this universe according to each of these factors.
Matthews Asia Value Fund
Portfolio Manager Commentary (unaudited)
For the first half of 2020, the Matthews Asia Value Fund returned –4.43% (Investor Class) and –4.28 (Institutional Class), while its benchmark, the MSCI All Country Asia ex Japan Index, returned –4.65%. For the quarter ending June 30, 2020, the Fund returned 16.28% (Investor Class and Institutional Class) vs. the benchmark, which returned 16.79%.
Market Environment:
The first half of the year was a tale of two halves—a global market plunge that set quite a few records in the first quarter followed by a huge rally in the second. Central banks worldwide have pumped an unprecedented amount of liquidity into the system to stem potential COVID-19 lockdown-induced economic collapse. We believe that this extraordinary amount of liquidity has found its way to the global equity market, fueling one of the biggest quarterly rallies seen in modern history. The extent of the logic-defying rally, however, contrasts sharply with the underlying bleak economic and unemployment data worldwide. The two are increasingly detached from each other, particularly for the U.S. market. Value stocks in Asia, as well as elsewhere, continued to lag substantially whereas investors cannot seemingly buy enough of growth and momentum driven stocks, particularly in the technology sector.
Performance Contributors and Detractors:
The Fund slightly outperformed the index in the first half of the year and held onto the big rally in the second quarter without lagging much, thanks to stock selection. Our top contributor was again South Korea’s Samsung SDI, which specializes in lithium ion battery technology, with the market getting bullish on long-term profitability of its electric vehicle (EV) battery business. We suspect that Tesla’s recent meteoric rise in its share price has also brought a halo effect to many stocks plugged into the EV supply chain. We took advantage of the euphoria and trimmed our stakes in Samsung SDI substantially in the quarter.
Bharti Infratel, the largest telecom tower business in India, was the other major positive contributor in the second quarter. We initiated our position in the first quarter when there was substantial fear in the market that one of their biggest customers, Vodafone Idea, was going to collapse. This remains an overhang as a final supreme court ruling—on how much and over how long of a payment term that all telecom carriers can pay back overdue tax to the government—is now further postponed. However, news flows throughout the second quarter signaled to the market that pricing in the overall mobile telecom industry hit bottom last year. This has likely eased concerns around the tower business, hence the big share price rally in the quarter. Regardless of the eventual ruling outcome, we continue to believe that Bharti Infratel will remain a strategically important asset for the industry players for many years to come.
On the other hand, China Mobile as well as the three Japanese small-cap holdings, Asante, Gakujo, and San-A, did not participate in the market rally. The Japanese names are all facing various degrees of challenges in their offline businesses due to COVID-19, but detraction from these names were fairly modest.
(continued)
| 1 | Prospectus expense ratios. |
| 2 | Matthews has contractually agreed (i) to waive fees and reimburse expenses to the extent needed to limit Total Annual Fund Operating Expenses (excluding Rule 12b-1 fees, taxes, interest, brokerage commissions, short sale dividend expenses, expenses incurred in connection with any merger or reorganization or extraordinary expenses such as litigation) of the Institutional Class to 1.20% first by waiving class specific expenses (i.e., shareholder service fees specific to a particular class) of the Institutional Class and then, to the extent necessary, by waiving non-class specific expenses (e.g., custody fees) of the Institutional Class, and (ii) if any Fund-wide expenses (i.e., expenses that apply to both the Institutional Class and the Investor Class) are waived for the Institutional Class to maintain the 1.20% expense limitation, to waive an equal amount (in annual percentage terms) of those same expenses for the Investor Class. The Total Annual Fund Operating Expenses After Fee Waiver and Expense Reimbursement for the Investor Class may vary from year to year and will in some years exceed 1.20%. If the operating expenses fall below the expense limitation in a year within three years after Matthews has made a waiver or reimbursement, the Fund may reimburse Matthews up to an amount that does not cause the expenses for that year to exceed the lesser of (i) the expense limitation applicable at the time of that fee waiver and/or expense reimbursement or (ii) the expense limitation in effect at the time of recoupment. This agreement will remain in place until April 30, 2021 and may be terminated at any time by the Board of Trustees on behalf of the Fund on 60 days’ written notice to Matthews. Matthews may decline to renew this agreement by written notice to the Trust at least 30 days before its annual expiration date. |
| 3 | The lesser of fiscal year 2019 long-term purchase costs or sales proceeds divided by the average monthly market value of long-term securities. |
| | | | |
| matthewsasia.com | 800.789.ASIA | | | 35 | |
| | | | | | | | | | | | | | | | | | | | | | | | |
| | | | | | | |
| PERFORMANCE AS OF JUNE 30, 2020 | | | | | | | | | | | | | | | | | | |
| | | | | | | | | | | | Average Annual Total
Returns | | | | |
| | | 3 Months | | | YTD | | | 1 Year | | | 3 Years | | | Since
Inception | | | Inception
Date | |
| Investor Class (MAVRX) | | | 16.28% | | | | -4.43% | | | | -3.33% | | | | 1.04% | | | | 6.40% | | | | 11/30/15 | |
| Institutional Class (MAVAX) | | | 16.28% | | | | -4.28% | | | | -3.21% | | | | 1.25% | | | | 6.65% | | | | 11/30/15 | |
| MSCI AC Asia ex Japan Index4 | | | 16.79% | | | | -4.65% | | | | 1.97% | | | | 3.90% | | | | 8.48% | | | | | |
Performance assumes reinvestment of all dividends and/or distributions before taxes. All performance quoted represents past performance and is no guarantee of future results. Investment return and principal value will fluctuate with market conditions so that when redeemed, shares may be worth more or less than their original cost. Current performance may be lower or higher than the return figures quoted. Returns would have been lower if certain of the Fund’s fees and expenses had not been waived. For the Fund’s most recent month-end performance visit matthewsasia.com.
GROWTH OF A HYPOTHETICAL $10,000 INVESTMENT SINCE INCEPTION—INVESTOR CLASS
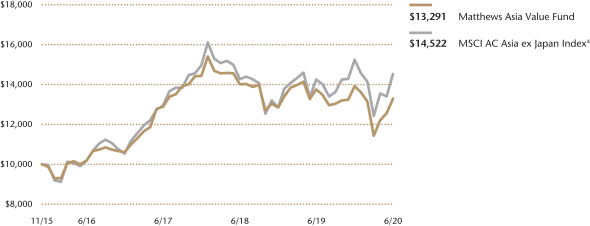
Plotted monthly. The performance data and graph do not reflect the deduction of taxes that a shareholder would pay on dividends, capital gain distributions or redemption of Fund shares. Values are in US$.
| | 4 | It is not possible to invest directly in an index. Source: Index data from Morgan Stanley Capital International and Bloomberg; total return calculations performed by BNY Mellon Investment Servicing (US) Inc. Please see page 90 for index definition. |
| | | | | | | | | | | | |
| | | | | |
| TOP TEN HOLDINGS5 | | | | | | | | | | |
| | | Sector | | Country | | | | | % of Net Assets | |
| Bharti Infratel, Ltd. | | Communication Services | | India | | | | | | | 6.6% | |
| Cie Financiere Richemont SA | | Consumer Discretionary | | Switzerland | | | | | | | 4.5% | |
| CK Hutchison Holdings, Ltd. | | Industrials | | China/Hong Kong | | | | | | | 4.4% | |
| China Isotope & Radiation Corp. | | Health Care | | China/Hong Kong | | | | | | | 3.9% | |
| Straits Trading Co., Ltd. | | Materials | | Singapore | | | | | | | 3.9% | |
| Prosus N.V. | | Consumer Discretionary | | China/Hong Kong | | | | | | | 3.8% | |
| NAVER Corp. | | Communication Services | | South Korea | | | | | | | 3.8% | |
| China Mobile, Ltd. | | Communication Services | | China/Hong Kong | | | | | | | 3.4% | |
| Geumhwa PSC Co., Ltd. | | Industrials | | South Korea | | | | | | | 3.3% | |
| Samsung Electronics Co., Ltd., Pfd. | | Information Technology | | South Korea | | | | | | | 3.2% | |
| % OF ASSETS IN TOP TEN | | | | | | | | | | | 40.8% | |
| | 5 | Holdings may combine more than one security from same issuer and related depositary receipts. |
Matthews Asia Value Fund
Portfolio Manager Commentary (unaudited) (continued)
Notable Portfolio Changes:
We did not initiate any new names in the quarter as the big market rally made many stocks on our watch list less compelling. We eliminated one name, Anhui Gujing Distillery B-share, in the quarter as its share price reached our estimated intrinsic value. Its share price has more than doubled since we initiated the position in early 2017. It’s a solid branded liquor business in China and we’d be happy to revisit it if its share price has a major correction.
We participated in the Fund’s first IPO in the quarter, Agora Inc., a Chinese software business listed in the U.S. with the ticker API. Its ticker reveals its business model—a software application programming interface (API) business rather than a software business. Software APIs are building blocks used by software developers to produce end software products, akin to Lego pieces that kids use to build all kinds of things. In this instance, Agora’s API is used to enable real-time video communications. In the parlance that’s now seeped into our daily language, Agora is democratizing Zoom to enable their customers to do what Zoom does—whether their customers’ app is in education, gaming, social networking, or dating, etc. On its debut day, its share price went up around 150%, which exceeded even our most optimistic scenario. We did not expect to unload our shares so soon but we could not justify holding onto them so we sold our shares on day one when its share price multiple hit 25x sales ex cash.
Outlook:
The COVID-19 coronavirus outbreak has brought severe impacts on human lives and unprecedented challenges to society. However, if we only looked at our stock market, it appears there are no signs of the pandemic we are going through right now. Either the market will come down to meet with humdrum corporate reality or corporate reality will have to deliver earnings growth in the midst of a partial global economic lockdown to meet the market’s lofty expectations. There’s no third possibility here. Impact from this pandemic will be felt long after it’s gone. Therefore, we’ve been adjusting companies’ post-COVID-19 profit level to reflect the new reality. We are looking for businesses that are structural beneficiaries of the pandemic as well as those that are temporarily hurt by the pandemic, as long as we believe there remains a meaningful gap between the share price and our estimated post-COVID intrinsic value of the business.
| | | | |
| |
| COUNTRY ALLOCATION (%)6,7 | |
| South Korea | | | 21.8 | |
| China/Hong Kong | | | 17.2 | |
| Japan | | | 8.1 | |
| India | | | 7.6 | |
| Singapore | | | 6.6 | |
| Switzerland | | | 4.5 | |
| Netherlands | | | 3.8 | |
| Taiwan | | | 1.6 | |
| Cash and Other Assets, Less Liabilities | | | 28.7 | |
| Total | | | 99.9 | |
| | | | |
| |
| SECTOR ALLOCATION (%)7 | |
| Consumer Discretionary | | | 14.9 | |
| Communication Services | | | 13.7 | |
| Industrials | | | 12.4 | |
| Health Care | | | 12.3 | |
| Materials | | | 5.7 | |
| Information Technology | | | 5.0 | |
| Financials | | | 3.9 | |
| Consumer Staples | | | 3.4 | |
| Cash and Other Assets, Less Liabilities | | | 28.7 | |
| Total | | | 100.0 | |
| | | | |
| |
| MARKET CAP EXPOSURE (%)7 | |
| Mega Cap (over $25B) | | | 23.4 | |
| Large Cap ($10B–$25B) | | | 7.6 | |
| Mid Cap ($3B–10B) | | | 9.8 | |
| Small Cap (under $3B) | | | 30.4 | |
| Cash and Other Assets, Less Liabilities | | | 28.7 | |
| 6 | Not all countries where the Fund may invest are included in the benchmark index. |
| 7 | Source: FactSet Research Systems. Percentage values in data are rounded to the nearest tenth of one percent, so the values may not sum to 100% due to rounding. Percentage values may be derived from different data sources and may not be consistent with other Fund literature. |
| | | | |
| matthewsasia.com | 800.789.ASIA | | | 37 | |
Matthews Asia Value Fund
June 30, 2020
Schedule of Investmentsa (unaudited)
| | |
| COMMON EQUITIES: 63.3% | | PREFERRED EQUITIES: 8.0% |
| | | | | | | | |
| | | Shares | | | Value | |
| | | | | | | | |
| | |
| CHINA/HONG KONG: 21.1% | | | | | | | | |
CK Hutchison Holdings, Ltd. | | | 92,000 | | | | $595,754 | |
| | |
China Isotope & Radiation Corp. | | | 185,200 | | | | 531,208 | |
| | |
Prosus N.V.b | | | 5,563 | | | | 517,125 | |
| | |
China Mobile, Ltd. | | | 67,000 | | | | 452,388 | |
| | |
China National Accord Medicines Corp., Ltd. B Shares | | | 101,807 | | | | 286,655 | |
| | |
Alibaba Group Holding, Ltd. ADRb | | | 1,200 | | | | 258,840 | |
| | |
Shandong Weigao Group Medical Polymer Co., Ltd. H Shares | | | 84,000 | | | | 187,559 | |
| | | | | | | | |
Total China/Hong Kong | | | | | | | 2,829,529 | |
| | | | | | | | |
| | | | | | | | |
| | | |
| SOUTH KOREA: 13.8% | | | | | | | | |
NAVER Corp. | | | 2,242 | | | | 504,413 | |
| | |
Geumhwa PSC Co., Ltd. | | | 20,736 | | | | 444,787 | |
| | |
Shinyoung Securities Co., Ltd. | | | 10,318 | | | | 366,593 | |
| | |
Hyundai Greenfood Co., Ltd. | | | 46,750 | | | | 301,970 | |
| | |
Young Poong Corp. | | | 627 | | | | 242,254 | |
| | | | | | | | |
Total South Korea | | | | | | | 1,860,017 | |
| | | | | | | | |
| | | | | | | | |
| | | |
| JAPAN: 8.1% | | | | | | | | |
Medikit Co., Ltd. | | | 8,400 | | | | 276,220 | |
| | |
YAMADA Consulting Group Co., Ltd. | | | 22,100 | | | | 275,984 | |
| | |
Asante, Inc. | | | 17,700 | | | | 240,769 | |
| | |
San-A Co., Ltd. | | | 4,200 | | | | 161,002 | |
| | |
Gakujo Co., Ltd. | | | 12,500 | | | | 139,241 | |
| | | | | | | | |
Total Japan | | | | | | | 1,093,216 | |
| | | | | | | | |
| | | | | | | | |
| | | |
| INDIA: 7.6% | | | | | | | | |
Bharti Infratel, Ltd. | | | 299,732 | | | | 881,000 | |
| | |
Wipro, Ltd. | | | 46,474 | | | | 135,663 | |
| | | | | | | | |
Total India | | | | | | | 1,016,663 | |
| | | | | | | | |
| | | | | | | | |
| | | |
| SINGAPORE: 6.6% | | | | | | | | |
Straits Trading Co., Ltd. | | | 454,700 | | | | 523,284 | |
| | |
Haw Par Corp., Ltd. | | | 51,900 | | | | 367,057 | |
| | | | | | | | |
Total Singapore | | | | | | | 890,341 | |
| | | | | | | | |
| | | | | | | | |
| | | |
| SWITZERLAND: 4.5% | | | | | | | | |
Cie Financiere Richemont SA | | | 9,283 | | | | 598,757 | |
| | | | | | | | |
Total Switzerland | | | | | | | 598,757 | |
| | | | | | | | |
| | | | | | | | |
| | | |
| TAIWAN: 1.6% | | | | | | | | |
P-Duke Technology Co., Ltd. | | | 95,500 | | | | 218,643 | |
| | | | | | | | |
Total Taiwan | | | | | | | 218,643 | |
| | | | | | | | |
| | | | | | | | |
| | |
| TOTAL COMMON EQUITIES | | | | 8,507,166 | |
| | | | | | | | |
(Cost $8,584,518) | | | | | | | | |
| | | | | | | | |
| | | | | | | | |
| | | Shares | | | Value | |
| | | | | | | | |
| | |
| SOUTH KOREA: 8.0% | | | | | | | | |
Samsung Electronics Co., Ltd., Pfd. | | | 10,917 | | | | $425,264 | |
| | |
Hyundai Motor Co., Ltd., 2nd Pfd. | | | 8,095 | | | | 387,069 | |
| | |
Samsung Fire & Marine Insurance Co., Ltd., Pfd. | | | 1,497 | | | | 156,699 | |
| | |
Samsung SDI Co., Ltd., Pfd. | | | 584 | | | | 109,503 | |
| | | | | | | | |
Total South Korea | | | | | | | 1,078,535 | |
| | | | | | | | |
| | | | | | | | |
| | | |
| TOTAL PREFERRED EQUITIES | | | | | | | 1,078,535 | |
| | | | | | | | |
(Cost $1,333,455) | | | | | | | | |
| | | | | | | | |
| | | |
| TOTAL INVESTMENTS: 71.3% | | | | | | | 9,585,701 | |
(Cost $9,917,973) | | | | | | | | |
| | | | | | | | |
| | |
CASH AND OTHER ASSETS,
LESS LIABILITIES: 28.7% | | | | | | | 3,863,423 | |
| | | | | | | | |
| | |
NET ASSETS: 100.0% | | | | | | | $13,449,124 | |
| | | | | | | | |
| a | Certain securities were fair valued under the valuation policies approved by the Board of Trustees (Note 2-A). |
| b | Non-income producing security. |
| ADR | American Depositary Receipt |
See accompanying notes to financial statements.

| | | | |
| PORTFOLIO MANAGERS* |
| |
| Taizo Ishida | | |
Lead Manager | | |
| |
| Michael J Oh, CFA | | |
Co-Manager | | |
|
* As of August 31, 2020 |
|
| FUND FACTS |
| | |
| | | Investor | | Institutional |
Ticker | | MPACX | | MIAPX |
CUSIP | | 577130867 | | 577130776 |
Inception | | 10/31/03 | | 10/29/10 |
NAV | | $30.47 | | $30.75 |
Initial Investment | | $2,500 | | $100,000 |
Gross Expense Ratio1 | | 1.09% | | 0.94% |
Portfolio Statistics | | | | |
Total # of Positions | | | | 60 |
Net Assets | | | | $1.3 billion |
Weighted Average Market Cap | | $39.6 billion |
Portfolio Turnover2 | | 38.05% |
Benchmark |
MSCI AC Asia Pacific Index |
OBJECTIVE
Long-term capital appreciation.
STRATEGY
Under normal market conditions, the Fund seeks to achieve its investment objective by investing at least 80% of its net assets, which include borrowings for investment purposes, in the common and preferred stocks of companies located in Asia. Asia consists of all countries and markets in Asia, and includes developed, emerging and frontier countries and markets in the Asian region. The Fund may also invest in the convertible securities, of any duration or quality, of Asian companies.
Matthews Asia Growth Fund
Portfolio Manager Commentary (unaudited)
For the first half of 2020, the Matthews Asia Growth Fund returned 8.43% (Investor Class) and 8.50% (Institutional Class), while its benchmark, the MSCI All Country Asia Pacific Index, returned –6.29% over the same period. For the quarter ending June 30, the Fund returned 30.94% (Investor Class) and 30.96% (Institutional Class), while the benchmark returned 15.99%.
Market Environment:
Asia’s capital markets were volatile in the first half, falling sharply in the first quarter on fears of slowing growth related to the COVID-19 pandemic. Cyclically sensitive sectors such as energy, materials, industrials and financials suffered most in the first quarter, while companies related to communication services and technology performed better. In the second quarter, most Asian markets moved higher as major economies continued to relax shelter-in-place restrictions. Although Covid-19 cases continued to rise significantly in the second quarter, the gradual reopening of businesses helped bolster sentiment. The health care sector outperformed the broader markets by a wide margin in the second quarter and cyclicals such as materials and energy stocks bounced back. Financials continued to lag in the second quarter.
Chinese equities generated strong absolute returns in the first half, as domestic Chinese sentiment gained strength on the back of a quick resumption of economic activity. China, South Korea and Taiwan each made considerable progress in flattening their curves of new virus infections in the reporting period. Stimulus in China remains modest, but supportive of economic growth. Amid strong returns, we also saw some volatility related to the Chinese government’s amendment of national security laws in Hong Kong, which attracted international attention and protests from Hong Kong citizens.
Japan’s broader equity market was negative in the first half, but recovered quite a bit of lost ground in the second quarter. At the start of 2020, Japanese equities experienced steeper declines than those of other developed economies in anticipation of the global manufacturing cycle deteriorating to a recession territory. However, since March, Japan has been one of the strongest equity markets globally. The country experienced lower COVID-19 cases than other developed countries due to widespread adoption of masks and extensive contact tracing. Japanese corporates had strong cash positions to weather the economic downturn.
Performance Contributors and Detractors:
The Fund outperformed its benchmark in the first half. Contributors included the health care sector, where strong stock selection and an overweight allocation generated attractive returns. Companies such as Innovent Biologics, Wuxi Biologics and M3, Inc. were each contributors. Innovent is one of the leading Chinese biopharmaceutical companies with the recent success of the country’s first domestic PD-1 cancer drug. Wuxi Biologics is one the largest CDMOs (Contract Development and Manufacturing Organization) in the world that helps many of large global and smaller regional pharma companies get drugs developed. M3 Inc. is a Japanese med-tech company providing many online medical solutions including clinical trials to doctors and medical practices not only in Japan, but also in China, U.S. and Europe. Stock selection in China, as well as a slight overweight to China, was also a notable contributor. Chinese video content company Bilibili generated significant gains in the reporting period. The company, which caters to young viewers attracted new users as the pandemic accelerated demand for online entertainment and social media interaction.
(continued)
| 1 | Prospectus expense ratios. |
| 2 | The lesser of fiscal year 2019 long-term purchase costs or sales proceeds divided by the average monthly market value of long-term securities. |
| | | | |
| matthewsasia.com | 800.789.ASIA | | | 39 | |
| | | | | | | | | | | | | | | | | | | | | | | | | | | | | | | | |
| |
| PERFORMANCE AS OF JUNE 30, 2020 | |
| | | | | | | | | | | | Average Annual Total Returns | | | | |
| | | 3 Months | | | YTD | | | 1 Year | | | 3 Years | | | 5 Years | | | 10 Years | | | Since
Inception | | | Inception
Date | |
| Investor Class (MPACX) | | | 30.94% | | | | 8.43% | | | | 18.17% | | | | 10.30% | | | | 9.04% | | | | 9.53% | | | | 9.49% | | | | 10/31/03 | |
| Institutional Class (MIAPX) | | | 30.96% | | | | 8.50% | | | | 18.29% | | | | 10.48% | | | | 9.23% | | | | n.a. | | | | 7.92% | | | | 10/29/10 | |
| MSCI AC Asia Pacific Index3 | | | 15.99% | | | | -6.29% | | | | 1.35% | | | | 3.50% | | | | 4.33% | | | | 6.30% | | | | 6.58% | 4 | | | | |
Performance assumes reinvestment of all dividends and/or distributions before taxes. All performance quoted represents past performance and is no guarantee of future results. Investment return and principal value will fluctuate with market conditions so that when redeemed, shares may be worth more or less than their original cost. Current performance may be lower or higher than the return figures quoted. For the Fund’s most recent month-end performance, visit matthewsasia.com.
GROWTH OF A HYPOTHETICAL $10,000 INVESTMENT SINCE INCEPTION—INVESTOR CLASS
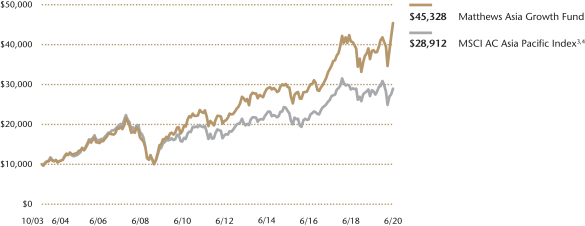
Plotted monthly. The performance data and graph do not reflect the deduction of taxes that a shareholder would pay on dividends, capital gains distributions or redemption of Fund shares. Values are in US$.
| | 3 | It is not possible to invest directly in an index. Source: Index data from Morgan Stanley Capital International and Bloomberg; total return calculations performed by BNY Mellon Investment Servicing (US) Inc. Please see page 90 for index definition. |
| | 4 | Calculated from 10/31/03. |
| | | | | | | | | | |
| | | | | |
| TOP TEN HOLDINGS5 | | | | | | | | | |
| | | Sector | | Country | | | | % of Net Assets | |
| Wuxi Biologics Cayman, Inc. | | Health Care | | China/Hong Kong | | | | | 5.2% | |
| Bilibili, Inc. | | Communication Services | | China/Hong Kong | | | | | 5.1% | |
| Innovent Biologics, Inc. | | Health Care | | China/Hong Kong | | | | | 4.0% | |
| PT Bank Rakyat Indonesia Persero | | Financials | | Indonesia | | | | | 3.4% | |
| BeiGene, Ltd. | | Health Care | | China/Hong Kong | | | | | 3.2% | |
| HDFC Bank, Ltd. | | Financials | | India | | | | | 3.0% | |
| Sony Corp. | | Consumer Discretionary | | Japan | | | | | 2.9% | |
| Terumo Corp. | | Health Care | | Japan | | | | | 2.7% | |
| Nintendo Co., Ltd. | | Communication Services | | Japan | | | | | 2.6% | |
| Keyence Corp. | | Information Technology | | Japan | | | | | 2.4% | |
| % OF ASSETS IN TOP TEN | | | | | | | | | 34.5% | |
| | 5 | Holdings may combine more than one security from same issuer and related depositary receipts. |
Matthews Asia Growth Fund
Portfolio Manager Commentary (unaudited) (continued)
Detractors included small positions in Bangladesh and Sri Lanka, which are not in the Fund’s benchmark. Bangladeshi financials company Brac Bank and Sri Lankan financials company Sampath Bank experienced share price declines amid worries that economies in South and Southeast Asia might face a longer road to recovery from the economic impacts of the pandemic. These are very small positions that we continue to monitor. The Fund’s underweight in information technology, as well as stock selection in the sector, also detracted from performance. Shares of Japanese computer software company Kudan Inc. fell in the reporting period. The company specializes in artificial perception, helping computers “see” for tasks such as autonomous driving. This position was small and we exited the position in the second quarter.
Notable Portfolio Changes:
We initiated several new positions in the second quarter, including Burning Rock Biotech and Legend Biotech. Burning Rock Biotech is a leading Chinese molecule diagnostics company focused on cancer detection. Legend Biotech is a Chinese biopharma company developing CAR-T cell therapies, which help patient’s T cells combat cancer more effectively. We also initiated a position in Chinese information technology company Silergy Corp, which mainly makes power management analog semiconductors. With high margin products and a strong management team, we believe that Silergy is well positioned to take advantage of growing demand for local tech solutions in China. We also trimmed a handful of stocks to reallocate capital to higher growth names.
Outlook:
While China’s economic recovery is still in very early stages, recent data suggests the pace and progress of the recovery may be sustainable. CapEx spending among businesses, auto sales among consumers and property sales all began to rebound in the second quarter of 2020. This is not to suggest that China is out of the woods yet. The potential for a second wave of virus infections remains, particularly as Chinese citizens return home from abroad. Unemployment remains high in China, as it does globally, which could create a drag on spending. And a slowing global economy could slow China’s rebound.
Japanese corporates had strong cash positions to weather the economic downturn. Furthermore, while economic conditions remain weak globally, sentiment is improving. In regard to monetary and fiscal policy, recent central bank actions and government spending bills offer ballast for Japan’s overall market and economy. The Bank of Japan, Japan’s central bank, announced plans to double its purchases of exchange-traded funds (ETFs). Reflecting monetary easing efforts around the globe, Japan’s central bank is committed to providing liquidity. The Japanese government has also passed a stimulus package that are one of the largest in terms of percentage of GDP, both headline numbers and direct spending.
Turning to South and Southeast Asia, we’ve reduced our exposure over the past year as an outcome of our bottom up stock selection process. In terms of broader macroeconomic conditions, the pandemic may have an outsized impact on Asia’s less developed economies, which have generally had a harder time flattening their rates of new infections. In addition, smaller government balance sheets may allow for less fiscal and monetary stimulus.
Over the long term, we continue to see attractive opportunities in the health care sector. In our view, the sector is still in the very early stages of its growth potential, particularly in Asia, where rising incomes are naturally leading to a desire for greater quality of life and patient care. We believe health care companies that compete on innovation and improved patient outcomes will continue to expand their role in Asia’s economies.
| | | | |
| |
| COUNTRY ALLOCATION (%)6,7 | |
| China/Hong Kong | | | 40.1 | |
| Japan | | | 33.6 | |
| United States | | | 7.1 | |
| Indonesia | | | 4.0 | |
| Australia | | | 3.4 | |
| India | | | 3.0 | |
| Bangladesh | | | 1.6 | |
| Vietnam | | | 1.2 | |
| Switzerland | | | 0.9 | |
| Sri Lanka | | | 0.7 | |
| Cash and Other Assets, Less Liabilities | | | 4.4 | |
| Total | | | 100.0 | |
| | | | |
| |
| SECTOR ALLOCATION (%)7 | |
| Health Care | | | 48.4 | |
| Consumer Discretionary | | | 14.8 | |
| Communication Services | | | 9.7 | |
| Financials | | | 7.7 | |
| Information Technology | | | 6.1 | |
| Industrials | | | 5.0 | |
| Energy | | | 2.0 | |
| Consumer Staples | | | 1.8 | |
| Cash and Other Assets, Less Liabilities | | | 4.4 | |
| Total | | | 99.9 | |
| | | | |
| |
| MARKET CAP EXPOSURE (%)7 | |
| Mega Cap (over $25B) | | | 31.6 | |
| Large Cap ($10B–$25B) | | | 20.9 | |
| Mid Cap ($3B–10B) | | | 20.7 | |
| Small Cap (under $3B) | | | 22.4 | |
| Cash and Other Assets, Less Liabilities | | | 4.4 | |
| 6 | Not all countries where the Fund may invest are included in the benchmark index. |
| 7 | Source: FactSet Research Systems. Percentage values in data are rounded to the nearest tenth of one percent, so the values may not sum to 100% due to rounding. Percentage values may be derived from different data sources and may not be consistent with other Fund literature. |
| | | | |
| matthewsasia.com | 800.789.ASIA | | | 41 | |
Matthews Asia Growth Fund
June 30, 2020
Schedule of Investmentsa (unaudited)
COMMON EQUITIES: 95.6%
| | | | | | | | |
| | | Shares | | | Value | |
| | |
| CHINA/HONG KONG: 40.1% | | | | | | | | |
Wuxi Biologics Cayman, Inc.b,c,d | | | 3,693,000 | | | | $67,787,291 | |
| | |
Bilibili, Inc. ADRc | | | 1,434,500 | | | | 66,446,040 | |
| | |
Innovent Biologics, Inc.b,c,d | | | 6,984,500 | | | | 51,983,526 | |
| | |
BeiGene, Ltd. ADRc | | | 225,200 | | | | 42,427,680 | |
Alibaba Group Holding, Ltd. ADRc | | | 146,700 | | | | 31,643,190 | |
| | |
Baozun, Inc. ADRc | | | 818,500 | | | | 31,471,325 | |
| | |
Shenzhou International Group Holdings, Ltd. | | | 2,365,300 | | | | 28,755,459 | |
| | |
Alphamab Oncologyb,c,d | | | 11,948,000 | | | | 27,807,800 | |
Burning Rock Biotech, Ltd. ADRc | | | 907,209 | | | | 24,503,715 | |
| | |
Jiangsu Hengrui Medicine Co., Ltd. A Shares | | | 1,789,348 | | | | 23,396,468 | |
| | |
Shenzhen Inovance Technology Co., Ltd. A Shares | | | 4,069,575 | | | | 21,951,020 | |
Genscript Biotech Corp.c | | | 9,144,000 | | | | 18,910,601 | |
| | |
Hansoh Pharmaceutical Group Co.,
Ltd.b,c,d | | | 3,472,000 | | | | 16,420,520 | |
| | |
InnoCare Pharma, Ltd.b,c,d | | | 8,323,000 | | | | 15,814,574 | |
| | |
Kangji Medical Holdings, Ltd.c | | | 3,989,000 | | | | 15,337,359 | |
| | |
Silergy Corp. | | | 228,000 | | | | 14,935,893 | |
| | |
Peijia Medical, Ltd.b,c,d | | | 3,008,000 | | | | 13,622,450 | |
| | |
AK Medical Holdings, Ltd.b,d | | | 4,212,000 | | | | 13,426,732 | |
| | | | | | | | |
Total China/Hong Kong | | | | | | | 526,641,643 | |
| | | | | | | | |
| | | | | | | | |
| | | |
| JAPAN: 33.6% | | | | | | | | |
| | |
Sony Corp. | | | 552,500 | | | | 38,139,174 | |
| | |
Terumo Corp. | | | 921,900 | | | | 35,090,073 | |
| | |
Nintendo Co., Ltd. | | | 74,900 | | | | 33,485,457 | |
| | |
Keyence Corp. | | | 76,600 | | | | 32,100,114 | |
| | |
SoftBank Group Corp. | | | 552,400 | | | | 27,856,245 | |
| | |
PeptiDream, Inc.c | | | 555,300 | | | | 25,585,709 | |
| | |
Takeda Pharmaceutical Co., Ltd. | | | 690,400 | | | | 24,804,669 | |
| | |
Fast Retailing Co., Ltd. | | | 33,600 | | | | 19,312,337 | |
| | |
HEALIOS KKc | | | 1,149,400 | | | | 18,473,243 | |
| | |
Eisai Co., Ltd. | | | 221,500 | | | | 17,597,939 | |
| | |
Rozetta Corp.c | | | 516,600 | | | | 17,437,065 | |
| | |
M3, Inc. | | | 400,400 | | | | 17,009,446 | |
| | |
Nitori Holdings Co., Ltd. | | | 80,900 | | | | 15,861,988 | |
| | |
Kyoritsu Maintenance Co., Ltd. | | | 432,900 | | | | 14,809,775 | |
| | |
Sansan, Inc.c | | | 378,700 | | | | 14,535,636 | |
| | |
Hikari Tsushin, Inc. | | | 61,100 | | | | 13,970,406 | |
| | |
Nidec Corp. | | | 200,600 | | | | 13,514,179 | |
| | |
Japan Elevator Service Holdings Co., Ltd. | | | 402,600 | | | | 13,023,943 | |
| | |
Sysmex Corp. | | | 153,200 | | | | 11,759,891 | |
| | |
AI inside, Inc.c | | | 37,900 | | | | 11,400,477 | |
| | |
Shionogi & Co., Ltd. | | | 146,600 | | | | 9,196,714 | |
| | |
Sosei Group Corp.c | | | 550,900 | | | | 8,408,272 | |
| | |
Freee KKc | | | 158,000 | | | | 7,192,077 | |
| | | | | | | | |
Total Japan | | | | | | | 440,564,829 | |
| | | | | | | | |
| | | | | | | | |
| | | |
| UNITED STATES: 6.7% | | | | | | | | |
| | |
Schrodinger, Inc.c | | | 279,700 | | | | 25,612,129 | |
| | |
Legend Biotech Corp. ADRc | | | 537,538 | | | | 22,877,617 | |
| | |
Frequency Therapeutics, Inc.c | | | 476,465 | | | | 11,077,811 | |
| | |
Turning Point Therapeutics, Inc.c | | | 118,000 | | | | 7,621,620 | |
| | |
Oyster Point Pharma, Inc.c | | | 225,000 | | | | 6,498,000 | |
| | |
ORIC Pharmaceuticals, Inc.c | | | 191,568 | | | | 6,461,589 | |
| | |
NextCure, Inc.c | | | 253,300 | | | | 5,430,752 | |
| | |
REVOLUTION Medicines, Inc.c | | | 93,307 | | | | 2,945,702 | |
| | | | | | | | |
Total United States | | | | | | | 88,525,220 | |
| | | | | | | | |
| | | | | | | | |
| | | Shares | | | Value | |
| | |
| INDONESIA: 4.0% | | | | | | | | |
| | |
PT Bank Rakyat Indonesia Persero | | | 205,971,900 | | | | $43,963,287 | |
| | |
PT Mayora Indah | | | 54,105,900 | | | | 8,582,255 | |
| | | | | | | | |
Total Indonesia | | | | | | | 52,545,542 | |
| | | | | | | | |
| | | | | | | | |
| | | |
| AUSTRALIA: 3.4% | | | | | | | | |
| | |
Oil Search, Ltd. | | | 11,936,340 | | | | 26,452,766 | |
| | |
CSL, Ltd. | | | 89,666 | | | | 17,833,522 | |
| | | | | | | | |
Total Australia | | | | | | | 44,286,288 | |
| | | | | | | | |
| | | | | | | | |
| | | |
| INDIA: 3.0% | | | | | | | | |
| | |
HDFC Bank, Ltd. | | | 2,837,251 | | | | 39,879,046 | |
| | | | | | | | |
Total India | | | | | | | 39,879,046 | |
| | | | | | | | |
| | | | | | | | |
| | | |
| BANGLADESH: 1.6% | | | | | | | | |
| | |
Square Pharmaceuticals, Ltd. | | | 6,658,497 | | | | 13,183,589 | |
| | |
BRAC Bank, Ltd. | | | 24,353,713 | | | | 8,266,198 | |
| | | | | | | | |
Total Bangladesh | | | | | | | 21,449,787 | |
| | | | | | | | |
| | | | | | | | |
| | | |
| VIETNAM: 1.2% | | | | | | | | |
| | |
Vietnam Dairy Products JSC | | | 3,116,592 | | | | 15,234,729 | |
| | | | | | | | |
Total Vietnam | | | | | | | 15,234,729 | |
| | | | | | | | |
| | | | | | | | |
| | | |
| SWITZERLAND: 0.9% | | | | | | | | |
| | |
ADC Therapeutics SAc | | | 239,500 | | | | 11,210,995 | |
| | | | | | | | |
Total Switzerland | | | | | | | 11,210,995 | |
| | | | | | | | |
| | | | | | | | |
| | | |
| SRI LANKA: 0.7% | | | | | | | | |
| | |
Sampath Bank PLC | | | 13,125,953 | | | | 8,953,965 | |
| | | | | | | | |
Total Sri Lanka | | | | | | | 8,953,965 | |
| | | | | | | | |
| | | | | | | | |
| | | |
| CANADA: 0.4% | | | | | | | | |
| | |
Zymeworks, Inc.c | | | 129,700 | | | | 4,678,279 | |
| | | | | | | | |
Total Canada | | | | | | | 4,678,279 | |
| | | | | | | | |
| | | | | | | | |
| | |
| TOTAL INVESTMENTS: 95.6% | | | | 1,253,970,323 | |
(Cost $897,299,213) | | | | | | | | |
| | | | | | | | |
| | |
CASH AND OTHER ASSETS,
LESS LIABILITIES: 4.4% | | | | | | | 58,238,276 | |
| | | | | | | | |
| | |
NET ASSETS: 100.0% | | | | | | | $1,312,208,599 | |
| | | | | | | | |
| a | Certain securities were fair valued under the valuation policies approved by the Board of Trustees (Note 2-A). |
| b | Security exempt from registration under Rule 144A of the Securities Act of 1933, as amended. The security may be resold in transactions exempt from registration normally to qualified institutional buyers. The security has been determined to be liquid in accordance with procedures adopted by the Funds’ Board of Trustees. At June 30, 2020, the aggregate value is $206,862,893, which is 15.76% of net assets. |
| c | Non-income producing security. |
| d | The securities may be resold to qualified foreign investors and foreign institutional buyers under Regulation S of the Securities Act of 1933. |
| ADR | American Depositary Receipt |
See accompanying notes to financial statements.
| | | | |
| PORTFOLIO MANAGERS |
| | |
| Sharat Shroff, CFA | | | | |
Lead Manager | | | | |
| |
Inbok Song | | Raymond Deng |
Co-Manager | | Co-Manager |
| | |
| FUND FACTS | | | | |
| | |
| | | Investor | | Institutional |
Ticker | | MAPTX | | MIPTX |
CUSIP | | 577130107 | | 577130834 |
Inception | | 9/12/94 | | 10/29/10 |
NAV | | $27.38 | | $27.36 |
Initial Investment | | $2,500 | | $100,000 |
Gross Expense Ratio1 | | 1.08% | | 0.93% |
After Fee Waiver and Reimbursement2 | | 1.05% | | 0.91% |
Portfolio Statistics | | |
Total # of Positions | | 55 |
Net Assets | | $6.7 billion |
Weighted Average Market Cap | | $142.6 billion |
Portfolio Turnover3 | | 17.08% |
Benchmark |
MSCI AC Asia ex Japan Index |
OBJECTIVE
Long-term capital appreciation.
STRATEGY
Under normal market conditions, the Fund seeks to achieve its investment objective by investing at least 80% of its net assets, which include borrowings for investment purposes, in the common and preferred stocks of companies located in Asia ex Japan, which consists of all countries and markets in Asia excluding Japan, but including all other developed, emerging and frontier countries and markets in the Asian region.
Matthews Pacific Tiger Fund
Portfolio Manager Commentary (unaudited)
For the first half of 2020, the Matthews Pacific Tiger Fund returned –4.73% (Investor Class) and –4.70% (Institutional Class), while its benchmark, the MSCI All Country Asia ex Japan Index, returned –4.65% over the same period. For the quarter ending June 30, 2020, the Fund returned 20.35% (Investor Class) and 20.37% (Institutional Class), while the benchmark returned 16.79%.
Market Environment:
Asia’s markets experienced considerable volatility stemming from the global COVID-19 pandemic with significant decline in capital markets in the first quarter followed by a sharp recovery in the second. As the efforts to contain the spread of the virus are starting to take hold, especially in North Asia, the narrative is clearly shifting from survival to the revival in many of these economies. While most of the country-specific indices and currencies recovered from the sharp drop in the first quarter, there remained noticeable bifurcation between sectoral indices with health care, technology and consumer discretionary being the best performing, and real estate and utilities barely recovering. This dynamic reflects a world of intangible investments, automation, and low to zero interest rates.
Chinese equities generated the strongest returns in the region on the back of expectations around a return to normalcy in economic activity. The continued recovery and unattractiveness of other investing alternatives is drawing investors into China’s equity markets, albeit the participation is still narrowly focused on a select group of sectors. Towards the end of the quarter, expectations have started to build around greater infrastructure spending as is being reflected in some of the high frequency indicators, but the Chinese government remains mindful of the risks stemming from excessive stimulus.
South Korea and Taiwan also made considerable progress in flattening their curves of new virus infections in the reporting period. South Korean equities were roughly flat on fears of slowing global growth. Korea’s valuations are some of the region’s most attractive although a significant shift in corporate capital allocation decisions may be needed for a sustained rerating of equities. Meanwhile, Taiwanese equities are well positioned to benefit from the increasing adoption of technology in everyday lives.
Elsewhere, equity prices in parts of South and Southeast Asia—including India, Indonesia, the Philippines and Thailand—suffered as investors feared a slower recovery from the pandemic for these economies, in spite of a partial recovery in the second quarter. Less developed parts of Asia have had a harder time flattening their rates of new infections. And smaller government balance sheets may allow for less fiscal and monetary stimulus. However, we continue to see these economies playing a vital role in Asia’s growth over the long term.
Contributors and Detractors:
In the first half, the Fund’s performance was roughly in line with its benchmark. The portfolio’s overweight to India and Indonesia detracted from performance in the first half. From a sector perspective, stock selection in health care and real estate detracted from performance. Turning to contributors, strong stock selection in China was additive to relative performance. China’s equity markets experienced a notable rebound in the second quarter as sentiment improved on progress toward containing the spread of COVID-19 in China.
In the second quarter, the Fund outperformed its benchmark, primarily driven by strong stock selection. Stock selection in China and South Korea contributed to relative performance. In China, domestic tourism is starting to resume, consumer spending is recovering and businesses are looking for improved productivity solutions, trends that benefited portfolio holdings. In South Korea, portfolio holdings benefited from the potential for increased demand for IT solutions and online games and entertainment. Meanwhile, stock selection in India and Indonesia detracted from performance in the second quarter. Consumer spending in India and Indonesia was particularly weak amid the pandemic. Many of the portfolio’s consumer-related stocks, while generating positive absolute returns in the quarter, trailed the benchmark.
(continued)
| 1 | Prospectus Expense Ratios. |
| 2 | Matthews has contractually agreed to waive a portion of its advisory fee and administrative and shareholder services fee if the Fund’s average daily net assets are over $3 billion, as follows: for every $2.5 billion average daily net assets of the Fund that are over $3 billion, the advisory fee rate and the administrative and shareholder services fee rate for the Fund with respect to such excess average daily net assets will be each reduced by 0.01%, in each case without reducing such fee rate below 0.00%. Any amount waived by Matthews pursuant to this agreement may not be recouped by Matthews. This agreement will remain in place until April 30, 2021 and may be terminated (i) at any time by the Board of Trustees upon 60 days’ prior written notice to Matthews; or (ii) by Matthews at the annual expiration date of the agreement upon 60 days’ prior written notice to the Trust, in each case without payment of any penalty. |
| 3 | The lesser of fiscal year 2019 long-term purchase costs or sales proceeds divided by the average monthly market value of long-term securities. |
| | | | |
| matthewsasia.com | 800.789.ASIA | | | 43 | |
| | | | | | | | | | | | | | | | | | | | | | | | | | | | | | | | |
| |
| PERFORMANCE AS OF JUNE 30, 2020 | |
| | | | | | | | | | | | Average Annual Total Returns | | | | |
| | | 3 Months | | | YTD | | | 1 Year | | | 3 Years | | | 5 Years | | | 10 Years | | | Since
Inception | | | Inception
Date | |
| Investor Class (MAPTX) | | | 20.35% | | | | -4.73% | | | | -2.00% | | | | 2.97% | | | | 3.64% | | | | 7.01% | | | | 8.11% | | | | 9/12/94 | |
| Institutional Class (MIPTX) | | | 20.37% | | | | -4.70% | | | | -1.88% | | | | 3.12% | | | | 3.82% | | | | n.a. | | | | 5.26% | | | | 10/29/10 | |
| MSCI AC Asia ex Japan Index4 | | | 16.79% | | | | -4.65% | | | | 1.97% | | | | 3.80% | | | | 4.70% | | | | 6.21% | | | | 4.40% | 5 | | | | |
Performance assumes reinvestment of all dividends and/or distributions before taxes. All performance quoted represents past performance and is no guarantee of future results. Investment return and principal value will fluctuate with market conditions so that when redeemed, shares may be worth more or less than their original cost. Current performance may be lower or higher than the return figures quoted. Returns would have been lower if certain of the Fund’s fees and expenses had not been waived. For the Fund’s most recent month-end performance, visit matthewsasia.com.
GROWTH OF A HYPOTHETICAL $10,000 INVESTMENT SINCE INCEPTION—INVESTOR CLASS
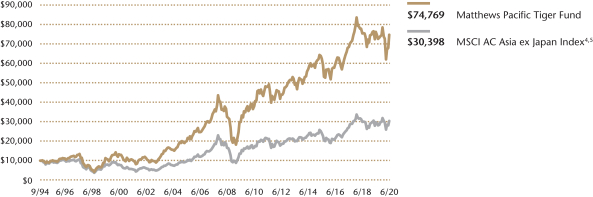
Plotted monthly. The performance data and graph do not reflect the deduction of taxes that a shareholder would pay on dividends, capital gains distributions or redemption of Fund shares. Values are in US$.
| | 4 | It is not possible to invest directly in an index. Source: Index data from Morgan Stanley Capital International and Bloomberg; total return calculations performed by BNY Mellon Investment Servicing (US) Inc. Please see page 90 for index definition. |
| | 5 | Calculated from 8/31/94. |
| | | | | | | | |
| | | | |
| TOP TEN HOLDINGS6 | | | | | | | |
| | | Sector | | Country | | % of Net Assets | |
| Tencent Holdings, Ltd. | | Communication Services | | China/Hong Kong | | | 7.2% | |
| Alibaba Group Holding, Ltd. | | Consumer Discretionary | | China/Hong Kong | | | 7.0% | |
| Samsung Electronics Co., Ltd. | | Information Technology | | South Korea | | | 4.9% | |
| NAVER Corp. | | Communication Services | | South Korea | | | 4.3% | |
| Hong Kong Exchanges & Clearing, Ltd. | | Financials | | China/Hong Kong | | | 3.9% | |
| AIA Group, Ltd. | | Financials | | China/Hong Kong | | | 3.4% | |
| China Resources Land, Ltd. | | Real Estate | | China/Hong Kong | | | 3.1% | |
| Taiwan Semiconductor Manufacturing Co., Ltd. | | Information Technology | | Taiwan | | | 3.0% | |
| China Resources Beer Holdings Co., Ltd. | | Consumer Staples | | China/Hong Kong | | | 2.9% | |
| Kweichow Moutai Co., Ltd. | | Consumer Staples | | China/Hong Kong | | | 2.6% | |
| % OF ASSETS IN TOP TEN | | | | | | | 42.3% | |
| | 6 | Holdings may combine more than one security from same issuer and related depositary receipts. |
Matthews Pacific Tiger Fund
Portfolio Manager Commentary (unaudited) (continued)
Among individual securities, a contributor to relative performance in the first half was Hong Kong Exchanges & Clearing Ltd. The prospect of dual listing for some of the larger Chinese companies currently listed in U.S. exchange, coupled with continued capital raising by mainland Chinese companies may lead to greater trading volumes on the exchange. The portfolio’s holdings in Indian financials HDFC Bank and Kotak Mahindra Bank were the biggest detractors from relative performance in the first half as worries about the impact of the lockdown on banking balance sheets weighed on investor sentiment.
Notable Portfolio Changes:
From a country perspective, the Fund’s exposure to China has continued to increase during the first half with new additions, especially in the first quarter. From a sector perspective, we continue to add exposure to consumer discretionary, industrial businesses and IT. With new types of companies emerging within IT across Asia, we are interested in companies that compete on intellectual property, companies with strong competitive moats and companies that capture the growth of consumer spending.
In the second quarter, we initiated a position in Tata Consultancy Services, a leading IT services company with clients in a variety of economic sectors. The company remains well positioned to help their clients navigate the journey towards higher digitization in their businesses, and has been able to secure larger-sized deals which create a moat for the company. We also exited Surya Citra Media Tbk PT, an Indonesian mass media company. Although the company remains a respectable player in the market with leading market share, we believe the overall shift from TV to digital advertising is a significant structural headwind for the company. While it has taken steps to address this shift to digital it was hard for us to see meaningful progress going forward, given the competitive environment. As such, we decided to exit our position in order to pursue other opportunities.
Outlook:
The pace of recovery from economic lockdowns across Asia varies by geography. In some parts of Asia like China, the worry is about a potential second wave, while in other countries like India, the first wave still continues unabated. These challenges can act as a stimulant for structural reforms. China continues to open up the capital markets to allow for greater flow of capital across borders and ease the constraints for companies to access funding. In India, there has been an effort on the part of the government to deregulate the agricultural market, and some state/local governments have also eased onerous labor provisions.
In addition to the health care and economic challenges, the political climate has also deteriorated with tensions between the U.S. and China ratcheting up as we close in on U.S. elections in November. It is hard to predict the course of actions by either administration. But from an economic standpoint, China has become increasingly self-sufficient, with the ability to drive economic growth within the country although sectors like technology are still dependent on critical imports. The portfolio’s Chinese holdings are less exposed to trade between the U.S. and China.
In spite of all the above headwinds, it is encouraging to see a steady recovery in economic activity in countries like China, South Korea, and Taiwan—all of which have benefited from decisive action early on in controlling the spread of the virus. However, equity markets remain quite focused on sectors like IT, consumer discretionary, and communication services. This reflects a conundrum whereby there is a clear and widening gap between stocks in the top quintile and bottom quintile of valuation multiples. Some of this dichotomy may be justified as there continues to be considerable change in corporate Asia, which may favor those companies with access to capital and a willingness to embrace technological disruption. At the same time, as economic recovery strengthens, there may be an opportunity in a broader variety of sectors, which may have been ignored so far. We continue to remain vigilant for such opportunities in businesses that are capable of sustained growth with good profitability and cash flows.
| | | | |
| |
| COUNTRY ALLOCATION (%)7,8 | |
| China/Hong Kong | | | 53.7 | |
| South Korea | | | 11.4 | |
| India | | | 10.0 | |
| Taiwan | | | 9.6 | |
| Indonesia | | | 5.6 | |
| Philippines | | | 2.4 | |
| Switzerland | | | 1.5 | |
| Vietnam | | | 1.4 | |
| Thailand | | | 1.3 | |
| Malaysia | | | 1.0 | |
| Cash and Other Assets, Less Liabilities | | | 2.2 | |
| Total | | | 100.1 | |
| | | | |
| |
| SECTOR ALLOCATION (%)8 | |
| Consumer Discretionary | | | 17.8 | |
| Financials | | | 17.3 | |
| Communication Services | | | 15.2 | |
| Consumer Staples | | | 14.6 | |
| Information Technology | | | 14.1 | |
| Real Estate | | | 6.0 | |
| Health Care | | | 5.6 | |
| Industrials | | | 4.3 | |
| Utilities | | | 3.0 | |
| Cash and Other Assets, Less Liabilities | | | 2.2 | |
| Total | | | 100.1 | |
| | | | |
| |
| MARKET CAP EXPOSURE (%)8 | |
| Mega Cap (over $25B) | | | 59.9 | |
| Large Cap ($10B–$25B) | | | 20.2 | |
| Mid Cap ($3B–10B) | | | 13.9 | |
| Small Cap (under $3B) | | | 3.7 | |
| Unassigned | | | 0.1 | |
| Cash and Other Assets, Less Liabilities | | | 2.2 | |
| 7 | Not all countries where the Fund may invest are included in the benchmark index. |
| 8 | Source: FactSet Research Systems. Percentage values in data are rounded to the nearest tenth of one percent, so the values may not sum to 100% due to rounding. Percentage values may be derived from different data sources and may not be consistent with other Fund literature. |
| | | | |
| matthewsasia.com | 800.789.ASIA | | | 45 | |
Matthews Pacific Tiger Fund
June 30, 2020
Schedule of Investmentsa (unaudited)
COMMON EQUITIES: 97.8%
| | | | | | | | |
| | | Shares | | | Value | |
| | |
| CHINA/HONG KONG: 53.7% | | | | | | | | |
Tencent Holdings, Ltd. | | | 7,567,800 | | | | $484,928,830 | |
| | |
Alibaba Group Holding, Ltd.b | | | 12,961,800 | | | | 349,758,646 | |
| | |
Hong Kong Exchanges & Clearing, Ltd. | | | 6,114,000 | | | | 260,405,848 | |
| | |
AIA Group, Ltd. | | | 24,134,000 | | | | 225,836,441 | |
| | |
China Resources Land, Ltd. | | | 53,912,000 | | | | 206,062,188 | |
| | |
China Resources Beer Holdings Co., Ltd. | | | 34,721,775 | | | | 193,816,975 | |
| | |
Kweichow Moutai Co., Ltd. A Shares | | | 832,173 | | | | 172,899,764 | |
| | |
Ping An Insurance Group Co. of China, Ltd. H Shares | | | 17,334,000 | | | | 172,802,504 | |
| | |
China Tourism Group Duty Free Corp., Ltd. A Shares | | | 6,754,078 | | | | 148,096,785 | |
| | |
Inner Mongolia Yili Industrial Group Co., Ltd. A Shares | | | 31,574,808 | | | | 139,487,429 | |
| | |
Wuxi Biologics Cayman, Inc.b,c,d | | | 7,409,500 | | | | 136,005,938 | |
| | |
Alibaba Group Holding, Ltd. ADRb | | | 540,075 | | | | 116,494,178 | |
| | |
Jiangsu Hengrui Medicine Co., Ltd. A Shares | | | 8,525,841 | | | | 111,478,913 | |
| | |
ENN Energy Holdings, Ltd. | | | 8,936,700 | | | | 100,989,058 | |
| | |
China East Education Holdings, Ltd.c,d | | | 52,703,000 | | | | 95,803,657 | |
| | |
Guotai Junan Securities Co., Ltd. H Sharesc,d | | | 66,072,000 | | | | 91,885,867 | |
| | |
Fuyao Glass Industry Group Co., Ltd. H Sharesc,d,† | | | 37,397,200 | | | | 89,539,503 | |
| | |
Topsports International Holdings, Ltd.c,d | | | 65,513,000 | | | | 84,286,622 | |
| | |
Yum China Holdings, Inc. | | | 1,741,201 | | | | 83,699,532 | |
| | |
Midea Group Co., Ltd. A Shares | | | 8,999,536 | | | | 76,331,952 | |
| | |
Tencent Music Entertainment Group ADRb | | | 4,655,200 | | | | 62,658,992 | |
| | |
Kingdee International Software Group Co., Ltd. | | | 24,954,000 | | | | 58,389,453 | |
| | |
Weichai Power Co., Ltd. A Shares | | | 21,684,069 | | | | 42,231,801 | |
| | |
Midea Group Co., Ltd. A Shares | | | 4,206,937 | | | | 35,664,850 | |
| | |
Kingsoft Cloud Holdings, Ltd. ADRb | | | 992,754 | | | | 31,291,606 | |
| | |
CITIC Securities Co., Ltd. H Shares | | | 10,908,000 | | | | 20,806,758 | |
| | | | | | | | |
Total China/Hong Kong | | | | | | | 3,591,654,090 | |
| | | | | | | | |
| | | | | | | | |
| | | |
| SOUTH KOREA: 11.4% | | | | | | | | |
Samsung Electronics Co., Ltd. | | | 7,392,883 | | | | 327,265,427 | |
| | |
NAVER Corp. | | | 1,271,618 | | | | 286,092,784 | |
| | |
NCSoft Corp. | | | 105,867 | | | | 78,757,347 | |
| | |
Orion Holdings Corp.† | | | 3,198,402 | | | | 35,540,544 | |
| | |
Hanon Systems | | | 4,206,299 | | | | 31,878,311 | |
| | |
SK Biopharmaceuticals Co., Ltd.b | | | 93,484 | | | | 3,808,219 | |
| | | | | | | | |
Total South Korea | | | | | | | 763,342,632 | |
| | | | | | | | |
| | | | | | | | |
| | | |
| INDIA: 10.0% | | | | | | | | |
Housing Development Finance Corp., Ltd. | | | 6,708,642 | | | | 155,990,164 | |
| | |
Dabur India, Ltd. | | | 16,112,505 | | | | 99,517,751 | |
| | |
Tata Power Co., Ltd.† | | | 165,316,487 | | | | 98,536,843 | |
| | |
Kotak Mahindra Bank, Ltd. | | | 5,354,922 | | | | 96,656,434 | |
| | |
Container Corp. of India, Ltd. | | | 16,080,979 | | | | 88,921,748 | |
| | |
Titan Co., Ltd. | | | 6,423,426 | | | | 80,878,554 | |
| | |
Tata Consultancy Services, Ltd. | | | 1,202,565 | | | | 33,103,640 | |
| | |
HDFC Bank, Ltd. | | | 1,171,079 | | | | 16,460,128 | |
| | | | | | | | |
Total India | | | | | | | 670,065,262 | |
| | | | | | | | |
| | | | | | | | |
| | | | | | | | |
| | | Shares | | | Value | |
| | |
| TAIWAN: 9.6% | | | | | | | | |
Taiwan Semiconductor Manufacturing Co., Ltd. | | | 18,700,000 | | | | $199,707,030 | |
| | |
MediaTek, Inc. | | | 8,174,000 | | | | 161,605,122 | |
| | |
President Chain Store Corp. | | | 14,521,608 | | | | 146,082,633 | |
| | |
Realtek Semiconductor Corp. | | | 7,610,000 | | | | 77,565,129 | |
| | |
Delta Electronics, Inc. | | | 9,973,182 | | | | 56,910,928 | |
| | | | | | | | |
Total Taiwan | | | | | | | 641,870,842 | |
| | | | | | | | |
| | | | | | | | |
| | | |
| INDONESIA: 5.6% | | | | | | | | |
PT Bank Central Asia | | | 59,006,900 | | | | 118,061,077 | |
| | |
PT Telekomunikasi Indonesia Persero | | | 479,046,700 | | | | 102,617,733 | |
| | |
PT Indofood CBP Sukses Makmur | | | 147,199,100 | | | | 96,605,772 | |
| | |
PT Mitra Keluarga Karyasehatd | | | 358,729,800 | | | | 57,066,512 | |
| | | | | | | | |
Total Indonesia | | | | | | | 374,351,094 | |
| | | | | | | | |
| | | | | | | | |
| | | |
| PHILIPPINES: 2.4% | | | | | | | | |
SM Prime Holdings, Inc. | | | 159,670,771 | | | | 102,693,017 | |
| | |
GT Capital Holdings, Inc. | | | 6,376,833 | | | | 58,531,087 | |
| | | | | | | | |
Total Philippines | | | | | | | 161,224,104 | |
| | | | | | | | |
| | | | | | | | |
| | | |
| SWITZERLAND: 1.4% | | | | | | | | |
DKSH Holding AG | | | 1,509,437 | | | | 97,249,858 | |
| | | | | | | | |
Total Switzerland | | | | | | | 97,249,858 | |
| | | | | | | | |
| | | | | | | | |
| | | |
| VIETNAM: 1.4% | | | | | | | | |
Vietnam Dairy Products JSC | | | 18,849,190 | | | | 92,139,847 | |
| | | | | | | | |
Total Vietnam | | | | | | | 92,139,847 | |
| | | | | | | | |
| | | | | | | | |
| | | |
| THAILAND: 1.3% | | | | | | | | |
Central Pattana Public Co., Ltd. | | | 56,511,100 | | | | 89,828,984 | |
| | | | | | | | |
Total Thailand | | | | | | | 89,828,984 | |
| | | | | | | | |
| | | | | | | | |
| | | |
| MALAYSIA: 1.0% | | | | | | | | |
IHH Healthcare BHD | | | 50,774,600 | | | | 65,453,140 | |
| | | | | | | | |
Total Malaysia | | | | | | | 65,453,140 | |
| | | | | | | | |
| | | | | | | | |
| | | |
| TOTAL INVESTMENTS: 97.8% | | | | | | | 6,547,179,853 | |
(Cost $4,472,778,772) | | | | | | | | |
| | | | | | | | |
| | |
CASH AND OTHER ASSETS,
LESS LIABILITIES: 2.2% | | | | | | | 146,465,749 | |
| | | | | | | | |
| | |
NET ASSETS: 100.0% | | | | | | | $6,693,645,602 | |
| | | | | | | | |
Matthews Pacific Tiger Fund
June 30, 2020
Schedule of Investmentsa (unaudited) (continued)
| a | Certain securities were fair valued under the valuation policies approved by the Board of Trustees (Note 2-A). |
| b | Non-income producing security. |
| c | Security exempt from registration under Rule 144A of the Securities Act of 1933, as amended. The security may be resold in transactions exempt from registration normally to qualified institutional buyers. The security has been determined to be liquid in accordance with procedures adopted by the Funds’ Board of Trustees. At June 30, 2020, the aggregate value is $497,521,587, which is 7.43% of net assets. |
| d | The securities may be resold to qualified foreign investors and foreign institutional buyers under Regulation S of the Securities Act of 1933. |
| † | Affiliated Issuer, as defined under the Investment Company Act of 1940 (ownership of 5% or more of the outstanding voting securities of this issuer) |
| ADR | American Depositary Receipt |
See accompanying notes to financial statements.
| | | | |
| matthewsasia.com | 800.789.ASIA | | | 47 | |
| | | | |
| PORTFOLIO MANAGERS |
| |
| Vivek Tanneeru | | |
Lead Manager | | |
| |
| Winnie Chwang | | |
Co-Manager | | | | |
|
| FUND FACTS |
| | |
| | | Investor | | Institutional |
Ticker | | MASGX | | MISFX |
CUSIP | | 577130727 | | 577130719 |
Inception | | 4/30/15 | | 4/30/15 |
NAV | | $11.15 | | $11.14 |
Initial Investment | | $2,500 | | $100,000 |
Gross Expense Ratio1 | | 1.54% | | 1.41% |
After Fee Waiver and Reimbursement2 | | 1.38% | | 1.20% |
Portfolio Statistics | | | | |
Total # of Positions | | 56 |
Net Assets | | $55.5 million |
Weighted Average
Market Cap | | $20.9 billion |
Portfolio Turnover3 | | 29.67% |
Benchmark | | |
MSCI AC Asia ex Japan Index |
OBJECTIVE
Long-term capital appreciation.
STRATEGY
Under normal market conditions, the Fund seeks to achieve its investment objective by investing at least 80% of its net assets, which include borrowings for investment purposes, in the common and preferred stocks of companies of any market capitalization located in Asia that Matthews believes satisfy one or more of its environmental, social and governance (“ESG”) standards. Asia consists of all countries and markets in Asia and includes developed, emerging, and frontier countries and markets in the Asia region. The Fund may also invest in convertible securities and fixed-income securities, of any duration or quality, including high yield securities, of Asian companies.
Matthews Asia ESG Fund
Portfolio Manager Commentary (unaudited)
For the first half of 2020, the Matthews Asia ESG Fund returned 0.63% (Investor Class) and 0.72% (Institutional Class), while its benchmark, the MSCI All Country Asia ex Japan Index, returned –4.65. For the quarter ending June 30, 2020, the Matthews Asia ESG Fund returned 31.80% (Investor Class) and 31.83% (Institutional Class), while the benchmark returned 16.79.
Market Environment:
Asia’s markets experienced considerable volatility stemming from the global COVID-19 pandemic with significant decline in equity markets in the first quarter followed by a sharp recovery in the second. As the efforts to contain the spread of the virus are starting to take hold, especially in North Asia, the narrative is clearly shifting from survival to the revival in many of these economies. While most country-specific indices and currencies recovered from the sharp drop in the first quarter, there remained noticeable bifurcation between sectoral indices with health care, technology and consumer discretionary being the best performing, with financials and real estate suffering. This dynamic reflects a world of intangible investments, increased use of consumer internet in a pandemic, and low to zero interest rates.
The Taiwan dollar appreciated relative to the U.S. dollar (up 1.60%) in the first half, as did the Hong Kong dollar (up 0.53%). Most other Asian currencies depreciated, including the Chinese renminbi (–1.53%) and the South Korean won (–3.86%). Turning to financial markets, China’s equity markets were among the strongest in the region for the first half, despite U.S.—China trade tensions. South Korea’s equity markets were slightly negative, but made up considerable ground toward the end of the first half. Equity prices in parts of South and Southeast Asia—including India, Indonesia, the Philippines and Thailand—suffered as investors feared a slower recovery from the pandemic for these economies, in spite of a partial recovery in the second quarter. Less developed parts of Asia have had a harder time flattening their rates of new infections. And smaller government balance sheets may allow for less fiscal and monetary stimulus.
Performance Contributors and Detractors:
Stock selection in South Korea—particularly among information technology stocks—contributed to relative performance in the first half. Samsung SDI is one of the world’s leading small, automotive and energy storage battery suppliers. It also has a minority equity stake in the world’s largest display company. In addition, Samsung SDI also has an electronic materials division. The company is one of the global leaders in the large battery chemicals used in electric vehicles (EVs) and utility-grade energy storage systems. Samsung SDI has spent the last decade heavily investing in the large battery R&D and production capacity and the market now expects the company to breakeven in this segment. Given the strong performance of EV vehicle sales in Europe, the main end market for Samsung SDI’s automotive battery cells, the market is beginning to recognize its strengths even amid the COVID19 pandemic.
The Fund’s Indian financial holdings detracted from performance during the first half of the year. Going into 2020, Indian banking system that was already dealing
(continued)
| 1 | Prospectus expense ratios. |
| 2 | Matthews has contractually agreed (i) to waive fees and reimburse expenses to the extent needed to limit Total Annual Fund Operating Expenses (excluding Rule 12b-1 fees, taxes, interest, brokerage commissions, short sale dividend expenses, expenses incurred in connection with any merger or reorganization or extraordinary expenses such as litigation) of the Institutional Class to 1.20% first by waiving class specific expenses (i.e., shareholder service fees specific to a particular class) of the Institutional Class and then, to the extent necessary, by waiving non-class specific expenses (e.g., custody fees) of the Institutional Class, and (ii) if any Fund-wide expenses (i.e., expenses that apply to both the Institutional Class and the Investor Class) are waived for the Institutional Class to maintain the 1.20% expense limitation, to waive an equal amount (in annual percentage terms) of those same expenses for the Investor Class. The Total Annual Fund Operating Expenses After Fee Waiver and Expense Reimbursement for the Investor Class may vary from year to year and will in some years exceed 1.20%. If the operating expenses fall below the expense limitation in a year within three years after Matthews has made a waiver or reimbursement, the Fund may reimburse Matthews up to an amount that does not cause the expenses for that year to exceed the lesser of (i) the expense limitation applicable at the time of that fee waiver and/or expense reimbursement or (ii) the expense limitation in effect at the time of recoupment. This agreement will remain in place until April 30, 2021 and may be terminated at any time by the Board of Trustees on behalf of the Fund on 60 days’ written notice to Matthews. Matthews may decline to renew this agreement by written notice to the Trust at least 30 days before its annual expiration date. |
| 3 | The lesser of fiscal year 2019 long-term purchase costs or sales proceeds divided by the average monthly market value of long-term securities. |
| | | | | | | | | | | | | | | | | | | | | | | | | | | | |
| |
| PERFORMANCE AS OF JUNE 30, 2020 | |
| | | | | | | | | | | | Average Annual Total Returns | | | | |
| | | 3 Months | | | YTD | | | 1 Year | | | 3 years | | | 5 years | | | Since
Inception | | | Inception
Date | |
| Investor Class (MASGX) | | | 31.80% | | | | 0.63% | | | | 3.32% | | | | 4.70% | | | | 4.90% | | | | 4.42% | | | | 4/30/15 | |
| Institutional Class (MISFX) | | | 31.83% | | | | 0.72% | | | | 3.48% | | | | 4.93% | | | | 5.15% | | | | 4.65% | | | | 4/30/15 | |
| MSCI AC Asia ex Japan Index4 | | | 16.79% | | | | -4.65% | | | | 1.97% | | | | 3.90% | | | | 4.70% | | | | 3.27% | | | | | |
Performance assumes reinvestment of all dividends and/or distributions before taxes. All performance quoted represents past performance and is no guarantee of future results. Investment return and principal value will fluctuate with market conditions so that when redeemed, shares may be worth more or less than their original cost. Current performance may be lower or higher than the return figures quoted. Returns would have been lower if certain of the Fund’s fees and expenses had not been waived. For the Fund’s most recent month-end performance visit matthewsasia.com.
GROWTH OF A HYPOTHETICAL $10,000 INVESTMENT SINCE INCEPTION—INVESTOR CLASS
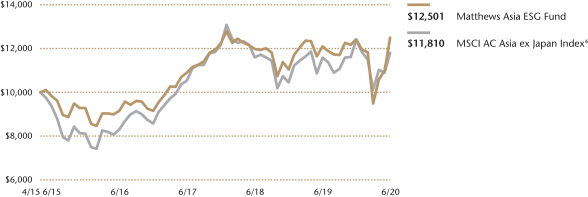
Plotted Monthly. The performance data and graph do not reflect the deduction of taxes that a shareholder would pay on dividends, capital gain distributions or redemption of Fund shares. Values are in US$.
| | 4 | It is not possible to invest directly in an index. Source: Index data from Morgan Stanley Capital International; total return calculations performed by BNY Mellon Investment Servicing (US) Inc. Please see page 90 for index definition. |
| | | | | | | | | | | | |
| | | | | |
| TOP TEN HOLDINGS5 | | | | | | | | | | |
| | | Sector | | Country | | | | | % of Net Assets | |
| Samsung SDI Co., Ltd., Pfd. | | Information Technology | | South Korea | | | | | | | 5.0% | |
| Bandhan Bank, Ltd. | | Financials | | India | | | | | | | 5.0% | |
| Hong Kong Exchanges & Clearing, Ltd. | | Financials | | China/Hong Kong | | | | | | | 4.7% | |
| Unicharm Corp. | | Consumer Staples | | Japan | | | | | | | 4.1% | |
| Meituan Dianping Class B | | Consumer Discretionary | | China/Hong Kong | | | | | | | 4.1% | |
| Hangzhou Tigermed Consulting Co., Ltd. | | Health Care | | China/Hong Kong | | | | | | | 3.5% | |
| Mahindra & Mahindra, Ltd. | | Consumer Discretionary | | India | | | | | | | 3.4% | |
| China Conch Venture Holdings, Ltd. | | Industrials | | China/Hong Kong | | | | | | | 3.3% | |
| CSPC Pharmaceutical Group, Ltd. | | Health Care | | China/Hong Kong | | | | | | | 3.2% | |
| Yonghui Superstores Co., Ltd. | | Consumer Staples | | China/Hong Kong | | | | | | | 3.1% | |
| % OF ASSETS IN TOP TEN | | | | | | | | | | | 39.4% | |
| | 5 | Holdings may combine more than one security from same issuer and related depositary receipts. |
| | | | |
| matthewsasia.com | 800.789.ASIA | | | 49 | |
| | | | |
| | |
| COUNTRY ALLOCATION (%)6,7 | | | |
| China/Hong Kong | | | 35.3 | |
| India | | | 16.4 | |
| Taiwan | | | 10.7 | |
| South Korea | | | 9.2 | |
| Japan | | | 7.6 | |
| United States | | | 6.2 | |
| Bangladesh | | | 3.5 | |
| Indonesia | | | 2.4 | |
| Thailand | | | 2.3 | |
| Singapore | | | 1.8 | |
| Philippines | | | 1.7 | |
| Vietnam | | | 0.9 | |
| Pakistan | | | 0.1 | |
Cash and Other Assets, Less Liabilities | | | 1.9 | |
| Total | | | 100.0 | |
| | | | |
| | |
| SECTOR ALLOCATION (%)7 | | | |
| Financials | | | 17.8 | |
| Consumer Discretionary | | | 16.1 | |
| Health Care | | | 16.1 | |
| Information Technology | | | 14.7 | |
| Industrials | | | 9.8 | |
| Consumer Staples | | | 8.9 | |
| Communication Services | | | 8.3 | |
| Materials | | | 3.3 | |
| Real Estate | | | 3.1 | |
Cash and Other Assets, Less Liabilities | | | 1.9 | |
| Total | | | 100.0 | |
| | | | |
| | |
| MARKET CAP EXPOSURE (%)7 | | | |
| Mega Cap (over $25B) | | | 20.8 | |
| Large Cap ($10B–$25B) | | | 21.4 | |
| Mid Cap ($3B–10B) | | | 28.0 | |
| Small Cap (under $3B) | | | 27.6 | |
| Unassigned | | | 0.3 | |
| Cash and Other Assets, Less Liabilities | | | 1.9 | |
| 6 | Not all countries are included in the benchmark index. |
| 7 | Source: FactSet Research Systems. Percentage values in data are rounded to the nearest tenth of one percent, so the values may not sum to 100% due to rounding. Percentage values may be derived from different data sources and may not be consistent with other Fund literature. |
Matthews Asia ESG Fund
Portfolio Manager Commentary (unaudited) (continued)
with the after effects of several years of anemic growth and the resultant credit cycle was presented with a new challenge in the form of COVID-19-related lockdown in India. In addition, Yes Bank, a troubled small private Indian bank, was rescued in March by a bank consortium and temporary restrictions were imposed on deposit withdrawals from the bank. This led to worries about a systemic risk in the Indian banking system and some small- and mid-sized banks were sold-off aggressively, as the market worried about the possibility of deposit flight. Non-Banking Financial Services Companies (NBFCs) also bore the brunt of worries about a funding crunch, especially, after Franklin Templeton closed six of its Indian bond funds abruptly. A combination of worries about liquidity as well as the as-yet-unknown credit costs emanating from COVID-19 induced lockdowns led to a sharp sell-off. India’s central bank, Reserve Bank of India (RBI), stepped in to ease rates, provide liquidity and also offer a moratorium to borrowers on account of COVID-19. India’s central government also announced a slew of fiscal measures to support the economy. Our bank holdings recovered well from their first quarter bottoms in the second quarter. We continue to remain vigilant about the liquidity and credit risks. Given the strong capital position of our holdings, attractive asset yields, improving deposit profiles and very attractive valuations, we remain positive on their long-term potential.
Notable Portfolio Changes:
We initiated a position in Legend Biotech in the second quarter. Legend Biotech is a Chinese biopharma company developing breakthrough CAR-T cell therapies, which help patient’s T cells combat cancer more effectively. In China, where the incidence of certain cancers such as lung cancer and gastric cancer is higher, there is a strong need for local and relatively affordable drugs and therapies. Legend has a very strong R&D capability and also a strong product pipeline. Its flagship CAR-T therapy’s global clinical trials, in partnership with global health care major Johnson & Johnson, have demonstrated promising data so far. Legend has a strong and well-rounded management team.
Outlook:
The pace of recovery from economic lockdowns across Asia varies by geography. In some parts of Asia like China, the worry is about a potential second wave, while in other countries like India, the first wave still continues unabated. These challenges can act as a stimulant for structural reforms. China continues to open up its capital markets to allow for greater flow of capital across borders and ease the constraints for companies to access funding. In India, there has been an effort on the part of the government to deregulate the agricultural market, and some state/local governments have also eased onerous labor provisions.
The pandemic has brought into clear focus ESG issues related to health care services and access, employment opportunities and the climate. Generating sustainable economic growth will require more inclusive economic growth. Asia remains at the epicenter of essential ESG issues globally. Looking ahead, we will continue to engage with our portfolio companies on issues related to sustainability, inclusiveness and profitability.
Matthews Asia ESG Fund
June 30, 2020
Schedule of Investmentsa (unaudited)
COMMON EQUITIES: 90.3%
| | | | | | | | |
| | | Shares | | | Value | |
| | | | | | | | |
| | |
| CHINA/HONG KONG: 35.3% | | | | | | | | |
Hong Kong Exchanges & Clearing, Ltd. | | | 61,700 | | | | $2,627,910 | |
| | |
Meituan Dianping Class Bb,c | | | 102,000 | | | | 2,279,330 | |
| | |
Hangzhou Tigermed Consulting Co., Ltd. A Shares | | | 134,076 | | | | 1,930,951 | |
| | |
China Conch Venture Holdings, Ltd. | | | 427,500 | | | | 1,814,475 | |
| | |
CSPC Pharmaceutical Group, Ltd. | | | 945,600 | | | | 1,790,860 | |
| | |
Yonghui Superstores Co., Ltd. A Shares | | | 1,313,895 | | | | 1,747,557 | |
| | |
Wuxi Biologics Cayman, Inc.b,c,d | | | 72,000 | | | | 1,321,604 | |
| | |
Tencent Music Entertainment Group ADRb | | | 93,600 | | | | 1,259,856 | |
| | |
HKBN, Ltd. | | | 688,500 | | | | 1,207,329 | |
| | |
New Oriental Education & Technology Group, Inc. ADRb | | | 8,300 | | | | 1,080,909 | |
| | |
Xinyi Glass Holdings, Ltd. | | | 522,000 | | | | 644,212 | |
| | |
ASM Pacific Technology, Ltd. | | | 53,900 | | | | 569,615 | |
| | |
AIA Group, Ltd. | | | 46,800 | | | | 437,936 | |
| | |
Innovent Biologics, Inc.b,c,d | | | 54,000 | | | | 401,906 | |
| | |
Kingsoft Cloud Holdings, Ltd. ADRb | | | 11,545 | | | | 363,898 | |
| | |
MTR Corp., Ltd. | | | 20,500 | | | | 106,615 | |
| | | | | | | | |
Total China/Hong Kong | | | | | | | 19,584,963 | |
| | | | | | | | |
| | | | | | | | |
| | | |
| INDIA: 16.4% | | | | | | | | |
| | |
Bandhan Bank, Ltd.c,d | | | 645,506 | | | | 2,752,766 | |
| | |
Mahindra & Mahindra, Ltd. | | | 276,738 | | | | 1,878,419 | |
| | |
IndusInd Bank, Ltd. | | | 203,435 | | | | 1,281,835 | |
| | |
Shriram City Union Finance, Ltd. | | | 109,588 | | | | 969,612 | |
| | |
Minda Industries, Ltd. | | | 213,544 | | | | 777,748 | |
| | |
NBCC India, Ltd. | | | 2,324,874 | | | | 717,476 | |
| | |
Lupin, Ltd. | | | 32,205 | | | | 389,133 | |
| | |
Lemon Tree Hotels, Ltd.b,c,d | | | 1,053,619 | | | | 318,435 | |
| | | | | | | | |
Total India | | | | | | | 9,085,424 | |
| | | | | | | | |
| | | | | | | | |
| | | |
| TAIWAN: 10.7% | | | | | | | | |
Zhen Ding Technology Holding, Ltd. | | | 384,000 | | | | 1,685,178 | |
| | |
Sporton International, Inc. | | | 152,903 | | | | 1,252,136 | |
| | |
Poya International Co., Ltd. | | | 55,000 | | | | 1,086,882 | |
| | |
Merida Industry Co., Ltd. | | | 88,000 | | | | 601,572 | |
| | |
Sunonwealth Electric Machine Industry Co., Ltd. | | | 305,000 | | | | 534,493 | |
| | |
Taiwan Semiconductor Manufacturing Co., Ltd. | | | 50,000 | | | | 533,976 | |
| | |
Taiwan Sakura Corp. | | | 153,000 | | | | 246,028 | |
| | | | | | | | |
Total Taiwan | | | | | | | 5,940,265 | |
| | | | | | | | |
| | | | | | | | |
| | | |
| JAPAN: 7.6% | | | | | | | | |
Unicharm Corp. | | | 55,600 | | | | 2,280,296 | |
| | |
UT Group Co., Ltd.b | | | 26,700 | | | | 614,402 | |
| | |
Tsukui Corp. | | | 81,500 | | | | 383,005 | |
| | |
Koa Corp. | | | 36,800 | | | | 344,072 | |
| | |
Sosei Group Corp.b | | | 21,300 | | | | 325,098 | |
| | |
Fuji Seal International, Inc. | | | 12,800 | | | | 249,100 | |
| | | | | | | | |
Total Japan | | | | | | | 4,195,973 | |
| | | | | | | | |
| | | | | | | | |
| | | | | | | | |
| | | Shares | | | Value | |
| | | | | | | | |
| | |
| UNITED STATES: 6.2% | | | | | | | | |
Legend Biotech Corp. ADRb | | | 31,088 | | | | $1,323,105 | |
| | |
STAAR Surgical Co.b | | | 14,500 | | | | 892,330 | |
| | |
Micron Technology, Inc.b | | | 14,300 | | | | 736,736 | |
| | |
Universal Display Corp. | | | 1,800 | | | | 269,316 | |
| | |
Applied Materials, Inc. | | | 3,900 | | | | 235,755 | |
| | | | | | | | |
Total United States | | | | | | | 3,457,242 | |
| | | | | | | | |
| | | | | | | | |
| | | |
| BANGLADESH: 3.5% | | | | | | | | |
BRAC Bank, Ltd. | | | 3,201,170 | | | | 1,086,549 | |
| | |
GrameenPhone, Ltd. | | | 319,501 | | | | 866,060 | |
| | | | | | | | |
Total Bangladesh | | | | | | | 1,952,609 | |
| | | | | | | | |
| | | | | | | | |
| | | |
| INDONESIA: 2.4% | | | | | | | | |
PT Bank Rakyat Indonesia Persero | | | 3,413,400 | | | | 728,567 | |
| | |
PT Jaya Real Property | | | 21,603,300 | | | | 618,602 | |
| | | | | | | | |
Total Indonesia | | | | | | | 1,347,169 | |
| | | | | | | | |
| | | | | | | | |
| | | |
| THAILAND: 2.3% | | | | | | | | |
Total Access Communication Public Co., Ltd. NVDR | | | 1,009,100 | | | | 1,287,867 | |
| | | | | | | | |
Total Thailand | | | | | | | 1,287,867 | |
| | | | | | | | |
| | | | | | | | |
| | | |
| SINGAPORE: 1.8% | | | | | | | | |
Ascendas India Trust | | | 612,100 | | | | 593,543 | |
| | |
SATS, Ltd. | | | 187,500 | | | | 388,656 | |
| | | | | | | | |
Total Singapore | | | | | | | 982,199 | |
| | | | | | | | |
| | | | | | | | |
| | | |
| PHILIPPINES: 1.7% | | | | | | | | |
Puregold Price Club, Inc. | | | 1,005,830 | | | | 938,697 | |
| | | | | | | | |
Total Philippines | | | | | | | 938,697 | |
| | | | | | | | |
| | | | | | | | |
| | | |
| SOUTH KOREA: 1.4% | | | | | | | | |
Eugene Technology Co., Ltd. | | | 28,069 | | | | 644,492 | |
| | |
SK Biopharmaceuticals Co., Ltd.b | | | 3,804 | | | | 154,962 | |
| | | | | | | | |
Total South Korea | | | | | | | 799,454 | |
| | | | | | | | |
| | | | | | | | |
| | | |
| VIETNAM: 0.9% | | | | | | | | |
Nam Long Investment Corp. | | | 462,599 | | | | 489,361 | |
| | | | | | | | |
Total Vietnam | | | | | | | 489,361 | |
| | | | | | | | |
| | | | | | | | |
| | | |
| PAKISTAN: 0.1% | | | | | | | | |
Abbott Laboratories Pakistan, Ltd. | | | 9,450 | | | | 37,316 | |
| | | | | | | | |
Total Pakistan | | | | | | | 37,316 | |
| | | | | | | | |
| | | | | | | | |
| | | |
| TOTAL COMMON EQUITIES | | | | | | | 50,098,539 | |
| | | | | | | | |
(Cost $46,453,423) | | | | | | | | |
| | | | | | | | |
| | | | |
| matthewsasia.com | 800.789.ASIA | | | 51 | |
Matthews Asia ESG Fund
June 30, 2020
Schedule of Investmentsa (unaudited) (continued)
PREFERRED EQUITIES: 7.8%
| | | | | | | | |
| | | Shares | | | Value | |
| | | | | | | | |
| |
| SOUTH KOREA: 7.8% | | | | | |
Samsung SDI Co., Ltd., Pfd. | | | 14,734 | | | | $2,762,711 | |
| | |
LG Chem, Ltd., Pfd. | | | 7,395 | | | | 1,555,800 | |
| | | | | | | | |
Total South Korea | | | | | | | 4,318,511 | |
| | | | | | | | |
| | | | | | | | |
| | |
| TOTAL PREFERRED EQUITIES | | | | 4,318,511 | |
| | | | | | | | |
(Cost $2,558,844) | | | | | | | | |
| | | | | | | | |
| | | |
| TOTAL INVESTMENTS: 98.1% | | | | | | | 54,417,050 | |
(Cost $49,012,267) | | | | | | | | |
| | | | | | | | |
| | |
CASH AND OTHER ASSETS,
LESS LIABILITIES: 1.9% | | | | | | | 1,076,810 | |
| | | | | | | | |
| | |
NET ASSETS: 100.0% | | | | | | | $55,493,860 | |
| | | | | | | | |
| a | Certain securities were fair valued under the valuation policies approved by the Board of Trustees (Note 2-A). |
| b | Non-income producing security. |
| c | The securities may be resold to qualified foreign investors and foreign institutional buyers under Regulation S of the Securities Act of 1933. |
| d | Security exempt from registration under Rule 144A of the Securities Act of 1933, as amended. The security may be resold in transactions exempt from registration normally to qualified institutional buyers. The security has been determined to be liquid in accordance with procedures adopted by the Funds’ Board of Trustees. At June 30, 2020, the aggregate value is $4,794,711, which is 8.64% of net assets. |
| ADR | American Depositary Receipt |
| NVDR | Non-voting Depositary Receipt |
See accompanying notes to financial statements.
| | | | |
| PORTFOLIO MANAGERS |
| |
| Taizo Ishida | | Robert Harvey, CFA |
Lead Manager | | Lead Manager |
|
| FUND FACTS |
| | |
| | | Investor | | Institutional |
Ticker | | MEASX | | MIASX |
CUSIP | | 577125883 | | 577125875 |
Inception | | 4/30/13 | | 4/30/13 |
NAV | | $9.05 | | $9.11 |
Initial Investment | | $2,500 | | $100,000 |
Gross Expense Ratio1 | | 1.65% | | 1.51% |
After Fee Waiver and Reimbursement2 | | 1.42% | | 1.20% |
Portfolio Statistics |
Total # of Positions | | 53 |
Net Assets | | $165.1 million |
Weighted Average Market Cap | | $2.0 billion |
Portfolio Turnover3 | | 18.77% |
Benchmark |
MSCI Emerging Markets Asia Index |
OBJECTIVE
Long-term capital appreciation.
STRATEGY
Under normal market conditions, the Fund seeks to achieve its investment objective by investing at least 80% of its net assets, which include borrowings for investment purposes, in the common and preferred stocks of companies located in Asia excluding Japan, South Korea, Hong Kong and Singapore. The Fund may also invest in the convertible securities, of any duration or quality, of companies located in Asia excluding Japan, South Korea, Hong Kong and Singapore. Under normal market conditions, the Fund is expected to invest a substantial portion of its net assets in the emerging countries and markets in the Asian region, including, but not limited to, Bangladesh, Cambodia, China (including Taiwan, but excluding Hong Kong), India, Indonesia, Laos, Malaysia, Mongolia, Myanmar, Pakistan, Papua New Guinea, Philippines, Sri Lanka, Thailand, and Vietnam.
Matthews Emerging Asia Fund
Portfolio Manager Commentary (unaudited)
For the first half of 2020, the Matthews Emerging Asia Fund returned –25.02% (Investor Class) and –24.90% (Institutional Class), while its benchmark, the MSCI Emerging Markets Asia Index, returned –3.39% over the same period. For the quarter ending June 30, 2020, the Matthews Emerging Asia Fund returned 19.55% (Investor Class) and 19.71% (Institutional Class), while the benchmark returned 17.91%.
Market Environment:
Asia’s markets experienced considerable volatility stemming from the global COVID-19 pandemic. Equity prices in parts of South and Southeast Asia—including India, Indonesia, the Philippines and Thailand—suffered as investors feared a slower recovery from the pandemic for these economies, in spite of a partial recovery in the second quarter. Less developed parts of Asia have had a harder time flattening their rates of new infections. In addition, smaller government balance sheets may allow for less fiscal and monetary stimulus. However, we continue to see these economies playing a vital role in Asia’s growth over the long term.
Stock exchanges in Sri Lanka and Bangladesh periodically halted trading temporarily in the first half, in response to the COVID-19 pandemic. These stock exchanges are not yet running on fully electronic trading systems, making it challenging for traders to work remotely during lockdown periods. Market closures meant that liquidity was temporarily frozen for any securities trading on those exchanges.
Foreign investor sentiment remained weak toward less developed markets in Asia in the first half, creating further downward pressure on these equity markets. Chinese equities, representing a more developed economy, generated the strongest returns in the region on the back of expectations around a quicker return to normalcy in economic activity. The continued recovery is drawing investors into China’s equity markets, albeit the participation is still narrowly focused on a select group of sectors. China’s equity returns tend to drive the benchmark’s overall returns. As before, we invest in a manner that is benchmark-agnostic, maintaining a sharp focus on less developed economies.
Performance Contributors and Detractors:
In first half, the Fund’s absolute and relative returns were disappointing. In the second quarter, absolute and relative returns were much improved. Amid the second quarter market rally, the Fund’s focus on well managed, high-quality companies with strong cash flows bore fruit. Stock selection in financials and consumer staples sectors contributed to Fund performance. Among individual securities, Bank Mandiri, a large bank in Indonesia, was a contributor. The company corrected more than the benchmark in the first quarter and bounced back in the second quarter. Bank Mandiri has a large book of loans for small and medium-sized enterprises. Investors worried about the strength of small businesses in Indonesia sold the stock early in the pandemic. The stock price later began to rise as investors realized the bank was in better shape than the market expected. The company benefits from a good management team, large balance sheet and strong market position.
(continued)
| 1 | Prospectus expense ratios. |
| 2 | Matthews has contractually agreed (i) to waive fees and reimburse expenses to the extent needed to limit Total Annual Fund Operating Expenses (excluding Rule 12b-1 fees, taxes, interest, brokerage commissions, short sale dividend expenses, expenses incurred in connection with any merger or reorganization or extraordinary expenses such as litigation) of the Institutional Class to 1.20% first by waiving class specific expenses (i.e., shareholder service fees specific to a particular class) of the Institutional Class and then, to the extent necessary, by waiving non-class specific expenses (e.g., custody fees) of the Institutional Class, and (ii) if any Fund-wide expenses (i.e., expenses that apply to both the Institutional Class and the Investor Class) are waived for the Institutional Class to maintain the 1.20% expense limitation, to waive an equal amount (in annual percentage terms) of those same expenses for the Investor Class. The Total Annual Fund Operating Expenses After Fee Waiver and Expense Reimbursement for the Investor Class may vary from year to year and will in some years exceed 1.20%. If the operating expenses fall below the expense limitation in a year within three years after Matthews has made a waiver or reimbursement, the Fund may reimburse Matthews up to an amount that does not cause the expenses for that year to exceed the lesser of (i) the expense limitation applicable at the time of that fee waiver and/or expense reimbursement or (ii) the expense limitation in effect at the time of recoupment. This agreement will remain in place until April 30, 2021 and may be terminated at any time by the Board of Trustees on behalf of the Fund on 60 days’ written notice to Matthews. Matthews may decline to renew this agreement by written notice to the Trust at least 30 days before its annual expiration date. |
| 3 | The lesser of fiscal year 2019 long-term purchase costs or sales proceeds divided by the average monthly market value of long-term securities. |
| | | | |
| matthewsasia.com | 800.789.ASIA | | | 53 | |
| | | | | | | | | | | | | | | | | | | | | | | | | | | | |
| |
| PERFORMANCE AS OF JUNE 30, 2020 | |
| | | | | | | | | Average Annual Total Returns | | | | |
| | | 3 Months | | | YTD | | | 1 Year | | | 3 Years | | | 5 Years | | | Since
Inception | | | Inception
Date | |
| Investor Class (MEASX) | | | 19.55% | | | | -25.02% | | | | -24.51% | | | | -13.32% | | | | -3.34% | | | | -0.25% | | | | 4/30/13 | |
| Institutional Class (MIASX) | | | 19.71% | | | | -24.90% | | | | -24.39% | | | | -13.11% | | | | -3.12% | | | | -0.03% | | | | 4/30/13 | |
| MSCI Emerging Markets Asia Index4 | | | 17.91% | | | | -3.39% | | | | 5.21% | | | | 4.45% | | | | 5.19% | | | | 5.39% | | | | | |
Performance assumes reinvestment of all dividends and/or distributions before taxes. All performance quoted represents past performance and is no guarantee of future results. Investment return and principal value will fluctuate with market conditions so that when redeemed, shares may be worth more or less than their original cost. Current performance may be lower or higher than the return figures quoted. Returns would have been lower if certain of the Fund’s fees and expenses had not been waived. For the Fund’s most recent month-end performance visit matthewsasia.com.
GROWTH OF A HYPOTHETICAL $10,000 INVESTMENT SINCE INCEPTION—INVESTOR CLASS
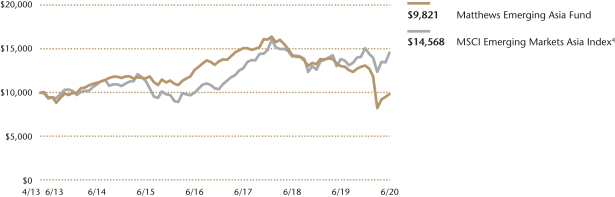
Plotted monthly. The performance data and graph do not reflect the deduction of taxes that a shareholder would pay on dividends, capital gain distributions or redemption of Fund shares. Values are in US$.
| | 4 | It is not possible to invest directly in an index. Source: Index data from Morgan Stanley Capital International and Bloomberg; total return calculations performed by BNY Mellon Investment Servicing (US) Inc. Please see page 90 for index definition. |
| | | | | | | | | | | | |
| | | | | |
| TOP TEN HOLDINGS5 | | | | | | | | | | |
| | | Sector | | Country | | | | | % of Net Assets | |
| Vinh Hoan Corp. | | Consumer Staples | | Vietnam | | | | | | | 4.2% | |
| British American Tobacco Bangladesh Co., Ltd. | | Consumer Staples | | Bangladesh | | | | | | | 3.9% | |
| Square Pharmaceuticals, Ltd. | | Health Care | | Bangladesh | | | | | | | 3.6% | |
| PT Kino Indonesia | | Consumer Staples | | Indonesia | | | | | | | 3.4% | |
| Berger Paints Bangladesh, Ltd. | | Materials | | Bangladesh | | | | | | | 3.3% | |
| John Keells Holdings PLC | | Industrials | | Sri Lanka | | | | | | | 3.1% | |
| Sampath Bank PLC | | Financials | | Sri Lanka | | | | | | | 3.1% | |
| Jollibee Foods Corp. | | Consumer Discretionary | | Philippines | | | | | | | 2.9% | |
| Mobile World Investment Corp. | | Consumer Discretionary | | Vietnam | | | | | | | 2.9% | |
| Cosco Capital, Inc. | | Consumer Staples | | Philippines | | | | | | | 2.7% | |
| % OF ASSETS IN TOP TEN | | | | | | | | | | | 33.1% | |
| | 5 | Holdings may combine more than one security from same issuer and related depositary receipts. |
Matthews Emerging Asia Fund
Portfolio Manager Commentary (unaudited) (continued)
In contrast, stock selection in health care and communication services sectors was a detractor. While the Fund is overweight the health care in aggregate versus its benchmark, Chinese health care stocks led the charge in the second quarter. We are underweight both China and Chinese health care because we view China as a more developed market. Stock selection in the Philippines was also a detractor in the second quarter. Among individual securities, STI Education Systems Holdings, which owns and operates college campuses in the Philippines, was a detractor. The stock price suffered amid disruptions in classroom education.
Notable Portfolio Changes:
During the second quarter, we initiated new positions in Thai Beverage Public Co., Ltd., Jollibee Foods Corp. and Central Retail Corp. Thai Beverage PCL is a large beer and spirits producer and distributor in Thailand. Jollibee Foods Corp. runs hamburger and other food franchises in the Philippines, as well as globally. Central Retail Corp. runs general merchandise stores in Thailand. We exited Shakey’s Pizza Asia Ventures, a restaurant chain serving fast food in the Philippines, as well as Expolanka Holdings, a diversified conglomerate in Sri Lanka.
Outlook:
While the COVID-19 pandemic remains a challenge for economies globally, we remain optimistic about the growth potential of Asia’s less developed economies and markets. The path forward may not be easy. However, we expect many lesser-developed economies will find ways to continue essential economic activities during the ongoing health care crisis. Our investment universe includes many countries with attractive demographics in terms of young workforces. We also see many of these economies having favorable geographic locations in terms of trade routes within and across Asia. In addition, we see very low current valuations for equities with attractive earnings growth. All of these provide the ingredients for attracting future investment and generating long-term growth.
| | | | |
| |
| COUNTRY ALLOCATION (%)6,7 | |
| Vietnam | | | 18.5 | |
| Indonesia | | | 15.9 | |
| Bangladesh | | | 14.3 | |
| Pakistan | | | 13.9 | |
| Sri Lanka | | | 10.8 | |
| Philippines | | | 7.7 | |
| Thailand | | | 4.9 | |
| India | | | 2.8 | |
| Australia | | | 1.7 | |
| Singapore | | | 1.3 | |
| Cash and Other Assets, Less Liabilities | | | 8.1 | |
| Total | | | 99.9 | |
| | | | |
| |
| SECTOR ALLOCATION (%)7 | |
| Consumer Staples | | | 33.0 | |
| Consumer Discretionary | | | 21.9 | |
| Financials | | | 16.1 | |
| Industrials | | | 6.2 | |
| Health Care | | | 6.1 | |
| Materials | | | 4.5 | |
| Real Estate | | | 2.3 | |
| Energy | | | 1.7 | |
| Information Technology | | | 0.1 | |
| Cash and Other Assets, Less Liabilities | | | 8.1 | |
| Total | | | 100.0 | |
| | | | |
| |
| MARKET CAP EXPOSURE (%)7 | |
| Mega Cap (over $25B) | | | 0 | |
| Large Cap ($10B–$25B) | | | 4.9 | |
| Mid Cap ($3B–10B) | | | 13.2 | |
| Small Cap (under $3B) | | | 73.8 | |
| Cash and Other Assets, Less Liabilities | | | 8.1 | |
| 6 | Not all countries where the Fund may invest are included in the benchmark index. |
| 7 | Source: FactSet Research Systems. Percentage values in data are rounded to the nearest tenth of one percent, so the values may not sum to 100% due to rounding. Percentage values may be derived from different data sources and may not be consistent with other Fund literature. |
| | | | |
| matthewsasia.com | 800.789.ASIA | | | 55 | |
Matthews Emerging Asia Fund
June 30, 2020
Schedule of Investmentsa (unaudited)
COMMON EQUITIES: 91.9%
| | | | | | | | |
| | | Shares | | | Value | |
| | |
| VIETNAM: 18.5% | | | | | | | | |
Vinh Hoan Corp.b | | | 4,545,600 | | | | $6,944,753 | |
| | |
Mobile World Investment Corp.b | | | 1,360,605 | | | | 4,785,975 | |
| | |
Military Commercial Joint Stock Bankb | | | 6,050,438 | | | | 4,364,001 | |
| | |
Phu Nhuan Jewelry JSC | | | 1,689,494 | | | | 4,212,160 | |
| | |
Taisun International Holding Corp. | | | 676,000 | | | | 3,007,484 | |
| | |
Vietnam National Seed Group JSC† | | | 996,222 | | | | 2,704,558 | |
| | |
Thien Long Group Corp. | | | 1,068,330 | | | | 1,658,725 | |
| | |
Nam Long Investment Corp. | | | 1,483,082 | | | | 1,568,881 | |
| | |
Lix Detergent JSC | | | 299,655 | | | | 699,408 | |
| | |
Domesco Medical Import Export JSC | | | 175,230 | | | | 376,265 | |
| | |
FPT Corp. | | | 103,000 | | | | 204,044 | |
| | | | | | | | |
Total Vietnam | | | | | | | 30,526,254 | |
| | | | | | | | |
| | | | | | | | |
| | | |
| INDONESIA: 16.0% | | | | | | | | |
PT Kino Indonesia | | | 23,448,700 | | | | 5,692,588 | |
| | |
PT Bank Mandiri Persero | | | 11,812,400 | | | | 4,101,620 | |
| | |
PT Mayora Indah | | | 16,785,800 | | | | 2,662,557 | |
| | |
PT Adira Dinamika Multi Finance | | | 5,188,400 | | | | 2,627,878 | |
| | |
PT Ramayana Lestari Sentosa | | | 61,600,200 | | | | 2,578,481 | |
| | |
PT Gudang Garam | | | 756,500 | | | | 2,505,058 | |
| | |
PT Indofood CBP Sukses Makmur | | | 3,756,200 | | | | 2,465,169 | |
| | |
PT Hexindo Adiperkasa | | | 10,781,800 | | | | 2,405,375 | |
| | |
PT Catur Sentosa Adiprana | | | 52,249,000 | | | | 1,275,654 | |
| | | | | | | | |
Total Indonesia | | | | | | | 26,314,380 | |
| | | | | | | | |
| | | | | | | | |
| | | |
| BANGLADESH: 14.3% | | | | | | | | |
British American Tobacco Bangladesh Co., Ltd.c | | | 644,765 | | | | 6,380,020 | |
| | |
Square Pharmaceuticals, Ltd. | | | 3,003,514 | | | | 5,946,852 | |
| | |
Berger Paints Bangladesh, Ltd. | | | 364,446 | | | | 5,454,878 | |
| | |
Marico Bangladesh, Ltd. | | | 130,603 | | | | 2,332,999 | |
| | |
BRAC Bank, Ltd. | | | 5,336,335 | | | | 1,811,272 | |
| | |
Olympic Industries, Ltd. | | | 994,735 | | | | 1,735,071 | |
| | | | | | | | |
Total Bangladesh | | | | | | | 23,661,092 | |
| | | | | | | | |
| | | | | | | | |
| | | |
| PAKISTAN: 13.9% | | | | | | | | |
Indus Motor Co., Ltd. | | | 700,030 | | | | 4,148,439 | |
| | |
Meezan Bank, Ltd. | | | 9,354,697 | | | | 3,836,039 | |
| | |
PAK Suzuki Motor Co., Ltd.b | | | 3,845,400 | | | | 3,738,193 | |
| | |
GlaxoSmithKline Consumer Healthcare Pakistan, Ltd. | | | 1,564,757 | | | | 2,531,943 | |
| | |
United Bank, Ltd. | | | 3,643,622 | | | | 2,251,847 | |
| | |
Hascol Petroleum, Ltd.b | | | 25,492,510 | | | | 2,064,908 | |
| | |
ICI Pakistan, Ltd. | | | 468,800 | | | | 1,949,760 | |
| | |
Shifa International Hospitals, Ltd. | | | 1,346,251 | | | | 1,883,430 | |
| | |
Honda Atlas Cars Pakistan, Ltd. | | | 468,000 | | | | 543,206 | |
| | | | | | | | |
Total Pakistan | | | | | | | 22,947,765 | |
| | | | | | | | |
| | | | | | | | |
| | | |
| SRI LANKA: 10.8% | | | | | | | | |
John Keells Holdings PLC | | | 7,836,716 | | | | 5,168,078 | |
| | |
Sampath Bank PLC | | | 7,399,518 | | | | 5,047,635 | |
| | |
Teejay Lanka PLC | | | 18,318,101 | | | | 2,990,159 | |
| | |
Ceylon Cold Stores PLC | | | 710,896 | | | | 2,634,744 | |
| | |
Ceylon Tobacco Co. PLC | | | 245,624 | | | | 1,258,282 | |
| | |
LB Finance PLC | | | 1,050,515 | | | | 794,845 | |
| | | | | | | | |
Total Sri Lanka | | | | | | | 17,893,743 | |
| | | | | | | | |
| | | | | | | | |
| | | Shares | | | Value | |
| | |
| PHILIPPINES: 7.7% | | | | | | | | |
Jollibee Foods Corp. | | | 1,714,290 | | | | $4,840,042 | |
| | |
Cosco Capital, Inc. | | | 44,191,200 | | | | 4,481,456 | |
| | |
Universal Robina Corp. | | | 929,900 | | | | 2,434,315 | |
| | |
STI Education Systems Holdings, Inc. | | | 149,395,000 | | | | 899,572 | |
| | | | | | | | |
Total Philippines | | | | | | | 12,655,385 | |
| | | | | | | | |
| | | | | | | | |
| | | |
| THAILAND: 4.9% | | | | | | | | |
Central Retail Corp. Public Co., Ltd.b | | | 3,786,700 | | | | 4,057,591 | |
| | |
Thai Beverage Public Co., Ltd. | | | 8,283,400 | | | | 4,043,650 | |
| | | | | | | | |
Total Thailand | | | | | | | 8,101,241 | |
| | | | | | | | |
| | | | | | | | |
| | | |
| INDIA: 2.8% | | | | | | | | |
L&T Finance Holdings, Ltd. | | | 2,007,708 | | | | 1,752,157 | |
| | |
Poly Medicure, Ltd. | | | 263,369 | | | | 1,028,736 | |
| | |
Praj Industries, Ltd. | | | 1,124,808 | | | | 946,905 | |
| | |
Caplin Point Laboratories, Ltd. | | | 219,706 | | | | 907,912 | |
| | | | | | | | |
Total India | | | | | | | 4,635,710 | |
| | | | | | | | |
| | | | | | | | |
| | | |
| AUSTRALIA: 1.7% | | | | | | | | |
Oil Search, Ltd. | | | 1,284,334 | | | | 2,846,282 | |
| | | | | | | | |
Total Australia | | | | | | | 2,846,282 | |
| | | | | | | | |
| | | | | | | | |
| | | |
| SINGAPORE: 1.3% | | | | | | | | |
Yoma Strategic Holdings, Ltd.b | | | 9,555,766 | | | | 2,184,284 | |
| | | | | | | | |
Total Singapore | | | | | | | 2,184,284 | |
| | | | | | | | |
| | | | | | | | |
| | | |
| TOTAL INVESTMENTS: 91.9% | | | | | | | 151,766,136 | |
(Cost $190,175,208) | | | | | | | | |
| | | | | | | | |
| | |
CASH AND OTHER ASSETS,
LESS LIABILITIES: 8.1% | | | | | | | 13,341,923 | |
| | | | | | | | |
| | |
NET ASSETS: 100.0% | | | | | | | $165,108,059 | |
| | | | | | | | |
| a | Certain securities were fair valued under the valuation policies approved by the Board of Trustees (Note 2-A). |
| b | Non-income producing security. |
| c | Security is valued using significant unobservable inputs and is classified as Level 3 in the fair value hierarchy. The aggregate value of Level 3 security is $6,380,020 and 3.86% of net assets. |
| † | Affiliated Issuer, as defined under the Investment Company Act of 1940 (ownership of 5% or more of the outstanding voting securities of this issuer) |
See accompanying notes to financial statements.
| | | | |
| PORTFOLIO MANAGERS* |
| |
| Michael J. Oh, CFA | | |
Lead Manager | | | | |
| |
| Raymond Deng | | |
Co-Manager | | |
| |
* As of August 31, 2020 | | |
| | |
| FUND FACTS | | | | |
| | |
| | | Investor | | Institutional |
Ticker | | MATFX | | MITEX |
CUSIP | | 577130883 | | 577125859 |
Inception | | 12/27/99 | | 4/30/13 |
NAV | | $18.48 | | $18.61 |
Initial Investment | | $2,500 | | $100,000 |
Gross Expense Ratio1 | | 1.19% | | 1.05% |
Portfolio Statistics | | | | |
Total # of Positions | | 40 |
Net Assets | | $835.7 million |
Weighted Average Market Cap | | $124.1 billion |
Portfolio Turnover2 | | 80.10% |
Benchmark | | | | |
MSCI AC Asia ex Japan Index |
OBJECTIVE
Long-term capital appreciation.
STRATEGY
Under normal market conditions, the Fund seeks to achieve its investment objective by investing at least 80% of its net assets, which include borrowings for investment purposes, in the common and preferred stocks of companies located in Asia that Matthews believes are innovators in their products, services, processes, business models, management, use of technology, or approach to creating, expanding or servicing their markets. Asia consists of all countries and markets in Asia, including developed, emerging, and frontier countries and markets in the Asian region.
Matthews Asia Innovators Fund
Portfolio Manager Commentary (unaudited)
For the first half of 2020, the Matthews Asia Innovators Fund returned 27.01% (Investor Class) and 27.12% (Institutional Class), while its benchmark, the MSCI All Country Asia ex Japan Index, returned –4.65% over the same period. For the quarter ending June 30, 2019, the Fund returned 38.74% (Investor Class) and 38.78% (Institutional Class), while the benchmark returned 16.79%.
Market Environment:
Asia’s markets experienced considerable volatility related to the global COVID-19 pandemic, but parts of Asia ended the first half with a rebound. Chinese equities generated the strongest returns in the region, as domestic Chinese sentiment gained strength on the back of a quick resumption of economic activity. China, South Korea and Taiwan each made considerable progress in flattening their curves of new virus infections in the reporting period. Stimulus in China remains modest, but supportive of economic growth. Amid strong returns, we also saw some volatility related to the Chinese government’s amendment of national security laws in Hong Kong, which attracted international attention and protests from Hong Kong citizens.
South Korean equities were roughly flat on fears slowing global growth. On the plus side, Korea’s response to COVID-19 was prompt and effective. The country’s health care infrastructure and resources appear well positioned to fend off a second wave of infections. What’s more, Korea has plenty of fiscal firepower for stimulus and has begun to use its resources. Korea’s valuations are some of the region’s most attractive and the prospect of earnings growth from a very low base is a good possibility, especially if its influential neighbor, China, continues to recover. Elsewhere, equity prices in parts of South and Southeast Asia—including India, Indonesia, the Philippines and Thailand—suffered as investors feared a slower recovery from the pandemic for these economies.
Performance Contributors and Detractors:
Stock selection in China made a significant contribution to relative performance in the first half of the year. Among individual securities, contributors included Chinese video content company Bilibili. The company, which caters to young viewers, attracted new users as the pandemic accelerated demand for online entertainment and social media interaction. We see Bilibili emerging as a new, distinct social media platform in its own right. With a growing user base and distinctive value proposition for its users, we find the company to have attractive long-term prospects. Another contributor was Meituan Dianping, China’s largest food delivery service. The company enjoys a dominant market share in food delivery, capturing roughly 60% of the market. In addition to its core operations around food delivery, the company also runs a successful business review service, similar to Yelp, as well as a travel booking service for hotels. Forecasts of increased profitability caused the stock to rise in May. Meituan Dianping is also leveraging the benefits of scale to drive down its logistics costs.
The Fund’s small allocation to Vietnam, which is not in the Fund’s benchmark, was a detractor in the first half. Amid the global COVID-19 pandemic, Vietnam’s equity markets suffered steeper drops than more developed parts of Asia. Vietnamese markets rebounded in the second quarter, but had not fully recovered to pre-crisis levels by the end of the reporting period. Jewelry maker Phu Nhuan Jewelry, which we exited during the reporting period, was a detractor. Vietnamese retailer Mobile World Investment Corp. was another detractor. The company’s stock price suffered on lower retail sales and weak consumer demand. We continue to monitor the position. A slight overweight in India and stock selection, including HDFC Banks,
(continued)
| 1 | Prospectus expense ratios. |
| 2 | The lesser of fiscal year 2019 long-term purchase costs or sales proceeds divided by the average monthly market value of long-term securities. |
| | | | |
| matthewsasia.com | 800.789.ASIA | | | 57 | |
| | | | | | | | | | | | | | | | | | | | | | | | | | | | | | | | |
| |
| PERFORMANCE AS OF JUNE 30, 2020 | |
| | | | | | | | | | | | Average Annual Total Returns | | | | | | | |
| | | 3 Months | | | YTD | | | 1 Year | | | 3 Years | | | 5 Years | | | 10 Years | | | Since
Inception | | | Inception
Date | |
| Investor Class (MATFX) | | | 38.74% | | | | 27.01% | | | | 38.22% | | | | 16.33% | | | | 12.33% | | | | 13.19% | | | | 5.24% | | | | 12/27/99 | |
| Institutional Class (MITEX) | | | 38.78% | | | | 27.12% | | | | 38.36% | | | | 16.52% | | | | 12.53% | | | | n.a. | | | | 14.80% | | | | 4/30/13 | |
| MSCI AC Asia ex Japan Index3 | | | 16.79% | | | | -4.65% | | | | 1.97% | | | | 3.90% | | | | 4.70% | | | | 6.21% | | | | 6.03% | 4 | | | | |
Performance assumes reinvestment of all dividends and/or distributions before taxes. All performance quoted represents past performance and is no guarantee of future results. Investment return and principal value will fluctuate with market conditions so that when redeemed, shares may be worth more or less than their original cost. Current performance may be lower or higher than the return figures quoted. For the Fund’s most recent month-end performance, visit matthewsasia.com.
GROWTH OF A HYPOTHETICAL $10,000 INVESTMENT SINCE INCEPTION—INVESTOR CLASS
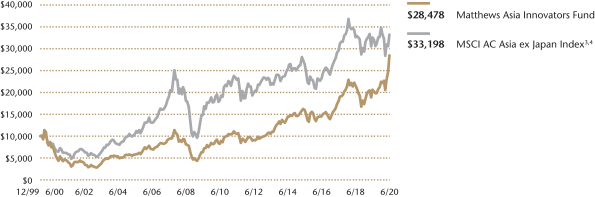
Plotted monthly. The performance data and graph do not reflect the deduction of taxes that a shareholder would pay on dividends, capital gains distributions or redemption of Fund shares. Values are in US$.
| | 3 | It is not possible to invest directly in an index. Source: Index data from Morgan Stanley Capital International and Bloomberg; total return calculations performed by BNY Mellon Investment Servicing (US) Inc. Please see page 90 for index definition. |
| | 4 | Calculated from 12/31/99. |
| | | | | | | | |
| | | | |
| TOP TEN HOLDINGS5 | | | | | | | |
| | | Sector | | Country | | % of Net Assets | |
| Tencent Holdings, Ltd. | | Communication Services | | China/Hong Kong | | | 6.0% | |
| Alibaba Group Holding, Ltd. | | Consumer Discretionary | | China/Hong Kong | | | 5.9% | |
| Bilibili, Inc. | | Communication Services | | China/Hong Kong | | | 5.3% | |
| Sea, Ltd. | | Communication Services | | Singapore | | | 5.0% | |
| Meituan Dianping Class B | | Consumer Discretionary | | China/Hong Kong | | | 4.8% | |
| TAL Education Group | | Consumer Discretionary | | China/Hong Kong | | | 4.2% | |
| Wuxi Biologics Cayman, Inc. | | Health Care | | China/Hong Kong | | | 4.2% | |
| Samsung Electronics Co., Ltd. | | Information Technology | | South Korea | | | 3.7% | |
| Wuliangye Yibin Co., Ltd. | | Consumer Staples | | China/Hong Kong | | | 3.4% | |
| Kingdee International Software Group Co., Ltd. | | Information Technology | | China/Hong Kong | | | 3.1% | |
| % OF ASSETS IN TOP TEN | | | | | | | 45.6% | |
| | 5 | Holdings may combine more than one security from same issuer and related depositary receipts. |
Matthews Asia Innovators Fund
Portfolio Manager Commentary (unaudited) (continued)
were also detractors. Financials were weak in the reporting period, but we continue to like the company’s long-term prospects. As one of India’s oldest private sector banks, HDFC is a high-quality bank primarily serving retail customers.
Notable Portfolio Changes:
Notable additions in the second quarter included South Korean search engine and internet content provider NAVER. As South Korea lacks a dominant e-commerce platform, consumers increasingly are using NAVER’s search-engine functions as a primary shopping tool. NAVER also has introduced its own digital-payments service, turning its search engine into an e-commerce platform. We also initiated a position in South Korean pharmaceutical company Hugel, which manufactures botulinum toxin, the main ingredient for Botox. Market volatility created opportunities to buy both companies at attractive valuations. Meanwhile, we exited a position in Chinese appliance maker Midea Group. In addition, we sold Venus Medtech and consolidated the proceeds into another medical device holding in China.
Outlook:
While China’s economic recovery is still in very early stages, recent data suggests the pace and progress of the recovery may be sustainable. Containment of COVID-19 has been effective in the second quarter, although small outbreaks still occasionally emerge. CapEx spending among businesses, auto sales among consumers and property sales all began to rebound in April and May. However, unemployment remains high in China, as it does globally, which could create a drag on spending. In addition, a slowing global economy could slow China’s rebound. South Korea, another leader in containing the pandemic, continues to roll out considerable fiscal stimulus. Key stimulus efforts include bolstering domestic demand and supporting labor markets. Turning to India, containment of the virus remains a work in progress. New cases rose in the second quarter as lockdowns eased.
Looking ahead, risks remain to the global economy. At the same, we expect companies with strong organic structural growth to remain more resilient. Sectors such as health care, communication services, software and online education continue to perform strongly. Price-to-earnings multiples for innovative companies have risen sharply in the first half. The major players in the market are changing, with innovative companies growing quickly and at very low marginal costs. Intangibles—such as intellectual property, network and data—are the main determinants of future cash flows. These companies now trade higher multiples than other types of businesses. Volatility could linger in the near term. On a long-term view, we believe it is still a good time to invest in innovative companies. Fundamental research and active security selection remain key.
| | | | |
| | |
| COUNTRY ALLOCATION (%)6,7 | | | |
| China/Hong Kong | | | 63.3 | |
| South Korea | | | 11.8 | |
| India | | | 7.5 | |
| Singapore | | | 6.5 | |
| France | | | 2.7 | |
| Taiwan | | | 1.5 | |
| United States | | | 1.3 | |
| Vietnam | | | 0.4 | |
| Cash and Other Assets, Less Liabilities | | | 4.7 | |
| Total | | | 99.7 | |
| | | | |
| | |
| SECTOR ALLOCATION (%)7 | | | |
| Consumer Discretionary | | | 23.7 | |
| Communication Services | | | 20.2 | |
| Health Care | | | 18.1 | |
| Consumer Staples | | | 12.6 | |
| Information Technology | | | 10.8 | |
| Financials | | | 6.5 | |
| Energy | | | 2.0 | |
| Industrials | | | 1.5 | |
| Cash and Other Assets, Less Liabilities | | | 4.7 | |
| Total | | | 100.1 | |
| | | | |
| | |
| MARKET CAP EXPOSURE (%)7 | | | |
| Mega Cap (over $25B) | | | 53.7 | |
| Large Cap ($10B-$25B) | | | 14.7 | |
| Mid Cap ($3B-10B) | | | 18.1 | |
| Small Cap (under $3B) | | | 8.7 | |
| Cash and Other Assets, Less Liabilities | | | 4.7 | |
| | 6 | Not all countries are included in the benchmark index. |
| | 7 | Source: FactSet Research Systems. Percentage values in data are rounded to the nearest tenth of one percent, so the values may not sum to 100% due to rounding. Percentage values may be derived from different data sources and may not be consistent with other Fund literature. |
| | | | |
| matthewsasia.com | 800.789.ASIA | | | 59 | |
Matthews Asia Innovators Fund
June 30, 2020
Schedule of Investmentsa (unaudited)
COMMON EQUITIES: 95.3%
| | | | | | | | |
| | | Shares | | | Value | |
| | |
| CHINA/HONG KONG: 63.4% | | | | | | | | |
Tencent Holdings, Ltd. | | | 777,000 | | | | $49,788,538 | |
| | |
Alibaba Group Holding, Ltd.b | | | 1,817,900 | | | | 49,053,854 | |
| | |
Bilibili, Inc. ADRb | | | 954,344 | | | | 44,205,214 | |
| | |
Meituan Dianping Class Bb,c | | | 1,801,300 | | | | 40,252,529 | |
| | |
TAL Education Group ADRb | | | 512,500 | | | | 35,044,750 | |
| | |
Wuxi Biologics Cayman, Inc.b,c,d | | | 1,904,000 | | | | 34,949,093 | |
| | |
Wuliangye Yibin Co., Ltd. A Shares | | | 1,182,795 | | | | 28,752,322 | |
| | |
Kingdee International Software Group Co., Ltd. | | | 11,234,000 | | | | 26,286,251 | |
| | |
China Tourism Group Duty Free Corp., Ltd. A Shares | | | 913,794 | | | | 20,036,777 | |
| | |
Silergy Corp. | | | 301,000 | | | | 19,717,999 | |
| | |
AIA Group, Ltd. | | | 2,097,600 | | | | 19,628,512 | |
| | |
Peijia Medical, Ltd.b,c,d | | | 3,974,000 | | | | 17,997,213 | |
| | |
Jonjee Hi-Tech Industrial And Commercial Holding Co., Ltd. A Shares | | | 1,788,090 | | | | 14,834,179 | |
| | |
Sun Art Retail Group, Ltd. | | | 8,360,000 | | | | 14,342,605 | |
| | |
Li Ning Co., Ltd. | | | 4,347,500 | | | | 13,922,610 | |
| | |
Jiangsu Hengrui Medicine Co., Ltd. A Shares | | | 1,044,395 | | | | 13,655,899 | |
| | |
Haidilao International Holding, Ltd.c,d | | | 3,041,000 | | | | 12,924,080 | |
| | |
Innovent Biologics, Inc.b,c,d | | | 1,615,000 | | | | 12,019,958 | |
| | |
Shenzhen Mindray Bio-Medical Electronics Co., Ltd. A Shares | | | 275,230 | | | | 11,900,475 | |
| | |
Kangji Medical Holdings, Ltd.b | | | 2,939,500 | | | | 11,302,122 | |
| | |
Alphamab Oncologyb,c,d | | | 4,773,000 | | | | 11,108,690 | |
| | |
Proya Cosmetics Co., Ltd. A Shares | | | 404,244 | | | | 10,316,939 | |
| | |
Burning Rock Biotech, Ltd. ADRb | | | 327,500 | | | | 8,845,775 | |
| | |
InnoCare Pharma, Ltd.b,c,d | | | 4,627,000 | | | | 8,791,786 | |
| | | | | | | | |
Total China/Hong Kong | | | | | | | 529,678,170 | |
| | | | | | | | |
| | | | | | | | |
| | | |
| SOUTH KOREA: 11.8% | | | | | | | | |
Samsung Electronics Co., Ltd. | | | 707,108 | | | | 31,301,997 | |
| | |
NAVER Corp. | | | 91,793 | | | | 20,651,890 | |
| | |
Orion Corp. | | | 180,286 | | | | 20,182,989 | |
| | |
LG Household & Health Care, Ltd. | | | 14,854 | | | | 16,648,509 | |
| | |
Hugel, Inc.b | | | 25,704 | | | | 10,117,329 | |
| | | | | | | | |
Total South Korea | | | | | | | 98,902,714 | |
| | | | | | | | |
| | | | | | | | |
| | | |
| INDIA: 7.6% | | | | | | | | |
HDFC Bank, Ltd. | | | 1,482,191 | | | | 20,832,969 | |
| | |
Reliance Industries, Ltd. | | | 721,422 | | | | 16,409,768 | |
| | |
Housing Development Finance Corp., Ltd. | | | 596,168 | | | | 13,862,171 | |
| | |
Info Edge India, Ltd. | | | 327,569 | | | | 11,962,211 | |
| | | | | | | | |
Total India | | | | | | | 63,067,119 | |
| | | | | | | | |
| | | | | | | | |
| | | |
| SINGAPORE: 6.5% | | | | | | | | |
Sea, Ltd. ADRb | | | 391,400 | | | | 41,973,736 | |
| | |
SATS, Ltd. | | | 5,873,700 | | | | 12,175,190 | |
| | | | | | | | |
Total Singapore | | | | | | | 54,148,926 | |
| | | | | | | | |
| | | | | | | | |
| | | |
| FRANCE: 2.7% | | | | | | | | |
LVMH Moet Hennessy Louis Vuitton SE | | | 51,486 | | | | 22,730,716 | |
| | | | | | | | |
Total France | | | | | | | 22,730,716 | |
| | | | | | | | |
| | | | | | | | |
| | | |
| TAIWAN: 1.5% | | | | | | | | |
MediaTek, Inc. | | | 651,000 | | | | 12,870,679 | |
| | | | | | | | |
Total Taiwan | | | | | | | 12,870,679 | |
| | | | | | | | |
| | | | | | | | |
| | | | | | | | |
| | | Shares | | | Value | |
| | |
| UNITED STATES: 1.3% | | | | | | | | |
Legend Biotech Corp. ADRb | | | 256,851 | | | | $10,931,579 | |
| | | | | | | | |
Total United States | | | | | | | 10,931,579 | |
| | | | | | | | |
| | | | | | | | |
| | | |
| VIETNAM: 0.5% | | | | | | | | |
Mobile World Investment Corp.b | | | 1,047,293 | | | | 3,683,889 | |
| | |
Phu Nhuan Jewelry JSC | | | 3 | | | | 8 | |
| | | | | | | | |
Total Vietnam | | | | | | | 3,683,897 | |
| | | | | | | | |
| | | | | | | | |
| | | |
| TOTAL INVESTMENTS: 95.3% | | | | | | | 796,013,800 | |
(Cost $563,622,837) | | | | | | | | |
| | | | | | | | |
| | |
CASH AND OTHER ASSETS,
LESS LIABILITIES: 4.7% | | | | | | | 39,693,146 | |
| | | | | | | | |
| | |
NET ASSETS: 100.0% | | | | | | | $835,706,946 | |
| | | | | | | | |
| a | Certain securities were fair valued under the valuation policies approved by the Board of Trustees (Note 2-A). |
| b | Non-income producing security. |
| c | The securities may be resold to qualified foreign investors and foreign institutional buyers under Regulation S of the Securities Act of 1933. |
| d | Security exempt from registration under Rule 144A of the Securities Act of 1933, as amended. The security may be resold in transactions exempt from registration normally to qualified institutional buyers. The security has been determined to be liquid in accordance with procedures adopted by the Funds’ Board of Trustees. At June 30, 2020, the aggregate value is $97,790,820, which is 11.70% of net assets. |
| ADR | American Depositary Receipt |
See accompanying notes to financial statements.
| | | | |
| PORTFOLIO MANAGERS |
| |
| Andrew Mattock, CFA | | |
Lead Manager | | |
| |
| Winnie Chwang | | |
Co-Manager | | |
| | |
| FUND FACTS | | | | |
| | |
| | | Investor | | Institutional |
Ticker | | MCHFX | | MICFX |
CUSIP | | 577130701 | | 577130818 |
Inception | | 2/19/98 | | 10/29/10 |
NAV | | $21.47 | | $21.45 |
Initial Investment | | $2,500 | | $100,000 |
Gross Expense Ratio1 | | 1.09% | | 0.91% |
Portfolio Statistics |
Total # of Positions | | 39 |
Net Assets | | $1.1 billion |
Weighted Average
Market Cap | | $205.7 billion |
Portfolio Turnover2 | | 68.93% |
Benchmarks |
MSCI China Index |
MSCI China All Shares Index |
OBJECTIVE
Long-term capital appreciation.
STRATEGY
Under normal market conditions, the Fund seeks to achieve its investment objective by investing at least 80% of its net assets, which include borrowings for investment purposes, in the common and preferred stocks of companies located in China. China includes its administrative and other districts, such as Hong Kong.
Matthews China Fund
Portfolio Manager Commentary (unaudited)
For the first half of 2020, the Matthews China Fund returned 12.29% (Investor Class) and 12.42% (Institutional Class), while its benchmark, the MSCI China Index, returned 3.58% over the same period. For the quarter ending June 30, 2019, the Matthews China Fund returned 23.04% (Investor Class) and 23.13% (Institutional Class), while the benchmark returned 15.37%.
Market Environment:
Chinese equities were resilient in the first half. Our colleagues on the ground in China report the country was highly successful at flattening its curve of COVID-19 infections through testing, contact tracing and mask adoption. Reports from our local offices and official economic data imply that recovery is well under way. Factory workers have reported back to the assembly line, local shops and restaurants are accepting walk-in customers and some travel restrictions are being lifted. Life in China is slowly normalizing. However in the second quarter, volatility in Chinese equities resurfaced as the Chinese government proposed—and eventually passed—an amendment to the national security laws in Hong Kong. This action attracted international attention and protests from Hong Kong citizens. Uncertainty around this legislation combined with feared backlash from foreigners caused additional pockets of volatility. However, Chinese equities were strong diversifiers for global investors, posting double-digit positive returns in the first half, while U.S. equities were slightly negative. The Chinese government’s track record of willingness and ability to support markets and their economy during volatile times has become a source of confidence for investors.
Performance Contributors and Detractors:
Strong stock selection drove the Fund’s outperformance in the first half. From a sector perspective, stock selection in the consumer discretionary and information technology sectors contributed to relative performance. In the consumer discretionary space, strong online sales amid the COVID-19 pandemic benefited the Fund’s holdings and we continue to see ecommerce attracting new consumers. A contributor among individual stocks was Meituan Dianping, China’s largest food delivery service. The company enjoys a dominant market share in food delivery, capturing roughly 60% of the market. In addition to its core operations around food delivery, the company also runs a successful business review service, similar to Yelp, as well as a travel booking service for hotels. Forecasts of increased profitability caused the stock to rise in May. Meituan Dianping is also leveraging the benefits of scale to drive down its logistics costs.
Turning to detractors, stock selection in the health care sector was a slight detractor from relative performance. The portfolio remains overweight the sector relative to the benchmark, which was a plus for relative performance. However, one health care stock in the portfolio experienced share price weakness amid market volatility. Sinopharm is China’s largest pharmaceutical distributor. It is one of China’s few distributors with a meaningful nationwide presence. Sinopharm saw weak results in the first half of 2020 owing to negative economic impact from the COVID-19 outbreak. Hospital visitation during the pandemic fell, which reduced pharmaceutical distribution needs. At the same time, the company saw increased operational expenses associated with the prevention and containment of the virus situation. Sinopharm trades at attractive valuations and commands a still large and dominant presence in China’s health care distribution industry. We continue to monitor this position for updates and operational improvements.
(continued)
| 1 | Prospectus expense ratios. |
| 2 | The lesser of fiscal year 2019 long-term purchase costs or sales proceeds divided by the average monthly market value of long-term securities. |
| | | | |
| matthewsasia.com | 800.789.ASIA | | | 61 | |
| | | | | | | | | | | | | | | | | | | | | | | | | | | | | | | | |
| |
| PERFORMANCE AS OF JUNE 30, 2020 | |
| | | | | | | | | | | | Average Annual Total Returns | | | | |
| | | 3 Months | | | YTD | | | 1 Year | | | 3 Years | | | 5 Years | | | 10 Years | | | Since
Inception | | | Inception
Date | |
| Investor Class (MCHFX) | | | 23.04% | | | | 12.29% | | | | 23.58% | | | | 13.31% | | | | 9.21% | | | | 7.30% | | | | 10.26% | | | | 2/19/98 | |
| Institutional Class (MICFX) | | | 23.13% | | | | 12.42% | | | | 23.83% | | | | 13.54% | | | | 9.40% | | | | n.a. | | | | 5.66% | | | | 10/29/10 | |
| MSCI China Index3 | | | 15.37% | | | | 3.58% | | | | 13.28% | | | | 8.73% | | | | 5.49% | | | | 6.60% | | | | 4.85% | 4 | | | | |
| MSCI China All Shares Index3 | | | 15.52% | | | | 4.11% | | | | 13.11% | | | | 6.61% | | | | 1.19% | | | | n.a. | | | | n.a. | 5 | | | | |
Performance assumes reinvestment of all dividends and/or distributions before taxes. All performance quoted represents past performance and is no guarantee of future results. Investment return and principal value will fluctuate with market conditions so that when redeemed, shares may be worth more or less than their original cost. Current performance may be lower or higher than the return figures quoted. For the Fund’s most recent month-end performance, visit matthewsasia.com.
GROWTH OF A HYPOTHETICAL $10,000 INVESTMENT SINCE INCEPTION—INVESTOR CLASS
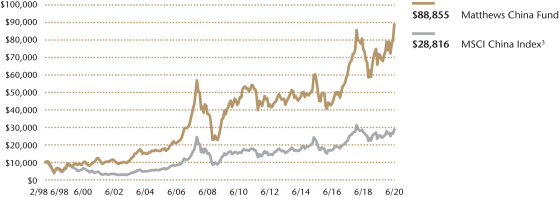
Plotted monthly. The performance data and graph do not reflect the deduction of taxes that a shareholder would pay on dividends, capital gains distributions or redemption of Fund shares. Values are in US$.
| | 3 | It is not possible to invest directly in an index. Source: Index data from Morgan Stanley Capital International and Bloomberg; total return calculations performed by BNY Mellon Investment Servicing (US) Inc. Please see page 90 for index definition. |
| | 4 | Calculated from 2/28/98. |
| | 5 | Index performance data prior to 11/25/08 is not available. |
| | | | | | | | |
| | | | |
| TOP TEN HOLDINGS5 | | | | | | | |
| | | Sector | | | | % of Net Assets | |
| Tencent Holdings, Ltd. | | Communication Services | | | | | 12.9% | |
| Alibaba Group Holding, Ltd. | | Consumer Discretionary | | | | | 11.9% | |
| JD.com, Inc. | | Consumer Discretionary | | | | | 5.5% | |
| China Construction Bank Corp. | | Financials | | | | | 4.3% | |
| China Merchants Bank Co., Ltd. | | Financials | | | | | 4.3% | |
| AIA Group, Ltd. | | Financials | | | | | 4.0% | |
| Hong Kong Exchanges & Clearing, Ltd. | | Financials | | | | | 3.8% | |
| Ping An Insurance Group Co. of China, Ltd. | | Financials | | | | | 3.0% | |
| CITIC Securities Co., Ltd. | | Financials | | | | | 2.8% | |
| China International Capital Corp., Ltd. | | Financials | | | | | 2.7% | |
| % OF ASSETS IN TOP TEN | | | | | | | 55.2% | |
| | 5 | Holdings may combine more than one security from same issuer and related depositary receipts. |
Matthews China Fund
Portfolio Manager Commentary (unaudited) (continued)
Notable Portfolio Changes:
In the second quarter, we added two new communication services stocks, as well as a utilities stock. Demand for digital entertainment and online social media platforms continues to grow and is being accelerated by social distancing conventions. Joyy Inc. is a social media platform we recently added that allows users to interact in real time. Utilities stocks experienced price declines in the reporting period, creating the opportunity to pick up a high-quality provider at a very attractive valuation. ENN Energy Holdings is one of the largest clean energy distributors in China. We also exited a position in outdoor advertising amid falling ad sales company Focus Media, while also reducing exposure to U.S.-listed Chinese ADRs. We also sought to take advantage of the volatility to increase the quality and concentration of the portfolio by trimming some smaller/lower conviction holdings on valuation opportunities elsewhere.
Outlook:
While China’s economic recovery is still in very early stages, recent data suggests the pace and progress of the recovery may be sustainable. CapEx spending among businesses, auto sales among consumers and property sales all began to rebound in the second quarter of 2020. This is not to suggest that China is out of the woods yet. The potential for a second wave of virus infections remains, particularly as Chinese citizens return home from abroad. Unemployment remains high in China, as it does globally, which could create a drag on spending. And a slowing global economy could slow China’s rebound.
On the positive side, China has done a much better job of flattening its curve of new infections than any other large economy. Public health policy is, in our view, robust and run by the central government, providing coordinated response. China still has considerable dry powder in its arsenal of stimulus tool, and long-term secular growth trends in China remain in play. Consumers continue to seek upgrades across all facets of quality of life. Some of these upgrades may be delayed, but we believe consumer behavior remains remarkably consistent over the long term.
While additional volatility could lie ahead, we believe the long-term prospects for Chinese companies with strong competitive positions remain attractive. The pandemic has enabled some strong players to become even stronger and gain market share. And periods of market disruption have historically spurred new opportunities for innovation and business investment.
| | | | |
| |
| COUNTRY ALLOCATION (%)6 | |
| China/Hong Kong | | | 95.7 | |
Cash and Other Assets, Less Liabilities | | | 4.3 | |
| Total | | | 100.0 | |
| | | | |
| |
| SECTOR ALLOCATION (%)6 | |
| Consumer Discretionary | | | 25.9 | |
| Financials | | | 24.9 | |
| Communication Services | | | 15.2 | |
| Information Technology | | | 7.7 | |
| Health Care | | | 7.3 | |
| Real Estate | | | 6.1 | |
| Consumer Staples | | | 4.0 | |
| Materials | | | 2.0 | |
| Industrials | | | 1.5 | |
| Utilities | | | 0.9 | |
Cash and Other Assets, Less Liabilities | | | 4.3 | |
| Total | | | 99.8 | |
| | | | |
| |
| MARKET CAP EXPOSURE (%)6 | |
| Mega Cap (over $25B) | | | 66.2 | |
| Large Cap ($10B-$25B) | | | 12.1 | |
| Mid Cap ($3B-10B) | | | 12.6 | |
| Small Cap (under $3B) | | | 4.7 | |
| Cash and Other Assets, Less Liabilities | | | 4.3 | |
| 6 | Source: FactSet Research Systems. Percentage values in data are rounded to the nearest tenth of one percent, so the values may not sum to 100% due to rounding. Percentage values may be derived from different data sources and may not be consistent with other Fund literature. |
| | | | |
| matthewsasia.com | 800.789.ASIA | | | 63 | |
Matthews China Fund
June 30, 2020
Schedule of Investmentsa (unaudited)
COMMON EQUITIES: 95.7%
| | | | | | | | |
| | | Shares | | | Value | |
| | | | | | | | |
| | |
| CONSUMER DISCRETIONARY: 26.0% | | | | | | | | |
Internet & Direct Marketing Retail: 19.3% | | | | | | | | |
Alibaba Group Holding, Ltd.b | | | 4,804,000 | | | | $129,630,185 | |
| | |
JD.com, Inc. ADRb | | | 998,779 | | | | 60,106,520 | |
| | |
Meituan Dianping Class Bb,c | | | 906,200 | | | | 20,250,287 | |
| | | | | | | | |
| | | | | | | 209,986,992 | |
| | | | | | | | |
| | | | | | | | |
Household Durables: 2.1% | | | | | | | | |
Midea Group Co., Ltd. A Shares | | | 2,740,752 | | | | 23,246,415 | |
| | | | | | | | |
| | | | | | | | |
Specialty Retail: 1.9% | | | | | | | | |
Zhongsheng Group Holdings, Ltd. | | | 3,595,000 | | | | 20,105,861 | |
| | | | | | | | |
| | | | | | | | |
Diversified Consumer Services: 1.8% | | | | | | | | |
New Oriental Education & Technology Group, Inc. ADRb | | | 150,700 | | | | 19,625,661 | |
| | | | | | | | |
| | | | | | | | |
Hotels, Restaurants & Leisure: 0.9% | | | | | | | | |
Galaxy Entertainment Group, Ltd. | | | 1,434,000 | | | | 9,836,881 | |
| | | | | | | | |
Total Consumer Discretionary | | | | | | | 282,801,810 | |
| | | | | | | | |
| | | | | | | | |
| | | |
| FINANCIALS: 24.9% | | | | | | | | |
Capital Markets: 9.3% | | | | | | | | |
Hong Kong Exchanges & Clearing, Ltd. | | | 967,000 | | | | 41,186,204 | |
| | |
CITIC Securities Co., Ltd. H Shares | | | 16,199,000 | | | | 30,899,219 | |
| | |
China International Capital Corp., Ltd. H Sharesb,c,d | | | 14,751,200 | | | | 29,186,052 | |
| | | | | | | | |
| | | | | | | 101,271,475 | |
| | | | | | | | |
| | | | | | | | |
Banks: 8.6% | | | | | | | | |
China Construction Bank Corp. H Shares | | | 58,204,660 | | | | 47,342,689 | |
| | |
China Merchants Bank Co., Ltd. A Shares | | | 9,730,523 | | | | 46,607,486 | |
| | | | | | | | |
| | | | | | | 93,950,175 | |
| | | | | | | | |
| | | | | | | | |
Insurance: 7.0% | | | | | | | | |
AIA Group, Ltd. | | | 4,696,400 | | | | 43,947,056 | |
| | |
Ping An Insurance Group Co. of China, Ltd. A Shares | | | 3,214,346 | | | | 32,548,282 | |
| | | | | | | | |
| | | | | | | 76,495,338 | |
| | | | | | | | |
Total Financials | | | | | | | 271,716,988 | |
| | | | | | | | |
| | | | | | | | |
| | | |
| COMMUNICATION SERVICES: 15.2% | | | | | | | | |
Interactive Media & Services: 14.1% | | | | | | | | |
Tencent Holdings, Ltd. | | | 2,202,400 | | | | 141,125,196 | |
| | |
JOYY, Inc.b | | | 145,480 | | | | 12,882,254 | |
| | | | | | | | |
| | | | | | | 154,007,450 | |
| | | | | | | | |
| | | | | | | | |
Entertainment: 1.1% | | | | | | | | |
Tencent Music Entertainment Group ADRb | | | 901,400 | | | | 12,132,844 | |
| | | | | | | | |
Total Communication Services | | | | | | | 166,140,294 | |
| | | | | | | | |
| | | | | | | | |
| | | |
| INFORMATION TECHNOLOGY: 7.8% | | | | | | | | |
Electronic Equipment, Instruments & Components: 3.4% | |
Luxshare Precision Industry Co., Ltd. A Shares | | | 2,925,262 | | | | 21,398,196 | |
| | |
NAURA Technology Group Co., Ltd. A Shares | | | 500,916 | | | | 12,148,496 | |
| | |
AVIC Jonhon Optronic Technology Co., Ltd. A Shares | | | 500,284 | | | | 2,914,133 | |
| | | | | | | | |
| | | | | | | 36,460,825 | |
| | | | | | | | |
| | | | | | | | |
| | | | | | | | |
| | | Shares | | | Value | |
| | | | | | | | |
Software: 2.3% | | | | | | | | |
Weimob, Inc.b,c,d | | | 10,312,000 | | | | $13,040,338 | |
| | |
Kingdee International Software Group Co., Ltd. | | | 5,313,000 | | | | 12,431,801 | |
| | | | | | | | |
| | | | | | | 25,472,139 | |
| | | | | | | | |
| | | | | | | | |
IT Services: 2.1% | | | | | | | | |
Chinasoft International, Ltd. | | | 40,894,000 | | | | 22,530,212 | |
| | | | | | | | |
Total Information Technology | | | | | | | 84,463,176 | |
| | | | | | | | |
| | | | | | | | |
| | | |
| HEALTH CARE: 7.3% | | | | | | | | |
Life Sciences Tools & Services: 2.6% | | | | | | | | |
Wuxi Biologics Cayman, Inc.b,c,d | | | 811,000 | | | | 14,886,405 | |
| | |
Hangzhou Tigermed Consulting Co., Ltd. A Shares | | | 906,686 | | | | 13,058,015 | |
| | | | | | | | |
| | | | | | | 27,944,420 | |
| | | | | | | | |
| | | | | | | | |
Health Care Equipment & Supplies: 1.8% | | | | | | | | |
Lepu Medical Technology Beijing Co., Ltd. A Shares | | | 3,786,679 | | | | 19,574,022 | |
| | | | | | | | |
| | | | | | | | |
Pharmaceuticals: 1.7% | | | | | | | | |
Sino Biopharmaceutical, Ltd. | | | 10,133,000 | | | | 19,098,640 | |
| | | | | | | | |
| | | | | | | | |
Health Care Providers & Services: 1.2% | | | | | | | | |
Sinopharm Group Co., Ltd. H Shares | | | 5,203,600 | | | | 13,378,238 | |
| | | | | | | | |
Total Health Care | | | | | | | 79,995,320 | |
| | | | | | | | |
| | | | | | | | |
| | | |
| REAL ESTATE: 6.1% | | | | | | | | |
Real Estate Management & Development: 6.1% | | | | | |
| | |
Times China Holdings, Ltd. | | | 10,717,000 | | | | 19,983,714 | |
| | |
China Resources Land, Ltd. | | | 4,998,000 | | | | 19,103,332 | |
| | |
CIFI Holdings Group Co., Ltd. | | | 23,328,000 | | | | 18,376,899 | |
| | |
China Overseas Property Holdings, Ltd. | | | 8,520,000 | | | | 9,082,808 | |
| | | | | | | | |
| | |
Total Real Estate | | | | | | | 66,546,753 | |
| | | | | | | | |
| | | | | | | | |
| | | |
| CONSUMER STAPLES: 4.0% | | | | | | | | |
Beverages: 4.0% | | | | | | | | |
| | |
Wuliangye Yibin Co., Ltd. A Shares | | | 908,477 | | | | 22,083,981 | |
| | |
Kweichow Moutai Co., Ltd. A Shares | | | 102,423 | | | | 21,280,326 | |
| | | | | | | | |
Total Consumer Staples | | | | | | | 43,364,307 | |
| | | | | | | | |
| | | | | | | | |
| | | |
| MATERIALS: 2.0% | | | | | | | | |
Construction Materials: 1.0% | | | | | | | | |
Anhui Conch Cement Co., Ltd. A Shares | | | 1,440,144 | | | | 10,837,895 | |
| | | | | | | | |
| | | | | | | | |
Chemicals: 1.0% | | | | | | | | |
Wanhua Chemical Group Co., Ltd. A Shares | | | 1,501,419 | | | | 10,655,350 | |
| | | | | | | | |
Total Materials | | | | | | | 21,493,245 | |
| | | | | | | | |
| | | | | | | | |
| | | |
| INDUSTRIALS: 1.5% | | | | | | | | |
Machinery: 0.8% | | | | | | | | |
Estun Automation Co., Ltd. A Sharesb | | | 5,342,825 | | | | 9,068,556 | |
| | | | | | | | |
| | | | | | | | |
Transportation Infrastructure: 0.7% | | | | | | | | |
Beijing Capital International Airport Co., Ltd. H Shares | | | 11,338,000 | | | | 7,095,769 | |
| | | | | | | | |
Total Industrials | | | | | | | 16,164,325 | |
| | | | | | | | |
| | | | | | | | |
Matthews China Fund
June 30, 2020
Schedule of Investmentsa (unaudited) (continued)
COMMON EQUITIES (continued)
| | | | | | | | |
| | | Shares | | | Value | |
| | | | | | | | |
| | |
| UTILITIES: 0.9% | | | | | | | | |
Gas Utilities: 0.9% | | | | | | | | |
ENN Energy Holdings, Ltd. | | | 878,900 | | | | $9,931,998 | |
| | | | | | | | |
Total Utilities | | | | | | | 9,931,998 | |
| | | | | | | | |
| | | | | | | | |
| | | |
| TOTAL INVESTMENTS: 95.7% | | | | | | | 1,042,618,216 | |
(Cost $847,902,826) | | | | | | | | |
| | | | | | | | |
| | |
CASH AND OTHER ASSETS,
LESS LIABILITIES: 4.3% | | | | | | | 47,257,713 | |
| | | | | | | | |
| | |
NET ASSETS: 100.0% | | | | | | | $1,089,875,929 | |
| | | | | | | | |
| a | Certain securities were fair valued under the valuation policies approved by the Board of Trustees (Note 2-A). |
| b | Non-income producing security. |
| c | The securities may be resold to qualified foreign investors and foreign institutional buyers under Regulation S of the Securities Act of 1933. |
| d | Security exempt from registration under Rule 144A of the Securities Act of 1933, as amended. The security may be resold in transactions exempt from registration normally to qualified institutional buyers. The security has been determined to be liquid in accordance with procedures adopted by the Funds’ Board of Trustees. At June 30, 2020, the aggregate value is $57,112,795, which is 5.24% of net assets. |
| ADR | American Depositary Receipt |
See accompanying notes to financial statements.
| | | | |
| matthewsasia.com | 800.789.ASIA | | | 65 | |
| | | | |
| PORTFOLIO MANAGERS |
| |
| Peeyush Mittal,CFA | | |
Lead Manager | | |
| |
| Sharat Shroff, CFA | | |
Co-Manager | | |
|
| FUND FACTS |
| | |
| | | Investor | | Institutional |
Ticker | | MINDX | | MIDNX |
CUSIP | | 577130859 | | 577130768 |
Inception | | 10/31/05 | | 10/29/10 |
NAV | | $18.77 | | $19.00 |
Initial Investment | | $2,500 | | $100,000 |
Gross Expense Ratio1 | | 1.11% | | 0.94% |
Portfolio Statistics | | | | |
Total # of Positions | | 58 |
Net Assets | | $552.2 million |
Weighted Average Market Cap | | $34.9 billion |
Portfolio Turnover2 | | 24.00% |
Benchmark | | |
S&P Bombay Stock Exchange 100 Index |
OBJECTIVE
Long-term capital appreciation.
STRATEGY
Under normal market conditions, the Fund seeks to achieve its investment objective by investing at least 80% of its net assets, which include borrowings for investment purposes, in publicly traded common stocks, preferred stocks and convertible securities of companies located in India.
Matthews India Fund
Portfolio Manager Commentary (unaudited)
For the first half of 2020, the Matthews India Fund returned –19.37% (Investor Class) and –19.32% (Institutional Class) while its benchmark, the S&P Bombay Stock Exchange 100 Index, returned –19.29%. For the quarter ending June 30, the Fund returned 19.40% (Investor Class) and 19.42% (Institutional Class), while its benchmark returned 19.99%.
Market Environment:
Amid fears over the economic impacts of the COVID-19 pandemic, Indian equities were highly volatile in the first half of 2020. India’s COVID-19 cases increased exponentially in March, albeit from low reported levels. Investors worried that India reacted late in containing the virus and that the country’s health care infrastructure may not be adequate. To slow the spread of the virus, the government implemented a nationwide lockdown at the end of March, which lasted through early June. The most notable market declines occurred in March, with India’s broader markets down approximately 25% in a single month.
Equity prices then began a rebound from April through June as the lockdown measures started to get relaxed from April onwards. Although Indian shares were some of the strongest regional performers in the second quarter of 2020, their gains were not enough to make up first quarter losses. The government has announced large headline stimulus of approximately 10% of GDP. Loan guarantees and liquidity injections made up the majority of the stimulus, as opposed to direct fiscal spending, which could limit short-term effectiveness.
In terms of economic activity, we are witnessing normalization of economic activity based on high frequency data like power consumption, fuel consumption, highway toll collection etc. While the pace of improvement in May and the early part of June was very quick, we have seen plateauing of the same in the second half of June.
Performance Contributors and Detractors:
Fund performance was roughly in line with its benchmark for the first half. Contributors to performance included an overweight and stock selection in the health care sector. Among individual securities, Alembic Pharmaceuticals Limited, an Indian multinational pharmaceutical company headquartered in Vadodara city of Gujarat, was a contributor. Alembic Pharma has been expanding its export business on back of more generic product launches in United States. Further, company has also benefitted from substantial market share gains in specific molecules targeting cardio-vascular ailments.
Detractors from performance included a slight overweight and stock selection in the financials sectors. As a cyclical sector, financial stocks were pummeled in the first quarter of 2020 during the market panic phase of the global pandemic. At the same time, financials play an important role in India’s equity markets, making up roughly one third of the Fund’s benchmark universe. Among individual securities, Shriram City Union Finance (SCUF) Limited was a detractor. A non-banking financial company (NBFC), SCUF is among the largest lenders making small business loans. NBFCs were hit hard in the first half amid liquidity fears, as asset manager Franklin Templeton abruptly liquidated six of its Indian debt funds in April. We continue to monitor our position in SCUF. SCUF is very well capitalized with equity capital in excess of 20%. Over the long term, we believe lending to small businesses has a long runway for additional growth in India, so we remain constructive on the company’s future prospects.
(continued)
| 1 | Prospectus expense ratios. |
| 2 | The lesser of fiscal year 2019 long-term purchase costs or sales proceeds divided by the average monthly market value of long-term securities. |
| | | | | | | | | | | | | | | | | | | | | | | | | | | | | | | | |
| |
| PERFORMANCE AS OF JUNE 30, 2020 | |
| | | | | | | | | | | | Average Annual Total Returns | | | | |
| | | 3 Months | | | YTD | | | 1 Year | | | 3 Years | | | 5 Years | | | 10 Years | | | Since
Inception | | | Inception
Date | |
| Investor Class (MINDX) | | | 19.40% | | | | -19.37% | | | | -21.86% | | | | -7.22% | | | | -1.80% | | | | 4.06% | | | | 8.08% | | | | 10/31/05 | |
| Institutional Class (MIDNX) | | | 19.42% | | | | -19.32% | | | | -21.76% | | | | -7.08% | | | | -1.62% | | | | n.a. | | | | 2.31% | | | | 10/29/10 | |
| S&P Bombay Stock Exchange 100 Index3 | | | 19.99% | | | | -19.29% | | | | -19.28% | | | | -2.11% | | | | 2.03% | | | | 3.00% | | | | 8.11% | 4 | | | | |
Performance assumes reinvestment of all dividends and/or distributions before taxes. All performance quoted represents past performance and is no guarantee of future results. Investment return and principal value will fluctuate with market conditions so that when redeemed, shares may be worth more or less than their original cost. Current performance may be lower or higher than the return figures quoted. For the Fund’s most recent month-end performance, visit matthewsasia.com.
GROWTH OF A HYPOTHETICAL $10,000 INVESTMENT SINCE INCEPTION—INVESTOR CLASS
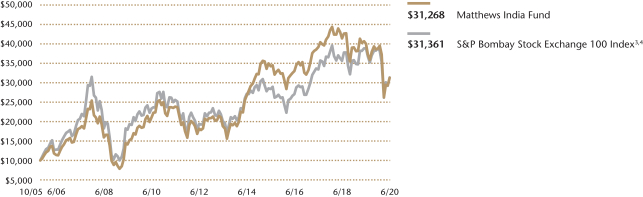
Plotted monthly. The performance data and graph do not reflect the deduction of taxes that a shareholder would pay on dividends, capital gains distributions or redemption of Fund shares. Values are in US$.
| | 3 | It is not possible to invest directly in an index. Source: Index data from S&P BSE 100 Index and Bloomberg; total return calculations performed by BNY Mellon Investment Servicing (US) Inc. Please see page 90 for index definition. |
| | 4 | Calculated from 10/31/05. |
| | | | | | | | |
| | | | |
| TOP TEN HOLDINGS5 | | | | | | | |
| | | Sector | | | | % of Net Assets | |
| Reliance Industries, Ltd. | | Energy | | | | | 9.1% | |
| HDFC Bank, Ltd. | | Financials | | | | | 8.1% | |
| Infosys, Ltd. | | Information Technology | | | | | 4.8% | |
| Housing Development Finance Corp., Ltd. | | Financials | | | | | 4.1% | |
| ICICI Bank, Ltd. | | Financials | | | | | 4.0% | |
| Kotak Mahindra Bank, Ltd. | | Financials | | | | | 3.9% | |
| VST Industries, Ltd. | | Consumer Staples | | | | | 3.7% | |
| Info Edge India, Ltd. | | Communication Services | | | | | 3.5% | |
| Bharti Airtel, Ltd. | | Communication Services | | | | | 3.3% | |
| Zydus Wellness, Ltd. | | Consumer Staples | | | | | 3.0% | |
| % OF ASSETS IN TOP TEN | | | | | | | 47.5% | |
| | 5 | Holdings may combine more than one security from same issuer and related depositary receipts. |
| | | | |
| matthewsasia.com | 800.789.ASIA | | | 67 | |
| | | | |
| |
| COUNTRY ALLOCATION (%)6 | |
| India | | | 95.6 | |
| Japan | | | 1.0 | |
| Cash and Other Assets, Less Liabilities | | | 3.4 | |
| Total | | | 100.0 | |
| | | | |
| |
| SECTOR ALLOCATION (%)6 | |
| Financials | | | 31.4 | |
| Consumer Staples | | | 14.3 | |
| Information Technology | | | 13.2 | |
| Energy | | | 9.1 | |
| Consumer Discretionary | | | 7.8 | |
| Communication Services | | | 7.6 | |
| Health Care | | | 6.9 | |
| Industrials | | | 4.3 | |
| Materials | | | 1.9 | |
| Cash and Other Assets, Less Liabilities | | | 3.4 | |
| Total | | | 99.9 | |
| | | | |
| |
| MARKET CAP EXPOSURE (%)6 | |
| Mega Cap (over $25B) | | | 41.7 | |
| Large Cap ($10B–$25B) | | | 8.4 | |
| Mid Cap ($3B–10B) | | | 16.8 | |
| Small Cap (under $3B) | | | 29.7 | |
| Cash and Other Assets, Less Liabilities | | | 3.4 | |
| 6 | Source: FactSet Research Systems. Percentage values in data are rounded to the nearest tenth of one percent, so the values may not sum to 100% due to rounding. Percentage values may be derived from different data sources and may not be consistent with other Fund literature. |
Matthews India Fund
Portfolio Manager Commentary (unaudited) (continued)
Notable Portfolio Changes:
We took advantage of market volatility to add several new positions in the second quarter of 2020. Tata Consultancy Services is an Indian multinational information technology (IT) services and consulting company with headquarters in Mumbai. The pandemic continues to accelerate the need for better enterprise IT solutions, creating growing demand for products that can help companies enhance employee productivity. We also initiated a position in HDFC Life Insurance. HDFC’s distribution network spans 401 outlets catering to approx. 2,400 towns and cities across India. It also has offices in London, Singapore and Dubai to services associates in the Middle East. Meanwhile, we exited Cholamandalam Investment and Finance Co., Ltd. (CIFC), a non-banking financial company. CIFC has substantial exposure to commercial vehicle financing segment. It is expected that credit quality in this asset class is going to deteriorate substantially given the inability of asset owners to put their asset to productive use under COVID-19 related lockdown imposed by central government. Given the risk associated, we decided to exit the investment.
Outlook:
We expect economic recovery from COVID-19-induced stress to be gradual. Urban India is going to take longer to recover given that social distancing requirements in dense cities is affecting the pace of economic recovery. However, rural parts of the country has spurred a surprise. After a robust monsoon last year, we are again seeing good rainfall, which bodes well for rural demand and consumption. We are already witnessing strong growth in demand for tractors, two wheelers and crop inputs. Expectation is that demand is going to remain strong through the course of year barring unforeseen circumstances.
While we do not anticipate further fiscal spending announcements, we continue to believe that India’s central bank would remain accommodative on the monetary policy side despite the more recent elevated inflation print. However, the uncertain economic outlook is going to keep the financial sector risk averse and that is likely going to affect any near-term monetary policy transmission. Highly rated corporates with stable cash flows will likely see substantial benefit accrue to them on the back of cheap financing.
There has been a lot written about inadequate fiscal spending by the central government. In our view, there may be a positive aspect to fiscal restraint, which is likely to create price and foreign exchange stability for India. In the long run, we believe this will help attract foreign capital, as investors would have greater confidence in underlying fiscal stability of the country. Additionally, the government’s concerted efforts more recently to further improve the ease of doing business in India, along with tax and financial incentives, will likely create the necessary backdrop for global corporations to consider India as an investment destination.
On the equity markets front, valuations on the surface might look stretched. However, when compared with the anticipated reduction in cost of capital, valuations start to look a lot more reasonable. Given existing conditions today, we think markets are neither cheap nor expensive and hence the path forward would be solely determined by pace of earnings growth.
Matthews India Fund
June 30, 2020
Schedule of Investmentsa (unaudited)
COMMON EQUITIES: 96.6%
| | | | | | | | |
| | | Shares | | | Value | |
| | | | | | | | |
| | |
| FINANCIALS: 31.4% | | | | | | | | |
Banks: 19.8% | | | | | | | | |
HDFC Bank, Ltd. | | | 3,177,984 | | | | $44,668,226 | |
| | |
ICICI Bank, Ltd. | | | 4,709,461 | | | | 21,956,195 | |
| | |
Kotak Mahindra Bank, Ltd. | | | 1,190,196 | | | | 21,483,058 | |
| | |
Bandhan Bank, Ltd.b,c | | | 3,511,810 | | | | 14,976,143 | |
| | |
DCB Bank, Ltd.d | | | 6,122,208 | | | | 6,145,588 | |
| | | | | | | | |
| | | | | | | 109,229,210 | |
| | | | | | | | |
| | | | | | | | |
Thrifts & Mortgage Finance: 4.7% | | | | | | | | |
Housing Development Finance Corp., Ltd. | | | 979,767 | | | | 22,781,662 | |
| | |
Aavas Financiers, Ltd.d | | | 197,713 | | | | 3,490,791 | |
| | | | | | | | |
| | | | | | | 26,272,453 | |
| | | | | | | | |
| | | | | | | | |
Consumer Finance: 4.6% | | | | | | | | |
Shriram City Union Finance, Ltd. | | | 1,333,549 | | | | 11,798,971 | |
| | |
Bajaj Finance, Ltd. | | | 209,492 | | | | 7,884,894 | |
| | |
Sundaram Finance, Ltd. | | | 303,133 | | | | 5,832,891 | |
| | | | | | | | |
| | | | | | | 25,516,756 | |
| | | | | | | | |
| | | | | | | | |
Capital Markets: 1.5% | | | | | | | | |
Indian Energy Exchange, Ltd.b,c | | | 1,729,716 | | | | 4,132,291 | |
| | |
Multi Commodity Exchange of India, Ltd. | | | 236,732 | | | | 4,030,425 | |
| | | | | | | | |
| | | | | | | 8,162,716 | |
| | | | | | | | |
| | | | | | | | |
Insurance: 0.8% | | | | | | | | |
HDFC Life Insurance Co., Ltd.b,c,d | | | 588,556 | | | | 4,298,902 | |
| | | | | | | | |
Total Financials | | | | | | | 173,480,037 | |
| | | | | | | | |
| | | | | | | | |
| | | |
| CONSUMER STAPLES: 14.3% | | | | | | | | |
Tobacco: 4.8% | | | | | | | | |
VST Industries, Ltd. | | | 495,531 | | | | 20,612,088 | |
| | |
ITC, Ltd.d | | | 2,293,801 | | | | 5,922,806 | |
| | | | | | | | |
| | | | | | | 26,534,894 | |
| | | | | | | | |
| | | | | | | | |
Food Products: 4.2% | | | | | | | | |
Zydus Wellness, Ltd. | | | 993,440 | | | | 16,785,991 | |
| | |
Britannia Industries, Ltd. | | | 126,580 | | | | 6,053,558 | |
| | | | | | | | |
| | | | | | | 22,839,549 | |
| | | | | | | | |
| | | | | | | | |
Personal Products: 3.8% | | | | | | | | |
Marico, Ltd. | | | 1,911,004 | | | | 8,909,947 | |
| | |
Dabur India, Ltd. | | | 1,091,104 | | | | 6,739,127 | |
| | |
Bajaj Consumer Care, Ltd.d | | | 2,802,123 | | | | 5,444,305 | |
| | | | | | | | |
| | | | | | | 21,093,379 | |
| | | | | | | | |
| | | | | | | | |
Household Products: 1.0% | | | | | | | | |
Hindustan Unilever, Ltd. | | | 195,789 | | | | 5,660,413 | |
| | | | | | | | |
| | | | | | | | |
Food & Staples Retailing: 0.5% | | | | | | | | |
Avenue Supermarts, Ltd.b,c,d | | | 95,462 | | | | 2,929,751 | |
| | | | | | | | |
Total Consumer Staples | | | | | | | 79,057,986 | |
| | | | | | | | |
| | | | | | | | |
| | | |
| INFORMATION TECHNOLOGY: 13.2% | | | | | | | | |
IT Services: 13.2% | | | | | | | | |
Infosys, Ltd. | | | 2,709,355 | | | | 26,336,857 | |
| | |
Tata Consultancy Services, Ltd. | | | 472,418 | | | | 13,004,499 | |
| | |
Wipro, Ltd. | | | 4,361,116 | | | | 12,730,617 | |
| | |
Larsen & Toubro Infotech, Ltd.b,c | | | 446,973 | | | | 11,602,941 | |
| | |
Mphasis, Ltd. | | | 466,577 | | | | 5,443,681 | |
| | |
Tech Mahindra, Ltd. | | | 529,073 | | | | 3,806,756 | |
| | | | | | | | |
Total Information Technology | | | | | | | 72,925,351 | |
| | | | | | | | |
| | | | | | | | |
| | | Shares | | | Value | |
| | | | | | | | |
| | |
| ENERGY: 9.1% | | | | | | | | |
Oil, Gas & Consumable Fuels: 9.1% | | | | | | | | |
Reliance Industries, Ltd. | | | 2,135,196 | | | | $48,568,066 | |
| | |
Reliance Industries, Ltd. | | | 142,346 | | | | 1,503,702 | |
| | | | | | | | |
Total Energy | | | | | | | 50,071,768 | |
| | | | | | | | |
| | | | | | | | |
| | | |
| CONSUMER DISCRETIONARY: 7.8% | | | | | | | | |
Automobiles: 3.8% | | | | | | | | |
Eicher Motors, Ltd. | | | 32,536 | | | | 7,900,227 | |
| | |
Hero MotoCorp, Ltd. | | | 222,917 | | | | 7,533,025 | |
| | |
Suzuki Motor Corp. | | | 164,300 | | | | 5,610,206 | |
| | | | | | | | |
| | | | | | | 21,043,458 | |
| | | | | | | | |
| | | | | | | | |
Household Durables: 2.6% | | | | | | | | |
Symphony, Ltd. | | | 627,172 | | | | 7,296,429 | |
| | |
Crompton Greaves Consumer Electricals, Ltd. | | | 1,544,217 | | | | 4,884,281 | |
| | |
Amber Enterprises India, Ltd. | | | 121,560 | | | | 2,316,282 | |
| | | | | | | | |
| | | | | | | 14,496,992 | |
| | | | | | | | |
| | | | | | | | |
Multiline Retail: 0.7% | | | | | | | | |
Trent, Ltd. | | | 461,454 | | | | 3,758,795 | |
| | | | | | | | |
| | | | | | | | |
Hotels, Restaurants & Leisure: 0.7% | | | | | | | | |
Delta Corp., Ltd. | | | 3,240,807 | | | | 3,718,713 | |
| | | | | | | | |
Total Consumer Discretionary | | | | | | | 43,017,958 | |
| | | | | | | | |
| | | | | | | | |
| | | |
| COMMUNICATION SERVICES: 7.6% | | | | | | | | |
Interactive Media & Services: 3.5% | | | | | | | | |
Info Edge India, Ltd. | | | 532,072 | | | | 19,430,280 | |
| | | | | | | | |
| | | | | | | | |
Wireless Telecommunication Services: 3.3% | | | | | | | | |
Bharti Airtel, Ltd.d | | | 2,447,838 | | | | 18,180,030 | |
| | | | | | | | |
| | | | | | | | |
Media: 0.6% | | | | | | | | |
Affle India, Ltd.d | | | 160,101 | | | | 3,093,214 | |
| | | | | | | | |
| | | | | | | | |
Entertainment: 0.2% | | | | | | | | |
Saregama India, Ltd. | | | 238,020 | | | | 1,352,574 | |
| | | | | | | | |
Total Communication Services | | | | | | | 42,056,098 | |
| | | | | | | | |
| | | | | | | | |
| | | |
| HEALTH CARE: 6.9% | | | | | | | | |
Pharmaceuticals: 4.4% | | | | | | | | |
Lupin, Ltd. | | | 593,043 | | | | 7,165,748 | |
| | |
Caplin Point Laboratories, Ltd. | | | 1,305,429 | | | | 5,394,547 | |
| | |
Alembic Pharmaceuticals, Ltd. | | | 402,416 | | | | 4,858,543 | |
| | |
Laurus Labs, Ltd.b,c | | | 544,586 | | | | 3,750,759 | |
| | |
Natco Pharma, Ltd. | | | 397,187 | | | | 3,338,672 | |
| | | | | | | | |
| | | | | | | 24,508,269 | |
| | | | | | | | |
| | | | | | | | |
Health Care Equipment & Supplies: 1.0% | | | | | | | | |
Poly Medicure, Ltd. | | | 1,405,323 | | | | 5,489,280 | |
| | | | | | | | |
| | | | | | | | |
Life Sciences Tools & Services: 1.0% | | | | | | | | |
Syngene International, Ltd.b,c | | | 1,018,203 | | | | 5,428,934 | |
| | | | | | | | |
| | | | | | | | |
Health Care Providers & Services: 0.5% | | | | | | | | |
Metropolis Healthcare, Ltd.b,c | | | 161,085 | | | | 2,894,897 | |
| | | | | | | | |
Total Health Care | | | | | | | 38,321,380 | |
| | | | | | | | |
| | | | | | | | |
| | | | |
| matthewsasia.com | 800.789.ASIA | | | 69 | |
Matthews India Fund
June 30, 2020
Schedule of Investmentsa (unaudited) (continued)
COMMON EQUITIES (continued)
| | | | | | | | |
| | | Shares | | | Value | |
| | | | | | | | |
| | |
| INDUSTRIALS: 4.4% | | | | | | | | |
Machinery: 2.8% | | | | | | | | |
AIA Engineering, Ltd. | | | 309,580 | | | | $6,570,983 | |
| | |
Escorts, Ltd. | | | 436,073 | | | | 6,008,446 | |
| | |
Ashok Leyland, Ltd. | | | 4,533,453 | | | | 2,823,902 | |
| | | | | | | | |
| | | | | | | 15,403,331 | |
| | | | | | | | |
| | | | | | | | |
Air Freight & Logistics: 1.1% | | | | | | | | |
Blue Dart Express, Ltd. | | | 216,887 | | | | 5,856,750 | |
| | | | | | | | |
| | | | | | | | |
Airlines: 0.5% | | | | | | | | |
InterGlobe Aviation, Ltd.b,c | | | 209,796 | | | | 2,738,970 | |
| | | | | | | | |
Total Industrials | | | | | | | 23,999,051 | |
| | | | | | | | |
| | | | | | | | |
| | | |
| MATERIALS: 1.9% | | | | | | | | |
Construction Materials: 1.0% | | | | | | | | |
Ambuja Cements, Ltd. | | | 2,210,044 | | | | 5,665,967 | |
| | | | | | | | |
| | | | | | | | |
Metals & Mining: 0.6% | | | | | | | | |
NMDC, Ltd. | | | 2,844,621 | | | | 3,079,926 | |
| | | | | | | | |
| | | | | | | | |
Chemicals: 0.3% | | | | | | | | |
PI Industries, Ltd. | | | 79,797 | | | | 1,587,384 | |
| | | | | | | | |
Total Materials | | | | | | | 10,333,277 | |
| | | | | | | | |
| | | | | | | | |
| | |
| TOTAL INVESTMENTS: 96.6% | | | | 533,262,906 | |
(Cost $564,661,837) | | | | | | | | |
| | | | | | | | |
| | |
CASH AND OTHER ASSETS,
LESS LIABILITIES: 3.4% | | | | | | | 18,908,219 | |
| | | | | | | | |
| | |
NET ASSETS: 100.0% | | | | | | | $552,171,125 | |
| | | | | | | | |
| a | Certain securities were fair valued under the valuation policies approved by the Board of Trustees (Note 2-A). |
| b | Security exempt from registration under Rule 144A of the Securities Act of 1933, as amended. The security may be resold in transactions exempt from registration normally to qualified institutional buyers. The security has been determined to be liquid in accordance with procedures adopted by the Funds’ Board of Trustees. At June 30, 2020, the aggregate value is $52,753,588, which is 9.55% of net assets. |
| c | The securities may be resold to qualified foreign investors and foreign institutional buyers under Regulation S of the Securities Act of 1933. |
| d | Non-income producing security. |
See accompanying notes to financial statements.
| | | | |
PORTFOLIO MANAGERS |
| | |
| Taizo Ishida | | | | |
Lead Manager | | | | |
| | |
| Shuntaro Takeuchi | | | | |
Co-Manager | | | | |
|
| FUND FACTS |
| | |
| | | Investor | | Institutional |
Ticker | | MJFOX | | MIJFX |
CUSIP | �� | 577130800 | | 577130792 |
Inception | | 12/31/98 | | 10/29/10 |
NAV | | $21.52 | | $21.56 |
Initial Investment | | $2,500 | | $100,000 |
Gross Expense Ratio1 | | 0.93% | | 0.88% |
Portfolio Statistics | | | | |
Total # of Positions | | 47 |
Net Assets | | $1.5 billion |
Weighted Average Market Cap | | $34.5 billion |
Portfolio Turnover2 | | 25.42% |
Benchmark |
MSCI Japan Index |
OBJECTIVE
Long-term capital appreciation.
STRATEGY
Under normal market conditions, the Fund seeks to achieve its investment objective by investing at least 80% of its net assets, which include borrowings for investment purposes, in the common and preferred stocks of companies located in Japan.
Matthews Japan Fund
Portfolio Manager Commentary (unaudited)
For the first half of 2020, the Matthews Japan Fund returned 0.05% (Investor Class) and 0.05% (Institutional Class), while its benchmark, the MSCI Japan Index, returned –6.92% over the same period. For the quarter ending June 30, 2020, the Fund returned 18.18% (Investor Class) and 18.14% (Institutional Class), while its benchmark returned 11.64%.
Market Environment:
The first half of 2020 was turbulent for the economy and equity markets. In January and February, Japanese equities experienced steeper declines than those of other developed economies in anticipation of the global manufacturing cycle deteriorating to a recession territory. However, since March, Japan has been one of the strongest equity markets globally. The country experienced lower COVID 19 cases than other developed countries due to widespread adoption of masks and extensive contact tracing. Japanese corporates had strong cash positions to weather the economic downturn. Furthermore, while economic conditions remain weak globally, sentiment is improving.
Turning to monetary and fiscal policy, recent central bank actions and government spending bills offer ballast for Japan’s overall market and economy. The Bank of Japan, Japan’s central bank, announced plans to double its purchases of exchange-traded funds (ETFs). Reflecting monetary easing efforts around the globe, Japan’s central bank is committed to providing liquidity. The Japanese government has also passed a stimulus package that are one of the largest in terms of percentage of GDP, both headline numbers and direct spending.
Performance Contributors and Detractors:
On a relative basis, the Fund outperformed its benchmark in the first half of the year. Mega-cap and large-cap stocks (those over US$10 billion in market cap) outperformed small- and mid-cap stocks (those under US$10 billion) in the reporting period. Although small- and mid-size companies make up nearly half of the Fund’s portfolio, portfolio managers overcame the Fund’s underweight to mega caps via strong stock selection. From a sector perspective, information technology (IT) and industrials were contributors to performance. The consumer staples sector was a lone detractor to overall results.
Turning to individual securities, Lasertec, which makes photomask inspection equipment, contributed to overall performance in the first half. The company is currently the only provider of mask and mask-blank inspection equipment using EUV (extreme ultraviolet) as a light source. EUV adoption in major foundries and increased usage in memory makers is, in our view, likely to further enhance the business opportunity of the company. Property, casualty, and life insurance company Tokio Marine Holdings detracted from performance. Amid widening credit spreads, the firm announced no buybacks in the most recent fiscal year results. However, we continue to find the company’s long-term prospects attractive. We believe the company is well run and growing globally with solid bolt-on acquisitions.
Notable Portfolio Changes:
In the quarter ending June 30, 2020, we continued to take advantage of the market correction to enhance the quality of the portfolio, making several changes in the quarter and reducing our total number of portfolio holdings.
New positions include ERP software and service company OBIC. The company mainly serve medium-size businesses in Japan with a core software product called OBIC7. OBIC7 is a Microsoft SQL based ERP (enterprise resource planning) program that is component based (personnel, payroll, working hours management,
(continued)
| 1 | Prospectus expense ratios. |
| 2 | The lesser of fiscal year 2019 long-term purchase costs or sales proceeds divided by the average monthly market value of long-term securities. |
| | | | |
| matthewsasia.com | 800.789.ASIA | | | 71 | |
| | | | | | | | | | | | | | | | | | | | | | | | | | | | | | | | |
| | |
| PERFORMANCE AS OF JUNE 30, 2020 | | | | |
| | | | | | | | | Average Annual Total Returns | | | | |
| | | 3 Months | | | YTD | | | 1 Year | | | 3 Years | | | 5 Years | | | 10 Years | | | Since
Inception | | | Inception
Date | |
| Investor Class (MJFOX) | | | 18.18% | | | | 0.05% | | | | 10.88% | | | | 5.36% | | | | 5.86% | | | | 10.27% | | | | 6.07% | | | | 12/31/98 | |
| Institutional Class (MIJFX) | | | 18.14% | | | | 0.05% | | | | 10.92% | | | | 5.42% | | | | 5.94% | | | | n.a. | | | | 9.38% | | | | 10/29/10 | |
| MSCI Japan Index3 | | | 11.64% | | | | -6.92% | | | | 3.51% | | | | 3.34% | | | | 3.81% | | | | 6.39% | | | | 3.37% | 4 | | | | |
Performance assumes reinvestment of all dividends and/or distributions before taxes. All performance quoted represents past performance and is no guarantee of future results. Investment return and principal value will fluctuate with market conditions so that when redeemed, shares may be worth more or less than their original cost. Current performance may be lower or higher than the return figures quoted. For the Fund’s most recent month-end performance, visit matthewsasia.com.
GROWTH OF A HYPOTHETICAL $10,000 INVESTMENT SINCE INCEPTION—INVESTOR CLASS
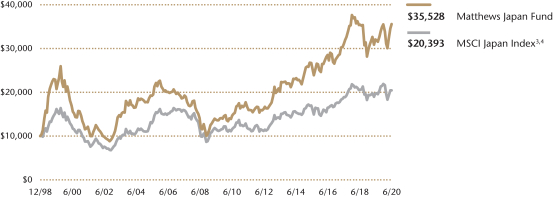
Plotted monthly. The performance data and graph do not reflect the deduction of taxes that a shareholder would pay on dividends, capital gains distributions or redemption of Fund shares. Values are in US$.
| | 3 | It is not possible to invest directly in an index. Source: Index data from Morgan Stanley Capital International and Bloomberg; total return calculations performed by BNY Mellon Investment Servicing (US) Inc. Please see page 90 for index definitions. |
| | 4 | Calculated from 12/31/98. |
| | | | | | | | |
| | | | |
| TOP TEN HOLDINGS5 | | | | | | | |
| | | Sector | | | | % of Net Assets | |
| Lasertec Corp. | | Information Technology | | | | | 4.6% | |
| ITOCHU Techno-Solutions Corp. | | Information Technology | | | | | 3.9% | |
| Daikin Industries, Ltd. | | Industrials | | | | | 3.8% | |
| Sony Corp. | | Consumer Discretionary | | | | | 3.8% | |
| Keyence Corp. | | Information Technology | | | | | 3.8% | |
| Nintendo Co., Ltd. | | Communication Services | | | | | 3.6% | |
| Shin-Etsu Chemical Co., Ltd. | | Materials | | | | | 3.4% | |
| Nippon Telegraph & Telephone Corp. | | Communication Services | | | | | 3.1% | |
| Nihon M&A Center, Inc. | | Industrials | | | | | 3.0% | |
| Nitori Holdings Co., Ltd. | | Consumer Discretionary | | | | | 2.9% | |
| % OF ASSETS IN TOP TEN | | | | | | | 35.9% | |
| | 5 | Holdings may combine more than one security from same issuer and related depositary receipts. |
Matthews Japan Fund
Portfolio Manager Commentary (unaudited) (continued)
marketing and production system) and configured by client base. The ongoing shift to cloud-based software is expanding the company’s growth opportunities.
We have also re-initiated a position in HOYA, a manufacturer of semiconductor mask blanks, optical lenses and endoscopes. We believe the firm may benefit from accelerating development of cutting-edge technology in the EUV area. To fund these positions, we exited several positions, including MUFG, Kyowa Exeo and Shimadzu.
Outlook:
Following the initial outbreak of the pandemic, economic conditions and the outlook for corporate profits were “less worse” than investors initially feared. The rally in global equity prices in the first half was driven by rising investor optimism, regardless of the absolute level of economic activity globally. Japanese equity prices shared in this sentiment-driven rally. Japanese equities are currently trading in a middle range of their long-term historical averages. Prospects for a strong recovery scenario are somewhat already reflected in share prices. In the near term, we expect to see a tug of war between the trajectory of COVID-19 infections globally and the magnitude of the government and central bank stimulus around the world.
In our view, Japanese equities are well positioned relative to other developed and emerging market peers because of their strong balance sheets. If the recovery of the economy becomes slower than expected by reacceleration in COVID-19 cases, Japanese corporates have some cushion available with high levels of cash reserves. Nearly half of Japanese listed companies are net cash. On the other hand, if COVID-19 case growth subside and we see faster recovery globally, Japanese corporate profits may benefit as well, as profits tend to rise when global manufacturing activity increases. Valuation levels are still at a discount to U.S. and European markets, both in PER and PBR basis.
From a structural point of view, we continue to believe the earnings capability of Japanese companies has improved meaningfully over the past economic cycle, driven by better corporate governance and a higher focus on capital efficiency. Multiyear trends such as productivity growth, health care, technology and material science innovation—where Japanese corporations excel versus global peers—remain intact. What’s more, we expect the pace of change to accelerate as COVID-19 continues to stress test health care systems and costs. The pandemic also highlights the need for greater labor productivity among white-collar jobs as more people work remotely. Against this backdrop, we are optimistic about opportunities for generating long-term alpha within Japanese equities.
| | | | |
| |
| COUNTRY ALLOCATION (%)6 | |
| Japan | | | 94.8 | |
Cash and Other Assets, Less Liabilities | | | 5.2 | |
| Total | | | 100.0 | |
| | | | |
| | |
| SECTOR ALLOCATION (%)6 | | | |
| Information Technology | | | 27.0 | |
| Health Care | | | 19.1 | |
| Consumer Discretionary | | | 14.9 | |
| Industrials | | | 14.1 | |
| Communication Services | | | 9.6 | |
| Financials | | | 5.3 | |
| Materials | | | 3.4 | |
| Consumer Staples | | | 1.5 | |
Cash and Other Assets, Less Liabilities | | | 5.2 | |
| Total | | | 100.1 | |
| | | | |
| | |
| MARKET CAP EXPOSURE (%)6 | | | |
| Mega Cap (over $25B) | | | 48.4 | |
| Large Cap ($10B–$25B) | | | 17.2 | |
| Mid Cap ($3B–10B) | | | 21.5 | |
| Small Cap (under $3B) | | | 7.8 | |
| Cash and Other Assets, Less Liabilities | | | 5.2 | |
| 6 | Source: FactSet Research Systems. Percentage values in data are rounded to the nearest tenth of one percent, so the values may not sum to 100% due to rounding. Percentage values may be derived from different data sources and may not be consistent with other Fund literature. |
| | | | |
| matthewsasia.com | 800.789.ASIA | | | 73 | |
Matthews Japan Fund
June 30, 2020
Schedule of Investmentsa (unaudited)
COMMON EQUITIES: 94.8%
| | | | | | | | |
| | | Shares | | | Value | |
| | | | | | | | |
| | |
| INFORMATION TECHNOLOGY: 27.0% | | | | | | | | |
Electronic Equipment, Instruments & Components: 10.7% | |
Keyence Corp. | | | 132,200 | | | | $55,399,936 | |
| | |
TDK Corp. | | | 428,400 | | | | 42,647,832 | |
| | |
Murata Manufacturing Co., Ltd. | | | 627,100 | | | | 36,966,607 | |
| | |
Ibiden Co., Ltd. | | | 753,000 | | | | 22,040,206 | |
| | | | | | | | |
| | | | | | | 157,054,581 | |
| | | | | | | | |
| | | | | | | | |
Semiconductors & Semiconductor Equipment: 6.6% | |
Lasertec Corp. | | | 708,500 | | | | 66,974,915 | |
| | |
Disco Corp. | | | 121,700 | | | | 29,681,251 | |
| | | | | | | | |
| | | | | | | 96,656,166 | |
| | | | | | | | |
| | | | | | | | |
IT Services: 5.8% | | | | | | | | |
ITOCHU Techno-Solutions Corp. | | | 1,540,300 | | | | 57,925,767 | |
| | |
OBIC Co., Ltd. | | | 128,300 | | | | 22,611,462 | |
| | |
Hennge KKb | | | 118,100 | | | | 5,346,222 | |
| | | | | | | | |
| | | | | | | 85,883,451 | |
| | | | | | | | |
| | | | | | | | |
Software: 2.4% | | | | | | | | |
Sansan, Inc.b | | | 360,000 | | | | 13,817,875 | |
| | |
Freee KKb | | | 152,600 | | | | 6,946,272 | |
| | |
Infomart Corp. | | | 783,700 | | | | 5,423,881 | |
| | |
Oracle Corp. Japan | | | 42,400 | | | | 5,029,177 | |
| | |
Kaonavi, Inc.b | | | 97,100 | | | | 3,969,833 | |
| | | | | | | | |
| | | | | | | 35,187,038 | |
| | | | | | | | |
| | | | | | | | |
Technology Hardware, Storage & Peripherals: 1.5% | |
FUJIFILM Holdings Corp. | | | 511,900 | | | | 21,910,196 | |
| | | | | | | | |
Total Information Technology | | | | | | | 396,691,432 | |
| | | | | | | | |
| | | | | | | | |
| | | |
| HEALTH CARE: 19.1% | | | | | | | | |
Health Care Equipment & Supplies: 7.1% | | | | | | | | |
Terumo Corp. | | | 1,050,700 | | | | 39,992,558 | |
| | |
Hoya Corp. | | | 385,200 | | | | 36,886,365 | |
| | |
Asahi Intecc Co., Ltd. | | | 981,400 | | | | 28,009,504 | |
| | | | | | | | |
| | | | | | | 104,888,427 | |
| | | | | | | | |
| | | | | | | | |
Pharmaceuticals: 6.7% | | | | | | | | |
Takeda Pharmaceutical Co., Ltd. | | | 1,016,300 | | | | 36,513,594 | |
| | |
Santen Pharmaceutical Co., Ltd. | | | 1,459,900 | | | | 26,875,970 | |
| | |
Eisai Co., Ltd. | | | 298,700 | | | | 23,731,397 | |
| | |
Shionogi & Co., Ltd. | | | 174,800 | | | | 10,965,795 | |
| | | | | | | | |
| | | | | | | 98,086,756 | |
| | | | | | | | |
| | | | | | | | |
Biotechnology: 2.8% | | | | | | | | |
PeptiDream, Inc.b | | | 880,300 | | | | 40,560,237 | |
| | | | | | | | |
| | | | | | | | |
Health Care Technology: 2.5% | | | | | | | | |
M3, Inc. | | | 879,100 | | | | 37,345,165 | |
| | | | | | | | |
Total Health Care | | | | | | | 280,880,585 | |
| | | | | | | | |
| | | | | | | | |
| | | |
| CONSUMER DISCRETIONARY: 14.9% | | | | | | | | |
Specialty Retail: 6.5% | | | | | |
Nitori Holdings Co., Ltd. | | | 220,600 | | | | 43,252,837 | |
| | |
Fast Retailing Co., Ltd. | | | 52,000 | | | | 29,888,141 | |
| | |
Hikari Tsushin, Inc. | | | 98,300 | | | | 22,476,119 | |
| | | | | | | | |
| | | | | | | 95,617,097 | |
| | | | | | | | |
| | | | | | | | |
| | | | | | | | |
| | | Shares | | | Value | |
| | | | | | | | |
Household Durables: 3.8% | | | | | | | | |
Sony Corp. | | | 808,300 | | | | $55,797,094 | |
| | | | | | | | |
| | | | | | | | |
Multiline Retail: 1.7% | | | | | | | | |
Pan Pacific International Holdings Corp. | | | 1,116,700 | | | | 24,586,041 | |
| | | | | | | | |
| | | | | | | | |
Leisure Products: 1.5% | | | | | | | | |
Bandai Namco Holdings, Inc. | | | 407,700 | | | | 21,460,542 | |
| | | | | | | | |
| | | | | | | | |
Hotels, Restaurants & Leisure: 1.1% | | | | | | | | |
Kyoritsu Maintenance Co., Ltd. | | | 488,500 | | | | 16,711,886 | |
| | | | | | | | |
| | | | | | | | |
Distributors: 0.3% | | | | | | | | |
PALTAC Corp. | | | 93,800 | | | | 4,327,306 | |
| | | | | | | | |
Total Consumer Discretionary | | | | | | | 218,499,966 | |
| | | | | | | | |
| | | | | | | | |
| | | |
| INDUSTRIALS: 14.1% | | | | | | | | |
Professional Services: 6.8% | | | | | | | | |
| | |
Nihon M&A Center, Inc. | | | 953,700 | | | | 43,372,345 | |
| | |
SMS Co., Ltd. | | | 1,151,800 | | | | 25,919,562 | |
| | |
Recruit Holdings Co., Ltd. | | | 639,800 | | | | 22,002,850 | |
| | |
TechnoPro Holdings, Inc. | | | 152,600 | | | | 8,809,534 | |
| | | | | | | | |
| | | | | | | 100,104,291 | |
| | | | | | | | |
| | | | | | | | |
Building Products: 3.8% | | | | | | | | |
Daikin Industries, Ltd. | | | 347,700 | | | | 56,257,866 | |
| | | | | | | | |
| | | | | | | | |
Machinery: 2.8% | | | | | | | | |
SMC Corp. | | | 80,400 | | | | 41,319,252 | |
| | | | | | | | |
| | | | | | | | |
Electrical Equipment: 0.7% | | | | | | | | |
Nidec Corp. | | | 139,400 | | | | 9,391,209 | |
| | | | | | | | |
Total Industrials | | | | | | | 207,072,618 | |
| | | | | | | | |
| | | | | | | | |
| | | |
| COMMUNICATION SERVICES: 9.6% | | | | | | | | |
Entertainment: 3.6% | | | | | | | | |
Nintendo Co., Ltd. | | | 119,700 | | | | 53,514,142 | |
| | | | | | | | |
| | | | | | | | |
Diversified Telecommunication Services: 3.1% | | | | | |
Nippon Telegraph & Telephone Corp. | | | 1,956,900 | | | | 45,594,698 | |
| | | | | | | | |
| | | | | | | | |
Wireless Telecommunication Services: 2.9% | | | | | |
SoftBank Group Corp. | | | 835,700 | | | | 42,142,404 | |
| | | | | | | | |
Total Communication Services | | | | | | | 141,251,244 | |
| | | | | | | | |
| | | | | | | | |
| | | |
| FINANCIALS: 5.3% | | | | | | | | |
Insurance: 3.7% | | | | | | | | |
| | |
Tokio Marine Holdings, Inc. | | | 929,800 | | | | 40,700,162 | |
| | |
Dai-ichi Life Holdings, Inc. | | | 1,164,700 | | | | 13,941,460 | |
| | | | | | | | |
| | | | | | | 54,641,622 | |
| | | | | | | | |
| | | | | | | | |
Diversified Financial Services: 1.6% | | | | | | | | |
eGuarantee, Inc. | | | 952,300 | | | | 22,602,302 | |
| | | | | | | | |
Total Financials | | | | | | | 77,243,924 | |
| | | | | | | | |
| | | | | | | | |
| | | |
| MATERIALS: 3.3% | | | | | | | | |
Chemicals: 3.3% | | | | | | | | |
Shin-Etsu Chemical Co., Ltd. | | | 419,800 | | | | 49,268,367 | |
| | | | | | | | |
Total Materials | | | | | | | 49,268,367 | |
| | | | | | | | |
| | | | | | | | |
Matthews Japan Fund
June 30, 2020
Schedule of Investmentsa (unaudited) (continued)
COMMON EQUITIES (continued)
| | | | | | | | |
| | | Shares | | | Value | |
| | | | | | | | |
| | |
| CONSUMER STAPLES: 1.5% | | | | | | | | |
Personal Products: 1.5% | | | | | | | | |
Kao Corp. | | | 279,000 | | | | $22,140,831 | |
| | | | | | | | |
Total Consumer Staples | | | | | | | 22,140,831 | |
| | | | | | | | |
| | | | | | | | |
| | | |
| TOTAL INVESTMENTS: 94.8% | | | | | | | 1,393,048,967 | |
(Cost $1,112,170,226) | | | | | | | | |
| | | | | | | | |
| | |
CASH AND OTHER ASSETS,
LESS LIABILITIES: 5.2% | | | | | | | 75,868,088 | |
| | | | | | | | |
| | |
NET ASSETS: 100.0% | | | | | | | $1,468,917,055 | |
| | | | | | | | |
| a | Certain securities were fair valued under the valuation policies approved by the Board of Trustees (Note 2-A). |
| b | Non-income producing security. |
See accompanying notes to financial statements.
| | | | |
| matthewsasia.com | 800.789.ASIA | | | 75 | |
| | | | |
| PORTFOLIO MANAGERS |
| |
| Michael J. Oh, CFA | | |
Lead Manager | | | | |
| |
| Elli Lee | | |
Co-Manager | | | | |
|
| FUND FACTS |
| | |
| | | Investor | | Institutional |
Ticker | | MAKOX | | MIKOX |
CUSIP | | 577130305 | | 577130826 |
Inception | | 1/3/95 | | 10/29/10 |
NAV | | $4.20 | | $4.23 |
Initial Investment | | $2,500 | | $100,000 |
Gross Expense Ratio1 | | 1.15% | | 1.05% |
Portfolio Statistics |
Total # of Positions | | 32 |
Net Assets | | $113.1 million |
Weighted Average
Market Cap | | $77.8 billion |
Portfolio Turnover2 | | 36.63% |
Benchmark |
Korea Composite Stock Price Index |
OBJECTIVE
Long-term capital appreciation.
STRATEGY
Under normal market conditions, the Fund seeks to achieve its investment objective by investing at least 80% of its net assets, which include borrowings for investment purposes, in the common and preferred stocks of companies located in South Korea.
Matthews Korea Fund
Portfolio Manager Commentary (unaudited)
For the first half of 2020, the Matthews Korea Fund returned –4.11% (Investor Class) and –4.30% (Institutional Class), while its benchmark, the Korea Composite Stock Price Index, returned –7.33% over the same period. For the quarter ending June 30, 2020, the Matthews Korea Fund returned 23.53% (Investor Class) and 23.32% (Institutional Class), while the benchmark returned 21.95%.
Market Environment:
Following a drop in the first quarter, South Korean equities began to recover in the second quarter. Looking back to the beginning of 2020, early optimism surrounding the U.S.—China trade resolution faded quickly as investors weighed potential negative spillover of the coronavirus into slower trade, tourism and global demand. So far, the economic slowdown has been relatively mild, and external demand-driven weakness seems to be fading. Countries which are thought to be linked to the global economy, like South Korea, are beginning to recover as major economies gradually reopen.
Performance Contributors and Detractors:
The Fund outperformed its benchmark in the first half, primarily due to strong selection in the information technology (IT) and communication services sectors. Among individual securities, Leeno Industrial Inc., which develops and manufactures testing socket and pin used in the semiconductor industry, was a contributor in the first half. In addition, Leeno is successfully expanding its exposure to the health care industry with higher profitability. In the communication services sector, Kakao, which operates a dominant mobile messaging app, was also a contributor. With COVID-19, Kakao’s presence has been growing even bigger in daily life of users. Kakao’s profitability is improving meaningfully as the company starts monetizing its advertising capabilities and moving into e-commerce. In addition, it is expanding its fintech arm, Kakao Pay, more aggressively.
Detractors in the first half included stock selection in health care and a slight overweight to consumer discretionary. Share prices of Interojo, a vision care manufacturer and wholesaler, declined in the first half. We exited the position as we saw higher-than-expected competition environment globally. Hyundai Mobis was also a detractor. Hyundai Mobis is the core parts and after service arm of the Hyundai Group. As the global automotive industry is seeing not only demand disruption, but also production and supply chain disruption, automotive stocks share prices were weak. While we are closely monitoring the Group’s cash flow and liquidity, we believe our automotive holdings have the potential to emerge stronger than global peers over the long term with improving product cycles and its stronger position in new energy vehicle opportunity.
Notable Portfolio Changes:
During the second quarter, we initiated a position in drug maker SK Biopharmaceuticals Co Ltd, which develops treatments for epilepsy and central nervous system disorders with superior efficacy vs. existing players. It received both FDA and marketing approval in U.S. for a new product. In addition, we exited Interojo Co Ltd.
Outlook:
South Korea has a few potential tailwinds going into the second half of 2020. The country’s health care infrastructure and resources are adequate to reduce the impact of a potential second wave of COVID-19. In addition, the country’s external vulnerability and financing risks are low. Korea’s valuations are one of the regions’
(continued)
| 1 | Prospectus expense ratios. |
| 2 | The lesser of fiscal year 2019 long-term purchase costs or sales proceeds divided by the average monthly market value of long-term securities. |
| | | | | | | | | | | | | | | | | | | | | | | | | | | | | | | | |
| | | | | | | | | |
| PERFORMANCE AS OF JUNE 30, 2020 | | | | | | | | | | | | | | | | | | | | | | | | |
| | | | | | | | | | | | Average Annual Total Returns | | | | |
| | | 3 Months | | | YTD | | | 1 Year | | | 3 Years | | | 5 Years | | | 10 Years | | | Since
Inception | | | Inception
Date | |
| Investor Class (MAKOX) | | | 23.53% | | | | -4.11% | | | | 0.41% | | | | -4.28% | | | | 0.73% | | | | 6.83% | | | | 5.33% | | | | 01/03/95 | |
| Institutional Class (MIKOX) | | | 23.32% | | | | -4.30% | | | | 0.19% | | | | -4.23% | | | | 0.81% | | | | n.a. | | | | 5.45% | | | | 10/29/10 | |
| Korea Composite Stock Price Index3 | | | 21.95% | | | | -7.33% | | | | -2.69% | | | | -3.72% | | | | 0.84% | | | | 4.03% | | | | 2.78% | 4 | | | | |
Performance assumes reinvestment of all dividends and/or distributions before taxes. All performance quoted represents past performance and is no guarantee of future results. Investment return and principal value will fluctuate with market conditions so that when redeemed, shares may be worth more or less than their original cost. Current performance may be lower or higher than the return figures quoted. For the Fund’s most recent month-end performance, visit matthewsasia.com.
GROWTH OF A HYPOTHETICAL $10,000 INVESTMENT SINCE INCEPTION—INVESTOR CLASS
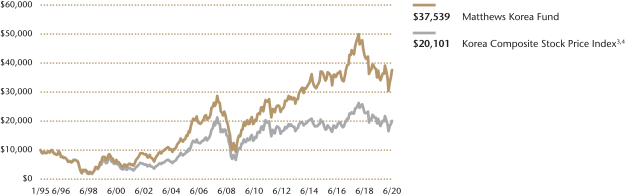
Plotted monthly. The performance data and graph do not reflect the deduction of taxes that a shareholder would pay on dividends, capital gains distributions or redemption of Fund shares. Values are in US$.
| | 3 | Korea Composite Stock Price Index performance data may be readjusted periodically by the Korea Exchange due to certain factors, including the declaration of dividends. It is not possible to invest directly in an index. Source: Index data from Korea Composite Stock Price Index and Bloomberg; total return calculations performed by BNY Mellon Investment Servicing (US) Inc. Please see page 90 for index definition. |
| | | | | | | | |
| | | | |
| TOP TEN HOLDINGS5 | | | | | | | |
| | | Sector | | | | % of Net Assets | |
| Samsung Electronics Co., Ltd., Pfd. | | Information Technology | | | | | 15.6% | |
| Samsung Electronics Co., Ltd. | | Information Technology | | | | | 6.5% | |
| Orion Corp. | | Consumer Staples | | | | | 5.9% | |
| NAVER Corp. | | Communication Services | | | | | 5.3% | |
| Kakao Corp. | | Communication Services | | | | | 5.0% | |
| SK Hynix, Inc. | | Information Technology | | | | | 4.8% | |
| LG Household & Health Care, Ltd., Pfd. | | Consumer Staples | | | | | 4.7% | |
| Hyundai Mobis Co., Ltd. | | Consumer Discretionary | | | | | 4.5% | |
| Shinhan Financial Group Co., Ltd. | | Financials | | | | | 3.8% | |
| LG Chem, Ltd., Pfd. | | Materials | | | | | 3.6% | |
| % OF ASSETS IN TOP TEN | | | | | | | 59.7% | |
| | 5 | Holdings may combine more than one security from same issuer and related depositary receipts. |
| | | | |
| matthewsasia.com | 800.789.ASIA | | | 77 | |
| | | | |
| |
| COUNTRY ALLOCATION (%)6 | |
| South Korea | | | 98.5 | |
Cash and Other Assets, Less Liabilities | | | 1.5 | |
| Total | | | 100.0 | |
| | | | |
| |
| SECTOR ALLOCATION (%)6 | |
| Information Technology | | | 34.3 | |
| Consumer Staples | | | 16.9 | |
| Communication Services | | | 13.8 | |
| Consumer Discretionary | | | 12.2 | |
| Financials | | | 7.4 | |
| Health Care | | | 7.0 | |
| Materials | | | 3.6 | |
| Real Estate | | | 1.3 | |
| Energy | | | 1.1 | |
| Industrials | | | 1.0 | |
| Cash and Other Assets, Less Liabilities | | | 1.5 | |
| Total | | | 100.1 | |
| | | | |
| |
| MARKET CAP EXPOSURE (%)6 | |
| Mega Cap (over $25B) | | | 39.3 | |
| Large Cap ($10B–$25B) | | | 24.4 | |
| Mid Cap ($3B–10B) | | | 11.1 | |
| Small Cap (under $3B) | | | 23.4 | |
| Unassigned | | | 0.2 | |
| Cash and Other Assets, Less Liabilities | | | 1.5 | |
| 6 | Source: FactSet Research Systems. Percentage values in data are rounded to the nearest tenth of one percent, so the values may not sum to 100% due to rounding. Percentage values may be derived from different data sources and may not be consistent with other Fund literature. |
Matthews Korea Fund
Portfolio Manager Commentary (unaudited) (continued)
most attractive and the prospect of earnings growth from a very low base is a good possibility, especially if its influential neighbor, China, continues to recover.
We continue to look for companies with strong structural growth potential—those that can grow organically without the assistance of strong macroeconomic tailwinds. Our portfolio includes companies that can drive and benefit from structural changes in consumption within Korea, as well as those companies headquartered in Korea that are effectively competing and innovating in global markets. Over the longer term, we expect innovative companies to continue to provide attractive growth opportunities.
Matthews Korea Fund
June 30, 2020
Schedule of Investmentsa (unaudited)
COMMON EQUITIES: 68.9%
| | | | | | | | |
| | | Shares | | | Value | |
| | | | | | | | |
| | |
| INFORMATION TECHNOLOGY: 18.7% | | | | | | | | |
Semiconductors & Semiconductor Equipment: 9.0% | | | | | |
SK Hynix, Inc. | | | 76,482 | | | | $5,460,701 | |
| | |
Koh Young Technology, Inc. | | | 31,363 | | | | 2,621,263 | |
| | |
LEENO Industrial, Inc. | | | 22,205 | | | | 2,102,233 | |
| | | | | | | | |
| | | | | | | 10,184,197 | |
| | | | | | | | |
| | | | | | | | |
Technology Hardware, Storage & Peripherals: 6.5% | | | | | |
Samsung Electronics Co., Ltd. | | | 165,299 | | | | 7,317,395 | |
| | | | | | | | |
| | | | | | | | |
Electronic Equipment, Instruments & Components: 3.2% | |
Samsung SDI Co., Ltd. | | | 11,831 | | | | 3,617,466 | |
| | | | | | | | |
Total Information Technology | | | | | | | 21,119,058 | |
| | | | | | | | |
| | | | | | | | |
| | | |
| COMMUNICATION SERVICES: 13.8% | | | | | | | | |
Interactive Media & Services: 12.1% | | | | | | | | |
NAVER Corp. | | | 26,805 | | | | 6,030,677 | |
| | |
Kakao Corp. | | | 25,446 | | | | 5,710,149 | |
| | |
AfreecaTV Co., Ltd. | | | 36,089 | | | | 1,914,104 | |
| | | | | | | | |
| | | | | | | 13,654,930 | |
| | | | | | | | |
| | | | | | | | |
Entertainment: 1.7% | | | | | | | | |
NCSoft Corp. | | | 2,652 | | | | 1,972,895 | |
| | | | | | | | |
Total Communication Services | | | | | | | 15,627,825 | |
| | | | | | | | |
| | | | | | | | |
| | | |
| CONSUMER STAPLES: 11.2% | | | | | | | | |
Food Products: 7.1% | | | | | | | | |
Orion Corp. | | | 59,138 | | | | 6,620,489 | |
Maeil Dairies Co., Ltd. | | | 20,959 | | | | 1,387,363 | |
| | | | | | | | |
| | | | | | | 8,007,852 | |
| | | | | | | | |
| | | | | | | | |
Tobacco: 2.1% | | | | | | | | |
KT&G Corp. | | | 36,592 | | | | 2,389,692 | |
| | | | | | | | |
| | | | | | | | |
Food & Staples Retailing: 2.0% | | | | | | | | |
BGF Retail Co., Ltd. | | | 19,377 | | | | 2,246,139 | |
| | | | | | | | |
Total Consumer Staples | | | | | | | 12,643,683 | |
| | | | | | | | |
| | | | | | | | |
| | | |
| CONSUMER DISCRETIONARY: 8.6% | | | | | | | | |
Auto Components: 5.4% | | | | | | | | |
Hyundai Mobis Co., Ltd. | | | 31,393 | | | | 5,039,179 | |
| | |
Hanon Systems | | | 144,824 | | | | 1,097,579 | |
| | | | | | | | |
| | | | | | | 6,136,758 | |
| | | | | | | | |
| | | | | | | | |
Household Durables: 1.7% | | | | | | | | |
Lock&Lock Co., Ltd.b | | | 200,694 | | | | 1,886,676 | |
| | | | | | | | |
| | | | | | | | |
Automobiles: 1.5% | | | | | | | | |
Kia Motors Corp. | | | 64,400 | | | | 1,740,254 | |
| | | | | | | | |
Total Consumer Discretionary | | | | | | | 9,763,688 | |
| | | | | | | | |
| | | | | | | | |
| | | |
| FINANCIALS: 7.4% | | | | | | | | |
Banks: 3.8% | | | | | | | | |
Shinhan Financial Group Co., Ltd. | | | 176,755 | | | | 4,271,499 | |
| | | | | | | | |
| | | | | | | | |
Capital Markets: 3.6% | | | | | | | | |
Shinyoung Securities Co., Ltd. | | | 67,629 | | | | 2,402,824 | |
| | |
Kiwoom Securities Co., Ltd. | | | 22,615 | | | | 1,653,416 | |
| | | | | | | | |
| | | | | | | 4,056,240 | |
| | | | | | | | |
Total Financials | | | | | | | 8,327,739 | |
| | | | | | | | |
| | | | | | | | |
| | | | | | | | |
| | | Shares | | | Value | |
| | | | | | | | |
| | |
| HEALTH CARE: 7.0% | | | | | | | | |
Pharmaceuticals: 4.5% | | | | | | | | |
Yuhan Corp. | | | 68,150 | | | | $2,887,247 | |
| | |
DongKook Pharmaceutical Co., Ltd. | | | 20,571 | | | | 2,076,059 | |
| | |
SK Biopharmaceuticals Co., Ltd.b | | | 4,668 | | | | 190,158 | |
| | | | | | | | |
| | | | | | | 5,153,464 | |
| | | | | | | | |
| | | | | | | | |
Biotechnology: 2.5% | | | | | | | | |
Hugel, Inc.b | | | 7,075 | | | | 2,784,785 | |
| | | | | | | | |
Total Health Care | | | | | | | 7,938,249 | |
| | | | | | | | |
| | | | | | | | |
| | | |
| REAL ESTATE: 1.3% | | | | | | | | |
Equity REITs: 1.3% | | | | | | | | |
LOTTE Reit Co., Ltd., REIT | | | 317,568 | | | | 1,462,296 | |
| | | | | | | | |
Total Real Estate | | | | | | | 1,462,296 | |
| | | | | | | | |
| | | | | | | | |
| | | |
| INDUSTRIALS: 0.9% | | | | | | | | |
Machinery: 0.9% | | | | | | | | |
SFA Engineering Corp. | | | 39,632 | | | | 1,084,311 | |
| | | | | | | | |
Total Industrials | | | | | | | 1,084,311 | |
| | | | | | | | |
| | | | | | | | |
| | | |
| TOTAL COMMON EQUITIES | | | | | | | 77,966,849 | |
| | | | | | | | |
(Cost $71,409,395) | | | | | | | | |
| | | | | | | | |
| |
PREFERRED EQUITIES: 29.6% | | | | | |
| | | |
| INFORMATION TECHNOLOGY: 15.6% | | | | | | | | |
Technology Hardware, Storage & Peripherals: 15.6% | | | | | |
Samsung Electronics Co., Ltd., Pfd. | | | 452,443 | | | | 17,624,602 | |
| | | | | | | | |
Total Information Technology | | | | | | | 17,624,602 | |
| | | | | | | | |
| | | | | | | | |
| | | |
| CONSUMER STAPLES: 5.7% | | | | | | | | |
Personal Products: 5.7% | | | | | | | | |
LG Household & Health Care, Ltd., Pfd. | | | 8,754 | | | | 5,303,244 | |
| | |
Amorepacific Corp., Pfd. | | | 20,064 | | | | 1,195,161 | |
| | | | | | | | |
Total Consumer Staples | | | | | | | 6,498,405 | |
| | | | | | | | |
| | | | | | | | |
| | | |
| MATERIALS: 3.6% | | | | | | | | |
Chemicals: 3.6% | | | | | | | | |
LG Chem, Ltd., Pfd. | | | 19,241 | | | | 4,048,024 | |
| | | | | | | | |
Total Materials | | | | | | | 4,048,024 | |
| | | | | | | | |
| | | | | | | | |
| | | |
| CONSUMER DISCRETIONARY: 3.6% | | | | | | | | |
Automobiles: 3.6% | | | | | | | | |
Hyundai Motor Co., Ltd., Pfd. | | | 86,680 | | | | 4,012,876 | |
| | | | | | | | |
Total Consumer Discretionary | | | | | | | 4,012,876 | |
| | | | | | | | |
| | | | | | | | |
| | | | |
| matthewsasia.com | 800.789.ASIA | | | 79 | |
Matthews Korea Fund
June 30, 2020
Schedule of Investmentsa (unaudited) (continued)
PREFERRED EQUITIES (continued)
| | | | | | | | |
| | | Shares | | | Value | |
| | | | | | | | |
| | |
| ENERGY: 1.1% | | | | | | | | |
Oil, Gas & Consumable Fuels: 1.1% | | | | | | | | |
S-Oil Corp., Pfd. | | | 40,100 | | | | $1,253,389 | |
| | | | | | | | |
Total Energy | | | | | | | 1,253,389 | |
| | | | | | | | |
| | | | | | | | |
| | | |
| TOTAL PREFERRED EQUITIES | | | | | | | 33,437,296 | |
| | | | | | | | |
(Cost $26,025,327) | | | | | | | | |
| | | | | | | | |
| | | |
| TOTAL INVESTMENTS: 98.5% | | | | | | | 111,404,145 | |
(Cost $97,434,722) | | | | | | | | |
| | | | | | | | |
| | |
CASH AND OTHER ASSETS,
LESS LIABILITIES: 1.5% | | | | | | | 1,712,878 | |
| | | | | | | | |
| | |
NET ASSETS: 100.0% | | | | | | | $113,117,023 | |
| | | | | | | | |
| a | Certain securities were fair valued under the valuation policies approved by the Board of Trustees (Note 2-A). |
| b | Non-income producing security. Pfd. Preferred |
| REIT | Real Estate Investment Trust |
See accompanying notes to financial statements.

| | | | |
| PORTFOLIO MANAGERS* |
| |
| Vivek Tanneeru | | |
| Lead Manager | | |
|
* As of August 31, 2020 |
|
| FUND FACTS |
| | |
| | | Investor | | Institutional |
Ticker | | MSMLX | | MISMX |
CUSIP | | 577125206 | | 577125867 |
Inception | | 9/15/08 | | 4/30/13 |
NAV | | $19.93 | | $19.90 |
Initial Investment | | $2,500 | | $100,000 |
Gross Expense Ratio1 | | 1.60% | | 1.46% |
After Fee Waiver and Reimbursement2 | | 1.41% | | 1.20% |
Portfolio Statistics | | |
Total # of Positions | | 63 |
Net Assets | | $171.7 million |
Weighted Average
Market Cap | | $3.6 billion |
Portfolio Turnover3 | | 59.10% |
Benchmark | | |
MSCI AC Asia ex Japan Small Cap Index |
OBJECTIVE
Long-term capital appreciation.
STRATEGY
Under normal market conditions, the Fund seeks to achieve its investment objective by investing at least 80% of its net assets, which include borrowings for investment purposes, in the common and preferred stocks of Small Companies located in Asia ex Japan, which consists of all countries and markets in Asia excluding Japan, but including all other developed, emerging and frontier countries and markets in the Asian region. The Fund defines Small Companies as companies with market capitalization no higher than the greater of $5 billion or the market capitalization of the largest company included in the Fund’s primary benchmark, the MSCI All Country Asia ex Japan Small Cap Index.
Matthews Asia Small Companies Fund
Portfolio Manager Commentary (unaudited)
For the first half of 2020, the Matthews Asia Small Companies Fund returned 10.11% (Investor Class) and 10.19% (Institutional Class), while its benchmark, the MSCI All Country Asia ex Japan Small Cap Index, returned –6.45%. For the quarter ending June 30, 2020, the Fund returned 37.26% (Investor Class) and 37.34% (Institutional Class), outperforming its benchmark, which returned 26.28%.
Market Environment:
The COVID-19 coronavirus pandemic continued to deeply affect global communities during the second quarter of 2020. Asian countries acted swiftly to contain the virus with varying degrees of success. The impact on Asia has been twofold: the impact on local economic activity due to lock-downs and social distancing and the impact on exports to non-Asian countries, where demands for goods have dropped as well due to the virus. We see the impact on the company earnings across the region with China, South Korea and Taiwan being the most resilient while harder hit economies suffered, such as Indonesia, the Philippines and Thailand.
China has been a resilient market year to date due to its strong measures to contain the virus and its domestic consumption engine that is nimble enough to shift from physical to virtual within months. Taiwan and South Korea continued to benefit from a supply chain reshuffling in Asia driven by ongoing trade tensions between the U.S. and China. During the first quarter, harsher impact on Southeast Asian and Indian equity markets have been more pronounced as these economies could no longer rely on tourism as global travel comes to a halt and worries about currency volatility. However, these markets recovered partially into the second quarter from the first quarter’s oversold levels due to central bank interventions to maintain global liquidity.
Performance Contributors and Detractors:
Stock selections in China/Hong Kong contributed to the portfolio’s relative outperformance over the benchmark during the second quarter. Among individual securities, Silergy Corp., one of China’s largest analog semiconductor companies and Kingdee International, a Chinese enterprise software provider registered strong positive performance. On the other hand, DCB Bank in India was a detractor, where the financial sector was particularly hard hit after COVID-19 lockdowns. From a sector perspective, there were no detractors during the quarter. The top sector performers were in information technology, health care and real estate. As earnings in these sectors have been more resilient overall, their share prices have performed better as well.
Notable Portfolio Changes:
In the second quarter, we rotated capital within the portfolio. We exited DCB Bank in India in the quarter due to lack of visibility on the asset quality post the COVID pandemic and social platform JOYY Inc., a Chinese social media platform operator, due to valuations. We initiated a few new positions in China and South Korea during the quarter to capture next generation innovators. The portfolio’s exposure in Southeast Asia was also reduced due to concerns over prolonged earnings
(continued)
| 1 | Prospectus expense ratios. |
| 2 | Matthews has contractually agreed (i) to waive fees and reimburse expenses to the extent needed to limit Total Annual Fund Operating Expenses (excluding Rule 12b-1 fees, taxes, interest, brokerage commissions, short sale dividend expenses, expenses incurred in connection with any merger or reorganization or extraordinary expenses such as litigation) of the Institutional Class to 1.20% first by waiving class specific expenses (i.e., shareholder service fees specific to a particular class) of the Institutional Class and then, to the extent necessary, by waiving non-class specific expenses (e.g., custody fees) of the Institutional Class, and (ii) if any Fund-wide expenses (i.e., expenses that apply to both the Institutional Class and the Investor Class) are waived for the Institutional Class to maintain the 1.20% expense limitation, to waive an equal amount (in annual percentage terms) of those same expenses for the Investor Class. The Total Annual Fund Operating Expenses After Fee Waiver and Expense Reimbursement for the Investor Class may vary from year to year and will in some years exceed 1.20%. If the operating expenses fall below the expense limitation in a year within three years after Matthews has made a waiver or reimbursement, the Fund may reimburse Matthews up to an amount that does not cause the expenses for that year to exceed the lesser of (i) the expense limitation applicable at the time of that fee waiver and/or expense reimbursement or (ii) the expense limitation in effect at the time of recoupment. This agreement will remain in place until April 30, 2021 and may be terminated at any time by the Board of Trustees on behalf of the Fund on 60 days’ written notice to Matthews. Matthews may decline to renew this agreement by written notice to the Trust at least 30 days before its annual expiration date. |
| 3 | The lesser of fiscal year 2019 long-term purchase costs or sales proceeds divided by the average monthly market value of long-term securities. |
| | | | |
| matthewsasia.com | 800.789.ASIA | | | 81 | |
| | | | | | | | | | | | | | | | | | | | | | | | | | | | | | | | |
| | | | | | | | | |
| PERFORMANCE AS OF JUNE 30, 2020 | | | | | | | | | | | | | | | | | | | | | | | | |
| | | | | | | | | Average Annual Total Returns | | | | |
| | | 3 Months | | | YTD | | | 1 Year | | | 3 Years | | | 5 Years | | | 10 Years | | | Since
Inception | | | Inception
Date | |
| Investor Class (MSMLX) | | | 37.26% | | | | 10.11% | | | | 14.74% | | | | 6.51% | | | | 3.10% | | | | 6.72% | | | | 10.29% | | | | 09/15/08 | |
| Institutional Class (MISMX) | | | 37.34% | | | | 10.19% | | | | 14.99% | | | | 6.71% | | | | 3.33% | | | | n.a. | | | | 4.77% | | | | 04/30/13 | |
| MSCI AC Asia ex Japan Small Cap Index4 | | | 26.28% | | | | -6.45% | | | | -4.46% | | | | -1.94% | | | | -1.39% | | | | 2.70% | | | | 5.48% | 5 | | | | |
Performance assumes reinvestment of all dividends and/or distributions before taxes. All performance quoted represents past performance and is no guarantee of future results. Investment return and principal value will fluctuate with market conditions so that when redeemed, shares may be worth more or less than their original cost. Current performance may be lower or higher than the return figures quoted. Returns would have been lower if certain of the Fund’s fees and expenses had not been waived. For the Fund’s most recent month-end performance, visit matthewsasia.com.
GROWTH OF A HYPOTHETICAL $10,000 INVESTMENT SINCE INCEPTION—INVESTOR CLASS
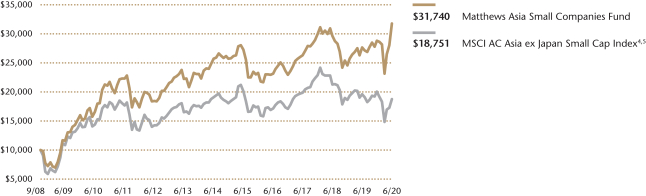
Plotted monthly. The performance data and graph do not reflect the deduction of taxes that a shareholder would pay on dividends, capital gains distributions or redemption of Fund shares. Values are in US$.
| | 4 | It is not possible to invest directly in an index. Source: Index data from Morgan Stanley Capital International and Bloomberg; total return calculations performed by BNY Mellon Investment Servicing (US) Inc. Please see page 90 for index definition. |
| | 5 | Calculated from 9/15/08. |
| | | | | | | | |
| | | | |
| TOP TEN HOLDINGS6 | | | | | | | |
| | | Sector | | Country | | % of Net Assets | |
| Silergy Corp. | | Information Technology | | China/Hong Kong | | | 6.5% | |
| Kingdee International Software Group Co., Ltd. | | Information Technology | | China/Hong Kong | | | 3.5% | |
| Innovent Biologics, Inc. | | Health Care | | China/Hong Kong | | | 2.7% | |
| Joyoung Co., Ltd. | | Consumer Discretionary | | China/Hong Kong | | | 2.6% | |
| Peijia Medical, Ltd. | | Health Care | | China/Hong Kong | | | 2.6% | |
| Jiajiayue Group Co., Ltd. | | Consumer Staples | | China/Hong Kong | | | 2.5% | |
| Alphamab Oncology | | Health Care | | China/Hong Kong | | | 2.4% | |
| Venus MedTech Hangzhou, Inc. | | Health Care | | China/Hong Kong | | | 2.4% | |
| Hua Hong Semiconductor, Ltd. | | Information Technology | | China/Hong Kong | | | 2.2% | |
| Sichuan Teway Food Group Co., Ltd. | | Consumer Staples | | China/Hong Kong | | | 2.1% | |
| % OF ASSETS IN TOP TEN | | | | | | | 29.5% | |
| | 6 | Holdings may combine more than one security from same issuer and related depositary receipts. |
Matthews Asia Small Companies Fund
Portfolio Manager Commentary (unaudited) (continued)
contraction and better risk reward in North Asia. We trimmed our positions in several companies in Thailand, Indonesia, and Malaysia that we believe would fare unfavorably for the remainder of 2020.
We initiated new positions in Korean health care company, Hugel, which manufactures botulinum toxin, the main ingredient in Botox. We also added Hong Kong-listed structural heart device company, Peijia Medical, and A-share listed power relay company, Hongfa Technology. Hugel has demonstrated strong execution in product development and marketing. We expect its entry into the China market as the next significant catalyst. Peijia is an IPO during the second quarter with products that help patients with stroke management and avoid open-heart surgery. Hongfa has reasonable valuations and a broad exposure to electric vehicles, power grid investments and automation.
Outlook:
The COVID-19 coronavirus outbreak has brought severe impacts on human lives and unprecedented challenges to society. The near-term economic weakness globally is unavoidable due to sudden demand shock and supply chain disruptions. We are mindful of the challenges under the current macroeconomic environment. Meanwhile many Asian countries have established various containment and stimulus policies in response to counter economic shocks. Small companies in Asia are not immune to these challenges; however, the degree of impact on company fundamentals vary from industry to industry, as well as the financial strengths of their underlying businesses.
We believe companies that are in cyclical industries may have to be conservative with their use of cash and cost management as demand shock could be prolonged. Corporate managers may need to adjust their policies in adapting to the new normal as various stakeholders are affected, which might affect profitability in the short term. Businesses that are leveraged to virtual or digital economy will, in our view, likely be beneficiaries in the short to medium term while travel spending would be subdued but home improvement spending may pick up. We believe that domestically oriented companies in Asia that deliver innovative and differentiated products and services continue to present attractive long-term investment opportunities as domestic demands continue to evolve and normalcy is gradually restored.
| | | | |
| |
| COUNTRY ALLOCATION (%)7,8 | |
China/Hong Kong | | | 52.4 | |
Taiwan | | | 16.0 | |
South Korea | | | 9.0 | |
India | | | 8.1 | |
Vietnam | | | 2.6 | |
Thailand | | | 2.1 | |
United States | | | 1.7 | |
Philippines | | | 1.6 | |
Indonesia | | | 0.8 | |
Cash and Other Assets, Less Liabilities | | | 5.6 | |
Total | | | 99.9 | |
| | | | |
| |
| SECTOR ALLOCATION (%)8 | |
Information Technology | | | 27.2 | |
Health Care | | | 24.8 | |
Industrials | | | 12.9 | |
Consumer Discretionary | | | 10.5 | |
Consumer Staples | | | 7.9 | |
Real Estate | | | 4.0 | |
Communication Services | | | 3.7 | |
Financials | | | 2.1 | |
Materials | | | 1.3 | |
Cash and Other Assets, Less Liabilities | | | 5.6 | |
| Total | | | 100.0 | |
| | | | |
| |
| MARKET CAP EXPOSURE (%)8,9 | |
Mega Cap (over $25B) | | | 0 | |
Large Cap ($10B-$25B) | | | 2.9 | |
Mid Cap ($3B-10B) | | | 46.1 | |
Small Cap (under $3B) | | | 45.4 | |
Unassigned | | | 0.1 | |
| Cash and Other Assets, Less Liabilities | | | 5.6 | |
| 7 | Not all countries where the Fund may invest are included in the benchmark index. |
| 8 | Source: FactSet Research Systems. Percentage values in data are rounded to the nearest tenth of one percent, so the values may not sum to 100% due to rounding. Percentage values may be derived from different data sources and may not be consistent with other Fund literature. |
| 9 | The Fund defines Small Companies as companies with market capitalization no higher than the greater of $5 billion or the market capitalization of the largest company included in the Fund’s primary benchmark, the MSCI All Country Asia ex Japan Small Cap Index. |
| | | | |
| matthewsasia.com | 800.789.ASIA | | | 83 | |
Matthews Asia Small Companies Fund
June 30, 2020
Schedule of Investmentsa (unaudited)
COMMON EQUITIES: 94.4%
| | | | | | | | |
| | | Shares | | | Value | |
| | |
| CHINA/HONG KONG: 52.4% | | | | | | | | |
| | |
Silergy Corp. | | | 171,000 | | | | $11,201,920 | |
| | |
Kingdee International Software Group Co., Ltd. | | | 2,572,000 | | | | 6,018,180 | |
| | |
Innovent Biologics, Inc.b,c,d | | | 612,000 | | | | 4,554,931 | |
| | |
Joyoung Co., Ltd. A Shares | | | 854,948 | | | | 4,518,596 | |
| | |
Peijia Medical, Ltd.b,c,d | | | 989,000 | | | | 4,478,924 | |
| | |
Jiajiayue Group Co., Ltd. A Shares | | | 622,389 | | | | 4,342,279 | |
| | |
Alphamab Oncologyb,c,d | | | 1,795,000 | | | | 4,177,687 | |
| | |
Venus MedTech Hangzhou, Inc. H Sharesb,c,d | | | 413,000 | | | | 4,080,018 | |
| | |
Hua Hong Semiconductor, Ltd.b,c,d | | | 1,075,000 | | | | 3,768,595 | |
| | |
Sichuan Teway Food Group Co., Ltd. A Shares | | | 460,310 | | | | 3,631,151 | |
| | |
Times China Holdings, Ltd. | | | 1,894,000 | | | | 3,531,693 | |
| | |
InnoCare Pharma, Ltd.b,c,d | | | 1,848,000 | | | | 3,511,394 | |
| | |
Asymchem Laboratories (Tianjin) Co., Ltd. A Shares | | | 86,714 | | | | 2,982,532 | |
| | |
Hangzhou Onechance Tech Corp. A Shares | | | 119,025 | | | | 2,952,707 | |
| | |
Zai Lab, Ltd. ADRc | | | 34,100 | | | | 2,800,633 | |
| | |
Winning Health Technology Group Co., Ltd. A Shares | | | 847,080 | | | | 2,764,007 | |
| | |
Pharmaron Beijing Co., Ltd. H Sharesb,d | | | 265,100 | | | | 2,745,481 | |
| | |
Centre Testing International Group Co., Ltd. A Shares | | | 932,174 | | | | 2,614,865 | |
| | |
Airtac International Group | | | 148,000 | | | | 2,614,448 | |
| | |
Yihai International Holding, Ltd. | | | 210,000 | | | | 2,164,061 | |
| | |
Yantai China Pet Foods Co., Ltd. A Shares | | | 312,800 | | | | 1,812,594 | |
| | |
Hongfa Technology Co., Ltd. A Shares | | | 315,100 | | | | 1,794,757 | |
| | |
Jiumaojiu International Holdings, Ltd.b,c,d | | | 987,000 | | | | 1,712,878 | |
| | |
SITC International Holdings Co., Ltd. | | | 1,535,000 | | | | 1,643,587 | |
| | |
Aoyuan Healthy Life Group Co., Ltd.d | | | 1,370,000 | | | | 1,415,885 | |
| | |
Koolearn Technology Holding, Ltd.b,c,d | | | 295,500 | | | | 1,192,588 | |
| | |
Kangji Medical Holdings, Ltd.c | | | 178,000 | | | | 684,395 | |
| | |
Hygeia Healthcare Holdings Co., Ltd.b,c,d | | | 53,200 | | | | 183,271 | |
| | | | | | | | |
Total China/Hong Kong | | | | | | | 89,894,057 | |
| | | | | | | | |
| | | | | | | | |
| | | |
| TAIWAN: 16.0% | | | | | | | | |
| | |
WIN Semiconductors Corp. | | | 338,000 | | | | 3,451,005 | |
| | |
Accton Technology Corp. | | | 431,000 | | | | 3,346,975 | |
| | |
Chief Telecom, Inc. | | | 261,000 | | | | 3,323,251 | |
| | |
Sunny Friend Environmental Technology Co., Ltd. | | | 344,000 | | | | 3,012,148 | |
| | |
Foxsemicon Integrated Technology, Inc. | | | 477,000 | | | | 2,934,904 | |
| | |
Voltronic Power Technology Corp. | | | 100,000 | | | | 2,881,515 | |
| | |
Sunonwealth Electric Machine Industry Co., Ltd. | | | 1,533,000 | | | | 2,686,486 | |
| | |
Chroma ATE, Inc. | | | 481,000 | | | | 2,489,267 | |
| | |
Realtek Semiconductor Corp. | | | 176,000 | | | | 1,793,885 | |
| | |
Great Tree Pharmacy Co., Ltd. | | | 527,282 | | | | 1,604,160 | |
| | | | | | | | |
Total Taiwan | | | | | | | 27,523,596 | |
| | | | | | | | |
| | | | | | | | |
| | | |
| SOUTH KOREA: 9.0% | | | | | | | | |
| | |
LEENO Industrial, Inc. | | | 32,833 | | | | 3,108,427 | |
| | |
Koh Young Technology, Inc. | | | 32,566 | | | | 2,721,807 | |
| | |
Douzone Bizon Co., Ltd. | | | 30,163 | | | | 2,577,143 | |
| | |
Vitzrocell Co., Ltd. | | | 146,753 | | | | 2,020,789 | |
| | |
Hugel, Inc.c | | | 4,817 | | | | 1,896,015 | |
| | |
AfreecaTV Co., Ltd. | | | 30,169 | | | | 1,600,117 | |
| | |
KINX, Inc. | | | 29,197 | | | | 1,444,382 | |
| | |
SK Biopharmaceuticals Co., Ltd.c | | | 3,474 | | | | 141,519 | |
| | | | | | | | |
Total South Korea | | | | | | | 15,510,199 | |
| | | | | | | | |
| | | | | | | | |
| | | Shares | | | Value | |
| | |
| INDIA: 8.2% | | | | | | | | |
| | |
Dr. Lal PathLabs, Ltd.b,d | | | 146,798 | | | $ | 3,041,543 | |
| | |
ICICI Securities, Ltd.b,d | | | 338,096 | | | | 2,104,255 | |
| | |
Galaxy Surfactants, Ltd.d | | | 102,137 | | | | 2,007,341 | |
| | |
Crompton Greaves Consumer Electricals, Ltd. | | | 580,756 | | | | 1,836,902 | |
| | |
Shankara Building Products, Ltd. | | | 351,683 | | | | 1,656,510 | |
| | |
Amrutanjan Health Care, Ltd. | | | 345,519 | | | | 1,651,330 | |
| | |
Gabriel India, Ltd. | | | 1,252,483 | | | | 1,435,722 | |
| | |
M.M. Forgings, Ltd. | | | 71,268 | | | | 172,722 | |
| | |
Elgi Equipments, Ltd. | | | 39,733 | | | | 76,860 | |
| | | | | | | | |
Total India | | | | | | | 13,983,185 | |
| | | | | | | | |
| | | | | | | | |
| | | |
| VIETNAM: 2.6% | | | | | | | | |
| | |
Nam Long Investment Corp. | | | 1,778,822 | | | | 1,881,731 | |
| | |
Saigon Cargo Service Corp. | | | 261,820 | | | | 1,305,841 | |
| | |
FPT Corp. | | | 644,000 | | | | 1,275,768 | |
| | | | | | | | |
Total Vietnam | | | | | | | 4,463,340 | |
| | | | | | | | |
| | | | | | | | |
| | | |
| THAILAND: 2.1% | | | | | | | | |
| | |
Humanica Public Co., Ltd. | | | 7,293,300 | | | | 2,061,679 | |
| | |
Muangthai Capital Public Co., Ltd.c | | | 905,800 | | | | 1,538,575 | |
| | | | | | | | |
Total Thailand | | | | | | | 3,600,254 | |
| | | | | | | | |
| | | | | | | | |
| | | |
| UNITED STATES: 1.7% | | | | | | | | |
| | |
Legend Biotech Corp. ADRc | | | 68,659 | | | | 2,922,127 | |
| | | | | | | | |
Total United States | | | | | | | 2,922,127 | |
| | | | | | | | |
| | | | | | | | |
| | | |
| PHILIPPINES: 1.6% | | | | | | | | |
| | |
Wilcon Depot, Inc. | | | 8,837,700 | | | | 2,746,012 | |
| | | | | | | | |
Total Philippines | | | | | | | 2,746,012 | |
| | | | | | | | |
| | | | | | | | |
| | | |
| INDONESIA: 0.8% | | | | | | | | |
| | |
PT Arwana Citramulia | | | 53,015,500 | | | | 1,415,836 | |
| | | | | | | | |
Total Indonesia | | | | | | | 1,415,836 | |
| | | | | | | | |
| | | | | | | | |
| | | |
| TOTAL INVESTMENTS: 94.4% | | | | | | | 162,058,606 | |
| | |
(Cost $116,589,521) | | | | | | | | |
| | | | | | | | |
| | |
CASH AND OTHER ASSETS,
LESS LIABILITIES: 5.6% | | | | | | | 9,630,776 | |
| | | | | | | | |
| | |
NET ASSETS: 100.0% | | | | | | | $171,689,382 | |
| | | | | | | | |
| a | Certain securities were fair valued under the valuation policies approved by the Board of Trustees (Note 2-A). |
| b | Security exempt from registration under Rule 144A of the Securities Act of 1933, as amended. The security may be resold in transactions exempt from registration normally to qualified institutional buyers. The security has been determined to be liquid in accordance with procedures adopted by the Funds’ Board of Trustees. At June 30, 2020, the aggregate value is $35,551,565, which is 20.71% of net assets. |
| c | Non-income producing security. |
| d | The securities may be resold to qualified foreign investors and foreign institutional buyers under Regulation S of the Securities Act of 1933. |
| ADR | American Depositary Receipt |
| | | | |
| PORTFOLIO MANAGERS* | | |
| | |
| Winnie Chwang | | | | |
Lead Manager | | | | |
| | |
| Andrew Mattock, CFA | | | | |
Lead Manager | | | | |
|
* As of August 31, 2020 |
| |
| FUND FACTS | | |
| | |
| | | Investor | | Institutional |
Ticker | | MCSMX | | MICHX |
CUSIP | | 577125404 | | 577125842 |
Inception | | 5/31/11 | | 11/30/17 |
NAV | | $20.24 | | $20.28 |
Initial Investment | | $2,500 | | $100,000 |
Gross Expense Ratio1 | | 1.62% | | 1.51% |
After Fee Waiver and Reimbursement2 | | 1.38% | | 1.20% |
Portfolio Statistics | | |
Total # of Positions | | 51 |
Net Assets | | $373.7 million |
Weighted Average Market Cap | | $4.9 billion |
Portfolio Turnover3 | | 68.17% |
Benchmark | | |
MSCI China Small Cap Index |
OBJECTIVE
Long-term capital appreciation.
STRATEGY
Under normal market conditions, the Fund seeks to achieve its investment objective by investing at least 80% of its net assets, which include borrowings for investment purposes, in the common and preferred stocks of Small Companies located in China. China includes its administrative and other districts, such as Hong Kong. The Fund defines Small Companies as companies with market capitalization no higher than the greater of $5 billion or the market capitalization of the largest company included in the Fund’s primary benchmark, the MSCI China Small Cap Index.
Matthews China Small Companies Fund
Portfolio Manager Commentary (unaudited)
For the first half of 2020, the Matthews China Small Companies Fund returned 57.63% (Investor Class) and 57.70% (Institutional Class), while its benchmark, the MSCI China Small Cap Index, returned -1.75% over the same period. For the quarter ending June 30, 2020, the Fund returned 42.64% (Investor Class) and 42.62% (Institutional Class), while the benchmark returned 13.18%.
Market Environment:
During the first half of the year, the COVID-19 pandemic continued to cause significant disruption to businesses around the world. The deep drops suffered across risk assets during the first quarter were almost entirely reversed over the last three months with central bank and government intervention. Governments around the world continue to provide monetary and fiscal support.
Pre-COVID-19, China was on track for a strong earnings recovery 2020 after a first phase trade deal was signed in January by the U.S. and China. Business spending, which was muted for three years due to the U.S.—China trade conflict, was set to rebound and domestic consumption continued to be strong. The recovery in 2020 was briefly disrupted by COVID-19. Given China’s quick response to quarantining the epicenter city of Wuhan and other high-infection rate cities, businesses in China have largely resumed work. The government has also put into place targeted stimulus towards elevating small to medium business cash flow disruptions with easier access to loans and reduced tax burdens. Overall, we expect gradual recovery in business activity in China for the rest of the year despite localized second and third wave infections.
From both a top-down and bottom-up perspective, we anticipate long-term sustainable growth in the Chinese economy and in corporate earnings. Market concerns over trade disruption should, in our view, have little impact on China’s smaller companies, given their domestic focus and lower dependence on financial leverage.
Performance Contributors and Detractors:
Our focus on finding innovative and capital-efficient small companies that are relatively insulated from macroeconomic uncertainties served us well during the first half of the year. Strong stock selection in the information technology, health care and consumer staples sectors contributed the most to the Fund’s outperformance versus the benchmark. There were no sector level detractors on performance during the second quarter.
Top contributors to Fund performance were our two largest positions in the portfolio, Silergy Corp. and Kingdee International. Silergy is a top analog semiconductor company from China. Its main power management integrated circuit products are going through an accelerated structural growth phase with more complex power management needs in data centers, 5G network equipment and laptops for working remotely. Kingdee, China’s top enterprise resource software-as-a-service (SaaS) company, helps firms managing their businesses digitally. The COVID-19 pandemic has quickened the pace of connecting the real world to the digital economy, and we expect Kingdee to benefit longer term from this structural trend.
There were no significant detractors during the quarter. Burning Rock Biotech, a new position in the portfolio, detracted slightly from performance this quarter.
(continued)
| 1 | Prospectus expense ratios. |
| 2 | Matthews has contractually agreed (i) to waive fees and reimburse expenses to the extent needed to limit Total Annual Fund Operating Expenses (excluding Rule 12b-1 fees, taxes, interest, brokerage commissions, short sale dividend expenses, expenses incurred in connection with any merger or reorganization or extraordinary expenses such as litigation) of the Institutional Class to 1.20% first by waiving class specific expenses (i.e., shareholder service fees specific to a particular class) of the Institutional Class and then, to the extent necessary, by waiving non-class specific expenses (e.g., custody fees) of the Institutional Class, and (ii) if any Fund-wide expenses (i.e., expenses that apply to both the Institutional Class and the Investor Class) are waived for the Institutional Class to maintain the 1.20% expense limitation, to waive an equal amount (in annual percentage terms) of those same expenses for the Investor Class. The Total Annual Fund Operating Expenses After Fee Waiver and Expense Reimbursement for the Investor Class may vary from year to year and will in some years exceed 1.20%. If the operating expenses fall below the expense limitation in a year within three years after Matthews has made a waiver or reimbursement, the Fund may reimburse Matthews up to an amount that does not cause the expenses for that year to exceed the lesser of (i) the expense limitation applicable at the time of that fee waiver and/or expense reimbursement or (ii) the expense limitation in effect at the time of recoupment. This agreement will remain in place until April 30, 2021 and may be terminated at any time by the Board of Trustees on behalf of the Fund on 60 days’ written notice to Matthews. Matthews may decline to renew this agreement by written notice to the Trust at least 30 days before its annual expiration date. |
| 3 | The lesser of fiscal year 2019 long-term purchase costs or sales proceeds divided by the average monthly market value of long-term securities. |
| | | | |
| matthewsasia.com | 800.789.ASIA | | | 85 | |
| | | | | | | | | | | | | | | | | | | | | | | | | | | | |
| | | | | | | | |
| PERFORMANCE AS OF JUNE 30, 2020 | | | | | | | | | | | | | | | | | | | | | |
| | | | | | | | | Average Annual Total Returns | | | | |
| | | 3 Months | | | YTD | | | 1 Year | | | 3 Years | | | 5 Years | | | Since
Inception | | | Inception
date | |
| Investor Class (MCSMX) | | | 42.64% | | | | 57.63% | | | | 79.85% | | | | 29.98% | | | | 18.72% | | | | 11.40% | | | | 05/31/11 | |
| Institutional Class (MICHX) | | | 42.62% | | | | 57.70% | | | | 79.99% | | | | n.a. | | | | n.a. | | | | 27.58% | | | | 11/30/17 | |
| MSCI China Small Cap Index4 | | | 13.18% | | | | -1.75% | | | | -2.99% | | | | -1.15% | | | | -4.44% | | | | -0.37% | 5 | | | | |
Performance assumes reinvestment of all dividends and/or distributions before taxes. All performance quoted represents past performance and is no guarantee of future results. Investment return and principal value will fluctuate with market conditions so that when redeemed, shares may be worth more or less than their original cost. Current performance may be lower or higher than the return figures quoted. Returns would have been lower if certain of the Fund’s fees and expenses had not been waived. For the Fund’s most recent month-end performance, visit matthewsasia.com.
GROWTH OF A HYPOTHETICAL $10,000 INVESTMENT SINCE INCEPTION—INVESTOR CLASS
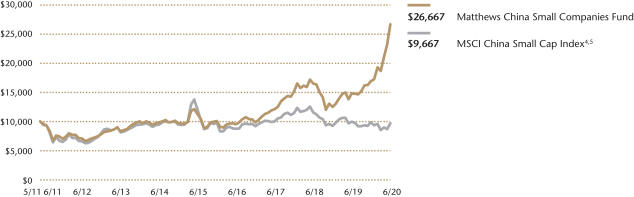
Plotted monthly. The performance data and graph do not reflect the deduction of taxes that a shareholder would pay on dividends, capital gains distributions or redemption of Fund shares. Values are in US$.
| | 4 | It is not possible to invest directly in an index. Source: Index data from Morgan Stanley Capital International and Bloomberg; total return calculations performed by BNY Mellon Investment Servicing (US) Inc. Please see page 90 for index definition. |
| | | | | | | | |
| | | | |
| TOP TEN HOLDINGS6 | | | | | | | |
| | | Sector | | | | % of Net Assets | |
Kingdee International Software Group Co., Ltd. | | Information Technology | | | | | 7.5% | |
Silergy Corp. | | Information Technology | | | | | 7.4% | |
China Youzan, Ltd. | | Information Technology | | | | | 3.1% | |
Jiajiayue Group Co., Ltd. | | Consumer Staples | | | | | 3.1% | |
Zai Lab, Ltd. | | Health Care | | | | | 3.0% | |
KWG Group Holdings, Ltd. | | Real Estate | | | | | 2.9% | |
Sichuan Teway Food Group Co., Ltd. | | Consumer Staples | | | | | 2.8% | |
Times China Holdings, Ltd. | | Real Estate | | | | | 2.8% | |
Peijia Medical, Ltd. | | Health Care | | | | | 2.4% | |
China Meidong Auto Holdings, Ltd. | | Consumer Discretionary | | | | | 2.3% | |
% OF ASSETS IN TOP TEN | | | | | | | 37.3% | |
| | 6 | Holdings may combine more than one security from same issuer and related depositary receipts. |
Matthews China Small Companies Fund
Portfolio Manager Commentary (unaudited) (continued)
Burning Rock is a front runner in the precision diagnostics space in China. The company uses next generation sequencing technology to facilitate cancer diagnosis and for determining course of treatment through identification of cancer biomarkers such as Tumor Mutation Burden (TMB). We believe the company has a long runway of growth in this growing space.
Notable Portfolio Changes:
During the quarter, we also initiated positions in Peijia Medical and Hongfa Technology. Peijia completed its initial public offering during the second quarter. Peijia’s products help patients with stroke management to avoid open heart surgery. Hongfa is a top power relay company in China with reasonable valuations and a broad exposure to electric vehicles, power grid investments and automation.
During the quarter we exited our positions in Cstone Pharmaceutical and TK Group as we identified better risk-reward candidates from our watch list. Cstone Pharmaceutical has an impressive pipeline of clinical stage oncology assets but it may be too much for a young biotech company to manage. TK Group continues to be a respectable plastic mold and parts producer in China but its end exposures in consumer electronics, automotive and household appliances may be a negative drag for longer than expected due to COVID-19.
Outlook:
We remain optimistic about China’s small-cap market amid heightened market volatility as we continue to focus rigorously on the sound fundamentals of our portfolio companies. From a macroeconomic perspective, we believe China can stabilize its economy through monetary flexibility, fiscal spending, tax reform, interest-rate adjustments and currency management. In addition, we believe that steps to correct China’s structural issues are on the right track. We will continue to seek companies with sustainable, quality earnings streams, strong cash flows and good balance sheets that can weather uncertain economic conditions. We believe sectors such as industrial automation, consumer, health care and technology are among the most attractive from a secular growth perspective.
| | | | |
| |
| COUNTRY ALLOCATION (%)7 | |
| China/Hong Kong | | | 91.2 | |
| Taiwan | | | 2.7 | |
United States | | | 1.5 | |
| Cash and Other Assets, Less Liabilities | | | 10.6 | |
| | | | |
| |
| SECTOR ALLOCATION (%)7 | |
| Health Care | | | 28.8 | |
| Information Technology | | | 22.4 | |
| Consumer Staples | | | 13.2 | |
| Consumer Discretionary | | | 10.7 | |
| Industrials | | | 9.4 | |
| Real Estate | | | 7.2 | |
| Communication Services | | | 2.3 | |
| Materials | | | 1.4 | |
| Cash and Other Assets, Less Liabilities | | | 10.6 | |
| | | | |
| | |
| MARKET CAP EXPOSURE (%)7,8 | | | |
| Mega Cap (over $25B) | | | 0.0 | |
| Large Cap ($10B–$25B) | | | 4.1 | |
| Mid Cap ($3B–10B) | | | 69.0 | |
| Small Cap (under $3B) | | | 22.3 | |
| Cash and Other Assets, Less Liabilities | | | 4.6 | |
| 7 | Source: FactSet Research Systems. Percentage values in data are rounded to the nearest tenth of one percent, so the values may not sum to 100% due to rounding. Percentage values may be derived from different data sources and may not be consistent with other Fund literature. |
| 8 | The Fund defines Small Companies as companies with market capitalization no higher than the greater of $5 billion or the market capitalization of the largest company included in the Fund’s primary benchmark, the MSCI China Small Cap Index. |
| | | | |
| matthewsasia.com | 800.789.ASIA | | | 87 | |
Matthews China Small Companies Fund
June 30, 2020
Schedule of Investmentsa (unaudited)
COMMON EQUITIES: 95.4%
| | | | | | | | |
| | | Shares | | | Value | |
| | |
| HEALTH CARE: 28.8% | | | | | | | | |
Biotechnology: 12.8% | | | | | | | | |
Zai Lab, Ltd. ADRb | | | 135,400 | | | | $11,120,402 | |
Amoy Diagnostics Co., Ltd. A Shares | | | 781,530 | | | | 8,517,862 | |
Burning Rock Biotech, Ltd. ADRb | | | 269,700 | | | | 7,284,597 | |
Alphamab Oncologyb,c,d | | | 3,108,000 | | | | 7,233,566 | |
Legend Biotech Corp. ADRb | | | 133,525 | | | | 5,682,824 | |
Innovent Biologics, Inc.b,c,d | | | 596,500 | | | | 4,439,569 | |
InnoCare Pharma, Ltd.b,c,d | | | 1,866,000 | | | | 3,545,596 | |
| | | | | | | | |
| | | | | | | 47,824,416 | |
| | | | | | | | |
Health Care Equipment & Supplies: 8.4% | | | | | | | | |
Peijia Medical, Ltd.b,c,d | | | 1,982,000 | | | | 8,975,963 | |
Venus MedTech Hangzhou, Inc. H Sharesb,c,d | | | 752,500 | | | | 7,433,931 | |
AK Medical Holdings, Ltd.c,d | | | 2,262,000 | | | | 7,210,652 | |
Shanghai MicroPort Endovascular MedTech Co., Ltd. A Shares | | | 127,476 | | | | 6,274,701 | |
Kangji Medical Holdings, Ltd.b | | | 352,000 | | | | 1,353,409 | |
| | | | | | | | |
| | | | | | | 31,248,656 | |
| | | | | | | | |
Life Sciences Tools & Services: 3.0% | | | | | | | | |
Pharmaron Beijing Co., Ltd. H Sharesc,d | | | 537,100 | | | | 5,562,420 | |
Genscript Biotech Corp.b | | | 2,640,000 | | | | 5,459,754 | |
| | | | | | | | |
| | | | | | | 11,022,174 | |
| | | | | | | | |
Pharmaceuticals: 2.8% | | | | | | | | |
Asymchem Laboratories (Tianjin) Co., Ltd. A Shares | | | 157,137 | | | | 5,404,735 | |
CanSino Biologics, Inc. H Sharesb,c,d | | | 188,000 | | | | 5,176,647 | |
| | | | | | | | |
| | | | | | | 10,581,382 | |
| | | | | | | | |
Health Care Technology: 1.7% | | | | | | | | |
Winning Health Technology Group Co., Ltd. A Shares | | | 1,971,927 | | | | 6,434,363 | |
| | | | | | | | |
| | | | | | | | |
Health Care Providers & Services: 0.1% | | | | | | | | |
Hygeia Healthcare Holdings Co., Ltd.b,c,d | | | 107,000 | | | | 368,609 | |
| | | | | | | | |
Total Health Care | | | | | | | 107,479,600 | |
| | | | | | | | |
| | | | | | | | |
| | | |
| INFORMATION TECHNOLOGY: 22.4% | | | | | | | | |
Semiconductors & Semiconductor Equipment: 10.7% | | | | | |
Silergy Corp. | | | 424,000 | | | | 27,775,520 | |
StarPower Semiconductor, Ltd. A Shares | | | 238,592 | | | | 7,112,076 | |
WIN Semiconductors Corp. | | | 495,000 | | | | 5,053,988 | |
| | | | | | | | |
| | | | | | | 39,941,584 | |
| | | | | | | | |
Software: 10.6% | | | | | | | | |
Kingdee International Software Group Co., Ltd. | | | 11,950,000 | | | | 27,961,608 | |
China Youzan, Ltd.b | | | 69,964,000 | | | | 11,642,296 | |
| | | | | | | | |
| | | | | | | 39,603,904 | |
| | | | | | | | |
Communications Equipment: 1.1% | | | | | | | | |
Accton Technology Corp. | | | 513,000 | | | | 3,983,754 | |
| | | | | | | | |
Electronic Equipment, Instruments & Components: 0.0% | | | | | |
China High Precision Automation Group, Ltd.b,e | | | 195,000 | | | | 252 | |
| | | | | | | | |
Total Information Technology | | | | | | | 83,529,494 | |
| | | | | | | | |
| | | | | | | | |
| | | |
| CONSUMER STAPLES: 13.2% | | | | | | | | |
Food Products: 6.8% | | | | | | | | |
Sichuan Teway Food Group Co., Ltd. A Shares | | | 1,336,306 | | | | 10,541,438 | |
Jonjee Hi-Tech Industrial And Commercial Holding Co., Ltd. A Shares | | | 702,946 | | | | 5,831,713 | |
Yantai China Pet Foods Co., Ltd. A Shares | | | 973,449 | | | | 5,640,882 | |
Yihai International Holding, Ltd. | | | 327,000 | | | | 3,369,752 | |
| | | | | | | | |
| | | | | | | 25,383,785 | |
| | | | | | | | |
| | | | | | | | |
| | | Shares | | | Value | |
Food & Staples Retailing: 3.1% | | | | | | | | |
Jiajiayue Group Co., Ltd. A Shares | | | 1,662,527 | | | | $11,599,107 | |
| | | | | | | | |
Personal Products: 1.8% | | | | | | | | |
Proya Cosmetics Co., Ltd. A Shares | | | 263,725 | | | | 6,741,948 | |
| | | | | | | | |
Household Products: 1.5% | | | | | | | | |
Vinda International Holdings, Ltd. | | | 1,589,000 | | | | 5,708,141 | |
| | | | | | | | |
Total Consumer Staples | | | | | | | 49,432,981 | |
| | | | | | | | |
| | | | | | | | |
| | | |
| CONSUMER DISCRETIONARY: 10.7% | | | | | | | | |
Diversified Consumer Services: 3.1% | | | | | | | | |
Koolearn Technology Holding, Ltd.b,c,d | | | 1,639,500 | | | | 6,616,747 | |
China Yuhua Education Corp., Ltd.c,d | | | 6,186,000 | | | | 5,108,571 | |
| | | | | | | | |
| | | | | | | 11,725,318 | |
| | | | | | | | |
Specialty Retail: 2.4% | | | | | | | | |
China Meidong Auto Holdings, Ltd. | | | 3,548,000 | | | | 8,751,223 | |
| | | | | | | | |
Household Durables: 2.2% | | | | | | | | |
Joyoung Co., Ltd. A Shares | | | 1,576,383 | | | | 8,331,545 | |
| | | | | | | | |
Internet & Direct Marketing Retail: 2.0% | | | | | | | | |
Hangzhou Onechance Tech Corp. A Shares | | | 300,060 | | | | 7,443,723 | |
| | | | | | | | |
Hotels, Restaurants & Leisure: 1.0% | | | | | | | | |
Jiumaojiu International Holdings, Ltd.b,c,d | | | 2,156,000 | | | | 3,741,607 | |
| | | | | | | | |
Total Consumer Discretionary | | | | | | | 39,993,416 | |
| | | | | | | | |
| | | | | | | | |
| | | |
| INDUSTRIALS: 9.4% | | | | | | | | |
Commercial Services & Supplies: 3.6% | | | | | | | | |
Ever Sunshine Lifestyle Services Group, Ltd.d | | | 4,586,000 | | | | 7,153,903 | |
Greentown Service Group Co., Ltd.d | | | 4,254,000 | | | | 5,042,296 | |
Sunny Friend Environmental Technology Co., Ltd. | | | 124,000 | | | | 1,085,774 | |
| | | | | | | | |
| | | | | | | 13,281,973 | |
| | | | | | | | |
Professional Services: 1.8% | | | | | | | | |
Centre Testing International Group Co., Ltd. A Shares | | | 2,404,759 | | | | 6,745,651 | |
| | | | | | | | |
Marine: 1.5% | | | | | | | | |
SITC International Holdings Co., Ltd. | | | 5,286,500 | | | | 5,660,470 | |
| | | | | | | | |
Electrical Equipment: 1.4% | | | | | | | | |
Hongfa Technology Co., Ltd. A Shares | | | 922,592 | | | | 5,254,929 | |
| | | | | | | | |
Machinery: 1.1% | | | | | | | | |
Airtac International Group | | | 243,000 | | | | 4,292,641 | |
| | | | | | | | |
Total Industrials | | | | | | | 35,235,664 | |
| | | | | | | | |
| | | | | | | | |
| | | |
| REAL ESTATE: 7.2% | | | | | | | | |
Real Estate Management & Development: 7.2% | | | | | |
KWG Group Holdings, Ltd. | | | 6,468,000 | | | | 10,989,516 | |
Times China Holdings, Ltd. | | | 5,545,000 | | | | 10,339,619 | |
China Overseas Property Holdings, Ltd. | | | 5,395,000 | | | | 5,751,379 | |
| | | | | | | | |
Total Real Estate | | | | | | | 27,080,514 | |
| | | | | | | | |
| | | | | | | | |
| | | |
| COMMUNICATION SERVICES: 2.3% | | | | | | | | |
Entertainment: 1.7% | | | | | | | | |
Bilibili, Inc. ADRb | | | 135,700 | | | | 6,285,624 | |
| | | | | | | | |
Media: 0.6% | | | | | | | | |
Mobvista, Inc.c,d | | | 3,974,000 | | | | 2,284,769 | |
| | | | | | | | |
Total Communication Services | | | | | | | 8,570,393 | |
| | | | | | | | |
| | | | | | | | |
Matthews China Small Companies Fund
June 30, 2020
Schedule of Investmentsa (unaudited) (continued)
COMMON EQUITIES (continued)
| | | | | | | | |
| | | Shares | | | Value | |
| | | |
| MATERIALS: 1.4% | | | | | | | | |
Construction Materials: 1.4% | | | | | | | | |
Asia Cement China Holdings Corp. | | | 5,328,000 | | | | $5,264,686 | |
| | | | | | | | |
Total Materials | | | | | | | 5,264,686 | |
| | | | | | | | |
| | | | | | | | |
| | | |
| TOTAL INVESTMENTS: 95.4% | | | | | | | 356,586,748 | |
(Cost $245,956,440) | | | | | | | | |
| | | | | | | | |
| | |
CASH AND OTHER ASSETS, LESS LIABILITIES: 4.6% | | | | | | | 17,119,929 | |
| | | | | | | | |
| | |
NET ASSETS: 100.0% | | | | | | | $373,706,677 | |
| | | | | | | | |
| a | Certain securities were fair valued under the valuation policies approved by the Board of Trustees (Note 2-A). |
| b | Non-income producing security. |
| c | Security exempt from registration under Rule 144A of the Securities Act of 1933, as amended. The security may be resold in transactions exempt from registration normally to qualified institutional buyers. The security has been determined to be liquid in accordance with procedures adopted by the Funds’ Board of Trustees. At June 30, 2020, the aggregate value is $67,698,647, which is 18.12% of net assets. |
| d | The securities may be resold to qualified foreign investors and foreign institutional buyers under Regulation S of the Securities Act of 1933. |
| e | Security is valued using significant unobservable inputs and is classified as Level 3 in the fair value hierarchy. The aggregate value of Level 3 security is $252 and 0.00% of net assets. |
| ADR | American Depositary Receipt |
See accompanying notes to financial statements.
| | | | |
| matthewsasia.com | 800.789.ASIA | | | 89 | |
Index Definitions
The MSCI Emerging Markets Index is a free float-adjusted market capitalization-weighted index of the stock markets of Argentina, Brazil, Chile, China, Colombia, Czech Republic, Egypt, Greece, Hungary, India, Indonesia, Malaysia, Mexico, Pakistan, Peru, Philippines, Poland, Qatar, Russia, Saudi Arabia, South Africa, South Korea, Taiwan, Thailand, Turkey and United Arab Emirates.
The Markit iBoxx Asian Local Bond Index (ALBI) tracks the total return performance of a bond portfolio consisting of local currency denominated, high quality and liquid bonds in Asia ex Japan. The ALBI includes bonds from the following countries: China, Hong Kong, India, Indonesia, Malaysia, Philippines, Singapore, South Korea, Taiwan and Thailand.
The J.P. Morgan Asia Credit Index (JACI) tracks the total return performance of the Asia fixed-rate dollar bond market. JACI is a market capitalization-weighted index comprising sovereign, quasi-sovereign and corporate bonds and is partitioned by country, sector and credit rating. JACI includes bonds from the following countries: China, Hong Kong, India, Indonesia, Malaysia, Philippines, Singapore, South Korea and Thailand.
The MSCI All Country Asia ex Japan Index is a free float-adjusted market capitalization-weighted index of the stock markets of China, Hong Kong, India, Indonesia, Malaysia, Pakistan, Philippines, Singapore, South Korea, Taiwan and Thailand.
The MSCI All Country Asia Pacific Index is a free float-adjusted market capitalization-weighted index of the stock markets of Australia, China, Hong Kong, India, Indonesia, Japan, Malaysia, New Zealand, Pakistan, Philippines, Singapore, South Korea, Taiwan and Thailand.
The MSCI China Index is a free float-adjusted market capitalization-weighted index of Chinese equities that includes H shares listed on the Hong Kong exchange, B shares listed on the Shanghai and Shenzhen exchanges, Hong Kong-listed securities known as Red Chips (issued by entities owned by national or local governments in China) and P Chips (issued by companies controlled by individuals in China and deriving substantial revenues in China), and foreign listings (e.g., ADRs).
The MSCI Emerging Markets (EM) Asia Index is a free float-adjusted market capitalization-weighted index of the stock markets of China, India, Indonesia, Malaysia, Pakistan, Philippines, South Korea, Taiwan and Thailand.
The MSCI China All Shares Index captures large and mid-cap representation across China A shares, B shares, H shares, Red Chips (issued by entities owned by national or local governments in China), P Chips (issued by companies controlled by individuals in China and deriving substantial revenues in China), and foreign listings (e.g., ADRs). The index aims to reflect the opportunity set of China share classes listed in Hong Kong, Shanghai, Shenzhen and outside of China.
The S&P Bombay Stock Exchange (BSE) 100 Index is a free float-adjusted market capitalization-weighted index of the 100 stocks listed on the Bombay Stock Exchange.
The MSCI Japan Index is a free float-adjusted market capitalization-weighted index of Japanese equities listed in Japan.
The Korea Composite Stock Price Index (KOSPI) is a market capitalization-weighted index of all common stocks listed on the Korea Stock Exchange.
The MSCI All Country Asia ex Japan Small Cap Index is a free float-adjusted market capitalization-weighted small cap index of the stock markets of China, Hong Kong, India, Indonesia, Malaysia, Pakistan, Philippines, Singapore, South Korea, Taiwan and Thailand.
The MSCI China Small Cap Index is a free float-adjusted market capitalization-weighted small cap index of the Chinese equity securities markets, including H shares listed on the Hong Kong exchange, B shares listed on the Shanghai and Shenzhen exchanges, and Hong Kong-listed securities known as Red Chips (issued by entities owned by national or local governments in China) and P Chips (issued by companies controlled by individuals in China and deriving substantial revenues in China), and foreign listings (e.g., ADRs).
Disclosures
Fund Holdings: The Fund holdings shown in this report are as of June 30, 2020. Holdings are subject to change at any time, so holdings shown in this report may not reflect current Fund holdings. The Funds file complete schedules of portfolio holdings with the Securities and Exchange Commission (the “SEC”) for the first and third quarters of each fiscal year on Form N-PORT. The Funds’ Forms N-PORT are available on the SEC’s website at www.sec.gov. Complete schedules of investments are also available without charge, upon request, from the Funds by calling us at 800.789.ASIA (2742).
Proxy Voting Record: The Funds’ Statement of Additional Information containing a description of the policies and procedures that the Funds have used to vote proxies relating to portfolio securities, along with each Fund’s proxy voting record relating
to portfolio securities held during the most recent 12-month period ended June 30, is available upon request, at no charge, at the Funds’ website at matthewsasia.com or by calling 800.789.ASIA (2742), or on the SEC’s website at www.sec.gov.
Shareholder Reports and Prospectuses: To reduce the Funds’ expenses, we try to identify related shareholders in a household and send only one copy of the Funds’ prospectus and financial reports to that address. This process, called “householding,” will continue indefinitely unless you instruct us otherwise. At any time you may view the Funds’ current prospectus, summary prospectus and financial reports on our website. If you prefer to receive individual copies of the Funds’ prospectus or financial reports, please call us at 800.789.ASIA (2742).
| | | | |
| matthewsasia.com | 800.789.ASIA | | | 91 | |
Disclosure of Fund Expenses (unaudited)
We believe it is important for you to understand the impact of fees regarding your investment. All mutual funds have operating expenses. As a shareholder of a mutual fund, you incur ongoing costs, which include costs for portfolio management, administrative services, and shareholder reports (like this one), among others. Operating expenses, which are deducted from a fund’s gross income, directly reduce the investment return of the fund. A fund’s operating expenses are expressed as a percentage of its average net assets. This figure is known as the expense ratio. The following examples are intended to help you understand the ongoing fees (in dollars) of investing in your fund and to compare these costs with those of other mutual funds. The examples are based on an investment of $1,000 made at the beginning of the period shown and held for the entire period.
This table illustrates your fund’s costs in two ways:
Actual Fund Return: This section helps you to estimate the actual operating expenses, after any applicable fee waivers, that you paid over the period. The “Ending Account Value” shown is derived from the fund’s actual return for the past six month period, the “Expense Ratio” column shows the period’s annualized expense ratio, and the “Operating Expenses Paid During Period” column shows the dollar amount that would have been paid by an investor who started with $1,000 in the fund at the beginning of the period. You may use the information here, together with your account value, to estimate the expenses that you paid over the period. To do so, simply divide your account value by $1,000 (for example, an $8,600 account value divided
by $1,000 = 8.6), then multiply the result by the number given for your fund in the first line under the heading entitled “Operating Expenses Paid During Period.”
Hypothetical 5% Return: This section is intended to help you compare your fund’s costs with those of other mutual funds. It assumes that the fund had an annual return of 5% before operating expenses, but that the expense ratio is unchanged. In this case, because the return used is not the fund’s actual return, the results do not apply to your investment. This example is useful in making comparisons to other mutual funds because the Securities and Exchange Commission requires all mutual funds to calculate expenses based on an assumed 5% annual return. You can assess your fund’s costs by comparing this hypothetical example with the hypothetical examples that appear in shareholder reports of other funds.
Please note that the operating expenses shown in the table are meant to highlight and help you compare your ongoing costs only and do not reflect any transactional costs such as sales charges (loads), redemption fees, or exchange fees.
Matthews Asia Funds does not charge any sales loads, exchange fees, or 12b-1 fees, but these may be present in other funds to which you compare this data. Therefore, the hypothetical portions of the table are useful in comparing ongoing costs only, and will not help you determine the relative total costs of owning different funds.
June 30, 2020
Disclosure of Fund Expenses (unaudited) (continued)
| | | | | | | | | | | | | | | | | | | | | | | | | | | | | | | | | | | | |
| | | Investor | | | | | | Institutional | |
| | | Beginning
Account
Value
1/1/20 | | | Ending
Account
Value
6/30/20 | | | Expense
Ratio1 | | | Operating
Expenses
Paid During
Period
1/1/20–
6/30/202 | | | | | | Beginning
Account
Value
1/1/20 | | | Ending
Account
Value
6/30/20 | | | Expense
Ratio1 | | | Operating
Expenses
Paid During
Period
1/1/20–
6/30/202 | |
| GLOBAL EMERGING MARKETS STRATEGY | | | | | | | | | | | | | | | | | | | | | | | | | | | | | | | | | | | | |
Matthews Emerging Markets Equity Fund3 | | | | | | | | | | | | | | | | | | | | | | | | | | | | | | | | | | | | |
Actual Fund Return | | | $1,000.00 | | | | $1,167.00 | | | | 1.15% | | | | $2.08 | | | | | | | | $1,000.00 | | | | $1,167.00 | | | | 0.90% | | | | $1.63 | |
Hypothetical 5% Returns | | | $1,000.00 | | | | $1,006.42 | | | | 1.15% | | | | $1.92 | | | | | | | | $1,000.00 | | | | $1,006.83 | | | | 0.90% | | | | $1.51 | |
| | | | | | | | | |
| ASIA FIXED INCOME STRATEGIES | | | | | | | | | | | | | | | | | | | | | | | | | | | | | | | | | | | | |
Matthews Asia Total Return Bond Fund | | | | | | | | | | | | | | | | | | | | | | | | | | | | | | | | | | | | |
Actual Fund Return | | | $1,000.00 | | | | $963.50 | | | | 1.13% | | | | $5.52 | | | | | | | | $1,000.00 | | | | $964.50 | | | | 0.90% | | | | $4.40 | |
Hypothetical 5% Returns | | | $1,000.00 | | | | $1,019.24 | | | | 1.13% | | | | $5.67 | | | | | | | | $1,000.00 | | | | $1,020.39 | | | | 0.90% | | | | $4.52 | |
Matthews Asia Credit Opportunities Fund | | | | | | | | | | | | | | | | | | | | | | | | | | | | | | | | | | | | |
Actual Fund Return | | | $1,000.00 | | | | $952.60 | | | | 1.15% | | | | $5.58 | | | | | | | | $1,000.00 | | | | $953.80 | | | | 0.90% | | | | $4.37 | |
Hypothetical 5% Returns | | | $1,000.00 | | | | $1,019.14 | | | | 1.15% | | | | $5.77 | | | | | | | | $1,000.00 | | | | $1,020.39 | | | | 0.90% | | | | $4.52 | |
| | | | | | | | | |
| ASIA GROWTH AND INCOME STRATEGIES | | | | | | | | | | | | | | | | | | | | | | | | | | | | | | | | | | | | |
Matthews Asian Growth and Income Fund | | | | | | | | | | | | | | | | | | | | | | | | | | | | | | | | | | | | |
Actual Fund Return | | | $1,000.00 | | | | $930.50 | | | | 1.13% | | | | $5.42 | | | | | | | | $1,000.00 | | | | $931.70 | | | | 0.97% | | | | $4.66 | |
Hypothetical 5% Returns | | | $1,000.00 | | | | $1,019.24 | | | | 1.13% | | | | $5.67 | | | | | | | | $1,000.00 | | | | $1,020.04 | | | | 0.97% | | | | $4.87 | |
Matthews Asia Dividend Fund | | | | | | | | | | | | | | | | | | | | | | | | | | | | | | | | | | | | |
Actual Fund Return | | | $1,000.00 | | | | $973.80 | | | | 1.07% | | | | $5.25 | | | | | | | | $1,000.00 | | | | $974.30 | | | | 0.97% | | | | $4.76 | |
Hypothetical 5% Returns | | | $1,000.00 | | | | $1,019.54 | | | | 1.07% | | | | $5.37 | | | | | | | | $1,000.00 | | | | $1,020.04 | | | | 0.97% | | | | $4.87 | |
Matthews China Dividend Fund | | | | | | | | | | | | | | | | | | | | | | | | | | | | | | | | | | | | |
Actual Fund Return | | | $1,000.00 | | | | $1,040.20 | | | | 1.17% | | | | $5.93 | | | | | | | | $1,000.00 | | | | $1,040.90 | | | | 1.04% | | | | $5.28 | |
Hypothetical 5% Returns | | | $1,000.00 | | | | $1,019.05 | | | | 1.17% | | | | $5.87 | | | | | | | | $1,000.00 | | | | $1,019.69 | | | | 1.04% | | | | $5.22 | |
| | | | | | | | | |
| ASIA VALUE STRATEGY | | | | | | | | | | | | | | | | | | | | | | | | | | | | | | | | | | | | |
Matthews Asia Value Fund | | | | | | | | | | | | | | | | | | | | | | | | | | | | | | | | | | | | |
Actual Fund Return | | | $1,000.00 | | | | $955.70 | | | | 1.45% | | | | $7.05 | | | | | | | | $1,000.00 | | | | $957.20 | | | | 1.20% | | | | $5.84 | |
Hypothetical 5% Returns | | | $1,000.00 | | | | $1,017.65 | | | | 1.45% | | | | $7.27 | | | | | | | | $1,000.00 | | | | $1,018.90 | | | | 1.20% | | | | $6.02 | |
| | | | | | | | | |
| ASIA GROWTH STRATEGIES | | | | | | | | | | | | | | | | | | | | | | | | | | | | | | | | | | | | |
Matthews Asia Growth Fund | | | | | | | | | | | | | | | | | | | | | | | | | | | | | | | | | | | | |
Actual Fund Return | | | $1,000.00 | | | | $1,084.30 | | | | 1.11% | | | | $5.75 | | | | | | | | $1,000.00 | | | | $1,085.00 | | | | 0.97% | | | | $5.03 | |
Hypothetical 5% Returns | | | $1,000.00 | | | | $1,019.34 | | | | 1.11% | | | | $5.57 | | | | | | | | $1,000.00 | | | | $1,020.04 | | | | 0.97% | | | | $4.87 | |
Matthews Pacific Tiger Fund | | | | | | | | | | | | | | | | | | | | | | | | | | | | | | | | | | | | |
Actual Fund Return | | | $1,000.00 | | | | $952.70 | | | | 1.11% | | | | $5.39 | | | | | | | | $1,000.00 | | | | $953.00 | | | | 0.96% | | | | $4.66 | |
Hypothetical 5% Returns | | | $1,000.00 | | | | $1,019.34 | | | | 1.11% | | | | $5.57 | | | | | | | | $1,000.00 | | | | $1,020.09 | | | | 0.96% | | | | $4.82 | |
Matthews Asia ESG Fund | | | | | | | | | | | | | | | | | | | | | | | | | | | | | | | | | | | | |
Actual Fund Return | | | $1,000.00 | | | | $1,006.30 | | | | 1.39% | | | | $6.93 | | | | | | | | $1,000.00 | | | | $1,007.20 | | | | 1.20% | | | | $5.99 | |
Hypothetical 5% Returns | | | $1,000.00 | | | | $1,017.95 | | | | 1.39% | | | | $6.97 | | | | | | | | $1,000.00 | | | | $1,018.90 | | | | 1.20% | | | | $6.02 | |
Matthews Emerging Asia Fund | | | | | | | | | | | | | | | | | | | | | | | | | | | | | | | | | | | | |
Actual Fund Return | | | $1,000.00 | | | | $749.80 | | | | 1.45% | | | | $6.31 | | | | | | | | $1,000.00 | | | | $751.00 | | | | 1.20% | | | | $5.22 | |
Hypothetical 5% Returns | | | $1,000.00 | | | | $1,017.65 | | | | 1.45% | | | | $7.27 | | | | | | | | $1,000.00 | | | | $1,018.90 | | | | 1.20% | | | | $6.02 | |
Matthews Asia Innovators Fund | | | | | | | | | | | | | | | | | | | | | | | | | | | | | | | | | | | | |
Actual Fund Return | | | $1,000.00 | | | | $1,270.10 | | | | 1.11% | | | | $6.27 | | | | | | | | $1,000.00 | | | | $1,271.20 | | | | 0.96% | | | | $5.42 | |
Hypothetical 5% Returns | | | $1,000.00 | | | | $1,019.34 | | | | 1.11% | | | | $5.57 | | | | | | | | $1,000.00 | | | | $1,020.09 | | | | 0.96% | | | | $4.82 | |
Matthews China Fund | | | | | | | | | | | | | | | | | | | | | | | | | | | | | | | | | | | | |
Actual Fund Return | | | $1,000.00 | | | | $1,122.90 | | | | 1.11% | | | | $5.86 | | | | | | | | $1,000.00 | | | | $1,124.20 | | | | 0.93% | | | | $4.91 | |
Hypothetical 5% Returns | | | $1,000.00 | | | | $1,019.34 | | | | 1.11% | | | | $5.57 | | | | | | | | $1,000.00 | | | | $1,020.24 | | | | 0.93% | | | | $4.67 | |
Matthews India Fund | | | | | | | | | | | | | | | | | | | | | | | | | | | | | | | | | | | | |
Actual Fund Return | | | $1,000.00 | | | | $806.30 | | | | 1.25% | | | | $5.61 | | | | | | | | $1,000.00 | | | | $806.80 | | | | 1.10% | | | | $4.94 | |
Hypothetical 5% Returns | | | $1,000.00 | | | | $1,018.65 | | | | 1.25% | | | | $6.27 | | | | | | | | $1,000.00 | | | | $1,019.39 | | | | 1.10% | | | | $5.52 | |
| 1 | Annualized, based on the Fund’s most recent fiscal half-year expenses. |
| 2 | Operating expenses are equal to the Fund’s annualized expense ratio multiplied by the average account value over the period, multiplied by 182 days, then divided by 366. |
| 3 | The Fund commenced operations on April 30, 2020. Operating expenses are equal to the Fund’s annualized expense ratio multiplied by the average account value over the period, multiplied by 61 days, then divided by 366. |
| | | | |
| matthewsasia.com | 800.789.ASIA | | | 93 | |
June 30, 2020
Disclosure of Fund Expenses (unaudited) (continued)
| | | | | | | | | | | | | | | | | | | | | | | | | | | | | | | | | | | | |
| | | Investor | | | | | | Institutional | |
| | | Beginning
Account
Value
1/1/20 | | | Ending
Account
Value
6/30/20 | | | Expense
Ratio1 | | | Operating
Expenses
Paid During
Period
1/1/20–
6/30/202 | | | | | | Beginning
Account
Value
1/1/20 | | | Ending
Account
Value
6/30/20 | | | Expense
Ratio1 | | | Operating
Expenses
Paid During
Period
1/1/20–
6/30/202 | |
| ASIA GROWTH STRATEGIES (continued) | |
Matthews Japan Fund | | | | | | | | | | | | | | | | | | | | | | | | | | | | | | | | | | | | |
Actual Fund Return | | | $1,000.00 | | | | $1,000.50 | | | | 0.98% | | | | $4.87 | | | | | | | | $1,000.00 | | | | $1,000.50 | | | | 0.93% | | | | $4.63 | |
Hypothetical 5% Returns | | | $1,000.00 | | | | $1,019.99 | | | | 0.98% | | | | $4.92 | | | | | | | | $1,000.00 | | | | $1,020.24 | | | | 0.93% | | | | $4.67 | |
Matthews Korea Fund | | | | | | | | | | | | | | | | | | | | | | | | | | | | | | | | | | | | |
Actual Fund Return | | | $1,000.00 | | | | $958.90 | | | | 1.25% | | | | $6.09 | | | | | | | | $1,000.00 | | | | $957.00 | | | | 1.18% | | | | $5.74 | |
Hypothetical 5% Returns | | | $1,000.00 | | | | $1,018.65 | | | | 1.25% | | | | $6.27 | | | | | | | | $1,000.00 | | | | $1,019.00 | | | | 1.18% | | | | $5.92 | |
| | | | | | | | | |
| ASIA SMALL COMPANY STRATEGIES | | | | | | | | | | | | | | | | | | | | | | | | | | | | | | | | | | | | |
Matthews Asia Small Companies Fund | | | | | | | | | | | | | | | | | | | | | | | | | | | | | | | | | | | | |
Actual Fund Return | | | $1,000.00 | | | | $1,101.10 | | | | 1.42% | | | | $7.42 | | | | | | | | $1,000.00 | | | | $1,101.90 | | | | 1.20% | | | | $6.27 | |
Hypothetical 5% Returns | | | $1,000.00 | | | | $1,017.80 | | | | 1.42% | | | | $7.12 | | | | | | | | $1,000.00 | | | | $1,018.90 | | | | 1.20% | | | | $6.02 | |
Matthews China Small Companies Fund | | | | | | | | | | | | | | | | | | | | | | | | | | | | | | | | | | | | |
Actual Fund Return | | | $1,000.00 | | | | $1,576.30 | | | | 1.33% | | | | $8.52 | | | | | | | | $1,000.00 | | | | $1,577.00 | | | | 1.20% | | | | $7.69 | |
Hypothetical 5% Returns | | | $1,000.00 | | | | $1,018.25 | | | | 1.33% | | | | $6.67 | | | | | | | | $1,000.00 | | | | $1,018.90 | | | | 1.20% | | | | $6.02 | |
| 1 | Annualized, based on the Fund’s most recent fiscal half-year expenses. |
| 2 | Operating expenses are equal to the Fund’s annualized expense ratio multiplied by the average account value over the period, multiplied by 182 days, then divided by 366. |
| | |
| Statements of Assets and Liabilities (unaudited) | | June 30, 2020 |
| | | | | | | | | | | | |
| | | Matthews Emerging
Markets Equity Fund1 | | | Matthews Asia
Total Return
Bond Fund | | | Matthews Asia
Credit
Opportunities Fund | |
| | | |
ASSETS: | | | | | | | | | | | | |
| | | |
Investments at value (A) (Note 2-A and 7): | | | | | | | | | | | | |
| | | |
Unaffiliated issuers | | | $8,627,992 | | | | $98,058,134 | | | | $88,004,592 | |
| | | |
Cash | | | 591,123 | | | | 2,212,568 | | | | 3,246,027 | |
| | | |
Cash pledged collateral for OTC derivatives | | | — | | | | 520,000 | | | | — | |
| | | |
Segregated foreign currency at value | | | 195 | | | | 19,930 | | | | 6,733 | |
| | | |
Foreign currency at value (B) | | | 8,923 | | | | 576 | | | | 208 | |
| | | |
Dividends, interest and other receivable | | | 11,585 | | | | 1,763,666 | | | | 1,734,949 | |
| | | |
Receivable for securities sold | | | 27,475 | | | | — | | | | — | |
| | | |
Receivable for capital shares sold | | | 17,450 | | | | 26,203 | | | | 29,080 | |
| | | |
Due from Advisor (Note 5) | | | 13,230 | | | | — | | | | — | |
| | | |
Unrealized appreciation on forward foreign currency exchange contracts | | | — | | | | 3,528 | | | | — | |
| | | |
Unrealized appreciation on interest rate swaps | | | — | | | | 628,819 | | | | — | |
| | | |
Prepaid expenses | | | 39,514 | | | | 15,178 | | | | 29,881 | |
TOTAL ASSETS | | | 9,337,487 | | | | 103,248,602 | | | | 93,051,470 | |
| | | |
LIABILITIES: | | | | | | | | | | | | |
| | | |
Payable for securities purchased | | | 142,981 | | | | — | | | | — | |
| | | |
Payable for capital shares redeemed | | | — | | | | 233,869 | | | | 948,595 | |
| | | |
Unrealized depreciation on forward foreign currency exchange contracts | | | — | | | | 774,274 | | | | — | |
| | | |
Deferred foreign capital gains tax liability (Note 2-F) | | | 776 | | | | 23,175 | | | | — | |
| | | |
Due to Advisor (Note 5) | | | — | | | | 40,902 | | | | 39,593 | |
| | | |
Administration and accounting fees payable (Note 5) | | | 101 | | | | 1,353 | | | | 1,251 | |
| | | |
Administration and shareholder servicing fees payable (Note 5) | | | 1,040 | | | | 12,715 | | | | 11,665 | |
| | | |
Custodian fees payable | | | — | | | | 5,648 | | | | 137 | |
| | | |
Intermediary service fees payable (Note 5) | | | 776 | | | | 18,419 | | | | 4,329 | |
| | | |
Professional fees payable | | | — | | | | 23,907 | | | | 45,168 | |
| | | |
Transfer agent fees payable | | | 290 | | | | 975 | | | | 269 | |
| | | |
Accrued other expenses payable | | | 7,141 | | | | 8,125 | | | | 1,363 | |
TOTAL LIABILITIES | | | 153,105 | | | | 1,143,362 | | | | 1,052,370 | |
| | | |
NET ASSETS | | | $9,184,382 | | | | $102,105,240 | | | | $91,999,100 | |
| | | |
NET ASSETS: | | | | | | | | | | | | |
| | | |
Investor Class | | | $1,683,257 | | | | $36,245,173 | | | | $10,382,063 | |
| | | |
Institutional Class | | | 7,501,125 | | | | 65,860,067 | | | | 81,617,037 | |
TOTAL | | | $9,184,382 | | | | $102,105,240 | | | | $91,999,100 | |
| 1 | The Fund commenced operations on April 30, 2020. |
See accompanying notes to financial statements.
| | | | |
| matthewsasia.com | 800.789.ASIA | | | 95 | |
| | |
| Statements of Assets and Liabilities (unaudited) (continued) | | June 30, 2020 |
| | | | | | | | | | | | |
| | | Matthews Emerging
Markets Equity Fund1 | | | Matthews Asia
Total Return
Bond Fund | | | Matthews Asia
Credit
Opportunities Fund | |
SHARES OUTSTANDING: | | | | | | | | | | | | |
| | | |
(shares of beneficial interest issued and outstanding, respectively, unlimited number of shares authorized with a $0.001 par value) | | | | | | | | | | | | |
| | | |
Investor Class | | | 144,223 | | | | 3,438,820 | | | | 1,050,566 | |
| | | |
Institutional Class | | | 642,510 | | | | 6,247,235 | | | | 8,259,186 | |
TOTAL | | | 786,733 | | | | 9,686,055 | | | | 9,309,752 | |
| | | |
NET ASSET VALUE: | | | | | | | | | | | | |
Investor Class, offering price and redemption price | | | $11.67 | | | | $10.54 | | | | $9.88 | |
Institutional Class, offering price and redemption price | | | $11.67 | | | | $10.54 | | | | $9.88 | |
| | | |
NET ASSETS CONSISTS OF: | | | | | | | | | | | | |
| | | |
Capital paid-in | | | $7,995,540 | | | | $106,414,240 | | | | $97,084,674 | |
| | | |
Total distributable earnings/(accumulated loss) | | | 1,188,842 | | | | (4,309,000 | ) | | | (5,085,574 | ) |
NET ASSETS | | | $9,184,382 | | | | $102,105,240 | | | | $91,999,100 | |
| | | |
(A) Investments at cost: | | | | | | | | | | | | |
| | | |
Unaffiliated Issuers | | | $7,633,781 | | | | $98,733,723 | | | | $90,534,789 | |
| | | |
(B) Foreign Currency at Cost | | | $8,919 | | | | $576 | | | | $211 | |
| 1 | The Fund commenced operations on April 30, 2020. |
See accompanying notes to financial statements.
| | |
| Statements of Assets and Liabilities (unaudited) (continued) | | June 30, 2020 |
| | | | | | | | | | | | |
| | | Matthews Asian
Growth and
Income Fund | | | Matthews Asia
Dividend Fund | | | Matthews China
Dividend Fund | |
| | | |
ASSETS: | | | | | | | | | | | | |
| | | |
Investments at value (A) (Note 2-A and 7): | | | | | | | | | | | | |
| | | |
Unaffiliated issuers | | | $1,204,895,340 | | | | $3,235,153,183 | | | | $313,231,225 | |
| | | |
Affiliated issuers | | | — | | | | 585,082,499 | | | | — | |
| | | |
Cash | | | 41,903,058 | | | | — | | | | 4,727,753 | |
| | | |
Segregated foreign currency at value | | | — | | | | 155,696 | | | | 19,496 | |
| | | |
Foreign currency at value (B) | | | 641,564 | | | | 10,948,995 | | | | 1,282,631 | |
| | | |
Dividends, interest and other receivable | | | 4,812,616 | | | | 9,514,560 | | | | 1,501,878 | |
| | | |
Receivable for securities sold | | | 2,267,086 | | | | 25,079,035 | | | | 746,334 | |
| | | |
Receivable for capital shares sold | | | 1,576,385 | | | | 2,629,185 | | | | 1,274,034 | |
| | | |
Prepaid expenses | | | 71,067 | | | | — | | | | 44,241 | |
TOTAL ASSETS | | | 1,256,167,116 | | | | 3,868,563,153 | | | | 322,827,592 | |
| | | |
LIABILITIES: | | | | | | | | | | | | |
| | | |
Cash overdraft | | | — | | | | 5,443,467 | | | | — | |
| | | |
Payable for securities purchased | | | 800 | | | | 5,472,257 | | | | 199,110 | |
| | | |
Payable for capital shares redeemed | | | 1,552,299 | | | | 29,046,330 | | | | 490,037 | |
| | | |
Deferred foreign capital gains tax liability (Note 2-F) | | | 1,063,827 | | | | — | | | | — | |
| | | |
Due to Advisor (Note 5) | | | 682,680 | | | | 2,095,498 | | | | 170,360 | |
| | | |
Administration and accounting fees payable (Note 5) | | | 16,463 | | | | 50,317 | | | | 4,096 | |
| | | |
Administration and shareholder servicing fees payable (Note 5) | | | 152,893 | | | | 463,237 | | | | 38,174 | |
| | | |
Custodian fees payable | | | 61,722 | | | | 349,323 | | | | 20,161 | |
| | | |
Intermediary service fees payable (Note 5) | | | 261,687 | | | | 993,482 | | | | 81,768 | |
| | | |
Professional fees payable | | | 45,918 | | | | 87,012 | | | | 32,901 | |
| | | |
Transfer agent fees payable | | | 11,307 | | | | 21,627 | | | | 2,969 | |
| | | |
Accrued other expenses payable | | | 83,840 | | | | 324,547 | | | | 32,864 | |
TOTAL LIABILITIES | | | 3,933,436 | | | | 44,347,097 | | | | 1,072,440 | |
| | | |
NET ASSETS | | | $1,252,233,680 | | | | $3,824,216,056 | | | | $321,755,152 | |
| | | |
NET ASSETS: | | | | | | | | | | | | |
| | | |
Investor Class | | | $581,679,400 | | | | $1,748,123,813 | | | | $227,148,086 | |
| | | |
Institutional Class | | | 670,554,280 | | | | 2,076,092,243 | | | | 94,607,066 | |
TOTAL | | | $1,252,233,680 | | | | $3,824,216,056 | | | | $321,755,152 | |
See accompanying notes to financial statements.
| | | | |
| matthewsasia.com | 800.789.ASIA | | | 97 | |
| | |
| Statements of Assets and Liabilities (unaudited) (continued) | | June 30, 2020 |
| | | | | | | | | | | | |
| | | Matthews Asian
Growth and
Income Fund | | | Matthews Asia
Dividend Fund | | | Matthews China
Dividend Fund | |
SHARES OUTSTANDING: | | | | | | | | | | | | |
| | | |
(shares of beneficial interest issued and outstanding, respectively, unlimited number of shares authorized with a $0.001 par value) | | | | | | | | | | | | |
| | | |
Investor Class | | | 40,025,743 | | | | 103,781,893 | | | | 13,779,169 | |
| | | |
Institutional Class | | | 46,226,408 | | | | 123,295,511 | | | | 5,739,182 | |
TOTAL | | | 86,252,151 | | | | 227,077,404 | | | | 19,518,351 | |
| | | |
NET ASSET VALUE: | | | | | | | | | | | | |
Investor Class, offering price and redemption price | | | $14.53 | | | | $16.84 | | | | $16.48 | |
Institutional Class, offering price and redemption price | | | $14.51 | | | | $16.84 | | | | $16.48 | |
| | | |
NET ASSETS CONSISTS OF: | | | | | | | | | | | | |
| | | |
Capital paid-in | | | $1,194,161,017 | | | | $3,233,799,759 | | | | $302,997,215 | |
| | | |
Total distributable earnings/(accumulated loss) | | | 58,072,663 | | | | 590,416,297 | | | | 18,757,937 | |
NET ASSETS | | | $1,252,233,680 | | | | $3,824,216,056 | | | | $321,755,152 | |
| | | |
(A) Investments at cost: | | | | | | | | | | | | |
| | | |
Unaffiliated Issuers | | | $1,089,827,510 | | | | $2,547,095,933 | | | | $271,310,193 | |
| | | |
Affiliated Issuers | | | — | | | | 434,167,009 | | | | — | |
| | | |
(B) Foreign Currency at Cost | | | $641,264 | | | | $10,934,432 | | | | $1,284,824 | |
See accompanying notes to financial statements.
| | |
| Statements of Assets and Liabilities (unaudited) (continued) | | June 30, 2020 |
| | | | | | | | | | | | |
| | | Matthews Asia
Value Fund | | | Matthews Asia
Growth Fund | | | Matthews Pacific
Tiger Fund | |
| | | |
ASSETS: | | | | | | | | | | | | |
| | | |
Investments at value (A) (Note 2-A and 7): | | | | | | | | | | | | |
| | | |
Unaffiliated issuers | | | $9,585,701 | | | | $1,253,970,323 | | | | $6,323,562,963 | |
| | | |
Affiliated issuers | | | — | | | | — | | | | 223,616,890 | |
| | | |
Cash | | | 3,790,070 | | | | 59,981,556 | | | | 113,579,025 | |
| | | |
Segregated foreign currency at value | | | — | | | | — | | | | 206,222 | |
| | | |
Foreign currency at value (B) | | | 3,510 | | | | 687,193 | | | | 858,442 | |
| | | |
Dividends, interest and other receivable | | | 40,291 | | | | 1,032,799 | | | | 28,124,979 | |
| | | |
Receivable for securities sold | | | 88,665 | | | | 5,100,521 | | | | 24,072,282 | |
| | | |
Receivable for capital shares sold | | | 29,006 | | | | 7,990,787 | | | | 7,904,019 | |
| | | |
Due from Advisor (Note 5) | | | 3,039 | | | | — | | | | — | |
| | | |
Prepaid expenses | | | 11,432 | | | | 21,127 | | | | — | |
TOTAL ASSETS | | | 13,551,714 | | | | 1,328,784,306 | | | | 6,721,924,822 | |
| | | |
LIABILITIES: | | | | | | | | | | | | |
| | | |
Payable for securities purchased | | | — | | | | 13,615,056 | | | | 1,243,523 | |
| | | |
Payable for capital shares redeemed | | | — | | | | 1,777,373 | | | | 19,207,210 | |
| | | |
Deferred foreign capital gains tax liability (Note 2-F) | | | 27,125 | | | | — | | | | 1,093,060 | |
| | | |
Due to Advisor (Note 5) | | | — | | | | 688,243 | | | | 3,554,174 | |
| | | |
Administration and accounting fees payable (Note 5) | | | 169 | | | | 15,965 | | | | 85,120 | |
| | | |
Administration and shareholder servicing fees payable (Note 5) | | | 1,608 | | | | 154,110 | | | | 766,076 | |
| | | |
Custodian fees payable | | | 2,977 | | | | 81,683 | | | | 615,304 | |
| | | |
Intermediary service fees payable (Note 5) | | | 3,154 | | | | 167,703 | | | | 1,332,438 | |
| | | |
Professional fees payable | | | 45,954 | | | | 41,853 | | | | 115,566 | |
| | | |
Transfer agent fees payable | | | 550 | | | | 6,407 | | | | 23,142 | |
| | | |
Accrued other expenses payable | | | 21,053 | | | | 27,314 | | | | 243,607 | |
TOTAL LIABILITIES | | | 102,590 | | | | 16,575,707 | | | | 28,279,220 | |
| | | |
NET ASSETS | | | $13,449,124 | | | | $1,312,208,599 | | | | $6,693,645,602 | |
| | | |
NET ASSETS: | | | | | | | | | | | | |
| | | |
Investor Class | | | $8,104,886 | | | | $524,586,664 | | | | $2,029,934,322 | |
| | | |
Institutional Class | | | 5,344,238 | | | | 787,621,935 | | | | 4,663,711,280 | |
TOTAL | | | $13,449,124 | | | | $1,312,208,599 | | | | $6,693,645,602 | |
See accompanying notes to financial statements.
| | | | |
| matthewsasia.com | 800.789.ASIA | | | 99 | |
| | |
| Statements of Assets and Liabilities (unaudited) (continued) | | June 30, 2020 |
| | | | | | | | | | | | |
| | | Matthews Asia
Value Fund | | | Matthews Asia
Growth Fund | | | Matthews Pacific
Tiger Fund | |
SHARES OUTSTANDING: | | | | | | | | | | | | |
| | | |
(shares of beneficial interest issued and outstanding, respectively, unlimited number of shares authorized with a $0.001 par value) | | | | | | | | | | | | |
| | | |
Investor Class | | | 766,815 | | | | 17,218,916 | | | | 74,152,356 | |
| | | |
Institutional Class | | | 508,908 | | | | 25,611,550 | | | | 170,447,771 | |
TOTAL | | | 1,275,723 | | | | 42,830,466 | | | | 244,600,127 | |
| | | |
NET ASSET VALUE: | | | | | | | | | | | | |
Investor Class, offering price and redemption price | | | $10.57 | | | | $30.47 | | | | $27.38 | |
Institutional Class, offering price and redemption price | | | $10.50 | | | | $30.75 | | | | $27.36 | |
| | | |
NET ASSETS CONSISTS OF: | | | | | | | | | | | | |
| | | |
Capital paid-in | | | $17,779,306 | | | | $900,602,896 | | | | $4,418,030,806 | |
| | | |
Total distributable earnings/(accumulated loss) | | | (4,330,182 | ) | | | 411,605,703 | | | | 2,275,614,796 | |
NET ASSETS | | | $13,449,124 | | | | $1,312,208,599 | | | | $6,693,645,602 | |
| | | |
(A) Investments at cost: | | | | | | | | | | | | |
| | | |
Unaffiliated Issuers | | | $9,917,973 | | | | $897,299,213 | | | | $4,050,817,956 | |
| | | |
Affiliated Issuers | | | — | | | | — | | | | 421,960,816 | |
| | | |
(B) Foreign Currency at Cost | | | $3,531 | | | | $688,851 | | | | $858,403 | |
See accompanying notes to financial statements.
| | |
| Statements of Assets and Liabilities (unaudited) (continued) | | June 30, 2020 |
| | | | | | | | | | | | |
| | | Matthews Asia
ESG Fund | | | Matthews Emerging
Asia Fund | | | Matthews Asia
Innovators Fund | |
| | | |
ASSETS: | | | | | | | | | | | | |
| | | |
Investments at value (A) (Note 2-A and 7): | | | | | | | | | | | | |
| | | |
Unaffiliated issuers | | | $54,417,050 | | | | $149,061,578 | | | | $796,013,800 | |
| | | |
Affiliated issuers | | | — | | | | 2,704,558 | | | | — | |
| | | |
Cash | | | 983,693 | | | | 10,666,954 | | | | 28,177,653 | |
| | | |
Segregated foreign currency at value | | | 717 | | | | — | | | | 7,861 | |
| | | |
Foreign currency at value (B) | | | 9,615 | | | | 1,260,321 | | | | 4,689,306 | |
| | | |
Dividends, interest and other receivable | | | 146,695 | | | | 966,298 | | | | 197,067 | |
| | | |
Receivable for securities sold | | | — | | | | 1,899,012 | | | | 978,833 | |
| | | |
Receivable for capital shares sold | | | 73,994 | | | | 85,802 | | | | 17,385,599 | |
| | | |
Prepaid expenses | | | 19,608 | | | | 22,725 | | | | 22,779 | |
TOTAL ASSETS | | | 55,651,372 | | | | 166,667,248 | | | | 847,472,898 | |
| | | |
LIABILITIES: | | | | | | | | | | | | |
| | | |
Payable for securities purchased | | | — | | | | — | | | | 10,124,771 | |
| | | |
Payable for capital shares redeemed | | | 42,223 | | | | 833,732 | | | | 249,600 | |
| | | |
Deferred foreign capital gains tax liability (Note 2-F) | | | 2,008 | | | | 292,743 | | | | 793,625 | |
| | | |
Due to Advisor (Note 5) | | | 27,696 | | | | 42,274 | | | | 402,804 | |
| | | |
Administration and accounting fees payable (Note 5) | | | 668 | | | | 2,161 | | | | 8,807 | |
| | | |
Administration and shareholder servicing fees payable (Note 5) | | | 6,469 | | | | 20,221 | | | | 90,184 | |
| | | |
Custodian fees payable | | | 23,803 | | | | 223,393 | | | | 28,826 | |
| | | |
Foreign capital gains tax payable (Note 2-F) | | | — | | | | 2,553 | | | | — | |
| | | |
Intermediary service fees payable (Note 5) | | | 6,387 | | | | 77,412 | | | | 16,094 | |
| | | |
Professional fees payable | | | 30,994 | | | | 28,780 | | | | 34,742 | |
| | | |
Transfer agent fees payable | | | 280 | | | | 2,569 | | | | 4,066 | |
| | | |
Accrued other expenses payable | | | 16,984 | | | | 33,351 | | | | 12,433 | |
TOTAL LIABILITIES | | | 157,512 | | | | 1,559,189 | | | | 11,765,952 | |
| | | |
NET ASSETS | | | $55,493,860 | | | | $165,108,059 | | | | $835,706,946 | |
| | | |
NET ASSETS: | | | | | | | | | | | | |
| | | |
Investor Class | | | $21,699,566 | | | | $49,595,798 | | | | $286,839,165 | |
| | | |
Institutional Class | | | 33,794,294 | | | | 115,512,261 | | | | 548,867,781 | |
TOTAL | | | $55,493,860 | | | | $165,108,059 | | | | $835,706,946 | |
See accompanying notes to financial statements.
| | | | |
| matthewsasia.com | 800.789.ASIA | | | 101 | |
| | |
| Statements of Assets and Liabilities (unaudited) (continued) | | June 30, 2020 |
| | | | | | | | | | | | |
| | | Matthews Asia
ESG Fund | | | Matthews Emerging
Asia Fund | | | Matthews Asia
Innovators Fund | |
SHARES OUTSTANDING: | | | | | | | | | | | | |
| | | |
(shares of beneficial interest issued and outstanding, respectively, unlimited number of shares authorized with a $0.001 par value) | | | | | | | | | | | | |
| | | |
Investor Class | | | 1,946,097 | | | | 5,478,189 | | | | 15,522,569 | |
| | | |
Institutional Class | | | 3,033,248 | | | | 12,676,753 | | | | 29,495,736 | |
TOTAL | | | 4,979,345 | | | | 18,154,942 | | | | 45,018,305 | |
| | | |
NET ASSET VALUE: | | | | | | | | | | | | |
Investor Class, offering price and redemption price | | | $11.15 | | | | $9.05 | | | | $18.48 | |
Institutional Class, offering price and redemption price | | | $11.14 | | | | $9.11 | | | | $18.61 | |
| | | |
NET ASSETS CONSISTS OF: | | | | | | | | | | | | |
| | | |
Capital paid-in | | | $51,820,040 | | | | $285,582,015 | | | | $603,321,618 | |
| | | |
Total distributable earnings/(accumulated loss) | | | 3,673,820 | | | | (120,473,956 | ) | | | 232,385,328 | |
NET ASSETS | | | $55,493,860 | | | | $165,108,059 | | | | $835,706,946 | |
| | | |
(A) Investments at cost: | | | | | | | | | | | | |
| | | |
Unaffiliated Issuers | | | $49,012,267 | | | | $186,637,865 | | | | $563,622,837 | |
| | | |
Affiliated Issuers | | | — | | | | 3,537,343 | | | | — | |
| | | |
(B) Foreign Currency at Cost | | | $9,611 | | | | $1,255,442 | | | | $4,689,058 | |
See accompanying notes to financial statements.
| | |
| Statements of Assets and Liabilities (unaudited) (continued) | | June 30, 2020 |
| | | | | | | | | | | | |
| | | Matthews
China Fund | | | Matthews
India Fund | | | Matthews
Japan Fund | |
| | | |
ASSETS: | | | | | | | | | | | | |
| | | |
Investments at value (A) (Note 2-A and 7): | | | | | | | | | | | | |
| | | |
Unaffiliated issuers | | | $1,042,618,216 | | | | $533,262,906 | | | | $1,393,048,967 | |
| | | |
Cash | | | 39,382,909 | | | | 18,549,282 | | | | 45,548,082 | |
| | | |
Segregated foreign currency at value | | | 34,355 | | | | — | | | | — | |
| | | |
Foreign currency at value (B) | | | 1,458 | | | | 838,603 | | | | 4,430,138 | |
| | | |
Dividends, interest and other receivable | | | 4,839,937 | | | | 3,495,333 | | | | 776,198 | |
| | | |
Receivable for securities sold | | | 3,946,882 | | | | 1,041,875 | | | | 43,361,995 | |
| | | |
Receivable for capital shares sold | | | 2,016,815 | | | | 697,872 | | | | 1,015,919 | |
| | | |
Prepaid expenses | | | 36,206 | | | | 6,045 | | | | 11,843 | |
TOTAL ASSETS | | | 1,092,876,778 | | | | 557,891,916 | | | | 1,488,193,142 | |
| | | |
LIABILITIES: | | | | | | | | | | | | |
| | | |
Payable for securities purchased | | | 744,550 | | | | 471,377 | | | | 9,568,396 | |
| | | |
Payable for capital shares redeemed | | | 1,139,040 | | | | 1,040,318 | | | | 8,051,021 | |
| | | |
Deferred foreign capital gains tax liability (Note 2-F) | | | — | | | | 3,210,660 | | | | — | |
| | | |
Due to Advisor (Note 5) | | | 573,909 | | | | 298,729 | | | | 814,078 | |
| | | |
Administration and accounting fees payable (Note 5) | | | 13,122 | | | | 7,159 | | | | 20,702 | |
| | | |
Administration and shareholder servicing fees payable (Note 5) | | | 128,601 | | | | 66,722 | | | | 182,273 | |
| | | |
Custodian fees payable | | | 24,420 | | | | 181,565 | | | | 48,221 | |
| | | |
Intermediary service fees payable (Note 5) | | | 125,958 | | | | 324,559 | | | | 285,383 | |
| | | |
Professional fees payable | | | 34,402 | | | | 28,781 | | | | 48,167 | |
| | | |
Transfer agent fees payable | | | 15,229 | | | | 16,198 | | | | 24,966 | |
| | | |
Accrued other expenses payable | | | 201,618 | | | | 74,723 | | | | 232,880 | |
TOTAL LIABILITIES | | | 3,000,849 | | | | 5,720,791 | | | | 19,276,087 | |
| | | |
NET ASSETS | | | $1,089,875,929 | | | | $552,171,125 | | | | $1,468,917,055 | |
| | | |
NET ASSETS: | | | | | | | | | | | | |
| | | |
Investor Class | | | $740,104,504 | | | | $477,579,100 | | | | $961,996,490 | |
| | | |
Institutional Class | | | 349,771,425 | | | | 74,592,025 | | | | 506,920,565 | |
TOTAL | | | $1,089,875,929 | | | | $552,171,125 | | | | $1,468,917,055 | |
See accompanying notes to financial statements.
| | | | |
| matthewsasia.com | 800.789.ASIA | | | 103 | |
| | |
| Statements of Assets and Liabilities (unaudited) (continued) | | June 30, 2020 |
| | | | | | | | | | | | |
| | | Matthews
China Fund | | | Matthews
India Fund | | | Matthews
Japan Fund | |
SHARES OUTSTANDING: | | | | | | | | | | | | |
| | | |
(shares of beneficial interest issued and outstanding, respectively, unlimited number of shares authorized with a $0.001 par value) | | | | | | | | | | | | |
| | | |
Investor Class | | | 34,467,078 | | | | 25,449,434 | | | | 44,705,554 | |
| | | |
Institutional Class | | | 16,309,310 | | | | 3,925,436 | | | | 23,508,154 | |
TOTAL | | | 50,776,388 | | | | 29,374,870 | | | | 68,213,708 | |
| | | |
NET ASSET VALUE: | | | | | | | | | | | | |
Investor Class, offering price and redemption price | | | $21.47 | | | | $18.77 | | | | $21.52 | |
Institutional Class, offering price and redemption price | | | $21.45 | | | | $19.00 | | | | $21.56 | |
| | | |
NET ASSETS CONSISTS OF: | | | | | | | | | | | | |
| | | |
Capital paid-in | | | $891,213,359 | | | | $620,521,583 | | | | $1,155,018,140 | |
| | | |
Total distributable earnings/(accumulated loss) | | | 198,662,570 | | | | (68,350,458 | ) | | | 313,898,915 | |
NET ASSETS | | | $1,089,875,929 | | | | $552,171,125 | | | | $1,468,917,055 | |
| | | |
(A) Investments at cost: | | | | | | | | | | | | |
| | | |
Unaffiliated Issuers | | | $847,902,826 | | | | $564,661,837 | | | | $1,112,170,226 | |
| | | |
(B) Foreign Currency at Cost | | | $1,458 | | | | $839,186 | | | | $4,440,832 | |
See accompanying notes to financial statements.
| | |
| Statements of Assets and Liabilities (unaudited) (continued) | | June 30, 2020 |
| | | | | | | | | | | | |
| | | Matthews
Korea Fund | | | Matthews Asia
Small Companies
Fund | | | Matthews China
Small Companies
Fund | |
| | | |
ASSETS: | | | | | | | | | | | | |
| | | |
Investments at value (A) (Note 2-A and 7): | | | | | | | | | | | | |
| | | |
Unaffiliated issuers | | | $111,404,145 | | | | $162,058,606 | | | | $356,586,748 | |
| | | |
Cash | | | 1,755,886 | | | | 9,909,417 | | | | 11,809,550 | |
| | | |
Segregated foreign currency at value | | | — | | | | 3,302 | | | | 15,169 | |
| | | |
Foreign currency at value (B) | | | — | | | | 214,960 | | | | 383,241 | |
| | | |
Dividends, interest and other receivable | | | 273,005 | | | | 510,575 | | | | 1,048,244 | |
| | | |
Receivable for securities sold | | | — | | | | 120,702 | | | | — | |
| | | |
Receivable for capital shares sold | | | 11,116 | | | | 127,910 | | | | 8,695,594 | |
| | | |
Prepaid expenses | | | 16,236 | | | | 11,099 | | | | 53,736 | |
TOTAL ASSETS | | | 113,460,388 | | | | 172,956,571 | | | | 378,592,282 | |
| | | |
LIABILITIES: | | | | | | | | | | | | |
| | | |
Payable for securities purchased | | | — | | | | 48 | | | | 3,950,764 | |
| | | |
Payable for capital shares redeemed | | | 172,211 | | | | 986,896 | | | | 600,918 | |
| | | |
Due to Advisor (Note 5) | | | 61,778 | | | | 99,104 | | | | 248,448 | |
| | | |
Administration and accounting fees payable (Note 5) | | | 1,437 | | | | 2,069 | | | | 3,982 | |
| | | |
Administration and shareholder servicing fees payable (Note 5) | | | 13,820 | | | | 19,766 | | | | 39,657 | |
| | | |
Custodian fees payable | | | 11,500 | | | | 47,961 | | | | 5,047 | |
| | | |
Intermediary service fees payable (Note 5) | | | 31,028 | | | | 39,398 | | | | — | |
| | | |
Professional fees payable | | | 27,332 | | | | 50,282 | | | | 30,579 | |
| | | |
Transfer agent fees payable | | | 4,335 | | | | 3,029 | | | | 1,168 | |
| | | |
Accrued other expenses payable | | | 19,924 | | | | 18,636 | | | | 5,042 | |
TOTAL LIABILITIES | | | 343,365 | | | | 1,267,189 | | | | 4,885,605 | |
| | | |
NET ASSETS | | | $113,117,023 | | | | $171,689,382 | | | | $373,706,677 | |
| | | |
NET ASSETS: | | | | | | | | | | | | |
| | | |
Investor Class | | | $105,138,108 | | | | $83,269,574 | | | | $213,237,378 | |
| | | |
Institutional Class | | | 7,978,915 | | | | 88,419,808 | | | | 160,469,299 | |
TOTAL | | | $113,117,023 | | | | $171,689,382 | | | | $373,706,677 | |
See accompanying notes to financial statements.
| | | | |
| matthewsasia.com | 800.789.ASIA | | | 105 | |
| | |
| Statements of Assets and Liabilities (unaudited) (continued) | | June 30, 2020 |
| | | | | | | | | | | | |
| | | Matthews
Korea Fund | | | Matthews Asia
Small Companies
Fund | | | Matthews China
Small Companies
Fund | |
SHARES OUTSTANDING: | | | | | | | | | | | | |
| | | |
(shares of beneficial interest issued and outstanding, respectively, unlimited number of shares authorized with a $0.001 par value) | | | | | | | | | | | | |
| | | |
Investor Class | | | 25,042,402 | | | | 4,177,723 | | | | 10,538,009 | |
| | | |
Institutional Class | | | 1,885,747 | | | | 4,442,317 | | | | 7,912,022 | |
TOTAL | | | 26,928,149 | | | | 8,620,040 | | | | 18,450,031 | |
| | | |
NET ASSET VALUE: | | | | | | | | | | | | |
Investor Class, offering price and redemption price | | | $4.20 | | | | $19.93 | | | | $20.24 | |
Institutional Class, offering price and redemption price | | | $4.23 | | | | $19.90 | | | | $20.28 | |
| | | |
NET ASSETS CONSISTS OF: | | | | | | | | | | | | |
| | | |
Capital paid-in | | | $109,269,137 | | | | $160,107,853 | | | | $257,962,360 | |
| | | |
Total distributable earnings/(accumulated loss) | | | 3,847,886 | | | | 11,581,529 | | | | 115,744,317 | |
NET ASSETS | | | $113,117,023 | | | | $171,689,382 | | | | $373,706,677 | |
| | | |
(A) Investments at cost: | | | | | | | | | | | | |
| | | |
Unaffiliated Issuers | | | $97,434,722 | | | | $116,589,521 | | | | $245,956,440 | |
| | | |
(B) Foreign Currency at Cost | | | $— | | | | $214,686 | | | | $383,241 | |
See accompanying notes to financial statements.
| | |
| Statements of Operations (unaudited) | | Six-Month Period Ended June 30, 2020 |
| | | | | | | | | | | | |
| | | Matthews Emerging
Markets Equity Fund1 | | | Matthews Asia
Total Return
Bond Fund | | | Matthews Asia
Credit
Opportunities Fund | |
| | | |
INVESTMENT INCOME: | | | | | | | | | | | | |
| | | |
Dividends—Unaffiliated Issuers | | | $39,801 | | | | $10,253 | | | | $8,735 | |
| | | |
Interest | | | — | | | | 3,155,491 | | | | 2,769,312 | |
| | | |
Foreign withholding tax | | | (4,145 | ) | | | (87,731 | ) | | | (82,958 | ) |
TOTAL INVESTMENT INCOME | | | 35,656 | | | | 3,078,013 | | | | 2,695,089 | |
| | | |
EXPENSES: | | | | | | | | | | | | |
| | | |
Investment advisory fees (Note 5) | | | 8,425 | | | | 295,480 | | | | 261,358 | |
| | | |
Administration and accounting fees (Note 5) | | | 101 | | | | 4,298 | | | | 3,802 | |
| | | |
Administration and shareholder servicing fees (Note 5) | | | 1,897 | | | | 79,356 | | | | 70,259 | |
| | | |
Accounting out-of-pocket fees | | | 4,541 | | | | 12,328 | | | | 9,973 | |
| | | |
Custodian fees | | | 9,330 | | | | 19,928 | | | | 10,342 | |
| | | |
Printing fees | | | 2,957 | | | | 14,368 | | | | 12,281 | |
| | | |
Intermediary service fees (Note 5) | | | 926 | | | | 69,733 | | | | 33,797 | |
| | | |
Professional fees | | | 11,847 | | | | 30,707 | | | | 30,111 | |
| | | |
Registration fees | | | 7,166 | | | | 21,672 | | | | 22,298 | |
| | | |
Transfer agent fees | | | 316 | | | | 2,864 | | | | 1,007 | |
| | | |
Trustees fees | | | 126 | | | | 3,110 | | | | 2,150 | |
| | | |
Other expenses | | | 2,163 | | | | 8,543 | | | | 2,135 | |
TOTAL EXPENSES | | | 49,795 | | | | 562,387 | | | | 459,513 | |
| | | |
Advisory fees waived and expenses waived or reimbursed (Note 5) | | | (38,005 | ) | | | (36,242 | ) | | | (17,723 | ) |
NET EXPENSES | | | 11,790 | | | | 526,145 | | | | 441,790 | |
| | | |
NET INVESTMENT INCOME (LOSS) | | | 23,866 | | | | 2,551,868 | | | | 2,253,299 | |
| | | |
| REALIZED AND UNREALIZED GAIN (LOSS) ON INVESTMENTS, FORWARD FOREIGN CURRENCY EXCHANGE CONTRACTS, FOREIGN CURRENCY RELATED TRANSACTIONS, SWAPS, AND FOREIGN CAPITAL GAINS TAXES: | | | | | | | | | | | | |
| | | |
Net realized gain (loss) on investments—Unaffiliated Issuers | | | 178,885 | | | | (2,520,007 | ) | | | (3,103,571 | ) |
| | | |
Net realized gain (loss) on forward foreign currency exchange contracts | | | — | | | | (56,573 | ) | | | — | |
| | | |
Net realized gain (loss) on swaps | | | — | | | | 21,732 | | | | — | |
| | | |
Net realized foreign capital gains tax | | | (5,711 | ) | | | (29,129 | ) | | | — | |
| | | |
Net realized gain (loss) on foreign currency related transactions | | | (1,542 | ) | | | (110,160 | ) | | | (668 | ) |
| | | |
Net change in unrealized appreciation/depreciation on investments—Unaffiliated Issuers | | | 994,211 | | | | (4,164,191 | ) | | | (4,066,821 | ) |
| | | |
Net change in unrealized appreciation/depreciation on forward foreign currency exchange contracts | | | — | | | | (909,133 | ) | | | — | |
| | | |
Net change in unrealized appreciation/depreciation on swaps | | | — | | | | 460,955 | | | | — | |
| | | |
Net change in deferred foreign capital gains taxes on unrealized appreciation/depreciation | | | (776 | ) | | | 38,552 | | | | — | |
| | | |
Net change in unrealized appreciation/depreciation on foreign currency related translations | | | (91 | ) | | | 4,055 | | | | (61 | ) |
Net realized and unrealized gain (loss) on investments, forward foreign currency exchange contracts, foreign currency related transactions, swaps, and foreign capital gains taxes | | | 1,164,976 | | | | (7,263,899 | ) | | | (7,171,121 | ) |
| | | |
NET INCREASE (DECREASE) IN NET ASSETS FROM OPERATIONS | | | $1,188,842 | | | | ($4,712,031 | ) | | | ($4,917,822 | ) |
| 1 | The Fund commenced operations on April 30, 2020. |
See accompanying notes to financial statements.
| | | | |
| matthewsasia.com | 800.789.ASIA | | | 107 | |
| | |
| Statements of Operations (unaudited) (continued) | | Six-Month Period Ended June 30, 2020 |
| | | | | | | | | | | | |
| | | Matthews Asian
Growth and
Income Fund | | | Matthews Asia
Dividend Fund | | | Matthews China
Dividend Fund | |
| | | |
INVESTMENT INCOME: | | | | | | | | | | | | |
| | | |
Dividends—Unaffiliated Issuers | | | $18,691,963 | | | | $42,415,952 | | | | $5,223,312 | |
| | | |
Dividends—Affiliated Issuers (Note 7) | | | — | | | | 10,624,903 | | | | — | |
| | | |
Interest | | | 936,534 | | | | — | | | | — | |
| | | |
Foreign withholding tax | | | (1,341,026 | ) | | | (3,185,559 | ) | | | (180,245 | ) |
TOTAL INVESTMENT INCOME | | | 18,287,471 | | | | 49,855,296 | | | | 5,043,067 | |
| | | |
EXPENSES: | | | | | | | | | | | | |
| | | |
Investment advisory fees (Note 5) | | | 4,354,888 | | | | 14,112,838 | | | | 1,087,808 | |
| | | |
Administration and accounting fees (Note 5) | | | 52,268 | | | | 169,422 | | | | 13,056 | |
| | | |
Administration and shareholder servicing fees (Note 5) | | | 965,343 | | | | 3,121,944 | | | | 241,040 | |
| | | |
Accounting out-of-pocket fees | | | 19,563 | | | | 19,083 | | | | 16,126 | |
| | | |
Custodian fees | | | 201,117 | | | | 714,191 | | | | 70,238 | |
| | | |
Printing fees | | | 79,441 | | | | 204,849 | | | | 32,987 | |
| | | |
Intermediary service fees (Note 5) | | | 981,090 | | | | 2,753,858 | | | | 302,271 | |
| | | |
Professional fees | | | 42,673 | | | | 98,807 | | | | 27,652 | |
| | | |
Registration fees | | | 32,484 | | | | 79,343 | | | | 29,289 | |
| | | |
Transfer agent fees | | | 30,490 | | | | 50,357 | | | | 8,020 | |
| | | |
Trustees fees | | | 38,516 | | | | 143,245 | | | | 9,487 | |
| | | |
Other expenses | | | 32,079 | | | | 153,381 | | | | 7,647 | |
TOTAL EXPENSES | | | 6,829,952 | | | | 21,621,318 | | | | 1,845,621 | |
| | | |
Advisory fees waived and expenses waived or reimbursed (Note 5) | | | — | | | | (62,600 | ) | | | — | |
| | | |
Administration fees waived (Note 5) | | | — | | | | (62,600 | ) | | | — | |
NET EXPENSES | | | 6,829,952 | | | | 21,496,118 | | | | 1,845,621 | |
| | | |
NET INVESTMENT INCOME (LOSS) | | | 11,457,519 | | | | 28,359,178 | | | | 3,197,446 | |
| | | |
| REALIZED AND UNREALIZED GAIN (LOSS) ON INVESTMENTS, FOREIGN CURRENCY RELATED TRANSACTIONS, AND FOREIGN CAPITAL GAINS TAXES: | | | | | | | | | | | | |
| | | |
Net realized gain (loss) on investments—Unaffiliated Issuers | | | (48,828,440 | ) | | | (131,657,830 | ) | | | (12,811,072 | ) |
| | | |
Net realized gain (loss) on investments—Affiliated Issuers | | | — | | | | 6,259,519 | | | | — | |
| | | |
Net realized foreign capital gains tax | | | (107,997 | ) | | | — | | | | — | |
| | | |
Net realized gain (loss) on foreign currency related transactions | | | (544,433 | ) | | | (1,695,734 | ) | | | (17,885 | ) |
| | | |
Net change in unrealized appreciation/depreciation on investments—Unaffiliated Issuers | | | (72,758,910 | ) | | | (110,059,759 | ) | | | 17,642,870 | |
| | | |
Net change in unrealized appreciation/depreciation on investments—Affiliated Issuers | | | — | | | | (68,789,746 | ) | | | — | |
| | | |
Net change in deferred foreign capital gains taxes on unrealized appreciation/depreciation | | | (404,318 | ) | | | — | | | | — | |
| | | |
Net change in unrealized appreciation/depreciation on foreign currency related translations | | | 2,472 | | | | (92,184 | ) | | | (4,901 | ) |
Net realized and unrealized gain (loss) on investments, foreign currency related transactions, and foreign capital gains taxes | | | (122,641,626 | ) | | | (306,035,734 | ) | | | 4,809,012 | |
| | | |
NET INCREASE (DECREASE) IN NET ASSETS FROM OPERATIONS | | | ($111,184,107 | ) | | | ($277,676,556 | ) | | | $8,006,458 | |
See accompanying notes to financial statements.
| | |
| Statements of Operations (unaudited) (continued) | | Six-Month Period Ended June 30, 2020 |
| | | | | | | | | | | | |
| | | Matthews Asia
Value Fund | | | Matthews Asia
Growth Fund | | | Matthews Pacific
Tiger Fund | |
| | | |
INVESTMENT INCOME: | | | | | | | | | | | | |
| | | |
Dividends—Unaffiliated Issuers | | | $168,929 | | | | $6,700,153 | | | | $60,556,257 | |
| | | |
Foreign withholding tax | | | (14,137 | ) | | | (489,884 | ) | | | (5,347,716 | ) |
TOTAL INVESTMENT INCOME | | | 154,792 | | | | 6,210,269 | | | | 55,208,541 | |
| | | |
EXPENSES: | | | | | | | | | | | | |
| | | |
Investment advisory fees (Note 5) | | | 50,560 | | | | 3,779,819 | | | | 23,675,895 | |
| | | |
Administration and accounting fees (Note 5) | | | 607 | | | | 45,362 | | | | 284,211 | |
| | | |
Administration and shareholder servicing fees (Note 5) | | | 11,165 | | | | 838,340 | | | | 5,239,139 | |
| | | |
Accounting out-of-pocket fees | | | 13,748 | | | | 17,185 | | | | 19,371 | |
| | | |
Custodian fees | | | 12,082 | | | | 261,568 | | | | 1,663,954 | |
| | | |
Printing fees | | | 10,893 | | | | 44,665 | | | | 208,637 | |
| | | |
Intermediary service fees (Note 5) | | | 14,873 | | | | 687,078 | | | | 4,312,534 | |
| | | |
Professional fees | | | 30,162 | | | | 38,714 | | | | 149,003 | |
| | | |
Registration fees | | | 20,941 | | | | 36,334 | | | | 109,907 | |
| | | |
Transfer agent fees | | | 1,530 | | | | 19,014 | | | | 60,172 | |
| | | |
Trustees fees | | | 559 | | | | 31,030 | | | | 269,759 | |
| | | |
Other expenses | | | 7,731 | | | | 24,742 | | | | 203,976 | |
TOTAL EXPENSES | | | 174,851 | | | | 5,823,851 | | | | 36,196,558 | |
| | | |
Advisory fees waived and expenses waived or reimbursed (Note 5) | | | (71,279 | ) | | | — | | | | (296,352 | ) |
| | | |
Administration fees waived (Note 5) | | | — | | | | — | | | | (296,141 | ) |
NET EXPENSES | | | 103,572 | | | | 5,823,851 | | | | 35,604,065 | |
| | | |
NET INVESTMENT INCOME (LOSS) | | | 51,220 | | | | 386,418 | | | | 19,604,476 | |
| | | |
| REALIZED AND UNREALIZED GAIN (LOSS) ON INVESTMENTS, FOREIGN CURRENCY RELATED TRANSACTIONS, AND FOREIGN CAPITAL GAINS TAXES: | | | | | | | | | | | | |
| | | |
Net realized gain (loss) on investments—Unaffiliated Issuers | | | (1,015,912 | ) | | | 51,411,473 | | | | 303,754,401 | |
| | | |
Net realized gain (loss) on investments—Affiliated Issuers | | | — | | | | — | | | | (184,976,125 | ) |
| | | |
Net realized foreign capital gains tax | | | (1,250 | ) | | | — | | | | (4,654 | ) |
| | | |
Net realized gain (loss) on foreign currency related transactions | | | (19,051 | ) | | | (405,647 | ) | | | (2,500,843 | ) |
| | | |
Net change in unrealized appreciation/depreciation on investments—Unaffiliated Issuers | | | (783,624 | ) | | | 50,119,527 | | | | (809,993,389 | ) |
| | | |
Net change in unrealized appreciation/depreciation on investments—Affiliated Issuers | | | — | | | | — | | | | 87,876,273 | |
| | | |
Net change in deferred foreign capital gains taxes on unrealized appreciation/depreciation | | | (19,474 | ) | | | 246,697 | | | | 29,522,255 | |
| | | |
Net change in unrealized appreciation/depreciation on foreign currency related translations | | | (112 | ) | | | 33,548 | | | | 93,335 | |
Net realized and unrealized gain (loss) on investments, foreign currency related transactions, and foreign capital gains taxes | | | (1,839,423 | ) | | | 101,405,598 | | | | (576,228,747 | ) |
| | | |
NET INCREASE (DECREASE) IN NET ASSETS FROM OPERATIONS | | | ($1,788,203 | ) | | | $101,792,016 | | | | ($556,624,271 | ) |
See accompanying notes to financial statements.
| | | | |
| matthewsasia.com | 800.789.ASIA | | | 109 | |
| | |
| Statements of Operations (unaudited) (continued) | | Six-Month Period Ended June 30, 2020 |
| | | | | | | | | | | | |
| | | Matthews Asia
ESG Fund | | | Matthews Emerging
Asia Fund | | | Matthews Asia
Innovators Fund | |
| | | |
INVESTMENT INCOME: | | | | | | | | | | | | |
| | | |
Dividends—Unaffiliated Issuers | | | $371,375 | | | | $3,389,007 | | | | $1,867,176 | |
| | | |
Dividends—Affiliated Issuers (Note 7) | | | — | | | | — | | | | — | |
| | | |
Foreign withholding tax | | | (34,854 | ) | | | (325,376 | ) | | | (147,367 | ) |
TOTAL INVESTMENT INCOME | | | 336,521 | | | | 3,063,631 | | | | 1,719,809 | |
| | | |
EXPENSES: | | | | | | | | | | | | |
| | | |
Investment advisory fees (Note 5) | | | 169,359 | | | | 1,074,009 | | | | 1,531,947 | |
| | | |
Administration and accounting fees (Note 5) | | | 2,033 | | | | 8,592 | | | | 18,374 | |
| | | |
Administration and shareholder servicing fees (Note 5) | | | 37,521 | | | | 157,705 | | | | 341,475 | |
| | | |
Accounting out-of-pocket fees | | | 17,850 | | | | 17,872 | | | | 14,340 | |
| | | |
Custodian fees | | | 54,284 | | | | 471,713 | | | | 102,342 | |
| | | |
Printing fees | | | 10,998 | | | | 25,401 | | | | 23,776 | |
| | | |
Intermediary service fees (Note 5) | | | 26,265 | | | | 170,579 | | | | 237,437 | |
| | | |
Professional fees | | | 26,325 | | | | 37,365 | | | | 32,405 | |
| | | |
Registration fees | | | 18,489 | | | | 30,437 | | | | 27,176 | |
| | | |
Transfer agent fees | | | 814 | | | | 6,657 | | | | 11,360 | |
| | | |
Trustees fees | | | 1,399 | | | | 9,302 | | | | 8,428 | |
| | | |
Other expenses | | | 7,742 | | | | 15,052 | | | | 11,610 | |
TOTAL EXPENSES | | | 373,079 | | | | 2,024,684 | | | | 2,360,670 | |
| | | |
Advisory fees waived and expenses waived or reimbursed (Note 5) | | | (50,390 | ) | | | (661,452 | ) | | | — | |
NET EXPENSES | | | 322,689 | | | | 1,363,232 | | | | 2,360,670 | |
| | | |
NET INVESTMENT INCOME (LOSS) | | | 13,832 | | | | 1,700,399 | | | | (640,861 | ) |
| | | |
| REALIZED AND UNREALIZED GAIN (LOSS) ON INVESTMENTS, FOREIGN CURRENCY RELATED TRANSACTIONS, AND FOREIGN CAPITAL GAINS TAXES: | | | | | | | | | | | | |
| | | |
Net realized gain (loss) on investments—Unaffiliated Issuers | | | (1,738,797 | ) | | | (53,989,898 | ) | | | 222,790 | |
| | | |
Net realized gain (loss) on investments—Affiliated Issuers | | | — | | | | (30,892 | ) | | | — | |
| | | |
Net realized foreign capital gains tax | | | (26,447 | ) | | | 111,969 | | | | — | |
| | | |
Net realized gain (loss) on foreign currency related transactions | | | 8,084 | | | | (533,698 | ) | | | (191,164 | ) |
| | | |
Net change in unrealized appreciation/depreciation on investments—Unaffiliated Issuers | | | 1,604,861 | | | | (24,048,275 | ) | | | 164,958,944 | |
| | | |
Net change in unrealized appreciation/depreciation on investments—Affiliated Issuers | | | — | | | | (1,275,061 | ) | | | — | |
| | | |
Net change in deferred foreign capital gains taxes on unrealized appreciation/depreciation | | | 96,012 | | | | 1,452,652 | | | | 207,304 | |
| | | |
Net change in unrealized appreciation/depreciation on foreign currency related translations | | | 577 | | | | (41,869 | ) | | | (24,434 | ) |
Net realized and unrealized gain (loss) on investments, foreign currency related transactions, and foreign capital gains taxes | | | (55,710 | ) | | | (78,355,072 | ) | | | 165,173,440 | |
| | | |
NET INCREASE (DECREASE) IN NET ASSETS FROM OPERATIONS | | | ($41,878 | ) | | | ($76,654,673 | ) | | | $164,532,579 | |
See accompanying notes to financial statements.
| | |
| Statements of Operations (unaudited) (continued) | | Six-Month Period Ended June 30, 2020 |
| | | | | | | | | | | | |
| | | Matthews
China Fund | | | Matthews
India Fund | | | Matthews
Japan Fund | |
| | | |
INVESTMENT INCOME: | | | | | | | | | | | | |
| | | |
Dividends—Unaffiliated Issuers | | | $9,027,629 | | | | $4,942,255 | | | | $15,399,988 | |
| | | |
Foreign withholding tax | | | (452,252 | ) | | | (45,827 | ) | | | (1,558,341 | ) |
TOTAL INVESTMENT INCOME | | | 8,575,377 | | | | 4,896,428 | | | | 13,841,647 | |
| | | |
EXPENSES: | | | | | | | | | | | | |
| | | |
Investment advisory fees (Note 5) | | | 3,057,357 | | | | 2,317,081 | | | | 5,915,541 | |
| | | |
Administration and accounting fees (Note 5) | | | 36,687 | | | | 27,825 | | | | 71,012 | |
| | | |
Administration and shareholder servicing fees (Note 5) | | | 679,010 | | | | 511,245 | | | | 1,309,350 | |
| | | |
Accounting out-of-pocket fees | | | 14,977 | | | | 16,551 | | | | 17,154 | |
| | | |
Custodian fees | | | 161,394 | | | | 285,998 | | | | 106,344 | |
| | | |
Printing fees | | | 51,319 | | | | 69,310 | | | | 192,929 | |
| | | |
Intermediary service fees (Note 5) | | | 739,854 | | | | 830,112 | | | | 693,339 | |
| | | |
Professional fees | | | 33,854 | | | | 66,752 | | | | 49,284 | |
| | | |
Registration fees | | | 30,110 | | | | 38,144 | | | | 38,650 | |
| | | |
Transfer agent fees | | | 42,939 | | | | 42,682 | | | | 67,536 | |
| | | |
Trustees fees | | | 23,313 | | | | 29,371 | | | | 62,177 | |
| | | |
Other expenses | | | 14,522 | | | | 25,157 | | | | 50,277 | |
TOTAL EXPENSES | | | 4,885,336 | | | | 4,260,228 | | | | 8,573,593 | |
| | | |
NET INVESTMENT INCOME (LOSS) | | | 3,690,041 | | | | 636,200 | | | | 5,268,054 | |
| | | |
| REALIZED AND UNREALIZED GAIN (LOSS) ON INVESTMENTS, FOREIGN CURRENCY RELATED TRANSACTIONS, AND FOREIGN CAPITAL GAINS TAXES: | | | | | | | | | | | | |
| | | |
Net realized gain (loss) on investments—Unaffiliated Issuers | | | 32,940,685 | | | | (51,188,168 | ) | | | 40,935,090 | |
| | | |
Net realized foreign capital gains tax | | | — | | | | (1,747,851 | ) | | | — | |
| | | |
Net realized gain (loss) on foreign currency related transactions | | | (21,458 | ) | | | (416,955 | ) | | | (38,941 | ) |
| | | |
Net change in unrealized appreciation/depreciation on investments—Unaffiliated Issuers | | | 83,386,795 | | | | (146,924,852 | ) | | | (124,761,127 | ) |
| | | |
Net change in deferred foreign capital gains taxes on unrealized appreciation/depreciation | | | — | | | | 10,100,989 | | | | — | |
| | | |
Net change in unrealized appreciation/depreciation on foreign currency related translations | | | 7,230 | | | | (40,832 | ) | | | 29,931 | |
Net realized and unrealized gain (loss) on investments, foreign currency related transactions, and foreign capital gains taxes | | | 116,313,252 | | | | (190,217,669 | ) | | | (83,835,047 | ) |
| | | |
NET INCREASE (DECREASE) IN NET ASSETS FROM OPERATIONS | | | $120,003,293 | | | | ($189,581,469 | ) | | | ($78,566,993 | ) |
See accompanying notes to financial statements.
| | | | |
| matthewsasia.com | 800.789.ASIA | | | 111 | |
| | |
| Statements of Operations (unaudited) (continued) | | Six-Month Period Ended June 30, 2020 |
| | | | | | | | | | | | |
| | | Matthews
Korea Fund | | | Matthews Asia
Small Companies
Fund | | | Matthews China
Small Companies
Fund | |
| | | |
INVESTMENT INCOME: | | | | | | | | | | | | |
| | | |
Dividends—Unaffiliated Issuers | | | $419,823 | | | | $1,142,951 | | | | $2,492,364 | |
| | | |
Dividends—Affiliated Issuers (Note 7) | | | — | | | | — | | | | — | |
| | | |
Foreign withholding tax | | | (69,016 | ) | | | (61,548 | ) | | | (42,653 | ) |
TOTAL INVESTMENT INCOME | | | 350,807 | | | | 1,081,403 | | | | 2,449,711 | |
| | | |
EXPENSES: | | | | | | | | | | | | |
| | | |
Investment advisory fees (Note 5) | | | 375,457 | | | | 802,549 | | | | 964,292 | |
| | | |
Administration and accounting fees (Note 5) | | | 4,507 | | | | 6,420 | | | | 7,714 | |
| | | |
Administration and shareholder servicing fees (Note 5) | | | 83,084 | | | | 118,511 | | | | 143,882 | |
| | | |
Accounting out-of-pocket fees | | | 15,078 | | | | 19,549 | | | | 16,592 | |
| | | |
Custodian fees | | | 27,620 | | | | 106,266 | | | | 48,290 | |
| | | |
Printing fees | | | 15,132 | | | | 19,286 | | | | 14,728 | |
| | | |
Intermediary service fees (Note 5) | | | 114,195 | | | | 124,158 | | | | 85,396 | |
| | | |
Professional fees | | | 23,430 | | | | 32,592 | | | | 24,326 | |
| | | |
Registration fees | | | 19,654 | | | | 23,429 | | | | 21,800 | |
| | | |
Transfer agent fees | | | 11,648 | | | | 8,504 | | | | 5,177 | |
| | | |
Trustees fees | | | 4,431 | | | | 4,880 | | | | 2,601 | |
| | | |
Other expenses | | | 4,906 | | | | 9,751 | | | | 2,386 | |
TOTAL EXPENSES | | | 699,142 | | | | 1,275,895 | | | | 1,337,184 | |
| | | |
Advisory fees waived and expenses waived or reimbursed (Note 5) | | | — | | | | (222,432 | ) | | | (106,645 | ) |
NET EXPENSES | | | 699,142 | | | | 1,053,463 | | | | 1,230,539 | |
| | | |
NET INVESTMENT INCOME (LOSS) | | | (348,335 | ) | | | 27,940 | | | | 1,219,172 | |
| | | |
| REALIZED AND UNREALIZED GAIN (LOSS) ON INVESTMENTS, FOREIGN CURRENCY RELATED TRANSACTIONS, AND FOREIGN CAPITAL GAINS TAXES: | | | | | | | | | | | | |
| | | |
Net realized gain (loss) on investments—Unaffiliated Issuers | | | (4,183,548 | ) | | | (32,747,997 | ) | | | 4,905,848 | |
| | | |
Net realized foreign capital gains tax | | | — | | | | (380,107 | ) | | | — | |
| | | |
Net realized gain (loss) on foreign currency related transactions | | | (222,044 | ) | | | (45,775 | ) | | | (20,351 | ) |
| | | |
Net change in unrealized appreciation/depreciation on investments—Unaffiliated Issuers | | | (1,841,080 | ) | | | 45,379,939 | | | | 99,386,779 | |
| | | |
Net change in unrealized appreciation/depreciation on investments—Affiliated Issuers | | | — | | | | — | | | | — | |
| | | |
Net change in deferred foreign capital gains taxes on unrealized appreciation/depreciation | | | — | | | | 1,058,762 | | | | — | |
| | | |
Net change in unrealized appreciation/depreciation on foreign currency related translations | | | (5,961 | ) | | | (10,728 | ) | | | 3,398 | |
Net realized and unrealized gain (loss) on investments, foreign currency related transactions, and foreign capital gains taxes | | | (6,252,633 | ) | | | 13,254,094 | | | | 104,275,674 | |
| | | |
NET INCREASE (DECREASE) IN NET ASSETS FROM OPERATIONS | | | ($6,600,968 | ) | | | $13,282,034 | | | | $105,494,846 | |
See accompanying notes to financial statements.
Statements of Changes in Net Assets
| | | | |
| MATTHEWS EMERGING MARKETS EQUITY FUND | | For the Period
Ended June 30, 20201
(unaudited) | |
| |
OPERATIONS: | | | | |
| |
Net investment income (loss) | | | $23,866 | |
| |
Net realized gain (loss) on investments and foreign currency related transactions | | | 171,632 | |
| |
Net unrealized appreciation/depreciation on investments and foreign currency related translations | | | 994,120 | |
| |
Net foreign capital gains taxes on unrealized appreciation/depreciation | | | (776 | ) |
Net increase (decrease) in net assets resulting from operations | | | 1,188,842 | |
CAPITAL SHARE TRANSACTIONS (net) (Note 4) | | | 7,995,540 | |
Total increase (decrease) in net assets | | | 9,184,382 | |
NET ASSETS: | | | | |
| |
Beginning of period | | | — | |
End of period | | | $9,184,382 | |
| 1 | The Fund commenced operations on April 30, 2020. |
| | | | | | | | |
| MATTHEWS ASIA TOTAL RETURN BOND FUND | | Six-Month Period
Ended June 30, 2020
(unaudited) | | | Year Ended
December 31, 2019 | |
| | |
OPERATIONS: | | | | | | | | |
| | |
Net investment income (loss) | | | $2,551,868 | | | | $5,275,508 | |
| | |
Net realized gain (loss) on investments and foreign currency related transactions | | | (2,694,137 | ) | | | 2,760,825 | |
| | |
Net change in unrealized appreciation/depreciation on investments and foreign currency related translations | | | (5,069,269 | ) | | | 5,339,732 | |
| | |
Net change on foreign capital gains taxes on unrealized appreciation/depreciation | | | 38,552 | | | | (61,630 | ) |
| | |
Net change in unrealized appreciation/depreciation on swaps | | | 460,955 | | | | 167,864 | |
Net increase (decrease) in net assets resulting from operations | | | (4,712,031 | ) | | | 13,482,299 | |
| | |
DISTRIBUTIONS TO SHAREHOLDERS: | | | | | | | | |
| | |
Investor Class | | | (597,697 | ) | | | (1,587,247 | ) |
| | |
Institutional Class | | | (1,233,765 | ) | | | (3,115,399 | ) |
Net decrease in net assets resulting from distributions | | | (1,831,462 | ) | | | (4,702,646 | ) |
CAPITAL SHARE TRANSACTIONS (net) (Note 4) | | | (8,064,931 | ) | | | 7,218,828 | |
Total increase (decrease) in net assets | | | (14,608,424 | ) | | | 15,998,481 | |
NET ASSETS: | | | | | | | | |
| | |
Beginning of period | | | 116,713,664 | | | | 100,715,183 | |
End of period | | | $102,105,240 | | | | $116,713,664 | |
See accompanying notes to financial statements.
| | | | |
| matthewsasia.com | 800.789.ASIA | | | 113 | |
Statements of Changes in Net Assets (continued)
| | | | | | | | |
| MATTHEWS ASIA CREDIT OPPORTUNITIES FUND | | Six-Month Period
Ended June 30, 2020
(unaudited) | | | Year Ended
December 31, 2019 | |
| | |
OPERATIONS: | | | | | | | | |
| | |
Net investment income (loss) | | | $2,253,299 | | | | $2,714,178 | |
| | |
Net realized gain (loss) on investments and foreign currency related transactions | | | (3,104,239 | ) | | | 1,177,604 | |
| | |
Net change in unrealized appreciation/depreciation on investments and foreign currency related translations | | | (4,066,882 | ) | | | 2,960,665 | |
Net increase (decrease) in net assets resulting from operations | | | (4,917,822 | ) | | | 6,852,447 | |
| | |
DISTRIBUTIONS TO SHAREHOLDERS: | | | | | | | | |
| | |
Investor Class | | | (204,011 | ) | | | (524,567 | ) |
| | |
Institutional Class | | | (1,697,185 | ) | | | (2,481,265 | ) |
Net decrease in net assets resulting from distributions | | | (1,901,196 | ) | | | (3,005,832 | ) |
CAPITAL SHARE TRANSACTIONS (net) (Note 4) | | | 6,383,390 | | | | 48,835,145 | |
Total increase (decrease) in net assets | | | (435,628 | ) | | | 52,681,760 | |
NET ASSETS: | | | | | | | | |
| | |
Beginning of period | | | 92,434,728 | | | | 39,752,968 | |
End of period | | | $91,999,100 | | | | $92,434,728 | |
| | |
| MATTHEWS ASIAN GROWTH AND INCOME FUND | | Six-Month Period
Ended June 30, 2020
(unaudited) | | | Year Ended
December 31, 2019 | |
| | |
OPERATIONS: | | | | | | | | |
| | |
Net investment income (loss) | | | $11,457,519 | | | | $24,839,454 | |
| | |
Net realized gain (loss) on investments and foreign currency related transactions | | | (49,480,870 | ) | | | 33,418,182 | |
| | |
Net change in unrealized appreciation/depreciation on investments and foreign currency related translations | | | (72,756,438 | ) | | | 169,842,257 | |
| | |
Net change on foreign capital gains taxes on unrealized appreciation/depreciation | | | (404,318 | ) | | | (415,629 | ) |
Net increase (decrease) in net assets resulting from operations | | | (111,184,107 | ) | | | 227,684,264 | |
| | |
DISTRIBUTIONS TO SHAREHOLDERS: | | | | | | | | |
| | |
Investor Class | | | (4,224,486 | ) | | | (27,564,628 | ) |
| | |
Institutional Class | | | (5,432,329 | ) | | | (26,611,609 | ) |
Net decrease in net assets resulting from distributions | | | (9,656,815 | ) | | | (54,176,237 | ) |
CAPITAL SHARE TRANSACTIONS (net) (Note 4) | | | (94,691,737 | ) | | | (101,433,061 | ) |
Total increase (decrease) in net assets | | | (215,532,659 | ) | | | 72,074,966 | |
NET ASSETS: | | | | | | | | |
| | |
Beginning of period | | | 1,467,766,339 | | | | 1,395,691,373 | |
End of period | | | $1,252,233,680 | | | | $1,467,766,339 | |
See accompanying notes to financial statements.
Statements of Changes in Net Assets (continued)
| | | | | | | | |
| MATTHEWS ASIA DIVIDEND FUND | | Six-Month Period
Ended June 30, 2020
(unaudited) | | | Year Ended
December 31, 2019 | |
| | |
OPERATIONS: | | | | | | | | |
| | |
Net investment income (loss) | | | $28,359,178 | | | | $102,330,702 | |
| | |
Net realized gain (loss) on investments and foreign currency related transactions | | | (127,094,045 | ) | | | (18,513,511 | ) |
| | |
Net change in unrealized appreciation/depreciation on investments and foreign currency related translations | | | (178,941,689 | ) | | | 510,591,484 | |
| | |
Net change on foreign capital gains taxes on unrealized appreciation/depreciation | | | — | | | | 4,810,331 | |
Net increase (decrease) in net assets resulting from operations | | | (277,676,556 | ) | | | 599,219,006 | |
| | |
DISTRIBUTIONS TO SHAREHOLDERS: | | | | | | | | |
| | |
Investor Class | | | (17,561,281 | ) | | | (53,870,328 | ) |
| | |
Institutional Class | | | (22,639,878 | ) | | | (70,646,662 | ) |
Net decrease in net assets resulting from distributions | | | (40,201,159 | ) | | | (124,516,990 | ) |
CAPITAL SHARE TRANSACTIONS (net) (Note 4) | | | (1,228,362,103 | ) | | | (872,071,489 | ) |
Total increase (decrease) in net assets | | | (1,546,239,818 | ) | | | (397,369,473 | ) |
NET ASSETS: | | | | | | | | |
| | |
Beginning of period | | | 5,370,455,874 | | | | 5,767,825,347 | |
End of period | | | $3,824,216,056 | | | | $5,370,455,874 | |
| | |
| MATTHEWS CHINA DIVIDEND FUND | | Six-Month Period
Ended June 30, 2020
(unaudited) | | | Year Ended
December 31, 2019 | |
| | |
OPERATIONS: | | | | | | | | |
| | |
Net investment income (loss) | | | $3,197,446 | | | | $7,645,006 | |
| | |
Net realized gain (loss) on investments and foreign currency related transactions | | | (12,828,957 | ) | | | (4,537,088 | ) |
| | |
Net change in unrealized appreciation/depreciation on investments and foreign currency related translations | | | 17,637,969 | | | | 39,016,746 | |
Net increase (decrease) in net assets resulting from operations | | | 8,006,458 | | | | 42,124,664 | |
| | |
DISTRIBUTIONS TO SHAREHOLDERS: | | | | | | | | |
| | |
Investor Class | | | (4,927,611 | ) | | | (4,319,260 | ) |
| | |
Institutional Class | | | (2,126,434 | ) | | | (1,789,894 | ) |
Net decrease in net assets resulting from distributions | | | (7,054,045 | ) | | | (6,109,154 | ) |
CAPITAL SHARE TRANSACTIONS (net) (Note 4) | | | (59,937,880 | ) | | | 75,065,788 | |
Total increase (decrease) in net assets | | | (58,985,467 | ) | | | 111,081,298 | |
NET ASSETS: | | | | | | | | |
| | |
Beginning of period | | | 380,740,619 | | | | 269,659,321 | |
End of period | | | $321,755,152 | | | | $380,740,619 | |
See accompanying notes to financial statements.
| | | | |
| matthewsasia.com | 800.789.ASIA | | | 115 | |
Statements of Changes in Net Assets (continued)
| | | | | | | | |
| MATTHEWS ASIA VALUE FUND | | Six-Month Period
Ended June 30, 2020
(unaudited) | | | Year Ended
December 31, 2019 | |
| | |
OPERATIONS: | | | | | | | | |
| | |
Net investment income (loss) | | | $51,220 | | | | $344,009 | |
| | |
Net realized gain (loss) on investments and foreign currency related transactions | | | (1,036,213 | ) | | | (982,277 | ) |
| | |
Net change in unrealized appreciation/depreciation on investments and foreign currency related translations | | | (783,736 | ) | | | 2,169,863 | |
| | |
Net change on foreign capital gains taxes on unrealized appreciation/depreciation | | | (19,474 | ) | | | (3,548 | ) |
Net increase (decrease) in net assets resulting from operations | | | (1,788,203 | ) | | | 1,528,047 | |
| | |
DISTRIBUTIONS TO SHAREHOLDERS: | | | | | | | | |
| | |
Investor Class | | | — | | | | (781,895 | ) |
| | |
Institutional Class | | | — | | | | (402,259 | ) |
Net decrease in net assets resulting from distributions | | | — | | | | (1,184,154 | ) |
CAPITAL SHARE TRANSACTIONS (net) (Note 4) | | | (4,582,546 | ) | | | (3,719,029 | ) |
Total increase (decrease) in net assets | | | (6,370,749 | ) | | | (3,375,136 | ) |
NET ASSETS: | | | | | | | | |
| | |
Beginning of period | | | 19,819,873 | | | | 23,195,009 | |
End of period | | | $13,449,124 | | | | $19,819,873 | |
| | |
| MATTHEWS ASIA GROWTH FUND | | Six-Month Period
Ended June 30, 2020
(unaudited) | | | Year Ended
December 31, 2019 | |
| | |
OPERATIONS: | | | | | | | | |
| | |
Net investment income (loss) | | | $386,418 | | | | ($715,202 | ) |
| | |
Net realized gain (loss) on investments and foreign currency related transactions | | | 51,005,826 | | | | 19,441,989 | |
| | |
Net change in unrealized appreciation/depreciation on investments and foreign currency related translations | | | 50,153,075 | | | | 228,921,472 | |
| | |
Net change on foreign capital gains taxes on unrealized appreciation/depreciation | | | 246,697 | | | | 511,519 | |
Net increase (decrease) in net assets resulting from operations | | | 101,792,016 | | | | 248,159,778 | |
| | |
DISTRIBUTIONS TO SHAREHOLDERS: | | | | | | | | |
| | |
Investor Class | | | — | | | | (4,892,092 | ) |
| | |
Institutional Class | | | — | | | | (6,690,700 | ) |
Net decrease in net assets resulting from distributions | | | — | | | | (11,582,792 | ) |
CAPITAL SHARE TRANSACTIONS (net) (Note 4) | | | 7,082,194 | | | | 36,423,847 | |
Total increase (decrease) in net assets | | | 108,874,210 | | | | 273,000,833 | |
NET ASSETS: | | | | | | | | |
| | |
Beginning of period | | | 1,203,334,389 | | | | 930,333,556 | |
End of period | | | $1,312,208,599 | | | | $1,203,334,389 | |
See accompanying notes to financial statements.
Statements of Changes in Net Assets (continued)
| | | | | | | | |
| MATTHEWS PACIFIC TIGER FUND | | Six-Month Period
Ended June 30, 2020
(unaudited) | | | Year Ended
December 31, 2019 | |
| | |
OPERATIONS: | | | | | | | | |
| | |
Net investment income (loss) | | | $19,604,476 | | | | $66,894,383 | |
| | |
Net realized gain (loss) on investments and foreign currency related transactions | | | 116,272,779 | | | | 216,614,527 | |
| | |
Net change in unrealized appreciation/depreciation on investments and foreign currency related translations | | | (722,023,781 | ) | | | 599,062,809 | |
| | |
Net change on foreign capital gains taxes on unrealized appreciation/depreciation | | | 29,522,255 | | | | (14,695,530 | ) |
Net increase (decrease) in net assets resulting from operations | | | (556,624,271 | ) | | | 867,876,189 | |
| | |
DISTRIBUTIONS TO SHAREHOLDERS: | | | | | | | | |
| | |
Investor Class | | | — | | | | (85,396,598 | ) |
| | |
Institutional Class | | | — | | | | (218,660,671 | ) |
Net decrease in net assets resulting from distributions | | | — | | | | (304,057,269 | ) |
CAPITAL SHARE TRANSACTIONS (net) (Note 4) | | | (1,475,588,817 | ) | | | (145,194,433 | ) |
Total increase (decrease) in net assets | | | (2,032,213,088 | ) | | | 418,624,487 | |
NET ASSETS: | | | | | | | | |
| | |
Beginning of period | | | 8,725,858,690 | | | | 8,307,234,203 | |
End of period | | | $6,693,645,602 | | | | $8,725,858,690 | |
| | |
| MATTHEWS ASIA ESG FUND | | Six-Month Period
Ended June 30, 2020
(unaudited) | | | Year Ended
December 31, 2019 | |
| | |
OPERATIONS: | | | | | | | | |
| | |
Net investment income (loss) | | | $13,832 | | | | $222,042 | |
| | |
Net realized gain (loss) on investments and foreign currency related transactions | | | (1,757,160 | ) | | | 918,570 | |
| | |
Net change in unrealized appreciation/depreciation on investments and foreign currency related translations | | | 1,605,438 | | | | 3,585,929 | |
| | |
Net change on foreign capital gains taxes on unrealized appreciation/depreciation | | | 96,012 | | | | (64,762 | ) |
Net increase (decrease) in net assets resulting from operations | | | (41,878 | ) | | | 4,661,779 | |
| | |
DISTRIBUTIONS TO SHAREHOLDERS: | | | | | | | | |
| | |
Investor Class | | | — | | | | (254,181 | ) |
| | |
Institutional Class | | | — | | | | (519,330 | ) |
Net decrease in net assets resulting from distributions | | | — | | | | (773,511 | ) |
CAPITAL SHARE TRANSACTIONS (net) (Note 4) | | | 236,906 | | | | 18,878,771 | |
Total increase (decrease) in net assets | | | 195,028 | | | | 22,767,039 | |
NET ASSETS: | | | | | | | | |
| | |
Beginning of period | | | 55,298,832 | | | | 32,531,793 | |
End of period | | | $55,493,860 | | | | $55,298,832 | |
See accompanying notes to financial statements.
| | | | |
| matthewsasia.com | 800.789.ASIA | | | 117 | |
Statements of Changes in Net Assets (continued)
| | | | | | | | |
| MATTHEWS EMERGING ASIA FUND | | Six-Month Period
Ended June 30, 2020
(unaudited) | | | Year Ended
December 31, 2019 | |
| | |
OPERATIONS: | | | | | | | | |
| | |
Net investment income (loss) | | | $1,700,399 | | | | $5,409,950 | |
| | |
Net realized gain (loss) on investments and foreign currency related transactions | | | (54,442,519 | ) | | | (28,825,183 | ) |
| | |
Net change in unrealized appreciation/depreciation on investments and foreign currency related translations | | | (25,365,205 | ) | | | 15,008,562 | |
| | |
Net change on foreign capital gains taxes on unrealized appreciation/depreciation | | | 1,452,652 | | | | 825,523 | |
Net increase (decrease) in net assets resulting from operations | | | (76,654,673 | ) | | | (7,581,148 | ) |
| | |
DISTRIBUTIONS TO SHAREHOLDERS: | | | | | | | | |
| | |
Investor Class | | | — | | | | (2,211,813 | ) |
| | |
Institutional Class | | | — | | | | (6,143,721 | ) |
Net decrease in net assets resulting from distributions | | | — | | | | (8,355,534 | ) |
CAPITAL SHARE TRANSACTIONS (net) (Note 4) | | | (78,419,267 | ) | | | (39,111,583 | ) |
REDEMPTION FEES | | | — | | | | 55,503 | |
Total increase (decrease) in net assets | | | (155,073,940 | ) | | | (54,992,762 | ) |
NET ASSETS: | | | | | | | | |
| | |
Beginning of period | | | 320,181,999 | | | | 375,174,761 | |
End of period | | | $165,108,059 | | | | $320,181,999 | |
| | |
| MATTHEWS ASIA INNOVATORS FUND | | Six-Month Period
Ended June 30, 2020
(unaudited) | | | Year Ended
December 31, 2019 | |
| | |
OPERATIONS: | | | | | | | | |
| | |
Net investment income (loss) | | | ($640,861 | ) | | | $46,812 | |
| | |
Net realized gain (loss) on investments and foreign currency related transactions | | | 31,626 | | | | 2,617,309 | |
| | |
Net change in unrealized appreciation/depreciation on investments and foreign currency related translations | | | 164,934,510 | | | | 68,307,210 | |
| | |
Net change on foreign capital gains taxes on unrealized appreciation/depreciation | | | 207,304 | | | | (579,902 | ) |
Net increase (decrease) in net assets resulting from operations | | | 164,532,579 | | | | 70,391,429 | |
| | |
DISTRIBUTIONS TO SHAREHOLDERS: | | | | | | | | |
| | |
Investor Class | | | — | | | | (517,344 | ) |
| | |
Institutional Class | | | — | | | | (360,553 | ) |
Net decrease in net assets resulting from distributions | | | — | | | | (877,897 | ) |
CAPITAL SHARE TRANSACTIONS (net) (Note 4) | | | 366,625,188 | | | | (9,182,208 | ) |
Total increase (decrease) in net assets | | | 531,157,767 | | | | 60,331,324 | |
NET ASSETS: | | | | | | | | |
| | |
Beginning of period | | | 304,549,179 | | | | 244,217,855 | |
End of period | | | $835,706,946 | | | | $304,549,179 | |
See accompanying notes to financial statements.
Statements of Changes in Net Assets (continued)
| | | | | | | | |
| MATTHEWS CHINA FUND | | Six-Month Period
Ended June 30, 2020
(unaudited) | | | Year Ended
December 31, 2019 | |
| | |
OPERATIONS: | | | | | | | | |
| | |
Net investment income (loss) | | | $3,690,041 | | | | $8,157,012 | |
| | |
Net realized gain (loss) on investments and foreign currency related transactions | | | 32,919,227 | | | | (10,571,367 | ) |
| | |
Net change in unrealized appreciation/depreciation on investments and foreign currency related translations | | | 83,394,025 | | | | 228,077,121 | |
Net increase (decrease) in net assets resulting from operations | | | 120,003,293 | | | | 225,662,766 | |
| | |
DISTRIBUTIONS TO SHAREHOLDERS: | | | | | | | | |
| | |
Investor Class | | | — | | | | (8,017,681 | ) |
| | |
Institutional Class | | | — | | | | (2,383,141 | ) |
Net decrease in net assets resulting from distributions | | | — | | | | (10,400,822 | ) |
CAPITAL SHARE TRANSACTIONS (net) (Note 4) | | | 67,477,611 | | | | 74,020,367 | |
Total increase (decrease) in net assets | | | 187,480,904 | | | | 289,282,311 | |
NET ASSETS: | | | | | | | | |
| | |
Beginning of period | | | 902,395,025 | | | | 613,112,714 | |
End of period | | | $1,089,875,929 | | | | $902,395,025 | |
| | |
| MATTHEWS INDIA FUND | | Six-Month Period
Ended June 30, 2020
(unaudited) | | | Year Ended
December 31, 2019 | |
| | |
OPERATIONS: | | | | | | | | |
| | |
Net investment income (loss) | | | $636,200 | | | | $26,423 | |
| | |
Net realized gain (loss) on investments and foreign currency related transactions | | | (53,352,974 | ) | | | 32,455,342 | |
| | |
Net change in unrealized appreciation/depreciation on investments and foreign currency related translations | | | (146,965,684 | ) | | | (48,195,961 | ) |
| | |
Net change on foreign capital gains taxes on unrealized appreciation/depreciation | | | 10,100,989 | | | | (1,438,891 | ) |
Net increase (decrease) in net assets resulting from operations | | | (189,581,469 | ) | | | (17,153,087 | ) |
| | |
DISTRIBUTIONS TO SHAREHOLDERS: | | | | | | | | |
| | |
Investor Class | | | — | | | | (88,576,196 | ) |
| | |
Institutional Class | | | — | | | | (20,261,209 | ) |
Net decrease in net assets resulting from distributions | | | — | | | | (108,837,405 | ) |
CAPITAL SHARE TRANSACTIONS (net) (Note 4) | | | (222,654,310 | ) | | | (451,382,627 | ) |
Total increase (decrease) in net assets | | | (412,235,779 | ) | | | (577,373,119 | ) |
NET ASSETS: | | | | | | | | |
| | |
Beginning of period | | | 964,406,904 | | | | 1,541,780,023 | |
End of period | | | $552,171,125 | | | | $964,406,904 | |
See accompanying notes to financial statements.
| | | | |
| matthewsasia.com | 800.789.ASIA | | | 119 | |
Statements of Changes in Net Assets (continued)
| | | | | | | | |
| MATTHEWS JAPAN FUND | | Six-Month Period
Ended June 30, 2020
(unaudited) | | | Year Ended
December 31, 2019 | |
| | |
OPERATIONS: | | | | | | | | |
| | |
Net investment income (loss) | | | $5,268,054 | | | | $13,902,590 | |
| | |
Net realized gain (loss) on investments and foreign currency related transactions | | | 40,896,149 | | | | 120,429,499 | |
| | |
Net change in unrealized appreciation/depreciation on investments and foreign currency related translations | | | (124,731,196 | ) | | | 491,227,271 | |
Net increase (decrease) in net assets resulting from operations | | | (78,566,993 | ) | | | 625,559,360 | |
| | |
DISTRIBUTIONS TO SHAREHOLDERS: | | | | | | | | |
| | |
Investor Class | | | — | | | | (120,196,392 | ) |
| | |
Institutional Class | | | — | | | | (74,901,937 | ) |
Net decrease in net assets resulting from distributions | | | — | | | | (195,098,329 | ) |
CAPITAL SHARE TRANSACTIONS (net) (Note 4) | | | (759,185,142 | ) | | | (995,366,160 | ) |
Total increase (decrease) in net assets | | | (837,752,135 | ) | | | (564,905,129 | ) |
NET ASSETS: | | | | | | | | |
| | |
Beginning of period | | | 2,306,669,190 | | | | 2,871,574,319 | |
End of period | | | $1,468,917,055 | | | | $2,306,669,190 | |
| | |
| MATTHEWS KOREA FUND | | Six-Month Period
Ended June 30, 2020
(unaudited) | | | Year Ended
December 31, 2019 | |
| | |
OPERATIONS: | | | | | | | | |
| | |
Net investment income (loss) | | | ($348,335 | ) | | | $413,405 | |
| | |
Net realized gain (loss) on investments and foreign currency related transactions | | | (4,405,592 | ) | | | (2,970,527 | ) |
| | |
Net change in unrealized appreciation/depreciation on investments and foreign currency related translations | | | (1,847,041 | ) | | | 7,136,355 | |
Net increase (decrease) in net assets resulting from operations | | | (6,600,968 | ) | | | 4,579,233 | |
| | |
DISTRIBUTIONS TO SHAREHOLDERS: | | | | | | | | |
| | |
Investor Class | | | — | | | | (9,142,261 | ) |
| | |
Institutional Class | | | — | | | | (1,778,394 | ) |
Net decrease in net assets resulting from distributions | | | — | | | | (10,920,655 | ) |
CAPITAL SHARE TRANSACTIONS (net) (Note 4) | | | (17,095,952 | ) | | | (3,301,705 | ) |
Total increase (decrease) in net assets | | | (23,696,920 | ) | | | (9,643,127 | ) |
NET ASSETS: | | | | | | | | |
| | |
Beginning of period | | | 136,813,943 | | | | 146,457,070 | |
End of period | | | $113,117,023 | | | | $136,813,943 | |
See accompanying notes to financial statements.
Statements of Changes in Net Assets (continued)
| | | | | | | | |
| MATTHEWS ASIA SMALL COMPANIES FUND | | Six-Month Period
Ended June 30, 2020
(unaudited) | | | Year Ended
December 31, 2019 | |
| | |
OPERATIONS: | | | | | | | | |
| | |
Net investment income (loss) | | | $27,940 | | | | $1,449,817 | |
| | |
Net realized gain (loss) on investments and foreign currency related transactions | | | (33,173,879 | ) | | | (465,246 | ) |
| | |
Net change in unrealized appreciation/depreciation on investments and foreign currency related translations | | | 45,369,211 | | | | 29,646,396 | |
| | |
Net change on foreign capital gains taxes on unrealized appreciation/depreciation | | | 1,058,762 | | | | (61,919 | ) |
Net increase (decrease) in net assets resulting from operations | | | 13,282,034 | | | | 30,569,048 | |
| | |
DISTRIBUTIONS TO SHAREHOLDERS: | | | | | | | | |
| | |
Investor Class | | | — | | | | (493,289 | ) |
| | |
Institutional Class | | | — | | | | (598,845 | ) |
Net decrease in net assets resulting from distributions | | | — | | | | (1,092,134 | ) |
CAPITAL SHARE TRANSACTIONS (net) (Note 4) | | | (22,826,908 | ) | | | (34,658,494 | ) |
REDEMPTION FEES | | | — | | | | 25,416 | |
Total increase (decrease) in net assets | | | (9,544,874 | ) | | | (5,156,164 | ) |
NET ASSETS: | | | | | | | | |
| | |
Beginning of period | | | 181,234,256 | | | | 186,390,420 | |
End of period | | | $171,689,382 | | | | $181,234,256 | |
| | |
| MATTHEWS CHINA SMALL COMPANIES FUND | | Six-Month Period
Ended June 30, 2020
(unaudited) | | | Year Ended
December 31, 2019 | |
| | |
OPERATIONS: | | | | | | | | |
| | |
Net investment income (loss) | | | $1,219,172 | | | | $966,048 | |
| | |
Net realized gain (loss) on investments and foreign currency related transactions | | | 4,885,497 | | | | (928,242 | ) |
| | |
Net change in unrealized appreciation/depreciation on investments and foreign currency related translations | | | 99,390,177 | | | | 22,074,402 | |
Net increase (decrease) in net assets resulting from operations | | | 105,494,846 | | | | 22,112,208 | |
| | |
DISTRIBUTIONS TO SHAREHOLDERS: | | | | | | | | |
| | |
Investor Class | | | — | | | | (636,765 | ) |
| | |
Institutional Class | | | — | | | | (367,639 | ) |
Net decrease in net assets resulting from distributions | | | — | | | | (1,004,404 | ) |
CAPITAL SHARE TRANSACTIONS (net) (Note 4) | | | 172,403,538 | | | | 12,164,538 | |
REDEMPTION FEES | | | — | | | | 56,296 | |
Total increase (decrease) in net assets | | | 277,898,384 | | | | 33,328,638 | |
NET ASSETS: | | | | | | | | |
| | |
Beginning of period | | | 95,808,293 | | | | 62,479,655 | |
End of period | | | $373,706,677 | | | | $95,808,293 | |
See accompanying notes to financial statements.
| | | | |
| matthewsasia.com | 800.789.ASIA | | | 121 | |
Financial Highlights
Matthews Emerging Markets Equity Fund
The tables below set forth financial data for a share of beneficial interest outstanding throughout the period presented.
| | | | |
| INVESTOR CLASS | | Period Ended
June 30, 20201
(unaudited) | |
Net Asset Value, beginning of period | | | $10.00 | |
INCOME (LOSS) FROM INVESTMENT OPERATIONS: | | | | |
Net investment income (loss)2 | | | 0.03 | |
Net realized gain (loss) and unrealized appreciation/depreciation on investments, foreign currency related transactions and foreign capital gains taxes | | | 1.64 | |
Total from investment operations | | | 1.67 | |
Net Asset Value, end of period | | | $11.67 | |
TOTAL RETURN | | | 16.70% | 3 |
| |
RATIOS/SUPPLEMENTAL DATA | | | | |
Net assets, end of period (in 000’s) | | | $1,683 | |
Ratio of expenses to average net assets before any reimbursement, waiver or recapture of expenses by Advisor and Administrator (Note 5) | | | 3.96% | 4 |
Ratio of expenses to average net assets after any reimbursement, waiver or recapture of expenses by Advisor and Administrator | | | 1.15% | 4 |
Ratio of net investment income (loss) to average net assets | | | 1.88% | 4 |
Portfolio turnover5 | | | 58.23% | 3 |
| |
| INSTITUTIONAL CLASS | | Period Ended
June 30, 2020
(unaudited)1 | |
Net Asset Value, beginning of period | | | $10.00 | |
INCOME (LOSS) FROM INVESTMENT OPERATIONS: | | | | |
Net investment income (loss)2 | | | 0.03 | |
Net realized gain (loss) and unrealized appreciation/depreciation on investments, foreign currency related transactions and foreign capital gains taxes | | | 1.64 | |
Total from investment operations | | | 1.67 | |
Net Asset Value, end of period | | | $11.67 | |
TOTAL RETURN | | | 16.70% | 3 |
| |
RATIOS/SUPPLEMENTAL DATA | | | | |
Net assets, end of period (in 000’s) | | | $7,501 | |
Ratio of expenses to average net assets before any reimbursement, waiver or recapture of expenses by Advisor and Administrator (Note 5) | | | 3.94% | 4 |
Ratio of expenses to average net assets after any reimbursement, waiver or recapture of expenses by Advisor and Administrator | | | 0.90% | 4 |
Ratio of net investment income (loss) to average net assets | | | 1.89% | 4 |
Portfolio turnover5 | | | 58.23% | 3 |
| 1 | Commenced operations on April 30, 2020. |
| 2 | Calculated using the average daily shares method. |
| 5 | The portfolio turnover rate is calculated on the Fund as a whole without distinguishing between classes of shares issued. |
See accompanying notes to financial statements.
Financial Highlights (continued)
Matthews Asia Total Return Bond Fund
The tables below set forth financial data for a share of beneficial interest outstanding throughout each period presented.
| | | | | | | | | | | | | | | | | | | | | | | | |
| | | Six-Month
Period Ended
June 30, 2020
(unaudited) | | | Year Ended Dec. 31 | |
| INVESTOR CLASS | | 2019 | | | 2018 | | | 2017 | | | 2016 | | | 2015 | |
Net Asset Value, beginning of period | | | $11.12 | | | | $10.25 | | | | $10.98 | | | | $10.43 | | | | $9.96 | | | | $10.31 | |
INCOME (LOSS) FROM INVESTMENT OPERATIONS: | | | | | | | | | | | | | | | | | | | | | | | | |
Net investment income (loss)1 | | | 0.24 | | | | 0.50 | | | | 0.40 | | | | 0.51 | | | | 0.50 | | | | 0.47 | |
Net realized gain (loss) and unrealized appreciation/depreciation on investments, forward foreign currency exchange contracts, swaps, foreign currency related transactions, and foreign capital gains taxes | | | (0.65 | ) | | | 0.81 | | | | (0 84 | ) | | | 0.46 | | | | 0.38 | | | | (0 53 | ) |
Total from investment operations | | | (0.41 | ) | | | 1.31 | | | | (0.44 | ) | | | 0.97 | | | | 0.88 | | | | (0.06 | ) |
LESS DISTRIBUTIONS FROM: | | | | | | | | | | | | | | | | | | | | | | | | |
Net investment income | | | (0.17 | ) | | | (0.44 | ) | | | (0.25 | ) | | | (0.42 | ) | | | (0.41 | ) | | | (0.29 | ) |
Return of capital | | | — | | | | — | | | | (0.04 | ) | | | — | | | | — | | | | — | |
Total distributions | | | (0.17 | ) | | | (0.44 | ) | | | (0.29 | ) | | | (0.42 | ) | | | (0.41 | ) | | | (0.29 | ) |
Paid-in capital from redemption fees (Note 4) | | | — | | | | — | | | | — | | | | — | | | | — | | | | — | 2 |
Net Asset Value, end of period | | | $10.54 | | | | $11.12 | | | | $10.25 | | | | $10.98 | | | | $10.43 | | | | $9.96 | |
TOTAL RETURN | | | (3.65% | )3 | | | 13.00% | | | | (4.05% | ) | | | 9.40% | | | | 8.85% | | | | (0.58% | ) |
| | | | | | |
RATIOS/SUPPLEMENTAL DATA | | | | | | | | | | | | | | | | | | | | | | | | |
Net assets, end of period (in 000’s) | | | $36,245 | | | | $39,485 | | | | $40,698 | | | | $63,437 | | | | $55,409 | | | | $51,130 | |
Ratio of expenses to average net assets before any reimbursement, waiver or recapture of expenses by Advisor and Administrator (Note 5) | | | 1.15% | 4 | | | 1.08% | | | | 1.23% | | | | 1.29% | | | | 1.33% | | | | 1.28% | |
Ratio of expenses to average net assets after any reimbursement, waiver or recapture of expenses by Advisor and Administrator | | | 1.13% | 4 | | | 1.07% | | | | 1.15% | | | | 1.15% | | | | 1.15% | | | | 1.12% | |
Ratio of net investment income (loss) to average net assets | | | 4.60% | 4 | | | 4.61% | | | | 3.76% | | | | 4.70% | | | | 4.85% | | | | 4.57% | |
Portfolio turnover5 | | | 21.45% | 3 | | | 84.38% | | | | 82.32% | | | | 36.58% | | | | 71.50% | | | | 50.09% | |
| | |
| | | Six-Month
Period Ended
June 30, 2020
(unaudited) | | | Year Ended Dec. 31 | |
| INSTITUTIONAL CLASS | | 2019 | | | 2018 | | | 2017 | | | 2016 | | | 2015 | |
Net Asset Value, beginning of period | | | $11.12 | | | | $10.25 | | | | $10.97 | | | | $10.42 | | | | $9.96 | | | | $10.30 | |
INCOME (LOSS) FROM INVESTMENT OPERATIONS: | | | | | | | | | | | | | | | | | | | | | | | | |
Net investment income (loss)1 | | | 0.25 | | | | 0.52 | | | | 0.42 | | | | 0.53 | | | | 0.53 | | | | 0.49 | |
Net realized gain (loss) and unrealized appreciation/depreciation on investments, forward foreign currency exchange contracts, swaps, foreign currency related transactions, and foreign capital gains taxes | | | (0.65 | ) | | | 0.81 | | | | (0 83 | ) | | | 0.47 | | | | 0.36 | | | | (0 52 | ) |
Total from investment operations | | | (0.40 | ) | | | 1.33 | | | | (0.41 | ) | | | 1.00 | | | | 0.89 | | | | (0.03 | ) |
LESS DISTRIBUTIONS FROM: | | | | | | | | | | | | | | | | | | | | | | | | |
Net investment income | | | (0.18 | ) | | | (0.46 | ) | | | (0.27 | ) | | | (0.45 | ) | | | (0.43 | ) | | | (0.31 | ) |
Return of capital | | | — | | | | — | | | | (0.04 | ) | | | — | | | | — | | | | — | |
Total distributions | | | (0.18 | ) | | | (0.46 | ) | | | (0.31 | ) | | | (0.45 | ) | | | (0.43 | ) | | | (0.31 | ) |
Paid-in capital from redemption fees (Note 4) | | | — | | | | — | | | | — | | | | — | | | | — | | | | — | 2 |
Net Asset Value, end of period | | | $10.54 | | | | $11.12 | | | | $10.25 | | | | $10.97 | | | | $10.42 | | | | $9.96 | |
TOTAL RETURN | | | (3.55% | )3 | | | 13.20% | | | | (3.78% | ) | | | 9.67% | | | | 9.02% | | | | (0.27% | ) |
| | | | | | |
RATIOS/SUPPLEMENTAL DATA | | | | | | | | | | | | | | | | | | | | | | | | |
Net assets, end of period (in 000’s) | | | $65,860 | | | | $77,228 | | | | $60,017 | | | | $31,155 | | | | $13,398 | | | | $11,001 | |
Ratio of expenses to average net assets before any reimbursement, waiver or recapture of expenses by Advisor and Administrator (Note 5) | | | 0.99% | 4 | | | 0.97% | | | | 1.04% | | | | 1.08% | | | | 1.12% | | | | 1.09% | |
Ratio of expenses to average net assets after any reimbursement, waiver or recapture of expenses by Advisor and Administrator | | | 0.90% | 4 | | | 0.90% | | | | 0.90% | | | | 0.90% | | | | 0.90% | | | | 0.90% | |
Ratio of net investment income (loss) to average net assets | | | 4.83% | 4 | | | 4.81% | | | | 4.03% | | | | 4.93% | | | | 5.13% | | | | 4.81% | |
Portfolio turnover5 | | | 21.45% | 3 | | | 84.38% | | | | 82.32% | | | | 36.58% | | | | 71.50% | | | | 50.09% | |
| 1 | Calculated using the average daily shares method. |
| 2 | Less than $0.01 per share. |
| 5 | The portfolio turnover rate is calculated on the Fund as a whole without distinguishing between classes of shares issued. |
See accompanying notes to financial statements.
| | | | |
| matthewsasia.com | 800.789.ASIA | | | 123 | |
Financial Highlights (continued)
Matthews Asia Credit Opportunities Fund
The tables below set forth financial data for a share of beneficial interest outstanding throughout each period presented.
| | | | | | | | | | | | | | | | | | | | |
| INVESTOR CLASS | | Six-Month
Period Ended
June 30, 2020
(unaudited) | | | Year Ended Dec. 31 | | | Period Ended
Dec. 31, 20161 | |
| | 2019 | | | 2018 | | | 2017 | |
Net Asset Value, beginning of period | | | $10.57 | | | | $9.76 | | | | $10.39 | | | | $10.13 | | | | $10.00 | |
INCOME (LOSS) FROM INVESTMENT OPERATIONS: | | | | | | | | | | | | | | | | | | | | |
Net investment income (loss)2 | | | 0.23 | | | | 0.47 | | | | 0.37 | | | | 0.44 | | | | 0.29 | |
Net realized gain (loss) and unrealized appreciation/depreciation on investments, swaps, and foreign currency related transactions | | | (0.74 | ) | | | 0.82 | | | | (0.67 | ) | | | 0.35 | | | | 0.18 | |
Total from investment operations | | | (0.51 | ) | | | 1.29 | | | | (0.30 | ) | | | 0.79 | | | | 0.47 | |
LESS DISTRIBUTIONS FROM: | | | | | | | | | | | | | | | | | | | | |
Net investment income | | | (0.18 | ) | | | (0.44 | ) | | | (0.33 | ) | | | (0.43 | ) | | | (0.32 | ) |
Net realized gains on investments | | | — | | | | (0.04 | ) | | | — | | | | (0.10 | ) | | | (0.02 | ) |
Total distributions | | | (0.18 | ) | | | (0.48 | ) | | | (0.33 | ) | | | (0.53 | ) | | | (0.34 | ) |
Net Asset Value, end of period | | | $9.88 | | | | $10.57 | | | | $9.76 | | | | $10.39 | | | | $10.13 | |
TOTAL RETURN | | | (4.74% | )3 | | | 13.34% | | | | (2.88% | ) | | | 7.86% | | | | 4.66% | 3 |
| | | | | |
RATIOS/SUPPLEMENTAL DATA | | | | | | | | | | | | | | | | | | | | |
Net assets, end of period (in 000’s) | | | $10,382 | | | | $12,997 | | | | $8,668 | | | | $10,201 | | | | $10,119 | |
Ratio of expenses to average net assets before any reimbursement, waiver or recapture of expenses by Advisor and Administrator (Note 5) | | | 1.15% | 4 | | | 1.24% | | | | 1.44% | | | | 1.86% | | | | 2.24% | 4 |
Ratio of expenses to average net assets after any reimbursement, waiver or recapture of expenses by Advisor and Administrator | | | 1.15% | 4 | | | 1.12% | | | | 1.15% | | | | 1.15% | | | | 1.15% | 4 |
Ratio of net investment income (loss) to average net assets | | | 4.49% | 4 | | | 4.55% | | | | 3.62% | | | | 4.17% | | | | 4.12% | 4 |
Portfolio turnover5 | | | 14.86% | 3 | | | 81.08% | | | | 49.06% | | | | 27.86% | | | | 18.80% | 3 |
| | | |
| INSTITUTIONAL CLASS | | Six-Month
Period Ended
June 30, 2020
(unaudited) | | | Year Ended Dec. 31 | | | Period Ended
Dec. 31, 20161 | |
| | 2019 | | | 2018 | | | 2017 | |
Net Asset Value, beginning of period | | | $10.57 | | | | $9.75 | | | | $10.39 | | | | $10.13 | | | | $10.00 | |
INCOME (LOSS) FROM INVESTMENT OPERATIONS: | | | | | | | | | | | | | | | | | | | | |
Net investment income (loss)2 | | | 0.24 | | | | 0.50 | | | | 0.39 | | | | 0.46 | | | | 0.30 | |
Net realized gain (loss) and unrealized appreciation/depreciation on investments, swaps, and foreign currency related transactions | | | (0.73 | ) | | | 0.82 | | | | (0.67 | ) | | | 0.36 | | | | 0.18 | |
Total from investment operations | | | (0.49 | ) | | | 1.32 | | | | (0.28 | ) | | | 0.82 | | | | 0.48 | |
LESS DISTRIBUTIONS FROM: | | | | | | | | | | | | | | | | | | | | |
Net investment income | | | (0.20 | ) | | | (0.46 | ) | | | (0.36 | ) | | | (0.46 | ) | | | (0.33 | ) |
Net realized gains on investments | | | — | | | | (0.04 | ) | | | — | | | | (0.10 | ) | | | (0.02 | ) |
Total distributions | | | (0.20 | ) | | | (0.50 | ) | | | (0.36 | ) | | | (0.56 | ) | | | (0.35 | ) |
Net Asset Value, end of period | | | $9.88 | | | | $10.57 | | | | $9.75 | | | | $10.39 | | | | $10.13 | |
TOTAL RETURN | | | (4.62% | )3 | | | 13.69% | | | | (2.75% | ) | | | 8.13% | | | | 4.82% | 3 |
| | | | | |
RATIOS/SUPPLEMENTAL DATA | | | | | | | | | | | | | | | | | | | | |
Net assets, end of period (in 000’s) | | | $81,617 | | | | $79,438 | | | | $31,085 | | | | $21,491 | | | | $6,205 | |
Ratio of expenses to average net assets before any reimbursement, waiver or recapture of expenses by Advisor and Administrator (Note 5) | | | 0.94% | 4 | | | 1.07% | | | | 1.25% | | | | 1.62% | | | | 1.99% | 4 |
Ratio of expenses to average net assets after any reimbursement, waiver or recapture of expenses by Advisor and Administrator | | | 0.90% | 4 | | | 0.90% | | | | 0.90% | | | | 0.90% | | | | 0.90% | 4 |
Ratio of net investment income (loss) to average net assets | | | 4.78% | 4 | | | 4.79% | | | | 3.90% | | | | 4.45% | | | | 4.28% | 4 |
Portfolio turnover5 | | | 14.86% | 3 | | | 81.08% | | | | 49.06% | | | | 27.86% | | | | 18.80% | 3 |
| 1 | Commenced operations on April, 29 2016. |
| 2 | Calculated using the average daily shares method. |
| 5 | The portfolio turnover rate is calculated on the Fund as a whole without distinguishing between classes of shares issued. |
See accompanying notes to financial statements.
Financial Highlights (continued)
Matthews Asian Growth And Income Fund
The tables below set forth financial data for a share of beneficial interest outstanding throughout each period presented.
| | | | | | | | | | | | | | | | | | | | | | | | |
| | | Six-Month
Period Ended
June 30, 2020
(unaudited) | | | Year Ended Dec. 31 | |
| INVESTOR CLASS | | 2019 | | | 2018 | | | 2017 | | | 2016 | | | 2015 | |
Net Asset Value, beginning of period | | | $15.73 | | | | $13.92 | | | | $17.46 | | | | $14.94 | | | | $16.03 | | | | $18.01 | |
INCOME (LOSS) FROM INVESTMENT OPERATIONS: | | | | | | | | | | | | | | | | | | | | | | | | |
Net investment income (loss)1 | | | 0.12 | | | | 0.25 | | | | 0.32 | | | | 0.33 | | | | 0.32 | | | | 0.39 | |
Net realized gain (loss) and unrealized appreciation/depreciation on investments, foreign currency related transactions and foreign capital gains taxes | | | (1.21 | ) | | | 2.13 | | | | (2.20 | ) | | | 2.92 | | | | (0.06 | ) | | | (1.19 | ) |
Total from investment operations | | | (1.09 | ) | | | 2.38 | | | | (1.88 | ) | | | 3.25 | | | | 0.26 | | | | (0.80 | ) |
LESS DISTRIBUTIONS FROM: | | | | | | | | | | | | | | | | | | | | | | | | |
Net investment income | | | (0.11 | ) | | | (0.35 | ) | | | (0.32 | ) | | | (0.46 | ) | | | (0.48 | ) | | | (0.42 | ) |
Net realized gains on investments | | | — | | | | (0.22 | ) | | | (1.34 | ) | | | (0.27 | ) | | | (0.87 | ) | | | (0.76 | ) |
Total distributions | | | (0.11 | ) | | | (0.57 | ) | | | (1.66 | ) | | | (0.73 | ) | | | (1.35 | ) | | | (1.18 | ) |
Paid-in capital from redemption fees (Note 4) | | | — | | | | — | | | | — | | | | — | 2 | | | — | | | | — | 2 |
Net Asset Value, end of period | | | $14.53 | | | | $15.73 | | | | $13.92 | | | | $17.46 | | | | $14.94 | | | | $16.03 | |
TOTAL RETURN | | | (6.95% | )3 | | | 17.26% | | | | (10.96% | ) | | | 21.85% | | | | 1.34% | | | | (4.50% | ) |
| | | | | | |
RATIOS/SUPPLEMENTAL DATA | | | | | | | | | | | | | | | | | | | | | | | | |
Net assets, end of period (in 000’s) | | | $581,679 | | | | $723,815 | | | | $799,328 | | | | $1,535,746 | | | | $1,684,987 | | | | $2,045,435 | |
Ratio of expenses to average net assets before any reimbursement, waiver or recapture of expenses by Advisor and Administrator (Note 5) | | | 1.13% | 4 | | | 1.08% | | | | 1.08% | | | | 1.07% | | | | 1.09% | | | | 1.09% | |
Ratio of net investment income (loss) to average net assets | | | 1.65% | 4 | | | 1.67% | | | | 1.95% | | | | 1.95% | | | | 1.90% | | | | 2.17% | |
Portfolio turnover5 | | | 17.90% | 3 | | | 21.89% | | | | 32.24% | | | | 23.23% | | | | 15.64% | | | | 16.48% | |
| | |
| | | Six-Month
Period Ended
June 30, 2020
(unaudited) | | | Year Ended Dec. 31 | |
| INSTITUTIONAL CLASS | | 2019 | | | 2018 | | | 2017 | | | 2016 | | | 2015 | |
Net Asset Value, beginning of period | | | $15.70 | | | | $13.89 | | | | $17.43 | | | | $14.92 | | | | $16.02 | | | | $18.00 | |
INCOME (LOSS) FROM INVESTMENT OPERATIONS: | | | | | | | | | | | | | | | | | | | | | | | | |
Net investment income (loss)1 | | | 0.13 | | | | 0.27 | | | | 0.35 | | | | 0.36 | | | | 0.34 | | | | 0.42 | |
Net realized gain (loss) and unrealized appreciation/depreciation on investments, foreign currency related transactions and foreign capital gains taxes | | | (1.20 | ) | | | 2.14 | | | | (2.20 | ) | | | 2.91 | | | | (0.07 | ) | | | (1.19 | ) |
Total from investment operations | | | (1.07 | ) | | | 2.41 | | | | (1.85 | ) | | | 3.27 | | | | 0.27 | | | | (0.77 | ) |
LESS DISTRIBUTIONS FROM: | | | | | | | | | | | | | | | | | | | | | | | | |
Net investment income | | | (0.12 | ) | | | (0.38 | ) | | | (0.35 | ) | | | (0.49 | ) | | | (0.50 | ) | | | (0.45 | ) |
Net realized gains on investments | | | — | | | | (0.22 | ) | | | (1.34 | ) | | | (0.27 | ) | | | (0.87 | ) | | | (0.76 | ) |
Total distributions | | | (0.12 | ) | | | (0.60 | ) | | | (1.69 | ) | | | (0.76 | ) | | | (1.37 | ) | | | (1.21 | ) |
Paid-in capital from redemption fees (Note 4) | | | — | | | | — | | | | — | | | | — | 2 | | | — | | | | — | 2 |
Net Asset Value, end of period | | | $14.51 | | | | $15.70 | | | | $13.89 | | | | $17.43 | | | | $14.92 | | | | $16.02 | |
TOTAL RETURN | | | (6.83% | )3 | | | 17.46% | | | | (10.84% | ) | | | 22.00% | | | | 1.44% | | | | (4.33% | ) |
| | | | | | |
RATIOS/SUPPLEMENTAL DATA | | | | | | | | | | | | | | | | | | | | | | | | |
Net assets, end of period (in 000’s) | | | $670,554 | | | | $743,951 | | | | $596,364 | | | | $1,310,168 | | | | $809,254 | | | | $823,619 | |
Ratio of expenses to average net assets before any reimbursement, waiver or recapture of expenses by Advisor and Administrator (Note 5) | | | 0.97% | 4 | | | 0.94% | | | | 0.93% | | | | 0.93% | | | | 0.94% | | | | 0.92% | |
Ratio of net investment income (loss) to average net assets | | | 1.84% | 4 | | | 1.80% | | | | 2.14% | | | | 2.16% | | | | 2.06% | | | | 2.34% | |
Portfolio turnover5 | | | 17.90% | 3 | | | 21.89% | | | | 32.24% | | | | 23.23% | | | | 15.64% | | | | 16.48% | |
| 1 | Calculated using the average daily shares method. |
| 2 | Less than $0.01 per share. |
| 5 | The portfolio turnover rate is calculated on the Fund as a whole without distinguishing between classes of shares issued. |
See accompanying notes to financial statements.
| | | | |
| matthewsasia.com | 800.789.ASIA | | | 125 | |
Financial Highlights (continued)
Matthews Asia Dividend Fund
The tables below set forth financial data for a share of beneficial interest outstanding throughout each period presented.
| | | | | | | | | | | | | | | | | | | | | | | | |
| | | Six-Month
Period Ended
June 30, 2020
(unaudited) | | | Year Ended Dec. 31 | |
| INVESTOR CLASS | | 2019 | | | 2018 | | | 2017 | | | 20161 | | | 20151 | |
Net Asset Value, beginning of period | | | $17.47 | | | | $16.05 | | | | $19.74 | | | | $15.52 | | | | $15.36 | | | | $15.26 | |
INCOME (LOSS) FROM INVESTMENT OPERATIONS: | | | | | | | | | | | | | | | | | | | | | | | | |
Net investment income (loss)2 | | | 0.11 | | | | 0.28 | | | | 0.37 | | | | 0.31 | | | | 0.28 | | | | 0.29 | |
Net realized gain (loss) and unrealized appreciation/depreciation on investments, foreign currency related transactions and foreign capital gains taxes | | | (0.58 | ) | | | 1.50 | | | | (2.83 | ) | | | 5.02 | | | | 0.37 | | | | 0.31 | |
Total from investment operations | | | (0.47 | ) | | | 1.78 | | | | (2.46 | ) | | | 5.33 | | | | 0.65 | | | | 0.60 | |
LESS DISTRIBUTIONS FROM: | | | | | | | | | | | | | | | | | | | | | | | | |
Net investment income | | | (0.16 | ) | | | (0.36 | ) | | | (0.31 | ) | | | (0.69 | ) | | | (0.29 | ) | | | (0.27 | ) |
Net realized gains on investments | | | — | | | | — | | | | (0.92 | )�� | | | (0.42 | ) | | | (0.11 | ) | | | (0.23 | ) |
Return of capital | | | — | | | | — | | | | — | | | | — | | | | (0.09 | ) | | | — | |
Total distributions | | | (0.16 | ) | | | (0.36 | ) | | | (1.23 | ) | | | (1.11 | ) | | | (0.49 | ) | | | (0.50 | ) |
Paid-in capital from redemption fees (Note 4) | | | — | | | | — | | | | — | | | | — | 3 | | | — | | | | — | 3 |
Net Asset Value, end of period | | | $16.84 | | | | $17.47 | | | | $16.05 | | | | $19.74 | | | | $15.52 | | | | $15.36 | |
TOTAL RETURN | | | (2.62% | )4 | | | 11.17% | | | | (12.72% | ) | | | 34.69% | | | | 4.13% | | | | 3.86% | |
| | | | | | |
RATIOS/SUPPLEMENTAL DATA | | | | | | | | | | | | | | | | | | | | | | | | |
Net assets, end of period (in 000’s) | | | $1,748,124 | | | | $2,312,560 | | | | $2,728,599 | | | | $3,713,276 | | | | $2,650,611 | | | | $2,757,910 | |
Ratio of expenses to average net assets before any reimbursement, waiver or recapture of expenses by Advisor and Administrator (Note 5) | | | 1.08% | 5 | | | 1.03% | | | | 1.02% | | | | 1.03% | | | | 1.06% | | | | 1.06% | |
Ratio of expenses to average net assets after any reimbursement, waiver or recapture of expenses by Advisor and Administrator | | | 1.07% | 5 | | | 1.02% | | | | 1.01% | | | | 1.02% | | | | 1.06% | | | | 1.05% | |
Ratio of net investment income (loss) to average net assets | | | 1.33% | 5 | | | 1.68% | | | | 1.97% | | | | 1.67% | | | | 1.79% | | | | 1.82% | |
Portfolio turnover6 | | | 22.60% | 4 | | | 30.32% | | | | 39.75% | | | | 28.11% | | | | 39.76% | | | | 35.98% | |
| | |
| | | Six-Month
Period Ended
June 30, 2020
(unaudited) | | | Year Ended Dec. 31 | |
| INSTITUTIONAL CLASS | | 2019 | | | 2018 | | | 2017 | | | 20161 | | | 20151 | |
Net Asset Value, beginning of period | | | $17.47 | | | | $16.04 | | | | $19.73 | | | | $15.52 | | | | $15.35 | | | | $15.26 | |
INCOME (LOSS) FROM INVESTMENT OPERATIONS: | | | | | | | | | | | | | | | | | | | | | | | | |
Net investment income (loss)2 | | | 0.11 | | | | 0.30 | | | | 0.39 | | | | 0.33 | | | | 0.30 | | | | 0.32 | |
Net realized gain (loss) and unrealized appreciation/depreciation on investments, foreign currency related transactions and foreign capital gains taxes | | | (0.57 | ) | | | 1.50 | | | | (2.83 | ) | | | 5.01 | | | | 0.38 | | | | 0.29 | |
Total from investment operations | | | (0.46 | ) | | | 1.80 | | | | (2.44 | ) | | | 5.34 | | | | 0.68 | | | | 0.61 | |
LESS DISTRIBUTIONS FROM: | | | | | | | | | | | | | | | | | | | | | | | | |
Net investment income | | | (0.17 | ) | | | (0.37 | ) | | | (0.33 | ) | | | (0.71 | ) | | | (0.31 | ) | | | (0.29 | ) |
Net realized gains on investments | | | — | | | | — | | | | (0.92 | ) | | | (0.42 | ) | | | (0.11 | ) | | | (0.23 | ) |
Return of capital | | | — | | | | — | | | | — | | | | — | | | | (0.09 | ) | | | — | |
Total distributions | | | (0.17 | ) | | | (0.37 | ) | | | (1.25 | ) | | | (1.13 | ) | | | (0.51 | ) | | | (0.52 | ) |
Paid-in capital from redemption fees (Note 4) | | | — | | | | — | | | | — | | | | — | 3 | | | — | | | | — | 3 |
Net Asset Value, end of period | | | $16.84 | | | | $17.47 | | | | $16.04 | | | | $19.73 | | | | $15.52 | | | | $15.35 | |
TOTAL RETURN | | | (2.57% | )4 | | | 11.35% | | | | (12.64% | ) | | | 34.77% | | | | 4.33% | | | | 3.93% | |
| | | | | | |
RATIOS/SUPPLEMENTAL DATA | | | | | | | | | | | | | | | | | | | | | | | | |
Net assets, end of period (in 000’s) | | | $2,076,092 | | | | $3,057,896 | | | | $3,039,226 | | | | $3,284,070 | | | | $2,034,276 | | | | $2,045,713 | |
Ratio of expenses to average net assets before any reimbursement, waiver or recapture of expenses by Advisor and Administrator (Note 5) | | | 0.98% | 5 | | | 0.93% | | | | 0.91% | | | | 0.92% | | | | 0.94% | | | | 0.93% | |
Ratio of expenses to average net assets after any reimbursement, waiver or recapture of expenses by Advisor and Administrator | | | 0.97% | 5 | | | 0.92% | | | | 0.90% | | | | 0.91% | | | | 0.93% | | | | 0.92% | |
Ratio of net investment income (loss) to average net assets | | | 1.35% | 5 | | | 1.80% | | | | 2.09% | | | | 1.81% | | | | 1.91% | | | | 1.98% | |
Portfolio turnover6 | | | 22.60% | 4 | | | 30.32% | | | | 39.75% | | | | 28.11% | | | | 39.76% | | | | 35.98% | |
| 1 | Consolidated Financial Highlights. See Note 2-C. |
| 2 | Calculated using the average daily shares method. |
| 3 | Less than $0.01 per share. |
| 6 | The portfolio turnover rate is calculated on the Fund as a whole without distinguishing between classes of shares issued. |
See accompanying notes to financial statements.
Financial Highlights (continued)
Matthews China Dividend Fund
The tables below set forth financial data for a share of beneficial interest outstanding throughout each period presented.
| | | | | | | | | | | | | | | | | | | | | | | | |
| | | Six-Month
Period Ended
June 30, 2020
(unaudited) | | | Year Ended Dec. 31 | |
| INVESTOR CLASS | | 2019 | | | 2018 | | | 2017 | | | 2016 | | | 2015 | |
Net Asset Value, beginning of period | | | $16.20 | | | | $14.32 | | | | $17.61 | | | | $14.09 | | | | $13.79 | | | | $13.37 | |
INCOME (LOSS) FROM INVESTMENT OPERATIONS: | | | | | | | | | | | | | | | | | | | | | | | | |
Net investment income (loss)1 | | | 0.15 | | | | 0.34 | | | | 0.41 | | | | 0.35 | | | | 0.31 | | | | 0.29 | |
Net realized gain (loss) and unrealized appreciation/depreciation on investments and foreign currency related transactions | | | 0.49 | | | | 1.80 | | | | (2.09 | ) | | | 4.85 | | | | 0 47 | | | | 1 01 | |
Total from investment operations | | | 0.64 | | | | 2.14 | | | | (1.68 | ) | | | 5.20 | | | | 0.78 | | | | 1.30 | |
LESS DISTRIBUTIONS FROM: | | | | | | | | | | | | | | | | | | | | | | | | |
Net investment income | | | (0.36 | ) | | | (0.26 | ) | | | (0.40 | ) | | | (0.49 | ) | | | (0.28 | ) | | | (0.28 | ) |
Net realized gains on investments | | | — | | | | — | | | | (1.21 | ) | | | (1.19 | ) | | | (0.20 | ) | | | (0.60 | ) |
Total distributions | | | (0.36 | ) | | | (0.26 | ) | | | (1.61 | ) | | | (1.68 | ) | | | (0.48 | ) | | | (0.88 | ) |
Paid-in capital from redemption fees (Note 4) | | | — | | | | — | | | | — | | | | — | | | | — | | | | — | 2 |
Net Asset Value, end of period | | | $16.48 | | | | $16.20 | | | | $14.32 | | | | $17.61 | | | | $14.09 | | | | $13.79 | |
TOTAL RETURN | | | 4.02% | 3 | | | 15.00% | | | | (9.98% | ) | | | 37.69% | | | | 5.70% | | | | 9.54% | |
| | | | | | |
RATIOS/SUPPLEMENTAL DATA | | | | | | | | | | | | | | | | | | | | | | | | |
Net assets, end of period (in 000’s) | | | $227,148 | | | | $258,111 | | | | $196,626 | | | | $260,593 | | | | $160,400 | | | | $165,514 | |
Ratio of expenses to average net assets before any reimbursement, waiver or recapture of expenses by Advisor and Administrator (Note 5) | | | 1.17% | 4 | | | 1.15% | | | | 1.15% | | | | 1.19% | | | | 1.22% | | | | 1.19% | |
Ratio of net investment income (loss) to average net assets | | | 1.96% | 4 | | | 2.14% | | | | 2.33% | | | | 2.12% | | | | 2.28% | | | | 1.97% | |
Portfolio turnover5 | | | 38.27% | 3 | | | 65.69% | | | | 66.47% | | | | 69.14% | | | | 72.96% | | | | 79.91% | |
| | |
| | | Six-Month
Period Ended
June 30, 2020
(unaudited) | | | Year Ended Dec. 31 | |
| INSTITUTIONAL CLASS | | 2019 | | | 2018 | | | 2017 | | | 2016 | | | 2015 | |
Net Asset Value, beginning of period | | | $16.20 | | | | $14.32 | | | | $17.61 | | | | $14.09 | | | | $13.79 | | | | $13.37 | |
INCOME (LOSS) FROM INVESTMENT OPERATIONS: | | | | | | | | | | | | | | | | | | | | | | | | |
Net investment income (loss)1 | | | 0.15 | | | | 0.35 | | | | 0.42 | | | | 0.37 | | | | 0.29 | | | | 0.28 | |
Net realized gain (loss) and unrealized appreciation/depreciation on investments and foreign currency related transactions | | | 0 51 | | | | 1 81 | | | | (2.07 | ) | | | 4.85 | | | | 0.51 | | | | 1 04 | |
Total from investment operations | | | 0.66 | | | | 2.16 | | | | (1.65 | ) | | | 5.22 | | | | 0.80 | | | | 1.32 | |
LESS DISTRIBUTIONS FROM: | | | | | | | | | | | | | | | | | | | | | | | | |
Net investment income | | | (0.38 | ) | | | (0.28 | ) | | | (0.43 | ) | | | (0.51 | ) | | | (0.30 | ) | | | (0.30 | ) |
Net realized gains on investments | | | — | | | | — | | | | (1.21 | ) | | | (1.19 | ) | | | (0.20 | ) | | | (0.60 | ) |
Total distributions | | | (0.38 | ) | | | (0.28 | ) | | | (1.64 | ) | | | (1.70 | ) | | | (0.50 | ) | | | (0.90 | ) |
Paid-in capital from redemption fees (Note 4) | | | — | | | | — | | | | — | | | | — | | | | — | | | | — | 2 |
Net Asset Value, end of period | | | $16.48 | | | | $16.20 | | | | $14.32 | | | | $17.61 | | | | $14.09 | | | | $13.79 | |
TOTAL RETURN | | | 4.09% | 3 | | | 15.16% | | | | (9.83% | ) | | | 37.88% | | | | 5.90% | | | | 9.71% | |
| | | | | | |
RATIOS/SUPPLEMENTAL DATA | | | | | | | | | | | | | | | | | | | | | | | | |
Net assets, end of period (in 000’s) | | | $94,607 | | | | $122,630 | | | | $73,033 | | | | $54,147 | | | | $27,758 | | | | $15,406 | |
Ratio of expenses to average net assets before any reimbursement, waiver or recapture of expenses by Advisor and Administrator (Note 5) | | | 1.04% | 4 | | | 1.01% | | | | 1.01% | | | | 1.04% | | | | 1.06% | | | | 1.00% | |
Ratio of net investment income (loss) to average net assets | | | 1.96% | 4 | | | 2.25% | | | | 2.44% | | | | 2.25% | | | | 2.09% | | | | 1.89% | |
Portfolio turnover5 | | | 38.27% | 3 | | | 65.69% | | | | 66.47% | | | | 69.14% | | | | 72.96% | | | | 79.91% | |
| 1 | Calculated using the average daily shares method. |
| 2 | Less than $0.01 per share. |
| 5 | The portfolio turnover rate is calculated on the Fund as a whole without distinguishing between classes of shares issued. |
See accompanying notes to financial statements.
| | | | |
| matthewsasia.com | 800.789.ASIA | | | 127 | |
Financial Highlights (continued)
Matthews Asia Value Fund
The tables below set forth financial data for a share of beneficial interest outstanding throughout each period presented.
| | | | | | | | | | | | | | | | | | | | | | | | |
| INVESTOR CLASS | | Six-Month
Period Ended
June 30, 2020
(unaudited) | | | Year Ended Dec. 31 | | | Period Ended Dec. 31, 20151 | |
| | 2019 | | | 2018 | | | 2017 | | | 2016 | |
Net Asset Value, beginning of period | | | $11.06 | | | | $10.86 | | | | $12.83 | | | | $9.96 | | | | $9.85 | | | | $10.00 | |
INCOME (LOSS) FROM INVESTMENT OPERATIONS: | | | | | | | | | | | | | | | | | | | | | | | | |
Net investment income (loss)2 | | | 0.03 | | | | 0.15 | | | | 0.10 | | | | 0.14 | | | | 0.09 | | | | 0.02 | |
Net realized gain (loss) and unrealized appreciation/depreciation on investments, foreign currency related transactions and foreign capital gains taxes | | | (0.52 | ) | | | 0.73 | | | | (1.49 | ) | | | 3.45 | | | | 0.65 | | | | (0.16 | ) |
Total from investment operations | | | (0.49 | ) | | | 0.88 | | | | (1.39 | ) | | | 3.59 | | | | 0.74 | | | | (0.14 | ) |
LESS DISTRIBUTIONS FROM: | | | | | | | | | | | | | | | | | | | | | | | | |
Net investment income | | | — | | | | (0.68 | ) | | | (0.16 | ) | | | (0.29 | ) | | | (0.59 | ) | | | (0.01 | ) |
Net realized gains on investments | | | — | | | | — | | | | (0.42 | ) | | | (0.43 | ) | | | (0.04 | ) | | | — | |
Total distributions | | | — | | | | (0.68 | ) | | | (0.58 | ) | | | (0.72 | ) | | | (0.63 | ) | | | (0.01 | ) |
Net Asset Value, end of period | | | $10.57 | | | | $11.06 | | | | $10.86 | | | | $12.83 | | | | $9.96 | | | | $9.85 | |
TOTAL RETURN | | | (4.43% | )3 | | | 8.23% | | | | (10.93% | ) | | | 36.12% | | | | 7.43% | | | | (1.35% | )3 |
| | | | | | |
RATIOS/SUPPLEMENTAL DATA | | | | | | | | | | | | | | | | | | | | | | | | |
Net assets, end of period (in 000’s) | | | $8,105 | | | | $13,246 | | | | $16,326 | | | | $27,346 | | | | $2,548 | | | | $1,589 | |
Ratio of expenses to average net assets before any reimbursement, waiver or recapture of expenses by Advisor and Administrator (Note 5) | | | 2.36% | 4 | | | 1.85% | | | | 1.77% | | | | 2.32% | | | | 11.48% | | |
| 36.42%
| 4
|
Ratio of expenses to average net assets after any reimbursement, waiver or recapture of expenses by Advisor and Administrator | | | 1.45% | 4 | | | 1.42% | | | | 1.50% | | | | 1.50% | | | | 1.50% | | | | 1.50% | 4 |
Ratio of net investment income (loss) to average net assets | | | 0.51% | 4 | | | 1.35% | | | | 0.81% | | | | 1.10% | | | | 0.84% | | | | 2.70% | 4 |
Portfolio turnover5 | | | 21.77% | 3 | | | 32.03% | | | | 48.29% | | | | 31.93% | | | | 19.60% | | | | 10.80% | 3 |
| | | |
| INSTITUTIONAL CLASS | | Six-Month
Period Ended
June 30, 2020
(unaudited) | | | Year Ended Dec. 31 | | | Period Ended Dec. 31, 20151 | |
| | 2019 | | | 2018 | | | 2017 | | | 2016 | |
Net Asset Value, beginning of period | | | $10.97 | | | | $10.78 | | | | $12.73 | | | | $9.85 | | | | $9.83 | | | | $10.00 | |
INCOME (LOSS) FROM INVESTMENT OPERATIONS: | | | | | | | | | | | | | | | | | | | | | | | | |
Net investment income (loss)2 | | | 0.05 | | | | 0.17 | | | | 0.14 | | | | 0.32 | | | | 0.10 | | | | 0.02 | |
Net realized gain (loss) and unrealized appreciation/depreciation on investments, foreign currency related transactions and foreign capital gains taxes | | | (0.52 | ) | | | 0.72 | | | | (1.49 | ) | | | 3.25 | | | | 0.67 | | | | (0.15 | ) |
Total from investment operations | | | (0.47 | ) | | | 0.89 | | | | (1.35 | ) | | | 3.57 | | | | 0.77 | | | | (0.13 | ) |
LESS DISTRIBUTIONS FROM: | | | | | | | | | | | | | | | | | | | | | | | | |
Net investment income | | | — | | | | (0.70 | ) | | | (0.18 | ) | | | (0.26 | ) | | | (0.71 | ) | | | (0.04 | ) |
Net realized gains on investments | | | — | | | | — | | | | (0.42 | ) | | | (0.43 | ) | | | (0.04 | ) | | | — | |
Total distributions | | | — | | | | (0.70 | ) | | | (0.60 | ) | | | (0.69 | ) | | | (0.75 | ) | | | (0.04 | ) |
Net Asset Value, end of period | | | $10.50 | | | | $10.97 | | | | $10.78 | | | | $12.73 | | | | $9.85 | | | | $9.83 | |
TOTAL RETURN | | | (4.28% | )3 | | | 8.35% | | | | (10.65% | ) | | | 36.35% | | | | 7.72% | | | | (1.30% | )3 |
| | | | | | |
RATIOS/SUPPLEMENTAL DATA | | | | | | | | | | | | | | | | | | | | | | | | |
Net assets, end of period (in 000’s) | | | $5,344 | | | | $6,574 | | | | $6,869 | | | | $3,388 | | | | $155 | | | | $143 | |
Ratio of expenses to average net assets before any reimbursement, waiver or recapture of expenses by Advisor and Administrator (Note 5) | | | 2.20% | 4 | | | 1.74% | | | | 1.54% | | | | 2.08% | | | | 11.26% | | | | 36.17% | 4 |
Ratio of expenses to average net assets after any reimbursement, waiver or recapture of expenses by Advisor and Administrator | | | 1.20% | 4 | | | 1.24% | | | | 1.25% | | | | 1.25% | | | | 1.25% | | | | 1.25% | 4 |
Ratio of net investment income (loss) to average net assets | | | 0.99% | 4 | | | 1.49% | | | | 1.18% | | | | 2.59% | | | | 1.01% | | | | 2.41% | 4 |
Portfolio turnover5 | | | 21.77% | 3 | | | 32.03% | | | | 48.29% | | | | 31.93% | | | | 19.60% | | | | 10.80% | 3 |
| 1 | Commenced operations on November 30, 2015. |
| 2 | Calculated using the average daily shares method. |
| 5 | The portfolio turnover rate is calculated on the Fund as a whole without distinguishing between classes of shares issued. |
See accompanying notes to financial statements.
Financial Highlights (continued)
Matthews Asia Growth Fund
The tables below set forth financial data for a share of beneficial interest outstanding throughout each period presented.
| | | | | | | | | | | | | | | | | | | | | | | | |
| INVESTOR CLASS | | Six-Month
Period Ended
June 30, 2020
(unaudited) | | | Year Ended Dec. 31 | |
| | 2019 | | | 2018 | | | 2017 | | | 2016 | | | 2015 | |
Net Asset Value, beginning of period | | | $28.10 | | | | $22.49 | | | | $27.25 | | | | $21.05 | | | | $21.09 | | | | $21.10 | |
INCOME (LOSS) FROM INVESTMENT OPERATIONS: | | | | | | | | | | | | | | | | | | | | | | | | |
Net investment income (loss)1 | | | — | 2 | | | (0.03 | ) | | | — | 2 | | | 0.04 | | | | 0.06 | | | | 0.11 | |
Net realized gain (loss) and unrealized appreciation/depreciation on investments, foreign currency related transactions and foreign capital gains taxes | | | 2.37 | | | | 5.91 | | | | (4.41 | ) | | | 8.14 | | | | 0.13 | | | | (0.12 | ) |
Total from investment operations | | | 2.37 | | | | 5.88 | | | | (4.41 | ) | | | 8.18 | | | | 0.19 | | | | (0.01 | ) |
LESS DISTRIBUTIONS FROM: | | | | | | | | | | | | | | | | | | | | | | | | |
Net investment income | | | — | | | | — | | | | (0.03 | ) | | | (0.16 | ) | | | (0.23 | ) | | | — | |
Net realized gains on investments | | | — | | | | (0.27 | ) | | | (0.32 | ) | | | (1.82 | ) | | | — | | | | — | |
Total distributions | | | — | | | | (0.27 | ) | | | (0.35 | ) | | | (1.98 | ) | | | (0.23 | ) | | | — | |
Paid-in capital from redemption fees (Note 4) | | | — | | | | — | | | | — | | | | — | | | | — | | | | — | 2 |
Net Asset Value, end of period | | | $30.47 | | | | $28.10 | | | | $22.49 | | | | $27.25 | | | | $21.05 | | | | $21.09 | |
TOTAL RETURN | | | 8.43% | 3 | | | 26.18% | | | | (16.25% | ) | | | 39.39% | | | | 0.92% | | | | (0.05% | ) |
| | | | | | |
RATIOS/SUPPLEMENTAL DATA | | | | | | | | | | | | | | | | | | | | | | | | |
Net assets, end of period (in 000’s) | | | $524,587 | | | | $504,538 | | | | $463,600 | | | | $554,309 | | | | $419,516 | | | | $526,969 | |
Ratio of expenses to average net assets | | | 1.11% | 4 | | | 1.09% | | | | 1.10% | | | | 1.12% | | | | 1.14% | | | | 1.11% | |
Ratio of net investment income (loss) to average net assets | | | (0.01% | )4 | | | (0.14% | ) | | | —% | 5 | | | 0.16% | | | | 0.30% | | | | 0.49% | |
Portfolio turnover6 | | | 26.63% | 3 | | | 38.05% | | | | 12.12% | | | | 23.19% | | | | 13.61% | | | | 29.51% | |
| | |
| INSTITUTIONAL CLASS | | Six-Month
Period Ended
June 30, 2020
(unaudited) | | | Year Ended Dec. 31 | |
| | 2019 | | | 2018 | | | 2017 | | | 2016 | | | 2015 | |
Net Asset Value, beginning of period | | | $28.34 | | | | $22.65 | | | | $27.45 | | | | $21.19 | | | | $21.24 | | | | $21.19 | |
INCOME (LOSS) FROM INVESTMENT OPERATIONS: | | | | | | | | | | | | | | | | | | | | | | | | |
Net investment income (loss)1 | | | 0.02 | | | | — | 2 | | | 0.05 | | | | 0.09 | | | | 0.10 | | | | 0.16 | |
Net realized gain (loss) and unrealized appreciation/depreciation on investments, foreign currency related transactions and foreign capital gains taxes | | | 2.39 | | | | 5.96 | | | | (4.45 | ) | | | 8.20 | | | | 0.13 | | | | (0.11 | ) |
Total from investment operations | | | 2.41 | | | | 5.96 | | | | (4.40 | ) | | | 8.29 | | | | 0.23 | | | | 0.05 | |
LESS DISTRIBUTIONS FROM: | | | | | | | | | | | | | | | | | | | | | | | | |
Net investment income | | | — | | | | — | | | | (0.08 | ) | | | (0.21 | ) | | | (0.28 | ) | | | — | |
Net realized gains on investments | | | — | | | | (0.27 | ) | | | (0.32 | ) | | | (1.82 | ) | | | — | | | | — | |
Total distributions | | | — | | | | (0.27 | ) | | | (0.40 | ) | | | (2.03 | ) | | | (0.28 | ) | | | — | |
Paid-in capital from redemption fees (Note 4) | | | — | | | | — | | | | — | | | | — | | | | — | | | | — | 2 |
Net Asset Value, end of period | | | $30.75 | | | | $28.34 | | | | $22.65 | | | | $27.45 | | | | $21.19 | | | | $21.24 | |
TOTAL RETURN | | | 8.50% | 3 | | | 26.34% | | | | (16.10% | ) | | | 39.64% | | | | 1.06% | | | | 0.24% | |
| | | | | | |
RATIOS/SUPPLEMENTAL DATA | | | | | | | | | | | | | | | | | | | | | | | | |
Net assets, end of period (in 000’s) | | | $787,622 | | | | $698,797 | | | | $466,733 | | | | $296,253 | | | | $195,949 | | | | $249,886 | |
Ratio of expenses to average net assets | | | 0.97% | 4 | | | 0.94% | | | | 0.93% | | | | 0.93% | | | | 0.96% | | | | 0.91% | |
Ratio of net investment income (loss) to average net assets | | | 0.13% | 4 | | | —% | 5 | | | 0.17% | | | | 0.35% | | | | 0.47% | | | | 0.72% | |
Portfolio turnover6 | | | 26.63% | 3 | | | 38.05% | | | | 12.12% | | | | 23.19% | | | | 13.61% | | | | 29.51% | |
| 1 | Calculated using the average daily shares method. |
| 2 | Less than $0.01 per share. |
| 6 | The portfolio turnover rate is calculated on the Fund as a whole without distinguishing between classes of shares issued. |
See accompanying notes to financial statements.
| | | | |
| matthewsasia.com | 800.789.ASIA | | | 129 | |
Financial Highlights (continued)
Matthews Pacific Tiger Fund
The tables below set forth financial data for a share of beneficial interest outstanding throughout each period presented.
| | | | | | | | | | | | | | | | | | | | | | | | |
| INVESTOR CLASS | | Six-Month
Period Ended
June 30, 2020
(unaudited) | | | Year Ended Dec. 31 | |
| | 2019 | | | 2018 | | | 2017 | | | 2016 | | | 2015 | |
Net Asset Value, beginning of period | | | $28.74 | | | | $26.86 | | | | $31.66 | | | | $22.92 | | | | $23.54 | | | | $26.57 | |
INCOME (LOSS) FROM INVESTMENT OPERATIONS: | | | | | | | | | | | | | | | | | | | | | | | | |
Net investment income (loss)1 | | | 0.06 | | | | 0.19 | | | | 0.24 | | | | 0.17 | | | | 0.11 | | | | 0.42 | |
Net realized gain (loss) and unrealized appreciation/depreciation on investments, foreign currency related transactions and foreign capital gains taxes | | | (1.42 | ) | | | 2.68 | | | | (3.75 | ) | | | 8.96 | | | | (0.13 | ) | | | (0.82 | ) |
Total from investment operations | | | (1.36 | ) | | | 2.87 | | | | (3.51 | ) | | | 9.13 | | | | (0.02 | ) | | | (0.40 | ) |
LESS DISTRIBUTIONS FROM: | | | | | | | | | | | | | | | | | | | | | | | | |
Net investment income | | | — | | | | (0.15 | ) | | | (0.21 | ) | | | (0.17 | ) | | | (0.13 | ) | | | (0.42 | ) |
Net realized gains on investments | | | — | | | | (0.84 | ) | | | (1.08 | ) | | | (0.22 | ) | | | (0.47 | ) | | | (2.21 | ) |
Total distributions | | | — | | | | (0.99 | ) | | | (1.29 | ) | | | (0.39 | ) | | | (0.60 | ) | | | (2.63 | ) |
Paid-in capital from redemption fees (Note 4) | | | — | | | | — | 2 | | | — | | | | — | 2 | | | — | | | | — | 2 |
Net Asset Value, end of period | | | $27.38 | | | | $28.74 | | | | $26.86 | | | | $31.66 | | | | $22.92 | | | | $23.54 | |
TOTAL RETURN | | | (4.73% | )3 | | | 10.72% | | | | (11.11% | ) | | | 39.96% | | | | (0.16% | ) | | | (1.30% | ) |
| | | | | | |
RATIOS/SUPPLEMENTAL DATA | | | | | | | | | | | | | | | | | | | | | | | | |
Net assets, end of period (in 000’s) | | | $2,029,934 | | | | $2,536,844 | | | | $2,618,155 | | | | $3,335,795 | | | | $2,445,183 | | | | $2,720,869 | |
Ratio of expenses to average net assets before any reimbursement, waiver or recapture of expenses by Advisor and Administrator (Note 5) | | | 1.13% | 4 | | | 1.08% | | | | 1.07% | | | | 1.08% | | | | 1.09% | | | | 1.09% | |
Ratio of expenses to average net assets after any reimbursement, waiver or recapture of expenses by Advisor and Administrator | | | 1.11% | 4 | | | 1.05% | | | | 1.04% | | | | 1.06% | | | | 1.08% | | | | 1.07% | |
Ratio of net investment income (loss) to average net assets | | | 0.47% | 4 | | | 0.66% | | | | 0.79% | | | | 0.63% | | | | 0.47% | | | | 1.53% | |
Portfolio turnover5 | | | 15.62% | 3 | | | 17.08% | | | | 11.48% | | | | 9.18% | | | | 5.73% | | | | 12.56% | |
| | |
| INSTITUTIONAL CLASS | | Six-Month
Period Ended
June 30, 2020
(unaudited) | | | Year Ended Dec. 31 | |
| | 2019 | | | 2018 | | | 2017 | | | 2016 | | | 2015 | |
Net Asset Value, beginning of period | | | $28.71 | | | | $26.83 | | | | $31.63 | | | | $22.90 | | | | $23.52 | | | | $26.56 | |
INCOME (LOSS) FROM INVESTMENT OPERATIONS: | | | | | | | | | | | | | | | | | | | | | | | | |
Net investment income (loss)1 | | | 0.08 | | | | 0.23 | | | | 0.28 | | | | 0.22 | | | | 0.16 | | | | 0.44 | |
Net realized gain (loss) and unrealized appreciation/depreciation on investments, foreign currency related transactions and foreign capital gains taxes | | | (1.43 | ) | | | 2.68 | | | | (3.74 | ) | | | 8.95 | | | | (0.14 | ) | | | (0.80 | ) |
Total from investment operations | | | (1.35 | ) | | | 2.91 | | | | (3.46 | ) | | | 9.17 | | | | 0.02 | | | | (0.36 | ) |
LESS DISTRIBUTIONS FROM: | | | | | | | | | | | | | | | | | | | | | | | | |
Net investment income | | | — | | | | (0.19 | ) | | | (0.26 | ) | | | (0.22 | ) | | | (0.17 | ) | | | (0.47 | ) |
Net realized gains on investments | | | — | | | | (0.84 | ) | | | (1.08 | ) | | | (0.22 | ) | | | (0.47 | ) | | | (2.21 | ) |
Total distributions | | | — | | | | (1.03 | ) | | | (1.34 | ) | | | (0.44 | ) | | | (0.64 | ) | | | (2.68 | ) |
Paid-in capital from redemption fees (Note 4) | | | — | | | | — | 2 | | | — | | | | — | 2 | | | — | | | | — | 2 |
Net Asset Value, end of period | | | $27.36 | | | | $28.71 | | | | $26.83 | | | | $31.63 | | | | $22.90 | | | | $23.52 | |
TOTAL RETURN | | | (4.70% | )3 | | | 10.90% | | | | (10.94% | ) | | | 40.17% | | | | 0.03% | | | | (1.15% | ) |
| | | | | | |
RATIOS/SUPPLEMENTAL DATA | | | | | | | | | | | | | | | | | | | | | | | | |
Net assets, end of period (in 000’s) | | | $4,663,711 | | | | $6,189,015 | | | | $5,689,079 | | | | $6,389,242 | | | | $4,207,508 | | | | $3,964,547 | |
Ratio of expenses to average net assets before any reimbursement, waiver or recapture of expenses by Advisor and Administrator (Note 5) | | | 0.97% | 4 | | | 0.93% | | | | 0.90% | | | | 0.91% | | | | 0.91% | | | | 0.91% | |
Ratio of expenses to average net assets after any reimbursement, waiver or recapture of expenses by Advisor and Administrator | | | 0.96% | 4 | | | 0.91% | | | | 0.88% | | | | 0.89% | | | | 0.90% | | | | 0.89% | |
Ratio of net investment income (loss) to average net assets | | | 0.59% | 4 | | | 0.80% | | | | 0.95% | | | | 0.80% | | | | 0.65% | | | | 1.61% | |
Portfolio turnover5 | | | 15.62% | 3 | | | 17.08% | | | | 11.48% | | | | 9.18% | | | | 5.73% | | | | 12.56% | |
| 1 | Calculated using the average daily shares method. |
| 2 | Less than $0.01 per share. |
| 5 | The portfolio turnover rate is calculated on the Fund as a whole without distinguishing between classes of shares issued. |
See accompanying notes to financial statements.
Financial Highlights (continued)
Matthews Asia ESG Fund
The tables below set forth financial data for a share of beneficial interest outstanding throughout each period presented.
| | | | | | | | | | | | | | | | | | | | | | | | |
| INVESTOR CLASS | | Six-Month
Period Ended
June 30, 2020
(unaudited) | | | Year Ended Dec. 31 | | | Period Ended Dec. 31, 20151 | |
| | 2019 | | | 2018 | | | 2017 | | | 2016 | |
Net Asset Value, beginning of period | | | $11.08 | | | | $9.98 | | | | $11.56 | | | | $8.97 | | | | $9.23 | | | | $10.00 | |
INCOME (LOSS) FROM INVESTMENT OPERATIONS: | | | | | | | | | | | | | | | | | | | | | | | | |
Net investment income (loss)2 | | | — | 3 | | | 0.04 | | | | 0.03 | | | | 0.05 | | | | 0.07 | | | | 0.02 | |
Net realized gain (loss) and unrealized appreciation/depreciation on investments, foreign currency related transactions and foreign capital gains taxes | | | 0.07 | | | | 1.21 | | | | (1.16 | ) | | | 2.97 | | | | (0.20 | ) | | | (0.75 | ) |
Total from investment operations | | | 0.07 | | | | 1.25 | | | | (1.13 | ) | | | 3.02 | | | | (0.13 | ) | | | (0.73 | ) |
LESS DISTRIBUTIONS FROM: | | | | | | | | | | | | | | | | | | | | | | | | |
Net investment income | | | — | | | | (0.03 | ) | | | (0.02 | ) | | | (0.27 | ) | | | (0.13 | ) | | | (0.04 | ) |
Net realized gains on investments | | | — | | | | (0.12 | ) | | | (0.43 | ) | | | (0.16 | ) | | | — | | | | — | |
Total distributions | | | — | | | | (0.15 | ) | | | (0.45 | ) | | | (0.43 | ) | | | (0.13 | ) | | | (0.04 | ) |
Net Asset Value, end of period | | | $11.15 | | | | $11.08 | | | | $9.98 | | | | $11.56 | | | | $8.97 | | | | $9.23 | |
TOTAL RETURN | | | 0.63% | 4 | | | 12.55% | | | | (9.73% | ) | | | 33.79% | | | | (1.40% | ) | | | (7.30% | )4 |
| | | | | | |
RATIOS/SUPPLEMENTAL DATA | | | | | | | | | | | | | | | | | | | | | | | | |
Net assets, end of period (in 000’s) | | | $21,700 | | | | $19,291 | | | | $9,283 | | | | $10,695 | | | | $5,376 | | | | $3,248 | |
Ratio of expenses to average net assets before any reimbursement, waiver or recapture of expenses by Advisor and Administrator (Note 5) | | | 1.55% | 5 | | | 1.54% | | | | 2.20% | | | | 2.65% | | | | 3.54% | | | | 9.09% | 5 |
Ratio of expenses to average net assets after any reimbursement, waiver or recapture of expenses by Advisor and Administrator | | | 1.39% | 5 | | | 1.42% | | | | 1.50% | | | | 1.50% | | | | 1.48% | | | | 1.44% | 5 |
Ratio of net investment income (loss) to average net assets | | | (0.03% | )5 | | | 0.41% | | | | 0.27% | | | | 0.45% | | | | 0.77% | | | | 0.25% | 5 |
Portfolio turnover6 | | | 51.33% | 4 | | | 29.67% | | | | 22.93% | | | | 28.82% | | | | 16.10% | | | | 21.72% | 4 |
| | | |
| INSTITUTIONAL CLASS | | Six-Month
Period Ended
June 30, 2020
(unaudited) | | | Year Ended Dec. 31 | | | Period Ended Dec. 31, 20151 | |
| | 2019 | | | 2018 | | | 2017 | | | 2016 | |
Net Asset Value, beginning of period | | | $11.06 | | | | $9.96 | | | | $11.50 | | | | $8.92 | | | | $9.17 | | | | $10.00 | |
INCOME (LOSS) FROM INVESTMENT OPERATIONS: | | | | | | | | | | | | | | | | | | | | | | | | |
Net investment income (loss)2 | | | 0.01 | | | | 0.06 | | | | 0.06 | | | | 0.08 | | | | 0.09 | | | | 0.05 | |
Net realized gain (loss) and unrealized appreciation/depreciation on investments, foreign currency related transactions and foreign capital gains taxes | | | 0.07 | | | | 1.21 | | | | (1.16 | ) | | | 2.95 | | | | (0.19 | ) | | | (0.77 | ) |
Total from investment operations | | | 0.08 | | | | 1.27 | | | | (1.10 | ) | | | 3.03 | | | | (0.10 | ) | | | (0.72 | ) |
LESS DISTRIBUTIONS FROM: | | | | | | | | | | | | | | | | | | | | | | | | |
Net investment income | | | — | | | | (0.05 | ) | | | (0.01 | ) | | | (0.29 | ) | | | (0.15 | ) | | | (0.11 | ) |
Net realized gains on investments | | | — | | | | (0.12 | ) | | | (0.43 | ) | | | (0.16 | ) | | | — | | | | — | |
Total distributions | | | — | | | | (0.17 | ) | | | (0.44 | ) | | | (0.45 | ) | | | (0.15 | ) | | | (0.11 | ) |
Net Asset Value, end of period | | | $11.14 | | | | $11.06 | | | | $9.96 | | | | $11.50 | | | | $8.92 | | | | $9.17 | |
TOTAL RETURN | | | 0.72% | 4 | | | 12.74% | | | | (9.52% | ) | | | 34.11% | | | | (1.16% | ) | | | (7.14% | )4 |
| | | | | | |
RATIOS/SUPPLEMENTAL DATA | | | | | | | | | | | | | | | | | | | | | | | | |
Net assets, end of period (in 000’s) | | | $33,794 | | | | $36,008 | | | | $23,249 | | | | $7,359 | | | | $3,382 | | | | $1,686 | |
Ratio of expenses to average net assets before any reimbursement, waiver or recapture of expenses by Advisor and Administrator (Note 5) | | | 1.42% | 5 | | | 1.41% | | | | 2.01% | | | | 2.46% | | | | 3.36% | | | | 8.90% | 5 |
Ratio of expenses to average net assets after any reimbursement, waiver or recapture of expenses by Advisor and Administrator | | | 1.20% | 5 | | | 1.24% | | | | 1.25% | | | | 1.25% | | | | 1.25% | | | | 1.25% | 5 |
Ratio of net investment income (loss) to average net assets | | | 0.11% | 5 | | | 0.54% | | | | 0.55% | | | | 0.71% | | | | 0.97% | | | | 0.75% | 5 |
Portfolio turnover6 | | | 51.33% | 4 | | | 29.67% | | | | 22.93% | | | | 28.82% | | | | 16.10% | | | | 21.72% | 4 |
| 1 | Commenced operations on April 30, 2015. |
| 2 | Calculated using the average daily shares method. |
| 3 | Less than $0.01 per share. |
| 6 | The portfolio turnover rate is calculated on the Fund as a whole without distinguishing between classes of shares issued. |
See accompanying notes to financial statements.
| | | | |
| matthewsasia.com | 800.789.ASIA | | | 131 | |
Financial Highlights (continued)
Matthews Emerging Asia Fund
The tables below set forth financial data for a share of beneficial interest outstanding throughout each period presented.
| | | | | | | | | | | | | | | | | | | | | | | | |
| INVESTOR CLASS | | Six-Month
Period Ended
June 30, 2020
(unaudited) | | | Year Ended Dec. 31 | |
| | 2019 | | | 2018 | | | 2017 | | | 2016 | | | 2015 | |
Net Asset Value, beginning of period | | | $12.07 | | | | $12.50 | | | | $15.51 | | | | $13.18 | | | | $11.27 | | | | $11.60 | |
INCOME (LOSS) FROM INVESTMENT OPERATIONS: | | | | | | | | | | | | | | | | | | | | | | | | |
Net investment income (loss)1 | | | 0.07 | | | | 0.14 | | | | 0.10 | | | | 0.07 | | | | 0.15 | | | | 0.04 | |
Net realized gain (loss) and unrealized appreciation/depreciation on investments, foreign currency related transactions and foreign capital gains taxes | | | (3.09 | ) | | | (0.27 | ) | | | (2.82 | ) | | | 2.35 | | | | 2.01 | | | | (0.34 | ) |
Total from investment operations | | | (3.02 | ) | | | (0.13 | ) | | | (2.72 | ) | | | 2.42 | | | | 2.16 | | | | (0.30 | ) |
LESS DISTRIBUTIONS FROM: | | | | | | | | | | | | | | | | | | | | | | | | |
Net investment income | | | — | | | | — | | | | (0.10 | ) | | | (0.04 | ) | | | (0.13 | ) | | | — | 2 |
Net realized gains on investments | | | — | | | | (0.30 | ) | | | (0.19 | ) | | | (0.05 | ) | | | (0.13 | ) | | | (0.03 | ) |
Total distributions | | | — | | | | (0.30 | ) | | | (0.29 | ) | | | (0.09 | ) | | | (0.26 | ) | | | (0.03 | ) |
Paid-in capital from redemption fees (Note 4) | | | — | | | | — | 3 | | | — | 2 | | | — | 2 | | | 0.01 | | | | — | 2 |
Net Asset Value, end of period | | | $9.05 | | | | $12.07 | | | | $12.50 | | | | $15.51 | | | | $13.18 | | | | $11.27 | |
TOTAL RETURN | | | (25.02% | )4 | | | (1.01% | ) | | | (17.58% | ) | | | 18.42% | | | | 19.25% | | | | (2.56% | ) |
| | | | | | |
RATIOS/SUPPLEMENTAL DATA | | | | | | | | | | | | | | | | | | | | | | | | |
Net assets, end of period (in 000’s) | | | $49,596 | | | | $84,543 | | | | $118,505 | | | | $219,596 | | | | $145,164 | | | | $114,590 | |
Ratio of expenses to average net assets before any reimbursement, waiver or recapture of expenses by Advisor and Administrator (Note 5) | | | 1.98% | 5 | | | 1.65% | | | | 1.66% | | | | 1.70% | | | | 1.77% | | | | 1.75% | |
Ratio of expenses to average net assets after any reimbursement, waiver or recapture of expenses by Advisor and Administrator | | | 1.45% | 5 | | | 1.46% | | | | 1.48% | | | | 1.48% | | | | 1.47% | | | | 1.50% | |
Ratio of net investment income (loss) to average net assets | | | 1.42% | 5 | | | 1.15% | | | | 0.72% | | | | 0.49% | | | | 1.26% | | | | 0.33% | |
Portfolio turnover6 | | | 10.65% | 4 | | | 18.77% | | | | 26.09% | | | | 7.74% | | | | 34.90% | | | | 12.14% | |
| | |
| INSTITUTIONAL CLASS | | Six-Month
Period Ended
June 30, 2020
(unaudited) | | | Year Ended Dec. 31 | |
| | 2019 | | | 2018 | | | 2017 | | | 2016 | | | 2015 | |
Net Asset Value, beginning of period | | | $12.13 | | | | $12.54 | | | | $15.57 | | | | $13.22 | | | | $11.29 | | | | $11.60 | |
INCOME (LOSS) FROM INVESTMENT OPERATIONS: | | | | | | | | | | | | | | | | | | | | | | | | |
Net investment income (loss)1 | | | 0.08 | | | | 0.17 | | | | 0.14 | | | | 0.10 | | | | 0.21 | | | | 0.07 | |
Net realized gain (loss) and unrealized appreciation/depreciation on investments, foreign currency related transactions and foreign capital gains taxes | | | (3.10 | ) | | | (0.28 | ) | | | (2.85 | ) | | | 2.37 | | | | 1.99 | | | | (0.34 | ) |
Total from investment operations | | | (3.02 | ) | | | (0.11 | ) | | | (2.71 | ) | | | 2.47 | | | | 2.20 | | | | (0.27 | ) |
LESS DISTRIBUTIONS FROM: | | | | | | | | | | | | | | | | | | | | | | | | |
Net investment income | | | — | | | | — | | | | (0.13 | ) | | | (0.07 | ) | | | (0.15 | ) | | | (0.01 | ) |
Net realized gains on investments | | | — | | | | (0.30 | ) | | | (0.19 | ) | | | (0.05 | ) | | | (0.13 | ) | | | (0.03 | ) |
Total distributions | | | — | | | | (0.30 | ) | | | (0.32 | ) | | | (0.12 | ) | | | (0.28 | ) | | | (0.04 | ) |
Paid-in capital from redemption fees (Note 4) | | | — | | | | — | 3 | | | — | 2 | | | — | 2 | | | 0.01 | | | | — | 2 |
Net Asset Value, end of period | | | $9.11 | | | | $12.13 | | | | $12.54 | | | | $15.57 | | | | $13.22 | | | | $11.29 | |
TOTAL RETURN | | | (24.90% | )4 | | | (0.85% | ) | | | (17.41% | ) | | | 18.70% | | | | 19.61% | | | | (2.33% | ) |
| | | | | | |
RATIOS/SUPPLEMENTAL DATA | | | | | | | | | | | | | | | | | | | | | | | | |
Net assets, end of period (in 000’s) | | | $115,512 | | | | $235,639 | | | | $256,669 | | | | $275,233 | | | | $95,724 | | | | $55,278 | |
Ratio of expenses to average net assets before any reimbursement, waiver or recapture of expenses by Advisor and Administrator (Note 5) | | | 1.85% | 5 | | | 1.51% | | | | 1.50% | | | | 1.52% | | | | 1.62% | | | | 1.57% | |
Ratio of expenses to average net assets after any reimbursement, waiver or recapture of expenses by Advisor and Administrator | | | 1.20% | 5 | | | 1.25% | | | | 1.25% | | | | 1.25% | | | | 1.25% | | | | 1.25% | |
Ratio of net investment income (loss) to average net assets | | | 1.65% | 5 | | | 1.39% | | | | 0.97% | | | | 0.70% | | | | 1.72% | | | | 0.65% | |
Portfolio turnover6 | | | 10.65% | 4 | | | 18.77% | | | | 26.09% | | | | 7.74% | | | | 34.90% | | | | 12.14% | |
| 1 | Calculated using the average daily shares method. |
| 2 | Less than $0.01 per share. |
| 3 | The Fund charged redemption fees through October 31, 2019. |
| 6 | The portfolio turnover rate is calculated on the Fund as a whole without distinguishing between classes of shares issued. |
See accompanying notes to financial statements.
Financial Highlights (continued)
Matthews Asia Innovators Fund
The tables below set forth financial data for a share of beneficial interest outstanding throughout each period presented.
| | | | | | | | | | | | | | | | | | | | | | | | |
INVESTOR CLASS | | Six-Month
Period Ended
June 30, 2020 (unaudited) | | | Year Ended Dec. 31 | |
| | 2019 | | | 2018 | | | 2017 | | | 2016 | | | 2015 | |
Net Asset Value, beginning of period | | | $14.55 | | | | $11.26 | | | | $14.19 | | | | $10.10 | | | | $12.32 | | | | $13.61 | |
INCOME (LOSS) FROM INVESTMENT OPERATIONS: | | | | | | | | | | | | | | | | | | | | | | | | |
Net investment income (loss)1 | | | (0.03 | ) | | | (0.01 | ) | | | (0.01 | ) | | | (0.02 | ) | | | (0.02 | ) | | | (0.05 | ) |
Net realized gain (loss) and unrealized appreciation/depreciation on investments, foreign currency related transactions and foreign capital gains taxes | | | 3.96 | | | | 3.34 | | | | (2.62 | ) | | | 5.31 | | | | (1.07 | ) | | | 0.64 | |
Total from investment operations | | | 3.93 | | | | 3.33 | | | | (2.63 | ) | | | 5.29 | | | | (1.09 | ) | | | 0.59 | |
LESS DISTRIBUTIONS FROM: | | | | | | | | | | | | | | | | | | | | | | | | |
Net investment income | | | — | | | | — | | | | (0.04 | ) | | | (0.24 | ) | | | — | | | | — | |
Net realized gains on investments | | | — | | | | (0.04 | ) | | | (0.26 | ) | | | (0.96 | ) | | | (1.13 | ) | | | (1.88 | ) |
Total distributions | | | — | | | | (0.04 | ) | | | (0.30 | ) | | | (1.20 | ) | | | (1.13 | ) | | | (1.88 | ) |
Net Asset Value, end of period | | | $18.48 | | | | $14.55 | | | | $11.26 | | | | $14.19 | | | | $10.10 | | | | $12.32 | |
TOTAL RETURN | | | 27.01% | 2 | | | 29.60% | | | | (18.62% | ) | | | 52.88% | | | | (9.10% | ) | | | 4.48% | |
| | | | | | |
RATIOS/SUPPLEMENTAL DATA | | | | | | | | | | | | | | | | | | | | | | | | |
Net assets, end of period (in 000’s) | | | $286,839 | | | | $177,639 | | | | $152,449 | | | | $175,331 | | | | $83,926 | | | | $129,763 | |
Ratio of expenses to average net assets | | | 1.11% | 3 | | | 1.19% | | | | 1.19% | | | | 1.24% | | | | 1.24% | | | | 1.18% | |
Ratio of net investment income (loss) to average net assets | | | (0.44% | )3 | | | (0.04% | ) | | | (0.07% | ) | | | (0.18% | ) | | | (0.19% | ) | | | (0.33% | ) |
Portfolio turnover4 | | | 42.24% | 2 | | | 80.10% | | | | 85.73% | | | | 66.51% | | | | 92.25% | | | | 72.85% | |
| | |
| INSTITUTIONAL CLASS | | Six-Month
Period Ended
June 30, 2020 (unaudited) | | | Year Ended Dec. 31 | |
| | 2019 | | | 2018 | | | 2017 | | | 2016 | | | 2015 | |
Net Asset Value, beginning of period | | | $14.64 | | | | $11.32 | | | | $14.26 | | | | $10.14 | | | | $12.34 | | | | $13.61 | |
INCOME (LOSS) FROM INVESTMENT OPERATIONS: | | | | | | | | | | | | | | | | | | | | | | | | |
Net investment income (loss)1 | | | (0.01 | ) | | | 0.01 | | | | 0.01 | | | | 0.01 | | | | 0.01 | | | | (0.02 | ) |
Net realized gain (loss) and unrealized appreciation/depreciation on investments, foreign currency related transactions and foreign capital gains taxes | | | 3.98 | | | | 3.35 | | | | (2.62 | ) | | | 5.33 | | | | (1.08 | ) | | | 0.63 | |
Total from investment operations | | | 3.97 | | | | 3.36 | | | | (2.61 | ) | | | 5.34 | | | | (1.07 | ) | | | 0.61 | |
LESS DISTRIBUTIONS FROM: | | | | | | | | | | | | | | | | | | | | | | | | |
Net investment income | | | — | | | | — | | | | (0.07 | ) | | | (0.26 | ) | | | — | | | | — | |
Net realized gains on investments | | | — | | | | (0.04 | ) | | | (0.26 | ) | | | (0.96 | ) | | | (1.13 | ) | | | (1.88 | ) |
Total distributions | | | — | | | | (0.04 | ) | | | (0.33 | ) | | | (1.22 | ) | | | (1.13 | ) | | | (1.88 | ) |
Net Asset Value, end of period | | | $18.61 | | | | $14.64 | | | | $11.32 | | | | $14.26 | | | | $10.14 | | | | $12.34 | |
TOTAL RETURN | | | 27.12% | 2 | | | 29.71% | | | | (18.40% | ) | | | 53.18% | | | | (8.92% | ) | | | 4.63% | |
| | | | | | |
RATIOS/SUPPLEMENTAL DATA | | | | | | | | | | | | | | | | | | | | | | | | |
Net assets, end of period (in 000’s) | | | $548,868 | | | | $126,911 | | | | $91,769 | | | | $30,957 | | | | $16,545 | | | | $36,770 | |
Ratio of expenses to average net assets | | | 0.96% | 3 | | | 1.05% | | | | 1.02% | | | | 1.05% | | | | 1.01% | | | | 0.97% | |
Ratio of net investment income (loss) to average net assets | | | (0.15% | )3 | | | 0.10% | | | | 0.07% | | | | 0.06% | | | | 0.06% | | | | (0.16% | ) |
Portfolio turnover4 | | | 42.24% | 2 | | | 80.10% | | | | 85.73% | | | | 66.51% | | | | 92.25% | | | | 72.85% | |
| 1 | Calculated using the average daily shares method. |
| 4 | The portfolio turnover rate is calculated on the Fund as a whole without distinguishing between classes of shares issued. |
See accompanying notes to financial statements.
| | | | |
| matthewsasia.com | 800.789.ASIA | | | 133 | |
Financial Highlights (continued)
Matthews China Fund
The tables below set forth financial data for a share of beneficial interest outstanding throughout each period presented.
| | | | | | | | | | | | | | | | | | | | | | | | |
| | | Six-Month
Period Ended
June 30, 2020 (unaudited) | | | Year Ended Dec. 31 | |
| INVESTOR CLASS | | 2019 | | | 2018 | | | 2017 | | | 20161 | | | 20151 | |
Net Asset Value, beginning of period | | | $19.12 | | | | $14.37 | | | | $22.20 | | | | $15.47 | | | | $18.42 | | | | $21.46 | |
INCOME (LOSS) FROM INVESTMENT OPERATIONS: | | | | | | | | | | | | | | | | | | | | | | | | |
Net investment income (loss)2 | | | 0.06 | | | | 0.16 | | | | 0.21 | | | | 0.16 | | | | 0.21 | | | | 0.20 | |
Net realized gain (loss) and unrealized appreciation/depreciation on investments and foreign currency related transactions | | | 2.29 | | | | 4.80 | | | | (4.84 | ) | | | 8.86 | | | | (1.04 | ) | | | 0.30 | |
Total from investment operations | | | 2.35 | | | | 4.96 | | | | (4.63 | ) | | | 9.02 | | | | (0.83 | ) | | | 0.50 | |
LESS DISTRIBUTIONS FROM: | | | | | | | | | | | | | | | | | | | | | | | | |
Net investment income | | | — | | | | (0.21 | ) | | | (0.29 | ) | | | (0.37 | ) | | | (0.26 | ) | | | (0.21 | ) |
Net realized gains on investments | | | — | | | | — | | | | (2.91 | ) | | | (1.92 | ) | | | (1.29 | ) | | | (3.33 | ) |
Return of capital | | | — | | | | — | | | | — | | | | — | | | | (0.57 | ) | | | — | |
Total distributions | | | — | | | | (0.21 | ) | | | (3.20 | ) | | | (2.29 | ) | | | (2.12 | ) | | | (3.54 | ) |
Paid-in capital from redemption fees (Note 4) | | | — | | | | — | | | | — | | | | — | | | | — | 3 | | | — | 3 |
Net Asset Value, end of period | | | $21.47 | | | | $19.12 | | | | $14.37 | | | | $22.20 | | | | $15.47 | | | | $18.42 | |
TOTAL RETURN | | | 12.29% | 4 | | | 34.56% | | | | (21.42% | ) | | | 59.37% | | | | (5.18% | ) | | | 2.41% | |
| | | | | | |
RATIOS/SUPPLEMENTAL DATA | | | | | | | | | | | | | | | | | | | | | | | | |
Net assets, end of period (in 000’s) | | | $740,105 | | | | $718,633 | | | | $566,456 | | | | $843,508 | | | | $495,900 | | | | $709,767 | |
Ratio of expenses to average net assets | | | 1.11% | 5 | | | 1.09% | | | | 1.10% | | | | 1.09% | | | | 1.18% | | | | 1.14% | |
Ratio of net investment income (loss) to average net assets | | | 0.64% | 5 | | | 0.96% | | | | 1.00% | | | | 0.78% | | | | 1.24% | | | | 0.89% | |
Portfolio turnover6 | | | 33.43% | 4 | | | 68.93% | | | | 96.98% | | | | 78.74% | | | | 83.82% | | | | 66.22% | |
| | |
| | | Six-Month
Period Ended
June 30, 2020 (unaudited) | | | Year Ended Dec. 31 | |
| INSTITUTIONAL CLASS | | 2019 | | | 2018 | | | 2017 | | | 20161 | | | 20151 | |
Net Asset Value, beginning of period | | | $19.08 | | | | $14.33 | | | | $22.17 | | | | $15.44 | | | | $18.39 | | | | $21.44 | |
INCOME (LOSS) FROM INVESTMENT OPERATIONS: | | | | | | | | | | | | | | | | | | | | | | | | |
Net investment income (loss)2 | | | 0.13 | | | | 0.20 | | | | 0.33 | | | | 0.21 | | | | 0.22 | | | | 0.25 | |
Net realized gain (loss) and unrealized appreciation/depreciation on investments and foreign currency related transactions | | | 2.24 | | | | 4.80 | | | | (4.93 | ) | | | 8.84 | | | | (1.03 | ) | | | 0.27 | |
Total from investment operations | | | 2.37 | | | | 5.00 | | | | (4.60 | ) | | | 9.05 | | | | (0.81 | ) | | | 0.52 | |
LESS DISTRIBUTIONS FROM: | | | | | | | | | | | | | | | | | | | | | | | | |
Net investment income | | | — | | | | (0.25 | ) | | | (0.33 | ) | | | (0.40 | ) | | | (0.28 | ) | | | (0.24 | ) |
Net realized gains on investments | | | — | | | | — | | | | (2.91 | ) | | | (1.92 | ) | | | (1.29 | ) | | | (3.33 | ) |
Return of capital | | | — | | | | — | | | | — | | | | — | | | | (0.57 | ) | | | — | |
Total distributions | | | — | | | | (0.25 | ) | | | (3.24 | ) | | | (2.32 | ) | | | (2.14 | ) | | | (3.57 | ) |
Paid-in capital from redemption fees (Note 4) | | | — | | | | — | | | | — | | | | — | | | | — | 3 | | | — | 3 |
Net Asset Value, end of period | | | $21.45 | | | | $19.08 | | | | $14.33 | | | | $22.17 | | | | $15.44 | | | | $18.39 | |
TOTAL RETURN | | | 12.42% | 4 | | | 34.90% | | | | (21.32% | ) | | | 59.71% | | | | (5.06% | ) | | | 2.50% | |
| | | | | | |
RATIOS/SUPPLEMENTAL DATA | | | | | | | | | | | | | | | | | | | | | | | | |
Net assets, end of period (in 000’s) | | | $349,771 | | | | $183,762 | | | | $46,657 | | | | $61,975 | | | | $15,874 | | | | $24,276 | |
Ratio of expenses to average net assets | | | 0.93% | 5 | | | 0.91% | | | | 0.91% | | | | 0.93% | | | | 1.03% | | | | 0.99% | |
Ratio of net investment income (loss) to average net assets | | | 1.32% | 5 | | | 1.17% | | | | 1.53% | | | | 0.99% | | | | 1.32% | | | | 1.09% | |
Portfolio turnover6 | | | 33.43% | 4 | | | 68.93% | | | | 96.98% | | | | 78.74% | | | | 83.82% | | | | 66.22% | |
| 1 | Consolidated Financial Highlights. See Note 2-C. |
| 2 | Calculated using the average daily shares method. |
| 3 | Less than $0.01 per share. |
| 6 | The portfolio turnover rate is calculated on the Fund as a whole without distinguishing between classes of shares issued. |
See accompanying notes to financial statements.
Financial Highlights (continued)
Matthews India Fund
The tables below set forth financial data for a share of beneficial interest outstanding throughout each period presented.
| | | | | | | | | | | | | | | | | | | | | | | | |
| | | Six-Month
Period Ended
June 30, 2020 (unaudited) | | | Year Ended Dec. 31 | |
| INVESTOR CLASS | | 2019 | | | 2018 | | | 2017 | | | 2016 | | | 2015 | |
Net Asset Value, beginning of period | | | $23.27 | | | | $26.32 | | | | $34.31 | | | | $25.65 | | | | $26.43 | | | | $26.46 | |
INCOME (LOSS) FROM INVESTMENT OPERATIONS: | | | | | | | | | | | | | | | | | | | | | | | | |
Net investment income (loss)1 | | | 0.01 | | | | (0.01 | ) | | | (0.05 | ) | | | (0.09 | ) | | | 0.01 | | | | (0.05 | ) |
Net realized gain (loss) and unrealized appreciation/depreciation on investments, foreign currency related transactions and foreign capital gains taxes | | | (4.51 | ) | | | (0.24 | ) | | | (3.60 | ) | | | 9.24 | | | | (0.33 | ) | | | 0.26 | |
Total from investment operations | | | (4.50 | ) | | | (0.25 | ) | | | (3.65 | ) | | | 9.15 | | | | (0.32 | ) | | | 0.21 | |
LESS DISTRIBUTIONS FROM: | | | | | | | | | | | | | | | | | | | | | | | | |
Net investment income | | | — | | | | — | | | | — | | | | — | | | | — | | | | (0.03 | ) |
Net realized gains on investments | | | — | | | | (2.80 | ) | | | (4.34 | ) | | | (0.49 | ) | | | (0.46 | ) | | | (0.23 | ) |
Total distributions | | | — | | | | (2.80 | ) | | | (4.34 | ) | | | (0.49 | ) | | | (0.46 | ) | | | (0.26 | ) |
Paid-in capital from redemption fees (Note 4) | | | — | | | | — | | | | — | | | | — | | | | — | | | | 0.02 | |
Net Asset Value, end of period | | | $18.77 | | | | $23.27 | | | | $26.32 | | | | $34.31 | | | | $25.65 | | | | $26.43 | |
TOTAL RETURN | | | (19.37% | )2 | | | (0.88% | ) | | | (10.09% | ) | | | 35.79% | | | | (1.23% | ) | | | 0.90% | |
| | | | | | |
RATIOS/SUPPLEMENTAL DATA | | | | | | | | | | | | | | | | | | | | | | | | |
Net assets, end of period (in 000’s) | | | $477,579 | | | | $786,881 | | | | $1,077,990 | | | | $1,484,045 | | | | $967,009 | | | | $1,151,948 | |
Ratio of expenses to average net assets | | | 1.25% | 3 | | | 1.11% | | | | 1.09% | | | | 1.09% | | | | 1.12% | | | | 1.11% | |
Ratio of net investment income (loss) to average net assets | | | 0.15% | 3 | | | (0.03% | ) | | | (0.16% | ) | | | (0.30% | ) | | | 0.02% | | | | (0.17% | ) |
Portfolio turnover4 | | | 29.46% | 2 | | | 24.00% | | | | 20.87% | | | | 16.81% | | | | 15.76% | | | | 9.51% | |
| | |
| | | Six-Month
Period Ended
June 30, 2020 (unaudited) | | | Year Ended Dec. 31 | |
| INSTITUTIONAL CLASS | | 2019 | | | 2018 | | | 2017 | | | 2016 | | | 2015 | |
Net Asset Value, beginning of period | | | $23.55 | | | | $26.56 | | | | $34.51 | | | | $25.77 | | | | $26.49 | | | | $26.49 | |
INCOME (LOSS) FROM INVESTMENT OPERATIONS: | | | | | | | | | | | | | | | | | | | | | | | | |
Net investment income (loss)1 | | | 0.04 | | | | 0.02 | | | | 0.01 | | | | (0.03 | ) | | | 0.04 | | | | 0.01 | |
Net realized gain (loss) and unrealized appreciation/depreciation on investments, foreign currency related transactions and foreign capital gains taxes | | | (4.59 | ) | | | (0.23 | ) | | | (3.62 | ) | | | 9.29 | | | | (0.30 | ) | | | 0.26 | |
Total from investment operations | | | (4.55 | ) | | | (0.21 | ) | | | (3.61 | ) | | | 9.26 | | | | (0.26 | ) | | | 0.27 | |
LESS DISTRIBUTIONS FROM: | | | | | | | | | | | | | | | | | | | | | | | | |
Net investment income | | | — | | | | — | | | | — | | | | (0.03 | ) | | | — | | | | (0.06 | ) |
Net realized gains on investments | | | — | | | | (2.80 | ) | | | (4.34 | ) | | | (0.49 | ) | | | (0.46 | ) | | | (0.23 | ) |
Total distributions | | | — | | | | (2.80 | ) | | | (4.34 | ) | | | (0.52 | ) | | | (0.46 | ) | | | (0.29 | ) |
Paid-in capital from redemption fees (Note 4) | | | — | | | | — | | | | — | | | | — | | | | — | | | | 0.02 | |
Net Asset Value, end of period | | | $19.00 | | | | $23.55 | | | | $26.56 | | | | $34.51 | | | | $25.77 | | | | $26.49 | |
TOTAL RETURN | | | (19.32% | )2 | | | (0.76% | ) | | | (9.92% | ) | | | 36.05% | | | | (1.00% | ) | | | 1.12% | |
| | | | | | |
RATIOS/SUPPLEMENTAL DATA | | | | | | | | | | | | | | | | | | | | | | | | |
Net assets, end of period (in 000’s) | | | $74,592 | | | | $177,526 | | | | $463,790 | | | | $788,388 | | | | $551,202 | | | | $353,879 | |
Ratio of expenses to average net assets | | | 1.10% | 3 | | | 0.94% | | | | 0.90% | | | | 0.89% | | | | 0.91% | | | | 0.90% | |
Ratio of net investment income (loss) to average net assets | | | 0.37% | 3 | | | 0.09% | | | | 0.02% | | | | (0.08% | ) | | | 0.16% | | | | 0.02% | |
Portfolio turnover4 | | | 29.46% | 2 | | | 24.00% | | | | 20.87% | | | | 16.81% | | | | 15.76% | | | | 9.51% | |
| 1 | Calculated using the average daily shares method. |
| 4 | The portfolio turnover rate is calculated on the Fund as a whole without distinguishing between classes of shares issued. |
See accompanying notes to financial statements.
| | | | |
| matthewsasia.com | 800.789.ASIA | | | 135 | |
Financial Highlights (continued)
Matthews Japan Fund
The tables below set forth financial data for a share of beneficial interest outstanding throughout each period presented.
| | | | | | | | | | | | | | | | | | | | | | | | |
| | | Six-Month
Period Ended
June 30, 2020 (unaudited) | | | Year Ended Dec. 31 | |
| INVESTOR CLASS | | 2019 | | | 2018 | | | 2017 | | | 2016 | | | 2015 | |
Net Asset Value, beginning of period | | | $21.51 | | | | $18.53 | | | | $24.12 | | | | $18.83 | | | | $18.97 | | | | $15.70 | |
INCOME (LOSS) FROM INVESTMENT OPERATIONS: | | | | | | | | | | | | | | | | | | | | | | | | |
Net investment income (loss)1 | | | 0.06 | | | | 0.11 | | | | 0.09 | | | | 0.09 | | | | 0.08 | | | | 0.04 | |
Net realized gain (loss) and unrealized appreciation/depreciation on investments and foreign currency related transactions | | | (0.05 | ) | | | 4.73 | | | | (4.91 | ) | | | 6.13 | | | | (0.01 | ) | | | 3.23 | |
Total from investment operations | | | 0.01 | | | | 4.84 | | | | (4.82 | ) | | | 6.22 | | | | 0.07 | | | | 3.27 | |
LESS DISTRIBUTIONS FROM: | | | | | | | | | | | | | | | | | | | | | | | | |
Net investment income | | | — | | | | (0.12 | ) | | | (0.06 | ) | | | (0.20 | ) | | | (0.16 | ) | | | — | |
Net realized gains on investments | | | — | | | | (1.74 | ) | | | (0.71 | ) | | | (0.73 | ) | | | (0.05 | ) | | | — | |
Total distributions | | | — | | | | (1.86 | ) | | | (0.77 | ) | | | (0.93 | ) | | | (0.21 | ) | | | — | |
Paid-in capital from redemption fees (Note 4) | | | — | | | | — | | | | — | | | | — | | | | — | | | | — | 2 |
Net Asset Value, end of period | | | $21.52 | | | | $21.51 | | | | $18.53 | | | | $24.12 | | | | $18.83 | | | | $18.97 | |
TOTAL RETURN | | | 0.05% | 3 | | | 26.08% | | | | (20.18% | ) | | | 33.14% | | | | 0.40% | | | | 20.83% | |
| | | | | | |
RATIOS/SUPPLEMENTAL DATA | | | | | | | | | | | | | | | | | | | | | | | | |
Net assets, end of period (in 000’s) | | | $961,996 | | | | $1,466,194 | | | | $1,704,102 | | | | $2,155,280 | | | | $1,685,872 | | | | $1,330,743 | |
Ratio of expenses to average net assets before any reimbursement, waiver or recapture of expenses by Advisor and Administrator (Note 5) | | | 0.98% | 4 | | | 0.93% | | | | 0.91% | | | | 0.95% | | | | 0.98% | | | | 0.99% | |
Ratio of expenses to average net assets after any reimbursement, waiver or recapture of expenses by Advisor and Administrator | | | 0.98% | 4 | | | 0.93% | | | | 0.91% | | | | 0.94% | | | | 0.98% | | | | 0.99% | |
Ratio of net investment income (loss) to average net assets | | | 0.63% | 4 | | | 0.51% | | | | 0.40% | | | | 0.40% | | | | 0.43% | | | | 0.22% | |
Portfolio turnover5 | | | 25.20% | 3 | | | 25.42% | | | | 46.11% | | | | 44.34% | | | | 55.15% | | | | 24.19% | |
| | |
| | | Six-Month
Period Ended
June 30, 2020 (unaudited) | | | Year Ended Dec. 31 | |
| INSTITUTIONAL CLASS | | 2019 | | | 2018 | | | 2017 | | | 2016 | | | 2015 | |
Net Asset Value, beginning of period | | | $21.55 | | | | $18.57 | | | | $24.16 | | | | $18.86 | | | | $19.00 | | | | $15.71 | |
INCOME (LOSS) FROM INVESTMENT OPERATIONS: | | | | | | | | | | | | | | | | | | | | | | | | |
Net investment income (loss)1 | | | 0.05 | | | | 0.11 | | | | 0.11 | | | | 0.10 | | | | 0.10 | | | | 0.05 | |
Net realized gain (loss) and unrealized appreciation/depreciation on investments and foreign currency related transactions | | | (0.04 | ) | | | 4.74 | | | | (4.91 | ) | | | 6.14 | | | | — | 2 | | | 3.24 | |
Total from investment operations | | | 0.01 | | | | 4.85 | | | | (4.80 | ) | | | 6.24 | | | | 0.10 | | | | 3.29 | |
LESS DISTRIBUTIONS FROM: | | | | | | | | | | | | | | | | | | | | | | | | |
Net investment income | | | — | | | | (0.13 | ) | | | (0.08 | ) | | | (0.21 | ) | | | (0.19 | ) | | | — | |
Net realized gains on investments | | | — | | | | (1.74 | ) | | | (0.71 | ) | | | (0.73 | ) | | | (0.05 | ) | | | — | |
Total distributions | | | — | | | | (1.87 | ) | | | (0.79 | ) | | | (0.94 | ) | | | (0.24 | ) | | | — | |
Paid-in capital from redemption fees (Note 4) | | | — | | | | — | | | | — | | | | — | | | | — | | | | — | 2 |
Net Asset Value, end of period | | | $21.56 | | | | $21.55 | | | | $18.57 | | | | $24.16 | | | | $18.86 | | | | $19.00 | |
TOTAL RETURN | | | 0.05% | 3 | | | 26.10% | | | | (20.08% | ) | | | 33.23% | | | | 0.51% | | | | 20.94% | |
| | | | | | |
RATIOS/SUPPLEMENTAL DATA | | | | | | | | | | | | | | | | | | | | | | | | |
Net assets, end of period (in 000’s) | | | $506,921 | | | | $840,476 | | | | $1,167,472 | | | | $1,957,214 | | | | $1,302,317 | | | | $618,583 | |
Ratio of expenses to average net assets before any reimbursement, waiver or recapture of expenses by Advisor and Administrator (Note 5) | | | 0.93% | 4 | | | 0.88% | | | | 0.85% | | | | 0.87% | | | | 0.88% | �� | | | 0.87% | |
Ratio of expenses to average net assets after any reimbursement, waiver or recapture of expenses by Advisor and Administrator | | | 0.93% | 4 | | | 0.88% | | | | 0.84% | | | | 0.86% | | | | 0.88% | | | | 0.87% | |
Ratio of net investment income (loss) to average net assets | | | 0.53% | 4 | | | 0.53% | | | | 0.46% | | | | 0.46% | | | | 0.54% | | | | 0.28% | |
Portfolio turnover5 | | | 25.20% | 3 | | | 25.42% | | | | 46.11% | | | | 44.34% | | | | 55.15% | | | | 24.19% | |
| 1 | Calculated using the average daily shares method. |
| 2 | Less than $0.01 per share. |
| 5 | The portfolio turnover rate is calculated on the Fund as a whole without distinguishing between classes of shares issued. |
See accompanying notes to financial statements.
Financial Highlights (continued)
Matthews Korea Fund
The tables below set forth financial data for a share of beneficial interest outstanding throughout each period presented.
| | | | | | | | | | | | | | | | | | | | | | | | |
| | | Six-Month
Period Ended
June 30, 2020 (unaudited) | | | Year Ended Dec. 31 | |
| INVESTOR CLASS | | 2019 | | | 2018 | | | 2017 | | | 2016 | | | 2015 | |
Net Asset Value, beginning of period | | | $4.38 | | | | $4.58 | | | | $6.91 | | | | $5.25 | | | | $6.15 | | | | $5.65 | |
INCOME (LOSS) FROM INVESTMENT OPERATIONS: | | | | | | | | | | | | | | | | | | | | | | | | |
Net investment income (loss)1 | | | (0.01 | ) | | | 0.01 | | | | 0.06 | | | | 0.06 | | | | 0.02 | | | | 0.01 | |
Net realized gain (loss) and unrealized appreciation/depreciation on investments and foreign currency related transactions | | | (0.17 | ) | | | 0.16 | | | | (1.61 | ) | | | 2.22 | | | | (0.41 | ) | | | 0.83 | |
Total from investment operations | | | (0.18 | ) | | | 0.17 | | | | (1.55 | ) | | | 2.28 | | | | (0.39 | ) | | | 0.84 | |
LESS DISTRIBUTIONS FROM: | | | | | | | | | | | | | | | | | | | | | | | | |
Net investment income | | | — | | | | — | | | | (0.13 | ) | | | (0.29 | ) | | | (0.08 | ) | | | (0.01 | ) |
Net realized gains on investments | | | — | | | | (0.37 | ) | | | (0.65 | ) | | | (0.33 | ) | | | (0.43 | ) | | | (0.33 | ) |
Total distributions | | | — | | | | (0.37 | ) | | | (0.78 | ) | | | (0.62 | ) | | | (0.51 | ) | | | (0.34 | ) |
Paid-in capital from redemption fees (Note 4) | | | — | | | | — | | | | — | | | | — | | | | — | | | | — | 2 |
Net Asset Value, end of period | | | $4.20 | | | | $4.38 | | | | $4.58 | | | | $6.91 | | | | $5.25 | | | | $6.15 | |
TOTAL RETURN | | | (4.11% | )3 | | | 3.80% | | | | (22.21% | ) | | | 43.70% | | | | (6.32% | ) | | | 15.16% | |
| | | | | | |
RATIOS/SUPPLEMENTAL DATA | | | | | | | | | | | | | | | | | | | | | | | | |
Net assets, end of period (in 000’s) | | | $105,138 | | | | $113,388 | | | | $127,080 | | | | $192,431 | | | | $142,726 | | | | $147,685 | |
Ratio of expenses to average net assets | | | 1.25% | 4 | | | 1.15% | | | | 1.14% | | | | 1.15% | | | | 1.15% | | | | 1.10% | |
Ratio of net investment income (loss) to average net assets | | | (0.58% | )4 | | | 0.28% | | | | 1.01% | | | | 0.90% | | | | 0.41% | | | | 0.18% | |
Portfolio turnover5 | | | 13.73% | 3 | | | 36.63% | | | | 35.60% | | | | 25.37% | | | | 34.73% | | | | 20.36% | |
| | |
| | | Six-Month
Period Ended
June 30, 2020 (unaudited) | | | Year Ended Dec. 31 | |
| INSTITUTIONAL CLASS | | 2019 | | | 2018 | | | 2017 | | | 2016 | | | 2015 | |
Net Asset Value, beginning of period | | | $4.42 | | | | $4.61 | | | | $6.95 | | | | $5.27 | | | | $6.18 | | | | $5.68 | |
INCOME (LOSS) FROM INVESTMENT OPERATIONS: | | | | | | | | | | | | | | | | | | | | | | | | |
Net investment income (loss)1 | | | (0.02 | ) | | | 0.01 | | | | 0.04 | | | | 0.10 | | | | (0.02 | ) | | | 0.02 | |
Net realized gain (loss) and unrealized appreciation/depreciation on investments and foreign currency related transactions | | | (0.17 | ) | | | 0.17 | | | | (1.60 | ) | | | 2.21 | | | | (0.37 | ) | | | 0.83 | |
Total from investment operations | | | (0.19 | ) | | | 0.18 | | | | (1.56 | ) | | | 2.31 | | | | (0.39 | ) | | | 0.85 | |
LESS DISTRIBUTIONS FROM: | | | | | | | | | | | | | | | | | | | | | | | | |
Net investment income | | | — | | | | — | | | | (0.13 | ) | | | (0.30 | ) | | | (0.09 | ) | | | (0.02 | ) |
Net realized gains on investments | | | — | | | | (0.37 | ) | | | (0.65 | ) | | | (0.33 | ) | | | (0.43 | ) | | | (0.33 | ) |
Total distributions | | | — | | | | (0.37 | ) | | | (0.78 | ) | | | (0.63 | ) | | | (0.52 | ) | | | (0.35 | ) |
Paid-in capital from redemption fees (Note 4) | | | — | | | | — | | | | — | | | | — | | | | — | | | | — | 2 |
Net Asset Value, end of period | | | $4.23 | | | | $4.42 | | | | $4.61 | | | | $6.95 | | | | $5.27 | | | | $6.18 | |
TOTAL RETURN | | | (4.30% | )3 | | | 4.01% | | | | (22.15% | ) | | | 44.11% | | | | (6.31% | ) | | | 15.27% | |
| | | | | | |
RATIOS/SUPPLEMENTAL DATA | | | | | | | | | | | | | | | | | | | | | | | | |
Net assets, end of period (in 000’s) | | | $7,979 | | | | $23,426 | | | | $19,377 | | | | $32,587 | | | | $7,462 | | | | $59,982 | |
Ratio of expenses to average net assets | | | 1.18% | 4 | | | 1.05% | | | | 1.02% | | | | 1.01% | | | | 0.97% | | | | 0.93% | |
Ratio of net investment income (loss) to average net assets | | | (0.89% | )4 | | | 0.29% | | | | 0.67% | | | | 1.51% | | | | (0.31% | ) | | | 0.28% | |
Portfolio turnover5 | | | 13.73% | 3 | | | 36.63% | | | | 35.60% | | | | 25.37% | | | | 34.73% | | | | 20.36% | |
| 1 | Calculated using the average daily shares method. |
| 2 | Less than $0.01 per share. |
| 5 | The portfolio turnover rate is calculated on the Fund as a whole without distinguishing between classes of shares issued. |
See accompanying notes to financial statements.
| | | | |
| matthewsasia.com | 800.789.ASIA | | | 137 | |
Financial Highlights (continued)
Matthews Asia Small Companies Fund
The tables below set forth financial data for a share of beneficial interest outstanding throughout each period presented.
| | | | | | | | | | | | | | | | | | | | | | | | |
| | | Six-Month
Period Ended
June 30, 2020 (unaudited) | | | Year Ended Dec. 31 | |
| INVESTOR CLASS | | 2019 | | | 2018 | | | 2017 | | | 2016 | | | 2015 | |
Net Asset Value, beginning of period | | | $18.10 | | | | $15.50 | | | | $22.89 | | | | $19.05 | | | | $19.41 | | | | $21.46 | |
INCOME (LOSS) FROM INVESTMENT OPERATIONS: | | | | | | | | | | | | | | | | | | | | | | | | |
Net investment income (loss)1 | | | (0.01 | ) | | | 0.12 | | | | 0.12 | | | | 0.02 | | | | 0.09 | | | | 0.02 | |
Net realized gain (loss) and unrealized appreciation/depreciation on investments, foreign currency related transactions and foreign capital gains taxes | | | 1.84 | | | | 2.57 | | | | (4.20 | ) | | | 5.68 | | | | (0.37 | ) | | | (2.05 | ) |
Total from investment operations | | | 1.83 | | | | 2.69 | | | | (4.08 | ) | | | 5.70 | | | | (0.28 | ) | | | (2.03 | ) |
LESS DISTRIBUTIONS FROM: | | | | | | | | | | | | | | | | | | | | | | | | |
Net investment income | | | — | | | | (0.09 | ) | | | (0.08 | ) | | | (0.10 | ) | | | (0.08 | ) | | | (0.03 | ) |
Net realized gains on investments | | | — | | | | — | | | | (3.23 | ) | | | (1.76 | ) | | | — | | | | — | |
Total distributions | | | — | | | | (0.09 | ) | | | (3.31 | ) | | | (1.86 | ) | | | (0.08 | ) | | | (0.03 | ) |
Paid-in capital from redemption fees (Note 4) | | | — | | | | — | 2 | | | — | 3 | | | — | 3 | | | — | 3 | | | 0.01 | |
Net Asset Value, end of period | | | $19.93 | | | | $18.10 | | | | $15.50 | | | | $22.89 | | | | $19.05 | | | | $19.41 | |
TOTAL RETURN | | | 10.11% | 4 | | | 17.38% | | | | (18.05% | ) | | | 30.59% | | | | (1.44% | ) | | | (9.43% | ) |
| | | | | | |
RATIOS/SUPPLEMENTAL DATA | | | | | | | | | | | | | | | | | | | | | | | | |
Net assets, end of period (in 000’s) | | | $83,270 | | | | $96,229 | | | | $111,456 | | | | $208,339 | | | | $254,226 | | | | $387,747 | |
Ratio of expenses to average net assets before any reimbursement, waiver or recapture of expenses by Advisor and Administrator (Note 5) | | | 1.66% | 5 | | | 1.60% | | | | 1.51% | | | | 1.49% | | | | 1.49% | | | | 1.48% | |
Ratio of expenses to average net assets after any reimbursement, waiver or recapture of expenses by Advisor and Administrator | | | 1.42% | 5 | | | 1.45% | | | | 1.46% | | | | 1.46% | | | | 1.47% | | | | 1.47% | |
Ratio of net investment income (loss) to average net assets | | | (0.08% | )5 | | | 0.72% | | | | 0.53% | | | | 0.09% | | | | 0.45% | | | | 0.08% | |
Portfolio turnover6 | | | 57.38% | 4 | | | 59.10% | | | | 69.79% | | | | 67.13% | | | | 44.44% | | | | 48.29% | |
| | |
| | | Six-Month
Period Ended
June 30, 2020 (unaudited) | | | Year Ended Dec. 31 | |
| INSTITUTIONAL CLASS | | 2019 | | | 2018 | | | 2017 | | | 2016 | | | 2015 | |
Net Asset Value, beginning of period | | | $18.06 | | | | $15.46 | | | | $22.86 | | | | $19.03 | | | | $19.40 | | | | $21.46 | |
INCOME (LOSS) FROM INVESTMENT OPERATIONS: | | | | | | | | | | | | | | | | | | | | | | | | |
Net investment income (loss)1 | | | 0.01 | | | | 0.15 | | | | 0.16 | | | | 0.07 | | | | 0.12 | | | | 0.11 | |
Net realized gain (loss) and unrealized appreciation/depreciation on investments, foreign currency related transactions and foreign capital gains taxes | | | 1.83 | | | | 2.58 | | | | (4.19 | ) | | | 5.67 | | | | (0.36 | ) | | | (2.10 | ) |
Total from investment operations | | | 1.84 | | | | 2.73 | | | | (4.03 | ) | | | 5.74 | | | | (0.24 | ) | | | (1.99 | ) |
LESS DISTRIBUTIONS FROM: | | | | | | | | | | | | | | | | | | | | | | | | |
Net investment income | | | — | | | | (0.13 | ) | | | (0.14 | ) | | | (0.15 | ) | | | (0.13 | ) | | | (0.08 | ) |
Net realized gains on investments | | | — | | | | — | | | | (3.23 | ) | | | (1.76 | ) | | | — | | | | — | |
Total distributions | | | — | | | | (0.13 | ) | | | (3.37 | ) | | | (1.91 | ) | | | (0.13 | ) | | | (0.08 | ) |
Paid-in capital from redemption fees (Note 4) | | | — | | | | — | 2 | | | — | 3 | | | — | 3 | | | — | 3 | | | 0.01 | |
Net Asset Value, end of period | | | $19.90 | | | | $18.06 | | | | $15.46 | | | | $22.86 | | | | $19.03 | | | | $19.40 | |
TOTAL RETURN | | | 10.19% | 4 | | | 17.65% | | | | (17.86% | ) | | | 30.85% | | | | (1.24% | ) | | | (9.23% | ) |
| | | | | | |
RATIOS/SUPPLEMENTAL DATA | | | | | | | | | | | | | | | | | | | | | | | | |
Net assets, end of period (in 000’s) | | | $88,420 | | | | $85,006 | | | | $74,935 | | | | $232,954 | | | | $174,962 | | | | $222,168 | |
Ratio of expenses to average net assets before any reimbursement, waiver or recapture of expenses by Advisor and Administrator (Note 5) | | | 1.52% | 5 | | | 1.46% | | | | 1.37% | | | | 1.35% | | | | 1.34% | | | | 1.30% | |
Ratio of expenses to average net assets after any reimbursement, waiver or recapture of expenses by Advisor and Administrator | | | 1.20% | 5 | | | 1.24% | | | | 1.25% | | | | 1.25% | | | | 1.25% | | | | 1.25% | |
Ratio of net investment income (loss) to average net assets | | | 0.15% | 5 | | | 0.85% | | | | 0.73% | | | | 0.34% | | | | 0.64% | | | | 0.53% | |
Portfolio turnover6 | | | 57.38% | 4 | | | 59.10% | | | | 69.79% | | | | 67.13% | | | | 44.44% | | | | 48.29% | |
| 1 | Calculated using the average daily shares method. |
| 2 | The Fund charged redemption fees through October 31, 2019. |
| 3 | Less than $0.01 per share. |
| 6 | The portfolio turnover rate is calculated on the Fund as a whole without distinguishing between classes of shares issued. |
See accompanying notes to financial statements.
Financial Highlights (continued)
Matthews China Small Companies Fund
The tables below set forth financial data for a share of beneficial interest outstanding throughout each period presented.
| | | | | | | | | | | | | | | | | | | | | | | | |
| | | Six-Month
Period Ended
June 30, 2020 (unaudited) | | | Year Ended Dec. 31 | |
| INVESTOR CLASS | | 2019 | | | 2018 | | | 2017 | | | 2016 | | | 2015 | |
Net Asset Value, beginning of period | | | $12.84 | | | | $9.58 | | | | $11.89 | | | | $8.21 | | | | $8.79 | | | | $9.21 | |
INCOME (LOSS) FROM INVESTMENT OPERATIONS: | | | | | | | | | | | | | | | | | | | | | | | | |
Net investment income (loss)1 | | | 0.09 | | | | 0.14 | | | | 0.09 | | | | 0.07 | | | | 0.10 | | | | 0.08 | |
Net realized gain (loss) and unrealized appreciation/depreciation on investments and foreign currency related transactions | | | 7.31 | | | | 3.24 | | | | (2.23 | ) | | | 4.27 | | | | (0.28 | ) | | | 0.27 | |
Total from investment operations | | | 7.40 | | | | 3.38 | | | | (2.14 | ) | | | 4.34 | | | | (0.18 | ) | | | 0.35 | |
LESS DISTRIBUTIONS FROM: | | | | | | | | | | | | | | | | | | | | | | | | |
Net investment income | | | — | | | | (0.13 | ) | | | (0.05 | ) | | | (0.11 | ) | | | (0.03 | ) | | | (0.06 | ) |
Net realized gains on investments | | | — | | | | — | | | | (0.16 | ) | | | (0.56 | ) | | | (0.37 | ) | | | (0.72 | ) |
Total distributions | | | — | | | | (0.13 | ) | | | (0.21 | ) | | | (0.67 | ) | | | (0.40 | ) | | | (0.78 | ) |
Paid-in capital from redemption fees (Note 4) | | | — | | | | 0.01 | 2 | | | 0.04 | | | | 0.01 | | | | — | 3 | | | 0.01 | |
Net Asset Value, end of period | | | $20.24 | | | | $12.84 | | | | $9.58 | | | | $11.89 | | | | $8.21 | | | | $8.79 | |
TOTAL RETURN | | | 57.63% | 4 | | | 35.41% | | | | (17.68% | ) | | | 53.88% | | | | (2.35% | ) | | | 4.07% | |
| | | | | | |
RATIOS/SUPPLEMENTAL DATA | | | | | | | | | | | | | | | | | | | | | | | | |
Net assets, end of period (in 000’s) | | | $213,237 | | | | $63,432 | | | | $41,740 | | | | $35,209 | | | | $16,101 | | | | $21,546 | |
Ratio of expenses to average net assets before any reimbursement, waiver or recapture of expenses by Advisor and Administrator (Note 5) | | | 1.43% | 5 | | | 1.62% | | | | 1.97% | | | | 2.34% | | | | 2.24% | | | | 2.10% | |
Ratio of expenses to average net assets after any reimbursement, waiver or recapture of expenses by Advisor and Administrator | | | 1.33% | 5 | | | 1.42% | | | | 1.50% | | | | 1.50% | | | | 1.50% | | | | 1.50% | |
Ratio of net investment income (loss) to average net assets | | | 1.21% | 5 | | | 1.25% | | | | 0.78% | | | | 0.66% | | | | 1.17% | | | | 0.80% | |
Portfolio turnover6 | | | 37.97% | 4 | | | 68.17% | | | | 76.67% | | | | 67.22% | | | | 63.15% | | | | 72.49% | |
| | | | | |
| | | Six-Month
Period Ended
June 30, 2020 (unaudited) | | | Year Ended Dec. 31 | | | Period Ended Dec. 31, 20177 | | | | | | | |
| INSTITUTIONAL CLASS | | 2019 | | | 2018 | | | | | | | |
Net Asset Value, beginning of period | | | $12.86 | | | | $9.59 | | | | $11.87 | | | | $11.90 | | | | | | | | | |
INCOME (LOSS) FROM INVESTMENT OPERATIONS: | | | | | | | | | | | | | | | | | | | | | | | | |
Net investment income (loss)1 | | | 0.11 | | | | 0.15 | | | | 0.11 | | | | (0.01 | ) | | | | | | | | |
Net realized gain (loss) and unrealized appreciation/depreciation on investments and foreign currency related transactions | | | 7.31 | | | | 3.26 | | | | (2.21 | ) | | | 0.67 | | | | | | | | | |
Total from investment operations | | | 7.42 | | | | 3.41 | | | | (2.10 | ) | | | 0.66 | | | | | | | | | |
LESS DISTRIBUTIONS FROM: | | | | | | | | | | | | | | | | | | | | | | | | |
Net investment income | | | — | | | | (0.15 | ) | | | (0.05 | ) | | | (0.13 | ) | | | | | | | | |
Net realized gains on investments | | | — | | | | — | | | | (0.16 | ) | | | (0.56 | ) | | | | | | | | |
Total distributions | | | — | | | | (0.15 | ) | | | (0.21 | ) | | | (0.69 | ) | | | | | | | | |
Paid-in capital from redemption fees (Note 4) | | | — | | | | 0.01 | 2 | | | 0.03 | | | | — | | | | | | | | | |
Net Asset Value, end of period | | | $20.28 | | | | $12.86 | | | | $9.59 | | | | $11.87 | | | | | | | | | |
TOTAL RETURN | | | 57.70% | 4 | | | 35.68% | | | | (17.48% | ) | | | 6.19% | 4 | | | | | | | | |
| | | | | | |
RATIOS/SUPPLEMENTAL DATA | | | | | | | | | | | | | | | | | | | | | | | | |
Net assets, end of period (in 000’s) | | | $160,469 | | | | $32,376 | | | | $20,740 | | | | $476 | | | | | | | | | |
Ratio of expenses to average net assets before any reimbursement, waiver or recapture of expenses by Advisor and Administrator (Note 5) | | | 1.33% | 5 | | | 1.51% | | | | 1.79% | | | | 2.09% | 5 | | | | | | | | |
Ratio of expenses to average net assets after any reimbursement, waiver or recapture of expenses by Advisor and Administrator | | | 1.20% | 5 | | | 1.24% | | | | 1.25% | | | | 1.25% | 5 | | | | | | | | |
Ratio of net investment income (loss) to average net assets | | | 1.34% | 5 | | | 1.34% | | | | 1.05% | | | | (1.20% | )5 | | | | | | | | |
Portfolio turnover6 | | | 37.97% | 4 | | | 68.17% | | | | 76.67% | | | | 67.22% | 4 | | | | | | | | |
| 1 | Calculated using the average daily shares method. |
| 2 | The Fund charged redemption fees through October 31, 2019. |
| 3 | Less than $0.01 per share. |
| 6 | The portfolio turnover rate is calculated on the Fund as a whole without distinguishing between classes of shares issued. |
| 7 | Commenced operations on November 30, 2017. |
See accompanying notes to financial statements.
| | | | |
| matthewsasia.com | 800.789.ASIA | | | 139 | |
Notes to Financial Statements (unaudited)
Matthews Asia Funds (the “Trust”) is an open-end management investment company registered under the Investment Company Act of 1940, as amended (the “1940 Act”). The Trust currently issues eighteen separate series of shares (each a “Fund”, and collectively, the “Funds”): Matthews Emerging Markets Equity Fund, Matthews Asia Total Return Bond Fund, Matthews Asia Credit Opportunities Fund, Matthews Asian Growth and Income Fund, Matthews Asia Dividend Fund, Matthews China Dividend Fund, Matthews Asia Value Fund, Matthews Asia Growth Fund, Matthews Pacific Tiger Fund, Matthews Asia ESG Fund, Matthews Emerging Asia Fund, Matthews Asia Innovators Fund, Matthews China Fund, Matthews India Fund, Matthews Japan Fund, Matthews Korea Fund, Matthews Asia Small Companies Fund, and Matthews China Small Companies Fund. The Matthews Emerging Markets Equity Fund commenced investment operations on April 30, 2020. Each Fund currently offers two classes of shares: Investor Class and Institutional Class. Each class of shares has identical voting, dividend, liquidation and other rights and the same terms and conditions, except each class may be subject to different class expenses as outlined in the relevant prospectus and each class has exclusive voting rights with respect to matters solely affecting such class.
| 2. | SIGNIFICANT ACCOUNTING POLICIES |
The following is a summary of significant accounting policies consistently followed by the Funds in preparation of their financial statements. Each Fund follows the investment company accounting and reporting guidance of the Financial Accounting Standards Board (FASB) Accounting Standard Codification Topic 946 Financial Services—Investment Companies. The accounting policies are in conformity with accounting principles generally accepted in the United States of America (“U.S. GAAP”).
| A. | SECURITY VALUATION: The value of the Trust’s securities is based on market quotations for those securities, or on their fair value determined by the valuation policies approved by the Funds’ Board of Trustees (the “Board”). Market quotations and valuation information are provided by commercial pricing services or securities dealers that are independent of the Funds and Matthews International Capital Management, LLC (“Matthews”), in accordance with procedures established by the Funds’ Board. Foreign exchange-traded securities are valued as of the close of trading on the primary exchange on which they trade. Securities that trade in over-the-counter markets, including most debt securities (bonds), may be valued by other third-party vendors or by using indicative bid quotations from dealers or market makers, or other available market information. Market values for securities are determined based on quotations, market data or other information from the principal (or most advantageous) market on which the security is traded. Market quotations for equity securities used by the Funds include last reported sale prices, or, if such prices are not reported or available, bid and ask prices. Swap agreements are valued utilizing quotes received daily by the Funds’ pricing service or through brokers, which are derived using daily swap curves and models that incorporate a number of market data factors, such as discounted cash flows, trades and values of the underlying reference instruments. Foreign currency exchange contracts are valued at the mean between the bid and ask prices and are determined at the close of business on the New York Stock Exchange (“NYSE”). Interpolated values are derived when the settlement date of the contract is an interim date for which quotations are not available. The Funds may also utilize independent pricing services to assist them in determining a current market value for each security based on sources believed to be reliable. |
The Board has delegated to the Board’s Valuation Committee the responsibility for oversight of the fair valuation process under the Trust’s Pricing and Valuation Policy. The Board’s Valuation Committee, in turn, has delegated the determination of fair value prices under Matthews’ Pricing and Valuation Procedures to Matthews’ Valuation Committee (the “Valuation Committee”). The Board’s Valuation Committee will review and approve fair value determinations by Matthews’ Valuation Committee in accordance with the Pricing and Valuation Policy. When fair value pricing is employed, the prices of securities used by a Fund to calculate its Net Asset Value (“NAV”) may differ from any quoted or published prices for the same securities for that day. All fair value determinations are made subject to the Board’s oversight. Events affecting the value of foreign investments may occur between the time at which they are determined and when the Funds calculate their NAV, which is normally the close of trading on the NYSE. If such events render market quotations unreliable, and the impact of such events can be reasonably determined, the investments will be valued at their fair value in accordance with pricing policies. The fair value of a security held by the Funds may be determined using the services of third-party pricing services to assist in this process.
The books and records of the Funds are maintained in U.S. dollars. Transactions, portfolio securities, and assets and liabilities denominated in a foreign currency are translated and recorded in U.S. dollars at the prevailing exchange rate as of the close of trading on the NYSE. The Fund does not isolate the effect of changes in foreign exchange rates from changes in market prices on securities held. Accordingly, such changes are included within “Net change in unrealized appreciation/depreciation on investments” on the Statements of Operations. Translation gains or losses resulting from changes in the exchange rate during the reporting period and realized gains and losses on the settlement of foreign currency transactions are reported in the results of operations for the current period. The Funds isolate that portion of gains and losses on investments in fixed income securities that is due to changes in foreign exchange rate from that which is due to changes in market prices of securities.
Foreign securities held by the Funds may be traded on days and at times when the NYSE is closed. Accordingly, the value of the Funds may be significantly affected on days when shareholders have no access to the Funds.
| B. | FAIR VALUE MEASUREMENTS: The Funds follow a fair value hierarchy that distinguishes between market data obtained from independent sources (observable inputs) and the Funds’ own market assumptions (unobservable inputs). These inputs are used in determining the value of the Funds’ financial instruments and are summarized in the following fair value hierarchy: |
Level 1: Quoted prices in active markets for identical securities (foreign securities that are valued based on market quotations).
Level 2: Other significant observable inputs. Certain foreign securities may be fair valued by Matthews using information such as quoted prices for similar securities, interest rates, prepayment speeds, credit risk, and foreign exchange. Additionally, external pricing services are used when the Funds determine that events affecting the value of foreign securities which occur between the time at which they are determined and the close of trading on the NYSE render market quotations unreliable.
Level 3: Significant unobservable inputs. As described in Note 2-A, Level 3 securities are valued based on significant unobservable inputs as determined under the direction of the Board. Characterization of such securities as Level 3 securities are not necessarily an indication of their liquidity or the risk associated with investing in these securities. A significant change in the unobservable inputs could result in a significantly lower or higher value in such Level 3 securities and could impact overall Fund performance. Level 3 securities consisted of equities that, as of June 30, 2020, were suspended from trading.
The input levels are not necessarily an indication of the risk or liquidity associated with financial instruments at that level.
Notes to Financial Statements (unaudited) (continued)
Levels for Multi-Country Funds (1 of 2):
Summary of inputs used to determine the fair valuation of multi-country Funds’ investments as of June 30, 2020.
| | | | | | | | | | | | | | | | | | | | | | | | | | | | |
| | | Matthews
Emerging Markets
Equity Fund | | | Matthews Asia
Total Return
Bond Fund | | | Matthews Asia
Credit
Opportunities
Fund | | | Matthews Asian
Growth and
Income Fund | | | Matthews Asia
Dividend Fund | | | Matthews Asia
Value Fund | | | Matthews Asia
Growth Fund | |
| Assets: | | | | | | | | | | | | | | | | | | | | | | | | | | | | |
| | | | | | | |
| Investments: | | | | | | | | | | | | | | | | | | | | | | | | | | | | |
Level 1: Quoted Prices | | | | | | | | | | | | | | | | | | | | | | | | | | | | |
Common Equities: | | | | | | | | | | | | | | | | | | | | | | | | | | | | |
Argentina | | | $149,850 | | | | $— | | | | $— | | | | $— | | | | $— | | | | $— | | | | $— | |
Brazil | | | 617,035 | | | | — | | | | — | | | | — | | | | — | | | | — | | | | — | |
Canada | | | — | | | | — | | | | — | | | | — | | | | — | | | | — | | | | 4,678,279 | |
China/Hong Kong | | | 936,492 | | | | — | | | | — | | | | 55,679,991 | | | | — | | | | 775,965 | | | | 225,451,759 | |
India | | | 215,124 | | | | — | | | | — | | | | — | | | | — | | | | — | | | | — | |
Mexico | | | 356,329 | | | | — | | | | — | | | | — | | | | — | | | | — | | | | — | |
Russia | | | 155,062 | | | | — | | | | — | | | | — | | | | — | | | | — | | | | — | |
Singapore | | | 107,240 | | | | — | | | | — | | | | — | | | | — | | | | — | | | | — | |
Switzerland | | | — | | | | — | | | | — | | | | — | | | | — | | | | — | | | | 11,210,995 | |
Taiwan | | | 420,098 | | | | — | | | | — | | | | — | | | | 68,699,648 | | | | — | | | | — | |
United States | | | 116,926 | | | | — | | | | — | | | | 22,282,066 | | | | — | | | | — | | | | 88,525,220 | |
Zambia | | | 99,624 | | | | — | | | | — | | | | — | | | | — | | | | — | | | | — | |
Level 2: Other Significant Observable Inputs | | | | | | | | | | | | | | | | | | | | | | | | | | | | |
Foreign Government Obligationsa | | | — | | | | 23,736,616 | | | | 5,680,390 | | | | — | | | | — | | | | — | | | | — | |
Non-Convertible Corporate Bondsa | | | — | | | | 62,350,161 | | | | 71,577,086 | | | | — | | | | — | | | | — | | | | — | |
Convertible Corporate Bondsa | | | — | | | | 11,714,662 | | | | 10,747,116 | | | | 102,696,018 | | | | — | | | | — | | | | — | |
Common Equities: | | | | | | | | | | | | | | | | | | | | | | | | | | | | |
Australia | | | — | | | | — | | | | — | | | | 16,363,176 | | | | 238,097,556 | | | | — | | | | 44,286,288 | |
Bangladesh | | | — | | | | — | | | | — | | | | — | | | | 45,173,878 | | | | — | | | | 21,449,787 | |
Brazil | | | 37,982 | | | | — | | | | — | | | | — | | | | — | | | | — | | | | — | |
China/Hong Kong | | | 2,021,402 | | | | — | | | | — | | | | 432,865,200 | | | | 1,357,188,493 | | | | 2,053,564 | | | | 301,189,884 | |
France | | | 351,417 | | | | — | | | | — | | | | 39,888,914 | | | | — | | | | — | | | | — | |
India | | | 493,625 | | | | — | | | | — | | | | 80,914,436 | | | | 62,849,455 | | | | 1,016,663 | | | | 39,879,046 | |
Indonesia | | | 147,404 | | | | — | | | | — | | | | 34,567,717 | | | | — | | | | — | | | | 52,545,542 | |
Japan | | | — | | | | — | | | | — | | | | 18,645,233 | | | | 1,221,066,376 | | | | 1,093,216 | | | | 440,564,829 | |
Philippines | | | 274,147 | | | | — | | | | — | | | | 17,746,490 | | | | 77,816,261 | | | | — | | | | — | |
Poland | | | 186,318 | | | | — | | | | — | | | | — | | | | — | | | | — | | | | — | |
Russia | | | 489,772 | | | | — | | | | — | | | | — | | | | — | | | | — | | | | — | |
Singapore | | | 173,871 | | | | — | | | | — | | | | 108,155,335 | | | | 288,130,124 | | | | 890,341 | | | | — | |
South Korea | | | 572,349 | | | | — | | | | — | | | | 97,486,937 | | | | 147,306,925 | | | | 1,860,017 | | | | — | |
Sri Lanka | | | — | | | | — | | | | — | | | | — | | | | — | | | | — | | | | 8,953,965 | |
Switzerland | | | — | | | | — | | | | — | | | | — | | | | — | | | | 598,757 | | | | — | |
Taiwan | | | 120,765 | | | | — | | | | — | | | | 105,668,687 | | | | 71,516,179 | | | | 218,643 | | | | — | |
Thailand | | | — | | | | — | | | | — | | | | 12,539,899 | | | | 60,106,538 | | | | — | | | | — | |
United Kingdom | | | 159,174 | | | | — | | | | — | | | | 16,953,010 | | | | — | | | | — | | | | — | |
Vietnam | | | 91,213 | | | | — | | | | — | | | | 17,578,658 | | | | — | | | | — | | | | 15,234,729 | |
Preferred Equities: | | | | | | | | | | | | | | | | | | | | | | | | | | | | |
South Korea | | | 334,773 | | | | — | | | | — | | | | 24,863,573 | | | | 182,284,249 | | | | 1,078,535 | | | | — | |
Level 3: Significant Unobservable Inputs | | | | | | | | | | | | | | | | | | | | | | | | | | | | |
Non-Convertible Corporate Bondsa | | | — | | | | 256,695 | | | | — | | | | — | | | | — | | | | — | | | | — | |
Total Market Value of Investments | | | $8,627,992 | | | | $98,058,134 | | | | $88,004,592 | | | | $1,204,895,340 | | | | $3,820,235,682 | | | | $9,585,701 | | | | $1,253,970,323 | |
| a | Industry, countries, or security types are disclosed on the Schedule of Investments. |
| | | | |
| matthewsasia.com | 800.789.ASIA | | | 141 | |
Notes to Financial Statements (unaudited) (continued)
Levels for Multi-Country Funds (2 of 2):
Summary of inputs used to determine the fair valuation of multi-country Funds’ investments as of June 30, 2020.
| | | | | | | | | | | | | | | | | | | | |
| | | Matthews Pacific
Tiger Fund | | | Matthews
Asia ESG
Fund | | | Matthews
Emerging Asia
Fund | | | Matthews Asia
Innovators
Fund | | | Matthews Asia
Small Companies
Fund | |
| Assets: | | | | | | | | | | | | | | | | | | | | |
| | | | | |
| Investments: | | | | | | | | | | | | | | | | | | | | |
Level 1: Quoted Prices | | | | | | | | | | | | | | | | | | | | |
Common Equities: | | | | | | | | | | | | | | | | | | | | |
China/Hong Kong | | | $294,144,308 | | | | $2,704,663 | | | | $— | | | | $117,395,074 | | | | $8,147,223 | |
India | | | — | | | | — | | | | — | | | | — | | | | 1,435,722 | |
Pakistan | | | — | | | | 37,316 | | | | 12,581,329 | | | | — | | | | — | |
Singapore | | | — | | | | — | | | | — | | | | 41,973,736 | | | | — | |
South Korea | | | 3,808,219 | | | | 154,962 | | | | — | | | | — | | | | 141,519 | |
Sri Lanka | | | — | | | | — | | | | 2,634,744 | | | | — | | | | — | |
United States | | | — | | | | 3,457,242 | | | | — | | | | 10,931,579 | | | | 2,922,127 | |
Vietnam | | | — | | | | — | | | | 2,704,558 | | | | — | | | | — | |
Level 2: Other Significant Observable Inputs | | | | | | | | | | | | | | | | | | | | |
Common Equities: | | | | | | | | | | | | | | | | | | | | |
Australia | | | — | | | | — | | | | 2,846,282 | | | | — | | | | — | |
Bangladesh | | | — | | | | 1,952,609 | | | | 17,281,072 | | | | — | | | | — | |
China/Hong Kong | | | 3,297,509,782 | | | | 16,880,300 | | | | — | | | | 412,283,096 | | | | 81,746,834 | |
France | | | — | | | | — | | | | — | | | | 22,730,716 | | | | — | |
India | | | 670,065,262 | | | | 9,085,424 | | | | 4,635,710 | | | | 63,067,119 | | | | 12,547,463 | |
Indonesia | | | 374,351,094 | | | | 1,347,169 | | | | 26,314,380 | | | | — | | | | 1,415,836 | |
Japan | | | — | | | | 4,195,973 | | | | — | | | | — | | | | — | |
Malaysia | | | 65,453,140 | | | | — | | | | — | | | | — | | | | — | |
Pakistan | | | — | | | | — | | | | 10,366,436 | | | | — | | | | — | |
Philippines | | | 161,224,104 | | | | 938,697 | | | | 12,655,385 | | | | — | | | | 2,746,012 | |
Singapore | | | — | | | | 982,199 | | | | 2,184,284 | | | | 12,175,190 | | | | — | |
South Korea | | | 759,534,413 | | | | 644,492 | | | | — | | | | 98,902,714 | | | | 15,368,680 | |
Sri Lanka | | | — | | | | — | | | | 15,258,999 | | | | — | | | | — | |
Switzerland | | | 97,249,858 | | | | — | | | | — | | | | — | | | | — | |
Taiwan | | | 641,870,842 | | | | 5,940,265 | | | | — | | | | 12,870,679 | | | | 27,523,596 | |
Thailand | | | 89,828,984 | | | | 1,287,867 | | | | 8,101,241 | | | | — | | | | 3,600,254 | |
Vietnam | | | 92,139,847 | | | | 489,361 | | | | 27,821,696 | | | | 3,683,897 | | | | 4,463,340 | |
Preferred Equities: | | | | | | | | | | | | | | | | | | | | |
South Korea | | | — | | | | 4,318,511 | | | | — | | | | — | | | | — | |
Level 3: Significant Unobservable Inputs | | | | | | | | | | | | | | | | | | | | |
Common Equities: | | | | | | | | | | | | | | | | | | | | |
Bangladesh | | | — | | | | — | | | | 6,380,020 | | | | — | | | | — | |
Total Market Value of Investments | | | $6,547,179,853 | | | | $54,417,050 | | | | $151,766,136 | | | | $796,013,800 | | | | $162,058,606 | |
Notes to Financial Statements (unaudited) (continued)
Levels for Single Country Funds:
Summary of inputs used to determine the fair valuation of the single country Funds’ investments as of June 30, 2020.
| | | | | | | | | | | | | | | | | | | | | | | | |
| | | Matthews China
Dividend Fund | | | Matthews China Fund | | | Matthews
India Fund | | | Matthews Japan Fund | | | Matthews
Korea Fund | | | Matthews
China Small
Companies
Fund | |
| Assets: | | | | | | | | | | | | | | | | | | | | | | | | |
| | | | | | |
| Investments: | | | | | | | | | | | | | | | | | | | | | | | | |
Level 1: Quoted Prices | | | | | | | | | | | | | | | | | | | | | | | | |
Common Equities: | | | | | | | | | | | | | | | | | | | | | | | | |
Communication Services | | | $8,931,104 | | | | $25,015,098 | | | | $— | | | | $— | | | | $— | | | | $6,285,624 | |
Consumer Discretionary | | | 5,455,303 | | | | 79,732,181 | | | | — | | | | — | | | | — | | | | — | |
Energy | | | — | | | | — | | | | 1,503,702 | | | | — | | | | — | | | | — | |
Health Care | | | 1,693,264 | | | | — | | | | — | | | | — | | | | 190,158 | | | | 34,785,804 | |
Level 2: Other Significant Observable Inputs | | | | | | | | | | | | | | | | | | | | | | | | |
Common Equities: | | | | | | | | | | | | | | | | | | | | | | | | |
Communication Services | | | 49,814,769 | | | | 141,125,196 | | | | 42,056,098 | | | | 141,251,244 | | | | 15,627,825 | | | | 2,284,769 | |
Consumer Discretionary | | | 59,311,865 | | | | 203,069,629 | | | | 43,017,958 | | | | 218,499,966 | | | | 9,763,688 | | | | 39,993,416 | |
Consumer Staples | | | 39,373,377 | | | | 43,364,307 | | | | 79,057,986 | | | | 22,140,831 | | | | 12,643,683 | | | | 49,432,981 | |
Energy | | | 13,227,514 | | | | — | | | | 48,568,066 | | | | — | | | | — | | | | — | |
Financials | | | 22,277,973 | | | | 271,716,988 | | | | 173,480,037 | | | | 77,243,924 | | | | 8,327,739 | | | | — | |
Health Care | | | 22,028,881 | | | | 79,995,320 | | | | 38,321,380 | | | | 280,880,585 | | | | 7,748,091 | | | | 72,693,796 | |
Industrials | | | 27,237,183 | | | | 16,164,325 | | | | 23,999,051 | | | | 207,072,618 | | | | 1,084,311 | | | | 35,235,664 | |
Information Technology | | | 31,932,114 | | | | 84,463,176 | | | | 72,925,351 | | | | 396,691,432 | | | | 21,119,058 | | | | 83,529,242 | |
Materials | | | 12,390,215 | | | | 21,493,245 | | | | 10,333,277 | | | | 49,268,367 | | | | — | | | | 5,264,686 | |
Real Estate | | | 19,557,663 | | | | 66,546,753 | | | | — | | | | — | | | | 1,462,296 | | | | 27,080,514 | |
Utilities | | | — | | | | 9,931,998 | | | | — | | | | — | | | | — | | | | — | |
Preferred Equities: | | | | | | | | | | | | | | | | | | | | | | | | |
Consumer Discretionary | | | — | | | | — | | | | — | | | | — | | | | 4,012,876 | | | | — | |
Consumer Staples | | | — | | | | — | | | | — | | | | — | | | | 6,498,405 | | | | — | |
Energy | | | — | | | | — | | | | — | | | | — | | | | 1,253,389 | | | | — | |
Information Technology | | | — | | | | — | | | | — | | | | — | | | | 17,624,602 | | | | — | |
Materials | | | — | | | | — | | | | — | | | | — | | | | 4,048,024 | | | | — | |
Level 3: Significant Unobservable Inputs | | | | | | | | | | | | | | | | | | | | | | | | |
Common Equities: | | | | | | | | | | | | | | | | | | | | | | | | |
Information Technology | | | — | | | | — | | | | — | | | | — | | | | — | | | | 252 | |
Total Market Value of Investments | | | $313,231,225 | | | | $1,042,618,216 | | | | $533,262,906 | | | | $1,393,048,967 | | | | $111,404,145 | | | | $356,586,748 | |
Levels for Derivatives Financial Instruments:
Summary of inputs used to determine the fair valuation of the Funds’ derivative financial instruments as of June 30, 2020.
| | | | |
| | | Matthews Asia
Total Return
Bond Fund | |
Derivative Financial Instruments1 | | | | |
Assets | | | | |
| Level 2: Other Significant Observable Inputs | | | | |
| |
Forward Foreign Currency Exchange Contracts | | | $3,528 | |
| |
Interest Rate Swaps | | | 628,819 | |
| | | | |
| | | $632,347 | |
| | | | |
| |
Liabilities | | | | |
| Level 2: Other Significant Observable Inputs | | | | |
| |
Forward Foreign Currency Exchange Contracts | | | ($774,274) | |
| | | | |
| 1 | Derivative financial instruments are forward foreign currency exchange contracts and interest rate swaps. Forward foreign currency exchange contracts and interest rate swaps are valued at the unrealized appreciation/depreciation on the instrument. |
| | | | |
| matthewsasia.com | 800.789.ASIA | | | 143 | |
Notes to Financial Statements (unaudited) (continued)
Changes in the Balances of Level 3 Securities:
The Funds’ policy is to recognize transfers in and transfers out of Level 3 during the reporting period.
| | | | | | | | | | | | |
| | | Matthews Asia
Total Return Bond
Fund | | | Matthews
Emerging Asia Fund | | | Matthews China
Small Companies Fund | |
| | | Non-Convertible
Corporate Bonds —
China/Hong Kong | | | Common Equities —
Bangladesh | | | Common Equities —
Information Technology | |
| Balance as of 12/31/19 (market value) | | $ | — | | | $ | — | | | $ | 250 | |
| | | |
| Accrued discounts/premiums | | | 1,471 | | | | — | | | | — | |
| | | |
| Realized gain/(loss) | | | — | | | | (33,526 | ) | | | — | |
| | | |
| Change in unrealized appreciation/(depreciation) | | | (6,388 | ) | | | (928,957 | ) | | | 2 | |
| | | |
| Purchases | | | — | | | | — | | | | — | |
| | | |
| Sales | | | — | | | | (1,392,736 | ) | | | — | |
| | | |
| Transfers in to Level 3* | | | 261,612 | | | | 8,735,239 | | | | — | |
| | | |
| Transfer out of Level 3* | | | — | | | | — | | | | — | |
| Balance as of 6/30/20 (market value) | | $ | 256,695 | | | $ | 6,380,020 | | | $ | 252 | |
Net change in unrealized appreciation/depreciation on Level 3 investments held as of 6/30/20** | | ($ | 6,388 | ) | | ($ | 928,957 | ) | | $ | 2 | |
| * | The Fund’s policy is to recognize transfers in and transfers out as of the beginning of the reporting period. |
| ** | Included in the related amounts on the Statements of Operations. |
During the six-month period ended June 30, 2020, transfers into Level 3 resulted from a lack of observable market data for a security and its price as of the reporting date was determined by the Valuation Committee. The following table summarizes the valuation techniques used and unobservable inputs developed by the Valuation Committee to determine the fair value of certain, material Level 3 investments:
| | | | | | | | | | | | |
| | | Value | | | Valuation
Technique | | Unobservable Input1 | | Unobservable Input— Proxy Factor
Price Movement | |
| Matthews Emerging Asia Fund Assets: | | | | | | | | | | | | |
Common Equity—Bangladesh | | | $6,380,020 | | | Market transactions | | Point in most recent block trading range | | | BDT 839.6 - BDT 890.0 | |
| 1 | Increase in unobservable input may result in a significant increase to value, while a decrease in unobservable input may result in a significant decrease to value. |
| C. | BASIS OF CONSOLIDATION: The accompanying consolidated financial highlights of Matthews China Fund and Matthews Asia Dividend Fund (the “Investing Funds”) for the 2015-2016 period include the accounts of the Matthews CF-U Series and Matthews ADF-U Series (the “U Series Funds”), respectively. The U Series Funds were series of Matthews A Share Selections Fund, LLC, a Delaware limited liability company registered under the 1940 Act. All of the interests offered by U Series Funds were exclusively owned by the Investing Funds. The U Series Funds primarily invested in the stocks of Chinese companies listed on Mainland China Stock Exchanges, and traded and denominated in the currency of China, the Renminbi. To allow U Series Funds to invest in China A Shares Matthews applied for and received a license from the China Securities Regulatory Commission as a Qualified Foreign Institutional Investor (“QFII”) and had been allocated by the State Administration of Foreign Exchange of China an initial quota of $100 million in June 2014, and an additional quota of $440 million in July 2015, representing the equivalent value in Renminbi of China A Shares that the Funds could purchase. Access to the quota was subject to Matthews’ trade allocation procedures and access allocation procedures. The U |
Series Funds were subject to the same investment policies and restrictions that apply to Investing Funds. Intercompany accounts and transactions had been eliminated in the consolidation process. The U Series Funds were intended to be disregarded entities for tax purposes. Therefore, no federal tax provisions were required. Consolidated financial statements included expenses that were accrued for and paid by the Investing Funds. These included on-going operational costs as well as costs in connection with the launching of the U Series Funds.
In September 2016, the Board of Directors of the Matthews A Share Selections Fund, LLC adopted resolutions authorizing the termination and liquidation of the Matthews A Share Selections Fund, LLC. Consequently, as of September 30, 2016, the U Series Funds sold their securities and effectively ceased investment operations. The outstanding interests of each U Series Fund were redeemed by its respective Investing Fund. The Matthews A Share Selections Fund, LLC filed an initial application for deregistration as a registered investment company with the U.S. Securities and Exchange Commission in October 2016, which was subsequently granted in February 2017.
| D. | RISKS ASSOCIATED WITH NON-U.S. COMPANIES: Investments by the Funds in the securities of non-U.S. companies may involve investment risks not typically associated with investments in U.S. issuers. These risks include possible political, economic, social and religious instability, inadequate investor protection; changes in laws or regulations of countries within the Asia Pacific region (including in countries where the Funds may invest, as well as in the broader region); international relations with other nations; natural disasters; corruption; and military activity. Foreign securities may be subject to greater fluctuations in price than securities of domestic corporations or the U.S. government. Foreign investing may also include the risk of expropriation or confiscatory taxation, limitation on the removal of funds or other assets, currency crises and exchange controls, the imposition of foreign withholding tax on the interest income payable on such instruments, the possible seizure or nationalization of foreign deposits or assets, or the adoption of other foreign government restrictions that might adversely affect the foreign securities held by the Funds. Additionally, Asia Pacific countries may utilize formal or informal currency exchange controls or “capital controls” that may limit the ability to repatriate investments or income or adversely affect the value of portfolio investments. The economies of many Asia Pacific countries differ from the economies of more developed countries in many respects, such as their rate of growth, inflation, capital reinvestment, resource self-sufficiency and dependence on other economies, financial system stability, the national balance of payments position and sensitivity to changes in global trade. |
Notes to Financial Statements (unaudited) (continued)
Certain Asia Pacific countries are highly dependent upon and may be affected by developments in the economies of other countries. Non-U.S. companies are subject to different accounting, auditing, and financial reporting standards, practices, and requirements than U.S. companies. There is generally less government regulation of stock exchanges, brokers, and listed companies abroad than in the United States, which may result in less transparency with respect to a company’s operations, and make obtaining information about them more difficult (or such information may be unavailable).
Among other risks of investing in foreign markets are the variable quality and reliability of financial information and related audits of companies. In some cases, financial information and related audits can be unreliable and not subject to verification. Auditing firms in some of these markets are not subject to independent inspection or oversight of audit quality. For example, China does not allow the Public Company Accounting Oversight Board to inspect the work that auditors perform in China for Chinese companies that sell stock into U.S. markets. This can result in investment decisions being made based on flawed or misleading information.
Foreign stock markets may not be as developed or efficient as those in the United States, and the absence of negotiated brokerage commissions in certain countries may result in higher brokerage fees. The time between the trade and settlement dates of securities transactions on foreign exchanges ranges from one day to four weeks or longer and may result in higher custody charges. Custodial arrangements may be less well developed than in the United States. Foreign securities are generally denominated and pay distributions in foreign currencies, exposing the Funds to changes in foreign currency exchange rates. Investing in any country in the Asia Pacific region will also entail risks specific and unique to that country, and these risks can be significant and change rapidly.
Changes in interest rates in each of the countries in which the Funds may invest, as well as interest rates in more-developed countries, may cause a decline in the market value of an investment. Generally, fixed income securities will decrease in value when interest rates rise and can be expected to rise in value when interest rates decline. As interest rates decline, debt issuers may repay or refinance their loans or obligations earlier than anticipated. The issuers of fixed income securities may, therefore, repay principal in advance. This would force the Funds to reinvest the proceeds from the principal prepayments at lower rates, which reduces the Funds’ income.
| E. | DISTRIBUTIONS TO SHAREHOLDERS: It is the policy of the Matthews Asian Growth and Income Fund and the Matthews China Dividend Fund to distribute net investment income on a semi-annual basis and capital gains, if any, annually. It is the policy of the Matthews Asia Dividend Fund to distribute net investment income on a quarterly basis and capital gains, if any, annually. It is the policy of the Matthews Asia Total Return Bond Fund and the Matthews Asia Credit Opportunities Fund to distribute net investment income on a monthly basis and capital gains, if any, annually. Each of the other Funds distributes a net investment income and capital gains, if any, annually. Distributions to shareholders are recorded on the ex-dividend date. Income and capital gain distributions are determined in accordance with income tax regulations which may differ from U.S. GAAP. |
The tax character of distributions paid for the fiscal year ended December 31, 2019 was as follows:
| | | | | | | | | | | | |
| YEAR ENDED DECEMBER 31, 2019 | | Ordinary
Income | | | Net Long-Term
Capital Gains | | | Total Taxable
Distributions | |
| Matthews Asia Total Return Bond Fund | | | $4,702,646 | | | | $— | | | | $4,702,646 | |
| Matthews Asia Credit Opportunities Fund | | | 2,963,829 | | | | 42,003 | | | | 3,005,832 | |
| Matthews Asian Growth and Income Fund | | | 35,418,572 | | | | 22,400,844 | | | | 57,819,416 | |
| Matthews Asia Dividend Fund | | | 124,516,990 | | | | — | | | | 124,516,990 | |
| Matthews China Dividend Fund | | | 6,111,641 | | | | — | | | | 6,111,641 | |
| Matthews Asia Value Fund | | | 1,184,154 | | | | — | | | | 1,184,154 | |
| Matthews Asia Growth Fund | | | 373,187 | | | | 12,060,061 | | | | 12,433,248 | |
| Matthews Pacific Tiger Fund | | | 59,773,643 | | | | 269,683,012 | | | | 329,456,655 | |
| Matthews Asia ESG Fund | | | 204,697 | | | | 588,349 | | | | 793,046 | |
| Matthews Emerging Asia Fund | | | 244 | | | | 8,355,290 | | | | 8,355,534 | |
| Matthews Asia Innovators Fund | | | — | | | | 976,006 | | | | 976,006 | |
| Matthews China Fund | | | 10,400,822 | | | | — | | | | 10,400,822 | |
| Matthews India Fund | | | 1,864,672 | | | | 115,678,091 | | | | 117,542,763 | |
| Matthews Japan Fund | | | 14,895,033 | | | | 190,758,914 | | | | 205,653,947 | |
| Matthews Korea Fund | | | 133 | | | | 10,920,522 | | | | 10,920,655 | |
| Matthews Asia Small Companies Fund | | | 1,036,516 | | | | 79,318 | | | | 1,115,834 | |
| Matthews China Small Companies Fund | | | 1,012,660 | | | | — | | | | 1,012,660 | |
| F. | INVESTMENT TRANSACTIONS AND INCOME: Securities transactions are accounted for on the date the securities are purchased or sold or on the following business day. Financial statements reflect security transactions on trade date. Gains or losses on the sale of securities are determined on the identified cost basis. Interest income is recorded on the accrual basis. Interest income, including amortization and accretion of premiums and discounts on debt securities, is recognized daily on an accrual basis. For convertible securities, premiums attributable to the conversion feature are not amortized. Dividend income is generally recorded on the ex-dividend date net of any foreign taxes withheld at the source. Dividend income for certain issuers headquartered in countries which the Funds invest may not be recorded until approved by the shareholders (which may occur after the ex-dividend date) if, in the judgment of management, such dividends are not reasonably determined as of the ex-dividend date. Income and realized and unrealized gains or losses on investments are allocated to each class of shares based on its relative net assets. |
The Funds may be subject to foreign taxation related to income received, capital gains on the sale of securities and certain foreign currency transactions in the foreign jurisdictions in which they invest. Foreign taxes, if any, are recorded based on the tax regulations and rates that exist in the foreign markets in which the Funds invest. When a capital gain tax is determined to apply, the Funds record an estimated deferred tax liability in an amount that may be payable if the securities were disposed of on the valuation date.
| G. | FUND EXPENSE ALLOCATIONS: The Funds account separately for the assets, liabilities and operations of each Fund. Estimated expenses are accrued daily. Direct expenses of each Fund or class are charged to that Fund or class while general expenses are allocated pro-rata among the Funds based on net assets or other appropriate methods. |
| | | | |
| matthewsasia.com | 800.789.ASIA | | | 145 | |
Notes to Financial Statements (unaudited) (continued)
| H. | CASH, CASH OVERDRAFTS, AND FOREIGN CURRENCY: QFII accounts (i.e., the accounts through which the QFII quota is accessed) are required by the local market to maintain a cash reserve. The cash reserve is based upon a fixed ratio of the QFII’s approved investment quota, which is defined as the amount remitted into its special Renminbi (RMB) cash account. These amounts, if any, are included in “Segregated foreign currency at value” on the Statements of Assets and Liabilities. The fixed ratio is set at 0.08 percent for the Shanghai and 0.06 percent for the Shenzhen market. When any of the Funds’ cash balances are overdrawn, a Fund is charged an overdraft fee by the custodian of 1.00% above the 30-day LIBOR rate on outstanding balances. These amounts, if any, are included in “Other expenses” on the Statements of Operations. |
| I. | USE OF ESTIMATES: The preparation of financial statements in conformity with U.S. GAAP requires management to make estimates and assumptions that affect the amounts reported in the financial statements and accompanying notes. Actual results may differ from those estimates. |
| J. | RECENT ACCOUNTING GUIDANCE: In March 2020, the Financial Accounting Standards Board (FASB) issued Accounting Standards Update (ASU) No. 2020-04, Reference Rate Reform (Topic 848)—Facilitation of the Effects of Reference Rate Reform on Financial Reporting. The amendments in the ASU provides optional temporary financial reporting relief from the effect of certain types of contract modifications due to the planned discontinuation of the London Interbank Offered Rate (LIBOR) and other interbank-offered based reference rates as of the end of 2021. The ASU is effective for certain reference rate-related contract modifications that occur during the period March 12, 2020 through December 31, 2022. Management is currently evaluating the impact, if any, of applying this ASU. |
| 3. | DERIVATIVE FINANCIAL INSTRUMENTS |
Each of the Matthews Asia Total Return Bond Fund and the Matthews Asia Credit Opportunities Fund engages in derivative transactions for a variety of purposes, including managing interest rate, currency and credit exposure. Derivative transactions in which each Fund may engage include financial futures contracts, swaps and/or forward foreign currency exchange contracts.
Certain derivative transactions may result in each Fund’s exposure to a currency to exceed the value of the Fund’s assets and the Fund could be exposed to currency risk whether or not it holds a bond or other instrument denominated in that currency. The gross notional value of derivative financial instruments and transactions could exceed the value of the Fund’s net assets, although the net market value of these instruments and transactions, on a marked-to-market basis, at most times, is expected to be substantially lower.
The primary risks associated with the use of derivative financial instruments are: (i) Matthews may not correctly predict the direction of currency exchange rates, interest rates, security prices, or other economic factors; (ii) Matthews may not correctly predict changes in the value of derivative financial instruments and related underlying instruments or assets, which may result in disproportionately increased losses and/or reduced opportunities for gains; (iii) imperfect correlation between the change in market value of the securities held by a Fund and the price of financial futures contracts and credit default swaps contracts; (iv) the lack of, or a reduction in the liquidity of, any secondary market for the instrument, and the resulting inability to close the position (or exit the position) when desired; (v) losses, which are potentially unlimited, due to unanticipated market movements; (vi) the value of the instrument may change unfavorably due to movements in the value of the referenced foreign currencies; (vii) a Fund may suffer disproportionately heavy losses relative to the amount invested; (viii) changes in the value of the derivatives may not match or fully offset changes in the value of hedged or related portfolio securities, thereby failing to achieve the hedging or investment purpose for the derivative transaction; and (ix) the other party to the instrument may fail to fulfill its obligation.
Forward Foreign Currency Exchange Contracts: The Matthews Asia Total Return Bond Fund and the Matthews Asia Credit Opportunities Fund enter into forward foreign currency exchange contracts to gain or reduce exposure to foreign currency exchange rate risk. A forward foreign currency exchange contract is an agreement between two parties to buy and sell a currency at a set exchange rate on a future date. The contract is marked-to-market daily and the change in market value is recorded by the Fund as an unrealized gain or loss. When the contract is closed, the Fund records a realized gain or loss equal to the difference between the value at the time it was opened and the value at the time it was closed. The Matthews Asia Total Return Bond Fund and the Matthews Asia Credit Opportunities Fund do not offset financial assets and financial liabilities on forward foreign currency contacts in the Statements of Assets and Liabilities as they are not subject to netting arrangements.
Swaps: The Matthews Asia Total Return Bond Fund and the Matthews Asia Credit Opportunities Fund enter into swap contracts to manage exposure to issuers, markets and securities to reduce their risk exposure to defaults of corporate and/or sovereign issuers or to create exposure to corporate and/or sovereign issuers to which they are not otherwise exposed (credit risk). Such contracts are agreements between the Funds and a counterparty to make periodic net payments on a specified notional amount or a net payment upon termination. Swap agreements are privately negotiated in the OTC market and may be entered into as a bilateral contract (“OTC Swaps”) or centrally cleared (“centrally cleared swaps”).
For OTC swaps, any upfront premiums paid and any upfront fees received are shown as swap premiums paid and swap premiums received, respectively, in the Statements of Assets and Liabilities and amortized over the term of the contract. The daily fluctuation in market value is recorded as unrealized appreciation (depreciation) on OTC Swaps in the Statements of Assets and Liabilities. Payments received or paid are recorded in the Statements of Operations as realized gains or losses, respectively. When an OTC swap is terminated, a realized gain or loss is recorded in the Statements of Operations equal to the difference between the proceeds from (or cost of) the closing transaction and the Funds’ basis in the contract, if any. Generally, the basis of the contract is the amortized premium received or paid.
The Funds may buy credit default swaps on single-name issuers (corporate or sovereign), a combination or basket of single-name issuers or traded indexes. Credit default swaps are agreements in which the protection buyer pays fixed periodic payments to the seller in consideration for a promise from the protection seller to make a specific payment should a negative credit event take place with respect to the referenced entity (e.g., bankruptcy, failure to pay, obligation acceleration, repudiation, moratorium or restructuring). As a buyer, if an underlying credit event occurs, the Funds will either (i) receive from the seller an amount equal to the notional amount of the swap and deliver the referenced security or underlying securities comprising the index, or (ii) receive a net settlement of cash equal to the notional amount of the swap less the recovery value of the security or underlying securities comprising the index.
The Funds may enter into interest rate swaps to gain or reduce exposure to interest rates or to manage duration, the yield curve or interest rate (interest rate risk).
Interest rate swaps are agreements to exchange cash flows based on the difference between specified interest rates applied to a notional principal
amount for a specified period of time. Risks related to the use of interest rate swaps include the potential for unanticipated movements in interest or currency rates, the possible failure of a counterparty to perform in accordance with the terms of the swap agreements and potential government regulation that could adversely affect the Funds’ swap investments.
Counterparty Credit Risk: A derivative contract may suffer a mark to market loss if the value of the contract decreases due to an unfavorable change in the market rates or values of the underlying instrument. Losses can also occur if the counterparty does not perform under the contract.
A Fund’s risk of loss from counterparty credit risk on OTC derivatives is generally limited to the aggregate unrealized gain netted against any collateral held by such Fund.
Notes to Financial Statements (unaudited) (continued)
With exchange traded futures and centrally cleared swaps, there is less counterparty credit risk to the Funds since the exchange or clearinghouse, as counterparty to such instruments, guarantees against a possible default. The clearinghouse stands between the buyer and the seller of the contract; therefore, the credit risk is limited to failure of the clearinghouse. While offset rights may exist under applicable law, a Fund does not have a contractual right of offset against a clearing broker or clearinghouse in the event of a default (including the bankruptcy or insolvency) of the clearing broker or clearinghouse. Additionally, credit risk exists in exchange traded futures and centrally cleared swaps with respect to initial and variation margin that is held in a clearing broker’s customer accounts. While clearing brokers are required to segregate customer margin from their own assets, in the event that a clearing broker becomes insolvent or goes into bankruptcy and at that time there is a shortfall in the aggregate amount of margin held by the clearing broker for all its clients, typically the shortfall would be allocated on a pro rata basis across all the clearing broker’s customers, potentially resulting in losses to the Funds.
In order to better define its contractual rights and to secure rights that will help the Funds mitigate their counterparty risk, a Fund may enter into an International Swaps and Derivatives Association, Inc. Master Agreement (“ISDA Master Agreement”) or similar agreement with its derivative contract counterparties. An ISDA Master Agreement is a bilateral agreement between each Fund and a counterparty that governs OTC derivatives and typically contains, among other things, collateral posting terms and netting provisions in the event of a default and/or termination event. Under an ISDA Master Agreement, each Fund may, under certain circumstances, offset with the counterparty certain derivative financial instruments’ payables and/or receivables with collateral held and/or posted and create one single net payment. The provisions of the ISDA Master Agreement typically permit a single net payment in the event of default including the bankruptcy or insolvency of the counterparty. However, bankruptcy or insolvency laws of a particular jurisdiction may impose restrictions on or prohibitions against the right of offset in bankruptcy, insolvency or other events. In addition, certain ISDA Master Agreements allow counterparties to OTC derivatives to terminate derivative contracts prior to maturity in the event a Fund’s net assets decline by a stated percentage or the Fund fails to meet the terms of its ISDA Master Agreements, which would cause the Fund to accelerate payment of any net liability owed to the counterparty.
Collateral requirements: For derivatives traded under an ISDA Master Agreement, the collateral requirements are typically calculated by netting the mark to market amount for each transaction under such agreement and comparing that amount to the value of any collateral currently pledged by a Fund and the counterparty. Cash collateral that has been pledged to cover obligations of a Fund, if any, is reported separately on the Statements of Assets and Liabilities as cash pledged as collateral. Non-cash collateral pledged by a Fund, if any, is noted in the Schedules of Investments.
For financial reporting purposes, the Funds do not offset derivative assets and derivative liabilities that are subject to netting arrangements in the Statements of Assets and Liabilities.
As of June 30, 2020, the Matthews Asia Total Return Bond Fund had $628,819 in gross/net assets in the Statements of Assets and Liabilities for OTC Interest Rate Swaps and gross assets of $3,528 and net liabilities of $562,497 for the Forward foreign currency exchange contracts with Bank of America, N.A. The Fund had gross/net liabilities with JPMorgan Chase & Co. of $211,777 for the Forward foreign currency exchange contracts. The Fund pledged cash collateral of $180,000 to Bank of America, N.A. for the open OTC Interest Rate Swaps and Forward foreign currency exchange contracts and pledged $340,000 to JPMorgan Chase & Co. for the open Forward foreign currency exchange contracts.
Levels for Derivative Financial Instruments:
Summary of inputs used to determine the fair valuation of the Funds’ derivatives financial instruments as of June 30, 2020.
| | | | | | | | | | |
| | | Statements of Assets and Liabilities Location | | | | | Matthews Asia
Total Return Bond
Fund | |
| | Asset Derivatives | | | | | | | | |
| | Unrealized appreciation on forward foreign | | | | | | | | |
| Forward foreign currency exchange contracts | | currency exchange contracts | | | | | | | $3,528 | |
| Interest rate contracts | | Unrealized appreciation on Swaps | | | | | | | 628,819 | |
| | | | | | | | | | |
| | Total | | | | | | | $632,347 | |
| | | | | | | | | | |
| | Liability Derivatives | | | | | | | | |
| | Unrealized depreciation on forward foreign | | | | | | | | |
| Forward foreign currency exchange contracts | | currency exchange contracts | | | | | | | ($774,274 | ) |
| | | | | | | | | | |
For the six-month period ended June 30, 2020, the effects of derivative financial instruments on the Statements of Operations were as follows:
| | | | | | |
| Derivative type | | Statements of Operations Location | | Matthews Asia
Total Return Bond
Fund | |
Net Realized Gain (Loss) | | | | | | |
| Foreign currency contracts: | | | | | | |
| | |
Forward foreign currency exchange contracts | | Net realized gain (loss) on forward foreign | | | | |
| | currency exchange contracts | | | ($56,573 | ) |
| Interest rate swaps: | | | | | | |
| | |
Interest rate contracts | | Net realized gain (loss) on swaps | | | 21,732 | |
| | | | | | |
| | Total | | | ($34,841 | ) |
| | | | | | |
Net Change In Unrealized Appreciation (Depreciation) | | | | | | |
| Foreign currency contracts: | | | | | | |
| | |
Forward foreign currency exchange contracts | | Net change in unrealized appreciation/ | | | | |
| | depreciation on forward foreign currency | | | | |
| | exchange contracts | | | ($909,133 | ) |
| Interest rate swaps: | | | | | | |
| | |
Interest rate contracts | | Net change in unrealized appreciation/ | | | | |
| | depreciation on swaps | | | 460,955 | |
| | | | | | |
| | Total | | | ($448,178 | ) |
| | | | | | |
| | | | |
| matthewsasia.com | 800.789.ASIA | | | 147 | |
Notes to Financial Statements (unaudited) (continued)
In regards to the forward foreign currency exchange contracts entered into by the Matthews Asia Total Return Bond Fund, the average notional ending quarterly amounts purchased in USD were $2,474,627 and the average notional ending quarterly amounts sold in USD were $24,866,876. In regards to the interest rate swap contracts entered into by the Matthews Asia Total Return Bond Fund, where the Fund receives the fixed rate and pays the floating rate, the average notional ending quarterly amounts in USD was $18,445,370.
| 4. | CAPITAL SHARE TRANSACTIONS |
| | | | | | | | |
| | | For the Period
Ended June 30, 2020 (Unaudited) | |
| | | Shares | | | Amount | |
MATTHEWS EMERGING MARKETS EQUITY FUND1 | | | | | | | | |
| | |
Investor Class | | | | | | | | |
| | |
Shares sold | | | 146,902 | | | | $1,544,813 | |
| | |
Shares issued through reinvestment of distributions | | | — | | | | — | |
| | |
Shares redeemed | | | (2,679 | ) | | | (29,407 | ) |
Net increase | | | 144,223 | | | | $1,515,406 | |
Institutional Class | | | | | | | | |
| | |
Shares sold | | | 642,510 | | | | $6,480,134 | |
| | |
Shares issued through reinvestment of distributions | | | — | | | | — | |
| | |
Shares redeemed | | | — | | | | — | |
Net increase | | | 642,510 | | | | $6,480,134 | |
| | | | | | | | | | | | | | | | |
| | | Six-Month Period Ended
June 30, 2020 (Unaudited) | | | Year Ended December 31, 2019 | |
| | | Shares | | | Amount | | | Shares | | | Amount | |
MATTHEWS ASIA TOTAL RETURN BOND FUND | | | | | | | | | | | | | | | | |
| | | | |
Investor Class | | | | | | | | | | | | | | | | |
| | | | |
Shares sold | | | 461,210 | | | | $4,829,213 | | | | 531,369 | | | | $5,763,612 | |
| | | | |
Shares issued through reinvestment of distributions | | | 56,855 | | | | 594,231 | | | | 145,300 | | | | 1,576,564 | |
| | | | |
Shares redeemed | | | (631,209 | ) | | | (6,404,444 | ) | | | (1,094,258 | ) | | | (11,768,876 | ) |
Net (decrease) | | | (113,144 | ) | | | ($981,000 | ) | | | (417,589 | ) | | | ($4,428,700 | ) |
Institutional Class | | | | | | | | | | | | | | | | |
| | | | |
Shares sold | | | 592,359 | | | | $6,275,500 | | | | 1,930,123 | | | | $20,678,547 | |
| | | | |
Shares issued through reinvestment of distributions | | | 105,858 | | | | 1,105,516 | | | | 247,825 | | | | 2,689,277 | |
| | | | |
Shares redeemed | | | (1,397,568 | ) | | | (14,464,947 | ) | | | (1,084,707 | ) | | | (11,720,296 | ) |
Net increase (decrease) | | | (699,351 | ) | | | ($7,083,931 | ) | | | 1,093,241 | | | | $11,647,528 | |
MATTHEWS ASIA CREDIT OPPORTUNITIES FUND | | | | | | | | | | | | | | | | |
| | | | |
Investor Class | | | | | | | | | | | | | | | | |
| | | | |
Shares sold | | | 222,124 | | | | $2,221,986 | | | | 539,096 | | | | $5,563,787 | |
| | | | |
Shares issued through reinvestment of distributions | | | 20,577 | | | | 201,164 | | | | 50,305 | | | | 523,714 | |
| | | | |
Shares redeemed | | | (421,521 | ) | | | (4,253,567 | ) | | | (248,407 | ) | | | (2,552,245 | ) |
Net increase (decrease) | | | (178,820 | ) | | | ($1,830,417 | ) | | | 340,994 | | | | $3,535,256 | |
Institutional Class | | | | | | | | | | | | | | | | |
| | | | |
Shares sold | | | 1,803,893 | | | | $18,544,862 | | | | 4,598,478 | | | | $48,037,680 | |
| | | | |
Shares issued through reinvestment of distributions | | | 152,526 | | | | 1,484,098 | | | | 188,769 | | | | 1,969,854 | |
| | | | |
Shares redeemed | | | (1,212,183 | ) | | | (11,815,153 | ) | | | (459,087 | ) | | | (4,707,645 | ) |
Net increase | | | 744,236 | | | | $8,213,807 | | | | 4,328,160 | | | | $45,299,889 | |
MATTHEWS ASIAN GROWTH AND INCOME FUND | | | | | | | | | | | | | | | | |
| | | | |
Investor Class | | | | | | | | | | | | | | | | |
| | | | |
Shares sold | | | 2,243,909 | | | | $32,121,911 | | | | 4,872,266 | | | | $72,535,793 | |
| | | | |
Shares issued through reinvestment of distributions | | | 285,716 | | | | 4,142,872 | | | | 1,729,925 | | | | 26,744,737 | |
| | | | |
Shares redeemed | | | (8,528,496 | ) | | | (120,322,804 | ) | | | (18,009,566 | ) | | | (272,354,103 | ) |
Net (decrease) | | | (5,998,871 | ) | | | ($84,058,021 | ) | | | (11,407,375 | ) | | | ($173,073,573 | ) |
Institutional Class | | | | | | | | | | | | | | | | |
| | | | |
Shares sold | | | 13,274,197 | | | | $186,150,093 | | | | 25,459,302 | | | | $387,665,569 | |
| | | | |
Shares issued through reinvestment of distributions | | | 361,420 | | | | 5,229,737 | | | | 1,643,462 | | | | 25,409,900 | |
| | | | |
Shares redeemed | | | (14,800,750 | ) | | | (202,013,546 | ) | | | (22,634,082 | ) | | | (341,434,957 | ) |
Net increase (decrease) | | | (1,165,133 | ) | | | ($10,633,716 | ) | | | 4,468,682 | | | | $71,640,512 | |
| 1 | The Fund commenced operations on April 30, 2020. |
Notes to Financial Statements (unaudited) (continued)
| | | | | | | | | | | | | | | | |
| | | Six-Month Period Ended
June 30, 2020 (Unaudited) | | | Year Ended December 31, 2019 | |
| | | Shares | | | Amount | | | Shares | | | Amount | |
MATTHEWS ASIA DIVIDEND FUND | | | | | | | | | | | | | | | | |
| | | | |
Investor Class | | | | | | | | | | | | | | | | |
| | | | |
Shares sold | | | 9,780,000 | | | | $151,763,861 | | | | 23,080,251 | | | | $386,877,636 | |
| | | | |
Shares issued through reinvestment of distributions | | | 1,074,747 | | | | 17,206,239 | | | | 3,039,442 | | | | 51,047,011 | |
| | | | |
Shares redeemed | | | (39,439,454 | ) | | | (616,522,453 | ) | | | (63,800,331 | ) | | | (1,067,632,982 | ) |
Net (decrease) | | | (28,584,707 | ) | | | ($447,552,353 | ) | | | (37,680,638 | ) | | | ($629,708,335 | ) |
Institutional Class | | | | | | | | | | | | | | | | |
| | | | |
Shares sold | | | 13,309,272 | | | | $206,457,522 | | | | 47,879,707 | | | | $804,748,356 | |
| | | | |
Shares issued through reinvestment of distributions | | | 1,258,014 | | | | 20,068,252 | | | | 3,784,649 | | | | 63,570,444 | |
| | | | |
Shares redeemed | | | (66,348,004 | ) | | | (1,007,335,524 | ) | | | (66,039,551 | ) | | | (1,110,681,954 | ) |
Net (decrease) | | | (51,780,718 | ) | | | ($780,809,750 | ) | | | (14,375,195 | ) | | | ($242,363,154 | ) |
MATTHEWS CHINA DIVIDEND FUND | | | | | | | | | | | | | | | | |
| | | | |
Investor Class | | | | | | | | | | | | | | | | |
| | | | |
Shares sold | | | 3,138,790 | | | | $48,032,375 | | | | 8,109,547 | | | | $128,681,746 | |
| | | | |
Shares issued through reinvestment of distributions | | | 297,355 | | | | 4,814,184 | | | | 266,077 | | | | 4,182,441 | |
| | | | |
Shares redeemed | | | (5,593,627 | ) | | | (85,603,074 | ) | | | (6,173,811 | ) | | | (97,098,245 | ) |
Net increase (decrease) | | | (2,157,482 | ) | | | ($32,756,515 | ) | | | 2,201,813 | | | | $35,765,942 | |
Institutional Class | | | | | | | | | | | | | | | | |
| | | | |
Shares sold | | | 1,288,811 | | | | $20,028,059 | | | | 4,062,893 | | | | $64,306,979 | |
| | | | |
Shares issued through reinvestment of distributions | | | 127,181 | | | | 2,059,058 | | | | 113,134 | | | | 1,780,502 | |
| | | | |
Shares redeemed | | | (3,248,048 | ) | | | (49,268,482 | ) | | | (1,706,106 | ) | | | (26,787,635 | ) |
Net increase (decrease) | | | (1,832,056 | ) | | | ($27,181,365 | ) | | | 2,469,921 | | | | $39,299,846 | |
MATTHEWS ASIA VALUE FUND | | | | | | | | | | | | | | | | |
| | | | |
Investor Class | | | | | | | | | | | | | | | | |
| | | | |
Shares sold | | | 103,871 | | | | $1,071,332 | | | | 519,639 | | | | $5,951,759 | |
| | | | |
Shares issued through reinvestment of distributions | | | — | | | | — | | | | 71,981 | | | | 781,711 | |
| | | | |
Shares redeemed | | | (534,794 | ) | | | (4,789,073 | ) | | | (896,532 | ) | | | (10,062,716 | ) |
Net (decrease) | | | (430,923 | ) | | | ($3,717,741 | ) | | | (304,912 | ) | | | ($3,329,246 | ) |
Institutional Class | | | | | | | | | | | | | | | | |
| | | | |
Shares sold | | | 79,508 | | | | $838,620 | | | | 517,708 | | | | $5,900,220 | |
| | | | |
Shares issued through reinvestment of distributions | | | — | | | | — | | | | 31,352 | | | | 337,973 | |
| | | | |
Shares redeemed | | | (169,792 | ) | | | (1,703,425 | ) | | | (586,821 | ) | | | (6,627,976 | ) |
Net (decrease) | | | (90,284 | ) | | | ($864,805 | ) | | | (37,761 | ) | | | ($389,783 | ) |
MATTHEWS ASIA GROWTH FUND | | | | | | | | | | | | | | | | |
| | | | |
Investor Class | | | | | | | | | | | | | | | | |
| | | | |
Shares sold | | | 2,474,211 | | | | $66,399,223 | | | | 4,541,007 | | | | $115,967,177 | |
| | | | |
Shares issued through reinvestment of distributions | | | — | | | | — | | | | 171,836 | | | | 4,780,476 | |
| | | | |
Shares redeemed | | | (3,211,940 | ) | | | (85,476,657 | ) | | | (7,367,330 | ) | | | (188,876,592 | ) |
Net (decrease) | | | (737,729 | ) | | | ($19,077,434 | ) | | | (2,654,487 | ) | | | ($68,128,939 | ) |
Institutional Class | | | | | | | | | | | | | | | | |
| | | | |
Shares sold | | | 4,709,555 | | | | $126,501,448 | | | | 7,619,976 | | | | $196,483,749 | |
| | | | |
Shares issued through reinvestment of distributions | | | — | | | | — | | | | 173,818 | | | | 4,875,584 | |
| | | | |
Shares redeemed | | | (3,754,900 | ) | | | (100,341,820 | ) | | | (3,742,483 | ) | | | (96,806,547 | ) |
Net increase | | | 954,655 | | | | $26,159,628 | | | | 4,051,311 | | | | $104,552,786 | |
MATTHEWS PACIFIC TIGER FUND | | | | | | | | | | | | | | | | |
| | | | |
Investor Class | | | | | | | | | | | | | | | | |
| | | | |
Shares sold | | | 6,711,730 | | | | $168,812,296 | | | | 14,430,758 | | | | $406,894,363 | |
| | | | |
Shares issued through reinvestment of distributions | | | — | | | | — | | | | 2,845,287 | | | | 81,033,776 | |
| | | | |
Shares redeemed | | | (20,814,223 | ) | | | (520,264,710 | ) | | | (26,486,333 | ) | | | (742,801,344 | ) |
Net (decrease) | | | (14,102,493 | ) | | | ($351,452,414 | ) | | | (9,210,288 | ) | | | ($254,873,205 | ) |
Institutional Class | | | | | | | | | | | | | | | | |
| | | | |
Shares sold | | | 17,898,903 | | | | $455,025,717 | | | | 49,951,152 | | | | $1,407,060,783 | |
| | | | |
Shares issued through reinvestment of distributions | | | — | | | | — | | | | 6,705,677 | | | | 190,776,524 | |
| | | | |
Shares redeemed | | | (63,039,659 | ) | | | (1,579,162,120 | ) | | | (53,091,456 | ) | | | (1,488,158,535 | ) |
Net increase (decrease) | | | (45,140,756 | ) | | | ($1,124,136,403 | ) | | | 3,565,373 | | | | $109,678,772 | |
| | | | |
| matthewsasia.com | 800.789.ASIA | | | 149 | |
Notes to Financial Statements (unaudited) (continued)
| | | | | | | | | | | | | | | | |
| | | Six-Month Period Ended
June 30, 2020 (Unaudited) | | | Year Ended December 31, 2019 | |
| | | Shares | | | Amount | | | Shares | | | Amount | |
MATTHEWS ASIA ESG FUND | | | | | | | | | | | | | | | | |
| | | | |
Investor Class | | | | | | | | | | | | | | | | |
| | | | |
Shares sold | | | 534,410 | | | | $5,231,398 | | | | 1,184,049 | | | | $12,826,439 | |
| | | | |
Shares issued through reinvestment of distributions | | | — | | | | — | | | | 22,962 | | | | 252,585 | |
| | | | |
Shares redeemed | | | (329,485 | ) | | | (3,167,495 | ) | | | (395,976 | ) | | | (4,181,719 | ) |
Net increase | | | 204,925 | | | | $2,063,903 | | | | 811,035 | | | | $8,897,305 | |
Institutional Class | | | | | | | | | | | | | | | | |
| | | | |
Shares sold | | | 446,808 | | | | $4,173,494 | | | | 1,081,878 | | | | $11,684,318 | |
| | | | |
Shares issued through reinvestment of distributions | | | — | | | | — | | | | 31,337 | | | | 344,077 | |
| | | | |
Shares redeemed | | | (669,291 | ) | | | (6,000,491 | ) | | | (191,932 | ) | | | (2,046,929 | ) |
Net increase (decrease) | | | (222,483 | ) | | | ($1,826,997 | ) | | | 921,283 | | | | $9,981,466 | |
MATTHEWS EMERGING ASIA FUND | | | | | | | | | | | | | | | | |
| | | | |
Investor Class | | | | | | | | | | | | | | | | |
| | | | |
Shares sold | | | 798,452 | | | | $7,301,113 | | | | 1,977,945 | | | | $25,017,512 | |
| | | | |
Shares issued through reinvestment of distributions | | | — | | | | — | | | | 184,599 | | | | 2,200,419 | |
| | | | |
Shares redeemed | | | (2,327,465 | ) | | | (22,949,575 | ) | | | (4,636,314 | ) | | | (57,325,455 | ) |
Net (decrease) | | | (1,529,013 | ) | | | ($15,648,462 | ) | | | (2,473,770 | ) | | | ($30,107,524 | ) |
Institutional Class | | | | | | | | | | | | | | | | |
| | | | |
Shares sold | | | 3,543,031 | | | | $32,362,649 | | | | 10,746,157 | | | | $135,847,255 | |
| | | | |
Shares issued through reinvestment of distributions | | | — | | | | — | | | | 496,581 | | | | 5,949,041 | |
| | | | |
Shares redeemed | | | (10,295,148 | ) | | | (95,133,454 | ) | | | (12,287,844 | ) | | | (150,800,355 | ) |
Net (decrease) | | | (6,752,117 | ) | | | ($62,770,805 | ) | | | (1,045,106 | ) | | | ($9,004,059 | ) |
MATTHEWS ASIA INNOVATORS FUND | | | | | | | | | | | | | | | | |
| | | | |
Investor Class | | | | | | | | | | | | | | | | |
| | | | |
Shares sold | | | 6,709,677 | | | | $100,622,722 | | | | 3,537,078 | | | | $45,933,297 | |
| | | | |
Shares issued through reinvestment of distributions | | | — | | | | — | | | | 34,901 | | | | 503,279 | |
| | | | |
Shares redeemed | | | (3,394,928 | ) | | | (50,888,488 | ) | | | (4,901,397 | ) | | | (63,792,703 | ) |
Net increase (decrease) | | | 3,314,749 | | | | $49,734,234 | | | | (1,329,418 | ) | | | ($17,356,127 | ) |
Institutional Class | | | | | | | | | | | | | | | | |
| | | | |
Shares sold | | | 23,466,424 | | | | $355,928,711 | | | | 2,497,746 | | | | $33,297,458 | |
| | | | |
Shares issued through reinvestment of distributions | | | — | | | | — | | | | 24,526 | | | | 355,872 | |
| | | | |
Shares redeemed | | | (2,638,144 | ) | | | (39,037,757 | ) | | | (1,965,087 | ) | | | (25,479,411 | ) |
Net increase | | | 20,828,280 | | | | $316,890,954 | | | | 557,185 | | | | $8,173,919 | |
MATTHEWS CHINA FUND | | | | | | | | | | | | | | | | |
| | | | |
Investor Class | | | | | | | | | | | | | | | | |
| | | | |
Shares sold | | | 6,904,667 | | | | $130,212,546 | | | | 9,307,763 | | | | $160,049,101 | |
| | | | |
Shares issued through reinvestment of distributions | | | — | | | | — | | | | 413,049 | | | | 7,823,154 | |
| | | | |
Shares redeemed | | | (10,023,568 | ) | | | (188,940,690 | ) | | | (11,566,339 | ) | | | (197,267,770 | ) |
Net (decrease) | | | (3,118,901 | ) | | | ($58,728,144 | ) | | | (1,845,527 | ) | | | ($29,395,515 | ) |
Institutional Class | | | | | | | | | | | | | | | | |
| | | | |
Shares sold | | | 9,404,449 | | | | $178,035,169 | | | | 8,093,642 | | | | $133,433,967 | |
| | | | |
Shares issued through reinvestment of distributions | | | — | | | | — | | | | 47,201 | | | | 892,099 | |
| | | | |
Shares redeemed | | | (2,727,266 | ) | | | (51,829,414 | ) | | | (1,765,278 | ) | | | (30,910,184 | ) |
Net increase | | | 6,677,183 | | | | $126,205,755 | | | | 6,375,565 | | | | $103,415,882 | |
MATTHEWS INDIA FUND | | | | | | | | | | | | | | | | |
| | | | |
Investor Class | | | | | | | | | | | | | | | | |
| | | | |
Shares sold | | | 2,295,796 | | | | $44,130,619 | | | | 7,731,394 | | | | $200,765,536 | |
| | | | |
Shares issued through reinvestment of distributions | | | — | | | | — | | | | 3,684,970 | | | | 85,638,714 | |
| | | | |
Shares redeemed | | | (10,658,554 | ) | | | (200,743,485 | ) | | | (18,554,986 | ) | | | (473,744,143 | ) |
Net (decrease) | | | (8,362,758 | ) | | | ($156,612,866 | ) | | | (7,138,622 | ) | | | ($187,339,893 | ) |
Institutional Class | | | | | | | | | | | | | | | | |
| | | | |
Shares sold | | | 747,405 | | | | $14,807,893 | | | | 6,857,047 | | | | $178,913,179 | |
| | | | |
Shares issued through reinvestment of distributions | | | — | | | | — | | | | 607,390 | | | | 14,279,727 | |
| | | | |
Shares redeemed | | | (4,360,551 | ) | | | (80,849,337 | ) | | | (17,386,942 | ) | | | (457,235,640 | ) |
Net (decrease) | | | (3,613,146 | ) | | | ($66,041,444 | ) | | | (9,922,505 | ) | | | ($264,042,734 | ) |
Notes to Financial Statements (unaudited) (continued)
| | | | | | | | | | | | | | | | |
| | | Six-Month Period Ended
June 30, 2020 (Unaudited) | | | Year Ended December 31, 2019 | |
| | | Shares | | | Amount | | | Shares | | | Amount | |
MATTHEWS JAPAN FUND | | | | | | | | | | | | | | | | |
| | | | |
Investor Class | | | | | | | | | | | | | | | | |
| | | | |
Shares sold | | | 6,500,547 | | | | $125,334,773 | | | | 14,040,067 | | | | $281,660,571 | |
| | | | |
Shares issued through reinvestment of distributions | | | — | | | | — | | | | 5,462,457 | | | | 117,661,321 | |
| | | | |
Shares redeemed | | | (29,974,061 | ) | | | (583,697,506 | ) | | | (43,276,411 | ) | | | (904,215,429 | ) |
Net (decrease) | | | (23,473,514 | ) | | | ($458,362,733 | ) | | | (23,773,887 | ) | | | ($504,893,537 | ) |
Institutional Class | | | | | | | | | | | | | | | | |
| | | | |
Shares sold | | | 4,075,615 | | | | $78,965,213 | | | | 10,666,389 | | | | $222,188,400 | |
| | | | |
Shares issued through reinvestment of distributions | | | — | | | | — | | | | 1,514,104 | | | | 32,674,366 | |
| | | | |
Shares redeemed | | | (19,577,673 | ) | | | (379,787,622 | ) | | | (36,054,972 | ) | | | (745,335,389 | ) |
Net (decrease) | | | (15,502,058 | ) | | | ($300,822,409 | ) | | | (23,874,479 | ) | | | ($490,472,623 | ) |
MATTHEWS KOREA FUND | | | | | | | | | | | | | | | | |
| | | | |
Investor Class | | | | | | | | | | | | | | | | |
| | | | |
Shares sold | | | 1,632,630 | | | | $6,345,362 | | | | 2,059,086 | | | | $9,109,614 | |
| | | | |
Shares issued through reinvestment of distributions | | | — | | | | — | | | | 2,084,515 | | | | 8,984,260 | |
| | | | |
Shares redeemed | | | (2,460,490 | ) | | | (9,561,763 | ) | | | (6,006,394 | ) | | | (26,550,755 | ) |
Net (decrease) | | | (827,860 | ) | | | ($3,216,401 | ) | | | (1,862,793 | ) | | | ($8,456,881 | ) |
Institutional Class | | | | | | | | | | | | | | | | |
| | | | |
Shares sold | | | 429,725 | | | | $1,731,785 | | | | 3,918,143 | | | | $17,759,942 | |
| | | | |
Shares issued through reinvestment of distributions | | | — | | | | — | | | | 393,829 | | | | 1,709,218 | |
| | | | |
Shares redeemed | | | (3,845,310 | ) | | | (15,611,336 | ) | | | (3,210,203 | ) | | | (14,313,984 | ) |
Net increase (decrease) | | | (3,415,585 | ) | | | ($13,879,551 | ) | | | 1,101,769 | | | | $5,155,176 | |
MATTHEWS ASIA SMALL COMPANIES FUND | | | | | | | | | | | | | | | | |
| | | | |
Investor Class | | | | | | | | | | | | | | | | |
| | | | |
Shares sold | | | 476,524 | | | | $8,064,884 | | | | 1,052,343 | | | | $17,606,463 | |
| | | | |
Shares issued through reinvestment of distributions | | | — | | | | — | | | | 26,715 | | | | 477,400 | |
| | | | |
Shares redeemed | | | (1,614,446 | ) | | | (27,263,660 | ) | | | (2,952,819 | ) | | | (50,877,217 | ) |
Net (decrease) | | | (1,137,922 | ) | | | ($19,198,776 | ) | | | (1,873,761 | ) | | | ($32,793,354 | ) |
Institutional Class | | | | | | | | | | | | | | | | |
| | | | |
Shares sold | | | 1,067,251 | | | | $18,457,589 | | | | 2,286,863 | | | | $38,931,702 | |
| | | | |
Shares issued through reinvestment of distributions | | | — | | | | — | | | | 31,309 | | | | 558,232 | |
| | | | |
Shares redeemed | | | (1,332,532 | ) | | | (22,085,721 | ) | | | (2,456,706 | ) | | | (41,355,074 | ) |
Net (decrease) | | | (265,281 | ) | | | ($3,628,132 | ) | | | (138,534 | ) | | | ($1,865,140 | ) |
MATTHEWS CHINA SMALL COMPANIES FUND | | | | | | | | | | | | | | | | |
| | | | |
Investor Class | | | | | | | | | | | | | | | | |
| | | | |
Shares sold | | | 9,872,332 | | | | $158,402,319 | | | | 2,414,807 | | | | $28,243,922 | |
| | | | |
Shares issued through reinvestment of distributions | | | — | | | | — | | | | 48,885 | | | | 626,223 | |
| | | | |
Shares redeemed | | | (4,275,321 | ) | | | (68,023,247 | ) | | | (1,880,948 | ) | | | (20,832,077 | ) |
Net increase | | | 5,597,011 | | | | $90,379,072 | | | | 582,744 | | | | $8,038,068 | |
Institutional Class | | | | | | | | | | | | | | | | |
| | | | |
Shares sold | | | 6,758,811 | | | | $103,652,043 | | | | 1,234,398 | | | | $13,977,800 | |
| | | | |
Shares issued through reinvestment of distributions | | | — | | | | — | | | | 25,389 | | | | 325,995 | |
| | | | |
Shares redeemed | | | (1,364,782 | ) | | | (21,627,577 | ) | | | (904,930 | ) | | | (10,177,325 | ) |
Net increase | | | 5,394,029 | | | | $82,024,466 | | | | 354,857 | | | | $4,126,470 | |
| 5. | INVESTMENT ADVISORY FEES AND OTHER TRANSACTIONS WITH AFFILIATES |
Matthews, a registered investment advisor under the 1940 Act, provides the Funds with investment management services. Pursuant to the prior Investment Advisory Agreement dated August 13, 2004, as amended (the “Prior Advisory Agreement”) and the current Investment Advisory Agreement dated February 1, 2016, as amended (the “Current Advisory Agreement,” and together with the Prior Advisory Agreement, the “Advisory Agreement”), the Funds pay Matthews (i) for management and advisory services; and (ii) for certain administrative services, an annual fee as a percentage of average daily net assets. Under the Advisory Agreement each of the Funds, other than Matthews Asia Total Return Bond Fund, Matthews Asia Credit Opportunities Fund, Matthews Emerging Asia Fund, Matthews Asia Small Companies Fund, and Matthews China Small Companies Fund (the “Family-Priced Funds”), pays Matthews 0.75% of their aggregate average daily net assets up to $2 billion, 0.6834% of their aggregate average daily net assets over $2 billion up to $5 billion, 0.65% of their aggregate average daily net assets over $5 billion up to $25 billion, 0.64% of their aggregate average daily net assets over $25 billion up to $30 billion, 0.63% of their aggregate average daily net assets over $30 billion up to $35 billion, 0.62% of their aggregate average daily net assets over $35 billion up to $40 billion, 0.61% of their aggregate average daily net assets over $40 billion up to $45 billion, and
| | | | |
| matthewsasia.com | 800.789.ASIA | | | 151 | |
Notes to Financial Statements (unaudited) (continued)
0.60% of their aggregate average daily net assets over $45 billion. Each of the Matthews Asia Total Return Bond Fund and Matthews Asia Credit Opportunities Fund paid Matthews an annual fee of 0.55% of such Fund’s annual average daily net assets pursuant to the Advisory Agreement. Each of the Matthews Emerging Asia Fund, Matthews Asia Small Companies Fund, and the Matthews China Small Companies Fund pays Matthews an annual fee of 1.00% of the average daily net assets of such Fund up to $1 billion and 0.95% of the average daily net assets of such Fund over $1 billion pursuant to the Advisory Agreement. Each Fund pays Matthews a monthly fee at the annual rate using the applicable management fee calculated based on the actual number of days of that month and based on the Fund’s average daily net asset value for the month.
Pursuant to a fee waiver letter agreement, effective as of September 1, 2014, between the Trust, on behalf of the Family-Priced Funds, and Matthews (as amended from time to time, the “Fee Waiver Agreement”), for each Family-Priced Fund, Matthews has agreed to waive a portion of the fee payable under the Advisory Agreement and a portion of the fee payable under the Administration and Shareholder Services Agreement, if any Family-Priced Fund’s average daily net assets are over $3 billion, as follows: for every $2.5 billion average daily net assets of a Family-Priced Fund that are over $3 billion, the fee rates that otherwise would be applied for calculating fees payable under the Advisory Agreement and the Administration and Shareholder Services Agreement for such Family-Priced Fund with respect to such excess average daily net assets will be each reduced by 0.01%, in each case without reducing such fee rate below 0.00%.
Investment advisory fees charged, waived fees and reimbursed additional expenses for the six-month period ended June 30, 2020, were as follows:
| | | | | | | | | | | | |
| | | Gross Advisory Fees | | | Advisory Fees Waived and Reimbursed in Excess of the Expense Limitation | | | Net Advisory Fee/ Reimbursement | |
| Matthews Emerging Markets Equity Fund | | | $8,425 | | | | ($38,005 | ) | | | ($29,580 | ) |
| Matthews Asia Total Return Bond Fund | | | 295,480 | | | | (36,242 | ) | | | 259,238 | |
| Matthews Asia Credit Opportunities Fund | | | 261,358 | | | | (17,723 | ) | | | 243,635 | |
| Matthews Asian Growth and Income Fund | | | 4,354,888 | | | | — | | | | 4,354,888 | |
| Matthews Asia Dividend Fund | | | 14,112,838 | | | | (62,600 | ) | | | 14,050,238 | |
| Matthews China Dividend Fund | | | 1,087,808 | | | | — | | | | 1,087,808 | |
| Matthews Asia Value Fund | | | 50,560 | | | | (71,279 | ) | | | (20,719 | ) |
| Matthews Asia Growth Fund | | | 3,779,819 | | | | — | | | | 3,779,819 | |
| Matthews Pacific Tiger Fund | | | 23,675,895 | | | | (296,352 | ) | | | 23,379,543 | |
| Matthews Asia ESG Fund | | | 169,359 | | | | (50,390 | ) | | | 118,969 | |
| Matthews Emerging Asia Fund | | | 1,074,009 | | | | (661,452 | ) | | | 412,557 | |
| Matthews Asia Innovators Fund | | | 1,531,947 | | | | — | | | | 1,531,947 | |
| Matthews China Fund | | | 3,057,357 | | | | — | | | | 3,057,357 | |
| Matthews India Fund | | | 2,317,081 | | | | — | | | | 2,317,081 | |
| Matthews Japan Fund | | | 5,915,541 | | | | — | | | | 5,915,541 | |
| Matthews Korea Fund | | | 375,457 | | | | — | | | | 375,457 | |
| Matthews Asia Small Companies Fund | | | 802,549 | | | | (222,432 | ) | | | 580,117 | |
| Matthews China Small Companies Fund | | | 964,292 | | | | (106,645 | ) | | | 857,647 | |
| | | | |
| | | $63,834,663 | | | | ($1,563,120 | ) | | | $62,271,543 | |
| | | | |
Under a written agreement between the Funds and Matthews (the “Operating Expense Agreement”), Matthews agrees to waive fees and reimburse expenses to a Fund if its expense ratio exceeds a certain percentage level. Effective April 30, 2020 for all Funds, except the Matthews Emerging Markets Equity Fund, the Matthews Asia Total Return Bond Fund and the Matthews Asia Credit Opportunities Fund, this level is 1.20% for the Institutional Class. Prior to April 30, 2020, Matthews had agreed to voluntarily reduce the expense limitation to 1.20% for the Institutional Class beginning on November 1, 2019. Matthews agrees to reduce the expense ratio by waiving an equal amount of non-class specific expenses (e.g., custody fees) for the Investor Class. Because certain expenses of the Investor Class may be higher than those of the Institutional Class and because class specific expenses may be waived solely for the Institutional Class, total annual Fund expenses for the Investor Class may exceed 1.20%. For the Matthews Emerging Markets Equity Fund, the Matthews Asia Total Return Bond Fund and the Matthews Asia Credit Opportunities Fund this level is 0.90% for the Institutional Class. Matthews agrees to reduce the expense ratio by waiving an equal amount of non-class specific expenses (e.g., custody fees) for the Investor Class. Because certain expenses of the Investor Class may be higher than those of the Institutional Class and because class specific expenses may be waived solely for the Institutional Class, total annual Fund expenses for the Investor Class may exceed 0.90%. In turn, if the expenses of a Fund, other than the Matthews Asia Total Return Bond Fund and the Matthews Asia Credit Opportunities Fund, fall below the level noted within three years after Matthews has made such a reimbursement, the Fund may reimburse Matthews up to an amount of the recoupment available not to exceed the lesser of (i) the expense limitation applicable at the time of that fee waiver and/or expense reimbursement or (ii) the expense limitation in effect at the time of recoupment. For the Matthews Asia Total Return Bond Fund and the Matthews Asia Credit Opportunities Fund, any amount waived for prior fiscal years is not subject to recoupment. This agreement will continue through April 30, 2021, may be extended for additional periods not exceeding one year, and may be terminated at any time by the Board of Trustees on behalf of the Fund on 60 days’ written notice to Matthews. Matthews may decline to renew this agreement by written notice to the Trust at least 30 days before its annual expiration date.
Notes to Financial Statements (unaudited) (continued)
| | Waived | Fees Subject to Possible Future Recoupment: |
On June 30, 2020, the amounts expired and subject to possible future recoupment under the expense limitation agreement are as follows:
| | | | | | | | | | | | | | | | |
| | | Expiring December 31, | |
| | | 2020 | | | 2021 | | | 2022 | | | 2023 | |
| Matthews Emerging Markets Equity Fund | | | $— | | | | $— | | | | $— | | | | $38,005 | |
| Matthews Asia Value Fund | | | 119,683 | | | | 81,767 | | | | 111,890 | | | | 71,279 | |
| Matthews Asia ESG Fund | | | 156,429 | | | | 156,459 | | | | 67,253 | | | | 50,390 | |
| Matthews Emerging Asia Fund | | | 878,171 | | | | 1,073,964 | | | | 997,574 | | | | 661,452 | |
| Matthews Asia Small Companies Fund | | | 272,597 | | | | 308,001 | | | | 336,966 | | | | 222,432 | |
| Matthews China Small Companies Fund | | | 184,162 | | | | 275,220 | | | | 167,178 | | | | 106,645 | |
The Funds have an Administration and Shareholder Services Agreement dated August 13, 2004, as amended (the “Shareholder Services Agreement” or “Services Agreement”), in which the Funds pay an annual administration and shareholder servicing fee to Matthews, as a percentage of the average daily net assets of each Fund in aggregate, computed and prorated on a daily basis. Under the Shareholder Services Agreement, the Funds in the aggregate pay Matthews 0.25% of their aggregate average daily net assets up to $2 billion, 0.1834% of their aggregate average daily net assets over $2 billion up to $5 billion, 0.15% of their aggregate average daily net assets over $5 billion up to $7.5 billion, 0.125% of their aggregate average daily net assets over $7.5 billion up to $15 billion, 0.11% of their aggregate average daily net assets over $15 billion up to $22.5 billion, 0.10% of their aggregate average daily net assets over $22.5 billion up to $25 billion, 0.09% of their aggregate average daily net assets over $25 billion up to $30 billion, 0.08% of their aggregate average daily net assets over $30 billion up to $35 billion, 0.07% of their aggregate average daily net assets over $35 billion up to $40 billion, 0.06% of their aggregate average daily net assets over $40 billion up to $45 billion, and 0.05% of their aggregate average daily net assets over $45 billion.
Administration and shareholder servicing fees charged, for the six-month period ended June 30, 2020, were as follows:
| | | | | | | | | | | | |
| | | Gross
Administration and
Shareholder
Servicing Fees | | | Administration and
Shareholder
Servicing Fees
Waived in Excess of
Expense Limitation | | | Net
Administration and
Shareholder
Servicing Fees | |
| Matthews Emerging Markets Equity Fund | | | $1,897 | | | | $— | | | | $1,897 | |
| Matthews Asia Total Return Bond Fund | | | 79,356 | | | | — | | | | 79,356 | |
| Matthews Asia Credit Opportunities Fund | | | 70,259 | | | | — | | | | 70,259 | |
| Matthews Asian Growth and Income Fund | | | 965,343 | | | | — | | | | 965,343 | |
| Matthews Asia Dividend Fund | | | 3,121,944 | | | | (62,600 | ) | | | 3,059,344 | |
| Matthews China Dividend Fund | | | 241,040 | | | | — | | | | 241,040 | |
| Matthews Asia Value Fund | | | 11,165 | | | | — | | | | 11,165 | |
| Matthews Asia Growth Fund | | | 838,340 | | | | — | | | | 838,340 | |
| Matthews Pacific Tiger Fund | | | 5,239,139 | | | | (296,141 | ) | | | 4,942,998 | |
| Matthews Asia ESG Fund | | | 37,521 | | | | — | | | | 37,521 | |
| Matthews Emerging Asia Fund | | | 157,705 | | | | — | | | | 157,705 | |
| Matthews Asia Innovators Fund | | | 341,475 | | | | — | | | | 341,475 | |
| Matthews China Fund | | | 679,010 | | | | — | | | | 679,010 | |
| Matthews India Fund | | | 511,245 | | | | — | | | | 511,245 | |
| Matthews Japan Fund | | | 1,309,350 | | | | — | | | | 1,309,350 | |
| Matthews Korea Fund | | | 83,084 | | | | — | | | | 83,084 | |
| Matthews Asia Small Companies Fund | | | 118,511 | | | | — | | | | 118,511 | |
| Matthews China Small Companies Fund | | | 143,882 | | | | — | | | | 143,882 | |
In addition to the fees paid to the Funds’ transfer agent, the Funds bear the cost of fees paid to certain service providers or intermediaries, including supermarkets, which provide transfer agency, record-keeping and shareholder servicing to certain shareholders. These fees are referred to as intermediary service fees on the Statements of Assets and Liabilities as well as the Statements of Operations. Additional information concerning these services and fees is contained in the Funds’ prospectuses.
| | | | |
| matthewsasia.com | 800.789.ASIA | | | 153 | |
Notes to Financial Statements (unaudited) (continued)
BNY Mellon Investment Servicing (US) Inc. (“BNY Mellon”), an indirect wholly owned subsidiary of The Bank of New York Mellon Corporation, serves as the Funds’ administrator, and in that capacity, performs various administrative and accounting services for each Fund. BNY Mellon also serves as the Funds’ transfer agent, dividend disbursing agent and registrar. An officer of BNY Mellon serves as Assistant Treasurer to the Funds. Total fees accrued by the Funds for administration and accounting services for the six-month period ended June 30, 2020 were as follows:
| | | | |
| | | Administration and
Accounting fees | |
| Matthews Emerging Markets Equity Fund | | | $101 | |
| Matthews Asia Total Return Bond Fund | | | 4,298 | |
| Matthews Asia Credit Opportunities Fund | | | 3,802 | |
| Matthews Asian Growth and Income Fund | | | 52,268 | |
| Matthews Asia Dividend Fund | | | 169,422 | |
| Matthews China Dividend Fund | | | 13,056 | |
| Matthews Asia Value Fund | | | 607 | |
| Matthews Asia Growth Fund | | | 45,362 | |
| Matthews Pacific Tiger Fund | | | 284,211 | |
| Matthews Asia ESG Fund | | | 2,033 | |
| Matthews Emerging Asia Fund | | | 8,592 | |
| Matthews Asia Innovators Fund | | | 18,374 | |
| Matthews China Fund | | | 36,687 | |
| Matthews India Fund | | | 27,825 | |
| Matthews Japan Fund | | | 71,012 | |
| Matthews Korea Fund | | | 4,507 | |
| Matthews Asia Small Companies Fund | | | 6,420 | |
| Matthews China Small Companies Fund | | | 7,714 | |
As of June 30, 2020, Matthews and its affiliates held significant shares in the Funds as follows:
| | | | | | | | |
| | | Shares held by Matthews
and its Affiliates | | | Percentage of
Outstanding Shares | |
| Matthews Emerging Markets Equity Fund | | | 665,995 | | | | 85 | % |
| Matthews Asia ESG Fund | | | 1,041,697 | | | | 21 | % |
Certain officers and Trustees of the Funds are also officers and directors of Matthews. All officers serve without compensation from the Funds. The Funds paid the Independent Trustees $832,305 in aggregate for regular compensation during the six-month period ended June 30, 2020.
The value of investment transactions made for affiliated and unaffiliated holdings for the six-month period ended June 30, 2020 were as follows:
| | | | | | | | | | | | | | | | |
| | | Affiliated Purchases | | | Proceeds from
Affiliated Sales | | | Unaffiliated Purchases | | | Proceeds from
Unaffiliated Sales | |
| Matthews Emerging Markets Equity Fund | | | $— | | | | $— | | | | $10,530,244 | | | | $3,075,348 | |
| Matthews Asia Total Return Bond Fund | | | — | | | | — | | | | 22,193,791 | | | | 27,468,915 | |
| Matthews Asia Credit Opportunities Fund | | | — | | | | — | | | | 25,206,868 | | | | 13,179,317 | |
| Matthews Asian Growth and Income Fund | | | — | | | | — | | | | 227,064,864 | | | | 338,154,578 | |
| Matthews Asia Dividend Fund | | | 2,542,270 | | | | 25,441,760 | | | | 949,755,915 | | | | 2,111,222,550 | |
| Matthews China Dividend Fund | | | — | | | | — | | | | 121,272,754 | | | | 183,442,749 | |
| Matthews Asia Value Fund | | | — | | | | — | | | | 2,723,531 | | | | 8,118,589 | |
| Matthews Asia Growth Fund | | | — | | | | — | | | | 293,904,798 | | | | 312,753,897 | |
| Matthews Pacific Tiger Fund | | | — | | | | 59,915,123 | | | | 1,100,473,030 | | | | 2,590,074,090 | |
| Matthews Asia ESG Fund | | | — | | | | — | | | | 25,998,211 | | | | 26,062,949 | |
| Matthews Emerging Asia Fund | | | — | | | | 364,804 | | | | 21,921,157 | | | | 109,455,057 | |
| Matthews Asia Innovators Fund | | | — | | | | — | | | | 523,630,166 | | | | 194,576,361 | |
| Matthews China Fund | | | — | | | | — | | | | 328,049,468 | | | | 295,924,028 | |
| Matthews India Fund | | | — | | | | — | | | | 204,019,774 | | | | 434,441,254 | |
| Matthews Japan Fund | | | — | | | | — | | | | 428,693,109 | | | | 1,203,425,944 | |
| Matthews Korea Fund | | | — | | | | — | | | | 15,063,539 | | | | 31,808,307 | |
| Matthews Asia Small Companies Fund | | | — | | | | — | | | | 86,877,304 | | | | 109,977,967 | |
| Matthews China Small Companies Fund | | | — | | | | — | | | | 236,923,560 | | | | 70,278,460 | |
Notes to Financial Statements (unaudited) (continued)
| 7. | HOLDINGS OF 5% VOTING SHARES OF PORTFOLIO COMPANIES |
The 1940 Act defines “affiliated companies” to include investments in portfolio companies in which a fund owns 5% or more of the outstanding voting shares. During the six-month period ended June 30, 2020, the Funds below held 5% or more of the outstanding voting shares of the noted portfolio companies. During this period, other Funds in the Trust may also have held voting shares of the issuers at levels below 5%.
Investments in affiliates:
A summary of transactions in securities of issuers affiliated with a Fund for the six-month period ended June 30, 2020 is as follows:
| | | | | | | | | | | | | | | | | | | | | | | | | | | | | | | | |
| | | Value at Dec. 31, 2019 | | | Purchases | | | Sales | | | Net Realized Gain (Loss) Jan. 1, 2020– June 30, 2020 | | | Net Change in Unrealized
Appreciation
(Depreciation) | | | Value at June 30, 2020 | | | Shares June 30, 2020 | | | Dividend Income Jan. 1, 2020– June 30, 2020 | |
| | | | | | |
| MATTHEWS ASIA DIVIDEND FUND | | | | | | | | | | | | | | | | | | | | | | | | | |
| | | | | | | | |
| Name of Issuer: | | | | | | | | | | | | | | | | | | | | | | | | | | | | | | | | |
| | | | | | | | |
Anritsu Corp.† | | | $164,799,203 | | | | $— | | | | $41,873,701 | | | | $— | | | | $— | | | | $— | | | | 6,038,300 | | | | $— | |
BELLSYSTEM24 Holdings, Inc. | | | 87,951,535 | | | | — | | | | 5,711,909 | | | | (1,539,863 | ) | | | (13,841,413 | ) | | | 66,858,350 | | | | 5,137,700 | | | | 922,190 | |
Breville Group, Ltd. | | | 96,607,872 | | | | — | | | | 3,947,919 | | | | 1,725,889 | | | | 25,181,849 | | | | 119,567,691 | | | | 7,564,257 | | | | 970,044 | |
China Steel Chemical Corp.† | | | 58,070,775 | | | | — | | | | 30,619,920 | | | | — | | | | — | | | | — | | | | 5,272,000 | | | | — | |
Eiken Chemical Co., Ltd.† | | | 67,587,182 | | | | — | | | | 56,990,165 | | | | — | | | | — | | | | — | | | | 403,000 | | | | — | |
KATITAS Co., Ltd. | | | 92,256,441 | | | | 2,542,270 | †† | | | 2,585,178 | | | | 569,687 | | | | 5,181,265 | | | | 97,964,485 | | | | 4,210,800 | | | | 472,883 | |
Minda Industries, Ltd. | | | 71,216,192 | | | | — | | | | 3,848,324 | | | | 504,104 | | | | (18,586,279 | ) | | | 49,285,693 | | | | 13,532,234 | | | | 79,287 | |
Minth Group, Ltd. | | | 238,203,085 | | | | — | | | | 8,604,450 | | | | 4,721,987 | | | | (48,785,665 | ) | | | 185,534,957 | | | | 64,635,000 | | | | 5,636,386 | |
Yuexiu Transport Infrastructure, Ltd. | | | 84,277,091 | | | | — | | | | 743,980 | | | | 277,715 | | | | (17,939,503 | ) | | | 65,871,323 | | | | 93,902,000 | | | | 2,544,113 | |
| | | | | | | | | | | | | | | | | | | | | | | | |
Total Affiliates | | | | | | | | | | | | | | | $6,259,519 | | | | $(68,789,746 | ) | | | $585,082,499 | | | | | | | | $10,624,903 | |
| | | | | | | | | | | | | | | | | | | | | | | | |
| | | | | | | |
| MATTHEWS ASIA GROWTH FUND | | | | | | | | | | | | | | | | | | | | | | | | | | | | | |
| | | | | | | | |
| Name of Issuer: | | | | | | | | | | | | | | | | | | | | | | | | | | | | | | | | |
| | | | | | | | |
Rozetta Corp.† | | | $18,601,381 | | | | $— | | | | $— | | | | $— | | | | $— | | | | $— | | | | 516,600 | | | | $— | |
Sampath Bank PLC† | | | 19,610,214 | | | | — | | | | 5,249,643 | | | | — | | | | — | | | | — | | | | 13,125,953 | | | | — | |
| | | | | | | | | | | | | | | | | | | | | | | | |
Total Affiliates | | | | | | | | | | | | | | | $— | | | | $— | | | | $— | | | | | | | | $— | |
| | | | | | | | | | | | | | | | | | | | | | | | |
| | | | | | | |
| MATTHEWS PACIFIC TIGER FUND | | | | | | | | | | | | | | | | | | | | | | | | | | | | | |
| | | | | | | | |
| Name of Issuer: | | | | | | | | | | | | | | | | | | | | | | | | | | | | | | | | |
| | | | | | | | |
DKSH Holding AG† | | | $219,652,228 | | | | $— | | | | $143,936,918 | | | | $— | | | | $— | | | | $— | | | | 1,509,437 | | | | $— | |
Fuyao Glass Industry Group Co., Ltd. H Shares | | | 150,920,324 | | | | — | | | | 26,788,432 | | | | (3,738,866 | ) | | | (30,853,523 | ) | | | 89,539,503 | | | | 37,397,200 | | | | — | |
Guotai Junan Securities Co., Ltd. H Shares† | | | 145,823,286 | | | | — | | | | 22,756,501 | | | | — | | | | — | | | | — | | | | 66,072,000 | | | | — | |
Orion Holdings Corp. | | | 86,931,374 | | | | — | | | | 27,054,024 | | | | (150,052,730 | ) | | | 125,715,924 | | | | 35,540,544 | | | | 3,198,402 | | | | — | |
Tata Power Co., Ltd. | | | 142,780,167 | | | | — | | | | 6,072,667 | | | | (31,184,529 | ) | | | (6,986,128 | ) | | | 98,536,843 | | | | 165,316,487 | | | | — | |
| | | | | | | | | | | | | | | | | | | | | | | | |
Total Affiliates | | | | | | | | | | | | | | | $(184,976,125 | ) | | | $87,876,273 | | | | $223,616,890 | | | | | | | | $— | |
| | | | | | | | | | | | | | | | | | | | | | | | |
| | | | | | |
| MATTHEWS EMERGING ASIA FUND | | | | | | | | | | | | | | | | | | | | | | | | | |
| | | | | | | |
| Name of Issuer: | | | | | | | | | | | | | | | | | | | | | | | | | | | | | |
| | | | | | | | |
PAK Suzuki Motor Co., Ltd.† | | | $7,778,239 | | | | $— | | | | $1,378,229 | | | | $— | | | | $— | | | | $— | | | | 3,845,400 | | | | $— | |
Vietnam National Seed Group JSC | | | 4,375,315 | | | | — | | | | 364,804 | | | | (30,892 | ) | | | (1,275,061 | ) | | | 2,704,558 | | | | 996,222 | | | | — | |
| | | | | | | | | | | | | | | | | | | | | | | | |
Total Affiliates | | | | | | | | | | | | | | | $(30,892 | ) | | | $(1,275,061 | ) | | | $2,704,558 | | | | | | | | $— | |
| | | | | | | | | | | | | | | | | | | | | | | | |
| | | | | | | |
| MATTHEWS INDIA FUND | | | | | | | | | | | | | | | | | | | | | | | | | | | | | |
| | | | | | | | |
| Name of Issuer: | | | | | | | | | | | | | | | | | | | | | | | | | | | | | | | | |
| | | | | | | | |
VST Industries, Ltd.† | | | $48,471,387 | | | | $— | | | | $15,296,470 | | | | $— | | | | $— | | | | $— | | | | 495,531 | | | | $— | |
| † | Issuer was not an affiliated company as of June 30, 2020. |
| †† | Includes stock split during the period. |
It is the policy of the Funds to comply with all requirements of the Internal Revenue Code of 1986, as amended (“the Code”), applicable to regulated investment companies and to distribute substantially all of their taxable income to their shareholders. The Funds have met the requirements of the Code applicable to regulated investment companies for the six-month period ended June 30, 2020. Therefore, no federal income tax provision is required.
Management has analyzed the Funds’ tax positions taken on federal income tax returns for all open tax years (current and prior three tax years), and has concluded that no provision for federal income tax is required in the Funds’ financial statements. The Funds’ federal and state income and federal excise tax returns for tax years for which the applicable statutes of limitations have not expired are subject to examination by the Internal Revenue Service and state departments of revenue.
| | | | |
| matthewsasia.com | 800.789.ASIA | | | 155 | |
Notes to Financial Statements (unaudited) (continued)
Under current tax law, the Funds have elected to defer certain qualified late-year losses and recognize such losses in the year ending December 31, 2019:
| | | | |
| | | Late Year Losses* | |
| Matthews Asia Credit Opportunities Fund | | | ($40,191 | ) |
| Matthews China Dividend Fund | | | (3,920,578 | ) |
| Matthews Asia Growth Fund | | | (1,542,268 | ) |
| Matthews Japan Fund | | | (10,705,586 | ) |
| Matthews China Small Companies Fund | | | (440,033 | ) |
| * | As permitted by the Internal Revenue Service, the Funds have elected to defer certain qualified late-year losses and recognize such losses in the next fiscal year. |
As of December 31, 2019, the Funds have capital loss carryforwards available to offset future realized capital gains through the indicated expiration dates as follows:
| | | | | | | | | | | | |
| | | Amount With No Expiration | | | | |
| | | Short-term
Losses | | | Long-term
Losses | | | Total | |
| Matthews Asia Total Return Bond Fund | | | $1,503,507 | | | | $— | | | | $1,503,507 | |
| Matthews Asia Dividend Fund | | | 82,955,984 | | | | — | | | | 82,955,984 | |
| Matthews China Dividend Fund | | | 1,827,665 | | | | — | | | | 1,827,665 | |
| Matthews Asia Value Fund | | | 222,757 | | | | 1,791,146 | | | | 2,013,903 | |
| Matthews Emerging Asia Fund | | | 857,272 | | | | 31,558,227 | | | | 32,415,499 | |
| Matthews China Fund | | | 8,066,547 | | | | 16,259,682 | | | | 24,326,229 | |
| Matthews Korea Fund | | | 1,762,326 | | | | 3,270,056 | | | | 5,032,382 | |
| Matthews China Small Companies Fund | | | — | | | | 453,542 | | | | 453,542 | |
Under the Regulated Investment Company Modernization Act of 2010, the Funds are permitted to carry forward capital losses incurred in taxable years beginning after December 22, 2010 for an unlimited period. However, any losses incurred during those future taxable years will be required to be utilized prior to any losses incurred in pre-enactment taxable years, which generally expire after eight years from when they are incurred. Additionally, post-enactment capital losses that are carried forward will retain their character as either short-term or long-term capital losses rather than being considered all short-term as under previous law.
As of June 30, 2020, the tax cost of investments, including derivatives, and the related net unrealized appreciation and depreciation were as follows:
| | | | | | | | | | | | | | | | |
| | | Tax Cost | | | Gross
Unrealized
Appreciation | | | Gross
Unrealized
Depreciation | | | Net Unrealized
Appreciation
(Depreciation) | |
| Matthews Emerging Markets Equity Fund | | | $7,633,781 | | | | $1,023,155 | | | | ($28,944 | ) | | | $994,211 | |
| Matthews Asia Total Return Bond Fund | | | 98,733,723 | | | | 2,079,944 | | | | (2,755,533 | ) | | | (675,589 | ) |
| Matthews Asia Credit Opportunities Fund | | | 90,534,789 | | | | 1,138,482 | | | | (3,668,679 | ) | | | (2,530,197 | ) |
| Matthews Asian Growth and Income Fund | | | 1,091,046,650 | | | | 215,396,202 | | | | (101,547,512 | ) | | | 113,848,690 | |
| Matthews Asia Dividend Fund | | | 2,985,211,489 | | | | 1,072,655,472 | | | | (237,631,279 | ) | | | 835,024,193 | |
| Matthews China Dividend Fund | | | 271,873,614 | | | | 65,579,901 | | | | (24,222,290 | ) | | | 41,357,611 | |
| Matthews Asia Value Fund | | | 10,081,308 | | | | 1,138,252 | | | | (1,633,859 | ) | | | (495,607 | ) |
| Matthews Asia Growth Fund | | | 900,801,853 | | | | 396,928,589 | | | | (43,760,119 | ) | | | 353,168,470 | |
| Matthews Pacific Tiger Fund | | | 4,473,667,405 | | | | 2,378,194,424 | | | | (304,681,976 | ) | | | 2,073,512,448 | |
| Matthews Asia ESG Fund | | | 51,187,204 | | | | 10,543,966 | | | | (7,314,120 | ) | | | 3,229,846 | |
| Matthews Emerging Asia Fund | | | 190,194,927 | | | | 13,159,517 | | | | (51,588,308 | ) | | | (38,428,791 | ) |
| Matthews Asia Innovators Fund | | | 566,984,737 | | | | 234,789,522 | | | | (5,760,459 | ) | | | 229,029,063 | |
| Matthews China Fund | | | 852,018,151 | | | | 208,818,622 | | | | (18,218,557 | ) | | | 190,600,065 | |
| Matthews India Fund | | | 577,277,104 | | | | 71,854,642 | | | | (115,868,840 | ) | | | (44,014,198 | ) |
| Matthews Japan Fund | | | 1,114,042,321 | | | | 307,930,964 | | | | (28,924,318 | ) | | | 279,006,646 | |
| Matthews Korea Fund | | | 97,893,019 | | | | 23,101,735 | | | | (9,590,609 | ) | | | 13,511,126 | |
| Matthews Asia Small Companies Fund | | | 116,746,714 | | | | 48,575,836 | | | | (3,263,944 | ) | | | 45,311,892 | |
| Matthews China Small Companies Fund | | | 246,181,120 | | | | 112,631,273 | | | | (2,225,645 | ) | | | 110,405,628 | |
| 9. | PUBLIC HEALTH EMERGENCY RISKS: |
Pandemics and other public health emergencies, including outbreaks of infectious diseases such as the current outbreak of the novel coronavirus (“COVID-19”), can result, and in the case of COVID-19 is resulting, in market volatility and disruption, and materially and adversely impact economic conditions in ways that cannot be predicted, all of which could result in substantial investment losses. Containment efforts and related restrictive actions by governments and businesses have significantly diminished and disrupted global economic activity across many industries. Less
Notes to Financial Statements (unaudited) (continued)
developed countries and their health systems may be more vulnerable to these impacts. The ultimate impact of COVID-19 or other health emergencies on global economic conditions and businesses is impossible to predict accurately. Ongoing and potential additional material adverse economic effects of indeterminate duration and severity are possible. The resulting adverse impact on the value of investment in the Funds could be significant and prolonged.
On August 6, 2020, the Board of Trustees of the Matthews International Funds (d/b/a Matthews Asia Funds) approved a proposal to close the Matthews Asia Value Fund (the “Value Fund”) to purchases and thereafter to liquidate the Value Fund. Accordingly, effective on August 25, 2020, the Value Fund no longer accepted purchase orders. On or about September 30, 2020 (the “Liquidation Date”), all of the assets of the Value Fund will be liquidated completely, the shares of any interest holders on the Liquidation Date will be redeemed at the NAV per share and the Value Fund will then be terminated as a series of the Trust.
| | | | |
| matthewsasia.com | 800.789.ASIA | | | 157 | |
| | |
| Matthews Asia Funds | | |
| |
INVESTMENT ADVISOR Matthews International Capital Management, LLC Four Embarcadero Center, Suite 550 San Francisco, CA 94111 800.789.ASIA CUSTODIAN Brown Brothers Harriman & Co. 50 Post Office Square Boston, MA 02110 | | ACCOUNT SERVICES Matthews Asia Funds P.O. Box 9791 Providence, RI 02940 800.789.ASIA LEGAL COUNSEL Paul Hastings LLP 101 California Street, 48th Floor San Francisco, CA 94111 |

P.O. Box 9791 | Providence, RI 02940 | matthewsasia.com | 800.789.ASIA (2742)
Matthews Asia Funds are distributed in the United States by Foreside Funds Distributors LLC, Berwyn, Pennsylvania
Matthews Asia Funds are distributed in Latin America by HMC Partners

SAR-0620
158
Not applicable.
| Item 3. | Audit Committee Financial Expert. |
Not applicable.
| Item 4. | Principal Accountant Fees and Services. |
Not applicable.
| Item 5. | Audit Committee of Listed Registrants. |
Not applicable.
| (a) | Schedule of Investments in securities of unaffiliated issuers as of the close of the reporting period is included as part of the report to shareholders filed under Item 1 of this form. |
| Item 7. | Disclosure of Proxy Voting Policies and Procedures for Closed-End Management Investment Companies. |
Not applicable.
| Item 8. | Portfolio Managers of Closed-End Management Investment Companies. |
Not applicable.
| Item 9. | Purchases of Equity Securities by Closed-End Management Investment Company and Affiliated Purchasers. |
Not applicable.
| Item 10. | Submission of Matters to a Vote of Security Holders. |
There have been no material changes to the procedures by which the shareholders may recommend nominees to the registrant’s board of directors, where those changes were implemented after the registrant last provided disclosure in response to the requirements of Item 407(c)(2)(iv) of Regulation S-K (17 CFR 229.407) (as required by Item 22(b)(15) of Schedule 14A (17 CFR 240.14a-101)), or this Item.
| Item 11. | Controls and Procedures. |
| | (a) | The registrant’s principal executive and principal financial officers, or persons performing similar functions, have concluded that the registrant’s disclosure controls and procedures (as defined in Rule 30a-3(c) under the Investment Company Act of 1940, as amended (the “1940 Act”) (17 CFR 270.30a-3(c))) are effective, as of a date within 90 days of the filing date of the report that includes the disclosure required by this paragraph, based on their evaluation of these controls and procedures required by Rule 30a-3(b) under the 1940 Act (17 CFR 270.30a-3(b)) and Rules 13a-15(b) or 15d-15(b) under the Securities Exchange Act of 1934, as amended (17 CFR 240.13a-15(b) or 240.15d-15(b)). |
| | (b) | There were no changes in the registrant’s internal control over financial reporting (as defined in Rule 30a-3(d) under the 1940 Act (17 CFR 270.30a-3(d))) that occurred during the period covered by this report that has materially affected, or is reasonably likely to materially affect, the registrant’s internal control over financial reporting. |
| Item 12. | Disclosure of Securities Lending Activities for Closed-End Management Investment Companies. |
Not applicable.
SIGNATURES
Pursuant to the requirements of the Securities Exchange Act of 1934 and the Investment Company Act of 1940, the registrant has duly caused this report to be signed on its behalf by the undersigned, thereunto duly authorized.
| | |
| (Registrant) | | Matthews International Funds |
| |
| By (Signature and Title)* | | /s/ William J. Hackett |
| | William J. Hackett, President |
| | (principal executive officer) |
| |
| Date | | September 4, 2020 |
Pursuant to the requirements of the Securities Exchange Act of 1934 and the Investment Company Act of 1940, this report has been signed below by the following persons on behalf of the registrant and in the capacities and on the dates indicated.
| | |
| By (Signature and Title)* | | /s/ William J. Hackett |
| | William J. Hackett, President |
| | (principal executive officer) |
| |
| Date | | September 4, 2020 |
| |
| By (Signature and Title)* | | Shai Malka |
| | Shai Malka, Treasurer |
| | (principal financial officer) |
| |
| Date | | September 4, 2020 |
| * | Print the name and title of each signing officer under his or her signature. |