UNITED STATES
SECURITIES AND EXCHANGE COMMISSION
Washington, D.C. 20549
FORM N-CSR
CERTIFIED SHAREHOLDER REPORT OF REGISTERED
MANAGEMENT INVESTMENT COMPANIES
Investment Company Act file number 811-08510
Matthews International Funds
(Exact name of registrant as specified in charter)
Four Embarcadero Center, Suite 550
San Francisco, CA 94111
(Address of principal executive offices) (Zip code)
William J. Hackett, President
Four Embarcadero Center, Suite 550
San Francisco, CA 94111
(Name and address of agent for service)
Registrant’s telephone number, including area code: 415-788-7553
Date of fiscal year end: December 31
Date of reporting period: June 30, 2017
Form N-CSR is to be used by management investment companies to file reports with the Commission not later than 10 days after the transmission to stockholders of any report that is required to be transmitted to stockholders under Rule 30e-1 under the Investment Company Act of 1940 (17 CFR 270.30e-1). The Commission may use the information provided on Form N-CSR in its regulatory, disclosure review, inspection, and policymaking roles.
A registrant is required to disclose the information specified by Form N-CSR, and the Commission will make this information public. A registrant is not required to respond to the collection of information contained in Form N-CSR unless the Form displays a currently valid Office of Management and Budget (“OMB”) control number. Please direct comments concerning the accuracy of the information collection burden estimate and any suggestions for reducing the burden to Secretary, Securities and Exchange Commission, 100 F Street, NE, Washington, DC 20549. The OMB has reviewed this collection of information under the clearance requirements of 44 U.S.C. § 3507.
Item 1. Reports to Stockholders.
The Report to Shareholders is attached herewith.
Matthews Asia Funds | Semi-Annual Report
June 30, 2017 | matthewsasia.com
ASIA FIXED INCOME STRATEGIES
Matthews Asia Strategic Income Fund
Matthews Asia Credit Opportunities Fund
ASIA GROWTH AND INCOME STRATEGIES
Matthews Asian Growth and Income Fund
Matthews Asia Dividend Fund
Matthews China Dividend Fund
ASIA VALUE STRATEGY
Matthews Asia Value Fund
ASIA GROWTH STRATEGIES
Matthews Asia Focus Fund
Matthews Asia Growth Fund
Matthews Pacific Tiger Fund
Matthews Asia ESG Fund
Matthews Emerging Asia Fund
Matthews Asia Innovators Fund
Matthews China Fund
Matthews India Fund
Matthews Japan Fund
Matthews Korea Fund
ASIA SMALL COMPANY STRATEGIES
Matthews Asia Small Companies Fund
Matthews China Small Companies Fund


Contents
Cover photo: Conical Vietnamese hats, Hanoi, Vietnam
This report has been prepared for Matthews International Funds (d/b/a Matthews Asia Funds) shareholders. It is not authorized for distribution to prospective investors unless accompanied or preceded by a current Matthews Asia Funds prospectus, which contains more complete information about the Funds’ investment objectives, risks and expenses. Additional copies of the prospectus or summary prospectus may be obtained at matthewsasia.com. Please read the prospectus carefully before you invest or send money.
The views and opinions in this report were current as of June 30, 2017. They are not guarantees of performance or investment results and should not be taken as investment advice. Investment decisions reflect a variety of factors, and the managers reserve the right to change their views about individual stocks, sectors and the markets at any time. As a result, the views expressed should not be relied upon as a forecast of a Fund’s future investment intent. Current and future portfolio holdings are subject to risk.
Statements of fact are from sources considered reliable, but neither the Funds nor the Investment Advisor makes any representation or guarantee as to their completeness or accuracy.
Investment Risk: Mutual fund shares are not deposits or obligations of, or guaranteed by, any depositary institution. Shares are not insured by the FDIC, Federal Reserve Board or any government agency and are subject to investment risks, including possible loss of principal amount invested. Investing in international and emerging markets may involve additional risks, such as social and political instability, market illiquidity, exchange-rate fluctuations, a high level of volatility and limited regulation. Fixed income investments are subject to additional risks, including, but not limited to, interest rate, credit and inflation risks. In addition, single-country and sector funds may be subject to a higher degree of market risk than diversified funds because of concentration in a specific industry, sector or geographic location. Investing in small and mid-size companies is more risky than investing in large companies as they may be more volatile and less liquid than larger companies. Please see the Funds’ prospectus and Statement of Additional Information for more risk disclosure.
Investor Class Performance and Expenses (June 30, 2017)
| | | | | | | | | | | | | | | | | | | | | | | | | | | | |
Investor Class | | | | | Average Annual Total Return† | | | Inception
Date | | | Prospectus
Expense
Ratios* | | | Prospectus
Expense Ratios
after Fee Waiver
and Expense
Reimbursement* | |
| | 1 year | | | 5 years | | | 10 years | | | Since
Inception | | | | |
ASIA FIXED INCOME STRATEGIES | | | | | | | | | | | | | | | | | | | | | | | | | | | | |
Asia Strategic Income Fund (MAINX) | | | 8.69% | | | | 4.94% | | | | n.a. | | | | 5.08% | | | | 11/30/11 | | | | 1.33% | | | | 1.15% | 1 |
Asia Credit Opportunities Fund (MCRDX) | | | 8.67% | | | | n.a. | | | | n.a. | | | | 8.72% | | | | 4/29/16 | | | | 2.24% | | | | 1.15% | 1 |
ASIA GROWTH AND INCOME STRATEGIES | | | | | | | | | | | | | | | | | | | | | | | | | | | | |
Asian Growth and Income Fund (MACSX) | | | 8.75% | | | | 6.05% | | | | 5.06% | | | | 9.50% | | | | 9/12/94 | | | | 1.09% | | | | n.a. | |
Asia Dividend Fund (MAPIX) | | | 16.37% | | | | 9.81% | | | | 8.37% | | | | 9.65% | | | | 10/31/06 | | | | 1.06% | | | | n.a. | |
China Dividend Fund (MCDFX) | | | 24.88% | | | | 12.46% | | | | n.a. | | | | 10.39% | | | | 11/30/09 | | | | 1.22% | | | | n.a. | |
ASIA VALUE STRATEGY | | | | | | | | | | | | | | | | | | | | | | | | | | | | |
Asia Value Fund (MAVRX) | | | 26.51% | | | | n.a. | | | | n.a. | | | | 17.36% | | | | 11/30/15 | | | | 11.48% | | | | 1.50% | 3 |
ASIA GROWTH STRATEGIES | | | | | | | | | | | | | | | | | | | | | | | | | | | | |
Asia Focus Fund (MAFSX) | | | 18.39% | | | | n.a. | | | | n.a. | | | | 2.95% | | | | 4/30/13 | | | | 2.47% | | | | 1.50% | 3 |
Asia Growth Fund (MPACX) | | | 15.86% | | | | 10.11% | | | | 5.95% | | | | 9.32% | | | | 10/31/03 | | | | 1.14% | | | | n.a. | |
Pacific Tiger Fund (MAPTX) | | | 15.35% | | | | 9.25% | | | | 6.97% | | | | 8.81% | | | | 9/12/94 | | | | 1.09% | | | | 1.08% | 2 |
Asia ESG Fund (MASGX) | | | 19.18% | | | | n.a. | | | | n.a. | | | | 4.02% | | | | 4/30/15 | | | | 3.54% | | | | 1.48% | 3 |
Emerging Asia Fund (MEASX) | | | 19.88% | | | | n.a. | | | | n.a. | | | | 10.36% | | | | 4/30/13 | | | | 1.77% | | | | 1.47% | 3 |
Asia Innovators Fund (MATFX) | | | 24.21% | | | | 14.61% | | | | 6.85% | | | | 3.44% | | | | 12/27/99 | | | | 1.24% | | | | n.a. | |
China Fund (MCHFX) | | | 40.32% | | | | 7.19% | | | | 4.98% | | | | 9.80% | | | | 2/19/98 | | | | 1.18% | | | | n.a. | |
India Fund (MINDX) | | | 18.58% | | | | 16.66% | | | | 7.92% | | | | 12.42% | | | | 10/31/05 | | | | 1.12% | | | | n.a. | |
Japan Fund (MJFOX) | | | 8.27% | | | | 13.74% | | | | 4.54% | | | | 6.19% | | | | 12/31/98 | | | | 0.98% | | | | n.a. | |
Korea Fund (MAKOX) | | | 19.23% | | | | 12.30% | | | | 5.57% | | | | 6.68% | | | | 1/3/95 | | | | 1.15% | | | | n.a. | |
ASIA SMALL COMPANY STRATEGIES | | | | | | | | | | | | | | | | | | | | | | | | | | | | |
Asia Small Companies Fund (MSMLX) | | | 13.60% | | | | 7.31% | | | | n.a. | | | | 11.62% | | | | 9/15/08 | | | | 1.49% | | | | 1.47% | 3 |
China Small Companies Fund (MCSMX) | | | 27.82% | | | | 11.37% | | | | n.a. | | | | 3.25% | | | | 5/31/11 | | | | 2.24% | | | | 1.50% | 4 |
| † | Annualized performance for periods of at least one year, otherwise cumulative. |
| * | These figures are from the Funds’ prospectus dated as of April 28, 2017, and may differ from the actual expense ratios for fiscal year 2017, as shown in the financial highlights section of this report. |
| 1 | Matthews has contractually agreed (i) to waive fees and reimburse expenses to the extent needed to limit Total Annual Fund Operating Expenses (excluding Rule 12b-1 fees, taxes, interest, brokerage commissions, short sale dividend expenses, expenses incurred in connection with any merger or reorganization or extraordinary expenses such as litigation) of the Institutional Class to 0.90% first by waiving class specific expenses (i.e., shareholder service fees specific to a particular class) of the Institutional Class and then, to the extent necessary, by waiving non-class specific expenses of the Institutional Class, and (ii) if any Fund-wide expenses (i.e., expenses that apply to both the Institutional Class and the Investor Class) are waived for the Institutional Class to maintain the 0.90% expense limitation, to waive an equal amount (in annual percentage terms) of those same expenses for the Investor Class. The Total Annual Fund Operating Expenses After Fee Waiver and Expense Reimbursement for the Investor Class may vary from year to year and will in some years exceed 0.90%. If the operating expenses fall below the expense limitation in a year within three years after Matthews has made a waiver or reimbursement, the Fund may reimburse Matthews up to an amount that does not cause the expenses for that year to exceed the lesser of the (i) expense limitation applicable at the time of that fee waiver and/or expense reimbursement or (ii) the expense limitation in effect at the time of recoupment. This agreement will remain in place until April 30, 2018 and may be terminated at any time by the Board of Trustees on behalf of the Fund on 60 days’ written notice to Matthews. Matthews may decline to renew this agreement by written notice to the Trust at least 30 days before its annual expiration date. |
| 2 | Matthews has contractually agreed to waive a portion of its advisory fee and administrative and shareholder services fee if the Fund’s average daily net assets are over $3 billion, as follows: for every $2.5 billion average daily net assets of the Fund that are over $3 billion, the advisory fee rate and the administrative and shareholder services fee rate for the Fund with respect to such excess average daily net assets will be each reduced by 0.01%, in each case without reducing such fee rate below 0.00%. Any amount waived by Matthews pursuant to this agreement may not be recouped by Matthews. This agreement will remain in place until April 30, 2018 and may be terminated at any time (i) by the Trust on behalf of the Fund or by the Board of Trustees upon 60 days’ prior written notice to Matthews; or (ii) by Matthews upon 60 days’ prior written notice to the Trust, in each case without payment of any penalty. |
| 3 | Matthews has contractually agreed (i) to waive fees and reimburse expenses to the extent needed to limit Total Annual Fund Operating Expenses (excluding Rule 12b-1 fees, taxes, interest, brokerage commissions, short sale dividend expenses, expenses incurred in connection with any merger or reorganization or extraordinary expenses such as litigation) of the Institutional Class to 1.25% first by waiving class specific expenses (i.e., shareholder service fees specific to a particular class) of the Institutional Class and then, to the extent necessary, by waiving non-class specific expenses of the Institutional Class, and (ii) if any Fund-wide expenses (i.e., expenses that apply to both the Institutional Class and the Investor Class) are waived for the Institutional Class to maintain the 1.25% expense limitation, to waive an equal amount (in annual percentage terms) of those same expenses for the Investor Class. The Total Annual Fund Operating Expenses After Fee Waiver and Expense Reimbursement for the Investor Class may vary from year to year and will in some years exceed 1.25%. If the operating expenses fall below the expense limitation in a year within three years after Matthews has made a waiver or reimbursement, the Fund may reimburse Matthews up to an amount that does not cause the expenses for that year to exceed the lesser of (i) the expense limitation applicable at the time of that fee waiver and/or expense reimbursement or (ii) the expense limitation in effect at the time of recoupment. This agreement will remain in place until April 30, 2018 and may be terminated at any time by the Board of Trustees on behalf of the Fund on 60 days’ written notice to Matthews. Matthews may decline to renew this agreement by written notice to the Trust at least 30 days before its annual expiration date. |
| 4 | Matthews has contractually agreed to waive fees and reimburse expenses to the extent needed to limit Total Annual Fund Operating Expenses (excluding Rule 12b-1 fees, taxes, interest, brokerage commissions, short sale dividend expenses, expenses incurred in connection with any merger or reorganization or extraordinary expenses such as litigation) to 1.50%. If the operating expenses fall below the expense limitation in a year within three years after Matthews has made a waiver or reimbursement, the Fund may reimburse Matthews up to an amount that does not cause the expenses for that year to exceed the lesser of (i) the expense limitation applicable at the time of that fee waiver and/or expense reimbursement or (ii) the expense limitation in effect at the time of recoupment. This agreement will remain in place until April 30, 2018 and may be terminated at any time by the Board of Trustees on behalf of the Fund on 60 days’ written notice to Matthews. Matthews may decline to renew this agreement by written notice to the Trust at least 30 days before its annual expiration date. |
Institutional Class Performance and Expenses (June 30, 2017)
| | | | | | | | | | | | | | | | | | | | | | | | | | | | |
| Institutional Class | | | | | Average Annual Total Return† | | | Inception
Date | | | Prospectus
Expense
Ratios* | | | Prospectus
Expense Ratios
after Fee Waiver
and Expense
Reimbursement* | |
| | 1 year | | | 5 years | | | 10 years | | | Since
Inception | | | | |
ASIA FIXED INCOME STRATEGIES | | | | | | | | | | | | | | | | | | | | | | | | | | | | |
Asia Strategic Income Fund (MINCX) | | | 8.96% | | | | 5.15% | | | | n.a. | | | | 5.29% | | | | 11/30/11 | | | | 1.12% | | | | 0.90% | 1 |
Asia Credit Opportunities Fund (MICPX) | | | 8.99% | | | | n.a. | | | | n.a. | | | | 8.95% | | | | 4/29/16 | | | | 1.99% | | | | 0.90% | 1 |
ASIA GROWTH AND INCOME STRATEGIES | | | | | | | | | | | | | | | | | | | | | | | | | | | | |
Asian Growth and Income Fund (MICSX) | | | 8.94% | | | | 6.22% | | | | n.a. | | | | 4.71% | | | | 10/29/10 | | | | 0.94% | | | | n.a. | |
Asia Dividend Fund (MIPIX) | | | 16.43% | | | | 9.94% | | | | n.a. | | | | 7.50% | | | | 10/29/10 | | | | 0.94% | | | | 0.93% | 3 |
China Dividend Fund (MICDX) | | | 25.05% | | | | 12.68% | | | | n.a. | | | | 9.08% | | | | 10/29/10 | | | | 1.06% | | | | n.a. | |
ASIA VALUE STRATEGY | | | | | | | | | | | | | | | | | | | | | | | | | | | | |
Asia Value Fund (MAVAX) | | | 26.87% | | | | n.a. | | | | n.a. | | | | 17.69% | | | | 11/30/15 | | | | 11.26% | | | | 1.25% | 2 |
ASIA GROWTH STRATEGIES | | | | | | | | | | | | | | | | | | | | | | | | | | | | |
Asia Focus Fund (MIFSX) | | | 18.60% | | | | n.a. | | | | n.a. | | | | 3.20% | | | | 4/30/13 | | | | 2.29% | | | | 1.25% | 2 |
Asia Growth Fund (MIAPX) | | | 16.06% | | | | 10.32% | | | | n.a. | | | | 6.79% | | | | 10/29/10 | | | | 0.96% | | | | n.a. | |
Pacific Tiger Fund (MIPTX) | | | 15.57% | | | | 9.44% | | | | n.a. | | | | 6.24% | | | | 10/29/10 | | | | 0.91% | | | | 0.90% | 3 |
Asia ESG Fund (MISFX) | | | 19.46% | | | | n.a. | | | | n.a. | | | | 4.27% | | | | 4/30/15 | | | | 3.36% | | | | 1.25% | 2 |
Emerging Asia Fund (MIASX) | | | 20.11% | | | | n.a. | | | | n.a. | | | | 10.60% | | | | 4/30/13 | | | | 1.62% | | | | 1.25% | 2 |
Asia Innovators Fund (MITEX) | | | 24.51% | | | | n.a. | | | | n.a. | | | | 13.57% | | | | 4/30/13 | | | | 1.01% | | | | n.a. | |
China Fund (MICFX) | | | 40.57% | | | | 7.35% | | | | n.a. | | | | 2.30% | | | | 10/29/10 | | | | 1.03% | | | | n.a. | |
India Fund (MIDNX) | | | 18.85% | | | | 16.87% | | | | n.a. | | | | 6.84% | | | | 10/29/10 | | | | 0.91% | | | | n.a. | |
Japan Fund (MIJFX) | | | 8.38% | | | | 13.88% | | | | n.a. | | | | 11.21% | | | | 10/29/10 | | | | 0.88% | | | | n.a. | |
Korea Fund (MIKOX) | | | 19.31% | | | | 12.42% | | | | n.a. | | | | 10.12% | | | | 10/29/10 | | | | 0.97% | | | | n.a. | |
ASIA SMALL COMPANY STRATEGY | | | | | | | | | | | | | | | | | | | | | | | | | | | | |
Asia Small Companies Fund (MISMX) | | | 13.89% | | | | n.a. | | | | n.a. | | | | 3.39% | | | | 4/30/13 | | | | 1.34% | | | | 1.25% | 2 |
| † | Annualized performance for periods of at least one year, otherwise cumulative. |
| * | These figures are from the Funds’ prospectus dated as of April 28, 2017, and may differ from the actual expense ratios for fiscal year 2017, as shown in the financial highlights section of this report. |
| 1 | Matthews has contractually agreed to waive fees and reimburse expenses to the extent needed to limit Total Annual Fund Operating Expenses (excluding Rule 12b-1 fees, taxes, interest, brokerage commissions, short sale dividend expenses, expenses incurred in connection with any merger or reorganization or extraordinary expenses such as litigation) of the Institutional Class to 0.90%. If the operating expenses fall below the expense limitation in a year within three years after Matthews has made a waiver or reimbursement, the Fund may reimburse Matthews up to an amount that does not cause the expenses for that year to exceed the lesser of (i) the expense limitation applicable at the time of that fee waiver and/or expense reimbursement or (ii) the expense limitation in effect at the time of recoupment. This agreement will remain in place until April 30, 2018 and may be terminated at any time by the Board of Trustees on behalf of the Fund on 60 days’ written notice to Matthews. Matthews may decline to renew this agreement by written notice to the Trust at least 30 days before its annual expiration date. |
| 2 | Matthews has contractually agreed to waive fees and reimburse expenses to the extent needed to limit Total Annual Fund Operating Expenses (excluding Rule 12b-1 fees, taxes, interest, brokerage commissions, short sale dividend expenses, expenses incurred in connection with any merger or reorganization or extraordinary expenses such as litigation) of the Institutional Class to 1.25%. If the operating expenses fall below the expense limitation in a year within three years after Matthews has made a waiver or reimbursement, the Fund may reimburse Matthews up to an amount that does not cause the expenses for that year to exceed the lesser of (i) the expense limitation applicable at the time of that fee waiver and/or expense reimbursement or (ii) the expense limitation in effect at the time of recoupment. This agreement will remain in place until April 30, 2018 and may be terminated at any time by the Board of Trustees on behalf of the Fund on 60 days’ written notice to Matthews. Matthews may decline to renew this agreement by written notice to the Trust at least 30 days before its annual expiration date. |
| 3 | Matthews has contractually agreed to waive a portion of its advisory fee and administrative and shareholder services fee if the Fund’s average daily net assets are over $3 billion, as follows: for every $2.5 billion average daily net assets of the Fund that are over $3 billion, the advisory fee rate and the administrative and shareholder services fee rate for the Fund with respect to such excess average daily net assets will be each reduced by 0.01%, in each case without reducing such fee rate below 0.00%. Any amount waived by Matthews pursuant to this agreement may not be recouped by Matthews. This agreement will remain in place until April 30, 2018 and may be terminated at any time (i) by the Trust on behalf of the Fund or by the Board of Trustees upon 60 days’ prior written notice to Matthews; or (ii) by Matthews upon 60 days’ prior written notice to the Trust, in each case without payment of any penalty. |
Past Performance: All performance quoted in this report is past performance and is no guarantee of future results. Investment return and principal value will fluctuate with changing market conditions so that when redeemed, shares may be worth more or less than their original cost. Current performance may be lower or higher than the returns quoted. If certain of the Funds’ fees and expenses had not been waived, returns would have been lower. For the Funds’ most recent month-end performance, please call 800.789.ASIA (2742) or visit matthewsasia.com.
| | | | |
| matthewsasia.com | 800.789.ASIA | | | 3 | |
Message to Shareholders from the Investment Advisor
Dear Valued Investors,
Twenty years ago on July 2 1997, Thailand devalued its currency, the baht. Thus began the final denouement of years of overinvesting in Asia that came to be called the Asian Financial Crisis.
One after another, markets and economies toppled like dominoes. I remember being in Hong Kong during the crisis as hedge funds tried to attack the Hong Kong dollar peg; stock prices dove in a frenzy. I saw professional South Korean investors reduced to tears, ashen faced, as they watched what they feared was the unravelling not just of their stock markets but of their country. Foreigners bid US$1 for indebted Korean companies. “On the tombstone of every bankrupt company in Asia, you’ll see the names of Korean Banks,” remarked one stock broker, alluding to the region-wide loans these banks had made.
It hadn’t started as such a panic. The first analysis that greeted the baht devaluation included the idea that Thailand was managing its currency to smooth out volatility as they tried to reflate the economy. The baht fell 10% to 20% on that first day and it was just starting. “Just wait until the market opens,” one person told me after the devaluation: “It is going to soar.” Within two years, it had lost 80% of its value.
In truth Thailand needed deflation not inflation. It had persistently been spending more than it saved. Economies elsewhere in Asia also needed to deflate. But devaluing currencies couldn’t do the job—it just increased the burden of U.S. dollar debt, on which their companies had binged, sent these businesses into bankruptcy and thereby further crippled the economy. Indonesia’s total GDP eventually fell by nearly 60% in U.S. dollar terms; Thailand and South Korea’s dropped by nearly 40%. Stock markets fell by considerably more than that. The memory of this event has persisted even longer; it still casts a shadow over the region, even as Asia’s markets rally.
Asia’s markets have gotten off to a strong start this year, and yet the most common refrain I hear is one of fear. Is it too late? Have they overheated again?
But 2017 is not 1997.
We are nowhere near having overheated economies. Singapore, Taiwan and South Korea indeed are running very large current account surpluses (meaning their domestic savings are greater than their spending). Thailand, whose current account was in deficit as recently as 2013, now runs one at 11% of GDP. Nor is inflation a problem—core inflation in the 12 major markets of the region averages less than 2%. In India and Indonesia (which until recently had inflation problems), rates have been lowered to a moderate 4.1% and 3.3%, respectively. Asian currencies, which had weakened in 2014 and 2015 as economies wrung out some excesses, have now stabilized and (like the South Korean won and the Taiwan dollar) even strengthened against the U.S. dollar. U.S. dollar external debt is simply not an issue as it was 20 years ago. This time, the currencies did their job. These are all signs of stability; indeed, one can reasonably argue that what Asia really needs is a burst of stimulus.
Corporate earnings are finally on the move, too. Year-to-date, earnings per share in Asia ex Japan have risen by 7%.* This is a dramatic acceleration in growth and it has helped the markets move higher and outperform both the U.S. and Europe. But, as I have pointed out before, Asia’s corporate profits have been in the doldrums for a few years now. We must consider the recent improvement in profits in the context of many years of zero growth. When we do, the recent performance is less surprising. Today, earnings per share in Asia ex Japan are still 4% lower than they were nearly six years ago. So,
what we are seeing is accelerating profit growth over just a few months—after no growth in U.S. dollar terms for six years—even though sales per share have risen by 10% in U.S. dollars over that time, despite currency weakness.
Can this acceleration in earnings be sustained?
Likely yes, I believe, especially if several factors continue: First, is moderate GDP growth. This is the basic fuel for sales and profit growth. The IMF expects the Asia Pacific region to grow by 6.4% a year in U.S. dollar terms between 2016 and 2022. Growth should be even faster in Southeast Asia at 8% per annum. Second, is the fact that this growth should be supported by fiscal and monetary loosening. Asia has plenty of room to stimulate its economies, with its high savings ratios and low core inflation. Third, is the fact that corporate margins appear to be improving. We are not seeing the same wage hikes in Asia that characterized the years between 2010 and 2015 in particular, as minimum wages were hiked above the rate of productivity growth.
Asia’s earnings are looking better, but they are still lower than they were six years ago. I am hopeful the better growth in earnings can be sustained. This should help to sustain increasing investor confidence from abroad. Headline valuations are high on measures like price-to-earnings, but they don’t look that high when you take into account that earnings are depressed. There have been some false dawns over the last couple of years, with expectations of earnings growth slipping away. But I am more confident now that the recent earnings strength can be sustained. Of course, markets don’t go up in a straight line and the recent low volatility will not be sustained. However, if current economic conditions persist, I would be inclined to treat such volatility as an opportunity—not something to fear.

Robert Horrocks, PhD
Chief Investment Officer
Matthews International Capital Management, LLC
| * | All EPS data from Factset Asia ex Japan Index as of June 16, 2017. |
| | | | |
| matthewsasia.com | 800.789.ASIA | | | 5 | |

| | | | |
| PORTFOLIO MANAGERS |
| Teresa Kong, CFA | | |
Lead Manager | | |
| Satya Patel | | |
Co-Manager | | |
|
| FUND FACTS |
| | | Investor | | Institutional |
Ticker | | MAINX | | MINCX |
CUSIP | | 577125503 | | 577125602 |
Inception | | 11/30/11 | | 11/30/11 |
NAV | | $10.87 | | $10.86 |
Initial Investment | | $2,500 | | $100,000 |
Gross Expense Ratio1 | | 1.33% | | 1.12% |
After Fee Waiver and Reimbursement2 | | 1.15% | | 0.90% |
Portfolio Statistics | | | | |
Total # of Positions | | 33 |
Net Assets | | $76.3 million |
Modified Duration3 | | 3.6 |
Portfolio Turnover4 | | 71.50% |
Benchmark | | |
Markit iBoxx Asian Local Bond Index* |
OBJECTIVE
Total return over the long term with an emphasis on income.
STRATEGY
Under normal market conditions, the Fund seeks to achieve its investment objective by investing at least 80% of its net assets, which include borrowings for investment purposes, in income-producing securities including, but not limited to, dividend paying equity securities, and debt and debt-related instruments issued by governments, quasi-governmental entities, supra-national institutions, and companies in Asia. Asia consists of all countries and markets in Asia, such as China and India, and includes developed, emerging, and frontier countries and markets in the Asian region. Investments may be denominated in any currency, and may represent any part of a company’s capital structure from debt to equity or with features of both.
Matthews Asia Strategic Income Fund
Portfolio Manager Commentary (unaudited)
Period ended June 30, 2017
For the first half of 2017, the Matthews Asia Strategic Income Fund returned 5.68% (Investor Class) and 5.80% (Institutional Class) while its benchmark, the Markit iBoxx Asian Local Bond Index, returned 6.41%. For the quarter ending June 30, 2017, the Fund returned 3.18% (Investor Class) and 3.24% (Institutional Class) compared to the benchmark return of 1.76% over the same period.
Market Environment:
Interest rates across Asia fell in the second quarter. Markets appear to believe it is increasingly unlikely that U.S. President Donald Trump will be able to pass policies on his agenda that would lead to higher growth and inflation, including tax cuts, trade and fiscal expansion. The most notable exception is in China, where the central bank deliberately tightened credit conditions to force banks and shadow lending entities to deleverage, leading to a rise in yields.
High yield credit spreads widened slightly in the quarter amidst a strong environment for new issuance, but history indicates spreads typically tighten during U.S. rate hike cycles. Globally, high yield credit spreads in the U.S., Europe and Latin America have tightened by more than historical averages; Asia high yield credit spreads are unique in that they remain wider than average. We believe this presents an attractive entry point for Asia credit, and we expect spreads to tighten even further.
After a very strong start to the year, Asian currencies were mixed in the second quarter. The Malaysian ringgit and Chinese renminbi (RMB) were amongst the best performers. We think Chinese policymakers may have moved the currency to a path of appreciation versus the U.S. dollar ahead of July’s implementation of “China Direct Bond Connect.” The worst-performing currency of the quarter was the South Korean won, which fell more than 2%. It remains, however, one of the strongest-performing Asian currencies in 2017.
Performance Contributors and Detractors:
The biggest contributors to Fund performance were our positions in U.S. dollar (USD) bonds, followed by Indonesia rupiah (IDR)-denominated Indonesian government bonds and Indian rupee (INR)-denominated corporate bonds. With our U.S. dollar-denominated holdings, the biggest gainer was our position in China Hongqiao Group, which recovered after a short seller report in February questioned the company’s financial performance, accounting and valuation. We do not believe these issues will materially affect the company’s credit profile and we saw the short-term volatility as an opportunity to add to our position in the second quarter. In the case of our Indonesian holdings, the returns were driven by both a fall in Indonesian interest rates and the high coupon.
The biggest detractor to our portfolio’s performance was a currency forward position in the Korean won. Our long position in the currency produced negative returns as it depreciated relative to the U.S. dollar.
(continued)
| * | The Index performance reflects the returns of the discontinued predecessor HSBC Asian Local Bond Index up to December 31, 2012 and the returns of the successor Markit iBoxx Asian Local Bond Index thereafter. |
| 1 | Prospectus expense ratios. |
| 2 | Matthews has contractually agreed (i) to waive fees and reimburse expenses to the extent needed to limit Total Annual Fund Operating Expenses (excluding Rule 12b-1 fees, taxes, interest, brokerage commissions, short sale dividend expenses, expenses incurred in connection with any merger or reorganization or extraordinary expenses such as litigation) of the Institutional Class to 0.90% first by waiving class specific expenses (i.e., shareholder service fees specific to a particular class) of the Institutional Class and then, to the extent necessary, by waiving non-class specific expenses of the Institutional Class, and (ii) if any Fund-wide expenses (i.e., expenses that apply to both the Institutional Class and the Investor Class) are waived for the Institutional Class to maintain the 0.90% expense limitation, to waive an equal amount (in annual percentage terms) of those same expenses for the Investor Class. The Total Annual Fund Operating Expenses After Fee Waiver and Expense Reimbursement for the Investor Class may vary from year to year and will in some years exceed 0.90%. If the operating expenses fall below the expense limitation in a year within three years after Matthews has made a waiver or reimbursement, the Fund may reimburse Matthews up to an amount that does not cause the expenses for that year to exceed the lesser of (i) the expense limitation applicable at the time of that fee waiver and/or expense reimbursement or (ii) the expense limitation in effect at the time of recoupment. This agreement will remain in place until April 30, 2018 and may be terminated at any time by the Board of Trustees on behalf of the Fund on 60 days’ written notice to Matthews. Matthews may decline to renew this agreement by written notice to the Trust at least 30 days before its annual expiration date. |
| 3 | Modified duration measures the percent change in value of the fixed income portion of the portfolio in response to a 1% change in interest rates. In a multi-currency denominated portfolio with sensitivities to different interest rate regimes, modified duration will not accurately reflect the change in value of the overall portfolio from a change in any one interest rate regime. |
| 4 | The lesser of fiscal year 2016 long-term purchase costs or sales proceeds divided by the average monthly market value of long-term securities. |
| | | | | | | | | | | | | | | | | | | | | | | | | | | | |
| | | | | | | | |
| PERFORMANCE AS OF JUNE 30, 2017 | | | | | | | | | | | | | | | | | | | | | |
| | | | | | | | | | | | Average Annual Total Returns | | | | |
| | | 3 Months | | | YTD | | | 1 Year | | | 3 Years | | | 5 Years | | | Since
Inception | | | Inception
Date | |
| Investor Class (MAINX) | | | 3.18% | | | | 5.68% | | | | 8.69% | | | | 3.90% | | | | 4.94% | | | | 5.08% | | | | 11/30/11 | |
| Institutional Class (MINCX) | | | 3.24% | | | | 5.80% | | | | 8.96% | | | | 4.15% | | | | 5.15% | | | | 5.29% | | | | 11/30/11 | |
| Markit iBoxx Asian Local Bond Index5 | | | 1.76% | | | | 6.41% | | | | 0.89% | | | | 1.42% | | | | 1.78% | | | | 2.16% | | | | | |
| Lipper Emerging Markets Hard Currency Debt Funds Category Average6 | | | 2.13% | | | | 6.62% | | | | 7.77% | | | | 2.57% | | | | 3.82% | | | | 4.87% | | | | | |
Performance assumes reinvestment of all dividends and/or distributions before taxes. All performance quoted represents past performance and is no guarantee of future results. Investment return and principal value will fluctuate with market conditions so that when redeemed, shares may be worth more or less than their original cost. Current performance may be lower or higher than the return figures quoted. Returns would have been lower if certain of the Fund’s fees and expenses had not been waived. For the Fund’s most recent month-end performance visit matthewsasia.com.
| | | | | | | | | | | | | | | | | | | | | | | | | | | | | | | | | | | | | | | | | | | | |
| | | | | | | | | | |
| INCOME DISTRIBUTION HISTORY | | | | | | | | | | | | | | | | | | | | | | | | | | | | |
| | | 2017 | | | | | | 2016 | |
| | | Q1 | | | Q2 | | | Q3 | | | Q4 | | | Total | | | | | | Q1 | | | Q2 | | | Q3 | | | Q4 | | | Total | |
| Investor (MAINX) | | $ | 0.07 | | | $ | 0.08 | | | | n.a. | | | | n.a. | | | | n.a. | | | | | | | $ | 0.06 | | | $ | 0.11 | | | $ | 0.11 | | | $ | 0.13 | | | $ | 0.41 | |
| Inst’l (MINCX) | | $ | 0.08 | | | $ | 0.08 | | | | n.a. | | | | n.a. | | | | n.a. | | | | | | | $ | 0.06 | | | $ | 0.12 | | | $ | 0.12 | | | $ | 0.13 | | | $ | 0.43 | |
Note: This table does not include capital gains distributions. Totals may differ by $0.02 due to rounding. For income distribution history, visit matthewsasia.com.
| | | | |
30-DAY YIELD: Investor Class: 4.70% (4.57% excluding waivers) Institutional Class: 4.95% (4.80% excluding waivers) The 30-Day Yield represents net investment income earned by the Fund over the 30-day period ended 6/30/17, expressed as an annual percentage rate based on the Fund’s share price at the end of the 30-day period. The 30-Day Yield should be regarded as an estimate of the Fund’s rate of investment income, and it may not equal the Fund’s actual income distribution rate. Source: BNY Mellon Investment Servicing (US) Inc. | | | | YIELD TO WORST: 6.00% Yield to worst is the lowest yield that can be received on a bond assuming that the issuer does not default. It is calculated by utilizing the worst case assumptions for a bond with respect to certain income-reducing factors, including prepayment, call or sinking fund provisions. It does not represent the yield that an investor should expect to receive. Past yields are no guarantee of future yields. Source: FactSet Research Systems |
GROWTH OF A $10,000 INVESTMENT SINCE INCEPTION—INVESTOR CLASS
Plotted monthly. The performance data and graph do not reflect the deduction of taxes that a shareholder would pay on dividends, capital gains distributions or redemption of Fund shares. Values are in US$.
| | 5 | It is not possible to invest directly in an index. Source: Index data from HSBC, Markit iBoxx and Bloomberg; total return calculations performed by BNY Mellon Investment Servicing (US) Inc. Please see page 91 for index definitions. The Index performance reflects the returns of the discontinued predecessor HSBC Asian Local Bond Index up to December 31, 2012 and the returns of the successor Markit iBoxx Asian Local Bond Index thereafter. |
| | 6 | The Lipper Category Average does not reflect sales charges and is based on total return, including reinvestment of dividends and capital gains for the stated periods. |
| | | | | | | | |
| | | | |
| TOP TEN HOLDINGS | | | | | | | |
| | | Sector | | Currency | | % of Net Assets | |
| Malaysia Government Investment Issue, 3.508%, 05/15/2018 | | Foreign Government Bonds | | Malaysian Ringgit | | | 5.3% | |
| Malaysia Government Investment Issue, 3.226%, 04/15/2020 | | Foreign Government Bonds | | Malaysian Ringgit | | | 5.0% | |
| Standard Chartered PLC, 6.500%, 12/29/2049 | | Financials | | U.S. Dollar | | | 5.0% | |
| Harvest Operations Corp., 6.875%, 10/01/2017 | | Energy | | U.S. Dollar | | | 4.7% | |
| Delta Investment Horizon International, Ltd., Cnv., 3.000%, 05/26/2020 | | Telecommunication Services | | U.S. Dollar | | | 4.5% | |
| Pakistan Government Bond, 8.250%, 04/15/2024 | | Foreign Government Bonds | | U.S. Dollar | | | 4.5% | |
| Indonesia Treasury Bond, 8.375%, 03/15/2034 | | Foreign Government Bonds | | Indonesian Rupiah | | | 4.4% | |
| Indonesia Treasury Bond, 8.375%, 03/15/2024 | | Foreign Government Bonds | | Indonesian Rupiah | | | 4.3% | |
| China Government Bond, 3.550%, 12/12/2021 | | Foreign Government Bonds | | Chinese Renminbi | | | 4.1% | |
| Debt and Asset Trading Corp., 1.000%, 10/10/2025 | | Financials | | U.S. Dollar | | | 4.1% | |
| % OF ASSETS IN TOP TEN | | | | | | | 45.9% | |
| | | | |
| matthewsasia.com | 800.789.ASIA | | | 7 | |
| | | | |
| |
| CURRENCY ALLOCATION (%)7,8 | |
| U.S. Dollar (USD) | | | 53.0 | |
| Indonesian Rupiah (IDR) | | | 13.9 | |
| Malaysian Ringgit (MYR) | | | 10.3 | |
| Indian Rupee (INR) | | | 9.5 | |
| China Renminbi (CNY) | | | 7.8 | |
| Vietnamese Dong (VND) | | | 2.5 | |
| South Korean Won (KRW) | | | 0.5 | |
| Cash and Other Assets, Less Liabilities | | | 2.4 | |
| | | | |
| |
| COUNTRY ALLOCATION (%)7,8,9 | |
| Indonesia | | | 23.5 | |
| China/Hong Kong | | | 20.6 | |
| Malaysia | | | 10.3 | |
| India | | | 9.5 | |
| Sri Lanka | | | 9.5 | |
| Vietnam | | | 8.1 | |
| South Korea | | | 5.2 | |
| Pakistan | | | 4.5 | |
| Thailand | | | 3.8 | |
| United States | | | 2.6 | |
| Cash and Other Assets, Less Liabilities | | | 2.4 | |
| | | | |
| |
| SECTOR ALLOCATION (%)7,8 | |
| Foreign Government Bonds | | | 40.5 | |
| Financials | | | 27.2 | |
| Telecommunication Services | | | 7.1 | |
| Real Estate | | | 5.6 | |
| Utilities | | | 4.8 | |
| Energy | | | 4.7 | |
| Materials | | | 3.9 | |
| Consumer Staples | | | 3.8 | |
| Cash and Other Assets, Less Liabilities | | | 2.4 | |
Please note: Foreign Government Bonds category includes Supranationals.
| | | | |
| |
| ASSET TYPE BREAKDOWN (%)7,8 | |
| Non-Convertible Corporate Bonds | | | 48.8 | |
| Government Bonds | | | 40.5 | |
| Convertible Corporate Bonds | | | 8.3 | |
| Cash and Other Assets, Less Liabilities | | | 2.4 | |
| 7 | Source: FactSet Research Systems. Percentage values in data are rounded to the nearest tenth of one percent; the values may not sum to 100% due to rounding. |
| 8 | Cash and other assets may include forward currency exchange contracts and certain derivative instruments that have been marked-to-market. |
| 9 | Not all countries where the Fund may invest are included in the benchmark index. |
Matthews Asia Strategic Income Fund
Portfolio Manager Commentary (unaudited) (continued)
Notable Changes to Portfolio:
We made a number of changes to our currency and credit allocations in the second quarter. We increased our allocation to Asian currencies, including the Malaysian ringgit, Singapore dollar, Chinese renminbi and Thai baht. Depending on our assessment of local interest rates, our local currency allocations came in a combination of currency and duration in corporate, quasi- and sovereign bonds, and currency forwards. We reduced exposure to the Sri Lankan rupee because of the risk that policymakers would allow a more significant currency depreciation than we previously anticipated.
In credit, we initiated positions in Modernland Realty, an Indonesian property developer, and State Grid Corp. of China, the government-owned electric utility monopoly of China. Modernland is a well-managed, midsize property developer with an improving operational profile, and we believe its bonds offer an attractive yield for the risk profile of the company. State Grid Corp. of China’s bond is our first investment in the onshore Chinese bond market. Tight onshore liquidity has led to a rise in yields, and with the upcoming implementation of “Bond Connect,” we expect the RMB to appreciate relative to the U.S. dollar.
Outlook:
Overall, we are optimistic about the prospects for Asia bonds. Mild reflation in the U.S. and Europe, which together account for about half of global GDP, creates a “Goldilocks scenario” for emerging markets as economic growth and search for yield drive both the demand for goods and investment opportunities in emerging markets. Despite a recent decrease in oil prices, we see mild reflation solidifying, driven by tighter labor markets and improving consumer and global manufacturing sentiment.
Country-specific fundamentals will drive investment opportunities. Chinese local currency bonds, for instance, provide attractive relative value since tight onshore liquidity has led to a rise in yields, and the currency has moved to an appreciation path ahead of the opening of “Bond Connect.”
Out of the three key drivers of return, we think currency and credit will continue to be positive drivers while interest rates might be a mild detractor. We see long-term fundamentals as well as short-term technical factors favoring Asian currencies over the U.S. dollar. Lastly, based on any measure of fair value, we believe the U.S. dollar is currently overvalued. As a result, we increased our exposure to Asian currencies during the first quarter. While rate hikes are more or less priced into Fed funds, most of the economies in Asia are just beginning to see the rise in the producer price index passing through to consumer prices.
We believe credit spreads will remain stable or even tighten as default rates stay low. This is because sustained credit spread widening requires the combination of increasing defaults and a U.S. recession.
Fixed income investments are subject to risks, including, but not limited to, interest rate, credit and inflation risks. Investing in emerging markets involves different and greater risks, as these countries are substantially smaller, less liquid and more volatile than securities markets in more developed markets.
Matthews Asia Strategic Income Fund
June 30, 2017
Schedule of Investmentsa (unaudited)
| | |
| NON-CONVERTIBLE CORPORATE BONDS: 48.8% | | FOREIGN GOVERNMENT OBLIGATIONS: 40.5% |
| | | | | | | | |
| | | Face Amount* | | | Value | |
| CHINA/HONG KONG: 16.4% | |
Standard Chartered PLC
6.500%b, 12/29/49 | | | 3,700,000 | | | | $3,778,625 | |
China Hongqiao Group, Ltd.
6.875%, 05/03/18 | | | 3,000,000 | | | | 2,977,596 | |
State Grid Corp. of China
3.150%, 11/14/21 | | | CNY 20,000,000 | | | | 2,800,944 | |
HSBC Holdings PLC
6.375%b, 12/29/49 | | | 2,500,000 | | | | 2,660,000 | |
Wanda Properties International Co., Ltd. | | | | | |
7.250%, 01/29/24 | | | 300,000 | | | | 314,960 | |
| | | | | | | | |
Total China/Hong Kong | | | | | | | 12,532,125 | |
| | | | | | | | |
| | | | | | | | |
| INDIA: 9.6% | | | | | | | | |
Housing Development Finance Corp., Ltd. | | | | | |
9.240%, 06/24/24 | | | INR 100,000,000 | | | | 1,682,217 | |
Housing Development Finance Corp., Ltd. | | | | | |
8.950%, 03/21/23 | | | INR 100,000,000 | | | | 1,635,343 | |
Power Finance Corp., Ltd.
7.470%, 09/16/21 | | | INR 90,000,000 | | | | 1,390,001 | |
Rural Electrification Corp., Ltd.
9.340%, 08/25/24 | | | INR 52,000,000 | | | | 892,918 | |
Power Grid Corp. of India, Ltd., Series B
9.300%, 09/04/24 | | | INR 52,000,000 | | | | 891,237 | |
Rural Electrification Corp., Ltd.
9.020%, 06/18/19 | | | INR 50,000,000 | | | | 798,598 | |
| | | | | | | | |
Total India | | | | | | | 7,290,314 | |
| | | | | | | | |
| | | | | | | | |
| SRI LANKA: 6.3% | | | | | | | | |
DFCC Bank PLC
9.625%, 10/31/18 | | | 2,650,000 | | | | 2,751,389 | |
National Savings Bank
5.150%, 09/10/19 | | | 2,000,000 | | | | 2,027,400 | |
| | | | | | | | |
Total Sri Lanka | | | | | | | 4,778,789 | |
| | | | | | | | |
| | | | | | | | |
| INDONESIA: 5.1% | | | | | | | | |
Modernland Overseas Pte, Ltd.
6.950%, 04/13/24 | | | 1,900,000 | | | | 1,888,410 | |
Alam Synergy Pte, Ltd.
6.950%, 03/27/20c | | | 1,500,000 | | | | 1,518,750 | |
Alam Synergy Pte, Ltd.
6.950%, 03/27/20 | | | 500,000 | | | | 506,250 | |
| | | | | | | | |
Total Indonesia | | | | 3,913,410 | |
| | | | | | | | |
| | | | | | | | |
| SOUTH KOREA: 4.7% | | | | | | | | |
Harvest Operations Corp.
6.875%, 10/01/17 | | | 3,620,000 | | | | 3,610,950 | |
| | | | | | | | |
Total South Korea | | | | 3,610,950 | |
| | | | | | | | |
| | | | | | | | |
| VIETNAM: 4.1% | | | | | | | | |
Debt and Asset Trading Corp.
1.000%, 10/10/25 | | | 5,100,000 | | | | 3,156,900 | |
| | | | | | | | |
Total Vietnam | | | | 3,156,900 | |
| | | | | | | | |
| | | | | | | | |
| UNITED STATES: 2.6% | | | | | | | | |
Sprint Communications, Inc.
6.000%, 11/15/22 | | | 1,863,000 | | | | 1,974,780 | |
| | | | | | | | |
Total United States | | | | | | | 1,974,780 | |
| | | | | | | | |
| | | | | | | | |
| TOTAL NON-CONVERTIBLE CORPORATE BONDS | | | | 37,257,268 | |
| | | | | | | | |
(Cost $35,824,282) | | | | | | | | |
| | | | | | | | |
| | | Face Amount* | | | Value | |
| INDONESIA: 13.9% | |
Indonesia Treasury Bond
8.375%, 03/15/34 | | | IDR 42,000,000,000 | | | | $3,392,459 | |
Indonesia Treasury Bond
8.375%, 03/15/24 | | | IDR 40,500,000,000 | | | | 3,299,023 | |
Indonesia Treasury Bond
7.875%, 04/15/19 | | | IDR 38,000,000,000 | | | | 2,923,241 | |
Indonesia Treasury Bond
7.000%, 05/15/27 | | | IDR 13,000,000,000 | | | | 987,620 | |
| | | | | | | | |
Total Indonesia | | | | 10,602,343 | |
| | | | | | | | |
| | | | | | | | |
| MALAYSIA: 10.3% | |
Malaysia Government Investment Issue
| | | | | |
3.508%, 05/15/18 | | | MYR 17,300,000 | | | | 4,037,935 | |
Malaysia Government Investment Issue | | | | | |
3.226%, 04/15/20 | | | MYR 16,600,000 | | | | 3,830,098 | |
| | | | | | | | |
Total Malaysia | | | | 7,868,033 | |
| | | | | | | | |
| | | | | | | | |
| PAKISTAN: 4.5% | |
Pakistan Government Bond
8.250%, 04/15/24 | | | 3,000,000 | | | | 3,404,004 | |
| | | | | | | | |
Total Pakistan | | | | 3,404,004 | |
| | | | | | | | |
| | | | | | | | |
| CHINA/HONG KONG: 4.1% | |
China Government Bond
3.550%, 12/12/21 | | | CNY 22,000,000 | | | | 3,166,405 | |
| | | | | | | | |
Total China/Hong Kong | | | | 3,166,405 | |
| | | | | | | | |
| | | | | | | | |
| VIETNAM: 4.0% | |
Socialist Republic of Vietnam
5.200%, 01/12/22 | | | VND 43,000,000,000 | | | | 1,916,055 | |
Socialist Republic of Vietnam
4.800%, 11/19/24 | | | 1,055,000 | | | | 1,108,731 | |
| | | | | | | | |
Total Vietnam | | | | 3,024,786 | |
| | | | | | | | |
| | | | | | | | |
| SRI LANKA: 3.2% | |
Sri Lanka Government Bond
6.125%, 06/03/25 | | | 2,400,000 | | | | 2,449,270 | |
| | | | | | | | |
Total Sri Lanka | | | | 2,449,270 | |
| | | | | | | | |
| | | | | | | | |
| SOUTH KOREA: 0.5% | |
Korea Treasury Bond
3.500%, 03/10/24 | | | KRW 400,000,000 | | | | 379,868 | |
| | | | | | | | |
Total South Korea | | | | 379,868 | |
| | | | | | | | |
| | | | | | | | |
TOTAL FOREIGN GOVERNMENT OBLIGATIONS
| | | | 30,894,709 | |
| | | | | | | | |
(Cost $30,184,102) | | | | | | | | |
| | | | | | | | |
| CONVERTIBLE CORPORATE BONDS: 8.3% | |
| INDONESIA: 4.5% | |
Delta Investment Horizon International, Ltd., Cnv. | | | | | |
3.000%, 05/26/20 | | | 3,500,000 | | | | 3,473,750 | |
| | | | | | | | |
Total Indonesia | | | | | | | 3,473,750 | |
| | | | | | | | |
| | | | | | | | |
| | | | |
| matthewsasia.com | 800.789.ASIA | | | 9 | |
Matthews Asia Strategic Income Fund
June 30, 2017
Schedule of Investmentsa (unaudited) (continued)
CONVERTIBLE CORPORATE BONDS (continued)
| | | | | | | | |
| | | Face Amount* | | | Value | |
| THAILAND: 3.8% | |
CP Foods Holdings, Ltd., Cnv.
0.500%, 09/22/21 | | | 2,800,000 | | | | $2,877,000 | |
| | | | | | | | |
Total Thailand | | | | 2,877,000 | |
| | | | | | | | |
| | | | | | | | |
| TOTAL CONVERTIBLE CORPORATE BONDS | | | | 6,350,750 | |
| | | | | | | | |
(Cost $6,147,128) | | | | | | | | |
| | | | | | | | |
| TOTAL INVESTMENTS: 97.6% | | | | | | | 74,502,727 | |
(Cost $72,155,512d) | |
| | | | | | | | |
CASH AND OTHER ASSETS,
LESS LIABILITIES: 2.4% | | | | | | | 1,835,696 | |
| | | | | | | | |
| | |
NET ASSETS: 100.0% | | | | | | | $76,338,423 | |
| | | | | | | | |
| a | Certain securities were fair valued under the valuation policies approved by the Board of Trustees (Note 2-A). |
| b | Contingent convertible and variable rate security. The rate represents the rate in effect at June 30, 2017. |
| c | Security exempt from registration under Rule 144A of the Securities Act of 1933, as amended. The security may be resold in transactions exempt from registration normally to qualified institutional buyers. The security has been determined to be liquid in accordance with procedures adopted by the Fund’s Board of Directors. At June 30, 2017, the aggregate value is $1,518,750 , which is 1.99% of net assets. |
| d | Cost for federal income tax purposes is $72,155,512 and net unrealized appreciation consists of: |
| | | | |
Gross unrealized appreciation | | | $2,661,913 | |
Gross unrealized depreciation | | | (314,698 | ) |
| | | | |
Net unrealized appreciation | | | $2,347,215 | |
| | | | |
| * | All values are in USD unless otherwise specified. |
| CNY | Chinese Renminbi (Yuan) |
FORWARD FOREIGN CURRENCY EXCHANGE CONTRACTS:
| | | | | | | | | | | | | | | | |
| | | Currency Purchased | | Currency Sold | | | Counterparty | | Settlement
Date | | | Unrealized
Appreciation
(Depreciation) | |
LONG | | PHP 215,021,500 | | | USD 4,300,000 | | | JPMorgan Chase & Co. | | | 07/26/17 | | | | ($47,874 | ) |
| | SGD 4,879,350 | | | USD 3,500,000 | | | Merrill Lynch & Co., Inc. | | | 08/02/17 | | | | 46,044 | |
| | SGD 4,876,900 | | | USD 3,500,000 | | | JPMorgan Chase & Co. | | | 08/02/17 | | | | 44,264 | |
| | THB 120,680,000 | | | USD 3,500,000 | | | JPMorgan Chase & Co. | | | 08/02/17 | | | | 52,552 | |
| | KRW 4,004,000,000 | | | USD 3,500,000 | | | Merrill Lynch & Co., Inc. | | | 10/10/17 | | | | (107 | ) |
| | | | | | | | | | | | | | | | |
| | | | | | | | | | | | | | | 94,879 | |
| | | | | | | | | | | | | | | | |
| | | | | |
SHORT | | USD 4,280,739 | | | PHP 215,021,500 | | | JPMorgan Chase & Co. | | | 07/26/17 | | | | $28,613 | |
| | | | | | | | | | | | | | | | |
OTC CREDIT DEFAULT SWAPS - BUY PROTECTION*
| | | | | | | | | | | | | | | | | | | | | | | | |
| Issuer | | Pay
Fixed
Rate | | Counterparty | | Expiration
Date | | | Notional
Amount
(000) | | | Value | | | Premiums Received | | | Unrealized
Appreciation | |
Republic of Korea | | 1.00% | | Bank of America, N.A. | | | 6/20/2022 | | | | USD 8,000 | | | | ($180,914 | ) | | | ($183,599 | ) | | | $2,685 | |
| | | | | | | | | | | | | | | | | | | | | | | | |
| * | Swap is not centrally cleared. |
See accompanying notes to financial statements.
| | | | |
| PORTFOLIO MANAGERS |
| Teresa Kong, CFA | | Satya Patel |
Lead Manager | | Lead Manager |
| | |
| FUND FACTS | | | | |
| | | Investor | | Institutional |
Ticker | | MCRDX | | MICPX |
CUSIP | | 577130677 | | 577130669 |
Inception | | 4/29/16 | | 4/29/16 |
NAV | | $10.47 | | $10.47 |
Initial Investment | | $2,500 | | $100,000 |
Gross Expense Ratio1 | | 2.24% | | 1.99% |
After Fee Waiver and Reimbursement2 | | 1.15% | | 0.90% |
Portfolio Statistics | | |
Total # of Positions | | 25 |
Net Assets | | $19.8 million |
Modified Duration3 | | 3.3 |
Portfolio Turnover4 | | 18.80% |
Benchmark | | | | |
J.P. Morgan Asia Credit Index |
OBJECTIVE
Total return over the long term.
STRATEGY
Under normal market conditions, the Fund seeks to achieve its investment objective by investing at least 80% of its net assets, which include borrowings for investment purposes, in debt and debt-related instruments issued by companies as well as governments, quasi-governmental entities, and supranational institutions in Asia. Debt and debt-related instruments typically include bonds, debentures, bills, securitized instruments (which are vehicles backed by pools of assets such as loans or other receivables), notes, certificates of deposit and other bank obligations, bank loans, senior secured bank debt, convertible debt securities, credit-linked notes, inflation linked instruments, repurchase agreements, payment-in-kind securities and derivative instruments with fixed income characteristics. Asia consists of all countries and markets in Asia, such as China and Indonesia, in addition to the developed, emerging, and frontier countries and markets in the Asian region.
Matthews Asia Credit Opportunities Fund
Portfolio Manager Commentary (unaudited)
Period ended June 30, 2017
For the first half of 2017, the Matthews Asia Credit Opportunities Fund returned 5.34% (Investor Class) and 5.44% (Institutional Class), outperforming its benchmark, the J.P Morgan Asia Credit Index (JACI), which returned 3.81% over the same period. For the quarter ending June 30, 2017, the Fund returned 2.63% (Investor Class) and 2.66% (Institutional Class) compared to the benchmark return of 1.22% over the same period.
Market Environment:
Asia credit has continued to provide positive returns even amid volatility in the U.S. interest rate environment. Credit spreads widened slightly in the quarter amid a strong environment for new issuance, but history indicates spreads typically tighten during U.S. rate hike cycles. Investment grade spreads continued to hover near historical lows. Globally, we believe high yield credit spreads in the U.S., Europe and Latin America are now overvalued, trading at levels well below historical averages. Asia is the only region where high yield spreads are still trading at relatively fair value, at spreads slightly wider than average. We believe this presents an attractive entry point for Asia credit, particularly given historically higher returns and lower volatility in Asia relative to U.S., European and Latin American high yield. The preconditions for credit spreads to spike historically have been the combination of expectations of higher defaults and an impending economic recession. With commodity prices recovering and no recession in sight, we expect spreads to tighten even further.
Performance Contributors and Detractors:
During the second quarter, among the biggest contributors to Fund performance were our holdings in the bonds of Debt and Asset Trading Corp, China Hongqiao Group and the HSBC Holdings PLC’s contingent convertible bonds. Debt and Asset Trading Corp. is a wholly owned subsidiary of Vietnam’s Ministry of Finance, and its bonds provide an attractive spread pickup to sovereign bonds. China Hongqiao Group was the Fund’s biggest detractor to returns in the first quarter after a short seller report in February questioned the company’s financial performance, accounting and valuation. It recovered strongly in the second quarter, and we do not believe that these issues will materially affect the company’s credit profile. We saw short-term volatility during the quarter as an opportunity to add to our position. HSBC contingent convertible bonds continued to perform well as Europe continues on its recovery path. While HSBC’s revenues and overwhelming majority of its operating profits are derived from Asia, it nevertheless is more correlated to European than to Asian banks. As such, we were able to buy these bonds when the rest of its European peers had troubles. The only detractor to performance was our long credit default position in Korea, where we bought five-year protection on the South Korean sovereign as a hedge against tail risk* driven by North Korea. While spreads widened in the quarter, the coupon we paid for the default protection led to a slight loss on the position.
Notable Changes to Portfolio:
We took profits on a portion of our investment in Sprint, a U.S. wireless communications company with majority ownership by SoftBank, a Japanese media
| * | Tail risk: The small statistical probability that an asset price will move more than three standard deviations from its current and/or average price level. |
(continued)
| 1 | Prospectus expense ratios. |
| 2 | Matthews has contractually agreed (i) to waive fees and reimburse expenses to the extent needed to limit Total Annual Fund Operating Expenses (excluding Rule 12b-1 fees, taxes, interest, brokerage commissions, short sale dividend expenses, expenses incurred in connection with any merger or reorganization or extraordinary expenses such as litigation) of the Institutional Class to 0.90% first by waiving class specific expenses (i.e., shareholder service fees specific to a particular class) of the Institutional Class and then, to the extent necessary, by waiving non-class specific expenses of the Institutional Class, and (ii) if any Fund-wide expenses (i.e., expenses that apply to both the Institutional Class and the Investor Class) are waived for the Institutional Class to maintain the 0.90% expense limitation, to waive an equal amount (in annual percentage terms) of those same expenses for the Investor Class. The Total Annual Fund Operating Expenses After Fee Waiver and Expense Reimbursement for the Investor Class may vary from year to year and will in some years exceed 0.90%. If the operating expenses fall below the expense limitation in a year within three years after Matthews has made a waiver or reimbursement, the Fund may reimburse Matthews up to an amount that does not cause the expenses for that year to exceed the lesser of (i) the expense limitation applicable at the time of that fee waiver and/or expense reimbursement or (ii) the expense limitation in effect at the time of recoupment. This agreement will remain in place until April 30, 2018 and may be terminated at any time by the Board of Trustees on behalf of the Fund on 60 days’ written notice to Matthews. Matthews may decline to renew this agreement by written notice to the Trust at least 30 days before its annual expiration date. |
| 3 | Modified duration measures the percent change in value of the fixed income portion of the portfolio in response to a 1% change in interest rates. In a multi-currency denominated portfolio with sensitivities to different interest rate regimes, modified duration will not accurately reflect the change in value of the overall portfolio from a change in any one interest rate regime. |
| 4 | Not annualized. The lesser of fiscal year 2016 long-term purchase costs or sales proceeds divided by the average monthly market value of long-term securities. |
| | | | |
| matthewsasia.com | 800.789.ASIA | | | 11 | |
| | | | | | | | | | | | | | | | | | | | |
| | | | | |
| PERFORMANCE AS OF JUNE 30, 2017 | | | | | | | | | | | | |
| | | | | | | | | | | | Average Annual
Total Returns | | | | |
| | | 3 Months | | | YTD | | | 1 Year | | | Since Inception | | | Inception
Date | |
Investor Class (MCRDX) | | | 2.63% | | | | 5.34% | | | | 8.67% | | | | 8.72% | | | | 4/29/16 | |
| Institutional Class (MICPX) | | | 2.66% | | | | 5.44% | | | | 8.99% | | | | 8.95% | | | | 4/29/16 | |
J.P. Morgan Asia Credit Index5 | | | 1.22% | | | | 3.81% | | | | 3.10% | | | | 4.50% | | | | | |
| Lipper Alternative Credit Focus Funds Category Average6 | | | 1.28% | | | | 2.91% | | | | 6.09% | | | | 6.57% | | | | | |
Performance assumes reinvestment of all dividends and/or distributions before taxes. All performance quoted represents past performance and is no guarantee of future results. Investment return and principal value will fluctuate with market conditions so that when redeemed, shares may be worth more or less than their original cost. Current performance may be lower or higher than the return figures quoted. Returns would have been lower if certain of the Fund’s fees and expenses had not been waived. For the Fund’s most recent month-end performance, visit matthewsasia.com.
| | | | | | | | | | | | | | | | | | | | | | | | | | | | | | | | | | | | | | | | | | | | |
| | | | |
| INCOME DISTRIBUTION HISTORY | | | | | | | | | |
| | | 2017 | | | | | | 2016 | |
| | | Q1 | | | Q2 | | | Q3 | | | Q4 | | | Total | | | | | | Q1 | | | Q2 | | | Q3 | | | Q4 | | | Total | |
| Investor (MCRDX) | | $ | 0.12 | | | $ | 0.08 | | | | n.a. | | | | n.a. | | | | n.a. | | | | | | | | n.a. | | | $ | 0.06 | | | $ | 0.10 | | | $ | 0.16 | | | $ | 0.32 | |
| Inst’l (MICPX) | | $ | 0.12 | | | $ | 0.08 | | | | n.a. | | | | n.a. | | | | n.a. | | | | | | | | n.a. | | | $ | 0.06 | | | $ | 0.11 | | | $ | 0.16 | | | $ | 0.33 | |
Note: This table does not include capital gains distributions. Totals may differ by $0.02 due to rounding. For income distribution history, visit matthewsasia.com.
| | | | |
30-DAY YIELD: Investor Class: 4.08% (3.73% excluding waivers) Institutional Class: 4.33% (3.74% excluding waivers) The 30-Day Yield represents net investment income earned by the Fund over the 30-day period ended 6/30/17, expressed as an annual percentage rate based on the Fund’s share price at the end of the 30-day period. The 30-Day Yield should be regarded as an estimate of the Fund’s rate of investment income, and it may not equal the Fund’s actual income distribution rate. Source: BNY Mellon Investment Servicing (US) Inc. | | | | YIELD TO WORST: 5.52% Yield to worst is the lowest yield that can be received on a bond assuming that the issuer does not default. It is calculated by utilizing the worst case assumptions for a bond with respect to certain income-reducing factors, including prepayment, call or sinking fund provisions. It does not represent the yield that an investor should expect to receive. Past yields are no guarantee of future yields. Source: FactSet Research Systems |
GROWTH OF A $10,000 INVESTMENT SINCE INCEPTION—INVESTOR CLASS
Plotted monthly. The performance data and graph do not reflect the deduction of taxes that a shareholder would pay on dividends, capital gains distributions, or redemption of Fund shares. Values are in US$.
| | 5 | It is not possible to invest directly in an index. Source: Index data from J.P. Morgan and Bloomberg; total return calculations performed by BNY Mellon Investment Servicing (US) Inc. Please see page 91 for index definition. |
| | 6 | The Lipper Category Average does not reflect sales charges and is based on total return, including reinvestment of dividends and capital gains for the stated periods. |
| | | | | | | | |
| | | | |
| TOP TEN HOLDINGS | | | | | | | |
| | | Sector | | Currency | | % of Net Assets | |
| China Hongqiao Group, Ltd., 6.875%, 05/03/2018 | | Materials | | U.S. Dollar | | | 5.5% | |
| Debt and Asset Trading Corp., 1.000%, 10/10/2025 | | Financials | | U.S. Dollar | | | 5.3% | |
| Harvest Operations Corp., 6.875%, 10/01/2017 | | Energy | | U.S. Dollar | | | 5.2% | |
| DFCC Bank PLC, 9.625%, 10/31/2018 | | Financials | | U.S. Dollar | | | 4.7% | |
| Sri Lanka Government Bond, 6.125%, 06/03/2025 | | Foreign Government Bonds | | U.S. Dollar | | | 4.6% | |
| Alam Synergy Pte, Ltd., 6.950%, 03/27/2020 | | Real Estate | | U.S. Dollar | | | 4.6% | |
| Pakistan Government Bond, 8.250%, 04/15/2024 | | Foreign Government Bonds | | U.S. Dollar | | | 4.6% | |
| Delta Investment Horizon International, Ltd., Cnv., 3.000%, 05/26/2020 | | Telecommunication Services | | U.S. Dollar | | | 4.5% | |
| ICTSI Treasury BV, 5.875%, 09/17/2025 | | Industrials | | U.S. Dollar | | | 4.4% | |
| HSBC Holdings PLC, 6.375%, 12/29/2049 | | Financials | | U.S. Dollar | | | 4.3% | |
| % OF ASSETS IN TOP TEN | | | | | | | 47.7% | |
Matthews Asia Credit Opportunities Fund
Portfolio Manager Commentary (unaudited) (continued)
conglomerate. The bonds have performed well over the past year as its operational turnaround has continued, allowing the company to shore up its balance sheet and tap into new sources of liquidity. We continue to hold a position as the company explores mergers/partnerships with larger competitors that may further improve its competitive position and further credit improvement. We also initiated new positions in Modernland Realty, an Indonesian property developer, and State Grid Corp of China, the government-owned electric utility monopoly of China. Modernland is a well-managed, midsize property developer with an improving operational profile, and we believe the bonds offer an attractive yield for the risk profile of the company. State Grid Corp of China’s bond is RMB-denominated and is the Fund’s only non-U.S. dollar holding and our first investment in China’s onshore bond market. Tight onshore liquidity has led to a rise in interest rates and credit spreads, enabling us to purchase these bonds at prices well below historical levels. With the upcoming implementation of “Bond Connect,” we expect the RMB to be stable, with an appreciation bias relative to the U.S. dollar. We invested in a quasi-sovereign entity because we generally believe that credit risk is mispriced in the onshore market in China, and that investors are not adequately compensated for taking on additional credit risk.
Outlook:
Though interest rates have risen, good liquidity conditions and still relatively low interest rates across Asia continue to support market access and credit. Combined with the inflows into emerging markets and high yield asset classes, we see the near term as still supportive of Asian credit.
Some market participants continue to have concerns over China, especially regarding the recent volatility in money market rates. We see the recent intentional pull back of short-term liquidity as a prudent measure to reduce the leverage employed in wealth management products. Thus, we do not view the recent volatility in the money markets as a sign of stress, capital flight or policy missteps, and instead see it as a possible buying opportunity.
We are more concerned about risks arising from U.S. politics than from China-related risks. These include a potential ad-hoc, country-specific tariff on China. Chinese exports involve products from other Asian countries as the integrated supply chain in Asia is a well-documented phenomenon. A direct tariff levied on China will have indirect but painful effects on Asia, especially smaller, export-oriented economies, such as Taiwan and South Korea. While we do not see a tariff on China as our base case, we are positioning the portfolio to minimize the effects of such a scenario by limiting exposure to export-driven companies.
Fixed income investments are subject to risks, including, but not limited to, interest rate, credit and inflation risks. Investing in emerging markets involves different and greater risks, as these countries are substantially smaller, less liquid and more volatile than securities markets in more developed markets.
| | | | |
| |
| CURRENCY ALLOCATION (%)7,8 | |
| U.S. Dollar (USD) | | | 90.0 | |
| China Renminbi (CNY) | | | 2.8 | |
| Cash and Other Assets, Less Liabilities | | | 7.2 | |
| | | | |
| |
| COUNTRY ALLOCATION (%)7,8,9 | |
| China/Hong Kong | | | 31.3 | |
| Indonesia | | | 20.9 | |
| Sri Lanka | | | 12.5 | |
| Vietnam | | | 7.4 | |
| South Korea | | | 5.2 | |
| Pakistan | | | 4.6 | |
| Philippines | | | 4.4 | |
| Thailand | | | 4.2 | |
| United States | | | 2.3 | |
| Cash and Other Assets, Less Liabilities | | | 7.2 | |
| | | | |
| |
| SECTOR ALLOCATION (%)7,8 | |
| Financials | | | 21.7 | |
| Real Estate | | | 17.4 | |
| Foreign Government Bonds | | | 11.3 | |
| Telecommunication Services | | | 8.9 | |
| Utilities | | | 6.9 | |
| Materials | | | 5.5 | |
| Consumer Discretionary | | | 5.2 | |
| Energy | | | 5.2 | |
| Industrials | | | 4.4 | |
| Consumer Staples | | | 4.2 | |
| Information Technology | | | 2.1 | |
| Cash and Other Assets, Less Liabilities | | | 7.2 | |
| | | | |
| |
| ASSET TYPE BREAKDOWN (%)7,8 | |
| Non-Convertible Corporate Bonds | | | 72.8 | |
| Government Bonds | | | 11.3 | |
| Convertible Corporate Bonds | | | 8.7 | |
| Cash and Other Assets, Less Liabilities | | | 7.2 | |
| 7 | Source: FactSet Research Systems. Percentage values in data are rounded to the nearest tenth of one percent; the values may not sum to 100% due to rounding. |
| 8 | Cash and other assets may include forward currency exchange contracts and certain derivative instruments that have been marked-to-market. |
| 9 | Not all countries where the Fund may invest are included in the benchmark index. |
| | | | |
| matthewsasia.com | 800.789.ASIA | | | 13 | |
Matthews Asia Credit Opportunities Fund
June 30, 2017
Schedule of Investmentsa (unaudited)
| | |
| NON-CONVERTIBLE CORPORATE BONDS: 72.8% | | FOREIGN GOVERNMENT OBLIGATIONS: 11.3% |
| | | | | | | | |
| | | Face Amount* | | | Value | |
| CHINA/HONG KONG: 31.3% | | | | | | | | |
China Hongqiao Group, Ltd.
6.875%, 05/03/18 | | | 1,100,000 | | | | $1,091,785 | |
HSBC Holdings PLC
6.375%b, 12/29/49 | | | 800,000 | | | | 851,200 | |
KWG Property Holding, Ltd.
8.975%, 01/14/19 | | | 800,000 | | | | 831,038 | |
Standard Chartered PLC
6.500%b, 12/29/49 | | | 800,000 | | | | 817,000 | |
Wanda Properties International Co., Ltd. | | | | | |
7.250%, 01/29/24 | | | 750,000 | | | | 787,400 | |
State Grid Corp. of China
3.150%, 11/14/21 | | | CNY 4,000,000 | | | | 560,189 | |
Shimao Property Holdings, Ltd.
8.125%, 01/22/21 | | | 400,000 | | | | 424,008 | |
Unigroup International Holdings, Ltd. | | | | | |
6.000%, 12/10/20 | | | 400,000 | | | | 422,608 | |
Wynn Macau, Ltd.
5.250%, 10/15/21 | | | 400,000 | | | | 410,000 | |
| | | | | | | | |
Total China/Hong Kong | | | | | | | 6,195,228 | |
| | | | | | | | |
| | | | | | | | |
| INDONESIA: 16.4% | |
Alam Synergy Pte, Ltd.
6.950%, 03/27/20 | | | 900,000 | | | | 911,250 | |
Listrindo Capital BV
4.950%, 09/14/26 | | | 800,000 | | | | 810,000 | |
MPM Global Pte, Ltd.
6.750%, 09/19/19 | | | 600,000 | | | | 622,266 | |
Modernland Overseas Pte, Ltd.
6.950%, 04/13/24 | | | 500,000 | | | | 496,950 | |
TBG Global Pte, Ltd.
5.250%, 02/10/22 | | | 400,000 | | | | 414,617 | |
| | | | | | | | |
Total Indonesia | | | | | | | 3,255,083 | |
| | | | | | | | |
| | | | | | | | |
| SRI LANKA: 7.9% | |
DFCC Bank PLC
9.625%, 10/31/18 | | | 900,000 | | | | 934,434 | |
National Savings Bank
8.875%, 09/18/18 | | | 600,000 | | | | 632,820 | |
| | | | | | | | |
Total Sri Lanka | | | | | | | 1,567,254 | |
| | | | | | | | |
| | | | | | | | |
| VIETNAM: 5.3% | |
Debt and Asset Trading Corp.
1.000%, 10/10/25 | | | 1,700,000 | | | | 1,052,300 | |
| | | | | | | | |
Total Vietnam | | | | | | | 1,052,300 | |
| | | | | | | | |
| | | | | | | | |
| SOUTH KOREA: 5.2% | |
Harvest Operations Corp.
6.875%, 10/01/17 | | | 1,030,000 | | | | 1,027,425 | |
| | | | | | | | |
Total South Korea | | | | | | | 1,027,425 | |
| | | | | | | | |
| | | | | | | | |
| PHILIPPINES: 4.4% | |
ICTSI Treasury BV
5.875%, 09/17/25 | | | 800,000 | | | | 867,341 | |
| | | | | | | | |
Total Philippines | | | | | | | 867,341 | |
| | | | | | | | |
| | | | | | | | |
| UNITED STATES: 2.3% | |
Sprint Communications, Inc.
6.000%, 11/15/22 | | | 420,000 | | | | 445,200 | |
| | | | | | | | |
Total United States | | | | | | | 445,200 | |
| | | | | | | | |
| | | | | | | | |
| TOTAL NON-CONVERTIBLE CORPORATE BONDS | | | | 14,409,831 | |
| | | | | | | | |
(Cost $14,044,126) | | | | | | | | |
| | | | | | | | |
| | | | | | | | |
| | | Face Amount* | | | Value | |
| SRI LANKA: 4.6% | | | | | | | | |
Sri Lanka Government Bond
6.125%, 06/03/25 | | | 900,000 | | | | $918,476 | |
| | | | | | | | |
Total Sri Lanka | | | | | | | 918,476 | |
| | | | | | | | |
| | | | | | | | |
| PAKISTAN: 4.6% | |
Pakistan Government Bond
8.250%, 04/15/24 | | | 800,000 | | | | 907,734 | |
| | | | | | | | |
Total Pakistan | | | | | | | 907,734 | |
| | | | | | | | |
| | | | | | | | |
| VIETNAM: 2.1% | |
Socialist Republic of Vietnam
4.800%, 11/19/24 | | | 400,000 | | | | 420,372 | |
| | | | | | | | |
Total Vietnam | | | | | | | 420,372 | |
| | | | | | | | |
| | | | | | | | |
| TOTAL FOREIGN GOVERNMENT OBLIGATIONS | | | | 2,246,582 | |
| | | | | | | | |
(Cost $2,146,531) | | | | | | | | |
| | | | | | | | |
CONVERTIBLE CORPORATE BONDS: 8.7% | |
| INDONESIA: 4.5% | | | | | | | | |
Delta Investment Horizon International, Ltd., Cnv. | | | | | |
3.000%, 05/26/20 | | | 900,000 | | | | 893,250 | |
| | | | | | | | |
Total Indonesia | | | | | | | 893,250 | |
| | | | | | | | |
| | | | | | | | |
| THAILAND: 4.2% | |
CP Foods Holdings, Ltd., Cnv.
0.500%, 09/22/21 | | | 800,000 | | | | 822,000 | |
| | | | | | | | |
Total Thailand | | | | | | | 822,000 | |
| | | | | | | | |
| | | | | | | | |
| TOTAL CONVERTIBLE CORPORATE BONDS | | | | 1,715,250 | |
| | | | | | | | |
(Cost $1,658,682) | | | | | | | | |
| | | | | | | | |
| TOTAL INVESTMENTS: 92.8% | | | | 18,371,663 | |
(Cost $17,849,339C) | | | | | | | | |
| | | | | | | | |
CASH AND OTHER ASSETS,
LESS LIABILITIES: 7.2% | | | | | | | 1,417,030 | |
| | | | | | | | |
| | |
NET ASSETS: 100.0% | | | | | | | $19,788,693 | |
| | | | | | | | |
| a | Certain securities were fair valued under the valuation policies approved by the Board of Trustees (Note 2-A). |
| b | Variable rate security. The rate represents the rate in effect at June 30, 2017. |
| c | Cost for federal income tax purposes is $17,849,339 and net unrealized appreciation consists of: |
| | | | |
Gross unrealized appreciation | | | $553,176 | |
Gross unrealized depreciation | | | (30,852 | ) |
| | | | |
Net unrealized appreciation | | | $522,324 | |
| | | | |
| * | All values are in USD unless otherwise noted. |
| CNY | Chinese Renminbi (Yuan) |
Matthews Asia Credit Opportunities Fund
June 30, 2017
Schedule of Investmentsa (unaudited) (continued)
OTC CREDIT DEFAULT SWAPS - BUY PROTECTION*
| | | | | | | | | | | | | | | | | | | | | | |
| Issuer | | Pay
Fixed
Rate | | Counterparty | | Expiration
Date | | Notional
Amount
(000) | | | Value | | | Premiums
Received | | | Unrealized
Appreciation | |
Republic of Korea | | 1.00% | | Bank of America, N.A. | | 6/20/2022 | | | USD 2,000 | | | | ($45,229 | ) | | | ($45,900 | ) | | | $671 | |
| | | | | | | | | | | | | | | | | | | | | | |
| * | Swap is not centrally cleared. |
See accompanying notes to financial statements.
| | | | |
| matthewsasia.com | 800.789.ASIA | | | 15 | |

| | | | |
| PORTFOLIO MANAGERS |
| Robert J. Horrocks, PhD | | |
Lead Manager | | |
| Kenneth Lowe, CFA | | |
Lead Manager | | | | |
|
| FUND FACTS |
| | | Investor | | Institutional |
Ticker | | MACSX | | MICSX |
CUSIP | | 577130206 | | 577130842 |
Inception | | 9/12/94 | | 10/29/10 |
NAV | | $17.06 | | $17.04 |
Initial Investment | | $2,500 | | $100,000 |
Gross Expense Ratio1 | | 1.09% | | 0.94% |
Portfolio Statistics | | | | |
Total # of Positions | | 60 |
Net Assets | | $2.9 billion |
Weighted Average Market Cap | | $44.0 billion |
Portfolio Turnover2 | | 15.64% |
Benchmark | | |
MSCI AC Asia ex Japan Index |
OBJECTIVE
Long-term capital appreciation. The Fund also seeks to provide some current income.
STRATEGY
Under normal market conditions, the Fund seeks to achieve its investment objective by investing at least 80% of its total net assets, which include borrowings for investment purposes, in dividend-paying common stock, preferred stock and other equity securities, and convertible securities as well as fixed-income securities, of any duration or quality, of companies located in Asia, which consists of all countries and markets in Asia, including developed, emerging and frontier countries and markets in the Asian region.
Matthews Asian Growth and Income Fund
Portfolio Manager Commentary (unaudited)
Period ended June 30, 2017
For the first half of 2017, the Matthews Asian Growth and Income Fund returned 14.87% (Investor Class) and 14.99% (Institutional Class) while its benchmark, the MSCI All Country Asia ex Japan Index, returned 22.93%. For the quarter ending June 30, 2017, the Fund returned 5.03% (Investor Class) and 5.07% (Institutional Class) compared to the benchmark return of 8.40% over the same period.
Market Environment:
Asian equity markets continued their strong performance into the second quarter as sentiment for emerging markets has shifted from being largely negative in many allocators’ minds to being somewhat more constructive. The prior five years of weaker-than-anticipated earnings growth and poor dollar-denominated market performance has turned as earnings expectations have been on the rise through a combination of base effects, reflation in China and a strong technology cycle. Additionally, a prospective border adjustment tax from the U.S. appears unlikely to succeed in its current form and European political risk has waned with the election of Europhile Emmanuel Macron as France’s new president. These points have all helped the asset class as “risk-on” assets gather momentum and volatility remains low.
More structurally during the quarter, we witnessed the inclusion of China A-shares to MSCI benchmarks. Initially, 222 large-capitalization stocks from the mainland will be included into the Emerging Markets Index at a small weighting slated to begin next spring. This, alongside the strength of internet stocks, likely helped China to become the region’s strongest performer during the quarter.
Performance Contributors and Detractors:
The bulk of the stocks within the portfolio rose during the quarter with the largest contributor to returns coming once more from Pan-Asian life insurer AIA Group, a core holding. The stock reached all-time highs during the period as its value of new business rose by an impressive 55% in constant currency terms during the first quarter. It remains clear that fundamental demand for covering protection gaps remains strong and the company’s cash generation will enable it to continue to grow dividends substantially. Other Hong Kong stocks, VTech Holdings and Techtronic Industries, also delivered strong performance. The former bounced back from a weak first quarter as earnings positively surprised on the integration of fellow electronic learning product company Leapfrog, as well as revenue growth in commercial phone sales and contract manufacturing. Techtronic Industries benefited from solid revenue growth in power tools, particularly as its partner, Home Depot, continues to post impressive year-over-year comparable store sales.
Information technology stocks also delivered strong absolute performance for the portfolio with Samsung Electronics rising on strong memory pricing and an ongoing share buyback. However, the portfolio’s underweight within the sector, given its large size in the index, hurt relative performance as Chinese internet stocks and many others within the technology supply chain rallied.
Beyond this, South Korean holdings Kangwon Land and Kepco Plant Service & Engineering (KPS) detracted from performance. The former is the country’s only casino in which local residents are allowed to gamble and there are concerns that this could change. The stock also has been hurt by poor earnings. KPS sputtered on weaker-than-expected overseas order wins and expectations for South Korea’s new president to readdress the use of nuclear power in the country.
Notable Changes to Portfolio:
We added a number of new holdings to the portfolio during the quarter, including U.S.-listed fabless semiconductor company Broadcom. The business was formed
(continued)
| 1 | Prospectus expense ratios. |
| 2 | The lesser of fiscal year 2016 long-term purchase costs or sales proceeds divided by the average monthly market value of long-term securities. |
| | | | | | | | | | | | | | | | | | | | | | | | | | | | | | | | |
| | | |
| PERFORMANCE AS OF JUNE 30, 2017 | | | | | | | |
| | | | | | | | | | | | Average Annual Total Returns | | | | |
| | | 3 Months | | | YTD | | | 1 Year | | | 3 Years | | | 5 Years | | | 10 Years | | | Since
Inception | | | Inception
Date | |
| Investor Class (MACSX) | | | 5.03% | | | | 14.87% | | | | 8.75% | | | | 1.73% | | | | 6.05% | | | | 5.06% | | | | 9.50% | | | | 9/12/94 | |
| Institutional Class (MICSX) | | | 5.07% | | | | 14.99% | | | | 8.94% | | | | 1.89% | | | | 6.22% | | | | n.a. | | | | 4.71% | | | | 10/29/10 | |
| MSCI AC Asia ex Japan Index3 | | | 8.40% | | | | 22.93% | | | | 27.06% | | | | 5.32% | | | | 8.27% | | | | 4.48% | | | | 4.46% | 4 | | | | |
| Lipper Pacific Region Funds Category Average5 | | | 6.61% | | | | 17.21% | | | | 18.61% | | | | 4.51% | | | | 8.36% | | | | 2.88% | | | | 4.27% | | | | | |
Performance assumes reinvestment of all dividends and/or distributions before taxes. All performance quoted represents past performance and is no guarantee of future results. Investment return and principal value will fluctuate with market conditions so that when redeemed, shares may be worth more or less than their original cost. Current performance may be lower or higher than the return figures quoted. Returns would have been lower if certain of the Fund’s fees and expenses had not been waived. For the Fund’s most recent month-end performance, visit matthewsasia.com.
| | | | | | | | | | | | | | | | | | | | | | | | | | | | |
| | | | | | | | |
| INCOME DISTRIBUTION HISTORY | | | | | | | | | | | | | | | | | | | | | |
| | | 2017 | | | | | | 2016 | |
| | | June | | �� | December | | | Total | | | | | | June | | | December | | | Total | |
| Investor (MACSX) | | $ | 0.10 | | | | n.a. | | | | n.a. | | | | | | | $ | 0.15 | | | $ | 0.33 | | | $ | 0.48 | |
| Inst’l (MICSX) | | $ | 0.12 | | | | n.a. | | | | n.a. | | | | | | | $ | 0.16 | | | $ | 0.34 | | | $ | 0.50 | |
Note: This table does not include capital gains distributions. Totals may differ by $0.01 due to rounding. For income distribution history, visit matthewsasia.com.
| | | | |
30-DAY YIELD: 1.71% (Investor Class) 1.88% (Institutional Class) The 30-Day Yield represents net investment income earned by the Fund over the 30-day period ended 6/30/17, expressed as an annual percentage rate based on the Fund’s share price at the end of the 30-day period. The 30-Day Yield should be regarded as an estimate of the Fund’s rate of investment income, and it may not equal the Fund’s actual income distribution rate. Source: BNY Mellon Investment Servicing (US) Inc. | | | | DIVIDEND YIELD: 3.27% The dividend yield (trailing) for the portfolio is the weighted average sum of the dividends paid by each equity security held by the Fund over the 12 months ended 6/30/17 divided by the current price of each equity as of 6/30/17. The annualized dividend yield for the Fund is for the equity-only portion of the portfolio. Please note that this is based on gross equity portfolio holdings and does not reflect the actual yield an investor in the Fund would receive. Past yields are no guarantee of future yields. Source: FactSet Research Systems, Bloomberg, MICM |
GROWTH OF A $10,000 INVESTMENT SINCE INCEPTION—INVESTOR CLASS
Plotted monthly. The performance data and graph do not reflect the deduction of taxes that a shareholder would pay on dividends, capital gains distributions or redemption of Fund shares. Values are in US$.
| | 3 | It is not possible to invest directly in an index. Source: Index data from Morgan Stanley Capital International and Bloomberg; total return calculations performed by BNY Mellon Investment Servicing (US) Inc. Please see page 91 for index definition. |
| | 4 | Calculated from 8/31/94. |
| | 5 | The Lipper Category Average does not reflect sales charges and is based on total return, including reinvestment of dividends and capital gains for the stated periods. |
| | | | | | | | |
| | | | |
| TOP TEN HOLDINGS6 | | | | | | | |
| | | Sector | | Country | | % of Net Assets | |
| AIA Group, Ltd. | | Financials | | China/Hong Kong | | | 3.6% | |
| Taiwan Semiconductor Manufacturing Co., Ltd. | | Information Technology | | Taiwan | | | 3.3% | |
| Samsung Electronics Co., Ltd. | | Information Technology | | South Korea | | | 3.1% | |
| CapitaLand, Ltd., Cnv., 1.950%, 10/17/2023 | | Real Estate | | Singapore | | | 2.5% | |
| Singapore Telecommunications, Ltd. | | Telecommunication Services | | Singapore | | | 2.4% | |
| Techtronic Industries Co., Ltd. | | Consumer Discretionary | | China/Hong Kong | | | 2.3% | |
| Ascendas REIT | | Real Estate | | Singapore | | | 2.3% | |
| United Overseas Bank, Ltd. | | Financials | | Singapore | | | 2.2% | |
| Genting Malaysia BHD | | Consumer Discretionary | | Malaysia | | | 2.1% | |
| HSBC Holdings PLC | | Financials | | China/Hong Kong | | | 2.0% | |
| % OF ASSETS IN TOP TEN | | | | | | | 25.8% | |
| | 6 | Holdings may combine more than one security from same issuer and related depositary receipts. |
| | | | |
| matthewsasia.com | 800.789.ASIA | | | 17 | |
| | | | |
| |
| COUNTRY ALLOCATION (%)7,8 | |
| China/Hong Kong | | | 32.2 | |
| Singapore | | | 14.1 | |
| South Korea | | | 12.0 | |
| Japan | | | 6.2 | |
| Australia | | | 4.9 | |
| Taiwan | | | 4.8 | |
| Indonesia | | | 3.9 | |
| Malaysia | | | 3.4 | |
| United States | | | 3.2 | |
| Thailand | | | 2.6 | |
| India | | | 1.7 | |
| Vietnam | | | 1.5 | |
| Norway | | | 1.5 | |
| New Zealand | | | 1.4 | |
| Philippines | | | 1.0 | |
| Cash and Other Assets, Less Liabilities | | | 5.6 | |
| | | | |
| | |
| SECTOR ALLOCATION (%)8 | | | |
| Industrials | | | 15.4 | |
| Consumer Discretionary | | | 15.2 | |
| Telecommunication Services | | | 14.2 | |
| Consumer Staples | | | 13.6 | |
| Financials | | | 10.5 | |
| Information Technology | | | 9.2 | |
| Real Estate | | | 7.3 | |
| Utilities | | | 5.3 | |
| Health Care | | | 3.7 | |
| Cash and Other Assets, Less Liabilities | | | 5.6 | |
| | | | |
| |
| MARKET CAP EXPOSURE (%)8 | |
| Mega Cap (over $25B) | | | 39.3 | |
| Large Cap ($10B–$25B) | | | 18.7 | |
| Mid Cap ($3B–10B) | | | 25.4 | |
| Small Cap (under $3B) | | | 11.0 | |
| Cash and Other Assets, Less Liabilities | | | 5.6 | |
| | | | |
| |
| ASSET TYPE BREAKDOWN (%)8,9 | |
| Common Equities and ADRs | | | 81.2 | |
| Convertible Corporate Bonds | | | 10.2 | |
| Preferred Equities | | | 3.1 | |
| Cash and Other Assets, Less Liabilities | | | 5.6 | |
| 7 | Not all countries where the Fund may invest are included in the benchmark index. |
| 8 | Source: FactSet Research Systems. Percentage values in data are rounded to the nearest tenth of one percent; the values may not sum to 100% due to rounding. |
| 9 | Bonds are not included in the MSCI All Country Asia ex Japan Index. |
Matthews Asian Growth and Income Fund
Portfolio Manager Commentary (unaudited) (continued)
through the merger of Avago Technologies and Broadcom last year with headquarters in the U.S. and in Singapore. Much of the company’s product suite in areas such as wireless connectivity, network switching, data center storage etc. holds strong market positions and is mission critical to its customers. This enables high margins and strong free cash flow. We believe both wired and wireless products have a solid sustainable growth outlook that should lead to attractive dividend growth to accompany an already reasonable valuation of a 1.7% dividend yield and 15x price-to-earnings (P/E) ratio.*
We also added Indonesian bank and micro finance lender Bank Rakyat Indonesia. The company not only has an impressive pedigree in what is a lucrative business, but it also has a strong balance sheet with a Tier 1 ratio of 19.6%, a healthy funding base and fairly robust loan loss reserves. There have been some question marks over the company’s decision to increase corporate lending in recent years, but new management has sensibly refocused on micro lending once more. We believe that a franchise of this caliber was attractively priced at around 13.4x forward P/E and a 2.8% dividend yield. These additions were funded through the closure of positions in Keppel Corporation, ARA Asset Management and Transcosmos.
Outlook:
The strength of Asian equity markets this year has been, to a reasonable extent, justified by fundamentals. An improvement in earnings momentum and some level of de-risking being attempted within the Chinese financial system are both positive outcomes. Further, tail risks from global politics appear to have waned. Valuations, however, have returned to a level that on a trailing basis are in line with medium-term averages. Additionally, volatility is astoundingly low and it is sensible to question how long this can persist as monetary policy across the globe appears to be tightening. Despite government officials in China being aware of the debt challenges, deleveraging has not yet occurred and the quantity of outstanding credit and capital misallocation remains a concern.
With a backdrop of reasonable fundamentals, middling valuations and some residual tail risks, we will continue to offer our investors what we believe to be a portfolio that delivers solid risk-adjusted returns through a full economic cycle. We will avoid the chase for beta† in such an unsustainably low volatility environment and deploy capital sensibly in those businesses that attempt to create value for minority shareholders over the long term.
| * | Price-to-Earnings (P/E) Ratio: Price-to-Earnings Ratio (P/E Ratio) is a valuation ratio of a company’s current share price compared to its per-share earnings. |
| † | Beta is a measure of volatility, or systemic risk, of a security or a portfolio in comparison to the market as a whole. |
Matthews Asian Growth and Income Fund
June 30, 2017
Schedule of Investmentsa (unaudited)
COMMON EQUITIES: 81.1%
| | | | | | | | |
| | | Shares | | | Value | |
| CHINA/HONG KONG: 25.9% | | | | | | | | |
AIA Group, Ltd. | | | 14,184,800 | | | | $103,781,118 | |
Techtronic Industries Co., Ltd. | | | 14,665,000 | | | | 67,385,621 | |
HSBC Holdings PLC ADR | | | 1,264,833 | | | | 58,675,603 | |
Jardine Matheson Holdings, Ltd. | | | 909,900 | | | | 58,411,923 | |
CK Hutchison Holdings, Ltd. | | | 4,438,672 | | | | 55,703,316 | |
China Mobile, Ltd. ADR | | | 964,000 | | | | 51,178,760 | |
CLP Holdings, Ltd. | | | 4,667,200 | | | | 49,352,586 | |
Guangdong Investment, Ltd. | | | 32,744,000 | | | | 45,126,537 | |
Pacific Textiles Holdings, Ltd.b | | | 31,906,000 | | | | 40,866,096 | |
Hang Lung Properties, Ltd. | | | 15,220,920 | | | | 38,039,312 | |
HKT Trust & HKT, Ltd. | | | 27,873,000 | | | | 36,557,329 | |
Café de Coral Holdings, Ltd. | | | 10,968,000 | | | | 35,531,367 | |
VTech Holdings, Ltd. | | | 2,227,500 | | | | 35,285,624 | |
Vitasoy International Holdings, Ltd. | | | 16,747,000 | | | | 34,471,064 | |
Cheung Kong Property Holdings, Ltd. | | | 4,400,172 | | | | 34,432,586 | |
| | | | | | | | |
Total China/Hong Kong | | | | | | | 744,798,842 | |
| | | | | | | | |
| | | | | | | | |
| SINGAPORE: 11.6% | | | | | | | | |
Singapore Telecommunications, Ltd. | | | 24,329,100 | | | | 68,707,340 | |
Ascendas REIT | | | 35,011,100 | | | | 66,337,382 | |
United Overseas Bank, Ltd. | | | 3,796,000 | | | | 63,729,683 | |
Singapore Technologies Engineering, Ltd. | | | 21,623,025 | | | | 57,767,079 | |
SIA Engineering Co., Ltd. | | | 15,928,900 | | | | 47,196,298 | |
ComfortDelGro Corp., Ltd. | | | 19,003,800 | | | | 31,742,150 | |
| | | | | | | | |
Total Singapore | | | | | | | 335,479,932 | |
| | | | | | | | |
| | | | | | | | |
| SOUTH KOREA: 8.9% | | | | | | | | |
Samsung Electronics Co., Ltd. | | | 43,412 | | | | 90,419,463 | |
Kangwon Land, Inc. | | | 1,557,377 | | | | 47,457,161 | |
KT&G Corp. | | | 451,143 | | | | 46,148,182 | |
GS Home Shopping, Inc. | | | 225,202 | | | | 45,550,368 | |
KEPCO Plant Service & Engineering Co., Ltd. | | | 634,668 | | | | 24,500,156 | |
ING Life Insurance Korea, Ltd.c,d | | | 126,843 | | | | 3,769,315 | |
| | | | | | | | |
Total South Korea | | | | | | | 257,844,645 | |
| | | | | | | | |
| | | | | | | | |
| JAPAN: 6.2% | | | | | | | | |
Japan Tobacco, Inc. | | | 1,528,200 | | | | 53,713,336 | |
Kao Corp. | | | 861,700 | | | | 51,235,254 | |
KDDI Corp. | | | 1,480,800 | | | | 39,163,646 | |
USS Co., Ltd. | | | 1,681,400 | | | | 33,512,134 | |
| | | | | | | | |
Total Japan | | | | | | | 177,624,370 | |
| | | | | | | | |
| | | | | | | | |
| AUSTRALIA: 4.9% | | | | | | | | |
CSL, Ltd. | | | 448,874 | | | | 47,638,765 | |
Brambles, Ltd. | | | 4,238,855 | | | | 31,696,332 | |
Insurance Australia Group, Ltd. | | | 5,886,381 | | | | 30,677,668 | |
Domino’s Pizza Enterprises, Ltd. | | | 759,157 | | | | 30,378,103 | |
| | | | | | | | |
Total Australia | | | | | | | 140,390,868 | |
| | | | | | | | |
| | | | | | | | |
| TAIWAN: 4.8% | | | | | | | | |
Taiwan Semiconductor Manufacturing Co., Ltd. | | | 11,282,187 | | | | 77,082,308 | |
Chunghwa Telecom Co., Ltd. ADR | | | 1,226,825 | | | | 43,208,776 | |
Taiwan Semiconductor Manufacturing Co., Ltd. ADR | | | 477,024 | | | | 16,676,759 | |
| | | | | | | | |
Total Taiwan | | | | | | | 136,967,843 | |
| | | | | | | | |
| | | | | | | | |
| | | | | | | | |
| | | Shares | | | Value | |
| INDONESIA: 3.9% | | | | | | | | |
PT Telekomunikasi Indonesia Persero ADR | | | 1,435,400 | | | | $48,329,918 | |
PT Bank Rakyat Indonesia Persero | | | 35,607,600 | | | | 40,629,487 | |
PT Perusahaan Gas Negara Persero | | | 139,319,300 | | | | 23,497,913 | |
| | | | | | | | |
Total Indonesia | | | | | | | 112,457,318 | |
| | | | | | | | |
| | | | | | | | |
| MALAYSIA: 3.4% | | | | | | | | |
Genting Malaysia BHD | | | 47,850,100 | | | | 61,300,920 | |
British American Tobacco Malaysia BHD | | | 3,498,400 | | | | 35,386,190 | |
| | | | | | | | |
Total Malaysia | | | | | | | 96,687,110 | |
| | | | | | | | |
| | | | | | | | |
| UNITED STATES: 3.2% | | | | | | | | |
ResMed, Inc. | | | 589,000 | | | | 45,865,430 | |
Broadcom, Ltd. | | | 196,700 | | | | 45,840,935 | |
| | | | | | | | |
Total United States | | | | | | | 91,706,365 | |
| | | | | | | | |
| | | | | | | | |
| INDIA: 1.7% | | | | | | | | |
Bharti Infratel, Ltd. | | | 8,473,114 | | | | 49,082,753 | |
| | | | | | | | |
Total India | | | | | | | 49,082,753 | |
| | | | | | | | |
| | | | | | | | |
| VIETNAM: 1.5% | | | | | | | | |
Vietnam Dairy Products JSC | | | 6,294,291 | | | | 43,639,975 | |
| | | | | | | | |
Total Vietnam | | | | | | | 43,639,975 | |
| | | | | | | | |
| | | | | | | | |
| NORWAY: 1.5% | | | | | | | | |
Telenor ASA | | | 2,542,183 | | | | 42,175,432 | |
| | | | | | | | |
Total Norway | | | | | | | 42,175,432 | |
| | | | | | | | |
| | | | | | | | |
| NEW ZEALAND: 1.4% | | | | | | | | |
SKYCITY Entertainment Group, Ltd. | | | 13,775,057 | | | | 41,199,718 | |
| | | | | | | | |
Total New Zealand | | | | | | | 41,199,718 | |
| | | | | | | | |
| | | | | | | | |
| THAILAND: 1.2% | | | | | | | | |
Glow Energy Public Co., Ltd. | | | 15,554,000 | | | | 36,045,578 | |
| | | | | | | | |
Total Thailand | | | | | | | 36,045,578 | |
| | | | | | | | |
| | | | | | | | |
| PHILIPPINES: 1.0% | | | | | | | | |
Globe Telecom, Inc. | | | 742,500 | | | | 30,135,553 | |
| | | | | | | | |
Total Philippines | | | | | | | 30,135,553 | |
| | | | | | | | |
| | | | | | | | |
| TOTAL COMMON EQUITIES: | | | | | | | 2,336,236,302 | |
| | | | | | | | |
(Cost $2,010,691,958) | | | | | | | | |
| | | | | | | | |
| | | | |
| matthewsasia.com | 800.789.ASIA | | | 19 | |
Matthews Asian Growth and Income Fund
June 30, 2017
Schedule of Investmentsa (unaudited) (continued)
| | |
| CONVERTIBLE CORPORATE BONDS: 10.2% | | PREFERRED EQUITIES: 3.1% |
| | | | | | | | |
| | | Face Amount* | | | Value | |
| CHINA/HONG KONG: 6.3% | |
Shine Power International, Ltd., Cnv.
0.000%, 07/28/19 | | | HKD 446,000,000 | | | | $57,481,957 | |
Johnson Electric Holdings, Ltd., Cnv.
1.000%, 04/02/21 | | | 49,750,000 | | | | 54,849,375 | |
Hengan International Group Co., Ltd., Cnv. | | | | | |
0.000%, 06/27/18 | | | HKD 339,000,000 | | | | 45,699,620 | |
Haitian International Holdings, Ltd., Cnv. | | | | | |
2.000%, 02/13/19 | | | 21,500,000 | | | | 23,596,250 | |
| | | | | | | | |
Total China/Hong Kong | | | | | | | 181,627,202 | |
| | | | | | | | |
| | | | | | | | |
| SINGAPORE: 2.5% | | | | | | | | |
CapitaLand, Ltd., Cnv.
1.950%, 10/17/23 | | | SGD 96,500,000 | | | | 71,774,832 | |
| | | | | | | | |
Total Singapore | | | | | | | 71,774,832 | |
| | | | | | | | |
| | | | | | | | |
| THAILAND: 1.4% | | | | | | | | |
CP Foods Holdings, Ltd., Cnv.
0.500%, 09/22/21 | | | 27,200,000 | | | | 27,948,000 | |
Bangkok Dusit Medical Services Public Co., Ltd., Cnv. | | | | | |
0.000%, 09/18/19 | | | THB 385,000,000 | | | | 11,999,374 | |
| | | | | | | | |
Total Thailand | | | | | | | 39,947,374 | |
| | | | | | | | |
| | | | | | | | |
| TOTAL CONVERTIBLE CORPORATE BONDS | | | | 293,349,408 | |
| | | | | | | | |
(Cost $298,038,029) | | | | | | | | |
| | | | | | | | |
| | | Shares | | | Value | |
| SOUTH KOREA: 3.1% | | | | | | | | |
LG Household & Health Care, Ltd., Pfd. | | | 99,637 | | | | $54,073,592 | |
Hyundai Motor Co., Ltd., Pfd. | | | 355,983 | | | | 35,162,206 | |
| | | | | | | | |
Total South Korea | | | | | | | 89,235,798 | |
| | | | | | | | |
| | | | | | | | |
| TOTAL PREFERRED EQUITIES | | | | | | | 89,235,798 | |
| | | | | | | | |
(Cost $21,226,632) | | | | | | | | |
| | | | | | | | |
| TOTAL INVESTMENTS: 94.4% | | | | | | | 2,718,821,508 | |
(Cost $2,329,956,619e) | | | | | | | | |
| | | | | | | | |
CASH AND OTHER ASSETS,
LESS LIABILITIES: 5.6% | | | | | | | 160,844,837 | |
| | | | | | | | |
| | |
NET ASSETS: 100.0% | | | | | | | $2,879,666,345 | |
| | | | | | | | |
| a | Certain securities were fair valued under the valuation policies approved by the Board of Trustees (Note 2-A). |
| b | Illiquid security, trading was halted at June 30, 2017. |
| c | Non-income producing security. |
| d | Security exempt from registration under Rule 144A of the Securities Act of 1933, as amended. The security may be resold in transactions exempt from registration normally to qualified institutional buyers. The security has been determined to be liquid in accordance with procedures adopted by the Fund’s Board of Directors. At June 30, 2017, the aggregate value is $3,769,315, which is 0.13% of net assets. |
| e | Cost for federal income tax purposes is $2,330,194,338 and net unrealized appreciation consists of: |
| | | | |
Gross unrealized appreciation | | | $560,949,317 | |
Gross unrealized depreciation | | | (172,322,147 | ) |
| | | | |
Net unrealized appreciation | | | $388,627,170 | |
| | | | |
| * | All values are in USD unless otherwise noted. |
| ADR | American Depositary Receipt |
| REIT | Real Estate Investment Trust |
See accompanying notes to financial statements.
| | | | |
| PORTFOLIO MANAGERS |
| Yu Zhang, CFA | | Robert Horrocks, PhD |
Lead Manager | | Lead Manager |
| Vivek Tanneeru | | |
Co-Manager | | | | |
|
| FUND FACTS |
| | | Investor | | Institutional |
Ticker | | MAPIX | | MIPIX |
CUSIP | | 577125107 | | 577130750 |
Inception | | 10/31/06 | | 10/29/10 |
NAV | | $18.30 | | $18.29 |
Initial Investment | | $2,500 | | $100,000 |
Gross Expense Ratio1 | | 1.06% | | 0.94% |
After Fee Waiver and Reimbursement2 | | 1.06%* | | 0.93% |
Portfolio Statistics |
Total # of Positions | | 69 |
Net Assets | | $6.0 billion |
Weighted Average Market Cap | | $49.6 billion |
Portfolio Turnover3 | | 39.76% |
Benchmark | | | | |
MSCI AC Asia Pacific Index |
OBJECTIVE
Total return with an emphasis on providing current income.
STRATEGY
Under normal market conditions, the Fund seeks to achieve its investment objective by investing at least 80% of its total net assets, which include borrowings for investment purposes, in dividend-paying equity securities of companies located in Asia. Asia consists of all countries and markets in Asia, and includes developed, emerging and frontier countries and markets in the Asian region. The Fund may also invest in convertible debt and equity securities.
Matthews Asia Dividend Fund
Portfolio Manager Commentary (unaudited)
For the first half of 2017, the Matthews Asia Dividend Fund returned 19.02% (Investor Class) and 19.03% (Institutional Class), outperforming its benchmark, the MSCI All Country Asia Pacific Index, which returned 15.91% over the same period. For the quarter ending June 30, 2017, the Fund returned 6.57% (Investor Class) and 6.54% (Institutional Class) compared to the benchmark return of 5.87% over the same period.
Market Environment:
Asian equity markets further extended strong year-to-date performance during the second quarter of the year, owing to improving macroeconomic conditions and a positive, but benign, inflation environment. While most individual markets delivered solid returns, Australia and China’s domestic A-share market were laggards amid the rally. In China, this resulted from liquidity tightening by its central bank in an effort to deleverage its financial system. In Australia, there were increased market concerns about an overheated property market and the potential risks to Australian banks with exposure to the mortgage market.
Meanwhile, investor exuberance toward Chinese technology companies, including names like Tencent and Alibaba, drove some of those stocks to record-setting market capitalizations.
Performance Contributors and Detractors:
Despite the lackluster performance of China’s A-share market, top contributors to portfolio returns during the second quarter included home appliance manufacturer Midea Group and liquor maker Kweichou Moutai—both A-share stocks. Both stocks appeared to receive a boost from anticipation over being included in index provider MSCI’s global indices. However, we believe their strong fundamentals were more likely the key drivers of their performance. MSCI announced in late June its long-awaited decision to include China A-shares into its Emerging Market Index. We believe A-share companies with unique business models and strong fundamentals could attract the attention of more global long-term investors—which would be a positive development for the A-share market.
Our position in Hyundai Mobis, a South Korean auto parts company, which was initiated recently, was the biggest detractor to returns during the quarter. As part of the Hyundai Motor Group, Hyundai Mobis’s business is facing some clear challenges, mostly related to the poor sales performance by its main original equipment manufacturing (OEM) customers, including Hyundai Motors and Kia Motors. At the current distressed valuation multiples, we believe most of the negatives already have been factored into the share price. On the other hand, South Korea’s family-run chaebol companies are likely to face increasing scrutiny from the newly elected government, which has vowed to reform corporate governance. Given Hyundai Mobis’ strategic position within the Hyundai Group, especially its 20% stake in Hyundai Motor, any potential group-level restructuring could start unlocking the value of its investment holdings. We like its strong free-cash-flow generation and net-cash balance sheet and believe they may help Mobis increase shareholder returns, including higher dividend payouts.
Notable Changes to Portfolio:
During the quarter, we initiated a few new names, including Chinese life insurer Ping An Insurance. The company, which manages one of the most efficient life
(continued)
| * | Reimbursement was below 0.01% |
| 1 | Prospectus expense ratios. |
| 2 | Matthews has contractually agreed to waive a portion of its advisory fee and administrative and shareholder services fee if the Fund’s average daily net assets are over $3 billion, as follows: for every $2.5 billion average daily net assets of the Fund that are over $3 billion, the advisory fee rate and the administrative and shareholder services fee rate for the Fund with respect to such excess average daily net assets will be each reduced by 0.01%, in each case without reducing such fee rate below 0.00%. Any amount waived by Matthews pursuant to this agreement may not be recouped by Matthews. This agreement will remain in place until April 30, 2018 and may be terminated at any time (i) by the Trust on behalf of the Fund or by the Board of Trustees upon 60 days’ prior written notice to Matthews; or (ii) by Matthews upon 60 days’ prior written notice to the Trust, in each case without payment of any penalty. |
| 3 | The lesser of fiscal year 2016 long-term purchase costs or sales proceeds divided by the average monthly market value of long-term securities. |
| | | | |
| matthewsasia.com | 800.789.ASIA | | | 21 | |
| | | | | | | | | | | | | | | | | | | | | | | | | | | | | | | | |
| | | | | | | | | |
| PERFORMANCE AS OF JUNE 30, 2017 | | | | | | | | | | | | | | | | | | | | | | | | |
| | | | | | | | | | | | Average Annual Total Returns | | | | |
| | | 3 Months | | | YTD | | | 1 Year | | | 3 Years | | | 5 Years | | | 10 Years | | | Since
Inception | | | Inception
Date | |
| Investor Class (MAPIX) | | | 6.57% | | | | 19.02% | | | | 16.37% | | | | 6.81% | | | | 9.81% | | | | 8.37% | | | | 9.65% | | | | 10/31/06 | |
| Institutional Class (MIPIX) | | | 6.54% | | | | 19.03% | | | | 16.43% | | | | 6.94% | | | | 9.94% | | | | n.a. | | | | 7.50% | | | | 10/29/10 | |
| MSCI AC Asia Pacific Index4 | | | 5.87% | | | | 15.91% | | | | 23.00% | | | | 4.76% | | | | 8.59% | | | | 2.83% | | | | 4.18% | 5 | | | | |
| Lipper International Equity Income Funds Category Average6 | | | 5.17% | | | | 13.07% | | | | 16.10% | | | | -0.61% | | | | 5.77% | | | | 0.84% | | | | 2.69% | | | | | |
Performance assumes reinvestment of all dividends and/or distributions before taxes. All performance quoted represents past performance and is no guarantee of future results. Investment return and principal value will fluctuate with market conditions so that when redeemed, shares may be worth more or less than their original cost. Current performance may be lower or higher than the return figures quoted. Returns would have been lower if certain of the Fund’s fees and expenses had not been waived. For the Fund’s most recent month-end performance, visit matthewsasia.com.
| | | | | | | | | | | | | | | | | | | | | | | | | | | | | | | | | | | | | | | | | | | | |
| | | | | | | | | | |
| INCOME DISTRIBUTION HISTORY | | | | | | | | | | | | | | | | | | | | | | | | | | | | |
| | | 2017 | | | | | | 2016 | |
| | | Q1 | | | Q2 | | | Q3 | | | Q4 | | | Total | | | | | | Q1 | | | Q2 | | | Q3 | | | Q4 | | | Total | |
| Investor (MAPIX) | | $ | 0.02 | | | $ | 0.15 | | | | n.a. | | | | n.a. | | | | n.a. | | | | | | | $ | 0.01 | | | $ | 0.19 | | | $ | 0.06 | | | $ | 0.04 | | | $ | 0.29 | |
| Inst’l (MIPIX) | | $ | 0.03 | | | $ | 0.15 | | | | n.a. | | | | n.a. | | | | n.a. | | | | | | | $ | 0.02 | | | $ | 0.19 | | | $ | 0.07 | | | $ | 0.05 | | | $ | 0.32 | |
Totals may differ by $0.01 due to rounding and a return of capital. For distribution history please visit matthewsasia.com.
| | | | |
30-DAY YIELD: 1.46% (Investor Class) 1.58% (Institutional Class) The 30-Day Yield represents net investment income earned by the Fund over the 30-day period ended 6/30/17, expressed as an annual percentage rate based on the Fund’s share price at the end of the 30-day period. The 30-Day Yield should be regarded as an estimate of the Fund’s rate of investment income, and it may not equal the Fund’s actual income distribution rate. Source: BNY Mellon Investment Servicing (US) Inc. | | | | DIVIDEND YIELD: 2.66% The dividend yield (trailing) for the portfolio is the weighted average sum of the dividends paid by each equity security held by the Fund over the 12 months ended 6/30/17 divided by the current price of each equity as of 6/30/17. The annualized dividend yield for the Fund is for the equity-only portion of the portfolio. Please note that this is based on gross equity portfolio holdings and does not reflect the actual yield an investor in the Fund would receive. Past yields are no guarantee of future yields. Source: FactSet Research Systems, Bloomberg, MICM. |
GROWTH OF A $10,000 INVESTMENT SINCE INCEPTION—INVESTOR CLASS
Plotted monthly. The performance data and graph do not reflect the deduction of taxes that a shareholder would pay on dividends, capital gains distributions or redemption of Fund shares. Values are in US$.
| | 4 | It is not possible to invest directly in an index. Source: Index data from Morgan Stanley Capital International and Bloomberg; total return calculations performed by BNY Mellon Investment Servicing (US) Inc. Please see page 91 for index definition. |
| | 5 | Calculated from 10/31/06. |
| | 6 | The Lipper Category Average does not reflect sales charges and is based on total return, including reinvestment of dividends and capital gains for the stated periods. |
| | | | | | | | |
| | | | |
| TOP TEN HOLDINGS7 | | | | | | | |
| | | Sector | | Country | | % of Net Assets | |
| Minth Group, Ltd. | | Consumer Discretionary | | China/Hong Kong | | | 4.1% | |
| HSBC Holdings PLC | | Financials | | China/Hong Kong | | | 2.9% | |
| Shenzhou International Group Holdings, Ltd. | | Consumer Discretionary | | China/Hong Kong | | | 2.8% | |
| Mitsubishi UFJ Financial Group, Inc. | | Financials | | Japan | | | 2.8% | |
| LG Chem, Ltd., Pfd. | | Materials | | South Korea | | | 2.7% | |
| Sumitomo Mitsui Financial Group, Inc. | | Financials | | Japan | | | 2.7% | |
| Ping An Insurance Group Co. of China, Ltd. | | Financials | | China/Hong Kong | | | 2.5% | |
| Hyundai Mobis Co., Ltd. | | Consumer Discretionary | | South Korea | | | 2.5% | |
| Samsung Electronics Co., Ltd., Pfd. | | Information Technology | | South Korea | | | 2.5% | |
| Midea Group Co., Ltd. | | Consumer Discretionary | | China/Hong Kong | | | 2.4% | |
| % OF ASSETS IN TOP TEN | | | | | | | 27.9% | |
| | 7 | Holdings may combine more than one security from same issuer and related depositary receipts. |
Matthews Asia Dividend Fund
Portfolio Manager Commentary (unaudited) (continued)
insurance businesses in China, has been benefiting from rising affluence in China and has focused on growing its business. Shareholder returns were not among its top priorities. After our recent interactions with the firm, however, management sent a clear message that the company is now in a position to deliver both growth and shareholder returns via higher dividend payouts. As the interest rate yield curve in China is steepening with the central bank’s measures to tighten liquidity, including squeezing out “rogue players” in the insurance market, large players like Ping An are likely to see both higher investment returns and improving competitive conditions. The initiation in Ping An Insurance, alongside a few other new positions, was partially funded by exiting our positions in Jiangsu Expressway and PICC Property & Casualty, whose business fundamentals look less attractive today.
Outlook:
After two years of disappointing earnings, Asian companies delivered both strong positive earnings-per-share growth and free cash flow growth during the first quarter of the year. Notwithstanding strong year-to-date share performance, valuations for the region remain at long-term averages. As managers of a total-return dividend strategy, we believe Asian companies today are better-positioned to deliver both attractive dividend yield and higher dividend growth.
| | | | |
| |
| COUNTRY ALLOCATION (%)8,9 | |
| China/Hong Kong | | | 33.3 | |
| Japan | | | 26.8 | |
| South Korea | | | 13.8 | |
| Singapore | | | 7.5 | |
| India | | | 4.4 | |
| Taiwan | | | 2.7 | |
| Indonesia | | | 2.6 | |
| Thailand | | | 2.1 | |
| Australia | | | 1.4 | |
| Vietnam | | | 1.4 | |
| Luxembourg | | | 1.4 | |
| Philippines | | | 1.0 | |
| Cash and Other Assets, Less Liabilities | | | 1.6 | |
| | | | |
| SECTOR ALLOCATION (%)9 | |
| Consumer Discretionary | | | 20.3 | |
| Consumer Staples | | | 20.0 | |
| Financials | | | 18.9 | |
| Industrials | | | 10.3 | |
| Information Technology | | | 6.5 | |
| Telecommunication Services | | | 5.7 | |
| Energy | | | 4.2 | |
| Real Estate | | | 3.8 | |
| Materials | | | 3.7 | |
| Health Care | | | 2.7 | |
| Utilities | | | 2.3 | |
| Cash and Other Assets, Less Liabilities | | | 1.6 | |
| | | | |
| MARKET CAP EXPOSURE (%)9 | |
| Mega Cap (over $25B) | | | 38.2 | |
| Large Cap ($10B–$25B) | | | 23.6 | |
| Mid Cap ($3B–10B) | | | 23.7 | |
| Small Cap (under $3B) | | | 13.0 | |
| Cash and Other Assets, Less Liabilities | | | 1.6 | |
| 8 | Not all countries where the Fund may invest are included in the benchmark index. |
| 9 | Source: FactSet Research Systems. Percentage values in data are rounded to the nearest tenth of one percent; the values may not sum to 100% due to rounding. |
| | | | |
| matthewsasia.com | 800.789.ASIA | | | 23 | |
Matthews Asia Dividend Fund
June 30, 2017
Schedule of Investmentsa (unaudited)
COMMON EQUITIES: 93.3%
| | | | | | | | |
| | | Shares | | | Value | |
| CHINA/HONG KONG: 33.3% | | | | | | | | |
Minth Group, Ltd.† | | | 57,319,000 | | | | $242,821,512 | |
Shenzhou International Group Holdings, Ltd. | | | 25,854,000 | | | | 169,999,690 | |
Ping An Insurance Group Co. of China, Ltd. H Shares | | | 23,135,500 | | | | 152,402,772 | |
Midea Group Co., Ltd. A Shares | | | 22,819,730 | | | | 144,858,326 | |
HSBC Holdings PLC | | | 14,318,000 | | | | 133,019,814 | |
China Petroleum & Chemical Corp. H Shares | | | 168,640,000 | | | | 132,045,415 | |
Sands China, Ltd. | | | 27,533,600 | | | | 126,036,153 | |
Kweichow Moutai Co., Ltd. A Shares | | | 1,657,292 | | | | 115,391,551 | |
China Construction Bank Corp. H Shares | | | 131,449,000 | | | | 102,220,835 | |
China Gas Holdings, Ltd. | | | 47,510,000 | | | | 95,915,068 | |
Fuyao Glass Industry Group Co., Ltd. H Shares b | | | 21,248,000 | | | | 81,339,958 | |
China Mobile, Ltd. ADR | | | 1,509,825 | | | | 80,156,609 | |
Yuexiu Transport Infrastructure, Ltd.† | | | 92,646,000 | | | | 66,443,763 | |
Far East Horizon, Ltd. | | | 67,294,000 | | | | 58,705,627 | |
Dairy Farm International Holdings, Ltd. | | | 7,424,400 | | | | 58,504,272 | |
Café de Coral Holdings, Ltd. | | | 17,330,000 | | | | 56,141,373 | |
Henan Shuanghui Investment & Development Co., Ltd. A Shares | | | 13,214,900 | | | | 46,294,546 | |
HKBN, Ltd. | | | 45,415,623 | | | | 45,449,152 | |
HSBC Holdings PLC ADR | | | 855,800 | | | | 39,700,562 | |
China Conch Venture Holdings, Ltd. | | | 19,200,500 | | | | 35,151,536 | |
China Petroleum & Chemical Corp. ADR | | | 153,000 | | | | 12,025,800 | |
| | | | | | | | |
Total China/Hong Kong | | | | | | | 1,994,624,334 | |
| | | | | | | | |
| | | | | | | | |
| JAPAN: 26.8% | | | | | | | | |
Mitsubishi UFJ Financial Group, Inc. | | | 24,719,900 | | | | 166,736,924 | |
Sumitomo Mitsui Financial Group, Inc. | | | 4,069,100 | | | | 158,875,830 | |
Hoya Corp. | | | 2,370,300 | | | | 123,401,071 | |
Pigeon Corp. | | | 3,077,300 | | | | 111,876,228 | |
Japan Tobacco, Inc. | | | 3,123,500 | | | | 109,785,109 | |
MISUMI Group, Inc. | | | 4,617,000 | | | | 105,819,998 | |
Seven & I Holdings Co., Ltd. | | | 2,162,900 | | | | 89,250,869 | |
Kao Corp. | | | 1,402,700 | | | | 83,402,218 | |
Seven Bank, Ltd. | | | 23,009,400 | | | | 82,499,203 | |
Sohgo Security Services Co., Ltd. | | | 1,758,100 | | | | 79,360,800 | |
Mitsubishi Pencil Co., Ltd. | | | 2,628,400 | | | | 74,183,014 | |
Kyushu Railway Co. | | | 2,142,300 | | | | 69,483,599 | |
Anritsu Corp.† | | | 7,080,000 | | | | 63,970,616 | |
ITOCHU Corp. | | | 4,152,500 | | | | 61,826,275 | |
Fuji Seal International, Inc. | | | 2,138,600 | | | | 59,123,835 | |
NTT DoCoMo, Inc. | | | 2,367,700 | | | | 55,997,729 | |
Nifco, Inc. | | | 689,800 | | | | 37,100,959 | |
LIXIL VIVA Corp. | | | 1,999,900 | | | | 36,041,763 | |
Suntory Beverage & Food, Ltd. | | | 643,600 | | | | 29,915,059 | |
Skylark Co., Ltd. | | | 424,500 | | | | 6,099,101 | |
| | | | | | | | |
Total Japan | | | | | | | 1,604,750,200 | |
| | | | | | | | |
| | | | | | | | |
| SOUTH KOREA: 8.7% | | | | | | | | |
Hyundai Mobis Co., Ltd. | | | 682,941 | | | | 149,298,982 | |
BGF Retail Co., Ltd. | | | 1,531,424 | | | | 135,298,371 | |
KT&G Corp. | | | 978,858 | | | | 100,129,043 | |
Woori Bank | | | 4,866,238 | | | | 78,389,696 | |
Samsung Electronics Co., Ltd. | | | 27,949 | | | | 58,212,788 | |
| | | | | | | | |
Total South Korea | | | | | | | 521,328,880 | |
| | | | | | | | |
| | | | | | | | |
| | | | | | | | |
| | | Shares | | | Value | |
| SINGAPORE: 7.5% | | | | | | | | |
United Overseas Bank, Ltd. | | | 8,576,000 | | | | $143,979,388 | |
CapitaLand, Ltd. | | | 50,207,800 | | | | 127,579,014 | |
Singapore Technologies Engineering, Ltd. | | | 28,460,000 | | | | 76,032,427 | |
CapitaLand Retail China Trust, REIT† | | | 48,605,700 | | | | 57,899,654 | |
Ascendas India Trust† | | | 53,470,700 | | | | 44,031,497 | |
| | | | | | | | |
Total Singapore | | | | | | | 449,521,980 | |
| | | | | | | | |
| | | | | | | | |
| INDIA: 4.4% | | | | | | | | |
ITC, Ltd. | | | 20,701,500 | | | | 103,557,961 | |
Bharti Infratel, Ltd. | | | 17,014,689 | | | | 98,562,084 | |
Gujarat Pipavav Port, Ltd. | | | 21,381,946 | | | | 49,379,677 | |
Shriram City Union Finance, Ltd. | | | 348,532 | | | | 12,854,232 | |
Minda Industries, Ltd. | | | 93,673 | | | | 927,089 | |
| | | | | | | | |
Total India | | | | | | | 265,281,043 | |
| | | | | | | | |
| | | | | | | | |
| TAIWAN: 2.7% | | | | | | | | |
Taiwan Semiconductor Manufacturing Co., Ltd. ADR | | | 3,027,940 | | | | 105,856,782 | |
St. Shine Optical Co., Ltd. | | | 1,965,000 | | | | 41,111,372 | |
Taiwan Semiconductor Manufacturing Co., Ltd. | | | 2,336,469 | | | | 15,963,255 | |
| | | | | | | | |
Total Taiwan | | | | | | | 162,931,409 | |
| | | | | | | | |
| | | | | | | | |
| INDONESIA: 2.6% | | | | | | | | |
PT United Tractors | | | 51,000,100 | | | | 104,968,756 | |
PT Cikarang Listrindob | | | 443,866,500 | | | | 39,965,470 | |
PT Hanjaya Mandala Sampoerna | | | 25,476,200 | | | | 7,340,357 | |
| | | | | | | | |
Total Indonesia | | | | | | | 152,274,583 | |
| | | | | | | | |
| | | | | | | | |
| THAILAND: 2.1% | | | | | | | | |
Thai Beverage Public Co., Ltd. | | | 189,041,400 | | | | 123,578,083 | |
| | | | | | | | |
Total Thailand | | | | | | | 123,578,083 | |
| | | | | | | | |
| | | | | | | | |
| AUSTRALIA: 1.4% | | | | | | | | |
Breville Group, Ltd.† | | | 10,644,019 | | | | 85,484,086 | |
| | | | | | | | |
Total Australia | | | | | | | 85,484,086 | |
| | | | | | | | |
| | | | | | | | |
| VIETNAM: 1.4% | | | | | | | | |
Vietnam Dairy Products JSC | | | 11,887,938 | | | | 82,422,200 | |
| | | | | | | | |
Total Vietnam | | | | | | | 82,422,200 | |
| | | | | | | | |
| | | | | | | | |
| LUXEMBOURG: 1.4% | | | | | | | | |
L’Occitane International SA | | | 35,557,750 | | | | 81,557,941 | |
| | | | | | | | |
Total Luxembourg | | | | | | | 81,557,941 | |
| | | | | | | | |
| | | | | | | | |
| PHILIPPINES: 1.0% | | | | | | | | |
Globe Telecom, Inc. | | | 1,447,730 | | | | 58,758,443 | |
| | | | | | | | |
Total Philippines | | | | | | | 58,758,443 | |
| | | | | | | | |
| | | | | | | | |
| TOTAL COMMON EQUITIES: | | | | 5,582,513,182 | |
| | | | | | | | |
(Cost $4,417,086,648) | | | | | | | | |
Matthews Asia Dividend Fund
June 30, 2017
Schedule of Investmentsa (unaudited) (continued)
PREFERRED EQUITIES: 5.1%
| | | | | | | | |
| | | Shares | | | Value | |
| SOUTH KOREA: 5.1% | | | | | | | | |
LG Chem, Ltd., Pfd. | | | 909,328 | | | | $160,563,145 | |
Samsung Electronics Co., Ltd., Pfd. | | | 90,196 | | | | 147,064,410 | |
| | | | | | | | |
Total South Korea | | | | | | | 307,627,555 | |
| | | | | | | | |
| | | | | | | | |
| TOTAL PREFERRED EQUITIES | | | | 307,627,555 | |
| | | | | | | | |
(Cost $195,924,175) | | | | | | | | |
| | | | | | | | |
| TOTAL INVESTMENTS: 98.4% | | | | 5,890,140,737 | |
(Cost $4,613,010,823C) | | | | | | | | |
| | | | | | | | |
CASH AND OTHER ASSETS,
LESS LIABILITIES : 1.6% | | | | | | | 93,363,674 | |
| | | | | | | | |
| | |
NET ASSETS: 100.0% | | | | | | | $5,983,504,411 | |
| | | | | | | | |
| a | Certain securities were fair valued under the valuation policies approved by the Board of Trustees (Note 2-A). |
| b | Security exempt from registration under Rule 144A of the Securities Act of 1933, as amended. The security may be resold in transactions exempt from registration normally to qualified institutional buyers. The security has been determined to be liquid in accordance with procedures adopted by the Fund’s Board of Directors. At June 30, 2017, the aggregate value is $121,305,428, which is 2.03% of net assets. |
| c | Cost for federal income tax purposes is $4,618,478,562 and net unrealized appreciation consists of: |
| | | | |
Gross unrealized appreciation | | | $1,368,121,068 | |
Gross unrealized depreciation | | | (96,458,893 | ) |
| | | | |
Net unrealized appreciation | | | $1,271,662,175 | |
| | | | |
| † | Affiliated Issuer, as defined under the Investment Company Act of 1940 (ownership of 5% or more of the outstanding voting securities of this issuer) |
| ADR | American Depositary Receipt |
| REIT | Real Estate Investment Trust |
See accompanying notes to financial statements.
| | | | |
| matthewsasia.com | 800.789.ASIA | | | 25 | |
| | | | |
| PORTFOLIO MANAGERS |
| Yu Zhang, CFA | | |
Lead Manager | | | | |
| Sherwood Zhang, CFA | | |
Co-Manager | | | | |
| | |
| FUND FACTS | | | | |
| | | Investor | | Institutional |
Ticker | | MCDFX | | MICDX |
CUSIP | | 577125305 | | 577130735 |
Inception | | 11/30/09 | | 10/29/10 |
NAV | | $16.30 | | $16.30 |
Initial Investment | | $2,500 | | $100,000 |
Gross Expense Ratio1 | | 1.22% | | 1.06% |
Portfolio Statistics | | |
Total # of Positions | | 45 |
Net Assets | | $238.0 million |
Weighted Average Market Cap | | $54.6 billion |
Portfolio Turnover2 | | 72.96% |
Benchmark | | | | |
MSCI China Index |
OBJECTIVE
Total return with an emphasis on providing current income.
STRATEGY
Under normal market conditions, the Fund seeks to achieve its investment objective by investing at least 80% of its total net assets, which include borrowings for investment purposes, in dividend-paying equity securities of companies located in China. China includes its administrative and other districts, such as Hong Kong. The Fund may also invest in convertible debt and equity securities.
Matthews China Dividend Fund
Portfolio Manager Commentary (unaudited)
Period ended June 30, 2017
For the first half of 2017, the Matthews China Dividend Fund returned 17.11% (Investor Class) and 17.19% (Institutional Class) while its benchmark, the MSCI China Index, returned 24.96%. For the quarter ending June 30, 2017, the Fund returned 8.13% (Investor Class) and 8.14% (Institutional Class) compared to the benchmark return of 10.66% over the same period.
Market Environment:
Chinese equities continued to perform well over the second quarter of the year, particularly within the information technology sector as two internet giants, Tencent and Alibaba, reported strong earnings and guidance. During the quarter, the U.S. Federal Reserve also announced an additional interest rate hike, though emerging markets remained stable and China’s currency appreciated to a new high for the year. In late June, global index provider MSCI announced its decision to include a select number of China A-share stocks into its emerging market index, concluding a three-year evaluation. The initial weighting of A-shares in the index will be minimal, representing about 0.73% of the index. The inclusion, however, serves as a vote of confidence in China’s reform efforts and policies toward opening and developing its capital markets. The domestic A-Share market rallied strongly on the back of this news.
Performance Contributors and Detractors:
During the first half of the year, our lower allocation to the information technology sector versus the benchmark was the biggest detractor to our relative performance. While Tencent, China’s leading social media and gaming operator, continued to be the top performer for the second quarter, we maintained a lower allocation to the technology sector as many such companies tend to be lacking in terms of making regular dividend payments. The portfolio also underperformed the benchmark in the second quarter due to its lower allocation in auto-related industries.
Hangzhou Hikvision Digital Technology, a global leader in video surveillance equipment, was another strong performer during the second quarter. It benefited from market excitement over technology it has developed, which is being increasingly adopted into artificial intelligence applications.
In terms of detractors to Fund performance, Guangshen Railway was the largest detractor to performance during the quarter, as it faces greater competition from a newly built high speed railway connecting Hong Kong–Shenzhen–Guangzhou, while its ability to raise ticket prices still lags behind our initial expectation. HKBN, a local Hong Kong telecom operator, was the second-largest detractor to Fund performance as the company failed to deliver on its most recent acquisition, while the market started to worry about pricing competition. We are closely watching both companies and reviewing their portfolio positions.
Notable Changes to Portfolio:
During the second quarter, we initiated another position in the A-share stocks of Midea Group, a leader in manufacturing electrical appliances. With an impressive portfolio of home appliances—ranging from small appliances to larger white goods—the company should be well-poised to benefit from China’s ongoing trend of urbanization. Its acquisition of Kuka, a global leader of industrial robotics, could also provide more upside potential if well-integrated. Within the financials sector, we swapped life insurance provider AIA group for Ping An Insurance Group, as we believe Ping An could deliver stronger earnings growth while also being more attractively valued compared to AIA.
(continued)
| 1 | Prospectus expense ratio. |
| 2 | The lesser of fiscal year 2016 long-term purchase costs or sales proceeds divided by the average monthly market value of long-term securities. |
| | | | | | | | | | | | | | | | | | | | | | | | | | | | |
| | |
| PERFORMANCE AS OF JUNE 30, 2017 | | | | |
| | | | | | | | | | | | Average Annual Total Returns | | | | |
| | | 3 Months | | | YTD | | | 1 Year | | | 3 Year | | | 5 Year | | | Since
Inception | | | Inception
Date | |
| Investor Class (MCDFX) | | | 8.13% | | | | 17.11% | | | | 24.88% | | | | 11.40% | | | | 12.46% | | | | 10.39% | | | | 11/30/09 | |
| Institutional Class (MICDX) | | | 8.14% | | | | 17.19% | | | | 25.05% | | | | 11.58% | | | | 12.68% | | | | 9.08% | | | | 10/29/10 | |
| MSCI China Index3 | | | 10.66% | | | | 24.96% | | | | 32.34% | | | | 8.29% | | | | 9.20% | | | | 4.46% | 4 | | | | |
| Lipper China Region Funds Category Average5 | | | 8.83% | | | | 21.85% | | | | 25.75% | | | | 6.93% | | | | 8.79% | | | | 5.04% | | | | | |
Performance assumes reinvestment of all dividends and/or distributions before taxes. All performance quoted represents past performance and is no guarantee of future results. Investment return and principal value will fluctuate with market conditions so that when redeemed, shares may be worth more or less than their original cost. Current performance may be lower or higher than the return figures quoted. For the Fund’s most recent month-end performance, visit matthewsasia.com.
| | | | | | | | | | | | | | | | | | | | | | | | | | | | |
| | | | | | |
| INCOME DISTRIBUTION HISTORY | | | | | | | | | | | | | | | | |
| | | 2017 | | | | | | 2016 | |
| | | June | | | December | | | Total | | | | | | June | | | December | | | Total | |
| Investor (MCDFX) | | $ | 0.20 | | | | n.a. | | | | n.a. | | | | | | | $ | 0.21 | | | $ | 0.07 | | | $ | 0.28 | |
| Inst’l (MICDX) | | $ | 0.21 | | | | n.a. | | | | n.a. | | | | | | | $ | 0.22 | | | $ | 0.08 | | | $ | 0.30 | |
Note: This table does not include capital gains distributions. Totals may differ by $0.01 due to rounding. For income distribution history, visit matthewsasia.com.
| | | | |
30-DAY YIELD: 2.13% (Investor Class) 2.28% (Institutional Class) The 30-Day Yield represents net investment income earned by the Fund over the 30-day period ended 6/30/17, expressed as an annual percentage rate based on the Fund’s share price at the end of the 30-day period. The 30-Day Yield should be regarded as an estimate of the Fund’s rate of investment income, and it may not equal the Fund’s actual income distribution rate. Source: BNY Mellon Investment Servicing (US) Inc. | | | | DIVIDEND YIELD: 2.92% The dividend yield (trailing) for the portfolio is the weighted average sum of the dividends paid by each equity security held by the Fund over the 12 months ended 6/30/17 divided by the current price of each equity as of 6/30/17. The annualized dividend yield for the Fund is for the equity-only portion of the portfolio. Please note that this is based on gross equity portfolio holdings and does not reflect the actual yield an investor in the Fund would receive. Past yields are no guarantee of future yields. Source: FactSet Research Systems, Bloomberg, MICM. |
GROWTH OF A $10,000 INVESTMENT SINCE INCEPTION—INVESTOR CLASS
Plotted monthly. The performance data and graph do not reflect the deduction of taxes that a shareholder would pay on dividends, capital gains distributions or redemption of Fund shares. Values are in US$.
| | 3 | It is not possible to invest directly in an index. Source: Index data from Morgan Stanley Capital International and Bloomberg; total return calculations performed by BNY Mellon Investment Servicing (US) Inc. Please see page 91 for index definition. |
| | 4 | Calculated from 11/30/09. |
| | 5 | The Lipper Category Average does not reflect sales charges and is based on total return, including reinvestment of dividends and capital gains for the stated periods. |
| | | | | | | | |
| | | | |
| TOP TEN HOLDINGS6 | | | | | | | |
| | | Sector | | | | % of Net Assets | |
| Tencent Holdings, Ltd. | | Information Technology | | | | | 6.2% | |
| HSBC Holdings PLC | | Financials | | | | | 4.0% | |
| Midea Group Co., Ltd. | | Consumer Discretionary | | | | | 3.5% | |
| WH Group, Ltd. | | Consumer Staples | | | | | 3.2% | |
| Ping An Insurance Group Co. of China, Ltd. | | Financials | | | | | 3.1% | |
| China Petroleum & Chemical Corp. | | Energy | | | | | 2.9% | |
| China Everbright, Ltd. | | Financials | | | | | 2.9% | |
| Chow Tai Fook Jewellery Group, Ltd. | | Consumer Discretionary | | | | | 2.9% | |
| PICC Property & Casualty Co., Ltd. | | Financials | | | | | 2.9% | |
| Bank of China, Ltd. | | Financials | | | | | 2.8% | |
| % OF ASSETS IN TOP TEN | | | | | | | 34.4% | |
| | 6 | Holdings may combine more than one security from same issuer and related depositary receipts. |
| | | | |
| matthewsasia.com | 800.789.ASIA | | | 27 | |
| | | | |
| |
| COUNTRY ALLOCATION (%)7,8 | |
| China/Hong Kong | | | 92.1 | |
| Taiwan | | | 2.6 | |
| Singapore | | | 2.0 | |
| Cash and Other Assets, Less Liabilities | | | 3.3 | |
| | | | |
SECTOR ALLOCATION (%)8 | |
| Financials | | | 18.5 | |
| Consumer Discretionary | | | 17.3 | |
| Information Technology | | | 16.2 | |
| Industrials | | | 12.6 | |
| Telecommunication Services | | | 7.5 | |
| Health Care | | | 7.2 | |
| Consumer Staples | | | 6.3 | |
| Real Estate | | | 3.9 | |
| Energy | | | 2.9 | |
| Materials | | | 2.3 | |
| Utilities | | | 2.0 | |
| Cash and Other Assets, Less Liabilities | | | 3.3 | |
| | | | |
MARKET CAP EXPOSURE (%)8 | |
| Mega Cap (over $25B) | | | 30.2 | |
| Large Cap ($10B–$25B) | | | 13.0 | |
| Mid Cap ($3B–10B) | | | 22.7 | |
| Small Cap (under $3B) | | | 30.9 | |
| Cash and Other Assets, Less Liabilities | | | 3.3 | |
| 7 | Not all countries where the Fund may invest are included in the benchmark index. |
| 8 | Source: FactSet Research Systems. Percentage values in data are rounded to the nearest tenth of one percent; the values may not sum to 100% due to rounding. |
Matthews China Dividend Fund
Portfolio Manager Commentary (unaudited) (continued)
We also exited China Machinery Engineering during the quarter. While we believe the company appears to benefit from China’s so-called “One Belt, One Road” development strategy to push infrastructure investment in developing countries, increasing domestic competition may negatively impact profitability.
Outlook:
For the remainder of the year, we believe the market will again turn its attention to China’s headline GDP growth figure, which will be compared to the high base set by last year’s strong second half. We believe GDP headline growth has more impact on short term sentiment than it does on long-term investments. In the meantime, U.S.-China tensions could also get further attention due to trade and other geopolitical issues. As long as China remains committed to globalization and open trade, we believe it will present more investment opportunities, rather than becoming a casualty of a trade war.
Matthews China Dividend Fund
June 30, 2017
Schedule of Investmentsa (unaudited)
COMMON EQUITIES: 96.7%
| | | | | | | | |
| | | Shares | | | Value | |
| FINANCIALS: 18.5% | | | | | | | | |
Banks: 8.8% | | | | | | | | |
HSBC Holdings PLC | | | 1,031,600 | | | | $9,583,967 | |
Bank of China, Ltd. H Shares | | | 13,509,000 | | | | 6,624,366 | |
Dah Sing Financial Holdings, Ltd. | | | 578,000 | | | | 4,851,729 | |
| | | | | | | | |
| | | | | | | 21,060,062 | |
| | | | | | | | |
Insurance: 6.8% | | | | | | | | |
Ping An Insurance Group Co. of China, Ltd. H Shares | | | 1,136,500 | | | | 7,486,579 | |
PICC Property & Casualty Co., Ltd. H Shares | | | 4,110,000 | | | | 6,864,149 | |
Fanhua, Inc. ADR | | | 213,900 | | | | 1,830,984 | |
| | | | | | | | |
| | | | | | | 16,181,712 | |
| | | | | | | | |
Capital Markets: 2.9% | | | | | | | | |
China Everbright, Ltd. | | | 3,180,000 | | | | 6,916,204 | |
| | | | | | | | |
Total Financials | | | | | | | 44,157,978 | |
| | | | | | | | |
| | | | | | | | |
| CONSUMER DISCRETIONARY: 17.3% | | | | | | | | |
Hotels, Restaurants & Leisure: 4.1% | | | | | | | | |
China International Travel Service Corp., Ltd. A Shares | | | 1,153,360 | | | | 5,126,093 | |
Shanghai Jin Jiang International Hotels Group Co., Ltd. H Shares | | | 14,574,000 | | | | 4,553,790 | |
| | | | | | | | |
| | | | | | | 9,679,883 | |
| | | | | | | | |
Diversified Consumer Services: 3.6% | | | | | | | | |
China Maple Leaf Educational Systems, Ltd. | | | 5,920,000 | | | | 4,836,261 | |
Tarena International, Inc. ADR | | | 207,300 | | | | 3,712,743 | |
| | | | | | | | |
| | | | | | | 8,549,004 | |
| | | | | | | | |
Household Durables: 3.5% | | | | | | | | |
Midea Group Co., Ltd. A Shares | | | 1,302,411 | | | | 8,267,630 | |
| | | | | | | | |
| | | | | | | | |
Specialty Retail: 2.9% | | | | | | | | |
Chow Tai Fook Jewellery Group, Ltd. | | | 6,490,600 | | | | 6,876,665 | |
| | | | | | | | |
| | | | | | | | |
Auto Components: 1.7% | | | | | | | | |
Weifu High-Technology Group Co., Ltd. B Shares | | | 1,725,512 | | | | 4,084,706 | |
| | | | | | | | |
| | | | | | | | |
Textiles, Apparel & Luxury Goods: 1.5% | | | | | | | | |
Shenzhou International Group Holdings, Ltd. | | | 563,000 | | | | 3,701,935 | |
| | | | | | | | |
Total Consumer Discretionary | | | | | | | 41,159,823 | |
| | | | | | | | |
| | | | | | | | |
| INFORMATION TECHNOLOGY: 16.2% | | | | | | | | |
Internet Software & Services: 8.7% | | | | | | | | |
Tencent Holdings, Ltd. | | | 412,100 | | | | 14,784,071 | |
NetEase, Inc. ADR | | | 20,200 | | | | 6,072,726 | |
| | | | | | | | |
| | | | | | | 20,856,797 | |
| | | | | | | | |
Electronic Equipment, Instruments & Components: 2.9% | |
Hangzhou Hikvision Digital Technology Co., Ltd. A Shares | | | 1,182,800 | | | | 5,640,944 | |
Aurora Corp. | | | 603,000 | | | | 1,174,992 | |
| | | | | | | | |
| | | | 6,815,936 | |
| | | | | | | | |
| | | | | | | | |
IT Services: 2.6% | | | | | | | | |
TravelSky Technology, Ltd. H Shares | | | 2,099,000 | | | | 6,182,611 | |
| | | | | | | | |
| | | | | | | | |
Semiconductors & Semiconductor Equipment: 2.0% | | | | | |
Hua Hong Semiconductor, Ltd.c | | | 3,462,000 | | | | 4,695,698 | |
| | | | | | | | |
Total Information Technology | | | | | | | 38,551,042 | |
| | | | | | | | |
| | | | | | | | |
| | | Shares | | | Value | |
| INDUSTRIALS: 12.6% | | | | | | | | |
Transportation Infrastructure: 5.9% | | | | | | | | |
Guangdong Provincial Expressway Development Co., Ltd. B Shares | | | 8,325,006 | | | | $6,301,774 | |
Shanghai International Airport Co., Ltd. A Shares | | | 825,005 | | | | 4,540,676 | |
Qingdao Port International Co., Ltd. H Sharesc | | | 5,546,000 | | | | 3,186,346 | |
| | | | | | | | |
| | | | | | | 14,028,796 | |
| | | | | | | | |
Marine: 2.0% | | | | | | | | |
SITC International Holdings Co., Ltd. | | | 6,144,000 | | | | 4,828,732 | |
| | | | | | | | |
| | | | | | | | |
Machinery: 1.6% | | | | | | | | |
China Conch Venture Holdings, Ltd. | | | 2,033,500 | | | | 3,722,854 | |
| | | | | | | | |
| | | | | | | | |
Road & Rail: 1.4% | | | | | | | | |
Guangshen Railway Co., Ltd. H Shares | | | 5,854,000 | | | | 2,901,151 | |
Guangshen Railway Co., Ltd. ADR | | | 14,400 | | | | 357,984 | |
| | | | | | | | |
| | | | | | | 3,259,135 | |
| | | | | | | | |
Electrical Equipment: 1.0% | | | | | | | | |
Xin Point Holdings, Ltd.b | | | 5,415,000 | | | | 2,385,875 | |
| | | | | | | | |
| | | | | | | | |
Professional Services: 0.7% | | | | | | | | |
Sporton International, Inc. | | | 343,000 | | | | 1,736,423 | |
| | | | | | | | |
Total Industrials | | | | | | | 29,961,815 | |
| | | | | | | | |
| | | | | | | | |
| TELECOMMUNICATION SERVICES: 7.5% | | | | | | | | |
Diversified Telecommunication Services: 4.8% | | | | | |
HKBN, Ltd. | | | 5,839,957 | | | | 5,844,268 | |
CITIC Telecom International Holdings, Ltd. | | | 17,186,000 | | | | 5,501,277 | |
| | | | | | | | |
| | | | | | | 11,345,545 | |
| | | | | | | | |
Wireless Telecommunication Services: 2.7% | | | | | | | | |
China Mobile, Ltd. ADR | | | 121,330 | | | | 6,441,410 | |
| | | | | | | | |
Total Telecommunication Services | | | | | | | 17,786,955 | |
| | | | | | | | |
| | | | | | | | |
| HEALTH CARE: 7.2% | | | | | | | | |
Health Care Providers & Services: 3.5% | | | | | |
China National Accord Medicines Corp., Ltd. B Shares | | | 733,413 | | | | 4,270,403 | |
Universal Medical Financial & Technical Advisory Services Co., Ltd.c | | | 5,097,000 | | | | 4,073,452 | |
| | | | | | | | |
| | | | | | | 8,343,855 | |
| | | | | | | | |
Health Care Equipment & Supplies: 2.2% | | | | | |
Shandong Weigao Group Medical Polymer Co., Ltd. H Shares | | | 6,568,000 | | | | 5,152,781 | |
| | | | | | | | |
| | | | | | | | |
Pharmaceuticals: 1.5% | | | | | | | | |
Luye Pharma Group, Ltd. | | | 6,589,500 | | | | 3,612,509 | |
| | | | | | | | |
Total Health Care | | | | | | | 17,109,145 | |
| | | | | | | | |
| | | | | | | | |
| CONSUMER STAPLES: 6.3% | | | | | | | | |
Food Products: 3.2% | | | | | | | | |
WH Group, Ltd.c | | | 7,652,000 | | | | 7,726,773 | |
| | | | | | | | |
| | | | | | | | |
Food & Staples Retailing: 3.1% | | | | | | | | |
Shanghai Bailian Group Co., Ltd. B Sharesb | | | 2,717,024 | | | | 4,110,857 | |
Taiwan FamilyMart Co., Ltd. | | | 487,000 | | | | 3,274,940 | |
| | | | | | | | |
| | | | | | | 7,385,797 | |
| | | | | | | | |
Total Consumer Staples | | | | | | | 15,112,570 | |
| | | | | | | | |
| | | | |
| matthewsasia.com | 800.789.ASIA | | | 29 | |
Matthews China Dividend Fund
June 30, 2017
Schedule of Investmentsa (unaudited) (continued)
COMMON EQUITIES (continued)
| | | | | | | | |
| | | Shares | | | Value | |
| REAL ESTATE: 3.9% | | | | | | | | |
Equity REITs: 2.1% | | | | | | | | |
CapitaLand Retail China Trust, REIT | | | 4,087,100 | | | | $4,868,599 | |
| | | | | | | | |
| | | | | | | | |
Real Estate Management & Development: 1.8% | |
Red Star Macalline Group Corp., Ltd. H Sharesc | | | 4,213,600 | | | | 4,317,517 | |
| | | | | | | | |
Total Real Estate | | | | | | | 9,186,116 | |
| | | | | | | | |
| | | | | | | | |
| ENERGY: 2.9% | | | | | | | | |
Oil, Gas & Consumable Fuels: 2.9% | | | | | | | | |
China Petroleum & Chemical Corp. H Shares | | | 8,926,000 | | | | 6,989,074 | |
| | | | | | | | |
Total Energy | | | | | | | 6,989,074 | |
| | | | | | | | |
| | | | | | | | |
| MATERIALS: 2.3% | | | | | | | | |
Containers & Packaging: 2.3% | | | | | | | | |
Greatview Aseptic Packaging Co., Ltd. | | | 8,609,000 | | | | 5,369,803 | |
| | | | | | | | |
Total Materials | | | | | | | 5,369,803 | |
| | | | | | | | |
| | | | | | | | |
| UTILITIES: 2.0% | | | | | | | | |
Gas Utilities: 2.0% | | | | | | | | |
China Gas Holdings, Ltd. | | | 2,394,000 | | | | 4,833,102 | |
| | | | | | | | |
Total Utilities | | | | | | | 4,833,102 | |
| | | | | | | | |
| | | | | | | | |
| TOTAL INVESTMENTS: 96.7% | | | | | | | 230,217,423 | |
(Cost $209,111,394d) | | | | | | | | |
| | | | | | | | |
CASH AND OTHER ASSETS,
LESS LIABILITIES: 3.3% | | | | | | | 7,761,717 | |
| | | | | | | | |
| | |
NET ASSETS: 100.0% | | | | | | | $237,979,140 | |
| | | | | | | | |
| a | Certain securities were fair valued under the valuation policies approved by the Board of Trustees (Note 2-A). |
| b | Non-income producing security. |
| c | Security exempt from registration under Rule 144A of the Securities Act of 1933, as amended. The security may be resold in transactions exempt from registration normally to qualified institutional buyers. The security has been determined to be liquid in accordance with procedures adopted by the Fund’s Board of Directors. At June 30, 2017, the aggregate value is $23,999,786, which is 10.08% of net assets. |
| d | Cost for federal income tax purposes is $209,157,094 and net unrealized appreciation consists of: |
| | | | |
Gross unrealized appreciation | | | $27,886,219 | |
Gross unrealized depreciation | | | (6,825,890 | ) |
| | | | |
Net unrealized appreciation | | | $21,060,329 | |
| | | | |
| ADR | American Depositary Receipt |
| REIT | Real Estate Investment Trust |
See accompanying notes to financial statements.

| | | | |
| PORTFOLIO MANAGERS |
| Beini Zhou, CFA |
Lead Manager |
| Michael B. Han, CFA |
Co-Manager |
| | |
| FUND FACTS | | | | |
| | | Investor | | Institutional |
Ticker | | MAVRX | | MAVAX |
CUSIP | | 577130693 | | 577130685 |
Inception | | 11/30/15 | | 11/30/15 |
NAV | | $12.11 | | $11.99 |
Initial Investment | | $2,500 | | $100,000 |
Gross Expense Ratio1 | | 11.48% | | 11.26% |
After Fee Waiver and Reimbursement2 | | 1.50% | | 1.25% |
Portfolio Statistics | | | | |
Total # of Positions | | 43 |
Net Assets | | $20.1 million |
Weighted Average Market Cap | | $25.5 billion |
Portfolio Turnover3 | | 19.60% |
Benchmark | | | | |
MSCI AC Asia ex Japan Index |
OBJECTIVE
Long term capital appreciation.
STRATEGY
Under normal market conditions, the Fund seeks to achieve its investment objective by investing at least 80% of its net assets, which include borrowings for investment purposes, in common stock, preferred stock and other equity securities, and convertible securities of companies located in Asia. The Fund seeks to create an investable universe of value companies that it believes trade at market values with discounts to their intrinsic value, have strong financial and market positions, have strong management and are oriented to creating value for their shareholders. Matthews assesses companies within this universe according to each of these factors.
Matthews Asia Value Fund
Portfolio Manager Commentary (unaudited)
Period ended June 30, 2017
For the first half of 2017, the Matthews Asia Value Fund returned 21.59% (Investor Class) and 21.73% (Institutional Class) while its benchmark, the MSCI All Country Asia ex Japan Index, returned 22.93%. For the quarter ending June 30, 2017, the Fund returned 10.49% (Investor Class) and 10.61% (Institutional Class) compared to the benchmark return of 8.40% over the same period.
Market Environment:
The second quarter of the year was relatively uneventful compared with the general market movements of recent years. It might be hard to believe but Brexit took place a year ago, followed immediately by a global market plunge. In contrast to the panic that ensued back then, Asia’s emerging markets, led by stocks in the information technology sector, continued to move upward in the second quarter. These markets shook off warning signs, including lingering concerns about China’s growth and its currency, nuclear tensions on the Korean peninsula, uncertainty over Brexit in Europe and the as yet untested young Trump administration. As widely expected, the U.S. Federal Reserve raised its benchmark interest rate in June for the second time this year, though most Asian currencies are still up against the U.S dollar year to date.
Performance Contributors and Detractors:
Yamada Consulting, a management consulting firm serving mostly small and midsize enterprises in Japan, was by far the biggest contributor during the quarter. A growing portion of its business comes from higher-margin mergers and acquisition advisory work, which will continue to be a booming area in Japan due to a lack of succession planning among family businesses set up decades ago. Yamada Consulting reported good full-year numbers during the quarter. In Yamada, we believed we had found the rare alignment of a good shareholder-return policy at a bargain valuation—which led this to be our top position in the Fund. We initiated our position in early 2016 at 6x earnings, before interest and taxes (EBIT)*, and we were pleased with the share price run over the quarter. Its share price remained at less than 10x EBIT—a reasonable valuation relative to what we see as the company’s growth prospects.
In Korea, both Samsung Electronics and Samsung SDI did well during the quarter. Samsung Electronics is the flagship electronics company within the Samsung group. Moving past its Galaxy Note 7 smartphone recall late last year, it successfully launched its new smartphones series (Galaxy S8) in April this year, and it expects to continue dominating the booming memory-chip market. Samsung SDI, the Samsung Group’s battery company, is one of the biggest battery suppliers for electric vehicles globally along with LG Chemical and Panasonic. Samsung SDI’s share price has rebounded strongly after a poor 2016 as the company is expected to finally turn profitable later this year. During the quarter, we saw few significant detractors. However, Taro pharmaceutical was among the relative laggards. The generic drug maker—a subsidiary of India’s Sun Pharmaceutical Industries—continued to experience pricing pressure in its main market, the U.S. Its absolute negative contribution to the portfolio, however, was minimal and we continue to own the stock as we believe its depressed share price has already factored in news of the pricing challenges.
| * | Earnings Before Interest and Tax (EBIT): Earnings before interest and tax is an indicator of a company’s profitability, often calculated as revenue minus expenses, excluding tax and interest. |
(continued)
| 1 | Prospectus expense ratios. |
| 2 | Matthews has contractually agreed (i) to waive fees and reimburse expenses to the extent needed to limit Total Annual Fund Operating Expenses (excluding Rule 12b-1 fees, taxes, interest, brokerage commissions, short sale dividend expenses, expenses incurred in connection with any merger or reorganization or extraordinary expenses such as litigation) of the Institutional Class to 1.25% first by waiving class specific expenses (i.e., shareholder service fees specific to a particular class) of the Institutional Class and then, to the extent necessary, by waiving non-class specific expenses of the Institutional Class, and (ii) if any Fund-wide expenses (i.e., expenses that apply to both the Institutional Class and the Investor Class) are waived for the Institutional Class to maintain the 1.25% expense limitation, to waive an equal amount (in annual percentage terms) of those same expenses for the Investor Class. The Total Annual Fund Operating Expenses After Fee Waiver and Expense Reimbursement for the Investor Class may vary from year to year and will in some years exceed 1.25%. If the operating expenses fall below the expense limitation in a year within three years after Matthews has made a waiver or reimbursement, the Fund may reimburse Matthews up to an amount that does not cause the expenses for that year to exceed the lesser of (i) the expense limitation applicable at the time of that fee waiver and/or expense reimbursement or (ii) the expense limitation in effect at the time of recoupment. This agreement will remain in place until April 30, 2018 and may be terminated at any time by the Board of Trustees on behalf of the Fund on 60 days’ written notice to Matthews. Matthews may decline to renew this agreement by written notice to the Trust at least 30 days before its annual expiration date. |
| 3 | The lesser of fiscal year 2016 long-term purchase costs or sales proceeds divided by the average monthly market value of long-term securities. |
| | | | |
| matthewsasia.com | 800.789.ASIA | | | 31 | |
| | | | | | | | | | | | | | | | | | | | |
| | | | | | |
| PERFORMANCE AS OF JUNE 30, 2017 | | | | | | | | | | | | | | | |
| | | | | | | | | | | | Average Annual
Total Returns | | | | |
| | | 3 Months | | | YTD | | | 1 Year | | | Since Inception | | | Inception
Date | |
| Investor Class (MAVRX) | | | 10.49% | | | | 21.59% | | | | 26.51% | | | | 17.36% | | | | 11/30/15 | |
| Institutional Class (MAVAX) | | | 10.61% | | | | 21.73% | | | | 26.87% | | | | 17.69% | | | | 11/30/15 | |
| MSCI AC Asia ex Japan Index4 | | | 8.40% | | | | 22.93% | | | | 27.06% | | | | 17.71% | | | | | |
| Lipper Pacific Region Funds Category Average5 | | | 6.61% | | | | 17.21% | | | | 18.61% | | | | 13.26% | | | | | |
Performance assumes reinvestment of all dividends and/or distributions before taxes. All performance quoted represents past performance and is no guarantee of future results. Investment return and principal value will fluctuate with market conditions so that when redeemed, shares may be worth more or less than their original cost. Current performance may be lower or higher than the return figures quoted. Returns would have been lower if certain of the Fund’s fees and expenses had not been waived. For the Fund’s most recent month-end performance visit matthewsasia.com.
GROWTH OF A $10,000 INVESTMENT SINCE INCEPTION—INVESTOR CLASS
Plotted monthly. The performance data and graph do not reflect the deduction of taxes that a shareholder would pay on dividends, capital gain distributions or redemption of Fund shares. Values are in US$.
| | 4 | It is not possible to invest directly in an index. Source: Index data from Morgan Stanley Capital International and Bloomberg; total return calculations performed by BNY Mellon Investment Servicing (US) Inc. Please see page 91 for index definition. |
| | 5 | The Lipper Category Average does not reflect sales charges and is based on total return, including reinvestment of dividends and capital gains for the stated periods. |
| | | | | | | | |
| | | | |
| TOP TEN HOLDINGS6 | | | | | | | |
| | | Sector | | Country | | % of Net Assets | |
| YAMADA Consulting Group Co., Ltd. | | Industrials | | Japan | | | 5.7% | |
| Baidu, Inc. | | Information Technology | | China/Hong Kong | | | 5.7% | |
| Samsung Electronics Co., Ltd., Pfd. | | Information Technology | | South Korea | | | 4.6% | |
| MPHB Capital BHD | | Financials | | Malaysia | | | 3.6% | |
| CK Hutchison Holdings, Ltd. | | Industrials | | China/Hong Kong | | | 3.6% | |
| Kukbo Design Co., Ltd. | | Consumer Discretionary | | South Korea | | | 3.6% | |
| Samsung SDI Co., Ltd., Pfd. | | Information Technology | | South Korea | | | 3.3% | |
| DGB Financial Group, Inc. | | Financials | | South Korea | | | 3.1% | |
| Shinyoung Securities Co., Ltd. | | Financials | | South Korea | | | 3.1% | |
| Hyundai Greenfood Co., Ltd. | | Consumer Staples | | South Korea | | | 3.1% | |
| % OF ASSETS IN TOP TEN | | | | | | | 39.4% | |
| | 6 | Holdings may combine more than one security from same issuer and related depositary receipts. |
Matthews Asia Value Fund
Portfolio Manager Commentary (unaudited) (continued)
Notable Portfolio Changes:
We exited more companies than usual in the quarter as some had already been diluted to tiny position sizes following a large cash inflow into the Fund. Rather than adding to the positions in which we had valuation concerns, we exited them. We enjoyed substantial gains upon selling our holdings of Cognizant and ARA Asset Management.
Among the companies in which we initiated positions, we bought two names that are classic value stocks in terms of valuation. We bought stakes in Cosco Shipping International at a price well below the cash value on its balance sheet. This is an asset-light service subsidiary of Cosco Shipping, the Chinese shipping giant. Its share price has been depressed primarily due to a current slump in the global shipping industry. We bought the B shares† of Jiangling Motors at a little above its cash value on the balance sheet. It is one of two Ford joint-venture partners in China and is effectively managed by Ford and focused more on commercial rather than passenger vehicles. Its profit took a dive last year due to its higher spending on new car model launches and transitions between models. We believe the share price was attractive because in our view it included its core operating business more or less for free.
Outlook:
Rather than spending an undue amount of time discussing the outlook or growth prospects in management meetings, we often like to evaluate past track records, and see how management has handled various situations in the past. History doesn’t repeat itself but it can certainly rhyme.
In the face of uncertainty, we wait patiently, aiming to react to bad news only opportunistically. We then always ask ourselves if the bad news has been more than discounted in an already depressed share price. We firmly believe to do so would be a winning formula over the long run.
| † | B-Shares: B-Shares are mainland Chinese companies listed on the Shanghai and Shenzhen stock exchanges, available to both Chinese and non-Chinese investors. |
| | | | |
| |
| COUNTRY ALLOCATION (%)7,8 | |
| South Korea | | | 34.6 | |
| China/Hong Kong | | | 26.0 | |
| Japan | | | 11.0 | |
| Taiwan | | | 5.1 | |
| Malaysia | | | 4.6 | |
| Singapore | | | 4.3 | |
| United States | | | 1.5 | |
| Switzerland | | | 1.5 | |
| Israel | | | 1.0 | |
| Cash and Other Assets, Less Liabilities | | | 10.4 | |
| | | | |
| |
| SECTOR ALLOCATION (%)8 | |
| Consumer Discretionary | | | 23.6 | |
| Industrials | | | 18.2 | |
| Information Technology | | | 16.3 | |
| Financials | | | 13.0 | |
| Consumer Staples | | | 8.1 | |
| Health Care | | | 5.7 | |
| Materials | | | 4.7 | |
| Cash and Other Assets, Less Liabilities | | | 10.4 | |
| | | | |
| |
| MARKET CAP EXPOSURE (%)8 | |
| Mega Cap (over $25B) | | | 18.4 | |
| Large Cap ($10B–$25B) | | | 3.3 | |
| Mid Cap ($3B–10B) | | | 7.3 | |
| Small Cap (under $3B) | | | 60.6 | |
| Cash and Other Assets, Less Liabilities | | | 10.4 | |
| 7 | Not all countries where the Fund may invest are included in the benchmark index. |
| 8 | Source: FactSet Research Systems. Percentage values in data are rounded to the nearest tenth of one percent; the values may not sum to 100% due to rounding. |
| | | | |
| matthewsasia.com | 800.789.ASIA | | | 33 | |
Matthews Asia Value Fund
June 30, 2017
Schedule of Investmentsa (unaudited)
COMMON EQUITIES: 80.3%
| | | | | | | | |
| | | Shares | | | Value | |
| CHINA/HONG KONG: 26.0% | | | | | | | | |
Baidu, Inc. ADRb | | | 6,400 | | | | $1,144,704 | |
CK Hutchison Holdings, Ltd. | | | 58,000 | | | | 727,874 | |
Clear Media, Ltd. | | | 498,000 | | | | 588,100 | |
Texwinca Holdings, Ltd. | | | 894,000 | | | | 543,884 | |
Shandong Weigao Group Medical Polymer Co., Ltd. H Shares | | | 584,000 | | | | 458,164 | |
COSCO SHIPPING International Hong Kong Co., Ltd. | | | 968,000 | | | | 386,811 | |
Goldlion Holdings, Ltd. | | | 773,000 | | | | 344,548 | |
Anhui Gujing Distillery Co., Ltd. B Shares | | | 75,500 | | | | 326,267 | |
Jiangling Motors Corp., Ltd. B Shares | | | 96,779 | | | | 202,910 | |
Sohu.com, Inc.b | | | 4,300 | | | | 193,758 | |
Qualcomm, Inc. | | | 3,500 | | | | 193,270 | |
Kweichow Moutai Co., Ltd. A Shares | | | 1,700 | | | | 118,365 | |
| | | | | | | | |
Total China/Hong Kong | | | | | | | 5,228,655 | |
| | | | | | | | |
| | | | | | | | |
| SOUTH KOREA: 25.3% | |
Kukbo Design Co., Ltd. | | | 48,811 | | | | 720,958 | |
DGB Financial Group, Inc. | | | 60,895 | | | | 627,809 | |
Shinyoung Securities Co., Ltd. | | | 12,995 | | | | 624,678 | |
Hyundai Greenfood Co., Ltd. | | | 40,374 | | | | 624,520 | |
Kwangju Bank Co., Ltd. | | | 54,049 | | | | 618,860 | |
CMS Edu Co., Ltd. | | | 14,104 | | | | 355,616 | |
Kangnam Jevisco Co., Ltd. | | | 9,744 | | | | 335,545 | |
Geumhwa PSC Co., Ltd. | | | 10,576 | | | | 332,305 | |
POSCO Chemtech Co., Ltd. | | | 17,957 | | | | 241,028 | |
Grand Korea Leisure Co., Ltd. | | | 12,298 | | | | 240,768 | |
Hy-Lok Corp. | | | 9,185 | | | | 202,227 | |
Nice Information & Telecommunication, Inc. | | | 7,007 | | | | 160,760 | |
| | | | | | | | |
Total South Korea | | | | | | | 5,085,074 | |
| | | | | | | | |
| | | | | | | | |
| JAPAN: 11.0% | |
YAMADA Consulting Group Co., Ltd. | | | 17,100 | | | | 1,147,225 | |
Honma Golf, Ltd.b,c | | | 311,500 | | | | 301,412 | |
San-A Co., Ltd. | | | 4,500 | | | | 199,044 | |
Ohashi Technica, Inc. | | | 15,600 | | | | 195,057 | |
Naigai Trans Line, Ltd. | | | 17,100 | | | | 195,002 | |
Asante, Inc. | | | 9,300 | | | | 160,917 | |
| | | | | | | | |
Total Japan | | | | | | | 2,198,657 | |
| | | | | | | | |
| | | | | | | | |
| TAIWAN: 5.1% | |
Tehmag Foods Corp. | | | 43,000 | | | | 357,683 | |
P-Duke Technology Co., Ltd. | | | 150,000 | | | | 342,334 | |
Lumax International Corp., Ltd. | | | 171,000 | | | | 330,749 | |
| | | | | | | | |
Total Taiwan | | | | | | | 1,030,766 | |
| | | | | | | | |
| | | | | | | | |
| MALAYSIA: 4.6% | |
MPHB Capital BHDb | | | 1,931,400 | | | | 733,389 | |
Genting BHD | | | 89,700 | | | | 196,630 | |
| | | | | | | | |
Total Malaysia | | | | | | | 930,019 | |
| | | | | | | | |
| | | | | | | | |
| SINGAPORE: 4.3% | |
Haw Par Corp., Ltd. | | | 60,200 | | | | 489,426 | |
Straits Trading Co., Ltd. | | | 210,800 | | | | 375,153 | |
| | | | | | | | |
Total Singapore | | | | | | | 864,579 | |
| | | | | | | | |
| | | | | | | | |
| | | | | | | | |
| | | Shares | | | Value | |
| UNITED STATES: 1.5% | | | | | | | | |
News Corp. Class B | | | 21,400 | | | | $302,810 | |
| | | | | | | | |
Total United States | | | | | | | 302,810 | |
| | | | | | | | |
| | | | | | | | |
| SWITZERLAND: 1.5% | |
Cie Financiere Richemont SA | | | 3,640 | | | | 301,206 | |
| | | | | | | | |
Total Switzerland | | | | | | | 301,206 | |
| | | | | | | | |
| | | | | | | | |
| ISRAEL: 1.0% | |
Taro Pharmaceutical Industries, Ltd.b | | | 1,700 | | | | 190,502 | |
| | | | | | | | |
Total Israel | | | | | | | 190,502 | |
| | | | | | | | |
| | | | | | | | |
| TOTAL COMMON EQUITIES: | | | | 16,132,268 | |
| | | | | | | | |
(Cost $15,567,727) | | | | | | | | |
| | | | | | | | |
PREFERRED EQUITIES: 9.3% | |
| SOUTH KOREA: 9.3% | |
Samsung Electronics Co., Ltd., Pfd. | | | 569 | | | | 927,753 | |
Samsung SDI Co., Ltd., Pfd. | | | 9,050 | | | | 653,020 | |
Hyundai Motor Co., Ltd., 2nd Pfd. | | | 2,840 | | | | 289,173 | |
| | | | | | | | |
Total South Korea | | | | | | | 1,869,946 | |
| | | | | | | | |
| | | | | | | | |
| TOTAL PREFERRED EQUITIES | | | | 1,869,946 | |
| | | | | | | | |
(Cost $1,673,776) | | | | | | | | |
| | | | | | | | |
| TOTAL INVESTMENTS: 89.6% | | | | 18,002,214 | |
(Cost $17,241,503d) | | | | | | | | |
| | | | | | | | |
CASH AND OTHER ASSETS,
LESS LIABILITIES: 10.4% | | | | 2,089,814 | |
| | | | | | | | |
| |
NET ASSETS: 100.0% | | | | $20,092,028 | |
| | | | | | | | |
| a | Certain securities were fair valued under the valuation policies approved by the Board of Trustees (Note 2-A). |
| b | Non-income producing security. |
| c | Security exempt from registration under Rule 144A of the Securities Act of 1933, as amended. The security may be resold in transactions exempt from registration normally to qualified institutional buyers. The security has been determined to be liquid in accordance with procedures adopted by the Fund’s Board of Directors. At June 30, 2017, the aggregate value is $301,412, which is 1.50% of net assets. |
| d | Cost for federal income tax purposes is $17,244,237 and net unrealized appreciation consists of: |
| | | | |
Gross unrealized appreciation | | | $817,431 | |
Gross unrealized depreciation | | | (59,454 | ) |
| | | | |
Net unrealized appreciation | | | $757,977 | |
| | | | |
| ADR | American Depositary Receipt |
See accompanying notes to financial statements.

| | | | |
| PORTFOLIO MANAGERS |
| Kenneth Lowe, CFA | | |
Lead Manager | | | | |
| S. Joyce Li, CFA | | |
Co-Manager | | |
|
| FUND FACTS |
| | | Investor | | Institutional |
Ticker | | MAFSX | | MIFSX |
CUSIP | | 577125701 | | 577125800 |
Inception | | 4/30/13 | | 4/30/13 |
NAV | | $10.82 | | $10.85 |
Initial Investment | | $2,500 | | $100,000 |
Gross Expense Ratio1 | | 2.47% | | 2.29% |
After Fee Waiver and Reimbursement2 | | 1.50% | | 1.25% |
Portfolio Statistics |
Total # of Positions | | 32 |
Net Assets | | $12.0 million |
Weighted Average Market Cap | | $73.5 billion |
Portfolio Turnover3 | | 21.10% |
Benchmark |
MSCI AC Asia ex Japan Index |
OBJECTIVE
Long term capital appreciation.
STRATEGY
Under normal market conditions, the Fund seeks to achieve its investment objective by investing at least 80% of its total assets, which include borrowings for investment purposes, in the common and preferred stocks of companies located in Asia excluding Japan, but including all other developed, emerging and frontier countries and markets in the Asian region. The Fund is currently expected to hold stocks of between 25 and 35 companies under normal market conditions.
Matthews Asia Focus Fund
Portfolio Manager Commentary (unaudited)
Period ended June 30, 2017
For the first half of 2017, the Matthews Asia Focus Fund returned 20.49% (Investor Class) and 20.69% (Institutional Class) while its benchmark, the MSCI All Country Asia ex Japan Index, returned 22.93%. For the quarter ending June 30, 2017, the Fund returned 7.34% (Investor Class) and 7.43% (Institutional Class) compared to the benchmark return of 8.40% over the same period.
Market Environment:
The second quarter saw continued strong performance in Asian equity markets as sentiment appears to have meaningfully improved. The negative views of the past few years have made way for more constructive conversations from asset allocators. To a large degree, this has been driven by fundamentals as the earnings misses over the period preceding this rally have been replaced by rising earnings expectations. Base effects have played a role alongside a strong technology cycle and reflation in China—although it remains to be seen if this uplift is sustainable. Beyond this, risk assets have benefited from a perceived reduction in potential fat tail events, such as rising protectionism in the U.S. and European political risk. The latter is true given the election of new French President and Europhile Emmanuel Macron, although U.S. policy remains uncertain.
From a longer-term perspective, the most meaningful event of the quarter was the introduction of China’s domestic A-shares into MSCI benchmarks. This process will start in May 2018 and will see 222 large capitalization stocks make up a small 0.73% of the emerging markets index. This is an important step for China and further liberalization should follow. A combination of this and the strength of internet stocks led to China’s markets being the region’s strongest performer during the quarter.
Performance Contributors and Detractors:
The largest contributor to returns during the quarter came from the portfolio’s holdings in the financials sector. AIA Group was the strongest of these, as the Pan-Asian life insurer once again beat growth expectations, with the important measurement of new business growing an impressive 55% in constant currency terms during the first quarter. The company’s cash generation continues to grow as demand for closing protection gaps across the region remains strong. Bank Rakyat Indonesia, the largest microfinance provider in the archipelago, also rose as a new CEO refocuses on micro and away from corporate lending, which has been challenging for the company. It also appears that loan growth and new non-performing loan formation also have improved.
Beyond the financial sector, information technology stocks contributed to performance. Tencent Holdings was particularly strong as first quarter results from the internet giant were stellar. All divisions reported attractive revenue growth with revenues in mobile gaming, social networking, advertising and payments delivering.
However, the strategy’s underweight to the sector hurt relative performance as it has become such a meaningful component of the overall benchmark, and many internet and hardware stocks performed well. At a stock-specific level, our holdings
(continued)
| 1 | Prospectus expense ratios. |
| 2 | Matthews has contractually agreed (i) to waive fees and reimburse expenses to the extent needed to limit Total Annual Fund Operating Expenses (excluding Rule 12b-1 fees, taxes, interest, brokerage commissions, short sale dividend expenses, expenses incurred in connection with any merger or reorganization or extraordinary expenses such as litigation) of the Institutional Class to 1.25% first by waiving class specific expenses (i.e., shareholder service fees specific to a particular class) of the Institutional Class and then, to the extent necessary, by waiving non-class specific expenses of the Institutional Class, and (ii) if any Fund-wide expenses (i.e., expenses that apply to both the Institutional Class and the Investor Class) are waived for the Institutional Class to maintain the 1.25% expense limitation, to waive an equal amount (in annual percentage terms) of those same expenses for the Investor Class. The Total Annual Fund Operating Expenses After Fee Waiver and Expense Reimbursement for the Investor Class may vary from year to year and will in some years exceed 1.25%. If the operating expenses fall below the expense limitation in a year within three years after Matthews has made a waiver or reimbursement, the Fund may reimburse Matthews up to an amount that does not cause the expenses for that year to exceed the lesser of (i) the expense limitation applicable at the time of that fee waiver and/or expense reimbursement or (ii) the expense limitation in effect at the time of recoupment. This agreement will remain in place until April 30, 2018 and may be terminated at any time by the Board of Trustees on behalf of the Fund on 60 days’ written notice to Matthews. Matthews may decline to renew this agreement by written notice to the Trust at least 30 days before its annual expiration date. |
| 3 | The lesser of fiscal year 2016 long-term purchase costs or sales proceeds divided by the average monthly market value of long-term securities. |
| | | | |
| matthewsasia.com | 800.789.ASIA | | | 35 | |
| | | | | | | | | | | | | | | | | | | | | | | | |
| | | | | | | |
| PERFORMANCE AS OF JUNE 30, 2017 | | | | | | | | | | | | | | | | | | |
| | | | | | | | | | | | Average Annual Total Returns | | | | |
| | | 3 Months | | | YTD | | | 1 Year | | | 3 Years | | | Since
Inception | | | Inception
Date | |
| Investor Class (MAFSX) | | | 7.34% | | | | 20.49% | | | | 18.39% | | | | 3.06% | | | | 2.95% | | | | 4/30/13 | |
| Institutional Class (MIFSX) | | | 7.43% | | | | 20.69% | | | | 18.60% | | | | 3.33% | | | | 3.20% | | | | 4/30/13 | |
| MSCI AC Asia ex Japan Index4 | | | 8.40% | | | | 22.93% | | | | 27.06% | | | | 5.32% | | | | 5.89% | | | | | |
| Lipper Pacific ex Japan Funds Category Average5 | | | 7.97% | | | | 22.02% | | | | 21.94% | | | | 4.36% | | | | 4.95% | | | | | |
Performance assumes reinvestment of all dividends and/or distributions before taxes. All performance quoted represents past performance and is no guarantee of future results. Investment return and principal value will fluctuate with market conditions so that when redeemed, shares may be worth more or less than their original cost. Current performance may be lower or higher than the return figures quoted. Returns would have been lower if certain of the Fund’s fees and expenses had not been waived. For the Fund’s most recent month-end performance visit matthewsasia.com.
GROWTH OF A $10,000 INVESTMENT SINCE INCEPTION—INVESTOR CLASS
Plotted monthly. The performance data and graph do not reflect the deduction of taxes that a shareholder would pay on dividends, capital gain distributions or redemption of Fund shares. Values are in US$.
| | 4 | It is not possible to invest directly in an index. Source: Index data from Morgan Stanley Capital International and Bloomberg; total return calculations performed by BNY Mellon Investment Servicing (US) Inc. Please see page 91 for index definition. |
| | 5 | The Lipper Category Average does not reflect sales charges and is based on total return, including reinvestment of dividends and capital gains for the stated periods. |
| | | | | | | | |
| | | | |
| TOP TEN HOLDINGS6 | | | | | | | |
| | | Sector | | Country | | % of Net Assets | |
| AIA Group, Ltd. | | Financials | | China/Hong Kong | | | 6.9% | |
| Tencent Holdings, Ltd. | | Information Technology | | China/Hong Kong | | | 5.6% | |
| Samsung Electronics Co., Ltd. | | Information Technology | | South Korea | | | 4.3% | |
| Techtronic Industries Co., Ltd. | | Consumer Discretionary | | China/Hong Kong | | | 4.1% | |
| PT Bank Rakyat Indonesia Persero | | Financials | | Indonesia | | | 3.9% | |
| Singapore Telecommunications, Ltd. | | Telecommunication Services | | Singapore | | | 3.6% | |
| Samsonite International SA | | Consumer Discretionary | | China/Hong Kong | | | 3.2% | |
| Taiwan Semiconductor Manufacturing Co., Ltd. | | Information Technology | | Taiwan | | | 3.2% | |
| United Overseas Bank, Ltd. | | Financials | | Singapore | | | 3.2% | |
| LG Household & Health Care, Ltd. | | Consumer Staples | | South Korea | | | 3.1% | |
| % OF ASSETS IN TOP TEN | | | | | | | 41.1% | |
| | 6 | Holdings may combine more than one security from same issuer and related depositary receipts. |
Matthews Asia Focus Fund
Portfolio Manager Commentary (unaudited) (continued)
in consumer companies Tata Motors and Kangwon Land also detracted from performance. The former sputtered following frustration over a lack of delivery in cash flow growth due to some foreign exchange challenges and execution missteps despite solid volume growth for Jaguar Land Rover. Kangwon Land was weak due to poor first quarter results and a concern that it could lose its monopoly over being the only casino that local residents are allowed to gamble in.
Notable Changes to Portfolio:
We added one new holding to the portfolio during the quarter, U.S. listed fabless semiconductor company Broadcom. The business was formed through the merger of Avago Technologies and Broadcom last year and has headquarters in the U.S. and in Singapore. Much of the company’s product suite in areas like RF components, wireless connectivity, network switching, data center storage, etc. have a strong market position and are mission critical to its customers. This enables high margins and strong free cash flow. We believe that both wired and wireless products have a solid sustainable growth outlook that should lead to attractive dividend growth to accompany already reasonable valuations.
Outlook:
As we have noted, an improvement in earnings expectations as well as reduced tail risks* have led to a turn in sentiment for Asian equities. However, strong performance has resulted in valuations that are now at levels comparable with medium-term averages as forward price-to-earnings† ratios are about 13.5x. Further, although Chinese authorities recognize the risk that such high debt levels domestically entails and are de-risking the most dangerous parts of the system, this does remain a concern. Ongoing low levels of volatility are unlikely to persist in perpetuity, especially in light of an increasingly coordinated global monetary policy tightening cycle.
With this backdrop, earnings, cash flow and dividends are likely to pay shareholders over the medium term as the period of expanding multiples may be ending. We will continue to avoid chasing beta‡ in an upward market and focus on disconnects where high quality businesses are trading at valuations that we believe are below a company’s intrinsic value.
| * | Tail risk: The small statistical probability that an asset price will move more than three standard deviations from its current and/or average price level. |
| † | Price-to-Earnings (P/E) Ratio: Price-to-Earnings Ratio (P/E Ratio) is a valuation ratio of a company’s current share price compared to its per-share earnings. |
| ‡ | Beta: Beta is a measure of the volatility, or systematic risk, of a security or a portfolio in comparison to the market as a whole. |
| | | | |
| |
| COUNTRY ALLOCATION (%)7,8 | |
| China/Hong Kong | | | 33.8 | |
| South Korea | | | 13.5 | |
| Singapore | | | 12.4 | |
| Taiwan | | | 7.3 | |
| Malaysia | | | 5.3 | |
| United States | | | 5.2 | |
| India | | | 4.3 | |
| Indonesia | | | 3.9 | |
| Thailand | | | 2.7 | |
| Japan | | | 2.6 | |
| Switzerland | | | 2.4 | |
| Australia | | | 2.1 | |
| Cash and Other Assets, Less Liabilities | | | 4.5 | |
| | | | |
SECTOR ALLOCATION (%)8 | |
| Financials | | | 21.3 | |
| Consumer Discretionary | | | 20.9 | |
| Information Technology | | | 19.5 | |
| Consumer Staples | | | 11.1 | |
| Industrials | | | 10.7 | |
| Telecommunication Services | | | 7.6 | |
| Health Care | | | 2.7 | |
| Real Estate | | | 1.7 | |
| Cash and Other Assets, Less Liabilities | | | 4.5 | |
| | | | |
MARKET CAP EXPOSURE (%)8 | |
| Mega Cap (over $25B) | | | 50.5 | |
| Large Cap ($10B–$25B) | | | 18.0 | |
| Mid Cap ($3B–10B) | | | 17.7 | |
| Small Cap (under $3B) | | | 9.4 | |
| Cash and Other Assets, Less Liabilities | | | 4.5 | |
| 7 | Not all countries where the Fund may invest are included in the benchmark index. |
| 8 | Source: FactSet Research Systems. Percentage values in data are rounded to the nearest tenth of one percent; the values may not sum to 100% due to rounding. |
| | | | |
| matthewsasia.com | 800.789.ASIA | | | 37 | |
Matthews Asia Focus Fund
June 30, 2017
Schedule of Investmentsa (unaudited)
COMMON EQUITIES: 95.5%
| | | | | | | | |
| | | Shares | | | Value | |
| CHINA/HONG KONG: 33.8% | |
AIA Group, Ltd. | | | 112,200 | | | | $820,896 | |
Tencent Holdings, Ltd. | | | 18,800 | | | | 674,449 | |
Techtronic Industries Co., Ltd. | | | 108,000 | | | | 496,260 | |
Samsonite International SA | | | 93,000 | | | | 388,535 | |
CK Hutchison Holdings, Ltd. | | | 26,728 | | | | 335,424 | |
Jardine Matheson Holdings, Ltd. | | | 5,100 | | | | 327,400 | |
HSBC Holdings PLC | | | 34,000 | | | | 315,873 | |
China Mobile, Ltd. | | | 25,000 | | | | 265,045 | |
Baidu, Inc. ADRb | | | 1,237 | | | | 221,250 | |
Hang Lung Group, Ltd. | | | 50,000 | | | | 206,880 | |
| | | | | | | | |
Total China/Hong Kong | | | | 4,052,012 | |
| | | | | | | | |
| | | | | | | | |
| SOUTH KOREA: 13.5% | |
Samsung Electronics Co., Ltd. | | | 250 | | | | 520,706 | |
LG Household & Health Care, Ltd. | | | 434 | | | | 377,104 | |
Coway Co., Ltd. | | | 4,044 | | | | 367,526 | |
Kangwon Land, Inc. | | | 11,355 | | | | 346,015 | |
| | | | | | | | |
Total South Korea | | | | 1,611,351 | |
| | | | | | | | |
| | | | | | | | |
| SINGAPORE: 12.4% | |
Singapore Telecommunications, Ltd. | | | 152,300 | | | | 430,108 | |
United Overseas Bank, Ltd. | | | 22,500 | | | | 377,744 | |
Singapore Technologies Engineering, Ltd. | | | 135,300 | | | | 361,461 | |
Sheng Siong Group, Ltd. | | | 436,800 | | | | 314,102 | |
| | | | | | | | |
Total Singapore | | | | 1,483,415 | |
| | | | | | | | |
| | | | | | | | |
| TAIWAN: 7.3% | |
Taiwan Semiconductor Manufacturing Co., Ltd. | | | 56,000 | | | | 382,604 | |
Aerospace Industrial Development Corp. | | | 217,000 | | | | 255,369 | |
Ennoconn Corp. | | | 19,000 | | | | 240,536 | |
| | | | | | | | |
Total Taiwan | | | | 878,509 | |
| | | | | | | | |
| | | | | | | | |
| MALAYSIA: 5.3% | |
Heineken Malaysia BHD | | | 73,700 | | | | 317,624 | |
Genting Malaysia BHD | | | 243,400 | | | | 311,821 | |
| | | | | | | | |
Total Malaysia | | | | 629,445 | |
| | | | | | | | |
| | | | | | | | |
| UNITED STATES: 5.2% | |
ResMed, Inc. | | | 4,100 | | | | 319,267 | |
Broadcom, Ltd. | | | 1,300 | | | | 302,965 | |
| | | | | | | | |
Total United States | | | | 622,232 | |
| | | | | | | | |
| | | | | | | | |
| INDIA: 4.3% | |
Tata Motors, Ltd. | | | 46,144 | | | | 308,209 | |
Bharti Infratel, Ltd. | | | 36,411 | | | | 210,920 | |
| | | | | | | | |
Total India | | | | 519,129 | |
| | | | | | | | |
| | | | | | | | |
| INDONESIA: 3.9% | |
PT Bank Rakyat Indonesia Persero | | | 410,400 | | | | 468,280 | |
| | | | | | | | |
Total Indonesia | | | | 468,280 | |
| | | | | | | | |
| | | | | | | | |
| | | | | | | | |
| | | Shares | | | Value | |
| THAILAND: 2.7% | |
Kasikornbank Public Co., Ltd. | | | 55,500 | | | | $324,011 | |
| | | | | | | | |
Total Thailand | | | | 324,011 | |
| | | | | | | | |
| | | | | | | | |
| JAPAN: 2.6% | |
Japan Tobacco, Inc. | | | 9,000 | | | | 316,333 | |
| | | | | | | | |
Total Japan | | | | 316,333 | |
| | | | | | | | |
| | | | | | | | |
| SWITZERLAND: 2.4% | |
Cie Financiere Richemont SA | | | 3,467 | | | | 286,890 | |
| | | | | | | | |
Total Switzerland | | | | 286,890 | |
| | | | | | | | |
| | | | | | | | |
| AUSTRALIA: 2.1% | |
Insurance Australia Group, Ltd. | | | 48,086 | | | | 250,607 | |
| | | | | | | | |
Total Australia | | | | 250,607 | |
| | | | | | | | |
| | | | | | | | |
| TOTAL INVESTMENTS: 95.5% | | | | | | | 11,442,214 | |
(Cost $10,168,187c) | |
| | | | | | | | |
CASH AND OTHER ASSETS,
LESS LIABILITIES: 4.5% | | | | 536,422 | |
| | | | | | | | |
| |
NET ASSETS: 100.0% | | | | $11,978,636 | |
| | | | | | | | |
| a | Certain securities were fair valued under the valuation policies approved by the Board of Trustees (Note 2-A). |
| b | Non-income producing security. |
| c | Cost for federal income tax purposes is $10,209,721 and net unrealized appreciation consists of: |
| | | | |
Gross unrealized appreciation | | | $1,648,396 | |
Gross unrealized depreciation | | | (415,903 | ) |
| | | | |
Net unrealized appreciation | | | $1,232,493 | |
| | | | |
| ADR | American Depositary Receipt |
See accompanying notes to financial statements.
| | | | |
| PORTFOLIO MANAGERS |
| Taizo Ishida | | |
Lead Manager | | |
| Sharat Shroff, CFA | | |
Co-Manager | | |
|
| FUND FACTS |
| | | Investor | | Institutional |
Ticker | | MPACX | | MIAPX |
CUSIP | | 577130867 | | 577130776 |
Inception | | 10/31/03 | | 10/29/10 |
NAV | | $25.05 | | $25.24 |
Initial Investment | | $2,500 | | $100,000 |
Gross Expense Ratio1 | | 1.14% | | 0.96% |
Portfolio Statistics | | | | |
Total # of Positions | | | | 54 |
Net Assets | | | | $711.7 million |
Weighted Average Market Cap | | $25.1 billion |
Portfolio Turnover2 | | | | 13.61% |
Benchmark |
MSCI AC Asia Pacific Index |
OBJECTIVE
Long-term capital appreciation.
STRATEGY
Under normal market conditions, the Fund seeks to achieve its investment objective by investing at least 80% of its total net assets, which include borrowings for investment purposes, in the common and preferred stocks of companies located in Asia. Asia consists of all countries and markets in Asia, and includes developed, emerging and frontier countries and markets in the Asian region. The Fund may also invest in the convertible securities, of any duration or quality, of Asian companies.
Matthews Asia Growth Fund
Portfolio Manager Commentary (unaudited)
Period ended June 30, 2017
For the first half of 2017, the Matthews Asia Growth Fund returned 19.00% (Investor Class) and 19.11% (Institutional Class), outperforming its benchmark, the MSCI All Country Asia Pacific Index, which returned 15.91% over the same period. For the quarter ending June 30, 2017, the Fund returned 9.87% (Investor Class) and 9.93% (Institutional Class) compared to the benchmark return of 5.87% over the same period.
Market Environment:
Asian markets were strong during the second quarter, following robust first quarter performance. In fact, this was the first time we saw two consecutive quarters of solid gains over the last three years. Despite significant global events such as the presidential elections in France and South Korea, and tensions stemming from North Korean provocations, Northeast Asian countries performed much better than Southeast Asian nations. The ASEAN (Association of Southeast Asian Nations) markets had mixed results. Indonesia and Philippines performed well, while Thailand did not. Frontier markets generally underperformed with the exception of Sri Lanka, which has struggled in recent years. The “value” rally we saw over the previous two quarters appeared to fade as more quality, growth names came back in favor during the second quarter, coinciding with a diminished “Trump reflation story.”
Performance Contributors and Detractors:
The strongest performance came from Chinese internet firms, including Baozun, a relatively new name for the portfolio. Baozun is an e-commerce solutions firm that is becoming an essential partner to global brands, such as Nike, for online business in China. Autohome, the largest internet auto website in China, was another good performer on the back of cheap valuations and constant upward earnings revisions. Lanka ORIX Leasing of Sri Lanka also rebounded during the quarter after faltering over the past six months. The company’s focus on Cambodia’s microfinancing business began to bolster its enterprise value, and its expansion plans into Pakistan and Indonesia helped to boost its stock price.
On the negative contribution side, among the relatively few detractors were two Indian pharmaceutical names. One was Lupin and the other Sun Pharmaceutical. Both stocks suffered from pricing pressure from powerful third-party administrators called pharmacy benefit managers who are hired by insurers, employers and unions to negotiate discounts from drug makers. Another factor was ever-intensifying competition in the U.S. generic drug industry. It appears that the high growth stage of India’s pharmaceutical companies is ending as some large Indian generic drug makers are stepping up their focus on more complex (and more costly) generic products in order to seek further growth opportunities. We think that large and resourceful companies such as Lupin and Sun Pharmaceutical ultimately will prevail, although it may take some time.
Notable Portfolio Changes:
During the quarter, no major additions or deletions were made in the portfolio. We did add to our position in Japan’s Softbank during the quarter as we found valuations to be very attractive. While Softbank is categorized as a telecommunications firm and its valuation tends to be treated as a mere utility holding, the firm’s business profile is much broader and includes large and diversified tech investments.
(continued)
| 1 | Prospectus expense ratios. |
| 2 | The lesser of fiscal year 2016 long-term purchase costs or sales proceeds divided by the average monthly market value of long-term securities. |
| | | | |
| matthewsasia.com | 800.789.ASIA | | | 39 | |
| | | | | | | | | | | | | | | | | | | | | | | | | | | | | | | | |
| | | |
| PERFORMANCE AS OF JUNE 30, 2017 | | | | | | | |
| | | | | | | | | | | | Average Annual Total Returns | | | | |
| | | 3 Months | | | YTD | | | 1 Year | | | 3 Years | | | 5 Years | | | 10 Years | | | Since
Inception | | | Inception
Date | |
| Investor Class (MPACX) | | | 9.87% | | | | 19.00% | | | | 15.86% | | | | 5.47% | | | | 10.11% | | | | 5.95% | | | | 9.32% | | | | 10/31/03 | |
| Institutional Class (MIAPX) | | | 9.93% | | | | 19.11% | | | | 16.06% | | | | 5.68% | | | | 10.32% | | | | n.a. | | | | 6.79% | | | | 10/29/10 | |
| MSCI AC Asia Pacific Index3 | | | 5.87% | | | | 15.91% | | | | 23.00% | | | | 4.76% | | | | 8.59% | | | | 2.83% | | | | 7.26% | 4 | | | | |
| Lipper Pacific Region Funds Category Average5 | | | 6.61% | | | | 17.21% | | | | 18.61% | | | | 4.51% | | | | 8.36% | | | | 2.88% | | | | 7.52% | | | | | |
Performance assumes reinvestment of all dividends and/or distributions before taxes. All performance quoted represents past performance and is no guarantee of future results. Investment return and principal value will fluctuate with market conditions so that when redeemed, shares may be worth more or less than their original cost. Current performance may be lower or higher than the return figures quoted. For the Fund’s most recent month-end performance, visit matthewsasia.com.
GROWTH OF A $10,000 INVESTMENT SINCE INCEPTION—INVESTOR CLASS
Plotted monthly. The performance data and graph do not reflect the deduction of taxes that a shareholder would pay on dividends, capital gains distributions or redemption of Fund shares. Values are in US$.
| | 3 | It is not possible to invest directly in an index. Source: Index data from Morgan Stanley Capital International and Bloomberg; total return calculations performed by BNY Mellon Investment Servicing (US) Inc. Please see page 91 for index definition. |
| | 4 | Calculated from 10/31/03. |
| | 5 | The Lipper Category Average does not reflect sales charges and is based on total return, including reinvestment of dividends and capital gains for the stated periods. |
| | | | | | | | |
| | | | |
| TOP TEN HOLDINGS6 | | | | | | | |
| | | Sector | | Country | | % of Net Assets | |
| PT Bank Rakyat Indonesia Persero | | Financials | | Indonesia | | | 4.7% | |
| PT Astra International | | Consumer Discretionary | | Indonesia | | | 4.1% | |
| Shenzhou International Group Holdings, Ltd. | | Consumer Discretionary | | China/Hong Kong | | | 4.0% | |
| HDFC Bank, Ltd. | | Financials | | India | | | 4.0% | |
| Start Today Co., Ltd. | | Consumer Discretionary | | Japan | | | 3.5% | |
| M3, Inc. | | Health Care | | Japan | | | 3.5% | |
| ITC, Ltd. | | Consumer Staples | | India | | | 3.1% | |
| ORIX Corp. | | Financials | | Japan | | | 3.0% | |
| Baozun, Inc. | | Information Technology | | China/Hong Kong | | | 2.9% | |
| China Lodging Group, Ltd. ADS | | Consumer Discretionary | | China/Hong Kong | | | 2.8% | |
| % OF ASSETS IN TOP TEN | | | | | | | 35.6% | |
| | 6 | Holdings may combine more than one security from same issuer and related depositary receipts. |
Matthews Asia Growth Fund
Portfolio Manager Commentary (unaudited) (continued)
Outlook:
We remain cautious about the trajectory of global economic growth. As the price of oil and other commodities remain depressed, inflationary pressures are still benign. For the time being, global trade appears to be shrugging off the potential for protectionist policies by the Trump administration. However, without any meaningful “macro” growth anywhere, the market may refocus on “micro” company earnings reports.
Large Chinese e-commerce companies are now expanding to Southeast Asian countries, which were previously not considered “e-commerce friendly” markets due to logistical challenges relating to poor infrastructure and isolated islands in Indonesia and the Philippines. However, the expansion of the e-commerce firms seems to be a testament to their further growth potential. We will continue to monitor this industry.
Given arguably slower top-line growth for some technology firms, we see firms continuing to look toward artificial intelligence and robotics technology in order to increase efficiencies. Here, we continue seeing investment opportunities in our search to add more quality growth names to the portfolio.
| | | | |
| |
| COUNTRY ALLOCATION (%)7,8 | |
| Japan | | | 38.0 | |
| China/Hong Kong | | | 16.5 | |
| Indonesia | | | 14.9 | |
| India | | | 10.6 | |
| Australia | | | 4.5 | |
| Sri Lanka | | | 3.5 | |
| Vietnam | | | 2.9 | |
| Philippines | | | 2.9 | |
| Bangladesh | | | 2.9 | |
| Pakistan | | | 1.4 | |
| Thailand | | | 1.1 | |
| Taiwan | | | 0.5 | |
| Cash and Other Assets, Less Liabilities | | | 0.3 | |
| | | | |
| |
| SECTOR ALLOCATION (%)8 | |
| Consumer Discretionary | | | 21.4 | |
| Health Care | | | 18.4 | |
| Consumer Staples | | | 17.7 | |
| Financials | | | 17.2 | |
| Information Technology | | | 11.0 | |
| Industrials | | | 7.0 | |
| Telecommunication Services | | | 2.2 | |
| Materials | | | 2.0 | |
| Energy | | | 1.8 | |
| Real Estate | | | 1.0 | |
| Cash and Other Assets, Less Liabilities | | | 0.3 | |
| | | | |
| |
| MARKET CAP EXPOSURE (%)8 | |
| Mega Cap (over $25B) | | | 28.6 | |
| Large Cap ($10B–$25B) | | | 12.6 | |
| Mid Cap ($3B–10B) | | | 33.7 | |
| Small Cap (under $3B) | | | 24.8 | |
| Cash and Other Assets, Less Liabilities | | | 0.3 | |
| 7 | Not all countries where the Fund may invest are included in the benchmark index. |
| 8 | Source: FactSet Research Systems. Percentage values in data are rounded to the nearest tenth of one percent; the values may not sum to 100% due to rounding. |
| | | | |
| matthewsasia.com | 800.789.ASIA | | | 41 | |
Matthews Asia Growth Fund
June 30, 2017
Schedule of Investmentsa (unaudited)
COMMON EQUITIES: 99.7%
| | | | | | | | |
| | | Shares | | | Value | |
| JAPAN: 38.0% | | | | | | | | |
Start Today Co., Ltd. | | | 1,009,800 | | | | $24,886,209 | |
M3, Inc. | | | 891,000 | | | | 24,579,467 | |
ORIX Corp. | | | 1,358,300 | | | | 21,134,959 | |
Pigeon Corp. | | | 544,900 | | | | 19,810,014 | |
Nidec Corp. | | | 178,600 | | | | 18,349,365 | |
SoftBank Group Corp. | | | 194,000 | | | | 15,770,288 | |
Nitori Holdings Co., Ltd. | | | 111,800 | | | | 14,965,913 | |
Nitto Denko Corp. | | | 171,400 | | | | 14,154,442 | |
Ariake Japan Co., Ltd. | | | 194,800 | | | | 13,574,937 | |
PeptiDream, Inc.b | | | 384,400 | | | | 12,169,336 | |
TechnoPro Holdings, Inc. | | | 257,800 | | | | 10,376,904 | |
CYBERDYNE, Inc.b | | | 768,500 | | | | 10,240,661 | |
Sysmex Corp. | | | 163,500 | | | | 9,786,083 | |
Sosei Group Corp.b | | | 86,600 | | | | 9,526,150 | |
Kakaku.com, Inc. | | | 626,200 | | | | 9,001,582 | |
Komatsu, Ltd. | | | 288,200 | | | | 7,397,359 | |
Rinnai Corp. | | | 76,400 | | | | 7,137,773 | |
Seven & I Holdings Co., Ltd. | | | 165,200 | | | | 6,816,886 | |
Daiken Medical Co., Ltd. | | | 911,500 | | | | 6,514,222 | |
Gunosy, Inc.b | | | 281,000 | | | | 5,827,319 | |
FANUC Corp. | | | 29,600 | | | | 5,728,954 | |
HEALIOS KKb | | | 203,200 | | | | 2,783,858 | |
| | | | | | | | |
Total Japan | | | | | | | 270,532,681 | |
| | | | | | | | |
| | | | | | | | |
| CHINA/HONG KONG: 16.5% | | | | | | | | |
Shenzhou International Group Holdings, Ltd. | | | 4,378,000 | | | | 28,786,982 | |
Baozun, Inc. ADRb | | | 918,100 | | | | 20,354,277 | |
China Lodging Group, Ltd. ADSb | | | 245,900 | �� | | | 19,839,212 | |
Autohome, Inc. ADRb | | | 409,600 | | | | 18,579,456 | |
Alibaba Group Holding, Ltd. ADRb | | | 116,200 | | | | 16,372,580 | |
Baidu, Inc. ADRb | | | 44,600 | | | | 7,977,156 | |
Shanghai Haohai Biological Technology Co., Ltd. H Sharesc | | | 959,400 | | | | 5,210,224 | |
| | | | | | | | |
Total China/Hong Kong | | | | | | | 117,119,887 | |
| | | | | | | | |
| | | | | | | | |
| INDONESIA: 14.9% | | | | | | | | |
PT Bank Rakyat Indonesia Persero | | | 29,535,100 | | | | 33,700,557 | |
PT Astra International | | | 43,107,700 | | | | 28,882,046 | |
PT Indofood CBP Sukses Makmur | | | 23,574,000 | | | | 15,578,221 | |
PT Ace Hardware Indonesia | | | 154,466,000 | | | | 12,285,422 | |
PT Mayora Indah | | | 47,580,700 | | | | 7,909,173 | |
PT Arwana Citramulia | | | 214,668,400 | | | | 7,704,532 | |
| | | | | | | | |
Total Indonesia | | | | | | | 106,059,951 | |
| | | | | | | | |
| | | | | | | | |
| INDIA: 10.6% | | | | | | | | |
HDFC Bank, Ltd. | | | 1,102,893 | | | | 28,172,918 | |
ITC, Ltd. | | | 4,455,774 | | | | 22,289,731 | |
Emami, Ltd.b | | | 805,608 | | | | 13,406,007 | |
Lupin, Ltd. | | | 420,088 | | | | 6,887,473 | |
Sun Pharmaceutical Industries, Ltd. | | | 510,687 | | | | 4,387,268 | |
| | | | | | | | |
Total India | | | | | | | 75,143,397 | |
| | | | | | | | |
| | | | | | | | |
| AUSTRALIA: 4.5% | | | | | | | | |
CSL, Ltd. | | | 181,525 | | | | 19,265,154 | |
Oil Search, Ltd. | | | 2,481,915 | | | | 12,996,729 | |
| | | | | | | | |
Total Australia | | | | | | | 32,261,883 | |
| | | | | | | | |
| | | | | | | | |
| | | | | | | | |
| | | Shares | | | Value | |
| SRI LANKA: 3.5% | | | | | | | | |
Sampath Bank PLC | | | 8,533,267 | | | | $15,936,407 | |
Lanka Orix Leasing Co. PLCb | | | 12,121,473 | | | | 8,915,928 | |
| | | | | | | | |
Total Sri Lanka | | | | | | | 24,852,335 | |
| | | | | | | | |
| | | | | | | | |
| VIETNAM: 2.9% | | | | | | | | |
Vietnam Dairy Products JSC | | | 2,597,160 | | | | 18,006,793 | |
Taisun International Holding Corp.b | | | 648,000 | | | | 2,931,757 | |
| | | | | | | | |
Total Vietnam | | | | | | | 20,938,550 | |
| | | | | | | | |
| | | | | | | | |
| PHILIPPINES: 2.9% | | | | | | | | |
Jollibee Foods Corp. | | | 2,007,890 | | | | 8,112,797 | |
Vista Land & Lifescapes, Inc. | | | 58,472,700 | | | | 6,739,650 | |
Emperador, Inc. | | | 37,942,500 | | | | 5,669,569 | |
| | | | | | | | |
Total Philippines | | | | | | | 20,522,016 | |
| | | | | | | | |
| | | | | | | | |
| BANGLADESH: 2.9% | | | | | | | | |
Square Pharmaceuticals, Ltd. | | | 4,382,312 | | | | 15,738,075 | |
BRAC Bank, Ltd. | | | 4,545,139 | | | | 4,564,937 | |
| | | | | | | | |
Total Bangladesh | | | | | | | 20,303,012 | |
| | | | | | | | |
| | | | | | | | |
| PAKISTAN: 1.4% | | | | | | | | |
Habib Bank, Ltd. | | | 4,001,000 | | | | 10,270,187 | |
| | | | | | | | |
Total Pakistan | | | | | | | 10,270,187 | |
| | | | | | | | |
| | | | | | | | |
| THAILAND: 1.1% | | | | | | | | |
Major Cineplex Group Public Co., Ltd. | | | 7,714,400 | | | | 7,664,439 | |
| | | | | | | | |
Total Thailand | | | | | | | 7,664,439 | |
| | | | | | | | |
| | | | | | | | |
| TAIWAN: 0.5% | | | | | | | | |
St. Shine Optical Co., Ltd. | | | 173,000 | | | | 3,619,475 | |
| | | | | | | | |
Total Taiwan | | | | | | | 3,619,475 | |
| | | | | | | | |
| | | | | | | | |
| TOTAL INVESTMENTS: 99.7% | | | | | | | 709,287,813 | |
(Cost $501,081,590d) | | | | | | | | |
| | | | | | | | |
CASH AND OTHER ASSETS,
LESS LIABILITIES: 0.3% | | | | | | | 2,372,053 | |
| | | | | | | | |
| | |
NET ASSETS: 100.0% | | | | | | | $711,659,866 | |
| | | | | | | | |
| a | Certain securities were fair valued under the valuation policies approved by the Board of Trustees (Note 2-A). |
| b | Non-income producing security. |
| c | Security exempt from registration under Rule 144A of the Securities Act of 1933, as amended. The security may be resold in transactions exempt from registration normally to qualified institutional buyers. The security has been determined to be liquid in accordance with procedures adopted by the Fund’s Board of Directors. At June 30, 2017, the aggregate value is $5,210,224 which is 0.73% of net assets. |
| d | Cost for federal income tax purposes is $501,081,590 and net unrealized appreciation consists of: |
| | | | |
Gross unrealized appreciation | | | $238,628,077 | |
Gross unrealized depreciation | | | (30,421,854 | ) |
| | | | |
Net unrealized appreciation | | | $208,206,223 | |
| | | | |
| ADR | American Depositary Receipt |
| ADS | American Depositary Share |
See accompanying notes to financial statements.
| | | | |
| PORTFOLIO MANAGERS |
| Sharat Shroff, CFA | | | | |
Lead Manager | | | | |
| Rahul Gupta | | | | |
Co-Manager | | | | |
| | |
| FUND FACTS | | | | |
| | | Investor | | Institutional |
Ticker | | MAPTX | | MIPTX |
CUSIP | | 577130107 | | 577130834 |
Inception | | 9/12/94 | | 10/29/10 |
NAV | | $27.55 | | $27.55 |
Initial Investment | | $2,500 | | $100,000 |
Gross Expense Ratio1 | | 1.09% | | 0.91% |
After Fee Waiver and Reimbursement2 | | 1.08% | | 0.90% |
Portfolio Statistics | | |
Total # of Positions | | 66 |
Net Assets | | $8.2 billion |
Weighted Average Market Cap | | $49.1 billion |
Portfolio Turnover3 | | | | 5.73% |
Benchmark |
MSCI AC Asia ex Japan Index |
OBJECTIVE
Long-term capital appreciation.
STRATEGY
Under normal market conditions, the Fund seeks to achieve its investment objective by investing at least 80% of its total net assets, which include borrowings for investment purposes, in the common and preferred stocks of companies located in Asia ex Japan, which consists of all countries and markets in Asia excluding Japan, but including all other developed, emerging and frontier countries and markets in the Asian region.
Matthews Pacific Tiger Fund
Portfolio Manager Commentary (unaudited)
For the first half of 2017, the Matthews Pacific Tiger Fund returned 20.20% (Investor Class) and 20.31% (Institutional Class), while its benchmark, the MSCI All Country Asia ex Japan Index, returned 22.93%. For the quarter ending June 30, 2017, the Fund returned 6.62% (Investor Class) and 6.66% (Institutional Class) compared to benchmark return of 8.40% over the same period.
Market Environment:
Asian markets have performed well so far this year, including during the second quarter, due to earnings upgrades that have continued over the past 12 months—reflecting an improved market environment compared with more than a year ago.
In India, optimism surrounds ongoing reforms, including its Goods and Services Tax (GST) to be implemented starting in the third quarter. During the second quarter, however, we also saw a setback in policy direction when India’s largest state government announced it would forgive farm loans, which could amount to about 2.6% of the state’s GDP. We are wary of such populist measures despite our confidence in the direction of India’s broader reform efforts.
A marquee event this quarter was index provider MSCI’s inclusion of China’s domestic A-shares in its global indices. The first-round weighting will be minimal and unlikely to lead to a large influx of capital. The inclusion is an encouraging sign, however, and we believe this market is a compelling source of opportunities that has been overlooked by global investors due to its relative inaccessibility. We believe the weighting should increase over time, acknowledging the growing importance of the Chinese economy.
During the quarter, there were a number of indicators of improvements to corporate governance, particularly in China and also in South Korea, where the new president has committed to reform the country’s large family-controlled conglomerates known as chaebol.
Performance Contributors and Detractors:
The Fund performed strongly in absolute terms during the quarter but trailed its benchmark largely due to underweight positions in information technology stocks. Hardware industries did well amid a “technology refresh” cycle. Our portfolio’s lack of exposure to semiconductors, however, posed a drag on relative performance. A handful of internet stocks also grew to quite sizable weights in the Index, which also affected relative performance. While we have held some strong internet stocks, we find it imprudent to carry outsized positions as the Index does. In addition, some detractors to performance also came from a few of our Indian holdings, particularly Sun Pharmaceutical Industries and Tata Power due to near-term business challenges.
Contribution to absolute performance returns was broad-based from a number of portfolio holdings. Key contributors included a mall operator in Thailand, private banks in India and insurance companies in China.
Notable Changes to Portfolio:
While there were no major additions or exits in the portfolio during the quarter, incremental allocations were made toward domestic demand businesses in China and toward more attractively valued ASEAN countries where economic performance is stabilizing. We are finding attractive opportunities that we believe may benefit from Asia’s rising affluence.
(continued)
| 1 | Prospectus expense ratios. |
| 2 | Matthews has contractually agreed to waive a portion of its advisory fee and administrative and shareholder services fee if the Fund’s average daily net assets are over $3 billion, as follows: for every $2.5 billion average daily net assets of the Fund that are over $3 billion, the advisory fee rate and the administrative and shareholder services fee rate for the Fund with respect to such excess average daily net assets will be each reduced by 0.01%, in each case without reducing such fee rate below 0.00%. Any amount waived by Matthews pursuant to this agreement may not be recouped by Matthews. This agreement will remain in place until April 30, 2018 and may be terminated at any time (i) by the Trust on behalf of the Fund or by the Board of Trustees upon 60 days’ prior written notice to Matthews; or (ii) by Matthews upon 60 days’ prior written notice to the Trust, in each case without payment of any penalty. |
| 3 | The lesser of fiscal year 2016 long-term purchase costs or sales proceeds divided by the average monthly market value of long-term securities. |
| | | | |
| matthewsasia.com | 800.789.ASIA | | | 43 | |
| | | | | | | | | | | | | | | | | | | | | | | | | | | | | | | | |
| |
| PERFORMANCE AS OF JUNE 30, 2017 | |
| | | | | | | | | | | | Average Annual Total Returns | | | | |
| | | 3 Months | | | YTD | | | 1 Year | | | 3 Years | | | 5 Years | | | 10 Years | | | Since
Inception | | | Inception
Date | |
| Investor Class (MAPTX) | | | 6.62% | | | | 20.20% | | | | 15.35% | | | | 6.22% | | | | 9.25% | | | | 6.97% | | | | 8.81% | | | | 9/12/94 | |
| Institutional Class (MIPTX) | | | 6.66% | | | | 20.31% | | | | 15.57% | | | | 6.41% | | | | 9.44% | | | | n.a. | | | | 6.24% | | | | 10/29/10 | |
| MSCI AC Asia ex Japan Index4 | | | 8.40% | | | | 22.93% | | | | 27.06% | | | | 5.32% | | | | 8.27% | | | | 4.48% | | | | 4.46% | 5 | | | | |
| Lipper Pacific ex Japan Funds Category Average6 | | | 7.97% | | | | 22.02% | | | | 21.94% | | | | 4.36% | | | | 7.64% | | | | 4.15% | | | | 5.18% | | | | | |
Performance assumes reinvestment of all dividends and/or distributions before taxes. All performance quoted represents past performance and is no guarantee of future results. Investment return and principal value will fluctuate with market conditions so that when redeemed, shares may be worth more or less than their original cost. Current performance may be lower or higher than the return figures quoted. Returns would have been lower if certain of the Fund’s fees and expenses had not been waived. For the Fund’s most recent month-end performance, visit matthewsasia.com.
GROWTH OF A $10,000 INVESTMENT SINCE INCEPTION—INVESTOR CLASS
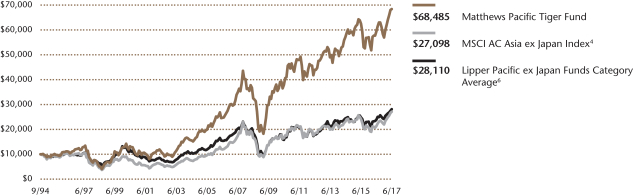
Plotted monthly. The performance data and graph do not reflect the deduction of taxes that a shareholder would pay on dividends, capital gains distributions or redemption of Fund shares. Values are in US$.
| | 4 | It is not possible to invest directly in an index. Source: Index data from Morgan Stanley Capital International and Bloomberg; total return calculations performed by BNY Mellon Investment Servicing (US) Inc. Please see page 91 for index definition. |
| | 5 | Calculated from 8/31/94. |
| | 6 | The Lipper Category Average does not reflect sales charges and is based on total return, including reinvestment of dividends and capital gains for the stated periods. |
| | | | | | | | |
| | | | |
| TOP TEN HOLDINGS7 | | | | | | | |
| | | Sector | | Country | | % of Net Assets | |
| Central Pattana Public Co., Ltd. | | Real Estate | | Thailand | | | 3.1% | |
| Ping An Insurance Group Co. of China, Ltd. | | Financials | | China/Hong Kong | | | 3.1% | |
| Kotak Mahindra Bank, Ltd. | | Financials | | India | | | 3.0% | |
| Baidu, Inc. | | Information Technology | | China/Hong Kong | | | 2.6% | |
| DKSH Holding, Ltd. | | Industrials | | Switzerland | | | 2.6% | |
| Vietnam Dairy Products JSC | | Consumer Staples | | Vietnam | | | 2.6% | |
| Tencent Holdings, Ltd. | | Information Technology | | China/Hong Kong | | | 2.6% | |
| Tata Power Co., Ltd. | | Utilities | | India | | | 2.5% | |
| Sinopharm Group Co., Ltd. | | Health Care | | China/Hong Kong | | | 2.5% | |
| Titan Co., Ltd. | | Consumer Discretionary | | India | | | 2.4% | |
| % OF ASSETS IN TOP TEN | | | | | | | 27.0% | |
| | 7 | Holdings may combine more than one security from same issuer and related depositary receipts. |
Matthews Pacific Tiger Fund
Portfolio Manager Commentary (unaudited) (continued)
Outlook:
We have seen improvements in the market environment over the past two quarters. We still find sentiment around China, and Asia in general, to be only lukewarm. Given the strength and stabilization of the Chinese economy, including housing, we are beginning to see that authorities are tightening on the margin. Aggressive capital deployment by some insurance companies, for example, has come under greater scrutiny. In our view, this is a positive proactive approach. We continue to see Chinese authorities nudge the economy toward a much higher services mix. That should continue to provide us with attractive, long-term investment opportunities in the services sector.
In India, the balancing act has become a bit tighter. Markets have done well but earnings have not followed as strongly. Policymakers are trying to implement important changes that should help India’s economy over the medium to long term, but are disrupters in the short term. The implementation of the GST could add to that turbulence, but we will believe these ultimately should be just growing pains.
Lastly, the long-term case for the Asian consumer remains resilient. Businesses focused on this segment of the region’s economies continue to be well-represented in the portfolio.
| | | | |
| |
| COUNTRY ALLOCATION (%)8,9 | |
| China/Hong Kong | | | 31.4 | |
| India | | | 19.9 | |
| South Korea | | | 12.6 | |
| Indonesia | | | 6.4 | |
| Thailand | | | 5.8 | |
| Taiwan | | | 5.7 | |
| Malaysia | | | 3.5 | |
| United States | | | 2.8 | |
| Switzerland | | | 2.6 | |
| Vietnam | | | 2.6 | |
| Philippines | | | 2.4 | |
| Singapore | | | 0.2 | |
| Japan | | | 0.1 | |
| Cash and Other Assets, Less Liabilities | | | 4.0 | |
| | | | |
| |
| SECTOR ALLOCATION (%)9 | |
| Financials | | | 19.9 | |
| Consumer Staples | | | 19.3 | |
| Information Technology | | | 18.0 | |
| Consumer Discretionary | | | 9.9 | |
| Health Care | | | 7.6 | |
| Real Estate | | | 6.3 | |
| Utilities | | | 5.0 | |
| Industrials | | | 5.0 | |
| Telecommunication Services | | | 3.6 | |
| Materials | | | 1.4 | |
| Cash and Other Assets, Less Liabilities | | | 4.0 | |
| | | | |
| |
| MARKET CAP EXPOSURE (%)9 | |
| Mega Cap (over $25B) | | | 32.6 | |
| Large Cap ($10B–$25B) | | | 23.1 | |
| Mid Cap ($3B–10B) | | | 34.0 | |
| Small Cap (under $3B) | | | 6.4 | |
| Cash and Other Assets, Less Liabilities | | | 4.0 | |
| 8 | Not all countries where the Fund may invest are included in the benchmark index. |
| 9 | Source: FactSet Research Systems. Percentage values in data are rounded to the nearest tenth of one percent; the values may not sum to 100% due to rounding. |
| | | | |
| matthewsasia.com | 800.789.ASIA | | | 45 | |
Matthews Pacific Tiger Fund
June 30, 2017
Schedule of Investmentsa (unaudited)
COMMON EQUITIES: 95.9%
| | | | | | | | |
| | | Shares | | | Value | |
| CHINA/HONG KONG: 31.4% | |
Ping An Insurance Group Co. of China, Ltd. H Shares | | | 38,343,000 | | | | $252,580,643 | |
Baidu, Inc. ADRb | | | 1,211,800 | | | | 216,742,548 | |
Tencent Holdings, Ltd. | | | 5,886,500 | | | | 211,177,955 | |
Sinopharm Group Co., Ltd. H Shares | | | 45,134,400 | | | | 203,913,236 | |
China Resources Beer Holdings Co., Ltd. | | | 75,359,775 | | | | 190,052,025 | |
Alibaba Group Holding, Ltd. ADRb | | | 1,291,700 | | | | 182,000,530 | |
AIA Group, Ltd. | | | 22,790,800 | | | | 166,745,721 | |
Hengan International Group Co., Ltd. | | | 19,471,500 | | | | 143,643,713 | |
China Resources Land, Ltd. | | | 47,814,000 | | | | 139,294,921 | |
China Mobile, Ltd. ADR | | | 2,380,026 | | | | 126,355,580 | |
Inner Mongolia Yili Industrial Group Co., Ltd. A Shares | | | 38,503,482 | | | | 122,713,504 | |
Fuyao Glass Industry Group Co., Ltd. H Shares†,c | | | 31,836,000 | | | | 121,872,124 | |
Dairy Farm International Holdings, Ltd. | | | 15,454,946 | | | | 121,784,974 | |
Tasly Pharmaceutical Group Co., Ltd. A Shares | | | 14,569,795 | | | | 89,276,004 | |
Guangdong Advertising Group Co., Ltd. A Shares | | | 62,473,566 | | | | 73,953,055 | |
Hong Kong Exchanges & Clearing, Ltd. | | | 2,603,000 | | | | 67,246,926 | |
Lenovo Group, Ltd. | | | 73,394,000 | | | | 46,321,297 | |
Yum China Holdings, Inc.b | | | 1,174,410 | | | | 46,306,986 | |
Shandong Weigao Group Medical Polymer Co., Ltd. H Shares | | | 36,796,000 | | | | 28,867,501 | |
Swire Pacific, Ltd. A Share Class | | | 1,363,000 | | | | 13,305,139 | |
Fuyao Glass Industry Group Co., Ltd. A Shares | | | 2,589,387 | | | | 9,948,477 | |
Guotai Junan Securities Co., Ltd. H Sharesb,c | | | 3,806,400 | | | | 7,956,560 | |
| | | | | | | | |
Total China/Hong Kong | | | | 2,582,059,419 | |
| | | | | | | | |
| | | | | | | | |
| INDIA: 19.9% | |
Kotak Mahindra Bank, Ltd. | | | 16,873,409 | | | | 249,333,405 | |
Tata Power Co., Ltd.† | | | 164,620,436 | | | | 204,993,040 | |
Titan Co., Ltd.b | | | 24,643,894 | | | | 199,845,941 | |
HDFC Bank, Ltd. | | | 6,223,409 | | | | 158,974,253 | |
GAIL India, Ltd. | | | 26,059,477 | | | | 145,618,564 | |
ITC, Ltd. | | | 28,102,500 | | | | 140,581,001 | |
Housing Development Finance Corp., Ltd. | | | 4,935,685 | | | | 123,263,891 | |
Container Corp. of India, Ltd. | | | 6,839,995 | | | | 121,174,644 | |
Sun Pharmaceutical Industries, Ltd. | | | 12,045,017 | | | | 103,477,710 | |
Dabur India, Ltd. | | | 21,117,482 | | | | 95,392,515 | |
Thermax, Ltd. | | | 5,310,034 | | | | 76,764,518 | |
Just Dial, Ltd.†,b | | | 3,557,718 | | | | 20,438,099 | |
| | | | | | | | |
Total India | | | | 1,639,857,581 | |
| | | | | | | | |
| | | | | | | | |
| SOUTH KOREA: 12.6% | |
Samsung Electronics Co., Ltd. | | | 95,105 | | | | 198,086,773 | |
Dongbu Insurance Co., Ltd. | | | 3,159,380 | | | | 187,755,541 | |
Naver Corp. | | | 244,116 | | | | 178,944,552 | |
Orion Corp.d | | | 217,080 | | | | 151,121,738 | |
Green Cross Corp.† | | | 776,872 | | | | 118,518,293 | |
Cheil Worldwide, Inc.† | | | 6,954,297 | | | | 111,853,311 | |
Amorepacific Corp. | | | 345,972 | | | | 91,885,577 | |
| | | | | | | | |
Total South Korea | | | | 1,038,165,785 | |
| | | | | | | | |
| | | | | | | | |
| | | | | | | | |
| | | Shares | | | Value | |
| INDONESIA: 6.4% | |
PT Telekomunikasi Indonesia Persero | | | 421,304,300 | | | | $143,071,377 | |
PT Bank Central Asia | | | 100,580,000 | | | | 137,172,886 | |
PT Indofood CBP Sukses Makmur | | | 191,522,600 | | | | 126,562,372 | |
PT Perusahaan Gas Negara Persero | | | 298,485,100 | | | | 50,343,182 | |
PT Astra International | | | 66,745,900 | | | | 44,719,579 | |
PT Telekomunikasi Indonesia Persero ADR | | | 728,140 | | | | 24,516,474 | |
| | | | | | | | |
Total Indonesia | | | | 526,385,870 | |
| | | | | | | | |
| | | | | | | | |
| THAILAND: 5.8% | |
Central Pattana Public Co., Ltd. | | | 126,625,200 | | | | 257,940,393 | |
The Siam Cement Public Co., Ltd. | | | 7,522,950 | | | | 111,573,857 | |
Kasikornbank Public Co., Ltd. | | | 18,431,800 | | | | 107,605,594 | |
| | | | | | | | |
Total Thailand | | | | 477,119,844 | |
| | | | | | | | |
| | | | | | | | |
| TAIWAN: 5.7% | |
President Chain Store Corp. | | | 21,486,608 | | | | 193,062,448 | |
Delta Electronics, Inc. | | | 31,251,182 | | | | 170,954,693 | |
Synnex Technology International Corp.† | | | 95,600,921 | | | | 107,098,852 | |
| | | | | | | | |
Total Taiwan | | | | 471,115,993 | |
| | | | | | | | |
| | | | | | | | |
| MALAYSIA: 3.4% | |
Genting BHD | | | 52,881,000 | | | | 115,919,565 | |
Public Bank BHD | | | 17,846,594 | | | | 84,469,130 | |
IHH Healthcare BHD | | | 47,676,300 | | | | 63,884,398 | |
IHH Healthcare BHD | | | 11,543,000 | | | | 15,762,368 | |
| | | | | | | | |
Total Malaysia | | | | 280,035,461 | |
| | | | | | | | |
| | | | | | | | |
| UNITED STATES: 2.8% | |
Cognizant Technology Solutions Corp. Class A | | | 2,186,600 | | | | 145,190,240 | |
Yum! Brands, Inc. | | | 1,174,410 | | | | 86,624,482 | |
| | | | | | | | |
Total United States | | | | 231,814,722 | |
| | | | | | | | |
| | | | | | | | |
| SWITZERLAND: 2.6% | |
DKSH Holding, Ltd. | | | 2,638,062 | | | | 214,480,394 | |
| | | | | | | | |
Total Switzerland | | | | 214,480,394 | |
| | | | | | | | |
| | | | | | | | |
| VIETNAM: 2.6% | |
Vietnam Dairy Products JSC | | | 30,834,534 | | | | 213,783,932 | |
| | | | | | | | |
Total Vietnam | | | | 213,783,932 | |
| | | | | | | | |
| | | | | | | | |
| PHILIPPINES: 2.4% | |
SM Prime Holdings, Inc. | | | 164,670,771 | | | | 107,593,353 | |
GT Capital Holdings, Inc. | | | 3,897,540 | | | | 93,342,085 | |
| | | | | | | | |
Total Philippines | | | | 200,935,438 | |
| | | | | | | | |
| | | | | | | | |
| SINGAPORE: 0.2% | |
Hyflux, Ltd. | | | 35,190,730 | | | | 14,058,399 | |
| | | | | | | | |
Total Singapore | | | | 14,058,399 | |
| | | | | | | | |
| | | | | | | | |
| JAPAN: 0.1% | |
LINE Corp. ADRb | | | 195,200 | | | | 6,789,056 | |
| | | | | | | | |
Total Japan | | | | 6,789,056 | |
| | | | | | | | |
| | | | | | | | |
| TOTAL COMMON EQUITIES | | | | 7,896,601,894 | |
| | | | | | | | |
(Cost $5,386,026,733) | | | | | | | | |
Matthews Pacific Tiger Fund
June 30, 2017
Schedule of Investmentsa (unaudited) (continued)
WARRANTS: 0.1%
| | | | | | | | |
| | | Shares | | | Value | |
| MALAYSIA: 0.1% | | | | | | | | |
Genting BHD, expires 12/18/18b | | | 12,253,875 | | | | $4,653,027 | |
| | | | | | | | |
Total Malaysia | | | | | | | 4,653,027 | |
| | | | | | | | |
| | | | | | | | |
| TOTAL WARRANTS | | | | | | | 4,653,027 | |
| | | | | | | | |
(Cost $5,593,674) | | | | | | | | |
| | | | | | | | |
| TOTAL INVESTMENTS: 96.0% | | | | | | | 7,901,254,921 | |
(Cost $5,391,620,407e) | | | | | | | | |
| | | | | | | | |
CASH AND OTHER ASSETS,
LESS LIABILITIES: 4.0% | | | | | | | 328,625,248 | |
| | | | | | | | |
| | |
NET ASSETS: 100.0% | | | | | | | $8,229,880,169 | |
| | | | | | | | |
| a | Certain securities were fair valued under the valuation policies approved by the Board of Trustees (Note 2-A). |
| b | Non-income producing security. |
| c | Security exempt from registration under Rule 144A of the Securities Act of 1933, as amended. The security may be resold in transactions exempt from registration normally to qualified institutional buyers. The security has been determined to be liquid in accordance with procedures adopted by the Fund’s Board of Directors. At June 30, 2017, the aggregate value is $129,828,684 which is 1.58% of net assets. |
| d | Illiquid security, trading was halted at June 30, 2017. |
| e | Cost for federal income tax purposes is $5,393,356,757 and net unrealized appreciation consists of: |
| | | | |
Gross unrealized appreciation | | | $2,878,141,706 | |
Gross unrealized depreciation | | | (370,243,542 | ) |
| | | | |
Net unrealized appreciation | | | $2,507,898,164 | |
| | | | |
| † | Affiliated Issuer, as defined under the Investment Company Act of 1940 (ownership of 5% or more of the outstanding voting securities of this issuer) |
| ADR | American Depositary Receipt |
See accompanying notes to financial statements.
| | | | |
| matthewsasia.com | 800.789.ASIA | | | 47 | |
| | | | |
| PORTFOLIO MANAGERS |
| Vivek Tanneeru | | |
Lead Manager | | |
| Winnie Chwang | | |
Co-Manager | | | | |
|
| FUND FACTS |
| | | Investor | | Institutional |
Ticker | | MASGX | | MISFX |
CUSIP | | 577130727 | | 577130719 |
Inception | | 4/30/15 | | 4/30/15 |
NAV | | $10.69 | | $10.64 |
Initial Investment | | $2,500 | | $100,000 |
Gross Expense Ratio1 | | 3.54% | | 3.36% |
After Fee Waiver and Reimbursement2 | | 1.48% | | 1.25% |
Portfolio Statistics | | | | |
Total # of Positions | | 57 |
Net Assets | | $13.1 million |
Weighted Average Market Cap | | $17.3 billion |
Portfolio Turnover3 | | 16.10% |
Benchmark | | |
MSCI AC Asia ex Japan Index |
OBJECTIVE
Long term capital appreciation.
STRATEGY
Under normal market conditions, the Fund seeks to achieve its investment objective by investing at least 80% of its total assets, which include borrowings for investment purposes, in the common and preferred stocks of companies of any market capitalization located in Asia that Matthews believes satisfy one or more of its environmental, social and governance (“ESG”) standards. Asia consists of all countries and markets in Asia and includes developed, emerging, and frontier countries and markets in the Asia region. The Fund may also invest in convertible securities and fixed-income securities, of any duration or quality, including high yield securities of Asian companies.
Matthews Asia ESG Fund
Portfolio Manager Commentary (unaudited)
For the period ending June 30, 2017
For the first half of 2017, the Matthews ESG Fund returned 19.18% (Investor Class) and 19.28% (Institutional Class) while its benchmark, the MSCI All Country Asia ex Japan Index, returned 22.93%. For the quarter ending June 30, 2017, the Fund returned 6.16% (Investor Class) and 6.19% (Institutional Class) compared to the benchmark return of 8.40% over the same period.
Market Environment:
Asia’s markets further built on the strong start to the year, rising during the second quarter. As near-term risks, such as an adverse outcome in the French presidential election, receded and confidence in global growth increased, global markets continue to inch up.
South Korea and China/Hong Kong were the best-performing markets during the second quarter, while Pakistan and Japan were the worst-performing. The second quarter saw a continuation of strong performance from the information technology sector, while the energy sector gave back some of the recent gains. South and Southeast Asian currencies generally appreciated against the U.S. dollar, led by the Malaysian ringgit, which saw a 3% appreciation, while the South Korean won depreciated by 2.2%.
Performance Contributors and Detractors:
During the quarter, stock selection in India and Taiwan detracted from the Fund’s relative performance. The Fund’s underweight allocation to the information technology sector, especially within the Chinese internet and e-commerce areas, proved a drag as did an overweight allocation to the health care sector.
Samsung SDI, a South Korean battery and electronic materials company, was the biggest contributor to performance during the quarter. The company’s stock price corrected sharply toward the end of 2016 as its smartphone battery recall affected the company’s profitability and provided a very attractive entry point. We remain confident in the company’s long-term growth prospects. Profitability is normalizing for Samsung’s phone battery unit, its automotive batteries continue to gain scale and its electronic materials business is growing. Samsung SDI also has a minority stake in the world’s largest organic light-emitting diode (OLED) display panel company. We believe Samsung SDI should benefit as the adoption of OLED panels, especially in smartphones, is poised for a sharp pickup over the coming years.
Lupin, an Indian pharmaceutical company, was the biggest detractor to performance during the quarter. The company faltered as distributor and retailer consolidation in the U.S., a key market for Lupin, led to increased pricing pressures on generic drug manufacturers globally. We expect that over the medium term the channel consolidation will lead weaker players to exit the market as prices are driven to unsustainably low levels. The company also has been increasing its spending on research and development to diversify into higher value-added products. We remain positive on the company’s long-term prospects given its strong development pipeline and attractive valuations.
(continued)
| 1 | Prospectus expense ratio. |
| 2 | Matthews has contractually agreed (i) to waive fees and reimburse expenses to the extent needed to limit Total Annual Fund Operating Expenses (excluding Rule 12b-1 fees, taxes, interest, brokerage commissions, short sale dividend expenses, expenses incurred in connection with any merger or reorganization or extraordinary expenses such as litigation) of the Institutional Class to 1.25% first by waiving class specific expenses (i.e., shareholder service fees specific to a particular class) of the Institutional Class and then, to the extent necessary, by waiving non-class specific expenses of the Institutional Class, and (ii) if any Fund-wide expenses (i.e., expenses that apply to both the Institutional Class and the Investor Class) are waived for the Institutional Class to maintain the 1.25% expense limitation, to waive an equal amount (in annual percentage terms) of those same expenses for the Investor Class. The Total Annual Fund Operating Expenses After Fee Waiver and Expense Reimbursement for the Investor Class may vary from year to year and will in some years exceed 1.25%. If the operating expenses fall below the expense limitation in a year within three years after Matthews has made a waiver or reimbursement, the Fund may reimburse Matthews up to an amount that does not cause the expenses for that year to exceed the lesser of (i) the expense limitation applicable at the time of that fee waiver and/or expense reimbursement or (ii) the expense limitation in effect at the time of recoupment. This agreement will remain in place until April 30, 2018 and may be terminated at any time by the Board of Trustees on behalf of the Fund on 60 days’ written notice to Matthews. Matthews may decline to renew this agreement by written notice to the Trust at least 30 days before its annual expiration date. |
| 3 | The lesser of fiscal year 2016 long-term purchase costs or sales proceeds divided by the average monthly market value of long-term securities. |
| | | | | | | | | | | | | | | | | | | | |
| | | | | | |
| PERFORMANCE AS OF JUNE 30, 2017 | | | | | | | | | | | | | | | |
| | | | | | | | | | | | Average Annual
Total Returns | | | | |
| | | 3 Months | | | YTD | | | 1 Year | | | Since
Inception | | | Inception
Date | |
| Investor Class (MASGX) | | | 6.16% | | | | 19.18% | | | | 19.18% | | | | 4.02% | | | | 4/30/15 | |
| Institutional Class (MISFX) | | | 6.19% | | | | 19.28% | | | | 19.46% | | | | 4.27% | | | | 4/30/15 | |
| MSCI AC Asia ex Japan Index4 | | | 8.40% | | | | 22.93% | | | | 27.06% | | | | 2.40% | | | | | |
| Lipper Pacific Region Funds Category Average5 | | | 6.61% | | | | 17.21% | | | | 18.61% | | | | 3.34% | | | | | |
Performance assumes reinvestment of all dividends and/or distributions before taxes. All performance quoted represents past performance and is no guarantee of future results. Investment return and principal value will fluctuate with market conditions so that when redeemed, shares may be worth more or less than their original cost. Current performance may be lower or higher than the return figures quoted. Returns would have been lower if certain of the Fund’s fees and expenses had not been waived. For the Fund’s most recent month-end performance visit matthewsasia.com.
GROWTH OF A $10,000 INVESTMENT SINCE INCEPTION—INVESTOR CLASS
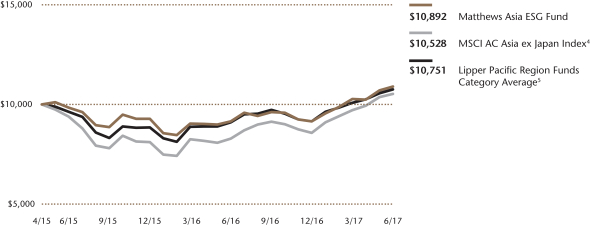
Plotted Monthly. The performance data and graph do not reflect the deduction of taxes that a shareholder would pay on dividends, capital gain distributions or redemption of Fund shares. Values are in US$.
| | 4 | It is not possible to invest directly in an index. Source: Index data from Morgan Stanley Capital International; total return calculations performed by BNY Mellon Investment Servicing (US) Inc. Please see page 91 for index definition. |
| | 5 | The Lipper Category Average does not reflect sales charges and is based on total return, including reinvestment of dividends and capital gains for the stated periods. |
| | | | | | | | |
| | | | |
| TOP TEN HOLDINGS6 | | | | | | | |
| | | Sector | | Country | | % of Net Assets | |
| Samsung SDI Co., Ltd., Pfd. | | Information Technology | | South Korea | | | 4.7% | |
| Taiwan Semiconductor Manufacturing Co., Ltd. | | Information Technology | | Taiwan | | | 4.2% | |
| Inner Mongolia Yili Industrial Group Co., Ltd. | | Consumer Staples | | China/Hong Kong | | | 3.4% | |
| PT Bank Rakyat Indonesia Persero | | Financials | | Indonesia | | | 3.4% | |
| Total Access Communication Public Co., Ltd. NVDR | | Telecommunication Services | | Thailand | | | 3.3% | |
| Shriram City Union Finance, Ltd. | | Financials | | India | | | 3.3% | |
| BRAC Bank, Ltd. | | Financials | | Bangladesh | | | 3.2% | |
| Hanon Systems | | Consumer Discretionary | | South Korea | | | 2.7% | |
| Lupin, Ltd. | | Health Care | | India | | | 2.6% | |
| JD.com, Inc. | | Consumer Discretionary | | China/Hong Kong | | | 2.5% | |
| % OF ASSETS IN TOP TEN | | | | | | | 33.3% | |
| | 6 | Holdings may combine more than one security from same issuer and related depositary receipts. |
| | | | |
| matthewsasia.com | 800.789.ASIA | | | 49 | |
| | | | |
| | |
| COUNTRY ALLOCATION (%)7 | | | |
| China/Hong Kong | | | 22.0 | |
| South Korea | | | 13.7 | |
| Japan | | | 13.4 | |
| Taiwan | | | 12.2 | |
| India | | | 12.1 | |
| Bangladesh | | | 5.8 | |
| Philippines | | | 4.9 | |
| Thailand | | | 4.4 | |
| Indonesia | | | 3.4 | |
| Pakistan | | | 2.6 | |
| Singapore | | | 2.5 | |
| Luxembourg | | | 1.6 | |
| Sri Lanka | | | 1.1 | |
| Cash and Other Assets, Less Liabilities | | | 0.3 | |
| | | | |
| | |
| SECTOR ALLOCATION (%)8 | | | |
| Financials | | | 20.3 | |
| Health Care | | | 17.8 | |
| Information Technology | | | 13.0 | |
| Industrials | | | 12.8 | |
| Consumer Discretionary | | | 11.6 | |
| Consumer Staples | | | 8.5 | |
| Telecommunication Services | | | 6.7 | |
| Utilities | | | 4.7 | |
| Materials | | | 3.0 | |
| Real Estate | | | 1.3 | |
| Cash and Other Assets, Less Liabilities | | | 0.3 | |
| | | | |
| | |
| MARKET CAP EXPOSURE (%)8 | | | |
| Mega Cap (over $25B) | | | 17.9 | |
| Large Cap ($10B–$25B) | | | 12.6 | |
| Mid Cap ($3B–10B) | | | 24.0 | |
| Small Cap (under $3B) | | | 45.2 | |
| Cash and Other Assets, Less Liabilities | | | 0.3 | |
| 7 | Not all countries are included in the benchmark index. |
| 8 | Source: FactSet Research Systems. Percentage values in data are rounded to the nearest tenth of one percent; the values may not sum to 100% due to rounding. |
Matthews Asia ESG Fund
Portfolio Manager Commentary (unaudited) (continued)
Notable Portfolio Changes:
During the quarter, the Fund added a position in Wuxi Biologics Cayman, a Chinese biologics contract development and manufacturing organization. Wuxi helps biotech companies convert a product idea into a commercial reality in a cost-effective and expedient fashion, leading to better health care outcomes for patients globally. Wuxi is a global top five player and the leader in the Chinese biologics outsourcing market with dominant market share. It is favorably exposed to fast-growing global biologics outsourcing services in general and to the Chinese outsourcing market in particular. We like the company in part for its strong employee equity participation and training programs.
During the quarter, we took profits after the strong performance of Japan’s Nakanishi, a dental equipment maker, and Taiwan’s Lumax International, an industrials sector holding, and exited our small positions in them.
Outlook:
We continue to watch for early signs of trouble for the Trump administration in pushing its agenda, in areas such as health care and on punitive trade policies, through Congress. Despite the related risks, we take comfort in economic fundamentals that appear to be improving globally as well as positive nominal GDP growth prospects in Asia. Furthermore, Asian consumers are increasingly focusing on products and services with positive environmental and social impacts, while Asian governments and regulators are pushing companies to strive for better environmental and governance standards—regardless of whether the U.S. retains policies established by the Obama administration. We believe such a push provides an encouraging backdrop for pursuing ESG-focused investing in Asia.
We employ a fundamental, bottom-up investment process in managing a portfolio of companies that make a positive environmental, social and economic impact while aiming to generate profitable growth. We will be on the lookout for market dislocations in Asia as they often present an opportunity to buy high-quality companies with best-in-class ESG attributes at reasonable prices.
Matthews Asia ESG Fund
June 30, 2017
Schedule of Investmentsa (unaudited)
COMMON EQUITIES: 95.0%
| | | | | | | | |
| | | Shares | | | Value | |
| CHINA/HONG KONG: 22.0% | |
Inner Mongolia Yili Industrial Group Co., Ltd. A Shares | | | 138,200 | | | | $440,454 | |
JD.com, Inc. ADRb | | | 8,400 | | | | 329,447 | |
Wuxi Biologics Cayman, Inc.b,c | | | 82,000 | | | | 308,257 | |
MTR Corp., Ltd. | | | 54,500 | | | | 306,690 | |
AIA Group, Ltd. | | | 38,200 | | | | 279,485 | |
HKBN, Ltd. | | | 270,000 | | | | 270,199 | |
CSPC Pharmaceutical Group, Ltd. | | | 126,000 | | | | 184,037 | |
China Conch Venture Holdings, Ltd. | | | 95,000 | | | | 173,922 | |
Hong Kong Exchanges & Clearing, Ltd. | | | 6,400 | | | | 165,340 | |
Guangdong Investment, Ltd. | | | 106,000 | | | | 146,085 | |
Haier Electronics Group Co., Ltd. | | | 55,000 | | | | 142,995 | |
Beijing Urban Construction Design & Development Group Co., Ltd. H Sharesc | | | 231,000 | | | | 124,529 | |
| | | | | | | | |
Total China/Hong Kong | | | | 2,871,440 | |
| | | | | | | | |
| | | | | | | | |
| JAPAN: 13.4% | |
Fuji Seal International, Inc. | | | 9,900 | | | | 273,696 | |
Tsukui Corp. | | | 46,200 | | | | 271,167 | |
Daikin Industries, Ltd. | | | 2,600 | | | | 266,739 | |
Sohgo Security Services Co., Ltd. | | | 5,900 | | | | 266,327 | |
Hoya Corp. | | | 3,200 | | | | 166,596 | |
Bunka Shutter Co., Ltd. | | | 18,800 | | | | 144,409 | |
Koito Manufacturing Co., Ltd. | | | 2,600 | | | | 134,447 | |
Ain Holdings, Inc. | | | 1,600 | | | | 115,791 | |
LINE Corp. ADRb | | | 3,200 | | | | 111,297 | |
| | | | | | | | |
Total Japan | | | | 1,750,469 | |
| | | | | | | | |
| | | | | | | | |
| TAIWAN: 12.2% | |
Taiwan Semiconductor Manufacturing Co., Ltd. | | | 80,000 | | | | 546,577 | |
Sitronix Technology Corp. | | | 73,000 | | | | 225,097 | |
Zhen Ding Technology Holding, Ltd. | | | 85,000 | | | | 201,256 | |
Tehmag Foods Corp. | | | 21,000 | | | | 174,682 | |
Merida Industry Co., Ltd. | | | 25,000 | | | | 133,808 | |
CHC Resources Corp. | | | 64,000 | | | | 116,257 | |
ECOVE Environment Corp. | | | 17,000 | | | | 99,195 | |
Sporton International, Inc. | | | 18,247 | | | | 92,375 | |
| | | | | | | | |
Total Taiwan | | | | 1,589,247 | |
| | | | | | | | |
| | | | | | | | |
| INDIA: 12.1% | |
Shriram City Union Finance, Ltd. | | | 11,642 | | | | 429,369 | |
Lupin, Ltd. | | | 20,770 | | | | 340,531 | |
Bharat Financial Inclusion, Ltd.b | | | 21,869 | | | | 243,707 | |
Power Grid Corp. of India, Ltd.b | | | 68,252 | | | | 222,241 | |
Ipca Laboratories, Ltd.b | | | 27,668 | | | | 210,717 | |
Sanofi India, Ltd. | | | 2,005 | | | | 128,817 | |
| | | | | | | | |
Total India | | | | 1,575,382 | |
| | | | | | | | |
| | | | | | | | |
| SOUTH KOREA: 9.0% | |
Hanon Systems | | | 38,444 | | | | 346,232 | |
KT Skylife Co., Ltd. | | | 14,719 | | | | 210,383 | |
iMarketKorea, Inc. | | | 16,719 | | | | 198,845 | |
DGB Financial Group, Inc. | | | 18,921 | | | | 195,070 | |
Samjin Pharmaceutical Co., Ltd. | | | 5,932 | | | | 171,006 | |
Samsung Biologics Co., Ltd.b,c | | | 210 | | | | 53,569 | |
| | | | | | | | |
Total South Korea | | | | 1,175,105 | |
| | | | | | | | |
| | | | | | | | |
| | | Shares | | | Value | |
| BANGLADESH: 5.8% | |
BRAC Bank, Ltd. | | | 413,907 | | | | $415,710 | |
GrameenPhone, Ltd. | | | 40,983 | | | | 175,036 | |
Square Pharmaceuticals, Ltd. | | | 46,337 | | | | 166,409 | |
| | | | | | | | |
Total Bangladesh | | | | 757,155 | |
| | | | | | | | |
| | | | | | | | |
| PHILIPPINES: 4.9% | |
Puregold Price Club, Inc. | | | 271,200 | | | | 239,436 | |
Energy Development Corp. | | | 1,980,000 | | | | 237,241 | |
Security Bank Corp. | | | 37,580 | | | | 161,599 | |
| | | | | | | | |
Total Philippines | | | | 638,276 | |
| | | | | | | | |
| | | | | | | | |
| THAILAND: 4.4% | |
Total Access Communication Public Co., Ltd. NVDR | | | 280,300 | | | | 432,770 | |
Kasikornbank Public Co., Ltd. NVDR | | | 24,100 | | | | 140,697 | |
| | | | | | | | |
Total Thailand | | | | 573,467 | |
| | | | | | | | |
| | | | | | | | |
| INDONESIA: 3.4% | |
PT Bank Rakyat Indonesia Persero | | | 385,300 | | | | 439,640 | |
| | | | | | | | |
Total Indonesia | | | | 439,640 | |
| | | | | | | | |
| | | | | | | | |
| PAKISTAN: 2.6% | |
Bank Alfalah, Ltd.b | | | 457,500 | | | | 175,408 | |
Abbott Laboratories Pakistan, Ltd. | | | 18,350 | | | | 164,751 | |
| | | | | | | | |
Total Pakistan | | | | 340,159 | |
| | | | | | | | |
| | | | | | | | |
| SINGAPORE: 2.5% | |
Parkway Life REIT | | | 87,000 | | | | 169,356 | |
Raffles Medical Group, Ltd. | | | 165,500 | | | | 161,191 | |
| | | | | | | | |
Total Singapore | | | | 330,547 | |
| | | | | | | | |
| | | | | | | | |
| LUXEMBOURG: 1.6% | |
L’Occitane International SA | | | 91,750 | | | | 210,445 | |
| | | | | | | | |
Total Luxembourg | | | | 210,445 | |
| | | | | | | | |
| | | | | | | | |
| SRI LANKA: 1.1% | |
Nestle Lanka PLC | | | 10,717 | | | | 141,864 | |
| | | | | | | | |
Total Sri Lanka | | | | 141,864 | |
| | | | | | | | |
| | | | | | | | |
| TOTAL COMMON EQUITIES | | | | | | | 12,393,196 | |
| | | | | | | | |
(Cost $10,983,695) | | | | | | | | |
| | | | | | | | |
| | | | |
| matthewsasia.com | 800.789.ASIA | | | 51 | |
Matthews Asia ESG Fund
June 30, 2017
Schedule of Investmentsa (unaudited) (continued)
PREFERRED EQUITIES: 4.7%
| | | | | | | | |
| | | Shares | | | Value | |
| SOUTH KOREA: 4.7% | | | | | | | | |
Samsung SDI Co., Ltd., Pfd. | | | 8,541 | | | | $616,292 | |
| | | | | | | | |
Total South Korea | | | | | | | 616,292 | |
| | | | | | | | |
| | | | | | | | |
| TOTAL PREFERRED EQUITIES | | | | | | | 616,292 | |
| | | | | | | | |
(Cost $434,248) | | | | | | | | |
| | | | | | | | |
| TOTAL INVESTMENTS: 99.7% | | | | | | | 13,009,488 | |
(Cost $11,417,943d) | | | | | | | | |
| | | | | | | | |
CASH AND OTHER ASSETS,
LESS LIABILITIES: 0.3% | | | | | | | 42,213 | |
| | | | | | | | |
| | |
NET ASSETS: 100.0% | | | | | | | $13,051,701 | |
| | | | | | | | |
| a | Certain securities were fair valued under the valuation policies approved by the Board of Trustees (Note 2-A). |
| b | Non-income producing security. |
| c | Security exempt from registration under Rule 144A of the Securities Act of 1933, as amended. The security may be resold in transactions exempt from registration normally to qualified institutional buyers. The security has been determined to be liquid in accordance with procedures adopted by the Fund’s Board of Directors. At June 30, 2017, the aggregate value is $486,355, which is 3.73% of net assets. |
| d | Cost for federal income tax purposes is $11,432,555 and net unrealized appreciation consists of: |
| | | | |
Gross unrealized appreciation | | | $1,969,666 | |
Gross unrealized depreciation | | | (392,733 | ) |
| | | | |
Net unrealized appreciation | | | $1,576,933 | |
| | | | |
| ADR | American Depositary Receipt |
| NVDR | Non-voting Depositary Receipt |
| REIT | Real Estate Investment Trust |
See accompanying notes to financial statements.
| | | | |
| PORTFOLIO MANAGERS |
| Taizo Ishida | | Robert Harvey, CFA |
Lead Manager | | Lead Manager |
|
| FUND FACTS |
| | | Investor | | Institutional |
Ticker | | MEASX | | MIASX |
CUSIP | | 577125883 | | 577125875 |
Inception | | 4/30/13 | | 4/30/13 |
NAV | | $14.66 | | $14.71 |
Initial Investment | | $2,500 | | $100,000 |
Gross Expense Ratio1 | | 1.77% | | 1.62% |
After Fee Waiver and Reimbursement2 | | 1.47% | | 1.25% |
Portfolio Statistics |
Total # of Positions | | 77 |
Net Assets | | $376.8 million |
Weighted Average Market Cap | | $2.4 billion |
Portfolio Turnover3 | | 34.90% |
Benchmark |
MSCI Emerging Markets Asia Index |
Redemption Fee |
2% within first 90 calendar days of purchase |
OBJECTIVE
Long term capital appreciation.
STRATEGY
Under normal market conditions, the Fund seeks to achieve its investment objective by investing at least 80% of its total assets, which include borrowings for investment purposes, in the common and preferred stocks of companies located in Asia excluding Japan, South Korea, Hong Kong and Singapore. The Fund may also invest in the convertible securities, of any duration or quality of companies located in Asia excluding Japan, South Korea, Hong Kong and Singapore. Under normal market conditions, the Fund is expected to invest a substantial portion of its net assets in the emerging countries and markets in the Asian region, including, but not limited to, Bangladesh, Cambodia, China (including Taiwan, but excluding Hong Kong), India, Indonesia, Laos, Malaysia, Mongolia, Myanmar, Pakistan, Papua New Guinea, Philippines, Sri Lanka, Thailand, and Vietnam.
Matthews Emerging Asia Fund
Portfolio Manager Commentary (unaudited)
Period ended June 30, 2017
For the first half of 2017, the Matthews Emerging Asia Fund returned 11.23% (Investor Class) and 11.27% (Institutional Class) while its benchmark, the MSCI Emerging Markets Asia Index, returned 23.31%. For the quarter ending June 30, 2017, the Fund returned 6.54% (Investor Class) and 6.52% (Institutional Class) compared with the benchmark return of 8.74% over the same period.
Market Environment:
The first half of 2017 delivered relatively strong returns for Asian investors, despite concerns at the start of the year over growth, as well as the controversial election rhetoric and policy uncertainties of the Trump administration. Since then, we have seen little to no traction on Trump’s plans for health care or tax reform. We have also seen China fortifying islands in the South China Sea and North Korea firing missiles into the ocean off the coast of Japan—an interesting backdrop for such solid performance. In the second quarter, the strongest-performing markets in the Asia region have been South Korea, China and Taiwan. This was the result of a change in investor growth expectations combined with low valuations in these markets. The Indian market—where valuations were arguably expensive at the start of the year—has performed surprisingly well, even while delivering relatively soft earnings.
Frontier and smaller markets in Southeast Asia have broadly been ignored in the first half of the year. Markets like Vietnam and Bangladesh delivered solid economic growth and stable currencies. Meanwhile, Pakistan and Sri Lanka faced headwinds from macro concerns, especially with regard to their external accounts. Strong imports have overshadowed relatively weak export performance and soft remittance data has caused concerns for both the Sri Lankan and Pakistani rupee.
Performance Contributors and Detractors:
Emerging Asia underperformed the benchmark for both the second quarter and first half of the year, primarily due to differences in asset allocation. The majority of the benchmark’s performance has been driven by strong returns from three countries: South Korea, Taiwan and China. These three countries account for approximately 70% weighting in the benchmark while Emerging Asia, during the second quarter, saw a combined weighting in these markets of about 8%.
We continue to view South Korea and Taiwan as “developed” rather than “emerging” markets and will continue to offer our clients exposure to the least-developed parts of Asia that we believe have the most growth potential.
The main detractors to Fund performance were The Searle Company and K-Electric, both of Pakistan. Pharmaceutical firm Searle had become expensive and we reduced our position earlier in the year, while K-Electric faces the possibility of a tariff reduction after the latest regulatory review. The firm has appealed the decision and we await the outcome. Hong Kong-listed Tongda Group also was a notable detractor after it was featured in a short-sellers research report. The share price of this high-precision component maker has since stabilized and investors are now awaiting developments before the stock can move upward.
(continued)
| 1 | Prospectus expense ratios. |
| 2 | Matthews has contractually agreed (i) to waive fees and reimburse expenses to the extent needed to limit Total Annual Fund Operating Expenses (excluding Rule 12b-1 fees, taxes, interest, brokerage commissions, short sale dividend expenses, expenses incurred in connection with any merger or reorganization or extraordinary expenses such as litigation) of the Institutional Class to 1.25% first by waiving class specific expenses (i.e., shareholder service fees specific to a particular class) of the Institutional Class and then, to the extent necessary, by waiving non-class specific expenses of the Institutional Class, and (ii) if any Fund-wide expenses (i.e., expenses that apply to both the Institutional Class and the Investor Class) are waived for the Institutional Class to maintain the 1.25% expense limitation, to waive an equal amount (in annual percentage terms) of those same expenses for the Investor Class. The Total Annual Fund Operating Expenses After Fee Waiver and Expense Reimbursement for the Investor Class may vary from year to year and will in some years exceed 1.25%. If the operating expenses fall below the expense limitation in a year within three years after Matthews has made a waiver or reimbursement, the Fund may reimburse Matthews up to an amount that does not cause the expenses for that year to exceed the lesser of (i) the expense limitation applicable at the time of that fee waiver and/or expense reimbursement or (ii) the expense limitation in effect at the time of recoupment. This agreement will remain in place until April 30, 2018 and may be terminated at any time by the Board of Trustees on behalf of the Fund on 60 days’ written notice to Matthews. Matthews may decline to renew this agreement by written notice to the Trust at least 30 days before its annual expiration date. |
| 3 | The lesser of fiscal year 2016 long-term purchase costs or sales proceeds divided by the average monthly market value of long-term securities. |
| | | | |
| matthewsasia.com | 800.789.ASIA | | | 53 | |
| | | | | | | | | | | | | | | | | | | | | | | | |
| |
| PERFORMANCE AS OF JUNE 30, 2017 | |
| | | | | | | | | | | | Average Annual
Total Returns | | | | |
| | | 3 Months | | | YTD | | | 1 Year | | | 3 Years | | | Since
Inception | | | Inception
Date | |
| Investor Class (MEASX) | | | 6.54% | | | | 11.23% | | | | 19.88% | | | | 10.65% | | | | 10.36% | | | | 4/30/13 | |
| Institutional Class (MIASX) | | | 6.52% | | | | 11.27% | | | | 20.11% | | | | 10.89% | | | | 10.60% | | | | 4/30/13 | |
| MSCI Emerging Markets Asia Index4 | | | 8.74% | | | | 23.31% | | | | 28.26% | | | | 5.37% | | | | 6.07% | | | | | |
| Lipper Emerging Markets Funds Category Average5 | | | 5.79% | | | | 17.73% | | | | 20.22% | | | | 0.28% | | | | 1.37% | | | | | |
Performance assumes reinvestment of all dividends and/or distributions before taxes. All performance quoted represents past performance and is no guarantee of future results. Investment return and principal value will fluctuate with market conditions so that when redeemed, shares may be worth more or less than their original cost. Current performance may be lower or higher than the return figures quoted. Returns would have been lower if certain of the Fund’s fees and expenses had not been waived. For the Fund’s most recent month-end performance visit matthewsasia.com.
GROWTH OF A $10,000 INVESTMENT SINCE INCEPTION—INVESTOR CLASS
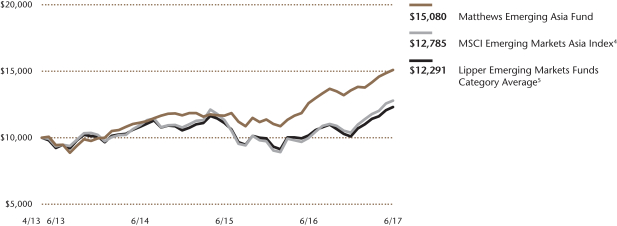
Plotted monthly. The performance data and graph do not reflect the deduction of taxes that a shareholder would pay on dividends, capital gain distributions or redemption of Fund shares. Values are in US$.
| | 4 | It is not possible to invest directly in an index. Source: Index data from Morgan Stanley Capital International and Bloomberg; total return calculations performed by BNY Mellon Investment Servicing (US) Inc. Please see page 91 for index definition. |
| | 5 | The Lipper Category Average does not reflect sales charges and is based on total return, including reinvestment of dividends and capital gains for the stated periods. |
| | | | | | | | |
| | | | |
| TOP TEN HOLDINGS6 | | | | | | | |
| | | Sector | | Country | | % of Net Assets | |
| Saigon Beer Alcohol Beverage Corp. | | Consumer Staples | | Vietnam | | | 3.6% | |
| Shenzhou International Group Holdings, Ltd. | | Consumer Discretionary | | China/Hong Kong | | | 2.8% | |
| BRAC Bank, Ltd. | | Financials | | Bangladesh | | | 2.8% | |
| British American Tobacco Bangladesh Co., Ltd. | | Consumer Staples | | Bangladesh | | | 2.6% | |
| PC Jeweller, Ltd. | | Consumer Discretionary | | India | | | 2.5% | |
| Phu Nhuan Jewelry JSC | | Consumer Discretionary | | Vietnam | | | 2.5% | |
| Indus Motor Co., Ltd. | | Consumer Discretionary | | Pakistan | | | 2.4% | |
| PT Bank Mandiri Persero | | Financials | | Indonesia | | | 2.4% | |
| Vinh Hoan Corp. | | Consumer Staples | | Vietnam | | | 2.3% | |
| Balkrishna Industries, Ltd. | | Consumer Discretionary | | India | | | 2.2% | |
| % OF ASSETS IN TOP TEN | | | | | | | 26.1% | |
| | 6 | Holdings may combine more than one security from same issuer and related depositary receipts. |
Matthews Emerging Asia Fund
Portfolio Manager Commentary (unaudited) (continued)
By country, Vietnam, India and Indonesia were top contributors to Fund performance during the quarter, while Thailand and Myanmar delivered negative returns. The portfolio’s small weighting in these countries, however, limited the impact of the declines.
The largest contributor to returns during the quarter came from Vietnam’s Phu Nhuan Jewelry, which continued to deliver strong earnings from an expanding store base. Another notable contributor in Vietnam was Military Commercial Bank. The bank performed well, appreciating by about 61% since the start of the year, as investors seemed more optimistic about banks in general. Military Commercial Bank had an attractive valuation and also delivered solid earnings growth during the quarter.
Notable Portfolio Changes:
During the quarter, we initiated a sizable new position in Saigon Beer Alcohol Beverage, Vietnam’s dominant brewery. The country’s beer market has grown significantly over the past decade. We believe the company has significant potential for further growth along with operational efficiencies. We also added to our position in Indus Motor in Pakistan and Tongda Group following share price weakness induced by market short sellers.
Prior to the second quarter, we had already begun to trim our position in DHG Pharmaceuticals following sharp price appreciation—the share price having doubled in the first six months of the year—and ultimately we began to exit our position as we believe its valuation had become too rich versus our more moderate growth expectations.
Outlook:
In our view, growth opportunities in more developed markets remain relatively limited, broadly speaking, as compared with the opportunities we are finding in the emerging and frontier markets. Valuations in some stocks and some markets are now higher, making the opportunities less attractive. We will focus on offering investors exposure to the least developed markets in Asia, driven by a bottom-up fundamental process.
In the shorter term, the outlook is clouded by the ever-shifting sentiment of international investors. In the medium term, high debt levels globally remain a concern and a headwind to growth. We remain concerned about the potential impact on oil prices from political tensions across the world and in the Middle East. A prolonged disruption to oil supply could lead to a sharp and sustained recovery in oil prices, which would negatively affect Emerging Asian economies.
Looking forward, Asian frontier markets are likely to continue to attract foreign direct investment, create new manufacturing jobs, receive growing remittance flows and increase their share of global exports off a low base. We believe these factors should lead to a relatively bright future for patient investors.
| | | | |
| |
| COUNTRY ALLOCATION (%)7,8 | |
| Vietnam | | | 20.4 | |
| Pakistan | | | 18.0 | |
| Indonesia | | | 12.3 | |
| India | | | 12.3 | |
| Bangladesh | | | 11.7 | |
| China/Hong Kong | | | 8.1 | |
| Sri Lanka | | | 6.7 | |
| Philippines | | | 5.2 | |
| Australia | | | 0.6 | |
| Singapore | | | 0.6 | |
| Thailand | | | 0.5 | |
| Cash and Other Assets, Less Liabilities | | | 3.6 | |
| | | | |
| |
| SECTOR ALLOCATION (%)8 | |
| Consumer Staples | | | 27.2 | |
| Consumer Discretionary | | | 24.2 | |
| Financials | | | 16.2 | |
| Health Care | | | 8.8 | |
| Industrials | | | 7.5 | |
| Materials | | | 4.9 | |
| Real Estate | | | 2.8 | |
| Information Technology | | | 2.2 | |
| Energy | | | 1.4 | |
| Utilities | | | 1.2 | |
| Cash and Other Assets, Less Liabilities | | | 3.6 | |
| | | | |
| |
| MARKET CAP EXPOSURE (%)8 | |
| Mega Cap (over $25B) | | | 0.0 | |
| Large Cap ($10B–$25B) | | | 4.6 | |
| Mid Cap ($3B–10B) | | | 13.9 | |
| Small Cap (under $3B) | | | 77.9 | |
| Cash and Other Assets, Less Liabilities | | | 3.6 | |
| 7 | Not all countries where the Fund may invest are included in the benchmark index. |
| 8 | Source: FactSet Research Systems. Percentage values in data are rounded to the nearest tenth of one percent; the values may not sum to 100% due to rounding. |
| | | | |
| matthewsasia.com | 800.789.ASIA | | | 55 | |
Matthews Emerging Asia Fund
June 30, 2017
Schedule of Investmentsa (unaudited)
COMMON EQUITIES: 96.4%
| | | | | | | | |
| | | Shares | | | Value | |
| VIETNAM: 20.4% | | | | | | | | |
Saigon Beer Alcohol Beverage Corp. | | | 1,462,000 | | | | $13,397,326 | |
Phu Nhuan Jewelry JSC | | | 2,063,683 | | | | 9,242,134 | |
Vinh Hoan Corp. | | | 3,315,820 | | | | 8,606,457 | |
Masan Group Corp. | | | 3,610,260 | | | | 6,670,666 | |
Tien Phong Plastic JSC | | | 1,861,224 | | | | 5,485,989 | |
Thien Long Group Corp. | | | 906,250 | | | | 5,481,913 | |
National Seed JSC† | | | 979,585 | | | | 4,697,319 | |
Mobile World Investment Corp. | | | 1,020,454 | | | | 4,619,450 | |
Domesco Medical Import Export JSCb | | | 787,290 | | | | 4,502,560 | |
Military Commercial Joint Stock Bank | | | 4,483,600 | | | | 4,398,587 | |
Nam Long Investment Corp. | | | 3,272,278 | | | | 4,102,763 | |
Lix Detergent JSC | | | 1,047,635 | | | | 2,396,596 | |
Dinh Vu Port Investment & Development JSC | | | 517,550 | | | | 1,593,540 | |
Taisun International Holding Corp.b | | | 293,000 | | | | 1,325,625 | |
DHG Pharmaceutical JSC | | | 30,000 | | | | 164,049 | |
| | | | | | | | |
Total Vietnam | | | | | | | 76,684,974 | |
| | | | | | | | |
| | | | | | | | |
| PAKISTAN: 18.0% | | | | | | | | |
Indus Motor Co., Ltd. | | | 536,030 | | | | 9,158,964 | |
PAK Suzuki Motor Co., Ltd. | | | 1,081,900 | | | | 8,052,184 | |
Hascol Petroleum, Ltd. | | | 2,365,500 | | | | 7,715,551 | |
Shifa International Hospitals, Ltd. | | | 2,172,451 | | | | 6,837,471 | |
The Searle Company, Ltd. | | | 1,220,869 | | | | 5,961,473 | |
Habib Bank, Ltd. | | | 1,885,000 | | | | 4,838,616 | |
ICI Pakistan, Ltd. | | | 451,900 | | | | 4,717,474 | |
K-Electric, Ltd.b | | | 66,568,500 | | | | 4,393,959 | |
Akzo Nobel Pakistan, Ltd. | | | 1,854,100 | | | | 4,244,006 | |
Pakistan Petroleum, Ltd. | | | 2,127,300 | | | | 3,005,176 | |
National Foods, Ltd. | | | 958,500 | | | | 2,477,382 | |
Meezan Bank, Ltd. | | | 3,276,000 | | | | 2,468,326 | |
Hum Network, Ltd.b | | | 17,939,500 | | | | 2,008,676 | |
GlaxoSmithKline Consumer Healthcare Pakistan, Ltd.b | | | 973,957 | | | | 1,941,505 | |
| | | | | | | | |
Total Pakistan | | | | | | | 67,820,763 | |
| | | | | | | | |
| | | | | | | | |
| INDONESIA: 12.3% | | | | | | | | |
PT Bank Mandiri Persero | | | 9,531,400 | | | | 9,136,046 | |
PT Gudang Garam | | | 1,393,100 | | | | 8,191,558 | |
PT Matahari Department Store | | | 7,077,200 | | | | 7,526,402 | |
PT Hexindo Adiperkasa | | | 18,901,100 | | | | 5,460,081 | |
PT Adira Dinamika Multi Finance | | | 8,203,300 | | | | 4,176,895 | |
PT Mayora Indah | | | 24,273,200 | | | | 4,034,849 | |
PT Kino Indonesia | | | 16,629,000 | | | | 2,841,769 | |
PT Catur Sentosa Adiprana | | | 70,131,000 | | | | 2,503,205 | |
PT Sumber Alfaria Trijaya | | | 50,991,700 | | | | 2,180,849 | |
PT BFI Finance Indonesia | | | 7,965,000 | | | | 310,771 | |
| | | | | | | | |
Total Indonesia | | | | | | | 46,362,425 | |
| | | | | | | | |
| | | | | | | | |
| INDIA: 12.3% | | | | | | | | |
PC Jeweller, Ltd. | | | 1,249,637 | | | | 9,466,827 | |
Balkrishna Industries, Ltd. | | | 324,532 | | | | 8,347,045 | |
Kwality, Ltd. | | | 2,533,204 | | | | 5,782,081 | |
Caplin Point Laboratories, Ltd. | | | 489,805 | | | | 4,186,477 | |
Praj Industries, Ltd.b | | | 3,594,497 | | | | 4,173,796 | |
Shriram Transport Finance Co., Ltd. | | | 268,352 | | | | 4,145,941 | |
| | | | | | | | |
| | | Shares | | | Value | |
Supreme Industries, Ltd. | | | 178,934 | | | | $3,395,760 | |
VST Industries, Ltd. | | | 60,083 | | | | 3,315,940 | |
Cipla India, Ltd. | | | 311,919 | | | | 2,681,301 | |
Poly Medicure, Ltd. | | | 234,582 | | | | 796,971 | |
| | | | | | | | |
Total India | | | | | | | 46,292,139 | |
| | | | | | | | |
| | | | | | | | |
| BANGLADESH: 11.7% | | | | | | | | |
BRAC Bank, Ltd. | | | 10,465,792 | | | | 10,511,381 | |
British American Tobacco Bangladesh Co., Ltd. | | | 278,950 | | | | 9,792,583 | |
Square Pharmaceuticals, Ltd. | | | 2,236,661 | | | | 8,032,458 | |
Berger Paints Bangladesh, Ltd. | | | 235,998 | | | | 6,149,213 | |
The City Bank, Ltd. | | | 9,945,509 | | | | 4,615,200 | |
Olympic Industries, Ltd. | | | 757,426 | | | | 2,612,330 | |
Marico Bangladesh, Ltd. | | | 191,945 | | | | 2,433,280 | |
| | | | | | | | |
Total Bangladesh | | | | | | | 44,146,445 | |
| | | | | | | | |
| | | | | | | | |
| CHINA/HONG KONG: 8.1% | | | | | | | | |
Shenzhou International Group Holdings, Ltd. | | | 1,630,000 | | | | 10,717,858 | |
Tongda Group Holdings, Ltd. | | | 27,650,000 | | | | 8,249,092 | |
Luk Fook Holdings International, Ltd. | | | 1,822,000 | | | | 6,229,824 | |
Red Star Macalline Group Corp., Ltd. H Sharesc | | | 2,429,000 | | | | 2,488,905 | |
Future Bright Holdings, Ltd. | | | 18,612,000 | | | | 1,669,574 | |
The 13 Holdings, Ltd.b | | | 5,608,000 | | | | 1,156,444 | |
| | | | | | | | |
Total China/Hong Kong | | | | | | | 30,511,697 | |
| | | | | | | | |
| | | | | | | | |
| SRI LANKA: 6.7% | | | | | | | | |
Ceylon Cold Stores PLC | | | 1,350,000 | | | | 7,794,078 | |
Sampath Bank PLC | | | 3,248,392 | | | | 6,066,574 | |
Teejay Lanka PLC | | | 14,268,292 | | | | 3,907,719 | |
National Development Bank PLC | | | 3,502,989 | | | | 3,287,293 | |
Expolanka Holdings PLC | | | 73,732,547 | | | | 3,269,416 | |
Ceylon Tobacco Co. PLC | | | 90,306 | | | | 585,765 | |
Lanka Orix Leasing Co. PLCb | | | 573,466 | | | | 421,812 | |
| | | | | | | | |
Total Sri Lanka | | | | | | | 25,332,657 | |
| | | | | | | | |
| | | | | | | | |
| PHILIPPINES: 5.2% | | | | | | | | |
STI Education Systems Holdings, Inc. | | | 235,681,000 | | | | 6,679,030 | |
Cosco Capital, Inc. | | | 34,548,800 | | | | 5,405,692 | |
San Miguel Pure Foods Co., Inc. | | | 753,370 | | | | 4,726,852 | |
Vista Land & Lifescapes, Inc. | | | 12,519,100 | | | | 1,442,970 | |
Emperador, Inc. | | | 9,266,300 | | | | 1,384,619 | |
| | | | | | | | |
Total Philippines | | | | | | | 19,639,163 | |
| | | | | | | | |
| | | | | | | | |
| AUSTRALIA: 0.6% | | | | | | | | |
Oil Search, Ltd. | | | 467,309 | | | | 2,447,098 | |
| | | | | | | | |
Total Australia | | | | | | | 2,447,098 | |
| | | | | | | | |
| | | | | | | | |
| SINGAPORE: 0.6% | | | | | | | | |
Yoma Strategic Holdings, Ltd. | | | 5,491,766 | | | | 2,333,706 | |
| | | | | | | | |
Total Singapore | | | | | | | 2,333,706 | |
| | | | | | | | |
| | | | | | | | |
Matthews Emerging Asia Fund
June 30, 2017
Schedule of Investmentsa (unaudited) (continued)
COMMON EQUITIES (continued)
| | | | | | | | |
| | | Shares | | | Value | |
| THAILAND: 0.5% | | | | | | | | |
SNC Former Public Co., Ltd. | | | 4,002,800 | | | | $1,707,973 | |
| | | | | | | | |
Total Thailand | | | | | | | 1,707,973 | |
| | | | | | | | |
| | | | | | | | |
| TOTAL INVESTMENTS: 96.4% | | | | 363,279,040 | |
(Cost $307,535,416d) | | | | | | | | |
| | | | | | | | |
CASH AND OTHER ASSETS,
LESS LIABILITIES: 3.6% | | | | | | | 13,527,714 | |
| | | | | | | | |
| | |
NET ASSETS: 100.0% | | | | | | | $376,806,754 | |
| | | | | | | | |
| a | Certain securities were fair valued under the valuation policies approved by the Board of Trustees (Note 2-A). |
| b | Non-income producing security. |
| c | Security exempt from registration under Rule 144A of the Securities Act of 1933, as amended. The security may be resold in transactions exempt from registration normally to qualified institutional buyers. The security has been determined to be liquid in accordance with procedures adopted by the Fund’s Board of Directors. At June 30, 2017, the aggregate value is $2,488,905, which is 0.66% of net assets. |
| d | Cost for federal income tax purposes is $307,535,416 and net unrealized appreciation consists of: |
| | | | |
Gross unrealized appreciation | | | $71,118,412 | |
Gross unrealized depreciation | | | (15,374,788 | ) |
| | | | |
Net unrealized appreciation | | | $55,743,624 | |
| | | | |
| † | Affiliated Issuer, as defined under the Investment Company Act of 1940 (ownership of 5% or more of the outstanding voting securities of this issuer) |
See accompanying notes to financial statements.
| | | | |
| matthewsasia.com | 800.789.ASIA | | | 57 | |
| | | | |
| PORTFOLIO MANAGERS |
| Michael J. Oh, CFA | | |
Lead Manager | | | | |
| Lydia So, CFA | | Robert Harvey, CFA |
Co-Manager | | Co-Manager |
| | |
| FUND FACTS | | | | |
| | | Investor | | Institutional |
Ticker | | MATFX | | MITEX |
CUSIP | | 577130883 | | 577125859 |
Inception | | 12/27/99 | | 4/30/13 |
NAV | | $13.14 | | $13.21 |
Initial Investment | | $2,500 | | $100,000 |
Gross Expense Ratio1 | | 1.24% | | 1.01% |
Portfolio Statistics | | | | |
Total # of Positions | | 45 |
Net Assets | | $149.3 million |
Weighted Average Market Cap | | $76.5 billion |
Portfolio Turnover2 | | 92.25% |
Benchmark | | | | |
MSCI AC Asia ex Japan Index |
OBJECTIVE
Long-term capital appreciation.
STRATEGY
Under normal market conditions, the Fund seeks to achieve its investment objective by investing at least 80% of its net assets, which include borrowings for investment purposes, in the common and preferred stocks of companies located in Asia that Matthews believes are innovators in their products, services, processes, business models, management, use of technology, or approach to creating, expanding or servicing their markets. Asia consists of all countries and markets in Asia, including developed, emerging, and frontier countries and markets in the Asian region.
Matthews Asia Innovators Fund
Portfolio Manager Commentary (unaudited)
Period ended June 30, 2017
For the first half of 2017, the Matthews Asia Innovators Fund returned 30.10% (Investor Class) and 30.28% (Institutional Class), outperforming its benchmark, the MSCI All Country Asia ex Japan Index, which returned 22.93% over the same period. For the quarter ending June 30, 2017, the Fund returned 13.57% (Investor Class) and 13.68% (Institutional Class) compared with the benchmark return of 8.40% over the same period.
Market Environment:
Asia’s equity markets generally showed strong performance during the second quarter despite rising geopolitical risks caused by North Korea’s nuclear ambitions and uncertainties stemming from the Trump administration’s unclear policies toward Asia and the rest of the world. North Asian markets performed particularly well during the quarter, mostly led by strong earnings momentum from the technology and consumer sectors. Asia’s markets comfortably digested the second rate hike from the U.S. Federal Reserve and the overall improvement in the global economy seems to have had a positive impact on the Asian economy.
Performance Contributors and Detractors:
The biggest contributor during the quarter was Hugel, a South Korea-based biopharmaceutical company that focuses on developing beauty-related products, including botulinum toxin (botox). Hugel’s main target markets are emerging economies. We added this holding to the portfolio after an onsite visit in March 2016. The share price was strong during the second quarter as a result of strong earnings growth, and on the back of news that Bain Capital had agreed to acquire a majority stake in the company in order to gain control. Hugel’s products are well positioned to benefit from rising disposable income in Asia as well as in other emerging countries elsewhere in the world. As discussed in our first quarter commentary, we have been increasing our exposure to China’s e-commerce sector and that has benefited Fund performance during the second quarter as both Alibaba and JD.com performed well.
Notable Changes to Portfolio:
During the quarter, the Fund added three A-share (mainland China) listed companies—Midea Group, Wuliangye Yibin and Shenzhen Inovance Technology. Midea, one of China’s major consumer appliance makers, recently acquired Kuka, a major German automation company. The automation market in China remains bright and we believe that Midea can play a major role in developing China’s automation industry. Wuliangye Yibin is a high-end liquor-maker that is innovative in its development of new products based on traditional Chinese spirits. Shenzhen Inovance Technology manufactures key automation-related components. We also added more exposure to banks that are well positioned to lead the Fintech sector in the region.
Outlook:
Asian equity markets have been performing well on the back of strong earnings growth stemming mainly from information technology, consumer and financial companies. We view any volatility as a good opportunity to accumulate high-quality, innovative companies that are well-positioned to benefit from rising disposable income in the region. We believe the Asian market is primed to benefit from innovation. We will continue to focus on companies that can create products and services that capture opportunities created by long-term trends in the region.
| 1 | Prospectus expense ratios. |
| 2 | The lesser of fiscal year 2016 long-term purchase costs or sales proceeds divided by the average monthly market value of long-term securities. |
| | | | | | | | | | | | | | | | | | | | | | | | | | | | | | | | |
| |
| PERFORMANCE AS OF JUNE 30, 2017 | |
| | | | | | | | | | | | Average Annual Total Returns | | | | |
| | | 3 Months | | | YTD | | | 1 Year | | | 3 Years | | | 5 Years | | | 10 Years | | | Since
Inception | | | Inception
Date | |
| Investor Class (MATFX) | | | 13.57% | | | | 30.10% | | | | 24.21% | | | | 7.76% | | | | 14.61% | | | | 6.85% | | | | 3.44% | | | | 12/27/99 | |
| Institutional Class (MITEX) | | | 13.68% | | | | 30.28% | | | | 24.51% | | | | 7.97% | | | | n.a. | | | | n.a. | | | | 13.57% | | | | 4/30/13 | |
| MSCI AC Asia ex Japan Index3 | | | 8.40% | | | | 22.93% | | | | 27.06% | | | | 5.32% | | | | 8.27% | | | | 4.48% | | | | 6.40% | 4 | | | | |
| Lipper Pacific ex Japan Funds Category Average5 | | | 7.97% | | | | 22.02% | | | | 21.94% | | | | 4.36% | | | | 7.64% | | | | 4.15% | | | | 6.79% | | | | | |
Performance assumes reinvestment of all dividends and/or distributions before taxes. All performance quoted represents past performance and is no guarantee of future results. Investment return and principal value will fluctuate with market conditions so that when redeemed, shares may be worth more or less than their original cost. Current performance may be lower or higher than the return figures quoted. For the Fund’s most recent month-end performance, visit matthewsasia.com.
GROWTH OF A $10,000 INVESTMENT SINCE INCEPTION—INVESTOR CLASS
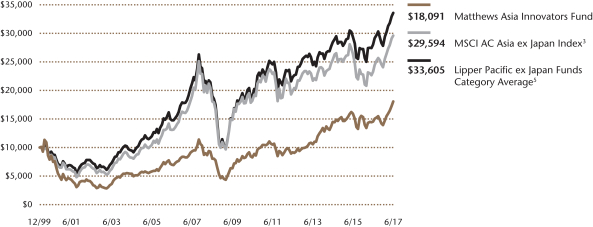
Plotted monthly. The performance data and graph do not reflect the deduction of taxes that a shareholder would pay on dividends, capital gains distributions or redemption of Fund shares. Values are in US$.
| | 3 | It is not possible to invest directly in an index. Source: Index data from Morgan Stanley Capital International and Bloomberg; total return calculations performed by BNY Mellon Investment Servicing (US) Inc. Please see page 91 for index definition. |
| | 4 | Calculated from 12/31/99. |
| | 5 | The Lipper Category Average does not reflect sales charges and is based on total return, including reinvestment of dividends and capital gains for the stated periods. |
| | | | | | | | |
| | | | |
| TOP TEN HOLDINGS6 | | | | | | | |
| | | Sector | | Country | | % of Net Assets | |
| Alibaba Group Holding, Ltd. | | Information Technology | | China/Hong Kong | | | 4.5% | |
| Tencent Holdings, Ltd. | | Information Technology | | China/Hong Kong | | | 4.1% | |
| Hugel, Inc. | | Health Care | | South Korea | | | 3.9% | |
| Taiwan Semiconductor Manufacturing Co., Ltd. | | Information Technology | | Taiwan | | | 3.6% | |
| Samsung Electronics Co., Ltd., Pfd. | | Information Technology | | South Korea | | | 3.2% | |
| Samsung Electronics Co., Ltd. | | Information Technology | | South Korea | | | 3.2% | |
| Jiangsu Hengrui Medicine Co., Ltd. | | Health Care | | China/Hong Kong | | | 3.1% | |
| NetEase, Inc. | | Information Technology | | China/Hong Kong | | | 2.9% | |
| Ping An Insurance Group Co. of China, Ltd. | | Financials | | China/Hong Kong | | | 2.8% | |
| Midea Group Co., Ltd. | | Consumer Discretionary | | China/Hong Kong | | | 2.7% | |
| % OF ASSETS IN TOP TEN | | | | | | | 34.0% | |
| | 6 | Holdings may combine more than one security from same issuer and related depositary receipts. |
| | | | |
| | |
| COUNTRY ALLOCATION (%)7,8 | | | |
| China/Hong Kong | | | 41.4 | |
| South Korea | | | 25.6 | |
| Taiwan | | | 7.0 | |
| India | | | 6.7 | |
| Indonesia | | | 5.1 | |
| Vietnam | | | 3.4 | |
| Thailand | | | 3.3 | |
| Bangladesh | | | 2.6 | |
| Philippines | | | 2.6 | |
| Cash and Other Assets, Less Liabilities | | | 2.3 | |
| | | | |
| | |
| SECTOR ALLOCATION (%)8 | | | |
| Information Technology | | | 36.3 | |
| Financials | | | 18.1 | |
| Consumer Discretionary | | | 17.1 | |
| Health Care | | | 13.1 | |
| Consumer Staples | | | 10.4 | |
| Materials | | | 1.4 | |
| Industrials | | | 1.3 | |
| Cash and Other Assets, Less Liabilities | | | 2.3 | |
| | | | |
| | |
| MARKET CAP EXPOSURE (%)8 | | | |
| Mega Cap (over $25B) | | | 40.1 | |
| Large Cap ($10B–$25B) | | | 22.0 | |
| Mid Cap ($3B–10B) | | | 9.1 | |
| Small Cap (under $3B) | | | 26.4 | |
| Cash and Other Assets, Less Liabilities | | | 2.3 | |
| | 7 | Not all countries are included in the benchmark index(es). |
| | 8 | Source: FactSet Research Systems. Percentage values in data are rounded to the nearest tenth of one percent; the values may not sum to 100% due to rounding. |
| | | | |
| matthewsasia.com | 800.789.ASIA | | | 59 | |
Matthews Asia Innovators Fund
June 30, 2017
Schedule of Investmentsa (unaudited)
COMMON EQUITIES: 94.5%
| | | | | | | | |
| | | Shares | | | Value | |
| CHINA/HONG KONG: 41.4% | | | | | | | | |
Alibaba Group Holding, Ltd. ADRb | | | 47,800 | | | | $6,735,020 | |
Tencent Holdings, Ltd. | | | 172,500 | | | | 6,188,431 | |
Jiangsu Hengrui Medicine Co., Ltd. A Shares | | | 624,995 | | | | 4,663,392 | |
NetEase, Inc. ADR | | | 14,300 | | | | 4,299,009 | |
Ping An Insurance Group Co. of China, Ltd. H Shares | | | 637,500 | | | | 4,199,467 | |
Midea Group Co., Ltd. A Shares | | | 646,338 | | | | 4,102,916 | |
TAL Education Group ADR | | | 31,600 | | | | 3,864,996 | |
JD.com, Inc. ADRb | | | 97,300 | | | | 3,816,106 | |
Ctrip.com International, Ltd. ADRb | | | 67,900 | | | | 3,657,094 | |
Wuliangye Yibin Co., Ltd. A Shares | | | 397,976 | | | | 3,267,088 | |
China Construction Bank Corp. H Shares | | | 3,850,000 | | | | 2,993,938 | |
Baidu, Inc. ADRb | | | 16,000 | | | | 2,861,760 | |
China Biologic Products, Inc.b | | | 25,000 | | | | 2,827,500 | |
Sino Biopharmaceutical, Ltd. | | | 3,075,000 | | | | 2,718,988 | |
Tongda Group Holdings, Ltd. | | | 6,610,000 | | | | 1,972,025 | |
Shenzhen Inovance Technology Co., Ltd. A Shares | | | 513,280 | | | | 1,932,825 | |
Wuxi Biologics Cayman, Inc.b | | | 480,000 | | | | 1,804,430 | |
| | | | | | | | |
Total China/Hong Kong | | | | | | | 61,904,985 | |
| | | | | | | | |
| | | | | | | | |
| SOUTH KOREA: 22.4% | | | | | | | | |
Hugel, Inc.b | | | 11,836 | | | | 5,787,172 | |
Samsung Electronics Co., Ltd. | | | 2,277 | | | | 4,742,585 | |
Samsung SDI Co., Ltd. | | | 25,760 | | | | 3,867,182 | |
Hana Financial Group, Inc. | | | 96,420 | | | | 3,807,867 | |
KB Financial Group, Inc. | | | 59,444 | | | | 3,001,342 | |
SK Hynix, Inc. | | | 49,230 | | | | 2,898,649 | |
Naver Corp. | | | 3,551 | | | | 2,602,992 | |
Hana Tour Service, Inc. | | | 32,463 | | | | 2,596,132 | |
BGF Retail Co., Ltd. | | | 25,400 | | | | 2,244,041 | |
LG Household & Health Care, Ltd. | | | 2,211 | | | | 1,921,145 | |
| | | | | | | | |
Total South Korea | | | | | | | 33,469,107 | |
| | | | | | | | |
| | | | | | | | |
| TAIWAN: 7.0% | | | | | | | | |
Taiwan Semiconductor Manufacturing Co., Ltd. | | | 782,000 | | | | 5,342,791 | |
Wistron NeWeb Corp. | | | 940,000 | | | | 2,797,044 | |
Ennoconn Corp. | | | 187,162 | | | | 2,369,436 | |
| | | | | | | | |
Total Taiwan | | | | | | | 10,509,271 | |
| | | | | | | | |
| | | | | | | | |
| INDIA: 6.7% | | | | | | | | |
IndusInd Bank, Ltd. | | | 136,690 | | | | 3,125,138 | |
Info Edge India, Ltd. | | | 171,922 | | | | 2,749,350 | |
Britannia Industries, Ltd. | | | 35,934 | | | | 2,051,288 | |
Supreme Industries, Ltd. | | | 106,077 | | | | 2,013,100 | |
| | | | | | | | |
Total India | | | | | | | 9,938,876 | |
| | | | | | | | |
| | | | | | | | |
| INDONESIA: 5.1% | | | | | | | | |
PT Bank Mandiri Persero | | | 3,122,900 | | | | 2,993,365 | |
PT Media Nusantara Citrab | | | 17,757,900 | | | | 2,448,066 | |
PT Sumber Alfaria Trijaya | | | 50,808,100 | | | | 2,172,997 | |
| | | | | | | | |
Total Indonesia | | | | | | | 7,614,428 | |
| | | | | | | | |
| | | | | | | | |
| | | | | | | | |
| | | Shares | | | Value | |
| VIETNAM: 3.4% | | | | | | | | |
Mobile World Investment Corp. | | | 707,470 | | | | $3,202,616 | |
Domesco Medical Import Export JSCb | | | 315,410 | | | | 1,803,849 | |
| | | | | | | | |
Total Vietnam | | | | | | | 5,006,465 | |
| | | | | | | | |
| | | | | | | | |
| THAILAND: 3.3% | | | | | | | | |
Kasikornbank Public Co., Ltd. | | | 520,200 | | | | 3,036,949 | |
Major Cineplex Group Public Co., Ltd. | | | 1,874,100 | | | | 1,861,963 | |
| | | | | | | | |
Total Thailand | | | | | | | 4,898,912 | |
| | | | | | | | |
| | | | | | | | |
| BANGLADESH: 2.6% | | | | | | | | |
BRAC Bank, Ltd. | | | 3,876,131 | | | | 3,893,015 | |
| | | | | | | | |
Total Bangladesh | | | | | | | 3,893,015 | |
| | | | | | | | |
| | | | | | | | |
| PHILIPPINES: 2.6% | | | | | | | | |
Puregold Price Club, Inc. | | | 2,569,600 | | | | 2,268,642 | |
San Miguel Pure Foods Co., Inc. | | | 248,530 | | | | 1,559,346 | |
| | | | | | | | |
Total Philippines | | | | | | | 3,827,988 | |
| | | | | | | | |
| | | | | | | | |
| TOTAL COMMON EQUITIES | | | | | | | 141,063,047 | |
| | | | | | | | |
(Cost $100,204,693) | | | | | | | | |
| | | | | | | | |
PREFERRED EQUITIES: 3.2% | | | | | | | | |
| SOUTH KOREA: 3.2% | | | | | | | | |
Samsung Electronics Co., Ltd., Pfd. | | | 2,942 | | | | 4,796,926 | |
| | | | | | | | |
Total South Korea | | | | | | | 4,796,926 | |
| | | | | | | | |
| | | | | | | | |
| TOTAL PREFERRED EQUITIES | | | | | | | 4,796,926 | |
| | | | | | | | |
(Cost $2,989,622) | | | | | | | | |
| | | | | | | | |
| TOTAL INVESTMENTS: 97.7% | | | | | | | 145,859,973 | |
(Cost $103,194,315c) | | | | | | | | |
| | | | | | | | |
CASH AND OTHER ASSETS,
LESS LIABILITIES: 2.3% | | | | | | | 3,482,497 | |
| | | | | | | | |
| | |
NET ASSETS: 100.0% | | | | | | | $149,342,470 | |
| | | | | | | | |
| a | Certain securities were fair valued under the valuation polices approved by the Board of Trustees (Note 2-A). |
| b | Non-income producing security. |
| c | Cost for federal income tax purposes is $103,485,316 and net unrealized appreciation consists of: |
| | | | |
Gross unrealized appreciation | | | $42,833,119 | |
Gross unrealized depreciation | | | (458,462 | ) |
| | | | |
Net unrealized appreciation | | | $42,374,657 | |
| | | | |
| ADR | American Depositary Receipt |
See accompanying notes to financial statements.
| | | | |
| PORTFOLIO MANAGERS |
| Andrew Mattock, CFA | | |
Lead Manager | | |
| Henry Zhang, CFA | | Winnie Chwang |
Co-Manager | | Co-Manager |
| | |
| FUND FACTS | | | | |
| | | Investor | | Institutional |
Ticker | | MCHFX | | MICFX |
CUSIP | | 577130701 | | 577130818 |
Inception | | 2/19/98 | | 10/29/10 |
NAV | | $20.12 | | $20.10 |
Initial Investment | | $2,500 | | $100,000 |
Gross Expense Ratio1 | | 1.18% | | 1.03% |
Portfolio Statistics |
Total # of Positions | | 47 |
Net Assets | | $654.4 million |
Weighted Average
Market Cap | | $116.0 billion |
Portfolio Turnover2 | | 83.82% |
Benchmark |
MSCI China Index |
OBJECTIVE
Long-term capital appreciation.
STRATEGY
Under normal market conditions, the Fund seeks to achieve its investment objective by investing at least 80% of its total net assets, which include borrowings for investment purposes, in the common and preferred stocks of companies located in China. China includes its administrative and other districts, such as Hong Kong.
Matthews China Fund
Portfolio Manager Commentary (unaudited)
Period ended June 30, 2017
For the first half of 2017, the Matthews China Fund returned 30.06% (Investor Class) and 30.18% (Institutional Class), outperforming its benchmark, the MSCI China Index, which returned 24.96% over the same period. For the quarter ending June 30, 2017, the Fund returned 12.28% (Investor Class) and 12.35% (Institutional Class) compared with the benchmark return of 10.66% over the same period.
Market Environment:
China’s second quarter GDP growth of 6.9% matched that of the first quarter of the year, and relieved concerns about China’s ability to realize its target GDP growth rate of 6.5% for the year. The market trends we saw in the first quarter appeared to continue, and China’s economic activity has continued to skew toward its newer economy sectors. While producer prices—a metric that tracks manufacturing activity—continued to decrease from the peak seen in the first quarter, other areas such as e-commerce, continued to register strong growth of more than 30% over the first five months of 2017. China has also continued efforts to deleverage its economy in the second quarter, and raised its borrowing rates for most of the second quarter. Elsewhere, high property prices in major Chinese cities continue to be of concern despite the restrictive policies already in place. Property prices in lower tier cities, however, remain priced at more reasonable levels. Equity valuations also continue to be reasonable given better-than-expected earnings growth thus far this year.
Performance Contributors and Detractors:
The Fund outperformed its benchmark during the quarter owing to good stock selection. The top three contributors to absolute performance were information technology holdings. Hangzhou Hikvision Digital Technology, a leader in the video surveillance industry, performed strongly during the quarter and was among the top contributors to performance. Investors were impressed by the firm’s new product offerings in smart home, industrial robots and auto electronics, on top of solid core business growth. We used the rally to trim some of our exposure as the stock became fully valued. Ping An Insurance Group, a financial conglomerate and China’s second-largest life insurer, was also a main contributor to Fund performance. The company is expected to maintain sustainable and quality growth as its efforts to push out long-term protection products and its success in consumer finance business start to bear fruit. While Tencent Holdings and Alibaba Group were also the top contributors to absolute Fund performance, they were relative detractors during the quarter as the two companies combined accounted for about 26% of the Index (versus 17.6% for the Fund).
Conversely, our holdings in the industrials sector performed poorly and were among the major detractors to Fund performance. China Everbright International, an environmental resource management conglomerate, corrected during the quarter as its rapid expansion has put a strain on cash flow.
Notable Changes to Portfolio:
During the second quarter, we exited our position in Chongqing Changan Automobile as we saw intensified competition among domestic auto brands and a lack of new models from its joint venture with Ford Motor. We initiated a position in Beijing Capital International Airport as we were attracted to its strong cash flow and the fact that it benefits from a new round of bidding for its duty free shop concession rights. We also added some positions to the materials, health care and
(continued)
| 1 | Prospectus expense ratios. |
| 2 | The lesser of fiscal year 2016 long-term purchase costs or sales proceeds divided by the average monthly market value of long-term securities. |
| | | | |
| matthewsasia.com | 800.789.ASIA | | | 61 | |
| | | | | | | | | | | | | | | | | | | | | | | | | | | | | | | | |
| |
| PERFORMANCE AS OF JUNE 30, 2017 | |
| | | | | | | | | | | | Average Annual Total Returns | | | | |
| | | 3 Months | | | YTD | | | 1 Year | | | 3 Years | | | 5 Years | | | 10 Years | | | Since
Inception | | | Inception
Date | |
| Investor Class (MCHFX) | | | 12.28% | | | | 30.06% | | | | 40.32% | | | | 8.38% | | | | 7.19% | | | | 4.98% | | | | 9.80% | | | | 2/19/98 | |
| Institutional Class (MICFX) | | | 12.35% | | | | 30.18% | | | | 40.57% | | | | 8.52% | | | | 7.35% | | | | n.a. | | | | 2.30% | | | | 10/29/10 | |
| MSCI China Index3 | | | 10.66% | | | | 24.96% | | | | 32.34% | | | | 8.29% | | | | 9.20% | | | | 4.24% | | | | 4.26% | 4 | | | | |
| Lipper China Region Funds Category Average5 | | | 8.83% | | | | 21.85% | | | | 25.75% | | | | 6.93% | | | | 8.79% | | | | 3.47% | | | | 7.49% | | | | | |
Performance assumes reinvestment of all dividends and/or distributions before taxes. All performance quoted represents past performance and is no guarantee of future results. Investment return and principal value will fluctuate with market conditions so that when redeemed, shares may be worth more or less than their original cost. Current performance may be lower or higher than the return figures quoted. For the Fund’s most recent month-end performance, visit matthewsasia.com.
GROWTH OF A $10,000 INVESTMENT SINCE INCEPTION—INVESTOR CLASS
Plotted monthly. The performance data and graph do not reflect the deduction of taxes that a shareholder would pay on dividends, capital gains distributions or redemption of Fund shares. Values are in US$.
| | 3 | It is not possible to invest directly in an index. Source: Index data from Morgan Stanley Capital International and Bloomberg; total return calculations performed by BNY Mellon Investment Servicing (US) Inc. Please see page 91 for index definition. |
| | 4 | Calculated from 2/28/98. |
| | 5 | The Lipper Category Average does not reflect sales charges and is based on total return, including reinvestment of dividends and capital gains for the stated periods. |
| | | | | | | | |
| | | | |
| TOP TEN HOLDINGS6 | | | | | | | |
| | | Sector | | | | % of Net Assets | |
| Tencent Holdings, Ltd. | | Information Technology | | | | | 10.9% | |
| Alibaba Group Holding, Ltd. | | Information Technology | | | | | 6.7% | |
| China Life Insurance Co., Ltd. | | Financials | | | | | 6.7% | |
| Ping An Insurance Group Co. of China, Ltd. | | Financials | | | | | 5.0% | |
| China Construction Bank Corp. | | Financials | | | | | 4.7% | |
| Industrial & Commercial Bank of China, Ltd. | | Financials | | | | | 4.4% | |
| China Merchants Bank Co., Ltd. | | Financials | | | | | 3.5% | |
| Ctrip.com International, Ltd. | | Consumer Discretionary | | | | | 2.6% | |
| SINA Corp. | | Information Technology | | | | | 2.4% | |
| CITIC Securities Co., Ltd. | | Financials | | | | | 2.4% | |
| % OF ASSETS IN TOP TEN | | | | | | | 49.3% | |
| | 6 | Holdings may combine more than one security from same issuer and related depositary receipts. |
Matthews China Fund
Portfolio Manager Commentary (unaudited) (continued)
consumer discretionary sectors. One such company, Beijing Oriental Yuhong Waterproof Technology, is well-known among Chinese property developers for its quality waterproofing products and brand name, and has consistently gained market share. We exited Fuyao Glass and Brilliance China Automotive as both stocks rallied and were no longer attractively priced.
Outlook:
China’s ongoing transition toward service-oriented sectors continues to benefit a sustainably growing economy. We also note further progress on supply reforms and longer term, we anticipate that China’s so-called “One Belt, One Road” development strategy will ultimately increase China’s presence on the global stage. In late June, we were very encouraged by index provider MSCI’s long-awaited decision to include China’s domestic A-share stocks into its Emerging Markets Index after an evaluation period that took several years. This inclusion will initially be comprised of a list of 222 stocks, representing 0.73% of the MSCI Emerging Market Index and is projected to begin in June 2018. While this marks a relatively small and gradual rollout, the initial inclusion could spur about US$8 billion to US$10 billion in fund flows to China’s A-share markets. It also marks a historic first step toward further inclusion in the future. At Matthews Asia, we believe that this is positive news for China’s domestic equity markets and a testament to the country’s progress in opening up its financial markets. In the long run, we believe that China’s representation in global indices will continue to be enhanced and look forward to identifying good companies at reasonable valuations for our portfolios.
| | | | |
| |
| COUNTRY ALLOCATION (%)7 | |
| China/Hong Kong | | | 98.9 | |
| Cash and Other Assets, Less Liabilities | | | 1.1 | |
| | | | |
| |
| SECTOR ALLOCATION (%)7 | |
| Information Technology | | | 30.9 | |
| Financials | | | 28.9 | |
| Consumer Discretionary | | | 14.1 | |
| Energy | | | 5.9 | |
| Industrials | | | 4.1 | |
| Real Estate | | | 3.8 | |
| Consumer Staples | | | 3.8 | |
| Materials | | | 3.5 | |
| Utilities | | | 1.9 | |
| Telecommunication Services | | | 1.5 | |
| Health Care | | | 0.5 | |
| Cash and Other Assets, Less Liabilities | | | 1.1 | |
| | | | |
| |
| MARKET CAP EXPOSURE (%)7 | |
| Mega Cap (over $25B) | | | 67.4 | |
| Large Cap ($10B–$25B) | | | 6.7 | |
| Mid Cap ($3B–10B) | | | 16.6 | |
| Small Cap (under $3B) | | | 8.3 | |
| Liabilities in Excess of Cash and Other Assets | | | 1.1 | |
| 7 | Source: FactSet Research Systems. Percentage values in data are rounded to the nearest tenth of one percent; the values may not sum to 100% due to rounding. |
| | | | |
| matthewsasia.com | 800.789.ASIA | | | 63 | |
Matthews China Fund
June 30, 2017
Schedule of Investmentsa (unaudited)
COMMON EQUITIES: 98.9%
| | | | | | | | |
| | | Shares | | | Value | |
| INFORMATION TECHNOLOGY: 30.9% | | | | | | | | |
Internet Software & Services: 24.9% | | | | | | | | |
Tencent Holdings, Ltd. | | | 1,988,800 | | | | $71,348,121 | |
Alibaba Group Holding, Ltd. ADRb | | | 312,200 | | | | 43,988,980 | |
SINA Corp.b | | | 186,900 | | | | 15,880,893 | |
NetEase, Inc. ADR | | | 38,610 | | | | 11,607,324 | |
Baidu, Inc. ADRb | | | 58,100 | | | | 10,391,766 | |
Baozun, Inc. ADRb | | | 384,541 | | | | 8,525,274 | |
Weibo Corp. ADRb | | | 18,690 | | | | 1,242,324 | |
| | | | | | | | |
| | | | | | | 162,984,682 | |
| | | | | | | | |
| | | | | | | | |
Electronic Equipment, Instruments & Components: 2.6% | | | | | |
Hangzhou Hikvision Digital Technology Co., Ltd. A Shares | | | 2,875,700 | | | | 13,714,629 | |
Chaozhou Three-Circle Group Co., Ltd. A Shares | | | 1,018,638 | | | | 3,153,501 | |
| | | | | | | | |
| | | | | | | 16,868,130 | |
| | | | | | | | |
IT Services: 1.8% | | | | | | | | |
Chinasoft International, Ltd. | | | 21,998,000 | | | | 11,654,166 | |
| | | | | | | | |
| | | | | | | | |
Communications Equipment: 1.6% | | | | | | | | |
ZTE Corp. H Sharesb | | | 4,565,400 | | | | 10,889,594 | |
| | | | | | | | |
Total Information Technology | | | | | | | 202,396,572 | |
| | | | | | | | |
| | | | | | | | |
| FINANCIALS: 28.9% | | | | | | | | |
Banks: 14.8% | | | | | | | | |
China Construction Bank Corp. H Shares | | | 39,068,660 | | | | 30,381,601 | |
Industrial & Commercial Bank of China, Ltd. H Shares | | | 42,445,000 | | | | 28,645,397 | |
China Merchants Bank Co., Ltd. H Shares | | | 7,659,643 | | | | 23,081,428 | |
Bank of China, Ltd. H Shares | | | 29,420,000 | | | | 14,426,594 | |
| | | | | | | | |
| | | | | | | 96,535,020 | |
| | | | | | | | |
| | | | | | | | |
Insurance: 11.7% | | | | | | | | |
China Life Insurance Co., Ltd. H Shares | | | 14,236,000 | | | | 43,506,027 | |
Ping An Insurance Group Co. of China, Ltd. H Shares | | | 5,010,500 | | | | 33,006,163 | |
| | | | | | | | |
| | | | | | | 76,512,190 | |
| | | | | | | | |
| | | | | | | | |
Capital Markets: 2.4% | | | | | | | | |
CITIC Securities Co., Ltd. H Shares | | | 7,626,000 | | | | 15,771,942 | |
| | | | | | | | |
Total Financials | | | | | | | 188,819,152 | |
| | | | | | | | |
| | | | | | | | |
| CONSUMER DISCRETIONARY: 14.1% | | | | | | | | |
Household Durables: 6.3% | | | | | | | | |
Gree Electric Appliances, Inc. of Zhuhai A Shares | | | 2,228,200 | | | | 13,534,708 | |
Midea Group Co., Ltd. A Shares | | | 2,046,772 | | | | 12,992,790 | |
Zhejiang Supor Cookware Co., Ltd. A Shares | | | 1,837,769 | | | | 11,126,659 | |
Suofeiya Home Collection Co., Ltd. A Shares | | | 564,743 | | | | 3,415,037 | |
| | | | | | | | |
| | | | | | | 41,069,194 | |
| | | | | | | | |
| | | | | | | | |
Internet & Direct Marketing Retail: 4.4% | | | | | | | | |
Ctrip.com International, Ltd. ADRb | | | 318,600 | | | | 17,159,796 | |
JD.com, Inc. ADRb | | | 304,979 | | | | 11,961,276 | |
| | | | | | | | |
| | | | | | | 29,121,072 | |
| | | | | | | | |
| | | | | | | | |
| | | | | | | | |
| | | Shares | | | Value | |
Auto Components: 3.4% | | | | | | | | |
Nexteer Automotive Group, Ltd. | | | 6,449,000 | | | | $10,102,726 | |
Huayu Automotive Systems Co., Ltd. A Shares | | | 1,925,450 | | | | 6,885,202 | |
Xinyi Glass Holdings, Ltd. | | | 5,176,000 | | | | 5,123,332 | |
| | | | | | | | |
| | | | | | | 22,111,260 | |
| | | | | | | | |
Total Consumer Discretionary | | | | | | | 92,301,526 | |
| | | | | | | | |
| | | | | | | | |
| ENERGY: 5.9% | | | | | | | | |
Oil, Gas & Consumable Fuels: 5.9% | | | | | | | | |
China Petroleum & Chemical Corp. H Shares | | | 19,166,000 | | | | 15,007,012 | |
Yanzhou Coal Mining Co., Ltd. H Shares | | | 16,188,000 | | | | 14,511,277 | |
China Shenhua Energy Co., Ltd. H Shares | | | 4,129,000 | | | | 9,186,503 | |
| | | | | | | | |
Total Energy | | | | | | | 38,704,792 | |
| | | | | | | | |
| | | | | | | | |
| INDUSTRIALS: 4.1% | | | | | | | | |
Commercial Services & Supplies: 1.7% | | | | | | | | |
China Everbright International, Ltd. | | | 9,046,000 | | | | 11,282,247 | |
| | | | | | | | |
| | | | | | | | |
Construction & Engineering: 1.5% | | | | | | | | |
China Railway Construction Corp., Ltd. H Shares | | | 5,657,500 | | | | 7,375,237 | |
China State Construction International Holdings, Ltd. | | | 1,380,000 | | | | 2,361,303 | |
| | | | | | | | |
| | | | | | | 9,736,540 | |
| | | | | | | | |
| | | | | | | | |
Transportation Infrastructure: 0.9% | | | | | | | | |
Beijing Capital International Airport Co., Ltd. H Shares | | | 3,998,000 | | | | 5,631,019 | |
| | | | | | | | |
Total Industrials | | | | | | | 26,649,806 | |
| | | | | | | | |
| | | | | | | | |
| REAL ESTATE: 3.8% | | | | | | | | |
Real Estate Management & Development: 3.8% | | | | | |
China Overseas Grand Oceans Group, Ltd. | | | 20,951,000 | | | | 11,186,819 | |
China Resources Land, Ltd. | | | 2,954,000 | | | | 8,605,789 | |
KWG Property Holding, Ltd. | | | 7,640,500 | | | | 5,118,135 | |
| | | | | | | | |
Total Real Estate | | | | | | | 24,910,743 | |
| | | | | | | | |
| | | | | | | | |
| CONSUMER STAPLES: 3.8% | | | | | | | | |
Food Products: 2.1% | | | | | | | | |
WH Group, Ltd.c | | | 8,518,000 | | | | 8,601,235 | |
Angel Yeast Co., Ltd. A Shares | | | 1,332,281 | | | | 5,087,717 | |
| | | | | | | | |
| | | | | | | 13,688,952 | |
| | | | | | | | |
| | | | | | | | |
Beverages: 1.7% | | | | | | | | |
Wuliangye Yibin Co., Ltd. A Shares | | | 884,949 | | | | 7,269,811 | |
Wuliangye Yibin Co., Ltd. A Shares | | | 452,841 | | | | 3,717,489 | |
| | | | | | | | |
| | | | | | | 10,987,300 | |
| | | | | | | | |
Total Consumer Staples | | | | | | | 24,676,252 | |
| | | | | | | | |
| | | | | | | | |
| MATERIALS: 3.5% | | | | | | | | |
Construction Materials: 2.7% | | | | | | | | |
China National Materials Co., Ltd. H Shares | | | 37,937,000 | | | | 12,676,724 | |
Beijing Oriental Yuhong Waterproof Technology Co., Ltd. A Shares | | | 968,912 | | | | 5,301,747 | |
| | | | | | | | |
| | | | | | | 17,978,471 | |
| | | | | | | | |
| | | | | | | | |
Metals & Mining: 0.8% | | | | | | | | |
MMG, Ltd.b | | | 14,056,000 | | | | 5,184,752 | |
| | | | | | | | |
Total Materials | | | | | | | 23,163,223 | |
| | | | | | | | |
| | | | | | | | |
Matthews China Fund
June 30, 2017
Schedule of Investmentsa (unaudited) (continued)
COMMON EQUITIES (continued)
| | | | | | | | |
| | | Shares | | | Value | |
| UTILITIES: 1.9% | | | | | | | | |
Water Utilities: 1.9% | | | | | | | | |
Beijing Enterprises Water Group, Ltd. | | | 15,746,000 | | | | $12,219,420 | |
| | | | | | | | |
Total Utilities | | | | | | | 12,219,420 | |
| | | | | | | | |
| | | | | | | | |
| TELECOMMUNICATION SERVICES: 1.5% | |
Diversified Telecommunication Services: 1.5% | | | | | |
China Unicom Hong Kong, Ltd.b | | | 6,802,000 | | | | 10,096,699 | |
| | | | | | | | |
Total Telecommunication Services | | | | | | | 10,096,699 | |
| | | | | | | | |
| | | | | | | | |
| HEALTH CARE: 0.5% | | | | | | | | |
Pharmaceuticals: 0.5% | | | | | | | | |
Dong-E-E-Jiao Co., Ltd. A Shares | | | 312,583 | | | | 3,314,321 | |
| | | | | | | | |
Total Health Care | | | | | | | 3,314,321 | |
| | | | | | | | |
| | | | | | | | |
| TOTAL INVESTMENTS: 98.9% | | | | | | | 647,252,506 | |
(COST $528,039,466d) | | | | | | | | |
| | | | | | | | |
CASH AND OTHER ASSETS,
LESS LIABILITIES : 1.1% | | | | | | | 7,121,990 | |
| | | | | | | | |
| | |
NET ASSETS: 100.0% | | | | | | | $654,374,496 | |
| | | | | | | | |
| a | Certain securities were fair valued under the valuation polices approved by the Board of Trustees (Note 2-A). |
| b | Non-income producing security. |
| c | Security exempt from registration under Rule 144A of the Securities Act of 1933, as amended. The security may be resold in transactions exempt from registration normally to qualified institutional buyers. The security has been determined to be liquid in accordance with procedures adopted by the Fund’s Board of Directors. At June 30, 2017, the aggregate value is $8,601,235, which is 1.31% of net assets. |
| d | Cost for federal income tax purposes is $536,694,800 and net unrealized appreciation consists of: |
| | | | |
Gross unrealized appreciation | | | $126,611,948 | |
Gross unrealized depreciation | | | (16,054,242 | ) |
| | | | |
Net unrealized appreciation | | | $110,557,706 | |
| | | | |
| ADR | American Depositary Receipt |
See accompanying notes to financial statements.
| | | | |
| matthewsasia.com | 800.789.ASIA | | | 65 | |
| | | | |
| PORTFOLIO MANAGERS |
| Sunil Asnani | | | | |
Lead Manager | | | | |
| Sharat Shroff, CFA | | |
Co-Manager | | | | |
|
| FUND FACTS |
| | | Investor | | Institutional |
Ticker | | MINDX | | MIDNX |
CUSIP | | 577130859 | | 577130768 |
Inception | | 10/31/05 | | 10/29/10 |
NAV | | $31.34 | | $31.52 |
Initial Investment | | $2,500 | | $100,000 |
Gross Expense Ratio1 | | 1.12% | | 0.91% |
Portfolio Statistics | | | | |
Total # of Positions | | 52 |
Net Assets | | $2.2 billion |
Weighted Average Market Cap | | $16.5 billion |
Portfolio Turnover2 | | 15.76% |
Benchmark | | |
S&P Bombay Stock Exchange 100 Index |
OBJECTIVE
Long-term capital appreciation.
STRATEGY
Under normal market conditions, the Fund seeks to achieve its investment objective by investing at least 80% of its total net assets, which include borrowings for investment purposes, in publicly traded common stocks, preferred stocks and convertible securities of companies located in India.
Matthews India Fund
Portfolio Manager Commentary (unaudited)
Period ended June 30, 2017
For the first half of 2017, the Matthews India Fund returned 22.18% (Investor Class) and 22.31% (Institutional Class) while its benchmark, the S&P Bombay Stock Exchange 100 Index, returned 24.55%. For the quarter ending June 30, 2017, the Fund returned 4.05% (Investor Class) and 4.13% (Institutional Class) compared with the benchmark return of 4.63% over the same period.
Market environment:
In the second quarter of the year, Indian equities continued to rally, led by strong performance in the financials and consumer staples sectors. Many state-owned banks reported better-than-expected earnings amid a moderation in loan loss provisions owing to the previous quarter’s low base. This could reverse as more provisions are made toward nonperforming assets. Consumer stocks rallied in anticipation of the Goods and Services Tax (GST) reforms. The positive sentiment also was fueled by the strength of Prime Minister Narendra Modi’s party in the elections in India’s largest state, Uttar Pradesh, last quarter. Other factors that helped sentiments included excess liquidity in formal channels following India’s demonetization program and U.S. Federal Reserve interest rate policy moves.
Performance Contributors and Detractors:
During the quarter, the portfolio’s higher allocation to the information and health care sectors could have detracted from returns. Stock-specific factors, however, helped to mitigate pressures in these industries in export markets such as the U.S. Shares of Cognizant Technology, for example, rallied after the firm agreed to undergo operational improvements suggested by U.S. hedge fund Elliott Management, which owns a stake in the company. Cognizant’s earnings results during the quarter also were positive, demonstrating its ability to sustain profitable growth amid sectoral headwinds.
The largest detractor to Fund performance during the quarter was industrials holding AIA Engineering, which provides chrome-based grinding media solutions for global utility and mining companies. The firm has been affected by both an increase in its raw material prices and an appreciating rupee, resulting in a compression of its gross margins. We believe AIA Engineering’s long-term growth drivers remain intact, however, and that the company should be able to pass on the cost increase for raw materials to its customers.
The portfolio’s lower allocation to the metals and energy sectors, and its higher allocation to consumer staples helped relative returns. Commodity prices have been in correction mode, while consumer staples companies have been recovering from a correction that was induced by last year’s fears of demonetization.
Notable Portfolio Changes:
We added two new positions during the quarter: Suzuki Motor and Pidilite Industries. Suzuki Motor is the parent of Maruti Suzuki, which claims half of the market share in India’s underpenetrated passenger-car segment and derives the majority of its earnings from the Indian subsidiary. Given the discrepancy in valuations of the two entities, we preferred to own the parent company rather than its Indian subsidiary. Pidilite is a high-quality branded adhesives and sealants company in an underpenetrated and growing market. We like that the firm has been undergoing a business transformation led by a professional management team as the family owners take a more hands-off approach.
(continued)
| 1 | Prospectus expense ratios. |
| 2 | The lesser of fiscal year 2016 long-term purchase costs or sales proceeds divided by the average monthly market value of long-term securities. |
| | | | | | | | | | | | | | | | | | | | | | | | | | | | | | | | |
| | | | | | | | | |
| PERFORMANCE AS OF JUNE 30, 2017 | | | | | | | | | | | | | | | | | | | | | | | | |
| | | | | | | | | | | | Average Annual Total Returns | | | | |
| | | 3 Months | | | YTD | | | 1 Year | | | 3 Years | | | 5 Years | | | 10 Years | | | Since
Inception | | | Inception
Date | |
| Investor Class (MINDX) | | | 4.05% | | | | 22.18% | | | | 18.58% | | | | 13.61% | | | | 16.66% | | | | 7.92% | | | | 12.42% | | | | 10/31/05 | |
| Institutional Class (MIDNX) | | | 4.13% | | | | 22.31% | | | | 18.85% | | | | 13.86% | | | | 16.87% | | | | n.a. | | | | 6.84% | | | | 10/29/10 | |
| S&P Bombay Stock Exchange 100 Index3 | | | 4.63% | | | | 24.55% | | | | 23.73% | | | | 7.23% | | | | 11.53% | | | | 4.90% | | | | 10.90% | 4 | | | | |
| Lipper India Region Funds Category Average5 | | | 4.64% | | | | 25.65% | | | | 23.34% | | | | 9.61% | | | | 12.82% | | | | 3.57% | | | | 9.27% | | | | | |
Performance assumes reinvestment of all dividends and/or distributions before taxes. All performance quoted represents past performance and is no guarantee of future results. Investment return and principal value will fluctuate with market conditions so that when redeemed, shares may be worth more or less than their original cost. Current performance may be lower or higher than the return figures quoted. For the Fund’s most recent month-end performance, visit matthewsasia.com.
GROWTH OF A $10,000 INVESTMENT SINCE INCEPTION—INVESTOR CLASS
Plotted monthly. The performance data and graph do not reflect the deduction of taxes that a shareholder would pay on dividends, capital gains distributions or redemption of Fund shares. Values are in US$.
| | 3 | It is not possible to invest directly in an index. Source: Index data from S&P BSE 100 Index and Bloomberg; total return calculations performed by BNY Mellon Investment Servicing (US) Inc. Please see page 91 for index definition. |
| | 4 | Calculated from 10/31/05. |
| | 5 | The Lipper Category Average does not reflect sales charges and is based on total return, including reinvestment of dividends and capital gains for the stated periods. |
| | | | | | | | |
| | | | |
| TOP TEN HOLDINGS6 | | | | | | | |
| | | Sector | | | | % of Net Assets | |
| HDFC Bank, Ltd. | | Financials | | | | | 5.9% | |
| ITC, Ltd. | | Consumer Staples | | | | | 5.2% | |
| IndusInd Bank, Ltd. | | Financials | | | | | 4.9% | |
| Kotak Mahindra Bank, Ltd. | | Financials | | | | | 4.6% | |
| Eicher Motors, Ltd. | | Industrials | | | | | 4.1% | |
| Suzuki Motor Corp. | | Consumer Discretionary | | | | | 4.1% | |
| Cognizant Technology Solutions Corp. | | Information Technology | | | | | 4.0% | |
| Taro Pharmaceutical Industries, Ltd. | | Health Care | | | | | 3.9% | |
| Shriram City Union Finance, Ltd. | | Financials | | | | | 3.2% | |
| VST Industries, Ltd. | | Consumer Staples | | | | | 3.0% | |
| % OF ASSETS IN TOP TEN | | | | | | | 42.9% | |
| | 6 | Holdings may combine more than one security from same issuer and related depositary receipts. |
| | | | |
| matthewsasia.com | 800.789.ASIA | | | 67 | |
| | | | |
| |
| COUNTRY ALLOCATION (%)7 | |
| India | | | 86.6 | |
| Japan | | | 4.1 | |
| United States | | | 4.0 | |
| Israel | | | 3.9 | |
| Cash and Other Assets Les Liabilities | | | 1.4 | |
| | | | |
| |
| SECTOR ALLOCATION (%)7 | |
| Financials | | | 32.6 | |
| Consumer Staples | | | 17.9 | |
| Information Technology | | | 12.4 | |
| Industrials | | | 11.9 | |
| Health Care | | | 10.7 | |
| Consumer Discretionary | | | 9.4 | |
| Materials | | | 3.7 | |
| Cash and Other Assets, Less Liabilities | | | 1.4 | |
| | | | |
| |
| MARKET CAP EXPOSURE (%)7 | |
| Mega Cap (over $25B) | | | 24.2 | |
| Large Cap ($10B–$25B) | | | 16.7 | |
| Mid Cap ($3B–10B) | | | 14.5 | |
| Small Cap (under $3B) | | | 43.3 | |
| Cash and Other Assets, Less Liabilities | | | 1.4 | |
| 7 | Source: FactSet Research Systems. Percentage values in data are rounded to the nearest tenth of one percent; the values may not sum to 100% due to rounding. |
Matthews India Fund
Portfolio Manager Commentary (unaudited) (continued)
Outlook:
India’s market valuations remain ahead of fundamentals even though the near-term outlook for corporate earnings do not appear any better than they did in the recent past. If anything, metals and commodities companies could report disappointing results as the impact of a correction in global material prices is baked into upcoming financial results. A destocking by channel partners, amid the changing taxation regime, also could keep reported earnings growth low in the short term. The investment climate is likely to remain subdued until there is greater clarity on the GST and its resulting impact on various segments of the economy. Core infrastructure and banking reforms also are running behind schedule. Despite all the challenges, we believe the central bank may need to take a more accommodative stance on its monetary policy in an environment of low inflationary expectations, decelerating industrial growth and high real interest rates. If it does, this could provide some support to valuations over the short run.
Matthews India Fund
June 30, 2017
Schedule of Investmentsa (unaudited)
COMMON EQUITIES: 98.6%
| | | | | | | | |
| | | Shares | | | Value | |
| FINANCIALS: 32.6% | | | | | | | | |
Banks: 18.6% | | | | | | | | |
HDFC Bank, Ltd. | | | 4,345,349 | | | | $111,000,034 | |
IndusInd Bank, Ltd. | | | 4,625,934 | | | | 105,762,553 | |
Kotak Mahindra Bank, Ltd. | | | 6,697,258 | | | | 98,963,413 | |
DCB Bank, Ltd. | | | 12,139,846 | | | | 37,281,976 | |
Yes Bank, Ltd. | | | 920,000 | | | | 20,812,817 | |
HDFC Bank, Ltd. ADR | | | 206,922 | | | | 17,996,006 | |
IDFC Bank, Ltd. | | | 13,650,467 | | | | 11,541,250 | |
| | | | | | | | |
| | | | | | | 403,358,049 | |
| | | | | | | | |
| | | | | | | | |
Consumer Finance: 7.3% | | | | | | | | |
Shriram City Union Finance, Ltd. | | | 1,873,192 | | | | 69,085,321 | |
Bharat Financial Inclusion, Ltd.b | | | 4,499,665 | | | | 50,144,026 | |
Cholamandalam Investment and Finance Co., Ltd. | | | 1,359,532 | | | | 23,641,568 | |
Sundaram Finance, Ltd. | | | 588,318 | | | | 14,622,226 | |
| | | | | | | | |
| | | | | | | 157,493,141 | |
| | | | | | | | |
| | | | | | | | |
Thrifts & Mortgage Finance: 4.2% | | | | | | | | |
Housing Development Finance Corp., Ltd. | | | 2,458,810 | | | | 61,406,368 | |
GRUH Finance, Ltd. | | | 4,266,010 | | | | 29,378,503 | |
| | | | | | | | |
| | | | | | | 90,784,871 | |
| | | | | | | | |
| | | | | | | | |
Capital Markets: 2.1% | | | | | | | | |
CRISIL, Ltd. | | | 1,515,723 | | | | 45,597,504 | |
| | | | | | | | |
| | | | | | | | |
Diversified Financial Services: 0.4% | | | | | | | | |
IDFC, Ltd.b | | | 11,350,467 | | | | 9,690,561 | |
| | | | | | | | |
Total Financials | | | | | | | 706,924,126 | |
| | | | | | | | |
| | | | | | | | |
| CONSUMER STAPLES: 17.9% | | | | | | | | |
Tobacco: 8.3% | | | | | | | | |
ITC, Ltd. | | | 22,771,965 | | | | 113,915,333 | |
VST Industries, Ltd.† | | | 1,185,704 | | | | 65,438,203 | |
| | | | | | | | |
| | | | | | | 179,353,536 | |
| | | | | | | | |
| | | | | | | | |
Personal Products: 7.4% | | | | | | | | |
Dabur India, Ltd. | | | 11,252,176 | | | | 50,828,663 | |
Emami, Ltd.b | | | 2,665,122 | | | | 44,349,912 | |
Bajaj Corp., Ltd. | | | 6,199,447 | | | | 36,558,215 | |
Marico, Ltd. | | | 6,222,328 | | | | 30,239,280 | |
| | | | | | | | |
| | | | | | | 161,976,070 | |
| | | | | | | | |
| | | | | | | | |
Food Products: 2.2% | | | | | | | | |
Nestle India, Ltd. | | | 244,636 | | | | 25,492,064 | |
Zydus Wellness, Ltd. | | | 1,670,471 | | | | 21,933,276 | |
| | | | | | | | |
| | | | | | | 47,425,340 | |
| | | | | | | | |
Total Consumer Staples | | | | | | | 388,754,946 | |
| | | | | | | | |
| | | | | | | | |
| INFORMATION TECHNOLOGY: 12.4% | | | | | | | | |
IT Services: 10.0% | | | | | | | | |
Cognizant Technology Solutions Corp. Class A | | | 1,300,300 | | | | 86,339,920 | |
eClerx Services, Ltd.† | | | 2,701,931 | | | | 55,257,016 | |
Mindtree, Ltd. | | | 4,936,665 | | | | 40,369,436 | |
Tata Consultancy Services, Ltd. | | | 950,000 | | | | 34,699,683 | |
| | | | | | | | |
| | | | | | | 216,666,055 | |
| | | | | | | | |
| | | | | | | | |
| | | | | | | | |
| | | Shares | | | Value | |
Internet Software & Services: 2.4% | | | | | | | | |
Info Edge India, Ltd. | | | 3,230,761 | | | | $51,665,838 | |
| | | | | | | | |
Total Information Technology | | | | | | | 268,331,893 | |
| | | | | | | | |
| | | | | | | | |
| INDUSTRIALS: 11.9% | | | | | | | | |
Machinery: 8.9% | | | | | | | | |
Eicher Motors, Ltd.b | | | 214,500 | | | | 89,660,288 | |
AIA Engineering, Ltd. | | | 2,933,837 | | | | 63,331,391 | |
Ashok Leyland, Ltd.b | | | 15,856,152 | | | | 23,004,957 | |
Thermax, Ltd. | | | 1,161,822 | | | | 16,795,882 | |
| | | | | | | | |
| | | | | | | 192,792,518 | |
| | | | | | | | |
| | | | | | | | |
Air Freight & Logistics: 1.3% | | | | | | | | |
Blue Dart Express, Ltd. | | | 380,973 | | | | 27,748,751 | |
| | | | | | | | |
| | | | | | | | |
Transportation Infrastructure: 0.9% | | | | | | | | |
Gujarat Pipavav Port, Ltd. | | | 8,578,564 | | | | 19,811,420 | |
| | | | | | | | |
| | | | | | | | |
Road & Rail: 0.8% | | | | | | | | |
Container Corp. of India, Ltd. | | | 1,002,568 | | | | 17,761,098 | |
| | | | | | | | |
Total Industrials | | | | | | | 258,113,787 | |
| | | | | | | | |
| | | | | | | | |
| HEALTH CARE: 10.7% | | | | | | | | |
Pharmaceuticals: 10.1% | | | | | | | | |
Taro Pharmaceutical Industries, Ltd.b | | | 759,400 | | | | 85,098,364 | |
Ajanta Pharma, Ltd. | | | 2,426,230 | | | | 57,964,847 | |
Caplin Point Laboratories, Ltd. | | | 3,028,687 | | | | 25,886,886 | |
Alembic Pharmaceuticals, Ltd. | | | 2,640,862 | | | | 20,664,945 | |
Sun Pharma Advanced Research Co., Ltd.b | | | 3,796,014 | | | | 17,887,623 | |
Sun Pharmaceutical Industries, Ltd. | | | 1,352,917 | | | | 11,622,794 | |
| | | | | | | | |
| | | | | | | 219,125,459 | |
| | | | | | | | |
| | | | | | | | |
Health Care Equipment & Supplies: 0.6% | | | | | | | | |
Poly Medicure, Ltd. | | | 4,153,464 | | | | 14,111,014 | |
| | | | | | | | |
Total Health Care | | | | | | | 233,236,473 | |
| | | | | | | | |
| | | | | | | | |
| CONSUMER DISCRETIONARY: 9.4% | | | | | | | | |
Automobiles: 4.1% | | | | | | | | |
Suzuki Motor Corp. | | | 1,857,900 | | | | 88,506,592 | |
| | | | | | | | |
| | | | | | | | |
Textiles, Apparel & Luxury Goods: 2.8% | | | | | | | | |
Page Industries, Ltd. | | | 107,100 | | | | 27,728,665 | |
Titan Co., Ltd.b | | | 3,178,691 | | | | 25,777,115 | |
Kewal Kiran Clothing, Ltd. | | | 330,462 | | | | 8,772,613 | |
| | | | | | | | |
| | | | | | | 62,278,393 | |
| | | | | | | | |
| | | | | | | | |
Household Durables: 2.5% | | | | | | | | |
Symphony, Ltd. | | | 2,023,202 | | | | 42,598,547 | |
LA Opala RG, Ltd. | | | 1,481,323 | | | | 11,770,139 | |
| | | | | | | | |
| | | | | | | 54,368,686 | |
| | | | | | | | |
Total Consumer Discretionary | | | | | | | 205,153,671 | |
| | | | | | | | |
| | | | | | | | |
| MATERIALS: 3.7% | | | | | | | | |
Chemicals: 3.7% | | | | | | | | |
Supreme Industries, Ltd. | | | 1,206,965 | | | | 22,905,451 | |
Pidilite Industries, Ltd. | | | 1,800,000 | | | | 22,443,961 | |
Asian Paints, Ltd. | | | 1,176,000 | | | | 20,042,980 | |
Castrol India, Ltd. | | | 2,299,063 | | | | 14,384,913 | |
| | | | | | | | |
Total Materials | | | | | | | 79,777,305 | |
| | | | | | | | |
| | | | | | | | |
| | | | |
| matthewsasia.com | 800.789.ASIA | | | 69 | |
Matthews India Fund
June 30, 2017
Schedule of Investmentsa (unaudited) (continued)
COMMON EQUITIES (continued)
| | | | | | | | |
| | | | | | Value | |
| TOTAL INVESTMENTS: 98.6% | | | | $2,140,292,201 | |
(Cost $1,599,844,472c) | | | | | | | | |
| | | | | | | | |
CASH AND OTHER ASSETS,
LESS LIABILITIES: 1.4% | | | | | | | 30,059,317 | |
| | | | | | | | |
| | |
NET ASSETS: 100.0% | | | | | | | $2,170,351,518 | |
| | | | | | | | |
| a | Certain securities were fair valued under the valuation policies approved by the Board of Trustees (Note 2-A). |
| b | Non-income producing security. |
| c | Cost for federal income tax purposes is $1,599,947,578 and net unrealized appreciation consists of: |
| | | | |
Gross unrealized appreciation | | | $605,468,470 | |
Gross unrealized depreciation | | | (65,123,847 | ) |
| | | | |
Net unrealized appreciation | | | $540,344,623 | |
| | | | |
| † | Affiliated Issuer, as defined under the Investment Company Act of 1940 (ownership of 5% or more of the outstanding voting securities of this issuer) |
| ADR | American Depositary Receipt |
See accompanying notes to financial statements.
| | | | |
PORTFOLIO MANAGERS |
| Kenichi Amaki | | | | |
Lead Manager | | | | |
| Taizo Ishida | | | | |
Co-Manager | | | | |
|
| FUND FACTS |
| | | Investor | | Institutional |
Ticker | | MJFOX | | MIJFX |
CUSIP | | 577130800 | | 577130792 |
Inception | | 12/31/98 | | 10/29/10 |
NAV | | $21.58 | | $21.62 |
Initial Investment | | $2,500 | | $100,000 |
Gross Expense Ratio1 | | 0.98% | | 0.88% |
Portfolio Statistics | | | | |
Total # of Positions | | 61 |
Net Assets | | $3.5 billion |
Weighted Average Market Cap | | $21.4 billion |
Portfolio Turnover2 | | 55.15% |
Benchmark |
MSCI Japan Index |
OBJECTIVE
Long-term capital appreciation.
STRATEGY
Under normal market conditions, the Fund seeks to achieve its investment objective by investing at least 80% of its total net assets, which include borrowings for investment purposes, in the common and preferred stocks of companies located in Japan.
Matthews Japan Fund*
Portfolio Manager Commentary (unaudited)
Period ended June 30, 2017
For the first half of 2017, the Matthews Japan Fund returned 14.61% (Investor Class) and 14.63% (Institutional Class), outperforming its benchmark, the MSCI Japan Index, which returned 10.11% over the same period. For the quarter ending June 30, 2017, the Fund returned 6.73% (Investor Class) and 6.71% (Institutional Class) compared to the benchmark return of 5.23% over the same period.
Market Environment:
Japan’s equity markets advanced steadily during the second quarter, and ended the first half of the year with a healthy double-digit gain. Market participants seem to have shifted their focus toward improving corporate fundamentals rather than political headlines for the time being. On the currency front, the yen reversed the strengthening trend seen in the first quarter amid talk of a Federal Reserve balance sheet unwind, though it remains stronger than it was at the beginning of the year.
The Japanese economy has continued to expand at a modest pace. First quarter GDP growth figures were revised down to 1% from the preliminary reading of 2.2% but were largely due to a decline in inventories of oil and other raw materials. Business spending and exports have been robust in recent quarters while consumption also showed some improvement. Demand for labor remains strong with the job offer-to-applicant ratio reaching 1.49x in May, levels not seen since 1974. Unemployment has edged up but largely due to discouraged workers returning to the labor force and should bode well for job creation.
Performance Contributors and Detractors:
For both the second quarter and half-year period, stock selection was the source of the Fund’s relative outperformance versus its benchmark while sector allocation slightly detracted. During the second quarter, the consumer discretionary sector was the leading source of outperformance. Our decision to avoid mega-cap auto producers with large exposure to the saturated U.S. auto market has worked in our favor. Additionally, our holding Suzuki Motor performed well on the back of growth of its India business and margin improvements outside of India. Misumi Group, a manufacturer and distributor of machinery and factory automation components, was the single-largest contributor to returns. The stock performed well on the back of particularly robust monthly sales figures, aided by strong domestic demand and expansion overseas.
On the other hand, Mabuchi Motor, which makes micro-size motors for the auto industry, was the leading detractor. Mabuchi performed poorly due to concerns that its revenue and profits may decline this year due to weak auto-related motor sales. Automobiles account for roughly 70% of Mabuchi’s revenue. We believe such concern is slightly short-sighted, however, as the number of motors per car is expected to continue growing along with electrification. Mabuchi also is expanding its product lineup into slightly larger and higher priced motors and is taking market share from existing players.
Notable Portfolio Changes:
During the quarter we added staffing and recruiting company Temp Holdings (renamed Persol Holdings as of July 2017). We believe Japan’s labor market tightening is structural, with demand driven by service sectors jobs while supply remains constrained due to an aging population. Demand for staffing is growing at
(continued)
| * | The Matthews Japan Fund closed to most new investors effective after market closing on July 29, 2016, but will continue to accept investments from existing shareholders. |
| 1 | Prospectus expense ratios. |
| 2 | The lesser of fiscal year 2016 long-term purchase costs or sales proceeds divided by the average monthly market value of long-term securities. |
| | | | |
| matthewsasia.com | 800.789.ASIA | | | 71 | |
| | | | | | | | | | | | | | | | | | | | | | | | | | | | | | | | |
| | | | | | | | | |
| PERFORMANCE AS OF JUNE 30, 2017 | | | | | | | | | | | | | | | | | | | | | | | | |
| | | | | | | | | | | | Average Annual Total Returns | | | | |
| | | 3 Months | | | YTD | | | 1 Year | | | 3 Years | | | 5 Years | | | 10 Years | | | Since
Inception | | | Inception
Date | |
| Investor Class (MJFOX) | | | 6.73% | | | | 14.61% | | | | 8.27% | | | | 9.56% | | | | 13.74% | | | | 4.54% | | | | 6.19% | | | | 12/31/98 | |
| Institutional Class (MIJFX) | | | 6.71% | | | | 14.63% | | | | 8.38% | | | | 9.68% | | | | 13.88% | | | | n.a. | | | | 11.21% | | | | 10/29/10 | |
| MSCI Japan Index3 | | | 5.23% | | | | 10.11% | | | | 19.58% | | | | 5.87% | | | | 9.86% | | | | 1.42% | | | | 3.37% | 4 | | | | |
| Lipper Japanese Funds Category Average5 | | | 6.14% | | | | 12.16% | | | | 20.37% | | | | 7.73% | | | | 11.47% | | | | 3.11% | | | | 4.66% | | | | | |
Performance assumes reinvestment of all dividends and/or distributions before taxes. All performance quoted represents past performance and is no guarantee of future results. Investment return and principal value will fluctuate with market conditions so that when redeemed, shares may be worth more or less than their original cost. Current performance may be lower or higher than the return figures quoted. For the Fund’s most recent month-end performance, visit matthewsasia.com.
GROWTH OF A $10,000 INVESTMENT SINCE INCEPTION—INVESTOR CLASS
Plotted monthly. The performance data and graph do not reflect the deduction of taxes that a shareholder would pay on dividends, capital gains distributions or redemption of Fund shares. Values are in US$.
| | 3 | It is not possible to invest directly in an index. Source: Index data from Morgan Stanley Capital International and Bloomberg; total return calculations performed by BNY Mellon Investment Servicing (US) Inc. Please see page 91 for index definitions. |
| | 4 | Calculated from 12/31/98. |
| | 5 | The Lipper Category Average does not reflect sales charges and is based on total return, including reinvestment of dividends and capital gains for the stated periods. |
| | | | | | | | |
| | | | |
| TOP TEN HOLDINGS6 | | | | | | | |
| | | Sector | | | | % of Net Assets | |
| Mitsubishi UFJ Financial Group, Inc. | | Financials | | | | | 3.6% | |
| Suzuki Motor Corp. | | Consumer Discretionary | | | | | 3.0% | |
| Murata Manufacturing Co., Ltd. | | Information Technology | | | | | 2.7% | |
| Nitori Holdings Co., Ltd. | | Consumer Discretionary | | | | | 2.5% | |
| Keyence Corp. | | Information Technology | | | | | 2.5% | |
| Nidec Corp. | | Industrials | | | | | 2.5% | |
| Sumitomo Mitsui Financial Group, Inc. | | Financials | | | | | 2.3% | |
| SoftBank Group Corp. | | Telecommunication Services | | | | | 2.2% | |
| MISUMI Group, Inc. | | Industrials | | | | | 2.1% | |
| Ryohin Keikaku Co., Ltd. | | Consumer Discretionary | | | | | 2.1% | |
| % OF ASSETS IN TOP TEN | | | | | | | 25.5% | |
| | 6 | Holdings may combine more than one security from same issuer and related depositary receipts. |
Matthews Japan Fund
Portfolio Manager Commentary (unaudited) (continued)
close to double-digit rates as companies seek to fulfill their labor needs. We also added human resource solution and marketing media company Recruit Holdings. Indeed, the U.S. based online job search engine is the crown jewel in Recruit’s business portfolio. Indeed is aggressively expanding its footprint outside of the U.S., supported by Recruit’s know-how in marketing and training. We also believe Recruit’s capability to provide productivity enhancing technology solutions to business customers in Japan will become even more valuable as the labor shortage continues.
To fund these new positions, we exited railway operator Kyushu Railway and financial services firm Financial Products Group. We had subscribed to Kyushu Railway’s IPO as the offer price was at a sizeable discount to other listed railway operators. With share price appreciation, the valuation gap with peers had closed and therefore we decided to exit the stock. With regards to Financial Products Group, we were a bit disappointed by slowing sales growth for its mainstay tax planning product in what seems to be a favorable business environment. The company seems to be taking a conservative approach as growth had been very robust in recent years. Additionally, tax authorities are starting to clamp down on tax loopholes, which may affect a portion of their business.
Outlook:
Prime Minister Shinzo Abe’s approval ratings have declined sharply following much-reported turmoil amid allegations of cronyism. As a result, the Liberal Democratic Party was routed in the Tokyo Metropolitan Government elections, ceding seats to the new regional Tomin First Party. We don’t believe this is an immediate threat to Abe’s administration due to the lack of a credible opponent at the national level. But Abe will likely be desperate to score points on the economic front, including the possibility of an expanded fiscal spending package. If implemented, it should bode well for domestic demand and the inflation outlook. We are wary, however, of the political situation around Abe and his administration. If Abe were to be forced out of office, the resulting uncertainty may negatively affect corporate sentiment and equity valuations over the short term. We retain an optimistic view of Japanese equities as valuations remain among the most inexpensive in developed markets despite solid corporate earnings growth combined with the potential for further improvements in shareholder returns.
| | | | |
| |
| COUNTRY ALLOCATION (%)7 | |
Japan | | | 97.6 | |
| Cash and Other Assets, Less Liabilities | | | 2.4 | |
| | | | |
| | |
| SECTOR ALLOCATION (%)7 | | | |
| Industrials | | | 24.8 | |
| Consumer Discretionary | | | 18.0 | |
| Financials | | | 12.1 | |
| Consumer Staples | | | 11.2 | |
| Information Technology | | | 10.4 | |
| Health Care | | | 9.9 | |
| Materials | | | 5.7 | |
| Real Estate | | | 3.3 | |
| Telecommunication Services | | | 2.2 | |
| Cash and Other Assets, Less Liabilities | | | 2.4 | |
| | | | |
| | |
| MARKET CAP EXPOSURE (%)7 | | | |
| Mega Cap (over $25B) | | | 32.0 | |
| Large Cap ($10B–$25B) | | | 19.4 | |
| Mid Cap ($3B–10B) | | | 20.0 | |
| Small Cap (under $3B) | | | 26.1 | |
| Cash and Other Assets, Less Liabilities | | | 2.4 | |
| 7 | Source: FactSet Research Systems. Percentage values in data are rounded to the nearest tenth of one percent; the values may not sum to 100% due to rounding. |
| | | | |
| matthewsasia.com | 800.789.ASIA | | | 73 | |
Matthews Japan Fund
June 30, 2017
Schedule of Investmentsa (unaudited)
COMMON EQUITIES: 97.6%
| | | | | | | | |
| | | Shares | | | Value | |
| INDUSTRIALS: 24.8% | | | | | | | | |
Professional Services: 6.8% | | | | | | | | |
TechnoPro Holdings, Inc.† | | | 1,755,600 | | | | $70,665,994 | |
Nihon M&A Center, Inc. | | | 1,622,600 | | | | 59,394,335 | |
Temp Holdings Co., Ltd. | | | 2,777,100 | | | | 52,176,698 | |
Recruit Holdings Co., Ltd. | | | 3,006,900 | | | | 51,748,400 | |
| | | | | | | | |
| | | | | | | 233,985,427 | |
| | | | | | | | |
| | | | | | | | |
Machinery: 5.5% | | | | | | | | |
SMC Corp. | | | 230,900 | | | | 70,584,354 | |
Komatsu, Ltd. | | | 2,413,000 | | | | 61,935,553 | |
Harmonic Drive Systems, Inc. | | | 1,685,300 | | | | 58,467,029 | |
| | | | | | | | |
| | | | | | | 190,986,936 | |
| | | | | | | | |
| | | | | | | | |
Electrical Equipment: 4.4% | | | | | | | | |
Nidec Corp. | | | 833,400 | | | | 85,623,520 | |
Mabuchi Motor Co., Ltd. | | | 1,300,300 | | | | 64,992,726 | |
| | | | | | | | |
| | | | | | | 150,616,246 | |
| | | | | | | | |
| | | | | | | | |
Trading Companies & Distributors: 4.2% | | | | | | | | |
MISUMI Group, Inc. | | | 3,229,700 | | | | 74,023,575 | |
Mitsui & Co., Ltd. | | | 5,054,600 | | | | 72,360,830 | |
| | | | | | | | |
| | | | | | | 146,384,405 | |
| | | | | | | | |
| | | | | | | | |
Building Products: 2.8% | | | | | | | | |
Daikin Industries, Ltd. | | | 607,900 | | | | 62,365,710 | |
Aica Kogyo Co., Ltd. | | | 1,169,300 | | | | 35,704,935 | |
| | | | | | | | |
| | | | | | | 98,070,645 | |
| | | | | | | | |
| | | | | | | | |
Construction & Engineering: 0.9% | | | | | | | | |
Totetsu Kogyo Co., Ltd. | | | 997,600 | | | | 30,549,943 | |
| | | | | | | | |
| | | | | | | | |
Road & Rail: 0.2% | | | | | | | | |
Trancom Co., Ltd. | | | 164,400 | | | | 8,034,008 | |
| | | | | | | | |
Total Industrials | | | | | | | 858,627,610 | |
| | | | | | | | |
| | | | | | | | |
| CONSUMER DISCRETIONARY: 18.0% | | | | | | | | |
Automobiles: 4.1% | | | | | | | | |
Suzuki Motor Corp. | | | 2,155,900 | | | | 102,702,708 | |
Subaru Corp. | | | 1,166,900 | | | | 39,567,314 | |
| | | | | | | | |
| | | | | | | 142,270,022 | |
| | | | | | | | |
| | | | | | | | |
Specialty Retail: 3.7% | | | | | | | | |
Nitori Holdings Co., Ltd. | | | 649,800 | | | | 86,984,347 | |
JINS, Inc. | | | 761,500 | | | | 42,424,677 | |
| | | | | | | | |
| | | | | | | 129,409,024 | |
| | | | | | | | |
| | | | | | | | |
Auto Components: 3.5% | | | | | | | | |
NGK Spark Plug Co., Ltd. | | | 2,066,000 | | | | 44,254,782 | |
Nifco, Inc. | | | 786,000 | | | | 42,275,086 | |
Nippon Seiki Co., Ltd. | | | 1,660,000 | | | | 33,466,250 | |
| | | | | | | | |
| | | | | | | 119,996,118 | |
| | | | | | | | |
| | | | | | | | |
Multiline Retail: 2.1% | | | | | | | | |
Ryohin Keikaku Co., Ltd. | | | 289,300 | | | | 72,406,222 | |
| | | | | | | | |
| | | | | | | | |
Internet & Direct Marketing Retail: 1.6% | | | | | | | | |
Start Today Co., Ltd. | | | 2,251,300 | | | | 55,482,594 | |
| | | | | | | | |
| | | | | | | | |
Media: 1.0% | | | | | | | | |
LIFULL Co., Ltd. | | | 4,069,900 | | | | 35,765,132 | |
| | | | | | | | |
| | | | | | | | |
| | | | | | | | |
| | | Shares | | | Value | |
Distributors: 1.0% | | | | | | | | |
Doshisha Co., Ltd. | | | 1,854,800 | | | | $35,322,529 | |
| | | | | | | | |
| | | | | | | | |
Hotels, Restaurants & Leisure: 1.0% | | | | | | | | |
Kyoritsu Maintenance Co., Ltd. | | | 1,158,500 | | | | 33,741,748 | |
| | | | | | | | |
Total Consumer Discretionary | | | | | | | 624,393,389 | |
| | | | | | | | |
| | | | | | | | |
| FINANCIALS: 12.1% | | | | | | | | |
Banks: 6.8% | | | | | | | | |
Mitsubishi UFJ Financial Group, Inc. | | | 18,369,700 | | | | 123,904,517 | |
Sumitomo Mitsui Financial Group, Inc. | | | 2,025,300 | | | | 79,076,754 | |
Seven Bank, Ltd. | | | 9,537,500 | | | | 34,196,291 | |
| | | | | | | | |
| | | | | | | 237,177,562 | |
| | | | | | | | |
| | | | | | | | |
Insurance: 3.8% | | | | | | | | |
Tokio Marine Holdings, Inc. | | | 1,670,400 | | | | 69,510,812 | |
Dai-ichi Life Holdings, Inc. | | | 3,414,400 | | | | 61,976,191 | |
| | | | | | | | |
| | | | | | | 131,487,003 | |
| | | | | | | | |
| | | | | | | | |
Diversified Financial Services: 1.5% | | | | | | | | |
ORIX Corp. | | | 3,209,500 | | | | 49,939,372 | |
| | | | | | | | |
Total Financials | | | | | | | 418,603,937 | |
| | | | | | | | |
| | | | | | | | |
| CONSUMER STAPLES: 11.2% | | | | | | | | |
Food & Staples Retailing: 3.4% | | | | | | | | |
Seven & I Holdings Co., Ltd. | | | 1,656,600 | | | | 68,358,680 | |
San-A Co., Ltd. | | | 1,131,900 | | | | 50,066,289 | |
| | | | | | | | |
| | | | | | | 118,424,969 | |
| | | | | | | | |
| | | | | | | | |
Food Products: 2.6% | | | | | | | | |
Ezaki Glico Co., Ltd. | | | 956,300 | | | | 51,490,343 | |
Ariake Japan Co., Ltd. | | | 535,100 | | | | 37,289,264 | |
| | | | | | | | |
| | | | | | | 88,779,607 | |
| | | | | | | | |
| | | | | | | | |
Personal Products: 1.9% | | | | | | | | |
Kao Corp. | | | 1,129,100 | | | | 67,134,415 | |
| | | | | | | | |
| | | | | | | | |
Tobacco: 1.8% | | | | | | | | |
Japan Tobacco, Inc. | | | 1,769,700 | | | | 62,201,603 | |
| | | | | | | | |
| | | | | | | | |
Household Products: 1.5% | | | | | | | | |
Pigeon Corp. | | | 1,404,600 | | | | 51,064,683 | |
| | | | | | | | |
Total Consumer Staples | | | | | | | 387,605,277 | |
| | | | | | | | |
| | | | | | | | |
| INFORMATION TECHNOLOGY: 10.4% | | | | | | | | |
Electronic Equipment, Instruments & Components: 6.7% | |
Murata Manufacturing Co., Ltd. | | | 619,800 | | | | 94,622,409 | |
Keyence Corp. | | | 197,000 | | | | 86,724,889 | |
Horiba, Ltd. | | | 843,600 | | | | 51,459,260 | |
| | | | | | | | |
| | | | | | | 232,806,558 | |
| | | | | | | | |
| | | | | | | | |
Software: 1.7% | | | | | | | | |
Oracle Corp. Japan | | | 912,800 | | | | 59,375,555 | |
| | | | | | | | |
| | | | | | | | |
Internet Software & Services: 1.4% | | | | | | | | |
Infomart Corp. | | | 6,408,700 | | | | 48,763,044 | |
| | | | | | | | |
| | | | | | | | |
Semiconductors & Semiconductor Equipment: 0.6% | |
Lasertec Corp. | | | 1,453,700 | | | | 20,248,574 | |
| | | | | | | | |
Total Information Technology | | | | | | | 361,193,731 | |
| | | | | | | | |
| | | | | | | | |
Matthews Japan Fund
June 30, 2017
Schedule of Investmentsa (unaudited) (continued)
COMMON EQUITIES (continued)
| | | | | | | | |
| | | Shares | | | Value | |
| HEALTH CARE: 9.9% | | | | | | | | |
Health Care Equipment & Supplies: 7.2% | |
Hoya Corp. | | | 1,345,400 | | | | $70,043,371 | |
Asahi Intecc Co., Ltd. | | | 1,485,700 | | | | 67,605,491 | |
Sysmex Corp. | | | 1,058,600 | | | | 63,361,147 | |
CYBERDYNE, Inc.b | | | 2,719,000 | | | | 36,232,086 | |
Daiken Medical Co., Ltd.† | | | 1,660,000 | | | | 11,863,532 | |
| | | | | | | | |
| | | | | | | 249,105,627 | |
| | | | | | | | |
| | | | | | | | |
Health Care Technology: 1.6% | | | | | | | | |
M3, Inc. | | | 1,981,400 | | | | 54,659,658 | |
| | | | | | | | |
| | | | | | | | |
Biotechnology: 0.6% | | | | | | | | |
PeptiDream, Inc.b | | | 724,600 | | | | 22,939,389 | |
| | | | | | | | |
| | | | | | | | |
Health Care Providers & Services: 0.5% | |
Japan Lifeline Co., Ltd. | | | 423,700 | | | | 17,921,350 | |
| | | | | | | | |
Total Health Care | | | | | | | 344,626,024 | |
| | | | | | | | |
| | | | | | | | |
| MATERIALS: 5.7% | | | | | | | | |
Chemicals: 5.7% | | | | | | | | |
Shin-Etsu Chemical Co., Ltd. | | | 769,900 | �� | | | 70,070,816 | |
Nitto Denko Corp. | | | 743,800 | | | | 61,424,001 | |
W-Scope Corp.† | | | 2,315,300 | | | | 40,670,604 | |
Fuso Chemical Co., Ltd. | | | 792,800 | | | | 25,799,376 | |
| | | | | | | | |
Total Materials | | | | | | | 197,964,797 | |
| | | | | | | | |
| | | | | | | | |
| REAL ESTATE: 3.3% | | | | | | | | |
Real Estate Management & Development: 3.3% | |
Relo Group, Inc. | | | 3,661,400 | | | | 71,283,888 | |
Mitsui Fudosan Co., Ltd. | | | 1,866,500 | | | | 44,718,555 | |
| | | | | | | | |
Total Real Estate | | | | | | | 116,002,443 | |
| | | | | | | | |
| | | | | | | | |
| TELECOMMUNICATION SERVICES: 2.2% | | | | | |
Wireless Telecommunication Services: 2.2% | | | | | |
SoftBank Group Corp. | | | 957,600 | | | | 77,843,443 | |
| | | | | | | | |
Total Telecommunication Services | | | | | | | 77,843,443 | |
| | | | | | | | |
| | | | | | | | |
| TOTAL INVESTMENTS: 97.6% | | | | | | | 3,386,860,651 | |
(Cost $2,906,660,943c) | | | | | | | | |
| | | | | | | | |
CASH AND OTHER ASSETS,
LESS LIABILITIES: 2.4% | | | | | | | 83,058,473 | |
| | | | | | | | |
| | |
NET ASSETS: 100.0% | | | | | | | $3,469,919,124 | |
| | | | | | | | |
| a | Certain securities were fair valued under the valuation policies approved by the Board of Trustees (Note 2-A). |
| b | Non-income producing security. |
| c | Cost for federal income tax purposes is $2,909,138,488 and net unrealized appreciation consists of: |
| | | | |
Gross unrealized appreciation | | | $531,716,703 | |
Gross unrealized depreciation | | | (53,994,540 | ) |
| | | | |
Net unrealized appreciation | | | $477,722,163 | |
| | | | |
| † | Affiliated Issuer, as defined under the Investment Company Act of 1940 (ownership of 5% or more of the outstanding voting securities of this issuer) |
See accompanying notes to financial statements.
| | | | |
| matthewsasia.com | 800.789.ASIA | | | 75 | |
| | | | |
| PORTFOLIO MANAGERS |
| Michael J. Oh, CFA | | | | |
Lead Manager | | | | |
| Michael B. Han, CFA | | |
Co-Manager | | | | |
|
| FUND FACTS |
| | | Investor | | Institutional |
Ticker | | MAKOX | | MIKOX |
CUSIP | | 577130305 | | 577130826 |
Inception | | 1/3/95 | | 10/29/10 |
NAV | | $6.66 | | $6.70 |
Initial Investment | | $2,500 | | $100,000 |
Gross Expense Ratio1 | | 1.15% | | 0.97% |
Portfolio Statistics |
Total # of Positions | | 45 |
Net Assets | | $201.7 million |
Weighted Average
Market Cap | | $60.8 billion |
Portfolio Turnover2 | | 34.73% |
Benchmark |
Korea Composite Stock Price Index |
OBJECTIVE
Long-term capital appreciation.
STRATEGY
Under normal market conditions, the Fund seeks to achieve its investment objective by investing at least 80% of its total net assets, which include borrowings for investment purposes, in the common and preferred stocks of companies located in South Korea.
Matthews Korea Fund
Portfolio Manager Commentary (unaudited)
Period ended June 30, 2017
For the first half of 2017, the Matthews Korea Fund returned 26.86% (Investor Class) and 27.14% (Institutional Class), outperforming its benchmark, the Korea Composite Stock Price Index, which returned 24.66% over the same period. For the quarter ending June 30, 2017, the Fund returned 9.00% (Investor Class) and 9.12% (Institutional Class) compared with the benchmark return of 8.22% over the same period.
Market Environment:
During the first half of the year, the Korean market performed strongly thanks in part to a snap election that ended the recent political vacuum that followed the impeachment of the previous president. President Moon Jae-In won the election by a wide margin and was inaugurated a day after election without the traditional transition period. Given that this was his second bid for the presidency, we believe he seems well-prepared for the position. He showed his commitment for reform and change by appointing impressive figures for key cabinet positions. For example, he appointed a minority shareholder activist as a head of the country’s Fair Trade Commission. The Korean public showed strong support for such moves through record high approval ratings that were well above 70%. We are optimistic that President Moon has strong political power to initiate reforms that we believe will benefit the Korean economy.
Performance Contributors and Detractors:
During the first six months, the top contributors were Samsung Electronics, SK Hnynix and Modetour Network. Both Samsung Electronics and SK Hynix performed strongly as they are leaders in the memory semiconductor industry and benefited from an improving market position amid industry consolidation against robust demand. Modetour Network, an outbound tour operator, performed strongly as the leisure industry, especially outbound travel, continues to be strong.
Major detractors to the performance were Amorepacific Corp., Dong-A ST Co., and KEPCO Plant Service & Engineering Co., Ltd. Amorepacific, a leading cosmetics brand with sizable revenues coming from Chinese consumers, suffered from the recent diplomatic conflict with China on the deployment of a missile defense system. Dong-A ST, a pharmaceutical company, and KEPCO Plant Service & Engineering both suffered from weak earnings. In the first quarter, we swapped our preferred shares of Amorepacific Corp. with those of AMOREPACIFIC Group as we saw better opportunities with its holding company.
Notable Changes to Portfolio:
During the quarter, we initiated a position in Woori Bank, a major commercial bank. The company had been under government receivership for over a decade following the Asian Financial Crisis but was recently privatized. We found the valuations attractive while the new management may be more profit-oriented than the previous management. We exited positions in Silicon Works, a chip designer, and Daesang, a major food company, as both are undergoing restructuring, which often can take longer than anticipated.
Outlook:
President Moon seems to have secured solid political support from the public with his strong reform drive to boost transparency and improve overall governance. We believe that his reform measures benefit minority investors in South Korea. While the Moon administration is facing a difficult geopolitical environment, mostly
(continued)
| 1 | Prospectus expense ratios. |
| 2 | The lesser of fiscal year 2016 long-term purchase costs or sales proceeds divided by the average monthly market value of long-term securities. |
| | | | | | | | | | | | | | | | | | | | | | | | | | | | | | | | |
| | | | | | | | | |
| PERFORMANCE AS OF JUNE 30, 2017 | | | | | | | | | | | | | | | | | | | | | | | | |
| | | | | | | | | | | | Average Annual Total Returns | | | | |
| | | 3 Months | | | YTD | | | 1 Year | | | 3 Years | | | 5 Years | | | 10 Years | | | Since
Inception | | | Inception
Date | |
| Investor Class (MAKOX) | | | 9.00% | | | | 26.86% | | | | 19.23% | | | | 8.84% | | | | 12.30% | | | | 5.57% | | | | 6.68% | | | | 1/3/95 | |
| Institutional Class (MIKOX) | | | 9.12% | | | | 27.14% | | | | 19.31% | | | | 9.03% | | | | 12.42% | | | | n.a. | | | | 10.12% | | | | 10/29/10 | |
| Korea Composite Stock Price Index3 | | | 8.22% | | | | 24.66% | | | | 24.48% | | | | 3.51% | | | | 6.72% | | | | 2.52% | | | | 3.67% | 4 | | | | |
| Lipper Pacific ex Japan Funds Category Average5 | | | 7.97% | | | | 22.02% | | | | 21.94% | | | | 4.36% | | | | 7.64% | | | | 4.15% | | | | 6.53% | | | | | |
Performance assumes reinvestment of all dividends and/or distributions before taxes. All performance quoted represents past performance and is no guarantee of future results. Investment return and principal value will fluctuate with market conditions so that when redeemed, shares may be worth more or less than their original cost. Current performance may be lower or higher than the return figures quoted. For the Fund’s most recent month-end performance, visit matthewsasia.com.
GROWTH OF A $10,000 INVESTMENT SINCE INCEPTION—INVESTOR CLASS
Plotted monthly. The performance data and graph do not reflect the deduction of taxes that a shareholder would pay on dividends, capital gains distributions or redemption of Fund shares. Values are in US$.
| | 3 | Korea Composite Stock Price Index performance data may be readjusted periodically by the Korea Exchange due to certain factors, including the declaration of dividends. It is not possible to invest directly in an index. Source: Index data from Korea Composite Stock Price Index and Bloomberg; total return calculations performed by BNY Mellon Investment Servicing (US) Inc. Please see page 91 for index definition. |
| | 5 | The Lipper Category Average does not reflect sales charges and is based on total return, including reinvestment of dividends and capital gains for the stated periods. |
| | | | | | | | |
| | | | |
| TOP TEN HOLDINGS6 | | | | | | | |
| | | Sector | | | | % of Net Assets | |
| Samsung Electronics Co., Ltd., Pfd. | | Information Technology | | | | | 8.2% | |
| Samsung Electronics Co., Ltd. | | Information Technology | | | | | 8.2% | |
| SK Hynix, Inc. | | Information Technology | | | | | 4.5% | |
| Hana Financial Group, Inc. | | Financials | | | | | 3.8% | |
| KB Financial Group, Inc. | | Financials | | | | | 3.7% | |
| Shinhan Financial Group Co., Ltd. | | Financials | | | | | 3.4% | |
| Modetour Network, Inc. | | Consumer Discretionary | | | | | 3.2% | |
| Naver Corp. | | Information Technology | | | | | 3.2% | |
| LG Household & Health Care, Ltd., Pfd. | | Consumer Staples | | | | | 3.1% | |
| Hyundai Motor Co., Ltd., 2nd Pfd. | | Consumer Discretionary | | | | | 3.0% | |
| % OF ASSETS IN TOP TEN | | | | | | | 44.3% | |
| | 6 | Holdings may combine more than one security from same issuer and related depositary receipts. |
| | | | |
| matthewsasia.com | 800.789.ASIA | | | 77 | |
| | | | |
| |
| COUNTRY ALLOCATION (%)7 | |
| South Korea | | | 98.5 | |
| Cash and Other Assets, Less Liabilities | | | 1.5 | |
| | | | |
| |
| SECTOR ALLOCATION (%)7 | |
| Information Technology | | | 28.1 | |
| Financials | | | 21.2 | |
| Consumer Discretionary | | | 19.0 | |
| Consumer Staples | | | 9.6 | |
| Materials | | | 6.0 | |
| Health Care | | | 5.5 | |
| Telecommunication Services | | | 3.8 | |
| Energy | | | 3.7 | |
| Industrials | | | 1.6 | |
| Cash and Other Assets, Less Liabilities | | | 1.5 | |
| | | | |
| |
| MARKET CAP EXPOSURE (%)7 | |
| Mega Cap (over $25B) | | | 23.8 | |
| Large Cap ($10B–$25B) | | | 36.9 | |
| Mid Cap ($3B–10B) | | | 17.0 | |
| Small Cap (under $3B) | | | 20.8 | |
| Cash and Other Assets, Less Liabilities | | | 1.5 | |
| 7 | Source: FactSet Research Systems. Percentage values in data are rounded to the nearest tenth of one percent; the values may not sum to 100% due to rounding. |
Matthews Korea Fund
Portfolio Manager Commentary (unaudited) (continued)
stemming from North Korea’s continuing nuclear and long-range missile development, the administration’s pragmatic approach to pursuing dialogue might provide an alternative approach to previous administrations.
Consumer sentiment, after dropping significantly at the height of massive protest in November 2016, has significantly improved. The composite consumer sentiment index hit a multiyear high in June. Despite geopolitical uncertainty, a strong reform drive coupled with consumer optimism, we believe that Korea’s economic outlook in the near term remains bright.
Matthews Korea Fund
June 30, 2017
Schedule of Investmentsa (unaudited)
COMMON EQUITIES: SOUTH KOREA: 76.6%
| | | | | | | | |
| | | Shares | | | Value | |
| INFORMATION TECHNOLOGY: 19.3% | | | | | | | | |
Technology Hardware, Storage & Peripherals: 8.2% | |
Samsung Electronics Co., Ltd. | | | 7,921 | | | | $16,498,032 | |
| | | | | | | | |
| | | | | | | | |
Semiconductors & Semiconductor Equipment: 5.4% | |
SK Hynix, Inc. | | | 153,358 | | | | 9,029,676 | |
Koh Young Technology, Inc. | | | 35,261 | | | | 1,849,461 | |
| | | | | | | | |
| | | | | | | 10,879,137 | |
| | | | | | | | |
| | | | | | | | |
Internet Software & Services: 3.1% | | | | | | | | |
Naver Corp. | | | 8,678 | | | | 6,361,241 | |
| | | | | | | | |
| | | | | | | | |
Electronic Equipment, Instruments & Components: 2.6% | |
Samsung SDI Co., Ltd. | | | 34,435 | | | | 5,169,503 | |
| | | | | | | | |
Total Information Technology | | | | | | | 38,907,913 | |
| | | | | | | | |
| | | | | | | | |
| FINANCIALS: 18.7% | | | | | | | | |
Banks: 13.2% | | | | | | | | |
Hana Financial Group, Inc. | | | 193,005 | | | | 7,622,252 | |
KB Financial Group, Inc. | | | 148,355 | | | | 7,490,480 | |
Shinhan Financial Group Co., Ltd. | | | 158,869 | | | | 6,854,432 | |
Woori Bank | | | 199,948 | | | | 3,220,940 | |
DGB Financial Group, Inc. | | | 147,735 | | | | 1,523,102 | |
| | | | | | | | |
| | | | | | | 26,711,206 | |
| | | | | | | | |
| | | | | | | | |
Capital Markets: 3.6% | | | | | | | | |
Kiwoom Securities Co., Ltd. | | | 51,053 | | | | 4,164,002 | |
Shinyoung Securities Co., Ltd. | | | 63,434 | | | | 3,049,312 | |
| | | | | | | | |
| | | | | | | 7,213,314 | |
| | | | | | | | |
| | | | | | | | |
Insurance: 1.9% | | | | | | | | |
Dongbu Insurance Co., Ltd. | | | 65,165 | | | | 3,872,624 | |
| | | | | | | | |
Total Financials | | | | | | | 37,797,144 | |
| | | | | | | | |
| | | | | | | | |
| CONSUMER DISCRETIONARY: 16.0% | | | | | | | | |
Auto Components: 5.2% | | | | | | | | |
Hyundai Mobis Co., Ltd. | | | 26,986 | | | | 5,899,459 | |
Hankook Tire Co., Ltd. | | | 81,800 | | | | 4,546,986 | |
| | | | | | | | |
| | | | | | | 10,446,445 | |
| | | | | | | | |
| | | | | | | | |
Hotels, Restaurants & Leisure: 5.1% | | | | | | | | |
Modetour Network, Inc. | | | 234,114 | | | | 6,476,181 | |
Kangwon Land, Inc. | | | 128,193 | | | | 3,906,360 | |
| | | | | | | | |
| | | | | | | 10,382,541 | |
| | | | | | | | |
| | | | | | | | |
Specialty Retail: 1.7% | | | | | | | | |
LOTTE Himart Co., Ltd. | | | 55,183 | | | | 3,366,493 | |
| | | | | | | | |
| | | | | | | | |
Media: 1.2% | | | | | | | | |
Innocean Worldwide, Inc. | | | 44,713 | | | | 2,495,566 | |
| | | | | | | | |
| | | | | | | | |
Automobiles: 1.1% | | | | | | | | |
Kia Motors Corp. | | | 65,541 | | | | 2,188,786 | |
| | | | | | | | |
| | | | | | | | |
Household Durables: 1.0% | | | | | | | | |
Cuckoo Electronics Co., Ltd. | | | 15,695 | | | | 1,988,388 | |
| | | | | | | | |
| | | | | | | | |
Multiline Retail: 0.7% | | | | | | | | |
Hyundai Department Store Co., Ltd. | | | 15,163 | | | | 1,464,585 | |
| | | | | | | | |
Total Consumer Discretionary | | | | | | | 32,332,804 | |
| | | | | | | | |
| | | | | | | | |
| | | | | | | | |
| | | Shares | | | Value | |
| HEALTH CARE: 5.5% | | | | | | | | |
Biotechnology: 2.9% | | | | | | | | |
Hugel, Inc.b | | | 11,909 | | | | $5,822,865 | |
| | | | | | | | |
| | | | | | | | |
Pharmaceuticals: 2.6% | | | | | | | | |
Yuhan Corp. | | | 14,793 | | | | 3,180,292 | |
DongKook Pharmaceutical Co., Ltd. | | | 28,602 | | | | 1,579,006 | |
Dong-A ST Co., Ltd. | | | 6,065 | | | | 488,690 | |
| | | | | | | | |
| | | | | | | 5,247,988 | |
| | | | | | | | |
Total Health Care | | | | | | | 11,070,853 | |
| | | | | | | | |
| | | | | | | | |
| CONSUMER STAPLES: 5.1% | | | | | | | | |
Food & Staples Retailing: 2.8% | | | | | | | | |
BGF Retail Co., Ltd. | | | 48,425 | | | | 4,278,256 | |
Hyundai Greenfood Co., Ltd. | | | 87,793 | | | | 1,358,014 | |
| | | | | | | | |
| | | | | | | 5,636,270 | |
| | | | | | | | |
| | | | | | | | |
Food Products: 2.3% | | | | | | | | |
Orion Corp.c | | | 6,707 | | | | 4,669,124 | |
| | | | | | | | |
Total Consumer Staples | | | | | | | 10,305,394 | |
| | | | | | | | |
| | | | | | | | |
| MATERIALS: 4.1% | | | | | | | | |
Metals & Mining: 4.1% | | | | | | | | |
POSCO | | | 22,860 | | | | 5,726,249 | |
Korea Zinc Co., Ltd. | | | 6,362 | | | | 2,535,165 | |
| | | | | | | | |
Total Materials | | | | | | | 8,261,414 | |
| | | | | | | | |
| | | | | | | | |
| TELECOMMUNICATION SERVICES: 3.9% | | | | | | | | |
Wireless Telecommunication Services: 2.1% | |
SK Telecom Co., Ltd. ADR | | | 159,000 | | | | 4,081,530 | |
| | | | | | | | |
| | | | | | | | |
Diversified Telecommunication Services: 1.8% | |
KT Corp. ADR | | | 220,400 | | | | 3,667,456 | |
| | | | | | | | |
Total Telecommunication Services | | | | | | | 7,748,986 | |
| | | | | | | | |
| | | | | | | | |
| ENERGY: 2.4% | | | | | | | | |
Oil, Gas & Consumable Fuels: 2.4% | | | | | | | | |
SK Innovation Co., Ltd. | | | 24,541 | | | | 3,398,840 | |
S-Oil Corp. | | | 18,205 | | | | 1,508,329 | |
| | | | | | | | |
Total Energy | | | | | | | 4,907,169 | |
| | | | | | | | |
| | | | | | | | |
| INDUSTRIALS: 1.6% | | | | | | | | |
Aerospace & Defense: 1.0% | | | | | | | | |
LIG Nex1 Co., Ltd. | | | 29,375 | | | | 1,900,374 | |
| | | | | | | | |
| | | | | | | | |
Commercial Services & Supplies: 0.6% | | | | | | | | |
KEPCO Plant Service & Engineering Co., Ltd. | | | 33,138 | | | | 1,279,230 | |
| | | | | | | | |
Total Industrials | | | | | | | 3,179,604 | |
| | | | | | | | |
| | | | | | | | |
| TOTAL COMMON EQUITIES | | | | | | | 154,511,281 | |
| | | | | | | | |
(Cost $97,348,176) | | | | | | | | |
| | | | | | | | |
PREFERRED EQUITIES: SOUTH KOREA: 21.9% | |
| INFORMATION TECHNOLOGY: 8.8% | | | | | | | | |
Technology Hardware, Storage & Peripherals: 8.2% | |
Samsung Electronics Co., Ltd., Pfd. | | | 10,149 | | | | 16,547,926 | |
| | | | | | | | |
| | | | |
| matthewsasia.com | 800.789.ASIA | | | 79 | |
Matthews Korea Fund
June 30, 2017
Schedule of Investmentsa (unaudited) (continued)
PREFERRED EQUITIES: SOUTH KOREA (continued)
| | | | | | | | |
| | | Shares | | | Value | |
Electronic Equipment, Instruments & Components: 0.6% | |
Samsung SDI Co., Ltd., Pfd. | | | 17,470 | | | | $1,260,580 | |
| | | | | | | | |
Total Information Technology | | | | | | | 17,808,506 | |
| | | | | | | | |
| | | | | | | | |
| CONSUMER STAPLES: 4.5% | | | | | | | | |
Personal Products: 4.5% | | | | | | | | |
LG Household & Health Care, Ltd., Pfd. | | | 11,638 | | | | 6,316,012 | |
AMOREPACIFIC Group, Pfd. | | | 51,316 | | | | 2,783,403 | |
| | | | | | | | |
Total Consumer Staples | | | | | | | 9,099,415 | |
| | | | | | | | |
| | | | | | | | |
| CONSUMER DISCRETIONARY: 3.0% | | | | | | | | |
Automobiles: 3.0% | | | | | | | | |
Hyundai Motor Co., Ltd., 2nd Pfd. | | | 59,135 | | | | 6,021,213 | |
| | | | | | | | |
Total Consumer Discretionary | | | | | | | 6,021,213 | |
| | | | | | | | |
| | | | | | | | |
| FINANCIALS: 2.4% | | | | | | | | |
Insurance: 2.4% | | | | | | | | |
Samsung Fire & Marine Insurance Co., Ltd., Pfd. | | | 28,572 | | | | 4,869,589 | |
| | | | | | | | |
Total Financials | | | | | | | 4,869,589 | |
| | | | | | | | |
| | | | | | | | |
| MATERIALS: 1.9% | | | | | | | | |
Chemicals: 1.9% | | | | | | | | |
LG Chem, Ltd., Pfd. | | | 22,073 | | | | 3,897,505 | |
| | | | | | | | |
Total Materials | | | | | | | 3,897,505 | |
| | | | | | | | |
| | | | | | | | |
| ENERGY: 1.3% | | | | | | | | |
Oil, Gas & Consumable Fuels: 1.3% | | | | | | | | |
S-Oil Corp., Pfd. | | | 38,278 | | | | 2,575,632 | |
| | | | | | | | |
Total Energy | | | | | | | 2,575,632 | |
| | | | | | | | |
| | | | | | | | |
| TOTAL PREFERRED EQUITIES | | | | | | | 44,271,860 | |
| | | | | | | | |
(Cost $25,465,257) | | | | | | | | |
| | | | | | | | |
| TOTAL INVESTMENTS: 98.5% | | | | | | | 198,783,141 | |
(Cost $122,813,433d) | | | | | | | | |
| | | | | | | | |
CASH AND OTHER ASSETS,
LESS LIABILITIES: 1.5% | | | | | | | 2,941,263 | |
| | | | | | | | |
| | |
NET ASSETS: 100.0% | | | | | | | $201,724,404 | |
| | | | | | | | |
| a | Certain securities were fair valued under the valuation policies approved by the Board of Trustees (Note 2-A). |
| b | Non-income producing security. |
| c | Illiquid security, trading was halted at June 30, 2017. |
| d | Cost for federal income tax purposes is $123,935,393 and net unrealized appreciation consists of: |
| | | | |
Gross unrealized appreciation | | | $77,237,322 | |
Gross unrealized depreciation | | | (2,389,574 | ) |
| | | | |
Net unrealized appreciation | | | $74,847,748 | |
| | | | |
| ADR | American Depositary Receipt |
See accompanying notes to financial statements.

| | | | |
| PORTFOLIO MANAGERS |
| Lydia So, CFA | | |
Lead Manager | | |
| Kenichi Amaki | | Beini Zhou, CFA |
Co-Manager | | Co-Manager |
|
| FUND FACTS |
| | | Investor | | Institutional |
Ticker | | MSMLX | | MISMX |
CUSIP | | 577125206 | | 577125867 |
Inception | | 9/15/08 | | 4/30/13 |
NAV | | $21.81 | | $21.82 |
Initial Investment | | $2,500 | | $100,000 |
Gross Expense Ratio1 | | 1.49% | | 1.34% |
After Fee Waiver and Reimbursement2 | | 1.47% | | 1.25% |
Portfolio Statistics | | |
Total # of Positions | | 81 |
Net Assets | | $399.9 million |
Weighted Average
Market Cap | | $1.1 billion |
Portfolio Turnover3 | | 44.44% |
Benchmark | | |
MSCI AC Asia ex Japan Small Cap Index |
Redemption Fee | | |
2% within first 90 calendar days of purchase |
OBJECTIVE
Long-term capital appreciation.
STRATEGY
Under normal market conditions, the Fund seeks to achieve its investment objective by investing at least 80% of its total net assets, which include borrowings for investment purposes, in the common and preferred stocks of Small Companies located in Asia ex Japan, which consists of all countries and markets in Asia excluding Japan, but including all other developed, emerging and frontier countries and markets in the Asian region.
Matthews Asia Small Companies Fund
Portfolio Manager Commentary (unaudited)
Period ended June 30, 2017
For the first half of 2017, the Matthews Asia Small Companies Fund returned 14.49% (Investor Class) and 14.66% (Institutional Class) while its benchmark, the MSCI All Country Asia ex Japan Small Cap Index, returned 16.25% over the same period. For the quarter ending June 30, 2017, the Fund returned 3.66% (Investor Class) and 3.71% (Institutional Class) compared with the benchmark return of 3.06% over the same period.
Market Environment:
Asian equity markets continued to perform well in the second quarter after an exceptionally strong first quarter. Large-cap stocks performed better than their small-cap counterparts by a wide margin due to strong earnings by some high-profile companies, most notably in the technology sector. Compared with the preceding quarter, investors seemed to have focused more on earnings and fundamentals than sentiment around U.S. President Donald Trump’s policy agenda.
Corporate earnings in China continued to stabilize and improve. Reforms in India have gradually taken place, meanwhile, with a generally positive market reaction. However, implementation issues surrounding India’s Goods and Services Tax reforms, set to take place late this summer, have caused some anxiety in the marketplace. Lastly, the U.S. Federal Reserve raised interest rates by 25 basis points (0.25%) in June, which was in line with market sentiment.
Performance Contributors and Detractors:
Holdings in China/Hong Kong, Malaysia and the Philippines contributed positively to performance while some holdings in South Korea, Taiwan and Singapore suffered in the second quarter. GD Express Carrier, a courier service provider in Malaysia, was among the top performers during the quarter due to keen investor interest in the company’s growth prospects, which are linked to the domestic e-commerce market. Melco International Development, a Macau-centric gaming company, also performed strongly thanks to solid business momentum and a willingness to improve capital allocation.
By sector, absolute performance was driven by holdings in materials, information technology and financials, which performed strongly during the quarter. Our holding in TCC International, a cement producer based in Southern China, was a top contributor to Fund performance following a privatization offer at a substantial premium by its Taiwan-based parent company.
During the quarter, some holdings did not perform as well as we had hoped. For example, IMAX China, a manufacturer and operator of cinema screens, experienced de-rating pressures due to lackluster box office results in China over the first half of this year.
Notable Portfolio Changes:
We took profits on highfliers, such as GD Express, whose valuations we believe had become too rich. We exited Malaysia’s GD Express and Chinese materials firm TCC International, both due to unfavorable risk-reward profiles. We also exited some long-term holdings such as Hy-lok in South Korea and CRISIL in India over concerns relating to moderated growth outlooks due to unfavorable industry dynamics that may be out of management’s influence or control.
(continued)
| 1 | Prospectus expense ratios. |
| 2 | Matthews has contractually agreed (i) to waive fees and reimburse expenses to the extent needed to limit Total Annual Fund Operating Expenses (excluding Rule 12b-1 fees, taxes, interest, brokerage commissions, short sale dividend expenses, expenses incurred in connection with any merger or reorganization or extraordinary expenses such as litigation) of the Institutional Class to 1.25% first by waiving class specific expenses (i.e., shareholder service fees specific to a particular class) of the Institutional Class and then, to the extent necessary, by waiving non-class specific expenses of the Institutional Class, and (ii) if any Fund-wide expenses (i.e., expenses that apply to both the Institutional Class and the Investor Class) are waived for the Institutional Class to maintain the 1.25% expense limitation, to waive an equal amount (in annual percentage terms) of those same expenses for the Investor Class. The Total Annual Fund Operating Expenses After Fee Waiver and Expense Reimbursement for the Investor Class may vary from year to year and will in some years exceed 1.25%. If the operating expenses fall below the expense limitation in a year within three years after Matthews has made a waiver or reimbursement, the Fund may reimburse Matthews up to an amount that does not cause the expenses for that year to exceed the lesser of (i) the expense limitation applicable at the time of that fee waiver and/or expense reimbursement or (ii) the expense limitation in effect at the time of recoupment. This agreement will remain in place until April 30, 2018 and may be terminated at any time by the Board of Trustees on behalf of the Fund on 60 days’ written notice to Matthews. Matthews may decline to renew this agreement by written notice to the Trust at least 30 days before its annual expiration date. |
| 3 | The lesser of fiscal year 2016 long-term purchase costs or sales proceeds divided by the average monthly market value of long-term securities. |
| | | | |
| matthewsasia.com | 800.789.ASIA | | | 81 | |
| | | | | | | | | | | | | | | | | | | | | | | | | | | | |
| | | | | | | | |
| PERFORMANCE AS OF JUNE 30, 2017 | | | | | | | | | | | | | | | | | | | | | |
| | | | | | | | | | | | Average Annual Total Returns | | | | |
| | | 3 Months | | | YTD | | | 1 Year | | | 3 Years | | | 5 Years | | | Since
Inception | | | Inception
Date | |
| Investor Class (MSMLX) | | | 3.66% | | | | 14.49% | | | | 13.60% | | | | 0.68% | | | | 7.31% | | | | 11.62% | | | | 9/15/08 | |
| Institutional Class (MISMX) | | | 3.71% | | | | 14.66% | | | | 13.89% | | | | 0.93% | | | | n.a. | | | | 3.39% | | | | 4/30/13 | |
| MSCI AC Asia ex Japan Small Cap Index4 | | | 3.06% | | | | 16.25% | | | | 15.92% | | | | 1.34% | | | | 6.86% | | | | 8.14% | 5 | | | | |
| Lipper Pacific ex Japan Funds Category Average6 | | | 7.97% | | | | 22.02% | | | | 21.94% | | | | 4.36% | | | | 7.64% | | | | 9.10% | 7 | | | | |
Performance assumes reinvestment of all dividends and/or distributions before taxes. All performance quoted represents past performance and is no guarantee of future results. Investment return and principal value will fluctuate with market conditions so that when redeemed, shares may be worth more or less than their original cost. Current performance may be lower or higher than the return figures quoted. Returns would have been lower if certain of the Fund’s fees and expenses had not been waived. For the Fund’s most recent month-end performance, visit matthewsasia.com.
GROWTH OF A $10,000 INVESTMENT SINCE INCEPTION—INVESTOR CLASS

Plotted monthly. The performance data and graph do not reflect the deduction of taxes that a shareholder would pay on dividends, capital gains distributions or redemption of Fund shares. Values are in US$.
| | 4 | It is not possible to invest directly in an index. Source: Index data from Morgan Stanley Capital International and Bloomberg; total return calculations performed by BNY Mellon Investment Servicing (US) Inc. Please see page 91 for index definition. |
| | 5 | Calculated from 9/15/08. |
| | 6 | The Lipper Category Average does not reflect sales charges and is based on total return, including reinvestment of dividends and capital gains for the stated periods. |
| | 7 | Calculated from 9/30/08. |
| | | | | | | | |
| | | | |
| TOP TEN HOLDINGS8 | | | | | | | |
| | | Sector | | Country | | % of Net Assets | |
| GRUH Finance, Ltd. | | Financials | | India | | | 2.0% | |
| Concepcion Industrial Corp. | | Industrials | | Philippines | | | 1.9% | |
| Clear Media, Ltd. | | Consumer Discretionary | | China/Hong Kong | | | 1.8% | |
| Value Partners Group, Ltd. | | Financials | | China/Hong Kong | | | 1.8% | |
| Unisem M BHD | | Information Technology | | Malaysia | | | 1.8% | |
| Vitasoy International Holdings, Ltd. | | Consumer Staples | | China/Hong Kong | | | 1.7% | |
| Silergy Corp. | | Information Technology | | China/Hong Kong | | | 1.7% | |
| Bursa Malaysia BHD | | Financials | | Malaysia | | | 1.7% | |
| SITC International Holdings Co., Ltd. | | Industrials | | China/Hong Kong | | | 1.6% | |
| Q Technology Group Co., Ltd. | | Consumer Discretionary | | China/Hong Kong | | | 1.6% | |
| % OF ASSETS IN TOP TEN | | | | | | | 17.6% | |
| | 8 | Holdings may combine more than one security from same issuer and related depositary receipts. |
Matthews Asia Small Companies Fund
Portfolio Manager Commentary (unaudited) (continued)
We have become more constructive on certain sub-segments within the information technology sector. During the quarter we initiated new positions in Douzone Bizon Co., Ltd., a South Korean enterprise software company and Advanced Ceramic X, a Taiwanese radio frequency component manufacturer. We believe both companies are well-positioned for the rising adoption of these specific components and their potential to gain market share in their respective markets.
Outlook:
We are keen on companies that are well-positioned to take advantage of changing consumption trends and behaviors. We are constructive on innovative yet capital-efficient companies that have built strong brands and unique product offerings that cater to Asia’s growing middle class. We are mindful, however, that valuations for some pockets of the market might have garnered too much investor enthusiasm and seem somewhat stretched. In addition, uncertainties could arise from geopolitical fronts in Asia and policy risks could emerge in the west. We will continue to hold companies in the portfolio that have strong attributes, can propel long-term growth and are financially sound enough to weather the uncertainties brought on by external forces.
| | | | |
| |
| COUNTRY ALLOCATION (%)9,10 | |
| China/Hong Kong | | | 29.8 | |
| South Korea | | | 15.5 | |
| Taiwan | | | 14.2 | |
| India | | | 10.9 | |
| Indonesia | | | 7.2 | |
| Malaysia | | | 4.5 | |
| Thailand | | | 3.4 | |
| Japan | | | 3.4 | |
| Philippines | | | 3.0 | |
| Singapore | | | 1.3 | |
| United States | | | 1.2 | |
| Israel | | | 0.3 | |
| Vietnam | | | 0.1 | |
| Cash and Other Assets, Less Liabilities | | | 5.2 | |
| | | | |
| |
| SECTOR ALLOCATION (%)10 | |
| Consumer Discretionary | | | 20.3 | |
| Information Technology | | | 16.7 | |
| Industrials | | | 16.6 | |
| Health Care | | | 11.1 | |
| Financials | | | 10.8 | |
| Consumer Staples | | | 10.7 | |
| Materials | | | 6.0 | |
| Real Estate | | | 1.5 | |
| Energy | | | 1.1 | |
| Cash and Other Assets, Less Liabilities | | | 5.2 | |
| | | | |
| |
| MARKET CAP EXPOSURE (%)10,11 | |
| Mega Cap (over $25B) | | | 0.0 | |
| Large Cap ($10B–$25B) | | | 0.0 | |
| Mid Cap ($3B–10B) | | | 2.7 | |
| Small Cap (under $3B) | | | 92.1 | |
| Cash and Other Assets, Less Liabilities | | | 5.2 | |
| 9 | Not all countries where the Fund may invest are included in the benchmark index. |
| 10 | Source: FactSet Research Systems. Percentage values in data are rounded to the nearest tenth of one percent; the values may not sum to 100% due to rounding. |
| 11 | The Fund defines Small Companies as companies with market capitalization generally between $100 million and $3 billion or the largest company included in the Fund’s primary benchmark, the MSCI All Country Asia ex Japan Small Cap Index. |
| | | | |
| matthewsasia.com | 800.789.ASIA | | | 83 | |
Matthews Asia Small Companies Fund
June 30, 2017
Schedule of Investmentsa (unaudited)
COMMON EQUITIES: 94.8%
| | | | | | | | |
| | | Shares | | | Value | |
| CHINA/HONG KONG: 29.8% | | | | | | | | |
Clear Media, Ltd. | | | 6,111,000 | | | | $7,216,622 | |
Value Partners Group, Ltd. | | | 7,848,000 | | | | 7,143,583 | |
Vitasoy International Holdings, Ltd. | | | 3,368,000 | | | | 6,932,498 | |
Silergy Corp. | | | 358,000 | | | | 6,893,260 | |
SITC International Holdings Co., Ltd. | | | 8,300,000 | | | | 6,523,189 | |
Q Technology Group Co., Ltd. | | | 6,549,000 | | | | 6,466,315 | |
Melco International Development, Ltd. | | | 2,376,000 | | | | 6,356,676 | |
China Meidong Auto Holdings, Ltd. | | | 22,254,000 | | | | 6,299,283 | |
Ten Pao Group Holdings, Ltd. | | | 24,760,000 | | | | 6,219,641 | |
Lifetech Scientific Corp.b | | | 26,176,000 | | | | 6,202,416 | |
Jacobson Pharma Corp., Ltd. | | | 22,250,000 | | | | 5,865,685 | |
Chow Sang Sang Holdings International, Ltd. | | | 2,485,000 | | | | 5,799,717 | |
Beijing Urban Construction Design & Development Group Co., Ltd. H Sharesc | | | 9,158,000 | | | | 4,936,970 | |
Hutchison China MediTech, Ltd. ADRb | | | 210,900 | | | | 4,916,079 | |
Shanghai Haohai Biological Technology Co., Ltd. H Sharesc | | | 871,500 | | | | 4,732,864 | |
Zhou Hei Ya International Holdings Co., Ltd.c | | | 4,518,500 | | | | 4,534,377 | |
China Yuchai International, Ltd. | | | 246,634 | | | | 4,491,205 | |
Sinopec Kantons Holdings, Ltd. | | | 8,018,000 | | | | 4,423,823 | |
Genscript Biotech Corp. | | | 7,488,000 | | | | 4,047,787 | |
IMAX China Holding, Inc.b,c | | | 1,143,100 | | | | 3,506,048 | |
Gridsum Holding, Inc. ADRb | | | 359,747 | | | | 3,079,434 | |
Times Property Holdings, Ltd. | | | 3,317,000 | | | | 2,072,593 | |
Qingdao Port International Co., Ltd. H Sharesc | | | 1,094,000 | | | | 628,536 | |
| | | | | | | | |
Total China/Hong Kong | | | | | | | 119,288,601 | |
| | | | | | | | |
| | | | | | | | |
| SOUTH KOREA: 15.5% | | | | | | | | |
Yonwoo Co., Ltd.b | | | 244,968 | | | | 6,234,087 | |
Incross Co., Ltd.b | | | 126,376 | | | | 5,732,564 | |
i-SENS, Inc. | | | 221,966 | | | | 5,332,575 | |
Medy-Tox, Inc. | | | 10,871 | | | | 5,323,523 | |
LEENO Industrial, Inc. | | | 126,432 | | | | 5,301,633 | |
CLIO Cosmetics Co., Ltd. | | | 141,727 | | | | 4,806,195 | |
Douzone Bizon Co., Ltd. | | | 169,526 | | | | 4,564,276 | |
Value Added Technologies Co., Ltd. | | | 185,639 | | | | 4,533,281 | |
LIG Nex1 Co., Ltd. | | | 67,462 | | | | 4,364,359 | |
Wonik Materials Co., Ltd.b | | | 61,690 | | | | 4,141,720 | |
Vitzrocell Co., Ltd.d | | | 389,604 | | | | 3,629,074 | |
BH Co., Ltd.b | | | 197,835 | | | | 2,925,312 | |
Dexter Studios Co., Ltd.b | | | 359,761 | | | | 2,614,099 | |
Cell Biotech Co., Ltd. | | | 69,643 | | | | 2,365,782 | |
| | | | | | | | |
Total South Korea | | | | | | | 61,868,480 | |
| | | | | | | | |
| | | | | | | | |
| TAIWAN: 14.2% | | | | | | | | |
Macauto Industrial Co., Ltd. | | | 1,074,000 | | | | 6,352,135 | |
Elite Material Co., Ltd. | | | 1,301,000 | | | | 6,304,894 | |
Sunny Friend Environmental Technology Co., Ltd. | | | 1,218,000 | | | | 6,285,881 | |
Taiwan Paiho, Ltd. | | | 1,633,000 | | | | 6,142,170 | |
Kinik Co. | | | 2,307,000 | | | | 5,825,114 | |
Sinbon Electronics Co., Ltd. | | | 2,269,060 | | | | 5,356,085 | |
Advanced Ceramic X Corp. | | | 410,000 | | | | 4,983,971 | |
PChome Online, Inc. | | | 569,916 | | | | 4,406,318 | |
Kerry TJ Logistics Co., Ltd. | | | 3,060,000 | | | | 3,814,196 | |
Great Tree Pharmacy Co., Ltd. | | | 908,000 | | | | 2,900,297 | |
MPI Corp. | | | 842,000 | | | | 2,518,939 | |
Aerospace Industrial Development Corp. | | | 1,684,000 | | | | 1,981,758 | |
| | | | | | | | |
Total Taiwan | | | | | | | 56,871,758 | |
| | | | | | | | |
| | | | | | | | |
| | | | | | | | |
| | | Shares | | | Value | |
| INDIA: 10.9% | | | | | | | | |
GRUH Finance, Ltd. | | | 1,133,699 | | | | $7,807,383 | |
Supreme Industries, Ltd. | | | 291,245 | | | | 5,527,168 | |
DCB Bank, Ltd. | | | 1,756,753 | | | | 5,395,062 | |
Page Industries, Ltd. | | | 19,677 | | | | 5,094,463 | |
AIA Engineering, Ltd. | | | 227,923 | | | | 4,920,069 | |
Cholamandalam Investment and Finance Co., Ltd. | | | 259,942 | | | | 4,520,259 | |
LA Opala RG, Ltd. | | | 540,917 | | | | 4,297,961 | |
Berger Paints India, Ltd. | | | 1,029,713 | | | | 3,917,601 | |
Gabriel India, Ltd. | | | 537,391 | | | | 1,252,939 | |
Merck, Ltd. | | | 57,533 | | | | 949,679 | |
| | | | | | | | |
Total India | | | | | | | 43,682,584 | |
| | | | | | | | |
| | | | | | | | |
| INDONESIA: 7.2% | | | | | | | | |
PT Bank Tabungan Pensiunan Nasional | | | 32,789,300 | | | | 6,101,479 | |
PT Sumber Alfaria Trijaya | | | 122,674,800 | | | | 5,246,643 | |
PT Astra Otoparts | | | 26,538,125 | | | | 5,157,287 | |
PT Ultrajaya Milk Industry & Trading Co.b | | | 12,206,500 | | | | 4,583,781 | |
PT Puradelta Lestari | | | 245,920,800 | | | | 3,980,263 | |
PT Arwana Citramulia | | | 107,723,800 | | | | 3,866,249 | |
| | | | | | | | |
Total Indonesia | | | | | | | 28,935,702 | |
| | | | | | | | |
| | | | | | | | |
| MALAYSIA: 4.5% | | | | | | | | |
Unisem M BHD | | | 8,490,900 | | | | 7,077,832 | |
Bursa Malaysia BHD | | | 2,728,300 | | | | 6,752,743 | |
Karex BHD | | | 10,820,825 | | | | 4,285,325 | |
| | | | | | | | |
Total Malaysia | | | | | | | 18,115,900 | |
| | | | | | | | |
| | | | | | | | |
| THAILAND: 3.4% | | | | | | | | |
Aeon Thana Sinsap Thailand Public Co., Ltd. | | | 1,582,800 | | | | 4,938,969 | |
Forth Smart Service Public Co., Ltd. | | | 8,674,600 | | | | 4,775,243 | |
Plan B Media Public Co., Ltd. F Shares | | | 22,306,600 | | | | 3,739,111 | |
Aeon Thana Sinsap Thailand Public Co., Ltd. NVDR | | | 88,700 | | | | 276,780 | |
| | | | | | | | |
Total Thailand | | | | | | | 13,730,103 | |
| | | | | | | | |
| | | | | | | | |
| JAPAN: 3.4% | | | | | | | | |
Honma Golf, Ltd.b,c | | | 5,375,000 | | | | 5,200,927 | |
W-Scope Corp. | | | 241,600 | | | | 4,243,950 | |
Tri Chemical Laboratories, Inc. | | | 156,400 | | | | 4,005,152 | |
| | | | | | | | |
Total Japan | | | | | | | 13,450,029 | |
| | | | | | | | |
| | | | | | | | |
| PHILIPPINES: 3.0% | | | | | | | | |
Concepcion Industrial Corp. | | | 4,450,460 | | | | 7,532,090 | |
Philippine Seven Corp. | | | 1,217,291 | | | | 4,319,492 | |
| | | | | | | | |
Total Philippines | | | | | | | 11,851,582 | |
| | | | | | | | |
| | | | | | | | |
| SINGAPORE: 1.3% | | | | | | | | |
Delfi, Ltd. | | | 3,563,300 | | | | 5,176,394 | |
| | | | | | | | |
Total Singapore | | | | | | | 5,176,394 | |
| | | | | | | | |
| | | | | | | | |
| UNITED STATES: 1.2% | | | | | | | | |
Oclaro, Inc.b | | | 501,700 | | | | 4,685,878 | |
| | | | | | | | |
Total United States | | | | | | | 4,685,878 | |
| | | | | | | | |
| | | | | | | | |
Matthews Asia Small Companies Fund
June 30, 2017
Schedule of Investmentsa (unaudited) (continued)
COMMON EQUITIES (continued)
| | | | | | | | |
| | | Shares | | | Value | |
| ISRAEL: 0.3% | | | | | | | | |
Sarine Technologies, Ltd. | | | 1,236,500 | | | | $1,383,120 | |
| | | | | | | | |
Total Israel | | | | | | | 1,383,120 | |
| | | | | | | | |
| | | | | | | | |
| VIETNAM: 0.1% | | | | | | | | |
DHG Pharmaceutical JSC | | | 33,960 | | | | 185,704 | |
| | | | | | | | |
Total Vietnam | | | | | | | 185,704 | |
| | | | | | | | |
| | | | | | | | |
| TOTAL INVESTMENTS: 94.8% | | | | | | | 379,225,835 | |
(Cost $333,972,463e) | | | | | | | | |
| | | | | | | | |
CASH AND OTHER ASSETS,
LESS LIABILITIES: 5.2% | | | | | | | 20,687,984 | |
| | | | | | | | |
| | |
NET ASSETS: 100.0% | | | | | | | $399,913,819 | |
| | | | | | | | |
| a | Certain securities were fair valued under the valuation policies approved by the Board of Trustees (Note 2-A). |
| b | Non-income producing security. |
| c | Security exempt from registration under Rule 144A of the Securities Act of 1933, as amended. The security may be resold in transactions exempt from registration normally to qualified institutional buyers. The security has been determined to be liquid in accordance with procedures adopted by the Fund’s Board of Directors. At June 30, 2017, the aggregate value is $23,539,722, which is 5.89% of net assets. |
| d | Illiquid security, trading was halted at June 30, 2017. |
| e | Cost for federal income tax purposes is $334,751,020 and net unrealized appreciation consists of: |
| | | | |
Gross unrealized appreciation | | | $71,162,440 | |
Gross unrealized depreciation | | | (26,687,625 | ) |
| | | | |
Net unrealized appreciation | | | $44,474,815 | |
| | | | |
| ADR | American Depositary Receipt |
| NVDR | Non-voting Depositary Receipt |
See accompanying notes to financial statements.
| | | | |
| matthewsasia.com | 800.789.ASIA | | | 85 | |
| | |
| PORTFOLIO MANAGERS |
| Tiffany Hsiao, CFA | | |
Lead Manager | | |
| Kenichi Amaki | | |
Co-Manager | | |
|
| FUND FACTS |
| | | Investor |
Ticker | | MCSMX |
CUSIP | | 577125404 |
Inception | | 5/31/11 |
NAV | | $10.11 |
Initial Investment | | $2,500 |
Gross Expense Ratio1 | | 2.24% |
After Fee Waiver and Reimbursement2 | | 1.50% |
Portfolio Statistics | | |
Total # of Positions | | 56 |
Net Assets | | $20.0 million |
Weighted Average Market Cap | | $1.7 billion |
Portfolio Turnover3 | | 63.15% |
Benchmark | | |
MSCI China Small Cap Index |
Redemption Fee | | |
2% within first 90 calendar days of purchase |
OBJECTIVE
Long-term capital appreciation.
STRATEGY
Under normal market conditions, the Fund seeks to achieve its investment objective by investing at least 80% of its total net assets, which include borrowings for investment purposes, in the common and preferred stocks of Small Companies located in China. China includes its administrative and other districts, such as Hong Kong.
Matthews China Small Companies Fund
Portfolio Manager Commentary (unaudited)
Period ended June 30, 2017
For the first half of 2017, the Matthews China Small Companies Fund returned 23.14% (Investor Class), outperforming its benchmark, the MSCI China Small Cap Index, which returned 8.76% over the same period. For the quarter ending June 30, 2017, the Fund returned 7.44% (Investor Class) compared with the benchmark return of –1.06% over the same period.
Market Environment:
China’s equity market saw a strong start to 2017, which we believe may be a result of it being oversold in the fourth quarter of 2016 when investors held deeper concerns over U.S.-China trade relations. However, a more fundamental reason may be that China is finally seeing a broad-based earnings recovery. With a mild global reflation and stable nominal GDP growth of approximately 6.5%, we hold an optimistic outlook for the revenue growth of Chinese corporations. China has been decelerating its loan growth and cleaning up overcapacity since 2009. This has led to a recovery in corporate margins despite a rebound in the producer price index. We are encouraged that property sales and consumption continued at a steady pace even as the government started tightening liquidity and home purchase restrictions during the first half of the year. From both a top-down and a bottom-up perspective, we see a noticeable and likely sustainable recovery in the Chinese economy, albeit at a slower pace compared with the sharp rebound in the first half of this year.
Performance Contributors and Detractors:
For the second quarter of 2017, our positive stock selection in the consumer discretionary and industrials sectors contributed to the Fund’s outperformance. Our holdings in the real estate and materials sectors, however, were slight drags on portfolio returns. For the first half of the year, the industrials and consumer discretionary sectors were among our top-performing sectors due to stock selection. The portfolio’s real estate holdings detracted from returns during the first half of the year due to the allocation effect.
During the quarter, two top individual contributors to Fund performance were TK Group, a high-end plastic mold company, and Melco International Development, an Asian gaming company with significant exposure to Macau. TK Group grew by diversifying and expanding its product categories and applications, demonstrating impressive, strong execution capabilities versus that of their competition. Melco International Development continues to benefit from a recovery in Macau’s gaming market as the city works to diversify its revenue source away from VIP high-rollers.
Among the top detractors to Fund performance during the quarter were Gridsum Holding and IMAX China. Gridsum suffered during the quarter as investors worried about the sustainability of its search engine optimization business. We believe the company is on track to diversify its product suite and we continue to hold a positive view of the shares. IMAX China suffered from another disappointing quarter of weak box office sales and worries about the financial stability of its top Chinese cinema client. We are monitoring the situation closely.
Notable Portfolio Changes:
During the quarter, we exited car component manufacturer Hu Lane Associate. While the company continues to execute well in the face of challenging input cost
(continued)
| 1 | Prospectus expense ratios. |
| 2 | Matthews has contractually agreed to waive fees and reimburse expenses to the extent needed to limit Total Annual Fund Operating Expenses (excluding Rule 12b-1 fees, taxes, interest, brokerage commissions, short sale dividend expenses, expenses incurred in connection with any merger or reorganization or extraordinary expenses such as litigation) to 1.50%. If the operating expenses fall below the expense limitation in a year within three years after Matthews has made a waiver or reimbursement, the Fund may reimburse Matthews up to an amount that does not cause the expenses for that year to exceed the lesser of (i) the expense limitation applicable at the time of that fee waiver and/or expense reimbursement or (ii) the expense limitation in effect at the time of recoupment. This agreement will remain in place until April 30, 2018 and may be terminated at any time by the Board of Trustees on behalf of the Fund on 60 days’ written notice to Matthews. Matthews may decline to renew this agreement by written notice to the Trust at least 30 days before its annual expiration date. |
| 3 | The lesser of fiscal year 2016 long-term purchase costs or sales proceeds divided by the average monthly market value of long-term securities. |
| | | | | | | | | | | | | | | | | | | | | | | | | | | | |
| | | | | | | | |
| PERFORMANCE AS OF JUNE 30, 2017 | | | | | | | | | | | | | | | | | | | | | |
| | | | | | | | | | | | Average Annual Total Returns | | | | |
| | | 3 Months | | | YTD | | | 1 Year | | | 3 Years | | | 5 Years | | | Since
Inception | | | Inception
date | |
| Investor Class (MCSMX) | | | 7.44% | | | | 23.14% | | | | 27.82% | | | | 7.21% | | | | 11.37% | | | | 3.25% | | | | 5/31/11 | |
| MSCI China Small Cap Index4 | | | -1.06% | | | | 8.76% | | | | 14.49% | | | | 1.82% | | | | 8.75% | | | | 0.01% | | | | | |
| Lipper China Region Funds Category Average5 | | | 8.83% | | | | 21.85% | | | | 25.75% | | | | 6.93% | | | | 8.79% | | | | 3.16% | | | | | |
Performance assumes reinvestment of all dividends and/or distributions before taxes. All performance quoted represents past performance and is no guarantee of future results. Investment return and principal value will fluctuate with market conditions so that when redeemed, shares may be worth more or less than their original cost. Current performance may be lower or higher than the return figures quoted. Returns would have been lower if certain of the Fund’s fees and expenses had not been waived. For the Fund’s most recent month-end performance, visit matthewsasia.com.
GROWTH OF A $10,000 INVESTMENT SINCE INCEPTION—INVESTOR CLASS
Plotted monthly. The performance data and graph do not reflect the deduction of taxes that a shareholder would pay on dividends, capital gains distributions or redemption of Fund shares. Values are in US$.
| | 4 | It is not possible to invest directly in an index. Source: Index data from Morgan Stanley Capital International and Bloomberg; total return calculations performed by BNY Mellon Investment Servicing (US) Inc. Please see page 91 for index definition. |
| | 5 | The Lipper Category Average does not reflect sales charges and is based on total return, including reinvestment of dividends and capital gains for the stated periods. |
| | | | | | | | |
| | | | |
| TOP TEN HOLDINGS6 | | | | | | | |
| | | Sector | | | | % of Net Assets | |
| Silergy Corp. | | Information Technology | | | | | 5.4% | |
| Wuxi Little Swan Co., Ltd. | | Consumer Discretionary | | | | | 3.9% | |
| SITC International Holdings Co., Ltd. | | Industrials | | | | | 3.4% | |
| Sunny Friend Environmental Technology Co., Ltd. | | Industrials | | | | | 3.1% | |
| TK Group Holdings, Ltd. | | Industrials | | | | | 3.0% | |
| China Aviation Oil Singapore Corp., Ltd. | | Energy | | | | | 2.9% | |
| Q Technology Group Co., Ltd. | | Consumer Discretionary | | | | | 2.9% | |
| China Biologic Products, Inc. | | Health Care | | | | | 2.8% | |
| Qingdao Port International Co., Ltd. | | Industrials | | | | | 2.8% | |
| Yuexiu Transport Infrastructure, Ltd. | | Industrials | | | | | 2.6% | |
| % OF ASSETS IN TOP TEN | | | | | | | 32.8% | |
| | 6 | Holdings may combine more than one security from same issuer and related depositary receipts. |
| | | | |
| matthewsasia.com | 800.789.ASIA | | | 87 | |
| | | | |
| |
| COUNTRY ALLOCATION (%)7 | |
| China/Hong Kong | | | 82.2 | |
| Taiwan | | | 10.5 | |
| Japan | | | 1.7 | |
| United States | | | 1.4 | |
| Cash and Other Assets, Less Liabilities | | | 4.2 | |
| | | | |
| |
| SECTOR ALLOCATION (%)7 | |
| Industrials | | | 25.3 | |
| Consumer Discretionary | | | 21.7 | |
| Information Technology | | | 15.9 | |
| Health Care | | | 12.8 | |
| Real Estate | | | 5.9 | |
| Financials | | | 4.2 | |
| Materials | | | 3.8 | |
| Energy | | | 3.6 | |
| Consumer Staples | | | 2.6 | |
| Cash and Other Assets, Less Liabilities | | | 4.2 | |
| | | | |
| | |
| MARKET CAP EXPOSURE (%)7,8 | | | |
| Mega Cap (over $25B) | | | 0.0 | |
| Large Cap ($10B–$25B) | | | 0.0 | |
| Mid Cap ($3B–10B) | | | 18.7 | |
| Small Cap (under $3B) | | | 77.0 | |
| Cash and Other Assets, Less Liabilities | | | 4.2 | |
| 7 | Source: FactSet Research Systems. Percentage values in data are rounded to the nearest tenth of one percent; the values may not sum to 100% due to rounding. |
| 8 | The Fund defines Small Companies as companies with market capitalization generally between $100 million and $3 billion or the largest company included in the Fund’s primary benchmark, the MSCI China Small Cap Index. |
Matthews China Small Companies Fund
Portfolio Manager Commentary (unaudited) (continued)
inflation, especially in copper, we prefer the risk-reward opportunities we are finding among auto dealers at current valuations. We continue to like the auto space in China and initiated positions in auto dealers China Meidong Auto, for exposure to smaller cities, and China Zhengtong Auto, for exposure to the country’s major cities.
Outlook:
Given the uncertainty surrounding global trade policies, we are cautious heading into the second half of 2017. We continue to believe, however, that China has the ability to stabilize its economy through fiscal spending, interest rate adjustments and currency management. In addition, steps taken to correct China’s structural issues continue to progress. For now, we are focused on seeking innovative and capital-efficient, small companies that are relatively insulated from macroeconomic uncertainties. We will continue to seek companies that can weather uncertain economic conditions with sustainable, quality earnings streams, strong cash flows and good balance sheets. We believe sectors such as industrial automation, health care and consumer discretionary are among the most attractive from a secular growth perspective.
Matthews China Small Companies Fund
June 30, 2017
Schedule of Investmentsa (unaudited)
COMMON EQUITIES: 95.8%
| | | | | | | | |
| | | Shares | | | Value | |
| INDUSTRIALS: 25.3% | |
Transportation Infrastructure: 5.4% | | | | | | | | |
Qingdao Port International Co., Ltd. H Sharesb | | | 964,000 | | | | $553,846 | |
Yuexiu Transport Infrastructure, Ltd. | | | 724,000 | | | | 519,238 | |
| | | | | | | | |
| | | | | | | 1,073,084 | |
| | | | | | | | |
| | | | | | | | |
Commercial Services & Supplies: 5.2% | | | | | | | | |
Sunny Friend Environmental Technology Co., Ltd. | | | 119,000 | | | | 614,138 | |
Greentown Service Group Co., Ltd. | | | 786,000 | | | | 431,051 | |
| | | | | | | | |
| | | | | | | 1,045,189 | |
| | | | | | | | |
| | | | | | | | |
Machinery: 5.0% | | | | | | | | |
TK Group Holdings, Ltd. | | | 1,460,000 | | | | 594,079 | |
China Yuchai International, Ltd. | | | 16,300 | | | | 296,823 | |
CIMC Enric Holdings, Ltd.c | | | 174,000 | | | | 108,846 | |
| | | | | | | | |
| | | | | | | 999,748 | |
| | | | | | | | |
| | | | | | | | |
Marine: 3.4% | | | | | | | | |
SITC International Holdings Co., Ltd. | | | 858,000 | | | | 674,325 | |
| | | | | | | | |
| | | | | | | | |
Air Freight & Logistics: 2.4% | | | | | | | | |
Kerry Logistics Network, Ltd. | | | 331,500 | | | | 489,841 | |
| | | | | | | | |
| | | | | | | | |
Electrical Equipment: 1.5% | | | | | | | | |
Voltronic Power Technology Corp. | | | 17,974 | | | | 295,839 | |
| | | | | | | | |
| | | | | | | | |
Professional Services: 1.2% | | | | | | | | |
51job, Inc. ADRc | | | 5,424 | | | | 242,616 | |
| | | | | | | | |
| | | | | | | | |
Construction & Engineering: 1.2% | | | | | | | | |
Beijing Urban Construction Design & Development Group Co., Ltd. H Sharesb | | | 431,000 | | | | 232,347 | |
| | | | | | | | |
| | | | | | | | |
Total Industrials | | | | | | | 5,052,989 | |
| | | | | | | | |
| | | | | | | | |
| CONSUMER DISCRETIONARY: 21.7% | |
Household Durables: 10.0% | | | | | | | | |
Wuxi Little Swan Co., Ltd. B Shares | | | 175,717 | | | | 785,021 | |
Q Technology Group Co., Ltd. | | | 583,000 | | | | 575,639 | |
Vatti Corp., Ltd. A Shares | | | 94,294 | | | | 336,535 | |
Guangzhou Holike Creative Home Co., Ltd. A Shares | | | 58,378 | | | | 300,924 | |
| | | | | | | | |
| | | | | | | 1,998,119 | |
| | | | | | | | |
| | | | | | | | |
Specialty Retail: 3.2% | | | | | | | | |
Chow Sang Sang Holdings International, Ltd. | | | 160,000 | | | | 373,422 | |
China ZhengTong Auto Services Holdings, Ltd. | | | 164,500 | | | | 131,611 | |
China Meidong Auto Holdings, Ltd. | | | 440,000 | | | | 124,548 | |
| | | | | | | | |
| | | | | | | 629,581 | |
| | | | | | | | |
| | | | | | | | |
Hotels, Restaurants & Leisure: 3.0% | | | | | | | | |
Melco International Development, Ltd. | | | 141,000 | | | | 377,227 | |
Fairwood Holdings, Ltd. | | | 53,500 | | | | 225,073 | |
| | | | | | | | |
| | | | | | | 602,300 | |
| | | | | | | | |
| | | | | | | | |
Media: 2.5% | | | | | | | | |
Clear Media, Ltd. | | | 328,000 | | | | 387,343 | |
IMAX China Holding, Inc.b,c | | | 34,900 | | | | 107,043 | |
| | | | | | | | |
| | | | | | | 494,386 | |
| | | | | | | | |
| | | | | | | | |
Leisure Products: 1.7% | | | | | | | | |
Honma Golf, Ltd.b,c | | | 354,500 | | | | 343,019 | |
| | | | | | | | |
| | | | | | | | |
| | | | | | | | |
| | | Shares | | | Value | |
Diversified Consumer Services: 1.3% | | | | | | | | |
China Maple Leaf Educational Systems, Ltd. | | | 312,000 | | | | $254,884 | |
| | | | | | | | |
| | | | | | | | |
Total Consumer Discretionary | | | | | | | 4,322,289 | |
| | | | | | | | |
| | | | | | | | |
| INFORMATION TECHNOLOGY: 15.9% | |
Semiconductors & Semiconductor Equipment: 6.4% | |
Silergy Corp. | | | 56,000 | | | | 1,078,276 | |
Parade Technologies, Ltd. | | | 16,000 | | | | 196,678 | |
| | | | | | | | |
| | | | | | | 1,274,954 | |
| | | | | | | | |
| | | | | | | | |
Electronic Equipment, Instruments & Components: 4.1% | |
All Ring Tech Co., Ltd. | | | 165,000 | | | | 313,760 | |
China Innovationpay Group, Ltd.c | | | 4,572,000 | | | | 292,806 | |
Elite Material Co., Ltd. | | | 44,000 | | | | 213,232 | |
China High Precision Automation Group, Ltd.c,d | | | 195,000 | | | | 250 | |
| | | | | | | | |
| | | | | | | 820,048 | |
| | | | | | | | |
| | | | | | | | |
Communications Equipment: 3.2% | | | | | | | | |
Oclaro, Inc.c | | | 28,700 | | | | 268,059 | |
Advanced Ceramic X Corp. | | | 18,000 | | | | 218,808 | |
O-Net Technologies Group, Ltd.c | | | 271,000 | | | | 143,009 | |
| | | | | | | | |
| | | | | | | 629,876 | |
| | | | | | | | |
| | | | | | | | |
Software: 1.2% | | | | | | | | |
Gridsum Holding, Inc. ADRc | | | 29,165 | | | | 249,652 | |
| | | | | | | | |
| | | | | | | | |
Internet Software & Services: 1.0% | | | | | | | | |
Sohu.com, Inc.c | | | 4,400 | | | | 198,264 | |
| | | | | | | | |
| | | | | | | | |
Total Information Technology | | | | | | | 3,172,794 | |
| | | | | | | | |
| | | | | | | | |
| HEALTH CARE: 12.8% | |
Biotechnology: 5.3% | | | | | | | | |
China Biologic Products, Inc.c | | | 5,000 | | | | 565,500 | |
Shanghai Haohai Biological Technology Co., Ltd. H Sharesb | | | 89,200 | | | | 484,419 | |
| | | | | | | | |
| | | | | | | 1,049,919 | |
| | | | | | | | |
| | | | | | | | |
Health Care Equipment & Supplies: 3.6% | | | | | | | | |
Shandong Weigao Group Medical Polymer Co., Ltd. H Shares | | | 560,000 | | | | 439,336 | |
Lifetech Scientific Corp.c | | | 1,172,000 | | | | 277,706 | |
| | | | | | | | |
| | | | | | | 717,042 | |
| | | | | | | | |
| | | | | | | | |
Life Sciences Tools & Services: 1.8% | | | | | | | | |
Genscript Biotech Corp. | | | 664,000 | | | | 358,939 | |
| | | | | | | | |
| | | | | | | | |
Pharmaceuticals: 1.1% | | | | | | | | |
Jacobson Pharma Corp., Ltd. | | | 866,000 | | | | 228,300 | |
| | | | | | | | |
| | | | | | | | |
Health Care Providers & Services: 1.0% | | | | | | | | |
Zhejiang Dian Diagnostics Co., Ltd. A Shares | | | 44,600 | | | | 207,021 | |
| | | | | | | | |
| | | | | | | | |
Total Health Care | | | | | | | 2,561,221 | |
| | | | | | | | |
| | | | | | | | |
| REAL ESTATE: 5.9% | |
Real Estate Management & Development: 5.9% | |
CIFI Holdings Group Co., Ltd. | | | 1,146,000 | | | | 509,676 | |
KWG Property Holding, Ltd. | | | 526,000 | | | | 352,351 | |
K Wah International Holdings, Ltd. | | | 361,000 | | | | 219,142 | |
Times Property Holdings, Ltd. | | | 161,000 | | | | 100,599 | |
| | | | | | | | |
Total Real Estate | | | | | | | 1,181,768 | |
| | | | | | | | |
| | | | | | | | |
| | | | |
| matthewsasia.com | 800.789.ASIA | | | 89 | |
Matthews China Small Companies Fund
June 30, 2017
Schedule of Investmentsa (unaudited) (continued)
COMMON EQUITIES (continued)
| | | | | | | | |
| | | Shares | | | Value | |
| FINANCIALS: 4.2% | | | | | | | | |
Capital Markets: 2.5% | | | | | | | | |
Value Partners Group, Ltd. | | | 558,000 | | | | $507,915 | |
| | | | | | | | |
| | | | | | | | |
Banks: 1.7% | | | | | | | | |
Dah Sing Banking Group, Ltd. | | | 158,400 | | | | 337,165 | |
| | | | | | | | |
| | | | | | | | |
Total Financials | | | | | | | 845,080 | |
| | | | | | | | |
| | | | | | | | |
| MATERIALS: 3.8% | | | | | | | | |
Construction Materials: 2.5% | | | | | | | | |
China Resources Cement Holdings, Ltd. | | | 1,024,000 | | | | 508,757 | |
| | | | | | | | |
| | | | | | | | |
Metals & Mining: 0.7% | | | | | | | | |
MMG, Ltd.c | | | 360,000 | | | | 132,791 | |
| | | | | | | | |
| | | | | | | | |
Containers & Packaging: 0.6% | | | | | | | | |
CPMC Holdings, Ltd. | | | 228,000 | | | | 112,410 | |
| | | | | | | | |
| | | | | | | | |
Total Materials | | | | | | | 753,958 | |
| | | | | | | | |
| | | | | | | | |
| ENERGY: 3.6% | | | | | | | | |
Oil, Gas & Consumable Fuels: 3.6% | | | | | | | | |
China Aviation Oil Singapore Corp., Ltd. | | | 481,100 | | | | 583,390 | |
Sinopec Kantons Holdings, Ltd. | | | 232,000 | | | | 128,003 | |
| | | | | | | | |
Total Energy | | | | | | | 711,393 | |
| | | | | | | | |
| | | | | | | | |
| CONSUMER STAPLES: 2.6% | | | | | | | | |
Food Products: 2.6% | | | | | | | | |
Vitasoy International Holdings, Ltd. | | | 132,000 | | | | 271,701 | |
Tehmag Foods Corp. | | | 30,000 | | | | 249,546 | |
| | | | | | | | |
Total Consumer Staples | | | | | | | 521,247 | |
| | | | | | | | |
| | | | | | | | |
| TOTAL INVESTMENTS: 95.8% | | | | | | | 19,122,739 | |
(Cost $16,227,379e) | | | | | | | | |
| | | | | | | | |
CASH AND OTHER ASSETS,
LESS LIABILITIES: 4.2% | | | | | | | 846,970 | |
| | | | | | | | |
| | |
NET ASSETS: 100.0% | | | | | | | $19,969,709 | |
| | | | | | | | |
| a | Certain securities were fair valued under the valuation policies approved by the Board of Trustees (Note 2-A). |
| b | Security exempt from registration under Rule 144A of the Securities Act of 1933, as amended. The security may be resold in transactions exempt from registration normally to qualified institutional buyers. The security has been determined to be liquid in accordance with procedures adopted by the Fund’s Board of Directors. At June 30, 2017, the aggregate value is $1,720,674, which is 8.62% of net assets. |
| c | Non-income producing security. |
| d | Illiquid security, trading was halted at June 30, 2017. |
| e | Cost for federal income tax purposes is $16,248,039 and net unrealized appreciation consists of: |
| | | | |
Gross unrealized appreciation | | | $3,444,966 | |
Gross unrealized depreciation | | | (570,266 | ) |
| | | | |
Net unrealized appreciation | | | $2,874,700 | |
| | | | |
| ADR | American Depositary Receipt |
See accompanying notes to financial statements.
Index Definitions
The Markit iBoxx Asian Local Bond Index (ALBI) tracks the total return performance of a bond portfolio consisting of local-currency denominated, high quality and liquid bonds in Asia ex-Japan. The ALBI includes bonds from the following countries: Korea, Hong Kong, India, Singapore, Taiwan, Malaysia, Thailand, Philippines, Indonesia and China.
The J.P. Morgan Asia Credit Index (JACI) tracks the total return performance of the Asia fixed-rate dollar bond market. JACI is a market cap-weighted index comprising sovereign, quasi-sovereign and corporate bonds and is partitioned by country, sector and credit rating. JACI includes bonds from the following countries: China, Hong Kong, India, Indonesia, Korea, Philippines, Thailand and Singapore.
The MSCI All Country Asia ex Japan Index is a free float–adjusted market capitalization–weighted index of the stock markets of China, Hong Kong, India, Indonesia, Malaysia, Philippines, Singapore, South Korea, Taiwan and Thailand.
The MSCI All Country Asia Pacific Index is a free float–adjusted market capitalization–weighted index of the stock markets of Australia, China, Hong Kong, India, Indonesia, Japan, Malaysia, New Zealand, Philippines, Singapore, South Korea, Taiwan and Thailand.
The MSCI Emerging Markets (EM) Asia Index is a free float-adjusted market capitalization weighted index of the stock markets of China, India, Indonesia, Korea, Malaysia, Philippines, Taiwan and Thailand.
The MSCI China Index is a free float–adjusted market capitalization–weighted index of Chinese equities that includes China-affiliated corporations and H shares listed on the Hong Kong
exchange, and B shares listed on the Shanghai and Shenzhen exchanges.
The S&P Bombay Stock Exchange (BSE) 100 Index is a free float–adjusted market capitalization–weighted index of the 100 stocks listed on the Bombay Stock Exchange.
The MSCI Japan Index is a free float–adjusted market capitalization–weighted index of Japanese equities listed in Japan.
The Korea Composite Stock Price Index (KOSPI) is a market capitalization–weighted index of all common stocks listed on the Korea Stock Exchange.
The MSCI All Country Asia ex Japan Small Cap Index is a free float–adjusted market capitalization–weighted small cap index of the stock markets of China, Hong Kong, India, Indonesia, Malaysia, Philippines, Singapore, South Korea, Taiwan and Thailand.
The MSCI China Small Cap Index is a free float–adjusted market capitalization–weighted small cap index of the Chinese equity securities markets, including H shares listed on the Hong Kong exchange, B shares listed on the Shanghai and Shenzhen exchanges, and Hong Kong-listed securities known as Red Chips (issued by entities owned by national or local governments in China) and P Chips (issued by companies controlled by individuals in China and deriving substantial revenues in China).
The MSCI All Country Asia Index is a free float–adjusted market capitalization–weighted index of the stock markets of China, Hong Kong, India, Indonesia, Japan, Malaysia, Philippines, Singapore, South Korea, Taiwan and Thailand.
| | | | |
| matthewsasia.com | 800.789.ASIA | | | 91 | |
Disclosures
Fund Holdings: The Fund holdings shown in this report are as of June 30, 2017. Holdings are subject to change at any time, so holdings shown in this report may not reflect current Fund holdings. The Funds file complete schedules of portfolio holdings with the U.S. Securities and Exchange Commission (the “SEC”) for the first and third quarters of each fiscal year on Form N-Q. The Funds’ Form N-Q is filed with the SEC within 60 days of the end of the quarter to which it relates, and is available on the SEC’s website at www.sec.gov. It may also be reviewed and copied at the Commission’s Public Reference Room in Washington, D.C. Information on the operation of the Public Reference Room may be obtained by calling 800.SEC.0330. Complete schedules of investments are also available without charge, upon request, from the Funds by calling us at 800.789.ASIA (2742).
Proxy Voting Record: The Funds’ Statement of Additional Information containing a description of the policies and procedures that the Funds have used to vote proxies relating to portfolio securities, along with each Fund’s proxy voting record relating to portfolio securities held during the most recent 12-month period ended June 30, is available upon request, at no charge, at the Funds’ website at matthewsasia.com or by calling 800.789.ASIA (2742), or on the SEC’s website at www.sec.gov.
Shareholder Reports and Prospectuses: To reduce the Funds’ expenses, we try to identify related shareholders in a household and send only one copy of the Funds’ prospectus and financial reports to that address. This process, called “householding,” will continue indefinitely unless you instruct us otherwise. At any time you may view the Funds’ current prospectus, summary prospectus and financial reports on our website. If you prefer to receive individual copies of the Funds’ prospectus or financial reports, please call us at 800.789.ASIA (2742).
Redemption Fee Policy: As of June 30, 2017, a 2.00% redemption fee was assessed on the sale or exchange of shares of the Matthews Emerging Asia Fund, Matthews Asia Small Companies Fund and Matthews China Small Companies Fund
(collectively, the “Covered Funds”) within 90 days after the date an investor purchases shares of the Covered Funds. The imposition of redemption fees pursuant to the Funds’ Short-Term Trading Redemption Fee Policy for the Covered Funds may assist the Covered Funds in discouraging market timing activity.
The redemption fee is also imposed to discourage short-term buying and selling of shares of the Covered Funds, which can disrupt the management of the Covered Funds’ investment portfolios and may have detrimental effects on the Covered Funds and other shareholders, and to allocate the costs the Covered Funds incur as a result of short-term trading and market timing. This fee is payable directly to the Covered Funds.
To determine whether the redemption fee applies, the Covered Funds do not count the day that shares were purchased, and first redeem the shares that have been held the longest.
The Covered Funds may grant exemptions from the redemption fee in certain circumstances. For more information on this policy, please see the Funds’ prospectus.
The Funds (or their agents) attempt to contact shareholders whom the Funds (or their agents) believe have violated the Funds’ policies and procedures related to short-term trading and market-timing activity, and notify them that they will no longer be permitted to buy (or exchange) shares of the Funds. When a shareholder has purchased shares of the Funds through an intermediary, the Funds may not be able to notify the shareholder of a violation of the Funds’ policies or that the Funds have taken steps to address the situation (for example, the Funds may be unable to notify a shareholder that his or her privileges to purchase or exchange shares of the Funds have been terminated). Nonetheless, additional purchase and exchange orders for such investors will not be accepted by the Funds.
The Funds may reject for any reason, or cancel as permitted or required by law, any purchase or exchange, including transactions deemed to represent excessive trading, at any time.
Disclosure of Fund Expenses (unaudited)
We believe it is important for you to understand the impact of fees regarding your investment. All mutual funds have operating expenses. As a shareholder of a mutual fund, you incur ongoing costs, which include costs for portfolio management, administrative services, and shareholder reports (like this one), among others. Operating expenses, which are deducted from a fund’s gross income, directly reduce the investment return of the fund. A fund’s operating expenses are expressed as a percentage of its average net assets. This figure is known as the expense ratio. The following examples are intended to help you understand the ongoing fees (in dollars) of investing in your fund and to compare these costs with those of other mutual funds. The examples are based on an investment of $1,000 made at the beginning of the period shown and held for the entire period.
This table illustrates your fund’s costs in two ways:
Actual Fund Return: This section helps you to estimate the actual operating expenses, after any applicable fee waivers, that you paid over the period. The “Ending Account Value” shown is derived from the fund’s actual return for the past six month period, the “Expense Ratio” column shows the period’s annualized expense ratio, and the “Operating Expenses Paid During Period” column shows the dollar amount that would have been paid by an investor who started with $1,000 in the fund at the beginning of the period. You may use the information here, together with your account value, to estimate the expenses that you paid over the period. To do so, simply divide your account value by $1,000 (for example, an
$8,600 account value divided by $1,000 = 8.6), then multiply the result by the number given for your fund in the first line under the heading entitled “Operating Expenses Paid During Period.”
Hypothetical 5% Return: This section is intended to help you compare your fund’s costs with those of other mutual funds. It assumes that the fund had an annual return of 5% before operating expenses, but that the expense ratio is unchanged. In this case, because the return used is not the fund’s actual return, the results do not apply to your investment. This example is useful in making comparisons to other mutual funds because the U.S. Securities and Exchange Commission requires all mutual funds to calculate expenses based on an assumed 5% annual return. You can assess your fund’s costs by comparing this hypothetical example with the hypothetical examples that appear in shareholder reports of other funds.
Please note that the operating expenses shown in the table are meant to highlight and help you compare your ongoing costs only and do not reflect any transactional costs such as sales charges (loads), redemption fees, or exchange fees.
Matthews Asia Funds does not charge any sales loads, exchange fees, or 12b-1 fees, but these may be present in other funds to which you compare this data. Therefore, the hypothetical portions of the table are useful in comparing ongoing costs only, and will not help you determine the relative total costs of owning different funds.
| | | | |
| matthewsasia.com | 800.789.ASIA | | | 93 | |
June 30, 2017
Disclosure of Fund Expenses (unaudited) (continued)
Annualized, based on the Fund’s most recent fiscal half year expenses
| | | | | | | | | | | | | | | | | | | | | | | | | | | | | | | | | | | | |
| | | INVESTOR CLASS | | | | | | INSTITUTIONAL CLASS | |
| | | Beginning
Account Value 1/1/17 | | | Ending
Account Value 6/30/17 | | | Expense
Ratio1 | | | Operating
Expenses
Paid During
Period
1/1/17–
6/30/172 | | | | | | Beginning
Account Value 1/1/17 | | | Ending
Account Value 6/30/17 | | | Expense
Ratio1 | | | Operating
Expenses
Paid During
Period
1/1/17–
6/30/172 | |
| ASIA FIXED INCOME STRATEGIES | | | | | | | | | | | | | | | | | | | | | | | | | | | | | | | | | | | | |
Matthews Asia Strategic Income Fund | | | | | | | | | | | | | | | | | | | | | | | | | | | | | | | | | | | | |
Actual Fund Return | | | $1,000.00 | | | | $1,056.80 | | | | 1.15% | | | | $5.86 | | | | | | | | $1,000.00 | | | | $1,058.00 | | | | 0.90% | | | | $4.59 | |
Hypothetical 5% Return | | | $1,000.00 | | | | $1,030.50 | | | | 1.15% | | | | $5.79 | | | | | | | | $1,000.00 | | | | $1,029.26 | | | | 0.90% | | | | $4.53 | |
Matthews Asia Credit Opportunities Fund | | | | | | | | | | | | | | | | | | | | | | | | | | | | | | | | | | | | |
Actual Fund Return | | | $1,000.00 | | | | $1,053.40 | | | | 1.15% | | | | $5.86 | | | | | | | | $1,000.00 | | | | $1,054.40 | | | | 0.90% | | | | $4.58 | |
Hypothetical 5% Return | | | $1,000.00 | | | | $1,030.50 | | | | 1.15% | | | | $5.79 | | | | | | | | $1,000.00 | | | | $1,029.26 | | | | 0.90% | | | | $4.53 | |
| | | | | | | | | |
| ASIAN GROWTH AND INCOME STRATEGIES | | | | | | | | | | | | | | | | | | | | | | | | | | | | | | | | | | | | |
Matthews Asian Growth and Income Fund | | | | | | | | | | | | | | | | | | | | | | | | | | | | | | | | | | | | |
Actual Fund Return | | | $1,000.00 | | | | $1,148.70 | | | | 1.11% | | | | $5.91 | | | | | | | | $1,000.00 | | | | $1,149.90 | | | | 0.94% | | | | $5.01 | |
Hypothetical 5% Return | | | $1,000.00 | | | | $1,030.30 | | | | 1.11% | | | | $5.59 | | | | | | | | $1,000.00 | | | | $1,029.46 | | | | 0.94% | | | | $4.73 | |
Matthews Asia Dividend Fund | | | | | | | | | | | | | | | | | | | | | | | | | | | | | | | | | | | | |
Actual Fund Return | | | $1,000.00 | | | | $1,190.20 | | | | 1.04% | | | | $5.65 | | | | | | | | $1,000.00 | | | | $1,190.30 | | | | 0.91% | | | | $4.94 | |
Hypothetical 5% Return | | | $1,000.00 | | | | $1,029.95 | | | | 1.04% | | | | $5.23 | | | | | | | | $1,000.00 | | | | $1,029.31 | | | | 0.91% | | | | $4.58 | |
Matthews China Dividend Fund | | | | | | | | | | | | | | | | | | | | | | | | | | | | | | | | | | | | |
Actual Fund Return | | | $1,000.00 | | | | $1,171.10 | | | | 1.19% | | | | $6.41 | | | | | | | | $1,000.00 | | | | $1,171.90 | | | | 1.04% | | | | $5.60 | |
Hypothetical 5% Return | | | $1,000.00 | | | | $1,030.70 | | | | 1.19% | | | | $5.99 | | | | | | | | $1,000.00 | | | | $1,029.95 | | | | 1.04% | | | | $5.23 | |
| | | | | | | | | |
| ASIA VALUE STRATEGY | | | | | | | | | | | | | | | | | | | | | | | | | | | | | | | | | | | | |
Matthews Asia Value Fund | | | | | | | | | | | | | | | | | | | | | | | | | | | | | | | | | | | | |
Actual Fund Return | | | $1,000.00 | | | | $1,215.90 | | | | 1.50% | | | | $8.24 | | | | | | | | $1,000.00 | | | | $1,217.30 | | | | 1.25% | | | | $6.87 | |
Hypothetical 5% Return | | | $1,000.00 | | | | $1,032.23 | | | | 1.50% | | | | $7.56 | | | | | | | | $1,000.00 | | | | $1,030.99 | | | | 1.25% | | | | $6.29 | |
| | | | | | | | | |
| ASIA GROWTH STRATEGIES | | | | | | | | | | | | | | | | | | | | | | | | | | | | | | | | | | | | |
Matthews Asia Focus Fund | | | | | | | | | | | | | | | | | | | | | | | | | | | | | | | | | | | | |
Actual Fund Return | | | $1,000.00 | | | | $1,204.90 | | | | 1.50% | | | | $8.20 | | | | | | | | $1,000.00 | | | | $1,206.90 | | | | 1.25% | | | | $6.84 | |
Hypothetical 5% Return | | | $1,000.00 | | | | $1,032.23 | | | | 1.50% | | | | $7.56 | | | | | | | | $1,000.00 | | | | $1,030.99 | | | | 1.25% | | | | $6.29 | |
Matthews Asia Growth Fund | | | | | | | | | | | | | | | | | | | | | | | | | | | | | | | | | | | | |
Actual Fund Return | | | $1,000.00 | | | | $1,190.00 | | | | 1.14% | | | | $6.19 | | | | | | | | $1,000.00 | | | | $1,191.10 | | | | 0.94% | | | | $5.11 | |
Hypothetical 5% Return | | | $1,000.00 | | | | $1,030.45 | | | | 1.14% | | | | $5.74 | | | | | | | | $1,000.00 | | | | $1,029.46 | | | | 0.94% | | | | $4.73 | |
Matthews Pacific Tiger Fund | | | | | | | | | | | | | | | | | | | | | | | | | | | | | | | | | | | | |
Actual Fund Return | | | $1,000.00 | | | | $1,202.00 | | | | 1.07% | | | | $5.84 | | | | | | | | $1,000.00 | | | | $1,203.10 | | | | 0.90% | | | | $4.92 | |
Hypothetical 5% Return | | | $1,000.00 | | | | $1,030.10 | | | | 1.07% | | | | $5.39 | | | | | | | | $1,000.00 | | | | $1,029.26 | | | | 0.90% | | | | $4.53 | |
Matthews Asia ESG Fund | | | | | | | | | | | | | | | | | | | | | | | | | | | | | | | | | | | | |
Actual Fund Return | | | $1,000.00 | | | | $1,191.80 | | | | 1.50% | | | | $8.15 | | | | | | | | $1,000.00 | | | | $1,192.80 | | | | 1.25% | | | | $6.80 | |
Hypothetical 5% Return | | | $1,000.00 | | | | $1,032.23 | | | | 1.50% | | | | $7.56 | | | | | | | | $1,000.00 | | | | $1,030.99 | | | | 1.25% | | | | $6.29 | |
Matthews Emerging Asia Fund | | | | | | | | | | | | | | | | | | | | | | | | | | | | | | | | | | | | |
Actual Fund Return | | | $1,000.00 | | | | $1,112.30 | | | | 1.44% | | | | $7.54 | | | | | | | | $1,000.00 | | | | $1,112.70 | | | | 1.25% | | | | $6.55 | |
Hypothetical 5% Return | | | $1,000.00 | | | | $1,031.94 | | | | 1.44% | | | | $7.25 | | | | | | | | $1,000.00 | | | | $1,030.99 | | | | 1.25% | | | | $6.29 | |
Matthews Asia Innovators Fund | | | | | | | | | | | | | | | | | | | | | | | | | | | | | | | | | | | | |
Actual Fund Return | | | $1,000.00 | | | | $1,301.00 | | | | 1.26% | | | | $7.19 | | | | | | | | $1,000.00 | | | | $1,302.80 | | | | 1.05% | | | | $6.00 | |
Hypothetical 5% Return | | | $1,000.00 | | | | $1,031.04 | | | | 1.26% | | | | $6.35 | | | | | | | | $1,000.00 | | | | $1,030.00 | | | | 1.05% | | | | $5.28 | |
Matthews China Fund | | | | | | | | | | | | | | | | | | | | | | | | | | | | | | | | | | | | |
Actual Fund Return | | | $1,000.00 | | | | $1,300.60 | | | | 1.13% | | | | $6.45 | | | | | | | | $1,000.00 | | | | $1,301.80 | | | | 0.99% | | | | $5.65 | |
Hypothetical 5% Return | | | $1,000.00 | | | | $1,030.40 | | | | 1.13% | | | | $5.69 | | | | | | | | $1,000.00 | | | | $1,029.70 | | | | 0.99% | | | | $4.98 | |
Matthews India Fund | | | | | | | | | | | | | | | | | | | | | | | | | | | | | | | | | | | | |
Actual Fund Return | | | $1,000.00 | | | | $1,221.80 | | | | 1.09% | | | | $6.00 | | | | | | | | $1,000.00 | | | | $1,223.10 | | | | 0.89% | | | | $4.91 | |
Hypothetical 5% Return | | | $1,000.00 | | | | $1,030.20 | | | | 1.09% | | | | $5.49 | | | | | | | | $1,000.00 | | | | $1,029.21 | | | | 0.89% | | | | $4.48 | |
| 1 | Annualized, based on the Fund’s most recent fiscal half-year expenses. |
| 2 | Operating expenses are equal to the Fund’s annualized expense ratio multiplied by the average account value over the period, multiplied by 181 days, then divided by 365. |
Disclosure of Fund Expenses (unaudited) (continued)
| | | | | | | | | | | | | | | | | | | | | | | | | | | | | | | | | | | | |
| | | INVESTOR CLASS | | | | | | INSTITUTIONAL CLASS | |
| | | Beginning
Account Value 1/1/17 | | | Ending
Account Value 6/30/17 | | | Expense
Ratio1 | | | Operating
Expenses
Paid During
Period
1/1/17–
6/30/172 | | | | | | Beginning
Account Value 1/1/17 | | | Ending
Account Value 6/30/17 | | | Expense
Ratio1 | | | Operating
Expenses
Paid During
Period
1/1/17–
6/30/172 | |
| ASIA GROWTH STRATEGIES (continued) | | | | | | | | | | | | | | | | | | | | | | | | | | | | | | | | | | | | |
Matthews Japan Fund | | | | | | | | | | | | | | | | | | | | | | | | | | | | | | | | | | | | |
Actual Fund Return | | | $1,000.00 | | | | $1,146.10 | | | | 0.96% | | | | $5.11 | | | | | | | | $1,000.00 | | | | $1,146.30 | | | | 0.86% | | | | $4.58 | |
Hypothetical 5% Return | | | $1,000.00 | | | | $1,029.56 | | | | 0.96% | | | | $4.83 | | | | | | | | $1,000.00 | | | | $1,029.06 | | | | 0.86% | | | | $4.33 | |
Matthews Korea Fund | | | | | | | | | | | | | | | | | | | | | | | | | | | | | | | | | | | | |
Actual Fund Return | | | $1,000.00 | | | | $1,268.60 | | | | 1.13% | | | | $6.36 | | | | | | | | $1,000.00 | | | | $1,271.40 | | | | 1.01% | | | | $5.69 | |
Hypothetical 5% Return | | | $1,000.00 | | | | $1,030.40 | | | | 1.13% | | | | $5.69 | | | | | | | | $1,000.00 | | | | $1,029.80 | | | | 1.01% | | | | $5.08 | |
| | | | | | | | | |
| ASIA SMALL COMPANY STRATEGIES | | | | | | | | | | | | | | | | | | | | | | | | | | | | | | | | | | | | |
Matthews Asia Small Companies Fund | | | | | | | | | | | | | | | | | | | | | | | | | | | | | | | | | | | | |
Actual Fund Return | | | $1,000.00 | | | | $1,144.90 | | | | 1.50% | | | | $7.98 | | | | | | | | $1,000.00 | | | | $1,146.60 | | | | 1.25% | | | | $6.65 | |
Hypothetical 5% Return | | | $1,000.00 | | | | $1,032.23 | | | | 1.50% | | | | $7.56 | | | | | | | | $1,000.00 | | | | $1,030.99 | | | | 1.25% | | | | $6.29 | |
Matthews China Small Companies Fund | | | | | | | | | | | | | | | | | | | | | | | | | | | | | | | | | | | | |
Actual Fund Return | | | $1,000.00 | | | | $1,231.40 | | | | 1.50% | | | | $8.30 | | | | | | | | | | | | | | | | | | | | | |
Hypothetical 5% Return | | | $1,000.00 | | | | $1,032.23 | | | | 1.50% | | | | $7.56 | | | | | | | | | | | | | | | | | | | | | |
| 1 | Annualized, based on the Fund’s most recent fiscal half-year expenses. |
| 2 | Operating expenses are equal to the Fund’s annualized expense ratio multiplied by the average account value over the period, multiplied by 181 days, then divided by 365. |
| | | | |
| matthewsasia.com | 800.789.ASIA | | | 95 | |
Statements of Assets and Liabilities (unaudited)
| | | | | | | | | | | | |
| | | Matthews Asia
Strategic
Income Fund | | | Matthews Asia
Credit
Opportunities Fund | | | Matthews Asian
Growth and
Income Fund | |
ASSETS: | | | | | | | | | | | | |
Investments at value (A) (Note 2-A and 7): | | | | | | | | | | | | |
Unaffiliated issuers | | | $74,502,727 | | | | $18,371,663 | | | | $2,718,821,508 | |
Affiliated issuers | | | — | | | | — | | | | — | |
Total investments | | | 74,502,727 | | | | 18,371,663 | | | | 2,718,821,508 | |
Cash | | | 489,820 | | | | 1,339,391 | | | | 169,991,192 | |
Segregated foreign currency at value (B) | | | — | | | | — | | | | — | |
Foreign currency at value (B) | | | 271,974 | | | | 54,893 | | | | 1,103,915 | |
Dividends, interest and other receivable—Unaffiliated issuers | | | 1,239,726 | | | | 338,515 | | | | 7,140,748 | |
Receivable for securities sold | | | — | | | | — | | | | 470,972 | |
Receivable for capital shares sold | | | 41,930 | | | | 26,449 | | | | 3,852,588 | |
Due from Advisor (Note 5) | | | — | | | | — | | | | — | |
Unrealized appreciation on forward foreign currency exchange contracts | | | 171,473 | | | | — | | | | — | |
Unrealized appreciation on credit default swaps | | | 2,685 | | | | 671 | | | | — | |
Prepaid expenses and other assets | | | 25,052 | | | | 39,618 | | | | 83,647 | |
TOTAL ASSETS | | | 76,745,387 | | | | 20,171,200 | | | | 2,901,464,570 | |
LIABILITIES: | | | | | | | | | | | | |
Payable for securities purchased | | | — | | | | 301,938 | | | | 15,678,421 | |
Payable for capital shares redeemed | | | 8,865 | | | | 955 | | | | 2,525,522 | |
Swaps premium received | | | 183,599 | | | | 45,900 | | | | — | |
Unrealized depreciation on forward foreign currency exchange contracts | | | 47,981 | | | | — | | | | — | |
Deferred foreign capital gains tax liability (Note 2-D) | | | 59,355 | | | | — | | | | 478,319 | |
Due to Advisor (Note 5) | | | 34,841 | | | | 5,248 | | | | 1,677,525 | |
Administration and accounting fees payable | | | 1,033 | | | | 266 | | | | 39,366 | |
Administration and shareholder servicing fees payable | | | 9,064 | | | | 2,343 | | | | 345,163 | |
Custodian fees payable | | | — | | | | — | | | | 112,040 | |
Intermediary service fees payable | | | 18,732 | | | | 2,644 | | | | 658,713 | |
Professional fees payable | | | 32,397 | | | | 20,588 | | | | 49,179 | |
Transfer agent fees payable | | | 732 | | | | 79 | | | | 14,109 | |
Offering costs (Note 2-E) | | | — | | | | — | | | | — | |
Accrued other expenses payable | | | 10,365 | | | | 2,546 | | | | 219,868 | |
TOTAL LIABILITIES | | | 406,964 | | | | 382,507 | | | | 21,798,225 | |
NET ASSETS | | | $76,338,423 | | | | $19,788,693 | | | | $2,879,666,345 | |
NET ASSETS: | | | | | | | | | | | | |
Investor Class | | | $51,819,442 | | | | $6,774,908 | | | | $1,702,130,763 | |
Institutional Class | | | 24,518,981 | | | | 13,013,785 | | | | 1,177,535,582 | |
TOTAL | | | $76,338,423 | | | | $19,788,693 | | | | $2,879,666,345 | |
See accompanying notes to financial statements.
June 30, 2017
| | | | | | | | | | | | | | | | | | | | | | |
| | | | | |
Matthews Asia
Dividend Fund | | | Matthews China
Dividend Fund | | | Matthews Asia
Value Fund | | | Matthews Asia
Focus Fund | | | Matthews Asia
Growth Fund | | | Matthews Pacific
Tiger Fund | |
| | | | | | | | | | | | | | | | | | | | | | |
| | | | | | | | | | | | | | | | | | | | | | |
| | $5,329,489,609 | | | | $230,217,423 | | | | $18,002,214 | | | | $11,442,214 | | | | $709,287,813 | | | | $7,216,481,202 | |
| | 560,651,128 | | | | — | | | | — | | | | — | | | | — | | | | 684,773,719 | |
| | 5,890,140,737 | | | | 230,217,423 | | | | 18,002,214 | | | | 11,442,214 | | | | 709,287,813 | | | | 7,901,254,921 | |
| | 69,617,866 | | | | 4,263,934 | | | | 3,233,227 | | | | 518,502 | | | | 6,602,925 | | | | 316,736,114 | |
| | 54,565 | | | | 10,433 | | | | — | | | | — | | | | — | | | | 2,615,344 | |
| | 6,508,361 | | | | 1,457,763 | | | | — | | | | — | | | | 74,771 | | | | 9,232,930 | |
| | 23,493,682 | | | | 1,232,304 | | | | 22,007 | | | | 34,930 | | | | 1,293,849 | | | | 14,349,598 | |
| | 39,461,586 | | | | 466,635 | | | | — | | | | — | | | | — | | | | — | |
| | 11,520,916 | | | | 633,013 | | | | 440,800 | | | | 350 | | | | 560,210 | | | | 16,757,696 | |
| | — | | | | — | | | | 3,427 | | | | 3,854 | | | | — | | | | — | |
| | — | | | | — | | | | — | | | | — | | | | — | | | | — | |
| | — | | | | — | | | | — | | | | — | | | | — | | | | — | |
| | 89,253 | | | | 21,958 | | | | 24,421 | | | | 43,425 | | | | 27,520 | | | | 100,592 | |
| | 6,040,886,966 | | | | 238,303,463 | | | | 21,726,096 | | | | 12,043,275 | | | | 717,847,088 | | | | 8,261,047,195 | |
| | | | | | | | | | | | | | | | | | | | | | |
| | 47,534,223 | | | | — | | | | 1,549,142 | | | | — | | | | 2,986,611 | | | | 16,624,258 | |
| | 2,406,729 | | | | 92,474 | | | | — | | | | 15,839 | | | | 1,533,731 | | | | 7,090,319 | |
| | — | | | | — | | | | — | | | | — | | | | — | | | | — | |
| | — | | | | — | | | | — | | | | — | | | | — | | | | — | |
| | 1,808,131 | | | | — | | | | — | | | | 7,790 | | | | 898,007 | | | | — | |
| | 3,427,824 | | | | 135,849 | | | | — | | | | — | | | | 414,254 | | | | 4,681,935 | |
| | 80,067 | | | | 3,133 | | | | 120 | | | | 164 | | | | 9,670 | | | | 110,865 | |
| | 681,926 | | | | 27,956 | | | | 1,547 | | | | 1,431 | | | | 85,273 | | | | 907,061 | |
| | 233,398 | | | | — | | | | — | | | | — | | | | 39,125 | | | | 535,925 | |
| | 786,708 | | | | 37,797 | | | | 3,214 | | | | — | | | | 136,345 | | | | 936,485 | |
| | 60,313 | | | | 21,769 | | | | 29,674 | | | | 32,966 | | | | 30,467 | | | | 80,936 | |
| | 102,514 | | | | 2,045 | | | | 120 | | | | 445 | | | | 4,813 | | | | 42,388 | |
| | — | | | | — | | | | 50,251 | | | | — | | | | — | | | | — | |
| | 260,722 | | | | 3,300 | | | | — | | | | 6,004 | | | | 48,926 | | | | 156,854 | |
| | 57,382,555 | | | | 324,323 | | | | 1,634,068 | | | | 64,639 | | | | 6,187,222 | | | | 31,167,026 | |
| | $5,983,504,411 | | | | $237,979,140 | | | | $20,092,028 | | | | $11,978,636 | | | | $711,659,866 | | | | $8,229,880,169 | |
| | | | | | | | | | | | | | | | | | | | | | |
| | $3,145,517,994 | | | | $199,697,161 | | | | $19,662,352 | | | | $5,476,460 | | | | $464,308,497 | | | | $2,899,368,564 | |
| | 2,837,986,417 | | | | 38,281,979 | | | | 429,676 | | | | 6,502,176 | | | | 247,351,369 | | | | 5,330,511,605 | |
| | $5,983,504,411 | | | | $237,979,140 | | | | $20,092,028 | | | | $11,978,636 | | | | $711,659,866 | | | | $8,229,880,169 | |
| | | | |
| matthewsasia.com | 800.789.ASIA | | | 97 | |
Statements of Assets and Liabilities (unaudited) (continued)
| | | | | | | | | | | | |
| | | Matthews Asia
Strategic
Income Fund | | | Matthews Asia
Credit
Opportunities Fund | | | Matthews Asian
Growth and
Income Fund | |
SHARES OUTSTANDING: | | | | | | | | | | | | |
(shares of beneficial interest issued and outstanding, respectively, unlimited number of shares authorized with a $0.001 par value) | | | | | | | | | | | | |
Investor Class | | | 4,769,328 | | | | 647,267 | | | | 99,792,396 | |
Institutional Class | | | 2,257,799 | | | | 1,243,390 | | | | 69,116,897 | |
TOTAL | | | 7,027,127 | | | | 1,890,657 | | | | 168,909,293 | |
NET ASSET VALUE: | | | | | | | | | | | | |
Investor Class, offering price and redemption price | | | $10.87 | | | | $10.47 | | | | $17.06 | |
Institutional Class, offering price and redemption price | | | $10.86 | | | | $10.47 | | | | $17.04 | |
NET ASSETS CONSIST OF: | | | | | | | | | | | | |
Capital paid-in | | | $75,589,545 | | | | $19,047,859 | | | | $2,463,465,134 | |
Undistributed (distributions in excess of) net investment income (loss) | | | 492,505 | | | | 49,756 | | | | (29,334,201 | ) |
Undistributed/accumulated net realized gain (loss) on investments, foreign currency related transactions and swaps | | | (2,162,770 | ) | | | 167,895 | | | | 57,162,391 | |
Net unrealized appreciation (depreciation) on investments, foreign currency translations, swaps and foreign capital gains taxes | | | 2,419,143 | | | | 523,183 | | | | 388,373,021 | |
NET ASSETS | | | $76,338,423 | | | | $19,788,693 | | | | $2,879,666,345 | |
(A) Investments at cost: | | | | | | | | | | | | |
Unaffiliated issuers | | | $72,155,512 | | | | $17,849,339 | | | | $2,329,956,619 | |
Affiliated issuers | | | — | | | | — | | | | — | |
Total investments at cost | | | $72,155,512 | | | | $17,849,339 | | | | $2,329,956,619 | |
(B) Foreign currency at cost | | | $271,414 | | | | $54,738 | | | | $1,103,915 | |
See accompanying notes to financial statements.
June 30, 2017
| | | | | | | | | | | | | | | | | | | | | | |
| | | | | |
Matthews Asia
Dividend Fund | | | Matthews China
Dividend Fund | | | Matthews Asia
Value Fund | | | Matthews Asia
Focus Fund | | | Matthews Asia
Growth Fund | | | Matthews Pacific
Tiger Fund | |
| | | | | | | | | | | | | | | | | | | | | | |
| | | | | |
| | | | | | | | | | | | | | | | | | | | | | |
| | 171,917,363 | | | | 12,250,489 | | | | 1,623,270 | | | | 505,940 | | | | 18,537,039 | | | | 105,247,410 | |
| | 155,144,864 | | | | 2,348,039 | | | | 35,850 | | | | 599,157 | | | | 9,800,748 | | | | 193,498,427 | |
| | 327,062,227 | | | | 14,598,528 | | | | 1,659,120 | | | | 1,105,097 | | | | 28,337,787 | | | | 298,745,837 | |
| | | | | | | | | | | | | | | | | | | | | | |
| | $18.30 | | | | $16.30 | | | | $12.11 | | | | $10.82 | | | | $25.05 | | | | $27.55 | |
| | $18.29 | | | | $16.30 | | | | $11.99 | | | | $10.85 | | | | $25.24 | | | | $27.55 | |
| | | | | | | | | | | | | | | | | | | | | | |
| | $4,614,885,863 | | | | $202,234,901 | | | | $19,240,640 | | | | $11,664,975 | | | | $483,950,686 | | | | $5,658,782,630 | |
| | (3,742,006 | ) | | | (58,916 | ) | | | 5,321 | | | | 136,719 | | | | (2,408,182 | ) | | | 27,882,485 | |
| | | | | |
| | 97,096,515 | | | | 14,673,932 | | | | 85,388 | | | | (1,089,200 | ) | | | 22,817,205 | | | | 33,535,967 | |
| | | | | |
| | 1,275,264,039 | | | | 21,129,223 | | | | 760,679 | | | | 1,266,142 | | | | 207,300,157 | | | | 2,509,679,087 | |
| | $5,983,504,411 | | | | $237,979,140 | | | | $20,092,028 | | | | $11,978,636 | | | | $711,659,866 | | | | $8,229,880,169 | |
| | | | | | | | | | | | | | | | | | | | | | |
| | $4,274,768,153 | | | | $209,111,394 | | | | $17,241,503 | | | | $10,168,187 | | | | $501,081,590 | | | | $4,673,444,075 | |
| | 338,242,670 | | | | — | | | | — | | | | — | | | | — | | | | 718,176,332 | |
| | $4,613,010,823 | | | | $209,111,394 | | | | $17,241,503 | | | | $10,168,187 | | | | $501,081,590 | | | | $5,391,620,407 | |
| | $6,548,770 | | | | $1,433,699 | | | | $— | | | | $— | | | | $74,771 | | | | $9,231,094 | |
| | | | |
| matthewsasia.com | 800.789.ASIA | | | 99 | |
Statements of Assets and Liabilities (unaudited) (continued)
| | | | | | | | | | | | |
| | | |
| | | Matthews Asia
ESG Fund | | | Matthews Emerging
Asia Fund | | | Matthews Asia
Innovators Fund | |
ASSETS: | | | | | | | | | | | | |
Investments at value (A) (Note 2-A and 7): | | | | | | | | | | | | |
Unaffiliated issuers | | | $13,009,488 | | | | $358,581,721 | | | | $145,859,973 | |
Affiliated issuers | | | — | | | | 4,697,319 | | | | — | |
Total investments | | | 13,009,488 | | | | 363,279,040 | | | | 145,859,973 | |
Cash | | | 30,164 | | | | 17,899,230 | | | | 4,244,214 | |
Segregated foreign currency at value (B) | | | 65 | | | | — | | | | — | |
Foreign currency at value (B) | | | 49,087 | | | | 2,633,119 | | | | 426,288 | |
Dividends, interest and other receivable—Unaffiliated issuers | | | 56,216 | | | | 836,382 | | | | 377,512 | |
Receivable for securities sold | | | 19,206 | | | | — | | | | — | |
Receivable for capital shares sold | | | 28,759 | | | | 2,040,120 | | | | 213,577 | |
Due from Advisor (Note 5) | | | 9,284 | | | | — | | | | — | |
Prepaid expenses and other assets | | | 46,685 | | | | 59,704 | | | | 27,394 | |
TOTAL ASSETS | | | 13,248,954 | | | | 386,747,595 | | | | 151,148,958 | |
LIABILITIES: | | | | | | | | | | | | |
Payable for securities purchased | | | 18,056 | | | | 5,320,280 | | | | 1,147,461 | |
Payable for capital shares redeemed | | | — | | | | 270,715 | | | | 205,089 | |
Deferred foreign capital gains tax liability (Note 2-D) | | | 46,241 | | | | 3,983,805 | | | | 282,004 | |
Foreign capital gains tax payable (Note 2-D) | | | 2,707 | | | | — | | | | — | |
Due to Advisor (Note 5) | | | — | | | | 247,848 | | | | 82,353 | |
Administration and accounting fees payable | | | 75 | | | | 4,735 | | | | 1,872 | |
Administration and shareholder servicing fees payable | | | 1,547 | | | | 42,973 | | | | 16,941 | |
Custodian fees payable | | | — | | | | 23,402 | | | | — | |
Intermediary service fees payable | | | 1,223 | | | | 8,666 | | | | 33,390 | |
Professional fees payable | | | 31,727 | | | | 33,005 | | | | 26,719 | |
Transfer agent fees payable | | | 136 | | | | 1,918 | | | | 2,833 | |
Offering costs (Note 2-E) | | | 78,686 | | | | — | | | | — | |
Accrued other expenses payable | | | 16,855 | | | | 3,494 | | | | 7,826 | |
TOTAL LIABILITIES | | | 197,253 | | | | 9,940,841 | | | | 1,806,488 | |
NET ASSETS | | | $13,051,701 | | | | $376,806,754 | | | | $149,342,470 | |
NET ASSETS: | | | | | | | | | | | | |
Investor Class | | | $7,932,493 | | | | $201,021,894 | | | | $122,547,154 | |
Institutional Class | | | 5,119,208 | | | | 175,784,860 | | | | 26,795,316 | |
TOTAL | | | $13,051,701 | | | | $376,806,754 | | | | $149,342,470 | |
See accompanying notes to financial statements.
June 30, 2017
| | | | | | | | | | | | | | | | | | | | | | |
Matthews China
Fund | | | Matthews India
Fund | | | Matthews Japan
Fund | | | Matthews Korea
Fund | | | Matthews Asia
Small Companies
Fund | | | Matthews China
Small Companies
Fund | |
| | | | | | | | | | | | | | | | | | | | | | |
| | | | | | | | | | | | | | | | | | | | | | |
| | $647,252,506 | | | | $2,019,596,982 | | | | $3,263,660,521 | | | | $198,783,141 | | | | $379,225,835 | | | | $19,122,739 | |
| | — | | | | 120,695,219 | | | | 123,200,130 | | | | — | | | | — | | | | — | |
| | 647,252,506 | | | | 2,140,292,201 | | | | 3,386,860,651 | | | | 198,783,141 | | | | 379,225,835 | | | | 19,122,739 | |
| | 3,837,396 | | | | 32,451,887 | | | | 48,623,544 | | | | 2,893,216 | | | | 19,008,758 | | | | 1,066,328 | |
| | 34,068 | | | | — | | | | — | | | | — | | | | — | | | | 565 | |
| | 908,747 | | | | — | | | | 1 | | | | — | | | | 1,152,005 | | | | 68,618 | |
| | 5,733,849 | | | | 3,429,249 | | | | 10,454,314 | | | | 108,996 | | | | 799,472 | | | | 90,629 | |
| | — | | | | — | | | | 26,491,252 | | | | — | | | | 2,075,806 | | | | — | |
| | 1,172,092 | | | | 3,385,114 | | | | 20,205,887 | | | | 415,409 | | | | 3,247,821 | | | | 109,800 | |
| | — | | | | — | | | | — | | | | — | | | | — | | | | — | |
| | 43,041 | | | | 60,801 | | | | 70,645 | | | | 31,332 | | | | 49,588 | | | | 31,359 | |
| | 658,981,699 | | | | 2,179,619,252 | | | | 3,492,706,294 | | | | 202,232,094 | | | | 405,559,285 | | | | 20,490,038 | |
| | | | | | | | | | | | | | | | | | | | | | |
| | 198,506 | | | | — | | | | 15,463,951 | | | | — | | | | 4,241,409 | | | | 465,195 | |
| | 3,455,258 | | | | 1,118,836 | | | | 4,276,858 | | | | 301,170 | | | | 518,882 | | | | 3,500 | |
| | — | | | | 6,102,890 | | | | — | | | | — | | | | 279,263 | | | | — | |
| | — | | | | — | | | | — | | | | — | | | | — | | | | — | |
| | 372,674 | | | | 1,254,422 | | | | 2,032,493 | | | | 116,297 | | | | 318,364 | | | | 1,933 | |
| | 8,571 | | | | 29,214 | | | | 47,235 | | | | 2,696 | | | | 5,422 | | | | 256 | |
| | 76,600 | | | | 258,435 | | | | 415,346 | | | | 23,940 | | | | 47,057 | | | | 2,261 | |
| | — | | | | 115,809 | | | | 37,363 | | | | — | | | | 25,559 | | | | — | |
| | 156,120 | | | | 261,195 | | | | 438,724 | | | | 19,060 | | | | 119,591 | | | | 3,476 | |
| | 31,889 | | | | 28,944 | | | | 35,855 | | | | 27,368 | | | | 34,203 | | | | 31,461 | |
| | 14,325 | | | | 15,006 | | | | 23,145 | | | | 4,160 | | | | 3,695 | | | | 718 | |
| | — | | | | — | | | | — | | | | — | | | | — | | | | — | |
| | 293,260 | | | | 82,983 | | | | 16,200 | | | | 12,999 | | | | 52,021 | | | | 11,529 | |
| | 4,607,203 | | | | 9,267,734 | | | | 22,787,170 | | | | 507,690 | | | | 5,645,466 | | | | 520,329 | |
| | $654,374,496 | | | | $2,170,351,518 | | | | $3,469,919,124 | | | | $201,724,404 | | | | $399,913,819 | | | | $19,969,709 | |
| | | | | | | | | | | | | | | | | | | | | | |
| | $617,321,924 | | | | $1,300,230,311 | | | | $1,954,900,507 | | | | $182,165,058 | | | | $204,540,323 | | | | $19,969,709 | |
| | 37,052,572 | | | | 870,121,207 | | | | 1,515,018,617 | | | | 19,559,346 | | | | 195,373,496 | | | | — | |
| | $654,374,496 | | | | $2,170,351,518 | | | | $3,469,919,124 | | | | $201,724,404 | | | | $399,913,819 | | | | $19,969,709 | |
| | | | |
| matthewsasia.com | 800.789.ASIA | | | 101 | |
Statements of Assets and Liabilities (unaudited) (continued)
| | | | | | | | | | | | |
| | | |
| | | Matthews Asia
ESG Fund | | | Matthews Emerging
Asia Fund | | | Matthews Asia
Innovators Fund | |
SHARES OUTSTANDING: | | | | | | | | | | | | |
(shares of beneficial interest issued and outstanding, respectively, unlimited number of shares authorized with a $0.001 par value) | | | | | | | | | | | | |
Investor Class | | | 742,392 | | | | 13,713,253 | | | | 9,325,738 | |
Institutional Class | | | 481,295 | | | | 11,948,929 | | | | 2,028,597 | |
TOTAL | | | 1,223,687 | | | | 25,662,182 | | | | 11,354,335 | |
NET ASSET VALUE: | | | | | | | | | | | | |
Investor Class, offering price and redemption price | | | $10.69 | | | | $14.66 | | | | $13.14 | |
Institutional Class, offering price and redemption price | | | $10.64 | | | | $14.71 | | | | $13.21 | |
NET ASSETS CONSIST OF: | | | | | | | | | | | | |
Capital paid-in | | | $11,314,591 | | | | $320,957,310 | | | | $94,762,847 | |
Undistributed (distributions in excess of) net investment income (loss) | | | 27,389 | | | | 857,440 | | | | 50,898 | |
Undistributed/accumulated net realized gain (loss) on investments, and foreign currency related transactions | | | 164,990 | | | | 3,225,846 | | | | 12,146,184 | |
Net unrealized appreciation (depreciation) on investments, foreign currency translations and foreign capital gains taxes | | | 1,544,731 | | | | 51,766,158 | | | | 42,382,541 | |
NET ASSETS | | | $13,051,701 | | | | $376,806,754 | | | | $149,342,470 | |
(A) Investments at cost: | |
Unaffiliated issuers | | | $11,417,943 | | | | $303,602,375 | | | | $103,194,315 | |
Affiliated issuers | | | — | | | | 3,933,041 | | | | — | |
Total investments at cost | | | $11,417,943 | | | | $307,535,416 | | | | $103,194,315 | |
(B) Foreign currency at cost | | | $49,782 | | | | $2,633,749 | | | | $426,297 | |
See accompanying notes to financial statements.
June 30, 2017
| | | | | | | | | | | | | | | | | | | | | | |
Matthews China
Fund | | | Matthews India
Fund | | | Matthews Japan
Fund | | | Matthews Korea
Fund | | | Matthews Asia
Small Companies
Fund | | | Matthews China
Small Companies
Fund | |
| | | | | | | | | | | | | | | | | | | | | | |
| | | | | |
| | | | | | | | | | | | | | | | | | | | | | |
| | 30,682,748 | | | | 41,481,759 | | | | 90,607,416 | | | | 27,367,345 | | | | 9,377,032 | | | | 1,974,761 | |
| | 1,843,009 | | | | 27,606,003 | | | | 70,072,243 | | | | 2,921,023 | | | | 8,954,256 | | | | — | |
| | 32,525,757 | | | | 69,087,762 | | | | 160,679,659 | | | | 30,288,368 | | | | 18,331,288 | | | | 1,974,761 | |
| | | | | | | | | | | | | | | | | | | | | | |
| | $20.12 | | | | $31.34 | | | | $21.58 | | | | $6.66 | | | | $21.81 | | | | $10.11 | |
| | $20.10 | | | | $31.52 | | | | $21.62 | | | | $6.70 | | | | $21.82 | | | | $— | |
| | | | | | | | | | | | | | | | | | | | | | |
| | $502,756,957 | | | | $1,605,455,999 | | | | $2,895,399,282 | | | | $114,208,115 | | | | $333,621,784 | | | | $16,245,039 | |
| | 4,112,989 | | | | (1,137,375 | ) | | | 2,094,199 | | | | (1,785,076 | ) | | | 1,279,658 | | | | 288,530 | |
| | | | | |
| | 28,297,449 | | | | 31,808,098 | | | | 92,331,580 | | | | 13,331,913 | | | | 20,051,520 | | | | 539,827 | |
| | | | | |
| | 119,207,101 | | | | 534,224,796 | | | | 480,094,063 | | | | 75,969,452 | | | | 44,960,857 | | | | 2,896,313 | |
| | $654,374,496 | | | | $2,170,351,518 | | | | $3,469,919,124 | | | | $201,724,404 | | | | $399,913,819 | | | | $19,969,709 | |
| | | | | | | | | | | | | | | | | | | | | | |
| | $528,039,466 | | | | $1,524,131,349 | | | | $2,798,032,124 | | | | $122,813,433 | | | | $333,972,463 | | | | $16,227,379 | |
| | — | | | | 75,713,123 | | | | 108,628,819 | | | | — | | | | — | | | | — | |
| | $528,039,466 | | | | $1,599,844,472 | | | | $2,906,660,943 | | | | $122,813,433 | | | | $333,972,463 | | | | $16,227,379 | |
| | $908,719 | | | | $— | | | | $1 | | | | $— | | | | $1,151,352 | | | | $67,589 | |
| | | | |
| matthewsasia.com | 800.789.ASIA | | | 103 | |
Statements of Operations (unaudited)
| | | | | | | | | | | | |
| | | Matthews Asia
Strategic
Income Fund | | | Matthews Asia
Credit
Opportunities Fund | | | Matthews Asian
Growth and
Income Fund | |
INVESTMENT INCOME: | | | | | | | | | | | | |
Dividends—Unaffiliated Issuers | | | $3,282 | | | | $3,159 | | | | $38,480,744 | |
Dividends—Affiliated Issuers (Note 7) | | | — | | | | — | | | | — | |
Interest | | | 2,265,441 | | | | 487,470 | | | | 2,557,496 | |
Foreign withholding tax | | | (64,950 | ) | | | — | | | | (2,456,932 | ) |
TOTAL INVESTMENT INCOME | | | 2,203,773 | | | | 490,629 | | | | 38,581,308 | |
EXPENSES: | | | | | | | | | | | | |
Investment advisory fees (Note 5) | | | 234,406 | | | | 58,256 | | | | 9,108,024 | |
Administration and accounting fees (Note 5) | | | 2,885 | | | | 717 | | | | 109,838 | |
Administration and shareholder servicing fees (Note 5) | | | 50,545 | | | | 12,555 | | | | 1,924,192 | |
Accounting out-of-pocket fees | | | 9,325 | | | | 3,113 | | | | 21,250 | |
Custodian fees | | | 16,245 | | | | 2,470 | | | | 461,237 | |
Printing fees | | | 10,487 | | | | 1,832 | | | | 156,942 | |
Intermediary service fees | | | 69,292 | | | | 11,393 | | | | 2,350,168 | |
Professional fees | | | 32,045 | | | | 26,614 | | | | 58,705 | |
Registration fees | | | 13,361 | | | | 959 | | | | 24,630 | |
Transfer agent fees | | | 1,706 | | | | 245 | | | | 30,803 | |
Trustees fees | | | 1,930 | | | | 457 | | | | 76,856 | |
Offering costs (Note 2-E) | | | — | | | | 33,230 | | | | — | |
Other expenses | | | 7,443 | | | | 5,411 | | | | 34,942 | |
TOTAL EXPENSES | | | 449,670 | | | | 157,252 | | | | 14,357,587 | |
Advisory fees waived and expenses waived or reimbursed (Note 5) | | | (59,105 | ) | | | (65,407 | ) | | | — | |
Administration fees waived (Note 5) | | | — | | | | — | | | | — | |
NET EXPENSES | | | 390,565 | | | | 91,845 | | | | 14,357,587 | |
NET INVESTMENT INCOME (LOSS) | | | 1,813,208 | | | | 398,784 | | | | 24,223,721 | |
| REALIZED AND UNREALIZED GAIN (LOSS) ON INVESTMENTS, FOREIGN CURRENCY RELATED TRANSACTIONS, SWAPS AND FOREIGN CAPITAL GAINS TAXES: | | | | | | | | | | | | |
Net realized gain (loss) on investments—Unaffiliated Issuers | | | 860,904 | | | | 142,133 | | | | 13,252,430 | |
Net realized gain (loss) on investments—Affiliated Issuers | | | — | | | | — | | | | — | |
Net realized gain (loss) on swaps | | | (41,090 | ) | | | (10,272 | ) | | | — | |
Net realized foreign capital gains tax | | | — | | | | — | | | | — | |
Net realized gain (loss) on foreign currency related transactions | | | (779,046 | ) | | | 150 | | | | 681,377 | |
Net change in unrealized appreciation/depreciation on investments | | | 2,170,837 | | | | 385,769 | | | | 335,926,104 | |
Net change in deferred foreign capital gains taxes on unrealized appreciation | | | (42,725 | ) | | | — | | | | (478,319 | ) |
Net change in unrealized appreciation/depreciation on swaps | | | 33,592 | | | | 8,398 | | | | — | |
Net change in unrealized appreciation/depreciation on foreign currency related translations | | | (46,079 | ) | | | 187 | | | | (22,675 | ) |
Net realized and unrealized gain (loss) on investments, foreign currency related transactions, swaps and foreign capital gains taxes | | | 2,156,393 | | | | 526,365 | | | | 349,358,917 | |
| | | |
NET INCREASE (DECREASE) IN NET ASSETS FROM OPERATIONS | | | $3,969,601 | | | | $925,149 | | | | $373,582,638 | |
See accompanying notes to financial statements.
Six-Month Period Ended June 30, 2017
| | | | | | | | | | | | | | | | | | | | | | |
| | | | | |
Matthews Asia
Dividend Fund | | | Matthews China
Dividend Fund | | | Matthews Asia Value Fund | | | Matthews Asia
Focus Fund | | | Matthews Asia
Growth Fund | | | Matthews Pacific
Tiger Fund | |
| | | | | | | | | | | | | | | | | | | | | | |
| | $80,506,393 | | | | $4,286,001 | | | | $53,699 | | | | $159,726 | | | | $6,338,413 | | | | $65,772,956 | |
| | 11,860,182 | | | | — | | | | — | | | | — | | | | — | | | | 3,514,861 | |
| | — | | | | — | | | | 73 | | | | — | | | | — | | | | — | |
| | (5,650,236 | ) | | | (215,705 | ) | | | (4,774 | ) | | | (8,693 | ) | | | (612,406 | ) | | | (5,529,611 | ) |
| | 86,716,339 | | | | 4,070,296 | | | | 48,998 | | | | 151,033 | | | | 5,726,007 | | | | 63,758,206 | |
| | | | | | | | | | | | | | | | | | | | | | |
| | 17,727,659 | | | | 700,442 | | | | 16,942 | | | | 37,085 | | | | 2,209,260 | | | | 24,986,569 | |
| | 213,797 | | | | 8,447 | | | | 204 | | | | 447 | | | | 26,643 | | | | 301,336 | |
| | 3,742,948 | | | | 147,900 | | | | 3,548 | | | | 7,833 | | | | 466,686 | | | | 5,276,650 | |
| | 23,905 | | | | 17,491 | | | | 16,753 | | | | 14,606 | | | | 19,547 | | | | 23,194 | |
| | 704,686 | | | | 72,089 | | | | 15,500 | | | | 12,702 | | | | 182,129 | | | | 1,613,200 | |
| | 179,388 | | | | 13,715 | | | | 1,671 | | | | 2,199 | | | | 33,828 | | | | 162,126 | |
| | 3,301,980 | | | | 205,030 | | | | 6,155 | | | | 8,682 | | | | 520,848 | | | | 3,900,184 | |
| | 83,808 | | | | 24,628 | | | | 23,921 | | | | 25,393 | | | | 34,857 | | | | 111,150 | |
| | 28,570 | | | | 19,927 | | | | 4,090 | | | | 9,369 | | | | 29,572 | | | | 33,270 | |
| | 234,875 | | | | 4,632 | | | | 351 | | | | 1,003 | | | | 10,803 | | | | 88,978 | |
| | 130,191 | | | | 4,775 | | | | 64 | | | | 341 | | | | 18,233 | | | | 190,408 | |
| | — | | | | — | | | | — | | | | — | | | | — | | | | — | |
| | 59,513 | | | | 8,429 | | | | 6,830 | | | | 7,414 | | | | 14,379 | | | | 67,521 | |
| | 26,431,320 | | | | 1,227,505 | | | | 96,029 | | | | 127,074 | | | | 3,566,785 | | | | 36,754,586 | |
| | (122,046 | ) | | | — | | | | (57,927 | ) | | | (50,794 | ) | | | — | | | | (328,970 | ) |
| | (122,046 | ) | | | — | | | | — | | | | — | | | | — | | | | (328,970 | ) |
| | 26,187,228 | | | | 1,227,505 | | | | 38,102 | | | | 76,280 | | | | 3,566,785 | | | | 36,096,646 | |
| | 60,529,111 | | | | 2,842,791 | | | | 10,896 | | | | 74,753 | | | | 2,159,222 | | | | 27,661,560 | |
| | | | | |
| | | | | | | | | | | | | | | | | | | | | | |
| | 99,642,164 | | | | 12,601,814 | | | | 94,191 | | | | (152,885 | ) | | | 19,092,731 | | | | 36,651,890 | |
| | 10,522,110 | | | | — | | | | — | | | | — | | | | — | | | | (6,161,828 | ) |
| | — | | | | — | | | | — | | | | — | | | | — | | | | — | |
| | (189,342 | ) | | | — | | | | — | | | | — | | | | — | | | | — | |
| | 635,964 | | | | (9,877 | ) | | | (4,680 | ) | | | 2,168 | | | | 34,311 | | | | 523,848 | |
| | 739,986,653 | | | | 17,681,703 | | | | 670,807 | | | | 2,138,011 | | | | 94,456,600 | | | | 1,288,344,591 | |
| | | | | |
| | (1,808,131 | ) | | | — | | | | — | | | | (7,790 | ) | | | (364,742 | ) | | | — | |
| | — | | | | — | | | | — | | | | — | | | | — | | | | — | |
| | | | | |
| | 12,934 | | | | 18,326 | | | | (90 | ) | | | 164 | | | | (5,083 | ) | | | 247,638 | |
| | | | | |
| | 848,802,352 | | | | 30,291,966 | | | | 760,228 | | | | 1,979,668 | | | | 113,213,817 | | | | 1,319,606,139 | |
| | | | | |
| | $909,331,463 | | | | $33,134,757 | | | | $771,124 | | | | $2,054,421 | | | | $115,373,039 | | | | $1,347,267,699 | |
| | | | |
| matthewsasia.com | 800.789.ASIA | | | 105 | |
Statements of Operations (unaudited) (continued)
| | | | | | | | | | | | |
| | | |
| | | Matthews Asia
ESG Fund | | | Matthews Emerging
Asia Fund | | | Matthews Asia
Innovators Fund | |
INVESTMENT INCOME: | | | | | | | | | | | | |
Dividends—Unaffiliated Issuers | | | $141,055 | | | | $3,335,857 | | | | $1,040,947 | |
Dividends—Affiliated Issuers (Note 7) | | | — | | | | 64,787 | | | | — | |
Interest | | | — | | | | — | | | | — | |
Foreign withholding tax | | | (13,616 | ) | | | (343,466 | ) | | | (137,868 | ) |
TOTAL INVESTMENT INCOME | | | 127,439 | | | | 3,057,178 | | | | 903,079 | |
EXPENSES: | | | | | | | | | | | | |
Investment advisory fees (Note 5) | | | 37,651 | | | | 1,512,414 | | | | 396,093 | |
Administration and accounting fees (Note 5) | | | 454 | | | | 12,099 | | | | 4,777 | |
Administration and shareholder servicing fees (Note 5) | | | 7,942 | | | | 211,674 | | | | 83,580 | |
Accounting out-of-pocket fees | | | 20,257 | | | | 22,498 | | | | 16,822 | |
Custodian fees | | | 26,010 | | | | 326,642 | | | | 52,518 | |
Printing fees | | | 787 | | | | 7,156 | | | | 10,328 | |
Intermediary service fees | | | 9,706 | | | | 190,315 | | | | 106,774 | |
Professional fees | | | 25,442 | | | | 32,687 | | | | 27,889 | |
Registration fees | | | 8,141 | | | | 15,331 | | | | 12,360 | |
Transfer agent fees | | | 285 | | | | 4,805 | | | | 6,334 | |
Trustees fees | | | 234 | | | | 5,090 | | | | 3,858 | |
Other expenses | | | 7,231 | | | | 11,753 | | | | 8,651 | |
TOTAL EXPENSES | | | 144,140 | | | | 2,352,464 | | | | 729,984 | |
Advisory fees waived and expenses waived or reimbursed (Note 5) | | | (64,567 | ) | | | (304,462 | ) | | | — | |
Administration fees waived (Note 5) | | | — | | | | — | | | | — | |
NET EXPENSES | | | 79,573 | | | | 2,048,002 | | | | 729,984 | |
NET INVESTMENT INCOME (LOSS) | | | 47,866 | | | | 1,009,176 | | | | 173,095 | |
| REALIZED AND UNREALIZED GAIN (LOSS) ON INVESTMENTS, FOREIGN CURRENCY RELATED TRANSACTIONS AND FOREIGN CAPITAL GAINS TAXES: | | | | | | | | | | | | |
Net realized gain (loss) on investments—Unaffiliated Issuers | | | 228,626 | | | | 3,708,993 | | | | 3,221,780 | |
Net realized gain (loss) on investments—Affiliated Issuers | | | — | | | | — | | | | — | |
Net realized foreign capital gains tax | | | (2,910 | ) | | | (202,710 | ) | | | — | |
Net realized gain (loss) on foreign currency related transactions | | | (1,353 | ) | | | (215,075 | ) | | | (9,821 | ) |
Net change in unrealized appreciation/depreciation on investments | | | 1,655,253 | | | | 28,314,104 | | | | 27,605,874 | |
Net change in deferred foreign capital gains taxes on unrealized appreciation | | | (26,127 | ) | | | (1,040,444 | ) | | | (264,202 | ) |
Net change in unrealized appreciation/depreciation on foreign currency related translations | | | 1,163 | | | | 5,616 | | | | (220 | ) |
Net realized and unrealized gain (loss) on investments, foreign currency related transactions and foreign capital gains taxes | | | 1,854,652 | | | | 30,570,484 | | | | 30,553,411 | |
| | | |
NET INCREASE (DECREASE) IN NET ASSETS FROM OPERATIONS | | | $1,902,518 | | | | $31,579,660 | | | | $30,726,506 | |
See accompanying notes to financial statements.
Six-Month Period Ended June 30, 2017
| | | | | | | | | | | | | | | | | | | | | | |
Matthews
China Fund | | | Matthews
India Fund | | | Matthews
Japan Fund | | | Matthews
Korea Fund | | | Matthews Asia
Small Companies
Fund | | | Matthews China
Small Companies
Fund | |
| | | | | | | | | | | | | | | | | | | | | | |
| | $8,040,696 | | | | $7,828,551 | | | | $27,000,507 | | | | $1,139,477 | | | | $2,839,259 | | | | $256,901 | |
| | — | | | | — | | | | 1,284,694 | | | | — | | | | — | | | | — | |
| | — | | | | — | | | | — | | | | — | | | | 368 | | | | — | |
| | (631,229 | ) | | | — | | | | (2,816,185 | ) | | | (187,146 | ) | | | (179,506 | ) | | | (4,302 | ) |
| | 7,409,467 | | | | 7,828,551 | | | | 25,469,016 | | | | 952,331 | | | | 2,660,121 | | | | 252,599 | |
| | | | | | | | | | | | | | | | | | | | | | |
| | 1,933,767 | | | | 6,291,665 | | | | 10,724,823 | | | | 600,824 | | | | 2,041,610 | | | | 88,282 | |
| | 23,321 | | | | 75,882 | | | | 129,338 | | | | 7,246 | | | | 16,333 | | | | 706 | |
| | 408,376 | | | | 1,327,622 | | | | 2,265,279 | | | | 126,859 | | | | 286,475 | | | | 12,372 | |
| | 15,155 | | | | 19,051 | | | | 22,767 | | | | 19,833 | | | | 23,675 | | | | 19,605 | |
| | 97,068 | | | | 391,167 | | | | 195,863 | | | | 36,563 | | | | 163,983 | | | | 27,052 | |
| | 74,401 | | | | 75,501 | | | | 75,002 | | | | 9,021 | | | | 27,616 | | | | 2,688 | |
| | 615,944 | | | | 1,220,549 | | | | 1,152,508 | | | | 157,691 | | | | 342,258 | | | | 22,071 | |
| | 29,783 | | | | 54,597 | | | | 56,419 | | | | 24,520 | | | | 37,084 | | | | 25,118 | |
| | 12,568 | | | | 27,916 | | | | 34,896 | | | | 10,852 | | | | 20,465 | | | | 5,830 | |
| | 31,540 | | | | 33,694 | | | | 52,434 | | | | 9,322 | | | | 7,688 | | | | 1,580 | |
| | 16,203 | | | | 43,009 | | | | 82,336 | | | | 4,780 | | | | 14,913 | | | | 546 | |
| | 21,474 | | | | 20,835 | | | | 30,872 | | | | 8,128 | | | | 13,157 | | | | 6,445 | |
| | 3,279,600 | | | | 9,581,488 | | | | 14,822,537 | | | | 1,015,639 | | | | 2,995,257 | | | | 212,295 | |
| | — | | | | — | | | | (11,276 | ) | | | — | | | | (170,971 | ) | | | (79,810 | ) |
| | — | | | | — | | | | (11,276 | ) | | | — | | | | — | | | | — | |
| | 3,279,600 | | | | 9,581,488 | | | | 14,799,985 | | | | 1,015,639 | | | | 2,824,286 | | | | 132,485 | |
| | 4,129,867 | | | | (1,752,937 | ) | | | 10,669,031 | | | | (63,308 | ) | | | (164,165 | ) | | | 120,114 | |
| | | | | |
| | | | | | | | | | | | | | | | | | | | | | |
| | 39,948,883 | | | | 18,597,821 | | | | 28,791,499 | | | | 4,303,710 | | | | 22,008,592 | | | | 417,727 | |
| | — | | | | 202,048 | | | | 2,189,720 | | | | — | | | | — | | | | — | |
| | — | | | | — | | | | — | | | | — | | | | (372 | ) | | | — | |
| | 46,499 | | | | (337,931 | ) | | | 133,814 | | | | 106,519 | | | | 66,997 | | | | (237 | ) |
| | | | | |
| | 106,253,234 | | | | 348,231,118 | | | | 394,278,016 | | | | 37,438,448 | | | | 34,356,316 | | | | 3,131,714 | |
| | — | | | | (6,102,890 | ) | | | — | | | | — | | | | (279,263 | ) | | | — | |
| | | | | |
| | 28,256 | | | | 6,924 | | | | (120,676 | ) | | | (3,796 | ) | | | 1,376 | | | | 926 | |
| | | | | |
| | 146,276,872 | | | | 360,597,090 | | | | 425,272,373 | | | | 41,844,881 | | | | 56,153,646 | | | | 3,550,130 | |
| | | | | |
| | $150,406,739 | | | | $358,844,153 | | | | $435,941,404 | | | | $41,781,573 | | | | $55,989,481 | | | | $3,670,244 | |
| | | | |
| matthewsasia.com | 800.789.ASIA | | | 107 | |
Statements of Changes in Net Assets
| | | | | | | | |
| MATTHEWS ASIA STRATEGIC INCOME FUND | | Six-Month Period
Ended June 30, 2017
(unaudited) | | | Year Ended
December 31, 2016 | |
OPERATIONS: | | | | | | | | |
Net investment income (loss) | | | $1,813,208 | | | | $3,216,131 | |
Net realized gain (loss) on investments and foreign currency related transactions | | | 40,768 | | | | (1,417,663 | ) |
Net change in unrealized appreciation/depreciation on investments and foreign currency related translations | | | 2,124,758 | | | | 3,618,263 | |
Net change on foreign capital gains taxes on unrealized appreciation | | | (42,725 | ) | | | (15,665 | ) |
Net change in unrealized appreciation/depreciation on swaps | | | 33,592 | | | | (30,907 | ) |
Net increase (decrease) in net assets resulting from operations | | | 3,969,601 | | | | 5,370,159 | |
DISTRIBUTIONS TO SHAREHOLDERS FROM: | | | | | | | | |
Net investment income: | | | | | | | | |
Investor Class | | | (725,965 | ) | | | (2,093,040 | ) |
Institutional Class | | | (316,334 | ) | | | (510,269 | ) |
Net decrease in net assets resulting from distributions | | | (1,042,299 | ) | | | (2,603,309 | ) |
CAPITAL SHARE TRANSACTIONS (net) (Note 4) | | | 4,604,258 | | | | 3,909,410 | |
Total increase (decrease) in net assets | | | 7,531,560 | | | | 6,676,260 | |
NET ASSETS: | | | | | | | | |
Beginning of period | | | 68,806,863 | | | | 62,130,603 | |
End of period (including undistributed/(distributions in excess of) net investment income of $492,505 and ($278,404), respectively) | | | $76,338,423 | | | | $68,806,863 | |
| | |
| MATTHEWS ASIA CREDIT OPPORTUNITIES FUND | | Six-Month Period
Ended June 30, 2017
(unaudited) | | | Year Ended
December 31, 20161 | |
OPERATIONS: | |
Net investment income (loss) | | | $398,784 | | | | $424,556 | |
Net realized gain (loss) on investments and foreign currency related transactions | | | 132,011 | | | | 67,487 | |
Net change in unrealized appreciation/depreciation on investments and foreign currency related translations | | | 385,956 | | | | 136,556 | |
Net change in unrealized appreciation/depreciation on swaps | | | 8,398 | | | | (7,727 | ) |
Net increase (decrease) in net assets resulting from operations | | | 925,149 | | | | 620,872 | |
DISTRIBUTIONS TO SHAREHOLDERS FROM: | |
Net investment income: | |
Investor Class | | | (167,884 | ) | | | (323,728 | ) |
Institutional Class | | | (187,537 | ) | | | (168,476 | ) |
Realized gains on investments: | |
Investor Class | | | — | | | | (16,637 | ) |
Institutional Class | | | — | | | | (8,450 | ) |
Net decrease in net assets resulting from distributions | | | (355,421 | ) | | | (517,291 | ) |
CAPITAL SHARE TRANSACTIONS (net) (Note 4) | | | 2,894,995 | | | | 16,220,389 | |
Total increase (decrease) in net assets | | | 3,464,723 | | | | 16,323,970 | |
NET ASSETS: | |
Beginning of period | | | 16,323,970 | | | | — | |
End of period (including undistributed net investment income of $49,756 and $6,393, respectively) | | | $19,788,693 | | | | $16,323,970 | |
|
1 Matthews Asia Credit Opportunities Fund commenced operations on April 29, 2016. | |
See accompanying notes to financial statements.
| | | | | | | | |
| MATTHEWS ASIAN GROWTH AND INCOME FUND | | Six-Month Period
Ended June 30, 2017
(unaudited) | | | Year Ended
December 31, 2016 | |
OPERATIONS: | | | | | | | | |
Net investment income (loss) | | | $24,223,721 | | | | $57,141,212 | |
Net realized gain (loss) on investments and foreign currency related transactions | | | 13,933,807 | | | | 148,265,239 | |
Net change in unrealized appreciation/depreciation on investments and foreign currency related translations | | | 335,903,429 | | | | (163,358,332 | ) |
Net change on foreign capital gains taxes on unrealized appreciation | | | (478,319 | ) | | | — | |
Net increase (decrease) in net assets resulting from operations | | | 373,582,638 | | | | 42,048,119 | |
DISTRIBUTIONS TO SHAREHOLDERS FROM: | | | | | | | | |
Net investment income: | | | | | | | | |
Investor Class | | | (10,274,392 | ) | | | (54,001,197 | ) |
Institutional Class | | | (8,012,571 | ) | | | (28,340,600 | ) |
Realized gains on investments: | | | | | | | | |
Investor Class | | | — | | | | (96,373,726 | ) |
Institutional Class | | | — | | | | (49,003,449 | ) |
Net decrease in net assets resulting from distributions | | | (18,286,963 | ) | | | (227,718,972 | ) |
CAPITAL SHARE TRANSACTIONS (net) (Note 4) | | | 30,129,231 | | | | (189,142,084 | ) |
REDEMPTION FEES | | | 7 | | | | — | |
Total increase (decrease) in net assets | | | 385,424,913 | | | | (374,812,937 | ) |
NET ASSETS: | | | | | | | | |
Beginning of period | | | 2,494,241,432 | | | | 2,869,054,369 | |
End of period (including distributions in excess of net investment income of ($29,334,201) and ($35,270,959), respectively) | | | $2,879,666,345 | | | | $2,494,241,432 | |
| | |
| MATTHEWS ASIA DIVIDEND FUND | | Six-Month Period
Ended June 30, 2017
(unaudited) | | | Year Ended
December 31, 20161 | |
OPERATIONS: | |
Net investment income (loss) | | | $60,529,111 | | | | $87,117,020 | |
Net realized gain (loss) on investments and foreign currency related transactions | | | 110,610,896 | | | | 55,403,187 | |
Net change in unrealized appreciation/depreciation on investments and foreign currency related translations | | | 739,999,587 | | | | 36,474,493 | |
Net change on foreign capital gains taxes on unrealized appreciation | | | (1,808,131 | ) | | | — | |
Net increase (decrease) in net assets resulting from operations | | | 909,331,463 | | | | 178,994,700 | |
DISTRIBUTIONS TO SHAREHOLDERS FROM: | |
Net investment income: | |
Investor Class | | | (28,768,499 | ) | | | (49,010,082 | ) |
Institutional Class | | | (27,454,551 | ) | | | (39,312,230 | ) |
Realized gains on investments: | |
Investor Class | | | — | | | | (17,325,153 | ) |
Institutional Class | | | — | | | | (13,260,152 | ) |
Return of Capital: | |
Investor Class | | | — | | | | (15,297,114 | ) |
Institutional Class | | | — | | | | (11,747,472 | ) |
Net decrease in net assets resulting from distributions | | | (56,223,050 | ) | | | (145,952,203 | ) |
CAPITAL SHARE TRANSACTIONS (net) (Note 4) | | | 445,509,039 | | | | (151,779,230 | ) |
REDEMPTION FEES | | | — | | | | 9 | |
Total increase (decrease) in net assets | | | 1,298,617,452 | | | | (118,736,724 | ) |
NET ASSETS: | |
Beginning of period | | | 4,684,886,959 | | | | 4,803,623,683 | |
End of period (including distributions in excess of net investment income of ($3,742,006) and ($8,048,067), respectively) | | | $5,983,504,411 | | | | $4,684,886,959 | |
| 1 | Consolidated Statement of Changes in Net Assets. See Note 2-C. |
See accompanying notes to financial statements.
| | | | |
| matthewsasia.com | 800.789.ASIA | | | 109 | |
Statements of Changes in Net Assets (continued)
| | | | | | | | |
| MATTHEWS CHINA DIVIDEND FUND | | Six-Month Period
Ended June 30, 2017
(unaudited) | | | Year Ended
December 31, 2016 | |
OPERATIONS: | | | | | | | | |
Net investment income (loss) | | | $2,842,791 | | | | $3,827,576 | |
Net realized gain (loss) on investments and foreign currency related transactions | | | 12,591,937 | | | | 4,186,024 | |
Net change in unrealized appreciation/depreciation on investments and foreign currency related translations | | | 17,700,029 | | | | (1,681,925 | ) |
Net increase (decrease) in net assets resulting from operations | | | 33,134,757 | | | | 6,331,675 | |
DISTRIBUTIONS TO SHAREHOLDERS FROM: | | | | | | | | |
Net investment income: | | | | | | | | |
Investor Class | | | (2,397,156 | ) | | | (3,001,665 | ) |
Institutional Class | | | (483,473 | ) | | | (469,585 | ) |
Realized gains on investments: | | | | | | | | |
Investor Class | | | — | | | | (2,247,824 | ) |
Institutional Class | | | — | | | | (382,120 | ) |
Net decrease in net assets resulting from distributions | | | (2,880,629 | ) | | | (6,101,194 | ) |
CAPITAL SHARE TRANSACTIONS (net) (Note 4) | | | 19,567,853 | | | | 7,006,687 | |
Total increase (decrease) in net assets | | | 49,821,981 | | | | 7,237,168 | |
NET ASSETS: | | | | | | | | |
Beginning of period | | | 188,157,159 | | | | 180,919,991 | |
End of period (including distributions in excess of net investment income of ($58,916) and ($21,078), respectively) | | | $237,979,140 | | | | $188,157,159 | |
| | |
| MATTHEWS ASIA VALUE FUND | | Six-Month Period
Ended June 30, 2017
(unaudited) | | | Year Ended
December 31, 2016 | |
OPERATIONS: | | | | | | | | |
Net investment income (loss) | | | $10,896 | | | | $18,087 | |
Net realized gain (loss) on investments and foreign currency related transactions | | | 89,511 | | | | 25,479 | |
Net change in unrealized appreciation/depreciation on investments and foreign currency related translations | | | 670,717 | | | | 106,708 | |
Net increase (decrease) in net assets resulting from operations | | | 771,124 | | | | 150,274 | |
DISTRIBUTIONS TO SHAREHOLDERS FROM: | | | | | | | | |
Net investment income: | | | | | | | | |
Investor Class | | | — | | | | (129,547 | ) |
Institutional Class | | | — | | | | (10,399 | ) |
Realized gains on investments: | | | | | | | | |
Investor Class | | | — | | | | (8,096 | ) |
Institutional Class | | | — | | | | (542 | ) |
Net decrease in net assets resulting from distributions | | | — | | | | (148,584 | ) |
CAPITAL SHARE TRANSACTIONS (net) (Note 4) | | | 16,617,344 | | | | 969,275 | |
Total increase (decrease) in net assets | | | 17,388,468 | | | | 970,965 | |
NET ASSETS: | | | | | | | | |
Beginning of period | | | 2,703,560 | | | | 1,732,595 | |
End of period (including undistributed/(distributions in excess of) net investment income of $5,321 and ($5,575), respectively) | | | $20,092,028 | | | | $2,703,560 | |
See accompanying notes to financial statements.
| | | | | | | | |
| MATTHEWS ASIA FOCUS FUND | | Six-Month Period
Ended June 30, 2017
(unaudited) | | | Year Ended
December 31, 2016 | |
OPERATIONS: | | | | | | | | |
Net investment income (loss) | | | $74,753 | | | | $140,261 | |
Net realized gain (loss) on investments and foreign currency related transactions | | | (150,717 | ) | | | (230,413 | ) |
Net change in unrealized appreciation/depreciation on investments and foreign currency related translations | | | 2,138,175 | | | | 597,323 | |
Net change on foreign capital gains taxes on unrealized appreciation | | | (7,790 | ) | | | — | |
Net increase (decrease) in net assets resulting from operations | | | 2,054,421 | | | | 507,171 | |
DISTRIBUTIONS TO SHAREHOLDERS FROM: | | | | | | | | |
Net investment income: | | | | | | | | |
Investor Class | | | — | | | | (70,761 | ) |
Institutional Class | | | — | | | | (87,218 | ) |
Net decrease in net assets resulting from distributions | | | — | | | | (157,979 | ) |
CAPITAL SHARE TRANSACTIONS (net) (Note 4) | | | (184,886 | ) | | | (1,414,939 | ) |
Total increase (decrease) in net assets | | | 1,869,535 | | | | (1,065,747 | ) |
NET ASSETS: | | | | | | | | |
Beginning of period | | | 10,109,101 | | | | 11,174,848 | |
End of period (including undistributed net investment income of $136,719 and $61,966, respectively) | | | $11,978,636 | | | | $10,109,101 | |
| | |
| MATTHEWS ASIA GROWTH FUND | | Six-Month Period
Ended June 30, 2017
(unaudited) | | | Year Ended
December 31, 2016 | |
OPERATIONS: | | | | | | | | |
Net investment income (loss) | | | $2,159,222 | | | | $2,400,166 | |
Net realized gain (loss) on investments and foreign currency related transactions | | | 19,127,042 | | | | 23,160,593 | |
Net change in unrealized appreciation/depreciation on investments and foreign currency related translations | | | 94,451,517 | | | | (21,403,951 | ) |
Net change on foreign capital gains taxes on unrealized appreciation | | | (364,742 | ) | | | (391,511 | ) |
Net increase (decrease) in net assets resulting from operations | | | 115,373,039 | | | | 3,765,297 | |
DISTRIBUTIONS TO SHAREHOLDERS FROM: | | | | | | | | |
Net investment income: | | | | | | | | |
Investor Class | | | — | | | | (4,658,025 | ) |
Institutional Class | | | — | | | | (2,552,696 | ) |
Net decrease in net assets resulting from distributions | | | — | | | | (7,210,721 | ) |
CAPITAL SHARE TRANSACTIONS (net) (Note 4) | | | (19,178,258 | ) | | | (157,945,254 | ) |
Total increase (decrease) in net assets | | | 96,194,781 | | | | (161,390,678 | ) |
NET ASSETS: | | | | | | | | |
Beginning of period | | | 615,465,085 | | | | 776,855,763 | |
End of period (including distributions in excess of net investment income of ($2,408,182) and ($4,567,404), respectively) | | | $711,659,866 | | | | $615,465,085 | |
See accompanying notes to financial statements.
| | | | |
| matthewsasia.com | 800.789.ASIA | | | 111 | |
Statements of Changes in Net Assets (continued)
| | | | | | | | |
| MATTHEWS PACIFIC TIGER FUND | | Six-Month Period
Ended June 30, 2017
(unaudited) | | | Year Ended
December 31, 2016 | |
OPERATIONS: | | | | | | | | |
Net investment income (loss) | | | $27,661,560 | | | | $39,910,764 | |
Net realized gain (loss) on investments and foreign currency related transactions | | | 31,013,910 | | | | 131,856,477 | |
Net change in unrealized appreciation/depreciation on investments and foreign currency related translations | | | 1,288,592,229 | | | | (195,810,377 | ) |
Net increase (decrease) in net assets resulting from operations | | | 1,347,267,699 | | | | (24,043,136 | ) |
DISTRIBUTIONS TO SHAREHOLDERS FROM: | | | | | | | | |
Net investment income: | | | | | | | | |
Investor Class | | | — | | | | (13,577,737 | ) |
Institutional Class | | | — | | | | (31,600,912 | ) |
Realized gains on investments: | | | | | | | | |
Investor Class | | | — | | | | (50,432,820 | ) |
Institutional Class | | | — | | | | (86,777,397 | ) |
Net decrease in net assets resulting from distributions | | | — | | | | (182,388,866 | ) |
CAPITAL SHARE TRANSACTIONS (net) (Note 4) | | | 229,921,546 | | | | 173,707,489 | |
REDEMPTION FEES | | | 53 | | | | 30 | |
Total increase (decrease) in net assets | | | 1,577,189,298 | | | | (32,724,483 | ) |
NET ASSETS: | | | | | | | | |
Beginning of period | | | 6,652,690,871 | | | | 6,685,415,354 | |
End of period (including undistributed net investment income of $27,882,485 and $220,925, respectively) | | | $8,229,880,169 | | | | $6,652,690,871 | |
| | |
| MATTHEWS ASIA ESG FUND | | Six-Month Period
Ended June 30, 2017
(unaudited) | | | Year Ended
December 31, 2016 | |
OPERATIONS: | | | | | | | | |
Net investment income (loss) | | | $47,866 | | | | $66,399 | |
Net realized gain (loss) on investments and foreign currency related transactions | | | 224,363 | | | | (10,559 | ) |
Net change in unrealized appreciation/depreciation on investments and foreign currency related translations | | | 1,656,416 | | | | 53,654 | |
Net change on foreign capital gains taxes on unrealized appreciation | | | (26,127 | ) | | | (10,279 | ) |
Net increase (decrease) in net assets resulting from operations | | | 1,902,518 | | | | 99,215 | |
DISTRIBUTIONS TO SHAREHOLDERS FROM: | | | | | | | | |
Net investment income: | | | | | | | | |
Investor Class | | | — | | | | (85,420 | ) |
Institutional Class | | | — | | | | (54,320 | ) |
Net decrease in net assets resulting from distributions | | | — | | | | (139,740 | ) |
CAPITAL SHARE TRANSACTIONS (net) (Note 4) | | | 2,391,756 | | | | 3,863,601 | |
Total increase (decrease) in net assets | | | 4,294,274 | | | | 3,823,076 | |
NET ASSETS: | | | | | | | | |
Beginning of period | | | 8,757,427 | | | | 4,934,351 | |
End of period (including undistributed/(distributions in excess of) net investment income of $27,389 and ($20,477), respectively) | | | $13,051,701 | | | | $8,757,427 | |
See accompanying notes to financial statements.
| | | | | | | | |
| MATTHEWS EMERGING ASIA FUND | | Six-Month Period
Ended June 30, 2017
(unaudited) | | | Year Ended
December 31, 2016 | |
OPERATIONS: | | | | | | | | |
Net investment income (loss) | | | $1,009,176 | | | | $2,490,968 | |
Net realized gain (loss) on investments and foreign currency related transactions | | | 3,291,208 | | | | 2,695,061 | |
Net change in unrealized appreciation/depreciation on investments and foreign currency related translations | | | 28,319,720 | | | | 21,190,343 | |
Net change on foreign capital gains taxes on unrealized appreciation | | | (1,040,444 | ) | | | (1,282,859 | ) |
Net increase (decrease) in net assets resulting from operations | | | 31,579,660 | | | | 25,093,513 | |
DISTRIBUTIONS TO SHAREHOLDERS FROM: | | | | | | | | |
Net investment income: | | | | | | | | |
Investor Class | | | — | | | | (1,321,879 | ) |
Institutional Class | | | — | | | | (1,048,573 | ) |
Realized gains on investments: | | | | | | | | |
Investor Class | | | — | | | | (1,325,678 | ) |
Institutional Class | | | — | | | | (887,884 | ) |
Net decrease in net assets resulting from distributions | | | — | | | | (4,584,014 | ) |
CAPITAL SHARE TRANSACTIONS (net) (Note 4) | | | 104,279,690 | | | | 50,373,123 | |
REDEMPTION FEES | | | 59,421 | | | | 136,866 | |
Total increase (decrease) in net assets | | | 135,918,771 | | | | 71,019,488 | |
NET ASSETS: | | | | | | | | |
Beginning of period | | | 240,887,983 | | | | 169,868,495 | |
End of period (including undistributed/(distributions in excess of) net investment income of $857,440 and ($151,736), respectively) | | | $376,806,754 | | | | $240,887,983 | |
| | |
| MATTHEWS ASIA INNOVATORS FUND | | Six-Month Period
Ended June 30, 2017
(unaudited) | | | Year Ended
December 31, 20161 | |
OPERATIONS: | | | | | | | | |
Net investment income (loss) | | | $173,095 | | | | ($190,585 | ) |
Net realized gain (loss) on investments and foreign currency related transactions | | | 3,211,959 | | | | 8,883,438 | |
Net change in unrealized appreciation/depreciation on investments and foreign currency related translations | | | 27,605,654 | | | | (23,846,357 | ) |
Net change on foreign capital gains taxes on unrealized appreciation | | | (264,202 | ) | | | (17,802 | ) |
Net increase (decrease) in net assets resulting from operations | | | 30,726,506 | | | | (15,171,306 | ) |
DISTRIBUTIONS TO SHAREHOLDERS FROM: | | | | | | | | |
Realized gains on investments: | | | | | | | | |
Investor Class | | | — | | | | (8,895,423 | ) |
Institutional Class | | | — | | | | (1,728,457 | ) |
Net decrease in net assets resulting from distributions | | | — | | | | (10,623,880 | ) |
CAPITAL SHARE TRANSACTIONS (net) (Note 4) | | | 18,145,010 | | | | (40,266,401 | ) |
Total increase (decrease) in net assets | | | 48,871,516 | | | | (66,061,587 | ) |
NET ASSETS: | | | | | | | | |
Beginning of period | | | 100,470,954 | | | | 166,532,541 | |
End of period (including undistributed net investment income (loss) of $50,898 and ($122,197), respectively) | | | $149,342,470 | | | | $100,470,954 | |
| 1 | The Fund’s name changed from Matthews Asia Science and Technology Fund to Matthews Asia Innovators Fund on April 29, 2016. |
See accompanying notes to financial statements.
| | | | |
| matthewsasia.com | 800.789.ASIA | | | 113 | |
Statements of Changes in Net Assets (continued)
| | | | | | | | |
| MATTHEWS CHINA FUND | | Six-Month Period
Ended June 30, 2017
(unaudited) | | | Year Ended
December 31, 20161 | |
OPERATIONS: | |
Net investment income (loss) | | | $4,129,867 | | | | $7,458,536 | |
Net realized gain (loss) on investments and foreign currency related transactions | | | 39,995,382 | | | | 13,454,903 | |
Net change in unrealized appreciation/depreciation on investments and foreign currency related translations | | | 106,281,490 | | | | (61,459,566 | ) |
Net change on foreign capital gains taxes on Unrealized appreciation | | | — | | | | (17,605 | ) |
Net increase (decrease) in net assets resulting from operations | | | 150,406,739 | | | | (40,546,127 | ) |
DISTRIBUTIONS TO SHAREHOLDERS FROM: | |
Net investment income: | |
Investor Class | | | — | | | | (7,918,085 | ) |
Institutional Class | | | — | | | | (287,088 | ) |
Realized gains on investments: | |
Investor Class | | | — | | | | (38,601,123 | ) |
Institutional Class | | | — | | | | (1,268,492 | ) |
Return of Capital: | |
Investor Class | | | — | | | | (17,371,599 | ) |
Institutional Class | | | — | | | | (571,054 | ) |
Net decrease in net assets resulting from distributions | | | — | | | | (66,017,441 | ) |
CAPITAL SHARE TRANSACTIONS (net) (Note 4) | | | (7,806,348 | ) | | | (115,705,461 | ) |
REDEMPTION FEES | | | — | | | | 51 | |
Total increase (decrease) in net assets | | | 142,600,391 | | | | (222,268,978 | ) |
NET ASSETS: | |
Beginning of period | | | 511,774,105 | | | | 734,043,083 | |
End of period (including undistributed/(distributions in excess of) net investment income of $4,112,989 and ($16,878), respectively) | | | $654,374,496 | | | | $511,774,105 | |
| | |
1 Consolidated Statement of Changes in Net Assets. See Note 2-C. | | | | | | | | |
| | |
| MATTHEWS INDIA FUND | | Six-Month Period
Ended June 30, 2017
(unaudited) | | | Year Ended
December 31, 2016 | |
OPERATIONS: | | | | | | | | |
Net investment income (loss) | | | ($1,752,937 | ) | | | $1,007,080 | |
Net realized gain (loss) on investments and foreign currency related transactions | | | 18,461,938 | | | | 28,818,985 | |
Net change in unrealized appreciation/depreciation on investments and foreign currency related translations | | | 348,238,042 | | | | (50,411,276 | ) |
Net change on foreign capital gains taxes on unrealized appreciation | | | (6,102,890 | ) | | | 1,942,487 | |
Net increase (decrease) in net assets resulting from operations | | | 358,844,153 | | | | (18,642,724 | ) |
DISTRIBUTIONS TO SHAREHOLDERS FROM: | | | | | | | | |
Realized gains on investments: | | | | | | | | |
Investor Class | | | — | | | | (17,649,381 | ) |
Institutional Class | | | — | | | | (9,260,856 | ) |
Net decrease in net assets resulting from distributions | | | — | | | | (26,910,237 | ) |
CAPITAL SHARE TRANSACTIONS (net) (Note 4) | | | 293,296,738 | | | | 57,936,594 | |
Total increase (decrease) in net assets | | | 652,140,891 | | | | 12,383,633 | |
NET ASSETS: | | | | | | | | |
Beginning of period | | | 1,518,210,627 | | | | 1,505,826,994 | |
End of period (including undistributed net investment income (loss) of ($1,137,375) and $615,562, respectively) | | | $2,170,351,518 | | | | $1,518,210,627 | |
See accompanying notes to financial statements.
| | | | | | | | |
| MATTHEWS JAPAN FUND | | Six-Month Period
Ended June 30, 2017
(unaudited) | | | Year Ended
December 31, 2016 | |
OPERATIONS: | | | | | | | | |
Net investment income (loss) | | | $10,669,031 | | | | $13,934,587 | |
Net realized gain (loss) on investments and foreign currency related transactions | | | 31,115,033 | | | | 140,692,829 | |
Net change in unrealized appreciation/depreciation on investments and foreign currency related translations | | | 394,157,340 | | | | (83,399,840 | ) |
Net increase (decrease) in net assets resulting from operations | | | 435,941,404 | | | | 71,227,576 | |
DISTRIBUTIONS TO SHAREHOLDERS FROM: | | | | | | | | |
Net investment income: | | | | | | | | |
Investor Class | | | — | | | | (14,892,806 | ) |
Institutional Class | | | — | | | | (12,780,128 | ) |
Realized gains on investments: | | | | | | | | |
Investor Class | | | — | | | | (4,615,399 | ) |
Institutional Class | | | — | | | | (3,490,954 | ) |
Net decrease in net assets resulting from distributions | | | — | | | | (35,779,287 | ) |
CAPITAL SHARE TRANSACTIONS (net) (Note 4) | | | 45,789,099 | | | | 1,003,413,662 | |
Total increase (decrease) in net assets | | | 481,730,503 | | | | 1,038,861,951 | |
NET ASSETS: | | | | | | | | |
Beginning of period | | | 2,988,188,621 | | | | 1,949,326,670 | |
End of period (including undistributed/(distributions in excess of) net investment income of $2,094,199 and ($8,574,832), respectively) | | | $3,469,919,124 | | | | $2,988,188,621 | |
| | |
| MATTHEWS KOREA FUND | | Six-Month Period
Ended June 30, 2017
(unaudited) | | | Year Ended
December 31, 2016 | |
OPERATIONS: | | | | | | | | |
Net investment income (loss) | | | ($63,308 | ) | | | $434,470 | |
Net realized gain (loss) on investments and foreign currency related transactions | | | 4,410,229 | | | | 16,478,510 | |
Net change in unrealized appreciation/depreciation on investments and foreign currency related translations | | | 37,434,652 | | | | (27,906,464 | ) |
Net increase (decrease) in net assets resulting from operations | | | 41,781,573 | | | | (10,993,484 | ) |
DISTRIBUTIONS TO SHAREHOLDERS FROM: | | | | | | | | |
Net investment income: | | | | | | | | |
Investor Class | | | — | | | | (2,065,275 | ) |
Institutional Class | | | — | | | | (116,928 | ) |
Realized gains on investments: | | | | | | | | |
Investor Class | | | — | | | | (10,912,600 | ) |
Institutional Class | | | — | | | | (554,186 | ) |
Net decrease in net assets resulting from distributions | | | — | | | | (13,648,989 | ) |
CAPITAL SHARE TRANSACTIONS (net) (Note 4) | | | 9,755,040 | | | | (32,836,778 | ) |
Total increase (decrease) in net assets | | | 51,536,613 | | | | (57,479,251 | ) |
NET ASSETS: | | | | | | | | |
Beginning of period | | | 150,187,791 | | | | 207,667,042 | |
End of period (including distributions in excess of net investment income of ($1,785,076) and ($1,721,768), respectively) | | | $201,724,404 | | | | $150,187,791 | |
See accompanying notes to financial statements.
| | | | |
| matthewsasia.com | 800.789.ASIA | | | 115 | |
Statements of Changes in Net Assets (continued)
| | | | | | | | |
| MATTHEWS ASIA SMALL COMPANIES FUND | | Six-Month Period
Ended June 30, 2017
(unaudited) | | | Year Ended
December 31, 2016 | |
OPERATIONS: | | | | | | | | |
Net investment income (loss) | | | ($164,165 | ) | | | $2,775,600 | |
Net realized gain (loss) on investments and foreign currency related transactions | | | 22,075,217 | | | | 11,047,982 | |
Net change in unrealized appreciation/depreciation on investments and foreign currency related translations | | | 34,357,692 | | | | (19,272,943 | ) |
Net change on foreign capital gains taxes on unrealized appreciation | | | (279,263 | ) | | | 56,811 | |
Net increase (decrease) in net assets resulting from operations | | | 55,989,481 | | | | (5,392,550 | ) |
DISTRIBUTIONS TO SHAREHOLDERS FROM: | | | | | | | | |
Net investment income: | | | | | | | | |
Investor Class | | | — | | | | (1,145,221 | ) |
Institutional Class | | | — | | | | (1,307,167 | ) |
Net decrease in net assets resulting from distributions | | | — | | | | (2,452,388 | ) |
CAPITAL SHARE TRANSACTIONS (net) (Note 4) | | | (85,275,226 | ) | | | (173,006,090 | ) |
REDEMPTION FEES | | | 12,254 | | | | 123,630 | |
Total increase (decrease) in net assets | | | (29,273,491 | ) | | | (180,727,398 | ) |
NET ASSETS: | | | | | | | | |
Beginning of period | | | 429,187,310 | | | | 609,914,708 | |
End of period (including undistributed net investment income of $1,279,658 and $1,443,823, respectively) | | | $399,913,819 | | | | $429,187,310 | |
| | |
| MATTHEWS CHINA SMALL COMPANIES FUND | | Six-Month Period
Ended June 30, 2017
(unaudited) | | | Year Ended
December 31, 2016 | |
OPERATIONS: | | | | | | | | |
Net investment income (loss) | | | $120,114 | | | | $224,432 | |
Net realized gain (loss) on investments and foreign currency related transactions | | | 417,490 | | | | 168,743 | |
Net change in unrealized appreciation/depreciation on investments and foreign currency related translations | | | 3,132,640 | | | | (882,977 | ) |
Net increase (decrease) in net assets resulting from operations | | | 3,670,244 | | | | (489,802 | ) |
DISTRIBUTIONS TO SHAREHOLDERS FROM: | | | | | | | | |
Net investment income: | | | | | | | | |
Investor Class | | | — | | | | (57,353 | ) |
Realized gains on investments: | | | | | | | | |
Investor Class | | | — | | | | (747,907 | ) |
Net decrease in net assets resulting from distributions | | | — | | | | (805,260 | ) |
CAPITAL SHARE TRANSACTIONS (net) (Note 4) | | | 197,482 | | | | (4,154,641 | ) |
REDEMPTION FEES | | | 760 | | | | 4,924 | |
Total increase (decrease) in net assets | | | 3,868,486 | | | | (5,444,779 | ) |
NET ASSETS: | | | | | | | | |
Beginning of period | | | 16,101,223 | | | | 21,546,002 | |
End of period (including undistributed net investment income of $288,530 and $168,416, respectively) | | | $19,969,709 | | | | $16,101,223 | |
See accompanying notes to financial statements.
Financial Highlights
Matthews Asia Strategic Income Fund
The tables below set forth financial data for a share of beneficial interest outstanding throughout each period presented.
| | | | | | | | | | | | | | | | | | | | | | | | |
INVESTOR CLASS | |
| Six-Month
Period Ended June 30, 2017 (unaudited) |
| | | Year Ended Dec. 31 | |
| | | 2016 | | | 2015 | | | 2014 | | | 2013 | | | 2012 | |
Net Asset Value, beginning of period | | | $10.43 | | | | $9.96 | | | | $10.31 | | | | $10.42 | | | | $10.84 | | | | $9.93 | |
INCOME (LOSS) FROM INVESTMENT OPERATIONS: | | | | | | | | | | | | | | | | | | | | | | | | |
Net investment income (loss)1 | | | 0.26 | | | | 0.50 | | | | 0.47 | | | | 0.46 | | | | 0.40 | | | | 0.37 | |
Net realized gain (loss) and unrealized appreciation/depreciation on investments, financial futures contracts and foreign currency related transactions, swaps and foreign capital gains taxes | | | 0.33 | | | | 0.38 | | | | (0.53 | ) | | | (0.19 | ) | | | (0.48 | ) | | | 0.95 | |
Total from investment operations | | | 0.59 | | | | 0.88 | | | | (0.06 | ) | | | 0.27 | | | | (0.08 | ) | | | 1.32 | |
LESS DISTRIBUTIONS FROM: | | | | | | | | | | | | | | | | | | | | | | | | |
Net investment income | | | (0.15 | ) | | | (0.41 | ) | | | (0.29 | ) | | | (0.38 | ) | | | (0.35 | ) | | | (0.42 | ) |
Net realized gains on investments | | | — | | | | — | | | | — | | | | — | | | | (0.01 | ) | | | — | |
Total distributions | | | (0.15 | ) | | | (0.41 | ) | | | (0.29 | ) | | | (0.38 | ) | | | (0.36 | ) | | | (0.42 | ) |
Paid-in capital from redemption fees (Note 4) | | | — | | | | — | | | | — | 2 | | | — | 2 | | | 0.02 | | | | 0.01 | |
Net Asset Value, end of period | | | $10.87 | | | | $10.43 | | | | $9.96 | | | | $10.31 | | | | $10.42 | | | | $10.84 | |
TOTAL RETURN | | | 5.68% | 3 | | | 8.85% | | | | (0.58% | ) | | | 2.54% | | | | (0.50% | ) | | | 13.62% | |
| | | | | | |
RATIOS/SUPPLEMENTAL DATA | | | | | | | | | | | | | | | | | | | | | | | | |
Net assets, end of period (in 000’s) | | | $51,819 | | | | $55,409 | | | | $51,130 | | | | $58,594 | | | | $38,051 | | | | $29,479 | |
Ratio of expenses to average net assets before any reimbursement, waiver or recapture of expenses by Advisor and Administrator (Note 5) | | | 1.30% | 4 | | | 1.33% | | | | 1.28% | | | | 1.27% | | | | 1.28% | | | | 1.85% | |
Ratio of expenses to average net assets after any reimbursement, waiver or recapture of expenses by Advisor and Administrator | | | 1.15% | 4 | | | 1.15% | | | | 1.12% | | | | 1.13% | | | | 1.20% | | | | 1.17% | |
Ratio of net investment income (loss) to average net assets | | | 4.96% | 4 | | | 4.85% | | | | 4.57% | | | | 4.36% | | | | 3.75% | | | | 3.58% | |
Portfolio turnover5 | | | 26.36% | 3 | | | 71.50% | | | | 50.09% | | | | 34.28% | | | | 48.71% | | | | 18.45% | |
| | |
| INSTITUTIONAL CLASS | |
| Six-Month
Period Ended June 30, 2017 (unaudited) |
| | | Year Ended Dec. 31 | |
| | | 2016 | | | 2015 | | | 2014 | | | 2013 | | | 2012 | |
Net Asset Value, beginning of period | | | $10.42 | | | | $9.96 | | | | $10.30 | | | | $10.42 | | | | $10.83 | | | | $9.93 | |
INCOME (LOSS) FROM INVESTMENT OPERATIONS: | | | | | | | | | | | | | | | | | | | | | | | | |
Net investment income (loss)1 | | | 0.28 | | | | 0.53 | | | | 0.49 | | | | 0.48 | | | | 0.42 | | | | 0.39 | |
Net realized gain (loss) and unrealized appreciation/depreciation on investments, financial futures contracts, and foreign currency related transactions, swaps and foreign capital gains taxes | | | 0.32 | | | | 0.36 | | | | (0.52 | ) | | | (0.20 | ) | | | (0.46 | ) | | | 0.94 | |
Total from investment operations | | | 0.60 | | | | 0.89 | | | | (0.03 | ) | | | 0.28 | | | | (0.04 | ) | | | 1.33 | |
LESS DISTRIBUTIONS FROM: | | | | | | | | | | | | | | | | | | | | | | | | |
Net investment income | | | (0.16 | ) | | | (0.43 | ) | | | (0.31 | ) | | | (0.40 | ) | | | (0.38 | ) | | | (0.44 | ) |
Net realized gains on investments | | | — | | | | — | | | | — | | | | — | | | | (0.01 | ) | | | — | |
Total distributions | | | (0.16 | ) | | | (0.43 | ) | | | (0.31 | ) | | | (0.40 | ) | | | (0.39 | ) | | | (0.44 | ) |
Paid-in capital from redemption fees (Note 4) | | | — | | | | — | | | | — | 2 | | | — | 2 | | | 0.02 | | | | 0.01 | |
Net Asset Value, end of period | | | $10.86 | | | | $10.42 | | | | $9.96 | | | | $10.30 | | | | $10.42 | | | | $10.83 | |
TOTAL RETURN | | | 5.80% | 3 | | | 9.02% | | | | (0.27% | ) | | | 2.64% | | | | (0.20% | ) | | | 13.74% | |
| | | | | | |
RATIOS/SUPPLEMENTAL DATA | | | | | | | | | | | | | | | | | | | | | | | | |
Net assets, end of period (in 000’s) | | | $24,519 | | | | $13,398 | | | | $11,001 | | | | $7,840 | | | | $7,662 | | | | $6,205 | |
Ratio of expenses to average net assets before any reimbursement, waiver or recapture of expenses by Advisor and Administrator (Note 5) | | | 1.09% | 4 | | | 1.12% | | | | 1.09% | | | | 1.07% | | | | 1.09% | | | | 1.70% | |
Ratio of expenses to average net assets after any reimbursement, waiver or recapture of expenses by Advisor and Administrator | | | 0.90% | 4 | | | 0.90% | | | | 0.90% | | | | 0.93% | | | | 1.00% | | | | 1.00% | |
Ratio of net investment income (loss) to average net assets | | | 5.22% | 4 | | | 5.13% | | | | 4.81% | | | | 4.55% | | | | 3.99% | | | | 3.70% | |
Portfolio turnover5 | | | 26.36% | 3 | | | 71.50% | | | | 50.09% | | | | 34.28% | | | | 48.71% | | | | 18.45% | |
| 1 | Calculated using the average daily shares method. |
| 2 | Less than $0.01 per share. |
| 5 | The portfolio turnover rate is calculated on the Fund as a whole without distinguishing between classes of shares issued. |
See accompanying notes to financial statements.
| | | | |
| matthewsasia.com | 800.789.ASIA | | | 117 | |
Financial Highlights (continued)
Matthews Asia Credit Opportunities Fund
The tables below set forth financial data for a share of beneficial interest outstanding throughout the period presented.
| | | | | | | | |
| INVESTOR CLASS | | Six-Month
Period Ended
June 30, 2017
(unaudited) | | | Period Ended
December 31, 20161 | |
Net Asset Value, beginning of period | | | $10.13 | | | | $10.00 | |
INCOME (LOSS) FROM INVESTMENT OPERATIONS: | | | | | | | | |
Net investment income (loss)2 | | | 0.22 | | | | 0.29 | |
Net realized gain (loss) and unrealized appreciation/depreciation on
investments, swaps, and foreign currency related transactions | | | 0.32 | | | | 0.18 | |
Total from investment operations | | | 0.54 | | | | 0.47 | |
LESS DISTRIBUTIONS FROM: | | | | | | | | |
Net investment income | | | (0.20 | ) | | | (0.32 | ) |
Net realized gains on investments | | | — | | | | (0.02 | ) |
Total distributions | | | (0.20 | ) | | | (0.34 | ) |
Net Asset Value, end of period | | | $10.47 | | | | $10.13 | |
TOTAL RETURN | | | 5.34% | 3 | | | 4.66% | 3 |
| | |
RATIOS/SUPPLEMENTAL DATA | | | | | | | | |
Net assets, end of period (in 000’s) | | | $6,775 | | | | $10,119 | |
Ratio of expenses to average net assets before any reimbursement,
waiver or recapture of expenses by Advisor and Administrator (Note 5) | | | 1.88% | 4 | | | 2.24% | 4 |
Ratio of expenses to average net assets after any reimbursement,
waiver or recapture of expenses by Advisor and Administrator | | | 1.15% | 4 | | | 1.15% | 4 |
Ratio of net investment income (loss) to average net assets | | | 4.26% | 4 | | | 4.12% | 4 |
Portfolio turnover5 | | | 16.08% | 3 | | | 18.80% | 3 |
| | |
| INSTITUTIONAL CLASS | | Six-Month
Period Ended
June 30, 2017
(unaudited) | | | Period Ended
December 31, 20161 | |
Net Asset Value, beginning of period | | | $10.13 | | | | $10.00 | |
INCOME (LOSS) FROM INVESTMENT OPERATIONS: | | | | | | | | |
Net investment income (loss)2 | | | 0.24 | | | | 0.30 | |
Net realized gain (loss) and unrealized appreciation/depreciation on
investments, swaps, and foreign currency related transactions | | | 0.31 | | | | 0.18 | |
Total from investment operations | | | 0.31 | | | | 0.48 | |
LESS DISTRIBUTIONS FROM: | | | | | | | | |
Net investment income | | | (0.21 | ) | | | (0.33 | ) |
Net realized gains on investments | | | | | | | (0.02 | ) |
Total distributions | | | (0.21 | ) | | | (0.35 | ) |
Net Asset Value, end of period | | | $10.47 | | | | $10.13 | |
TOTAL RETURN | | | 5.44% | 3 | | | 4.82% | 3 |
| | |
RATIOS/SUPPLEMENTAL DATA | | | | | | | | |
Net assets, end of period (in 000’s) | | | $13,014 | | | | $6,205 | |
Ratio of expenses to average net assets before any reimbursement,
waiver or recapture of expenses by Advisor and Administrator (Note 5) | | | 1.63% | 4 | | | 1.99% | 4 |
Ratio of expenses to average net assets after any reimbursement,
waiver or recapture of expenses by Advisor and Administrator | | | 0.90% | 4 | | | 0.90% | 4 |
Ratio of net investment income (loss) to average net assets | | | 4.64% | 4 | | | 4.28% | 4 |
Portfolio turnover5 | | | 16.08% | 3 | | | 18.80% | 3 |
| 1 | Commenced operations on April 29, 2016. |
| 2 | Calculated using the average daily shares method. |
| 5 | The portfolio turnover rate is calculated on the Fund as a whole without distinguishing between classes of shares issued. |
See accompanying notes to financial statements.
Matthews Asian Growth and Income Fund
The tables below set forth financial data for a share of beneficial interest outstanding throughout each period presented.
| | | | | | | | | | | | | | | | | | | | | | | | |
| | | Six-Month
Period Ended
June 30, 2017
(unaudited) | | | Year Ended Dec. 31 | |
| INVESTOR CLASS | | | 2016 | | | 2015 | | | 2014 | | | 2013 | | | 2012 | |
Net Asset Value, beginning of period | | | $14.94 | | | | $16.03 | | | | $18.01 | | | | $18.91 | | | | $18.61 | | | | $15.07 | |
INCOME (LOSS) FROM INVESTMENT OPERATIONS: | | | | | | | | | | | | | | | | | | | | | | | | |
Net investment income (loss)1 | | | 0.14 | | | | 0.32 | | | | 0.39 | | | | 0.39 | | | | 0.41 | | | | 0.43 | |
Net realized gain (loss) and unrealized appreciation/depreciation on investments, foreign currency related transactions and foreign capital gains taxes | | | 2.08 | | | | (0.06 | ) | | | (1.19 | ) | | | (0.50 | ) | | | 0.47 | | | | 3.58 | |
Total from investment operations | | | 2.22 | | | | 0.26 | | | | (0.80 | ) | | | (0.11 | ) | | | 0.88 | | | | 4.01 | |
LESS DISTRIBUTIONS FROM: | | | | | | | | | | | | | | | | | | | | | | | | |
Net investment income | | | (0.10 | ) | | | (0.48 | ) | | | (0.42 | ) | | | (0.35 | ) | | | (0.46 | ) | | | (0.47 | ) |
Net realized gains on investments | | | — | | | | (0.87 | ) | | | (0.76 | ) | | | (0.44 | ) | | | (0.12 | ) | | | — | |
Total distributions | | | (0.10 | ) | | | (1.35 | ) | | | (1.18 | ) | | | (0.79 | ) | | | (0.58 | ) | | | (0.47 | ) |
Paid-in capital from redemption fees (Note 4) | | | — | | | | — | | | | — | 2 | | | — | 2 | | | — | 2 | | | — | 2 |
Net Asset Value, end of period | | | $17.06 | | | | $14.94 | | | | $16.03 | | | | $18.01 | | | | $18.91 | | | | $18.61 | |
TOTAL RETURN | | | 14.87% | 3 | | | 1.34% | | | | (4.50% | ) | | | (0.65% | ) | | | 4.83% | | | | 26.90% | |
| | | | | | |
RATIOS/SUPPLEMENTAL DATA | | | | | | | | | | | | | | | | | | | | | | | | |
Net assets, end of period (in 000’s) | | | $1,702,131 | | | | $1,684,987 | | | | $2,045,435 | | | | $3,052,565 | | | | $3,278,586 | | | | $3,214,984 | |
Ratio of expenses to average net assets before any reimbursement or waiver or recapture of expenses by Advisor and Administrator (Note 5) | | | 1.11% | 4 | | | 1.09% | | | | 1.09% | | | | 1.08% | | | | 1.08% | | | | 1.11% | |
Ratio of expenses to average net assets after any reimbursement or waiver or recapture of expenses by Advisor and Administrator | | | 1.11% | 4 | | | 1.09% | | | | 1.09% | | | | 1.08% | | | | 1.08% | | | | 1.11% | |
Ratio of net investment income (loss) to average net assets | | | 1.68% | 4 | | | 1.90% | | | | 2.17% | | | | 2.03% | | | | 2.14% | | | | 2.52% | |
Portfolio turnover5 | | | 7.91% | 3 | | | 15.64% | | | | 16.48% | | | | 16.79% | | | | 15.27% | | | | 17.43% | |
| | |
INSTITUTIONAL CLASS | | Six-Month
Period Ended
June 30, 2017 (unaudited) | | | Year Ended Dec. 31 | |
| | | 2016 | | | 2015 | | | 2014 | | | 2013 | | | 2012 | |
Net Asset Value, beginning of period | | | $14.92 | | | | $16.02 | | | | $18.00 | | | | $18.90 | | | | $18.60 | | | | $15.06 | |
INCOME (LOSS) FROM INVESTMENT OPERATIONS: | | | | | | | | | | | | | | | | | | | | | | | | |
Net investment income (loss)1 | | | 0.16 | | | | 0.34 | | | | 0.42 | | | | 0.42 | | | | 0.44 | | | | 0.45 | |
Net realized gain (loss) and unrealized appreciation/depreciation on investments, foreign currency related transactions and foreign capital gains taxes | | | 2.08 | | | | (0.07 | ) | | | (1.19 | ) | | | (0.50 | ) | | | 0.48 | | | | 3.58 | |
Total from investment operations | | | 2.24 | | | | 0.27 | | | | (0.77 | ) | | | (0.08 | ) | | | 0.92 | | | | 4.03 | |
LESS DISTRIBUTIONS FROM: | | | | | | | | | | | | | | | | | | | | | | | | |
Net investment income | | | (0.12 | ) | | | (0.50 | ) | | | (0.45 | ) | | | (0.38 | ) | | | (0.50 | ) | | | (0.49 | ) |
Net realized gains on investments | | | — | | | | (0.87 | ) | | | (0.76 | ) | | | (0.44 | ) | | | (0.12 | ) | | | — | |
Total distributions | | | (0.12 | ) | | | (1.37 | ) | | | (1.21 | ) | | | (0.82 | ) | | | (0.62 | ) | | | (0.49 | ) |
Paid-in capital from redemption fees (Note 4) | | | — | | | | — | | | | — | 2 | | | — | 2 | | | — | 2 | | | — | |
Net Asset Value, end of period | | | $17.04 | | | | $14.92 | | | | $16.02 | | | | $18.00 | | | | $18.90 | | | | $18.60 | |
TOTAL RETURN | | | 14.99% | 3 | | | 1.44% | | | | (4.33% | ) | | | (0.48% | ) | | | 5.04% | | | | 27.09% | |
| | | | | | |
RATIOS/SUPPLEMENTAL DATA | | | | | | | | | | | | | | | | | | | | | | | | |
Net assets, end of period (in 000’s) | | | $1,177,535 | | | | $809,254 | | | | $823,619 | | | | $1,182,690 | | | | $1,120,218 | | | | $856,876 | |
Ratio of expenses to average net assets before any reimbursement or waiver or recapture of expenses by Advisor and Administrator (Note 5) | | | 0.94% | 4 | | | 0.94% | | | | 0.92% | | | | 0.92% | | | | 0.93% | | | | 0.97% | |
Ratio of expenses to average net assets after any reimbursement or waiver or recapture of expenses by Advisor and Administrator | | | 0.94% | 4 | | | 0.94% | | | | 0.92% | | | | 0.92% | | | | 0.93% | | | | 0.97% | |
Ratio of net investment income (loss) to average net assets | | | 1.92% | 4 | | | 2.06% | | | | 2.34% | | | | 2.19% | | | | 2.30% | | | | 2.69% | |
Portfolio turnover5 | | | 7.91% | 3 | | | 15.64% | | | | 16.48% | | | | 16.79% | | | | 15.27% | | | | 17.43% | |
| 1 | Calculated using the average daily shares method. |
| 2 | Less than $0.01 per share. |
| 5 | The portfolio turnover rate is calculated on the Fund as a whole without distinguishing between classes of shares issued. |
See accompanying notes to financial statements.
| | | | |
| matthewsasia.com | 800.789.ASIA | | | 119 | |
Financial Highlights (continued)
Matthews Asia Dividend Fund
The tables below set forth financial data for a share of beneficial interest outstanding throughout each period presented.
| | | | | | | | | | | | | | | | | | | | | | | | |
INVESTOR CLASS | |
| Six-Month
Period Ended
June 30, 2017
(unaudited) |
| | | Year Ended Dec. 31 | |
| | | 20161 | | | 20151 | | | 20141 | | | 2013 | | | 2012 | |
Net Asset Value, beginning of period | | | $15.52 | | | | $15.36 | | | | $15.26 | | | | $15.60 | | | | $14.58 | | | | $12.48 | |
INCOME (LOSS) FROM INVESTMENT OPERATIONS: | | | | | | | | | | | | | | | | | | | | | | | | |
Net investment income (loss)2 | | | 0.19 | | | | 0.28 | | | | 0.29 | | | | 0.30 | | | | 0.32 | | | | 0.36 | |
Net realized gain (loss) and unrealized appreciation/depreciation on investments, foreign currency related transactions and foreign capital gains taxes | | | 2.76 | | | | 0.37 | | | | 0.31 | | | | (0.34 | ) | | | 1.30 | | | | 2.30 | |
Total from investment operations | | | 2.95 | | | | 0.65 | | | | 0.60 | | | | (0.04 | ) | | | 1.62 | | | | 2.66 | |
LESS DISTRIBUTIONS FROM: | | | | | | | | | | | | | | | | | | | | | | | | |
Net investment income | | | (0.17 | ) | | | (0.29 | ) | | | (0.27 | ) | | | (0.23 | ) | | | (0.60 | ) | | | (0.56 | ) |
Net realized gains on investments | | | — | | | | (0.11 | ) | | | (0.23 | ) | | | — | | | | — | | | | — | |
Return of capital | | | — | | | | (0.09 | ) | | | — | | | | (0.07 | ) | | | — | | | | — | |
Total distributions | | | (0.17 | ) | | | (0.49 | ) | | | (0.50 | ) | | | (0.30 | ) | | | (0.60 | ) | | | (0.56 | ) |
Paid-in capital from redemption fees (Note 4) | | | — | | | | — | | | | — | 3 | | | — | 3 | | | — | 3 | | | — | 3 |
Net Asset Value, end of period | | | $18.30 | | | | $15.52 | | | | $15.36 | | | | $15.26 | | | | $15.60 | | | | $14.58 | |
TOTAL RETURN | | | 19.02% | 4 | | | 4.13% | | | | 3.86% | | | | (0.32% | ) | | | 11.27% | | | | 21.63% | |
| | | | | | |
RATIOS/SUPPLEMENTAL DATA | | | | | | | | | | | | | | | | | | | | | | | | |
Net assets, end of period (in 000’s) | | | $3,145,518 | | | | $2,650,611 | | | | $2,757,910 | | | | $2,918,228 | | | | $3,669,690 | | | | $2,780,043 | |
Ratio of expenses to average net assets before any reimbursement, waiver or recapture of expenses by Advisor and Administrator (Note 5) | | | 1.05% | 5 | | | 1.06% | | | | 1.06% | | | | 1.06% | | | | 1.06% | | | | 1.09% | |
Ratio of expenses to average net assets after any reimbursement, waiver or recapture of expenses by Advisor and Administrator | | | 1.04% | 5 | | | 1.06% | | | | 1.05% | | | | 1.05% | | | | 1.06% | | | | 1.09% | |
Ratio of net investment income (loss) to average net assets | | | 2.18% | 5 | | | 1.79% | | | | 1.82% | | | | 1.89% | | | | 2.04% | | | | 2.65% | |
Portfolio turnover6 | | | 14.24% | 4 | | | 39.76% | | | | 35.98% | | | | 20.06% | | | | 14.06% | | | | 9.17% | |
| | |
INSTITUTIONAL CLASS | |
| Six-Month
Period Ended
June 30, 2017
(unaudited) |
| | | Year Ended Dec. 31 | |
| | | 20161 | | | 20151 | | | 20141 | | | 2013 | | | 2012 | |
Net Asset Value, beginning of period | | | $15.52 | | | | $15.35 | | | | $15.26 | | | | $15.59 | | | | $14.57 | | | | $12.48 | |
INCOME (LOSS) FROM INVESTMENT OPERATIONS: | | | | | | | | | | | | | | | | | | | | | | | | |
Net investment income (loss)2 | | | 0.20 | | | | 0.30 | | | | 0.32 | | | | 0.32 | | | | 0.34 | | | | 0.37 | |
Net realized gain (loss) and unrealized appreciation/depreciation on investments, foreign currency related transactions and foreign capital gains taxes | | | 2.75 | | | | 0.38 | | | | 0.29 | | | | (0.33 | ) | | | 1.30 | | | | 2.29 | |
Total from investment operations | | | 2.95 | | | | 0.68 | | | | 0.61 | | | | (0.01 | ) | | | 1.64 | | | | 2.66 | |
LESS DISTRIBUTIONS FROM: | | | | | | | | | | | | | | | | | | | | | | | | |
Net investment income | | | (0.18 | ) | | | (0.31 | ) | | | (0.29 | ) | | | (0.25 | ) | | | (0.62 | ) | | | (0.57 | ) |
Net realized gains on investments | | | — | | | | (0.11 | ) | | | (0.23 | ) | | | — | | | | — | | | | — | |
Return of capital | | | — | | | | (0.09 | ) | | | — | | | | (0.07 | ) | | | — | | | | — | |
Total distributions | | | (0.18 | ) | | | (0.51 | ) | | | (0.52 | ) | | | (0.32 | ) | | | (0.62 | ) | | | (0.57 | ) |
Paid-in capital from redemption fees (Note 4) | | | — | | | | — | | | | — | 3 | | | — | 3 | | | — | 3 | | | — | 3 |
Net Asset Value, end of period | | | $18.29 | | | | $15.52 | | | | $15.35 | | | | $15.26 | | | | $15.59 | | | | $14.57 | |
TOTAL RETURN | | | 19.03% | 4 | | | 4.33% | | | | 3.93% | | | | (0.18% | ) | | | 11.43% | | | | 21.70% | |
| | | | | | |
RATIOS/SUPPLEMENTAL DATA | | | | | | | | | | | | | | | | | | | | | | | | |
Net assets, end of period (in 000’s) | | | $2,837,986 | | | | $2,034,276 | | | | $2,045,713 | | | | $2,107,371 | | | | $2,124,214 | | | | $922,561 | |
Ratio of expenses to average net assets before any reimbursement, waiver or recapture of expenses by Advisor and Administrator (Note 5) | | | 0.92% | 5 | | | 0.94% | | | | 0.93% | | | | 0.93% | | | | 0.93% | | | | 0.97% | |
Ratio of expenses to average net assets after any reimbursement, waiver or recapture of expenses by Advisor and Administrator | | | 0.91% | 5 | | | 0.93% | | | | 0.92% | | | | 0.93% | | | | 0.93% | | | | 0.97% | |
Ratio of net investment income (loss) to average net assets | | | 2.37% | 5 | | | 1.91% | | | | 1.98% | | | | 2.02% | | | | 2.17% | | | | 2.72% | |
Portfolio turnover6 | | | 14.24% | 4 | | | 39.76% | | | | 35.98% | | | | 20.06% | | | | 14.06% | | | | 9.17% | |
| 1 | Consolidated Financial Highlights. See Notes 2-C. |
| 2 | Calculated using the average daily shares method. |
| 3 | Less than $0.01 per share. |
| 6 | The portfolio turnover rate is calculated on the Fund as a whole without distinguishing between classes of shares issued. |
See accompanying notes to financial statements.
Matthews China Dividend Fund
The tables below set forth financial data for a share of beneficial interest outstanding throughout each period presented.
| | | | | | | | | | | | | | | | | | | | | | | | |
INVESTOR CLASS | |
| Six-Month
Period Ended June 30, 2017 (unaudited) |
| | | Year Ended Dec. 31 | |
| | | 2016 | | | 2015 | | | 2014 | | | 2013 | | | 2012 | |
Net Asset Value, beginning of period | | | $14.09 | | | | $13.79 | | | | $13.37 | | | | $13.74 | | | | $12.35 | | | | $10.06 | |
INCOME (LOSS) FROM INVESTMENT OPERATIONS: | | | | | | | | | | | | | | | | | | | | | | | | |
Net investment income (loss)1 | | | 0.20 | | | | 0.31 | | | | 0.29 | | | | 0.25 | | | | 0.25 | | | | 0.25 | |
Net realized gain (loss) and unrealized appreciation/depreciation on investments and foreign currency related transactions | | | 2.21 | | | | 0.47 | | | | 1.01 | | | | (0.12 | ) | | | 1.35 | | | | 2.49 | |
Total from investment operations | | | 2.41 | | | | 0.78 | | | | 1.30 | | | | 0.13 | | | | 1.60 | | | | 2.74 | |
LESS DISTRIBUTIONS FROM: | | | | | | | | | | | | | | | | | | | | | | | | |
Net investment income | | | (0.20 | ) | | | (0.28 | ) | | | (0.28 | ) | | | (0.36 | ) | | | (0.23 | ) | | | (0.46 | ) |
Net realized gains on investments | | | — | | | | (0.20 | ) | | | (0.60 | ) | | | (0.14 | ) | | | — | | | | — | |
Total distributions | | | (0.20 | ) | | | (0.48 | ) | | | (0.88 | ) | | | (0.50 | ) | | | (0.23 | ) | | | (0.46 | ) |
Paid-in capital from redemption fees (Note 4) | | | — | | | | — | | | | — | 2 | | | — | 2 | | | 0.02 | | | | 0.01 | |
Net Asset Value, end of period | | | $16.30 | | | | $14.09 | | | | $13.79 | | | | $13.37 | | | | $13.74 | | | | $12.35 | |
TOTAL RETURN | | | 17.11% | 3 | | | 5.70% | | | | 9.54% | | | | 0.93% | | | | 13.35% | | | | 27.81% | |
| | | | | | |
RATIOS/SUPPLEMENTAL DATA | | | | | | | | | | | | | | | | | | | | | | | | |
Net assets, end of period (in 000’s) | | | $199,697 | | | | $160,400 | | | | $165,514 | | | | $116,954 | | | | $125,965 | | | | $59,535 | |
Ratio of expenses to average net assets before any reimbursement or waiver or recapture of expenses by Advisor and Administrator (Note 5) | | | 1.19% | 4 | | | 1.22% | | | | 1.19% | | | | 1.19% | | | | 1.24% | | | | 1.47% | |
Ratio of expenses to average net assets after any reimbursement or waiver or recapture of expenses by Advisor and Administrator | | | 1.19% | 4 | | | 1.22% | | | | 1.19% | | | | 1.19% | | | | 1.34% | | | | 1.50% | |
Ratio of net investment income (loss) to average net assets | | | 2.65% | 4 | | | 2.28% | | | | 1.97% | | | | 1.88% | | | | 1.94% | | | | 2.24% | |
Portfolio turnover5 | | | 45.29% | 3 | | | 72.96% | | | | 79.91% | | | | 25.43% | | | | 20.52% | | | | 21.40% | |
| | |
| INSTITUTIONAL CLASS | |
| Six-Month
Period Ended June 30, 2017 (unaudited) |
| | | Year Ended Dec. 31 | |
| | | 2016 | | | 2015 | | | 2014 | | | 2013 | | | 2012 | |
Net Asset Value, beginning of period | | | $14.09 | | | | $13.79 | | | | $13.37 | | | | $13.74 | | | | $12.34 | | | | $10.06 | |
INCOME (LOSS) FROM INVESTMENT OPERATIONS: | | | | | | | | | | | | | | | | | | | | | | | | |
Net investment income (loss)1 | | | 0.22 | | | | 0.29 | | | | 0.28 | | | | 0.28 | | | | 0.33 | | | | 0.22 | |
Net realized gain (loss) and unrealized appreciation/depreciation on investments and foreign currency related transactions | | | 2.20 | | | | 0.51 | | | | 1.04 | | | | (0.13 | ) | | | 1.32 | | | | 2.53 | |
Total from investment operations | | | 2.42 | | | | 0.80 | | | | 1.32 | | | | 0.15 | | | | 1.65 | | | | 2.75 | |
LESS DISTRIBUTIONS FROM: | | | | | | | | | | | | | | | | | | | | | | | | |
Net investment income | | | (0.21 | ) | | | (0.30 | ) | | | (0.30 | ) | | | (0.38 | ) | | | (0.26 | ) | | | (0.48 | ) |
Net realized gains on investments | | | — | | | | (0.20 | ) | | | (0.60 | ) | | | (0.14 | ) | | | — | | | | — | |
Total distributions | | | (0.21 | ) | | | (0.50 | ) | | | (0.90 | ) | | | (0.52 | ) | | | (0.26 | ) | | | (0.48 | ) |
Paid-in capital from redemption fees (Note 4) | | | — | | | | — | | | | — | 2 | | | — | 2 | | | 0.01 | | | | 0.01 | |
Net Asset Value, end of period | | | $16.30 | | | | $14.09 | | | | $13.79 | | | | $13.37 | | | | $13.74 | | | | $12.34 | |
TOTAL RETURN | | | 17.19% | 3 | | | 5.90% | | | | 9.71% | | | | 1.11% | | | | 13.72% | | | | 27.90% | |
| | | | | | |
RATIOS/SUPPLEMENTAL DATA | | | | | | | | | | | | | | | | | | | | | | | | |
Net assets, end of period (in 000’s) | | | $38,282 | | | | $27,758 | | | | $15,406 | | | | $30,662 | | | | $24,790 | | | | $201 | |
Ratio of expenses to average net assets before any reimbursement or waiver or recapture of expenses by Advisor and Administrator (Note 5) | | | 1.04% | 4 | | | 1.06% | | | | 1.00% | | | | 1.01% | | | | 1.08% | | | | 1.29% | |
Ratio of expenses to average net assets after any reimbursement or waiver or recapture of expenses by Advisor and Administrator | | | 1.04% | 4 | | | 1.06% | | | | 1.00% | | | | 1.01% | | | | 1.08% | | | | 1.29% | |
Ratio of net investment income (loss) to average net assets | | | 2.92% | 4 | | | 2.09% | | | | 1.89% | | | | 2.06% | | | | 2.54% | | | | 1.87% | |
Portfolio turnover5 | | | 45.29% | 3 | | | 72.96% | | | | 79.91% | | | | 25.43% | | | | 20.52% | | | | 21.40% | |
| 1 | Calculated using the average daily shares method. |
| 2 | Less than $0.01 per share. |
| 5 | The portfolio turnover rate is calculated on the Fund as a whole without distinguishing between classes of shares issued. |
See accompanying notes to financial statements.
| | | | |
| matthewsasia.com | 800.789.ASIA | | | 121 | |
Financial Highlights (continued)
Matthews Asia Value Fund
The tables below set forth financial data for a share of beneficial interest outstanding throughout each period presented.
| | | | | | | | | | | | |
| INVESTOR CLASS | | Six-Month
Period Ended
June 30, 2017
(unaudited) | | | Year Ended
Dec. 31, 2016 | | | Period Ended
Dec. 31, 20151 | |
Net Asset Value, beginning of period | | | $9.96 | | | | $9.85 | | | | $10.00 | |
INCOME (LOSS) FROM INVESTMENT OPERATIONS: | | | | | | | | | | | | |
Net investment income (loss)2 | | | 0.02 | | | | $0.09 | | | | 0.02 | |
Net realized gain (loss) and unrealized appreciation/depreciation on
investments and foreign currency related transactions | | | 2.13 | | | | $0.65 | | | | (0.16 | ) |
Total from investment operations | | | 2.15 | | | | 0.74 | | | | (0.14 | ) |
LESS DISTRIBUTIONS FROM: | | | | | | | | | | | | |
Net investment income | | | — | | | | ($0.59 | ) | | | (0.01 | ) |
Net realized gains on investments | | | — | | | | ($0.04 | ) | | | — | |
Total distributions | | | — | | | | ($0.63 | ) | | | (0.01 | ) |
Net Asset Value, end of period | | | $12.11 | | | | $9.96 | | | | $9.85 | |
TOTAL RETURN | | | 21.59% | 3 | | | 7.43% | | | | (1.35% | )3 |
| | | |
RATIOS/SUPPLEMENTAL DATA | | | | | | | | | | | | |
Net assets, end of period (in 000’s) | | | $19,662 | | | | $2,548 | | | | $1,589 | |
Ratio of expenses to average net assets before any reimbursement,
waiver or recapture of expenses by Advisor and Administrator (Note 5) | | | 3.77% | 4 | | | 11.48% | | | | 36.42% | 4 |
Ratio of expenses to average net assets after any reimbursement,
waiver or recapture of expenses by Advisor and Administrator | | | 1.50% | 4 | | | 1.50% | | | | 1.50% | 4 |
Ratio of net investment income (loss) to average net assets | | | 0.42% | 4 | | | 0.84% | | | | 2.70% | 4 |
Portfolio turnover5 | | | 10.52% | 3 | | | 19.60% | | | | 10.80% | 3 |
| | | |
| INSTITUTIONAL CLASS | | Six-Month
Period Ended
June 30, 2017
(unaudited) | | | Year Ended
Dec. 31, 2016 | | | Period Ended
Dec. 31, 20151 | |
Net Asset Value, beginning of period | | | $9.85 | | | | $9.83 | | | | $10.00 | |
INCOME (LOSS) FROM INVESTMENT OPERATIONS: | | | | | | | | | | | | |
Net investment income (loss)2 | | | 0.03 | | | | 0.10 | | | | 0.02 | |
Net realized gain (loss) and unrealized appreciation/depreciation on
investments and foreign currency related transactions | | | 2.11 | | | | 0.67 | | | | (0.15 | ) |
Total from investment operations | | | 2.14 | | | | 0.77 | | | | (0.13 | ) |
LESS DISTRIBUTIONS FROM: | | | | | | | | | | | | |
Net investment income | | | — | | | | (0.71 | ) | | | (0.04 | ) |
Net realized gains on investments | | | — | | | | (0.04 | ) | | | — | |
Total distributions | | | — | | | | (0.75 | ) | | | (0.04 | ) |
Net Asset Value, end of period | | | $11.99 | | | | $9.85 | | | | $9.83 | |
TOTAL RETURN | | | 21.73% | 3 | | | 7.72% | | | | (1.30% | )3 |
| | | |
RATIOS/SUPPLEMENTAL DATA | | | | | | | | | | | | |
Net assets, end of period (in 000’s) | | | $430 | | | | $155 | | | | $143 | |
Ratio of expenses to average net assets before any reimbursement,
waiver or recapture of expenses by Advisor and Administrator (Note 5) | | | 3.52% | 4 | | | 11.26% | | | | 36.17% | 4 |
Ratio of expenses to average net assets after any reimbursement,
waiver or recapture of expenses by Advisor and Administrator | | | 1.25% | 4 | | | 1.25% | | | | 1.25% | 4 |
Ratio of net investment income (loss) to average net assets | | | 0.59% | 4 | | | 1.01% | | | | 2.41% | 4 |
Portfolio turnover5 | | | 10.52% | 3 | | | 19.60% | | | | 10.80% | 3 |
| 1 | Commenced operations on November 30, 2015. |
| 2 | Calculated using the average daily shares method. |
| 5 | The portfolio turnover rate is calculated on the Fund as a whole without distinguishing between classes of share issues. |
See accompanying notes to financial statements.
Matthews Asia Focus Fund
The tables below set forth financial data for a share of beneficial interest outstanding throughout each period presented.
| | | | | | | | | | | | | | | | | | | | |
| INVESTOR CLASS | |
| Six-Month
Period Ended
June 30, 2017
(unaudited) |
| | | Year Ended Dec. 31 | | |
| Period Ended
Dec. 31, 20131 |
|
| | | 2016 | | | 2015 | | | 2014 | | |
Net Asset Value, beginning of period | | | $8.98 | | | | $8.69 | | | | $10.01 | | | | $9.66 | | | | $10.00 | |
INCOME (LOSS) FROM INVESTMENT OPERATIONS: | | | | | | | | | | | | | | | | | | | | |
Net investment income (loss)2 | | | 0.06 | | | | 0.10 | | | | 0.11 | | | | 0.09 | | | | 0.04 | |
Net realized gain (loss) and unrealized appreciation/depreciation on
investments, and foreign currency related transactions and
foreign capital gains taxes | | | 1.78 | | | | 0.32 | | | | (1.31 | ) | | | 0.33 | | | | (0.30 | ) |
Total from investment operations | | | 1.84 | | | | 0.42 | | | | (1.20 | ) | | | 0.42 | | | | (0.26 | ) |
LESS DISTRIBUTIONS FROM: | | | | | | | | | | | | | | | | | | | | |
Net investment income | | | — | | | | (0.13 | ) | | | (0.07 | ) | | | (0.07 | ) | | | (0.08 | ) |
Net realized gains on investments | | | — | | | | — | | | | (0.05 | ) | | | — | | | | — | |
Total distributions | | | — | | | | (0.13 | ) | | | (0.12 | ) | | | (0.07 | ) | | | (0.08 | ) |
Paid-in capital from redemption fees (Note 4) | | | — | | | | — | | | | — | 3 | | | — | 3 | | | — | 3 |
Net Asset Value, end of period | | | $10.82 | | | | $8.98 | | | | $8.69 | | | | $10.01 | | | | $9.66 | |
TOTAL RETURN | | | 20.49% | 4 | | | 4.82% | | | | (12.07% | ) | | | 4.38% | | | | (2.63% | )4 |
| | | | | |
RATIOS/SUPPLEMENTAL DATA | | | | | | | | | | | | | | | | | | | | |
Net assets, end of period (in 000’s) | | | $5,477 | | | | $4,713 | | | | $5,474 | | | | $7,839 | | | | $6,258 | |
Ratio of expenses to average net assets before any reimbursement,
waiver or recapture of expenses by Advisor and Administrator (Note 5) | | | 2.37% | 5 | | | 2.47% | | | | 2.07% | | | | 2.16% | | | | 3.50% | 5 |
Ratio of expenses to average net assets after any reimbursement,
waiver or recapture of expenses by Advisor and Administrator | | | 1.50% | 5 | | | 1.50% | | | | 1.50% | | | | 1.57% | | | | 1.71% | 5 |
Ratio of net investment income (loss) to average net assets | | | 1.20% | 5 | | | 1.14% | | | | 1.08% | | | | 0.87% | | | | 0.64% | 5 |
Portfolio turnover6 | | | 8.64% | 4 | | | 21.10% | | | | 23.60% | | | | 24.12% | | | | 16.23% | 4 |
| | | |
| INSTITUTIONAL CLASS | |
| Six-Month
Period Ended
June 30, 2017
(unaudited) |
| | | Year Ended Dec. 31 | | |
| Period Ended
Dec. 31, 20131 |
|
| | | 2016 | | | 2015 | | | 2014 | | |
Net Asset Value, beginning of period | | | $8.99 | | | | $8.69 | | | | $10.04 | | | | $9.66 | | | | $10.00 | |
INCOME (LOSS) FROM INVESTMENT OPERATIONS: | | | | | | | | | | | | | | | | | | | | |
Net investment income (loss)2 | | | 0.07 | | | | 0.13 | | | | 0.13 | | | | 0.10 | | | | 0.05 | |
Net realized gain (loss) and unrealized appreciation/depreciation on
investments, and foreign currency related transactions and
foreign capital gains taxes | | | 1.79 | | | | 0.31 | | | | (1.33 | ) | | | 0.36 | | | | (0.30 | ) |
Total from investment operations | | | 1.86 | | | | 0.44 | | | | (1.20 | ) | | | 0.46 | | | | (0.25 | ) |
LESS DISTRIBUTIONS FROM: | | | | | | | | | | | | | | | | | | | | |
Net investment income | | | — | | | | (0.14 | ) | | | (0.10 | ) | | | (0.08 | ) | | | (0.09 | ) |
Net realized gains on investments | | | — | | | | — | | | | (0.05 | ) | | | — | | | | — | |
Total distributions | | | — | | | | (0.14 | ) | | | (0.15 | ) | | | (0.08 | ) | | | (0.09 | ) |
Paid-in capital from redemption fees (Note 4) | | | — | | | | — | | | | — | 3 | | | — | 3 | | | — | 3 |
Net Asset Value, end of period | | | $10.85 | | | | $8.99 | | | | $8.69 | | | | $10.04 | | | | $9.66 | |
TOTAL RETURN | | | 20.69% | 4 | | | 5.05% | | | | (11.96% | ) | | | 4.77% | | | | (2.48% | )4 |
| | | | | |
RATIOS/SUPPLEMENTAL DATA | | | | | | | | | | | | | | | | | | | | |
Net assets, end of period (in 000’s) | | | $6,502 | | | | $5,397 | | | | $5,700 | | | | $7,148 | | | | $2,118 | |
Ratio of expenses to average net assets before any reimbursement,
waiver or recapture of expenses by Advisor and Administrator (Note 5) | | | 2.19% | 5 | | | 2.29% | | | | 1.91% | | | | 1.94% | | | | 3.32% | 5 |
Ratio of expenses to average net assets after any reimbursement,
waiver or recapture of expenses by Advisor and Administrator | | | 1.25% | 5 | | | 1.25% | | | | 1.25% | | | | 1.31% | | | | 1.50% | 5 |
Ratio of net investment income (loss) to average net assets | | | 1.46% | 5 | | | 1.37% | | | | 1.30% | | | | 0.96% | | | | 0.79% | 5 |
Portfolio turnover6 | | | 8.64% | 4 | | | 21.10% | | | | 23.60% | | | | 24.12% | | | | 16.23% | 4 |
| 1 | Commenced operations on April 30, 2013. |
| 2 | Calculated using the average daily shares method. |
| 3 | Less than $0.01 per share. |
| 6 | The portfolio turnover rate is calculated on the Fund as a whole without distinguishing between classes of shares issued. |
See accompanying notes to financial statements.
| | | | |
| matthewsasia.com | 800.789.ASIA | | | 123 | |
Financial Highlights (continued)
Matthews Asia Growth Fund
The tables below set forth financial data for a share of beneficial interest outstanding throughout each period presented.
| | | | | | | | | | | | | | | | | | | | | | | | |
| INVESTOR CLASS | |
| Six-Month
Period Ended June 30, 2017 (unaudited) |
| | | Year Ended Dec. 31 | |
| | | 2016 | | | 2015 | | | 2014 | | | 2013 | | | 2012 | |
Net Asset Value, beginning of period | | | $21.05 | | | | $21.09 | | | | $21.10 | | | | $21.17 | | | | $18.02 | | | | $15.34 | |
INCOME (LOSS) FROM INVESTMENT OPERATIONS: | | | | | | | | | | | | | | | | | | | | | | | | |
Net investment income (loss)1 | | | 0.07 | | | | 0.06 | | | | 0.11 | | | | 0.12 | | | | 0.11 | | | | 0.15 | |
Net realized gain (loss) and unrealized appreciation/depreciation on investments, foreign currency related transactoins and foreign capital gains taxes | | | 3.93 | | | | 0.13 | | | | (0.12 | ) | | | 0.19 | | | | 3.37 | | | | 2.53 | |
Total from investment operations | | | 4.00 | | | | 0.19 | | | | (0.01 | ) | | | 0.31 | | | | 3.48 | | | | 2.68 | |
LESS DISTRIBUTIONS FROM: | | | | | | | | | | | | | | | | | | | | | | | | |
Net investment income | | | — | | | | (0.23 | ) | | | — | | | | (0.38 | ) | | | (0.33 | ) | | | — | |
Total distributions | | | — | | | | (0.23 | ) | | | — | | | | (0.38 | ) | | | (0.33 | ) | | | — | |
Paid-in capital from redemption fees (Note 4) | | | — | | | | — | | | | — | 2 | | | — | 2 | | | — | 2 | | | — | 2 |
Net Asset Value, end of period | | | $25.05 | | | | $21.05 | | | | $21.09 | | | | $21.10 | | | | $21.17 | | | | $18.02 | |
TOTAL RETURN | | | 19.00% | 3 | | | 0.92% | | | | (0.05% | ) | | | 1.49% | | | | 19.35% | | | | 17.47% | |
| | | | | | |
RATIOS/SUPPLEMENTAL DATA | | | | | | | | | | | | | | | | | | | | | | | | |
Net assets, end of period (in 000’s) | | | $464,309 | | | | $419,516 | | | | $526,969 | | | | $561,922 | | | | $558,407 | | | | $276,884 | |
Ratio of expenses to average net assets | | | 1.14% | 4 | | | 1.14% | | | | 1.11% | | | | 1.11% | | | | 1.12% | | | | 1.16% | |
Ratio of net investment income (loss) to average net assets | | | 0.57% | 4 | | | 0.30% | | | | 0.49% | | | | 0.55% | | | | 0.55% | | | | 0.92% | |
Portfolio turnover5 | | | 8.71% | 3 | | | 13.61% | | | | 29.51% | | | | 22.24% | | | | 10.77% | | | | 44.76% | |
| | |
INSTITUTIONAL CLASS | |
| Six-Month
Period Ended June 30, 2017 (unaudited) |
| | | Year Ended Dec. 31 | |
| | | 2016 | | | 2015 | | | 2014 | | | 2013 | | | 2012 | |
Net Asset Value, beginning of period | | | $21.19 | | | | $21.24 | | | | $21.19 | | | | $21.26 | | | | $18.08 | | | | $15.37 | |
INCOME (LOSS) FROM INVESTMENT OPERATIONS: | | | | | | | | | | | | | | | | | | | | | | | | |
Net investment income (loss)1 | | | 0.09 | | | | 0.10 | | | | 0.16 | | | | 0.16 | | | | 0.15 | | | | 0.17 | |
Net realized gain (loss) and unrealized appreciation/depreciation on investments, foreign currency related transactoins and foreign capital gains taxes | | | 3.96 | | | | 0.13 | | | | (0.11 | ) | | | 0.19 | | | | 3.39 | | | | 2.54 | |
Total from investment operations | | | 4.05 | | | | 0.23 | | | | 0.05 | | | | 0.35 | | | | 3.54 | | | | 2.71 | |
LESS DISTRIBUTIONS FROM: | | | | | | | | | | | | | | | | | | | | | | | | |
Net investment income | | | — | | | | (0.28 | ) | | | — | | | | (0.42 | ) | | | (0.36 | ) | | | — | |
Total distributions | | | — | | | | (0.28 | ) | | | — | | | | (0.42 | ) | | | (0.36 | ) | | | — | |
Paid-in capital from redemption fees (Note 4) | | | — | | | | — | | | | — | 2 | | | — | 2 | | | — | 2 | | | — | 2 |
Net Asset Value, end of period | | | $25.24 | | | | $21.19 | | | | $21.24 | | | | $21.19 | | | | $21.26 | | | | $18.08 | |
TOTAL RETURN | | | 19.11% | 3 | | | 1.06% | | | | 0.24% | | | | 1.63% | | | | 19.63% | | | | 17.63% | |
| | | | | | |
RATIOS/SUPPLEMENTAL DATA | | | | | | | | | | | | | | | | | | | | | | | | |
Net assets, end of period (in 000’s) | | | $247,351 | | | | $195,949 | | | | $249,886 | | | | $287,262 | | | | $227,852 | | | | $147,142 | |
Ratio of expenses to average net assets | | | 0.94% | 4 | | | 0.96% | | | | 0.91% | | | | 0.91% | | | | 0.93% | | | | 0.98% | |
Ratio of net investment income (loss) to average net assets | | | 0.80% | 4 | | | 0.47% | | | | 0.72% | | | | 0.74% | | | | 0.73% | | | | 1.02% | |
Portfolio turnover5 | | | 8.71% | 3 | | | 13.61% | | | | 29.51% | | | | 22.24% | | | | 10.77% | | | | 44.76% | |
| 1 | Calculated using the average daily shares method. |
| 2 | Less than $0.01 per share. |
| 5 | The portfolio turnover rate is calculated on the Fund as a whole without distinguishing between classes of shares issued. |
See accompanying notes to financial statements.
Matthews Pacific Tiger Fund
The tables below set forth financial data for a share of beneficial interest outstanding throughout each period presented.
| | | | | | | | | | | | | | | | | | | | | | | | |
INVESTOR CLASS | | Six-Month
Period Ended
June 30, 2017
(unaudited) | | | Year Ended Dec. 31 | |
| | | 2016 | | | 2015 | | | 2014 | | | 2013 | | | 2012 | |
Net Asset Value, beginning of period | | | $22.92 | | | | $23.54 | | | | $26.57 | | | | $24.99 | | | | $24.42 | | | | $20.33 | |
INCOME (LOSS) FROM INVESTMENT OPERATIONS: | | | | | | | | | | | | | | | | | | | | | | | | |
Net investment income (loss)1 | | | 0.08 | | | | 0.11 | | | | 0.42 | | | | 0.14 | | | | 0.17 | | | | 0.18 | |
Net realized gain (loss) and unrealized appreciation/depreciation on investments and foreign currency related transactions | | | 4.55 | | | | (0.13 | ) | | | (0.82 | ) | | | 2.80 | | | | 0.72 | | | | 4.09 | |
Total from investment operations | | | 4.63 | | | | (0.02 | ) | | | (0.40 | ) | | | 2.94 | | | | 0.89 | | | | 4.27 | |
LESS DISTRIBUTIONS FROM: | | | | | | | | | | | | | | | | | | | | | | | | |
Net investment income | | | — | | | | (0.13 | ) | | | (0.42 | ) | | | (0.13 | ) | | | (0.16 | ) | | | (0.16 | ) |
Net realized gains on investments | | | — | | | | (0.47 | ) | | | (2.21 | ) | | | (1.23 | ) | | | (0.16 | ) | | | (0.02 | ) |
Total distributions | | | — | | | | (0.60 | ) | | | (2.63 | ) | | | (1.36 | ) | | | (0.32 | ) | | | (0.18 | ) |
Paid-in capital from redemption fees (Note 4) | | | — | 2 | | | — | | | | — | 2 | | | — | 2 | | | — | 2 | | | — | 2 |
Net Asset Value, end of period | | | $27.55 | | | | $22.92 | | | | $23.54 | | | | $26.57 | | | | $24.99 | | | | $24.42 | |
TOTAL RETURN | | | 20.20% | 3 | | | (0.16% | ) | | | (1.30% | ) | | | 11.79% | | | | 3.63% | | | | 21.00% | |
| | | | | | |
RATIOS/SUPPLEMENTAL DATA | | | | | | | | | | | | | | | | | | | | | | | | |
Net assets, end of period (in 000’s) | | | $2,899,368 | | | | $2,445,183 | | | | $2,720,869 | | | | $3,047,077 | | | | $2,954,108 | | | | $2,994,026 | |
Ratio of expenses to average net assets before any reimbursement or waiver or recapture of expenses by Advisor and Administrator (Note 5) | | | 1.09% | 4 | | | 1.09% | | | | 1.09% | | | | 1.09% | | | | 1.09% | | | | 1.11% | |
Ratio of expenses to average net assets after any reimbursement or waiver or recapture of expenses by Advisor and Administrator | | | 1.07% | 4 | | | 1.08% | | | | 1.07% | | | | 1.08% | | | | 1.09% | | | | 1.11% | |
Ratio of net investment income (loss) to average net assets | | | 0.61% | 4 | | | 0.47% | | | | 1.53% | | | | 0.52% | | | | 0.67% | | | | 0.82% | |
Portfolio turnover5 | | | 2.98% | 3 | | | 5.73% | | | | 12.56% | | | | 11.38% | | | | 7.73% | | | | 6.53% | |
| | |
INSTITUTIONAL CLASS | | Six-Month
Period Ended
June 30, 2017 (unaudited) | | | Year Ended Dec. 31 | |
| | | 2016 | | | 2015 | | | 2014 | | | 2013 | | | 2012 | |
Net Asset Value, beginning of period | | | $22.90 | | | | $23.52 | | | | $26.56 | | | | $24.97 | | | | $24.41 | | | | $20.32 | |
INCOME (LOSS) FROM INVESTMENT OPERATIONS: | | | | | | | | | | | | | | | | | | | | | | | | |
Net investment income (loss)1 | | | 0.10 | | | | 0.16 | | | | 0.44 | | | | 0.18 | | | | 0.21 | | | | 0.21 | |
Net realized gain (loss) and unrealized appreciation/depreciation on investments and foreign currency related transactions | | | 4.55 | | | | (0.14 | ) | | | (0.80 | ) | | | 2.82 | | | | 0.71 | | | | 4.10 | |
Total from investment operations | | | 4.65 | | | | 0.02 | | | | (0.36 | ) | | | 3.00 | | | | 0.92 | | | | 4.31 | |
LESS DISTRIBUTIONS FROM: | | | | | | | | | | | | | | | | | | | | | | | | |
Net investment income | | | — | | | | (0.17 | ) | | | (0.47 | ) | | | (0.18 | ) | | | (0.20 | ) | | | (0.20 | ) |
Net realized gains on investments | | | — | | | | (0.47 | ) | | | (2.21 | ) | | | (1.23 | ) | | | (0.16 | ) | | | (0.02 | ) |
Total distributions | | | — | | | | (0.64 | ) | | | (2.68 | ) | | | (1.41 | ) | | | (0.36 | ) | | | (0.22 | ) |
Paid-in capital from redemption fees (Note 4) | | | — | 2 | | | — | | | | — | 2 | | | — | 2 | | | — | 2 | | | — | 2 |
Net Asset Value, end of period | | | $27.55 | | | | $22.90 | | | | $23.52 | | | | $26.56 | | | | $24.97 | | | | $24.41 | |
TOTAL RETURN | | | 20.31% | 3 | | | 0.03% | | | | (1.15% | ) | | | 12.03% | | | | 3.78% | | | | 21.24% | |
| | | | | | |
RATIOS/SUPPLEMENTAL DATA | | | | | | | | | | | | | | | | | | | | | | | | |
Net assets, end of period (in 000’s) | | | $5,330,512 | | | | $4,207,508 | | | | $3,964,547 | | | | $5,049,643 | | | | $4,679,039 | | | | $3,770,568 | |
Ratio of expenses to average net assets before any reimbursement or waiver or recapture of expenses by Advisor and Administrator (Note 5) | | | 0.91% | 4 | | | 0.91% | | | | 0.91% | | | | 0.92% | | | | 0.92% | | | | 0.95% | |
Ratio of expenses to average net assets after any reimbursement or waiver or recapture of expenses by Advisor and Administrator | | | 0.90% | 4 | | | 0.90% | | | | 0.89% | | | | 0.91% | | | | 0.92% | | | | 0.95% | |
Ratio of net investment income (loss) to average net assets | | | 0.80% | 4 | | | 0.65% | | | | 1.61% | | | | 0.68% | | | | 0.83% | | | | 0.95% | |
Portfolio turnover5 | | | 2.98% | 3 | | | 5.73% | | | | 12.56% | | | | 11.38% | | | | 7.73% | | | | 6.53% | |
| 1 | Calculated using the average daily shares method. |
| 2 | Less than $0.01 per share. |
| 5 | The portfolio turnover rate is calculated on the Fund as a whole without distinguishing between classes of shares issued. |
See accompanying notes to financial statements.
| | | | |
| matthewsasia.com | 800.789.ASIA | | | 125 | |
Financial Highlights (continued)
Matthews Asia ESG Fund
The tables below set forth financial data for a share of beneficial interest outstanding throughout each period presented.
| | | | | | | | | | | | |
| INVESTOR CLASS | | Six-Month
Period Ended
June 30, 2017
(unaudited) | | | Year Ended
Dec. 31, 2016 | | | Period Ended
Dec. 31, 20151 | |
Net Asset Value, beginning of period | | | $8.97 | | | | $9.23 | | | | $10.00 | |
INCOME (LOSS) FROM INVESTMENT OPERATIONS: | | | | | | | | | | | | |
Net investment income (loss)2 | | | 0.04 | | | | 0.07 | | | | 0.02 | |
Net realized gain (loss) and unrealized appreciation/depreciation on
investments, foreign currency related transactions and
foreign capital gains taxes | | | 1.68 | | | | (0.20 | ) | | | (0.75 | ) |
Total from investment operations | | | 1.72 | | | | (0.13 | ) | | | (0.73 | ) |
LESS DISTRIBUTIONS FROM: | | | | | | | | | | | | |
Net investment income | | | — | | | | (0.13 | ) | | | (0.04 | ) |
Total distributions | | | — | | | | (0.13 | ) | | | (0.04 | ) |
Net Asset Value, end of period | | | $10.69 | | | | $8.97 | | | | $9.23 | |
TOTAL RETURN | | | 19.18% | 3 | | | (1.40% | ) | | | (7.30% | )3 |
| | | |
RATIOS/SUPPLEMENTAL DATA | | | | | | | | | | | | |
Net assets, end of period (in 000’s) | | | $7,933 | | | | $5,376 | | | | $3,248 | |
Ratio of expenses to average net assets before any reimbursement,
waiver or recapture of expenses by Advisor and Administrator (Note 5) | | | 2.62% | 4 | | | 3.54% | | | | 9.09% | 4 |
Ratio of expenses to average net assets after any reimbursement,
waiver or recapture of expenses by Advisor and Administrator | | | 1.50% | 4 | | | 1.48% | | | | 1.44% | 4 |
Ratio of net investment income (loss) to average net assets | | | 0.70% | 4 | | | 0.77% | | | | 0.25% | 4 |
Portfolio turnover5 | | | 16.30% | 3 | | | 16.10% | | | | 21.72% | 3 |
| | | |
| INSTITUTIONAL CLASS | | Six-Month
Period Ended
June 30, 2017
(unaudited) | | | Year Ended
Dec. 31, 2016 | | | Period Ended
Dec. 31, 20151 | |
Net Asset Value, beginning of period | | | $8.92 | | | | $9.17 | | | | $10.00 | |
INCOME (LOSS) FROM INVESTMENT OPERATIONS: | | | | | | | | | | | | |
Net investment income (loss)2 | | | 0.05 | | | | 0.09 | | | | 0.05 | |
Net realized gain (loss) and unrealized appreciation/depreciation on
investments, foreign currency related transactions and
foreign capital gains taxes | | | 1.67 | | | | (0.19 | ) | | | (0.77 | ) |
Total from investment operations | | | 1.72 | | | | (0.10 | ) | | | (0.72 | ) |
LESS DISTRIBUTIONS FROM: | | | | | | | | | | | | |
Net investment income | | | — | | | | (0.15 | ) | | | (0.11 | ) |
Total distributions | | | — | | | | (0.15 | ) | | | (0.11 | ) |
Net Asset Value, end of period | | | $10.64 | | | | $8.92 | | | | $9.17 | |
TOTAL RETURN | | | 19.28% | 3 | | | (1.16% | ) | | | (7.14% | )3 |
| | | |
RATIOS/SUPPLEMENTAL DATA | | | | | | | | | | | | |
Net assets, end of period (in 000’s) | | | $5,119 | | | | $3,382 | | | | $1,686 | |
Ratio of expenses to average net assets before any reimbursement,
waiver or recapture of expenses by Advisor and Administrator (Note 5) | | | 2.42% | 4 | | | 3.36% | | | | 8.90% | 4 |
Ratio of expenses to average net assets after any reimbursement,
waiver or recapture of expenses by Advisor and Administrator | | | 1.25% | 4 | | | 1.25% | | | | 1.25% | 4 |
Ratio of net investment income (loss) to average net assets | | | 1.06% | 4 | | | 0.97% | | | | 0.75% | 4 |
Portfolio turnover5 | | | 16.30% | 3 | | | 16.10% | | | | 21.72% | 3 |
| 1 | Commenced operations on April 30, 2015. |
| 2 | Calculated using the average daily shares method. |
| 5 | The portfolio turnover rate is calculated on the Fund as a whole without distinguishing between classes of shares issued. |
See accompanying notes to financial statements.
Matthews Emerging Asia Fund
The tables below set forth financial data for a share of beneficial interest outstanding throughout each period presented.
| | | | | | | | | | | | | | | | | | | | |
| INVESTOR CLASS | |
| Six-Month
Period Ended
June 30, 2017
(unaudited) |
| | | Year Ended Dec. 31 | | |
| Period Ended
Dec. 31, 20131 |
|
| | | 2016 | | | 2015 | | | 2014 | | |
Net Asset Value, beginning of period | | | $13.18 | | | | $11.27 | | | | $11.60 | | | | $9.93 | | | | $10.00 | |
INCOME (LOSS) FROM INVESTMENT OPERATIONS: | | | | | | | | | | | | | | | | | | | | |
Net investment income (loss)2 | | | 0.04 | | | | 0.15 | | | | 0.04 | | | | 0.04 | | | | (0.01 | ) |
Net realized gain (loss) and unrealized appreciation/depreciation on investments, foreign currency related transactions and foreign capital gains taxes | | | 1.44 | | | | 2.01 | | | | (0.34 | ) | | | 1.69 | | | | (0.05 | ) |
Total from investment operations | | | 1.48 | | | | 2.16 | | | | (0.30 | ) | | | 1.73 | | | | (0.06 | ) |
LESS DISTRIBUTIONS FROM: | | | | | | | | | | | | | | | | | | | | |
Net investment income | | | — | | | | (0.13 | ) | | | — | 3 | | | (0.06 | ) | | | — | 3 |
Return of capital | | | — | | | | — | | | | — | | | | — | | | | (0.01 | ) |
Net realized gains on investments | | | — | | | | (0.13 | ) | | | (0.03 | ) | | | — | | | | — | |
Total distributions | | | — | | | | (0.26 | ) | | | (0.03 | ) | | | (0.06 | ) | | | (0.01 | ) |
Paid-in capital from redemption fees (Note 4) | | | — | 3 | | | 0.01 | | | | — | 3 | | | — | 3 | | | — | 3 |
Net Asset Value, end of period | | | $14.66 | | | | $13.18 | | | | $11.27 | | | | $11.60 | | | | $9.93 | |
TOTAL RETURN | | | 11.23% | 4 | | | 19.25% | | | | (2.56% | ) | | | 17.39% | | | | (0.61% | )4 |
| | | | | |
RATIOS/SUPPLEMENTAL DATA | | | | | | | | | | | | | | | | | | | | |
Net assets, end of period (in 000’s) | | | $201,022 | | | | $145,164 | | | | $114,590 | | | | $110,363 | | | | $38,022 | |
Ratio of expenses to average net assets before any reimbursement, waiver or recapture of expenses by Advisor and Administrator (Note 5) | | | 1.62% | 5 | | | 1.77% | | | | 1.75% | | | | 1.78% | | | | 2.39% | 5 |
Ratio of expenses to average net assets after any reimbursement, waiver or recapture of expenses by Advisor and Administrator | | | 1.44% | 5 | | | 1.47% | | | | 1.50% | | | | 1.58% | | | | 1.98% | 5 |
Ratio of net investment income (loss) to average net assets | | | 0.57% | 5 | | | 1.26% | | | | 0.33% | | | | 0.34% | | | | (0.08% | )5 |
Portfolio turnover6 | | | 7.93% | 4 | | | 34.90% | | | | 12.14% | | | | 8.21% | | | | 1.66% | 4 |
| | | |
| INSTITUTIONAL CLASS | |
| Six-Month
Period Ended
June 30, 2017
(unaudited) |
| | | Year Ended Dec. 31 | | |
| Period Ended
Dec. 31, 20131 |
|
| | | 2016 | | | 2015 | | | 2014 | | |
Net Asset Value, beginning of period | | | $13.22 | | | | $11.29 | | | | $11.60 | | | | $9.92 | | | | $10.00 | |
INCOME (LOSS) FROM INVESTMENT OPERATIONS: | | | | | | | | | | | | | | | | | | | | |
Net investment income (loss)2 | | | 0.06 | | | | 0.21 | | | | 0.07 | | | | 0.06 | | | | 0.01 | |
Net realized gain (loss) and unrealized appreciation/depreciation on investments, foreign currency related transactions and foreign capital gains taxes | | | 1.43 | | | | 1.99 | | | | (0.34 | ) | | | 1.69 | | | | (0.07 | ) |
Total from investment operations | | | 1.49 | | | | 2.20 | | | | (0.27 | ) | | | 1.75 | | | | (0.06 | ) |
LESS DISTRIBUTIONS FROM: | | | | | | | | | | | | | | | | | | | | |
Net investment income | | | — | | | | (0.15 | ) | | | (0.01 | ) | | | (0.07 | ) | | | — | 3 |
Return of capital | | | — | | | | — | | | | — | | | | — | | | | (0.02 | ) |
Net realized gains on investments | | | — | | | | (0.13 | ) | | | (0.03 | ) | | | — | | | | — | |
Total distributions | | | — | | | | (0.28 | ) | | | (0.04 | ) | | | (0.07 | ) | | | (0.02 | ) |
Paid-in capital from redemption fees (Note 4) | | | — | 3 | | | 0.01 | | | | — | 3 | | | — | 3 | | | — | 3 |
Net Asset Value, end of period | | | $14.71 | | | | $13.22 | | | | $11.29 | | | | $11.60 | | | | $9.92 | |
TOTAL RETURN | | | 11.27% | 4 | | | 19.61% | | | | (2.33% | ) | | | 17.68% | | | | (0.55% | )4 |
| | | | | |
RATIOS/SUPPLEMENTAL DATA | | | | | | | | | | | | | | | | | | | | |
Net assets, end of period (in 000’s) | | | $175,785 | | | | $95,724 | | | | $55,278 | | | | $21,350 | | | | $2,017 | |
Ratio of expenses to average net assets before any reimbursement, waiver or recapture of expenses by Advisor and Administrator (Note 5) | | | 1.48% | 5 | | | 1.62% | | | | 1.57% | | | | 1.59% | | | | 2.21% | 5 |
Ratio of expenses to average net assets after any reimbursement, waiver or recapture of expenses by Advisor and Administrator | | | 1.25% | 5 | | | 1.25% | | | | 1.25% | | | | 1.33% | | | | 1.75% | 5 |
Ratio of net investment income (loss) to average net assets | | | 0.79% | 5 | | | 1.72% | | | | 0.65% | | | | 0.55% | | | | 0.19% | 5 |
Portfolio turnover6 | | | 7.93% | 4 | | | 34.90% | | | | 12.14% | | | | 8.21% | | | | 1.66% | 4 |
| 1 | Commenced operations on April 30, 2013. |
| 2 | Calculated using the average daily shares method. |
| 3 | Less than $0.01 per share. |
| 6 | The portfolio turnover rate is calculated on the Fund as a whole without distinguishing between classes of shares issued. |
See accompanying notes to financial statements.
| | | | |
| matthewsasia.com | 800.789.ASIA | | | 127 | |
Financial Highlights (continued)
Matthews Asia Innovators Fund
The tables below set forth financial data for a share of beneficial interest outstanding throughout each period presented.
| | | | | | | | | | | | | | | | | | | | | | | | |
| | | Six-Month Period Ended June 30, 2017 (unaudited) | | | Year Ended Dec. 31 | |
| INVESTOR CLASS | | | 2016 | | | 2015 | | | 2014 | | | 2013 | | | 2012 | |
Net Asset Value, beginning of period | | | $10.10 | | | | $12.32 | | | | $13.61 | | | | $12.59 | | | | $9.29 | | | | $8.16 | |
INCOME (LOSS) FROM INVESTMENT OPERATIONS: | | | | | | | | | | | | | | | | | | | | | | | | |
Net investment income (loss)1 | | | 0.01 | | | | (0.02 | ) | | | (0.05 | ) | | | — | 2 | | | 0.01 | | | | 0.03 | |
Net realized gain (loss) and unrealized appreciation/depreciation
on investments, foreign currency related transactions and
foreign capital gains taxes | | | 3.03 | | | | (1.07 | ) | | | 0.64 | | | | 1.16 | | | | 3.30 | | | | 1.12 | |
Total from investment operations | | | 3.04 | | | | (1.09 | ) | | | 0.59 | | | | 1.16 | | | | 3.31 | | | | 1.15 | |
LESS DISTRIBUTIONS FROM: | | | | | | | | | | | | | | | | | | | | | | | | |
Net investment income | | | — | | | | — | | | | — | | | | (0.06 | ) | | | (0.01 | ) | | | (0.02 | ) |
Net realized gains on investments | | | — | | | | (1.13 | ) | | | (1.88 | ) | | | (0.08 | ) | | | — | | | | — | |
Total distributions | | | — | | | | (1.13 | ) | | | (1.88 | ) | | | (0.14 | ) | | | (0.01 | ) | | | (0.02 | ) |
Paid-in capital from redemption fees (Note 4) | | | — | | | | — | | | | — | 2 | | | — | 2 | | | — | 2 | | | — | 2 |
Net Asset Value, end of period | | | $13.14 | | | | $10.10 | | | | $12.32 | | | | $13.61 | | | | $12.59 | | | | $9.29 | |
TOTAL RETURN | | | 30.10% | 5 | | | (9.10% | ) | | | 4.48% | | | | 9.24% | | | | 35.61% | | | | 14.11% | |
| | | | | | |
RATIOS/SUPPLEMENTAL DATA | | | | | | | | | | | | | | | | | | | | | | | | |
Net assets, end of period (in 000’s) | | | $122,547 | | | | $83,926 | | | | $129,763 | | | | $125,612 | | | | $111,751 | | | | $131,629 | |
Ratio of expenses to average net assets | | | 1.26% | 6 | | | 1.24% | | | | 1.18% | | | | 1.16% | | | | 1.18% | | | | 1.18% | |
Ratio of net investment income (loss) to average net assets | | | 0.25% | 6 | | | (0.19% | ) | | | (0.33% | ) | | | (0.02% | ) | | | 0.07% | | | | 0.30% | |
Portfolio turnover | | | 24.77% | 3,5 | | | 92.25% | 3 | | | 72.85% | 3 | | | 62.99% | 3 | | | 62.04% | 3 | | | 45.76% | |
| | | | |
| INSTITUTIONAL CLASS | | Six-Month Period Ended June 30, 2017 (unaudited) | | | Year Ended Dec. 31 | | | Period Ended Dec. 31, 20134 | | | | |
| | | 2016 | | | 2015 | | | 2014 | | | |
Net Asset Value, beginning of period | | | $10.14 | | | | $12.34 | | | | $13.61 | | | | $12.58 | | | | $10.09 | | | | | |
INCOME (LOSS) FROM INVESTMENT OPERATIONS: | | | | | | | | | | | | | | | | | | | | | | | | |
Net investment income (loss)1 | | | 0.03 | | | | 0.01 | | | | (0.02 | ) | | | 0.03 | | | | 0.04 | | | | | |
Net realized gain (loss) and unrealized appreciation/depreciation
on investments, foreign currency related transactions and
foreign capital gains taxes | | | 3.04 | | | | (1.08 | ) | | | 0.63 | | | | 1.17 | | | | 2.48 | | | | | |
Total from investment operations | | | 3.07 | | | | (1.07 | ) | | | 0.61 | | | | 1.20 | | | | 2.52 | | | | | |
LESS DISTRIBUTIONS FROM: | | | | | | | | | | | | | | | | | | | | | | | | |
Net investment income | | | — | | | | — | | | | — | | | | (0.09 | ) | | | (0.03 | ) | | | | |
Net realized gains on investments | | | — | | | | (1.13 | ) | | | (1.88 | ) | | | (0.08 | ) | | | — | | | | | |
Total distributions | | | — | | | | (1.13 | ) | | | (1.88 | ) | | | (0.17 | ) | | | (0.03 | ) | | | | |
Paid-in capital from redemption fees (Note 4) | | | — | | | | — | | | | — | 2 | | | — | 2 | | | — | 2 | | | | |
Net Asset Value, end of period | | | $13.21 | | | | $10.14 | | | | $12.34 | | | | $13.61 | | | | $12.58 | | | | | |
TOTAL RETURN | | | 30.28% | 5 | | | (8.92% | ) | | | 4.63% | | | | 9.54% | | | | 24.99% | 5 | | | | |
| | | | | | |
RATIOS/SUPPLEMENTAL DATA | | | | | | | | | | | | | | | | | | | | | | | | |
Net assets, end of period (in 000’s) | | | $26,795 | | | | $16,545 | | | | $36,770 | | | | $61,088 | | | | $49,236 | | | | | |
Ratio of expenses to average net assets | | | 1.05% | 6 | | | 1.01% | | | | 0.97% | | | | 0.95% | | | | 1.00% | 6 | | | | |
Ratio of net investment income (loss) to average net assets | | | 0.47% | 6 | | | 0.06% | | | | (0.16% | ) | | | 0.21% | | | | 0.56% | 6 | | | | |
Portfolio turnover3 | | | 24.77% | 5 | | | 92.25% | | | | 72.85% | | | | 62.99% | | | | 62.04% | 5 | | | | |
| 1 | Calculated using the average daily shares method. |
| 2 | Less than $0.01 per share. |
| 3 | The portfolio turnover rate is calculated on the Fund as a whole without distinguishing between classes of shares issued. |
| 4 | Institutional Class commenced operations on April 30, 2013. |
See accompanying notes to financial statements.
Matthews China Fund
The tables below set forth financial data for a share of beneficial interest outstanding throughout each period presented.
| | | | | | | | | | | | | | | | | | | | | | | | |
| | | Six-Month
Period Ended
June 30, 2017
(unaudited) | | | Year Ended Dec. 31 | |
| INVESTOR CLASS | | | 20161 | | | 20151 | | | 20141 | | | 2013 | | | 2012 | |
Net Asset Value, beginning of period | | | $15.47 | | | | $18.42 | | | | $21.46 | | | | $22.84 | | | | $23.47 | | | | $21.51 | |
INCOME (LOSS) FROM INVESTMENT OPERATIONS: | | | | | | | | | | | | | | | | | | | | | | | | |
Net investment income (loss)2 | | | 0.12 | | | | 0.21 | | | | 0.20 | | | | 0.24 | | | | 0.25 | | | | 0.30 | |
Net realized gain (loss) and unrealized appreciation/depreciation on investments, foreign currency related transactions and foreign capital gains taxes | | | 4.53 | | | | (1.04 | ) | | | 0.30 | | | | (1.25 | ) | | | 1.33 | | | | 2.26 | |
Total from investment operations | | | 4.65 | | | | (0.83 | ) | | | 0.50 | | | | (1.01 | ) | | | 1.58 | | | | 2.56 | |
LESS DISTRIBUTIONS FROM: | | | | | | | | | | | | | | | | | | | | | | | | |
Net investment income | | | — | | | | (0.26 | ) | | | (0.21 | ) | | | (0.27 | ) | | | (0.26 | ) | | | (0.35 | ) |
Net realized gains on investments | | | — | | | | (1.29 | ) | | | (3.33 | ) | | | (0.10 | ) | | | (1.95 | ) | | | (0.25 | ) |
Return of capital | | | — | | | | (0.57 | ) | | | — | | | | — | | | | — | | | | — | |
Total distributions | | | — | | | | (2.12 | ) | | | (3.54 | ) | | | (0.37 | ) | | | (2.21 | ) | | | (0.60 | ) |
Paid-in capital from redemption fees (Note 4) | | | — | | | | — | 3 | | | — | 3 | | | — | 3 | | | — | 3 | | | — | 3 |
Net Asset Value, end of period | | | $20.12 | | | | $15.47 | | | | $18.42 | | | | $21.46 | | | | $22.84 | | | | $23.47 | |
TOTAL RETURN | | | 30.06% | 4 | | | (5.18% | ) | | | 2.41% | | | | (4.42% | ) | | | 6.84% | | | | 11.96% | |
| | | | | | |
RATIOS/SUPPLEMENTAL DATA | | | | | | | | | | | | | | | | | | | | | | | | |
Net assets, end of period (in 000’s) | | | $617,322 | | | | $495,900 | | | | $709,767 | | | | $947,740 | | | | $1,286,309 | | | | $1,642,090 | |
Ratio of expenses to average net assets | | | 1.13% | 5 | | | 1.18% | | | | 1.14% | | | | 1.11% | | | | 1.08% | | | | 1.12% | |
Ratio of net investment income (loss) to average net assets | | | 1.38% | 5 | | | 1.24% | | | | 0.89% | | | | 1.09% | | | | 1.06% | | | | 1.33% | |
Portfolio turnover6 | | | 41.09% | 4 | | | 83.82% | | | | 66.22% | | | | 10.23% | | | | 6.29% | | | | 9.61% | |
| | |
INSTITUTIONAL CLASS | | Six-Month Period Ended June 30, 2017 (unaudited) | | | Year Ended Dec. 31 | |
| | | 20161 | | | 20151 | | | 20141 | | | 2013 | | | 2012 | |
Net Asset Value, beginning of period | | | $15.44 | | | | $18.39 | | | | $21.44 | | | | $22.81 | | | | $23.45 | | | | $21.49 | |
INCOME (LOSS) FROM INVESTMENT OPERATIONS: | | | | | | | | | | | | | | | | | | | | | | | | |
Net investment income (loss)2 | | | 0.21 | | | | 0.22 | | | | 0.25 | | | | 0.28 | | | | 0.26 | | | | 0.36 | |
Net realized gain (loss) and unrealized appreciation/depreciation on investments, foreign currency related transactions and foreign capital gains taxes | | | 4.45 | | | | (1.03 | ) | | | 0.27 | | | | (1.25 | ) | | | 1.36 | | | | 2.25 | |
Total from investment operations | | | 4.66 | | | | (0.81 | ) | | | 0.52 | | | | (0.97 | ) | | | 1.62 | | | | 2.61 | |
LESS DISTRIBUTIONS FROM: | | | | | | | | | | | | | | | | | | | | | | | | |
Net investment income | | | — | | | | (0.28 | ) | | | (0.24 | ) | | | (0.30 | ) | | | (0.31 | ) | | | (0.40 | ) |
Net realized gains on investments | | | — | | | | (1.29 | ) | | | (3.33 | ) | | | (0.10 | ) | | | (1.95 | ) | | | (0.25 | ) |
Return of capital | | | — | | | | (0.57 | ) | | | — | | | | — | | | | — | | | | — | |
Total distributions | | | — | | | | (2.14 | ) | | | (3.57 | ) | | | (0.40 | ) | | | (2.26 | ) | | | (0.65 | ) |
Paid-in capital from redemption fees (Note 4) | | | — | | | | — | 3 | | | — | 3 | | | — | 3 | | | — | 3 | | | — | 3 |
Net Asset Value, end of period | | | $20.10 | | | | $15.44 | | | | $18.39 | | | | $21.44 | | | | $22.81 | | | | $23.45 | |
TOTAL RETURN | | | 30.18% | 4 | | | (5.06% | ) | | | 2.50% | | | | (4.22% | ) | | | 6.97% | | | | 12.22% | |
| | | | | | |
RATIOS/SUPPLEMENTAL DATA | | | | | | | | | | | | | | | | | | | | | | | | |
Net assets, end of period (in 000’s) | | | $37,052 | | | | $15,874 | | | | $24,276 | | | | $52,478 | | | | $117,678 | | | | $390,744 | |
Ratio of expenses to average net assets | | | 0.99% | 5 | | | 1.03% | | | | 0.99% | | | | 0.95% | | | | 0.91% | | | | 0.91% | |
Ratio of net investment income (loss) to average net assets | | | 2.32% | 5 | | | 1.32% | | | | 1.09% | | | | 1.27% | | | | 1.13% | | | | 1.58% | |
Portfolio turnover6 | | | 41.09% | 4 | | | 83.82% | | | | 66.22% | | | | 10.23% | | | | 6.29% | | | | 9.61% | |
| 1 | Consolidated Financial Highlights. |
| 2 | Calculated using the average daily shares method. |
| 3 | Less than $0.01 per share. |
| 6 | The portfolio turnover rate is calculated on the Fund as a whole without distinguishing between classes of share issued. |
See accompanying notes to financial statements.
| | | | |
| matthewsasia.com | 800.789.ASIA | | | 129 | |
Financial Highlights (continued)
Matthews India Fund
The tables below set forth financial data for a share of beneficial interest outstanding throughout each period presented.
| | | | | | | | | | | | | | | | | | | | | | | | |
INVESTOR CLASS | |
| Six-Month
Period Ended June 30, 2017 (unaudited) |
| | | Year Ended Dec. 31 | |
| | | 2016 | | | 2015 | | | 2014 | | | 2013 | | | 2012 | |
Net Asset Value, beginning of period | | | $25.65 | | | | $26.43 | | | | $26.46 | | | | $16.28 | | | | $17.51 | | | | $13.59 | |
INCOME (LOSS) FROM INVESTMENT OPERATIONS: | | | | | | | | | | | | | | | | | | | | | | | | |
Net investment income (loss)1 | | | (0.04 | ) | | | 0.01 | | | | (0.05 | ) | | | 0.07 | | | | 0.08 | | | | 0.11 | |
Net realized gain (loss) and unrealized appreciation/depreciation on investments, foreign currency related transactions and foreign capital gains taxes | | | 5.73 | | | | (0.33 | ) | | | 0.26 | | | | 10.29 | | | | (1.13 | ) | | | 4.17 | |
Total from investment operations | | | 5.69 | | | | (0.32 | ) | | | 0.21 | | | | 10.36 | | | | (1.05 | ) | | | 4.28 | |
LESS DISTRIBUTIONS FROM: | | | | | | | | | | | | | | | | | | | | | | | | |
Net investment income | | | — | | | | — | | | | (0.03 | ) | | | (0.05 | ) | | | (0.18 | ) | | | (0.09 | ) |
Net realized gains on investments | | | — | | | | (0.46 | ) | | | (0.23 | ) | | | (0.14 | ) | | | (0.01 | ) | | | (0.27 | ) |
Total distributions | | | — | | | | (0.46 | ) | | | (0.26 | ) | | | (0.19 | ) | | | (0.19 | ) | | | (0.36 | ) |
Paid-in capital from redemption fees (Note 4) | | | — | | | | — | | | | 0.02 | | | | 0.01 | | | | 0.01 | | | | — | 2 |
Net Asset Value, end of period | | | $31.34 | | | | $25.65 | | | | $26.43 | | | | $26.46 | | | | $16.28 | | | | $17.51 | |
TOTAL RETURN | | | 22.18% | 3 | | | (1.23% | ) | | | 0.90% | | | | 63.71% | | | | (5.90% | ) | | | 31.54% | |
| | | | | | |
RATIOS/SUPPLEMENTAL DATA | | | | | | | | | | | | | | | | | | | | | | | | |
Net assets, end of period (in 000’s) | | | $1,300,231 | | | | $967,009 | | | | $1,151,948 | | | | $974,838 | | | | $427,861 | | | | $607,800 | |
Ratio of expenses to average net assets | | | 1.09% | 4 | | | 1.12% | | | | 1.11% | | | | 1.12% | | | | 1.13% | | | | 1.18% | |
Ratio of net investment income (loss) to average net assets | | | (0.26% | )4 | | | 0.02% | | | | (0.17% | ) | | | 0.32% | | | | 0.48% | | | | 0.65% | |
Portfolio turnover5 | | | 3.20% | 3 | | | 15.76% | | | | 9.51% | | | | 14.86% | | | | 8.70% | | | | 7.03% | |
| | |
INSTITUTIONAL CLASS | |
| Six-Month
Period Ended June 30, 2017 (unaudited) |
| | | Year Ended Dec. 31 | |
| | | 2016 | | | 2015 | | | 2014 | | | 2013 | | | 2012 | |
Net Asset Value, beginning of period | | | $25.77 | | | | $26.49 | | | | $26.49 | | | | $16.31 | | | | $17.53 | | | | $13.61 | |
INCOME (LOSS) FROM INVESTMENT OPERATIONS: | | | | | | | | | | | | | | | | | | | | | | | | |
Net investment income (loss)1 | | | (0.01 | ) | | | 0.04 | | | | 0.01 | | | | 0.09 | | | | 0.10 | | | | 0.14 | |
Net realized gain (loss) and unrealized appreciation/depreciation on investments, foreign currency related transactions and foreign capital gains taxes | | | 5.76 | | | | (0.30 | ) | | | 0.26 | | | | 10.29 | | | | (1.11 | ) | | | 4.17 | |
Total from investment operations | | | 5.75 | | | | (0.26 | ) | | | 0.27 | | | | 10.38 | | | | (1.01 | ) | | | 4.31 | |
LESS DISTRIBUTIONS FROM: | | | | | | | | | | | | | | | | | | | | | | | | |
Net investment income | | | — | | | | — | | | | (0.06 | ) | | | (0.08 | ) | | | (0.21 | ) | | | (0.12 | ) |
Net realized gains on investments | | | — | | | | (0.46 | ) | | | (0.23 | ) | | | (0.14 | ) | | | (0.01 | ) | | | (0.27 | ) |
Total distributions | | | — | | | | (0.46 | ) | | | (0.29 | ) | | | (0.22 | ) | | | (0.22 | ) | | | (0.39 | ) |
Paid-in capital from redemption fees (Note 4) | | | — | | | | — | | | | 0.02 | | | | 0.02 | | | | 0.01 | | | | — | 2 |
Net Asset Value, end of period | | | $31.52 | | | | $25.77 | | | | $26.49 | | | | $26.49 | | | | $16.31 | | | | $17.53 | |
TOTAL RETURN | | | 22.31% | 3 | | | (1.00% | ) | | | 1.12% | | | | 63.80% | | | | (5.67% | ) | | | 31.74% | |
| | | | | | |
RATIOS/SUPPLEMENTAL DATA | | | | | | | | | | | | | | | | | | | | | | | | |
Net assets, end of period (in 000’s) | | | $870,121 | | | | $551,202 | | | | $353,879 | | | | $109,331 | | | | $3,234 | | | | $36,166 | |
Ratio of expenses to average net assets | | | 0.89% | 4 | | | 0.91% | | | | 0.90% | | | | 0.94% | | | | 0.95% | | | | 0.98% | |
Ratio of net investment income (loss) to average net assets | | | (0.06% | )4 | | | 0.16% | | | | 0.02% | | | | 0.38% | | | | 0.61% | | | | 0.87% | |
Portfolio turnover5 | | | 3.20% | 3 | | | 15.76% | | | | 9.51% | | | | 14.86% | | | | 8.70% | | | | 7.03% | |
| 1 | Calculated using the average daily shares method. |
| 2 | Less than $0.01 per share. |
| 5 | The portfolio turnover rate is calculated on the Fund as a whole without distinguishing between classes of shares issued. |
See accompanying notes to financial statements.
Matthews Japan Fund
The tables below set forth financial data for a share of beneficial interest outstanding throughout each period presented.
| | | | | | | | | | | | | | | | | | | | | | | | |
| INVESTOR CLASS | | Six-Month Period Ended June 30, 2017 (unaudited) | | | Year Ended Dec. 31 | |
| | | 2016 | | | 2015 | | | 2014 | | | 2013 | | | 2012 | |
Net Asset Value, beginning of period | | | $18.83 | | | | $18.97 | | | | $15.70 | | | | $16.20 | | | | $12.27 | | | | $11.34 | |
INCOME (LOSS) FROM INVESTMENT OPERATIONS: | | | | | | | | | | | | | | | | | | | | | | | | |
Net investment income (loss)1 | | | 0.06 | | | | 0.08 | | | | 0.04 | | | | 0.05 | | | | 0.03 | | | | 0.10 | |
Net realized gain (loss) and unrealized appreciation/depreciation on investments and foreign currency related transactions | | | 2.69 | | | | (0.01 | ) | | | 3.23 | | | | (0.48 | ) | | | 4.12 | | | | 0.84 | |
Total from investment operations | | | 2.75 | | | | 0.07 | | | | 3.27 | | | | (0.43 | ) | | | 4.15 | | | | 0.94 | |
LESS DISTRIBUTIONS FROM: | | | | | | | | | | | | | | | | | | | | | | | | |
Net investment income | | | — | | | | (0.16 | ) | | | — | | | | (0.08 | ) | | | (0.24 | ) | | | (0.01 | ) |
Net realized gains on investments | | | — | | | | (0.05 | ) | | | — | | | | — | | | | — | | | | — | |
Total distributions | | | — | | | | (0.21 | ) | | | — | | | | (0.08 | ) | | | (0.24 | ) | | | (0.01 | ) |
Paid-in capital from redemption fees (Note 4) | | | — | | | | — | | | | — | 2 | | | 0.01 | | | | 0.02 | | | | — | 2 |
Net Asset Value, end of period | | | $21.58 | | | | $18.83 | | | | $18.97 | | | | $15.70 | | | | $16.20 | | | | $12.27 | |
TOTAL RETURN | | | 14.61% | 3 | | | 0.40% | | | | 20.83% | | | | (2.60% | ) | | | 34.03% | | | | 8.32% | |
| | | | | | |
RATIOS/SUPPLEMENTAL DATA | | | | | | | | | | | | | | | | | | | | | | | | |
Net assets, end of period (in 000’s) | | | $1,954,900 | | | | $1,685,872 | | | | $1,330,743 | | | | $467,854 | | | | $312,988 | | | | $82,463 | |
Ratio of expenses to average net assets before any reimbursement, waiver or recapture of expenses by Advisor and Administrator (Note 5) | | | 0.96% | 4 | | | 0.98% | | | | 0.99% | | | | 1.03% | | | | 1.10% | | | | 1.20% | |
Ratio of expenses to average net assets after any reimbursement, waiver or recapture of expenses by Advisor and Administrator | | | 0.96% | 4 | | | 0.98% | | | | 0.99% | | | | 1.03% | | | | 1.10% | | | | 1.20% | |
Ratio of net investment income (loss) to average net assets | | | 0.62% | 4 | | | 0.43% | | | | 0.22% | | | | 0.32% | | | | 0.19% | | | | 0.81% | |
Portfolio turnover5 | | | 22.23% | 3 | | | 55.15% | | | | 24.19% | | | | 42.52% | | | | 22.72% | | | | 48.58% | |
| | |
INSTITUTIONAL CLASS | | Six-Month Period Ended June 30, 2017 (unaudited) | | | Year Ended Dec. 31 | |
| | | 2016 | | | 2015 | | | 2014 | | | 2013 | | | 2012 | |
Net Asset Value, beginning of period | | | $18.86 | | | | $19.00 | | | | $15.71 | | | | $16.20 | | | | $12.26 | | | | $11.34 | |
INCOME (LOSS) FROM INVESTMENT OPERATIONS: | | | | | | | | | | | | | | | | | | | | | | | | |
Net investment income (loss)1 | | | 0.07 | | | | 0.10 | | | | 0.05 | | | | 0.09 | | | | 0.06 | | | | 0.12 | |
Net realized gain (loss) and unrealized appreciation/depreciation on investments and foreign currency related transactions | | | 2.69 | | | | — | 2 | | | 3.24 | | | | (0.50 | ) | | | 4.12 | | | | 0.84 | |
Total from investment operations | | | 2.76 | | | | 0.10 | | | | 3.29 | | | | (0.41 | ) | | | 4.18 | | | | 0.96 | |
LESS DISTRIBUTIONS FROM: | | | | | | | | | | | | | | | | | | | | | | | | |
Net investment income | | | — | | | | (0.19 | ) | | | — | | | | (0.09 | ) | | | (0.26 | ) | | | (0.04 | ) |
Net realized gains on investments | | | — | | | | (0.05 | ) | | | — | | | | — | | | | — | | | | — | |
Total distributions | | | — | | | | (0.24 | ) | | | — | | | | (0.09 | ) | | | (0.26 | ) | | | (0.04 | ) |
Paid-in capital from redemption fees (Note 4) | | | — | | | | — | | | | — | 2 | | | 0.01 | | | | 0.02 | | | | — | 2 |
Net Asset Value, end of period | | | $21.62 | | | | $18.86 | | | | $19.00 | | | | $15.71 | | | | $16.20 | | | | $12.26 | |
TOTAL RETURN | | | 14.63% | 3 | | | 0.51% | | | | 20.94% | | | | (2.47% | ) | | | 34.27% | | | | 8.47% | |
| | | | | | |
RATIOS/SUPPLEMENTAL DATA | | | | | | | | | | | | | | | | | | | | | | | | |
Net assets, end of period (in 000’s) | | | $1,515,019 | | | | $1,302,317 | | | | $618,583 | | | | $154,750 | | | | $59,702 | | | | $22,233 | |
Ratio of expenses to average net assets before any reimbursement, waiver or recapture of expenses by Advisor and Administrator (Note 5) | | | 0.86% | 4 | | | 0.88% | | | | 0.87% | | | | 0.90% | | | | 0.96% | | | | 1.04% | |
Ratio of expenses to average net assets after any reimbursement, waiver or recapture of expenses by Advisor and Administrator | | | 0.86% | 4 | | | 0.88% | | | | 0.87% | | | | 0.90% | | | | 0.96% | | | | 1.04% | |
Ratio of net investment income (loss) to average net assets | | | 0.71% | 4 | | | 0.54% | | | | 0.28% | | | | 0.58% | | | | 0.41% | | | | 0.99% | |
Portfolio turnover5 | | | 22.23% | 3 | | | 55.15% | | | | 24.19% | | | | 42.52% | | | | 22.72% | | | | 48.58% | |
| 1 | Calculated using the average daily shares method. |
| 2 | Less than $0.01 per share. |
| 5 | The portfolio turnover rate is calculated on the Fund as a whole without distinguishing between classes of shares issued. |
See accompanying notes to financial statements.
| | | | |
| matthewsasia.com | 800.789.ASIA | | | 131 | |
Financial Highlights (continued)
Matthews Korea Fund
The tables below set forth financial data for a share of beneficial interest outstanding throughout each period presented.
| | | | | | | | | | | | | | | | | | | | | | | | |
INVESTOR CLASS | | Six-Month
Period Ended
June 30, 2017 (unaudited) | | | Year Ended Dec. 31 | |
| | | 2016 | | | 2015 | | | 2014 | | | 2013 | | | 2012 | |
Net Asset Value, beginning of period | | | $5.25 | | | | $6.15 | | | | $5.65 | | | | $5.95 | | | | $5.64 | | | | $4.59 | |
INCOME (LOSS) FROM INVESTMENT OPERATIONS: | | | | | | | | | | | | | | | | | | | | | | | | |
Net investment income (loss)1 | | | — | | | | 0.02 | | | | 0.01 | | | | — | 2 | | | — | 2 | | | — | 2 |
Net realized gain (loss) and unrealized appreciation/depreciation on investments and foreign currency related transactions | | | 1.41 | | | | (0.41 | ) | | | 0.83 | | | | (0.05 | ) | | | 0.57 | | | | 1.10 | |
Total from investment operations | | | 1.41 | | | | (0.39 | ) | | | 0.84 | | | | (0.05 | ) | | | 0.57 | | | | 1.10 | |
LESS DISTRIBUTIONS FROM: | | | | | | | | | | | | | | | | | | | | | | | | |
Net investment income | | | — | | | | (0.08 | ) | | | (0.01 | ) | | | — | | | | (0.02 | ) | | | — | |
Net realized gains on investments | | | — | | | | (0.43 | ) | | | (0.33 | ) | | | (0.25 | ) | | | (0.24 | ) | | | (0.05 | ) |
Total distributions | | | — | | | | (0.51 | ) | | | (0.34 | ) | | | (0.25 | ) | | | (0.26 | ) | | | (0.05 | ) |
Paid-in capital from redemption fees (Note 4) | | | — | | | | — | | | | — | 2 | | | — | 2 | | | — | 2 | | | — | 2 |
Net Asset Value, end of period | | | $6.66 | | | | $5.25 | | | | $6.15 | | | | $5.65 | | | | $5.95 | | | | $5.64 | |
TOTAL RETURN | | | 26.86% | 3 | | | (6.32% | ) | | | 15.16% | | | | (0.73% | ) | | | 10.11% | | | | 24.05% | |
| | | | | | |
RATIOS/SUPPLEMENTAL DATA | | | | | | | | | | | | | | | | | | | | | | | | |
Net assets, end of period (in 000’s) | | | $182,165 | | | | $142,726 | | | | $147,685 | | | | $127,774 | | | | $138,830 | | | | $141,247 | |
Ratio of expenses to average net assets | | | 1.13% | 4 | | | 1.15% | | | | 1.10% | | | | 1.11% | | | | 1.13% | | | | 1.16% | |
Ratio of net investment income (loss) to average net assets | | | (0.08% | )4 | | | 0.41% | | | | 0.18% | | | | 0.04% | | | | 0.02% | | | | 0.01% | |
Portfolio turnover5 | | | 8.63% | 3 | | | 34.73% | | | | 20.36% | | | | 17.37% | | | | 46.20% | | | | 34.84% | |
| | |
| INSTITUTIONAL CLASS | | Six-Month Period Ended June 30, 2017 (unaudited) | | | Year Ended Dec. 31 | |
| | | 2016 | | | 2015 | | | 2014 | | | 2013 | | | 2012 | |
Net Asset Value, beginning of period | | | $5.27 | | | | $6.18 | | | | $5.68 | | | | $5.96 | | | | $5.67 | | | | $4.61 | |
INCOME (LOSS) FROM INVESTMENT OPERATIONS: | | | | | | | | | | | | | | | | | | | | | | | | |
Net investment income (loss)1 | | | — | | | | (0.02 | ) | | | 0.02 | | | | 0.05 | | | | — | 2 | | | — | 2 |
Net realized gain (loss) and unrealized appreciation/depreciation on investments and foreign currency related transactions | | | 1.43 | | | | (0.37 | ) | | | 0.83 | | | | (0.08 | ) | | | 0.56 | | | | 1.11 | |
Total from investment operations | | | 1.43 | | | | (0.39 | ) | | | 0.85 | | | | (0.03 | ) | | | 0.56 | | | | 1.11 | |
LESS DISTRIBUTIONS FROM: | | | | | | | | | | | | | | | | | | | | | | | | |
Net investment income | | | — | | | | (0.09 | ) | | | (0.02 | ) | | | — | | | | (0.03 | ) | | | — | |
Net realized gains on investments | | | — | | | | (0.43 | ) | | | (0.33 | ) | | | (0.25 | ) | | | (0.24 | ) | | | (0.05 | ) |
Total distributions | | | — | | | | (0.52 | ) | | | (0.35 | ) | | | (0.25 | ) | | | (0.27 | ) | | | (0.05 | ) |
Paid-in capital from redemption fees (Note 4) | | | — | | | | — | | | | — | 2 | | | — | 2 | | | — | 2 | | | — | 2 |
Net Asset Value, end of period | | | $6.70 | | | | $5.27 | | | | $6.18 | | | | $5.68 | | | | $5.96 | | | | $5.67 | |
TOTAL RETURN | | | 27.14% | 3 | | | (6.31% | ) | | | 15.27% | | | | (0.39% | ) | | | 9.87% | | | | 24.16% | |
| | | | | | |
RATIOS/SUPPLEMENTAL DATA | | | | | | | | | | | | | | | | | | | | | | | | |
Net assets, end of period (in 000’s) | | | $19,599 | | | | $7,462 | | | | $59,982 | | | | $91,431 | | | | $12,283 | | | | $8,597 | |
Ratio of expenses to average net assets | | | 1.01% | 4 | | | 0.97% | | | | 0.93% | | | | 0.93% | | | | 0.97% | | | | 1.00% | |
Ratio of net investment income (loss) to average net assets | | | 0.01% | 4 | | | (0.31% | ) | | | 0.28% | | | | 0.87% | | | | (0.03% | ) | | | (0.07% | ) |
Portfolio turnover5 | | | 8.63% | 3 | | | 34.73% | | | | 20.36% | | | | 17.37% | | | | 46.20% | | | | 34.84% | |
| 1 | Calculated using the average daily shares method. |
| 2 | Less than $0.01 per share. |
| 5 | The portfolio turnover rate is calculated on the Fund as a whole without distinguishing between classes of share issued. |
See accompanying notes to financial statements.
Matthews Asia Small Companies Fund
The tables below set forth financial data for a share of beneficial interest outstanding throughout each period presented.
| | | | | | | | | | | | | | | | | | | | | | | | |
INVESTOR CLASS | |
| Six-Month
Period Ended June 30, 2017 (unaudited) |
| | | Year Ended Dec. 31 | |
| | | 2016 | | | 2015 | | | 2014 | | | 2013 | | | 2012 | |
Net Asset Value, beginning of period | | | $19.05 | | | | $19.41 | | | | $21.46 | | | | $19.34 | | | | $18.13 | | | | $14.77 | |
INCOME (LOSS) FROM INVESTMENT OPERATIONS: | | | | | | | | | | | | | | | | | | | | | | | | |
Net investment income (loss)1 | | | (0.02 | ) | | | 0.09 | | | | 0.02 | | | | 0.09 | | | | 0.11 | | | | 0.17 | |
Net realized gain (loss) and unrealized appreciation/depreciation on investments, foreign currency related transactions and
foreign capital gains taxes | | | 2.78 | | | | (0.37 | ) | | | (2.05 | ) | | | 2.11 | | | | 1.19 | | | | 3.36 | |
Total from investment operations | | | 2.76 | | | | (0.28 | ) | | | (2.03 | ) | | | 2.20 | | | | 1.30 | | | | 3.53 | |
LESS DISTRIBUTIONS FROM: | | | | | | | | | | | | | | | | | | | | | | | | |
Net investment income | | | — | | | | (0.08 | ) | | | (0.03 | ) | | | (0.08 | ) | | | (0.09 | ) | | | (0.09 | ) |
Net realized gains on investments | | | — | | | | — | | | | — | | | | — | | | | — | | | | (0.08 | ) |
Total distributions | | | — | | | | (0.08 | ) | | | (0.03 | ) | | | (0.08 | ) | | | (0.09 | ) | | | (0.17 | ) |
Paid-in capital from redemption fees (Note 4) | | | — | 2 | | | — | 2 | | | 0.01 | | | | — | 2 | | | — | 2 | | | — | 2 |
Net Asset Value, end of period | | | $21.81 | | | | $19.05 | | | | $19.41 | | | | $21.46 | | | | $19.34 | | | | $18.13 | |
TOTAL RETURN | | | 14.49% | 3 | | | (1.44% | ) | | | (9.43% | ) | | | 11.39% | | | | 7.19% | | | | 23.92% | |
| | | | | | |
RATIOS/SUPPLEMENTAL DATA | | | | | | | | | | | | | | | | | | | | | | | | |
Net assets, end of period (in 000’s) | | | $204,540 | | | | $254,226 | | | | $387,747 | | | | $599,082 | | | | $407,352 | | | | $366,753 | |
Ratio of expenses to average net assets before any reimbursement, waiver or recapture of expenses by Advisor and Administrator (Note 5) | | | 1.55% | 4 | | | 1.49% | | | | 1.48% | | | | 1.47% | | | | 1.47% | | | | 1.50% | |
Ratio of expenses to average net assets after any reimbursement, waiver or recapture of expenses by Advisor and Administrator | | | 1.50% | 4 | | | 1.47% | | | | 1.47% | | | | 1.47% | | | | 1.47% | | | | 1.50% | |
Ratio of net investment income (loss) to average net assets | | | (0.24% | )4 | | | 0.45% | | | | 0.08% | | | | 0.44% | | | | 0.58% | | | | 1.06% | |
Portfolio turnover | | | 31.93% | 3,5 | | | 44.44% | 5 | | | 48.29% | 5 | | | 21.70% | 5 | | | 37.01% | 5 | | | 27.95% | |
| | | | |
INSTITUTIONAL CLASS | | Six-Month
Period Ended
June 30, 2017 (unaudited) | | | Year Ended Dec. 31 | | | Period Ended Dec. 31, 20136 | | | | |
| | | 2016 | | | 2015 | | | 2014 | | | |
Net Asset Value, beginning of period | | | $19.03 | | | | $19.40 | | | | $21.46 | | | | $19.33 | | | | $19.44 | | | | | |
INCOME (LOSS) FROM INVESTMENT OPERATIONS: | | | | | | | | | | | | | | | | | | | | | | | | |
Net investment income (loss)1 | | | 0.01 | | | | 0.12 | | | | 0.11 | | | | 0.15 | | | | 0.18 | | | | | |
Net realized gain (loss) and unrealized appreciation/depreciation on investments, foreign currency related transactions and
foreign capital gains taxes | | | 2.78 | | | | (0.36 | ) | | | (2.10 | ) | | | 2.10 | | | | (0.16 | ) | | | | |
Total from investment operations | | | 2.79 | | | | (0.24 | ) | | | (1.99 | ) | | | 2.25 | | | | 0.02 | | | | | |
LESS DISTRIBUTIONS FROM: | | | | | | | | | | | | | | | | | | | | | | | | |
Net investment income | | | — | | | | (0.13 | ) | | | (0.08 | ) | | | (0.12 | ) | | | (0.13 | ) | | | | |
Total distributions | | | — | | | | (0.13 | ) | | | (0.08 | ) | | | (0.12 | ) | | | (0.13 | ) | | | | |
Paid-in capital from redemption fees (Note 4) | | | — | 2 | | | — | 2 | | | 0.01 | | | | — | 2 | | �� | — | 2 | | | | |
Net Asset Value, end of period | | | $21.82 | | | | $19.03 | | | | $19.40 | | | | $21.46 | | | | $19.33 | | | | | |
TOTAL RETURN | | | 14.66% | 3 | | | (1.24% | ) | | | (9.23% | ) | | | 11.65% | | | | 0.13% | 3 | | | | |
| | | | | | |
RATIOS/SUPPLEMENTAL DATA | | | | | | | | | | | | | | | | | | | | | | | | |
Net assets, end of period (in 000’s) | | | $195,374 | | | | $174,962 | | | | $222,168 | | | | $77,168 | | | | $44,769 | | | | | |
Ratio of expenses to average net assets before any reimbursement, waiver or recapture of expenses by Advisor and Administrator (Note 5) | | | 1.37% | 4 | | | 1.34% | | | | 1.30% | | | | 1.27% | | | | 1.25% | 4 | | | | |
Ratio of expenses to average net assets after any reimbursement, waiver or recapture of expenses by Advisor and Administrator | | | 1.25% | 4 | | | 1.25% | | | | 1.25% | | | | 1.26% | | | | 1.25% | 4 | | | | |
Ratio of net investment income (loss) to average net assets | | | 0.10% | 4 | | | 0.64% | | | | 0.53% | | | | 0.70% | | | | 1.39% | 4 | | | | |
Portfolio turnover5 | | | 31.93% | 3 | | | 44.44% | | | | 48.29% | | | | 21.70% | | | | 37.01% | 3 | | | | |
| 1 | Calculated using the average daily shares method. |
| 2 | Less than $0.01 per share. |
| 5 | The portfolio turnover rate is calculated on the Fund as a whole without distinguishing between classes of shares issued. |
| 6 | Institutional Class commenced operations on April 30, 2013. |
See accompanying notes to financial statements.
| | | | |
| matthewsasia.com | 800.789.ASIA | | | 133 | |
Financial Highlights (continued)
Matthews China Small Companies Fund
The table below sets forth financial data for a share of beneficial interest outstanding throughout each period presented.
| | | | | | | | | | | | | | | | | | | | | | | | |
| INVESTOR CLASS | |
| Six-Month
Period Ended June 30, 2017 (unaudited) |
| | | Year Ended Dec. 31 | |
| | | 2016 | | | 2015 | | | 2014 | | | 2013 | | | 2012 | |
Net Asset Value, beginning of period | | | $8.21 | | | | $8.79 | | | | $9.21 | | | | $9.89 | | | | $7.76 | | | | $7.04 | |
INCOME (LOSS) FROM INVESTMENT OPERATIONS: | | | | | | | | | | | | | | | | | | | | | | | | |
Net investment income (loss)1 | | | 0.06 | | | | 0.10 | | | | 0.08 | | | | 0.01 | | | | 0.02 | | | | 0.03 | |
Net realized gain (loss) and unrealized appreciation/depreciation on investments and foreign currency related transactions | | | 1.84 | | | | (0.28 | ) | | | 0.27 | | | | (0.33 | ) | | | 2.22 | | | | 0.68 | |
Total from investment operations | | | 1.90 | | | | (0.18 | ) | | | 0.35 | | | | (0.32 | ) | | | 2.24 | | | | 0.71 | |
LESS DISTRIBUTIONS FROM: | | | | | | | | | | | | | | | | | | | | | | | | |
Net investment income | | | — | | | | (0.03 | ) | | | (0.06 | ) | | | (0.02 | ) | | | (0.11 | ) | | | (0.02 | ) |
Net realized gains on investments | | | — | | | | (0.37 | ) | | | (0.72 | ) | | | — | | | | — | | | | — | |
Return of capital; | | | — | | | | — | | | | — | | | | (0.34 | ) | | | — | | | | — | |
Total distributions | | | — | | | | (0.40 | ) | | | (0.78 | ) | | | (0.36 | ) | | | (0.11 | ) | | | (0.02 | ) |
Paid-in capital from redemption fees (Note 4) | | | — | 2 | | | — | 2 | | | 0.01 | | | | — | 2 | | | — | 2 | | | 0.03 | |
Net Asset Value, end of period | | | $10.11 | | | | $8.21 | | | | $8.79 | | | | $9.21 | | | | $9.89 | | | | $7.76 | |
TOTAL RETURN | | | 23.14% | 3 | | | (2.35% | ) | | | 4.07% | | | | (3.33% | ) | | | 28.85% | | | | 10.53% | |
| | | | | | |
RATIOS/SUPPLEMENTAL DATA | | | | | | | | | | | | | | | | | | | | | | | | |
Net assets, end of period (in 000’s) | | | $19,970 | | | | $16,101 | | | | $21,546 | | | | $22,068 | | | | $26,674 | | | | $10,266 | |
Ratio of expenses to average net assets before any reimbursement, waiver or recapture of expenses by Advisor and Administrator (Note 5) | | | 2.41% | 4 | | | 2.24% | | | | 2.10% | | | | 1.90% | | | | 2.04% | | | | 3.26% | |
Ratio of expenses to average net assets after any reimbursement, waiver or recapture of expenses by Advisor and Administrator | | | 1.50% | 4 | | | 1.50% | | | | 1.50% | | | | 1.67% | | | | 2.00% | | | | 2.00% | |
Ratio of net investment income (loss) to average net assets | | | 1.36% | 4 | | | 1.17% | | | | 0.80% | | | | 0.14% | | | | 0.17% | | | | 0.40% | |
Portfolio turnover | | | 30.20% | 3 | | | 63.15% | | | | 72.49% | | | | 32.42% | | | | 10.28% | | | | 34.01% | |
| 1 | Calculated using the average daily shares method. |
| 2 | Less than $0.01 per share. |
See accompanying notes to financial statements.
Notes to Financial Statements (unaudited)
Matthews Asia Funds (the “Trust”) is an open-end management investment company registered under the Investment Company Act of 1940, as amended (the “1940 Act”). The Trust currently issues eighteen separate series of shares (each a “Fund” and collectively, the “Funds”): Matthews Asia Strategic Income Fund, Matthews Asia Credit Opportunities Fund, Matthews Asian Growth and Income Fund, Matthews Asia Dividend Fund, Matthews China Dividend Fund, Matthews Asia Value Fund, Matthews Asia Focus Fund, Matthews Asia Growth Fund, Matthews Pacific Tiger Fund, Matthews Asia ESG Fund, Matthews Emerging Asia Fund, Matthews Asia Innovators Fund, Matthews China Fund, Matthews India Fund, Matthews Japan Fund, Matthews Korea Fund, Matthews Asia Small Companies Fund, and Matthews China Small Companies Fund. Each Fund except for Matthews China Small Companies Fund currently offers two classes of shares: Investor Class and Institutional Class. Matthews China Small Companies Fund currently offers only Investor Class shares. Each class of shares has identical voting, dividend, liquidation and other rights and the same terms and conditions, except each class may be subject to different class expenses as outlined in the relevant prospectus and each class has exclusive voting rights with respect to matters solely affecting such class.
The Matthews Japan Fund closed to most new investors effective after market closing on July 29, 2016, but will continue to accept investments from existing shareholders.
| 2. | SIGNIFICANT ACCOUNTING POLICIES |
The following is a summary of significant accounting policies consistently followed by the Funds in preparation of their financial statements.
| A. | SECURITY VALUATION: The value of the Matthews Asia Funds’ (each a “Fund”, and collectively the “Funds” or the “Trust”) securities is based on market quotations for those securities, or on their fair value determined by the valuation policies approved by the Funds’ Board of Trustees (the “Board”). Market quotations and valuation information are provided by commercial pricing services or securities dealers that are independent of the Funds and Matthews International Capital Management, LLC (“Matthews”), in accordance with procedures established by the Funds’ Board. Foreign exchange-traded securities are valued as of the close of trading on the primary exchange on which they trade. Securities that trade in over-the-counter markets, including most debt securities (bonds), may be valued by other third-party vendors or by using indicative bid quotations from dealers or market makers, or other available market information. Market values for securities are determined based on quotations, market data or other information from the principal (or most advantageous) market on which the security is traded. Market quotations for equity securities used by the Funds include last reported sale prices, or, if such prices are not reported or available, bid and ask prices. Financial futures contracts traded on exchanges are valued at their settlement price. Swap agreements are valued utilizing quotes received daily by the Funds’ pricing service or through brokers, which are derived using daily swap curves and models that incorporate a number of market data factors, such as discounted cash flows, trades and values of the underlying reference instruments. Foreign currency exchange contracts are valued at the mean between the bid and ask prices and are determined at the close of business on the New York Stock Exchange (“NYSE”). Interpolated values are derived when the settlement date of the contract is an interim date for which quotations are not available. The Funds may also utilize independent pricing services to assist them in determining a current market value for each security based on sources believed to be reliable. |
The Board has delegated to the Board’s Valuation Committee the responsibility for oversight of the fair valuation process under the Trust’s Valuation and Pricing Policy. The Board’s Valuation Committee, in turn, has delegated the determination of fair value prices under Matthews’ Valuation and Pricing Procedures to Matthews’ Valuation Committee (the “Valuation Committee”). The Board’s Valuation Committee will review and approve fair value determinations by Matthews’ Valuation Committee in accordance with the Valuation and Pricing Policy. When fair value pricing is employed, the prices of securities used by a Fund to calculate its Net Asset Value (“NAV”) may differ from any quoted or published prices for the same securities for that day. All fair value determinations are made subject to the Board’s oversight. Events affecting the value of foreign investments may occur between the time at which they are determined and when the Funds calculate their NAV, which is normally the close of trading on the NYSE. If such events render market quotations unreliable, and the impact of such events can be reasonably determined, the investments will be valued at their fair value in accordance with pricing policies. The fair value of a security held by the Funds may be determined using the services of third-party pricing services to assist in this process.
The books and records of the Funds are maintained in U.S. dollars. Transactions, portfolio securities, and assets and liabilities denominated in a foreign currency are translated and recorded in U.S. dollars at the prevailing exchange rate as of the close of trading on the NYSE. Translation gains or losses resulting from changes in the exchange rate during the reporting period and realized gains and losses on the settlement of foreign currency transactions are reported in the results of operations for the current period. The Funds isolate that portion of gains and losses on investments in fixed income securities that is due to changes in foreign exchange rate from that which is due to changes in market prices of securities.
Foreign securities held by the Funds may be traded on days and at times when the NYSE is closed. Accordingly, the value of the Funds may be significantly affected on days when shareholders have no access to the Funds.
| B. | FAIR VALUE MEASUREMENTS: In accordance with the guidance on fair value measurements and disclosures under generally accepted accounting principles in the United States (“U.S. GAAP”), the Funds disclose the fair value of their investments and derivative financial instruments in a hierarchy that prioritizes the inputs to valuation techniques used to measure the fair value. The hierarchy gives the highest priority to valuations based upon unadjusted quoted prices in active markets for identical assets or liabilities (Level 1 measurements) and the lowest priority to valuations based upon unobservable inputs that are significant to the valuation (Level 3 measurements). Various inputs are used in determining the fair value of investments and derivative financial instruments, which are as follows: |
Level 1: Quoted prices in active markets for identical securities.
Level 2: Other significant observable inputs (including quoted prices for similar securities, interest rates, prepayment speeds, credit risk, foreign exchange etc.).
Level 3: Significant unobservable inputs (including the Fund’s own assumptions in determining the fair value of investments and derivative financial instruments).
| | | | |
| matthewsasia.com | 800.789.ASIA | | | 135 | |
Notes to Financial Statements (unaudited) (continued)
The summary of inputs used to determine the fair valuation of the Fund’s investments and derivative financials instruments as of June 30, 2017 is as follows:
| | | | | | | | | | | | | | | | | | | | | | | | | | | | |
| | | Matthews Asia
Strategic Income Fund | | | Matthews Asia Credit
Opportunities Fund | | | Matthews Asian
Growth and
Income Fund | | | Matthews Asia
Dividend Fund | | | Matthews Asia
Value Fund | | | Matthews Asia
Focus Fund | | | Matthews Asia
Growth Fund | |
| Assets: | | | | | | | | | | | | | | | | | | | | | | | | | | | | |
| Investments: | | | | | | | | | | | | | | | | | | | | | | | | | | | | |
Level 1: Quoted Prices | | | | | | | | | | | | | | | | | | | | | | | | | | | | |
China/Hong Kong | | | $— | | | | $— | | | | $146,411,692 | | | | $381,540,115 | | | | $2,464,380 | | | | $221,250 | | | | $88,332,905 | |
India | | | — | | | | — | | | | — | | | | 12,854,232 | | | | — | | | | — | | | | — | |
Indonesia | | | — | | | | — | | | | 48,329,918 | | | | 47,305,827 | | | | — | | | | — | | | | 12,285,422 | |
Israel | | | — | | | | — | | | | — | | | | — | | | | 190,502 | | | | — | | | | — | |
Japan | | | — | | | | — | | | | — | | | | 36,041,763 | | | | — | | | | — | | | | — | |
Malaysia | | | — | | | | — | | | | 35,386,190 | | | | — | | | | 733,389 | | | | 317,624 | | | | — | |
Pakistan | | | — | | | | — | | | | — | | | | — | | | | — | | | | — | | | | 10,270,187 | |
Philippines | | | — | | | | — | | | | 30,135,553 | | | | 58,758,443 | | | | — | | | | — | | | | 5,669,569 | |
Singapore | | | — | | | | — | | | | — | | | | 57,899,654 | | | | — | | | | — | | | | — | |
South Korea | | | — | | | | — | | | | 3,769,315 | | | | — | | | | 1,694,056 | | | | — | | | | — | |
Sri Lanka | | | — | | | | — | | | | — | | | | — | | | | — | | | | — | | | | 24,852,335 | |
Taiwan | | | — | | | | — | | | | 59,885,535 | | | | 105,856,782 | | | | — | | | | — | | | | — | |
United States | | | — | | | | — | | | | 91,706,365 | | | | — | | | | 302,810 | | | | 622,232 | | | | — | |
Vietnam | | | — | | | | — | | | | 43,639,975 | | | | 82,422,200 | | | | — | | | | — | | | | 18,006,793 | |
Level 2: Other Significant Observable Inputs | | | | | | | | | | | | | | | | | | | | | | | | | |
Foreign Government Obligationsa | | | 30,894,709 | | | | 2,246,582 | | | | — | | | | — | | | | — | | | | — | | | | — | |
Non-Convertible Corporate Bondsa | | | 37,257,268 | | | | 14,409,831 | | | | — | | | | — | | | | — | | | | — | | | | — | |
Convertible Corporate Bondsa | | | 6,350,750 | | | | 1,715,250 | | | | 293,349,408 | | | | — | | | | — | | | | — | | | | — | |
Common Equities: | | | | | | | | | | | | | | | | | | | | | | | | | | | | |
Australia | | | — | | | | — | | | | 140,390,868 | | | | 85,484,086 | | | | — | | | | 250,607 | | | | 32,261,883 | |
Bangladesh | | | — | | | | — | | | | — | | | | — | | | | — | | | | — | | | | 20,303,012 | |
China/Hong Kong | | | — | | | | — | | | | 557,521,054 | | | | 1,613,084,219 | | | | 2,764,275 | | | | 3,830,762 | | | | 28,786,982 | |
India | | | — | | | | — | | | | 49,082,753 | | | | 252,426,811 | | | | — | | | | 519,129 | | | | 75,143,397 | |
Indonesia | | | — | | | | — | | | | 64,127,400 | | | | 104,968,756 | | | | — | | | | 468,280 | | | | 93,774,529 | |
Japan | | | — | | | | — | | | | 177,624,370 | | | | 1,568,708,437 | | | | 2,198,657 | | | | 316,333 | | | | 270,532,681 | |
Luxembourg | | | — | | | | — | | | | — | | | | 81,557,941 | | | | — | | | | — | | | | — | |
Malaysia | | | — | | | | — | | | | 61,300,920 | | | | — | | | | 196,630 | | | | 311,821 | | | | — | |
New Zealand | | | — | | | | — | | | | 41,199,718 | | | | — | | | | — | | | | — | | | | — | |
Norway | | | — | | | | — | | | | 42,175,432 | | | | — | | | | — | | | | — | | | | — | |
Philippines | | | — | | | | — | | | | — | | | | — | | | | — | | | | — | | | | 14,852,447 | |
Singapore | | | — | | | | — | | | | 335,479,932 | | | | 391,622,326 | | | | 864,579 | | | | 1,483,415 | | | | — | |
South Korea | | | — | | | | — | | | | 254,075,330 | | | | 521,328,880 | | | | 3,391,018 | | | | 1,611,351 | | | | — | |
Switzerland | | | — | | | | — | | | | — | | | | — | | | | 301,206 | | | | 286,890 | | | | — | |
Taiwan | | | — | | | | — | | | | 77,082,308 | | | | 57,074,627 | | | | 1,030,766 | | | | 878,509 | | | | 3,619,475 | |
Thailand | | | — | | | | — | | | | 36,045,578 | | | | 123,578,083 | | | | — | | | | 324,011 | | | | 7,664,439 | |
Vietnam | | | — | | | | — | | | | — | | | | — | | | | — | | | | — | | | | 2,931,757 | |
Preferred Equities: | | | | | | | | | | | | | | | | | | | | | | | | | | | | |
South Korea | | | — | | | | — | | | | 89,235,798 | | | | 307,627,555 | | | | 1,869,946 | | | | — | | | | — | |
Level 3: Significant Unobservable Inputs | | | | | | | | | | | | | | | | | | | | | | | | | | | | |
Common Equities: | | | | | | | | | | | | | | | | | | | | | | | | | | | | |
China/Hong Kong | | | — | | | | — | | | | 40,866,096 | | | | — | | | | — | | | | — | | | | — | |
Total Market Value of Investments | | | $74,502,727 | | | | $18,371,663 | | | | $2,718,821,508 | | | | $5,890,140,737 | | | | $18,002,214 | | | | $11,442,214 | | | | $709,287,813 | |
| a | Industry, countries, or security types are disclosed on the Schedule of Investments. |
| | | | | | | | |
| | | Matthews Asia
Strategic Income
Fund | | | Matthews Asia
Credit Opportunities
Fund | |
Derivative Financial Instruments1 | | | | | | | | |
Assets | | | | | | | | |
Level 2: Other Significant Observable Inputs | | | | | | | | |
Foreign Currency Exchange Contracts | | | $171,473 | | | | $— | |
Credit default swaps | | | 2,685 | | | | 671 | |
| | | | | | | | |
| | | $174,158 | | | | $671 | |
Liabilities | | | | | | | | |
Level 2: Other Significant Observable Inputs | | | | | | | | |
Foreign Currency Exchange Contracts | | | ($47,981 | ) | | | $— | |
| | | | | | | | |
| 1 | Derivative financial instruments are foreign currency exchange contracts and swaps. Foreign currency exchange contracts and swaps are valued at the unrealized appreciation/depreciation on the instrument. |
| | | | | | | | | | | | | | | | | | | | | | | | |
| | | Matthews China
Dividend Fund | | | Matthews
China Fund | | | Matthews India Fund | | | Matthews Japan Fund | | | Matthews Korea Fund | | | Matthews China Small
Companies Fund | |
| Assets: | | | | | | | | | | | | | | | | | | | | | | | | |
| Investments: | | | | | | | | | | | | | | | | | | | | | | | | |
Level 1: Quoted Prices | | | | | | | | | | | | | | | | | | | | | | | | |
Common Equities: | | | | | | | | | | | | | | | | | | | | | | | | |
Consumer Discretionary | | | $11,980,373 | | | | $56,655,558 | | | | $8,772,613 | | | | $— | | | | $9,842,674 | | | | $1,597,836 | |
Consumer Staples | | | 4,110,857 | | | | 3,717,489 | | | | 65,438,203 | | | | — | | | | — | | | | — | |
Financials | | | 1,830,984 | | | | — | | | | 87,081,327 | | | | — | | | | 3,049,312 | | | | — | |
Health Care | | | 4,270,403 | | | | 3,314,321 | | | | 99,209,378 | | | | — | | | | — | | | | 1,049,919 | |
Industrials | | | 10,782,056 | | | | — | | | | 63,331,391 | | | | — | | | | — | | | | 539,439 | |
Information Technology | | | 6,072,726 | | | | 94,790,062 | | | | 86,339,920 | | | | — | | | | — | | | | 715,975 | |
Materials | | | — | | | | 5,301,747 | | | | — | | | | — | | | | — | | | | — | |
Real Estate | | | 9,186,116 | | | | — | | | | — | | | | — | | | | — | | | | — | |
Telecommunication Services | | | 6,441,410 | | | | — | | | | — | | | | — | | | | 7,748,986 | | | | — | |
Preferred Equities: | | | | | | | | | | | | | | | | | | | | | | | | |
Financials | | | — | | | | — | | | | — | | | | — | | | | 4,869,589 | | | | — | |
Level 2: Other Significant Observable Inputs | | | | | | | | | | | | | | | | | | | | | | | | |
Common Equities: | | | | | | | | | | | | | | | | | | | | | | | | |
Consumer Discretionary | | | 29,179,450 | | | | 35,645,968 | | | | 196,381,058 | | | | 624,393,389 | | | | 22,490,130 | | | | 2,724,453 | |
Consumer Staples | | | 11,001,713 | | | | 20,958,763 | | | | 323,316,743 | | | | 387,605,277 | | | | 5,636,270 | | | | 521,247 | |
Energy | | | 6,989,074 | | | | 38,704,792 | | | | — | | | | — | | | | 4,907,169 | | | | 711,393 | |
Financials | | | 42,326,994 | | | | 188,819,152 | | | | 619,842,799 | | | | 418,603,937 | | | | 34,747,832 | | | | 845,080 | |
Health Care | | | 12,838,742 | | | | — | | | | 134,027,095 | | | | 344,626,024 | | | | 11,070,853 | | | | 1,511,302 | |
Industrials | | | 19,179,759 | | | | 26,649,806 | | | | 194,782,396 | | | | 858,627,610 | | | | 3,179,604 | | | | 4,513,550 | |
Information Technology | | | 32,478,316 | | | | 107,606,510 | | | | 181,991,973 | | | | 361,193,731 | | | | 38,907,913 | | | | 2,456,569 | |
Materials | | | 5,369,803 | | | | 17,861,476 | | | | 79,777,305 | | | | 197,964,797 | | | | 8,261,414 | | | | 753,958 | |
Real Estate | | | — | | | | 24,910,743 | | | | — | | | | 116,002,443 | | | | — | | | | 1,181,768 | |
Telecommunication Services | | | 11,345,545 | | | | 10,096,699 | | | | — | | | | 77,843,443 | | | | — | | | | — | |
Utilities | | | 4,833,102 | | | | 12,219,420 | | | | — | | | | — | | | | — | | | | — | |
Preferred Equities: | | | | | | | | | | | | | | | | | | | | | | | | |
Consumer Discretionary | | | — | | | | — | | | | — | | | | — | | | | 6,021,213 | | | | — | |
Consumer Staples | | | — | | | | — | | | | — | | | | — | | | | 9,099,415 | | | | — | |
Energy | | | — | | | | — | | | | — | | | | — | | | | 2,575,632 | | | | — | |
Information Technology | | | — | | | | — | | | | — | | | | — | | | | 17,808,506 | | | | — | |
Materials | | | — | | | | — | | | | — | | | | — | | | | 3,897,505 | | | | — | |
Level 3: Significant Unobservable Inputs | | | | | | | | | | | | | | | | | | | | | | | | |
Common Equities: | | | | | | | | | | | | | | | | | | | | | | | | |
Consumer Staples | | | — | | | | — | | | | — | | | | — | | | | 4,669,124 | | | | — | |
Information Technology | | | — | | | | — | | | | — | | | | — | | | | — | | | | 250 | |
Total Market Value of Investments | | | $230,217,423 | | | | $647,252,506 | | | | $2,140,292,201 | | | | $3,386,860,651 | | | | $198,783,141 | | | | $19,122,739 | |
| | | | |
| matthewsasia.com | 800.789.ASIA | | | 137 | |
Notes to Financial Statements (unaudited) (continued)
| | | | | | | | | | | | | | | | | | | | |
| | | Matthews Pacific Tiger Fund | | | Matthews Asia ESG Fund | | | Matthews
Emerging Asia
Fund | | | Matthews Asia
Innovators Fund | | | Matthews Asia Small Companies Fund | |
| Assets: | | | | | | | | | | | | | | | | | | | | |
| Investments: | | | | | | | | | | | | | | | | | | | | |
Level 1: Quoted Prices | | | | | | | | | | | | | | | | | | | | |
Common Equities: | | | | | | | | | | | | | | | | | | | | |
Bangladesh | | | $— | | | | $— | | | | $22,990,276 | | | | $— | | | | $— | |
China/Hong Kong | | | 701,147,178 | | | | 637,704 | | | | 3,645,349 | | | | 41,899,311 | | | | 30,735,487 | |
India | | | — | | | | 558,186 | | | | 4,112,911 | | | | — | | | | 4,920,069 | |
Indonesia | | | 24,516,474 | | | | — | | | | 7,951,701 | | | | 2,172,997 | | | | 16,505,409 | |
Israel | | | — | | | | — | | | | — | | | | — | | | | 1,383,120 | |
Japan | | | 6,789,056 | | | | 111,297 | | | | — | | | | — | | | | — | |
Malaysia | | | 15,762,368 | | | | — | | | | — | | | | — | | | | 4,285,325 | |
Pakistan | | | — | | | | 175,408 | | | | 43,547,113 | | | | — | | | | — | |
Philippines | | | — | | | | 239,436 | | | | 12,790,501 | | | | 3,827,988 | | | | 7,532,090 | |
Singapore | | | 14,058,399 | | | | 169,356 | | | | — | | | | — | | | | 5,176,394 | |
South Korea | | | — | | | | — | | | | — | | | | 2,596,132 | | | | 10,538,759 | |
Sri Lanka | | | — | | | | 141,864 | | | | 13,665,521 | | | | — | | | | — | |
Taiwan | | | — | | | | 191,570 | | | | — | | | | — | | | | — | |
United States | | | 231,814,722 | | | | — | | | | — | | | | — | | | | 4,685,878 | |
Vietnam | | | 213,783,932 | | | | — | | | | 73,765,809 | | | | 5,006,465 | | | | 185,704 | |
Warrants: | | | | | | | | | | | | | | | | | | | | |
Malaysia | | | 4,653,027 | | | | — | | | | — | | | | — | | | | — | |
Level 2: Other Significant Observable Inputs | | | | | | | | | | | | | | | | | | | | |
Common Equities: | | | | | | | | | | | | | | | | | | | | |
Australia | | | — | | | | — | | | | 2,447,098 | | | | — | | | | — | |
Bangladesh | | | — | | | | 757,155 | | | | 21,156,169 | | | | 3,893,015 | | | | — | |
China/Hong Kong | | | 1,880,912,241 | | | | 2,233,736 | | | | 26,866,348 | | | | 20,005,674 | | | | 88,553,114 | |
India | | | 1,639,857,581 | | | | 1,017,196 | | | | 42,179,228 | | | | 9,938,876 | | | | 38,762,515 | |
Indonesia | | | 501,869,396 | | | | 439,640 | | | | 38,410,724 | | | | 5,441,431 | | | | 12,430,293 | |
Japan | | | — | | | | 1,639,172 | | | | — | | | | — | | | | 13,450,029 | |
Luxembourg | | | — | | | | 210,445 | | | | — | | | | — | | | | — | |
Malaysia | | | 264,273,093 | | | | — | | | | — | | | | — | | | | 13,830,575 | |
Pakistan | | | — | | | | 164,751 | | | | 24,273,650 | | | | — | | | | — | |
Philippines | | | 200,935,438 | | | | 398,840 | | | | 6,848,662 | | | | — | | | | 4,319,492 | |
Singapore | | | — | | | | 161,191 | | | | 2,333,706 | | | | — | | | | — | |
South Korea | | | 887,044,047 | | | | 1,175,105 | | | | — | | | | 30,872,975 | | | | 47,700,647 | |
Sri Lanka | | | — | | | | — | | | | 11,667,136 | | | | — | | | | — | |
Switzerland | | | 214,480,394 | | | | — | | | | — | | | | — | | | | — | |
Taiwan | | | 471,115,993 | | | | 1,397,677 | | | | — | | | | 10,509,271 | | | | 56,871,758 | |
Thailand | | | 477,119,844 | | | | 573,467 | | | | 1,707,973 | | | | 4,898,912 | | | | 13,730,103 | |
Vietnam | | | — | | | | — | | | | 2,919,165 | | | | — | | | | — | |
Preferred Equities: | | | | | | | | | | | | | | | | | | | | |
South Korea | | | — | | | | 616,292 | | | | — | | | | 4,796,926 | | | | — | |
Level 3: Significant Unobservable Inputs | | | | | | | | | | | | | | | | | | | | |
Common Equities: | | | | | | | | | | | | | | | | | | | | |
South Korea | | | 151,121,738 | | | | — | | | | — | | | | — | | | | 3,629,074 | |
Total Market Value of Investments | | | $7,901,254,921 | | | | $13,009,488 | | | | $363,279,040 | | | | $145,859,973 | | | | $379,225,835 | |
Foreign securities that are valued based on market quotations are categorized as Level 1 in the fair value hierarchy. Certain foreign securities may be fair valued by external pricing services when the Funds determine that events affecting the value of foreign securities which occur between the time at which they are determined and the close of trading on the NYSE render market quotations unreliable. Such fair valuations are typically categorized as Level 2 in the fair value hierarchy. The Funds’ policy is to recognize transfers in and transfers out as of the beginning of the reporting period. At June 30, 2017, the Funds utilized third-party pricing services to fair value certain securities, some of which were different than the securities which had been valued by third-party pricing services at December 31, 2016. As a result, certain securities held by the Funds were transferred from Level 2 into Level 1 and certain securities held by the Funds were transferred from Level 1 to Level 2 with beginning of period values as follows:
| | | | | | | | |
| | | Transfer to Level 1
from Level 2 | | | Transfer to Level 2
from Level 1 | |
| Matthews Asian Growth and Income Fund | | | $57,174,611 | | | | $— | |
| Matthews Asia Dividend Fund | | | 289,078,417 | | | | 126,089,312 | |
| Matthews China Dividend Fund | | | 16,285,742 | | | | — | |
| Matthews Asia Value Fund | | | 147,205 | | | | — | |
| Matthews Asia Focus Fund | | | 243,603 | | | | — | |
| Matthews Asia Growth Fund | | | 33,320,944 | | | | 23,164,790 | |
| Matthews Pacific Tiger Fund | | | 286,185,709 | | | | 123,629,144 | |
| Matthews Asia ESG Fund | | | 174,565 | | | | 717,536 | |
| Matthews Emerging Asia Fund | | | 29,510,658 | | | | 23,199,434 | |
| Matthews Asia Innovators Fund | | | 8,169,004 | | | | 1,989,052 | |
| Matthews India Fund | | | 115,040,381 | | | | 105,964,950 | |
| Matthews Japan Fund | | | — | | | | — | |
| Matthews Korea Fund | | | 11,536,221 | | | | — | |
| Matthews Asia Small Companies Fund | | | 28,868,521 | | | | 17,874,071 | |
| Matthews China Small Companies Fund | | | 746,492 | | | | 681,018 | |
Level 3 securities consisted of equities that, as of June 30, 2017, were suspended from trading. As described in Note 2-A, these securities are valued based on their fair value as determined under the direction of the Board. The significant unobservable inputs, the methodology used for valuing such securities, and the characterization of such securities as Level 3 securities are not necessarily an indication of liquidity, or the risk associated with investing in these securities. A significant change in the unobservable inputs could result in a significantly lower or higher value in such Level 3 securities and could impact overall Fund performance. Level 2 equity securities consist primarily of securities that have been fair valued by third-party pricing services (see Note 2-A).
A reconciliation of Level 3 investments for which significant unobservable inputs were used to determine value are as follows:
| | | | | | | | | | | | | | | | | | | | | | | | |
| | | Matthews
Asian Growth
and Income Fund | | | Matthews
Pacific Tiger
Fund | | | Matthews
Emerging Asia
Fund | | | Matthews
Korea Fund | | | Matthews
Asia Small
Companies Fund | | | Matthews
China Small
Companies Fund | |
| | | Common
Equities —
China/Hong Kong | | | Common
Equities —
South Korea | | | Common
Equities —
Pakistan | | | Common
Equities —
Consumer Staples | | | Common
Equities —
South Korea | | | Common
Equities —
Information
Technology | |
| Balance as of 12/31/16 (market value) | | | $— | | | | $43,840,293 | | | | $332,382 | | | | $— | | | | $— | | | | $251 | |
| | | | | | |
| Accrued discounts/premiums | | | — | | | | — | | | | — | | | | — | | | | — | | | | — | |
| | | | | | |
| Realized gain/(loss) | | | — | | | | — | | | | — | | | | — | | | | 25,442 | | | | — | |
| | | | | | |
| Change in unrealized appreciation/depreciation | | | 6,282,955 | | | | 33,462,006 | | | | — | | | | 955,718 | | | | (841,640 | ) | | | (1 | ) |
| | | | | | |
| Purchases | | | — | | | | — | | | | — | | | | 1,713,928 | | | | 3,476,933 | | | | — | |
| | | | | | |
| Sales | | | — | | | | — | | | | — | | | | | | | | (250,036 | ) | | | — | |
| | | | | | |
| Transfers in to Level 3* | | | 34,583,141 | | | | 117,659,732 | | | | — | | | | 1,999,478 | | | | 1,218,375 | | | | — | |
| | | | | | |
| Transfers out of Level 3* | | | — | | | | (43,840,293 | ) | | | (332,382 | ) | | | — | | | | — | | | | — | |
| Balance as of 6/30/17 (market value) | | | $40,866,096 | | | | $151,121,738 | | | | $— | | | | $4,669,124 | | | | $3,629,074 | | | | $250 | |
| Net change in unrealized appreciation/depreciation on Level 3 investments held as of 6/30/17** | | | $6,282,955 | | | | $33,462,006 | | | | $— | | | | $955,718 | | | | ($841,640 | ) | | | ($1 | ) |
| * | The Fund’s policy is to recognize transfers in and transfers out as of the beginning of the reporting period. |
| ** | Included in the related amounts on the Statements of Operations. |
Certain foreign securities, for which market quotations are not readily available, may be fair valued and classified as either Level 2 or Level 3. When the underlying inputs include significant observable inputs obtained from sources independent of the Funds, the securities are classified as Level 2. These inputs include evaluated prices from the Funds’ pricing vendors, day-on-day price changes, primary and ancillary pricing sources, and other available independent market indicators of value. When the underlying inputs include significant unobservable inputs and reflect assumptions of market participants, the securities are classified as Level 3. As of June 30, 2017, the Funds that previously used quoted prices or observable inputs now also utilize significant unobservable inputs for certain securities that were suspended from trading. As a result, certain securities held by the Funds that were previously classified as Level 1 or Level 2 were transferred to Level 3. Certain securities held by the Funds that were suspended from trading and classified as Level 3 on December 31, 2016 subsequently resumed trading and were transferred from Level 3 to Level 1, Level 2 or were sold.
| | | | |
| matthewsasia.com | 800.789.ASIA | | | 139 | |
Notes to Financial Statements (unaudited) (continued)
The following table summarizes the valuation techniques used and unobservable inputs developed by the Valuation Committee to determine the fair value of certain, material Level 3 investments:
| | | | | | | | | | | | |
| | | Value | | | Valuation
Technique | | Unobservable
Input1 | | Unobservable
Input - Proxy
Factor Price
Movement | |
| Matthews Asia Small Companies Fund Assets: | | | | | | | | | | | | |
Common Equity | | | $3,629,074 | | | Last Price2 Multiplied by Proxy factor3 | | Proxy factor3 | | | -7% | |
| 1 | Increase in unobservable input may result in a significant increase to value, while a decrease in unobservable input may result in a significant decrease to value. |
| 2 | Last Price could include closing price, last reported sales price, or last fair valued price as described in Note 2-A. |
| 3 | Proxy factor considers movement of Vitzro Tech Co., Ltd. |
| C. | BASIS OF CONSOLIDATION: The accompanying consolidated financial statements of Matthews China Fund and Matthews Asia Dividend Fund (the “Investing Funds”) include the accounts of the Matthews CF-U Series and Matthews ADF-U Series (the “U Series Funds”), respectively. The U Series Funds are series of Matthews A Share Selections Fund, LLC, a Delaware limited liability company registered under the 1940 Act. All of the interests offered by U Series Funds are exclusively owned by the Investing Funds. The U Series Funds primarily invest in the stocks of Chinese companies listed on Mainland China Stock Exchanges, and traded and denominated in the currency of China, the Renminbi. To allow U Series Funds to invest in China A Shares Matthews applied for and received a license from the China Securities Regulatory Commission as a Qualified Foreign Institutional Investor (“QFII”) and had been allocated by the State Administration of Foreign Exchange of China an initial quota of $100 million in June 2014, and an additional quota of $440 million in July 2015, representing the equivalent value in Renminbi of China A Shares that the Funds could purchase. Access to the quota is subject to Matthews’ trade allocation procedures and access allocation procedures. The U Series Funds are subject to the same investment policies and restrictions that apply to Investing Funds. Intercompany accounts and transactions, if any, have been eliminated in the consolidation process. The U Series Funds are intended to be disregarded entities for the tax purposes. Therefore, no federal tax provision is required. Consolidated financial statements include expenses that are accrued for and paid by the Investing Funds. These include on-going operational costs as well as costs in connection with the launching of the U Series Funds. |
In September 2016, the Board of Directors of the Matthews A Share Selections Fund, LLC adopted resolutions authorizing the termination and liquidation of the Matthews A Share Selections Fund, LLC. Consequently, as of September 30, 2016, the U Series Funds sold their securities and effectively ceased investment operations. The outstanding interests of each U Series Fund were redeemed by its respective Investing Fund. The Matthews A Share Selections Fund, LLC filed an initial application for deregistration as a registered investment company with the U.S. Securities and Exchange Commission in October 2016, which was subsequently granted in February 2017.
| D. | RISKS ASSOCIATED WITH NON-U.S. COMPANIES: Investments by the Funds in the securities of non-U.S. companies may involve investment risks not typically associated with investments in U.S. issuers. These risks include possible political, economic, social and religious instability, inadequate investor protection; changes in laws or regulations of countries within the Asia Pacific region (including in countries where the Funds may invest, as well as in the broader region); international relations with other nations; natural disasters; corruption; and military activity. Foreign securities may be subject to greater fluctuations in price than securities of domestic corporations or the U.S. government. Foreign investing may also include the risk of expropriation or confiscatory taxation, limitation on the removal of funds or other assets, currency crises and exchange controls, the imposition of foreign withholding tax on the interest income payable on such instruments, the possible seizure or nationalization of foreign deposits or assets, or the adoption of other foreign government restrictions that might adversely affect the foreign securities held by the Funds. Additionally, Asia Pacific countries may utilize formal or informal currency exchange controls or “capital controls” that may limit the ability to repatriate investments or income or adversely affect the value of portfolio investments. The economies of many Asia Pacific countries differ from the economies of more developed countries in many respects, such as their rate of growth, inflation, capital reinvestment, resource self-sufficiency and dependence on other economies, financial system stability, the national balance of payments position and sensitivity to changes in global trade. Certain Asia Pacific countries are highly dependent upon and may be affected by developments in the economies of other countries. Non-U.S. companies are subject to different accounting, auditing, and financial reporting standards, practices, and requirements than U.S. companies. There is generally less government regulation of stock exchanges, brokers, and listed companies abroad than in the United States, which may result in less transparency with respect to a company’s operations, and make obtaining information about them more difficult (or such information may be unavailable). |
Foreign stock markets may not be as developed or efficient as those in the United States, and the absence of negotiated brokerage commissions in certain countries may result in higher brokerage fees. The time between the trade and settlement dates of securities transactions on foreign exchanges ranges from one day to four weeks or longer and may result in higher custody charges. Custodial arrangements may be less well developed than in the United States. Foreign securities are generally denominated and pay distributions in foreign currencies, exposing the Funds to changes in foreign currency exchange rates. Investing in any country in the Asia Pacific region will also entail risks specific and unique to that country, and these risks can be significant and change rapidly.
Changes in interest rates in each of the countries in which the Funds may invest, as well as interest rates in more-developed countries, may cause a decline in the market value of an investment. Generally, fixed income securities will decrease in value when interest rates rise and can be expected to rise in value when interest rates decline. As interest rates decline, debt issuers may repay or refinance their loans or obligations earlier than anticipated. The issuers of fixed income securities may, therefore, repay principal in advance. This would force the Funds to reinvest the proceeds from the principal prepayments at lower rates, which reduces the Funds’ income.
| E. | OFFERING COSTS: Offering costs are amortized on a straight-line basis over one year from each Fund’s respective commencement of operations. In the event that any of the initial shares are redeemed during the period of amortization of the Fund’s offering costs, the redemption proceeds will be reduced by any such unamortized offering costs in the same proportion as the number of shares being redeemed bears to the number of those shares outstanding at the time of redemption. |
| F. | DISTRIBUTIONS TO SHAREHOLDERS: It is the policy of Matthews Asian Growth and Income Fund and Matthews China Dividend Fund to distribute net investment income on a semi-annual basis and capital gains, if any, annually. It is the policy of Matthews Asia Dividend Fund, Matthews Asia Strategic Income Fund and Matthews Asia Credit Opportunities Fund to distribute net investment income on a quarterly basis and capital gains, if any, annually. Each of the other Funds distributes a net investment income and capital gains, if any, annually. Distributions to shareholders are recorded on the ex-dividend date. Income and capital gain distributions are determined in accordance with income tax regulations which may differ from U.S. GAAP. |
The tax character of distributions paid for the fiscal year ended December 31, 2016 was as follows:
| | | | | | | | | | | | | | | | |
| YEAR ENDED DECEMBER 31, 2016 | | Ordinary
Income | | | Net Long-Term
Capital Gains | | | Total Taxable
Distributions | | | Return of
Capital | |
| Matthews Asia Strategic Income Fund | | | $2,603,309 | | | | $— | | | | $2,603,309 | | | | $— | |
| Matthews Asia Credit Opportunities Fund | | | 517,291 | | | | — | | | | 517,291 | | | | — | |
| Matthews Asian Growth and Income Fund | | | 82,341,797 | | | | 145,377,175 | | | | 227,718,972 | | | | — | |
| Matthews Asia Dividend Fund | | | 88,322,312 | | | | 30,585,305 | | | | 118,907,617 | | | | 27,044,586 | |
| Matthews China Dividend Fund | | | 3,471,251 | | | | 2,629,943 | | | | 6,101,194 | | | | — | |
| Matthews Asia Value Fund | | | 148,584 | | | | — | | | | 148,584 | | | | — | |
| Matthews Asia Focus Fund | | | 157,979 | | | | — | | | | 157,979 | | | | — | |
| Matthews Asia Growth Fund | | | 7,210,721 | | | | — | | | | 7,210,721 | | | | — | |
| Matthews Pacific Tiger Fund | | | 60,675,860 | | | | 121,713,006 | | | | 182,388,866 | | | | — | |
| Matthews Asia ESG Fund | | | 139,740 | | | | — | | | | 139,740 | | | | — | |
| Matthews Emerging Asia Fund | | | 2,483,804 | | | | 2,100,210 | | | | 4,584,014 | | | | — | |
| Matthews Asia Innovators Fund | | | — | | | | 10,623,880 | | | | 10,623,880 | | | | — | |
| Matthews China Fund | | | 8,205,173 | | | | 39,869,615 | | | | 48,074,788 | | | | 17,942,653 | |
| Matthews India Fund | | | 112,375 | | | | 26,797,862 | | | | 26,910,237 | | | | — | |
| Matthews Japan Fund | | | 26,243,561 | | | | 9,535,726 | | | | 35,779,287 | | | | — | |
| Matthews Korea Fund | | | 2,252,578 | | | | 13,672,732 | | | | 15,925,310 | | | | — | |
| Matthews Asia Small Companies Fund | | | 2,452,388 | | | | — | | | | 2,452,388 | | | | — | |
| Matthews China Small Companies Fund | | | 57,353 | | | | 747,907 | | | | 805,260 | | | | — | |
| G. | INVESTMENT TRANSACTIONS AND INCOME: Securities transactions are accounted for on the date the securities are purchased or sold or on the following business day. Financial statements reflect security transactions on trade date. Gains or losses on the sale of securities are determined on the identified cost basis. Interest income is recorded on an accrual basis. Interest income, including amortization and accretion of premiums and discounts on debt securities, is recognized daily on an accrual basis. For convertible securities, premiums attributable to the conversion feature are not amortized. Dividend income is generally recorded on the ex-dividend date net of any foreign taxes withheld at the source. Dividend income for certain issuers headquartered in countries which the Funds invest may not be recorded until approved by the shareholders (which may occur after the ex-dividend date) if, in the judgment of management, such dividends are not reasonably determined as of the ex-dividend date. Income and realized and unrealized gains or losses on investments are allocated to each class of shares based on its relative net assets. |
The Funds may be subject to foreign taxation related to income received, capital gains on the sale of securities and certain foreign currency transactions in the foreign jurisdictions in which they invest. Foreign taxes, if any, are recorded based on the tax regulations and rates that exist in the foreign markets in which the Funds invest. When a capital gain tax is determined to apply, the Funds record an estimated deferred tax liability in an amount that may be payable if the securities were disposed of on the valuation date.
| H. | FUND EXPENSE ALLOCATIONS: The Funds account separately for the assets, liabilities and operations of each Fund. Direct expenses of each Fund or class are charged to that Fund or class while general expenses are allocated pro-rata among the Funds based on net assets or other appropriate methods. |
| I. | CASH, CASH OVERDRAFTS, AND FOREIGN CURRENCY: QFII accounts are required by the local market to maintain a cash reserve. The cash reserve is based upon a fixed ratio of the QFII’s approved investment quota, which is defined as the amount remitted into its special renminbi (RMB) cash account. These amounts, if any, are included in “Segregated foreign currency at value” on the Statements of Assets and Liabilities. The fixed ratio is set at 0.08 percent for the Shanghai and 0.06 percent for the Shenzhen market. When any of the Funds’ cash balances are overdrawn, a Fund is charged an overdraft fee by the custodian of 1.00% above the 30-day LIBOR rate on outstanding balances. These amounts, if any, are included in “Other expenses” on the Statements of Operations. |
| J. | USE OF ESTIMATES: The preparation of financial statements in conformity with U.S. GAAP requires management to make estimates and assumptions that affect the amounts reported in the financial statements and accompanying notes. Actual results may differ from those estimates. |
| K. | RECENT ACCOUNTING GUIDANCE: In October 2016, the U.S. Securities and Exchange Commission (SEC) issued a new rule, Investment Company Reporting Modernization, which, among other provisions, amends Regulation S-X to require standardized, enhanced disclosures, particularly related to derivatives, in investment company financial statements. Compliance with the guidance is effective for financial statements filed with the SEC on or after August 1, 2017; adoption will have no effect on the Funds’ net assets or results of operations. Management is evaluating the impact, if any, of this guidance on the Funds’ financial statement disclosures. |
| 3. | DERIVATIVE FINANCIAL INSTRUMENTS |
Each of the Matthews Asia Strategic Income Fund and the Matthews Asia Credit Opportunities Fund engages in derivative transactions for a variety of purposes, including managing interest rate, currency and credit exposure. In particular, each Fund may seek to take on currency exposure by using derivatives such as currency forwards, and the Matthews Asia Strategic Income Fund may also employ a currency overlay strategy in an effort to enhance returns and moderate volatility. Derivative financial instruments and transactions in which each Fund may engage include financial futures contracts, swaps and/or forward foreign currency exchange contracts. The currency overlay strategy involves long and short positions on one or more currencies. As a result, each Fund’s exposure to a currency could exceed the value of the Fund’s assets and the Fund could be exposed to currency risk whether or not it holds a bond or other instrument denominated in that currency. The gross notional value of derivative financial instruments and transactions could exceed the value of the Fund’s net assets, although the net market value of these instruments and transactions, on a marked-to-market basis, at most times, is expected to be substantially lower. The primary risks associated with the use of derivative financial instruments are: (i) Matthews may not correctly predict the direction of currency exchange rates, interest rates, security prices, or other economic factors; (ii) Matthews may not correctly predict changes in the value of derivative financial instruments and related underlying instruments or assets, which may result in disproportionately increased losses and/or reduced opportunities for gains; (iii) imperfect correlation between the change in market value of the securities held by a Fund and the price of financial futures contracts and credit default swaps contracts; (iv) the lack of, or a reduction in the liquidity of, any secondary market for the instrument, and the resulting inability to close the position (or exit the position) when desired; (v) losses, which are potentially unlimited, due to unanticipated market movements; (vi) the value of the instrument may change unfavorably due to
| | | | |
| matthewsasia.com | 800.789.ASIA | | | 141 | |
Notes to Financial Statements (unaudited) (continued)
movements in the value of the referenced foreign currencies; (vii) a Fund may suffer disproportionately heavy losses relative to the amount invested; (viii) changes in the value of the derivatives may not match or fully offset changes in the value of hedged or related portfolio securities, thereby failing to achieve the hedging or investment purpose for the derivative transaction; and (ix) the other party to the instrument may fail to fulfill its obligation.
Financial Futures Contracts: Financial futures contracts are agreements between the Fund and a counterparty to buy or sell a specific quantity of an underlying instrument at a specified price and at a specified date. Depending on the terms of the particular contract, futures contracts are settled either through physical delivery of the underlying instrument on the settlement date or by payment of a cash settlement amount on settlement date. Pursuant to the contract, the Fund agrees to receive from or pay an amount of cash equal to the daily fluctuation in value of the contract. Such receipts or payments are known as variation margin and are recorded by the Fund as unrealized appreciation or depreciation. When the contract is closed, the Fund records a realized gain or loss equal to the difference between the value of the contract at the time it was opened and the value at the time it was closed.
Forward Foreign Currency Exchange Contracts: A forward foreign currency exchange contract is an agreement between two parties to buy and sell a currency at a set exchange rate on a future date. The contract is marked-to-market daily and the change in market value is recorded by the Fund as an unrealized gain or loss. When the contract is closed, the Fund records a realized gain or loss equal to the difference between the value at the time it was opened and the value at the time it was closed. The Matthews Asia Strategic Income Fund does not offset financial assets and financial liabilities on forward foreign currency contacts in the Statements of Assets and Liabilities as they are not subject to netting arrangements.
Swaps: The Matthews Asia Strategic Income Fund and the Matthews Asia Credit Opportunities Fund enter into swap contracts to manage exposure to issuers, markets and securities to reduce their risk exposure to defaults of corporate and/or sovereign issuers or to create exposure to corporate and/or sovereign issuers to which they are not otherwise exposed (credit risk). Such contracts are agreements between the Funds and a counterparty to make periodic net payments on a specified notional amount or a net payment upon termination. Swap agreements are privately negotiated in the OTC market and may be entered into as a bilateral contract (“OTC Swaps”) or centrally cleared (“centrally cleared swaps”).
For OTC swaps, any upfront premiums paid and any upfront fees received are shown as swap premiums paid and swap premiums received, respectively, in the Statements of Assets and Liabilities and amortized over the term of the contract. The daily fluctuation in market value is recorded as unrealized appreciation (depreciation) on OTC Swaps in the Statements of Assets and Liabilities. Payments received or paid are recorded in the Statements of Operations as realized gains or losses, respectively. When an OTC swap is terminated, a realized gain or loss is recorded in the Statements of Operations equal to the difference between the proceeds from (or cost of) the closing transaction and the Funds’ basis in the contract, if any. Generally, the basis of the contract is the amortized premium received or paid.
The Funds may buy credit default swaps on single-name issuers (corporate or sovereign), a combination or basket of single-name issuers or traded indexes. Credit default swaps are agreements in which the protection buyer pays fixed periodic payments to the seller in consideration for a promise from the protection seller to make a specific payment should a negative credit event take place with respect to the referenced entity (e.g., bankruptcy, failure to pay, obligation acceleration, repudiation, moratorium or restructuring). As a buyer, if an underlying credit event occurs, the Funds will either (i) receive from the seller an amount equal to the notional amount of the swap and deliver the referenced security or underlying securities comprising the index, or (ii) receive a net settlement of cash equal to the notional amount of the swap less the recovery value of the security or underlying securities comprising the index.
Counterparty Credit Risk: A derivative contract may suffer a mark to market loss if the value of the contract decreases due to an unfavorable change in the market rates or values of the underlying instrument. Losses can also occur if the counterparty does not perform under the contract.
A Fund’s risk of loss from counterparty credit risk on OTC derivatives is generally limited to the aggregate unrealized gain netted against any collateral held by such Fund.
With exchange traded futures and centrally cleared swaps, there is less counterparty credit risk to the Funds since the exchange or clearinghouse, as counterparty to such instruments, guarantees against a possible default. The clearinghouse stands between the buyer and the seller of the contract; therefore, the credit risk is limited to failure of the clearinghouse. While offset rights may exist under applicable law, a Fund does not have a contractual right of offset against a clearing broker or clearinghouse in the event of a default (including the bankruptcy or insolvency) of the clearing broker or clearinghouse. Additionally, credit risk exists in exchange traded futures and centrally cleared swaps with respect to initial and variation margin that is held in a clearing broker’s customer accounts. While clearing brokers are required to segregate customer margin from their own assets, in the event that a clearing broker becomes insolvent or goes into bankruptcy and at that time there is a shortfall in the aggregate amount of margin held by the clearing broker for all its clients, typically the shortfall would be allocated on a pro rata basis across all the clearing broker’s customers, potentially resulting in losses to the Funds.
In order to better define its contractual rights and to secure rights that will help the Funds mitigate their counterparty risk, a Fund may enter into an International Swaps and Derivatives Association, Inc. Master Agreement (“ISDA Master Agreement”) or similar agreement with its derivative contract counterparties. An ISDA Master Agreement is a bilateral agreement between each Fund and a counterparty that governs OTC derivatives and typically contains, among other things, collateral posting terms and netting provisions in the event of a default and/or termination event. Under an ISDA Master Agreement, each Fund may, under certain circumstances, offset with the counterparty certain derivative financial instruments’ payables and/ or receivables with collateral held and/or posted and create one single net payment. The provisions of the ISDA Master Agreement typically permit a single net payment in the event of default including the bankruptcy or insolvency of the counterparty. However, bankruptcy or insolvency laws of a particular jurisdiction may impose restrictions on or prohibitions against the right of offset in bankruptcy, insolvency or other events. In addition, certain ISDA Master Agreements allow counterparties to OTC derivatives to terminate derivative contracts prior to maturity in the event a Fund’s net assets decline by a stated percentage or the Fund fails to meet the terms of its ISDA Master Agreements, which would cause the Fund to accelerate payment of any net liability owed to the counterparty.
Collateral requirements: For derivatives traded under an ISDA Master Agreement, the collateral requirements are typically calculated by netting the mark to market amount for each transaction under such agreement and comparing that amount to the value of any collateral currently pledged by a Fund and the counterparty. Cash collateral that has been pledged to cover obligations of a Fund, if any, is reported separately on the Statements of Assets and Liabilities as cash pledged as collateral. Non-cash collateral pledged by a Fund, if any, is noted in the Schedules of Investments.
For financial reporting purposes, the Funds do not offset derivative assets and derivative liabilities that are subject to netting arrangements in the Statements of Assets and Liabilities.
The Funds have implemented the disclosure requirements pursuant to FASB Accounting Standards update No. 2011-11, Disclosures about Offsetting Assets and Liabilities, that requires disclosures to make financial statements that are prepared under U.S. GAAP more comparable to those prepared under International Financial Reporting Standards. Under this guidance the Funds disclose in the statements of assets and liabilities both gross and net information about instruments and transactions eligible for offset such as instruments and transactions subject to an agreement similar to a master netting arrangement. In addition, the Funds disclose collateral received and posted in connection with master netting agreements or similar arrangements.
The following tables present the Funds’ OTC derivatives by counterparty net of amounts available for offset under an ISDA Master agreement or similar agreements and net of the related collateral received or pledged by the Funds:
| | | | | | | | | | | | |
| Matthews Asia Strategic Income Fund | | | | | | | | | | | | |
| Counterparty | | Gross Assets in the
Statements of Assets and Liabilities | | | Collateral
Received1 | | Assets/(Liabilities)
Available for Offset2 | | Net Amount of
Assets3 | |
| Bank of America, N.A. | | | $2,685 | | | $— | | $(2,685) | | | $— | |
| Counterparty | | Gross Liabilities in the Statements of Assets and Liabilities | | | Collateral
Pledged | | Assets/(Liabilities)
Available for Offset2 | | Net Amount of
Liabilities4 | |
| Bank of America, N.A. | | | $(183,599) | | | $— | | $2,685 | | | $(180,914) | |
| | | | |
| Matthews Asia Credit Opportunities Fund | | | | | | | | | | | | |
| Counterparty | | Gross Assets in the
Statements of Assets and Liabilities | | | Collateral
Received1 | | Assets/(Liabilities)
Available for Offset2 | | Net Amount of
Assets3 | |
| Bank of America, N.A. | | | $671 | | | $— | | $(671) | | | $— | |
| Counterparty | | Gross Liabilities in the
Statements of Assets and Liabilities | | | Collateral
Pledged | | Assets/(Liabilities)
Available for Offset2 | | Net Amount of
Liabilities4 | |
| Bank of America, N.A. | | | $(45,900) | | | $— | | $671 | | | $(45,229) | |
| 1 | Excess of collateral received from the individual counterparty may not be shown for financial reporting purposes. |
| 2 | The amount of derivatives available for offset is limited to the amount of assets and/or liabilities that are subject to a master netting agreement. |
| 3 | Net amount represents the net amount receivable from the counterparty in the event of default. |
| 4 | Net amount represents the net amount payable due to the counterparty in the event of default. |
Derivative Financial Instruments Categorized by Risk Exposure:
As of June 30, 2017, the fair values of derivative financial instruments were as follows:
| | | | | | | | | | |
| | | Statement of Assets and Liabilities Location | | Matthews Asia
Strategic Income
Fund | | | Matthews Asia
Credit Opportunities
Fund | |
| | Asset Derivatives | | | | | | | | |
| Forward foreign currency exchange contracts | | Unrealized appreciation on forward foreign currency exchange contracts | | | $171,473 | | | | $— | |
| Credit contracts | | Value (unrealized appreciation on swaps) | | | 2,685 | | | | 671 | |
| | | | | | | | | | |
| | | | | $174,158 | | | | $671 | |
| | Liability Derivatives | | | | | | | | |
| Forward foreign currency exchange contracts | | Unrealized depreciation on forward foreign currency exchange contracts | | | ($47,981 | ) | | | $— | |
| Credit contracts | | Value (swaps premium received) | | | (183,599 | ) | | | (45,900 | ) |
| | | | | | | | | | |
| | | | | ($231,580 | ) | | | ($45,900 | ) |
| | | | | | | | | | |
For the six-month period ended June 30, 2017, the effects of derivative financial instruments on the Statements of Operations were as follows:
| | | | | | | | | | |
| Derivative type | | Statement of Operations Location | | Matthews Asia
Strategic Income
Fund | | | Matthews Asia
Credit Opportunities
Fund | |
Net Realized Gain (Loss) | | | | | | | | | | |
| Foreign currency contracts: | | | | | | | | | | |
Foreign currency exchange contracts | | Net realized gain (loss) on foreign currency related transactions | | | ($607,139 | ) | | | $— | |
| Credit default swaps: | | | | | | | | | | |
Credit contracts | | Net realized gain (loss) on swaps | | | (41,090 | ) | | | ($10,272 | ) |
| | | | | | | | | | |
| Total | | | | | ($648,229 | ) | | | ($10,272 | ) |
| | | | | | | | | | |
| | | |
Net Change in Unrealized Appreciation (Depreciation) | | | | | | | | | | |
| Foreign currency contracts: | | | | | | | | | | |
Foreign currency exchange contracts | | Net change in unrealized appreciation/depreciation on foreign currency related translations | | | ($59,045 | ) | | | $— | |
| Credit default swaps: | | | | | | | | | | |
Credit contracts | | Net change in unrealized appreciation/depreciation on swaps | | | 33,592 | | | | 8,398 | |
| | | | | | | | | | |
| Total | | | | | ($25,453 | ) | | | $8,398 | |
| | | | | | | | | | |
The notional amounts disclosed on the Matthews Asia Strategic Income and Matthews Asia Credit Opportunities Funds’ Schedules of Investments are indicative of the activity during the six months for buy protection on credit default swaps. Regarding forward foreign currency exchange contracts entered into by the Matthews Asia Strategic Income Fund, the average notional ending quarterly amounts purchased in USD were $5,140,370 and the average notional ending quarterly amounts sold in USD were $16,550,685.
| | | | |
| matthewsasia.com | 800.789.ASIA | | | 143 | |
Notes to Financial Statements (unaudited) (continued)
| 4. | CAPITAL SHARE TRANSACTIONS |
Each Fund is authorized to issue an unlimited number of shares of beneficial interest with a par value of $0.001 per share.
| | | | | | | | | | | | | | | | |
| | | Six-Month Period Ended June 30, 2017 (Unaudited) | | | Year Ended December 31, 2016 | |
| | | Shares | | | Amount | | | Shares | | | Amount | |
MATTHEWS ASIA STRATEGIC INCOME FUND | | | | | | | | | | | | | | | | |
Investor Class | | | | | | | | | | | | | | | | |
Shares sold | | | 744,802 | | | | $7,951,051 | | | | 1,159,976 | | | | $12,036,561 | |
Shares issued through reinvestment of distributions | | | 67,449 | | | | 722,689 | | | | 200,404 | | | | 2,086,240 | |
Shares redeemed | | | (1,354,948 | ) | | | (14,400,228 | ) | | | (1,179,567 | ) | | | (12,189,837 | ) |
Net increase (decrease) | | | (542,697 | ) | | | ($5,726,488 | ) | | | 180,813 | | | | $1,932,964 | |
Institutional Class | | | | | | | | | | | | | | | | |
Shares sold | | | 1,031,809 | | | | $10,958,784 | | | | 394,381 | | | | $4,226,734 | |
Shares issued through reinvestment of distributions | | | 15,691 | | | | 168,098 | | | | 48,941 | | | | 509,450 | |
Shares redeemed | | | (75,008 | ) | | | (796,136 | ) | | | (262,800 | ) | | | (2,759,738 | ) |
Net increase (decrease) | | | 972,492 | | | | $10,330,746 | | | | 180,522 | | | | $1,976,446 | |
MATTHEWS ASIA CREDIT OPPORTUNITIES FUND* | | | | | | | | | | | | | | | | |
Investor Class | | | | | | | | | | | | | | | | |
Shares sold | | | 286,771 | | | | $2,967,853 | | | | 1,262,312 | | | | $12,795,706 | |
Shares issued through reinvestment of distributions | | | 16,240 | | | | 167,884 | | | | 33,461 | | | | 340,366 | |
Shares redeemed | | | (654,699 | ) | | | (6,765,979 | ) | | | (296,818 | ) | | | (3,053,588 | ) |
Net increase (decrease) | | | (351,688 | ) | | | ($3,630,242 | ) | | | 998,955 | | | | $10,082,484 | |
Institutional Class | | | | | | | | | | | | | | | | |
Shares sold | | | 661,477 | | | | $6,845,854 | | | | 604,202 | | | | $6,052,800 | |
Shares issued through reinvestment of distributions | | | 3,843 | | �� | | 39,816 | | | | 8,340 | | | | 85,105 | |
Shares redeemed | | | (34,472 | ) | | | (360,433 | ) | | | — | | | | — | |
Net increase (decrease) | | | 630,848 | | | | $6,525,237 | | | | 612,542 | | | | $6,137,905 | |
MATTHEWS ASIAN GROWTH AND INCOME FUND | | | | | | | | | | | | | | | | |
Investor Class | | | | | | | | | | | | | | | | |
Shares sold | | | 10,136,696 | | | | $163,409,448 | | | | 22,685,379 | | | | $370,706,327 | |
Shares issued through reinvestment of distributions | | | 568,958 | | | | 9,762,989 | | | | 9,221,755 | | | | 142,699,973 | |
Shares redeemed | | | (23,730,317 | ) | | | (386,122,587 | ) | | | (46,658,662 | ) | | | (755,701,576 | ) |
Net increase (decrease) | | | (13,024,663 | ) | | | ($212,950,150 | ) | | | (14,751,528 | ) | | | ($242,295,276 | ) |
Institutional Class | | | | | | | | | | | | | | | | |
Shares sold | | | 20,648,288 | | | | $337,029,495 | | | | 20,043,072 | | | | $329,220,035 | |
Shares issued through reinvestment of distributions | | | 446,126 | | | | 7,642,135 | | | | 4,935,874 | | | | 76,286,208 | |
Shares redeemed | | | (6,227,556 | ) | | | (101,592,249 | ) | | | (22,147,192 | ) | | | (352,353,051 | ) |
Net increase (decrease) | | | 14,866,858 | | | | $243,079,381 | | | | 2,831,754 | | | | $53,153,192 | |
MATTHEWS ASIA DIVIDEND FUND | | | | | | | | | | | | | | | | |
Investor Class | | | | | | | | | | | | | | | | |
Shares sold | | | 24,864,660 | | | | $429,349,196 | | | | 27,984,752 | | | | $444,670,505 | |
Shares issued through reinvestment of distributions | | | 1,490,637 | | | | 27,018,629 | | | | 4,679,731 | | | | 75,148,885 | |
Shares redeemed | | | (25,206,024 | ) | | | (423,930,034 | ) | | | (41,501,686 | ) | | | (644,529,546 | ) |
Net increase (decrease) | | | 1,149,273 | | | | $32,437,791 | | | | (8,837,203 | ) | | | ($124,710,156 | ) |
Institutional Class | | | | | | | | | | | | | | | | |
Shares sold | | | 33,078,217 | | | | $563,880,378 | | | | 30,119,651 | | | | $475,655,888 | |
Shares issued through reinvestment of distributions | | | 1,142,316 | | | | 20,695,740 | | | | 2,741,360 | | | | 44,022,850 | |
Shares redeemed | | | (10,163,871 | ) | | | (171,504,870 | ) | | | (35,037,220 | ) | | | (546,747,812 | ) |
Net increase (decrease) | | | 24,056,662 | | | | $413,071,248 | | | | (2,176,209 | ) | | | ($27,069,074 | ) |
| * | Investor Class and Institutional Class commencement of operations on April 29, 2016. |
| | | | | | | | | | | | | | | | |
| | | Six-Month Period Ended June 30, 2017 (Unaudited) | | | Year Ended December 31, 2016 | |
| | | Shares | | | Amount | | | Shares | | | Amount | |
MATTHEWS CHINA DIVIDEND FUND | | | | | | | | | | | | | | | | |
Investor Class | | | | | | | | | | | | | | | | |
Shares sold | | | 2,701,618 | | | | $41,263,117 | | | | 3,715,788 | | | | $52,252,711 | |
Shares issued through reinvestment of distributions | | | 147,683 | | | | 2,371,503 | | | | 373,101 | | | | 5,189,800 | |
Shares redeemed | | | (1,982,942 | ) | | | (29,930,754 | ) | | | (4,710,228 | ) | | | (63,571,849 | ) |
Net increase (decrease) | | | 866,359 | | | | $13,703,866 | | | | (621,339 | ) | | | ($6,129,338 | ) |
Institutional Class | | | | | | | | | | | | | | | | |
Shares sold | | | 404,621 | | | | $6,248,089 | | | | 1,816,522 | | | | $24,989,758 | |
Shares issued through reinvestment of distributions | | | 30,066 | | | | 483,160 | | | | 60,896 | | | | 851,567 | |
Shares redeemed | | | (56,584 | ) | | | (867,262 | ) | | | (1,024,910 | ) | | | (12,705,300 | ) |
Net increase (decrease) | | | 378,103 | | | | $5,863,987 | | | | 852,508 | | | | $13,136,025 | |
MATTHEWS ASIA VALUE FUND | | | | | | | | | | | | | | | | |
Investor Class | | | | | | | | | | | | | | | | |
Shares sold | | | 1,409,417 | | | | $16,816,425 | | | | 116,636 | | | | $1,176,796 | |
Shares issued through reinvestment of distributions | | | — | | | | — | | | | 13,611 | | | | 137,070 | |
Shares redeemed | | | (42,014 | ) | | | (454,035 | ) | | | (35,718 | ) | | | (356,533 | ) |
Net increase (decrease) | | | 1,367,403 | | | | $16,362,390 | | | | 94,529 | | | | $957,333 | |
Institutional Class | | | | | | | | | | | | | | | | |
Shares sold | | | 20,113 | | | | $255,154 | | | | 94 | | | | $1,000 | |
Shares issued through reinvestment of distributions | | | — | | | | — | | | | 1,100 | | | | 10,942 | |
Shares redeemed | | | (17 | ) | | | (200 | ) | | | — | | | | — | |
Net increase (decrease) | | | 20,096 | | | | $254,954 | | | | 1,194 | | | | $11,942 | |
MATTHEWS ASIA FOCUS FUND | | | | | | | | | | | | | | | | |
Investor Class | | | | | | | | | | | | | | | | |
Shares sold | | | 31,623 | | | | $320,746 | | | | 50,201 | | | | $471,150 | |
Shares issued through reinvestment of distributions | | | — | | | | — | | | | 7,605 | | | | 70,199 | |
Shares redeemed | | | (50,653 | ) | | | (496,378 | ) | | | (162,641 | ) | | | (1,484,289 | ) |
Net increase (decrease) | | | (19,030 | ) | | | ($175,632 | ) | | | (104,835 | ) | | | ($942,940 | ) |
Institutional Class | | | | | | | | | | | | | | | | |
Shares sold | | | 3,780 | | | | $40,981 | | | | 43,659 | | | | $429,950 | |
Shares issued through reinvestment of distributions | | | — | | | | — | | | | 9,439 | | | | 87,218 | |
Shares redeemed | | | (4,989 | ) | | | (50,235 | ) | | | (108,595 | ) | | | (989,167 | ) |
Net increase (decrease) | | | (1,209 | ) | | | ($9,254 | ) | | | (55,497 | ) | | | ($471,999 | ) |
MATTHEWS ASIA GROWTH FUND | | | | | | | | | | | | | | | | |
Investor Class | | | | | | | | | | | | | | | | |
Shares sold | | | 1,691,436 | | | | $38,702,392 | | | | 2,949,928 | | | | $63,405,015 | |
Shares issued through reinvestment of distributions | | | — | | | | — | | | | 188,951 | | | | 3,971,819 | |
Shares redeemed | | | (3,085,505 | ) | | | (70,258,463 | ) | | | (8,189,460 | ) | | | (174,198,638 | ) |
Net increase (decrease) | | | (1,394,069 | ) | | | ($31,556,071 | ) | | | (5,050,581 | ) | | | ($106,821,804 | ) |
Institutional Class | | | | | | | | | | | | | | | | |
Shares sold | | | 1,197,233 | | | | $27,430,295 | | | | 3,415,256 | | | | $73,020,609 | |
Shares issued through reinvestment of distributions | | | — | | | | — | | | | 74,896 | | | | 1,584,032 | |
Shares redeemed | | | (645,106 | ) | | | (15,052,482 | ) | | | (6,008,790 | ) | | | (125,728,091 | ) |
Net increase (decrease) | | | 552,127 | | | | $12,377,813 | | | | (2,518,638 | ) | | | ($51,123,450 | ) |
MATTHEWS PACIFIC TIGER FUND | | | | | | | | | | | | | | | | |
Investor Class | | | | | | | | | | | | | | | | |
Shares sold | | | 11,406,137 | | | | $296,661,452 | | | | 17,131,149 | | | | $413,602,913 | |
Shares issued through reinvestment of distributions | | | — | | | | — | | | | 2,559,033 | | | | 60,214,039 | |
Shares redeemed | | | (12,838,150 | ) | | | (324,844,990 | ) | | | (28,593,668 | ) | | | (674,989,402 | ) |
Net increase (decrease) | | | (1,432,013 | ) | | | ($28,183,538 | ) | | | (8,903,486 | ) | | | ($201,172,450 | ) |
Institutional Class | | | | | | | | | | | | | | | | |
Shares sold | | | 28,167,395 | | | | $731,255,351 | | | | 56,472,145 | | | | $1,339,949,453 | |
Shares issued through reinvestment of distributions | | | — | | | | — | | | | 2,784,965 | | | | 65,450,776 | |
Shares redeemed | | | (18,400,185 | ) | | | (473,150,267 | ) | | | (44,079,703 | ) | | | (1,030,520,290 | ) |
Net increase (decrease) | | | 9,767,210 | | | | $258,105,084 | | | | 15,177,407 | | | | $374,879,939 | |
| | | | |
| matthewsasia.com | 800.789.ASIA | | | 145 | |
Notes to Financial Statements (unaudited) (continued)
| | | | | | | | | | | | | | | | |
| | | Six-Month Period Ended June 30, 2017 (Unaudited) | | | Year Ended December 31, 2016 | |
| | | Shares | | | Amount | | | Shares | | | Amount | |
MATTHEWS ASIA ESG FUND | | | | | | | | | | | | | | | | |
Investor Class | | | | | | | | | | | | | | | | |
Shares sold | | | 198,954 | | | | $1,978,857 | | | | 392,569 | | | | $3,433,859 | |
Shares issued through reinvestment of distributions | | | — | | | | — | | | | 9,403 | | | | 85,286 | |
Shares redeemed | | | (55,587 | ) | | | (563,431 | ) | | | (154,929 | ) | | | (1,375,756 | ) |
Net increase (decrease) | | | 143,367 | | | | $1,415,426 | | | | 247,043 | | | | $2,143,389 | |
Institutional Class | | | | | | | | | | | | | | | | |
Shares sold | | | 211,087 | | | | $2,092,234 | | | | 190,080 | | | | $1,675,988 | |
Shares issued through reinvestment of distributions | | | — | | | | — | | | | 6,022 | | | | 54,320 | |
Shares redeemed | | | (108,768 | ) | | | (1,115,904 | ) | | | (1,101 | ) | | | (10,096 | ) |
Net increase (decrease) | | | 102,319 | | | | $976,330 | | | | 195,001 | | | | $1,720,212 | |
MATTHEWS EMERGING ASIA FUND | | | | | | | | | | | | | | | | |
Investor Class | | | | | | | | | | | | | | | | |
Shares sold | | | 5,554,151 | | | | $77,220,775 | | | | 7,191,280 | | | | $93,797,154 | |
Shares issued through reinvestment of distributions | | | — | | | | — | | | | 201,637 | | | | 2,637,405 | |
Shares redeemed | | | (2,851,070 | ) | | | (39,187,324 | ) | | | (6,553,598 | ) | | | (74,847,077 | ) |
Net increase (decrease) | | | 2,703,081 | | | | $38,033,451 | | | | 839,319 | | | | $21,587,482 | |
Institutional Class | | | | | | | | | | | | | | | | |
Shares sold | | | 5,248,448 | | | | $73,767,864 | | | | 3,585,928 | | | | $43,671,071 | |
Shares issued through reinvestment of distributions | | | — | | | | — | | | | 147,701 | | | | 1,936,356 | |
Shares redeemed | | | (540,714 | ) | | | (7,521,625 | ) | | | (1,388,856 | ) | | | (16,821,786 | ) |
Net increase (decrease) | | | 4,707,734 | | | | $66,246,239 | | | | 2,344,773 | | | | $28,785,641 | |
MATTHEWS ASIA INNOVATORS FUND | | | | | | | | | | | | | | | | |
Investor Class | | | | | | | | | | | | | | | | |
Shares sold | | | 2,635,026 | | | | $31,926,814 | | | | 1,489,685 | | | | $17,976,640 | |
Shares issued through reinvestment of distributions | | | — | | | | — | | | | 824,801 | | | | 8,528,446 | |
Shares redeemed | | | (1,618,213 | ) | | | (18,691,150 | ) | | | (4,537,543 | ) | | | (51,381,223 | ) |
Net increase (decrease) | | | 1,016,813 | | | | $13,235,664 | | | | (2,223,057 | ) | | | ($24,876,137 | ) |
Institutional Class | | | | | | | | | | | | | | | | |
Shares sold | | | 397,882 | | | | $4,913,772 | | | | 338,687 | | | | $3,702,742 | |
Shares issued through reinvestment of distributions | | | — | | | | — | | | | 76,287 | | | | 791,856 | |
Shares redeemed | | | (351 | ) | | | (4,426 | ) | | | (1,763,369 | ) | | | (19,884,862 | ) |
Net increase (decrease) | | | 397,531 | | | | $4,909,346 | | | | (1,348,395 | ) | | | ($15,390,264 | ) |
MATTHEWS CHINA FUND | | | | | | | | | | | | | | | | |
Investor Class | | | | | | | | | | | | | | | | |
Shares sold | | | 2,389,422 | | | | $44,181,454 | | | | 2,148,342 | | | | $35,732,757 | |
Shares issued through reinvestment of distributions | | | — | | | | — | | | | 3,793,239 | | | | 62,095,323 | |
Shares redeemed | | | (3,764,846 | ) | | | (67,291,006 | ) | | | (12,420,378 | ) | | | (207,255,992 | ) |
Net increase (decrease) | | | (1,375,424 | ) | | | ($23,109,552 | ) | | | (6,478,797 | ) | | | ($109,427,912 | ) |
Institutional Class | | | | | | | | | | | | | | | | |
Shares sold | | | 1,131,247 | | | | $21,293,347 | | | | 499,092 | | | | $7,772,205 | |
Shares issued through reinvestment of distributions | | | — | | | | — | | | | 130,030 | | | | 2,125,988 | |
Shares redeemed | | | (316,166 | ) | | | (5,990,143 | ) | | | (921,220 | ) | | | (16,175,742 | ) |
Net increase (decrease) | | | 815,081 | | | | $15,303,204 | | | | (292,098 | ) | | | ($6,277,549 | ) |
MATTHEWS INDIA FUND | | | | | | | | | | | | | | | | |
Investor Class | | | | | | | | | | | | | | | | |
Shares sold | | | 8,924,679 | | | | $261,532,792 | | | | 9,247,717 | | | | $242,746,822 | |
Shares issued through reinvestment of distributions | | | — | | | | — | | | | 624,141 | | | | 16,190,215 | |
Shares redeemed | | | (5,136,427 | ) | | | (149,416,904 | ) | | | (15,766,962 | ) | | | (410,982,081 | ) |
Net increase (decrease) | | | 3,788,252 | | | | $112,115,888 | | | | (5,895,104 | ) | | | ($152,045,044 | ) |
Institutional Class | | | | | | | | | | | | | | | | |
Shares sold | | | 8,834,174 | | | | $258,688,066 | | | | 11,428,013 | | | | $300,476,619 | |
Shares issued through reinvestment of distributions | | | — | | | | — | | | | 105,665 | | | | 2,753,632 | |
Shares redeemed | | | (2,617,582 | ) | | | (77,507,216 | ) | | | (3,502,779 | ) | | | (93,248,613 | ) |
Net increase (decrease) | | | 6,216,592 | | | | $181,180,850 | | | | 8,030,899 | | | | $209,981,638 | |
| | | | | | | | | | | | | | | | |
| | | Six-Month Period Ended June 30, 2017 (Unaudited) | | | Year Ended December 31, 2016 | |
| | | Shares | | | Amount | | | Shares | | | Amount | |
MATTHEWS JAPAN FUND | | | | | | | | | | | | | | | | |
Investor Class | | | | | | | | | | | | | | | | |
Shares sold | | | 15,767,844 | | | | $319,882,054 | | | | 74,348,475 | | | | $1,376,674,296 | |
Shares issued through reinvestment of distributions | | | — | | | | — | | | | 1,004,971 | | | | 18,963,796 | |
Shares redeemed | | | (14,684,832 | ) | | | (296,311,667 | ) | | | (55,996,138 | ) | | | (1,083,210,353 | ) |
Net increase (decrease) | | | 1,083,012 | | | | $23,570,387 | | | | 19,357,308 | | | | $312,427,739 | |
Institutional Class | | | | | | | | | | | | | | | | |
Shares sold | | | 12,063,646 | | | | $247,081,154 | | | | 46,376,072 | | | | $877,486,384 | |
Shares issued through reinvestment of distributions | | | — | | | | — | | | | 187,215 | | | | 3,536,499 | |
Shares redeemed | | | (11,041,257 | ) | | | (224,862,442 | ) | | | (10,076,300 | ) | | | (190,036,960 | ) |
Net increase (decrease) | | | 1,022,389 | | | | $22,218,712 | | | | 36,486,987 | | | | $690,985,923 | |
MATTHEWS KOREA FUND | | | | | | | | | | | | | | | | |
Investor Class | | | | | | | | | | | | | | | | |
Shares sold | | | 4,010,988 | | | | $24,162,948 | | | | 8,524,610 | | | | $50,478,123 | |
Shares issued through reinvestment of distributions | | | — | | | | — | | | | 2,345,781 | | | | 12,432,626 | |
Shares redeemed | | | (3,846,271 | ) | | | (23,038,781 | ) | | | (7,683,043 | ) | | | (45,259,031 | ) |
Net increase (decrease) | | | 164,717 | | | | $1,124,167 | | | | 3,187,348 | | | | $17,651,718 | |
Institutional Class | | | | | | | | | | | | | | | | |
Shares sold | | | 1,695,377 | | �� | | $9,768,382 | | | | 3,215,987 | | | | $19,291,961 | |
Shares issued through reinvestment of distributions | | | — | | | | — | | | | 125,391 | | | | 668,333 | |
Shares redeemed | | | (189,115 | ) | | | (1,137,509 | ) | | | (11,634,445 | ) | | | (70,448,790 | ) |
Net increase (decrease) | | | 1,506,262 | | | | $8,630,873 | | | | (8,293,067 | ) | | | ($50,488,496 | ) |
MATTHEWS ASIA SMALL COMPANIES FUND | | | | | | | | | | | | | | | | |
Investor Class | | | | | | | | | | | | | | | | |
Shares sold | | | 784,439 | | | | $16,527,662 | | | | 1,475,764 | | | | $28,101,064 | |
Shares issued through reinvestment of distributions | | | — | | | | — | | | | 55,224 | | | | 1,077,417 | |
Shares redeemed | | | (4,751,763 | ) | | | (96,378,889 | ) | | | (8,162,469 | ) | | | (159,237,120 | ) |
Net increase (decrease) | | | (3,967,324 | ) | | | ($79,851,227 | ) | | | (6,631,481 | ) | | | ($130,058,639 | ) |
Institutional Class | | | | | | | | | | | | | | | | |
Shares sold | | | 1,854,110 | | | | $37,793,667 | | | | 1,431,111 | | | | $26,873,891 | |
Shares issued through reinvestment of distributions | | | — | | | | — | | | | 66,423 | | | | 1,294,585 | |
Shares redeemed | | | (2,093,389 | ) | | | (43,217,666 | ) | | | (3,758,085 | ) | | | (71,115,927 | ) |
Net increase (decrease) | | | (239,279 | ) | | | ($5,423,999 | ) | | | (2,260,551 | ) | | | ($42,947,451 | ) |
MATTHEWS CHINA SMALL COMPANIES FUND | | | | | | | | | | | | | | | | |
Investor Class | | | | | | | | | | | | | | | | |
Shares sold | | | 503,187 | | | | $4,755,639 | | | | 253,087 | | | | $2,130,881 | |
Shares issued through reinvestment of distributions | | | — | | | | — | | | | 91,953 | | | | 794,479 | |
Shares redeemed | | | (488,827 | ) | | | (4,558,157 | ) | | | (837,034 | ) | | | (7,080,001 | ) |
Net increase (decrease) | | | 14,360 | | | | $197,482 | | | | (491,994 | ) | | | ($4,154,641 | ) |
As of June 30, 2017, a 2.00% redemption fee will be assessed on the sale or exchange of shares of the Matthews Emerging Asia Fund, Matthews Asia Small Companies Fund and Matthews China Small Companies Fund (collectively, the “Covered Funds”) within 90 days after the date an investor purchases shares of the Covered Funds. The imposition of redemption fees pursuant to the Funds’ Short-Term Trading Redemption Fee Policy for the Covered Funds may assist the Covered Funds in discouraging market timing activity.
The redemption fee is imposed to discourage market timing and short-term buying and selling of shares of the Covered Funds, which can disrupt the management of the Covered Funds’ investment portfolios and may have detrimental effects on the Covered Funds and other shareholders, and to allocate the costs the Covered Funds incur as a result of short-term trading and market timing. This fee is payable directly to the Covered Funds.
To determine whether the redemption fee applies, the Covered Funds do not count the day that shares were purchased, and first redeem the shares that have been held the longest.
The Covered Funds may grant an exemption from the redemption fee when the Covered Funds have previously received assurances that transactions do not involve a substantial risk of the type of harm that the policy is designed to avoid. The Covered Funds may also waive the imposition of redemption fees in certain circumstances. For more information on this policy, please see the Funds’ prospectuses. The redemption fees returned to the assets of the Funds are stated in the Statements of Changes in Net Assets.
The Funds (or their agents) attempt to contact shareholders whom the Funds (or their agents) believe have violated the Funds’ policies and procedures related to short-term trading and market-timing activity, and notify them that they will no longer be permitted to buy (or exchange) shares of the Funds. When a shareholder has purchased shares of the Funds through an intermediary, the Funds may not be able to notify the shareholder of a violation of the Funds’ policies or that the Funds have taken steps to address the situation (for example, the Funds may be unable to notify a share- holder that his or her privileges to purchase or exchange shares of the Funds have been terminated). Nonetheless, additional purchase and exchange orders for such investors will not be accepted by the Funds.
| | | | |
| matthewsasia.com | 800.789.ASIA | | | 147 | |
Notes to Financial Statements (unaudited) (continued)
The Funds may reject for any reason, or cancel as permitted or required by law, any purchase or exchange, including transactions deemed to represent excessive trading, at any time.
| 5. | INVESTMENT ADVISORY FEES AND OTHER TRANSACTIONS WITH AFFILIATES |
Matthews, a registered investment advisor under the 1940 Act, provides the Funds with investment management services. Pursuant to the prior Investment Advisory Agreement dated August 13, 2004, as amended (the “Prior Advisory Agreement”) and the current Investment Advisory Agreement dated February 1, 2016, as amended (the “Current Advisory Agreement,” and together with the Prior Advisory Agreement, the “Advisory Agreement”), the Funds pay Matthews (i) for management and advisory services; and (ii) for certain administrative services, an annual fee as a percentage of average daily net assets. Under the Advisory Agreement each of the Funds, other than Matthews Asia Strategic Income Fund, Matthews Asia Credit Opportunities Fund, Matthews Emerging Asia Fund, Matthews Asia Small Companies Fund, and Matthews China Small Companies Fund (the “Family-Priced Funds”), pays Matthews 0.75% of their aggregate average daily net assets up to $2 billion, 0.6834% of their aggregate average daily net assets over $2 billion up to $5 billion, 0.65% of their aggregate average daily net assets over $5 billion up to $25 billion, 0.64% of their aggregate average daily net assets over $25 billion up to $30 billion, 0.63% of their aggregate average daily net assets over $30 billion up to $35 billion, 0.62% of their aggregate average daily net assets over $35 billion up to $40 billion, 0.61% of their aggregate average daily net assets over $40 billion up to $45 billion, and 0.60% of their aggregate average daily net assets over $45 billion. Each of the Matthews Asia Strategic Income Fund and Matthews Asia Credit Opportunities Fund pays Matthews an annual fee of 0.65% of such Fund’s annual average daily net assets pursuant to the Advisory Agreement. Each of the Matthews Emerging Asia Fund, Matthews Asia Small Companies Fund, and the Matthews China Small Companies Fund pays Matthews an annual fee of 1.00% of the average daily net assets of such Fund up to $1 billion and 0.95% of the average daily net assets of such Fund over $1 billion pursuant to the Advisory Agreement. Each Fund pays Matthews a monthly fee at the annual rate using the applicable management fee calculated based on the actual number of days of that month and based on the Fund’s average daily net asset value for the month.
Pursuant to a fee waiver letter agreement, effective as of September 1, 2014, between the Trust, on behalf of the Family-Priced Funds, and Matthews (as amended from time to time, the “Fee Waiver Agreement”), for each Family-Priced Fund, Matthews has agreed to waive a portion of the fee payable under the Advisory Agreement and a portion of the fee payable under the Administration and Shareholder Services Agreement, if any Family-Priced Fund’s average daily net assets are over $3 billion, as follows: for every $2.5 billion average daily net assets of a Family-Priced Fund that are over $3 billion, the fee rates that otherwise would be applied for calculating fees payable under the Advisory Agreement and the Administration and Shareholder Services Agreement for such Family-Priced Fund with respect to such excess average daily net assets will be each reduced by 0.01%, in each case without reducing such fee rate below 0.00%.
Under a written agreement between the Funds and Matthews (the “Operating Expense Agreement”), Matthews agrees to waive fees and reimburse expenses to a Fund if its expense ratio exceeds a certain percentage level. Effective April 28, 2017 for all Funds, except Matthews Asia Strategic Income Fund, Matthews Asia Credit Opportunities Fund, and Matthews China Small Companies Fund, this level is 1.25% for the Institutional Class. Matthews agrees to reduce the expense ratio by waiving an equal amount of non-class specific expenses for the Investor Class. Because certain expenses of the Investor Class may be higher than those of the Institutional Class and because class specific expenses may be waived solely for the Institutional Class, total annual Fund expenses for the Investor Class may exceed 1.25%. For Matthews Asia Strategic Income Fund and Matthews Asia Credit Opportunities Fund this level is 0.90% for the Institutional Class. Matthews agrees to reduce the expense ratio by waiving an equal amount of non-class specific expenses for the Investor Class. Because certain expenses of the Investor Class may be higher than those of the Institutional Class and because class specific expenses may be waived solely for the Institutional Class, total annual Fund expenses for the Investor Class may exceed 0.90%. For Matthews China Small Companies Fund this level is 1.50% for the Investor Class. In turn, if a Fund’s expenses fall below the level noted within three years after Matthews has made such a reimbursement, the Fund may reimburse Matthews up to an amount of the recoupment available not to exceed the lesser of (i) the expense limitation applicable at the time of that fee waiver and/or expense reimbursement or (ii) the expense limitation in effect at the time of recoupment. This agreement will continue through April 30, 2018, may be extended for additional periods not exceeding one year, and may be terminated at any time by the Board of Trustees on behalf of the Fund on 60 days’ written notice to Matthews. Matthews may decline to renew this agreement by written notice to the Trust at least 30 days before its annual expiration date.
On June 30, 2017, the amounts subject to possible future recoupment under the expense limitation agreement are as follows:
| | | | | | | | | | | | | | | | |
| | | Expiring December 31, | |
| | | 2017 | | | 2018 | | | 2019 | | | 2020 | |
| Matthews Asia Strategic Income Fund | | | $79,504 | | | | $113,621 | | | | $123,474 | | | | $59,105 | |
| Matthews Asia Credit Opportunities Fund | | | — | | | | — | | | | 110,447 | | | | 65,407 | |
| Matthews Asia Value Fund | | | — | | | | 41,278 | | | | 211,035 | | | | 57,927 | |
| Matthews Asia Focus Fund | | | 62,897 | | | | 87,252 | | | | 111,801 | | | | 50,794 | |
| Matthews Asia ESG Fund | | | — | | | | 183,986 | | | | 163,853 | | | | 64,566 | |
| Matthews Emerging Asia Fund | | | 152,284 | | | | 452,048 | | | | 553,167 | | | | 304,462 | |
| Matthews Asia Small Companies Fund | | | 15,270 | | | | 113,037 | | | | 252,008 | | | | 170,971 | |
| Matthews China Small Companies Fund | | | 63,212 | | | | 133,327 | | | | 142,295 | | | | 79,810 | |
Investment advisory fees charged, waived fees and reimbursed additional expenses for the six-month period ended June 30, 2017, were as follows:
| | | | | | | | | | | | |
| | | Gross Advisory Fees | | | Advisory Fees
Waived and
Reimbursed in
Excess of the
Expense Limitation | | | Net Advisory Fee/
Reimbursement | |
| Matthews Asia Strategic Income Fund | | | $234,406 | | | | ($59,105 | ) | | | $175,301 | |
| Matthews Asia Credit Opportunities Fund | | | 58,256 | | | | (65,407 | ) | | | (7,151 | ) |
| Matthews Asian Growth and Income Fund | | | 9,108,024 | | | | — | | | | 9,108,024 | |
| Matthews Asia Dividend Fund | | | 17,727,659 | | | | (122,046 | ) | | | 17,605,613 | |
| Matthews China Dividend Fund | | | 700,442 | | | | — | | | | 700,442 | |
| Matthews Asia Value Fund | | | 16,942 | | | | (57,927 | ) | | | (40,985 | ) |
| | | | | | | | | | | | |
| | | Gross Advisory Fees | | | Advisory Fees
Waived and
Reimbursed in
Excess of the
Expense Limitation | | | Net Advisory Fee/
Reimbursement | |
| Matthews Asia Focus Fund | | | $37,085 | | | | ($50,794 | ) | | | ($13,709 | ) |
| Matthews Asia Growth Fund | | | 2,209,260 | | | | — | | | | 2,209,260 | |
| Matthews Pacific Tiger Fund | | | 24,986,569 | | | | (328,970 | ) | | | 24,657,599 | |
| Matthews Asia ESG Fund | | | 37,651 | | | | (64,567 | ) | | | (26,916 | ) |
| Matthews Emerging Asia Fund | | | 1,512,414 | | | | (304,462 | ) | | | 1,207,952 | |
| Matthews Asia Innovators Fund | | | 396,093 | | | | — | | | | 396,093 | |
| Matthews China Fund | | | 1,933,767 | | | | — | | | | 1,933,767 | |
| Matthews India Fund | | | 6,291,665 | | | | — | | | | 6,291,665 | |
| Matthews Japan Fund | | | 10,724,823 | | | | (11,276 | ) | | | 10,713,547 | |
| Matthews Korea Fund | | | 600,824 | | | | — | | | | 600,824 | |
| Matthews Asia Small Companies Fund | | | 2,041,610 | | | | (170,971 | ) | | | 1,870,639 | |
| Matthews China Small Companies Fund | | | 88,282 | | | | (79,810 | ) | | | 8,472 | |
The Funds have an Administration and Shareholder Services Agreement dated August 13, 2004, as amended (the “Shareholder Services Agreement” or “Services Agreement”), in which the Funds pay an annual administration and shareholder servicing fee to Matthews, as a percentage of the average daily net assets of each Fund in aggregate, computed and prorated on a daily basis. Under the Shareholder Services Agreement, the Funds in the aggregate pay Matthews 0.25% of their aggregate average daily net assets up to $2 billion, 0.1834% of their aggregate average daily net assets over $2 billion up to $5 billion, 0.15% of their aggregate average daily net assets over $5 billion up to $7.5 billion, 0.125% of their aggregate average daily net assets over $7.5 billion up to $15 billion, 0.11% of their aggregate average daily net assets over $15 billion up to $22.5 billion, 0.10% of their aggregate average daily net assets over $22.5 billion up to $25 billion, 0.09% of their aggregate average daily net assets over $25 billion up to $30 billion, 0.08% of their aggregate average daily net assets over $30 billion up to $35 billion, 0.07% of their aggregate average daily net assets over $35 billion up to $40 billion, 0.06% of their aggregate average daily net assets over $40 billion up to $45 billion, and 0.05% of their aggregate average daily net assets over $45 billion.
Administration and shareholder servicing fees charged, for the six-month period ended June 30, 2017, were as follows:
| | | | | | | | | | | | |
| | | Gross
Administration and
Shareholder
Servicing Fees | | | Administration and
Shareholder
Servicing Fees
Waived in Excess of
Expense Limitation | | | Net
Administration and
Shareholder
Servicing Fees | |
| Matthews Asia Strategic Income Fund | | | $50,545 | | | | $— | | | | $50,545 | |
| Matthews Asia Credit Opportunities Fund | | | 12,555 | | | | — | | | | 12,555 | |
| Matthews Asian Growth and Income Fund | | | 1,924,192 | | | | — | | | | 1,924,192 | |
| Matthews Asia Dividend Fund | | | 3,742,948 | | | | (122,046 | ) | | | 3,620,902 | |
| Matthews China Dividend Fund | | | 147,900 | | | | — | | | | 147,900 | |
| Matthews Asia Value Fund | | | 3,548 | | | | — | | | | 3,548 | |
| Matthews Asia Focus Fund | | | 7,833 | | | | — | | | | 7,833 | |
| Matthews Asia Growth Fund | | | 466,686 | | | | — | | | | 466,686 | |
| Matthews Pacific Tiger Fund | | | 5,276,650 | | | | (328,970 | ) | | | 4,947,680 | |
| Matthews Asia ESG Fund | | | 7,942 | | | | — | | | | 7,942 | |
| Matthews Emerging Asia Fund | | | 211,674 | | | | — | | | | 211,674 | |
| Matthews Asia Innovators Fund | | | 83,580 | | | | — | | | | 83,580 | |
| Matthews China Fund | | | 408,376 | | | | — | | | | 408,376 | |
| Matthews India Fund | | | 1,327,622 | | | | — | | | | 1,327,622 | |
| Matthews Japan Fund | | | 2,265,279 | | | | (11,276 | ) | | | 2,254,003 | |
| Matthews Korea Fund | | | 126,859 | | | | — | | | | 126,859 | |
| Matthews Asia Small Companies Fund | | | 286,475 | | | | — | | | | 286,475 | |
| Matthews China Small Companies Fund | | | 12,372 | | | | — | | | | 12,372 | |
In addition to the fees paid to the Funds’ transfer agent, the Funds bear the cost of fees paid to certain service providers or intermediaries, including supermarkets, which provide transfer agency, record-keeping and shareholder servicing to certain shareholders. These fees are referred to as intermediary service fees on the Statements of Assets and Liabilities as well as the Statements of Operations. Additional information concerning these services and fees is contained in the Funds’ prospectuses.
| | | | |
| matthewsasia.com | 800.789.ASIA | | | 149 | |
Notes to Financial Statements (unaudited) (continued)
BNY Mellon Investment Servicing (US) Inc. (“BNY Mellon”), an indirect wholly owned subsidiary of The Bank of New York Mellon Corporation, serves as the Funds’ administrator, and in that capacity, performs various administrative and accounting services for each Fund. BNY Mellon also serves as the Funds’ transfer agent, dividend disbursing agent and registrar. An officer of BNY Mellon serves as Assistant Treasurer to the Funds. Total fees accrued by the Funds for administration and accounting services for the six-month period ended June 30, 2017 were as follows:
| | | | |
| | | Administration and
Accounting Fees | |
| Matthews Asia Strategic Income Fund | | | $2,885 | |
| Matthews Asia Credit Opportunities Fund | | | 717 | |
| Matthews Asian Growth and Income Fund | | | 109,838 | |
| Matthews Asia Dividend Fund | | | 213,797 | |
| Matthews China Dividend Fund | | | 8,447 | |
| Matthews Asia Value Fund | | | 204 | |
| Matthews Asia Focus Fund | | | 447 | |
| Matthews Asia Growth Fund | | | 26,643 | |
| Matthews Pacific Tiger Fund | | | 301,336 | |
| Matthews Asia ESG Fund | | | 454 | |
| Matthews Emerging Asia Fund | | | 12,099 | |
| Matthews Asia Innovators Fund | | | 4,777 | |
| Matthews China Fund | | | 23,321 | |
| Matthews India Fund | | | 75,882 | |
| Matthews Japan Fund | | | 129,338 | |
| Matthews Korea Fund | | | 7,246 | |
| Matthews Asia Small Companies Fund | | | 16,333 | |
| Matthews China Small Companies Fund | | | 706 | |
Brown Brothers Harriman & Co. serves as the Funds’ custodian. Foreside Funds Distributors LLC, serves as the Funds’ distributor in the United States pursuant to an Underwriting Agreement. Matthews Asia Funds are distributed in Latin America by HMC Partners.
Cross trades for the six-month period ended June 30, 2017, were executed by the Funds pursuant to Rule 17a-7 under the 1940 Act. Cross trading is the buying or selling of portfolio securities between Funds to which Matthews International Capital Management, LLC serves as investment advisor. At its regularly scheduled quarterly meetings, the Board reviews such transactions as of the most recent calendar quarter for compliance with the requirements and restrictions set forth by Rule 17a-7. For the six-month period ended June 30, 2017, the purchase and sale transactions with an affiliated Fund in compliance with Rule 17a-7 under the 1940 Act were as follows:
| | | | | | | | |
| | | Purchases | | | Sales | |
| Matthews Asia Dividend Fund | | | $6,715,506 | | | | $— | |
| Matthews Japan Fund | | | — | | | | 6,715,506 | |
As of June 30, 2017, Matthews and its affiliates held significant shares in the Funds as follows:
| | | | | | | | |
| | | Shares held by Matthews and its Affiliates | | | Percentage of Outstanding Shares | |
| Matthews Asia Strategic Income Fund | | | $1,496,908 | | | | 21 | % |
| Matthews Asia Credit Opportunities Fund | | | 1,209,403 | | | | 64 | % |
| Matthews Asia Value Fund | | | 147,613 | | | | 9 | % |
| Matthews Asia Focus Fund | | | 150,175 | | | | 14 | % |
| Matthews Asia ESG Fund | | | 392,816 | | | | 32 | % |
| Matthews China Small Companies Fund | | | 447,950 | | | | 23 | % |
Certain officers and Trustees of the Funds are also officers and directors of Matthews. All officers serve without compensation from the Funds. The Funds paid the Independent Trustees $785,250 in aggregate for regular compensation during the six-month period ended June 30, 2017.
The value of investment transactions made for affiliated and unaffiliated holdings for the six-month period ended June 30, 2017 were as follows:
| | | | | | | | | | | | | | | | |
| | | Affiliated Purchases | | | Proceeds from
Affiliated Sales | | | Unaffiliated Purchases | | | Proceeds from
Unaffiliated Sales | |
| Matthews Asia Strategic Income Fund | | | $— | | | | $— | | | | $24,857,893 | | | | $18,121,825 | |
| Matthews Asia Credit Opportunities Fund | | | — | | | | | | | | 4,809,676 | | | | 2,572,517 | |
| Matthews Asian Growth and Income Fund | | | — | | | | — | | | | 206,537,575 | | | | 298,910,599 | |
| Matthews Asia Dividend Fund | | | 20,130,546 | | | | 18,541,886 | | | | 1,187,596,230 | | | | 726,885,938 | |
| Matthews China Dividend Fund | | | — | | | | | | | | 111,413,978 | | | | 91,921,002 | |
| Matthews Asia Value Fund | | | — | | | | — | | | | 15,534,303 | | | | 549,628 | |
| Matthews Asia Focus Fund | | | — | | | | — | | | | 916,373 | | | | 1,230,040 | |
| | | | | | | | | | | | | | | | |
| | | Affiliated Purchases | | | Proceeds from
Affiliated Sales | | | Unaffiliated Purchases | | | Proceeds from
Unaffiliated Sales | |
| Matthews Asia Growth Fund | | | $— | | | | $— | | | | $56,532,360 | | | | $66,534,543 | |
| Matthews Pacific Tiger Fund | | | 7,061,379 | | | | 32,644,536 | | | | 237,203,995 | | | | 184,723,849 | |
| Matthews Asia ESG Fund | | | — | | | | — | | | | 4,346,090 | | | | 1,783,986 | |
| Matthews Emerging Asia Fund | | | — | | | | — | | | | 121,897,685 | | | | 22,656,509 | |
| Matthews Asia Innovators Fund | | | — | | | | — | | | | 44,021,733 | | | | 28,824,709 | |
| Matthews China Fund | | | — | | | | — | | | | 236,182,434 | | | | 248,992,623 | |
| Matthews India Fund | | | — | | | | 842,616 | | | | 350,273,068 | | | | 57,646,666 | |
| Matthews Japan Fund | | | — | | | | 9,503,418 | | | | 705,225,502 | | | | 687,788,011 | |
| Matthews Korea Fund | | | — | | | | — | | | | 24,851,205 | | | | 15,220,451 | |
| Matthews Asia Small Companies Fund | | | �� | | | | — | | | | 124,816,242 | | | | 215,856,923 | |
| Matthews China Small Companies Fund | | | — | | | | — | | | | 5,160,816 | | | | 5,691,814 | |
| 7. | HOLDINGS OF 5% VOTING SHARES OF PORTFOLIO COMPANIES |
The 1940 Act defines “affiliated companies” to include investments in portfolio companies in which a fund owns 5% or more of the outstanding voting shares. During the six-month period ended June 30, 2017, the Funds below held 5% or more of the outstanding voting shares of the noted portfolio companies. During this period, other Funds in the Trust may also have held voting shares of the issuers at levels below 5%.
Investments in affiliates:
A summary of transactions in securities of issuers affiliated with a Fund for the six-month period ended June 30, 2017 is as follows:
| | | | | | | | | | | | | | | | | | | | | | | | | | | | |
| | | Shares Held at
Dec. 31, 2016 | | | Shares
Purchased | | | Shares Sold | | | Shares Held at
June 30, 2017 | | | Value at June 30, 2017 | | | Dividend Income Jan. 1, 2017– June 30, 2017 | | | Net Realized Gain (Loss) Jan. 1, 2017– June 30, 2017 | |
| | | | | | |
| MATTHEWS ASIA DIVIDEND FUND | | | | | | | | | | | | | | | | | | | | | | | | | |
| Name of Issuer: | | | | | | | | | | | | | | | | | | | | | | | | | | | | |
Anritsu Corp. | | | 6,321,500 | | | | 758,500 | | | | — | | | | 7,080,000 | | | | $63,970,616 | | | | $478,228 | | | | $— | |
Ascendas India Trust | | | 53,470,700 | | | | — | | | | — | | | | 53,470,700 | | | | 44,031,497 | | | | 1,134,779 | | | | — | |
Breville Group, Ltd. | | | 10,644,019 | | | | — | | | | — | | | | 10,644,019 | | | | 85,484,086 | | | | 1,252,712 | | | | — | |
CapitaLand Retail China Trust, REIT | | | 43,232,400 | | | | 5,373,300 | | | | — | | | | 48,605,700 | | | | 57,899,654 | | | | 1,451,462 | | | | — | |
Minth Group, Ltd. | | | 57,963,000 | | | | 2,538,000 | | | | 3,182,000 | | | | 57,319,000 | | | | 242,821,512 | | | | 5,162,870 | | | | 9,835,536 | |
Yuexiu Transport Infrastructure, Ltd. | | | 100,968,000 | | | | — | | | | 8,322,000 | | | | 92,646,000 | | | | 66,443,763 | | | | 2,380,131 | | | | 686,574 | |
| | | | | | | | | | | | | | | | | | | | |
Total Affiliates | | | | | | | | | | | | | | | | | | | $560,651,128 | | | | $11,860,182 | | | | $10,522,110 | |
| | | | | | | | | | | | | | | | | | | | |
| | | | | | |
| MATTHEWS PACIFIC TIGER FUND | | | | | | | | | | | | | | | | | | | | | | | | | |
| Name of Issuer: | | | | | | | | | | | | | | | | | | | | | | | | | | | | |
Cheil Worldwide, Inc. | | | 6,504,297 | | | | 450,000 | | | | — | | | | 6,954,297 | | | | $111,853,311 | | | | $— | | | | $— | |
Fuyao Glass Industry Group Co., Ltd. H Shares | | | 34,836,000 | | | | — | | | | 3,000,000 | | | | 31,836,000 | | | | 121,872,124 | | | | 3,514,861 | | | | 2,745,465 | |
Green Cross Corp. | | | 776,872 | | | | — | | | | — | | | | 776,872 | | | | 118,518,293 | | | | — | | | | — | |
Just Dial, Ltd. | | | 3,557,718 | | | | — | | | | — | | | | 3,557,718 | | | | 20,438,099 | | | | — | | | | — | |
Synnex Technology International Corp. | | | 103,100,921 | | | | — | | | | 7,500,000 | | | | 95,600,921 | | | | 107,098,852 | | | | — | | | | (1,174,468 | ) |
Tata Power Co., Ltd. | | | 171,620,436 | | | | — | | | | 7,000,000 | | | | 164,620,436 | | | | 204,993,040 | | | | — | | | | (7,732,825 | ) |
| | | | | | | | | | | | | | | | | | | | |
Total Affiliates | | | | | | | | | | | | | | | | | | | $684,773,719 | | | | $3,514,861 | | | | ($6,161,828 | ) |
| | | | | | | | | | | | | | | | | | | | |
| | | | | | |
| MATTHEWS EMERGING ASIA FUND | | | | | | | | | | | | | | | | | | | | | | | | | |
| Name of Issuer: | | | | | | | | | | | | | | | | | | | | | | | | | | | | |
National Seed JSC | | | 979,585 | | | | — | | | | — | | | | 979,585 | | | | $4,697,319 | | | | $64,787 | | | | $— | |
| | | | | | | | | | | | | | | | | | | | |
Total Affiliates | | | | | | | | | | | | | | | | | | | $4,697,319 | | | | $64,787 | | | | $— | |
| | | | | | | | | | | | | | | | | | | | |
| | | | | | |
| MATTHEWS INDIA FUND | | | | | | | | | | | | | | | | | | | | | | | | | |
| Name of Issuer: | | | | | | | | | | | | | | | | | | | | | | | | | | | | |
eClerx Services, Ltd. | | | 2,751,931 | | | | — | | | | 50,000 | | | | 2,701,931 | | | | $55,257,016 | | | | $— | | | | $202,048 | |
VST Industries, Ltd. | | | 1,185,704 | | | | — | | | | — | | | | 1,185,704 | | | | 65,438,203 | | | | — | | | | — | |
| | | | | | | | | | | | | | | | | | | | |
Total Affiliates | | | | | | | | | | | | | | | | | | | $120,695,219 | | | | $— | | | | $202,048 | |
| | | | | | | | | | | | | | | | | | | | |
| | | | |
| matthewsasia.com | 800.789.ASIA | | | 151 | |
Notes to Financial Statements (unaudited) (continued)
| | | | | | | | | | | | | | | | | | | | | | | | | | | | |
| | | Shares Held at
Dec. 31, 2016 | | | Shares
Purchased | | | Shares Sold | | | Shares Held at
June 30, 2017 | | | Value at June 30, 2017 | | | Dividend Income Jan. 1, 2017– June 30, 2017 | | | Net Realized Gain (Loss) Jan. 1, 2017– June 30, 2017 | |
| | | | | | |
| MATTHEWS JAPAN FUND | | | | | | | | | | | | | | | | | | | | | | | | | |
| Name of Issuer: | | | | | | | | | | | | | | | | | | | | | | | | | | | | |
Daiken Medical Co., Ltd. | | | 1,755,200 | | | | — | | | | 95,200 | | | | 1,660,000 | | | | $11,863,532 | | | | $272,314 | | | | $56,958 | |
Doshisha Co., Ltd.† | | | 1,989,400 | | | | — | | | | 134,600 | | | | 1,854,800 | | | | — | | | | — | | | | — | |
Infomart Corp.† | | | 6,539,000 | | | | — | | | | 130,300 | | | | 6,408,700 | | | | — | | | | — | | | | — | |
Septeni Holdings Co., Ltd.† | | | 7,039,100 | | | | — | | | | 7,039,100 | | | | — | | | | — | | | | — | | | | — | |
TechnoPro Holdings, Inc. | | | 2,045,800 | | | | — | | | | 290,200 | | | | 1,755,600 | | | | 70,665,994 | | | | 1,012,380 | | | | 2,132,762 | |
W-Scope Corp. | | | 2,315,300 | | | | — | | | | — | | | | 2,315,300 | | | | 40,670,604 | | | | — | | | | — | |
| | | | | | | | | | | | | | | | | | | | |
Total Affiliates | | | | | | | | | | | | | | | | | | | $123,200,130 | | | | $1,284,694 | | | | $2,189,720 | |
| | | | | | | | | | | | | | | | | | | | |
| † | Issuer was not an affiliated company as of June 30, 2017. |
| 8. | INCOME TAX INFORMATION INCOME AND WITHHOLDING TAXES |
It is the policy of the Funds to comply with all requirements of the Internal Revenue Code of 1986, as amended (“the Code”), applicable to regulated investment companies and to distribute substantially all of their taxable income to their shareholders. The Funds have met the requirements of the Code applicable to regulated investment companies for the year ended December 31, 2016. Therefore, no federal income tax provision is required.
Management has analyzed the Funds’ tax positions taken on federal income tax returns for all open tax years (current and prior three tax years), and has concluded that no provision for federal income tax is required in the Funds’ financial statements. The Funds’ federal and state income and federal excise tax returns for tax years for which the applicable statutes of limitations have not expired are subject to examination by the Internal Revenue Service and state departments of revenue
Under current tax law, the Funds have elected to defer certain qualified late-year losses and recognize such losses in the year ending December 31, 2016:
| | | | |
| | | Late Year
Losses* | |
| Matthews Asia Strategic Income Fund | | | $121,441 | |
| Matthews Asian Growth and Income Fund | | | 7,187,374 | |
| Matthews Asia Dividend Fund | | | 10,884,608 | |
| Matthews China Dividend Fund | | | 13,952 | |
| Matthews Asia ESG Fund | | | 13,364 | |
| Matthews China Fund | | | 1,208,997 | |
| Matthews Japan Fund | | | 2,221,694 | |
| * | As permitted by the Internal Revenue Service, the Funds have elected to defer certain qualified late-year losses and recognize such losses in the next fiscal year. |
As of December 31, 2016, the Funds have capital loss carryforwards available to offset future realized capital gains through the indicated expiration dates as follows:
| | | | | | | | | | | | |
| | | Amount With No Expiration* | | | | |
| LOSSES DEFERRED EXPIRING IN: | | Short-term
Losses | | | Long-term
Losses | | | Total | |
| Matthews Asia Strategic Income Fund | | | $1,806,590 | | | | $396,949 | | | | $2,203,539 | |
| Matthews Asia Focus Fund | | | 153,688 | | | | 740,492 | | | | 894,180 | |
| Matthews Asia ESG Fund | | | 42,774 | | | | — | | | | 42,774 | |
| Matthews Asia Small Companies Fund | | | 1,481,217 | | | | — | | | | 1,481,217 | |
| * | Post-Enactment Losses: Must be utilized prior to losses subject to expiration. |
Under the Regulated Investment Company Modernization Act of 2010, the Funds are permitted to carry forward capital losses incurred in taxable years beginning after December 22, 2010 for an unlimited period. However, any losses incurred during those future taxable years will be required to be utilized prior to any losses incurred in pre-enactment taxable years, which generally expire after eight years from when they are incurred. Additionally, post-enactment capital losses that are carried forward will retain their character as either short-term or long-term capital losses rather than being considered all short-term as under previous law.
Management has evaluated the impact of all subsequent events on the Funds through the date the financial statements were issued, and has determined that there were no subsequent events that require recognition or disclosure in the financial statements.
| | |
| Matthews Asia Funds | | |
| |
INVESTMENT ADVISOR Matthews International Capital Management, LLC Four Embarcadero Center, Suite 550 San Francisco, CA 94111 800.789.ASIA CUSTODIAN Brown Brothers Harriman & Co. 50 Milk Street Boston, MA 02109 | | ACCOUNT SERVICES Matthews Asia Funds P.O. Box 9791 Providence, RI 02940 800.789.ASIA LEGAL COUNSEL Paul Hastings LLP 55 Second Street, 24th Floor San Francisco, CA 94105 |

P.O. Box 9791 | Providence, RI 02940 | matthewsasia.com | 800.789.ASIA (2742)
Matthews Asia Funds are distributed in the United States by Foreside Funds Distributors LLC, Berwyn, Pennsylvania
Matthews Asia Funds are distributed in Latin America by HMC Partners

SAR-0617-243M
Item 2. Code of Ethics.
Not applicable.
Item 3. Audit Committee Financial Expert.
Not applicable.
Item 4. Principal Accountant Fees and Services.
Not applicable.
Item 5. Audit Committee of Listed Registrants.
Not applicable.
Item 6. Investments.
| (a) | Schedule of Investments in securities of unaffiliated issuers as of the close of the reporting period is included as part of the report to shareholders filed under Item 1 of this form. |
Item 7. Disclosure of Proxy Voting Policies and Procedures for Closed-End Management Investment Companies.
Not applicable.
Item 8. Portfolio Managers of Closed-End Management Investment Companies.
Not applicable.
Item 9. Purchases of Equity Securities by Closed-End Management Investment Company and Affiliated Purchasers.
Not applicable.
Item 10. Submission of Matters to a Vote of Security Holders.
There have been no material changes to the procedures by which the shareholders may recommend nominees to the registrant’s board of directors, where those changes were implemented after the registrant last provided disclosure in response to the requirements of Item 407(c)(2)(iv) of Regulation S-K (17 CFR 229.407) (as required by Item 22(b)(15) of Schedule 14A (17 CFR 240.14a-101)), or this Item.
Item 11. Controls and Procedures.
| | (a) | The registrant’s principal executive and principal financial officers, or persons performing similar functions, have concluded that the registrant’s disclosure controls and procedures (as defined in Rule 30a-3(c) under the Investment Company Act of 1940, as amended (the “1940 Act”) (17 CFR 270.30a-3(c))) are effective, as of a date within 90 days of the filing date of the report that includes the disclosure required by this paragraph, based on their evaluation of these controls and procedures required by Rule 30a-3(b) under the 1940 Act (17 CFR 270.30a-3(b)) and Rules 13a-15(b) or 15d-15(b) under the Securities Exchange Act of 1934, as amended (17 CFR 240.13a-15(b) or 240.15d-15(b)). |
| | (b) | There were no changes in the registrant’s internal control over financial reporting (as defined in Rule 30a-3(d) under the 1940 Act (17 CFR 270.30a-3(d))) that occurred during the registrant’s second fiscal quarter of the period covered by this report that has materially affected, or is reasonably likely to materially affect, the registrant’s internal control over financial reporting. |
Item 12. Exhibits.
| | (a)(2) | Certifications pursuant to Rule 30a-2(a) under the 1940 Act and Section 302 of the Sarbanes-Oxley Act of 2002 are attached hereto. |
| | (b) | Certifications pursuant to Rule 30a-2(b) under the 1940 Act and Section 906 of the Sarbanes-Oxley Act of 2002 are attached hereto. |
SIGNATURES
Pursuant to the requirements of the Securities Exchange Act of 1934 and the Investment Company Act of 1940, the registrant has duly caused this report to be signed on its behalf by the undersigned, thereunto duly authorized.
(Registrant) Matthews International Funds
By (Signature and Title)* /s/ William J. Hackett
William J. Hackett, President
(principal executive officer)
Date September 7, 2017
Pursuant to the requirements of the Securities Exchange Act of 1934 and the Investment Company Act of 1940, this report has been signed below by the following persons on behalf of the registrant and in the capacities and on the dates indicated.
By (Signature and Title)* /s/ William J. Hackett
William J. Hackett, President
(principal executive officer)
Date September 7, 2017
By (Signature and Title)* /s/ Shai Malka
Shai Malka, Treasurer
(principal financial officer)
Date September 7, 2017
| * | Print the name and title of each signing officer under his or her signature. |