UNITED STATES
SECURITIES AND EXCHANGE COMMISSION
Washington, D.C. 20549
FORM N-CSR
CERTIFIED SHAREHOLDER REPORT OF REGISTERED MANAGEMENT
INVESTMENT COMPANIES
| Investment Company Act file number | 811-08510 | |
| | |
| Matthews International Funds | |
| (Exact name of registrant as specified in charter) | |
| | |
| Four Embarcadero Center, Suite 550 | |
| | San Francisco, CA 94111 | | |
| (Address of principal executive offices) (Zip code) | |
| | |
| William J. Hackett, President | |
| Four Embarcadero Center, Suite 550 | |
| | San Francisco, CA 94111 | | |
| (Name and address of agent for service) | |
| | |
| Registrant’s telephone number, including area code: 415-788-7553 | |
| | |
| Date of fiscal year end: December 31 | |
| | |
| Date of reporting period: June 30, 2015 | |
| | | | | |
Form N-CSR is to be used by management investment companies to file reports with the Commission not later than 10 days after the transmission to stockholders of any report that is required to be transmitted to stockholders under Rule 30e-1 under the Investment Company Act of 1940 (17 CFR 270.30e-1). The Commission may use the information provided on Form N-CSR in its regulatory, disclosure review, inspection, and policymaking roles.
A registrant is required to disclose the information specified by Form N-CSR, and the Commission will make this information public. A registrant is not required to respond to the collection of information contained in Form N-CSR unless the Form displays a currently valid Office of Management and Budget (“OMB”) control number. Please direct comments concerning the accuracy of the information collection burden estimate and any suggestions for reducing the burden to Secretary, Securities and Exchange Commission, 100 F Street, NE, Washington, DC 20549. The OMB has reviewed this collection of information under the clearance requirements of 44 U.S.C. § 3507.
Item 1. Reports to Stockholders.
The Report to Shareholders is attached herewith.
Matthews Asia Funds | Semi-Annual Report
June 30, 2015 | matthewsasia.com
ASIA FIXED INCOME STRATEGY
Matthews Asia Strategic Income Fund
ASIA GROWTH AND INCOME STRATEGIES
Matthews Asian Growth and Income Fund
Matthews Asia Dividend Fund
Matthews China Dividend Fund
ASIA GROWTH STRATEGIES
Matthews Asia Focus Fund
Matthews Asia Growth Fund
Matthews Pacific Tiger Fund
Matthews Asia ESG Fund
Matthews Emerging Asia Fund
Matthews China Fund
Matthews India Fund
Matthews Japan Fund
Matthews Korea Fund
ASIA SMALL COMPANY STRATEGIES
Matthews Asia Small Companies Fund
Matthews China Small Companies Fund
ASIA SPECIALTY STRATEGY
Matthews Asia Science and Technology Fund


Message to Shareholders | | | 4 | | |
Manager Commentaries, Fund Characteristics and Schedules of Investments: | |
ASIA FIXED INCOME STRATEGY | |
Matthews Asia Strategic Income Fund | | | 6 | | |
ASIA GROWTH AND INCOME STRATEGIES | |
Matthews Asian Growth and Income Fund | | | 11 | | |
Matthews Asia Dividend Fund | | | 16 | | |
Matthews China Dividend Fund | | | 21 | | |
ASIA GROWTH STRATEGIES | |
Matthews Asia Focus Fund | | | 26 | | |
Matthews Asia Growth Fund | | | 30 | | |
Matthews Pacific Tiger Fund | | | 35 | | |
Matthews Asia ESG Fund | | | 40 | | |
Matthews Emerging Asia Fund | | | 45 | | |
Matthews China Fund | | | 50 | | |
Matthews India Fund | | | 55 | | |
Matthews Japan Fund | | | 60 | | |
Matthews Korea Fund | | | 65 | | |
ASIA SMALL COMPANY STRATEGIES | |
Matthews Asia Small Companies Fund | | | 70 | | |
Matthews China Small Companies Fund | | | 75 | | |
ASIA SPECIALTY STRATEGY | |
Matthews Asia Science and Technology Fund | | | 80 | | |
Disclosures | | | 85 | | |
Index Definitions | | | 85 | | |
Disclosure of Fund Expenses | | | 86 | | |
Statements of Assets and Liabilities | | | 88 | | |
Statements of Operations | | | 96 | | |
Statements of Changes in Net Assets | | | 100 | | |
Financial Highlights | | | 108 | | |
Notes to Financial Statements | | | 124 | | |
Approval of Investment Advisory Agreement | | | 141 | | |
Results of Special Meeting of Shareholders | | | 143 | | |
Cover photo: Ancient Architecture, China
This report has been prepared for Matthews Asia Funds shareholders. It is not authorized for distribution to prospective investors unless accompanied or preceded by a current Matthews Asia Funds prospectus, which contains more complete information about the Funds' investment objectives, risks and expenses. Additional copies of the prospectus or summary prospectus may be obtained at matthewsasia.com. Please read the prospectus carefully before you invest or send money.
The views and opinions in this report were current as of June 30, 2015. They are not guarantees of performance or investment results and should not be taken as investment advice. Investment decisions reflect a variety of factors, and the managers reserve the right to change their views about individual stocks, sectors and the markets at any time. As a result, the views expressed should not be relied upon as a forecast of a Fund's future investment intent. Current and future portfolio holdings are subject to risk.
Statements of fact are from sources considered reliable, but neither the Funds nor the Investment Advisor makes any representation or guarantee as to their completeness or accuracy.
Investment Risk: Mutual fund shares are not deposits or obligations of, or guaranteed by, any depositary institution. Shares are not insured by the FDIC, Federal Reserve Board or any government agency and are subject to investment risks, including possible loss of principal amount invested. Investing in international and emerging markets may involve additional risks, such as social and political instability, market illiquidity, exchange-rate fluctuations, a high level of volatility and limited regulation. Fixed income investments are subject to additional risks, including, but not limited to, interest rate, credit and inflation risks. In addition, single-country and sector funds may be subject to a higher degree of market risk than diversified funds because of concentration in a specific industry, sector or geographic location. Investing in small and mid-size companies is more risky than investing in large companies as they may be more volatile and less liquid than larger companies. Please see the Funds' prospectus and Statement of Additional Information for more risk disclosure.
Investor Class Performance and Expenses (June 30, 2015)
| | | | | Average Annual Total Return | | | | Prospectus | | Prospectus
Expense Ratios
after Fee Waiver | |
Investor Class | | 1 year | | 5 years | | 10 years | | Since
Inception | | Inception
Date | | Expense
Ratios* | | and Expense
Reimbursement* | |
ASIA FIXED INCOME STRATEGY | |
Asia Strategic Income Fund (MAINX) | | | -1.54 | % | | | n.a. | | | | n.a. | | | | 4.17 | % | | 11/30/11 | | | 1.27 | % | | | 1.10 | %1 | |
ASIA GROWTH AND INCOME STRATEGIES | |
Asian Growth and Income Fund (MACSX) | | | -2.03 | % | | | 7.49 | % | | | 8.76 | % | | | 10.08 | % | | 9/12/94 | | | 1.08 | % | | | n.a. | | |
Asia Dividend Fund (MAPIX) | | | 6.64 | % | | | 9.89 | % | | | n.a. | | | | 10.30 | % | | 10/31/06 | | | 1.06 | % | | | 1.05 | %2 | |
China Dividend Fund (MCDFX) | | | 25.14 | % | | | 13.12 | % | | | n.a. | | | | 12.35 | % | | 11/30/09 | | | 1.19 | % | | | n.a. | | |
ASIA GROWTH STRATEGIES | |
Asia Focus Fund (MAFSX) | | | -2.32 | % | | | n.a. | | | | n.a. | | | | 0.33 | % | | 4/30/13 | | | 2.16 | % | | | 1.50 | %3 | |
Asia Growth Fund (MPACX) | | | 2.15 | % | | | 10.03 | % | | | 8.70 | % | | | 9.69 | % | | 10/31/03 | | | 1.11 | % | | | n.a. | | |
Pacific Tiger Fund (MAPTX) | | | 9.41 | % | | | 10.49 | % | | | 12.10 | % | | | 9.21 | % | | 9/12/94 | | | 1.09 | % | | | 1.08 | %2 | |
Asia ESG Fund (MASGX) | | | n.a. | | | | n.a. | | | | n.a. | | | | -1.60 | % | | 4/30/15 | | | 2.11 | % | | | 1.45 | %3 | |
Emerging Asia Fund (MEASX) | | | 4.56 | % | | | n.a. | | | | n.a. | | | | 7.25 | % | | 4/30/13 | | | 1.78 | % | | | 1.48 | %3 | |
China Fund (MCHFX) | | | 19.20 | % | | | 5.42 | % | | | 13.14 | % | | | 10.57 | % | | 2/19/98 | | | 1.13 | % | | | n.a. | | |
India Fund (MINDX) | | | 28.22 | % | | | 10.27 | % | | | n.a. | | | | 13.58 | % | | 10/31/05 | | | 1.12 | % | | | n.a. | | |
Japan Fund (MJFOX) | | | 15.69 | % | | | 14.87 | % | | | 4.18 | % | | | 6.14 | % | | 12/31/98 | | | 1.03 | % | | | n.a. | | |
Korea Fund (MAKOX) | | | 9.04 | % | | | 13.30 | % | | | 10.19 | % | | | 6.48 | % | | 1/3/95 | | | 1.11 | % | | | n.a. | | |
ASIA SMALL COMPANY STRATEGIES | |
Asia Small Companies Fund (MSMLX) | | | 5.83 | % | | | 10.47 | % | | | n.a. | | | | 15.91 | % | | 9/15/08 | | | 1.47 | % | | | n.a. | | |
China Small Companies Fund (MCSMX) | | | 14.72 | % | | | n.a. | | | | n.a. | | | | 3.05 | % | | 5/31/11 | | | 1.90 | % | | | 1.50 | %4 | |
ASIA SPECIALTY STRATEGY | |
Asia Science and Technology Fund (MATFX) | | | 10.13 | % | | | 14.05 | % | | | 10.67 | % | | | 3.04 | % | | 12/27/99 | | | 1.16 | % | | | n.a. | | |
* These figures are from the fund's prospectus dated as of April 30, 2015, and may differ from the actual expense ratios for fiscal year 2015, as shown in the financial highlights section of this report.
1 Matthews has contractually agreed (i) to waive fees and reimburse expenses to the extent needed to limit Total Annual Fund Operating Expenses (excluding Rule 12b-1 fees, front-end or contingent deferred loads, taxes, interest, brokerage commissions, short sale dividend expenses, expenses incurred in connection with any merger or reorganization or extraordinary expenses such as litigation) of the Institutional Class to 0.90%, and (ii) if any Fund-wide expenses (i.e., expenses that apply to both the Institutional Class and the Investor Class) are waived for the Institutional Class to maintain the 0.90% expense limitation, to waive an equal amount (in annual percentage terms) of those same expenses for the Investor Class. The Total Annual Fund Operating Expenses After Fee Waiver and Expense Reimbursement for the Investor Class may vary from year to year and will in some years exceed 0.90%. If the operating expenses fall below the expense limitation in a year within three years after Matthews has made a waiver or reimbursement, the Fund may reimburse Matthews up to an amount that does not cause the expenses for that year to exceed the expense limitation applicable at the time of that fee waiver and/or expense reimbursement or to exceed any other agreed upon expense limitation for that year. This agreement will remain in place until April 30, 2016, may be renewed for additional periods not exceeding one year and may be terminated at any time by the Board of Trustees or the Trust on behalf of the Fund on 60 days' written notice to Matthews. Matthews may decline to renew this agreement by written notice to the Trust at least 30 days before its annual expiration date.
2. Matthews has contractually agreed to waive a portion of its advisory fee and administrative and shareholder services fee if the Fund's average daily net assets are over $3 billion, as follows: for every $2.5 billion average daily net assets of the Fund that are over $3 billion, the advisory fee rate and the administrative and shareholder services fee rate for the Fund with respect to such excess average daily net assets will be each reduced by 0.01%, in each case without reducing such fee rate below 0.00%. Any amount waived by Matthews pursuant to this agreement may not be recouped by Matthews. This agreement will remain in place until April 30, 2016, may be renewed for additional periods not exceeding one year and may be terminated at any time (i) by the Trust on behalf of the Fund or by the Board of Trustees upon 60 days' prior written notice to Matthews; or (ii) by Matthews upon 60 days' prior written notice to the Trust, in each case without payment of any penalty.
3. Matthews has contractually agreed (i) to waive fees and reimburse expenses to the extent needed to limit Total Annual Fund Operating Expenses (excluding Rule 12b-1 fees, front-end or contingent deferred loads, taxes, interest, brokerage commissions, short sale dividend expenses, expenses incurred in connection with any merger or reorganization or extraordinary expenses such as litigation) of the Institutional Class to 1.25%, and (ii) if any Fund-wide expenses (i.e., expenses that apply to both the Institutional Class and the Investor Class) are waived for the Institutional Class to maintain the 1.25% expense limitation, to waive an equal amount (in annual percentage terms) of those same expenses for the Investor Class. The Total Annual Fund Operating Expenses After Fee Waiver and Expense Reimbursement for the Investor Class may vary from year to year and will in some years exceed 1.25%. If the operating expenses fall below the expense limitation in a year within three years after Matthews has made a waiver or reimbursement, the Fund may reimburse Matthews up to an amount that does not cause the expenses for that year to exceed the expense limitation applicable at the time of that fee waiver and/or expense reimbursement or to exceed any other agreed upon expense limitation for that year. This agreement will remain in place until April 30, 2016 for the Asia Focus Fund and Emerging Asia Fund, and until April 30, 2017 for the Asia ESG Fund, may be renewed for additional periods not exceeding one year and may be terminated at any time by the Board of Trustees or the Trust on behalf of the Fund on 60 days' written notice to Matthews. Matthews may decline to renew this agreement by written notice to the Trust at least 30 days before its annual expiration date.
4. Matthews has contractually agreed to waive fees and reimburse expenses to the extent needed to limit Total Annual Fund Operating Expenses (excluding Rule 12b-1 fees, front-end or contingent deferred loads, taxes, interest, brokerage commissions, short sale dividend expenses, expenses incurred in connection with any merger or reorganization or extraordinary expenses such as litigation) to 1.50%. If the operating expenses fall below the expense limitation in a year within three years after Matthews has made a waiver or reimbursement, the Fund may reimburse Matthews up to an amount that does not cause the expenses for that year to exceed the expense limitation applicable at the time of that fee waiver and/or expense reimbursement or to exceed any other agreed upon expense limitation for that year. This agreement will remain in place until April 30, 2016, may be renewed for additional periods not exceeding one year and may be terminated at any time by the Board of Trustees or the Trust on behalf of the Fund on 60 days' written notice to Matthews. Matthews may decline to renew this agreement by written notice to the Trust at least 30 days before its annual expiration date.
2 MATTHEWS ASIA FUNDS
Institutional Class Performance and Expenses (June 30, 2015)
| | | | | Average Annual Total Return | | | | Prospectus | | Prospectus
Expense Ratios
after Fee Waiver | |
Institutional Class | | 1 year | | 5 years | | 10 years | | Since
Inception | | Inception
Date | | Expense
Ratios* | | and Expense
Reimbursement* | |
ASIA FIXED INCOME STRATEGY | |
Asia Strategic Income Fund (MINCX) | | | -1.34 | % | | | n.a. | | | | n.a. | | | | 4.35 | % | | 11/30/11 | | | 1.07 | % | | | 0.90 | %1 | |
ASIA GROWTH AND INCOME STRATEGIES | |
Asian Growth and Income Fund (MICSX) | | | -1.86 | % | | | n.a. | | | | n.a. | | | | 5.10 | % | | 10/29/10 | | | 0.92 | % | | | n.a. | | |
Asia Dividend Fund (MIPIX) | | | 6.80 | % | | | n.a. | | | | n.a. | | | | 7.72 | % | | 10/29/10 | | | 0.93 | % | | | n.a. | | |
China Dividend Fund (MICDX) | | | 25.28 | % | | | n.a. | | | | n.a. | | | | 10.73 | % | | 10/29/10 | | | 1.01 | % | | | n.a. | | |
ASIA GROWTH STRATEGIES | |
Asia Focus Fund (MIFSX) | | | -2.05 | % | | | n.a. | | | | n.a. | | | | 0.58 | % | | 4/30/13 | | | 1.94 | % | | | 1.25 | %3 | |
Asia Growth Fund (MIAPX) | | | 2.33 | % | | | n.a. | | | | n.a. | | | | 6.54 | % | | 10/29/10 | | | 0.91 | % | | | n.a. | | |
Pacific Tiger Fund (MIPTX) | | | 9.56 | % | | | n.a. | | | | n.a. | | | | 6.84 | % | | 10/29/10 | | | 0.92 | % | | | 0.91 | %2 | |
Asia ESG Fund (MISFX) | | | n.a. | | | | n.a. | | | | n.a. | | | | -1.60 | % | | 4/30/15 | | | 1.95 | % | | | 1.25 | %3 | |
Emerging Asia Fund (MIASX) | | | 4.80 | % | | | n.a. | | | | n.a. | | | | 7.49 | % | | 4/30/13 | | | 1.59 | % | | | 1.25 | %3 | |
China Fund (MICFX) | | | 19.35 | % | | | n.a. | | | | n.a. | | | | 1.80 | % | | 10/29/10 | | | 0.97 | % | | | n.a. | | |
India Fund (MIDNX) | | | 28.48 | % | | | n.a. | | | | n.a. | | | | 6.69 | % | | 10/29/10 | | | 0.94 | % | | | n.a. | | |
Japan Fund (MIJFX) | | | 15.82 | % | | | n.a. | | | | n.a. | | | | 13.19 | % | | 10/29/10 | | | 0.90 | % | | | n.a. | | |
Korea Fund (MIKOX) | | | 9.35 | % | | | n.a. | | | | n.a. | | | | 10.66 | % | | 10/29/10 | | | 0.93 | % | | | n.a. | | |
ASIA SMALL COMPANY STRATEGY | |
Asia Small Companies Fund (MISMX) | | | 6.07 | % | | | n.a. | | | | n.a. | | | | 8.17 | % | | 4/30/13 | | | 1.25 | % | | | n.a. | | |
ASIA SPECIALTY STRATEGY | |
Asia Science and Technology Fund (MITEX) | | | 10.34 | % | | | n.a. | | | | n.a. | | | | 20.20 | % | | 4/30/13 | | | 0.95 | % | | | n.a. | | |
* These figures are from the fund's prospectus dated as of April 30, 2015, and may differ from the actual expense ratios for fiscal year 2015, as shown in the financial highlights section of this report.
1 Matthews has contractually agreed to waive fees and reimburse expenses to the extent needed to limit Total Annual Fund Operating Expenses (excluding Rule 12b-1 fees, front-end or contingent deferred loads, taxes, interest, brokerage commissions, short sale dividend expenses, expenses incurred in connection with any merger or reorganization or extraordinary expenses such as litigation) of the Institutional Class to 0.90%. If the operating expenses fall below the expense limitation in a year within three years after Matthews has made a waiver or reimbursement, the Fund may reimburse Matthews up to an amount that does not cause the expenses for that year to exceed the expense limitation applicable at the time of that fee waiver and/or expense reimbursement or to exceed any other agreed upon expense limitation for that year. This agreement will remain in place until April 30, 2016, may be renewed for additional periods not exceeding one year and may be terminated at any time by the Board of Trustees or the Trust on behalf of the Fund on 60 days' written notice to Matthews. Matthews may decline to renew this agreement by written notice to the Trust at least 30 days before its annual expiration date.
2. Matthews has contractually agreed to waive a portion of its advisory fee and administrative and shareholder services fee if the Fund's average daily net assets are over $3 billion, as follows: for every $2.5 billion average daily net assets of the Fund that are over $3 billion, the advisory fee rate and the administrative and shareholder services fee rate for the Fund with respect to such excess average daily net assets will be each reduced by 0.01%, in each case without reducing such fee rate below 0.00%. Any amount waived by Matthews pursuant to this agreement may not be recouped by Matthews. This agreement will remain in place until April 30, 2016, may be renewed for additional periods not exceeding one year and may be terminated at any time (i) by the Trust on behalf of the Fund or by the Board of Trustees upon 60 days' prior written notice to Matthews; or (ii) by Matthews upon 60 days' prior written notice to the Trust, in each case without payment of any penalty.
3. Matthews has contractually agreed to waive fees and reimburse expenses to the extent needed to limit Total Annual Fund Operating Expenses (excluding Rule 12b-1 fees, front-end or contingent deferred loads, taxes, interest, brokerage commissions, short sale dividend expenses, expenses incurred in connection with any merger or reorganization or extraordinary expenses such as litigation) of the Institutional Class to 1.25%. If the operating expenses fall below the expense limitation in a year within three years after Matthews has made a waiver or reimbursement, the Fund may reimburse Matthews up to an amount that does not cause the expenses for that year to exceed the expense limitation applicable at the time of that fee waiver and/or expense reimbursement or to exceed any other agreed upon expense limitation for that year. This agreement will remain in place until April 30, 2016 for the Asia Focus Fund and the Emerging Asia Fund, and until April 30, 2017 for the Asia ESG Fund, may be renewed for additional periods not exceeding one year and may be terminated at any time by the Board of Trustees or the Trust on behalf of the Fund on 60 days' written notice to Matthews. Matthews may decline to renew this agreement by written notice to the Trust at least 30 days before its annual expiration date.
Past Performance: All performance quoted in this report is past performance and is no guarantee of future results. Investment return and principal value will fluctuate with changing market conditions so that when redeemed, shares may be worth more or less than their original cost. Current performance may be lower or higher than the returns quoted. If certain of the Funds' fees and expenses had not been waived, returns would have been lower. For the Funds' most recent month-end performance, please call 800.789.ASIA (2742) or visit matthewsasia.com.
matthewsasia.com | 800.789.ASIA 3

Message to Shareholders from the Investment Advisor
Dear Valued Investors,
Valuations remain at the forefront of my thoughts when I look at Asia's stock markets. We are swimming against the tide a bit now, as the markets have risen at a faster pace than the underlying growth of Asia's companies. A price-to-earnings ratio* of 15.6X for Asia ex Japan is significantly above long-run averages. Now, I know that there is some justification for higher valuations in a world in which bond yields are extremely low. And there is some good news for investors in Asia's equity markets—they remain at a similar valuation to troubled Europe and at a discount of about 15% to the U.S.1 There are clearly some signs of excess as I'll get into in discussing China and India. And there is always the danger of dismissing everything as a bubble when there is still value to be had in the markets. Nevertheless, I do think it is wise to tread a little more cautiously in light of the re-rating of Asian equities in recent months.
Let us start with China. There has been plenty of talk about bubbles recently. Isn't it peculiar how China has just switched from one form of pessimism (a fear of imminent economic collapse) to another (a fear of an overheated stock market) without the usual step of optimism in between? Such is the lot of the world's second-largest economy and pretender to the U.S.'s crown. Undoubtedly, there are some strange goings-on in China's market. High retail participation increases the casino-like actions in the markets. Taking a passive approach to the markets right now risks buying into some companies that have very limited history and business models that are built on hopes rather than reality—and yet they can be multibillion dollar companies thanks to the valuations put on them by local speculators. And certainly, China stocks as a whole have seen the biggest short-term rise in their average valuations in the region. Yet, it remains true that the market of Hong Kong, through which most China investing is done, remains much more reasonably priced, at 14.4X forward earnings. Indeed, one can find businesses that have stood the test of time still trading at reasonable, sometimes cheap valuations. But it is definitely an environment in which one needs to tread carefully, and not get carried away.
In India, the problem remains partly cyclical and partly structural. Macroeconomic policy has been fairly tight over the past couple of years. This has impacted earnings growth, which has been disappointing. And although the new Modi government appears to be making changes to some of India's structural bottlenecks—and particularly improving the efficiency of government—it has to contend with pushback from India's formidable bureaucracy and the need to maintain foreign investor confidence. Reforms will likely have to be funded by fickle foreign portfolio flows, unless India can do better at attracting foreign direct investment. All of this should be seen as more of an opportunity than a threat—if it were not for the valuations of the markets, which at 16.4X forward earnings, is still among the more expensive in the region. We have been fairly cautious on India for a while. The good news is that the market has faltered this year and so the sentiment is no longer perhaps as ebullient as it has been. But the market hasn't really become any cheaper either. Stock prices have just reacted to weak underlying corporate results.
In Japan, we have noted some success from attempts to reflate the economy, much to the surprise of those who suggested it would merely debase the currency and precipitate a debt crisis. The stock market has performed strongly.
4 MATTHEWS ASIA FUNDS
And this performance has only been enhanced with recent moves to improve corporate governance, particularly when highly rated companies embrace the government's push for greater transparency. It gives other companies nowhere to hide. No longer can they say: "Well, the most respected companies don't do it, why should we?" But at the same time, we have yet to see a lot of evidence for change in the operating metrics of corporate Japan. That may come. Until now, there remains more hope than reality, too. We have certainly seen, however, some signs of better use of cash. In a deflationary world, it was easy to let cash build up on the balance sheet, because it was earning a return. Now, with positive inflation rates, we have seen companies more inclined to raise dividend payments. Japan is by no means, however, a cheap market. And to justify the current valuations, companies have to follow through with better operating results.
In contrast to the big three economies, it is the Association of Southeast Asian Nations (ASEAN) that has struggled a bit recently, and now appears the more reasonably priced part of the region. It also remains among the more vulnerable to tighter money and a series of U.S. Federal Reserve rate hikes. My view remains that we ought not to see a series of Fed rate hikes in the current environment. Inflation is still in abeyance. The most likely scenario that would justify a sustained series of rate hikes would be a return of faster nominal growth in the world—real growth plus inflation. In such an environment, even higher interest rates are unlikely to be too much of a headwind, as Asia, and particularly ASEAN economies should benefit from easier business conditions.
I have been fairly upbeat in the recent past about the economic conditions in Asia. And I remain upbeat. Governments in the region seem to be determined to tackle long-term structural issues. The reason for my more cautious message is simply valuation. I admit that there is a risk in being too sensitive to valuations, but there does seem to be a relationship between current valuation levels and future returns on average. It often pays, unsurprisingly, to be buying when markets are cheap; it is just hard to do. As always, it pays to be patient—to buy quality, sustainable growth, but to do so at reasonable prices.

Robert Horrocks, PhD
Chief Investment Officer
Matthews Asia
1 In terms of Factset aggregates.
* Price-to-Earnings Ratio (P/E Ratio) is a valuation ratio of a company's current share price compared to its per-share earnings and is calculated as the market value per share divided by the Earnings per Share (EPS).
matthewsasia.com | 800.789.ASIA 5

ASIA FIXED INCOME STRATEGY
PORTFOLIO MANAGERS
Teresa Kong, CFA | | | |
Lead Manager | | | |
Gerald M. Hwang, CFA | | Satya Patel | |
Co-Manager | | Co-Manager | |
FUND FACTS
| | | Investor Class | | Institutional Class | |
Ticker | | MAINX | | MINCX | |
CUSIP | | 577125503 | | 577125602 | |
Inception | | 11/30/11 | | 11/30/11 | |
NAV | | $10.25 | | $10.24 | |
Initial Investment | | $2,500 | | $3 million | |
Gross Expense Ratio1 | | 1.27% | | 1.07% | |
After Fee Waiver and
Reimbursement2 | | 1.10% | | 0.90% | |
Portfolio Statistics
Total # of Positions | | 51 | |
Net Assets | | $69.9 million | |
Modified Duration | | 3.83 | |
Portfolio Turnover | | 34.28%4 | |
Benchmark
HSBC Asian Local Bond Index | |
OBJECTIVE
Total return over the long term with an emphasis on income.
STRATEGY
Under normal market conditions, the Fund seeks to achieve its investment objective by investing at least 80% of its total assets, which include borrowings for investment purposes, in income-producing securities including, but not limited to, debt and debt-related instruments issued by governments, quasi-governmental entities, supra-national institutions, and companies in Asia. Asia consists of all countries and markets in Asia and includes developed, emerging, and frontier countries and markets in the Asian region. Investments may be denominated in any currency, and may represent any part of a company's capital structure from debt to equity or with features of both.
1 Prospectus expense ratios.
2 Matthews has contractually agreed (i) to waive fees and reimburse expenses to the extent needed to limit Total Annual Fund Operating Expenses (excluding Rule 12b-1 fees, front-end or contingent deferred loads, taxes, interest, brokerage commissions, short sale dividend expenses, expenses incurred in connection with any merger or reorganization or extraordinary expenses such as litigation) of the Institutional Class to 0.90%, and (ii) if any Fund-wide expenses (i.e., expenses that apply to both the Institutional Class and the Investor Class) are waived for the Institutional Class to maintain the 0.90% expense limitation, to waive an equal amount (in annual percentage terms) of those same expenses for the Investor Class. The Total Annual Fund Operating Expenses After Fee Waiver and Expense Reimbursement for the Investor Class may vary from year to year and will in some years exceed 0.90%. If the operating expenses fall below the expense limitation in a year within three years after Matthews has made a waiver or reimbursement, the Fund may reimburse Matthews up to an amount that does not cause the expenses for that year to exceed the expense limitation applicable at the time of that fee waiver and/or expense reimbursement or to exceed any other agreed upon expense limitation for that year. This agreement will remain in place until April 30, 2016, may be renewed for additional periods not exceeding one year and may be terminated at any time by the Board of Trustees or the Trust on behalf of the Fund on 60 days' written notice to Matthews. Matthews may decline to renew this agreement by written notice to the Trust at least 30 days before its annual expiration date.
3 Modified duration measures the percent change in value of the fixed income portion of the portfolio in response to a 1% change in interest rates. In a multi-currency denominated portfolio with sensitivities to different interest rate regimes, modified duration will not accurately reflect the change in value of the overall portfolio from a change in any one interest rate regime.
4 The lesser of fiscal year 2014 long-term purchase costs or sales proceeds divided by the average monthly market value of long-term securities.
Matthews Asia Strategic Income Fund
Portfolio Manager Commentary
Period ended June 30, 2015
For the first half of 2015, the Matthews Asia Strategic Income Fund returned 0.38% (Investor Class) and 0.48% (Institutional Class), while its benchmark, the HSBC Asian Local Bond Index (ALBI) returned –0.44%. For the quarter ending June 30, the Fund returned –0.31% (Investor Class) and –0.26% (Institutional Class), while its benchmark returned –0.76%.
Market Environment:
As we look back at the first half of 2015, we recall the headline events of the Greek default, the meteoric rise and fall of Chinese onshore equity markets, and the debt restructuring of Puerto Rico. While all these events caused short-term volatility, the real drivers of return in Asia bonds were the steady depreciation of Asian currencies and the steepening of yield curves.
Most Asian currencies continued to mildly depreciate, relative to the U.S. dollar, as the U.S. Federal Reserve is expected to raise interest rates while most Asian governments have been operating more in terms of monetary easing instead of tightening. The general steepening of yield curves should be framed more as normalizing from unusually flat curves at the end of 2014, resulting from global disinflation. The dovish bias of Asian central banks pushed short-dated yields (less than two years) lower while the normalization described caused medium and long-end yields to rise. Finally, credit spreads diverged. Investment-grade spreads widened by about 10 basis points (0.10%), in line with the mild rise one would expect from steepening yield curves. Conversely, non-investment grade spreads tightened by about 27 basis points (0.27%), driven largely by Chinese property bonds. In the first quarter, Chinese property developer Kaisa defaulted on its bonds. The market recovered as the market came to the conclusion that the Kaisa default was not contagious and home prices recovered from further central bank easing and loosening of home ownership regulations.
Performance Contributors and Detractors:
The biggest positive contributors to performance for the first half of the year were our holdings in convertible and corporate bonds issued by Chinese companies. We made a deliberate reallocation away from local currency bonds into the convertible bonds. We found value in several convertibles of Chinese companies as Chinese equity markets rallied. This upside skew, combined with protected downside risk (as we targeted convertibles of solid companies with little leverage that were valued at or below their bond floor), provided attractive return vs. risk. Examples include our holdings of Ctrip.com and Biostime convertible bonds. The other category of outperformers included Chinese real estate holdings as our holdings recovered from the containment of the Kaisa default as well as the rise in property prices described previously.
The biggest detractors to performance were bonds of longest duration as the yield curves steepened. These hit our holdings of Yum! Brands, a solid investment grade name. Since these are the longest bonds in our portfolio, with a maturity of 2043, these bonds sold off the most. Our holdings
6 MATTHEWS ASIA FUNDS
PERFORMANCE AS OF JUNE 30, 2015
| | | | | | | | | Average Annual
Total Returns | | | |
| | | 3 Months | | YTD | | 1 Year | | 3 Years | | Since
Inception | |
Inception Date | |
Investor Class (MAINX) | | | -0.31 | % | | | 0.38 | % | | | -1.54 | % | | | 3.76 | % | | | 4.17 | % | | 11/30/11 | |
Institutional Class (MINCX) | | | -0.26 | % | | | 0.48 | % | | | -1.34 | % | | | 3.94 | % | | | 4.35 | % | | 11/30/11 | |
HSBC Asian Local Bond Index5 | | | -0.76 | % | | | -0.44 | % | | | -1.04 | % | | | 1.40 | % | | | 2.04 | % | | | | | |
Lipper International Income Funds Category Average6 | | | -1.60 | % | | | -3.10 | % | | | -6.81 | % | | | -0.08 | % | | | 0.83 | % | | | | | |
| Performance assumes reinvestment of all dividends and/or distributions before taxes. All performance quoted represents past performance and is no guarantee of future results. Investment return and principal value will fluctuate with market conditions so that when redeemed, shares may be worth more or less than their original cost. Current performance may be lower or higher than the return figures quoted. Returns would have been lower if certain of the Fund's fees and expenses had not been waived. For the Fund's most recent month-end performance visit matthewsasia.com. | |
INCOME DISTRIBUTION HISTORY
| | 2015 | | 2014 | |
| | Q1 | | Q2 | | Q3 | | Q4 | | Total | | Q1 | | Q2 | | Q3 | | Q4 | | Total | |
Investor (MAINX) | | $ | 0.00 | | | $ | 0.10 | | | | n.a. | | | | n.a. | | | | n.a. | | | $ | 0.10 | | | $ | 0.09 | | | $ | 0.07 | | | $ | 0.10 | | | $ | 0.38 | | |
Inst'l (MINCX) | | $ | 0.01 | | | $ | 0.10 | | | | n.a. | | | | n.a. | | | | n.a. | | | $ | 0.11 | | | $ | 0.10 | | | $ | 0.08 | | | $ | 0.11 | | | $ | 0.40 | | |
Note: This table does not include capital gains distributions. Totals may differ by $0.02 due to rounding. For income distribution history, visit matthewsasia.com.
30-DAY YIELD:
Investor Class: 4.58% (4.36% excluding expense waiver)
Inst'l Class: 4.83% (4.59% excluding expense waiver)
The 30-Day Yield represents net investment income earned by the Fund over the 30-day period ended 6/30/15, expressed as an annual percentage rate based on the Fund's share price at the end of the 30-day period. The 30-Day Yield should be regarded as an estimate of the Fund's rate of investment income, and it may not equal the Fund's actual income distribution rate.
Source: BNY Mellon Investment Servicing (US) Inc.
YIELD TO WORST:
6.33%
Yield to worst is the lowest yield that can be received on a bond assuming that the issuer does not default. It is calculated by utilizing the worst case assumptions for a bond with respect to certain income-reducing factors, including prepayment, call or sinking fund provisions. It does not represent the yield that an investor should expect to receive. Past yields are no guarantee of future yields.
Source: FactSet Research Systems
GROWTH OF A $10,000 INVESTMENT SINCE INCEPTION—INVESTOR CLASS
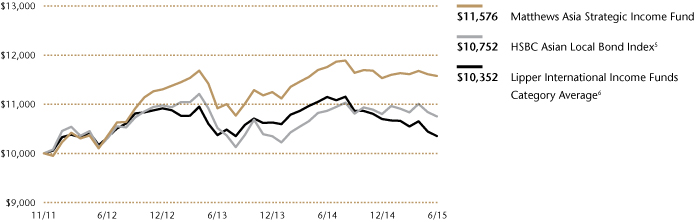
Plotted monthly. The performance data and graph do not reflect the deduction of taxes that a shareholder would pay on dividends, capital gains distributions or redemption of Fund shares. Values are in US$.
5 It is not possible to invest directly in an index. Source: Index data from HSBC, and Bloomberg; total return calculations performed by BNY Mellon Investment Servicing (US) Inc. Please see page 85 for index definitions.
6 The Lipper Category Average does not reflect sales charges and is based on total return, including reinvestment of dividends and capital gains for the stated periods.
TOP TEN POSITIONS
| | | Sector | | Currency | | % of Net Assets | |
DFCC Bank PLC, 9.625%, 10/31/2018 | | Financials | | U.S. Dollar | | | 4.0 | % | |
Homeinns Hotel Group, Cnv., 2.000%, 12/15/2015 | | Consumer Discretionary | | U.S. Dollar | | | 3.9 | % | |
PT Perusahaan Listrik Negara, 5.250%, 10/24/2042 | | Utilities | | U.S. Dollar | | | 3.1 | % | |
Longfor Properties Co., Ltd., 6.875%, 10/18/2019 | | Financials | | U.S. Dollar | | | 3.0 | % | |
TML Holdings Pte, Ltd., 5.750%, 05/07/2021 | | Consumer Discretionary | | U.S. Dollar | | | 3.0 | % | |
Bank of Baroda, 6.625%, 05/25/2022 | | Financials | | U.S. Dollar | | | 3.0 | % | |
ICICI Bank, Ltd., 6.375%, 04/30/2022 | | Financials | | U.S. Dollar | | | 2.9 | % | |
Shimao Property Holdings, Ltd., 6.625%, 01/14/2020 | | Financials | | U.S. Dollar | | | 2.9 | % | |
Global Logistic Properties, Ltd., 3.375%, 05/11/2016 | | Financials | | Chinese Renminbi | | | 2.9 | % | |
Value Success International, Ltd., 4.750%, 11/04/2018 | | Financials | | Chinese Renminbi | | | 2.8 | % | |
% OF ASSETS IN TOP TEN | | | | | | | 31.5 | % | |
matthewsasia.com | 800.789.ASIA 7
CURRENCY ALLOCATION (%)7,8
U.S. Dollar (USD) | | | 60.4 | | |
Indian Rupee (INR) | | | 11.6 | | |
Singapore Dollar (SGD) | | | 0.8 | | |
Indonesian Rupiah (IDR) | | | 5.4 | | |
Sri Lanka Rupee (LKR) | | | 5.5 | | |
Chinese Renminbi (CNY) | | | 7.7 | | |
South Korean Won (KRW) | | | 2.3 | | |
Hong Kong Dollar (HKD) | | | 2.4 | | |
Philippine Peso (PHP) | | | 0.5 | | |
Cash and Other Assets, Less Liabilities | | | 3.4 | | |
COUNTRY ALLOCATION (%)8,9
China/Hong Kong | | | 32.9 | | |
India | | | 22.8 | | |
Indonesia | | | 16.9 | | |
Sri Lanka | | | 13.0 | | |
Singapore | | | 3.7 | | |
South Korea | | | 2.3 | | |
Philippines | | | 2.1 | | |
Australia | | | 1.8 | | |
Supranational10 | | | 1.1 | | |
Cash and Other Assets, Less Liabilities | | | 3.4 | | |
SECTOR ALLOCATION (%)8
Financials | | | 44.9 | | |
Consumer Discretionary | | | 16.5 | | |
Foreign Government Bonds | | | 13.8 | | |
Industrials | | | 8.5 | | |
Utilities | | | 6.6 | | |
Consumer Staples | | | 2.5 | | |
Information Technology | | | 2.4 | | |
Telecommunication Services | | | 1.4 | | |
Cash and Other Assets, Less Liabilities | | | 3.4 | | |
Please note: Foreign Government Bonds category includes Supranationals.
ASSET TYPE BREAKDOWN (%)7,8
Non-Convertible Corporate Bonds | | | 65.2 | | |
Convertible Corporate Bonds | | | 16.3 | | |
Government Bonds | | | 13.8 | | |
Common Equities and ADRs | | | 1.3 | | |
Cash and Other Assets, Less Liabilities | | | 3.4 | | |
7 Source: FactSet Research Systems. Percentage values in data are rounded to the nearest tenth of one percent; the values may not sum to 100% due to rounding.
8 Cash and other assets may include forward currency exchange contracts and certain derivative instruments that have been marked-to-market.
9 Not all countries where the Fund may invest are included in the benchmark index.
10 Supranational is an international organization in which member states transcend national boundaries (ex. IMF).
Matthews Asia Strategic Income Fund
Portfolio Manager Commentary (continued)
in Indonesian government bonds were also hurt from yield curve steepening as well as the 7% depreciation of the Indonesian rupiah over this period.
Notable Portfolio Changes:
The most important change in our portfolio was our increased allocation into convertible bonds from local currency bonds. As mentioned above, we believed that convertibles represented the positive return potential given their upside optionality; protected downside when priced at or below the bond floor; and their low sensitivity to interest rates. We allocated away from local currency bonds as we expected Asian currencies to continue their gradual depreciation against the U.S. dollar.
Outlook:
At the time of writing, the market is digesting two major uncertainties from two ancient civilizations: Greece and China. The Greek referendum has resulted in a "No" vote. This signals a fundamental structural shift in the Euro zone, throwing into question the sanctity of a monetary union and higher volatility for all risky assets. Because of the bi-modal nature of the vote, the market has not priced in the uncertainties and the potential secondary effects. Instead of this news dissipating in weeks, the volatility could endure for several quarters as a chain reaction unfolds. One thing we learned from the default of Lehman Brothers is that it took more than two quarters for markets to bottom. Potential chain reactions might lead to the actual withdrawal of Greece from the Euro zone, which throws into question the potential for other countries to follow the same path.
While the fall of Chinese equities has certainly been sharp, the surprise has not been the fall but the policy response. Most investors understand that any market that rises so fast typically has the potential to fall twice as fast. More unexpected has been the rapid response of the Chinese government, which seems to signal that it is worried about the potential contagion resulting from an unwinding of assets, as providers of leverage may seize and sell collateral. This signals the vulnerability of a market in which the average participant is trading more on speculation than on fundamentals.
Given this highly uncertain context, we expect short-term returns to be driven by their historical and perceived riskiness. This means that the highest-carry currencies will underperform relative to safe-haven currencies; for sub-investment grade to underperform investment grade; for interest rates in safe-haven currencies to fall; and for interest rates in most Asian countries to rise. In summary, we expect Asia bonds to be volatile. Contributors to performance might even flip-flop in the short run as our convertible bonds may sell-off from falling Chinese equities, and our long duration, investment grade U.S. dollar assets may rally on their safe-haven characteristics. By the end of the year, we expect this volatility to subside and Asian assets to trade more on the relatively good fundamentals rather than the systematic risks we've highlighted.
Fixed income investments are subject to additional risks, including, but not limited to, interest rate, credit and inflation risks. Investing in emerging markets involves different and greater risks, as these countries are substantially smaller, less liquid and more volatile than securities markets in more developed markets.
8 MATTHEWS ASIA FUNDS
Matthews Asia Strategic Income Fund June 30, 2015
Schedule of Investmentsa (unaudited)
NON-CONVERTIBLE CORPORATE BONDS: 65.2%
| | Face Amount* | | Value | |
INDIA: 22.8% | |
TML Holdings Pte, Ltd.
5.750%, 05/07/21 | | | 2,000,000 | | | $ | 2,068,660 | | |
Bank of Baroda
6.625%b, 05/25/22 | | | 2,000,000 | | | | 2,067,068 | | |
ICICI Bank, Ltd.
6.375%b, 04/30/22 | | | 2,000,000 | | | | 2,055,820 | | |
Housing Development Finance Corp., Ltd.
9.240%, 06/24/24 | | INR | 100,000,000 | | | | 1,619,786 | | |
Housing Development Finance Corp., Ltd.
8.950%, 03/21/23 | | INR | 100,000,000 | | | | 1,589,777 | | |
Power Grid Corp. of India, Ltd.
9.250%, 12/26/15 | | INR | 100,000,000 | | | | 1,573,665 | | |
Delhi International Airport, Ltd.
6.125%, 02/03/22 | | | 1,400,000 | | | | 1,413,304 | | |
Axis Bank, Ltd.
7.250%b, 08/12/21 | | | 1,000,000 | | | | 1,024,220 | | |
Rural Electrification Corp., Ltd.
9.340%, 08/25/24 | | INR | 52,000,000 | | | | 856,747 | | |
Power Grid Corp. of India, Ltd., Series B
9.300%, 09/04/24 | | INR | 52,000,000 | | | | 854,668 | | |
Rural Electrification Corp., Ltd.
9.020%, 06/18/19 | | INR | 50,000,000 | | | | 799,770 | | |
Total India | | | | | 15,923,485 | | |
CHINA/HONG KONG: 16.6% | |
Longfor Properties Co., Ltd.
6.875%, 10/18/19 | | | 2,000,000 | | | | 2,084,500 | | |
Shimao Property Holdings, Ltd.
6.625%, 01/14/20 | | | 2,000,000 | | | | 2,017,600 | | |
Value Success International, Ltd.
4.750%, 11/04/18 | | CNY | 12,000,000 | | | | 1,980,664 | | |
Yum! Brands, Inc.
5.350%, 11/01/43 | | | 2,000,000 | | | | 1,913,690 | | |
MCE Finance, Ltd.
5.000%, 02/15/21 | | | 2,000,000 | | | | 1,900,000 | | |
Wynn Macau, Ltd.
5.250%, 10/15/21 | | | 1,480,000 | | | | 1,398,600 | | |
Alibaba Group Holding, Ltd.
3.600%, 11/28/24c | | | 300,000 | | | | 288,838 | | |
Total China/Hong Kong | | | | | 11,583,892 | | |
INDONESIA: 12.0% | |
PT Perusahaan Listrik Negara
5.250%, 10/24/42 | | | 2,500,000 | | | | 2,175,000 | | |
Theta Capital Pte, Ltd.
7.000%, 05/16/19 | | | 1,500,000 | | | | 1,544,154 | | |
Alam Synergy Pte, Ltd.
6.950%, 03/27/20c | | | 1,500,000 | | | | 1,447,500 | | |
Jababeka International BV
7.500%, 09/24/19 | | | 1,400,000 | | | | 1,378,213 | | |
TBG Global Pte, Ltd.
4.625%, 04/03/18c | | | 1,000,000 | | | | 995,000 | | |
Alam Synergy Pte, Ltd.
6.950%, 03/27/20 | | | 500,000 | | | | 482,500 | | |
PT Astra Sedaya Finance
8.600%, 02/21/17 | | IDR | 5,000,000,000 | | | | 369,173 | | |
Total Indonesia | | | | | 8,391,540 | | |
| | Face Amount* | | Value | |
SRI LANKA: 7.5% | |
DFCC Bank PLC
9.625%, 10/31/18 | | | 2,650,000 | | | $ | 2,784,275 | | |
National Savings Bank
5.150%, 09/10/19 | | | 2,000,000 | | | | 1,935,000 | | |
National Savings Bank
8.875%, 09/18/18 | | | 500,000 | | | | 541,900 | | |
Total Sri Lanka | | | | | 5,261,175 | | |
SINGAPORE: 2.9% | |
Global Logistic Properties, Ltd.
3.375%, 05/11/16 | | CNY | 12,500,000 | | | | 2,002,392 | | |
Total Singapore | | | | | 2,002,392 | | |
AUSTRALIA: 1.8% | |
Macquarie Bank, Ltd.
6.625%, 04/07/21 | | | 1,100,000 | | | | 1,258,761 | | |
Total Australia | | | | | 1,258,761 | | |
PHILIPPINES: 1.6% | |
Alliance Global Group, Inc.
6.500%, 08/18/17 | | | 1,050,000 | | | | 1,113,000 | | |
Total Philippines | | | | | 1,113,000 | | |
TOTAL NON-CONVERTIBLE CORPORATE BONDS | | | | | 45,534,245 | | |
(Cost $46,766,409) | | | | | | | |
CONVERTIBLE CORPORATE BONDS: 16.3%
CHINA/HONG KONG: 16.3% | |
Homeinns Hotel Group, Cnv.
2.000%, 12/15/15 | | | 2,800,000 | | | | 2,751,000 | | |
E-House China Holdings, Ltd., Cnv.
2.750%, 12/15/18c | | | 2,010,000 | | | | 1,924,575 | | |
Biostime International Holdings, Ltd., Cnv.
0.000%, 02/20/19 | | HKD | 14,000,000 | | | | 1,709,013 | | |
China Singyes Solar Technologies Holdings, Ltd., Cnv.
5.000%, 08/08/19 | | CNY | 9,000,000 | | | | 1,429,688 | | |
Qihoo 360 Technology Co., Ltd., Cnv.
1.750%, 08/15/21c | | | 1,500,000 | | | | 1,383,750 | | |
Ctrip.com International, Ltd., Cnv.
1.250%, 10/15/18 | | | 1,000,000 | | | | 1,141,250 | | |
Johnson Electric Holdings, Ltd., Cnv.
1.000%, 04/02/21 | | | 1,000,000 | | | | 1,050,000 | | |
Total China/Hong Kong | | | | | 11,389,276 | | |
TOTAL CONVERTIBLE CORPORATE BONDS | | | | | 11,389,276 | | |
(Cost $11,217,305) | | | | | |
matthewsasia.com | 800.789.ASIA 9
Matthews Asia Strategic Income Fund June 30, 2015
Schedule of Investmentsa (unaudited) (continued)
FOREIGN GOVERNMENT OBLIGATIONS: 13.8%
| | Face Amount* | | Value | |
SRI LANKA: 5.5% | |
Sri Lanka Government Bond
8.500%, 06/01/18 | | LKR | 200,000,000 | | | $ | 1,525,788 | | |
Sri Lanka Government Bond
8.500%, 04/01/18 | | LKR | 110,000,000 | | | | 840,194 | | |
Sri Lanka Government Bond
8.500%, 07/15/18 | | LKR | 100,000,000 | | | | 761,641 | | |
Sri Lanka Government Bond
8.000%, 11/15/18 | | LKR | 100,000,000 | | | | 750,970 | | |
Total Sri Lanka | | | | | 3,878,593 | | |
INDONESIA: 4.9% | |
Indonesia Treasury Bond
7.875%, 04/15/19 | | IDR | 20,000,000,000 | | | | 1,486,983 | | |
Indonesia Treasury Bond
6.125%, 05/15/28 | | IDR | 16,000,000,000 | | | | 985,142 | | |
Indonesia Treasury Bond
9.000%, 03/15/29 | | IDR | 12,000,000,000 | | | | 948,659 | | |
Total Indonesia | | | | | 3,420,784 | | |
SOUTH KOREA: 2.3% | |
Korea Treasury Bond
3.500%, 09/10/16 | | KRW | 1,000,000,000 | | | | 915,911 | | |
Korea Treasury Bond
3.500%, 03/10/24 | | KRW | 400,000,000 | | | | 388,990 | | |
Korea Treasury Bond
4.000%, 09/10/15 | | KRW | 300,000,000 | | | | 270,217 | | |
Total South Korea | | | | | 1,575,118 | | |
SUPRANATIONAL: 1.1% | |
International Finance Corp.
7.750%, 12/03/16 | | INR | 50,000,000 | | | | 788,713 | | |
Total Supranational | | | | | 788,713 | | |
TOTAL FOREIGN GOVERNMENT OBLIGATIONS | | | | | 9,663,208 | | |
(Cost $9,923,901) | | | |
COMMON EQUITIES: 1.3%
| | Shares | | | |
SINGAPORE: 0.8% | |
Vicom, Ltd. | | | 118,000 | | | | 544,946 | | |
Total Singapore | | | | | 544,946 | | |
PHILIPPINES: 0.5% | |
Alliance Global Group, Inc. | | | 780,000 | | | | 375,486 | | |
Total Philippines | | | | | 375,486 | | |
TOTAL COMMON EQUITIES | | | | | 920,432 | | |
(Cost $1,039,054) | | | |
TOTAL INVESTMENTS: 96.6% | | | | | 67,507,161 | | |
(Cost $68,946,669d) | |
CASH AND OTHER ASSETS,
LESS LIABILITIES: 3.4% | | | | | 2,411,314 | | |
NET ASSETS: 100.0% | | | | $ | 69,918,475 | | |
a Certain securities were fair valued under the valuation polices approved by the Board of Trustees (Note 2-A).
b Variable rate security. The rate represents the rate in effect at June 30, 2015.
c Security exempt from registration under Rule 144A of the Securities Act of 1933, as amended. The security may be resold in transactions exempt from registration normally to qualified institutional buyers. The security has been determined to be liquid in accordance with procedures adopted by the Fund's Board of Directors.
d Cost for federal income tax purposes is $68,946,669 and net unrealized depreciation consists of:
Gross unrealized appreciation | | $ | 724,327 | | |
Gross unrealized depreciation | | | (2,163,835 | ) | |
Net unrealized depreciation | | ($ | 1,439,508 | ) | |
* All values are in USD unless otherwise noted.
Cnv. Convertible
CNY Chinese Renminbi (Yuan)
IDR Indonesian Rupiah
INR Indian Rupee
HKD Hong Kong Dollar
KRW Korean Won
LKR Sri Lankan Rupee
USD U.S. Dollar
See accompanying notes to financial statements.
10 MATTHEWS ASIA FUNDS

ASIA GROWTH AND INCOME STRATEGIES
PORTFOLIO MANAGERS
Robert J. Horrocks, PhD
Lead Manager
Kenneth Lowe, CFA
Lead Manager
FUND FACTS
| | | Investor Class | | Institutional Class | |
Ticker | | MACSX | | MICSX | |
CUSIP | | 577130206 | | 577130842 | |
Inception | | 9/12/94 | | 10/29/10 | |
NAV | | $18.42 | | $18.41 | |
Initial Investment | | $2,500 | | $3 million | |
Gross Expense Ratio1 | | 1.08% | | 0.92% | |
Portfolio Statistics
Total # of Positions | | 60 | |
Net Assets | | $4.0 billion | |
Weighted Average Market Cap | | $34.2 billion | |
Portfolio Turnover | | 16.79%2 | |
Benchmark
MSCI AC Asia ex Japan Index
OBJECTIVE
Long-term capital appreciation. The Fund also seeks to provide some current income.
STRATEGY
Under normal market conditions, the Fund seeks to achieve its investment objective by investing at least 80% of its total net assets, which include borrowings for investment purposes, in dividend-paying common stock, preferred stock and other equity securities, and convertible securities as well as fixed-income securities, of any duration or quality, of companies located in Asia, which consists of all countries and markets in Asia, including developed, emerging and frontier countries and markets in the Asian region.
1 Prospectus expense ratios.
2 The lesser of fiscal year 2014 long-term purchase costs or sales proceeds divided by the average monthly market value of long-term securities.
Matthews Asian Growth and Income Fund
Portfolio Manager Commentary
For the first half of 2015, the Matthews Asian Growth and Income Fund gained 3.46% (Investor Class) and 3.55% (Institutional Class), underperforming its benchmark, the MSCI All Country Asia ex Japan Index, which rose 5.59%. For the quarter ending June 30, the Fund gained 1.43% (Investor Class) and 1.51% (Institutional Class) while its benchmark rose 0.65%.
Market Environment:
Monetary policy and politics took center stage during the second quarter of the year, sparking yet further volatility across global markets. In the U.S., following the dropping of the word "patient" from the previous U.S. Federal Reserve policy statement, Fed Chairwoman Janet Yellen further commented that rate rises will be gradual in nature as they wait for more decisive evidence of economic growth. In Europe, Greece once again dominated headlines as the heavily indebted nation defaulted on a repayment to the International Monetary Fund. Despite this, at the time of writing, the Greek government continues to refuse European officials' request for structural reform in order to ensure additional bailout funds. Turning to Asia, China underwent further liquidity injections into the financial system through reserve ratio requirement cuts, interest rate reductions and capital injections into state-owned policy banks. Additionally, the Chinese finance ministry, central bank and banking regulator announced plans to allow commercial banks to use local government bonds that they purchase as collateral for low-cost loans from the central bank in order to increase overall liquidity. All of these measures, alongside yet more retail investor participation and margin lending, led the domestic Chinese and Hong Kong markets to outperform those across the rest of the region. Markets in Southeast Asia were the poorest performers on slowing growth and political woes.
Portfolio Contributors and Detractors:
The largest contributors to Fund performance during the quarter came from our holdings in Hong Kong and China, with our convertible bond in Hong Kong Exchanges & Clearing the strongest of these. The underlying stock was up strongly on increasing average daily turnover as markets rallied and Exchange Traded Funds participation increased. We used this as an opportunity to exit our position as valuations had become stretched at 40X price-to-earnings.* Yum! Brands, the quick service restaurant chain that owns Taco Bell, KFC and Pizza Hut, also performed well as it appears that the reputational damage they suffered from supply chain issues in China is subsiding, and customers are returning to their stores. The stock was also helped after a well-known activist investor took a stake in the company, highlighting potential value realization from a break up of its businesses.
Although the Fund has little exposure to the Philippines, our holding in Globe Telecom, the number two wireless carrier in the market, also helped returns. Increasing smartphone penetration and decreasing competitive intensity on data pricing helped the firm deliver good earnings growth.
The Fund's holdings within Malaysia were the largest detractors to returns, partially due to a challenging political backdrop in the wake of a corruption scandal involving Prime Minister Najib Razak and the state-owned investment fund 1Malaysia Development Bhd (1MDB). Alongside this, the country's exposure to energy prices also created challenges. Additionally, we witnessed stock weakness in holdings, such as commercial bank AMMB, as concerns arise around potential asset quality issues within the financial system.
matthewsasia.com | 800.789.ASIA 11
PERFORMANCE AS OF JUNE 30, 2015
| | | | | | | | | Average Annual Total Returns | | | |
| | | 3 Months | | YTD | | 1 Year | | 3 Years | | 5 Years | | 10 Years | | Since
Inception | | Inception
Date | |
Investor Class (MACSX) | | | 1.43 | % | | | 3.46 | % | | | -2.03 | % | | | 7.68 | % | | | 7.49 | % | | | 8.76 | % | | | 10.08 | % | | 9/12/94 | |
Institutional Class (MICSX) | | | 1.51 | % | | | 3.55 | % | | | -1.86 | % | | | 7.84 | % | | | n.a. | | | | n.a. | | | | 5.10 | % | | 10/29/10 | |
MSCI AC Asia ex Japan Index3 | | | 0.65 | % | | | 5.59 | % | | | 4.14 | % | | | 9.87 | % | | | 7.74 | % | | | 9.68 | % | | | 4.33 | %4 | | | | | |
Lipper Pacific Region Funds Category Average5 | | | 1.24 | % | | | 6.66 | % | | | 2.78 | % | | | 10.13 | % | | | 8.61 | % | | | 6.79 | % | | | 4.18 | %4 | | | | | |
Performance assumes reinvestment of all dividends and/or distributions before taxes. All performance quoted represents past performance and is no guarantee of future results. Investment return and principal value will fluctuate with market conditions so that when redeemed, shares may be worth more or less than their original cost. Current performance may be lower or higher than the return figures quoted. For the Fund's most recent month-end performance, visit matthewsasia.com.
INCOME DISTRIBUTION HISTORY
| | 2015 | | 2014 | |
| | June | | December | | Total | | June | | December | | Total | |
Investor (MACSX) | | $ | 0.21 | | | | n.a. | | | | n.a. | | | $ | 0.15 | | | $ | 0.20 | | | $ | 0.35 | | |
Inst'l (MICSX) | | $ | 0.23 | | | | n.a. | | | | n.a. | | | $ | 0.16 | | | $ | 0.21 | | | $ | 0.38 | | |
Note: This table does not include capital gains distributions. Totals may differ by $0.01 due to rounding. For income distribution history, visit matthewsasia.com.
30-DAY YIELD:
2.13% (Investor Class) 2.30% (Institutional Class)
The 30-Day Yield represents net investment income earned by the Fund over the 30-day period ended 6/30/15, expressed as an annual percentage rate based on the Fund's share price at the end of the 30-day period. The 30-Day Yield should be regarded as an estimate of the Fund's rate of investment income, and it may not equal the Fund's actual income distribution rate.
Source: BNY Mellon Investment Servicing (US) Inc.
DIVIDEND YIELD: 3.46%
The dividend yield (trailing) for the portfolio is the weighted average sum of the dividends paid by each equity security held by the Fund over the 12 months ended 6/30/15 divided by the current price of each equity as of 6/30/15. The annualized dividend yield for the Fund is for the equity-only portion of the portfolio. Please note that this is based on gross equity portfolio holdings and does not reflect the actual yield an investor in the Fund would receive. Past yields are no guarantee of future yields.
Source: FactSet Research Systems, Bloomberg, MICM
GROWTH OF A $10,000 INVESTMENT SINCE INCEPTION—INVESTOR CLASS
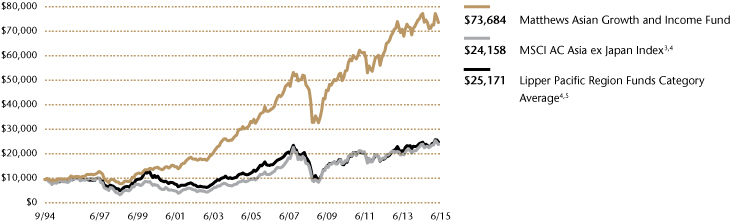
Plotted monthly. The performance data and graph do not reflect the deduction of taxes that a shareholder would pay on dividends, capital gains distributions or redemption of Fund shares. Values are in US$.
3 It is not possible to invest directly in an index. Source: Index data from Morgan Stanley Capital International and Bloomberg; total return calculations performed by BNY Mellon Investment Servicing (US) Inc. Please see page 85 for index definition.
4 Calculated from 8/31/94.
5 The Lipper Category Average does not reflect sales charges and is based on total return, including reinvestment of dividends and capital gains for the stated periods.
TOP TEN HOLDINGS6
| | | Sector | | Country | | % of Net Assets | |
Jardine Matheson Holdings, Ltd. | | Industrials | | China/Hong Kong | | | 3.4 | % | |
Yum! Brands, Inc. | | Consumer Discretionary | | China/Hong Kong | | | 2.9 | % | |
Taiwan Semiconductor Manufacturing Co., Ltd. | | Information Technology | | Taiwan | | | 2.9 | % | |
AIA Group, Ltd. | | Financials | | China/Hong Kong | | | 2.8 | % | |
Globe Telecom, Inc. | | Telecommunication Services | | Philippines | | | 2.6 | % | |
Singapore Technologies Engineering, Ltd. | | Industrials | | Singapore | | | 2.5 | % | |
United Overseas Bank, Ltd. | | Financials | | Singapore | | | 2.5 | % | |
Ascendas REIT | | Financials | | Singapore | | | 2.4 | % | |
Hang Lung Properties, Ltd. | | Financials | | China/Hong Kong | | | 2.2 | % | |
HSBC Holdings PLC | | Financials | | China/Hong Kong | | | 2.2 | % | |
% OF ASSETS IN TOP TEN | | | | | | | 26.4 | % | |
6 Holdings may combine more than one security from same issuer and related depositary receipts.
12 MATTHEWS ASIA FUNDS
Matthews Asian Growth and Income Fund
Portfolio Manager Commentary (continued)
Notable Portfolio Changes:
The Fund initiated four new positions during the quarter. The first of these was Techtronic Industries, a market-leading power tool and floor care appliance brand owner and manufacturer. We believe the company has fairly strong growth prospects as it continues to win market share from its rivals in both the DIY and professional power tool markets due to its impressive cordless technology and price points. Earnings should also benefit from lower commodity prices and greater efficiencies. The stock is trading at what we believe to be an attractive 17x P/E in light of these growth prospects and a strong balance sheet.
We also initiated positions in Singapore Telecom ("Singtel"), a regional wireless company, Guangdong Investment, and Insurance Australia Group. For Singtel, we believe that the company has an attractive set of quality assets across Asia Pacific that still has room for growth as smartphone and 4G penetration increase, whilst the company continues to better tier pricing. The stock currently provides a healthy combination of both growth potential and income given its yield of about 4% year to date. Guangdong Investment is somewhat similar in nature as the regulated water utility provides a defensive and visible stream of earnings and dividends that are both still growing healthily on continued volume increases and new projects. Insurance Australia Group is the country's largest personal lines insurance company, and as of the end of June offered an attractive 5% yield given an interesting combination of stable cash flow at home and growth options in Asia.
These positions were funded through the sale of our holdings in Hong Kong Exchanges & Clearing, and China Oilfield Services Limited.
Outlook:
The overall demand backdrop across the globe continues to be moderately weak, with Europe particularly challenged by the threat of deflation, leading to little support for Asian exports. Additionally, fairly aggressive credit growth across much of Asia since the Global Financial Crisis of 2008 means that further increases in indebtedness is unlikely to fuel economic growth. In prior commentaries we have noted that many governments throughout the region now have pro-reform regimes in place, and progress within these is vital in order to ensure that the region sees sustainable growth coming from productivity improvements. Although moderately early on in the reigns of many, change has been somewhat slow to materialize, at the very least in relation to what were quite lofty expectations for leaders such as India's Narendra Modi and Indonesia's Joko Widodo. In the latter case, for example, we have seen an array of mixed signals and nationalistic tendencies in what appears to be a man in a weak leadership position.
With these issues in mind, we believe that it is likely that the corporate earnings cycle in Asia will continue to disappoint and suffer further downgrades. A combination of volatile macroeconomic headlines, weak earnings and valuations that are not overly compelling—at about 18.7x P/E on average for the MSCI All Country Asia ex Japan Index on an equal weighted-basis year to date—provide us with reason for caution. More positively, despite this, the Fund looks relatively well-placed given our ethos of buying into what we believe are quality companies at attractive valuations that have the ability to protect our fund holder's capital in more challenging environments.
* Price-to-Earnings Ratio (P/E Ratio) is a valuation ratio of a company's current share price compared to its per-share earnings and is calculated as the market value per share divided by the Earnings per Share (EPS).
COUNTRY ALLOCATION (%)7
China/Hong Kong | | | 33.1 | | |
Singapore | | | 16.5 | | |
South Korea | | | 9.2 | | |
Malaysia | | | 7.8 | | |
Japan | | | 5.6 | | |
Australia | | | 4.5 | | |
Taiwan | | | 4.2 | | |
Thailand | | | 4.2 | | |
New Zealand | | | 3.0 | | |
Indonesia | | | 3.0 | | |
Philippines | | | 2.6 | | |
Vietnam | | | 1.7 | | |
United Kingdom | | | 1.4 | | |
Cash and Other Assets, Less Liabilities | | | 3.2 | | |
SECTOR ALLOCATION (%)
Financials | | | 19.2 | | |
Consumer Discretionary | | | 17.1 | | |
Industrials | | | 16.0 | | |
Telecommunication Services | | | 15.2 | | |
Consumer Staples | | | 14.2 | | |
Information Technology | | | 6.3 | | |
Utilities | | | 5.7 | | |
Health Care | | | 1.7 | | |
Materials | | | 1.4 | | |
Cash and Other Assets, Less Liabilities | | | 3.2 | | |
MARKET CAP EXPOSURE (%)8
Mega Cap (over $25B) | | | 33.9 | | |
Large Cap ($10B–$25B) | | | 21.8 | | |
Mid Cap ($3B–$10B) | | | 29.0 | | |
Small Cap (under $3B) | | | 12.1 | | |
Cash and Other Assets, Less Liabilities | | | 3.2 | | |
ASSET TYPE BREAKDOWN (%)9
Common Equities and ADRs | | | 87.9 | | |
Convertible Corporate Bonds | | | 6.5 | | |
Preferred Equities | | | 2.4 | | |
Cash and Other Assets, Less Liabilities | | | 3.2 | | |
7 Not all countries where the Fund may invest are included in the benchmark index.
8 Source: FactSet Research Systems. Percentage values in data are rounded to the nearest tenth of one percent; the values may not sum to 100% due to rounding.
9 Bonds are not included in the MSCI All Country Asia ex Japan Index.
matthewsasia.com | 800.789.ASIA 13
Matthews Asian Growth and Income Fund June 30, 2015
Schedule of Investmentsa (unaudited)
COMMON EQUITIES: 87.9%
| | Shares | | Value | |
CHINA/HONG KONG: 28.7% | |
Jardine Matheson Holdings, Ltd. | | | 2,402,000 | | | $ | 136,175,020 | | |
Yum! Brands, Inc. | | | 1,317,300 | | | | 118,662,384 | | |
AIA Group, Ltd. | | | 17,078,600 | | | | 111,671,128 | | |
Hang Lung Properties, Ltd. | | | 30,498,920 | | | | 90,640,467 | | |
HSBC Holdings PLC ADR | | | 1,987,433 | | | | 89,056,873 | | |
Vitasoy International Holdings, Ltd. | | | 49,593,000 | | | | 84,451,187 | | |
CLP Holdings, Ltd. | | | 9,338,700 | | | | 79,370,101 | | |
China Mobile, Ltd. ADR | | | 1,233,400 | | | | 79,048,606 | | |
VTech Holdings, Ltd. | | | 5,885,200 | | | | 78,052,355 | | |
Techtronic Industries Co., Ltd. | | | 21,378,000 | | | | 69,898,083 | | |
Café de Coral Holdings, Ltd. | | | 18,352,000 | | | | 66,290,742 | | |
CK Hutchison Holdings, Ltd. | | | 4,400,172 | | | | 64,691,242 | | |
Guangdong Investment, Ltd. | | | 31,217,000 | | | | 43,683,322 | | |
Cheung Kong Property Holdings, Ltd.b | | | 4,400,172 | | | | 36,499,934 | | |
Television Broadcasts, Ltd. | | | 2,213,000 | | | | 13,132,599 | | |
Total China/Hong Kong | | | | | 1,161,324,043 | | |
SINGAPORE: 14.4% | |
Singapore Technologies Engineering, Ltd. | | | 41,921,425 | | | | 102,640,929 | | |
United Overseas Bank, Ltd. | | | 5,797,000 | | | | 99,180,737 | | |
Ascendas REIT | | | 53,925,000 | | | | 98,452,352 | | |
Singapore Telecommunications, Ltd. | | | 21,686,400 | | | | 67,677,170 | | |
Keppel Corp., Ltd. | | | 9,879,000 | | | | 60,213,746 | | |
SIA Engineering Co., Ltd. | | | 20,761,800 | | | | 59,190,283 | | |
Singapore Post, Ltd. | | | 38,209,000 | | | | 53,735,043 | | |
ARA Asset Management, Ltd. | | | 31,219,210 | | | | 40,441,777 | | |
Total Singapore | | | | | 581,532,037 | | |
MALAYSIA: 7.8% | |
Genting Malaysia BHD | | | 75,188,700 | | | | 83,639,567 | | |
British American Tobacco Malaysia BHD | | | 4,164,600 | | | | 68,370,561 | | |
AMMB Holdings BHD | | | 40,974,400 | | | | 65,417,633 | | |
Axiata Group BHD | | | 37,993,923 | | | | 64,422,296 | | |
Telekom Malaysia BHD | | | 20,245,551 | | | | 35,026,107 | | |
Total Malaysia | | | | | 316,876,164 | | |
SOUTH KOREA: 6.8% | |
Kangwon Land, Inc. | | | 2,051,776 | | | | 67,988,681 | | |
KT&G Corp. | | | 743,294 | | | | 62,997,051 | | |
Samsung Electronics Co., Ltd. | | | 54,642 | | | | 61,996,060 | | |
GS Home Shopping, Inc. | | | 227,544 | | | | 42,801,951 | | |
KEPCO Plant Service & Engineering
Co., Ltd. | | | 386,300 | | | | 40,865,480 | | |
Total South Korea | | | | | 276,649,223 | | |
JAPAN: 5.6% | |
Japan Tobacco, Inc. | | | 2,299,400 | | | | 81,742,011 | | |
Lawson, Inc. | | | 1,086,500 | | | | 74,350,517 | | |
KDDI Corp. | | | 3,000,100 | | | | 72,398,273 | | |
Total Japan | | | | | 228,490,801 | | |
| | Shares | | Value | |
AUSTRALIA: 4.5% | |
CSL, Ltd. | | | 1,044,381 | | | $ | 69,625,190 | | |
Insurance Australia Group, Ltd. | | | 14,241,305 | | | | 61,228,782 | | |
Woolworths, Ltd. | | | 2,394,197 | | | | 49,749,694 | | |
Total Australia | | | | | 180,603,666 | | |
TAIWAN: 4.2% | |
Taiwan Semiconductor Manufacturing
Co., Ltd. | | | 13,915,187 | | | | 63,294,891 | | |
Chunghwa Telecom Co., Ltd. ADR | | | 1,747,125 | | | | 55,768,230 | | |
Taiwan Semiconductor Manufacturing
Co., Ltd. ADR | | | 2,296,124 | | | | 52,144,976 | | |
Total Taiwan | | | | | 171,208,097 | | |
THAILAND: 4.2% | |
Advanced Info Service Public Co., Ltd. | | | 9,595,700 | | | | 67,998,121 | | |
Glow Energy Public Co., Ltd. | | | 21,887,400 | | | | 55,085,771 | | |
BEC World Public Co., Ltd. | | | 40,566,000 | | | | 44,915,793 | | |
Total Thailand | | | | | 167,999,685 | | |
NEW ZEALAND: 3.0% | |
SKYCITY Entertainment Group, Ltd. | | | 21,703,820 | | | | 61,751,609 | | |
SKY Network Television, Ltd. | | | 15,123,711 | | | | 61,569,049 | | |
Total New Zealand | | | | | 123,320,658 | | |
INDONESIA: 3.0% | |
PT Telekomunikasi Indonesia Persero ADR | | | 1,621,002 | | | | 70,335,277 | | |
PT Perusahaan Gas Negara Persero | | | 159,343,000 | | | | 51,469,002 | | |
Total Indonesia | | | | | 121,804,279 | | |
PHILIPPINES: 2.6% | |
Globe Telecom, Inc. | | | 1,862,720 | | | | 103,621,475 | | |
Total Philippines | | | | | 103,621,475 | | |
VIETNAM: 1.7% | |
Vietnam Dairy Products JSC | | | 13,033,926 | | | | 67,442,070 | | |
Total Vietnam | | | | | 67,442,070 | | |
UNITED KINGDOM: 1.4% | |
BHP Billiton PLC | | | 2,888,196 | | | | 56,786,446 | | |
Total United Kingdom | | | | | 56,786,446 | | |
TOTAL COMMON EQUITIES | | | | | 3,557,658,644 | | |
(Cost $3,056,798,480) | | | | | |
PREFERRED EQUITIES: 2.4%
SOUTH KOREA: 2.4% | |
LG Household & Health Care, Ltd., Pfd. | | | 121,855 | | | | 36,996,804 | | |
Hyundai Motor Co., Ltd., Pfd. | | | 355,983 | | | | 32,534,786 | | |
Hyundai Motor Co., Ltd., 2nd Pfd. | | | 318,246 | | | | 29,927,645 | | |
Total South Korea | | | | | 99,459,235 | | |
TOTAL PREFERRED EQUITIES | | | | | 99,459,235 | | |
(Cost $38,549,481) | | | | | |
14 MATTHEWS ASIA FUNDS
Matthews Asian Growth and Income Fund June 30, 2015
Schedule of Investmentsa (unaudited) (continued)
CONVERTIBLE CORPORATE BONDS: 6.5%
| | Face Amount* | | Value | |
CHINA/HONG KONG: 4.4% | |
Shine Power International, Ltd., Cnv.
0.000%, 07/28/19 | | HKD | 446,000,000 | | | $ | 56,170,379 | | |
Johnson Electric Holdings, Ltd., Cnv.
1.000%, 04/02/21 | | | 49,750,000 | | | | 52,237,500 | | |
Hengan International Group Co., Ltd., Cnv.
0.000%, 06/27/18 | | HKD | 339,000,000 | | | | 46,575,846 | | |
PB Issuer No. 2, Ltd., Cnv.
1.750%, 04/12/16 | | | 21,820,000 | | | | 21,383,600 | | |
Total China/Hong Kong | | | | | 176,367,325 | | |
SINGAPORE: 2.1% | |
CapitaLand, Ltd., Cnv.
1.950%, 10/17/23 | | SGD | 110,250,000 | | | | 85,111,510 | | |
Total Singapore | | | | | 85,111,510 | | |
TOTAL CONVERTIBLE CORPORATE BONDS | | | | | 261,478,835 | | |
(Cost $265,389,724) | | | | | |
TOTAL INVESTMENTS: 96.8% | | | | | 3,918,596,714 | | |
(Cost $3,360,737,685c) | | | | | |
CASH AND OTHER ASSETS,
LESS LIABILITIES: 3.2% | | | | | 129,922,019 | | |
NET ASSETS: 100.0% | | | | $ | 4,048,518,733 | | |
a Certain securities were fair valued under the valuation polices approved by the Board of Trustees (Note 2-A).
b Non-income producing security.
c Cost for federal income tax purposes is $3,361,040,470 and net unrealized appreciation consists of:
Gross unrealized appreciation | | $ | 745,986,047 | | |
Gross unrealized depreciation | | | (188,429,803 | ) | |
Net unrealized appreciation | | $ | 557,556,244 | | |
* All values are in USD unless otherwise noted.
ADR American Depositary Receipt
BHD Berhad
Cnv. Convertible
HKD Hong Kong Dollar
JSC Joint Stock Co.
Pfd. Preferred
REIT Real Estate Investment Trust
SGD Singapore Dollar
USD U.S. Dollar
See accompanying notes to financial statements.
matthewsasia.com | 800.789.ASIA 15

ASIA GROWTH AND INCOME STRATEGIES
PORTFOLIO MANAGERS
Yu Zhang, CFA | | Robert Horrocks, PhD | |
Lead Manager | | Lead Manager | |
Vivek Tanneeru | | | |
Co-Manager | | | |
FUND FACTS
| | | Investor Class | | Institutional Class | |
Ticker | | MAPIX | | MIPIX | |
CUSIP | | 577125107 | | 577130750 | |
Inception | | 10/31/06 | | 10/29/10 | |
NAV | | $16.99 | | $16.99 | |
Initial Investment | | $2,500 | | $3 million | |
Gross Expense Ratio1 | | 1.06% | | 0.93% | |
After Fee Waiver and
Reimbursement | | 1.05%2 | | n.a. | |
Portfolio Statistics
Total # of Positions | | 72 | |
Net Assets | | $5.9 billion | |
Weighted Average Market Cap | | $35.8 billion | |
Portfolio Turnover | | 20.06%3 | |
Benchmark
MSCI AC Asia Pacific Index
OBJECTIVE
Total return with an emphasis on providing current income.
STRATEGY
Under normal market conditions, the Fund seeks to achieve its investment objective by investing at least 80% of its total net assets, which include borrowings for investment purposes, in dividend-paying equity securities of companies located in Asia. Asia consists of all countries and markets in Asia, and includes developed, emerging and frontier countries and markets in the Asian region. The Fund may also invest in convertible debt and equity securities.
1 Prospectus expense ratios.
2 Matthews has contractually agreed to waive a portion of its advisory fee and administrative and shareholder services fee if the Fund's average daily net assets are over $3 billion, as follows: for every $2.5 billion average daily net assets of the Fund that are over $3 billion, the advisory fee rate and the administrative and shareholder services fee rate for the Fund with respect to such excess average daily net assets will be each reduced by 0.01%, in each case without reducing such fee rate below 0.00%. Any amount waived by Matthews pursuant to this agreement may not be recouped by Matthews. This agreement will remain in place until April 30, 2016, may be renewed for additional periods not exceeding one year and may be terminated at any time (i) by the Trust on behalf of the Fund or by the Board of Trustees upon 60 days' prior written notice to Matthews; or (ii) by Matthews upon 60 days' prior written notice to the Trust, in each case without payment of any penalty.
3 The lesser of fiscal year 2014 long-term purchase costs or sales proceeds divided by the average monthly market value of long-term securities.
Matthews Asia Dividend Fund
Portfolio Manager Commentary
For the first half of 2015, the Matthews Asia Dividend Fund returned 12.65% (Investor Class) and 12.72% (Institutional Class), outperforming its benchmark, the MSCI All Country Asia Pacific Index, which returned 7.54%. For the quarter ending June 30, the Fund rose 3.69% (Investor Class) and 3.72% (Institutional Class) while its benchmark returned 0.71%. In June, the Fund distributed 18.23 cents per share (Investor Class) and 18.74 cents per share (Institutional Class), bringing its total year-to-date income distribution to 20.08 cents and 21.13 cents per share, respectively.
Market Environment:
During the second quarter of the year, the rapid rally of China's equity market took many investors by surprise. While China's underlying economy has continued to grind gradually slower, China's equity market reacted positively to government policy support, including an easing of monetary policy and financial reform initiatives. On the other hand, a number of other Asian markets, most notably those in Southeast Asia, experienced rather subdued equity performance during the quarter. Share prices came under pressure against a backdrop of weak consumption demand, slowing corporate earnings growth and depreciating local currencies. Markets, such as Indonesia and India, saw some profit-taking, as investor excitement over economic reform prospects began to wane.
Performance Contributors and Detractors:
During the second quarter, our portfolio holdings in Chinese stocks were among the largest contributors to Fund performance. The launch of the Shanghai-Hong Kong Stock Connect Program further opened China's mainland A-share market to foreign investors and at the same time allowed those from the mainland to invest in the offshore Hong Kong market. The new program boosted investor sentiment toward the respective markets. While the most recent pull back of the mainland A-share market, in early July triggered by forced liquidation of leveraged margin accounts, has spilled over into the Hong Kong market, and negatively impacted the share performance of H shares, we remain constructive on our H-share holdings, as we continue to view those names as offering both attractive dividend yields and underappreciated growth prospects.
Fund performance for the second quarter was also helped by BGF Retail and GS Retail, two South Korean convenience store operators, which delivered strong share performance. While their positive same-store-sales figures have been driving up share prices, we also believe the industry is still in its infancy in South Korea, compared with more advanced convenience store markets like Japan. As Korea has an aging demographic and a trend of smaller households, we expect solid, long-term growth to continue for both companies. The firms also appear well-positioned to deliver sustainable dividend growth due to the cash-generative nature of the convenience store business model.
Conversely, India's Tata Motors was the largest detractor to the Fund's performance during the second quarter. Following impressive performance over the last two years, Tata Motor's latest financial results pointed
16 MATTHEWS ASIA FUNDS
PERFORMANCE AS OF JUNE 30, 2015
| | | | | | | | | Average Annual Total Returns | | | |
| | | 3 Months | | YTD | | 1 Year | | 3 Years | | 5 Years | | Since
Inception | | Inception
Date | |
Investor Class (MAPIX) | | | 3.69 | % | | | 12.65 | % | | | 6.64 | % | | | 11.80 | % | | | 9.89 | % | | | 10.30 | % | | 10/31/06 | |
Institutional Class (MIPIX) | | | 3.72 | % | | | 12.72 | % | | | 6.80 | % | | | 11.95 | % | | | n.a. | | | | 7.72 | % | | 10/29/10 | |
MSCI AC Asia Pacific Index4 | | | 0.71 | % | | | 7.54 | % | | | 3.12 | % | | | 10.64 | % | | | 8.30 | % | | | 3.86 | %5 | | | | | |
Lipper Pacific Region Funds Category Average6 | | | 1.24 | % | | | 6.66 | % | | | 2.78 | % | | | 10.13 | % | | | 8.61 | % | | | 4.45 | %5 | | | | | |
Performance assumes reinvestment of all dividends and/or distributions before taxes. All performance quoted represents past performance and is no guarantee of future results. Investment return and principal value will fluctuate with market conditions so that when redeemed, shares may be worth more or less than their original cost. Current performance may be lower or higher than the return figures quoted. For the Fund's most recent month-end performance, visit matthewsasia.com.
DISTRIBUTION HISTORY
| | 2015 | | 2014 | |
| | Q1 | | Q2 | | Q3 | | Q4 | | Total | | Q1 | | Q2 | | Q3 | | Q4 | | Total | |
Investor (MAPIX) | | $ | 0.02 | | | $ | 0.18 | | | | n.a. | | | | n.a. | | | | n.a. | | | $ | 0.03 | | | $ | 0.11 | | | $ | 0.17 | | | $ | 0.00 | | | $ | 0.30 | | |
Inst'l (MIPIX) | | $ | 0.02 | | | $ | 0.19 | | | | n.a. | | | | n.a. | | | | n.a. | | | $ | 0.03 | | | $ | 0.11 | | | $ | 0.17 | | | $ | 0.00 | | | $ | 0.32 | | |
Note: This table does not include capital gains distributions but does include return of capital totaling $0.065 (Investor Class) and $0.068 (Institutional Class) for 2014. Totals may differ by $0.01 due to rounding. For distribution history please visit matthewsasia.com.
30-DAY YIELD:
1.59% (Investor Class) 1.72% (Institutional Class)
The 30-Day Yield represents net investment income earned by the Fund over the 30-day period ended 6/30/15, expressed as an annual percentage rate based on the Fund's share price at the end of the 30-day period. The 30-Day Yield should be regarded as an estimate of the Fund's rate of investment income, and it may not equal the Fund's actual income distribution rate.
Source: BNY Mellon Investment Servicing (US) Inc.
DIVIDEND YIELD: 2.81%
The dividend yield (trailing) for the portfolio is the weighted average sum of the dividends paid by each equity security held by the Fund over the 12 months ended 6/30/15 divided by the current price of each equity as of 6/30/15. The annualized dividend yield for the Fund is for the equity-only portion of the portfolio. Please note that this is based on gross equity portfolio holdings and does not reflect the actual yield an investor in the Fund would receive. Past yields are no guarantee of future yields.
Source: FactSet Research Systems, Bloomberg, MICM.
GROWTH OF A $10,000 INVESTMENT SINCE INCEPTION—INVESTOR CLASS
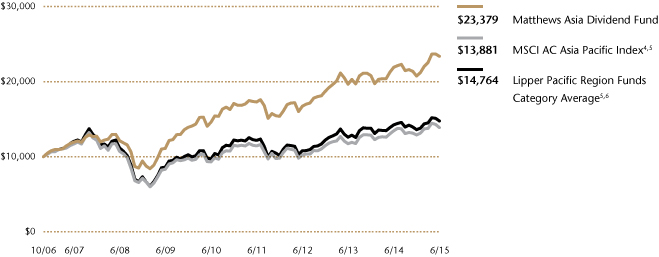
Plotted monthly. The performance data and graph do not reflect the deduction of taxes that a shareholder would pay on dividends, capital gains distributions or redemption of Fund shares. Values are in US$.
4 It is not possible to invest directly in an index. Source: Index data from Morgan Stanley Capital International and Bloomberg; total return calculations performed by BNY Mellon Investment Servicing (US) Inc. Please see page 85 for index definition.
5 Calculated from 10/31/06.
6 The Lipper Category Average does not reflect sales charges and is based on total return, including reinvestment of dividends and capital gains for the stated periods.
TOP TEN HOLDINGS7
| | | Sector | | Country | | % of Net Assets | |
Japan Tobacco, Inc. | | Consumer Staples | | Japan | | | 3.7 | % | |
Pigeon Corp. | | Consumer Staples | | Japan | | | 3.4 | % | |
Shenzhou International Group Holdings, Ltd. | | Consumer Discretionary | | China/Hong Kong | | | 3.0 | % | |
Hoya Corp. | | Health Care | | Japan | | | 2.8 | % | |
Suntory Beverage & Food, Ltd. | | Consumer Staples | | Japan | | | 2.5 | % | |
LG Chem, Ltd., Pfd. | | Materials | | South Korea | | | 2.4 | % | |
ITOCHU Corp. | | Industrials | | Japan | | | 2.3 | % | |
Sumitomo Mitsui Financial Group, Inc. | | Financials | | Japan | | | 2.3 | % | |
Minth Group, Ltd. | | Consumer Discretionary | | China/Hong Kong | | | 2.3 | % | |
China Construction Bank Corp. | | Financials | | China/Hong Kong | | | 2.2 | % | |
% OF ASSETS IN TOP TEN | | | | | | | 26.9 | % | |
7 Holdings may combine more than one security from same issuer and related depositary receipts.
matthewsasia.com | 800.789.ASIA 17
COUNTRY ALLOCATION (%)8
China/Hong Kong | | | 31.6 | | |
Japan | | | 29.3 | | |
South Korea | | | 6.6 | | |
Singapore | | | 4.9 | | |
Australia | | | 4.8 | | |
Indonesia | | | 4.6 | | |
Taiwan | | | 4.6 | | |
Thailand | | | 2.9 | | |
India | | | 2.6 | | |
Luxembourg | | | 1.7 | | |
Philippines | | | 1.4 | | |
Vietnam | | | 1.0 | | |
Cash and Other Assets, Less Liabilities | | | 4.0 | | |
SECTOR ALLOCATION (%)
Consumer Staples | | | 24.5 | | |
Consumer Discretionary | | | 16.7 | | |
Industrials | | | 13.8 | | |
Telecommunication Services | | | 11.9 | | |
Financials | | | 11.1 | | |
Health Care | | | 6.1 | | |
Information Technology | | | 4.4 | | |
Utilities | | | 4.0 | | |
Materials | | | 3.5 | | |
Cash and Other Assets, Less Liabilities | | | 4.0 | | |
MARKET CAP EXPOSURE (%)9
Mega Cap (over $25B) | | | 24.6 | | |
Large Cap ($10B–$25B) | | | 23.9 | | |
Mid Cap ($3B–$10B) | | | 29.6 | | |
Small Cap (under $3B) | | | 17.9 | | |
Cash and Other Assets, Less Liabilities | | | 4.0 | | |
8 Not all countries where the Fund may invest are included in the benchmark index.
9 Source: FactSet Research Systems. Percentage values in data are rounded to the nearest tenth of one percent; the values may not sum to 100% due to rounding.
Matthews Asia Dividend Fund
Portfolio Manager Commentary (continued)
to early signs of slowing growth in Jaguar Land Rover sales in key markets such as China. Tata's domestic Indian market sales also continued to struggle. To our disappointment, the company also decided to cancel its dividend payments for the latest fiscal year as the losses in its standalone Indian operations constrained the company's ability to pay dividends, even though the consolidated entity continued to be profitable. This latest development has prompted us to further review our investment thesis.
Notable Portfolio Changes:
During the quarter, the Fund initiated several new positions. While we believe certain parts of the Chinese A-share market—mainly small-capitalization companies with unproven business models and stretched valuations—appeared overblown, our dividend-investing approach steered our research efforts toward large-capitalization Chinese A-share companies. Notably, we were attracted to those firms in which see unique business models, strong cash generation ability, and either a proven dividend track record or a potential to increase dividend payouts substantially. Unlike their small-cap peers, valuation multiples for some of these large-cap, blue chip companies continued to be compelling. Two new A-share additions to the portfolio, Daqin Railway, a freight railway asset owner and operator, and Kweichow Moutai, the best-known brand for Chinese white spirits, fit our bill. On the other hand, we exited several holdings, including Link REIT, United Overseas Bank and Yum! Brands, as valuations appeared to become too rich. With their more compressed dividend yields, they have become less attractive as total return investments for us.
Outlook:
Looking ahead to the remainder of the year, slowing economic growth may continue to pose challenges to many Asian economies, and irrational exuberance in certain individual markets could bring increased volatility. However, we remain constructive over the region's long-term growth outlook, and believe individual countries are making some progress to address their own unique set of problems and issues, slowly but surely. We continue to adhere to our dividend-investing approach, and seek companies with strong cash generation ability, prudent capital management policies and clear alignments between majority and minority shareholders. Asia's companies continue to offer compelling opportunities for investors looking for both attractive dividend yield and dividend growth.
18 MATTHEWS ASIA FUNDS
Matthews Asia Dividend Fund June 30, 2015
Consolidated Schedule of Investmentsa (unaudited)
COMMON EQUITIES: 93.5%
| | Shares | | Value | |
CHINA/HONG KONG: 31.6% | |
Shenzhou International Group
Holdings, Ltd. | | | 36,841,000 | | | $ | 179,177,803 | | |
Minth Group, Ltd.† | | | 60,267,000 | | | | 134,677,726 | | |
China Construction Bank Corp.
H Shares | | | 145,985,000 | | | | 133,161,097 | | |
China Mobile, Ltd. ADR | | | 1,635,400 | | | | 104,812,786 | | |
Qualcomm, Inc. | | | 1,635,100 | | | | 102,406,313 | | |
Guangdong Investment, Ltd. | | | 71,350,000 | | | | 99,843,195 | | |
Daqin Railway Co., Ltd. A Shares | | | 38,426,031 | | | | 86,918,934 | | |
Kweichow Moutai Co., Ltd. A Sharesb | | | 2,089,866 | | | | 86,750,171 | | |
Yuexiu Transport Infrastructure, Ltd.† | | | 109,490,000 | | | | 78,758,588 | | |
China Power International
Development, Ltd. | | | 103,202,000 | | | | 78,578,054 | | |
Far East Horizon, Ltd. | | | 78,331,000 | | | | 74,445,407 | | |
Television Broadcasts, Ltd. | | | 11,550,200 | | | | 68,542,318 | | |
Haitian International Holdings, Ltd. | | | 28,970,000 | | | | 68,008,112 | | |
Café de Coral Holdings, Ltd. | | | 17,614,000 | | | | 63,624,952 | | |
Greatview Aseptic Packaging Co., Ltd.† | | | 110,945,000 | | | | 63,155,530 | | |
Shanghai International Airport Co., Ltd.
A Sharesc | | | 12,098,309 | | | | 61,847,508 | | |
Fuyao Glass Industry Group Co., Ltd.
H Sharesb | | | 24,768,400 | | | | 60,646,481 | | |
China Machinery Engineering Corp.
H Shares† | | | 53,737,000 | | | | 57,861,755 | | |
HSBC Holdings PLC ADR | | | 1,277,791 | | | | 57,257,815 | | |
Shanghai Lujiazui Finance & Trade
Zone Development Co., Ltd. B Shares | | | 17,071,624 | | | | 54,492,624 | | |
Jiangsu Expressway Co., Ltd. H Shares | | | 39,640,000 | | | | 52,004,532 | | |
Hopewell Holdings, Ltd. | | | 12,600,500 | | | | 46,133,478 | | |
HKBN, Ltd.b | | | 42,083,623 | | | | 43,758,216 | | |
China Mobile, Ltd. | | | 1,379,000 | | | | 17,642,809 | | |
Guotai Junan Securities Co., Ltd.
A Sharesb,c | | | 8,000 | | | | 44,302 | | |
Total China/Hong Kong | | | | | 1,874,550,506 | | |
JAPAN: 29.3% | |
Japan Tobacco, Inc. | | | 6,220,400 | | | | 221,130,733 | | |
Pigeon Corp.† | | | 6,435,700 | | | | 202,679,268 | | |
Hoya Corp. | | | 4,116,600 | | | | 164,868,745 | | |
Suntory Beverage & Food, Ltd. | | | 3,779,300 | | | | 150,457,615 | | |
ITOCHU Corp. | | | 10,359,400 | | | | 136,818,836 | | |
Sumitomo Mitsui Financial Group, Inc. | | | 3,057,900 | | | | 136,135,272 | | |
Bridgestone Corp. | | | 3,434,900 | | | | 126,962,800 | | |
Kao Corp. | | | 2,570,400 | | | | 119,541,563 | | |
Toyo Suisan Kaisha, Ltd. | | | 2,795,000 | | | | 101,841,031 | | |
Toyota Motor Corp. | | | 1,468,800 | | | | 98,288,106 | | |
NTT DoCoMo, Inc. | | | 5,118,600 | | | | 98,269,759 | | |
Skylark Co., Ltd. | | | 4,528,600 | | | | 59,655,699 | | |
Lawson, Inc. | | | 815,100 | | | | 55,778,284 | | |
Anritsu Corp.† | | | 7,304,500 | | | | 49,241,185 | | |
Toyota Motor Corp. ADR | | | 104,721 | | | | 14,006,434 | | |
Total Japan | | | | | 1,735,675,330 | | |
| | Shares | | Value | |
SINGAPORE: 4.9% | |
Singapore Technologies Engineering, Ltd. | | | 30,906,000 | | | $ | 75,670,628 | | |
CapitaLand Retail China Trust, REIT† | | | 44,079,400 | | | | 56,884,936 | | |
Super Group, Ltd. | | | 51,979,000 | | | | 42,813,275 | | |
Ascendas REIT | | | 21,614,400 | | | | 39,462,003 | | |
ARA Asset Management, Ltd. | | | 29,964,660 | | | | 38,816,617 | | |
Ascendas India Trust† | | | 55,065,000 | | | | 36,591,436 | | |
Total Singapore | | | | | 290,238,895 | | |
AUSTRALIA: 4.8% | |
Ansell, Ltd. | | | 4,791,085 | | | | 88,879,940 | | |
Spotless Group Holdings, Ltd. | | | 48,598,387 | | | | 78,229,234 | | |
Primary Health Care, Ltd. | | | 17,034,772 | | | | 66,117,922 | | |
Breville Group, Ltd.† | | | 10,847,453 | | | | 51,959,652 | | |
Total Australia | | | | | 285,186,748 | | |
INDONESIA: 4.6% | |
PT United Tractors | | | 50,193,000 | | | | 76,550,535 | | |
PT Perusahaan Gas Negara Persero | | | 179,997,000 | | | | 58,140,402 | | |
PT Telekomunikasi Indonesia Persero | | | 254,438,500 | | | | 55,771,459 | | |
PT Telekomunikasi Indonesia Persero ADR | | | 1,140,834 | | | | 49,500,787 | | |
PT Bank Rakyat Indonesia Persero | | | 41,611,746 | | | | 32,206,153 | | |
Total Indonesia | | | | | 272,169,336 | | |
TAIWAN: 4.6% | |
Chunghwa Telecom Co., Ltd. ADR | | | 3,653,301 | | | | 116,613,368 | | |
Taiwan Semiconductor Manufacturing
Co., Ltd. ADR | | | 4,005,040 | | | | 90,954,458 | | |
St. Shine Optical Co., Ltd.† | | | 2,674,000 | | | | 42,504,986 | | |
Taiwan Semiconductor Manufacturing
Co., Ltd. | | | 4,646,469 | | | | 21,135,019 | | |
Total Taiwan | | | | | 271,207,831 | | |
SOUTH KOREA: 4.1% | |
KT&G Corp. | | | 1,481,716 | | | | 125,581,180 | | |
BGF Retail Co., Ltd. | | | 462,216 | | | | 66,215,145 | | |
GS Retail Co., Ltd. | | | 1,288,580 | | | | 53,910,709 | | |
Total South Korea | | | | | 245,707,034 | | |
THAILAND: 2.9% | |
Thai Beverage Public Co., Ltd. | | | 175,591,000 | | | | 99,737,539 | | |
Total Access Communication Public
Co., Ltd. NVDR | | | 19,350,300 | | | | 47,594,545 | | |
Total Access Communication Public
Co., Ltd. | | | 10,420,700 | | | | 25,631,048 | | |
Total Thailand | | | | | 172,963,132 | | |
INDIA: 2.6% | |
ITC, Ltd. | | | 13,250,000 | | | | 65,492,751 | | |
Bharti Infratel, Ltd. | | | 8,846,586 | | | | 61,905,364 | | |
Tata Motors, Ltd.—A—DVR | | | 6,702,106 | | | | 27,388,238 | | |
Total India | | | | | 154,786,353 | | |
matthewsasia.com | 800.789.ASIA 19
Matthews Asia Dividend Fund June 30, 2015
Consolidated Schedule of Investmentsa (unaudited) (continued)
COMMON EQUITIES (continued)
| | Shares | | Value | |
LUXEMBOURG: 1.7% | |
L'Occitane International SA | | | 36,075,000 | | | $ | 102,851,365 | | |
Total Luxembourg | | | | | 102,851,365 | | |
PHILIPPINES: 1.4% | |
Globe Telecom, Inc. | | | 1,503,820 | | | | 83,656,184 | | |
Total Philippines | | | | | 83,656,184 | | |
VIETNAM: 1.0% | |
Vietnam Dairy Products JSC | | | 11,228,882 | | | | 58,102,144 | | |
Total Vietnam | | | | | 58,102,144 | | |
TOTAL COMMON EQUITIES | | | | | 5,547,094,858 | | |
(Cost $4,545,252,204) | | | | | |
PREFERRED EQUITIES: 2.5%
SOUTH KOREA: 2.5% | |
LG Chem, Ltd., Pfd. | | | 860,900 | | | | 145,000,980 | | |
Total South Korea | | | | | 145,000,980 | | |
TOTAL PREFERRED EQUITIES | | | | | 145,000,980 | | |
(Cost $75,570,675) | | | | | |
TOTAL INVESTMENTS: 96.0% | | | | | 5,692,095,838 | | |
(Cost $4,620,822,879d) | | | | | |
CASH AND OTHER ASSETS,
LESS LIABILITIES: 4.0% | | | | | 238,763,927 | | |
NET ASSETS: 100.0% | | | | $ | 5,930,859,765 | | |
a Certain securities were fair valued under the valuation polices approved by the Board of Trustees (Note 2-A).
b Non-income producing security.
c Security held by Matthews ADF-U Series.
d Cost for federal income tax purposes is $4,621,396,706 and net unrealized appreciation consists of:
Gross unrealized appreciation | | $ | 1,382,492,213 | | |
Gross unrealized depreciation | | | (311,793,081 | ) | |
Net unrealized appreciation | | $ | 1,070,699,132 | | |
† Affiliated Issuer, as defined under the Investment Company Act of 1940 (ownership of 5% or more of the outstanding voting securities of this issuer)
ADR American Depositary Receipt
DVR Differential Voting Right
JSC Joint Stock Co.
NVDR Non-voting Depositary Receipt
Pfd. Preferred
REIT Real Estate Investment Trust
See accompanying notes to financial statements.
20 MATTHEWS ASIA FUNDS

ASIA GROWTH AND INCOME STRATEGIES
PORTFOLIO MANAGERS
Yu Zhang, CFA
Lead Manager
Sherwood Zhang, CFA
Co-Manager
FUND FACTS
| | | Investor Class | | Institutional Class | |
Ticker | | MCDFX | | MICDX | |
CUSIP | | 577125305 | | 577130735 | |
Inception | | 11/30/09 | | 10/29/10 | |
NAV | | $16.15 | | $16.15 | |
Initial Investment | | $2,500 | | $3 million | |
Gross Expense Ratio1 | | 1.19% | | 1.01% | |
Portfolio Statistics
Total # of Positions | | 51 | |
Net Assets | | $229.9 million | |
Weighted Average Market Cap | | $33.3 billion | |
Portfolio Turnover | | 25.43%2 | |
Benchmark
MSCI China Index
OBJECTIVE
Total return with an emphasis on providing current income.
STRATEGY
Under normal market conditions, the Fund seeks to achieve its investment objective by investing at least 80% of its total net assets, which include borrowings for investment purposes, in dividend-paying equity securities of companies located in China. China includes its administrative and other districts, such as Hong Kong. The Fund may also invest in convertible debt and equity securities.
1 Prospectus expense ratios.
2 The lesser of fiscal year 2014 long-term purchase costs or sales proceeds divided by the average monthly market value of long-term securities.
Matthews China Dividend Fund
Portfolio Manager Commentary
For the first half of 2015, the Matthews China Dividend Fund rose 22.74% (Investor Class) and 22.78% (Institutional Class), outperforming its benchmark, the MSCI China Index, which returned 14.84%. For the quarter ending June 30, the Fund returned 14.68% (Investor Class) and 14.72% (Institutional Class), while its benchmark was up 6.22%.
Market Environment:
China's equity market experienced another roller coaster ride during the second quarter of the year. Market participants were initially encouraged by the successful launch of the Shanghai—Hong Kong Stock Connect Program, as well as plans for the launch of another linkage between the Hong Kong and Shenzhen exchanges. On the monetary policy front, China's central bank cut interest rates twice during the quarter, and also cut the reserve requirement ratio by another one percentage point. Retail investors pushed China's A-share market to a seven-year high, as if convinced that its fountain of wealth would never dry up.
However, when the market sensed hesitation in further monetary easing by the central bank and Chinese securities regulators began clamping down on unregulated margin financing activities in June, the A-share market began to sharply correct. The bearish sentiment quickly spread into the Hong Kong market, and we also saw a global sell-off triggered by economic uncertainty in Greece. Chinese equities listed on the Hong Kong exchange suffered a heavy sell off into quarter end.
Performance Contributors and Detractors:
During the quarter, the top two contributors to Fund performance were Boer Power, an integrated electrical distribution system provider, and Shanghai Jinjiang International Hotels Development, a budget hotel chain operator. The two holdings continued to lead portfolio contributions for the industrials and consumer discretionary sectors. China Power International Development, an independent power generation firm that we added in the first quarter of the year, was also among the top contributors to Fund performance during the quarter. The market is becoming somewhat less concerned about the electricity price cuts mandated by the government, and is instead turning bullish on China's electricity system reform and the pace of acquisition opportunities from China Power International Development's parent company.
Conversely, the market sold down Hong Kong telecom operator HKBN during the quarter, making it the largest drag on Fund performance as investors worried that competition in Hong Kong's broadband market could heat up. We first added HKBN during its initial public offering in March, and continue to hold that company as we believe the low-cost leader should be able to withstand market share competition over the long term.
Notable Portfolio Changes:
During the quarter, the Fund began utilizing the Shanghai—Hong Kong Stock Connect Program to invest in China's A-share market. We added: Shanghai International Airport, Daqin Railway, Kweichow Moutai and Shanghai Jahwa United. The firms hold both leading industry positions
matthewsasia.com | 800.789.ASIA 21
PERFORMANCE AS OF JUNE 30, 2015
| | | | | | | | | Average Annual Total Returns | | | |
| | | 3 Months | | YTD | | 1 Year | | 3 Year | | 5 Year | | Since
Inception | | Inception
Date | |
Investor Class (MCDFX) | | | 14.68 | % | | | 22.74 | % | | | 25.14 | % | | | 17.65 | % | | | 13.12 | % | | | 12.35 | % | | 11/30/09 | |
Institutional Class (MICDX) | | | 14.72 | % | | | 22.78 | % | | | 25.28 | % | | | 17.88 | % | | | n.a. | | | | 10.73 | % | | 10/29/10 | |
MSCI China Index3 | | | 6.22 | % | | | 14.84 | % | | | 24.95 | % | | | 15.18 | % | | | 7.72 | % | | | 5.80 | %4 | | | | | |
Lipper China Region Funds Category Average5 | | | 7.64 | % | | | 14.90 | % | | | 22.40 | % | | | 14.31 | % | | | 8.30 | % | | | 6.28 | %4 | | | | | |
Performance assumes reinvestment of all dividends and/or distributions before taxes. All performance quoted represents past performance and is no guarantee of future results. Investment return and principal value will fluctuate with market conditions so that when redeemed, shares may be worth more or less than their original cost. Current performance may be lower or higher than the return figures quoted. For the Fund's most recent month-end performance, visit matthewsasia.com.
INCOME DISTRIBUTION HISTORY
| | 2015 | | 2014 | |
| | June | | December | | Total | | June | | December | | Total | |
Investor (MCDFX) | | $ | 0.27 | | | | n.a. | | | | n.a. | | | $ | 0.16 | | | $ | 0.20 | | | $ | 0.36 | | |
Inst'l (MICDX) | | $ | 0.28 | | | | n.a. | | | | n.a. | | | $ | 0.17 | | | $ | 0.21 | | | $ | 0.38 | | |
Note: This table does not include capital gains distributions. Totals may differ by $0.01 due to rounding. For income distribution history, visit matthewsasia.com.
30-DAY YIELD:
1.50% (Investor Class) 1.62% (Institutional Class)
The 30-Day Yield represents net investment income earned by the Fund over the 30-day period ended 6/30/15, expressed as an annual percentage rate based on the Fund's share price at the end of the 30-day period. The 30-Day Yield should be regarded as an estimate of the Fund's rate of investment income, and it may not equal the Fund's actual income distribution rate.
Source: BNY Mellon Investment Servicing (US) Inc.
DIVIDEND YIELD: 2.77%
The dividend yield (trailing) for the portfolio is the weighted average sum of the dividends paid by each equity security held by the Fund over the 12 months ended 6/30/15 divided by the current price of each equity as of 6/30/15. The annualized dividend yield for the Fund is for the equity-only portion of the portfolio. Please note that this is based on gross equity portfolio holdings and does not reflect the actual yield an investor in the Fund would receive. Past yields are no guarantee of future yields.
Source: FactSet Research Systems, Bloomberg, MICM.
GROWTH OF A $10,000 INVESTMENT SINCE INCEPTION—INVESTOR CLASS
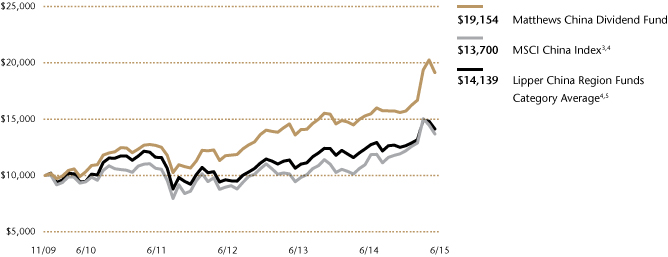
Plotted monthly. The performance data does not reflect the deduction of taxes that a shareholder would pay on dividends, capital gains distributions or redemption of Fund shares. Values are in US$.
3 It is not possible to invest directly in an index. Source: Index data from Morgan Stanley Capital International and Bloomberg; total return calculations performed by BNY Mellon Investment Servicing (US) Inc. Please see page 85 for index definition.
4 Calculated from 11/30/09.
5 The Lipper Category Average does not reflect sales charges and is based on total return, including reinvestment of dividends and capital gains for the stated periods.
TOP TEN HOLDINGS6
| | | Sector | | % of Net Assets | |
China Merchants Bank Co., Ltd. | | Financials | | | 3.2 | % | |
China Construction Bank Corp. | | Financials | | | 3.2 | % | |
Boer Power Holdings, Ltd. | | Industrials | | | 3.0 | % | |
Kweichow Moutai Co., Ltd. | | Consumer Staples | | | 2.8 | % | |
Huishang Bank Corp., Ltd. | | Financials | | | 2.7 | % | |
New Oriental Education & Technology Group, Inc. | | Consumer Discretionary | | | 2.7 | % | |
China Power International Development, Ltd. | | Utilities | | | 2.7 | % | |
Shenzhou International Group Holdings, Ltd. | | Consumer Discretionary | | | 2.6 | % | |
Shanghai Jahwa United Co., Ltd. | | Consumer Staples | | | 2.4 | % | |
Daqin Railway Co., Ltd. | | Industrials | | | 2.3 | % | |
% OF ASSETS IN TOP TEN | | | | | 27.6 | % | |
6 Holdings may combine more than one security from same issuer and related depositary receipts.
22 MATTHEWS ASIA FUNDS
Matthews China Dividend Fund
Portfolio Manager Commentary (continued)
and attractive valuations. In addition, we also added CITIC Telecom International, a leading telecom operator in Macau, as we aim to increase exposure to stable dividend-paying businesses. During the quarter, we exited Shanghai Baosight Software, Link REIT and BAIOO Family Interactive, mainly for valuation concerns.
Outlook:
The speed and magnitude of the correction in China's domestic A-share market led by small-cap companies took many market participants by surprise late in the quarter. Hopefully, both retail investors and regulators could draw an important, albeit painful, lesson about speculating using leverage. And if Chinese authorities continue to enact reforms and further open its equities market to international investors, a healthier market with lower retail speculation and higher participation from institutional investors could be a silver lining to the recent turmoil. China's middle class needs a true capital market in which to invest its wealth. Meanwhile, we will continue to look for stable businesses with high levels of sustainable payout during this volatile period as the current market turmoil leaves China's central bank with limited options other than to continue its monetary easing. Such policies, in turn, should make high dividend-paying stocks more attractive.
COUNTRY ALLOCATION (%)7
China/Hong Kong | | | 83.7 | | |
Taiwan | | | 8.5 | | |
Singapore | | | 1.1 | | |
Cash and Other Assets, Less Liabilities | | | 6.7 | | |
SECTOR ALLOCATION (%)
Industrials | | | 23.2 | | |
Financials | | | 17.7 | | |
Consumer Discretionary | | | 13.6 | | |
Consumer Staples | | | 11.1 | | |
Information Technology | | | 8.4 | | |
Telecommunication Services | | | 6.1 | | |
Utilities | | | 4.3 | | |
Health Care | | | 3.8 | | |
Energy | | | 3.0 | | |
Materials | | | 2.1 | | |
Cash and Other Assets, Less Liabilities | | | 6.7 | | |
MARKET CAP EXPOSURE (%)8
Mega Cap (over $25B) | | | 19.8 | | |
Large Cap ($10B–$25B) | | | 2.0 | | |
Mid Cap ($3B–$10B) | | | 33.9 | | |
Small Cap (under $3B) | | | 37.6 | | |
Cash and Other Assets, Less Liabilities | | | 6.7 | | |
7 Not all countries where the Fund may invest are included in the benchmark index.
8 Source: FactSet Research Systems. Percentage values in data are rounded to the nearest tenth of one percent; the values may not sum to 100% due to rounding.
matthewsasia.com | 800.789.ASIA 23
Matthews China Dividend Fund June 30, 2015
Schedule of Investmentsa (unaudited)
COMMON EQUITIES: 93.3%
| | Shares | | Value | |
INDUSTRIALS: 23.2% | |
Electrical Equipment: 5.1% | |
Boer Power Holdings, Ltd. | | | 3,287,000 | | | $ | 6,948,066 | | |
Voltronic Power Technology Corp. | | | 375,850 | | | | 4,736,935 | | |
| | | | | 11,685,001 | | |
Road & Rail: 3.3% | |
Daqin Railway Co., Ltd. A Shares | | | 2,353,614 | | | | 5,323,829 | | |
Guangshen Railway Co., Ltd. H Shares | | | 2,454,000 | | | | 1,349,650 | | |
Guangshen Railway Co., Ltd. ADR | | | 37,100 | | | | 1,014,314 | | |
| | | | | 7,687,793 | | |
Transportation Infrastructure: 3.0% | |
Yuexiu Transport Infrastructure, Ltd. | | | 6,606,000 | | | | 4,751,842 | | |
Shanghai International Airport Co., Ltd.
A Shares | | | 403,264 | | | | 2,059,541 | | |
| | | | | 6,811,383 | | |
Machinery: 2.8% | |
Shanghai Mechanical and Electrical
Industry Co., Ltd. B Shares | | | 1,583,560 | | | | 4,861,529 | | |
Haitian International Holdings, Ltd. | | | 705,000 | | | | 1,655,013 | | |
| | | | | 6,516,542 | | |
Marine: 2.3% | |
SITC International Holdings Co., Ltd. | | | 7,876,000 | | | | 5,198,973 | | |
Construction & Engineering: 2.0% | |
China Machinery Engineering Corp.
H Shares | | | 4,390,000 | | | | 4,726,968 | | |
Professional Services: 1.7% | |
Sporton International, Inc. | | | 577,070 | | | | 3,892,476 | | |
Industrial Conglomerates: 1.6% | |
Hopewell Holdings, Ltd. | | | 996,500 | | | | 3,648,427 | | |
Air Freight & Logistics: 1.4% | |
Shenzhen Chiwan Petroleum B Sharesb | | | 1,131,368 | | | | 3,259,148 | | |
Total Industrials | | | | | 53,426,711 | | |
FINANCIALS: 17.7% | |
Banks: 10.3% | |
China Merchants Bank Co., Ltd. H Shares | | | 2,513,500 | | | | 7,300,865 | | |
China Construction Bank Corp. H Shares | | | 7,961,000 | | | | 7,261,674 | | |
Huishang Bank Corp., Ltd. H Shares | | | 12,075,000 | | | | 6,273,004 | | |
HSBC Holdings PLC ADR | | | 64,100 | | | | 2,872,321 | | |
| | | | | 23,707,864 | | |
Capital Markets: 2.3% | |
China Everbright, Ltd. | | | 1,490,000 | | | | 5,159,600 | | |
Diversified Financial Services: 2.0% | |
Far East Horizon, Ltd. | | | 4,906,000 | | | | 4,662,639 | | |
Real Estate Management & Development: 2.0% | |
Shanghai Lujiazui Finance & Trade Zone
Development Co., Ltd. B Shares | | | 1,441,679 | | | | 4,601,839 | | |
| | Shares | | Value | |
Real Estate Investment Trusts (REITS): 1.1% | |
CapitaLand Retail China Trust, REIT | | | 1,941,000 | | | $ | 2,504,881 | | |
Total Financials | | | | | 40,636,823 | | |
CONSUMER DISCRETIONARY: 13.6% | |
Auto Components: 4.0% | |
Minth Group, Ltd. | | | 2,266,000 | | | | 5,063,795 | | |
Fuyao Glass Industry Group Co., Ltd.
H Sharesb | | | 1,662,400 | | | | 4,070,457 | | |
| | | | | 9,134,252 | | |
Hotels, Restaurants & Leisure: 3.0% | |
Café de Coral Holdings, Ltd. | | | 1,216,000 | | | | 4,392,412 | | |
Shanghai Jinjiang International Hotels
Development Co., Ltd. B Shares | | | 583,609 | | | | 1,658,006 | | |
Xiao Nan Guo Restaurants Holdings, Ltd.b | | | 7,834,000 | | | | 933,965 | | |
| | | | | 6,984,383 | | |
Diversified Consumer Services: 2.7% | |
New Oriental Education & Technology
Group, Inc. ADRb | | | 254,000 | | | | 6,228,080 | | |
Textiles, Apparel & Luxury Goods: 2.6% | |
Shenzhou International Group Holdings, Ltd. | | | 1,238,000 | | | | 6,021,067 | | |
Media: 1.3% | |
Television Broadcasts, Ltd. | | | 505,700 | | | | 3,000,974 | | |
Total Consumer Discretionary | | | | | 31,368,756 | | |
CONSUMER STAPLES: 11.1% | |
Beverages: 4.6% | |
Kweichow Moutai Co., Ltd. A Sharesb | | | 156,003 | | | | 6,475,672 | | |
Yantai Changyu Pioneer Wine Co., Ltd.
B Shares | | | 976,327 | | | | 4,019,144 | | |
| | | | | 10,494,816 | | |
Personal Products: 2.3% | |
Shanghai Jahwa United Co., Ltd. A Shares | | | 775,693 | | | | 5,411,850 | | |
Food & Staples Retailing: 2.3% | |
Shanghai Bailian Group Co., Ltd. B Shares | | | 2,369,677 | | | | 5,208,055 | | |
Food Products: 1.9% | |
Vitasoy International Holdings, Ltd. | | | 2,614,000 | | | | 4,451,342 | | |
Total Consumer Staples | | | | | 25,566,063 | | |
INFORMATION TECHNOLOGY: 8.4% | |
Communications Equipment: 3.9% | |
Qualcomm, Inc. | | | 78,100 | | | | 4,891,403 | | |
Sercomm Corp. | | | 2,043,000 | | | | 4,117,325 | | |
| | | | | 9,008,728 | | |
Electronic Equipment, Instruments & Components: 2.0% | |
Sunny Optical Technology Group Co., Ltd. | | | 2,058,000 | | | | 4,479,649 | | |
Software: 1.4% | |
Chanjet Information Technology Co., Ltd.
H Shares | | | 949,400 | | | | 3,316,233 | | |
24 MATTHEWS ASIA FUNDS
Matthews China Dividend Fund June 30, 2015
Schedule of Investmentsa (unaudited) (continued)
COMMON EQUITIES (continued)
| | Shares | | Value | |
Semiconductors & Semiconductor Equipment: 1.1% | |
Taiwan Semiconductor Manufacturing
Co., Ltd. | | | 527,000 | | | $ | 2,397,122 | | |
Total Information Technology | | | | | 19,201,732 | | |
TELECOMMUNICATION SERVICES: 6.1% | |
Diversified Telecommunication Services: 3.8% | |
CITIC Telecom International Holdings, Ltd. | | | 10,085,000 | | | | 4,675,897 | | |
HKBN, Ltd.b | | | 3,987,957 | | | | 4,146,646 | | |
| | | | | 8,822,543 | | |
Wireless Telecommunication Services: 2.3% | |
China Mobile, Ltd. ADR | | | 81,530 | | | | 5,225,258 | | |
Total Telecommunication Services | | | | | 14,047,801 | | |
UTILITIES: 4.3% | |
Independent Power and Renewable Electricity Producers: 2.7% | |
China Power International
Development, Ltd. | | | 8,012,000 | | | | 6,100,341 | | |
Water Utilities: 1.6% | |
Guangdong Investment, Ltd. | | | 2,644,000 | | | | 3,699,865 | | |
Total Utilities | | | | | 9,800,206 | | |
HEALTH CARE: 3.8% | |
Pharmaceuticals: 2.0% | |
Tianjin ZhongXin Pharmaceutical Group
Corp., Ltd. S Shares | | | 2,966,200 | | | | 4,567,800 | | |
Health Care Equipment & Supplies: 1.8% | |
Pacific Hospital Supply Co., Ltd. | | | 1,333,000 | | | | 2,655,303 | | |
St. Shine Optical Co., Ltd. | | | 91,811 | | | | 1,459,396 | | |
| | | | | 4,114,699 | | |
Total Health Care | | | | | 8,682,499 | | |
ENERGY: 3.0% | |
Oil, Gas & Consumable Fuels: 1.6% | |
PetroChina Co., Ltd. H Shares | | | 3,312,000 | | | | 3,688,565 | | |
Energy Equipment & Services: 1.4% | |
Hilong Holding, Ltd. | | | 10,826,000 | | | | 3,134,341 | | |
Total Energy | | | | | 6,822,906 | | |
MATERIALS: 2.1% | |
Containers & Packaging: 2.1% | |
Greatview Aseptic Packaging Co., Ltd. | | | 8,688,000 | | | | 4,945,651 | | |
Total Materials | | | | | 4,945,651 | | |
TOTAL INVESTMENTS: 93.3% | | | | | 214,499,148 | | |
(Cost $185,055,077c) | | | | | |
CASH AND OTHER ASSETS,
LESS LIABILITIES: 6.7% | | | | | 15,406,138 | | |
NET ASSETS: 100.0% | | | | $ | 229,905,286 | | |
a Certain securities were fair valued under the valuation polices approved by the Board of Trustees (Note 2-A).
b Non-income producing security.
c Cost for federal income tax purposes is $185,076,983 and net unrealized appreciation consists of:
Gross unrealized appreciation | | $ | 37,294,706 | | |
Gross unrealized depreciation | | | (7,872,541 | ) | |
Net unrealized appreciation | | $ | 29,422,165 | | |
ADR American Depositary Receipt
REIT Real Estate Investment Trust
See accompanying notes to financial statements.
matthewsasia.com | 800.789.ASIA 25

PORTFOLIO MANAGERS
Kenneth Lowe, CFA | | | | | |
Lead Manager | | | | | |
Michael J. Oh, CFA | | Sharat Shroff, CFA | | | |
Co-Manager | | Co-Manager | | | |
FUND FACTS
| | | Investor | | Institutional | |
Ticker | | MAFSX | | MIFSX | |
CUSIP | | 577125701 | | 577125800 | |
Inception | | 4/30/13 | | 4/30/13 | |
NAV | | $9.92 | | $9.95 | |
Initial Investment | | $2,500 | | $3 million | |
Gross Expense Ratio1 | | 2.16% | | 1.94% | |
After Fee Waiver and
Reimbursement2 | | 1.50% | | 1.25% | |
Portfolio Statistics
Total # of Positions | | 29 | |
Net Assets | | $15.5 million | |
Weighted Average Market Cap | | $43.3 billion | |
Portfolio Turnover | | 24.12%3 | |
Benchmark
MSCI AC Asia ex Japan Index | |
OBJECTIVE
Long term capital appreciation. | |
STRATEGY
Under normal market conditions, the Fund seeks to achieve its investment objective by investing at least 80% of its total assets, which include borrowings for investment purposes, in the common and preferred stocks of companies located in Asia excluding Japan, but including all other developed, emerging and frontier countries and markets in the Asian region.
1 Prospectus expense ratios.
2 Matthews has contractually agreed (i) to waive fees and reimburse expenses to the extent needed to limit Total Annual Fund Operating Expenses (excluding Rule 12b-1 fees, front-end or contingent deferred loads, taxes, interest, brokerage commissions, short sale dividend expenses, expenses incurred in connection with any merger or reorganization or extraordinary expenses such as litigation) of the Institutional Class to 1.25%, and (ii) if any Fund-wide expenses (i.e., expenses that apply to both the Institutional Class and the Investor Class) are waived for the Institutional Class to maintain the 1.25% expense limitation, to waive an equal amount (in annual percentage terms) of those same expenses for the Investor Class. The Total Annual Fund Operating Expenses After Fee Waiver and Expense Reimbursement for the Investor Class may vary from year to year and will in some years exceed 1.25%. If the operating expenses fall below the expense limitation in a year within three years after Matthews has made a waiver or reimbursement, the Fund may reimburse Matthews up to an amount that does not cause the expenses for that year to exceed the expense limitation applicable at the time of that fee waiver and/or expense reimbursement or to exceed any other agreed upon expense limitation for that year. This agreement will remain in place until April 30, 2016, may be renewed for additional periods not exceeding one year and may be terminated at any time by the Board of Trustees or the Trust on behalf of the Fund on 60 days' written notice to Matthews. Matthews may decline to renew this agreement by written notice to the Trust at least 30 days before its annual expiration date.
3 The lesser of fiscal year 2014 long-term purchase costs or sales proceeds divided by the average monthly market value of long-term securities.
Matthews Asia Focus Fund
Portfolio Manager Commentary
For the first half of 2015, the Matthews Asia Focus Fund returned –0.90% (Investor and Institutional Class), underperforming its benchmark, the MSCI All Country Asia ex Japan Index, which rose 5.59%. For the quarter ending June 30, the Fund fell –4.16% (Investor Class) and –4.14% (Institutional Class) while its benchmark returned 0.65%.
Market Environment:
Politics and monetary policies were once more at the forefront of short-term market movements throughout much of the globe. In the U.S., policy normalization still appears to be in the distance as Fed Chairwoman Janet Yellen emphasized the need for a shallow rate hike path as economic data continues to improve. In Europe, Greece missed a 1.5 billion euro payment to the International Monetary Fund, forcing it to impose capital controls as, at the time of writing, it refuses the structural reform requests of European officials required to ensure additional bailout funds. Turning to Asia, Chinese policy has been the primary driver of markets as the central bank underwent additional liquidity injections into the financial system through cuts in the reserve requirement ratio and in interest rates, whilst also providing the state-owned policy banks with more capital. Additionally, the finance ministry, central bank and banking regulator jointly announced plans to allow commercial banks to use the local government bonds that they have purchased as collateral for low-interest loans from the central bank, allowing a further boost to system liquidity. As the Chinese government actively support markets, retail participation has also grown and been compounded by increases in margin lending. All of these factors led mainland Chinese and Hong Kong markets to be the strongest performers in the second quarter, heavily outperforming markets in Southeast Asia as they struggled due to sputtering growth and political challenges.
Performance Contributors and Detractors:
The second quarter was somewhat challenging for the Fund, with some of the largest detractors to performance coming from Southeast Asia yet again. Our holdings in Indonesia were particularly weak, with the Indonesian market suffering from concerns that President Joko Widodo's initial reform-oriented plans appear to be challenging to enact given his weak political position. Bank Rakyat Indonesia Persero, in particular, struggled as earnings expectations were impacted by weaker economic growth, causing asset quality issues, alongside caps on interest rates to certain asset classes that may hurt interest income. Our holding in regional conglomerate Jardine Matheson was also hit by the weak Indonesian macroeconomic backdrop as its subsidiary, Astra International, is seeing weaker car and motorcycle demand. The stock has also been hurt by a technical issue as its lack of daily liquidity may force it out of the local Singapore index.
Beyond Indonesia, our holding in Tata Motors gave up some of its gains from the last few years as China volumes are weaker-than-expected for the first time. This has led to an increase in inventories and dealership incentives that may cause some margin pressure for the company in the short term.
Our Australia holdings were also weak. Ansell, a health and safety protection solutions company, has suffered from concerns that a weak euro will provide a headwind to earnings given its cost base is largely in U.S. dollars.
Among the largest contributors to returns were some of the Fund's core holdings such as Yum! Brands and AIA Group. According to the
26 MATTHEWS ASIA FUNDS
PERFORMANCE AS OF JUNE 30, 2015
| | | | | | | | | Average Annual
Total Returns | |
| |
| | | 3 Months | | YTD | | 1 Year | | Since
Inception | | Inception
Date | |
Investor Class (MAFSX) | | | -4.16 | % | | | -0.90 | % | | | -2.32 | % | | | 0.33 | % | | 4/30/13 | |
Institutional Class (MIFSX) | | | -4.14 | % | | | -0.90 | % | | | -2.05 | % | | | 0.58 | % | | 4/30/13 | |
MSCI AC Asia ex Japan Index4 | | | 0.65 | % | | | 5.59 | % | | | 4.14 | % | | | 5.88 | % | | | | | |
Lipper Pacific ex Japan Funds Category Average5 | | | -0.25 | % | | | 4.27 | % | | | 0.56 | % | | | 3.14 | % | | | | | |
Performance assumes reinvestment of all dividends and/or distributions before taxes. All performance quoted represents past performance and is no guarantee of future results. Investment return and principal value will fluctuate with market conditions so that when redeemed, shares may be worth more or less than their original cost. Current performance may be lower or higher than the return figures quoted. Returns would have been lower if certain of the Fund's fees and expenses had not been waived. For the Fund's most recent month-end performance visit matthewsasia.com.
GROWTH OF A $10,000 INVESTMENT SINCE INCEPTION—INVESTOR CLASS
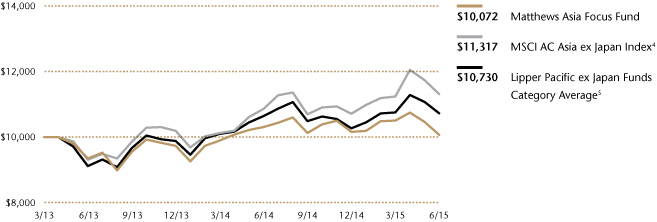
Plotted monthly. The performance data does not reflect the deduction of taxes that a shareholder would pay on dividends, capital gain distributions or redemption of Fund shares. Values are in US$.
4 It is not possible to invest directly in an index. Source: Index data from Morgan Stanley Capital International and Bloomberg; total return calculations performed by BNY Mellon Investment Servicing (US) Inc. Please see page 85 for index definition.
5 The Lipper Category Average does not reflect sales charges and is based on total return, including reinvestment of dividends and capital gains for the stated periods.
TOP TEN HOLDINGS6
| | | Sector | | Country | | % of Net Assets | |
AIA Group, Ltd. | | Financials | | China/Hong Kong | | | 6.2 | % | |
Jardine Matheson Holdings, Ltd. | | Industrials | | China/Hong Kong | | | 5.6 | % | |
Baidu, Inc. | | Information Technology | | China/Hong Kong | | | 4.3 | % | |
Singapore Telecommunications, Ltd. | | Telecommunication Services | | Singapore | | | 4.1 | % | |
Yum! Brands, Inc. | | Consumer Discretionary | | China/Hong Kong | | | 4.1 | % | |
Samsonite International SA | | Consumer Discretionary | | China/Hong Kong | | | 4.1 | % | |
Taiwan Semiconductor Manufacturing Co., Ltd. | | Information Technology | | Taiwan | | | 3.6 | % | |
Mead Johnson Nutrition Co. | | Consumer Staples | | USA | | | 3.5 | % | |
Samsung Electronics Co., Ltd. | | Information Technology | | South Korea | | | 3.3 | % | |
Techtronic Industries Co., Ltd. | | Consumer Discretionary | | China/Hong Kong | | | 3.3 | % | |
% OF ASSETS IN TOP TEN | | | | | | | 42.1 | % | |
6 Holdings may combine more than one security from same issuer and related depositary receipts.
matthewsasia.com | 800.789.ASIA 27
COUNTRY ALLOCATION (%)7
China/Hong Kong | | | 40.8 | | |
Singapore | | | 9.5 | | |
Malaysia | | | 8.9 | | |
Australia | | | 6.0 | | |
Indonesia | | | 4.8 | | |
Thailand | | | 4.8 | | |
Taiwan | | | 3.6 | | |
United States | | | 3.5 | | |
South Korea | | | 3.4 | | |
Switzerland | | | 3.2 | | |
India | | | 2.9 | | |
United Kingdom | | | 1.7 | | |
Cash and Other Assets, Less Liabilities | | | 6.9 | | |
SECTOR ALLOCATION (%)
Financials | | | 24.4 | | |
Consumer Discretionary | | | 20.8 | | |
Information Technology | | | 14.3 | | |
Industrials | | | 10.9 | | |
Telecommunication Services | | | 9.2 | | |
Consumer Staples | | | 8.7 | | |
Health Care | | | 3.1 | | |
Materials | | | 1.7 | | |
Cash and Other Assets, Less Liabilities | | | 6.9 | | |
MARKET CAP EXPOSURE (%)8
Mega Cap (over $25B) | | | 46.5 | | |
Large Cap ($10B–$25B) | | | 19.9 | | |
Mid Cap ($3B–$10B) | | | 20.7 | | |
Small Cap (under $3B) | | | 6.0 | | |
Cash and Other Assets, Less Liabilities | | | 6.9 | | |
7 Not all countries where the Fund may invest are included in the benchmark index.
8 Source: FactSet Research Systems. Percentage values in data are rounded to the nearest tenth of one percent; the values may not sum to 100% due to rounding.
Matthews Asia Focus Fund
Portfolio Manager Commentary (continued)
management of Yum, all signs point to a recovery within Chinese demand after another supply problem last year. This, alongside activist investor involvement highlighting the latent value in the various brands, has helped the stock move upward. For AIA Group, operational delivery on earnings, capital generation and value of new business growth continue to be strong.
Notable Portfolio Changes:
During the quarter, the Fund added two new holdings. The first of these was Techtronic Industries, a world leader in power tool and floor care appliances. Formerly a white label manufacturer, we believe an excellent management team has transformed the company into a strong player in both the DIY and professional sectors of power tools through brands such as Ryobi and Milwaukee. We expect that growth will continue to be strong on further market share wins through their impressive cordless technology, alongside manufacturing efficiencies. In conjunction with having a fairly wide economic moat, the company also boasts a strong balance sheet and an attractive valuation at 17.2x price-to-earnings (P/E) ratio* with the potential for mid-teens growth.
The Fund also added Thai telecom company, Intouch Holdings. Intouch's subsidiary, Advanced Info Services, boasts the largest network and customer base in the country. Further, we expect attractive earnings and cash flow growth to come from increasing data revenues and cost savings from a change in network structure. Despite having an attractive growth profile, due to regulatory noise, the stock was yielding around 6.6% when we purchased it.
These new holdings were funded through the sale of Australia mining explosives company Orica and Malaysian commercial bank AMMB due to our weakening conviction in both names.
Outlook:
The outlook for economic growth throughout much of the globe remains fairly tepid, particularly in Europe as policymakers attempt to deal with deflationary forces and heavily indebted nations. Further, the bulk of Asian countries have engaged in fairly aggressive credit growth since the step change in global monetary policy after the financial crisis of 2008. These two points leave exports and credit expansion as unlikely to be large drivers of nearer-term economic growth for the region, placing the emphasis of sustainable improvements on supply-side reform sparking productivity gains. We have commented previously that many reform-oriented regimes have been put into place throughout the last couple of years. This has been pleasing, but substantial progress on fundamental change has struggled to materialize at an appropriate pace in certain geographies, albeit against what we believe were fairly unrealistic expectations at the outset.
Given this backdrop, it is likely that both economic and corporate earnings growth across Asia will remain sluggish. Compounding this is the fact that valuations are not particularly compelling at an 18.7x P/E ratio on average for the MSCI All Country Asia ex Japan Index on an equal weighted-basis year to date. Although this appears fairly bleak, it ultimately emphasizes the need for active stock-picking within a region that, despite its challenges, we believe still has a wealth of opportunities. The Fund's lack of exposure to the "hot" themes of the day over the last few years leaves our portfolio at an attractive 14x P/E ratio for companies that we believe should be able to deliver attractive economic value creation that will compound over market cycles to the benefit of minority shareholders.
* Price-to-Earnings Ratio (P/E Ratio) is a valuation ratio of a company's current share price compared to its per-share earnings and is calculated as the market value per share divided by the Earnings per Share (EPS).
28 MATTHEWS ASIA FUNDS
Matthews Asia Focus Fund June 30, 2015
Schedule of Investmentsa (unaudited)
COMMON EQUITIES: 93.1%
| | Shares | | Value | |
CHINA/HONG KONG: 40.8% | |
AIA Group, Ltd. | | | 147,600 | | | $ | 965,106 | | |
Jardine Matheson Holdings, Ltd. | | | 15,200 | | | | 861,724 | | |
Baidu, Inc. ADRb | | | 3,337 | | | | 664,330 | | |
Yum! Brands, Inc. | | | 7,050 | | | | 635,064 | | |
Samsonite International SA | | | 183,600 | | | | 633,893 | | |
Techtronic Industries Co., Ltd. | | | 158,500 | | | | 518,236 | | |
HSBC Holdings PLC | | | 55,200 | | | | 495,544 | | |
VTech Holdings, Ltd. | | | 35,500 | | | | 470,818 | | |
CK Hutchison Holdings, Ltd. | | | 28,728 | | | | 422,358 | | |
Hang Lung Group, Ltd. | | | 93,000 | | | | 409,339 | | |
Cheung Kong Property Holdings, Ltd.b | | | 28,728 | | | | 238,302 | | |
Total China/Hong Kong | | | | | 6,314,714 | | |
SINGAPORE: 9.5% | |
Singapore Telecommunications, Ltd. | | | 205,000 | | | | 639,748 | | |
United Overseas Bank, Ltd. | | | 25,000 | | | | 427,724 | | |
Singapore Technologies Engineering, Ltd. | | | 166,500 | | | | 407,661 | | |
Total Singapore | | | | | 1,475,133 | | |
MALAYSIA: 8.9% | |
Genting Malaysia BHD | | | 431,800 | | | | 480,332 | | |
Axiata Group BHD | | | 264,500 | | | | 448,485 | | |
Guinness Anchor BHD | | | 118,400 | | | | 447,675 | | |
Total Malaysia | | | | | 1,376,492 | | |
AUSTRALIA: 6.0% | |
Ansell, Ltd. | | | 25,795 | | | | 478,526 | | |
Insurance Australia Group, Ltd. | | | 104,938 | | | | 451,168 | | |
Total Australia | | | | | 929,694 | | |
INDONESIA: 4.8% | |
PT Bank Rakyat Indonesia Persero | | | 506,600 | | | | 392,092 | | |
PT Indofood Sukses Makmur | | | 726,300 | | | | 357,394 | | |
Total Indonesia | | | | | 749,486 | | |
THAILAND: 4.8% | |
Kasikornbank Public Co., Ltd. | | | 70,500 | | | | 393,319 | | |
Intouch Holdings Public Co., Ltd. NVDR | | | 148,500 | | | | 342,596 | | |
Total Thailand | | | | | 735,915 | | |
TAIWAN: 3.6% | |
Taiwan Semiconductor Manufacturing
Co., Ltd. | | | 124,000 | | | | 564,029 | | |
Total Taiwan | | | | | 564,029 | | |
UNITED STATES: 3.5% | |
Mead Johnson Nutrition Co. | | | 5,968 | | | | 538,433 | | |
Total United States | | | | | 538,433 | | |
SOUTH KOREA: 3.4% | |
Samsung Electronics Co., Ltd. | | | 457 | | | | 518,506 | | |
Total South Korea | | | | | 518,506 | | |
| | Shares | | Value | |
SWITZERLAND: 3.2% | |
Cie Financiere Richemont SA | | | 6,182 | | | $ | 502,460 | | |
Total Switzerland | | | | | 502,460 | | |
INDIA: 2.9% | |
Tata Motors, Ltd. | | | 66,381 | | | | 449,789 | | |
Total India | | | | | 449,789 | | |
UNITED KINGDOM: 1.7% | |
BHP Billiton PLC | | | 13,563 | | | | 266,670 | | |
Total United Kingdom | | | | | 266,670 | | |
TOTAL INVESTMENTS: 93.1% | | | | | 14,421,321 | | |
(Cost $14,576,223c) | |
CASH AND OTHER ASSETS,
LESS LIABILITIES: 6.9% | | | | | 1,068,744 | | |
NET ASSETS: 100.0% | | | | $ | 15,490,065 | | |
a Certain securities were fair valued under the valuation polices approved by the Board of Trustees (Note 2-A).
b Non-income producing security.
c Cost for federal income tax purposes is $14,650,506 and net unrealized depreciation consists of:
Gross unrealized appreciation | | $ | 968,894 | | |
Gross unrealized depreciation | | | (1,198,079 | ) | |
Net unrealized depreciation | | ($ | 229,185 | ) | |
ADR American Depositary Receipt
BHD Berhad
NVDR Non-voting Depositary Receipt
See accompanying notes to financial statements.
matthewsasia.com | 800.789.ASIA 29

PORTFOLIO MANAGERS
Taizo Ishida
Lead Manager
Sharat Shroff, CFA
Co-Manager
FUND FACTS
| | | Investor Class | | Institutional Class | |
Ticker | | MPACX | | MIAPX | |
CUSIP | | 577130867 | | 577130776 | |
Inception | | 10/31/03 | | 10/29/10 | |
NAV | | $22.05 | | $22.17 | |
Initial Investment | | $2,500 | | $3 million | |
Gross Expense Ratio1 | | 1.11% | | 0.91% | |
Portfolio Statistics
Total # of Positions | | 66 | |
Net Assets | | $990.6 million | |
Weighted Average Market Cap | | $25.8 billion | |
Portfolio Turnover | | 22.24%2 | |
Benchmark
MSCI AC Asia Pacific Index
OBJECTIVE
Long-term capital appreciation.
STRATEGY
Under normal market conditions, the Fund seeks to achieve its investment objective by investing at least 80% of its total net assets, which include borrowings for investment purposes, in the common and preferred stocks of companies located in Asia. Asia consists of all countries and markets in Asia, and includes developed, emerging and frontier countries and markets in the Asian region. The Fund may also invest in the convertible securities, of any duration or quality, of Asian companies.
1 Prospectus expense ratios.
2 The lesser of fiscal year 2014 long-term purchase costs or sales proceeds divided by the average monthly market value of long-term securities.
Matthews Asia Growth Fund
Portfolio Manager Commentary
For the first half of 2015, the Matthews Asia Growth Fund gained 4.50% (Investor Class) and 4.63% (Institutional Class), underperforming its benchmark, the MSCI All Country Asia Pacific Index, which returned 7.54%. For the quarter ending June 30, the Fund fell –2.04% (Investor Class) and –1.99% (Institutional Class) while its benchmark returned 0.71%.
Market Environment:
During the second quarter of the year, global equity markets continued to focus on politics and monetary policy, particularly the potential for a U.S. Federal rates rise and further risks imposed by the situation involving Greece. Emerging markets were weaker than developed markets globally during the first half of 2015, including in Asia. One of the weakest markets was Indonesia, which declined approximately 16% during the quarter because of weaker-than-expected earnings and GDP growth. Its market was negatively impacted by a perceived lack of leadership from President Jokowi, and concerns that his initial reform-oriented plans appear to be challenging to enact. The market also struggled as inflation re-emerged during the quarter. On the other hand, Asia's frontier markets held up. We saw flat performance in Sri Lanka, and almost double-digit performance in Vietnam and Pakistan. Japan continued to be among the few bright spots in global equity markets as renewed enthusiasm surrounding its corporate governance code continued to push the market up. Early in the first half of the year, we saw a strong rally in Chinese stocks in response to the launch of the Shanghai—Hong Kong Stock Connect Program.
Performance Contributors and Detractors:
For the second quarter, the majority of our top 10 contributors to Fund performance were our Japanese holdings, including Benefit One. The firm provides a variety of benefit programs to corporate employees in areas such as education, health care, leisure and shopping. The stock has done well due to a strong increase in membership.
By country, Chinese holdings also benefited performance, including Shenzhou International Group Holdings, one of the biggest and best apparel manufacturers for leading global brands like Nike, Adidas and Uniqlo. Shenzhou International's stock has been a long-term holding in our portfolio for over five years. The firm has benefited from a better mix of sales, including more sportswear apparel, as well as from stable or lower input prices. It has a newly constructed fabric mill in Vietnam, which is key to its future expansion, and we continue to expect further growth opportunities for this company.
The biggest detractors to Fund performance came from our holdings in Indonesia and the Philippines as we saw currency weakness and softer domestic demand. The portfolio's overweight in Indonesia and the Philippines, compared to the benchmark, contributed to its relative underperformance for the second quarter. Astra International, an Indonesian conglomerate, and Bank Rakyat Indonesia Persero were among the leading detractors to Fund performance. Bank Rakyat, in particular, struggled due to weaker first quarter earnings results and the slowing economy.
30 MATTHEWS ASIA FUNDS
PERFORMANCE AS OF JUNE 30, 2015
| | | | | | | | | Average Annual Total Returns | | | |
| | | 3 Months | | YTD | | 1 Year | | 3 Years | | 5 Years | | 10 Years | | Since
Inception | | Inception
Date | |
Investor Class (MPACX) | | | -2.04 | % | | | 4.50 | % | | | 2.15 | % | | | 12.10 | % | | | 10.03 | % | | | 8.70 | % | | | 9.69 | % | | 10/31/03 | |
Institutional Class (MIAPX) | | | -1.99 | % | | | 4.63 | % | | | 2.33 | % | | | 12.32 | % | | | n.a. | | | | n.a. | | | | 6.54 | % | | 10/29/10 | |
MSCI AC Asia Pacific Index3 | | | 0.71 | % | | | 7.54 | % | | | 3.12 | % | | | 10.64 | % | | | 8.30 | % | | | 6.66 | % | | | 7.55 | %4 | | | | | |
Lipper Pacific Region Funds Category Average5 | | | 1.24 | % | | | 6.66 | % | | | 2.78 | % | | | 10.13 | % | | | 8.61 | % | | | 6.79 | % | | | 7.69 | %4 | | | | | |
Performance assumes reinvestment of all dividends and/or distributions before taxes. All performance quoted represents past performance and is no guarantee of future results. Investment return and principal value will fluctuate with market conditions so that when redeemed, shares may be worth more or less than their original cost. Current performance may be lower or higher than the return figures quoted. For the Fund's most recent month-end performance, visit matthewsasia.com.
GROWTH OF A $10,000 INVESTMENT SINCE INCEPTION—INVESTOR CLASS
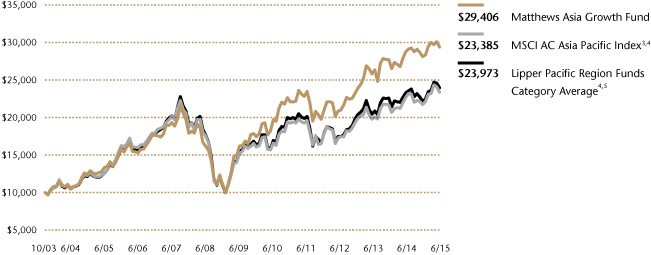
Plotted monthly. The performance data and graph do not reflect the deduction of taxes that a shareholder would pay on dividends, capital gains distributions or redemption of Fund shares. Values are in US$.
3 It is not possible to invest directly in an index. Source: Index data from Morgan Stanley Capital International and Bloomberg; total return calculations performed by BNY Mellon Investment Servicing (US) Inc. Please see page 85 for index definition.
4 Calculated from 10/31/03.
5 The Lipper Category Average does not reflect sales charges and is based on total return, including reinvestment of dividends and capital gains for the stated periods.
TOP TEN HOLDINGS6
| | | Sector | | Country | | % of Net Assets | |
Baidu, Inc. | | Information Technology | | China/Hong Kong | | | 3.7 | % | |
ORIX Corp. | | Financials | | Japan | | | 3.6 | % | |
Omron Corp. | | Information Technology | | Japan | | | 3.6 | % | |
Sysmex Corp. | | Health Care | | Japan | | | 3.4 | % | |
Emami, Ltd. | | Consumer Staples | | India | | | 2.9 | % | |
SoftBank Corp. | | Telecommunication Services | | Japan | | | 2.8 | % | |
PT Bank Rakyat Indonesia Persero | | Financials | | Indonesia | | | 2.5 | % | |
Shenzhou International Group Holdings, Ltd. | | Consumer Discretionary | | China/Hong Kong | | | 2.4 | % | |
PT Astra International | | Consumer Discretionary | | Indonesia | | | 2.3 | % | |
Unicharm Corp. | | Consumer Staples | | Japan | | | 2.2 | % | |
% OF ASSETS IN TOP TEN | | | | | | | 29.4 | % | |
6 Holdings may combine more than one security from same issuer and related depositary receipts.
matthewsasia.com | 800.789.ASIA 31
COUNTRY ALLOCATION (%)7
Japan | | | 41.9 | | |
China/Hong Kong | | | 15.5 | | |
India | | | 10.6 | | |
Indonesia | | | 7.6 | | |
Philippines | | | 4.5 | | |
Australia | | | 3.2 | | |
Sri Lanka | | | 3.2 | | |
South Korea | | | 2.6 | | |
Taiwan | | | 2.3 | | |
Malaysia | | | 1.4 | | |
Thailand | | | 1.2 | | |
Vietnam | | | 0.9 | | |
Pakistan | | | 0.6 | | |
Cash and Other Assets, Less Liabilities | | | 4.5 | | |
SECTOR ALLOCATION (%)
Consumer Staples | | | 18.4 | | |
Information Technology | | | 15.6 | | |
Industrials | | | 14.7 | | |
Financials | | | 13.9 | | |
Consumer Discretionary | | | 13.6 | | |
Health Care | | | 13.0 | | |
Telecommunication Services | | | 2.7 | | |
Energy | | | 1.9 | | |
Materials | | | 1.7 | | |
Cash and Other Assets, Less Liabilities | | | 4.5 | | |
MARKET CAP EXPOSURE (%)8
Mega Cap (over $25B) | | | 22.9 | | |
Large Cap ($10B–$25B) | | | 25.9 | | |
Mid Cap ($3B–$10B) | | | 28.0 | | |
Small Cap (under $3B) | | | 18.7 | | |
Cash and Other Assets, Less Liabilities | | | 4.5 | | |
7 Not all countries where the Fund may invest are included in the benchmark index.
8 Source: FactSet Research Systems. Percentage values in data are rounded to the nearest tenth of one percent; the values may not sum to 100% due to rounding.
Matthews Asia Growth Fund
Portfolio Manager Commentary (continued)
Vista Land, a real estate firm in the Philippines, also posed a drag on Fund performance as it retreated from a strong rally in the first quarter, despite a solid first-quarter earnings announcement in mid-May.
Notable Portfolio Changes:
During the second quarter, we participated in the US$1.02 billion stock sale of Pakistan's Habib Bank, the country's largest private-sector bank. It was the single largest divestment by the Pakistani government and the deal was enormously successful, attracting many quality foreign investors, including IFC (International Finance Corporation). Our team has been researching Pakistani companies for over a year, and we took advantage of this opportunity in early April. With a market capitalization of US$3 billion, the bank offered good double-digit earnings growth potential and a 20% return on equity* in 2014.
Outlook:
We expect global investors to continue to focus on the timing of a potential U.S. rate hike. On the macroeconomic front, Asia appears relatively solid compared to global averages, aided by weak commodity and oil prices, which would help lower import bills. The majority of countries in Asia still have the ability to cut interest rates to stimulate the economy if necessary, which may not be an option for more developed countries.
We continue embracing the idea of mixing current portfolio assets with frontier markets as they serve as somewhat of a hedging vehicle for the Fund. With this mind, we will continue to seek investment opportunities in China's A-share market as we believe we may identify good quality companies with reasonable valuations.
* Return on Equity is the amount of net income returned as a percentage of shareholder equity. Return on equity is a measure of profitability by assessing profit against investment.
32 MATTHEWS ASIA FUNDS
Matthews Asia Growth Fund June 30, 2015
Schedule of Investmentsa (unaudited)
COMMON EQUITIES: 95.5%
| | Shares | | Value | |
JAPAN: 41.9% | |
ORIX Corp. | | | 2,411,000 | | | $ | 35,802,100 | | |
Omron Corp. | | | 813,400 | | | | 35,332,702 | | |
Sysmex Corp. | | | 568,600 | | | | 33,864,399 | | |
SoftBank Corp. | | | 464,900 | | | | 27,384,002 | | |
Unicharm Corp. | | | 919,600 | | | | 21,844,665 | | |
Seven & I Holdings Co., Ltd. | | | 471,800 | | | | 20,252,313 | | |
FANUC Corp. | | | 98,600 | | | | 20,175,099 | | |
Daikin Industries, Ltd. | | | 274,000 | | | | 19,697,416 | | |
M3, Inc. | | | 966,900 | | | | 19,436,077 | | |
Komatsu, Ltd. | | | 925,100 | | | | 18,560,573 | | |
Kakaku.com, Inc. | | | 1,183,400 | | | | 17,122,230 | | |
Nitto Denko Corp. | | | 208,200 | | | | 17,097,873 | | |
Nidec Corp. | | | 218,800 | | | | 16,374,514 | | |
Pigeon Corp. | | | 503,400 | | | | 15,853,558 | | |
Glory, Ltd. | | | 480,100 | | | | 14,203,376 | | |
Benefit One, Inc. | | | 620,500 | | | | 13,922,152 | | |
Calbee, Inc. | | | 263,500 | | | | 11,100,738 | | |
Recruit Holdings Co., Ltd. | | | 358,000 | | | | 10,916,946 | | |
Toyota Motor Corp. | | | 162,000 | | | | 10,840,600 | | |
Rinnai Corp. | | | 132,100 | | | | 10,402,229 | | |
COOKPAD, Inc. | | | 570,600 | | | | 10,345,820 | | |
Daiken Medical Co., Ltd. | | | 911,500 | | | | 9,073,887 | | |
Yokogawa Electric Corp. | | | 401,100 | | | | 5,165,851 | | |
Total Japan | | | | | 414,769,120 | | |
CHINA/HONG KONG: 15.5% | |
Baidu, Inc. ADRb | | | 183,700 | | | | 36,570,996 | | |
Shenzhou International Group
Holdings, Ltd. | | | 4,792,000 | | | | 23,306,100 | | |
Alibaba Group Holding, Ltd. ADRb | | | 218,900 | | | | 18,008,903 | | |
Haitian International Holdings, Ltd. | | | 5,192,000 | | | | 12,188,406 | | |
Luk Fook Holdings International, Ltd. | | | 3,859,000 | | | | 11,363,841 | | |
Autohome, Inc. ADRb | | | 202,400 | | | | 10,229,296 | | |
China Lodging Group, Ltd. ADSb | | | 366,800 | | | | 8,957,256 | | |
Sands China, Ltd. | | | 2,632,000 | | | | 8,845,628 | | |
Galaxy Entertainment Group, Ltd. | | | 1,958,000 | | | | 7,790,814 | | |
Dairy Farm International Holdings, Ltd. | | | 727,554 | | | | 6,300,788 | | |
Tingyi (Cayman Islands) Holding Corp. | | | 1,888,000 | | | | 3,851,964 | | |
Hang Lung Group, Ltd. | | | 742,000 | | | | 3,265,907 | | |
Shanghai Haohai Biological Technology
Co., Ltd. H Sharesb | | | 432,900 | | | | 2,764,421 | | |
Total China/Hong Kong | | | | | 153,444,320 | | |
INDIA: 10.6% | |
Emami, Ltd. | | | 1,551,001 | | | | 28,228,520 | | |
HDFC Bank, Ltd. | | | 1,102,893 | | | | 18,462,590 | | |
Sun Pharmaceutical Industries, Ltd. | | | 1,306,465 | | | | 17,943,378 | | |
Lupin, Ltd. | | | 585,342 | | | | 17,322,006 | | |
ITC, Ltd. | | | 2,970,516 | | | | 14,682,812 | | |
Multi Commodity Exchange of India, Ltd. | | | 516,163 | | | | 8,443,100 | | |
Total India | | | | | 105,082,406 | | |
| | Shares | | Value | |
INDONESIA: 7.6% | |
PT Bank Rakyat Indonesia Persero | | | 31,353,900 | | | $ | 24,266,910 | | |
PT Astra International | | | 43,107,700 | | | | 22,817,526 | | |
PT Indofood CBP Sukses Makmur | | | 14,320,100 | | | | 13,366,485 | | |
PT Ace Hardware Indonesia | | | 194,172,500 | | | | 9,383,789 | | |
PT Arwana Citramulia | | | 145,017,700 | | | | 5,725,060 | | |
Total Indonesia | | | | | 75,559,770 | | |
PHILIPPINES: 4.5% | |
Vista Land & Lifescapes, Inc. | | | 117,224,100 | | | | 16,506,094 | | |
Universal Robina Corp. | | | 2,873,600 | | | | 12,355,934 | | |
Jollibee Foods Corp. | | | 2,007,890 | | | | 8,783,802 | | |
Emperador, Inc. | | | 37,942,500 | | | | 7,234,320 | | |
Total Philippines | | | | | 44,880,150 | | |
AUSTRALIA: 3.2% | |
CSL, Ltd. | | | 253,921 | | | | 16,928,015 | | |
Oil Search, Ltd. | | | 2,632,693 | | | | 14,471,107 | | |
Total Australia | | | | | 31,399,122 | | |
SRI LANKA: 3.2% | |
Sampath Bank PLC | | | 7,897,235 | | | | 15,310,053 | | |
Lanka Orix Leasing Co. PLCb | | | 12,121,473 | | | | 9,032,219 | | |
John Keells Holdings PLCc | | | 4,592,683 | | | | 6,963,891 | | |
Total Sri Lanka | | | | | 31,306,163 | | |
SOUTH KOREA: 2.6% | |
Samsung Electronics Co., Ltd. | | | 14,838 | | | | 16,834,990 | | |
Orion Corp. | | | 9,402 | | | | 8,816,604 | | |
Total South Korea | | | | | 25,651,594 | | |
TAIWAN: 2.3% | |
St. Shine Optical Co., Ltd. | | | 711,000 | | | | 11,301,812 | | |
Sinmag Equipment Corp. | | | 1,196,740 | | | | 6,627,816 | | |
Synnex Technology International Corp. | | | 3,133,000 | | | | 4,644,793 | | |
Total Taiwan | | | | | 22,574,421 | | |
MALAYSIA: 1.4% | |
7-Eleven Malaysia Holdings BHD | | | 21,204,100 | | | | 9,040,345 | | |
SapuraKencana Petroleum BHD | | | 7,729,800 | | | | 4,828,082 | | |
Total Malaysia | | | | | 13,868,427 | | |
THAILAND: 1.2% | |
Major Cineplex Group Public Co., Ltd. | | | 11,921,000 | | | | 11,882,281 | | |
Total Thailand | | | | | 11,882,281 | | |
VIETNAM: 0.9% | |
Vietnam Dairy Products JSC | | | 1,803,584 | | | | 9,332,371 | | |
Total Vietnam | | | | | 9,332,371 | | |
matthewsasia.com | 800.789.ASIA 33
Matthews Asia Growth Fund June 30, 2015
Schedule of Investmentsa (unaudited) (continued)
COMMON EQUITIES (continued)
| | Shares | | Value | |
PAKISTAN: 0.6% | |
Habib Bank, Ltd. | | | 2,991,900 | | | $ | 6,324,808 | | |
Total Pakistan | | | | | 6,324,808 | | |
TOTAL INVESTMENTS: 95.5% | | | | | 946,074,953 | | |
(Cost $754,148,703d) | |
CASH AND OTHER ASSETS,
LESS LIABILITIES: 4.5% | | | | | 44,542,623 | | |
NET ASSETS: 100.0% | | | | $ | 990,617,576 | | |
a Certain securities were fair valued under the valuation polices approved by the Board of Trustees (Note 2-A).
b Non-income producing security.
c Illiquid security, trading was halted at 6/30/15.
d Cost for federal income tax purposes is $754,148,703 and net unrealized appreciation consists of:
Gross unrealized appreciation | | $ | 229,626,255 | | |
Gross unrealized depreciation | | | (37,700,005 | ) | |
Net unrealized appreciation | | $ | 191,926,250 | | |
ADR American Depositary Receipt
ADS American Depositary Share
BHD Berhad
JSC Joint Stock Co.
See accompanying notes to financial statements.
34 MATTHEWS ASIA FUNDS

PORTFOLIO MANAGERS*
Sharat Shroff, CFA | | Richard Gao | |
Lead Manager | | Co-Manager | |
Rahul Gupta | | In-Bok Song | |
Co-Manager | | Co-Manager | |
* Effective April 30, 2015, Rahul Gupta became a Co-Manager of this Fund. Effective July 1, 2015, Richard Gao is no longer Co-Manager of this Fund.
FUND FACTS
| | | Investor Class | | Institutional Class | |
Ticker | | MAPTX | | MIPTX | |
CUSIP | | 577130107 | | 577130834 | |
Inception | | 9/12/94 | | 10/29/10 | |
NAV | | $28.73 | | $28.73 | |
Initial Investment | | $2,500 | | $3 million | |
Gross Expense Ratio1 | | 1.09% | | 0.92% | |
After Fee Waiver and
Reimbursement2 | | 1.08% | | 0.91% | |
Portfolio Statistics
Total # of Positions | | 67 | |
Net Assets | | $9.4 billion | |
Weighted Average Market Cap | | $33.3 billion | |
Portfolio Turnover | | 11.38%3 | |
Benchmark
MSCI AC Asia ex Japan Index
OBJECTIVE
Long-term capital appreciation.
STRATEGY
Under normal market conditions, the Fund seeks to achieve its investment objective by investing at least 80% of its total net assets, which include borrowings for investment purposes, in the common and preferred stocks of companies located in Asia ex Japan, which consists of all countries and markets in Asia excluding Japan, but including all other developed, emerging and frontier countries and markets in the Asian region.
1 Prospectus expense ratios.
2 Matthews has contractually agreed to waive a portion of its advisory fee and administrative and shareholder services fee if the Fund's average daily net assets are over $3 billion, as follows: for every $2.5 billion average daily net assets of the Fund that are over $3 billion, the advisory fee rate and the administrative and shareholder services fee rate for the Fund with respect to such excess average daily net assets will be each reduced by 0.01%, in each case without reducing such fee rate below 0.00%. Any amount waived by Matthews pursuant to this agreement may not be recouped by Matthews. This agreement will remain in place until April 30, 2016, may be renewed for additional periods not exceeding one year and may be terminated at any time (i) by the Trust on behalf of the Fund or by the Board of Trustees upon 60 days' prior written notice to Matthews; or (ii) by Matthews upon 60 days' prior written notice to the Trust, in each case without payment of any penalty.
3 The lesser of fiscal year 2014 long-term purchase costs or sales proceeds divided by the average monthly market value of long-term securities.
Matthews Pacific Tiger Fund
Portfolio Manager Commentary
For the first half of 2015, the Matthews Pacific Tiger Fund gained 8.13% (Investor Class) and 8.17% (Institutional Class) while its benchmark, the MSCI All Country Asia ex Japan Index, returned 5.59%. For the quarter ending June, the Fund returned 0.56% (Investor Class) and 0.60% (Institutional Class), while its benchmark returned 0.65%.
Market Environment:
The macroeconomic environment in Asia was challenging over the first half of 2015, with limited evidence of a pickup in demand across the region. Investment demand was sluggish for a variety of country-specific reasons. In China, the government has deliberately steered away from traditional investment-led growth and attempted to gradually move toward consumption. In Indonesia, India and Thailand, government-led investment expectations have fallen short of market expectations, and private investment is missing due to lack of progress over structural reforms. However, there are some hopeful signs emerging. In India, monthly indicators are turning positive. But these can vacillate and need to be sustainable. In China, the real estate sector is stabilizing on the back of lower rates and other supportive measures by authorities.
Asia's consumption demand has been more resilient on the back of secular increases in wealth. Demand has also been cyclically supported by lower inflation—helped by lower food and oil prices. However, there are some exceptions, including Thailand and Malaysia, where higher levels of debt may pose headwinds to growth in consumption.
Performance Contributors and Detractors:
The tough macroeconomic environment has resulted in difficult business conditions thus far this year. Most businesses in Asia continue to see weak sales growth, although there are some signs of stabilization in profitability, especially in the non-commodity sectors. In the absence of strong earnings growth, the performance in stocks has largely been a result of changes in valuations. Faith in supportive policies in China led to a sharp spike within the mainland equity markets, driving stock prices in sectors like financials.
The portfolio's underweight, especially in Chinese banks, was among the detractors to relative performance against the benchmark in the second quarter. Indonesia and Taiwan were also among the leading detractors. In Indonesia, our holdings struggled due to currency weakness and uncertainty around the profitability of Perusahaan Gas Negara, the country's the largest natural gas transportation and distribution company. In Taiwan, holdings have struggled due to negative earnings revisions due to near-term factors and stretched expectations.
Portfolio performance has also been affected by weakness in some currencies, especially among the Association of Southeast Asian Nations (ASEAN). However, the impact is not as great as it was in 2013 at the start of taper tantrum.
matthewsasia.com | 800.789.ASIA 35
PERFORMANCE AS OF JUNE 30, 2015
| | | | | | | | | Average Annual Total Returns | | | |
| | | 3 Months | | YTD | | 1 Year | | 3 Years | | 5 Years | | 10 Years | | Since
Inception | | Inception
Date | |
Investor Class (MAPTX) | | | 0.56 | % | | | 8.13 | % | | | 9.41 | % | | | 12.42 | % | | | 10.49 | % | | | 12.10 | % | | | 9.21 | % | | 9/12/94 | |
Institutional Class (MIPTX) | | | 0.60 | % | | | 8.17 | % | | | 9.56 | % | | | 12.60 | % | | | n.a. | | | | n.a. | | | | 6.84 | % | | 10/29/10 | |
MSCI AC Asia ex Japan Index4 | | | 0.65 | % | | | 5.59 | % | | | 4.14 | % | | | 9.87 | % | | | 7.74 | % | | | 9.68 | % | | | 4.33 | %5 | | | | | |
Lipper Pacific ex Japan Funds Category Average6 | | | -0.25 | % | | | 4.27 | % | | | 0.56 | % | | | 8.60 | % | | | 7.11 | % | | | 8.66 | % | | | 4.79 | %5 | | | | | |
Performance assumes reinvestment of all dividends and/or distributions before taxes. All performance quoted represents past performance and is no guarantee of future results. Investment return and principal value will fluctuate with market conditions so that when redeemed, shares may be worth more or less than their original cost. Current performance may be lower or higher than the return figures quoted. For the Fund's most recent month-end performance, visit matthewsasia.com.
GROWTH OF A $10,000 INVESTMENT SINCE INCEPTION—INVESTOR CLASS

Plotted monthly. The performance data and graph do not reflect the deduction of taxes that a shareholder would pay on dividends, capital gains distributions or redemption of Fund shares. Values are in US$.
4 It is not possible to invest directly in an index. Source: Index data from Morgan Stanley Capital International and Bloomberg; total return calculations performed by BNY Mellon Investment Servicing (US) Inc. Please see page 85 for index definition.
5 Calculated from 8/31/94.
6 The Lipper Category Average does not reflect sales charges and is based on total return, including reinvestment of dividends and capital gains for the stated periods.
TOP TEN HOLDINGS7
| | | Sector | | Country | | % of Net Assets | |
Amorepacific Corp. | | Consumer Staples | | South Korea | | | 3.3 | % | |
Ping An Insurance Group Co. of China, Ltd. | | Financials | | China/Hong Kong | | | 3.1 | % | |
Sinopharm Group Co., Ltd. | | Health Care | | China/Hong Kong | | | 2.7 | % | |
Green Cross Corp. | | Health Care | | South Korea | | | 2.5 | % | |
Naver Corp. | | Information Technology | | South Korea | | | 2.5 | % | |
Kotak Mahindra Bank, Ltd. | | Financials | | India | | | 2.4 | % | |
Hengan International Group Co., Ltd. | | Consumer Staples | | China/Hong Kong | | | 2.3 | % | |
Baidu, Inc. | | Information Technology | | China/Hong Kong | | | 2.3 | % | |
Central Pattana Public Co., Ltd. | | Financials | | Thailand | | | 2.2 | % | |
DKSH Holding, Ltd. | | Industrials | | Switzerland | | | 2.2 | % | |
% OF ASSETS IN TOP TEN | | | | | | | 25.5 | % | |
7 Holdings may combine more than one security from same issuer and related depositary receipts.
36 MATTHEWS ASIA FUNDS
Matthews Pacific Tiger Fund
Portfolio Manager Commentary (continued)
South Korea was a top contributor to Fund performance for the second quarter, with holdings in cosmetics and health care industries doing well. Amorepacific continued to gain traction with Chinese consumers. Green Cross, one of our health care holdings which focuses on vaccines and blood derivative products, has done well and was rewarded by the stock market as its management has been investing and building its R&D capabilities.
Notable Portfolio Changes:
During the second quarter, we made our first investment in China's A-share market. We view the gradual opening of China's domestic markets as a significant development as it expands the subset of companies available for the strategy, especially in consumer-related and health care sectors. We will remain mindful of the valuations. Hence, our allocation in companies we deem desirable will increase only over time.
We continue to take advantage of volatility in the region to trim positions that have done well and whose valuations have become too rich. We also added opportunities in China and Hong Kong that we believe are attractive. Overall, valuations in India have eased recently. In addition, some of our Indian holdings have been affected due to near-term, stock-specific factors. We will look to take advantage of these short-term price corrections, especially in situations in which long-term fundamentals remain attractive.
Outlook:
Asia's markets have been wary of the potential for an increase in U.S. interest rates and many Asian currencies have been depreciating. We continue to believe that Asia's economies are better-positioned to withstand such situations that leave markets anxious. For instance, compared to the summer of 2013, real interest rates across many parts of Asia have increased, providing some cushion against a U.S. rate hike.
Valuation levels across the region have crept up, although it is fair to say that there is higher disparity in valuations across different parts of Asia. While the domestic Chinese equity market has been on a tear recently, parts of the ASEAN and Indian capital markets are starting to more appropriately reflect the weakening growth outlook. Given our benchmark-agnostic approach, we continue to be guided by our understanding of companies and management teams that we believe are capable of delivering steady, sustainable growth at reasonable valuations.
COUNTRY ALLOCATION (%)8
China/Hong Kong | | | 32.9 | | |
India | | | 18.2 | | |
South Korea | | | 15.7 | | |
Taiwan | | | 6.5 | | |
Indonesia | | | 6.1 | | |
Thailand | | | 4.9 | | |
Malaysia | | | 3.1 | | |
Philippines | | | 2.7 | | |
Switzerland | | | 2.2 | | |
Vietnam | | | 1.3 | | |
United States | | | 0.9 | | |
Singapore | | | 0.4 | | |
Cash and Other Assets, Less Liabilities | | | 5.1 | | |
SECTOR ALLOCATION (%)
Financials | | | 26.7 | | |
Consumer Staples | | | 19.4 | | |
Information Technology | | | 16.2 | | |
Health Care | | | 9.6 | | |
Consumer Discretionary | | | 8.0 | | |
Utilities | | | 5.1 | | |
Industrials | | | 5.0 | | |
Telecommunication Services | | | 3.2 | | |
Materials | | | 1.7 | | |
Cash and Other Assets, Less Liabilities | | | 5.1 | | |
MARKET CAP EXPOSURE (%)9
Mega Cap (over $25B) | | | 24.2 | | |
Large Cap ($10B–$25B) | | | 33.6 | | |
Mid Cap ($3B–$10B) | | | 29.0 | | |
Small Cap (under $3B) | | | 8.1 | | |
Cash and Other Assets, Less Liabilities | | | 5.1 | | |
8 Not all countries where the Fund may invest are included in the benchmark index.
9 Source: FactSet Research Systems. Percentage values in data are rounded to the nearest tenth of one percent; the values may not sum to 100% due to rounding.
matthewsasia.com | 800.789.ASIA 37
Matthews Pacific Tiger Fund June 30, 2015
Schedule of Investmentsa (unaudited)
COMMON EQUITIES: 94.9%
| | Shares | | Value | |
CHINA/HONG KONG: 32.9% | |
Ping An Insurance Group Co. of China,
Ltd. H Shares | | | 21,266,000 | | | $ | 286,995,830 | | |
Sinopharm Group Co., Ltd. H Shares | | | 56,363,200 | | | | 250,291,014 | | |
Hengan International Group Co., Ltd. | | | 18,183,500 | | | | 215,839,774 | | |
Baidu, Inc. ADRb | | | 1,081,800 | | | | 215,364,744 | | |
China Resources Land, Ltd. | | | 61,952,000 | | | | 200,498,404 | | |
Lenovo Group, Ltd. | | | 131,144,000 | | | | 181,315,058 | | |
China Mobile, Ltd. ADR | | | 2,653,701 | | | | 170,075,697 | | |
China Resources Enterprise, Ltd. | | | 51,802,000 | | | | 166,848,745 | | |
Dairy Farm International Holdings, Ltd. | | | 17,292,546 | | | | 149,757,495 | | |
Hang Lung Group, Ltd. | | | 32,614,000 | | | | 143,550,254 | | |
Hong Kong Exchanges and Clearing, Ltd. | | | 3,664,500 | | | | 129,117,086 | | |
Yum! Brands, Inc. | | | 1,326,110 | | | | 119,455,989 | | |
Tencent Holdings, Ltd. | | | 5,886,500 | | | | 117,709,591 | | |
AIA Group, Ltd. | | | 16,545,200 | | | | 108,183,408 | | |
Alibaba Group Holding, Ltd. ADRb | | | 1,291,700 | | | | 106,268,159 | | |
China Vanke Co., Ltd. H Shares | | | 39,141,304 | | | | 96,101,423 | | |
WuXi PharmaTech Cayman, Inc. ADRb | | | 2,243,158 | | | | 94,795,857 | | |
Tingyi (Cayman Islands) Holding Corp. | | | 42,146,000 | | | | 85,987,746 | | |
Swire Pacific, Ltd. A Share Class | | | 6,353,500 | | | | 79,780,783 | | |
Dongfeng Motor Group Co., Ltd.
H Shares | | | 53,690,000 | | | | 71,927,665 | | |
Inner Mongolia Yili Industrial Group
Co., Ltd. A Shares | | | 16,740,874 | | | | 51,133,241 | | |
Fuyao Glass Industry Group Co., Ltd.
H Sharesb | | | 18,527,200 | | | | 45,364,637 | | |
Total China/Hong Kong | | | | | 3,086,362,600 | | |
INDIA: 18.2% | |
Kotak Mahindra Bank, Ltd. | | | 10,515,816 | | | | 228,527,048 | | |
Tata Power Co., Ltd.† | | | 173,781,367 | | | | 202,052,307 | | |
Container Corp. of India, Ltd. | | | 6,836,659 | | | | 179,816,332 | | |
Sun Pharmaceutical Industries, Ltd. | | | 12,953,258 | | | | 177,903,886 | | |
Housing Development Finance Corp. | | | 8,010,685 | | | | 162,945,027 | | |
Titan Co., Ltd. | | | 27,457,503 | | | | 157,745,397 | | |
GAIL India, Ltd. | | | 24,282,108 | | | | 149,546,930 | | |
ITC, Ltd. | | | 24,735,000 | | | | 122,261,373 | | |
HDFC Bank, Ltd. | | | 7,235,920 | | | | 121,130,360 | | |
Dabur India, Ltd. | | | 25,308,038 | | | | 111,188,539 | | |
Thermax, Ltd. | | | 5,310,034 | | | | 87,192,793 | | |
HDFC Bank, Ltd. ADR | | | 119,500 | | | | 7,233,335 | | |
Total India | | | | | 1,707,543,327 | | |
SOUTH KOREA: 15.7% | |
Amorepacific Corp. | | | 824,220 | | | | 308,226,124 | | |
Green Cross Corp.† | | | 1,008,655 | | | | 231,738,001 | | |
Naver Corp. | | | 407,316 | | | | 231,207,530 | | |
Dongbu Insurance Co., Ltd.† | | | 4,020,500 | | | | 203,307,255 | | |
Orion Corp. | | | 191,751 | | | | 179,812,026 | | |
Samsung Electronics Co., Ltd. | | | 141,754 | | | | 160,832,134 | | |
Cheil Worldwide, Inc.b† | | | 6,420,440 | | | | 99,391,590 | | |
Yuhan Corp. | | | 225,201 | | | | 55,063,826 | | |
Total South Korea | | | | | 1,469,578,486 | | |
| | Shares | | Value | |
TAIWAN: 6.5% | |
President Chain Store Corp. | | | 26,989,608 | | | $ | 189,748,989 | | |
Delta Electronics, Inc. | | | 35,562,000 | | | | 181,930,585 | | |
Synnex Technology International Corp.† | | | 102,065,354 | | | | 151,315,826 | | |
Taiwan Semiconductor Manufacturing
Co., Ltd. | | | 19,423,513 | | | | 88,350,170 | | |
Total Taiwan | | | | | 611,345,570 | | |
INDONESIA: 6.1% | |
PT Indofood CBP Sukses Makmur | | | 129,546,800 | | | | 120,919,921 | | |
PT Astra International | | | 227,099,300 | | | | 120,206,925 | | |
PT Bank Central Asia | | | 115,688,500 | | | | 116,831,173 | | |
PT Telekomunikasi Indonesia Persero | | | 507,302,500 | | | | 111,197,797 | | |
PT Perusahaan Gas Negara Persero | | | 272,552,100 | | | | 88,036,404 | | |
PT Telekomunikasi Indonesia Persero ADR | | | 375,700 | | | | 16,301,623 | | |
Total Indonesia | | | | | 573,493,843 | | |
THAILAND: 4.9% | |
Central Pattana Public Co., Ltd. | | | 146,457,600 | | | | 205,550,431 | | |
The Siam Cement Public Co., Ltd. | | | 10,728,500 | | | | 164,794,730 | | |
Kasikornbank Public Co., Ltd. NVDR | | | 14,927,700 | | | | 83,281,620 | | |
Kasikornbank Public Co., Ltd. | | | 385,000 | | | | 2,147,915 | | |
Total Thailand | | | | | 455,774,696 | | |
MALAYSIA: 3.1% | |
Genting BHD | | | 62,030,600 | | | | 132,480,346 | | |
Public Bank BHD | | | 14,954,994 | | | | 74,200,235 | | |
IHH Healthcare BHD | | | 47,676,300 | | | | 71,472,536 | | |
IHH Healthcare BHD | | | 11,543,000 | | | | 17,721,404 | | |
Total Malaysia | | | | | 295,874,521 | | |
PHILIPPINES: 2.7% | |
SM Prime Holdings, Inc. | | | 309,277,171 | | | | 137,043,849 | | |
GT Capital Holdings, Inc. | | | 3,897,540 | | | | 117,976,857 | | |
Total Philippines | | | | | 255,020,706 | | |
SWITZERLAND: 2.2% | |
DKSH Holding, Ltd. | | | 2,820,879 | | | | 203,889,686 | | |
Total Switzerland | | | | | 203,889,686 | | |
VIETNAM: 1.3% | |
Vietnam Dairy Products JSC | | | 23,633,198 | | | | 122,286,392 | | |
Total Vietnam | | | | | 122,286,392 | | |
UNITED STATES: 0.9% | |
Cognizant Technology Solutions Corp.
Class Ab | | | 1,382,600 | | | | 84,463,034 | | |
Total United States | | | | | 84,463,034 | | |
SINGAPORE: 0.4% | |
Hyflux, Ltd.† | | | 65,284,280 | | | | 41,695,369 | | |
Total Singapore | | | | | 41,695,369 | | |
TOTAL COMMON EQUITIES | | | | | 8,907,328,230 | | |
(Cost $6,022,624,691) | | | | | |
38 MATTHEWS ASIA FUNDS
Matthews Pacific Tiger Fund June 30, 2015
Schedule of Investmentsa (unaudited) (continued)
WARRANTS: 0.0%
| | Shares | | Value | |
MALAYSIA: 0.0% | |
Genting BHD, expires 12/18/18 | | | 12,253,875 | | | $ | 3,442,647 | | |
Total Malaysia | | | | | 3,442,647 | | |
TOTAL WARRANTS | | | | | 3,442,647 | | |
(Cost $5,593,674) | | | | | |
TOTAL INVESTMENTS: 94.9% | | | | | 8,910,770,877 | | |
(Cost $6,028,218,365c) | |
CASH AND OTHER ASSETS,
LESS LIABILITIES: 5.1% | | | | | 478,419,552 | | |
NET ASSETS: 100.0% | | | | $ | 9,389,190,429 | | |
a Certain securities were fair valued under the valuation polices approved by the Board of Trustees (Note 2-A).
b Non-income producing security.
c Cost for federal income tax purposes is $6,029,480,768 and net unrealized appreciation consists of:
Gross unrealized appreciation | | $ | 3,096,600,513 | | |
Gross unrealized depreciation | | | (215,310,404 | ) | |
Net unrealized appreciation | | $ | 2,881,290,109 | | |
† Affiliated Issuer, as defined under the Investment Company Act of 1940 (ownership of 5% or more of the outstanding voting securities of this issuer)
ADR American Depositary Receipt
BHD Berhad
JSC Joint Stock Co.
NVDR Non-voting Depositary Receipt
See accompanying notes to financial statements.
matthewsasia.com | 800.789.ASIA 39

PORTFOLIO MANAGERS
Vivek Tanneeru | | Winnie Chwang | |
Lead Manager | | Co-Manager | |
FUND FACTS
| | | Investor | | Institutional | |
Ticker | | MASGX | | MISFX | |
CUSIP | | 577125701 | | 577125800 | |
Inception | | 4/30/15 | | 4/30/15 | |
NAV | | $9.84 | | $9.84 | |
Initial Investment | | $2,500 | | $3 million | |
Gross Expense Ratio1 | | 2.11% | | 1.95% | |
After Fee Waiver and
Reimbursement2 | | 1.45% | | 1.25% | |
Portfolio Statistics
Total # of Positions | | 51 | |
Net Assets | | $1.7 million | |
Weighted Average Market Cap | | 10.9 billion | |
Portfolio Turnover | | N/A3 | |
Benchmark
MSCI AC Asia ex Japan Index
OBJECTIVE
Long term capital appreciation.
STRATEGY
Under normal market conditions, the Fund seeks to achieve its investment objective by investing at least 80% of its total assets, which include borrowings for investment purposes, in the common and preferred stocks of companies of any market capitalization located in Asia that Matthews believes satisfy one or more of its environmental, social and governance ("ESG") standards. Asia consists of all countries and markets in Asia and includes developed, emerging, and frontier countries and markets in the Asia region. The Fund may also invest in convertible securities and fixed-income securities, of any duration or quality, including high yield securities of Asian companies.
1 Prospectus expense ratios.
2 Matthews has contractually agreed (i) to waive fees and reimburse expenses to the extent needed to limit Total Annual Fund Operating Expenses (excluding Rule 12b-1 fees, front-end or contingent deferred loads, taxes, interest, brokerage commissions, short sale dividend expenses, expenses incurred in connection with any merger or reorganization or extraordinary expenses such as litigation) of the Institutional Class to 1.25%, and (ii) if any Fund-wide expenses (i.e., expenses that apply to both the Institutional Class and the Investor Class) are waived for the Institutional Class to maintain the 1.25% expense limitation, to waive an equal amount (in annual percentage terms) of those same expenses for the Investor Class. The Total Annual Fund Operating Expenses After Fee Waiver and Expense Reimbursement for the Investor Class may vary from year to year and will in some years exceed 1.25%. If the operating expenses fall below the expense limitation in a year within three years after Matthews has made a waiver or reimbursement, the Fund may reimburse Matthews up to an amount that does not cause the expenses for that year to exceed the expense limitation applicable at the time of that fee waiver and/or expense reimbursement or to exceed any other agreed upon expense limitation for that year. This agreement will remain in place until April 30, 2017, may be renewed for additional periods not exceeding one year and may be terminated at any time by the Board of Trustees or the Trust on behalf of the Fund on 60 days' written notice to Matthews. Matthews may decline to renew this agreement by written notice to the Trust at least 30 days before its annual expiration date.
3 The Fund commenced operations on April 30, 2015.
Matthews Asia ESG Fund
Portfolio Manager Commentary
At Matthews Asia, we aim to introduce new strategies when we identify compelling investment opportunities in the region. On April 30, 2015, we launched the Matthews Asia ESG Fund, which incorporates Environmental, Social and Governance (ESG) factors in its investment process. Assessing solid corporate governance has always been the bedrock of our investment process at Matthews Asia, and the launch of an Asia ESG strategy represents an evolution of that focus with the formal addition of environmental and social dimensions into the decision-making process. We believe that companies that focus on ESG issues are not only better able to identify and execute on long-term growth opportunities, but also can more effectively address and mitigate the risks that impact their businesses—potentially resulting in better risk-adjusted returns over the long term.
For investors looking to make investment decisions based upon ESG factors, we believe Asia represents one of the best opportunities to gain exposure to companies that can make a long-term difference to the region and the world. For instance, we believe many global environmental issues cannot be addressed effectively without focusing on Asia. On the issue of climate change, Asia Pacific emits four times and two and a half times as much carbon as Europe and North America, respectively, so addressing climate change issues in Asia is a precondition for fixing the issue globally.
Sizeable segments of middle class populations in the region that have emerged from decades of robust economic growth are increasingly focusing on quality of life issues, such as clean air and water, access to health care and product safety. Our investment process focuses on businesses that improve quality of life and make human or business activity less destructive to the environment, while promoting social and economic development. In constructing the portfolio, we look for companies that have solid or improving ESG standards, growth prospects and attractive valuations. We also actively seek investment opportunities in frontier markets, such as Pakistan and Bangladesh, as well as in mid- and small-capitalization stocks whose ESG qualities are less appreciated and data provider coverage is insufficient. And we do this by leveraging Matthews Asia's extensive research capabilities. Engagement is a key aspect of our process. As Asian investment specialists, our 43-member investment team conducts more than 2,500 company meetings each year. These touch points offer us a great opportunity to continually assess and engage companies on ESG matters.
Performance Contributors and Detractors:
The Matthews Asia ESG Fund returned –1.60% (Investor and Institutional Class) from its inception on April 30, 2015 through June 30, 2015 while its benchmark, the MSCI All Country Asia ex Japan Index, returned –6.15% during the same period.
During the second quarter of 2015, China continued to dominate market attention. China's markets experienced a strong rally early in the quarter, which was somewhat offset by a reversal by the end of June. In early July, despite government efforts, the A-share market entered a bear market. The Fund has taken positions in two well-run, market-leading, attractively valued large-capitalization companies in the A-share market by utilizing
40 MATTHEWS ASIA FUNDS
PERFORMANCE AS OF JUNE 30, 2015
| | | Actual Returns,
Not Annualized | | | |
| | | Since
Inception | | Inception
Date | |
Investor Class (MASGX) | | | -1.60 | % | | 4/30/15 | |
Institutional Class (MISFX) | | | -1.60 | % | | 4/30/15 | |
MSCI AC Asia ex Japan Index4 | | | -6.15 | % | | | | | |
Lipper Pacific Region Funds Category Average5 | | | -16.73 | % | | | | | |
Performance assumes reinvestment of all dividends and/or distributions before taxes. All performance quoted represents past performance and is no guarantee of future results. Investment return and principal value will fluctuate with market conditions so that when redeemed, shares may be worth more or less than their original cost. Current performance may be lower or higher than the return figures quoted. Returns would have been lower if certain of the Fund's fees and expenses had not been waived. For the Fund's most recent month-end performance visit matthewsasia.com.
The performance data does not reflect the deduction of taxes that a shareholder would pay on dividends, capital gain distributions or redemption of Fund shares. Values are in US$.
4 It is not possible to invest directly in an index. Source: Index data from Morgan Stanley Capital International; total return calculations performed by BNY Mellon Investment Servicing (US) Inc. Please see page 85 for index definition.
5 The Lipper Category Average does not reflect sales charges and is based on total return, including reinvestment of dividends and capital gains for the stated periods.
TOP TEN HOLDINGS6
| | | Sector | | Country | | % of Net Assets | |
Total Access Communication Public Co., Ltd. NVDR | | Telecommunication Services | | Thailand | | | 3.9 | % | |
Bharti Infratel, Ltd. | | Telecommunication Services | | India | | | 3.3 | % | |
Halla Visteon Climate Control Corp. | | Consumer Discretionary | | South Korea | | | 3.2 | % | |
Bata India, Ltd. | | Consumer Discretionary | | India | | | 3.1 | % | |
Sino Biopharmaceutical, Ltd. | | Health Care | | China/Hong Kong | | | 3.1 | % | |
Taiwan Semiconductor Manufacturing Co., Ltd. | | Information Technology | | Taiwan | | | 3.0 | % | |
MTR Corp., Ltd. | | Industrials | | China/Hong Kong | | | 2.9 | % | |
Inner Mongolia Yili Industrial Group Co., Ltd. | | Consumer Staples | | China/Hong Kong | | | 2.9 | % | |
Sanofi India, Ltd. | | Health Care | | India | | | 2.8 | % | |
JD.com, Inc. | | Consumer Discretionary | | China/Hong Kong | | | 2.7 | % | |
% OF ASSETS IN TOP TEN | | | | | | | 30.9 | % | |
6 Holdings may combine more than one security from same issuer and related depositary receipts.
matthewsasia.com | 800.789.ASIA 41
COUNTRY ALLOCATION (%)7
China/Hong Kong | | | 23.0 | | |
India | | | 18.6 | | |
Taiwan | | | 11.1 | | |
South Korea | | | 8.8 | | |
Thailand | | | 4.7 | | |
Philippines | | | 4.5 | | |
Japan | | | 4.0 | | |
Pakistan | | | 2.7 | | |
Australia | | | 2.3 | | |
Indonesia | | | 2.3 | | |
Singapore | | | 2.0 | | |
Luxembourg | | | 1.9 | | |
Bangladesh | | | 1.7 | | |
United States | | | 0.3 | | |
Cash and Other Assets, Less Liabilities | | | 12.1 | | |
SECTOR ALLOCATION (%)
Health Care | | | 19.6 | | |
Consumer Discretionary | | | 16.7 | | |
Industrials | | | 13.7 | | |
Utilities | | | 8.5 | | |
Telecommunication Services | | | 7.6 | | |
Financials | | | 7.2 | | |
Information Technology | | | 6.6 | | |
Consumer Staples | | | 5.9 | | |
Materials | | | 2.1 | | |
Cash and Other Assets, Less Liabilities | | | 12.1 | | |
MARKET CAP EXPOSURE (%)8
Mega Cap (over $25B) | | | 10.5 | | |
Large Cap ($10B–$25B) | | | 11.6 | | |
Mid Cap ($3B–$10B) | | | 22.4 | | |
Small Cap (under $3B) | | | 43.4 | | |
Cash and Other Assets, Less Liabilities | | | 12.1 | | |
7 Not all countries are included in the benchmark index.
8 Source: FactSet Research Systems. Percentage values in data are rounded to the nearest tenth of one percent; the values may not sum to 100% due to rounding.
Matthews Asia ESG Fund
Portfolio Manager Commentary (continued)
the Shanghai—Hong Kong Stock Connect Program. We continue to take a favorable long-term view on their prospects and maintain our holdings.
Elsewhere, markets in the Association of Southeast Asian Nations lost further ground during the quarter as the regional economies slowed amid weak exports. India, followed by Japan, were the biggest contributors to Fund performance for the period since inception, while China/Hong Kong detracted most. The health care and utilities sectors were the biggest positive and negative contributors to performance, respectively, for the period since inception.
Bharti Infratel, India's largest telecommunications tower company, contributed most to performance. Bharti enables the spread of telecom infrastructure in India with a reduced environmental footprint by enabling shared tower infrastructure. The company has also invested significantly in powering their towers with renewable energy to further reduce environmental impact. The company continues to benefit from the increasing data coverage in the country and from the market entry of a large new telecom player. Bharti Infratel is an example of the companies we like—with somewhat predictable cash flow growth and favorable ESG characteristics, run by high quality management teams. Towngas China, a Chinese gas distribution company, was the biggest detractor from Fund performance as the market worried about the loss of competitiveness for natural gas (as prices are regulated), compared to cheaper alternatives such as fuel oil and also about the impact of a slowing Chinese economy on gas volumes. Natural gas continues to be a key interim solution in reducing reliance on coal and we continue to believe that Towngas would do well over the long-term as natural gas penetration is very low in China and as the firm's green field ventures mature.
Outlook:
Looking ahead, market volatility may continue amid the uncertain macroeconomic environment. However, we employ a fundamental, bottom-up investment process in managing the portfolio of companies that make positive environmental, social and economic impact while generating profitable growth. We are passionate about ESG investing and believe our knowledge and experience investing in Asian markets enables us to identify companies that may perform well over the long term.
Finally, we have always championed Asian investment solutions for our clients. The Matthews Asia ESG Fund provides investors with an opportunity to gain exposure to quality companies with the potential to benefit from the fast-growing economies of Asia while making a positive ESG impact, and can be considered a core holding for those long-term investors seeking regional exposure to Asia.
42 MATTHEWS ASIA FUNDS
Matthews Asia ESG Fund June 30, 2015
Schedule of Investmentsa (unaudited)
COMMON EQUITIES: 87.9%
| | Shares | | Value | |
CHINA/HONG KONG: 23.0% | |
Sino Biopharmaceutical, Ltd. | | | 44,000 | | | $ | 51,012 | | |
MTR Corp., Ltd. | | | 10,500 | | | | 48,852 | | |
Inner Mongolia Yili Industrial Group Co., Ltd.
A Shares | | | 15,800 | | | | 48,259 | | |
JD.com, Inc. ADRb | | | 1,300 | | | | 44,330 | | |
Towngas China Co., Ltd. | | | 48,000 | | | | 43,851 | | |
Beijing Urban Construction Design &
Development Group Co., Ltd. H Shares | | | 35,000 | | | | 29,572 | | |
China Conch Venture Holdings, Ltd. | | | 10,500 | | | | 24,087 | | |
CSPC Pharmaceutical Group, Ltd. | | | 20,000 | | | | 19,748 | | |
Haier Electronics Group Co., Ltd. | | | 7,000 | | | | 18,847 | | |
Weifu High-Technology Group Co., Ltd.
B Shares | | | 4,200 | | | | 17,040 | | |
Guangdong Investment, Ltd. | | | 12,000 | | | | 16,792 | | |
CIMC Enric Holdings, Ltd. | | | 14,000 | | | | 11,877 | | |
HKBN, Ltd.b | | | 7,500 | | | | 7,798 | | |
Total China/Hong Kong | | | | | 382,065 | | |
INDIA: 18.6% | |
Bharti Infratel, Ltd. | | | 7,736 | | | | 54,134 | | |
Bata India, Ltd.b | | | 3,142 | | | | 52,175 | | |
Sanofi India, Ltd. | | | 858 | | | | 47,351 | | |
Ipca Laboratories, Ltd. | | | 3,459 | | | | 38,487 | | |
Infosys, Ltd. | | | 2,042 | | | | 31,733 | | |
Power Grid Corp of India, Ltd. | | | 14,095 | | | | 30,776 | | |
Lupin, Ltd. | | | 817 | | | | 24,177 | | |
SKS Microfinance, Ltd.b | | | 2,465 | | | | 18,045 | | |
KPIT Technologies, Ltd. | | | 8,080 | | | | 11,808 | | |
Total India | | | | | 308,686 | | |
TAIWAN: 11.1% | |
Taiwan Semiconductor Manufacturing Co., Ltd. | | | 11,000 | | | | 50,035 | | |
CHC Resources Corp. | | | 14,000 | | | | 34,833 | | |
Sporton International, Inc. | | | 4,000 | | | | 26,981 | | |
KD Holding Corp. | | | 4,000 | | | | 21,963 | | |
Merida Industry Co., Ltd. | | | 3,000 | | | | 19,453 | | |
Lumax International Corp., Ltd. | | | 9,000 | | | | 16,009 | | |
St. Shine Optical Co., Ltd. | | | 1,000 | | | | 15,896 | | |
Total Taiwan | | | | | 185,170 | | |
SOUTH KOREA: 8.8% | |
Halla Visteon Climate Control Corp. | | | 1,518 | | | | 52,433 | | |
KT Skylife Co., Ltd. | | | 1,893 | | | | 34,336 | | |
DGB Financial Group, Inc. | | | 2,926 | | | | 30,643 | | |
iMarketKorea, Inc. | | | 1,065 | | | | 28,636 | | |
Total South Korea | | | | | 146,048 | | |
| | | Shares | | Value | |
THAILAND: 4.7% | |
Total Access Communication Public Co., Ltd.
NVDR | | | 26,400 | | | $ | 64,934 | | |
Bumrungrad Hospital Public Co., Ltd. | | | 2,500 | | | | 13,810 | | |
Total Thailand | | | | | 78,744 | | |
PHILIPPINES: 4.5% | |
Puregold Price Club, Inc. | | | 50,400 | | | | 41,336 | | |
Energy Development Corp. | | | 203,400 | | | | 33,729 | | |
Total Philippines | | | | | 75,065 | | |
JAPAN: 4.0% | |
Tsukui Corp. | | | 4,500 | | | | 35,283 | | |
Daikin Industries, Ltd. | | | 200 | | | | 14,378 | | |
Ain Pharmaciez, Inc. | | | 200 | | | | 9,275 | | |
Koito Manufacturing Co., Ltd. | | | 200 | | | | 7,787 | | |
Total Japan | | | | | 66,723 | | |
PAKISTAN: 2.7% | |
Abbott Laboratories Pakistan, Ltd. | | | 4,350 | | | | 28,522 | | |
Bank Alfalah, Ltd. | | | 68,500 | | | | 17,028 | | |
Total Pakistan | | | | | 45,550 | | |
AUSTRALIA: 2.3% | |
Ansell, Ltd. | | | 1,240 | | | | 23,003 | | |
Tox Free Solutions, Ltd. | | | 6,622 | | | | 15,473 | | |
Total Australia | | | | | 38,476 | | |
INDONESIA: 2.3% | |
PT Bank Rakyat Indonesia Persero | | | 26,400 | | | | 20,433 | | |
PT Perusahaan Gas Negara Persero | | | 53,000 | | | | 17,119 | | |
Total Indonesia | | | | | 37,552 | | |
SINGAPORE: 2.0% | |
Parkway Life REIT | | | 19,300 | | | | 32,958 | | |
Total Singapore | | | | | 32,958 | | |
LUXEMBOURG: 1.9% | |
L'Occitane International SA | | | 10,750 | | | | 30,649 | | |
Total Luxembourg | | | | | 30,649 | | |
BANGLADESH: 1.7% | |
Square Pharmaceuticals, Ltd. | | | 8,484 | | | | 28,602 | | |
Total Bangladesh | | | | | 28,602 | | |
matthewsasia.com | 800.789.ASIA 43
Matthews Asia ESG Fund June 30, 2015
Schedule of Investmentsa (unaudited) (continued)
COMMON EQUITIES (continued)
| | Shares | | Value | |
UNITED STATES: 0.3% | |
Sensata Technologies Holding NVb | | | 100 | | | $ | 5,274 | | |
Total United States | | | | | 5,274 | | |
TOTAL INVESTMENTS: 87.9% | | | | | 1,461,562 | | |
(Cost $1,488,276c) | |
CASH AND OTHER ASSETS,
LESS LIABILITIES: 12.1% | | | | | 201,493 | | |
NET ASSETS: 100.0% | | | | $ | 1,663,055 | | |
a Certain securities were fair valued under the valuation polices approved by the Board of Trustees (Note 2-A).
b Non-income producing security.
c Cost for federal income tax purposes is $1,488,276 and net unrealized depreciation consists of:
Gross unrealized appreciation | | $ | 38,948 | | |
Gross unrealized depreciation | | | (65,662 | ) | |
Net unrealized depreciation | | ($ | 26,714 | ) | |
ADR American Depositary Receipt
NVDR Non-voting Depositary Receipt
REIT Real Estate Investment Trust
See accompanying notes to financial statements.
44 MATTHEWS ASIA FUNDS

PORTFOLIO MANAGERS
Taizo Ishida | | Robert Harvey, CFA | | | |
Lead Manager | | Co-Manager | | | |
FUND FACTS
| | | Investor | | Institutional | |
Ticker | | MEASX | | MIASX | |
CUSIP | | 577125883 | | 577125875 | |
Inception | | 4/30/13 | | 4/30/13 | |
NAV | | $11.57 | | $11.59 | |
Initial Investment | | $2,500 | | $3 million | |
Gross Expense Ratio1 | | 1.78% | | 1.59% | |
After Fee Waiver and
Reimbursement2 | | 1.48% | | 1.25% | |
Portfolio Statistics
Total # of Positions | | 81 | |
Net Assets | | $176.8 million | |
Weighted Average Market Cap | | $6.8 billion | |
Portfolio Turnover | | 8.21%3 | |
Benchmark
MSCI Emerging Markets Asia Index
Redemption Fee
2% within first 90 calendar days of purchase
OBJECTIVE
Long term capital appreciation.
STRATEGY
Under normal market conditions, the Fund seeks to achieve its investment objective by investing at least 80% of its total assets, which include borrowings for investment purposes, in the common and preferred stocks of companies located in Asia excluding Japan, South Korea, Hong Kong and Singapore. The Fund may also invest in the convertible securities, of any duration or quality of companies located in Asia excluding Japan, South Korea, Hong Kong and Singapore. Once fully invested and under normal market conditions, the Fund is expected to invest a substantial portion of its net assets in the emerging countries and markets in the Asian region, including, but not limited to, Bangladesh, Cambodia, China (including Taiwan, but excluding Hong Kong), India, Indonesia, Laos, Malaysia, Mongolia, Myanmar, Pakistan, Papua New Guinea, Philippines, Sri Lanka, Thailand, and Vietnam.
1 Prospectus expense ratios.
2 Matthews has contractually agreed (i) to waive fees and reimburse expenses to the extent needed to limit Total Annual Fund Operating Expenses (excluding Rule 12b-1 fees, front-end or contingent deferred loads, taxes, interest, brokerage commissions, short sale dividend expenses, expenses incurred in connection with any merger or reorganization or extraordinary expenses such as litigation) of the Institutional Class to 1.25%, and (ii) if any Fund-wide expenses (i.e., expenses that apply to both the Institutional Class and the Investor Class) are waived for the Institutional Class to maintain the 1.25% expense limitation, to waive an equal amount (in annual percentage terms) of those same expenses for the Investor Class. The Total Annual Fund Operating Expenses After Fee Waiver and Expense Reimbursement for the Investor Class may vary from year to year and will in some years exceed 1.25%. If the operating expenses fall below the expense limitation in a year within three years after Matthews has made a waiver or reimbursement, the Fund may reimburse Matthews up to an amount that does not cause the expenses for that year to exceed the expense limitation applicable at the time of that fee waiver and/or expense reimbursement or to exceed any other agreed upon expense limitation for that year. This agreement will remain in place until April 30, 2016, may be renewed for additional periods not exceeding one year and may be terminated at any time by the Board of Trustees or the Trust on behalf of the Fund on 60 days' written notice to Matthews. Matthews may decline to renew this agreement by written notice to the Trust at least 30 days before its annual expiration date.
3 The lesser of fiscal year 2014 long-term purchase costs or sales proceeds divided by the average monthly market value of long-term securities.
Matthews Emerging Asia Fund
Portfolio Manager Commentary
For the first half of 2015, the Matthews Emerging Asia Fund fell –0.26% (Investor Class) and –0.09% (Institutional Class) while its benchmark, the MSCI Emerging Markets Asia Index, rose 5.22%. For the quarter ending June 30, the Fund returned 0.44% (Investor Class) and 0.52% (Institutional Class) while its benchmark slipped –0.04%.
Market Environment:
Asia's emerging markets rose steadily and peaked, late in April, before rolling over and retracing some earlier gains. Investors generally favored the Asian markets of South Korea and Taiwan, which drove up the benchmark index. The rise was also further fueled by the strong rally in Chinese stocks—a response to the launch of the Shanghai—Hong Kong Stock Connect Program. Smaller emerging markets suffered as investor sentiment toward them soured. Indonesia, in particular, suffered as currency weakness and soft domestic demand resulted in sharp earnings downgrades. Thailand's economy remains weak, driving earnings downgrades. In contrast to the strength of the Asian markets to the north for much of the first half of the year, the region's frontier markets lagged at the start to the year, driven in part by a combination of profit-taking, redemptions in mutual funds, as well as a prominent fund's liquidation due to its firm's unconnected losses on the Swiss franc. Frontier markets in the region rebounded from their lows before the end of the second quarter, driven by their relatively resilient domestic economies and encouraging earnings guidance.
Performance Contributors and Detractors:
Searle Company, a Pakistani pharmaceutical manufacturer, made the largest positive contribution to Fund performance for the second quarter as the stock rose over 50% in the three months. In fact, six of the top eight contributors to performance were from Pakistan as the market recovered from a weak first quarter, driven by a combination of improving economy, a stabilized political situation and optimism around future Chinese foreign direct investment. Two Indian companies, PC Jeweller and Praj Industries, also made solid contributions as they increased 19% and 48%, respectively, for the second quarter, and 92% and 58%, respectively, year-to-date.
Detractors to relative performance in the quarter came primarily from China/Hong Kong, the Philippines and Indonesia. The negative impact on relative performance from China/Hong Kong was primarily because of our underweight versus the benchmark. Both the Philippines and Indonesia experienced negative quarters. In the Philippines, underperformance was primarily driven by Vista Land & Lifescapes and Emperador, which declined 26% and 27%, respectively. Indonesia was also weak as both its currency and market weakened, driven by concerns over soft commodity prices, weak domestic demand and foreign exchange costs weighing on first half earnings per share.
matthewsasia.com | 800.789.ASIA 45
PERFORMANCE AS OF JUNE 30, 2015
| | | | | | | | | Average Annual
Total Return | | | |
| | | 3 Months | | YTD | | 1 Year | | Since
Inception | | Inception
Date | |
Investor Class (MEASX) | | | 0.44 | % | | | -0.26 | % | | | 4.56 | % | | | 7.25 | % | | 4/30/13 | |
Institutional Class (MIASX) | | | 0.52 | % | | | -0.09 | % | | | 4.80 | % | | | 7.49 | % | | 4/30/13 | |
MSCI Emerging Markets Asia Index4 | | | -0.04 | % | | | 5.22 | % | | | 3.51 | % | | | 5.85 | % | | | | | |
Lipper Emerging Markets Funds Category Average5 | | | 0.67 | % | | | 1.78 | % | | | -7.00 | % | | | -1.41 | % | | | | | |
Performance assumes reinvestment of all dividends and/or distributions before taxes. All performance quoted represents past performance and is no guarantee of future results. Investment return and principal value will fluctuate with market conditions so that when redeemed, shares may be worth more or less than their original cost. Current performance may be lower or higher than the return figures quoted. Returns would have been lower if certain of the Fund's fees and expenses had not been waived. For the Fund's most recent month-end performance visit matthewsasia.com.
GROWTH OF A $10,000 INVESTMENT SINCE INCEPTION—INVESTOR CLASS
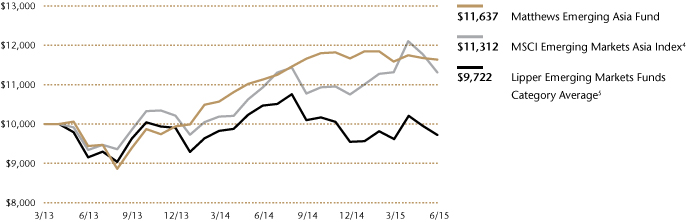
Plotted monthly. The performance data does not reflect the deduction of taxes that a shareholder would pay on dividends, capital gain distributions or redemption of Fund shares. Values are in US$.
4 It is not possible to invest directly in an index. Source: Index data from Morgan Stanley Capital International and Bloomberg; total return calculations performed by BNY Mellon Investment Servicing (US) Inc. Please see page 85 for index definition.
5 The Lipper Category Average does not reflect sales charges and is based on total return, including reinvestment of dividends and capital gains for the stated periods.
TOP TEN HOLDINGS6
| | | Sector | | Country | | % of Net Assets | |
The Searle Pakistan, Ltd. | | Health Care | | Pakistan | | | 3.6 | % | |
British American Tobacco Bangladesh Co., Ltd. | | Consumer Staples | | Bangladesh | | | 2.8 | % | |
National Development Bank PLC | | Financials | | Sri Lanka | | | 2.8 | % | |
PC Jeweller, Ltd. | | Consumer Discretionary | | India | | | 2.7 | % | |
Sampath Bank PLC | | Financials | | Sri Lanka | | | 2.7 | % | |
Vinh Hoan Corp. | | Consumer Staples | | Vietnam | | | 2.6 | % | |
Square Pharmaceuticals, Ltd. | | Health Care | | Bangladesh | | | 2.4 | % | |
K-Electric, Ltd. | | Utilities | | Pakistan | | | 2.1 | % | |
PT Matahari Department Store | | Consumer Discretionary | | Indonesia | | | 2.1 | % | |
CIMC Enric Holdings, Ltd. | | Industrials | | China/Hong Kong | | | 2.1 | % | |
% OF ASSETS IN TOP TEN | | | | | | | 25.9 | % | |
6 Holdings may combine more than one security from same issuer and related depositary receipts.
46 MATTHEWS ASIA FUNDS
Matthews Emerging Asia Fund
Portfolio Manager Commentary (continued)
Notable Portfolio Changes:
During the quarter, we sold out of a position in Sun Art Retail Group, which we had held since inception, as aggressive online retailers had negatively impacted prospects for both its revenue and margins. We also exited a small position in Malaysian oil services company SapuraKencana Petroleum as it faces a weaker demand environment given the lower oil prices. This sale brings our Malaysian exposure to zero. We also disposed of major Sri Lankan food and beverage company, Cargills Ceylon, after the company failed to get its brewery operational and continues to experience problems with its retail format.
We initiated positions in Sumber Alfaria Trijaya, an Indonesian convenience store operator, and added to Yoma Strategic of Myanmar (listed in Singapore) after a constructive onsite company visit. We also initiated new positions in Pakistan—making it our single-largest country market exposure—with additions that included Habib Bank and Hum Network, a domestic media company. We also raised our weighting in Karachi-based utility company K-Electric as it continues to deliver strong operational performance.
Outlook:
Our short-term outlook is clouded by global issues, including the Greek financial crisis, ongoing tensions in the Middle East and a fragile global economy. Many investors are also guardedly awaiting the outcome of a possible U.S. Federal Reserve rate hike on Asia's smaller economies. While these market woes have bedeviled investors for some time, they do raise legitimate worries and may temporarily drive investors away from smaller Asian markets. On the more positive side, we have seen a marked reduction in political uncertainty in emerging Asian markets, which is somewhat reassuring for the second half. This outlook would be materially supported by steady or weaker oils prices, while sharply rising prices would continue to pose a real risk. Despite the shorter-term uncertainties, we believe emerging Asian equity markets will continue to offer buying opportunities and we intend to remain focused on our core competency of stock-picking based on fundamental bottom-up research.
COUNTRY ALLOCATION (%)7
Pakistan | | | 17.0 | | |
Bangladesh | | | 12.3 | | |
China/Hong Kong | | | 12.0 | | |
Vietnam | | | 11.6 | | |
India | | | 11.3 | | |
Indonesia | | | 9.0 | | |
Sri Lanka | | | 8.7 | | |
Philippines | | | 6.9 | | |
Thailand | | | 2.7 | | |
Cambodia | | | 1.2 | | |
Australia | | | 1.1 | | |
Singapore | | | 1.0 | | |
Cash and Other Assets, Less Liabilities | | | 5.2 | | |
SECTOR ALLOCATION (%)
Consumer Staples | | | 24.9 | | |
Consumer Discretionary | | | 20.9 | | |
Financials | | | 18.5 | | |
Health Care | | | 9.4 | | |
Industrials | | | 9.0 | | |
Materials | | | 3.8 | | |
Information Technology | | | 3.3 | | |
Energy | | | 2.9 | | |
Utilities | | | 2.1 | | |
Cash and Other Assets, Less Liabilities | | | 5.2 | | |
MARKET CAP EXPOSURE (%)8
Mega Cap (over $25B) | | | 2.4 | | |
Large Cap ($10B–$25B) | | | 1.6 | | |
Mid Cap ($3B–$10B) | | | 17.6 | | |
Small Cap (under $3B) | | | 73.2 | | |
Cash and Other Assets, Less Liabilities | | | 5.2 | | |
7 Not all countries where the Fund may invest are included in the benchmark index.
8 Source: FactSet Research Systems. Percentage values in data are rounded to the nearest tenth of one percent; the values may not sum to 100% due to rounding.
matthewsasia.com | 800.789.ASIA 47
Matthews Emerging Asia Fund June 30, 2015
Schedule of Investmentsa (unaudited)
COMMON EQUITIES: 94.8%
| | Shares | | Value | |
PAKISTAN: 17.0% | |
The Searle Pakistan, Ltd.b | | | 2,041,700 | | | $ | 6,433,336 | | |
K-Electric, Ltd.b | | | 45,595,000 | | | | 3,772,143 | | |
Habib Bank, Ltd. | | | 1,508,100 | | | | 3,188,089 | | |
PAK Suzuki Motor Co., Ltd. | | | 688,600 | | | | 2,965,989 | | |
Pakistan Petroleum, Ltd. | | | 1,487,800 | | | | 2,401,238 | | |
Abbott Laboratories Pakistan, Ltd. | | | 347,100 | | | | 2,275,837 | | |
GlaxoSmithKline Pakistan, Ltd. | | | 1,021,540 | | | | 1,962,682 | | |
Hum Network, Ltd. | | | 12,085,000 | | | | 1,910,564 | | |
ICI Pakistan, Ltd. | | | 452,600 | | | | 1,904,229 | | |
Engro Foods, Ltd.b | | | 1,237,100 | | | | 1,836,507 | | |
National Foods, Ltd. | | | 429,700 | | | | 1,434,360 | | |
Total Pakistan | | | | | 30,084,974 | | |
BANGLADESH: 12.3% | |
British American Tobacco Bangladesh Co.,
Ltd. | | | 126,740 | | | | 4,962,048 | | |
Square Pharmaceuticals, Ltd. | | | 1,263,770 | | | | 4,260,501 | | |
Olympic Industries, Ltd. | | | 1,193,695 | | | | 3,613,313 | | |
United Commercial Bank, Ltd. | | | 11,765,239 | | | | 2,928,571 | | |
Marico Bangladesh, Ltd. | | | 161,759 | | | | 2,768,612 | | |
Berger Paints Bangladesh, Ltd. | | | 69,450 | | | | 1,432,755 | | |
Bata Shoe Co. Bangladesh, Ltd. | | | 75,700 | | | | 1,220,432 | | |
Apex Footwear, Ltd. | | | 113,800 | | | | 505,768 | | |
Total Bangladesh | | | | | 21,692,000 | | |
CHINA/HONG KONG: 12.0% | |
CIMC Enric Holdings, Ltd. | | | 4,378,000 | | | | 3,714,104 | | |
Luk Fook Holdings International, Ltd. | | | 1,200,000 | | | | 3,533,716 | | |
Shenzhou International Group Holdings, Ltd. | | | 689,000 | | | | 3,350,981 | | |
Alibaba Group Holding, Ltd. ADRb | | | 29,300 | | | | 2,410,511 | | |
Tencent Holdings, Ltd. | | | 88,700 | | | | 1,773,692 | | |
Playmates Toys, Ltd. | | | 8,756,000 | | | | 1,692,490 | | |
Future Bright Holdings, Ltd. | | | 9,948,000 | | | | 1,667,793 | | |
Haitian International Holdings, Ltd. | | | 618,000 | | | | 1,450,777 | | |
Melco Crown Entertainment, Ltd. ADR | | | 49,500 | | | | 971,685 | | |
Louis XIII Holdings, Ltd.b | | | 1,923,000 | | | | 734,315 | | |
Total China/Hong Kong | | | | | 21,300,064 | | |
VIETNAM: 11.6% | |
Vinh Hoan Corp. | | | 2,579,760 | | | | 4,555,898 | | |
Phu Nhuan Jewelry JSC | | | 2,007,863 | | | | 3,659,164 | | |
National Seed JSC | | | 539,115 | | | | 2,393,113 | | |
Tien Phong Plastic JSC | | | 1,141,217 | | | | 2,354,321 | | |
Mobile World Investment Corp.b | | | 632,587 | | | | 2,129,045 | | |
Dinh Vu Port Investment & Development JSC | | | 517,550 | | | | 1,231,256 | | |
Nam Long Investment Corp. | | | 1,286,590 | | | | 1,119,363 | | |
DHG Pharmaceutical JSC | | | 306,320 | | | | 1,030,955 | | |
Masan Group Corp.b | | | 273,360 | | | | 1,013,905 | | |
Saigon Securities, Inc. | | | 746,208 | | | | 829,603 | | |
Phuoc Hoa Rubber JSC | | | 304,000 | | | | 278,407 | | |
Total Vietnam | | | | | 20,595,030 | | |
| | Shares | | Value | |
INDIA: 11.3% | |
PC Jeweller, Ltd. | | | 801,621 | | | $ | 4,826,849 | | |
Supreme Industries, Ltd. | | | 223,468 | | | | 2,369,495 | | |
Emami, Ltd. | | | 126,978 | | | | 2,311,024 | | |
Praj Industries, Ltd. | | | 1,224,447 | | | | 1,812,689 | | |
Info Edge India, Ltd. | | | 124,174 | | | | 1,661,394 | | |
VST Industries, Ltd. | | | 49,694 | | | | 1,270,202 | | |
GRUH Finance, Ltd. | | | 304,007 | | | | 1,248,383 | | |
Shriram City Union Finance, Ltd. | | | 41,454 | | | | 1,140,636 | | |
Shriram Transport Finance Co., Ltd. | | | 83,544 | | | | 1,119,437 | | |
Shalimar Paints, Ltd.b | | | 525,830 | | | | 1,024,328 | | |
Cipla India, Ltd. | | | 60,053 | | | | 579,828 | | |
Multi Commodity Exchange of India, Ltd. | | | 32,155 | | | | 525,973 | | |
Total India | | | | | 19,890,238 | | |
INDONESIA: 9.0% | |
PT Matahari Department Store | | | 3,032,600 | | | | 3,758,598 | | |
PT Gudang Garam | | | 1,058,900 | | | | 3,574,212 | | |
PT Bank Mandiri Persero | | | 3,728,900 | | | | 2,803,127 | | |
PT Mayora Indah | | | 1,179,600 | | | | 2,299,012 | | |
PT Sumber Alfaria Trijaya | | | 38,533,300 | | | | 1,700,934 | | |
PT Indofood CBP Sukses Makmur | | | 1,301,700 | | | | 1,215,016 | | |
PT Electronic City Indonesia | | | 4,989,600 | | | | 482,774 | | |
Total Indonesia | | | | | 15,833,673 | | |
SRI LANKA: 8.7% | |
National Development Bank PLC | | | 2,515,196 | | | | 4,893,165 | | |
Sampath Bank PLC | | | 2,483,749 | | | | 4,815,145 | | |
Hemas Holdings PLC | | | 2,750,677 | | | | 1,685,766 | | |
Aitken Spence Hotel Holdings PLC | | | 1,973,457 | | | | 1,089,710 | | |
Chevron Lubricants Lanka PLC | | | 260,863 | | | | 716,886 | | |
Ceylinco Insurance Co. PLC | | | 51,393 | | | | 605,308 | | |
Ceylon Tobacco Co. PLC | | | 85,424 | | | | 574,856 | | |
Expolanka Holdings PLCb | | | 9,348,946 | | | | 565,968 | | |
Lanka Orix Leasing Co. PLCb | | | 573,466 | | | | 427,314 | | |
Total Sri Lanka | | | | | 15,374,118 | | |
PHILIPPINES: 6.9% | |
Puregold Price Club, Inc. | | | 4,214,000 | | | | 3,456,170 | | |
Vista Land & Lifescapes, Inc. | | | 18,094,100 | | | | 2,547,795 | | |
Universal Robina Corp. | | | 505,710 | | | | 2,174,457 | | |
Emperador, Inc. | | | 9,273,800 | | | | 1,768,192 | | |
GT Capital Holdings, Inc. | | | 40,630 | | | | 1,229,853 | | |
RFM Corp. | | | 11,430,400 | | | | 1,051,082 | | |
Total Philippines | | | | | 12,227,549 | | |
THAILAND: 2.7% | |
SNC Former Public Co., Ltd. | | | 5,111,700 | | | | 2,372,453 | | |
Srisawad Power 1979 Public Co., Ltd. | | | 1,283,568 | | | | 1,516,710 | | |
Beauty Community Public Co., Ltd. | | | 7,142,000 | | | | 852,461 | | |
Total Thailand | | | | | 4,741,624 | | |
CAMBODIA: 1.2% | |
NagaCorp, Ltd. | | | 2,828,000 | | | | 2,082,025 | | |
Total Cambodia | | | | | 2,082,025 | | |
48 MATTHEWS ASIA FUNDS
Matthews Emerging Asia Fund June 30, 2015
Schedule of Investmentsa (unaudited) (continued)
COMMON EQUITIES (continued)
| | Shares | | Value | |
AUSTRALIA: 1.1% | |
Oil Search, Ltd. | | | 349,221 | | | $ | 1,919,561 | | |
Total Australia | | | | | 1,919,561 | | |
SINGAPORE: 1.0% | |
Yoma Strategic Holdings, Ltd.b | | | 5,491,766 | | | | 1,729,842 | | |
Total Singapore | | | | | 1,729,842 | | |
TOTAL COMMON EQUITIES | | | | | 167,470,698 | | |
(Cost $157,687,929) | | | | | |
WARRANTS: 0.0%
THAILAND: 0.0% | |
Srisawad Power 1979 Public Co., Ltd.,
expires 6/11/20 | | | 50,336 | | | | 19,225 | | |
Total Thailand | | | | | 19,225 | | |
TOTAL WARRANTS | | | | | 19,225 | | |
(Cost $0) | | | | | |
TOTAL INVESTMENTS: 94.8% | | | | | 167,489,923 | | |
(Cost $157,687,929c) | |
CASH AND OTHER ASSETS,
LESS LIABILITIES: 5.2% | | | | | 9,263,067 | | |
NET ASSETS: 100.0% | | | | $ | 176,752,990 | | |
a Certain securities were fair valued under the valuation polices approved by the Board of Trustees (Note 2-A).
b Non-income producing security.
c Cost for federal income tax purposes is $157,687,929 and net unrealized appreciation consists of:
Gross unrealized appreciation | | $ | 23,712,049 | | |
Gross unrealized depreciation | | | (13,910,055 | ) | |
Net unrealized appreciation | | $ | 9,801,994 | | |
ADR American Depositary Receipt
JSC Joint Stock Co.
See accompanying notes to financial statements.
matthewsasia.com | 800.789.ASIA 49

PORTFOLIO MANAGERS*
Richard Gao | | Andrew Mattock, CFA | |
Lead Manager | | Co-Manager | |
Henry Zhang, CFA | | Winnie Chwang | |
Co-Manager | | Co-Manager | |
* Effective April 30, 2015, Andrew Mattock, CFA, became a Co-Manager of this Fund. Effective July 1, 2015, Andrew Mattock, CFA, replaced Richard Gao as Lead Manager of this Fund.
FUND FACTS
| | | Investor Class | | Institutional Class | |
Ticker | | MCHFX | | MICFX | |
CUSIP | | 577130701 | | 577130818 | |
Inception | | 2/19/98 | | 10/29/10 | |
NAV | | $25.38 | | $25.37 | |
Initial Investment | | $2,500 | | $3 million | |
Gross Expense Ratio1 | | 1.13% | | 0.97% | |
Portfolio Statistics
Total # of Positions | | 51 | |
Net Assets | | $1.1 billion | |
Weighted Average Market Cap | | $53.2 billion | |
Portfolio Turnover | | 10.23%2 | |
Benchmark
MSCI China Index
OBJECTIVE
Long-term capital appreciation.
STRATEGY
Under normal market conditions, the Fund seeks to achieve its investment objective by investing at least 80% of its total net assets, which include borrowings for investment purposes, in the common and preferred stocks of companies located in China. China includes its administrative and other districts, such as Hong Kong.
1 Prospectus expense ratios.
2 The lesser of fiscal year 2014 long-term purchase costs or sales proceeds divided by the average monthly market value of long-term securities.
Matthews China Fund
Portfolio Manager Commentary
For the first half of 2015, the Matthews China Fund returned 18.27% (Investor Class) and 18.33% (Institutional Class), outperforming its benchmark, the MSCI China Index, which returned 14.84%. For the quarter ending June 30, the Fund returned 10.64% (Investor Class) and 10.69% (Institutional Class) while its benchmark rose 6.22%.
Market Environment:
Chinese equities rallied strongly during the second quarter, driven by the central bank's continued loosening of monetary policy as well as strong liquidity in the stock market. The central bank has lowered interest rates three times since last November and cut its reserve ratio twice thus far in 2015. The positive effects of these measures began emerging during the quarter, led by a strong sales volume recovery in the property market, and by increased signs of stabilization in the industrials sector.
Volatility in Chinese equities also rose sharply during the quarter, particularly among China's domestic A-share market. With the A-share index reaching a seven-year high, investors are concerned about the valuation and are turning more cautious about the near-term outlook. The A-share market has experienced a roller coaster ride during the quarter, with some rocky patches in June, and market tumult in early July.
Performance Contributors and Detractors:
During the second quarter, our holdings in the information technology and financials sectors were top contributors to Fund performance. Within information technology, our long-term approach of investing in smaller, quality companies has done well. Kingdee International Software Group, a firm focused on enterprise resource planning systems, and Sina, a Chinese version of Twitter, are among two such companies that contributed most to Fund performance. Both companies belong to the small-capitalization category and fell under much selling pressure last year amid concerns that smaller companies would struggle under a slowing and uncertain business environment. However, the two companies were able to withstand the headwinds and eventually boost their underlying business.
In terms of detractors, the consumer staples sector continued to disappoint, and posed one of the biggest drags on Fund performance. China's consumer price index inflation continues to hover at a low level, which has put pressure on the sector. In addition, China's e-commerce players have been growing rapidly, which has also hampered the sector.
Notable Portfolio Changes:
The Fund continued to consolidate its exposure in the consumer discretionary and consumer staples sectors, and has focused more on the holdings in which we hold a high conviction. We trimmed or exited companies that appeared to be losing their competitive positioning, such as supermarket and hypermarket operator Sun Art Retail Group. We exited the holding during the quarter as it has been losing market share to e-commerce players in recent years. We raised our exposure in the financials sector, including property companies and banks, as we see increasing signs of recovery in those areas.
50 MATTHEWS ASIA FUNDS
PERFORMANCE AS OF JUNE 30, 2015
| | | | | | | | | Average Annual Total Returns | | | |
| | | 3 Months | | YTD | | 1 Year | | 3 Years | | 5 Years | | 10 Years | | Since
Inception | | Inception
Date | |
Investor Class (MCHFX) | | | 10.64 | % | | | 18.27 | % | | | 19.20 | % | | | 9.83 | % | | | 5.42 | % | | | 13.14 | % | | | 10.57 | % | | 2/19/98 | |
Institutional Class (MICFX) | | | 10.69 | % | | | 18.33 | % | | | 19.35 | % | | | 10.01 | % | | | n.a. | | | | n.a. | | | | 1.80 | % | | 10/29/10 | |
MSCI China Index3 | | | 6.22 | % | | | 14.84 | % | | | 24.95 | % | | | 15.18 | % | | | 7.72 | % | | | 14.20 | % | | | 4.67 | %4 | | | | | |
Lipper China Region Funds Category Average5 | | | 7.64 | % | | | 14.90 | % | | | 22.40 | % | | | 14.31 | % | | | 8.30 | % | | | 10.10 | % | | | 8.02 | %4 | | | | | |
Performance assumes reinvestment of all dividends and/or distributions before taxes. All performance quoted represents past performance and is no guarantee of future results. Investment return and principal value will fluctuate with market conditions so that when redeemed, shares may be worth more or less than their original cost. Current performance may be lower or higher than the return figures quoted. For the Fund's most recent month-end performance, visit matthewsasia.com.
GROWTH OF A $10,000 INVESTMENT SINCE INCEPTION—INVESTOR CLASS

Plotted monthly. The performance data and graph do not reflect the deduction of taxes that a shareholder would pay on dividends, capital gains distributions or redemption of Fund shares. Values are in US$.
3 It is not possible to invest directly in an index. Source: Index data from Morgan Stanley Capital International and Bloomberg; total return calculations performed by BNY Mellon Investment Servicing (US) Inc. Please see page 85 for index definition.
4 Calculated from 2/28/98.
5 The Lipper Category Average does not reflect sales charges and is based on total return, including reinvestment of dividends and capital gains for the stated periods.
TOP TEN HOLDINGS6
| | | Sector | | % of Net Assets | |
Tencent Holdings, Ltd. | | Information Technology | | | 5.2 | % | |
Ping An Insurance Group Co. of China, Ltd. | | Financials | | | 4.7 | % | |
China Resources Land, Ltd. | | Financials | | | 4.0 | % | |
China Vanke Co., Ltd. | | Financials | | | 3.8 | % | |
Sinopharm Group Co., Ltd. | | Health Care | | | 3.4 | % | |
China Mobile, Ltd. | | Telecommunication Services | | | 3.3 | % | |
China Merchants Bank Co., Ltd. | | Financials | | | 3.2 | % | |
China Construction Bank Corp. | | Financials | | | 3.0 | % | |
Sino Biopharmaceutical, Ltd. | | Health Care | | | 2.8 | % | |
Hangzhou Hikvision Digital Technology Co., Ltd. | | Information Technology | | | 2.5 | % | |
% OF ASSETS IN TOP TEN | | | | | 35.9 | % | |
6 Holdings may combine more than one security from same issuer and related depositary receipts.
matthewsasia.com | 800.789.ASIA 51
SECTOR ALLOCATION (%)
Financials | | | 23.3 | | |
Information Technology | | | 22.2 | | |
Industrials | | | 13.9 | | |
Consumer Discretionary | | | 11.2 | | |
Health Care | | | 9.1 | | |
Consumer Staples | | | 5.9 | | |
Utilities | | | 4.2 | | |
Telecommunication Services | | | 4.0 | | |
Energy | | | 2.2 | | |
Cash and Other Assets, Less Liabilities | | | 4.0 | | |
MARKET CAP EXPOSURE (%)7
Mega Cap (over $25B) | | | 42.5 | | |
Large Cap ($10B–$25B) | | | 22.7 | | |
Mid Cap ($3B–$10B) | | | 17.1 | | |
Small Cap (under $3B) | | | 13.7 | | |
Cash and Other Assets, Less Liabilities | | | 4.0 | | |
7 Source: FactSet Research Systems. Percentage values in data are rounded to the nearest tenth of one percent; the values may not sum to 100% due to rounding.
Matthews China Fund
Portfolio Manager Commentary (continued)
Outlook:
While we are encouraged by early signs of stabilization among China's property-related firms and industrials, we also note that the economy has yet to achieve a full recovery. Exports remain weak and overall corporate earnings are still under pressure, especially in the consumer discretionary and staples sectors. We expect to see some further easing of monetary policies going forward to help stimulate the economy. In terms of reforms, China continues to take drastic action in several areas. In a recent move, officials aimed to lift a rule that caps lending by commercial banks in China at 75% of their deposits. This, along with the interest rate liberalization and measures to deal with local government financial vehicles, should help strengthen the entire banking sector over the long term.
We are cautious over the near-term developments of the A-share market, mainly due to its high valuations and volatilities. Compared to the A-share market, Chinese companies listed in Hong Kong are generally trading at more reasonable valuations and much less volatile. Currently, we continue to focus our efforts on finding solid companies within the Hong Kong universe.
During the second quarter, we also announced that Richard Gao, the Fund's long-time manager, will commence a requested sabbatical at year-end. Effective July 1, 2015, Andrew Mattock, CFA, Co-Manager of the Matthews China Fund assumed Lead Manager responsibility of the Fund. Winnie Chwang and Henry Zhang will continue to serve as Co-Managers of the Fund. In the interim period, Richard is serving as an analyst on the Matthews China Fund.
52 MATTHEWS ASIA FUNDS
Matthews China Fund June 30, 2015
Consolidated Schedule of Investmentsa (unaudited)
COMMON EQUITIES: 96.0%
| | Shares | | Value | |
FINANCIALS: 23.3% | |
Banks: 8.3% | |
China Merchants Bank Co., Ltd. H Shares | | | 11,749,643 | | | $ | 34,128,727 | | |
China Construction Bank Corp. H Shares | | | 35,150,660 | | | | 32,062,886 | | |
BOC Hong Kong Holdings, Ltd. | | | 5,366,500 | | | | 22,335,648 | | |
| | | | | 88,527,261 | | |
Real Estate Management & Development: 8.0% | |
China Resources Land, Ltd. | | | 13,246,000 | | | | 42,868,703 | | |
China Vanke Co., Ltd. H Shares | | | 16,513,368 | | | | 40,544,336 | | |
Hang Lung Group, Ltd. | | | 379,000 | | | | 1,668,165 | | |
| | | | | 85,081,204 | | |
Insurance: 4.7% | |
Ping An Insurance Group Co. of China, Ltd.
H Shares | | | 3,715,500 | | | | 50,142,622 | | |
Diversified Financial Services: 2.3% | |
Hong Kong Exchanges and Clearing, Ltd. | | | 681,300 | | | | 24,005,313 | | |
Total Financials | | | | | 247,756,400 | | |
INFORMATION TECHNOLOGY: 22.2% | |
Internet Software & Services: 12.8% | |
Tencent Holdings, Ltd. | | | 2,754,000 | | | | 55,070,452 | | |
Baidu, Inc. ADRb | | | 130,500 | | | | 25,979,940 | | |
NetEase, Inc. ADR | | | 175,800 | | | | 25,467,267 | | |
Alibaba Group Holding, Ltd. ADRb | | | 188,100 | | | | 15,474,987 | | |
Sina Corp.b | | | 272,200 | | | | 14,580,393 | | |
| | | | | 136,573,039 | | |
Electronic Equipment, Instruments & Components: 3.8% | |
Hangzhou Hikvision Digital Technology
Co., Ltd. A Sharesc | | | 3,705,959 | | | | 26,637,702 | | |
Hollysys Automation Technologies, Ltd. | | | 590,900 | | | | 14,199,327 | | |
| | | | | 40,837,029 | | |
Software: 2.4% | |
Kingdee International Software Group
Co., Ltd. | | | 42,250,800 | | | | 25,127,991 | | |
Communications Equipment: 2.0% | |
ZTE Corp. H Shares | | | 8,164,765 | | | | 20,731,727 | | |
Technology Hardware, Storage & Peripherals: 1.2% | |
Lenovo Group, Ltd. | | | 9,250,000 | | | | 12,788,723 | | |
Total Information Technology | | | | | 236,058,509 | | |
INDUSTRIALS: 13.9% | |
Transportation Infrastructure: 4.2% | |
Yuexiu Transport Infrastructure, Ltd. | | | 34,195,000 | | | | 24,597,223 | | |
China Merchants Holdings International
Co., Ltd. | | | 4,718,581 | | | | 20,213,696 | | |
| | | | | 44,810,919 | | |
Machinery: 3.2% | |
CRRC Corp., Ltd. H Shares | | | 15,422,000 | | | | 23,660,357 | | |
Airtac International Group | | | 1,568,700 | | | | 9,838,836 | | |
| | | | | 33,499,193 | | |
| | Shares | | Value | |
Commercial Services & Supplies: 2.2% | |
China Everbright International, Ltd. | | | 13,168,000 | | | $ | 23,583,866 | | |
Construction & Engineering: 2.0% | |
China State Construction International
Holdings, Ltd. | | | 11,588,000 | | | | 20,846,704 | | |
Airlines: 1.8% | |
Air China, Ltd. H Sharesd | | | 17,247,900 | | | | 19,301,670 | | |
Industrial Conglomerates: 0.5% | |
NWS Holdings, Ltd. | | | 4,016,914 | | | | 5,806,636 | | |
Total Industrials | | | | | 147,848,988 | | |
CONSUMER DISCRETIONARY: 11.2% | |
Hotels, Restaurants & Leisure: 5.5% | |
Café de Coral Holdings, Ltd. | | | 6,714,100 | | | | 24,252,543 | | |
Homeinns Hotel Group ADRb | | | 670,946 | | | | 20,745,650 | | |
Sands China, Ltd. | | | 3,876,800 | | | | 13,029,152 | | |
| | | | | 58,027,345 | | |
Diversified Consumer Services: 1.2% | |
New Oriental Education & Technology
Group, Inc. ADRb | | | 539,700 | | | | 13,233,444 | | |
Media: 1.1% | |
Television Broadcasts, Ltd. | | | 1,999,500 | | | | 11,865,627 | | |
Textiles, Apparel & Luxury Goods: 1.0% | |
Belle International Holdings, Ltd. | | | 9,544,000 | | | | 10,994,952 | | |
Automobiles: 0.9% | |
Dongfeng Motor Group Co., Ltd.
H Shares | | | 6,974,000 | | | | 9,342,960 | | |
Internet & Catalog Retail: 0.6% | |
Jumei International Holding, Ltd. ADRb | | | 270,200 | | | | 6,171,368 | | |
Multiline Retail: 0.5% | |
Golden Eagle Retail Group, Ltd. | | | 3,904,000 | | | | 5,227,796 | | |
Auto Components: 0.4% | |
Fuyao Glass Industry Group Co., Ltd.
H Sharesb | | | 1,784,400 | | | | 4,369,179 | | |
Total Consumer Discretionary | | | | | 119,232,671 | | |
HEALTH CARE: 9.1% | |
Pharmaceuticals: 4.8% | |
Sino Biopharmaceutical, Ltd. | | | 25,408,000 | | | | 29,457,317 | | |
Jiangsu Hengrui Medicine Co., Ltd.
A Sharesc | | | 2,979,219 | | | | 21,398,873 | | |
| | | | | 50,856,190 | | |
Health Care Providers & Services: 3.4% | |
Sinopharm Group Co., Ltd. H Shares | | | 8,238,400 | | | | 36,584,110 | | |
Health Care Equipment & Supplies: 0.9% | |
Ginko International Co., Ltd. | | | 748,000 | | | | 9,401,476 | | |
Total Health Care | | | | | 96,841,776 | | |
matthewsasia.com | 800.789.ASIA 53
Matthews China Fund June 30, 2015
Consolidated Schedule of Investmentsa (unaudited) (continued)
COMMON EQUITIES (continued)
| | Shares | | Value | |
CONSUMER STAPLES: 5.9% | |
Food Products: 2.2% | |
China Mengniu Dairy Co., Ltd. | | | 4,021,000 | | | $ | 19,944,690 | | |
Tingyi (Cayman Islands) Holding Corp. | | | 1,949,000 | | | | 3,976,418 | | |
| | | | | 23,921,108 | | |
Beverages: 2.1% | |
Kweichow Moutai Co., Ltd. A Sharesb,c | | | 531,617 | | | | 22,088,554 | | |
Personal Products: 1.6% | |
Hengan International Group Co., Ltd. | | | 1,421,000 | | | | 16,867,397 | | |
Total Consumer Staples | | | | | 62,877,059 | | |
UTILITIES: 4.2% | |
Independent Power and Renewable Electricity Producers: 2.4% | |
China Longyuan Power Group Corp.
H Shares | | | 22,495,000 | | | | 24,968,357 | | |
Electric Utilities: 1.8% | |
Cheung Kong Infrastructure Holdings, Ltd. | | | 2,447,500 | | | | 18,998,485 | | |
Total Utilities | | | | | 43,966,842 | | |
TELECOMMUNICATION SERVICES: 4.0% | |
Wireless Telecommunication Services: 3.4% | |
China Mobile, Ltd. ADR | | | 302,700 | | | | 19,400,043 | | |
China Mobile, Ltd. | | | 1,265,583 | | | | 16,191,762 | | |
| | | | | 35,591,805 | | |
Diversified Telecommunication Services: 0.6% | |
China Communications Services Corp.,
Ltd. H Shares | | | 13,248,800 | | | | 6,690,726 | | |
Total Telecommunication Services | | | | | 42,282,531 | | |
ENERGY: 2.2% | |
Oil, Gas & Consumable Fuels: 1.1% | |
CNOOC, Ltd. | | | 8,436,000 | | | | 11,966,275 | | |
Energy Equipment & Services: 1.1% | |
China Oilfield Services, Ltd. H Shares | | | 7,294,000 | | | | 11,599,473 | | |
Total Energy | | | | | 23,565,748 | | |
TOTAL INVESTMENTS: 96.0% | | | | | 1,020,430,524 | | |
(Cost $706,034,775e) | |
CASH AND OTHER ASSETS,
LESS LIABILITIES : 4.0% | | | | | 43,023,460 | | |
NET ASSETS: 100.0% | | | | $ | 1,063,453,984 | | |
a Certain securities were fair valued under the valuation polices approved by the Board of Trustees (Note 2-A).
b Non-income producing security.
c Security held by Matthews ADF-U Series.
d Illiquid security, trading was halted at 6/30/15.
e Cost for federal income tax purposes is $706,662,541 and net unrealized appreciation consists of:
Gross unrealized appreciation | | $ | 351,105,267 | | |
Gross unrealized depreciation | | | (37,267,284 | ) | |
Net unrealized appreciation | | $ | 313,767,963 | | |
ADR American Depositary Receipt
See accompanying notes to financial statements.
54 MATTHEWS ASIA FUNDS

PORTFOLIO MANAGERS
Sunil Asnani
Lead Manager
Sharat Shroff, CFA
Co-Manager
FUND FACTS
| | | Investor Class | | Institutional Class | |
Ticker | | MINDX | | MIDNX | |
CUSIP | | 577130859 | | 577130768 | |
Inception | | 10/31/05 | | 10/29/10 | |
NAV | | $28.17 | | $28.23 | |
Initial Investment | | $2,500 | | $3 million | |
Gross Expense Ratio1 | | 1.12% | | 0.94% | |
Portfolio Statistics
Total # of Positions | | 49 | |
Net Assets | | $1.6 billion | |
Weighted Average Market Cap | | $9.3 billion | |
Portfolio Turnover | | 14.86%2 | |
Benchmark
S&P Bombay Stock Exchange 100 Index
OBJECTIVE
Long-term capital appreciation.
STRATEGY
Under normal market conditions, the Fund seeks to achieve its investment objective by investing at least 80% of its total net assets, which include borrowings for investment purposes, in publicly traded common stocks, preferred stocks and convertible securities of companies located in India.
1 Prospectus expense ratios.
2 The lesser of fiscal year 2014 long-term purchase costs or sales proceeds divided by the average monthly market value of long-term securities.
Matthews India Fund
Portfolio Manager Commentary
For the first half of 2015, the Matthews India Fund gained 6.46% (Investor Class) and 6.57% (Institutional Class), outperforming its benchmark, the S&P Bombay Stock Exchange 100 Index (the "S&P BSE 100"), which returned 1.20%. For the quarter ending June 30, the Fund returned –3.53% (Investor Class) and –3.49% (Institutional Class), compared to its benchmark, which returned –3.21%.
Market Environment:
Over the first half of the year, investor sentiment toward Indian markets was volatile. The slow pace of legislative reforms relating to land, labor and taxation issues dampened earlier investor optimism. With regard to the outlook for revenue and earnings growth across sectors, corporate guidance was also very cautious, and seemed to indicate expectations for further earnings downgrades.
The issue of a retrospective Minimum Alternative Tax for foreign portfolio managers added further to investor concerns. However, incoming data on inflation and industrial activity kept spirits hopeful. Inflation remained benign and expectations of continued monetary easing also helped preserve some optimism. Early expectations for a weak monsoon season added to market jitters. However, the sentiment improved following good rainfall in early June.
Performance Contributors and Detractors:
During the first half of the year, small- and mid-capitalization stocks in the benchmark underperformed relative to their larger peers. Given our overweight in this segment, this was a detractor to relative Fund performance. However, this was mitigated by stock-specific factors during the first half of the year, leading to outperformance versus the benchmark. While stock-specific factors also helped during the second quarter, they were not enough to overcome the large allocation to small- and mid-capitalization stocks versus the benchmark, and the Fund underperformed. Small- and mid-cap stocks rallied in 2014, and their valuation differential had narrowed. The current market action could be a reversion to the mean.
Another detractor to relative Fund performance over the first half resulted from our under-allocation versus the benchmark in the energy sector. Energy stocks performed well since fuel prices are no longer subsidized. We remain under-allocated to this sector because the dependence on macro and policy factors remains high. While our exposure to metal stocks has been limited, one of our holdings, AIA Engineering, which supplies chrome-based grinding materials for utilities, cement and mining companies, was affected by a global slowdown in demand for metals. Mining has contributed to a big portion of growth for AIA Engineering over the last couple of years. A slowdown in China is likely going to restrict global growth of the mining industry, and expectations over this may have negatively impacted the stock.
matthewsasia.com | 800.789.ASIA 55
PERFORMANCE AS OF JUNE 30, 2015
| | | | | | | | | Average Annual Total Returns | | | |
| | | 3 Months | | YTD | | 1 Year | | 3 Years | | 5 Years | | Since
Inception | | Inception
Date | |
Investor Class (MINDX) | | | -3.53 | % | | | 6.46 | % | | | 28.22 | % | | | 23.62 | % | | | 10.27 | % | | | 13.58 | % | | 10/31/05 | |
Institutional Class (MIDNX) | | | -3.49 | % | | | 6.57 | % | | | 28.48 | % | | | 23.80 | % | | | n.a. | | | | 6.69 | % | | 10/29/10 | |
Bombay Stock Exchange 100 Index3 | | | -3.21 | % | | | 1.20 | % | | | 4.63 | % | | | 13.55 | % | | | 3.97 | % | | | 11.39 | %4 | | | | | |
Lipper India Region Funds Category Average5 | | | -3.57 | % | | | 1.82 | % | | | 10.09 | % | | | 15.10 | % | | | 4.32 | % | | | 9.62 | %4 | | | | | |
Performance assumes reinvestment of all dividends and/or distributions before taxes. All performance quoted represents past performance and is no guarantee of future results. Investment return and principal value will fluctuate with market conditions so that when redeemed, shares may be worth more or less than their original cost. Current performance may be lower or higher than the return figures quoted. For the Fund's most recent month-end performance, visit matthewsasia.com.
GROWTH OF A $10,000 INVESTMENT SINCE INCEPTION—INVESTOR CLASS

Plotted monthly. The performance data and graph do not reflect the deduction of taxes that a shareholder would pay on dividends, capital gains distributions or redemption of Fund shares. Values are in US$.
3 It is not possible to invest directly in an index. Source: Index data from Morgan Stanley Capital International and Bloomberg; total return calculations performed by BNY Mellon Investment Servicing (US) Inc. Please see page 85 for index definition.
4 Calculated from 10/31/05.
5 The Lipper Category Average does not reflect sales charges and is based on total return, including reinvestment of dividends and capital gains for the stated periods.
TOP TEN HOLDINGS6
| | | Sector | | % of Net Assets | |
Shriram City Union Finance, Ltd. | | Financials | | | 5.1 | % | |
Taro Pharmaceutical Industries, Ltd. | | Health Care | | | 5.0 | % | |
Ajanta Pharma, Ltd. | | Health Care | | | 4.8 | % | |
ITC, Ltd. | | Consumer Staples | | | 4.5 | % | |
IndusInd Bank, Ltd. | | Financials | | | 4.1 | % | |
Cognizant Technology Solutions Corp. | | Information Technology | | | 4.1 | % | |
Emami, Ltd. | | Consumer Staples | | | 4.1 | % | |
Housing Development Finance Corp. | | Financials | | | 3.7 | % | |
Kotak Mahindra Bank, Ltd. | | Financials | | | 3.6 | % | |
Mindtree, Ltd. | | Information Technology | | | 3.6 | % | |
% OF ASSETS IN TOP TEN | | | | | 42.6 | % | |
6 Holdings may combine more than one security from same issuer and related depositary receipts.
56 MATTHEWS ASIA FUNDS
Matthews India Fund
Portfolio Manager Commentary (continued)
Notable Portfolio Changes:
During the quarter, we initiated some new positions in the technology and health care sectors. We also exited Grasim Industries, a manufacturer of cement and viscose staple fiber that is somewhat more dependent on macroeconomic factors than other portfolio holdings. We sold out of this position in favor of more attractive alternatives.
Among our new portfolio holdings in health care is one of India's oldest pharmaceuticals companies—a vertically integrated pharma firm that is strong in therapeutic areas such as cardiology and gynecology. We found its management to be focused on improving its R&D capabilities, and the firm has been investing heavily in research to develop a pipeline of complex new products that should translate into higher barriers to entry. It has already received some early success in penetrating the U.S. generics market.
Outlook:
While India's government should be doing more to jumpstart the economy through increased spending on infrastructure, one major obstacle has been the country's high fiscal deficit. We expect that structural changes implemented last year—such as the withdrawal of fuel subsidies, directed liquefied petroleum gas subsidies and the enforcement of highway taxes—should help improve the availability of government funds so that infrastructure investment may receive a boost in the coming quarters.
Employment growth through infrastructure investment and a possible moderation in interest rates amid benign inflation should also lead to improvements in consumer discretionary sales. We are already seeing sporadic growth in auto sales, but it is far from a trend. A good harvest for India's agricultural sector would also help revive rural consumption demand.
The Indian government seems to be committed to implementing structural reforms. While Prime Minister Narendra Modi's government is known for its commitment to implementing structural reforms, it does not hold a majority in the Upper House, and also lacks support from the majority of state legislatures. In May, India's Goods and Services Tax bill—proposed as a comprehensive indirect national tax levy on the manufacture, sale and consumption of goods as well as services—was cleared by the parliament's Lower House. Separately, a land bill also appears likely to be presented for parliamentary approval soon. It is our belief that a positive outcome on one or both these bills should help improve business sentiment, and in turn, advance private investment expenditure in India.
SECTOR ALLOCATION (%)
Financials | | | 26.2 | | |
Consumer Staples | | | 17.6 | | |
Health Care | | | 15.1 | | |
Information Technology | | | 14.2 | | |
Industrials | | | 11.5 | | |
Consumer Discretionary | | | 8.6 | | |
Materials | | | 6.2 | | |
Cash and Other Assets, Less Liabilities | | | 0.6 | | |
MARKET CAP EXPOSURE (%)7
Mega Cap (over $25B) | | | 16.4 | | |
Large Cap ($10B–$25B) | | | 4.8 | | |
Mid Cap ($3B–$10B) | | | 28.8 | | |
Small Cap (under $3B) | | | 49.4 | | |
Cash and Other Assets, Less Liabilities | | | 0.6 | | |
7 Source: FactSet Research Systems. Percentage values in data are rounded to the nearest tenth of one percent; the values may not sum to 100% due to rounding.
matthewsasia.com | 800.789.ASIA 57
Matthews India Fund June 30, 2015
Schedule of Investmentsa (unaudited)
COMMON EQUITIES: 99.4%
| | Shares | | Value | |
FINANCIALS: 26.2% | |
Banks: 10.0% | |
IndusInd Bank, Ltd. | | | 4,725,934 | | | $ | 64,707,442 | | |
Kotak Mahindra Bank, Ltd. | | | 2,623,629 | | | | 57,016,040 | | |
HDFC Bank, Ltd. | | | 2,030,165 | | | | 33,985,259 | | |
HDFC Bank, Ltd. ADR | | | 30,922 | | | | 1,871,709 | | |
| | | | | 157,580,450 | | |
Consumer Finance: 5.9% | |
Shriram City Union Finance, Ltd. | | | 2,910,154 | | | | 80,074,935 | | |
Sundaram Finance, Ltd. | | | 503,318 | | | | 12,483,361 | | |
| | | | | 92,558,296 | | |
Diversified Financial Services: 4.8% | |
CRISIL, Ltd. | | | 1,423,753 | | | | 43,274,892 | | |
IDFC, Ltd. | | | 13,050,467 | | | | 30,216,067 | | |
Multi Commodity Exchange of India, Ltd. | | | 168,101 | | | | 2,749,700 | | |
| | | | | 76,240,659 | | |
Thrifts & Mortgage Finance: 4.8% | |
Housing Development Finance Corp. | | | 2,898,810 | | | | 58,964,580 | | |
GRUH Finance, Ltd. | | | 4,008,445 | | | | 16,460,394 | | |
| | | | | 75,424,974 | | |
Real Estate Management & Development: 0.7% | |
Ascendas India Trust | | | 17,817,000 | | | | 11,839,637 | | |
Total Financials | | | | | 413,644,016 | | |
CONSUMER STAPLES: 17.6% | |
Personal Products: 9.7% | |
Emami, Ltd. | | | 3,514,801 | | | | 63,970,062 | | |
Bajaj Corp., Ltd. | | | 5,479,447 | | | | 37,413,058 | | |
Dabur India, Ltd. | | | 7,142,176 | | | | 31,378,494 | | |
Marico, Ltd. | | | 2,995,223 | | | | 21,118,298 | | |
| | | | | 153,879,912 | | |
Tobacco: 6.4% | |
ITC, Ltd. | | | 14,217,949 | | | | 70,277,177 | | |
VST Industries, Ltd.† | | | 1,193,704 | | | | 30,511,629 | | |
| | | | | 100,788,806 | | |
Food Products: 1.5% | |
Zydus Wellness, Ltd. | | | 1,670,471 | | | | 23,525,100 | | |
Total Consumer Staples | | | | | 278,193,818 | | |
HEALTH CARE: 15.1% | |
Pharmaceuticals: 14.1% | |
Taro Pharmaceutical Industries, Ltd.b | | | 544,600 | | | | 78,253,574 | | |
Ajanta Pharma, Ltd. | | | 3,103,072 | | | | 76,230,867 | | |
Sun Pharmaceutical Industries, Ltd. | | | 2,188,559 | | | | 30,058,318 | | |
Sun Pharma Advanced Research Co., Ltd.b | | | 4,816,014 | | | | 29,684,337 | | |
Alembic Pharmaceuticals, Ltd. | | | 508,327 | | | | 5,288,734 | | |
Caplin Point Laboratories, Ltd. | | | 236,003 | | | | 3,429,134 | | |
| | | | | 222,944,964 | | |
| | Shares | | Value | |
Health Care Equipment & Supplies: 1.0% | |
Poly Medicure, Ltd. | | | 2,076,732 | | | $ | 15,006,411 | | |
Total Health Care | | | | | 237,951,375 | | |
INFORMATION TECHNOLOGY: 14.2% | |
IT Services: 11.2% | |
Cognizant Technology Solutions Corp.
Class Ab | | | 1,047,700 | | | | 64,003,993 | | |
Mindtree, Ltd. | | | 2,808,292 | | | | 56,122,182 | | |
eClerx Services, Ltd.† | | | 2,299,076 | | | | 53,723,933 | | |
CMC, Ltd. | | | 110,000 | | | | 3,406,666 | | |
| | | | | 177,256,774 | | |
Internet Software & Services: 3.0% | |
Info Edge India, Ltd. | | | 3,072,208 | | | | 41,104,798 | | |
Just Dial, Ltd. | | | 305,341 | | | | 6,084,284 | | |
| | | | | 47,189,082 | | |
Total Information Technology | | | | | 224,445,856 | | |
INDUSTRIALS: 11.5% | |
Machinery: 5.5% | |
AIA Engineering, Ltd. | | | 2,699,467 | | | | 42,623,734 | | |
Thermax, Ltd. | | | 1,598,128 | | | | 26,241,874 | | |
Ashok Leyland, Ltd. | | | 16,456,152 | | | | 18,715,257 | | |
| | | | | 87,580,865 | | |
Transportation Infrastructure: 2.2% | |
Gujarat Pipavav Port, Ltd.b | | | 10,073,564 | | | | 34,438,070 | | |
Road & Rail: 2.2% | |
Container Corp. of India, Ltd. | | | 1,291,324 | | | | 33,964,126 | | |
Air Freight & Logistics: 1.6% | |
Blue Dart Express, Ltd. | | | 261,973 | | | | 25,423,057 | | |
Total Industrials | | | | | 181,406,118 | | |
CONSUMER DISCRETIONARY: 8.6% | |
Textiles, Apparel & Luxury Goods: 5.5% | |
Titan Co., Ltd. | | | 9,430,467 | | | | 54,178,734 | | |
Page Industries, Ltd. | | | 97,600 | | | | 23,143,309 | | |
Kewal Kiran Clothing, Ltd. | | | 175,852 | | | | 5,844,936 | | |
Vaibhav Global, Ltd. | | | 500,000 | | | | 3,843,436 | | |
| | | | | 87,010,415 | | |
Household Durables: 2.4% | |
Symphony, Ltd. | | | 1,126,560 | | | | 37,439,799 | | |
Media: 0.5% | |
Jagran Prakashan, Ltd. | | | 4,154,523 | | | | 7,724,490 | | |
Auto Components: 0.2% | |
Exide Industries, Ltd. | | | 1,478,554 | | | | 3,438,590 | | |
Total Consumer Discretionary | | | | | 135,613,294 | | |
58 MATTHEWS ASIA FUNDS
Matthews India Fund June 30, 2015
Schedule of Investmentsa (unaudited) (continued)
COMMON EQUITIES (continued)
| | Shares | | Value | |
MATERIALS: 6.2% | |
Chemicals: 3.4% | |
Supreme Industries, Ltd. | | | 1,895,000 | | | $ | 20,093,225 | | |
Asian Paints, Ltd. | | | 1,571,000 | | | | 18,619,457 | | |
Castrol India, Ltd. | | | 2,139,063 | | | | 14,549,915 | | |
| | | | | 53,262,597 | | |
Metals & Mining: 2.8% | |
NMDC, Ltd. | | | 23,423,892 | | | | 43,611,275 | | |
Total Materials | | | | | 96,873,872 | | |
TOTAL INVESTMENTS: 99.4% | | | | | 1,568,128,349 | | |
(Cost $1,228,718,532c) | |
CASH AND OTHER ASSETS,
LESS LIABILITIES: 0.6% | | | | | 10,130,326 | | |
NET ASSETS: 100.0% | | | | $ | 1,578,258,675 | | |
a Certain securities were fair valued under the valuation polices approved by the Board of Trustees (Note 2-A).
b Non-income producing security.
c Cost for federal income tax purposes is $1,228,821,638 and net unrealized appreciation consists of:
Gross unrealized appreciation | | $ | 403,759,351 | | |
Gross unrealized depreciation | | | (64,452,640 | ) | |
Net unrealized appreciation | | $ | 339,306,711 | | |
† Affiliated Issuer, as defined under the Investment Company Act of 1940 (ownership of 5% or more of the outstanding voting securities of this issuer)
ADR American Depositary Receipt
See accompanying notes to financial statements.
matthewsasia.com | 800.789.ASIA 59

PORTFOLIO MANAGERS*
Kenichi Amaki
Lead Manager
Taizo Ishida
Co-Manager
* Effective April 30, 2015, Kenichi Amaki became Lead Manager and Taizo Ishida became Co-Manager of this Fund.
FUND FACTS
| | | Investor Class | | Institutional Class | |
Ticker | | MJFOX | | MIJFX | |
CUSIP | | 577130800 | | 577130792 | |
Inception | | 12/31/98 | | 10/29/10 | |
NAV | | $19.20 | | $19.22 | |
Initial Investment | | $2,500 | | $3 million | |
Gross Expense Ratio1 | | 1.03% | | 0.90% | |
Portfolio Statistics
Total # of Positions | | 58 | |
Net Assets | | $1.3 billion | |
Weighted Average Market Cap | | $20.9 billion | |
Portfolio Turnover | | 42.52%2 | |
Benchmarks
MSCI Japan Index
OBJECTIVE
Long-term capital appreciation.
STRATEGY
Under normal market conditions, the Fund seeks to achieve its investment objective by investing at least 80% of its total net assets, which include borrowings for investment purposes, in the common and preferred stocks of companies located in Japan.
1 Prospectus expense ratios.
2 The lesser of fiscal year 2014 long-term purchase costs or sales proceeds divided by the average monthly market value of long-term securities.
Matthews Japan Fund
Portfolio Manager Commentary
For the first half of 2015, the Matthews Japan Fund gained 22.29% (Investor Class) and 22.34% (Institutional Class), outperforming its benchmark, the MSCI Japan Index, which returned 13.79%. For the quarter ending June 30, the Fund returned 4.18% (Investor Class) and 4.23% (Institutional Class), outperforming the benchmark, which returned 3.12%.
Market Environment:
Japan's equity market delivered solid returns during the first half buoyed by a recovery in macroeconomic growth and robust corporate earnings. An increase in equity allocations by domestic pension funds has also supported market performance. The yen weakened –2.3% toward the end of the half, prompted by a heightened possibility of a U.S. Federal Reserve rate hike. However, the decline was not momentous enough to significantly dampen U.S. dollar-based returns.
The Corporate Governance Code, a key component of Prime Minister Shinzo Abe's "Third Arrow" growth strategy, was implemented in June. In our meetings with various companies, we feel that this has stimulated more extensive thought, at the management level, regarding capital efficiency with particular attention to shareholder returns such as dividends and share buybacks.
Performance Contributors and Detractors:
Benefit One, a provider of outsourced employee benefit plans, was the top contributor to performance during the second quarter. Its growth is accelerating on the back of an expanding membership base for its health care, incentive and personal benefits services. We are a bit more cautious than before on the firm as valuations have re-rated, but continue to see solid momentum in its business.
By sector, consumer discretionary was the main driver of the Fund's outperformance versus the benchmark. Japan's consumption environment is slowly improving as the rise in nominal wages is prompting consumers to spend a little more on quality. Ryohin Keikaku, the owner of the MUJI retail brand of clothing and housewares, is benefiting from this recovery and performed solidly during the quarter. Auto dealership VT Holdings also performed well on the back of recovering repair and service sales.
On the other hand, the financials sector was the biggest drag on relative performance. Our underweight position in banks hurt us as markets applauded actions by banks to dispose of their cross shareholdings, and return cash to investors. Additionally, profit-taking hit Financial Products Group, following its stellar performance last quarter. Efforts by tax authorities to step up scrutiny of tax savings products have weighed on sentiment, but these measures targeting large corporations are unlikely to affect the group's client base, which consists mostly of small companies.
Notable Portfolio Changes:
During the quarter, we added Kyoritsu Maintenance, an operator of hotels and dormitories. Hotel operations have been benefiting from the influx of inbound tourists, which has pushed up both occupancy and prices. The company plans to aggressively invest in the expansion of its hotel
60 MATTHEWS ASIA FUNDS
PERFORMANCE AS OF JUNE 30, 2015
| | | | | | | | | Average Annual Total Returns | | | |
| | | 3 Months | | YTD | | 1 Year | | 3 Years | | 5 Years | | 10 Years | | Since
Inception | | Inception
Date | |
Investor Class (MJFOX) | | | 4.18 | % | | | 22.29 | % | | | 15.69 | % | | | 18.75 | % | | | 14.87 | % | | | 4.18 | % | | | 6.14 | % | | 12/31/98 | |
Institutional Class (MIJFX) | | | 4.23 | % | | | 22.34 | % | | | 15.82 | % | | | 18.91 | % | | | n.a. | | | | n.a. | | | | 13.19 | % | | 10/29/10 | |
MSCI Japan Index3 | | | 3.12 | % | | | 13.79 | % | | | 8.63 | % | | | 13.56 | % | | | 9.03 | % | | | 4.39 | % | | | 3.24 | %4 | | | | | |
Lipper Japanese Funds Category Average5 | | | 3.95 | % | | | 15.88 | % | | | 11.28 | % | | | 14.13 | % | | | 10.61 | % | | | 3.83 | % | | | 4.21 | %4 | | | | | |
| Performance assumes reinvestment of all dividends and/or distributions before taxes. All performance quoted represents past performance and is no guarantee of future results. Investment return and principal value will fluctuate with market conditions so that when redeemed, shares may be worth more or less than their original cost. Current performance may be lower or higher than the return figures quoted. For the Fund's most recent month-end performance, visit matthewsasia.com. | |
GROWTH OF A $10,000 INVESTMENT SINCE INCEPTION—INVESTOR CLASS
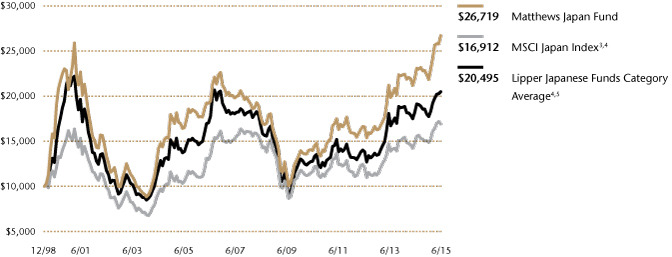
Plotted montly. The performance data and graph do not reflect the deduction of taxes that a shareholder would pay on dividends, capital gains distributions or redemption of Fund shares. Values are in US$.
3 It is not possible to invest directly in an index. Source: Index data from Morgan Stanley Capital International and Bloomberg; total return calculations performed by BNY Mellon Investment Servicing (US) Inc. Please see page 85 for index definitions.
4 Calculated from 12/31/98.
5 The Lipper Category Average does not reflect sales charges and is based on total return, including reinvestment of dividends and capital gains for the stated periods.
TOP TEN HOLDINGS6
| | | Sector | | % of Net Assets | |
Toyota Motor Corp. | | Consumer Discretionary | | | 3.3 | % | |
Kao Corp. | | Consumer Staples | | | 3.0 | % | |
Tokio Marine Holdings, Inc. | | Financials | | | 2.5 | % | |
COOKPAD, Inc. | | Information Technology | | | 2.5 | % | |
Seven & I Holdings Co., Ltd. | | Consumer Staples | | | 2.5 | % | |
Keyence Corp. | | Information Technology | | | 2.5 | % | |
ORIX Corp. | | Financials | | | 2.3 | % | |
Hoya Corp. | | Health Care | | | 2.3 | % | |
Asahi Intecc Co., Ltd. | | Health Care | | | 2.2 | % | |
Komatsu, Ltd. | | Industrials | | | 2.2 | % | |
% OF ASSETS IN TOP TEN | | | | | 25.3 | % | |
6 Holdings may combine more than one security from same issuer and related depositary receipts.
matthewsasia.com | 800.789.ASIA 61
SECTOR ALLOCATION (%)
Industrials | | | 22.9 | | |
Consumer Discretionary | | | 15.4 | | |
Consumer Staples | | | 14.6 | | |
Information Technology | | | 14.3 | | |
Health Care | | | 13.4 | | |
Financials | | | 11.2 | | |
Materials | | | 2.4 | | |
Telecommunication Services | | | 2.1 | | |
Cash and Other Assets, Less Liabilities | | | 3.7 | | |
MARKET CAP EXPOSURE (%)7
Mega Cap (over $25B) | | | 19.1 | | |
Large Cap ($10B–$25B) | | | 22.0 | | |
Mid Cap ($3B–$10B) | | | 18.4 | | |
Small Cap (under $3B) | | | 36.8 | | |
Cash and Other Assets, Less Liabilities | | | 3.7 | | |
7 Source: FactSet Research Systems. Percentage values in data are rounded to the nearest tenth of one percent; the values may not sum to 100% due to rounding.
Matthews Japan Fund
Portfolio Manager Commentary (continued)
portfolio and given their track record, we are quite optimistic on its ability to execute. Meanwhile, we significantly trimmed our position in robotics company FANUC. Though we applaud the company's new shareholder return policy, we believe the share price has moved away from fundamentals, which is becoming increasingly challenging with declining market share in numerical control and decelerating capital investment by smartphone manufacturers.
Additionally, as a result of the merger of the Nomura Japan Fund into the Matthews Japan Fund, the number of holdings increased beyond its typical range. However, through selective selling, we have returned the portfolio to within our normal range of 50 to 70 holdings.
Outlook:
Uncertainty in the external environment is mounting. Markets appear to have baked in an interest rate hike by the Federal Reserve, to a certain extent, but if the pace of rate hikes were to be accelerated, the yen could weaken further from current levels. The era of ultra-low interest rates in the U.S. is coming to an end, and it remains to be seen how global risk assets respond to this change. We will continue to monitor developments closely to assess any potential impact on portfolio holdings. Still, Japan's fundamentals remain solid. Unemployment is low, nominal wages are rising, exports are improving and corporate earnings are growing. There are certain areas of the market in which valuations have become rich. However, on average, Japan's market remains attractive relative to other developed markets. Additionally, we are seeing encouraging signs of change in corporate governance practices. It won't be an overnight transformation, but it is reasonable to expect positive changes to capital allocation policies over the next several years, leaving an optimistic outlook for Japanese companies.
62 MATTHEWS ASIA FUNDS
Matthews Japan Fund June 30, 2015
Schedule of Investmentsa (unaudited)
COMMON EQUITIES: JAPAN: 96.3%
| | Shares | | Value | |
INDUSTRIALS: 22.9% | |
Machinery: 9.8% | |
Komatsu, Ltd. | | | 1,391,100 | | | $ | 27,910,078 | | |
Mitsubishi Heavy Industries, Ltd. | | | 4,046,000 | | | | 24,595,458 | | |
Harmonic Drive Systems, Inc. | | | 1,152,000 | | | | 22,586,535 | | |
Nabtesco Corp. | | | 827,200 | | | | 20,749,268 | | |
SMC Corp. | | | 59,900 | | | | 18,025,056 | | |
FANUC Corp. | | | 46,400 | | | | 9,494,164 | | |
| | | | | 123,360,559 | | |
Professional Services: 4.6% | |
Nihon M&A Center, Inc. | | | 621,100 | | | | 25,604,625 | | |
Benefit One, Inc. | | | 751,200 | | | | 16,854,666 | | |
Recruit Holdings Co., Ltd. | | | 530,100 | | | | 16,165,009 | | |
| | | | | 58,624,300 | | |
Electrical Equipment: 3.7% | |
Nidec Corp. | | | 337,000 | | | | 25,220,344 | | |
Mabuchi Motor Co., Ltd. | | | 333,900 | | | | 21,119,984 | | |
| | | | | 46,340,328 | | |
Building Products: 2.5% | |
Daikin Industries, Ltd. | | | 253,000 | | | | 18,187,760 | | |
Aica Kogyo Co., Ltd. | | | 553,800 | | | | 12,864,152 | | |
| | | | | 31,051,912 | | |
Road & Rail: 1.6% | |
Trancom Co., Ltd. | | | 363,200 | | | | 19,830,636 | | |
Air Freight & Logistics: 0.7% | |
AIT Corp.† | | | 999,900 | | | | 9,477,338 | | |
Total Industrials | | | | | 288,685,073 | | |
CONSUMER DISCRETIONARY: 15.4% | |
Specialty Retail: 5.0% | |
VT Holdings Co., Ltd. | | | 3,391,100 | | | | 20,285,821 | | |
Sac's Bar Holdings, Inc. | | | 983,250 | | | | 17,737,637 | | |
United Arrows, Ltd. | | | 484,300 | | | | 15,174,746 | | |
Workman Co., Ltd. | | | 170,100 | | | | 9,345,869 | | |
| | | | | 62,544,073 | | |
Automobiles: 3.3% | |
Toyota Motor Corp. | | | 626,400 | | | | 41,916,987 | | |
Hotels, Restaurants & Leisure: 2.1% | |
Kyoritsu Maintenance Co., Ltd. | | | 328,600 | | | | 21,121,903 | | |
Ride On Express Co., Ltd. | | | 490,300 | | | | 5,804,998 | | |
| | | | | 26,926,901 | | |
Multiline Retail: 1.9% | |
Ryohin Keikaku Co., Ltd. | | | 122,000 | | | | 23,658,060 | | |
Auto Components: 1.9% | |
Nifco, Inc. | | | 544,900 | | | | 23,617,155 | | |
Household Durables: 1.2% | |
Rinnai Corp. | | | 196,800 | | | | 15,497,038 | | |
Total Consumer Discretionary | | | | | 194,160,214 | | |
| | Shares | | Value | |
CONSUMER STAPLES: 14.6% | |
Food & Staples Retailing: 6.2% | |
Seven & I Holdings Co., Ltd. | | | 731,600 | | | $ | 31,404,392 | | |
San-A Co., Ltd. | | | 546,200 | | | | 24,172,920 | | |
Cosmos Pharmaceutical Corp. | | | 166,400 | | | | 22,578,911 | | |
| | | | | 78,156,223 | | |
Household Products: 4.1% | |
Unicharm Corp. | | | 1,163,600 | | | | 27,640,770 | | |
Pigeon Corp. | | | 758,900 | | | | 23,900,010 | | |
| | | | | 51,540,780 | | |
Personal Products: 3.0% | |
Kao Corp. | | | 809,800 | | | | 37,661,359 | | |
Food Products: 1.3% | |
Calbee, Inc. | | | 404,200 | | | | 17,028,153 | | |
Total Consumer Staples | | | | | 184,386,515 | | |
INFORMATION TECHNOLOGY: 14.3% | |
Electronic Equipment, Instruments & Components: 8.6% | |
Keyence Corp. | | | 57,600 | | | | 31,045,069 | | |
Murata Manufacturing Co., Ltd. | | | 138,900 | | | | 24,240,196 | | |
Omron Corp. | | | 549,600 | | | | 23,873,682 | | |
Yokogawa Electric Corp. | | | 1,429,500 | | | | 18,410,830 | | |
Anritsu Corp. | | | 1,663,700 | | | | 11,215,355 | | |
| | | | | 108,785,132 | | |
Internet Software & Services: 3.6% | |
COOKPAD, Inc. | | | 1,747,500 | | | | 31,684,755 | | |
Kakaku.com, Inc. | | | 983,000 | | | | 14,222,707 | | |
| | | | | 45,907,462 | | |
Semiconductors & Semiconductor Equipment: 2.1% | |
Rohm Co., Ltd. | | | 395,600 | | | | 26,504,847 | | |
Total Information Technology | | | | | 181,197,441 | | |
HEALTH CARE: 13.4% | |
Health Care Equipment & Supplies: 8.6% | |
Hoya Corp. | | | 719,100 | | | | 28,799,765 | | |
Asahi Intecc Co., Ltd. | | | 413,600 | | | | 28,336,307 | | |
Sysmex Corp. | | | 419,800 | | | | 25,002,242 | | |
Daiken Medical Co., Ltd. | | | 1,411,000 | | | | 14,046,357 | | |
CYBERDYNE, Inc.b | | | 475,200 | | | | 12,369,857 | | |
| | | | | 108,554,528 | | |
Health Care Technology: 2.1% | |
M3, Inc. | | | 1,351,900 | | | | 27,175,130 | | |
Pharmaceuticals: 1.5% | |
Rohto Pharmaceutical Co., Ltd. | | | 1,138,100 | | | | 18,773,514 | | |
Health Care Providers & Services: 1.2% | |
N Field Co., Ltd.b,† | | | 672,600 | | | | 10,577,014 | | |
WIN-Partners Co., Ltd. | | | 311,000 | | | | 4,076,022 | | |
| | | | | 14,653,036 | | |
Total Health Care | | | | | 169,156,208 | | |
matthewsasia.com | 800.789.ASIA 63
Matthews Japan Fund June 30, 2015
Schedule of Investmentsa (unaudited) (continued)
COMMON EQUITIES: JAPAN (continued)
| | Shares | | Value | |
FINANCIALS: 11.2% | |
Diversified Financial Services: 6.5% | |
ORIX Corp. | | | 1,954,600 | | | $ | 29,024,797 | | |
Zenkoku Hosho Co., Ltd. | | | 638,100 | | | | 22,712,158 | | |
Financial Products Group Co., Ltd. | | | 2,286,500 | | | | 17,338,634 | | |
eGuarantee, Inc.† | | | 638,000 | | | | 13,238,188 | | |
| | | | | 82,313,777 | | |
Insurance: 2.5% | |
Tokio Marine Holdings, Inc. | | | 763,900 | | | | 31,769,914 | | |
Banks: 2.2% | |
Sumitomo Mitsui Financial Group, Inc. | | | 609,200 | | | | 27,121,099 | | |
Total Financials | | | | | 141,204,790 | | |
MATERIALS: 2.4% | |
Chemicals: 2.4% | |
Shin-Etsu Chemical Co., Ltd. | | | 297,000 | | | | 18,417,239 | | |
MORESCO Corp.† | | | 636,600 | | | | 11,694,482 | | |
Total Materials | | | | | 30,111,721 | | |
TELECOMMUNICATION SERVICES: 2.1% | |
Wireless Telecommunication Services: 2.1% | |
SoftBank Corp. | | | 443,800 | | | | 26,141,148 | | |
Total Telecommunication Services | | | | | 26,141,148 | | |
TOTAL INVESTMENTS: 96.3% | | | | | 1,215,043,110 | | |
(Cost $1,039,302,564c) | |
CASH AND OTHER ASSETS,
LESS LIABILITIES: 3.7% | | | | | 47,105,083 | | |
NET ASSETS: 100.0% | | | | $ | 1,262,148,193 | | |
a Certain securities were fair valued under the valuation polices approved by the Board of Trustees (Note 2-A).
b Non-income producing security.
c Cost for federal income tax purposes is $1,039,974,017 and net unrealized appreciation consists of:
Gross unrealized appreciation | | $ | 184,765,205 | | |
Gross unrealized depreciation | | | (9,696,112 | ) | |
Net unrealized appreciation | | $ | 175,069,093 | | |
† Affiliated Issuer, as defined under the Investment Company Act of 1940 (ownership of 5% or more of the outstanding voting securities of this issuer)
See accompanying notes to financial statements.
64 MATTHEWS ASIA FUNDS

PORTFOLIO MANAGERS
Michael J. Oh, CFA
Lead Manager
Michael B. Han, CFA
Co-Manager
FUND FACTS
| | | Investor Class | | Institutional Class | |
Ticker | | MAKOX | | MIKOX | |
CUSIP | | 577130305 | | 577130826 | |
Inception | | 1/3/95 | | 10/29/10 | |
NAV | | $6.54 | | $6.58 | |
Initial Investment | | $2,500 | | $3 million | |
Gross Expense Ratio1 | | 1.11% | | 0.93% | |
Portfolio Statistics
Total # of Positions | | | 53 | | |
Net Assets | | $215.8 million | |
Weighted Average Market Cap | | $21.2 billion | |
Portfolio Turnover | | | 17.37 | %2 | |
Benchmark
Korea Composite Stock Price Index
OBJECTIVE
Long-term capital appreciation.
STRATEGY
Under normal market conditions, the Fund seeks to achieve its investment objective by investing at least 80% of its total net assets, which include borrowings for investment purposes, in the common and preferred stocks of companies located in South Korea.
1 Prospectus expense ratios.
2 The lesser of fiscal year 2014 long-term purchase costs or sales proceeds divided by the average monthly market value of long-term securities.
Matthews Korea Fund
Portfolio Manager Commentary
For the first half of 2015, the Matthews Korea Fund rose 15.75% (Investor Class) and 15.85% (Institutional Class), outperforming its benchmark, the Korea Composite Stock Price Index, which returned 6.25%. For the quarter ending June 30, the Fund returned 6.51% (Investor Class) and 6.65% (Institutional Class) while its benchmark was nearly flat at 0.82%.
Market Environment:
Early during the second quarter, the Korean stock market experienced a strong rebound amid signs of improving domestic consumption and sentiment. However the outbreak of a virus, the Middle East Respiratory Syndrome (MERS), in late May triggered concerns over the economy. While the spread of MERS was generally confined to hospitals, infecting fewer than 200 people, the outbreak impacted domestic consumption as well as tourism, and overall economic activity declined. South Korea's tourism sector reported a significant rate of cancellations, mainly from the greater China region, reminiscent of the Severe Acute Respiratory Syndrome (SARS) epidemic that disrupted the region a decade ago.
In an effort to contain further economic fallout, the central bank cut its policy rate by 25 basis points (0.25%) in June. The Ministry of Finance also drew up a supplementary budget after cutting its economic growth forecast for the year. Policy support, as well as stronger measures to contain the epidemic, improved investor sentiment as South Korea's stock market began to rebound toward the end of June.
Performance Contributors and Detractors:
Among the top contributors to Fund performance during the first six months of the year were BGF retail, Amorepacific and CJ CGV. BGF retail, one of Korea's major convenience store operators, appreciated sharply after announcing strong first quarter results. A cigarette price hike early this year also helped the company since sales of cigarettes did not decline as much as had been expected.
Beauty product maker Amorepacific's common and preferred shares both performed well following solid first quarter results. The company's strong sales to Chinese tourists via the duty free channel, as well as robust business in China overall, were notable.
Conversely, among the biggest detractors to Fund performance were auto names such as Hankook Tire and Hyundai Motor as well as SK Hynix, a semiconductor manufacturer. Both Hyundai Motor and Hankook Tire have been suffering from adverse business environments as their industries struggle with rising competition in China and a weaker yen that benefited Japanese competitors. These factors have led to disappointing earnings and operating performance in recent quarters. SK Hynix corrected despite strong first quarter results as the market appeared concerned over weaker demand in personal computers and intensified competition among three major players, which may hurt profitability.
Notable Portfolio Changes:
During the quarter, we started a position in Daesang, a major South Korean food manufacturer and distributor. The company has a strong franchise in the traditional sauce, seasoning and food material business
matthewsasia.com | 800.789.ASIA 65
PERFORMANCE AS OF JUNE 30, 2015
| | | | | | | | | Average Annual Total Returns | | | |
| | | 3 Months | | YTD | | 1 Year | | 3 Years | | 5 Years | | 10 Years | | Since
Inception | | Inception
Date | |
Investor Class (MAKOX) | | | 6.51 | % | | | 15.75 | % | | | 9.04 | % | | | 14.73 | % | | | 13.30 | % | | | 10.19 | % | | | 6.48 | % | | 1/3/95 | |
Institutional Class (MIKOX) | | | 6.65 | % | | | 15.85 | % | | | 9.35 | % | | | 14.85 | % | | | n.a. | | | | n.a. | | | | 10.66 | % | | 10/29/10 | |
Korea Composite Stock Price Index3 | | | 0.82 | % | | | 6.25 | % | | | -5.00 | % | | | 5.84 | % | | | 7.30 | % | | | 8.26 | % | | | 3.25 | %4 | | | | | |
Lipper Pacific ex Japan Funds Category Average5 | | | -0.25 | % | | | 4.27 | % | | | 0.56 | % | | | 8.60 | % | | | 7.11 | % | | | 8.66 | % | | | 6.37 | %4 | | | | | |
Performance assumes reinvestment of all dividends and/or distributions before taxes. All performance quoted represents past performance and is no guarantee of future results. Investment return and principal value will fluctuate with market conditions so that when redeemed, shares may be worth more or less than their original cost. Current performance may be lower or higher than the return figures quoted. For the Fund's most recent month-end performance, visit matthewsasia.com.
GROWTH OF A $10,000 INVESTMENT SINCE INCEPTION—INVESTOR CLASS
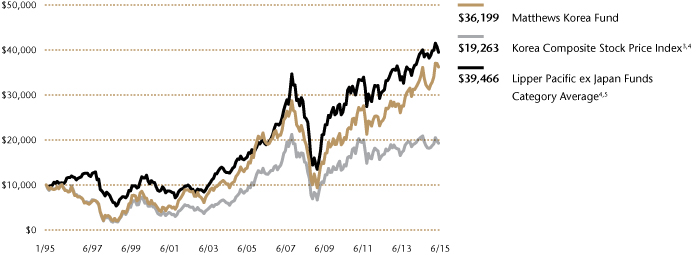
Plotted monthly. The performance data and graph do not reflect the deduction of taxes that a shareholder would pay on dividends, capital gains distributions or redemption of Fund shares. Values are in US$.
3 It is not possible to invest directly in an index. Source: Index data from Morgan Stanley Capital International and Bloomberg; total return calculations performed by BNY Mellon Investment Servicing (US) Inc. Please see page 85 for index definition.
4 Calculated from 1/3/95.
5 The Lipper Category Average does not reflect sales charges and is based on total return, including reinvestment of dividends and capital gains for the stated periods.
TOP TEN HOLDINGS6
| | | Sector | | % of Net Assets | |
BGF Retail Co., Ltd. | | Consumer Staples | | | 4.7 | % | |
Samsung Electronics Co., Ltd. | | Information Technology | | | 3.8 | % | |
Shinhan Financial Group Co., Ltd. | | Financials | | | 3.6 | % | |
Samsung Fire & Marine Insurance Co., Ltd., Pfd. | | Financials | | | 3.3 | % | |
Amorepacific Corp., Pfd. | | Consumer Staples | | | 3.2 | % | |
Samsung Electronics Co., Ltd., Pfd. | | Information Technology | | | 3.1 | % | |
Naver Corp. | | Information Technology | | | 2.7 | % | |
Ottogi Corp. | | Consumer Staples | | | 2.5 | % | |
Orion Corp. | | Consumer Staples | | | 2.5 | % | |
E-Mart Co., Ltd. | | Consumer Staples | | | 2.4 | % | |
% OF ASSETS IN TOP TEN | | | | | 31.8 | % | |
6 Holdings may combine more than one security from same issuer and related depositary receipts.
66 MATTHEWS ASIA FUNDS
Matthews Korea Fund
Portfolio Manager Commentary (continued)
with significant market share in an oligopolistic market. In recent years, the company has been expanding into related businesses through acquisitions. We believe that the company's past acquisitions have been successful, as it bought small players at reasonable prices and its further acquisitions should help it leverage its strong brand and distribution capabilities. A recent correction of its share price due to disappointing earnings provided a good buying opportunity for us.
Outlook:
While the MERS outbreak hurt near-term domestic consumption, we believe that its impact on South Korea will be short-lived given the government's swift policy response. We also remain optimistic over the investment outlook among the country's structural growth opportunities.
More importantly, we have observed an interesting case of shareholder activism in South Korea initiated by a U.S. hedge fund, which condemned a Samsung group merger plan on the belief that the deal between two key Samsung group units is not in the best interest of shareholders. The crux of the issue is the perceived potential for conflicts of interest between outside investors and the controlling chaebol, or large family conglomerates.
Many observers believe that the deal is not motivated by a desire to create synergies, such as cost savings, but instead by a desire to benefit one of South Korea's wealthiest families. Given the recent positive changes in shareholder policies in Japan, driven in part by government policies, we believe that South Korea may also experience a continued groundswell in shareholder activism toward better corporate governance.
SECTOR ALLOCATION (%)
Consumer Staples | | | 25.6 | | |
Consumer Discretionary | | | 21.9 | | |
Financials | | | 16.7 | | |
Information Technology | | | 12.8 | | |
Industrials | | | 6.4 | | |
Materials | | | 4.2 | | |
Telecommunication Services | | | 3.8 | | |
Health Care | | | 3.7 | | |
Energy | | | 2.7 | | |
Cash and Other Assets, Less Liabilities | | | 2.2 | | |
MARKET CAP EXPOSURE (%)7
Mega Cap (over $25B) | | | 10.7 | | |
Large Cap ($10B–$25B) | | | 31.3 | | |
Mid Cap ($3B–$10B) | | | 25.8 | | |
Small Cap (under $3B) | | | 30.0 | | |
Cash and Other Assets, Less Liabilities | | | 2.2 | | |
7 Source: FactSet Research Systems. Percentage values in data are rounded to the nearest tenth of one percent; the values may not sum to 100% due to rounding.
matthewsasia.com | 800.789.ASIA 67
Matthews Korea Fund June 30, 2015
Schedule of Investmentsa (unaudited)
COMMON EQUITIES: SOUTH KOREA: 79.7%
| | Shares | | Value | |
CONSUMER STAPLES: 20.0% | |
Food & Staples Retailing: 8.9% | |
BGF Retail Co., Ltd. | | | 70,346 | | | $ | 10,077,476 | | |
E-Mart Co., Ltd. | | | 25,451 | | | | 5,268,520 | | |
Hyundai Greenfood Co., Ltd. | | | 207,304 | | | | 3,917,259 | | |
| | | | | 19,263,255 | | |
Food Products: 7.7% | |
Ottogi Corp. | | | 7,732 | | | | 5,503,795 | | |
Orion Corp. | | | 5,767 | | | | 5,407,930 | | |
Binggrae Co., Ltd. | | | 46,866 | | | | 3,549,282 | | |
Daesang Corp. | | | 70,618 | | | | 2,247,676 | | |
| | | | | 16,708,683 | | |
Household Products: 1.7% | |
LG Household & Health Care, Ltd. | | | 5,375 | | | | 3,725,919 | | |
Personal Products: 1.7% | |
Amorepacific Corp. | | | 9,508 | | | | 3,555,621 | | |
Total Consumer Staples | | | | | 43,253,478 | | |
CONSUMER DISCRETIONARY: 18.7% | |
Hotels, Restaurants & Leisure: 6.1% | |
Kangwon Land, Inc. | | | 140,084 | | | | 4,641,894 | | |
Modetour Network, Inc. | | | 148,910 | | | | 4,425,153 | | |
Shinsegae Food Co., Ltd. | | | 25,035 | | | | 4,123,250 | | |
| | | | | 13,190,297 | | |
Auto Components: 3.4% | |
Hankook Tire Co., Ltd. | | | 115,792 | | | | 4,354,765 | | |
Hyundai Mobis Co., Ltd. | | | 15,943 | | | | 3,026,741 | | |
| | | | | 7,381,506 | | |
Media: 3.2% | |
CJ CGV Co., Ltd. | | | 43,843 | | | | 5,024,377 | | |
Cheil Worldwide, Inc.b | | | 121,725 | | | | 1,884,363 | | |
| | | | | 6,908,740 | | |
Specialty Retail: 2.1% | |
Hotel Shilla Co., Ltd. | | | 45,346 | | | | 4,533,237 | | |
Automobiles: 1.6% | |
Kia Motors Corp. | | | 83,931 | | | | 3,405,079 | | |
Multiline Retail: 1.4% | |
Hyundai Department Store Co., Ltd. | | | 23,671 | | | | 3,115,433 | | |
Internet & Catalog Retail: 0.9% | |
Hyundai Home Shopping Network Corp. | | | 17,709 | | | | 1,944,823 | | |
Total Consumer Discretionary | | | | | 40,479,115 | | |
FINANCIALS: 13.4% | |
Banks: 6.3% | |
Shinhan Financial Group Co., Ltd. | | | 207,398 | | | | 7,719,763 | | |
KB Financial Group, Inc. | | | 96,407 | | | | 3,184,121 | | |
DGB Financial Group, Inc. | | | 250,588 | | | | 2,624,320 | | |
| | | | | 13,528,204 | | |
| | Shares | | Value | |
Insurance: 3.6% | |
Dongbu Insurance Co., Ltd. | | | 99,061 | | | $ | 5,009,282 | | |
Samsung Fire & Marine Insurance Co., Ltd. | | | 10,355 | | | | 2,728,555 | | |
| | | | | 7,737,837 | | |
Capital Markets: 3.5% | |
Shinyoung Securities Co., Ltd. | | | 80,699 | | | | 4,088,759 | | |
Kiwoom Securities Co., Ltd. | | | 54,034 | | | | 3,574,929 | | |
| | | | | 7,663,688 | | |
Total Financials | | | | | 28,929,729 | | |
INFORMATION TECHNOLOGY: 9.7% | |
Technology Hardware, Storage & Peripherals: 3.8% | |
Samsung Electronics Co., Ltd. | | | 7,226 | | | | 8,198,520 | | |
Semiconductors & Semiconductor Equipment: 2.8% | |
SK Hynix, Inc. | | | 92,046 | | | | 3,488,683 | | |
Koh Young Technology, Inc. | | | 67,933 | | | | 2,500,253 | | |
| | | | | 5,988,936 | | |
Internet Software & Services: 2.7% | |
Naver Corp. | | | 10,157 | | | | 5,765,486 | | |
Electronic Equipment, Instruments & Components: 0.4% | |
Bixolon Co., Ltd. | | | 84,519 | | | | 965,541 | | |
Total Information Technology | | | | | 20,918,483 | | |
INDUSTRIALS: 6.4% | |
Commercial Services & Supplies: 2.1% | |
KEPCO Plant Service & Engineering Co., Ltd. | | | 43,728 | | | | 4,625,850 | | |
Machinery: 1.6% | |
Hy-Lok Corp. | | | 97,458 | | | | 3,381,258 | | |
Professional Services: 1.5% | |
SaraminHR Co., Ltd. | | | 146,986 | | | | 3,281,143 | | |
Trading Companies & Distributors: 1.2% | |
iMarketKorea, Inc. | | | 94,864 | | | | 2,550,676 | | |
Total Industrials | | | | | 13,838,927 | | |
TELECOMMUNICATION SERVICES: 3.8% | |
Wireless Telecommunication Services: 2.3% | |
SK Telecom Co., Ltd. ADR | | | 197,900 | | | | 4,905,941 | | |
Diversified Telecommunication Services: 1.5% | |
KT Corp. ADRb | | | 252,900 | | | | 3,204,243 | | |
Total Telecommunication Services | | | | | 8,110,184 | | |
HEALTH CARE: 3.7% | |
Pharmaceuticals: 3.7% | |
Yuhan Corp. | | | 14,035 | | | | 3,431,693 | | |
Dong-A ST Co., Ltd. | | | 23,987 | | | | 3,188,538 | | |
DongKook Pharmaceutical Co., Ltd. | | | 24,611 | | | | 1,275,968 | | |
Total Health Care | | | | | 7,896,199 | | |
68 MATTHEWS ASIA FUNDS
Matthews Korea Fund June 30, 2015
Schedule of Investmentsa (unaudited) (continued)
COMMON EQUITIES: SOUTH KOREA (continued)
| | Shares | | Value | |
MATERIALS: 2.1% | |
Chemicals: 2.1% | |
LG Chem, Ltd. | | | 12,837 | | | $ | 3,201,371 | | |
KPX Chemical Co., Ltd. | | | 24,566 | | | | 1,276,532 | | |
Total Materials | | | | | 4,477,903 | | |
ENERGY: 1.9% | |
Oil, Gas & Consumable Fuels: 1.9% | |
SK Innovation Co., Ltd.b | | | 22,253 | | | | 2,426,222 | | |
S-Oil Corp. | | | 27,690 | | | | 1,673,546 | | |
Total Energy | | | | | 4,099,768 | | |
TOTAL COMMON EQUITIES | | | | | 172,003,786 | | |
(Cost $110,144,116) | | | | | |
PREFERRED EQUITIES: SOUTH KOREA: 18.1%
CONSUMER STAPLES: 5.6% | |
Personal Products: 3.2% | |
Amorepacific Corp., Pfd. | | | 37,590 | | | | 6,908,378 | | |
Household Products: 2.4% | |
LG Household & Health Care, Ltd., Pfd. | | | 17,189 | | | | 5,218,810 | | |
Total Consumer Staples | | | | | 12,127,188 | | |
FINANCIALS: 3.3% | |
Insurance: 3.3% | |
Samsung Fire & Marine Insurance
Co., Ltd., Pfd. | | | 44,291 | | | | 7,132,200 | | |
Total Financials | | | | | 7,132,200 | | |
CONSUMER DISCRETIONARY: 3.2% | |
Automobiles: 2.2% | |
Hyundai Motor Co., Ltd., 2nd Pfd. | | | 51,719 | | | | 4,863,621 | | |
Specialty Retail: 1.0% | |
Hotel Shilla Co., Ltd., Pfd. | | | 35,672 | | | | 2,142,115 | | |
Total Consumer Discretionary | | | | | 7,005,736 | | |
INFORMATION TECHNOLOGY: 3.1% | |
Technology Hardware, Storage & Peripherals: 3.1% | |
Samsung Electronics Co., Ltd., Pfd. | | | 7,423 | | | | 6,596,974 | | |
Total Information Technology | | | | | 6,596,974 | | |
MATERIALS: 2.1% | |
Chemicals: 2.1% | |
LG Chem, Ltd., Pfd. | | | 26,973 | | | | 4,543,050 | | |
Total Materials | | | | | 4,543,050 | | |
| | Shares | | Value | |
ENERGY: 0.8% | |
Oil, Gas & Consumable Fuels: 0.8% | |
S-Oil Corp., Pfd. | | | 43,425 | | | $ | 1,623,603 | | |
Total Energy | | | | | 1,623,603 | | |
TOTAL PREFERRED EQUITIES | | | | | 39,028,751 | | |
(Cost $23,290,441) | | | | | |
TOTAL INVESTMENTS: 97.8% | | | | | 211,032,537 | | |
(Cost $133,434,557c) | |
CASH AND OTHER ASSETS,
LESS LIABILITIES: 2.2% | | | | | 4,774,646 | | |
NET ASSETS: 100.0% | | | | $ | 215,807,183 | | |
a Certain securities were fair valued under the valuation polices approved by the Board of Trustees (Note 2-A).
b Non-income producing security.
c Cost for federal income tax purposes is $134,180,355 and net unrealized appreciation consists of:
Gross unrealized appreciation | | $ | 80,100,048 | | |
Gross unrealized depreciation | | | (3,247,866 | ) | |
Net unrealized appreciation | | $ | 76,852,182 | | |
ADR American Depositary Receipt
Pfd. Preferred
See accompanying notes to financial statements.
matthewsasia.com | 800.789.ASIA 69

ASIA SMALL COMPANY STRATEGIES
PORTFOLIO MANAGERS
Lydia So, CFA
Lead Manager
Kenichi Amaki | | Beini Zhou, CFA | |
Co-Manager | | Co-Manager | |
FUND FACTS
| | | Investor Class | | Institutional Class | |
Ticker | | MSMLX | | MISMX | |
CUSIP | | 577125206 | | 577125867 | |
Inception | | 9/15/08 | | 4/30/13 | |
NAV | | $22.74 | | $22.76 | |
Initial Investment | | $2,500 | | $3 million | |
Gross Expense Ratio1 | | 1.47% | | 1.25% | |
Portfolio Statistics
Total # of Positions | | 80 | |
Net Assets | | $829.0 million | |
Weighted Average Market Cap | | $1.3 billion | |
Portfolio Turnover | | 21.70%2 | |
Benchmark
MSCI AC Asia ex Japan Small Cap Index
Redemption Fee
2% within first 90 calendar days of purchase
OBJECTIVE
Long-term capital appreciation.
STRATEGY
Under normal market conditions, the Fund seeks to achieve its investment objective by investing at least 80% of its total net assets, which include borrowings for investment purposes, in the common and preferred stocks of Small Companies located in Asia ex Japan, which consists of all countries and markets in Asia excluding Japan, but including all other developed, emerging and frontier countries and markets in the Asian region.
1 Prospectus expense ratios.
2 The lesser of fiscal year 2014 long-term purchase costs or sales proceeds divided by the average monthly market value of long-term securities.
Matthews Asia Small Companies Fund
Portfolio Manager Commentary
For the first half of 2015, the Matthews Asia Small Companies Fund returned 5.96% (Investor Class) and 6.06% (Institutional Class), while its benchmark, the MSCI All Country Asia ex Japan Small Cap Index, returned 11.37%. For the quarter ending June 30, the Fund returned 3.55% (Investor Class) and 3.60% (Institutional Class), while its benchmark returned 5.50%.
Market Environment:
The beginning of the quarter witnessed a solid rally in China and Hong Kong markets. In particular, the Hang Seng Index rose nearly 20% from mid-March to the end of April, driven by record liquidity from mainland China investors who took advantage of the relatively new Shanghai—Hong Kong Stock Connect Program that was launched last November. China's domestic A-share market also continued its rally. The A-share index troughed about a year ago in mid-2014 and then proceeded to more than double in less than 12 months.
Unlike many markets in the rest of the world, retail investors have dominated China's A-share market trading. This has led to not only higher volatility but also an increasing detachment of share prices away from underlying fundamentals. Triple digit price-to-earnings ratios* are now not uncommon among A-share stocks. Many A-share companies traded at unjustifiably hefty multiples, much higher than their Hong Kong-traded industry peers. To offer an example of the recent buying frenzy, one A share-listed real estate firm saw its share price more than double within a week of merely announcing a corporate name change to reflect its intention to enter peer-to-peer lending.
However the China bull market run, which was driven in part by margin lending, was not sustainable. In early July, shares on both the Hong Kong and China domestic A-share markets plummeted as local investors seemed to pay little attention to company fundamentals. The market tumult appeared to stabilize within a few days.
Performance Contributors and Detractors:
The Fund's underperformance versus its benchmark during the quarter came primarily from two sources—the portfolio's underweight in the Hong Kong market and its overweight in the Indonesian market. Our under-allocation in Hong Kong hurt performance following that market's rally early in the quarter. The Hong Kong rally was somewhat reminiscent of the junk rally in 2009, when lower-quality companies jumped higher than higher-quality companies. As our long-time shareholders may know, we seek a portfolio of high-quality securities. However, the higher-quality names lagged those in the index during the rally. Regarding Indonesia, the country marked disappointing first quarter GDP growth partly due to declining commodity prices. Slow policy action has also tempered investors' expectations of the new Jokowi government, leading to weakness in the local currency. We believe it will take some time for the new government's policies, especially those related to infrastructure projects, to enhance Indonesia's economy.
Among the biggest detractors to Fund performance in the quarter was Arwana Citramulia, an Indonesian ceramic tile business that we added
70 MATTHEWS ASIA FUNDS
PERFORMANCE AS OF JUNE 30, 2015
| | | | | | | | | Average Annual Total Returns | | | |
| | | 3 Months | | YTD | | 1 Year | | 3 Years | | 5 Years | | Since
Inception | | Inception
Date | |
Investor Class (MSMLX) | | | 3.55 | % | | | 5.96 | % | | | 5.83 | % | | | 13.85 | % | | | 10.47 | % | | | 15.91 | % | | 9/15/08 | |
Institutional Class (MISMX) | | | 3.60 | % | | | 6.06 | % | | | 6.07 | % | | | n.a. | | | | n.a. | | | | 8.17 | % | | 4/30/13 | |
MSCI AC Asia ex Japan Small Cap Index3 | | | 5.50 | % | | | 11.37 | % | | | 5.26 | % | | | 12.11 | % | | | 6.96 | % | | | 10.84 | %4 | | | | | |
Lipper Pacific ex Japan Funds Category Average5 | | | -0.25 | % | | | 4.27 | % | | | 0.56 | % | | | 8.60 | % | | | 7.11 | % | | | 9.33 | %6 | | | | | |
Performance assumes reinvestment of all dividends and/or distributions before taxes. All performance quoted represents past performance and is no guarantee of future results. Investment return and principal value will fluctuate with market conditions so that when redeemed, shares may be worth more or less than their original cost. Current performance may be lower or higher than the return figures quoted. For the Fund's most recent month-end performance, visit matthewsasia.com.
GROWTH OF A $10,000 INVESTMENT SINCE INCEPTION—INVESTOR CLASS
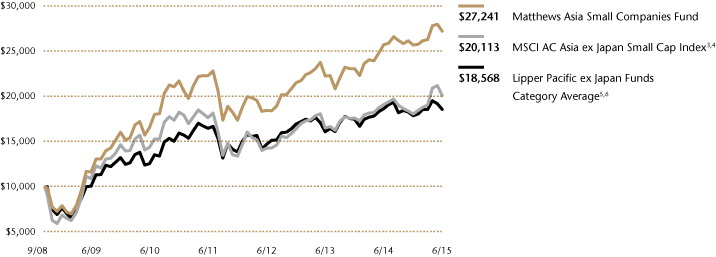
Plotted monthly. The performance data does not reflect the deduction of taxes that a shareholder would pay on dividends, capital gains distributions or redemption of Fund shares. Values are in US$.
3 It is not possible to invest directly in an index. Source: Index data from Morgan Stanley Capital International and Bloomberg; total return calculations performed by BNY Mellon Investment Servicing (US) Inc. Please see page 85 for index definition.
4 Calculated from 9/15/08.
5 The Lipper Category Average does not reflect sales charges and is based on total return, including reinvestment of dividends and capital gains for the stated periods.
6 Calculated from 9/30/08.
TOP TEN HOLDINGS7
| | | Sector | | Country | | % of Net Assets | |
PChome Online, Inc. | | Information Technology | | Taiwan | | | 2.6 | % | |
i-SENS, Inc. | | Health Care | | South Korea | | | 2.1 | % | |
Vitasoy International Holdings, Ltd. | | Consumer Staples | | China/Hong Kong | | | 2.1 | % | |
Kerry Logistics Network, Ltd. | | Industrials | | China/Hong Kong | | | 2.0 | % | |
Lee's Pharmaceutical Holdings, Ltd. | | Health Care | | China/Hong Kong | | | 2.0 | % | |
Hy-Lok Corp. | | Industrials | | South Korea | | | 1.9 | % | |
Voltronic Power Technology Corp. | | Industrials | | Taiwan | | | 1.8 | % | |
ARA Asset Management, Ltd. | | Financials | | Singapore | | | 1.8 | % | |
Interpark Corp. | | Consumer Discretionary | | South Korea | | | 1.8 | % | |
Medy-Tox, Inc. | | Health Care | | South Korea | | | 1.8 | % | |
% OF ASSETS IN TOP TEN | | | | | | | 19.9 | % | |
7 Holdings may combine more than one security from same issuer and related depositary receipts.
matthewsasia.com | 800.789.ASIA 71
COUNTRY ALLOCATION (%)8
China/Hong Kong | | | 30.3 | | |
Taiwan | | | 15.9 | | |
India | | | 11.9 | | |
South Korea | | | 11.6 | | |
Indonesia | | | 6.9 | | |
Singapore | | | 6.5 | | |
Malaysia | | | 5.7 | | |
Philippines | | | 4.5 | | |
Thailand | | | 3.6 | | |
Vietnam | | | 0.1 | | |
Cash and Other Assets, Less Liabilities | | | 3.0 | | |
SECTOR ALLOCATION (%)
Industrials | | | 19.2 | | |
Consumer Staples | | | 17.3 | | |
Information Technology | | | 15.2 | | |
Health Care | | | 14.6 | | |
Consumer Discretionary | | | 14.2 | | |
Financials | | | 12.8 | | |
Materials | | | 2.0 | | |
Utilities | | | 1.7 | | |
Cash and Other Assets, Less Liabilities | | | 3.0 | | |
MARKET CAP EXPOSURE (%)9,10
Mega Cap (over $25B) | | | 0.0 | | |
Large Cap ($10B–$25B) | | | 0.0 | | |
Mid Cap ($3B–$10B) | | | 2.3 | | |
Small Cap (under $3B) | | | 94.7 | | |
Cash and Other Assets, Less Liabilities | | | 3.0 | | |
8 Not all countries where the Fund may invest are included in the benchmark index.
9 Source: FactSet Research Systems. Percentage values in data are rounded to the nearest tenth of one percent; the values may not sum to 100% due to rounding.
10 The Fund defines Small Companies as companies with market capitalization generally between $100 million and $3 billion or the largest company included in the Fund's primary benchmark, the MSCI All Country Asia ex Japan Small Cap Index.
Matthews Asia Small Companies Fund
Portfolio Manager Commentary (continued)
two years ago. The firm's sales saw a double-digit drop during the first quarter of the year. Demand for tiles slowed due to a weakening macro environment. Margins also declined sharply as gas prices—the biggest cost component for the firm, which is also priced in U.S. dollars—ceased to fall lower. We continue to hold the name as we believe the company remains one of the most cost-competitive players in the country and we expect its profitability to rebound once demand returns later in the year.
On the positive side, South Korea's Ezwelfare, a provider of outsourced corporate benefit programs, reported solid numbers for the first quarter and its share price reacted positively. It's worth mentioning that this stock currently lacks any broker coverage so it is likely that few follow it. We always love the idea of doing original research on under-followed small-cap stocks in Asia because this may help one uncover pricing inefficiencies.
Notable Portfolio Changes:
Early in the quarter, we initiated a position in Clear Media in Hong Kong, an outdoor media company running the largest bus shelter advertising network in China with dominant positions in major cities. The company is controlled by Clear Channel, one of the biggest outdoor media companies in the U.S. We like the firm's market position as well as its cash flow generation capabilities, and were able to initiate our position at an attractive multiple. On the sell side, we exited Osim International in Singapore. Its core massage chair business in China turned out to be more challenging than we originally anticipated. We decided to exit this position and redeploy the proceeds to some of our names in Indonesia and Taiwan across several sectors.
Outlook:
After years of declining global interest rates, the "day of reckoning" seems closer now. Markets seem to be baking in expectations of a modest interest rate increase by the U.S. Federal Reserve later this year. Despite the recent high volatility in the China and Hong Kong markets, we continue to focus on bottom-up fundamentals and avoid jumping on any bandwagons to chase market rallies. We remain attentive to the small-cap companies that we believe generate high returns on capital, are run by sensible capital allocators and are insulated from rising costs of capital with strong balance sheets.
Investing in small- and mid-size companies is more risky than investing in large companies as they may be more volatile and less liquid than larger companies.
* Price-to-Earnings Ratio (P/E Ratio) is a valuation ratio of a company's current share price compared to its per-share earnings and is calculated as the market value per share divided by the Earnings per Share (EPS).
72 MATTHEWS ASIA FUNDS
Matthews Asia Small Companies Fund June 30, 2015
Schedule of Investmentsa (unaudited)
COMMON EQUITIES: 97.0%
| | Shares | | Value | |
CHINA/HONG KONG: 30.3% | |
Vitasoy International Holdings, Ltd. | | | 10,072,000 | | | $ | 17,151,460 | | |
Kerry Logistics Network, Ltd. | | | 10,732,000 | | | | 16,954,253 | | |
Lee's Pharmaceutical Holdings, Ltd. | | | 10,010,000 | | | | 16,632,648 | | |
Towngas China Co., Ltd. | | | 15,907,000 | | | | 14,532,017 | | |
Fairwood Holdings, Ltd. | | | 4,792,000 | | | | 14,342,215 | | |
China Biologic Products, Inc.b | | | 122,154 | | | | 14,067,255 | | |
Lifetech Scientific Corp.b | | | 44,900,000 | | | | 12,859,106 | | |
Goldpac Group, Ltd. | | | 19,681,000 | | | | 12,554,104 | | |
Sunny Optical Technology Group Co., Ltd. | | | 5,586,000 | | | | 12,159,048 | | |
PAX Global Technology, Ltd.b | | | 8,385,000 | | | | 12,010,777 | | |
51job, Inc. ADRb | | | 349,200 | | | | 11,607,408 | | |
Minth Group, Ltd. | | | 5,122,000 | | | | 11,446,054 | | |
Qingdao Port International Co., Ltd.
H Shares | | | 19,260,000 | | | | 11,273,308 | | |
Airtac International Group | | | 1,636,996 | | | | 10,267,187 | | |
China Distance Education
Holdings, Ltd. ADR | | | 637,200 | | | | 10,220,688 | | |
Clear Media, Ltd. | | | 8,694,000 | | | | 10,201,248 | | |
Convenience Retail Asia, Ltd. | | | 14,450,000 | | | | 8,332,721 | | |
China Merchants China Direct
Investments, Ltd. | | | 3,452,000 | | | | 8,234,752 | | |
Bitauto Holdings, Ltd. ADRb | | | 149,100 | | | | 7,611,555 | | |
YGM Trading, Ltd. | | | 5,708,000 | | | | 7,398,534 | | |
Stelux Holdings International, Ltd. | | | 34,459,000 | | | | 5,729,044 | | |
Beijing Capital Land, Ltd. H Shares | | | 7,140,000 | | | | 5,480,586 | | |
Total China/Hong Kong | | | | | 251,065,968 | | |
TAIWAN: 15.9% | |
PChome Online, Inc. | | | 1,303,841 | | | | 21,522,708 | | |
Voltronic Power Technology Corp. | | | 1,208,600 | | | | 15,232,300 | | |
Adlink Technology, Inc. | | | 4,193,000 | | | | 14,136,520 | | |
Sporton International, Inc. | | | 1,955,660 | | | | 13,191,397 | | |
TSC Auto ID Technology Co., Ltd. | | | 1,411,000 | | | | 12,375,565 | | |
Merida Industry Co., Ltd. | | | 1,860,000 | | | | 12,060,977 | | |
FineTek Co., Ltd.† | | | 2,891,000 | | | | 11,742,861 | | |
Sinmag Equipment Corp. | | | 2,047,253 | | | | 11,338,149 | | |
Aerospace Industrial Development Corp.b | | | 7,600,000 | | | | 10,499,545 | | |
Addcn Technology Co., Ltd. | | | 725,000 | | | | 9,588,007 | | |
Total Taiwan | | | | | 131,688,029 | | |
INDIA: 11.9% | |
Emami, Ltd. | | | 648,059 | | | | 11,794,800 | | |
Bajaj Corp., Ltd. | | | 1,566,339 | | | | 10,694,790 | | |
Page Industries, Ltd. | | | 43,016 | | | | 10,200,129 | | |
Mindtree, Ltd. | | | 491,862 | | | | 9,829,593 | | |
Supreme Industries, Ltd. | | | 914,042 | | | | 9,691,848 | | |
GRUH Finance, Ltd. | | | 2,164,292 | | | | 8,887,511 | | |
Ipca Laboratories, Ltd. | | | 768,213 | | | | 8,547,660 | | |
AIA Engineering, Ltd. | | | 515,228 | | | | 8,135,288 | | |
Gujarat Pipavav Port, Ltd.b | | | 2,368,308 | | | | 8,096,435 | | |
Berger Paints India, Ltd. | | | 2,174,029 | | | | 6,656,546 | | |
CRISIL, Ltd. | | | 217,039 | | | | 6,596,888 | | |
Total India | | | | | 99,131,488 | | |
| | Shares | | Value | |
SOUTH KOREA: 11.6% | |
i-SENS, Inc.b | | | 323,343 | | | $ | 17,650,095 | | |
Hy-Lok Corp. | | | 450,972 | | | | 15,646,256 | | |
Interpark Corp. | | | 664,236 | | | | 14,809,994 | | |
Medy-Tox, Inc. | | | 29,466 | | | | 14,702,836 | | |
Ezwelfare Co., Ltd.† | | | 874,223 | | | | 13,974,263 | | |
Binggrae Co., Ltd. | | | 166,238 | | | | 12,589,629 | | |
Pyeong Hwa Automotive Co., Ltd. | | | 521,429 | | | | 6,603,844 | | |
Total South Korea | | | | | 95,976,917 | | |
INDONESIA: 6.9% | |
PT AKR Corporindo | | | 20,771,300 | | | | 9,215,904 | | |
PT Selamat Sempurna | | | 26,591,300 | | | | 9,184,696 | | |
PT Sumber Alfaria Trijaya | | | 180,090,800 | | | | 7,949,555 | | |
PT Bank Tabungan Pensiunan Nasionalb | | | 29,993,400 | | | | 7,739,632 | | |
PT Arwana Citramulia | | | 159,244,000 | | | | 6,286,691 | | |
PT Ultrajaya Milk Industry & Trading Co. | | | 17,446,900 | | | | 5,091,283 | | |
PT Modern Internasional | | | 143,102,900 | | | | 4,711,957 | | |
PT Astra Otoparts | | | 20,759,825 | | | | 3,892,710 | | |
PT Wismilak Inti Makmur† | | | 114,350,600 | | | | 3,511,541 | | |
Total Indonesia | | | | | 57,583,969 | | |
SINGAPORE: 6.5% | |
ARA Asset Management, Ltd. | | | 11,437,000 | | | | 14,815,641 | | |
Raffles Medical Group, Ltd. | | | 4,289,900 | | | | 14,651,624 | | |
Super Group, Ltd. | | | 11,846,400 | | | | 9,757,464 | | |
Petra Foods, Ltd. | | | 3,569,300 | | | | 9,275,383 | | |
ISEC Healthcare, Ltd. | | | 17,932,900 | | | | 5,325,879 | | |
Total Singapore | | | | | 53,825,991 | | |
MALAYSIA: 5.7% | |
Karex BHD | | | 14,419,450 | | | | 11,732,762 | | |
7-Eleven Malaysia Holdings BHD | | | 27,461,900 | | | | 11,708,351 | | |
Alliance Financial Group BHD | | | 8,677,500 | | | | 10,087,167 | | |
KPJ Healthcare BHD | | | 6,966,893 | | | | 7,792,284 | | |
Oldtown BHD | | | 13,431,825 | | | | 5,692,869 | | |
Total Malaysia | | | | | 47,013,433 | | |
PHILIPPINES: 4.5% | |
Security Bank Corp. | | | 4,054,327 | | | | 14,519,418 | | |
Vista Land & Lifescapes, Inc. | | | 68,192,400 | | | | 9,602,038 | | |
RFM Corp. | | | 101,503,200 | | | | 9,333,722 | | |
Philippine Seven Corp. | | | 1,454,751 | | | | 3,871,593 | | |
Total Philippines | | | | | 37,326,771 | | |
THAILAND: 3.6% | |
Bangkok Chain Hospital Public Co., Ltd. | | | 37,431,675 | | | | 7,809,290 | | |
Tisco Financial Group Public Co., Ltd. | | | 5,402,710 | | | | 7,352,276 | | |
Supalai Public Co., Ltd. | | | 12,090,800 | | | | 6,711,342 | | |
Aeon Thana Sinsap Thailand Public
Co., Ltd. | | | 1,861,800 | | | | 5,192,941 | | |
Siam Global House Public Co., Ltd. | | | 5,338,400 | | | | 1,390,887 | | |
Aeon Thana Sinsap Thailand Public Co.,
Ltd. NVDR | | | 461,300 | | | | 1,286,660 | | |
Total Thailand | | | | | 29,743,396 | | |
matthewsasia.com | 800.789.ASIA 73
Matthews Asia Small Companies Fund June 30, 2015
Schedule of Investmentsa (unaudited) (continued)
COMMON EQUITIES (continued)
| | Shares | | Value | |
VIETNAM: 0.1% | |
DHG Pharmaceutical JSC | | | 270,000 | | | $ | 908,716 | | |
Total Vietnam | | | | | 908,716 | | |
TOTAL INVESTMENTS: 97.0% | | | | | 804,264,678 | | |
(Cost $681,049,943c) | |
CASH AND OTHER ASSETS,
LESS LIABILITIES: 3.0% | | | | | 24,778,495 | | |
NET ASSETS: 100.0% | | | | $ | 829,043,173 | | |
a Certain securities were fair valued under the valuation polices approved by the Board of Trustees (Note 2-A).
b Non-income producing security.
c Cost for federal income tax purposes is $681,049,943 and net unrealized appreciation consists of:
Gross unrealized appreciation | | $ | 179,796,771 | | |
Gross unrealized depreciation | | | (56,582,036 | ) | |
Net unrealized appreciation | | $ | 123,214,735 | | |
† Affiliated Issuer, as defined under the Investment Company Act of 1940 (ownership of 5% or more of the outstanding voting securities of this issuer)
ADR American Depositary Receipt
BHD Berhad
JSC Joint Stock Co.
NVDR Non-voting Depositary Receipt
See accompanying notes to financial statements.
74 MATTHEWS ASIA FUNDS

ASIA SMALL COMPANY STRATEGIES
PORTFOLIO MANAGERS*
Richard Gao | | Henry Zhang, CFA | |
Lead Manager | | Co-Manager | |
* Effective July 1, 2015, Tiffany Hsiao, CFA, replaced Richard Gao as Lead Manager of this Fund and Kenichi Amaki became a Co-Manager of this Fund.
FUND FACTS
| | | Investor Class | |
Ticker | | MCSMX | |
CUSIP | | 577125404 | |
Inception | | 5/31/11 | |
NAV | | $10.73 | |
Initial Investment | | $2,500 | |
Gross Expense Ratio1 | | 1.90% | |
After Fee Waiver and
Reimbursement2 | | 1.50% | |
Portfolio Statistics
Total # of Positions | | 39 | |
Net Assets | | $26.0 million | |
Weighted Average Market Cap | | $2.1 billion | |
Portfolio Turnover | | 32.42%3 | |
Benchmark
MSCI China Small Cap Index
Redemption Fee
2% within first 90 calendar days of purchase
OBJECTIVE
Long-term capital appreciation.
STRATEGY
Under normal market conditions, the Fund seeks to achieve its investment objective by investing at least 80% of its total net assets, which include borrowings for investment purposes, in the common and preferred stocks of Small Companies located in China. China includes its administrative and other districts, such as Hong Kong.
1 Prospectus expense ratios.
2 Matthews has contractually agreed to waive fees and reimburse expenses to the extent needed to limit Total Annual Fund Operating Expenses (excluding Rule 12b-1 fees, front-end or contingent deferred loads, taxes, interest, brokerage commissions, short sale dividend expenses, expenses incurred in connection with any merger or reorganization or extraordinary expenses such as litigation) to 1.50%. If the operating expenses fall below the expense limitation in a year within three years after Matthews has made a waiver or reimbursement, the Fund may reimburse Matthews up to an amount that does not cause the expenses for that year to exceed the expense limitation applicable at the time of that fee waiver and/or expense reimbursement or to exceed any other agreed upon expense limitation for that year. This agreement will remain in place until April 30, 2016, may be renewed for additional periods not exceeding one year and may be terminated at any time by the Board of Trustees or the Trust on behalf of the Fund on 60 days' written notice to Matthews. Matthews may decline to renew this agreement by written notice to the Trust at least 30 days before its annual expiration date.
3 The lesser of fiscal year 2014 long-term purchase costs or sales proceeds divided by the average monthly market value of long-term securities.
Matthews China Small Companies Fund
Portfolio Manager Commentary
For the first half of 2015, the Matthews China Small Companies Fund returned 16.50%, while its benchmark, the MSCI China Small Cap Index was up 28.28%. For the quarter ending June 30, the Fund returned 14.27% while its benchmark returned 20.33%.
Market Environment:
Chinese equities outperformed the region in the second quarter of 2015, propelled by an accommodative monetary policy and a gradual and mild recovery in various economic indicators. Within China, small-capitalization companies outperformed their larger-cap peers during the quarter. Stocks for such smaller companies were also driven by positive sentiment over the impending launch of the much-anticipated Shenzhen—Hong Kong Stock Connect Program expected in the latter half of 2015.
Regarding monetary stimulus, China's lending and deposit rate cut in June was the fourth cut in seven months. In addition, the expansion of a targeted lending scheme from the People's Bank of China, via pledged supplementary loans, continues to send positive signals to the market. Economic indicators showed gradual improvement, albeit at a mild pace. The strongest pickup in economic indicators came from property sales (by floor area), and fixed asset investments, which reported year-on-year growth of 15% and 11%, respectively.
Performance Contributors and Detractors:
During the second quarter of 2015, our best-performing sectors were financials and industrials. Conversely, our worst-performing sectors were materials and consumer staples, which remained relatively flat during the quarter. On a relative basis, our overweight in the health care sector hurt our performance due to the sector's relatively muted response in the second quarter market rally.
Two of our biggest contributors on a stock level were Guotai Junan International and PAX Global Technology. Guotai Junan International is the international unit of one of China's largest stock brokers and has seen significant pickup in business volume through the Shanghai—Hong Kong Connect Program. PAX Global has been a long-term portfolio holding, and continues to execute well in the financial transaction Point-of-Sales equipment market.
Our top detractors were Qingdao Port International and CIMC Enric Holdings. We added Qingdao Port as a new position late in the quarter and its stock fell along with the market during the volatile second half of June. However, we have a favorable view of its dominant positioning on the Shandong Peninsula. The share price for CIMC Enric, an industrial design and engineering company, was hurt by weak oil prices in the second half of 2014, impacting its first half 2015 results. Longer term, we are still confident in the firm's fundamentals given our positive view on natural gas adoption in China.
Notable Portfolio Changes:
We increased our exposure to the financials and technology sectors during the quarter, and reduced our industrials and consumer-related sector exposure. These changes were mainly as a result of our bottom-up stock selection process.
matthewsasia.com | 800.789.ASIA 75
PERFORMANCE AS OF JUNE 30, 2015
| | | | | | | | | Average Annual
Total Returns | |
| |
| | | 3 Months | | YTD | | 1 Year | | 3 Years | | Since
Inception | | Inception
date | |
Investor Class (MCSMX) | | | 14.27 | % | | | 16.50 | % | | | 14.72 | % | | | 16.84 | % | | | 3.05 | % | | 5/31/11 | |
MSCI China Small Cap Index4 | | | 20.33 | % | | | 28.28 | % | | | 27.94 | % | | | 22.62 | % | | | 4.84 | % | | | | | |
Lipper China Region Funds Category Average5 | | | 7.64 | % | | | 14.90 | % | | | 22.40 | % | | | 14.31 | % | | | 4.26 | % | | | | | |
Performance assumes reinvestment of all dividends and/or distributions before taxes. All performance quoted represents past performance and is no guarantee of future results. Investment return and principal value will fluctuate with market conditions so that when redeemed, shares may be worth more or less than their original cost. Current performance may be lower or higher than the return figures quoted. Returns would have been lower if certain of the Fund's fees and expenses had not been waived. For the Fund's most recent month-end performance, visit matthewsasia.com.
GROWTH OF A $10,000 INVESTMENT SINCE INCEPTION—INVESTOR CLASS
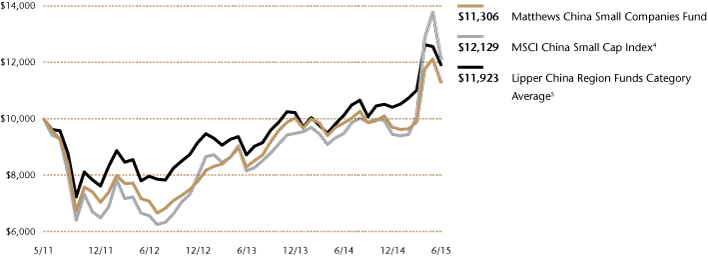
Plotted monthly. The performance data does not reflect the deduction of taxes that a shareholder would pay on dividends, capital gains distributions or redemption of Fund shares. Values are in US$.
4 It is not possible to invest directly in an index. Source: Index data from Morgan Stanley Capital International and Bloomberg; total return calculations performed by BNY Mellon Investment Servicing (US) Inc. Please see page 85 for index definition.
5 The Lipper Category Average does not reflect sales charges and is based on total return, including reinvestment of dividends and capital gains for the stated periods.
TOP TEN HOLDINGS6
| | | Sector | | % of Net Assets | |
PAX Global Technology, Ltd. | | Information Technology | | | 6.4 | % | |
Lee's Pharmaceutical Holdings, Ltd. | | Health Care | | | 5.4 | % | |
Sino Biopharmaceutical, Ltd. | | Health Care | | | 5.1 | % | |
Boer Power Holdings, Ltd. | | Industrials | | | 5.0 | % | |
Sunny Optical Technology Group Co., Ltd. | | Information Technology | | | 4.2 | % | |
SITC International Holdings Co., Ltd. | | Industrials | | | 4.1 | % | |
Shenzhen Chiwan Petroleum | | Industrials | | | 4.0 | % | |
China Biologic Products, Inc. | | Health Care | | | 3.9 | % | |
Franshion Properties China, Ltd. | | Financials | | | 3.8 | % | |
Towngas China Co., Ltd. | | Utilities | | | 3.5 | % | |
% OF ASSETS IN TOP TEN | | | | | 45.4 | % | |
6 Holdings may combine more than one security from same issuer and related depositary receipts.
76 MATTHEWS ASIA FUNDS
Matthews China Small Companies Fund
Portfolio Manager Commentary (continued)
In terms of specific positions, we exited our position in Formosa Optical Technology given a very slow recovery in the Chinese contact lens industry. We also exited slower growing industrial companies such as Yungtay Engineering, Haitian International and Greatview Aseptic Packaging and put the proceeds to add TK Group Holdings, a key plastic injection mold global supplier.
Outlook:
Small-cap companies in China's domestic A-share market outperformed their Hong Kong-listed and U.S.-listed peers during the quarter. However, due to lofty valuations and a government crackdown on margin trading, we started to see a correction in onshore-listed securities toward the second half of June. We expect the trading environment to be choppy entering the year's first half earnings season.
Fundamentally, corporate earnings recovery remains relatively mild compared to previous cycles. In fact, compared to the last big China rally in 2007, corporate earnings growth this time has failed to keep up with valuation expansion. As a result, we are focused on those names in which we hold a long-term conviction over competitive positioning and high quality earnings growth, rather than speculative multiples expansion. We continue to see better risk/reward investment opportunities in Hong Kong-listed and U.S.-listed China small companies. Ultimately, we believe, a gradual low-inflationary recovery in China's economy is the best scenario for Chinese equities and we expect to see this continue playing out for the remainder of the year.
During the quarter, we also announced that Richard Gao, the Fund's long-time manager, will commence a requested sabbatical at year-end. Effective July 1, 2015, Tiffany Hsiao, CFA, assumed Lead Manager responsibility of the Fund. We are also pleased to announce that Kenichi Amaki, Lead Manager of the Matthews Japan Fund and Co-Manager of the Matthews Asia Small Companies Fund has been named a Co-Manager of the Matthews China Small Companies Fund. There have been no other changes to the portfolio management team, with Henry Zhang, CFA, remaining as a Co-Manager.
Investing in small- and mid-size companies is more risky than investing in large companies as they may be more volatile and less liquid than larger companies.
COUNTRY ALLOCATION (%)
China/Hong Kong | | | 88.6 | | |
Taiwan | | | 5.3 | | |
Cash and Other Assets, Less Liabilities | | | 6.1 | | |
SECTOR ALLOCATION (%)
Industrials | | | 29.7 | | |
Health Care | | | 22.7 | | |
Information Technology | | | 13.3 | | |
Consumer Discretionary | | | 11.6 | | |
Financials | | | 11.5 | | |
Utilities | | | 3.5 | | |
Consumer Staples | | | 1.6 | | |
Cash and Other Assets, Less Liabilities | | | 6.1 | | |
MARKET CAP EXPOSURE (%)7,8
Mega Cap (over $25B) | | | 0.0 | | |
Large Cap ($10B–$25B) | | | 0.0 | | |
Mid Cap ($3B–$10B) | | | 16.4 | | |
Small Cap (under $3B) | | | 77.5 | | |
Cash and Other Assets, Less Liabilities | | | 6.1 | | |
7 Source: FactSet Research Systems. Percentage values in data are rounded to the nearest tenth of one percent; the values may not sum to 100% due to rounding.
8 The Fund defines Small Companies as companies with market capitalization generally between $100 million and $3 billion or the largest company included in the Fund's primary benchmark, the MSCI China Small Cap Index.
matthewsasia.com | 800.789.ASIA 77
Matthews China Small Companies Fund June 30, 2015
Schedule of Investmentsa (unaudited)
COMMON EQUITIES: 93.9%
| | Shares | | Value | |
INDUSTRIALS: 29.7% | |
Electrical Equipment: 7.6% | |
Boer Power Holdings, Ltd. | | | 615,000 | | | $ | 1,299,988 | | |
Voltronic Power Technology Corp. | | | 54,200 | | | | 683,097 | | |
| | | | | 1,983,085 | | |
Professional Services: 5.3% | |
Sporton International, Inc. | | | 104,100 | | | | 702,180 | | |
51job, Inc. ADRb | | | 20,324 | | | | 675,570 | | |
| | | | | 1,377,750 | | |
Transportation Infrastructure: 4.5% | |
Yuexiu Transport Infrastructure, Ltd. | | | 1,042,000 | | | | 749,534 | | |
Qingdao Port International Co., Ltd.
H Shares | | | 730,000 | | | | 427,285 | | |
| | | | | 1,176,819 | | |
Machinery: 4.2% | |
CIMC Enric Holdings, Ltd. | | | 574,000 | | | | 486,957 | | |
TK Group Holdings, Ltd. | | | 1,456,000 | | | | 485,676 | | |
Airtac International Group | | | 16,811 | | | | 105,435 | | |
| | | | | 1,078,068 | | |
Marine: 4.1% | |
SITC International Holdings Co., Ltd. | | | 1,608,000 | | | | 1,061,446 | | |
Air Freight & Logistics: 4.0% | |
Shenzhen Chiwan Petroleum B Sharesb | | | 364,084 | | | | 1,048,822 | | |
Total Industrials | | | | | 7,725,990 | | |
HEALTH CARE: 22.7% | |
Pharmaceuticals: 15.9% | |
Lee's Pharmaceutical Holdings, Ltd. | | | 851,500 | | | | 1,414,855 | | |
Sino Biopharmaceutical, Ltd. | | | 1,152,000 | | | | 1,335,596 | | |
CSPC Pharmaceutical Group, Ltd. | | | 686,000 | | | | 677,351 | | |
SSY Group, Ltd.c | | | 1,666,000 | | | | 574,203 | | |
Tianjin ZhongXin Pharmaceutical Group
Corp., Ltd. S Shares | | | 79,000 | | | | 121,656 | | |
| | | | | 4,123,661 | | |
Biotechnology: 4.2% | |
China Biologic Products, Inc.b | | | 8,900 | | | | 1,024,924 | | |
Shanghai Haohai Biological Technology Co.,
Ltd. H Sharesb | | | 10,700 | | | | 68,328 | | |
| | | | | 1,093,252 | | |
Life Sciences Tools & Services: 2.6% | |
WuXi PharmaTech Cayman, Inc. ADRb | | | 16,200 | | | | 684,612 | | |
Total Health Care | | | | | 5,901,525 | | |
| | Shares | | Value | |
INFORMATION TECHNOLOGY: 13.3% | |
Electronic Equipment, Instruments & Components: 10.6% | |
PAX Global Technology, Ltd.b | | | 1,156,000 | | | $ | 1,655,868 | | |
Sunny Optical Technology Group Co., Ltd. | | | 504,000 | | | | 1,097,057 | | |
China High Precision Automation
Group, Ltd.b,c | | | 195,000 | | | | 7,547 | | |
| | | | | 2,760,472 | | |
Software: 1.9% | |
Chanjet Information Technology Co., Ltd.
H Shares | | | 139,600 | | | | 487,620 | | |
Technology Hardware, Storage & Peripherals: 0.8% | |
Goldpac Group, Ltd. | | | 333,000 | | | | 212,414 | | |
Total Information Technology | | | | | 3,460,506 | | |
CONSUMER DISCRETIONARY: 11.6% | |
Diversified Consumer Services: 5.5% | |
China Distance Education Holdings, Ltd. ADR | | | 42,660 | | | | 684,266 | | |
New Oriental Education & Technology
Group, Inc. ADRb | | | 16,600 | | | | 407,032 | | |
TAL Education Group ADRb | | | 9,600 | | | | 338,880 | | |
| | | | | 1,430,178 | | |
Auto Components: 3.4% | |
Minth Group, Ltd. | | | 398,000 | | | | 889,404 | | |
Hotels, Restaurants & Leisure: 2.6% | |
Fairwood Holdings, Ltd. | | | 107,500 | | | | 321,742 | | |
Homeinns Hotel Group ADRb | | | 7,550 | | | | 233,446 | | |
China Lodging Group, Ltd. ADSb | | | 4,200 | | | | 102,564 | | |
| | | | | 657,752 | | |
Media: 0.1% | |
Clear Media, Ltd. | | | 27,000 | | | | 31,681 | | |
Total Consumer Discretionary | | | | | 3,009,015 | | |
FINANCIALS: 11.5% | |
Real Estate Management & Development: 6.8% | |
Franshion Properties China, Ltd. | | | 2,776,000 | | | | 990,746 | | |
KWG Property Holding, Ltd. | | | 912,500 | | | | 767,770 | | |
| | | | | 1,758,516 | | |
Capital Markets: 3.2% | |
Guotai Junan International Holdings, Ltd. | | | 1,299,000 | | | | 844,433 | | |
Diversified Financial Services: 1.5% | |
China Merchants China Direct
Investments, Ltd. | | | 162,000 | | | | 386,451 | | |
Total Financials | | | | | 2,989,400 | | |
78 MATTHEWS ASIA FUNDS
Matthews China Small Companies Fund June 30, 2015
Schedule of Investmentsa (unaudited) (continued)
COMMON EQUITIES (continued)
| | Shares | | Value | |
UTILITIES: 3.5% | |
Gas Utilities: 3.5% | |
Towngas China Co., Ltd. | | | 988,000 | | | $ | 902,598 | | |
Total Utilities | | | | | 902,598 | | |
CONSUMER STAPLES: 1.6% | |
Food Products: 1.6% | |
China Modern Dairy Holdings, Ltd. | | | 784,000 | | | | 281,826 | | |
Vitasoy International Holdings, Ltd. | | | 72,000 | | | | 122,608 | | |
Total Consumer Staples | | | | | 404,434 | | |
TOTAL INVESTMENTS: 93.9% | | | | | 24,393,468 | | |
(Cost $17,980,357d) | |
CASH AND OTHER ASSETS,
LESS LIABILITIES: 6.1% | | | | | 1,583,081 | | |
NET ASSETS: 100.0% | | | | $ | 25,976,549 | | |
a Certain securities were fair valued under the valuation polices approved by the Board of Trustees (Note 2-A).
b Non-income producing security.
c Illiquid security, trading was halted at 6/30/15.
d Cost for federal income tax purposes is $18,026,279 and net unrealized appreciation consists of:
Gross unrealized appreciation | | $ | 7,215,973 | | |
Gross unrealized depreciation | | | (848,784 | ) | |
Net unrealized appreciation | | $ | 6,367,189 | | |
ADR American Depositary Receipt
ADS American Depositary Share
See accompanying notes to financial statements.
matthewsasia.com | 800.789.ASIA 79

PORTFOLIO MANAGERS
Michael J. Oh, CFA
Lead Manager
Lydia So, CFA
Co-Manager
FUND FACTS
| | | Investor Class | | Institutional Class | |
Ticker | | MATFX | | MITEX | |
CUSIP | | 577130883 | | 577125859 | |
Inception | | 12/27/99 | | 4/30/13 | |
NAV | | $14.80 | | $14.81 | |
Initial Investment | | $2,500 | | $3 million | |
| Gross Expense Ratio1 | | 1.16% | | 0.95% | |
Portfolio Statistics
Total # of Positions | | 54 | |
Net Assets | | $182.0 million | |
Weighted Average Market Cap | | $31.3 billion | |
Portfolio Turnover | | 62.99%2 | |
Benchmark
MSCI AC Asia Index
MSCI AC Asia Information Technology Index
OBJECTIVE
Long-term capital appreciation.
STRATEGY
Under normal market conditions, the Fund seeks to achieve its investment objective by investing at least 80% of its total net assets, which include borrowings for investment purposes, in the common and preferred stocks of companies located in Asia that derive more than 50% of their revenues from the sale of products or services in science- and technology-related industries and services. Asia consists of all countries and markets in Asia, including developed, emerging, and frontier countries and markets in the Asian region.
1 Prospectus expense ratios.
2 The lesser of fiscal year 2014 long-term purchase costs or sales proceeds divided by the average monthly market value of long-term securities.
Matthews Asia Science and Technology Fund
Portfolio Manager Commentary
For the first half of 2015, the Matthews Asia Science and Technology Fund gained 8.74% (Investor Class) and 8.82% (Institutional Class) while its primary benchmark, the MSCI All Country Asia Index, and its secondary benchmark, the MSCI All Country Asia Information Technology Index, returned 9.34% and 6.51%, respectively. For the quarter ending June 30, the Fund returned 3.71% (Investor Class) and 3.78% (Institutional Class) while its benchmarks returned 1.80% and –2.79%, respectively.
Market Environment:
Overall, we have seen a strong ongoing growth environment for Internet service companies globally while the outlook for the technology hardware space has remained weak. Demand for online services is particularly robust in China and the country's Internet sector also performed strongly on the back of the strength of the China A-share market.
While overall growth in smartphones throughout the region was weaker than expected during the first half of the year—following the strong growth seen last year—demand in emerging parts of Asia, including Southeast Asia, remains healthy.
Meanwhile, demand for health care products and services remained high in the region, along with rising incomes and improved welfare policies, as less wealthy countries continued to drive the sector. As more consumers shift to mobile devices, demand for PCs has continued to slide.
Performance Contributors and Detractors:
SaraminHR, a South Korean human resources and recruitment firm, was the top contributor to Fund performance during the second quarter. The firm is the second-largest player in the duopolistic market and operates a popular jobsite portal. Its main competitor has been bought out by a foreign company and SaraminHR has been gaining market share by responding faster to both clients and users.
Conversely, Delta Electronics was among the major detractors to Fund performance for the second quarter. Delta Electronics dominates the power supply business for various segments. Its PC-related business was a drag on performance, but we remain positive about the company's future growth outlook, especially its automation-related businesses.
Notable Portfolio Changes:
During the second quarter, we added Japanese consumer discretionary holding Shimano, which manufactures components for sporting equipment such as bicycles and rowing gear. The company holds a strong industry franchise and has continuously innovated with new designs and products. It stands to benefit as rising incomes and improving lifestyles in Asia create new demand for leisure products.
We believe China continues to be a bright spot for Asia's tech investors, with high consumer demand for various Internet services. We are seeing robust entrepreneurial activity in China's online-to-offline industry
80 MATTHEWS ASIA FUNDS
PERFORMANCE AS OF JUNE 30, 2015
| | | | | | | | | Average Annual Total Returns | | | |
| | | 3 Months | | YTD | | 1 Year | | 3 Years | | 5 Years | | 10 Years | | Since
Inception | | Inception
Date | |
Investor Class (MATFX) | | | 3.71 | % | | | 8.74 | % | | | 10.13 | % | | | 20.28 | % | | | 14.05 | % | | | 10.67 | % | | | 3.04 | % | | 12/27/99 | |
Institutional Class (MITEX) | | | 3.78 | % | | | 8.82 | % | | | 10.34 | % | | | n.a. | | | | n.a. | | | | n.a. | | | | 20.20 | % | | 4/30/13 | |
MSCI AC Asia Index3 | | | 1.80 | % | | | 9.34 | % | | | 6.22 | % | | | 11.55 | % | | | 8.30 | % | | | 6.48 | % | | | 2.43 | %4 | | | | | |
MSCI AC Asia Information Technology Index3 | | | -2.79 | % | | | 6.51 | % | | | 3.12 | % | | | 14.47 | % | | | 10.18 | % | | | 6.63 | % | | | -1.03 | %4 | | | | | |
Lipper Global Science and Technology Funds
Category Average5 2.66% | | | 5.65 | % | | | 9.16 | % | | | 17.95 | % | | | 15.78 | % | | | 10.77 | % | | | 1.91 | %4 | | | | | |
Performance assumes reinvestment of all dividends and/or distributions before taxes. All performance quoted represents past performance and is no guarantee of future results. Investment return and principal value will fluctuate with market conditions so that when redeemed, shares may be worth more or less than their original cost. Current performance may be lower or higher than the return figures quoted. For the Fund's most recent month-end performance, visit matthewsasia.com.
GROWTH OF A $10,000 INVESTMENT SINCE INCEPTION—INVESTOR CLASS

Plotted monthly. The performance data and graph do not reflect the deduction of taxes that a shareholder would pay on dividends, capital gains distributions or redemption of Fund shares. Values are in US$.
3 It is not possible to invest directly in an index. Source: Index data from Morgan Stanley Capital International and Bloomberg; total return calculations performed by BNY Mellon Investment Servicing (US) Inc. Please see page 85 for index definition.
4 Calculated from 12/31/99.
5 The Lipper Category Average does not reflect sales charges and is based on total return, including reinvestment of dividends and capital gains for the stated periods.
TOP TEN HOLDINGS6
| | | Sector | | Country | | % of Net Assets | |
Baidu, Inc. | | Information Technology | | China/Hong Kong | | | 9.0 | % | |
JD.com, Inc. | | Consumer Discretionary | | China/Hong Kong | | | 3.6 | % | |
Ctrip.com International, Ltd. | | Consumer Discretionary | | China/Hong Kong | | | 3.0 | % | |
Info Edge India, Ltd. | | Information Technology | | India | | | 3.0 | % | |
PChome Online, Inc. | | Information Technology | | Taiwan | | | 2.7 | % | |
CITIC Telecom International Holdings, Ltd. | | Telecommunication Services | | China/Hong Kong | | | 2.7 | % | |
Naver Corp. | | Information Technology | | South Korea | | | 2.6 | % | |
Samsung Electronics Co., Ltd., Pfd. | | Information Technology | | South Korea | | | 2.5 | % | |
NetEase, Inc. | | Information Technology | | China/Hong Kong | | | 2.5 | % | |
China Biologic Products, Inc. | | Health Care | | China/Hong Kong | | | 2.3 | % | |
% OF ASSETS IN TOP TEN | | | | | | | 33.9 | % | |
6 Holdings may combine more than one security from same issuer and related depositary receipts.
matthewsasia.com | 800.789.ASIA 81
COUNTRY ALLOCATION (%)7
China/Hong Kong | | | 44.6 | | |
Japan | | | 14.0 | | |
South Korea | | | 13.5 | | |
Taiwan | | | 11.0 | | |
India | | | 9.1 | | |
United States | | | 1.5 | | |
Singapore | | | 1.5 | | |
Indonesia | | | 1.5 | | |
Thailand | | | 1.1 | | |
Vietnam | | | 0.7 | | |
Cash and Other Assets, Less Liabilities | | | 1.5 | | |
SECTOR ALLOCATION (%)
Information Technology | | | 50.6 | | |
Health Care | | | 15.8 | | |
Consumer Discretionary | | | 14.6 | | |
Industrials | | | 10.0 | | |
Telecommunication Services | | | 4.3 | | |
Consumer Staples | | | 3.2 | | |
Cash and Other Assets, Less Liabilities | | | 1.5 | | |
MARKET CAP EXPOSURE (%)8
Mega Cap (over $25B) | | | 30.3 | | |
Large Cap ($10B–$25B) | | | 21.2 | | |
Mid Cap ($3B–$10B) | | | 9.5 | | |
Small Cap (under $3B) | | | 37.5 | | |
Cash and Other Assets, Less Liabilities | | | 1.5 | | |
7 Not all countries are included in the benchmark index(es).
8 Source: FactSet Research Systems. Percentage values in data are rounded to the nearest tenth of one percent; the values may not sum to 100% due to rounding.
Matthews Asia Science and Technology Fund
Portfolio Manager Commentary (continued)
(O2O), which is an e-commerce model that combines online platforms with more traditionally offline opportunities and business models. We are seeing this trend throughout Asia but the trend is most evident in China. We expect to see more investments to come in the O2O space in coming years. The proliferation of smartphone devices continues to expand the market for Asia's Internet companies. We remain overweight versus the benchmark in the software and services industries, in particular among Internet companies, and especially in China.
Despite the strong growth in the past few years, Internet penetration in Asia is still at around 35%, and future growth prospects are solid. The portfolio's exposure to China's domestic A-share market remains minimal, primarily due to the currently high valuations. However, we may seek to increase this exposure once valuations become more reasonable.
Outlook:
We continue to focus on identifying innovative companies in secular growth industries such as software, health care, Internet, consumer and industrial services. We expect firms in such areas to be less affected by macroeconomic events as these industries should be able to organically capture market share from "old economy" companies. We continue to take a long-term approach in seeking pioneering companies that are well-positioned to benefit as the region's growth drivers see an ongoing shift from capital and labor inputs to productivity growth.
82 MATTHEWS ASIA FUNDS
Matthews Asia Science and Technology Fund June 30, 2015
Schedule of Investmentsa (unaudited)
COMMON EQUITIES: 94.3%
| | Shares | | Value | |
CHINA/HONG KONG: 44.6% | |
Baidu, Inc. ADRb | | | 82,100 | | | $ | 16,344,468 | | |
JD.com, Inc. ADRb | | | 194,200 | | | | 6,622,220 | | |
Ctrip.com International, Ltd. ADRb | | | 75,300 | | | | 5,468,286 | | |
CITIC Telecom International Holdings, Ltd. | | | 10,752,000 | | | | 4,985,151 | | |
NetEase, Inc. ADR | | | 31,000 | | | | 4,490,815 | | |
China Biologic Products, Inc.b | | | 36,000 | | | | 4,145,760 | | |
PAX Global Technology, Ltd.b | | | 2,762,000 | | | | 3,956,323 | | |
WuXi PharmaTech Cayman, Inc. ADRb | | | 88,100 | | | | 3,723,106 | | |
Alibaba Group Holding, Ltd. ADRb | | | 43,100 | | | | 3,545,837 | | |
21Vianet Group, Inc. ADRb | | | 156,000 | | | | 3,201,120 | | |
CAR, Inc.b | | | 1,491,000 | | | | 3,168,702 | | |
Tencent Holdings, Ltd. | | | 148,700 | | | | 2,973,484 | | |
Sino Biopharmaceutical, Ltd. | | | 2,400,000 | | | | 2,782,492 | | |
Shanghai Jahwa United Co., Ltd. A Shares | | | 398,341 | | | | 2,779,143 | | |
Qunar Cayman Islands, Ltd. ADRb | | | 63,900 | | | | 2,738,115 | | |
51job, Inc. ADRb | | | 81,018 | | | | 2,693,038 | | |
Sunny Optical Technology Group Co., Ltd. | | | 1,235,000 | | | | 2,688,225 | | |
Zhaopin, Ltd. ADRb | | | 171,663 | | | | 2,640,177 | | |
China Distance Education Holdings, Ltd. ADR | | | 135,200 | | | | 2,168,608 | | |
Total China/Hong Kong | | | | | 81,115,070 | | |
JAPAN: 14.0% | |
Olympus Corp. | | | 110,400 | | | | 3,811,561 | | |
Hoya Corp. | | | 88,200 | | | | 3,532,387 | | |
Sony Corp. ADRb | | | 111,400 | | | | 3,162,646 | | |
Murata Manufacturing Co., Ltd. | | | 17,600 | | | | 3,071,472 | | |
Asahi Intecc Co., Ltd. | | | 39,100 | | | | 2,678,795 | | |
FANUC Corp. | | | 12,000 | | | | 2,455,387 | | |
Rohm Co., Ltd. | | | 35,300 | | | | 2,365,068 | | |
Keyence Corp. | | | 4,300 | | | | 2,317,601 | | |
Shimano, Inc. | | | 15,000 | | | | 2,046,906 | | |
Total Japan | | | | | 25,441,823 | | |
TAIWAN: 11.0% | |
PChome Online, Inc. | | | 302,174 | | | | 4,988,034 | | |
Hermes Microvision, Inc. | | | 52,000 | | | | 3,376,739 | | |
Largan Precision Co., Ltd. | | | 27,000 | | | | 3,082,072 | | |
Ennoconn Corp. | | | 256,000 | | | | 3,054,526 | | |
Taiwan Semiconductor
Manufacturing Co., Ltd. | | | 500,933 | | | | 2,278,554 | | |
Delta Electronics, Inc. | | | 432,000 | | | | 2,210,056 | | |
Merida Industry Co., Ltd. | | | 156,000 | | | | 1,011,566 | | |
Total Taiwan | | | | | 20,001,547 | | |
| | Shares | | Value | |
SOUTH KOREA: 9.3% | |
Naver Corp. | | | 8,286 | | | $ | 4,703,438 | | |
SaraminHR Co., Ltd. | | | 125,545 | | | | 2,802,520 | | |
Samsung Electronics Co., Ltd. | | | 2,259 | | | | 2,563,030 | | |
SK Hynix, Inc. | | | 66,570 | | | | 2,523,104 | | |
iMarketKorea, Inc. | | | 87,703 | | | | 2,358,133 | | |
Koh Young Technology, Inc. | | | 51,761 | | | | 1,905,048 | | |
Total South Korea | | | | | 16,855,273 | | |
INDIA: 9.1% | |
Info Edge India, Ltd. | | | 402,704 | | | | 5,388,003 | | |
Lupin, Ltd. | | | 113,328 | | | | 3,353,711 | | |
Just Dial, Ltd. | | | 125,653 | | | | 2,503,786 | | |
Blue Dart Express, Ltd. | | | 22,300 | | | | 2,164,094 | | |
Ipca Laboratories, Ltd. | | | 168,583 | | | | 1,875,769 | | |
Mindtree, Ltd. | | | 65,378 | | | | 1,306,544 | | |
Total India | | | | | 16,591,907 | | |
UNITED STATES: 1.5% | |
Cognizant Technology Solutions Corp.
Class Ab | | | 45,300 | | | | 2,767,377 | | |
Total United States | | | | | 2,767,377 | | |
SINGAPORE: 1.5% | |
Raffles Medical Group, Ltd. | | | 809,900 | | | | 2,766,114 | | |
Total Singapore | | | | | 2,766,114 | | |
INDONESIA: 1.5% | |
PT Telekomunikasi Indonesia Persero ADR | | | 63,300 | | | | 2,746,587 | | |
Total Indonesia | | | | | 2,746,587 | | |
THAILAND: 1.1% | |
Major Cineplex Group Public Co., Ltd. | | | 2,039,400 | | | | 2,032,776 | | |
Total Thailand | | | | | 2,032,776 | | |
VIETNAM: 0.7% | |
Mobile World Investment Corp.b | | | 375,365 | | | | 1,263,334 | | |
Total Vietnam | | | | | 1,263,334 | | |
TOTAL COMMON EQUITIES | | | | | 171,581,808 | | |
(Cost $119,778,360) | | | | | |
matthewsasia.com | 800.789.ASIA 83
Matthews Asia Science and Technology Fund June 30, 2015
Schedule of Investmentsa (unaudited) (continued)
PREFERRED EQUITIES: 4.2%
| | Shares | | Value | |
SOUTH KOREA: 4.2% | |
Samsung Electronics Co., Ltd., Pfd. | | | 5,054 | | | $ | 4,491,594 | | |
LG Household & Health Care, Ltd., Pfd. | | | 10,272 | | | | 3,118,716 | | |
Total South Korea | | | | | 7,610,310 | | |
TOTAL PREFERRED EQUITIES | | | | | 7,610,310 | | |
(Cost $7,871,331) | | | | | |
TOTAL INVESTMENTS: 98.5% | | | | | 179,192,118 | | |
(Cost $127,649,691c) | |
CASH AND OTHER ASSETS,
LESS LIABILITIES: 1.5% | | | | | 2,785,946 | | |
NET ASSETS: 100.0% | | | | $ | 181,978,064 | | |
a Certain securities were fair valued under the valuation polices approved by the Board of Trustees (Note 2-A).
b Non-income producing security.
c Cost for federal income tax purposes is $127,729,096 and net unrealized appreciation consists of:
Gross unrealized appreciation | | $ | 54,230,275 | | |
Gross unrealized depreciation | | | (2,767,253 | ) | |
Net unrealized appreciation | | $ | 51,463,022 | | |
ADR American Depositary Receipt
Pfd. Preferred
See accompanying notes to financial statements.
84 MATTHEWS ASIA FUNDS
Disclosures
Fund Holdings: The Fund holdings shown in this report are as of June 30, 2015. Holdings are subject to change at any time, so holdings shown in this report may not reflect current Fund holdings. The Funds file complete schedules of portfolio holdings with the Securities and Exchange Commission (the "SEC") for the first and third quarters of each fiscal year on Form N-Q. The Funds' Form N-Q is filed with the SEC within 60 days of the end of the quarter to which it relates, and is available on the SEC's website at www.sec.gov. It may also be reviewed and copied at the Commission's Public Reference Room in Washington, D.C. Information on the operation of the Public Reference Room may be obtained by calling 800.SEC.0330. Complete schedules of investments are also available without charge, upon request, from the Funds by calling us at 800.789.ASIA (2742).
Proxy Voting Record: The Funds' Statement of Additional Information containing a description of the policies and procedures that the Funds have used to vote proxies relating to portfolio securities, along with each Fund's proxy voting record relating to portfolio securities held during the most recent 12-month period ended June 30, is available upon request, at no charge, at the Funds' website at matthewsasia.com or by calling 800.789.ASIA (2742), or on the SEC's website at www.sec.gov.
Shareholder Reports and Prospectuses: To reduce the Funds' expenses, we try to identify related shareholders in a household and send only one copy of the Funds' prospectus and financial reports to that address. This process, called "householding," will continue indefinitely unless you instruct us otherwise. At any time you may view the Funds' current prospectus, summary prospectus and financial reports on our website. If you prefer to receive individual copies of the Funds' prospectus or financial reports, please call us at 800.789.ASIA (2742).
Redemption Fee Policy: Currently, a 2.00% redemption fee will be assessed on the sale or exchange of shares of the Matthews Emerging Asia Fund, Matthews Asia Small Companies Fund and Matthews China Small Companies Fund (collectively, the "Covered Funds") within 90 days after the date an investor purchases shares of the Covered Funds. The imposition of redemption fees pursuant to the Funds' Short-Term Trading Redemption Fee Policy for the Covered Funds may assist the Covered Funds in discouraging market timing activity.
The redemption fee is also imposed to discourage short-term buying and selling of shares of the Covered Funds, which can disrupt the management of the Covered Funds' investment portfolios and may have detrimental effects on the Covered Funds and other shareholders, and to allocate the costs the Covered Funds incur as a result of short-term trading and market timing. This fee is payable directly to the Covered Funds.
To determine whether the redemption fee applies, the Covered Funds do not count the day that you purchased your shares, and first redeem the shares that you have held the longest.
The Covered Funds may grant exemptions from the redemption fee in certain circumstances. For more information on this policy, please see the Funds' prospectus.
Index Definitions
The HSBC Asian Local Bond Index (ALBI) tracks the total return performance of a bond portfolio consisting of local-currency denominated, high quality and liquid bonds in Asia ex-Japan. The ALBI includes bonds from the following countries: Korea, Hong Kong, India, Singapore, Taiwan, Malaysia, Thailand, Philippines, Indonesia and China.
The MSCI All Country Asia ex Japan Index is a free float–adjusted market capitalization–weighted index of the stock markets of China, Hong Kong, India, Indonesia, Malaysia, Philippines, Singapore, South Korea, Taiwan and Thailand.
The MSCI All Country Asia Pacific Index is a free float– adjusted market capitalization–weighted index of the stock markets of Australia, China, Hong Kong, India, Indonesia, Japan, Malaysia, New Zealand, Philippines, Singapore, South Korea, Taiwan and Thailand.
The MSCI Emerging Markets (EM) Asia Index is a free float-adjusted market capitalization weighted index of the stock markets of China, India, Indonesia, Korea, Malaysia, the Philippines, Taiwan and Thailand.
The MSCI China Index is a free float–adjusted market capitalization–weighted index of Chinese equities that includes China-affiliated corporations and H shares listed on the Hong Kong exchange, and B shares listed on the Shanghai and Shenzhen exchanges.
The S&P Bombay Stock Exchange (BSE) 100 Index is a free float–adjusted market capitalization–weighted index of the 100 stocks listed on the Bombay Stock Exchange.
The MSCI Japan Index is a free float–adjusted market capitalization–weighted index of Japanese equities listed in Japan.
The Korea Composite Stock Price Index (KOSPI) is a market capitalization–weighted index of all common stocks listed on the Korea Stock Exchange.
The MSCI All Country Asia ex Japan Small Cap Index is a free float–adjusted market capitalization–weighted small cap index of the stock markets of China, Hong Kong, India, Indonesia, Malaysia, Philippines, Singapore, South Korea, Taiwan and Thailand.
The MSCI China Small Cap Index is a free float–adjusted market capitalization–weighted small cap index of the Chinese equity securities markets, including H shares listed on the Hong Kong exchange, B shares listed on the Shanghai and Shenzhen exchanges, and Hong Kong-listed securities known as Red Chips (issued by entities owned by national or local governments in China) and P Chips (issued by companies controlled by individuals in China and deriving substantial revenues in China).
The MSCI All Country Asia Index is a free float–adjusted market capitalization–weighted index of the stock markets of China, Hong Kong, India, Indonesia, Japan, Malaysia, Philippines, Singapore, South Korea, Taiwan and Thailand.
The MSCI All Country Asia Information Technology Index is a free float–adjusted market capitalization–weighted index designed to measure the combined equity market performance of companies in the information technology sector of developed and emerging markets countries in Asia. Component companies include those of software and services, technology hardware and equipment, and semiconductors and semiconductor equipment.
matthewsasia.com | 800.789.ASIA 85
Disclosure of Fund Expenses (Unaudited)
We believe it is important for you to understand the impact of fees regarding your investment. All mutual funds have operating expenses. As a shareholder of a mutual fund, you incur ongoing costs, which include costs for portfolio management, administrative services, and shareholder reports (like this one), among others. Operating expenses, which are deducted from a fund's gross income, directly reduce the investment return of the fund. A fund's operating expenses are expressed as a percentage of its average net assets. This figure is known as the expense ratio. The following examples are intended to help you understand the ongoing fees (in dollars) of investing in your fund and to compare these costs with those of other mutual funds. The examples are based on an investment of $1,000 made at the beginning of the period shown and held for the entire period.
This table illustrates your fund's costs in two ways:
Actual Fund Return: This section helps you to estimate the actual operating expenses, after any applicable fee waivers, that you paid over the period. The "Ending Account Value" shown is derived from the fund's actual return for the past six month period, the "Expense Ratio" column shows the period's annualized expense ratio, and the "Operating Expenses Paid During Period" column shows the dollar amount that would have been paid by an investor who started with $1,000 in the fund at the beginning of the period. You may use the information here, together with your account value, to estimate the expenses that you paid over the period. To do so, simply divide your account value by $1,000 (for example, an
$8,600 account value divided by $1,000 = 8.6), then multiply the result by the number given for your fund in the first line under the heading entitled "Operating Expenses Paid During Period."
Hypothetical 5% Return: This section is intended to help you compare your fund's costs with those of other mutual funds. It assumes that the fund had an annual return of 5% before operating expenses, but that the expense ratio is unchanged. In this case, because the return used is not the fund's actual return, the results do not apply to your investment. This example is useful in making comparisons to other mutual funds because the Securities and Exchange Commission requires all mutual funds to calculate expenses based on an assumed 5% annual return. You can assess your fund's costs by comparing this hypothetical example with the hypothetical examples that appear in shareholder reports of other funds.
Please note that the operating expenses shown in the table are meant to highlight and help you compare your ongoing costs only and do not reflect any transactional costs such as sales charges (loads), redemption fees, or exchange fees.
Matthews Asia Funds does not charge any sales loads, exchange fees, or 12b-1 fees, but these may be present in other funds to which you compare this data. Therefore, the hypothetical portions of the table are useful in comparing ongoing costs only, and will not help you determine the relative total costs of owning different funds.
86 MATTHEWS ASIA FUNDS
June 30, 2015
| | | INVESTOR CLASS | | INSTITUTIONAL CLASS | |
| | | Beginning
Account
Value
1/1/15 | | Ending
Account
Value
6/30/15 | | Expense
Ratio1 | | Operating
Expenses
Paid During
Period
1/1/15–
6/30/152 | | Beginning
Account
Value
1/1/15 | | Ending
Account
Value
6/30/15 | | Expense
Ratio1 | | Operating
Expenses
Paid During
Period
1/1/15–
6/30/152 | |
ASIA FIXED INCOME STRATEGY | |
Matthews Asia Strategic Income Fund | |
Actual Fund Return | | $ | 1,000.00 | | | $ | 1,003.80 | | | | 1.11 | % | | $ | 5.51 | | | $ | 1,000.00 | | | $ | 1,004.80 | | | | 0.90 | % | | $ | 4.47 | | |
Hypothetical 5% Return | | $ | 1,000.00 | | | $ | 1,019.29 | | | | 1.11 | % | | $ | 5.56 | | | $ | 1,000.00 | | | $ | 1,020.33 | | | | 0.90 | % | | $ | 4.51 | | |
ASIA GROWTH AND INCOME STRATEGIES | |
Matthews Asian Growth and Income Fund | |
Actual Fund Return | | $ | 1,000.00 | | | $ | 1,034.60 | | | | 1.08 | % | | $ | 5.45 | | | $ | 1,000.00 | | | $ | 1,035.50 | | | | 0.92 | % | | $ | 4.64 | | |
Hypothetical 5% Return | | $ | 1,000.00 | | | $ | 1,019.44 | | | | 1.08 | % | | $ | 5.41 | | | $ | 1,000.00 | | | $ | 1,020.23 | | | | 0.92 | % | | $ | 4.61 | | |
Matthews Asia Dividend Fund | |
Actual Fund Return | | $ | 1,000.00 | | | $ | 1,126.50 | | | | 1.04 | % | | $ | 5.48 | | | $ | 1,000.00 | | | $ | 1,127.20 | | | | 0.92 | % | | $ | 4.85 | | |
Hypothetical 5% Return | | $ | 1,000.00 | | | $ | 1,019.64 | | | | 1.04 | % | | $ | 5.21 | | | $ | 1,000.00 | | | $ | 1,020.23 | | | | 0.92 | % | | $ | 4.61 | | |
Matthews China Dividend Fund | |
Actual Fund Return | | $ | 1,000.00 | | | $ | 1,227.40 | | | | 1.12 | % | | $ | 6.19 | | | $ | 1,000.00 | | | $ | 1,227.80 | | | | 0.99 | % | | $ | 5.47 | | |
Hypothetical 5% Return | | $ | 1,000.00 | | | $ | 1,019.24 | | | | 1.12 | % | | $ | 5.61 | | | $ | 1,000.00 | | | $ | 1,019.89 | | | | 0.99 | % | | $ | 4.96 | | |
ASIA GROWTH STRATEGIES | |
Matthews Asia Focus Fund | |
Actual Fund Return | | $ | 1,000.00 | | | $ | 991.00 | | | | 1.50 | % | | $ | 7.40 | | | $ | 1,000.00 | | | $ | 991.00 | | | | 1.25 | % | | $ | 6.17 | | |
Hypothetical 5% Return | | $ | 1,000.00 | | | $ | 1,017.36 | | | | 1.50 | % | | $ | 7.50 | | | $ | 1,000.00 | | | $ | 1,018.60 | | | | 1.25 | % | | $ | 6.26 | | |
Matthews Asia Growth Fund | |
Actual Fund Return | | $ | 1,000.00 | | | $ | 1,045.00 | | | | 1.09 | % | | $ | 5.53 | | | $ | 1,000.00 | | | $ | 1,046.30 | | | | 0.91 | % | | $ | 4.62 | | |
Hypothetical 5% Return | | $ | 1,000.00 | | | $ | 1,019.39 | | | | 1.09 | % | | $ | 5.46 | | | $ | 1,000.00 | | | $ | 1,020.28 | | | | 0.91 | % | | $ | 4.56 | | |
Matthews Pacific Tiger Fund | |
Actual Fund Return | | $ | 1,000.00 | | | $ | 1,081.30 | | | | 1.05 | % | | $ | 5.42 | | | $ | 1,000.00 | | | $ | 1,081.70 | | | | 0.88 | % | | $ | 4.54 | | |
Hypothetical 5% Return | | $ | 1,000.00 | | | $ | 1,019.59 | | | | 1.05 | % | | $ | 5.26 | | | $ | 1,000.00 | | | $ | 1,020.43 | | | | 0.88 | % | | $ | 4.41 | | |
Matthews Asia ESG Fund* | |
Actual Fund Return | | $ | 1,000.00 | | | $ | 923.74 | | | | 1.50 | % | | $ | 2.41 | | | $ | 1,000.00 | | | $ | 920.78 | | | | 1.25 | % | | $ | 2.013 | | |
Hypothetical 5% Return | | $ | 1,000.00 | | | $ | 1,017.36 | | | | 1.50 | % | | $ | 7.50 | | | $ | 1,000.00 | | | $ | 1,018.60 | | | | 1.25 | % | | $ | 6.262 | | |
Matthews Emerging Asia Fund | |
Actual Fund Return | | $ | 1,000.00 | | | $ | 997.40 | | | | 1.47 | % | | $ | 7.28 | | | $ | 1,000.00 | | | $ | 999.10 | | | | 1.25 | % | | $ | 6.20 | | |
Hypothetical 5% Return | | $ | 1,000.00 | | | $ | 1,017.50 | | | | 1.47 | % | | $ | 7.35 | | | $ | 1,000.00 | | | $ | 1,018.60 | | | | 1.25 | % | | $ | 6.26 | | |
Matthews China Fund | |
Actual Fund Return | | $ | 1,000.00 | | | $ | 1,182.70 | | | | 1.13 | % | | $ | 6.12 | | | $ | 1,000.00 | | | $ | 1,183.30 | | | | 0.99 | % | | $ | 5.36 | | |
Hypothetical 5% Return | | $ | 1,000.00 | | | $ | 1,019.19 | | | | 1.13 | % | | $ | 5.66 | | | $ | 1,000.00 | | | $ | 1,019.89 | | | | 0.99 | % | | $ | 4.96 | | |
Matthews India Fund | |
Actual Fund Return | | $ | 1,000.00 | | | $ | 1,064.60 | | | | 1.07 | % | | $ | 5.48 | | | $ | 1,000.00 | | | $ | 1,065.70 | | | | 0.89 | % | | $ | 4.56 | | |
Hypothetical 5% Return | | $ | 1,000.00 | | | $ | 1,019.49 | | | | 1.07 | % | | $ | 5.36 | | | $ | 1,000.00 | | | $ | 1,020.38 | | | | 0.89 | % | | $ | 4.46 | | |
Matthews Japan Fund | |
Actual Fund Return | | $ | 1,000.00 | | | $ | 1,222.90 | | | | 0.98 | % | | $ | 5.40 | | | $ | 1,000.00 | | | $ | 1,223.40 | | | | 0.88 | % | | $ | 4.85 | | |
Hypothetical 5% Return | | $ | 1,000.00 | | | $ | 1,019.93 | | | | 0.98 | % | | $ | 4.91 | | | $ | 1,000.00 | | | $ | 1,020.43 | | | | 0.88 | % | | $ | 4.41 | | |
Matthews Korea Fund | |
Actual Fund Return | | $ | 1,000.00 | | | $ | 1,157.50 | | | | 1.10 | % | | $ | 5.88 | | | $ | 1,000.00 | | | $ | 1,158.50 | | | | 0.94 | % | | $ | 5.03 | | |
Hypothetical 5% Return | | $ | 1,000.00 | | | $ | 1,019.34 | | | | 1.10 | % | | $ | 5.51 | | | $ | 1,000.00 | | | $ | 1,020.13 | | | | 0.94 | % | | $ | 4.71 | | |
ASIA SMALL COMPANY STRATEGIES | |
Matthews Asia Small Companies Fund | |
Actual Fund Return | | $ | 1,000.00 | | | $ | 1,059.60 | | | | 1.46 | % | | $ | 7.46 | | | $ | 1,000.00 | | | $ | 1,060.60 | | | | 1.25 | % | | $ | 6.39 | | |
Hypothetical 5% Return | | $ | 1,000.00 | | | $ | 1,017.55 | | | | 1.46 | % | | $ | 7.30 | | | $ | 1,000.00 | | | $ | 1,018.60 | | | | 1.25 | % | | $ | 6.26 | | |
Matthews China Small Companies Fund | |
Actual Fund Return | | $ | 1,000.00 | | | $ | 1,165.00 | | | | 1.50 | % | | $ | 8.05 | | | | | | | | | | | | | | | | | | |
Hypothetical 5% Return | | $ | 1,000.00 | | | $ | 1,017.36 | | | | 1.50 | % | | $ | 7.50 | | | | | | | | | | | | | | | | | | |
ASIA SPECIALTY STRATEGY | �� |
Matthews Asia Science and Technology Fund | |
Actual Fund Return | | $ | 1,000.00 | | | $ | 1,087.40 | | | | 1.15 | % | | $ | 5.95 | | | $ | 1,000.00 | | | $ | 1,088.20 | | | | 0.95 | % | | $ | 4.92 | | |
Hypothetical 5% Return | | $ | 1,000.00 | | | $ | 1,019.09 | | | | 1.15 | % | | $ | 5.76 | | | $ | 1,000.00 | | | $ | 1,020.08 | | | | 0.95 | % | | $ | 4.76 | | |
* Commenced operations on April 30, 2015.
1 Annualized, based on the Fund's most recent fiscal half-year expenses.
2 Operating expenses are equal to the Fund's annualized expense ratio multiplied by the average account value over the period, multiplied by 181 days, then divided by 365.
3 Operating expenses are equal to the Fund's annualized expense ratio multiplied by the average account value over the period, multiplied by 61 days, then divided by 365.
matthewsasia.com | 800.789.ASIA 87
Statements of Assets and Liabilities (Unaudited) June 30, 2015
| | | Matthews Asia
Strategic
Income Fund | | Matthews Asian
Growth and
Income Fund | | Matthews Asia
Dividend Fund1 | | Matthews China
Dividend Fund | |
ASSETS: | |
Investments at value (A) (Note 2-A and 7): | |
Unaffiliated issuers | | $ | 67,507,161 | | | $ | 3,918,596,714 | | | $ | 4,917,780,776 | | | $ | 214,499,148 | | |
Affiliated issuers | | | — | | | | — | | | | 774,315,062 | | | | — | | |
Total investments | | | 67,507,161 | | | | 3,918,596,714 | | | | 5,692,095,838 | | | | 214,499,148 | | |
Cash | | | 3,013,442 | | | | 126,591,117 | | | | 148,869,956 | | | | 14,961,385 | | |
Segregated foreign currency at value (B) | | | — | | | | — | | | | 58,837 | | | | — | | |
Foreign currency at value (B) | | | — | | | | 2,297,580 | | | | 59,495,564 | | | | 410,905 | | |
Dividends, interest and other receivable—Unaffiliated issuers | | | 1,002,795 | | | | 8,612,195 | | | | 21,031,721 | | | | 1,493,912 | | |
Dividends receivable—Affiliated issuers | | | — | | | | — | | | | 1,431,382 | | | | — | | |
Receivable for securities sold | | | — | | | | 30,949,327 | | | | 13,335,528 | | | | 2,190,907 | | |
Receivable for capital shares sold | | | 11,929 | | | | 6,348,420 | | | | 21,596,999 | | | | 1,166,481 | | |
Due from Advisor (Note 5) | | | — | | | | — | | | | — | | | | — | | |
Deferred offering costs (Note 2-E) | | | — | | | | — | | | | 240 | | | | — | | |
Prepaid expenses and other assets | | | 30,598 | | | | 41,111 | | | | 44,790 | | | | 14,173 | | |
TOTAL ASSETS | | | 71,565,925 | | | | 4,093,436,464 | | | | 5,957,960,855 | | | | 234,736,911 | | |
LIABILITIES: | |
Payable for securities purchased | | | 1,450,847 | | | | 8,800,219 | | | | 13,729,001 | | | | 203,504 | | |
Payable for capital shares redeemed | | | 106,239 | | | | 31,695,490 | | | | 7,257,584 | | | | 4,403,869 | | |
Deferred foreign capital gains tax liability (Note 2-G) | | | 11,647 | | | | — | | | | 523,860 | | | | — | | |
Due to Advisor (Note 5) | | | 24,124 | | | | 2,287,384 | | | | 3,224,911 | | | | 133,143 | | |
Administration and accounting fees payable | | | 935 | | | | 57,019 | | | | 78,804 | | | | 3,012 | | |
Administration and shareholder servicing fees payable | | | 14,607 | | | | 897,563 | | | | 1,012,733 | | | | 40,092 | | |
Custodian fees payable | | | 1,828 | | | | 282,926 | | | | 323,733 | | | | 4,981 | | |
Transfer agent fees payable | | | 13,728 | | | | 886,948 | | | | 781,545 | | | | 26,796 | | |
Offering costs (Note 2-E) | | | — | | | | — | | | | — | | | | — | | |
Trustees fees payable | | | — | | | | — | | | | — | | | | — | | |
Accrued other expenses payable | | | 23,495 | | | | 10,182 | | | | 168,919 | | | | 16,228 | | |
TOTAL LIABILITIES | | | 1,647,450 | | | | 44,917,731 | | | | 27,101,090 | | | | 4,831,625 | | |
NET ASSETS | | $ | 69,918,475 | | | $ | 4,048,518,733 | | | $ | 5,930,859,765 | | | $ | 229,905,286 | | |
NET ASSETS: | |
Investor Class | | $ | 58,170,952 | | | $ | 2,914,655,558 | | | $ | 3,214,367,459 | | | $ | 203,456,699 | | |
Institutional Class | | | 11,747,523 | | | | 1,133,863,175 | | | | 2,716,492,306 | | | | 26,448,587 | | |
TOTAL | | $ | 69,918,475 | | | $ | 4,048,518,733 | | | $ | 5,930,859,765 | | | $ | 229,905,286 | | |
SHARES OUTSTANDING: | |
(shares of beneficial interest issued and outstanding, respectively,
unlimited number of shares authorized with a $0.001 par value) | |
Investor Class | | | 5,674,719 | | | | 158,198,925 | | | | 189,190,124 | | | | 12,598,167 | | |
Institutional Class | | | 1,146,729 | | | | 61,593,494 | | | | 159,928,466 | | | | 1,637,460 | | |
TOTAL | | | 6,821,448 | | | | 219,792,419 | | | | 349,118,590 | | | | 14,235,627 | | |
1 Consolidated Statements of Assets and Liabilities.
See accompanying notes to financial statements.
88 MATTHEWS ASIA FUNDS
| | | Matthews Asia
Focus Fund | | Matthews Asia
Growth Fund | | Matthews Pacific
Tiger Fund | | Matthews Asia
ESG Fund | |
ASSETS: | |
Investments at value (A) (Note 2-A and 7): | |
Unaffiliated issuers | | $ | 14,421,321 | | | $ | 946,074,953 | | | $ | 7,981,270,529 | | | $ | 1,461,562 | | |
Affiliated issuers | | | — | | | | — | | | | 929,500,348 | | | | — | | |
Total investments | | | 14,421,321 | | | | 946,074,953 | | | | 8,910,770,877 | | | | 1,461,562 | | |
Cash | | | 912,227 | | | | 43,495,579 | | | | 455,609,681 | | | | 183,239 | | |
Segregated foreign currency at value (B) | | | — | | | | — | | | | — | | | | — | | |
Foreign currency at value (B) | | | — | | | | 969,884 | | | | 7,870,986 | | | | 310 | | |
Dividends, interest and other receivable—Unaffiliated issuers | | | 49,157 | | | | 994,052 | | | | 25,374,636 | | | | 3,501 | | |
Dividends receivable—Affiliated issuers | | | — | | | | — | | | | — | | | | — | | |
Receivable for securities sold | | | 434,150 | | | | — | | | | — | | | | — | | |
Receivable for capital shares sold | | | 33,000 | | | | 997,974 | | | | 24,109,693 | | | | 8,362 | | |
Due from Advisor (Note 5) | | | — | | | | — | | | | — | | | | 5,658 | | |
Deferred offering costs (Note 2-E) | | | — | | | | — | | | | — | | | | — | | |
Prepaid expenses and other assets | | | 35,221 | | | | 40,255 | | | | 81,808 | | | | 16,456 | | |
TOTAL ASSETS | | | 15,885,076 | | | | 992,572,697 | | | | 9,423,817,681 | | | | 1,679,088 | | |
LIABILITIES: | |
Payable for securities purchased | | | 342,659 | | | | — | | | | 22,240,500 | | | | 8,285 | | |
Payable for capital shares redeemed | | | 47,373 | | | | 835,737 | | | | 3,928,913 | | | | — | | |
Deferred foreign capital gains tax liability (Note 2-G) | | | 11 | | | | 151,277 | | | | — | | | | 2,588 | | |
Due to Advisor (Note 5) | | | 44 | | | | 550,916 | | | | 5,081,979 | | | | — | | |
Administration and accounting fees payable | | | 216 | | | | 13,372 | | | | 126,351 | | | | 20 | | |
Administration and shareholder servicing fees payable | | | 927 | | | | 176,828 | | | | 1,444,882 | | | | 250 | | |
Custodian fees payable | | | — | | | | 76,999 | | | | 751,531 | | | | 3,208 | | |
Transfer agent fees payable | | | — | | | | 131,018 | | | | 1,017,613 | | | | 314 | | |
Offering costs (Note 2-E) | | | — | | | | — | | | | — | | | | 1,322 | | |
Trustees fees payable | | | — | | | | — | | | | — | | | | 46 | | |
Accrued other expenses payable | | | 3,781 | | | | 18,974 | | | | 35,483 | | | | — | | |
TOTAL LIABILITIES | | | 395,011 | | | | 1,955,121 | | | | 34,627,252 | | | | 16,033 | | |
NET ASSETS | | $ | 15,490,065 | | | $ | 990,617,576 | | | $ | 9,389,190,429 | | | $ | 1,663,055 | | |
NET ASSETS: | |
Investor Class | | $ | 8,259,842 | | | $ | 655,613,712 | | | $ | 3,369,529,222 | | | $ | 560,535 | | |
Institutional Class | | | 7,230,223 | | | | 335,003,864 | | | | 6,019,661,207 | | | | 1,102,520 | | |
TOTAL | | $ | 15,490,065 | | | $ | 990,617,576 | | | $ | 9,389,190,429 | | | $ | 1,663,055 | | |
SHARES OUTSTANDING: | |
(shares of beneficial interest issued and outstanding, respectively,
unlimited number of shares authorized with a $0.001 par value) | |
Investor Class | | | 832,716 | | | | 29,738,193 | | | | 117,290,956 | | | | 56,967 | | |
Institutional Class | | | 726,700 | | | | 15,112,293 | | | | 209,494,677 | | | | 112,000 | | |
TOTAL | | | 1,559,416 | | | | 44,850,486 | | | | 326,785,633 | | | | 168,967 | | |
matthewsasia.com | 800.789.ASIA 89
Statements of Assets and Liabilities (Unaudited) (continued) June 30, 2015
| | | Matthews Asia
Strategic
Income Fund | | Matthews Asian
Growth and
Income Fund | | Matthews Asia
Dividend Fund1 | | Matthews China
Dividend Fund | |
NET ASSET VALUE: | |
Investor Class, offering price and redemption price | | $ | 10.25 | | | $ | 18.42 | | | $ | 16.99 | | | $ | 16.15 | | |
Institutional Class, offering price and redemption price | | $ | 10.24 | | | $ | 18.41 | | | $ | 16.99 | | | $ | 16.15 | | |
NET ASSETS CONSIST OF: | |
Capital paid-in | | $ | 72,968,691 | | | $ | 3,318,369,070 | | | $ | 4,904,054,146 | | | $ | 191,575,895 | | |
Undistributed (distributions in excess of) net investment income (loss) | | | 675,540 | | | | (15,063,051 | ) | | | (61,970,572 | ) | | | (2,375,745 | ) | |
Undistributed/accumulated net realized gain (loss) on investments,
financial futures contracts, and foreign currency related transactions | | | (2,269,281 | ) | | | 187,352,322 | | | | 17,897,622 | | | | 11,259,907 | | |
Net unrealized appreciation (depreciation) on investments, financial
futures contracts, foreign currency translations and deferred
foreign capital gains taxes | | | (1,456,475 | ) | | | 557,860,392 | | | | 1,070,878,569 | | | | 29,445,229 | | |
NET ASSETS | | $ | 69,918,475 | | | $ | 4,048,518,733 | | | $ | 5,930,859,765 | | | $ | 229,905,286 | | |
| | (A) Investments at cost: | | |
Unaffiliated issuers | | $ | 68,946,669 | | | $ | 3,360,737,685 | | | $ | 4,086,448,636 | | | $ | 185,055,077 | | |
Affiliated issuers | | | — | | | | — | | | | 534,374,243 | | | | — | | |
Total investments at cost | | $ | 68,946,669 | | | $ | 3,360,737,685 | | | $ | 4,620,822,879 | | | $ | 185,055,077 | | |
| | (B) Foreign currency at cost | | | $ | — | | | $ | 2,297,580 | | | $ | 59,448,354 | | | $ | 410,905 | | |
1 Consolidated Statements of Assets and Liabilities.
See accompanying notes to financial statements.
90 MATTHEWS ASIA FUNDS
| | | Matthews Asia
Focus Fund | | Matthews Asia
Growth Fund | | Matthews Pacific
Tiger Fund | | Matthews Asia
ESG Fund | |
NET ASSET VALUE: | |
Investor Class, offering price and redemption price | | $ | 9.92 | | | $ | 22.05 | | | $ | 28.73 | | | $ | 9.84 | | |
Institutional Class, offering price and redemption price | | $ | 9.95 | | | $ | 22.17 | | | $ | 28.73 | | | $ | 9.84 | | |
NET ASSETS CONSIST OF: | |
Capital paid-in | | $ | 15,660,919 | | | $ | 826,036,707 | | | $ | 6,225,494,914 | | | $ | 1,689,723 | | |
Undistributed (distributions in excess of) net investment income (loss) | | | 106,777 | | | | (8,175,623 | ) | | | 29,143,867 | | | | 3,083 | | |
Undistributed/accumulated net realized gain (loss) on investments,
financial futures contracts, and foreign currency related transactions | | | (123,883 | ) | | | (19,021,428 | ) | | | 251,929,973 | | | | (453 | ) | |
Net unrealized appreciation (depreciation) on investments, financial
futures contracts, foreign currency translations and deferred
foreign capital gains taxes | | | (153,748 | ) | | | 191,777,920 | | | | 2,882,621,675 | | | | (29,298 | ) | |
NET ASSETS | | $ | 15,490,065 | | | $ | 990,617,576 | | | $ | 9,389,190,429 | | | $ | 1,663,055 | | |
| | (A) Investments at cost: | | |
Unaffiliated issuers | | $ | 14,576,223 | | | $ | 754,148,703 | | | $ | 5,156,490,445 | | | $ | 1,488,276 | | |
Affiliated issuers | | | — | | | | — | | | | 871,727,920 | | | | — | | |
Total investments at cost | | $ | 14,576,223 | | | $ | 754,148,703 | | | $ | 6,028,218,365 | | | $ | 1,488,276 | | |
| | (B) Foreign currency at cost | | | $ | — | | | $ | 970,732 | | | $ | 7,864,067 | | | $ | 310 | | |
matthewsasia.com | 800.789.ASIA 91
Statements of Assets and Liabilities (Unaudited) (continued) June 30, 2015
| | | Matthews Emerging
Asia Fund | | Matthews
China Fund1 | | Matthews
India Fund | | Matthews
Japan Fund | |
ASSETS: | |
Investments at value (A) (Note 2-A and 7): | |
Unaffiliated issuers | | $ | 167,489,923 | | | $ | 1,020,430,524 | | | $ | 1,483,892,787 | | | $ | 1,170,056,088 | | |
Affiliated issuers | | | — | | | | — | | | | 84,235,562 | | | | 44,987,022 | | |
Total investments | | | 167,489,923 | | | | 1,020,430,524 | | | | 1,568,128,349 | | | | 1,215,043,110 | | |
Cash | | | 11,052,778 | | | | 18,541,619 | | | | 17,209,258 | | | | 74,851,703 | | |
Segregated foreign currency at value (B) | | | — | | | | 63,067 | | | | — | | | | — | | |
Foreign currency at value (B) | | | 622,588 | | | | 17,169,118 | | | | 1,027,481 | | | | 1,125,622 | | |
Dividends, interest and other receivable—Unaffiliated issuers | | | 244,595 | | | | 7,802,521 | | | | 2,498,655 | | | | 531,101 | | |
Receivable for securities sold | | | — | | | | 12,974,650 | | | | 1,656,411 | | | | 453,066 | | |
Receivable for capital shares sold | | | 234,464 | | | | 743,593 | | | | 2,131,918 | | | | 23,936,374 | | |
Deferred offering costs (Note 2-E) | | | — | | | | 240 | | | | — | | | | — | | |
Prepaid expenses and other assets | | | 59,605 | | | | 37,331 | | | | 52,800 | | | | 43,303 | | |
TOTAL ASSETS | | | 179,703,953 | | | | 1,077,762,663 | | | | 1,592,704,872 | | | | 1,315,984,279 | | |
LIABILITIES: | |
Payable for securities purchased | | | 1,192,486 | | | | 8,012,431 | | | | 1,902,391 | | | | 51,172,309 | | |
Payable for capital shares redeemed | | | 257,276 | | | | 5,033,193 | | | | 4,754,279 | | | | 1,792,739 | | |
Cash overdraft | | | — | | | | — | | | | — | | | | — | | |
Deferred foreign capital gains tax liability (Note 2-G) | | | 1,335,721 | | | | — | | | | 6,389,876 | | | | — | | |
Due to Advisor (Note 5) | | | 102,694 | | | | 617,909 | | | | 854,538 | | | | 626,499 | | |
Administration and accounting fees payable | | | 2,296 | | | | 15,144 | | | | 20,763 | | | | 14,241 | | |
Administration and shareholder servicing fees payable | | | 30,769 | | | | 242,904 | | | | 267,107 | | | | 153,329 | | |
Professional fees payable | | | 7,095 | | | | 25,461 | | | | 30,235 | | | | 21,005 | | |
Transfer agent fees payable | | | 22,626 | | | | 242,517 | | | | 189,665 | | | | 55,964 | | |
Accrued other expenses payable | | | — | | | | 119,120 | | | | 37,343 | | | | — | | |
TOTAL LIABILITIES | | | 2,950,963 | | | | 14,308,679 | | | | 14,446,197 | | | | 53,836,086 | | |
NET ASSETS | | $ | 176,752,990 | | | $ | 1,063,453,984 | | | $ | 1,578,258,675 | | | $ | 1,262,148,193 | | |
NET ASSETS: | |
Investor Class | | $ | 121,918,842 | | | $ | 1,003,166,495 | | | $ | 1,312,573,632 | | | $ | 887,345,980 | | |
Institutional Class | | | 54,834,148 | | | | 60,287,489 | | | | 265,685,043 | | | | 374,802,213 | | |
TOTAL | | $ | 176,752,990 | | | $ | 1,063,453,984 | | | $ | 1,578,258,675 | | | $ | 1,262,148,193 | | |
SHARES OUTSTANDING: | |
(shares of beneficial interest issued and outstanding, respectively,
unlimited number of shares authorized with a $0.001 par value) | |
Investor Class | | | 10,533,484 | | | | 39,520,433 | | | | 46,601,402 | | | | 46,216,138 | | |
Institutional Class | | | 4,731,725 | | | | 2,376,261 | | | | 9,411,429 | | | | 19,503,615 | | |
TOTAL | | | 15,265,209 | | | | 41,896,694 | | | | 56,012,831 | | | | 65,719,753 | | |
1 Consolidated Statements of Assets and Liabilities.
See accompanying notes to financial statements.
92 MATTHEWS ASIA FUNDS
| | | Matthews
Korea Fund | | Matthews Asia
Small Companies
Fund | | Matthews China
Small Companies
Fund | | Matthews Asia
Science and
Technology Fund | |
ASSETS: | |
Investments at value (A) (Note 2-A and 7): | |
Unaffiliated issuers | | $ | 211,032,537 | | | $ | 775,036,013 | | | $ | 24,393,468 | | | $ | 179,192,118 | | |
Affiliated issuers | | | — | | | | 29,228,665 | | | | — | | | | — | | |
Total investments | | | 211,032,537 | | | | 804,264,678 | | | | 24,393,468 | | | | 179,192,118 | | |
Cash | | | 4,559,511 | | | | 23,586,673 | | | | 1,377,059 | | | | — | | |
Segregated foreign currency at value (B) | | | — | | | | — | | | | — | | | | — | | |
Foreign currency at value (B) | | | — | | | | 3,391,567 | | | | 6,141 | | | | 1,073,321 | | |
Dividends, interest and other receivable—Unaffiliated issuers | | | 61,704 | | | | 1,075,086 | | | | 88,527 | | | | 190,834 | | |
Receivable for securities sold | | | 249,347 | | | | 1,616,615 | | | | — | | | | 2,112,567 | | |
Receivable for capital shares sold | | | 404,330 | | | | 2,534,619 | | | | 211,900 | | | | 119,179 | | |
Deferred offering costs (Note 2-E) | | | — | | | | — | | | | — | | | | — | | |
Prepaid expenses and other assets | | | 18,447 | | | | 42,137 | | | | 15,134 | | | | 14,814 | | |
TOTAL ASSETS | | | 216,325,876 | | | | 836,511,375 | | | | 26,092,229 | | | | 182,702,833 | | |
LIABILITIES: | |
Payable for securities purchased | | | 242,506 | | | | 5,184,954 | | | | — | | | | 335,825 | | |
Payable for capital shares redeemed | | | 68,113 | | | | 1,171,148 | | | | 70,701 | | | | 180,050 | | |
Cash overdraft | | | — | | | | — | | | | — | | | | 11,789 | | |
Deferred foreign capital gains tax liability (Note 2-G) | | | — | | | | 41,983 | | | | — | | | | — | | |
Due to Advisor (Note 5) | | | 117,995 | | | | 689,149 | | | | 14,773 | | | | 102,852 | | |
Administration and accounting fees payable | | | 2,892 | | | | 10,991 | | | | 356 | | | | 2,630 | | |
Administration and shareholder servicing fees payable | | | 36,471 | | | | 162,840 | | | | 5,675 | | | | 34,701 | | |
Professional fees payable | | | 18,884 | | | | 21,941 | | | | 18,546 | | | | 21,816 | | |
Transfer agent fees payable | | | 26,785 | | | | 140,428 | | | | 5,629 | | | | 28,717 | | |
Accrued other expenses payable | | | 5,047 | | | | 44,768 | | | | — | | | | 6,389 | | |
TOTAL LIABILITIES | | | 518,693 | | | | 7,468,202 | | | | 115,680 | | | | 724,769 | | |
NET ASSETS | | $ | 215,807,183 | | | $ | 829,043,173 | | | $ | 25,976,549 | | | $ | 181,978,064 | | |
NET ASSETS: | |
Investor Class | | $ | 155,937,366 | | | $ | 563,009,144 | | | $ | 25,976,549 | | | $ | 144,997,712 | | |
Institutional Class | | | 59,869,817 | | | | 266,034,029 | | | | — | | | | 36,980,352 | | |
TOTAL | | $ | 215,807,183 | | | $ | 829,043,173 | | | $ | 25,976,549 | | | $ | 181,978,064 | | |
SHARES OUTSTANDING: | |
(shares of beneficial interest issued and outstanding, respectively,
unlimited number of shares authorized with a $0.001 par value) | |
Investor Class | | | 23,826,308 | | | | 24,762,356 | | | | 2,421,528 | | | | 9,795,386 | | |
Institutional Class | | | 9,100,580 | | | | 11,690,441 | | | | — | | | | 2,497,510 | | |
TOTAL | | | 32,926,888 | | | | 36,452,797 | | | | 2,421,528 | | | | 12,292,896 | | |
matthewsasia.com | 800.789.ASIA 93
Statements of Assets and Liabilities (Unaudited) (continued) June 30, 2015
| | | Matthews Emerging
Asia Fund | | Matthews
China Fund1 | | Matthews
India Fund | | Matthews
Japan Fund | |
NET ASSET VALUE: | |
Investor Class, offering price and redemption price | | $ | 11.57 | | | $ | 25.38 | | | $ | 28.17 | | | $ | 19.20 | | |
Institutional Class, offering price and redemption price | | $ | 11.59 | | | $ | 25.37 | | | $ | 28.23 | | | $ | 19.22 | | |
NET ASSETS CONSIST OF: | |
Capital paid-in | | $ | 167,858,367 | | | $ | 695,597,690 | | | $ | 1,225,101,896 | | | $ | 1,159,608,124 | | |
Undistributed (distributions in excess of) net investment income (loss) | | | (71,837 | ) | | | 8,674,968 | | | | (597,605 | ) | | | (2,081,499 | ) | |
Undistributed/accumulated net realized gain (loss) on investments
and foreign currency related transactions | | | 500,451 | | | | 44,766,037 | | | | 20,837,265 | | | | (71,128,974 | ) | |
Net unrealized appreciation (depreciation) on investments, financial
futures contracts, foreign currency translations and deferred foreign
capital gains taxes | | | 8,466,009 | | | | 314,415,289 | | | | 332,917,119 | | | | 175,750,542 | | |
NET ASSETS | | $ | 176,752,990 | | | $ | 1,063,453,984 | | | $ | 1,578,258,675 | | | $ | 1,262,148,193 | | |
| | (A) Investments at cost: | | |
Unaffiliated issuers | | $ | 157,687,929 | | | $ | 706,034,775 | | | $ | 1,147,290,692 | | | $ | 998,342,212 | | |
Affiliated issuers | | | — | | | | — | | | | 81,427,840 | | | | 40,960,352 | | |
Total investments at cost | | $ | 157,687,929 | | | $ | 706,034,775 | | | $ | 1,228,718,532 | | | $ | 1,039,302,564 | | |
| | (B) Foreign currency at cost | | | $ | 622,709 | | | $ | 17,152,442 | | | $ | 1,026,063 | | | $ | 1,126,156 | | |
1 Consolidated Statements of Assets and Liabilities.
See accompanying notes to financial statements.
94 MATTHEWS ASIA FUNDS
| | Matthews
Korea Fund | | Matthews Asia
Small Companies
Fund | | Matthews China
Small Companies
Fund | | Matthews Asia
Science and
Technology Fund | |
NET ASSET VALUE: | |
Investor Class, offering price and redemption price | | $ | 6.54 | | | $ | 22.74 | | | $ | 10.73 | | | $ | 14.80 | | |
Institutional Class, offering price and redemption price | | $ | 6.58 | | | $ | 22.76 | | | $ | — | | | $ | 14.81 | | |
NET ASSETS CONSIST OF: | |
Capital paid-in | | $ | 126,794,671 | | | $ | 687,218,518 | | | $ | 19,729,893 | | | $ | 99,085,431 | | |
Undistributed (distributions in excess of) net investment income (loss) | | | (309,453 | ) | | | 1,926,373 | | | | 118,435 | | | | (210,811 | ) | |
Undistributed/accumulated net realized gain (loss) on investments
and foreign currency related transactions | | | 11,701,062 | | | | 16,739,338 | | | | (284,923 | ) | | | 31,557,995 | | |
Net unrealized appreciation (depreciation) on investments, financial
futures contracts, foreign currency translations and deferred foreign
capital gains taxes | | | 77,620,903 | | | | 123,158,944 | | | | 6,413,144 | | | | 51,545,449 | | |
NET ASSETS | | $ | 215,807,183 | | | $ | 829,043,173 | | | $ | 25,976,549 | | | $ | 181,978,064 | | |
| | (A) Investments at cost: | | |
Unaffiliated issuers | | $ | 133,434,557 | | | $ | 650,619,133 | | | $ | 17,980,357 | | | $ | 127,649,691 | | |
Affiliated issuers | | | — | | | | 30,430,810 | | | | — | | | | — | | |
Total investments at cost | | $ | 133,434,557 | | | $ | 681,049,943 | | | $ | 17,980,357 | | | $ | 127,649,691 | | |
| | (B) Foreign currency at cost | | | $ | — | | | $ | 3,391,302 | | | $ | 6,141 | | | $ | 1,073,554 | | |
matthewsasia.com | 800.789.ASIA 95
Statements of Operations (Unaudited) Six-Month Period Ended June 30, 2015
| | | Matthews Asia
Strategic
Income Fund | | Matthews Asian
Growth and
Income Fund | | Matthews Asia
Dividend Fund1 | | Matthews China
Dividend Fund | |
INVESTMENT INCOME: | |
Dividends—Unaffiliated Issuers | | $ | 41,780 | | | $ | 69,628,276 | | | $ | 85,065,142 | | | $ | 3,999,777 | | |
Dividends—Affiliated Issuers (Note 7) | | | — | | | | — | | | | 12,413,786 | | | | — | | |
Interest | | | 1,961,196 | | | | 2,478,777 | | | | 564 | | | | 49,188 | | |
Foreign withholding tax | | | (35,271 | ) | | | (3,811,073 | ) | | | (6,641,706 | ) | | | (258,092 | ) | |
TOTAL INVESTMENT INCOME | | | 1,967,705 | | | | 68,295,980 | | | | 90,837,786 | | | | 3,790,873 | | |
EXPENSES: | |
Investment advisory fees (Note 5) | | | 222,994 | | | | 14,035,776 | | | | 18,381,645 | | | | 598,131 | | |
Administration and accounting fees (Note 5) | | | 2,722 | | | | 168,057 | | | | 253,288 | | | | 7,171 | | |
Administration and shareholder servicing fees (Note 5) | | | 67,628 | | | | 4,144,080 | | | | 4,928,989 | | | | 168,713 | | |
Accounting out-of-pocket fees | | | 16,460 | | | | 19,062 | | | | 19,898 | | | | 12,765 | | |
Custodian fees | | | 14,295 | | | | 655,144 | | | | 743,285 | | | | 44,645 | | |
Printing fees | | | 2,569 | | | | 189,541 | | | | 220,740 | | | | 9,257 | | |
Professional fees | | | 23,048 | | | | 53,995 | | | | 94,209 | | | | 20,230 | | |
Registration fees | | | 18,071 | | | | 54,832 | | | | 49,701 | | | | 20,485 | | |
Transfer agent fees | | | 42,399 | | | | 2,502,526 | | | | 2,485,202 | | | | 94,948 | | |
Trustees fees | | | 1,163 | | | | 77,061 | | | | 87,999 | | | | 3,934 | | |
Offering costs (Note 2-E) | | | — | | | | — | | | | 96,561 | | | | — | | |
Other expenses | | | 8,669 | | | | 51,586 | | | | 61,157 | | | | 5,658 | | |
TOTAL EXPENSES | | | 420,018 | | | | 21,951,660 | | | | 27,422,674 | | | | 985,937 | | |
Advisory fees waived and expenses waived or reimbursed (Note 5) | | | (53,170 | ) | | | (61,816 | ) | | | (136,298 | ) | | | — | | |
Administration fees waived (Note 5) | | | — | | | | (61,816 | ) | | | (136,298 | ) | | | — | | |
NET EXPENSES | | | 366,848 | | | | 21,828,028 | | | | 27,150,078 | | | | 985,937 | | |
NET INVESTMENT INCOME (LOSS) | | | 1,600,857 | | | | 46,467,952 | | | | 63,687,708 | | | | 2,804,936 | | |
REALIZED AND UNREALIZED GAIN (LOSS) ON INVESTMENTS,
FINANCIAL FUTURES CONTRACTS, FOREIGN CURRENCY RELATED
TRANSACTIONS AND DEFERRED CAPITAL GAINS TAXES: | |
Net realized gain (loss) on investments—Unaffiliated Issuers | | | (76,741 | ) | | | 165,861,952 | | | | 179,865,802 | | | | 11,786,773 | | |
Net realized gain (loss) on investments—Affiliated Issuers | | | — | | | | — | | | | 22,598,923 | | | | — | | |
Net realized gain (loss) on financial futures contracts | | | (88,422 | ) | | | — | | | | — | | | | — | �� | |
Net realized foreign capital gains tax | | | — | | | | — | | | | (216,219 | ) | | | — | | |
Net realized gain (loss) on foreign currency related transactions | | | (781,609 | ) | | | (528,623 | ) | | | (997,632 | ) | | | (10,215 | ) | |
Net change in unrealized appreciation/depreciation on investments | | | (389,728 | ) | | | (66,631,300 | ) | | | 365,595,360 | | | | 17,863,329 | | |
Net change in deferred foreign capital gains taxes on unrealized
appreciation | | | 7,721 | | | | — | | | | 6,778,589 | | | | — | | |
Net change in unrealized appreciation/depreciation on financial
futures contracts | | | (12,891 | ) | | | — | | | | — | | | | — | | |
Net change in unrealized appreciation/depreciation on foreign
currency related translations | | | 3,444 | | | | (45,534 | ) | | | 60,369 | | | | 1,197 | | |
Net realized and unrealized gain (loss) on investments, financial
futures contracts, foreign currency related transactions and
deferred capital gains taxes | | | (1,338,226 | ) | | | 98,656,495 | | | | 573,685,192 | | | | 29,641,084 | | |
NET INCREASE (DECREASE) IN NET ASSETS FROM OPERATIONS | | $ | 262,631 | | | $ | 145,124,447 | | | $ | 637,372,900 | | | $ | 32,446,020 | | |
* Matthews Asia ESG Fund commenced operations on April 30, 2015.
1 Consolidated Statements of Operations.
See accompanying notes to financial statements.
96 MATTHEWS ASIA FUNDS
| | | Matthews Asia
Focus Fund | | Matthews Asia
Growth Fund | | Matthews Pacific
Tiger Fund | | Matthews Asia
ESG Fund* | |
INVESTMENT INCOME: | |
Dividends—Unaffiliated Issuers | | $ | 222,307 | | | $ | 9,185,108 | | | $ | 77,712,774 | | | $ | 6,969 | | |
Dividends—Affiliated Issuers (Note 7) | | | — | | | | — | | | | 783,666 | | | | — | | |
Interest | | | 4 | | | | 53 | | | | 71 | | | | — | | |
Foreign withholding tax | | | (8,475 | ) | | | (760,211 | ) | | | (6,858,508 | ) | | | (519 | ) | |
TOTAL INVESTMENT INCOME | | | 213,836 | | | | 8,424,950 | | | | 71,638,003 | | | | 6,450 | | |
EXPENSES: | |
Investment advisory fees (Note 5) | | | 52,176 | | | | 3,108,755 | | | | 29,987,067 | | | | 1,682 | | |
Administration and accounting fees (Note 5) | | | 625 | | | | 37,242 | | | | 359,120 | | | | 20 | | |
Administration and shareholder servicing fees (Note 5) | | | 14,764 | | | | 856,874 | | | | 7,727,651 | | | | 408 | | |
Accounting out-of-pocket fees | | | 11,032 | | | | 19,593 | | | | 21,071 | | | | 922 | | |
Custodian fees | | | 7,817 | | | | 212,207 | | | | 1,675,835 | | | | 3,234 | | |
Printing fees | | | 742 | | | | 28,600 | | | | 178,668 | | | | 317 | | |
Professional fees | | | 15,430 | | | | 30,591 | | | | 97,480 | | | | 7,495 | | |
Registration fees | | | 13,605 | | | | 27,960 | | | | 37,650 | | | | — | | |
Transfer agent fees | | | 8,703 | | | | 437,899 | | | | 3,258,744 | | | | 341 | | |
Trustees fees | | | 396 | | | | 14,912 | | | | 151,394 | | | | 47 | | |
Offering costs (Note 2-E) | | | — | | | | — | | | | — | | | | 1,322 | | |
Other expenses | | | 7,965 | | | | 9,878 | | | | 77,268 | | | | 73 | | |
TOTAL EXPENSES | | | 133,255 | | | | 4,784,511 | | | | 43,571,948 | | | | 15,861 | | |
Advisory fees waived and expenses waived or reimbursed (Note 5) | | | (25,173 | ) | | | — | | | | (532,699 | ) | | | (12,494 | ) | |
Administration fees waived (Note 5) | | | — | | | | — | | | | (532,699 | ) | | | — | | |
NET EXPENSES | | | 108,082 | | | | 4,784,511 | | | | 42,506,550 | | | | 3,367 | | |
NET INVESTMENT INCOME (LOSS) | | | 105,754 | | | | 3,640,439 | | | | 29,131,453 | | | | 3,083 | | |
REALIZED AND UNREALIZED GAIN (LOSS) ON INVESTMENTS,
FINANCIAL FUTURES CONTRACTS, FOREIGN CURRENCY RELATED
TRANSACTIONS AND DEFERRED CAPITAL GAINS TAXES: | |
Net realized gain (loss) on investments—Unaffiliated Issuers | | | (106,766 | ) | | | 7,518,678 | | | | 215,940,286 | | | | — | | |
Net realized gain (loss) on investments—Affiliated Issuers | | | — | | | | — | | | | — | | | | — | | |
Net realized gain (loss) on financial futures contracts | | | — | | | | — | | | | — | | | | — | | |
Net realized foreign capital gains tax | | | — | | | | — | | | | — | | | | — | | |
Net realized gain (loss) on foreign currency related transactions | | | (1,008 | ) | | | (70,977 | ) | | | 829,003 | | | | (453 | ) | |
Net change in unrealized appreciation/depreciation on investments | | | (177,141 | ) | | | 25,253,080 | | | | 414,806,197 | | | | (26,714 | ) | |
Net change in deferred foreign capital gains taxes on unrealized
appreciation | | | 971 | | | | 111,257 | | | | 5,827,625 | | | | (2,588 | ) | |
Net change in unrealized appreciation/depreciation on financial
futures contracts | | | — | | | | — | | | | — | | | | — | | |
Net change in unrealized appreciation/depreciation on foreign
currency related translations | | | 1,309 | | | | 10,191 | | | | 40,169 | | | | 4 | | |
Net realized and unrealized gain (loss) on investments, financial
futures contracts, foreign currency related transactions and
deferred capital gains taxes | | | (282,635 | ) | | | 32,822,229 | | | | 637,443,280 | | | | (29,751 | ) | |
NET INCREASE (DECREASE) IN NET ASSETS FROM OPERATIONS | | ($ | 176,881 | ) | | $ | 36,462,668 | | | $ | 666,574,733 | | | ($ | 26,668 | ) | |
matthewsasia.com | 800.789.ASIA 97
Statements of Operations (Unaudited) (continued) Six-Month Period Ended June 30, 2015
| | | Matthews Emerging
Asia Fund | | Matthews
China Fund1 | | Matthews
India Fund | | Matthews
Japan Fund | |
INVESTMENT INCOME: | |
Dividends—Unaffiliated Issuers | | $ | 1,568,503 | | | $ | 15,273,560 | | | $ | 5,399,264 | | | $ | 5,836,910 | | |
Dividends—Affiliated Issuers (Note 7) | | | — | | | | — | | | | — | | | | 392,829 | | |
Interest | | | — | | | | 3 | | | | 2 | | | | 3 | | |
Foreign withholding tax | | | (152,356 | ) | | | (776,277 | ) | | | — | | | | (622,213 | ) | |
TOTAL INVESTMENT INCOME | | | 1,416,147 | | | | 14,497,286 | | | | 5,399,266 | | | | 5,607,529 | | |
EXPENSES: | |
Investment advisory fees (Note 5) | | | 811,132 | | | | 3,519,786 | | | | 4,962,268 | | | | 2,782,035 | | |
Administration and accounting fees (Note 5) | | | 6,436 | | | | 72,181 | | | | 59,437 | | | | 33,360 | | |
Administration and shareholder servicing fees (Note 5) | | | 157,823 | | | | 1,072,305 | | | | 1,435,526 | | | | 690,709 | | |
Accounting out-of-pocket fees | | | 20,660 | | | | 17,019 | | | | 15,654 | | | | 22,634 | | |
Custodian fees | | | 145,394 | | | | 183,175 | | | | 310,143 | | | | 65,728 | | |
Printing fees | | | 5,232 | | | | 82,871 | | | | 49,162 | | | | 16,391 | | |
Professional fees | | | 16,635 | | | | 56,059 | | | | 38,035 | | | | 25,713 | | |
Registration fees | | | 17,484 | | | | 22,755 | | | | 26,727 | | | | 26,879 | | |
Transfer agent fees | | | 95,028 | | | | 741,979 | | | | 854,961 | | | | 278,824 | | |
Trustees fees | | | 2,158 | | | | 18,390 | | | | 22,202 | | | | 11,763 | | |
Offering costs (Note 2-E) | | | — | | | | 96,561 | | | | — | | | | — | | |
Other expenses | | | 9,393 | | | | 13,150 | | | | 20,034 | | | | 11,332 | | |
TOTAL EXPENSES | | | 1,287,375 | | | | 5,896,231 | | | | 7,794,149 | | | | 3,965,368 | | |
Advisory fees waived and expenses waived or reimbursed (Note 5) | | | (148,704 | ) | | | — | | | | — | | | | — | | |
NET EXPENSES | | | 1,138,671 | | | | 5,896,231 | | | | 7,794,149 | | | | 3,965,368 | | |
NET INVESTMENT INCOME (LOSS) | | | 277,476 | | | | 8,601,055 | | | | (2,394,883 | ) | | | 1,642,161 | | |
REALIZED AND UNREALIZED GAIN (LOSS) ON INVESTMENTS,
FOREIGN CURRENCY RELATED TRANSACTIONS AND DEFERRED
CAPITAL GAINS TAXES: | |
Net realized gain (loss) on investments—Unaffiliated Issuers | | | 187,562 | | | | 30,938,204 | | | | 18,497,387 | | | | 18,772,189 | | |
Net realized gain (loss) on investments—Affiliated Issuers | | | — | | | | — | | | | 142,516 | | | | 142,916 | | |
Net realized foreign capital gains tax | | | (50,611 | ) | | | — | | | | — | | | | — | | |
Net realized gain (loss) on foreign currency related transactions | | | (69,472 | ) | | | (29,661 | ) | | | (814,511 | ) | | | (185,691 | ) | |
Net change in unrealized appreciation/depreciation on investments | | | (636,999 | ) | | | 133,051,568 | | | | 34,621,854 | | | | 131,033,154 | | |
Net change in deferred foreign capital gains taxes on unrealized
appreciation | | | (405,767 | ) | | | 4,990 | | | | 2,237,183 | | | | — | | |
Net change in unrealized appreciation/depreciation on foreign
currency related translations | | | 1,015 | | | | 47,803 | | | | 865 | | | | 9,554 | | |
Net realized and unrealized gain (loss) on investments, foreign
currency related transactions and deferred capital gains taxes | | | (974,272 | ) | | | 164,012,904 | | | | 54,685,294 | | | | 149,772,122 | | |
NET INCREASE (DECREASE) IN NET ASSETS FROM OPERATIONS | | ($ | 696,796 | ) | | $ | 172,613,959 | | | $ | 52,290,411 | | | $ | 151,414,283 | | |
1 Consolidated Statements of Operations.
See accompanying notes to financial statements.
98 MATTHEWS ASIA FUNDS
| | | Matthews
Korea Fund | | Matthews Asia
Small Companies
Fund | | Matthews China
Small Companies
Fund | | Matthews Asia
Science and
Technology Fund | |
INVESTMENT INCOME: | |
Dividends—Unaffiliated Issuers | | $ | 474,102 | | | $ | 5,896,882 | | | $ | 336,019 | | | $ | 926,689 | | |
Dividends—Affiliated Issuers (Note 7) | | | — | | | | 116,759 | | | | — | | | | — | | |
Interest | | | — | | | | 5 | | | | — | | | | — | | |
Foreign withholding tax | | | (77,829 | ) | | | (274,763 | ) | | | (3,599 | ) | | | (83,322 | ) | |
TOTAL INVESTMENT INCOME | | | 396,273 | | | | 5,738,883 | | | | 332,420 | | | | 843,367 | | |
EXPENSES: | |
Investment advisory fees (Note 5) | | | 667,119 | | | | 3,780,373 | | | | 117,616 | | | | 643,632 | | |
Administration and accounting fees (Note 5) | | | 7,995 | | | | 30,013 | | | | 934 | | | | 7,710 | | |
Administration and shareholder servicing fees (Note 5) | | | 175,758 | | | | 743,604 | | | | 24,331 | | | | 177,716 | | |
Accounting out-of-pocket fees | | | 17,458 | | | | 20,946 | | | | 17,172 | | | | 15,203 | | |
Custodian fees | | | 37,228 | | | | 180,627 | | | | 15,925 | | | | 52,399 | | |
Printing fees | | | 8,550 | | | | 24,605 | | | | 1,426 | | | | 8,835 | | |
Professional fees | | | 20,582 | | | | 32,762 | | | | 19,331 | | | | 25,334 | | |
Registration fees | | | 17,462 | | | | 22,482 | | | | 9,082 | | | | 18,962 | | |
Transfer agent fees | | | 85,714 | | | | 457,017 | | | | 17,914 | | | | 96,492 | | |
Trustees fees | | | 3,634 | | | | 16,176 | | | | 630 | | | | 3,645 | | |
Offering costs (Note 2-E) | | | — | | | | — | | | | — | | | | — | | |
Other expenses | | | 7,158 | | | | 9,676 | | | | 1,853 | | | | 3,463 | | |
TOTAL EXPENSES | | | 1,048,658 | | | | 5,318,281 | | | | 226,214 | | | | 1,053,391 | | |
Advisory fees waived and expenses waived or reimbursed (Note 5) | | | — | | | | (5,305 | ) | | | (50,769 | ) | | | — | | |
NET EXPENSES | | | 1,048,658 | | | | 5,312,976 | | | | 175,445 | | | | 1,053,391 | | |
NET INVESTMENT INCOME (LOSS) | | | (652,385 | ) | | | 425,907 | | | | 156,975 | | | | (210,024 | ) | |
REALIZED AND UNREALIZED GAIN (LOSS) ON INVESTMENTS,
FOREIGN CURRENCY RELATED TRANSACTIONS AND DEFERRED
CAPITAL GAINS TAXES: | |
Net realized gain (loss) on investments—Unaffiliated Issuers | | | 6,950,532 | | | | 22,169,997 | | | | 587,249 | | | | 22,665,860 | | |
Net realized gain (loss) on investments—Affiliated Issuers | | | — | | | | — | | | | — | | | | — | | |
Net realized foreign capital gains tax | | | — | | | | — | | | | — | | | | — | | |
Net realized gain (loss) on foreign currency related transactions | | | (120,376 | ) | | | 13,022 | | | | (2,071 | ) | | | (78,850 | ) | |
Net change in unrealized appreciation/depreciation on investments | | | 21,953,427 | | | | 19,004,805 | | | | 2,630,512 | | | | (5,439,223 | ) | |
Net change in deferred foreign capital gains taxes on unrealized
appreciation | | | — | | | | 392,942 | | | | — | | | | — | | |
Net change in unrealized appreciation/depreciation on foreign
currency related translations | | | (18,427 | ) | | | 3,735 | | | | (793 | ) | | | 1,101 | | |
Net realized and unrealized gain (loss) on investments, foreign
currency related transactions and deferred capital gains taxes | | | 28,765,156 | | | | 41,584,501 | | | | 3,214,897 | | | | 17,148,888 | | |
NET INCREASE (DECREASE) IN NET ASSETS FROM OPERATIONS | | $ | 28,112,771 | | | $ | 42,010,408 | | | $ | 3,371,872 | | | $ | 16,938,864 | | |
matthewsasia.com | 800.789.ASIA 99
Statements of Changes in Net Assets
MATTHEWS ASIA STRATEGIC INCOME FUND | | Six-Month Period
Ended June 30, 2015
(unaudited) | | Year Ended
December 31, 2014 | |
OPERATIONS: | |
Net investment income (loss) | | $ | 1,600,857 | | | $ | 2,549,890 | | |
Net realized gain (loss) on investments, financial futures contracts and foreign currency
related transactions | | | (946,772 | ) | | | (1,349,144 | ) | |
Net change in unrealized appreciation/depreciation on investments and foreign currency
related translations | | | (386,284 | ) | | | (188,122 | ) | |
Net change on deferred foreign capital gains taxes on unrealized appreciation | | | 7,721 | | | | (15,022 | ) | |
Net change in unrealized appreciation/depreciation on financial futures contracts | | | (12,891 | ) | | | (52,031 | ) | |
Net increase (decrease) in net assets resulting from operations | | | 262,631 | | | | 945,571 | | |
DISTRIBUTIONS TO SHAREHOLDERS FROM: | |
Net investment income: | |
Investor Class | | | (560,679 | ) | | | (1,819,452 | ) | |
Institutional Class | | | (123,471 | ) | | | (294,936 | ) | |
Net decrease in net assets resulting from distributions | | | (684,150 | ) | | | (2,114,388 | ) | |
CAPITAL SHARE TRANSACTIONS (net) (Note 4) | | | 3,904,032 | | | | 21,884,520 | | |
REDEMPTION FEES | | | 1,288 | | | | 6,087 | | |
Total increase (decrease) in net assets | | | 3,483,801 | | | | 20,721,790 | | |
NET ASSETS: | |
Beginning of period | | | 66,434,674 | | | | 45,712,884 | | |
End of period (including undistributed/(distributions in excess of) net investment income of
$675,540 and ($241,167), respectively) | | $ | 69,918,475 | | | $ | 66,434,674 | | |
MATTHEWS ASIAN GROWTH AND INCOME FUND | | Six-Month Period
Ended June 30, 2015
(unaudited) | | Year Ended
December 31, 2014 | |
OPERATIONS: | |
Net investment income (loss) | | $ | 46,467,952 | | | $ | 92,607,652 | | |
Net realized gain (loss) on investments and foreign currency related transactions | | | 165,333,329 | | | | 117,898,875 | | |
Net change in unrealized appreciation/depreciation on investments and foreign currency
related translations | | | (66,676,834 | ) | | | (247,572,282 | ) | |
Net increase (decrease) in net assets resulting from operations | | | 145,124,447 | | | | (37,065,755 | ) | |
DISTRIBUTIONS TO SHAREHOLDERS FROM: | |
Net investment income: | |
Investor Class | | | (33,703,439 | ) | | | (58,176,498 | ) | |
Institutional Class | | | (14,414,606 | ) | | | (24,675,840 | ) | |
Realized gains on investments: | |
Investor Class | | | — | | | | (73,703,258 | ) | |
Institutional Class | | | — | | | | (28,748,112 | ) | |
Net decrease in net assets resulting from distributions | | | (48,118,045 | ) | | | (185,303,708 | ) | |
CAPITAL SHARE TRANSACTIONS (net) (Note 4) | | | (283,860,810 | ) | | | 58,477,140 | | |
REDEMPTION FEES | | | 118,360 | | | | 343,294 | | |
Total increase (decrease) in net assets | | | (186,736,048 | ) | | | (163,549,029 | ) | |
NET ASSETS: | |
Beginning of period | | | 4,235,254,781 | | | | 4,398,803,810 | | |
End of period (including distributions in excess of net investment income of ($15,063,051) and
($13,412,958), respectively) | | $ | 4,048,518,733 | | | $ | 4,235,254,781 | | |
See accompanying notes to financial statements.
100 MATTHEWS ASIA FUNDS
MATTHEWS ASIA DIVIDEND FUND | | Six-Month Period
Ended June 30, 2015
(unaudited)1 | | Year Ended
December 31, 20141 | |
OPERATIONS: | |
Net investment income (loss) | | $ | 63,687,708 | | | $ | 103,460,502 | | |
Net realized gain (loss) on investments and foreign currency related transactions | | | 201,250,874 | | | | 116,243,335 | | |
Net change in unrealized appreciation/depreciation on investments and foreign currency
related translations | | | 365,655,729 | | | | (236,016,208 | ) | |
Net change on deferred foreign capital gains taxes on unrealized appreciation | | | 6,778,589 | | | | (5,021,270 | ) | |
Net increase (decrease) in net assets resulting from operations | | | 637,372,900 | | | | (21,333,641 | ) | |
DISTRIBUTIONS TO SHAREHOLDERS FROM: | |
Net investment income: | |
Investor Class | | | (37,723,828 | ) | | | (47,911,397 | ) | |
Institutional Class | | | (32,304,900 | ) | | | (32,066,176 | ) | |
Return of Capital: | |
Investor Class | | | — | | | | (13,172,130 | ) | |
Institutional Class | | | — | | | | (8,815,853 | ) | |
Net decrease in net assets resulting from distributions | | | (70,028,728 | ) | | | (101,965,556 | ) | |
CAPITAL SHARE TRANSACTIONS (net) (Note 4) | | | 337,855,957 | | | | (645,503,365 | ) | |
REDEMPTION FEES | | | 60,893 | | | | 497,372 | | |
Total increase (decrease) in net assets | | | 905,261,022 | | | | (768,305,190 | ) | |
NET ASSETS: | |
Beginning of period | | | 5,025,598,743 | | | | 5,793,903,933 | | |
End of period (including distributions in excess of net investment income of ($61,970,572) and
($55,629,552), respectively) | | $ | 5,930,859,765 | | | $ | 5,025,598,743 | | |
1 Consolidated Statements of Changes in Net Assets.
MATTHEWS CHINA DIVIDEND FUND | | Six-Month Period
Ended June 30, 2015
(unaudited) | | Year Ended
December 31, 2014 | |
OPERATIONS: | |
Net investment income (loss) | | $ | 2,804,936 | | | $ | 2,671,693 | | |
Net realized gain (loss) on investments and foreign currency related transactions | | | 11,776,558 | | | | 2,594,721 | | |
Net change in unrealized appreciation/depreciation on investments and foreign currency
related translations | | | 17,864,526 | | | | (5,177,012 | ) | |
Net increase (decrease) in net assets resulting from operations | | | 32,446,020 | | | | 89,402 | | |
DISTRIBUTIONS TO SHAREHOLDERS FROM: | |
Net investment income: | |
Investor Class | | | (3,443,169 | ) | | | (2,935,482 | ) | |
Institutional Class | | | (452,347 | ) | | | (817,023 | ) | |
Realized gains on investments: | |
Investor Class | | | — | | | | (1,191,973 | ) | |
Institutional Class | | | — | | | | (314,911 | ) | |
Net decrease in net assets resulting from distributions | | | (3,895,516 | ) | | | (5,259,389 | ) | |
CAPITAL SHARE TRANSACTIONS (net) (Note 4) | | | 53,728,162 | | | | 1,987,255 | | |
REDEMPTION FEES | | | 9,777 | | | | 45,150 | | |
Total increase (decrease) in net assets | | | 82,288,443 | | | | (3,137,582 | ) | |
NET ASSETS: | |
Beginning of period | | | 147,616,843 | | | | 150,754,425 | | |
End of period (including distributions in excess of net investment income of ($2,375,745) and
($1,285,165), respectively) | | $ | 229,905,286 | | | $ | 147,616,843 | | |
See accompanying notes to financial statements.
matthewsasia.com | 800.789.ASIA 101
Statements of Changes in Net Assets (continued)
MATTHEWS ASIA FOCUS FUND | | Six-Month Period
Ended June 30, 2015
(unaudited) | | Year Ended
December 31, 2014 | |
OPERATIONS: | |
Net investment income (loss) | | $ | 105,754 | | | $ | 93,078 | | |
Net realized gain (loss) on investments and foreign currency related transactions | | | (107,774 | ) | | | 90,648 | | |
Net change in unrealized appreciation/depreciation on investments and foreign currency
related translations | | | (175,832 | ) | | | 65,598 | | |
Net change on deferred foreign capital gains taxes on unrealized appreciation | | | 971 | | | | 8,519 | | |
Net increase (decrease) in net assets resulting from operations | | | (176,881 | ) | | | 257,843 | | |
DISTRIBUTIONS TO SHAREHOLDERS FROM: | |
Net investment income: | |
Investor Class | | | — | | | | (55,443 | ) | |
Institutional Class | | | — | | | | (57,082 | ) | |
Net decrease in net assets resulting from distributions | | | — | | | | (112,525 | ) | |
CAPITAL SHARE TRANSACTIONS (net) (Note 4) | | | 678,146 | | | | 6,463,284 | | |
REDEMPTION FEES | | | 1,869 | | | | 2,548 | | |
Total increase (decrease) in net assets | | | 503,134 | | | | 6,611,150 | | |
NET ASSETS: | |
Beginning of period | | | 14,986,931 | | | | 8,375,781 | | |
End of period (including undistributed net investment income of $106,777 and $1,023, respectively) | | $ | 15,490,065 | | | $ | 14,986,931 | | |
MATTHEWS ASIA GROWTH FUND | | Six-Month Period
Ended June 30, 2015
(unaudited) | | Year Ended
December 31, 2014 | |
OPERATIONS: | |
Net investment income (loss) | | $ | 3,640,439 | | | $ | 4,953,601 | | |
Net realized gain (loss) on investments and foreign currency related transactions | | | 7,447,701 | | | | 15,349,737 | | |
Net change in unrealized appreciation/depreciation on investments and foreign currency
related translations | | | 25,263,271 | | | | (9,391,211 | ) | |
Net change on deferred foreign capital gains taxes on unrealized appreciation | | | 111,257 | | | | (262,534 | ) | |
Net increase (decrease) in net assets resulting from operations | | | 36,462,668 | | | | 10,649,593 | | |
DISTRIBUTIONS TO SHAREHOLDERS FROM: | |
Net investment income: | |
Investor Class | | | — | | | | (10,002,000 | ) | |
Institutional Class | | | — | | | | (5,438,617 | ) | |
Net decrease in net assets resulting from distributions | | | — | | | | (15,440,617 | ) | |
CAPITAL SHARE TRANSACTIONS (net) (Note 4) | | | 104,944,407 | | | | 67,553,705 | | |
REDEMPTION FEES | | | 26,521 | | | | 162,173 | | |
Total increase (decrease) in net assets | | | 141,433,596 | | | | 62,924,854 | | |
NET ASSETS: | |
Beginning of period | | | 849,183,980 | | | | 786,259,126 | | |
End of period (including distributions in excess of net investment income of ($8,175,623) and
($11,816,062), respectively) | | $ | 990,617,576 | | | $ | 849,183,980 | | |
See accompanying notes to financial statements.
102 MATTHEWS ASIA FUNDS
MATTHEWS PACIFIC TIGER FUND | | Six-Month Period
Ended June 30, 2015
(unaudited) | | Year Ended
December 31, 2014 | |
OPERATIONS: | |
Net investment income (loss) | | $ | 29,131,453 | | | $ | 47,931,459 | | |
Net realized gain (loss) on investments and foreign currency related transactions | | | 216,769,289 | | | | 301,174,040 | | |
Net change in unrealized appreciation/depreciation on investments and foreign currency
related translations | | | 414,846,366 | | | | 479,195,485 | | |
Net change on deferred foreign capital gains taxes on unrealized appreciation | | | 5,827,625 | | | | (4,638,516 | ) | |
Net increase (decrease) in net assets resulting from operations | | | 666,574,733 | | | | 823,662,468 | | |
DISTRIBUTIONS TO SHAREHOLDERS FROM: | |
Net investment income: | |
Investor Class | | | — | | | | (14,427,716 | ) | |
Institutional Class | | | — | | | | (32,970,946 | ) | |
Realized gains on investments: | |
Investor Class | | | — | | | | (134,989,408 | ) | |
Institutional Class | | | — | | | | (226,070,336 | ) | |
Net decrease in net assets resulting from distributions | | | — | | | | (408,458,406 | ) | |
CAPITAL SHARE TRANSACTIONS (net) (Note 4) | | | 625,794,016 | | | | 48,148,464 | | |
REDEMPTION FEES | | | 102,095 | | | | 220,012 | | |
Total increase (decrease) in net assets | | | 1,292,470,844 | | | | 463,572,538 | | |
NET ASSETS: | |
Beginning of period | | | 8,096,719,585 | | | | 7,633,147,047 | | |
End of period (including undistributed net investment income of $29,143,867 and
$12,414, respectively) | | $ | 9,389,190,429 | | | $ | 8,096,719,585 | | |
| MATTHEWS ASIA ESG FUND | | Period Ended
June 30, 20151
(unaudited) | |
OPERATIONS: | |
Net investment income (loss) | | $ | 3,083 | | |
Net realized gain (loss) on investments and foreign currency related transactions | | | (453 | ) | |
Net change in unrealized appreciation/depreciation on investments and foreign currency
related translations | | | (26,710 | ) | |
Net change on deferred foreign capital gains taxes on unrealized appreciation | | | (2,588 | ) | |
Net increase (decrease) in net assets resulting from operations | | | (26,668 | ) | |
CAPITAL SHARE TRANSACTIONS (net) (Note 4) | | | 1,689,723 | | |
Total increase (decrease) in net assets | | | 1,663,055 | | |
NET ASSETS: | |
Beginning of period | | | — | | |
End of period (including undistributed net investment income of $3,083) | | $ | 1,663,055 | | |
1 Matthews Asia ESG Fund commenced operations on April 30, 2015.
See accompanying notes to financial statements.
matthewsasia.com | 800.789.ASIA 103
Statements of Changes in Net Assets (continued)
MATTHEWS EMERGING ASIA FUND | | Six-Month Period
Ended June 30, 2015
(unaudited) | | Year Ended
December 31, 2014 | |
OPERATIONS: | |
Net investment income (loss) | | $ | 277,476 | | | $ | 282,110 | | |
Net realized gain (loss) on investments and foreign currency related transactions | | | 67,479 | | | | 520,478 | | |
Net change in unrealized appreciation/depreciation on investments and foreign currency
related translations | | | (635,984 | ) | | | 9,875,738 | | |
Net change on deferred foreign capital gains taxes on unrealized appreciation | | | (405,767 | ) | | | (757,162 | ) | |
Net increase (decrease) in net assets resulting from operations | | | (696,796 | ) | | | 9,921,164 | | |
DISTRIBUTIONS TO SHAREHOLDERS FROM: | |
Net investment income: | |
Investor Class | | | — | | | | (518,224 | ) | |
Institutional Class | | | — | | | | (105,103 | ) | |
Net decrease in net assets resulting from distributions | | | — | | | | (623,327 | ) | |
CAPITAL SHARE TRANSACTIONS (net) (Note 4) | | | 45,721,605 | | | | 82,361,403 | | |
REDEMPTION FEES | | | 15,478 | | | | 14,452 | | |
Total increase (decrease) in net assets | | | 45,040,287 | | | | 91,673,692 | | |
NET ASSETS: | |
Beginning of period | | | 131,712,703 | | | | 40,039,011 | | |
End of period (including distributions in excess of net investment income of ($71,837) and
($349,313), respectively) | | $ | 176,752,990 | | | $ | 131,712,703 | | |
MATTHEWS CHINA FUND | | Six-Month Period
Ended June 30, 2015
(unaudited)1 | | Year Ended
December 31, 20141 | |
OPERATIONS: | |
Net investment income (loss) | | $ | 8,601,055 | | | $ | 12,670,620 | | |
Net realized gain (loss) on investments and foreign currency related transactions | | | 30,908,543 | | | | 19,391,086 | | |
Net change in unrealized appreciation/depreciation on investments and foreign currency
related translations | | | 133,104,361 | | | | (96,779,181 | ) | |
Net change on deferred foreign capital gains taxes on unrealized appreciation | | | — | | | | (4,990 | ) | |
Net increase (decrease) in net assets resulting from operations | | | 172,613,959 | | | | (64,722,465 | ) | |
DISTRIBUTIONS TO SHAREHOLDERS FROM: | |
Net investment income: | |
Investor Class | | | — | | | | (11,939,433 | ) | |
Institutional Class | | | — | | | | (897,946 | ) | |
Realized gains on investments: | |
Investor Class | | | — | | | | (4,591,640 | ) | |
Institutional Class | | | — | | | | (303,495 | ) | |
Net decrease in net assets resulting from distributions | | | — | | | | (17,732,514 | ) | |
CAPITAL SHARE TRANSACTIONS (net) (Note 4) | | | (109,406,009 | ) | | | (321,454,659 | ) | |
REDEMPTION FEES | | | 27,489 | | | | 141,324 | | |
Total increase (decrease) in net assets | | | 63,235,439 | | | | (403,768,314 | ) | |
NET ASSETS: | |
Beginning of period | | | 1,000,218,545 | | | | 1,403,986,859 | | |
End of period (including undistributed net investment income of $8,674,968 and
$73,913, respectively) | | $ | 1,063,453,984 | | | $ | 1,000,218,545 | | |
1 Consolidated Statements of Changes in Net Assets.
See accompanying notes to financial statements.
104 MATTHEWS ASIA FUNDS
MATTHEWS INDIA FUND | | Six-Month Period
Ended June 30, 2015
(unaudited) | | Year Ended
December 31, 2014 | |
OPERATIONS: | |
Net investment income (loss) | | ($ | 2,394,883 | ) | | $ | 2,121,302 | | |
Net realized gain (loss) on investments and foreign currency related transactions | | | 17,825,392 | | | | 6,119,604 | | |
Net change in unrealized appreciation/depreciation on investments and foreign currency
related translations | | | 34,622,719 | | | | 298,047,926 | | |
Net change on deferred foreign capital gains taxes on unrealized appreciation | | | 2,237,183 | | | | (8,627,059 | ) | |
Net increase (decrease) in net assets resulting from operations | | | 52,290,411 | | | | 297,661,773 | | |
DISTRIBUTIONS TO SHAREHOLDERS FROM: | |
Net investment income: | |
Investor Class | | | — | | | | (1,672,358 | ) | |
Institutional Class | | | — | | | | (176,254 | ) | |
Realized gains on investments: | |
Investor Class | | | — | | | | (5,267,446 | ) | |
Institutional Class | | | — | | | | (320,352 | ) | |
Net decrease in net assets resulting from distributions | | | — | | | | (7,436,410 | ) | |
CAPITAL SHARE TRANSACTIONS (net) (Note 4) | | | 440,720,894 | | | | 362,428,175 | | |
REDEMPTION FEES | | | 1,078,666 | | | | 420,708 | | |
Total increase (decrease) in net assets | | | 494,089,971 | | | | 653,074,246 | | |
NET ASSETS: | |
Beginning of period | | | 1,084,168,704 | | | | 431,094,458 | | |
End of period (including undistributed/(distributions in excess of) net investment income (loss) of
($597,605) and $1,797,278, respectively) | | $ | 1,578,258,675 | | | $ | 1,084,168,704 | | |
MATTHEWS JAPAN FUND | | Six-Month Period
Ended June 30, 2015
(unaudited) | | Year Ended
December 31, 2014 | |
OPERATIONS: | |
Net investment income (loss) | | $ | 1,642,161 | | | $ | 1,903,581 | | |
Net realized gain (loss) on investments and foreign currency related transactions | | | 18,729,414 | | | | 13,363,795 | | |
Net change in unrealized appreciation/depreciation on investments and foreign currency
related translations | | | 131,042,708 | | | | (29,305,954 | ) | |
Net increase (decrease) in net assets resulting from operations | | | 151,414,283 | | | | (14,038,578 | ) | |
DISTRIBUTIONS TO SHAREHOLDERS FROM: | |
Net investment income: | |
Investor Class | | | — | | | | (2,432,405 | ) | |
Institutional Class | | | — | | | | (893,149 | ) | |
Net decrease in net assets resulting from distributions | | | — | | | | (3,325,554 | ) | |
CAPITAL SHARE TRANSACTIONS (net) (Note 4) | | | 488,099,788 | | | | 267,055,762 | | |
REDEMPTION FEES | | | 30,317 | | | | 221,547 | | |
Total increase (decrease) in net assets | | | 639,544,388 | | | | 249,913,177 | | |
NET ASSETS: | |
Beginning of period | | | 622,603,805 | | | | 372,690,628 | | |
End of period (including distributions in excess of net investment income of ($2,081,499) and
($3,723,660), respectively) | | $ | 1,262,148,193 | | | $ | 622,603,805 | | |
See accompanying notes to financial statements.
matthewsasia.com | 800.789.ASIA 105
Statements of Changes in Net Assets (continued)
MATTHEWS KOREA FUND | | Six-Month Period
Ended June 30, 2015
(unaudited) | | Year Ended
December 31, 2014 | |
OPERATIONS: | |
Net investment income (loss) | | ($ | 652,385 | ) | | $ | 550,797 | | |
Net realized gain (loss) on investments and foreign currency related transactions | | | 6,830,156 | | | | 5,707,881 | | |
Net change in unrealized appreciation/depreciation on investments and foreign currency
related translations | | | 21,935,000 | | | | (9,305,293 | ) | |
Net increase (decrease) in net assets resulting from operations | | | 28,112,771 | | | | (3,046,615 | ) | |
DISTRIBUTIONS TO SHAREHOLDERS FROM: | |
Realized gains on investments: | |
Investor Class | | | — | | | | (5,528,243 | ) | |
Institutional Class | | | — | | | | (4,268,341 | ) | |
Net decrease in net assets resulting from distributions | | | — | | | | (9,796,584 | ) | |
CAPITAL SHARE TRANSACTIONS (net) (Note 4) | | | (31,517,669 | ) | | | 80,886,069 | | |
REDEMPTION FEES | | | 7,705 | | | | 48,449 | | |
Total increase (decrease) in net assets | | | (3,397,193 | ) | | | 68,091,319 | | |
NET ASSETS: | |
Beginning of period | | | 219,204,376 | | | | 151,113,057 | | |
End of period (including undistributed net investment income (loss) of ($309,453) and
$342,932, respectively) | | $ | 215,807,183 | | | $ | 219,204,376 | | |
MATTHEWS ASIA SMALL COMPANIES FUND | | Six-Month Period
Ended June 30, 2015
(unaudited) | | Year Ended
December 31, 2014 | |
OPERATIONS: | |
Net investment income (loss) | | $ | 425,907 | | | $ | 2,628,989 | | |
Net realized gain (loss) on investments and foreign currency related transactions | | | 22,183,019 | | | | 2,692,424 | | |
Net change in unrealized appreciation/depreciation on investments and foreign currency
related translations | | | 19,008,540 | | | | 48,527,175 | | |
Net change on deferred foreign capital gains taxes on unrealized appreciation | | | 392,942 | | | | 458,859 | | |
Net increase (decrease) in net assets resulting from operations | | | 42,010,408 | | | | 54,307,447 | | |
DISTRIBUTIONS TO SHAREHOLDERS FROM: | |
Net investment income: | |
Investor Class | | | — | | | | (2,240,054 | ) | |
Institutional Class | | | — | | | | (425,758 | ) | |
Net decrease in net assets resulting from distributions | | | — | | | | (2,665,812 | ) | |
CAPITAL SHARE TRANSACTIONS (net) (Note 4) | | | 110,728,534 | | | | 172,402,487 | | |
REDEMPTION FEES | | | 53,950 | | | | 85,734 | | |
Total increase (decrease) in net assets | | | 152,792,892 | | | | 224,129,856 | | |
NET ASSETS: | |
Beginning of period | | | 676,250,281 | | | | 452,120,425 | | |
End of period (including undistributed net investment income of $1,926,373 and
$1,500,466, respectively) | | $ | 829,043,173 | | | $ | 676,250,281 | | |
See accompanying notes to financial statements.
106 MATTHEWS ASIA FUNDS
MATTHEWS CHINA SMALL COMPANIES FUND | | Six-Month Period
Ended June 30, 2015
(unaudited) | | Year Ended
December 31, 2014 | |
OPERATIONS: | |
Net investment income (loss) | | $ | 156,975 | | | $ | 32,748 | | |
Net realized gain (loss) on investments and foreign currency related transactions | | | 585,178 | | | | 725,842 | | |
Net change in unrealized appreciation/depreciation on investments and foreign currency
related translations | | | 2,629,719 | | | | (1,527,785 | ) | |
Net increase (decrease) in net assets resulting from operations | | | 3,371,872 | | | | (769,195 | ) | |
DISTRIBUTIONS TO SHAREHOLDERS FROM: | |
Net investment income: | |
Investor Class | | | — | | | | (50,571 | ) | |
Return of Capital: | |
Investor Class | | | — | | | | (828,820 | ) | |
Net decrease in net assets resulting from distributions | | | — | | | | (879,391 | ) | |
CAPITAL SHARE TRANSACTIONS (net) (Note 4) | | | 534,064 | | | | (2,960,536 | ) | |
REDEMPTION FEES | | | 2,701 | | | | 2,817 | | |
Total increase (decrease) in net assets | | | 3,908,637 | | | | (4,606,305 | ) | |
NET ASSETS: | |
Beginning of period | | | 22,067,912 | | | | 26,674,217 | | |
End of period (including undistributed/(distributions in excess of) net investment income of
$118,435 and ($38,540), respectively) | | $ | 25,976,549 | | | $ | 22,067,912 | | |
MATTHEWS ASIA SCIENCE AND TECHNOLOGY FUND | | Six-Month Period
Ended June 30, 2015
(unaudited) | | Year Ended
December 31, 2014 | |
OPERATIONS: | |
Net investment income (loss) | | ($ | 210,024 | ) | | ($ | 87,025 | ) | |
Net realized gain (loss) on investments and foreign currency related transactions | | | 22,587,010 | | | | 15,185,277 | | |
Net change in unrealized appreciation/depreciation on investments and foreign currency
related translations | | | (5,438,122 | ) | | | (362,764 | ) | |
Net change on deferred foreign capital gains taxes on unrealized appreciation | | | — | | | | 201,559 | | |
Net increase (decrease) in net assets resulting from operations | | | 16,938,864 | | | | 15,111,097 | | |
DISTRIBUTIONS TO SHAREHOLDERS FROM: | |
Net investment income: | |
Investor Class | | | — | | | | (545,161 | ) | |
Institutional Class | | | — | | | | (384,106 | ) | |
Realized gains on investments: | |
Investor Class | | | — | | | | (769,763 | ) | |
Institutional Class | | | — | | | | (372,799 | ) | |
Net decrease in net assets resulting from distributions | | | — | | | | (2,071,829 | ) | |
CAPITAL SHARE TRANSACTIONS (net) (Note 4) | | | (21,665,478 | ) | | | 12,612,113 | | |
REDEMPTION FEES | | | 4,494 | | | | 61,504 | | |
Total increase (decrease) in net assets | | | (4,722,120 | ) | | | 25,712,885 | | |
NET ASSETS: | |
Beginning of period | | | 186,700,184 | | | | 160,987,299 | | |
End of period (including distributions in excess of net investment income (loss) of ($210,811) and
($787), respectively) | | $ | 181,978,064 | | | $ | 186,700,184 | | |
See accompanying notes to financial statements.
matthewsasia.com | 800.789.ASIA 107
Matthews Asia Strategic Income Fund
The tables below set forth financial data for a share of beneficial interest outstanding throughout each period presented.
| | | Six-Month
Period Ended
June 30, 2015 | | Year Ended Dec. 31 | | Period Ended | |
INVESTOR CLASS | | (unaudited) | | 2014 | | 2013 | | 2012 | | Dec. 31, 20111 | |
Net Asset Value, beginning of period | | $ | 10.31 | | | $ | 10.42 | | | $ | 10.84 | | | $ | 9.93 | | | $ | 10.00 | | |
INCOME (LOSS) FROM INVESTMENT OPERATIONS: | |
Net investment income (loss)2 | | | 0.24 | | | | 0.46 | | | | 0.40 | | | | 0.37 | | | | 0.02 | | |
Net realized gain (loss) and unrealized appreciation/depreciation
on investments, financial futures contracts and foreign currency | | | (0.20 | ) | | | (0.19 | ) | | | (0.48 | ) | | | 0.95 | | | | (0.07 | ) | |
Total from investment operations | | | 0.04 | | | | 0.27 | | | | (0.08 | ) | | | 1.32 | | | | (0.05 | ) | |
LESS DISTRIBUTIONS FROM: | |
Net investment income | | | (0.10 | ) | | | (0.38 | ) | | | (0.35 | ) | | | (0.42 | ) | | | (0.02 | ) | |
Net realized gains on investments | | | — | | | | — | | | | (0.01 | ) | | | — | | | | — | | |
Total distributions | | | (0.10 | ) | | | (0.38 | ) | | | (0.36 | ) | | | (0.42 | ) | | | (0.02 | ) | |
Paid-in capital from redemption fees (Note 4) | | | —3 | | | | —3 | | | | 0.02 | | | | 0.01 | | | | — | | |
Net Asset Value, end of period | | $ | 10.25 | | | $ | 10.31 | | | $ | 10.42 | | | $ | 10.84 | | | $ | 9.93 | | |
TOTAL RETURN | | | 0.38 | %4 | | | 2.54 | % | | | (0.50 | %) | | | 13.62 | % | | | (0.52 | %)4 | |
RATIOS/SUPPLEMENTAL DATA | |
Net assets, end of period (in 000's) | | $ | 58,171 | | | $ | 58,594 | | | $ | 38,051 | | | $ | 29,479 | | | $ | 7,746 | | |
Ratio of expenses to average net assets before any reimbursement,
waiver or recapture of expenses by Advisor and Administrator (Note 5) | | | 1.26 | %5 | | | 1.27 | % | | | 1.28 | % | | | 1.85 | % | | | 3.20 | %5 | |
Ratio of expenses to average net assets after any reimbursement,
waiver or recapture of expenses by Advisor and Administrator | | | 1.11 | %5 | | | 1.13 | % | | | 1.20 | % | | | 1.17 | % | | | 1.00 | %5 | |
Ratio of net investment income (loss) to average net assets | | | 4.66 | %5 | | | 4.36 | % | | | 3.75 | % | | | 3.58 | % | | | 2.06 | %5 | |
Portfolio turnover6 | | | 34.37 | %4 | | | 34.28 | % | | | 48.71 | % | | | 18.45 | % | | | 3.66 | %4 | |
| | | Six-Month
Period Ended
June 30, 2015 | | Year Ended Dec. 31 | | Period Ended | |
INSTITUTIONAL CLASS | | (unaudited) | | 2014 | | 2013 | | 2012 | | Dec. 31, 20111 | |
Net Asset Value, beginning of period | | $ | 10.30 | | | $ | 10.42 | | | $ | 10.83 | | | $ | 9.93 | | | $ | 10.00 | | |
INCOME (LOSS) FROM INVESTMENT OPERATIONS: | |
Net investment income (loss)2 | | | 0.25 | | | | 0.48 | | | | 0.42 | | | | 0.39 | | | | 0.02 | | |
Net realized gain (loss) and unrealized appreciation/depreciation
on investments, financial futures contracts, and foreign currency | | | (0.20 | ) | | | (0.20 | ) | | | (0.46 | ) | | | 0.94 | | | | (0.07 | ) | |
Total from investment operations | | | 0.05 | | | | 0.28 | | | | (0.04 | ) | | | 1.33 | | | | (0.05 | ) | |
LESS DISTRIBUTIONS FROM: | |
Net investment income | | | (0.11 | ) | | | (0.40 | ) | | | (0.38 | ) | | | (0.44 | ) | | | (0.02 | ) | |
Net realized gains on investments | | | — | | | | — | | | | (0.01 | ) | | | — | | | | — | | |
Total distributions | | | (0.11 | ) | | | (0.40 | ) | | | (0.39 | ) | | | (0.44 | ) | | | (0.02 | ) | |
Paid-in capital from redemption fees (Note 4) | | | —3 | | | | —3 | | | | 0.02 | | | | 0.01 | | | | — | | |
Net Asset Value, end of period | | $ | 10.24 | | | $ | 10.30 | | | $ | 10.42 | | | $ | 10.83 | | | $ | 9.93 | | |
TOTAL RETURN | | | 0.48 | %4 | | | 2.64 | % | | | (0.20 | %) | | | 13.74 | % | | | (0.52 | %)4 | |
RATIOS/SUPPLEMENTAL DATA | |
Net assets, end of period (in 000's) | | $ | 11,748 | | | $ | 7,840 | | | $ | 7,662 | | | $ | 6,205 | | | $ | 5,266 | | |
Ratio of expenses to average net assets before any reimbursement,
waiver or recapture of expenses by Advisor and Administrator (Note 5) | | | 1.07 | %5 | | | 1.07 | % | | | 1.09 | % | | | 1.70 | % | | | 3.20 | %5 | |
Ratio of expenses to average net assets after any reimbursement,
waiver or recapture of expenses by Advisor and Administrator | | | 0.90 | %5 | | | 0.93 | % | | | 1.00 | % | | | 1.00 | % | | | 1.00 | %5 | |
Ratio of net investment income (loss) to average net assets | | | 4.94 | %5 | | | 4.55 | % | | | 3.99 | % | | | 3.70 | % | | | 1.96 | %5 | |
Portfolio turnover6 | | | 34.37 | %4 | | | 34.28 | % | | | 48.71 | % | | | 18.45 | % | | | 3.66 | %4 | |
1 Commencement of operations on November 30, 2011.
2 Calculated using the average daily shares method.
3 Less than $0.01 per share.
4 Not annualized.
5 Annualized.
6 The portfolio turnover rate is calculated on the Fund as a whole without distinguishing between classes of shares issued.
See accompanying notes to financial statements.
108 MATTHEWS ASIA FUNDS
Matthews Asian Growth and Income Fund
The tables below set forth financial data for a share of beneficial interest outstanding throughout each period presented.
| | | Six-Month
Period Ended
June 30, 2015 | | Year Ended Dec. 31 | |
INVESTOR CLASS | | (unaudited) | | 2014 | | 2013 | | 2012 | | 2011 | | 2010 | |
Net Asset Value, beginning of period | | $ | 18.01 | | | $ | 18.91 | | | $ | 18.61 | | | $ | 15.07 | | | $ | 18.04 | | | $ | 15.77 | | |
INCOME (LOSS) FROM INVESTMENT OPERATIONS: | |
Net investment income (loss)1 | | | 0.20 | | | | 0.39 | | | | 0.41 | | | | 0.43 | | | | 0.47 | | | | 0.41 | | |
Net realized gain (loss) and unrealized appreciation/
depreciation on investments and foreign currency | | | 0.42 | | | | (0.50 | ) | | | 0.47 | | | | 3.58 | | | | (2.36 | ) | | | 2.57 | | |
Total from investment operations | | | 0.62 | | | | (0.11 | ) | | | 0.88 | | | | 4.01 | | | | (1.89 | ) | | | 2.98 | | |
LESS DISTRIBUTIONS FROM: | |
Net investment income | | | (0.21 | ) | | | (0.35 | ) | | | (0.46 | ) | | | (0.47 | ) | | | (0.47 | ) | | | (0.47 | ) | |
Net realized gains on investments | | | — | | | | (0.44 | ) | | | (0.12 | ) | | | — | | | | (0.61 | ) | | | (0.24 | ) | |
Total distributions | | | (0.21 | ) | | | (0.79 | ) | | | (0.58 | ) | | | (0.47 | ) | | | (1.08 | ) | | | (0.71 | ) | |
Paid-in capital from redemption fees (Note 4)2 | | | — | | | | — | | | | — | | | | — | | | | — | | | | — | | |
Net Asset Value, end of period | | $ | 18.42 | | | $ | 18.01 | | | $ | 18.91 | | | $ | 18.61 | | | $ | 15.07 | | | $ | 18.04 | | |
TOTAL RETURN | | | 3.46 | %3 | | | (0.65 | %) | | | 4.83 | % | | | 26.90 | % | | | (10.62 | %) | | | 19.18 | % | |
RATIOS/SUPPLEMENTAL DATA | |
Net assets, end of period (in 000's) | | $ | 2,914,656 | | | $ | 3,052,565 | | | $ | 3,278,586 | | | $ | 3,214,984 | | | $ | 2,340,606 | | | $ | 3,926,253 | | |
Ratio of expenses to average net assets before any
reimbursement or waiver or recapture of expenses by
Advisor and Administrator (Note 5) | | | 1.09 | %4 | | | 1.08 | % | | | 1.08 | % | | | 1.11 | % | | | 1.12 | % | | | 1.13 | % | |
Ratio of expenses to average net assets after any
reimbursement or waiver or recapture of expenses by
Advisor and Administrator | | | 1.08 | %4 | | | 1.08 | % | | | 1.08 | % | | | 1.11 | % | | | 1.12 | % | | | 1.13 | % | |
Ratio of net investment income (loss) to average net assets | | | 2.16 | %4 | | | 2.03 | % | | | 2.14 | % | | | 2.52 | % | | | 2.71 | % | | | 2.47 | % | |
Portfolio turnover5 | | | 13.09 | %3 | | | 16.79 | % | | | 15.27 | % | | | 17.43 | % | | | 16.54 | % | | | 19.84 | % | |
| | | Six-Month
Period Ended
June 30, 2015 | | Year Ended Dec. 31 | | Period Ended | |
INSTITUTIONAL CLASS | | (unaudited) | | 2014 | | 2013 | | 2012 | | 2011 | | Dec. 31, 20106 | |
Net Asset Value, beginning of period | | $ | 18.00 | | | $ | 18.90 | | | $ | 18.60 | | | $ | 15.06 | | | $ | 18.04 | | | $ | 18.13 | | |
INCOME (LOSS) FROM INVESTMENT OPERATIONS: | |
Net investment income (loss)1 | | | 0.22 | | | | 0.42 | | | | 0.44 | | | | 0.45 | | | | 0.52 | | | | 0.07 | | |
Net realized gain (loss) and unrealized appreciation/
depreciation on investments and foreign currency | | | 0.42 | | | | (0.50 | ) | | | 0.48 | | | | 3.58 | | | | (2.39 | ) | | | 0.37 | | |
Total from investment operations | | | 0.64 | | | | (0.08 | ) | | | 0.92 | | | | 4.03 | | | | (1.87 | ) | | | 0.44 | | |
LESS DISTRIBUTIONS FROM: | |
Net investment income | | | (0.23 | ) | | | (0.38 | ) | | | (0.50 | ) | | | (0.49 | ) | | | (0.50 | ) | | | (0.29 | ) | |
Net realized gains on investments | | | — | | | | (0.44 | ) | | | (0.12 | ) | | | — | | | | (0.61 | ) | | | (0.24 | ) | |
Total distributions | | | (0.23 | ) | | | (0.82 | ) | | | (0.62 | ) | | | (0.49 | ) | | | (1.11 | ) | | | (0.53 | ) | |
Paid-in capital from redemption fees (Note 4) | | | —2 | | | | —2 | | | | —2 | | | | —2 | | | | —2 | | | | — | | |
Net Asset Value, end of period | | $ | 18.41 | | | $ | 18.00 | | | $ | 18.90 | | | $ | 18.60 | | | $ | 15.06 | | | $ | 18.04 | | |
TOTAL RETURN | | | 3.55 | %3 | | | (0.48 | %) | | | 5.04 | % | | | 27.09 | % | | | (10.54 | %) | | | 2.49 | %3 | |
RATIOS/SUPPLEMENTAL DATA | |
Net assets, end of period (in 000's) | | $ | 1,133,863 | | | $ | 1,182,690 | | | $ | 1,120,218 | | | $ | 856,876 | | | $ | 531,493 | | | $ | 128,417 | | |
Ratio of expenses to average net assets before any
reimbursement or waiver or recapture of expenses by
Advisor and Administrator (Note 5) | | | 0.93 | %4 | | | 0.92 | % | | | 0.93 | % | | | 0.97 | % | | | 0.99 | % | | | 0.93 | %4 | |
Ratio of expenses to average net assets after any
reimbursement or waiver or recapture of expenses by
Advisor and Administrator | | | 0.92 | %4 | | | 0.92 | % | | | 0.93 | % | | | 0.97 | % | | | 0.99 | % | | | 0.93 | %4 | |
Ratio of net investment income (loss) to average net assets | | | 2.34 | %4 | | | 2.19 | % | | | 2.30 | % | | | 2.69 | % | | | 3.05 | % | | | 2.46 | %4 | |
Portfolio turnover5 | | | 13.09 | %3 | | | 16.79 | % | | | 15.27 | % | | | 17.43 | % | | | 16.54 | % | | | 19.84 | %3 | |
1 Calculated using the average daily shares method.
2 Less than $0.01 per share.
3 Not annualized.
4 Annualized.
5 The portfolio turnover rate is calculated on the Fund as a whole without distinguishing between classes of shares issued.
6 Institutional Class commenced operations on October 29, 2010.
See accompanying notes to financial statements.
matthewsasia.com | 800.789.ASIA 109
Financial Highlights (continued)
Matthews Asia Dividend Fund
The tables below set forth financial data for a share of beneficial interest outstanding throughout each period presented.
| | | Six-Month
Period Ended
June 30, 20151 | | Year Ended Dec. 31 | |
INVESTOR CLASS | | (unaudited) | | 20141 | | 2013 | | 2012 | | 2011 | | 2010 | |
Net Asset Value, beginning of period | | $ | 15.26 | | | $ | 15.60 | | | $ | 14.58 | | | $ | 12.48 | | | $ | 14.33 | | | $ | 12.06 | | |
INCOME (LOSS) FROM INVESTMENT OPERATIONS: | |
Net investment income (loss)2 | | | 0.18 | | | | 0.30 | | | | 0.32 | | | | 0.36 | | | | 0.36 | | | | 0.31 | | |
Net realized gain (loss) and unrealized appreciation/
depreciation on investments and foreign currency | | | 1.75 | | | | (0.34 | ) | | | 1.30 | | | | 2.30 | | | | (1.78 | ) | | | 2.40 | | |
Total from investment operations | | | 1.93 | | | | (0.04 | ) | | | 1.62 | | | | 2.66 | | | | (1.42 | ) | | | 2.71 | | |
LESS DISTRIBUTIONS FROM: | |
Net investment income | | | (0.20 | ) | | | (0.23 | ) | | | (0.60 | ) | | | (0.56 | ) | | | (0.37 | ) | | | (0.41 | ) | |
Return of capital | | | — | | | | (0.07 | ) | | | — | | | | — | | | | — | | | | — | | |
Net realized gains on investments | | | — | | | | — | | | | — | | | | — | | | | (0.06 | ) | | | (0.04 | ) | |
Total distributions | | | (0.20 | ) | | | (0.30 | ) | | | (0.60 | ) | | | (0.56 | ) | | | (0.43 | ) | | | (0.45 | ) | |
Paid-in capital from redemption fees (Note 4) | | | —3 | | | | —3 | | | | —3 | | | | —3 | | | | —3 | | | | 0.01 | | |
Net Asset Value, end of period | | $ | 16.99 | | | $ | 15.26 | | | $ | 15.60 | | | $ | 14.58 | | | $ | 12.48 | | | $ | 14.33 | | |
TOTAL RETURN | | | 12.65 | %4 | | | (0.32 | %) | | | 11.27 | % | | | 21.63 | % | | | (10.02 | %) | | | 22.83 | % | |
RATIOS/SUPPLEMENTAL DATA | |
Net assets, end of period (in 000's) | | $ | 3,214,367 | | | $ | 2,918,228 | | | $ | 3,669,690 | | | $ | 2,780,043 | | | $ | 1,930,363 | | | $ | 1,933,383 | | |
Ratio of expenses to average net assets before any
reimbursement, waiver or recapture of expenses by
Advisor and Administrator (Note 5) | | | 1.05 | %5 | | | 1.06 | % | | | 1.06 | % | | | 1.09 | % | | | 1.10 | % | | | 1.14 | % | |
Ratio of expenses to average net assets after any
reimbursement, waiver or recapture of expenses by
Advisor and Administrator | | | 1.04 | %5 | | | 1.05 | % | | | 1.06 | % | | | 1.09 | % | | | 1.10 | % | | | 1.15 | % | |
Ratio of net investment income (loss) to average net assets | | | 2.22 | %5 | | | 1.89 | % | | | 2.04 | % | | | 2.65 | % | | | 2.61 | % | | | 2.31 | % | |
Portfolio turnover6 | | | 19.83 | %4 | | | 20.06 | % | | | 14.06 | % | | | 9.17 | % | | | 16.48 | % | | | 10.48 | % | |
| | | Six-Month
Period Ended
June 30, 20151 | | Year Ended Dec. 31 | | Period Ended | |
INSTITUTIONAL CLASS | | (unaudited) | | 20141 | | 2013 | | 2012 | | 2011 | | Dec. 31, 20107 | |
Net Asset Value, beginning of period | | $ | 15.26 | | | $ | 15.59 | | | $ | 14.57 | | | $ | 12.48 | | | $ | 14.33 | | | $ | 14.13 | | |
INCOME (LOSS) FROM INVESTMENT OPERATIONS: | |
Net investment income (loss)2 | | | 0.20 | | | | 0.32 | | | | 0.34 | | | | 0.37 | | | | 0.41 | | | | 0.09 | | |
Net realized gain (loss) and unrealized appreciation/
depreciation on investments and foreign currency | | | 1.74 | | | | (0.33 | ) | | | 1.30 | | | | 2.29 | | | | (1.82 | ) | | | 0.32 | | |
Total from investment operations | | | 1.94 | | | | (0.01 | ) | | | 1.64 | | | | 2.66 | | | | (1.41 | ) | | | 0.41 | | |
LESS DISTRIBUTIONS FROM: | |
Net investment income | | | (0.21 | ) | | | (0.25 | ) | | | (0.62 | ) | | | (0.57 | ) | | | (0.38 | ) | | | (0.17 | ) | |
Return of capital | | | — | | | | (0.07 | ) | | | — | | | | — | | | | — | | | | — | | |
Net realized gains on investments | | | — | | | | — | | | | — | | | | — | | | | (0.06 | ) | | | (0.04 | ) | |
Total distributions | | | (0.21 | ) | | | (0.32 | ) | | | (0.62 | ) | | | (0.57 | ) | | | (0.44 | ) | | | (0.21 | ) | |
Paid-in capital from redemption fees (Note 4)3 | | | — | | | | — | | | | — | | | | — | | | | — | | | | — | | |
Net Asset Value, end of period | | $ | 16.99 | | | $ | 15.26 | | | $ | 15.59 | | | $ | 14.57 | | | $ | 12.48 | | | $ | 14.33 | | |
TOTAL RETURN | | | 12.72 | %4 | | | (0.18 | %) | | | 11.43 | % | | | 21.70 | % | | | (9.93 | %) | | | 2.95 | %4 | |
RATIOS/SUPPLEMENTAL DATA | |
Net assets, end of period (in 000's) | | $ | 2,716,492 | | | $ | 2,107,371 | | | $ | 2,124,214 | | | $ | 922,561 | | | $ | 344,502 | | | $ | 48,293 | | |
Ratio of expenses to average net assets before any
reimbursement, waiver or recapture of expenses by
Advisor and Administrator (Note 5) | | | 0.93 | %5 | | | 0.93 | % | | | 0.93 | % | | | 0.97 | % | | | 1.00 | % | | | 1.02 | %5 | |
Ratio of expenses to average net assets after any
reimbursement, waiver or recapture of expenses by
Advisor and Administrator | | | 0.92 | %5 | | | 0.93 | % | | | 0.93 | % | | | 0.97 | % | | | 1.00 | % | | | 1.02 | %5 | |
Ratio of net investment income (loss) to average net assets | | | 2.43 | %5 | | | 2.02 | % | | | 2.17 | % | | | 2.72 | % | | | 3.03 | % | | | 3.86 | %5 | |
Portfolio turnover6 | | | 19.83 | %4 | | | 20.06 | % | | | 14.06 | % | | | 9.17 | % | | | 16.48 | % | | | 10.48 | %4 | |
1 Consolidated Financial Highlights.
2 Calculated using the average daily shares method.
3 Less than $0.01 per share.
4 Not annualized.
5 Annualized.
6 The portfolio turnover rate is calculated on the Fund as a whole without distinguishing between classes of shares issued.
7 Institutional Class commenced operations on October 29, 2010.
See accompanying notes to financial statements.
110 MATTHEWS ASIA FUNDS
Matthews China Dividend Fund
The tables below set forth financial data for a share of beneficial interest outstanding throughout each period presented.
| | | Six-Month
Period Ended
June 30, 2015 | | Year Ended Dec. 31 | |
INVESTOR CLASS | | (unaudited) | | 2014 | | 2013 | | 2012 | | 2011 | | 2010 | |
Net Asset Value, beginning of period | | $ | 13.37 | | | $ | 13.74 | | | $ | 12.35 | | | $ | 10.06 | | | $ | 12.17 | | | $ | 10.18 | | |
INCOME (LOSS) FROM INVESTMENT OPERATIONS: | |
Net investment income (loss)1 | | | 0.25 | | | | 0.25 | | | | 0.25 | | | | 0.25 | | | | 0.29 | | | | 0.17 | | |
Net realized gain (loss) and unrealized appreciation/
depreciation on investments and foreign currency | | | 2.80 | | | | (0.12 | ) | | | 1.35 | | | | 2.49 | | | | (2.04 | ) | | | 2.09 | | |
Total from investment operations | | | 3.05 | | | | 0.13 | | | | 1.60 | | | | 2.74 | | | | (1.75 | ) | | | 2.26 | | |
LESS DISTRIBUTIONS FROM: | |
Net investment income | | | (0.27 | ) | | | (0.36 | ) | | | (0.23 | ) | | | (0.46 | ) | | | (0.35 | ) | | | (0.24 | ) | |
Net realized gains on investments | | | — | | | | (0.14 | ) | | | — | | | | — | | | | (0.02 | ) | | | (0.04 | ) | |
Total distributions | | | (0.27 | ) | | | (0.50 | ) | | | (0.23 | ) | | | (0.46 | ) | | | (0.37 | ) | | | (0.28 | ) | |
Paid-in capital from redemption fees (Note 4) | | | —2 | | | | —2 | | | | 0.02 | | | | 0.01 | | | | 0.01 | | | | 0.01 | | |
Net Asset Value, end of period | | $ | 16.15 | | | $ | 13.37 | | | $ | 13.74 | | | $ | 12.35 | | | $ | 10.06 | | | $ | 12.17 | | |
TOTAL RETURN | | | 22.74 | %3 | | | 0.93 | % | | | 13.35 | % | | | 27.81 | % | | | (14.44 | %) | | | 22.53 | % | |
RATIOS/SUPPLEMENTAL DATA | |
Net assets, end of period (in 000's) | | $ | 203,457 | | | $ | 116,954 | | | $ | 125,965 | | | $ | 59,535 | | | $ | 26,467 | | | $ | 45,364 | | |
Ratio of expenses to average net assets before any
reimbursement or waiver or recapture of expenses by
Advisor and Administrator (Note 5) | | | 1.12 | %4 | | | 1.19 | % | | | 1.24 | % | | | 1.47 | % | | | 1.52 | % | | | 1.95 | % | |
Ratio of expenses to average net assets after any
reimbursement or waiver or recapture of expenses by
Advisor and Administrator | | | 1.12 | %4 | | | 1.19 | % | | | 1.34 | % | | | 1.50 | % | | | 1.50 | % | | | 1.50 | % | |
Ratio of net investment income (loss) to average net assets | | | 3.27 | %4 | | | 1.88 | % | | | 1.94 | % | | | 2.24 | % | | | 2.47 | % | | | 1.49 | % | |
Portfolio turnover5 | | | 38.44 | %3 | | | 25.43 | % | | | 20.52 | % | | | 21.40 | % | | | 22.31 | % | | | 6.84 | % | |
| | | Six-Month
Period Ended
June 30, 2015 | | Year Ended Dec. 31 | | Period Ended | |
INSTITUTIONAL CLASS | | (unaudited) | | 2014 | | 2013 | | 2012 | | 2011 | | Dec 31, 20106 | |
Net Asset Value, beginning of period | | $ | 13.37 | | | $ | 13.74 | | | $ | 12.34 | | | $ | 10.06 | | | $ | 12.17 | | | $ | 11.87 | | |
INCOME (LOSS) FROM INVESTMENT OPERATIONS: | |
Net investment income (loss)1 | | | 0.18 | | | | 0.28 | | | | 0.33 | | | | 0.22 | | | | 0.30 | | | | —2 | | |
Net realized gain (loss) and unrealized appreciation/
depreciation on investments and foreign currency | | | 2.88 | | | | (0.13 | ) | | | 1.32 | | | | 2.53 | | | | (2.01 | ) | | | 0.47 | | |
Total from investment operations | | | 3.06 | | | | 0.15 | | | | 1.65 | | | | 2.75 | | | | (1.71 | ) | | | 0.47 | | |
LESS DISTRIBUTIONS FROM: | |
Net investment income | | | (0.28 | ) | | | (0.38 | ) | | | (0.26 | ) | | | (0.48 | ) | | | (0.38 | ) | | | (0.13 | ) | |
Net realized gains on investments | | | — | | | | (0.14 | ) | | | — | | | | — | | | | (0.02 | ) | | | (0.04 | ) | |
Total distributions | | | (0.28 | ) | | | (0.52 | ) | | | (0.26 | ) | | | (0.48 | ) | | | (0.40 | ) | | | (0.17 | ) | |
Paid-in capital from redemption fees (Note 4) | | | —2 | | | | —2 | | | | 0.01 | | | | 0.01 | | | | —2 | | | | — | | |
Net Asset Value, end of period | | $ | 16.15 | | | $ | 13.37 | | | $ | 13.74 | | | $ | 12.34 | | | $ | 10.06 | | | $ | 12.17 | | |
TOTAL RETURN | | | 22.78 | %3 | | | 1.11 | % | | | 13.72 | % | | | 27.90 | % | | | (14.22 | %) | | | 3.91 | %3 | |
RATIOS/SUPPLEMENTAL DATA | |
Net assets, end of period (in 000's) | | $ | 26,449 | | | $ | 30,662 | | | $ | 24,790 | | | $ | 201 | | | $ | 12 | | | $ | 4 | | |
Ratio of expenses to average net assets | | | 0.99 | %4 | | | 1.01 | % | | | 1.08 | % | | | 1.29 | % | | | 1.31 | % | | | 1.24 | %4 | |
Ratio of net investment income (loss) to average net assets | | | 2.40 | %4 | | | 2.06 | % | | | 2.54 | % | | | 1.87 | % | | | 2.61 | % | | | (0.06 | %)4 | |
Portfolio turnover5 | | | 38.44 | %3 | | | 25.43 | % | | | 20.52 | % | | | 21.40 | % | | | 22.31 | % | | | 6.84 | %3 | |
1 Calculated using the average daily shares method.
2 Less than $0.01 per share.
3 Not annualized.
4 Annualized.
5 The portfolio turnover rate is calculated on the Fund as a whole without distinguishing between classes of shares issued.
6 Institutional Class commenced operations on October 29, 2010.
See accompanying notes to financial statements.
matthewsasia.com | 800.789.ASIA 111
Financial Highlights (continued)
Matthews Asia Focus Fund
The tables below set forth financial data for a share of beneficial interest outstanding throughout each period presented.
INVESTOR CLASS | | Six-Month
Period Ended
June 30, 2015
(unaudited) | | Year Ended
Dec. 31, 2014 | | Period Ended
Dec. 31, 20131 | |
Net Asset Value, beginning of period | | $ | 10.01 | | | $ | 9.66 | | | $ | 10.00 | | |
INCOME (LOSS) FROM INVESTMENT OPERATIONS: | |
Net investment income (loss)2 | | | 0.06 | | | | 0.09 | | | | 0.04 | | |
Net realized gain (loss) and unrealized appreciation/
depreciation on investments and foreign currency | | | (0.15 | ) | | | 0.33 | | | | (0.30 | ) | |
Total from investment operations | | | (0.09 | ) | | | 0.42 | | | | (0.26 | ) | |
LESS DISTRIBUTIONS FROM: | |
Net investment income | | | — | | | | (0.07 | ) | | | (0.08 | ) | |
Total distributions | | | — | | | | (0.07 | ) | | | (0.08 | ) | |
Paid-in capital from redemption fees (Note 4)3 | | | — | | | | — | | | | — | | |
Net Asset Value, end of period | | $ | 9.92 | | | $ | 10.01 | | | $ | 9.66 | | |
TOTAL RETURN | | | (0.90 | %)4 | | | 4.38 | % | | | (2.63 | %)4 | |
RATIOS/SUPPLEMENTAL DATA | |
Net assets, end of period (in 000's) | | $ | 8,260 | | | $ | 7,839 | | | $ | 6,258 | | |
Ratio of expenses to average net assets before any reimbursement,
waiver or recapture of expenses by Advisor and Administrator (Note 5) | | | 1.81 | %5 | | | 2.16 | % | | | 3.50 | %5 | |
Ratio of expenses to average net assets after any reimbursement,
waiver or recapture of expenses by Advisor and Administrator | | | 1.50 | %5 | | | 1.57 | % | | | 1.71 | %5 | |
Ratio of net investment income (loss) to average net assets | | | 1.25 | %5 | | | 0.87 | % | | | 0.64 | %5 | |
Portfolio turnover6 | | | 9.73 | %4 | | | 24.12 | % | | | 16.23 | %4 | |
INSTITUTIONAL CLASS | | Six-Month
Period Ended
June 30, 2015
(unaudited) | | Year Ended
Dec. 31, 2014 | | Period Ended
Dec. 31, 20131 | |
Net Asset Value, beginning of period | | $ | 10.04 | | | $ | 9.66 | | | $ | 10.00 | | |
INCOME (LOSS) FROM INVESTMENT OPERATIONS: | |
Net investment income (loss)2 | | | 0.08 | | | | 0.10 | | | | 0.05 | | |
Net realized gain (loss) and unrealized appreciation/
depreciation on investments and foreign currency | | | (0.17 | ) | | | 0.36 | | | | (0.30 | ) | |
Total from investment operations | | | (0.09 | ) | | | 0.46 | | | | (0.25 | ) | |
LESS DISTRIBUTIONS FROM: | |
Net investment income | | | — | | | | (0.08 | ) | | | (0.09 | ) | |
Total distributions | | | — | | | | (0.08 | ) | | | (0.09 | ) | |
Paid-in capital from redemption fees (Note 4)3 | | | — | | | | — | | | | — | | |
Net Asset Value, end of period | | $ | 9.95 | | | $ | 10.04 | | | $ | 9.66 | | |
TOTAL RETURN | | | (0.90 | %)4 | | | 4.77 | % | | | (2.48 | %)4 | |
RATIOS/SUPPLEMENTAL DATA | |
Net assets, end of period (in 000's) | | $ | 7,230 | | | $ | 7,148 | | | $ | 2,118 | | |
Ratio of expenses to average net assets before any reimbursement,
waiver or recapture of expenses by Advisor and Administrator (Note 5) | | | 1.59 | %5 | | | 1.94 | % | | | 3.32 | %5 | |
Ratio of expenses to average net assets after any reimbursement,
waiver or recapture of expenses by Advisor and Administrator | | | 1.25 | %5 | | | 1.31 | % | | | 1.50 | %5 | |
Ratio of net investment income (loss) to average net assets | | | 1.47 | %5 | | | 0.96 | % | | | 0.79 | %5 | |
Portfolio turnover6 | | | 9.73 | %4 | | | 24.12 | % | | | 16.23 | %4 | |
1 Commenced operations on April 30, 2013.
2 Calculated using the average daily shares method.
3 Less than $0.01 per share.
4 Not annualized.
5 Annualized.
6 The portfolio turnover rate is calculated on the Fund as a whole without distinguishing between classes of shares issued.
See accompanying notes to financial statements.
112 MATTHEWS ASIA FUNDS
Matthews Asia Growth Fund
The tables below set forth financial data for a share of beneficial interest outstanding throughout each period presented.
| | | Six-Month
Period Ended
June 30, 2015 | | Year Ended Dec. 31 | |
INVESTOR CLASS | | (unaudited) | | 2014 | | 2013 | | 2012 | | 2011 | | 2010 | |
Net Asset Value, beginning of period | | $ | 21.10 | | | $ | 21.17 | | | $ | 18.02 | | | $ | 15.34 | | | $ | 17.97 | | | $ | 14.29 | | |
INCOME (LOSS) FROM INVESTMENT OPERATIONS: | |
Net investment income (loss)1 | | | 0.08 | | | | 0.12 | | | | 0.11 | | | | 0.15 | | | | 0.11 | | | | 0.10 | | |
Net realized gain (loss) and unrealized appreciation/
depreciation on investments and foreign currency | | | 0.87 | | | | 0.19 | | | | 3.37 | | | | 2.53 | | | | (2.41 | ) | | | 3.72 | | |
Total from investment operations | | | 0.95 | | | | 0.31 | | | | 3.48 | | | | 2.68 | | | | (2.30 | ) | | | 3.82 | | |
LESS DISTRIBUTIONS FROM: | |
Net investment income | | | — | | | | (0.38 | ) | | | (0.33 | ) | | | — | | | | (0.35 | ) | | | (0.15 | ) | |
Total distributions | | | — | | | | (0.38 | ) | | | (0.33 | ) | | | — | | | | (0.35 | ) | | | (0.15 | ) | |
Paid-in capital from redemption fees (Note 4) | | | —2 | | | | —2 | | | | —2 | | | | —2 | | | | 0.02 | | | | 0.01 | | |
Net Asset Value, end of period | | $ | 22.05 | | | $ | 21.10 | | | $ | 21.17 | | | $ | 18.02 | | | $ | 15.34 | | | $ | 17.97 | | |
TOTAL RETURN | | | 4.50 | %3 | | | 1.49 | % | | | 19.35 | % | | | 17.47 | % | | | (12.70 | %) | | | 26.85 | % | |
RATIOS/SUPPLEMENTAL DATA | |
Net assets, end of period (in 000's) | | $ | 655,614 | | | $ | 561,922 | | | $ | 558,407 | | | $ | 276,884 | | | $ | 259,166 | | | $ | 335,429 | | |
Ratio of expenses to average net assets | | | 1.09 | %4 | | | 1.11 | % | | | 1.12 | % | | | 1.16 | % | | | 1.19 | % | | | 1.19 | % | |
Ratio of net investment income (loss) to average net assets | | | 0.71 | %4 | | | 0.55 | % | | | 0.55 | % | | | 0.92 | % | | | 0.63 | % | | | 0.63 | % | |
Portfolio turnover5 | | | 11.20 | %3 | | | 22.24 | % | | | 10.77 | % | | | 44.76 | % | | | 28.06 | % | | | 26.33 | % | |
| | | Six-Month
Period Ended
June 30, 2015 | | Year Ended Dec. 31 | | Period Ended | |
INSTITUTIONAL CLASS | | (unaudited) | | 2014 | | 2013 | | 2012 | | 2011 | | Dec. 31, 20106 | |
Net Asset Value, beginning of period | | $ | 21.19 | | | $ | 21.26 | | | $ | 18.08 | | | $ | 15.37 | | | $ | 17.98 | | | $ | 17.65 | | |
INCOME (LOSS) FROM INVESTMENT OPERATIONS: | |
Net investment income (loss)1 | | | 0.10 | | | | 0.16 | | | | 0.15 | | | | 0.17 | | | | 0.14 | | | | 0.01 | | |
Net realized gain (loss) and unrealized appreciation/
depreciation on investments and foreign currency | | | 0.88 | | | | 0.19 | | | | 3.39 | | | | 2.54 | | | | (2.42 | ) | | | 0.47 | | |
Total from investment operations | | | 0.98 | | | | 0.35 | | | | 3.54 | | | | 2.71 | | | | (2.28 | ) | | | 0.48 | | |
LESS DISTRIBUTIONS FROM: | |
Net investment income | | | — | | | | (0.42 | ) | | | (0.36 | ) | | | — | | | | (0.35 | ) | | | (0.15 | ) | |
Total distributions | | | — | | | | (0.42 | ) | | | (0.36 | ) | | | — | | | | (0.35 | ) | | | (0.15 | ) | |
Paid-in capital from redemption fees (Note 4) | | | —2 | | | | —2 | | | | —2 | | | | —2 | | | | 0.02 | | | | — | | |
Net Asset Value, end of period | | $ | 22.17 | | | $ | 21.19 | | | $ | 21.26 | | | $ | 18.08 | | | $ | 15.37 | | | $ | 17.98 | | |
TOTAL RETURN | | | 4.63 | %3 | | | 1.63 | % | | | 19.63 | % | | | 17.63 | % | | | (12.58 | %) | | | 2.76 | %3 | |
RATIOS/SUPPLEMENTAL DATA | |
Net assets, end of period (in 000's) | | $ | 335,004 | | | $ | 287,262 | | | $ | 227,852 | | | $ | 147,142 | | | $ | 84,302 | | | $ | 8,853 | | |
Ratio of expenses to average net assets | | | 0.91 | %4 | | | 0.91 | % | | | 0.93 | % | | | 0.98 | % | | | 1.03 | % | | | 0.99 | %4 | |
Ratio of net investment income (loss) to average net assets | | | 0.92 | %4 | | | 0.74 | % | | | 0.73 | % | | | 1.02 | % | | | 0.84 | % | | | 0.37 | %4 | |
Portfolio turnover5 | | | 11.20 | %3 | | | 22.24 | % | | | 10.77 | % | | | 44.76 | % | | | 28.06 | % | | | 26.33 | %3 | |
1 Calculated using the average daily shares method.
2 Less than $0.01 per share.
3 Not annualized.
4 Annualized.
5 The portfolio turnover rate is calculated on the Fund as a whole without distinguishing between classes of shares issued.
6 Institutional Class commenced operations on October 29, 2010.
See accompanying notes to financial statements.
matthewsasia.com | 800.789.ASIA 113
Financial Highlights (continued)
Matthews Pacific Tiger Fund
The tables below set forth financial data for a share of beneficial interest outstanding throughout each period presented.
| | | Six-Month
Period Ended
June 30, 2015 | | Year Ended Dec. 31 | |
INVESTOR CLASS | | (unaudited) | | 2014 | | 2013 | | 2012 | | 2011 | | 2010 | |
Net Asset Value, beginning of period | | $ | 26.57 | | | $ | 24.99 | | | $ | 24.42 | | | $ | 20.33 | | | $ | 23.44 | | | $ | 19.23 | | |
INCOME (LOSS) FROM INVESTMENT OPERATIONS: | |
Net investment income (loss)1 | | | 0.07 | | | | 0.14 | | | | 0.17 | | | | 0.18 | | | | 0.10 | | | | 0.09 | | |
Net realized gain (loss) and unrealized appreciation/
depreciation on investments and foreign currency | | | 2.09 | | | | 2.80 | | | | 0.72 | | | | 4.09 | | | | (2.78 | ) | | | 4.20 | | |
Total from investment operations | | | 2.16 | | | | 2.94 | | | | 0.89 | | | | 4.27 | | | | (2.68 | ) | | | 4.29 | | |
LESS DISTRIBUTIONS FROM: | |
Net investment income | | | — | | | | (0.13 | ) | | | (0.16 | ) | | | (0.16 | ) | | | (0.11 | ) | | | (0.08 | ) | |
Net realized gains on investments | | | — | | | | (1.23 | ) | | | (0.16 | ) | | | (0.02 | ) | | | (0.33 | ) | | | — | | |
Total distributions | | | — | | | | (1.36 | ) | | | (0.32 | ) | | | (0.18 | ) | | | (0.44 | ) | | | (0.08 | ) | |
Paid-in capital from redemption fees (Note 4) | | | —2 | | | | —2 | | | | —2 | | | | —2 | | | | 0.01 | | | | —2 | | |
Net Asset Value, end of period | | $ | 28.73 | | | $ | 26.57 | | | $ | 24.99 | | | $ | 24.42 | | | $ | 20.33 | | | $ | 23.44 | | |
TOTAL RETURN | | | 8.13 | %3 | | | 11.79 | % | | | 3.63 | % | | | 21.00 | % | | | (11.41 | %) | | | 22.30 | % | |
RATIOS/SUPPLEMENTAL DATA | |
Net assets, end of period (in 000's) | | $ | 3,369,529 | | | $ | 3,047,077 | | | $ | 2,954,108 | | | $ | 2,994,026 | | | $ | 2,780,640 | | | $ | 5,196,743 | | |
Ratio of expenses to average net assets before any
reimbursement or waiver or recapture of expenses by
Advisor and Administrator (Note 5) | | | 1.08 | %4 | | | 1.09 | % | | | 1.09 | % | | | 1.11 | % | | | 1.11 | % | | | 1.09 | % | |
Ratio of expenses to average net assets after any
reimbursement or waiver or recapture of expenses by
Advisor and Administrator | | | 1.05 | %4 | | | 1.08 | % | | | 1.09 | % | | | 1.11 | % | | | 1.11 | % | | | 1.09 | % | |
Ratio of net investment income (loss) to average net assets | | | 0.53 | %4 | | | 0.52 | % | | | 0.67 | % | | | 0.82 | % | | | 0.44 | % | | | 0.43 | % | |
Portfolio turnover 5 | | | 5.98 | %3 | | | 11.38 | % | | | 7.73 | % | | | 6.53 | % | | | 10.51 | % | | | 11.43 | % | |
| | | Six-Month
Period Ended
June 30, 2015 | | Year Ended Dec. 31 | | Period Ended | |
INSTITUTIONAL CLASS | | (unaudited) | | 2014 | | 2013 | | 2012 | | 2011 | | Dec. 31, 20106 | |
Net Asset Value, beginning of period | | $ | 26.56 | | | $ | 24.97 | | | $ | 24.41 | | | $ | 20.32 | | | $ | 23.44 | | | $ | 23.37 | | |
INCOME (LOSS) FROM INVESTMENT OPERATIONS: | |
Net investment income (loss)1 | | | 0.10 | | | | 0.18 | | | | 0.21 | | | | 0.21 | | | | 0.23 | | | | 0.01 | | |
Net realized gain (loss) and unrealized appreciation/
depreciation on investments and foreign currency | | | 2.07 | | | | 2.82 | | | | 0.71 | | | | 4.10 | | | | (2.87 | ) | | | 0.15 | | |
Total from investment operations | | | 2.17 | | | | 3.00 | | | | 0.92 | | | | 4.31 | | | | (2.64 | ) | | | 0.16 | | |
LESS DISTRIBUTIONS FROM: | |
Net investment income | | | — | | | | (0.18 | ) | | | (0.20 | ) | | | (0.20 | ) | | | (0.15 | ) | | | (0.09 | ) | |
Net realized gains on investments | | | — | | | | (1.23 | ) | | | (0.16 | ) | | | (0.02 | ) | | | (0.33 | ) | | | — | | |
Total distributions | | | — | | | | (1.41 | ) | | | (0.36 | ) | | | (0.22 | ) | | | (0.48 | ) | | | (0.09 | ) | |
Paid-in capital from redemption fees (Note 4)2 | | | — | | | | — | | | | — | | | | — | | | | — | | | | — | | |
Net Asset Value, end of period | | $ | 28.73 | | | $ | 26.56 | | | $ | 24.97 | | | $ | 24.41 | | | $ | 20.32 | | | $ | 23.44 | | |
TOTAL RETURN | | | 8.17 | %3 | | | 12.03 | % | | | 3.78 | % | | | 21.24 | % | | | (11.28 | %) | | | 0.67 | %3 | |
RATIOS/SUPPLEMENTAL DATA | |
Net assets, end of period (in 000's) | | $ | 6,019,661 | | | $ | 5,049,643 | | | $ | 4,679,039 | | | $ | 3,770,568 | | | $ | 2,029,091 | | | $ | 540,469 | | |
Ratio of expenses to average net assets before any
reimbursement or waiver or recapture of expenses by
Advisor and Administrator (Note 5) | | | 0.91 | %4 | | | 0.92 | % | | | 0.92 | % | | | 0.95 | % | | | 0.95 | % | | | 0.95 | %4 | |
Ratio of expenses to average net assets after any
reimbursement or waiver or recapture of expenses by
Advisor and Administrator | | | 0.88 | %4 | | | 0.91 | % | | | 0.92 | % | | | 0.95 | % | | | 0.95 | % | | | 0.95 | %4 | |
Ratio of net investment income (loss) to average net assets | | | 0.72 | %4 | | | 0.68 | % | | | 0.83 | % | | | 0.95 | % | | | 1.03 | % | | | 0.38 | %4 | |
Portfolio turnover5 | | | 5.98 | %3 | | | 11.38 | % | | | 7.73 | % | | | 6.53 | % | | | 10.51 | % | | | 11.43 | %3 | |
1 Calculated using the average daily shares method.
2 Less than $0.01 per share.
3 Not annualized.
4 Annualized.
5 The portfolio turnover rate is calculated on the Fund as a whole without distinguishing between classes of shares issued.
6 Institutional Class commenced operations on October 29, 2010.
See accompanying notes to financial statements.
114 MATTHEWS ASIA FUNDS
Matthews Asia ESG Fund
The tables below set forth financial data for a share of beneficial interest outstanding throughout each period presented.
INVESTOR CLASS | | Period Ended
June 30, 2015
(unaudited)1 | |
Net Asset Value, beginning of period | | $ | 10.00 | | |
INCOME (LOSS) FROM INVESTMENT OPERATIONS: | |
Net investment income (loss)2 | | | 0.02 | | |
Net realized gain (loss) and unrealized appreciation/
depreciation on investments and foreign currency | | | (0.18 | ) | |
Total from investment operations | | | (0.16 | ) | |
Paid-in capital from redemption fees (Note 4) | | | — | | |
Net Asset Value, end of period | | $ | 9.84 | | |
TOTAL RETURN | | | (1.60 | %)3 | |
RATIOS/SUPPLEMENTAL DATA | |
Net assets, end of period (in 000's) | | $ | 561 | | |
Ratio of expenses to average net assets before any reimbursement,
waiver or recapture of expenses by Advisor and Administrator (Note 5) | | | 6.32 | %4 | |
Ratio of expenses to average net assets after any reimbursement,
waiver or recapture of expenses by Advisor and Administrator | | | 1.50 | %4 | |
Ratio of net investment income (loss) to average net assets | | | 1.12 | %4 | |
Portfolio turnover5 | | | 0.00 | %3 | |
INSTITUTIONAL CLASS | | Period Ended
June 30, 2015
(unaudited)1 | |
Net Asset Value, beginning of period | | $ | 10.00 | | |
INCOME (LOSS) FROM INVESTMENT OPERATIONS: | |
Net investment income (loss)2 | | | 0.02 | | |
Net realized gain (loss) and unrealized appreciation/
depreciation on investments and foreign currency | | | (0.18 | ) | |
Total from investment operations | | | (0.16 | ) | |
Paid-in capital from redemption fees (Note 4) | | | — | | |
Net Asset Value, end of period | | $ | 9.84 | | |
TOTAL RETURN | | | (1.60 | %)3 | |
RATIOS/SUPPLEMENTAL DATA | |
Net assets, end of period (in 000's) | | $ | 1,103 | | |
Ratio of expenses to average net assets before any reimbursement,
waiver or recapture of expenses by Advisor and Administrator (Note 5) | | | 6.20 | %4 | |
Ratio of expenses to average net assets after any reimbursement,
waiver or recapture of expenses by Advisor and Administrator | | | 1.25 | %4 | |
Ratio of net investment income (loss) to average net assets | | | 1.25 | %4 | |
Portfolio turnover5 | | | 0.00 | %3 | |
1 Commenced operations on April 30, 2015.
2 Calculated using the average daily shares method.
3 Not annualized.
4 Annualized.
5 The portfolio turnover rate is calculated on the Fund as a whole without distinguishing between classes of shares issued.
See accompanying notes to financial statements.
matthewsasia.com | 800.789.ASIA 115
Financial Highlights (continued)
Matthews Emerging Asia Fund
The tables below set forth financial data for a share of beneficial interest outstanding throughout each period presented.
INVESTOR CLASS | | Six-Month
Period Ended
June 30, 2015
(unaudited) | | Year Ended
Dec. 31, 2014 | | Period Ended
Dec. 31, 20131 | |
Net Asset Value, beginning of period | | $ | 11.60 | | | $ | 9.93 | | | $ | 10.00 | | |
INCOME (LOSS) FROM INVESTMENT OPERATIONS: | |
Net investment income (loss)2 | | | 0.02 | | | | 0.04 | | | | (0.01 | ) | |
Net realized gain (loss) and unrealized appreciation/
depreciation on investments and foreign currency | | | (0.05 | ) | | | 1.69 | | | | (0.05 | ) | |
Total from investment operations | | | (0.03 | ) | | | 1.73 | | | | (0.06 | ) | |
LESS DISTRIBUTIONS FROM: | |
Net investment income | | | — | | | | (0.06 | ) | | | —3 | | |
Return of capital | | | — | | | | — | | | | (0.01 | ) | |
Total distributions | | | — | | | | (0.06 | ) | | | (0.01 | ) | |
Paid-in capital from redemption fees (Note 4)3 | | | — | | | | — | | | | — | | |
Net Asset Value, end of period | | $ | 11.57 | | | $ | 11.60 | | | $ | 9.93 | | |
TOTAL RETURN | | | (0.26 | %)4 | | | 17.39 | % | | | (0.61 | %)4 | |
RATIOS/SUPPLEMENTAL DATA | |
Net assets, end of period (in 000's) | | $ | 121,919 | | | $ | 110,363 | | | $ | 38,022 | | |
Ratio of expenses to average net assets before any reimbursement,
waiver or recapture of expenses by Advisor and Administrator (Note 5) | | | 1.65 | %5 | | | 1.78 | % | | | 2.39 | %5 | |
Ratio of expenses to average net assets after any reimbursement,
waiver or recapture of expenses by Advisor and Administrator | | | 1.47 | %5 | | | 1.58 | % | | | 1.98 | %5 | |
Ratio of net investment income (loss) to average net assets | | | 0.27 | %5 | | | 0.34 | % | | | (0.08 | %)5 | |
Portfolio turnover6 | | | 9.42 | %4 | | | 8.21 | % | | | 1.66 | %4 | |
INSTITUTIONAL CLASS | | Six-Month
Period Ended
June 30, 2015
(unaudited) | | Year Ended
Dec. 31, 2014 | | Period Ended
Dec. 31, 20131 | |
Net Asset Value, beginning of period | | $ | 11.60 | | | $ | 9.92 | | | $ | 10.00 | | |
INCOME (LOSS) FROM INVESTMENT OPERATIONS: | |
Net investment income (loss)2 | | | 0.03 | | | | 0.06 | | | | 0.01 | | |
Net realized gain (loss) and unrealized appreciation/
depreciation on investments and foreign currency | | | (0.04 | ) | | | 1.69 | | | | (0.07 | ) | |
Total from investment operations | | | (0.01 | ) | | | 1.75 | | | | (0.06 | ) | |
LESS DISTRIBUTIONS FROM: | |
Net investment income | | | — | | | | (0.07 | ) | | | —3 | | |
Return of capital | | | — | | | | — | | | | (0.02 | ) | |
Total distributions | | | — | | | | (0.07 | ) | | | (0.02 | ) | |
Paid-in capital from redemption fees (Note 4)3 | | | — | | | | — | | | | — | | |
Net Asset Value, end of period | | $ | 11.59 | | | $ | 11.60 | | | $ | 9.92 | | |
TOTAL RETURN | | | (0.09 | %)4 | | | 17.68 | % | | | (0.55 | %)4 | |
RATIOS/SUPPLEMENTAL DATA | |
Net assets, end of period (in 000's) | | $ | 54,834 | | | $ | 21,350 | | | $ | 2,017 | | |
Ratio of expenses to average net assets before any reimbursement,
waiver or recapture of expenses by Advisor and Administrator (Note 5) | | | 1.46 | %5 | | | 1.59 | % | | | 2.21 | %5 | |
Ratio of expenses to average net assets after any reimbursement,
waiver or recapture of expenses by Advisor and Administrator | | | 1.25 | %5 | | | 1.33 | % | | | 1.75 | %5 | |
Ratio of net investment income (loss) to average net assets | | | 0.57 | %5 | | | 0.55 | % | | | 0.19 | %5 | |
Portfolio turnover6 | | | 9.42 | %4 | | | 8.21 | % | | | 1.66 | %4 | |
1 Commenced operations on April 30, 2013.
2 Calculated using the average daily shares method.
3 Less than $0.01 per share.
4 Not annualized.
5 Annualized.
6 The portfolio turnover rate is calculated on the Fund as a whole without distinguishing between classes of shares issued.
See accompanying notes to financial statements.
116 MATTHEWS ASIA FUNDS
Matthews China Fund
The tables below set forth financial data for a share of beneficial interest outstanding throughout each period presented.
| | | Six-Month
Period Ended
June 30, 20151 | | Year Ended Dec. 31 | |
INVESTOR CLASS | | (unaudited) | | 20141 | | 2013 | | 2012 | | 2011 | | 2010 | |
Net Asset Value, beginning of period | | $ | 21.46 | | | $ | 22.84 | | | $ | 23.47 | | | $ | 21.51 | | | $ | 29.36 | | | $ | 25.50 | | |
INCOME (LOSS) FROM INVESTMENT OPERATIONS: | |
Net investment income (loss)2 | | | 0.19 | | | | 0.24 | | | | 0.25 | | | | 0.30 | | | | 0.26 | | | | 0.15 | | |
Net realized gain (loss) and unrealized appreciation/
depreciation on investments and foreign currency | | | 3.73 | | | | (1.25 | ) | | | 1.33 | | | | 2.26 | | | | (5.78 | ) | | | 3.86 | | |
Total from investment operations | | | 3.92 | | | | (1.01 | ) | | | 1.58 | | | | 2.56 | | | | (5.52 | ) | | | 4.01 | | |
LESS DISTRIBUTIONS FROM: | |
Net investment income | | | — | | | | (0.27 | ) | | | (0.26 | ) | | | (0.35 | ) | | | (0.28 | ) | | | (0.15 | ) | |
Net realized gains on investments | | | — | | | | (0.10 | ) | | | (1.95 | ) | | | (0.25 | ) | | | (2.06 | ) | | | (0.02 | ) | |
Total distributions | | | — | | | | (0.37 | ) | | | (2.21 | ) | | | (0.60 | ) | | | (2.34 | ) | | | (0.17 | ) | |
Paid-in capital from redemption fees (Note 4) | | | —3 | | | | —3 | | | | —3 | | | | —3 | | | | 0.01 | | | | 0.02 | | |
Net Asset Value, end of period | | $ | 25.38 | | | $ | 21.46 | | | $ | 22.84 | | | $ | 23.47 | | | $ | 21.51 | | | $ | 29.36 | | |
TOTAL RETURN | | | 18.27 | %4 | | | (4.42 | %) | | | 6.84 | % | | | 11.96 | % | | | (18.93 | %) | | | 15.77 | % | |
RATIOS/SUPPLEMENTAL DATA | |
Net assets, end of period (in 000's) | | $ | 1,003,166 | | | $ | 947,740 | | | $ | 1,286,309 | | | $ | 1,642,090 | | | $ | 1,836,333 | | | $ | 2,939,638 | | |
Ratio of expenses to average net assets | | | 1.13 | %5 | | | 1.11 | % | | | 1.08 | % | | | 1.12 | % | | | 1.13 | % | | | 1.15 | % | |
Ratio of net investment income (loss) to average net assets | | | 1.62 | %5 | | | 1.09 | % | | | 1.06 | % | | | 1.33 | % | | | 0.93 | % | | | 0.54 | % | |
Portfolio turnover6 | | | 9.33 | %4 | | | 10.23 | % | | | 6.29 | % | | | 9.61 | % | | | 8.43 | % | | | 9.98 | % | |
| | | Six-Month
Period Ended
June 30, 20151 | | Year Ended Dec. 31 | | Period Ended | |
INSTITUTIONAL CLASS | | (unaudited) | | 20141 | | 2013 | | 2012 | | 2011 | | Dec. 31, 20107 | |
Net Asset Value, beginning of period | | $ | 21.44 | | | $ | 22.81 | | | $ | 23.45 | | | $ | 21.49 | | | $ | 29.36 | | | $ | 30.02 | | |
INCOME (LOSS) FROM INVESTMENT OPERATIONS: | |
Net investment income (loss)2 | | | 0.21 | | | | 0.28 | | | | 0.26 | | | | 0.36 | | | | 0.26 | | | | (0.04 | ) | |
Net realized gain (loss) and unrealized appreciation/
depreciation on investments and foreign currency | | | 3.72 | | | | (1.25 | ) | | | 1.36 | | | | 2.25 | | | | (5.73 | ) | | | (0.44 | ) | |
Total from investment operations | | | 3.93 | | | | (0.97 | ) | | | 1.62 | | | | 2.61 | | | | (5.47 | ) | | | (0.48 | ) | |
LESS DISTRIBUTIONS FROM: | |
Net investment income | | | — | | | | (0.30 | ) | | | (0.31 | ) | | | (0.40 | ) | | | (0.34 | ) | | | (0.16 | ) | |
Net realized gains on investments | | | — | | | | (0.10 | ) | | | (1.95 | ) | | | (0.25 | ) | | | (2.06 | ) | | | (0.02 | ) | |
Total distributions | | | — | | | | (0.40 | ) | | | (2.26 | ) | | | (0.65 | ) | | | (2.40 | ) | | | (0.18 | ) | |
Paid-in capital from redemption fees (Note 4) | | | —3 | | | | —3 | | | | —3 | | | | —3 | | | | —3 | | | | — | | |
Net Asset Value, end of period | | $ | 25.37 | | | $ | 21.44 | | | $ | 22.81 | | | $ | 23.45 | | | $ | 21.49 | | | $ | 29.36 | | |
TOTAL RETURN | | | 18.33 | %4 | | | (4.22 | %) | | | 6.97 | % | | | 12.22 | % | | | (18.80 | %) | | | (1.62 | %)4 | |
RATIOS/SUPPLEMENTAL DATA | |
Net assets, end of period (in 000's) | | $ | 60,287 | | | $ | 52,478 | | | $ | 117,678 | | | $ | 390,744 | | | $ | 288,277 | | | $ | 41,545 | | |
Ratio of expenses to average net assets | | | 0.99 | %5 | | | 0.95 | % | | | 0.91 | % | | | 0.91 | % | | | 0.96 | % | | | 0.97 | %5 | |
Ratio of net investment income (loss) to average net assets | | | 1.76 | %5 | | | 1.27 | % | | | 1.13 | % | | | 1.58 | % | | | 0.99 | % | | | (0.74 | %)5 | |
Portfolio turnover6 | | | 9.33 | %4 | | | 10.23 | % | | | 6.29 | % | | | 9.61 | % | | | 8.43 | % | | | 9.98 | %4 | |
1 Consolidated Financial Highlights.
2 Calculated using the average daily shares method.
3 Less than $0.01 per share.
4 Not annualized.
5 Annualized.
6 The portfolio turnover rate is calculated on the Fund as a whole without distinguishing between classes of shares issued.
7 Institutional Class commenced operations on October 29, 2010.
See accompanying notes to financial statements.
matthewsasia.com | 800.789.ASIA 117
Financial Highlights (continued)
Matthews India Fund
The tables below set forth financial data for a share of beneficial interest outstanding throughout each period presented.
| | | Six-Month
Period Ended
June 30, 2015 | | Year Ended Dec. 31 | |
INVESTOR CLASS | | (unaudited) | | 2014 | | 2013 | | 2012 | | 2011 | | 2010 | |
Net Asset Value, beginning of period | | $ | 26.46 | | | $ | 16.28 | | | $ | 17.51 | | | $ | 13.59 | | | $ | 21.49 | | | $ | 16.29 | | |
INCOME (LOSS) FROM INVESTMENT OPERATIONS: | |
Net investment income (loss)1 | | | (0.05 | ) | | | 0.07 | | | | 0.08 | | | | 0.11 | | | | 0.11 | | | | 0.05 | | |
Net realized gain (loss) and unrealized appreciation/
depreciation on investments and foreign currency | | | 1.74 | | | | 10.29 | | | | (1.13 | ) | | | 4.17 | | | | (7.96 | ) | | | 5.22 | | |
Total from investment operations | | | 1.69 | | | | 10.36 | | | | (1.05 | ) | | | 4.28 | | | | (7.85 | ) | | | 5.27 | | |
LESS DISTRIBUTIONS FROM: | |
Net investment income | | | — | | | | (0.05 | ) | | | (0.18 | ) | | | (0.09 | ) | | | (0.07 | ) | | | (0.09 | ) | |
Net realized gains on investments | | | — | | | | (0.14 | ) | | | (0.01 | ) | | | (0.27 | ) | | | — | | | | — | | |
Total distributions | | | — | | | | (0.19 | ) | | | (0.19 | ) | | | (0.36 | ) | | | (0.07 | ) | | | (0.09 | ) | |
Paid-in capital from redemption fees (Note 4) | | | 0.02 | | | | 0.01 | | | | 0.01 | | | | —2 | | | | 0.02 | | | | 0.02 | | |
Net Asset Value, end of period | | $ | 28.17 | | | $ | 26.46 | | | $ | 16.28 | | | $ | 17.51 | | | $ | 13.59 | | | $ | 21.49 | | |
TOTAL RETURN | | | 6.46 | %3 | | | 63.71 | % | | | (5.90 | %) | | | 31.54 | % | | | (36.48 | %) | | | 32.53 | % | |
RATIOS/SUPPLEMENTAL DATA | |
Net assets, end of period (in 000's) | | $ | 1,312,574 | | | $ | 974,838 | | | $ | 427,861 | | | $ | 607,800 | | | $ | 559,337 | | | $ | 1,388,892 | | |
Ratio of expenses to average net assets | | | 1.07 | %4 | | | 1.12 | % | | | 1.13 | % | | | 1.18 | % | | | 1.18 | % | | | 1.18 | % | |
Ratio of net investment income (loss) to average net assets | | | (0.35 | %)4 | | | 0.32 | % | | | 0.48 | % | | | 0.65 | % | | | 0.58 | % | | | 0.25 | % | |
Portfolio turnover5 | | | 4.83 | %3 | | | 14.86 | % | | | 8.70 | % | | | 7.03 | % | | | 3.51 | % | | | 6.14 | % | |
| | | Six-Month
Period Ended
June 30, 2015 | | Year Ended Dec. 31 | | Period Ended | |
INSTITUTIONAL CLASS | | (unaudited) | | 2014 | | 2013 | | 2012 | | 2011 | | Dec. 31, 20106 | |
Net Asset Value, beginning of period | | $ | 26.49 | | | $ | 16.31 | | | $ | 17.53 | | | $ | 13.61 | | | $ | 21.48 | | | $ | 22.03 | | |
INCOME (LOSS) FROM INVESTMENT OPERATIONS: | |
Net investment income (loss)1 | | | (0.02 | ) | | | 0.09 | | | | 0.10 | | | | 0.14 | | | | 0.16 | | | | (0.02 | ) | |
Net realized gain (loss) and unrealized appreciation/
depreciation on investments and foreign currency | | | 1.74 | | | | 10.29 | | | | (1.11 | ) | | | 4.17 | | | | (7.96 | ) | | | (0.43 | ) | |
Total from investment operations | | | 1.72 | | | | 10.38 | | | | (1.01 | ) | | | 4.31 | | | | (7.80 | ) | | | (0.45 | ) | |
LESS DISTRIBUTIONS FROM: | |
Net investment income | | | — | | | | (0.08 | ) | | | (0.21 | ) | | | (0.12 | ) | | | (0.07 | ) | | | (0.10 | ) | |
Net realized gains on investments | | | — | | | | (0.14 | ) | | | (0.01 | ) | | | (0.27 | ) | | | — | | | | — | | |
Total distributions | | | — | | | | (0.22 | ) | | | (0.22 | ) | | | (0.39 | ) | | | (0.07 | ) | | | (0.10 | ) | |
Paid-in capital from redemption fees (Note 4) | | | 0.02 | | | | 0.02 | | | | 0.01 | | | | —2 | | | | —2 | | | | — | | |
Net Asset Value, end of period | | $ | 28.23 | | | $ | 26.49 | | | $ | 16.31 | | | $ | 17.53 | | | $ | 13.61 | | | $ | 21.48 | | |
TOTAL RETURN | | | 6.57 | %3 | | | 63.80 | % | | | (5.67 | %) | | | 31.74 | % | | | (36.35 | %) | | | (2.01 | %)3 | |
RATIOS/SUPPLEMENTAL DATA | |
Net assets, end of period (in 000's) | | $ | 265,685 | | | $ | 109,331 | | | $ | 3,234 | | | $ | 36,166 | | | $ | 26,920 | | | $ | 48,119 | | |
Ratio of expenses to average net assets | | | 0.89 | %4 | | | 0.94 | % | | | 0.95 | % | | | 0.98 | % | | | 0.99 | % | | | 0.99 | %4 | |
Ratio of net investment income (loss) to average net assets | | | (0.12 | %)4 | | | 0.38 | % | | | 0.61 | % | | | 0.87 | % | | | 0.86 | % | | | (0.51 | %)4 | |
Portfolio turnover5 | | | 4.83 | %3 | | | 14.86 | % | | | 8.70 | % | | | 7.03 | % | | | 3.51 | % | | | 6.14 | %3 | |
1 Calculated using the average daily shares method.
2 Less than $0.01 per share.
3 Not annualized.
4 Annualized.
5 The portfolio turnover rate is calculated on the Fund as a whole without distinguishing between classes of shares issued.
6 Institutional Class commenced operations on October 29, 2010.
See accompanying notes to financial statements.
118 MATTHEWS ASIA FUNDS
Matthews Japan Fund
The tables below set forth financial data for a share of beneficial interest outstanding throughout each period presented.
| | | Six-Month
Period Ended
June 30, 2015 | | Year Ended Dec. 31 | |
INVESTOR CLASS | | (unaudited) | | 2014 | | 2013 | | 2012 | | 2011 | | 2010 | |
Net Asset Value, beginning of period | | $ | 15.70 | | | $ | 16.20 | | | $ | 12.27 | | | $ | 11.34 | | | $ | 12.53 | | | $ | 10.91 | | |
INCOME (LOSS) FROM INVESTMENT OPERATIONS: | |
Net investment income (loss)1 | | | 0.03 | | | | 0.05 | | | | 0.03 | | | | 0.10 | | | | 0.07 | | | | 0.02 | | |
Net realized gain (loss) and unrealized appreciation/
depreciation on investments and foreign currency | | | 3.47 | | | | (0.48 | ) | | | 4.12 | | | | 0.84 | | | | (1.06 | ) | | | 2.09 | | |
Total from investment operations | | | 3.50 | | | | (0.43 | ) | | | 4.15 | | | | 0.94 | | | | (0.99 | ) | | | 2.11 | | |
LESS DISTRIBUTIONS FROM: | |
Net investment income | | | — | | | | (0.08 | ) | | | (0.24 | ) | | | (0.01 | ) | | | (0.22 | ) | | | (0.49 | ) | |
Total distributions | | | — | | | | (0.08 | ) | | | (0.24 | ) | | | (0.01 | ) | | | (0.22 | ) | | | (0.49 | ) | |
Paid-in capital from redemption fees (Note 4) | | | —2 | | | | 0.01 | | | | 0.02 | | | | —2 | | | | 0.02 | | | | —2 | | |
Net Asset Value, end of period | | $ | 19.20 | | | $ | 15.70 | | | $ | 16.20 | | | $ | 12.27 | | | $ | 11.34 | | | $ | 12.53 | | |
TOTAL RETURN | | | 22.29 | %3 | | | (2.60 | %) | | | 34.03 | % | | | 8.32 | % | | | (7.72 | %) | | | 19.58 | % | |
RATIOS/SUPPLEMENTAL DATA | |
Net assets, end of period (in 000's) | | $ | 887,346 | | | $ | 467,854 | | | $ | 312,988 | | | $ | 82,463 | | | $ | 101,369 | | | $ | 67,805 | | |
Ratio of expenses to average net assets | | | 0.98 | %4 | | | 1.03 | % | | | 1.10 | % | | | 1.20 | % | | | 1.22 | % | | | 1.30 | % | |
Ratio of net investment income (loss) to average net assets | | | 0.39 | %4 | | | 0.32 | % | | | 0.19 | % | | | 0.81 | % | | | 0.54 | % | | | 0.13 | % | |
Portfolio turnover5 | | | 16.36 | %3 | | | 42.52 | % | | | 22.72 | % | | | 48.58 | % | | | 34.94 | % | | | 46.29 | % | |
| | | Six-Month
Period Ended
June 30, 2015 | | Year Ended Dec. 31 | | Period Ended | |
INSTITUTIONAL CLASS | | (unaudited) | | 2014 | | 2013 | | 2012 | | 2011 | | Dec. 31, 20106 | |
Net Asset Value, beginning of period | | $ | 15.71 | | | $ | 16.20 | | | $ | 12.26 | | | $ | 11.34 | | | $ | 12.53 | | | $ | 11.73 | | |
INCOME (LOSS) FROM INVESTMENT OPERATIONS: | |
Net investment income (loss)1 | | | 0.04 | | | | 0.09 | | | | 0.06 | | | | 0.12 | | | | 0.06 | | | | (0.01 | ) | |
Net realized gain (loss) and unrealized appreciation/
depreciation on investments and foreign currency | | | 3.47 | | | | (0.50 | ) | | | 4.12 | | | | 0.84 | | | | (1.04 | ) | | | 1.30 | | |
Total from investment operations | | | 3.51 | | | | (0.41 | ) | | | 4.18 | | | | 0.96 | | | | (0.98 | ) | | | 1.29 | | |
LESS DISTRIBUTIONS FROM: | |
Net investment income | | | — | | | | (0.09 | ) | | | (0.26 | ) | | | (0.04 | ) | | | (0.22 | ) | | | (0.49 | ) | |
Total distributions | | | — | | | | (0.09 | ) | | | (0.26 | ) | | | (0.04 | ) | | | (0.22 | ) | | | (0.49 | ) | |
Paid-in capital from redemption fees (Note 4) | | | —2 | | | | 0.01 | | | | 0.02 | | | | —2 | | | | 0.01 | | | | — | | |
Net Asset Value, end of period | | $ | 19.22 | | | $ | 15.71 | | | $ | 16.20 | | | $ | 12.26 | | | $ | 11.34 | | | $ | 12.53 | | |
TOTAL RETURN | | | 22.34 | %3 | | | (2.47 | %) | | | 34.27 | % | | | 8.47 | % | | | (7.72 | %) | | | 11.22 | %3 | |
RATIOS/SUPPLEMENTAL DATA | |
Net assets, end of period (in 000's) | | $ | 374,802 | | | $ | 154,750 | | | $ | 59,702 | | | $ | 22,233 | | | $ | 30,302 | | | $ | 4 | | |
Ratio of expenses to average net assets | | | 0.88 | %4 | | | 0.90 | % | | | 0.96 | % | | | 1.04 | % | | | 1.07 | % | | | 1.08 | %4 | |
Ratio of net investment income (loss) to average net assets | | | 0.41 | %4 | | | 0.58 | % | | | 0.41 | % | | | 0.99 | % | | | 0.46 | % | | | (0.51 | %)4 | |
Portfolio turnover5 | | | 16.36 | %3 | | | 42.52 | % | | | 22.72 | % | | | 48.58 | % | | | 34.94 | % | | | 46.29 | %3 | |
1 Calculated using the average daily shares method.
2 Less than $0.01 per share.
3 Not annualized.
4 Annualized.
5 The portfolio turnover rate is calculated on the Fund as a whole without distinguishing between classes of shares issued.
6 Institutional Class commenced operations on October 29, 2010.
See accompanying notes to financial statements.
matthewsasia.com | 800.789.ASIA 119
Financial Highlights (continued)
Matthews Korea Fund
The tables below set forth financial data for a share of beneficial interest outstanding throughout each period presented.
| | | Six-Month
Period Ended
June 30, 2015 | | Year Ended Dec. 31 | |
INVESTOR CLASS | | (unaudited) | | 2014 | | 2013 | | 2012 | | 2011 | | 2010 | |
Net Asset Value, beginning of period | | $ | 5.65 | | | $ | 5.95 | | | $ | 5.64 | | | $ | 4.59 | | | $ | 5.14 | | | $ | 4.31 | | |
INCOME (LOSS) FROM INVESTMENT OPERATIONS: | |
Net investment income (loss)1 | | | (0.02 | ) | | | —2 | | | | —2 | | | | —2 | | | | (0.01 | ) | | | 0.01 | | |
Net realized gain (loss) and unrealized appreciation/
depreciation on investments and foreign currency | | | 0.91 | | | | (0.05 | ) | | | 0.57 | | | | 1.10 | | | | (0.31 | ) | | | 0.93 | | |
Total from investment operations | | | 0.89 | | | | (0.05 | ) | | | 0.57 | | | | 1.10 | | | | (0.32 | ) | | | 0.94 | | |
LESS DISTRIBUTIONS FROM: | |
Net investment income | | | — | | | | — | | | | (0.02 | ) | | | — | | | | (0.01 | ) | | | — | | |
Net realized gains on investments | | | — | | | | (0.25 | ) | | | (0.24 | ) | | | (0.05 | ) | | | (0.22 | ) | | | (0.11 | ) | |
Total distributions | | | — | | | | (0.25 | ) | | | (0.26 | ) | | | (0.05 | ) | | | (0.23 | ) | | | (0.11 | ) | |
Paid-in capital from redemption fees (Note 4)2 | | | — | | | | — | | | | — | | | | — | | | | — | | | | — | | |
Net Asset Value, end of period | | $ | 6.54 | | | $ | 5.65 | | | $ | 5.95 | | | $ | 5.64 | | | $ | 4.59 | | | $ | 5.14 | | |
TOTAL RETURN | | | 15.75 | %3 | | | (0.73 | %) | | | 10.11 | % | | | 24.05 | % | | | (6.45 | %) | | | 21.86 | % | |
RATIOS/SUPPLEMENTAL DATA | |
Net assets, end of period (in 000's) | | $ | 155,937 | | | $ | 127,774 | | | $ | 138,830 | | | $ | 141,247 | | | $ | 141,590 | | | $ | 166,990 | | |
Ratio of expenses to average net assets | | | 1.10 | %4 | | | 1.11 | % | | | 1.13 | % | | | 1.16 | % | | | 1.18 | % | | | 1.21 | % | |
Ratio of net investment income (loss) to average net assets | | | (0.70 | %)4 | | | 0.04 | % | | | 0.02 | % | | | 0.01 | % | | | (0.18 | %) | | | 0.16 | % | |
Portfolio turnover 5 | | | 11.26 | %3 | | | 17.37 | % | | | 46.20 | % | | | 34.84 | % | | | 30.13 | % | | | 39.05 | % | |
| | | Six-Month
Period Ended
June 30, 2015 | | Year Ended Dec. 31 | | Period Ended | |
INSTITUTIONAL CLASS | | (unaudited) | | 2014 | | 2013 | | 2012 | | 2011 | | Dec. 31, 20106 | |
Net Asset Value, beginning of period | | $ | 5.68 | | | $ | 5.96 | | | $ | 5.67 | | | $ | 4.61 | | | $ | 5.14 | | | $ | 4.84 | | |
INCOME (LOSS) FROM INVESTMENT OPERATIONS: | |
Net investment income (loss)1 | | | (0.02 | ) | | | 0.05 | | | | —2 | | | | —2 | | | | 0.17 | | | | 0.03 | | |
Net realized gain (loss) and unrealized appreciation/
depreciation on investments and foreign currency | | | 0.92 | | | | (0.08 | ) | | | 0.56 | | | | 1.11 | | | | (0.47 | ) | | | 0.38 | | |
Total from investment operations | | | 0.90 | | | | (0.03 | ) | | | 0.56 | | | | 1.11 | | | | (0.30 | ) | | | 0.41 | | |
LESS DISTRIBUTIONS FROM: | |
Net investment income | | | — | | | | — | | | | (0.03 | ) | | | — | | | | (0.01 | ) | | | — | | |
Net realized gains on investments | | | — | | | | (0.25 | ) | | | (0.24 | ) | | | (0.05 | ) | | | (0.22 | ) | | | (0.11 | ) | |
Total distributions | | | — | | | | (0.25 | ) | | | (0.27 | ) | | | (0.05 | ) | | | (0.23 | ) | | | (0.11 | ) | |
Paid-in capital from redemption fees (Note 4) | | | —2 | | | | —2 | | | | —2 | | | | —2 | | | | —2 | | | | — | | |
Net Asset Value, end of period | | $ | 6.58 | | | $ | 5.68 | | | $ | 5.96 | | | $ | 5.67 | | | $ | 4.61 | | | $ | 5.14 | | |
TOTAL RETURN | | | 15.85 | %3 | | | (0.39 | %) | | | 9.87 | % | | | 24.16 | % | | | (6.05 | %) | | | 8.51 | %3 | |
RATIOS/SUPPLEMENTAL DATA | |
Net assets, end of period (in 000's) | | $ | 59,870 | | | $ | 91,431 | | | $ | 12,283 | | | $ | 8,597 | | | $ | 15,109 | | | $ | 4 | | |
Ratio of expenses to average net assets | | | 0.94 | %4 | | | 0.93 | % | | | 0.97 | % | | | 1.00 | % | | | 1.07 | % | | | 0.91 | %4 | |
Ratio of net investment income (loss) to average net assets | | | (0.55 | %)4 | | | 0.87 | % | | | (0.03 | %) | | | (0.07 | %) | | | 3.37 | % | | | 3.74 | %4 | |
Portfolio turnover5 | | | 11.26 | %3 | | | 17.37 | % | | | 46.20 | % | | | 34.84 | % | | | 30.13 | % | | | 39.05 | %3 | |
1 Calculated using the average daily shares method.
2 Less than $0.01 per share.
3 Not annualized.
4 Annualized.
5 The portfolio turnover rate is calculated on the Fund as a whole without distinguishing between classes of shares issued.
6 Institutional Class commenced operations on October 29, 2010.
See accompanying notes to financial statements.
120 MATTHEWS ASIA FUNDS
Matthews Asia Small Companies Fund
The tables below set forth financial data for a share of beneficial interest outstanding throughout each period presented.
| | | Six-Month
Period Ended
June 30, 2015 | | Year Ended Dec. 31 | |
INVESTOR CLASS | | (unaudited) | | 2014 | | 2013 | | 2012 | | 2011 | | 2010 | |
Net Asset Value, beginning of period | | $ | 21.46 | | | $ | 19.34 | | | $ | 18.13 | | | $ | 14.77 | | | $ | 21.16 | | | $ | 15.79 | | |
INCOME (LOSS) FROM INVESTMENT OPERATIONS: | |
Net investment income (loss)1 | | | (0.01 | ) | | | 0.09 | | | | 0.11 | | | | 0.17 | | | | 0.15 | | | | 0.04 | | |
Net realized gain (loss) and unrealized appreciation/
depreciation on investments and foreign currency | | | 1.29 | | | | 2.11 | | | | 1.19 | | | | 3.36 | | | | (4.35 | ) | | | 5.55 | | |
Total from investment operations | | | 1.28 | | | | 2.20 | | | | 1.30 | | | | 3.53 | | | | (4.20 | ) | | | 5.59 | | |
LESS DISTRIBUTIONS FROM: | |
Net investment income | | | — | | | | (0.08 | ) | | | (0.09 | ) | | | (0.09 | ) | | | (0.17 | ) | | | (0.09 | ) | |
Net realized gains on investments | | | — | | | | — | | | | — | | | | (0.08 | ) | | | (2.04 | ) | | | (0.15 | ) | |
Total distributions | | | — | | | | (0.08 | ) | | | (0.09 | ) | | | (0.17 | ) | | | (2.21 | ) | | | (0.24 | ) | |
Paid-in capital from redemption fees (Note 4) | | | —2 | | | | —2 | | | | —2 | | | | —2 | | | | 0.02 | | | | 0.02 | | |
Net Asset Value, end of period | | $ | 22.74 | | | $ | 21.46 | | | $ | 19.34 | | | $ | 18.13 | | | $ | 14.77 | | | $ | 21.16 | | |
TOTAL RETURN | | | 5.96 | %3 | | | 11.39 | % | | | 7.19 | % | | | 23.92 | % | | | (20.03 | %) | | | 35.54 | % | |
RATIOS/SUPPLEMENTAL DATA | |
Net assets, end of period (in 000's) | | $ | 563,009 | | | $ | 599,082 | | | $ | 407,352 | | | $ | 366,753 | | | $ | 258,944 | | | $ | 547,094 | | |
Ratio of expenses to average net assets before any
reimbursement, waiver or recapture of expenses by
Advisor and Administrator (Note 5) | | | 1.46 | %4 | | | 1.47 | % | | | 1.47 | % | | | 1.50 | % | | | 1.52 | % | | | 1.59 | % | |
Ratio of expenses to average net assets after any
reimbursement, waiver or recapture of expenses by
Advisor and Administrator | | | 1.46 | %4 | | | 1.47 | % | | | 1.47 | % | | | 1.50 | % | | | 1.52 | % | | | 1.63 | % | |
Ratio of net investment income (loss) to average net assets | | | (0.05 | %)4 | | | 0.44 | % | | | 0.58 | % | | | 1.06 | % | | | 0.76 | % | | | 0.24 | % | |
Portfolio turnover | | | 16.36 | %3,5 | | | 21.70 | %5 | | | 37.01 | %5 | | | 27.95 | % | | | 19.97 | % | | | 23.99 | % | |
INSTITUTIONAL CLASS | | Six-Month
Period Ended
June 30, 2015
(unaudited) | | Year Ended
Dec. 31, 2014 | | Period Ended
Dec. 31, 20136 | |
Net Asset Value, beginning of period | | $ | 21.46 | | | $ | 19.33 | | | $ | 19.44 | | |
INCOME (LOSS) FROM INVESTMENT OPERATIONS: | |
Net investment income (loss)1 | | | 0.08 | | | | 0.15 | | | | 0.18 | | |
Net realized gain (loss) and unrealized appreciation/
depreciation on investments and foreign currency | | | 1.22 | | | | 2.10 | | | | (0.16 | ) | |
Total from investment operations | | | 1.30 | | | | 2.25 | | | | 0.02 | | |
LESS DISTRIBUTIONS FROM: | |
Net investment income | | | — | | | | (0.12 | ) | | | (0.13 | ) | |
Net realized gains on investments | | | — | | | | — | | | | — | | |
Total distributions | | | — | | | | (0.12 | ) | | | (0.13 | ) | |
Paid-in capital from redemption fees (Note 4)2 | | | — | | | | — | | | | — | | |
Net Asset Value, end of period | | $ | 22.76 | | | $ | 21.46 | | | $ | 19.33 | | |
TOTAL RETURN | | | 6.06 | %3 | | | 11.65 | % | | | 0.13 | %3 | |
RATIOS/SUPPLEMENTAL DATA | |
Net assets, end of period (in 000's) | | $ | 266,034 | | | $ | 77,168 | | | $ | 44,769 | | |
Ratio of expenses to average net assets before any
reimbursement, waiver or recapture of expenses by
Advisor and Administrator (Note 5) | | | 1.26 | %4 | | | 1.27 | % | | | 1.25 | %4 | |
Ratio of expenses to average net assets after any
reimbursement, waiver or recapture of expenses by
Advisor and Administrator | | | 1.25 | %4 | | | 1.26 | % | | | 1.25 | %4 | |
Ratio of net investment income (loss) to average net assets | | | 0.71 | %4 | | | 0.70 | % | | | 1.39 | %4 | |
Portfolio turnover5 | | | 16.36 | %3 | | | 21.70 | % | | | 37.01 | %3 | |
1 Calculated using the average daily shares method.
2 Less than $0.01 per share.
3 Not annualized.
4 Annualized.
5 The portfolio turnover rate is calculated on the Fund as a whole without distinguishing between classes of shares issued.
6 Institutional Class commenced operations on April 30, 2013.
See accompanying notes to financial statements.
matthewsasia.com | 800.789.ASIA 121
Financial Highlights (continued)
Matthews China Small Companies Fund
The table below sets forth financial data for a share of beneficial interest outstanding throughout each period presented.
| | | Six-Month
Period Ended
June 30, 2015 | | Year Ended Dec. 31 | | Period Ended | |
INVESTOR CLASS | | (unaudited) | | 2014 | | 2013 | | 2012 | | Dec. 31, 20111 | |
Net Asset Value, beginning of period | | $ | 9.21 | | | $ | 9.89 | | | $ | 7.76 | | | $ | 7.04 | | | $ | 10.00 | | |
INCOME (LOSS) FROM INVESTMENT OPERATIONS: | |
Net investment income (loss)2 | | | 0.07 | | | | 0.01 | | | | 0.02 | | | | 0.03 | | | | (0.02 | ) | |
Net realized gain (loss) and unrealized appreciation/
depreciation on investments and foreign currency | | | 1.45 | | | | (0.33 | ) | | | 2.22 | | | | 0.68 | | | | (2.96 | ) | |
Total from investment operations | | | 1.52 | | | | (0.32 | ) | | | 2.24 | | | | 0.71 | | | | (2.98 | ) | |
LESS DISTRIBUTIONS FROM: | |
Net investment income | | | — | | | | (0.02 | ) | | | (0.11 | ) | | | (0.02 | ) | | | (0.01 | ) | |
Return of capital | | | — | | | | (0.34 | ) | | | — | | | | — | | | | — | | |
Total distributions | | | — | | | | (0.36 | ) | | | (0.11 | ) | | | — | | | | (0.01 | ) | |
Paid-in capital from redemption fees (Note 4) | | | —3 | | | | —3 | | | | —3 | | | | 0.03 | | | | 0.03 | | |
Net Asset Value, end of period | | $ | 10.73 | | | $ | 9.21 | | | $ | 9.89 | | | $ | 7.78 | | | $ | 7.04 | | |
TOTAL RETURN | | | 16.50 | %4 | | | (3.33 | %) | | | 28.85 | % | | | 10.53 | % | | | (29.51 | %)4 | |
RATIOS/SUPPLEMENTAL DATA | |
Net assets, end of period (in 000's) | | $ | 25,977 | | | $ | 22,068 | | | $ | 26,674 | | | $ | 10,266 | | | $ | 4,493 | | |
Ratio of expenses to average net assets before any reimbursement,
waiver or recapture of expenses by Advisor and Administrator (Note 5) | | | 1.94 | %5 | | | 1.90 | % | | | 2.04 | % | | | 3.26 | % | | | 5.32 | %5 | |
Ratio of expenses to average net assets after any reimbursement,
waiver or recapture of expenses by Advisor and Administrator | | | 1.50 | %5 | | | 1.67 | % | | | 2.00 | % | | | 2.00 | % | | | 2.00 | %5 | |
Ratio of net investment income (loss) to average net assets | | | 1.34 | %5 | | | 0.14 | % | | | 0.17 | % | | | 0.40 | % | | | (0.53 | %)5 | |
Portfolio turnover | | | 33.21 | %4 | | | 32.42 | % | | | 10.28 | % | | | 34.01 | % | | | 6.08 | %4 | |
1 Investor Class commenced operations on May 31, 2011.
2 Calculated using the average daily shares method.
3 Less than $0.01 per share.
4 Not annualized.
5 Annualized.
See accompanying notes to financial statements.
122 MATTHEWS ASIA FUNDS
Matthews Asia Science and Technology Fund
The tables below set forth financial data for a share of beneficial interest outstanding throughout each period presented.
| | | Six-Month
Period Ended
June 30, 2015 | | Year Ended Dec. 31 | |
INVESTOR CLASS | | (unaudited) | | 2014 | | 2013 | | 2012 | | 2011 | | 2010 | |
Net Asset Value, beginning of period | | $ | 13.61 | | | $ | 12.59 | | | $ | 9.29 | | | $ | 8.16 | | | $ | 9.89 | | | $ | 8.02 | | |
INCOME (LOSS) FROM INVESTMENT OPERATIONS: | |
Net investment income (loss)1 | | | (0.02 | ) | | | —2 | | | | 0.01 | | | | 0.03 | | | | 0.02 | | | | 0.03 | | |
Net realized gain (loss) and unrealized appreciation/
depreciation on investments and foreign currency | | | 1.21 | | | | 1.16 | | | | 3.30 | | | | 1.12 | | | | (1.74 | ) | | | 1.86 | | |
Total from investment operations | | | 1.19 | | | | 1.16 | | | | 3.31 | | | | 1.15 | | | | (1.72 | ) | | | 1.89 | | |
LESS DISTRIBUTIONS FROM: | |
Net investment income | | | — | | | | (0.06 | ) | | | (0.01 | ) | | | (0.02 | ) | | | (0.02 | ) | | | (0.02 | ) | |
Net realized gains on investments | | | — | | | | (0.08 | ) | | | — | | | | — | | | | — | | | | — | | |
Total distributions | | | — | | | | (0.14 | ) | | | (0.01 | ) | | | (0.02 | ) | | | (0.02 | ) | | | (0.02 | ) | |
Paid-in capital from redemption fees (Note 4) | | | —2 | | | | —2 | | | | —2 | | | | —2 | | | | 0.01 | | | | —2 | | |
Net Asset Value, end of period | | $ | 14.80 | | | $ | 13.61 | | | $ | 12.59 | | | $ | 9.29 | | | $ | 8.16 | | | $ | 9.89 | | |
TOTAL RETURN | | | 8.74 | %3 | | | 9.24 | % | | | 35.61 | % | | | 14.11 | % | | | (17.26 | %) | | | 23.58 | % | |
RATIOS/SUPPLEMENTAL DATA | |
Net assets, end of period (in 000's) | | $ | 144,998 | | | $ | 125,612 | | | $ | 111,751 | | | $ | 131,629 | | | $ | 153,349 | | | $ | 190,436 | | |
Ratio of expenses to average net assets | | | 1.15 | %4 | | | 1.16 | % | | | 1.18 | % | | | 1.18 | % | | | 1.21 | % | | | 1.26 | % | |
Ratio of net investment income (loss) to average net assets | | | (0.25 | %)4 | | | (0.02 | %) | | | 0.07 | % | | | 0.30 | % | | | 0.23 | % | | | 0.35 | % | |
Portfolio turnover | | | 43.56 | %3,5 | | | 62.99 | %5 | | | 62.04 | %5 | | | 45.76 | % | | | 65.47 | % | | | 61.61 | % | |
INSTITUTIONAL CLASS | | Six-Month
Period Ended
June 30, 2015
(unaudited) | | Year Ended
Dec. 31, 2014 | | Period Ended
Dec. 31, 20136 | |
Net Asset Value, beginning of period | | $ | 13.61 | | | $ | 12.58 | | | $ | 10.09 | | |
INCOME (LOSS) FROM INVESTMENT OPERATIONS: | |
Net investment income (loss)1 | | | (0.01 | ) | | | 0.03 | | | | 0.04 | | |
Net realized gain (loss) and unrealized appreciation/
depreciation on investments and foreign currency | | | 1.21 | | | | 1.17 | | | | 2.48 | | |
Total from investment operations | | | 1.20 | | | | 1.20 | | | | 2.52 | | |
LESS DISTRIBUTIONS FROM: | |
Net investment income | | | — | | | | (0.09 | ) | | | (0.03 | ) | |
Net realized gains on investments | | | — | | | | (0.08 | ) | | | — | | |
Total distributions | | | — | | | | (0.17 | ) | | | (0.03 | ) | |
Paid-in capital from redemption fees (Note 4)2 | | | — | | | | — | | | | — | | |
Net Asset Value, end of period | | $ | 14.81 | | | $ | 13.61 | | | $ | 12.58 | | |
TOTAL RETURN | | | 8.82 | %3 | | | 9.54 | % | | | 24.99 | %3 | |
RATIOS/SUPPLEMENTAL DATA | |
Net assets, end of period (in 000's) | | $ | 36,980 | | | $ | 61,088 | | | $ | 49,236 | | |
Ratio of expenses to average net assets | | | 0.95 | %4 | | | 0.95 | % | | | 1.00 | %4 | |
Ratio of net investment income (loss) to average net assets | | | (0.14 | %)4 | | | 0.21 | % | | | 0.56 | %4 | |
Portfolio turnover5 | | | 43.56 | %3 | | | 62.99 | % | | | 62.04 | %3 | |
1 Calculated using the average daily shares method.
2 Less than $0.01 per share.
3 Not annualized.
4 Annualized.
5 The portfolio turnover rate is calculated on the Fund as a whole without distinguishing between classes of shares issued.
6 Institutional Class commenced operations on April 30, 2013.
See accompanying notes to financial statements.
matthewsasia.com | 800.789.ASIA 123
Notes to Financial Statements (unaudited)
1. ORGANIZATION
Matthews Asia Funds (the "Trust") is an open-end management investment company registered under the Investment Company Act of 1940, as amended (the "1940 Act"). The Trust currently issues sixteen separate series of shares (each a "Fund" and collectively, the "Funds"): Matthews Asia Strategic Income Fund, Matthews Asian Growth and Income Fund, Matthews Asia Dividend Fund, Matthews China Dividend Fund, Matthews Asia Focus Fund, Matthews Asia Growth Fund, Matthews Pacific Tiger Fund, Matthews Asia ESG Fund, Matthews Emerging Asia Fund, Matthews China Fund, Matthews India Fund, Matthews Japan Fund, Matthews Korea Fund, Matthews Asia Small Companies Fund, Matthews China Small Companies Fund and Matthews Asia Science and Technology Fund. Each Fund except for Matthews China Small Companies Fund currently offers two classes of shares: Investor Class and Institutional Class. Matthews China Small Companies Fund currently offers only Investor Class shares. Each class of shares has identical voting, dividend, liquidation and other rights and the same terms and conditions, except each class may be subject to different class expenses as outlined in the relevant prospectus and each class has exclusive voting rights with respect to matters solely affecting such class.
2. SIGNIFICANT ACCOUNTING POLICIES
The following is a summary of significant accounting policies consistently followed by the Funds in preparation of their financial statements.
A. SECURITY VALUATION: The value of the Funds' securities is based on market quotations for those securities, or on their fair value determined by the valuation policies approved by the Funds' Board of Trustees (the "Board"). Market quotations and valuation information are provided by commercial pricing services or securities dealers that are independent of the Funds and Matthews International Capital Management, LLC ("Matthews"), in accordance with procedures established by the Funds' Board. Foreign exchange-traded securities are valued as of the close of trading on the primary exchange on which they trade. Securities that trade in over-the-counter markets, including most debt securities (bonds), may be valued by other third-party vendors or by using indicative bid quotations from dealers or market makers, or other available market information. Market values for securities are determined based on quotations, market data or other information from the principal (or most advantageous) market on which the security is traded. Market quotations for equity securities used by the Funds include last reported sale prices, or, if such prices are not reported or available, bid and ask prices. Financial futures contracts traded on exchanges are valued at their settlement price. Foreign currency exchange contracts are valued at the mean between the bid and ask prices and are determined at the close of business on the New York Stock Exchange ("NYSE"). Interpolated values are derived when the settlement date of the contract is an interim date for which quotations are not available. The Funds may also utilize independent pricing services to assist them in determining a current market value for each security based on sources believed to be reliable.
The Board has delegated the responsibility of making fair value determinations to the Funds' Valuation Committee (the "Valuation Committee") subject to the Funds' pricing policies. When fair value pricing is employed, the prices of securities used by a Fund to calculate its Net Asset Value ("NAV") may differ from any quoted or published prices for the same securities for that day. All fair value determinations are made subject to the Board's oversight. Events affecting the value of foreign investments may occur between the time at which they are determined and when the Funds calculate their NAV, which is normally the close of trading on the NYSE. If such events render market quotations unreliable, and the impact of such events can be reasonably determined, the investments will be valued at their fair value in accordance with pricing policies. The fair value of a security held by the Funds may be determined using the services of third-party pricing services to assist in this process.
The books and records of the Funds are maintained in U.S. dollars. Transactions, portfolio securities, and assets and liabilities denominated in a foreign currency are translated and recorded in U.S. dollars at the prevailing exchange rate as of the close of trading on the NYSE. Translation gains or losses resulting from changes in the exchange rate during the reporting period and realized gains and losses on the settlement of foreign currency transactions are reported in the results of operations for the current period. The Funds do not isolate that portion of gains and losses on investments in equity securities that is due to changes in foreign exchange rate from that which is due to changes in market prices of securities.
Foreign securities held by the Funds may be traded on days and at times when the NYSE is closed. Accordingly, the NAV of the Funds may be significantly affected on days when shareholders have no access to the Funds.
B. FAIR VALUE MEASUREMENTS: In accordance with the guidance on fair value measurements and disclosures under generally accepted accounting principles in the United States ("U.S. GAAP"), the Funds disclose the fair value of their investments and derivative financial instruments in a hierarchy that prioritizes the inputs to valuation techniques used to measure the fair value. The hierarchy gives the highest priority to valuations based upon unadjusted quoted prices in active markets for identical assets or liabilities (Level 1 measurement) and the lowest priority to valuations based upon unobservable inputs that are significant to the valuation (Level 3 measurements). Various inputs are used in determining the fair value of investments and derivative financial instruments, which are as follows:
Level 1: Quoted prices in active markets for identical securities.
Level 2: Other significant observable inputs (including quoted prices for similar securities, interest rates, prepayment speeds, credit risk, etc.).
Level 3: Significant unobservable inputs (including the Fund's own assumptions in determining the fair value of investments and derivative financial instruments).
Level 3 securities consisted of equities that, as of June 30, 2015, were suspended from trading. As described in Note 2-A, these securities are valued based on their fair value as determined under the direction of the Board. The significant unobservable inputs, the methodology used for valuing such securities, and the characterization of such securities as Level 3 securities are not necessarily an indication of liquidity, or the risk associated with investing in these securities. A significant change in the unobservable inputs could result in a significantly lower or higher value in such Level 3 securities and could impact overall Fund performance. Level 2 equity securities consist primarily of securities that have been fair valued by third-party pricing services (see Note 2-A).
124 MATTHEWS ASIA FUNDS
The summary of inputs used to determine the fair valuation of the Fund's investments as of June 30, 2015 is as follows:
| | | Matthews Asia
Strategic
Income Fund | | Matthews Asian
Growth and
Income Fund | | Matthews Asia
Dividend Fund | | Matthews Asia
Focus Fund | | Matthews Asia
Growth Fund | |
Assets: | |
Investments: | |
Level 1: Quoted Prices | |
China/Hong Kong | | $ | — | | | $ | 487,142,325 | | | $ | 970,280,223 | | | $ | 1,537,696 | | | $ | 99,836,972 | | |
India | | | — | | | | — | | | | — | | | | — | | | | 17,943,378 | | |
Indonesia | | | — | | | | 70,335,277 | | | | 49,500,787 | | | | — | | | | — | | |
Japan | | | — | | | | — | | | | 14,006,434 | | | | — | | | | — | | |
Luxembourg | | | — | | | | — | | | | 102,851,365 | | | | — | | | | — | | |
Pakistan | | | — | | | | — | | | | — | | | | — | | | | 6,324,808 | | |
Singapore | | | 544,946 | | | | — | | | | 36,591,436 | | | | — | | | | — | | |
South Korea | | | — | | | | 40,865,480 | | | | — | | | | — | | | | — | | |
Sri Lanka | | | — | | | | — | | | | — | | | | — | | | | 9,032,219 | | |
Taiwan | | | — | | | | 107,913,206 | | | | 207,567,826 | | | | — | | | | — | | |
United States | | | — | | | | — | | | | — | | | | 538,433 | | | | — | | |
Vietnam | | | — | | | | 67,442,070 | | | | 58,102,144 | | | | — | | | | 9,332,371 | | |
Level 2: Other Significant Observable Inputs | |
Foreign Government Obligationsa | | | 9,663,208 | | | | — | | | | — | | | | — | | | | — | | |
Non-Convertible Corporate Bondsa | | | 45,534,245 | | | | — | | | | — | | | | — | | | | — | | |
Convertible Corporate Bondsa | | | 11,389,276 | | | | 261,478,835 | | | | — | | | | — | | | | — | | |
Common Equities: | |
Australia | | | — | | | | 180,603,666 | | | | 285,186,748 | | | | 929,694 | | | | 31,399,122 | | |
China/Hong Kong | | | — | | | | 674,181,718 | | | | 904,270,283 | | | | 4,777,018 | | | | 53,607,348 | | |
India | | | — | | | | — | | | | 154,786,353 | | | | 449,789 | | | | 87,139,028 | | |
Indonesia | | | — | | | | 51,469,002 | | | | 222,668,549 | | | | 749,486 | | | | 75,559,770 | | |
Japan | | | — | | | | 228,490,801 | | | | 1,721,668,896 | | | | — | | | | 414,769,120 | | |
Malaysia | | | — | | | | 316,876,164 | | | | — | | | | 1,376,492 | | | | 13,868,427 | | |
New Zealand | | | — | | | | 123,320,658 | | | | — | | | | — | | | | — | | |
Philippines | | | 375,486 | | | | 103,621,475 | | | | 83,656,184 | | | | — | | | | 44,880,150 | | |
Singapore | | | — | | | | 581,532,037 | | | | 253,647,459 | | | | 1,475,133 | | | | — | | |
South Korea | | | — | | | | 235,783,743 | | | | 245,707,034 | | | | 518,506 | | | | 25,651,594 | | |
Sri Lanka | | | — | | | | — | | | | — | | | | — | | | | 15,310,053 | | |
Switzerland | | | — | | | | — | | | | — | | | | 502,460 | | | | — | | |
Taiwan | | | — | | | | 63,294,891 | | | | 63,640,005 | | | | 564,029 | | | | 22,574,421 | | |
Thailand | | | — | | | | 167,999,685 | | | | 172,963,132 | | | | 735,915 | | | | 11,882,281 | | |
United Kingdom | | | — | | | | 56,786,446 | | | | — | | | | 266,670 | | | | — | | |
Preferred Equities: | |
South Korea | | | — | | | | 99,459,235 | | | | 145,000,980 | | | | — | | | | — | | |
Level 3: Significant Unobservable Inputs | |
Common Equities: | |
Sri Lanka | | | — | | | | — | | | | — | | | | — | | | | 6,963,891 | | |
Total Market Value of Investments | | $ | 67,507,161 | | | $ | 3,918,596,714 | | | $ | 5,692,095,838 | | | $ | 14,421,321 | | | $ | 946,074,953 | | |
a Industry, countries, or security types are disclosed on the Schedule of Investments.
matthewsasia.com | 800.789.ASIA 125
Notes to Financial Statements (unaudited) (continued)
| | | Matthews China
Dividend Fund | | Matthews
China Fund | | Matthews
India Fund | | Matthews
Japan Fund | | Matthews
Korea Fund | | Matthews
China Small
Companies
Fund | |
Assets: | |
Investments: | |
Level 1: Quoted Prices | |
Common Equities: | |
Consumer Discretionary | | $ | 23,712,990 | | | $ | 96,860,559 | | | $ | 11,567,926 | | | $ | 5,804,998 | | | $ | 1,944,823 | | | $ | 2,087,930 | | |
Consumer Staples | | | 14,946,158 | | | | 22,088,554 | | | | 60,938,158 | | | | — | | | | 5,503,795 | | | | 122,608 | | |
Financials | | | 7,474,160 | | | | — | | | | 149,544,534 | | | | — | | | | — | | | | — | | |
Health Care | | | — | | | | 21,398,873 | | | | 123,318,303 | | | | 4,076,022 | | | | — | | | | 3,192,719 | | |
Industrials | | | 16,518,361 | | | | — | | | | 26,241,874 | | | | 9,477,338 | | | | 11,288,251 | | | | 1,724,392 | | |
Information Technology | | | 4,891,403 | | | | 95,701,914 | | | | 127,218,876 | | | | — | | | | — | | | | — | | |
Telecommunication Services | | | 9,371,904 | | | | 19,400,043 | | | | — | | | | — | | | | 8,110,184 | | | | — | | |
Preferred Equities: | |
Consumer Staples | | | — | | | | — | | | | — | | | | — | | | | 6,908,378 | | | | — | | |
Level 2: Other Significant Observable Inputs | |
Common Equities: | |
Consumer Discretionary | | | 7,655,766 | | | | 22,372,112 | | | | 124,045,368 | | | | 188,355,216 | | | | 38,534,292 | | | | 921,085 | | |
Consumer Staples | | | 10,619,905 | | | | 40,788,505 | | | | 217,255,660 | | | | 184,386,515 | | | | 37,749,683 | | | | 281,826 | | |
Energy | | | 6,822,906 | | | | 23,565,748 | | | | — | | | | — | | | | 4,099,768 | | | | — | | |
Financials | | | 33,162,663 | | | | 247,756,400 | | | | 264,099,482 | | | | 141,204,790 | | | | 28,929,729 | | | | 2,989,400 | | |
Health Care | | | 8,682,499 | | | | 75,442,903 | | | | 114,633,072 | | | | 165,080,186 | | | | 7,896,199 | | | | 2,134,603 | | |
Industrials | | | 36,908,350 | | | | 128,547,318 | | | | 155,164,244 | | | | 279,207,735 | | | | 2,550,676 | | | | 6,001,598 | | |
Information Technology | | | 14,310,329 | | | | 140,356,595 | | | | 97,226,980 | | | | 181,197,441 | | | | 20,918,483 | | | | 3,452,959 | | |
Materials | | | 4,945,651 | | | | — | | | | 96,873,872 | | | | 30,111,721 | | | | 4,477,903 | | | | — | | |
Telecommunication Services | | | 4,675,897 | | | | 22,882,488 | | | | — | | | | 26,141,148 | | | | — | | | | — | | |
Utilities | | | 9,800,206 | | | | 43,966,842 | | | | — | | | | — | | | | — | | | | 902,598 | | |
Preferred Equities: | |
Consumer Discretionary | | | — | | | | — | | | | — | | | | — | | | | 7,005,736 | | | | — | | |
Consumer Staples | | | — | | | | — | | | | — | | | | — | | | | 5,218,810 | | | | — | | |
Energy | | | — | | | | — | | | | — | | | | — | | | | 1,623,603 | | | | — | | |
Financials | | | — | | | | — | | | | — | | | | — | | | | 7,132,200 | | | | — | | |
Information Technology | | | — | | | | — | | | | — | | | | — | | | | 6,596,974 | | | | — | | |
Materials | | | — | | | | — | | | | — | | | | — | | | | 4,543,050 | | | | — | | |
Level 3: Significant Unobservable Inputs | |
Common Equities: | |
Health Care | | | — | | | | — | | | | — | | | | — | | | | — | | | | 574,203 | | |
Industrials | | | — | | | | 19,301,670 | | | | — | | | | — | | | | — | | | | — | | |
Information Technology | | | — | | | | — | | | | — | | | | — | | | | — | | | | 7,547 | | |
Total Market Value of Investments | | $ | 214,499,148 | | | $ | 1,020,430,524 | | | $ | 1,568,128,349 | | | $ | 1,215,043,110 | | | $ | 211,032,537 | | | $ | 24,393,468 | | |
126 MATTHEWS ASIA FUNDS
| | | Matthews
Pacific Tiger
Fund | | Matthews
Asia ESG
Fund | | Matthews
Emerging Asia
Fund | | Matthews Asia
Small Companies
Fund | | Matthews Asia
Science and
Technology Fund | |
Assets: | |
Investments: | |
Level 1: Quoted Prices | |
Common Equities: | |
Bangladesh | | $ | — | | | $ | 28,602 | | | $ | 10,655,304 | | | $ | — | | | $ | — | | |
China/Hong Kong | | | 751,325,083 | | | | 69,168 | | | | 7,467,492 | | | | 112,825,056 | | | | 57,781,550 | | |
India | | | 272,330,014 | | | | — | | | | 2,164,964 | | | | 17,291,678 | | | | 2,503,786 | | |
Indonesia | | | 16,301,623 | | | | — | | | | 482,774 | | | | 8,604,667 | | | | 2,746,587 | | |
Japan | | | — | | | | — | | | | — | | | | — | | | | 3,162,646 | | |
Luxembourg | | | — | | | | 30,649 | | | | — | | | | — | | | | — | | |
Malaysia | | | 74,200,235 | | | | — | | | | — | | | | 19,525,046 | | | | — | | |
Pakistan | | | — | | | | 45,550 | | | | 23,378,249 | | | | — | | | | — | | |
Philippines | | | — | | | | — | | | | — | | | | 3,871,593 | | | | — | | |
Singapore | | | — | | | | 32,958 | | | | — | | | | 29,252,886 | | | | 2,766,114 | | |
South Korea | | | — | | | | — | | | | — | | | | 15,646,256 | | | | 2,802,520 | | |
Sri Lanka | | | — | | | | — | | | | 9,469,263 | | | | — | | | | — | | |
Thailand | | | — | | | | — | | | | — | | | | 1,390,887 | | | | — | | |
United States | | | 84,463,034 | | | | 5,274 | | | | — | | | | — | | | | 2,767,377 | | |
Vietnam | | | 122,286,392 | | | | — | | | | 5,571,675 | | | | 908,716 | | | | 1,263,334 | | |
Warrants: | |
Malaysia | | | 3,442,647 | | | | — | | | | — | | | | — | | | | — | | |
Thailand | | | — | | | | — | | | | 19,225 | | | | — | | | | — | | |
Level 2: Other Significant Observable Inputs | |
Common Equities: | |
Australia | | | — | | | | 38,476 | | | | 1,919,561 | | | | — | | | | — | | |
Bangladesh | | | — | | | | — | | | | 11,036,696 | | | | — | | | | — | | |
Cambodia | | | — | | | | — | | | | 2,082,025 | | | | — | | | | — | | |
China/Hong Kong | | | 2,335,037,517 | | | | 312,897 | | | | 13,832,572 | | | | 138,240,912 | | | | 23,333,520 | | |
India | | | 1,435,213,313 | | | | 308,686 | | | | 17,725,274 | | | | 81,839,810 | | | | 14,088,121 | | |
Indonesia | | | 557,192,220 | | | | 37,552 | | | | 15,350,899 | | | | 48,979,302 | | | | — | | |
Japan | | | — | | | | 66,723 | | | | — | | | | — | | | | 22,279,177 | | |
Malaysia | | | 221,674,286 | | | | — | | | | — | | | | 27,488,387 | | | | — | | |
Pakistan | | | — | | | | — | | | | 6,706,725 | | | | — | | | | — | | |
Philippines | | | 255,020,706 | | | | 75,065 | | | | 12,227,549 | | | | 33,455,178 | | | | — | | |
Singapore | | | 41,695,369 | | | | — | | | | 1,729,842 | | | | 24,573,105 | | | | — | | |
South Korea | | | 1,469,578,486 | | | | 146,048 | | | | — | | | | 80,330,661 | | | | 14,052,753 | | |
Sri Lanka | | | — | | | | — | | | | 5,904,855 | | | | — | | | | — | | |
Switzerland | | | 203,889,686 | | | | — | | | | — | | | | — | | | | — | | |
Taiwan | | | 611,345,570 | | | | 185,170 | | | | — | | | | 131,688,029 | | | | 20,001,547 | | |
Thailand | | | 455,774,696 | | | | 78,744 | | | | 4,741,624 | | | | 28,352,509 | | | | 2,032,776 | | |
Vietnam | | | — | | | | — | | | | 15,023,355 | | | | — | | | | — | | |
Preferred Equities: | |
South Korea | | | — | | | | — | | | | — | | | | — | | | | 7,610,310 | | |
Total Market Value of Investments | | $ | 8,910,770,877 | | | $ | 1,461,562 | | | $ | 167,489,923 | | | $ | 804,264,678 | | | $ | 179,192,118 | | |
matthewsasia.com | 800.789.ASIA 127
Notes to Financial Statements (unaudited) (continued)
Foreign securities that are valued based on market quotations are categorized as Level 1 in the fair value hierarchy (see Note 2-B). Certain foreign securities may be fair valued by external pricing services when the Funds determine that events affecting the value of foreign securities which occur between the time at which they are determined and the close of trading on the NYSE render market quotations unreliable. Such fair valuations are typically categorized as Level 2 in the fair value hierarchy. The Funds' policy is to recognize transfers in and transfers out as of the beginning of the reporting period. At June 30, 2015, the Funds utilized third party pricing services to fair value certain securities, some of which were different than the securities which had been valued by third party pricing services at December 31, 2014. As a result, certain securities held by the Funds were transferred from Level 2 into Level 1 and certain securities held by the Funds were transferred from Level 1 to Level 2 with beginning of period values as follows:
| | | Transfer to Level 1
from Level 2 | | Transfer to Level 2
from Level 1 | |
Matthews Asian Growth and Income Fund | | $ | 353,122,393 | | | $ | — | | |
Matthews Asia Dividend Fund | | | 469,043,850 | | | | 105,927,798 | | |
Matthews China Dividend Fund | | | 21,749,760 | | | | 5,540,598 | | |
Matthews Asia Growth Fund | | | 34,200,423 | | | | 21,030,185 | | |
Matthews Pacific Tiger Fund | | | 404,603,083 | | | | 152,036,514 | | |
Matthews Emerging Asia Fund | | | 15,356,429 | | | | 21,811,256 | | |
Matthews China Fund | | | 62,588,277 | | | | 34,669,634 | | |
Matthews India Fund | | | 172,457,067 | | | | 108,530,208 | | |
Matthews Japan Fund | | | 6,769,754 | | | | 7,076,440 | | |
Matthews Korea Fund | | | 16,051,649 | | | | 8,171,888 | | |
Matthews Asia Small Companies Fund | | | 90,394,459 | | | | 48,312,454 | | |
Matthews China Small Companies Fund | | | 1,164,507 | | | | — | | |
Matthews Asia Science and Technology Fund | | | 6,066,730 | | | | 1,997,151 | | |
A reconciliation of Level 3 investments for which significant unobservable inputs were used to determine value are as follows:
| | | Matthews
China
Fund | | Matthews
Asia Growth
Fund | | Matthews
China Small
Companies Fund | | Matthews
China Small
Companies Fund | | Matthews
China Small
Companies Fund | | Matthews
China Dividend
Fund | | Matthews
China Dividend
Fund | | Matthews
China Dividend
Fund | |
| | Common
Equities —
Industrials | | Common
Equities —
Sri Lanka | | Common
Equities —
Health Care | | Common
Equities —
Industrials | | Common
Equities —
Information
Technology | | Common
Equities —
Consumer
Discretionary | | Common
Equities —
Industrials | | Common
Equities —
Information
Technology | |
Balance as of
12/31/14 (market
value) | | $ | — | | | $ | — | | | $ | — | | | $ | 898,951 | | | $ | 7,544 | | | $ | 5,999,103 | | | $ | 4,694,035 | | | $ | 3,526,660 | | |
Accrued discounts/
premiums | | | — | | | | — | | | | — | | | | — | | | | — | | | | — | | | | — | | | | — | | |
Realized gain/(loss) | | | 2,061,905 | | | | (1,055,643 | ) | | | — | | | | — | | | | — | | | | — | | | | — | | | | — | | |
Change in unrealized
(depreciation) | | | 4,159,497 | | | | (2,980,996 | ) | | | (187,801 | ) | | | — | | | | 3 | | | | — | | | | — | | | | — | | |
Purchases | | | — | | | | — | | | | — | | | | — | | | | — | | | | — | | | | — | | | | — | | |
Sales | | | (3,961,895 | ) | | | (10,010,779 | ) | | | — | | | | — | | | | — | | | | — | | | | — | | | | — | | |
Transfers in to Level 3* | | | 17,042,163 | | | | 21,011,309 | | | | 762,004 | | | | — | | | | — | | | | — | | | | — | | | | — | | |
Transfers out of
Level 3* | | | — | | | | — | | | | — | | | | (898,951 | ) | | | — | | | | (5,999,103 | ) | | | (4,694,035 | ) | | | (3,526,660 | ) | |
Balance as of 6/30/15
(market value) | | $ | 19,301,670 | | | $ | 6,963,891 | | | $ | 574,203 | | | $ | — | | | $ | 7,547 | | | $ | — | | | $ | — | | | $ | — | | |
Net change in
unrealized
appreciation/
depreciation on
Level 3 investments
held as of 6/30/15** | | $ | 4,159,497 | | | ($ | 2,980,996 | ) | | ($ | 187,801 | ) | | $ | — | | | $ | 3 | | | $ | — | | | $ | — | | | $ | — | | |
* The Fund's policy is to recognize transfers in and transfers out as of the beginning of the reporting period.
** Included in the related amounts on the Statements of Operations.
128 MATTHEWS ASIA FUNDS
Certain foreign securities, for which market quotations are not readily available, may be fair valued and classified as either Level 2 or Level 3. When the underlying inputs include significant observable inputs obtained from sources independent of the Funds, the securities are classified as Level 2. These inputs include evaluated prices from the Funds' pricing vendors, day-on-day price changes, primary and ancillary pricing sources, and other available independent market indicators of value. When the underlying inputs include significant unobservable inputs and reflect assumptions of market participants, the securities are classified as Level 3. As of June 30, 2015, the Funds that previously used quoted prices or observable inputs now also utilize significant unobservable inputs for certain securities that were suspended from trading. As a result, certain securities held by the Funds that were previously classified as Level 1 or Level 2 were transferred to Level 3. Certain securities held by the Funds that were suspended from trading and classified as level 3 on December 31, 2014 subsequently resumed trading and were transferred from Level 3 to Level 1, Level 2 or were sold.
The following table summarizes the valuation techniques used and unobservable inputs developed by the Valuation Committee to determine the fair value of certain, material Level 3 investments:
| | | Value | | Valuation
Technique | | Unobservable
Input1 | | Range of
Unobservable
Inputs | |
Matthews China Small Companies Fund Assets: | |
Common Equity | | $ | 574,203 | | | Last Price2
Multiplied by
Proxy factor3 | | Proxy factor3 | | | 5 | % | |
1 Increase in unobservable input may result in a significant increase to value, while a decrease in unobservable input may result in a significant decrease to value.
2 Last Price could include closing price, last reported sales price, or last fair valued price as described in Note A.
3 Proxy factor considers movement of the Hang Seng Index.
C. BASIS OF CONSOLIDATION: The accompanying consolidated financial statements of Matthews China Fund and Matthews Asia Dividend Fund (the "Investing Funds") includes the accounts of the Matthews CF-U Series and Matthews ADF-U Series (the "U Series Funds"), respectively. The U Series Funds are series of Matthews A Share Selections Fund, LLC, a Delaware limited liability company registered under the 1940 Act. All of the interests offered by U Series Funds are exclusively owned by the Investing Funds. The U Series Funds primarily invest in the stocks of Chinese companies listed on Mainland China Stock Exchanges, and traded and denominated in the currency of China, the Renminbi. To allow U Series Funds to invest in China A Shares Matthews has applied for and received a license from the China Securities Regulatory Commission as a Qualified Foreign Institutional Investor ("QFII") and has been allocated by the State Administration of Foreign Exchange of China a quota of up to $100 million, representing the equivalent value in Renminbi of China A Shares that the U Series Funds may purchase. Access to the quota will be subject to Matthews' trade allocation procedures and access allocation procedures. The U Series Funds are subject to the same investment policies and restrictions that apply to Investing Funds. The net assets of Matthews CF-U Series and Matthews ADF-U Series at June 30, 2015, were $86,639,517 and $111,065,305 respectively. Intercompany accounts and transactions, if any, have been eliminated in the consolidation process. The U Series Funds are intended to be disregarded entities for the tax purposes. Therefore, no federal tax provision is required. Consolidated financial statements include expenses that are accrued for and paid by the Investing Funds. These include on-going operational costs as well as costs in connection with the launching of the U Series Funds (see offering cost, note E).
D. RISKS ASSOCIATED WITH NON-U.S. COMPANIES: Investments by the Funds in the securities of non-U.S. companies may involve investment risks not typically associated with investments in U.S. issuers. These risks include possible political, economic, social and religious instability, inadequate investor protection; changes in laws or regulations of countries within the Asia Pacific region (including both in countries where you invest, as well as in the broader region); international relations with other nations; natural disasters; corruption; and military activity. Foreign securities may be subject to greater fluctuations in price than securities of domestic corporations or the U.S. government. Foreign investing may also include the risk of expropriation or confiscatory taxation, limitation on the removal of funds or other assets, currency crises and exchange controls, the imposition of foreign withholding tax on the interest income payable on such instruments, the possible seizure or nationalization of foreign deposits or assets, or the adoption of other foreign government restrictions that might adversely affect the foreign securities held by the Funds. Additionally, Asia Pacific countries may utilize formal or informal currency exchange controls or "capital controls" that may limit the ability to repatriate investments or income or adversely affect the value of portfolio investments. The economies of many Asia Pacific countries differ from the economies of more developed countries in many respects, such as their rate of growth, inflation, capital reinvestment, resource self-sufficiency and dependence on other economies, financial system stability, the national balance of payments position and sensitivity to changes in global trade. Certain Asia Pacific countries are highly dependent upon and may be affected by developments in the economies of other countries. Non-U.S. companies are subject to different accounting, auditing, and financial reporting standards, practices, and requirements than U.S. companies. There is generally less government regulation of stock exchanges, brokers, and listed companies abroad than in the United States, which may result in less transparency with respect to a company's operations, and make obtaining information about them more difficult (or such information may be unavailable).
Foreign stock markets may not be as developed or efficient as those in the United States, and the absence of negotiated brokerage commissions in certain countries may result in higher brokerage fees. The time between the trade and settlement dates of securities transactions on foreign exchanges ranges from one day to four weeks or longer and may result in higher custody charges. Custodial arrangements may be less well developed than in the United States. Foreign securities are generally denominated and pay distributions in foreign currencies, exposing the Funds to changes in foreign currency exchange rates. Investing in any country in the Asia Pacific region will also entail risks specific and unique to that country, and these risks can be significant and change rapidly.
Currently, Chinese law permits a QFII, such as Matthews, to repatriate an Investment Quota (including the proceeds of the Investment Quota) once every seven days. In the recent past, repatriation by a QFII was limited to once every 30 days (and other types of QFIIs may operate under greater or different repatriation restrictions). As a result of this restriction, the Company sought and has been granted by the U.S. Securities and Exchange Commission an exemption (the "Exemptive Order") from the provisions of Section 22(e) of the 1940 Act and Rule 22c-1 thereunder to the extent necessary to permit the Company to operate as an "extended payment fund." As extended payment funds, the U Series Funds (see Note 2-C) will only redeem Interests on a periodic basis, which, pursuant to the Exemptive Order, shall be no less frequent than on one day each month. Currently, the Funds redeem Interests once each seven days.
matthewsasia.com | 800.789.ASIA 129
Notes to Financial Statements (unaudited) (continued)
E. OFFERING COSTS: Offering costs are amortized on a straight-line basis over one year from each Fund's respective commencement of operations. In the event that any of the initial shares are redeemed during the period of amortization of the Fund's offering costs, the redemption proceeds will be reduced by any such unamortized offering costs in the same proportion as the number of shares being redeemed bears to the number of those shares outstanding at the time of redemption.
F. DISTRIBUTIONS TO SHAREHOLDERS: It is the policy of Matthews Asian Growth and Income Fund and Matthews China Dividend Fund to distribute net investment income on a semi-annual basis and capital gains, if any, annually. It is the policy of Matthews Asia Dividend Fund and Matthews Asia Strategic Income Fund to distribute net investment income on a quarterly basis and capital gains, if any, annually. Each of the other Funds distributes a net investment income and capital gains, if any, annually. Distributions to shareholders are recorded on the ex-dividend date. Income and capital gain distributions are determined in accordance with income tax regulations which may differ from U.S. GAAP.
The tax character of distributions paid for the fiscal year ended December 31, 2014 was as follows:
YEAR ENDED DECEMBER 31, 2014 | | Ordinary Income | | Net Long-Term
Capital Gains | | Return of
Capital | | Total Taxable
Distributions | |
Matthews Asia Strategic Income Fund | | $ | 2,114,388 | | | $ | — | | | $ | — | | | $ | 2,114,388 | | |
Matthews Asian Growth and Income Fund | | | 82,852,338 | | | | 102,451,370 | | | | — | | | | 185,303,708 | | |
Matthews Asia Dividend Fund | | | 79,977,573 | | | | — | | | | 21,987,983 | | | | 101,965,556 | | |
Matthews China Dividend Fund | | | 4,550,194 | | | | 709,195 | | | | — | | | | 5,259,389 | | |
Matthews Asia Focus Fund | | | 112,525 | | | | — | | | | — | | | | 112,525 | | |
Matthews Asia Growth Fund | | | 15,440,617 | | | | — | | | | — | | | | 15,440,617 | | |
Matthews Pacific Tiger Fund | | | 47,680,793 | | | | 360,777,613 | | | | — | | | | 408,458,406 | | |
Matthews Emerging Asia Fund | | | 618,186 | | | | 5,141 | | | | — | | | | 623,327 | | |
Matthews China Fund | | | 12,883,867 | | | | 4,848,647 | | | | — | | | | 17,732,514 | | |
Matthews India Fund | | | 1,848,612 | | | | 5,587,798 | | | | — | | | | 7,436,410 | | |
Matthews Japan Fund | | | 3,325,554 | | | | — | | | | — | | | | 3,325,554 | | |
Matthews Korea Fund | | | — | | | | 9,796,584 | | | | — | | | | 9,796,584 | | |
Matthews Asia Small Companies Fund | | | 2,665,812 | | | | — | | | | — | | | | 2,665,812 | | |
Matthews China Small Companies Fund | | | 50,571 | | | | — | | | | 828,820 | | | | 879,391 | | |
Matthews Asia Science and Technology Fund | | | 929,241 | | | | 1,142,588 | | | | — | | | | 2,071,829 | | |
G. INVESTMENT TRANSACTIONS AND INCOME: Securities transactions are accounted for on the date the securities are purchased or sold. Gains or losses on the sale of securities are determined on the identified cost basis. Interest income is recorded on the accrual basis. Dividend income is generally recorded on the ex-dividend date. Dividend income for certain issuers headquartered in countries which the Funds invest may not be recorded until approved by the shareholders (which may occur after the ex-dividend date) if, in the judgment of management, such dividends are not reasonably determined as of the ex-dividend date. Income and realized and unrealized gains or losses on investments are allocated to each class of shares based on its relative net assets.
The Funds may be subject to foreign taxation related to income received, capital gains on the sale of securities and certain foreign currency transactions in the foreign jurisdictions in which they invest. Foreign taxes, if any, are recorded based on the tax regulations and rates that exist in the foreign markets in which the Funds invest. When a capital gain tax is determined to apply the Funds record an estimated deferred tax liability in an amount that may be payable if the securities were disposed of on the valuation date.
H. FUND EXPENSE ALLOCATIONS: The Funds account separately for the assets, liabilities and operations of each Fund. Direct expenses of each Fund or class are charged to that Fund or class while general expenses are allocated pro-rata among the Funds based on net assets or other appropriate methods.
I. CASH, CASH OVERDRAFTS, AND FOREIGN CURRENCY: The U Series Funds are required by the local market to maintain a cash reserve. The cash reserve is based upon a fixed ratio of the QFII's approved investment quota, which is defined as the amount remitted into its special renminbi (RMB) cash account. The fixed ratio is set at 0.08 percent for the Shanghai and 0.06 percent for the Shenzhen market. When any of the Funds' cash balances are overdrawn, a Fund is charged an overdraft fee by the custodian of 1.00% above the 30-day LIBOR rate on outstanding balances. These amounts, if any, are included in "Other expenses" on the Statements of Operations.
J. USE OF ESTIMATES: The preparation of financial statements in conformity with U.S. GAAP requires management to make estimates and assumptions that affect the amounts reported in the financial statements and accompanying notes. Actual results may differ from those estimates.
3. DERIVATIVE FINANCIAL INSTRUMENTS
Matthews Asia Strategic Income Fund engages in derivative transactions for a variety of purposes, including managing interest rate, currency and credit exposure. In particular, the Fund may seek to take on currency exposure by using derivatives such as currency forwards, and the Fund may also employ a currency overlay strategy in an effort to enhance returns and moderate volatility. Derivative financial instruments and transactions in which the Fund may engage include financial futures contracts and/or forward foreign currency exchange contracts. The currency overlay strategy involves long and short positions on one or more currencies. As a result, the Fund's exposure to a currency could exceed the value of the Fund's assets and the Fund could be exposed to currency risk whether or not it holds a bond or other instrument denominated in that currency. The gross notional value of derivative financial instruments and transactions could exceed the value of the Fund's net assets, although the net market value of these instruments and transactions, on a marked-to-market basis, at most times, is expected to be substantially lower. The primary risks associated with the use of derivative financial instruments are: (i) Matthews may not correctly predict the direction of currency exchange rates, interest rates, security prices, or other economic factors; (ii) Matthews may not correctly predict changes in the value of derivative financial instruments and related underlying instruments or assets, which may result in disproportionately increased losses and/or reduced opportunities for gains; (iii) imperfect correlation between the change in
130 MATTHEWS ASIA FUNDS
market value of the securities held by the Fund and the price of financial futures contracts; (iv) the lack of, or a reduction in the liquidity of, any secondary market for the instrument, and the resulting inability to close the position (or exit the position) when desired; (v) losses, which are potentially unlimited, due to unanticipated market movements; (vi) the value of the instrument may change unfavorably due to movements in the value of the referenced foreign currencies; (vii) the Fund may suffer disproportionately heavy losses relative to the amount invested; (viii) changes in the value of the derivatives may not match or fully offset changes in the value of hedged or related portfolio securities, thereby failing to achieve the hedging or investment purpose for the derivative transaction; and (ix) the other party to the instrument may fail to fulfill its obligation.
Financial Futures Contracts: Financial futures contracts are agreements between the Fund and a counterparty to buy or sell a specific quantity of an underlying instrument at a specified price and at a specified date. Depending on the terms of the particular contract, futures contracts are settled either through physical delivery of the underlying instrument on the settlement date or by payment of a cash settlement amount on settlement date. Pursuant to the contract, the Fund agrees to receive from or pay an amount of cash equal to the daily fluctuation in value of the contract. Such receipts or payments are known as variation margin and are recorded by the Fund as unrealized appreciation or depreciation. When the contract is closed, the Fund records a realized gain or loss equal to the difference between the value of the contract at the time it was opened and the value at the time it was closed.
Forward Foreign Currency Exchange Contracts: A forward foreign currency exchange contract is an agreement between two parties to buy and sell a currency at a set exchange rate on a future date. The contract is marked-to-market daily and the change in market value is recorded by the Fund as an unrealized gain or loss. When the contract is closed, the Fund records a realized gain or loss equal to the difference between the value at the time it was opened and the value at the time it was closed.
Derivative Financial Instruments Categorized by Risk Exposure:
For the period ended June 30, 2015, the effects of derivative financial instruments on the Statements of Operations were as follows:
Derivative type | | Statement of Operations Location | | Matthews Asia
Strategic Income
Fund | |
Net Realized Gain (Loss) | |
Interest rate contracts: | |
Financial futures contracts | | Net realized gain (loss) on financial futures contracts | | ($ | 88,422 | ) | |
Net Change in Unrealized Appreciation (Depreciation) | |
Interest rate contracts: | |
Financial futures contracts | | Net change in unrealized appreciation/depreciation on
financial futures contracts | | ($ | 12,891 | ) | |
4. CAPITAL SHARE TRANSACTIONS
Each Fund is authorized to issue an unlimited number of shares of beneficial interest with a par value of $0.001 per share.
| | | Six-Month Period Ended
June 30, 2015 (Unaudited) | | Year Ended December 31, 2014 | |
| | | Shares | | Amount | | Shares | | Amount | |
MATTHEWS ASIA STRATEGIC INCOME FUND | |
Investor Class | |
Shares sold | | | 876,435 | | | $ | 9,082,505 | | | | 2,868,763 | | | $ | 30,387,264 | | |
Shares issued through reinvestment of distributions | | | 54,413 | | | | 558,854 | | | | 170,890 | | | | 1,792,188 | | |
Shares redeemed | | | (939,352 | ) | | | (9,722,120 | ) | | | (1,006,520 | ) | | | (10,564,074 | ) | |
Net increase (decrease) | | | (8,504 | ) | | ($ | 80,761 | ) | | | 2,033,133 | | | $ | 21,615,378 | | |
Institutional Class | |
Shares sold | | | 450,302 | | | $ | 4,657,698 | | | | 8,500 | | | $ | 90,318 | | |
Shares issued through reinvestment of distributions | | | 12,009 | | | | 123,262 | | | | 28,064 | | | | 294,191 | | |
Shares redeemed | | | (76,558 | ) | | | (796,167 | ) | | | (11,064 | ) | | | (115,367 | ) | |
Net increase (decrease) | | | 385,753 | | | $ | 3,984,793 | | | | 25,500 | | | $ | 269,142 | | |
MATTHEWS ASIAN GROWTH AND INCOME FUND | |
Investor Class | |
Shares sold | | | 15,121,300 | | | $ | 281,274,576 | | | | 42,335,422 | | | $ | 806,641,528 | | |
Shares issued through reinvestment of distributions | | | 1,698,345 | | | | 31,572,017 | | | | 6,792,538 | | | | 123,896,096 | | |
Shares redeemed | | | (28,105,283 | ) | | | (522,132,529 | ) | | | (53,031,955 | ) | | | (997,653,204 | ) | |
Net increase (decrease) | | | (11,285,638 | ) | | ($ | 209,285,936 | ) | | | (3,903,995 | ) | | ($ | 67,115,580 | ) | |
Institutional Class | |
Shares sold | | | 6,169,369 | | | $ | 115,315,892 | | | | 17,734,558 | | | $ | 339,731,302 | | |
Shares issued through reinvestment of distributions | | | 759,329 | | | | 14,108,337 | | | | 2,873,664 | | | | 52,402,976 | | |
Shares redeemed | | | (11,045,874 | ) | | | (203,999,103 | ) | | | (14,176,690 | ) | | | (266,541,558 | ) | |
Net increase (decrease) | | | (4,117,176 | ) | | ($ | 74,574,874 | ) | | | 6,431,532 | | | $ | 125,592,720 | | |
matthewsasia.com | 800.789.ASIA 131
Notes to Financial Statements (unaudited) (continued)
| | | Six-Month Period Ended
June 30, 2015 (Unaudited) | | Year Ended December 31, 2014 | |
| | | Shares | | Amount | | Shares | | Amount | |
MATTHEWS ASIA DIVIDEND FUND | |
Investor Class | |
Shares sold | | | 18,093,983 | | | $ | 302,774,240 | | | | 27,074,172 | | | $ | 421,810,410 | | |
Shares issued through reinvestment of distributions | | | 2,029,163 | | | | 34,535,889 | | | | 3,452,211 | | | | 55,280,782 | | |
Shares redeemed | | | (22,121,681 | ) | | | (362,819,584 | ) | | | (74,520,827 | ) | | | (1,151,165,817 | ) | |
Net increase (decrease) | | | (1,998,535 | ) | | ($ | 25,509,455 | ) | | | (43,994,444 | ) | | ($ | 674,074,625 | ) | |
Institutional Class | |
Shares sold | | | 30,609,598 | | | $ | 508,252,367 | | | | 47,197,289 | | | $ | 735,042,714 | | |
Shares issued through reinvestment of distributions | | | 952,860 | | | | 16,197,964 | | | | 1,435,590 | | | | 22,955,772 | | |
Shares redeemed | | | (9,734,461 | ) | | | (161,084,919 | ) | | | (46,762,733 | ) | | | (729,427,226 | ) | |
Net increase (decrease) | | | 21,827,997 | | | $ | 363,365,412 | | | | 1,870,146 | | | $ | 28,571,260 | | |
MATTHEWS CHINA DIVIDEND FUND | |
Investor Class | |
Shares sold | | | 5,932,939 | | | $ | 96,081,905 | | | | 3,469,549 | | | $ | 46,973,569 | | |
Shares issued through reinvestment of distributions | | | 196,768 | | | | 3,311,576 | | | | 293,612 | | | | 3,935,098 | | |
Shares redeemed | | | (2,278,246 | ) | | | (35,510,452 | ) | | | (4,184,807 | ) | | | (55,511,036 | ) | |
Net increase (decrease) | | | 3,851,461 | | | $ | 63,883,029 | | | | (421,646 | ) | | ($ | 4,602,369 | ) | |
Institutional Class | |
Shares sold | | | 372,068 | | | $ | 5,411,968 | | | | 1,028,815 | | | $ | 13,795,976 | | |
Shares issued through reinvestment of distributions | | | 26,877 | | | | 452,346 | | | | 84,509 | | | | 1,131,935 | | |
Shares redeemed | | | (1,054,912 | ) | | | (16,019,181 | ) | | | (624,547 | ) | | | (8,338,287 | ) | |
Net increase (decrease) | | | (655,967 | ) | | ($ | 10,154,867 | ) | | | 488,777 | | | $ | 6,589,624 | | |
MATTHEWS ASIA FOCUS FUND | |
Investor Class | |
Shares sold | | | 169,784 | | | $ | 1,757,057 | | | | 435,111 | | | $ | 4,372,718 | | |
Shares issued through reinvestment of distributions | | | — | | | | — | | | | 5,515 | | | | 55,145 | | |
Shares redeemed | | | (119,774 | ) | | | (1,232,981 | ) | | | (305,685 | ) | | | (2,951,262 | ) | |
Net increase (decrease) | | | 50,010 | | | $ | 524,076 | | | | 134,941 | | | $ | 1,476,601 | | |
Institutional Class | |
Shares sold | | | 37,594 | | | $ | 390,975 | | | | 562,972 | | | $ | 5,679,393 | | |
Shares issued through reinvestment of distributions | | | — | | | | — | | | | 5,697 | | | | 57,082 | | |
Shares redeemed | | | (23,160 | ) | | | (236,905 | ) | | | (75,633 | ) | | | (749,792 | ) | |
Net increase (decrease) | | | 14,434 | | | $ | 154,070 | | | | 493,036 | | | $ | 4,986,683 | | |
MATTHEWS ASIA GROWTH FUND | |
Investor Class | |
Shares sold | | | 6,855,571 | | | $ | 152,356,366 | | | | 8,352,421 | | | $ | 176,815,714 | | |
Shares issued through reinvestment of distributions | | | — | | | | — | | | | 364,634 | | | | 7,679,192 | | |
Shares redeemed | | | (3,752,836 | ) | | | (81,901,558 | ) | | | (8,456,299 | ) | | | (177,869,893 | ) | |
Net increase (decrease) | | | 3,102,735 | | | $ | 70,454,808 | | | | 260,756 | | | $ | 6,625,013 | | |
Institutional Class | |
Shares sold | | | 2,452,876 | | | $ | 54,570,542 | | | | 3,166,264 | | | $ | 68,111,071 | | |
Shares issued through reinvestment of distributions | | | — | | | | — | | | | 233,352 | | | | 4,937,721 | | |
Shares redeemed | | | (895,096 | ) | | | (20,080,943 | ) | | | (564,454 | ) | | | (12,120,100 | ) | |
Net increase (decrease) | | | 1,557,780 | | | $ | 34,489,599 | | | | 2,835,162 | | | $ | 60,928,692 | | |
MATTHEWS PACIFIC TIGER FUND | |
Investor Class | |
Shares sold | | | 10,400,255 | | | $ | 298,167,499 | | | | 13,461,553 | | | $ | 362,907,557 | | |
Shares issued through reinvestment of distributions | | | — | | | | — | | | | 5,254,231 | | | | 139,026,894 | | |
Shares redeemed | | | (7,783,054 | ) | | | (222,690,313 | ) | | | (22,276,690 | ) | | | (585,489,213 | ) | |
Net increase (decrease) | | | 2,617,201 | | | $ | 75,477,186 | | | | (3,560,906 | ) | | ($ | 83,554,762 | ) | |
132 MATTHEWS ASIA FUNDS
| | | Six-Month Period Ended
June 30, 2015 (Unaudited) | | Year Ended December 31, 2014 | |
| | | Shares | | Amount | | Shares | | Amount | |
Institutional Class | |
Shares sold | | | 25,672,672 | | | $ | 731,850,211 | | | | 41,237,653 | | | $ | 1,119,555,511 | | |
Shares issued through reinvestment of distributions | | | — | | | | — | | | | 5,592,016 | | | | 147,852,921 | | |
Shares redeemed | | | (6,335,672 | ) | | | (181,533,381 | ) | | | (44,056,685 | ) | | | (1,135,705,206 | ) | |
Net increase (decrease) | | | 19,337,000 | | | $ | 550,316,830 | | | | 2,772,984 | | | $ | 131,703,226 | | |
MATTHEWS ASIA ESG FUND* | |
Investor Class | |
Shares sold | | | 56,967 | | | $ | 569,723 | | | | | | |
Shares issued through reinvestment of distributions | | | — | | | | — | | | | | | |
Shares redeemed | | | — | | | | — | | | | | | |
Net increase (decrease) | | | 56,967 | | | $ | 569,723 | | | | | | |
Institutional Class | |
Shares sold | | | 112,000 | | | $ | 1,120,000 | | | | | | |
Shares issued through reinvestment of distributions | | | — | | | | — | | | | | | |
Shares redeemed | | | — | | | | — | | | | | | |
Net increase (decrease) | | | 112,000 | | | $ | 1,120,000 | | | | | | |
MATTHEWS EMERGING ASIA FUND | |
Investor Class | |
Shares sold | | | 2,399,051 | | | $ | 28,072,613 | | | | 6,358,977 | | | $ | 71,447,277 | | |
Shares issued through reinvestment of distributions | | | — | | | | — | | | | 44,331 | | | | 513,799 | | |
Shares redeemed | | | (1,378,356 | ) | | | (16,015,371 | ) | | | (719,405 | ) | | | (7,920,065 | ) | |
Net increase (decrease) | | | 1,020,695 | | | $ | 12,057,242 | | | | 5,683,903 | | | $ | 64,041,011 | | |
Institutional Class | |
Shares sold | | | 3,109,175 | | | $ | 36,191,509 | | | | 1,672,829 | | | $ | 18,713,467 | | |
Shares issued through reinvestment of distributions | | | — | | | | — | | | | 9,076 | | | | 105,103 | | |
Shares redeemed | | | (217,815 | ) | | | (2,527,146 | ) | | | (44,825 | ) | | | (498,178 | ) | |
Net increase (decrease) | | | 2,891,360 | | | $ | 33,664,363 | | | | 1,637,080 | | | $ | 18,320,392 | | |
MATTHEWS CHINA FUND | |
Investor Class | |
Shares sold | | | 2,892,534 | | | $ | 72,847,976 | | | | 4,652,101 | | | $ | 101,501,385 | | |
Shares issued through reinvestment of distributions | | | — | | | | — | | | | 752,109 | | | | 16,034,960 | | |
Shares redeemed | | | (7,531,512 | ) | | | (180,469,212 | ) | | | (17,574,642 | ) | | | (379,926,583 | ) | |
Net increase (decrease) | | | (4,638,978 | ) | | ($ | 107,621,236 | ) | | | (12,170,432 | ) | | ($ | 262,390,238 | ) | |
Institutional Class | |
Shares sold | | | 387,023 | | | $ | 9,194,619 | | | | 572,587 | | | $ | 12,475,109 | | |
Shares issued through reinvestment of distributions | | | — | | | | — | | | | 55,031 | | | | 1,172,155 | | |
Shares redeemed | | | (458,617 | ) | | | (10,979,392 | ) | | | (3,338,212 | ) | | | (72,711,685 | ) | |
Net increase (decrease) | | | (71,594 | ) | | ($ | 1,784,773 | ) | | | (2,710,594 | ) | | ($ | 59,064,421 | ) | |
MATTHEWS INDIA FUND | |
Investor Class | |
Shares sold | | | 21,831,391 | | | $ | 627,617,969 | | | | 18,378,382 | | | $ | 428,347,047 | | |
Shares issued through reinvestment of distributions | | | — | | | | — | | | | 251,419 | | | | 6,614,834 | | |
Shares redeemed | | | (12,072,263 | ) | | | (338,406,815 | ) | | | (8,069,436 | ) | | | (172,617,142 | ) | |
Net increase (decrease) | | | 9,759,128 | | | $ | 289,211,154 | | | | 10,560,365 | | | $ | 262,344,739 | | |
Institutional Class | |
Shares sold | | | 5,628,070 | | | $ | 161,077,083 | | | | 4,119,011 | | | $ | 103,116,285 | | |
Shares issued through reinvestment of distributions | | | — | | | | — | | | | 4,649 | | | | 122,448 | | |
Shares redeemed | | | (343,341 | ) | | | (9,567,343 | ) | | | (195,207 | ) | | | (3,155,297 | ) | |
Net increase (decrease) | | | 5,284,729 | | | $ | 151,509,740 | | | | 3,928,453 | | | $ | 100,083,436 | | |
* Investor Class and Institutional Class commencement of operations on April 30, 2015.
matthewsasia.com | 800.789.ASIA 133
Notes to Financial Statements (unaudited) (continued)
| | | Six-Month Period Ended
June 30, 2015 (Unaudited) | | Year Ended December 31, 2014 | |
| | | Shares | | Amount | | Shares | | Amount | |
MATTHEWS JAPAN FUND | |
Investor Class | |
Shares sold | | | 20,733,176 | | | $ | 384,451,913 | | | | 14,683,754 | | | $ | 236,544,103 | | |
Merger | | | — | | | | — | | | | 9,304,606 | | | | 143,006,595 | | |
Shares issued through reinvestment of distributions | | | — | | | | — | | | | 136,979 | | | | 2,162,925 | | |
Shares redeemed | | | (4,320,462 | ) | | | (75,199,862 | ) | | | (13,641,932 | ) | | | (216,980,228 | ) | |
Net increase (decrease) | | | 16,412,714 | | | $ | 309,252,051 | | | | 10,483,407 | | | $ | 164,733,395 | | |
Institutional Class | |
Shares sold | | | 9,778,067 | | | $ | 180,936,884 | | | | 7,921,739 | | | $ | 130,732,644 | | |
Merger | | | — | | | | — | | | | 117,933 | | | | 1,814,626 | | |
Shares issued through reinvestment of distributions | | | — | | | | — | | | | 27,262 | | | | 430,732 | | |
Shares redeemed | | | (125,363 | ) | | | (2,089,147 | ) | | | (1,901,165 | ) | | | (30,655,635 | ) | |
Net increase (decrease) | | | 9,652,704 | | | $ | 178,847,737 | | | | 6,165,769 | | | $ | 102,322,367 | | |
MATTHEWS KOREA FUND | |
Investor Class | |
Shares sold | | | 3,483,591 | | | $ | 22,657,278 | | | | 2,855,980 | | | $ | 17,811,596 | | |
Shares issued through reinvestment of distributions | | | — | | | | — | | | | 958,127 | | | | 5,298,441 | | |
Shares redeemed | | | (2,255,882 | ) | | | (13,979,248 | ) | | | (4,561,112 | ) | | | (27,333,556 | ) | |
Net increase (decrease) | | | 1,227,709 | | | $ | 8,678,030 | | | | (747,005 | ) | | ($ | 4,223,519 | ) | |
Institutional Class | |
Shares sold | | | 919 | | | $ | 6,000 | | | | 15,224,562 | | | $ | 92,211,027 | | |
Shares issued through reinvestment of distributions | | | — | | | | — | | | | 294,354 | | | | 1,633,663 | | |
Shares redeemed | | | (7,003,625 | ) | | | (40,201,699 | ) | | | (1,475,555 | ) | | | (8,735,102 | ) | |
Net increase (decrease) | | | (7,002,706 | ) | | ($ | 40,195,699 | ) | | | 14,043,361 | | | $ | 85,109,588 | | |
MATTHEWS ASIA SMALL COMPANIES FUND | |
Investor Class | |
Shares sold | | | 6,090,726 | | | $ | 135,255,252 | | | | 12,269,745 | | | $ | 256,739,667 | | |
Shares issued through reinvestment of distributions | | | — | | | | — | | | | 91,722 | | | | 1,980,278 | | |
Shares redeemed | | | (9,238,384 | ) | | | (207,709,993 | ) | | | (5,510,122 | ) | | | (113,024,665 | ) | |
Net increase (decrease) | | | (3,147,658 | ) | | ($ | 72,454,741 | ) | | | 6,851,345 | | | $ | 145,695,280 | | |
Institutional Class | |
Shares sold | | | 8,543,839 | | | $ | 193,108,931 | | | | 1,637,024 | | | $ | 34,046,110 | | |
Shares issued through reinvestment of distributions | | | — | | | | — | | | | 11,551 | | | | 249,394 | | |
Shares redeemed | | | (449,284 | ) | | | (9,925,656 | ) | | | (368,351 | ) | | | (7,588,297 | ) | |
Net increase (decrease) | | | 8,094,555 | | | $ | 183,183,275 | | | | 1,280,224 | | | $ | 26,707,207 | | |
MATTHEWS CHINA SMALL COMPANIES FUND | |
Investor Class | |
Shares sold | | | 459,440 | | | $ | 4,800,619 | | | | 1,079,235 | | | $ | 10,536,592 | | |
Shares issued through reinvestment of distributions | | | — | | | | — | | | | 91,585 | | | | 856,321 | | |
Shares redeemed | | | (433,109 | ) | | | (4,266,555 | ) | | | (1,472,901 | ) | | | (14,353,449 | ) | |
Net increase (decrease) | | | 26,331 | | | $ | 534,064 | | | | (302,081 | ) | | ($ | 2,960,536 | ) | |
MATTHEWS ASIA SCIENCE AND TECHNOLOGY FUND | |
Investor Class | |
Shares sold | | | 1,385,972 | | | $ | 20,094,064 | | | | 2,001,250 | | | $ | 26,712,471 | | |
Shares issued through reinvestment of distributions | | | — | | | | — | | | | 92,181 | | | | 1,261,036 | | |
Shares redeemed | | | (817,998 | ) | | | (11,726,153 | ) | | | (1,740,481 | ) | | | (22,680,601 | ) | |
Net increase (decrease) | | | 567,974 | | | $ | 8,367,911 | | | | 352,950 | | | $ | 5,292,906 | | |
Institutional Class | |
Shares sold | | | 2,118 | | | $ | 31,603 | | | | 533,868 | | | $ | 6,731,909 | | |
Shares issued through reinvestment of distributions | | | — | | | | — | | | | 55,365 | | | | 756,846 | | |
Shares redeemed | | | (1,994,358 | ) | | | (30,064,992 | ) | | | (12,051 | ) | | | (169,548 | ) | |
Net increase (decrease) | | | (1,992,240 | ) | | ($ | 30,033,389 | ) | | | 577,182 | | | $ | 7,319,207 | | |
134 MATTHEWS ASIA FUNDS
Currently, a 2.00% redemption fee will be assessed on the sale or exchange of shares of the Matthews Emerging Asia Fund, Matthews Asia Small Companies Fund and Matthews China Small Companies Fund (collectively, the "Covered Funds") within 90 days after the date an investor purchases shares of the Covered Funds. The imposition of redemption fees pursuant to the Funds' Short-Term Trading Redemption Fee Policy for the Covered Funds may assist the Covered Funds in discouraging market timing activity.
The redemption fee is imposed to discourage market timing and short-term buying and selling of shares of the Covered Funds, which can disrupt the management of the Covered Funds' investment portfolios and may have detrimental effects on the Covered Funds and other shareholders, and to allocate the costs the Covered Funds incur as a result of short-term trading and market timing. This fee is payable directly to the Covered Funds.
To determine whether the redemption fee applies, the Covered Funds do not count the day that you purchased your shares, and first redeem the shares that you have held the longest.
The Covered Funds may grant an exemption from the redemption fee when the Covered Funds have previously received assurances that transactions do not involve a substantial risk of the type of harm that the policy is designed to avoid. The Covered Funds may also waive the imposition of redemption fees in certain circumstances. For more information on this policy, please see the Funds' prospectuses. The redemption fees returned to the assets of the Funds are stated in the Statements of Changes in Net Assets.
5. INVESTMENT ADVISORY FEES AND OTHER TRANSACTIONS WITH AFFILIATES
Matthews, a registered investment advisor under the 1940 Act, provides the Funds with investment management services. Pursuant to an Investment Advisory Agreement dated August 13, 2004, as amended (the "Advisory Agreement"), the Funds pay Matthews (i) for management and advisory services; and (ii) for certain administrative services, an annual fee as a percentage of average daily net assets. Under the Advisory Agreement each of the Funds, other than Matthews Asia Strategic Income Fund, Matthews Emerging Asia Fund, Matthews Asia Small Companies Fund, and Matthews China Small Companies Fund (the "Family-Priced Funds"), pays Matthews 0.75% of their aggregate average daily net assets up to $2 billion, 0.6834% of their aggregate average daily net assets over $2 billion up to $5 billion, 0.65% of their aggregate average daily net assets over $5 billion up to $25 billion, 0.64% of their aggregate average daily net assets over $25 billion up to $30 billion, 0.63% of their aggregate average daily net assets over $30 billion up to $35 billion, 0.62% of their aggregate average daily net assets over $35 billion up to $40 billion, 0.61% of their aggregate average daily net assets over $40 billion up to $45 billion, and 0.60% of their aggregate average daily net assets over $45 billion. Matthews Asia Strategic Income Fund pays Matthews an annual fee of 0.65% of its annual average daily net assets pursuant to the Advisory Agreement. Each of the Matthews Emerging Asia Fund, Matthews Asia Small Companies Fund, and the Matthews China Small Companies Fund pays Matthews an annual fee of 1.00% of the average daily net assets of such Fund up to $1 billion and 0.95% of the average daily net assets of such Fund over $1 billion pursuant to the Advisory Agreement. Each Fund pays Matthews a monthly fee of one-twelfth (1/12) of the management fee of the Fund's average daily net asset value.
Pursuant to a fee waiver letter agreement, effective as of September 1, 2014, between the Trust, on behalf of the Family-Priced Funds, and Matthews, for each Family-Priced Fund, Matthews has agreed to waive a portion of the fee payable under the Advisory Agreement and a portion of the fee payable under the Administration and Shareholder Services Agreement, if any Family-Priced Fund's average daily net assets are over $3 billion, as follows: for every $2.5 billion average daily net assets of a Family-Priced Fund that are over $3 billion, the fee rates that otherwise would be applied for calculating fees payable under the Advisory Agreement and the Administration and Shareholder Services Agreement for such Family-Priced Fund with respect to such excess average daily net assets will be each reduced by 0.01%, in each case without reducing such fee rate below 0.00%.
Under a written agreement between the Funds and Matthews, Matthews agrees to waive fees and reimburse expenses to a Fund if its expense ratio exceeds a certain percentage level. Effective April 30, 2015 for all Funds, except Matthews Asia Strategic Income Fund and Matthews China Small Companies Fund, this level is 1.25% for the Institutional Class. Matthews agrees to reduce the expense ratio by waiving an equal amount of non-class specific expenses for the Investor Class. Because certain expenses of the Investor Class may be higher than Institutional Class and class specific expenses may be waived solely for the Institutional Class, total annual Fund expenses for the Investor Class may exceed 1.25%. For Matthews Asia Strategic Income Fund this level is 0.90% for Institutional Class. Matthews agrees to reduce the expense ratio by waiving an equal amount of non-class expenses for the Investor Class. Because certain expenses of the Investor Class may be higher that the Institutional Class and class specific expenses may be waived solely for the Institutional Class, total annual Fund expenses for the Investor Class may exceed 0.90%. For Matthews China Small Companies Fund this level is 1.50% for the Investor Class. Prior to May 1, 2014 for Matthews China Fund, Matthews India Fund, Matthews Japan Fund, Matthews Korea Fund, Matthews Asia Small Companies Fund, Matthews China Small Companies Fund and Matthews Asia Science and Technology Fund, this level was 2.00%. For Matthews Asian Growth and Income Fund, Matthews Asia Growth Fund and Matthews Pacific Tiger Fund, this level was 1.90%. For Matthews Asia Dividend Fund and Matthews China Dividend Fund, this level was 1.50%. For Matthews Asia Strategic Income Fund, Matthews Asia Focus Fund and Matthews Emerging Asia Fund, Matthews agreed to waive fees and reimburse expenses to each Fund if its expense ratio exceeded 1.25%, 1.75%, 2.00%, respectively, for the Institutional Class and agreed to reduce the expense ratio by an equal amount for the Investor Class. In turn, if a Fund's expenses fall below the level noted within three years after Matthews has made such a reimbursement, the Fund may reimburse Matthews up to an amount of the recoupment available not to exceed its expense limitation. For each Fund other than the Matthews Asia ESG Fund, this agreement will continue through at least April 30, 2016 and may be extended for additional periods not exceeding one year. For the Matthews Asia ESG Fund, this agreement will continue through April 30, 2017 and may be extended for additional periods not exceeding one year.
On June 30, 2015, the amounts subject to possible future recoupment under the expense limitation agreement are as follows:
| | | Expiring December 31, | |
| | | 2015 | | 2016 | | 2017 | | 2018 | |
Matthews Asia Strategic Income Fund | | $ | 161,965 | | | $ | 41,268 | | | $ | 79,504 | | | $ | 53,170 | | |
Matthews Asia Focus Fund | | | — | | | | 87,951 | | | | 62,897 | | | | 25,173 | | |
Matthews Asia ESG Fund | | | — | | | | — | | | | — | | | | 12,494 | | |
Matthews Emerging Asia Fund | | | — | | | | 76,881 | | | | 152,283 | | | | 148,704 | | |
Matthews Asia Small Companies Fund | | | — | | | | — | | | | 15,271 | | | | 5,305 | | |
Matthews China Small Companies Fund | | | 76,425 | | | | 7,801 | | | | 63,212 | | | | 50,769 | | |
Matthews Asian Growth and Income Fund, Matthews Asia Dividend Fund, Matthews China Dividend Fund, Matthews Asia Growth Fund, Matthews Pacific Tiger Fund, Matthews China Fund, Matthews India Fund, Matthews Japan Fund, Matthews Korea Fund, Matthews Asia Science and Technology Fund had no amounts available for recoupment and no amounts recouped during the six-month period ended June 30, 2015.
matthewsasia.com | 800.789.ASIA 135
Notes to Financial Statements (unaudited) (continued)
Investment advisory fees charged, waived fees and reimbursed additional expenses for the six-month period ended June 30, 2015, were as follows:
| | | Gross Advisory Fees | | Advisory Fees
Waived and
Reimbursed in
Excess of the
Expense Limitation | | Net Advisory Fee/
Reimbursement | |
Matthews Asia Strategic Income Fund | | $ | 222,994 | | | ($ | 53,170 | ) | | $ | 169,824 | | |
Matthews Asian Growth and Income Fund | | | 14,035,776 | | | | (61,816 | ) | | | 13,973,960 | | |
Matthews Asia Dividend Fund | | | 18,381,645 | | | | (136,298 | ) | | | 18,245,347 | | |
Matthews China Dividend Fund | | | 598,131 | | | | — | | | | 598,131 | | |
Matthews Asia Focus Fund | | | 52,176 | | | | (25,173 | ) | | | 27,003 | | |
Matthews Asia Growth Fund | | | 3,108,755 | | | | — | | | | 3,108,755 | | |
Matthews Pacific Tiger Fund | | | 29,987,067 | | | | (532,699 | ) | | | 29,454,368 | | |
Matthews Asia ESG Fund | | | 1,682 | | | | (12,494 | ) | | | (10,812 | ) | |
Matthews Emerging Asia Fund | | | 811,132 | | | | (148,704 | ) | | | 662,428 | | |
Matthews China Fund | | | 3,519,786 | | | | — | | | | 3,519,786 | | |
Matthews India Fund | | | 4,962,268 | | | | — | | | | 4,962,268 | | |
Matthews Japan Fund | | | 2,782,035 | | | | — | | | | 2,782,035 | | |
Matthews Korea Fund | | | 667,119 | | | | — | | | | 667,119 | | |
Matthews Asia Small Companies Fund | | | 3,780,373 | | | | (5,305 | ) | | | 3,775,068 | | |
Matthews China Small Companies Fund | | | 117,616 | | | | (50,769 | ) | | | 66,847 | | |
Matthews Asia Science and Technology Fund | | | 643,632 | | | | — | | | | 643,632 | | |
Certain officers and Trustees of the Funds are also officers and directors of Matthews. All officers serve without compensation from the Funds. The Funds paid the Independent Trustees $483,500 in aggregate for regular compensation during the six-month period ended June 30, 2015.
The Funds have an Administration and Shareholder Services Agreement dated August 13, 2004, as amended (the "Shareholder Services Agreement" or "Services Agreement"), in which the Funds pay an annual administration and shareholder servicing fee to Matthews, as a percentage of the average daily net assets of each Fund in aggregate, computed and prorated on a daily basis. Under the Shareholder Services Agreement, the Funds in the aggregate pay Matthews 0.25% of their aggregate average daily net assets up to $2 billion, 0.1834% of their aggregate average daily net assets over $2 billion up to $5 billion, 0.15% of their aggregate average daily net assets over $5 billion up to $7.5 billion, 0.125% of their aggregate average daily net assets over $7.5 billion up to $15 billion, 0.11% of their aggregate average daily net assets over $15 billion up to $22.5 billion, 0.10% of their aggregate average daily net assets over $22.5 billion up to $25 billion, 0.09% of their aggregate average daily net assets over $25 billion up to $30 billion, 0.08% of their aggregate average daily net assets over $30 billion up to $35 billion, 0.07% of their aggregate average daily net assets over $35 billion up to $40 billion, 0.06% of their aggregate average daily net assets over $40 billion up to $45 billion, and 0.05% of their aggregate average daily net assets over $45 billion.
Pursuant to a fee waiver letter agreement, effective as of September 1, 2014, between the Trust, on behalf of the Family-Priced Funds, and Matthews, for each Family-Priced Fund, Matthews has agreed to waive a portion of the fee payable under the Advisory Agreement and a portion of the fee payable under the Services Agreement, if any Family-Priced Fund's average daily net assets are over $3 billion, as follows: for every $2.5 billion average daily net assets of a Family-Priced Fund that are over $3 billion, the fee rates that otherwise would be applied for calculating fees payable under the Advisory Agreement and the Services Agreement for such Family-Priced Fund with respect to such excess average daily net assets will be each reduced by 0.01%, in each case without reducing such fee rate below 0.00%.
Administration and shareholder servicing fees charged, for the six-month period ended June 30, 2015, were as follows:
| | Gross
Administration and
Shareholder
Servicing Fees | | Administration and
Shareholder
Servicing Fees
Waived in Excess of
Expense Limitation | | Net
Administration and
Shareholder
Servicing Fees | |
Matthews Asia Strategic Income Fund | | $ | 47,245 | | | $ | — | | | $ | 47,245 | | |
Matthews Asian Growth and Income Fund | | | 2,917,574 | | | | (61,816 | ) | | | 2,855,758 | | |
Matthews Asia Dividend Fund | | | 3,817,832 | | | | (136,298 | ) | | | 3,681,534 | | |
Matthews China Dividend Fund | | | 124,013 | | | | — | | | | 124,013 | | |
Matthews Asia Focus Fund | | | 10,843 | | | | — | | | | 10,843 | | |
Matthews Asia Growth Fund | | | 645,587 | | | | — | | | | 645,587 | | |
Matthews Pacific Tiger Fund | | | 6,229,089 | | | | (532,699 | ) | | | 5,696,390 | | |
Matthews Asia ESG Fund | | | 344 | | | | — | | | | 344 | | |
Matthews Emerging Asia Fund | | | 111,629 | | | | — | | | | 111,629 | | |
Matthews China Fund | | | 731,145 | | | | — | | | | 731,145 | | |
Matthews India Fund | | | 1,030,098 | | | | — | | | | 1,030,098 | | |
Matthews Japan Fund | | | 576,519 | | | | — | | | | 576,519 | | |
Matthews Korea Fund | | | 138,590 | | | | — | | | | 138,590 | | |
Matthews Asia Small Companies Fund | | | 520,140 | | | | — | | | | 520,140 | | |
Matthews China Small Companies Fund | | | 16,178 | | | | — | | | | 16,178 | | |
Matthews Asia Science and Technology Fund | | | 133,745 | | | | — | | | | 133,745 | | |
136 MATTHEWS ASIA FUNDS
The Funds bear a portion of the fees paid to certain service providers (exclusive of the Funds' transfer agent) which provide transfer agency and shareholder servicing to certain shareholders. Additional information concerning these services and fees is contained in the Funds' prospectuses. Fees accrued to pay to such service providers for the six-month period ended June 30, 2015 are a component of transfer agent fees and administration and shareholder servicing fees in the Statements of Operations as follows:
| | | Transfer Agent Fees | | Administration and
Shareholder
Servicing Fees | | Total | |
Matthews Asia Strategic Income Fund | | $ | 40,767 | | | $ | 20,383 | | | $ | 61,150 | | |
Matthews Asian Growth and Income Fund | | | 2,453,012 | | | | 1,226,506 | | | | 3,679,518 | | |
Matthews Asia Dividend Fund | | | 2,222,314 | | | | 1,111,157 | | | | 3,333,471 | | |
Matthews China Dividend Fund | | | 89,401 | | | | 44,700 | | | | 134,101 | | |
Matthews Asia Focus Fund | | | 7,843 | | | | 3,921 | | | | 11,764 | | |
Matthews Asia Growth Fund | | | 422,574 | | | | 211,287 | | | | 633,861 | | |
Matthews Pacific Tiger Fund | | | 2,997,123 | | | | 1,498,562 | | | | 4,495,685 | | |
Matthews Asia ESG Fund | | | 129 | | | | 64 | | | | 193 | | |
Matthews Emerging Asia Fund | | | 92,389 | | | | 46,194 | | | | 138,583 | | |
Matthews China Fund | | | 682,319 | | | | 341,160 | | | | 1,023,479 | | |
Matthews India Fund | | | 810,857 | | | | 405,428 | | | | 1,216,285 | | |
Matthews Japan Fund | | | 228,379 | | | | 114,190 | | | | 342,569 | | |
Matthews Korea Fund | | | 74,337 | | | | 37,168 | | | | 111,505 | | |
Matthews Asia Small Companies Fund | | | 446,927 | | | | 223,464 | | | | 670,391 | | |
Matthews China Small Companies Fund | | | 16,307 | | | | 8,153 | | | | 24,460 | | |
Matthews Asia Science and Technology Fund | | | 87,941 | | | | 43,971 | | | | 131,912 | | |
BNY Mellon Investment Servicing (US) Inc. ("BNY Mellon"), an indirect wholly owned subsidiary of The Bank of New York Mellon Corporation, serves as the Funds' administrator, and in that capacity, performs various administrative and accounting services for each Fund. BNY Mellon also serves as the Funds' transfer agent, dividend disbursing agent and registrar. An officer of BNY Mellon serves as Assistant Treasurer to the Funds. Total fees accrued by the Funds for administration and accounting services for the six-month period ended June 30, 2015 were as follows:
| | | Administration and
Accounting Fees | |
Matthews Asia Strategic Income Fund | | $ | 2,722 | | |
Matthews Asian Growth and Income Fund | | | 168,057 | | |
Matthews Asia Dividend Fund | | | 253,288 | | |
Matthews China Dividend Fund | | | 7,171 | | |
Matthews Asia Focus Fund | | | 625 | | |
Matthews Asia Growth Fund | | | 37,242 | | |
Matthews Pacific Tiger Fund | | | 359,120 | | |
Matthews Asia ESG Fund | | | 20 | | |
Matthews Emerging Asia Fund | | | 6,436 | | |
Matthews China Fund | | | 72,181 | | |
Matthews India Fund | | | 59,437 | | |
Matthews Japan Fund | | | 33,360 | | |
Matthews Korea Fund | | | 7,995 | | |
Matthews Asia Small Companies Fund | | | 30,013 | | |
Matthews China Small Companies Fund | | | 934 | | |
Matthews Asia Science and Technology Fund | | | 7,710 | | |
Brown Brothers Harriman & Co. serves as the Funds' custodian. Foreside Funds Distributors LLC, serves as the Funds' distributor in the United States pursuant to an Underwriting Agreement. Matthews Asia Funds are distributed in Latin America by HMC Partners.
On November 30, 2011, Matthews invested $10 million in Matthews Asia Strategic Income Fund to provide the Fund with its initial investment assets. As of June 30, 2015, the Fund's net assets were $69,918,475 of which 1,133,385 shares held by Matthews represented 17%.
As of June 30, 2015, Matthews and its affiliates held 140,001.480 shares of the Matthews Asia ESG Fund, representing approximately 88% of that Fund's outstanding shares.
matthewsasia.com | 800.789.ASIA 137
Notes to Financial Statements (unaudited) (continued)
6. INVESTMENTS
The value of investment transactions made for affiliated and unaffiliated holdings for the six-month period ended June 30, 2015 were as follows:
| | | Affiliated Purchases | | Proceeds from
Affiliated Sales | | Unaffiliated Purchases | | Proceeds from
Unaffiliated Sales | |
Matthews Asia Strategic Income Fund | | $ | — | | | $ | — | | | $ | 23,033,183 | | | $ | 22,855,468 | | |
Matthews Asian Growth and Income Fund | | | — | | | | — | | | | 540,702,312 | | | | 962,811,417 | | |
Matthews Asia Dividend Fund | | | 48,785,254 | | | | 32,576,429 | | | | 1,215,024,711 | | | | 1,039,676,989 | | |
Matthews China Dividend Fund | | | — | | | | — | | | | 109,159,790 | | | | 67,418,851 | | |
Matthews Asia Focus Fund | | | — | | | | — | | | | 2,086,529 | | | | 1,417,571 | | |
Matthews Asia Growth Fund | | | — | | | | — | | | | 200,804,865 | | | | 100,324,613 | | |
Matthews Pacific Tiger Fund | | | 13,814,711 | | | | — | | | | 756,432,500 | | | | 520,585,899 | | |
Matthews Asia ESG Fund | | | — | | | | — | | | | 1,488,276 | | | | — | | |
Matthews Emerging Asia Fund | | | — | | | | — | | | | 56,911,193 | | | | 14,389,705 | | |
Matthews China Fund | | | — | | | | — | | | | 96,628,995 | | | | 227,289,774 | | |
Matthews India Fund | | | 33,937,528 | | | | 989,076 | | | | 481,765,009 | | | | 69,584,603 | | |
Matthews Japan Fund | | | 18,177,455 | | | | 483,811 | | | | 567,942,068 | | | | 135,035,875 | | |
Matthews Korea Fund | | | — | | | | — | | | | 22,368,287 | | | | 55,110,183 | | |
Matthews Asia Small Companies Fund | | | 15,003,642 | | | | — | | | | 223,982,911 | | | | 118,907,348 | | |
Matthews China Small Companies Fund | | | — | | | | — | | | | 7,626,233 | | | | 8,049,530 | | |
Matthews Asia Science and Technology Fund | | | — | | | | — | | | | 82,125,246 | | | | 102,418,030 | | |
7. HOLDINGS OF 5% VOTING SHARES OF PORTFOLIO COMPANIES
The 1940 Act defines "affiliated companies" to include investments in portfolio companies in which a fund owns 5% or more of the outstanding voting shares. During the six-month period ended June 30, 2015, the Funds below held 5% or more of the outstanding voting shares of the noted portfolio companies. During this period, other Funds in the Trust may also have held voting shares of the issuers at levels below 5%.
Investments in affiliates:
A summary of transactions in securities of issuers affiliated with a Fund for the six-month period ended June 30, 2015 is as follows:
| | | Shares Held at
Dec. 31, 2014 | | Shares
Purchased | | Shares
Sold | | Shares Held at
June 30, 2015 | | Value at
June 30, 2015 | | Dividend
Income
Jan. 1, 2015–
June 30, 2015 | | Net Realized
Gain
Jan. 1, 2015–
June 30, 2015 | |
MATTHEWS ASIAN GROWTH AND INCOME FUND | |
Name of Issuer: | |
CITIC Telecom International
Holdings, Ltd.† | | | 188,818,250 | | | | — | | | | 188,818,250 | | | | — | | | $ | — | | | $ | — | | | $ | — | | |
Total Affiliates | | | | | | | | | | $ | — | | | $ | — | | | $ | — | | |
MATTHEWS ASIA DIVIDEND FUND | |
Name of Issuer: | |
Anritsu Corp. | | | 6,853,300 | | | | 451,200 | | | | — | | | | 7,304,500 | | | $ | 49,241,185 | | | $ | 735,599 | | | $ | — | | |
Ascendas India Trust | | | 55,065,000 | | | | — | | | | — | | | | 55,065,000 | | | | 36,591,436 | | | | 1,023,691 | | | | — | | |
Breville Group, Ltd. | | | 10,847,453 | | | | — | | | | — | | | | 10,847,453 | | | | 51,959,652 | | | | 1,162,669 | | | | — | | |
CapitaLand Retail China Trust, REIT | | | 52,179,400 | | | | — | | | | 8,100,000 | | | | 44,079,400 | | | | 56,884,936 | | | | 1,871,160 | | | | 4,730,451 | | |
China Machinery Engineering
Corp. H Shares | | | — | | | | 53,737,000 | | | | — | | | | 53,737,000 | | | | 57,861,755 | | | | — | | | | — | | |
Greatview Aseptic Packaging
Co., Ltd. | | | 110,945,000 | | | | — | | | | — | | | | 110,945,000 | | | | 63,155,530 | | | | — | | | | — | | |
Minth Group, Ltd. | | | 61,267,000 | | | | — | | | | 1,000,000 | | | | 60,267,000 | | | | 134,677,726 | | | | 4,009,279 | | | | 1,442,779 | | |
Pigeon Corp. | | | 2,377,800 | | | | 4,755,600 | †† | | | 697,700 | | | | 6,435,700 | | | | 202,679,268 | | | | 1,211,669 | | | | 16,425,693 | | |
Springland International
Holdings, Ltd.† | | | 138,171,000 | | | | — | | | | 138,171,000 | | | | — | | | | — | | | | — | | | | — | | |
St. Shine Optical Co., Ltd. | | | 2,674,000 | | | | — | | | | — | | | | 2,674,000 | | | | 42,504,986 | | | | — | | | | — | | |
Xingda International
Holdings, Ltd. H Shares† | | | 87,141,000 | | | | — | | | | 87,141,000 | | | | — | | | | — | | | | — | | | | — | | |
Yuexiu Transport Infrastructure, Ltd. | | | 109,490,000 | | | | — | | | | — | | | | 109,490,000 | | | | 78,758,588 | | | | 2,399,719 | | | | — | | |
Total Affiliates | | | | | | | | | | $ | 774,315,062 | | | $ | 12,413,786 | | | $ | 22,598,923 | | |
138 MATTHEWS ASIA FUNDS
| | | Shares Held at
Dec. 31, 2014 | | Shares
Purchased | | Shares
Sold | | Shares Held at
June 30, 2015 | | Value at
June 30, 2015 | | Dividend
Income
Jan. 1, 2015–
June 30, 2015 | | Net Realized
Gain
Jan. 1, 2015–
June 30, 2015 | |
MATTHEWS PACIFIC TIGER FUND | |
Name of Issuer: | |
Cheil Worldwide, Inc. | | | 6,420,440 | | | | — | | | | — | | | | 6,420,440 | | | $ | 99,391,590 | | | $ | — | | | $ | — | | |
Dongbu Insurance Co., Ltd. | | | 4,020,500 | | | | — | | | | — | | | | 4,020,500 | | | | 203,307,255 | | | | — | | | | — | | |
Green Cross Corp. | | | 1,008,655 | | | | — | | | | — | | | | 1,008,655 | | | | 231,738,001 | | | | — | | | | — | | |
Hyflux, Ltd. | | | 65,284,280 | | | | — | | | | — | | | | 65,284,280 | | | | 41,695,369 | | | | 783,666 | | | | — | | |
Synnex Technology
International Corp. | | | 102,065,354 | | | | — | | | | — | | | | 102,065,354 | | | | 151,315,826 | | | | — | | | | — | | |
Tata Power Co., Ltd. | | | 162,545,436 | | | | 11,235,931 | | | | — | | | | 173,781,367 | | | | 202,052,307 | | | | — | | | | — | | |
Total Affiliates | | | | | | | | | | $ | 929,500,348 | | | $ | 783,666 | | | $ | — | | |
MATTHEWS INDIA FUND | |
Name of Issuer: | |
eClerx Services, Ltd. | | | 1,189,293 | | | | 1,149,783 | | | | 40,000 | | | | 2,299,076 | | | $ | 53,723,933 | | | $ | — | | | $ | 142,516 | | |
VST Industries, Ltd. | | | 855,933 | | | | 337,771 | | | | — | | | | 1,193,704 | | | | 30,511,629 | | | | — | | | | — | | |
Total Affiliates | | | | | | | | | | $ | 84,235,562 | | | $ | — | | | $ | 142,516 | | |
MATTHEWS JAPAN FUND | |
Name of Issuer: | |
AIT Corp. | | | 678,700 | | | | 368,600 | | | | 47,400 | | | | 999,900 | | | $ | 9,477,338 | | | $ | 212,478 | | | $ | 142,916 | | |
eGuarantee, Inc. | | | 401,000 | | | | 237,000 | | | | — | | | | 638,000 | | | | 13,238,188 | | | | 104,565 | | | | — | | |
MORESCO Corp. | | | 400,300 | | | | 236,300 | | | | — | | | | 636,600 | | | | 11,694,482 | | | | 75,786 | | | | — | | |
N Field Co., Ltd. | | | 276,800 | | | | 395,800 | | | | — | | | | 672,600 | | | | 10,577,014 | | | | — | | | | — | | |
Total Affiliates | | | | | | | | | | $ | 44,987,022 | | | $ | 392,829 | | | $ | 142,916 | | |
MATTHEWS ASIA SMALL COMPANIES FUND | |
Name of Issuer: | |
Ezwelfare Co., Ltd. | | | 742,858 | | | | 131,365 | | | | — | | | | 874,223 | | | $ | 13,974,263 | | | $ | — | | | $ | — | | |
FineTek Co., Ltd. | | | — | | | | 2,891,000 | | | | — | | | | 2,891,000 | | | | 11,742,861 | | | | — | | | | — | | |
SaraminHR Co., Ltd.† | | | 682,434 | | | | — | | | | 682,434 | | | | — | | | | — | | | | — | | | | — | | |
PT Wismilak Inti Makmur | | | 107,640,100 | | | | 6,710,500 | | | | — | | | | 114,350,600 | | | | 3,511,541 | | | | 116,759 | | | | — | | |
Total Affiliates | | | | | | | | | | $ | 29,228,665 | | | $ | 116,759 | | | $ | — | | |
† Issuer was not an affiliated company as of June 30, 2015.
†† Includes stock split during the period.
8. INCOME TAX INFORMATION, INCOME AND WITHHOLDING TAXES
It is the policy of the Funds to comply with all requirements of the Internal Revenue Code of 1986, as amended ("the Code"), applicable to regulated investment companies and to distribute substantially all of their taxable income to their shareholders. The Funds have met the requirements of the Code applicable to regulated investment companies for the year ended December 31, 2014. Therefore, no federal income tax provision is required.
Management has analyzed the Funds' tax positions taken on federal income tax returns for all open tax years (current and prior three tax years), and has concluded that no provision for federal income tax is required in the Funds' financial statements. The Funds' federal and state income and federal excise tax returns for tax years for which the applicable statutes of limitations have not expired are subject to examination by the Internal Revenue Service and state departments of revenue.
Under current tax law, the Funds have elected to defer certain qualified late-year losses and recognize such losses in the year ending December 31, 2015.
| | | Late Year
Losses* | |
Matthews Asia Strategic Income Fund | | $ | 209,651 | | |
Matthews China Dividend Fund | | | 586,052 | | |
Matthews Asia Growth Fund | | | 3,220,533 | | |
Matthews Emerging Asia Fund | | | 137,282 | | |
Matthews Japan Fund | | | 817,239 | | |
Matthews China Small Companies Fund | | | 33,976 | | |
Matthews Asia Science and Technology Fund | | | 787 | | |
* The Funds have elected to defer certain qualified late-year losses and recognize such losses in the next fiscal year.
matthewsasia.com | 800.789.ASIA 139
Notes to Financial Statements (unaudited) (continued)
For federal income tax purposes, the Funds indicated below have capital loss carryforwards as of December 31, 2014, which expire in the year indicated, which are available to offset future capital gains, if any:
| | | | | | | | | Amount With No Expiration* | | | |
LOSSES DEFERRED EXPIRING IN: | | 2016 | | 2017 | | 2018 | | Short-term
Losses | | Long-term
Losses | | Total | |
Matthews Asia Strategic Income Fund | | $ | — | | | $ | — | | | $ | — | | | $ | 1,178,601 | | | $ | 131,017 | | | $ | 1,309,618 | | |
Matthews Asia Dividend Fund | | | — | | | | — | | | | — | | | | 67,300,117 | | | | 115,478,982 | | | | 182,779,099 | | |
Matthews Asia Growth Fund | | | — | | | | 26,429,909 | | | | — | | | | — | | | | — | | | | 26,429,909 | | |
Matthews Japan Fund | | | 44,233,750 | | | | 44,032,426 | | | | — | | | | — | | | | — | | | | 88,266,176 | | |
Matthews Asia Small Companies Fund | | | — | | | | — | | | | — | | | | 5,443,681 | | | | — | | | | 5,443,681 | | |
Matthews China Small Companies Fund | | | — | | | | — | | | | — | | | | 734,068 | | | | — | | | | 734,068 | | |
* Post-Enactment Losses: Must be utilized prior to losses subject to expiration.
Under the Regulated Investment Company Modernization Act of 2010, the Funds are permitted to carry forward capital losses incurred in taxable years beginning after December 22, 2010 for an unlimited period. However, any losses incurred during those future taxable years will be required to be utilized prior to any losses incurred in pre-enactment taxable years, which generally expire after eight years from when they are incurred. Additionally, post-enactment capital losses that are carried forward will retain their character as either short-term or long-term capital losses rather than being considered all short-term as under previous law.
9. SUBSEQUENT EVENTS
Management has evaluated the impact of all subsequent events on the Funds through the date the financial statements were issued, and has determined that there were no subsequent events that require recognition or disclosure in the financial statements.
140 MATTHEWS ASIA FUNDS
Approval of Investment Advisory Agreement (Unaudited)
The Matthews Asia ESG Fund (the "Fund"), which is a new series of the Trust, has retained Matthews International Capital Management, LLC ("Matthews") to manage its assets pursuant to the Advisory Agreement, which has been approved by the Board of Trustees of the Fund, including the Independent Trustees. Following an initial term with respect to the Fund upon its commencement of operations, the Advisory Agreement continues in effect from year-to-year provided that the continuance is specifically approved at least annually by the vote of the holders of at least a majority of the outstanding shares of the Fund, or by the Board of Trustees, and, in either event, by a majority of the Independent Trustees of the Trust casting votes in person at a meeting called for that purpose.
At a meeting held on February 23 and 24, 2015, the Board, including the Independent Trustees of the Trust, approved the Advisory Agreement, with respect to the Fund, for an initial term through August 31, 2016.
The Independent Trustees reviewed and discussed the information provided by Matthews at that meeting. The Independent Trustees were assisted in their deliberations by their independent legal counsel. Below is a summary of the factors considered by the Board in approving the Advisory Agreement with respect to the Fund.
 The nature, extent and quality of the services provided by Matthews under the Advisory Agreement. The Trustees considered the experience and qualifications of the personnel at Matthews who would be responsible for providing services to the Fund and would be responsible for the daily management of the Fund's portfolio. The Trustees noted that Matthews has continued to expand its professional staff at both senior and junior levels over the past several years, and has enjoyed relative stability of its senior executive and portfolio management. The Trustees noted Matthews' on-going commitment to governance, compliance, risk and valuation practices. The Trustees viewed Matthews as well positioned to provide high quality services to the Fund under various market conditions, as demonstrated by the past volatile and challenging securities markets that have caused either contracting revenues or rapidly expanding assets at different times. The Trustees concluded that Matthews has the quality of personnel and other investment resources essential to performing its duties under the Advisory Agreement, and that the nature, overall quality, cost and extent of such management services are expected to be satisfactory and reliable.
 The investment performance of Matthews. The Trustees are familiar with the short-term and long-term performance of other series of the Trust on both
an absolute basis and in comparison to peer funds and benchmark indices. This is a new Fund without any prior performance. The Trustees also emphasized longer-term performance goals, which they believe are more important than short isolated periods for purposes of evaluating Matthews' success in meeting Fund and shareholder objectives. The Trustees concluded that Matthews has the potential to generate acceptable long-term performance for the Fund.
 The extent to which Matthews realizes economies of scale as the Fund grows larger and whether Fund investors benefit from any economies of scale. Because the Fund is new, it is not expected to recognize economies of scale for some time. The Trustees expect to monitor the Fund's growth and evaluate economies of scale at future renewals of the Advisory Agreement. They expect that the Fund will benefit from existing economies of scale because of the family pricing of certain series of the Trust, including the Fund, including recently negotiated breakpoints. Additional fee reductions were adopted under the Administration and Shareholder Services Agreement for all series of the Trust for each increment of $5 billion of additional assets over $25 billion, with the lowest fee rate on assets over $45 billion. As a result, the Trustees remain satisfied about the extent to which economies of scale would be shared with the Fund and its shareholders.
 The costs of the services provided by Matthews and others. The Trustees considered the advisory fees and total fees and expenses of the Fund in comparison to the advisory fees and other fees and expenses of other funds in the Trust, noting that the Fund does not have a suitable peer group for its specialty strategy. The Trustees noted that the expense limitation that would apply is the same as has been applied to certain other new series of the Trust, and that the administrative fee would be based on the combined family pricing for the Trust. Also, the total expense ratio to be paid by investors in the Fund, which is most representative of an investor's net experience, would be reasonable.
 The profits to be realized by Matthews and its affiliates from the relationships with the Fund. The Trustees recognized that, as a new fund with expense limitations in place, it is unlikely that the Fund will generate profits for Matthews initially and may not do so until the Fund has experienced some significant growth. The Trustees also considered that the additional benefits expected to be derived by Matthews from its relationship with the Fund are limited solely to research benefits received in exchange for "soft dollars."
141 MATTHEWS ASIA FUNDS
Approval of Investment Advisory Agreement (Unaudited) (continued)
No single factor was determinative of the Board's decision to approve the Advisory Agreement, but rather the Trustees based their determination on the total mix of information available to them. After considering the factors described above, the Board concluded that the terms of the advisory arrangements would be fair and reasonable to the Fund in light of the services that Matthews is expected to provide, and that the Fund's shareholders are expected to receive reasonable value in return for the advisory fees paid. For these reasons, the approval of the Advisory Agreement with respect to the Fund would be in the best interests of the Fund and its shareholders.
The Advisory Agreement may be terminated by the Trustees on behalf of the Fund or by Matthews upon 60 days' prior written notice without penalty. The Advisory Agreement will also terminate automatically in the event of its assignment, as defined in the 1940 Act.
matthewsasia.com | 800.789.ASIA 142
Results of Special Meeting of Shareholders
At a Special Meeting of Shareholders of the Matthews International Funds d/b/a Matthews Asia Funds (the "Trust") held on February 24, 2015, the following individuals were elected to serve on the Board of Trustees by the shareholders of all Funds of the Trust voting together in the aggregate:
Trustee Nominee | | No. of "FOR" Votes | | No. of Votes Withheld | |
Jonathan F. Zeschin | | | 997,754,666 | | | | 26,529,962 | | |
Gale K. Caruso | | | 999,653,419 | | | | 24,606,739 | | |
William J. Hackett | | | 999,316,883 | | | | 24,969,720 | | |
Christopher F. Lee | | | 999,290,595 | | | | 24,974,426 | | |
Richard K. Lyons | | | 997,655,611 | | | | 26,639,787 | | |
143 MATTHEWS ASIA FUNDS

Matthews Asia Funds
INVESTMENT ADVISOR
Matthews International Capital Management, LLC
Four Embarcadero Center, Suite 550
San Francisco, CA 94111
800.789.ASIA
CUSTODIAN
Brown Brothers Harriman & Co.
50 Milk Street
Boston, MA 02109
ACCOUNT SERVICES
Matthews Asia Funds
P.O. Box 9791
Providence, RI 02940
800.789.ASIA
LEGAL COUNSEL
Paul Hastings LLP
55 Second Street, 24th Floor
San Francisco, CA 94105
145 MATTHEWS ASIA FUNDS

P.O. Box 9791 | Providence, RI 02940 | matthewsasia.com | 800.789.ASIA (2742)
Matthews Asia Funds are distributed in the United States by Foreside Funds Distributors LLC, Berwyn, Pennsylvania
Matthews Asia Funds are distributed in Latin America by HMC Partners SAR-0615-194M


Item 2. Code of Ethics.
Not applicable.
Item 3. Audit Committee Financial Expert.
Not applicable.
Item 4. Principal Accountant Fees and Services.
Not applicable.
Item 5. Audit Committee of Listed Registrants.
Not applicable.
Item 6. Investments.
(a) Schedule of Investments in securities of unaffiliated issuers as of the close of the reporting period is included as part of the report to shareholders filed under Item 1 of this form.
(b) Not applicable.
Item 7. Disclosure of Proxy Voting Policies and Procedures for Closed-End Management Investment Companies.
Not applicable.
Item 8. Portfolio Managers of Closed-End Management Investment Companies.
Not applicable.
Item 9. Purchases of Equity Securities by Closed-End Management Investment Company and Affiliated Purchasers.
Not applicable.
Item 10. Submission of Matters to a Vote of Security Holders.
There have been no material changes to the procedures by which the shareholders may recommend nominees to the registrant’s board of directors, where those changes were implemented after the registrant last provided disclosure in response to the requirements of Item 407(c)(2)(iv) of Regulation S-K (17 CFR 229.407) (as required by Item 22(b)(15) of Schedule 14A (17 CFR 240.14a-101)), or this Item.
Item 11. Controls and Procedures.
| (a) | The registrant’s principal executive and principal financial officers, or persons performing similar functions, have concluded that the registrant’s disclosure controls and procedures (as defined in Rule 30a-3(c) under the Investment Company Act of 1940, as amended (the “1940 Act”) (17 CFR 270.30a-3(c))) are effective, as of a date within 90 days of the filing date of the report that includes the disclosure required by this paragraph, based on their evaluation of these controls and procedures required by Rule 30a-3(b) under the 1940 Act (17 CFR 270.30a-3(b)) and Rules 13a-15(b) or 15d-15(b) under the Securities Exchange Act of 1934, as amended (17 CFR 240.13a-15(b) or 240.15d-15(b)). |
| | |
| | |
| (b) | There were no changes in the registrant’s internal control over financial reporting (as defined in Rule 30a-3(d) under the 1940 Act (17 CFR 270.30a-3(d)) that occurred during the registrant’s second fiscal quarter of the period covered by this report that has materially affected, or is reasonably likely to materially affect, the registrant’s internal control over financial reporting. |
Item 12. Exhibits.
(a)(1) Not applicable.
(a)(2) Certifications pursuant to Rule 30a-2(a) under the 1940 Act and Section 302 of the Sarbanes-Oxley Act of 2002 are attached hereto.
(a)(3) Not applicable.
(b) Certifications pursuant to Rule 30a-2(b) under the 1940 Act and Section 906 of the Sarbanes-Oxley Act of 2002 are attached hereto.
SIGNATURES
Pursuant to the requirements of the Securities Exchange Act of 1934 and the Investment Company Act of 1940, the registrant has duly caused this report to be signed on its behalf by the undersigned, thereunto duly authorized.
(Registrant) | | Matthews International Funds | |
| | |
| | |
By (Signature and Title)* | | /s/ William J. Hackett | |
| | William J. Hackett, President |
| | (principal executive officer) |
| | |
Date | | September 4, 2015 | |
| | | | | | |
Pursuant to the requirements of the Securities Exchange Act of 1934 and the Investment Company Act of 1940, this report has been signed below by the following persons on behalf of the registrant and in the capacities and on the dates indicated.
By (Signature and Title)* | | /s/ William J. Hackett | |
| | William J. Hackett, President |
| | (principal executive officer) |
| | |
Date | | September 4, 2015 | |
| | |
| | |
By (Signature and Title)* | | /s/ Shai Malka | |
| | Shai Malka, Treasurer |
| | (principal financial officer) |
| | |
Date | | September 4, 2015 | |
| | | | | |
* Print the name and title of each signing officer under his or her signature.