UNITED STATES
SECURITIES AND EXCHANGE COMMISSION
Washington, D.C. 20549
FORM N-CSR
CERTIFIED SHAREHOLDER REPORT OF REGISTERED
MANAGEMENT INVESTMENT COMPANIES
Investment Company Act file number | 811-08510 |
|
Matthews International Funds |
(Exact name of registrant as specified in charter) |
|
Four Embarcadero Center, Suite 550 San Francisco, CA 94111 |
(Address of principal executive offices) (Zip code) |
|
William J. Hackett, President Four Embarcadero Center, Suite 550 San Francisco, CA 94111 |
(Name and address of agent for service) |
|
Registrant’s telephone number, including area code: | 415-788-7553 | |
|
Date of fiscal year end: | December 31 | |
|
Date of reporting period: | June 30, 2012 | |
| | | | | | |
Form N-CSR is to be used by management investment companies to file reports with the Commission not later than 10 days after the transmission to stockholders of any report that is required to be transmitted to stockholders under Rule 30e-1 under the Investment Company Act of 1940 (17 CFR 270.30e-1). The Commission may use the information provided on Form N-CSR in its regulatory, disclosure review, inspection, and policymaking roles.
A registrant is required to disclose the information specified by Form N-CSR, and the Commission will make this information public. A registrant is not required to respond to the collection of information contained in Form N-CSR unless the Form displays a currently valid Office of Management and Budget ("OMB") control number. Please direct comments concerning the accuracy of the information collection burden estimate and any suggestions for reducing the burden to Secretary, Securities and Exchange Commission, 100 F Street, NE, Washington, DC 20549. The OMB has reviewed this collection of information under the clearance requirements of 44 U.S.C. § 3507.
Item 1. Reports to Stockholders.
The Report to Shareholders is attached herewith.
Matthews Asia Funds | Semi-Annual Report
June 30, 2012 | matthewsasia.com
ASIA FIXED INCOME STRATEGY
Matthews Asia Strategic Income Fund
ASIA GROWTH AND INCOME STRATEGIES
Matthews Asian Growth and Income Fund
Matthews Asia Dividend Fund
Matthews China Dividend Fund
ASIA GROWTH STRATEGIES
Matthews Asia Growth Fund
Matthews Pacific Tiger Fund
Matthews China Fund
Matthews India Fund
Matthews Japan Fund
Matthews Korea Fund
ASIA SMALL COMPANY STRATEGIES
Matthews Asia Small Companies Fund
Matthews China Small Companies Fund
ASIA SPECIALTY STRATEGY
Matthews Asia Science and Technology Fund
'12

Performance and Expenses
| | | | | Average Annual Total Return | | | | 2011 Gross
Annual | |
| | | 1 year | | 5 years | | 10 years | | Since
Inception | | Inception
Date | | Operating
Expenses* | |
| Matthews Asia Strategic Income Fund | |
| Investor Class (MAINX) | | | n.a. | | | | n.a. | | | | n.a. | | | | 3.64 | %1 | | | 11/30/11 | | | | 1.93 | %2 | |
| After Fee Waiver and Reimbursement | | | | | | | | | | | | | | | | | | | | | | | 1.40 | %3 | |
| Institutional Class (MINCX) | | | n.a. | | | | n.a. | | | | n.a. | | | | 3.73 | %1 | | | 11/30/11 | | | | 1.78 | %2 | |
| After Fee Waiver and Reimbursement | | | | | | | | | | | | | | | | | | | | | | | 1.25 | %3 | |
| Matthews Asian Growth & Income Fund | |
| Investor Class (MACSX) | | | -3.68 | % | | | 4.08 | % | | | 12.33 | % | | | 10.49 | % | | | 9/12/94 | | | | 1.12 | % | |
| Institutional Class (MICSX) | | | -3.55 | % | | | n.a. | | | | n.a. | | | | 0.33 | % | | | 10/29/10 | | | | 0.99 | % | |
| Matthews Asia Dividend Fund | |
| Investor Class (MAPIX) | | | -3.30 | % | | | 6.95 | % | | | n.a. | | | | 9.51 | % | | | 10/31/06 | | | | 1.10 | % | |
| Institutional Class (MIPIX) | | | -3.21 | % | | | n.a. | | | | n.a. | | | | 0.51 | % | | | 10/29/10 | | | | 1.00 | % | |
| Matthews China Dividend Fund | |
| Investor Class (MCDFX) | | | -7.25 | % | | | n.a. | | | | n.a. | | | | 6.50 | % | | | 11/30/09 | | | | 1.52 | % | |
| After Fee Waiver and Reimbursement | | | | | | | | | | | | | | | | | | | | | | | 1.50 | %4 | |
| Institutional Class (MICDX) | | | -7.05 | % | | | n.a. | | | | n.a. | | | | -1.04 | % | | | 10/29/10 | | | | 1.31 | % | |
| Matthews Asia Growth Fund | |
| Investor Class (MPACX) | | | -8.58 | % | | | 1.94 | % | | | n.a. | | | | 8.86 | % | | | 10/31/03 | | | | 1.18 | % | |
| Institutional Class (MIAPX) | | | -8.46 | % | | | n.a. | | | | n.a. | | | | -3.12 | % | | | 10/29/10 | | | | 1.03 | % | |
| Matthews Pacific Tiger Fund | |
| Investor Class (MAPTX) | | | -8.34 | % | | | 4.73 | % | | | 14.57 | % | | | 8.68 | % | | | 9/12/94 | | | | 1.11 | % | |
| Institutional Class (MIPTX) | | | -8.20 | % | | | n.a. | | | | n.a. | | | | -2.80 | % | | | 10/29/10 | | | | 0.95 | % | |
| Matthews China Fund | |
| Investor Class (MCHFX) | | | -17.13 | % | | | 2.81 | % | | | 14.40 | % | | | 10.72 | % | | | 2/19/98 | | | | 1.13 | % | |
| Institutional Class (MICFX) | | | -16.94 | % | | | n.a. | | | | n.a. | | | | -11.45 | % | | | 10/29/10 | | | | 0.96 | % | |
| Matthews India Fund | |
| Investor Class (MINDX) | | | -23.88 | % | | | -0.16 | % | | | n.a. | | | | 9.33 | % | | | 10/31/05 | | | | 1.18 | % | |
| Institutional Class (MIDNX) | | | -23.72 | % | | | n.a. | | | | n.a. | | | | -18.35 | % | | | 10/29/10 | | | | 0.99 | % | |
| Matthews Japan Fund | |
| Investor Class (MJFOX) | | | -5.69 | % | | | -3.92 | % | | | 2.98 | % | | | 3.52 | % | | | 12/31/98 | | | | 1.21 | % | |
| Institutional Class (MIJFX) | | | -5.54 | % | | | n.a. | | | | n.a. | | | | 3.59 | % | | | 10/29/10 | | | | 1.07 | % | |
| Matthews Korea Fund | |
| Investor Class (MAKOX) | | | -10.28 | % | | | -0.76 | % | | | 10.84 | % | | | 5.13 | % | | | 1/3/95 | | | | 1.18 | % | |
| Institutional Class (MIKOX) | | | -10.08 | % | | | n.a. | | | | n.a. | | | | 3.51 | % | | | 10/29/10 | | | | 1.07 | % | |
| Matthews Asia Small Companies Fund | |
| Investor Class (MSMLX) | | | -17.24 | % | | | n.a. | | | | n.a. | | | | 17.56 | % | | | 9/15/08 | | | | 1.52 | % | |
| Matthews China Small Companies Fund | |
| Investor Class (MCSMX) | | | -26.16 | % | | | n.a. | | | | n.a. | | | | -27.23 | % | | | 5/31/11 | | | | 5.32 | %2 | |
| After Fee Waiver and Reimbursement | | | | | | | | | | | | | | | | | | | | | | | 2.00 | %5 | |
| Matthews Asia Science and Technology Fund | |
| Investor Class (MATFX) | | | -12.69 | % | | | -0.38 | % | | | 9.12 | % | | | -0.71 | % | | | 12/27/99 | | | | 1.21 | % | |
* These figures are from the Funds' current prospectus and may differ from the actual expense ratios for the preceding fiscal year, as shown in the Financial Highlights section of this report.
1 Actual return for fiscal period beginning 11/30/11 through 6/30/12, not annualized.
2 Gross annual operating expenses for 2011 are annualized.
3 Matthews has contractually agreed to waive fees and reimburse expenses until August 31, 2014 to the extent needed to limit Total Annual Fund Operating Expenses to 1.25% for the Institutional Class and agreed to reduce the expense ratio by an equal amount for the Investor Class. Because certain expenses of the Investor Class may be higher than the Institutional Class, the Total Annual Fund Operating Expenses After Fee Waiver and Expense Reimbursement for the Investor Class may exceed 1.25%. The amounts of the waivers and reimbursements are based on estimated Fund expenses. The fee waiver and expense reimbursement may be terminated at any time by the Fund on 60 days' written notice.
4 The Advisor has contractually agreed to waive the Fund's fees and reimburse expenses until at least August 31, 2013 to the extent needed to limit total annual operating expenses to 1.50%.
5 The Advisor has contractually agreed to waive the Fund's fees and reimburse expenses until at least August 31, 2014 to the extent needed to limit total annual operating expenses to 2.00%.
Past Performance: All performance quoted in this report is past performance and is no guarantee of future results. Investment return and principal value will fluctuate with changing market conditions so that when redeemed, shares may be worth more or less than their original cost. Current performance may be lower or higher than the returns quoted. If certain of the Funds' fees and expenses had not been waived, returns would have been lower. For the Funds' most recent month-end performance, please call 800.789.ASIA (2742) or visit matthewsasia.com.
Investment Risk: Mutual fund shares are not deposits or obligations of, or guaranteed by, any depositary institution. Shares are not insured by the FDIC, Federal Reserve Board or any government agency and are subject to investment risks, including possible loss of principal amount invested. Investing in international and emerging markets may involve additional risks, such as social and political instability, market illiquidity, exchange-rate fluctuations, a high level of volatility and limited regulation. Fixed income investments are subject to additional risks, including, but not limited to, interest rate, credit and inflation risks. In addition, single-country and sector funds may be subject to a higher degree of market risk than diversified funds because of concentration in a specific industry, sector or geographic location. Investing in small and mid-size companies is more risky than investing in large companies as they may be more volatile and less liquid than larger companies. Please see the Funds' prospectus and Statement of Additional Information for more risk disclosure.
Contents
| Message to Shareholders | | | 2 | | |
|
| Manager Commentaries, Fund Characteristics and Schedules of Investments: | |
|
| ASIA FIXED INCOME STRATEGY | |
|
| Matthews Asia Strategic Income Fund | | | 4 | | |
|
| ASIA GROWTH AND INCOME STRATEGIES | |
|
| Matthews Asian Growth and Income Fund | | | 9 | | |
|
| Matthews Asia Dividend Fund | | | 14 | | |
|
| Matthews China Dividend Fund | | | 19 | | |
|
| ASIA GROWTH STRATEGIES | |
|
| Matthews Asia Growth Fund | | | 24 | | |
|
| Matthews Pacific Tiger Fund | | | 29 | | |
|
| Matthews China Fund | | | 34 | | |
|
| Matthews India Fund | | | 39 | | |
|
| Matthews Japan Fund | | | 44 | | |
|
| Matthews Korea Fund | | | 49 | | |
|
| ASIA SMALL COMPANY STRATEGIES | |
|
| Matthews Asia Small Companies Fund | | | 54 | | |
|
| Matthews China Small Companies Fund | | | 59 | | |
|
| ASIA SPECIALTY STRATEGY | |
|
| Matthews Asia Science and Technology Fund | | | 64 | | |
|
| Disclosures | | | 68 | | |
|
| Index Definitions | | | 69 | | |
|
| Disclosure of Fund Expenses | | | 70 | | |
|
| Statements of Assets and Liabilities | | | 72 | | |
|
| Statements of Operations | | | 75 | | |
|
| Statements of Changes in Net Assets | | | 78 | | |
|
| Financial Highlights | | | 85 | | |
|
| Notes to Financial Statements | | | 98 | | |
|
Cover photo: Open umbrella under tree, Kyoto, Japan
This report has been prepared for Matthews Asia Funds shareholders. It is not authorized for distribution to prospective investors unless accompanied or preceded by a current Matthews Asia Funds prospectus, which contains more complete information about the Funds' investment objectives, risks and expenses. Additional copies of the prospectus may be obtained at matthewsasia.com. Please read the prospectus carefully before you invest or send money.
The views and opinions in this report were current as of June 30, 2012. They are not guarantees of performance or investment results and should not be taken as investment advice. Investment decisions reflect a variety of factors, and the managers reserve the right to change their views about individual stocks, sectors and the markets at any time. As a result, the views expressed should not be relied upon as a forecast of a Fund's future investment intent. Current and future portfolio holdings are subject to risk.
Statements of fact are from sources considered reliable, but neither the Funds nor the Investment Advisor makes any representation or guarantee as to their completeness or accuracy.
Matthews Asia Funds are distributed in the United States by Foreside Funds Distributors LLC, Berwyn, Pennsylvania
Matthews Asia Funds are distributed in Latin America by HMC Partners

"We focus on companies that we believe will be good stewards of capital; that allocate investments carefully and delight in creating value for shareholders..."
Message to Shareholders
from the Investment Advisor
July 2012
Dear Fellow Shareholders,
According to legend, King Midas gained the power to turn everything that he touched into gold. Delighted with this power, he touched the branch of a tree and it turned to gold. But he soon found himself unable to drink or eat as anything that touched his lips aurified instantly. His final tragedy came when, heedless of his despairing protests, his daughter embraced him and thus was transformed into a priceless, lifeless golden statue. Midas had managed to deprive his life of all value.
I see parallels in the current market environment. Cash, cash and cash—it is all that anyone seems to care about at the moment. European nations need it to pay down debt as do U.S. homeowners and China's local governments. Central banks, meanwhile, seem disinclined to increase the rate at which new cash is supplied. That is the case even in the U.S. and Europe, but it is particularly striking in Asia where central banks have been following quite a tight policy. This has all led to a scramble for cash and, as a consequence, machines idle and rust and labor languishes unemployed. At least in my view, these investors appear to be focusing on the value of cash to the extent that they lose sight of value elsewhere. Midas eventually starved for his love of gold and it is hard not to draw the conclusion that love of cash is starving the world of economic activity and starving labor of potential productivity.
Investors have also bid up prices of the "next best thing to cash"—U.S. treasuries, for example. And they have bid down prices of what are seen as riskier assets such as Asian equities. The notion of a "risk on, risk off" narrative has also added the fuel of a short-term mentality to this investment approach. It has brought valuations in Asia's markets down to levels that are below historic 20-year averages. At the end of the second quarter, a broad-based universe of Asia ex-Japan stocks was trading on about 10X forward 12-month earnings. This is about a 20% discount to that 20-year average, which has historically been an infrequent occurrence. The current Asia ex-Japan dividend yield of 2.7% is similarly infrequently seen. Given the slow drips of bad news out of the U.S. and Europe, the markets have had plenty of time to ruminate on risks to short-term and long-term growth. This is not a fast-moving crisis, and much analysis has been focused on the issues concerning investors. This means it is not something that the markets have had to try to digest quickly with no past knowledge, insight or experience. Consequently, the low valuations are based on relatively subdued forecasts for the near term. Margins are expected to decline year-over-year.
For us, it does mean that there is more value in the markets than there has been in a while. And as a portfolio manager, it is always enticing to see established, seasoned businesses offering good dividend or cash flow yields, particularly when convinced of the long-term demand for their services or products. The frustration of a portfolio manager is, of course, that at the very time when there are so many enticing options, you often don't have the cash to capture that value. At Matthews, portfolio managers witness the high value many investors place on cash—one of the things that we value least. Cash levels in the Funds reflect this. We generally remain fully invested.
2 MATTHEWS ASIA FUNDS
It is not that we don't care about cash—indeed we focus on companies that we believe will be good stewards of capital; that allocate investments carefully, and delight in creating value for shareholders or returning cash to them. As portfolio managers, we are interested in cash only to immediately put it to work, for we see a greater value in what we believe to be the underappreciated potential of Asia's 4 billion people. In the past, extreme demand for cash has often been transitory—which is not the assumption that markets seem to be making about today's world. The "new normal" and similar discussions of a loss of potential output in the global economy make sense to me only if they are a surrender to the idea that this love of cash will be much longer-lasting. Whether or not that assumption is right, it seems to be less appropriate for Asia, where the proximate cause of demand for cash may be the fact that policymakers and central banks have been following relatively tight policies. Compare this policy conservatism with the rest of the world in which one can blame the accumulation of excessive debt over years, even decades. For us, it remains a view that seems to be at odds with the broad sweep of Asia's development and also with our discussions in recent company meetings.
We are meeting companies at a faster pace this year than we did last year. This is partly because we are in the enviable position of having been able to increase our investment team's research resources over the past year and now have "more hands on the wheel." It is also because during these times, when everyone is focusing on cash, short-term trends and the macro picture, we think it is best to take a view which the market may view as contrarian.
As I mentioned in some of my previous communications, we spend a lot of time looking at India and China, particularly small-capitalization companies. But, in truth, the opportunities are quite broad-based across countries and industries. We have seen some effect of the slowdown in global growth. Nevertheless, many of the companies we visit are focused on domestic demand and are somewhat insulated from the weakness in Europe and the U.S.
The portfolios remain fully invested: biased toward businesses that we believe will grow profitably over the coming decades from the growth in spending of Asia's households, the development of new products, the enjoyment of new services and the enhanced expression of individual tastes and preferences. As such we hope to avoid King Midas's fate, to focus instead on what can be valued over the long term.
As always, it is a privilege to act as your investment advisor.

Robert Horrocks, PhD
Chief Investment Officer
Matthews International Capital Management, LLC
Shareholder Notification
Dear Valued Investor,
Beginning with the quarter ending September 30, 2012, Matthews will cease its production of the First Quarter and Third Quarter shareholder reports. The information previously contained in these reports has been and will continue to be available on matthewsasia.com.
As many of our communications are now accessed primarily online, we believe that eliminating these reports—and publishing the information online—is not only a more time-efficient means of communicating updates, but will also result in cost savings for shareholders. All elements previously contained in the First and Third Quarter reports can be found on matthewsasia.com, including:
• Message to Shareholders from the Investment Advisor
• Fund Manager Commentaries
• Performance and Expenses
• Top 10 and Portfolio Holdings
• Fund Characteristics
matthewsasia.com | 800.789.ASIA 3

ASIA FIXED INCOME STRATEGY
PORTFOLIO MANAGERS
Teresa Kong, CFA
Lead Manager
Gerald M. Hwang, CFA, Robert J. Horrocks, PhD
Co-Managers
FUND FACTS
| | | Investor Class | | Institutional Class | |
| Ticker | | MAINX | | MINCX | |
| CUSIP | | 577125503 | | 577125602 | |
| Inception | | 11/30/11 | | 11/30/11 | |
| NAV | | $10.18 | | $10.18 | |
| Initial Investment | | $2,500 | | $3 million | |
| Gross Expense Ratio1 | | 1.93% | | 1.78% | |
After fee waiver,
Reimbursement and
Recoupment | | 1.40% | | 1.25% | |
Portfolio Statistics
| Total # of Positions | | 46 | |
| Net Assets | | $23.2 million | |
| Modified Duration | | 5.1 years2 | |
| Portfolio Turnover | | 3.66%3 | |
Benchmarks
HSBC Asian Local Bond Index
J.P. Morgan Asia Credit Index
Redemption Fee
2% within first 90 calendar days of purchase
OBJECTIVE
Total return over the long term with an emphasis on income.
STRATEGY
Under normal market conditions, the Fund seeks to achieve its investment objective by investing at least 80% of its total assets, which include borrowings for investment purposes, in income-producing securities including, but not limited to, debt and debt-related instruments issued by governments, quasi-governmental entities, supra-national institutions, and companies in Asia. Investments may be denominated in any currency, and may represent any part of a company's capital structure from debt to equity or with features of both.
1 Gross annual operating expenses for the Fund for 2011 are annualized. The Advisor has contractually agreed to waive fees and reimburse expenses until August 31, 2014 to the extent needed to limit Total Annual Fund Operating Expenses to 1.25% for the Institutional Class and agreed to reduce the expense ratio by an equal amount for the Investor Class. Because certain expenses of the Investor Class may be higher than the Institutional Class, the Total Annual Fund Operating Expenses After Fee Waiver and Expense Reimbursement for the Investor Class may exceed 1.25%. The amounts of the waivers and reimbursements are based on estimated Fund expenses. The fee waiver and expense reimbursement may be terminated at any time by the Fund on 60 days' written notice. Matthews Asia Funds does not charge 12b-1 fees.
2 Modified duration measures the percent change in value of the fixed income portion of the portfolio in response to a 1% change in interest rates. In a multi-currency denominated portfolio with sensitivities to different interest rate regimes, modified duration will not accurately reflect the change in value of the overall portfolio from a change in any one interest rate regime.
3 Not annualized. The Fund commenced operations on November 30, 2011. The lesser of fiscal year 2011 long-term purchase costs or sales proceeds divided by the average monthly market value of long-term securities.
Matthews Asia Strategic Income Fund
Portfolio Manager Commentary
For the first half of 2012, the Matthews Asia Strategic Income Fund gained 4.18% (Investor Class) and 4.27% (Institutional Class) while its primary benchmark, the HSBC Asian Local Bond Index and its secondary benchmark, the J.P. Morgan Asia Credit Index, gained 2.35% and 6.68%, respectively. For the quarter ended June 30, the Fund returned 0.59% (Investor Class) and 0.64% (Institutional Class), while the indices returned –0.42% and 2.60%, respectively.
Overall, securities with consistent and sustainable cash flows did well during this period of uncertainty and low global yields. The top contributor to performance by issuer was the Republic of Philippines during the second quarter. Philippines bonds rallied on positive performance in credit, currency and interest rates. The credit spread on the U.S. dollar-denominated Republic of Philippines bonds tightened on expectations that this sovereign will be the next to be upgraded to investment grade status. The Philippine peso was the second best returning currency after the Japanese yen over the quarter with a spot return of 1.82%. The country's robust economy and continued foreign inflows sustained the strength of the peso. The policy rate remained stable at 4%, with inflation coming in lower than expected despite robust GDP growth. Local interest rates fell with greater demand for the Republic of Philippines bonds, driving up prices.
The biggest detractors to performance during the second quarter included positions denominated in Indonesian rupiah and Malaysian ringgit and the Japanese yen. The Fund's Indonesian rupiah-denominated, Indonesian Government bonds (due 2021) and Malaysian ringgit-denominated Malaysian Government bonds (due 2021) lagged due to the underperformance of these currencies relative to the U.S. dollar. Conversely, the Fund's short position in a Japanese yen currency forward underperformed due to the outperformance of the Japanese yen against the U.S. dollar.
Across global bond markets, government yields have hit historic lows. The U.S. 10-year Treasury yield reached 1.45% in June, the lowest yield since the founding of the New York Stock Exchange in 1792. At the same time, yields for Hong Kong and Singapore government bonds also hit multi-decade lows of 0.97% and 1.40%, respectively. This leads us to conclude that central banks are willing to keep interest rates low so capital remains cheap in order to re-start growth. It is at times like this when investors seem to have an insatiable appetite for assets considered "risk-free." We believe a contrarian approach is appropriate. Hence, we have adjusted the portfolio's credit, currency and interest rate positioning.
First on credit, we want to highlight the Fund's increased exposure to Chinese property. Chinese property is going through a perfect storm on three fronts: A slowdown in exports driven by the recession in Europe and slow recovery in the U.S.; the oversupply of residential property driven by China's stimulus in 2008—2009; and uncertainty stemming from China's once in a decade power transition. While the problems in Europe and the U.S. are persistent, we see China's housing oversupply and political issues as temporary in nature and may already be on the mend. While the property sector as a whole still faces challenges, we are finding value in solid companies whose bonds have priced in much of the downside. Specifically, we like developers with large shares in their local markets, strong balance sheets and access to capital. We believe these developers are likely going to gain market share at the detriment of
(continued)
4 MATTHEWS ASIA FUNDS
PERFORMANCE AS OF JUNE 30, 2012
| | | Actual Return,
Not Annualized | | | |
| | | 3 Months | | Since
Inception | | Inception
Date | |
| Investor Class (MAINX) | | | 0.59 | % | | | 3.64 | % | | 11/30/11 | |
| Institutional Class (MINCX) | | | 0.64 | % | | | 3.73 | % | | 11/30/11 | |
| HSBC Asian Local Bond Index4 | | | -0.42 | % | | | 3.13 | % | | | | | |
| J.P. Morgan Asia Credit Index4 | | | 2.60 | % | | | 7.63 | % | | | | | |
| Lipper Emerging Market Debt Category Average5 | | | -0.07 | % | | | 6.83 | % | | | | | |
Performance assumes reinvestment of all dividends and/or distributions before taxes. All performance quoted represents past performance and is no guarantee of future results. Investment return and principal value will fluctuate with market conditions so that when redeemed, shares may be worth more or less than their original cost. Current performance may be lower or higher than the return figures quoted. Returns would have been lower if certain of the Fund's fees and expenses had not been waived. For the Fund's most recent month-end performance visit matthewsasia.com.
The performance data does not reflect the deduction of taxes that a shareholder would pay on dividends, capital gains distributions or redemption of Fund shares. Values are in US$.
4 It is not possible to invest directly in an index. Source: Index data from HSBC and J.P. Morgan; total return calculations performed by BNY Mellon Investment Servicing (US) Inc. Please see page 69 for index definition.
5 The Lipper Category Average does not reflect sales charges and is based on total return, including reinvestment of dividends and capital gains for the stated periods.
INCOME DISTRIBUTION HISTORY
| | | 2012 | | 2011 | |
| | | Q1 | | Q2 | | Q3 | | Q4 | | Total | | Q1 | | Q2 | | Q3 | | Q4 | | Total | |
| Investor Class (MAINX) | | $ | 0.09 | | | $ | 0.07 | | | | n.a. | | | | n.a. | | | | n.a. | | | | n.a. | | | | n.a. | | | | n.a. | | | $ | 0.02 | | | $ | 0.02 | | |
| Institutional Class (MINCX) | | $ | 0.10 | | | $ | 0.07 | | | | n.a. | | | | n.a. | | | | n.a. | | | | n.a. | | | | n.a. | | | | n.a. | | | $ | 0.02 | | | $ | 0.02 | | |
Note: This table does not include capital gains distributions. For income distribution history, visit matthewsasia.com.
30-DAY YIELD:
3.87% (Investor Class) 4.02% (Institutional Class)
The 30-Day Yield represents net investment income earned by the Fund over the 30-day period ended 6/30/12, expressed as an annual percentage rate based on the Fund's share price at the end of the 30-day period. The 30-Day Yield should be regarded as an estimate of the Fund's rate of investment income, and it may not equal the Fund's actual income distribution rate.
Source: BNY Mellon Investment Servicing (US) Inc
YIELD TO WORST:
4.93%
Yield to worst is the lowest yield that can be received on a bond assuming that the issuer does not default. It is calculated by utilizing the worst case assumptions for a bond with respect to certain income-reducing factors, including prepayment, call or sinking fund provisions. It does not represent the yield that an investor should expect to receive. Past yields are no guarantee of future yields.
Source: FactSet Research Systems
TOP TEN POSITIONS6
| | | Sector | | Currency | | % Net Assets | |
| Malaysian Government Bond, 4.160%, 7/15/2021 | | Government Bonds | | Malaysian Ringgit | | | 7.1 | % | |
| Indonesia Government Bond, 8.250%, 7/15/2021 | | Government Bonds | | Indonesian Rupiah | | | 4.7 | % | |
| Korea Treasury Bond, 3.500%, 9/10/2016 | | Government Bonds | | Korean Won | | | 3.8 | % | |
| Longfor Properties Co., Ltd., 9.500%, 4/7/2016 | | Financials | | U.S. Dollar | | | 3.4 | % | |
| Melco Crown Entertainment, Ltd., 3.750%, 5/9/2013 | | Consumer Discretionary | | Chinese Renminbi | | | 3.3 | % | |
| Republic of Philippines, 6.250%, 1/14/2036 | | Government Bonds | | Philippine Peso | | | 3.3 | % | |
| KWG Property Holding, Ltd., 12.500%, 8/18/2017 | | Financials | | U.S. Dollar | | | 3.1 | % | |
| Galaxy Entertainment Group, Ltd., 4.625%, 12/16/2013 | | Consumer Discretionary | | Chinese Renminbi | | | 3.1 | % | |
| Axiata SPV1 Labuan, Ltd., 5.375%, 4/28/2020 | | Telecommunication Services | | U.S. Dollar | | | 3.0 | % | |
| Global Logistic Properties, Ltd., 3.375%, 5/11/2016 | | Financials | | Chinese Renminbi | | | 3.0 | % | |
| % OF ASSETS IN TOP TEN | | | | | | | 37.8 | % | |
6 Holdings may combine more than one security from same issuer and related depositary receipts.
CURRENCY ALLOCATION (%)7,8
| U.S. Dollar (USD) | | | 44.1 | | |
| Chinese Renminbi (CNY) | | | 11.4 | | |
| Korean Won (KRW) | | | 8.9 | | |
| Malaysian Ringgit (MYR) | | | 8.5 | | |
| Philippine Peso (PHP) | | | 6.1 | | |
| Singapore Dollar (SGD) | | | 5.3 | | |
| Indonesian Rupiah (IDR) | | | 4.7 | | |
| Thai Baht (THB) | | | 3.4 | | |
| Hong Kong Dollar (HKD) | | | 2.7 | | |
| Cash and Other Assets, Less Liabilities | | | 4.9 | | |
7 Source: FactSet Research Systems. Percentage values in data are rounded to the nearest tenth of one percent; the values may not sum to 100% due to rounding.
8 Cash and other assets may include forward currency exchange contracts and certain derivative instruments that have been marked-to-market.
COUNTRY ALLOCATION (%)8
(By issuer's country of risk)
| China/Hong Kong | | | 27.7 | | |
| Philippines | | | 14.7 | | |
| South Korea | | | 12.5 | | |
| Malaysia | | | 11.5 | | |
| Indonesia | | | 9.8 | | |
| Thailand | | | 7.1 | | |
| Singapore | | | 6.6 | | |
| Australia | | | 2.6 | | |
| Sri Lanka | | | 1.6 | | |
| Japan | | | 1.0 | | |
| Cash And Other Assets, Less Liabilities | | | 4.9 | | |
matthewsasia.com | 800.789.ASIA 5
SECTOR ALLOCATION (%)9
| Government Bonds | | | 34.9 | | |
| Financials | | | 28.7 | | |
| Consumer Discretionary | | | 8.6 | | |
| Industrials | | | 8.2 | | |
| Telecommunication Services | | | 5.0 | | |
| Energy | | | 4.9 | | |
| Utilities | | | 3.2 | | |
| Information Technology | | | 1.6 | | |
Cash and Other Assets,
Less Liabilities | | | 4.9 | | |
ASSET TYPE BREAKDOWN (%)9,10
| Corporate Bonds | | | 53.4 | | |
| Government Bonds | | | 34.9 | | |
| Common Equities and ADRs | | | 6.8 | | |
Cash and Other Assets,
Less Liabilities | | | 4.9 | | |
9 Cash and other assets may include forward currency exchange contracts and certain derivative instruments that have been marked-to-market.
10 Source: FactSet Research Systems. Percentage values in data are rounded to the nearest tenth of one percent; the values may not sum to 100% due to rounding.
Matthews Asia Strategic Income Fund
Portfolio Manager Commentary (continued)
smaller players who are over-leveraged or do not have the balance sheets to ride out this downturn.
Second, in terms of our currency exposure, on the margin, we have found more interesting opportunities in U.S. dollar-denominated Asian corporate bonds. Our U.S. dollar exposure is approximately 5% higher than it was at the end of the first quarter and is about 10% higher than it was at the end of 2011. During the quarter, we reduced the portfolio's exposure to the Indonesian rupiah (by selling rupiah-denominated Indonesian Government bonds) given the country's overly loose monetary policy and increasingly protectionist policies that could depress foreign interest going forward. These policies include limiting participation of foreign banks in Indonesia's foreign exchange market, as well as potential limitations on foreign ownership of Indonesian banks.
Finally, in terms of interest rate exposure, we moderated our exposure to Indonesia given our view that interest rates were much more likely to rise than fall. We saw the long end of the yield curve as being especially vulnerable given the relative flatness of the curve. As such, we sold our long-dated Indonesian Government bonds. We believe shorter-term rates are relatively anchored since we don't anticipate Bank Indonesia lowering or raising rates in the medium term.
As always, we will continue to focus on valuations. We believe the market is overly focused on macro events and outcomes rather than security selection, leaving certain issues undervalued. Accordingly, we anticipate taking positions in securities where our own views may differ from implied market expectations of the securities' credit, currency and interest rates.
Fixed income investments are subject to additional risks, including, but not limited to, interest rate, credit and inflation risks. Investing in emerging markets involves different and greater risks, as these countries are substantially smaller, less liquid and more volatile than securities markets in more developed markets.
6 MATTHEWS ASIA FUNDS
Matthews Asia Strategic Income Fund June 30, 2012
Schedule of Investmentsa (unaudited)
FOREIGN GOVERNMENT OBLIGATIONS: 34.9%
| | | Face Amount* | | Value | |
| SOUTH KOREA: 8.9% | |
Korea Treasury Bond
3.500%, 09/10/16 | | KRW | 1,000,000,000 | | | $ | 875,701 | | |
Korea Treasury Bond
5.750%, 09/10/18 | | KRW | 500,000,000 | | | | 489,742 | | |
Korea Treasury Bond
3.250%, 12/10/14 | | KRW | 500,000,000 | | | | 436,138 | | |
Korea Treasury Bond
4.000%, 09/10/15 | | KRW | 300,000,000 | | | | 266,846 | | |
| Total South Korea | | | | | 2,068,427 | | |
| MALAYSIA: 8.5% | |
Malaysian Government Bond
4.160%, 07/15/21 | | MYR | 5,000,000 | | | | 1,655,390 | | |
Malaysian Government Bond
3.580%, 09/28/18 | | MYR | 1,000,000 | | | | 318,904 | | |
| Total Malaysia | | | | | 1,974,294 | | |
| PHILIPPINES: 7.9% | |
Republic of Philippines
6.250%, 01/14/36 | | PHP | 30,000,000 | | | | 759,167 | | |
Republic of Philippines
6.375%, 01/15/32 | | | 500,000 | | | | 631,250 | | |
Republic of Philippines
4.950%, 01/15/21 | | PHP | 18,000,000 | | | | 445,087 | | |
| Total Philippines | | | | | 1,835,504 | | |
| INDONESIA: 6.0% | |
Indonesia Government Bond
8.250%, 07/15/21 | | IDR | 9,000,000,000 | | | | 1,094,037 | | |
Republic of Indonesia
5.875%, 03/13/20 | | | 250,000 | | | | 288,125 | | |
| Total Indonesia | | | | | 1,382,162 | | |
| THAILAND: 2.0% | |
Thailand Government Bond
4.250%, 03/13/13 | | THB | 15,000,000 | | | | 475,884 | | |
| Total Thailand | | | | | 475,884 | | |
| SRI LANKA: 1.6% | |
Republic of Sri Lanka
7.400%, 01/22/15 | | | 350,000 | | | | 374,500 | | |
| Total Sri Lanka | | | | | 374,500 | | |
| TOTAL FOREIGN GOVERNMENT OBLIGATIONS | | | | | 8,110,771 | | |
| (Cost $8,094,663) | | | | | | | |
CORPORATE BONDS: 53.4%
| | | Face Amount* | | Value | |
| CHINA/HONG KONG: 25.0% | |
Longfor Properties Co., Ltd.
9.500%, 04/07/16 | | | 750,000 | | | $ | 783,750 | | |
Melco Crown Entertainment, Ltd.
3.750%, 05/09/13 | | CNY | 5,000,000 | | | | 777,925 | | |
KWG Property Holding, Ltd.
12.500%, 08/18/17 | | | 750,000 | | | | 726,039 | | |
Galaxy Entertainment Group, Ltd.
4.625%, 12/16/13 | | CNY | 4,500,000 | | | | 708,895 | | |
FPT Finance, Ltd.
6.375%, 09/28/20 | | | 550,000 | | | | 573,312 | | |
Hutchison Whampoa International 11, Ltd.
4.625%, 01/13/22b | | | 500,000 | | | | 524,540 | | |
Standard Chartered Bank Hong Kong, Ltd.
4.150%c, 10/27/21 | | SGD | 500,000 | | | | 406,627 | | |
Wharf Finance No. 1, Ltd.
4.500%, 07/20/21 | | SGD | 500,000 | | | | 392,801 | | |
Tencent Holdings, Ltd.
4.625%, 12/12/16b | | | 350,000 | | | | 361,389 | | |
Fita International, Ltd.
7.000%, 02/10/20 | | | 300,000 | | | | 312,217 | | |
Beijing Enterprises Water Group, Ltd.
3.750%, 06/30/14 | | CNY | 1,500,000 | | | | 234,165 | | |
| Total China/Hong Kong | | | | | 5,801,660 | | |
| PHILIPPINES: 5.9% | |
Alliance Global Group, Inc.
6.500%, 08/18/17 | | | 550,000 | | | | 579,958 | | |
SM Investments Corp.
5.500%, 10/13/17 | | | 500,000 | | | | 507,002 | | |
International Container Terminal Services, Inc.
7.375%, 03/17/20 | | | 250,000 | | | | 276,929 | | |
| Total Philippines | | | | | 1,363,889 | | |
| SINGAPORE: 4.7% | |
Global Logistic Properties, Ltd.
3.375%, 05/11/16 | | CNY | 4,500,000 | | | | 687,924 | | |
Oversea-Chinese Banking Corp., Ltd.
3.750%c, 11/15/22 | | | 400,000 | | | | 401,941 | | |
| Total Singapore | | | | | 1,089,865 | | |
| THAILAND: 3.8% | |
Bangkok Bank Public Co., Ltd.
9.025%, 03/15/29 | | | 500,000 | | | | 612,500 | | |
PTTEP Canada International Finance, Ltd.
5.692%, 04/05/21b | | | 250,000 | | | | 266,680 | | |
| Total Thailand | | | | | 879,180 | | |
| INDONESIA: 3.8% | |
PT Berau Coal Energy
7.250%, 03/13/17b | | | 400,000 | | | | 389,000 | | |
PT Adaro Indonesia
7.625%, 10/22/19b | | | 250,000 | | | | 265,000 | | |
Berau Capital Resources Pte., Ltd.
12.500%, 07/08/15 | | | 200,000 | | | | 220,000 | | |
| Total Indonesia | | | | | 874,000 | | |
matthewsasia.com | 800.789.ASIA 7
Matthews Asia Strategic Income Fund June 30, 2012
Schedule of Investmentsa (unaudited) (continued)
CORPORATE BONDS (continued)
| | | Face Amount* | | Value | |
| SOUTH KOREA: 3.6% | |
Kia Motors Corp.
3.625%, 06/14/16 | | | 500,000 | | | $ | 513,385 | | |
Korea Hydro & Nuclear Power Co., Ltd.
4.750%, 07/13/21 | | | 300,000 | | | | 326,133 | | |
| Total South Korea | | | | | 839,518 | | |
| MALAYSIA: 3.0% | |
Axiata SPV1 Labuan, Ltd.
5.375%, 04/28/20 | | | 650,000 | | | | 705,871 | | |
| Total Malaysia | | | | | 705,871 | | |
| AUSTRALIA: 2.6% | |
Macquarie Bank, Ltd.
6.625%, 04/07/21 | | | 600,000 | | | | 602,001 | | |
| Total Australia | | | | | 602,001 | | |
| JAPAN: 1.0% | |
ORIX Corp.
4.000%, 11/29/14 | | CNY | 1,500,000 | | | | 234,839 | | |
| Total Japan | | | | | 234,839 | | |
| TOTAL CORPORATE BONDS | | | | | 12,390,823 | | |
| (Cost $12,242,828) | | | | | |
COMMON EQUITIES: 6.8%
| | | Shares | | | |
| CHINA/HONG KONG: 2.7% | |
| The Link REIT | | | 55,000 | | | | 225,437 | | |
| HSBC Holdings PLC | | | 24,000 | | | | 212,330 | | |
| Power Assets Holdings, Ltd. | | | 25,000 | | | | 187,605 | | |
| Total China/Hong Kong | | | | | 625,372 | | |
| SINGAPORE: 1.9% | |
| StarHub, Ltd. | | | 90,000 | | | | 243,939 | | |
| Ascendas REIT | | | 110,000 | | | | 187,654 | | |
| Total Singapore | | | | | 431,593 | | |
| THAILAND: 1.3% | |
| Kasikornbank Public Co., Ltd. | | | 60,000 | | | | 309,371 | | |
| Total Thailand | | | | | 309,371 | | |
| | | Shares | | Value | |
| PHILIPPINES: 0.9% | |
| Globe Telecom, Inc. | | | 8,000 | | | $ | 212,495 | | |
| Total Philippines | | | | | 212,495 | | |
| TOTAL COMMON EQUITIES | | | | | 1,578,831 | | |
| (Cost $1,423,659) | | | |
| TOTAL INVESTMENTS: 95.1% | | | | | 22,080,425 | | |
| (Cost $21,761,150d) | |
CASH AND OTHER ASSETS,
LESS LIABILITIES: 4.9% | | | | | 1,147,620 | | |
| NET ASSETS: 100.0% | | | | $ | 23,228,045 | | |
a Certain securities were fair valued under the discretion of the Board of Trustees (Note 2-A).
b Security exempt from registration under Rule 144A of the Securities Act of 1933, as amended. The security may be resold in transactions exempt from registration normally to qualified institutional buyers. The security has been determined to be liquid in accordance with procedures adopted by the Fund's Board of Directors.
c Variable rate security. The rate represents the rate in effect at June 30, 2012.
d Cost for federal income tax purposes is $21,761,150 and net unrealized appreciation consists of:
| Gross unrealized appreciation | | $ | 484,699 | | |
| Gross unrealized depreciation | | | (165,424 | ) | |
| Net unrealized appreciation | | $ | 319,275 | | |
* All values are in USD unless otherwise noted.
CNY Chinese Renminbi (Yuan)
IDR Indonesian Rupiah
JPY Japanese Yen
KRW Korean Won
MYR Malaysian Ringgit
PHP Philippine Peso
REIT Real Estate Investment Trust
SGD Singapore Dollar
THB Thai Baht
USD U.S. Dollar
FORWARD FOREIGN CURRENCY EXCHANGE CONTRACTS:
| | | Currency Purchased | | Currency Sold | | Counterparty | | Settlement Date | | Unrealized
Appreciation | |
| LONG | | SGD | 1,000,000 | | | USD | 776,072 | | | Brown Brothers Harriman | | 09/05/12 | | $ | 13,397 | | |
| SHORT | | USD | 776,072 | | | JPY | 60,927,861 | | | Brown Brothers Harriman | | 09/05/12 | | $ | 13,116 | | |
FINANCIAL FUTURES CONTRACTS SOLD AS OF JUNE 30, 2012 WERE AS FOLLOWS:
| Contracts | | Issue | | Exchange | | Expiration | | Notional Value | | Unrealized
Appreciation | |
| | 10 | | | U.S. Treasury Notes (10 Year) | | Chicago Board of Trade | | September, 2012 | | $ | 1,333,750 | | | $ | 7,525 | | |
See accompanying notes to financial statements.
8 MATTHEWS ASIA FUNDS

ASIA GROWTH AND INCOME STRATEGIES
PORTFOLIO MANAGERS
Robert J. Horrocks, PhD
Lead Manager
Kenneth Lowe, CFA
Co-Manager
FUND FACTS
| | | Investor Class | | Institutional Class | |
| Ticker | | MACSX | | MICSX | |
| CUSIP | | 577130206 | | 577130842 | |
| Inception | | 9/12/94 | | 10/29/10 | |
| NAV | | $16.30 | | $16.30 | |
| Initial Investment | | $2,500 | | $3 million | |
| Gross Expense Ratio1 | | 1.12% | | 0.99% | |
Portfolio Statistics
| Total # of Positions | | 67 | |
| Net Assets | | $3.3 billion | |
| Weighted Average Market Cap | | $26.1 billion | |
| Portfolio Turnover | | 16.54%2 | |
Benchmark
MSCI AC Asia ex Japan Index
Redemption Fee
2% within first 90 calendar days of purchase
OBJECTIVE
Long-term capital appreciation. The Fund also seeks to provide some current income.
STRATEGY
Under normal market conditions, the Fund seeks to achieve its investment objective by investing at least 80% of its total net assets, which include borrowings for investment purposes, in dividend-paying common stock, preferred stock and other equity securities, and convertible securities as well as fixed-income securities, of any duration or quality, of companies located in Asia, including developed, emerging and frontier countries and markets in the Asian region.
1 Matthews Asia Funds does not charge 12b-1 fees.
2 The lesser of fiscal year 2011 long-term purchase costs or sales proceeds divided by the average monthly market value of long-term securities.
Matthews Asian Growth and Income Fund
Portfolio Manager Commentary
For the first half of 2012, the Matthews Asian Growth and Income Fund gained 9.51% (Investor Class) and 9.67% (Institutional Class), outperforming its benchmark, the MSCI All Country Asia ex Japan Index, which returned 6.10%. While Asia's stock markets declined in the second quarter, the Fund was able to outperform in this environment. For the quarter ended June 30, the Fund fell –1.35% (Investor Class) and –1.28% (Institutional Class), while its benchmark returned –6.74%.
Detractors to Fund performance over the quarter included, perhaps not surprisingly, the more cyclical industries such as energy, materials and industrials. Contributors to performance included telecommunications businesses, broadcast media, health care companies and some select consumer businesses. We believe the divergences in performance were mainly due to marginal investors taking a very short-term view of profits and trying to guess the course of major macroeconomic events for the remainder of the year.
We continue to evaluate new opportunities with the same philosophy as in the past. The strategy has sought downside protection with some participation on the upside—or what we sometimes refer to as "optionality" in the securities we own. This can be found through the type of security purchased, such as a convertible bond; by the kind of business purchased; or by taking advantage of valuations (particularly dividend yield) and what we see as perverse market sentiment. More recently, we have focused on identifying gaps between what we judge to be short-term market sentiment and our longer-term view of the world.
Starting with convertible bonds, we added to our position in the long-dated convertible bond of an Australian-based insurer, QBE Funding Trust. The bond offers a U.S. dollar yield to put of about 3%—the annualized yield should investors decide to sell back to the company at the next available call date. In addition, since the maturity date for the bond is May 2030, we stand to benefit from any improvement in the underlying business, which has been depressed now for five years. We exited smaller convertible bond positions that had less attractive risk-return profiles.
During the quarter, we also exited two relatively volatile equity positions—one was a Japanese manufacturer of photonics equipment and the other an Australian retailer. Shedding these positions allowed us to add a new position in BHP Billiton, an Australian-based natural resource giant. Typically, the energy and materials sectors have not held major weightings in the Fund. However, BHP is a large, dominant company in control of assets for which there should be long-term demand and its common stock was yielding close to 4% at the end of the second quarter, an attractive yield for this portfolio. BHP management has also postponed some capital expenditure and its CEO has announced: "We are not in the commodity business; we are in the shareholder return business." We wholeheartedly embrace the sentiments behind his comments.
We also added two holdings with long histories in Asia: AIA Group, a regional insurance company founded in 1919 and Jardine Matheson Holdings, a conglomerate that was founded in the 1800s. AIA has a leading position in developed markets such as Hong Kong and Singapore and a footprint in Asia's developing markets. Besides its long history in the region, AIA also exhibits an impressive professionalism and focus on
(continued)
matthewsasia.com | 800.789.ASIA 9
PERFORMANCE AS OF JUNE 30, 2012
| | | | | Average Annual Total Returns | | | |
| | | 3 Months | | 1 Year | | 3 Years | | 5 Years | | 10 Years | | Since
Inception | | Inception
Date | |
| Investor Class (MACSX) | | | -1.35 | % | | | -3.68 | % | | | 11.46 | % | | | 4.08 | % | | | 12.33 | % | | | 10.49 | % | | 9/12/94 | |
| Institutional Class (MICSX) | | | -1.28 | % | | | -3.55 | % | | | n.a. | | | | n.a. | | | | n.a. | | | | 0.33 | % | | 10/29/10 | |
| MSCI AC Asia ex Japan Index3 | | | -6.74 | % | | | -13.15 | % | | | 10.25 | % | | | 0.82 | % | | | 11.78 | % | | | 3.42 | %4 | | | |
| Lipper Pacific Region Funds Category Average5 | | | -5.56 | % | | | -9.80 | % | | | 7.39 | % | | | -3.10 | % | | | 7.37 | % | | | 3.12 | %4 | | | |
Performance assumes reinvestment of all dividends and/or distributions before taxes. All performance quoted represents past performance and is no guarantee of future results. Investment return and principal value will fluctuate with market conditions so that when redeemed, shares may be worth more or less than their original cost. Current performance may be lower or higher than the return figures quoted. Returns would have been lower if certain of the Fund's fees and expenses had not been waived. For the Fund's most recent month-end performance, visit matthewsasia.com.
INCOME DISTRIBUTION HISTORY
| | | 2012 | | 2011 | |
| | | June | | December | | Total | | June | | December | | Total | |
| Investor Class (MACSX) | | $ | 0.20 | | | n.a | | n.a | | $ | 0.27 | | | $ | 0.21 | | | $ | 0.48 | | |
| Institutional Class (MICSX) | | $ | 0.21 | | | n.a | | n.a | | $ | 0.28 | | | $ | 0.22 | | | $ | 0.50 | | |
Note: This table does not include capital gains distributions. Institutional Class Shares were first offered on October 29, 2010. For income distribution history, visit matthewsasia.com.
30-DAY YIELD:
2.91% (Investor Class) 3.07% (Institutional Class)
The 30-Day Yield represents net investment income earned by the Fund over the 30-day period ended 6/30/12, expressed as an annual percentage rate based on the Fund's share price at the end of the 30-day period. The 30-Day Yield should be regarded as an estimate of the Fund's rate of investment income, and it may not equal the Fund's actual income distribution rate.
Source: BNY Mellon Investment Servicing (US) Inc.
DIVIDEND YIELD: 3.43%
The dividend yield (trailing) for the portfolio is the weighted average sum of the dividend paid per share during the last 12 months divided by the current price. The annualized dividend yield for the Fund is for the equity-only portion of the portfolio. Please note that this is based on gross portfolio holdings and does not reflect the actual yield an investor in the Fund would receive. Past yields are no guarantee of future yields.
Source: FactSet Research Systems, Bloomberg, MICM
GROWTH OF A $10,000 INVESTMENT SINCE INCEPTION—INVESTOR CLASS
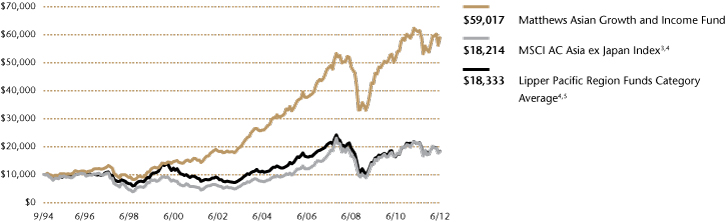
Plotted monthly. The performance data and graph do not reflect the deduction of taxes that a shareholder would pay on dividends, capital gains distributions or redemption of Fund shares. Values are in US$.
3 It is not possible to invest directly in an index. Source: Index data from Morgan Stanley Capital International and Bloomberg; total return calculations performed by BNY Mellon Investment Servicing (US) Inc. Please see page 69 for index definition.
4 Calculated from 8/31/94.
5 The Lipper Category Average does not reflect sales charges and is based on total return, including reinvestment of dividends and capital gains for the stated periods.
TOP TEN HOLDINGS6
| | | Sector | | Country | | % Net Assets | |
| Singapore Technologies Engineering, Ltd. | | Industrials | | Singapore | | | 3.9 | % | |
| Telstra Corp., Ltd. | | Telecommunication Services | | Australia | | | 3.6 | % | |
| Taiwan Semiconductor Manufacturing Co., Ltd. | | Information Technology | | Taiwan | | | 3.3 | % | |
| China Petroleum & Chemical Corp. (Sinopec), Cnv., 0.000%, 4/24/2014 | | Energy | | China/Hong Kong | | | 3.1 | % | |
| CLP Holdings, Ltd. | | Utilities | | China/Hong Kong | | | 3.1 | % | |
| HSBC Holdings PLC | | Financials | | China/Hong Kong | | | 3.0 | % | |
| Hisamitsu Pharmaceutical Co., Inc. | | Health Care | | Japan | | | 3.0 | % | |
| Ascendas REIT | | Financials | | Singapore | | | 2.8 | % | |
| PTT Public Co., Ltd. | | Energy | | Thailand | | | 2.7 | % | |
| AMMB Holdings BHD | | Financials | | Malaysia | | | 2.4 | % | |
| % OF ASSETS IN TOP TEN | | | | | | | 30.9 | % | |
6 Holdings may combine more than one security from same issuer and related depositary receipts.
10 MATTHEWS ASIA FUNDS
Matthews Asian Growth and Income Fund
Portfolio Manager Commentary (continued)
maintaining this competitive advantage over the long term. Whilst the absolute yield of the equity is not high—forecasts for the next 12 months suggest yield just short of 1.5%, that yield is growing due to careful management of the firm's capital and the breadth and quality of the franchise offers some protection from market volatility.
Focused traditionally on China, Jardine Matheson Holdings has more recently expanded into the fast-growing Indonesian economy and its businesses span across several industries including consumer staples, leisure, real estate, motor distribution and logistics. The common stock enjoys a dividend yield of about 2.4% and a free cash flow yield of about 7.4%. The company has been able to navigate Asia's political and financial upheavals throughout nearly two centuries. Its management has proven itself to be careful stewards of capital and we expect this to continue.
Undoubtedly, there are still risks in the markets—not least, the continued slowdown in China due to the determination of authorities to try to prevent a real estate bubble. Fumbles in Western economic policy still affect sentiment toward Asian markets. However, we approach the future with optimism, as we see opportunities to buy compelling business in various sectors at attractive valuations.
COUNTRY ALLOCATION (%)7
| China/Hong Kong | | | 26.8 | | |
| Singapore | | | 18.9 | | |
| Australia | | | 9.4 | | |
| Thailand | | | 7.8 | | |
| Japan | | | 6.3 | | |
| South Korea | | | 5.9 | | |
| India | | | 5.5 | | |
| Taiwan | | | 5.3 | | |
| Malaysia | | | 5.1 | | |
| Indonesia | | | 2.9 | | |
| United Kingdom | | | 1.9 | | |
| Philippines | | | 1.7 | | |
| Vietnam | | | 1.2 | | |
Cash and Other Assets,
Less Liabilities | | | 1.3 | | |
SECTOR ALLOCATION (%)
| Financials | | | 29.7 | | |
| Telecommunication Services | | | 14.7 | | |
| Industrials | | | 14.2 | | |
| Utilities | | | 7.7 | | |
| Energy | | | 6.9 | | |
| Health Care | | | 6.7 | | |
| Consumer Discretionary | | | 6.3 | | |
| Consumer Staples | | | 5.3 | | |
| Information Technology | | | 4.6 | | |
| Materials | | | 2.6 | | |
Cash and Other Assets,
Less Liabilities | | | 1.3 | | |
MARKET CAP EXPOSURE (%)8
| Large Cap (over $5B) | | | 68.6 | | |
| Mid Cap ($1B–$5B) | | | 23.9 | | |
| Small Cap (under $1B) | | | 6.2 | | |
Cash and Other Assets,
Less Liabilities | | | 1.3 | | |
ASSET TYPE BREAKDOWN (%)9
| Common Equities | | | 80.4 | | |
| Convertible Bonds | | | 15.0 | | |
| Preferred Equities | | | 3.1 | | |
| Corporate Bonds | | | 0.2 | | |
Cash and Other Assets,
Less Liabilities | | | 1.3 | | |
7 Australia, United Kingdom and Japan are not included in the MSCI All Country Asia ex Japan Index.
8 Source: FactSet Research Systems. Percentage values in data are rounded to the nearest tenth of one percent; the values may not sum to 100% due to rounding.
9 Bonds are not included in the MSCI All Country Asia ex Japan Index.
matthewsasia.com | 800.789.ASIA 11
Matthews Asian Growth and Income Fund June 30, 2012
Schedule of Investmentsa (unaudited)
COMMON EQUITIES: 80.4%
| | | Shares | | Value | |
| CHINA/HONG KONG: 22.0% | |
| CLP Holdings, Ltd. | | | 11,771,700 | | | $ | 100,045,971 | | |
| HSBC Holdings PLC ADR | | | 2,230,333 | | | | 98,424,595 | | |
| AIA Group, Ltd. | | | 19,459,600 | | | | 67,214,617 | | |
China Pacific Insurance Group Co., Ltd.
H Shares | | | 20,355,800 | | | | 66,428,693 | | |
| Hang Lung Properties, Ltd. | | | 19,139,920 | | | | 65,470,376 | | |
| Television Broadcasts, Ltd. | | | 8,897,000 | | | | 62,021,468 | | |
| China Mobile, Ltd. ADR | | | 905,500 | | | | 49,503,685 | | |
Shandong Weigao Group Medical
Polymer Co., Ltd. H Shares | | | 43,012,000 | | | | 48,013,455 | | |
| Vitasoy International Holdings, Ltd.† | | | 51,771,000 | | | | 43,506,325 | | |
| VTech Holdings, Ltd. | | | 3,405,300 | | | | 40,675,652 | | |
| Jardine Matheson Holdings, Ltd. | | | 736,000 | | | | 35,850,779 | | |
Citic Telecom International
Holdings, Ltd.† | | | 132,231,000 | | | | 24,130,131 | | |
| Cafe' de Coral Holdings, Ltd. | | | 6,726,000 | | | | 17,995,324 | | |
| I-CABLE Communications, Ltd.b | | | 2,870,000 | | | | 138,360 | | |
| Total China/Hong Kong | | | | | 719,419,431 | | |
| SINGAPORE: 14.6% | |
Singapore Technologies
Engineering, Ltd. | | | 52,104,125 | | | | 128,450,746 | | |
| Ascendas REIT | | | 53,925,000 | | | | 91,993,304 | | |
| Keppel Corp., Ltd. | | | 8,415,900 | | | | 68,947,418 | | |
| United Overseas Bank, Ltd. | | | 3,861,000 | | | | 57,334,053 | | |
| SIA Engineering Co., Ltd. | | | 10,768,000 | | | | 34,038,381 | | |
| Cerebos Pacific, Ltd. | | | 7,740,000 | | | | 32,342,880 | | |
| ARA Asset Management, Ltd. | | | 28,381,100 | | | | 32,133,029 | | |
| Singapore Post, Ltd. | | | 38,209,000 | | | | 31,880,558 | | |
| Total Singapore | | | | | 477,120,369 | | |
| THAILAND: 7.8% | |
| PTT Public Co., Ltd. | | | 8,719,200 | | | | 89,316,850 | | |
| BEC World Public Co., Ltd. | | | 30,807,800 | | | | 49,373,261 | | |
| Glow Energy Public Co., Ltd. | | | 21,887,400 | | | | 42,986,711 | | |
| Land & Houses Public Co., Ltd. NVDR | | | 145,090,300 | | | | 36,019,558 | | |
| Banpu Public Co., Ltd. | | | 2,480,250 | | | | 35,253,914 | | |
| Total Thailand | | | | | 252,950,294 | | |
| AUSTRALIA: 7.4% | |
| Telstra Corp., Ltd. | | | 31,377,088 | | | | 118,885,252 | | |
| CSL, Ltd. | | | 1,758,532 | | | | 71,329,094 | | |
| Macquarie Group, Ltd. | | | 1,879,326 | | | | 50,749,103 | | |
| Total Australia | | | | | 240,963,449 | | |
| JAPAN: 6.3% | |
| Hisamitsu Pharmaceutical Co., Inc. | | | 1,983,600 | | | | 97,622,058 | | |
| Japan Real Estate Investment Corp., REIT | | | 7,889 | | | | 72,332,312 | | |
| NTT DoCoMo, Inc. | | | 22,250 | | | | 37,024,057 | | |
| Total Japan | | | | | 206,978,427 | | |
| | | Shares | | Value | |
| TAIWAN: 5.3% | |
Taiwan Semiconductor
Manufacturing Co., Ltd.b | | | 20,673,187 | | | $ | 56,592,193 | | |
Taiwan Semiconductor
Manufacturing Co., Ltd. ADRb | | | 3,558,724 | | | | 49,679,787 | | |
| Chunghwa Telecom Co., Ltd. ADR | | | 1,277,525 | | | | 40,152,611 | | |
| Taiwan Hon Chuan Enterprise Co., Ltd. | | | 9,901,193 | | | | 22,303,528 | | |
| CyberLink Corp. | | | 1,146,770 | | | | 3,346,798 | | |
| Total Taiwan | | | | | 172,074,917 | | |
| MALAYSIA: 5.1% | |
| AMMB Holdings BHD | | | 40,175,100 | | | | 79,985,252 | | |
| Axiata Group BHD | | | 29,634,423 | | | | 51,298,507 | | |
| Telekom Malaysia BHD | | | 20,245,551 | | | | 36,189,871 | | |
| Total Malaysia | | | | | 167,473,630 | | |
| INDONESIA: 2.9% | |
| PT Perusahaan Gas Negara Persero | | | 141,686,000 | | | | 53,640,056 | | |
PT Telekomunikasi Indonesia
Persero ADR | | | 1,153,600 | | | | 40,179,888 | | |
| Total Indonesia | | | | | 93,819,944 | | |
| SOUTH KOREA: 2.8% | |
| S1 Corp. | | | 771,922 | | | | 38,873,383 | | |
| KT Corp. ADR | | | 2,089,505 | | | | 27,539,676 | | |
| GS Home Shopping, Inc. | | | 298,935 | | | | 25,255,502 | | |
| Total South Korea | | | | | 91,668,561 | | |
| UNITED KINGDOM: 1.9% | |
| BHP Billiton PLC | | | 2,153,817 | | | | 61,216,545 | | |
| Total United Kingdom | | | | | 61,216,545 | | |
| PHILIPPINES: 1.7% | |
| Globe Telecom, Inc. | | | 2,065,510 | | | | 54,863,987 | | |
| Total Philippines | | | | | 54,863,987 | | |
| INDIA: 1.4% | |
| Housing Development Finance Corp. | | | 3,875,750 | | | | 45,703,421 | | |
| Total India | | | | | 45,703,421 | | |
| VIETNAM: 1.2% | |
| Vietnam Dairy Products JSC | | | 5,842,535 | | | | 24,581,995 | | |
| Bao Viet Holdings | | | 7,539,961 | | | | 15,898,531 | | |
| Total Vietnam | | | | | 40,480,526 | | |
| TOTAL COMMON EQUITIES | | | | | 2,624,733,501 | | |
| (Cost $2,268,374,958) | | | | | |
12 MATTHEWS ASIA FUNDS
Matthews Asian Growth and Income Fund June 30, 2012
Schedule of Investmentsa (unaudited) (continued)
PREFERRED EQUITIES: 3.1%
| | | Shares | | Value | |
| SOUTH KOREA: 3.1% | |
Samsung Fire & Marine Insurance
Co., Ltd., Pfd. | | | 515,311 | | | $ | 33,248,774 | | |
| Hyundai Motor Co., Ltd., Pfd. | | | 541,280 | | | | 31,670,606 | | |
| Hyundai Motor Co., Ltd., 2nd Pfd. | | | 305,760 | | | | 20,089,861 | | |
| LG Household & Health Care, Ltd., Pfd. | | | 121,855 | | | | 16,255,597 | | |
| Total South Korea | | | | | 101,264,838 | | |
| TOTAL PREFERRED EQUITIES | | | | | 101,264,838 | | |
| (Cost $48,826,622) | | | | | |
CORPORATE BONDS: 15.2%
| | | Face Amount* | | | |
| CHINA/HONG KONG: 4.8% | |
China Petroleum & Chemical Corp.
(Sinopec), Cnv.
0.000%, 04/24/14 | | HKD | 676,210,000 | | | | 100,978,904 | | |
Power Regal Group, Ltd., Cnv.
2.250%, 06/02/14 | | HKD | 234,020,000 | | | | 35,293,267 | | |
PB Issuer No. 2, Ltd., Cnv.
1.750%, 04/12/16 | | | 21,820,000 | | | | 19,583,450 | | |
| Total China/Hong Kong | | | | | 155,855,621 | | |
| SINGAPORE: 4.3% | |
CapitaLand, Ltd., Cnv.
3.125%, 03/05/18 | | SGD | 62,000,000 | | | | 51,256,759 | | |
CapitaLand, Ltd., Cnv.
2.875%, 09/03/16 | | SGD | 41,750,000 | | | | 32,362,372 | | |
Wilmar International, Ltd., Cnv.
0.000%, 12/18/12 | | | 26,500,000 | | | | 30,713,500 | | |
Olam International, Ltd., Cnv.
6.000%, 10/15/16 | | | 24,300,000 | | | | 25,223,400 | | |
| Total Singapore | | | | | 139,556,031 | | |
| INDIA: 4.1% | |
Tata Power Co., Ltd., Cnv.
1.750%, 11/21/14 | | | 56,200,000 | | | | 55,160,300 | | |
Larsen & Toubro, Ltd., Cnv.
3.500%, 10/22/14 | | | 41,200,000 | | | | 41,117,600 | | |
Sintex Industries, Ltd., Cnv.
0.000%, 03/13/13 | | | 26,900,000 | | | | 30,733,250 | | |
Housing Development
Finance Corp.
0.000%, 08/24/12 | | INR | 300,000,000 | | | | 6,648,518 | | |
| Total India | | | | | 133,659,668 | | |
| | | Face Amount* | | Value | |
| AUSTRALIA: 2.0% | |
QBE Funding Trust, Cnv.
0.000%, 05/12/30 | | | 104,571,000 | | | $ | 66,402,585 | | |
| Total Australia | | | | | 66,402,585 | | |
| TOTAL CORPORATE BONDS | | | | | 495,473,905 | | |
| (Cost $514,114,277) | | | | | |
| TOTAL INVESTMENTS: 98.7% | | | | | 3,221,472,244 | | |
| (Cost $2,831,315,857c) | | | | | |
CASH AND OTHER ASSETS,
LESS LIABILITIES: 1.3% | | | | | 43,357,468 | | |
| NET ASSETS: 100.0% | | | | $ | 3,264,829,712 | | |
a Certain securities were fair valued under the discretion of the Board of Trustees (Note 2-A).
b Non-income producing security.
c Cost for federal income tax purposes is $2,834,173,847 and net unrealized appreciation consists of:
| Gross unrealized appreciation | | $ | 538,220,758 | | |
| Gross unrealized depreciation | | | (150,922,361 | ) | |
| Net unrealized appreciation | | $ | 387,298,397 | | |
† Affiliated Issuer, as defined under the Investment Company Act of 1940 (ownership of 5% or more of the outstanding voting securities of this issuer)
* All values are in USD unless otherwise noted.
ADR American Depositary Receipt
BHD Berhad
Cnv. Convertible
HKD Hong Kong Dollar
INR Indian Rupee
JSC Joint Stock Co.
NVDR Non-voting Depositary Receipt
Pfd. Preferred
REIT Real Estate Investment Trust
SGD Singapore Dollar
USD U.S. Dollar
See accompanying notes to financial statements.
matthewsasia.com | 800.789.ASIA 13

ASIA GROWTH AND INCOME STRATEGIES
PORTFOLIO MANAGERS
Jesper O. Madsen, CFA
Lead Manager
Yu Zhang, CFA
Co-Manager
FUND FACTS
| | | Investor Class | | Institutional Class | |
| Ticker | | MAPIX | | MIPIX | |
| CUSIP | | 577125107 | | 577130750 | |
| Inception | | 10/31/06 | | 10/29/10 | |
| NAV | | $13.37 | | $13.36 | |
| Initial Investment | | $2,500 | | $3 million | |
| Gross Expense Ratio1 | | 1.10% | | 1.00% | |
Portfolio Statistics
| Total # of Positions | | 61 | |
| Net Assets | | $2.8 billion | |
| Weighted Average Market Cap | | $24.4 billion | |
| Portfolio Turnover | | 16.48%2 | |
Benchmark
MSCI AC Asia Pacific Index
Redemption Fee
2% within first 90 calendar days of purchase
OBJECTIVE
Total return with an emphasis on providing current income.
STRATEGY
Under normal market conditions, the Fund seeks to achieve its investment objective by investing at least 80% of its total net assets, which include borrowings for investment purposes, in income-paying equity securities of companies located in Asia, including developed, emerging and frontier countries and markets in the Asian region. The Fund may also invest in convertible debt and equity securities.
1 Matthews Asia Funds does not charge 12b-1 fees.
2 The lesser of fiscal year 2011 long-term purchase costs or sales proceeds divided by the average monthly market value of long-term securities.
Matthews Asia Dividend Fund
Portfolio Manager Commentary
For the first half of 2012, the Matthews Asia Dividend Fund gained 8.76% (Investor Class) and 8.75% (Institutional Class), outperforming its benchmark, the MSCI All Country Asia Pacific Index, which rose 4.58%. For the quarter ended June 30, the Fund declined –2.50% (Investor Class) and –2.47% (Institutional Class) while its benchmark fell –6.70%. In June, the Fund distributed 13.9 cents per share (Investor Class), bringing its total year-to-date income distribution to 19.9 cents per share (Investor Class).
Volatility in financial markets picked up during the second quarter as it became evident that a political consensus around a clear resolution to Europe's debt crisis was not forthcoming. Furthermore, economic data continued to reflect a slowdown in economic activity, not just in Europe and the U.S., but also China. Earlier this year, China's leaders revised down the country's target for 2012 annual GDP growth to 7.5% from 8%—a sign that a moderation in economic expansion should be expected. Since taking its first steps toward opening its economy in 1978, China has evolved from an agrarian economy of about US$220 billion into the world's second-largest economy at almost US$7.3 trillion. Given the sheer scale of the economy, it should come as no surprise that China is likely to face a structural moderation in growth.
Investors and policymakers tend to be overly reliant on headline GDP growth as an indicator of economic activity. However, economic growth is neither one dimensional nor of uniform "quality." In China's case, a moderation in growth could result in growth of higher quality and sustainability—less fueled by fixed asset investments and powered instead by domestic consumption and services-based companies. While a slowdown in China's headline GDP growth may create short-term volatility in equities, investors that are exposed to companies catering to the rising consumption within China should find that such a moderation in growth may not be for the worst.
While May was a tough month in terms of absolute performance, the Fund held up well relative to its benchmark during the second quarter, mainly due to its Japanese holdings. Among the top three performers were Pigeon, a manufacturer of baby care products and Lawson, a convenience store retailer—both Japanese consumer staples firms—and EPS Corporation, a Japanese health care company. Given Japan's dour macroeconomic outlook, we are often asked why we invest in the country. Quite simply, the Fund invests in companies that we believe can grow dividends and pay investors an attractive yield relative to that growth. Since our portfolio construction is not dictated by its benchmark, we invest in companies, including Japanese companies, precisely because we believe they offer the attractive combination of growth and dividend yield. The overall positive performance of the Fund's Japanese holdings during the quarter also illustrated that they can act as effective diversifiers in choppy markets.
Not surprisingly, the Fund's Chinese holdings were the main detractors to performance during the second quarter, given general worries regarding the severity of an economic slowdown. Our Chinese holdings within the energy and materials sectors, which are perceived to be proxies for economic growth, were among the worst performers.
(continued)
14 MATTHEWS ASIA FUNDS
PERFORMANCE AS OF JUNE 30, 2012
| | | | | Average Annual Total Returns | | | |
| | | 3 Months | | 1 Year | | 3 Years | | 5 Years | | Since
Inception | | Inception
Date | |
| Investor Class (MAPIX) | | | -2.50 | % | | | -3.30 | % | | | 14.62 | % | | | 6.95 | % | | | 9.51 | % | | 10/31/06 | |
| Institutional Class (MIPIX) | | | -2.47 | % | | | -3.21 | % | | | n.a. | | | | n.a. | | | | 0.51 | % | | 10/29/10 | |
| MSCI AC Asia Pacific Index3 | | | -6.70 | % | | | -10.48 | % | | | 7.17 | % | | | -2.62 | % | | | 0.43 | %4 | | | |
| Lipper Pacific Region Funds Category Average5 | | | -5.56 | % | | | -9.80 | % | | | 7.39 | % | | | -3.10 | % | | | 0.64 | %4 | | | |
Performance assumes reinvestment of all dividends and/or distributions before taxes. All performance quoted represents past performance and is no guarantee of future results. Investment return and principal value will fluctuate with market conditions so that when redeemed, shares may be worth more or less than their original cost. Current performance may be lower or higher than the return figures quoted. Returns would have been lower if certain of the Fund's fees and expenses had not been waived. For the Fund's most recent month-end performance, visit matthewsasia.com.
INCOME DISTRIBUTION HISTORY
| | | 2012 | | 2011 | |
| | | Q1 | | Q2 | | Q3 | | Q4 | | Total | | Q1 | | Q2 | | Q3 | | Q4 | | Total | |
| Investor Class (MAPIX) | | $ | 0.06 | | | $ | 0.14 | | | | n.a. | | | | n.a. | | | | n.a. | | | $ | 0.10 | | | $ | 0.11 | | | $ | 0.12 | | | $ | 0.03 | | | $ | 0.36 | | |
| Institutional Class (MIPIX) | | $ | 0.06 | | | $ | 0.14 | | | | n.a. | | | | n.a. | | | | n.a. | | | $ | 0.11 | | | $ | 0.12 | | | $ | 0.12 | | | $ | 0.03 | | | $ | 0.38 | | |
Note: This table does not include capital gains distributions. Institutional Class Shares were first offered on October 29, 2010. For income distribution history, visit matthewsasia.com.
30-DAY YIELD:
3.13% (Investor Class) 3.25% (Institutional Class)
The 30-Day Yield represents net investment income earned by the Fund over the 30-day period ended 6/30/12, expressed as an annual percentage rate based on the Fund's share price at the end of the 30-day period. The 30-Day Yield should be regarded as an estimate of the Fund's rate of investment income, and it may not equal the Fund's actual income distribution rate.
Source: BNY Mellon Investment Servicing (US) Inc.
DIVIDEND YIELD: 4.09%
The dividend yield (trailing) for the portfolio is the weighted average sum of the dividend paid per share during the last 12 months divided by the current price. The annualized dividend yield for the Fund is for the equity-only portion of the portfolio. Please note that this is based on gross portfolio holdings and does not reflect the actual yield an investor in the Fund would receive. Past yields are no guarantee of future yields.
Source: FactSet Research Systems, Bloomberg, MICM.
GROWTH OF A $10,000 INVESTMENT SINCE INCEPTION—INVESTOR CLASS
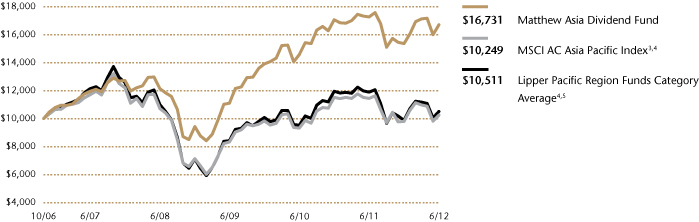
Plotted monthly. The performance data and graph do not reflect the deduction of taxes that a shareholder would pay on dividends, capital gains distributions or redemption of Fund shares. Values are in US$.
3 It is not possible to invest directly in an index. Source: Index data from Morgan Stanley Capital International and Bloomberg; total return calculations performed by BNY Mellon Investment Servicing (US) Inc. Please see page 69 for index definition.
4 Calculated from 10/31/06.
5 The Lipper Category Average does not reflect sales charges and is based on total return, including reinvestment of dividends and capital gains for the stated periods.
TOP TEN HOLDINGS6
| | | Sector | | Country | | % Net Assets | |
| Japan Tobacco, Inc. | | Consumer Staples | | Japan | | | 3.8 | % | |
| ITOCHU Corp. | | Industrials | | Japan | | | 3.6 | % | |
| ORIX Corp. | | Financials | | Japan | | | 3.3 | % | |
| HSBC Holdings PLC | | Financials | | China/Hong Kong | | | 3.1 | % | |
| Metcash, Ltd. | | Consumer Staples | | Australia | | | 3.1 | % | |
| KT&G Corp. | | Consumer Staples | | South Korea | | | 2.9 | % | |
| China Mobile, Ltd. | | Telecommunication Services | | China/Hong Kong | | | 2.8 | % | |
| Singapore Technologies Engineering, Ltd. | | Industrials | | Singapore | | | 2.7 | % | |
| Cheung Kong Infrastructure Holdings, Ltd. | | Utilities | | China/Hong Kong | | | 2.7 | % | |
| NTT DoCoMo, Inc. | | Telecommunication Services | | Japan | | | 2.6 | % | |
| % OF ASSETS IN TOP TEN | | | | | | | 30.6 | % | |
6 Holdings may combine more than one security from same issuer and related depositary receipts.
matthewsasia.com | 800.789.ASIA 15
COUNTRY ALLOCATION (%)7
| China/Hong Kong | | | 30.2 | | |
| Japan | | | 24.0 | | |
| Singapore | | | 11.8 | | |
| Australia | | | 8.2 | | |
| Taiwan | | | 7.9 | | |
| Thailand | | | 5.6 | | |
| South Korea | | | 4.1 | | |
| Indonesia | | | 3.1 | | |
| Philippines | | | 1.6 | | |
Cash and Other Assets,
Less Liabilities | | | 3.5 | | |
SECTOR ALLOCATION (%)
| Consumer Staples | | | 20.6 | | |
| Financials | | | 19.5 | | |
| Consumer Discretionary | | | 12.4 | | |
| Industrials | | | 10.8 | | |
| Telecommunication Services | | | 9.3 | | |
| Utilities | | | 6.3 | | |
| Health Care | | | 5.5 | | |
| Energy | | | 5.4 | | |
| Information Technology | | | 4.6 | | |
| Materials | | | 2.1 | | |
Cash and Other Assets,
Less Liabilities | | | 3.5 | | |
MARKET CAP EXPOSURE (%)8
| Large Cap (over $5B) | | | 49.7 | | |
| Mid Cap ($1B–$5B) | | | 25.2 | | |
| Small Cap (under $1B) | | | 21.6 | | |
Cash and Other Assets,
Less Liabilities | | | 3.5 | | |
7 The United Kingdom is not included in the MSCI All Country Asia Pacific Index.
8 Source: FactSet Research Systems. Percentage values in data are rounded to the nearest tenth of one percent; the values may not sum to 100% due to rounding.
Matthews Asia Dividend Fund
Portfolio Manager Commentary (continued)
Also in the second quarter, the Fund's holdings within the health care and telecommunications services sectors were main contributors to performance, while holdings in more cyclical sectors such as consumer discretionary and information technology hurt performance. Two of the Fund's consumer discretionary holdings, Esprit Holdings and Li Ning, continued to face ongoing challenges in turning around their businesses and both stocks suffered as a result. We continue to monitor these companies, which remain holdings as we believe their businesses are worth more than their current market capitalization reflects. More importantly, we believe both companies have the capacity to deliver dividend growth if and when they turn around their businesses.
Metcash, an Australian distribution and marketing company mainly within the grocery and liquor wholesaling industries, was the main detractor to performance during the quarter. Competition among Australia's supermarket chains has become increasingly fierce as two larger rivals have engaged in a price war to gain market share. In response, Metcash has attempted to apply its know-how as a wholesaler in other product categories. The company has previously engaged in acquisitions to support this type of expansion, and, during the second quarter, the company sold additional shares to fund further acquisitions. The uncertainty surrounding this broader business scope, alongside heightened competition, contributed to a sell-off in its shares.
Volatility tends to make it difficult for investors to maintain a long-term focus, and may cause some investors to overlook the longer-term potential for dividend growth and income that Asia offers. Of the 46 holdings in the portfolio that have paid a dividend year-to-date, 31 raised their dividends while nine cut them and six maintained them. In times of volatility it helps to tune out macro noise and instead focus on fundamentals. Companies in Asia generally continue to offer investors higher dividend yields than U.S. companies alongside the potential for long-term dividend growth.
16 MATTHEWS ASIA FUNDS
Matthews Asia Dividend Fund June 30, 2012
Schedule of Investmentsa (unaudited)
COMMON EQUITIES: 96.3%
| | | Shares | | Value | |
| CHINA/HONG KONG: 30.2% | |
| HSBC Holdings PLC ADR | | | 2,009,791 | | | $ | 88,692,077 | | |
| China Mobile, Ltd. ADR | | | 1,463,300 | | | | 79,998,611 | | |
Cheung Kong Infrastructure
Holdings, Ltd. | | | 12,468,000 | | | | 75,478,748 | | |
China Shenhua Energy Co., Ltd.
H Shares | | | 18,850,000 | | | | 66,697,063 | | |
Shenzhou International Group
Holdings, Ltd. | | | 35,791,000 | | | | 62,264,908 | | |
| Television Broadcasts, Ltd. | | | 8,815,000 | | | | 61,449,842 | | |
| Guangdong Investment, Ltd. | | | 68,798,000 | | | | 49,803,174 | | |
| Jiangsu Expressway Co., Ltd. H Shares | | | 46,944,000 | | | | 44,196,760 | | |
| Cafe' de Coral Holdings, Ltd. | | | 16,350,000 | | | | 43,744,207 | | |
| Yuexiu Transport Infrastructure, Ltd.† | | | 86,530,000 | | | | 42,736,057 | | |
| The Link REIT | | | 10,220,000 | | | | 41,890,366 | | |
| Minth Group, Ltd. | | | 34,441,000 | | | | 37,361,791 | | |
| China Fishery Group, Ltd. | | | 40,671,000 | | | | 28,283,642 | | |
| Sichuan Expressway Co., Ltd. H Shares† | | | 74,946,000 | | | | 25,437,685 | | |
| Xingda International Holdings, Ltd. | | | 67,852,000 | | | | 22,425,344 | | |
| Esprit Holdings, Ltd. | | | 15,574,700 | | | | 20,172,876 | | |
| Kingboard Laminates Holdings, Ltd. | | | 52,379,500 | | | | 19,376,840 | | |
| Li Ning Co., Ltd. | | | 30,961,000 | | | | 17,420,125 | | |
| Haitian International Holdings, Ltd. | | | 15,816,000 | | | | 15,758,470 | | |
| Yip's Chemical Holdings, Ltd. | | | 14,912,000 | | | | 9,580,657 | | |
| Total China/Hong Kong | | | | | 852,769,243 | | |
| JAPAN: 24.0% | |
| Japan Tobacco, Inc. | | | 3,580,000 | | | | 106,059,811 | | |
| ITOCHU Corp. | | | 9,663,000 | | | | 101,564,514 | | |
| ORIX Corp. | | | 996,140 | | | | 92,836,101 | | |
| NTT DoCoMo, Inc. | | | 44,250 | | | | 73,632,113 | | |
| Pigeon Corp.† | | | 1,501,800 | | | | 65,795,724 | | |
| Lawson, Inc. | | | 815,100 | | | | 57,001,146 | | |
| Hisamitsu Pharmaceutical Co., Inc. | | | 979,200 | | | | 48,190,925 | | |
| Miraca Holdings, Inc. | | | 1,078,200 | | | | 44,765,125 | | |
| EPS Corp.† | | | 14,592 | | | | 40,002,876 | | |
| Shinko Plantech Co., Ltd.† | | | 3,760,200 | | | | 32,656,661 | | |
| Hokuto Corp. | | | 848,200 | | | | 16,937,251 | | |
| Total Japan | | | | | 679,442,247 | | |
| SINGAPORE: 11.8% | |
Singapore Technologies
Engineering, Ltd. | | | 30,906,000 | | | | 76,191,640 | | |
| Ascendas REIT | | | 39,325,000 | | | | 67,086,448 | | |
| United Overseas Bank, Ltd. | | | 3,675,000 | | | | 54,572,040 | | |
| CapitaRetail China Trust, REIT† | | | 43,127,000 | | | | 44,690,705 | | |
| Super Group, Ltd. | | | 20,514,000 | | | | 34,100,268 | | |
| ARA Asset Management, Ltd. | | | 26,180,600 | | | | 29,641,627 | | |
| Ascendas India Trust† | | | 46,280,000 | | | | 27,879,247 | | |
| Total Singapore | | | | | 334,161,975 | | |
| | | Shares | | Value | |
| AUSTRALIA: 8.2% | |
| Metcash, Ltd. | | | 25,417,446 | | | $ | 88,055,006 | | |
| QBE Insurance Group, Ltd. | | | 4,484,726 | | | | 61,982,242 | | |
| Coca-Cola Amatil, Ltd. | | | 2,994,730 | | | | 41,154,831 | | |
| David Jones, Ltd. | | | 14,887,739 | | | | 39,808,613 | | |
| Total Australia | | | | | 231,000,692 | | |
| TAIWAN: 7.9% | |
Taiwan Semiconductor
Manufacturing Co., Ltd. ADRb | | | 4,005,040 | | | | 55,910,358 | | |
| Johnson Health Tech Co., Ltd.† | | | 13,807,100 | | | | 33,673,037 | | |
| TXC Corp.† | | | 21,549,524 | | | | 31,288,322 | | |
| Chunghwa Telecom Co., Ltd. ADR | | | 985,701 | | | | 30,980,582 | | |
| Taiwan Hon Chuan Enterprise Co., Ltd. | | | 12,151,948 | | | | 27,373,602 | | |
| St. Shine Optical Co., Ltd. | | | 1,911,000 | | | | 21,386,975 | | |
Taiwan Semiconductor
Manufacturing Co., Ltd.b | | | 4,646,469 | | | | 12,719,561 | | |
| CyberLink Corp. | | | 3,451,973 | | | | 10,074,433 | | |
| Total Taiwan | | | | | 223,406,870 | | |
| THAILAND: 5.4% | |
| Thai Beverage Public Co., Ltd. | | | 240,437,000 | | | | 64,763,469 | | |
PTT Exploration & Production
Public Co., Ltd. | | | 10,135,000 | | | | 54,019,887 | | |
| Tisco Financial Group Public Co., Ltd. | | | 28,100,000 | | | | 34,428,534 | | |
| Total Thailand | | | | | 153,211,890 | | |
| SOUTH KOREA: 4.1% | |
| KT&G Corp. | | | 1,143,000 | | | | 81,033,396 | | |
| Woongjin Thinkbig Co., Ltd.† | | | 2,079,870 | | | | 18,180,703 | | |
| MegaStudy Co., Ltd. | | | 232,984 | | | | 15,964,465 | | |
| Total South Korea | | | | | 115,178,564 | | |
| INDONESIA: 3.1% | |
| PT Perusahaan Gas Negara Persero | | | 142,302,000 | | | | 53,873,264 | | |
PT Telekomunikasi Indonesia
Persero ADR | | | 717,634 | | | | 24,995,192 | | |
| PT Telekomunikasi Indonesia Persero | | | 9,036,500 | | | | 7,895,049 | | |
| Total Indonesia | | | | | 86,763,505 | | |
| PHILIPPINES: 1.6% | |
| Globe Telecom, Inc. | | | 1,703,820 | | | | 45,256,793 | | |
| Total Philippines | | | | | 45,256,793 | | |
| TOTAL COMMON EQUITIES | | | | | 2,721,191,779 | | |
| (Cost $2,645,696,674) | | | | | |
matthewsasia.com | 800.789.ASIA 17
Matthews Asia Dividend Fund June 30, 2012
Schedule of Investmentsa (unaudited) (continued)
CLOSED-END INVESTMENT COMPANY: 0.2%
| | | Shares | | Value | |
| THAILAND: 0.2% | |
Tesco Lotus Retail Growth Freehold &
Leasehold Property Fundb | | | 18,820,900 | | | $ | 7,288,951 | | |
| Total Thailand | | | | | 7,288,951 | | |
| TOTAL CLOSED-END INVESTMENT COMPANY | | | | | 7,288,951 | | |
| (Cost $7,098,764) | | | | | |
| TOTAL INVESTMENTS: 96.5% | | | | | 2,728,480,730 | | |
| (Cost $2,652,795,438c) | | | | | |
CASH AND OTHER ASSETS,
LESS LIABILITIES: 3.5% | | | | | 98,338,633 | | |
| NET ASSETS: 100.0% | | | | $ | 2,826,819,363 | | |
a Certain securities were fair valued under the discretion of the Board of Trustees (Note 2-A).
b Non-income producing security.
c Cost for federal income tax purposes is $2,653,648,185 and net unrealized appreciation consists of:
| Gross unrealized appreciation | | $ | 363,378,203 | | |
| Gross unrealized depreciation | | | (288,545,658 | ) | |
| Net unrealized appreciation | | $ | 74,832,545 | | |
† Affiliated Issuer, as defined under the Investment Company Act of 1940 (ownership of 5% or more of the outstanding voting securities of this issuer)
ADR American Depositary Receipt
REIT Real Estate Investment Trust
See accompanying notes to financial statements.
18 MATTHEWS ASIA FUNDS

ASIA GROWTH AND INCOME STRATEGIES
PORTFOLIO MANAGERS
Jesper O. Madsen, CFA
Lead Manager
Yu Zhang, CFA
Co-Manager
FUND FACTS
| | | Investor Class | | Institutional Class | |
| Ticker | | MCDFX | | MICDX | |
| CUSIP | | 577125305 | | 577130735 | |
| Inception | | 11/30/09 | | 10/29/10 | |
| NAV | | $10.86 | | $10.86 | |
| Initial Investment | | $2,500 | | $3 million | |
| Gross Expense Ratio1 | | 1.52% | | 1.31% | |
After Fee Waiver and
Reimbursement | | 1.50% | | n.a. | |
Portfolio Statistics
| Total # of Positions | | 33 | |
| Net Assets | | $27.6 million | |
| Weighted Average Market Cap | | $27.5 billion | |
| Portfolio Turnover | | 22.31%2 | |
Benchmark
MSCI China Index
Redemption Fee
2% within first 90 calendar days of purchase
OBJECTIVE
Total return with an emphasis on providing current income.
STRATEGY
Under normal market conditions, the Fund seeks to achieve its investment objective by investing at least 80% of its total net assets, which include borrowings for investment purposes, in income-paying equity securities of companies located in China and Taiwan. The Fund may also invest in convertible debt and equity securities. China includes its administrative and other districts, such as Hong Kong.
1 The Advisor has contractually agreed to waive Matthews China Dividend Fund's fees and reimburse expenses until at least August 31, 2013 to the extent needed to limit total annual operating expenses to 1.50%. Matthews Asia Funds does not charge 12b-1 fees.
2 The lesser of fiscal year 2011 long-term purchase costs or sales proceeds divided by the average monthly market value of long-term securities.
Matthews China Dividend Fund
Portfolio Manager Commentary
For the first half of 2012, the Matthews China Dividend Fund gained 10.22% (Investor Class) and 10.25% (Institutional Class), outperforming its benchmark, the MSCI China Index, which rose 4.14%. For the quarter ended June 30, the Fund declined –3.58% (Investor Class) and –3.55% (Institutional Class) while the benchmark dropped –5.26%. In June, the Fund paid a semi-annual income distribution of 22.27 cents per share (Investor Class).
As the year progressed, China's economic slowdown increasingly weighed on equity markets. Incremental macroeconomic indicators and business activity all pointed to a further weakening. China's policymakers turned more aggressive in the second quarter, resetting economic policy priorities in an effort to stem further declines. A shift toward policy loosening was evidenced by the central bank's two consecutive interest rate cuts during the same month. In addition, Chinese banks were allowed more flexibility in setting their own rates, indicating an important step toward interest rate liberalization. This latest move, alongside lackluster loan demand and potential risks from non-performing-loans, could further squeeze bank profit margins. While Chinese banks are significant dividend payers within our investment universe, we continue to question the sustainability of their business model as it is difficult to estimate future dividend payments with enough confidence, and we therefore have continued to avoid direct investments in this sector.
During the first half of the year, our consumer discretionary holdings were the top contributors to the Fund's performance, thanks mainly to Shenzhou International, a textile group in mainland China, and Johnson Health Tech, a Taiwanese fitness equipment manufacturer. While both companies are involved in traditional export businesses, they have managed to overcome some industry headwinds. Shenzhou's integrated business model has helped the company benefit from scale and maintain its cost competitiveness. In addition, its research and development capability led to product differentiation, allowing Shenzhou to command better pricing power. Johnson Health Tech, which has traditionally made home fitness equipment, successfully penetrated the commercial fitness equipment segment, thereby adding this new growth driver to its core business. Both companies experienced strong earnings growth in 2011, and shareholders were rewarded with significant dividend growth. Shenzhou announced a 39% increase in dividends, while the dividend growth for Johnson was even higher at 300%.
The Fund's holdings in energy and materials, sectors which tend to be cyclical, were the main performance detractors during the first half of the year. Companies within these sectors faced strong short-term challenges, as both demand and pricing for their products quickly deteriorated during the economic slowdown. However, when we identify compelling opportunities within these sectors, particularly firms that can maintain their competitiveness and long-term growth prospects, we consider adding them should valuations appear attractive. In the first half of the year, we initiated positions in Xingda International, a Chinese materials company with leading domestic market share in certain tire components, and Haitian International, another mainland-based company with a dominant position in the plastic-injection molding machine industry. While industrial activities were rapidly weakening in China, affecting the
(continued)
matthewsasia.com | 800.789.ASIA 19
PERFORMANCE AS OF JUNE 30, 2012
| | | | | Average Annual
Total Returns | | | |
| | | 3 Months | | 1 Year | | Since
Inception | | Inception
Date | |
| Investor Class (MCDFX) | | | -3.58 | % | | | -7.25 | % | | | 6.50 | % | | 11/30/09 | |
| Institutional Class (MICDX) | | | -3.55 | % | | | -7.05 | % | | | -1.04 | % | | 10/29/10 | |
| MSCI China Index3 | | | -5.26 | % | | | -15.78 | % | | | -4.14 | %4 | | | | | |
| Lipper China Region Funds Category Average5 | | | -6.45 | % | | | -19.33 | % | | | -3.80 | %4 | | | | | |
Performance assumes reinvestment of all dividends and/or distributions before taxes. All performance quoted represents past performance and is no guarantee of future results. Investment return and principal value will fluctuate with market conditions so that when redeemed, shares may be worth more or less than their original cost. Current performance may be lower or higher than the return figures quoted. Returns would have been lower if certain of the Fund's fees and expenses had not been waived. For the Fund's most recent month-end performance, visit matthewsasia.com.
INCOME DISTRIBUTION HISTORY
| | | 2012 | | 2011 | |
| | | June | | December | | Total | | June | | December | | Total | |
| Investor Class (MCDFX) | | $ | 0.22 | | | n.a | | n.a | | $ | 0.15 | | | $ | 0.20 | | | $ | 0.35 | | |
| Institutional Class (MICDX) | | $ | 0.23 | | | n.a | | n.a | | $ | 0.17 | | | $ | 0.21 | | | $ | 0.38 | | |
Note: This table does not include capital gains distributions. Institutional Class Shares were first offered on October 29, 2010. For income distribution history, visit matthewsasia.com.
30-DAY YIELD:
3.03% (Investor Class) 3.12% (Institutional Class)
The 30-Day Yield represents net investment income earned by the Fund over the 30-day period ended 6/30/12, expressed as an annual percentage rate based on the Fund's share price at the end of the 30-day period. The 30-Day Yield should be regarded as an estimate of the Fund's rate of investment income, and it may not equal the Fund's actual income distribution rate.
Source: BNY Mellon Investment Servicing (US) Inc.
DIVIDEND YIELD: 4.10%
The dividend yield (trailing) for the portfolio is the weighted average sum of the dividend paid per share during the last 12 months divided by the current price. The annualized dividend yield for the Fund is for the equity-only portion of the portfolio. Please note that this is based on gross portfolio holdings and does not reflect the actual yield an investor in the Fund would receive. Past yields are no guarantee of future yields.
Source: FactSet Research Systems, Bloomberg, MICM.
GROWTH OF A $10,000 INVESTMENT SINCE INCEPTION—INVESTOR CLASS
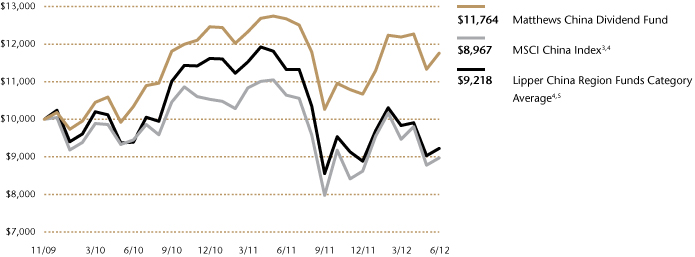
Plotted monthly. The performance data does not reflect the deduction of taxes that a shareholder would pay on dividends, capital gains distributions or redemption of Fund shares. Values are in US$.
3 It is not possible to invest directly in an index. Source: Index data from Morgan Stanley Capital International and Bloomberg; total return calculations performed by BNY Mellon Investment Servicing (US) Inc. Please see page 69 for index definition.
4 Calculated from 11/30/09.
5 The Lipper Category Average does not reflect sales charges and is based on total return, including reinvestment of dividends and capital gains for the stated periods.
TOP TEN HOLDINGS6
| | | Sector | | % Net Assets | |
| HSBC Holdings PLC | | Financials | | | 4.3 | | |
| Vitasoy International Holdings, Ltd. | | Consumer Staples | | | 4.3 | | |
| China Mobile, Ltd. | | Telecommunication Services | | | 4.1 | | |
| Guangdong Investment, Ltd. | | Utilities | | | 4.0 | | |
| Cheung Kong Infrastructure Holdings, Ltd. | | Utilities | | | 4.0 | | |
| Taiwan Hon Chuan Enterprise Co., Ltd. | | Materials | | | 3.9 | | |
| Television Broadcasts, Ltd. | | Consumer Discretionary | | | 3.9 | | |
| Taiwan Semiconductor Manufacturing Co., Ltd. | | Information Technology | | | 3.8 | | |
| CNOOC, Ltd. | | Energy | | | 3.8 | | |
| The Link REIT | | Financials | | | 3.8 | | |
| % OF ASSETS IN TOP TEN | | | | | 39.9 | % | |
6 Holdings may combine more than one security from same issuer and related depositary receipts.
20 MATTHEWS ASIA FUNDS
Matthews China Dividend Fund
Portfolio Manager Commentary (continued)
near-term business performance of both companies, we believe these firms have a sustainable competitive advantage over their competitors, and felt their valuations were compelling following the market sell-off.
During such volatile times, we continue to employ the same investment approach. As a bottom-up dividend-oriented investor, we believe a balanced approach that emphasizes both dividend yield and dividend growth is an effective tool to filter out short-term market noises and to capture long-term investment opportunities. Based on our fundamental analysis, we develop a view regarding forward-looking dividend growth rates that generally reflect our expectations for future business prospects. We also look at current dividend yield, which is a simple, yet powerful valuation yardstick: equity investors need to be adequately compensated for the risk taken by receiving a cash dividend stream while waiting for the business to deliver its growth. By combining those two factors, we aim to capture in a diversified portfolio both growth companies—those with higher dividend growth rates and moderate dividend yield—and more mature companies—those with higher, more stable dividend yields and moderate growth prospects. Our aim is to try to deliver capital appreciation supported by underlying dividend growth, while concurrently generating a dividend income stream.
Despite a weak economic environment and short-term market noise, our portfolio as a whole delivered on dividend growth. During the first half of 2012, all 33 portfolio holdings declared dividends. Out of these, 18 companies increased dividends, six companies maintained their dividends and nine companies showed a cut to their dividends. While the volatile equity market conditions are likely to persist in the near-term, we continue to find companies that offer attractive dividend yields and are well-positioned to grow dividends over time.
COUNTRY ALLOCATION (%)7
| China/Hong Kong | | | 73.7 | | |
| Taiwan | | | 21.9 | | |
| Singapore | | | 3.5 | | |
Cash and Other Assets,
Less Liabilities | | | 0.9 | | |
SECTOR ALLOCATION (%)
| Consumer Discretionary | | | 19.5 | | |
| Financials | | | 15.2 | | |
| Industrials | | | 14.5 | | |
| Information Technology | | | 10.7 | | |
| Energy | | | 9.3 | | |
| Materials | | | 8.3 | | |
| Utilities | | | 8.0 | | |
| Telecommunication Services | | | 6.4 | | |
| Consumer Staples | | | 4.3 | | |
| Health Care | | | 2.9 | | |
Cash and Other Assets,
Less Liabilities | | | 0.9 | | |
MARKET CAP EXPOSURE (%)8
| Large Cap (over $5B) | | | 35.9 | | |
| Mid Cap ($1B–$5B) | | | 29.7 | | |
| Small Cap (under $1B) | | | 33.5 | | |
Cash and Other Assets,
Less Liabilities | | | 0.9 | | |
7 The United Kingdom is not included in the MSCI China Index
8 Source: FactSet Research Systems. Percentage values in data are rounded to the nearest tenth of one percent; the values may not sum to 100% due to rounding.
matthewsasia.com | 800.789.ASIA 21
Matthews China Dividend Fund June 30, 2012
Schedule of Investmentsa (unaudited)
COMMON EQUITIES: 99.1%
| | | Shares | | Value | |
| CONSUMER DISCRETIONARY: 19.5% | |
| Auto Components: 5.0% | |
| Minth Group, Ltd. | | | 868,000 | | | $ | 941,611 | | |
| Xinyi Glass Holdings, Ltd. | | | 812,000 | | | | 437,838 | | |
| | | | | | 1,379,449 | | |
| Media: 3.9% | |
| Television Broadcasts, Ltd. | | | 153,000 | | | | 1,066,571 | | |
| Hotels, Restaurants & Leisure: 3.8% | |
| Cafe' de Coral Holdings, Ltd. | | | 388,000 | | | | 1,038,089 | | |
| Textiles, Apparel & Luxury Goods: 3.4% | |
Shenzhou International Group
Holdings, Ltd. | | | 549,000 | | | | 955,085 | | |
| Leisure Equipment & Products: 3.4% | |
| Johnson Health Tech Co., Ltd. | | | 388,425 | | | | 947,299 | | |
| Total Consumer Discretionary | | | | | 5,386,493 | | |
| FINANCIALS: 15.2% | |
| Real Estate Investment Trusts: 7.3% | |
| The Link REIT | | | 257,500 | | | | 1,055,457 | | |
| CapitaRetail China Trust, REIT | | | 930,000 | | | | 963,720 | | |
| | | | | | 2,019,177 | | |
| Commercial Banks: 4.3% | |
| HSBC Holdings PLC ADR | | | 27,000 | | | | 1,191,510 | | |
| Real Estate Management & Development: 3.6% | |
| Swire Pacific, Ltd. A Shares | | | 53,000 | | | | 616,435 | | |
| E-House China Holdings, Ltd. ADS | | | 70,000 | | | | 385,000 | | |
| | | | | | 1,001,435 | | |
| Total Financials | | | | | 4,212,122 | | |
| INDUSTRIALS: 14.5% | |
| Transportation Infrastructure: 9.3% | |
| Jiangsu Expressway Co., Ltd. H Shares | | | 996,000 | | | | 937,712 | | |
| Yuexiu Transport Infrastructure, Ltd. | | | 1,282,000 | | | | 633,163 | | |
China Merchants Holdings International
Co., Ltd. | | | 182,000 | | | | 556,784 | | |
| Sichuan Expressway Co., Ltd. H Shares | | | 1,356,000 | | | | 460,245 | | |
| | | | | | 2,587,904 | | |
| Machinery: 3.2% | |
| Haitian International Holdings, Ltd. | | | 880,000 | | | | 876,799 | | |
| Air Freight & Logistics: 2.0% | |
| Shenzhen Chiwan Petroleum, B Sharesb | | | 473,116 | | | | 561,406 | | |
| Total Industrials | | | | | 4,026,109 | | |
| | | Shares | | Value | |
| INFORMATION TECHNOLOGY: 10.7% | |
| Electronic Equipment, Instruments & Components: 4.5% | |
| TXC Corp. | | | 585,199 | | | $ | 849,666 | | |
| Digital China Holdings, Ltd. | | | 222,000 | | | | 391,215 | | |
| | | | | | 1,240,881 | | |
| Semiconductors & Semiconductor Equipment: 3.8% | |
Taiwan Semiconductor Manufacturing
Co., Ltd.b | | | 388,000 | | | | 1,062,138 | | |
| Software: 2.4% | |
| CyberLink Corp. | | | 226,963 | | | | 662,382 | | |
| Total Information Technology | | | | | 2,965,401 | | |
| ENERGY: 9.3% | |
| Oil, Gas & Consumable Fuels: 9.3% | |
| CNOOC, Ltd. ADR | | | 5,250 | | | | 1,056,562 | | |
| China Shenhua Energy Co., Ltd. H Shares | | | 238,000 | | | | 842,117 | | |
| China Petroleum & Chemical Corp. ADR | | | 7,440 | | | | 663,574 | | |
| Total Energy | | | | | 2,562,253 | | |
| MATERIALS: 8.3% | |
| Containers & Packaging: 4.0% | |
| Taiwan Hon Chuan Enterprise Co., Ltd. | | | 483,354 | | | | 1,088,808 | | |
| Chemicals: 2.2% | |
| Yip's Chemical Holdings, Ltd. | | | 950,000 | | | | 610,356 | | |
| Metals & Mining: 2.1% | |
| Xingda International Holdings, Ltd. | | | 1,777,000 | | | | 587,305 | | |
| Total Materials | | | | | 2,286,469 | | |
| UTILITIES: 8.0% | |
| Water Utilities: 4.0% | |
| Guangdong Investment, Ltd. | | | 1,536,000 | | | | 1,111,917 | | |
| Electric Utilities: 4.0% | |
| Cheung Kong Infrastructure Holdings, Ltd. | | | 182,000 | | | | 1,101,791 | | |
| Total Utilities | | | | | 2,213,708 | | |
| TELECOMMUNICATION SERVICES: 6.4% | |
| Wireless Telecommunication Services: 4.1% | |
| China Mobile, Ltd. ADR | | | 20,530 | | | | 1,122,375 | | |
| Diversified Telecommunication Services: 2.3% | |
| Chunghwa Telecom Co., Ltd. ADR | | | 20,604 | | | | 647,584 | | |
| Total Telecommunication Services | | | | | 1,769,959 | | |
22 MATTHEWS ASIA FUNDS
Matthews China Dividend Fund June 30, 2012
Schedule of Investmentsa (unaudited) (continued)
COMMON EQUITIES (continued)
| | | Shares | | Value | |
| CONSUMER STAPLES: 4.3% | |
| Food Products: 4.3% | |
| Vitasoy International Holdings, Ltd. | | | 1,406,000 | | | $ | 1,181,547 | | |
| Total Consumer Staples | | | | | 1,181,547 | | |
| HEALTH CARE: 2.9% | |
| Health Care Equipment & Supplies: 2.9% | |
| St. Shine Optical Co., Ltd. | | | 72,000 | | | | 805,789 | | |
| Total Health Care | | | | | 805,789 | | |
| TOTAL INVESTMENTS: 99.1% | | | | | 27,409,850 | | |
| (Cost $26,885,199c) | | | | | |
CASH AND OTHER ASSETS,
LESS LIABILITIES: 0.9% | | | | | 239,340 | | |
| NET ASSETS: 100.0% | | | | $ | 27,649,190 | | |
a Certain securities were fair valued under the discretion of the Board of Trustees (Note 2-A).
b Non-income producing security.
c Cost for federal income tax purposes is $26,885,199 and net unrealized appreciation consists of:
| Gross unrealized appreciation | | $ | 3,104,555 | | |
| Gross unrealized depreciation | | | (2,579,904 | ) | |
| Net unrealized appreciation | | $ | 524,651 | | |
ADR American Depositary Receipt
ADS American Depositary Share
REIT Real Estate Investment Trust
See accompanying notes to financial statements.
matthewsasia.com | 800.789.ASIA 23

ASIA GROWTH STRATEGIES
PORTFOLIO MANAGERS
Taizo Ishida
Lead Manager
Sharat Shroff, CFA
Co-Manager
FUND FACTS
| | | Investor Class | | Institutional Class | |
| Ticker | | MPACX | | MIAPX | |
| CUSIP | | 577130867 | | 577130776 | |
| Inception | | 10/31/03 | | 10/29/10 | |
| NAV | | $16.19 | | $16.23 | |
| Initial Investment | | $2,500 | | $3 million | |
| Gross Expense Ratio1 | | 1.18% | | 1.03% | |
Portfolio Statistics
| Total # of Positions | | 61 | |
| Net Assets | | $363.6 million | |
| Weighted Average Market Cap | | $16.1 billion | |
| Portfolio Turnover | | 28.06%2 | |
Benchmark
MSCI AC Asia Pacific Index
Redemption Fee
2% within first 90 calendar days of purchase
OBJECTIVE
Long-term capital appreciation.
STRATEGY
Under normal market conditions, the Fund seeks to achieve its investment objective by investing at least 80% of its total net assets, which include borrowings for investment purposes, in the common and preferred stocks of companies located in Asia, including developed, emerging and frontier countries and markets in the Asian region. The Fund may also invest in the convertible securities, of any duration or quality, of Asian companies.
1 Matthews Asia Funds does not charge 12b-1 fees.
2 The lesser of fiscal year 2011 long-term purchase costs or sales proceeds divided by the average monthly market value of long-term securities.
Matthews Asia Growth Fund
Portfolio Manager Commentary
For the first half of 2012, the Matthews Asia Growth Fund returned 5.54% (Investor Class) and 5.60% (Institutional Class) while its benchmark, the MSCI All Country Asia Pacific Index, returned 4.58%. For the quarter ended June 30, the Fund declined –5.65% (Investor Class) and –5.64% (Institutional Class) while the benchmark fell –6.70%.
During the second quarter, Asian markets were disrupted by two global events: a wide-reaching economic slowdown and negative sentiment toward global equity markets due mainly to uncertainties surrounding Europe's financial crisis. We saw downward revisions of GDP figures across the Asia Pacific region. Most closely watched were GDP estimates for China, which were hovering around 8% at the end of the second quarter. Fortunately, inflation in many emerging Asian markets seemed to have come under control due to lower prices for food and energy—a development that should help lower costs of government subsidies.
As trade with the West still accounts for a substantial portion of Asia's economic activity, the region continues to be impacted by global economic movements. However, during the second quarter, Indonesia's economy held up relatively well as its economy is structurally driven by domestic economic activity. Indonesian consumers are encouraged by their relatively high purchasing power, helped by lower inflation, which has been one of the drivers of its economic performance. On the other hand, India's economy showed just 5.3% GDP growth in the first quarter, stemming from sluggish policymaking by India's leaders. India stands to benefit significantly from lower oil prices as the government's costs for fuel, food and fertilizer subsidies is quite high, at more than 2% of GDP, by some estimates.
During the second quarter, the main detractors to performance came from two of the portfolio's most heavily weighted and economically sensitive sectors—industrials and consumer discretionary. The two sectors comprised a combined weighting of approximately 42% of the portfolio during the second quarter. Within industrials, heavy machinery companies, which are often exposed to commodity and mining industries, did not perform well, impacted by lower commodity prices. Sany Heavy Equipment International, a leading Chinese mining equipment firm, performed poorly as a result of lower coal prices. However, the company should continue to benefit from automation in coal mining, supported by a Chinese government policy to reduce mining accidents.
Within the consumer discretionary sector, our holdings in auto companies, such as Japan's Toyota Motor and Fuji Heavy Industries, as well as auto firms in China and Indonesia were negative contributors amid the global economic slowdown. Japanese auto companies continued to face headwinds from a strong yen, yet their production levels and revenues have sharply rebounded from last year's lows caused by natural disasters. However, despite lower short-term demand, we believe our auto-related holdings will continue to benefit over the long term.
During the first half of the year, we saw strong performance in the casino-related tourism industry. However, China's lodging industry has remained weak. By sector, financials were the top contributor to performance
(continued)
24 MATTHEWS ASIA FUNDS
PERFORMANCE AS OF JUNE 30, 2012
| | | | | Average Annual Total Returns | | | |
| | | 3 Months | | 1 Year | | 3 Years | | 5 Years | | Since
Inception | | Inception
Date | |
| Investor Class (MPACX) | | | -5.65 | % | | | -8.58 | % | | | 11.79 | % | | | 1.94 | % | | | 8.86 | % | | 10/31/03 | |
| Institutional Class (MIAPX) | | | -5.64 | % | | | -8.46 | % | | | n.a. | | | | n.a. | | | | -3.12 | % | | 10/29/10 | |
| MSCI AC Asia Pacific Index3 | | | -6.70 | % | | | -10.48 | % | | | 7.17 | % | | | -2.62 | % | | | 6.51 | %4 | | | | | |
| Lipper Pacific Region Funds Category Average5 | | | -5.56 | % | | | -9.80 | % | | | 7.39 | % | | | -3.10 | % | | | 6.33 | %4 | | | | | |
Performance assumes reinvestment of all dividends and/or distributions before taxes. All performance quoted represents past performance and is no guarantee of future results. Investment return and principal value will fluctuate with market conditions so that when redeemed, shares may be worth more or less than their original cost. Current performance may be lower or higher than the return figures quoted. Returns would have been lower if certain of the Fund's fees and expenses had not been waived. For the Fund's most recent month-end performance, visit matthewsasia.com.
GROWTH OF A $10,000 INVESTMENT SINCE INCEPTION—INVESTOR CLASS
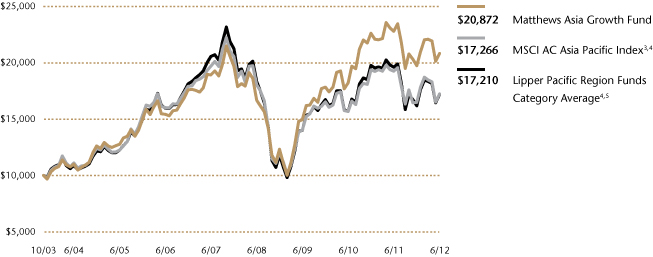
Plotted monthly. The performance data and graph do not reflect the deduction of taxes that a shareholder would pay on dividends, capital gains distributions or redemption of Fund shares. Values are in US$.
3 It is not possible to invest directly in an index. Source: Index data from Morgan Stanley Capital International and Bloomberg; total return calculations performed by BNY Mellon Investment Servicing (US) Inc. Please see page 69 for index definition.
4 Calculated from 10/31/03.
5 The Lipper Category Average does not reflect sales charges and is based on total return, including reinvestment of dividends and capital gains for the stated periods.
TOP TEN HOLDINGS6
| | | Sector | | Country | | % Net Assets | |
| Toyota Motor Corp. | | Consumer Discretionary | | Japan | | | 4.9 | % | |
| ORIX Corp. | | Financials | | Japan | | | 4.5 | % | |
| Mitsui & Co., Ltd. | | Industrials | | Japan | | | 4.1 | % | |
| Rakuten, Inc. | | Consumer Discretionary | | Japan | | | 2.6 | % | |
| Oil Search, Ltd. | | Energy | | Australia | | | 2.4 | % | |
| Sysmex Corp. | | Health Care | | Japan | | | 2.4 | % | |
| Nidec Corp. | | Industrials | | Japan | | | 2.3 | % | |
| Kakaku.com, Inc. | | Information Technology | | Japan | | | 2.3 | % | |
| PT Indofood CBP Sukses Makmur | | Consumer Staples | | Indonesia | | | 2.3 | % | |
| Rinnai Corp. | | Consumer Discretionary | | Japan | | | 2.2 | % | |
| % OF ASSETS IN TOP TEN | | | | | | | 30.0 | % | |
6 Holdings may combine more than one security from same issuer and related depositary receipts.
matthewsasia.com | 800.789.ASIA 25
COUNTRY ALLOCATION (%)
| Japan | | | 34.3 | | |
| China/Hong Kong | | | 22.9 | | |
| Thailand | | | 7.2 | | |
| India | | | 6.7 | | |
| Indonesia | | | 6.2 | | |
| Australia | | | 5.2 | | |
| Taiwan | | | 5.0 | | |
| Singapore | | | 3.5 | | |
| Cambodia | | | 2.2 | | |
| Vietnam | | | 1.8 | | |
| Sri Lanka | | | 1.6 | | |
| South Korea | | | 1.0 | | |
| Malaysia | | | 0.8 | | |
Cash and Other Assets,
Less Liabilities | | | 1.6 | | |
SECTOR ALLOCATION (%)
| Consumer Discretionary | | | 26.6 | | |
| Financials | | | 17.0 | | |
| Industrials | | | 14.7 | | |
| Health Care | | | 13.0 | | |
| Consumer Staples | | | 12.0 | | |
| Information Technology | | | 7.9 | | |
| Energy | | | 3.7 | | |
| Materials | | | 3.5 | | |
Cash and Other Assets,
Less Liabilities | | | 1.6 | | |
MARKET CAP EXPOSURE (%)7
| Large Cap (over $5B) | | | 49.0 | | |
| Mid Cap ($1B–$5B) | | | 32.9 | | |
| Small Cap (under $1B) | | | 16.4 | | |
Cash and Other Assets,
Less Liabilities | | | 1.6 | | |
7 Source: FactSet Research Systems. Percentage values in data are rounded to the nearest tenth of one percent; the values may not sum to 100% due to rounding.
Matthews Asia Growth Fund
Portfolio Manager Commentary (continued)
during the first six months of the year. Notably, our real estate holdings, predominantly Chinese property companies, contributed positively to performance. In addition, our health care sector holdings, driven by medical device companies also operating mainly in China, performed well as a result of their stable earnings power and defensive nature.
For the remainder of the year, we remain cautious as there does not appear to be a near-term resolution to the current global economic downturn. However, we maintain optimism over the stability and rising purchasing power of Asia's consumers. We look for healthy, domestic consumption rates across the region, and believe they are better indicators of long-term opportunities than headline macroeconomic figures.
26 MATTHEWS ASIA FUNDS
Matthews Asia Growth Fund June 30, 2012
Schedule of Investmentsa (unaudited)
COMMON EQUITIES: 98.4%
| | | Shares | | Value | |
| JAPAN: 34.3% | |
| Toyota Motor Corp. | | | 441,700 | | | $ | 17,827,993 | | |
| ORIX Corp. | | | 174,370 | | | | 16,250,558 | | |
| Mitsui & Co., Ltd. | | | 1,004,600 | | | | 14,928,208 | | |
| Rakuten, Inc. | | | 905,900 | | | | 9,365,802 | | |
| Sysmex Corp. | | | 222,100 | | | | 8,783,573 | | |
| Nidec Corp. | | | 109,400 | | | | 8,318,100 | | |
| Kakaku.com, Inc. | | | 244,900 | | | | 8,310,299 | | |
| Rinnai Corp. | | | 117,500 | | | | 8,107,674 | | |
| Start Today Co., Ltd. | | | 529,900 | | | | 7,405,084 | | |
| Komatsu, Ltd. | | | 188,900 | | | | 4,509,296 | | |
| Otsuka Holdings Co., Ltd. | | | 137,900 | | | | 4,232,873 | | |
| Nitto Denko Corp. | | | 98,400 | | | | 4,215,922 | | |
| Fuji Heavy Industries, Ltd. | | | 457,000 | | | | 3,702,647 | | |
| Pigeon Corp. | | | 72,700 | | | | 3,185,077 | | |
| FANUC Corp. | | | 18,700 | | | | 3,073,927 | | |
| Calbee, Inc. | | | 39,000 | | | | 2,449,032 | | |
| Total Japan | | | | | 124,666,065 | | |
| CHINA/HONG KONG: 22.9% | |
| Sinopharm Group Co., Ltd. H Shares | | | 2,836,800 | | | | 7,885,925 | | |
| Dairy Farm International Holdings, Ltd. | | | 602,454 | | | | 6,423,221 | | |
| China Kanghui Holdings, Inc. ADRb | | | 305,800 | | | | 6,024,260 | | |
| Sands China, Ltd. | | | 1,692,400 | | | | 5,444,496 | | |
| China Lodging Group, Ltd. ADSb | | | 453,600 | | | | 5,325,264 | | |
| China Vanke Co., Ltd. B Sharesb | | | 3,789,587 | | | | 4,995,857 | | |
| Dongfeng Motor Group Co., Ltd. H Shares | | | 3,184,000 | | | | 4,976,769 | | |
| Tingyi (Cayman Islands) Holding Corp. | | | 1,888,000 | | | | 4,864,252 | | |
| Hang Lung Group, Ltd. | | | 782,000 | | | | 4,835,238 | | |
Sany Heavy Equipment International
Holdings Co., Ltd. | | | 7,862,000 | | | | 4,246,918 | | |
Shandong Weigao Group Medical
Polymer Co., Ltd. H Shares | | | 3,804,000 | | | | 4,246,331 | | |
Lianhua Supermarket Holdings Co., Ltd.
H Shares | | | 4,165,000 | | | | 3,998,866 | | |
| Haitian International Holdings, Ltd. | | | 3,980,000 | | | | 3,965,523 | | |
Shenzhou International Group
Holdings, Ltd. | | | 2,259,000 | | | | 3,929,938 | | |
Kingdee International Software Group
Co., Ltd.b | | | 20,269,600 | | | | 3,815,603 | | |
| Baidu, Inc. ADRb | | | 30,300 | | | | 3,483,894 | | |
| Ctrip.com International, Ltd. ADRb | | | 188,000 | | | | 3,150,880 | | |
| EVA Precision Industrial Holdings, Ltd. | | | 19,492,000 | | | | 1,601,809 | | |
| Total China/Hong Kong | | | | | 83,215,044 | | |
| THAILAND: 7.2% | |
| Major Cineplex Group Public Co., Ltd. | | | 11,921,000 | | | | 6,570,984 | | |
| Siam Commercial Bank Public Co., Ltd. | | | 1,264,400 | | | | 5,917,053 | | |
| SVI Public Co., Ltd.b | | | 47,651,300 | | | | 5,315,402 | | |
| Banpu Public Co., Ltd. | | | 331,800 | | | | 4,716,157 | | |
| SNC Former Public Co., Ltd. | | | 4,457,900 | | | | 3,566,791 | | |
| Total Thailand | | | | | 26,086,387 | | |
| | | Shares | | Value | |
| INDIA: 6.7% | |
| Emami, Ltd. | | | 866,979 | | | $ | 7,780,363 | | |
| HDFC Bank, Ltd. | | | 627,431 | | | | 6,390,581 | | |
| Castrol India, Ltd. | | | 419,477 | | | | 4,122,426 | | |
| Sun Pharmaceutical Industries, Ltd. | | | 313,520 | | | | 3,594,188 | | |
| Multi Commodity Exchange of India, Ltd. | | | 121,695 | | | | 2,311,627 | | |
| Total India | | | | | 24,199,185 | | |
| INDONESIA: 6.2% | |
| PT Indofood CBP Sukses Makmurb | | | 13,349,000 | | | | 8,254,161 | | |
| PT Bank Rakyat Indonesia Persero | | | 11,610,500 | | | | 7,952,093 | | |
| PT Astra International | | | 8,425,000 | | | | 6,210,899 | | |
| Total Indonesia | | | | | 22,417,153 | | |
| AUSTRALIA: 5.2% | |
| Oil Search, Ltd. | | | 1,305,704 | | | | 8,893,857 | | |
| CSL, Ltd. | | | 137,045 | | | | 5,558,782 | | |
| BHP Billiton, Ltd. | | | 136,800 | | | | 4,455,895 | | |
| Total Australia | | | | | 18,908,534 | | |
| TAIWAN: 5.0% | |
| Synnex Technology International Corp. | | | 3,133,000 | | | | 7,667,124 | | |
| St. Shine Optical Co., Ltd. | | | 624,000 | | | | 6,983,502 | | |
| Gourmet Master Co., Ltd. | | | 520,800 | | | | 3,614,628 | | |
| Total Taiwan | | | | | 18,265,254 | | |
| SINGAPORE: 3.5% | |
| Keppel Land, Ltd. | | | 2,204,000 | | | | 5,671,700 | | |
| CapitaCommercial Trust, REIT | | | 3,676,000 | | | | 3,697,239 | | |
| Goodpack, Ltd. | | | 2,564,000 | | | | 3,512,011 | | |
| Total Singapore | | | | | 12,880,950 | | |
| CAMBODIA: 2.2% | |
| NagaCorp, Ltd. | | | 17,812,000 | | | | 7,965,135 | | |
| Total Cambodia | | | | | 7,965,135 | | |
| VIETNAM: 1.8% | |
| Vietnam Dairy Products JSC | | | 1,564,020 | | | | 6,580,488 | | |
| Total Vietnam | | | | | 6,580,488 | | |
| SRI LANKA: 1.6% | |
| John Keells Holdings PLC | | | 4,298,200 | | | | 5,895,388 | | |
| Total Sri Lanka | | | | | 5,895,388 | | |
| SOUTH KOREA: 1.0% | |
| Kiwoom Securities Co., Ltd. | | | 67,641 | | | | 3,635,160 | | |
| Total South Korea | | | | | 3,635,160 | | |
matthewsasia.com | 800.789.ASIA 27
Matthews Asia Growth Fund June 30, 2012
Schedule of Investmentsa (unaudited) (continued)
COMMON EQUITIES (continued)
| | | Shares | | Value | |
| MALAYSIA: 0.8% | |
| Parkson Holdings BHD | | | 2,096,969 | | | $ | 3,039,529 | | |
| Total Malaysia | | | | | 3,039,529 | | |
| TOTAL INVESTMENTS: 98.4% | | | | | 357,754,272 | | |
| (Cost $308,897,735c) | | | | | |
CASH AND OTHER ASSETS,
LESS LIABILITIES: 1.6% | | | | | 5,885,174 | | |
| NET ASSETS: 100.0% | | | | $ | 363,639,446 | | |
a Certain securities were fair valued under the discretion of the Board of Trustees (Note 2-A).
b Non-income producing security.
c Cost for federal income tax purposes is $308,897,738 and net unrealized appreciation consists of:
| Gross unrealized appreciation | | $ | 71,231,717 | | |
| Gross unrealized depreciation | | | (22,375,183 | ) | |
| Net unrealized appreciation | | $ | 48,856,534 | | |
ADR American Depositary Receipt
ADS American Depositary Share
BHD Berhad
JSC Joint Stock Co.
REIT Real Estate Investment Trust
See accompanying notes to financial statements.
28 MATTHEWS ASIA FUNDS

ASIA GROWTH STRATEGIES
PORTFOLIO MANAGERS
Richard H. Gao
Lead Manager
Sharat Shroff, CFA
Lead Manager
Mark W. Headley
Co-Manager
FUND FACTS
| | | Investor Class | | Institutional Class | |
| Ticker | | MAPTX | | MIPTX | |
| CUSIP | | 577130107 | | 577130834 | |
| Inception | | 9/12/94 | | 10/29/10 | |
| NAV | | $21.69 | | $21.70 | |
| Initial Investment | | $2,500 | | $3 million | |
| Gross Expense Ratio1 | | 1.11% | | 0.95% | |
Portfolio Statistics
| Total # of Positions | | 70 | |
| Net Assets | | $5.9 billion | |
| Weighted Average Market Cap | | $20.0 billion | |
| Portfolio Turnover | | 10.51%2 | |
Benchmark
MSCI AC Asia ex Japan Index
Redemption Fee
2% within first 90 calendar days of purchase
OBJECTIVE
Long-term capital appreciation.
STRATEGY
Under normal market conditions, the Fund seeks to achieve its investment objective by investing at least 80% of its total net assets, which include borrowings for investment purposes, in the common and preferred stocks of companies located in Asia, including developed, emerging and frontier countries and markets in the Asian region, excluding Japan.
1 Matthews Asia Funds does not charge 12b-1 fees.
2 The lesser of fiscal year 2011 long-term purchase costs or sales proceeds divided by the average monthly market value of long-term securities.
Matthews Pacific Tiger Fund
Portfolio Manager Commentary
For the first half of 2012, the Matthews Pacific Tiger Fund gained 6.69% (Investor Class) and 6.79% (Institutional Class) while the MSCI All Country Asia ex Japan Index rose 6.10%. For the quarter ended June 30, the Fund declined –3.81% (Investor and Institutional Class), while the benchmark lost –6.74%. It was a tale of two quarters, as the first quarter marked a partial recovery for equities in Asia that fizzled in the second quarter as hopes of a sustained economic recovery were overshadowed by renewed concerns over growth, particularly in China.
The downside risks to China's economic growth have become more evident, and a common result has been varying forms of restructuring—whether a shake-up of the management team or a complete overhaul of the business processes. Pressures from rising costs, fading demand and shrinking pools of funding have forced a wave of consolidations that are more acute in the small-capitalization universe of Chinese companies. In addition, there has been a spate of governance- related debacles that has raised the risk-premium for Chinese equities, most notably for small-capitalization firms. We are viewing this environment as an opportunity to scout for companies that have reasonable long-term prospects led by management teams that are vigorously taking corrective measures to deal with the current turmoil.
A common risk in investing is that one may be too early in including a stock into a portfolio. This was our experience when we added Li Ning, a leading Chinese company in the sportswear industry, earlier this year. In spite of a relatively modest position in the Fund, Li Ning was one of the biggest detractors to Fund performance during the quarter. After a burst of undisciplined growth leading into the Beijing Olympics, China's sportswear industry entered a phase of consolidation. Li Ning was a firm that had identified its problems early. We continue to own its stock as a more recent spate of management changes gives us some confidence that issues related to the distribution of their products will be reconciled over time. We believe that per capita spending on sportswear goods is still likely to rise in the coming years. However, Li Ning needs to build on its brand proposition to compete and capitalize on this secular economic growth. We will continue to monitor Li Ning, with a focus on its market positioning and branding efforts to gauge its progress.
In evaluating investment ideas, we continue to look for businesses and management teams that are well-suited to deal with the vicissitudes of changing political and macroeconomic environments. In recent periods, the Korean government has become rather active in micro-managing price levels across goods and services, such as insurance and health care, which has impacted some Fund holdings. As such, the shorter-term performance of some of our Korean holdings continues to test our investment thesis.
Relative bright spots across Asia during the quarter occurred in smaller markets, such as the Philippines and Thailand where operating performance remains generally favorable. By contrast, companies in India continued to suffer from an intractable investment climate. However, that did not prevent the portfolio's Indian holdings from delivering positive contributions to returns for the first half of the year. Over the past 18 months, the Fund has been adding to Indian holdings in the industrials sector where we remain comfortable with company-specific risk factors.
(continued)
matthewsasia.com | 800.789.ASIA 29
PERFORMANCE AS OF JUNE 30, 2012
| | | | | Average Annual Total Returns | | | |
| | | 3 Months | | 1 Year | | 3 Years | | 5 Years | | 10 Years | | Since
Inception | | Inception
Date | |
| Investor Class (MAPTX) | | | -3.81 | % | | | -8.34 | % | | | 13.80 | % | | | 4.73 | % | | | 14.57 | % | | | 8.68 | % | | 9/12/94 | |
| Institutional Class (MIPTX) | | | -3.81 | % | | | -8.20 | % | | | n.a. | | | | n.a. | | | | n.a. | | | | -2.80 | % | | 10/29/10 | |
| MSCI AC Asia ex Japan Index3 | | | -6.74 | % | | | -13.15 | % | | | 10.25 | % | | | 0.82 | % | | | 11.78 | % | | | 3.42 | %4 | | | | | |
| Lipper Pacific ex Japan Funds Category Average5 | | | -6.76 | % | | | -14.04 | % | | | 9.56 | % | | | 0.07 | % | | | 10.79 | % | | | 3.60 | %4 | | | | | |
Performance assumes reinvestment of all dividends and/or distributions before taxes. All performance quoted represents past performance and is no guarantee of future results. Investment return and principal value will fluctuate with market conditions so that when redeemed, shares may be worth more or less than their original cost. Current performance may be lower or higher than the return figures quoted. Returns would have been lower if certain of the Fund's fees and expenses had not been waived. For the Fund's most recent month-end performance, visit matthewsasia.com.
GROWTH OF A $10,000 INVESTMENT SINCE INCEPTION—INVESTOR CLASS
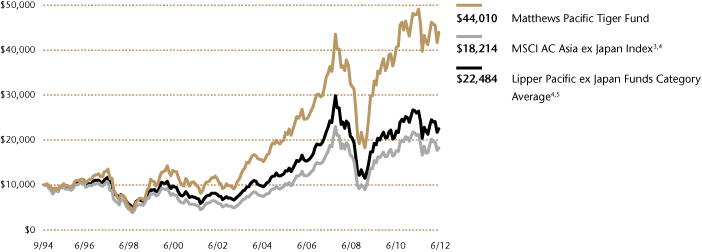
Plotted monthly. The performance data and graph do not reflect the deduction of taxes that a shareholder would pay on dividends, capital gains distributions or redemption of Fund shares. Values are in US$.
3 It is not possible to invest directly in an index. Source: Index data from Morgan Stanley Capital International and Bloomberg; total return calculations performed by BNY Mellon Investment Servicing (US) Inc. Please see page 69 for index definition.
4 Calculated from 8/31/94.
5 The Lipper Category Average does not reflect sales charges and is based on total return, including reinvestment of dividends and capital gains for the stated periods.
TOP TEN HOLDINGS6
| | | Sector | | Country | | % Net Assets | |
| Ping An Insurance Group Co. of China, Ltd. | | Financials | | China/Hong Kong | | | 2.6 | % | |
| Bank of Ayudhya Public Co., Ltd. | | Financials | | Thailand | | | 2.6 | % | |
| Tata Power Co., Ltd. | | Utilities | | India | | | 2.5 | % | |
| Delta Electronics, Inc. | | Information Technology | | Taiwan | | | 2.5 | % | |
| SM Prime Holdings, Inc. | | Financials | | Philippines | | | 2.4 | % | |
| Hang Lung Group, Ltd. | | Financials | | China/Hong Kong | | | 2.4 | % | |
| Genting BHD | | Consumer Discretionary | | Malaysia | | | 2.4 | % | |
| PT Perusahaan Gas Negara Persero | | Utilities | | Indonesia | | | 2.3 | % | |
| Dairy Farm International Holdings, Ltd. | | Consumer Staples | | China/Hong Kong | | | 2.3 | % | |
| Samsung Electronics Co., Ltd. | | Information Technology | | South Korea | | | 2.1 | % | |
| % OF ASSETS IN TOP TEN | | | | | | | 24.1 | % | |
6 Holdings may combine more than one security from same issuer and related depositary receipts.
30 MATTHEWS ASIA FUNDS
Matthews Pacific Tiger Fund
Portfolio Manager Commentary (continued)
A fairly recent addition to the portfolio, GAIL India is a key example. GAIL is the largest distributor of natural gas within the country. The biggest risk facing GAIL is the lack of availability of natural gas, and our contention is that this will change, helped by regulatory and technological shifts that are occurring globally. Common to both Li Ning and GAIL are our efforts to understand company-specific issues, which are currently a drag but can turn into tailwinds in spite of difficult macro conditions.
The last few years have been challenging for both Asian economies and capital markets given shifting business fundamentals and the consequent erosion of equity valuations. Some of these problems are a result of a previously indulgent capital market and benign economic conditions. It is natural that weaker businesses are being forced to exit, but it remains our view that the structural underpinnings of strong household balance sheets and growing prosperity provide a comparatively better outlook for Asia. In our view, the improved outlook and tailwinds from attractive valuations can be an opportunity to generate long-term performance. However a sluggish outlook for global growth doesn't leave room for too many misadventures, particularly with policymaking.
COUNTRY ALLOCATION (%)
| China/Hong Kong | | | 31.3 | | |
| India | | | 15.8 | | |
| South Korea | | | 13.9 | | |
| Indonesia | | | 8.5 | | |
| Taiwan | | | 8.3 | | |
| Thailand | | | 7.3 | | |
| Malaysia | | | 4.7 | | |
| Singapore | | | 2.7 | | |
| Philippines | | | 2.4 | | |
| Vietnam | | | 0.8 | | |
Cash and Other Assets,
Less Liabilities | | | 4.3 | | |
SECTOR ALLOCATION (%)
| Financials | | | 30.1 | | |
| Information Technology | | | 15.2 | | |
| Consumer Discretionary | | | 14.3 | | |
| Consumer Staples | | | 13.8 | | |
| Utilities | | | 7.1 | | |
| Health Care | | | 6.9 | | |
| Telecommunication Services | | | 3.3 | | |
| Materials | | | 1.9 | | |
| Energy | | | 1.9 | | |
| Industrials | | | 1.2 | | |
Cash and Other Assets,
Less Liabilities | | | 4.3 | | |
MARKET CAP EXPOSURE (%)7
| Large Cap (over $5B) | | | 68.4 | | |
| Mid Cap ($1B–$5B) | | | 25.2 | | |
| Small Cap (under $1B) | | | 2.1 | | |
Cash and Other Assets,
Less Liabilities | | | 4.3 | | |
7 Source: FactSet Research Systems. Percentage values in data are rounded to the nearest tenth of one percent; the values may not sum to 100% due to rounding.
matthewsasia.com | 800.789.ASIA 31
Matthews Pacific Tiger Fund June 30, 2012
Schedule of Investmentsa (unaudited)
COMMON EQUITIES: 95.7%
| | | Shares | | Value | |
| CHINA/HONG KONG: 31.3% | |
Ping An Insurance Group Co. of
China, Ltd. H Shares | | | 19,029,500 | | | $ | 153,869,876 | | |
| Hang Lung Group, Ltd. | | | 23,365,000 | | | | 144,469,744 | | |
| Dairy Farm International Holdings, Ltd. | | | 12,901,446 | | | | 137,552,134 | | |
| Sinopharm Group Co., Ltd. H Shares† | | | 43,503,200 | | | | 120,933,087 | | |
| China Mobile, Ltd. ADR | | | 2,063,150 | | | | 112,792,410 | | |
| China Resources Land, Ltd. | | | 53,478,000 | | | | 110,579,878 | | |
| Digital China Holdings, Ltd. | | | 53,828,000 | | | | 94,857,377 | | |
| Tingyi (Cayman Islands) Holding Corp. | | | 35,926,000 | | | | 92,559,911 | | |
| Lenovo Group, Ltd. | | | 105,568,000 | | | | 90,084,485 | | |
| Hengan International Group Co., Ltd. | | | 7,996,000 | | | | 77,890,285 | | |
| Li & Fung, Ltd. | | | 35,302,000 | | | | 68,353,526 | | |
New Oriental Education & Technology
Group, Inc. ADRb | | | 2,772,409 | | | | 67,924,020 | | |
| Swire Pacific, Ltd. A Shares | | | 5,683,500 | | | | 66,103,929 | | |
| China Vanke Co., Ltd. B Sharesb | | | 48,875,258 | | | | 64,432,823 | | |
| Shangri-La Asia, Ltd. | | | 31,457,333 | | | | 60,423,941 | | |
| Tencent Holdings, Ltd. | | | 2,011,900 | | | | 59,413,993 | | |
| China Resources Enterprise, Ltd. | | | 19,852,000 | | | | 59,313,127 | | |
| Baidu, Inc. ADRb | | | 497,700 | | | | 57,225,546 | | |
| Hong Kong Exchanges and Clearing, Ltd. | | | 3,664,500 | | | | 52,727,660 | | |
| Dongfeng Motor Group Co., Ltd. H Shares | | | 30,440,000 | | | | 47,579,412 | | |
| China Merchants Bank Co., Ltd. H Shares | | | 22,182,350 | | | | 42,059,699 | | |
| Ctrip.com International, Ltd. ADRb | | | 2,490,350 | | | | 41,738,266 | | |
| Li Ning Co., Ltd.† | | | 54,193,500 | | | | 30,491,829 | | |
| Total China/Hong Kong | | | | | 1,853,376,958 | | |
| INDIA: 15.8% | |
| Tata Power Co., Ltd. | | | 78,960,510 | | | | 149,396,140 | | |
| ITC, Ltd. | | | 21,185,000 | | | | 98,651,661 | | |
| Kotak Mahindra Bank, Ltd. | | | 8,767,491 | | | | 93,762,819 | | |
| Sun Pharmaceutical Industries, Ltd. | | | 7,676,815 | | | | 88,006,890 | | |
| HDFC Bank, Ltd. | | | 8,635,920 | | | | 87,959,541 | | |
| Housing Development Finance Corp. | | | 7,285,685 | | | | 85,913,881 | | |
| GAIL India, Ltd. | | | 10,609,419 | | | | 67,387,390 | | |
| Container Corp. of India, Ltd. | | | 3,641,969 | | | | 60,249,237 | | |
| Titan Industries, Ltd. | | | 13,593,760 | | | | 54,737,263 | | |
| Dabur India, Ltd. | | | 25,308,038 | | | | 52,147,259 | | |
| Infosys, Ltd. | | | 848,401 | | | | 38,462,427 | | |
| Sun TV Network, Ltd. | | | 4,804,753 | | | | 26,185,524 | | |
| Thermax, Ltd. | | | 1,237,793 | | | | 10,667,548 | | |
| HDFC Bank, Ltd. ADR | | | 319,500 | | | | 10,415,700 | | |
| Infosys, Ltd. ADR | | | 219,611 | | | | 9,895,672 | | |
| Total India | | | | | 933,838,952 | | |
| SOUTH KOREA: 13.9% | |
| Samsung Electronics Co., Ltd. | | | 119,904 | | | | 126,976,831 | | |
| Dongbu Insurance Co., Ltd. | | | 3,031,690 | | | | 111,927,329 | | |
| NHN Corp. | | | 436,302 | | | | 95,695,902 | | |
| Cheil Worldwide, Inc.† | | | 5,916,350 | | | | 94,499,024 | | |
| Green Cross Corp.† | | | 704,049 | | | | 92,051,949 | | |
| Hyundai Mobis | | | 327,719 | | | | 79,437,829 | | |
| Yuhan Corp.† | | | 584,138 | | | | 68,294,703 | | |
| Amorepacific Corp. | | | 67,652 | | | | 62,885,912 | | |
| POSCO | | | 195,584 | | | | 62,616,625 | | |
| MegaStudy Co., Ltd.† | | | 396,412 | | | | 27,162,833 | | |
| Total South Korea | | | | | 821,548,937 | | |
| | | Shares | | Value | |
| INDONESIA: 8.5% | |
| PT Perusahaan Gas Negara Persero | | | 364,396,500 | | | $ | 137,954,693 | | |
| PT Astra International | | | 146,652,300 | | | | 108,111,876 | | |
| PT Bank Central Asia | | | 115,688,500 | | | | 90,485,367 | | |
| PT Indofood CBP Sukses Makmurb | | | 132,314,000 | | | | 81,814,444 | | |
| PT Telekomunikasi Indonesia Persero | | | 80,460,500 | | | | 70,297,079 | | |
PT Telekomunikasi Indonesia
Persero ADR | | | 375,700 | | | | 13,085,631 | | |
| Total Indonesia | | | | | 501,749,090 | | |
| TAIWAN: 8.3% | |
| Delta Electronics, Inc. | | | 48,296,000 | | | | 148,249,699 | | |
| Synnex Technology International Corp. | | | 50,022,354 | | | | 122,415,439 | | |
| President Chain Store Corp. | | | 19,439,608 | | | | 103,721,840 | | |
| Yuanta Financial Holding Co., Ltd.b | | | 133,911,782 | | | | 61,357,209 | | |
Taiwan Semiconductor Manufacturing
Co., Ltd.b | | | 20,423,513 | | | | 55,908,719 | | |
| Total Taiwan | | | | | 491,652,906 | | |
| THAILAND: 7.3% | |
| Bank of Ayudhya Public Co., Ltd. | | | 163,168,600 | | | | 152,862,890 | | |
| Central Pattana Public Co., Ltd. | | | 81,096,100 | | | | 119,768,672 | | |
PTT Exploration & Production Public
Co., Ltd. | | | 20,425,000 | | | | 108,865,930 | | |
| Siam Cement Public Co., Ltd. NVDR | | | 5,087,900 | | | | 50,992,132 | | |
| Total Thailand | | | | | 432,489,624 | | |
| MALAYSIA: 4.7% | |
| Genting BHD | | | 47,065,500 | | | | 140,550,107 | | |
| Public Bank BHD | | | 22,511,386 | | | | 97,839,347 | | |
| Top Glove Corp. BHD | | | 25,175,960 | | | | 41,413,459 | | |
| Total Malaysia | | | | | 279,802,913 | | |
| SINGAPORE: 2.7% | |
| Keppel Land, Ltd. | | | 35,212,000 | | | | 90,613,381 | | |
| Hyflux, Ltd.† | | | 62,284,280 | | | | 66,709,992 | | |
| Total Singapore | | | | | 157,323,373 | | |
| PHILIPPINES: 2.4% | |
| SM Prime Holdings, Inc. | | | 466,949,271 | | | | 144,736,199 | | |
| Total Philippines | | | | | 144,736,199 | | |
| VIETNAM: 0.8% | |
| Vietnam Dairy Products JSC | | | 11,907,545 | | | | 50,100,036 | | |
| Total Vietnam | | | | | 50,100,036 | | |
32 MATTHEWS ASIA FUNDS
Matthews Pacific Tiger Fund June 30, 2012
Schedule of Investmentsa (unaudited) (continued)
COMMON EQUITIES (continued)
| | | Value | |
| TOTAL INVESTMENTS: 95.7% | | $ | 5,666,618,988 | | |
| (Cost $4,529,040,093c) | | | |
CASH AND OTHER ASSETS,
LESS LIABILITIES: 4.3% | | | 256,767,149 | | |
| NET ASSETS: 100.0% | | $ | 5,923,386,137 | | |
a Certain securities were fair valued under the discretion of the Board of Trustees (Note 2-A).
b Non-income producing security.
c Cost for federal income tax purposes is $4,530,302,695 and net unrealized appreciation consists of:
| Gross unrealized appreciation | | $ | 1,396,952,230 | | |
| Gross unrealized depreciation | | | (260,635,937 | ) | |
| Net unrealized appreciation | | $ | 1,136,316,293 | | |
† Affiliated Issuer, as defined under the Investment Company Act of 1940 (ownership of 5% or more of the outstanding voting securities of this issuer)
ADR American Depositary Receipt
BHD Berhad
JSC Joint Stock Co.
NVDR Non-voting Depositary Receipt
See accompanying notes to financial statements.
matthewsasia.com | 800.789.ASIA 33

ASIA GROWTH STRATEGIES
PORTFOLIO MANAGERS
Richard H. Gao
Lead Manager
Henry Zhang, CFA
Co-Manager
FUND FACTS
| | | Investor Class | | Institutional Class | |
| Ticker | | MCHFX | | MICFX | |
| CUSIP | | 577130701 | | 577130818 | |
| Inception | | 2/19/98 | | 10/29/10 | |
| NAV | | $21.95 | | $21.96 | |
| Initial Investment | | $2,500 | | $3 million | |
| Gross Expense Ratio1 | | 1.13% | | 0.96% | |
Portfolio Statistics
| Total # of Positions | | 60 | |
| Net Assets | | $2.1 billion | |
| Weighted Average Market Cap | | $29.1 billion | |
| Portfolio Turnover | | 8.43%2 | |
Benchmark
MSCI China Index
Redemption Fee
2% within first 90 calendar days of purchase
OBJECTIVE
Long-term capital appreciation.
STRATEGY
Under normal market conditions, the Fund seeks to achieve its investment objective by investing at least 80% of its total net assets, which include borrowings for investment purposes, in the common and preferred stocks of companies located in China and Taiwan. China includes its administrative and other districts, such as Hong Kong.
1 Matthews Asia Funds does not charge 12b-1 fees.
2 The lesser of fiscal year 2011 long-term purchase costs or sales proceeds divided by the average monthly market value of long-term securities.
Matthews China Fund
Portfolio Manager Commentary
For the first half of 2012, the Matthews China Fund gained 2.05% (Investor Class) and 2.19% (Institutional Class), underperforming its benchmark, the MSCI China Index, which returned 4.14%. For the quarter ended June 30, the Fund fell –6.36% (Investor Class) and –6.28% (Institutional Class) while its benchmark returned –5.26%.
After a strong rally in the first quarter, Chinese equities came under significant selling pressure during the second quarter. Uncertainties and worries about Europe's debt crisis, weak economic indicators, such as those for industrial output and retail sales, and downward earnings revisions by analysts were the main reasons behind the stock market decline. Investors had been expecting a recovery of China's economy in the second quarter but domestic consumption and industrial production continued to weaken.
In view of the tough economic environment, the government took more decisive action toward monetary easing: the central bank cut reserve ratios further, sped up new project approvals, lowered barriers for private investments and, most importantly, cut interest rates for the first time since 2008. China's subdued inflationary environment during the quarter was a favorable development, and one that should allow the government more room for easing in the coming months. China's June consumer price index stood at 2.2%, well within the government's 4% target.
During the second quarter, the Matthews China Fund gave up most of its gains from the first quarter mainly due to weak performance among its consumer discretionary and consumer staples holdings. The global economic slowdown and decline in exports, coupled with the government's recent efforts to cool the property market, negatively impacted consumer sentiment and spending. The portfolio's holdings in department store, hotel, supermarket and sportswear companies were some of the hardest hit in the second quarter. These companies continued to report weak growth figures and their near-term operating environments may still be challenging. We believe that our investments in most of these consumer areas are experiencing some short-term headwinds but the long-term secular growth of China's consumer demand remains unchanged. China's sportswear sector is an exception in that it is undergoing a restructuring, and positive results in this industry may take longer to develop.
We believe the country's long-term growth in consumer demand is supported by its growing middle class population and rising income levels of both urban and rural workers. Meanwhile, we are starting to see margin pressures ease for consumer companies as rental costs and commodity prices continue to go down. Overall, our long-term overweight positions in the consumer sectors remain unchanged.
Despite a challenging market environment, China's property sector rallied during the second quarter and our real estate company holdings were among the top contributors to Fund performance. Despite ongoing tightening in the country's real estate markets, the overall market seemed to be stabilizing and demand started to pick up, as shown by the increase in property transaction volume.
During the second quarter, no major changes were made to the Fund. We remained fully invested and diversified. We slightly increased our holdings in select health care and hotel companies as we believe valuations in these
(continued)
34 MATTHEWS ASIA FUNDS
PERFORMANCE AS OF JUNE 30, 2012
| | | | | Average Annual Total Returns | | | |
| | | 3 Months | | 1 Year | | 3 Years | | 5 Years | | 10 Years | | Since
Inception | | Inception
Date | |
| Investor Class (MCHFX) | | | -6.36 | % | | | -17.13 | % | | | 7.09 | % | | | 2.81 | % | | | 14.40 | % | | | 10.72 | % | | 2/19/98 | |
| Institutional Class (MICFX) | | | -6.28 | % | | | -16.94 | % | | | n.a. | | | | n.a. | | | | n.a. | | | | -11.45 | % | | 10/29/10 | |
| MSCI China Index3 | | | -5.26 | % | | | -15.78 | % | | | 1.79 | % | | | -0.49 | % | | | 15.76 | % | | | 2.59 | %4 | | | | | |
| Lipper China Region Funds Category Average5 | | | -6.45 | % | | | -19.33 | % | | | 2.58 | % | | | -2.95 | % | | | 10.58 | % | | | 7.42 | %4 | | | | | |
Performance assumes reinvestment of all dividends and/or distributions before taxes. All performance quoted represents past performance and is no guarantee of future results. Investment return and principal value will fluctuate with market conditions so that when redeemed, shares may be worth more or less than their original cost. Current performance may be lower or higher than the return figures quoted. Returns would have been lower if certain of the Fund's fees and expenses had not been waived. For the Fund's most recent month-end performance, visit matthewsasia.com.
GROWTH OF A $10,000 INVESTMENT SINCE INCEPTION—INVESTOR CLASS
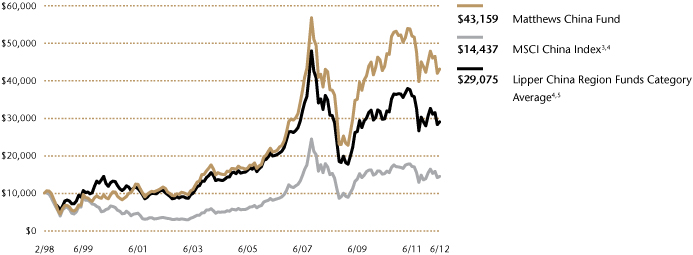
Plotted monthly. The performance data and graph do not reflect the deduction of taxes that a shareholder would pay on dividends, capital gains distributions or redemption of Fund shares. Values are in US$.
3 It is not possible to invest directly in an index. Source: Index data from Morgan Stanley Capital International and Bloomberg; total return calculations performed by BNY Mellon Investment Servicing (US) Inc. Please see page 69 for index definition.
4 Calculated from 2/28/98.
5 The Lipper Category Average does not reflect sales charges and is based on total return, including reinvestment of dividends and capital gains for the stated periods.
TOP TEN HOLDINGS6
| | | Sector | | % Net Assets | |
| China Mobile, Ltd. | | Telecommunication Services | | | 3.8 | % | |
| Digital China Holdings, Ltd. | | Information Technology | | | 3.0 | % | |
| Ping An Insurance Group Co. of China, Ltd. | | Financials | | | 2.8 | % | |
| Cheung Kong Infrastructure Holdings, Ltd. | | Utilities | | | 2.7 | % | |
| China Life Insurance Co., Ltd. | | Financials | | | 2.7 | % | |
| China Resources Land, Ltd. | | Financials | | | 2.6 | % | |
| Tingyi (Cayman Islands) Holding Corp. | | Consumer Staples | | | 2.5 | % | |
| China Vanke Co., Ltd. | | Financials | | | 2.4 | % | |
| Hang Lung Group, Ltd. | | Financials | | | 2.3 | % | |
| China Merchants Bank Co., Ltd. | | Financials | | | 2.2 | % | |
| % OF ASSETS IN TOP TEN | | | | | 27.0 | % | |
6 Holdings may combine more than one security from same issuer and related depositary receipts.
matthewsasia.com | 800.789.ASIA 35
SECTOR ALLOCATION (%)
| Financials | | | 22.8 | | |
| Consumer Discretionary | | | 21.0 | | |
| Information Technology | | | 11.9 | | |
| Consumer Staples | | | 11.8 | | |
| Industrials | | | 8.9 | | |
| Energy | | | 6.9 | | |
| Telecommunication Services | | | 5.9 | | |
| Utilities | | | 5.3 | | |
| Health Care | | | 4.1 | | |
Cash and Other Assets,
Less Liabilities | | | 1.4 | | |
MARKET CAP EXPOSURE (%)7
| Large Cap (over $5B) | | | 70.6 | | |
| Mid Cap ($1B–$5B) | | | 24.6 | | |
| Small Cap (under $1B) | | | 3.4 | | |
Cash and Other Assets,
Less Liabilities | | | 1.4 | | |
7 Source: FactSet Research Systems. Percentage values in data are rounded to the nearest tenth of one percent; the values may not sum to 100% due to rounding.
Matthews China Fund
Portfolio Manager Commentary (continued)
companies are attractive. Home Inns & Hotels Management, one of China's largest and earliest budget hotel chains with operations throughout the country, saw its stock come under selling pressure this year due to investor concerns over the economic slowdown and the effectiveness of the company's recent acquisition. We believe that Home Inns is among China's most efficient budget hotel operators with a strong track record and management team. Our visits and discussions with its management have convinced us of the strategic benefits of its earlier acquisition toward the company's long-term development. What's more, the integration process for the acquisition seems to be well on track.
Going forward, we believe that the Chinese economy will continue to face the challenge of slowing near-term growth. We expect that the recent easing of monetary policies should gradually take effect and help growth momentum recover toward the end of the year. Given that inflation is still in check, additional easing measures, both for monetary and fiscal policy, are likely. We will continue to emphasize our long-term approach and remain focused on companies with strong fundamentals that can hold up through these short-term headwinds and volatilities.
36 MATTHEWS ASIA FUNDS
Matthews China Fund June 30, 2012
Schedule of Investmentsa (unaudited)
COMMON EQUITIES: CHINA/HONG KONG: 98.6%
| | | Shares | | Value | |
| FINANCIALS: 22.8% | |
| Real Estate Management & Development: 8.6% | |
| China Resources Land, Ltd. | | | 26,366,000 | | | $ | 54,518,663 | | |
| China Vanke Co., Ltd. B Shares | | | 37,690,868 | | | | 49,688,311 | | |
| Hang Lung Group, Ltd. | | | 8,011,000 | | | | 49,533,367 | | |
| Swire Pacific, Ltd. A Shares | | | 2,411,500 | | | | 28,047,792 | | |
| | | | | | 181,788,133 | | |
| Commercial Banks: 7.2% | |
| China Merchants Bank Co., Ltd. H Shares | | | 24,978,114 | | | | 47,360,715 | | |
| BOC Hong Kong Holdings, Ltd. | | | 12,788,500 | | | | 39,368,828 | | |
| China Construction Bank Corp. H Shares | | | 51,366,660 | | | | 35,487,917 | | |
| Agricultural Bank of China, Ltd. H Shares | | | 71,103,000 | | | | 28,797,744 | | |
| | | | | | 151,015,204 | | |
| Insurance: 5.4% | |
Ping An Insurance Group Co. of
China, Ltd. H Shares | | | 7,271,000 | | | | 58,792,289 | | |
| China Life Insurance Co., Ltd. H Shares | | | 15,359,000 | | | | 40,447,993 | | |
| China Life Insurance Co., Ltd. ADR | | | 397,100 | | | | 15,681,479 | | |
| | | | | | 114,921,761 | | |
| Diversified Financial Services: 1.6% | |
| Hong Kong Exchanges and Clearing, Ltd. | | | 2,395,600 | | | | 34,469,745 | | |
| Total Financials | | | | | 482,194,843 | | |
| CONSUMER DISCRETIONARY: 21.0% | |
| Hotels, Restaurants & Leisure: 7.2% | |
| Cafe' de Coral Holdings, Ltd. | | | 17,212,100 | | | | 46,050,745 | | |
| Shangri-La Asia, Ltd. | | | 17,767,400 | | | | 34,128,015 | | |
| Sands China, Ltd. | | | 8,637,200 | | | | 27,786,104 | | |
Home Inns & Hotels
Management, Inc. ADRb | | | 1,221,746 | | | | 27,684,764 | | |
| Ctrip.com International, Ltd. ADRb | | | 1,032,000 | | | | 17,296,320 | | |
| | | | | | 152,945,948 | | |
| Multiline Retail: 3.0% | |
| Golden Eagle Retail Group, Ltd. | | | 20,899,000 | | | | 42,805,086 | | |
| Parkson Retail Group, Ltd. | | | 23,756,500 | | | | 21,221,811 | | |
| | | | | | 64,026,897 | | |
| Diversified Consumer Services: 2.2% | |
New Oriental Education & Technology
Group, Inc. ADRb | | | 1,927,900 | | | | 47,233,550 | | |
| Distributors: 2.1% | |
| Li & Fung, Ltd. | | | 23,298,400 | | | | 45,111,546 | | |
| Specialty Retail: 2.1% | |
| Belle International Holdings, Ltd. | | | 25,710,000 | | | | 44,045,348 | | |
| Automobiles: 1.9% | |
Dongfeng Motor Group Co., Ltd.
H Shares | | | 25,626,000 | | | | 40,054,862 | | |
| | | Shares | | Value | |
| Media: 1.4% | |
| Television Broadcasts, Ltd. | | | 4,082,000 | | | $ | 28,455,843 | | |
| Textiles, Apparel & Luxury Goods: 1.1% | |
| Ports Design, Ltd. | | | 14,983,500 | | | | 15,675,279 | | |
| Li Ning Co., Ltd. | | | 12,019,000 | | | | 6,762,458 | | |
| | | | | | 22,437,737 | | |
| Total Consumer Discretionary | | | | | 444,311,731 | | |
| INFORMATION TECHNOLOGY: 11.9% | |
| Internet Software & Services: 4.2% | |
| Netease, Inc. ADRb | | | 600,900 | | | | 35,362,965 | | |
| Tencent Holdings, Ltd. | | | 1,040,700 | | | | 30,733,209 | | |
| Sina Corp.b | | | 433,300 | | | | 22,449,273 | | |
| | | | | | 88,545,447 | | |
| Electronic Equipment, Instruments & Components: 3.0% | |
| Digital China Holdings, Ltd. | | | 35,645,000 | | | | 62,814,729 | | |
| Computers & Peripherals: 1.9% | |
| Lenovo Group, Ltd. | | | 46,332,000 | | | | 39,536,548 | | |
| Communications Equipment: 1.7% | |
| ZTE Corp. H Shares | | | 18,547,104 | | | | 36,177,046 | | |
| Software: 1.1% | |
Kingdee International Software Group
Co., Ltd.b | | | 123,524,800 | | | | 23,252,635 | | |
| Total Information Technology | | | | | 250,326,405 | | |
| CONSUMER STAPLES: 11.8% | |
| Food Products: 4.4% | |
| Tingyi (Cayman Islands) Holding Corp. | | | 20,295,000 | | | | 52,288,131 | | |
| China Mengniu Dairy Co., Ltd. | | | 9,651,000 | | | | 25,555,806 | | |
| China Yurun Food Group, Ltd. | | | 16,111,000 | | | | 14,230,474 | | |
| | | | | | 92,074,411 | | |
| Food & Staples Retailing: 3.3% | |
| China Resources Enterprise, Ltd. | | | 10,466,000 | | | | 31,269,957 | | |
Lianhua Supermarket Holdings Co., Ltd.
H Shares† | | | 28,947,800 | | | | 27,793,131 | | |
| Sun Art Retail Group, Ltd. | | | 9,443,000 | | | | 10,406,427 | | |
| | | | | | 69,469,515 | | |
| Personal Products: 2.1% | |
| Hengan International Group Co., Ltd. | | | 4,671,000 | | | | 45,500,941 | | |
| Beverages: 2.0% | |
| Tsingtao Brewery Co., Ltd. H Shares | | | 7,261,000 | | | | 41,491,356 | | |
| Total Consumer Staples | | | | | 248,536,223 | | |
matthewsasia.com | 800.789.ASIA 37
Matthews China Fund June 30, 2012
Schedule of Investmentsa (unaudited) (continued)
COMMON EQUITIES: CHINA/HONG KONG (continued)
| | | Shares | | Value | |
| INDUSTRIALS: 8.9% | |
| Machinery: 3.5% | |
| CSR Corp., Ltd. H Shares | | | 49,326,000 | | | $ | 38,717,268 | | |
Sany Heavy Equipment International
Holdings Co., Ltd. | | | 34,230,500 | | | | 18,490,731 | | |
China National Materials Co., Ltd.
H Shares | | | 55,910,000 | | | | 17,461,502 | | |
| | | | | | 74,669,501 | | |
| Transportation Infrastructure: 3.0% | |
China Merchants Holdings International
Co., Ltd. | | | 12,340,581 | | | | 37,752,933 | | |
| Yuexiu Transport Infrastructure, Ltd. | | | 50,775,000 | | | | 25,077,121 | | |
| | | | | | 62,830,054 | | |
| Airlines: 1.2% | |
| Air China, Ltd. H Shares | | | 45,027,900 | | | | 26,731,091 | | |
| Industrial Conglomerates: 1.2% | |
| NWS Holdings, Ltd. | | | 16,914,914 | | | | 24,739,181 | | |
| Total Industrials | | | | | 188,969,827 | | |
| ENERGY: 6.9% | |
| Oil, Gas & Consumable Fuels: 5.1% | |
| CNOOC, Ltd. | | | 19,737,000 | | | | 39,792,147 | | |
China Shenhua Energy Co., Ltd.
H Shares | | | 9,873,500 | | | | 34,935,462 | | |
China Petroleum & Chemical Corp.
(Sinopec) H Shares | | | 36,070,000 | | | | 32,236,736 | | |
| | | | | | 106,964,345 | | |
| Energy Equipment & Services: 1.8% | |
| China Oilfield Services, Ltd. H Shares | | | 26,168,000 | | | | 37,999,372 | | |
| Total Energy | | | | | 144,963,717 | | |
| TELECOMMUNICATION SERVICES: 5.9% | |
| Wireless Telecommunication Services: 3.9% | |
| China Mobile, Ltd. | | | 4,795,083 | | | | 52,637,980 | | |
| China Mobile, Ltd. ADR | | | 522,300 | | | | 28,554,141 | | |
| | | | | | 81,192,121 | | |
| Diversified Telecommunication Services: 2.0% | |
China Communications Services Corp.,
Ltd. H Sharesb | | | 85,864,800 | | | | 42,683,492 | | |
| Total Telecommunication Services | | | | | 123,875,613 | | |
| | | Shares | | Value | |
| UTILITIES: 5.3% | |
| Electric Utilities: 2.7% | |
| Cheung Kong Infrastructure Holdings, Ltd. | | | 9,397,500 | | | $ | 56,890,563 | | |
| Gas Utilities: 1.9% | |
| Hong Kong & China Gas Co., Ltd. | | | 19,200,739 | | | | 40,788,147 | | |
| Independent Power Producers & Energy Traders: 0.7% | |
China Longyuan Power Group Corp.
H Shares | | | 20,724,000 | | | | 13,685,710 | | |
| Total Utilities | | | | | 111,364,420 | | |
| HEALTH CARE: 4.1% | |
| Health Care Equipment & Supplies: 2.1% | |
| Mindray Medical International, Ltd. ADR | | | 1,470,668 | | | | 44,546,534 | | |
| Health Care Providers & Services: 2.0% | |
| Sinopharm Group Co., Ltd. H Shares | | | 15,334,800 | | | | 42,628,696 | | |
| Total Health Care | | | | | 87,175,230 | | |
| TOTAL INVESTMENTS: 98.6% | | | | | 2,081,718,009 | | |
| (Cost $1,889,236,523c) | | | | | |
CASH AND OTHER ASSETS,
LESS LIABILITIES: 1.4% | | | | | 29,932,528 | | |
| NET ASSETS: 100.0% | | | | $ | 2,111,650,537 | | |
a Certain securities were fair valued under the discretion of the Board of Trustees (Note 2-A).
b Non-income producing security.
c Cost for federal income tax purposes is $1,890,612,384 and net unrealized appreciation consists of:
| Gross unrealized appreciation | | $ | 401,748,744 | | |
| Gross unrealized depreciation | | | (210,643,119 | ) | |
| Net unrealized appreciation | | $ | 191,105,625 | | |
† Affiliated Issuer, as defined under the Investment Company Act of 1940 (ownership of 5% or more of the outstanding voting securities of this issuer)
ADR American Depositary Receipt
See accompanying notes to financial statements.
38 MATTHEWS ASIA FUNDS

ASIA GROWTH STRATEGIES
PORTFOLIO MANAGERS
Sharat Shroff, CFA
Lead Manager
Sunil Asnani
Co-Manager
FUND FACTS
| | | Investor Class | | Institutional Class | |
| Ticker | | MINDX | | MIDNX | |
| CUSIP | | 577130859 | | 577130768 | |
| Inception | | 10/31/05 | | 10/29/10 | |
| NAV | | $15.52 | | $15.56 | |
| Initial Investment | | $2,500 | | $3 million | |
| Gross Expense Ratio1 | | 1.18% | | 0.99% | |
Portfolio Statistics
| Total # of Positions | | 45 | |
| Net Assets | | $604.9 million | |
| Weighted Average Market Cap | | $7.4 billion | |
| Portfolio Turnover | | 3.51%2 | |
Benchmark
Bombay Stock Exchange 100 Index
Redemption Fee
2% within first 90 calendar days of purchase
OBJECTIVE
Long-term capital appreciation.
STRATEGY
Under normal market conditions, the Fund seeks to achieve its investment objective by investing at least 80% of its total net assets, which include borrowings for investment purposes, in publicly traded common stocks, preferred stocks and convertible securities of companies located in India.
1 Matthews Asia Funds does not charge 12b-1 fees.
2 The lesser of fiscal year 2011 long-term purchase costs or sales proceeds divided by the average monthly market value of long-term securities.
Matthews India Fund
Portfolio Manager Commentary
For the first half of 2012, the Matthews India Fund gained 14.20% (Investor Class) and 14.33% (Institutional Class), compared to its benchmark, the Bombay Stock Exchange 100 Index, which returned 11.33%. For the quarter ending June 30, the Fund declined –7.78% (Investor Class) and –7.71% (Institutional Class), while its benchmark fell –7.98%. The rupee has been among the region's worst-performing currencies thus far this year, suffering a 4.6% depreciation against the U.S. dollar.
The rupee's depreciation marks a contrast to the relatively stronger performance of the equity markets in local currency terms. This reflects the inherent dichotomy between the performance of the corporate sector, and India's deteriorating macroeconomic fundamentals. Earnings expectations across a broad basket of Indian companies are still coming down, but overall earnings growth is still holding up better than in other parts of Asia. Meanwhile, a persistently high fiscal deficit, slowing GDP growth and inconsistent policymaking are weakening India's macro fundamentals.
During the first half of the year, the portfolio's overweight to small- and mid-capitalization holdings, and limited exposure to volatile metal stocks helped it outperform the benchmark. Last year, small- and mid-cap stocks underwent a much larger correction than larger-cap stocks. We remained invested in these smaller holdings and, in fact, added to a few of them. That strategy paid off during the first half of this year, as small cap stocks have partly recovered, and the difference in valuations between small and large firms has started to narrow. While the earnings performance of smaller-cap firms has been mixed relative to their larger-cap peers over the past few quarters, the extent of the valuation disparity may have led the market to become more positive on small caps. However, this strategy has not worked across all industries. For example, in the second quarter the Fund's industrials sector holdings, where certain stock-specific factors coupled with regulatory headwinds, detracted from portfolio performance.
We attempt to find businesses that have steady secular growth with some ability to pass on cost increases to their customers. For example, India's largest paint maker and one of our larger holdings, Asian Paints, was able to pass on to its customers most of the increases in raw material costs last year. This pricing power is attributable to the company's strong brand, availability, scale and dominant market position within the decorative paint segment. The materials sector, including Asian Paints, was a key contributor to the portfolio's relative outperformance in the first half of the year.
During the first half of the year, the portfolio made no major shifts in strategy. However, we replaced a few information technology and financials sector stocks with companies which we believe have more attractive fundamentals. We also exited a few of our convertible bond holdings as we indentified more attractive risk-reward trade-offs in equities, where valuations were running below historical averages. A recent addition to the portfolio is Bajaj Corporation, a small-cap herbal hair oil maker and distributor. We like the company for its established brand name and wide distribution network for hair oils, although we believe more could be done to leverage its existing network. The firm has made recent changes in its leadership and shown renewed focus on expanding its business. We view these developments positively, and believe the company has the opportunity to diversify its product portfolio in coming years.
(continued)
matthewsasia.com | 800.789.ASIA 39
PERFORMANCE AS OF JUNE 30, 2012
| | | | | Average Annual Total Returns | | | |
| | | 3 Months | | 1 Year | | 3 Years | | 5 Years | | Since
Inception | | Inception
Date | |
| Investor Class (MINDX) | | | -7.78 | % | | | -23.88 | % | | | 8.81 | % | | | -0.16 | % | | | 9.33 | % | | 10/31/05 | |
| Institutional Class (MIDNX) | | | -7.71 | % | | | -23.72 | % | | | n.a. | | | | n.a. | | | | -18.35 | % | | 10/29/10 | |
| Bombay Stock Exchange 100 Index3 | | | -7.98 | % | | | -23.69 | % | | | 3.60 | % | | | -0.47 | % | | | 11.43 | %4 | | | | | |
| Lipper India Region Funds Category Average5 | | | -8.91 | % | | | -23.96 | % | | | 2.61 | % | | | -4.49 | % | | | 6.02 | %4 | | | | | |
Performance assumes reinvestment of all dividends and/or distributions before taxes. All performance quoted represents past performance and is no guarantee of future results. Investment return and principal value will fluctuate with market conditions so that when redeemed, shares may be worth more or less than their original cost. Current performance may be lower or higher than the return figures quoted. Returns would have been lower if certain of the Fund's fees and expenses had not been waived. For the Fund's most recent month-end performance, visit matthewsasia.com.
GROWTH OF A $10,000 INVESTMENT SINCE INCEPTION—INVESTOR CLASS
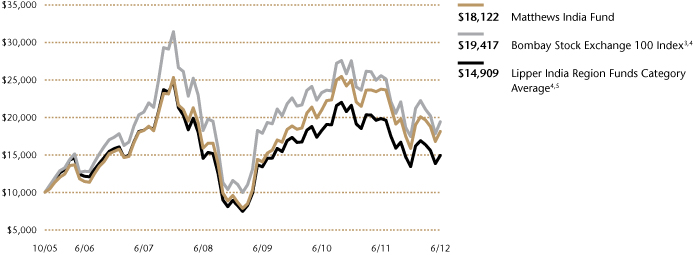
Plotted monthly. The performance data and graph do not reflect the deduction of taxes that a shareholder would pay on dividends, capital gains distributions or redemption of Fund shares. Values are in US$.
3 It is not possible to invest directly in an index. Source: Index data from Morgan Stanley Capital International and Bloomberg; total return calculations performed by BNY Mellon Investment Servicing (US) Inc. Please see page 69 for index definition.
4 Calculated from 10/31/05.
5 The Lipper Category Average does not reflect sales charges and is based on total return, including reinvestment of dividends and capital gains for the stated periods.
TOP TEN HOLDINGS6
| | | Sector | | % Net Assets | |
| Exide Industries, Ltd. | | Consumer Discretionary | | | 4.9 | % | |
| Emami, Ltd. | | Consumer Staples | | | 4.8 | % | |
| Sun Pharmaceutical Industries, Ltd. | | Health Care | | | 4.6 | % | |
| Asian Paints, Ltd. | | Materials | | | 4.5 | % | |
| HDFC Bank, Ltd. | | Financials | | | 4.1 | % | |
| Kotak Mahindra Bank, Ltd. | | Financials | | | 3.7 | % | |
| ICICI Bank, Ltd. | | Financials | | | 3.7 | % | |
| Info Edge India, Ltd. | | Information Technology | | | 3.6 | % | |
| Dabur India, Ltd. | | Consumer Staples | | | 3.6 | % | |
| Infosys, Ltd. | | Information Technology | | | 3.3 | % | |
| % OF ASSETS IN TOP TEN | | | | | 40.8 | % | |
6 Holdings may combine more than one security from same issuer and related depositary receipts.
40 MATTHEWS ASIA FUNDS
Matthews India Fund
Portfolio Manager Commentary (continued)
Much like Bajaj, companies and management teams continue to see opportunities for expanding their businesses, notably in the infrastructure sector. But some of these prospects are being stymied because of inconsistent government policies. We continue to believe that many of India's current macroeconomic problems are self-inflicted, and can be resolved with strong political leadership and clear policies that foster long-term decision making.
In spite of the lackluster policy environment, some companies are managing to deliver relatively robust results. This is most evident in the banking sector. A handful of private sector banks have reported better operating performance compared to their peers, and we believe this stems from superior management quality. Instead of eschewing investing in the country's long-term prospects, we remain focused on identifying business models run by management teams that stand a better chance of dealing with different micro and macroeconomic environment. Meanwhile, we are encouraged to find that current market valuations offer us opportunities to find compelling investments at reasonable prices, especially among small- and mid-cap names.
SECTOR ALLOCATION (%)
| Financials | | | 23.6 | | |
| Industrials | | | 17.4 | | |
| Consumer Staples | | | 12.8 | | |
| Materials | | | 12.6 | | |
| Consumer Discretionary | | | 11.6 | | |
| Information Technology | | | 8.8 | | |
| Utilities | | | 6.0 | | |
| Health Care | | | 5.5 | | |
| Energy | | | 1.1 | | |
Cash and Other Assets,
Less Liabilities | | | 0.6 | | |
MARKET CAP EXPOSURE (%)7
| Large Cap (over $5B) | | | 37.6 | | |
| Mid Cap ($1B–$5B) | | | 38.7 | | |
| Small Cap (under $1B) | | | 23.1 | | |
Liabilities in Excess of Cash
and Other Assets | | | 0.6 | | |
7 Source: FactSet Research Systems. Percentage values in data are rounded to the nearest tenth of one percent; the values may not sum to 100% due to rounding.
matthewsasia.com | 800.789.ASIA 41
Matthews India Fund June 30, 2012
Schedule of Investmentsa (unaudited)
COMMON EQUITIES: 97.2%
| | | Shares | | Value | |
| FINANCIALS: 23.6% | |
| Commercial Banks: 11.7% | |
| ICICI Bank, Ltd. | | | 1,150,000 | | | $ | 18,679,659 | | |
| HDFC Bank, Ltd. | | | 1,830,165 | | | | 18,640,802 | | |
| Allahabad Bank | | | 6,544,668 | | | | 17,703,896 | | |
| Axis Bank, Ltd. | | | 333,532 | | | | 6,136,172 | | |
| HDFC Bank, Ltd. ADR | | | 187,635 | | | | 6,116,901 | | |
| ICICI Bank, Ltd. ADR | | | 113,283 | | | | 3,671,502 | | |
| | | | | | 70,948,932 | | |
| Diversified Financial Services: 6.6% | |
| Kotak Mahindra Bank, Ltd. | | | 2,100,000 | | | | 22,458,183 | | |
| Infrastructure Development Finance Co., Ltd. | | | 6,211,855 | | | | 15,326,553 | | |
| Multi Commodity Exchange of India, Ltd. | | | 109,509 | | | | 2,080,151 | | |
| | | | | | 39,864,887 | | |
| Real Estate Management & Development: 2.9% | |
| Ascendas India Trust | | | 29,043,000 | | | | 17,495,613 | | |
| Thrifts & Mortgage Finance: 2.4% | |
| Housing Development Finance Corp. | | | 1,225,000 | | | | 14,445,382 | | |
| Total Financials | | | | | 142,754,814 | | |
| INDUSTRIALS: 17.4% | |
| Machinery: 7.9% | |
| Ashok Leyland, Ltd. | | | 40,022,554 | | | | 17,943,729 | | |
| AIA Engineering, Ltd. | | | 1,966,467 | | | | 12,164,983 | | |
| Thermax, Ltd. | | | 1,378,128 | | | | 11,876,983 | | |
| Jain Irrigation Systems, Ltd. | | | 3,675,635 | | | | 5,515,290 | | |
| | | | | | 47,500,985 | | |
| Road & Rail: 2.8% | |
| Container Corp. of India, Ltd. | | | 1,039,216 | | | | 17,191,791 | | |
| Industrial Conglomerates: 2.5% | |
| MAX India, Ltd.b | | | 4,388,102 | | | | 15,158,104 | | |
| Electrical Equipment: 2.2% | |
| Crompton Greaves, Ltd. | | | 6,187,500 | | | | 13,509,704 | | |
| Transportation Infrastructure: 2.0% | |
| Gujarat Pipavav Port, Ltd.b | | | 11,300,000 | | | | 11,864,253 | | |
| Total Industrials | | | | | 105,224,837 | | |
| CONSUMER STAPLES: 12.8% | |
| Personal Products: 9.6% | |
| Emami, Ltd. | | | 3,267,712 | | | | 29,324,799 | | |
| Dabur India, Ltd. | | | 10,654,430 | | | | 21,953,473 | | |
| Bajaj Corp., Ltd. | | | 3,362,178 | | | | 7,128,907 | | |
| | | | | | 58,407,179 | | |
| Tobacco: 3.2% | |
| ITC, Ltd. | | | 4,140,000 | | | | 19,278,635 | | |
| Total Consumer Staples | | | | | 77,685,814 | | |
| | | Shares | | Value | |
| CONSUMER DISCRETIONARY: 11.6% | |
| Media: 5.7% | |
| Jagran Prakashan, Ltd.b | | | 9,750,207 | | | $ | 15,329,304 | | |
| Sun TV Network, Ltd. | | | 2,650,127 | | | | 14,442,983 | | |
| Dish TV India, Ltd.b | | | 3,868,505 | | | | 4,439,974 | | |
| | | | | | 34,212,261 | | |
| Auto Components: 4.9% | |
| Exide Industries, Ltd. | | | 12,106,722 | | | | 29,772,273 | | |
| Textiles, Apparel & Luxury Goods: 1.0% | |
| Titan Industries, Ltd. | | | 1,538,820 | | | | 6,196,284 | | |
| Total Consumer Discretionary | | | | | 70,180,818 | | |
| MATERIALS: 11.6% | |
| Chemicals: 8.2% | |
| Asian Paints, Ltd. | | | 390,500 | | | | 27,259,646 | | |
| Castrol India, Ltd. | | | 1,881,301 | | | | 18,488,556 | | |
| Supreme Industries, Ltd. | | | 915,000 | | | | 3,675,070 | | |
| | | | | | 49,423,272 | | |
| Construction Materials: 1.7% | |
| Grasim Industries, Ltd. | | | 224,459 | | | | 10,648,119 | | |
| Metals & Mining: 1.7% | |
| NMDC, Ltd. | | | 2,995,923 | | | | 10,068,354 | | |
| Total Materials | | | | | 70,139,745 | | |
| INFORMATION TECHNOLOGY: 8.8% | |
| IT Services: 5.1% | |
| Infosys, Ltd. ADR | | | 238,179 | | | | 10,732,346 | | |
| Infosys, Ltd. | | | 206,281 | | | | 9,351,790 | | |
| CMC, Ltd. | | | 525,130 | | | | 7,992,484 | | |
| MindTree, Ltd. | | | 240,000 | | | | 2,778,160 | | |
| | | | | | 30,854,780 | | |
| Internet Software & Services: 3.7% | |
| Info Edge India, Ltd. | | | 3,324,978 | | | | 22,060,673 | | |
| Total Information Technology | | | | | 52,915,453 | | |
| HEALTH CARE: 5.5% | |
| Pharmaceuticals: 5.5% | |
| Sun Pharmaceutical Industries, Ltd. | | | 2,412,300 | | | | 27,654,570 | | |
| Cipla India, Ltd. | | | 988,275 | | | | 5,629,782 | | |
| Total Health Care | | | | | 33,284,352 | | |
| UTILITIES: 4.8% | |
| Gas Utilities: 3.1% | |
| GAIL India, Ltd. | | | 2,944,751 | | | | 18,704,048 | | |
| Electric Utilities: 1.7% | |
| CESC, Ltd. | | | 2,016,149 | | | | 10,528,779 | | |
| Total Utilities | | | | | 29,232,827 | | |
42 MATTHEWS ASIA FUNDS
Matthews India Fund June 30, 2012
Schedule of Investmentsa (unaudited) (continued)
COMMON EQUITIES (continued)
| | | Shares | | Value | |
| ENERGY: 1.1% | |
| Oil, Gas & Consumable Fuels: 1.1% | |
| Reliance Industries, Ltd. | | | 480,742 | | | $ | 6,402,511 | | |
| Total Energy | | | | | 6,402,511 | | |
| TOTAL COMMON EQUITIES | | | | | 587,821,171 | | |
| (Cost $604,458,375) | | | | | |
CORPORATE BONDS: 2.2%
| | | Face Amount | | | |
| UTILITIES: 1.2% | |
| Electric Utilities: 1.2% | |
Tata Power Co., Ltd., Cnv.
1.750%, 11/21/14 | | $ | 7,700,000 | | | | 7,557,550 | | |
| Total Utilities | | | | | 7,557,550 | | |
| MATERIALS: 1.0% | |
| Metals & Mining: 1.0% | |
Welspun Corp., Ltd., Cnv.
4.500%, 10/17/14 | | | 6,900,000 | | | | 5,830,500 | | |
| Total Materials | | | | | 5,830,500 | | |
| TOTAL CORPORATE BONDS | | | | | 13,388,050 | | |
| (Cost $16,596,125) | | | | | |
| TOTAL INVESTMENTS: 99.4% | | | | | 601,209,221 | | |
| (Cost $621,054,500c) | | | | | |
CASH AND OTHER ASSETS,
LESS LIABILITIES: 0.6% | | | | | 3,696,446 | | |
| NET ASSETS: 100.0% | | | | $ | 604,905,667 | | |
a Certain securities were fair valued under the discretion of the Board of Trustees (Note 2-A).
b Non-income producing security.
c Cost for federal income tax purposes is $621,376,739 and net unrealized depreciation consists of:
| Gross unrealized appreciation | | $ | 87,626,595 | | |
| Gross unrealized depreciation | | | (107,794,113 | ) | |
| Net unrealized depreciation | | ($ | 20,167,518 | ) | |
ADR American Depositary Receipt
Cnv. Convertible
USD U.S. Dollar
See accompanying notes to financial statements.
matthewsasia.com | 800.789.ASIA 43

ASIA GROWTH STRATEGIES
PORTFOLIO MANAGERS
Taizo Ishida
Lead Manager
Kenichi Amaki
Co-Manager
FUND FACTS
| | | Investor Class | | Institutional Class | |
| Ticker | | MJFOX | | MIJFX | |
| CUSIP | | 577130800 | | 577130792 | |
| Inception | | 12/31/98 | | 10/29/10 | |
| NAV | | $11.71 | | $11.72 | |
| Initial Investment | | $2,500 | | $3 million | |
| Gross Expense Ratio1 | | 1.21% | | 1.07% | |
Portfolio Statistics
| Total # of Positions | | 52 | |
| Net Assets | | $116.4 million | |
| Weighted Average Market Cap | | $15.2 billion | |
| Portfolio Turnover | | 34.94%2 | |
Benchmarks
MSCI Japan Index
Tokyo Stock Price Index (TOPIX)
Redemption Fee
2% within first 90 calendar days of purchase
OBJECTIVE
Long-term capital appreciation.
STRATEGY
Under normal market conditions, the Fund seeks to achieve its investment objective by investing at least 80% of its total net assets, which include borrowings for investment purposes, in the common and preferred stocks of companies located in Japan.
1 Matthews Asia Funds does not charge 12b-1 fees.
2 The lesser of fiscal year 2011 long-term purchase costs or sales proceeds divided by the average monthly market value of long-term securities.
Matthews Japan Fund
Portfolio Manager Commentary
For the first half of 2012, the Matthews Japan Fund returned 3.26% (Investor Class) and 3.35% (Institutional Class) while its benchmark, the MSCI Japan Index, advanced 3.23%. For the quarter ended June 30, the Fund declined –4.10% (Investor Class) and –4.09% (Institutional Class) while the benchmark fell –7.29%.
Investor sentiment toward Japan soured at the beginning of April as central bank monetary easing, which had been anticipated to continue, did not materialize. As the euphoria of easy money wore off, the realities of Europe's debt crisis settled in. Combined with signs of weaker growth from both China and the U.S., global risk appetite decreased considerably at the start of the second quarter. Risk aversion was apparent as cyclical sectors, such as energy, materials and information technology, performed poorly while defensive sectors such as health care, consumer staples and telecom outperformed.
One positive development during the second quarter was that despite the severity of the external environment, the yen did not revert back to historical high levels against the U.S. dollar. Though the yen did strengthen from its March lows, it hovered between 79 and 80 yen to the dollar for the majority of the second quarter, roughly where it was last fiscal year (most Japanese companies have March-end fiscal years). This response differed from recent years when the yen has continuously strengthened, acting as a safe-haven currency in times of crisis and declining risk tolerance. The Bank of Japan's expansionary policies may be responsible for stemming the yen's further rise, at least for the time being.
By sector, health care was the top contributor for the Fund during the second quarter. Medical consulting firm Ship Healthcare performed well on the back of healthy profit growth and a continued favorable outlook for capital spending among hospitals. Medical equipment company Asahi Intecc also showed strong performance as the company restarted operations at its Thai manufacturing facility, shut down since last autumn due to massive flooding in the country.
On the other hand, the industrials sector was the worst-performing sector for the Fund in the second quarter. EVA Precision Industrial declined considerably as global demand for office automation equipment remained weak amid the poor economic environment in developed markets. Demand for EVA's components did not occur at the pace the company had expected, leaving them with considerable underutilized capacity. To increase utilization, EVA took orders for other components, such as printers, but these products have much lower profit margins. Given the continued weak demand outlook for office automation equipment coupled with the deterioration in product mix, we exited our position toward the end of the quarter.
Precision motor manufacturer Nidec was the largest individual detractor to Fund performance during the quarter, as it faced headwinds from slowing demand for personal computers and hard disk drives. Though the environment for Nidec may remain challenging in the short term, we are encouraged by the advances the company is making in its industrial and automotive motor segments. We continue to view Nidec as one of Japan's premier growth companies with unique technological capability.
(continued)
44 MATTHEWS ASIA FUNDS
PERFORMANCE AS OF JUNE 30, 2012
| | | | | Average Annual Total Returns | | | |
| | | 3 Months | | 1 Year | | 3 Years | | 5 Years | | 10 Years | | Since
Inception | | Inception
Date | |
| Investor Class (MJFOX) | | | -4.10 | % | | | -5.69 | % | | | 7.39 | % | | | -3.92 | % | | | 2.98 | % | | | 3.52 | % | | 12/31/98 | |
| Institutional Class (MIJFX) | | | -4.09 | % | | | -5.54 | % | | | n.a. | | | | n.a. | | | | n.a. | | | | 3.59 | % | | 10/29/10 | |
| MSCI Japan Index3 | | | -7.29 | % | | | -7.07 | % | | | 2.00 | % | | | -6.37 | % | | | 2.63 | % | | | 1.07 | %4 | | | | | |
| Tokyo Stock Price Index3 | | | -6.61 | % | | | -6.53 | % | | | 1.91 | % | | | -5.97 | % | | | 2.63 | % | | | 1.41 | %4 | | | | | |
| Lipper Japanese Funds Category Average5 | | | -5.70 | % | | | -5.50 | % | | | 3.95 | % | | | -4.91 | % | | | 2.56 | % | | | 2.42 | %4 | | | | | |
Performance assumes reinvestment of all dividends and/or distributions before taxes. All performance quoted represents past performance and is no guarantee of future results. Investment return and principal value will fluctuate with market conditions so that when redeemed, shares may be worth more or less than their original cost. Current performance may be lower or higher than the return figures quoted. Returns would have been lower if certain of the Fund's fees and expenses had not been waived. For the Fund's most recent month-end performance, visit matthewsasia.com.
GROWTH OF A $10,000 INVESTMENT SINCE INCEPTION—INVESTOR CLASS
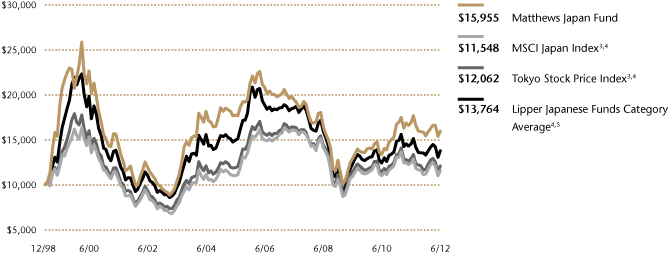
Plotted montly. The performance data and graph do not reflect the deduction of taxes that a shareholder would pay on dividends, capital gains distributions or redemption of Fund shares. Values are in US$.
3 It is not possible to invest directly in an index. Source: Index data from Morgan Stanley Capital International and Bloomberg; total return calculations performed by BNY Mellon Investment Servicing (US) Inc. Please see page 69 for index definitions.
4 Calculated from 12/31/98.
5 The Lipper Category Average does not reflect sales charges and is based on total return, including reinvestment of dividends and capital gains for the stated periods.
TOP TEN HOLDINGS6
| | | Sector | | % Net Assets | |
| ITOCHU Corp. | | Industrials | | | 4.8 | % | |
| Toyota Motor Corp. | | Consumer Discretionary | | | 4.4 | % | |
| ORIX Corp. | | Financials | | | 3.8 | % | |
| Rakuten, Inc. | | Consumer Discretionary | | | 3.5 | % | |
| Marubeni Corp. | | Industrials | | | 3.1 | % | |
| Mitsui & Co., Ltd. | | Industrials | | | 3.0 | % | |
| Nidec Corp. | | Industrials | | | 3.0 | % | |
| Rinnai Corp. | | Consumer Discretionary | | | 2.9 | % | |
| Sysmex Corp. | | Health Care | | | 2.9 | % | |
| Nissan Motor Co., Ltd. | | Consumer Discretionary | | | 2.8 | % | |
| % OF ASSETS IN TOP TEN | | | | | 34.2 | % | |
6 Holdings may combine more than one security from same issuer and related depositary receipts.
matthewsasia.com | 800.789.ASIA 45
SECTOR ALLOCATION (%)
| Industrials | | | 26.0 | | |
| Consumer Discretionary | | | 25.2 | | |
| Information Technology | | | 14.3 | | |
| Financials | | | 12.0 | | |
| Health Care | | | 9.9 | | |
| Consumer Staples | | | 6.7 | | |
| Materials | | | 4.2 | | |
| Telecommunication Services | | | 1.0 | | |
Cash and Other Assets,
Less Liabilities | | | 0.7 | | |
MARKET CAP EXPOSURE (%)7
| Large Cap (over $5B) | | | 54.3 | | |
| Mid Cap ($1B–$5B) | | | 21.8 | | |
| Small Cap (under $1B) | | | 23.2 | | |
Cash and Other Assets,
Less Liabilities | | | 0.7 | | |
7 Source: FactSet Research Systems. Percentage values in data are rounded to the nearest tenth of one percent; the values may not sum to 100% due to rounding.
Matthews Japan Fund
Portfolio Manager Commentary (continued)
The top contributors to Fund performance for the second quarter were Internet service companies Kakaku.com and Cookpad. After being the Fund's worst performer in the first quarter, Kakaku.com rebounded strongly on the back of solid earnings growth. The stock also got a boost after Japan's leading advertising agency, Dentsu, acquired a 15% stake in the firm. Cookpad, which operates a popular recipe website, surged amid the excitement surrounding the public offering of social networking site Facebook. Cookpad is the only Japanese Internet service company to be an official Facebook partner. Given the surge in the share price, we concluded that the "Facebook effect" had pushed valuations to unsustainable levels and exited the position during the second quarter. However, we maintain a favorable view of Cookpad's business model and will continue to monitor the company.
Looking ahead, Japanese lawmakers are considering a controversial consumption tax hike that is viewed as essential to fund growing social welfare costs while reducing the government's fiscal deficit. The proposal won approval in the Lower House of parliament in late June and if the bill passes in the Upper House, the consumption tax will be increased from 5% to 10% in two phases over the next three years. The bill is largely unpopular among the general public but is considered key to curbing growing costs as Japan's elderly population rises.
We continue to employ our bottom-up research process to identify companies with unique business models that we think can deliver growth over the long term. However, we remain mindful of external developments as we manage the portfolio going into the second half of this year.
46 MATTHEWS ASIA FUNDS
Matthews Japan Fund June 30, 2012
Schedule of Investmentsa (unaudited)
COMMON EQUITIES: 99.3%
| | | Shares | | Value | |
| INDUSTRIALS: 26.0% | |
| Trading Companies & Distributors: 10.9% | |
| ITOCHU Corp. | | | 532,800 | | | $ | 5,600,080 | | |
| Marubeni Corp. | | | 541,000 | | | | 3,604,629 | | |
| Mitsui & Co., Ltd. | | | 238,500 | | | | 3,544,075 | | |
| | | | | | 12,748,784 | | |
| Machinery: 6.9% | |
| Harmonic Drive Systems, Inc. | | | 101,700 | | | | 2,299,918 | | |
| Nabtesco Corp. | | | 80,400 | | | | 1,793,249 | | |
| Mitsubishi Heavy Industries, Ltd. | | | 399,000 | | | | 1,622,001 | | |
| Komatsu, Ltd. | | | 56,300 | | | | 1,343,957 | | |
| FANUC Corp. | | | 5,800 | | | | 953,411 | | |
| | | | | | 8,012,536 | | |
| Electrical Equipment: 3.0% | |
| Nidec Corp. | | | 46,500 | | | | 3,535,573 | | |
| Construction & Engineering: 2.1% | |
| JGC Corp. | | | 83,000 | | | | 2,406,282 | | |
| Commercial Services & Supplies: 2.0% | |
| JP-Holdings, Inc. | | | 236,500 | | | | 2,313,824 | | |
| Professional Services: 1.1% | |
| Nihon M&A Center, Inc. | | | 41,200 | | | | 1,255,199 | | |
| Total Industrials | | | | | 30,272,198 | | |
| CONSUMER DISCRETIONARY: 25.2% | |
| Automobiles: 9.2% | |
| Toyota Motor Corp. | | | 126,500 | | | | 5,105,821 | | |
| Nissan Motor Co., Ltd. | | | 346,100 | | | | 3,286,472 | | |
| Fuji Heavy Industries, Ltd. | | | 289,000 | | | | 2,341,499 | | |
| | | | | | 10,733,792 | | |
| Internet & Catalog Retail: 5.2% | |
| Rakuten, Inc. | | | 398,700 | | | | 4,122,028 | | |
| Start Today Co., Ltd. | | | 140,400 | | | | 1,962,019 | | |
| | | | | | 6,084,047 | | |
| Household Durables: 5.0% | |
| Rinnai Corp. | | | 49,700 | | | | 3,429,373 | | |
| HAJIME CONSTRUCTION Co., Ltd. | | | 80,400 | | | | 2,334,457 | | |
| | | | | | 5,763,830 | | |
| Auto Components: 2.7% | |
| Nifco, Inc. | | | 78,800 | | | | 1,904,857 | | |
| Bridgestone Corp. | | | 53,800 | | | | 1,235,469 | | |
| | | | | | 3,140,326 | | |
| Specialty Retail: 1.4% | |
| Sanrio Co., Ltd. | | | 43,300 | | | | 1,578,642 | | |
| Multiline Retail: 1.2% | |
| H2O Retailing Corp. | | | 145,000 | | | | 1,453,308 | | |
| | | Shares | | Value | |
| Diversified Consumer Services: 0.5% | |
| ESCRIT, Inc.b | | | 25,400 | | | $ | 612,599 | | |
| Total Consumer Discretionary | | | | | 29,366,544 | | |
| INFORMATION TECHNOLOGY: 14.3% | |
| Electronic Equipment, Instruments & Components: 7.7% | |
| Kyocera Corp. | | | 35,200 | | | | 3,046,207 | | |
| Hitachi, Ltd. | | | 491,000 | | | | 3,027,428 | | |
| Murata Manufacturing Co., Ltd. | | | 55,000 | | | | 2,893,033 | | |
| | | | | | 8,966,668 | | |
| Internet Software & Services: 2.8% | |
| Kakaku.com, Inc. | | | 96,200 | | | | 3,264,397 | | |
| IT Services: 2.2% | |
| GMO Payment Gateway, Inc. | | | 130,800 | | | | 2,578,525 | | |
| Software: 1.6% | |
| Capcom Co., Ltd. | | | 84,500 | | | | 1,768,432 | | |
| Total Information Technology | | | | | 16,578,022 | | |
| FINANCIALS: 12.0% | |
| Insurance: 5.3% | |
| Tokio Marine Holdings, Inc. | | | 100,100 | | | | 2,511,819 | | |
| Sony Financial Holdings, Inc. | | | 151,700 | | | | 2,476,001 | | |
| Anicom Holdings, Inc.b | | | 194,000 | | | | 1,182,779 | | |
| | | | | | 6,170,599 | | |
| Diversified Financial Services: 3.8% | |
| ORIX Corp. | | | 47,390 | | | | 4,416,551 | | |
| Real Estate Investment Trusts: 2.6% | |
| Kenedix Realty Investment Corp., REIT | | | 558 | | | | 1,804,131 | | |
Industrial & Infrastructure Fund
Investment Corp., REIT | | | 198 | | | | 1,279,248 | | |
| | | | | | 3,083,379 | | |
| Real Estate Management & Development: 0.3% | |
| Global Logistic Properties, Ltd.b | | | 188,000 | | | | 312,975 | | |
| Total Financials | | | | | 13,983,504 | | |
| HEALTH CARE: 9.9% | |
| Health Care Equipment & Supplies: 5.0% | |
| Sysmex Corp. | | | 85,200 | | | | 3,369,475 | | |
| Asahi Intecc Co., Ltd. | | | 93,200 | | | | 2,444,415 | | |
| | | | | | 5,813,890 | | |
| Health Care Providers & Services: 2.7% | |
| Ship Healthcare Holdings, Inc. | | | 78,800 | | | | 1,899,102 | | |
| Message Co., Ltd. | | | 383 | | | | 1,217,149 | | |
| | | | | | 3,116,251 | | |
| Pharmaceuticals: 1.4% | |
| Otsuka Holdings Co., Ltd. | | | 53,900 | | | | 1,654,473 | | |
matthewsasia.com | 800.789.ASIA 47
Matthews Japan Fund June 30, 2012
Schedule of Investmentsa (unaudited) (continued)
COMMON EQUITIES (continued)
| | | Shares | | Value | |
| Biotechnology: 0.8% | |
| 3-D Matrix, Ltd.b | | | 15,200 | | | $ | 943,838 | | |
| Total Health Care | | | | | 11,528,452 | | |
| CONSUMER STAPLES: 6.7% | |
| Food & Staples Retailing: 3.1% | |
| Ain Pharmaciez, Inc. | | | 30,200 | | | | 1,821,764 | | |
| Daikokutenbussan Co., Ltd. | | | 66,600 | | | | 1,726,543 | | |
| | | | | | 3,548,307 | | |
| Tobacco: 1.5% | |
| Japan Tobacco, Inc. | | | 58,000 | | | | 1,718,287 | | |
| Food Products: 1.1% | |
| Calbee, Inc. | | | 20,100 | | | | 1,262,193 | | |
| Household Products: 1.0% | |
| Pigeon Corp. | | | 27,300 | | | | 1,196,047 | | |
| Total Consumer Staples | | | | | 7,724,834 | | |
| MATERIALS: 4.2% | |
| Chemicals: 2.4% | |
| JSR Corp. | | | 86,800 | | | | 1,506,119 | | |
| Nitto Denko Corp. | | | 30,200 | | | | 1,293,911 | | |
| | | | | | 2,800,030 | | |
| Metals & Mining: 1.8% | |
| Hitachi Metals, Ltd. | | | 177,000 | | | | 2,112,331 | | |
| Total Materials | | | | | 4,912,361 | | |
| TELECOMMUNICATION SERVICES: 1.0% | |
| Wireless Telecommunication Services: 1.0% | |
| KDDI Corp. | | | 182 | | | | 1,174,066 | | |
| Total Telecommunication Services | | | | | 1,174,066 | | |
| TOTAL INVESTMENTS: 99.3% | | | | | 115,539,981 | | |
| (Cost $109,504,510c) | | | | | |
CASH AND OTHER ASSETS,
LESS LIABILITIES: 0.7% | | | | | 839,840 | | |
| NET ASSETS: 100.0% | | | | $ | 116,379,821 | | |
a Certain securities were fair valued under the discretion of the Board of Trustees (Note 2-A).
b Non-income producing security.
c Cost for federal income tax purposes is $109,504,510 and net unrealized appreciation consists of:
| Gross unrealized appreciation | | $ | 11,156,297 | | |
| Gross unrealized depreciation | | | (5,120,826 | ) | |
| Net unrealized appreciation | | $ | 6,035,471 | | |
REIT Real Estate Investment Trust
See accompanying notes to financial statements.
48 MATTHEWS ASIA FUNDS

ASIA GROWTH STRATEGIES
PORTFOLIO MANAGERS
J. Michael Oh, CFA
Lead Manager
Michael B. Han, CFA
Co-Manager
FUND FACTS
| | | Investor Class | | Institutional Class | |
| Ticker | | MAKOX | | MIKOX | |
| CUSIP | | 577130305 | | 577130826 | |
| Inception | | 1/3/95 | | 10/29/10 | |
| NAV | | $4.77 | | $4.79 | |
| Initial Investment | | $2,500 | | $3 million | |
| Gross Expense Ratio1 | | 1.18% | | 1.07% | |
Portfolio Statistics
| Total # of Positions | | 50 | |
| Net Assets | | $156.1 million | |
| Weighted Average Market Cap | | $28.1 billion | |
| Portfolio Turnover | | 30.13%2 | |
Benchmark
Korea Composite Stock Price Index
Redemption Fee
2% within first 90 calendar days of purchase
OBJECTIVE
Long-term capital appreciation.
STRATEGY
Under normal market conditions, the Fund seeks to achieve its investment objective by investing at least 80% of its total net assets, which include borrowings for investment purposes, in the common and preferred stocks of companies located in South Korea.
1 Matthews Asia Funds does not charge 12b-1 fees.
2 The lesser of fiscal year 2011 long-term purchase costs or sales proceeds divided by the average monthly market value of long-term securities.
Matthews Korea Fund
Portfolio Manager Commentary
For the first half of 2012, the Matthews Korea Fund gained 3.92% (Investor Class) and 3.91% (Institutional Class) while its benchmark, the Korea Composite Stock Price Index, returned 2.80%. For the quarter ended June 30, the Fund declined –5.36% (Investor Class) and –5.34% (Institutional Class) while the benchmark fell –8.75%.
The Korean equity market performed well during the first quarter as major markets showed signs of economic recovery. However, the market reversed course in the second quarter as expectations for global economic growth weakened. The Fund's outperformance against the benchmark was helped by the Fund's underweight positions in industrials and its overweight positions in consumer sectors, as well as by stock selection. Industrials segments, such as shipbuilding and construction, suffered from ongoing troubles in Europe as they tend to be susceptible to global economic cycles. In fact, overseas orders continued to slow during the first half of the year. However, we continue to look for long-term investment opportunities in the industrials sector though we remain underweight in this area due to its cyclical nature.
The rapid appreciation of Korea's currency, the won, was a key investor concern during the first quarter. However, the won weakened against the U.S. dollar during the second quarter, easing worries over its impact on Korean exporters. As the global economy recovers we expect the won will again appreciate; however, at the end of the second quarter the currency was still far below the level it reached before the start of the economic crisis in 2008. Exporters should be able to remain competitive even in the face of a steady appreciation in the currency, although short-term profitability could come under pressure. Many Korean companies have also been expanding their manufacturing capacities in overseas markets in efforts to diversify currency and geopolitical risks.
On a sector basis for the first half of the year, information technology and consumer discretionary firms performed well while materials and financials lagged. During the second quarter, Korea's consumer-related industries that derive earnings mainly from the domestic market outperformed as they were less affected by macroeconomic events. In particular, SBS Media Holdings, a diversified media group engaged in television, cable and radio broadcasting, was a notable new addition and among the top contributors to performance. Korea's television broadcasting companies continue to be among the country's most undervalued segments due to government regulations on such things as foreign investment and advertising rates. However, deregulation in the sector is underway and authorities are liberalizing the television advertising industry by allowing more private companies to operate in the segment. We believe Korean media companies are among the most attractively priced in the region with compelling growth opportunities as they are well-positioned to benefit from both growing discretionary income in Korea and ongoing deregulation in the sector. Prior to these deregulation efforts Korea had just one government-owned entity that controlled all television advertising slots and rates.
In June, Korea became the seventh nation to become a member of the so-called "20-50 club"—a label given to countries with a population over 50 million and average national per capita income exceeding US$20,000. Its peers in this group include the U.S., Japan, France, Italy, Germany and
(continued)
matthewsasia.com | 800.789.ASIA 49
PERFORMANCE AS OF JUNE 30, 2012
| | | | | Average Annual Total Returns | | | |
| | | 3 Months | | 1 Year | | 3 Years | | 5 Years | | 10 Years | | Since
Inception | | Inception
Date | |
| Investor Class (MAKOX) | | | -5.36 | % | | | -10.28 | % | | | 17.64 | % | | | -0.76 | % | | | 10.84 | % | | | 5.13 | % | | 1/3/95 | |
| Institutional Class (MIKOX) | | | -5.34 | % | | | -10.08 | % | | | n.a. | | | | n.a. | | | | n.a. | | | | 3.51 | % | | 10/29/10 | |
| Korea Composite Stock Price Index3 | | | -8.75 | % | | | -17.47 | % | | | 15.10 | % | | | -1.80 | % | | | 12.15 | % | | | 2.75 | %4 | | | | | |
| Lipper Pacific ex Japan Funds Category Average5 | | | -6.76 | % | | | -14.04 | % | | | 9.56 | % | | | 0.07 | % | | | 10.79 | % | | | 4.83 | %4 | | | | | |
Performance assumes reinvestment of all dividends and/or distributions before taxes. All performance quoted represents past performance and is no guarantee of future results. Investment return and principal value will fluctuate with market conditions so that when redeemed, shares may be worth more or less than their original cost. Current performance may be lower or higher than the return figures quoted. Returns would have been lower if certain of the Fund's fees and expenses had not been waived. For the Fund's most recent month-end performance, visit matthewsasia.com.
GROWTH OF A $10,000 INVESTMENT SINCE INCEPTION—INVESTOR CLASS
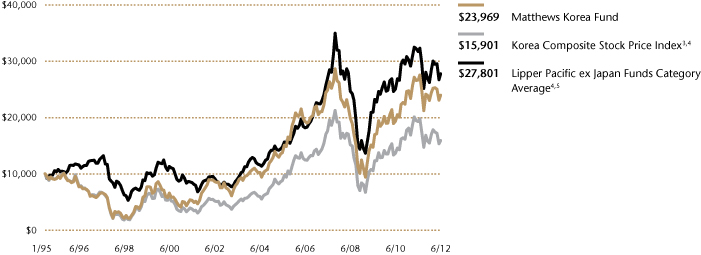
Plotted monthly. The performance data and graph do not reflect the deduction of taxes that a shareholder would pay on dividends, capital gains distributions or redemption of Fund shares. Values are in US$.
3 It is not possible to invest directly in an index. Source: Index data from Morgan Stanley Capital International and Bloomberg; total return calculations performed by BNY Mellon Investment Servicing (US) Inc. Please see page 69 for index definition.
4 Calculated from 12/31/94.
5 The Lipper Category Average does not reflect sales charges and is based on total return, including reinvestment of dividends and capital gains for the stated periods.
TOP TEN HOLDINGS6
| | | Sector | | % Net Assets | |
| Samsung Electronics Co., Ltd. | | Information Technology | | | 15.3 | % | |
| Kia Motors Corp. | | Consumer Discretionary | | | 3.6 | % | |
| POSCO | | Materials | | | 3.3 | % | |
| Shinhan Financial Group Co., Ltd. | | Financials | | | 3.1 | % | |
| Hyundai Motor Co., Ltd., 2nd Pfd. | | Consumer Discretionary | | | 2.8 | % | |
| NHN Corp. | | Information Technology | | | 2.8 | % | |
| Hyundai Motor Co. | | Consumer Discretionary | | | 2.6 | % | |
| Hyundai Mobis | | Consumer Discretionary | | | 2.6 | % | |
| LG Household & Health Care, Ltd. | | Consumer Staples | | | 2.5 | % | |
| Dongbu Insurance Co., Ltd. | | Financials | | | 2.5 | % | |
| % OF ASSETS IN TOP TEN | | | | | 41.1 | % | |
6 Holdings may combine more than one security from same issuer and related depositary receipts.
50 MATTHEWS ASIA FUNDS
Matthews Korea Fund
Portfolio Manager Commentary (continued)
United Kingdom. Korea is the only member that was not industrialized prior to World War II—a testament to the progress the country has made in a relatively short period of time.
There are still risks to the Korean economy and North Korea remains chief among them, particularly as its transition of power is ongoing and little is known about the North's new leadership. A slower-than-expected global recovery could also continue to negatively impact domestic consumer sentiment. In fact, there are already some signs of slowing domestic spending.
We continue to believe, however, that Korea is well-positioned in this difficult market. Korean companies in general are continuing to climb up the value chain, gaining market share and improved brand reputation in many industries, ranging from semiconductors to cars to cosmetics. We have also been encouraged to note the recent global success of some small- to medium-sized companies, particularly consumer markets in Asia. We expect to maintain a diversified portfolio with particular focus on the technology, financials and consumer sectors, as we believe they are sustainable long-term growth drivers of the Korean economy.
SECTOR ALLOCATION (%)
| Consumer Discretionary | | | 27.3 | | |
| Information Technology | | | 21.3 | | |
| Financials | | | 18.0 | | |
| Industrials | | | 9.5 | | |
| Consumer Staples | | | 9.4 | | |
| Materials | | | 9.0 | | |
| Energy | | | 2.3 | | |
| Health Care | | | 2.2 | | |
Cash and Other Assets,
Less Liabilities | | | 1.0 | | |
MARKET CAP EXPOSURE (%)7
| Large Cap (over $5B) | | | 58.6 | | |
| Mid Cap ($1B–$5B) | | | 25.7 | | |
| Small Cap (under $1B) | | | 14.7 | | |
Cash and Other Assets,
Less Liabilities | | | 1.0 | | |
7 Source: FactSet Research Systems. Percentage values in data are rounded to the nearest tenth of one percent; the values may not sum to 100% due to rounding.
matthewsasia.com | 800.789.ASIA 51
Matthews Korea Fund June 30, 2012
Schedule of Investmentsa (unaudited)
COMMON EQUITIES: SOUTH KOREA: 93.4%
| | | Shares | | Value | |
| CONSUMER DISCRETIONARY: 24.5% | |
| Automobiles: 6.2% | |
| Kia Motors Corp. | | | 86,100 | | | $ | 5,674,824 | | |
| Hyundai Motor Co. | | | 19,585 | | | | 4,020,690 | | |
| | | | | | 9,695,514 | | |
| Auto Components: 4.8% | |
| Hyundai Mobis | | | 16,526 | | | | 4,005,839 | | |
| Hankook Tire Co., Ltd. | | | 74,700 | | | | 2,978,985 | | |
| Motonic Corp. | | | 64,140 | | | | 389,810 | | |
| | | | | | 7,374,634 | | |
| Media: 4.5% | |
| SBS Media Holdings Co., Ltd. | | | 808,540 | | | | 2,966,126 | | |
| CJ CGV Co., Ltd. | | | 91,190 | | | | 2,076,727 | | |
| Cheil Worldwide, Inc. | | | 125,730 | | | | 2,008,225 | | |
| | | | | | 7,051,078 | | |
| Hotels, Restaurants & Leisure: 4.0% | |
| Shinsegae Food Co., Ltd. | | | 44,357 | | | | 3,251,632 | | |
| Modetour Network, Inc. | | | 167,436 | | | | 2,928,662 | | |
| | | | | | 6,180,294 | | |
| Multiline Retail: 3.4% | |
| Hyundai Greenfood Co., Ltd. | | | 205,380 | | | | 2,990,199 | | |
| Hyundai Department Store Co., Ltd. | | | 18,765 | | | | 2,345,534 | | |
| | | | | | 5,335,733 | | |
| Internet & Catalog Retail: 1.6% | |
| Hyundai Home Shopping Network Corp. | | | 25,728 | | | | 2,517,823 | | |
| Total Consumer Discretionary | | | | | 38,155,076 | | |
| INFORMATION TECHNOLOGY: 21.3% | |
| Semiconductors & Semiconductor Equipment: 15.3% | |
| Samsung Electronics Co., Ltd. | | | 22,604 | | | | 23,937,352 | | |
| Internet Software & Services: 5.7% | |
| NHN Corp. | | | 19,856 | | | | 4,355,098 | | |
| Daum Communications Corp. | | | 26,431 | | | | 2,377,175 | | |
| SBS Contents Hub Co., Ltd. | | | 188,088 | | | | 2,107,404 | | |
| | | | | | 8,839,677 | | |
| Electronic Equipment, Instruments & Components: 0.3% | |
| Uju Electronics Co., Ltd. | | | 25,296 | | | | 497,322 | | |
| Total Information Technology | | | | | 33,274,351 | | |
| FINANCIALS: 16.2% | |
| Insurance: 6.2% | |
| Dongbu Insurance Co., Ltd. | | | 103,751 | | | | 3,830,396 | | |
| Samsung Fire & Marine Insurance Co., Ltd. | | | 15,264 | | | | 3,029,002 | | |
| Hyundai Marine & Fire Insurance Co., Ltd. | | | 109,960 | | | | 2,865,028 | | |
| | | | | | 9,724,426 | | |
| | | Shares | | Value | |
| Commercial Banks: 5.6% | |
| Shinhan Financial Group Co., Ltd. | | | 138,924 | | | $ | 4,870,340 | | |
| KB Financial Group, Inc. | | | 66,716 | | | | 2,179,406 | | |
| Hana Financial Group, Inc. | | | 51,320 | | | | 1,640,607 | | |
| | | | | | 8,690,353 | | |
| Capital Markets: 3.7% | |
| Kiwoom Securities Co., Ltd. | | | 69,436 | | | | 3,731,626 | | |
| Samsung Securities Co., Ltd. | | | 47,910 | | | | 2,075,396 | | |
| | | | | | 5,807,022 | | |
| Diversified Financial Services: 0.7% | |
| NICE Information Service Co., Ltd. | | | 249,760 | | | | 999,710 | | |
| Total Financials | | | | | 25,221,511 | | |
| INDUSTRIALS: 9.5% | |
| Construction & Engineering: 2.9% | |
| Samsung Engineering Co., Ltd. | | | 15,473 | | | | 2,455,079 | | |
| Hyundai Engineering & Construction Co., Ltd. | | | 36,243 | | | | 2,084,111 | | |
| | | | | | 4,539,190 | | |
| Commercial Services & Supplies: 1.7% | |
| KEPCO Plant Service & Engineering Co., Ltd. | | | 64,238 | | | | 2,709,509 | | |
| Industrial Conglomerates: 1.5% | |
| Samsung Techwin Co., Ltd. | | | 35,222 | | | | 2,399,215 | | |
| Building Products: 1.5% | |
| KCC Corp. | | | 9,410 | | | | 2,306,791 | | |
| Airlines: 1.1% | |
| Asiana Airlines, Inc.b | | | 252,490 | | | | 1,656,776 | | |
| Electrical Equipment: 0.8% | |
| LS Corp. | | | 16,548 | | | | 1,250,444 | | |
| Total Industrials | | | | | 14,861,925 | | |
| CONSUMER STAPLES: 9.4% | |
| Food Products: 3.7% | |
| Orion Corp. | | | 4,059 | | | | 3,362,452 | | |
| Binggrae Co., Ltd. | | | 37,621 | | | | 2,365,180 | | |
| | | | | | 5,727,632 | | |
| Household Products: 2.5% | |
| LG Household & Health Care, Ltd. | | | 7,357 | | | | 3,969,239 | | |
| Personal Products: 2.1% | |
| Amorepacific Corp. | | | 3,531 | | | | 3,282,240 | | |
| Tobacco: 1.1% | |
| KT&G Corp. | | | 24,806 | | | | 1,758,630 | | |
| Total Consumer Staples | | | | | 14,737,741 | | |
52 MATTHEWS ASIA FUNDS
Matthews Korea Fund June 30, 2012
Schedule of Investmentsa (unaudited) (continued)
COMMON EQUITIES: SOUTH KOREA (continued)
| | | Shares | | Value | |
| MATERIALS: 8.0% | |
| Metals & Mining: 4.1% | |
| POSCO ADR | | | 63,400 | | | $ | 5,099,896 | | |
| Poongsan Corp. | | | 52,560 | | | | 1,261,230 | | |
| | | | | | 6,361,126 | | |
| Chemicals: 3.9% | |
| LG Chem, Ltd. | | | 14,694 | | | | 3,803,916 | | |
| OCI Materials Co., Ltd. | | | 32,024 | | | | 1,160,134 | | |
| KPX Chemical Co., Ltd. | | | 26,824 | | | | 1,128,928 | | |
| | | | | | 6,092,978 | | |
| Total Materials | | | | | 12,454,104 | | |
| ENERGY: 2.3% | |
| Oil, Gas & Consumable Fuels: 2.3% | |
| SK Innovation Co., Ltd. | | | 29,285 | | | | 3,587,632 | | |
| Total Energy | | | | | 3,587,632 | | |
| HEALTH CARE: 2.2% | |
| Pharmaceuticals: 2.2% | |
| Dong-A Pharmaceutical Co., Ltd. | | | 24,305 | | | | 1,790,482 | | |
| Yuhan Corp. | | | 13,878 | | | | 1,622,551 | | |
| Total Health Care | | | | | 3,413,033 | | |
| TOTAL COMMON EQUITIES | | | | | 145,705,373 | | |
| (Cost $99,520,988) | | | | | |
PREFERRED EQUITIES: SOUTH KOREA: 5.6%
| | | Shares | | Value | |
| CONSUMER DISCRETIONARY: 2.8% | |
| Automobiles: 2.8% | |
| Hyundai Motor Co., Ltd., 2nd Pfd. | | | 67,274 | | | $ | 4,420,216 | | |
| Total Consumer Discretionary | | | | | 4,420,216 | | |
| FINANCIALS: 1.8% | |
| Insurance: 1.8% | |
Samsung Fire & Marine
Insurance Co., Ltd., Pfd. | | | 44,809 | | | | 2,891,156 | | |
| Total Financials | | | | | 2,891,156 | | |
| MATERIALS: 1.0% | |
| Chemicals: 1.0% | |
| LG Chem, Ltd., Pfd. | | | 19,243 | | | | 1,504,025 | | |
| Total Materials | | | | | 1,504,025 | | |
| TOTAL PREFERRED EQUITIES | | | | | 8,815,397 | | |
| (Cost $7,437,374) | | | | | |
| TOTAL INVESTMENTS: 99.0% | | | | | 154,520,770 | | |
| (Cost $106,958,362c) | | | | | |
CASH AND OTHER ASSETS,
LESS LIABILITIES: 1.0% | | | | | 1,544,020 | | |
| NET ASSETS: 100.0% | | | | $ | 156,064,790 | | |
a Certain securities were fair valued under the discretion of the Board of Trustees (Note 2-A).
b Non-income producing security.
c Cost for federal income tax purposes is $108,123,028 and net unrealized appreciation consists of:
| Gross unrealized appreciation | | $ | 52,790,746 | | |
| Gross unrealized depreciation | | | (6,393,004 | ) | |
| Net unrealized appreciation | | $ | 46,397,742 | | |
ADR American Depositary Receipt
Pfd. Preferred
See accompanying notes to financial statements.
matthewsasia.com | 800.789.ASIA 53

ASIA SMALL COMPANY STRATEGIES
PORTFOLIO MANAGERS
Lydia So
Lead Manager
Michael B. Han, CFA
Co-Manager
FUND FACTS
| | | Investor Class | |
| Ticker | | MSMLX | |
| CUSIP | | 577125206 | |
| Inception | | 9/15/08 | |
| NAV | | $15.69 | |
| Initial Investment | | $2,500 | |
| Gross Expense Ratio1 | | 1.52% | |
Portfolio Statistics
| Total # of Positions | | 70 | |
| Net Assets | | $309.4 million | |
| Weighted Average Market Cap | | $1.2 billion | |
| Portfolio Turnover | | 19.97%2 | |
Benchmark
MSCI AC Asia ex Japan Small Cap Index
Redemption Fee
2% within first 90 calendar days of purchase
OBJECTIVE
Long-term capital appreciation.
STRATEGY
Under normal market conditions, the Fund seeks to achieve its investment objective by investing at least 80% of its total net assets, which include borrowings for investment purposes, in the common and preferred stocks of small companies located in Asia, including developed, emerging and frontier countries and markets in the Asian region, excluding Japan.
1 Matthews Asia Funds does not charge 12b-1 fees.
2 The lesser of fiscal year 2011 long-term purchase costs or sales proceeds divided by the average monthly market value of long-term securities.
Matthews Asia Small Companies Fund
Portfolio Manager Commentary
For the first half of 2012, the Matthews Asia Small Companies Fund returned 6.23%, while its benchmark, MSCI All Country Asia ex Japan Small Cap Index, returned 6.63%. For the quarter ending June 30, the Fund declined –6.99% and the benchmark fell –7.65%. Increased concerns surrounding Europe's debt crises resurfaced during the second quarter causing weakness in global equities markets and Asian markets were also impacted as investors became more risk averse.
While we are aware of Europe's unfavorable macroeconomic events that remain unresolved, they are beyond our control. More pertinent to our long-term investment approach is monitoring and adapting the portfolio to the structural developments and challenges facing Asian economies, and most importantly, identifying the individual companies poised to grow. During the second quarter, Fund performance was negatively impacted by slowing growth momentum in various sectors in China. Our long-term holding Trinity, a luxury menswear retailer, suffered from concerns over weakening demand for their high-end products. However, we continue hold this security as we believe its fundamentals and competitive advantage within the industry remain intact. We did exit other Chinese holdings in the portfolio for company-specific reasons, including PCD Stores, a Chinese department store operator. PCD was a disappointment due to its poor execution track record in new store openings as well as its foray into operating outlet stores, a business model that is somewhat new to the domestic market.
Another top holding, St. Shine Optical, a Taiwan-based contact lens manufacturer, performed poorly in the second quarter due to rising competition in the domestic market. In addition, one of its competitors was publicly listed in May, contributing to St. Shine's share price weakness. During the second quarter, our Indian holdings were exposed to considerable depreciation in India's rupee on the back of concerns over rising fiscal and trade deficits. The majority of the decline in our Indian holdings was due to the weakening of the rupee against the U.S dollar.
In such a volatile and uncertain investment environment, more defensive sectors, namely consumer staples, utilities, and health care, were among the brighter spots in the portfolio. Nippon Indosari, an Indonesia baked goods producer, registered positive returns in the first half of the year, thanks to the rising acceptance of packaged bread products and the company's growing distribution reach. During the second quarter, we also increased our weightings in other consumer staples names such as Super Group, a Singaporean instant coffee manufacturer, and Shenguan Holdings, a Chinese manufacturer of sausage skins. We believe that the demand for their products should remain resilient despite moderations in global economic outlook. The firms also appear to be on track in furthering their expansion and market penetration plans.
During the market sell-off in May, we continued to build up the small position we had initiated earlier in the year in Security Bank of the Philippines. Security Bank's lending franchise is particularly strong among the consumer segment and among small and medium enterprises. Its profitability is also quite strong for its industry. We think that demand for loans continues to be healthy as the economic growth prospects for the Philippines have strengthened.
(continued)
54 MATTHEWS ASIA FUNDS
PERFORMANCE AS OF JUNE 30, 2012
| | | | | Average Annual Total Returns | |
| | | 3 Months | | 1 Year | | 3 Years | | Inception
9/15/08 | |
| Investor Class (MSMLX) | | | -6.99 | % | | | -17.24 | % | | | 16.66 | % | | | 17.56 | % | |
| MSCI AC Asia ex Japan Small Cap Index3 | | | -7.65 | % | | | -19.14 | % | | | 9.47 | % | | | 9.84 | % | |
| Lipper Pacific ex Japan Funds Category Average4 | | | -6.76 | % | | | -14.04 | % | | | 9.56 | % | | | 9.61 | %5 | |
Performance assumes reinvestment of all dividends and/or distributions before taxes. All performance quoted represents past performance and is no guarantee of future results. Investment return and principal value will fluctuate with market conditions so that when redeemed, shares may be worth more or less than their original cost. Current performance may be lower or higher than the return figures quoted. Returns would have been lower if certain of the Fund's fees and expenses had not been waived. For the Fund's most recent month-end performance, visit matthewsasia.com.
GROWTH OF A $10,000 INVESTMENT SINCE INCEPTION—INVESTOR CLASS
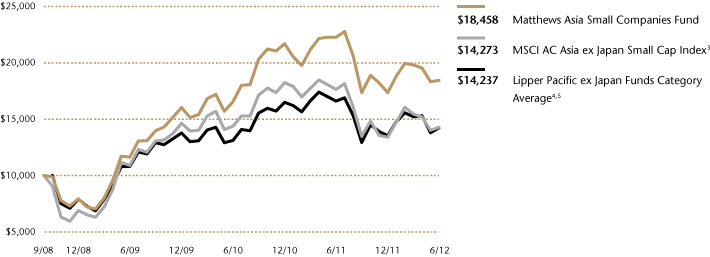
Plotted monthly. The performance data does not reflect the deduction of taxes that a shareholder would pay on dividends, capital gains distributions or redemption of Fund shares. Values are in US$.
3 It is not possible to invest directly in an index. Source: Index data from Morgan Stanley Capital International and Bloomberg; total return calculations performed by BNY Mellon Investment Servicing (US) Inc. Please see page 69 for index definition.
4 The Lipper Category Average does not reflect sales charges and is based on total return, including reinvestment of dividends and capital gains for the stated periods.
5 Calculated from 9/30/08.
TOP TEN HOLDINGS6
| | | Sector | | Country | | % Net Assets | |
| St. Shine Optical Co., Ltd. | | Health Care | | Taiwan | | | 2.8 | % | |
| Towngas China Co., Ltd. | | Utilities | | China/Hong Kong | | | 2.7 | % | |
| Vinda International Holdings, Ltd. | | Consumer Staples | | China/Hong Kong | | | 2.4 | % | |
| PT Nippon Indosari Corpindo | | Consumer Staples | | Indonesia | | | 2.0 | % | |
| PT Bank Tabungan Pensiunan Nasional | | Financials | | Indonesia | | | 2.0 | % | |
| Super Group, Ltd. | | Consumer Staples | | Singapore | | | 1.9 | % | |
| Pacific Hospital Supply Co., Ltd. | | Health Care | | Taiwan | | | 1.9 | % | |
| Emami, Ltd. | | Consumer Staples | | India | | | 1.9 | % | |
| Trinity, Ltd. | | Consumer Discretionary | | China/Hong Kong | | | 1.9 | % | |
| PT Jasa Marga Persero | | Industrials | | Indonesia | | | 1.8 | % | |
| % OF ASSETS IN TOP TEN | | | | | | | 21.3 | % | |
6 Holdings may combine more than one security from same issuer and related depositary receipts.
matthewsasia.com | 800.789.ASIA 55
COUNTRY ALLOCATION (%)
| China/Hong Kong | | | 28.2 | | |
| Taiwan | | | 15.8 | | |
| India | | | 14.9 | | |
| South Korea | | | 12.9 | | |
| Indonesia | | | 9.1 | | |
| Malaysia | | | 6.3 | | |
| Singapore | | | 4.9 | | |
| Thailand | | | 4.3 | | |
| Philippines | | | 2.0 | | |
Cash and Other Assets,
Less Liabilities | | | 1.6 | | |
SECTOR ALLOCATION (%)
| Consumer Discretionary | | | 17.4 | | |
| Industrials | | | 17.3 | | |
| Information Technology | | | 14.9 | | |
| Financials | | | 14.7 | | |
| Consumer Staples | | | 14.3 | | |
| Health Care | | | 10.4 | | |
| Materials | | | 6.7 | | |
| Utilities | | | 2.7 | | |
Cash and Other Assets,
Less Liabilities | | | 1.6 | | |
MARKET CAP EXPOSURE (%)7,8
| Large Cap (over $5B) | | | 1.0 | | |
| Mid Cap ($1B–$5B) | | | 47.2 | | |
| Small Cap (under $1B) | | | 50.2 | | |
Cash and Other Assets,
Less Liabilities | | | 1.6 | | |
7 Source: FactSet Research Systems. Percentage values in data are rounded to the nearest tenth of one percent; the values may not sum to 100% due to rounding.
8 The Fund defines Small Companies as companies with market capitalization generally between $100 million and $3 billion.
Matthews Asia Small Companies Fund
Portfolio Manager Commentary (continued)
During the second quarter, the Fund initiated a position in a top Taiwanese online retailer, PChome Online. The company has demonstrated its ability to increase its shipment units and manage its logistics effectively. As observed in developed countries, e-commerce has gained growing acceptance among consumers and this trend is also now occurring in parts of Asia.
We continue to direct our efforts in bottom-up, fundamental research to uncover compelling investment candidates, with less attention paid to extent forecasting unpredictable international market events. As the current operating environment for small companies remains challenging, we remain cautious over the potential effects of adverse macro events on our holdings. We are also wary of the potential pitfalls we have become attuned to: a lack of discipline in business expansion and cost management and, more importantly, lack of foresight in managing a sustainable franchise over varying business cycles. These are some of the risks associated with investing in small companies, and a diversified portfolio is one way to mitigate them.
In our research approach, we have a preference for seasoned, well-managed companies, and believe these trying times may actually present opportunities to gain market share. Emerging opportunities in Asia still exist in the small-cap universe for patient, long-term investors. Differentiating fundamentals among industry peers across Asia is critical to our stock selection process and we continue to seek companies with a strong domestic presence and good competitive positions in secular growth industries.
56 MATTHEWS ASIA FUNDS
Matthews Asia Small Companies Fund June 30, 2012
Schedule of Investmentsa (unaudited)
COMMON EQUITIES: 98.4%
| | | Shares | | Value | |
| CHINA/HONG KONG: 28.2% | |
| Towngas China Co., Ltd. | | | 11,357,000 | | | $ | 8,207,716 | | |
| Vinda International Holdings, Ltd. | | | 4,982,000 | | | | 7,439,858 | | |
| Trinity, Ltd. | | | 9,094,000 | | | | 5,760,817 | | |
| Shenguan Holdings Group, Ltd. | | | 9,524,000 | | | | 5,496,754 | | |
| Yip's Chemical Holdings, Ltd. | | | 8,018,000 | | | | 5,151,402 | | |
| Airtac International Groupb | | | 805,000 | | | | 4,637,307 | | |
| Stella International Holdings, Ltd. | | | 1,869,000 | | | | 4,632,023 | | |
| KWG Property Holding, Ltd. | | | 7,206,000 | | | | 4,608,421 | | |
| Dah Chong Hong Holdings, Ltd. | | | 5,082,000 | | | | 4,572,626 | | |
| Minth Group, Ltd. | | | 4,114,000 | | | | 4,462,890 | | |
| Lee's Pharmaceutical Holdings, Ltd. | | | 9,485,000 | | | | 4,427,329 | | |
| Comba Telecom Systems Holdings, Ltd. | | | 9,552,011 | | | | 4,013,184 | | |
| Kosmopolito Hotels International, Ltd. | | | 19,052,000 | | | | 3,498,221 | | |
| AAC Technologies Holdings, Inc. | | | 1,136,000 | | | | 3,305,937 | | |
| Singamas Container Holdings, Ltd. | | | 15,124,000 | | | | 3,297,806 | | |
| China Kanghui Holdings, Inc. ADRb | | | 164,900 | | | | 3,248,530 | | |
| SITC International Holdings Co., Ltd. | | | 11,893,000 | | | | 3,160,336 | | |
| Xingda International Holdings, Ltd. | | | 9,378,000 | | | | 3,099,465 | | |
| TAL Education Group ADRb | | | 231,562 | | | | 2,278,570 | | |
| E-Commerce China Dangdang, Inc. ADRb | | | 290,000 | | | | 1,931,400 | | |
| Fook Woo Group Holdings, Ltd.b,c | | | 24,622,000 | | | | 190,427 | | |
| Total China/Hong Kong | | | | | 87,421,019 | | |
| TAIWAN: 15.8% | |
| St. Shine Optical Co., Ltd. | | | 763,492 | | | | 8,544,628 | | |
| Pacific Hospital Supply Co., Ltd.b | | | 1,995,155 | | | | 6,016,155 | | |
| TXC Corp. | | | 3,784,792 | | | | 5,495,239 | | |
| Simplo Technology Co., Ltd. | | | 785,310 | | | | 5,423,652 | | |
| WT Microelectronics Co., Ltd. | | | 3,908,000 | | | | 5,313,077 | | |
| Wah Lee Industrial Corp. | | | 3,990,000 | | | | 5,050,741 | | |
| PChome Online, Inc. | | | 856,000 | | | | 4,852,766 | | |
| Chroma ATE, Inc. | | | 2,091,081 | | | | 4,773,541 | | |
| Formosa International Hotels Corp. | | | 315,717 | | | | 3,380,946 | | |
| Total Taiwan | | | | | 48,850,745 | | |
| INDIA: 14.9% | |
| Emami, Ltd. | | | 662,496 | | | | 5,945,310 | | |
| Ipca Laboratories, Ltd. | | | 808,208 | | | | 5,192,159 | | |
| Page Industries, Ltd. | | | 95,185 | | | | 4,936,144 | | |
| CRISIL, Ltd. | | | 243,954 | | | | 4,718,953 | | |
GlaxoSmithKline Consumer
Healthcare, Ltd. | | | 94,290 | | | | 4,659,980 | | |
| Gujarat Pipavav Port, Ltd.b | | | 4,061,512 | | | | 4,264,319 | | |
| Castrol India, Ltd. | | | 398,681 | | | | 3,918,052 | | |
| Federal Bank, Ltd. | | | 479,245 | | | | 3,885,035 | | |
| CMC, Ltd. | | | 220,478 | | | | 3,355,678 | | |
| AIA Engineering, Ltd. | | | 500,705 | | | | 3,097,468 | | |
| Exide Industries, Ltd. | | | 829,267 | | | | 2,039,294 | | |
| Total India | | | | | 46,012,392 | | |
| | | Shares | | Value | |
| SOUTH KOREA: 12.9% | |
| Pyeong Hwa Automotive Co., Ltd. | | | 319,541 | | | $ | 5,435,990 | | |
| Modetour Network, Inc. | | | 278,388 | | | | 4,869,350 | | |
| Dongbu Insurance Co., Ltd. | | | 120,231 | | | | 4,438,823 | | |
| Daum Communications Corp. | | | 49,259 | | | | 4,430,300 | | |
| KEPCO Plant Service & Engineering Co., Ltd. | | | 102,457 | | | | 4,321,557 | | |
| Cheil Worldwide, Inc. | | | 247,635 | | | | 3,955,355 | | |
| Kiwoom Securities Co., Ltd. | | | 68,166 | | | | 3,663,374 | | |
| POSCO Chemtech Co., Ltd. | | | 25,812 | | | | 3,076,525 | | |
| Korea Zinc Co., Ltd. | | | 8,661 | | | | 2,946,324 | | |
| OCI Materials Co., Ltd. | | | 74,585 | | | | 2,701,991 | | |
| Total South Korea | | | | | 39,839,589 | | |
| INDONESIA: 9.1% | |
| PT Nippon Indosari Corpindo | | | 14,332,000 | | | | 6,334,869 | | |
| PT Bank Tabungan Pensiunan Nasionalb | | | 14,671,500 | | | | 6,269,301 | | |
| PT Jasa Marga Persero | | | 9,869,000 | | | | 5,716,333 | | |
| PT AKR Corporindo | | | 12,888,000 | | | | 4,817,463 | | |
| PT Sumber Alfaria Trijayab | | | 5,659,000 | | | | 2,897,394 | | |
| PT Selamat Sempurna | | | 9,346,000 | | | | 2,024,878 | | |
| Total Indonesia | | | | | 28,060,238 | | |
| MALAYSIA: 6.3% | |
| Dialog Group BHD | | | 6,995,205 | | | | 5,215,722 | | |
| KPJ Healthcare BHD | | | 2,578,500 | | | | 4,793,101 | | |
| Alliance Financial Group BHD | | | 3,609,900 | | | | 4,763,073 | | |
| LPI Capital BHD | | | 1,081,900 | | | | 4,582,460 | | |
| Total Malaysia | | | | | 19,354,356 | | |
| SINGAPORE: 4.9% | |
| Super Group, Ltd. | | | 3,626,000 | | | | 6,027,473 | | |
| Petra Foods, Ltd. | | | 2,723,000 | | | | 5,398,650 | | |
| Amtek Engineering, Ltd. | | | 7,700,000 | | | | 3,801,669 | | |
| Total Singapore | | | | | 15,227,792 | | |
| THAILAND: 4.3% | |
| Tisco Financial Group Public Co., Ltd. | | | 4,198,900 | | | | 5,144,554 | | |
| Dynasty Ceramic Public Co., Ltd. | | | 2,777,000 | | | | 4,503,515 | | |
| SNC Former Public Co., Ltd. | | | 4,676,600 | | | | 3,741,774 | | |
| Total Thailand | | | | | 13,389,843 | | |
| PHILIPPINES: 2.0% | |
| Security Bank Corp. | | | 1,000,030 | | | | 3,397,798 | | |
| Alliance Global Group, Inc. | | | 10,215,000 | | | | 2,820,204 | | |
| Total Philippines | | | | | 6,218,002 | | |
| TOTAL COMMON EQUITIES | | | | | 304,373,976 | | |
| (Cost $317,309,503) | | | | | |
matthewsasia.com | 800.789.ASIA 57
Matthews Asia Small Companies Fund June 30, 2012
Schedule of Investmentsa (unaudited) (continued)
WARRANTS: 0.0%
| | | Shares | | Value | |
| MALAYSIA: 0.0% | |
| Dialog Group BHD, expires 02/12/17 | | | 582,933 | | | $ | 109,225 | | |
| Total Malaysia | | | | | 109,225 | | |
| TOTAL WARRANTS | | | | | 109,225 | | |
| (Cost $0) | | | | | |
| TOTAL INVESTMENTS: 98.4% | | | | | 304,483,201 | | |
| (Cost $317,309,503d) | | | | | |
CASH AND OTHER ASSETS,
LESS LIABILITIES: 1.6% | | | | | 4,963,025 | | |
| NET ASSETS: 100.0% | | | | $ | 309,446,226 | | |
a Certain securities were fair valued under the discretion of the Board of Trustees (Note 2-A).
b Non-income producing security.
c Illiquid security.
d Cost for federal income tax purposes is $317,344,786 and net unrealized depreciation consists of:
| Gross unrealized appreciation | | $ | 36,170,635 | | |
| Gross unrealized depreciation | | | (49,032,220 | ) | |
| Net unrealized depreciation | | ($ | 12,861,585 | ) | |
ADR American Depositary Receipt
BHD Berhad
See accompanying notes to financial statements.
58 MATTHEWS ASIA FUNDS

ASIA SMALL COMPANY STRATEGIES
PORTFOLIO MANAGERS
Richard H. Gao
Lead Manager
Henry Zhang, CFA
Co-Manager
FUND FACTS
| | | Investor Class | |
| Ticker | | MCSMX | |
| CUSIP | | 577125404 | |
| Inception | | 5/31/11 | |
| NAV | | $7.08 | |
| Initial Investment | | $2,500 | |
| Gross Expense Ratio1 | | 5.32% | |
After Fee Waiver,
Reimbursement and
Recoupment | | 2.00% | |
Portfolio Statistics
| Total # of Positions | | 44 | |
| Net Assets | | $5.2 million | |
| Weighted Average Market Cap | | $1.4 billion | |
| Portfolio Turnover | | 6.08%2 | |
Benchmark
MSCI China Small Cap Index
Redemption Fee
2% within first 90 calendar days of purchase
OBJECTIVE
Long-term capital appreciation.
STRATEGY
Under normal market conditions, the Fund seeks to achieve its investment objective by investing at least 80% of its total net assets, which include borrowings for investment purposes, in the common and preferred stocks of small companies located in China and Taiwan. China includes its administrative and other districts, such as Hong Kong.
1 Gross annual operating expenses for the Fund for 2011 are annualized. The Advisor has contractually agreed to waive Matthews China Small Companies Fund's fees and reimburse expenses until at least August 31, 2014 to the extent needed to limit total annual operating expenses to 2.00%. Matthews Asia Funds does not charge 12b-1 fees.
2 Not annualized. The Fund commenced operations on May 31, 2011
Matthews China Small Companies Fund
Portfolio Manager Commentary
For the first half of 2012, the Matthews China Small Companies Fund returned 0.57%, underperforming its benchmark, the MSCI China Small Cap Index, which returned 1.22%. For the quarter ending June 30, the Fund declined –8.05%, while its benchmark fell –8.38%.
The weakness in the equity market reflected investor concerns about Europe's debt crisis and some weaker-than-expected economic data in China. The broad slowdown triggered policy loosening, which, on the fiscal policy front, led China to accelerate approvals for new investment projects. In terms of monetary policy, the central bank again cut its bank reserve requirement ratio during the second quarter, and also cut both the benchmark one-year deposit and lending rates by 25 basis points (0.25%). In addition, Chinese banks were allowed more flexibility in setting their own rates—a significant step toward interest rate liberalization. Inflation in China remained benign and declined to 3% in May, remaining below the government's target of 4%.
During the second quarter, the financials sector, dominated by small real estate developers, rallied as China's property market began showing signs of stabilization and investor sentiment showed expectations for a gradually improving credit environment. The Fund had less exposure to the sector than the benchmark, and this underweight was a drag on performance. However, our financials sector holdings were top contributors to performance during the second quarter, as we saw strong returns for these holdings. China Overseas Grand Oceans Group, a Hong Kong-based property developer, was once again among the top contributors to performance. Given its seasoned management team and strong focus on expansion into smaller cities, the company stands to benefit from China's long-term trend of rising inland urbanization and growing household income.
China's health care sector also performed well in the second quarter. Health care companies showed their defensiveness and resilience amid the challenging economic climate, and our holdings in this sector delivered solid operating results. Holding company Sino Biopharmaceutical was among the Fund's top contributors for the second quarter. The firm has a diversified drug portfolio and a strong product pipeline in hepatitis, cardio-cerebral and oncology. While it may face some short-term macroeconomic uncertainties such as policies to centralize drug procurement in different provinces, the company is well-positioned to benefit from rising health care demand and the consequent long-term growth of China's pharmaceutical market.
Conversely, consumer discretionary and consumer staples sectors declined sharply during the quarter and were the major detractors to Fund performance. Investors sold off stocks in these industries due to recent weak consumer sentiment and a slowdown in consumer spending. Hengdeli Holdings, China's largest Swiss watch distributor and retailer, was sold off sharply as demand for mid-range to high-end consumer goods softened following the robust growth of the past two years. Despite the recent sluggish demand, we continue to hold this position as the company's business fundamentals and leading market position remain intact.
We have not made any major changes to the portfolio in terms of sector allocation. However, we did initiate a position in an oil jetty operator,
(continued)
matthewsasia.com | 800.789.ASIA 59
PERFORMANCE AS OF JUNE 30, 2012
| | | | | Average Annual
Total Returns | |
| | | 3 Months | | 1 Year | | Inception
5/31/11 | |
| Investor Class (MCSMX) | | | -8.05 | % | | | -26.16 | % | | | -27.23 | % | |
| MSCI China Small Cap Index3 | | | -8.38 | % | | | -30.26 | % | | | -32.08 | % | |
| Lipper China Funds Category Average4 | | | -6.45 | % | | | -19.33 | % | | | -20.98 | % | |
Performance assumes reinvestment of all dividends and/or distributions before taxes. All performance quoted represents past performance and is no guarantee of future results. Investment return and principal value will fluctuate with market conditions so that when redeemed, shares may be worth more or less than their original cost. Current performance may be lower or higher than the return figures quoted. Returns would have been lower if certain of the Fund's fees and expenses had not been waived. For the Fund's most recent month-end performance, visit matthewsasia.com.
GROWTH OF A $10,000 INVESTMENT SINCE INCEPTION—INVESTOR CLASS
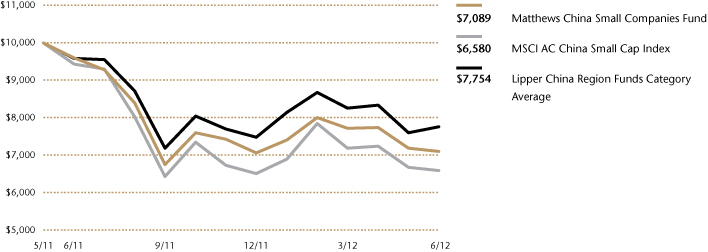
The performance data does not reflect the deduction of taxes that a shareholder would pay on dividends, capital gains distributions or redemption of Fund shares. Values are in US$.
3 It is not possible to invest directly in an index. Source: Index data from Morgan Stanley Capital International and Bloomberg; total return calculations performed by BNY Mellon Investment Servicing (US) Inc. Please see page 69 for index definition.
4 The Lipper Category Average does not reflect sales charges and is based on total return, including reinvestment of dividends and capital gains for the stated periods.
TOP TEN HOLDINGS5
| | | Sector | | % Net Assets | |
| Digital China Holdings, Ltd. | | Information Technology | | | 5.3 | % | |
| China Overseas Grand Oceans Group, Ltd. | | Financials | | | 5.1 | % | |
| Towngas China Co., Ltd. | | Utilities | | | 5.0 | % | |
| Franshion Properties China, Ltd. | | Financials | | | 4.0 | % | |
| Zhuzhou CSR Times Electric Co., Ltd. | | Industrials | | | 3.7 | % | |
| Yuexiu Transport Infrastructure, Ltd. | | Industrials | | | 3.3 | % | |
| Sino Biopharmaceutical | | Health Care | | | 3.3 | % | |
| Vinda International Holdings, Ltd. | | Consumer Staples | | | 3.3 | % | |
| WuXi PharmaTech Cayman, Inc. | | Health Care | | | 3.2 | % | |
| Television Broadcasts, Ltd. | | Consumer Discretionary | | | 3.2 | % | |
| % OF ASSETS IN TOP TEN | | | | | 39.4 | % | |
5 Holdings may combine more than one security from same issuer and related depositary receipts.
60 MATTHEWS ASIA FUNDS
Matthews China Small Companies Fund
Portfolio Manager Commentary (continued)
Sinopec Kantons Holdings, during the second quarter as it has a high business entry barrier and attractive assets. The company should benefit from long-term growth in China's oil demand.
We believe there will continue to be uncertainties in China as policymakers make ongoing adjustments to fix structural economic imbalances and set the country on a path to more sustainable growth. Small- and medium- enterprises (SMEs) are one of the main pillars of China's economy, and they currently contribute about 65% of GDP and 80% of urban employment. It is encouraging to see that the government has taken some initiative to lower funding costs and improve access to capital for entrepreneurs. Given the government's prompt response in setting a looser credit environment and speeding up new project approvals, we believe there is an increased chance that the economy should stabilize and regain some strength later this year.
COUNTRY ALLOCATION (%)
| China/Hong Kong | | | 94.6 | | |
| Taiwan | | | 3.3 | | |
Cash and Other Assets,
Less Liabilities | | | 2.1 | | |
SECTOR ALLOCATION (%)
| Consumer Discretionary | | | 20.5 | | |
| Industrials | | | 20.4 | | |
| Information Technology | | | 13.9 | | |
| Consumer Staples | | | 13.2 | | |
| Health Care | | | 9.2 | | |
| Financials | | | 9.1 | | |
| Utilities | | | 5.0 | | |
| Materials | | | 4.9 | | |
| Energy | | | 1.7 | | |
Cash and Other Assets,
Less Liabilities | | | 2.1 | | |
MARKET CAP EXPOSURE (%)6,7
| Large Cap (over $5B) | | | 0.0 | | |
| Mid Cap ($1B–$5B) | | | 60.5 | | |
| Small Cap (under $1B) | | | 37.4 | | |
Cash and Other Assets,
Less Liabilities | | | 2.1 | | |
6 Source: FactSet Research Systems. Percentage values in data are rounded to the nearest tenth of one percent; the values may not sum to 100% due to rounding.
7 The Fund defines Small Companies as companies with market capitalization generally between $100 million and $3 billion.
matthewsasia.com | 800.789.ASIA 61
Matthews China Small Companies Fund June 30, 2012
Schedule of Investmentsa (unaudited)
COMMON EQUITIES: 97.9%
| | | Shares | | Value | |
| CONSUMER DISCRETIONARY: 20.5% | |
| Hotels, Restaurants & Leisure: 5.7% | |
| Home Inns & Hotels Management, Inc. ADRb | | | 5,400 | | | $ | 122,364 | | |
| Ajisen China Holdings, Ltd. | | | 136,000 | | | | 94,633 | | |
| Gourmet Master Co., Ltd. | | | 11,970 | | | | 83,078 | | |
| | | | | | 300,075 | | |
| Textiles, Apparel & Luxury Goods: 4.0% | |
| Trinity, Ltd. | | | 234,000 | | | | 148,233 | | |
| Anta Sports Products, Ltd. | | | 98,000 | | | | 59,750 | | |
| | | | | | 207,983 | | |
| Media: 3.2% | |
| Television Broadcasts, Ltd. | | | 24,000 | | | | 167,305 | | |
| Specialty Retail: 3.0% | |
| Hengdeli Holdings, Ltd. | | | 484,000 | | | | 154,626 | | |
| Distributors: 2.1% | |
| Dah Chong Hong Holdings, Ltd. | | | 85,000 | | | | 76,480 | | |
| Sparkle Roll Group, Ltd. | | | 536,000 | | | | 34,170 | | |
| | | | | | 110,650 | | |
| Diversified Consumer Services: 1.7% | |
| TAL Education Group ADRb | | | 9,100 | | | | 89,544 | | |
| Leisure Equipment & Products: 0.8% | |
| Goodbaby International Holdings, Ltd. | | | 151,000 | | | | 44,312 | | |
| Total Consumer Discretionary | | | | | 1,074,495 | | |
| INDUSTRIALS: 20.4% | |
| Machinery: 6.7% | |
| Haitian International Holdings, Ltd. | | | 157,000 | | | | 156,429 | | |
| China National Materials Co., Ltd. H Shares | | | 348,000 | | | | 108,685 | | |
Sany Heavy Equipment International
Holdings Co., Ltd. | | | 157,000 | | | | 84,809 | | |
| | | | | | 349,923 | | |
| Electrical Equipment: 6.5% | |
Zhuzhou CSR Times Electric Co., Ltd.
H Shares | | | 70,000 | | | | 192,279 | | |
| Hangzhou Steam Turbine Co., Ltd. B Shares | | | 144,088 | | | | 148,348 | | |
| | | | | | 340,627 | | |
| Transportation Infrastructure: 4.5% | |
| Yuexiu Transport Infrastructure, Ltd. | | | 356,000 | | | | 175,824 | | |
| Dalian Port PDA Co., Ltd. H Sharesb | | | 272,000 | | | | 60,740 | | |
| | | | | | 236,564 | | |
| Industrial Conglomerates: 1.5% | |
Chongqing Machinery & Electric Co., Ltd.
H Shares | | | 570,000 | | | | 77,563 | | |
| Marine: 1.2% | |
| SITC International Holdings Co., Ltd. | | | 242,000 | | | | 64,307 | | |
| Total Industrials | | | | | 1,068,984 | | |
| | | Shares | | Value | |
| INFORMATION TECHNOLOGY: 13.9% | |
| Electronic Equipment, Instruments & Components: 5.9% | |
| Digital China Holdings, Ltd. | | | 157,000 | | | $ | 276,670 | | |
China High Precision Automation
Group, Ltd.c | | | 195,000 | | | | 34,408 | | |
| | | | | | 311,078 | | |
| Internet Software & Services: 2.5% | |
| 21Vianet Group, Inc. ADRb | | | 11,500 | | | | 131,675 | | |
| Communications Equipment: 2.3% | |
| Comba Telecom Systems Holdings, Ltd. | | | 285,000 | | | | 119,740 | | |
| Semiconductors & Semiconductor Equipment: 2.2% | |
| Spreadtrum Communications, Inc. ADR | | | 3,700 | | | | 65,305 | | |
| RDA Microelectronics, Inc. ADRb | | | 5,000 | | | | 50,200 | | |
| | | | | | 115,505 | | |
| Software: 1.0% | |
Kingdee International Software
Group Co., Ltd.b | | | 276,000 | | | | 51,955 | | |
| Total Information Technology | | | | | 729,953 | | |
| CONSUMER STAPLES: 13.2% | |
| Household Products: 5.0% | |
| Vinda International Holdings, Ltd. | | | 115,000 | | | | 171,735 | | |
| NVC Lighting Holdings, Ltd. | | | 481,000 | | | | 91,531 | | |
| | | | | | 263,266 | | |
| Food Products: 4.4% | |
| Shenguan Holdings Group, Ltd. | | | 198,000 | | | | 114,275 | | |
| Tenfu Cayman Holdings Co., Ltd. | | | 136,000 | | | | 88,028 | | |
| China Fishery Group, Ltd. | | | 46,000 | | | | 31,990 | | |
| | | | | | 234,293 | | |
| Food & Staples Retailing: 3.8% | |
| Wumart Stores, Inc. H Sharesb | | | 62,000 | | | | 126,045 | | |
Lianhua Supermarket
Holdings Co., Ltd. H Shares | | | 75,000 | | | | 72,008 | | |
| | | | | | 198,053 | | |
| Total Consumer Staples | | | | | 695,612 | | |
| HEALTH CARE: 9.2% | |
| Pharmaceuticals: 3.3% | |
| Sino Biopharmaceutical | | | 480,000 | | | | 174,085 | | |
| Life Sciences Tools & Services: 3.2% | |
| WuXi PharmaTech Cayman, Inc. ADRb | | | 12,000 | | | | 169,440 | | |
| Health Care Equipment & Supplies: 2.7% | |
| China Kanghui Holdings, Inc. ADRb | | | 7,100 | | | | 139,870 | | |
| Total Health Care | | | | | 483,395 | | |
62 MATTHEWS ASIA FUNDS
Matthews China Small Companies Fund June 30, 2012
Schedule of Investmentsa (unaudited) (continued)
COMMON EQUITIES (continued)
| | | Shares | | Value | |
| FINANCIALS: 9.1% | |
| Real Estate Management & Development: 9.1% | |
| China Overseas Grand Oceans Group, Ltd. | | | 294,750 | | | $ | 266,584 | | |
| Franshion Properties China, Ltd. | | | 698,000 | | | | 212,012 | | |
| Total Financials | | | | | 478,596 | | |
| UTILITIES: 5.0% | |
| Gas Utilities: 5.0% | |
| Towngas China Co., Ltd. | | | 362,000 | | | | 261,618 | | |
| Total Utilities | | | | | 261,618 | | |
| MATERIALS: 4.9% | |
| Containers & Packaging: 3.5% | |
| Greatview Aseptic Packaging Co., Ltd.b | | | 176,000 | | | | 92,781 | | |
| Taiwan Hon Chuan Enterprise Co., Ltd. | | | 39,535 | | | | 89,057 | | |
| | | | | | 181,838 | | |
| Chemicals: 1.4% | |
| Yip's Chemical Holdings, Ltd. | | | 114,000 | | | | 73,243 | | |
| Total Materials | | | | | 255,081 | | |
| ENERGY: 1.7% | |
| Oil, Gas & Consumable Fuels: 1.7% | |
| Sinopec Kantons Holdings, Ltd. | | | 122,000 | | | | 88,239 | | |
| Total Energy | | | | | 88,239 | | |
| TOTAL INVESTMENTS: 97.9% | | | | | 5,135,973 | | |
| (Cost $6,018,942d) | | | | | |
CASH AND OTHER ASSETS,
LESS LIABILITIES: 2.1% | | | | | 112,786 | | |
| NET ASSETS: 100.0% | | | | $ | 5,248,759 | | |
a Certain securities were fair valued under the discretion of the Board of Trustees (Note 2-A).
b Non-income producing security.
c Illiquid security.
d Cost for federal income tax purposes is $6,024,204 and net unrealized depreciation consists of:
| Gross unrealized appreciation | | $ | 313,946 | | |
| Gross unrealized depreciation | | | (1,202,177 | ) | |
| Net unrealized depreciation | | ($ | 888,231 | ) | |
ADR American Depositary Receipt
See accompanying notes to financial statements.
matthewsasia.com | 800.789.ASIA 63

ASIA SPECIALTY STRATEGY
PORTFOLIO MANAGERS
J. Michael Oh, CFA
Lead Manager
Lydia So
Co-Manager
FUND FACTS
| | | Investor Class | |
| Ticker | | MATFX | |
| CUSIP | | 577130883 | |
| Inception | | 12/27/99 | |
| NAV | | $8.62 | |
| Initial Investment | | $2,500 | |
| Gross Expense Ratio1 | | 1.21% | |
Portfolio Statistics
| Total # of Positions | | 58 | |
| Net Assets | | $138.5 million | |
| Weighted Average Market Cap | | $21.4 billion | |
| Portfolio Turnover | | 65.47%2 | |
Benchmark
MSCI AC Asia IT and Telecom Services Index
Redemption Fee
2% within first 90 calendar days of purchase
OBJECTIVE
Long-term capital appreciation.
STRATEGY
Under normal market conditions, the Fund seeks to achieve its investment objective by investing at least 80% of its total net assets, which include borrowings for investment purposes, in the common and preferred stocks of companies located in Asia, including developed, emerging and frontier countries and markets in the Asian region, that derive more than 50% of their revenues from the sale of products or services in science- and technology-related industries and services.
1 Matthews Asia Funds does not charge 12b-1 fees.
2 The lesser of fiscal year 2011 long-term purchase costs or sales proceeds divided by the average monthly market value of long-term securities.
Matthews Asia Science and Technology Fund
Portfolio Manager Commentary
For the first half of 2012, the Matthews Asia Science and Technology Fund gained 5.64% while its benchmark, MSCI All Country Asia IT and Telecom Services Index returned 4.39%. For the quarter ended June 30, the Fund declined –7.31%, while its benchmark lost –7.40%.
Following strong performance in the first quarter amid signs of global economic recovery, Asia's technology sector reversed course during the second quarter as Europe's sovereign debt crisis continued and the outlook for global economic growth weakened.
Europe's struggles took a heavy toll on Asian technology companies as the risk appetite among investors continued to decline. Europe continues to be a major importer of technology from Asia and ongoing uncertainty is likely to continue to negatively affect the sector. Concerns over a slowdown in China also significantly impacted performance during the second quarter as the Fund maintained an overweight position in China relative to the benchmark.
Most Asian manufacturers of personal computers faced strong headwinds as consumer computing habits continued to shift toward smartphones and tablets. We expect further consolidation in the sector, and believe this trend may benefit a few large players over the long term. There has also been further consolidation in the semiconductor sector since a major Japanese dynamic random memory (DRAM) manufacturer filed for bankruptcy in February. Although its assets were bought by a U.S. DRAM maker and the extent of any cuts to capacity remains to be seen, we expect reduced competition to benefit the surviving firms in this industry. Our telecommunication services sector holdings, which lagged during the first quarter, performed well during the second quarter as increased risk aversion led investors to shift toward defensive names.
Smartphone-related firms served as a rare bright spot during the first half of the year and Samsung Electronics was the top contributor to Fund performance. Key component suppliers to major smartphone and tablet makers performed well and Samsung maintained its dominant market share. It was one of the few smartphone makers in Asia to see growth during the first half of the year and is expected to continue to do well with the launch of the S3 model of its flagship Galaxy phone in July.
Sunny Optical Technology, a China-based optical lens maker, was the second-largest contributor to Fund performance during the first half of the year. Sunny Optical supplies optical lenses for mobile phones, including smartphones and digital cameras. The company has benefited from the strong growth of so-called "white-box," or unbranded, smartphones in China as well as increased sales of digital single-lens reflex cameras. The company should be well-positioned to benefit from continued growth of China's smartphone market, as it supplies several of the country's smartphone manufacturers.
By country, China was the worst performer during the second quarter. After doing well during the first quarter, Chinese companies underperformed as concerns over China's slowdown increased. Despite short term growth challenges, we continue to overweight China relative to the
(continued)
64 MATTHEWS ASIA FUNDS
PERFORMANCE AS OF JUNE 30, 2012
| | | | | Average Annual Total Returns | |
| | | 3 Months | | 1 Year | | 3 Years | | 5 Years | | 10 Years | | Inception
12/27/99 | |
| Investor Class (MATFX) | | | -7.31 | % | | | -12.69 | % | | | 13.02 | % | | | -0.38 | % | | | 9.12 | % | | | -0.71 | % | |
| MSCI AC Asia IT and Telecom Services Index3 | | | -7.40 | % | | | -4.95 | % | | | 10.12 | % | | | -0.90 | % | | | 4.90 | % | | | -4.47 | %4 | |
Lipper Global Sciences and Technology
Funds Category Average5 | | | -9.08 | % | | | -4.66 | % | | | 14.82 | % | | | 3.46 | % | | | 8.75 | % | | | -1.87 | %4 | |
Performance assumes reinvestment of all dividends and/or distributions before taxes. All performance quoted represents past performance and is no guarantee of future results. Investment return and principal value will fluctuate with market conditions so that when redeemed, shares may be worth more or less than their original cost. Current performance may be lower or higher than the return figures quoted. Returns would have been lower if certain of the Fund's fees and expenses had not been waived. For the Fund's most recent month-end performance, visit matthewsasia.com.
GROWTH OF A $10,000 INVESTMENT SINCE INCEPTION—INVESTOR CLASS
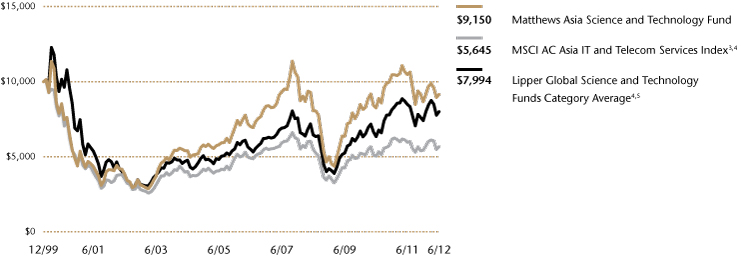
Plotted monthly. The performance data and graph do not reflect the deduction of taxes that a shareholder would pay on dividends, capital gains distributions or redemption of Fund shares. Values are in US$.
3 Formerly known as MSCI/Matthews Asian Technology Index. It is not possible to invest directly in an index. Source: Index data from Morgan Stanley Capital International and Bloomberg; total return calculations performed by BNY Mellon Investment Servicing (US) Inc. Please see page 69 for index definition.
4 Calculated from 12/31/99.
5 The Lipper Category Average does not reflect sales charges and is based on total return, including reinvestment of dividends and capital gains for the stated periods.
TOP TEN HOLDINGS6
| | | Sector | | Country | | % Net Assets | |
| Baidu, Inc. | | Information Technology | | China/Hong Kong | | | 6.8 | % | |
| Samsung Electronics Co., Ltd. | | Information Technology | | South Korea | | | 6.1 | % | |
| Taiwan Semiconductor Manufacturing Co., Ltd. | | Information Technology | | Taiwan | | | 2.9 | % | |
| Spreadtrum Communications, Inc. | | Information Technology | | China/Hong Kong | | | 2.9 | % | |
| NHN Corp. | | Information Technology | | South Korea | | | 2.7 | % | |
| Digital China Holdings, Ltd. | | Information Technology | | China/Hong Kong | | | 2.7 | % | |
| Hitachi, Ltd. | | Information Technology | | Japan | | | 2.7 | % | |
| Sunny Optical Technology Group Co., Ltd. | | Consumer Discretionary | | China/Hong Kong | | | 2.5 | % | |
| Nabtesco Corp. | | Industrials | | Japan | | | 2.3 | % | |
| Info Edge India, Ltd. | | Information Technology | | India | | | 2.3 | % | |
| % OF ASSETS IN TOP TEN | | | | | | | 33.9 | % | |
6 Holdings may combine more than one security from same issuer and related depositary receipts.
matthewsasia.com | 800.789.ASIA 65
COUNTRY ALLOCATION (%)7
| China/Hong Kong | | | 31.5 | | |
| South Korea | | | 20.1 | | |
| Japan | | | 19.6 | | |
| Taiwan | | | 18.4 | | |
| India | | | 3.1 | | |
| United States | | | 2.0 | | |
| Malaysia | | | 1.6 | | |
| Indonesia | | | 1.4 | | |
| Vietnam | | | 0.7 | | |
Cash and Other Assets,
Less Liabilities | | | 1.6 | | |
SECTOR ALLOCATION (%)
| Information Technology | | | 69.2 | | |
| Industrials | | | 8.4 | | |
| Health Care | | | 7.9 | | |
| Consumer Discretionary | | | 4.8 | | |
| Materials | | | 3.9 | | |
| Telecommunication Services | | | 2.8 | | |
| Financials | | | 1.4 | | |
Cash and Other Assets,
Less Liabilities | | | 1.6 | | |
MARKET CAP EXPOSURE (%)8
| Large Cap (over $5B) | | | 50.0 | | |
| Mid Cap ($1B–$5B) | | | 25.0 | | |
| Small Cap (under $1B) | | | 23.4 | | |
Cash and Other Assets,
Less Liabilities | | | 1.6 | | |
7 The United States is not included in the MSCI AC Asia IT and Telecom Services Index.
8 Source: FactSet Research Systems. Percentage values in data are rounded to the nearest tenth of one percent; the values may not sum to 100% due to rounding.
Matthews Asia Science and Technology Fund
Portfolio Manager Commentary (continued)
benchmark as we still see strong long-term growth potential in Chinese technology companies, especially in the Internet services sector.
Despite its weak performance during the second quarter, Taiwan was the top contributor to Fund performance during the first half of the year. Taiwanese technology companies rebounded in 2012 due to attractive valuations and higher yield, following a tough year last year. In particular, smartphone manufacturers saw improved performance.
During the second quarter, only Southeast Asian countries delivered positive returns while all other countries in the Fund posted negative returns. Domestically driven growth out of Southeast Asia has helped countries in that region remain relatively unharmed by global economic factors. However, valuations are becoming more demanding as the region continues to outperform its neighbors to the north.
Overall market sentiment remains weak for Asia's technology sector as no near-term resolutions to Europe's economic crisis appear forthcoming. However, the sector's valuations still remain attractive and any signs of global economic recovery should positively impact the sector. We continue to look for opportunities in secular growth industries, such as factory automation, Internet and IT services, which stand to benefit from Asia's long-term development.
Sector funds may be subject to a higher degree of market risk than diversified funds because of a concentration in a specific sector. The Fund's value may be affected by changes in the science and technology-related industries.
66 MATTHEWS ASIA FUNDS
Matthews Asia Science and Technology Fund June 30, 2012
Schedule of Investmentsa (unaudited)
COMMON EQUITIES: 97.9%
| | | Shares | | Value | |
| CHINA/HONG KONG: 31.5% | |
| Baidu, Inc. ADRb | | | 81,800 | | | $ | 9,405,364 | | |
| Spreadtrum Communications, Inc. ADR | | | 228,600 | | | | 4,034,790 | | |
| Digital China Holdings, Ltd. | | | 2,127,000 | | | | 3,748,266 | | |
| Sunny Optical Technology Group Co., Ltd. | | | 10,264,000 | | | | 3,496,436 | | |
| 21Vianet Group, Inc. ADRb | | | 271,301 | | | | 3,106,396 | | |
| Airtac International Groupb | | | 467,000 | | | | 2,690,214 | | |
| AAC Technologies Holdings, Inc. | | | 822,000 | | | | 2,392,148 | | |
| WuXi PharmaTech Cayman, Inc. ADRb | | | 160,900 | | | | 2,271,908 | | |
| Netease, Inc. ADRb | | | 38,300 | | | | 2,253,955 | | |
| China Mobile, Ltd. ADR | | | 36,100 | | | | 1,973,587 | | |
| ZTE Corp. H Shares | | | 991,144 | | | | 1,933,276 | | |
| Sinopharm Group Co., Ltd. H Shares | | | 658,400 | | | | 1,830,264 | | |
| Lenovo Group, Ltd. | | | 1,804,000 | | | | 1,539,410 | | |
| 51job, Inc. ADRb | | | 32,800 | | | | 1,494,040 | | |
| Sina Corp.b | | | 28,400 | | | | 1,471,404 | | |
| Total China/Hong Kong | | | | | 43,641,458 | | |
| JAPAN: 19.6% | |
| Hitachi, Ltd. | | | 606,000 | | | | 3,736,499 | | |
| Nabtesco Corp. | | | 144,700 | | | | 3,227,402 | | |
| Toshiba Corp. | | | 610,000 | | | | 2,321,879 | | |
| Hoya Corp. | | | 99,400 | | | | 2,189,784 | | |
| Asahi Intecc Co., Ltd. | | | 80,000 | | | | 2,098,210 | | |
| Murata Manufacturing Co., Ltd. | | | 39,200 | | | | 2,061,943 | | |
| Rakuten, Inc. | | | 192,600 | | | | 1,991,228 | | |
| SMC Corp. | | | 10,900 | | | | 1,889,817 | | |
| Hamamatsu Photonics, K.K. | | | 55,400 | | | | 1,879,493 | | |
| Nexon Co., Ltd.b | | | 85,500 | | | | 1,673,786 | | |
| Tokyo Electron, Ltd. | | | 34,200 | | | | 1,603,806 | | |
| FANUC Corp. | | | 8,400 | | | | 1,380,801 | | |
| Kakaku.com, Inc. | | | 33,000 | | | | 1,119,804 | | |
| Total Japan | | | | | 27,174,452 | | |
| SOUTH KOREA: 19.6% | |
| Samsung Electronics Co., Ltd. | | | 7,962 | | | | 8,431,658 | | |
| NHN Corp. | | | 17,194 | | | | 3,771,230 | | |
| Cheil Industries, Inc. | | | 33,514 | | | | 2,957,056 | | |
| Kiwoom Securities Co., Ltd. | | | 35,695 | | | | 1,918,319 | | |
| LG Chem, Ltd. | | | 6,923 | | | | 1,792,195 | | |
| Daum Communications Corp. | | | 19,635 | | | | 1,765,950 | | |
| SBS Contents Hub Co., Ltd. | | | 155,087 | | | | 1,737,649 | | |
| LG Display Co., Ltd.b | | | 88,500 | | | | 1,670,829 | | |
| Samsung SDI Co., Ltd. | | | 10,370 | | | | 1,388,829 | | |
| JVM Co., Ltd.b | | | 29,009 | | | | 1,007,554 | | |
| OCI Materials Co., Ltd. | | | 18,776 | | | | 680,198 | | |
| Total South Korea | | | | | 27,121,467 | | |
| TAIWAN: 18.4% | |
Taiwan Semiconductor Manufacturing
Co., Ltd.b | | | 1,483,933 | | | | 4,062,220 | | |
| Hon Hai Precision Industry Co., Ltd. | | | 887,982 | | | | 2,684,856 | | |
| TXC Corp. | | | 1,733,198 | | | | 2,516,476 | | |
| St. Shine Optical Co., Ltd. | | | 217,000 | | | | 2,428,558 | | |
| Delta Electronics, Inc. | | | 738,000 | | | | 2,265,369 | | |
| Chroma ATE, Inc. | | | 981,360 | | | | 2,240,259 | | |
| Simplo Technology Co., Ltd. | | | 323,980 | | | | 2,237,530 | | |
| | | Shares | | Value | |
| PChome Online, Inc. | | | 389,000 | | | $ | 2,205,287 | | |
| Synnex Technology International Corp. | | | 853,447 | | | | 2,088,568 | | |
| Largan Precision Co., Ltd. | | | 70,000 | | | | 1,463,713 | | |
| Foxconn Technology Co., Ltd. | | | 342,350 | | | | 1,246,468 | | |
| Total Taiwan | | | | | 25,439,304 | | |
| INDIA: 3.1% | |
| Info Edge India, Ltd. | | | 475,636 | | | | 3,155,765 | | |
| Exide Industries, Ltd. | | | 459,586 | | | | 1,130,192 | | |
| Multi Commodity Exchange of India, Ltd. | | | 1,540 | | | | 29,253 | | |
| Total India | | | | | 4,315,210 | | |
| UNITED STATES: 2.0% | |
Cognizant Technology Solutions Corp.
Class Ab | | | 44,700 | | | | 2,682,000 | | |
| Total United States | | | | | 2,682,000 | | |
| MALAYSIA: 1.6% | |
| KPJ Healthcare BHD | | | 1,217,600 | | | | 2,263,362 | | |
| Total Malaysia | | | | | 2,263,362 | | |
| INDONESIA: 1.4% | |
| PT Telekomunikasi Indonesia Persero ADR | | | 56,900 | | | | 1,981,827 | | |
| Total Indonesia | | | | | 1,981,827 | | |
| VIETNAM: 0.7% | |
| FPT Corp. | | | 433,700 | | | | 976,631 | | |
| Total Vietnam | | | | | 976,631 | | |
| TOTAL COMMON EQUITIES | | | | | 135,595,711 | | |
| (Cost $123,673,335) | | | | | |
PREFERRED EQUITIES: 0.5%
| SOUTH KOREA: 0.5% | |
| Samsung Electronics Co., Ltd., Pfd. | | | 1,089 | | | | 718,905 | | |
| Total South Korea | | | | | 718,905 | | |
| TOTAL PREFERRED EQUITIES | | | | | 718,905 | | |
| (Cost $695,255) | | | | | |
| TOTAL INVESTMENTS: 98.4% | | | | | 136,314,616 | | |
| (Cost $124,368,590c) | | | | | |
CASH AND OTHER ASSETS,
LESS LIABILITIES: 1.6% | | | | | 2,154,134 | | |
| NET ASSETS: 100.0% | | | | $ | 138,468,750 | | |
a Certain securities were fair valued under the discretion of the Board of Trustees (Note 2-A).
b Non-income producing security.
c Cost for federal income tax purposes is $124,448,514 and net unrealized appreciation consists of:
| Gross unrealized appreciation | | $ | 21,670,805 | | |
| Gross unrealized depreciation | | | (9,804,703 | ) | |
| Net unrealized appreciation | | $ | 11,866,102 | | |
ADR American Depositary Receipt
BHD Berhad
Pfd. Preferred
See accompanying notes to financial statements.
matthewsasia.com | 800.789.ASIA 67
Disclosures
Fund Holdings: The Fund holdings shown in this report are as of June 30, 2012. Holdings are subject to change at any time, so holdings shown in this report may not reflect current Fund holdings. The Funds file complete schedules of portfolio holdings with the Securities and Exchange Commission (the "SEC") for the first and third quarters of each fiscal year on Form N-Q. The Funds' Form N-Q is filed with the SEC within 60 days of the end of the quarter to which it relates, and is available on the SEC's website at www.sec.gov. It may also be reviewed and copied at the Commission's Public Reference Room in Washington, D.C. Information on the operation of the Public Reference Room may be obtained by calling 800-SEC-0330. Complete schedules of investments are also available without charge, upon request, from the Funds by calling us at 800.789.ASIA (2472).
Proxy Voting Record: The Funds' Statement of Additional Information containing a description of the policies and procedures that the Funds have used to vote proxies relating to portfolio securities, along with each Fund's proxy voting record relating to portfolio securities held during the most recent 12-month period ended June 30, is available upon request, at no charge, at the Funds' website at matthewsasia.com or by calling 800.789.ASIA (2742), or on the SEC's website at www.sec.gov.
Shareholder Reports and Prospectuses: To reduce the Funds' expenses, we try to identify related shareholders in a household and send only one copy of the Funds' prospectus and financial reports to that address. This process, called "householding," will continue indefinitely unless you instruct us otherwise. At any time you may view the Funds' current prospectus, summary prospectus and financial reports on our website. If you prefer to receive individual copies of the Funds' prospectus or financial reports, please call us at 800.789.ASIA (2742).
Redemption Fee Policy: The Funds assess a redemption fee of 2.00% on the total redemption proceeds on most sales or exchanges of shares that take place within 90 calendar days after their purchase as part of the Funds' efforts to discourage short-term trading activity. This fee is payable directly to the Funds. For purposes of determining whether the redemption fee applies, the shares that have been held longest will be redeemed first. The Funds may grant exemptions from the redemption fee in certain circumstances. For more information on this policy, please see the Funds' prospectus.
68 MATTHEWS ASIA FUNDS
Index Definitions
The HSBC Asian Local Bond Index (ALBI) tracks the total return performance of a bond portfolio consisting of local-currency denominated, high quality and liquid bonds in Asia ex-Japan. The ALBI includes bonds from the following countries: Korea, Hong Kong, India, Singapore, Taiwan, Malaysia, Thailand, Philippines, Indonesia and China.
The J.P. Morgan Asia Credit Index (JACI) tracks the total return performance of the Asia fixed-rate dollar bond market. JACI is a market cap-weighted index comprising sovereign, quasi-sovereign and corporate bonds and is partitioned by country, sector and credit rating. JACI includes bonds from the following countries: China, Hong Kong, India, Indonesia, Korea, Malaysia, Philippines, Thailand and Singapore.
The MSCI All Country Asia ex Japan Index is a free float–adjusted market capitalization–weighted index of the stock of markets of China, Hong Kong, India, Indonesia, Malaysia, Philippines, Singapore, South Korea, Taiwan and Thailand.
The MSCI All Country Asia Pacific Index is a free float– adjusted market capitalization–weighted index of the stock markets of Australia, China, Hong Kong, India, Indonesia, Japan, Malaysia, New Zealand, Philippines, Singapore, South Korea, Taiwan and Thailand.
The MSCI China Index is a free float–adjusted market capitalization–weighted index of Chinese equities that includes China-affiliated corporations and H shares listed on the Hong Kong Exchange, and B shares listed on the Shanghai and Shenzhen exchanges.
The Bombay Stock Exchange (BSE) 100 Index is a free float–adjusted market capitalization–weighted index of the 100 stocks listed on the Bombay Stock Exchange.
The MSCI Japan Index is a free float–adjusted market capitalization–weighted index of Japanese equities listed in Japan.
The Tokyo Stock Price Index (TOPIX) is a market capitalization–weighted index of all companies listed on the First Section of the Tokyo Stock Exchange.
The Korea Composite Stock Price Index (KOSPI) is a market capitalization–weighted index of all common stocks listed on the Korea Stock Exchange.
The MSCI All Country Asia ex Japan Small Cap Index is a free float–adjusted market capitalization–weighted small cap index of the stock markets of China, Hong Kong, India, Indonesia, Malaysia, Philippines, Singapore, South Korea, Taiwan and Thailand.
The MSCI China Small Cap Index is a free float–adjusted market capitalization–weighted small cap index of the Chinese equity securities markets, including H shares listed on the Hong Kong Exchange, B shares listed on the Shanghai and Shenzhen exchanges, and Hong Kong-listed securities known as Red Chips (issued by entities owned by national or local governments in China) and P Chips (issued by companies controlled by individuals in China and deriving substantial revenues in China).
The MSCI AC Asia IT and Telecom Services Index (formerly known as MSCI/Matthews Asian Technology Index) is a free float–adjusted market capitalization–weighted index of Asian equities tracking a broad range of technology stocks including semiconductor equipment and products, communications equipment, computers and peripherals, electronic equipment and instruments, office electronics, software, IT consulting and services, Internet software and services, diversified telecommunications services, and wireless telecommunications services.
matthewsasia.com | 800.789.ASIA 69
Disclosure of Fund Expenses (Unaudited)
We believe it is important for you to understand the impact of fees regarding your investment. All mutual funds have operating expenses. As a shareholder of a mutual fund, you incur ongoing costs, which include costs for portfolio management, administrative services, and shareholder reports (like this one), among others. Operating expenses, which are deducted from a fund's gross income, directly reduce the investment return of the fund. A fund's operating expenses are expressed as a percentage of its average net assets. This figure is known as the expense ratio. The following examples are intended to help you understand the ongoing fees (in dollars) of investing in your fund and to compare these costs with those of other mutual funds. The examples are based on an investment of $1,000 made at the beginning of the period shown and held for the entire period.
This table illustrates your fund's costs in two ways:
Actual Fund Return: This section helps you to estimate the actual operating expenses, after any applicable fee waivers, that you paid over the period. The "Ending Account Value" shown is derived from the fund's actual return for the past six month period, the "Expense Ratio" column shows the period's annualized expense ratio, and the "Operating Expenses Paid During Period" column shows the dollar amount that would have been paid by an investor who started with $1,000 in the fund at the beginning of the period. You may use the information here, together with your account value, to estimate the expenses that you paid over the period. To do so, simply divide your account value by $1,000 (for example, an $8,600 account value divided by $1,000 = 8.6), then multiply the result by the number given for your fund in the first line under the heading entitled "Operating Expenses Paid During Period."
Hypothetical 5% Return: This section is intended to help you compare your fund's costs with those of other mutual funds. It assumes that the fund had an annual return of 5% before operating expenses, but that the expense ratio is unchanged. In this case, because the return used is not the fund's actual return, the results do not apply to your investment. This example is useful in making comparisons to other mutual funds because the Securities and Exchange Commission requires all mutual funds to calculate expenses based on an assumed 5% annual return. You can assess your fund's costs by comparing this hypothetical example with the hypothetical examples that appear in shareholder reports of other funds.
Please note that the operating expenses shown in the table are meant to highlight and help you compare your ongoing costs only and do not reflect any transactional costs such as sales charges (loads), redemption fees, or exchange fees. The Funds generally assess a redemption fee of 2.00% of the total redemption proceeds if you sell or exchange your shares within 90 calendar days after purchasing them. The redemption fee is paid directly to the Funds and is designed to discourage frequent short-term trading and to offset transaction costs associated with such trading of Fund shares. For purposes of determining whether the redemption fee applies, the shares that have been held the longest will be redeemed first. The Funds may grant exemption from the redemption fee when the Funds have previously received assurances that transactions do not involve market timing activity. The Funds may also waive the imposition of redemption fees in certain circumstances.
For more information on this policy, please see the Funds' prospectus.
The Matthews Asia Funds do not charge any sales loads, exchange fees, or 12b-1 fees, but these may be present in other funds to which you compare this data. Therefore, the hypothetical portions of the table are useful in comparing ongoing costs only, and will not help you determine the relative total costs of owning different funds.
70 MATTHEWS ASIA FUNDS
June 30, 2012
| | | INVESTOR CLASS | | INSTITUTIONAL CLASS | |
| | | Beginning
Account
Value
1/1/12 | | Ending
Account
Value
6/30/12 | | Expense
Ratio1 | | Operating
Expenses
Paid During
Period
1/1/12–
6/30/122 | | Beginning
Account
Value
1/1/12 | | Ending
Account
Value
6/30/12 | | Expense
Ratio1 | | Operating
Expenses
Paid During
Period
1/1/12–
6/30/122 | |
| ASIA FIXED INCOME STRATEGIES | |
| Matthews Asia Strategic Income Fund | |
| Actual Fund Return | | $ | 1,000.00 | | | $ | 1,041.80 | | | | 1.11 | % | | $ | 5.67 | | | $ | 1,000.00 | | | $ | 1,042.70 | | | | 1.00 | % | | $ | 5.11 | | |
| Hypothetical 5% Return | | $ | 1,000.00 | | | $ | 1,019.45 | | | | 1.11 | % | | $ | 5.60 | | | $ | 1,000.00 | | | $ | 1,020.00 | | | | 1.00 | % | | $ | 5.05 | | |
| ASIA GROWTH AND INCOME STRATEGIES | |
| Matthews Asian Growth and Income Fund | |
| Actual Fund Return | | $ | 1,000.00 | | | $ | 1,095.10 | | | | 1.11 | % | | $ | 5.81 | | | $ | 1,000.00 | | | $ | 1,096.70 | | | | 0.98 | % | | $ | 5.14 | | |
| Hypothetical 5% Return | | $ | 1,000.00 | | | $ | 1,019.45 | | | | 1.11 | % | | $ | 5.60 | | | $ | 1,000.00 | | | $ | 1,020.10 | | | | 0.98 | % | | $ | 4.95 | | |
| Matthews Asia Dividend Fund | |
| Actual Fund Return | | $ | 1,000.00 | | | $ | 1,087.60 | | | | 1.08 | % | | $ | 5.64 | | | $ | 1,000.00 | | | $ | 1,087.50 | | | | 0.98 | % | | $ | 5.11 | | |
| Hypothetical 5% Return | | $ | 1,000.00 | | | $ | 1,019.60 | | | | 1.08 | % | | $ | 5.45 | | | $ | 1,000.00 | | | $ | 1,020.10 | | | | 0.98 | % | | $ | 4.95 | | |
| Matthews China Dividend Fund | |
| Actual Fund Return | | $ | 1,000.00 | | | $ | 1,102.20 | | | | 1.50 | % | | $ | 7.88 | | | $ | 1,000.00 | | | $ | 1,102.50 | | | | 1.40 | % | | $ | 7.36 | | |
| Hypothetical 5% Return | | $ | 1,000.00 | | | $ | 1,017.50 | | | | 1.50 | % | | $ | 7.57 | | | $ | 1,000.00 | | | $ | 1,018.00 | | | | 1.40 | % | | $ | 7.06 | | |
| ASIA GROWTH STRATEGIES | |
| Matthews Asia Growth Fund | |
| Actual Fund Return | | $ | 1,000.00 | | | $ | 1,055.40 | | | | 1.18 | % | | $ | 6.06 | | | $ | 1,000.00 | | | $ | 1,056.00 | | | | 1.00 | % | | $ | 5.14 | | |
| Hypothetical 5% Return | | $ | 1,000.00 | | | $ | 1,019.10 | | | | 1.18 | % | | $ | 5.96 | | | $ | 1,000.00 | | | $ | 1,020.00 | | | | 1.00 | % | | $ | 5.05 | | |
| Matthews Pacific Tiger Fund | |
| Actual Fund Return | | $ | 1,000.00 | | | $ | 1,066.90 | | | | 1.13 | % | | $ | 5.84 | | | $ | 1,000.00 | | | $ | 1,067.90 | | | | 0.95 | % | | $ | 4.91 | | |
| Hypothetical 5% Return | | $ | 1,000.00 | | | $ | 1,019.35 | | | | 1.13 | % | | $ | 5.70 | | | $ | 1,000.00 | | | $ | 1,020.25 | | | | 0.95 | % | | $ | 4.80 | | |
| Matthews China Fund | |
| Actual Fund Return | | $ | 1,000.00 | | | $ | 1,020.50 | | | | 1.14 | % | | $ | 5.76 | | | $ | 1,000.00 | | | $ | 1,021.90 | | | | 0.93 | % | | $ | 4.70 | | |
| Hypothetical 5% Return | | $ | 1,000.00 | | | $ | 1,019.30 | | | | 1.14 | % | | $ | 5.76 | | | $ | 1,000.00 | | | $ | 1,020.35 | | | | 0.93 | % | | $ | 4.70 | | |
| Matthews India Fund | |
| Actual Fund Return | | $ | 1,000.00 | | | $ | 1,142.00 | | | | 1.20 | % | | $ | 6.43 | | | $ | 1,000.00 | | | $ | 1,143.30 | | | | 1.01 | % | | $ | 5.41 | | |
| Hypothetical 5% Return | | $ | 1,000.00 | | | $ | 1,019.00 | | | | 1.20 | % | | $ | 6.06 | | | $ | 1,000.00 | | | $ | 1,019.95 | | | | 1.01 | % | | $ | 5.10 | | |
| Matthews Japan Fund | |
| Actual Fund Return | | $ | 1,000.00 | | | $ | 1,032.60 | | | | 1.23 | % | | $ | 6.25 | | | $ | 1,000.00 | | | $ | 1,033.50 | | | | 1.07 | % | | $ | 5.44 | | |
| Hypothetical 5% Return | | $ | 1,000.00 | | | $ | 1,018.85 | | | | 1.23 | % | | $ | 6.21 | | | $ | 1,000.00 | | | $ | 1,019.65 | | | | 1.07 | % | | $ | 5.40 | | |
| Matthews Korea Fund | |
| Actual Fund Return | | $ | 1,000.00 | | | $ | 1,039.20 | | | | 1.18 | % | | $ | 6.02 | | | $ | 1,000.00 | | | $ | 1,039.10 | | | | 0.99 | % | | $ | 5.05 | | |
| Hypothetical 5% Return | | $ | 1,000.00 | | | $ | 1,019.10 | | | | 1.18 | % | | $ | 5.96 | | | $ | 1,000.00 | | | $ | 1,020.05 | | | | 0.99 | % | | $ | 5.00 | | |
| ASIA SMALL COMPANY STRATEGY | |
| Matthews Asia Small Companies Fund | |
| Actual Fund Return | | $ | 1,000.00 | | | $ | 1,062.30 | | | | 1.52 | % | | $ | 7.84 | | | | | | | | | | |
| Hypothetical 5% Return | | $ | 1,000.00 | | | $ | 1,017.40 | | | | 1.52 | % | | $ | 7.67 | | | | | | | | | | |
| Matthews China Small Companies Fund | |
| Actual Fund Return | | $ | 1,000.00 | | | $ | 1,005.70 | | | | 2.00 | % | | $ | 10.03 | | | | | | | | | | |
| Hypothetical 5% Return | | $ | 1,000.00 | | | $ | 1,015.00 | | | | 2.00 | % | | $ | 10.08 | | | | | | | | | | |
| ASIA SPECIALTY STRATEGY | |
| Matthews Asia Science and Technology Fund | |
| Actual Fund Return | | $ | 1,000.00 | | | $ | 1,056.40 | | | | 1.21 | % | | $ | 6.22 | | | | | | | | | | |
| Hypothetical 5% Return | | $ | 1,000.00 | | | $ | 1,018.95 | | | | 1.21 | % | | $ | 6.11 | | | | | | | | | | |
1 Annualized, based on the Fund's most recent fiscal half-year expenses.
2 Operating expenses are equal to the Fund's annualized expense ratio multiplied by the average account value over the period, multiplied by 183 days, then divided by 366.
matthewsasia.com | 800.789.ASIA 71
Statements of Assets and Liabilities (Unaudited) June 30, 2012
| | | Matthews Asia
Strategic
Income Fund | | Matthews Asian
Growth and
Income Fund | | Matthews Asia
Dividend Fund | | Matthews China
Dividend Fund | | Matthews Asia
Growth Fund | |
| ASSETS: | |
| Investments at value (A) (Note 2-A and 7): | |
| Unaffiliated issuers | | $ | 22,080,425 | | | $ | 3,153,835,788 | | | $ | 2,366,139,713 | | | $ | 27,409,850 | | | $ | 357,754,272 | | |
| Affiliated issuers | | | — | | | | 67,636,456 | | | | 362,341,017 | | | | — | | | | — | | |
| Total investments | | | 22,080,425 | | | | 3,221,472,244 | | | | 2,728,480,730 | | | | 27,409,850 | | | | 357,754,272 | | |
| Cash | | | 880,186 | | | | 31,996,018 | | | | 82,696,075 | | | | 91,308 | | | | 2,603,140 | | |
| Cash pledged as collateral for financial futures contracts | | | 11,000 | | | | — | | | | — | | | | — | | | | — | | |
| Foreign currency at value (B) | | | — | | | | 6,247,891 | | | | 4,700,731 | | | | 60,506 | | | | 3,020,576 | | |
| Dividends, interest and other receivables—Unaffiliated issuers | | | 356,263 | | | | 7,964,459 | | | | 7,911,144 | | | | 168,128 | | | | 824,284 | | |
| Dividends receivable—Affiliated issuers | | | — | | | | — | | | | — | | | | — | | | | — | | |
| Receivable for securities sold | | | — | | | | 658,679 | | | | 541,957 | | | | — | | | | — | | |
| Receivable for capital shares sold | | | 149,820 | | | | 3,989,149 | | | | 11,883,249 | | | | 10,900 | | | | 270,547 | | |
| Receivable for daily variation margin on financial futures contracts | | | 5,469 | | | | — | | | | — | | | | — | | | | — | | |
| Due from Advisor (Note 5) | | | 3,104 | | | | — | | | | — | | | | — | | | | — | | |
| Deferred offering costs (Note 2-E) | | | 59,312 | | | | — | | | | — | | | | — | | | | — | | |
| Unrealized appreciation on forward foreign currency exchange contracts | | | 26,513 | | | | — | | | | — | | | | — | | | | — | | |
| Prepaid expenses | | | 8,644 | | | | 18,564 | | | | 41,748 | | | | 6,450 | | | | 11,227 | | |
| TOTAL ASSETS | | | 23,580,736 | | | | 3,272,347,004 | | | | 2,836,255,634 | | | | 27,747,142 | | | | 364,484,046 | | |
| LIABILITIES: | |
| Payable for securities purchased | | | 286,106 | | | | — | | | | 4,406,230 | | | | — | | | | — | | |
| Payable for capital shares redeemed | | | 5,101 | | | | 4,133,753 | | | | 2,415,568 | | | | 32,669 | | | | 434,605 | | |
| Cash overdraft | | | — | | | | — | | | | — | | | | — | | | | — | | |
| Deferred foreign capital gains tax liability (Note 2-D) | | | — | | | | 205,458 | | | | — | | | | — | | | | — | | |
| Due to Advisor (Note 5) | | | — | | | | 1,823,828 | | | | 1,556,036 | | | | 12,750 | | | | 203,792 | | |
| Administration and accounting fees payable | | | 300 | | | | 43,504 | | | | 36,605 | | | | 377 | | | | 4,912 | | |
| Administration and shareholder servicing fees payable | | | 1,424 | | | | 591,250 | | | | 464,087 | | | | 5,650 | | | | 67,900 | | |
| Printing fees payable | | | — | | | | 131,925 | | | | 161,519 | | | | 5,007 | | | | 23,346 | | |
| Professional fees payable | | | 14,291 | | | | 25,559 | | | | 23,010 | | | | 21,605 | | | | 22,448 | | |
| Trustees fees payable | | | — | | | | 1,023 | | | | — | | | | — | | | | — | | |
| Transfer agent fees payable | | | — | | | | 384,951 | | | | 267,057 | | | | 7,633 | | | | 53,870 | | |
| Offering costs | | | 42,618 | | | | — | | | | — | | | | — | | | | — | | |
| Accrued other expenses payable | | | 2,851 | | | | 176,041 | | | | 106,159 | | | | 12,261 | | | | 33,727 | | |
| TOTAL LIABILITIES | | | 352,691 | | | | 7,517,292 | | | | 9,436,271 | | | | 97,952 | | | | 844,600 | | |
| NET ASSETS | | $ | 23,228,045 | | | $ | 3,264,829,712 | | | $ | 2,826,819,363 | | | $ | 27,649,190 | | | $ | 363,639,446 | | |
| NET ASSETS: | |
| Investor Class | | $ | 17,695,792 | | | $ | 2,556,381,422 | | | $ | 2,258,864,457 | | | $ | 27,609,955 | | | $ | 258,248,987 | | |
| Institutional Class | | | 5,532,253 | | | | 708,448,290 | | | | 567,954,906 | | | | 39,235 | | | | 105,390,459 | | |
| TOTAL | | $ | 23,228,045 | | | $ | 3,264,829,712 | | | $ | 2,826,819,363 | | | $ | 27,649,190 | | | $ | 363,639,446 | | |
| SHARES OUTSTANDING: | |
(shares of beneficial interest issued and outstanding, respectively,
unlimited number of shares authorized with a $0.001 par value) | |
| Investor Class | | | 1,738,092 | | | | 156,788,211 | | | | 168,982,502 | | | | 2,543,517 | | | | 15,950,264 | | |
| Institutional Class | | | 543,588 | | | | 43,463,466 | | | | 42,510,833 | | | | 3,613 | | | | 6,491,806 | | |
| TOTAL | | | 2,281,680 | | | | 200,251,677 | | | | 211,493,335 | | | | 2,547,130 | | | | 22,442,070 | | |
| NET ASSET VALUE: | |
| Investor Class, offering price and redemption price | | $ | 10.18 | | | $ | 16.30 | | | $ | 13.37 | | | $ | 10.86 | | | $ | 16.19 | | |
| Institutional Class, offering price and redemption price | | $ | 10.18 | | | $ | 16.30 | | | $ | 13.36 | | | $ | 10.86 | | | $ | 16.23 | | |
| NET ASSETS CONSIST OF: | |
| Capital paid-in | | $ | 22,994,771 | | | $ | 2,941,341,682 | | | $ | 2,817,151,943 | | | $ | 28,688,291 | | | $ | 363,776,601 | | |
| Undistributed (distributions in excess of) net investment income (loss) | | | 15,580 | | | | (9,904,853 | ) | | | (15,278,248 | ) | | | (216,886 | ) | | | (1,040,068 | ) | |
Undistributed/accumulated net realized gain (loss) on investments, financial
futures contracts, and foreign currency related transactions | | | (134,011 | ) | | | (56,585,590 | ) | | | (50,741,493 | ) | | | (1,346,896 | ) | | | (47,969,652 | ) | |
Net unrealized appreciation (depreciation) on investments, financial futures
contracts, foreign currency translations and deferred foreign capital gains taxes | | | 351,705 | | | | 389,978,473 | | | | 75,687,161 | | | | 524,681 | | | | 48,872,565 | | |
| NET ASSETS | | $ | 23,228,045 | | | $ | 3,264,829,712 | | | $ | 2,826,819,363 | | | $ | 27,649,190 | | | $ | 363,639,446 | | |
| (A) Investments at cost: | |
| Unaffiliated issuers | | $ | 21,761,150 | | | $ | 2,765,976,922 | | | $ | 2,267,666,788 | | | $ | 26,885,199 | | | $ | 308,897,735 | | |
| Affiliated issuers | | | — | | | | 65,338,935 | | | | 385,128,650 | | | | — | | | | — | | |
| Total investments at cost | | $ | 21,761,150 | | | $ | 2,831,315,857 | | | $ | 2,652,795,438 | | | $ | 26,885,199 | | | $ | 308,897,735 | | |
| (B) Foreign currency at cost | | $ | — | | | $ | 6,242,348 | | | $ | 4,700,346 | | | $ | 60,506 | | | $ | 3,007,603 | | |
See accompanying notes to financial statements.
72 MATTHEWS ASIA FUNDS
| | | Matthews Pacific
Tiger Fund | | Matthews
China Fund | | Matthews
India Fund | | Matthews
Japan Fund | | Matthews
Korea Fund | |
| ASSETS: | |
| Investments at value (A) (Note 2-A and 7): | |
| Unaffiliated issuers | | $ | 5,166,475,571 | | | $ | 2,053,924,878 | | | $ | 601,209,221 | | | $ | 115,539,981 | | | $ | 154,520,770 | | |
| Affiliated issuers | | | 500,143,417 | | | | 27,793,131 | | | | — | | | | — | | | | — | | |
| Total investments | | | 5,666,618,988 | | | | 2,081,718,009 | | | | 601,209,221 | | | | 115,539,981 | | | | 154,520,770 | | |
| Cash | | | 278,871,777 | | | | 17,368,860 | | | | — | | | | 332,332 | | | | 1,185,333 | | |
| Cash pledged as collateral for financial futures contracts | | | — | | | | — | | | | — | | | | — | | | | — | | |
| Foreign currency at value (B) | | | 14,386,985 | | | | 2,286,102 | | | | 2,246,329 | | | | 264,576 | | | | 155,927 | | |
| Dividends, interest and other receivables—Unaffiliated issuers | | | 10,569,080 | | | | 13,920,950 | | | | 2,182,778 | | | | 168,482 | | | | 66,565 | | |
| Dividends receivable—Affiliated issuers | | | 1,106,875 | | | | 494,668 | | | | — | | | | — | | | | — | | |
| Receivable for securities sold | | | — | | | | — | | | | 3,503,994 | | | | — | | | | 472,232 | | |
| Receivable for capital shares sold | | | 8,220,048 | | | | 675,400 | | | | 97,374 | | | | 324,537 | | | | 69,577 | | |
| Receivable for daily variation margin on financial futures contracts | | | — | | | | — | | | | — | | | | — | | | | — | | |
| Due from Advisor (Note 5) | | | — | | | | — | | | | — | | | | — | | | | — | | |
| Deferred offering costs (Note 2-E) | | | — | | | | — | | | | — | | | | — | | | | — | | |
| Unrealized appreciation on forward foreign currency exchange contracts | | | — | | | | — | | | | — | | | | — | | | | — | | |
| Prepaid expenses | | | 86,903 | | | | 40,694 | | | | 5,409 | | | | 11,583 | | | | 12,269 | | |
| TOTAL ASSETS | | | 5,979,860,656 | | | | 2,116,504,683 | | | | 609,245,105 | | | | 116,641,491 | | | | 156,482,673 | | |
| LIABILITIES: | |
| Payable for securities purchased | | | 41,826,168 | | | | — | | | | 1,010,219 | | | | — | | | | — | | |
| Payable for capital shares redeemed | | | 8,059,057 | | | | 2,547,763 | | | | 1,026,973 | | | | 102,900 | | | | 213,322 | | |
| Cash overdraft | | | — | | | | — | | | | 1,534,187 | | | | — | | | | — | | |
| Deferred foreign capital gains tax liability (Note 2-D) | | | 927,214 | | | | — | | | | — | | | | — | | | | — | | |
| Due to Advisor (Note 5) | | | 3,200,249 | | | | 1,194,781 | | | | 335,507 | | | | 64,763 | | | | 88,831 | | |
| Administration and accounting fees payable | | | 75,590 | | | | 29,121 | | | | 8,110 | | | | 1,556 | | | | 2,303 | | |
| Administration and shareholder servicing fees payable | | | 1,038,184 | | | | 415,453 | | | | 117,492 | | | | 22,849 | | | | 30,966 | | |
| Printing fees payable | | | 205,874 | | | | 211,181 | | | | 81,101 | | | | 15,096 | | | | 14,971 | | |
| Professional fees payable | | | 19,856 | | | | 26,573 | | | | 34,697 | | | | 21,330 | | | | 22,669 | | |
| Trustees fees payable | | | — | | | | — | | | | — | | | | 70 | | | | — | | |
| Transfer agent fees payable | | | 695,877 | | | | 348,469 | | | | 121,910 | | | | 22,631 | | | | 29,828 | | |
| Offering costs | | | — | | | | — | | | | — | | | | — | | | | — | | |
| Accrued other expenses payable | | | 426,450 | | | | 80,805 | | | | 69,242 | | | | 10,475 | | | | 14,993 | | |
| TOTAL LIABILITIES | | | 56,474,519 | | | | 4,854,146 | | | | 4,339,438 | | | | 261,670 | | | | 417,883 | | |
| NET ASSETS | | $ | 5,923,386,137 | | | $ | 2,111,650,537 | | | $ | 604,905,667 | | | $ | 116,379,821 | | | $ | 156,064,790 | | |
| NET ASSETS: | |
| Investor Class | | $ | 2,994,944,504 | | | $ | 1,686,057,880 | | | $ | 574,490,183 | | | $ | 90,218,948 | | | $ | 133,511,920 | | |
| Institutional Class | | | 2,928,441,633 | | | | 425,592,657 | | | | 30,415,484 | | | | 26,160,873 | | | | 22,552,870 | | |
| TOTAL | | $ | 5,923,386,137 | | | $ | 2,111,650,537 | | | $ | 604,905,667 | | | $ | 116,379,821 | | | $ | 156,064,790 | | |
| SHARES OUTSTANDING: | |
(shares of beneficial interest issued and outstanding, respectively,
unlimited number of shares authorized with a $0.001 par value) | |
| Investor Class | | | 138,102,266 | | | | 76,809,260 | | | | 37,006,141 | | | | 7,707,151 | | | | 27,968,245 | | |
| Institutional Class | | | 134,957,427 | | | | 19,381,988 | | | | 1,955,154 | | | | 2,232,616 | | | | 4,705,668 | | |
| TOTAL | | | 273,059,693 | | | | 96,191,248 | | | | 38,961,295 | | | | 9,939,767 | | | | 32,673,913 | | |
| NET ASSET VALUE: | |
| Investor Class, offering price and redemption price | | $ | 21.69 | | | $ | 21.95 | | | $ | 15.52 | | | $ | 11.71 | | | $ | 4.77 | | |
| Institutional Class, offering price and redemption price | | $ | 21.70 | | | $ | 21.96 | | | $ | 15.56 | | | $ | 11.72 | | | $ | 4.79 | | |
| NET ASSETS CONSIST OF: | |
| Capital paid-in | | $ | 4,734,935,688 | | | $ | 1,871,021,629 | | | $ | 615,828,107 | | | $ | 187,045,067 | | | $ | 111,493,738 | | |
| Undistributed (distributions in excess of) net investment income (loss) | | | 31,197,884 | | | | 24,192,110 | | | | 4,577,507 | | | | 39,168 | | | | (448,040 | ) | |
Undistributed/accumulated net realized gain (loss) on investments, financial
futures contracts, and foreign currency related transactions | | | 20,634,731 | | | | 23,951,027 | | | | 4,447,539 | | | | (76,741,097 | ) | | | (2,543,595 | ) | |
Net unrealized appreciation (depreciation) on investments, financial futures
contracts, foreign currency translations and deferred foreign capital gains taxes | | | 1,136,617,834 | | | | 192,485,771 | | | | (19,947,486 | ) | | | 6,036,683 | | | | 47,562,687 | | |
| NET ASSETS | | $ | 5,923,386,137 | | | $ | 2,111,650,537 | | | $ | 604,905,667 | | | $ | 116,379,821 | | | $ | 156,064,790 | | |
| (A) Investments at cost: | |
| Unaffiliated issuers | | $ | 3,988,601,903 | | | $ | 1,864,345,263 | | | $ | 621,054,500 | | | $ | 109,504,510 | | | $ | 106,958,362 | | |
| Affiliated issuers | | | 540,438,190 | | | | 24,891,260 | | | | — | | | | — | | | | — | | |
| Total investments at cost | | $ | 4,529,040,093 | | | $ | 1,889,236,523 | | | $ | 621,054,500 | | | $ | 109,504,510 | | | $ | 106,958,362 | | |
| (B) Foreign currency at cost | | $ | 14,312,411 | | | $ | 2,286,101 | | | $ | 2,224,467 | | | $ | 264,576 | | | $ | 155,927 | | |
matthewsasia.com | 800.789.ASIA 73
Statements of Assets and Liabilities (Unaudited) (continued) June 30, 2012
| | | Matthews Asia
Small Companies
Fund | | Matthews China
Small Companies
Fund | | Matthews Asia
Science and
Technology Fund | |
| ASSETS: | |
| Investments at value (A) (Note 2-A and 7): | |
| Unaffiliated issuers | | $ | 304,483,201 | | | $ | 5,135,973 | | | $ | 136,314,616 | | |
| Cash | | | 7,394,206 | | | | 158,899 | | | | 2,130,493 | | |
| Foreign currency at value (B) | | | 365,797 | | | | — | | | | 603,057 | | |
| Dividends, interest and other receivables—Unaffiliated issuers | | | 746,498 | | | | 31,237 | | | | 228,726 | | |
| Receivable for securities sold | | | 569,027 | | | | — | | | | 310,901 | | |
| Receivable for capital shares sold | | | 406,375 | | | | — | | | | 2,661 | | |
| Due from Advisor (Note 5) | | | — | | | | 1,896 | | | | — | | |
| Prepaid expenses | | | 4,853 | | | | 13,881 | | | | 2,666 | | |
| TOTAL ASSETS | | | 313,969,957 | | | | 5,341,886 | | | | 139,593,120 | | |
| LIABILITIES: | |
| Payable for securities purchased | | | — | | | | 35,743 | | | | 695,255 | | |
| Payable for capital shares redeemed | | | 4,069,883 | | | | — | | | | 232,098 | | |
| Due to Advisor (Note 5) | | | 267,170 | | | | — | | | | 78,565 | | |
| Administration and accounting fees payable | | | 4,337 | | | | 77 | | | | 1,896 | | |
| Administration and shareholder servicing fees payable | | | 60,220 | | | | 766 | | | | 30,029 | | |
| Professional fees payable | | | 23,534 | | | | 15,003 | | | | 19,150 | | |
| Trustees fees payable | | | — | | | | — | | | | 42 | | |
| Offering costs | | | — | | | | 33,179 | | | | — | | |
| Accrued other expenses payable | | | 98,587 | | | | 8,359 | | | | 67,335 | | |
| TOTAL LIABILITIES | | | 4,523,731 | | | | 93,127 | | | | 1,124,370 | | |
| NET ASSETS | | $ | 309,446,226 | | | $ | 5,248,759 | | | $ | 138,468,750 | | |
| NET ASSETS: | |
| Investor Class | | $ | 309,446,226 | | | $ | 5,248,759 | | | $ | 138,468,750 | | |
| SHARES OUTSTANDING: | |
(shares of beneficial interest issued and outstanding, respectively,
unlimited number of shares authorized with a $0.001 par value) | |
| Investor Class | | | 19,725,943 | | | | 741,577 | | | | 16,057,376 | | |
| NET ASSET VALUE: | |
| Investor Class, offering price and redemption price | | $ | 15.69 | | | $ | 7.08 | | | $ | 8.62 | | |
| NET ASSETS CONSIST OF: | |
| Capital paid-in | | $ | 333,097,112 | | | $ | 6,735,795 | | | $ | 138,745,240 | | |
| Undistributed (distributions in excess of) net investment income (loss) | | | 1,476,781 | | | | 30,579 | | | | (106,929 | ) | |
Undistributed/accumulated net realized gain (loss) on investments
and foreign currency related transactions | | | (12,302,583 | ) | | | (634,662 | ) | | | (12,117,305 | ) | |
Net unrealized appreciation (depreciation) on investments and foreign
currency translations | | | (12,825,084 | ) | | | (882,953 | ) | | | 11,947,744 | | |
| NET ASSETS | | $ | 309,446,226 | | | $ | 5,248,759 | | | $ | 138,468,750 | | |
| (A) Investments at cost: Unaffiliated issuers | | $ | 317,309,503 | | | $ | 6,018,942 | | | $ | 124,368,590 | | |
| (B) Foreign currency at cost | | $ | 365,797 | | | $ | — | | | $ | 602,802 | | |
See accompanying notes to financial statements.
74 MATTHEWS ASIA FUNDS
Statements of Operations (Unaudited) Six-Month Period Ended June 30, 2012
| | | Matthews Asia
Strategic
Income Fund | | Matthews Asian
Growth and
Income Fund | | Matthews Asia
Dividend Fund | |
| INVESTMENT INCOME: | |
| Dividends—Unaffiliated Issuers | | $ | 41,562 | | | $ | 52,571,693 | | | $ | 50,380,652 | | |
| Dividends—Affiliated Issuers (Note 7) | | | — | | | | 1,227,194 | | | | 7,085,211 | | |
| Interest | | | 431,657 | | | | 10,129,352 | | | | 4,971 | | |
| Foreign withholding tax | | | (15,592 | ) | | | (2,553,427 | ) | | | (2,823,299 | ) | |
| TOTAL INVESTMENT INCOME | | | 457,627 | | | | 61,374,812 | | | | 54,647,535 | | |
| EXPENSES: | |
| Investment advisory fees (Note 5) | | | 63,267 | | | | 10,713,918 | | | | 8,801,237 | | |
| Administration and accounting fees (Note 5) | | | 774 | | | | 127,257 | | | | 104,531 | | |
| Administration and shareholder servicing fees (Note 5) | | | 17,737 | | | | 3,426,099 | | | | 2,722,770 | | |
| Custodian fees | | | 6,354 | | | | 466,351 | | | | 271,440 | | |
| Insurance fees | | | 37 | | | | 9,049 | | | | 6,921 | | |
| Printing fees | | | 1,035 | | | | 260,669 | | | | 239,524 | | |
| Professional fees | | | 14,055 | | | | 38,675 | | | | 34,016 | | |
| Registration fees | | | 4,344 | | | | 115,391 | | | | 83,059 | | |
| Transfer agent fees | | | 7,137 | | | | 1,989,059 | | | | 1,519,165 | | |
| Trustees fees | | | 379 | | | | 74,118 | | | | 58,467 | | |
| Offering costs (Note 2-E) | | | 55,010 | | | | — | | | | — | | |
| Other expenses | | | 6,632 | | | | 63,198 | | | | 58,224 | | |
| TOTAL EXPENSES | | | 176,761 | | | | 17,283,784 | | | | 13,899,354 | | |
| Advisory fees waived and expenses waived or reimbursed (Note 5) | | | (72,432 | ) | | | — | | | | — | | |
| NET EXPENSES | | | 104,329 | | | | 17,283,784 | | | | 13,899,354 | | |
| NET INVESTMENT INCOME (LOSS) | | | 353,298 | | | | 44,091,028 | | | | 40,748,181 | | |
REALIZED AND UNREALIZED GAIN (LOSS) ON INVESTMENTS,
FINANCAIL FUTURES CONTRACTS, FOREIGN CURRENCY
RELATED TRANSACTIONS AND DEFERRED TAXES: | |
| Net realized gain (loss) on investments—Unaffiliated Issuers | | | 75,438 | | | | (34,152,235 | ) | | | 3,931,815 | | |
| Net realized gain (loss) on financial futures contracts | | | (143,772 | ) | | | — | | | | — | | |
| Net realized foreign capital gains tax or refund | | | — | | | | (403,929 | ) | | | — | | |
| Net realized gain (loss) on foreign currency related transactions | | | (65,267 | ) | | | (5,380,612 | ) | | | 56,726 | | |
| Net change in unrealized appreciation/depreciation on investments | | | 383,456 | | | | 271,437,472 | | | | 158,817,185 | | |
| Net change in deferred foreign capital gains taxes on unrealized appreciation | | | 1,249 | | | | (205,458 | ) | | | — | | |
| Net change in unrealized appreciation/depreciation on financial futures contracts | | | 7,525 | | | | — | | | | — | | |
Net change in unrealized appreciation/depreciation on foreign
currency related translations | | | 43,004 | | | | 35,514 | | | | (26,971 | ) | |
Net realized and unrealized gain (loss) on investments, financial futures
contracts, foreign currency related transactions and deferred taxes | | | 301,633 | | | | 231,330,752 | | | | 162,778,755 | | |
| NET INCREASE (DECREASE) IN NET ASSETS FROM OPERATIONS | | $ | 654,931 | | | $ | 275,421,780 | | | $ | 203,526,936 | | |
See accompanying notes to financial statements.
matthewsasia.com | 800.789.ASIA 75
Statements of Operations (Unaudited) (continued) Six-Month Period Ended June 30, 2012
| | | Matthews China
Dividend Fund | | Matthews Asia
Growth Fund | | Matthews Pacific
Tiger Fund | | Matthews
China Fund | | Matthews
India Fund | |
| INVESTMENT INCOME: | |
| Dividends—Unaffiliated Issuers | | $ | 667,259 | | | $ | 4,430,808 | | | $ | 61,866,449 | | | $ | 38,157,797 | | | $ | 4,932,282 | | |
| Dividends—Affiliated Issuers (Note 7) | | | — | | | | — | | | | 2,100,535 | | | | 549,500 | | | | — | | |
| Interest | | | 1 | | | | 10,320 | | | | 53 | | | | 10 | | | | 621,832 | | |
| Foreign withholding tax | | | (16,909 | ) | | | (214,609 | ) | | | (4,018,451 | ) | | | (1,741,769 | ) | | | — | | |
| TOTAL INVESTMENT INCOME | | | 650,351 | | | | 4,226,519 | | | | 59,948,586 | | | | 36,965,538 | | | | 5,554,114 | | |
| EXPENSES: | |
| Investment advisory fees (Note 5) | | | 96,597 | | | | 1,251,474 | | | | 18,439,460 | | | | 7,812,110 | | | | 2,245,101 | | |
| Administration and accounting fees (Note 5) | | | 1,147 | | | | 14,864 | | | | 219,010 | | | | 92,762 | | | | 26,649 | | |
| Administration and shareholder servicing fees (Note 5) | | | 32,533 | | | | 391,322 | | | | 5,542,468 | | | | 2,519,389 | | | | 743,573 | | |
| Custodian fees | | | 9,801 | | | | 93,611 | | | | 1,058,767 | | | | 336,239 | | | | 191,040 | | |
| Insurance fees | | | 81 | | | | 1,050 | | | | 14,738 | | | | 6,244 | | | | 1,943 | | |
| Printing fees | | | 4,624 | | | | 34,826 | | | | 273,644 | | | | 253,238 | | | | 98,988 | | |
| Professional fees | | | 17,993 | | | | 20,260 | | | | 47,947 | | | | 28,968 | | | | 36,395 | | |
| Registration fees | | | 24,533 | | | | 29,660 | | | | 58,196 | | | | 53,341 | | | | 49,812 | | |
| Transfer agent fees | | | 25,901 | | | | 229,115 | | | | 2,827,020 | | | | 1,566,322 | | | | 537,337 | | |
| Trustees fees | | | 669 | | | | 8,692 | | | | 124,343 | | | | 55,513 | | | | 15,951 | | |
| Offering costs (Note 2-E) | | | — | | | | — | | | | — | | | | — | | | | — | | |
| Other expenses | | | 17,928 | | | | 25,511 | | | | 78,552 | | | | 49,302 | | | | 27,861 | | |
| TOTAL EXPENSES | | | 231,807 | | | | 2,100,385 | | | | 28,684,145 | | | | 12,773,428 | | | | 3,974,650 | | |
| Advisory fees waived and expenses waived or reimbursed (Note 5) | | | (16,559 | ) | | | — | | | | — | | | | — | | | | — | | |
| NET EXPENSES | | | 215,248 | | | | 2,100,385 | | | | 28,684,145 | | | | 12,773,428 | | | | 3,974,650 | | |
| NET INVESTMENT INCOME (LOSS) | | | 435,103 | | | | 2,126,134 | | | | 31,264,441 | | | | 24,192,110 | | | | 1,579,464 | | |
REALIZED AND UNREALIZED GAIN (LOSS) ON INVESTMENTS,
FOREIGN CURRENCY RELATED TRANSACTIONS AND DEFERRED TAXES: | |
| Net realized gain (loss) on investments—Unaffiliated Issuers | | | (645,620 | ) | | | 16,941,976 | | | | 17,091,681 | | | | 59,194,257 | | | | 2,103,481 | | |
| Net realized gain (loss) on foreign currency related transactions | | | 186 | | | | (39,273 | ) | | | (645,778 | ) | | | 14,094 | | | | (464,562 | ) | |
| Net change in unrealized appreciation/depreciation on investments | | | 2,814,440 | | | | (690,684 | ) | | | 265,255,397 | | | | (41,202,857 | ) | | | 79,599,840 | | |
| Net change in deferred foreign capital gains taxes on unrealized appreciation | | | — | | | | — | | | | (927,214 | ) | | | — | | | | — | | |
Net change in unrealized appreciation/depreciation on foreign
currency related translations | | | (93 | ) | | | 16,534 | | | | (55,262 | ) | | | (22 | ) | | | 578 | | |
Net realized and unrealized gain (loss) on investments, foreign currency
related transactions and deferred taxes | | | 2,168,913 | | | | 16,228,553 | | | | 280,718,824 | | | | 18,005,472 | | | | 81,239,337 | | |
| NET INCREASE (DECREASE) IN NET ASSETS FROM OPERATIONS | | $ | 2,604,016 | | | $ | 18,354,687 | | | $ | 311,983,265 | | | $ | 42,197,582 | | | $ | 82,818,801 | | |
See accompanying notes to financial statements.
76 MATTHEWS ASIA FUNDS
| | | Matthews
Japan Fund | | Matthews
Korea Fund | | Matthews Asia
Small Companies
Fund | | Matthews China
Small Companies
Fund | | Matthews Asia
Science and
Technology Fund | |
| INVESTMENT INCOME: | |
| Dividends—Unaffiliated Issuers | | $ | 1,482,376 | | | $ | 727,045 | | | $ | 4,169,124 | | | $ | 88,782 | | | $ | 786,186 | | |
| Dividends—Affiliated Issuers (Note 7) | | | — | | | | — | | | | — | | | | — | | | | — | | |
| Interest | | | 16 | | | | 114 | | | | 8,243 | | | | — | | | | 8 | | |
| Foreign withholding tax | | | (102,731 | ) | | | (120,096 | ) | | | (191,295 | ) | | | (1,387 | ) | | | (50,644 | ) | |
| TOTAL INVESTMENT INCOME | | | 1,379,661 | | | | 607,063 | | | | 3,986,072 | | | | 87,395 | | | | 735,550 | | |
| EXPENSES: | |
| Investment advisory fees (Note 5) | | | 410,130 | | | | 617,146 | | | | 1,592,549 | | | | 28,543 | | | | 504,929 | | |
| Administration and accounting fees (Note 5) | | | 4,872 | | | | 7,330 | | | | 12,669 | | | | 227 | | | | 5,997 | | |
| Administration and shareholder servicing fees (Note 5) | | | 129,807 | | | | 188,903 | | | | 353,606 | | | | 7,213 | | | | 163,138 | | |
| Custodian fees | | | 13,675 | | | | 31,090 | | | | 88,072 | | | | 6,588 | | | | 42,605 | | |
| Insurance fees | | | 409 | | | | 477 | | | | 846 | | | | 14 | | | | 482 | | |
| Printing fees | | | 15,994 | | | | 18,462 | | | | 32,807 | | | | 1,111 | | | | 19,874 | | |
| Professional fees | | | 18,407 | | | | 18,245 | | | | 25,262 | | | | 13,010 | | | | 19,384 | | |
| Registration fees | | | 26,818 | | | | 23,958 | | | | 33,901 | | | | 5,038 | | | | 18,512 | | |
| Transfer agent fees | | | 82,447 | | | | 111,368 | | | | 239,381 | | | | 7,142 | | | | 108,912 | | |
| Trustees fees | | | 3,054 | | | | 4,224 | | | | 6,977 | | | | 122 | | | | 3,684 | | |
| Offering costs (Note 2-E) | | | — | | | | — | | | | — | | | | 16,363 | | | | — | | |
| Other expenses | | | 22,614 | | | | 23,265 | | | | 23,432 | | | | 14,773 | | | | 21,100 | | |
| TOTAL EXPENSES | | | 728,227 | | | | 1,044,468 | | | | 2,409,502 | | | | 100,144 | | | | 908,617 | | |
| Advisory fees waived and expenses waived or reimbursed (Note 5) | | | — | | | | — | | | | — | | | | (43,328 | ) | | | — | | |
| NET EXPENSES | | | 728,227 | | | | 1,044,468 | | | | 2,409,502 | | | | 56,816 | | | | 908,617 | | |
| NET INVESTMENT INCOME (LOSS) | | | 651,434 | | | | (437,405 | ) | | | 1,576,570 | | | | 30,579 | | | | (173,067 | ) | |
REALIZED AND UNREALIZED GAIN (LOSS) ON INVESTMENTS,
FOREIGN CURRENCY RELATED TRANSACTIONS AND DEFERRED TAXES: | |
| Net realized gain (loss) on investments—Unaffiliated Issuers | | | 2,125,668 | | | | (3,348,770 | ) | | | (13,654,637 | ) | | | (518,091 | ) | | | (846,414 | ) | |
| Net realized gain (loss) on foreign currency related transactions | | | 37,977 | | | | (64,050 | ) | | | (52,479 | ) | | | (81 | ) | | | (44,646 | ) | |
| Net change in unrealized appreciation/depreciation on investments | | | 1,190,735 | | | | 7,877,804 | | | | 25,088,982 | | | | 371,711 | | | | 9,747,918 | | |
| Net change in deferred foreign capital gains taxes on unrealized appreciation | | | — | | | | — | | | | — | | | | — | | | | — | | |
Net change in unrealized appreciation/depreciation on foreign
currency related translations | | | (419 | ) | | | (3,562 | ) | | | 625 | | | | 15 | | | | 925 | | |
Net realized and unrealized gain (loss) on investments, foreign currency
related transactions and deferred taxes | | | 3,353,961 | | | | 4,461,422 | | | | 11,382,491 | | | | (146,446 | ) | | | 8,857,783 | | |
| NET INCREASE (DECREASE) IN NET ASSETS FROM OPERATIONS | | $ | 4,005,395 | | | $ | 4,024,017 | | | $ | 12,959,061 | | | ($ | 115,867 | ) | | $ | 8,684,716 | | |
matthewsasia.com | 800.789.ASIA 77
Statements of Changes in Net Assets
| MATTHEWS ASIA STRATEGIC INCOME FUND | | Six-Month Period
Ended June 30, 2012
(unaudited) | | Year Ended
December 31, 20111 | |
| OPERATIONS: | |
| Net investment income (loss) | | $ | 353,298 | | | $ | 20,982 | | |
| Net realized gain (loss) on investments and foreign currency related transactions | | | (133,601 | ) | | | 380 | | |
Net change in unrealized appreciation/depreciation on investments and foreign
currency related translations | | | 426,460 | | | | (82,280 | ) | |
| Net change on deferred foreign capital gains taxes on unrealized appreciation | | | 1,249 | | | | (1,249 | ) | |
| Net change in unrealized appreciation/depreciation on financial futures contracts | | | 7,525 | | | | — | | |
| Net increase (decrease) in net assets resulting from operations | | | 654,931 | | | | (62,167 | ) | |
| DISTRIBUTIONS TO SHAREHOLDERS FROM: | |
| Net investment income: | |
| Investor Class | | | (247,278 | ) | | | (13,720 | ) | |
| Institutional Class | | | (92,373 | ) | | | (9,676 | ) | |
| Net decrease in net assets resulting from distributions | | | (339,651 | ) | | | (23,396 | ) | |
| CAPITAL SHARE TRANSACTIONS (net) (Note 4) | | | 9,891,069 | | | | 13,096,972 | | |
| REDEMPTION FEES | | | 10,287 | | | | — | | |
| Total increase (decrease) in net assets | | | 10,216,636 | | | | 13,011,409 | | |
| NET ASSETS: | |
| Beginning of period | | | 13,011,409 | | | | — | | |
End of period (including undistributed net investment
income of $15,580 and $1,933, respectively) | | $ | 23,228,045 | | | $ | 13,011,409 | | |
1 Matthews Asia Strategic Income Fund commenced operations on November 30, 2011.
| MATTHEWS ASIAN GROWTH AND INCOME FUND | | Six-Month Period
Ended June 30, 2012
(unaudited) | | Year Ended
December 31, 2011 | |
| OPERATIONS: | |
| Net investment income (loss) | | $ | 44,091,028 | | | $ | 99,815,175 | | |
| Net realized gain (loss) on investments and foreign currency related transactions | | | (39,936,776 | ) | | | 75,127,361 | | |
Net change in unrealized appreciation/depreciation on investments and foreign
currency related translations | | | 271,472,986 | | | | (569,899,433 | ) | |
| Net change on deferred foreign capital gains taxes on unrealized appreciation | | | (205,458 | ) | | | 2,051,108 | | |
| Net increase (decrease) in net assets resulting from operations | | | 275,421,780 | | | | (392,905,789 | ) | |
| DISTRIBUTIONS TO SHAREHOLDERS FROM: | |
| Net investment income: | |
| Investor Class | | | (30,681,143 | ) | | | (76,967,577 | ) | |
| Institutional Class | | | (9,019,939 | ) | | | (19,206,528 | ) | |
| Realized gains on investments: | |
| Investor Class | | | — | | | | (93,455,486 | ) | |
| Institutional Class | | | — | | | | (22,304,133 | ) | |
| Net decrease in net assets resulting from distributions | | | (39,701,082 | ) | | | (211,933,724 | ) | |
| CAPITAL SHARE TRANSACTIONS (net) (Note 4) | | | 156,850,222 | | | | (578,220,072 | ) | |
| REDEMPTION FEES | | | 159,957 | | | | 487,841 | | |
| Total increase (decrease) in net assets | | | 392,730,877 | | | | (1,182,571,744 | ) | |
| NET ASSETS: | |
| Beginning of period | | | 2,872,098,835 | | | | 4,054,670,579 | | |
End of period (including distributions in excess of net investment
income of ($9,904,853) and ($14,294,799), respectively) | | $ | 3,264,829,712 | | | $ | 2,872,098,835 | | |
See accompanying notes to financial statements.
78 MATTHEWS ASIA FUNDS
| MATTHEWS ASIA DIVIDEND FUND | | Six-Month Period
Ended June 30, 2012
(unaudited) | | Year Ended
December 31, 2011 | |
| OPERATIONS: | |
| Net investment income (loss) | | $ | 40,748,181 | | | $ | 62,460,078 | | |
| Net realized gain (loss) on investments and foreign currency related transactions | | | 3,988,541 | | | | (46,007,986 | ) | |
Net change in unrealized appreciation/depreciation on investments and foreign
currency related translations | | | 158,790,214 | | | | (287,624,247 | ) | |
| Net increase (decrease) in net assets resulting from operations | | | 203,526,936 | | | | (271,172,155 | ) | |
| DISTRIBUTIONS TO SHAREHOLDERS FROM: | |
| Net investment income: | |
| Investor Class | | | (32,771,018 | ) | | | (55,295,897 | ) | |
| Institutional Class | | | (8,246,825 | ) | | | (9,863,378 | ) | |
| Realized gains on investments: | |
| Investor Class | | | — | | | | (9,863,184 | ) | |
| Institutional Class | | | — | | | | (1,815,393 | ) | |
| Net decrease in net assets resulting from distributions | | | (41,017,843 | ) | | | (76,837,852 | ) | |
| CAPITAL SHARE TRANSACTIONS (net) (Note 4) | | | 389,216,861 | | | | 640,377,706 | | |
| REDEMPTION FEES | | | 227,876 | | | | 821,527 | | |
| Total increase (decrease) in net assets | | | 551,953,830 | | | | 293,189,226 | | |
| NET ASSETS: | |
| Beginning of period | | | 2,274,865,533 | | | | 1,981,676,307 | | |
End of period (including distributions in excess of net investment
income of ($15,278,248) and ($15,008,586), respectively) | | $ | 2,826,819,363 | | | $ | 2,274,865,533 | | |
| MATTHEWS CHINA DIVIDEND FUND | | Six-Month Period
Ended June 30, 2012
(unaudited) | | Year Ended
December 31, 2011 | |
| OPERATIONS: | |
| Net investment income (loss) | | $ | 435,103 | | | $ | 987,303 | | |
| Net realized gain (loss) on investments and foreign currency related transactions | | | (645,434 | ) | | | (475,091 | ) | |
Net change in unrealized appreciation/depreciation on investments and foreign
currency related translations | | | 2,814,347 | | | | (7,111,732 | ) | |
| Net increase (decrease) in net assets resulting from operations | | | 2,604,016 | | | | (6,599,520 | ) | |
| DISTRIBUTIONS TO SHAREHOLDERS FROM: | |
| Net investment income: | |
| Investor Class | | | (565,840 | ) | | | (1,063,869 | ) | |
| Institutional Class | | | (798 | ) | | | (425 | ) | |
| Realized gains on investments: | |
| Investor Class | | | — | | | | (51,420 | ) | |
| Institutional Class | | | — | | | | (22 | ) | |
| Net decrease in net assets resulting from distributions | | | (566,638 | ) | | | (1,115,736 | ) | |
| CAPITAL SHARE TRANSACTIONS (net) (Note 4) | | | (885,185 | ) | | | (11,203,204 | ) | |
| REDEMPTION FEES | | | 18,882 | | | | 28,586 | | |
| Total increase (decrease) in net assets | | | 1,171,075 | | | | (18,889,874 | ) | |
| NET ASSETS: | |
| Beginning of period | | | 26,478,115 | | | | 45,367,989 | | |
End of period (including distributions in excess of net investment
income of ($216,886) and ($85,351), respectively) | | $ | 27,649,190 | | | $ | 26,478,115 | | |
See accompanying notes to financial statements.
matthewsasia.com | 800.789.ASIA 79
Statements of Changes in Net Assets
| MATTHEWS ASIA GROWTH FUND | | Six-Month Period
Ended June 30, 2012
(unaudited) | | Year Ended
December 31, 2011 | |
| OPERATIONS: | |
| Net investment income (loss) | | $ | 2,126,134 | | | $ | 2,302,379 | | |
| Net realized gain (loss) on investments and foreign currency related transactions | | | 16,902,703 | | | | 3,999,688 | | |
Net change in unrealized appreciation/depreciation on investments and foreign
currency related translations | | | (674,150 | ) | | | (55,786,729 | ) | |
| Net increase (decrease) in net assets resulting from operations | | | 18,354,687 | | | | (49,484,662 | ) | |
| DISTRIBUTIONS TO SHAREHOLDERS FROM: | |
| Net investment income: | |
| Investor Class | | | — | | | | (5,881,357 | ) | |
| Institutional Class | | | — | | | | (1,854,156 | ) | |
| Net decrease in net assets resulting from distributions | | | — | | | | (7,735,513 | ) | |
| CAPITAL SHARE TRANSACTIONS (net) (Note 4) | | | 1,784,832 | | | | 56,083,400 | | |
| REDEMPTION FEES | | | 31,775 | | | | 322,245 | | |
| Total increase (decrease) in net assets | | | 20,171,294 | | | | (814,530 | ) | |
| NET ASSETS: | |
| Beginning of period | | | 343,468,152 | | | | 344,282,682 | | |
End of period (including distributions in excess of net investment
income of ($1,040,068) and ($3,166,202), respectively) | | $ | 363,639,446 | | | $ | 343,468,152 | | |
| MATTHEWS PACIFIC TIGER FUND | | Six-Month Period
Ended June 30, 2012
(unaudited) | | Year Ended
December 31, 2011 | |
| OPERATIONS: | |
| Net investment income (loss) | | $ | 31,264,441 | | | $ | 32,155,967 | | |
| Net realized gain (loss) on investments and foreign currency related transactions | | | 16,445,903 | | | | 201,652,647 | | |
Net change in unrealized appreciation/depreciation on investments and foreign
currency related translations | | | 265,200,135 | | | | (873,676,041 | ) | |
| Net change on deferred foreign capital gains taxes on unrealized appreciation | | | (927,214 | ) | | | 3,089,305 | | |
| Net increase (decrease) in net assets resulting from operations | | | 311,983,265 | | | | (636,778,122 | ) | |
| DISTRIBUTIONS TO SHAREHOLDERS FROM: | |
| Net investment income: | |
| Investor Class | | | — | | | | (15,129,147 | ) | |
| Institutional Class | | | — | | | | (14,549,336 | ) | |
| Realized gains on investments: | |
| Investor Class | | | — | | | | (44,800,205 | ) | |
| Institutional Class | | | — | | | | (31,562,381 | ) | |
| Net decrease in net assets resulting from distributions | | | — | | | | (106,041,069 | ) | |
| CAPITAL SHARE TRANSACTIONS (net) (Note 4) | | | 801,261,894 | | | | (185,753,267 | ) | |
| REDEMPTION FEES | | | 409,766 | | | | 1,091,482 | | |
| Total increase (decrease) in net assets | | | 1,113,654,925 | | | | (927,480,976 | ) | |
| NET ASSETS: | |
| Beginning of period | | | 4,809,731,212 | | | | 5,737,212,188 | | |
End of period (including undistributed/(distributions in excess of) net investment
income of $31,197,884 and ($66,557), respectively) | | $ | 5,923,386,137 | | | $ | 4,809,731,212 | | |
See accompanying notes to financial statements.
80 MATTHEWS ASIA FUNDS
| MATTHEWS CHINA FUND | | Six-Month Period
Ended June 30, 2012
(unaudited) | | Year Ended
December 31, 2011 | |
| OPERATIONS: | |
| Net investment income (loss) | | $ | 24,192,110 | | | $ | 24,114,210 | | |
| Net realized gain (loss) on investments and foreign currency related transactions | | | 59,208,351 | | | | 145,213,641 | | |
Net change in unrealized appreciation/depreciation on investments and foreign
currency related translations | | | (41,202,879 | ) | | | (687,849,829 | ) | |
| Net increase (decrease) in net assets resulting from operations | | | 42,197,582 | | | | (518,521,978 | ) | |
| DISTRIBUTIONS TO SHAREHOLDERS FROM: | |
| Net investment income: | |
| Investor Class | | | — | | | | (22,545,562 | ) | |
| Institutional Class | | | — | | | | (1,635,702 | ) | |
| Realized gains on investments: | |
| Investor Class | | | — | | | | (165,934,653 | ) | |
| Institutional Class | | | — | | | | (9,954,863 | ) | |
| Net decrease in net assets resulting from distributions | | | — | | | | (200,070,780 | ) | |
| CAPITAL SHARE TRANSACTIONS (net) (Note 4) | | | (55,314,137 | ) | | | (138,886,741 | ) | |
| REDEMPTION FEES | | | 157,315 | | | | 906,432 | | |
| Total increase (decrease) in net assets | | | (12,959,240 | ) | | | (856,573,067 | ) | |
| NET ASSETS: | |
| Beginning of period | | | 2,124,609,777 | | | | 2,981,182,844 | | |
End of period (including undistributed net investment
income of $24,192,110 and $0, respectively) | | $ | 2,111,650,537 | | | $ | 2,124,609,777 | | |
| MATTHEWS INDIA FUND | | Six-Month Period
Ended June 30, 2012
(unaudited) | | Year Ended
December 31, 2011 | |
| OPERATIONS: | |
| Net investment income (loss) | | $ | 1,579,464 | | | $ | 5,816,036 | | |
| Net realized gain (loss) on investments and foreign currency related transactions | | | 1,638,919 | | | | 102,093,230 | | |
Net change in unrealized appreciation/depreciation on investments and foreign
currency related translations | | | 79,600,418 | | | | (520,083,666 | ) | |
| Net change on deferred foreign capital gains taxes on unrealized appreciation | | | — | | | | 4,120,779 | | |
| Net increase (decrease) in net assets resulting from operations | | | 82,818,801 | | | | (408,053,621 | ) | |
| DISTRIBUTIONS TO SHAREHOLDERS FROM: | |
| Net investment income: | |
| Investor Class | | | — | | | | (2,862,404 | ) | |
| Institutional Class | | | — | | | | (132,371 | ) | |
| Net decrease in net assets resulting from distributions | | | — | | | | (2,994,775 | ) | |
| CAPITAL SHARE TRANSACTIONS (net) (Note 4) | | | (64,281,613 | ) | | | (440,540,693 | ) | |
| REDEMPTION FEES | | | 111,781 | | | | 835,135 | | |
| Total increase (decrease) in net assets | | | 18,648,969 | | | | (850,753,954 | ) | |
| NET ASSETS: | |
| Beginning of period | | | 586,256,698 | | | | 1,437,010,652 | | |
End of period (including undistributed net investment
income of $4,577,507 and $2,998,043, respectively) | | $ | 604,905,667 | | | $ | 586,256,698 | | |
See accompanying notes to financial statements.
matthewsasia.com | 800.789.ASIA 81
Statements of Changes in Net Assets
| MATTHEWS JAPAN FUND | | Six-Month Period
Ended June 30, 2012
(unaudited) | | Year Ended
December 31, 2011 | |
| OPERATIONS: | |
| Net investment income (loss) | | $ | 651,434 | | | $ | 655,220 | | |
| Net realized gain (loss) on investments and foreign currency related transactions | | | 2,163,645 | | | | (4,003,806 | ) | |
Net change in unrealized appreciation/depreciation on investments and foreign
currency related translations | | | 1,190,316 | | | | (8,805,446 | ) | |
| Net increase (decrease) in net assets resulting from operations | | | 4,005,395 | | | | (12,154,032 | ) | |
| DISTRIBUTIONS TO SHAREHOLDERS FROM: | |
| Net investment income: | |
| Investor Class | | | — | | | | (2,022,578 | ) | |
| Institutional Class | | | — | | | | (583,768 | ) | |
| Net decrease in net assets resulting from distributions | | | — | | | | (2,606,346 | ) | |
| CAPITAL SHARE TRANSACTIONS (net) (Note 4) | | | (19,333,223 | ) | | | 78,411,635 | | |
| REDEMPTION FEES | | | 36,854 | | | | 209,844 | | |
| Total increase (decrease) in net assets | | | (15,290,974 | ) | | | 63,861,101 | | |
| NET ASSETS: | |
| Beginning of period | | | 131,670,795 | | | | 67,809,694 | | |
End of period (including undistributed/(distributions in excess of) net investment
income of $39,168 and ($612,266), respectively) | | $ | 116,379,821 | | | $ | 131,670,795 | | |
| MATTHEWS KOREA FUND | | Six-Month Period
Ended June 30, 2012
(unaudited) | | Year Ended
December 31, 2011 | |
| OPERATIONS: | |
| Net investment income (loss) | | ($ | 437,405 | ) | | ($ | 210,803 | ) | |
| Net realized gain (loss) on investments and foreign currency related transactions | | | (3,412,820 | ) | | | 1,335,161 | | |
Net change in unrealized appreciation/depreciation on investments and foreign
currency related translations | | | 7,874,242 | | | | (14,446,852 | ) | |
| Net increase (decrease) in net assets resulting from operations | | | 4,024,017 | | | | (13,322,494 | ) | |
| DISTRIBUTIONS TO SHAREHOLDERS FROM: | |
| Net investment income: | |
| Investor Class | | | — | | | | (218,988 | ) | |
| Institutional Class | | | — | | | | (23,737 | ) | |
| Realized gains on investments: | |
| Investor Class | | | — | | | | (6,521,874 | ) | |
| Institutional Class | | | — | | | | (706,903 | ) | |
| Net decrease in net assets resulting from distributions | | | — | | | | (7,471,502 | ) | |
| CAPITAL SHARE TRANSACTIONS (net) (Note 4) | | | (4,675,721 | ) | | | 10,383,940 | | |
| REDEMPTION FEES | | | 16,865 | | | | 115,820 | | |
| Total increase (decrease) in net assets | | | (634,839 | ) | | | (10,294,236 | ) | |
| NET ASSETS: | |
| Beginning of period | | | 156,699,629 | | | | 166,993,865 | | |
End of period (including distributions in excess of net investment
loss of ($448,040) and ($10,635), respectively) | | $ | 156,064,790 | | | $ | 156,669,629 | | |
See accompanying notes to financial statements.
82 MATTHEWS ASIA FUNDS
| MATTHEWS ASIA SMALL COMPANIES FUND | | Six-Month Period
Ended June 30, 2012
(unaudited) | | Year Ended
December 31, 2011 | |
| OPERATIONS: | |
| Net investment income (loss) | | $ | 1,576,570 | | | $ | 3,154,642 | | |
| Net realized gain (loss) on investments and foreign currency related transactions | | | (13,707,116 | ) | | | 35,003,030 | | |
Net change in unrealized appreciation/depreciation on investments and foreign
currency related translations | | | 25,089,607 | | | | (132,814,165 | ) | |
| Net change on deferred foreign capital gains taxes on unrealized appreciation | | | — | | | | 1,174,891 | | |
| Net increase (decrease) in net assets resulting from operations | | | 12,959,061 | | | | (93,481,602 | ) | |
| DISTRIBUTIONS TO SHAREHOLDERS FROM: | |
| Net investment income: | |
| Investor Class | | | — | | | | (2,890,029 | ) | |
| Realized gains on investments: | |
| Investor Class | | | — | | | | (34,232,017 | ) | |
| Net decrease in net assets resulting from distributions | | | — | | | | (37,122,046 | ) | |
| CAPITAL SHARE TRANSACTIONS (net) (Note 4) | | | 37,478,247 | | | | (157,938,046 | ) | |
| REDEMPTION FEES | | | 65,176 | | | | 391,117 | | |
| Total increase (decrease) in net assets | | | 50,502,484 | | | | (288,150,577 | ) | |
| NET ASSETS: | |
| Beginning of period | | | 258,943,742 | | | | 547,094,319 | | |
End of period (including undistributed/(distributions in excess of) net investment
income of $1,476,781 and ($99,789), respectively) | | $ | 309,446,226 | | | $ | 258,943,742 | | |
| MATTHEWS CHINA SMALL COMPANIES FUND | | Six-Month Period
Ended June 30, 2012
(unaudited) | | Year Ended
December 31, 20111 | |
| OPERATIONS: | |
| Net investment income (loss) | | $ | 30,579 | | | ($ | 12,320 | ) | |
| Net realized gain (loss) on investments and foreign currency related transactions | | | (518,172 | ) | | | (116,195 | ) | |
Net change in unrealized appreciation/depreciation on investments and foreign
currency related translations | | | 371,726 | | | | (1,254,679 | ) | |
| Net increase (decrease) in net assets resulting from operations | | | (115,867 | ) | | | (1,383,194 | ) | |
| DISTRIBUTIONS TO SHAREHOLDERS FROM: | |
| Net investment income: | |
| Investor Class | | | — | | | | (5,954 | ) | |
| Net decrease in net assets resulting from distributions | | | — | | | | (5,954 | ) | |
| CAPITAL SHARE TRANSACTIONS (net) (Note 4) | | | 850,823 | | | | 5,867,611 | | |
| REDEMPTION FEES | | | 20,505 | | | | 14,835 | | |
| Total increase (decrease) in net assets | | | 755,461 | | | | 4,493,298 | | |
| NET ASSETS: | |
| Beginning of period | | | 4,493,298 | | | | — | | |
End of period (including undistributed net investment
income of $30,579 and $0, respectively) | | $ | 5,248,759 | | | $ | 4,493,298 | | |
1 The Matthews China Small Companies Fund commenced operations on May 31, 2011.
See accompanying notes to financial statements.
matthewsasia.com | 800.789.ASIA 83
Statements of Changes in Net Assets
| MATTHEWS ASIA SCIENCE AND TECHNOLOGY FUND | | Six-Month Period
Ended June 30, 2012
(unaudited) | | Year Ended
December 31, 2011 | |
| OPERATIONS: | |
| Net investment income (loss) | | ($ | 173,067 | ) | | $ | 408,640 | | |
| Net realized gain (loss) on investments and foreign currency related transactions | | | (891,060 | ) | | | 12,874,420 | | |
Net change in unrealized appreciation/depreciation on investments and foreign
currency related translations | | | 9,748,843 | | | | (45,054,729 | ) | |
| Net increase (decrease) in net assets resulting from operations | | | 8,684,716 | | | | (31,771,669 | ) | |
| DISTRIBUTIONS TO SHAREHOLDERS FROM: | |
| Net investment income: | |
| Investor Class | | | — | | | | (454,558 | ) | |
| Net decrease in net assets resulting from distributions | | | — | | | | (454,558 | ) | |
| CAPITAL SHARE TRANSACTIONS (net) (Note 4) | | | (23,569,930 | ) | | | (5,021,334 | ) | |
| REDEMPTION FEES | | | 5,065 | | | | 160,697 | | |
| Total increase (decrease) in net assets | | | (14,880,149 | ) | | | (37,086,864 | ) | |
| NET ASSETS: | |
| Beginning of period | | | 153,348,899 | | | | 190,435,763 | | |
End of period (including undistributed net investment
income (loss) of ($106,929) and $66,138, respectively) | | $ | 138,468,750 | | | $ | 153,348,899 | | |
See accompanying notes to financial statements.
84 MATTHEWS ASIA FUNDS
Financial Highlights
Matthews Asia Strategic Income Fund
The tables below set forth financial data for a share of beneficial interest outstanding throughout each period presented.
| INVESTOR CLASS | | Six-Month
Period Ended
June 30, 2012
(unaudited) | | Period Ended
Dec. 31, 20111 | |
| Net Asset Value, beginning of period | | $ | 9.93 | | | $ | 10.00 | | |
| INCOME (LOSS) FROM INVESTMENT OPERATIONS: | |
| Net investment income (loss)2 | | | 0.19 | | | | 0.02 | | |
Net realized gain (loss) and unrealized appreciation/depreciation
on investments, financial futures contracts and foreign currency | | | 0.21 | | | | (0.07 | ) | |
| Total from investment operations | | | 0.40 | | | | (0.05 | ) | |
| LESS DISTRIBUTIONS FROM: | |
| Net investment income | | | (0.16 | ) | | | (0.02 | ) | |
| Total distributions | | | (0.16 | ) | | | (0.02 | ) | |
| Paid-in capital from redemption fees (Note 4) | | | 0.01 | | | | — | | |
| Net Asset Value, end of period | | $ | 10.18 | | | $ | 9.93 | | |
| TOTAL RETURN | | | 4.18 | %3 | | | (0.52 | %)3 | |
| RATIOS/SUPPLEMENTAL DATA | |
| Net assets, end of period (in 000's) | | $ | 17,696 | | | $ | 7,746 | | |
Ratio of expenses to average net assets before any reimbursement,
waiver or recapture of expenses by Advisor and Administrator (Note 5) | | | 1.86 | %4 | | | 3.20 | %4 | |
Ratio of expenses to average net assets after any reimbursement,
waiver or recapture of expenses by Advisor and Administrator | | | 1.11 | %4 | | | 1.00 | %4 | |
| Ratio of net investment income (loss) to average net assets | | | 3.65 | %4 | | | 2.06 | %4 | |
| Portfolio turnover5 | | | 8.66 | %3 | | | 3.66 | %3 | |
| INSTITUTIONAL CLASS | | Six-Month
Period Ended
June 30, 2012
(unaudited) | | Period Ended
Dec. 31, 20111 | |
| Net Asset Value, beginning of period | | $ | 9.93 | | | $ | 10.00 | | |
| INCOME (LOSS) FROM INVESTMENT OPERATIONS: | |
| Net investment income (loss)2 | | | 0.19 | | | | 0.02 | | |
Net realized gain (loss) and unrealized appreciation/depreciation
on investments, financial futures contracts, and foreign currency | | | 0.22 | | | | (0.07 | ) | |
| Total from investment operations | | | 0.41 | | | | (0.05 | ) | |
| LESS DISTRIBUTIONS FROM: | |
| Net investment income | | | (0.17 | ) | | | (0.02 | ) | |
| Total distributions | | | (0.17 | ) | | | (0.02 | ) | |
| Paid-in capital from redemption fees (Note 4) | | | 0.01 | | | | — | | |
| Net Asset Value, end of period | | $ | 10.18 | | | $ | 9.93 | | |
| TOTAL RETURN | | | 4.27 | %3 | | | (0.52 | %)3 | |
| RATIOS/SUPPLEMENTAL DATA | |
| Net assets, end of period (in 000's) | | $ | 5,532 | | | $ | 5,266 | | |
Ratio of expenses to average net assets before any reimbursement,
waiver or recapture of expenses by Advisor and Administrator (Note 5) | | | 1.75 | %4 | | | 3.20 | %4 | |
Ratio of expenses to average net assets after any reimbursement,
waiver or recapture of expenses by Advisor and Administrator | | | 1.00 | %4 | | | 1.00 | %4 | |
| Ratio of net investment income (loss) to average net assets | | | 3.66 | %4 | | | 1.96 | %4 | |
| Portfolio turnover5 | | | 8.66 | %3 | | | 3.66 | %3 | |
1 Commencement of operations on November 30, 2011.
2 Calculated using the average daily shares method.
3 Not annualized.
4 Annualized.
5 The portfolio turnover rate is calculated on the Fund as a whole without distinguishing between classes of shares issued.
See accompanying notes to financial statements.
matthewsasia.com | 800.789.ASIA 85
Financial Highlights
Matthews Asian Growth and Income Fund
The tables below set forth financial data for a share of beneficial interest outstanding throughout each period presented.
| | | Six-Month
Period Ended
June 30, 2012 | | Year Ended Dec. 31 | |
| INVESTOR CLASS | | (unaudited) | | 2011 | | 2010 | | 2009 | | 2008 | | 2007 | |
| Net Asset Value, beginning of period | | $ | 15.07 | | | $ | 18.04 | | | $ | 15.77 | | | $ | 11.50 | | | $ | 19.78 | | | $ | 18.68 | | |
| INCOME (LOSS) FROM INVESTMENT OPERATIONS: | |
| Net investment income (loss) | | | 0.221 | | | | 0.471 | | | | 0.411 | | | | 0.481 | | | | 0.541 | | | | 1.07 | | |
Net realized gain (loss) and unrealized appreciation/
depreciation on investments and foreign currency | | | 1.21 | | | | (2.36 | ) | | | 2.57 | | | | 4.23 | | | | (6.73 | ) | | | 2.93 | | |
| Total from investment operations | | | 1.43 | | | | (1.89 | ) | | | 2.98 | | | | 4.71 | | | | (6.19 | ) | | | 4.00 | | |
| LESS DISTRIBUTIONS FROM: | |
| Net investment income | | | (0.20 | ) | | | (0.47 | ) | | | (0.47 | ) | | | (0.44 | ) | | | (0.42 | ) | | | (0.90 | ) | |
| Net realized gains on investments | | | — | | | | (0.61 | ) | | | (0.24 | ) | | | — | | | | (1.67 | ) | | | (2.00 | ) | |
| Total distributions | | | (0.20 | ) | | | (1.08 | ) | | | (0.71 | ) | | | (0.44 | ) | | | (2.09 | ) | | | (2.90 | ) | |
| Paid-in capital from redemption fees (Note 4) | | | —2 | | | | —2 | | | | —2 | | | | —2 | | | | —2 | | | | —2 | | |
| Net Asset Value, end of period | | $ | 16.30 | | | $ | 15.07 | | | $ | 18.04 | | | $ | 15.77 | | | $ | 11.50 | | | $ | 19.78 | | |
| TOTAL RETURN | | | 9.51 | %3 | | | (10.62 | %) | | | 19.18 | % | | | 41.44 | % | | | (32.07 | %) | | | 21.54 | % | |
| RATIOS/SUPPLEMENTAL DATA | |
| Net assets, end of period (in 000's) | | $ | 2,556,381 | | | $ | 2,340,606 | | | $ | 3,926,253 | | | $ | 2,547,411 | | | $ | 1,089,712 | | | $ | 2,273,408 | | |
Ratio of expenses to average net assets before any
reimbursement, waiver or recapture of expenses by
Advisor and Administrator (Note 5) | | | 1.11 | %4 | | | 1.12 | % | | | 1.13 | % | | | 1.18 | % | | | 1.16 | % | | | 1.16 | % | |
Ratio of expenses to average net assets after any
reimbursement, waiver or recapture of expenses by
Advisor and Administrator | | | 1.11 | %4 | | | 1.12 | % | | | 1.13 | % | | | 1.18 | % | | | 1.16 | % | | | 1.15 | % | |
| Ratio of net investment income (loss) to average net assets | | | 2.73 | %4 | | | 2.71 | % | | | 2.47 | % | | | 3.47 | % | | | 3.19 | % | | | 2.59 | % | |
| Portfolio turnover | | | 7.76 | %3,5 | | | 16.54 | %5 | | | 19.84 | %5 | | | 17.51 | % | | | 25.16 | % | | | 27.93 | % | |
| INSTITUTIONAL CLASS | | Six-Month
Period Ended
June 30, 2012
(unaudited) | | Year Ended
Dec. 31, 2011 | | Period Ended
Dec. 31, 20106 | |
| Net Asset Value, beginning of period | | $ | 15.06 | | | $ | 18.04 | | | $ | 18.13 | | |
| INCOME (LOSS) FROM INVESTMENT OPERATIONS: | |
| Net investment income (loss)1 | | | 0.24 | | | | 0.52 | | | | 0.07 | | |
Net realized gain (loss) and unrealized appreciation/depreciation
on investments and foreign currency | | | 1.21 | | | | (2.39 | ) | | | 0.37 | | |
| Total from investment operations | | | 1.45 | | | | (1.87 | ) | | | 0.44 | | |
| LESS DISTRIBUTIONS FROM: | |
| Net investment income | | | (0.21 | ) | | | (0.50 | ) | | | (0.29 | ) | |
| Net realized gains on investments | | | — | | | | (0.61 | ) | | | (0.24 | ) | |
| Total distributions | | | (0.21 | ) | | | (1.11 | ) | | | (0.53 | ) | |
| Paid-in capital from redemption fees (Note 4) | | | —2 | | | | —2 | | | | — | | |
| Net Asset Value, end of period | | $ | 16.30 | | | $ | 15.06 | | | $ | 18.04 | | |
| TOTAL RETURN | | | 9.67 | %3 | | | (10.54 | %) | | | 2.49 | %3 | |
| RATIOS/SUPPLEMENTAL DATA | |
| Net assets, end of period (in 000's) | | $ | 708,448 | | | $ | 531,493 | | | $ | 128,417 | | |
| Ratio of expenses to average net assets | | | 0.98 | %4 | | | 0.99 | % | | | 0.93 | %4 | |
| Ratio of net investment income (loss) to average net assets | | | 2.94 | %4 | | | 3.05 | % | | | 2.46 | %4 | |
| Portfolio turnover5 | | | 7.76 | %3 | | | 16.54 | % | | | 19.84 | %3 | |
1 Calculated using the average daily shares method.
2 Less than $0.01 per share.
3 Not annualized.
4 Annualized.
5 The portfolio turnover rate is calculated on the Fund as a whole without distinguishing between classes of shares issued.
6 Institutional Class commenced operations on October 29, 2010.
See accompanying notes to financial statements.
86 MATTHEWS ASIA FUNDS
Matthews Asia Dividend Fund
The tables below set forth financial data for a share of beneficial interest outstanding throughout each period presented.
| | | Six-Month
Period Ended
June 30, 2012 | | Year Ended Dec. 31 | |
| INVESTOR CLASS | | (unaudited) | | 2011 | | 2010 | | 2009 | | 2008 | | 2007 | |
| Net Asset Value, beginning of period | | $ | 12.48 | | | $ | 14.33 | | | $ | 12.06 | | | $ | 8.61 | | | $ | 12.00 | | | $ | 10.77 | | |
| INCOME (LOSS) FROM INVESTMENT OPERATIONS: | |
| Net investment income (loss) | | | 0.201 | | | | 0.361 | | | | 0.311 | | | | 0.321 | | | | 0.381 | | | | 0.27 | | |
Net realized gain (loss) and unrealized appreciation/
depreciation on investments and foreign currency | | | 0.89 | | | | (1.78 | ) | | | 2.40 | | | | 3.67 | | | | (3.47 | ) | | | 1.67 | | |
| Total from investment operations | | | 1.09 | | | | (1.42 | ) | | | 2.71 | | | | 3.99 | | | | (3.09 | ) | | | 1.94 | | |
| LESS DISTRIBUTIONS FROM: | |
| Net investment income | | | (0.20 | ) | | | (0.37 | ) | | | (0.41 | ) | | | (0.55 | ) | | | (0.30 | ) | | | (0.27 | ) | |
| Net realized gains on investments | | | — | | | | (0.06 | ) | | | (0.04 | ) | | | — | | | | (0.02 | ) | | | (0.45 | ) | |
| Total distributions | | | (0.20 | ) | | | (0.43 | ) | | | (0.45 | ) | | | (0.55 | ) | | | (0.32 | ) | | | (0.72 | ) | |
| Paid-in capital from redemption fees (Note 4) | | | —2 | | | | —2 | | | | 0.01 | | | | 0.01 | | | | 0.02 | | | | 0.01 | | |
| Net Asset Value, end of period | | $ | 13.37 | | | $ | 12.48 | | | $ | 14.33 | | | $ | 12.06 | | | $ | 8.61 | | | $ | 12.00 | | |
| TOTAL RETURN | | | 8.76 | %3 | | | (10.02 | %) | | | 22.83 | % | | | 47.59 | % | | | (25.97 | %) | | | 18.05 | % | |
| RATIOS/SUPPLEMENTAL DATA | |
| Net assets, end of period (in 000's) | | $ | 2,258,864 | | | $ | 1,930,363 | | | $ | 1,933,383 | | | $ | 322,003 | | | $ | 141,951 | | | $ | 81,624 | | |
Ratio of expenses to average net assets before any
reimbursement, waiver or recapture of expenses by
Advisor and Administrator (Note 5) | | | 1.08 | %4 | | | 1.10 | % | | | 1.14 | % | | | 1.28 | % | | | 1.35 | % | | | 1.42 | % | |
Ratio of expenses to average net assets after any
reimbursement, waiver or recapture of expenses by
Advisor and Administrator | | | 1.08 | %4 | | | 1.10 | % | | | 1.15 | % | | | 1.30 | % | | | 1.32 | % | | | 1.39 | % | |
| Ratio of net investment income (loss) to average net assets | | | 3.06 | %4 | | | 2.61 | % | | | 2.31 | % | | | 3.16 | % | | | 3.74 | % | | | 2.66 | % | |
| Portfolio turnover | | | 3.38 | %3,5 | | | 16.48 | %5 | | | 10.48 | %5 | | | 32.41 | % | | | 25.07 | % | | | 26.95 | % | |
| INSTITUTIONAL CLASS | | Six-Month
Period Ended
June 30, 2012
(unaudited) | | Year Ended
Dec. 31, 2011 | | Period Ended
Dec. 31, 20106 | |
| Net Asset Value, beginning of period | | $ | 12.48 | | | $ | 14.33 | | | $ | 14.13 | | |
| INCOME (LOSS) FROM INVESTMENT OPERATIONS: | |
| Net investment income (loss)1 | | | 0.23 | | | | 0.41 | | | | 0.09 | | |
Net realized gain (loss) and unrealized appreciation/depreciation
on investments and foreign currency | | | 0.86 | | | | (1.82 | ) | | | 0.32 | | |
| Total from investment operations | | | 1.09 | | | | (1.41 | ) | | | 0.41 | | |
| LESS DISTRIBUTIONS FROM: | |
| Net investment income | | | (0.21 | ) | | | (0.38 | ) | | | (0.17 | ) | |
| Net realized gains on investments | | | — | | | | (0.06 | ) | | | (0.04 | ) | |
| Total distributions | | | (0.21 | ) | | | (0.44 | ) | | | (0.21 | ) | |
| Paid-in capital from redemption fees (Note 4)2 | | | — | | | | — | | | | — | | |
| Net Asset Value, end of period | | $ | 13.36 | | | $ | 12.48 | | | $ | 14.33 | | |
| TOTAL RETURN | | | 8.75 | %3 | | | (9.93 | %) | | | 2.95 | %3 | |
| RATIOS/SUPPLEMENTAL DATA | |
| Net assets, end of period (in 000's) | | $ | 567,955 | | | $ | 344,502 | | | $ | 48,293 | | |
| Ratio of expenses to average net assets | | | 0.98 | %4 | | | 1.00 | % | | | 1.02 | %4 | |
| Ratio of net investment income (loss) to average net assets | | | 3.39 | %4 | | | 3.03 | % | | | 3.86 | %4 | |
| Portfolio turnover5 | | | 3.38 | %3 | | | 16.48 | % | | | 10.48 | %3 | |
1 Calculated using the average daily shares method.
2 Less than $0.01 per share.
3 Not annualized.
4 Annualized.
5 The portfolio turnover rate is calculated on the Fund as a whole without distinguishing between classes of share issues.
6 Institutional Class commenced operations on October 29, 2010.
See accompanying notes to financial statements.
matthewsasia.com | 800.789.ASIA 87
Financial Highlights
Matthews China Dividend Fund
The tables below set forth financial data for a share of beneficial interest outstanding throughout each period presented.
| | | Six-Month
Period Ended
June 30, 2012 | | Year Ended Dec. 31 | | Period Ended | |
| INVESTOR CLASS | | (unaudited) | | 2011 | | 2010 | | Dec. 31, 20091 | |
| Net Asset Value, beginning of period | | $ | 10.06 | | | $ | 12.17 | | | $ | 10.18 | | | $ | 10.00 | | |
| INCOME (LOSS) FROM INVESTMENT OPERATIONS: | |
| Net investment income (loss)2 | | | 0.17 | | | | 0.29 | | | | 0.17 | | | | (0.01 | ) | |
Net realized gain (loss) and unrealized appreciation/depreciation
on investments and foreign currency | | | 0.84 | | | | (2.04 | ) | | | 2.09 | | | | 0.19 | | |
| Total from investment operations | | | 1.01 | | | | (1.75 | ) | | | 2.26 | | | | 0.18 | | |
| LESS DISTRIBUTIONS FROM: | |
| Net investment income | | | (0.22 | ) | | | (0.35 | ) | | | (0.24 | ) | | | — | | |
| Net realized gains on investments | | | — | | | | (0.02 | ) | | | (0.04 | ) | | | — | | |
| Total distributions | | | (0.22 | ) | | | (0.37 | ) | | | (0.28 | ) | | | — | | |
| Paid-in capital from redemption fees (Note 4) | | | 0.01 | | | | 0.01 | | | | 0.01 | | | | —3 | | |
| Net Asset Value, end of period | | $ | 10.86 | | | $ | 10.06 | | | $ | 12.17 | | | $ | 10.18 | | |
| TOTAL RETURN | | | 10.22 | %4 | | | (14.44 | %) | | | 22.53 | % | | | 1.80 | %4 | |
| RATIOS/SUPPLEMENTAL DATA | |
| Net assets, end of period (in 000's) | | $ | 27,610 | | | $ | 26,467 | | | $ | 45,364 | | | $ | 7,134 | | |
Ratio of expenses to average net assets before any reimbursement or
waiver or recapture of expenses by Advisor and Administrator (Note 5) | | | 1.62 | %5 | | | 1.52 | % | | | 1.95 | % | | | 10.50 | %5 | |
Ratio of expenses to average net assets after any reimbursement or
waiver or recapture of expenses by Advisor and Administrator | | | 1.50 | %5 | | | 1.50 | % | | | 1.50 | % | | | 1.50 | %5 | |
| Ratio of net investment income (loss) to average net assets | | | 3.03 | %5 | | | 2.47 | % | | | 1.49 | % | | | (0.81 | %)5 | |
| Portfolio turnover | | | 14.02 | %4,6 | | | 22.31 | %6 | | | 6.84 | %6 | | | 0.00 | %4 | |
| INSTITUTIONAL CLASS | | Six-Month
Period Ended
June 30, 2012
(unaudited) | | Year Ended
Dec. 31, 2011 | | Period Ended
Dec 31, 20107 | |
| Net Asset Value, beginning of period | | $ | 10.06 | | | $ | 12.17 | | | $ | 11.87 | | |
| INCOME (LOSS) FROM INVESTMENT OPERATIONS: | |
| Net investment income (loss)2 | | | 0.28 | | | | 0.30 | | | | —3 | | |
Net realized gain (loss) and unrealized appreciation/depreciation
on investments and foreign currency | | | 0.74 | | | | (2.01 | ) | | | 0.47 | | |
| Total from investment operations | | | 1.02 | | | | (1.71 | ) | | | 0.47 | | |
| LESS DISTRIBUTIONS FROM: | |
| Net investment income | | | (0.23 | ) | | | (0.38 | ) | | | (0.13 | ) | |
| Net realized gains on investments | | | — | | | | (0.02 | ) | | | (0.04 | ) | |
| Total distributions | | | (0.23 | ) | | | (0.40 | ) | | | (0.17 | ) | |
| Paid-in capital from redemption fees (Note 4) | | | 0.01 | | | | —3 | | | | — | | |
| Net Asset Value, end of period | | $ | 10.86 | | | $ | 10.06 | | | $ | 12.17 | | |
| TOTAL RETURN | | | 10.25 | %4 | | | (14.22 | %) | | | 3.91 | %4 | |
| RATIOS/SUPPLEMENTAL DATA | |
| Net assets, end of period (in 000's) | | $ | 39 | | | $ | 12 | | | $ | 4 | | |
| Ratio of expenses to average net assets | | | 1.40 | %5 | | | 1.31 | % | | | 1.24 | %5 | |
| Ratio of net investment income (loss) to average net assets | | | 5.07 | %5 | | | 2.61 | % | | | (0.06 | %)5 | |
| Portfolio turnover6 | | | 14.02 | %4 | | | 22.31 | % | | | 6.84 | %4 | |
1 Investor Class commenced operations on November 30, 2009.
2 Calculated using the average daily shares method.
3 Less than $0.01 per share.
4 Not annualized.
5 Annualized.
6 The portfolio turnover rate is calculated on the Fund as a whole without distinguishing between classes of shares issued.
7 Institutional Class commenced operations on October 29, 2010.
See accompanying notes to financial statements.
88 MATTHEWS ASIA FUNDS
Matthews Asia Growth Fund
The tables below set forth financial data for a share of beneficial interest outstanding throughout each period presented.
| | | Six-Month
Period Ended
June 30, 2012 | | Year Ended Dec. 31 | |
| INVESTOR CLASS | | (unaudited) | | 2011 | | 2010 | | 2009 | | 2008 | | 2007 | |
| Net Asset Value, beginning of period | | $ | 15.34 | | | $ | 17.97 | | | $ | 14.29 | | | $ | 10.03 | | | $ | 17.29 | | | $ | 16.92 | | |
| INCOME (LOSS) FROM INVESTMENT OPERATIONS: | |
| Net investment income (loss) | | | 0.091 | | | | 0.111 | | | | 0.101 | | | | 0.061 | | | | 0.131 | | | | 0.09 | | |
Net realized gain (loss) and unrealized appreciation/
depreciation on investments and foreign currency | | | 0.76 | | | | (2.41 | ) | | | 3.72 | | | | 4.44 | | | | (6.64 | ) | | | 2.02 | | |
| Total from investment operations | | | 0.85 | | | | (2.30 | ) | | | 3.82 | | | | 4.50 | | | | (6.51 | ) | | | 2.11 | | |
| LESS DISTRIBUTIONS FROM: | |
| Net investment income | | | — | | | �� | (0.35 | ) | | | (0.15 | ) | | | (0.24 | ) | | | — | | | | (0.09 | ) | |
| Net realized gains on investments | | | — | | | | — | | | | — | | | | — | | | | (0.76 | ) | | | (1.66 | ) | |
| Total distributions | | | — | | | | (0.35 | ) | | | (0.15 | ) | | | (0.24 | ) | | | (0.76 | ) | | | (1.75 | ) | |
| Paid-in capital from redemption fees (Note 4) | | | —2 | | | | 0.02 | | | | 0.01 | | | | —2 | | | | 0.01 | | | | 0.01 | | |
| Net Asset Value, end of period | | $ | 16.19 | | | $ | 15.34 | | | $ | 17.97 | | | $ | 14.29 | | | $ | 10.03 | | | $ | 17.29 | | |
| TOTAL RETURN | | | 5.54 | %3 | | | (12.70 | %) | | | 26.85 | % | | | 44.82 | % | | | (37.44 | %) | | | 11.92 | % | |
| RATIOS/SUPPLEMENTAL DATA | |
| Net assets, end of period (in 000's) | | $ | 258,249 | | | $ | 259,166 | | | $ | 335,429 | | | $ | 227,651 | | | $ | 168,031 | | | $ | 471,054 | | |
| Ratio of expenses to average net assets | | | 1.18 | %4 | | | 1.19 | % | | | 1.19 | % | | | 1.28 | % | | | 1.23 | % | | | 1.20 | % | |
| Ratio of net investment income (loss) to average net assets | | | 1.08 | %4 | | | 0.63 | % | | | 0.63 | % | | | 0.50 | % | | | 0.93 | % | | | 0.60 | % | |
| Portfolio turnover | | | 30.36 | %3,5 | | | 28.06 | %5 | | | 26.33 | %5 | | | 58.10 | % | | | 37.10 | % | | | 40.49 | % | |
| INSTITUTIONAL CLASS | | Six-Month
Period Ended
June 30, 2012
(unaudited) | | Year Ended
Dec. 31, 2011 | | Period Ended
Dec. 31, 20106 | |
| Net Asset Value, beginning of period | | $ | 15.37 | | | $ | 17.98 | | | $ | 17.65 | | |
| INCOME (LOSS) FROM INVESTMENT OPERATIONS: | |
| Net investment income (loss)1 | | | 0.11 | | | | 0.14 | | | | 0.01 | | |
Net realized gain (loss) and unrealized appreciation/depreciation
on investments and foreign currency | | | 0.75 | | | | (2.42 | ) | | | 0.47 | | |
| Total from investment operations | | | 0.86 | | | | (2.28 | ) | | | 0.48 | | |
| LESS DISTRIBUTIONS FROM: | |
| Net investment income | | | — | | | | (0.35 | ) | | | (0.15 | ) | |
| Total distributions | | | — | | | | (0.35 | ) | | | (0.15 | ) | |
| Paid-in capital from redemption fees (Note 4) | | | —2 | | | | 0.02 | | | | — | | |
| Net Asset Value, end of period | | $ | 16.23 | | | $ | 15.37 | | | $ | 17.98 | | |
| TOTAL RETURN | | | 5.60 | %3 | | | (12.58 | %) | | | 2.76 | %3 | |
| RATIOS/SUPPLEMENTAL DATA | |
| Net assets, end of period (in 000's) | | $ | 105,390 | | | $ | 84,302 | | | $ | 8,853 | | |
| Ratio of expenses to average net assets | | | 1.00 | %4 | | | 1.03 | % | | | 0.99 | %4 | |
| Ratio of net investment income (loss) to average net assets | | | 1.32 | %4 | | | 0.84 | % | | | 0.37 | %4 | |
| Portfolio turnover5 | | | 30.36 | %3 | | | 28.06 | % | | | 26.33 | %3 | |
1 Calculated using the average daily shares method.
2 Less than $0.01 per share.
3 Not annualized.
4 Annualized.
5 The portfolio turnover rate is calculated on the Fund as a whole without distinguishing between classes of shares issued.
6 Institutional Class commenced operations on October 29, 2010.
See accompanying notes to financial statements.
matthewsasia.com | 800.789.ASIA 89
Financial Highlights
Matthews Pacific Tiger Fund
The tables below set forth financial data for a share of beneficial interest outstanding throughout each period presented.
| | | Six-Month
Period Ended
June 30, 2012 | | Year Ended Dec. 31 | |
| INVESTOR CLASS | | (unaudited) | | 2011 | | 2010 | | 2009 | | 2008 | | 2007 | |
| Net Asset Value, beginning of period | | $ | 20.33 | | | $ | 23.44 | | | $ | 19.23 | | | $ | 11.05 | | | $ | 27.86 | | | $ | 23.71 | | |
| INCOME (LOSS) FROM INVESTMENT OPERATIONS: | |
| Net investment income (loss) | | | 0.111 | | | | 0.101 | | | | 0.091 | | | | 0.061 | | | | 0.241 | | | | 0.30 | | |
Net realized gain (loss) and unrealized appreciation/
depreciation on investments and foreign currency | | | 1.25 | | | | (2.78 | ) | | | 4.20 | | | | 8.27 | | | | (13.31 | ) | | | 7.78 | | |
| Total from investment operations | | | 1.36 | | | | (2.68 | ) | | | 4.29 | | | | 8.33 | | | | (13.07 | ) | | | 8.08 | | |
| LESS DISTRIBUTIONS FROM: | |
| Net investment income | | | — | | | | (0.11 | ) | | | (0.08 | ) | | | (0.15 | ) | | | (0.30 | ) | | | (0.31 | ) | |
| Net realized gains on investments | | | — | | | | (0.33 | ) | | | — | | | | — | | | | (3.44 | ) | | | (3.62 | ) | |
| Total distributions | | | — | | | | (0.44 | ) | | | (0.08 | ) | | | (0.15 | ) | | | (3.74 | ) | | | (3.93 | ) | |
| Paid-in capital from redemption fees (Note 4) | | | —2 | | | | 0.01 | | | | —2 | | | | — | | | | —2 | | | | —2 | | |
| Net Asset Value, end of period | | $ | 21.69 | | | $ | 20.33 | | | $ | 23.44 | | | $ | 19.23 | | | $ | 11.05 | | | $ | 27.86 | | |
| TOTAL RETURN | | | 6.69 | %3 | | | (11.41 | %) | | | 22.30 | % | | | 75.37 | % | | | (46.12 | %) | | | 33.66 | % | |
| RATIOS/SUPPLEMENTAL DATA | |
| Net assets, end of period (in 000's) | | $ | 2,994,945 | | | $ | 2,780,640 | | | $ | 5,196,743 | | | $ | 3,565,745 | | | $ | 1,202,441 | | | $ | 3,806,714 | | |
Ratio of expenses to average net assets before any
reimbursement, waiver or recapture of expenses by
Advisor and Administrator (Note 5) | | | 1.13 | %4 | | | 1.11 | % | | | 1.09 | % | | | 1.13 | % | | | 1.12 | % | | | 1.11 | % | |
Ratio of expenses to average net assets after any
reimbursement, waiver or recapture of expenses by
Advisor and Administrator | | | 1.13 | %4 | | | 1.11 | % | | | 1.09 | % | | | 1.13 | % | | | 1.12 | % | | | 1.10 | % | |
| Ratio of net investment income (loss) to average net assets | | | 1.03 | %4 | | | 0.44 | % | | | 0.43 | % | | | 0.41 | % | | | 1.10 | % | | | 1.12 | % | |
| Portfolio turnover | | | 2.55 | %3,5 | | | 10.51 | %5 | | | 11.43 | %5 | | | 13.22 | % | | | 16.76 | % | | | 24.09 | % | |
| INSTITUTIONAL CLASS | | Six-Month
Period Ended
June 30, 2012
(unaudited) | | Year Ended
Dec. 31, 2011 | | Period Ended
Dec. 31, 20106 | |
| Net Asset Value, beginning of period | | $ | 20.32 | | | $ | 23.44 | | | $ | 23.37 | | |
| INCOME (LOSS) FROM INVESTMENT OPERATIONS: | |
| Net investment income (loss)1 | | | 0.14 | | | | 0.23 | | | | 0.01 | | |
Net realized gain (loss) and unrealized appreciation/depreciation
on investments and foreign currency | | | 1.24 | | | | (2.87 | ) | | | 0.15 | | |
| Total from investment operations | | | 1.38 | | | | (2.64 | ) | | | 0.16 | | |
| LESS DISTRIBUTIONS FROM: | |
| Net investment income | | | — | | | | (0.15 | ) | | | (0.09 | ) | |
| Net realized gains on investments | | | — | | | | (0.33 | ) | | | — | | |
| Total distributions | | | — | | | | (0.48 | ) | | | (0.09 | ) | |
| Paid-in capital from redemption fees (Note 4)2 | | | — | | | | — | | | | — | | |
| Net Asset Value, end of period | | $ | 21.70 | | | $ | 20.32 | | | $ | 23.44 | | |
| TOTAL RETURN | | | 6.79 | %3 | | | (11.28 | %) | | | 0.67 | %3 | |
| RATIOS/SUPPLEMENTAL DATA | |
| Net assets, end of period (in 000's) | | $ | 2,928,442 | | | $ | 2,029,091 | | | $ | 540,469 | | |
| Ratio of expenses to average net assets | | | 0.95 | %4 | | | 0.95 | % | | | 0.95 | %4 | |
| Ratio of net investment income (loss) to average net assets | | | 1.28 | %4 | | | 1.03 | % | | | 0.38 | %4 | |
| Portfolio turnover5 | | | 2.55 | %3 | | | 10.51 | % | | | 11.43 | %3 | |
1 Calculated using the average daily shares method.
2 Less than $0.01 per share.
3 Not annualized.
4 Annualized.
5 The portfolio turnover rate is calculated on the Fund as a whole without distinguishing between classes of shares issued.
6 Institutional Class commenced operations on October 29, 2010.
See accompanying notes to financial statements.
90 MATTHEWS ASIA FUNDS
Matthews China Fund
The tables below set forth financial data for a share of beneficial interest outstanding throughout each period presented.
| | | Six-Month
Period Ended
June 30, 2012 | | Year Ended Dec. 31 | |
| INVESTOR CLASS | | (unaudited) | | 2011 | | 2010 | | 2009 | | 2008 | | 2007 | |
| Net Asset Value, beginning of period | | $ | 21.51 | | | $ | 29.36 | | | $ | 25.50 | | | $ | 14.34 | | | $ | 39.73 | | | $ | 24.16 | | |
| INCOME (LOSS) FROM INVESTMENT OPERATIONS: | |
| Net investment income (loss) | | | 0.231 | | | | 0.261 | | | | 0.151 | | | | 0.091 | | | | 0.301 | | | | 0.12 | | |
Net realized gain (loss) and unrealized appreciation/
depreciation on investments and foreign currency | | | 0.21 | | | | (5.78 | ) | | | 3.86 | | | | 11.12 | | | | (19.78 | ) | | | 16.85 | | |
| Total from investment operations | | | 0.44 | | | | (5.52 | ) | | | 4.01 | | | | 11.21 | | | | (19.48 | ) | | | 16.97 | | |
| LESS DISTRIBUTIONS FROM: | |
| Net investment income | | | — | | | | (0.28 | ) | | | (0.15 | ) | | | (0.07 | ) | | | (0.33 | ) | | | (0.11 | ) | |
| Net realized gains on investments | | | — | | | | (2.06 | ) | | | (0.02 | ) | | | — | | | | (5.62 | ) | | | (1.37 | ) | |
| Total distributions | | | — | | | | (2.34 | ) | | | (0.17 | ) | | | (0.07 | ) | | | (5.95 | ) | | | (1.48 | ) | |
| Paid-in capital from redemption fees (Note 4) | | | —2 | | | | 0.01 | | | | 0.02 | | | | 0.02 | | | | 0.04 | | | | 0.08 | | |
| Net Asset Value, end of period | | $ | 21.95 | | | $ | 21.51 | | | $ | 29.36 | | | $ | 25.50 | | | $ | 14.34 | | | $ | 39.73 | | |
| TOTAL RETURN | | | 2.05 | %3 | | | (18.93 | %) | | | 15.77 | % | | | 78.30 | % | | | (48.95 | %) | | | 70.14 | % | |
| RATIOS/SUPPLEMENTAL DATA | |
| Net assets, end of period (in 000's) | | $ | 1,686,058 | | | $ | 1,836,333 | | | $ | 2,939,638 | | | $ | 2,566,005 | | | $ | 781,104 | | | $ | 2,335,402 | | |
Ratio of expenses to average net assets before any
reimbursement, waiver or recapture of expenses by
Advisor and Administrator (Note 5) | | | 1.14 | %4 | | | 1.13 | % | | | 1.15 | % | | | 1.21 | % | | | 1.23 | % | | | 1.18 | % | |
Ratio of expenses to average net assets after any
reimbursement, waiver or recapture of expenses by
Advisor and Administrator | | | 1.14 | %4 | | | 1.13 | % | | | 1.15 | % | | | 1.21 | % | | | 1.23 | % | | | 1.17 | % | |
| Ratio of net investment income (loss) to average net assets | | | 2.02 | %4 | | | 0.93 | % | | | 0.54 | % | | | 0.46 | % | | | 1.03 | % | | | 0.49 | % | |
| Portfolio turnover | | | 7.17 | %3,5 | | | 8.43 | %5 | | | 9.98 | %5 | | | 5.28 | % | | | 7.91 | % | | | 22.13 | % | |
| INSTITUTIONAL CLASS | | Six-Month
Period Ended
June 30, 2012
(unaudited) | | Year Ended
Dec. 31, 2011 | | Period Ended
Dec. 31, 20106 | |
| Net Asset Value, beginning of period | | $ | 21.49 | | | $ | 29.36 | | | $ | 30.02 | | |
| INCOME (LOSS) FROM INVESTMENT OPERATIONS: | |
| Net investment income (loss)1 | | | 0.27 | | | | 0.26 | | | | (0.04 | ) | |
Net realized gain (loss) and unrealized appreciation/depreciation
on investments and foreign currency | | | 0.20 | | | | (5.73 | ) | | | (0.44 | ) | |
| Total from investment operations | | | 0.47 | | | | (5.47 | ) | | | (0.48 | ) | |
| LESS DISTRIBUTIONS FROM: | |
| Net investment income | | | — | | | | (0.34 | ) | | | (0.16 | ) | |
| Net realized gains on investments | | | — | | | | (2.06 | ) | | | (0.02 | ) | |
| Total distributions | | | — | | | | (2.40 | ) | | | (0.18 | ) | |
| Paid-in capital from redemption fees (Note 4) | | | —2 | | | | —2 | | | | — | | |
| Net Asset Value, end of period | | $ | 21.96 | | | $ | 21.49 | | | $ | 29.36 | | |
| TOTAL RETURN | | | 2.19 | %3 | | | (18.80 | %) | | | (1.62 | %)3 | |
| RATIOS/SUPPLEMENTAL DATA | |
| Net assets, end of period (in 000's) | | $ | 425,593 | | | $ | 288,277 | | | $ | 41,545 | | |
| Ratio of expenses to average net assets | | | 0.93 | %4 | | | 0.96 | % | | | 0.97 | %4 | |
| Ratio of net investment income (loss) to average net assets | | | 2.38 | %4 | | | 0.99 | % | | | (0.74 | %)4 | |
| Portfolio turnover5 | | | 7.17 | %3 | | | 8.43 | % | | | 9.98 | %3 | |
1 Calculated using the average daily shares method.
2 Less than $0.01 per share.
3 Not annualized.
4 Annualized.
5 The portfolio turnover rate is calculated on the Fund as a whole without distinguishing between classes of shares issued.
6 Institutional Class commenced operations on October 29, 2010.
See accompanying notes to financial statements.
matthewsasia.com | 800.789.ASIA 91
Financial Highlights
Matthews India Fund
The tables below set forth financial data for a share of beneficial interest outstanding throughout each period presented.
| | | Six-Month
Period Ended
June 30, 2012 | | Year Ended Dec. 31 | |
| INVESTOR CLASS | | (unaudited) | | 2011 | | 2010 | | 2009 | | 2008 | | 2007 | |
| Net Asset Value, beginning of period | | $ | 13.59 | | | $ | 21.49 | | | $ | 16.29 | | | $ | 8.37 | | | $ | 24.44 | | | $ | 15.45 | | |
| INCOME (LOSS) FROM INVESTMENT OPERATIONS: | |
| Net investment income (loss) | | | 0.041 | | | | 0.111 | | | | 0.051 | | | | 0.071 | | | | 0.031 | | | | (0.01 | ) | |
Net realized gain (loss) and unrealized appreciation/
depreciation on investments and foreign currency | | | 1.89 | | | | (7.96 | ) | | | 5.22 | | | | 8.06 | | | | (15.33 | ) | | | 9.87 | | |
| Total from investment operations | | | 1.93 | | | | (7.85 | ) | | | 5.27 | | | | 8.13 | | | | (15.30 | ) | | | 9.86 | | |
| LESS DISTRIBUTIONS FROM: | |
| Net investment income | | | — | | | | (0.07 | ) | | | (0.09 | ) | | | (0.10 | ) | | | (0.11 | ) | | | (0.21 | ) | |
| Net realized gains on investments | | | — | | | | — | | | | — | | | | (0.12 | ) | | | (0.69 | ) | | | (0.68 | ) | |
| Total distributions | | | — | | | | (0.07 | ) | | | (0.09 | ) | | | (0.22 | ) | | | (0.80 | ) | | | (0.89 | ) | |
| Paid-in capital from redemption fees (Note 4) | | | —2 | | | | 0.02 | | | | 0.02 | | | | 0.01 | | | | 0.03 | | | | 0.02 | | |
| Net Asset Value, end of period | | $ | 15.52 | | | $ | 13.59 | | | $ | 21.49 | | | $ | 16.29 | | | $ | 8.37 | | | $ | 24.44 | | |
| TOTAL RETURN | | | 14.20 | %3 | | | (36.48 | %) | | | 32.53 | % | | | 97.25 | % | | | (62.32 | %) | | | 64.13 | % | |
| RATIOS/SUPPLEMENTAL DATA | |
| Net assets, end of period (in 000's) | | $ | 574,490 | | | $ | 559,337 | | | $ | 1,388,892 | | | $ | 720,925 | | | $ | 317,516 | | | $ | 1,311,072 | | |
Ratio of expenses to average net assets before any
reimbursement, waiver or recapture of expenses by
Advisor and Administrator (Note 5) | | | 1.20 | %4 | | | 1.18 | % | | | 1.18 | % | | | 1.27 | % | | | 1.29 | % | | | 1.29 | % | |
Ratio of expenses to average net assets after any
reimbursement, waiver or recapture of expenses by
Advisor and Administrator | | | 1.20 | %4 | | | 1.18 | % | | | 1.18 | % | | | 1.27 | % | | | 1.29 | % | | | 1.28 | % | |
| Ratio of net investment income (loss) to average net assets | | | 0.46 | %4 | | | 0.58 | % | | | 0.25 | % | | | 0.59 | % | | | 0.16 | % | | | (0.04 | %) | |
| Portfolio turnover | | | 4.90 | %3,5 | | | 3.51 | %5 | | | 6.14 | %5 | | | 18.09 | % | | | 26.68 | % | | | 25.59 | % | |
| INSTITUTIONAL CLASS | | Six-Month
Period Ended
June 30, 2012
(unaudited) | | Year Ended
Dec. 31, 2011 | | Period Ended
Dec. 31, 20106 | |
| Net Asset Value, beginning of period | | $ | 13.61 | | | $ | 21.48 | | | $ | 22.03 | | |
| INCOME (LOSS) FROM INVESTMENT OPERATIONS: | |
| Net investment income (loss)1 | | | 0.06 | | | | 0.16 | | | | (0.02 | ) | |
Net realized gain (loss) and unrealized appreciation/depreciation
on investments and foreign currency | | | 1.89 | | | | (7.96 | ) | | | (0.43 | ) | |
| Total from investment operations | | | 1.95 | | | | (7.80 | ) | | | (0.45 | ) | |
| LESS DISTRIBUTIONS FROM: | |
| Net investment income | | | — | | | | (0.07 | ) | | | (0.10 | ) | |
| Total distributions | | | — | | | | (0.07 | ) | | | (0.10 | ) | |
| Paid-in capital from redemption fees (Note 4) | | | —2 | | | | —2 | | | | — | | |
| Net Asset Value, end of period | | $ | 15.56 | | | $ | 13.61 | | | $ | 21.48 | | |
| TOTAL RETURN | | | 14.33 | %3 | | | (36.35 | %) | | | (2.01 | %)3 | |
| RATIOS/SUPPLEMENTAL DATA | |
| Net assets, end of period (in 000's) | | $ | 30,415 | | | $ | 26,920 | | | $ | 48,119 | | |
| Ratio of expenses to average net assets | | | 1.01 | %4 | | | 0.99 | % | | | 0.99 | %4 | |
| Ratio of net investment income (loss) to average net assets | | | 0.71 | %4 | | | 0.86 | % | | | (0.51 | %)4 | |
| Portfolio turnover5 | | | 4.90 | %3 | | | 3.51 | % | | | 6.14 | %3 | |
1 Calculated using the average daily shares method.
2 Less than $0.01 per share.
3 Not annualized.
4 Annualized.
5 The portfolio turnover rate is calculated on the Fund as a whole without distinguishing between classes of shares issued.
6 Institutional Class commenced operations on October 29, 2010.
See accompanying notes to financial statements.
92 MATTHEWS ASIA FUNDS
Matthews Japan Fund
The tables below set forth financial data for a share of beneficial interest outstanding throughout each period presented.
| | | Six-Month
Period Ended
June 30, 2012 | | Year Ended Dec. 31 | |
| INVESTOR CLASS | | (unaudited) | | 2011 | | 2010 | | 2009 | | 2008 | | 2007 | |
| Net Asset Value, beginning of period | | $ | 11.34 | | | $ | 12.53 | | | $ | 10.91 | | | $ | 10.19 | | | $ | 14.55 | | | $ | 17.29 | | |
| INCOME (LOSS) FROM INVESTMENT OPERATIONS: | |
| Net investment income (loss) | | | 0.061 | | | | 0.071 | | | | 0.021 | | | | 0.101 | | | | 0.111 | | | | 0.03 | | |
Net realized gain (loss) and unrealized appreciation/
depreciation on investments and foreign currency | | | 0.31 | | | | (1.06 | ) | | | 2.09 | | | | 0.92 | | | | (4.26 | ) | | | (1.86 | ) | |
| Total from investment operations | | | 0.37 | | | | (0.99 | ) | | | 2.11 | | | | 1.02 | | | | (4.15 | ) | | | (1.83 | ) | |
| LESS DISTRIBUTIONS FROM: | |
| Net investment income | | | — | | | | (0.22 | ) | | | (0.49 | ) | | | (0.31 | ) | | | — | | | | (0.01 | ) | |
| Net realized gains on investments | | | — | | | | — | | | | — | | | | — | | | | (0.22 | ) | | | (0.91 | ) | |
| Total distributions | | | — | | | | (0.22 | ) | | | (0.49 | ) | | | (0.31 | ) | | | (0.22 | ) | | | (0.92 | ) | |
| Paid-in capital from redemption fees (Note 4) | | | —2 | | | | 0.02 | | | | —2 | | | | 0.01 | | | | 0.01 | | | | 0.01 | | |
| Net Asset Value, end of period | | $ | 11.71 | | | $ | 11.34 | | | $ | 12.53 | | | $ | 10.91 | | | $ | 10.19 | | | $ | 14.55 | | |
| TOTAL RETURN | | | 3.26 | %3 | | | (7.72 | %) | | | 19.58 | % | | | 10.06 | % | | | (28.38 | %) | | | (10.96 | %) | |
| RATIOS/SUPPLEMENTAL DATA | |
| Net assets, end of period (in 000's) | | $ | 90,219 | | | $ | 101,369 | | | $ | 67,805 | | | $ | 88,334 | | | $ | 123,674 | | | $ | 166,860 | | |
Ratio of expenses to average net assets before any
reimbursement, waiver or recapture of expenses by
Advisor and Administrator (Note 5) | | | 1.23 | %4 | | | 1.22 | % | | | 1.30 | % | | | 1.31 | % | | | 1.23 | % | | | 1.24 | % | |
Ratio of expenses to average net assets after any
reimbursement, waiver or recapture of expenses by
Advisor and Administrator | | | 1.23 | %4 | | | 1.22 | % | | | 1.30 | % | | | 1.31 | % | | | 1.23 | % | | | 1.23 | % | |
| Ratio of net investment income (loss) to average net assets | | | 1.05 | %4 | | | 0.54 | % | | | 0.13 | % | | | 0.97 | % | | | 0.84 | % | | | (0.01 | %) | |
| Portfolio turnover | | | 27.01 | %3,5 | | | 34.94 | %5 | | | 46.29 | %5 | | | 126.75 | % | | | 88.97 | % | | | 45.51 | % | |
| INSTITUTIONAL CLASS | | Six-Month
Period Ended
June 30, 2012
(unaudited) | | Year Ended
Dec. 31, 2011 | | Period Ended
Dec. 31, 20106 | |
| Net Asset Value, beginning of period | | $ | 11.34 | | | $ | 12.53 | | | $ | 11.73 | | |
| INCOME (LOSS) FROM INVESTMENT OPERATIONS: | |
| Net investment income (loss)1 | | | 0.07 | | | | 0.06 | | | | (0.01 | ) | |
Net realized gain (loss) and unrealized appreciation/depreciation
on investments and foreign currency | | | 0.31 | | | | (1.04 | ) | | | 1.30 | | |
| Total from investment operations | | | 0.38 | | | | (0.98 | ) | | | 1.29 | | |
| LESS DISTRIBUTIONS FROM: | |
| Net investment income | | | — | | | | (0.22 | ) | | | (0.49 | ) | |
| Total distributions | | | — | | | | (0.22 | ) | | | (0.49 | ) | |
| Paid-in capital from redemption fees (Note 4) | | | —2 | | | | 0.01 | | | | — | | |
| Net Asset Value, end of period | | $ | 11.72 | | | $ | 11.34 | | | $ | 12.53 | | |
| TOTAL RETURN | | | 3.35 | %3 | | | (7.72 | %) | | | 11.22 | %3 | |
| RATIOS/SUPPLEMENTAL DATA | |
| Net assets, end of period (in 000's) | | $ | 26,161 | | | $ | 30,302 | | | $ | 4 | | |
| Ratio of expenses to average net assets | | | 1.07 | %4 | | | 1.07 | % | | | 1.08 | %4 | |
| Ratio of net investment income (loss) to average net assets | | | 1.15 | %4 | | | 0.46 | % | | | (0.51 | %)4 | |
| Portfolio turnover5 | | | 27.01 | %3 | | | 34.94 | % | | | 46.29 | %3 | |
1 Calculated using the average daily shares method.
2 Less than $0.01 per share.
3 Not annualized.
4 Annualized.
5 The portfolio turnover rate is calculated on the Fund as a whole without distinguishing between classes of shares issued.
6 Institutional Class commenced operations on October 29, 2010.
See accompanying notes to financial statements.
matthewsasia.com | 800.789.ASIA 93
Financial Highlights
Matthews Korea Fund
The tables below set forth financial data for a share of beneficial interest outstanding throughout each period presented.
| | | Six-Month
Period Ended
June 30, 2012 | | Year Ended Dec. 31 | |
| INVESTOR CLASS | | (unaudited) | | 2011 | | 2010 | | 2009 | | 2008 | | 2007 | |
| Net Asset Value, beginning of period | | $ | 4.59 | | | $ | 5.14 | | | $ | 4.31 | | | $ | 2.75 | | | $ | 6.56 | | | $ | 6.23 | | |
| INCOME (LOSS) FROM INVESTMENT OPERATIONS: | |
| Net investment income (loss) | | | (0.01 | )1 | | | (0.01 | )1 | | | 0.011 | | | | (0.01 | )1 | | | (0.02 | )1 | | | 0.07 | | |
Net realized gain (loss) and unrealized appreciation/
depreciation on investments and foreign currency | | | 0.19 | | | | (0.31 | ) | | | 0.93 | | | | 1.74 | | | | (3.48 | ) | | | 1.15 | | |
| Total from investment operations | | | 0.18 | | | | (0.32 | ) | | | 0.94 | | | | 1.73 | | | | (3.50 | ) | | | 1.22 | | |
| LESS DISTRIBUTIONS FROM: | |
| Net investment income | | | — | | | | (0.01 | ) | | | — | | | | — | | | | (0.06 | ) | | | (0.02 | ) | |
| Net realized gains on investments | | | — | | | | (0.22 | ) | | | (0.11 | ) | | | (0.17 | ) | | | (0.25 | ) | | | (0.87 | ) | |
| Total distributions | | | — | | | | (0.23 | ) | | | (0.11 | ) | | | (0.17 | ) | | | (0.31 | ) | | | (0.89 | ) | |
| Paid-in capital from redemption fees (Note 4) | | | —2 | | | | —2 | | | | —2 | | | | —2 | | | | —2 | | | | —2 | | |
| Net Asset Value, end of period | | $ | 4.77 | | | $ | 4.59 | | | $ | 5.14 | | | $ | 4.31 | | | $ | 2.75 | | | $ | 6.56 | | |
| TOTAL RETURN | | | 3.92 | %3 | | | (6.45 | %) | | | 21.86 | % | | | 62.92 | % | | | (52.66 | %) | | | 18.90 | % | |
| RATIOS/SUPPLEMENTAL DATA | |
| Net assets, end of period (in 000's) | | $ | 133,512 | | | $ | 141,590 | | | $ | 166,990 | | | $ | 138,371 | | | $ | 87,253 | | | $ | 250,421 | | |
| Ratio of expenses to average net assets | | | 1.18 | %4 | | | 1.18 | % | | | 1.21 | % | | | 1.30 | % | | | 1.27 | % | | | 1.21 | % | |
| Ratio of net investment income (loss) to average net assets | | | (0.55 | %)4 | | | (0.18 | %) | | | 0.16 | % | | | (0.36 | %) | | | (0.34 | %) | | | 1.17 | % | |
| Portfolio turnover | | | 21.61 | %3,5 | | | 30.13 | %5 | | | 39.05 | %5 | | | 52.47 | % | | | 28.70 | % | | | 24.20 | % | |
| INSTITUTIONAL CLASS | | Six-Month
Period Ended
June 30, 2012
(unaudited) | | Year Ended
Dec. 31, 2011 | | Period Ended
Dec. 31, 20106 | |
| Net Asset Value, beginning of period | | $ | 4.61 | | | $ | 5.14 | | | $ | 4.84 | | |
| INCOME (LOSS) FROM INVESTMENT OPERATIONS: | |
| Net investment income (loss)1 | | | (0.01 | ) | | | 0.17 | | | | 0.03 | | |
Net realized gain (loss) and unrealized appreciation/depreciation
on investments and foreign currency | | | 0.19 | | | | (0.47 | ) | | | 0.38 | | |
| Total from investment operations | | | 0.18 | | | | (0.30 | ) | | | 0.41 | | |
| LESS DISTRIBUTIONS FROM: | |
| Net investment income | | | — | | | | (0.01 | ) | | | — | | |
| Net realized gains on investments | | | — | | | | (0.22 | ) | | | (0.11 | ) | |
| Total distributions | | | — | | | | (0.23 | ) | | | (0.11 | ) | |
| Paid-in capital from redemption fees (Note 4) | | | —2 | | | | —2 | | | | — | | |
| Net Asset Value, end of period | | $ | 4.79 | | | $ | 4.61 | | | $ | 5.14 | | |
| TOTAL RETURN | | | 3.91 | %3 | | | (6.05 | %) | | | 8.51 | %3 | |
| RATIOS/SUPPLEMENTAL DATA | |
| Net assets, end of period (in 000's) | | $ | 22,553 | | | $ | 15,109 | | | $ | 4 | | |
| Ratio of expenses to average net assets | | | 0.99 | %4 | | | 1.07 | % | | | 0.91 | %4 | |
| Ratio of net investment income (loss) to average net assets | | | (0.22 | %)4 | | | 3.37 | % | | | 3.74 | %4 | |
| Portfolio turnover5 | | | 21.61 | %3 | | | 30.13 | % | | | 39.05 | %3 | |
1 Calculated using the average daily shares method.
2 Less than $0.01 per share.
3 Not annualized.
4 Annualized.
5 The portfolio turnover rate is calculated on the Fund as a whole without distinguishing between classes of share issued.
6 Institutional Class commenced operations on October 29, 2010.
See accompanying notes to financial statements.
94 MATTHEWS ASIA FUNDS
Matthews Asia Small Companies Fund
The table below sets forth financial data for a share of beneficial interest outstanding throughout each period presented.
| | | Six-Month
Period Ended
June 30, 2012 | | Year Ended Dec. 31 | | Period Ended | |
| INVESTOR CLASS | | (unaudited) | | 2011 | | 2010 | | 2009 | | Dec. 31, 20081 | |
| Net Asset Value, beginning of period | | $ | 14.77 | | | $ | 21.16 | | | $ | 15.79 | | | $ | 7.89 | | | $ | 10.00 | | |
| INCOME (LOSS) FROM INVESTMENT OPERATIONS: | |
| Net investment income (loss)2 | | | 0.08 | | | | 0.15 | | | | 0.04 | | | | 0.02 | | | | 0.01 | | |
Net realized gain (loss) and unrealized appreciation/depreciation
on investments and foreign currency | | | 0.84 | | | | (4.35 | ) | | | 5.55 | | | | 8.04 | | | | (2.16 | ) | |
| Total from investment operations | | | 0.92 | | | | (4.20 | ) | | | 5.59 | | | | 8.06 | | | | (2.15 | ) | |
| LESS DISTRIBUTIONS FROM: | |
| Net investment income | | | — | | | | (0.17 | ) | | | (0.09 | ) | | | (0.05 | ) | | | (0.02 | ) | |
| Net realized gains on investments | | | — | | | | (2.04 | ) | | | (0.15 | ) | | | (0.15 | ) | | | — | | |
| Total distributions | | | — | | | | (2.21 | ) | | | (0.24 | ) | | | (0.20 | ) | | | (0.02 | ) | |
| Paid-in capital from redemption fees (Note 4) | | | —3 | | | | 0.02 | | | | 0.02 | | | | 0.04 | | | | 0.06 | | |
| Net Asset Value, end of period | | $ | 15.69 | | | $ | 14.77 | | | $ | 21.16 | | | $ | 15.79 | | | $ | 7.89 | | |
| TOTAL RETURN | | | 6.23 | %4 | | | (20.03 | %) | | | 35.54 | % | | | 103.00 | % | | | (21.03 | %)3 | |
| RATIOS/SUPPLEMENTAL DATA | |
| Net assets, end of period (in 000's) | | $ | 309,446 | | | $ | 258,944 | | | $ | 547,094 | | | $ | 109,726 | | | $ | 3,173 | | |
Ratio of expenses to average net assets before any reimbursement,
waiver or recapture of expenses by Advisor and Administrator (Note 5) | | | 1.52 | %5 | | | 1.52 | % | | | 1.59 | % | | | 2.90 | % | | | 14.31 | %4 | |
Ratio of expenses to average net assets after any reimbursement,
waiver or recapture of expenses by Advisor and Administrator | | | 1.52 | %5 | | | 1.52 | % | | | 1.63 | % | | | 2.00 | % | | | 2.00 | %4 | |
| Ratio of net investment income (loss) to average net assets | | | 1.00 | %5 | | | 0.76 | % | | | 0.24 | % | | | 0.13 | % | | | 0.15 | %4 | |
| Portfolio turnover | | | 12.96 | %4 | | | 19.97 | % | | | 23.99 | % | | | 21.39 | % | | | 3.10 | %3 | |
1 Investor Class commenced operations on September 15, 2008.
2 Calculated using the average daily shares method.
3 Less than $0.01 per share.
4 Not annualized.
5 Annualized.
See accompanying notes to financial statements.
matthewsasia.com | 800.789.ASIA 95
Financial Highlights
Matthews China Small Companies Fund
The table below sets forth financial data for a share of beneficial interest outstanding throughout each period presented.
| INVESTOR CLASS | | Six-Month
Period Ended
June 30, 2012
(unaudited) | | Period Ended
Dec. 31, 20111 | |
| Net Asset Value, beginning of period | | $ | 7.04 | | | $ | 10.00 | | |
| INCOME (LOSS) FROM INVESTMENT OPERATIONS: | |
| Net investment income (loss)2 | | | 0.04 | | | | (0.02 | ) | |
Net realized gain (loss) and unrealized appreciation/depreciation
on investments and foreign currency | | | (0.03 | ) | | | (2.96 | ) | |
| Total from investment operations | | | 0.01 | | | | (2.98 | ) | |
| LESS DISTRIBUTIONS FROM: | |
| Net investment income | | | — | | | | (0.01 | ) | |
| Total distributions | | | — | | | | (0.01 | ) | |
| Paid-in capital from redemption fees (Note 4) | | | 0.03 | | | | 0.03 | | |
| Net Asset Value, end of period | | $ | 7.08 | | | $ | 7.04 | | |
| TOTAL RETURN3 | | | 0.57 | % | | | (29.51 | %) | |
| RATIOS/SUPPLEMENTAL DATA | |
| Net assets, end of period (in 000's) | | $ | 5,249 | | | $ | 4,493 | | |
Ratio of expenses to average net assets before any reimbursement,
waiver or recapture of expenses by Advisor and Administrator (Note 5)4 | | | 3.53 | % | | | 5.32 | % | |
Ratio of expenses to average net assets after any reimbursement,
waiver or recapture of expenses by Advisor and Administrator4 | | | 2.00 | % | | | 2.00 | % | |
| Ratio of net investment income (loss) to average net assets4 | | | 1.08 | % | | | (0.53 | %) | |
| Portfolio turnover3 | | | 23.86 | % | | | 6.08 | % | |
1 Investor Class commenced operations on May 31, 2011.
2 Calculated using the average daily shares method.
3 Not annualized.
4 Annualized.
See accompanying notes to financial statements.
96 MATTHEWS ASIA FUNDS
Matthews Asia Science and Technology Fund
The table below sets forth financial data for a share of beneficial interest outstanding throughout each period presented.
| | | Six-Month
Period Ended
June 30, 2012 | | Year Ended Dec. 31 | |
| INVESTOR CLASS | | (unaudited) | | 2011 | | 2010 | | 2009 | | 2008 | | 2007 | |
| Net Asset Value, beginning of period | | $ | 8.16 | | | $ | 9.89 | | | $ | 8.02 | | | $ | 4.71 | | | $ | 9.80 | | | $ | 7.92 | | |
| INCOME (LOSS) FROM INVESTMENT OPERATIONS: | |
| Net investment income (loss) | | | (0.01 | )1 | | | 0.021 | | | | 0.031 | | | | —1,2 | | | | 0.011 | | | | —2 | | |
Net realized gain (loss) and unrealized appreciation/depreciation
on investments and foreign currency | | | 0.47 | | | | (1.74 | ) | | | 1.86 | | | | 3.31 | | | | (5.11 | ) | | | 1.87 | | |
| Total from investment operations | | | 0.46 | | | | (1.72 | ) | | | 1.89 | | | | 3.31 | | | | (5.10 | ) | | | 1.87 | | |
| LESS DISTRIBUTIONS FROM: | |
| Net investment income | | | — | | | | (0.02 | ) | | | (0.02 | ) | | | — | | | | — | | | | — | | |
| Total distributions | | | — | | | | (0.02 | ) | | | (0.02 | ) | | | — | | | | — | | | | — | | |
| Paid-in capital from redemption fees (Note 4) | | | —2 | | | | 0.01 | | | | —2 | | | | —2 | | | | 0.01 | | | | 0.01 | | |
| Net Asset Value, end of period | | $ | 8.62 | | | $ | 8.16 | | | $ | 9.89 | | | $ | 8.02 | | | $ | 4.71 | | | $ | 9.80 | | |
| TOTAL RETURN | | | 5.64 | %3 | | | (17.26 | %) | | | 23.58 | % | | | 70.28 | % | | | (51.94 | %) | | | 23.74 | % | |
| RATIOS/SUPPLEMENTAL DATA | |
| Net assets, end of period (in 000's) | | $ | 138,469 | | | $ | 153,349 | | | $ | 190,436 | | | $ | 130,367 | | | $ | 74,476 | | | $ | 252,304 | | |
Ratio of expenses to average net assets before any
reimbursement, waiver or recapture of expenses by
Advisor and Administrator (Note 5) | | | 1.21 | %4 | | | 1.21 | % | | | 1.26 | % | | | 1.40 | % | | | 1.33 | % | | | 1.26 | % | |
Ratio of expenses to average net assets after any
reimbursement, waiver or recapture of expenses by
Advisor and Administrator | | | 1.21 | %4 | | | 1.21 | % | | | 1.26 | % | | | 1.40 | % | | | 1.33 | % | | | 1.25 | % | |
| Ratio of net investment income (loss) to average net assets | | | (0.23 | %)4 | | | 0.23 | % | | | 0.35 | % | | | 0.30 | % | | | 0.08 | % | | | (0.30 | %) | |
| Portfolio turnover | | | 18.64 | %3 | | | 65.47 | % | | | 61.61 | % | | | 83.27 | % | | | 44.84 | % | | | 33.21 | % | |
1 Calculated using the average daily shares method.
2 Less than $0.01 per share.
3 Not annualized.
4 Annualized.
See accompanying notes to financial statements.
matthewsasia.com | 800.789.ASIA 97
Notes to Financial Statements (unaudited)
1. ORGANIZATION
Matthews Asia Funds (the "Trust") is an open-end management investment company registered under the Investment Company Act of 1940, as amended (the "1940 Act"). The Trust currently issues thirteen separate series of shares (each a "Fund" and collectively, the "Funds"): Matthews Asia Strategic Income Fund, Matthews Asian Growth and Income Fund, Matthews Asia Dividend Fund, Matthews China Dividend Fund, Matthews Asia Growth Fund, Matthews Pacific Tiger Fund, Matthews China Fund, Matthews India Fund, Matthews Japan Fund, Matthews Korea Fund, Matthews Asia Small Companies Fund, Matthews China Small Companies Fund and Matthews Asia Science and Technology Fund. Each Fund except for Matthews Asia Small Companies Fund, Matthews China Small Companies Fund and Matthews Asia Science and Technology Fund currently offers two classes of shares: Investor Class and Institutional Class. Matthews Asia Small Companies Fund, Matthews China Small Companies Fund and Matthews Asia Science and Technology Fund currently offer only Investor Class shares. Each class of shares has identical voting, dividend, liquidation and other rights and the same terms and conditions, except each class may be subject to different class expenses as outlined in the relevant prospectus and each class has exclusive voting rights with respect to matters solely affecting such class.
2. SIGNIFICANT ACCOUNTING POLICIES
The following is a summary of significant accounting policies consistently followed by the Funds in preparation of their financial statements.
A. SECURITY VALUATION: The value of the Funds' securities is based on market quotations for those securities, or on their fair value determined by or under the direction of the Funds' Board of Trustees (the "Board"). Market quotations and valuation information are provided by commercial pricing services or securities dealers that are independent of the Funds and Matthews, in accordance with procedures established by the Funds' Board. Foreign exchange-traded securities are valued as of the close of trading on the primary exchange on which they trade. Securities that trade in over-the-counter markets, including most debt securities (bonds), may be valued by other third-party vendors or by using indicative bid quotations from dealers or market makers, or other available market information. Market values for securities are determined based on quotations, market data or other information from the principal (or most advantageous) market on which the security is traded. Market quotations for equity securities used by the Funds include last reported sale prices, or, if such prices are not reported or available, bid and ask prices. Financial futures contracts traded on exchanges are valued at their settlement price. Foreign currency exchange contracts are valued at the mean between the bid and ask prices and are determined at the close of business on the New York Stock Exchange ("NYSE"). Interpolated values are derived when the settlement date of the contract is an interim date for which quotations are not available. The Funds may also utilize independent pricing services to assist them in determining a current market value for each security based on sources believed to be reliable.
The Board has delegated the responsibility of making fair value determinations to the Funds' Valuation Committee (the "Valuation Committee") subject to the Funds' Pricing Policies. When fair value pricing is employed, the prices of securities used by a Fund to calculate its Net Asset Value ("NAV") may differ from any quoted or published prices for the same securities for that day. All fair value determinations are made subject to the Board's oversight. Events affecting the value of foreign investments may occur between the time at which they are determined and when the Funds calculate their NAV, which is normally the close of trading on the NYSE. If such events render market quotations unreliable, and the impact of such events can be reasonably determined, the investments will be valued at their fair value. The fair value of a security held by the Funds may be determined using the services of third-party pricing services retained by the Funds or by the Valuation Committee, in either case subject to the Board's oversight.
The books and records of the Funds are maintained in U.S. dollars. Transactions, portfolio securities, and assets and liabilities denominated in a foreign currency are translated and recorded in U.S. dollars at the prevailing exchange rate as of the close of trading on the NYSE. Translation gains or losses resulting from changes in the exchange rate during the reporting period and realized gains and losses on the settlement of foreign currency transactions are reported in the results of operations for the current period. The Funds do not isolate that portion of gains and losses on investments in equity securities that is due to changes in foreign exchange rate from that which is due to changes in market prices of equity securities.
Foreign securities held by the Funds may be traded on days and at times when the NYSE is closed. Accordingly, the NAV of the Funds may be significantly affected on days when shareholders have no access to the Funds.
B. FAIR VALUE MEASUREMENTS: In accordance with the guidance on fair value measurements and disclosures under generally accepted accounting principles in the United States ("U.S. GAAP"), the Funds disclose the fair value of their investments in a hierarchy that prioritizes the inputs to valuation techniques used to measure the fair value. The hierarchy gives the highest priority to valuations based upon unadjusted quoted prices in active markets for identical assets or liabilities (Level 1 measurement) and the lowest priority to valuations based upon unobservable inputs that are significant to the valuation (Level 3 measurements). Various inputs are used in determining the fair value of investments and derivative financial instruments, which are as follows:
Level 1: Quoted prices in active markets for identical securities.
Level 2: Other significant observable inputs (including quoted prices for similar securities, interest rates, prepayment speeds, credit risk, etc.).
Level 3: Significant unobservable inputs (including the Fund's own assumptions in determining the fair value of investments).
As of June 30, 2012, Level 3 securities consist primarily of equities that, as of June 30, 2012, were suspended from trading. As described in Note 2-A, these securities are valued based on their fair value as determined under the direction of the Board. The significant unobservable inputs, the methodology used for valuing such securities, and the characterization of such securities as Level 3 securities are not necessarily an indication of liquidity, or the risk associated with investing in these securities. Level 2 equity securities consist primarily of securities that have been fair valued by third-party pricing services (see Note 2-A).
98 MATTHEWS ASIA FUNDS
The summary of inputs used to determine the fair valuation of the Fund's investments and derivative financial instruments as of June 30, 2012 is as follows:
| | | Matthews Asia
Strategic
Income Fund | | Matthews Asian
Growth and
Income Fund | | Matthews Asia
Dividend Fund | | Matthews Asia
Growth Fund | | Matthews Pacific
Tiger Fund | |
| Level 1: Quoted Prices | |
| Common Equities: | |
| China/Hong Kong | | $ | — | | | $ | 147,928,280 | | | $ | 168,690,688 | | | $ | 17,984,298 | | | $ | 279,680,242 | | |
| India | | | — | | | | — | | | | — | | | | 2,311,627 | | | | 20,311,372 | | |
| Indonesia | | | — | | | | 40,179,888 | | | | 24,995,192 | | | | — | | | | 13,085,631 | | |
| South Korea | | | — | | | | 27,539,676 | | | | 81,033,396 | | | | — | | | | — | | |
| Taiwan | | | — | | | | 89,832,398 | | | | 86,890,940 | | | | — | | | | — | | |
| Vietnam | | | — | | | | 24,581,995 | | | | — | | | | 6,580,488 | | | | 50,100,036 | | |
| Preferred Equities: | |
| South Korea | | | — | | | | 33,248,774 | | | | — | | | | — | | | | — | | |
| Closed-End Investment Company: | |
| Thailand | | | — | | | | — | | | | 7,288,951 | | | | — | | | | — | | |
| Level 2: Other Significant Observable Inputs | |
| Foreign Government Obligations | | | 8,110,711 | | | | — | | | | — | | | | — | | | | — | | |
| Corporate Bonds | | | 12,390,823 | | | | 488,825,387 | | | | — | | | | — | | | | — | | |
| Common Equities: | |
| Australia | | | — | | | | 240,963,449 | | | | 231,000,692 | | | | 18,908,534 | | | | — | | |
| Cambodia | | | — | | | | — | | | | — | | | | 7,965,135 | | | | — | | |
| China/Hong Kong | | | 625,372 | | | | 571,491,151 | | | | 684,078,555 | | | | 65,230,746 | | | | 1,573,696,716 | | |
| India | | | — | | | | 45,703,421 | | | | — | | | | 21,887,558 | | | | 913,527,580 | | |
| Indonesia | | | — | | | | 53,640,056 | | | | 61,768,313 | | | | 22,417,153 | | | | 488,663,459 | | |
| Japan | | | — | | | | 206,978,427 | | | | 679,442,247 | | | | 124,666,065 | | | | — | | |
| Malaysia | | | — | | | | 167,473,630 | | | | — | | | | 3,039,529 | | | | 279,802,913 | | |
| Philippines | | | 212,495 | | | | 54,863,987 | | | | 45,256,793 | | | | — | | | | 144,736,199 | | |
| Singapore | | | 431,593 | | | | 477,120,369 | | | | 334,161,975 | | | | 12,880,950 | | | | 157,323,373 | | |
| South Korea | | | — | | | | 64,128,885 | | | | 34,145,168 | | | | 3,635,160 | | | | 821,548,937 | | |
| Sri Lanka | | | — | | | | — | | | | — | | | | 5,895,388 | | | | — | | |
| Taiwan | | | — | | | | 82,242,519 | | | | 102,842,893 | | | | 18,265,254 | | | | 491,652,906 | | |
| Thailand | | | 309,371 | | | | 252,950,294 | | | | 153,211,890 | | | | 26,086,387 | | | | 432,489,624 | | |
| United Kingdom | | | — | | | | 61,216,545 | | | | — | | | | — | | | | — | | |
| Vietnam | | | — | | | | 15,898,531 | | | | — | | | | — | | | | — | | |
| Preferred Equities: | |
| South Korea | | | — | | | | 68,016,064 | | | | — | | | | — | | | | — | | |
| Level 3: Significant Unobservable Inputs | |
| Common Equities: | |
| Taiwan | | | — | | | | — | | | | 33,673,037 | | | | — | | | | — | | |
| Corporate Bonds | | | — | | | | 6,648,518 | | | | — | | | | — | | | | — | | |
| Total Market Value of Investments | | $ | 22,080,425 | | | $ | 3,221,472,244 | | | $ | 2,728,480,730 | | | $ | 357,754,272 | | | $ | 5,666,618,988 | | |
| | | Matthews Asia
Strategic Income
Fund | |
| Derivative Financial Instruments1 | |
| Assets | |
| Level 1: Quoted Prices | |
| Interest Rate Contracts | | $ | 7,525 | | |
| Level 2: Other Significant Observable Inputs | |
| Foreign Currency Exchange Contracts | | | 26,513 | | |
| Total Market Value of Derivative Financial Instruments | | $ | 34,038 | | |
1 Derivative financial instruments are financial futures contracts and foreign currency exchange contracts. Financial futures contracts and foreign currency exchange contracts are valued at the unrealized appreciation/depreciation on the instrument.
matthewsasia.com | 800.789.ASIA 99
Notes to Financial Statements (unaudited) (continued)
| | | Matthews China
Dividend Fund | | Matthews
China Fund | | Matthews
India Fund | | Matthews
Japan Fund | | Matthews
Korea Fund | | Matthews
China Small
Companies
Fund | |
| Investments | |
| Level 1: Quoted Prices | |
| Common Equities: | |
| Consumer Discretionary | | $ | — | | | $ | 92,214,634 | | | $ | — | | | $ | — | | | $ | — | | | $ | 211,908 | | |
| Consumer Staples | | | — | | | | — | | | | — | | | | — | | | | 1,758,630 | | | | — | | |
| Energy | | | 1,720,136 | | | | — | | | | — | | | | — | | | | — | | | | — | | |
| Financials | | | 1,576,510 | | | | 15,681,479 | | | | 11,868,554 | | | | — | | | | — | | | | — | | |
| Health Care | | | — | | | | 44,546,534 | | | | — | | | | — | | | | — | | | | 309,310 | | |
| Industrials | | | — | | | | — | | | | — | | | | — | | | | — | | | | — | | |
| Information Technology | | | — | | | | 57,812,238 | | | | 10,732,346 | | | | — | | | | — | | | | 247,180 | | |
| Materials | | | — | | | | — | | | | — | | | | — | | | | 5,099,896 | | | | — | | |
| Telecommunication Services | | | 1,769,959 | | | | 28,554,141 | | | | — | | | | — | | | | — | | | | — | | |
| Preferred Equities: | |
| Financials | | | — | | | | — | | | | — | | | | — | | | | 2,891,156 | | | | — | | |
| Level 2: Other Significant Observable Inputs | |
| Common Equities: | |
| Consumer Discretionary | | | 4,439,194 | | | | 352,097,097 | | | | 70,180,818 | | | | 29,366,544 | | | | 38,155,076 | | | | 862,587 | | |
| Consumer Staples | | | 1,181,547 | | | | 248,536,223 | | | | 77,685,814 | | | | 7,724,834 | | | | 12,979,111 | | | | 695,612 | | |
| Energy | | | 842,117 | | | | 144,963,717 | | | | 6,402,511 | | | | — | | | | 3,587,632 | | | | 88,239 | | |
| Financials | | | 2,635,612 | | | | 466,513,364 | | | | 130,886,260 | | | | 13,983,504 | | | | 25,221,511 | | | | 478,596 | | |
| Health Care | | | 805,789 | | | | 42,628,696 | | | | 33,284,352 | | | | 11,528,452 | | | | 3,413,033 | | | | 174,085 | | |
| Industrials | | | 4,026,109 | | | | 188,969,827 | | | | 105,224,837 | | | | 30,272,198 | | | | 14,861,925 | | | | 1,068,984 | | |
| Information Technology | | | 2,965,401 | | | | 192,514,167 | | | | 42,183,107 | | | | 16,578,022 | | | | 33,274,351 | | | | 448,365 | | |
| Materials | | | 2,286,469 | | | | — | | | | 70,139,745 | | | | 4,912,361 | | | | 7,354,208 | | | | 255,081 | | |
| Telecommunication Services | | | — | | | | 95,321,472 | | | | — | | | | 1,174,066 | | | | — | | | | — | | |
| Utilities | | | 2,213,708 | | | | 111,364,420 | | | | 29,232,827 | | | | — | | | | — | | | | 261,618 | | |
| Preferred Equities: | |
| Consumer Discretionary | | | — | | | | — | | | | — | | | | — | | | | 4,420,216 | | | | — | | |
| Materials | | | — | | | | — | | | | — | | | | — | | | | 1,504,025 | | | | — | | |
| Corporate Bonds | | | — | | | | — | | | | 13,388,050 | | | | — | | | | — | | | | — | | |
| Level 3: Significant Unobservable Inputs | |
| Common Equities: | |
| Consumer Discretionary | | | 947,299 | | | | — | | | | — | | | | — | | | | — | | | | — | | |
Electronic Equipment, Instruments &
Components | | | — | | | | — | | | | — | | | | — | | | | — | | | | 34,408 | | |
| Total Market Value of Investments | | $ | 27,409,850 | | | $ | 2,081,718,009 | | | $ | 601,209,221 | | | $ | 115,539,981 | | | $ | 154,520,770 | | | $ | 5,135,973 | | |
100 MATTHEWS ASIA FUNDS
| | | Matthews Asia
Small Companies
Fund | | Matthews Asia
Science and
Technology Fund | |
| Level 1: Quoted Prices | |
| Common Equities: | |
| China/Hong Kong | | $ | 7,458,500 | | | $ | 26,011,444 | | |
| India | | | 5,192,159 | | | | 29,253 | | |
| Indonesia | | | — | | | | 1,981,827 | | |
| United States | | | — | | | | 2,682,000 | | |
| Warrants: | |
| Malaysia | | | 109,225 | | | | — | | |
| Level 2: Other Significant Observable Inputs | |
| Common Equities: | |
| China/Hong Kong | | | 79,772,092 | | | | 17,630,014 | | |
| India | | | 40,820,233 | | | | 4,285,957 | | |
| Indonesia | | | 28,060,238 | | | | — | | |
| Japan | | | — | | | | 27,174,452 | | |
| Malaysia | | | 19,354,356 | | | | 2,263,362 | | |
| Philippines | | | 6,218,002 | | | | — | | |
| Singapore | | | 15,227,792 | | | | — | | |
| South Korea | | | 39,839,589 | | | | 27,121,467 | | |
| Taiwan | | | 48,850,745 | | | | 25,439,304 | | |
| Thailand | | | 13,389,843 | | | | — | | |
| Vietnam | | | — | | | | 976,631 | | |
| Preferred Equities: | |
| South Korea | | | — | | | | 718,905 | | |
| Level 3: Significant Unobservable Inputs | |
| Common Equities: | |
| China/Hong Kong | | | 190,427 | | | | — | | |
| Total Market Value of Investments | | $ | 304,483,201 | | | $ | 136,314,616 | | |
Certain foreign securities may be fair valued by external pricing services when the Funds determine that events affecting the value of foreign securities which occur between the time at which they are determined and the close of trading on the NYSE render market quotations unreliable. Such fair valuations are categorized as Level 2 in the fair value hierarchy. Foreign securities that are valued based on market quotations are categorized as Level 1 in the fair value hierarchy (see Note 2-A). The Funds' policy is to recognize transfers in and transfers out as of the beginning of the reporting period. At June 30, 2012, the Funds utilized third party pricing services to fair value certain markets which were different than markets which utilized third party pricing services at December 31, 2011. As a result, certain securities held by the Funds were transferred from Level 1 into Level 2 with beginning of period values as follows:
| | | Transfer to Level 2
from Level 1 | |
| Matthews Asia Strategic Income Fund | | $ | 926,898 | | |
| Matthews Asian Growth and Income Fund | | | 1,504,534,546 | | |
| Matthews Asia Dividend Fund | | | 1,624,303,181 | | |
| Matthews China Dividend Fund | | | 18,308,476 | | |
| Matthews Asia Growth Fund | | | 211,390,627 | | |
| Matthews Pacific Tiger Fund | | | 3,064,323,555 | | |
| Matthews China Fund | | | 1,864,395,755 | | |
| Matthews India Fund | | | 500,327,143 | | |
| Matthews Japan Fund | | | 89,275,533 | | |
| Matthews Korea Fund | | | 6,740,962 | | |
| Matthews Asia Small Companies Fund | | | 162,495,396 | | |
| Matthews China Small Companies Fund | | | 3,506,060 | | |
| Matthews Asia Science and Technology Fund | | | 72,260,460 | | |
matthewsasia.com | 800.789.ASIA 101
Notes to Financial Statements (unaudited) (continued)
Following is a reconciliation of Level 3 investments for which significant unobservable inputs were used to determine value:
| | | Matthews Asia
Strategic
Income Fund | | Matthews Asia
Strategic
Income Fund | | Matthews Asia
Dividend Fund | | Matthews China
Dividend Fund | | Matthews Asian
Growth and
Income Fund | | Matthews
India Fund | |
| | | Corporate Bonds | | Foreign
Government
Obligations | | Common
Equities —
Taiwan | | Common
Equities —
Consumer
Discretionary | | Corporate Bonds | | Corporate Bonds | |
Balance as of 12/31/11
(market value) | | $ | 4,268,354 | | | $ | 6,569,135 | | | $ | — | | | $ | — | | | $ | 468,582,867 | | | $ | 40,219,200 | | |
| Accrued discounts/premiums | | | — | | | | — | | | | — | | | | — | | | | 2,474,995 | | | | — | | |
| Realized gain/(loss) | | | — | | | | — | | | | — | | | | 129,504 | | | | (5,705,306 | ) | | | — | | |
Change in unrealized
appreciation/depreciation | | | — | | | | — | | | | 5,368,923 | | | | 99,023 | | | | 2,855,028 | | | | — | | |
| Net purchases | | | — | | | | — | | | | 4,320,092 | | | | — | | | | — | | | | — | | |
| Net sales | | | — | | | | — | | | | — | | | | (260,862 | ) | | | (32,921,590 | ) | | | — | | |
| Transfers in to Level 3* | | | — | | | | — | | | | 23,984,022 | | | | 979,634 | | | | — | | | | — | | |
| Transfers out of Level 3* | | | (4,268,354 | ) | | | (6,569,135 | ) | | | — | | | | — | | | | (428,637,476 | ) | | | (40,219,200 | ) | |
Balance as of 6/30/12
(market value) | | $ | — | | | $ | — | | | $ | 33,673,037 | | | $ | 947,299 | | | $ | 6,648,518 | | | $ | — | | |
Net change in unrealized
appreciation/depreciation
on Level 3 investments
held as of 6/30/12** | | $ | — | | | $ | — | | | $ | 5,368,923 | | | $ | 99,023 | | | $ | 2,855,028 | | | $ | — | | |
| | | Matthews
Asia Small
Companies
Fund | | Matthews
China Small
Companies
Fund | |
| | | Common
Equities —
China | | Common
Equities —
Information
Technology | |
| Balance as of 12/31/11 (market value) | | $ | 3,040,262 | | | $ | 37,218 | | |
| Accrued discounts/premiums | | | — | | | | — | | |
| Realized gain/(loss) | | | — | | | | — | | |
| Change in unrealized appreciation/depreciation | | | (2,849,835 | ) | | | (2,810 | ) | |
| Net Purchases | | | — | | | | — | | |
| Net Sales | | | — | | | | — | | |
| Transfers in to Level 3* | | | — | | | | — | | |
| Transfers out of Level 3* | | | — | | | | — | | |
| Balance as of 6/30/12 (market value) | | $ | 190,427 | | | $ | 34,408 | | |
Net change in unrealized appreciation/depreciation on
Level 3 investments held as of 6/30/12** | | ($ | 2,849,835 | ) | | ($ | 2,810 | ) | |
* The Fund's policy is to recognize transfers in and transfer out as of the beginning of the reporting period.
** Included in the related amounts on the Statements of Operations.
Certain foreign securities, for which market quotations are not readily available, may be fair valued and classified as either Level 2 or Level 3. When the underlying inputs include significant observable inputs obtained from sources independent of the Funds, the securities are classified as Level 2. When the underlying inputs include significant unobservable inputs and reflect assumptions of market participants, the securities are classified as Level 3. As of June 30, 2012, the Funds utilized significant observable inputs including evaluated price from the Funds' pricing vendors, day-on-day prices changes, primary and ancillary pricing sources, and other available independent market indicators of value. As a result, certain securities held by the Funds that were previously classified as Level 3 were transferred to Level 2. As of June 30, 2012, certain equity securities were suspended from trading and were transferred from Level 1 to Level 3.
102 MATTHEWS ASIA FUNDS
The following table summarizes the valuation techniques used and unobservable inputs developed by the Valuation Committee to determine the fair value of certain, material Level 3 investments:
| | | Value | | Valuation
Technique | | Unobservable
Input | | Range of
Unobservatble
Inputs | | Impact to
Valuation from
an Increase
in Inputs | |
| MATTHEWS ASIA DIVIDEND FUND | |
| Common Equities | | $ | 33,673,037 | | | Closing Price
Mulitplied by
Circuit Limit Fair
Valuation Factor | | Upward
Circuit Limit Fair
Valuation Factor | | | 0-2 | % | | Increase | |
| MATTHEWS CHINA DIVIDEND FUND | |
| Common Equities | | $ | 947,299 | | | Closing Price
Mulitplied by
Circuit Limit Fair
Valuation Factor | | Upward
Circuit Limit Fair
Valuation Factor | | | 0-2 | % | | Increase | |
In the event of a downward circuit limit fair valuation, an increase in input would result in a decrease in value.
C. RISKS ASSOCIATED WITH NON-U.S. COMPANIES: Investments by the Funds in the securities of non-U.S. companies may involve investment risks not typically associated with investments in U.S. issuers. These risks include possible political, economic, social and religious instability, inadequate investor protection; changes in laws or regulations of countries within the Asia Pacific region (including both in countries where you invest, as well as in the broader region); international relations with other nations; natural disasters; corruption; and military activity. Foreign securities may be subject to greater fluctuations in price than securities of domestic corporations or the U.S. government. Foreign investing may also include the risk of expropriation or confiscatory taxation, limitation on the removal or funds or other assets, currency crises and exchange controls, the imposition of foreign withholding tax on the interest income payable on such instruments, the possible seizure or nationalization of foreign deposits or assets, or the adoption of other foreign government restrictions that might adversely affect the foreign securities held by the Funds. Additionally, Asia Pacific countries may utilize formal or informal currency exchange controls or "capital controls" that may limit the ability to repatriate investments or income or adversely affect the value of portfolio investments. The economies of many Asia Pacific countries differ from the economies of more developed countries in many respects, such as their rate of growth, inflation, capital reinvestment, resource self-sufficiency and dependence on other economies, financial system stability, the national balance of payments position and sensitivity to changes in global trade. Certain Asia Pacific countries are highly dependent upon and may be affected by developments in the economies of other countries. Non-U.S. companies are subject to different accounting, auditing, and financial reporting standards, practices, and requirements than U.S. companies. There is generally less government regulation of stock exchanges, brokers, and listed companies abroad than in the United States, which may result in less transparency with respect to a company's operations, and make obtaining information about them more difficult (or such information may be unavailable).
Foreign stock markets may not be as developed or efficient as those in the United States, and the absence of negotiated brokerage commissions in certain countries may result in higher brokerage fees. The time between the trade and settlement dates of securities transactions on foreign exchanges ranges from one day to four weeks or longer and may result in higher custody charges. Custodial arrangements may be less well developed than in the United States. Foreign securities are generally denominated and pay distributions in foreign currencies, exposing the Funds to changes in foreign currency exchange rates. Investing in any country in the Asia Pacific region will also entail risks specific and unique to that country, and these risks can be significant and change rapidly.
D. INCOME AND WITHHOLDING TAXES: It is the policy of the Funds to comply with all requirements of the Internal Revenue Code of 1986, as amended ("the Code"), applicable to regulated investment companies and to distribute substantially all of their taxable income to their shareholders. The Funds have met the requirements of the Code applicable to regulated investment companies for six-month period ended June 30, 2012. Therefore, no federal income tax provision is required. Income and capital gains of the Funds are determined in accordance with both tax regulations and U.S. GAAP. Such treatment may result in temporary and permanent differences between tax basis earnings and earnings reported for financial statement purposes. These reclassifications, which have no impact on the net asset value of the Funds, are primarily attributable to certain differences in computation of distributable income and capital gains under federal tax rules versus U.S. GAAP, and the use of the tax accounting practice known as equalization.
Management has analyzed the Funds' tax positions taken on federal income tax returns for all open tax years (current and prior three tax years), and has concluded that no provision for federal income tax is required in the Funds' financial statements. The Funds' federal and state income and federal excise tax returns for tax years for which the applicable statutes of limitations have not expired are subject to examination by the Internal Revenue Service and state departments of revenue.
matthewsasia.com | 800.789.ASIA 103
Notes to Financial Statements (unaudited) (continued)
Under current tax law, the Funds have elected to defer certain qualified late-year losses and recognize such losses in the year ending December 31, 2012.
| | | Post October
Capital Losses | | Late Year
Ordinary Losses | |
| Matthews Asia Strategic Income Fund | | $ | 410 | | | $ | — | | |
| Matthews Asian Growth and Income Fund | | | 13,790,791 | | | | 7,343,712 | | |
| Matthews Asia Growth Fund | | | 5,622,994 | | | | 807,738 | | |
| Matthews Pacific Tiger Fund | | | — | | | | 66,556 | | |
| Matthews China Fund | | | 33,012,775 | | | | — | | |
| Matthews India Fund | | | — | | | | 90,831 | | |
| Matthews Japan Fund | | | 3,352,918 | | | | 19,415 | | |
| Matthews Korea Fund | | | — | | | | 10,635 | | |
| Matthews Asia Small Companies Fund | | | — | | | | 99,789 | | |
| Matthews China Small Companies Fund | | | 29,356 | | | | — | | |
| Matthews Asia Science and Technology Fund | | | 262,214 | | | | 401 | | |
For federal income tax purposes, the Funds indicated below have capital loss carryforwards as of December 31, 2011, which expire in the year indicated, which are available to offset future capital gains, if any:
| LOSSES DEFERRED EXPIRING IN: | | 2016 | | 2017 | | With No
Expiration* | | Total | |
| Matthews Asia Dividend Fund | | $ | — | | | $ | — | | | $ | 54,055,529 | | | $ | 54,055,529 | | |
| Matthews China Dividend Fund | | | — | | | | — | | | | 701,462 | | | | 701,462 | | |
| Matthews Asia Growth Fund | | | 1,000,383 | | | | 58,248,975 | | | | — | | | | 59,249,358 | | |
| Matthews Japan Fund | | | 30,079,024 | | | | 44,032,426 | | | | 1,382,944 | | | | 75,494,394 | | |
| Matthews China Small Companies Fund | | | — | | | | — | | | | 87,134 | | | | 87,134 | | |
| Matthews Asia Science and Technology Fund | | | — | | | | 10,329,226 | | | | — | | | | 10,329,226 | | |
* Post-Enactment Losses: Must be utilized prior to losses subject to expiration. All losses are short-term.
Under the Regulated Investment Company Modernization Act of 2010, the Funds are permitted to carry forward capital losses incurred in taxable years beginning after December 22, 2010 for an unlimited period. However, any losses incurred during those future taxable years will be required to be utilized prior to any losses incurred in pre-enactment taxable years, which generally expire after eight years from when they are incurred. Additionally, post-enactment capital losses that are carried forward will retain their character as either short-term or long-term capital losses rather than being considered all short-term as under previous law.
The Funds may be subject to foreign taxation related to income received, capital gains on the sale of securities and certain foreign currency transactions in the foreign jurisdictions in which it invests. Foreign taxes, if any, are recorded based on the tax regulations and rates that exist in the foreign markets in which the Funds invest. When a capital gain tax is determined to apply the Funds record an estimated deferred tax liability in an amount that may be payable if the securities were disposed of on the valuation date.
E. OFFERING COSTS: Offering costs are amortized on a straight-line basis over one year from each Fund's respective commencement of operations. In the event that any of the initial shares are redeemed during the period of amortization of the Fund's offering costs, the redemption proceeds will be reduced by any such unamortized offering costs in the same proportion as the number of shares being redeemed bears to the number of those shares outstanding at the time of redemption.
F. DISTRIBUTIONS TO SHAREHOLDERS: It is the policy of Matthews Asian Growth and Income Fund and Matthews China Dividend Fund to distribute net investment income on a semi-annual basis and capital gains, if any, annually. It is the policy of Matthews Asia Dividend Fund and Matthews Asia Strategic Income Fund to distribute net investment income on a quarterly basis and capital gains, if any, annually. Each of the other Funds distribute net investment income and capital gains, if any, annually. Distributions to shareholders are recorded on the ex-dividend date. Income and capital gain distributions are determined in accordance with income tax regulations which may differ from U.S. GAAP.Net investment losses may not be utilized to offset net investment income in future periods for tax purposes.
104 MATTHEWS ASIA FUNDS
The tax character of distributions paid for the fiscal year ended December 31, 2011 was as follows:
| YEAR ENDED DECEMBER 31, 2011 | | Ordinary Income | | Net Long-Term
Capital Gains | | Total Taxable
Distributions | |
| Matthews Asia Strategic Income Fund | | $ | 23,396 | | | $ | — | | | $ | 23,396 | | |
| Matthews Asian Growth and Income Fund | | | 99,386,784 | | | | 112,546,940 | | | | 211,933,724 | | |
| Matthews Asia Dividend Fund | | | 65,160,891 | | | | 11,676,961 | | | | 76,837,852 | | |
| Matthews China Dividend Fund | | | 1,087,962 | | | | 27,774 | | | | 1,115,736 | | |
| Matthews Asia Growth Fund | | | 7,735,513 | | | | — | | | | 7,735,513 | | |
| Matthews Pacific Tiger Fund | | | 28,983,044 | | | | 77,058,025 | | | | 106,041,069 | | |
| Matthews China Fund | | | 25,170,852 | | | | 174,899,928 | | | | 200,070,780 | | |
| Matthews India Fund | | | 2,994,775 | | | | — | | | | 2,994,775 | | |
| Matthews Japan Fund | | | 2,606,346 | | | | — | | | | 2,606,346 | | |
| Matthews Korea Fund | | | 1,792,530 | | | | 5,678,972 | | | | 7,471,502 | | |
| Matthews Asia Small Companies Fund | | | 2,884,834 | | | | 34,237,212 | | | | 37,122,046 | | |
| Matthews China Small Companies Fund | | | 5,954 | | | | — | | | | 5,954 | | |
| Matthews Asia Science and Technology Fund | | | 454,558 | | | | — | | | | 454,558 | | |
G. INVESTMENT TRANSACTIONS AND INCOME: Securities transactions are accounted for on the date the securities are purchased or sold. Gains or losses on the sale of securities are determined on the identified cost basis. Interest income is recorded on the accrual basis. Dividend income is generally recorded on the ex-dividend date. Dividend income for certain issuers headquartered in countries which the Funds invest may not be recorded until approved by the shareholders (which may occur after the ex-dividend date) if, in the judgment of management, such dividends are not reasonably determined as of the ex-dividend date. Income and realized and unrealized gains or losses on investments are allocated to each class of shares based on its relative net assets or another appropriate basis.
H. FUND EXPENSE ALLOCATIONS: The Funds account separately for the assets, liabilities and operations of each Fund. Direct expenses of each Fund or class are charged to that Fund or class while general expenses are allocated pro-rata among the Funds based on net assets or other appropriate methods.
I. CASH OVERDRAFTS: When cash balances are overdrawn, a Fund is charged an overdraft fee by the custodian of 1.00% above the 30-day LIBOR rate on outstanding balances. These amounts, if any, are included in "Other expenses" on the Statements of Operations.
J. USE OF ESTIMATES: The preparation of financial statements in conformity with U.S. GAAP requires management to make estimates and assumptions that affect the amounts reported in the financial statements and accompanying notes. Actual results may differ from those estimates.
3. DERIVATIVE FINANCIAL INSTRUMENTS
Matthews Asia Strategic Income Fund engages in various portfolio investment strategies using derivative contracts to hedge its exposure to foreign currency exchange rate risk. Losses may arise if the value of the contract decreases due to an unfavorable change in the market rates or values of the underlying instrument or if the counterparty does not perform under the contract. The Fund's primary risks associated with the use of derivatives include the other party to the derivative contract may fail to fulfill its obligation, reduced liquidity, the Fund may suffer disproportionately heavy losses relative to the amount invested, and changes in the value of the derivatives may not match or fully offset changes in the value of the hedged portfolio securities, thereby failing to achieve the original purpose for using the derivative.
Financial Futures Contracts: Matthews Asia Strategic Income Fund may purchase financial futures contracts for hedging purposes or to maintain liquidity. Financial futures contracts are agreements between the Fund and a counterparty to buy or sell a specific quantity of an underlying instrument at a specified price and at a specified date. Depending on the terms of the particular contract, futures contracts are settled either through physical delivery of the underlying instrument on the settlement date or by payment of a cash settlement amount on settlement date. Pursuant to the contract, the Fund agrees to receive from or pay an amount of cash equal to the daily fluctuation in value of the contract. Such receipts or payments are known as variation margin and are recorded by the Fund as unrealized appreciation or depreciation. When the contract is closed, the Fund records a realized gain or loss equal to the difference between the value of the contract at the time it was opened and the value at the time it was closed. The primary risks associated with the use of futures contracts are: (i) imperfect correlation between the change in market value of the securities held by the Fund and the price of futures contracts; (ii) possible lack of a liquid secondary market for a futures contract and the resulting inability to close a futures contract when desired; (iii) losses, which are potentially unlimited, due to unanticipated market movements; and (iv) Matthews' ability to predict correctly the direction of security prices, interest rates and other economic factors.
Forward Foreign Currency Exchange Contracts: Matthews Asia Strategic Income entered into forward foreign currency exchange contracts as a hedge against either specific transactions or portfolio instruments or to obtain exposure to foreign currencies (foreign currency exchange rate risk). Forward foreign currency exchange contracts, when used by the Fund, may also help to manage the overall exposure to the currencies (currency risk) in which some of the investments held by the Fund are denominated. A forward foreign currency exchange contract is an agreement between two parties to buy and sell a currency at a set exchange rate on a future date. The contract is marked-to-market daily and the change in market value is recorded by the Fund as an unrealized gain or loss. When the contract is closed, the Fund records a realized gain or loss equal to the difference between the value at the time it was opened and the value at the time it was closed. The use of forward foreign currency exchange contracts involves the risk that the value of a forward foreign currency exchange contract changes unfavorably due to movements in the value of the referenced foreign currencies and the risk that the counterparty to the contract does not perform its obligations under the agreement.
matthewsasia.com | 800.789.ASIA 105
Notes to Financial Statements (unaudited) (continued)
Derivative Financial Instruments Categorized by Risk Exposure:
| Fair Values of Derivative Financial Instruments as of June 30, 2012 | |
| | | Statements of Assets and Liabilities Location | | Matthews Asia
Strategic Income
Fund | |
| | | Asset Derivatives | |
| Interest rate contracts: | | Unrealized appreciation on financial futures contracts* | | $ | 7,525 | | |
| Forward foreign currency exchange contracts | | Unrealized appreciation on forward foreign currency
exchange contracts | | | 26,513 | | |
| | | Total | | $ | 34,038 | | |
* Includes cumulative appreciation/depreciation of financial futures contracts as reported in the Schedule of Investments. Only current day's margin variation is reported within the Statements of Assets and Liabilities.
| The Effect of Derivative Instruments on the Statements of Operations | |
| Six-Month Period Ended June 30, 2012 | | Matthews Asia
Strategic Income
Fund | |
| Net Realized Gain (Loss) | |
| Interest rate contracts: | |
| Financial futures contracts | | ($ | 143,772 | ) | |
| Forward Currency Exchange Contracts: | |
| Foreign currency related transactions | | ($ | 65,267 | ) | |
| Net Change in Unrealized Appreciation (Depreciation) | |
| Interest rate contracts: | |
| Financial futures contracts | | $ | 7,525 | | |
| Forward Currency Exchange Contracts: | |
| Foreign currency related translations | | $ | 43,004 | | |
For the six-month period ended June 30, 2012, the average quarterly balances of outstanding derivative financial instruments were as follows:
| | | Matthews Asia
Strategic Income
Fund | |
| Financial Futures Contracts (Interest Rate Risk): | |
| Average number of contracts sold | | | 15 | | |
| Average notional value of contracts sold | | $ | 1,961,719 | | |
| Forward Foreign Currency Exchange Contracts (Foreign Currency Exchange Risk): | |
| Average number of contracts—U.S. dollars purchased | | | 1 | | |
| Average U.S. dollar amounts purchased | | $ | 788,838 | | |
| Average number of contracts—U.S. dollars sold | | | 1 | | |
| Average U.S. dollar amounts sold | | $ | 788,926 | | |
4. CAPITAL SHARE TRANSACTIONS
Each Fund is authorized to issue an unlimited number of shares of beneficial interest with a par value of $0.001 per share.
| | | Six-Month Period Ended
June 30, 2012 (Unaudited) | | Period Ended December 31, 2011 | |
| MATTHEWS ASIA STRATEGIC INCOME FUND* | | Shares | | Amount | | Shares | | Amount | |
| Investor Class | |
| Shares sold | | | 1,111,806 | | | $ | 11,335,247 | | | | 778,753 | | | $ | 7,781,032 | | |
| Shares issued through reinvestment of distributions | | | 23,627 | | | | 239,374 | | | | 1,377 | | | | 13,650 | | |
| Shares redeemed | | | (177,419 | ) | | | (1,819,083 | ) | | | (52 | ) | | | (519 | ) | |
| Net increase (decrease) | | | 958,014 | | | $ | 9,755,538 | | | | 780,078 | | | $ | 7,794,163 | | |
106 MATTHEWS ASIA FUNDS
| | | Six-Month Period Ended
June 30, 2012 (Unaudited) | | Period Ended December 31, 2011 | |
| | | Shares | | Amount | | Shares | | Amount | |
| Institutional Class | |
| Shares sold | | | 5,962 | | | $ | 61,161 | | | | 529,314 | | | $ | 5,293,133 | | |
| Shares issued through reinvestment of distributions | | | 9,114 | | | | 92,374 | | | | 976 | | | | 9,676 | | |
| Shares redeemed | | | (1,778 | ) | | | (18,004 | ) | | | — | | | | — | | |
| Net increase (decrease) | | | 13,298 | | | $ | 135,531 | | | | 530,290 | | | $ | 5,302,809 | | |
* Investor Class and Institutional Class commenced of operations on November 30, 2011.
| | | Six-Month Period Ended
June 30, 2012 (Unaudited) | | Year Ended December 31, 2011 | |
| MATTHEWS ASIAN GROWTH AND INCOME FUND | | Shares | | Amount | | Shares | | Amount | |
| Investor Class | |
| Shares sold | | | 18,901,739 | | | $ | 306,087,654 | | | | 32,060,064 | | | $ | 559,112,796 | | |
| Shares issued through reinvestment of distributions | | | 1,814,819 | | | | 28,655,986 | | | | 10,068,790 | | | | 158,200,819 | | |
| Shares redeemed | | | (19,295,236 | ) | | | (312,606,086 | ) | | | (104,375,074 | ) | | | (1,819,398,166 | ) | |
| Net increase (decrease) | | | 1,421,322 | | | $ | 22,137,554 | | | | (62,246,220 | ) | | ($ | 1,102,084,551 | ) | |
| | | Six-Month Period Ended
June 30, 2012 (Unaudited) | | Year Ended December 31, 2011 | |
| | | Shares | | Amount | | Shares | | Amount | |
| Institutional Class | |
| Shares sold | | | 10,837,635 | | | $ | 177,542,777 | | | | 42,908,389 | | | $ | 768,482,507 | | |
| Shares issued through reinvestment of distributions | | | 510,238 | | | | 8,056,652 | | | | 2,445,888 | | | | 38,413,987 | | |
| Shares redeemed | | | (3,171,162 | ) | | | (50,886,761 | ) | | | (17,185,882 | ) | | | (283,032,015 | ) | |
| Net increase (decrease) | | | 8,176,711 | | | $ | 134,712,668 | | | | 28,168,395 | | | $ | 523,864,479 | | |
| | | Six-Month Period Ended
June 30, 2012 (Unaudited) | | Year Ended December 31, 2011 | |
| MATTHEWS ASIA DIVIDEND FUND | | Shares | | Amount | | Shares | | Amount | |
| Investor Class | |
| Shares sold | | | 37,785,921 | | | $ | 502,767,152 | | | | 110,243,475 | | | $ | 1,519,475,047 | | |
| Shares issued through reinvestment of distributions | | | 2,180,675 | | | | 28,630,288 | | | | 4,409,967 | | | | 57,884,041 | | |
| Shares redeemed | | | (25,608,185 | ) | | | (340,211,995 | ) | | | (94,904,591 | ) | | | (1,294,339,749 | ) | |
| Net increase (decrease) | | | 14,358,411 | | | $ | 191,185,445 | | | | 19,748,851 | | | $ | 283,019,339 | | |
| | | Six-Month Period Ended
June 30, 2012 (Unaudited) | | Year Ended December 31, 2011 | |
| | | Shares | | Amount | | Shares | | Amount | |
| Institutional Class | |
| Shares sold | | | 17,321,247 | | | $ | 230,373,541 | | | | 37,459,944 | | | $ | 527,212,815 | | |
| Shares issued through reinvestment of distributions | | | 387,207 | | | | 5,070,173 | | | | 394,869 | | | | 5,170,880 | | |
| Shares redeemed | | | (2,807,594 | ) | | | (37,412,298 | ) | | | (13,615,599 | ) | | | (175,025,328 | ) | |
| Net increase (decrease) | | | 14,900,860 | | | $ | 198,031,416 | | | | 24,239,214 | | | $ | 357,358,367 | | |
matthewsasia.com | 800.789.ASIA 107
Notes to Financial Statements (unaudited) (continued)
| | | Six-Month Period Ended
June 30, 2012 (Unaudited) | | Year Ended December 31, 2011 | |
| MATTHEWS CHINA DIVIDEND FUND | | Shares | | Amount | | Shares | | Amount | |
| Investor Class | |
| Shares sold | | | 535,697 | | | $ | 5,916,457 | | | | 1,578,670 | | | $ | 18,586,260 | | |
| Shares issued through reinvestment of distributions | | | 50,548 | | | | 535,306 | | | | 98,443 | | | | 1,066,240 | | |
| Shares redeemed | | | (673,105 | ) | | | (7,365,159 | ) | | | (2,774,075 | ) | | | (30,866,410 | ) | |
| Net increase (decrease) | | | (86,860 | ) | | ($ | 913,396 | ) | | | (1,096,962 | ) | | ($ | 11,213,910 | ) | |
| | | Six-Month Period Ended
June 30, 2012 (Unaudited) | | Year Ended December 31, 2011 | |
| | | Shares | | Amount | | Shares | | Amount | |
| Institutional Class | |
| Shares sold | | | 2,389 | | | $ | 27,413 | | | | 1,623 | | | $ | 20,100 | | |
| Shares issued through reinvestment of distributions | | | 75 | | | | 798 | | | | 42 | | | | 446 | | |
| Shares redeemed | | | — | | | | — | | | | (815 | ) | | | (9,840 | ) | |
| Net increase (decrease) | | | 2,464 | | | $ | 28,211 | | | | 850 | | | $ | 10,706 | | |
| | | Six-Month Period Ended
June 30, 2012 (Unaudited) | | Year Ended December 31, 2011 | |
| MATTHEWS ASIA GROWTH FUND | | Shares | | Amount | | Shares | | Amount | |
| Investor Class | |
| Shares sold | | | 1,648,664 | | | $ | 27,452,652 | | | | 5,632,916 | | | $ | 97,848,412 | | |
| Shares issued through reinvestment of distributions | | | 6 | | | | 99 | | | | 348,624 | | | | 5,393,217 | | |
| Shares redeemed | | | (2,593,072 | ) | | | (42,660,447 | ) | | | (7,753,246 | ) | | | (132,663,366 | ) | |
| Net increase (decrease) | | | (944,402 | ) | | ($ | 15,207,696 | ) | | | (1,771,706 | ) | | ($ | 29,421,737 | ) | |
| | | Six-Month Period Ended
June 30, 2012 (Unaudited) | | Year Ended December 31, 2011 | |
| | | Shares | | Amount | | Shares | | Amount | |
| Institutional Class | |
| Shares sold | | | 2,731,300 | | | $ | 45,877,524 | | | | 7,003,033 | | | $ | 119,247,333 | | |
| Shares issued through reinvestment of distributions | | | — | | | | — | | | | 118,577 | | | | 1,837,939 | | |
| Shares redeemed | | | (1,724,898 | ) | | | (28,884,996 | ) | | | (2,128,608 | ) | | | (35,580,135 | ) | |
| Net increase (decrease) | | | 1,006,402 | | | $ | 16,992,528 | | | | 4,993,002 | | | $ | 85,505,137 | | |
| | | Six-Month Period Ended
June 30, 2012 (Unaudited) | | Year Ended December 31, 2011 | |
| MATTHEWS PACIFIC TIGER FUND | | Shares | | Amount | | Shares | | Amount | |
| Investor Class | |
| Shares sold | | | 16,539,491 | | | $ | 361,437,123 | | | | 41,532,204 | | | $ | 934,343,952 | | |
| Shares issued through reinvestment of distributions | | | 1 | | | | 24 | | | | 2,676,956 | | | | 55,278,364 | | |
| Shares redeemed | | | (15,205,450 | ) | | | (330,190,300 | ) | | | (129,175,269 | ) | | | (2,984,869,324 | ) | |
| Net increase (decrease) | | | 1,334,042 | | | $ | 31,246,847 | | | | (84,966,109 | ) | | ($ | 1,995,247,008 | ) | |
108 MATTHEWS ASIA FUNDS
| | | Six-Month Period Ended
June 30, 2012 (Unaudited) | | Year Ended December 31, 2011 | |
| | | Shares | | Amount | | Shares | | Amount | |
| Institutional Class | |
| Shares sold | | | 41,944,006 | | | $ | 917,949,690 | | | | 91,157,431 | | | $ | 2,125,434,487 | | |
| Shares issued through reinvestment of distributions | | | — | | | | — | | | | 1,088,887 | | | | 22,463,738 | | |
| Shares redeemed | | | (6,823,017 | ) | | | (147,934,643 | ) | | | (15,469,797 | ) | | | (338,404,484 | ) | |
| Net increase (decrease) | | | 35,120,989 | | | $ | 770,015,047 | | | | 76,776,521 | | | $ | 1,809,493,741 | | |
| | | Six-Month Period Ended
June 30, 2012 (Unaudited) | | Year Ended December 31, 2011 | |
| MATTHEWS CHINA FUND | | Shares | | Amount | | Shares | | Amount | |
| Investor Class | |
| Shares sold | | | 6,906,230 | | | $ | 159,558,774 | | | | 16,475,470 | | | $ | 462,682,408 | | |
| Shares issued through reinvestment of distributions | | | 3 | | | | 55 | | | | 8,291,580 | | | | 182,081,269 | | |
| Shares redeemed | | | (15,466,381 | ) | | | (352,803,009 | ) | | | (39,534,640 | ) | | | (1,062,621,657 | ) | |
| Net increase (decrease) | | | (8,560,148 | ) | | ($ | 193,244,180 | ) | | | (14,767,590 | ) | | ($ | 417,857,980 | ) | |
| | | Six-Month Period Ended
June 30, 2012 (Unaudited) | | Year Ended December 31, 2011 | |
| | | Shares | | Amount | | Shares | | Amount | |
| Institutional Class | |
| Shares sold | | | 9,607,181 | | | $ | 220,388,221 | | | | 12,452,573 | | | $ | 289,794,029 | | |
| Shares issued through reinvestment of distributions | | | — | | | | — | | | | 254,874 | | | | 5,591,931 | | |
| Shares redeemed | | | (3,637,716 | ) | | | (82,458,178 | ) | | | (709,945 | ) | | | (16,414,721 | ) | |
| Net increase (decrease) | | | 5,969,465 | | | $ | 137,930,043 | | | | 11,997,502 | | | $ | 278,971,239 | | |
| | | Six-Month Period Ended
June 30, 2012 (Unaudited) | | Year Ended December 31, 2011 | |
| MATTHEWS INDIA FUND | | Shares | | Amount | | Shares | | Amount | |
| Investor Class | |
| Shares sold | | | 3,012,241 | | | $ | 48,586,663 | | | | 10,457,996 | | | $ | 199,418,664 | | |
| Shares issued through reinvestment of distributions | | | 1 | | | | 17 | | | | 182,527 | | | | 2,717,658 | | |
| Shares redeemed | | | (7,156,086 | ) | | | (112,446,582 | ) | | | (34,128,620 | ) | | | (639,558,369 | ) | |
| Net increase (decrease) | | | (4,143,844 | ) | | ($ | 63,859,902 | ) | | | (23,488,097 | ) | | ($ | 437,422,047 | ) | |
| | | Six-Month Period Ended
June 30, 2012 (Unaudited) | | Year Ended December 31, 2011 | |
| | | Shares | | Amount | | Shares | | Amount | |
| Institutional Class | |
| Shares sold | | | 22,556 | | | $ | 364,084 | | | | 371,582 | | | $ | 7,299,291 | | |
| Shares issued through reinvestment of distributions | | | — | | | | — | | | | 8,878 | | | | 132,371 | | |
| Shares redeemed | | | (45,897 | ) | | | (785,795 | ) | | | (641,677 | ) | | | (10,550,308 | ) | |
| Net increase (decrease) | | | (23,341 | ) | | ($ | 421,711 | ) | | | (261,217 | ) | | ($ | 3,118,646 | ) | |
matthewsasia.com | 800.789.ASIA 109
Notes to Financial Statements (unaudited) (continued)
| | | Six-Month Period Ended
June 30, 2012 (Unaudited) | | Year Ended December 31, 2011 | |
| MATTHEWS JAPAN FUND | | Shares | | Amount | | Shares | | Amount | |
| Investor Class | |
| Shares sold | | | 1,584,324 | | | $ | 18,650,782 | | | | 9,300,532 | | | $ | 114,703,172 | | |
| Shares issued through reinvestment of distributions | | | — | | | | — | | | | 167,878 | | | | 1,900,379 | | |
| Shares redeemed | | | (2,819,730 | ) | | | (32,833,094 | ) | | | (5,937,057 | ) | | | (71,506,114 | ) | |
| Net increase (decrease) | | | (1,235,406 | ) | | ($ | 14,182,312 | ) | | | 3,531,353 | | | $ | 45,097,437 | | |
| | | Six-Month Period Ended
June 30, 2012 (Unaudited) | | Year Ended December 31, 2011 | |
| | | Shares | | Amount | | Shares | | Amount | |
| Institutional Class | |
| Shares sold | | | 477,221 | | | $ | 5,661,121 | | | | 2,679,969 | | | $ | 33,412,230 | | |
| Shares issued through reinvestment of distributions | | | — | | | | — | | | | 34,653 | | | | 392,273 | | |
| Shares redeemed | | | (916,947 | ) | | | (10,812,032 | ) | | | (42,618 | ) | | | (490,305 | ) | |
| Net increase (decrease) | | | (439,726 | ) | | ($ | 5,150,911 | ) | | | 2,672,004 | | | $ | 33,314,198 | | |
| | | Six-Month Period Ended
June 30, 2012 (Unaudited) | | Year Ended December 31, 2011 | |
| MATTHEWS KOREA FUND | | Shares | | Amount | | Shares | | Amount | |
| Investor Class | |
| Shares sold | | | 1,322,413 | | | $ | 6,456,017 | | | | 9,980,437 | | | $ | 52,613,715 | | |
| Shares issued through reinvestment of distributions | | | — | | | | — | | | | 1,372,595 | | | | 6,464,876 | | |
| Shares redeemed | | | (4,170,481 | ) | | | (20,356,768 | ) | | | (13,035,214 | ) | | | (65,292,520 | ) | |
| Net increase (decrease) | | | (2,848,068 | ) | | ($ | 13,900,751 | ) | | | (1,682,182 | ) | | ($ | 6,213,929 | ) | |
| | | Six-Month Period Ended
June 30, 2012 (Unaudited) | | Year Ended December 31, 2011 | |
| | | Shares | | Amount | | Shares | | Amount | |
| Institutional Class | |
| Shares sold | | | 8,618,941 | | | $ | 42,519,900 | | | | 3,273,646 | | | $ | 16,597,460 | | |
| Shares issued through reinvestment of distributions | | | — | | | | — | | | | 21,797 | | | | 102,882 | | |
| Shares redeemed | | | (7,191,186 | ) | | | (33,294,870 | ) | | | (18,269 | ) | | | (102,473 | ) | |
| Net increase (decrease) | | | 1,427,755 | | | $ | 9,225,030 | | | | 3,277,174 | | | $ | 16,597,869 | | |
| | | Six-Month Period Ended
June 30, 2012 (Unaudited) | | Year Ended December 31, 2011 | |
| MATTHEWS ASIA SMALL COMPANIES FUND | | Shares | | Amount | | Shares | | Amount | |
| Investor Class | |
| Shares sold | | | 5,403,785 | | | $ | 88,688,403 | | | | 7,391,135 | | | $ | 149,600,807 | | |
| Shares issued through reinvestment of distributions | | | — | | | | — | | | | 2,209,203 | | | | 33,557,805 | | |
| Shares redeemed | | | (3,209,881 | ) | | | (51,210,156 | ) | | | (17,921,097 | ) | | | (341,096,658 | ) | |
| Net increase (decrease) | | | 2,193,904 | | | $ | 37,478,247 | | | | (8,320,759 | ) | | ($ | 157,938,046 | ) | |
110 MATTHEWS ASIA FUNDS
| | | Six-Month Period Ended
June 30, 2012 (Unaudited) | | Period Ended December 31, 2011 | |
| MATTHEWS CHINA SMALL COMPANIES FUND* | | Shares | | Amount | | Shares | | Amount | |
| Investor Class | |
| Shares sold | | | 370,546 | | | $ | 2,818,272 | | | | 850,982 | | | $ | 7,444,714 | | |
| Shares issued through reinvestment of distributions | | | — | | | | — | | | | 824 | | | | 5,923 | | |
| Shares redeemed | | | (267,579 | ) | | | (1,967,449 | ) | | | (213,196 | ) | | | (1,583,026 | ) | |
| Net increase (decrease) | | | 102,967 | | | $ | 850,823 | | | | 638,610 | | | $ | 5,867,611 | | |
* The Investor Class commenced operations on May 31, 2011.
| | | Six-Month Period Ended
June 30, 2012 (Unaudited) | | Year Ended December 31, 2011 | |
| MATTHEWS ASIA SCIENCE AND TECHNOLOGY FUND | | Shares | | Amount | | Shares | | Amount | |
| Investor Class | |
| Shares sold | | | 389,457 | | | $ | 3,445,528 | | | | 8,443,941 | | | $ | 78,551,775 | | |
| Shares issued through reinvestment of distributions | | | — | | | | — | | | | 50,284 | | | | 420,876 | | |
| Shares redeemed | | | (3,132,408 | ) | | | (27,015,458 | ) | | | (8,950,512 | ) | | | (83,993,985 | ) | |
| Net increase (decrease) | | | (2,742,951 | ) | | ($ | 23,569,930 | ) | | | (456,287 | ) | | ($ | 5,021,334 | ) | |
The Funds generally assess a redemption fee of 2.00% of the total redemption proceeds if shareholders sell or exchange their shares within 90 calendar days after purchasing them. The redemption fee is paid directly to the Funds and is designed to offset transaction costs associated with short-term trading of Fund shares. For purposes of determining whether the redemption fee applies, the shares that have been held the longest will be redeemed first. The Funds may grant an exemption from the redemption fee when the Funds have previously received assurances that transactions do not involve a substantial risk of the type of harm that the policy is designed to avoid. The Funds may also waive the imposition of redemption fees in certain circumstances. For more information on this policy, please see the Funds' prospectus. The redemption fees returned to the assets of the Funds are stated in the Statements of Changes in Net Assets.
5. INVESTMENT ADVISORY FEES AND OTHER TRANSACTIONS WITH AFFILIATES
Matthews International Capital Management, LLC ("Matthews"), a registered investment advisor under the 1940 Act, provides the Funds with investment management services. Pursuant to an Investment Advisory Agreement dated August 13, 2004, as amended (the "Advisory Agreement"), the Funds pay Matthews (i) for management and advisory services; and (ii) for certain administrative services, an annual fee as a percentage of average daily net assets. Under the Advisory Agreement each of the Funds, other than Matthews Asia Strategic Income Fund, Matthews Asia Small Companies Fund and Matthews China Small Companies Fund pays Matthews 0.75% of their annual aggregate average daily net assets up to $2 billion, 0.6834% of the annual aggregate average daily net assets between $2 billion and $5 billion, and 0.65% of the annual aggregate average daily net assets over $5 billion. Matthews Asia Strategic Income Fund pays Matthews an annual fee of 0.65% of its annual average daily net assets pursuant to the Advisory Agreement. Matthews Asia Small Companies Fund and Matthews China Small Companies Fund pay Matthews an annual fee of 1.00% of their annual average daily net assets pursuant to the Advisory Agreement. Each Fund pays Matthews a monthly fee of one-twelfth (1/12) of the management fee of the Fund's average daily net asset value.
Under a written agreement between the Funds and Matthews, Matthews agrees to waive fees and reimburse money to a Fund if its expense ratio exceeds a certain percentage level. For Matthews Asia Science and Technology Fund, Matthews China Fund, Matthews India Fund, Matthews Japan Fund, Matthews Korea Fund, Matthews Asia Small Companies Fund and Matthews China Small Companies Fund, this level is 2.00%. For Matthews Asia Growth Fund, Matthews Pacific Tiger Fund and Matthews Asian Growth and Income Fund, this level is 1.90%. For Matthews Asia Dividend Fund and Matthews China Dividend Fund, this level is 1.50%. For Matthews Asia Strategic Income Fund, Matthews agrees to waive fees and reimburse money to the Fund if its expense ratio exceeds 1.25% for the Institutional Class and agrees to reduce the expense ratio by an equal amount for the Investor Class. In turn, if a Fund's expenses fall below the level noted within three years after Matthews has made such a reimbursement, the Fund may reimburse Matthews up to an amount of the recoupment available not to exceed its expense limitation. For each Fund other than Matthews China Dividend Fund, Matthews China Small Companies Fund and Matthews Asia Strategic Income Fund, this agreement will continue through at least August 31, 2012. For Matthews China Dividend Fund, this agreement will continue through at least August 31, 2013. For Matthews China Small Companies Fund and Matthews Asia Strategic Income Fund, this agreement will continue through at least August 31, 2014. These agreements may be extended for additional periods for each of the Funds.
Matthews has also agreed to waive fees and reimburse additional expenses for the Institutional Class of Matthews Asia Strategic Income Fund on a voluntary basis if its expense ratio exceeds 1.00%. Furthermore, any amounts voluntarily waived by Matthews in respect of the Institutional Class of Matthews Asia Strategic Income Fund, excluding any voluntary waiver of class-specific shareholder servicing fees, will also be waived for the Investor Class of Matthews Asia Strategic Income Fund. These voluntary waivers and/or reimbursements may be terminated at any time in the sole and absolute discretion of Matthews. At June 30, 2012, Matthews China Dividend Fund had $151,750 available for recoupment, of which $30,662 expires in 2012, $96,407 expires in 2013, $8,122 expires in 2014 and $16,559 expires in 2015. Matthews China Small Companies Fund had $120,272 available for recoupment, which $76,945 expires in 2014 and $43,328 expires in 2015. Matthews Asia Strategic Income Fund had $95,228 available for recoupment, which $22,796 expires in 2014 and $72,432 expires in 2015. Matthews Asian Growth and Income Fund, Matthews Asia Dividend Fund, Matthews Asia Growth Fund, Matthews Pacific Tiger Fund, Matthews China Fund, Matthews India Fund, Matthews Japan Fund, Matthews Korea Fund, Matthews Asia Small Companies Fund, Matthews Asia Science and Technology Fund had no amounts available for recoupment and no amounts recouped during the year.
matthewsasia.com | 800.789.ASIA 111
Notes to Financial Statements (unaudited) (continued)
Investment advisory fees charged, waived and reimbursed for the six-month period ended June 30, 2012, were as follows:
| | | Gross Advisory Fees | | Advisory Fees
Waived and
Reimbursed in
Excess of the
Expense Limitation | | Net Advisory Fee/
Reimbursement | |
| Matthews Asia Strategic Income Fund | | $ | 63,267 | | | ($ | 72,432 | ) | | ($ | 9,165 | ) | |
| Matthews Asian Growth and Income Fund | | | 10,713,918 | | | | — | | | | 10,713,918 | | |
| Matthews Asia Dividend Fund | | | 8,801,237 | | | | — | | | | 8,801,237 | | |
| Matthews China Dividend Fund | | | 96,597 | | | | (16,559 | ) | | | 80,038 | | |
| Matthews Asia Growth Fund | | | 1,251,474 | | | | — | | | | 1,251,474 | | |
| Matthews Pacific Tiger Fund | | | 18,439,460 | | | | — | | | | 18,439,460 | | |
| Matthews China Fund | | | 7,812,110 | | | | — | | | | 7,812,110 | | |
| Matthews India Fund | | | 2,245,101 | | | | — | | | | 2,245,101 | | |
| Matthews Japan Fund | | | 410,130 | | | | — | | | | 410,130 | | |
| Matthews Korea Fund | | | 617,146 | | | | — | | | | 617,146 | | |
| Matthews Asia Small Companies Fund | | | 1,592,549 | | | | — | | | | 1,592,549 | | |
| Matthews China Small Companies Fund | | | 28,543 | | | | (43,328 | ) | | | (14,785 | ) | |
| Matthews Asia Science and Technology Fund | | | 504,929 | | | | — | | | | 504,929 | | |
Certain officers and Trustees of the Funds are also officers and directors of Matthews. All officers serve without compensation from the Funds. The Funds paid the Independent Trustees $338,000 in aggregate for regular compensation during the six-month period ended June 30, 2012.
The Funds have a Shareholder Services Agreement, in which the Funds pay an annual administration and shareholder servicing fee to Matthews, as a percentage of the average daily net assets of each Fund in aggregate, computed and prorated on a daily basis. Under the Shareholder Services Agreement, the Funds pay 0.25% of their aggregate average daily net assets between $0 and $2 billion, 0.1834% of their aggregate average daily net assets between $2 billion and $5 billion, 0.15% of their aggregate average daily net assets between $5 billion and $7.5 billion, 0.125% of their aggregate average daily net assets between $7.5 billion and $15 billion and 0.11% of their aggregate average daily net assets over $15 billion.
Administration and shareholder servicing fees charged, for the six-month period ended June 30, 2012, were as follows:
| | | Administration and
Shareholder
Servicing Fees | |
| Matthews Asia Strategic Income Fund | | $ | 15,176 | | |
| Matthews Asian Growth and Income Fund | | | 2,495,056 | | |
| Matthews Asia Dividend Fund | | | 2,049,499 | | |
| Matthews China Dividend Fund | | | 22,493 | | |
| Matthews Asia Growth Fund | | | 291,437 | | |
| Matthews Pacific Tiger Fund | | | 4,294,084 | | |
| Matthews China Fund | | | 1,819,119 | | |
| Matthews India Fund | | | 522,763 | | |
| Matthews Japan Fund | | | 95,557 | | |
| Matthews Korea Fund | | | 143,643 | | |
| Matthews Asia Small Companies Fund | | | 248,333 | | |
| Matthews China Small Companies Fund | | | 4,449 | | |
| Matthews Asia Science and Technology Fund | | | 117,611 | | |
112 MATTHEWS ASIA FUNDS
The Funds bear a portion of the fees paid to certain service providers (exclusive of the Funds' Transfer Agent) which provide transfer agency and shareholder servicing to certain shareholders. Additional information concerning these services and fees is contained in the Funds' prospectus. Fees accrued to pay to such service providers for the six-month period ended June 30, 2012 are a component of Transfer Agent fees and Administration and Shareholder Servicing Fees in the Statements of Operations as follows:
| | | Transfer Agent Fees | | Administration &
Shareholder
Servicing Fees | | Total | |
| Matthews Asia Strategic Income Fund | | $ | 5,121 | | | $ | 2,561 | | | $ | 7,682 | | |
| Matthews Asian Growth and Income Fund | | | 1,862,085 | | | | 931,043 | | | | 2,793,128 | | |
| Matthews Asia Dividend Fund | | | 1,346,543 | | | | 673,271 | | | | 2,019,814 | | |
| Matthews China Dividend Fund | | | 20,079 | | | | 10,040 | | | | 30,119 | | |
| Matthews Asia Growth Fund | | | 199,769 | | | | 99,885 | | | | 299,654 | | |
| Matthews Pacific Tiger Fund | | | 2,496,767 | | | | 1,248,384 | | | | 3,745,151 | | |
| Matthews China Fund | | | 1,400,541 | | | | 700,270 | | | | 2,100,811 | | |
| Matthews India Fund | | | 441,620 | | | | 220,810 | | | | 662,430 | | |
| Matthews Japan Fund | | | 68,500 | | | | 34,250 | | | | 102,750 | | |
| Matthews Korea Fund | | | 90,519 | | | | 45,260 | | | | 135,779 | | |
| Matthews Asia Small Companies Fund | | | 210,545 | | | | 105,273 | | | | 315,818 | | |
| Matthews China Small Companies Fund | | | 5,528 | | | | 2,764 | | | | 8,292 | | |
| Matthews Asia Science and Technology Fund | | | 91,055 | | | | 45,527 | | | | 136,582 | | |
BNY Mellon Investment Servicing (US) Inc. ("BNY Mellon"), an indirect wholly owned subsidiary of The Bank of New York Mellon Corporation, serves as the Funds administrator, and in that capacity, performs various administrative and accounting services for each Fund. BNY Mellon also serves as the Funds' transfer agent, dividend disbursing agent and registrar. An officer of BNY Mellon serves as Assistant Treasurer to the Funds. Total fees accrued by the Funds for administration and accounting services for the six-month period ended June 30, 2012 were as follows:
| | | Administration and
Accounting Fees | |
| Matthews Asia Strategic Income Fund | | $ | 774 | | |
| Matthews Asian Growth and Income Fund | | | 127,257 | | |
| Matthews Asia Dividend Fund | | | 104,531 | | |
| Matthews China Dividend Fund | | | 1,147 | | |
| Matthews Asia Growth Fund | | | 14,864 | | |
| Matthews Pacific Tiger Fund | | | 219,010 | | |
| Matthews China Fund | | | 92,762 | | |
| Matthews India Fund | | | 26,649 | | |
| Matthews Japan Fund | | | 4,872 | | |
| Matthews Korea Fund | | | 7,330 | | |
| Matthews Asia Small Companies Fund | | | 12,669 | | |
| Matthews China Small Companies Fund | | | 227 | | |
| Matthews Asia Science and Technology Fund | | | 5,997 | | |
Brown Brothers Harriman & Co. serves as the Funds' custodian. Foreside Funds Distributors LLC, serves as the Funds' distributor in the United States pursuant to an Underwriting Agreement. Matthews Asia Funds are distributed in Latin America by HMC Partners.
On November 30, 2011, Matthews invested USD$10 million in Matthews Asia Strategic Income Fund to provide the Fund with its initial investment assets. As of June 30, 2012, the Fund's net assets were $23,228,045, of which 1,018,524 shares held by Matthews represented 45%.
The Funds entered into transactions with J.P. Morgan Chase Bank, N.A., including its subsidiaries and affiliates ("J.P. Morgan") acting as a broker-dealer in the purchase and sale of portfolio investments on an agency basis. The aggregate value of such transactions with J.P. Morgan by the Funds in 2012 was $379,863. In addition, pursuant to an Administrative Fee Agreement dated July 1, 2009, the Funds received certain shareholder, administrative and sub-transfer agency services from J.P. Morgan (including transmission of purchase and redemption orders in accordance with the Funds' prospectus; maintenance of separate records for its clients; mailing of shareholder confirmations and periodic statements; processing dividend payments; and shareholder information and support). Pursuant to the agreement with J.P. Morgan, the Funds paid J.P. Morgan $487,275 for such services.
matthewsasia.com | 800.789.ASIA 113
Notes to Financial Statements (unaudited) (continued)
6. INVESTMENTS
The value of investment transactions made for affiliated and unaffiliated holdings for the six-month period ended June 30, 2012, excluding short-term investments, were as follows:
| | | Affiliated Purchases | | Unaffiliated
Purchases | | Proceeds from
Unaffiliated Sales | |
| Matthews Asia Strategic Income Fund | | $ | — | | | $ | 11,319,099 | | | $ | 1,574,573 | | |
| Matthews Asian Growth and Income Fund | | | — | | | | 433,969,757 | | | | 240,555,660 | | |
| Matthews Asia Dividend Fund | | | 35,658,359 | | | | 387,814,262 | | | | 85,545,499 | | |
| Matthews China Dividend Fund | | | — | | | | 3,929,220 | | | | 5,059,963 | | |
| Matthews Asia Growth Fund | | | — | | | | 117,155,647 | | | | 110,362,236 | | |
| Matthews Pacific Tiger Fund | | | 142,986,731 | | | | 694,681,318 | | | | 135,540,979 | | |
| Matthews China Fund | | | — | | | | 161,872,829 | | | | 182,213,610 | | �� |
| Matthews India Fund | | | — | | | | 31,872,636 | | | | 100,687,393 | | |
| Matthews Japan Fund | | | — | | | | 33,030,714 | | | | 52,534,265 | | |
| Matthews Korea Fund | | | — | | | | 37,933,371 | | | | 42,285,649 | | |
| Matthews Asia Small Companies Fund | | | — | | | | 78,489,366 | | | | 39,559,149 | | |
| Matthews China Small Companies Fund | | | — | | | | 2,204,834 | | | | 1,278,089 | | |
| Matthews Asia Science and Technology Fund | | | — | | | | 27,495,885 | | | | 52,216,667 | | |
7. HOLDINGS OF 5% VOTING SHARES OF PORTFOLIO COMPANIES
The 1940 Act defines "affiliated companies" to include investments in portfolio companies in which a fund owns 5% or more of the outstanding voting shares. During the six-month period ended June 30, 2012, the Funds below held 5% or more of the outstanding voting shares of the noted portfolio companies. During this period, other Funds in the Trust may also have held voting shares of the issuers at levels below 5%.
Investments in affiliates:
A summary of transactions in securities of issuers affiliated with a Fund for the six-month period ended June 30, 2012 is set forth below:
| | | Shares Held at
Dec. 31, 2011 | | Shares
Purchased | | Shares
Sold | | Shares Held at
June 30, 2012 | | Value at
June 30, 2012 | | Dividend
Income
Jan. 1, 2012–
June 30, 2012 | |
| MATTHEWS ASIAN GROWTH AND INCOME FUND | |
| Name of Issuer: | |
| Citic Telecom International Holdings, Ltd. | | | 132,231,000 | | | | — | | | | — | | | | 132,231,000 | | | $ | 24,130,131 | | | $ | 1,227,194 | | |
| Vitasoy International Holdings, Ltd. | | | 51,771,000 | | | | — | | | | — | | | | 51,771,000 | | | | 43,506,325 | | | | — | | |
| Total Affiliates | | | | | | | | | | $ | 67,636,456 | | | $ | 1,227,194 | | |
| MATTHEWS ASIA DIVIDEND FUND | |
| Name of Issuer: | |
| Ascendas India Trust | | | 46,280,000 | | | | — | | | | — | | | | 46,280,000 | | | $ | 27,879,247 | | | $ | 1,095,604 | | |
| CapitaRetail China Trust, REIT | | | 38,501,000 | | | | 4,626,000 | | | | — | | | | 43,127,000 | | | | 44,690,705 | | | | 1,369,049 | | |
| EPS Corp. | | | 14,592 | | | | — | | | | — | | | | 14,592 | | | | 40,002,876 | | | | 281,665 | | |
| Johnson Health Tech Co., Ltd. | | | 11,713,100 | | | | 2,094,000 | | | | — | | | | 13,807,100 | | | | 33,673,037 | | | | — | | |
| Pigeon Corp. | | | 1,381,300 | | | | 120,500 | | | | — | | | | 1,501,800 | | | | 65,795,724 | | | | 792,040 | | |
| Shinko Plantech Co., Ltd. | | | 2,400,200 | | | | 1,360,000 | | | | — | | | | 3,760,200 | | | | 32,656,661 | | | | 919,954 | | |
| Sichuan Expressway Co., Ltd. H Shares | | | 65,612,000 | | | | 9,334,000 | | | | — | | | | 74,946,000 | | | | 25,437,685 | | | | 1,065,449 | | |
| TXC Corp. | | | 21,549,524 | | | | — | | | | — | | | | 21,549,524 | | | | 31,288,322 | | | | — | | |
| Woongjin Thinkbig Co., Ltd. | | | 2,079,870 | | | | — | | | | — | | | | 2,079,870 | | | | 18,180,703 | | | | — | | |
| Yuexiu Transport Infrastructure, Ltd.† | | | 69,730,000 | | | | 16,800,000 | | | | — | | | | 86,530,000 | | | | 42,736,057 | | | | 1,561,450 | | |
| Total Affiliates | | | | | | | | | | $ | 362,341,017 | | | $ | 7,085,211 | | |
114 MATTHEWS ASIA FUNDS
| | | Shares Held at
Dec. 31, 2011 | | Shares
Purchased | | Shares
Sold | | Shares Held at
June 30, 2012 | | Value at
June 30, 2012 | | Dividend
Income
Jan. 1, 2012–
June 30, 2012 | |
| MATTHEWS PACIFIC TIGER FUND | |
| Name of Issuer: | |
| Cheil Worldwide, Inc. | | | 5,916,350 | | | | — | | | | — | | | | 5,916,350 | | | $ | 94,499,024 | | | $ | — | | |
| Green Cross Corp. | | | 684,049 | | | | 20,000 | | | | — | | | | 704,049 | | | | 92,051,949 | | | | — | | |
| Hyflux, Ltd.† | | | 28,487,280 | | | | 33,797,000 | | | | — | | | | 62,284,280 | | | | 66,709,992 | | | | 870,674 | | |
| Li Ning Co., Ltd. | | | — | | | | 54,193,500 | | | | — | | | | 54,193,500 | | | | 30,491,829 | | | | — | | |
| MegaStudy Co., Ltd. | | | 396,412 | | | | — | | | | — | | | | 396,412 | | | | 27,162,833 | | | | — | | |
| Sinopharm Group Co., Ltd. H Shares† | | | 25,328,800 | | | | 18,174,400 | | | | — | | | | 43,503,200 | | | | 120,933,087 | | | | 1,229,861 | | |
| Yuhan Corp. | | | 584,138 | | | | — | | | | — | | | | 584,138 | | | | 68,294,703 | | | | — | | |
| Total Affiliates | | | | | | | | | | $ | 500,143,417 | | | $ | 2,100,535 | | |
| MATTHEWS CHINA FUND | |
| Name of Issuer: | |
| Lianhua Supermarket Holdings Co., Ltd. H Shares | | | 28,947,800 | | | | — | | | | — | | | | 28,947,800 | | | $ | 27,793,131 | | | $ | 549,500 | | |
| Total Affiliates | | | | | | | | | | $ | 27,793,131 | | | $ | 549,500 | | |
† Issuer was not an affiliated company at December 31, 2011.
8. SUBSEQUENT EVENTS
Management has evaluated the impact of all subsequent events on the Funds through the date the financial statements were issued, and has determined that there no additional subsequent events that require recognition or disclosure in the financial statements.
matthewsasia.com | 800.789.ASIA 115

Matthews Asia Funds
INVESTMENT ADVISOR
Matthews International Capital Management, LLC
Four Embarcadero Center, Suite 550
San Francisco, CA 94111
800.789.ASIA
CUSTODIAN
Brown Brothers Harriman & Co.
50 Milk Street
Boston, MA 02109
ACCOUNT SERVICES
Matthews Asia Funds
P.O. Box 9791
Providence, RI 02940
800.789.ASIA
LEGAL COUNSEL
Paul Hastings LLP
55 Second Street, 24th Floor
San Francisco, CA 94105
matthewsasia.com | 800.789.ASIA

P.O. Box 9791 | Providence, RI 02940 | matthewsasia.com | 800.789.ASIA (2742)
SAR-0612-277M


Item 2. Code of Ethics.
Not applicable.
Item 3. Audit Committee Financial Expert.
Not applicable.
Item 4. Principal Accountant Fees and Services.
Not applicable.
Item 5. Audit Committee of Listed registrants.
Not applicable.
Item 6. Investments.
(a) Schedule of Investments in securities of unaffiliated issuers as of the close of the reporting period is included as part of the report to shareholders filed under Item 1 of this form.
(b) Not applicable.
Item 7. Disclosure of Proxy Voting Policies and Procedures for Closed-End Management Investment Companies.
Not applicable.
Item 8. Portfolio Managers of Closed-End Management Investment Companies.
Not applicable.
Item 9. Purchases of Equity Securities by Closed-End Management Investment Company and Affiliated Purchasers.
Not applicable.
Item 10. Submission of Matters to a Vote of Security Holders.
There have been no material changes to the procedures by which the shareholders may recommend nominees to the registrant’s board of directors, where those changes were implemented after the registrant last provided disclosure in response to the requirements of Item 407(c)(2)(iv) of Regulation S-K (17 CFR 229.407) (as required by Item 22(b)(15) of Schedule 14A (17 CFR 240.14a-101)), or this Item.
Item 11. Controls and Procedures.
(a) The registrant’s principal executive and principal financial officers, or persons performing similar functions, have concluded that the registrant’s disclosure controls and procedures (as defined in Rule 30a-3(c) under the Investment Company Act of 1940, as amended (the “1940 Act”) (17 CFR 270.30a-3(c))) are effective, as of a date within 90 days of the filing date of the report that includes the disclosure required by this paragraph, based on their evaluation of these controls and procedures required by Rule 30a-3(b) under the 1940 Act (17 CFR 270.30a-3(b)) and Rules 13a-15(b) or 15d-15(b) under the Securities Exchange Act of 1934, as amended (17 CFR 240.13a-15(b) or 240.15d-15(b)).
(b) There were no changes in the registrant’s internal control over financial reporting (as defined in Rule 30a-3(d) under the 1940 Act (17 CFR 270.30a-3(d)) that occurred during the registrant’s second fiscal quarter of the period covered by this report that has materially affected, or is reasonably likely to materially affect, the registrant’s internal control over financial reporting.
Item 12. Exhibits.
(a)(1) | Not applicable. |
| |
(a)(2) | Certifications pursuant to Rule 30a-2(a) under the 1940 Act and Section 302 of the Sarbanes-Oxley Act of 2002 are attached hereto. |
| |
(a)(3) | Not applicable. |
| |
(b) | Certifications pursuant to Rule 30a-2(b) under the 1940 Act and Section 906 of the Sarbanes-Oxley Act of 2002 are attached hereto. |
SIGNATURES
Pursuant to the requirements of the Securities Exchange Act of 1934 and the Investment Company Act of 1940, the registrant has duly caused this report to be signed on its behalf by the undersigned, thereunto duly authorized.
(registrant) | | Matthews International Funds |
| |
| |
By (Signature and Title)* | | /s/ William J. Hackett |
| | William J. Hackett, President |
| | (principal executive officer) |
| | |
Date | 8/29/12 | |
| | | | |
Pursuant to the requirements of the Securities Exchange Act of 1934 and the Investment Company Act of 1940, this report has been signed below by the following persons on behalf of the registrant and in the capacities and on the dates indicated.
By (Signature and Title)* | | /s/ William J. Hackett |
| | William J. Hackett, President |
| | (principal executive officer) |
| | |
Date | 8/29/12 | |
| | | |
By (Signature and Title)* | | /s/ Shai Malka |
| | Shai Malka, Treasurer |
| | (principal financial officer) |
| | |
Date | 8/29/12 | |
| | | |
* Print the name and title of each signing officer under his or her signature.