UNITED STATES
SECURITIES AND EXCHANGE COMMISSION
Washington, D.C. 20549
FORM N-CSR
CERTIFIED SHAREHOLDER REPORT OF REGISTERED
MANAGEMENT INVESTMENT COMPANIES
Investment Company Act file number 811-08510
Matthews International Funds
(Exact name of registrant as specified in charter)
Four Embarcadero Center, Suite 550
San Francisco, CA 94111
(Address of principal executive offices) (Zip code)
William J. Hackett, President
Four Embarcadero Center, Suite 550
San Francisco, CA 94111
(Name and address of agent for service)
Registrant’s telephone number, including area code: 415-788-7553
Date of fiscal year end: December 31
Date of reporting period: June 30, 2016
Form N-CSR is to be used by management investment companies to file reports with the Commission not later than 10 days after the transmission to stockholders of any report that is required to be transmitted to stockholders under Rule 30e-1 under the Investment Company Act of 1940 (17 CFR 270.30e-1). The Commission may use the information provided on Form N-CSR in its regulatory, disclosure review, inspection, and policymaking roles.
A registrant is required to disclose the information specified by Form N-CSR, and the Commission will make this information public. A registrant is not required to respond to the collection of information contained in Form N-CSR unless the Form displays a currently valid Office of Management and Budget (“OMB”) control number. Please direct comments concerning the accuracy of the information collection burden estimate and any suggestions for reducing the burden to Secretary, Securities and Exchange Commission, 100 F Street, NE, Washington, DC 20549. The OMB has reviewed this collection of information under the clearance requirements of 44 U.S.C. § 3507.
| Item 1. | Reports to Stockholders. |
The Report to Shareholders is attached herewith.
Matthews Asia Funds | Semi-Annual Report
June 30, 2016 | matthewsasia.com
ASIA FIXED INCOME STRATEGIES
Matthews Asia Strategic Income Fund
Matthews Asia Credit Opportunities Fund
ASIA GROWTH AND INCOME STRATEGIES
Matthews Asian Growth and Income Fund
Matthews Asia Dividend Fund
Matthews China Dividend Fund
ASIA VALUE STRATEGY
Matthews Asia Value Fund
ASIA GROWTH STRATEGIES
Matthews Asia Focus Fund
Matthews Asia Growth Fund
Matthews Pacific Tiger Fund
Matthews Asia ESG Fund
Matthews Emerging Asia Fund
Matthews Asia Innovators Fund
Matthews China Fund
Matthews India Fund
Matthews Japan Fund
Matthews Korea Fund
ASIA SMALL COMPANY STRATEGIES
Matthews Asia Small Companies Fund
Matthews China Small Companies Fund
'16


Contents
*The Fund’s name changed from Matthews Asia Science and Technology Fund to Matthews Asia Innovators Fund on April 29, 2016.
Cover photo: Karaweik palace in Yangon, Myanmar
This report has been prepared for Matthews Asia Funds shareholders. It is not authorized for distribution to prospective investors unless accompanied or preceded by a current Matthews Asia Funds prospectus, which contains more complete information about the Funds’ investment objectives, risks and expenses. Additional copies of the prospectus or summary prospectus may be obtained at matthewsasia.com. Please read the prospectus carefully before you invest or send money.
The views and opinions in this report were current as of June 30, 2016. They are not guarantees of performance or investment results and should not be taken as investment advice. Investment decisions reflect a variety of factors, and the managers reserve the right to change their views about individual stocks, sectors and the markets at any time. As a result, the views expressed should not be relied upon as a forecast of a Fund’s future investment intent. Current and future portfolio holdings are subject to risk.
Statements of fact are from sources considered reliable, but neither the Funds nor the Investment Advisor makes any representation or guarantee as to their completeness or accuracy.
Investment Risk: Mutual fund shares are not deposits or obligations of, or guaranteed by, any depositary institution. Shares are not insured by the FDIC, Federal Reserve Board or any government agency and are subject to investment risks, including possible loss of principal amount invested. Investing in international and emerging markets may involve additional risks, such as social and political instability, market illiquidity, exchange-rate fluctuations, a high level of volatility and limited regulation. Fixed income investments are subject to additional risks, including, but not limited to, interest rate, credit and inflation risks. In addition, single-country and sector funds may be subject to a higher degree of market risk than diversified funds because of concentration in a specific industry, sector or geographic location. Investing in small and mid-size companies is more risky than investing in large companies as they may be more volatile and less liquid than larger companies. Please see the Funds’ prospectus and Statement of Additional Information for more risk disclosure.
Investor Class Performance and Expenses (June 30, 2016)
| | | | | | | | | | | | | | | | | | | | | | | | | | | | |
Investor Class | | | | | Average Annual Total Return | | | Inception
Date | | | Prospectus
Expense
Ratios* | | | Prospectus
Expense Ratios
after Fee Waiver
and Expense
Reimbursement* | |
| | 1 year | | | 5 years | | | 10 years | | | Since
Inception | | | | |
ASIA FIXED INCOME STRATEGIES | | | | | | | | | | | | | | | | | | | | | | | | | | | | |
Asia Strategic Income Fund (MAINX) | | | 4.82% | | | | n.a. | | | | n.a. | | | | 4.31% | | | | 11/30/11 | | | | 1.28% | | | | 1.12% | 1 |
Asia Credit Opportunities Fund (MCRDX) | | | n.a. | | | | n.a. | | | | n.a. | | | | 1.46% | | | | 4/29/16 | | | | 2.10% | | | | 1.10% | 1 |
ASIA GROWTH AND INCOME STRATEGIES | | | | | | | | | | | | | | | | | | | | | | | | | | | | |
Asian Growth and Income Fund (MACSX) | | | -1.18% | | | | 3.51% | | | | 6.83% | | | | 9.54% | | | | 9/12/94 | | | | 1.09% | | | | n.a. | |
Asia Dividend Fund (MAPIX) | | | -1.81% | | | | 5.82% | | | | n.a. | | | | 8.98% | | | | 10/31/06 | | | | 1.06% | | | | 1.05% | 2 |
China Dividend Fund (MCDFX) | | | -11.53% | | | | 5.97% | | | | n.a. | | | | 8.35% | | | | 11/30/09 | | | | 1.19% | | | | n.a. | |
ASIA VALUE STRATEGY | | | | | | | | | | | | | | | | | | | | | | | | | | | | |
Asia Value Fund (MAVRX) | | | n.a. | | | | n.a. | | | | n.a. | | | | 1.85% | | | | 11/30/15 | | | | 36.42% | | | | 1.50% | 3 |
ASIA GROWTH STRATEGIES | | | | | | | | | | | | | | | | | | | | | | | | | | | | |
Asia Focus Fund (MAFSX) | | | -5.35% | | | | n.a. | | | | n.a. | | | | -1.50% | | | | 4/30/13 | | | | 2.07% | | | | 1.50% | 3 |
Asia Growth Fund (MPACX) | | | -0.86% | | | | 5.01% | | | | 6.56% | | | | 8.81% | | | | 10/31/03 | | | | 1.11% | | | | n.a. | |
Pacific Tiger Fund (MAPTX) | | | -5.04% | | | | 4.34% | | | | 9.19% | | | | 8.51% | | | | 9/12/94 | | | | 1.09% | | | | 1.07% | 2 |
Asia ESG Fund (MASGX) | | | -7.12% | | | | n.a. | | | | n.a. | | | | -7.42% | | | | 4/30/15 | | | | 9.09% | | | | 1.44% | 3 |
Emerging Asia Fund (MEASX) | | | 8.10% | | | | n.a. | | | | n.a. | | | | 7.51% | | | | 4/30/13 | | | | 1.75% | | | | 1.50% | 3 |
Asia Innovators Fund (MATFX) | | | -8.52% | | | | 6.80% | | | | 7.61% | | | | 2.30% | | | | 12/27/99 | | | | 1.18% | | | | n.a. | |
China Fund (MCHFX) | | | -23.89% | | | | -3.53% | | | | 7.49% | | | | 8.34% | | | | 2/19/98 | | | | 1.14% | | | | n.a. | |
India Fund (MINDX) | | | -3.54% | | | | 6.76% | | | | 11.21% | | | | 11.85% | | | | 10/31/05 | | | | 1.11% | | | | n.a. | |
Japan Fund (MJFOX) | | | 5.00% | | | | 10.65% | | | | 3.03% | | | | 6.07% | | | | 12/31/98 | | | | 0.99% | | | | n.a. | |
Korea Fund (MAKOX) | | | -0.83% | | | | 6.09% | | | | 6.41% | | | | 6.13% | | | | 1/3/95 | | | | 1.10% | | | | n.a. | |
ASIA SMALL COMPANY STRATEGIES | | | | | | | | | | | | | | | | | | | | | | | | | | | | |
Asia Small Companies Fund (MSMLX) | | | -15.10% | | | | 0.73% | | | | n.a. | | | | 11.36% | | | | 9/15/08 | | | | 1.48% | | | | 1.47% | 3 |
China Small Companies Fund (MCSMX) | | | -15.96% | | | | -0.21% | | | | n.a. | | | | -1.00% | | | | 5/31/11 | | | | 2.10% | | | | 1.50% | 4 |
| * | These figures are from the fund’s prospectus dated as of April 29, 2016, and may differ from the actual expense ratios for fiscal year 2016, as shown in the financial highlights section of this report. |
| 1 | Matthews has contractually agreed (i) to waive fees and reimburse expenses to the extent needed to limit Total Annual Fund Operating Expenses (excluding Rule 12b-1 fees taxes, interest, brokerage commissions, short sale dividend expenses, expenses incurred in connection with any merger or reorganization or extraordinary expenses such as litigation) of the Institutional Class to 0.90% first by waiving class specific expenses (i.e., shareholder service fees specific to a particular class) of the Institutional Class and then, to the extent necessary, by waiving non-class specific expenses of the Institutional Class, and (ii) if any Fund-wide expenses (i.e., expenses that apply to both the Institutional Class and the Investor Class) are waived for the Institutional Class to maintain the 0.90% expense limitation, to waive an equal amount (in annual percentage terms) of those same expenses for the Investor Class. The Total Annual Fund Operating Expenses After Fee Waiver and Expense Reimbursement for the Investor Class may vary from year to year and will in some years exceed 0.90%. If the operating expenses fall below the expense limitation in a year within three years after Matthews has made a waiver or reimbursement, the Fund may reimburse Matthews up to an amount that does not cause the expenses for that year to exceed the lesser of the (i) expense limitation applicable at the time of that fee waiver and/or expense reimbursement or (ii) the expense limitation in effect at the time of recoupment. This agreement will remain in place until April 30, 2017 for the Asia Strategic Income Fund and until April 30, 2018 for the Asia Credit Opportunities Fund and may be terminated at any time by the Board of Trustees on behalf of the Fund on 60 days’ written notice to Matthews. |
| 2 | Matthews has contractually agreed to waive a portion of its advisory fee and administrative and shareholder services fee if the Fund’s average daily net assets are over $3 billion, as follows: for every $2.5 billion average daily net assets of the Fund that are over $3 billion, the advisory fee rate and the administrative and shareholder services fee rate for the Fund with respect to such excess average daily net assets will be each reduced by 0.01%, in each case without reducing such fee rate below 0.00%. Any amount waived by Matthews pursuant to this agreement may not be recouped by Matthews. This agreement will remain in place until April 30, 2017 and may be terminated at any time (i) by the Trust on behalf of the Fund or by the Board of Trustees upon 60 days’ prior written notice to Matthews; or (ii) by Matthews upon 60 days’ prior written notice to the Trust, in each case without payment of any penalty. |
| 3 | Matthews has contractually agreed (i) to waive fees and reimburse expenses to the extent needed to limit Total Annual Fund Operating Expenses (excluding Rule 12b-1 fees, taxes, interest, brokerage commissions, short sale dividend expenses, expenses incurred in connection with any merger or reorganization or extraordinary expenses such as litigation) of the Institutional Class to 1.25% first by waiving class specific expenses (i.e., shareholder service fees specific to a particular class) of the Institutional Class and then, to the extent necessary, by waiving non-class specific expenses of the Institutional Class, and (ii) if any Fund-wide expenses (i.e., expenses that apply to both the Institutional Class and the Investor Class) are waived for the Institutional Class to maintain the 1.25% expense limitation, to waive an equal amount (in annual percentage terms) of those same expenses for the Investor Class. The Total Annual Fund Operating Expenses After Fee Waiver and Expense Reimbursement for the Investor Class may vary from year to year and will in some years exceed 1.25%. If the operating expenses fall below the expense limitation in a year within three years after Matthews has made a waiver or reimbursement, the Fund may reimburse Matthews up to an amount that does not cause the expenses for that year to exceed the lesser of (i) the expense limitation applicable at the time of that fee waiver and/or expense reimbursement or (ii) the expense limitation in effect at the time of recoupment. This agreement will remain in place until April 30, 2017 for the Asia Focus Fund, Emerging Asia Fund, Asia Small Companies Fund and Asia ESG Fund, and until April 30, 2018 for the Asia Value Fund and may be terminated at any time by the Board of Trustees on behalf of the Fund on 60 days’ written notice to Matthews. |
| 4 | Matthews has contractually agreed to waive fees and reimburse expenses to the extent needed to limit Total Annual Fund Operating Expenses (excluding Rule 12b-1 fees, taxes, interest, brokerage commissions, short sale dividend expenses, expenses incurred in connection with any merger or reorganization or extraordinary expenses such as litigation) to 1.50%. If the operating expenses fall below the expense limitation in a year within three years after Matthews has made a waiver or reimbursement, the Fund may reimburse Matthews up to an amount that does not cause the expenses for that year to exceed the lesser of (i) the expense limitation applicable at the time of that fee waiver and/or expense reimbursement or (ii) the expense limitation in effect at the time of recoupment. This agreement will remain in place until April 30, 2017 and may be terminated at any time by the Board of Trustees on behalf of the Fund on 60 days’ written notice to Matthews. |
Institutional Class Performance and Expenses (June 30, 2016)
| | | | | | | | | | | | | | | | | | | | | | | | | | | | |
| Institutional Class | | | | | Average Annual Total Return | | | Inception
Date | | | Prospectus Expense
Ratios* | | | Prospectus
Expense Ratios
after Fee Waiver and Expense
Reimbursement* | |
| | 1 year | | | 5 years | | | 10 years | | | Since
Inception | | | | |
ASIA FIXED INCOME STRATEGIES | | | | | | | | | | | | | | | | | | | | | | | | | | | | |
Asia Strategic Income Fund (MINCX) | | | 5.07% | | | | n.a. | | | | n.a. | | | | 4.51% | | | | 11/30/11 | | | | 1.09% | | | | 0.90% | 1 |
Asia Credit Opportunities Fund (MICPX) | | | n.a. | | | | n.a. | | | | n.a. | | | | 1.41% | | | | 4/29/16 | | | | 1.94% | | | | 0.90% | 1 |
ASIA GROWTH AND INCOME STRATEGIES | | | | | | | | | | | | | | | | | | | | | | | | | | | | |
Asian Growth and Income Fund (MICSX) | | | -1.06% | | | | 3.66% | | | | n.a. | | | | 3.98% | | | | 10/29/10 | | | | 0.92% | | | | n.a. | |
Asia Dividend Fund (MIPIX) | | | -1.66% | | | | 5.96% | | | | n.a. | | | | 6.00% | | | | 10/29/10 | | | | 0.93% | | | | 0.92% | 3 |
China Dividend Fund (MICDX) | | | -11.33% | | | | 6.19% | | | | n.a. | | | | 6.48% | | | | 10/29/10 | | | | 1.00% | | | | n.a. | |
ASIA VALUE STRATEGY | | | | | | | | | | | | | | | | | | | | | | | | | | | | |
Asia Value Fund (MAVAX) | | | n.a. | | | | n.a. | | | | n.a. | | | | 2.02% | | | | 11/30/15 | | | | 36.17% | | | | 1.25% | 2 |
ASIA GROWTH STRATEGIES | | | | | | | | | | | | | | | | | | | | | | | | | | | | |
Asia Focus Fund (MIFSX) | | | -5.03% | | | | n.a. | | | | n.a. | | | | -1.23% | | | | 4/30/13 | | | | 1.91% | | | | 1.25% | 2 |
Asia Growth Fund (MIAPX) | | | -0.63% | | | | 5.21% | | | | n.a. | | | | 5.24% | | | | 10/29/10 | | | | 0.91% | | | | n.a. | |
Pacific Tiger Fund (MIPTX) | | | -4.85% | | | | 4.51% | | | | n.a. | | | | 4.68% | | | | 10/29/10 | | | | 0.91% | | | | 0.89% | 3 |
Asia ESG Fund (MISFX) | | | -6.86% | | | | n.a. | | | | n.a. | | | | -7.20% | | | | 4/30/15 | | | | 8.90% | | | | 1.25% | 2 |
Emerging Asia Fund (MIASX) | | | 8.32% | | | | n.a. | | | | n.a. | | | | 7.75% | | | | 4/30/13 | | | | 1.57% | | | | 1.25% | 2 |
Asia Innovators Fund (MITEX) | | | -8.37% | | | | n.a. | | | | n.a. | | | | 10.33% | | | | 4/30/13 | | | | 0.97% | | | | n.a. | |
China Fund (MICFX) | | | -23.83% | | | | -3.37% | | | | n.a. | | | | -3.28% | | | | 10/29/10 | | | | 0.99% | | | | n.a. | |
India Fund (MIDNX) | | | -3.32% | | | | 6.95% | | | | n.a. | | | | 4.85% | | | | 10/29/10 | | | | 0.90% | | | | n.a. | |
Japan Fund (MIJFX) | | | 5.10% | | | | 10.79% | | | | n.a. | | | | 11.72% | | | | 10/29/10 | | | | 0.87% | | | | n.a. | |
Korea Fund (MIKOX) | | | -0.65% | | | | 6.24% | | | | n.a. | | | | 8.58% | | | | 10/29/10 | | | | 0.93% | | | | n.a. | |
ASIA SMALL COMPANY STRATEGY | | | | | | | | | | | | | | | | | | | | | | | | | | | | |
Asia Small Companies Fund (MISMX) | | | -14.89% | | | | n.a. | | | | n.a. | | | | 0.28% | | | | 4/30/13 | | | | 1.30% | | | | 1.25% | 2 |
| * | These figures are from the fund’s prospectus dated as of April 29, 2016, and may differ from the actual expense ratios for fiscal year 2016, as shown in the financial highlights section of this report. |
| 1 | Matthews has contractually agreed to waive fees and reimburse expenses to the extent needed to limit Total Annual Fund Operating Expenses (excluding Rule 12b-1 fees, taxes, interest, brokerage commissions, short sale dividend expenses, expenses incurred in connection with any merger or reorganization or extraordinary expenses such as litigation) of the Institutional Class to 0.90%. If the operating expenses fall below the expense limitation in a year within three years after Matthews has made a waiver or reimbursement, the Fund may reimburse Matthews up to an amount that does not cause the expenses for that year to exceed the lesser of (i) the expense limitation applicable at the time of that fee waiver and/or expense reimbursement or (ii) the expense limitation in effect at the time of recoupment. This agreement will remain in place until April 30, 2017 for the Asia Strategic Income Fund and until April 30, 2018 for the Asia Credit Opportunities Fund and may be terminated at any time by the Board of Trustees on behalf of the Fund on 60 days’ written notice to Matthews. |
| 2 | Matthews has contractually agreed to waive fees and reimburse expenses to the extent needed to limit Total Annual Fund Operating Expenses (excluding Rule 12b-1 fees, taxes, interest, brokerage commissions, short sale dividend expenses, expenses incurred in connection with any merger or reorganization or extraordinary expenses such as litigation) of the Institutional Class to 1.25%. If the operating expenses fall below the expense limitation in a year within three years after Matthews has made a waiver or reimbursement, the Fund may reimburse Matthews up to an amount that does not cause the expenses for that year to exceed the lesser of (i) the expense limitation applicable at the time of that fee waiver and/or expense reimbursement or (ii) the expense limitation in effect at the time of recoupment. This agreement will remain in place until April 30, 2017 for the Asia Focus Fund, Emerging Asia Fund, Asia Small Companies Fund and Asia ESG Fund, and until April 30, 2018 for the Asia Value Fund and may be terminated at any time by the Board of Trustees on behalf of the Fund on 60 days’ written notice to Matthews. |
| 3 | Matthews has contractually agreed to waive a portion of its advisory fee and administrative and shareholder services fee if the Fund’s average daily net assets are over $3 billion, as follows: for every $2.5 billion average daily net assets of the Fund that are over $3 billion, the advisory fee rate and the administrative and shareholder services fee rate for the Fund with respect to such excess average daily net assets will be each reduced by 0.01%, in each case without reducing such fee rate below 0.00%. Any amount waived by Matthews pursuant to this agreement may not be recouped by Matthews. This agreement will remain in place until April 30, 2017 and may be terminated at any time (i) by the Trust on behalf of the Fund or by the Board of Trustees upon 60 days’ prior written notice to Matthews; or (ii) by Matthews upon 60 days’ prior written notice to the Trust, in each case without payment of any penalty. |
Past Performance: All performance quoted in this report is past performance and is no guarantee of future results. Investment return and principal value will fluctuate with changing market conditions so that when redeemed, shares may be worth more or less than their original cost. Current performance may be lower or higher than the returns quoted. If certain of the Funds’ fees and expenses had not been waived, returns would have been lower. For the Funds’ most recent month-end performance, please call 800.789.ASIA (2742) or visit matthewsasia.com.
| | | | |
| matthewsasia.com | 800.789.ASIA | | | 3 | |

Message to Shareholders from the Investment Advisor
Dear Valued Investors,
As an Englishman, it’s hard for me not to get sucked into the whole Brexit chaos. Let me say two things about it—first, the initial reaction was quite extreme; second, there has been a temptation for people to look again at Asia in light of the concerns around Europe. I’d like to pause for a breath a bit and examine whether Brexit really is a reason to reallocate to Asia.
The initial reaction to the Brexit vote was one of real concern—lower GDP in Britain over the long term, a hit to investment in the short term, and worries that political turmoil in Europe might hold back spending there too. Well, some of this was perhaps overdone. The sterling’s fall on the Brexit news has probably provided something of a boost to the U.K. economy. The likelihood that the U.S. Federal Reserve will now be much slower to raise rates, too, has also calmed stock markets and allowed them to bounce back. So, the initial shock seems to have been excessive and everything is back on an even keel, economically speaking. Or so it might seem.
Politics is a different matter. Who would be leader of the U.K.’s governing Conservative Party now? Dumb question. There is always someone ambitious enough to step up. But they would probably face a short premiership before having to call a general election; the possibility of having to implement a tight budget; and the difficulty of getting votes through Parliament to actually execute the separation from Europe—most members of Parliament are probably in favor of remaining. All this is complicated by the fact that it seems very difficult to me to meet the desires of the British electorate as expressed in the last two referenda—most recently Brexit, and what seems just a moment ago, the referendum on whether Scotland should remain part of the United Kingdom. For, if one thing seems sure in this mess, it is that if the U.K. does leave Europe, Scotland will want to remain a part of the E.U. and that means splitting from the U.K. So, a Great British “muddle-through” is called for. All of which will take a lot of negotiating as they muddle. In the meantime, populist and separatist movements in France, Spain and Greece may gain traction. Other nations, probably the Netherlands and France, might want to join in any separation Britain wins from European immigration policy (a key cause of the leave campaign). So, the political mess will likely churn on in Europe for some time. This could depress investment. It might depress stock market sentiment, so it is not to be ignored.
But is that, in and of itself, a reason to turn to Asia? I would say not. Asia has to build its own case for investment, outside of what is happening in Europe. It’s not good enough just to be a less bad choice. There are reasons to be cautious about Asia, to be sure. Credit cycles seem to be worsening everywhere—from China, to Thailand, to India, and everywhere in between. This leaves us somewhat concerned about the ability of the financial systems to support near-term growth and for those companies reliant on borrowing to continue to grow. Consequently, our portfolios are relatively light on banking stocks and we have a natural bias toward self-funding companies with secular, if not always spectacular, growth trajectories. These qualities do not come cheaply in today’s markets. But nor is Asia expensive relative to the rest of the world. There does appear to be a valuation argument in favor of Asia—the U.S. trades at 17x forward Earnings Per Share*; Europe at 14.0x; and Asia at 13.5x. It is true that such valuation differences disappear if we look at a sector like consumer staples where Europe, the U.S. and Asia seem to be trading at similar levels. But here, the chance of Asia producing better future growth relative to these two areas seems reasonably strong.
After all, productivity levels are still low, but still growing. Governments have a keen eye on increasing both the efficiency of financial systems (China and Vietnam being cases in point); as well as legal systems (again China and India); corporate governance systems (Japan and Korea); and overhauling government investment in infrastructure, such as in Indonesia. Everywhere one looks, governments are at least trying to do the right things. And the record pace and levels of Asian countries—in terms of savings, manufacturing exposure, openness to trade, productivity growth, and increasing political stability—continue to be prominent in a world where the political trends in other regions seem to be challenging this openness. Even as immigration and trade treaties become political controversies in the U.S. and Europe, China is looking to deal with its demographic issues by opening up vast new trade routes and stepping up its foreign direct investment into the rest of the Asia region. These are multi-year, even multi-decade plans that show a long-term commitment to embrace the forces of growth. And despite many Doomsday headlines about China’s growth and its currency, it still achieves rates of growth that are the envy of much of the world and an increasing share of global exports. Asia is not perfect by any means, but it seems to me to still be on the right track.
But no, Brexit itself is not a reason to turn your attention to Asia. There is a danger in trying to respond to short-term political events. Rather, we try to take a long-term view of the region. This remains a view centered on the growth in productivity of Asia’s workforce, the emergence of domestic corporate champions, and the improving institutions of investment—markets, legal infrastructure and corporate governance. Our portfolios at the moment express some skepticism about the credit cycle, but we can still find good value in companies that are seeking to protect themselves from industry competition, allocating capital efficiently, and sometimes even paying out dividends that, despite their superior growth, are at higher yields than you find on average in the U.S. and that are comparable to Europe.
Since 2008, the world has become dominated by breathless hyperbole and shock headlines. Better, I think, to put them to the side of your mind and focus on the fundamentals of growing businesses and macroeconomic reform. In these areas, despite all its problems, Asia is doing quite well. And that is reason enough to consider it as an investment opportunity—but no, not just because my fellow Brits threw a hissy fit.

Robert Horrocks, PhD
Chief Investment Officer
Matthews International Capital Management, LLC
| * | Forward earnings are calculated by dividing market price per share by expected earnings per share. |
| | | | |
| matthewsasia.com | 800.789.ASIA | | | 5 | |

| | | | |
| PORTFOLIO MANAGERS |
| Teresa Kong, CFA | | |
Lead Manager | | |
| Gerald M. Hwang, CFA | | Satya Patel |
Co-Manager | | Co-Manager |
| | | | |
|
| FUND FACTS |
| | | Investor | | Institutional |
Ticker | | MAINX | | MINCX |
CUSIP | | 577125503 | | 577125602 |
Inception | | 11/30/11 | | 11/30/11 |
NAV | | $10.37 | | $10.36 |
Initial Investment | | $2,500 | | $3 million |
Gross Expense Ratio1 | | 1.28% | | 1.09% |
After Fee Waiver and Reimbursement2 | | 1.12% | | 0.90% |
Portfolio Statistics | | | | |
Total # of Positions | | 39 |
Net Assets | | $63.3 million |
Modified Duration3 | | 4.4 |
Portfolio Turnover4 | | 50.09% |
Benchmark | | |
Markit iBoxx Asian Local Bond Index* |
OBJECTIVE
Total return over the long term with an emphasis on income.
STRATEGY
Under normal market conditions, the Fund seeks to achieve its investment objective by investing at least 80% of its net assets, which include borrowings for investment purposes, in income-producing securities including, but not limited to, dividend paying equity securities, and debt and debt-related instruments issued by governments, quasi-governmental entities, supra-national institutions, and companies in Asia. Asia consists of all countries and markets in Asia, such as China and India, and includes developed, emerging, and frontier countries and markets in the Asian region. Investments may be denominated in any currency, and may represent any part of a company’s capital structure from debt to equity or with features of both.
Matthews Asia Strategic Income Fund
Portfolio Manager Commentary (unaudited)
For the first half of 2016, the Matthews Asia Strategic Income Fund returned 5.83% (Investor Class) and 5.86% (Institutional Class), while its benchmark, the Markit iBoxx Asian Local Bond Index*, returned 7.29%. For the quarter ending June 30, the Fund returned 2.47% (Investor Class) and 2.53% (Institutional Class) while its benchmark returned 0.88%.
Market Environment:
The second quarter of 2016 was dominated by two overarching forces for Asian Fixed Income: Federal Reserve rate hike probabilities and Brexit. For the majority of the second quarter, uncertainty about the timing of U.S. rate hikes by the Federal Reserve dominated market sentiment. Fed officials repeatedly suggested a rate hike was probable if economic data did not disappoint, yet Fed Chair Janet Yellen continued to delay rate hikes, citing external risks. This caused currency and rates markets in Asia to flip flop due to the continued repricing in the path for rate hikes expected from the Federal Reserve. While currencies and rates were somewhat volatile for most of the second quarter, significantly higher volatility affected the region following the surprise Brexit vote. Asia credit, however, was relatively insulated from Brexit effects as the trade exposure to the U.K. among Asian companies is limited. Despite the severe sell-off in almost all markets post-Brexit, Asia currencies, rates and credit markets quickly recovered in the following week. As of the end of the second quarter, Asia markets had largely returned to pre-Brexit levels.
Performance Contributors and Detractors:
The biggest contributors to Fund performance for the second quarter were our holdings in U.S. dollar-denominated bonds. Within U.S. dollar-denominated debt, bonds from Indonesian companies and our holdings of contingent convertible bonds of banks performed particularly well. As macroeconomic concerns around Indonesia’s growth, inflation and currency stability subsided, risk aversion faded, resulting in strong performance of our bonds. Our contingent convertibles performed well despite some volatility around Brexit.
The biggest detractors to Fund performance in the second quarter were our currency forward positions in the Indonesian rupiah, Malaysian ringgit and South Korean won. The U.S. dollar remained volatile but overall strengthened from the previous quarter.
Notable Portfolio Changes:
Given markets were pricing in a much lower probability of a Brexit vote than polls suggested, we pared back our exposure to higher beta currencies with limited appreciation potential. Notably, we increased our weight to the U.S. dollar and the Malaysian ringgit while reducing our exposure to the Chinese renminbi, the South Korean won, and the Singaporean dollar. We increased exposure to U.S. interest rates on the expectation that long-dated U.S. rates were well-anchored despite the potential for shorter rates to rise. We did not increase interest rate exposure to most Asian local markets as we believed that potential currency depreciation would likely more than offset any fall in interest rates. As spreads tightened, we
(continued)
| * | The Index performance reflects the returns of the discontinued predecessor HSBC Asian Local Bond Index up to December 31, 2012 and the returns of the successor Markit iBoxx Asian Local Bond Index thereafter. |
| 1 | Prospectus expense ratios. |
| 2 | Matthews has contractually agreed (i) to waive fees and reimburse expenses to the extent needed to limit Total Annual Fund Operating Expenses (excluding Rule 12b-1 fees, taxes, interest, brokerage commissions, short sale dividend expenses, expenses incurred in connection with any merger or reorganization or extraordinary expenses such as litigation) of the Institutional Class to 0.90% first by waiving class specific expenses (i.e., shareholder service fees specific to a particular class) of the Institutional Class and then, to the extent necessary, by waiving non-class specific expenses of the Institutional Class, and (ii) if any Fund-wide expenses (i.e., expenses that apply to both the Institutional Class and the Investor Class) are waived for the Institutional Class to maintain the 0.90% expense limitation, to waive an equal amount (in annual percentage terms) of those same expenses for the Investor Class. The Total Annual Fund Operating Expenses After Fee Waiver and Expense Reimbursement for the Investor Class may vary from year to year and will in some years exceed 0.90%. If the operating expenses fall below the expense limitation in a year within three years after Matthews has made a waiver or reimbursement, the Fund may reimburse Matthews up to an amount that does not cause the expenses for that year to exceed the lesser of (i) the expense limitation applicable at the time of that fee waiver and/or expense reimbursement or (ii) the expense limitation in effect at the time of recoupment. This agreement will remain in place until April 30, 2017 and may be terminated at any time by the Board of Trustees on behalf of the Fund on 60 days’ written notice to Matthews. |
| 3 | Modified duration measures the percent change in value of the fixed income portion of the portfolio in response to a 1% change in interest rates. In a multi-currency denominated portfolio with sensitivities to different interest rate regimes, modified duration will not accurately reflect the change in value of the overall portfolio from a change in any one interest rate regime. |
| 4 | The lesser of fiscal year 2015 long-term purchase costs or sales proceeds divided by the average monthly market value of long-term securities. |
| | | | | | | | | | | | | | | | | | | | | | | | |
| | | | | | | |
| PERFORMANCE AS OF JUNE 30, 2016 | | | | | | | | | | | | | | | | | | |
| | | | | | | | | | | | Average Annual
Total Returns | | | | |
| | | 3 Months | | | YTD | | | 1 Year | | | 3 Years | | | Since
Inception | | | Inception
Date | |
| Investor Class (MAINX) | | | 2.47% | | | | 5.83% | | | | 4.82% | | | | 3.59% | | | | 4.31% | | | | 11/30/11 | |
| Institutional Class (MINCX) | | | 2.53% | | | | 5.86% | | | | 5.07% | | | | 3.81% | | | | 4.51% | | | | 11/30/11 | |
| Markit iBoxx Asian Local Bond Index5 | | | 0.88% | | | | 7.29% | | | | 4.55% | | | | 2.01% | | | | 2.44% | | | | | |
| Lipper Emerging Markets Hard Currency Debt Funds Category Average6 | | | 4.68% | | | | 9.43% | | | | 4.98% | | | | 2.61% | | | | 4.19% | | | | | |
Performance assumes reinvestment of all dividends and/or distributions before taxes. All performance quoted represents past performance and is no guarantee of future results. Investment return and principal value will fluctuate with market conditions so that when redeemed, shares may be worth more or less than their original cost. Current performance may be lower or higher than the return figures quoted. Returns would have been lower if certain of the Fund’s fees and expenses had not been waived. For the Fund’s most recent month-end performance visit matthewsasia.com.
| | | | | | | | | | | | | | | | | | | | | | | | | | | | | | | | | | | | | | | | | | | | |
| | | | | | | |
| INCOME DISTRIBUTION HISTORY | | | | | | | | | | | | | | | | | | | |
| | | 2016 | | | | | | 2015 | |
| | Q1 | | | Q2 | | | Q3 | | | Q4 | | | Total | | | | | | Q1 | | | Q2 | | | Q3 | | | Q4 | | | Total | |
| Investor (MAINX) | | $ | 0.06 | | | $ | 0.11 | | | | n.a. | | | | n.a. | | | | n.a. | | | | | | | $ | 0.00 | | | $ | 0.10 | | | $ | 0.08 | | | $ | 0.11 | | | $ | 0.29 | |
| Inst’l (MINCX) | | $ | 0.06 | | | $ | 0.12 | | | | n.a. | | | | n.a. | | | | n.a. | | | | | | | $ | 0.01 | | | $ | 0.10 | | | $ | 0.09 | | | $ | 0.11 | | | $ | 0.31 | |
Note: This table does not include capital gains distributions. Totals may differ by $0.02 due to rounding. For income distribution history, visit matthewsasia.com.
| | | | |
30-DAY YIELD: Investor Class: 4.82% (4.72% excluding expense waiver) Inst’l Class: 5.08% (4.94% excluding expense waiver) The 30-Day Yield represents net investment income earned by the Fund over the 30-day period ended 6/30/16, expressed as an annual percentage rate based on the Fund’s share price at the end of the 30-day period. The 30-Day Yield should be regarded as an estimate of the Fund’s rate of investment income, and it may not equal the Fund’s actual income distribution rate. Source: BNY Mellon Investment Servicing (US) Inc. | | | | YIELD TO WORST: 6.38% Yield to worst is the lowest yield that can be received on a bond assuming that the issuer does not default. It is calculated by utilizing the worst case assumptions for a bond with respect to certain income-reducing factors, including prepayment, call or sinking fund provisions. It does not represent the yield that an investor should expect to receive. Past yields are no guarantee of future yields. Source: FactSet Research Systems |
GROWTH OF A $10,000 INVESTMENT SINCE INCEPTION—INVESTOR CLASS
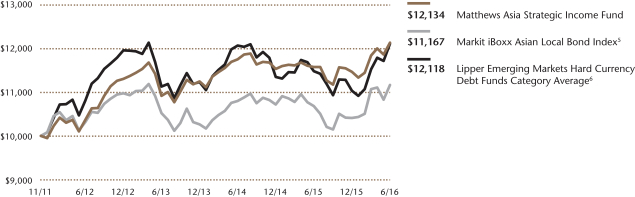
Plotted monthly. The performance data and graph do not reflect the deduction of taxes that a shareholder would pay on dividends, capital gains distributions or redemption of Fund shares. Values are in US$.
| | 5 | It is not possible to invest directly in an index. Source: Index data from HSBC, Markit iBoxx and Bloomberg; total return calculations performed by BNY Mellon Investment Servicing (US) Inc. Please see page 91 for index definitions. The Index performance reflects the returns of the discontinued predecessor HSBC Asian Local Bond Index up to December 31, 2012 and the returns of the successor Markit iBoxx Asian Local Bond Index thereafter. |
| | 6 | The Lipper Category Average does not reflect sales charges and is based on total return, including reinvestment of dividends and capital gains for the stated periods. |
| | | | | | | | |
| | | | |
| TOP TEN HOLDINGS | | | | | | | |
| | | Sector | | Currency | | % of Net Assets | |
| Indonesia Treasury Bond, 8.375%, 03/15/2034 | | Foreign Government Bonds | | Indonesian Rupiah | | | 5.3% | |
| Ctrip.com International, Ltd., Cnv., 1.000%, 07/01/2020 | | Consumer Discretionary | | U.S. Dollar | | | 5.0% | |
| DFCC Bank PLC, 9.625%, 10/31/2018 | | Financials | | U.S. Dollar | | | 4.4% | |
| Standard Chartered PLC, 6.500%, 12/29/2049 | | Financials | | U.S. Dollar | | | 4.2% | |
| PT Perusahaan Listrik Negara, 5.250%, 10/24/2042 | | Utilities | | U.S. Dollar | | | 3.8% | |
| HSBC Holdings PLC, 6.375%, 12/29/2049 | | Financials | | U.S. Dollar | | | 3.8% | |
| Sri Lanka Government Bond, 6.125%, 06/03/2025 | | Foreign Government Bonds | | U.S. Dollar | | | 3.5% | |
| Shimao Property Holdings, Ltd., 6.625%, 01/14/2020 | | Financials | | U.S. Dollar | | | 3.3% | |
| TML Holdings Pte, Ltd., 5.750%, 05/07/2021 | | Consumer Discretionary | | U.S. Dollar | | | 3.3% | |
| China Hongqiao Group, Ltd., 6.875%, 05/03/2018 | | Materials | | U.S. Dollar | | | 3.2% | |
| % OF ASSETS IN TOP TEN | | | | | | | 39.8% | |
| | | | |
| matthewsasia.com | 800.789.ASIA | | | 7 | |
| | | | |
| |
| CURRENCY ALLOCATION (%)7,8 | |
| U.S. Dollar (USD) | | | 71.5 | |
| Indian Rupee (INR) | | | 9.8 | |
| Indonesian Rupiah (IDR) | | | 8.3 | |
| Hong Kong Dollar (HKD) | | | 3.0 | |
| Sri Lankan Rupee (LKR) | | | 2.7 | |
| South Korean Won (KRW) | | | 2.0 | |
| Cash and Other Assets, Less Liabilities | | | 2.6 | |
| | | | |
| |
| COUNTRY ALLOCATION (%)7,8,9,10 | |
| China/Hong Kong | | | 36.5 | |
| Indonesia | | | 25.5 | |
| Sri Lanka | | | 14.5 | |
| India | | | 13.5 | |
| Pakistan | | | 2.5 | |
| South Korea | | | 2.0 | |
| Vietnam | | | 1.7 | |
| Supranational | | | 1.2 | |
| Cash and Other Assets, Less Liabilities | | | 2.6 | |
| | | | |
| |
| SECTOR ALLOCATION (%)7,8 | |
| Financials | | | 39.6 | |
| Foreign Government Bonds | | | 24.2 | |
| Consumer Discretionary | | | 15.5 | |
| Utilities | | | 5.1 | |
| Information Technology | | | 4.3 | |
| Materials | | | 3.2 | |
| Consumer Staples | | | 3.0 | |
| Telecommunication Services | | | 2.6 | |
| Cash and Other Assets, Less Liabilities | | | 2.6 | |
Please note: Foreign Government Bonds category includes Supranationals.
| | | | |
| |
| ASSET TYPE BREAKDOWN (%)7,8 | |
| Non-Convertible Corporate Bonds | | | 56.2 | |
| Government Bonds | | | 24.2 | |
| Convertible Corporate Bonds | | | 17.0 | |
| Cash and Other Assets, Less Liabilities | | | 2.6 | |
| 7 | Source: FactSet Research Systems. Percentage values in data are rounded to the nearest tenth of one percent; the values may not sum to 100% due to rounding. |
| 8 | Cash and other assets may include forward currency exchange contracts and certain derivative instruments that have been marked-to-market. |
| 9 | Not all countries where the Fund may invest are included in the benchmark index. |
| 10 | Supranational is an international organization in which member states transcend national boundaries (ex. IMF). |
Matthews Asia Strategic Income Fund
Portfolio Manager Commentary (unaudited) (continued)
replaced several credits, which have reached our spread targets, with new companies that offered relatively higher spreads. The exposure to relatively higher credit spreads despite falling interest rates resulted in relatively constant yields through the quarter.
We rebuilt a position in Sri Lankan rupee-denominated bonds after both the currency and rates sold off over the last several quarters. At current levels, we see returns skewed positively as fiscal and monetary policies will likely abide by International Monetary Fund (IMF)-prescribed guidelines. We believe the US$1.5 billion Extended Fund Facility from the IMF will help stabilize the macro economy in Sri Lanka, as well as help the country implement economic reforms. In addition to Sri Lanka, we also initiated a small position in Pakistan. Pakistan’s economy has seen steady improvement over the last several years with the help of the IMF. The fiscal deficit has declined and the government is working on improving infrastructure with the help of Chinese direct investment. Lastly, we have increased our exposure to long-dated Indonesian rates as we believe the central bank will cut interest rates further to support the economy. We funded these purchases by selling low-yielding bonds from companies in the Philippines, Indonesia, China, and Malaysia.
Outlook:
Brexit has injected uncertainty in the markets. Unlike risks that are identifiable and quantifiable, uncertainties are unknown and not measurable. In the absence of known near-term catalysts, markets will be very volatile. The silver lining is that Brexit is not likely to pose systematic risk, but instead more idiosyncratic risks to countries and sectors most exposed to the U.K. and Europe. As such, we believe Asia fixed income provides a relative safe haven to most other developed and emerging markets.
On interest rates, we believe chances of rate hikes in the U.S. have diminished following Brexit. We believe Asian countries will continue to have lower to stable rates as most countries have seen moderating inflation with slow growth, providing room for policymakers to continue easing. We believe Indonesia and India both have room for more interest rate cuts, which should support their local currency bond prices.
On currencies, we expect substantial uncertainties concerning the Brexit situation will continue to drive volatility in currencies in the coming quarters. Despite Asia’s relatively small trade exposure to the U.K., we believe concerns over the viability of the E.U. and general uncertainties regarding the framework under which Brexit will happen will continue to weigh on risk sentiment. Asian currencies will remain volatile, and we expect greater dispersion amongst returns. Higher yielding, high volatility currencies that have experienced the greatest depreciation in the last few years, like the Indonesian rupiah and the Malaysian ringgit, will continue to have the greatest likelihood of appreciating in 2016.
The easing bias of central banks will mitigate risks of rising defaults. Prudent carry strategies, such as Asia high yield, continue to be attractive. Entering at current levels has historically resulted in gains as long as investors have an investment horizon greater than two years.
Fixed income investments are subject to additional risks, including, but not limited to, interest rate, credit and inflation risks. Investing in emerging markets involves different and greater risks, as these countries are substantially smaller, less liquid and more volatile than securities markets in more developed markets.
Matthews Asia Strategic Income Fund
June 30, 2016
Schedule of Investmentsa (unaudited)
NON-CONVERTIBLE CORPORATE BONDS: 56.2%
| | | | | | | | |
| | | Face Amount* | | | Value | |
| CHINA/HONG KONG: 22.1% | |
Standard Chartered PLC
6.500%b, 12/29/49 | | | 2,900,000 | | | | $2,660,750 | |
HSBC Holdings PLC
6.375%b, 12/29/49 | | | 2,500,000 | | | | 2,381,250 | |
Shimao Property Holdings, Ltd.
6.625%, 01/14/20 | | | 2,000,000 | | | | 2,100,704 | |
China Hongqiao Group, Ltd.
6.875%, 05/03/18 | | | 2,000,000 | | | | 2,032,396 | |
MCE Finance, Ltd.
5.000%, 02/15/21 | | | 2,000,000 | | | | 1,979,050 | |
Yum! Brands, Inc.
5.350%, 11/01/43 | | | 2,000,000 | | | | 1,610,000 | |
Unigroup International Holdings, Ltd.
6.000%, 12/10/20 | | | 1,200,000 | | | | 1,253,432 | |
| | | | | | | | |
Total China/Hong Kong | | | | | | | 14,017,582 | |
| | | | | | | | |
| | | | | | | | |
| INDIA: 13.5% | | | | | |
TML Holdings Pte, Ltd.
5.750%, 05/07/21 | | | 2,000,000 | | | | 2,063,962 | |
Housing Development Finance Corp., Ltd. | | | | | |
9.240%, 06/24/24 | | | INR 100,000,000 | | | | 1,550,900 | |
Housing Development Finance Corp., Ltd. | | | | | |
8.950%, 03/21/23 | | | INR 100,000,000 | | | | 1,515,653 | |
Axis Bank, Ltd.
7.250%b, 08/12/21 | | | 1,000,000 | | | | 1,001,790 | |
Rural Electrification Corp., Ltd.
9.340%, 08/25/24 | | | INR 52,000,000 | | | | 823,763 | |
Power Grid Corp. of India, Ltd., Series B | | | | | |
9.300%, 09/04/24 | | | INR 52,000,000 | | | | 821,914 | |
Rural Electrification Corp., Ltd.
9.020%, 06/18/19 | | | INR 50,000,000 | | | | 762,533 | |
| | | | | | | | |
Total India | | | | | | | 8,540,515 | |
| | | | | | | | |
| | | | | | | | |
| INDONESIA: 12.3% | | | | | |
PT Perusahaan Listrik Negara
5.250%, 10/24/42 | | | 2,500,000 | | | | 2,399,025 | |
Theta Capital Pte, Ltd.
7.000%, 05/16/19 | | | 1,500,000 | | | | 1,555,831 | |
Alam Synergy Pte, Ltd.
6.950%, 03/27/20c | | | 1,500,000 | | | | 1,466,250 | |
Jababeka International BV
7.500%, 09/24/19 | | | 1,400,000 | | | | 1,466,046 | |
Alam Synergy Pte, Ltd.
6.950%, 03/27/20 | | | 500,000 | | | | 488,750 | |
PT Astra Sedaya Finance
8.600%, 02/21/17 | | | IDR 5,000,000,000 | | | | 380,738 | |
| | | | | | | | |
Total Indonesia | | | | | | | 7,756,640 | |
| | | | | | | | |
| | | | | | | | |
| SRI LANKA: 8.3% | | | | | |
DFCC Bank PLC
9.625%, 10/31/18 | | | 2,650,000 | | | | 2,781,096 | |
National Savings Bank
5.150%, 09/10/19 | | | 2,000,000 | | | | 1,946,160 | |
| | | | | | | | |
| | | Face Amount* | | | Value | |
National Savings Bank
8.875%, 09/18/18 | | | 500,000 | | | | $532,790 | |
| | | | | | | | |
Total Sri Lanka | | | | | | | 5,260,046 | |
| | | | | | | | |
| | | | | | | | |
| TOTAL NON-CONVERTIBLE CORPORATE BONDS | | | | 35,574,783 | |
| | | | | | | | |
(Cost $36,540,762) | | | | | | | | |
| | | | | | | | |
FOREIGN GOVERNMENT OBLIGATIONS: 24.2% | | | | | |
| INDONESIA: 10.6% | | | | | | | | |
Indonesia Treasury Bond
8.375%, 03/15/34 | | | IDR 42,000,000,000 | | | | 3,369,536 | |
Indonesia Government Bond
5.950%, 01/08/46 | | | 1,500,000 | | | | 1,767,498 | |
Indonesia Treasury Bond
7.875%, 04/15/19 | | | IDR 20,000,000,000 | | | | 1,535,667 | |
| | | | | | | | |
Total Indonesia | | | | | | | 6,672,701 | |
| | | | | | | | |
| | | | | | | | |
| SRI LANKA: 6.2% | | | | | |
Sri Lanka Government Bond
6.125%, 06/03/25 | | | 2,400,000 | | | | 2,241,941 | |
Sri Lanka Government Bond
8.500%, 07/15/18 | | | LKR 257,000,000 | | | | 1,682,252 | |
| | | | | | | | |
Total Sri Lanka | | | | | | | 3,924,193 | |
| | | | | | | | |
| | | | | | | | |
| PAKISTAN: 2.5% | | | | | |
Pakistan Government Bond
8.250%, 04/15/24 | | | 1,500,000 | | | | 1,577,603 | |
| | | | | | | | |
Total Pakistan | | | | | | | 1,577,603 | |
| | | | | | | | |
| | | | | | | | |
| SOUTH KOREA: 2.0% | | | | | |
Korea Treasury Bond
3.500%, 09/10/16 | | | KRW 1,000,000,000 | | | | 871,890 | |
Korea Treasury Bond
3.500%, 03/10/24 | | | KRW 400,000,000 | | | | 399,435 | |
| | | | | | | | |
Total South Korea | | | | | | | 1,271,325 | |
| | | | | | | | |
| | | | | | | | |
| VIETNAM: 1.7% | | | | | |
Socialist Republic of Vietnam
4.800%, 11/19/24 | | | 1,055,000 | | | | 1,085,607 | |
| | | | | | | | |
Total Vietnam | | | | | | | 1,085,607 | |
| | | | | | | | |
| | | | | | | | |
| SUPRANATIONAL: 1.2% | | | | | |
International Finance Corp.
7.750%, 12/03/16 | | | INR 50,000,000 | | | | 743,444 | |
| | | | | | | | |
Total Supranational | | | | | | | 743,444 | |
| | | | | | | | |
| | | | | | | | |
| TOTAL FOREIGN GOVERNMENT OBLIGATIONS | | | | 15,274,873 | |
| | | | | | | | |
(Cost $15,032,252) | | | | | | | | |
| | | | | | | | |
| | | | |
| matthewsasia.com | 800.789.ASIA | | | 9 | |
Matthews Asia Strategic Income Fund
June 30, 2016
Schedule of Investmentsa (unaudited) (continued)
CONVERTIBLE CORPORATE BONDS: 17.0%
| | | | | | | | |
| | | Face Amount* | | | Value | |
| CHINA/HONG KONG: 14.4% | | | | | |
Ctrip.com International, Ltd., Cnv.
1.000%, 07/01/20 | | | 3,000,000 | | | | $3,157,500 | |
E-House China Holdings, Ltd., Cnv.
2.750%, 12/15/18c | | | 2,010,000 | | | | 1,984,875 | |
Biostime International Holdings, Ltd., Cnv. | | | | | |
0.000%, 02/20/19 | | | HKD 14,000,000 | | | | 1,917,351 | |
Qihoo 360 Technology Co., Ltd., Cnv.
1.750%, 08/15/21 | | | 1,500,000 | | | | 1,459,688 | |
Vipshop Holdings Ltd., Cnv.
1.500%, 03/15/19 | | | 600,000 | | | | 589,500 | |
| | | | | | | | |
Total China/Hong Kong | | | | | | | 9,108,914 | |
| | | | | | | | |
| | | | | | | | |
| | | | | | | | |
| | | Face Amount* | | | Value | |
| INDONESIA: 2.6% | | | | | |
Delta Investment Horizon International, Ltd., Cnv. | | | | | |
3.000%, 05/26/20 | | | 1,800,000 | | | | $1,638,000 | |
| | | | | | | | |
Total Indonesia | | | | | | | 1,638,000 | |
| | | | | | | | |
| | | | | | | | |
| TOTAL CONVERTIBLE CORPORATE BONDS | | | | 10,746,914 | |
| | | | | | | | |
(Cost $10,266,289) | | | | | | | | |
| | | | | | | | |
| TOTAL INVESTMENTS: 97.4% | | | | | | | 61,596,570 | |
(Cost $61,839,303d) | | | | | | | | |
| | | | | | | | |
CASH AND OTHER ASSETS,
LESS LIABILITIES: 2.6% | | | | | | | 1,665,563 | |
| | | | | | | | |
| | |
NET ASSETS: 100.0% | | | | | | | $63,262,133 | |
| | | | | | | | |
| a | Certain securities were fair valued under the valuation polices approved by the Board of Trustees (Note 2-A). |
| b | Variable rate security. The rate represents the rate in effect at June 30, 2016. |
| c | Security exempt from registration under Rule 144A of the Securities Act of 1933, as amended. The security may be resold in transactions exempt from registration normally to qualified institutional buyers. The security has been determined to be liquid in accordance with procedures adopted by the Fund’s Board of Directors. |
| d | Cost for federal income tax purposes is $61,839,303 and net unrealized depreciation consists of: |
| * | All values are in USD unless otherwise noted. |
| | | | | | | | |
Gross unrealized appreciation | | | $1,512,041 | |
Gross unrealized depreciation | | | (1,754,774 | ) |
| | | | | | | | |
Net unrealized depreciation | | | ($242,733 | ) |
| | | | | | | | |
FORWARD FOREIGN CURRENCY EXCHANGE CONTRACTS:
| | | | | | | | | | | | |
| | | Currency
Purchased | | Currency Sold | | Counterparty | | Settlement
Date | | Unrealized
Appreciation | |
LONG | | MYR 24,615,000 | | USD 6,000,000 | | JP Morgan | | 09/21/16 | | | $164,393 | |
| | THB 105,870,000 | | USD 3,000,000 | | JP Morgan | | 09/21/16 | | | 8,735 | |
| | | | | | | | | | | | |
| | | | | | | | | | | $173,128 | |
| | | | | | | | | | | | |
See accompanying notes to financial statements.
| | | | |
| PORTFOLIO MANAGERS |
| Teresa Kong, CFA | | Satya Patel |
Lead Manager | | Lead Manager |
| | |
| FUND FACTS | | | | |
| | | Investor | | Institutional |
Ticker | | MCRDX | | MICPX |
CUSIP | | 577130677 | | 577130669 |
Inception | | 4/29/16 | | 4/29/16 |
NAV | | $10.09 | | $10.08 |
Initial Investment | | $2,500 | | $3 million |
Gross Expense Ratio1 | | 2.10% | | 1.94% |
After Fee Waiver and Reimbursement2 | | 1.10% | | 0.90% |
Portfolio Statistics | | |
Total # of Positions | | 25 |
Net Assets | | $12.8 million |
Modified Duration | | 4.03 |
Portfolio Turnover | | N/A4 |
Benchmark | | | | |
J.P. Morgan Asia Credit Index |
OBJECTIVE
Total return over the long term.
STRATEGY
Under normal market conditions, the Fund seeks to achieve its investment objective by investing at least 80% of its net assets, which include borrowings for investment purposes, in debt and debt-related instruments issued by companies as well as governments, quasi-governmental entities, and supranational institutions in Asia. Debt and debt-related instruments typically include bonds, debentures, bills, securitized instruments (which are vehicles backed by pools of assets such as loans or other receivables), notes, certificates of deposit and other bank obligations, bank loans, senior secured bank debt, convertible debt securities, credit-linked notes, inflation linked instruments, repurchase agreements, payment-in-kind securities and derivative instruments with fixed income characteristics. Asia consists of all countries and markets in Asia, such as China and Indonesia, in addition to the developed, emerging, and frontier countries and markets in the Asian region.
Matthews Asia Credit Opportunities Fund
Portfolio Manager Commentary (unaudited)
From inception to the quarter ending June 30, 2016, the Matthews Asia Credit Opportunities Fund returned 1.46% (Investor Class) and 1.41% (Institutional Class), while its benchmark, the J.P. Morgan Asia Credit Index (JACI) returned 2.10%.
At Matthews Asia, we aim to launch new strategies when we identify compelling investment opportunities in the region, and as such, our second dedicated fixed income investment strategy, the Matthews Asia Credit Opportunities Fund, was launched on April 29, 2016. The Fund is intended as a higher risk, higher return strategy than our Matthews Asia Strategic Income Fund, and offers investors the potential for attractive yield, exposure to the U.S. dollar, and diversification benefits from the lower correlation between Asian credit and developed Western fixed income markets. The Fund may be a complement to an emerging market fixed income or high yield strategy as a way to increase allocation to Asia.
Asia has two distinct bond markets—local currency-denominated and U.S. dollar-denominated bonds. The Matthews Asia Credit Opportunities Fund seeks total return over the long term and focuses more on investing in the sub-investment grade segment of the U.S. dollar-denominated bond market. This market is dominated by corporate borrowers, and allows investors to isolate the credit risk of issuers in Asia. The U.S. dollar-denominated bond market has grown in size to about US$623 billion and often offers the opportunity for attractive yields relative to its U.S. counterparts.
Because the strategy seeks to derive most of its returns from credit, exposure to currencies and interest rates of Asian countries will be minimized via holding majority of bonds denominated in U.S. dollar. Thus, the strategy may be appropriate for those investors seeking enhanced yield without foreign currency and interest rate exposure. We aim to add value through individual security selection based on the security’s credit worthiness, with an emphasis on companies with strong balance sheets, stable cash flows and business models that will thrive across various cycles.
Market Environment:
The second quarter of 2016 was a rollercoaster ride for Asian credit spreads, amid global, rather than Asia-specific, developments that drove spreads. Credit spreads gradually tightened from the beginning of quarter until the end of May, when risk aversion took over with Federal Reserve officials indicating that a rate hike was imminent in June. However, the Fed held rates steady, citing risks from overseas as well as continued low productivity gains in U.S., paving the way for a strong credit environment leading into the Brexit vote. Markets were pricing in a “remain” outcome for Britain, and the surprise result led to a sharp repricing of risk assets globally. Asian credit also sold off but then quickly recovered as the trade exposure to the U.K. for Asian corporate is relatively small. Overall, for the quarter, credit spreads ended slightly tighter than where they began.
Performance Contributors and Detractors:
The biggest contributors to Fund performance since inception were bonds issued by companies in Indonesia, Macau and Sri Lanka. Following a period of concern in
(continued)
| 1 | Prospectus expense ratios. |
| 2 | Matthews has contractually agreed (i) to waive fees and reimburse expenses to the extent needed to limit Total Annual Fund Operating Expenses (excluding Rule 12b-1 fees, taxes, interest, brokerage commissions, short sale dividend expenses, expenses incurred in connection with any merger or reorganization or extraordinary expenses such as litigation) of the Institutional Class to 0.90% first by waiving class specific expenses (i.e., shareholder service fees specific to a particular class) of the Institutional Class and then, to the extent necessary, by waiving non-class specific expenses of the Institutional Class, and (ii) if any Fund-wide expenses (i.e., expenses that apply to both the Institutional Class and the Investor Class) are waived for the Institutional Class to maintain the 0.90% expense limitation, to waive an equal amount (in annual percentage terms) of those same expenses for the Investor Class. The Total Annual Fund Operating Expenses After Fee Waiver and Expense Reimbursement for the Investor Class may vary from year to year and will in some years exceed 0.90%. If the operating expenses fall below the expense limitation in a year within three years after Matthews has made a waiver or reimbursement, the Fund may reimburse Matthews up to an amount that does not cause the expenses for that year to exceed the lesser of (i) the expense limitation applicable at the time of that fee waiver and/or expense reimbursement or (ii) the expense limitation in effect at the time of recoupment. This agreement will remain in place until April 30, 2018 and may be terminated at any time by the Board of Trustees on behalf of the Fund on 60 days’ written notice to Matthews. |
| 3 | Modified duration measures the percent change in value of the fixed income portion of the portfolio in response to a 1% change in interest rates. In a multi-currency denominated portfolio with sensitivities to different interest rate regimes, modified duration will not accurately reflect the change in value of the overall portfolio from a change in any one interest rate regime. |
| 4 | The Fund commenced operations on April 29, 2016. |
| | | | |
| matthewsasia.com | 800.789.ASIA | | | 11 | |
| | | | | | | | |
| | | |
| PERFORMANCE AS OF JUNE 30, 2016 | | | | | | |
| | | Actual Return,
Not Annualized | | | | |
| | | Since Inception | | | Inception Date | |
| Investor Class (MCRDX) | | | 1.46% | | | | 4/29/2016 | |
| Institutional Class (MICPX) | | | 1.41% | | | | 4/29/2016 | |
| J.P. Morgan Asia Credit Index5 | | | 2.10% | | | | | |
| Lipper Alternative Credit Focus Funds Category Average6 | | | 0.41% | | | | | |
Performance assumes reinvestment of all dividends and/or distributions before taxes. All performance quoted represents past performance and is no guarantee of future results. Investment return and principal value will fluctuate with market conditions so that when redeemed, shares may be worth more or less than their original cost. Current performance may be lower or higher than the return figures quoted. Returns would have been lower if certain of the Fund’s fees and expenses had not been waived. For the Fund’s most recent month-end performance, visit matthewsasia.com.
| | 5 | It is not possible to invest directly in an index. Source: Index data from J.P. Morgan and Bloomberg; total return calculations performed by BNY Mellon Investment Servicing (US) Inc. Please see page 91 for index definition. |
| | 6 | The Lipper Category Average does not reflect sales charges and is based on total return, including reinvestment of dividends and capital gains for the stated periods. |
| | | | | | | | | | | | | | | | |
| | | |
| INCOME DISTRIBUTION HISTORY | | | | | | |
| | | 2016 | |
| | | Q2 | | | Q3 | | | Q4 | | | Total | |
| Investor (MCRDX) | | $ | 0.06 | | | | n.a. | | | | n.a | | | | n.a | |
| Inst’l (MICPX) | | $ | 0.06 | | | | n.a. | | | | n.a | | | | n.a | |
Note: This table does not include capital gains distributions. Totals may differ by $0.02 due to rounding. For income distribution history, visit matthewsasia.com.
| | | | |
30-DAY YIELD: Investor Class: 4.04% (3.50% excluding waivers) Institutional Class: 4.27% (3.74% excluding waivers) The 30-Day Yield represents net investment income earned by the Fund over the 30-day period ended 6/30/16, expressed as an annual percentage rate based on the Fund’s share price at the end of the 30-day period. The 30-Day Yield should be regarded as an estimate of the Fund’s rate of investment income, and it may not equal the Fund’s actual income distribution rate. Source: BNY Mellon Investment Servicing (US) Inc. | | | | YIELD TO WORST: 5.79% Yield to worst is the lowest yield that can be received on a bond assuming that the issuer does not default. It is calculated by utilizing the worst case assumptions for a bond with respect to certain income-reducing factors, including prepayment, call or sinking fund provisions. It does not represent the yield that an investor should expect to receive. Past yields are no guarantee of future yields. Source: FactSet Research Systems |
| | | | | | | | |
| | | | |
| TOP TEN HOLDINGS | | | | | | | |
| | | Sector | | Currency | | % of Net Assets | |
| National Savings Bank, 8.875%, 09/18/2018 | | Financials | | U.S. Dollar | | | 5.0% | |
| Delta Investment Horizon International, Ltd., Cnv., 3.000%, 05/26/2020 | | Telecommunication Services | | U.S. Dollar | | | 5.0% | |
| Pakistan Government Bond, 8.250%, 04/15/2024 | | Foreign Government Bonds | | U.S. Dollar | | | 4.9% | |
| MPM Global Pte, Ltd., 6.750%, 09/19/2019 | | Consumer Discretionary | | U.S. Dollar | | | 4.8% | |
| China Hongqiao Group, Ltd., 6.875%, 05/03/2018 | | Materials | | U.S. Dollar | | | 4.8% | |
| HSBC Holdings PLC, 6.375%, 12/29/2049 | | Financials | | U.S. Dollar | | | 4.5% | |
| Standard Chartered PLC, 6.500%, 12/29/2049 | | Financials | | U.S. Dollar | | | 4.3% | |
| Biostime International Holdings, Ltd., Cnv., 0.000%, 02/20/2019 | | Consumer Staples | | Hong Kong Dollar | | | 4.3% | |
| Sri Lanka Government Bond, 6.125%, 06/03/2025 | | Foreign Government Bonds | | U.S. Dollar | | | 3.6% | |
| Shimao Property Holdings, Ltd., 8.125%, 01/22/2021 | | Financials | | U.S. Dollar | | | 3.4% | |
| % OF ASSETS IN TOP TEN | | | | | | | 44.6% | |
Matthews Asia Credit Opportunities Fund
Portfolio Manager Commentary (unaudited) (continued)
Indonesia around slowing growth, high inflation, and currency volatility, risk aversion faded and the rupiah stabilized, resulting in strong performance of our Indonesian corporate bonds. Issuers in Macau also performed well as signs pointed to stabilization in the mass segment of its casinos. Sri Lankan corporates also recovered as the country is on track to secure a US$1.5 billion loan from the International Monetary Fund (IMF). We believe this Facility will help stabilize the macro economic situation in Sri Lanka and provide for a more supportive environment for companies operating in the country, as well as help the country push further for economic reforms.
The biggest detractor to Fund performance during the period was our holding in a Ctrip.com International convertible bond. Despite the recent weakness in Ctrip shares, we remain convinced that online travel will continue to experience higher-than-average growth in China, and we believe Ctrip, with its overwhelming majority market share, will be the main beneficiary of this secular trend.
Outlook:
Brexit has injected uncertainty in the markets. Unlike risks that are identifiable and quantifiable, uncertainties are unknown and not measurable. In the absence of known near- term catalysts, markets will be very volatile. The silver lining is that Brexit is not likely to pose systematic risk, but instead more idiosyncratic risks to countries and sectors most exposed to the U.K. and Europe. As such, we believe Asia fixed income provides a relative safe haven to most other developed and emerging markets.
The easing bias of central banks will help mitigate risks of rising defaults. Prudent carry strategies such as Asia high yield continue to be attractive. Entering at current levels has historically resulted in gains as long as investors have an investment horizon greater than two years.
Historically, credit cycles have lasted eight to nine years, and with just over seven years having passed since the Global Financial Crisis-driven peak in corporate defaults, we expect that, over the medium term, the credit cycle is likely to turn. With this in mind, fundamental credit analysis is key as we believe the market will continue to reward prudent capital structures that are consistent with a company’s industry and strategy, and punish poor ones, driving increased dispersion in the credit market. As such, we seek to limit exposure to issuers with near-term financing needs as tight liquidity conditions may shut some issuers completely out of the market. Based on history, we believe current spread levels compensate investors who have a minimum two-year holding period for the risk that the credit cycle turns.
No doubt we are in a period of heightened volatility, driven by uncertainty in the path of U.S. rate hikes, Europe’s large dispersion in growth prospects, the extraordinary easing policies of the Bank of Japan, and, last but not least, China’s slowing growth, which has negatively impacted commodities. Despite that, we believe much of the downside risks have been priced in, and think Asian bonds may offer better value than they have in the last few years. It takes a lot of intestinal fortitude to buy when most are selling. But at today’s prices, we believe there is more room for upside potential than downside for investors with a long-term investment horizon.
Fixed income investments are subject to additional risks, including, but not limited to, interest rate, credit and inflation risks. Investing in emerging markets involves different and greater risks, as these countries are substantially smaller, less liquid and more volatile than securities markets in more developed markets.
| | | | |
| |
| CURRENCY ALLOCATION (%)7,8 | |
| U.S. Dollar (USD) | | | 87.2 | |
| Hong Kong Dollar (HKD) | | | 4.3 | |
| Cash and Other Assets, Less Liabilities | | | 8.6 | |
| | | | |
| |
| COUNTRY ALLOCATION (%)7,8,9 | |
| China/Hong Kong | | | 42.6 | |
| Indonesia | | | 28.7 | |
| Sri Lanka | | | 8.7 | |
| Pakistan | | | 4.9 | |
| Philippines | | | 3.3 | |
| Vietnam | | | 3.2 | |
| Cash and Other Assets, Less Liabilities | | | 8.6 | |
| | | | |
| |
| SECTOR ALLOCATION (%)7,8 | |
| Financials | | | 30.0 | |
| Consumer Discretionary | | | 16.5 | |
| Foreign Government Bonds | | | 15.1 | |
| Telecommunication Services | | | 8.1 | |
| Information Technology | | | 6.3 | |
| Materials | | | 4.8 | |
| Consumer Staples | | | 4.3 | |
| Industrials | | | 3.3 | |
| Utilities | | | 3.0 | |
| Cash and Other Assets, Less Liabilities | | | 8.6 | |
| | | | |
| |
| ASSET TYPE BREAKDOWN (%)7,8 | |
| Non-Convertible Corporate Bonds | | | 58.5 | |
| Convertible Corporate Bonds | | | 17.8 | |
| Government Bonds | | | 15.1 | |
| Cash and Other Assets, Less Liabilities | | | 8.6 | |
| 7 | Source: FactSet Research Systems. Percentage values in data are rounded to the nearest tenth of one percent; the values may not sum to 100% due to rounding. |
| 8 | Cash and other assets may include forward currency exchange contracts and certain derivative instruments that have been marked-to-market. |
| 9 | Not all countries where the Fund may invest are included in the benchmark index. |
| | | | |
| matthewsasia.com | 800.789.ASIA | | | 13 | |
Matthews Asia Credit Opportunities Fund
June 30, 2016
Schedule of Investmentsa (unaudited)
NON-CONVERTIBLE CORPORATE BONDS: 58.5%
| | | | | | | | |
| | | Face Amount* | | | Value | |
| CHINA/HONG KONG: 29.7% | | | | | | | | |
China Hongqiao Group, Ltd.
6.875%, 05/03/18 | | | 600,000 | | | | $609,719 | |
HSBC Holdings PLCb
6.375%, 12/29/49 | | | 600,000 | | | | 571,500 | |
Standard Chartered PLCb
6.500%, 12/29/49 | | | 600,000 | | | | 550,500 | |
Shimao Property Holdings, Ltd.
8.125%, 01/22/21 | | | 400,000 | | | | 441,968 | |
KWG Property Holding, Ltd.
8.975%, 01/14/19 | | | 400,000 | | | | 426,377 | |
Unigroup International Holdings, Ltd.
6.000%, 12/10/20 | | | 400,000 | | | | 417,811 | |
MCE Finance, Ltd.
5.000%, 02/15/21 | | | 400,000 | | | | 395,810 | |
Wynn Macau, Ltd.
5.250%, 10/15/21 | | | 400,000 | | | | 389,120 | |
| | | | | | | | |
Total China/Hong Kong | | | | | | | 3,802,805 | |
| | | | | | | | |
| | | | | | | | |
| INDONESIA: 20.5% | | | | | | | | |
MPM Global Pte, Ltd.
6.750%, 09/19/19 | | | 600,000 | | | | 620,242 | |
Jababeka International BV
7.500%, 09/24/19 | | | 400,000 | | | | 418,870 | |
Theta Capital Pte, Ltd.
7.000%, 05/16/19 | | | 400,000 | | | | 414,889 | |
TBG Global Pte, Ltd.
5.250%, 02/10/22 | | | 400,000 | | | | 406,273 | |
Alam Synergy Pte, Ltd.
6.950%, 03/27/20 | | | 400,000 | | | | 391,000 | |
PT Perusahaan Listrik Negara
5.250%, 10/24/42 | | | 400,000 | | | | 383,844 | |
| | | | | | | | |
Total Indonesia | | | | | | | 2,635,118 | |
| | | | | | | | |
| | | | | | | | |
| SRI LANKA: 5.0% | | | | | | | | |
National Savings Bank
8.875%, 09/18/18 | | | 600,000 | | | | 639,348 | |
| | | | | | | | |
Total Sri Lanka | | | | | | | 639,348 | |
| | | | | | | | |
| | | | | | | | |
| PHILIPPINES: 3.3% | | | | | | | | |
ICTSI Treasury BV
5.875%, 09/17/25 | | | 400,000 | | | | 427,000 | |
| | | | | | | | |
Total Philippines | | | | | | | 427,000 | |
| | | | | | | | |
| | | | | | | | |
TOTAL NON-CONVERTIBLE CORPORATE BONDS | | | | 7,504,271 | |
| | | | | | | | |
(Cost $7,403,146) | | | | | | | | |
| | | | | | | | |
CONVERTIBLE CORPORATE BONDS: 17.8% | |
| CHINA/HONG KONG: 12.9% | | | | | | | | |
Biostime International Holdings, Ltd., Cnv. | | | | | |
0.000%, 02/20/19 | | | HKD 4,000,000 | | | | 547,815 | |
Ctrip.com International, Ltd., Cnv.
1.000%, 07/01/20 | | | 400,000 | | | | 421,000 | |
SouFun Holdings, Ltd., Cnv.
2.000%, 12/15/18 | | | 400,000 | | | | 392,500 | |
Vipshop Holdings Ltd., Cnv.
1.500%, 03/15/19 | | | 300,000 | | | | 294,750 | |
| | | | | | | | |
Total China/Hong Kong | | | | | | | 1,656,065 | |
| | | | | | | | |
| | | | | | | | |
| | | Face Amount* | | | Value | |
| INDONESIA: 4.9% | | | | | | | | |
Delta Investment Horizon International, Ltd., Cnv. | | | | | |
3.000%, 05/26/20 | | | 700,000 | | | | $637,000 | |
| | | | | | | | |
Total Indonesia | | | | | | | 637,000 | |
| | | | | | | | |
| | | | | | | | |
TOTAL CONVERTIBLE CORPORATE BONDS | | | | 2,293,065 | |
| | | | | | | | |
(Cost $2,295,758) | | | | | | | | |
| | | | | | | | |
FOREIGN GOVERNMENT OBLIGATIONS: 15.1% | | | | | |
| PAKISTAN: 4.9% | | | | | | | | |
Pakistan Government Bond
8.250%, 04/15/24 | | | 600,000 | | | | 631,041 | |
| | | | | | | | |
Total Pakistan | | | | | | | 631,041 | |
| | | | | | | | |
| | | | | | | | |
| SRI LANKA: 3.7% | | | | | | | | |
Sri Lanka Government Bond
6.125%, 06/03/25 | | | 500,000 | | | | 467,071 | |
| | | | | | | | |
Total Sri Lanka | | | | | | | 467,071 | |
| | | | | | | | |
| | | | | | | | |
| INDONESIA: 3.3% | | | | | | | | |
Republic of Indonesia
5.125%, 01/15/45 | | | 400,000 | | | | 424,375 | |
| | | | | | | | |
Total Indonesia | | | | | | | 424,375 | |
| | | | | | | | |
| | | | | | | | |
| VIETNAM: 3.2% | | | | | | | | |
Socialist Republic of Vietnam
4.800%, 11/19/24 | | | 400,000 | | | | 411,604 | |
| | | | | | | | |
Total Vietnam | | | | | | | 411,604 | |
| | | | | | | | |
| | | | | | | | |
TOTAL FOREIGN GOVERNMENT OBLIGATIONS | | | | 1,934,091 | |
| | | | | | | | |
(Cost $1,917,752) | | | | | | | | |
| | | | | | | | |
| TOTAL INVESTMENTS: 91.4% | | | | | | | 11,731,427 | |
(Cost $11,616,656c) | | | | | | | | |
| | | | | | | | |
CASH AND OTHER ASSETS,
LESS LIABILITIES: 8.6% | | | | | | | 1,096,959 | |
| | | | | | | | |
| | |
NET ASSETS: 100.0% | | | | | | | $12,828,386 | |
| | | | | | | | |
| a | Certain securities were fair valued under the valuation polices approved by the Board of Trustees (Note 2-A). |
| b | Variable rate security. The rate represents the rate in effect at June 30, 2016. |
| c | Cost for federal income tax purposes is $11,616,656 and net unrealized appreciation consists of: |
| | | | |
Gross unrealized appreciation | | | $161,991 | |
Gross unrealized depreciation | | | (47,220 | ) |
| | | | |
Net unrealized appreciation | | | $114,771 | |
| | | | |
| * | All values are in USD unless otherwise noted. |
See accompanying notes to financial statements.

| | | | |
| PORTFOLIO MANAGERS |
| Robert J. Horrocks, PhD | | |
Lead Manager | | |
| Kenneth Lowe, CFA | | |
Lead Manager | | | | |
|
| FUND FACTS |
| | | Investor | | Institutional |
Ticker | | MACSX | | MICSX |
CUSIP | | 577130206 | | 577130842 |
Inception | | 9/12/94 | | 10/29/10 |
NAV | | $17.01 | | $16.99 |
Initial Investment | | $2,500 | | $3 million |
Gross Expense Ratio1 | | 1.09% | | 0.92% |
Portfolio Statistics | | | | |
Total # of Positions | | 58 |
Net Assets | | $3.0 billion |
Weighted Average Market Cap | | $33.5 billion |
Portfolio Turnover2 | | 16.48% |
Benchmark | | |
MSCI AC Asia ex Japan Index |
OBJECTIVE
Long-term capital appreciation. The Fund also seeks to provide some current income.
STRATEGY
Under normal market conditions, the Fund seeks to achieve its investment objective by investing at least 80% of its total net assets, which include borrowings for investment purposes, in dividend-paying common stock, preferred stock and other equity securities, and convertible securities as well as fixed-income securities, of any duration or quality, of companies located in Asia, which consists of all countries and markets in Asia, including developed, emerging and frontier countries and markets in the Asian region.
Matthews Asian Growth and Income Fund
Portfolio Manager Commentary (unaudited)
For the first half of 2016, the Matthews Asian Growth and Income Fund rose 7.05% (Investor Class) and 7.08% (Institutional Class), outperforming its benchmark, the MSCI All Country Asia ex Japan Index, which returned 2.32%. For the quarter ending June 30, the Fund returned 2.88% (Investor Class) and 2.91% (Institutional Class) while its benchmark returned 0.51%.
Market Environment:
Although markets ended the second quarter roughly flat in U.S. dollar terms, the preceding three months were filled with many undulations, whipsawing investors on an almost daily basis. The primary driver behind this was, once again, politics and policymakers, with Brexit, the much talked about U.K. vote to leave the European Union, dominating the headlines. The medium-term implications of such a move are unclear.
This issue certainly has important implications for global asset prices. At the very least, we have witnessed the probability of a hike in U.S. interest rates in December 2016 drop from over 80% earlier this year to about 8%. It also raises the specter of a change within the foundations of a European construct that is mired in deflationary problems with low productivity and paltry economic growth.
From an Asian investor’s standpoint, another tail risk event coming true does little to improve the appetite for risk assets. However, the initial plummet in equities following Brexit was eradicated swiftly. This is likely due to the lowering of U.S. rate expectations, and the increased policy leeway provided to Asian central banks to further ease against such a backdrop.
Performance Contributors and Detractors:
The largest contributors to returns came from our holdings within China and Hong Kong, benefited by our stock selection. Companies such as Guangdong Investment, the owner of the asset that supplies the majority of Hong Kong’s water supply as well as owning infrastructure and property assets in China and CLP Holdings, one of two key electricity suppliers in Hong Kong both performed well. An attractive combination of dividend yield and sustainable, visible growth through already set contracts with the Hong Kong government saw Guangdong Investment rising strongly through the quarter. CLP Holdings rose as the noise over the reset of their scheme of control—where the government determines the permitted return on net fixed assets—appears to be waning with expectations that the outcome will be better than initially feared.
South Korean consumer companies also delivered strong performance. The preferred share class of LG Household & Health was the Fund’s largest individual contributor during the second quarter as its discount to the common equity narrowed. Additionally, the cosmetics, personal care and beverage brand owner saw solid growth across all segments with good results from duty free store sales and its China business in cosmetics. Tobacco company KT&G also rose on domestic market share gains and improving export growth.
More negatively, we saw some sputtering performance from stocks in Malaysia and Thailand. A default by state-controlled investment vehicle 1MDB in Malaysia sparked general softness in that market, whilst telecom firm Advanced Info Service in Thailand was weak due to an aggressive bid made for additional wireless spectrum. We exited our positions in Advanced Info Service during the second quarter.
Some of our Hong Kong holdings were also weak, including CK Hutchison as the industrial conglomerate’s move to consolidate the wireless market in the U.K. has been defeated by European regulators on competition concerns. Children’s toy
(continued)
| 1 | Prospectus expense ratios. |
| 2 | The lesser of fiscal year 2015 long-term purchase costs or sales proceeds divided by the average monthly market value of long-term securities. |
| | | | |
| matthewsasia.com | 800.789.ASIA | | | 15 | |
| | | | | | | | | | | | | | | | | | | | | | | | | | | | | | | | |
| | | | |
| PERFORMANCE AS OF JUNE 30, 2016 | | | | | | | | | | |
| | | | | | | | | | | | Average Annual Total Returns | | | | |
| | | 3 Months | | | YTD | | | 1 Year | | | 3 Years | | | 5 Years | | | 10 Years | | | Since
Inception | | | Inception
Date | |
| Investor Class (MACSX) | | | 2.88% | | | | 7.05% | | | | -1.18% | | | | 1.52% | | | | 3.51% | | | | 6.83% | | | | 9.54% | | | | 9/12/94 | |
| Institutional Class (MICSX) | | | 2.91% | | | | 7.08% | | | | -1.06% | | | | 1.68% | | | | 3.66% | | | | n.a. | | | | 3.98% | | | | 10/29/10 | |
| MSCI AC Asia ex Japan Index3 | | | 0.51% | | | | 2.32% | | | | -11.72% | | | | 2.36% | | | | 0.34% | | | | 5.92% | | | | 3.53% | 4 | | | | |
| Lipper Pacific Region Funds Category Average5 | | | 2.45% | | | | 2.49% | | | | -6.50% | | | | 2.71% | | | | 2.76% | | | | 3.65% | | | | 3.69% | 4 | | | | |
Performance assumes reinvestment of all dividends and/or distributions before taxes. All performance quoted represents past performance and is no guarantee of future results. Investment return and principal value will fluctuate with market conditions so that when redeemed, shares may be worth more or less than their original cost. Current performance may be lower or higher than the return figures quoted. Returns would have been lower if certain of the Fund’s fees and expenses had not been waived. For the Fund’s most recent month-end performance, visit matthewsasia.com.
| | | | | | | | | | | | | | | | | | | | | | | | | | | | |
| | | | | | | | |
| INCOME DISTRIBUTION HISTORY | | | | | | | | | | | | | | | | | | | | | |
| | | 2016 | | | | | | 2015 | |
| | | June | | | December | | | Total | | | | | | June | | | December | | | Total | |
| Investor (MACSX) | | $ | 0.15 | | | | n.a. | | | | n.a. | | | | | | | $ | 0.21 | | | $ | 0.21 | | | $ | 0.42 | |
| Inst’l (MICSX) | | $ | 0.16 | | | | n.a. | | | | n.a. | | | | | | | $ | 0.23 | | | $ | 0.22 | | | $ | 0.45 | |
Note: This table does not include capital gains distributions. Totals may differ by $0.01 due to rounding. For income distribution history, visit matthewsasia.com.
| | | | |
30-DAY YIELD: 2.02% (Investor Class) 2.15% (Institutional Class) The 30-Day Yield represents net investment income earned by the Fund over the 30-day period ended 6/30/16, expressed as an annual percentage rate based on the Fund’s share price at the end of the 30-day period. The 30-Day Yield should be regarded as an estimate of the Fund’s rate of investment income, and it may not equal the Fund’s actual income distribution rate. Source: BNY Mellon Investment Servicing (US) Inc. | | | | DIVIDEND YIELD: 3.39% The dividend yield (trailing) for the portfolio is the weighted average sum of the dividends paid by each equity security held by the Fund over the 12 months ended 6/30/16 divided by the current price of each equity as of 6/30/16. The annualized dividend yield for the Fund is for the equity-only portion of the portfolio. Please note that this is based on gross equity portfolio holdings and does not reflect the actual yield an investor in the Fund would receive. Past yields are no guarantee of future yields. Source: FactSet Research Systems, Bloomberg, MICM |
GROWTH OF A $10,000 INVESTMENT SINCE INCEPTION—INVESTOR CLASS
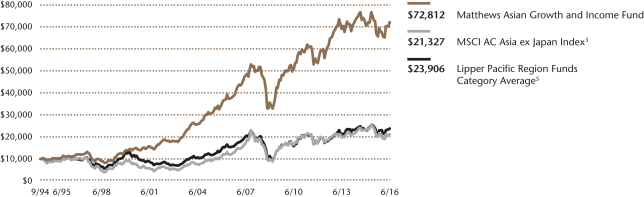
Plotted monthly. The performance data and graph do not reflect the deduction of taxes that a shareholder would pay on dividends, capital gains distributions or redemption of Fund shares. Values are in US$.
| | 3 | It is not possible to invest directly in an index. Source: Index data from Morgan Stanley Capital International and Bloomberg; total return calculations performed by BNY Mellon Investment Servicing (US) Inc. Please see page 91 for index definition. |
| | 4 | Calculated from 8/31/94. |
| | 5 | The Lipper Category Average does not reflect sales charges and is based on total return, including reinvestment of dividends and capital gains for the stated periods. |
| | | | | | | | |
| | | | |
| TOP TEN HOLDINGS6 | | | | | | | |
| | | Sector | | Country | | % of Net Assets | |
| Taiwan Semiconductor Manufacturing Co., Ltd. | | Information Technology | | Taiwan | | | 3.5% | |
| AIA Group, Ltd. | | Financials | | China/Hong Kong | | | 3.5% | |
| Jardine Matheson Holdings, Ltd. | | Industrials | | China/Hong Kong | | | 2.5% | |
| CapitaLand, Ltd., Cnv., 1.950%, 10/17/2023 | | Financials | | Singapore | | | 2.4% | |
| Genting Malaysia BHD | | Consumer Discretionary | | Malaysia | | | 2.4% | |
| SKYCITY Entertainment Group, Ltd. | | Consumer Discretionary | | New Zealand | | | 2.3% | |
| CLP Holdings, Ltd. | | Utilities | | China/Hong Kong | | | 2.3% | |
| Singapore Telecommunications, Ltd. | | Telecommunication Services | | Singapore | | | 2.2% | |
| China Mobile, Ltd. | | Telecommunication Services | | China/Hong Kong | | | 2.2% | |
| Ascendas REIT | | Financials | | Singapore | | | 2.2% | |
| % OF ASSETS IN TOP TEN | | | | | | | 25.5% | |
| | 6 | Holdings may combine more than one security from same issuer and related depositary receipts. |
Matthews Asian Growth and Income Fund
Portfolio Manager Commentary (unaudited) (continued)
and electronic learning products manufacturer VTech suffered poor performance on concerns over its cut in dividend in order to help fund the purchase of competitor Leapfrog.
Notable Portfolio Changes:
We initiated one new Fund position during the quarter in a Japanese operator and owner of used car facilities, USS. The firm takes a fee from sellers to list their cars for sale, and subsequently takes a fee on the completion of sale. A simple business model, the company provides a vital cog in the industry to allow dealers to alter the status of their inventory. We believe the stock has an attractive combination of both income and growth. It has a dividend yield of approximately 2.9%, and some growth through a combination of exports, some consolidation and improvement in the efficiency of existing sites as well as cost reductions. Additionally, management has done a solid job on share buybacks over the years, utilizing a strong, net cash balance sheet when they believe that the stock is undervalued.
Outlook:
Following the unexpected and frankly unclear path laid forth by the UK’s vote to leave the European Union, yet more uncertainty has been added to global asset prices. This is unlikely to be an idiosyncratic risk, and one must be aware of the impending heavy political calendar that looms. Early 2017 will see French elections, whilst October 2016 witnesses a referendum in Italy on potential constitutional reform. Added to this, of course, is the U.S. presidential election. Worryingly, there does appear to be an anti-establishment, protectionist—and arguably anti-globalization—movement underway across many electorates. This provides a level of uncertainty that may reduce sentiment for both corporates and consumers when it comes to investment and spending patterns.
The near-term positive for Asia is that the current climate provides central banks with the leeway to further loosen monetary policy, and we should expect to see such movement in places such as ultra-low inflation Japan and debt-ridden China. Of course, it is not this but supply-side reform that is paramount in creating sustainable economic growth and, on this front, it is disappointing to see India’s Rajan be pressured out of leading the Reserve Bank of India for another term due to a difference in priorities. Further, it is somewhat frustrating to hear China’s President Xi talk of increasing the Communist Party’s influence within state-owned enterprises, which he would like to see become “stronger, bigger and better.”
With a noisy backdrop of political changes, thriving populism, high debt levels, low growth and an increasingly forgotten reform agenda, the Fund will keep striving to deliver a portfolio that mitigates this volatility with a keen eye on protecting and growing shareholder capital over the long term.
| | | | |
| |
| COUNTRY ALLOCATION (%)7,8 | |
| China/Hong Kong | | | 31.6 | |
| Singapore | | | 17.1 | |
| South Korea | | | 12.0 | |
| Japan | | | 8.0 | |
| Malaysia | | | 6.3 | |
| Taiwan | | | 5.3 | |
| Australia | | | 2.8 | |
| Indonesia | | | 2.7 | |
| New Zealand | | | 2.3 | |
| United States | | | 1.7 | |
| Thailand | | | 1.6 | |
| Norway | | | 1.5 | |
| Vietnam | | | 1.4 | |
| Philippines | | | 1.3 | |
| Cash and Other Assets, Less Liabilities | | | 4.4 | |
| | | | |
| | |
| SECTOR ALLOCATION (%)8 | | | |
| Consumer Discretionary | | | 16.6 | |
| Financials | | | 16.5 | |
| Industrials | | | 16.2 | |
| Telecommunication Services | | | 15.3 | |
| Consumer Staples | | | 13.0 | |
| Information Technology | | | 8.3 | |
| Utilities | | | 6.7 | |
| Health Care | | | 3.0 | |
| Cash and Other Assets, Less Liabilities | | | 4.4 | |
| | | | |
| |
| MARKET CAP EXPOSURE (%)8 | |
| Mega Cap (over $25B) | | | 34.3 | |
| Large Cap ($10B-$25B) | | | 11.3 | |
| Mid Cap ($3B-10B) | | | 34.8 | |
| Small Cap (under $3B) | | | 15.2 | |
| Cash and Other Assets, Less Liabilities | | | 4.4 | |
| | | | |
| |
| ASSET TYPE BREAKDOWN (%)8,9 | |
| Common Equities and ADRs | | | 84.3 | |
| Convertible Corporate Bonds | | | 7.5 | |
| Preferred Equities | | | 3.8 | |
| Cash and Other Assets, Less Liabilities | | | 4.4 | |
| 7 | Not all countries where the Fund may invest are included in the benchmark index. |
| 8 | Source: FactSet Research Systems. Percentage values in data are rounded to the nearest tenth of one percent; the values may not sum to 100% due to rounding. |
| 9 | Bonds are not included in the MSCI All Country Asia ex Japan Index. |
| | | | |
| matthewsasia.com | 800.789.ASIA | | | 17 | |
Matthews Asian Growth and Income Fund
June 30, 2016
Schedule of Investmentsa (unaudited)
COMMON EQUITIES: 84.3%
| | | | | | | | |
| | | Shares | | | Value | |
| CHINA/HONG KONG: 26.5% | | | | | | | | |
AIA Group, Ltd. | | | 17,329,400 | | | | $104,214,246 | |
Jardine Matheson Holdings, Ltd. | | | 1,288,100 | | | | 75,307,114 | |
CLP Holdings, Ltd. | | | 6,725,200 | | | | 68,699,186 | |
China Mobile, Ltd. ADR | | | 1,125,500 | | | | 65,166,450 | |
Guangdong Investment, Ltd. | | | 40,648,000 | | | | 62,052,501 | |
Techtronic Industries Co., Ltd. | | | 14,665,000 | | | | 61,241,031 | |
Yum! Brands, Inc. | | | 665,600 | | | | 55,191,552 | |
CK Hutchison Holdings, Ltd. | | | 4,927,172 | | | | 54,201,167 | |
VTech Holdings, Ltd. | | | 4,390,100 | | | | 46,282,295 | |
HSBC Holdings PLC ADR | | | 1,472,033 | | | | 46,089,353 | |
Café de Coral Holdings, Ltd. | | | 14,582,000 | | | | 45,799,141 | |
Vitasoy International Holdings, Ltd. | | | 24,855,000 | | | | 45,215,449 | |
Hang Lung Properties, Ltd. | | | 17,153,920 | | | | 34,656,064 | |
Cheung Kong Property Holdings, Ltd. | | | 4,400,172 | | | | 27,723,954 | |
| | | | | | | | |
Total China/Hong Kong | | | | | | | 791,839,503 | |
| | | | | | | | |
| | | | | | | | |
| SINGAPORE: 14.7% | | | | | | | | |
Singapore Telecommunications, Ltd. | | | 21,686,400 | | | | 66,981,017 | |
Ascendas REIT | | | 35,011,100 | | | | 64,795,823 | |
United Overseas Bank, Ltd. | | | 4,274,500 | | | | 58,893,874 | |
Singapore Technologies Engineering, Ltd. | | | 24,912,425 | | | | 58,641,086 | |
SIA Engineering Co., Ltd. | | | 15,928,900 | | | | 43,584,821 | |
Singapore Post, Ltd. | | | 38,209,000 | | | | 41,869,332 | |
ComfortDelGro Corp., Ltd. | | | 19,003,800 | | | | 39,026,788 | |
ARA Asset Management, Ltd. | | | 36,838,667 | | | | 37,787,240 | |
Keppel Corp., Ltd. | | | 6,632,300 | | | | 27,360,278 | |
| | | | | | | | |
Total Singapore | | | | | | | 438,940,259 | |
| | | | | | | | |
| | | | | | | | |
| SOUTH KOREA: 8.2% | | | | | | | | |
KT&G Corp. | | | 529,674 | | | | 62,731,966 | |
Kangwon Land, Inc. | | | 1,557,377 | | | | 56,509,490 | |
Samsung Electronics Co., Ltd. | | | 43,412 | | | | 54,063,190 | |
KEPCO Plant Service & Engineering Co., Ltd. | | | 634,668 | | | | 35,882,387 | |
GS Home Shopping, Inc. | | | 227,544 | | | | 33,951,190 | |
| | | | | | | | |
Total South Korea | | | | | | | 243,138,223 | |
| | | | | | | | |
| | | | | | | | |
| JAPAN: 8.0% | | | | | | | | |
KDDI Corp. | | | 2,114,800 | | | | 64,310,511 | |
Japan Tobacco, Inc. | | | 1,581,000 | | | | 63,717,784 | |
USS Co., Ltd. | | | 2,579,300 | | | | 42,627,035 | |
Transcosmos, Inc. | | | 1,457,100 | | | | 41,497,463 | |
Lawson, Inc. | | | 340,300 | | | | 27,167,792 | |
| | | | | | | | |
Total Japan | | | | | | | 239,320,585 | |
| | | | | | | | |
| | | | | | | | |
| MALAYSIA: 6.3% | | | | | | | | |
Genting Malaysia BHD | | | 64,387,400 | | | | 71,190,999 | |
British American Tobacco Malaysia BHD | | | 3,498,400 | | | | 45,731,286 | |
Axiata Group BHD | | | 29,118,523 | | | | 40,754,708 | |
Telekom Malaysia BHD | | | 18,277,351 | | | | 30,763,559 | |
| | | | | | | | |
Total Malaysia | | | | | | | 188,440,552 | |
| | | | | | | | |
| | | | | | | | |
| TAIWAN: 5.3% | | | | | | | | |
Taiwan Semiconductor Manufacturing Co., Ltd. | | | 11,282,187 | | | | 56,858,807 | |
| | | | | | | | |
| | | Shares | | | Value | |
Chunghwa Telecom Co., Ltd. ADR | | | 1,422,425 | | | | $51,634,028 | |
Taiwan Semiconductor Manufacturing Co., Ltd. ADR | | | 1,838,624 | | | | 48,227,108 | |
| | | | | | | | |
Total Taiwan | | | | | | | 156,719,943 | |
| | | | | | | | |
| | | | | | | | |
| AUSTRALIA: 2.8% | | | | | | | | |
Insurance Australia Group, Ltd. | | | 11,324,603 | | | | 46,649,139 | |
CSL, Ltd. | | | 448,874 | | | | 37,854,749 | |
| | | | | | | | |
Total Australia | | | | | | | 84,503,888 | |
| | | | | | | | |
| | | | | | | | |
| INDONESIA: 2.7% | | | | | | | | |
PT Telekomunikasi Indonesia Persero ADR | | | 906,600 | | | | 55,719,636 | |
PT Perusahaan Gas Negara Persero | | | 139,319,300 | | | | 24,841,620 | |
| | | | | | | | |
Total Indonesia | | | | | | | 80,561,256 | |
| | | | | | | | |
| | | | | | | | |
| NEW ZEALAND: 2.3% | | | | | | | | |
SKYCITY Entertainment Group, Ltd. | | | 21,053,915 | | | | 68,916,114 | |
| | | | | | | | |
Total New Zealand | | | | | | | 68,916,114 | |
| | | | | | | | |
| | | | | | | | |
| UNITED STATES: 1.7% | | | | | | | | |
ResMed, Inc. | | | 809,400 | | | | 51,178,362 | |
| | | | | | | | |
Total United States | | | | | | | 51,178,362 | |
| | | | | | | | |
| | | | | | | | |
| THAILAND: 1.6% | | | | | | | | |
Glow Energy Public Co., Ltd. | | | 17,769,800 | | | | 43,463,330 | |
BEC World Public Co., Ltd. | | | 5,903,100 | | | | 3,841,135 | |
| | | | | | | | |
Total Thailand | | | | | | | 47,304,465 | |
| | | | | | | | |
| | | | | | | | |
| NORWAY: 1.5% | | | | | | | | |
Telenor ASA | | | 2,669,498 | | | | 44,188,258 | |
| | | | | | | | |
Total Norway | | | | | | | 44,188,258 | |
| | | | | | | | |
| | | | | | | | |
| VIETNAM: 1.4% | | | | | | | | |
Vietnam Dairy Products JSC | | | 6,818,401 | | | | 43,125,752 | |
| | | | | | | | |
Total Vietnam | | | | | | | 43,125,752 | |
| | | | | | | | |
| | | | | | | | |
| PHILIPPINES: 1.3% | | | | | | | | |
Globe Telecom, Inc. | | | 742,500 | | | | 37,533,918 | |
| | | | | | | | |
Total Philippines | | | | | | | 37,533,918 | |
| | | | | | | | |
| | | | | | | | |
| TOTAL COMMON EQUITIES | | | | | | | 2,515,711,078 | |
| | | | | | | | |
(Cost $2,246,246,206) | | | | | | | | |
| | | | | | | | |
CONVERTIBLE CORPORATE BONDS: 7.5% | | | | | |
| | | Face Amount* | | | Value | |
| CHINA/HONG KONG: 5.1% | | | | | | | | |
Shine Power International, Ltd., Cnv. 0.000%, 07/28/19 | | | HKD 446,000,000 | | | | 56,625,978 | |
Johnson Electric Holdings, Ltd., Cnv. 1.000%, 04/02/21 | | | 49,750,000 | | | | 51,242,500 | |
Hengan International Group Co., Ltd., Cnv. | | | | | |
0.000%, 06/27/18 | | | HKD 339,000,000 | | | | 45,990,320 | |
| | | | | | | | |
Total China/Hong Kong | | | | | | | 153,858,798 | |
| | | | | | | | |
| | | | | | | | |
Matthews Asian Growth and Income Fund
June 30, 2016
Schedule of Investmentsa (unaudited) (continued)
CONVERTIBLE CORPORATE BONDS (continued)
| | | | | | | | |
| | | Face Amount* | | | Value | |
| SINGAPORE: 2.4% | | | | | | | | |
CapitaLand, Ltd., Cnv.
1.950%, 10/17/23 | | | SGD 96,500,000 | | | | $71,366,732 | |
| | | | | | | | |
Total Singapore | | | | | | | 71,366,732 | |
| | | | | | | | |
| | | | | | | | |
| TOTAL CONVERTIBLE CORPORATE BONDS | | | | 225,225,530 | |
| | | | | | | | |
(Cost $234,700,057) | | | | | | | | |
| | | | | | | | |
PREFERRED EQUITIES: 3.8% | | | | | | | | |
| | | Shares | | | Value | |
| SOUTH KOREA: 3.8% | | | | | | | | |
LG Household & Health Care, Ltd., Pfd. | | | 97,336 | | | | 56,049,300 | |
Hyundai Motor Co., Ltd., Pfd. | | | 355,983 | | | | 29,330,892 | |
Hyundai Motor Co., Ltd., 2nd Pfd. | | | 318,246 | | | | 26,728,975 | |
| | | | | | | | |
Total South Korea | | | | | | | 112,109,167 | |
| | | | | | | | |
| | | | | | | | |
| TOTAL PREFERRED EQUITIES | | | | 112,109,167 | |
| | | | | | | | |
(Cost $38,144,725) | | | | | | | | |
| | | | | | | | |
| TOTAL INVESTMENTS: 95.6% | | | | | | | 2,853,045,775 | |
(Cost $2,519,090,988b) | | | | | | | | |
| | | | | | | | |
CASH AND OTHER ASSETS,
LESS LIABILITIES: 4.4% | | | | | | | 132,239,107 | |
| | | | | | | | |
| | |
NET ASSETS: 100.0% | | | | | | | $2,985,284,882 | |
| | | | | | | | |
| a | Certain securities were fair valued under the valuation polices approved by the Board of Trustees (Note 2-A). |
| b | Cost for federal income tax purposes is $2,519,393,773 and net unrealized appreciation consists of: |
| | | | |
Gross unrealized appreciation | | | $544,908,860 | |
Gross unrealized depreciation | | | (211,256,858 | ) |
| | | | |
Net unrealized appreciation | | | $333,652,002 | |
| | | | |
| * | All values are in USD unless otherwise noted. |
| ADR | American Depositary Receipt |
| REIT | Real Estate Investment Trust |
See accompanying notes to financial statements.
| | | | |
| matthewsasia.com | 800.789.ASIA | | | 19 | |
| | | | |
| PORTFOLIO MANAGERS |
| Yu Zhang, CFA | | Robert Horrocks, PhD |
Lead Manager | | Lead Manager |
| Vivek Tanneeru | | |
Co-Manager | | | | |
|
| FUND FACTS |
| | | Investor | | Institutional |
Ticker | | MAPIX | | MIPIX |
CUSIP | | 577125107 | | 577130750 |
Inception | | 10/31/06 | | 10/29/10 |
NAV | | $16.16 | | $16.16 |
Initial Investment | | $2,500 | | $3 million |
Gross Expense Ratio1 | | 1.06% | | 0.93% |
After Fee Waiver and Reimbursement2 | | 1.05% | | 0.92% |
Portfolio Statistics |
Total # of Positions | | 71 |
Net Assets | | $4.7 billion |
Weighted Average Market Cap | | $31.6 billion |
Portfolio Turnover3 | | 35.98% |
Benchmark | | | | |
MSCI AC Asia Pacific Index |
OBJECTIVE
Total return with an emphasis on providing current income.
STRATEGY
Under normal market conditions, the Fund seeks to achieve its investment objective by investing at least 80% of its total net assets, which include borrowings for investment purposes, in dividend-paying equity securities of companies located in Asia. Asia consists of all countries and markets in Asia, and includes developed, emerging and frontier countries and markets in the Asian region. The Fund may also invest in convertible debt and equity securities.
Matthews Asia Dividend Fund
Portfolio Manager Commentary (unaudited)
For the first half of 2016, the Matthews Asia Dividend Fund returned 6.50% (Investor Class) and 6.66% (Institutional Class), outperforming its benchmark, the MSCI All Country Asia Pacific Index, which returned -0.85%. For the quarter ending June 30, the Fund rose 3.99% (Investor Class) and 4.04% (Institutional Class) while its benchmark returned 0.77%. In June, the Fund distributed 18.52 cents per share (Investor Class) and 19.15 cents per share (Institutional Class), bringing its total year-to-date income distribution to 19.51 cents and 20.77 cents per share, respectively.
Market Environment:
Asian equity markets during the first half of the year were marked by volatility, with the second quarter particularly directionless. Some of the region’s major economies were confronted with various growth challenges. The resurgence of China’s credit growth cast doubts on the progress of its structural reforms, and Chinese equities struggled to stage a sustainable recovery. In Japan, the government’s delay of a second consumption tax hike came as little surprise, as the country’s currently anemic economic growth leaves little room for further fiscal consolidation. As the yen, a perceived safe-haven asset, further strengthened during the quarter, the local stock market started to underperform. India was a bright spot—the results of recent state elections strengthened the ruling coalition, increasing prospects of momentum in the reform process. In this context, initiatives such as the passage of the bankruptcy law can help in tackling long-standing issues with nonperforming loans in the banking system.
Performance Contributors and Detractors:
Amid market uncertainties, the Fund’s holdings in defensive business models with strong cash flow generation outperformed during the first half of 2016. One of the top contributors to Fund performance was our holding in Thai Beverage, Thailand’s largest hard liquor company, which announced stronger-than-expected quarterly earnings. Not only did its mainstay liquor division perform steadily, its Chang beer brands, which have struggled for some time, also showed a clear turnaround. This surprised the market with both meaningful volume and profit growth. Its stock rallied following the earnings results.
On the flip side, our holdings in Japanese export companies were among the biggest detractors to Fund performance during the first half of 2016. Bridgestone and Hoya, which both generated meaningful revenue and profits outside of Japan, saw their share prices correct significantly during the second quarter. Our investment thesis rests on their industry-leading positions and improving shareholder return policies via significant dividend hikes. We will continue to closely monitor each company’s business operations and further assess whether sustainable earnings growth and dividend growth can still be delivered amid potential currency headwinds.
Notable Portfolio Changes:
Among our new positions initiated during the quarter, the Fund participated in the initial public offering of Cikarang Listrindo, an independent Indonesian power producer. Despite its new-listing status, Cikarang Listrindo itself has been a major player in Indonesia’s electric power industry for over two decades. With favorable long-term demand outlook for electricity in Indonesia, we believe the firm is well-positioned to deliver sustainable earnings growth due to its visible capacity
(continued)
| 1 | Prospectus expense ratios. |
| 2 | Matthews has contractually agreed to waive a portion of its advisory fee and administrative and shareholder services fee if the Fund’s average daily net assets are over $3 billion, as follows: for every $2.5 billion average daily net assets of the Fund that are over $3 billion, the advisory fee rate and the administrative and shareholder services fee rate for the Fund with respect to such excess average daily net assets will be each reduced by 0.01%, in each case without reducing such fee rate below 0.00%. Any amount waived by Matthews pursuant to this agreement may not be recouped by Matthews. This agreement will remain in place until April 30, 2017 and may be terminated at any time (i) by the Trust on behalf of the Fund or by the Board of Trustees upon 60 days’ prior written notice to Matthews; or (ii) by Matthews upon 60 days’ prior written notice to the Trust, in each case without payment of any penalty. |
| 3 | The lesser of fiscal year 2015 long-term purchase costs or sales proceeds divided by the average monthly market value of long-term securities. |
| | | | | | | | | | | | | | | | | | | | | | | | | | | | |
| | | | | | | | |
| PERFORMANCE AS OF JUNE 30, 2016 | | | | | | | | | | | | | | | | | | | | | |
| | | | | | | | | | | | Average Annual Total Returns | | | | |
| | | 3 Months | | | YTD | | | 1 Year | | | 3 Years | | | 5 Years | | | Since
Inception | | | Inception
Date | |
| Investor Class (MAPIX) | | | 3.99% | | | | 6.50% | | | | -1.81% | | | | 5.30% | | | | 5.82% | | | | 8.98% | | | | 10/31/06 | |
| Institutional Class (MIPIX) | | | 4.04% | | | | 6.66% | | | | -1.66% | | | | 5.45% | | | | 5.96% | | | | 6.00% | | | | 10/29/10 | |
| MSCI AC Asia Pacific Index4 | | | 0.77% | | | | -0.85% | | | | -9.35% | | | | 2.33% | | | | 1.91% | | | | 2.41% | 5 | | | | |
| Lipper Pacific Region Funds Category Average6 | | | 2.45% | | | | 2.49% | | | | -6.50% | | | | 2.71% | | | | 2.76% | | | | 3.53% | 5 | | | | |
Performance assumes reinvestment of all dividends and/or distributions before taxes. All performance quoted represents past performance and is no guarantee of future results. Investment return and principal value will fluctuate with market conditions so that when redeemed, shares may be worth more or less than their original cost. Current performance may be lower or higher than the return figures quoted. Returns would have been lower if certain of the Fund’s fees and expenses had not been waived. For the Fund’s most recent month-end performance, visit matthewsasia.com.
| | | | | | | | | | | | | | | | | | | | | | | | | | | | | | | | | | | | | | | | | | | | |
| | | | | | | | | | | | |
| INCOME DISTRIBUTION HISTORY | | | | | | | | | | | | | | | | | | | | | | | | | | | | | | | | | |
| | | 2016 | | | | | | 2015 | |
| | | Q1 | | | Q2 | | | Q3 | | | Q4 | | | Total | | | | | | Q1 | | | Q2 | | | Q3 | | | Q4 | | | Total | |
| Investor (MAPIX) | | $ | 0.01 | | | $ | 0.19 | | | | n.a. | | | | n.a. | | | | n.a. | | | | | | | $ | 0.02 | | | $ | 0.18 | | | $ | 0.03 | | | $ | 0.04 | | | $ | 0.27 | |
| Inst’l (MIPIX) | | $ | 0.02 | | | $ | 0.19 | | | | n.a. | | | | n.a. | | | | n.a. | | | | | | | $ | 0.02 | | | $ | 0.19 | | | $ | 0.04 | | | $ | 0.04 | | | $ | 0.29 | |
Note: This table does not include capital gains distributions but does include return of capital totaling $0.065 (Investor Class) and $0.068 (Institutional Class) for 2014. Totals may differ by $0.01 due to rounding. For distribution history please visit matthewsasia.com.
| | | | |
30-DAY YIELD: 1.76% (Investor Class) 1.85% (Institutional Class) The 30-Day Yield represents net investment income earned by the Fund over the 30-day period ended 6/30/16, expressed as an annual percentage rate based on the Fund’s share price at the end of the 30-day period. The 30-Day Yield should be regarded as an estimate of the Fund’s rate of investment income, and it may not equal the Fund’s actual income distribution rate. Source: BNY Mellon Investment Servicing (US) Inc. | | | | DIVIDEND YIELD: 3.04% The dividend yield (trailing) for the portfolio is the weighted average sum of the dividends paid by each equity security held by the Fund over the 12 months ended 6/30/16 divided by the current price of each equity as of 6/30/16. The annualized dividend yield for the Fund is for the equity-only portion of the portfolio. Please note that this is based on gross equity portfolio holdings and does not reflect the actual yield an investor in the Fund would receive. Past yields are no guarantee of future yields. Source: FactSet Research Systems, Bloomberg, MICM. |
GROWTH OF A $10,000 INVESTMENT SINCE INCEPTION—INVESTOR CLASS
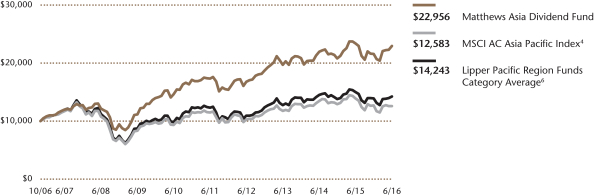
Plotted monthly. The performance data and graph do not reflect the deduction of taxes that a shareholder would pay on dividends, capital gains distributions or redemption of Fund shares. Values are in US$.
| | 4 | It is not possible to invest directly in an index. Source: Index data from Morgan Stanley Capital International and Bloomberg; total return calculations performed by BNY Mellon Investment Servicing (US) Inc. Please see page 91 for index definition. |
| | 5 | Calculated from 10/31/06. |
| | 6 | The Lipper Category Average does not reflect sales charges and is based on total return, including reinvestment of dividends and capital gains for the stated periods. |
| | | | | | | | |
| | | | |
| TOP TEN HOLDINGS7 | | | | | | | |
| | | Sector | | Country | | % of Net Assets | |
| Minth Group, Ltd. | | Consumer Discretionary | | China/Hong Kong | | | 4.1% | |
| Japan Tobacco, Inc. | | Consumer Staples | | Japan | | | 3.6% | |
| KT&G Corp. | | Consumer Staples | | South Korea | | | 3.1% | |
| NTT DoCoMo, Inc. | | Telecommunication Services | | Japan | | | 3.0% | |
| Hoya Corp. | | Health Care | | Japan | | | 2.8% | |
| Shenzhou International Group Holdings, Ltd. | | Consumer Discretionary | | China/Hong Kong | | | 2.8% | |
| LG Chem, Ltd., Pfd. | | Materials | | South Korea | | | 2.8% | |
| BGF Retail Co., Ltd. | | Consumer Staples | | South Korea | | | 2.8% | |
| Bridgestone Corp. | | Consumer Discretionary | | Japan | | | 2.7% | |
| Kao Corp. | | Consumer Staples | | Japan | | | 2.6% | |
| % OF ASSETS IN TOP TEN | | | | | | | 30.3% | |
| | 7 | Holdings may combine more than one security from same issuer and related depositary receipts. |
| | | | |
| matthewsasia.com | 800.789.ASIA | | | 21 | |
| | | | |
| |
| COUNTRY ALLOCATION (%)8,9 | |
| Japan | | | 30.9 | |
| China/Hong Kong | | | 29.9 | |
| South Korea | | | 8.7 | |
| Taiwan | | | 6.0 | |
| Indonesia | | | 5.4 | |
| Singapore | | | 4.7 | |
| India | | | 2.5 | |
| Australia | | | 2.5 | |
| Thailand | | | 2.3 | |
| Vietnam | | | 1.8 | |
| Luxembourg | | | 1.6 | |
| Philippines | | | 1.6 | |
| Cash and Other Assets, Less Liabilities | | | 2.1 | |
| | | | |
| |
| SECTOR ALLOCATION (%)9 | |
| Consumer Staples | | | 30.7 | |
| Consumer Discretionary | | | 16.8 | |
| Telecommunication Services | | | 13.4 | |
| Financials | | | 11.6 | |
| Industrials | | | 10.9 | |
| Information Technology | | | 5.2 | |
| Health Care | | | 3.8 | |
| Materials | | | 3.0 | |
| Energy | | | 1.3 | |
| Utilities | | | 1.2 | |
| Cash and Other Assets, Less Liabilities | | | 2.1 | |
| | | | |
| |
| MARKET CAP EXPOSURE (%)9 | |
| Mega Cap (over $25B) | | | 34.7 | |
| Large Cap ($10B–$25B) | | | 17.2 | |
| Mid Cap ($3B–10B) | | | 28.2 | |
| Small Cap (under $3B) | | | 17.8 | |
| Cash and Other Assets, Less Liabilities | | | 2.1 | |
| 8 | Not all countries where the Fund may invest are included in the benchmark index. |
| 9 | Source: FactSet Research Systems. Percentage values in data are rounded to the nearest tenth of one percent; the values may not sum to 100% due to rounding. |
Matthews Asia Dividend Fund
Portfolio Manager Commentary (unaudited) (continued)
expansion plan. Given the large ownership of its founding families, the company also has a clear dividend payout policy.
During the second quarter, the Fund exited its position in Guangdong Investment, a Chinese conglomerate. The firm had delivered steady financial results, benefiting from a stable and high margin water supply business, and its share price appreciated significantly since we first invested in it. At recent valuations, we found the risk-reward profile to be less attractive and decided to redeploy the capital into new ideas such as Cikarang Listrindo.
Outlook:
The volatility in the current market is likely to remain elevated, as a number of macro-driven events could continue to drive investor sentiment. However, the market can also overreact, especially in the short-term, creating buying opportunities for long-term investors to pick up quality companies at attractive valuations. We believe the current Asian market conditions provide such opportunities for us to invest in companies with attractive dividend yields and dividend growth.
Matthews Asia Dividend Fund
June 30, 2016
Consolidated Schedule of Investmentsa (unaudited)
COMMON EQUITIES: 95.1%
| | | | | | | | |
| | | Shares | | | Value | |
| JAPAN: 30.9% | | | | | | | | |
Japan Tobacco, Inc. | | | 4,163,100 | | | | $167,782,104 | |
NTT DoCoMo, Inc. | | | 5,294,500 | | | | 142,784,981 | |
Hoya Corp. | | | 3,748,300 | | | | 133,874,256 | |
Bridgestone Corp. | | | 3,960,200 | | | | 127,268,723 | |
Kao Corp. | | | 2,095,100 | | | | 122,023,145 | |
Pigeon Corp. | | | 3,806,100 | | | | 113,781,319 | |
Suntory Beverage & Food, Ltd. | | | 2,072,300 | | | | 93,773,916 | |
ITOCHU Corp. | | | 7,622,700 | | | | 93,250,110 | |
Skylark Co., Ltd. | | | 6,375,800 | | | | 80,809,739 | |
Sumitomo Mitsui Financial Group, Inc. | | | 2,572,800 | | | | 74,289,753 | |
MISUMI Group, Inc. | | | 4,006,600 | | | | 72,338,023 | |
Seven & I Holdings Co., Ltd. | | | 1,688,200 | | | | 70,783,041 | |
Toyo Suisan Kaisha, Ltd. | | | 1,693,500 | | | | 68,693,542 | |
Anritsu Corp.† | | | 7,909,500 | | | | 45,642,823 | |
Mitsubishi Pencil Co., Ltd. | | | 779,700 | | | | 36,542,100 | |
Itochu Enex Co., Ltd. | | | 1,614,700 | | | | 14,328,192 | |
| | | | | | | | |
Total Japan | | | | | | | 1,457,965,767 | |
| | | | | | | | |
| | | | | | | | |
| CHINA/HONG KONG: 29.9% | | | | | | | | |
Minth Group, Ltd.† | | | 59,535,000 | | | | 192,231,571 | |
Shenzhou International Group Holdings, Ltd. | | | 27,377,000 | | | | 132,386,048 | |
AIA Group, Ltd. | | | 18,703,600 | | | | 112,478,307 | |
China Construction Bank Corp. H Shares | | | 137,693,000 | | | | 91,791,399 | |
China Mobile, Ltd. ADR | | | 1,574,225 | | | | 91,147,628 | |
Qualcomm, Inc. | | | 1,569,800 | | | | 84,094,186 | |
Yuexiu Transport Infrastructure, Ltd.† | | | 103,392,000 | | | | 66,705,866 | |
Kweichow Moutai Co., Ltd. A Shares | | | 1,466,605 | | | | 64,319,278 | |
PICC Property & Casualty Co., Ltd. H Shares | | | 37,910,000 | | | | 59,770,575 | |
Café de Coral Holdings, Ltd. | | | 17,330,000 | | | | 54,430,058 | |
Far East Horizon, Ltd. | | | 67,294,000 | | | | 52,559,354 | |
Fuyao Glass Industry Group Co., Ltd. H Sharesc | | | 21,248,000 | | | | 49,449,218 | |
Jiangsu Expressway Co., Ltd. H Shares | | | 35,370,000 | | | | 49,393,723 | |
Dali Foods Group Co., Ltd. | | | 84,067,000 | | | | 47,900,755 | |
HKBN, Ltd. | | | 41,566,123 | | | | 43,841,167 | |
Henan Shuanghui Investment & Development Co., Ltd. A Sharesb | | | 12,972,979 | | | | 40,966,116 | |
China Machinery Engineering Corp. H Shares† | | | 56,592,000 | | | | 37,005,060 | |
Hopewell Holdings, Ltd. | | | 8,530,000 | | | | 27,122,175 | |
Red Star Macalline Group Corp., Ltd. H Sharesc | | | 23,377,200 | | | | 25,481,467 | |
Kweichow Moutai Co., Ltd. A Sharesb | | | 420,725 | | | | 18,511,956 | |
China Mobile, Ltd. | | | 1,411,000 | | | | 16,302,998 | |
Stella International Holdings, Ltd. | | | 9,146,500 | | | | 16,194,029 | |
China Power International Development, Ltd. | | | 42,567,000 | | | | 15,713,040 | |
Greatview Aseptic Packaging Co., Ltd. | | | 21,913,000 | | | | 10,423,853 | |
Shanghai Lujiazui Finance & Trade Zone Development Co., Ltd. B Shares | | | 5,188,890 | | | | 8,120,592 | |
China Nuclear Engineering Group Co. A Sharesb,c | | | 1,000 | | | | 3,149 | |
| | | | | | | | |
Total China/Hong Kong | | | | | | | 1,408,343,568 | |
| | | | | | | | |
| | | | | | | | |
| | | Shares | | | Value | |
| TAIWAN: 6.0% | | | | | | | | |
Chunghwa Telecom Co., Ltd. ADR | | | 3,324,301 | | | | $120,672,126 | |
Taiwan Semiconductor Manufacturing Co., Ltd. ADR | | | 3,027,940 | | | | 79,422,866 | |
St. Shine Optical Co., Ltd. | | | 1,965,000 | | | | 44,405,313 | |
Sercomm Corp. † | | | 12,177,000 | | | | 27,329,251 | |
Taiwan Semiconductor Manufacturing Co., Ltd. | | | 2,336,469 | | | | 11,775,096 | |
| | | | | | | | |
Total Taiwan | | | | | | | 283,604,652 | |
| | | | | | | | |
| | | | | | | | |
| SOUTH KOREA: 5.9% | | | | | | | | |
KT&G Corp. | | | 1,235,189 | | | | 146,289,669 | |
BGF Retail Co., Ltd. | | | 697,460 | | | | 129,863,372 | |
| | | | | | | | |
Total South Korea | | | | | | | 276,153,041 | |
| | | | | | | | |
| | | | | | | | |
| INDONESIA: 5.4% | | | | | | | | |
PT Telekomunikasi Indonesia Persero ADR | | | 1,040,634 | | | | 63,957,366 | |
PT Hanjaya Mandala Sampoerna | | | 211,122,500 | | | | 60,780,169 | |
PT United Tractors | | | 41,221,900 | | | | 46,509,336 | |
PT Cikarang Listrindoc | | | 371,011,100 | | | | 42,120,465 | |
PT Telekomunikasi Indonesia Persero | | | 130,591,800 | | | | 39,732,004 | |
| | | | | | | | |
Total Indonesia | | | | | | | 253,099,340 | |
| | | | | | | | |
| | | | | | | | |
| SINGAPORE: 4.7% | | | | | | | | |
Singapore Technologies Engineering, Ltd. | | | 28,460,000 | | | | 66,991,684 | |
CapitaLand Retail China Trust, REIT† | | | 43,232,400 | | | | 48,256,068 | |
Ascendas India Trust† | | | 53,470,700 | | | | 39,405,020 | |
ARA Asset Management, Ltd. | | | 34,749,418 | | | | 35,644,194 | |
Super Group, Ltd. | | | 48,842,900 | | | | 30,107,908 | |
| | | | | | | | |
Total Singapore | | | | | | | 220,404,874 | |
| | | | | | | | |
| | | | | | | | |
| INDIA: 2.5% | | | | | | | | |
ITC, Ltd. | | | 13,801,000 | | | | 75,558,959 | |
Bharti Infratel, Ltd. | | | 7,522,045 | | | | 38,543,439 | |
Gujarat Pipavav Port, Ltd.c | | | 2,019,621 | | | | 4,895,765 | |
| | | | | | | | |
Total India | | | | | | | 118,998,163 | |
| | | | | | | | |
| | | | | | | | |
| AUSTRALIA: 2.5% | | | | | | | | |
Breville Group, Ltd.† | | | 10,644,019 | | | | 60,033,974 | |
Spotless Group Holdings, Ltd. † | | | 58,411,087 | | | | 49,433,995 | |
Reliance Worldwide Corp., Ltd.c | | | 3,740,934 | | | | 8,621,076 | |
| | | | | | | | |
Total Australia | | | | | | | 118,089,045 | |
| | | | | | | | |
| | | | | | | | |
| THAILAND: 2.3% | | | | | | | | |
Thai Beverage Public Co., Ltd. | | | 161,322,100 | | | | 109,391,138 | |
| | | | | | | | |
Total Thailand | | | | | | | 109,391,138 | |
| | | | | | | | |
| | | | | | | | |
| VIETNAM: 1.8% | | | | | | | | |
Vietnam Dairy Products JSC | | | 13,680,740 | | | | 86,529,408 | |
| | | | | | | | |
Total Vietnam | | | | | | | 86,529,408 | |
| | | | | | | | |
| | | | | | | | |
| LUXEMBOURG: 1.6% | | | | | | | | |
L’Occitane International SA | | | 36,976,500 | | | | 75,737,977 | |
| | | | | | | | |
Total Luxembourg | | | | | | | 75,737,977 | |
| | | | | | | | |
| | | | | | | | |
| | | | |
| matthewsasia.com | 800.789.ASIA | | | 23 | |
Matthews Asia Dividend Fund
June 30, 2016
Consolidated Schedule of Investmentsa (unaudited) (continued)
COMMON EQUITIES (continued)
| | | | | | | | |
| | | Shares | | | Value | |
| PHILIPPINES: 1.6% | | | | | | | | |
Globe Telecom, Inc. | | | 1,447,730 | | | | $73,183,811 | |
| | | | | | | | |
Total Philippines | | | | | | | 73,183,811 | |
| | | | | | | | |
| | | | | | | | |
| NEW ZEALAND: 0.0% | | | | | | | | |
SKY Network Television, Ltd. | | | 667,879 | | | | 2,279,286 | |
| | | | | | | | |
Total New Zealand | | | | | | | 2,279,286 | |
| | | | | | | | |
| | | | | | | | |
| TOTAL COMMON EQUITIES | | | | | | | 4,483,780,070 | |
| | | | | | | | |
(Cost $3,781,310,598) | | | | | | | | |
| | | | | | | | |
PREFERRED EQUITIES: 2.8% | | | | | | | | |
| SOUTH KOREA: 2.8% | | | | | | | | |
LG Chem, Ltd., Pfd. | | | 790,477 | | | | 131,951,222 | |
| | | | | | | | |
Total South Korea | | | | | | | 131,951,222 | |
| | | | | | | | |
| | | | | | | | |
| TOTAL PREFERRED EQUITIES | | | | | | | 131,951,222 | |
| | | | | | | | |
(Cost $70,742,408) | | | | | | | | |
| | | | | | | | |
| TOTAL INVESTMENTS: 97.9% | | | | | | | 4,615,731,292 | |
(Cost $3,852,053,006d) | | | | | | | | |
| | | | | | | | |
| CASH AND OTHER ASSETS, LESS LIABILITIES: 2.1% | | | | | | | 98,758,198 | |
| | | | | | | | |
| | |
NET ASSETS: 100.0% | | | | | | | $4,714,489,490 | |
| | | | | | | | |
| a | Certain securities were fair valued under the valuation polices approved by the Board of Trustees (Note 2-A). |
| b | Security held by Matthews ADF-U Series. See note 2-C. |
| c | Non-income producing security. |
| d | Cost for federal income tax purposes is $3,859,310,506 and net unrealized appreciation consists of: |
| | | | |
Gross unrealized appreciation | | | $1,080,275,615 | |
Gross unrealized depreciation | | | (323,854,829 | ) |
| | | | |
Net unrealized appreciation | | | $ 756,420,786 | |
| | | | |
| † | Affiliated Issuer, as defined under the Investment Company Act of 1940 (ownership of 5% or more of the outstanding voting securities of this issuer) |
| ADR | American Depositary Receipt |
| REIT | Real Estate Investment Trust |
See accompanying notes to financial statements.
| | | | |
| PORTFOLIO MANAGERS |
| Yu Zhang, CFA | | |
Lead Manager | | | | |
| Sherwood Zhang, CFA | | |
Co-Manager | | | | |
| | |
| FUND FACTS | | | | |
| | | Investor | | Institutional |
Ticker | | MCDFX | | MICDX |
CUSIP | | 577125305 | | 577130735 |
Inception | | 11/30/09 | | 10/29/10 |
NAV | | $13.46 | | $13.46 |
Initial Investment | | $2,500 | | $3 million |
Gross Expense Ratio1 | | 1.19% | | 1.00% |
Portfolio Statistics | | |
Total # of Positions | | 48 |
Net Assets | | $164.4 million |
Weighted Average Market Cap | | $24.5 billion |
Portfolio Turnover2 | | 79.91% |
Benchmark | | | | |
MSCI China Index |
OBJECTIVE
Total return with an emphasis on providing current income.
STRATEGY
Under normal market conditions, the Fund seeks to achieve its investment objective by investing at least 80% of its total net assets, which include borrowings for investment purposes, in dividend-paying equity securities of companies located in China. China includes its administrative and other districts, such as Hong Kong. The Fund may also invest in convertible debt and equity securities.
Matthews China Dividend Fund
Portfolio Manager Commentary (unaudited)
For the first half of 2016, the Matthews China Dividend Fund returned –0.87% (Investor Class) and –0.76% (Institutional Class), while its benchmark, the MSCI China Index, returned –4.53%. For the quarter ending June 30, the Fund returned 1.87% (Investor Class) and 1.90% (Institutional Class), outperforming its benchmark, which returned 0.28%.
Market Environment:
The resurgence of China’s credit growth cast doubts on the progress of the country’s structural reforms. However, during the second quarter of the year, both China A-shares and Hong Kong markets were stable, as much negative sentiment seemed priced in. China’s domestic A-share markets even edged higher during the global sell-off that resulted immediately after the Brexit vote late in the second quarter. In June, global index provider MSCI again decided against including China A-shares in its global emerging markets index. While MSCI itself praised the significant progress made by Chinese regulators during the past year, its surprising decision had a minimal impact on the market.
Performance Contributors and Detractors:
During both the second quarter and year-to-date periods, China Maple Leaf Educational Systems, the leading private school operator, was our top contributor to Fund performance. The company reported strong earnings results due to increased student enrollment and a higher utilization rate of its schools. Auto parts supplier Minth Group also performed strongly. We have seen the company continue to grow its business beyond China’s domestic market, and also continue to diversify its product offerings. The market reacted positively when Minth announced its plan to enter the automotive camera business during the second quarter. NetEase, an online gaming operator that we initiated a position in earlier this year, was also among our top contributors. NetEase was among the first Chinese Internet companies listed on a U.S. exchange that adopted a consistent dividend policy. Its long-term returns since then should set a good example to all Chinese companies in fast-growing industries, such as technology, media and entertainment, listed overseas, as corporate management teams in such industries often neglect the importance of a dividend policy for public companies.
On the flip side, China Power International Development, an independent power producer, was the largest performance detractor both year-to-date and during the second quarter. Market participants worried that slower economic growth would negatively impact electricity demand, and shifting government policy added to the uncertainty regarding the company’s outlook. We are closely monitoring the policy direction and reassessing our investment thesis.
Notable Portfolio Changes:
We made a few changes within our financial sector holdings during the second quarter, based on our analysis of Chinese government policy responses. We initiated a new position in PICC Property & Casualty, the largest insurer in its field in China, as investors cast doubts on its future profitability after a pricing reform initiative was announced. We believe the scale of PICC Property & Casualty’s business and its supporting network will be advantages in serving a fast-growing auto market with a high accident rate, and the reform initiatives should likely play into its favor long term. Due to our concerns over China’s reaccelerated credit growth this year, we exited our position in Huishang Bank Corp., a regional bank in less-developed Anhui Province. We also sold out of China International Capital Corporation, a leading investment bank that had an initial public offering last year. Although the firm’s differentiated strategy and service standard among local peers continues to appeal to us, its decision not to pay dividends disappointed.
(continued)
| 1 | Prospectus expense ratios. |
| 2 | The lesser of fiscal year 2015 long-term purchase costs or sales proceeds divided by the average monthly market value of long-term securities. |
| | | | |
| matthewsasia.com | 800.789.ASIA | | | 25 | |
| | | | | | | | | | | | | | | | | | | | | | | | | | | | |
| | | |
| PERFORMANCE AS OF JUNE 30, 2016 | | | | | | | |
| | | | | | | | | | | | Average Annual Total Returns | | | | |
| | | 3 Months | | | YTD | | | 1 Year | | | 3 Year | | | 5 Year | | | Since
Inception | | | Inception
Date | |
| Investor Class (MCDFX) | | | 1.87% | | | | -0.87% | | | | -11.53% | | | | 7.59% | | | | 5.97% | | | | 8.35% | | | | 11/30/09 | |
| Institutional Class (MICDX) | | | 1.90% | | | | -0.76% | | | | -11.33% | | | | 7.80% | | | | 6.19% | | | | 6.48% | | | | 10/29/10 | |
| MSCI China Index3 | | | 0.28% | | | | -4.53% | | | | -23.20% | | | | 3.62% | | | | -0.24% | | | | 0.78% | 4 | | | | |
| Lipper China Region Funds Category Average5 | | | -0.10% | | | | -5.50% | | | | -19.94% | | | | 3.18% | | | | -0.21% | | | | 2.08% | 4 | | | | |
Performance assumes reinvestment of all dividends and/or distributions before taxes. All performance quoted represents past performance and is no guarantee of future results. Investment return and principal value will fluctuate with market conditions so that when redeemed, shares may be worth more or less than their original cost. Current performance may be lower or higher than the return figures quoted. For the Fund’s most recent month-end performance, visit matthewsasia.com.
| | | | | | | | | | | | | | | | | | | | | | | | | | | | |
| | | | | | | | |
| INCOME DISTRIBUTION HISTORY | | | | | | | | | | | | | | | | | | | | | |
| | | 2016 | | | | | | 2015 | |
| | | June | | | December | | | Total | | | | | | June | | | December | | | Total | |
| Investor (MCDFX) | | $ | 0.21 | | | | n.a. | | | | n.a. | | | | | | | $ | 0.27 | | | $ | 0.01 | | | $ | 0.28 | |
| Inst’l (MICDX) | | $ | 0.22 | | | | n.a. | | | | n.a. | | | | | | | $ | 0.28 | | | $ | 0.03 | | | $ | 0.30 | |
Note: This table does not include capital gains distributions. Totals may differ by $0.01 due to rounding. For income distribution history, visit matthewsasia.com.
| | | | |
30-DAY YIELD: 2.04% (Investor Class) 2.30% (Institutional Class) The 30-Day Yield represents net investment income earned by the Fund over the 30-day period ended 6/30/16, expressed as an annual percentage rate based on the Fund’s share price at the end of the 30-day period. The 30-Day Yield should be regarded as an estimate of the Fund’s rate of investment income, and it may not equal the Fund’s actual income distribution rate. Source: BNY Mellon Investment Servicing (US) Inc. | | | | DIVIDEND YIELD: 3.76% The dividend yield (trailing) for the portfolio is the weighted average sum of the dividends paid by each equity security held by the Fund over the 12 months ended 6/30/16 divided by the current price of each equity as of 6/30/16. The annualized dividend yield for the Fund is for the equity-only portion of the portfolio. Please note that this is based on gross equity portfolio holdings and does not reflect the actual yield an investor in the Fund would receive. Past yields are no guarantee of future yields. Source: FactSet Research Systems, Bloomberg, MICM. |
GROWTH OF A $10,000 INVESTMENT SINCE INCEPTION—INVESTOR CLASS
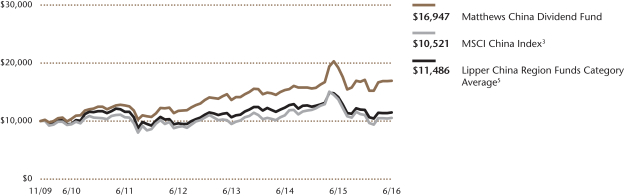
Plotted monthly. The performance data does not reflect the deduction of taxes that a shareholder would pay on dividends, capital gains distributions or redemption of Fund shares. Values are in US$.
| | 3 | It is not possible to invest directly in an index. Source: Index data from Morgan Stanley Capital International and Bloomberg; total return calculations performed by BNY Mellon Investment Servicing (US) Inc. Please see page 91 for index definition. |
| | 4 | Calculated from 11/30/09. |
| | 5 | The Lipper Category Average does not reflect sales charges and is based on total return, including reinvestment of dividends and capital gains for the stated periods. |
| | | | | | | | |
| | | | |
| TOP TEN HOLDINGS6 | | | | | | | |
| | | Sector | | | | % of Net Assets | |
| China Mobile, Ltd. | | Telecommunication Services | | | | | 3.3% | |
| China Medical System Holdings, Ltd. | | Health Care | | | | | 3.3% | |
| Minth Group, Ltd. | | Consumer Discretionary | | | | | 3.1% | |
| CITIC Telecom International Holdings, Ltd. | | Telecommunication Services | | | | | 3.0% | |
| China Construction Bank Corp. | | Financials | | | | | 3.0% | |
| PICC Property & Casualty Co., Ltd. | | Financials | | | | | 2.9% | |
| HKBN, Ltd. | | Telecommunication Services | | | | | 2.9% | |
| AIA Group, Ltd. | | Financials | | | | | 2.9% | |
| Kweichow Moutai Co., Ltd. | | Consumer Staples | | | | | 2.9% | |
| Red Star Macalline Group Corp., Ltd. | | Financials | | | | | 2.8% | |
| % OF ASSETS IN TOP TEN | | | | | | | 30.1% | |
| | 6 | Holdings may combine more than one security from same issuer and related depositary receipts. |
Matthews China Dividend Fund
Portfolio Manager Commentary (unaudited) (continued)
Outlook:
Global market volatility may remain high as a number of macroeconomic-driven events could drive investor sentiment during the second half of the year. For China, some government reform initiatives in several industries could lead to unintended consequences down the road. However, when markets overreact, especially in the short term, buying opportunities for long-term investors often present themselves, allowing quality companies to be picked up at attractive valuations. We will continue to look for good companies and businesses that may be less impacted by Chinese government policies.
| | | | |
| |
| COUNTRY ALLOCATION (%)7,8 | |
| China/Hong Kong | | | 83.9 | |
| Taiwan | | | 6.7 | |
| Singapore | | | 3.5 | |
| Cash and Other Assets, Less Liabilities | | | 5.9 | |
| | | | |
| |
| SECTOR ALLOCATION (%)8 | |
| Consumer Discretionary | | | 20.7 | |
| Financials | | | 18.9 | |
| Industrials | | | 15.1 | |
| Telecommunication Services | | | 9.3 | |
| Information Technology | | | 9.2 | |
| Consumer Staples | | | 9.0 | |
| Materials | | | 4.4 | |
| Health Care | | | 4.4 | |
| Utilities | | | 2.0 | |
| Energy | | | 1.1 | |
| Cash and Other Assets, Less Liabilities | | | 5.9 | |
| | | | |
| |
| MARKET CAP EXPOSURE (%)8 | |
| Mega Cap (over $25B) | | | 19.1 | |
| Large Cap ($10B–$25B) | | | 2.9 | |
| Mid Cap ($3B–10B) | | | 30.9 | |
| Small Cap (under $3B) | | | 41.2 | |
| Cash and Other Assets, Less Liabilities | | | 5.9 | |
| 7 | Not all countries where the Fund may invest are included in the benchmark index. |
| 8 | Source: FactSet Research Systems. Percentage values in data are rounded to the nearest tenth of one percent; the values may not sum to 100% due to rounding. |
| | | | |
| matthewsasia.com | 800.789.ASIA | | | 27 | |
Matthews China Dividend Fund
June 30, 2016
Schedule of Investmentsa (unaudited)
COMMON EQUITIES: 94.1%
| | | | | | | | |
| | | Shares | | | Value | |
| CONSUMER DISCRETIONARY: 20.7% | |
Auto Components: 6.1% | |
Minth Group, Ltd. | | | 1,596,000 | | | | $5,153,298 | |
Fuyao Glass Industry Group Co., Ltd. H Shares | | | 1,787,600 | | | | 4,160,176 | |
Xingda International Holdings, Ltd. H Shares | | | 3,060,000 | | | | 706,999 | |
| | | | | | | | |
| | | | 10,020,473 | |
| | | | | | | | |
| | | | | | | | |
Diversified Consumer Services: 4.8% | |
China Maple Leaf Educational Systems, Ltd. | | | 3,828,000 | | | | 3,454,092 | |
New Oriental Education & Technology Group, Inc. ADR | | | 71,000 | | | | 2,973,480 | |
China Distance Education Holdings, Ltd. ADR | | | 147,200 | | | | 1,522,048 | |
| | | | | | | | |
| | | | 7,949,620 | |
| | | | | | | | |
| | | | | | | | |
Textiles, Apparel & Luxury Goods: 4.2% | |
Heilan Home Co., Ltd. A Shares | | | 2,041,837 | | | | 3,475,699 | |
Shenzhou International Group Holdings, Ltd. | | | 701,000 | | | | 3,389,802 | |
| | | | | | | | |
Total Textiles, Apparel & Luxury Goods | | | | | | | 6,865,501 | |
| | | | | |
| | | | | | | | |
Hotels, Restaurants & Leisure: 3.3% | |
Café de Coral Holdings, Ltd. | | | 922,000 | | | | 2,895,817 | |
Shanghai Jin Jiang International Hotels Group Co., Ltd. H Shares | | | 7,490,000 | | | | 2,463,560 | |
Xiao Nan Guo Restaurants Holdings, Ltd.b | | | 1,416,000 | | | | 75,479 | |
| | | | | | | | |
| | | | 5,434,856 | |
| | | | | | | | |
| | | | | | | | |
Specialty Retail: 2.3% | |
Chow Tai Fook Jewellery Group, Ltd. | | | 3,758,200 | | | | 2,700,427 | |
China Harmony New Energy Auto Holding, Ltd. | | | 1,911,000 | | | | 1,029,482 | |
| | | | | | | | |
| | | | 3,729,909 | |
| | | | | | | | |
Total Consumer Discretionary | | | | 34,000,359 | |
| | | | | |
| | | | | | | | |
| FINANCIALS: 18.9% | |
Insurance: 5.9% | |
PICC Property & Casualty Co., Ltd. H Shares | | | 3,064,000 | | | | 4,830,837 | |
AIA Group, Ltd. | | | 799,200 | | | | 4,806,169 | |
| | | | | | | | |
Total Insurance | | | | 9,637,006 | |
| | | | | | | | |
| | | | | |
Banks: 5.8% | |
China Construction Bank Corp. H Shares | | | 7,317,000 | | | | 4,877,791 | |
China Merchants Bank Co., Ltd. H Shares | | | 2,051,500 | | | | 4,628,434 | |
| | | | | | | | |
| | | | 9,506,225 | |
| | | | | | | | |
| | | | | | | | |
Real Estate Management & Development: 3.6% | |
Red Star Macalline Group Corp., Ltd. H Shares | | | 4,274,000 | | | | 4,658,718 | |
Shanghai Lujiazui Finance & Trade Zone Development Co., Ltd. B Shares | | | 802,483 | | | | 1,255,883 | |
| | | | | | | | |
| | | | 5,914,601 | |
| | | | | | | | |
| | | | | | | | |
Real Estate Investment Trusts (REITS): 2.0% | |
CapitaLand Retail China Trust, REIT | | | 2,957,600 | | | | 3,301,277 | |
| | | | | | | | |
| | | | | | | | |
Capital Markets: 1.6% | |
China Everbright, Ltd. | | | 1,392,000 | | | | 2,700,926 | |
| | | | | | | | |
Total Financials | | | | 31,060,035 | |
| | | | | |
| | | | | | | | |
| | | | | | | | |
| | | Shares | | | Value | |
| INDUSTRIALS: 15.1% | |
Transportation Infrastructure: 4.3% | |
Qingdao Port International Co., Ltd. H Shares | | | 9,636,000 | | | | $4,390,020 | |
Yuexiu Transport Infrastructure, Ltd. | | | 4,290,000 | | | | 2,767,798 | |
| | | | | | | | |
| | | | 7,157,818 | |
| | | | | | | | |
| | | | | | | | |
Marine: 2.7% | |
SITC International Holdings Co., Ltd. | | | 8,403,000 | | | | 4,420,363 | |
| | | | | | | | |
| | | | | | | | |
Road & Rail: 2.3% | |
Guangshen Railway Co., Ltd. H Shares | | | 7,110,000 | | | | 3,392,128 | |
Guangshen Railway Co., Ltd. ADR | | | 14,400 | | | | 341,424 | |
| | | | | | | | |
| | | | 3,733,552 | |
| | | | | | | | |
| | | | | | | | |
Air Freight & Logistics: 2.1% | |
Sinotrans, Ltd. H Shares | | | 7,895,000 | | | | 3,524,826 | |
| | | | | | | | |
| | | | | | | | |
Construction & Engineering: 2.1% | |
China Machinery Engineering Corp. H Shares | | | 5,235,000 | | | | 3,423,125 | |
| | | | | | | | |
| | | | | | | | |
Electrical Equipment: 1.6% | |
Voltronic Power Technology Corp. | | | 187,049 | | | | 2,614,751 | |
| | | | | | | | |
Total Industrials | | | | 24,874,435 | |
| | | | | |
| | | | | | | | |
| TELECOMMUNICATION SERVICES: 9.3% | |
Diversified Telecommunication Services: 6.0% | |
CITIC Telecom International Holdings, Ltd. | | | 13,169,000 | | | | 4,979,208 | |
HKBN, Ltd. | | | 4,578,957 | | | | 4,829,578 | |
| | | | | | | | |
| | | | 9,808,786 | |
| | | | | | | | |
| | | | | | | | |
Wireless Telecommunication Services: 3.3% | |
China Mobile, Ltd. ADR | | | 94,330 | | | | 5,461,707 | |
| | | | | | | | |
Total Telecommunication Services | | | | 15,270,493 | |
| | | | | |
| | | | | | | | |
| INFORMATION TECHNOLOGY: 9.2% | |
Communications Equipment: 2.6% | |
Sercomm Corp. | | | 1,930,000 | | | | 4,331,564 | |
| | | | | | | | |
| | | | | | | | |
Internet Software & Services: 2.5% | |
NetEase, Inc. ADR | | | 21,200 | | | | 4,096,264 | |
| | | | | | | | |
| | | | | | | | |
Semiconductors & Semiconductor Equipment: 1.6% | |
Qualcomm, Inc. | | | 50,900 | | | | 2,726,713 | |
| | | | | | | | |
| | | | | | | | |
Software: 1.5% | |
IGG, Inc. | | | 5,675,000 | | | | 2,477,348 | |
| | | | | | | | |
| | | | | | | | |
Electronic Equipment, Instruments & Components: 1.0% | |
Aurora Corp. | | | 986,000 | | | | 1,601,502 | |
| | | | | | | | |
Total Information Technology | | | | 15,233,391 | |
| | | | | |
| | | | | | | | |
| CONSUMER STAPLES: 9.0% | |
Food & Staples Retailing: 3.8% | |
Sun Art Retail Group, Ltd. | | | 5,214,500 | | | | 3,666,760 | |
Taiwan FamilyMart Co., Ltd. | | | 399,000 | | | | 2,502,368 | |
| | | | | | | | |
Total Food & Staples Retailing | | | | 6,169,128 | |
| | | | | |
| | | | | | | | |
Beverages: 2.9% | |
Kweichow Moutai Co., Ltd. A Shares | | | 109,398 | | | | 4,797,747 | |
| | | | | | | | |
| | | | | | | | |
Food Products: 2.3% | |
Dali Foods Group Co., Ltd. | | | 6,647,000 | | | | 3,787,411 | |
| | | | | | | | |
Total Consumer Staples | | | | 14,754,286 | |
| | | | | |
| | | | | | | | |
Matthews China Dividend Fund
June 30, 2016
Schedule of Investmentsa (unaudited) (continued)
COMMON EQUITIES (continued)
| | | | | | | | |
| | | Shares | | | Value | |
| MATERIALS: 4.4% | |
Paper & Forest Products: 2.3% | |
Lee & Man Paper Manufacturing, Ltd. | | | 5,053,000 | | | | $3,774,972 | |
| | | | | | | | |
| | | | | | | | |
Containers & Packaging: 2.1% | |
Greatview Aseptic Packaging Co., Ltd. | | | 7,335,000 | | | | 3,489,205 | |
| | | | | | | | |
Total Materials | | | | 7,264,177 | |
| | | | | |
| | | | | | | | |
| HEALTH CARE: 4.4% | |
Pharmaceuticals: 4.4% | |
China Medical System Holdings, Ltd. | | | 3,498,000 | | | | 5,361,130 | |
Tianjin ZhongXin Pharmaceutical Group Corp., Ltd. S Shares | | | 2,439,700 | | | | 1,843,672 | |
| | | | | | | | |
Total Health Care | | | | 7,204,802 | |
| | | | | |
| | | | | | | | |
| UTILITIES: 2.0% | |
Independent Power and Renewable Electricity Producers: 2.0% | |
China Power International Development, Ltd. | | | 8,937,000 | | | | 3,298,974 | |
| | | | | | | | |
Total Utilities | | | | 3,298,974 | |
| | | | | |
| | | | | | | | |
| ENERGY: 1.1% | |
Energy Equipment & Services: 1.1% | |
Hilong Holding, Ltd. | | | 16,066,000 | | | | 1,759,467 | |
| | | | | | | | |
Total Energy | | | | 1,759,467 | |
| | | | | |
| | | | | | | | |
RIGHTS: 0.0% | |
| CONSUMER DISCRETIONARY: 0.0% | |
Hotels, Restaurants & Leisure: 0.0% | |
Xiao Nan Guo Restaurants Holdings, Ltd.,
expires 7/12/16b | | | 2,488,000 | | | | 1,135 | |
| | | | | | | | |
Total Consumer Discretionary | | | | | | | 1,135 | |
| | | | | | | | |
| | | | | | | | |
| TOTAL RIGHTS | | | | 1,135 | |
| | | | | | | | |
(Cost $0) | | | | | | | | |
| | | | | | | | |
| TOTAL INVESTMENTS: 94.1% | | | | 154,721,554 | |
(Cost $155,506,353C) | |
| | | | | | | | |
CASH AND OTHER ASSETS,
LESS LIABILITIES: 5.9% | | | | 9,659,251 | |
| | | | | |
| |
NET ASSETS: 100.0% | | | | $164,380,805 | |
| | | | | |
| a | Certain securities were fair valued under the valuation polices approved by the Board of Trustees (Note 2-A). |
| b | Non-income producing security. |
| c | Cost for federal income tax purposes is $155,571,255 and net unrealized depreciation consists of: |
| | | | |
Gross unrealized appreciation | | | $15,622,872 | |
Gross unrealized depreciation | | | (16,472,573 | ) |
| | | | |
Net unrealized depreciation | | | ($849,701 | ) |
| | | | |
| ADR | American Depositary Receipt |
| REIT | Real Estate Investment Trust |
See accompanying notes to financial statements.
| | | | |
| matthewsasia.com | 800.789.ASIA | | | 29 | |

| | | | |
| PORTFOLIO MANAGERS |
| Beini Zhou, CFA |
Lead Manager |
| Michael B. Han, CFA |
Co-Manager |
| | |
| FUND FACTS | | | | |
| | | Investor | | Institutional |
Ticker | | MAVRX | | MAVAX |
CUSIP | | 577130693 | | 577130685 |
Inception | | 11/30/15 | | 11/30/15 |
NAV | | $10.17 | | $10.16 |
Initial Investment | | $2,500 | | $3 million |
Gross Expense Ratio1 | | 36.42% | | 36.17% |
After fee waiver and Reimbursement2 | | 1.50% | | 1.25% |
Portfolio Statistics | | | | |
Total # of Positions | | 44 |
Net Assets | | $2.0 million |
Weighted Average Market Cap | | $21.1 billion |
Portfolio Turnover3 | | 10.80% |
Benchmark | | | | |
MSCI AC Asia ex Japan Index |
OBJECTIVE
Long term capital appreciation.
STRATEGY
Under normal market conditions, the Fund seeks to achieve its investment objective by investing at least 80% of its net assets, which include borrowings for investment purposes, in common stock, preferred stock and other equity securities, and convertible securities of companies located in Asia. The Fund seeks to create an investable universe of value companies that it believes trade at market values with discounts to their intrinsic value, have strong financial and market positions, have strong management and are oriented to creating value for their shareholders. Matthews assesses companies within this universe according to each of these factors.
Matthews Asia Value Fund
Portfolio Manager Commentary (unaudited)
For the first half of 2016, the Matthews Asia Value Fund returned 3.25% (Investor Class) and 3.36% (Institutional Class) while its benchmark, the MSCI All Country Asia ex Japan Index, returned 2.32%. For the quarter ending June 30, the Fund returned 1.30% (Investor) and 1.40% (Institutional Class) while its benchmark returned 0.51%.
Market Environment:
The second quarter would have been characterized as relatively uneventful had it ended a week earlier. On June 24th, much to the market’s surprise, the U.K. voted to leave the European Union in a referendum, a “black swan” event that few market pundits anticipated. As a result, global markets declined sharply for a day or two, but following the news of further fiscal stimulus and monetary easing globally, the S&P 500 largely recovered its losses to near its pre-Brexit level, while the MSCI AC Asia ex Japan Index even surpassed its pre-Brexit level over the week leading up to the Independence Day weekend.
Performance Contributors and Detractors:
Japan’s Yamada Consulting, a small management firm serving small-to-medium enterprise clients, was the largest contributor to Fund performance during the quarter. The share price rallied strongly after Yamada reported good fiscal year-end earnings. The company has solid financials with profits growing at a double digit compound annual growth rate (CAGR)† in recent years. Management has targeted a 20% return on equity (ROE) and 10% profit growth. Therefore, they aim to return half of their net income to shareholders via dividends and share buybacks; we are impressed by the management team’s approach to capital allocation. Prior to the rally in the share price, the company was trading at 3x earnings before interest and tax (EBIT)‡, and had close to a 5% dividend yield and double-digit profit growth. As value investors, we aim to find other companies with similarly attractive financials and valuations.
Following a solid first quarter, Kweichow Moutai, which is listed on China’s domestic A-share market, performed strongly again in the second quarter. Kweichow Moutai is one of the most well-known liquor companies in the country, and also one of the best known domestic consumer brands. In addition to reporting solid earnings results during the quarter, it was widely reported that strong end demand resulted in an increase in their wholesale pricing to their distributors. The share price is now trading at a high-teen price to earnings (P/E)* ratio ex cash, a still reasonable level.
Among the largest detractors to portfolio performance during the quarter were CK Hutchison and Shandong Weigao Group. CK Hutchison is Hong Kong business magnate Li Ka-Shing’s non-property holding company. It is a conglomerate with businesses such as telecom, energy, retail, infrastructure and ports. They have substantial mobile telecom and infrastructure assets in Europe, particularly in the U.K, and the share price declined significantly as a result of the Brexit vote.
(continued)
| † | Compound Annual Growth Rate (CAGR): Compound Annual Growth Rate (CAGR) is the year-over-year growth rate of an investment over a specified period of time. |
| ‡ | Earnings before Interest and tax (EBIT): Earnings before interest and tax is an indicator of a company’s profitability, often calculated as revenue minus expenses, excluding tax and interest. |
| * | Price-to-Earnings (P/E) Ratio: Price-to-Earnings Ratio (P/E Ratio) is a valuation ratio of a company’s current share price compared to its per-share earnings. |
| 1 | Prospectus expense ratios. |
| 2 | Matthews has contractually agreed (i) to waive fees and reimburse expenses to the extent needed to limit Total Annual Fund Operating Expenses (excluding Rule 12b-1 fees, taxes, interest, brokerage commissions, short sale dividend expenses, expenses incurred in connection with any merger or reorganization or extraordinary expenses such as litigation) of the Institutional Class to 1.25% first by waiving class specific expenses (i.e., shareholder service fees specific to a particular class) of the Institutional Class and then, to the extent necessary, by waiving non-class specific expenses of the Institutional Class, and (ii) if any Fund-wide expenses (i.e., expenses that apply to both the Institutional Class and the Investor Class) are waived for the Institutional Class to maintain the 1.25% expense limitation, to waive an equal amount (in annual percentage terms) of those same expenses for the Investor Class. The Total Annual Fund Operating Expenses After Fee Waiver and Expense Reimbursement for the Investor Class may vary from year to year and will in some years exceed 1.25%. If the operating expenses fall below the expense limitation in a year within three years after Matthews has made a waiver or reimbursement, the Fund may reimburse Matthews up to an amount that does not cause the expenses for that year to exceed the lesser of (i) the expense limitation applicable at the time of that fee waiver and/or expense reimbursement or (ii) the expense limitation in effect at the time of recoupment. This agreement will remain in place until April 30, 2018 and may be terminated at any time by the Board of Trustees on behalf of the Fund on 60 days’ written notice to Matthews. |
| 3 | Not annualized. The lesser of fiscal year 2015 long-term purchase costs or sales proceeds divided by the average monthly market value of long-term securities. |
| | | | | | | | | | | | | | | | |
| | | | | |
| PERFORMANCE AS OF JUNE 30, 2016 | | | | | | | | | | | | |
| | | Actual Return, Not Annualized | | | | |
| | | 3 Months | | | YTD | | | Since
Inception | | | Inception
Date | |
| Investor Class (MAVRX) | | | 1.30% | | | | 3.25% | | | | 1.85% | | | | 11/30/15 | |
| Institutional Class (MAVAX) | | | 1.40% | | | | 3.36% | | | | 2.02% | | | | 11/30/15 | |
| MSCI AC Asia ex Japan Index4 | | | 0.51% | | | | 2.32% | | | | 1.89% | | | | | |
| Lipper Pacific Region Funds Category Average5 | | | 2.45% | | | | 2.49% | | | | 2.26% | | | | | |
Performance assumes reinvestment of all dividends and/or distributions before taxes. All performance quoted represents past performance and is no guarantee of future results. Investment return and principal value will fluctuate with market conditions so that when redeemed, shares may be worth more or less than their original cost. Current performance may be lower or higher than the return figures quoted. Returns would have been lower if certain of the Fund’s fees and expenses had not been waived. For the Fund’s most recent month-end performance visit matthewsasia.com.
GROWTH OF A $10,000 INVESTMENT SINCE INCEPTION—INVESTOR CLASS
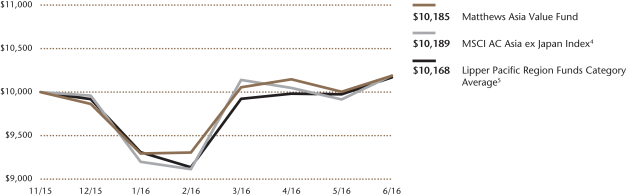
The performance data does not reflect the deduction of taxes that a shareholder would pay on dividends, capital gain distributions or redemption of Fund shares. Values are in US$.
| | 4 | It is not possible to invest directly in an index. Source: Index data from Morgan Stanley Capital International and Bloomberg; total return calculations performed by BNY Mellon Investment Servicing (US) Inc. Please see page 91 for index definition. |
| | 5 | The Lipper Category Average does not reflect sales charges and is based on total return, including reinvestment of dividends and capital gains for the stated periods. |
| | | | | | | | |
| | | | |
| TOP TEN HOLDINGS6 | | | | | | | |
| | | Sector | | Country | | % of Net Assets | |
| YAMADA Consulting Group Co., Ltd. | | Industrials | | Japan | | | 4.9% | |
| Shandong Weigao Group Medical Polymer Co., Ltd. | | Health Care | | China/Hong Kong | | | 4.6% | |
| Samsung Electronics Co., Ltd., Pfd. | | Information Technology | | South Korea | | | 4.6% | |
| Kweichow Moutai Co., Ltd. | | Consumer Staples | | China/Hong Kong | | | 4.3% | |
| CK Hutchison Holdings, Ltd. | | Industrials | | China/Hong Kong | | | 3.5% | |
| Qualcomm, Inc. | | Information Technology | | China/Hong Kong | | | 2.9% | |
| Samsung SDI Co., Ltd., Pfd. | | Information Technology | | South Korea | | | 2.8% | |
| ARA Asset Management, Ltd. | | Financials | | Singapore | | | 2.4% | |
| Hyundai Motor Co., Ltd., 2nd Pfd. | | Consumer Discretionary | | South Korea | | | 2.4% | |
| DGB Financial Group, Inc. | | Financials | | South Korea | | | 2.3% | |
| % OF ASSETS IN TOP TEN | | | | | | | 34.7% | |
| | 6 | Holdings may combine more than one security from same issuer and related depositary receipts. |
| | | | |
| matthewsasia.com | 800.789.ASIA | | | 31 | |
| | | | |
| |
| COUNTRY ALLOCATION (%)7,8 | |
| South Korea | | | 29.1 | |
| China/Hong Kong | | | 25.3 | |
| Japan | | | 9.0 | |
| Singapore | | | 6.9 | |
| Taiwan | | | 4.0 | |
| Malaysia | | | 2.8 | |
| United States | | | 2.1 | |
| Switzerland | | | 1.9 | |
| United Kingdom | | | 1.8 | |
| Israel | | | 1.4 | |
| Thailand | | | 0.9 | |
| Cash and Other Assets, Less Liabilities | | | 14.8 | |
| | | | |
| |
| SECTOR ALLOCATION (%)8 | |
Consumer Discretionary | | | 19.1 | |
Information Technology | | | 15.8 | |
Industrials | | | 14.6 | |
Financials | | | 12.8 | |
Consumer Staples | | | 8.4 | |
Health Care | | | 8.3 | |
Materials | | | 6.2 | |
Cash and Other Assets, Less Liabilities | | | 14.8 | |
| | | | |
| |
| MARKET CAP EXPOSURE (%)8 | |
| Mega Cap (over $25B) | | | 19.7 | |
| Large Cap ($10B–$25B) | | | 1.8 | |
| Mid Cap ($3B–10B) | | | 7.1 | |
| Small Cap (under $3B) | | | 56.5 | |
| Cash and Other Assets, Less Liabilities | | | 14.8 | |
| 7 | Not all countries where the Fund may invest are included in the benchmark index. |
| 8 | Source: FactSet Research Systems. Percentage values in data are rounded to the nearest tenth of one percent; the values may not sum to 100% due to rounding. |
Matthews Asia Value Fund
Portfolio Manager Commentary (unaudited) (continued)
Though the intrinsic value of the company has indeed come down post Brexit due to British pound weakness, we believe the value of the company remains substantially above book value, even after taking into account an appropriate level of discount for a conglomerate. Over the last few decades, Li Ka-Shing has created a lot of value for minority shareholders, culminating in the de-merging of the conglomerate into property and non-property assets in 2015, and we believe the Brexit result will not change the company’s savvy capital-allocation approach.
Shandong Weigao Group is one of the largest medical device companies in China. The company’s core business, which contributes close to three quarters of its profit, is medical consumables such as infusion sets, syringes, and needles—and they are by far the biggest domestic player in consumables. Two other smaller segments—orthopedics and dialysis—have good growth potential and are industry leaders. Shandong Weigao’s share price has been de-rated over the past few years due to decelerating growth in their core consumables business. During the quarter, Shangong announced its plans to list the orthopedics business on the domestic A-share market, and also awarded the orthopedics management team with related shares that would lead to earnings dilution in the short term. The market likely took the dilution news negatively. We, on the contrary, welcome the news and we believe that a more incentivized management team with newly awarded shares will more than offset the resulting dilution in earnings. We also believe that listing their orthopedics business on the domestic A-share market, which will likely attract a higher multiple, is a great way to unlock value. The current share price implies a high-single digit P/E for the company’s highly profitable medical consumables business which is still delivering 10% profit growth.
Notable Portfolio Changes:
During the quarter, we exited China’s Daqin Railway, Knowles Corp. of the U.S., and Japan’s Doshisha. The slight tariff cut announced by Daqin Railway—due to a depressed coal market—was unexpected as we had anticipated liberalization of their tariffs after years of regulatory control. We also sold Knowles Corp. as the company reported good earnings and its share price rallied to our estimated intrinsic value. We switched out of Doshisha to Yamada Consulting while maintaining our overall exposure to Japan as the latter became much more attractive.
We initiated a position in the Swiss luxury brand owner Cie Financiere Richemont during the quarter after they reported poor full-year earnings. Richemont owns a collection of some of the most coveted luxury brands such as Cartier and Van Cleef & Arpels. We estimate that more than half of their earnings comes from Asians, who purchase their products either domestically or overseas. However, the past few years have been difficult for luxury brands and Richemont has not been immune, as consumption in places such as Hong Kong and Macau drastically declined. However, we believe Richemont can look beyond this current rough patch and grow over time, as wealth creation continues in Asia and other emerging markets.
Outlook:
The post-Brexit outlook is as murky as ever and it is uncertain how Brexit will be implemented or even when the procedure will formally begin. There will be a myriad of details to negotiate between the two sides and, it is unlikely to be a clear-cut exit. As news come out along the way, we expect no less of a roller-coaster ride for the foreseeable future.
What do value investors do in such uncertain times? Not any different from past crises—treat it as macro noise and focus on individual company and balance sheet strength, have some dry powder and be ready to invest when compelling value emerges. Therefore, we are not shunning Europe and, quite the opposite as we are more attracted to Asian stocks that get unduly punished due to their exposure to Europe. We believe this crisis, Brexit, will prove no different over the long run as outperformance will come from buying or adding to undervalued quality companies whose share price weakens disproportionately.
Matthews Asia Value Fund
June 30, 2016
Schedule of Investmentsa (unaudited)
COMMON EQUITIES: 75.3%
| | | | | | | | |
| | | Shares | | | Value | |
| CHINA/HONG KONG: 25.3% | |
Shandong Weigao Group Medical Polymer Co., Ltd. H Shares | | | 164,000 | | | | $93,975 | |
Kweichow Moutai Co., Ltd. A Shares | | | 2,000 | | | | 87,712 | |
CK Hutchison Holdings, Ltd. | | | 6,500 | | | | 71,503 | |
Qualcomm, Inc. | | | 1,100 | | | | 58,927 | |
Clear Media, Ltd. | | | 51,000 | | | | 44,577 | |
Greatview Aseptic Packaging Co., Ltd. | | | 78,000 | | | | 37,104 | |
Fairwood Holdings, Ltd. | | | 9,000 | | | | 34,853 | |
Goldlion Holdings, Ltd. | | | 91,000 | | | | 34,158 | |
Pico Far East Holdings, Ltd. | | | 112,000 | | | | 31,680 | |
Future Bright Holdings, Ltd. | | | 168,000 | | | | 16,101 | |
| | | | | | | | |
Total China/Hong Kong | | | | 510,590 | |
| | | | | | | | |
| | | | | | | | |
| SOUTH KOREA: 19.2% | |
DGB Financial Group, Inc. | | | 6,103 | | | | 46,214 | |
Kwangju Bank | | | 5,946 | | | | 44,980 | |
MegaMD Co., Ltd.b | | | 13,292 | | | | 42,978 | |
Shinyoung Securities Co., Ltd. | | | 980 | | | | 42,540 | |
Samyung ENC Co., Ltd. | | | 5,148 | | | | 39,130 | |
POSCO Chemtech Co., Ltd. | | | 4,309 | | | | 38,946 | |
Kangnam Jevisco Co., Ltd. | | | 1,005 | | | | 30,687 | |
Kukbo Design Co., Ltd. | | | 1,633 | | | | 27,803 | |
Hyundai Greenfood Co., Ltd. | | | 1,420 | | | | 23,035 | |
Saeron Automotive Corp. | | | 3,321 | | | | 22,840 | |
Binggrae Co., Ltd. | | | 278 | | | | 16,395 | |
Hy-Lok Corp. | | | 654 | | | | 12,616 | |
| | | | | | | | |
Total South Korea | | | | 388,164 | |
| | | | | | | | |
| | | | | | | | |
| JAPAN: 9.0% | |
YAMADA Consulting Group Co., Ltd. | | | 2,300 | | | | 99,458 | |
Broadleaf Co., Ltd. | | | 3,500 | | | | 32,257 | |
Trancom Co., Ltd. | | | 400 | | | | 26,402 | |
San-A Co., Ltd. | | | 500 | | | | 24,674 | |
| | | | | | | | |
Total Japan | | | | 182,791 | |
| | | | | | | | |
| | | | | | | | |
| SINGAPORE: 6.9% | |
ARA Asset Management, Ltd. | | | 47,400 | | | | 48,621 | |
Haw Par Corp., Ltd. | | | 6,800 | | | | 45,612 | |
Vicom, Ltd. | | | 6,000 | | | | 25,575 | |
Kulicke & Soffa Industries, Inc.b | | | 1,600 | | | | 19,472 | |
| | | | | | | | |
Total Singapore | | | | 139,280 | |
| | | | | | | | |
| | | | | | | | |
| TAIWAN: 4.0% | |
P-Duke Technology Co., Ltd. | | | 21,000 | | | | 43,939 | |
Lumax International Corp., Ltd. | | | 13,000 | | | | 18,806 | |
Yung Chi Paint & Varnish Manufacturing Co., Ltd. | | | 8,000 | | | | 18,760 | |
| | | | | | | | |
Total Taiwan | | | | 81,505 | |
| | | | | | | | |
| | | | | | | | |
| MALAYSIA: 2.8% | |
MPHB Capital BHDb | | | 125,100 | | | | 41,442 | |
Genting BHD | | | 7,600 | | | | 15,480 | |
| | | | | | | | |
Total Malaysia | | | | 56,922 | |
| | | | | | | | |
| | | | | | | | |
| | | | | | | | |
| | | Shares | | | Value | |
| UNITED STATES: 2.1% | |
News Corp. B Shares | | | 2,400 | | | | $28,008 | |
Expeditors International of Washington, Inc. | | | 300 | | | | 14,712 | |
| | | | | | | | |
Total United States | | | | 42,720 | |
| | | | | | | | |
| | | | | | | | |
| SWITZERLAND: 1.9% | |
Cie Financiere Richemont SA | | | 664 | | | | 38,867 | |
| | | | | | | | |
Total Switzerland | | | | 38,867 | |
| | | | | | | | |
| | | | | | | | |
| UNITED KINGDOM: 1.8% | |
Standard Chartered PLC | | | 4,750 | | | | 35,554 | |
| | | | | | | | |
Total United Kingdom | | | | 35,554 | |
| | | | | | | | |
| | | | | | | | |
| ISRAEL: 1.4% | |
Taro Pharmaceutical Industries, Ltd.b | | | 200 | | | | 29,120 | |
| | | | | | | | |
Total Israel | | | | 29,120 | |
| | | | | | | | |
| | | | | | | | |
| THAILAND: 0.9% | |
Premier Marketing Public Co., Ltd. | | | 65,200 | | | | 17,378 | |
| | | | | | | | |
Total Thailand | | | | 17,378 | |
| | | | | | | | |
| | | | | | | | |
| TOTAL COMMON EQUITIES | | | | 1,522,891 | |
| | | | | | | | |
(Cost $1,462,921) | | | | | | | | |
| | | | | | | | |
PREFERRED EQUITIES: 9.9% | |
| SOUTH KOREA: 9.9% | |
Samsung Electronics Co., Ltd., Pfd. | | | 91 | | | | 93,874 | |
Samsung SDI Co., Ltd., Pfd. | | | 1,054 | | | | 56,804 | |
Hyundai Motor Co., Ltd., 2nd Pfd. | | | 576 | | | | 48,377 | |
| | | | | | | | |
Total South Korea | | | | 199,055 | |
| | | | | | | | |
| | | | | | | | |
| TOTAL PREFERRED EQUITIES | | | | 199,055 | |
| | | | | | | | |
(Cost $201,357) | | | | | | | | |
| | | | | | | | |
| TOTAL INVESTMENTS: 85.2% | | | | 1,721,946 | |
(Cost $1,664,278c) | |
| | | | | | | | |
CASH AND OTHER ASSETS,
LESS LIABILITIES: 14.8% | | | | 299,877 | |
| | | | | | | | |
| |
NET ASSETS: 100.0% | | | | $2,021,823 | |
| | | | | | | | |
| a | Certain securities were fair valued under the valuation polices approved by the Board of Trustees (Note 2-A). |
| b | Non-income producing security. |
| c | Cost for federal income tax purposes is $1,667,883 and net unrealized appreciation consists of: |
| | | | |
Gross unrealized appreciation | | | $131,812 | |
Gross unrealized depreciation | | | (77,749 | ) |
| | | | |
Net unrealized appreciation | | | $54,063 | |
| | | | |
See accompanying notes to financial statements.
| | | | |
| matthewsasia.com | 800.789.ASIA | | | 33 | |

| | | | |
| PORTFOLIO MANAGERS |
| Kenneth Lowe, CFA | | |
Lead Manager | | | | |
| Michael J. Oh, CFA | | Sharat Shroff, CFA |
Co-Manager | | Co-Manager | | |
|
| FUND FACTS |
| | | Investor | | Institutional |
Ticker | | MAFSX | | MIFSX |
CUSIP | | 577125701 | | 577125800 |
Inception | | 4/30/13 | | 4/30/13 |
NAV | | $9.27 | | $9.29 |
Initial Investment | | $2,500 | | $3 million |
Gross Expense Ratio1 | | 2.07% | | 1.91% |
After Fee Waiver and Reimbursement2 | | 1.50% | | 1.25% |
Portfolio Statistics |
Total # of Positions | | 32 |
Net Assets | | $10.8 million |
Weighted Average Market Cap | | $44.5 billion |
Portfolio Turnover3 | | 23.60% |
Benchmark |
MSCI AC Asia ex Japan Index |
OBJECTIVE
Long term capital appreciation.
STRATEGY
Under normal market conditions, the Fund seeks to achieve its investment objective by investing at least 80% of its total assets, which include borrowings for investment purposes, in the common and preferred stocks of companies located in Asia excluding Japan, but including all other developed, emerging and frontier countries and markets in the Asian region. The Fund is currently expected to hold stocks of between 25 and 35 companies under normal market conditions.
Matthews Asia Focus Fund
Portfolio Manager Commentary (unaudited)
For the first half of 2016, the Matthews Asia Focus Fund returned 6.68% (Investor Class) and 6.91% (Institutional Class), outperforming its benchmark, the MSCI All Country Asia ex Japan Index, which returned 2.32%. For the quarter ending June 30, the Fund returned 0.65% (Investor Class) and 0.87% (Institutional Class) while its benchmark returned 0.51%.
Market Environment:
The end outcome of largely flat returns for equity markets during the second quarter belies an environment that has been marked by large swings in sentiment from market participants as economic and political headlines dominate. The largest of these was Brexit, the much talked about U.K. vote to leave the European Union, which occurred toward the end of the quarter, and came as a shock to markets across the globe.
Over the medium term, it is unclear what implications this might have for the European Union as weak growth, high unemployment (in many cases), immigration concerns and deflationary issues have created an atmosphere in which change is deemed to be required. At a minimum, this environment led to a decrease in expectations for any rise in U.S. interest rates this year. Although initially fear was prevalent, this ultimately helped to bolster an improvement in sentiment for risky asset classes such as emerging markets and the Asia Pacific region.
Performance Contributors and Detractors:
The Fund rose in both absolute and relative terms during the first half of the year, amid this volatility. During the second quarter, the largest contributor to returns came from our holding in Tata Motors, India’s largest automotive company, producing Tata and Jaguar Land Rover (JLR) branded vehicles. The company is currently benefiting from a very strong product cycle that includes an initial foray into the lucrative compact luxury sports sedan market with the Jaguar XE. Further, management has invested wisely in the necessary capacity growth for the volume increase that is expected over the next few years. AIA Group was also a solid performer as it continued to deliver on strong growth in their value of new business as premiums and margins both rose, partially on a significant uplift in mainland visitor business in Hong Kong.
The Fund was also helped by good performance from our health care holdings. Among them is ResMed, a leader in the diagnosis and treatment of sleep apnea disorder. The stock rallied as the firm continues to win market share and see strong sales growth in its new platform—the AS10—with its strategic position also being enhanced through the acquisition of clinical software applications provider Brightree.
The largest detractors to returns came from our holdings in luggage manufacturer Samsonite International and Hong Kong conglomerate CK Hutchison Holdings. For Samsonite, soft travel demand and an expensive acquisition of the Tumi brand weighed on the stock. CK Hutchison was pressured by concerns on its U.K. assets as the European regulator defeated its move to consolidate the wireless market there on competition concerns.
(continued)
| 1 | Prospectus expense ratios. |
| 2 | Matthews has contractually agreed (i) to waive fees and reimburse expenses to the extent needed to limit Total Annual Fund Operating Expenses (excluding Rule 12b-1 fees, taxes, interest, brokerage commissions, short sale dividend expenses, expenses incurred in connection with any merger or reorganization or extraordinary expenses such as litigation) of the Institutional Class to 1.25% first by waiving class specific expenses (i.e., shareholder service fees specific to a particular class) of the Institutional Class and then, to the extent necessary, by waiving non-class specific expenses of the Institutional Class, and (ii) if any Fund-wide expenses (i.e., expenses that apply to both the Institutional Class and the Investor Class) are waived for the Institutional Class to maintain the 1.25% expense limitation, to waive an equal amount (in annual percentage terms) of those same expenses for the Investor Class. The Total Annual Fund Operating Expenses After Fee Waiver and Expense Reimbursement for the Investor Class may vary from year to year and will in some years exceed 1.25%. If the operating expenses fall below the expense limitation in a year within three years after Matthews has made a waiver or reimbursement, the Fund may reimburse Matthews up to an amount that does not cause the expenses for that year to exceed the lesser of (i) the expense limitation applicable at the time of that fee waiver and/or expense reimbursement or (ii) the expense limitation in effect at the time of recoupment. This agreement will remain in place until April 30, 2017 and may be terminated at any time by the Board of Trustees on behalf of the Fund on 60 days’ written notice to Matthews. |
| 3 | The lesser of fiscal year 2015 long-term purchase costs or sales proceeds divided by the average monthly market value of long-term securities. |
| | | | | | | | | | | | | | | | | | | | | | | | |
| | | | | | | |
| PERFORMANCE AS OF JUNE 30, 2016 | | | | | | | | | | | | | | | | | | |
| | | | | | | | | | | | Average Annual
Total Returns | | | | |
| | | 3 Months | | | YTD | | | 1 Year | | | 3 Years | | | Since Inception | | | Inception
Date | |
| Investor Class (MAFSX) | | | 0.65% | | | | 6.68% | | | | -5.35% | | | | 0.65% | | | | -1.50% | | | | 4/30/13 | |
| Institutional Class (MIFSX) | | | 0.87% | | | | 6.91% | | | | -5.03% | | | | 0.94% | | | | -1.23% | | | | 4/30/13 | |
| MSCI AC Asia ex Japan Index4 | | | 0.51% | | | | 2.32% | | | | -11.72% | | | | 2.36% | | | | -0.03% | | | | | |
| Lipper Pacific ex Japan Funds Category Average5 | | | 1.49% | | | | 2.44% | | | | -7.73% | | | | 2.81% | | | | -0.09% | | | | | |
Performance assumes reinvestment of all dividends and/or distributions before taxes. All performance quoted represents past performance and is no guarantee of future results. Investment return and principal value will fluctuate with market conditions so that when redeemed, shares may be worth more or less than their original cost. Current performance may be lower or higher than the return figures quoted. Returns would have been lower if certain of the Fund’s fees and expenses had not been waived. For the Fund’s most recent month-end performance visit matthewsasia.com.
GROWTH OF A $10,000 INVESTMENT SINCE INCEPTION—INVESTOR CLASS
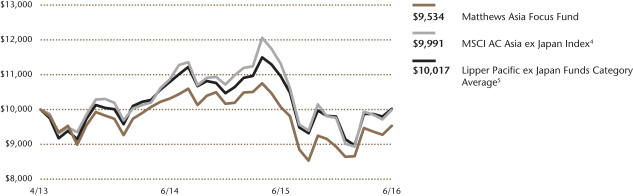
Plotted monthly. The performance data does not reflect the deduction of taxes that a shareholder would pay on dividends, capital gain distributions or redemption of Fund shares. Values are in US$.
| | 4 | It is not possible to invest directly in an index. Source: Index data from Morgan Stanley Capital International and Bloomberg; total return calculations performed by BNY Mellon Investment Servicing (US) Inc. Please see page 91 for index definition. |
| | 5 | The Lipper Category Average does not reflect sales charges and is based on total return, including reinvestment of dividends and capital gains for the stated periods. |
| | | | | | | | |
| | | | |
| TOP TEN HOLDINGS6 | | | | | | | |
| | | Sector | | Country | | % of Net Assets | |
| AIA Group, Ltd. | | Financials | | China/Hong Kong | | | 6.0% | |
| Singapore Telecommunications, Ltd. | | Telecommunication Services | | Singapore | | | 4.8% | |
| Techtronic Industries Co., Ltd. | | Consumer Discretionary | | China/Hong Kong | | | 4.1% | |
| Tencent Holdings, Ltd. | | Information Technology | | China/Hong Kong | | | 3.8% | |
| Mead Johnson Nutrition Co. | | Consumer Staples | | United States | | | 3.7% | |
| Taiwan Semiconductor Manufacturing Co., Ltd. | | Information Technology | | Taiwan | | | 3.7% | |
| ResMed, Inc. | | Health Care | | United States | | | 3.6% | |
| Japan Tobacco, Inc. | | Consumer Staples | | Japan | | | 3.3% | |
| Jardine Matheson Holdings, Ltd. | | Industrials | | China/Hong Kong | | | 3.3% | |
| Samsung Electronics Co., Ltd. | | Information Technology | | South Korea | | | 3.2% | |
| % OF ASSETS IN TOP TEN | | | | | | | 39.5% | |
| | 6 | Holdings may combine more than one security from same issuer and related depositary receipts. |
| | | | |
| matthewsasia.com | 800.789.ASIA | | | 35 | |
| | | | |
| |
| COUNTRY ALLOCATION (%)7,8 | |
| China/Hong Kong | | | 36.1 | |
| Singapore | | | 10.8 | |
| South Korea | | | 9.4 | |
| Malaysia | | | 8.8 | |
| United States | | | 7.3 | |
| Thailand | | | 4.5 | |
| Indonesia | | | 4.4 | |
| Taiwan | | | 3.7 | |
| Japan | | | 3.3 | |
| India | | | 3.2 | |
| Australia | | | 2.6 | |
| Switzerland | | | 2.6 | |
| Cash and Other Assets, Less Liabilities | | | 3.3 | |
| | | | |
| |
| SECTOR ALLOCATION (%)8 | |
| Consumer Discretionary | | | 25.1 | |
| Financials | | | 22.4 | |
| Information Technology | | | 15.5 | |
| Consumer Staples | | | 11.4 | |
| Industrials | | | 9.7 | |
| Telecommunication Services | | | 9.0 | |
| Health Care | | | 3.6 | |
| Cash and Other Assets, Less Liabilities | | | 3.3 | |
| | | | |
| |
| MARKET CAP EXPOSURE (%)8 | |
| Mega Cap (over $25B) | | | 41.2 | |
| Large Cap ($10B–$25B) | | | 19.5 | |
| Mid Cap ($3B–10B) | | | 30.0 | |
| Small Cap (under $3B) | | | 6.0 | |
| Cash and Other Assets, Less Liabilities | | | 3.3 | |
| 7 | Not all countries where the Fund may invest are included in the benchmark index. |
| 8 | Source: FactSet Research Systems. Percentage values in data are rounded to the nearest tenth of one percent; the values may not sum to 100% due to rounding. |
Matthews Asia Focus Fund
Portfolio Manager Commentary (unaudited) (continued)
Notable Portfolio Changes:
During the second quarter we initiated a position in Coway, a leading South Korean home appliance rental company for air purifiers, water purifiers and other products. Coway has a large and growing loyal customer base in South Korea that provides the company with stable cash flow and cross-selling opportunities. Coway’s valuation is supported by its steady earnings growth, attractive cash flow return and additional growth opportunities from overseas markets.
We exited our position in Australian glove maker Ansell Limited during the quarter. We were disappointed by the performance of its acquisitions and the change in its marketing strategy with some large customers, which prioritizes market share over pricing discipline.
Outlook:
The Brexit result has provided a question mark over the efficacy of the European construct, and an ensuing heavy political calendar in the continent adds further risks. Later this year witnesses a referendum in Italy on constitutional reform that would reduce the number of senators in the country and, hopefully, allow for more stable leadership with improved longevity. Of course, a change to the status quo does create uncertainty and this is also, prospectively, the case for France where elections will be held in early 2017. These risks are further compounded by the U.S. presidential election in November. With this in mind, there does appear to be an overarching movement toward change. Many electorates are clamoring for more protectionist and populist policies in a world where income inequality and immigration concerns have become paramount.
This backdrop does little to encourage risk-taking for either consumers or companies. It does, however, provide Asian governments and central banks with a greater ability to loosen monetary and fiscal policy given weak growth. Such moves are likely across the board, from debt-ridden China to job growth-challenged India. Whilst not wholly averse to this, it does provide the challenge that it removes the focus from what we believe to be the most powerful driver of economic growth and future prosperity—productivity gains. Further, the anti-globalization mentality pervading in parts of the West provides an additional headache.
Undoubtedly some of these issues have led higher growth companies to be hard to come by, and the valuations that one is being asked to pay for these within Asia is concerning. We believe that we must strike the correct balance between quality, value and sustainable growth, making sure that we do not forego value or quality for short-term results. To this end, we will remain patient to take advantage of this backdrop of volatility to ensure that we stay disciplined in looking after our shareholders capital, focusing on protecting and growing it over full economic cycles.
Matthews Asia Focus Fund
June 30, 2016
Schedule of Investmentsa (unaudited)
COMMON EQUITIES: 96.7%
| | | | | | | | |
| | | Shares | | | Value | |
| CHINA/HONG KONG: 36.1% | | | | | | | | |
AIA Group, Ltd. | | | 109,000 | | | | $655,496 | |
Techtronic Industries Co., Ltd. | | | 105,500 | | | | 440,568 | |
Tencent Holdings, Ltd. | | | 17,900 | | | | 410,620 | |
Jardine Matheson Holdings, Ltd. | | | 6,200 | | | | 362,472 | |
CK Hutchison Holdings, Ltd. | | | 31,728 | | | | 349,023 | |
Samsonite International SA | | | 118,800 | | | | 328,941 | |
Yum! Brands, Inc. | | | 3,850 | | | | 319,242 | |
VTech Holdings, Ltd. | | | 30,000 | | | | 316,273 | |
HSBC Holdings PLC | | | 41,600 | | | | 254,772 | |
Baidu, Inc. ADRb | | | 1,237 | | | | 204,291 | |
Hang Lung Group, Ltd. | | | 50,000 | | | | 150,641 | |
Cheung Kong Property Holdings, Ltd. | | | 19,728 | | | | 124,299 | |
| | | | | | | | |
Total China/Hong Kong | | | | | | | 3,916,638 | |
| | | | | | | | |
| | | | | | | | |
| SINGAPORE: 10.8% | | | | | | | | |
Singapore Telecommunications, Ltd. | | | 168,000 | | | | 518,888 | |
Singapore Technologies Engineering, Ltd. | | | 144,500 | | | | 340,137 | |
United Overseas Bank, Ltd. | | | 22,500 | | | | 310,004 | |
| | | | | | | | |
Total Singapore | | | | | | | 1,169,029 | |
| | | | | | | | |
| | | | | | | | |
| SOUTH KOREA: 9.4% | | | | | | | | |
Samsung Electronics Co., Ltd. | | | 281 | | | | 349,944 | |
Kangwon Land, Inc. | | | 9,458 | | | | 343,184 | |
Coway Co., Ltd. | | | 3,591 | | | | 326,970 | |
| | | | | | | | |
Total South Korea | | | | | | | 1,020,098 | |
| | | | | | | | |
| | | | | | | | |
| MALAYSIA: 8.8% | | | | | | | | |
Genting Malaysia BHD | | | 307,400 | | | | 339,882 | |
Heineken Malaysia BHD | | | 88,800 | | | | 333,164 | |
Axiata Group BHD | | | 199,100 | | | | 278,663 | |
| | | | | | | | |
Total Malaysia | | | | | | | 951,709 | |
| | | | | | | | |
| | | | | | | | |
| UNITED STATES: 7.3% | | | | | | | | |
Mead Johnson Nutrition Co. | | | 4,468 | | | | 405,471 | |
ResMed, Inc. | | | 6,100 | | | | 385,703 | |
| | | | | | | | |
Total United States | | | | | | | 791,174 | |
| | | | | | | | |
| | | | | | | | |
| THAILAND: 4.5% | | | | | | | | |
Kasikornbank Public Co., Ltd. | | | 61,900 | | | | 300,584 | |
Intouch Holdings Public Co., Ltd. NVDR | | | 118,200 | | | | 182,958 | |
| | | | | | | | |
Total Thailand | | | | | | | 483,542 | |
| | | | | | | | |
| | | | | | | | |
| INDONESIA: 4.4% | | | | | | | | |
PT Bank Rakyat Indonesia Persero | | | 421,400 | | | | 346,741 | |
PT Indofood Sukses Makmur | | | 245,000 | | | | 134,804 | |
| | | | | | | | |
Total Indonesia | | | | | | | 481,545 | |
| | | | | | | | |
| | | | | | | | |
| TAIWAN: 3.7% | | | | | | | | |
Taiwan Semiconductor Manufacturing Co., Ltd. | | | 79,000 | | | | 398,136 | |
| | | | | | | | |
Total Taiwan | | | | | | | 398,136 | |
| | | | | | | | |
| | | | | | | | |
| JAPAN: 3.3% | | | | | | | | |
Japan Tobacco, Inc. | | | 9,000 | | | | 362,720 | |
| | | | | | | | |
Total Japan | | | | | | | 362,720 | |
| | | | | | | | |
| | | | | | | | |
| | | Shares | | | Value | |
| INDIA: 3.2% | | | | | | | | |
Tata Motors, Ltd.b | | | 50,602 | | | | $346,411 | |
| | | | | | | | |
Total India | | | | | | | 346,411 | |
| | | | | | | | |
| | | | | | | | |
| AUSTRALIA: 2.6% | | | | | | | | |
Insurance Australia Group, Ltd. | | | 68,701 | | | | 282,998 | |
| | | | | | | | |
Total Australia | | | | | | | 282,998 | |
| | | | | | | | |
| | | | | | | | |
| SWITZERLAND: 2.6% | | | | | | | | |
Cie Financiere Richemont SA | | | 4,793 | | | | 280,557 | |
| | | | | | | | |
Total Switzerland | | | | | | | 280,557 | |
| | | | | | | | |
| | | | | | | | |
| TOTAL INVESTMENTS: 96.7% | | | | | | | 10,484,557 | |
(Cost $11,101,912c) | | | | | | | | |
| | | | | | | | |
CASH AND OTHER ASSETS, LESS LIABILITIES: 3.3% | | | | | | | 360,058 | |
| | | | | | | | |
| | |
NET ASSETS: 100.0% | | | | | | | $10,844,615 | |
| | | | | | | | |
| a | Certain securities were fair valued under the valuation polices approved by the Board of Trustees (Note 2-A). |
| b | Non-income producing security. |
| c | Cost for federal income tax purposes is $11,158,593 and net unrealized depreciation consists of: |
| | | | |
Gross unrealized appreciation | | | $616,215 | |
Gross unrealized depreciation | | | (1,290,251 | ) |
| | | | |
Net unrealized depreciation | | | ($674,036 | ) |
| | | | |
| ADR | American Depositary Receipt |
| NVDR | Non-voting Depositary Receipt |
See accompanying notes to financial statements.
| | | | |
| matthewsasia.com | 800.789.ASIA | | | 37 | |
| | | | |
| PORTFOLIO MANAGERS |
| Taizo Ishida | | |
Lead Manager | | |
| Sharat Shroff, CFA | | |
Co-Manager | | |
|
| FUND FACTS |
| | | Investor | | Institutional |
Ticker | | MPACX | | MIAPX |
CUSIP | | 577130867 | | 577130776 |
Inception | | 10/31/03 | | 10/29/10 |
NAV | | $21.86 | | $22.03 |
Initial Investment | | $2,500 | | $3 million |
Gross Expense Ratio1 | | 1.11% | | 0.91% |
Portfolio Statistics | | | | |
Total # of Positions | | | | 54 |
Net Assets | | | | $681.8 million |
Weighted Average Market Cap | | $14.0 billion |
Portfolio Turnover2 | | | | 29.51% |
Benchmark |
MSCI AC Asia Pacific Index |
OBJECTIVE
Long-term capital appreciation.
STRATEGY
Under normal market conditions, the Fund seeks to achieve its investment objective by investing at least 80% of its total net assets, which include borrowings for investment purposes, in the common and preferred stocks of companies located in Asia. Asia consists of all countries and markets in Asia, and includes developed, emerging and frontier countries and markets in the Asian region. The Fund may also invest in the convertible securities, of any duration or quality, of Asian companies.
Matthews Asia Growth Fund
Portfolio Manager Commentary (unaudited)
For the first half of 2016, the Matthews Asia Growth Fund returned 3.65% (Investor Class) and 3.72% (Institutional Class) while its benchmark, the MSCI All Country Asia Pacific Index, returned -0.85%. For the quarter ending June 30, 2016, the Fund returned 4.15% (Investor) and 4.21% (Institutional Class), while its benchmark returned 0.77%.
Market Environment:
The market continued to worry about the timing of Fed rate hikes in the early part of the quarter and became increasingly nervous about the potential outcome in the Brexit vote toward the end of the quarter. Interestingly enough, the rise in oil prices to $50 from $35 and a sharp appreciation in the yen to ¥104 from ¥110 were not as meaningful in the minds of investors. As a result, Asian markets were in a holding pattern in the absence of fresh news. Two central bank governors, Hiroki Kuroda of the Bank of Japan and Raghuram Rajan of the Reserve Bank of India, made headline news: Rajan leaving his post in September and Kuroda running out of “magic”, or ammunition to revive the Japanese economy, both verbally and through policy, were both a negative for the market.
Performance Contributors and Detractors:
Although Japan indices were generally flat in the second quarter, seven out of the top 10 contributors to Fund performance were Japanese companies. The top contributor was M3, Inc., an internet website for various medical services in Japan, U.S., U.K. and China. Investors are rewarding the company’s steady earnings growth and favorable growth prospects in its target markets and product offerings. This is one of our top three holdings in the portfolio. Start Today, Japan’s largest fashion apparel e-commerce company, was the second largest contributor with strong earnings results. The company continues to expand its buyer base by tapping into a fashion coordination app called “Wear” and started an alliance with another company’s popular blogsite called “Ameblo.”
On the other hand, five out of the bottom 10 detractors to Fund performance during the quarter were Chinese companies: Baidu was the single largest detractor. Autohome, one of China’s largest auto websites and JD.com, China’s version of Amazon in the U.S., both traded as American Depositary Receipts (ADRs), also dragged on Fund performance. A common thread among these Chinese ADR e-commerce companies is the perception of a slowing Chinese economy, although we would argue that consumption is doing rather well and is the strongest element of the economy. By country, security selection in Japan worked favorably for us during the quarter, and our overweight positions in India and Indonesia also performed well, while security selection in China/HK detracted from performance due mostly to the e-commerce companies mentioned above. By sector, our allocation and stock selection in health care and consumer staples worked well, while investments in information technology hurt performance.
Notable Portfolio Changes:
We initiated a position in Nitori, a Japanese furniture/life style retailer. Nitori is one of the best growth companies in Japan with 29 consecutive years of sales and earnings growth, a rare achievement anywhere. We had not held the company shares in the portfolio previously as the company never met with investors in the past. A new CEO and Japan’s push for better corporate governance changed Nitori’s investor relations policy. We fulfilled our due diligence process requirement by meeting with the company in June.
(continued)
| 1 | Prospectus expense ratios. |
| 2 | The lesser of fiscal year 2015 long-term purchase costs or sales proceeds divided by the average monthly market value of long-term securities. |
| | | | | | | | | | | | | | | | | | | | | | | | | | | | | | | | |
| | | | |
| PERFORMANCE AS OF JUNE 30, 2016 | | | | | | | | | | |
| | | | | | | | | | | | Average Annual Total Returns | | | | |
| | | 3 Months | | | YTD | | | 1 Year | | | 3 Years | | | 5 Years | | | 10 Years | | | Since
Inception | | | Inception
Date | |
| Investor Class (MPACX) | | | 4.15% | | | | 3.65% | | | | -0.86% | | | | 4.13% | | | | 5.01% | | | | 6.56% | | | | 8.81% | | | | 10/31/03 | |
| Institutional Class (MIAPX) | | | 4.21% | | | | 3.72% | | | | -0.63% | | | | 4.35% | | | | 5.21% | | | | n.a. | | | | 5.24% | | | | 10/29/10 | |
| MSCI AC Asia Pacific Index3 | | | 0.77% | | | | -0.85% | | | | -9.35% | | | | 2.33% | | | | 1.91% | | | | 2.83% | | | | 6.11% | 4 | | | | |
| Lipper Pacific Region Funds Category Average5 | | | 2.45% | | | | 2.49% | | | | -6.50% | | | | 2.71% | | | | 2.76% | | | | 3.65% | | | | 6.60% | 4 | | | | |
Performance assumes reinvestment of all dividends and/or distributions before taxes. All performance quoted represents past performance and is no guarantee of future results. Investment return and principal value will fluctuate with market conditions so that when redeemed, shares may be worth more or less than their original cost. Current performance may be lower or higher than the return figures quoted. For the Fund’s most recent month-end performance, visit matthewsasia.com.
GROWTH OF A $10,000 INVESTMENT SINCE INCEPTION—INVESTOR CLASS
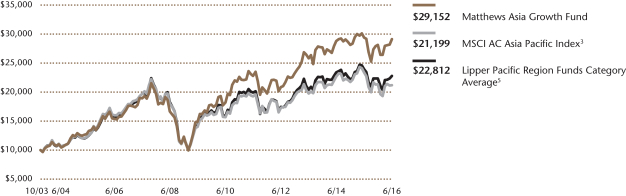
Plotted monthly. The performance data and graph do not reflect the deduction of taxes that a shareholder would pay on dividends, capital gains distributions or redemption of Fund shares. Values are in US$.
| | 3 | It is not possible to invest directly in an index. Source: Index data from Morgan Stanley Capital International and Bloomberg; total return calculations performed by BNY Mellon Investment Servicing (US) Inc. Please see page 91 for index definition. |
| | 4 | Calculated from 10/31/03. |
| | 5 | The Lipper Category Average does not reflect sales charges and is based on total return, including reinvestment of dividends and capital gains for the stated periods. |
| | | | | | | | |
| | | | |
| TOP TEN HOLDINGS6 | | | | | | | |
| | | Sector | | Country | | % of Net Assets | |
| M3, Inc. | | Health Care | | Japan | | | 4.9% | |
| Sysmex Corp. | | Health Care | | Japan | | | 4.5% | |
| Emami, Ltd. | | Consumer Staples | | India | | | 3.7% | |
| PT Astra International | | Consumer Discretionary | | Indonesia | | | 3.6% | |
| PT Bank Rakyat Indonesia Persero | | Financials | | Indonesia | | | 3.6% | |
| Kakaku.com, Inc. | | Information Technology | | Japan | | | 3.4% | |
| Shenzhou International Group Holdings, Ltd. | | Consumer Discretionary | | China/Hong Kong | | | 3.4% | |
| Baidu, Inc. | | Information Technology | | China/Hong Kong | | | 3.4% | |
| ORIX Corp. | | Financials | | Japan | | | 3.1% | |
| HDFC Bank, Ltd. | | Financials | | India | | | 2.8% | |
| % OF ASSETS IN TOP TEN | | | | | | | 36.4% | |
| | 6 | Holdings may combine more than one security from same issuer and related depositary receipts. |
| | | | |
| matthewsasia.com | 800.789.ASIA | | | 39 | |
| | | | |
| |
| COUNTRY ALLOCATION (%)7,8 | |
| Japan | | | 41.7 | |
| Indonesia | | | 12.4 | |
| India | | | 11.9 | |
| China/Hong Kong | | | 10.8 | |
| Philippines | | | 5.3 | |
| Australia | | | 4.1 | |
| Sri Lanka | | | 2.8 | |
| Vietnam | | | 2.0 | |
| Bangladesh | | | 1.9 | |
| South Korea | | | 1.1 | |
| Pakistan | | | 1.1 | |
| Thailand | | | 1.1 | |
| Taiwan | | | 0.9 | |
| Malaysia | | | 0.9 | |
| Cash and Other Assets, Less Liabilities | | | 2.0 | |
| | | | |
| |
| SECTOR ALLOCATION (%)8 | |
| Consumer Staples | | | 21.0 | |
| Health Care | | | 20.6 | |
| Consumer Discretionary | | | 19.2 | |
| Financials | | | 15.4 | |
| Industrials | | | 10.5 | |
| Information Technology | | | 7.9 | |
| Energy | | | 1.8 | |
| Materials | | | 1.6 | |
| Cash and Other Assets, Less Liabilities | | | 2.0 | |
| | | | |
| |
| MARKET CAP EXPOSURE (%)8 | |
| Mega Cap (over $25B) | | | 14.8 | |
| Large Cap ($10B–$25B) | | | 27.8 | |
| Mid Cap ($3B–10B) | | | 30.5 | |
| Small Cap (under $3B) | | | 24.8 | |
| Cash and Other Assets, Less Liabilities | | | 2.0 | |
| 7 | Not all countries where the Fund may invest are included in the benchmark index. |
| 8 | Source: FactSet Research Systems. Percentage values in data are rounded to the nearest tenth of one percent; the values may not sum to 100% due to rounding. |
Matthews Asia Growth Fund
Portfolio Manager Commentary (unaudited) (continued)
Outlook:
Our recent trip to India was enlightening, and we believe the country has a fair chance of performing better than expectations. Amidst the skeptical views, we think the Modi government is making efforts towards much-needed reform and infrastructure investment. Granted that large-cap growth companies are fairly valued in a slower earnings growth environment, we believe that good stock selection from smaller cap companies may prove to be fruitful. India has one of the deepest and most diverse stock markets in terms of the number of listed companies (about 5,000). We also like Indonesia for a series of reforms President Jakowi has completed, including the tax amnesty scheme to bring back “hidden” offshore money for better use in various domestic investment projects. On the other hand, our concern is that earnings of the leading Japanese exporters may slow if the current strong yen continues. Fortunately or unfortunately, as the yen is regarded as a safe haven for global investors, a more prolonged impact on earnings may persist unless we see a meaningful pickup in the global economy soon.
Matthews Asia Growth Fund
June 30, 2016
Schedule of Investmentsa (unaudited)
COMMON EQUITIES: 98.0%
| | | | | | | | |
| | | Shares | | | Value | |
| JAPAN: 41.7% | | | | | | | | |
M3, Inc. | | | 966,900 | | | | $33,744,795 | |
Sysmex Corp. | | | 445,100 | | | | 30,648,907 | |
Kakaku.com, Inc. | | | 1,183,400 | | | | 23,513,785 | |
ORIX Corp. | | | 1,647,100 | | | | 21,314,242 | |
Start Today Co., Ltd. | | | 336,600 | | | | 17,792,230 | |
Pigeon Corp. | | | 544,900 | | | | 16,289,493 | |
Nidec Corp. | | | 178,600 | | | | 13,595,572 | |
Glory, Ltd. | | | 480,100 | | | | 13,063,314 | |
CYBERDYNE, Inc.b | | | 577,600 | | | | 13,019,335 | |
Benefit One, Inc. | | | 433,800 | | | | 12,989,524 | |
Ariake Japan Co., Ltd. | | | 201,700 | | | | 12,008,390 | |
Rinnai Corp. | | | 132,100 | | | | 11,672,757 | |
Calbee, Inc. | | | 263,500 | | | | 11,023,770 | |
Nitto Denko Corp. | | | 171,400 | | | | 10,872,623 | |
Komatsu, Ltd. | | | 559,800 | | | | 9,724,665 | |
TechnoPro Holdings, Inc. | | | 257,800 | | | | 8,027,473 | |
Daiken Medical Co., Ltd. | | | 911,500 | | | | 6,932,742 | |
Seven & I Holdings Co., Ltd. | | | 165,200 | | | | 6,926,524 | |
Nitori Holdings Co., Ltd. | | | 52,400 | | | | 6,355,286 | |
FANUC Corp. | | | 29,600 | | | | 4,815,128 | |
| | | | | | | | |
Total Japan | | | | | | | 284,330,555 | |
| | | | | | | | |
| | | | | | | | |
| INDONESIA: 12.4% | | | | | | | | |
PT Astra International | | | 43,107,700 | | | | 24,302,476 | |
PT Bank Rakyat Indonesia Persero | | | 29,535,100 | | | | 24,302,430 | |
PT Indofood CBP Sukses Makmur | | | 11,787,000 | | | | 15,495,313 | |
PT Ace Hardware Indonesia | | | 191,978,200 | | | | 13,494,088 | |
PT Arwana Citramulia | | | 145,017,700 | | | | 6,717,581 | |
| | | | | | | | |
Total Indonesia | | | | | | | 84,311,888 | |
| | | | | | | | |
| | | | | | | | |
| INDIA: 11.9% | | | | | | | | |
Emami, Ltd. | | | 1,551,001 | | | | 25,353,134 | |
HDFC Bank, Ltd. | | | 1,102,893 | | | | 19,283,686 | |
ITC, Ltd. | | | 2,970,516 | | | | 16,263,249 | |
Lupin, Ltd. | | | 635,783 | | | | 14,545,036 | |
Sun Pharmaceutical Industries, Ltd. | | | 516,143 | | | | 5,852,226 | |
| | | | | | | | |
Total India | | | | | | | 81,297,331 | |
| | | | | | | | |
| | | | | | | | |
| CHINA/HONG KONG: 10.8% | | | | | | | | |
Shenzhou International Group Holdings, Ltd. | | | 4,792,000 | | | | 23,172,515 | |
Baidu, Inc. ADRb | | | 139,000 | | | | 22,955,850 | |
China Lodging Group, Ltd. ADS | | | 245,900 | | | | 8,958,137 | |
JD.com, Inc. ADRb | | | 288,700 | | | | 6,129,101 | |
Autohome, Inc. ADRb | | | 202,400 | | | | 4,070,264 | |
Alibaba Group Holding, Ltd. ADRb | | | 45,100 | | | | 3,586,803 | |
Shanghai Haohai Biological Technology Co., Ltd. H Shares | | | 734,500 | | | | 3,421,853 | |
Luk Fook Holdings International, Ltd. | | | 551,000 | | | | 1,218,017 | |
| | | | | | | | |
Total China/Hong Kong | | | | | | | 73,512,540 | |
| | | | | | | | |
| | | | | | | | |
| PHILIPPINES: 5.3% | | | | | | | | |
Vista Land & Lifescapes, Inc. | | | 117,224,100 | | | | 13,381,417 | |
Jollibee Foods Corp. | | | 2,007,890 | | | | 10,355,279 | |
Universal Robina Corp. | | | 1,483,980 | | | | 6,581,758 | |
Emperador, Inc. | | | 37,942,500 | | | | 5,836,458 | |
| | | | | | | | |
Total Philippines | | | | | | | 36,154,912 | |
| | | | | | | | |
| | | | | | | | |
| | | | | | | | |
| | | Shares | | | Value | |
| AUSTRALIA: 4.1% | | | | | | | | |
CSL, Ltd. | | | 181,525 | | | | $15,308,490 | |
Oil Search, Ltd. | | | 2,481,915 | | | | 12,532,611 | |
| | | | | | | | |
Total Australia | | | | | | | 27,841,101 | |
| | | | | | | | |
| | | | | | | | |
| SRI LANKA: 2.8% | | | | | | | | |
Sampath Bank PLC | | | 8,111,192 | | | | 12,718,862 | |
Lanka Orix Leasing Co. PLCb | | | 12,121,473 | | | | 6,510,212 | |
| | | | | | | | |
Total Sri Lanka | | | | | | | 19,229,074 | |
| | | | | | | | |
| | | | | | | | |
| VIETNAM: 2.0% | | | | | | | | |
Vietnam Dairy Products JSC | | | 2,164,300 | | | | 13,688,996 | |
| | | | | | | | |
Total Vietnam | | | | | | | 13,688,996 | |
| | | | | | | | |
| | | | | | | | |
| BANGLADESH: 1.9% | | | | | | | | |
Square Pharmaceuticals, Ltd. | | | 3,736,958 | | | | 12,679,036 | |
| | | | | | | | |
Total Bangladesh | | | | | | | 12,679,036 | |
| | | | | | | | |
| | | | | | | | |
| SOUTH KOREA: 1.1% | | | | | | | | |
Orion Corp. | | | 9,402 | | | | 7,717,395 | |
| | | | | | | | |
Total South Korea | | | | | | | 7,717,395 | |
| | | | | | | | |
| | | | | | | | |
| PAKISTAN: 1.1% | | | | | | | | |
Habib Bank, Ltd. | | | 4,001,000 | | | | 7,561,765 | |
| | | | | | | | |
Total Pakistan | | | | | | | 7,561,765 | |
| | | | | | | | |
| | | | | | | | |
| THAILAND: 1.1% | | | | | | | | |
Major Cineplex Group Public Co., Ltd. | | | 7,714,400 | | | | 7,266,624 | |
| | | | | | | | |
Total Thailand | | | | | | | 7,266,624 | |
| | | | | | | | |
| | | | | | | | |
| TAIWAN: 0.9% | | | | | | | | |
St. Shine Optical Co., Ltd. | | | 173,000 | | | | 3,909,475 | |
Sinmag Equipment Corp. | | | 691,674 | | | | 2,303,303 | |
| | | | | | | | |
Total Taiwan | | | | | | | 6,212,778 | |
| | | | | | | | |
| | | | | | | | |
| MALAYSIA: 0.9% | | | | | | | | |
7-Eleven Malaysia Holdings BHD | | | 17,944,600 | | | | 6,038,837 | |
| | | | | | | | |
Total Malaysia | | | | | | | 6,038,837 | |
| | | | | | | | |
| | | | | | | | |
| TOTAL INVESTMENTS: 98.0% | | | | 667,842,832 | |
(Cost $514,779,514c) | | | | | | | | |
| | | | | | | | |
CASH AND OTHER ASSETS,
LESS LIABILITIES: 2.0% | | | | | | | 13,957,879 | |
| | | | | | | | |
| | |
NET ASSETS: 100.0% | | | | | | | $681,800,711 | |
| | | | | | | | |
| a | Certain securities were fair valued under the valuation polices approved by the Board of Trustees (Note 2-A). |
| b | Non-income producing security. |
| c | Cost for federal income tax purposes is $514,779,514 and net unrealized appreciation consists of: |
| | | | |
Gross unrealized appreciation | | | $189,223,311 | |
Gross unrealized depreciation | | | (36,159,993 | ) |
| | | | |
Net unrealized appreciation | | | $153,063,318 | |
| | | | |
| ADR | American Depositary Receipt |
| ADS | American Depositary Share |
See accompanying notes to financial statements.
| | | | |
| matthewsasia.com | 800.789.ASIA | | | 41 | |
| | | | |
| PORTFOLIO MANAGERS |
| Sharat Shroff, CFA | | | | |
Lead Manager | | | | |
| Rahul Gupta | | | | |
Co-Manager | | | | |
| | |
| FUND FACTS | | | | |
| | | Investor | | Institutional |
Ticker | | MAPTX | | MIPTX |
CUSIP | | 577130107 | | 577130834 |
Inception | | 9/12/94 | | 10/29/10 |
NAV | | $24.49 | | $24.49 |
Initial Investment | | $2,500 | | $3 million |
Gross Expense Ratio1 | | 1.09% | | 0.91% |
After Fee Waiver and Reimbursement2 | | 1.07% | | 0.89% |
Portfolio Statistics | | |
Total # of Positions | | 64 |
Net Assets | | $7.0 billion |
Weighted Average Market Cap | | $31.9 billion |
Portfolio Turnover3 | | | | 12.56% |
Benchmark |
MSCI AC Asia ex Japan Index |
OBJECTIVE
Long-term capital appreciation.
STRATEGY
Under normal market conditions, the Fund seeks to achieve its investment objective by investing at least 80% of its total net assets, which include borrowings for investment purposes, in the common and preferred stocks of companies located in Asia ex Japan, which consists of all countries and markets in Asia excluding Japan, but including all other developed, emerging and frontier countries and markets in the Asian region.
Matthews Pacific Tiger Fund
Portfolio Manager Commentary (unaudited)
For the first half of 2016, the Matthews Pacific Tiger Fund returned 4.04% (Investor Class) and 4.12% (Institutional Class) while its benchmark, the MSCI All Country Asia ex Japan Index, returned 2.32%. For the quarter ending June 30, the Fund returned 3.82% (Investor) and 3.86% (Institutional Class) while its benchmark returned 0.51%.
Market Environment:
Since the start of the year, capital markets in Asia have battled concerns ranging from capital outflows from China and the impact of a rising U.S. dollar on Asian economies, to the more recent political developments in the U.K. and Europe. Following a rocky start, a partial recovery in Asian equities was led by large-cap stocks primarily in countries like Taiwan and South Korea. However, the potential negative impact from Brexit on global trade and financing flows may continue to weigh on the Asian region in the near term.
In spite of the variety of challenges during the first six months of the year Asia markets finished the period modestly higher, although that masks a wide divergence between country specific indices. Cyclical stocks bounced in a reflex rally toward the end of the first quarter, but then weakened again in the second quarter. Domestic mainland markets in China experienced the sharpest declines, while Thailand was one of the better performers.
Performance Contributors and Detractors:
Divergences across Asia markets continued in the second quarter, with well-capitalized, well-run businesses outperforming during the period. Consequently, stock selection was a key contributor to performance in the second quarter as reflected in our allocation to good, quality companies, including Central Pattana, a well-capitalized mall operator in Thailand and the best performer during the quarter. Central Pattana continues to deliver strong performance on the back of its solid business model. Genting, a gaming company in Malaysia, outperformed in the first quarter, although that reversed somewhat in the second quarter as earnings were soft given weakness in the gaming environment. Baidu, the leading search engine in China, was the largest detractor from performance in the second quarter, as it came under regulatory scrutiny due to issues in their health care business. Cleanup of this part of this business has affected near-term earnings, hence weakness in their stock price. Baidu has been in this predicament before but has shown they can clean up and improve their systems and sales processes. We expect a similar outcome in due course of time.
By country, India and South Korea were positive contributors to performance in the second quarter, largely reflecting a technical rebound following weakness seen in the first quarter.
Notable Portfolio Changes:
We continue to take advantage of volatility in markets by rotating capital away from our investments where valuations have become expensive to businesses that are more reasonably priced. In aggregate, this has resulted in shifting some of our allocation away from South Korea into China. In addition, we have deployed capital in India following weakness in specific stocks which we have been following.
(continued)
| 1 | Prospectus expense ratios. |
| 2 | Matthews has contractually agreed to waive a portion of its advisory fee and administrative and shareholder services fee if the Fund’s average daily net assets are over $3 billion, as follows: for every $2.5 billion average daily net assets of the Fund that are over $3 billion, the advisory fee rate and the administrative and shareholder services fee rate for the Fund with respect to such excess average daily net assets will be each reduced by 0.01%, in each case without reducing such fee rate below 0.00%. Any amount waived by Matthews pursuant to this agreement may not be recouped by Matthews. This agreement will remain in place until April 30, 2017 and may be terminated at any time (i) by the Trust on behalf of the Fund or by the Board of Trustees upon 60 days’ prior written notice to Matthews; or (ii) by Matthews upon 60 days’ prior written notice to the Trust, in each case without payment of any penalty. |
| 3 | The lesser of fiscal year 2015 long-term purchase costs or sales proceeds divided by the average monthly market value of long-term securities. |
| | | | | | | | | | | | | | | | | | | | | | | | | | | | | | | | |
| |
| PERFORMANCE AS OF JUNE 30, 2016 | |
| | | | | | | | | | | | Average Annual Total Returns | | | | |
| | | 3 Months | | | YTD | | | 1 Year | | | 3 Years | | | 5 Years | | | 10 Years | | | Since
Inception | | | Inception
Date | |
| Investor Class (MAPTX) | | | 3.82% | | | | 4.04% | | | | -5.04% | | | | 6.57% | | | | 4.34% | | | | 9.19% | | | | 8.51% | | | | 9/12/94 | |
| Institutional Class (MIPTX) | | | 3.86% | | | | 4.12% | | | | -4.85% | | | | 6.77% | | | | 4.51% | | | | n.a. | | | | 4.68% | | | | 10/29/10 | |
| MSCI AC Asia ex Japan Index4 | | | 0.51% | | | | 2.32% | | | | -11.72% | | | | 2.36% | | | | 0.34% | | | | 5.92% | | | | 3.53% | 5 | | | | |
| Lipper Pacific ex Japan Funds Category Average6 | | | 1.49% | | | | 2.44% | | | | -7.73% | | | | 2.81% | | | | 0.84% | | | | 5.79% | | | | 4.46% | 5 | | | | |
Performance assumes reinvestment of all dividends and/or distributions before taxes. All performance quoted represents past performance and is no guarantee of future results. Investment return and principal value will fluctuate with market conditions so that when redeemed, shares may be worth more or less than their original cost. Current performance may be lower or higher than the return figures quoted. Returns would have been lower if certain of the Fund’s fees and expenses had not been waived. For the Fund’s most recent month-end performance, visit matthewsasia.com.
GROWTH OF A $10,000 INVESTMENT SINCE INCEPTION—INVESTOR CLASS
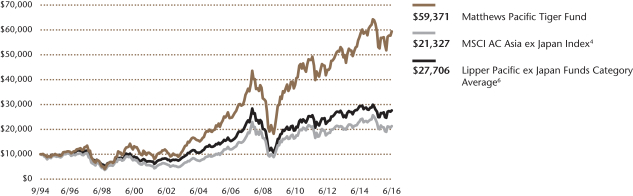
Plotted monthly. The performance data and graph do not reflect the deduction of taxes that a shareholder would pay on dividends, capital gains distributions or redemption of Fund shares. Values are in US$.
| | 4 | It is not possible to invest directly in an index. Source: Index data from Morgan Stanley Capital International and Bloomberg; total return calculations performed by BNY Mellon Investment Servicing (US) Inc. Please see page 91 for index definition. |
| | 5 | Calculated from 8/31/94. |
| | 6 | The Lipper Category Average does not reflect sales charges and is based on total return, including reinvestment of dividends and capital gains for the stated periods. |
| | | | | | | | |
| | | | |
| TOP TEN HOLDINGS7 | | | | | | | |
| | | Sector | | Country | | % of Net Assets | |
| Central Pattana Public Co., Ltd. | | Financials | | Thailand | | | 3.2% | |
| Kotak Mahindra Bank, Ltd. | | Financials | | India | | | 2.7% | |
| Dongbu Insurance Co., Ltd. | | Financials | | South Korea | | | 2.7% | |
| Naver Corp. | | Information Technology | | South Korea | | | 2.7% | |
| Baidu, Inc. ADR | | Information Technology | | China/Hong Kong | | | 2.7% | |
| Tata Power Co., Ltd. | | Utilities | | India | | | 2.6% | |
| DKSH Holding, Ltd. | | Industrials | | Switzerland | | | 2.6% | |
| Sinopharm Group Co., Ltd. | | Health Care | | China/Hong Kong | | | 2.5% | |
| Vietnam Dairy Products JSC | | Consumer Staples | | Vietnam | | | 2.5% | |
| President Chain Store Corp. | | Consumer Staples | | Taiwan | | | 2.4% | |
| % OF ASSETS IN TOP TEN | | | | | | | 26.6% | |
| | 7 | Holdings may combine more than one security from same issuer and related depositary receipts. |
| | | | |
| matthewsasia.com | 800.789.ASIA | | | 43 | |
| | | | |
| |
| COUNTRY ALLOCATION (%)8,9 | |
| China/Hong Kong | | | 28.9 | |
| India | | | 20.0 | |
| South Korea | | | 15.0 | |
| Indonesia | | | 6.7 | |
| Taiwan | | | 6.1 | |
| Thailand | | | 5.6 | |
| Malaysia | | | 3.9 | |
| Philippines | | | 3.1 | |
| Switzerland | | | 2.6 | |
| Vietnam | | | 2.5 | |
| United States | | | 1.2 | |
| Singapore | | | 0.2 | |
| Cash and Other Assets, Less Liabilities | | | 4.2 | |
| | | | |
| |
| SECTOR ALLOCATION (%)9 | |
| Financials | | | 25.4 | |
| Consumer Staples | | | 20.5 | |
| Information Technology | | | 17.2 | |
| Health Care | | | 8.5 | |
| Consumer Discretionary | | | 8.1 | |
| Utilities | | | 5.4 | |
| Industrials | | | 5.1 | |
| Telecommunication Services | | | 4.1 | |
| Materials | | | 1.5 | |
| Cash and Other Assets, Less Liabilities | | | 4.2 | |
| | | | |
| |
MARKET CAP EXPOSURE (%)9 | |
| Mega Cap (over $25B) | | | 25.5 | |
| Large Cap ($10B–$25B) | | | 25.9 | |
| Mid Cap ($3B–10B) | | | 35.6 | |
| Small Cap (under $3B) | | | 8.8 | |
| Cash and Other Assets, Less Liabilities | | | 4.2 | |
| 8 | Not all countries where the Fund may invest are included in the benchmark index. |
| 9 | Source: FactSet Research Systems. Percentage values in data are rounded to the nearest tenth of one percent; the values may not sum to 100% due to rounding. |
Matthews Pacific Tiger Fund
Portfolio Manager Commentary (unaudited) (continued)
Outlook:
For a change, the Asian region, more specifically the Chinese economy, is not driving the rise in global economic uncertainty. While the next steps and the fallout from Britain’s decision to leave the European Union remain uncertain, the outlook for domestic demand in Asia is much more easily understood. For the past two to three years, consumption has supported domestic demand, while investment activity has been grinding lower across many parts of Asia. However, it is also worth noting that in countries like Thailand and Malaysia, household debt has continued to expand in the past few years, and the tepid outlook for income growth suggests consumption growth may not be as supportive as in the recent past. Yet there are other countries such as India, Indonesia, and the Philippines where the outlook for income growth and household debt is not overly constraining to continued growth in private consumption.
That being said, policymakers and central bankers realize the need to boost investment growth, which has led to vigorous rate cuts in economies like Indonesia and hopes for greater fiscal support in other countries like India. The purest driver of investment activity is, however, continued emphasis on structural reforms to boost productivity and ease the cost of doing business in any given country. In this regard, progress has been slow and uneven, whether it is reform for state-owned enterprises (SOE) in China or easing land and labor regulations in India and Indonesia. Nonetheless, these are issues that are well defined and are being gradually addressed. We believe there is an opportunity for Asian businesses and policymakers to clearly set themselves apart from the uncertainty that might impact economic activity globally.
Matthews Pacific Tiger Fund
June 30, 2016
Schedule of Investmentsa (unaudited)
COMMON EQUITIES: 95.7%
| | | | | | | | |
| | | Shares | | | Value | |
| CHINA/HONG KONG: 28.9% | |
Baidu, Inc. ADRb | | | 1,131,800 | | | | $186,916,770 | |
Sinopharm Group Co., Ltd. H Shares | | | 36,984,400 | | | | 177,661,557 | |
Hengan International Group Co., Ltd. | | | 16,483,500 | | | | 138,061,439 | |
China Mobile, Ltd. ADR | | | 2,380,026 | | | | 137,803,505 | |
Ping An Insurance Group Co. of China, Ltd. H Shares | | | 30,743,000 | | | | 136,212,247 | |
Tencent Holdings, Ltd. | | | 5,886,500 | | | | 135,034,387 | |
AIA Group, Ltd. | | | 20,140,800 | | | | 121,121,233 | |
China Resources Land, Ltd. | | | 47,814,000 | | | | 112,671,271 | |
China Resources Beer Holdings Co., Ltd. | | | 50,502,000 | | | | 110,384,453 | |
Dairy Farm International Holdings, Ltd. | | | 15,454,946 | | | | 104,329,695 | |
Alibaba Group Holding, Ltd. ADRb | | | 1,291,700 | | | | 102,728,901 | |
Yum! Brands, Inc. | | | 1,174,410 | | | | 97,382,077 | |
Lenovo Group, Ltd. | | | 147,394,000 | | | | 89,591,124 | |
Fuyao Glass Industry Group Co., Ltd. H Shares† | | | 34,836,000 | | | | 81,071,770 | |
Inner Mongolia Yili Industrial Group Co., Ltd. A Shares | | | 32,078,874 | | | | 80,364,576 | |
Hong Kong Exchanges and Clearing, Ltd. | | | 2,603,000 | | | | 63,423,571 | |
Tasly Pharmaceutical Group Co., Ltd. A Shares | | | 10,220,127 | | | | 55,025,483 | |
Hang Lung Group, Ltd. | | | 12,815,000 | | | | 38,609,241 | |
Swire Pacific, Ltd. A Share Class | | | 2,813,000 | | | | 31,790,373 | |
China Vanke Co., Ltd. H Shares | | | 8,305,504 | | | | 16,401,804 | |
Qinqin Foodstuffs Group Cayman Co., Ltd.b,c | | | 3,296,700 | | | | 4,674,302 | |
| | | | | | | | |
Total China/Hong Kong | | | | 2,021,259,779 | |
| | | | | | | | |
| | | | | | | | |
| INDIA: 20.0% | |
Kotak Mahindra Bank, Ltd. | | | 16,873,409 | | | | 191,387,614 | |
Tata Power Co., Ltd.† | | | 165,620,436 | | | | 180,343,321 | |
Titan Co., Ltd. | | | 24,797,915 | | | | 149,562,223 | |
Sun Pharmaceutical Industries, Ltd. | | | 12,078,258 | | | | 136,947,885 | |
GAIL India, Ltd. | | | 22,282,108 | | | | 127,515,997 | |
Container Corp. of India, Ltd. | | | 5,471,996 | | | | 116,225,924 | |
HDFC Bank, Ltd. | | | 6,223,409 | | | | 108,814,059 | |
ITC, Ltd. | | | 18,735,000 | | | | 102,572,067 | |
Dabur India, Ltd. | | | 21,117,482 | | | | 96,730,442 | |
Housing Development Finance Corp., Ltd. | | | 4,935,685 | | | | 91,954,500 | |
Thermax, Ltd. | | | 5,310,034 | | | | 64,991,957 | |
Just Dial, Ltd. | | | 3,057,718 | | | | 27,779,841 | |
| | | | | | | | |
Total India | | | | 1,394,825,830 | |
| | | | | | | | |
| | | | | | | | |
| SOUTH KOREA: 15.0% | |
Dongbu Insurance Co., Ltd. | | | 3,159,119 | | | | 190,149,072 | |
Naver Corp. | | | 306,817 | | | | 190,078,071 | |
Orion Corp. | | | 203,080 | | | | 166,693,098 | |
Amorepacific Corp. | | | 415,972 | | | | 156,817,048 | |
Green Cross Corp.† | | | 776,872 | | | | 127,832,970 | |
Samsung Electronics Co., Ltd. | | | 101,105 | | | | 125,911,241 | |
Cheil Worldwide, Inc.† | | | 6,154,297 | | | | 90,836,833 | |
| | | | | | | | |
Total South Korea | | | | 1,048,318,333 | |
| | | | | | | | |
| | | | | | | | |
| | | | | | | | |
| | | Shares | | | Value | |
| INDONESIA: 6.7% | |
PT Telekomunikasi Indonesia Persero | | | 421,304,300 | | | | $128,180,055 | |
PT Indofood CBP Sukses Makmur | | | 95,761,300 | | | | 125,888,804 | |
PT Bank Central Asia | | | 100,580,000 | | | | 101,843,074 | |
PT Perusahaan Gas Negara Persero | | | 298,485,100 | | | | 53,222,012 | |
PT Astra International | | | 66,745,900 | | | | 37,628,790 | |
PT Telekomunikasi Indonesia Persero ADR | | | 364,070 | | | | 22,375,742 | |
| | | | | | | | |
Total Indonesia | | | | 469,138,477 | |
| | | | | | | | |
| | | | | | | | |
| TAIWAN: 6.1% | |
President Chain Store Corp. | | | 21,486,608 | | | | 167,882,525 | |
Delta Electronics, Inc. | | | 31,251,182 | | | | 152,484,597 | |
Synnex Technology International Corp.† | | | 98,191,354 | | | | 106,531,796 | |
| | | | | | | | |
Total Taiwan | | | | 426,898,918 | �� |
| | | | | | | | |
| | | | | | | | |
| THAILAND: 5.6% | |
Central Pattana Public Co., Ltd. | | | 131,488,800 | | | | 224,049,663 | |
The Siam Cement Public Co., Ltd. | | | 7,522,950 | | | | 102,202,369 | |
Kasikornbank Public Co., Ltd. | | | 13,427,700 | | | | 65,204,322 | |
Kasikornbank Public Co., Ltd. NVDR | | | 150,000 | | | | 728,393 | |
| | | | | | | | |
Total Thailand | | | | 392,184,747 | |
| | | | | | | | |
| | | | | | | | |
| MALAYSIA: 3.8% | |
Genting BHD | | | 52,881,000 | | | | 107,713,344 | |
IHH Healthcare BHD | | | 47,676,300 | | | | 78,051,241 | |
Public Bank BHD | | | 12,771,594 | | | | 61,539,385 | |
IHH Healthcare BHD | | | 11,543,000 | | | | 18,851,310 | |
| | | | | | | | |
Total Malaysia | | | | 266,155,280 | |
| | | | | | | | |
| | | | | | | | |
| PHILIPPINES: 3.1% | |
GT Capital Holdings, Inc. | | | 3,897,540 | | | | 119,817,330 | |
SM Prime Holdings, Inc. | | | 164,670,771 | | | | 96,201,023 | |
| | | | | | | | |
Total Philippines | | | | 216,018,353 | |
| | | | | | | | |
| | | | | | | | |
| SWITZERLAND: 2.6% | |
DKSH Holding, Ltd. | | | 2,738,062 | | | | 179,364,422 | |
| | | | | | | | |
Total Switzerland | | | | 179,364,422 | |
| | | | | | | | |
| | | | | | | | |
| VIETNAM: 2.5% | |
Vietnam Dairy Products JSC | | | 27,859,837 | | | | 176,210,878 | |
| | | | | | | | |
Total Vietnam | | | | 176,210,878 | |
| | | | | | | | |
| | | | | | | | |
| UNITED STATES: 1.2% | |
Cognizant Technology Solutions Corp. Class Ab | | | 1,457,600 | | | | 83,433,024 | |
| | | | | | | | |
Total United States | | | | 83,433,024 | |
| | | | | | | | |
| | | | | | | | |
| SINGAPORE: 0.2% | |
Hyflux, Ltd. | | | 35,190,730 | | | | 15,765,687 | |
| | | | | | | | |
Total Singapore | | | | 15,765,687 | |
| | | | | | | | |
| | | | | | | | |
| TOTAL COMMON EQUITIES | | | | 6,689,573,728 | |
| | | | | | | | |
(Cost $5,127,641,481) | | | | | | | | |
| | | | |
| matthewsasia.com | 800.789.ASIA | | | 45 | |
Matthews Pacific Tiger Fund
June 30, 2016
Schedule of Investmentsa (unaudited) (continued)
WARRANTS: 0.1%
| | | | | | | | |
| | | Shares | | | Value | |
| MALAYSIA: 0.1% | |
Genting BHD, expires 12/18/18 | | | 12,253,875 | | | | $4,680,880 | |
| | | | | | | | |
Total Malaysia | | | | 4,680,880 | |
| | | | | | | | |
| | | | | | | | |
| TOTAL WARRANTS | | | | 4,680,880 | |
| | | | | | | | |
(Cost $5,593,674) | | | | | | | | |
| | | | | | | | |
| TOTAL INVESTMENTS: 95.8% | | | | 6,694,254,608 | |
(Cost $5,133,235,155d) | | | | | | | | |
| | | | | | | | |
CASH AND OTHER ASSETS,
LESS LIABILITIES: 4.2% | | | | 290,311,721 | |
| | | | | | | | |
| |
NET ASSETS: 100.0% | | | | $6,984,566,329 | |
| | | | | | | | |
| a | Certain securities were fair valued under the valuation polices approved by the Board of Trustees (Note 2-A). |
| b | Non-income producing security. |
| c | Illiquid security, trading was halted at June 30, 2016. |
| d | Cost for federal income tax purposes is $5,135,313,671 and net unrealized appreciation consists of: |
| | | | |
Gross unrealized appreciation | | | $2,054,174,333 | |
Gross unrealized depreciation | | | (495,233,396 | ) |
| | | | |
Net unrealized appreciation | | | $1,558,940,937 | |
| | | | |
| † | Affiliated Issuer, as defined under the Investment Company Act of 1940 (ownership of 5% or more of the outstanding voting securities of this issuer) |
| ADR | American Depositary Receipt |
| NVDR | Non-voting Depositary Receipt |
See accompanying notes to financial statements.
| | | | |
| PORTFOLIO MANAGERS |
| Vivek Tanneeru | | |
Lead Manager | | |
| Winnie Chwang | | |
Co-Manager | | | | |
|
| FUND FACTS |
| | | Investor | | Institutional |
Ticker | | MASGX | | MISFX |
CUSIP | | 577130727 | | 577130719 |
Inception | | 4/30/15 | | 4/30/15 |
NAV | | $9.10 | | $9.05 |
Initial Investment | | $2,500 | | $3 million |
Gross Expense Ratio1 | | 9.09% | | 8.90% |
After Fee Waiver and Reimbursement2 | | 1.44% | | 1.25% |
Portfolio Statistics | | | | |
Total # of Positions | | 56 |
Net Assets | | $8.5 million |
Weighted Average Market Cap | | $13.0 billion |
Portfolio Turnover3 | | 21.72% |
Benchmark | | |
MSCI AC Asia ex Japan Index |
OBJECTIVE
Long term capital appreciation.
STRATEGY
Under normal market conditions, the Fund seeks to achieve its investment objective by investing at least 80% of its total assets, which include borrowings for investment purposes, in the common and preferred stocks of companies of any market capitalization located in Asia that Matthews believes satisfy one or more of its environmental, social and governance (“ESG”) standards. Asia consists of all countries and markets in Asia and includes developed, emerging, and frontier countries and markets in the Asia region. The Fund may also invest in convertible securities and fixed-income securities, of any duration or quality, including high yield securities of Asian companies.
Matthews Asia ESG Fund
Portfolio Manager Commentary (unaudited)
For the first half of 2016, the Matthews Asia ESG Fund returned -1.41% (Investor Class) and -1.31% (Institutional Class) while its benchmark, the MSCI All Country Asia ex Japan Index, returned 2.32%. For the quarter ending June 30, 2016, the Matthews Asia ESG Fund returned 1.22% (Investor Class) and 1.23% (Institutional Class), while its benchmark, the MSCI All Country Asia ex Japan Index returned 0.51%.
Market Environment:
Volatile market conditions continued in the second quarter of 2016. As in the first quarter, the market saw a correction early on, followed by a strong recovery into the quarter-end, which enabled the MSCI AC Asia ex Japan Index to finish the quarter modestly higher. The shocking “Brexit” referendum result in the U.K. raised further questions about the long-term future of the European Union. The quarter also saw expectations about the pace and scale of a U.S. Federal Reserve rate hiking cycle dialed back significantly.
South East and South Asian equity markets performed well during the quarter (led by the Philippines and Indonesia), with the exception of Malaysia, which was the worst regional performer, in-part led by the Malaysian ringgit depreciation of 3%. North Asian markets such as South Korea also lagged. On the other hand, the Japanese yen appreciated significantly (by 9%) during the quarter given its perceived “safe haven” status.
Performance Contributors and Detractors:
During the second quarter, the portfolio’s overweight allocation in Japan was the biggest positive contributor to returns, while Thailand detracted most from performance due to adverse stock selection. In terms of sectors, consumer staples were the biggest positive contributors, while telecom services detracted the most from performance due to unfavorable security selection.
At the stock level, Japanese elderly daycare company Tsukui was the biggest contributor to Fund performance led by positive operational performance as well as strong guidance for the next fiscal year. Elderly daycare is a cost effective way to provide senior care in Japan compared to in-home care and assisted living, especially in an environment where the Japanese government is reigning in its ballooning health care budget.
iMarketKorea, a Korean procurement services company, was among the biggest detractors. iMarketKorea, counts Samsung Electronics as its largest client. Its guaranteed contract with Samsung expires at the end of 2016, and the market has growing concerns about the outlook for iMarketKorea’s business with Samsung from 2017 onwards. In an effort to reduce its exposure to Samsung, iMarketKorea has been growing its non-Samsung business and has also acquired related distribution businesses. Current valuations lead us to believe that the market has given zero value to iMarketKorea’s business with Samsung. While we recognize that some of that revenue is at risk when the contract between iMarketKorea and Samsung expires, it is unlikely that Samsung will move its procurement services in-house entirely, as it is a non-core, high volume and low value-add business for Samsung.
(continued)
| 1 | Prospectus expense ratios. |
| 2 | Matthews has contractually agreed (i) to waive fees and reimburse expenses to the extent needed to limit Total Annual Fund Operating Expenses (excluding Rule 12b-1 fees, taxes, interest, brokerage commissions, short sale dividend expenses, expenses incurred in connection with any merger or reorganization or extraordinary expenses such as litigation) of the Institutional Class to 1.25% first by waiving class specific expenses (i.e., shareholder service fees specific to a particular class) of the Institutional Class and then, to the extent necessary, by waiving non-class specific expenses of the Institutional Class, and (ii) if any Fund-wide expenses (i.e., expenses that apply to both the Institutional Class and the Investor Class) are waived for the Institutional Class to maintain the 1.25% expense limitation, to waive an equal amount (in annual percentage terms) of those same expenses for the Investor Class. The Total Annual Fund Operating Expenses After Fee Waiver and Expense Reimbursement for the Investor Class may vary from year to year and will in some years exceed 1.25%. If the operating expenses fall below the expense limitation in a year within three years after Matthews has made a waiver or reimbursement, the Fund may reimburse Matthews up to an amount that does not cause the expenses for that year to exceed the lesser of (i) the expense limitation applicable at the time of that fee waiver and/or expense reimbursement or (ii) the expense limitation in effect at the time of recoupment. This agreement will remain in place until April 30, 2017 and may be terminated at any time by the Board of Trustees on behalf of the Fund on 60 days’ written notice to Matthews. |
| 3 | The lesser of fiscal year 2015 long-term purchase costs or sales proceeds divided by the average monthly market value of long-term securities. |
| | | | |
| matthewsasia.com | 800.789.ASIA | | | 47 | |
| | | | | | | | | | | | | | | | | | | | |
| | | | | | |
| PERFORMANCE AS OF JUNE 30, 2016 | | | | | | | | | | | | | | | |
| | | | | | | | | | | | Average Annual
Total Returns | | | | |
| | | 3 Months | | | YTD | | | 1 Year | | | Since Inception | | | Inception
Date | |
| Investor Class (MASGX) | | | 1.22% | | | | -1.41% | | | | -7.12% | | | | -7.42% | | | | 4/30/15 | |
| Institutional Class (MISFX) | | | 1.23% | | | | -1.31% | | | | -6.86% | | | | -7.20% | | | | 4/30/15 | |
| MSCI AC Asia ex Japan Index4 | | | 0.51% | | | | 2.32% | | | | -11.72% | | | | -14.88% | | | | | |
| Lipper Pacific Funds Category Average5 | | | 2.45% | | | | 2.49% | | | | -6.50% | | | | -8.23% | | | | | |
Performance assumes reinvestment of all dividends and/or distributions before taxes. All performance quoted represents past performance and is no guarantee of future results. Investment return and principal value will fluctuate with market conditions so that when redeemed, shares may be worth more or less than their original cost. Current performance may be lower or higher than the return figures quoted. Returns would have been lower if certain of the Fund’s fees and expenses had not been waived. For the Fund’s most recent month-end performance visit matthewsasia.com.
GROWTH OF A $10,000 INVESTMENT SINCE INCEPTION—INVESTOR CLASS
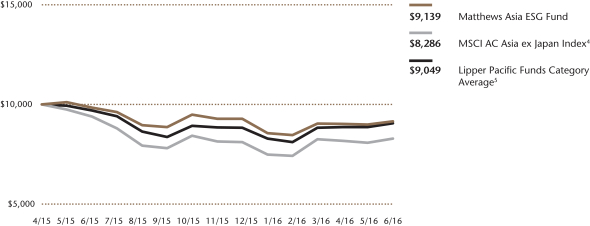
Plotted Monthly. The performance data does not reflect the deduction of taxes that a shareholder would pay on dividends, capital gain distributions or redemption of Fund shares. Values are in US$.
| | 4 | It is not possible to invest directly in an index. Source: Index data from Morgan Stanley Capital International; total return calculations performed by BNY Mellon Investment Servicing (US) Inc. Please see page 91 for index definition. |
| | 5 | The Lipper Category Average does not reflect sales charges and is based on total return, including reinvestment of dividends and capital gains for the stated periods. |
| | | | | | | | |
| | | | |
| TOP TEN HOLDINGS6 | | | | | | | |
| | | Sector | | Country | | % of Net Assets | |
| Taiwan Semiconductor Manufacturing Co., Ltd. | | Information Technology | | Taiwan | | | 3.2% | |
| Lupin, Ltd. | | Health Care | | India | | | 3.0% | |
| MTR Corp., Ltd. | | Industrials | | China/Hong Kong | | | 2.9% | |
| Total Access Communication Public Co., Ltd. NVDR | | Telecommunication Services | | Thailand | | | 2.7% | |
| Inner Mongolia Yili Industrial Group Co., Ltd. | | Consumer Staples | | China/Hong Kong | | | 2.7% | |
| PT Bank Rakyat Indonesia Persero | | Financials | | Indonesia | | | 2.7% | |
| CSPC Pharmaceutical Group, Ltd. | | Health Care | | China/Hong Kong | | | 2.5% | |
| Parkway Life REIT | | Financials | | Singapore | | | 2.4% | |
| Puregold Price Club, Inc. | | Consumer Staples | | Philippines | | | 2.4% | |
| JD.com, Inc. | | Consumer Discretionary | | China/Hong Kong | | | 2.4% | |
| % OF ASSETS IN TOP TEN | | | | | | | 26.9% | |
| | 6 | Holdings may combine more than one security from same issuer and related depositary receipts. |
Matthews Asia ESG Fund
Portfolio Manager Commentary (unaudited) (continued)
Notable Portfolio Changes:
We added Grameenphone, the leading mobile telecom operator in Bangladesh to the portfolio during the quarter. Grameenphone is a joint venture between Telenor of Norway and the Grameen Foundation of Bangladesh. The firm has the largest market share and is the most profitable operator in the country. The Bangladeshi market is one of the few telecom growth markets left in Asia, with a subscriber penetration of only about 50%. The company has embraced an ESG focus and has excellent initiatives in CO2 emission reduction, rain water harvesting and e-waste recycling, or the recycling of electronic products. The company also has strong supply chain sustainability programs that focus on mitigation of supply chain risk, anti-corruption in the supply chain and health, safety, security and environment (HSSE) training. Grameenphone also has built strong community relations by championing online schooling and telemedicine initiatives, among others.
The Fund exited several small positions during the quarter, including those that had become smaller due to profit taking over a period of time.
Outlook:
The end to volatility is not in sight amid an uncertain impact of “Brexit” on the European Union, a soft macroeconomic environment in China and uncertainty surrounding the future of U.S. Federal Reserve rate hikes. But Asian consumers are increasingly focusing on products and services that have a positive environmental and social impact, while Asian governments and regulators are pushing companies to strive for better environmental and governance standards. Such a push provides an encouraging backdrop in which to pursue ESG-focused investing in Asia.
Market dislocations in Asia often present an opportunity to buy high-quality companies with best-in-class ESG attributes at reasonable prices. Therefore, we continue to remain excited about the prospects of identifying and engaging attractive investment opportunities that make a positive environmental, social and economic impact in Asia amid current volatility.
| | | | |
| | |
| COUNTRY ALLOCATION (%)7 | | | |
| China/Hong Kong | | | 19.2 | |
| India | | | 15.1 | |
| Taiwan | | | 13.0 | |
| Japan | | | 9.1 | |
| South Korea | | | 7.7 | |
| Singapore | | | 4.9 | |
| Philippines | | | 4.7 | |
| Pakistan | | | 3.2 | |
| Thailand | | | 2.7 | |
| Indonesia | | | 2.7 | |
| Luxembourg | | | 2.1 | |
| Sri Lanka | | | 1.8 | |
| Bangladesh | | | 1.8 | |
| Australia | | | 0.7 | |
| Cash and Other Assets, Less Liabilities | | | 11.3 | |
| | | | |
| | |
| SECTOR ALLOCATION (%)8 | | | |
| Health Care | | | 20.1 | |
| Consumer Discretionary | | | 12.8 | |
| Financials | | | 12.6 | |
| Information Technology | | | 11.4 | |
| Industrials | | | 11.1 | |
| Consumer Staples | | | 7.7 | |
| Telecommunication Services | | | 6.7 | |
| Utilities | | | 5.2 | |
| Materials | | | 1.1 | |
| Cash and Other Assets, Less Liabilities | | | 11.3 | |
| | | | |
| | |
| MARKET CAP EXPOSURE (%)8 | | | |
| Mega Cap (over $25B) | | | 12.6 | |
| Large Cap ($10B-$25B) | | | 13.1 | |
| Mid Cap ($3B-10B) | | | 14.5 | |
| Small Cap (under $3B) | | | 48.6 | |
| Cash and Other Assets, Less Liabilities | | | 11.3 | |
| 7 | Not all countries are included in the benchmark index. |
| 8 | Source: FactSet Research Systems. Percentage values in data are rounded to the nearest tenth of one percent; the values may not sum to 100% due to rounding. |
| | | | |
| matthewsasia.com | 800.789.ASIA | | | 49 | |
Matthews Asia ESG Fund
June 30, 2016
Schedule of Investmentsa (unaudited)
COMMON EQUITIES: 88.7%
| | | | | | | | |
| | | Shares | | | Value | |
| CHINA/HONG KONG: 19.2% | |
MTR Corp., Ltd. | | | 49,000 | | | | $248,589 | |
Inner Mongolia Yili Industrial Group Co., Ltd. A Shares | | | 91,200 | | | | 228,476 | |
CSPC Pharmaceutical Group, Ltd. | | | 240,000 | | | | 214,431 | |
JD.com, Inc. ADRb | | | 9,600 | | | | 203,808 | |
AIA Group, Ltd. | | | 31,000 | | | | 186,425 | |
Sino Biopharmaceutical, Ltd. | | | 175,000 | | | | 114,857 | |
Guangdong Investment, Ltd. | | | 70,000 | | | | 106,861 | |
Beijing Urban Construction Design & Development Group Co., Ltd. H Shares | | | 163,000 | | | | 88,731 | |
HKBN, Ltd. | | | 83,500 | | | | 88,070 | |
China Conch Venture Holdings, Ltd. | | | 44,000 | | | | 87,496 | |
Haier Electronics Group Co., Ltd. | | | 50,000 | | | | 76,396 | |
| | | | | | | | |
Total China/Hong Kong | | | | 1,644,140 | |
| | | | | | | | |
| | | | | | | | |
| INDIA: 15.1% | | | | | | | | |
Lupin, Ltd. | | | 11,376 | | | | 260,253 | |
Bharti Infratel, Ltd. | | | 34,237 | | | | 175,433 | |
Ipca Laboratories, Ltd. | | | 23,560 | | | | 171,063 | |
Infosys, Ltd. | | | 9,468 | | | | 164,311 | |
Bata India, Ltd. | | | 18,523 | | | | 150,424 | |
Power Grid Corp. of India, Ltd. | | | 55,328 | | | | 133,961 | |
Bharat Financial Inclusion, Ltd.b | | | 8,274 | | | | 91,130 | |
Sanofi India, Ltd. | | | 1,292 | | | | 85,134 | |
KPIT Technologies, Ltd. | | | 20,027 | | | | 54,868 | |
| | | | | | | | |
Total India | | | | 1,286,577 | |
| | | | | | | | |
| | | | | | | | |
| TAIWAN: 13.0% | | | | | | | | |
Taiwan Semiconductor Manufacturing Co., Ltd. | | | 54,000 | | | | 272,144 | |
Zhen Ding Technology Holding, Ltd. | | | 64,000 | | | | 115,813 | |
Sitronix Technology Corp. | | | 33,000 | | | | 108,182 | |
Phison Electronics Corp. | | | 11,000 | | | | 95,344 | |
CHC Resources Corp. | | | 53,000 | | | | 95,328 | |
KD Holding Corp. | | | 17,000 | | | | 94,590 | |
Merida Industry Co., Ltd. | | | 21,000 | | | | 88,914 | |
Greatek Electronics, Inc. | | | 74,000 | | | | 87,223 | |
Sporton International, Inc. | | | 15,077 | | | | 78,129 | |
Lumax International Corp., Ltd. | | | 53,000 | | | | 76,669 | |
| | | | | | | | |
Total Taiwan | | | | 1,112,336 | |
| | | | | | | | |
| | | | | | | | |
| JAPAN: 9.1% | | | | | | | | |
Tsukui Corp. | | | 9,600 | | | | 170,131 | |
Daikin Industries, Ltd. | | | 1,800 | | | | 151,281 | |
Hoya Corp. | | | 3,300 | | | | 117,863 | |
Nihon Housing Co., Ltd. | | | 3,400 | | | | 108,323 | |
Koito Manufacturing Co., Ltd. | | | 1,800 | | | | 82,880 | |
Nakanishi, Inc. | | | 2,500 | | | | 73,597 | |
Ain Holdings, Inc. | | | 900 | | | | 69,810 | |
| | | | | | | | |
Total Japan | | | | 773,885 | |
| | | | | | | | |
| | | | | | | | |
| | | | | | | | |
| | | Shares | | | Value | |
| SOUTH KOREA: 7.7% | | | | | | | | |
KT Skylife Co., Ltd. | | | 13,593 | | | | $192,171 | |
DGB Financial Group, Inc. | | | 18,126 | | | | 137,256 | |
Hanon Systems | | | 13,187 | | | | 120,687 | |
iMarketKorea, Inc. | | | 11,769 | | | | 119,240 | |
Samjin Pharmaceutical Co., Ltd. | | | 2,976 | | | | 91,883 | |
| | | | | | | | |
Total South Korea | | | | 661,237 | |
| | | | | | | | |
| | | | | | | | |
| SINGAPORE: 4.9% | | | | | | | | |
Parkway Life REIT | | | 115,700 | | | | 208,158 | |
Raffles Medical Group, Ltd. | | | 111,900 | | | | 125,657 | |
Vicom, Ltd. | | | 19,400 | | | | 82,693 | |
| | | | | | | | |
Total Singapore | | | | 416,508 | |
| | | | | | | | |
| | | | | | | | |
| PHILIPPINES: 4.7% | | | | | | | | |
Puregold Price Club, Inc. | | | 227,800 | | | | 204,317 | |
Energy Development Corp. | | | 1,706,700 | | | | 201,432 | |
| | | | | | | | |
Total Philippines | | | | 405,749 | |
| | | | | | | | |
| | | | | | | | |
| PAKISTAN: 3.2% | | | | | | | | |
Abbott Laboratories Pakistan, Ltd. | | | 22,300 | | | | 161,331 | |
Bank Alfalah, Ltd. | | | 470,000 | | | | 114,773 | |
| | | | | | | | |
Total Pakistan | | | | 276,104 | |
| | | | | | | | |
| | | | | | | | |
| THAILAND: 2.7% | | | | | | | | |
Total Access Communication Public Co., Ltd. NVDR | | | 251,200 | | | | 231,188 | |
| | | | | | | | |
Total Thailand | | | | 231,188 | |
| | | | | | | | |
| | | | | | | | |
| INDONESIA: 2.7% | | | | | | | | |
PT Bank Rakyat Indonesia Persero | | | 275,700 | | | | 226,855 | |
| | | | | | | | |
Total Indonesia | | | | 226,855 | |
| | | | | | | | |
| | | | | | | | |
| LUXEMBOURG: 2.1% | | | | | | | | |
L’Occitane International SA | | | 85,750 | | | | 175,639 | |
| | | | | | | | |
Total Luxembourg | | | | 175,639 | |
| | | | | | | | |
| | | | | | | | |
| SRI LANKA: 1.8% | | | | | | | | |
Nestle Lanka PLC | | | 9,551 | | | | 157,380 | |
| | | | | | | | |
Total Sri Lanka | | | | 157,380 | |
| | | | | | | | |
| | | | | | | | |
| BANGLADESH: 1.8% | | | | | | | | |
GrameenPhone, Ltd. | | | 25,041 | | | | 81,377 | |
Square Pharmaceuticals, Ltd. | | | 20,853 | | | | 70,751 | |
| | | | | | | | |
Total Bangladesh | | | | 152,128 | |
| | | | | | | | |
| | | | | | | | |
| AUSTRALIA: 0.7% | | | | | | | | |
Ansell, Ltd. | | | 4,505 | | | | 61,656 | |
| | | | | | | | |
Total Australia | | | | 61,656 | |
| | | | | | | | |
| | | | | | | | |
| TOTAL INVESTMENTS: 88.7% | | | | | | | 7,581,382 | |
(Cost $7,576,334c) | | | | | | | | |
| | | | | | | | |
Matthews Asia ESG Fund
June 30, 2016
Schedule of Investmentsa (unaudited) (continued)
COMMON EQUITIES (continued)
| | | | | | | | |
| | | | | | Value | |
CASH AND OTHER ASSETS,
LESS LIABILITIES: 11.3% | | | | | | | $962,411 | |
| | | | | | | | |
| |
NET ASSETS: 100.0% | | | | $8,543,793 | |
| | | | | | | | |
| a | Certain securities were fair valued under the valuation polices approved by the Board of Trustees (Note 2-A). |
| b | Non-income producing security. |
| c | Cost for federal income tax purposes is $7,590,946 and net unrealized depreciation consists of: |
| | | | |
Gross unrealized appreciation | | | $614,975 | |
Gross unrealized depreciation | | | (624,539 | ) |
| | | | |
Net unrealized depreciation | | | ($9,564 | ) |
| | | | |
| ADR | American Depositary Receipt |
| NVDR | Non-voting Depositary Receipt |
| REIT | Real Estate Investment Trust |
See accompanying notes to financial statements.
| | | | |
| matthewsasia.com | 800.789.ASIA | | | 51 | |
| | | | |
| PORTFOLIO MANAGERS* |
| Taizo Ishida | | Robert Harvey, CFA |
Lead Manager | | Lead Manager |
|
* Effective April 29, 2016 Robert Harvey became a Lead Manager of this Fund. |
|
| FUND FACTS |
| | | Investor | | Institutional |
Ticker | | MEASX | | MIASX |
CUSIP | | 577125883 | | 577125875 |
Inception | | 4/30/13 | | 4/30/13 |
NAV | | $12.47 | | $12.51 |
Initial Investment | | $2,500 | | $3 million |
Gross Expense Ratio1 | | 1.75% | | 1.57% |
After Fee Waiver and Reimbursement2 | | 1.50% | | 1.25% |
Portfolio Statistics |
Total # of Positions | | 61 |
Net Assets | | $151.5 million |
Weighted Average Market Cap | | $1.7 billion |
Portfolio Turnover3 | | 12.14% |
Benchmark |
MSCI Emerging Markets Asia Index |
Redemption Fee |
2% within first 90 calendar days of purchase |
OBJECTIVE
Long term capital appreciation.
STRATEGY
Under normal market conditions, the Fund seeks to achieve its investment objective by investing at least 80% of its total assets, which include borrowings for investment purposes, in the common and preferred stocks of companies located in Asia excluding Japan, South Korea, Hong Kong and Singapore. The Fund may also invest in the convertible securities, of any duration or quality of companies located in Asia excluding Japan, South Korea, Hong Kong and Singapore. Once fully invested and under normal market conditions, the Fund is expected to invest a substantial portion of its net assets in the emerging countries and markets in the Asian region, including, but not limited to, Bangladesh, Cambodia, China (including Taiwan, but excluding Hong Kong), India, Indonesia, Laos, Malaysia, Mongolia, Myanmar, Pakistan, Papua New Guinea, Philippines, Sri Lanka, Thailand, and Vietnam.
Matthews Emerging Asia Fund
Portfolio Manager Commentary (unaudited)
For the first half of 2016, the Matthews Emerging Asia Fund returned 10.65% (Investor Class) and 10.81% (Institutional Class) while its benchmark, the MSCI Emerging Markets Asia Index, returned 2.42%. For the quarter ending June 30, the Fund returned 11.04% (Investor Class) and 11.10% (Institutional Class) while its benchmark returned 0.44%.
Market Environment:
Equity markets continued to focus on the challenges weighing on global economic growth in the second quarter. Markets also digested the British decision to exit the European Union, initially falling sharply but both emerging and developed markets recovered relatively quickly afterwards. Asian and global emerging market indices spent most of the quarter in negative territory but rose to close the quarter marginally positive. Commodity prices broadly rose during the period—a mixed blessing for Asian emerging markets—but we have seen weakness, especially in the energy sector, which is mostly positive for our economies post quarter.
Performance Contributors and Detractors:
The top markets that contributed to Fund performance in the second quarter were Vietnam, Pakistan and Bangladesh. Vietnam was the largest contributor to performance, driven by Phu Nhuan Jewelry, Vinh Hoan and Mobile World Investment. Investor sentiment toward Vietnam has continued to improve as prospects for strong GDP growth remain intact. The Searle Company in Pakistan was again a strong contributor to Fund performance on expectations of strong earnings growth, as well as new interest in the market following the MSCI’s announcement to reclassify the MSCI Pakistan Index from frontier to emerging markets at next year’s rebalancing.
Among the largest detractors of performance were National Foods of Pakistan, China’s Shenzhou International Group and Expolanka Holdings of Sri Lanka. National Foods declined as the company had become a bit expensive and corrected off this high base. Shenzhou International and Expolanka suffered on expectations of weaker global trade post the Brexit vote. We remain positive because we are long-term investors and the opportunity has not changed for these companies.
Please note we continue to focus our attention on a bottom-up, fundamental approach, building the portfolio one company at a time in Asia’s smaller but more rapidly developing economies with minimal regard for the backward-looking index.
Notable Portfolio Changes:
In the first quarter, we increased our portfolio weighting in Vietnam, and this change helped contribute to the solid performance in the second quarter. We did not make a material change in the portfolio in the second quarter, but sold out of Universal Robina as valuations were a bit rich. We also sold our residual holdings in CIMC Enric Holdings following disappointing earnings and a shift in its focus on bigger project-based contracts. We also sold our small position in Multi Commodity Exchange of India, as the company faces higher competition and disappointing execution to date. Most recently, we added to some of our weaker performing portfolio names as valuations became more attractive.
(continued)
| 1 | Prospectus expense ratios. |
| 2 | Matthews has contractually agreed (i) to waive fees and reimburse expenses to the extent needed to limit Total Annual Fund Operating Expenses (excluding Rule 12b-1 fees, taxes, interest, brokerage commissions, short sale dividend expenses, expenses incurred in connection with any merger or reorganization or extraordinary expenses such as litigation) of the Institutional Class to 1.25% first by waiving class specific expenses (i.e., shareholder service fees specific to a particular class) of the Institutional Class and then, to the extent necessary, by waiving non-class specific expenses of the Institutional Class, and (ii) if any Fund-wide expenses (i.e., expenses that apply to both the Institutional Class and the Investor Class) are waived for the Institutional Class to maintain the 1.25% expense limitation, to waive an equal amount (in annual percentage terms) of those same expenses for the Investor Class. The Total Annual Fund Operating Expenses After Fee Waiver and Expense Reimbursement for the Investor Class may vary from year to year and will in some years exceed 1.25%. If the operating expenses fall below the expense limitation in a year within three years after Matthews has made a waiver or reimbursement, the Fund may reimburse Matthews up to an amount that does not cause the expenses for that year to exceed the lesser of (i) the expense limitation applicable at the time of that fee waiver and/or expense reimbursement or (ii) the expense limitation in effect at the time of recoupment. This agreement will remain in place until April 30, 2017 and may be terminated at any time by the Board of Trustees on behalf of the Fund on 60 days’ written notice to Matthews. |
| 3 | The lesser of fiscal year 2015 long-term purchase costs or sales proceeds divided by the average monthly market value of long-term securities. |
| | | | | | | | | | | | | | | | | | | | | | | | |
| |
| PERFORMANCE AS OF JUNE 30, 2016 | |
| | | | | | | | | | | | Average Annual Total
Returns | | | | |
| | | 3 Months | | | YTD | | | 1 Year | | | 3 Years | | | Since Inception | | | Inception Date | |
| Investor Class (MEASX) | | | 11.04% | | | | 10.65% | | | | 8.10% | | | | 10.04% | | | | 7.51% | | | | 4/30/13 | |
| Institutional Class (MIASX) | | | 11.10% | | | | 10.81% | | | | 8.32% | | | | 10.30% | | | | 7.75% | | | | 4/30/13 | |
| MSCI Emerging Markets Asia Index4 | | | 0.44% | | | | 2.42% | | | | -11.88% | | | | 2.19% | | | | -0.10% | | | | | |
| Lipper Emerging Markets Funds Category Average5 | | | 2.11% | | | | 6.24% | | | | -10.14% | | | | -1.62% | | | | -4.22% | | | | | |
Performance assumes reinvestment of all dividends and/or distributions before taxes. All performance quoted represents past performance and is no guarantee of future results. Investment return and principal value will fluctuate with market conditions so that when redeemed, shares may be worth more or less than their original cost. Current performance may be lower or higher than the return figures quoted. Returns would have been lower if certain of the Fund’s fees and expenses had not been waived. For the Fund’s most recent month-end performance visit matthewsasia.com.
GROWTH OF A $10,000 INVESTMENT SINCE INCEPTION—INVESTOR CLASS
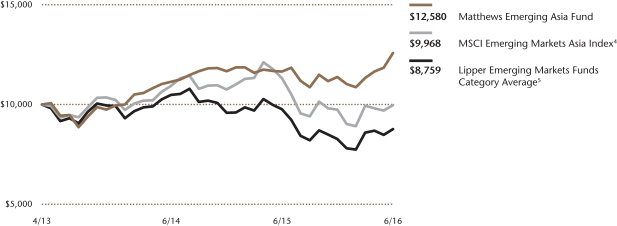
Plotted monthly. The performance data does not reflect the deduction of taxes that a shareholder would pay on dividends, capital gain distributions or redemption of Fund shares. Values are in US$.
| | 4 | It is not possible to invest directly in an index. Source: Index data from Morgan Stanley Capital International and Bloomberg; total return calculations performed by BNY Mellon Investment Servicing (US) Inc. Please see page 91 for index definition. |
| | 5 | The Lipper Category Average does not reflect sales charges and is based on total return, including reinvestment of dividends and capital gains for the stated periods. |
| | | | | | | | |
| | | | |
| TOP TEN HOLDINGS6 | | | | | | | |
| | | Sector | | Country | | % of Net Assets | |
| Phu Nhuan Jewelry JSC | | Consumer Discretionary | | Vietnam | | | 4.0% | |
| Vinh Hoan Corp. | | Consumer Staples | | Vietnam | | | 3.3% | |
| The Searle Company, Ltd. | | Health Care | | Pakistan | | | 3.3% | |
| BRAC Bank, Ltd. | | Financials | | Bangladesh | | | 3.1% | |
| Tien Phong Plastic JSC | | Industrials | | Vietnam | | | 3.0% | |
| National Seed JSC | | Consumer Staples | | Vietnam | | | 2.9% | |
| British American Tobacco Bangladesh Co., Ltd. | | Consumer Staples | | Bangladesh | | | 2.7% | |
| Sampath Bank PLC | | Financials | | Sri Lanka | | | 2.5% | |
| PT Gudang Garam | | Consumer Staples | | Indonesia | | | 2.5% | |
| Puregold Price Club, Inc. | | Consumer Staples | | Philippines | | | 2.4% | |
| % OF ASSETS IN TOP TEN | | | | | | | 29.7% | |
| | 6 | Holdings may combine more than one security from same issuer and related depositary receipts. |
| | | | |
| matthewsasia.com | 800.789.ASIA | | | 53 | |
| | | | |
| |
| COUNTRY ALLOCATION (%)7,8 | |
| Vietnam | | | 20.7 | |
| Pakistan | | | 18.7 | |
| Bangladesh | | | 14.3 | |
| India | | | 10.2 | |
| Indonesia | | | 8.6 | |
| Sri Lanka | | | 7.3 | |
| China/Hong Kong | | | 5.7 | |
| Philippines | | | 4.1 | |
| Singapore | | | 1.5 | |
| Thailand | | | 1.1 | |
| Australia | | | 0.8 | |
| Cash and Other Assets, Less Liabilities | | | 7.0 | |
| | | | |
| |
| SECTOR ALLOCATION (%)8 | |
| Consumer Staples | | | 24.7 | |
| Financials | | | 18.0 | |
| Consumer Discretionary | | | 17.8 | |
| Health Care | | | 12.3 | |
| Industrials | | | 9.1 | |
| Materials | | | 4.9 | |
| Energy | | | 2.9 | |
| Utilities | | | 2.3 | |
| Information Technology | | | 1.0 | |
| Cash and Other Assets, Less Liabilities | | | 7.0 | |
| | | | |
| |
| MARKET CAP EXPOSURE (%)8 | |
| Mega Cap (over $25B) | | | 0.0 | |
| Large Cap ($10B–$25B) | | | 3.3 | |
| Mid Cap ($3B–10B) | | | 8.4 | |
| Small Cap (under $3B) | | | 81.3 | |
| Cash and Other Assets, Less Liabilities | | | 7.0 | |
| 7 | Not all countries where the Fund may invest are included in the benchmark index. |
| 8 | Source: FactSet Research Systems. Percentage values in data are rounded to the nearest tenth of one percent; the values may not sum to 100% due to rounding. |
Matthews Emerging Asia Fund
Portfolio Manager Commentary (unaudited) (continued)
Outlook:
In the shorter term, the outlook is always clouded by the changeable sentiment of international investors. In the medium term, high debt levels globally remain a concern and a headwind to growth. We are also concerned about the potential impact of ongoing tensions in the Middle East on oil prices. A prolonged disruption to oil supply could lead to a sharp and sustained recovery in oil prices, which would negatively impact emerging Asian economies.
Looking ahead, political noise in the emerging and frontier Asian region has mostly subsided which, we believe, creates a foundation conducive for stability and growth. Foreign direct investments may continue to shift toward ASEAN and frontier countries, create new manufacturing jobs, receive growing remittance flows and grow their share of global exports off a low base. We believe these factors combined should help ensure a relatively bright future for patient investors.
Matthews Emerging Asia Fund
June 30, 2016
Schedule of Investmentsa (unaudited)
COMMON EQUITIES: 93.0%
| | | | | | | | |
| | | Shares | | | Value | |
| VIETNAM: 20.7% | | | | | | | | |
Phu Nhuan Jewelry JSC | | | 1,734,543 | | | | $5,988,155 | |
Vinh Hoan Corp. | | | 2,486,550 | | | | 5,068,322 | |
Tien Phong Plastic JSC | | | 1,551,020 | | | | 4,575,732 | |
National Seed JSC† | | | 979,585 | | | | 4,391,970 | |
Mobile World Investment Corp. | | | 510,227 | | | | 2,819,976 | |
Lix Detergent JSC | | | 592,870 | | | | 2,504,853 | |
DHG Pharmaceutical JSC | | | 436,320 | | | | 2,014,928 | |
Dinh Vu Port Investment & Development JSC | | | 517,550 | | | | 1,764,383 | |
Nam Long Investment Corp. | | | 1,386,590 | | | | 1,398,588 | |
Saigon Securities, Inc.b | | | 820,828 | | | | 767,970 | |
| | | | | | | | |
Total Vietnam | | | | | | | 31,294,877 | |
| | | | | | | | |
| | | | | | | | |
| PAKISTAN: 18.7% | | | | | | | | |
The Searle Company, Ltd. | | | 984,068 | | | | 5,056,003 | |
K-Electric, Ltd.b | | | 44,917,000 | | | | 3,462,599 | |
Pakistan Petroleum, Ltd. | | | 2,127,300 | | | | 3,161,707 | |
Shifa International Hospitals, Ltd. | | | 970,351 | | | | 2,791,689 | |
PAK Suzuki Motor Co., Ltd. | | | 727,400 | | | | 2,658,209 | |
Habib Bank, Ltd. | | | 1,370,900 | | | | 2,590,958 | |
Abbott Laboratories Pakistan, Ltd. | | | 282,750 | | | | 2,045,574 | |
ICI Pakistan, Ltd. | | | 451,900 | | | | 1,920,586 | |
GlaxoSmithKline Pakistan, Ltd. | | | 910,940 | | | | 1,806,037 | |
Hum Network, Ltd. | | | 13,501,000 | | | | 1,325,473 | |
National Foods, Ltd. | | | 429,700 | | | | 1,153,795 | |
GlaxoSmithKline Consumer Healthcare Pakistan, Ltd.c | | | 273,282 | | | | 272,577 | |
| | | | | | | | |
Total Pakistan | | | | | | | 28,245,207 | |
| | | | | | | | |
| | | | | | | | |
| BANGLADESH: 14.3% | | | | | | | | |
BRAC Bank, Ltd. | | | 6,956,565 | | | | 4,715,728 | |
British American Tobacco Bangladesh Co., Ltd. | | | 116,199 | | | | 4,017,606 | |
Square Pharmaceuticals, Ltd. | | | 1,021,126 | | | | 3,464,554 | |
Olympic Industries, Ltd. | | | 626,747 | | | | 2,761,285 | |
Marico Bangladesh, Ltd. | | | 158,867 | | | | 2,594,372 | |
United Commercial Bank, Ltd. | | | 9,499,996 | | | | 2,034,754 | |
Berger Paints Bangladesh, Ltd. | | | 69,450 | | | | 1,978,884 | |
| | | | | | | | |
Total Bangladesh | | | | | | | 21,567,183 | |
| | | | | | | | |
| | | | | | | | |
| INDIA: 10.2% | | | | | | | | |
PC Jeweller, Ltd. | | | 624,806 | | | | 3,584,598 | |
Supreme Industries, Ltd. | | | 178,934 | | | | 2,426,033 | |
Praj Industries, Ltd. | | | 1,679,488 | | | | 2,361,525 | |
Info Edge India, Ltd. | | | 124,174 | | | | 1,523,941 | |
Shriram Transport Finance Co., Ltd. | | | 83,544 | | | | 1,493,956 | |
VST Industries, Ltd. | | | 49,694 | | | | 1,254,678 | |
Cipla India, Ltd. | | | 153,551 | | | | 1,142,867 | |
Shalimar Paints, Ltd.b | | | 525,830 | | | | 1,053,332 | |
Balkrishna Industries, Ltd. | | | 63,807 | | | | 626,915 | |
| | | | | | | | |
Total India | | | | | | | 15,467,845 | |
| | | | | | | | |
| | | | | | | | |
| INDONESIA: 8.6% | | | | | | | | |
PT Gudang Garam | | | 712,800 | | | | 3,729,502 | |
PT Matahari Department Store | | | 1,933,600 | | | | 2,947,017 | |
PT Mayora Indah | | | 872,800 | | | | 2,572,985 | |
PT Bank Mandiri Persero | | | 1,819,200 | | | | 1,316,473 | |
PT Sumber Alfaria Trijaya | | | 28,307,700 | | | | 1,290,606 | |
PT Indofood CBP Sukses Makmur | | | 895,800 | | | | 1,177,628 | |
| | | | | | | | |
Total Indonesia | | | | 13,034,211 | |
| | | | | | | | |
| | | | | | | | |
| | | Shares | | | Value | |
| SRI LANKA: 7.3% | | | | | | | | |
Sampath Bank PLC | | | 2,457,411 | | | | $3,853,376 | |
National Development Bank PLC | | | 3,085,185 | | | | 3,587,478 | |
Expolanka Holdings PLC | | | 38,766,072 | | | | 1,734,995 | |
Hemas Holdings PLC | | | 2,203,512 | | | | 1,307,429 | |
Ceylinco Insurance Co. PLC | | | 31,393 | | | | 310,244 | |
Lanka Orix Leasing Co. PLCb | | | 573,466 | | | | 307,998 | |
| | | | | | | | |
Total Sri Lanka | | | | 11,101,520 | |
| | | | | | | | |
| | | | | | | | |
| CHINA/HONG KONG: 5.7% | |
Shenzhou International Group Holdings, Ltd. | | | 701,000 | | | | 3,389,802 | |
Luk Fook Holdings International, Ltd. | | | 1,113,000 | | | | 2,460,350 | |
Future Bright Holdings, Ltd. | | | 12,924,000 | | | | 1,238,661 | |
Red Star Macalline Group Corp., Ltd. H Shares | | | 1,131,400 | | | | 1,233,241 | |
The 13 Holdings, Ltd.b | | | 840,000 | | | | 293,902 | |
| | | | | | | | |
Total China/Hong Kong | | | | 8,615,956 | |
| | | | | | | | |
| | | | | | | | |
| PHILIPPINES: 4.1% | |
Puregold Price Club, Inc. | | | 4,072,300 | | | | 3,652,505 | |
Vista Land & Lifescapes, Inc. | | | 12,519,100 | | | | 1,429,086 | |
Emperador, Inc. | | | 7,631,300 | | | | 1,173,875 | |
| | | | | | | | |
Total Philippines | | | | 6,255,466 | |
| | | | | | | | |
| | | | | | | | |
| SINGAPORE: 1.5% | |
Yoma Strategic Holdings, Ltd.b | | | 5,491,766 | | | | 2,304,353 | |
| | | | | | | | |
Total Singapore | | | | 2,304,353 | |
| | | | | | | | |
| | | | | | | | |
| THAILAND: 1.1% | |
SNC Former Public Co., Ltd. | | | 4,002,800 | | | | 1,713,439 | |
| | | | | | | | |
Total Thailand | | | | 1,713,439 | |
| | | | | | | | |
| | | | | | | | |
| AUSTRALIA: 0.8% | |
Oil Search, Ltd. | | | 250,662 | | | | 1,265,736 | |
| | | | | | | | |
Total Australia | | | | 1,265,736 | |
| | | | | | | | |
| | | | | | | | |
| TOTAL INVESTMENTS: 93.0% | | | | | | | 140,865,793 | |
(Cost $126,732,477d) | |
| | | | | | | | |
CASH AND OTHER ASSETS,
LESS LIABILITIES: 7.0% | | | | 10,593,537 | |
| | | | | | | | |
| |
NET ASSETS: 100.0% | | | | $151,459,330 | |
| | | | | | | | |
| a | Certain securities were fair valued under the valuation polices approved by the Board of Trustees (Note 2-A). |
| b | Non-income producing security. |
| c | Illiquid security, trading was halted at June 30, 2016. |
| d | Cost for federal income tax purposes is $126,732,477 and net unrealized appreciation consists of: |
| | | | |
Gross unrealized appreciation | | | $26,202,311 | |
Gross unrealized depreciation | | | (12,068,995 | ) |
| | | | |
Net unrealized appreciation | | | $14,133,316 | |
| | | | |
| † | Affiliated Issuer, as defined under the Investment Company Act of 1940 (ownership of 5% or more of the outstanding voting securities of this issuer) |
See accompanying notes to financial statements.
| | | | |
| matthewsasia.com | 800.789.ASIA | | | 55 | |
| | | | |
| PORTFOLIO MANAGERS* |
| Michael J. Oh, CFA | | | | |
Lead Manager | | | | |
| Lydia So, CFA | | Robert Harvey, CFA |
Co-Manager | | Co-Manager |
|
* Effective April 29, 2016 Robert Harvey became a Co-Manager of this Fund. |
| | |
| FUND FACTS | | | | |
| | | Investor | | Institutional |
Ticker | | MATFX | | MITEX |
CUSIP | | 577130883 | | 577125859 |
Inception | | 12/27/99 | | 4/30/13 |
NAV | | $11.73 | | $11.76 |
Initial Investment | | $2,500 | | $3 million |
Gross Expense Ratio1 | | 1.18% | | 0.97% |
Portfolio Statistics | | | | |
Total # of Positions | | 48 |
Net Assets | | $145.5 million |
Weighted Average Market Cap | | $37.3 billion |
Portfolio Turnover2 | | 72.85% |
Benchmark | | | | |
MSCI AC Asia ex Japan Index‡ |
MSCI AC Asia Index |
OBJECTIVE
Long-term capital appreciation.
STRATEGY
Under normal market conditions, the Fund seeks to achieve its investment objective by investing at least 80% of its net assets, which include borrowings for investment purposes, in the common and preferred stocks of companies located in Asia that Matthews believes are innovators in their products, services, processes, business models, management, use of technology, or approach to creating, expanding or servicing their markets. Asia consists of all countries and markets in Asia, including developed, emerging, and frontier countries and markets in the Asian region.
Matthews Asia Innovators Fund†
Portfolio Manager Commentary (unaudited)
For the first half of 2016, the Matthews Asia Innovators Fund returned –4.79% (Investor Class) and –4.70%, (Institutional Class), underperforming its primary benchmark, the MSCI All Country Asia ex Japan Index, which returned 2.32%, and its secondary benchmark, the MSCI All Country Asia Index, which returned –1.41%. For the quarter ending June 30, the Fund returned 1.73% (Investor Class) and 1.82% (Institutional Class), while its benchmarks returned 0.51% and 0.78%, respectively.
Market Environment:
The overall market continued to recover from global macroeconomic uncertainties as most markets showed positive returns with the exception of China’s mainland markets. Sentiment toward China remained weak during the first half of the year as most economic data continued to point toward a slowing economy. Southeast Asian markets, in particular, showed decent performance during the first half of the year. The unexpected result from Britain’s referendum to leave the European Union caused volatility during the second quarter, but most Asian markets remained relatively calm. We expect further volatility in the global economy to result from the uncertainty caused by Brexit. However, we believe that Asia’s domestically oriented companies have been relatively unscathed, with the exception of some exporters who may experience more volatility.
As of April 29, 2016, the Fund expanded its investable universe to apply the same investment strategy and philosophy across all sectors and industries in Asia, while retaining a 25% concentration in industries such as Internet, technology and health care. The investment team believes that this change can provide better diversification and enable shareholders to participate in a broader set of innovative companies that stand to benefit from rising disposable income and changing lifestyles in Asia. The focus of the Fund remains on the innovative firms that are rising and cross-pollinating across many industries in the region.
Performance Contributors and Detractors:
LG Household and Health Care was the best-performing company during the first half of the year. The company has been benefiting from the rising popularity of Korean cosmetics in overseas markets, primarily China. The company has built a solid cosmetics brand portfolio and its other personal health care products are also well-positioned to benefit as consumers in Asia continue to trade up to higher quality brands.
By country, Indonesia was the biggest contributor to Fund performance during the first six months of the year while China was the biggest detractor. Indonesia’s Media Nusantara Citra, one of Indonesia’s biggest media companies, and Telekomunikasi Indonesia Persero also performed well as both companies are well-positioned to benefit from consumption growth in Indonesia.
Chinese Internet companies in general underperformed during the first half of the year and were the main detractors of Fund performance. The concern over a slowing Chinese economy is also spilling over to China’s Internet industry. The sector performed very well over the last three years and contributed significantly to Fund performance despite a slowing Chinese economy. However, we expect the overall growth rate to moderate going forward as smartphone penetration in major cities has mostly peaked. As a result, we reduced our exposure to Chinese Internet companies and mostly reallocated capital to Southeast Asia.
| † | The Fund’s name changed from Matthews Asia Science and Technology Fund to Matthews Asia Innovators Fund on April 29, 2016. |
(continued)
| ‡ | Effective on April 29, 2016, the Matthews Asia Innovators Fund changed its primary benchmark to the Matthews AC Asia Ex Japan Index and its secondary index became the MSCI AC Asia Index. |
| 1 | Prospectus expense ratios. |
| 2 | The lesser of fiscal year 2015 long-term purchase costs or sales proceeds divided by the average monthly market value of long-term securities. |
| | | | | | | | | | | | | | | | | | | | | | | | | | | | | | | | |
| |
| PERFORMANCE AS OF JUNE 30, 2016 | |
| | | | | | | | | | | | Average Annual Total Returns | | | | |
| | | 3 Months | | | YTD | | | 1 Year | | | 3 Years | | | 5 Years | | | 10 Years | | | Since Inception | | | Inception Date | |
| Investor Class (MATFX) | | | 1.73% | | | | -4.79% | | | | -8.52% | | | | 11.37% | | | | 6.80% | | | | 7.61% | | | | 2.30% | | | | 12/27/1999 | |
| Institutional Class (MITEX) | | | 1.82% | | | | -4.70% | | | | -8.37% | | | | 11.56% | | | | n.a. | | | | n.a. | | | | 10.33% | | | | 4/30/2013 | |
| MSCI AC Asia ex Japan Index3 | | | 0.51% | | | | 2.32% | | | | -11.72% | | | | 2.36% | | | | 0.34% | | | | 5.92% | | | | 5.26% | 4 | | | | |
| MSCI AC Asia Index3 | | | 0.78% | | | | -1.41% | | | | -10.16% | | | | 2.69% | | | | 2.25% | | | | 2.43% | | | | 1.61% | 4 | | | | |
| Lipper Pacific ex Japan Funds Category Average5 | | | 1.49% | | | | 2.44% | | | | -7.73% | | | | 2.81% | | | | 0.84% | | | | 5.79% | | | | 6.02% | 4 | | | | |
Performance assumes reinvestment of all dividends and/or distributions before taxes. All performance quoted represents past performance and is no guarantee of future results. Investment return and principal value will fluctuate with market conditions so that when redeemed, shares may be worth more or less than their original cost. Current performance may be lower or higher than the return figures quoted. For the Fund’s most recent month-end performance, visit matthewsasia.com.
GROWTH OF A $10,000 INVESTMENT SINCE INCEPTION—INVESTOR CLASS
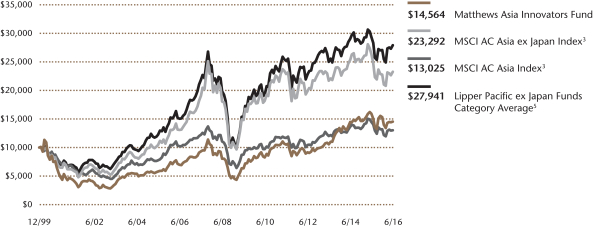
Plotted monthly. The performance data and graph do not reflect the deduction of taxes that a shareholder would pay on dividends, capital gains distributions or redemption of Fund shares. Values are in US$.
| | 3 | It is not possible to invest directly in an index. Source: Index data from Morgan Stanley Capital International and Bloomberg; total return calculations performed by BNY Mellon Investment Servicing (US) Inc. Please see page 91 for index definition. Effective on April 29, 2016, the Matthews Asia Innovators Fund changed its primary benchmark to the Matthews AC Asia Ex Japan Index and its secondary index became the MSCI AC Asia Index. |
| | 4 | Calculated from 12/31/99. |
| | 5 | The Lipper Category Average does not reflect sales charges and is based on total return, including reinvestment of dividends and capital gains for the stated periods. |
| | | | | | | | |
| | | | |
| TOP TEN HOLDINGS6 | | | | | | | |
| | | Sector | | Country | | % of Net Assets | |
| LG Household & Health Care, Ltd., Pfd. | | Consumer Staples | | South Korea | | | 4.4% | |
| Samsung Electronics Co., Ltd., Pfd. | | Information Technology | | South Korea | | | 4.1% | |
| Ctrip.com International, Ltd. | | Consumer Discretionary | | China/Hong Kong | | | 4.0% | |
| Tencent Holdings, Ltd. | | Information Technology | | China/Hong Kong | | | 3.6% | |
| Info Edge India, Ltd. | | Information Technology | | India | | | 3.0% | |
| Baidu, Inc. | | Information Technology | | China/Hong Kong | | | 2.9% | |
| Singapore Telecommunications, Ltd. | | Telecommunication Services | | Singapore | | | 2.9% | |
| JD.com, Inc. | | Consumer Discretionary | | China/Hong Kong | | | 2.8% | |
| China Mobile, Ltd. | | Telecommunication Services | | China/Hong Kong | | | 2.6% | |
| Naver Corp. | | Information Technology | | South Korea | | | 2.6% | |
| % OF ASSETS IN TOP TEN | | | | | | | 32.9% | |
| | 6 | Holdings may combine more than one security from same issuer and related depositary receipts. |
| | | | |
| matthewsasia.com | 800.789.ASIA | | | 57 | |
| | | | |
| | |
| COUNTRY ALLOCATION (%)7,8 | | | |
| China/Hong Kong | | | 30.0 | |
| South Korea | | | 25.1 | |
| Taiwan | | | 9.4 | |
| India | | | 9.3 | |
| Indonesia | | | 8.6 | |
| Singapore | | | 5.7 | |
| Thailand | | | 3.6 | |
| United States | | | 1.8 | |
| Vietnam | | | 1.4 | |
| Philippines | | | 1.4 | |
| Cash and Other Assets, Less Liabilities | | | 3.7 | |
| | | | |
| | |
| SECTOR ALLOCATION (%)8 | | | |
| Information Technology | | | 29.7 | |
| Consumer Discretionary | | | 18.0 | |
| Health Care | | | 13.4 | |
| Consumer Staples | | | 11.6 | |
| Telecommunication Services | | | 10.6 | |
| Financials | | | 8.4 | |
| Industrials | | | 2.6 | |
| Materials | | | 2.0 | |
| Cash and Other Assets, Less Liabilities | | | 3.7 | |
| | | | |
| | |
| MARKET CAP EXPOSURE (%)8 | | | |
| Mega Cap (over $25B) | | | 27.4 | |
| Large Cap ($10B-$25B) | | | 25.1 | |
| Mid Cap ($3B-10B) | | | 9.9 | |
| Small Cap (under $3B) | | | 33.9 | |
| Cash and Other Assets, Less Liabilities | | | 3.7 | |
| 7 | Not all countries are included in the benchmark index(es). |
| 8 | Source: FactSet Research Systems. Percentage values in data are rounded to the nearest tenth of one percent; the values may not sum to 100% due to rounding. |
Matthews Asia Innovators Fund
Portfolio Manager Commentary (unaudited) (continued)
iMarketKorea was another detractor to Fund performance during the first half of the year. iMarketKorea provides procurement services for office and health care products of companies based in Korea. Uncertainty surrounding iMarketKorea’s biggest clients, with contracts expiring soon, caused the stock to fall. We exited this holding during the second quarter.
Notable Portfolio Changes:
During the second quarter, we reduced our weighting in Baidu significantly. Its stock has performed very well for us since we first invested in the company during its initial public offering in 2005 and has been a top contributor to Fund performance on a three-year and five-year basis. Baidu has become China’s dominant search engine, and has continued to lead the search industry in both the PC and newer mobile spaces. However, the company is increasingly facing regulatory pressure from the government and has missed some new emerging opportunities in the online-to-offline space compared with other leading Internet companies in China. Nevertheless, Baidu remains a core holding in the portfolio given its attractive valuation level. We believe its dominance in the search industry is still likely to be sustained.
The Fund added to its financials sector holdings, particularly within Southeast Asian firms that have done well to adopt mobile and Internet banking applications. We expect more financial services to move online and companies that can adapt to mobile and Internet banking space are more likely to gain market share.
Outlook:
As the Asian region has continued to grow and develop significantly, we have come to see innovation in businesses outside of the traditional science and technology industries. Over time, the portfolio’s composition has, in some respects, come to reflect this change, with companies generating revenue from innovative services and products beyond the science and technology sectors represented in the portfolio. This led us to change the name of the Matthews Asia Science and Technology Fund to the Matthews Asia Innovators Fund. We will continue to seek companies that, we believe, demonstrate an innovative approach to their businesses while still focusing on the Internet, technology and health care sectors. This can be in the types of products or services they provide or in the way a business is managed or the technology used. Within that framework, we will try to identify companies with sustainable competitive advantages, capable and committed management and strong financials that stand to benefit from rising disposable income in Asia.
We believe that the region may continue to experience volatility following the Brexit vote. However, domestically oriented companies in Asia should be more immune to global macro uncertainties, and we will continue to emphasize the various consumer services industries in which we are seeing the most innovative companies advance.
Matthews Asia Innovators Fund
June 30, 2016
Schedule of Investmentsa (unaudited)
COMMON EQUITIES: 85.8%
| | | | | | | | |
| | | Shares | | | Value | |
| CHINA/HONG KONG: 30.0% | |
Ctrip.com International, Ltd. ADRb | | | 141,900 | | | | $5,846,280 | |
Tencent Holdings, Ltd. | | | 230,700 | | | | 5,292,183 | |
Baidu, Inc. ADRb | | | 25,900 | | | | 4,277,385 | |
JD.com, Inc. ADRb | | | 193,800 | | | | 4,114,374 | |
China Mobile, Ltd. | | | 332,500 | | | | 3,841,777 | |
NetEase, Inc. ADR | | | 18,400 | | | | 3,555,248 | |
China Biologic Products, Inc.b | | | 26,300 | | | | 2,796,216 | |
PICC Property & Casualty Co., Ltd. H Shares | | | 1,770,000 | | | | 2,790,660 | |
CITIC Telecom International Holdings, Ltd. | | | 6,390,000 | | | | 2,416,063 | |
CSPC Pharmaceutical Group, Ltd. | | | 2,682,000 | | | | 2,396,269 | |
Shandong Weigao Group Medical Polymer Co., Ltd. H Shares | | | 3,760,000 | | | | 2,154,553 | |
Jiangsu Hengrui Medicine Co., Ltd. A Shares | | | 341,145 | | | | 2,060,752 | |
Zhaopin, Ltd. ADRb | | | 141,763 | | | | 2,059,816 | |
| | | | | | | | |
Total China/Hong Kong | | | | | | | 43,601,576 | |
| | | | | | | | |
| | | | | | | | |
| SOUTH KOREA: 14.6% | |
Naver Corp. | | | 6,135 | | | | 3,800,731 | |
BGF Retail Co., Ltd. | | | 17,072 | | | | 3,178,716 | |
Hana Tour Service, Inc. | | | 42,361 | | | | 3,090,775 | |
Hugel, Inc.b | | | 9,915 | | | | 2,750,337 | |
Kiwoom Securities Co., Ltd. | | | 37,987 | | | | 2,377,119 | |
Samsung Fire & Marine Insurance Co., Ltd. | | | 10,231 | | | | 2,349,856 | |
Innocean Worldwide, Inc. | | | 30,112 | | | | 2,132,447 | |
Orion Corp. | | | 1,830 | | | | 1,502,109 | |
| | | | | | | | |
Total South Korea | | | | | | | 21,182,090 | |
| | | | | | | | |
| | | | | | | | |
| TAIWAN: 9.4% | |
Taiwan Semiconductor Manufacturing Co., Ltd. | | | 684,000 | | | | 3,447,153 | |
PChome Online, Inc. | | | 277,525 | | | | 3,076,285 | |
Delta Electronics, Inc. | | | 581,511 | | | | 2,837,380 | |
Ennoconn Corp. | | | 181,000 | | | | 2,432,245 | |
Ginko International Co., Ltd. | | | 187,000 | | | | 1,953,688 | |
| | | | | | | | |
Total Taiwan | | | | | | | 13,746,751 | |
| | | | | | | | |
| | | | | | | | |
| INDIA: 9.3% | |
Info Edge India, Ltd. | | | 358,398 | | | | 4,398,484 | |
Lupin, Ltd. | | | 126,795 | | | | 2,900,735 | |
Bharti Infratel, Ltd. | | | 478,543 | | | | 2,452,085 | |
Britannia Industries, Ltd. | | | 49,840 | | | | 2,041,711 | |
Blue Dart Express, Ltd. | | | 20,451 | | | | 1,808,244 | |
| | | | | | | | |
Total India | | | | | | | 13,601,259 | |
| | | | | | | | |
| | | | | | | | |
| INDONESIA: 8.6% | | | | | | | | |
PT Media Nusantara Citra | | | 17,798,000 | | | | 2,985,928 | |
PT Matahari Department Store | | | 1,862,900 | | | | 2,839,262 | |
PT Bank Mandiri Persero | | | 3,525,500 | | | | 2,551,246 | |
PT Telekomunikasi Indonesia Persero ADR | | | 39,900 | | | | 2,452,254 | |
PT Sumber Alfaria Trijaya | | | 38,218,200 | | | | 1,742,446 | |
| | | | | | | | |
Total Indonesia | | | | | | | 12,571,136 | |
| | | | | | | | |
| | | | | | | | |
| SINGAPORE: 5.7% | | | | | | | | |
Singapore Telecommunications, Ltd. | | | 1,373,000 | | | | 4,240,673 | |
Raffles Medical Group, Ltd. | | | 2,254,800 | | | | 2,532,014 | |
iFAST Corp., Ltd. | | | 1,980,100 | | | | 1,460,605 | |
| | | | | | | | |
Total Singapore | | | | | | | 8,233,292 | |
| | | | | | | | |
| | | | | | | | |
| | | Shares | | | Value | |
| THAILAND: 3.6% | | | | | | | | |
Major Cineplex Group Public Co., Ltd. | | | 3,261,900 | | | | $3,072,566 | |
Kasikornbank Public Co., Ltd. | | | 434,200 | | | | 2,108,456 | |
| | | | | | | | |
Total Thailand | | | | | | | 5,181,022 | |
| | | | | | | | |
| | | | | | | | |
| UNITED STATES: 1.8% | |
Cognizant Technology Solutions Corp. Class Ab | | | 46,500 | | | | 2,661,660 | |
| | | | | | | | |
Total United States | | | | | | | 2,661,660 | |
| | | | | | | | |
| | | | | | | | |
| VIETNAM: 1.4% | |
Mobile World Investment Corp. | | | 375,365 | | | | 2,074,606 | |
| | | | | | | | |
Total Vietnam | | | | | | | 2,074,606 | |
| | | | | | | | |
| | | | | | | | |
| PHILIPPINES: 1.4% | |
Puregold Price Club, Inc. | | | 2,282,900 | | | | 2,047,566 | |
| | | | | | | | |
Total Philippines | | | | | | | 2,047,566 | |
| | | | | | | | |
| | | | | | | | |
| TOTAL COMMON EQUITIES | | | | 124,900,958 | |
| | | | | | | | |
(Cost $102,842,423) | | | | | | | | |
| | | | | | | | |
PREFERRED EQUITIES: 10.5% | | | | | | | | |
| SOUTH KOREA: 10.5% | | | | | | | | |
LG Household & Health Care, Ltd., Pfd. | | | 11,178 | | | | 6,436,663 | |
Samsung Electronics Co., Ltd., Pfd. | | | 5,820 | | | | 6,003,839 | |
LG Chem, Ltd., Pfd. | | | 17,091 | | | | 2,852,934 | |
| | | | | | | | |
Total South Korea | | | | | | | 15,293,436 | |
| | | | | | | | |
| | | | | | | | |
| TOTAL PREFERRED EQUITIES | | | | 15,293,436 | |
| | | | | | | | |
(Cost $11,960,539) | | | | | | | | |
| | | | | | | | |
RIGHTS: 0.0% | | | | | | | | |
| TAIWAN: 0.0% | | | | | | | | |
Ennoconn Corp., expires 7/12/16 | | | 9,163 | | | | 12,921 | |
| | | | | | | | |
| | | | | | | | |
| TOTAL RIGHTS | | | | 12,921 | |
| | | | | | | | |
(Cost $0) | | | | | | | | |
| | | | | | | | |
| TOTAL INVESTMENTS: 96.3% | | | | | | | 140,207,315 | |
(Cost $114,802,959c) | | | | | | | | |
| | | | | | | | |
CASH AND OTHER ASSETS, LESS LIABILITIES: 3.7% | | | | | | | 5,330,758 | |
| | | | | | | | |
| | |
NET ASSETS: 100.0% | | | | | | | $145,538,073 | |
| | | | | | | | |
| a | Certain securities were fair valued under the valuation polices approved by the Board of Trustees (Note 2-A). |
| b | Non-income producing security. |
| c | Cost for federal income tax purposes is $114,933,251 and net unrealized appreciation consists of: |
| | | | |
Gross unrealized appreciation | | | $29,784,289 | |
Gross unrealized depreciation | | | (4,510,225 | ) |
| | | | |
Net unrealized appreciation | | | $25,274,064 | |
| | | | |
| ADR | American Depositary Receipt |
See accompanying notes to financial statements.
| | | | |
| matthewsasia.com | 800.789.ASIA | | | 59 | |
| | | | |
| PORTFOLIO MANAGERS |
| Andrew Mattock, CFA | | |
Lead Manager | | |
| Henry Zhang, CFA | | Winnie Chwang |
Co-Manager | | Co-Manager |
| | | | |
| | |
| FUND FACTS | | | | |
| | | Investor | | Institutional |
Ticker | | MCHFX | | MICFX |
CUSIP | | 577130701 | | 577130818 |
Inception | | 2/19/98 | | 10/29/10 |
NAV | | $16.19 | | $16.17 |
Initial Investment | | $2,500 | | $3 million |
Gross Expense Ratio1 | | 1.14% | | 0.99% |
Portfolio Statistics |
Total # of Positions | | 40 |
Net Assets | | $579.5 million |
Weighted Average
Market Cap | | $86.8 billion |
Portfolio Turnover2 | | 66.22% |
Benchmark |
MSCI China Index |
OBJECTIVE
Long-term capital appreciation.
STRATEGY
Under normal market conditions, the Fund seeks to achieve its investment objective by investing at least 80% of its total net assets, which include borrowings for investment purposes, in the common and preferred stocks of companies located in China. China includes its administrative and other districts, such as Hong Kong.
Matthews China Fund
Portfolio Manager Commentary (unaudited)
For the first half of 2016, the Matthews China Fund returned –12.11% (Investor Class) and –12.07% (Institutional Class) while its benchmark, the MSCI China Index, returned –4.53%. For the quarter ending June 30, the Fund returned –1.76% (Investor and Institutional Class) while its benchmark returned 0.28%.
Market Environment:
After somewhat of a recovery from the latter part of the first quarter, Chinese equities resumed their sell-off beginning in late April. Triggered, yet again, by slowing economic concerns, the sell-off was tied this time to disappointing news over the 14-month consecutive decline of the purchasing managers’ index—signaling continued macroeconomic weakness in China. Likewise, China’s domestic equity markets continued to be weak into the second quarter of 2016 and low trading volumes in these markets indicated prolonged risk-off investment attitudes. Toward the end of the second quarter, results of the Brexit vote continued to spark global concerns over equities. Amid this development, Asian stocks also came under pressure but held up considerably better than European and non-Asian emerging markets.
Performance Contributors and Detractors:
During the first half of the year, holdings in the financials and consumer discretionary sectors hurt Fund performance, and were impacted by investor concerns over China’s decelerating overall economic growth. JD.com, one of the largest online shopping platforms in China, was a major detractor to Fund performance during the first half of this year. The company reported relatively modest revenue growth as it tried to balance it along with profitability. In addition, JD continues to invest in its logistics network and expand its product offerings and geographic reach. While some of these initiatives may cause short-term earnings volatility, we expect the firm will ultimately benefit over the long run.
Information technology, energy and consumer staples were among the sectors that were positive contributors to Fund performance. NetEase, a leading Chinese Internet company, was one of the top performers in the second quarter. The firm is well-established in both mobile game and PC-game markets and has outstanding in-house development capabilities. As China’s mobile game market continues to grow and consolidate, we believe NetEase is well-positioned to benefit from this secular trend given its strong cash flow generation and solid balance sheet.
Notable Portfolio Changes:
During the period, we exited our position in China Vanke, a leading property developer. Over the past few months, China Vanke encountered a hostile takeover from Baoneng Group, a Shenzhen-based private conglomerate. Although the current chairman and management team have built the company from the ground up since 1988, their combined shareholding ownership is relatively small. Baoneng, the largest current shareholder of the company, recently proposed a removal of the entire board of directors, including the chairman. We believe the hostile takeover may affect the company’s normal operation and management stability. Since the stock had performed well in recent years and benefited from the takeover bid, we took the opportunity to exit this position.
Outlook:
Throughout the first two quarters of 2016, China’s economic statistics were uninspiring. As we await positive developments on the earnings recovery front, we are
(continued)
| 1 | Prospectus expense ratios. |
| 2 | The lesser of fiscal year 2015 long-term purchase costs or sales proceeds divided by the average monthly market value of long-term securities. |
| | | | | | | | | | | | | | | | | | | | | | | | | | | | | | | | |
| |
| PERFORMANCE AS OF JUNE 30, 2016 | |
| | | | | | | | | | | | Average Annual Total Returns | | | | |
| | | 3 Months | | | YTD | | | 1 Year | | | 3 Years | | | 5 Years | | | 10 Years | | | Since
Inception | | | Inception
Date | |
| Investor Class (MCHFX) | | | -1.76% | | | | -12.11% | | | | -23.89% | | | | 0.46% | | | | -3.53% | | | | 7.49% | | | | 8.34% | | | | 2/19/98 | |
| Institutional Class (MICFX) | | | -1.76% | | | | -12.07% | | | | -23.83% | | | | 0.58% | | | | -3.37% | | | | n.a. | | | | -3.28% | | | | 10/29/10 | |
| MSCI China Index3 | | | 0.28% | | | | -4.53% | | | | -23.20% | | | | 3.62% | | | | -0.24% | | | | 7.48% | | | | 2.92% | 4 | | | | |
| Lipper China Region Funds Category Average5 | | | -0.10% | | | | -5.50% | | | | -19.94% | | | | 3.18% | | | | -0.21% | | | | 6.03% | | | | 6.33% | 4 | | | | |
Performance assumes reinvestment of all dividends and/or distributions before taxes. All performance quoted represents past performance and is no guarantee of future results. Investment return and principal value will fluctuate with market conditions so that when redeemed, shares may be worth more or less than their original cost. Current performance may be lower or higher than the return figures quoted. For the Fund’s most recent month-end performance, visit matthewsasia.com.
GROWTH OF A $10,000 INVESTMENT SINCE INCEPTION—INVESTOR CLASS
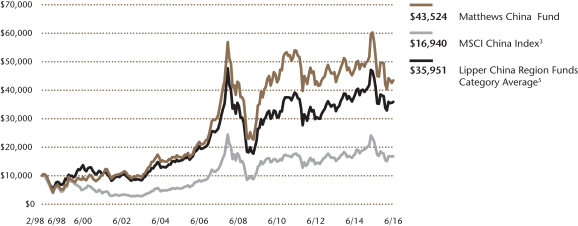
Plotted monthly. The performance data and graph do not reflect the deduction of taxes that a shareholder would pay on dividends, capital gains distributions or redemption of Fund shares. Values are in US$.
| | 3 | It is not possible to invest directly in an index. Source: Index data from Morgan Stanley Capital International and Bloomberg; total return calculations performed by BNY Mellon Investment Servicing (US) Inc. Please see page 91 for index definition. |
| | 4 | Calculated from 2/28/98. |
| | 5 | The Lipper Category Average does not reflect sales charges and is based on total return, including reinvestment of dividends and capital gains for the stated periods. |
| | | | | | |
| | | |
| TOP TEN HOLDINGS6 | | | | | |
| | | Sector | | % of Net Assets | |
| Tencent Holdings, Ltd. | | Information Technology | | | 10.9% | |
| Alibaba Group Holding, Ltd. | | Information Technology | | | 6.1% | |
| Ping An Insurance Group Co. of China, Ltd. | | Financials | | | 5.8% | |
| China Mobile, Ltd. | | Telecommunication Services | | | 4.8% | |
| China Construction Bank Corp. | | Financials | | | 4.7% | |
| Industrial & Commercial Bank of China, Ltd. | | Financials | | | 4.4% | |
| China Life Insurance Co., Ltd. | | Financials | | | 4.1% | |
| China Overseas Land & Investment, Ltd. | | Financials | | | 3.6% | |
| China Resources Land, Ltd. | | Financials | | | 3.4% | |
| China State Construction International Holdings, Ltd. | | Industrials | | | 2.9% | |
| % OF ASSETS IN TOP TEN | | | | | 50.7% | |
| | 6 | Holdings may combine more than one security from same issuer and related depositary receipts. |
| | | | |
| matthewsasia.com | 800.789.ASIA | | | 61 | |
| | | | |
| |
| SECTOR ALLOCATION (%)7 | |
| Financials | | | 35.7 | |
| Information Technology | | | 24.5 | |
| Consumer Discretionary | | | 11.7 | |
| Industrials | | | 9.1 | |
| Energy | | | 4.8 | |
| Telecommunication Services | | | 4.8 | |
| Health Care | | | 2.3 | |
| Materials | | | 2.2 | |
| Consumer Staples | | | 1.9 | |
| Utilities | | | 1.8 | |
| Cash and Other Assets, Less Liabilities | | | 1.2 | |
| | | | |
| |
| MARKET CAP EXPOSURE (%)7 | |
| Mega Cap (over $25B) | | | 60.5 | |
| Large Cap ($10B–$25B) | | | 16.1 | |
| Mid Cap ($3B–10B) | | | 19.6 | |
| Small Cap (under $3B) | | | 2.6 | |
| Cash and Other Assets, Less Liabilities | | | 1.2 | |
| 7 | Source: FactSet Research Systems. Percentage values in data are rounded to the nearest tenth of one percent; the values may not sum to 100% due to rounding. |
Matthews China Fund
Portfolio Manager Commentary (unaudited) (continued)
mindful of the volatility in the global environment and some of the opportunities or risks it presents. The trade impact of Brexit on the Chinese economy may not be great as the U.K. is a smaller trading partner. But implications on the longer-term stability of the E.U., which is China’s third-largest trading partner, could eventually trickle into larger concerns. The Fund has always maintained a focus on investing in companies focused on the domestic economy, which should be less effected by the volatility stemming from macro developments. We remain positive on the structural reform agenda in China and believe that valuations support an optimistic outlook on Chinese equities.
Matthews China Fund
June 30, 2016
Consolidated Schedule of Investmentsa (unaudited)
COMMON EQUITIES: CHINA/HONG KONG: 98.8%
| | | | | | | | |
| | | Shares | | | Value | |
| FINANCIALS: 35.7% | |
Banks: 13.6% | | | | | | | | |
China Construction Bank Corp. H Shares | | | 41,106,660 | | | | $27,403,265 | |
Industrial & Commercial Bank of China, Ltd.
H Shares | | | 45,794,000 | | | | 25,537,889 | |
China Merchants Bank Co., Ltd. H Shares | | | 6,328,643 | | | | 14,278,189 | |
Chongqing Rural Commercial Bank Co., Ltd.
H Shares | | | 22,684,000 | | | | 11,553,253 | |
| | | | | | | | |
| | | | | | | 78,772,596 | |
| | | | | | | | |
| | | | | | | | |
Insurance: 10.0% | | | | | | | | |
Ping An Insurance Group Co. of China, Ltd.
H Shares | | | 7,634,000 | | | | 33,823,774 | |
China Life Insurance Co., Ltd. H Shares | | | 11,038,000 | | | | 23,799,279 | |
| | | | | | | | |
| | | | | | | 57,623,053 | |
| | | | | | | | |
| | | | | | | | |
Real Estate Management & Development: 8.1% | | | | | |
China Overseas Land & Investment, Ltd. | | | 6,526,000 | | | | 20,803,920 | |
China Resources Land, Ltd. | | | 8,472,000 | | | | 19,963,839 | |
Shanghai Lujiazui Finance & Trade Zone Development Co., Ltd. B Shares | | | 3,915,136 | | | | 6,127,172 | |
| | | | | | | | |
| | | | | | | 46,894,931 | |
| | | | | | | | |
| | | | | | | | |
Capital Markets: 3.0% | | | | | | | | |
CITIC Securities Co., Ltd. H Shares | | | 5,125,500 | | | | 11,372,975 | |
China Galaxy Securities Co., Ltd. H Shares | | | 6,776,500 | | | | 6,115,523 | |
| | | | | | | | |
| | | | | | | 17,488,498 | |
| | | | | | | | |
| | | | | | | | |
Diversified Financial Services: 1.0% | | | | | | | | |
Hong Kong Exchanges and Clearing, Ltd. | | | 239,200 | | | | 5,828,244 | |
| | | | | | | | |
Total Financials | | | | | | | 206,607,322 | |
| | | | | | | | |
| | | | | | | | |
| INFORMATION TECHNOLOGY: 24.5% | |
Internet Software & Services: 21.6% | | | | | | | | |
Tencent Holdings, Ltd. | | | 2,763,500 | | | | 63,393,787 | |
Alibaba Group Holding, Ltd. ADRc | | | 441,700 | | | | 35,128,401 | |
Baidu, Inc. ADRc | | | 70,700 | | | | 11,676,105 | |
NetEase, Inc. ADR | | | 48,600 | | | | 9,390,492 | |
Wangsu Science & Technology Co., Ltd.
A Sharesd | | | 560,188 | | | | 5,712,464 | |
| | | | | | | | |
| | | | | | | 125,301,249 | |
| | | | | | | | |
| | | | | | | | |
Electronic Equipment, Instruments & Components: 1.6% | |
Hangzhou Hikvision Digital Technology Co., Ltd.
A Sharesd | | | 2,859,988 | | | | 9,297,733 | |
| | | | | | | | |
| | | | | | | | |
Communications Equipment: 1.3% | | | | | | | | |
ZTE Corp. H Shares | | | 5,927,164 | | | | 7,539,081 | |
| | | | | | | | |
Total Information Technology | | | | | | | 142,138,063 | |
| | | | | | | | |
| | | | | | | | |
| CONSUMER DISCRETIONARY: 11.7% | |
Internet & Catalog Retail: 6.2% | | | | | | | | |
JD.com, Inc. ADRc | | | 606,307 | | | | 12,871,898 | |
Ctrip.com International, Ltd. ADRc | | | 305,200 | | | | 12,574,240 | |
Vipshop Holdings, Ltd. ADRc | | | 950,929 | | | | 10,621,877 | |
| | | | | | | | |
| | | | | | | 36,068,015 | |
| | | | | | | | |
| | | | | | | | |
Automobiles: 2.4% | | | | | | | | |
Chongqing Changan Automobile Co., Ltd.
B Shares | | | 9,756,224 | | | | 13,666,354 | |
| | | | | | | | |
| | | | | | | | |
| | | | | | | | |
| | | Shares | | | Value | |
Household Durables: 2.0% | | | | | | | | |
Gree Electric Appliances, Inc. of Zhuhai
A Sharesb,d | | | 3,824,278 | | | | $11,542,467 | |
| | | | | | | | |
Auto Components: 1.1% | | | | | | | | |
Fuyao Glass Industry Group Co., Ltd. A Shares | | | 3,103,359 | | | | 6,556,486 | |
| | | | | | | | |
Total Consumer Discretionary | | | | | | | 67,833,322 | |
| | | | | | | | |
| | | | | | | | |
| INDUSTRIALS: 9.1% | |
Construction & Engineering: 4.6% | | | | | | | | |
China State Construction International Holdings, Ltd. | | | 12,716,000 | | | | 16,872,487 | |
| | |
China State Construction Engineering Corp.,
Ltd. A Shares | | | 12,178,889 | | | | 9,781,454 | |
| | | | | | | | |
Total Construction & Engineering | | | | | | | 26,653,941 | |
| | | | | | | | |
| | | | | | | | |
Commercial Services & Supplies: 3.2% | | | | | | | | |
China Everbright International, Ltd. | | | 9,723,000 | | | | 10,871,757 | |
Dongjiang Environmental Co., Ltd. H Shares | | | 4,353,400 | | | | 7,513,167 | |
| | | | | | | | |
| | | | | | | 18,384,924 | |
| | | | | | | | |
| | | | | | | | |
Electrical Equipment: 0.7% | | | | | | | | |
Boer Power Holdings, Ltd. | | | 9,644,000 | | | | 4,234,808 | |
| | | | | | | | |
| | | | | | | | |
Transportation Infrastructure: 0.6% | | | | | | | | |
Qingdao Port International Co., Ltd. H Shares | | | 7,662,000 | | | | 3,490,694 | |
| | | | | | | | |
Total Industrials | | | | | | | 52,764,367 | |
| | | | | | | | |
| | | | | | | | |
| ENERGY: 4.8% | | | | | | | | |
Oil, Gas & Consumable Fuels: 4.8% | | | | | | | | |
China Petroleum & Chemical Corp. H Shares | | | 19,686,000 | | | | 14,225,482 | |
China Shenhua Energy Co., Ltd. H Shares | | | 7,328,500 | | | | 13,630,284 | |
| | | | | | | | |
Total Energy | | | | | | | 27,855,766 | |
| | | | | | | | |
| | | | | | | | |
| TELECOMMUNICATION SERVICES: 4.8% | |
Wireless Telecommunication Services: 4.8% | |
China Mobile, Ltd. | | | 2,396,000 | | | | 27,683,900 | |
| | | | | | | | |
Total Telecommunication Services | | | | | | | 27,683,900 | |
| | | | | | | | |
| | | | | | | | |
| HEALTH CARE: 2.3% | |
Pharmaceuticals: 1.3% | | | | | | | | |
Sino Biopharmaceutical, Ltd. | | | 8,842,000 | | | | 5,803,215 | |
CSPC Pharmaceutical Group, Ltd. | | | 1,778,000 | | | | 1,588,578 | |
| | | | | | | | |
| | | | | | | 7,391,793 | |
| | | | | | | | |
| | | | | | | | |
Health Care Providers & Services: 1.0% | | | | | | | | |
Sinopharm Group Co., Ltd. H Shares | | | 1,195,600 | | | | 5,743,291 | |
| | | | | | | | |
Total Health Care | | | | | | | 13,135,084 | |
| | | | | | | | |
| | | | | | | | |
| MATERIALS: 2.2% | | | | | | | | |
Construction Materials: 2.2% | | | | | | | | |
Anhui Conch Cement Co., Ltd. H Shares | | | 5,374,500 | | | | 13,012,883 | |
| | | | | | | | |
Total Materials | | | | | | | 13,012,883 | |
| | | | | | | | |
| | | | | | | | |
| CONSUMER STAPLES: 1.9% | | | | | | | | |
Beverages: 1.9% | | | | | | | | |
Wuliangye Yibin Co., Ltd. A Sharesd | | | 2,267,626 | | | | 11,160,356 | |
| | | | | | | | |
Total Consumer Staples | | | | | | | 11,160,356 | |
| | | | | | | | |
| | | | | | | | |
| | | | |
| matthewsasia.com | 800.789.ASIA | | | 63 | |
Matthews China Fund
June 30, 2016
Consolidated Schedule of Investmentsa (unaudited) (continued)
COMMON EQUITIES: CHINA/HONG KONG (continued)
| | | | | | | | |
| | | Shares | | | Value | |
| UTILITIES: 1.8% | | | | | | | | |
Water Utilities: 1.8% | | | | | | | | |
Beijing Enterprises Water Group, Ltd. | | | 17,398,000 | | | | $10,536,062 | |
| | | | | | | | |
Total Utilities | | | | | | | 10,536,062 | |
| | | | | | | | |
| | | | | | | | |
| TOTAL INVESTMENTS: 98.8% | | | | | | | 572,727,125 | |
| | | | | | | | |
(Cost $598,229,860e) | | | | | | | | |
| | | | | | | | |
CASH AND OTHER ASSETS,
LESS LIABILITIES: 1.2% | | | | | | | 6,791,440 | |
| | | | | | | | |
| | |
NET ASSETS: 100.0% | | | | | | | $579,518,565 | |
| | | | | | | | |
| a | Certain securities were fair valued under the valuation polices approved by the Board of Trustees (Note 2-A). |
| b | Illiquid security, trading was halted at June 30, 2016. |
| c | Non-income producing security. |
| d | Security held by Matthews CF-U Series. See note 2-C. |
| e | Cost for federal income tax purposes is $606,897,341 and net unrealized depreciation consists of: |
| | | | |
Gross unrealized appreciation | | | $49,137,936 | |
Gross unrealized depreciation | | | (83,308,152 | ) |
| | | | |
Net unrealized depreciation | | | ($34,170,216 | ) |
| | | | |
| ADR | American Depositary Receipt |
See accompanying notes to financial statements.
| | | | |
| PORTFOLIO MANAGERS |
| Sunil Asnani | | | | |
Lead Manager | | | | |
| Sharat Shroff, CFA | | |
Co-Manager | | | | |
|
| FUND FACTS |
| | | Investor | | Institutional |
Ticker | | MINDX | | MIDNX |
CUSIP | | 577130859 | | 577130768 |
Inception | | 10/31/05 | | 10/29/10 |
NAV | | $26.90 | | $26.99 |
Initial Investment | | $2,500 | | $3 million |
Gross Expense Ratio1 | | 1.11% | | 0.90% |
Portfolio Statistics | | | | |
Total # of Positions | | 48 |
Net Assets | | $1.6 billion |
Weighted Average Market Cap | | $10.6 billion |
Portfolio Turnover2 | | 9.51% |
Benchmark | | |
S&P Bombay Stock Exchange 100 Index |
OBJECTIVE
Long-term capital appreciation.
STRATEGY
Under normal market conditions, the Fund seeks to achieve its investment objective by investing at least 80% of its total net assets, which include borrowings for investment purposes, in publicly traded common stocks, preferred stocks and convertible securities of companies located in India.
Matthews India Fund
Portfolio Manager Commentary (unaudited)
For the first half of 2016, the Matthews India Fund returned 1.78% (Investor Class) and 1.89% (Institutional Class), while its benchmark, the S&P Bombay Stock Exchange 100 Index, returned 3.00%. For the quarter ending June 30, the Fund returned 6.03% (Investor Class) and 6.05% (Institutional Class), while its benchmark returned 5.88%.
Market Environment:
Over the first half of the year, India’s market was impacted by a variety of macroeconomic uncertainties such as Britain’s vote to exit from the European Union, the announced departure of India’s central bank governor amid resurging inflation, and the Parliament’s continued challenge in legislating on key reform bills. Thankfully, India’s corporate earnings saw some recovery in the first quarter amid forecasts of adequate rainfall for the season, and the federal government’s approval of recommendations to raise salaries for millions of civil servants. There was also a marginal change in the composition of the Upper House, which sparked some hopes that critical bills pertaining to land acquisition and goods and services taxes could pass.
Performance Contributors and Detractors:
For both the first six months of the year and in the second quarter, small-capitalization stocks continued to underperform their larger peers, which hurt the Fund’s relative performance against its benchmark. Such a correction should be seen as a reversion to the mean, since small caps had significantly outperformed large caps over the previous two calendar years. Our higher allocation to technology and health care stocks also detracted from Fund performance during these periods as those sectors were relatively weak this year, despite continuing to deliver on earnings. Technology companies had offered guidance for a weaker outlook prior to the Brexit vote, while health care stocks, such as Sun Pharmaceuticals, were possibly weak amid increasingly stringent U.S. Food and Drug Administration inspections of facilities. While our portfolio holdings in these sectors have done better than their benchmark peers and have been less affected by such issues, our relative overweight posed a significant performance detractor.
Our limited exposure to metal stocks also did not help amid an environment of rising commodity prices. However, staying away from corporate banking and state-owned banks helped mitigate the portfolio underperformance during this period, as such banks were adversely hit by rising nonperforming assets in the corporate and infrastructure sectors. However, given Central Bank Governor Raghuram Rajan’s impending departure, the hope for possibly more accommodative monetary policies and the resulting steepening of the yield curve have led to a rally in such ailing stocks. During the second quarter, earnings disappointment in the energy and telecom sectors also contributed to our relative outperformance as the portfolio does not hold such stocks.
Notable Portfolio Changes:
During the last quarter, we exited property trust Ascendas India Trust, which is listed in Singapore but holds the bulk of its operational commercial real estate assets in India. We had been trimming this position for some time as the company’s pricing power and growth drivers were not as strong as we initially believed.
Outlook:
While the earnings recovery is good news, the Indian market continues to be running ahead of fundamentals, trading at multiples significantly higher than long-term averages. Potentially easier monetary policy that may be set may help
(continued)
| 1 | Prospectus expense ratios. |
| 2 | The lesser of fiscal year 2015 long-term purchase costs or sales proceeds divided by the average monthly market value of long-term securities. |
| | | | |
| matthewsasia.com | 800.789.ASIA | | | 65 | |
| | | | | | | | | | | | | | | | | | | | | | | | | | | | | | | | |
| | | | | | | | | |
| PERFORMANCE AS OF JUNE 30, 2016 | | | | | | | | | | | | | | | | | | | | | | | | |
| | | | | | | | | | | | Average Annual Total Returns | | | | |
| | | 3 Months | | | YTD | | | 1 Year | | | 3 Years | | | 5 Years | | | 10 Years | | | Since
Inception | | | Inception
Date | |
| Investor Class (MINDX) | | | 6.03% | | | | 1.78% | | | | -3.54% | | | | 20.61% | | | | 6.76% | | | | 11.21% | | | | 11.85% | | | | 10/31/05 | |
| Institutional Class (MIDNX) | | | 6.05% | | | | 1.89% | | | | -3.32% | | | | 20.83% | | | | 6.95% | | | | n.a. | | | | 4.85% | | | | 10/29/10 | |
| S&P Bombay Stock Exchange 100 Index3 | | | 5.88% | | | | 3.00% | | | | -4.75% | | | | 10.28% | | | | 1.08% | | | | 7.77% | | | | 9.77% | 4 | | | | |
| Lipper India Region Funds Category Average5 | | | 7.06% | | | | 2.42% | | | | -3.36% | | | | 13.78% | | | | 2.10% | | | | 6.84% | | | | 8.32% | 4 | | | | |
Performance assumes reinvestment of all dividends and/or distributions before taxes. All performance quoted represents past performance and is no guarantee of future results. Investment return and principal value will fluctuate with market conditions so that when redeemed, shares may be worth more or less than their original cost. Current performance may be lower or higher than the return figures quoted. For the Fund’s most recent month-end performance, visit matthewsasia.com.
GROWTH OF A $10,000 INVESTMENT SINCE INCEPTION—INVESTOR CLASS
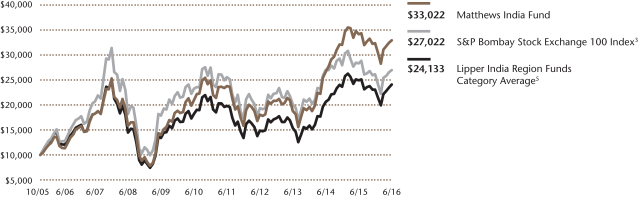
Plotted monthly. The performance data and graph do not reflect the deduction of taxes that a shareholder would pay on dividends, capital gains distributions or redemption of Fund shares. Values are in US$.
| | 3 | It is not possible to invest directly in an index. Source: Index data from Morgan Stanley Capital International and Bloomberg; total return calculations performed by BNY Mellon Investment Servicing (US) Inc. Please see page 91 for index definition. |
| | 4 | Calculated from 10/31/05. |
| | 5 | The Lipper Category Average does not reflect sales charges and is based on total return, including reinvestment of dividends and capital gains for the stated periods. |
| | | | | | |
| | | |
| TOP TEN HOLDINGS6 | | | | | |
| | | Sector | | % of Net Assets | |
| ITC, Ltd. | | Consumer Staples | | | 5.5% | |
| IndusInd Bank, Ltd. | | Financials | | | 4.8% | |
| Taro Pharmaceutical Industries, Ltd. | | Health Care | | | 4.6% | |
| Cognizant Technology Solutions Corp. | | Information Technology | | | 4.4% | |
| eClerx Services, Ltd. | | Information Technology | | | 4.2% | |
| Shriram City Union Finance, Ltd. | | Financials | | | 4.1% | |
| Kotak Mahindra Bank, Ltd. | | Financials | | | 4.1% | |
| Ajanta Pharma, Ltd. | | Health Care | | | 4.0% | |
| HDFC Bank, Ltd. | | Financials | | | 3.9% | |
| Emami, Ltd. | | Consumer Staples | | | 3.6% | |
| % OF ASSETS IN TOP TEN | | | | | 43.2% | |
| | 6 | Holdings may combine more than one security from same issuer and related depositary receipts. |
Matthews India Fund
Portfolio Manager Commentary (unaudited) (continued)
consumers and realty stocks in the short term, but they might also worsen India’s fiscal deficit and inflationary situation in the medium to long term. The resurgence in commodity prices and food inflation may contribute further to inflationary pressures. On the reform front, the government has been able to push through a few executive and policy decisions, such as increasing foreign direct investment limits with automatic approvals in some key sectors, and also pass bills to better regulate the bankruptcy process and real estate development. However, it has not been able to get approved legislation that would effectively improve taxation, banking and infrastructure. The changed composition of the Upper House also remains insufficient for a smooth passage of these laws in the near term. A bright spot for India investors has been the presence of businesses and entrepreneurs that are able to march along to a secular growth path regardless. But we believe that necessitates investing for the long term, with a bottom-up and a benchmark-agnostic investment philosophy.
| | | | |
| |
| SECTOR ALLOCATION (%)7 | |
| Financials | | | 26.4 | |
| Consumer Staples | | | 20.5 | |
| Information Technology | | | 15.5 | |
| Health Care | | | 13.6 | |
| Industrials | | | 9.4 | |
| Consumer Discretionary | | | 6.9 | |
| Materials | | | 4.5 | |
| Cash and Other Assets, Less Liabilities | | | 3.2 | |
| | | | |
| |
| MARKET CAP EXPOSURE (%)7 | |
| Mega Cap (over $25B) | | | 18.2 | |
| Large Cap ($10B-$25B) | | | 5.3 | |
| Mid Cap ($3B-10B) | | | 23.7 | |
| Small Cap (under $3B) | | | 49.6 | |
| Cash and Other Assets, Less Liabilities | | | 3.2 | |
| 7 | Source: FactSet Research Systems. Percentage values in data are rounded to the nearest tenth of one percent; the values may not sum to 100% due to rounding. |
| | | | |
| matthewsasia.com | 800.789.ASIA | | | 67 | |
Matthews India Fund
June 30, 2016
Schedule of Investmentsa (unaudited)
COMMON EQUITIES: 96.8%
| | | | | | | | |
| | | Shares | | | Value | |
| FINANCIALS: 26.4% | | | | | | | | |
Banks: 13.3% | | | | | | | | |
IndusInd Bank, Ltd. | | | 4,625,934 | | | | $76,445,083 | |
Kotak Mahindra Bank, Ltd. | | | 5,697,258 | | | | 64,621,477 | |
HDFC Bank, Ltd. | | | 2,782,565 | | | | 48,652,144 | |
HDFC Bank, Ltd. ADR | | | 206,922 | | | | 13,729,275 | |
IDFC Bank, Ltd.b | | | 11,550,467 | | | | 7,774,675 | |
| | | | | | | | |
| | | | | | | 211,222,654 | |
| | | | | | | | |
| | | | | | | | |
Consumer Finance: 4.9% | | | | | | | | |
Shriram City Union Finance, Ltd. | | | 2,660,274 | | | | 65,176,501 | |
Sundaram Finance, Ltd. | | | 588,318 | | | | 13,314,056 | |
| | | | | | | | |
| | | | | | | 78,490,557 | |
| | | | | | | | |
| | | | | | | | |
Thrifts & Mortgage Finance: 4.7% | | | | | | | | |
Housing Development Finance Corp., Ltd. | | | 2,958,810 | | | | 55,124,242 | |
GRUH Finance, Ltd. | | | 4,616,010 | | | | 19,666,984 | |
| | | | | | | | |
| | | | | | | 74,791,226 | |
| | | | | | | | |
| | | | | | | | |
Diversified Financial Services: 3.5% | | | | | | | | |
CRISIL, Ltd. | | | 1,527,723 | | | | 45,628,330 | |
IDFC, Ltd. | | | 11,350,467 | | | | 8,025,350 | |
Multi Commodity Exchange of India, Ltd. | | | 168,101 | | | | 2,502,227 | |
| | | | | | | | |
| | | | | | | 56,155,907 | |
| | | | | | | | |
Total Financials | | | | | | | 420,660,344 | |
| | | | | | | | |
| | | | | | | | |
| CONSUMER STAPLES: 20.5% | | | | | | | | |
Personal Products: 10.3% | | | | | | | | |
Emami, Ltd. | | | 3,520,577 | | | | 57,548,419 | |
Dabur India, Ltd. | | | 8,332,176 | | | | 38,166,248 | |
Bajaj Corp., Ltd. | | | 6,554,447 | | | | 37,815,842 | |
Marico, Ltd. | | | 7,902,328 | | | | 30,916,494 | |
| | | | | | | | |
| | | | | | | 164,447,003 | |
| | | | | | | | |
| | | | | | | | |
Tobacco: 7.5% | | | | | | | | |
ITC, Ltd. | | | 16,077,949 | | | | 88,025,004 | |
VST Industries, Ltd.† | | | 1,215,704 | | | | 30,694,195 | |
| | | | | | | | |
| | | | | | | 118,719,199 | |
| | | | | | | | |
| | | | | | | | |
Food Products: 2.7% | | | | | | | | |
Nestle India, Ltd. | | | 244,636 | | | | 23,608,342 | |
Zydus Wellness, Ltd. | | | 1,670,471 | | | | 19,765,550 | |
| | | | | | | | |
| | | | | | | 43,373,892 | |
| | | | | | | | |
Total Consumer Staples | | | | | | | 326,540,094 | |
| | | | | | | | |
| | | | | | | | |
| INFORMATION TECHNOLOGY: 15.5% | | | | | | | | |
IT Services: 11.9% | | | | | | | | |
Cognizant Technology Solutions Corp. Class Ab | | | 1,214,200 | | | | 69,500,808 | |
eClerx Services, Ltd.† | | | 3,113,051 | | | | 66,778,698 | |
Mindtree, Ltd. | | | 5,506,584 | | | | 54,360,848 | |
| | | | | | | | |
| | | | | | | 190,640,354 | |
| | | | | | | | |
| | | | | | | | |
Internet Software & Services: 3.6% | | | | | | | | |
Info Edge India, Ltd. | | | 3,300,761 | | | | 40,508,997 | |
Just Dial, Ltd. | | | 1,833,709 | | | | 16,659,530 | |
| | | | | | | | |
| | | | | | | 57,168,527 | |
| | | | | | | | |
Total Information Technology | | | | | | | 247,808,881 | |
| | | | | | | | |
| | | | | | | | |
| | | | | | | | |
| | | Shares | | | Value | |
| HEALTH CARE: 13.6% | | | | | | | | |
Pharmaceuticals: 12.8% | | | | | | | | |
Taro Pharmaceutical Industries, Ltd.b | | | 502,600 | | | | $73,178,560 | |
Ajanta Pharma, Ltd. | | | 2,848,230 | | | | 63,579,294 | |
Alembic Pharmaceuticals, Ltd. | | | 2,640,862 | | | | 22,517,783 | |
Sun Pharma Advanced Research Co., Ltd.b | | | 4,196,014 | | | | 20,765,794 | |
Sun Pharmaceutical Industries, Ltd. | | | 1,365,725 | | | | 15,485,110 | |
Caplin Point Laboratories, Ltd. | | | 602,387 | | | | 8,889,479 | |
| | | | | | | | |
| | | | | | | 204,416,020 | |
| | | | | | | | |
| | | | | | | | |
Health Care Equipment & Supplies: 0.8% | | | | | | | | |
Poly Medicure, Ltd. | | | 2,076,732 | | | | 12,063,970 | |
| | | | | | | | |
Total Health Care | | | | | | | 216,479,990 | |
| | | | | | | | |
| | | | | | | | |
| INDUSTRIALS: 9.4% | | | | | | | | |
Machinery: 4.8% | | | | | | | | |
AIA Engineering, Ltd. | | | 3,200,145 | | | | 48,872,346 | |
Thermax, Ltd. | | | 1,183,128 | | | | 14,480,850 | |
Ashok Leyland, Ltd. | | | 9,356,152 | | | | 13,681,570 | |
| | | | | | | | |
| | | | | | | 77,034,766 | |
| | | | | | | | |
| | | | | | | | |
Air Freight & Logistics: 1.9% | | | | | | | | |
Blue Dart Express, Ltd. | | | 346,973 | | | | 30,678,780 | |
| | | | | | | | |
| | | | | | | | |
Road & Rail: 1.4% | | | | | | | | |
Container Corp. of India, Ltd. | | | 1,034,055 | | | | 21,963,466 | |
| | | | | | | | |
| | | | | | | | |
Transportation Infrastructure: 1.3% | | | | | | | | |
Gujarat Pipavav Port, Ltd.b | | | 8,578,564 | | | | 20,795,305 | |
| | | | | | | | |
Total Industrials | | | | | | | 150,472,317 | |
| | | | | | | | |
| | | | | | | | |
| CONSUMER DISCRETIONARY: 6.9% | | | | | | | | |
Textiles, Apparel & Luxury Goods: 3.7% | | | | | | | | |
Titan Co., Ltd. | | | 4,360,467 | | | | 26,299,031 | |
Page Industries, Ltd. | | | 107,100 | | | | 22,286,019 | |
Kewal Kiran Clothing, Ltd. | | | 295,445 | | | | 7,957,908 | |
Vaibhav Global, Ltd.b | | | 500,000 | | | | 2,023,485 | |
| | | | | | | | |
| | | | | | | 58,566,443 | |
| | | | | | | | |
| | | | | | | | |
Household Durables: 3.2% | | | | | | | | |
Symphony, Ltd. | | | 1,166,560 | | | | 43,131,683 | |
LA Opala RG, Ltd. | | | 935,045 | | | | 7,657,229 | |
| | | | | | | | |
| | | | | | | 50,788,912 | |
| | | | | | | | |
Total Consumer Discretionary | | | | | | | 109,355,355 | |
| | | | | | | | |
| | | | | | | | |
| MATERIALS: 4.5% | | | | | | | | |
Chemicals: 3.5% | | | | | | | | |
Supreme Industries, Ltd. | | | 1,738,965 | | | | 23,577,335 | |
Asian Paints, Ltd. | | | 1,304,000 | | | | 19,413,595 | |
Castrol India, Ltd. | | | 2,139,063 | | | | 12,030,321 | |
| | | | | | | | |
| | | | | | | 55,021,251 | |
| | | | | | | | |
| | | | | | | | |
Metals & Mining: 1.0% | | | | | | | | |
NMDC, Ltd. | | | 11,963,892 | | | | 16,701,814 | |
| | | | | | | | |
Total Materials | | | | | | | 71,723,065 | |
| | | | | | | | |
| | | | | | | | |
| TOTAL INVESTMENTS: 96.8% | | | | | | | 1,543,040,046 | |
(Cost $1,269,828,903c) | | | | | | | | |
| | | | | | | | |
Matthews India Fund
June 30, 2016
Schedule of Investmentsa (unaudited) (continued)
COMMON EQUITIES (continued)
| | | | | | | | |
| | | | | | Value | |
CASH AND OTHER ASSETS,
LESS LIABILITIES: 3.2% | | | | | | | $51,000,444 | |
| | | | | | | | |
| | |
NET ASSETS: 100.0% | | | | | | | $1,594,040,490 | |
| | | | | | | | |
| a | Certain securities were fair valued under the valuation polices approved by the Board of Trustees (Note 2-A). |
| b | Non-income producing security. |
| c | Cost for federal income tax purposes is $1,269,932,009 and net unrealized appreciation consists of: |
| | | | |
Gross unrealized appreciation | | | $352,091,092 | |
Gross unrealized depreciation | | | (78,983,055 | ) |
| | | | |
Net unrealized appreciation | | | $273,108,037 | |
| | | | |
| † | Affiliated Issuer, as defined under the Investment Company Act of 1940 (ownership of 5% or more of the outstanding voting securities of this issuer) |
| ADR | American Depositary Receipt |
See accompanying notes to financial statements.
| | | | |
| matthewsasia.com | 800.789.ASIA | | | 69 | |
| | | | |
PORTFOLIO MANAGERS |
| Kenichi Amaki | | | | |
Lead Manager | | | | |
| Taizo Ishida | | | | |
Co-Manager | | | | |
|
| FUND FACTS |
| | | Investor | | Institutional |
Ticker | | MJFOX | | MIJFX |
CUSIP | | 577130800 | | 577130792 |
Inception | | 12/31/98 | | 10/29/10 |
NAV | | $20.16 | | $20.20 |
Initial Investment | | $2,500 | | $3 million |
Gross Expense Ratio1 | | 0.99% | | 0.87% |
Portfolio Statistics | | | | |
Total # of Positions | | | | 62 |
Net Assets | | | | $3.4 billion |
Weighted Average Market Cap | | $13.3 billion |
Portfolio Turnover2 | | | | 24.19% |
Benchmark |
MSCI Japan Index |
OBJECTIVE
Long-term capital appreciation.
STRATEGY
Under normal market conditions, the Fund seeks to achieve its investment objective by investing at least 80% of its total net assets, which include borrowings for investment purposes, in the common and preferred stocks of companies located in Japan.
Matthews Japan Fund
Portfolio Manager Commentary (unaudited)
For the first half of 2016, the Matthews Japan Fund returned 6.27% (Investor Class) and 6.32% (Institutional Class) while its benchmark, the MSCI Japan Index, returned –5.41%. For the quarter ending June 30, 2016, the Matthews Japan Fund returned 6.05% (Investor Class) and 6.04% (Institutional Class), while its benchmark, the MSCI Japan Index, returned 1.03%.
Market Environment:
During the first half of the year, the Japanese equity market performed poorly on a local currency basis. Slowing global economic activity, mounting debt in China and the Brexit vote prompted a “flight to safety” trade resulting in a sharp appreciation of the yen. The external environment has become increasingly challenging for Japanese corporate earnings, particularly for export related businesses. On the bright side, the Fund has been able to post positive returns as year-to-date yen appreciation of 16.55% has alleviated much of the decline in equity prices.
Japan’s first quarter GDP grew at an annualized 1.9% rate which was better than market expectations. Capital expenditures have been weak but private consumption has shown some recovery. During the second quarter, Prime Minister Abe announced the postponement of a planned sales tax increase, pushing it back from April 2017 to October 2019. Though this move was widely expected, it does erase some uncertainty in the short term.
Performance Contributors and Detractors:
Stock selection accounted for the majority of the Fund’s outperformance. During the second quarter, the financials sector was again the leading source of relative performance. Our strategy to focus on unique and growing financial services firms, while avoiding more traditional names in banking and real estate, has been a significant driver of outperformance for the Fund. Corporate welfare and real estate management company Relo Group, credit guarantee company eGuarantee and M&A advisory firm Nihon M&A Center all contributed positively to Fund performance. Additionally, our core holdings in the internet sector such as health care information service company M3 and fashion e-commerce company Start Today continue to deliver impressive returns. However, we have turned a bit more cautious on these names as strong performance has resulted in elevated valuation levels.
On the negative side, our lack of exposure to the telecom sector detracted from relative performance. We believe investors have gravitated towards this sector for its defensive characteristics and relatively higher yield. However, we remain concerned with the level of involvement from the government regarding wireless telecom tariffs and continue to avoid the sector.
Notable Portfolio Changes:
Since the middle of last year, we have focused our research efforts on identifying opportunities in companies that have struggled with a weaker yen. We believe that companies with fundamentally strong franchises and capable management teams have the ability to adapt to different currency regimes over time. Though we did not expect the yen to appreciate as much as it has year-to-date, the incremental changes we have made to the portfolio over the past year have benefited performance significantly.
During the quarter, we tilted the portfolio further towards companies that are strong yen beneficiaries while not compromising on medium-term growth potential and franchise quality. Nitori Holdings is one such example. As the leading
(continued)
| 1 | Prospectus expense ratios. |
| 2 | The lesser of fiscal year 2015 long-term purchase costs or sales proceeds divided by the average monthly market value of long-term securities. |
| | | | | | | | | | | | | | | | | | | | | | | | | | | | | | | | |
| |
| PERFORMANCE AS OF JUNE 30, 2016 | |
| | | 3 Months | | | YTD | | | 1 Year | | | Average Annual Total Returns | | | Inception
Date | |
| | | | | | 3 Years | | | 5 Years | | | 10 Years | | | Since
Inception | | |
Investor Class (MJFOX) | | | 6.05% | | | | 6.27% | | | | 5.00% | | | | 11.42% | | | | 10.65% | | | | 3.03% | | | | 6.07% | | | | 12/31/98 | |
Institutional Class (MIJFX) | | | 6.04% | | | | 6.32% | | | | 5.10% | | | | 11.56% | | | | 10.79% | | | | n.a. | | | | 11.72% | | | | 10/29/10 | |
MSCI Japan Index3 | | | 1.03% | | | | -5.41% | | | | -8.64% | | | | 3.00% | | | | 4.45% | | | | 0.33% | | | | 2.52% | 4 | | | | |
Lipper Japanese Funds Category Average5 | | | 0.56% | | | | -4.10% | | | | -6.60% | | | | 5.70% | | | | 6.36% | | | | 1.32% | | | | 4.01% | | | | | |
Performance assumes reinvestment of all dividends and/or distributions before taxes. All performance quoted represents past performance and is no guarantee of future results. Investment return and principal value will fluctuate with market conditions so that when redeemed, shares may be worth more or less than their original cost. Current performance may be lower or higher than the return figures quoted. For the Fund’s most recent month-end performance, visit matthewsasia.com.
GROWTH OF A $10,000 INVESTMENT SINCE INCEPTION—INVESTOR CLASS
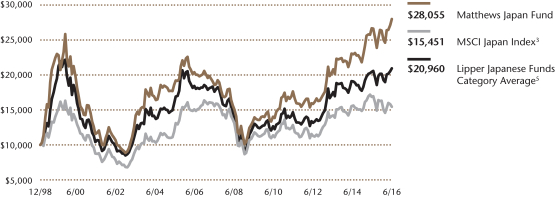
Plotted monthly. The performance data and graph do not reflect the deduction of taxes that a shareholder would pay on dividends, capital gains distributions or redemption of Fund shares. Values are in US$.
| | 3 | It is not possible to invest directly in an index. Source: Index data from Morgan Stanley Capital International and Bloomberg; total return calculations performed by BNY Mellon Investment Servicing (US) Inc. Please see page 91 for index definitions. |
| | 4 | Calculated from 12/31/98. |
| | 5 | The Lipper Category Average does not reflect sales charges and is based on total return, including reinvestment of dividends and capital gains for the stated periods. |
| | | | | | | | |
| | | | |
| TOP TEN HOLDINGS6 | | | | | | | |
| | | Sector | | | | % of Net Assets | |
Kao Corp. | | Consumer Staples | | | | | 2.9% | |
M3, Inc. | | Health Care | | | | | 2.9% | |
Start Today Co., Ltd. | | Consumer Discretionary | | | | | 2.8% | |
MISUMI Group, Inc. | | Industrials | | | | | 2.5% | |
Tokio Marine Holdings, Inc. | | Financials | | | | | 2.5% | |
ORIX Corp. | | Financials | | | | | 2.4% | |
Pigeon Corp. | | Consumer Staples | | | | | 2.4% | |
Nitori Holdings Co., Ltd. | | Consumer Discretionary | | | | | 2.4% | |
Keyence Corp. | | Information Technology | | | | | 2.4% | |
Ryohin Keikaku Co., Ltd. | | Consumer Discretionary | | | | | 2.4% | |
% OF ASSETS IN TOP TEN | | | | | | | 25.6% | |
| | 6 | Holdings may combine more than one security from same issuer and related depositary receipts. |
| | | | |
| matthewsasia.com | 800.789.ASIA | | | 71 | |
| | | | |
| | |
| SECTOR ALLOCATION (%)7 | | | |
| Industrials | | | 21.8 | |
| Consumer Discretionary | | | 19.3 | |
| Consumer Staples | | | 17.3 | |
| Financials | | | 14.2 | |
| Health Care | | | 12.0 | |
| Information Technology | | | 10.4 | |
| Materials | | | 1.5 | |
| Cash and Other Assets, Less Liabilities | | | 3.5 | |
| | | | |
| | |
| MARKET CAP EXPOSURE (%)7 | | | |
| Mega Cap (over $25B) | | | 11.1 | |
| Large Cap ($10B–$25B) | | | 24.6 | |
| Mid Cap ($3B–10B) | | | 26.0 | |
| Small Cap (under $3B) | | | 34.8 | |
| Cash and Other Assets, Less Liabilities | | | 3.5 | |
| 7 | Source: FactSet Research Systems. Percentage values in data are rounded to the nearest tenth of one percent; the values may not sum to 100% due to rounding. |
Matthews Japan Fund
Portfolio Manager Commentary (unaudited) (continued)
furniture retailer in Japan, Nitori has been consolidating market share in the country by expanding further into urban areas and delivering innovative products that have stimulated consumer demand. Nitori also plans to steadily increase its presence in China where, we believe, they have an advantage in terms of product offering, perception of quality and price in a very fragmented Chinese furniture retail industry. As a major importer, Nitori stands to benefit from a stronger yen over time.
Outlook:
We maintain a cautious view on the prospects for Japan’s economy given the sharp appreciation of the yen and weak global economic fundamentals. Though we are encouraged by signs of improved corporate governance as evidenced by robust share buyback activity, the stronger currency and uncertainties arising from the Brexit vote may prompt companies to curtail future investments. The corporate savings rate in Japan has been steadily rising over the last year and, in the past this has been a leading indicator of declining prices. Given these trends, we believe the Abe administration will announce a supplemental spending package in the fall to support domestic economic activity. That may be combined with further unconventional monetary stimulus measures from the Bank of Japan.
Despite the rather unattractive macro picture, we remain encouraged by the long-term growth prospects of our portfolio companies. We intend to take full advantage of the flexibility afforded by our active bottom-up approach to seek investment in companies that are leveraged to structural trends within Japan and broadly in Asia, capturing unique growth opportunities which are less affected by economic cyclicality. We believe this approach can benefit patient investors over the long term.
Matthews Japan Fund
June 30, 2016
Schedule of Investmentsa (unaudited)
COMMON EQUITIES: JAPAN: 96.5%
| | | | | | | | |
| | | Shares | | | Value | |
| INDUSTRIALS: 21.8% | | | | | | | | |
Machinery: 6.7% | | | | | | | | |
Komatsu, Ltd. | | | 4,056,000 | | | | $70,459,520 | |
Harmonic Drive Systems, Inc. | | | 2,222,900 | | | | 63,216,244 | |
SMC Corp. | | | 205,800 | | | | 50,632,185 | |
Mitsubishi Heavy Industries, Ltd. | | | 10,522,000 | | | | 42,311,290 | |
| | | | | | | | |
| | | | | | | 226,619,239 | |
| | | | | | | | |
| | | | | | | | |
Professional Services: 4.1% | | | | | | | | |
TechnoPro Holdings, Inc.† | | | 2,312,000 | | | | 71,991,926 | |
Nomura Co., Ltd. | | | 2,405,500 | | | | 36,114,885 | |
Benefit One, Inc. | | | 939,100 | | | | 28,120,014 | |
| | | | | | | | |
| | | | | | | 136,226,825 | |
| | | | | | | | |
| | | | | | | | |
Electrical Equipment: 3.8% | | | | | | | | |
Nidec Corp. | | | 899,100 | | | | 68,442,209 | |
Mabuchi Motor Co., Ltd. | | | 1,397,500 | | | | 59,190,757 | |
| | | | | | | | |
| | | | | | | 127,632,966 | |
| | | | | | | | |
| | | | | | | | |
Trading Companies & Distributors: 3.8% | | | | | | | | |
MISUMI Group, Inc. | | | 4,725,000 | | | | 85,308,530 | |
MonotaRO Co., Ltd. | | | 1,259,700 | | | | 41,646,874 | |
| | | | | | | | |
| | | | | | | 126,955,404 | |
| | | | | | | | |
| | | | | | | | |
Building Products: 2.3% | | | | | | | | |
Daikin Industries, Ltd. | | | 504,500 | | | | 42,400,590 | |
Aica Kogyo Co., Ltd. | | | 1,557,600 | | | | 35,596,347 | |
| | | | | | | | |
| | | | | | | 77,996,937 | |
| | | | | | | | |
| | | | | | | | |
Road & Rail: 1.1% | | | | | | | | |
Trancom Co., Ltd.† | | | 547,500 | | | | 36,137,592 | |
| | | | | | | | |
| | | | | | | | |
Air Freight & Logistics: 0.0% | | | | | | | | |
AIT Corp. | | | 26,600 | | | | 215,445 | |
| | | | | | | | |
Total Industrials | | | | | | | 731,784,408 | |
| | | | | | | | |
| | | | | | | | |
| CONSUMER DISCRETIONARY: 19.3% | | | | | | | | |
Specialty Retail: 4.0% | | | | | | | | |
Nitori Holdings Co., Ltd. | | | 665,000 | | | | 80,653,912 | |
VT Holdings Co., Ltd. | | | 5,505,300 | | | | 25,240,101 | |
Sac’s Bar Holdings, Inc.† | | | 1,810,350 | | | | 17,710,741 | |
Workman Co., Ltd. | | | 342,000 | | | | 11,490,542 | |
| | | | | | | | |
| | | | | | | 135,095,296 | |
| | | | | | | | |
| | | | | | | | |
Household Durables: 2.9% | | | | | | | | |
Fujitsu General, Ltd. | | | 2,716,000 | | | | 60,492,807 | |
Casio Computer Co., Ltd. | | | 2,656,300 | | | | 38,251,341 | |
| | | | | | | | |
| | | | | | | 98,744,148 | |
| | | | | | | | |
| | | | | | | | |
Internet & Catalog Retail: 2.8% | | | | | | | | |
Start Today Co., Ltd. | | | 1,765,200 | | | | 93,306,135 | |
| | | | | | | | |
| | | | | | | | |
Multiline Retail: 2.4% | | | | | | | | |
Ryohin Keikaku Co., Ltd. | | | 328,700 | | | | 80,103,403 | |
| | | | | | | | |
| | | | | | | | |
Hotels, Restaurants & Leisure: 1.6% | | | | | | | | |
Kyoritsu Maintenance Co., Ltd. | | | 809,700 | | | | 54,223,992 | |
| | | | | | | | |
| | | | | | | | |
Media: 1.5% | | | | | | | | |
Next Co., Ltd. | | | 5,760,000 | | | | 51,552,944 | |
| | | | | | | | |
| | | | | | | | |
Automobiles: 1.5% | | | | | | | | |
Toyota Motor Corp. | | | 1,003,200 | | | | 49,456,293 | |
| | | | | | | | |
| | | | | | | | |
| | | | | | | | |
| | | Shares | | | Value | |
Auto Components: 1.4% | | | | | | | | |
Nifco, Inc. | | | 891,500 | | | | $46,743,478 | |
| | | | | | | | |
| | | | | | | | |
Distributors: 1.2% | | | | | | | | |
Doshisha Co., Ltd.† | | | 2,092,800 | | | | 40,205,827 | |
| | | | | | | | |
Total Consumer Discretionary | | | | | | | 649,431,516 | |
| | | | | | | | |
| | | | | | | | |
| CONSUMER STAPLES: 17.3% | | | | | | | | |
Food & Staples Retailing: 6.6% | | | | | | | | |
Seven & I Holdings Co., Ltd. | | | 1,691,800 | | | | 70,933,983 | |
Sundrug Co., Ltd. | | | 667,700 | | | | 62,693,687 | |
San-A Co., Ltd. | | | 1,052,400 | | | | 51,933,117 | |
Cosmos Pharmaceutical Corp. | | | 173,100 | | | | 34,877,288 | |
| | | | | | | | |
| | | | | | | 220,438,075 | |
| | | | | | | | |
| | | | | | | | |
Food Products: 3.1% | | | | | | | | |
Calbee, Inc. | | | 1,624,100 | | | | 67,945,749 | |
Ariake Japan Co., Ltd. | | | 635,100 | | | | 37,811,248 | |
| | | | | | | | |
| | | | | | | 105,756,997 | |
| | | | | | | | |
| | | | | | | | |
Personal Products: 3.0% | | | | | | | | |
Kao Corp. | | | 1,703,000 | | | | 99,186,395 | |
| | | | | | | | |
| | | | | | | | |
Household Products: 2.4% | | | | | | | | |
Pigeon Corp. | | | 2,724,700 | | | | 81,453,446 | |
| | | | | | | | |
| | | | | | | | |
Tobacco: 2.2% | | | | | | | | |
Japan Tobacco, Inc. | | | 1,851,100 | | | | 74,603,409 | |
| | | | | | | | |
Total Consumer Staples | | | | | | | 581,438,322 | |
| | | | | | | | |
| | | | | | | | |
| FINANCIALS: 14.2% | | | | | | | | |
Diversified Financial Services: 7.5% | | | | | | | | |
ORIX Corp. | | | 6,364,300 | | | | 82,357,012 | |
Zenkoku Hosho Co., Ltd. | | | 1,471,600 | | | | 53,749,499 | |
Financial Products Group Co., Ltd.† | | | 4,966,900 | | | | 51,275,622 | |
Century Tokyo Leasing Corp. | | | 1,267,200 | | | | 41,010,680 | |
eGuarantee, Inc.† | | | 800,000 | | | | 25,442,790 | |
| | | | | | | | |
| | | | | | | 253,835,603 | |
| | | | | | | | |
| | | | | | | | |
Insurance: 2.5% | | | | | | | | |
Tokio Marine Holdings, Inc. | | | 2,562,200 | | | | 85,298,420 | |
| | | | | | | | |
| | | | | | | | |
Capital Markets: 2.4% | | | | | | | | |
Nihon M&A Center, Inc. | | | 1,220,900 | | | | 79,298,551 | |
| | | | | | | | |
| | | | | | | | |
Real Estate Management & Development: 1.8% | |
Relo Group, Inc. | | | 335,700 | | | | 59,416,405 | |
| | | | | | | | |
Total Financials | | | | | | | 477,848,979 | |
| | | | | | | | |
| | | | | | | | |
| HEALTH CARE: 12.0% | | | | | | | | |
Health Care Equipment & Supplies: 9.1% | | | | | | | | |
Asahi Intecc Co., Ltd. | | | 1,578,300 | | | | 77,125,884 | |
Sysmex Corp. | | | 1,107,200 | | | | 76,240,104 | |
Hoya Corp. | | | 1,975,900 | | | | 70,571,230 | |
CYBERDYNE, Inc.b | | | 3,062,900 | | | | 69,038,991 | |
Daiken Medical Co., Ltd.† | | | 1,755,200 | | | | 13,349,807 | |
| | | | | | | | |
| | | | | | | 306,326,016 | |
| | | | | | | | |
| | | | | | | | |
Health Care Technology: 2.9% | | | | | | | | |
M3, Inc. | | | 2,816,600 | | | | 98,299,295 | |
| | | | | | | | |
| | | | | | | | |
Health Care Providers & Services: 0.0% | | | | | | | | |
WIN-Partners Co., Ltd. | | | 52,600 | | | | 723,341 | |
| | | | | | | | |
Total Health Care | | | | | | | 405,348,652 | |
| | | | | | | | |
| | | | |
| matthewsasia.com | 800.789.ASIA | | | 73 | |
Matthews Japan Fund
June 30, 2016
Schedule of Investmentsa (unaudited) (continued)
COMMON EQUITIES: JAPAN (continued)
| | | | | | | | |
| | | Shares | | | Value | |
| INFORMATION TECHNOLOGY: 10.4% | | | | | | | | |
Electronic Equipment, Instruments & Components: 4.2% | |
Keyence Corp. | | | 117,400 | | | | $80,105,371 | |
Murata Manufacturing Co., Ltd. | | | 532,400 | | | | 59,689,839 | |
| | | | | | | | |
| | | | | | | 139,795,210 | |
| | | | | | | | |
Internet Software & Services: 4.0% | | | | | | | | |
Kakaku.com, Inc. | | | 3,279,800 | | | | 65,168,592 | |
DeNA Co., Ltd. | | | 1,508,900 | | | | 35,298,470 | |
Infomart Corp.† | | | 3,737,500 | | | | 34,224,891 | |
| | | | | | | | |
| | | | | | | 134,691,953 | |
| | | | | | | | |
Software: 1.6% | | | | | | | | |
NSD Co., Ltd. | | | 2,150,500 | | | | 34,263,924 | |
Broadleaf Co., Ltd.† | | | 2,162,000 | | | | 19,925,737 | |
| | | | | | | | |
| | | | | | | 54,189,661 | |
| | | | | | | | |
Technology Hardware, Storage & Peripherals: 0.6% | |
Elecom Co., Ltd. | | | 1,039,600 | | | | 21,619,152 | |
| | | | | | | | |
Total Information Technology | | | | | | | 350,295,976 | |
| | | | | | | | |
| | | | | | | | |
| MATERIALS: 1.5% | | | | | | | | |
Chemicals: 1.5% | | | | | | | | |
MORESCO Corp. | | | 318,200 | | | | 3,402,573 | |
W-Scope Corp.† | | | 1,999,600 | | | | 47,302,919 | |
| | | | | | | | |
Total Materials | | | | | | | 50,705,492 | |
| | | | | | | | |
| | | | | | | | |
| TOTAL INVESTMENTS: 96.5% | | | | | | | 3,246,853,345 | |
(Cost $2,806,633,772c) | | | | | | | | |
| | | | | | | | |
CASH AND OTHER ASSETS,
LESS LIABILITIES: 3.5% | | | | | | | 116,143,653 | |
| | | | | | | | |
| | |
NET ASSETS: 100.0% | | | | | | | $3,362,996,998 | |
| | | | | | | | |
| a | Certain securities were fair valued under the valuation polices approved by the Board of Trustees (Note 2-A). |
| b | Non-income producing security. |
| c | Cost for federal income tax purposes is $2,806,865,602 and net unrealized appreciation consists of: |
| | | | |
Gross unrealized appreciation | | | $545,711,029 | |
Gross unrealized depreciation | | | (105,723,286 | ) |
| | | | |
Net unrealized appreciation | | | $439,987,743 | |
| | | | |
| † | Affiliated Issuer, as defined under the Investment Company Act of 1940 (ownership of 5% or more of the outstanding voting securities of this issuer) |
See accompanying notes to financial statements.
| | | | |
| PORTFOLIO MANAGERS |
| Michael J. Oh, CFA | | | | |
Lead Manager | | | | |
| Michael B. Han, CFA | | |
Co-Manager | | | | |
| | | | |
|
| FUND FACTS |
| | | Investor | | Institutional |
Ticker | | MAKOX | | MIKOX |
CUSIP | | 577130305 | | 577130826 |
Inception | | 1/3/95 | | 10/29/10 |
NAV | | $6.13 | | $6.17 |
Initial Investment | | $2,500 | | $3 million |
Gross Expense Ratio1 | | 1.10% | | 0.93% |
Portfolio Statistics |
Total # of Positions | | 53 |
Net Assets | | $163.9 million |
Weighted Average
Market Cap | | $28.3 billion |
Portfolio Turnover2 | | 20.36% |
Benchmark |
Korea Composite Stock Price Index |
OBJECTIVE
Long-term capital appreciation.
STRATEGY
Under normal market conditions, the Fund seeks to achieve its investment objective by investing at least 80% of its total net assets, which include borrowings for investment purposes, in the common and preferred stocks of companies located in South Korea.
Matthews Korea Fund
Portfolio Manager Commentary (unaudited)
For the first half of 2016, the Matthews Korea Fund returned –0.33% (Investor Class) and –0.16% (Institutional Class) while its benchmark, the Korea Composite Stock Price Index*, returned 2.74%. For the quarter ending June 30, the Fund returned 0.16% (Investor Class) and 0.33% (Institutional Class) while its benchmark returned –2.12%.
Market Environment:
The Korean market performed reasonably well given the macroeconomic uncertainties stemming from slowing growth in China and the unexpected result of Britain’s referendum vote to leave the European Union. Even as global market volatility picked up and North Korea continued to test long-range missiles, Korean markets remained relatively calm. However, overall, exports continued to decline during the first half of the year mostly due to the slowing global economy. Imports fell more than exports resulting in a positive trade surplus.
Performance Contributors and Detractors:
LG Household & Health Care was the best performer during the first half of the year. The firm benefited from rising popularity for its cosmetics line among Chinese consumers. South Korean cosmetics are among the most popularly purchased products by Chinese tourists to South Korea. While LG has strong cosmetics brands, it also has broader personal care product brands that may be launched in China and other Asian markets in the future. Samsung Electronics was another strong performer for both the year-to-date and second quarter periods. Samsung’s new display technology—organic light-emitting diode (OLED)—is expected to replace the existing liquid crystal display (LCD) used in most smartphones today. Samsung is a few years ahead of its competitors in the OLED market, and we expect it will lead this space over the next few years. The firm also strengthened its position in the memory semiconductor industry with a newer chip design that improves product capacity but concurrently lowers production cost.
During the first half of the year, LG Chem was among the worst performers. While LG Chem’s traditional petrochemical business has been doing well, its battery business has been hurt by an uncertain outlook in China. The Chinese government has suspended Korean battery makers from participating in China’s electric vehicle subsidy program, which has caused the stock to underperform. Despite the uncertainty regarding its battery business in China, current valuations remain attractive, even excluding LG Chem’s battery business. The firm’s competitive position in batteries remains strong outside China.
We have traditionally been underweight the industrials and materials sectors in the portfolio, and that hurt the Fund’s relative performance in the first half of the year as such sectors rallied on the back of recovering commodity prices. However, we continue to underweight these sectors relative to the benchmark as we prefer to search for companies with sustainable business models and capable management teams.
Notable Portfolio Changes:
We added to our position in Samsung Electronics as we see OLED entering into a multi-year growth phase and we have seen Samsung’s position in the memory semiconductor industry strengthen. Samsung’s smartphone business also started to recover as the industry entered into a consolidation stage. We also increased the portfolio’s exposure to SK Hynix, a memory semiconductor supplier, as valuations for the stock had become attractive, and we believe that the fundamental competitive landscape has improved for existing companies.
| * | Korea Composite Stock Price Index performance data may be readjusted periodically by the Korea Exchange due to certain factors, including the declaration of dividends. |
(continued)
| 1 | Prospectus expense ratios. |
| 2 | The lesser of fiscal year 2015 long-term purchase costs or sales proceeds divided by the average monthly market value of long-term securities. |
| | | | |
| matthewsasia.com | 800.789.ASIA | | | 75 | |
| | | | | | | | | | | | | | | | | | | | | | | | | | | | | | | | |
| | | | | | | | |
| PERFORMANCE AS OF JUNE 30, 2016 | | | | | | | | | | | | | | | | | | | | | | |
| | | | | | | | | | | | Average Annual Total Returns | | | | |
| | | 3 Months | | | YTD | | | 1 Year | | | 3 Years | | | 5 Years | | | 10 Years | | | Since
Inception | | | Inception
Date | |
Investor Class (MAKOX) | | | 0.16% | | | | -0.33% | | | | -0.83% | | | | 11.32% | | | | 6.09% | | | | 6.41% | | | | 6.13% | | | | 1/3/95 | |
Institutional Class (MIKOX) | | | 0.33% | | | | -0.16% | | | | -0.65% | | | | 11.52% | | | | 6.24% | | | | n.a. | | | | 8.58% | | | | 10/29/10 | |
Korea Composite Stock Price Index3 | | | -2.12% | | | | 2.74% | | | | -6.35% | | | | 3.00% | | | | -1.46% | | | | 3.82% | | | | 2.79% | 4 | | | | |
Lipper Pacific ex Japan Funds Category Average5 | | | 1.49% | | | | 2.44% | | | | -7.73% | | | | 2.81% | | | | 0.84% | | | | 5.79% | | | | 5.92% | 4 | | | | |
Performance assumes reinvestment of all dividends and/or distributions before taxes. All performance quoted represents past performance and is no guarantee of future results. Investment return and principal value will fluctuate with market conditions so that when redeemed, shares may be worth more or less than their original cost. Current performance may be lower or higher than the return figures quoted. For the Fund’s most recent month-end performance, visit matthewsasia.com.
GROWTH OF A $10,000 INVESTMENT SINCE INCEPTION—INVESTOR CLASS
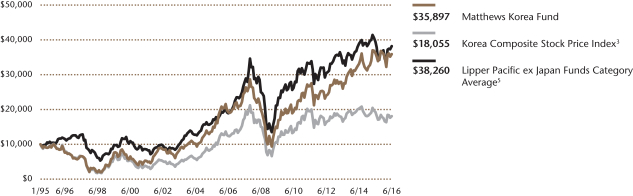
Plotted monthly. The performance data and graph do not reflect the deduction of taxes that a shareholder would pay on dividends, capital gains distributions or redemption of Fund shares. Values are in US$.
| | 3 | Korea Composite Stock Price Index performance data may be readjusted periodically by the Korea Exchange due to certain factors, including the declaration of dividends. It is not possible to invest directly in an index. Source: Index data from Morgan Stanley Capital International and Bloomberg; total return calculations performed by BNY Mellon Investment Servicing (US) Inc. Please see page 91 for index definition. |
| | 5 | The Lipper Category Average does not reflect sales charges and is based on total return, including reinvestment of dividends and capital gains for the stated periods. |
| | | | | | | | |
| | | | |
| TOP TEN HOLDINGS6 | | | | | | | |
| | | Sector | | | | % of Net Assets | |
| Samsung Electronics Co., Ltd., Pfd. | | Information Technology | | | | | 5.8% | |
| LG Household & Health Care, Ltd., Pfd. | | Consumer Staples | | | | | 5.2% | |
| Samsung Electronics Co., Ltd. | | Information Technology | | | | | 4.7% | |
| Shinhan Financial Group Co., Ltd. | | Financials | | | | | 3.6% | |
| Amorepacific Corp., Pfd. | | Consumer Staples | | | | | 3.5% | |
| Samsung Fire & Marine Insurance Co., Ltd., Pfd. | | Financials | | | | | 3.4% | |
| BGF Retail Co., Ltd. | | Consumer Staples | | | | | 3.2% | |
| Naver Corp. | | Information Technology | | | | | 3.0% | |
| Dongbu Insurance Co., Ltd. | | Financials | | | | | 2.9% | |
| Hyundai Mobis Co., Ltd. | | Consumer Discretionary | | | | | 2.8% | |
| % OF ASSETS IN TOP TEN | | | | | | | 38.1% | |
| | 6 | Holdings may combine more than one security from same issuer and related depositary receipts. |
Matthews Korea Fund
Portfolio Manager Commentary (unaudited) (continued)
Outlook:
The Korean market continues to be resilient on the back of global macro uncertainties stemming from the Brexit vote. Japan’s yen has strengthened more than 15% this year while the Korean won gained only about 1%, which has improved sentiment among Korea’s export industry. We expect Korea to remain relatively resilient given Korean corporates’ sound balance sheet. We continue to search for companies with sustainable business models and capable management that stand to benefit from Korea’s and the region’s rising disposable income and changing lifestyle.
| | | | |
| |
| SECTOR ALLOCATION (%)7 | |
| Consumer Staples | | | 22.6 | |
| Consumer Discretionary | | | 21.2 | |
| Financials | | | 19.3 | |
| Information Technology | | | 18.1 | |
| Materials | | | 5.7 | |
| Health Care | | | 5.3 | |
| Telecommunication Services | | | 4.0 | |
| Energy | | | 3.4 | |
| Industrials | | | 3.2 | |
| Liabilities in Excess of Cash and Other Assets | | | -2.8 | |
| | | | |
| |
| MARKET CAP EXPOSURE (%)7 | |
| Mega Cap (over $25B) | | | 12.7 | |
| Large Cap ($10B–$25B) | | | 37.1 | |
| Mid Cap ($3B–10B) | | | 22.1 | |
| Small Cap (under $3B) | | | 30.9 | |
| Liabilities in Excess of Cash and Other Assets | | | -2.8 | |
| 7 | Source: FactSet Research Systems. Percentage values in data are rounded to the nearest tenth of one percent; the values may not sum to 100% due to rounding. |
| | | | |
| matthewsasia.com | 800.789.ASIA | | | 77 | |
Matthews Korea Fund
June 30, 2016
Schedule of Investmentsa (unaudited)
COMMON EQUITIES: SOUTH KOREA: 77.2%
| | | | | | | | |
| | | Shares | | | Value | |
| CONSUMER DISCRETIONARY: 19.1% | | | | | | | | |
Auto Components: 5.4% | | | | | | | | |
Hyundai Mobis Co., Ltd. | | | 20,551 | | | | $4,521,290 | |
Hankook Tire Co., Ltd. | | | 98,194 | | | | 4,368,689 | |
| | | | | | | | |
| | | | | | | 8,889,979 | |
| | | | | | | | |
| | | | | | | | |
Hotels, Restaurants & Leisure: 5.1% | | | | | | | | |
Kangwon Land, Inc. | | | 115,477 | | | | 4,190,088 | |
Modetour Network, Inc. | | | 173,431 | | | | 4,186,133 | |
| | | | | | | | |
| | | | | | | 8,376,221 | |
| | | | | | | | |
| | | | | | | | |
Media: 2.8% | | | | | | | | |
Innocean Worldwide, Inc. | | | 39,601 | | | | 2,804,431 | |
CJ CGV Co., Ltd. | | | 18,344 | | | | 1,662,947 | |
| | | | | | | | |
| | | | | | | 4,467,378 | |
| | | | | | | | |
| | | | | | | | |
Specialty Retail: 2.7% | | | | | | | | |
Hotel Shilla Co., Ltd. | | | 39,910 | | | | 2,367,906 | |
LOTTE Himart Co., Ltd. | | | 50,482 | | | | 2,032,273 | |
| | | | | | | | |
| | | | | | | 4,400,179 | |
| | | | | | | | |
| | | | | | | | |
Automobiles: 1.6% | | | | | | | | |
Kia Motors Corp. | | | 70,459 | | | | 2,654,853 | |
| | | | | | | | |
| | | | | | | | |
Multiline Retail: 1.5% | | | | | | | | |
Hyundai Department Store Co., Ltd. | | | 22,042 | | | | 2,479,752 | |
| | | | | | | | |
Total Consumer Discretionary | | | | | | | 31,268,362 | |
| | | | | | | | |
| | | | | | | | |
| FINANCIALS: 15.9% | | | | | | | | |
Banks: 7.5% | | | | | | | | |
Shinhan Financial Group Co., Ltd. | | | 179,704 | | | | 5,906,692 | |
KB Financial Group, Inc. | | | 88,657 | | | | 2,521,047 | |
Hana Financial Group, Inc. | | | 109,716 | | | | 2,230,624 | |
DGB Financial Group, Inc. | | | 219,295 | | | | 1,660,572 | |
| | | | | | | | |
| | | | | | | 12,318,935 | |
| | | | | | | | |
| | | | | | | | |
Capital Markets: 4.3% | | | | | | | | |
Shinyoung Securities Co., Ltd. | | | 85,208 | | | | 3,698,733 | |
Kiwoom Securities Co., Ltd. | | | 52,812 | | | | 3,304,826 | |
| | | | | | | | |
| | | | | | | 7,003,559 | |
| | | | | | | | |
| | | | | | | | |
Insurance: 4.1% | | | | | | | | |
Dongbu Insurance Co., Ltd. | | | 78,974 | | | | 4,753,488 | |
Samsung Fire & Marine Insurance Co., Ltd. | | | 8,486 | | | | 1,949,064 | |
| | | | | | | | |
| | | | | | | 6,702,552 | |
| | | | | | | | |
Total Financials | | | | | | | 26,025,046 | |
| | | | | | | | |
| | | | | | | | |
| CONSUMER STAPLES: 13.1% | | | | | | | | |
Food Products: 6.4% | | | | | | | | |
Orion Corp. | | | 4,706 | | | | 3,862,801 | |
Binggrae Co., Ltd. | | | 41,850 | | | | 2,468,130 | |
Daesang Corp. | | | 93,319 | | | | 2,243,847 | |
Ottogi Corp. | | | 2,692 | | | | 1,932,237 | |
| | | | | | | | |
| | | | | | | 10,507,015 | |
| | | | | | | | |
| | | | | | | | |
Food & Staples Retailing: 5.0% | | | | | | | | |
BGF Retail Co., Ltd. | | | 28,429 | | | | 5,293,330 | |
Hyundai Greenfood Co., Ltd. | | | 179,318 | | | | 2,908,891 | |
| | | | | | | | |
| | | | | | | 8,202,221 | |
| | | | | | | | |
| | | | | | | | |
| | | | | | | | |
| | | Shares | | | Value | |
Personal Products: 1.7% | | | | | | | | |
LG Household & Health Care, Ltd. | | | 2,930 | | | | $2,861,308 | |
| | | | | | | | |
Total Consumer Staples | | | | | | | 21,570,544 | |
| | | | | | | | |
| | | | | | | | |
| INFORMATION TECHNOLOGY: 11.5% | | | | | | | | |
Technology Hardware, Storage & Peripherals: 4.7% | | | | | |
Samsung Electronics Co., Ltd. | | | 6,145 | | | | 7,652,684 | |
| | | | | | | | |
| | | | | | | | |
Semiconductors & Semiconductor Equipment: 3.6% | | | | | |
SK Hynix, Inc. | | | 110,913 | | | | 3,156,250 | |
Koh Young Technology, Inc. | | | 38,878 | | | | 1,388,871 | |
Silicon Works Co., Ltd. | | | 46,849 | | | | 1,353,676 | |
| | | | | | | | |
| | | | | | | 5,898,797 | |
| | | | | | | | |
| | | | | | | | |
Internet Software & Services: 3.0% | | | | | | | | |
Naver Corp. | | | 8,027 | | | | 4,972,856 | |
| | | | | | | | |
| | | | | | | | |
Electronic Equipment, Instruments & Components: 0.2% | |
Bixolon Co., Ltd. | | | 27,282 | | | | 331,636 | |
| | | | | | | | |
Total Information Technology | | | | | | | 18,855,973 | |
| | | | | | | | |
| | | | | | | | |
| HEALTH CARE: 5.3% | | | | | | | | |
Pharmaceuticals: 4.5% | | | | | | | | |
Yuhan Corp. | | | 11,775 | | | | 3,146,618 | |
Dong-A ST Co., Ltd. | | | 23,211 | | | | 2,750,713 | |
DongKook Pharmaceutical Co., Ltd. | | | 24,611 | | | | 1,546,022 | |
| | | | | | | | |
| | | | | | | 7,443,353 | |
| | | | | | | | |
| | | | | | | | |
Biotechnology: 0.8% | | | | | | | | |
Hugel, Inc.b | | | 4,507 | | | | 1,250,204 | |
| | | | | | | | |
Total Health Care | | | | | | | 8,693,557 | |
| | | | | | | | |
| | | | | | | | |
| TELECOMMUNICATION SERVICES: 4.0% | | | | | | | | |
Wireless Telecommunication Services: 2.5% | | | | | | | | |
SK Telecom Co., Ltd. ADR | | | 193,700 | | | | 4,052,204 | |
| | | | | | | | |
| | | | | | | | |
Diversified Telecommunication Services: 1.5% | | | | | | | | |
KT Corp. ADR | | | 177,000 | | | | 2,524,020 | |
| | | | | | | | |
Total Telecommunication Services | | | | | | | 6,576,224 | |
| | | | | | | | |
| | | | | | | | |
| INDUSTRIALS: 3.1% | | | | | | | | |
Commercial Services & Supplies: 1.2% | | | | | | | | |
KEPCO Plant Service & Engineering Co., Ltd. | | | 36,538 | | | | 2,065,758 | |
| | | | | | | | |
| | | | | | | | |
Machinery: 1.1% | | | | | | | | |
Hy-Lok Corp. | | | 90,946 | | | | 1,754,462 | |
| | | | | | | | |
| | | | | | | | |
Professional Services: 0.8% | | | | | | | | |
SaraminHR Co., Ltd. | | | 103,858 | | | | 1,356,210 | |
| | | | | | | | |
Total Industrials | | | | | | | 5,176,430 | |
| | | | | | | | |
| | | | | | | | |
| MATERIALS: 3.0% | | | | | | | | |
Metals & Mining: 1.9% | | | | | | | | |
Korea Zinc Co., Ltd. | | | 7,069 | | | | 3,134,744 | |
| | | | | | | | |
| | | | | | | | |
Chemicals: 1.1% | | | | | | | | |
LG Chem, Ltd. | | | 7,615 | | | | 1,739,028 | |
| | | | | | | | |
Total Materials | | | | | | | 4,873,772 | |
| | | | | | | | |
| | | | | | | | |
Matthews Korea Fund
June 30, 2016
Schedule of Investmentsa (unaudited) (continued)
COMMON EQUITIES: SOUTH KOREA (continued)
| | | | | | | | |
| | | Shares | | | Value | |
| ENERGY: 2.2% | | | | | | | | |
Oil, Gas & Consumable Fuels: 2.2% | | | | | | | | |
SK Innovation Co., Ltd. | | | 17,993 | | | | $2,216,994 | |
S-Oil Corp. | | | 20,074 | | | | 1,330,287 | |
| | | | | | | | |
Total Energy | | | | | | | 3,547,281 | |
| | | | | | | | |
| | | | | | | | |
| TOTAL COMMON EQUITIES | | | | 126,587,189 | |
| | | | | | | | |
(Cost $87,943,633) | | | | | |
| | | | | | | | |
PREFERRED EQUITIES: SOUTH KOREA: 25.6% | | | | | |
| CONSUMER STAPLES: 9.4% | | | | | | | | |
Personal Products: 9.4% | |
LG Household & Health Care, Ltd., Pfd. | | | 14,842 | | | | 8,546,516 | |
Amorepacific Corp., Pfd. | | | 26,587 | | | | 5,739,938 | |
AMOREPACIFIC Group, Pfd. | | | 17,463 | | | | 1,190,072 | |
| | | | | | | | |
Total Consumer Staples | | | | | | | 15,476,526 | |
| | | | | | | | |
| | | | | | | | |
| INFORMATION TECHNOLOGY: 6.6% | | | | | | | | |
Technology Hardware, Storage & Peripherals: 5.9% | | | | | |
Samsung Electronics Co., Ltd., Pfd. | | | 9,286 | | | | 9,579,322 | |
| | | | | | | | |
| | | | | | | | |
Electronic Equipment, Instruments & Components: 0.7% | |
Samsung SDI Co., Ltd., Pfd. | | | 21,382 | | | | 1,152,361 | |
| | | | | | | | |
Total Information Technology | | | | | | | 10,731,683 | |
| | | | | | | | |
| | | | | | | | |
| FINANCIALS: 3.4% | | | | | | | | |
Insurance: 3.4% | | | | | | | | |
Samsung Fire & Marine Insurance Co., Ltd., Pfd. | | | 36,454 | | | | 5,528,179 | |
| | | | | | | | |
Total Financials | | | | | | | 5,528,179 | |
| | | | | | | | |
| | | | | | | | |
| MATERIALS: 2.7% | | | | | | | | |
Chemicals: 2.7% | | | | | | | | |
LG Chem, Ltd., Pfd. | | | 26,648 | | | | 4,448,246 | |
| | | | | | | | |
Total Materials | | | | | | | 4,448,246 | |
| | | | | | | | |
| | | | | | | | |
| CONSUMER DISCRETIONARY: 2.1% | | | | | | | | |
Automobiles: 2.1% | | | | | | | | |
Hyundai Motor Co., Ltd., 2nd Pfd. | | | 41,663 | | | | 3,499,209 | |
| | | | | | | | |
Total Consumer Discretionary | | | | | | | 3,499,209 | |
| | | | | | | | |
| | | | | | | | |
| | | | | | | | |
| | | Shares | | | Value | |
| ENERGY: 1.4% | | | | | | | | |
Oil, Gas & Consumable Fuels: 1.4% | | | | | | | | |
S-Oil Corp., Pfd. | | | 50,188 | | | | $2,260,043 | |
| | | | | | | | |
Total Energy | | | | | | | 2,260,043 | |
| | | | | | | | |
| | | | | | | | |
| TOTAL PREFERRED EQUITIES | | | | | | | 41,943,886 | |
| | | | | | | | |
(Cost $22,680,753) | | | | | | | | |
| | | | | | | | |
| TOTAL INVESTMENTS: 102.8% | | | | | | | 168,531,075 | |
(Cost $110,624,386c) | | | | | | | | |
| | | | | | | | |
| LIABILITIES IN EXCESS OF CASH AND OTHER ASSETS: (2.8%) | | | | | | | (4,662,067 | ) |
| | | | | | | | |
| | |
NET ASSETS: 100.0% | | | | | | | $163,869,008 | |
| | | | | | | | |
| a | Certain securities were fair valued under the valuation polices approved by the Board of Trustees (Note 2-A). |
| b | Non-income producing security. |
| c | Cost for federal income tax purposes is $111,533,523 and net unrealized appreciation consists of: |
| | | | |
Gross unrealized appreciation | | | $61,498,809 | |
Gross unrealized depreciation | | | (4,501,257 | ) |
| | | | |
Net unrealized appreciation | | | $56,997,552 | |
| | | | |
| ADR | American Depositary Receipt |
See accompanying notes to financial statements.
| | | | |
| matthewsasia.com | 800.789.ASIA | | | 79 | |

| | | | |
| PORTFOLIO MANAGERS |
| Lydia So, CFA | | |
Lead Manager | | |
| Kenichi Amaki | | Beini Zhou, CFA |
Co-Manager | | Co-Manager |
| | | | |
|
| FUND FACTS |
| | | Investor | | Institutional |
Ticker | | MSMLX | | MISMX |
CUSIP | | 577125206 | | 577125867 |
Inception | | 9/15/08 | | 4/30/13 |
NAV | | $19.28 | | $19.29 |
Initial Investment | | $2,500 | | $3 million |
Gross Expense Ratio1 | | 1.48% | | 1.30% |
After Fee Waiver and Reimbursement2 | | 1.47% | | 1.25% |
Portfolio Statistics | | |
Total # of Positions | | 74 |
Net Assets | | $540.1 million |
Weighted Average
Market Cap | | $1.1 billion |
Portfolio Turnover3 | | 48.29% |
Benchmark | | |
MSCI AC Asia ex Japan Small Cap Index |
Redemption Fee | | |
2% within first 90 calendar days of purchase |
OBJECTIVE
Long-term capital appreciation.
STRATEGY
Under normal market conditions, the Fund seeks to achieve its investment objective by investing at least 80% of its total net assets, which include borrowings for investment purposes, in the common and preferred stocks of Small Companies located in Asia ex Japan, which consists of all countries and markets in Asia excluding Japan, but including all other developed, emerging and frontier countries and markets in the Asian region.
Matthews Asia Small Companies Fund
Portfolio Manager Commentary (unaudited)
For the first half of 2016, the Matthews Asia Small Companies Fund returned –0.67% (Investor Class) and –0.57% (Institutional Class) while its benchmark, the MSCI All Country Asia ex Japan Small Cap Index, returned –1.77%. For the quarter ending June 30, 2016, the Matthews Asia Small Companies Fund returned 0.52% (Investor Class) and 0.57% (Institutional Class), while its benchmark, the MSCI All Country Asia ex Japan Small Cap Index, returned –0.22%.
Market Environment:
After a roller-coaster ride to the start of the first quarter, equity markets continued to be sensitive to global macroeconomic events in the second quarter. The prospect of global deflation persisted while weak economic data released from China did not inspire confidence in a near-term economic rebound.
Toward the end of June, the United Kingdom passed a referendum to leave the European Union. The news sent global capital markets into panic mode as the event was unexpected, not priced in by markets and considered a “Black Swan” event. Although global equity markets stabilized in subsequent days, Brexit added more uncertainty to already fragile economic sentiment in Europe. Asian equity markets also sold off on the Brexit announcement but recovered somewhat in subsequent days as markets digested the news. Both the euro and British pound depreciated against the U.S. dollar following the Brexit announcement.
Performance Contributors and Detractors:
During the quarter, our Southeast Asian portfolio holdings, not including Malaysia, performed better relative to our holdings in North Asia. Holdings in information technology, materials, consumer staples and financials were positive contributors, whereas some holdings in consumer discretionary performed poorly. For example, China Distance Education, a Chinese internet-based education company, was the largest performance detractor. The company delivered below market expectation earnings results and a subdued growth outlook on the back of weak demand for test preparation courses for accounting and engineering in a slowing economy.
On the other hand, our long-term holdings in Sunny Optical Technology, ARA Asset Management and Fairwood Holdings performed well. These holdings were top contributors during the quarter thanks to strong operational performance that translated into solid earnings growth. It is encouraging to see these companies performing well in their respective industries in the midst of a slow-growth environment.
Notable Portfolio Changes:
We made a few adjustments to the portfolio during the quarter by shedding holdings that performed below our expectations. We exited Ipca Laboratories, an Indian pharmaceutical holding, due to concerns surrounding regulatory issues. The U.S. FDA issued warning letters to several of Ipca’s facilities, which would negatively affect the company’s ability to export its products to key markets. We feel that the resolution process could be time consuming and hence erode the company’s growth visibility.
(continued)
| 1 | Prospectus expense ratios. |
| 2 | Matthews has contractually agreed (i) to waive fees and reimburse expenses to the extent needed to limit Total Annual Fund Operating Expenses (excluding Rule 12b-1 fees, taxes, interest, brokerage commissions, short sale dividend expenses, expenses incurred in connection with any merger or reorganization or extraordinary expenses such as litigation) of the Institutional Class to 1.25% first by waiving class specific expenses (i.e., shareholder service fees specific to a particular class) of the Institutional Class and then, to the extent necessary, by waiving non-class specific expenses of the Institutional Class, and (ii) if any Fund-wide expenses (i.e., expenses that apply to both the Institutional Class and the Investor Class) are waived for the Institutional Class to maintain the 1.25% expense limitation, to waive an equal amount (in annual percentage terms) of those same expenses for the Investor Class. The Total Annual Fund Operating Expenses After Fee Waiver and Expense Reimbursement for the Investor Class may vary from year to year and will in some years exceed 1.25%. If the operating expenses fall below the expense limitation in a year within three years after Matthews has made a waiver or reimbursement, the Fund may reimburse Matthews up to an amount that does not cause the expenses for that year to exceed the lesser of (i) the expense limitation applicable at the time of that fee waiver and/or expense reimbursement or (ii) the expense limitation in effect at the time of recoupment. This agreement will remain in place until April 30, 2017 and may be terminated at any time by the Board of Trustees on behalf of the Fund on 60 days’ written notice to Matthews. |
| 3 | The lesser of fiscal year 2015 long-term purchase costs or sales proceeds divided by the average monthly market value of long-term securities. |
| | | | | | | | | | | | | | | | | | | | | | | | | | | | |
| | | | | | | | |
| PERFORMANCE AS OF JUNE 30, 2016 | | | | | | | | | | | | | | | | | | | | | |
| | | | | | | | | | | | Average Annual Total Returns | | | | |
| | | 3 Months | | | YTD | | | 1 Year | | | 3 Years | | | 5 Years | | | Since
Inception | | | Inception
Date | |
| Investor Class (MSMLX) | | | 0.52% | | | | -0.67% | | | | -15.10% | | | | 1.27% | | | | 0.73% | | | | 11.36% | | | | 9/15/2008 | |
| Institutional Class (MISMX) | | | 0.57% | | | | -0.57% | | | | -14.89% | | | | 1.50% | | | | n.a. | | | | 0.28% | | | | 4/30/2013 | |
| MSCI AC Asia ex Japan Small Cap Index4 | | | -0.22% | | | | -1.77% | | | | -14.70% | | | | 1.30% | | | | -0.57% | | | | 7.18% | 5 | | | | |
| Lipper Pacific ex Japan Funds Category Average6 | | | 1.49% | | | | 2.44% | | | | -7.73% | | | | 2.81% | | | | 0.84% | | | | 7.26% | 7 | | | | |
Performance assumes reinvestment of all dividends and/or distributions before taxes. All performance quoted represents past performance and is no guarantee of future results. Investment return and principal value will fluctuate with market conditions so that when redeemed, shares may be worth more or less than their original cost. Current performance may be lower or higher than the return figures quoted. Returns would have been lower if certain of the Fund’s fees and expenses had not been waived. For the Fund’s most recent month-end performance, visit matthewsasia.com.
GROWTH OF A $10,000 INVESTMENT SINCE INCEPTION—INVESTOR CLASS

Plotted monthly. The performance data does not reflect the deduction of taxes that a shareholder would pay on dividends, capital gains distributions or redemption of Fund shares. Values are in US$.
| | 4 | It is not possible to invest directly in an index. Source: Index data from Morgan Stanley Capital International and Bloomberg; total return calculations performed by BNY Mellon Investment Servicing (US) Inc. Please see page 91 for index definition. |
| | 5 | Calculated from 9/15/08. |
| | 6 | The Lipper Category Average does not reflect sales charges and is based on total return, including reinvestment of dividends and capital gains for the stated periods. |
| | 7 | Calculated from 9/30/08. |
| | | | | | | | |
| | | | |
| TOP TEN HOLDINGS8 | | | | | | | |
| | | Sector | | Country | | % of Net Assets | |
| Vitasoy International Holdings, Ltd. | | Consumer Staples | | China/Hong Kong | | | 2.8% | |
| Fairwood Holdings, Ltd. | | Consumer Discretionary | | China/Hong Kong | | | 2.7% | |
| PChome Online, Inc. | | Information Technology | | Taiwan | | | 2.5% | |
| Aerospace Industrial Development Corp. | | Industrials | | Taiwan | | | 2.3% | |
| ARA Asset Management, Ltd. | | Financials | | Singapore | | | 2.3% | |
| i-SENS, Inc. | | Health Care | | South Korea | | | 1.9% | |
| Value Partners Group, Ltd. | | Financials | | China/Hong Kong | | | 1.9% | |
| Clear Media, Ltd. | | Consumer Discretionary | | China/Hong Kong | | | 1.9% | |
| Lifetech Scientific Corp. | | Health Care | | China/Hong Kong | | | 1.9% | |
Delfi, Ltd. | | Consumer Staples | | Singapore | | | 1.8% | |
| % OF ASSETS IN TOP TEN | | | | | | | 22.0% | |
| | 8 | Holdings may combine more than one security from same issuer and related depositary receipts. |
| | | | |
| matthewsasia.com | 800.789.ASIA | | | 81 | |
| | | | |
| | |
| COUNTRY ALLOCATION (%)9,10 | | | |
| China/Hong Kong | | | 26.9 | |
| Taiwan | | | 14.8 | |
| South Korea | | | 13.5 | |
| India | | | 13.5 | |
| Thailand | | | 6.7 | |
| Singapore | | | 6.6 | |
| Indonesia | | | 6.2 | |
| Malaysia | | | 4.2 | |
| Philippines | | | 3.5 | |
| Vietnam | | | 0.8 | |
| Cash and Other Assets, Less Liabilities | | | 3.3 | |
| | | | |
| | |
| SECTOR ALLOCATION (%)10 | | | |
| Industrials | | | 20.7 | |
| Consumer Discretionary | | | 19.1 | |
| Information Technology | | | 14.8 | |
| Financials | | | 13.3 | |
| Consumer Staples | | | 13.1 | |
| Health Care | | | 11.6 | |
| Materials | | | 4.1 | |
| Cash and Other Assets, Less Liabilities | | | 3.3 | |
| | | | |
| | |
| MARKET CAP EXPOSURE (%)10,11 | | | |
| Mega Cap (over $25B) | | | 0.0 | |
| Large Cap ($10B–$25B) | | | 0.0 | |
| Mid Cap ($3B–10B) | | | 4.0 | |
| Small Cap (under $3B) | | | 92.7 | |
| Cash and Other Assets, Less Liabilities | | | 3.3 | |
| 9 | Not all countries where the Fund may invest are included in the benchmark index. |
| 10 | Source: FactSet Research Systems. Percentage values in data are rounded to the nearest tenth of one percent; the values may not sum to 100% due to rounding. |
| 11 | The Fund defines Small Companies as companies with market capitalization generally between $100 million and $3 billion or the largest company included in the Fund’s primary benchmark, the MSCI All Country Asia ex Japan Small Cap Index. |
Matthews Asia Small Companies Fund
Portfolio Manager Commentary (unaudited) (continued)
We initiated new positions in companies that, we believe, are beneficiaries of evolving consumption trends, including Macauto Industrial. The Taiwanese company is a manufacturer of automotive sunshades, which has been growing nicely due to the greater penetration of sunroofs in new cars and respectable profitability as a result of competitive cost structure and technologies. Another new addition to the portfolio was Yonwoo in South Korea. The company specializes in manufacturing packaging materials such as pumps and tubes for cosmetic companies in Korea and globally. We like Yonwoo’s focus on product quality, its close relationship with cosmetic brands and its prudent expansion plans. We believe the company should be well-positioned given the rising consumption of skin care and color cosmetic products in the emerging parts of Asia.
Outlook:
The uncertainty over Brexit’s political transmission mechanism will likely linger in the coming months. In addition, the anxiety surrounding the potential social and economic impact resulting from Brexit will continue to weigh on the economy and financial markets in the European region. Within Asia, companies that have meaningful exposure to European markets may face a more challenging operating environment and volatile currency movements.
From our portfolio’s perspective, we have a long-standing bias toward investing in companies that are beneficiaries of Asia’s domestic demand. To be fair, parts of Asia have also experienced their fair share of political issues and rising debt levels in recent years, thereby, dampening consumer sentiment and stock performance. Macroeconomic noise is beyond our control but sharp market corrections present a buying opportunity to invest in quality companies at more attractive valuations. We reiterate that Asia’s secular development of domestic service industries and the adoption of technologies in households and businesses present strong growth opportunities. We continue to have conviction in companies in our portfolio that are prudent capital allocators and are well-positioned to adapt to Asia’s dynamic consumption landscape.
Investing in small- and mid-size companies is more risky than investing in large companies as they may be more volatile and less liquid than larger companies.
Matthews Asia Small Companies Fund
June 30, 2016
Schedule of Investmentsa (unaudited)
COMMON EQUITIES: 96.7%
| | | | | | | | |
| | | Shares | | | Value | |
| CHINA/HONG KONG: 26.9% | | | | | | | | |
Vitasoy International Holdings, Ltd. | | | 8,458,000 | | | | $15,386,532 | |
Fairwood Holdings, Ltd. | | | 3,767,500 | | | | 14,589,660 | |
Value Partners Group, Ltd. | | | 11,123,000 | | | | 10,299,835 | |
Clear Media, Ltd. | | | 11,595,000 | | | | 10,134,686 | |
Lifetech Scientific Corp.b | | | 54,248,000 | | | | 10,112,933 | |
Sunny Optical Technology Group Co., Ltd. | | | 2,804,000 | | | | 9,872,459 | |
Bitauto Holdings, Ltd. ADRb | | | 339,300 | | | | 9,147,528 | |
SITC International Holdings Co., Ltd. | | | 15,951,000 | | | | 8,390,957 | |
Qingdao Port International Co., Ltd. H Shares | | | 17,665,000 | | | | 8,047,914 | |
Kerry Logistics Network, Ltd. | | | 6,012,500 | | | | 7,769,229 | |
51job, Inc. ADRb | | | 243,000 | | | | 7,122,330 | |
Best Pacific International Holdings, Ltd. H Shares | | | 9,110,000 | | | | 6,828,975 | |
eHi Car Services, Ltd. ADRb | | | 662,035 | | | | 6,693,174 | |
Genscript Biotech Corp.b | | | 38,918,000 | | | | 6,028,957 | |
Regina Miracle International Holdings, Ltd.b | | | 4,157,052 | | | | 5,516,389 | |
China Distance Education Holdings, Ltd. ADR | | | 508,400 | | | | 5,256,856 | |
YGM Trading, Ltd. | | | 5,383,000 | | | | 2,879,500 | |
IMAX China Holding, Inc.b | | | 208,000 | | | | 1,026,541 | |
| | | | | | | | |
Total China/Hong Kong | | | | | | | 145,104,455 | |
| | | | | | | | |
| | | | | | | | |
| TAIWAN: 14.8% | | | | | | | | |
PChome Online, Inc. | | | 1,228,241 | | | | 13,614,701 | |
Aerospace Industrial Development Corp. | | | 9,035,000 | | | | 12,393,075 | |
Merida Industry Co., Ltd. | | | 1,965,000 | | | | 8,319,829 | |
Adlink Technology, Inc. | | | 3,895,051 | | | | 8,094,116 | |
Sunny Friend Environmental Technology Co., Ltd. | | | 1,600,000 | | | | 7,580,130 | |
Addcn Technology Co., Ltd. | | | 1,019,500 | | | | 7,498,901 | |
Macauto Industrial Co., Ltd. | | | 1,234,000 | | | | 6,310,359 | |
Voltronic Power Technology Corp. | | | 406,848 | | | | 5,687,314 | |
FineTek Co., Ltd. | | | 1,862,940 | | | | 4,322,761 | |
Kerry TJ Logistics Co., Ltd. | | | 2,864,000 | | | | 3,762,747 | |
Poya International Co., Ltd. | | | 209,000 | | | | 2,330,667 | |
| | | | | | | | |
Total Taiwan | | | | | | | 79,914,600 | |
| | | | | | | | |
| | | | | | | | |
| SOUTH KOREA: 13.5% | | | | | | | | |
i-SENS, Inc.b | | | 324,337 | | | | 10,393,686 | |
NICE Holdings Co., Ltd. | | | 449,430 | | | | 8,141,328 | |
Yonwoo Co., Ltd.b | | | 167,375 | | | | 6,873,014 | |
Hy-Lok Corp. | | | 342,710 | | | | 6,611,304 | |
LIG Nex1 Co., Ltd. | | | 75,670 | | | | 6,430,211 | |
Value Added Technologies Co., Ltd. | | | 195,360 | | | | 6,408,705 | |
Silicon Works Co., Ltd. | | | 215,013 | | | | 6,212,681 | |
Interpark Corp. | | | 395,033 | | | | 5,689,540 | |
Dexter Studios Co., Ltd.b | | | 314,884 | | | | 5,574,104 | |
Cell Biotech Co., Ltd. | | | 104,679 | | | | 5,467,779 | |
Medy-Tox, Inc. | | | 14,135 | | | | 5,346,083 | |
| | | | | | | | |
Total South Korea | | | | | | | 73,148,435 | |
| | | | | | | | |
| | | | | | | | |
| | | | | | | | |
| | | Shares | | | Value | |
| INDIA: 13.5% | | | | | | | | |
GRUH Finance, Ltd. | | | 1,986,143 | | | | $8,462,166 | |
Supreme Industries, Ltd. | | | 586,973 | | | | 7,958,331 | |
Berger Paints India, Ltd. | | | 1,799,106 | | | | 7,381,556 | |
Bajaj Corp., Ltd. | | | 1,228,277 | | | | 7,086,537 | |
Mindtree, Ltd. | | | 710,104 | | | | 7,010,127 | |
AIA Engineering, Ltd. | | | 451,471 | | | | 6,894,827 | |
CRISIL, Ltd. | | | 219,411 | | | | 6,553,124 | |
Page Industries, Ltd. | | | 29,960 | | | | 6,234,259 | |
LA Opala RG, Ltd. | | | 645,536 | | | | 5,286,395 | |
Emami, Ltd. | | | 308,348 | | | | 5,040,350 | |
Gujarat Pipavav Port, Ltd.b | | | 2,036,929 | | | | 4,937,721 | |
| | | | | | | | |
Total India | | | | | | | 72,845,393 | |
| | | | | | | | |
| | | | | | | | |
| THAILAND: 6.7% | | | | | | | | |
KCE Electronics Public Co., Ltd. | | | 3,337,300 | | | | 7,935,166 | |
Supalai Public Co., Ltd. | | | 10,179,500 | | | | 6,940,906 | |
Bangkok Chain Hospital Public Co., Ltd. | | | 18,966,275 | | | | 6,708,750 | |
Aeon Thana Sinsap Thailand Public Co., Ltd. | | | 2,234,400 | | | | 6,120,120 | |
Forth Smart Service Public Co., Ltd. | | | 10,620,000 | | | | 4,842,993 | |
Plan B Media Public Co., Ltd. F Shares | | | 22,287,900 | | | | 3,370,244 | |
Aeon Thana Sinsap Thailand Public Co., Ltd. NVDR | | | 88,700 | | | | 242,953 | |
| | | | | | | | |
Total Thailand | | | | | | | 36,161,132 | |
| | | | | | | | |
| | | | | | | | |
| SINGAPORE: 6.6% | | | | | | | | |
ARA Asset Management, Ltd. | | | 11,869,818 | | | | 12,175,459 | |
Delfi, Ltd. | | | 4,597,600 | | | | 9,937,947 | |
Raffles Medical Group, Ltd. | | | 7,021,000 | | | | 7,884,191 | |
iFAST Corp., Ltd. | | | 7,443,000 | | | | 5,490,271 | |
| | | | | | | | |
Total Singapore | | | | | | | 35,487,868 | |
| | | | | | | | |
| | | | | | | | |
| INDONESIA: 6.2% | | | | | | | | |
PT Sumber Alfaria Trijaya | | | 167,969,200 | | | | 7,658,061 | |
PT Selamat Sempurna | | | 21,482,500 | | | | 7,609,317 | |
PT Bank Tabungan Pensiunan Nasionalb | | | 33,715,400 | | | | 6,302,898 | |
PT Astra Otoparts | | | 42,448,625 | | | | 6,007,866 | |
PT Ultrajaya Milk Industry & Trading Co.b | | | 17,446,900 | | | | 5,678,083 | |
| | | | | | | | |
Total Indonesia | | | | | | | 33,256,225 | |
| | | | | | | | |
| | | | | | | | |
| MALAYSIA: 4.2% | | | | | | | | |
Karex BHD | | | 13,856,625 | | | | 8,303,671 | |
7-Eleven Malaysia Holdings BHD | | | 23,095,300 | | | | 7,772,185 | |
GD Express Carrier BHD | | | 18,008,900 | | | | 6,902,789 | |
| | | | | | | | |
Total Malaysia | | | | | | | 22,978,645 | |
| | | | | | | | |
| | | | | | | | |
| PHILIPPINES: 3.5% | | | | | | | | |
Concepcion Industrial Corp. | | | 8,191,900 | | | | 8,183,629 | |
Security Bank Corp. | | | 1,666,597 | | | | 6,817,991 | |
Philippine Seven Corp. | | | 1,454,751 | | | | 3,815,848 | |
| | | | | | | | |
Total Philippines | | | | | | | 18,817,468 | |
| | | | | | | | |
| | | | | | | | |
| | | | |
| matthewsasia.com | 800.789.ASIA | | | 83 | |
Matthews Asia Small Companies Fund
June 30, 2016
Schedule of Investmentsa (unaudited) (continued)
COMMON EQUITIES (continued)
| | | | | | | | |
| | | Shares | | | Value | |
| VIETNAM: 0.8% | | | | | | | | |
DHG Pharmaceutical JSC | | | 995,900 | | | | $4,599,072 | |
| | | | | | | | |
Total Vietnam | | | | | | | 4,599,072 | |
| | | | | | | | |
| | | | | | | | |
| TOTAL INVESTMENTS: 96.7% | | | | | | | 522,313,293 | |
(Cost $489,572,512c) | | | | | | | | |
| | | | | | | | |
CASH AND OTHER ASSETS,
LESS LIABILITIES: 3.3% | | | | | | | 17,751,057 | |
| | | | | | | | |
| | |
NET ASSETS: 100.0% | | | | | | | $540,064,350 | |
| | | | | | | | |
| a | Certain securities were fair valued under the valuation polices approved by the Board of Trustees (Note 2-A). |
| b | Non-income producing security. |
| c | Cost for federal income tax purposes is $490,069,442 and net unrealized appreciation consists of: |
| | | | |
Gross unrealized appreciation | | | $93,174,716 | |
Gross unrealized depreciation | | | (60,930,865 | ) |
| | | | |
Net unrealized appreciation | | | $32,243,851 | |
| | | | |
| ADR | American Depositary Receipt |
| NVDR | Non-voting Depositary Receipt |
See accompanying notes to financial statements.
| | |
| PORTFOLIO MANAGERS |
| Tiffany Hsiao, CFA | | |
Lead Manager | | |
Kenichi Amaki | | |
Co-Manager | | |
|
| FUND FACTS |
| | | Investor |
Ticker | | MCSMX |
CUSIP | | 577125404 |
Inception | | 5/31/11 |
NAV | | $8.27 |
Initial Investment | | $2,500 |
Gross Expense Ratio1 | | 2.10% |
After Fee Waiver and Reimbursement2 | | 1.50% |
Portfolio Statistics | | |
Total # of Positions | | 38 |
Net Assets | | $18.4 million |
Weighted Average Market Cap | | $1.5 billion |
Portfolio Turnover3 | | 72.49% |
Benchmark | | |
MSCI China Small Cap Index |
Redemption Fee | | |
2% within first 90 calendar days of purchase |
OBJECTIVE
Long-term capital appreciation.
STRATEGY
Under normal market conditions, the Fund seeks to achieve its investment objective by investing at least 80% of its total net assets, which include borrowings for investment purposes, in the common and preferred stocks of Small Companies located in China. China includes its administrative and other districts, such as Hong Kong.
Matthews China Small Companies Fund
Portfolio Manager Commentary (unaudited)
For the first half of 2016, the Matthews China Small Companies Fund returned –5.92% while its benchmark, the MSCI China Small Cap Index, retreated –10.67%. For the quarter ending June 30, the Fund returned 0.12% while its benchmark returned –1.85%.
Market Environment:
Global markets were off to a rough start in 2016 as declining oil prices triggered fears of widespread recession and default risk. The recovery in commodity prices during the early part of the second quarter drove markets higher as the risks of default across the energy and commodity complex were seemingly reduced. However, political uncertainty continued to play a big hand in volatility across global markets. Although China is not immune to global uncertainty, its equity markets fared relatively better—especially late in the second quarter. The Fund’s relative outperformance against the benchmark reflects the view that even if events, such as Brexit, trigger uncertainty about the future of the European Union, China has enough tools to muddle through the crisis. These tools include fiscal spending, interest rate adjustments and currency management. It also helps that China is still relatively insulated from global turbulence due to its capital flow restrictions. We expect China to remain focused on its own structural reform initiatives to transition from an investment-driven model to a consumption-driven one, amid external distractions.
Performance Contributors and Detractors:
During the first half of 2016, the biggest contributors to the Fund’s relative outperformance versus the benchmark were the consumer discretionary and industrial sectors due to good stock selection. The biggest drag on Fund’s relative performance came from holdings in the financials and health care sectors.
Two of our best-performing stocks were Sunny Optical Technology, a premier Chinese optical lens and module provider, and Minth Group, a leading branded auto parts manufacturer. Both Sunny Optical and Minth grew by diversifying and expanding their product categories and applications. They showed impressive, strong execution capabilities versus that of their competition.
Among our top detractors of Fund performance during the second quarter were Lee’s Pharmaceutical Holdings and China Biologic Products. Both are health care companies, which were impacted by policy uncertainty. We believe Chinese pharmaceutical companies will face increasing headwinds in the coming years as the government pushes through significant health care reforms. Being a relatively small player in this negative regulatory environment will be taxing on Lee’s growth. China Biologic Products is in a better position to defend its market share and profitability given that there is a shortage and demand for its products.
Notable Portfolio Changes:
We exited TAL Education Group during the quarter as the position had done well for us over the years, and we believed its market capitalization had surpassed our ideal level. We also exited our positions related to natural gas distribution and equipment given the persistent disappointment in both volumes and prices in that sector. Within the health care sector, we also repositioned our holdings toward companies that may be subject to less risk of drug price reforms. As a result, we exited our position in Lee’s Pharmaceutical Holdings.
(continued)
| 1 | Prospectus expense ratios. |
| 2 | Matthews has contractually agreed to waive fees and reimburse expenses to the extent needed to limit Total Annual Fund Operating Expenses (excluding Rule 12b-1 fees, taxes, interest, brokerage commissions, short sale dividend expenses, expenses incurred in connection with any merger or reorganization or extraordinary expenses such as litigation) to 1.50%. If the operating expenses fall below the expense limitation in a year within three years after Matthews has made a waiver or reimbursement, the Fund may reimburse Matthews up to an amount that does not cause the expenses for that year to exceed the lesser of (i) the expense limitation applicable at the time of that fee waiver and/or expense reimbursement or (ii) the expense limitation in effect at the time of recoupment. This agreement will remain in place until April 30, 2017 and may be terminated at any time by the Board of Trustees on behalf of the Fund on 60 days’ written notice to Matthews. |
| 3 | The lesser of fiscal year 2015 long-term purchase costs or sales proceeds divided by the average monthly market value of long-term securities. |
| | | | |
| matthewsasia.com | 800.789.ASIA | | | 85 | |
| | | | | | | | | | | | | | | | | | | | | | | | | | | | |
| | | | | | | | |
| PERFORMANCE AS OF JUNE 30, 2016 | | | | | | | | | | | | | | | | | | | | | |
| | | | | | | | | | | | Average Annual Total Returns | | | | |
| | | 3 Months | | | YTD | | | 1 Year | | | 3 Years | | | 5 Years | | | Since
Inception | | | Inception
Date | |
Investor Class (MCSMX) | | | 0.12% | | | | -5.92% | | | | -15.96% | | | | 4.60% | | | | -0.21% | | | | -1.00% | | | | 5/31/2011 | |
MSCI China Small Cap Index4 | | | -1.85% | | | | -10.67% | | | | -27.94% | | | | 2.29% | | | | -1.51% | | | | -2.61% | | | | | |
Lipper China Region Funds Category Average5 | | | -0.10% | | | | -5.50% | | | | -19.94% | | | | 3.18% | | | | -0.21% | | | | -0.95% | | | | | |
Performance assumes reinvestment of all dividends and/or distributions before taxes. All performance quoted represents past performance and is no guarantee of future results. Investment return and principal value will fluctuate with market conditions so that when redeemed, shares may be worth more or less than their original cost. Current performance may be lower or higher than the return figures quoted. Returns would have been lower if certain of the Fund’s fees and expenses had not been waived. For the Fund’s most recent month-end performance, visit matthewsasia.com.
GROWTH OF A $10,000 INVESTMENT SINCE INCEPTION—INVESTOR CLASS
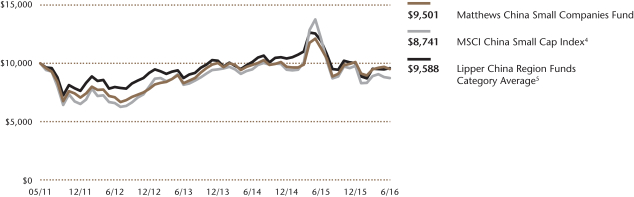
Plotted monthly. The performance data does not reflect the deduction of taxes that a shareholder would pay on dividends, capital gains distributions or redemption of Fund shares. Values are in US$.
| | 4 | It is not possible to invest directly in an index. Source: Index data from Morgan Stanley Capital International and Bloomberg; total return calculations performed by BNY Mellon Investment Servicing (US) Inc. Please see page 91 for index definition. |
| | 5 | The Lipper Category Average does not reflect sales charges and is based on total return, including reinvestment of dividends and capital gains for the stated periods. |
| | | | | | | | |
| | | | |
| TOP TEN HOLDINGS6 | | | | | | | |
| | | Sector | | | | % of Net Assets | |
| Minth Group, Ltd. | | Consumer Discretionary | | | | | 4.7% | |
| Wuxi Little Swan Co., Ltd. | | Consumer Discretionary | | | | | 4.5% | |
| SITC International Holdings Co., Ltd. | | Industrials | | | | | 4.5% | |
| Voltronic Power Technology Corp. | | Industrials | | | | | 4.1% | |
| Value Partners Group, Ltd. | | Financials | | | | | 3.9% | |
| China Biologic Products, Inc. | | Health Care | | | | | 3.6% | |
| Yuexiu Transport Infrastructure, Ltd. | | Industrials | | | | | 3.6% | |
| KWG Property Holding, Ltd. | | Financials | | | | | 3.4% | |
| Sunny Optical Technology Group Co., Ltd. | | Information Technology | | | | | 3.2% | |
| Fairwood Holdings, Ltd. | | Consumer Discretionary | | | | | 3.2% | |
| % OF ASSETS IN TOP TEN | | | | | | | 38.7% | |
| | 6 | Holdings may combine more than one security from same issuer and related depositary receipts. |
Matthews China Small Companies Fund
Portfolio Manager Commentary (unaudited) (continued)
Outlook:
Despite the macroeconomic uncertainty in China, the government is taking steps to correct its structural issues. This should provide a healthier macro outlook over the long run for businesses operating in China. For the time being, we continue to focus on innovative and capital-efficient small companies that stay relatively insulated from the macro slowdown. We will continue to focus on companies with sustainable quality earnings streams, strong cash flows and good balance sheets that can better weather uncertain economic conditions. We still find sectors, such as industrial automation, health care and increasingly consumer discretionary, to be among the most attractive from a secular growth perspective.
Investing in small- and mid-size companies is more risky than investing in large companies as they may be more volatile and less liquid than larger companies.
| | | | |
| | |
| COUNTRY ALLOCATION (%)7 | | | |
| China/Hong Kong | | | 81.1 | |
| Taiwan | | | 10.6 | |
| South Korea | | | 2.0 | |
| Cash and Other Assets, Less Liabilities | | | 6.3 | |
| | | | |
| | |
| SECTOR ALLOCATION (%)7 | | | |
| Consumer Discretionary | | | 29.4 | |
| Industrials | | | 29.0 | |
| Health Care | | | 13.3 | |
| Financials | | | 11.3 | |
| Information Technology | | | 8.3 | |
| Consumer Staples | | | 2.4 | |
| Cash and Other Assets, Less Liabilities | | | 6.3 | |
| | | | |
| | |
| MARKET CAP EXPOSURE (%)7,8 | | | |
| Mega Cap (over $25B) | | | 0.0 | |
| Large Cap ($10B–$25B) | | | 0.0 | |
| Mid Cap ($3B–10B) | | | 7.9 | |
| Small Cap (under $3B) | | | 85.8 | |
| Cash and Other Assets, Less Liabilities | | | 6.3 | |
| 7 | Source: FactSet Research Systems. Percentage values in data are rounded to the nearest tenth of one percent; the values may not sum to 100% due to rounding. |
| 8 | The Fund defines Small Companies as companies with market capitalization generally between $100 million and $3 billion or the largest company included in the Fund’s primary benchmark, the MSCI China Small Cap Index. |
| | | | |
| matthewsasia.com | 800.789.ASIA | | | 87 | |
Matthews China Small Companies Fund
June 30, 2016
Schedule of Investmentsa (unaudited)
COMMON EQUITIES: 93.7%
| | | | | | | | |
| | | Shares | | | Value | |
| CONSUMER DISCRETIONARY: 29.4% | | | | | | | | |
Household Durables: 7.2% | | | | | | | | |
Wuxi Little Swan Co., Ltd. B Shares | | | 244,017 | | | | $838,520 | |
Nien Made Enterprise Co., Ltd.b | | | 27,000 | | | | 246,329 | |
Guangzhou Holike Creative Home Co., Ltd. A Shares | | | 52,078 | | | | 245,643 | |
| | | | | | | | |
| | | | | | | 1,330,492 | |
| | | | | | | | |
| | | | | | | | |
Auto Components: 7.0% | | | | | | | | |
Minth Group, Ltd. | | | 266,000 | | | | 858,883 | |
Hu Lane Associate, Inc. | | | 100,000 | | | | 433,419 | |
| | | | | | | | |
| | | | | | | 1,292,302 | |
| | | | | | | | |
| | | | | | | | |
Textiles, Apparel & Luxury Goods: 5.4% | | | | | | | | |
Best Pacific International Holdings, Ltd. H Shares | | | 742,000 | | | | 556,213 | |
Regina Miracle International Holdings, Ltd.b | | | 331,000 | | | | 439,236 | |
| | | | | | | | |
| | | | | | | 995,449 | |
| | | | | | | | |
| | | | | | | | |
Media: 5.1% | | | | | | | | |
Clear Media, Ltd. | | | 484,000 | | | | 423,043 | |
Dexter Studios Co., Ltd.b | | | 21,195 | | | | 375,196 | |
IMAX China Holding, Inc.b | | | 27,200 | | | | 134,240 | |
| | | | | | | | |
| | | | | | | 932,479 | |
| | | | | | | | |
| | | | | | | | |
Hotels, Restaurants & Leisure: 4.7% | | | | | | | | |
Fairwood Holdings, Ltd. | | | 153,000 | | | | 592,493 | |
Tuniu Corp. ADRa | | | 32,100 | | | | 270,603 | |
| | | | | | | | |
| | | | | | | 863,096 | |
| | | | | | | | |
Total Consumer Discretionary | | | | | | | 5,413,818 | |
| | | | | | | | |
| | | | | | | | |
| INDUSTRIALS: 29.0% | | | | | | | | |
Transportation Infrastructure: 6.5% | | | | | | | | |
Yuexiu Transport Infrastructure, Ltd. | | | 1,018,000 | | | | 656,787 | |
Qingdao Port International Co., Ltd. H Shares | | | 1,206,000 | | | | 549,436 | |
| | | | | | | | |
| | | | | | | 1,206,223 | |
| | | | | | | | |
| | | | | | | | |
Marine: 4.5% | | | | | | | | |
SITC International Holdings Co., Ltd. | | | 1,569,000 | | | | 825,366 | |
| | | | | | | | |
| | | | | | | | |
Electrical Equipment: 4.1% | | | | | | | | |
Voltronic Power Technology Corp. | | | 54,261 | | | | 758,513 | |
| | | | | | | | |
| | | | | | | | |
Road & Rail: 3.2% | | | | | | | | |
eHi Car Services, Ltd. ADRb | | | 57,600 | | | | 582,336 | |
| | | | | | | | |
| | | | | | | | |
Professional Services: 3.0% | | | | | | | | |
51job, Inc. ADRb | | | 18,624 | | | | 545,869 | |
| | | | | | | | |
| | | | | | | | |
Machinery: 2.9% | | | | | | | | |
TK Group Holdings, Ltd. | | | 2,114,000 | | | | 539,464 | |
| | | | | | | | |
| | | | | | | | |
Air Freight & Logistics: 2.6% | | | | | | | | |
Kerry Logistics Network, Ltd. | | | 375,000 | | | | 484,567 | |
| | | | | | | | |
| | | | | | | | |
Commercial Services & Supplies: 2.2% | | | | | | | | |
Sunny Friend Environmental Technology Co., Ltd. | | | 87,000 | | | | 412,170 | |
| | | | | | | | |
Total Industrials | | | | | | | 5,354,508 | |
| | | | | | | | |
| | | | | | | | |
| | | | | | | | |
| | | Shares | | | Value | |
| HEALTH CARE: 13.3% | | | | | | | | |
Biotechnology: 6.1% | | | | | | | | |
China Biologic Products, Inc.b | | | 6,200 | | | | $659,184 | |
Shanghai Haohai Biological Technology Co., Ltd. H Shares | | | 98,000 | | | | 456,558 | |
| | | | | | | | |
| | | | | | | 1,115,742 | |
| | | | | | | | |
| | | | | | | | |
Health Care Equipment & Supplies: 3.5% | | | | | | | | |
Lifetech Scientific Corp.b | | | 1,972,000 | | | | 367,621 | |
Shandong Weigao Group Medical Polymer Co., Ltd. H Shares | | | 500,000 | | | | 286,510 | |
| | | | | | | | |
| | | | | | | 654,131 | |
| | | | | | | | |
| | | | | | | | |
Life Sciences Tools & Services: 2.1% | | | | | | | | |
Genscript Biotech Corp.b | | | 2,524,000 | | | | 391,004 | |
| | | | | | | | |
| | | | | | | | |
Pharmaceuticals: 1.6% | | | | | | | | |
SSY Group, Ltd. | | | 889,022 | | | | 287,919 | |
| | | | | | | | |
Total Health Care | | | | | | | 2,448,796 | |
| | | | | | | | |
| | | | | | | | |
| FINANCIALS: 11.3% | | | | | | | | |
Real Estate Management & Development: 6.5% | | | | | |
KWG Property Holding, Ltd. | | | 1,089,000 | | | | 635,681 | |
Beijing Properties Holdings, Ltd.b | | | 5,374,000 | | | | 344,171 | |
China Jinmao Holdings Group, Ltd. | | | 758,000 | | | | 214,479 | |
| | | | | | | | |
| | | | | | | 1,194,331 | |
| | | | | | | | |
| | | | | | | | |
Capital Markets: 3.8% | | | | | | | | |
Value Partners Group, Ltd. | | | 771,000 | | | | 713,942 | |
| | | | | | | | |
| | | | | | | | |
Diversified Financial Services: 1.0% | | | | | | | | |
China Merchants China Direct Investments, Ltd. | | | 136,000 | | | | 181,947 | |
| | | | | | | | |
Total Financials | | | | | | | 2,090,220 | |
| | | | | | | | |
| | | | | | | | |
| INFORMATION TECHNOLOGY: 8.3% | | | | | | | | |
Electronic Equipment, Instruments & Components: 4.2% | |
Sunny Optical Technology Group Co., Ltd. | | | 170,000 | | | | 598,544 | |
Technovator International, Ltd. | | | 358,000 | | | | 183,522 | |
China High Precision Automation Group, Ltd.b,c | | | 195,000 | | | | 251 | |
| | | | | | | | |
| | | | | | | 782,317 | |
| | | | | | | | |
| | | | | | | | |
Technology Hardware, Storage & Peripherals: 3.0% | | | | | |
Adlink Technology, Inc. | | | 261,868 | | | | 544,175 | |
| | | | | | | | |
| | | | | | | | |
Software: 1.1% | | | | | | | | |
Chanjet Information Technology Co., Ltd. H Sharesa | | | 173,000 | | | | 196,378 | |
| | | | | | | | |
Total Information Technology | | | | | | | 1,522,870 | |
| | | | | | | | |
| | | | | | | | |
| CONSUMER STAPLES: 2.4% | | | | | | | | |
Food Products: 2.4% | | | | | | | | |
Vitasoy International Holdings, Ltd. | | | 244,000 | | | | 443,877 | |
| | | | | | | | |
Total Consumer Staples | | | | | | | 443,877 | |
| | | | | | | | |
| | | | | | | | |
Matthews China Small Companies Fund
June 30, 2016
Schedule of Investmentsa (unaudited) (continued)
COMMON EQUITIES (continued)
| | | | | | | | |
| | | | | | Value | |
| TOTAL INVESTMENTS: 93.7% | | | | $17,274,089 | |
(Cost $17,149,197d) | | | | | | | | |
| | | | | | | | |
CASH AND OTHER ASSETS,
LESS LIABILITIES: 6.3% | | | | | | | 1,156,717 | |
| | | | | | | | |
| | |
NET ASSETS: 100.0% | | | | | | | $18,430,806 | |
| | | | | | | | |
| a | Certain securities were fair valued under the valuation polices approved by the Board of Trustees (Note 2- A). |
| b | Non-income producing security. |
| c | Illiquid security, trading was halted at June 30, 2016. |
| d | Cost for federal income tax purposes is $17,149,197 and net unrealized appreciation consists of: |
| | | | |
Gross unrealized appreciation | | | $2,300,036 | |
Gross unrealized depreciation | | | (2,175,144 | ) |
| | | | |
Net unrealized appreciation | | | $124,892 | |
| | | | |
| ADR | American Depositary Receipt |
See accompanying notes to financial statements.
| | | | |
| matthewsasia.com | 800.789.ASIA | | | 89 | |
Disclosures
Fund Holdings: The Fund holdings shown in this report are as of June 30, 2016. Holdings are subject to change at any time, so holdings shown in this report may not reflect current Fund holdings. The Funds file complete schedules of portfolio holdings with the Securities and Exchange Commission (the “SEC”) for the first and third quarters of each fiscal year on Form N-Q. The Funds’ Form N-Q is filed with the SEC within 60 days of the end of the quarter to which it relates, and is available on the SEC’s website at www.sec.gov. It may also be reviewed and copied at the Commission’s Public Reference Room in Washington, D.C. Information on the operation of the Public Reference Room may be obtained by calling 800.SEC.0330. Complete schedules of investments are also available without charge, upon request, from the Funds by calling us at 800.789.ASIA (2742).
Proxy Voting Record: The Funds’ Statement of Additional Information containing a description of the policies and procedures that the Funds have used to vote proxies relating to portfolio securities, along with each Fund’s proxy voting record relating to portfolio securities held during the most recent 12-month period ended June 30, is available upon request, at no charge, at the Funds’ website at matthewsasia.com or by calling 800.789.ASIA (2742), or on the SEC’s website at www.sec.gov.
Shareholder Reports and Prospectuses: To reduce the Funds’ expenses, we try to identify related shareholders in a household and send only one copy of the Funds’ prospectus and financial reports to that address. This process, called “householding,” will continue indefinitely unless you instruct us otherwise. At any time you may view the Funds’ current prospectus, summary
prospectus and financial reports on our website. If you prefer to receive individual copies of the Funds’ prospectus or financial reports, please call us at 800.789.ASIA (2742).
Redemption Fee Policy: Currently, a 2.00% redemption fee will be assessed on the sale or exchange of shares of the Matthews Emerging Asia Fund, Matthews Asia Small Companies Fund and Matthews China Small Companies Fund (collectively, the “Covered Funds”) within 90 days after the date an investor purchases shares of the Covered Funds. Effective April 30, 2015, Funds other than the Covered Funds discontinued the assessment of a 2.00% redemption fee, as approved by the Board of Trustees. The imposition of redemption fees pursuant to the Funds’ Short-Term Trading Redemption Fee Policy for the Covered Funds may assist the Covered Funds in discouraging market timing activity.
The redemption fee is also imposed to discourage short-term buying and selling of shares of the Covered Funds, which can disrupt the management of the Covered Funds’ investment portfolios and may have detrimental effects on the Covered Funds and other shareholders, and to allocate the costs the Covered Funds incur as a result of short-term trading and market timing. This fee is payable directly to the Covered Funds.
To determine whether the redemption fee applies, the Covered Funds do not count the day that you purchased your shares, and first redeem the shares that you have held the longest.
The Covered Funds may grant exemptions from the redemption fee in certain circumstances. For more information on this policy, please see the Funds’ prospectus.
Index Definitions
The Markit iBoxx Asian Local Bond Index (ALBI) tracks the total return performance of a bond portfolio consisting of local-currency denominated, high quality and liquid bonds in Asia ex-Japan. The ALBI includes bonds from the following countries: Korea, Hong Kong, India, Singapore, Taiwan, Malaysia, Thailand, Philippines, Indonesia and China.
The J.P. Morgan Asia Credit Index (JACI) tracks the total return performance of the Asia fixed-rate dollar bond market. JACI is a market cap-weighted index comprising sovereign, quasi-sovereign and corporate bonds and is partitioned by country, sector and credit rating. JACI includes bonds from the following countries: China, Hong Kong, India, Indonesia, Korea, Philippines, Thailand and Singapore.
The MSCI All Country Asia ex Japan Index is a free float–adjusted market capitalization–weighted index of the stock markets of China, Hong Kong, India, Indonesia, Malaysia, Philippines, Singapore, South Korea, Taiwan and Thailand.
The MSCI All Country Asia Pacific Index is a free float–adjusted market capitalization–weighted index of the stock markets of Australia, China, Hong Kong, India, Indonesia, Japan, Malaysia, New Zealand, Philippines, Singapore, South Korea, Taiwan and Thailand.
The MSCI Emerging Markets (EM) Asia Index is a free float-adjusted market capitalization weighted index of the stock markets of China, India, Indonesia, Korea, Malaysia, the Philippines, Taiwan and Thailand.
The MSCI China Index is a free float–adjusted market capitalization–weighted index of Chinese equities that includes China-affiliated corporations and H shares listed on the Hong Kong
exchange, and B shares listed on the Shanghai and Shenzhen exchanges.
The S&P Bombay Stock Exchange (BSE) 100 Index is a free float–adjusted market capitalization–weighted index of the 100 stocks listed on the Bombay Stock Exchange.
The MSCI Japan Index is a free float–adjusted market capitalization–weighted index of Japanese equities listed in Japan.
The Korea Composite Stock Price Index (KOSPI) is a market capitalization–weighted index of all common stocks listed on the Korea Stock Exchange.
The MSCI All Country Asia ex Japan Small Cap Index is a free float–adjusted market capitalization–weighted small cap index of the stock markets of China, Hong Kong, India, Indonesia, Malaysia, Philippines, Singapore, South Korea, Taiwan and Thailand.
The MSCI China Small Cap Index is a free float–adjusted market capitalization–weighted small cap index of the Chinese equity securities markets, including H shares listed on the Hong Kong exchange, B shares listed on the Shanghai and Shenzhen exchanges, and Hong Kong-listed securities known as Red Chips (issued by entities owned by national or local governments in China) and P Chips (issued by companies controlled by individuals in China and deriving substantial revenues in China).
The MSCI All Country Asia Index is a free float–adjusted market capitalization–weighted index of the stock markets of China, Hong Kong, India, Indonesia, Japan, Malaysia, Philippines, Singapore, South Korea, Taiwan and Thailand.
| | | | |
| matthewsasia.com | 800.789.ASIA | | | 91 | |
Disclosure of Fund Expenses (unaudited)
We believe it is important for you to understand the impact of fees regarding your investment. All mutual funds have operating expenses. As a shareholder of a mutual fund, you incur ongoing costs, which include costs for portfolio management, administrative services, and shareholder reports (like this one), among others. Operating expenses, which are deducted from a fund’s gross income, directly reduce the investment return of the fund. A fund’s operating expenses are expressed as a percentage of its average net assets. This figure is known as the expense ratio. The following examples are intended to help you understand the ongoing fees (in dollars) of investing in your fund and to compare these costs with those of other mutual funds. The examples are based on an investment of $1,000 made at the beginning of the period shown and held for the entire period.
This table illustrates your fund’s costs in two ways:
Actual Fund Return: This section helps you to estimate the actual operating expenses, after any applicable fee waivers, that you paid over the period. The “Ending Account Value” shown is derived from the fund’s actual return for the past six month period, the “Expense Ratio” column shows the period’s annualized expense ratio, and the “Operating Expenses Paid During Period” column shows the dollar amount that would have been paid by an investor who started with $1,000 in the fund at the beginning of the period. You may use the information here, together with your account value, to estimate the expenses that you paid over the period. To do so, simply divide your account value by $1,000 (for example, an
$8,600 account value divided by $1,000 = 8.6), then multiply the result by the number given for your fund in the first line under the heading entitled “Operating Expenses Paid During Period.”
Hypothetical 5% Return: This section is intended to help you compare your fund’s costs with those of other mutual funds. It assumes that the fund had an annual return of 5% before operating expenses, but that the expense ratio is unchanged. In this case, because the return used is not the fund’s actual return, the results do not apply to your investment. This example is useful in making comparisons to other mutual funds because the Securities and Exchange Commission requires all mutual funds to calculate expenses based on an assumed 5% annual return. You can assess your fund’s costs by comparing this hypothetical example with the hypothetical examples that appear in shareholder reports of other funds.
Please note that the operating expenses shown in the table are meant to highlight and help you compare your ongoing costs only and do not reflect any transactional costs such as sales charges (loads), redemption fees, or exchange fees.
Matthews Asia Funds does not charge any sales loads, exchange fees, or 12b-1 fees, but these may be present in other funds to which you compare this data. Therefore, the hypothetical portions of the table are useful in comparing ongoing costs only, and will not help you determine the relative total costs of owning different funds.
June 30, 2016
| | | | | | | | | | | | | | | | | | | | | | | | | | | | | | | | | | | | |
| | | INVESTOR CLASS | | | | | | INSTITUTIONAL CLASS | |
| | | Beginning Account Value 1/1/16 | | | Ending Account Value 6/30/16 | | | Expense Ratio1 | | | Operating Expenses Paid During Period 1/1/16– 6/30/162 | | | | | | Beginning Account Value 1/1/16 | | | Ending Account Value 6/30/16 | | | Expense Ratio1 | | | Operating Expenses Paid During Period
1/1/16–
6/30/162 | |
| ASIA FIXED INCOME STRATEGIES | | | | | | | | | | | | | | | | | | | | | | | | | | | | | | | | | | | | |
Matthews Asia Strategic Income Fund | | | | | | | | | | | | | | | | | | | | | | | | | | | | | | | | | | | | |
Actual Fund Return | | | $1,000.00 | | | | $1,058.30 | | | | 1.15% | | | | $5.89 | | | | | | | | $1,000.00 | | | | $1,058.60 | | | | 0.90% | | | | $4.61 | |
Hypothetical 5% Return | | | $1,000.00 | | | | $1,030.58 | | | | 1.15% | | | | $5.81 | | | | | | | | $1,000.00 | | | | $1,029.34 | | | | 0.90% | | | | $4.54 | |
Matthews Asia Credit Opportunities Fund* | | | | | | | | | | | | | | | | | | | | | | | | | | | | | | | | | | | | |
Actual Fund Return | | | $1,000.00 | | | | $1,014.60 | | | | 1.15% | | | | $1.96 | 3 | | | | | | | $1,000.00 | | | | $1,014.10 | | | | 0.90% | | | | $1.54 | 3 |
Hypothetical 5% Return | | | $1,000.00 | | | | $1,030.58 | | | | 1.15% | | | | $5.81 | 2 | | | | | | | $1,000.00 | | | | $1,029.34 | | | | 0.90% | | | | $4.54 | 2 |
| | | | | | | | | |
| ASIA GROWTH AND INCOME STRATEGIES | | | | | | | | | | | | | | | | | | | | | | | | | | | | | | | | | | | | |
Matthews Asian Growth and Income Fund | | | | | | | | | | | | | | | | | | | | | | | | | | | | | | | | | | | | |
Actual Fund Return | | | $1,000.00 | | | | $1,070.50 | | | | 1.11% | | | | $5.71 | | | | | | | | $1,000.00 | | | | $1,070.80 | | | | 0.94% | | | | $4.84 | |
Hypothetical 5% Return | | | $1,000.00 | | | | $1,030.38 | | | | 1.11% | | | | $5.60 | | | | | | | | $1,000.00 | | | | $1,029.54 | | | | 0.94% | | | | $4.74 | |
Matthews Asia Dividend Fund | | | | | | | | | | | | | | | | | | | | | | | | | | | | | | | | | | | | |
Actual Fund Return | | | $1,000.00 | | | | $1,065.00 | | | | 1.09% | | | | $5.60 | | | | | | | | $1,000.00 | | | | $1,066.60 | | | | 0.93% | | | | $4.78 | |
Hypothetical 5% Return | | | $1,000.00 | | | | $1,030.28 | | | | 1.09% | | | | $5.50 | | | | | | | | $1,000.00 | | | | $1,029.49 | | | | 0.93% | | | | $4.69 | |
Matthews China Dividend Fund | | | | | | | | | | | | | | | | | | | | | | | | | | | | | | | | | | | | |
Actual Fund Return | | | $1,000.00 | | | | $991.30 | | | | 1.21% | | | | $5.99 | | | | | | | | $1,000.00 | | | | $992.40 | | | | 1.02% | | | | $5.05 | |
Hypothetical 5% Return | | | $1,000.00 | | | | $1,030.88 | | | | 1.21% | | | | $6.11 | | | | | | | | $1,000.00 | | | | $1,029.94 | | | | 1.02% | | | | $5.15 | |
| | | | | | | | | |
| ASIA VALUE STRATEGY | | | | | | | | | | | | | | | | | | | | | | | | | | | | | | | | | | | | |
Matthews Asia Value Fund | | | | | | | | | | | | | | | | | | | | | | | | | | | | | | | | | | | | |
Actual Fund Return | | | $1,000.00 | | | | $1,032.50 | | | | 1.50% | | | | $7.58 | | | | | | | | $1,000.00 | | | | $1,033.60 | | | | 1.25% | | | | $6.32 | |
Hypothetical 5% Return | | | $1,000.00 | | | | $1,032.32 | | | | 1.50% | | | | $7.58 | | | | | | | | $1,000.00 | | | | $1,031.08 | | | | 1.25% | | | | $6.31 | |
| | | | | | | | | |
| ASIA GROWTH STRATEGIES | | | | | | | | | | | | | | | | | | | | | | | | | | | | | | | | | | | | |
Matthews Asia Focus Fund | | | | | | | | | | | | | | | | | | | | | | | | | | | | | | | | | | | | |
Actual Fund Return | | | $1,000.00 | | | | $1,066.80 | | | | 1.63% | | | | $8.38 | | | | | | | | $1,000.00 | | | | $1,069.10 | | | | 1.25% | | | | $6.43 | |
Hypothetical 5% Return | | | $1,000.00 | | | | $1,032.97 | | | | 1.63% | | | | $8.24 | | | | | | | | $1,000.00 | | | | $1,031.08 | | | | 1.25% | | | | $6.31 | |
Matthews Asia Growth Fund | | | | | | | | | | | | | | | | | | | | | | | | | | | | | | | | | | | | |
Actual Fund Return | | | $1,000.00 | | | | $1,036.50 | | | | 1.15% | | | | $5.82 | | | | | | | | $1,000.00 | | | | $1,037.20 | | | | 0.94% | | | | $4.76 | |
Hypothetical 5% Return | | | $1,000.00 | | | | $1,030.58 | | | | 1.15% | | | | $5.81 | | | | | | | | $1,000.00 | | | | $1,029.54 | | | | 0.94% | | | | $4.74 | |
Matthews Pacific Tiger Fund | | | | | | | | | | | | | | | | | | | | | | | | | | | | | | | | | | | | |
Actual Fund Return | | | $1,000.00 | | | | $1,040.40 | | | | 1.10% | | | | $5.58 | | | | | | | | $1,000.00 | | | | $1,041.20 | | | | 0.90% | | | | $4.57 | |
Hypothetical 5% Return | | | $1,000.00 | | | | $1,030.33 | | | | 1.10% | | | | $5.55 | | | | | | | | $1,000.00 | | | | $1,029.34 | | | | 0.90% | | | | $4.54 | |
Matthews Asia ESG Fund | | | | | | | | | | | | | | | | | | | | | | | | | | | | | | | | | | | | |
Actual Fund Return | | | $1,000.00 | | | | $985.90 | | | | 1.45% | | | | $7.16 | | | | | | | | $1,000.00 | | | | $986.90 | | | | 1.25% | | | | $6.18 | |
Hypothetical 5% Return | | | $1,000.00 | | | | $1,032.07 | | | | 1.45% | | | | $7.33 | | | | | | | | $1,000.00 | | | | $1,031.08 | | | | 1.25% | | | | $6.31 | |
Matthews Emerging Asia Fund | | | | | | | | | | | | | | | | | | | | | | | | | | | | | | | | | | | | |
Actual Fund Return | | | $1,000.00 | | | | $1,106.50 | | | | 1.50% | | | | $7.86 | | | | | | | | $1,000.00 | | | | $1,108.10 | | | | 1.25% | | | | $6.55 | |
Hypothetical 5% Return | | | $1,000.00 | | | | $1,032.32 | | | | 1.50% | | | | $7.58 | | | | | | | | $1,000.00 | | | | $1,031.08 | | | | 1.25% | | | | $6.31 | |
Matthews Asia Innovators Fund** | | | | | | | | | | | | | | | | | | | | | | | | | | | | | | | | | | | | |
Actual Fund Return | | | $1,000.00 | | | | $952.10 | | | | 1.20% | | | | $5.82 | | | | | | | | $1,000.00 | | | | $953.00 | | | | 0.97% | | | | $4.71 | |
Hypothetical 5% Return | | | $1,000.00 | | | | $1,030.83 | | | | 1.20% | | | | $6.06 | | | | | | | | $1,000.00 | | | | $1,029.69 | | | | 0.97% | | | | $4.90 | |
Matthews China Fund | | | | | | | | | | | | | | | | | | | | | | | | | | | | | | | | | | | | |
Actual Fund Return | | | $1,000.00 | | | | $878.90 | | | | 1.21% | | | | $5.65 | | | | | | | | $1,000.00 | | | | $879.30 | | | | 1.09% | | | | $5.09 | |
Hypothetical 5% Return | | | $1,000.00 | | | | $1,030.88 | | | | 1.21% | | | | $6.11 | | | | | | | | $1,000.00 | | | | $1,030.28 | | | | 1.09% | | | | $5.50 | |
Matthews India Fund | | | | | | | | | | | | | | | | | | | | | | | | | | | | | | | | | | | | |
Actual Fund Return | | | $1,000.00 | | | | $1,017.80 | | | | 1.13% | | | | $5.67 | | | | | | | | $1,000.00 | | | | $1,018.90 | | | | 0.90% | | | | $4.52 | |
Hypothetical 5% Return | | | $1,000.00 | | | | $1,030.48 | | | | 1.13% | | | | $5.70 | | | | | | | | $1,000.00 | | | | $1,029.34 | | | | 0.90% | | | | $4.54 | |
Matthews Japan Fund | | | | | | | | | | | | | | | | | | | | | | | | | | | | | | | | | | | | |
Actual Fund Return | | | $1,000.00 | | | | $1,062.70 | | | | 0.92% | | | | $4.72 | | | | | | | | $1,000.00 | | | | $1,063.20 | | | | 0.85% | | | | $4.36 | |
Hypothetical 5% Return | | | $1,000.00 | | | | $1,029.44 | | | | 0.92% | | | | $4.64 | | | | | | | | $1,000.00 | | | | $1,029.09 | | | | 0.85% | | | | $4.29 | |
| * | Commenced operations on April 29, 2016. |
| ** | The Fund’s name changed from Matthews Asia Science and Technology Fund to Matthews Asia Innovators Fund on April 29, 2016. |
| 1 | Annualized, based on the Fund’s most recent fiscal half-year expenses. |
| 2 | Operating expenses are equal to the Fund’s annualized expense ratio multiplied by the average account value over the period, multiplied by 182 days, then divided by 366. |
| 3 | Operating expenses are equal to the Fund’s annualized expense ratio multiplied by the average account value over the period, multiplied by 62 days, then divided by 366. |
| | | | |
| matthewsasia.com | 800.789.ASIA | | | 93 | |
Disclosure of Fund Expenses (unaudited) (continued)
| | | | | | | | | | | | | | | | | | | | | | | | | | | | | | | | | | | | |
| | | INVESTOR CLASS | | | | | | INSTITUTIONAL CLASS | |
| | | Beginning Account Value 1/1/16 | | | Ending Account Value 6/30/16 | | | Expense Ratio1 | | | Operating Expenses Paid During Period 1/1/16– 6/30/162 | | | | | | Beginning Account Value 1/1/16 | | | Ending Account Value 6/30/16 | | | Expense Ratio1 | | | Operating Expenses Paid During Period
1/1/16–
6/30/162 | |
| ASIA GROWTH STRATEGIES (continued) | | | | | | | | | | | | | | | | | | | | | | | | | | | | | | | | | | | | |
Matthews Korea Fund | | | | | | | | | | | | | | | | | | | | | | | | | | | | | | | | | | | | |
Actual Fund Return | | | $1,000.00 | | | | $996.70 | | | | 1.13% | | | | $5.61 | | | | | | | | $1,000.00 | | | | $998.40 | | | | 0.92% | | | | $4.57 | |
Hypothetical 5% Return | | | $1,000.00 | | | | $1,030.48 | | | | 1.13% | | | | $5.70 | | | | | | | | $1,000.00 | | | | $1,029.44 | | | | 0.92% | | | | $4.64 | |
| | | | | | | | | |
| ASIA SMALL COMPANY STRATEGIES | | | | | | | | | | | | | | | | | | | | | | | | | | | | | | | | | | | | |
Matthews Asia Small Companies Fund | | | | | | | | | | | | | | | | | | | | | | | | | | | | | | | | | | | | |
Actual Fund Return | | | $1,000.00 | | | | $993.30 | | | | 1.48% | | | | $7.33 | | | | | | | | $1,000.00 | | | | $994.30 | | | | 1.25% | | | | $6.20 | |
Hypothetical 5% Return | | | $1,000.00 | | | | $1,032.22 | | | | 1.48% | | | | $7.48 | | | | | | | | $1,000.00 | | | | $1,031.08 | | | | 1.25% | | | | $6.31 | |
Matthews China Small Companies Fund | | | | | | | | | | | | | | | | | | | | | | | | | | | | | | | | | | | | |
Actual Fund Return | | | $1,000.00 | | | | $940.80 | | | | 1.50% | | | | $7.24 | | | | | | | | | | | | | | | | | | | | | |
Hypothetical 5% Return | | | $1,000.00 | | | | $1,032.32 | | | | 1.50% | | | | $7.58 | | | | | | | | | | | | | | | | | | | | | |
| 1 | Annualized, based on the Fund’s most recent fiscal half-year expenses. |
| 2 | Operating expenses are equal to the Fund’s annualized expense ratio multiplied by the average account value over the period, multiplied by 182 days, then divided by 366. |
(This Page Intentionally Left Blank)
| | | | |
| matthewsasia.com | 800.789.ASIA | | | 95 | |
Statements of Assets and Liabilities (unaudited)
| | | | | | | | | | | | |
| | | Matthews Asia
Strategic
Income Fund | | | Matthews Asia Credit
Opportunities Fund* | | | Matthews Asian
Growth and
Income Fund | |
ASSETS: | | | | | | | | | | | | |
Investments at value (A) (Note 2-A and 7): | | | | | | | | | | | | |
Unaffiliated issuers | | | $61,596,570 | | | | $11,731,427 | | | | $2,853,045,775 | |
Affiliated issuers | | | — | | | | — | | | | — | |
Total investments | | | 61,596,570 | | | | 11,731,427 | | | | 2,853,045,775 | |
Cash | | | 2,187,449 | | | | 921,879 | | | | 116,985,751 | |
Segregated foreign currency at value (B) | | | — | | | | — | | | | — | |
Foreign currency at value (B) (Note 2-C) | | | — | | | | — | | | | 3,476,144 | |
Dividends, interest and other receivable—Unaffiliated issuers | | | 1,121,522 | | | | 164,847 | | | | 7,953,392 | |
Dividends receivable—Affiliated issuers | | | — | | | | — | | | | — | |
Receivable for securities sold | | | — | | | | — | | | | 355,628 | |
Receivable for capital shares sold | | | 6,662 | | | | 10,000 | | | | 14,550,261 | |
Due from Advisor (Note 5) | | | — | | | | — | | | | — | |
Deferred offering costs (Note 2-E) | | | — | | | | 29,686 | | | | — | |
Unrealized appreciation on forward foreign currency exchange contracts | | | 173,128 | | | | — | | | | — | |
Prepaid expenses and other assets | | | 36,971 | | | | 14,334 | | | | 223,509 | |
TOTAL ASSETS | | | 65,122,302 | | | | 12,872,173 | | | | 2,996,590,460 | |
LIABILITIES: | | | | | | | | | | | | |
Payable for securities purchased | | | 1,756,491 | | | | — | | | | 1,934,916 | |
Payable for capital shares redeemed | | | 12,411 | | | | — | | | | 6,124,740 | |
Cash overdraft | | | — | | | | — | | | | — | |
Deferred foreign capital gains tax liability (Note 2-G) | | | 19,355 | | | | — | | | | — | |
Due to Advisor (Note 5) | | | 26,482 | | | | 1,195 | | | | 1,601,039 | |
Administration and accounting fees payable | | | 1,243 | | | | 158 | | | | 58,645 | |
Administration and shareholder servicing fees payable | | | 7,238 | | | | 1,449 | | | | 343,738 | |
Custodian fees payable | | | — | | | | 1,129 | | | | 191,185 | |
Intermediary service fees payable (Note 5) | | | 11,057 | | | | 324 | | | | 808,878 | |
Professional fees payable | | | 18,101 | | | | 3,468 | | | | 38,920 | |
Transfer agent fees payable | | | 727 | | | | 304 | | | | 21,057 | |
Printing fees payable | | | — | | | | — | | | | 182,460 | |
Offering costs (Note 2-E) | | | — | | | | 35,760 | | | | — | |
Accrued other expenses payable | | | 7,064 | | | | — | | | | — | |
TOTAL LIABILITIES | | | 1,860,169 | | | | 43,787 | | | | 11,305,578 | |
NET ASSETS | | | $63,262,133 | | | | $12,828,386 | | | | $2,985,284,882 | |
NET ASSETS: | | | | | | | | | | | | |
Investor Class | | | $52,280,714 | | | | $7,745,749 | | | | $2,035,934,986 | |
Institutional Class | | | 10,981,419 | | | | 5,082,637 | | | | 949,349,896 | |
TOTAL | | | $63,262,133 | | | | $12,828,386 | | | | $2,985,284,882 | |
| * | Matthews Asia Credit Opportunities Fund commenced operations on April 29, 2016. |
| 1 | Consolidated Statements of Assets and Liabilities. See Note 2-C. |
See accompanying notes to financial statements.
June 30, 2016
| | | | | | | | | | | | | | | | | | | | | | |
| | | | | |
Matthews Asia
Dividend Fund1 | | | Matthews China
Dividend Fund | | | Matthews Asia
Value Fund | | | Matthews Asia
Focus Fund | | | Matthews Asia
Growth Fund | | | Matthews Pacific
Tiger Fund | |
| | | | | | | | | | | | | | | | | | | | | | |
| | | | | | | | | | | | | | | | | | | | | | |
| | $4,049,687,664 | | | | $154,721,554 | | | | $1,721,946 | | | | $10,484,557 | | | | $667,842,832 | | | | $6,107,637,918 | |
| | | | | |
| | 566,043,628 | | | | — | | | | — | | | | — | | | | — | | | | 586,616,690 | |
| | 4,615,731,292 | | | | 154,721,554 | | | | 1,721,946 | | | | 10,484,557 | | | | 667,842,832 | | | | 6,694,254,608 | |
| | 46,583,900 | | | | 6,930,024 | | | | 268,171 | | | | 284,705 | | | | — | | | | 242,998,423 | |
| | 72,748 | | | | — | | | | — | | | | — | | | | — | | | | — | |
| | 12,693,013 | | | | 287,183 | | | | 153 | | | | — | | | | 448,428 | | | | 3,028,863 | |
| | 22,863,142 | | | | 1,591,658 | | | | 4,059 | | | | 44,016 | | | | 717,178 | | | | 16,817,066 | |
| | 325,544 | | | | — | | | | — | | | | — | | | | — | | | | — | |
| | 21,133,333 | | | | 569,061 | | | | — | | | | — | | | | 19,102,629 | | | | 12,331,196 | |
| | 7,057,762 | | | | 1,079,561 | | | | — | | | | 2,649 | | | | 1,120,571 | | | | 26,350,255 | |
| | — | | | | — | | | | 13,568 | | | | 309 | | | | — | | | | — | |
| | 240 | | | | — | | | | 51,310 | | | | — | | | | — | | | | — | |
| — | | | | — | | | | — | | | | — | | | | — | | | | — | |
| | 80,057 | | | | 64,118 | | | | 29,989 | | | | 48,525 | | | | 67,548 | | | | 145,578 | |
| | 4,726,541,031 | | | | 165,243,159 | | | | 2,089,196 | | | | 10,864,761 | | | | 689,299,186 | | | | 6,995,925,989 | |
| | | | | | | | | | | | | | | | | | | | | | |
| | 622,856 | | | | 461,664 | | | | — | | | | — | | | | 3,914,989 | | | | — | |
| | 6,503,154 | | | | 236,051 | | | | 203 | | | | 5,055 | | | | 1,713,685 | | | | 5,009,895 | |
| | — | | | | — | | | | — | | | | — | | | | 1,064,261 | | | | — | |
| | 66,976 | | | | — | | | | — | | | | — | | | | 122,956 | | | | — | |
| | 2,546,069 | | | | 86,029 | | | | — | | | | — | | | | 367,620 | | | | 3,659,919 | |
| | 93,177 | | | | 3,054 | | | | 38 | | | | 220 | | | | 13,493 | | | | 132,611 | |
| | 535,666 | | | | 18,471 | | | | 231 | | | | 1,265 | | | | 78,929 | | | | 752,950 | |
| | 147,294 | | | | — | | | | — | | | | — | | | | — | | | | 407,321 | |
| | 1,106,107 | | | | 36,716 | | | | — | | | | — | | | | 177,443 | | | | 1,097,624 | |
| | 52,656 | | | | 17,331 | | | | 6,694 | | | | 13,223 | | | | 29,500 | | | | 80,132 | |
| | 127,239 | | | | 3,038 | | | | 84 | | | | 383 | | | | 6,825 | | | | 74,019 | |
| | 176,598 | | | | — | | | | — | | | | — | | | | 8,774 | | | | 145,189 | |
| | — | | | | — | | | | 60,123 | | | | — | | | | — | | | | — | |
| | 73,749 | | | | — | | | | — | | | | — | | | | — | | | | — | |
| | 12,051,541 | | | | 862,354 | | | | 67,373 | | | | 20,146 | | | | 7,498,475 | | | | 11,359,660 | |
| | $4,714,489,490 | | | | $164,380,805 | | | | $2,021,823 | | | | $10,844,615 | | | | $681,800,711 | | | | $6,984,566,329 | |
| | | | | | | | | | | | | | | | | | | | | | |
| | $2,709,574,471 | | | | $144,922,923 | | | | $1,873,953 | | | | $4,947,618 | | | | $476,134,562 | | | | $2,638,611,508 | |
| | 2,004,915,019 | | | | 19,457,882 | | | | 147,870 | | | | 5,896,997 | | | | 205,666,149 | | | | 4,345,954,821 | |
| | $4,714,489,490 | | | | $164,380,805 | | | | $2,021,823 | | | | $10,844,615 | | | | $681,800,711 | | | | $6,984,566,329 | |
| | | | |
| matthewsasia.com | 800.789.ASIA | | | 97 | |
Statements of Assets and Liabilities (unaudited) (continued)
| | | | | | | | | | | | |
| | | Matthews Asia
Strategic
Income Fund | | | Matthews Asia Credit
Opportunities Fund* | | | Matthews Asian
Growth and
Income Fund | |
SHARES OUTSTANDING: | | | | | | | | | | | | |
(shares of beneficial interest issued and outstanding, respectively, unlimited number of shares authorized with a $0.001 par value) | | | | | | | | | | | | |
Investor Class | | | 5,041,652 | | | | 767,974 | | | | 119,679,357 | |
Institutional Class | | | 1,059,764 | | | | 504,013 | | | | 55,863,477 | |
TOTAL | | | 6,101,416 | | | | 1,271,987 | | | | 175,542,834 | |
NET ASSET VALUE: | | | | | | | | | | | | |
Investor Class, offering price and redemption price | | | $10.37 | | | | $10.09 | | | | $17.01 | |
Institutional Class, offering price and redemption price | | | $10.36 | | | | $10.08 | | | | $16.99 | |
NET ASSETS CONSIST OF: | | | | | | | | | | | | |
Capital paid-in | | | $65,640,076 | | | | $12,715,496 | | | | $2,566,980,889 | |
Undistributed (distributions in excess of) net investment income (loss) | | | 274,982 | | | | (1,913 | ) | | | (9,840,813 | ) |
Undistributed/accumulated net realized gain (loss) on investments, and foreign currency related transactions | | | (2,555,214 | ) | | | 32 | | | | 94,158,578 | |
Net unrealized appreciation (depreciation) on investments, foreign currency translations and deferred foreign capital gains taxes | | | (97,711 | ) | | | 114,771 | | | | 333,986,228 | |
NET ASSETS | | | $63,262,133 | | | | $12,828,386 | | | | $2,985,284,882 | |
(A) Investments at cost: | | | | | | | | | | | | |
Unaffiliated issuers | | | $61,839,303 | | | | $11,616,656 | | | | $2,519,090,988 | |
Affiliated issuers | | | — | | | | — | | | | — | |
Total investments at cost | | | $61,839,303 | | | | $11,616,656 | | | | $2,519,090,988 | |
(B) Foreign currency at cost | | | $— | | | | $— | | | | $3,476,144 | |
| * | Matthews Asia Credit Opportunities Fund commenced operations on April 29, 2016. |
| 1 | Consolidated Statements of Assets and Liabilities. See Note 2-C. |
See accompanying notes to financial statements.
June 30, 2016
| | | | | | | | | | | | | | | | | | | | | | |
| | | | | |
Matthews Asia
Dividend Fund1 | | | Matthews China
Dividend Fund | | | Matthews Asia
Value Fund | | | Matthews Asia
Focus Fund | | | Matthews Asia
Growth Fund | | | Matthews Pacific
Tiger Fund | |
| | | | | | | | | | | | | | | | | | | | | | |
| | | | | | | | | | | | | | | | | | | | | | |
| | 167,625,677 | | | | 10,764,098 | | | | 184,306 | | | | 533,767 | | | | 21,784,140 | | | | 107,763,133 | |
| | 124,066,128 | | | | 1,445,251 | | | | 14,560 | | | | 634,975 | | | | 9,337,051 | | | | 177,464,640 | |
| | 291,691,805 | | | | 12,209,349 | | | | 198,866 | | | | 1,168,742 | | | | 31,121,191 | | | | 285,227,773 | |
| | | | | | | | | | | | | | | | | | | | | | |
| | $16.16 | | | | $13.46 | | | | $10.17 | | | | $9.27 | | | | $21.86 | | | | $24.49 | |
| | $16.16 | | | | $13.46 | | | | $10.16 | | | | $9.29 | | | | $22.03 | | | | $24.49 | |
| | | | | | | | | | | | | | | | | | | | | | |
| | $4,032,607,326 | | | | $165,474,597 | | | | $1,962,153 | | | | $12,216,459 | | | | $547,013,254 | | | | $5,289,277,745 | |
|
(8,012,188 |
) | | | (157,130 | ) | | | 12,518 | | | | 165,988 | | | | 2,901,723 | | | | 22,497,512 | |
|
(73,704,561) |
| | | (152,978 | ) | | | (10,520 | ) | | | (920,513 | ) | | | (21,055,517 | ) | | | 111,753,506 | |
|
763,598,913 |
| | | (783,684 | ) | | | 57,672 | | | | (617,319 | ) | | | 152,941,251 | | | | 1,561,037,566 | |
| | $4,714,489,490 | | | | $164,380,805 | | | | $2,021,823 | | | | $10,844,615 | | | | $681,800,711 | | | | $6,984,566,329 | |
| | | | | | | | | | | | | | | | | | | | | | |
| | $3,335,348,803 | | | | $155,506,353 | | | | $1,664,278 | | | | $11,101,912 | | | | $514,779,514 | | | | $4,437,739,299 | |
| | 516,704,203 | | | | — | | | | — | | | | — | | | | — | | | | 695,495,856 | |
| | $3,852,053,006 | | | | $155,506,353 | | | | $1,664,278 | | | | $11,101,912 | | | | $514,779,514 | | | | $5,133,235,155 | |
| | $12,691,740 | | | | $287,183 | | | | $153 | | | | $— | | | | $448,428 | | | | $3,028,775 | |
| | | | |
| matthewsasia.com | 800.789.ASIA | | | 99 | |
Statements of Assets and Liabilities (unaudited) (continued)
| | | | | | | | | | | | |
| | | |
| | | Matthews Asia
ESG Fund | | | Matthews Emerging
Asia Fund | | | Matthews Asia
Innovators Fund* | |
ASSETS: | | | | | | | | | | | | |
Investments at value (A) (Note 2-A and 7): | | | | | | | | | | | | |
Unaffiliated issuers | | | $7,581,382 | | | | $136,473,823 | | | | $140,207,315 | |
Affiliated issuers | | | — | | | | 4,391,970 | | | | — | |
Total investments | | | 7,581,382 | | | | 140,865,793 | | | | 140,207,315 | |
Cash | | | 1,138,677 | | | | 10,272,293 | | | | 4,590,842 | |
Segregated foreign currency at value (B) | | | — | | | | — | | | | — | |
Foreign currency at value (B) (Note 2-C) | | | — | | | | 613,668 | | | | 732,121 | |
Dividends, interest and other receivable—Unaffiliated issuers | | | 34,102 | | | | 445,787 | | | | 316,748 | |
Receivable for securities sold | | | — | | | | — | | | | — | |
Receivable for capital shares sold | | | — | | | | 555,246 | | | | 39,563 | |
Due from Advisor (Note 5) | | | 4,019 | | | | — | | | | — | |
Prepaid expenses and other assets | | | 37,474 | | | | 42,170 | | | | 38,674 | |
TOTAL ASSETS | | | 8,795,654 | | | | 152,794,957 | | | | 145,925,263 | |
LIABILITIES: | | | | | | | | | | | | |
Payable for securities purchased | | | 131,674 | | | | 39,041 | | | | — | |
Payable for capital shares redeemed | | | 2,256 | | | | 12,163 | | | | 227,698 | |
Cash overdraft | | | — | | | | — | | | | — | |
Deferred foreign capital gains tax liability (Note 2-G) | | | 16,053 | | | | 1,129,910 | | | | — | |
Due to Advisor (Note 5) | | | — | | | | 79,247 | | | | 72,066 | |
Administration and accounting fees payable | | | 42 | | | | 2,654 | | | | 2,917 | |
Administration and shareholder servicing fees payable | | | 952 | | | | 16,816 | | | | 16,892 | |
Custodian fees payable | | | — | | | | — | | | | — | |
Intermediary service fees payable (Note 5) | | | — | | | | 26,240 | | | | 31,862 | |
Professional fees payable | | | 8,968 | | | | 7,705 | | | | 28,007 | |
Transfer agent fees payable | | | 75 | | | | 1,376 | | | | 4,240 | |
Printing fees payable | | | 12,699 | | | | — | | | | — | |
Offering costs (Note 2-E) | | | 78,684 | | | | — | | | | — | |
Trustees fees payable | | | 458 | | | | — | | | | — | |
Accrued other expenses payable | | | — | | | | 20,475 | | | | 3,508 | |
TOTAL LIABILITIES | | | 251,861 | | | | 1,335,627 | | | | 387,190 | |
NET ASSETS | | | $8,543,793 | | | | $151,459,330 | | | | $145,538,073 | |
NET ASSETS: | | | | | | | | | | | | |
Investor Class | | | $5,608,248 | | | | $73,511,633 | | | | $107,362,389 | |
Institutional Class | | | 2,935,545 | | | | 77,947,697 | | | | 38,175,684 | |
TOTAL | | | $8,543,793 | | | | $151,459,330 | | | | $145,538,073 | |
| * | The Fund’s name changed from Matthews Asia Science and Technology Fund to Matthews Asia Innovators Fund on April 29, 2016. |
| 1 | Consolidated Statements of Assets and Liabilities. See Note 2-C. |
See accompanying notes to financial statements.
June 30, 2016
| | | | | | | | | | | | | | | | | | | | | | |
Matthews
China Fund1 | | | Matthews
India Fund | | | Matthews
Japan Fund | | | Matthews
Korea Fund | | | Matthews Asia
Small Companies
Fund | | | Matthews China
Small Companies
Fund | |
| | | | | | | | | | | | | | | | | | | | | | |
| | | | | | | | | | | | | | | | | | | | | | |
| | $572,727,125 | | | | $1,445,567,153 | | | | $2,889,285,493 | | | | $168,531,075 | | | | $522,313,293 | | | | $17,274,089 | |
| | — | | | | 97,472,893 | | | | 357,567,852 | | | | — | | | | — | | | | — | |
| | 572,727,125 | | | | 1,543,040,046 | | | | 3,246,853,345 | | | | 168,531,075 | | | | 522,313,293 | | | | 17,274,089 | |
| | 8,848,421 | | | | 48,795,005 | | | | 124,309,376 | | | | — | | | | 17,939,121 | | | | 908,557 | |
| | 72,770 | | | | — | | | | — | | | | — | | | | — | | | | — | |
| | 162,820 | | | | — | | | | 3,132,429 | | | | — | | | | 345,331 | | | | — | |
| | 7,700,701 | | | | 3,403,719 | | | | 4,689,297 | | | | 143,152 | | | | 623,493 | | | | 118,792 | |
| | 448,485 | | | | — | | | | 28,046,965 | | | | 32,933,767 | | | | 81,626 | | | | 122,522 | |
| | 94,247 | | | | 1,752,850 | | | | 14,462,400 | | | | 346,673 | | | | 215,917 | | | | 10,300 | |
| | — | | | | — | | | | — | | | | — | | | | — | | | | — | |
| | 60,860 | | | | 118,970 | | | | 342,734 | | | | 39,670 | | | | 64,732 | | | | 30,095 | |
| | 590,115,429 | | | | 1,597,110,590 | | | | 3,421,836,546 | | | | 201,994,337 | | | | 541,583,513 | | | | 18,464,355 | |
| | | | | | | | | | | | | | | | | | | | | | |
| | 8,463,593 | | | | 75,676 | | | | 43,786,527 | | | | — | | | | 53,779 | | | | — | |
| | 1,298,850 | | | | 1,436,857 | | | | 12,788,511 | | | | 2,743,549 | | | | 739,617 | | | | 5,695 | |
| | — | | | | — | | | | — | | | | 35,181,648 | | | | — | | | | — | |
| | — | | | | — | | | | — | | | | — | | | | — | | | | — | |
| | 304,039 | | | | 856,237 | | | | 1,792,907 | | | | 112,766 | | | | 429,135 | | | | 6,276 | |
| | 11,490 | | | | 30,171 | | | | 62,054 | | | | 4,072 | | | | 10,887 | | | | 382 | |
| | 65,677 | | | | 183,831 | | | | 383,266 | | | | 24,209 | | | | 63,278 | | | | 2,168 | |
| | 12,492 | | | | 106,681 | | | | — | | | | — | | | | 18,204 | | | | — | |
| | 202,199 | | | | 316,852 | | | | — | | | | 33,677 | | | | 140,930 | | | | — | |
| | 21,439 | | | | 18,176 | | | | — | | | | 19,387 | | | | 36,510 | | | | 18,280 | |
| | 24,725 | | | | 25,239 | | | | 26,283 | | | | 5,625 | | | | 4,855 | | | | 748 | |
| | 67,981 | | | | — | | | | — | | | | — | | | | — | | | | — | |
| | — | | | | — | | | | — | | | | — | | | | — | | | | — | |
| | — | | | | — | | | | — | | | | — | | | | — | | | | — | |
| | 124,379 | | | | 20,380 | | | | — | | | | 396 | | | | 21,968 | | | | — | |
| | 10,596,864 | | | | 3,070,100 | | | | 58,839,548 | | | | 38,125,329 | | | | 1,519,163 | | | | 33,549 | |
| | $579,518,565 | | | | $1,594,040,490 | | | | $3,362,996,998 | | | | $163,869,008 | | | | $540,064,350 | | | | $18,430,806 | |
| | | | | | | | | | | | | | | | | | | | | | |
| | $553,369,742 | | | | $1,094,817,573 | | | | $2,159,899,237 | | | | $133,613,503 | | | | $338,550,252 | | | | $18,430,806 | |
| | 26,148,823 | | | | 499,222,917 | | | | 1,203,097,761 | | | | 30,255,505 | | | | 201,514,098 | | | | — | |
| | $579,518,565 | | | | $1,594,040,490 | | | | $3,362,996,998 | | | | $163,869,008 | | | | $540,064,350 | | | | $18,430,806 | |
| | | | |
| matthewsasia.com | 800.789.ASIA | | | 101 | |
Statements of Assets and Liabilities (unaudited) (continued)
| | | | | | | | | | | | |
| | | |
| | | Matthews Asia
ESG Fund | | | Matthews Emerging
Asia Fund | | | Matthews Asia
Innovators Fund* | |
SHARES OUTSTANDING: | | | | | | | | | | | | |
(shares of beneficial interest issued and outstanding, respectively, unlimited number of shares authorized with a $0.001 par value) | | | | | | | | | | | | |
Investor Class | | | 616,320 | | | | 5,896,320 | | | | 9,153,256 | |
Institutional Class | | | 324,348 | | | | 6,231,461 | | | | 3,245,492 | |
TOTAL | | | 940,668 | | | | 12,127,781 | | | | 12,398,748 | |
NET ASSET VALUE: | | | | | | | | | | | | |
Investor Class, offering price and redemption price | | | $9.10 | | | | $12.47 | | | | $11.73 | |
Institutional Class, offering price and redemption price | | | $9.05 | | | | $12.51 | | | | $11.76 | |
NET ASSETS CONSIST OF: | | | | | | | | | | | | |
Capital paid-in | | | $8,582,777 | | | | $135,425,984 | | | | $104,619,357 | |
Undistributed (distributions in excess of) net investment income (loss) | | | 58,097 | | | | 1,419,800 | | | | (15,557 | ) |
Undistributed/accumulated net realized gain (loss) on investments, and foreign currency related transactions | | | (86,778 | ) | | | 1,610,159 | | | | 15,527,572 | |
Net unrealized appreciation (depreciation) on investments, foreign currency translations and deferred foreign capital gains taxes | | | (10,303 | ) | | | 13,003,387 | | | | 25,406,701 | |
NET ASSETS | | | $8,543,793 | | | | $151,459,330 | | | | $145,538,073 | |
(A) Investments at cost: | | | | | | | | | | | | |
Unaffiliated issuers | | | $7,576,334 | | | | $122,799,436 | | | | $114,802,959 | |
Affiliated issuers | | | — | | | | 3,933,041 | | | | — | |
Total investments at cost | | | $7,576,334 | | | | $126,732,477 | | | | $114,802,959 | |
(B) Foreign currency at cost | | | $— | | | | $613,693 | | | | $732,109 | |
| * | The Fund’s name changed from Matthews Asia Science and Technology Fund to Matthews Asia Innovators Fund on April 29, 2016. |
| 1 | Consolidated Statements of Assets and Liabilities. See Note 2-C. |
See accompanying notes to financial statements.
June 30, 2016
| | | | | | | | | | | | | | | | | | | | | | |
Matthews
China Fund1 | | | Matthews
India Fund | | | Matthews
Japan Fund | | | Matthews
Korea Fund | | | Matthews Asia
Small Companies
Fund | | | Matthews China
Small Companies
Fund | |
| | | | | | | | | | | | | | | | | | | | | | |
| | | | | |
| | | | | | | | | | | | | | | | | | | | | | |
| | 34,180,945 | | | | 40,704,948 | | | | 107,115,506 | | | | 21,787,574 | | | | 17,560,945 | | | | 2,229,700 | |
| | 1,616,621 | | | | 18,495,185 | | | | 59,548,805 | | | | 4,907,498 | | | | 10,448,360 | | | | — | |
| | 35,797,566 | | | | 59,200,133 | | | | 166,664,311 | | | | 26,695,072 | | | | 28,009,305 | | | | 2,229,700 | |
| | | | | | | | | | | | | | | | | | | | | | |
| | $16.19 | | | | $26.90 | | | | $20.16 | | | | $6.13 | | | | $19.28 | | | | $8.27 | |
| | $16.17 | | | | $26.99 | | | | $20.20 | | | | $6.17 | | | | $19.29 | | | | $— | |
| | | | | | | | | | | | | | | | | | | | | | |
| | $579,459,949 | | | | $1,311,997,317 | | | | $3,008,775,196 | | | | $92,903,527 | | | | $528,504,847 | | | | $18,346,520 | |
| | 7,379,875 | | | | 3,480,708 | | | | 10,650,893 | | | | (530,043 | ) | | | 2,261,963 | | | | 179,049 | |
|
18,179,477 |
| | | 5,485,720 | | | | (96,567,009 | ) | | | 13,469,359 | | | | (23,426,605 | ) | | | (219,743 | ) |
|
(25,500,736 |
) | | | 273,076,745 | | | | 440,137,918 | | | | 58,026,165 | | | | 32,724,145 | | | | 124,980 | |
| | $579,518,565 | | | | $1,594,040,490 | | | | $3,362,996,998 | | | | $163,869,008 | | | | $540,064,350 | | | | $18,430,806 | |
| | | | | | | | | | | | | | | | | | | | | | |
| | $598,229,860 | | | | $1,186,812,590 | | | | $2,484,497,003 | | | | $110,624,386 | | | | $489,572,512 | | | | $17,149,197 | |
| | — | | | | 83,016,313 | | | | 322,136,769 | | | | — | | | | — | | | | — | |
| | $598,229,860 | | | | $1,269,828,903 | | | | $2,806,633,772 | | | | $110,624,386 | | | | $489,572,512 | | | | $17,149,197 | |
| | $162,832 | | | | $— | | | | $3,127,534 | | | | $— | | | | $345,331 | | | | $— | |
| | | | |
| matthewsasia.com | 800.789.ASIA | | | 103 | |
Statements of Operations (unaudited)
| | | | | | | | | | | | |
| | | Matthews Asia
Strategic
Income Fund | | | Matthews Asia
Credit
Opportunities
Fund* | | | Matthews Asian
Growth and
Income Fund | |
INVESTMENT INCOME: | | | | | | | | | | | | |
Dividends—Unaffiliated Issuers | | | $1,514 | | | | $758 | | | | $42,500,579 | |
Dividends—Affiliated Issuers (Note 7) | | | — | | | | — | | | | — | |
Interest | | | 1,827,496 | | | | 89,100 | | | | 2,134,872 | |
Foreign withholding tax | | | (32,288 | ) | | | — | | | | (2,728,091 | ) |
TOTAL INVESTMENT INCOME | | | 1,796,722 | | | | 89,858 | | | | 41,907,360 | |
EXPENSES: | | | | | | | | | | | | |
Investment advisory fees (Note 5) | | | 201,344 | | | | 12,844 | | | | 9,493,005 | |
Administration and accounting fees (Note 5) | | | 2,485 | | | | 158 | | | | 114,491 | |
Administration and shareholder servicing fees (Note 5) | | | 44,747 | | | | 2,826 | | | | 2,061,834 | |
Accounting out-of-pocket fees | | | 12,922 | | | | 236 | | | | 13,865 | |
Custodian fees | | | 8,236 | | | | 1,133 | | | | 465,101 | |
Insurance fees | | | — | | | | — | | | | — | |
Intermediary service fees (Note 5) | | | 65,000 | | | | 2,819 | | | | 2,616,328 | |
Printing fees | | | 5,819 | | | | 84 | | | | 170,170 | |
Professional fees | | | 21,261 | | | | 5,269 | | | | 35,580 | |
Registration fees | | | 13,273 | | | | 84 | | | | 24,302 | |
Transfer agent fees | | | 1,459 | | | | 304 | | | | 35,805 | |
Trustees fees | | | 1,759 | | | | 84 | | | | 78,488 | |
Offering costs (Note 2-E) | | | — | | | | 6,074 | | | | — | |
Other expenses | | | 1,919 | | | | 51 | | | | 35,507 | |
TOTAL EXPENSES | | | 380,224 | | | | 31,966 | | | | 15,144,476 | |
Advisory fees waived and expenses waived or reimbursed (Note 5) | | | (37,218 | ) | | | (11,363 | ) | | | — | |
Administration fees waived (Note 5) | | | — | | | | — | | | | — | |
NET EXPENSES | | | 343,006 | | | | 20,603 | | | | 15,144,476 | |
NET INVESTMENT INCOME (LOSS) | | | 1,453,716 | | | | 69,255 | | | | 26,762,884 | |
| REALIZED AND UNREALIZED GAIN (LOSS) ON INVESTMENTS, FOREIGN CURRENCY RELATED TRANSACTIONS AND DEFERRED CAPITAL GAINS TAXES: | | | | | | | | | | | | |
Net realized gain (loss) on investments—Unaffiliated Issuers | | | (556,520 | ) | | | — | | | | 54,784,572 | |
Net realized gain (loss) on investments—Affiliated Issuers | | | — | | | | — | | | | — | |
Net realized gain (loss) on foreign currency related transactions | | | (463,163 | ) | | | 32 | | | | (877,816 | ) |
Net change in unrealized appreciation/depreciation on investments | | | 3,315,473 | | | | 114,771 | | | | 117,588,009 | |
Net change in deferred foreign capital gains taxes on unrealized appreciation | | | (18,390 | ) | | | — | | | | — | |
Net change in unrealized appreciation/depreciation on foreign currency related translations | | | (126,621 | ) | | | — | | | | 91,976 | |
Net realized and unrealized gain (loss) on investments, foreign currency related transactions and deferred capital gains taxes | | | 2,150,779 | | | | 114,803 | | | | 171,586,741 | |
| | | |
NET INCREASE (DECREASE) IN NET ASSETS FROM OPERATIONS | | | $3,604,495 | | | | $184,058 | | | | $198,349,625 | |
| * | Matthews Asia Credit Opportunities Fund commenced operations on April 29, 2016. |
| 1 | Consolidated Statements of Operations. See Note 2-C. |
See accompanying notes to financial statements.
Six-Month Period Ended June 30, 2016
| | | | | | | | | | | | | | | | | | | | | | |
Matthews Asia
Dividend Fund1 | | | Matthews China
Dividend Fund | | | Matthews Asia
Value Fund | | | Matthews Asia
Focus Fund | | | Matthews Asia
Growth Fund | | | Matthews Pacific
Tiger Fund | |
| | | | | | | | | | | | | | | | | | | | | | |
| | $72,593,886 | | | | $3,839,019 | | | | $19,200 | | | | $170,230 | | | | $6,996,336 | | | | $54,819,993 | |
| | 12,656,207 | | | | — | | | | — | | | | — | | | | — | | | | 3,599,251 | |
| | 1,060 | | | | 1 | | | | — | | | | 1 | | | | 10 | | | | — | |
| | (6,644,884 | ) | | | (219,786 | ) | | | (1,039 | ) | | | (7,236 | ) | | | (644,012 | ) | | | (4,400,462 | ) |
| | 78,606,269 | | | | 3,619,234 | | | | 18,161 | | | | 162,995 | | | | 6,352,334 | | | | 54,018,782 | |
| | | | | | | | | | | | | | | | | | | | | | |
| | 15,129,583 | | | | 507,135 | | | | 6,010 | | | | 36,061 | | | | 2,270,246 | | | | 21,358,088 | |
| | 222,102 | | | | 6,118 | | | | 73 | | | | 435 | | | | 27,386 | | | | 257,604 | |
| | 3,286,060 | | | | 110,187 | | | | 1,305 | | | | 7,834 | | | | 493,247 | | | | 4,638,917 | |
| | 15,058 | | | | 11,921 | | | | 9,027 | | | | 11,020 | | | | 13,705 | | | | 13,609 | |
| | 695,551 | | | | 47,423 | | | | 12,046 | | | | 7,502 | | | | 181,265 | | | | 1,316,249 | |
| | 428 | | | | — | | | | — | | | | — | | | | — | | | | — | |
| | 3,372,419 | | | | 174,151 | | | | 2,105 | | | | 11,616 | | | | 604,149 | | | | 3,784,293 | |
| | 184,681 | | | | 9,493 | | | | 941 | | | | 940 | | | | 28,808 | | | | 157,003 | |
| | 79,868 | | | | 18,031 | | | | 11,134 | | | | 21,490 | | | | 25,030 | | | | 73,073 | |
| | 30,891 | | | | 19,140 | | | | 2,277 | | | | 10,450 | | | | 31,276 | | | | 32,725 | |
| | 256,745 | | | | 5,052 | | | | 138 | | | | 811 | | | | 12,035 | | | | 74,833 | |
| | 123,822 | | | | 4,460 | | | | 44 | | | | 396 | | | | 19,684 | | | | 174,873 | |
| | — | | | | — | | | | 45,769 | | | | — | | | | — | | | | — | |
| | 52,589 | | | | 3,210 | | | | 621 | | | | 1,645 | | | | 22,705 | | | | 81,547 | |
| | 23,449,797 | | | | 916,321 | | | | 91,490 | | | | 110,200 | | | | 3,729,536 | | | | 31,962,814 | |
| | (78,720 | ) | | | — | | | | (78,075 | ) | | | (32,502 | ) | | | — | | | | (220,772 | ) |
| | (78,720 | ) | | | — | | | | — | | | | — | | | | — | | | | (220,772 | ) |
| | 23,292,357 | | | | 916,321 | | | | 13,415 | | | | 77,698 | | | | 3,729,536 | | | | 31,521,270 | |
| | 55,313,912 | | | | 2,702,913 | | | | 4,746 | | | | 85,297 | | | | 2,622,798 | | | | 22,497,512 | |
| | | | | | | | | | | | | | | | | | | | | | |
| | (30,860,132 | ) | | | (663,354 | ) | | | (10,093 | ) | | | (210,482 | ) | | | (1,648,454 | ) | | | 94,499,265 | |
| | (1,884,501 | ) | | | — | | | | — | | | | — | | | | — | | | | 3,794,822 | |
| | (474,805 | ) | | | (5,740 | ) | | | (427 | ) | | | (369 | ) | | | 99,141 | | | | 94,812 | |
| | 262,822,193 | | | | (5,895,880 | ) | | | 74,431 | | | | 843,934 | | | | 17,909,175 | | | | 144,103,988 | |
|
(66,976 |
) | | | — | | | | — | | | | — | | | | 18,798 | | | | — | |
|
245,606 |
| | | 1,077 | | | | (13 | ) | | | 313 | | | | 4,434 | | | | 36,343 | |
|
229,781,385 |
| | | (6,563,897 | ) | | | 63,898 | | | | 633,396 | | | | 16,383,094 | | | | 242,529,230 | |
| | | | | |
| | $285,095,297 | | | | ($3,860,984 | ) | | | $68,644 | | | | $718,693 | | | | $19,005,892 | | | | $265,026,742 | |
| | | | |
| matthewsasia.com | 800.789.ASIA | | | 105 | |
Statements of Operations (unaudited) (continued)
| | | | | | | | | | | | |
| | | |
| | | Matthews Asia ESG Fund | | | Matthews Emerging
Asia Fund | | | Matthews Asia Innovators Fund* | |
INVESTMENT INCOME: | | | | | | | | | | | | |
Dividends—Unaffiliated Issuers | | | $83,688 | | | | $2,395,660 | | | | $916,696 | |
Dividends—Affiliated Issuers (Note 7) | | | — | | | | — | | | | — | |
Interest | | | — | | | | — | | | | — | |
Foreign withholding tax | | | (7,183 | ) | | | (265,696 | ) | | | (92,218 | ) |
TOTAL INVESTMENT INCOME | | | 76,505 | | | | 2,129,964 | | | | 824,478 | |
EXPENSES: | | | | | | | | | | | | |
Investment advisory fees (Note 5) | | | 21,642 | | | | 706,895 | | | | 485,711 | |
Administration and accounting fees (Note 5) | | | 261 | | | | 5,673 | | | | 5,859 | |
Administration and shareholder servicing fees (Note 5) | | | 4,694 | | | | 102,214 | | | | 105,523 | |
Accounting out-of-pocket fees | | | 11,296 | | | | 15,394 | | | | 13,674 | |
Custodian fees | | | 23,368 | | | | 205,037 | | | | 46,765 | |
Intermediary service fees (Note 5) | | | 4,561 | | | | 116,341 | | | | 132,635 | |
Printing fees | | | 4,437 | | | | 6,196 | | | | 8,619 | |
Professional fees | | | 13,808 | | | | 23,563 | | | | 20,004 | |
Registration fees | | | 5,485 | | | | 15,269 | | | | 13,831 | |
Transfer agent fees | | | 214 | | | | 2,991 | | | | 7,335 | |
Trustees fees | | | 145 | | | | 4,237 | | | | 4,170 | |
Offering costs (Note 2-E) | | | 26,229 | | | | — | | | | — | |
Other expenses | | | 2,004 | | | | 3,545 | | | | 2,521 | |
TOTAL EXPENSES | | | 118,144 | | | | 1,207,355 | | | | 846,647 | |
Advisory fees waived and expenses waived or reimbursed (Note 5) | | | (73,031 | ) | | | (220,456 | ) | | | (6,612 | ) |
Administration fees waived (Note 5) | | | — | | | | — | | | | — | |
NET EXPENSES | | | 45,113 | | | | 986,899 | | | | 840,035 | |
NET INVESTMENT INCOME (LOSS) | | | 31,392 | | | | 1,143,065 | | | | (15,557 | ) |
| REALIZED AND UNREALIZED GAIN (LOSS) ON INVESTMENTS, FOREIGN CURRENCY RELATED TRANSACTIONS AND DEFERRED CAPITAL GAINS TAXES: | | | | | | | | | | | | |
Net realized gain (loss) on investments—Unaffiliated Issuers | | | (35,987 | ) | | | 3,171,686 | | | | 5,175,278 | |
Net realized gain (loss) on investments—Affiliated Issuers | | | — | | | | — | | | | — | |
Net realized foreign capital gains tax | | | — | | | | (448,789 | ) | | | — | |
Net realized gain (loss) on foreign currency related transactions | | | 1,279 | | | | (16,890 | ) | | | (53,479 | ) |
Net change in unrealized appreciation/depreciation on investments | | | 124,127 | | | | 7,893,088 | | | | (13,507,926 | ) |
Net change in deferred foreign capital gains taxes on unrealized appreciation | | | (6,218 | ) | | | 530,592 | | | | — | |
Net change in unrealized appreciation/depreciation on foreign currency related translations | | | 721 | | | | 309 | | | | 9,379 | |
Net realized and unrealized gain (loss) on investments, foreign currency related transactions and deferred capital gains taxes | | | 83,922 | | | | 11,129,996 | | | | (8,376,748 | ) |
| | | |
NET INCREASE (DECREASE) IN NET ASSETS FROM OPERATIONS | | | $115,314 | | | | $12,273,061 | | | | ($8,392,305 | ) |
| * | The Fund’s name changed from Matthews Asia Science and Technology Fund to Matthews Asia Innovators Fund on April 29, 2016. |
| 1 | Consolidated Statements of Operations. See Note 2-C. |
See accompanying notes to financial statements.
Six-Month Period Ended June 30, 2016
| | | | | | | | | | | | | | | | | | | | | | |
Matthews
China Fund1 | | | Matthews
India Fund | | | Matthews
Japan Fund | | | Matthews
Korea Fund | | | Matthews Asia Small Companies Fund | | | Matthews China Small Companies Fund | |
| | | | | | | | | | | | | | | | | | | | | | |
| | $11,935,949 | | | | $11,243,038 | | | | $20,950,786 | | | | $745,668 | | | | $5,044,347 | | | | $332,878 | |
| | — | | | | — | | | | 3,103,521 | | | | — | | | | — | | | | — | |
| | — | | | | 7 | | | | — | | | | — | | | | 790 | | | | — | |
| | (962,390 | ) | | | — | | | | (2,376,131 | ) | | | (123,078 | ) | | | (190,264 | ) | | | (10,649 | ) |
| | 10,973,559 | | | | 11,243,045 | | | | 21,678,176 | | | | 622,590 | | | | 4,854,873 | | | | 322,229 | |
| | | | | | | | | | | | | | | | | | | | | | |
| | 1,957,298 | | | | 4,791,556 | | | | 9,062,397 | | | | 660,970 | | | | 2,735,151 | | | | 96,081 | |
| | 60,904 | | | | 57,794 | | | | 109,244 | | | | 7,972 | | | | 21,943 | | | | 771 | |
| | 425,387 | | | | 1,040,318 | | | | 1,965,613 | | | | 143,553 | | | | 395,233 | | | | 13,885 | |
| | 13,830 | | | | 14,931 | | | | 14,764 | | | | 13,215 | | | | 14,824 | | | | 14,049 | |
| | 168,385 | | | | 332,929 | | | | 133,136 | | | | 34,272 | | | | 185,699 | | | | 15,631 | |
| | 705,653 | | | | 1,259,233 | | | | 705,185 | | | | 142,021 | | | | 465,888 | | | | 24,088 | |
| | 83,002 | | | | 60,454 | | | | 26,985 | | | | 7,419 | | | | 23,637 | | | | 2,276 | |
| | 50,691 | | | | 32,332 | | | | 30,029 | | | | 18,190 | | | | 25,683 | | | | 17,177 | |
| | 11,733 | | | | 27,041 | | | | 35,646 | | | | 10,367 | | | | 19,329 | | | | 6,080 | |
| | 48,060 | | | | 40,316 | | | | 55,119 | | | | 10,371 | | | | 8,660 | | | | 1,486 | |
| | 18,103 | | | | 38,413 | | | | 57,949 | | | | 5,344 | | | | 15,917 | | | | 557 | |
| | — | | | | — | | | | — | | | | — | | | | — | | | | — | |
| | 19,638 | | | | 16,155 | | | | 14,793 | | | | 5,531 | | | | 8,876 | | | | 1,261 | |
| | 3,562,684 | | | | 7,711,472 | | | | 12,210,860 | | | | 1,059,225 | | | | 3,920,840 | | | | 193,342 | |
| | | | | |
| | (1,868 | ) | | | — | | | | (2,893 | ) | | | — | | | | (83,760 | ) | | | (48,816 | ) |
| | — | | | | — | | | | (2,893 | ) | | | — | | | | — | | | | — | |
| | 3,560,816 | | | | 7,711,472 | | | | 12,205,074 | | | | 1,059,225 | | | | 3,837,080 | | | | 144,526 | |
| | 7,412,743 | | | | 3,531,573 | | | | 9,473,102 | | | | (436,635 | ) | | | 1,017,793 | | | | 177,703 | |
| | | | | |
| | | | | | | | | | | | | | | | | | | | | | |
| | 2,866,574 | | | | (5,746,000 | ) | | | (36,723,529 | ) | | | 7,098,788 | | | | (10,197,849 | ) | | | (922,006 | ) |
| | — | | | | 384,650 | | | | 6,649,002 | | | | — | | | | — | | | | — | |
| | — | | | | — | | | | — | | | | — | | | | — | | | | — | |
| | (166,503 | ) | | | (249,689 | ) | | | 902,096 | | | | 64,917 | | | | (33,518 | ) | | | 771 | |
| | | | | |
| | (99,904,502 | ) | | | 30,592,867 | | | | 270,884,964 | | | | (8,539,429 | ) | | | 2,566,450 | | | | (521,758 | ) |
| | | | | |
| | — | | | | 1,942,487 | | | | — | | | | — | | | | 56,811 | | | | — | |
| | | | | |
| | 18,589 | | | | (17,042 | ) | | | (83,609 | ) | | | 124,330 | | | | 2,324 | | | | 88 | |
| | | | | |
| | (97,185,842 | ) | | | 26,907,273 | | | | 241,628,924 | | | | (1,251,394 | ) | | | (7,605,782 | ) | | | (1,442,905 | ) |
| | | | | |
| | ($89,773,099 | ) | | | $30,438,846 | | | | $251,102,026 | | | | ($1,688,029 | ) | | | ($6,587,989 | ) | | | ($1,265,202 | ) |
| | | | |
| matthewsasia.com | 800.789.ASIA | | | 107 | |
Statements of Changes in Net Assets
| | | | | | | | |
| MATTHEWS ASIA STRATEGIC INCOME FUND | | Six-Month Period
Ended June 30, 2016
(unaudited) | | | Year Ended
December 31, 2015 | |
OPERATIONS: | | | | | | | | |
Net investment income (loss) | | | $1,453,716 | | | | $3,111,267 | |
Net realized gain (loss) on investments and foreign currency related transactions | | | (1,019,683 | ) | | | (1,299,648 | ) |
Net change in unrealized appreciation/depreciation on investments and foreign currency related translations | | | 3,188,852 | | | | (2,208,664 | ) |
Net change on deferred foreign capital gains taxes on unrealized appreciation | | | (18,390 | ) | | | 18,403 | |
Net change in unrealized appreciation/depreciation on financial future contracts | | | — | | | | (12,891 | ) |
Net increase (decrease) in net assets resulting from operations | | | 3,604,495 | | | | (391,533 | ) |
DISTRIBUTIONS TO SHAREHOLDERS FROM: | | | | | | | | |
Net investment income: | | | | | | | | |
Investor Class | | | (847,106 | ) | | | (1,574,263 | ) |
Institutional Class | | | (190,058 | ) | | | (350,781 | ) |
Net decrease in net assets resulting from distributions | | | (1,037,164 | ) | | | (1,925,044 | ) |
CAPITAL SHARE TRANSACTIONS (net) (Note 4) | | | (1,435,801 | ) | | | (1,988,782 | ) |
REDEMPTION FEES | | | — | | | | 1,288 | |
Total increase (decrease) in net assets | | | 1,131,530 | | | | (4,304,071 | ) |
NET ASSETS: | | | | | | | | |
Beginning of period | | | 62,130,603 | | | | 66,434,674 | |
End of period (including undistributed/(distributions in excess of) net investment income of $274,982 and ($141,570), respectively) | | | $63,262,133 | | | | $62,130,603 | |
| | |
| MATTHEWS ASIA CREDIT OPPORTUNITIES FUND | | Period Ended
June 30, 2016
(unaudited) 1 | | | | |
OPERATIONS: | | | | | | | | |
Net investment income (loss) | | | $69,255 | | | | | |
Net realized gain (loss) on investments and foreign currency related transactions | | | 32 | | | | | |
Net change in unrealized appreciation/depreciation on investments and foreign currency related translations | | | 114,771 | | | | | |
Net increase (decrease) in net assets resulting from operations | | | 184,058 | | | | | |
DISTRIBUTIONS TO SHAREHOLDERS FROM: | | | | | | | | |
Net investment income: | | | | | | | | |
Investor Class | | | (41,038 | ) | | | | |
Institutional Class | | | (30,130 | ) | | | | |
Net decrease in net assets resulting from distributions | | | (71,168 | ) | | | | |
CAPITAL SHARE TRANSACTIONS (net) (Note 4) | | | 12,715,496 | | | | | |
Total increase (decrease) in net assets | | | 12,828,386 | | | | | |
NET ASSETS: | | | | | | | | |
Beginning of period | | | — | | | | | |
End of period (including distributions in excess of net investment income of ($1,913)) | | | $12,828,386 | | | | | |
| | |
1 Matthews Asia Credit Opportunities Fund commenced operations on April 29, 2016. | | | | | | | | |
See accompanying notes to financial statements.
| | | | | | | | |
| MATTHEWS ASIAN GROWTH AND INCOME FUND | | Six-Month Period
Ended June 30, 2016
(unaudited) | | | Year Ended
December 31, 2015 | |
OPERATIONS: | | | | | | | | |
Net investment income (loss) | | | $26,762,884 | | | | $85,685,483 | |
Net realized gain (loss) on investments and foreign currency related transactions | | | 53,906,756 | | | | 160,262,613 | |
Net change in unrealized appreciation/depreciation on investments and foreign currency related translations | | | 117,679,985 | | | | (408,230,983 | ) |
Net increase (decrease) in net assets resulting from operations | | | 198,349,625 | | | | (162,282,887 | ) |
DISTRIBUTIONS TO SHAREHOLDERS FROM: | | | | | | | | |
Net investment income: | | | | | | | | |
Investor Class | | | (17,518,394 | ) | | | (60,473,615 | ) |
Institutional Class | | | (9,103,627 | ) | | | (25,646,657 | ) |
Realized gains on investments: | | | | | | | | |
Investor Class | | | — | | | | (99,500,383 | ) |
Institutional Class | | | — | | | | (38,663,330 | ) |
Net decrease in net assets resulting from distributions | | | (26,622,021 | ) | | | (224,283,985 | ) |
CAPITAL SHARE TRANSACTIONS (net) (Note 4) | | | (55,497,091 | ) | | | (979,815,420 | ) |
REDEMPTION FEES | | | — | | | | 181,880 | |
Total increase (decrease) in net assets | | | 116,230,513 | | | | (1,366,200,412 | ) |
NET ASSETS: | | | | | | | | |
Beginning of period | | | 2,869,054,369 | | | | 4,235,254,781 | |
End of period (including distributions in excess of net investment income of ($9,840,813) and ($9,981,676), respectively) | | | $2,985,284,882 | | | | $2,869,054,369 | |
| | | | | | | | |
| MATTHEWS ASIA DIVIDEND FUND | | Six-Month Period
Ended June 30, 2016
(unaudited)1 | | | Year Ended
December 31, 20151 | |
OPERATIONS: | | | | | | | | |
Net investment income (loss) | | | $55,313,912 | | | | $100,527,128 | |
Net realized gain (loss) on investments and foreign currency related transactions | | | (33,219,438 | ) | | | 257,971,919 | |
Net change in unrealized appreciation/depreciation on investments and foreign currency related translations | | | 263,067,799 | | | | (205,148,610 | ) |
Net change on deferred foreign capital gains taxes on unrealized appreciation | | | (66,976 | ) | | | 7,302,449 | |
Net increase (decrease) in net assets resulting from operations | | | 285,095,297 | | | | 160,652,886 | |
DISTRIBUTIONS TO SHAREHOLDERS FROM: | | | | | | | | |
Net investment income: | | | | | | | | |
Investor Class | | | (32,718,899 | ) | | | (50,178,458 | ) |
Institutional Class | | | (25,917,286 | ) | | | (42,940,313 | ) |
Realized gains on investments: | | | | | | | | |
Investor Class | | | — | | | | (40,978,371 | ) |
Institutional Class | | | — | | | | (30,690,700 | ) |
Net decrease in net assets resulting from distributions | | | (58,636,185 | ) | | | (164,787,842 | ) |
CAPITAL SHARE TRANSACTIONS (net) (Note 4) | | | (315,593,314 | ) | | | (217,935,493 | ) |
REDEMPTION FEES | | | 9 | | | | 95,389 | |
Total increase (decrease) in net assets | | | (89,134,193 | ) | | | (221,975,060 | ) |
NET ASSETS: | | | | | | | | |
Beginning of period | | | 4,803,623,683 | | | | 5,025,598,743 | |
End of period (including distributions in excess of net investment income of ($8,012,188) and ($4,689,915), respectively) | | | $4,714,489,490 | | | | $4,803,623,683 | |
| | |
1 Consolidated Statements of Changes in Net Assets. See Note 2-C. | | | | | | | | |
See accompanying notes to financial statements.
| | | | |
| matthewsasia.com | 800.789.ASIA | | | 109 | |
Statements of Changes in Net Assets (continued)
| | | | | | | | |
| MATTHEWS CHINA DIVIDEND FUND | | Six-Month Period
Ended June 30, 2016
(unaudited) | | | Year Ended
December 31, 2015 | |
OPERATIONS: | | | | | | | | |
Net investment income (loss) | | | $2,702,913 | | | | $3,500,086 | |
Net realized gain (loss) on investments and foreign currency related transactions | | | (669,094 | ) | | | 10,269,902 | |
Net change in unrealized appreciation/depreciation on investments and foreign currency related translations | | | (5,894,803 | ) | | | (6,469,584 | ) |
Net increase (decrease) in net assets resulting from operations | | | (3,860,984 | ) | | | 7,300,404 | |
DISTRIBUTIONS TO SHAREHOLDERS FROM: | | | | | | | | |
Net investment income: | | | | | | | | |
Investor Class | | | (2,183,089 | ) | | | (3,549,297 | ) |
Institutional Class | | | (309,349 | ) | | | (479,873 | ) |
Realized gains on investments: | | | | | | | | |
Investor Class | | | — | | | | (7,116,965 | ) |
Institutional Class | | | — | | | | (673,526 | ) |
Net decrease in net assets resulting from distributions | | | (2,492,438 | ) | | | (11,819,661 | ) |
CAPITAL SHARE TRANSACTIONS (net) (Note 4) | | | (10,185,765 | ) | | | 37,808,908 | |
REDEMPTION FEES | | | 1 | | | | 13,497 | |
Total increase (decrease) in net assets | | | (16,539,186 | ) | | | 33,303,148 | |
NET ASSETS: | | | | | | | | |
Beginning of period | | | 180,919,991 | | | | 147,616,843 | |
End of period (including distributions in excess of net investment income of ($157,130) and ($367,605), respectively) | | | $164,380,805 | | | | $180,919,991 | |
| | | | | | | | |
| MATTHEWS ASIA VALUE FUND | | Six-Month Period Ended June 30, 2016
(unaudited) | | | Period Ended December 31, 20151 | |
OPERATIONS: | | | | | | | | |
Net investment income (loss) | | | $4,746 | | | | $3,161 | |
Net realized gain (loss) on investments and foreign currency related transactions | | | (10,520 | ) | | | (988 | ) |
Net change in unrealized appreciation/depreciation on investments and foreign currency related translations | | | 74,418 | | | | (16,746 | ) |
Net increase (decrease) in net assets resulting from operations | | | 68,644 | | | | (14,573 | ) |
DISTRIBUTIONS TO SHAREHOLDERS FROM: | | | | | | | | |
Net investment income: | | | | | | | | |
Investor Class | | | — | | | | (1,748 | ) |
Institutional Class | | | — | | | | (581 | ) |
Net decrease in net assets resulting from distributions | | | — | | | | (2,329 | ) |
CAPITAL SHARE TRANSACTIONS (net) (Note 4) | | | 220,584 | | | | 1,749,497 | |
Total increase (decrease) in net assets | | | 289,228 | | | | 1,732,595 | |
NET ASSETS: | | | | | | | | |
Beginning of period | | | 1,732,595 | | | | — | |
End of period (including undistributed net investment income of $12,518 and $7,772, respectively) | | | $2,021,823 | | | | $1,732,595 | |
| 1 | Matthews Asia Value commenced operations on November 30, 2015. |
See accompanying notes to financial statements.
| | | | | | | | |
| MATTHEWS ASIA FOCUS FUND | | Six-Month Period Ended June 30, 2016 (unaudited) | | | Year Ended December 31, 2015 | |
OPERATIONS: | | | | | | | | |
Net investment income (loss) | | | $85,297 | | | | $170,208 | |
Net realized gain (loss) on investments and foreign currency related transactions | | | (210,851 | ) | | | (610,875 | ) |
Net change in unrealized appreciation/depreciation on investments and foreign currency related translations | | | 844,247 | | | | (1,483,661 | ) |
Net change on deferred foreign capital gains taxes on unrealized appreciation | | | — | | | | 982 | |
Net increase (decrease) in net assets resulting from operations | | | 718,693 | | | | (1,923,346 | ) |
DISTRIBUTIONS TO SHAREHOLDERS FROM: | | | | | | | | |
Net investment income: | | | | | | | | |
Investor Class | | | — | | | | (43,929 | ) |
Institutional Class | | | — | | | | (68,121 | ) |
Realized gains on investments: | | | | | | | | |
Investor Class | | | — | | | | (30,710 | ) |
Institutional Class | | | — | | | | (30,458 | ) |
Net decrease in net assets resulting from distributions | | | — | | | | (173,218 | ) |
CAPITAL SHARE TRANSACTIONS (net) (Note 4) | | | (1,048,926 | ) | | | (1,717,388 | ) |
REDEMPTION FEES | | | — | | | | 1,869 | |
Total increase (decrease) in net assets | | | (330,233 | ) | | | (3,812,083 | ) |
NET ASSETS: | | | | | | | | |
Beginning of period | | | 11,174,848 | | | | 14,986,931 | |
End of period (including undistributed net investment income of $165,988 and $80,691, respectively) | | | $10,844,615 | | | | $11,174,848 | |
| | | | | | | | |
| MATTHEWS ASIA GROWTH FUND | | Six-Month Period
Ended June 30, 2016
(unaudited) | | | Year Ended
December 31, 2015 | |
OPERATIONS: | | | | | | | | |
Net investment income (loss) | | | $2,622,798 | | | | $5,164,454 | |
Net realized gain (loss) on investments and foreign currency related transactions | | | (1,549,313 | ) | | | 13,893,458 | |
Net change in unrealized appreciation/depreciation on investments and foreign currency related translations | | | 17,913,609 | | | | (31,515,329 | ) |
Net change on deferred foreign capital gains taxes on unrealized appreciation | | | 18,798 | | | | 120,781 | |
Net increase (decrease) in net assets resulting from operations | | | 19,005,892 | | | | (12,336,636 | ) |
CAPITAL SHARE TRANSACTIONS (net) (Note 4) | | | (114,060,944 | ) | | | (60,027,645 | ) |
REDEMPTION FEES | | | — | | | | 36,064 | |
Total increase (decrease) in net assets | | | (95,055,052 | ) | | | (72,328,217 | ) |
NET ASSETS: | | | | | | | | |
Beginning of period | | | 776,855,763 | | | | 849,183,980 | |
End of period (including undistributed net investment income of $2,901,723 and $278,925, respectively) | | | $681,800,711 | | | | $776,855,763 | |
See accompanying notes to financial statements.
| | | | |
| matthewsasia.com | 800.789.ASIA | | | 111 | |
Statements of Changes in Net Assets (continued)
| | | | | | | | |
| MATTHEWS PACIFIC TIGER FUND | | Six-Month Period
Ended June 30, 2016
(unaudited) | | | Year Ended
December 31, 2015 | |
OPERATIONS: | | | | | | | | |
Net investment income (loss) | | | $22,497,512 | | | | $130,008,860 | |
Net realized gain (loss) on investments and foreign currency related transactions | | | 98,388,899 | | | | 665,475,960 | |
Net change in unrealized appreciation/depreciation on investments and foreign currency related translations | | | 144,140,331 | | | | (1,050,878,074 | ) |
Net change on deferred foreign capital gains taxes on unrealized appreciation | | | — | | | | 5,827,625 | |
Net increase (decrease) in net assets resulting from operations | | | 265,026,742 | | | | (249,565,629 | ) |
DISTRIBUTIONS TO SHAREHOLDERS FROM: | | | | | | | | |
Net investment income: | | | | | | | | |
Investor Class | | | — | | | | (44,786,496 | ) |
Institutional Class | | | — | | | | (72,239,388 | ) |
Realized gains on investments: | | | | | | | | |
Investor Class | | | — | | | | (237,860,447 | ) |
Institutional Class | | | — | | | | (343,244,442 | ) |
Net decrease in net assets resulting from distributions | | | — | | | | (698,130,773 | ) |
CAPITAL SHARE TRANSACTIONS (net) (Note 4) | | | 34,124,206 | | | | (463,729,788 | ) |
REDEMPTION FEES | | | 27 | | | | 121,959 | |
Total increase (decrease) in net assets | | | 299,150,975 | | | | (1,411,304,231 | ) |
NET ASSETS: | | | | | | | | |
Beginning of period | | | 6,685,415,354 | | | | 8,096,719,585 | |
End of period (including undistributed net investment income of $22,497,512 and $0, respectively) | | | $6,984,566,329 | | | | $6,685,415,354 | |
| | | | | | | | |
| MATTHEWS ASIA ESG FUND | | Six-Month Period
Ended June 30, 2016
(unaudited) | | | Period Ended
December 31, 20151 | |
OPERATIONS: | | | | | | | | |
Net investment income (loss) | | | $31,392 | | | | $10,336 | |
Net realized gain (loss) on investments and foreign currency related transactions | | | (34,708 | ) | | | (50,753 | ) |
Net change in unrealized appreciation/depreciation on investments and foreign currency related translations | | | 124,848 | | | | (119,098 | ) |
Net change on deferred foreign capital gains taxes on unrealized appreciation | | | (6,218 | ) | | | (9,835 | ) |
Net increase (decrease) in net assets resulting from operations | | | 115,314 | | | | (169,350 | ) |
DISTRIBUTIONS TO SHAREHOLDERS FROM: | | | | | | | | |
Net investment income: | | | | | | | | |
Investor Class | | | — | | | | (16,506 | ) |
Institutional Class | | | — | | | | (20,899 | ) |
Net decrease in net assets resulting from distributions | | | — | | | | (37,405 | ) |
CAPITAL SHARE TRANSACTIONS (net) (Note 4) | | | 3,494,128 | | | | 5,141,106 | |
Total increase (decrease) in net assets | | | 3,609,442 | | | | 4,934,351 | |
NET ASSETS: | | | | | | | | |
Beginning of period | | | 4,934,351 | | | | — | |
End of period (including undistributed net investment income of $58,097 and $26,705, respectively) | | | $8,543,793 | | | | $4,934,351 | |
| | |
1 Matthews Asia ESG Fund commenced operations on April 30, 2015. | | | | | | | | |
See accompanying notes to financial statements.
| | | | | | | | |
| MATTHEWS EMERGING ASIA FUND | | Six-Month Period
Ended June 30, 2016
(unaudited) | | | Year Ended
December 31, 2015 | |
OPERATIONS: | | | | | | | | |
Net investment income (loss) | | | $1,143,065 | | | | $703,470 | |
Net realized gain (loss) on investments and foreign currency related transactions | | | 2,706,007 | | | | (1,091,679 | ) |
Net change in unrealized appreciation/depreciation on investments and foreign currency related translations | | | 7,893,397 | | | | (4,197,814 | ) |
Net change on deferred foreign capital gains taxes on unrealized appreciation | | | 530,592 | | | | (730,548 | ) |
Net increase (decrease) in net assets resulting from operations | | | 12,273,061 | | | | (5,316,571 | ) |
DISTRIBUTIONS TO SHAREHOLDERS FROM: | | | | | | | | |
Net investment income: | | | | | | | | |
Investor Class | | | — | | | | (35,327 | ) |
Institutional Class | | | — | | | | (46,163 | ) |
Realized gains on investments: | | | | | | | | |
Investor Class | | | — | | | | (300,074 | ) |
Institutional Class | | | — | | | | (132,999 | ) |
Net decrease in net assets resulting from distributions | | | — | | | | (514,563 | ) |
CAPITAL SHARE TRANSACTIONS (net) (Note 4) | | | (30,695,791 | ) | | | 43,937,018 | |
REDEMPTION FEES | | | 13,565 | | | | 49,908 | |
Total increase (decrease) in net assets | | | (18,409,165 | ) | | | 38,155,792 | |
NET ASSETS: | | | | | | | | |
Beginning of period | | | 169,868,495 | | | | 131,712,703 | |
End of period (including undistributed net investment income of $1,419,800 and $276,735, respectively) | | | $151,459,330 | | | | $169,868,495 | |
| | | | | | | | |
| MATTHEWS ASIA INNOVATORS FUND | | Six-Month Period
Ended June 30, 2016
(unaudited)1 | | | Year Ended
December 31, 2015 | |
OPERATIONS: | | | | | | | | |
Net investment income (loss) | | | ($15,557 | ) | | | ($506,623 | ) |
Net realized gain (loss) on investments and foreign currency related transactions | | | 5,121,799 | | | | 27,158,911 | |
Net change in unrealized appreciation/depreciation on investments and foreign currency related translations | | | (13,498,547 | ) | | | (18,078,323 | ) |
Net increase (decrease) in net assets resulting from operations | | | (8,392,305 | ) | | | 8,573,965 | |
DISTRIBUTIONS TO SHAREHOLDERS FROM: | | | | | | | | |
Realized gains on investments: | | | | | | | | |
Investor Class | | | — | | | | (17,188,079 | ) |
Institutional Class | | | — | | | | (4,989,441 | ) |
Net decrease in net assets resulting from distributions | | | — | | | | (22,177,520 | ) |
CAPITAL SHARE TRANSACTIONS (net) (Note 4) | | | (12,602,163 | ) | | | (6,569,665 | ) |
REDEMPTION FEES | | | — | | | | 5,577 | |
Total increase (decrease) in net assets | | | (20,994,468 | ) | | | (20,167,643 | ) |
NET ASSETS: | | | | | | | | |
Beginning of period | | | 166,532,541 | | | | 186,700,184 | |
End of period (including undistributed net investment income (loss) of ($15,557) and $0, respectively) | | | $145,538,073 | | | | $166,532,541 | |
| |
1 The Fund’s name changed from Matthews Asia Science and Technology Fund to Matthews Asia Innovators Fund on April 29, 2016. | | | | | |
See accompanying notes to financial statements.
| | | | |
| matthewsasia.com | 800.789.ASIA | | | 113 | |
Statements of Changes in Net Assets (continued)
| | | | | | | | |
| MATTHEWS CHINA FUND | | Six-Month Period
Ended June 30, 2016
(unaudited)1 | | | Year Ended
December 31, 20151 | |
OPERATIONS: | | | | | | | | |
Net investment income (loss) | | | $7,412,743 | | | | $8,470,215 | |
Net realized gain (loss) on investments and foreign currency related transactions | | | 2,700,071 | | | | 131,220,057 | |
Net change in unrealized appreciation/depreciation on investments and foreign currency related translations | | | (99,885,913 | ) | | | (106,930,741 | ) |
Net change on deferred foreign capital gains taxes on unrealized appreciation | | | — | | | | 4,990 | |
Net increase (decrease) in net assets resulting from operations | | | (89,773,099 | ) | | | 32,764,521 | |
DISTRIBUTIONS TO SHAREHOLDERS FROM: | | | | | | | | |
Net investment income: | | | | | | | | |
Investor Class | | | — | | | | (7,271,979 | ) |
Institutional Class | | | — | | | | (292,369 | ) |
Realized gains on investments: | | | | | | | | |
Investor Class | | | — | | | | (112,695,199 | ) |
Institutional Class | | | — | | | | (3,998,950 | ) |
Net decrease in net assets resulting from distributions | | | — | | | | (124,258,497 | ) |
CAPITAL SHARE TRANSACTIONS (net) (Note 4) | | | (64,751,419 | ) | | | (174,745,783 | ) |
REDEMPTION FEES | | | — | | | | 64,297 | |
Total increase (decrease) in net assets | | | (154,524,518 | ) | | | (266,175,462 | ) |
NET ASSETS: | | | | | | | | |
Beginning of period | | | 734,043,083 | | | | 1,000,218,545 | |
End of period (including undistributed/(distributions in excess of) net investment income of $7,379,875 and ($32,868), respectively) | | | $579,518,565 | | | | $734,043,083 | |
| | |
1 Consolidated Statements of Changes in Net Assets. See Note 2-C. | | | | | | | | |
| | | | | | | | |
| MATTHEWS INDIA FUND | | Six-Month Period
Ended June 30, 2016
(unaudited) | | | Year Ended
December 31, 2015 | |
OPERATIONS: | | | | | | | | |
Net investment income (loss) | | | $3,531,573 | | | | ($2,170,656 | ) |
Net realized gain (loss) on investments and foreign currency related transactions | | | (5,611,039 | ) | | | 23,846,810 | |
Net change in unrealized appreciation/depreciation on investments and foreign currency related translations | | | 30,575,825 | | | | (62,183,356 | ) |
Net change on deferred foreign capital gains taxes on unrealized appreciation | | | 1,942,487 | | | | 6,684,572 | |
Net increase (decrease) in net assets resulting from operations | | | 30,438,846 | | | | (33,822,630 | ) |
DISTRIBUTIONS TO SHAREHOLDERS FROM: | | | | | | | | |
Net investment income: | | | | | | | | |
Investor Class | | | — | | | | (1,210,919 | ) |
Institutional Class | | | — | | | | (713,191 | ) |
Realized gains on investments: | | | | | | | | |
Investor Class | | | — | | | | (10,496,814 | ) |
Institutional Class | | | — | | | | (3,018,487 | ) |
Net decrease in net assets resulting from distributions | | | — | | | | (15,439,411 | ) |
CAPITAL SHARE TRANSACTIONS (net) (Note 4) | | | 57,774,650 | | | | 469,778,771 | |
REDEMPTION FEES | | | — | | | | 1,141,560 | |
Total increase (decrease) in net assets | | | 88,213,496 | | | | 421,658,290 | |
NET ASSETS: | | | | | | | | |
Beginning of period | | | 1,505,826,994 | | | | 1,084,168,704 | |
End of period (including undistributed/(distributions in excess of) net investment income of $3,480,708 and ($50,865), respectively) | | | $1,594,040,490 | | | | $1,505,826,994 | |
See accompanying notes to financial statements.
| | | | | | | | |
| MATTHEWS JAPAN FUND | | Six-Month Period
Ended June 30, 2016
(unaudited) | | | Year Ended
December 31, 2015 | |
OPERATIONS: | | | | | | | | |
Net investment income (loss) | | | $9,473,102 | | | | $2,748,307 | |
Net realized gain (loss) on investments and foreign currency related transactions | | | (29,172,431 | ) | | | 24,616,954 | |
Net change in unrealized appreciation/depreciation on investments and foreign currency related translations | | | 270,801,355 | | | | 124,628,729 | |
Net increase (decrease) in net assets resulting from operations | | | 251,102,026 | | | | 151,993,990 | |
CAPITAL SHARE TRANSACTIONS (net) (Note 4) | | | 1,162,568,302 | | | | 1,174,685,964 | |
REDEMPTION FEES | | | — | | | | 42,911 | |
Total increase (decrease) in net assets | | | 1,413,670,328 | | | | 1,326,722,865 | |
NET ASSETS: | | | | | | | | |
Beginning of period | | | 1,949,326,670 | | | | 622,603,805 | |
End of period (including undistributed net investment income of $10,650,893 and $1,177,791, respectively) | | | $3,362,996,998 | | | | $1,949,326,670 | |
| | | | | | | | |
| MATTHEWS KOREA FUND | | Six-Month Period
Ended June 30, 2016
(unaudited) | | | Year Ended
December 31, 2015 | |
OPERATIONS: | | | | | | | | |
Net investment income (loss) | | | ($436,635 | ) | | | $423,029 | |
Net realized gain (loss) on investments and foreign currency related transactions | | | 7,163,705 | | | | 13,649,607 | |
Net change in unrealized appreciation/depreciation on investments and foreign currency related translations | | | (8,415,099 | ) | | | 10,755,361 | |
Net increase (decrease) in net assets resulting from operations | | | (1,688,029 | ) | | | 24,827,997 | |
DISTRIBUTIONS TO SHAREHOLDERS FROM: | | | | | | | | |
Net investment income: | | | | | | | | |
Investor Class | | | — | | | | (299,912 | ) |
Institutional Class | | | — | | | | (230,197 | ) |
Realized gains on investments: | | | | | | | | |
Investor Class | | | — | | | | (7,587,708 | ) |
Institutional Class | | | — | | | | (3,214,060 | ) |
Net decrease in net assets resulting from distributions | | | — | | | | (11,331,877 | ) |
CAPITAL SHARE TRANSACTIONS (net) (Note 4) | | | (42,110,006 | ) | | | (25,043,885 | ) |
REDEMPTION FEES | | | 1 | | | | 10,431 | |
Total increase (decrease) in net assets | | | (43,798,034 | ) | | | (11,537,334 | ) |
NET ASSETS: | | | | | | | | |
Beginning of period | | | 207,667,042 | | | | 219,204,376 | |
End of period (including distributions in excess of net investment income of ($530,043) and ($93,408), respectively) | | | $163,869,008 | | | | $207,667,042 | |
See accompanying notes to financial statements.
| | | | |
| matthewsasia.com | 800.789.ASIA | | | 115 | |
Statements of Changes in Net Assets (continued)
| | | | | | | | |
| MATTHEWS ASIA SMALL COMPANIES FUND | | Six-Month Period
Ended June 30, 2016
(unaudited) | | | Year Ended
December 31, 2015 | |
OPERATIONS: | | | | | | | | |
Net investment income (loss) | | | $1,017,793 | | | | $1,492,221 | |
Net realized gain (loss) on investments and foreign currency related transactions | | | (10,231,367 | ) | | | (8,000,630 | ) |
Net change in unrealized appreciation/depreciation on investments and foreign currency related translations | | | 2,568,774 | | | | (74,037,016 | ) |
Net change on deferred foreign capital gains taxes on unrealized appreciation | | | 56,811 | | | | 378,114 | |
Net increase (decrease) in net assets resulting from operations | | | (6,587,989 | ) | | | (80,167,311 | ) |
DISTRIBUTIONS TO SHAREHOLDERS FROM: | | | | | | | | |
Net investment income: | | | | | | | | |
Investor Class | | | — | | | | (527,668 | ) |
Institutional Class | | | — | | | | (972,889 | ) |
Net decrease in net assets resulting from distributions | | | — | | | | (1,500,557 | ) |
CAPITAL SHARE TRANSACTIONS (net) (Note 4) | | | (63,369,171 | ) | | | 15,106,280 | |
REDEMPTION FEES | | | 106,802 | | | | 226,015 | |
Total increase (decrease) in net assets | | | (69,850,358 | ) | | | (66,335,573 | ) |
NET ASSETS: | | | | | | | | |
Beginning of period | | | 609,914,708 | | | | 676,250,281 | |
End of period (including undistributed net investment income of $2,261,963 and $1,244,170, respectively) | | | $540,064,350 | | | | $609,914,708 | |
| | | | | | | | |
| MATTHEWS CHINA SMALL COMPANIES FUND | | Six-Month Period
Ended June 30, 2016
(unaudited) | | | Year Ended
December 31, 2015 | |
OPERATIONS: | | | | | | | | |
Net investment income (loss) | | | $177,703 | | | | $178,243 | |
Net realized gain (loss) on investments and foreign currency related transactions | | | (921,235 | ) | | | 3,458,391 | |
Net change in unrealized appreciation/depreciation on investments and foreign currency related translations | | | (521,670 | ) | | | (3,136,775 | ) |
Net increase (decrease) in net assets resulting from operations | | | (1,265,202 | ) | | | 499,859 | |
DISTRIBUTIONS TO SHAREHOLDERS FROM: | | | | | | | | |
Net investment income: | | | | | | | | |
Investor Class | | | — | | | | (146,067 | ) |
Realized gains on investments: | | | | | | | | |
Investor Class | | | — | | | | (1,644,128 | ) |
Net decrease in net assets resulting from distributions | | | — | | | | (1,790,195 | ) |
CAPITAL SHARE TRANSACTIONS (net) (Note 4) | | | (1,852,741 | ) | | | 743,769 | |
REDEMPTION FEES | | | 2,747 | | | | 24,657 | |
Total increase (decrease) in net assets | | | (3,115,196 | ) | | | (521,910 | ) |
NET ASSETS: | | | | | | | | |
Beginning of period | | | 21,546,002 | | | | 22,067,912 | |
End of period (including undistributed net investment income of $179,049 and $1,346, respectively) | | | $18,430,806 | | | | $21,546,002 | |
See accompanying notes to financial statements.
Financial Highlights
Matthews Asia Strategic Income Fund
The tables below set forth financial data for a share of beneficial interest outstanding throughout each period presented.
| | | | | | | | | | | | | | | | | | | | | | | | |
| |
| Six-Month
Period Ended
June 30, 2016
(unaudited) |
| | | Year Ended Dec. 31 | | |
| Period Ended
Dec. 31, 20111 |
|
| INVESTOR CLASS | | | 2015 | | | 2014 | | | 2013 | | | 2012 | | |
Net Asset Value, beginning of period | | | $9.96 | | | | $10.31 | | | | $10.42 | | | | $10.84 | | | | $9.93 | | | | $10.00 | |
INCOME (LOSS) FROM INVESTMENT OPERATIONS: | | | | | | | | | | | | | | | | | | | | | | | | |
Net investment income (loss)2 | | | 0.23 | | | | 0.47 | | | | 0.46 | | | | 0.40 | | | | 0.37 | | | | 0.02 | |
Net realized gain (loss) and unrealized appreciation/depreciation on investments, financial futures contracts and foreign currency | | | 0.35 | | | | (0.53 | ) | | | (0.19 | ) | | | (0.48 | ) | | | 0.95 | | | | (0.07 | ) |
Total from investment operations | | | 0.58 | | | | (0.06 | ) | | | 0.27 | | | | (0.08 | ) | | | 1.32 | | | | (0.05 | ) |
LESS DISTRIBUTIONS FROM: | | | | | | | | | | | | | | | | | | | | | | | | |
Net investment income | | | (0.17 | ) | | | (0.29 | ) | | | (0.38 | ) | | | (0.35 | ) | | | (0.42 | ) | | | (0.02 | ) |
Net realized gains on investments | | | – | | | | – | | | | – | | | | (0.01 | ) | | | – | | | | – | |
Total distributions | | | (0.17 | ) | | | (0.29 | ) | | | (0.38 | ) | | | (0.36 | ) | | | (0.42 | ) | | | (0.02 | ) |
Paid-in capital from redemption fees (Note 4) | | | – | | | | – | 3 | | | – | 3 | | | 0.02 | | | | 0.01 | | | | – | |
Net Asset Value, end of period | | | $10.37 | | | | $9.96 | | | | $10.31 | | | | $10.42 | | | | $10.84 | | | | $9.93 | |
TOTAL RETURN | | | 5.83% | 4 | | | (0.58% | ) | | | 2.54% | | | | (0.50% | ) | | | 13.62% | | | | (0.52% | )4 |
| | | | | | |
RATIOS/SUPPLEMENTAL DATA | | | | | | | | | | | | | | | | | | | | | | | | |
Net assets, end of period (in 000’s) | | | $52,281 | | | | $51,130 | | | | $58,594 | | | | $38,051 | | | | $29,479 | | | | $7,746 | |
Ratio of expenses to average net assets before any reimbursement, waiver or recapture of expenses by Advisor and Administrator
(Note 5) | | | 1.26% | 5 | | | 1.28% | | | | 1.27% | | | | 1.28% | | | | 1.85% | | | | 3.20% | 5 |
Ratio of expenses to average net assets after any reimbursement, waiver or recapture of expenses by Advisor and Administrator | | | 1.15% | 5 | | | 1.12% | | | | 1.13% | | | | 1.20% | | | | 1.17% | | | | 1.00% | 5 |
Ratio of net investment income (loss) to average net assets | | | 4.64% | 5 | | | 4.57% | | | | 4.36% | | | | 3.75% | | | | 3.58% | | | | 2.06% | 5 |
Portfolio turnover6 | | | 35.92% | 4 | | | 50.09% | | | | 34.28% | | | | 48.71% | | | | 18.45% | | | | 3.66% | 4 |
| | | |
| |
| Six-Month
Period Ended
June 30, 2016
(unaudited) |
| | | Year Ended Dec. 31 | | |
| Period Ended
Dec. 31, 20111 |
|
| INSTITUTIONAL CLASS | | | 2015 | | | 2014 | | | 2013 | | | 2012 | | |
Net Asset Value, beginning of period | | | $9.96 | | | | $10.30 | | | | $10.42 | | | | $10.83 | | | | $9.93 | | | | $10.00 | |
INCOME (LOSS) FROM INVESTMENT OPERATIONS: | | | | | | | | | | | | | | | | | | | | | | | | |
Net investment income (loss)2 | | | 0.25 | | | | 0.49 | | | | 0.48 | | | | 0.42 | | | | 0.39 | | | | 0.02 | |
Net realized gain (loss) and unrealized appreciation/depreciation on investments, financial futures contracts, and foreign currency | | | 0.33 | | | | (0.52 | ) | | | (0.20 | ) | | | (0.46 | ) | | | 0.94 | | | | (0.07 | ) |
Total from investment operations | | | 0.58 | | | | (0.03 | ) | | | 0.28 | | | | (0.04 | ) | | | 1.33 | | | | (0.05 | ) |
LESS DISTRIBUTIONS FROM: | | | | | | | | | | | | | | | | | | | | | | | | |
Net investment income | | | (0.18 | ) | | | (0.31 | ) | | | (0.40 | ) | | | (0.38 | ) | | | (0.44 | ) | | | (0.02 | ) |
Net realized gains on investments | | | – | | | | – | | | | – | | | | (0.01 | ) | | | – | | | | – | |
Total distributions | | | (0.18 | ) | | | (0.31 | ) | | | (0.40 | ) | | | (0.39 | ) | | | (0.44 | ) | | | (0.02 | ) |
Paid-in capital from redemption fees (Note 4) | | | – | | | | – | 3 | | | – | 3 | | | 0.02 | | | | 0.01 | | | | – | |
Net Asset Value, end of period | | | $10.36 | | | | $9.96 | | | | $10.30 | | | | $10.42 | | | | $10.83 | | | | $9.93 | |
TOTAL RETURN | | | 5.86% | 4 | | | (0.27% | ) | | | 2.64% | | | | (0.20% | ) | | | 13.74% | | | | (0.52% | )4 |
| | | | | | |
RATIOS/SUPPLEMENTAL DATA | | | | | | | | | | | | | | | | | | | | | | | | |
Net assets, end of period (in 000’s) | | | $10,981 | | | | $11,001 | | | | $7,840 | | | | $7,662 | | | | $6,205 | | | | $5,266 | |
Ratio of expenses to average net assets before any reimbursement, waiver or recapture of expenses by Advisor and Administrator
(Note 5) | | | 1.04% | 5 | | | 1.09% | | | | 1.07% | | | | 1.09% | | | | 1.70% | | | | 3.20% | 5 |
Ratio of expenses to average net assets after any reimbursement, waiver or recapture of expenses by Advisor and Administrator | | | 0.90% | 5 | | | 0.90% | | | | 0.93% | | | | 1.00% | | | | 1.00% | | | | 1.00% | 5 |
Ratio of net investment income (loss) to average net assets | | | 4.88% | 5 | | | 4.81% | | | | 4.55% | | | | 3.99% | | | | 3.70% | | | | 1.96% | 5 |
Portfolio turnover6 | | | 35.92% | 4 | | | 50.09% | | | | 34.28% | | | | 48.71% | | | | 18.45% | | | | 3.66% | 4 |
| 1 | Commencement of operations on November 30, 2011. |
| 2 | Calculated using the average daily shares method. |
| 3 | Less than $0.01 per share. |
| 6 | The portfolio turnover rate is calculated on the Fund as a whole without distinguishing between classes of shares issued. |
See accompanying notes to financial statements.
| | | | |
| matthewsasia.com | 800.789.ASIA | | | 117 | |
Financial Highlights (continued)
Matthews Asia Credit Opportunities Fund
The tables below set forth financial data for a share of beneficial interest outstanding throughout each period presented.
| | | | |
| INVESTOR CLASS | | Period Ended
June 30, 2016
(unaudited)1 | |
Net Asset Value, beginning of period | | | $10.00 | |
INCOME (LOSS) FROM INVESTMENT OPERATIONS: | | | | |
Net investment income (loss)2 | | | 0.06 | |
Net realized gain (loss) and unrealized appreciation/depreciation on investments
and foreign currency | | | 0.09 | |
Total from investment operations | | | 0.15 | |
LESS DISTRIBUTIONS FROM: | | | | |
Net investment income | | | (0.06 | ) |
Total distributions | | | (0.06 | ) |
Net Asset Value, end of period | | | $10.09 | |
TOTAL RETURN | | | 1.46% | 3 |
| |
RATIOS/SUPPLEMENTAL DATA | | | | |
Net assets, end of period (in 000’s) | | | $7,746 | |
Ratio of expenses to average net assets before any reimbursement, waiver or recapture
of expenses by Advisor and Administrator (Note 5) | | | 1.73% | 4 |
Ratio of expenses to average net assets after any reimbursement, waiver or recapture
of expenses by Advisor and Administrator | | | 1.15% | 4 |
Ratio of net investment income (loss) to average net assets | | | 3.47% | 4 |
Portfolio turnover5 | | | 0.00% | 3 |
| |
| INSTITUTIONAL CLASS | | Period Ended
June 30, 20161
(unaudited) | |
Net Asset Value, beginning of period | | | $10.00 | |
INCOME (LOSS) FROM INVESTMENT OPERATIONS: | | | | |
Net investment income (loss)2 | | | 0.06 | |
Net realized gain (loss) and unrealized appreciation/depreciation on investments | | | | |
and foreign currency | | | 0.08 | |
Total from investment operations | | | 0.14 | |
LESS DISTRIBUTIONS FROM: | | | | |
Net investment income | | | (0.06 | ) |
Total distributions | | | (0.06 | ) |
Net Asset Value, end of period | | | $10.08 | |
TOTAL RETURN | | | 1.41% | 3 |
| |
RATIOS/SUPPLEMENTAL DATA | | | | |
Net assets, end of period (in 000’s) | | | $5,083 | |
Ratio of expenses to average net assets before any reimbursement, | | | | |
waiver or recapture of expenses by Advisor and Administrator (Note 5) | | | 1.47% | 4 |
Ratio of expenses to average net assets after any reimbursement, | | | | |
waiver or recapture of expenses by Advisor and Administrator | | | 0.90% | 4 |
Ratio of net investment income (loss) to average net assets | | | 3.55% | 4 |
Portfolio turnover5 | | | 0.00% | 3 |
| 1 | Commenced operations on April 29, 2016. |
| 2 | Calculated using the average daily shares method. |
| 5 | The portfolio turnover rate is calculated on the Fund as a whole without distinguishing between classes of shares issued. |
See accompanying notes to financial statements.
Matthews Asian Growth and Income Fund
The tables below set forth financial data for a share of beneficial interest outstanding throughout each period presented.
| | | | | | | | | | | | | | | | | | | | | | | | |
| | | Six-Month
Period Ended
June 30, 2016 (unaudited) | | | Year Ended Dec. 31 | |
| INVESTOR CLASS | | | 2015 | | | 2014 | | | 2013 | | | 2012 | | | 2011 | |
Net Asset Value, beginning of period | | | $16.03 | | | | $18.01 | | | | $18.91 | | | | $18.61 | | | | $15.07 | | | | $18.04 | |
INCOME (LOSS) FROM INVESTMENT OPERATIONS: | | | | | | | | | | | | | | | | | | | | | | | | |
Net investment income (loss)1 | | | 0.14 | | | | 0.39 | | | | 0.39 | | | | 0.41 | | | | 0.43 | | | | 0.47 | |
Net realized gain (loss) and unrealized appreciation/depreciation on investments and foreign currency | | | 0.99 | | | | (1.19 | ) | | | (0.50 | ) | | | 0.47 | | | | 3.58 | | | | (2.36 | ) |
Total from investment operations | | | 1.13 | | | | (0.80 | ) | | | (0.11 | ) | | | 0.88 | | | | 4.01 | | | | (1.89 | ) |
LESS DISTRIBUTIONS FROM: | | | | | | | | | | | | | | | | | | | | | | | | |
Net investment income | | | (0.15 | ) | | | (0.42 | ) | | | (0.35 | ) | | | (0.46 | ) | | | (0.47 | ) | | | (0.47 | ) |
Net realized gains on investments | | | – | | | | (0.76 | ) | | | (0.44 | ) | | | (0.12 | ) | | | – | | | | (0.61 | ) |
Total distributions | | | (0.15 | ) | | | (1.18 | ) | | | (0.79 | ) | | | (0.58 | ) | | | (0.47 | ) | | | (1.08 | ) |
Paid-in capital from redemption fees (Note 4) | | | – | | | | – | 2 | | | – | 2 | | | – | 2 | | | – | 2 | | | – | 2 |
Net Asset Value, end of period | | | $17.01 | | | | $16.03 | | | | $18.01 | | | | $18.91 | | | | $18.61 | | | | $15.07 | |
TOTAL RETURN | | | 7.05% | 3 | | | (4.50% | ) | | | (0.65% | ) | | | 4.83% | | | | 26.90% | | | | (10.62% | ) |
| | | | | | |
RATIOS/SUPPLEMENTAL DATA | | | | | | | | | | | | | | | | | | | | | | | | |
Net assets, end of period (in 000’s) | | | $2,035,935 | | | | $2,045,435 | | | | $3,052,565 | | | | $3,278,586 | | | | $3,214,984 | | | | $2,340,606 | |
Ratio of expenses to average net assets before any reimbursement or waiver or recapture of expenses by Advisor and Administrator (Note 5) | | | 1.11% | 4 | | | 1.09% | | | | 1.08% | | | | 1.08% | | | | 1.11% | | | | 1.12% | |
Ratio of expenses to average net assets after any reimbursement or waiver or recapture of expenses by Advisor and Administrator | | | 1.11% | 4 | | | 1.09% | | | | 1.08% | | | | 1.08% | | | | 1.11% | | | | 1.12% | |
Ratio of net investment income (loss) to average net assets | | | 1.79% | 4 | | | 2.17% | | | | 2.03% | | | | 2.14% | | | | 2.52% | | | | 2.71% | |
Portfolio turnover5 | | | 7.34% | 3 | | | 16.48% | | | | 16.79% | | | | 15.27% | | | | 17.43% | | | | 16.54% | |
| | |
| | | Six-Month
Period Ended
June 30, 2016 (unaudited) | | | Year Ended Dec. 31 | |
| INSTITUTIONAL CLASS | | | 2015 | | | 2014 | | | 2013 | | | 2012 | | | 2011 | |
Net Asset Value, beginning of period | | | $16.02 | | | | $18.00 | | | | $18.90 | | | | $18.60 | | | | $15.06 | | | | $18.04 | |
INCOME (LOSS) FROM INVESTMENT OPERATIONS: | | | | | | | | | | | | | | | | | | | | | | | | |
Net investment income (loss)1 | | | 0.16 | | | | 0.42 | | | | 0.42 | | | | 0.44 | | | | 0.45 | | | | 0.52 | |
Net realized gain (loss) and unrealized appreciation/depreciation on investments and foreign currency | | | 0.97 | | | | (1.19 | ) | | | (0.50 | ) | | | 0.48 | | | | 3.58 | | | | (2.39 | ) |
Total from investment operations | | | 1.13 | | | | (0.77 | ) | | | (0.08 | ) | | | 0.92 | | | | 4.03 | | | | (1.87 | ) |
LESS DISTRIBUTIONS FROM: | | | | | | | | | | | | | | | | | | | | | | | | |
Net investment income | | | (0.16 | ) | | | (0.45 | ) | | | (0.38 | ) | | | (0.50 | ) | | | (0.49 | ) | | | (0.50 | ) |
Net realized gains on investments | | | – | | | | (0.76 | ) | | | (0.44 | ) | | | (0.12 | ) | | | – | | | | (0.61 | ) |
Total distributions | | | (0.16 | ) | | | (1.21 | ) | | | (0.82 | ) | | | (0.62 | ) | | | (0.49 | ) | | | (1.11 | ) |
Paid-in capital from redemption fees (Note 4) | | | – | | | | – | 2 | | | – | 2 | | | – | 2 | | | – | 2 | | | – | 2 |
Net Asset Value, end of period | | | $16.99 | | | | $16.02 | | | | $18.00 | | | | $18.90 | | | | $18.60 | | | | $15.06 | |
TOTAL RETURN | | | 7.08% | 3 | | | (4.33% | ) | | | (0.48% | ) | | | 5.04% | | | | 27.09% | | | | (10.54% | ) |
| | | | | | |
RATIOS/SUPPLEMENTAL DATA | | | | | | | | | | | | | | | | | | | | | | | | |
Net assets, end of period (in 000’s) | | | $949,350 | | | | $823,619 | | | | $1,182,690 | | | | $1,120,218 | | | | $856,876 | | | | $531,493 | |
Ratio of expenses to average net assets before any reimbursement or waiver or recapture of expenses by Advisor and Administrator (Note 5) | | | 0.94% | 4 | | | 0.92% | | | | 0.92% | | | | 0.93% | | | | 0.97% | | | | 0.99% | |
Ratio of expenses to average net assets after any reimbursement or waiver or recapture of expenses by Advisor and Administrator | | | 0.94% | 4 | | | 0.92% | | | | 0.92% | | | | 0.93% | | | | 0.97% | | | | 0.99% | |
Ratio of net investment income (loss) to average net assets | | | 2.04% | 4 | | | 2.34% | | | | 2.19% | | | | 2.30% | | | | 2.69% | | | | 3.05% | |
Portfolio turnover5 | | | 7.34% | 3 | | | 16.48% | | | | 16.79% | | | | 15.27% | | | | 17.43% | | | | 16.54% | |
| 1 | Calculated using the average daily shares method. |
| 2 | Less than $0.01 per share. |
| 5 | The portfolio turnover rate is calculated on the Fund as a whole without distinguishing between classes of shares issued. |
See accompanying notes to financial statements.
| | | | |
| matthewsasia.com | 800.789.ASIA | | | 119 | |
Financial Highlights (continued)
Matthews Asia Dividend Fund
The tables below set forth financial data for a share of beneficial interest outstanding throughout each period presented.
| | | | | | | | | | | | | | | | | | | | | | | | |
| | | Six-Month
Period Ended
June 30, 20161 (unaudited) | | | Year Ended Dec. 31 | |
| INVESTOR CLASS | | | 20151 | | | 20141 | | | 2013 | | | 2012 | | | 2011 | |
Net Asset Value, beginning of period | | | $15.36 | | | | $15.26 | | | | $15.60 | | | | $14.58 | | | | $12.48 | | | | $14.33 | |
INCOME (LOSS) FROM INVESTMENT OPERATIONS: | | | | | | | | | | | | | | | | | | | | | | | | |
Net investment income (loss)2 | | | 0.18 | | | | 0.29 | | | | 0.30 | | | | 0.32 | | | | 0.36 | | | | 0.36 | |
Net realized gain (loss) and unrealized appreciation/depreciation on investments and foreign currency | | | 0.82 | | | | 0.31 | | | | (0.34 | ) | | | 1.30 | | | | 2.30 | | | | (1.78 | ) |
Total from investment operations | | | 1.00 | | | | 0.60 | | | | (0.04 | ) | | | 1.62 | | | | 2.66 | | | | (1.42 | ) |
LESS DISTRIBUTIONS FROM: | | | | | | | | | | | | | | | | | | | | | | | | |
Net investment income | | | (0.20 | ) | | | (0.27 | ) | | | (0.23 | ) | | | (0.60 | ) | | | (0.56 | ) | | | (0.37 | ) |
Return of capital | | | – | | | | – | | | | (0.07 | ) | | | – | | | | – | | | | – | |
Net realized gains on investments | | | – | | | | (0.23 | ) | | | – | | | | – | | | | – | | | | (0.06 | ) |
Total distributions | | | (0.20 | ) | | | (0.50 | ) | | | (0.30 | ) | | | (0.60 | ) | | | (0.56 | ) | | | (0.43 | ) |
Paid-in capital from redemption fees (Note 4)3 | | | – | | | | – | | | | – | | | | – | | | | – | | | | – | |
Net Asset Value, end of period | | | $16.16 | | | | $15.36 | | | | $15.26 | | | | $15.60 | | | | $14.58 | | | | $12.48 | |
TOTAL RETURN | | | 6.50% | 4 | | | 3.86% | | | | (0.32% | ) | | | 11.27% | | | | 21.63% | | | | (10.02% | ) |
| | | | | | |
RATIOS/SUPPLEMENTAL DATA | | | | | | | | | | | | | | | | | | | | | | | | |
Net assets, end of period (in 000’s) | | | $2,709,574 | | | | $2,757,910 | | | | $2,918,228 | | | | $3,669,690 | | | | $2,780,043 | | | | $1,930,363 | |
Ratio of expenses to average net assets before any reimbursement, waiver or recapture of expenses by Advisor and Administrator (Note 5) | | | 1.10% | 5 | | | 1.06% | | | | 1.06% | | | | 1.06% | | | | 1.09% | | | | 1.10% | |
Ratio of expenses to average net assets after any reimbursement, waiver or recapture of expenses by Advisor and Administrator | | | 1.09% | 5 | | | 1.05% | | | | 1.05% | | | | 1.06% | | | | 1.09% | | | | 1.10% | |
Ratio of net investment income (loss) to average net assets | | | 2.43% | 5 | | | 1.82% | | | | 1.89% | | | | 2.04% | | | | 2.65% | | | | 2.61% | |
Portfolio turnover6 | | | 11.37% | 4 | | | 35.98% | | | | 20.06% | | | | 14.06% | | | | 9.17% | | | | 16.48% | |
| | |
| | | Six-Month
Period Ended
June 30, 20161 (unaudited) | | | Year Ended Dec. 31 | |
| INSTITUTIONAL CLASS | | | 20151 | | | 20141 | | | 2013 | | | 2012 | | | 2011 | |
Net Asset Value, beginning of period | | | $15.35 | | | | $15.26 | | | | $15.59 | | | | $14.57 | | | | $12.48 | | | | $14.33 | |
INCOME (LOSS) FROM INVESTMENT OPERATIONS: | | | | | | | | | | | | | | | | | | | | | | | | |
Net investment income (loss)2 | | | 0.18 | | | | 0.32 | | | | 0.32 | | | | 0.34 | | | | 0.37 | | | | 0.41 | |
Net realized gain (loss) and unrealized appreciation/depreciation on investments and foreign currency | | | 0.84 | | | | 0.29 | | | | (0.33 | ) | | | 1.30 | | | | 2.29 | | | | (1.82 | ) |
Total from investment operations | | | 1.02 | | | | 0.61 | | | | (0.01 | ) | | | 1.64 | | | | 2.66 | | | | (1.41 | ) |
LESS DISTRIBUTIONS FROM: | | | | | | | | | | | | | | | | | | | | | | | | |
Net investment income | | | (0.21 | ) | | | (0.29 | ) | | | (0.25 | ) | | | (0.62 | ) | | | (0.57 | ) | | | (0.38 | ) |
Return of capital | | | – | | | | – | | | | (0.07 | ) | | | – | | | | – | | | | – | |
Net realized gains on investments | | | – | | | | (0.23 | ) | | | – | | | | – | | | | – | | | | (0.06 | ) |
Total distributions | | | (0.21 | ) | | | (0.52 | ) | | | (0.32 | ) | | | (0.62 | ) | | | (0.57 | ) | | | (0.44 | ) |
Paid-in capital from redemption fees (Note 4)3 | | | – | | | | – | | | | – | | | | – | | | | – | | | | – | |
Net Asset Value, end of period | | | $16.16 | | | | $15.35 | | | | $15.26 | | | | $15.59 | | | | $14.57 | | | | $12.48 | |
TOTAL RETURN | | | 6.66% | 4 | | | 3.93% | | | | (0.18% | ) | | | 11.43% | | | | 21.70% | | | | (9.93% | ) |
| | | | | | |
RATIOS/SUPPLEMENTAL DATA | | | | | | | | | | | | | | | | | | | | | | | | |
Net assets, end of period (in 000’s) | | | $2,004,915 | | | | $2,045,713 | | | | $2,107,371 | | | | $2,124,214 | | | | $922,561 | | | | $344,502 | |
Ratio of expenses to average net assets before any reimbursement, waiver or recapture of expenses by Advisor and Administrator (Note 5) | | | 0.94% | 5 | | | 0.93% | | | | 0.93% | | | | 0.93% | | | | 0.97% | | | | 1.00% | |
Ratio of expenses to average net assets after any reimbursement, waiver or recapture of expenses by Advisor and Administrator | | | 0.93% | 5 | | | 0.92% | | | | 0.93% | | | | 0.93% | | | | 0.97% | | | | 1.00% | |
Ratio of net investment income (loss) to average net assets | | | 2.42% | 5 | | | 1.98% | | | | 2.02% | | | | 2.17% | | | | 2.72% | | | | 3.03% | |
Portfolio turnover6 | | | 11.37% | 4 | | | 35.98% | | | | 20.06% | | | | 14.06% | | | | 9.17% | | | | 16.48% | |
| 1 | Consolidated Financial Highlights. See Note 2-C. |
| 2 | Calculated using the average daily shares method. |
| 3 | Less than $0.01 per share. |
| 6 | The portfolio turnover rate is calculated on the Fund as a whole without distinguishing between classes of shares issued. |
See accompanying notes to financial statements.
Matthews China Dividend Fund
The tables below set forth financial data for a share of beneficial interest outstanding throughout each period presented.
| | | | | | | | | | | | | | | | | | | | | | | | |
| | | Six-Month
Period Ended
June 30, 2016 (unaudited) | | | Year Ended Dec. 31 | |
| INVESTOR CLASS | | | 2015 | | | 2014 | | | 2013 | | | 2012 | | | 2011 | |
Net Asset Value, beginning of period | | | $13.79 | | | | $13.37 | | | | $13.74 | | | | $12.35 | | | | $10.06 | | | | $12.17 | |
INCOME (LOSS) FROM INVESTMENT OPERATIONS: | | | | | | | | | | | | | | | | | | | | | | | | |
Net investment income (loss)1 | | | 0.23 | | | | 0.29 | | | | 0.25 | | | | 0.25 | | | | 0.25 | | | | 0.29 | |
Net realized gain (loss) and unrealized appreciation/depreciation on investments and foreign currency | | | (0.35 | ) | | | 1.01 | | | | (0.12 | ) | | | 1.35 | | | | 2.49 | | | | (2.04 | ) |
Total from investment operations | | | (0.12 | ) | | | 1.30 | | | | 0.13 | | | | 1.60 | | | | 2.74 | | | | (1.75 | ) |
LESS DISTRIBUTIONS FROM: | | | | | | | | | | | | | | | | | | | | | | | | |
Net investment income | | | (0.21 | ) | | | (0.28 | ) | | | (0.36 | ) | | | (0.23 | ) | | | (0.46 | ) | | | (0.35 | ) |
Net realized gains on investments | | | – | | | | (0.60 | ) | | | (0.14 | ) | | | – | | | | – | | | | (0.02 | ) |
Total distributions | | | (0.21 | ) | | | (0.88 | ) | | | (0.50 | ) | | | (0.23 | ) | | | (0.46 | ) | | | (0.37 | ) |
Paid-in capital from redemption fees (Note 4) | | | – | 2 | | | – | 2 | | | – | 2 | | | 0.02 | | | | 0.01 | | | | 0.01 | |
Net Asset Value, end of period | | | $13.46 | | | | $13.79 | | | | $13.37 | | | | $13.74 | | | | $12.35 | | | | $10.06 | |
TOTAL RETURN | | | (0.87% | )3 | | | 9.54% | | | | 0.93% | | | | 13.35% | | | | 27.81% | | | | (14.44% | ) |
| | | | | | |
RATIOS/SUPPLEMENTAL DATA | | | | | | | | | | | | | | | | | | | | | | | | |
Net assets, end of period (in 000’s) | | | $144,923 | | | | $165,514 | | | | $116,954 | | | | $125,965 | | | | $59,535 | | | | $26,467 | |
Ratio of expenses to average net assets before any reimbursement or waiver or recapture of expenses by Advisor and Administrator (Note 5) | | | 1.21% | 4 | | | 1.19% | | | | 1.19% | | | | 1.24% | | | | 1.47% | | | | 1.52% | |
Ratio of expenses to average net assets after any reimbursement or waiver or recapture of expenses by Advisor and Administrator | |
| 1.21%
| 4
| | | 1.19% | | | | 1.19% | | | | 1.34% | | | | 1.50% | | | | 1.50% | |
Ratio of net investment income (loss) to average net assets | | | 3.49% | 4 | | | 1.97% | | | | 1.88% | | | | 1.94% | | | | 2.24% | | | | 2.47% | |
Portfolio turnover5 | | | 30.82% | 3 | | | 79.91% | | | | 25.43% | | | | 20.52% | | | | 21.40% | | | | 22.31% | |
| | |
| | | Six-Month
Period Ended
June 30, 2016 (unaudited) | | | Year Ended Dec. 31 | |
| INSTITUTIONAL CLASS | | | 2015 | | | 2014 | | | 2013 | | | 2012 | | | 2011 | |
Net Asset Value, beginning of period | | | $13.79 | | | | $13.37 | | | | $13.74 | | | | $12.34 | | | | $10.06 | | | | $12.17 | |
INCOME (LOSS) FROM INVESTMENT OPERATIONS: | | | | | | | | | | | | | | | | | | | | | | | | |
Net investment income (loss)1 | | | 0.27 | | | | 0.28 | | | | 0.28 | | | | 0.33 | | | | 0.22 | | | | 0.30 | |
Net realized gain (loss) and unrealized appreciation/depreciation on investments and foreign currency | | | (0.38 | ) | | | 1.04 | | | | (0.13 | ) | | | 1.32 | | | | 2.53 | | | | (2.01 | ) |
Total from investment operations | | | (0.11 | ) | | | 1.32 | | | | 0.15 | | | | 1.65 | | | | 2.75 | | | | (1.71 | ) |
LESS DISTRIBUTIONS FROM: | | | | | | | | | | | | | | | | | | | | | | | | |
Net investment income | | | (0.22 | ) | | | (0.30 | ) | | | (0.38 | ) | | | (0.26 | ) | | | (0.48 | ) | | | (0.38 | ) |
Net realized gains on investments | | | – | | | | (0.60 | ) | | | (0.14 | ) | | | – | | | | – | | | | (0.02 | ) |
Total distributions | | | (0.22 | ) | | | (0.90 | ) | | | (0.52 | ) | | | (0.26 | ) | | | (0.48 | ) | | | (0.40 | ) |
Paid-in capital from redemption fees (Note 4) | | | – | 2 | | | – | 2 | | | – | 2 | | | 0.01 | | | | 0.01 | | | | – | 2 |
Net Asset Value, end of period | | | $13.46 | | | | $13.79 | | | | $13.37 | | | | $13.74 | | | | $12.34 | | | | $10.06 | |
TOTAL RETURN | | | (0.76% | )3 | | | 9.71% | | | | 1.11% | | | | 13.72% | | | | 27.90% | | | | (14.22% | ) |
| | | | | | |
RATIOS/SUPPLEMENTAL DATA | | | | | | | | | | | | | | | | | | | | | | | | |
Net assets, end of period (in 000’s) | | | $19,458 | | | | $15,406 | | | | $30,662 | | | | $24,790 | | | | $201 | | | | $12 | |
Ratio of expenses to average net assets | | | 1.02% | 4 | | | 1.00% | | | | 1.01% | | | | 1.08% | | | | 1.29% | | | | 1.31% | |
Ratio of net investment income (loss) to average net assets | | | 4.13% | 4 | | | 1.89% | | | | 2.06% | | | | 2.54% | | | | 1.87% | | | | 2.61% | |
Portfolio turnover5 | | | 30.82% | 3 | | | 79.91% | | | | 25.43% | | | | 20.52% | | | | 21.40% | | | | 22.31% | |
| 1 | Calculated using the average daily shares method. |
| 2 | Less than $0.01 per share. |
| 5 | The portfolio turnover rate is calculated on the Fund as a whole without distinguishing between classes of shares issued. |
See accompanying notes to financial statements.
| | | | |
| matthewsasia.com | 800.789.ASIA | | | 121 | |
Financial Highlights (continued)
Matthews Asia Value Fund
The tables below set forth financial data for a share of beneficial interest outstanding throughout each period presented.
| | | | | | | | |
| INVESTOR CLASS | | Six-Month
Period Ended
June 30, 2016
(unaudited) | | | Period Ended
Dec. 31, 20151 | |
Net Asset Value, beginning of period | | | $9.85 | | | | $10.00 | |
INCOME (LOSS) FROM INVESTMENT OPERATIONS: | | | | | | | | |
Net investment income (loss)2 | | | 0.02 | | | | 0.02 | |
Net realized gain (loss) and unrealized appreciation/depreciation on investments
and foreign currency | | | 0.30 | | | | (0.16 | ) |
Total from investment operations | | | 0.32 | | | | (0.14 | ) |
LESS DISTRIBUTIONS FROM: | | | | | | | | |
Net investment income | | | – | | | | (0.01 | ) |
Total distributions | | | – | | | | (0.01 | ) |
Paid-in capital from redemption fees (Note 4) | | | – | | | | – | |
Net Asset Value, end of period | | | $10.17 | | | | $9.85 | |
TOTAL RETURN3 | | | 3.25% | | | | (1.35% | ) |
| | |
RATIOS/SUPPLEMENTAL DATA | | | | | | | | |
Net assets, end of period (in 000’s) | | | $1,874 | | | | $1,589 | |
Ratio of expenses to average net assets before any reimbursement, waiver or recapture
of expenses by Advisor and Administrator (Note 5)4 | | | 10.12% | | | | 36.42% | |
Ratio of expenses to average net assets after any reimbursement, waiver or recapture
of expenses by Advisor and Administrator4 | | | 1.50% | | | | 1.50% | |
Ratio of net investment income (loss) to average net assets4 | | | 0.51% | | | | 2.70% | |
Portfolio turnover3,5 | | | 10.69% | | | | 10.80% | |
| | |
| INSTITUTIONAL CLASS | | Six-Month
Period Ended
June 30, 2016
(unaudited) | | | Period Ended
Dec. 31, 20151 | |
Net Asset Value, beginning of period | | | $9.83 | | | | $10.00 | |
INCOME (LOSS) FROM INVESTMENT OPERATIONS: | | | | | | | | |
Net investment income (loss)2 | | | 0.03 | | | | 0.02 | |
Net realized gain (loss) and unrealized appreciation/depreciation on investments
and foreign currency | | | 0.30 | | | | (0.15 | ) |
Total from investment operations | | | 0.33 | | | | (0.13 | ) |
LESS DISTRIBUTIONS FROM: | | | | | | | | |
Net investment income | | | – | | | | (0.04 | ) |
Total distributions | | | – | | | | (0.04 | ) |
Paid-in capital from redemption fees (Note 4) | | | – | | | | – | |
Net Asset Value, end of period | | | $10.16 | | | | $9.83 | |
TOTAL RETURN3 | | | 3.36% | | | | (1.30% | ) |
| | |
RATIOS/SUPPLEMENTAL DATA | | | | | | | | |
Net assets, end of period (in 000’s) | | | $148 | | | | $143 | |
Ratio of expenses to average net assets before any reimbursement, waiver or recapture
of expenses by Advisor and Administrator (Note 5)4 | | | 9.89% | | | | 36.17% | |
Ratio of expenses to average net assets after any reimbursement, waiver or recapture
of expenses by Advisor and Administrator4 | | | 1.25% | | | | 1.25% | |
Ratio of net investment income (loss) to average net assets4 | | | 0.71% | | | | 2.41% | |
Portfolio turnover3,5 | | | 10.69% | | | | 10.80% | |
| 1 | Institutional Class commenced operations on November 30, 2015. |
| 2 | Calculated using the average daily shares method. |
| 5 | The portfolio turnover rate is calculated on the Fund as a whole without distinguishing between classes of share issues. |
See accompanying notes to financial statements.
Matthews Asia Focus Fund
The tables below set forth financial data for a share of beneficial interest outstanding throughout each period presented.
| | | | | | | | | | | | | | | | |
| | | Six-Month
Period Ended June 30, 2016 (unaudited) | | | Year Ended Dec. 31 | | | Period Ended Dec. 31, 20131 | |
| INVESTOR CLASS | | | 2015 | | | 2014 | | |
Net Asset Value, beginning of period | | | $8.69 | | | | $10.01 | | | | $9.66 | | | | $10.00 | |
INCOME (LOSS) FROM INVESTMENT OPERATIONS: | | | | | | | | | | | | | | | | |
Net investment income (loss)2 | | | 0.06 | | | | 0.11 | | | | 0.09 | | | | 0.04 | |
Net realized gain (loss) and unrealized appreciation/depreciation on investments and foreign currency | | | 0.52 | | | | (1.31 | ) | | | 0.33 | | | | (0.30 | ) |
Total from investment operations | | | 0.58 | | | | (1.20 | ) | | | 0.42 | | | | (0.26 | ) |
LESS DISTRIBUTIONS FROM: | | | | | | | | | | | | | | | | |
Net investment income | | | — | | | | (0.07 | ) | | | (0.07 | ) | | | (0.08 | ) |
Net realized gains on investments | | | — | | | | (0.05 | ) | | | — | | | | — | |
Total distributions | | | — | | | | (0.12 | ) | | | (0.07 | ) | | | (0.08 | ) |
Paid-in capital from redemption fees (Note 4) | | | — | | | | — | 3 | | | — | 3 | | | — | 3 |
Net Asset Value, end of period | | | $9.27 | | | | $8.69 | | | | $10.01 | | | | $9.66 | |
TOTAL RETURN | | | 6.68% | 4 | | | (12.07% | ) | | | 4.38% | | | | (2.63% | )4 |
| | | | |
RATIOS/SUPPLEMENTAL DATA | | | | | | | | | | | | | | | | |
Net assets, end of period (in 000’s) | | | $4,948 | | | | $5,474 | | | | $7,839 | | | | $6,258 | |
Ratio of expenses to average net assets before any reimbursement, waiver or recapture of expenses by Advisor and Administrator (Note 5) | | | 2.19% | 5 | | | 2.07% | | | | 2.16% | | | | 3.50% | 5 |
Ratio of expenses to average net assets after any reimbursement, waiver or recapture of expenses by Advisor and Administrator | | | 1.63% | 5 | | | 1.50% | | | | 1.57% | | | | 1.71% | 5 |
Ratio of net investment income (loss) to average net assets | | | 1.35% | 5 | | | 1.08% | | | | 0.87% | | | | 0.64% | 5 |
Portfolio turnover6 | | | 7.18% | 4 | | | 23.60% | | | | 24.12% | | | | 16.23% | 4 |
| | | |
| | | Six-Month
Period Ended June 30, 2016 (unaudited) | | | Year Ended Dec. 31 | | | Period Ended Dec. 31, 20131 | |
| INSTITUTIONAL CLASS | | | 2015 | | | 2014 | | |
Net Asset Value, beginning of period | | | $8.69 | | | | $10.04 | | | | $9.66 | | | | $10.00 | |
INCOME (LOSS) FROM INVESTMENT OPERATIONS: | | | | | | | | | | | | | | | | |
Net investment income (loss)2 | | | 0.08 | | | | 0.13 | | | | 0.10 | | | | 0.05 | |
Net realized gain (loss) and unrealized appreciation/depreciation on investments and foreign currency | | | 0.52 | | | | (1.33 | ) | | | 0.36 | | | | (0.30 | ) |
Total from investment operations | | | 0.60 | | | | (1.20 | ) | | | 0.46 | | | | (0.25 | ) |
LESS DISTRIBUTIONS FROM: | | | | | | | | | | | | | | | | |
Net investment income | | | — | | | | (0.10 | ) | | | (0.08 | ) | | | (0.09 | ) |
Net realized gains on investments | | | — | | | | (0.05 | ) | | | — | | | | — | |
Total distributions | | | — | | | | (0.15 | ) | | | (0.08 | ) | | | (0.09 | ) |
Paid-in capital from redemption fees (Note 4) | | | — | | | | — | 3 | | | —3 | | | | — | 3 |
Net Asset Value, end of period | | | $9.29 | | | | $8.69 | | | | $10.04 | | | | $9.66 | |
TOTAL RETURN | | | 6.91% | 4 | | | (11.96% | ) | | | 4.77% | | | | (2.48% | )4 |
| | | | |
RATIOS/SUPPLEMENTAL DATA | | | | | | | | | | | | | | | | |
Net assets, end of period (in 000’s) | | | $5,897 | | | | $5,700 | | | | $7,148 | | | | $2,118 | |
Ratio of expenses to average net assets before any reimbursement, waiver or recapture of expenses by Advisor and Administrator (Note 5) | | | 1.88% | 5 | | | 1.91% | | | | 1.94% | | | | 3.32% | 5 |
Ratio of expenses to average net assets after any reimbursement, waiver or recapture of expenses by Advisor and Administrator | | | 1.25% | 5 | | | 1.25% | | | | 1.31% | | | | 1.50% | 5 |
Ratio of net investment income (loss) to average net assets | | | 1.77% | 5 | | | 1.30% | | | | 0.96% | | | | 0.79% | 5 |
Portfolio turnover6 | | | 7.18% | 4 | | | 23.60% | | | | 24.12% | | | | 16.23% | 4 |
| 1 | Commenced operations on April 30, 2013. |
| 2 | Calculated using the average daily shares method. |
| 3 | Less than $0.01 per share. |
| 6 | The portfolio turnover rate is calculated on the Fund as a whole without distinguishing between classes of shares issued. |
See accompanying notes to financial statements.
| | | | |
| matthewsasia.com | 800.789.ASIA | | | 123 | |
Financial Highlights (continued)
Matthews Asia Growth Fund
The tables below set forth financial data for a share of beneficial interest outstanding throughout each period presented.
| | | | | | | | | | | | | | | | | | | | | | | | |
INVESTOR CLASS | |
| Six-Month
Period Ended
June 30, 2016 (unaudited) |
| | | Year Ended Dec. 31 | |
| | | 2015 | | | 2014 | | | 2013 | | | 2012 | | | 2011 | |
Net Asset Value, beginning of period | | | $21.09 | | | | $21.10 | | | | $21.17 | | | | $18.02 | | | | $15.34 | | | | $17.97 | |
INCOME (LOSS) FROM INVESTMENT OPERATIONS: | | | | | | | | | | | | | | | | | | | | | | | | |
Net investment income (loss)1 | | | 0.07 | | | | 0.11 | | | | 0.12 | | | | 0.11 | | | | 0.15 | | | | 0.11 | |
Net realized gain (loss) and unrealized appreciation/depreciation on investments and foreign currency | | | 0.70 | | | | (0.12 | ) | | | 0.19 | | | | 3.37 | | | | 2.53 | | | | (2.41 | ) |
Total from investment operations | | | 0.77 | | | | (0.01 | ) | | | 0.31 | | | | 3.48 | | | | 2.68 | | | | (2.30 | ) |
LESS DISTRIBUTIONS FROM: | | | | | | | | | | | | | | | | | | | | | | | | |
Net investment income | | | — | | | | — | | | | (0.38 | ) | | | (0.33 | ) | | | — | | | | (0.35 | ) |
Total distributions | | | — | | | | — | | | | (0.38 | ) | | | (0.33 | ) | | | — | | | | (0.35 | ) |
Paid-in capital from redemption fees (Note 4) | | | — | | | | — | 2 | | | — | 2 | | | — | 2 | | | — | 2 | | | 0.02 | |
Net Asset Value, end of period | | | $21.86 | | | | $21.09 | | | | $21.10 | | | | $21.17 | | | | $18.02 | | | | $15.34 | |
TOTAL RETURN | | | 3.65% | 3 | | | (0.05% | ) | | | 1.49% | | | | 19.35% | | | | 17.47% | | | | (12.70% | ) |
| | | | | | |
RATIOS/SUPPLEMENTAL DATA | | | | | | | | | | | | | | | | | | | | | | | | |
Net assets, end of period (in 000’s) | | | $476,135 | | | | $526,969 | | | | $561,922 | | | | $558,407 | | | | $276,884 | | | | $259,166 | |
Ratio of expenses to average net assets | | | 1.15% | 4 | | | 1.11% | | | | 1.11% | | | | 1.12% | | | | 1.16% | | | | 1.19% | |
Ratio of net investment income (loss) to average net assets | | | 0.71% | 4 | | | 0.49% | | | | 0.55% | | | | 0.55% | | | | 0.92% | | | | 0.63% | |
Portfolio turnover5 | | | 6.37% | 3 | | | 29.51% | | | | 22.24% | | | | 10.77% | | | | 44.76% | | | | 28.06% | |
| | |
| |
| Six-Month
Period Ended
June 30, 2016
(unaudited) |
| | | Year Ended Dec. 31 | |
| INSTITUTIONAL CLASS | | | 2015 | | | 2014 | | | 2013 | | | 2012 | | | 2011 | |
Net Asset Value, beginning of period | | | $21.24 | | | | $21.19 | | | | $21.26 | | | | $18.08 | | | | $15.37 | | | | $17.98 | |
INCOME (LOSS) FROM INVESTMENT OPERATIONS: | | | | | | | | | | | | | | | | | | | | | | | | |
Net investment income (loss)1 | | | 0.09 | | | | 0.16 | | | | 0.16 | | | | 0.15 | | | | 0.17 | | | | 0.14 | |
Net realized gain (loss) and unrealized appreciation/depreciation on investments and foreign currency | | | 0.70 | | | | (0.11 | ) | | | 0.19 | | | | 3.39 | | | | 2.54 | | | | (2.42 | ) |
Total from investment operations | | | 0.79 | | | | 0.05 | | | | 0.35 | | | | 3.54 | | | | 2.71 | | | | (2.28 | ) |
LESS DISTRIBUTIONS FROM: | | | | | | | | | | | | | | | | | | | | | | | | |
Net investment income | | | — | | | | — | | | | (0.42 | ) | | | (0.36 | ) | | | — | | | | (0.35 | ) |
Total distributions | | | — | | | | — | | | | (0.42 | ) | | | (0.36 | ) | | | — | | | | (0.35 | ) |
Paid-in capital from redemption fees (Note 4) | | | — | | | | — | 2 | | | — | 2 | | | — | 2 | | | — | 2 | | | 0.02 | |
Net Asset Value, end of period | | | $22.03 | | | | $21.24 | | | | $21.19 | | | | $21.26 | | | | $18.08 | | | | $15.37 | |
TOTAL RETURN | | | 3.72% | 3 | | | 0.24% | | | | 1.63% | | | | 19.63% | | | | 17.63% | | | | (12.58% | ) |
| | | | | | |
RATIOS/SUPPLEMENTAL DATA | | | | | | | | | | | | | | | | | | | | | | | | |
Net assets, end of period (in 000’s) | | | $205,666 | | | | $249,886 | | | | $287,262 | | | | $227,852 | | | | $147,142 | | | | $84,302 | |
Ratio of expenses to average net assets | | | 0.94% | 4 | | | 0.91% | | | | 0.91% | | | | 0.93% | | | | 0.98% | | | | 1.03% | |
Ratio of net investment income (loss) to average net assets | | | 0.90% | 4 | | | 0.72% | | | | 0.74% | | | | 0.73% | | | | 1.02% | | | | 0.84% | |
Portfolio turnover5 | | | 6.37% | 3 | | | 29.51% | | | | 22.24% | | | | 10.77% | | | | 44.76% | | | | 28.06% | |
| 1 | Calculated using the average daily shares method. |
| 2 | Less than $0.01 per share. |
| 5 | The portfolio turnover rate is calculated on the Fund as a whole without distinguishing between classes of shares issued. |
See accompanying notes to financial statements.
Matthews Pacific Tiger Fund
The tables below set forth financial data for a share of beneficial interest outstanding throughout each period presented.
| | | | | | | | | | | | | | | | | | | | | | | | |
INVESTOR CLASS | | Six-Month
Period Ended
June 30, 2016 (unaudited) | | | Year Ended Dec. 31 | |
| | | 2015 | | | 2014 | | | 2013 | | | 2012 | | | 2011 | |
Net Asset Value, beginning of period | | | $23.54 | | | | $26.57 | | | | $24.99 | | | | $24.42 | | | | $20.33 | | | | $23.44 | |
INCOME (LOSS) FROM INVESTMENT OPERATIONS: | | | | | | | | | | | | | | | | | | | | | | | | |
Net investment income (loss)1 | | | 0.06 | | | | 0.42 | | | | 0.14 | | | | 0.17 | | | | 0.18 | | | | 0.10 | |
Net realized gain (loss) and unrealized appreciation/depreciation on investments and foreign currency | | | 0.89 | | | | (0.82 | ) | | | 2.80 | | | | 0.72 | | | | 4.09 | | | | (2.78 | ) |
Total from investment operations | | | 0.95 | | | | (0.40 | ) | | | 2.94 | | | | 0.89 | | | | 4.27 | | | | (2.68 | ) |
LESS DISTRIBUTIONS FROM: | | | | | | | | | | | | | | | | | | | | | | | | |
Net investment income | | | — | | | | (0.42 | ) | | | (0.13 | ) | | | (0.16 | ) | | | (0.16 | ) | | | (0.11 | ) |
Net realized gains on investments | | | — | | | | (2.21 | ) | | | (1.23 | ) | | | (0.16 | ) | | | (0.02 | ) | | | (0.33 | ) |
Total distributions | | | — | | | | (2.63 | ) | | | (1.36 | ) | | | (0.32 | ) | | | (0.18 | ) | | | (0.44 | ) |
Paid-in capital from redemption fees (Note 4) | | | — | 2 | | | — | 2 | | | — | 2 | | | — | 2 | | | — | 2 | | | 0.01 | |
Net Asset Value, end of period | | | $24.49 | | | | $23.54 | | | | $26.57 | | | | $24.99 | | | | $24.42 | | | | $20.33 | |
TOTAL RETURN | | | 4.04% | 3 | | | (1.30% | ) | | | 11.79% | | | | 3.63% | | | | 21.00% | | | | (11.41% | ) |
| | | | | | |
RATIOS/SUPPLEMENTAL DATA | | | | | | | | | | | | | | | | | | | | | | | | |
Net assets, end of period (in 000’s) | | | $2,638,612 | | | | $2,720,869 | | | | $3,047,077 | | | | $2,954,108 | | | | $2,994,026 | | | | $2,780,640 | |
Ratio of expenses to average net assets before any reimbursement or waiver or recapture of expenses by Advisor and Administrator (Note 5) | | | 1.11% | 4 | | | 1.09% | | | | 1.09% | | | | 1.09% | | | | 1.11% | | | | 1.11% | |
Ratio of expenses to average net assets after any reimbursement or waiver or recapture of expenses by Advisor and Administrator | | | 1.10% | 4 | | | 1.07% | | | | 1.08% | | | | 1.09% | | | | 1.11% | | | | 1.11% | |
Ratio of net investment income (loss) to average net assets | | | 0.56% | 4 | | | 1.53% | | | | 0.52% | | | | 0.67% | | | | 0.82% | | | | 0.44% | |
Portfolio turnover 5 | | | 1.77% | 3 | | | 12.56% | | | | 11.38% | | | | 7.73% | | | | 6.53% | | | | 10.51% | |
| | |
INSTITUTIONAL CLASS | | Six-Month
Period Ended
June 30, 2016 (unaudited) | | | Year Ended Dec. 31 | |
| | | 2015 | | | 2014 | | | 2013 | | | 2012 | | | 2011 | |
Net Asset Value, beginning of period | | | $23.52 | | | | $26.56 | | | | $24.97 | | | | $24.41 | | | | $20.32 | | | | $23.44 | |
INCOME (LOSS) FROM INVESTMENT OPERATIONS: | | | | | | | | | | | | | | | | | | | | | | | | |
Net investment income (loss)1 | | | 0.09 | | | | 0.44 | | | | 0.18 | | | | 0.21 | | | | 0.21 | | | | 0.23 | |
Net realized gain (loss) and unrealized appreciation/depreciation on investments and foreign currency | | | 0.88 | | | | (0.80 | ) | | | 2.82 | | | | 0.71 | | | | 4.10 | | | | (2.87 | ) |
Total from investment operations | | | 0.97 | | | | (0.36 | ) | | | 3.00 | | | | 0.92 | | | | 4.31 | | | | (2.64 | ) |
LESS DISTRIBUTIONS FROM: | | | | | | | | | | | | | | | | | | | | | | | | |
Net investment income | | | — | | | | (0.47 | ) | | | (0.18 | ) | | | (0.20 | ) | | | (0.20 | ) | | | (0.15 | ) |
Net realized gains on investments | | | — | | | | (2.21 | ) | | | (1.23 | ) | | | (0.16 | ) | | | (0.02 | ) | | | (0.33 | ) |
Total distributions | | | — | | | | (2.68 | ) | | | (1.41 | ) | | | (0.36 | ) | | | (0.22 | ) | | | (0.48 | ) |
Paid-in capital from redemption fees (Note 4)2 | | | — | | | | — | | | | — | | | | — | | | | — | | | | — | |
Net Asset Value, end of period | | | $24.49 | | | | $23.52 | | | | $26.56 | | | | $24.97 | | | | $24.41 | | | | $20.32 | |
TOTAL RETURN | | | 4.12% | 3 | | | (1.15% | ) | | | 12.03% | | | | 3.78% | | | | 21.24% | | | | (11.28% | ) |
| | | | | | |
RATIOS/SUPPLEMENTAL DATA | | | | | | | | | | | | | | | | | | | | | | | | |
Net assets, end of period (in 000’s) | | | $4,345,955 | | | | $3,964,547 | | | | $5,049,643 | | | | $4,679,039 | | | | $3,770,568 | | | | $2,029,091 | |
Ratio of expenses to average net assets before any reimbursement or waiver or recapture of expenses by Advisor and Administrator (Note 5) | | | 0.92% | 4 | | | 0.91% | | | | 0.92% | | | | 0.92% | | | | 0.95% | | | | 0.95% | |
Ratio of expenses to average net assets after any reimbursement or waiver or recapture of expenses by Advisor and Administrator | | | 0.90% | 4 | | | 0.89% | | | | 0.91% | | | | 0.92% | | | | 0.95% | | | | 0.95% | |
Ratio of net investment income (loss) to average net assets | | | 0.79% | 4 | | | 1.61% | | | | 0.68% | | | | 0.83% | | | | 0.95% | | | | 1.03% | |
Portfolio turnover5 | | | 1.77% | 3 | | | 12.56% | | | | 11.38% | | | | 7.73% | | | | 6.53% | | | | 10.51% | |
| 1 | Calculated using the average daily shares method. |
| 2 | Less than $0.01 per share. |
| 5 | The portfolio turnover rate is calculated on the Fund as a whole without distinguishing between classes of shares issued. |
See accompanying notes to financial statements.
| | | | |
| matthewsasia.com | 800.789.ASIA | | | 125 | |
Financial Highlights (continued)
Matthews Asia ESG Fund
The tables below set forth financial data for a share of beneficial interest outstanding throughout each period presented.
| | | | | | | | |
| INVESTOR CLASS | | Six-Month
Period Ended
June 30, 2016
(unaudited) | | | Period Ended
Dec. 31, 20151 | |
Net Asset Value, beginning of period | | | $9.23 | | | | $10.00 | |
INCOME (LOSS) FROM INVESTMENT OPERATIONS: | | | | | | | | |
Net investment income (loss)2 | | | 0.04 | | | | 0.02 | |
Net realized gain (loss) and unrealized appreciation/depreciation on investments and foreign
currency | | | (0.17 | ) | | | (0.75 | ) |
Total from investment operations | | | (0.13 | ) | | | (0.73 | ) |
LESS DISTRIBUTIONS FROM: | | | | | | | | |
Net investment income | | | — | | | | (0.04 | ) |
Total distributions | | | — | | | | (0.04 | ) |
Paid-in capital from redemption fees (Note 4) | | | — | | | | — | |
Net Asset Value, end of period | | | $9.10 | | | | $9.23 | |
TOTAL RETURN3 | | | (1.41% | ) | | | (7.30% | ) |
| | |
RATIOS/SUPPLEMENTAL DATA | | | | | | | | |
Net assets, end of period (in 000’s) | | | $5,608 | | | | $3,248 | |
Ratio of expenses to average net assets before any reimbursement, waiver or recapture of expenses
by Advisor and Administrator (Note 5)4 | | | 3.68% | | | | 9.09% | |
Ratio of expenses to average net assets after any reimbursement, waiver or recapture of expenses
by Advisor and Administrator4 | | | 1.45% | | | | 1.44% | |
Ratio of net investment income (loss) to average net assets4 | | | 0.91% | | | | 0.25% | |
Portfolio turnover3,5 | | | 5.38% | | | | 21.72% | |
| | |
| INSTITUTIONAL CLASS | | Six-Month
Period Ended
June 30, 2016
(unaudited) | | | Period Ended
Dec. 31, 20151 | |
Net Asset Value, beginning of period | | | $9.17 | | | | $10.00 | |
INCOME (LOSS) FROM INVESTMENT OPERATIONS: | | | | | | | | |
Net investment income (loss)2 | | | 0.05 | | | | 0.05 | |
Net realized gain (loss) and unrealized appreciation/depreciation on investments and foreign
currency | | | (0.17 | ) | | | (0.77 | ) |
Total from investment operations | | | (0.12 | ) | | | (0.72 | ) |
LESS DISTRIBUTIONS FROM: | | | | | | | | |
Net investment income | | | — | | | | (0.11 | ) |
Total distributions | | | — | | | | (0.11 | ) |
Paid-in capital from redemption fees (Note 4) | | | — | | | | — | |
Net Asset Value, end of period | | | $9.05 | | | | $9.17 | |
TOTAL RETURN3 | | | (1.31% | ) | | | (7.14% | ) |
| | |
RATIOS/SUPPLEMENTAL DATA | | | | | | | | |
Net assets, end of period (in 000’s) | | | $2,936 | | | | $1,686 | |
Ratio of expenses to average net assets before any reimbursement, waiver or recapture of expenses
by Advisor and Administrator (Note 5)4 | | | 3.50% | | | | 8.90% | |
Ratio of expenses to average net assets after any reimbursement, waiver or recapture of expenses
by Advisor and Administrator4 | | | 1.25% | | | | 1.25% | |
Ratio of net investment income (loss) to average net assets4 | | | 1.06% | | | | 0.75% | |
Portfolio turnover3,5 | | | 5.38% | | | | 21.72% | |
| 1 | Commenced operations on April 30, 2015. |
| 2 | Calculated using the average daily shares method. |
| 5 | The portfolio turnover rate is calculated on the Fund as a whole without distinguishing between classes of shares issued. |
See accompanying notes to financial statements.
Matthews Emerging Asia Fund
The tables below set forth financial data for a share of beneficial interest outstanding throughout each period presented.
| | | | | | | | | | | | | | | | |
| INVESTOR CLASS | |
| Six-Month
Period Ended
June 30, 2016
(unaudited) |
| | | Year Ended Dec. 31 | | |
| Period Ended
Dec. 31, 20131 |
|
| | | 2015 | | | 2014 | | |
Net Asset Value, beginning of period | | | $11.27 | | | | $11.60 | | | | $9.93 | | | | $10.00 | |
INCOME (LOSS) FROM INVESTMENT OPERATIONS: | | | | | | | | | | | | | | | | |
Net investment income (loss)2 | | | 0.07 | | | | 0.04 | | | | 0.04 | | | | (0.01 | ) |
Net realized gain (loss) and unrealized appreciation/depreciation on investments and foreign currency | | | 1.13 | | | | (0.34 | ) | | | 1.69 | | | | (0.05 | ) |
Total from investment operations | | | 1.20 | | | | (0.30 | ) | | | 1.73 | | | | (0.06 | ) |
LESS DISTRIBUTIONS FROM: | | | | | | | | | | | | | | | | |
Net investment income | | | — | | | | — | 3 | | | (0.06 | ) | | | — | 3 |
Return of capital | | | — | | | | — | | | | — | | | | (0.01 | ) |
Net realized gains on investments | | | — | | | | (0.03 | ) | | | — | | | | — | |
Total distributions | | | — | | | | (0.03 | ) | | | (0.06 | ) | | | (0.01 | ) |
Paid-in capital from redemption fees (Note 4)3 | | | — | | | | — | | | | — | | | | — | |
Net Asset Value, end of period | | | $12.47 | | | | $11.27 | | | | $11.60 | | | | $9.93 | |
TOTAL RETURN | | | 10.65% | 4 | | | (2.56% | ) | | | 17.39% | | | | (0.61% | )4 |
| | | | |
RATIOS/SUPPLEMENTAL DATA | | | | | | | | | | | | | | | | |
Net assets, end of period (in 000’s) | | | $73,512 | | | | $114,590 | | | | $110,363 | | | | $38,022 | |
Ratio of expenses to average net assets before any reimbursement, waiver or recapture of expenses by Advisor and Administrator (Note 5) | | | 1.78% | 5 | | | 1.75% | | | | 1.78% | | | | 2.39% | 5 |
Ratio of expenses to average net assets after any reimbursement, waiver or recapture of expenses by Advisor and Administrator | | | 1.50% | 5 | | | 1.50% | | | | 1.58% | | | | 1.98% | 5 |
Ratio of net investment income (loss) to average net assets | | | 1.22% | 5 | | | 0.33% | | | | 0.34% | | | | (0.08% | )5 |
Portfolio turnover6 | | | 14.39% | 4 | | | 12.14% | | | | 8.21% | | | | 1.66% | 4 |
| | | |
| INSTITUTIONAL CLASS | |
| Six-Month
Period Ended
June 30, 2016
(unaudited) |
| | | Year Ended Dec. 31 | | |
| Period Ended
Dec. 31, 20131 |
|
| | | 2015 | | | 2014 | | |
Net Asset Value, beginning of period | | | $11.29 | | | | $11.60 | | | | $9.92 | | | | $10.00 | |
INCOME (LOSS) FROM INVESTMENT OPERATIONS: | | | | | | | | | | | | | | | | |
Net investment income (loss)2 | | | 0.12 | | | | 0.07 | | | | 0.06 | | | | 0.01 | |
Net realized gain (loss) and unrealized appreciation/depreciation on investments and foreign currency | | | 1.10 | | | | (0.34 | ) | | | 1.69 | | | | (0.07 | ) |
Total from investment operations | | | 1.22 | | | | (0.27 | ) | | | 1.75 | | | | (0.06 | ) |
LESS DISTRIBUTIONS FROM: | | | | | | | | | | | | | | | | |
Net investment income | | | — | | | | (0.01 | ) | | | (0.07 | ) | | | — | 3 |
Return of capital | | | — | | | | — | | | | — | | | | (0.02 | ) |
Net realized gains on investments | | | — | | | | (0.03 | ) | | | — | | | | — | |
Total distributions | | | — | | | | (0.04 | ) | | | (0.07 | ) | | | (0.02 | ) |
Paid-in capital from redemption fees (Note 4)3 | | | — | | | | — | | | | — | | | | — | |
Net Asset Value, end of period | | | $12.51 | | | | $11.29 | | | | $11.60 | | | | $9.92 | |
TOTAL RETURN | | | 10.81% | 4 | | | (2.33% | ) | | | 17.68% | | | | (0.55% | )4 |
| | | | |
RATIOS/SUPPLEMENTAL DATA | | | | | | | | | | | | | | | | |
Net assets, end of period (in 000’s) | | | $77,948 | | | | $55,278 | | | | $21,350 | | | | $2,017 | |
Ratio of expenses to average net assets before any reimbursement, waiver or recapture of expenses by Advisor and Administrator (Note 5) | | | 1.60% | 5 | | | 1.57% | | | | 1.59% | | | | 2.21% | 5 |
Ratio of expenses to average net assets after any reimbursement, waiver or recapture of expenses by Advisor and Administrator | | | 1.25% | 5 | | | 1.25% | | | | 1.33% | | | | 1.75% | 5 |
Ratio of net investment income (loss) to average net assets | | | 2.12% | 5 | | | 0.65% | | | | 0.55% | | | | 0.19% | 5 |
Portfolio turnover6 | | | 14.39% | 4 | | | 12.14% | | | | 8.21% | | | | 1.66% | 4 |
| 1 | Commenced operations on April 30, 2013. |
| 2 | Calculated using the average daily shares method. |
| 3 | Less than $0.01 per share. |
| 6 | The portfolio turnover rate is calculated on the Fund as a whole without distinguishing between classes of shares issued. |
See accompanying notes to financial statements.
| | | | |
| matthewsasia.com | 800.789.ASIA | | | 127 | |
Financial Highlights (continued)
Matthews Asia Innovators Fund*
The tables below set forth financial data for a share of beneficial interest outstanding throughout each period presented.
| | | | | | | | | | | | | | | | | | | | | | | | |
INVESTOR CLASS | |
| Six-Month
Period Ended
June 30, 2016
(unaudited) |
| | | Year Ended Dec. 31 | |
| | | 2015 | | | 2014 | | | 2013 | | | 2012 | | | 2011 | |
Net Asset Value, beginning of period | | | $12.32 | | | | $13.61 | | | | $12.59 | | | | $9.29 | | | | $8.16 | | | | $9.89 | |
INCOME (LOSS) FROM INVESTMENT OPERATIONS: | | | | | | | | | | | | | | | | | | | | | | | | |
Net investment income (loss)1 | | | (0.01 | ) | | | (0.05 | ) | | | — | 2 | | | 0.01 | | | | 0.03 | | | | 0.02 | |
Net realized gain (loss) and unrealized appreciation/
depreciation on investments and foreign currency | | | (0.58 | ) | | | 0.64 | | | | 1.16 | | | | 3.30 | | | | 1.12 | | | | (1.74 | ) |
Total from investment operations | | | (0.59 | ) | | | 0.59 | | | | 1.16 | | | | 3.31 | | | | 1.15 | | | | (1.72 | ) |
LESS DISTRIBUTIONS FROM: | | | | | | | | | | | | | | | | | | | | | | | | |
Net investment income | | | — | | | | — | | | | (0.06 | ) | | | (0.01 | ) | | | (0.02 | ) | | | (0.02 | ) |
Net realized gains on investments | | | — | | | | (1.88 | ) | | | (0.08 | ) | | | — | | | | — | | | | — | |
Total distributions | | | — | | | | (1.88 | ) | | | (0.14 | ) | | | (0.01 | ) | | | (0.02 | ) | | | (0.02 | ) |
Paid-in capital from redemption fees (Note 4) | | | — | | | | — | 2 | | | — | 2 | | | — | 2 | | | — | 2 | | | 0.01 | |
Net Asset Value, end of period | | | $11.73 | | | | $12.32 | | | | $13.61 | | | | $12.59 | | | | $9.29 | | | | $8.16 | |
TOTAL RETURN | | | (4.79% | )3 | | | 4.48% | | | | 9.24% | | | | 35.61% | | | | 14.11% | | | | (17.26% | ) |
| | | | | | |
RATIOS/SUPPLEMENTAL DATA | | | | | | | | | | | | | | | | | | | | | | | | |
Net assets, end of period (in 000’s) | | | $107,362 | | | | $129,763 | | | | $125,612 | | | | $111,751 | | | | $131,629 | | | | $153,349 | |
Ratio of expenses to average net assets before any reimbursement, waiver or recapture of expenses by Advisor and Administrator
(Note 5) | | | 1.21% | 4 | | | 1.18% | | | | 1.16% | | | | 1.18% | | | | 1.18% | | | | 1.21% | |
Ratio of expenses to average net assets after any reimbursement, waiver or recapture of expenses by Advisor and Administrator | | | 1.20% | 4 | | | 1.18% | | | | 1.16% | | | | 1.18% | | | | 1.18% | | | | 1.21% | |
Ratio of net investment income (loss) to average net assets | | | (0.09% | )4 | | | (0.33% | ) | | | (0.02% | ) | | | 0.07% | | | | 0.30% | | | | 0.23% | |
Portfolio turnover | | | 44.56% | 3,5 | | | 72.85% | 5 | | | 62.99% | 5 | | | 62.04% | 5 | | | 45.76% | | | | 65.47% | |
| | | | | | | | | | | | | | | | |
| INSTITUTIONAL CLASS | |
| Six-Month
Period Ended
June 30, 2016 (unaudited) |
| | | Year Ended Dec. 31 | | |
| Period Ended
Dec. 31, 20136 |
|
| | | 2015 | | | 2014 | | |
Net Asset Value, beginning of period | | | $12.34 | | | | $13.61 | | | | $12.58 | | | | $10.09 | |
INCOME (LOSS) FROM INVESTMENT OPERATIONS: | | | | | | | | | | | | | | | | |
Net investment income (loss)1 | | | 0.01 | | | | (0.02 | ) | | | 0.03 | | | | 0.04 | |
Net realized gain (loss) and unrealized appreciation/
depreciation on investments and foreign currency | | | (0.59 | ) | | | 0.63 | | | | 1.17 | | | | 2.48 | |
Total from investment operations | | | (0.58 | ) | | | 0.61 | | | | 1.20 | | | | 2.52 | |
LESS DISTRIBUTIONS FROM: | | | | | | | | | | | | | | | | |
Net investment income | | | — | | | | — | | | | (0.09 | ) | | | (0.03 | ) |
Net realized gains on investments | | | — | | | | (1.88 | ) | | | (0.08 | ) | | | — | |
Total distributions | | | — | | | | (1.88 | ) | | | (0.17 | ) | | | (0.03 | ) |
Paid-in capital from redemption fees (Note 4) | | | — | | | | — | 2 | | | — | 2 | | | — | 2 |
Net Asset Value, end of period | | | $11.76 | | | | $12.34 | | | | $13.61 | | | | $12.58 | |
TOTAL RETURN | | | (4.70% | )3 | | | 4.63% | | | | 9.54% | | | | 24.99% | 3 |
| | | | |
RATIOS/SUPPLEMENTAL DATA | | | | | | | | | | | | | | | | |
Net assets, end of period (in 000’s) | | | $38,176 | | | | $36,770 | | | | $61,088 | | | | $49,236 | |
Ratio of expenses to average net assets before any reimbursement,
waiver or recapture of expenses by Advisor and Administrator (Note 5) | | | 0.98% | 4 | | | 0.97% | | | | 0.95% | | | | 1.00% | 4 |
Ratio of expenses to average net assets after any reimbursement,
waiver or recapture of expenses by Advisor and Administrator | | | 0.97% | 4 | | | 0.97% | | | | 0.95% | | | | 1.00% | 4 |
Ratio of net investment income (loss) to average net assets | | | 0.20% | 4 | | | (0.16% | ) | | | 0.21% | | | | 0.56% | 4 |
Portfolio turnover5 | | | 44.56% | 3 | | | 72.85% | | | | 62.99% | | | | 62.04% | 3 |
| * | The Fund’s name changed from Matthews Asia Science and Technology Fund to Matthews Asia Innovators Fund on April 29, 2016. |
| 1 | Calculated using the average daily shares method. |
| 2 | Less than $0.01 per share. |
| 5 | The portfolio turnover rate is calculated on the Fund as a whole without distinguishing between classes of shares issued. |
| 6 | Institutional Class commenced operations on April 30, 2013. |
See accompanying notes to financial statements.
Matthews China Fund
The tables below set forth financial data for a share of beneficial interest outstanding throughout each period presented.
| | | | | | | | | | | | | | | | | | | | | | | | |
INVESTOR CLASS | | Six-Month
Period Ended
June 30, 20161 (unaudited) | | | Year Ended Dec. 31 | |
| | | 20151 | | | 20141 | | | 2013 | | | 2012 | | | 2011 | |
Net Asset Value, beginning of period | | | $18.42 | | | | $21.46 | | | | $22.84 | | | | $23.47 | | | | $21.51 | | | | $29.36 | |
INCOME (LOSS) FROM INVESTMENT OPERATIONS: | | | | | | | | | | | | | | | | | | | | | | | | |
Net investment income (loss)2 | | | 0.20 | | | | 0.20 | | | | 0.24 | | | | 0.25 | | | | 0.30 | | | | 0.26 | |
Net realized gain (loss) and unrealized appreciation/
depreciation on investments and foreign currency | | | (2.43 | ) | | | 0.30 | | | | (1.25 | ) | | | 1.33 | | | | 2.26 | | | | (5.78 | ) |
Total from investment operations | | | (2.23 | ) | | | 0.50 | | | | (1.01 | ) | | | 1.58 | | | | 2.56 | | | | (5.52 | ) |
LESS DISTRIBUTIONS FROM: | | | | | | | | | | | | | | | | | | | | | | | | |
Net investment income | | | — | | | | (0.21 | ) | | | (0.27 | ) | | | (0.26 | ) | | | (0.35 | ) | | | (0.28 | ) |
Net realized gains on investments | | | — | | | | (3.33 | ) | | | (0.10 | ) | | | (1.95 | ) | | | (0.25 | ) | | | (2.06 | ) |
Total distributions | | | — | | | | (3.54 | ) | | | (0.37 | ) | | | (2.21 | ) | | | (0.60 | ) | | | (2.34 | ) |
Paid-in capital from redemption fees (Note 4) | | | — | | | | — | 3 | | | — | 3 | | | — | 3 | | | — | 3 | | | 0.01 | |
Net Asset Value, end of period | | | $16.19 | | | | $18.42 | | | | $21.46 | | | | $22.84 | | | | $23.47 | | | | $21.51 | |
TOTAL RETURN | | | (12.11% | )4 | | | 2.41% | | | | (4.42% | ) | | | 6.84% | | | | 11.96% | | | | (18.93% | ) |
| | | | | | |
RATIOS/SUPPLEMENTAL DATA | | | | | | | | | | | | | | | | | | | | | | | | |
Net assets, end of period (in 000’s) | | | $553,370 | | | | $709,767 | | | | $947,740 | | | | $1,286,309 | | | | $1,642,090 | | | | $1,836,333 | |
Ratio of expenses to average net assets | | | 1.21% | 5 | | | 1.14% | | | | 1.11% | | | | 1.08% | | | | 1.12% | | | | 1.13% | |
Ratio of net investment income (loss) to average net assets | | | 2.50% | 5 | | | 0.89% | | | | 1.09% | | | | 1.06% | | | | 1.33% | | | | 0.93% | |
Portfolio turnover6 | | | 48.23% | 4 | | | 66.22% | | | | 10.23% | | | | 6.29% | | | | 9.61% | | | | 8.43% | |
| | |
| INSTITUTIONAL CLASS | | Six-Month
Period Ended
June 30, 20161 (unaudited) | | | Year Ended Dec. 31 | |
| | | 20151 | | | 20141 | | | 2013 | | | 2012 | | | 2011 | |
Net Asset Value, beginning of period | | | $18.39 | | | | $21.44 | | | | $22.81 | | | | $23.45 | | | | $21.49 | | | | $29.36 | |
INCOME (LOSS) FROM INVESTMENT OPERATIONS: | | | | | | | | | | | | | | | | | | | | | | | | |
Net investment income (loss)2 | | | 0.23 | | | | 0.25 | | | | 0.28 | | | | 0.26 | | | | 0.36 | | | | 0.26 | |
Net realized gain (loss) and unrealized appreciation/
depreciation on investments and foreign currency | | | (2.45 | ) | | | 0.27 | | | | (1.25 | ) | | | 1.36 | | | | 2.25 | | | | (5.73 | ) |
Total from investment operations | | | (2.22 | ) | | | 0.52 | | | | (0.97 | ) | | | 1.62 | | | | 2.61 | | | | (5.47 | ) |
LESS DISTRIBUTIONS FROM: | | | | | | | | | | | | | | | | | | | | | | | | |
Net investment income | | | — | | | | (0.24 | ) | | | (0.30 | ) | | | (0.31 | ) | | | (0.40 | ) | | | (0.34 | ) |
Net realized gains on investments | | | — | | | | (3.33 | ) | | | (0.10 | ) | | | (1.95 | ) | | | (0.25 | ) | | | (2.06 | ) |
Total distributions | | | — | | | | (3.57 | ) | | | (0.40 | ) | | | (2.26 | ) | | | (0.65 | ) | | | (2.40 | ) |
Paid-in capital from redemption fees (Note 4) | | | — | | | | — | 3 | | | — | 3 | | | — | 3 | | | — | 3 | | | — | 3 |
Net Asset Value, end of period | | | $16.17 | | | | $18.39 | | | | $21.44 | | | | $22.81 | | | | $23.45 | | | | $21.49 | |
TOTAL RETURN | | | (12.07% | )4 | | | 2.50% | | | | (4.22% | ) | | | 6.97% | | | | 12.22% | | | | (18.80% | ) |
| | | | | | |
RATIOS/SUPPLEMENTAL DATA | | | | | | | | | | | | | | | | | | | | | | | | |
Net assets, end of period (in 000’s) | | | $26,149 | | | | $24,276 | | | | $52,478 | | | | $117,678 | | | | $390,744 | | | | $288,277 | |
Ratio of expenses to average net assets | | | 1.09% | 5 | | | 0.99% | | | | 0.95% | | | | 0.91% | | | | 0.91% | | | | 0.96% | |
Ratio of net investment income (loss) to average net assets | | | 2.88% | 5 | | | 1.09% | | | | 1.27% | | | | 1.13% | | | | 1.58% | | | | 0.99% | |
Portfolio turnover6 | | | 48.23% | 4 | | | 66.22% | | | | 10.23% | | | | 6.29% | | | | 9.61% | | | | 8.43% | |
| 1 | Consolidated Financial Highlights. See Note 2-C. |
| 2 | Calculated using the average daily shares method. |
| 3 | Less than $0.01 per share. |
| 6 | The portfolio turnover rate is calculated on the Fund as a whole without distinguishing between classes of share issued. |
See accompanying notes to financial statements.
| | | | |
| matthewsasia.com | 800.789.ASIA | | | 129 | |
Financial Highlights (continued)
Matthews India Fund
The tables below set forth financial data for a share of beneficial interest outstanding throughout each period presented.
| | | | | | | | | | | | | | | | | | | | | | | | |
INVESTOR CLASS | | Six-Month
Period Ended
June 30, 2016 (unaudited) | | | Year Ended Dec. 31 | |
| | | 2015 | | | 2014 | | | 2013 | | | 2012 | | | 2011 | |
Net Asset Value, beginning of period | | | $26.43 | | | | $26.46 | | | | $16.28 | | | | $17.51 | | | | $13.59 | | | | $21.49 | |
INCOME (LOSS) FROM INVESTMENT OPERATIONS: | | | | | | | | | | | | | | | | | | | | | | | | |
Net investment income (loss)1 | | | 0.05 | | | | (0.05 | ) | | | 0.07 | | | | 0.08 | | | | 0.11 | | | | 0.11 | |
Net realized gain (loss) and unrealized appreciation/
depreciation on investments and foreign currency | | | 0.42 | | | | 0.26 | | | | 10.29 | | | | (1.13 | ) | | | 4.17 | | | | (7.96 | ) |
Total from investment operations | | | 0.47 | | | | 0.21 | | | | 10.36 | | | | (1.05 | ) | | | 4.28 | | | | (7.85 | ) |
LESS DISTRIBUTIONS FROM: | | | | | | | | | | | | | | | | | | | | | | | | |
Net investment income | | | — | | | | (0.03 | ) | | | (0.05 | ) | | | (0.18 | ) | | | (0.09 | ) | | | (0.07 | ) |
Net realized gains on investments | | | — | | | | (0.23 | ) | | | (0.14 | ) | | | (0.01 | ) | | | (0.27 | ) | | | — | |
Total distributions | | | — | | | | (0.26 | ) | | | (0.19 | ) | | | (0.19 | ) | | | (0.36 | ) | | | (0.07 | ) |
Paid-in capital from redemption fees (Note 4) | | | — | | | | 0.02 | | | | 0.01 | | | | 0.01 | | | | — | 2 | | | 0.02 | |
Net Asset Value, end of period | | | $26.90 | | | | $26.43 | | | | $26.46 | | | | $16.28 | | | | $17.51 | | | | $13.59 | |
TOTAL RETURN | | | 1.78% | 3 | | | 0.90% | | | | 63.71% | | | | (5.90% | ) | | | 31.54% | | | | (36.48% | ) |
| | | | | | |
RATIOS/SUPPLEMENTAL DATA | | | | | | | | | | | | | | | | | | | | | | | | |
Net assets, end of period (in 000’s) | | | $1,094,818 | | | | $1,151,948 | | | | $974,838 | | | | $427,861 | | | | $607,800 | | | | $559,337 | |
Ratio of expenses to average net assets | | | 1.13% | 4 | | | 1.11% | | | | 1.12% | | | | 1.13% | | | | 1.18% | | | | 1.18% | |
Ratio of net investment income (loss) to average net assets | | | 0.42% | 4 | | | (0.17% | ) | | | 0.32% | | | | 0.48% | | | | 0.65% | | | | 0.58% | |
Portfolio turnover5 | | | 5.58% | 3 | | | 9.51% | | | | 14.86% | | | | 8.70% | | | | 7.03% | | | | 3.51% | |
| | |
| INSTITUTIONAL CLASS | | Six-Month
Period Ended
June 30, 2016 (unaudited) | | | Year Ended Dec. 31 | |
| | | 2015 | | | 2014 | | | 2013 | | | 2012 | | | 2011 | |
Net Asset Value, beginning of period | | | $26.49 | | | | $26.49 | | | | $16.31 | | | | $17.53 | | | | $13.61 | | | | $21.48 | |
INCOME (LOSS) FROM INVESTMENT OPERATIONS: | | | | | | | | | | | | | | | | | | | | | | | | |
Net investment income (loss)1 | | | 0.08 | | | | 0.01 | | | | 0.09 | | | | 0.10 | | | | 0.14 | | | | 0.16 | |
Net realized gain (loss) and unrealized appreciation/
depreciation on investments and foreign currency | | | 0.42 | | | | 0.26 | | | | 10.29 | | | | (1.11 | ) | | | 4.17 | | | | (7.96 | ) |
Total from investment operations | | | 0.50 | | | | 0.27 | | | | 10.38 | | | | (1.01 | ) | | | 4.31 | | | | (7.80 | ) |
LESS DISTRIBUTIONS FROM: | | | | | | | | | | | | | | | | | | | | | | | | |
Net investment income | | | — | | | | (0.06 | ) | | | (0.08 | ) | | | (0.21 | ) | | | (0.12 | ) | | | (0.07 | ) |
Net realized gains on investments | | | — | | | | (0.23 | ) | | | (0.14 | ) | | | (0.01 | ) | | | (0.27 | ) | | | — | |
Total distributions | | | — | | | | (0.29 | ) | | | (0.22 | ) | | | (0.22 | ) | | | (0.39 | ) | | | (0.07 | ) |
Paid-in capital from redemption fees (Note 4) | | | — | | | | 0.02 | | | | 0.02 | | | | 0.01 | | | | — | 2 | | | — | 2 |
Net Asset Value, end of period | | | $26.99 | | | | $26.49 | | | | $26.49 | | | | $16.31 | | | | $17.53 | | | | $13.61 | |
TOTAL RETURN | | | 1.89% | 3 | | | 1.12% | | | | 63.80% | | | | (5.67% | ) | | | 31.74% | | | | (36.35% | ) |
| | | | | | |
RATIOS/SUPPLEMENTAL DATA | | | | | | | | | | | | | | | | | | | | | | | | |
Net assets, end of period (in 000’s) | | | $499,223 | | | | $353,879 | | | | $109,331 | | | | $3,234 | | | | $36,166 | | | | $26,920 | |
Ratio of expenses to average net assets | | | 0.90% | 4 | | | 0.90% | | | | 0.94% | | | | 0.95% | | | | 0.98% | | | | 0.99% | |
Ratio of net investment income (loss) to average net assets | | | 0.66% | 4 | | | 0.02% | | | | 0.38% | | | | 0.61% | | | | 0.87% | | | | 0.86% | |
Portfolio turnover5 | | | 5.58% | 3 | | | 9.51% | | | | 14.86% | | | | 8.70% | | | | 7.03% | | | | 3.51% | |
| 1 | Calculated using the average daily shares method. |
| 2 | Less than $0.01 per share. |
| 5 | The portfolio turnover rate is calculated on the Fund as a whole without distinguishing between classes of shares issued. |
See accompanying notes to financial statements.
Matthews Japan Fund
The tables below set forth financial data for a share of beneficial interest outstanding throughout each period presented.
| | | | | | | | | | | | | | | | | | | | | | | | |
| INVESTOR CLASS | | Six-Month Period Ended June 30, 2016 (unaudited) | | | Year Ended Dec. 31 | |
| | | 2015 | | | 2014 | | | 2013 | | | 2012 | | | 2011 | |
Net Asset Value, beginning of period | | | $18.97 | | | | $15.70 | | | | $16.20 | | | | $12.27 | | | | $11.34 | | | | $12.53 | |
INCOME (LOSS) FROM INVESTMENT OPERATIONS: | | | | | | | | | | | | | | | | | | | | | | | | |
Net investment income (loss)1 | | | 0.06 | | | | 0.04 | | | | 0.05 | | | | 0.03 | | | | 0.10 | | | | 0.07 | |
Net realized gain (loss) and unrealized appreciation/
depreciation on investments and foreign currency | | | 1.13 | | | | 3.23 | | | | (0.48 | ) | | | 4.12 | | | | 0.84 | | | | (1.06 | ) |
Total from investment operations | | | 1.19 | | | | 3.27 | | | | (0.43 | ) | | | 4.15 | | | | 0.94 | | | | (0.99 | ) |
LESS DISTRIBUTIONS FROM: | | | | | | | | | | | | | | | | | | | | | | | | |
Net investment income | | | — | | | | — | | | | (0.08 | ) | | | (0.24 | ) | | | (0.01 | ) | | | (0.22 | ) |
Total distributions | | | — | | | | — | | | | (0.08 | ) | | | (0.24 | ) | | | (0.01 | ) | | | (0.22 | ) |
Paid-in capital from redemption fees (Note 4) | | | — | | | | — | 2 | | | 0.01 | | | | 0.02 | | | | — | 2 | | | 0.02 | |
Net Asset Value, end of period | | | $20.16 | | | | $18.97 | | | | $15.70 | | | | $16.20 | | | | $12.27 | | | | $11.34 | |
TOTAL RETURN | | | 6.27% | 3 | | | 20.83% | | | | (2.60% | ) | | | 34.03% | | | | 8.32% | | | | (7.72% | ) |
| | | | | | |
RATIOS/SUPPLEMENTAL DATA | | | | | | | | | | | | | | | | | | | | | | | | |
Net assets, end of period (in 000’s) | | | $2,159,899 | | | | $1,330,743 | | | | $467,854 | | | | $312,988 | | | | $82,463 | | | | $101,369 | |
Ratio of expenses to average net assets | | | 0.92% | 4 | | | 0.99% | | | | 1.03% | | | | 1.10% | | | | 1.20% | | | | 1.22% | |
Ratio of net investment income (loss) to average net assets | | | 0.65% | 4 | | | 0.22% | | | | 0.32% | | | | 0.19% | | | | 0.81% | | | | 0.54% | |
Portfolio turnover5 | | | 16.41% | 3 | | | 24.19% | | | | 42.52% | | | | 22.72% | | | | 48.58% | | | | 34.94% | |
| | |
| INSTITUTIONAL CLASS | | Six-Month
Period Ended
June 30, 2016 (unaudited) | | | Year Ended Dec. 31 | |
| | | 2015 | | | 2014 | | | 2013 | | | 2012 | | | 2011 | |
Net Asset Value, beginning of period | | | $19.00 | | | | $15.71 | | | | $16.20 | | | | $12.26 | | | | $11.34 | | | | $12.53 | |
INCOME (LOSS) FROM INVESTMENT OPERATIONS: | | | | | | | | | | | | | | | | | | | | | | | | |
Net investment income (loss)1 | | | 0.07 | | | | 0.05 | | | | 0.09 | | | | 0.06 | | | | 0.12 | | | | 0.06 | |
Net realized gain (loss) and unrealized appreciation/
depreciation on investments and foreign currency | | | 1.13 | | | | 3.24 | | | | (0.50 | ) | | | 4.12 | | | | 0.84 | | | | (1.04 | ) |
Total from investment operations | | | 1.20 | | | | 3.29 | | | | (0.41 | ) | | | 4.18 | | | | 0.96 | | | | (0.98 | ) |
LESS DISTRIBUTIONS FROM: | | | | | | | | | | | | | | | | | | | | | | | | |
Net investment income | | | — | | | | — | | | | (0.09 | ) | | | (0.26 | ) | | | (0.04 | ) | | | (0.22 | ) |
Total distributions | | | — | | | | — | | | | (0.09 | ) | | | (0.26 | ) | | | (0.04 | ) | | | (0.22 | ) |
Paid-in capital from redemption fees (Note 4) | | | — | | | | — | 2 | | | 0.01 | | | | 0.02 | | | | — | 2 | | | 0.01 | |
Net Asset Value, end of period | | | $20.20 | | | | $19.00 | | | | $15.71 | | | | $16.20 | | | | $12.26 | | | | $11.34 | |
TOTAL RETURN | | | 6.32% | 3 | | | 20.94% | | | | (2.47% | ) | | | 34.27% | | | | 8.47% | | | | (7.72% | ) |
| | | | | | |
RATIOS/SUPPLEMENTAL DATA | | | | | | | | | | | | | | | | | | | | | | | | |
Net assets, end of period (in 000’s) | | | $1,203,098 | | | | $618,583 | | | | $154,750 | | | | $59,702 | | | | $22,233 | | | | $30,302 | |
Ratio of expenses to average net assets | | | 0.85% | 4 | | | 0.87% | | | | 0.90% | | | | 0.96% | | | | 1.04% | | | | 1.07% | |
Ratio of net investment income (loss) to average net assets | | | 0.78% | 4 | | | 0.28% | | | | 0.58% | | | | 0.41% | | | | 0.99% | | | | 0.46% | |
Portfolio turnover5 | | | 16.41% | 3 | | | 24.19% | | | | 42.52% | | | | 22.72% | | | | 48.58% | | | | 34.94% | |
| 1 | Calculated using the average daily shares method. |
| 2 | Less than $0.01 per share. |
| 5 | The portfolio turnover rate is calculated on the Fund as a whole without distinguishing between classes of shares issued. |
See accompanying notes to financial statements.
| | | | |
| matthewsasia.com | 800.789.ASIA | | | 131 | |
Financial Highlights (continued)
Matthews Korea Fund
The tables below set forth financial data for a share of beneficial interest outstanding throughout each period presented.
| | | | | | | | | | | | | | | | | | | | | | | | |
| INVESTOR CLASS | | Six-Month
Period Ended
June 30, 2016 (unaudited) | | | Year Ended Dec. 31 | |
| | | 2015 | | | 2014 | | | 2013 | | | 2012 | | | 2011 | |
Net Asset Value, beginning of period | | | $6.15 | | | | $5.65 | | | | $5.95 | | | | $5.64 | | | | $4.59 | | | | $5.14 | |
INCOME (LOSS) FROM INVESTMENT OPERATIONS: | | | | | | | | | | | | | | | | | | | | | | | | |
Net investment income (loss)1 | | | (0.01 | ) | | | 0.01 | | | | — | 2 | | | — | 2 | | | — | 2 | | | (0.01 | ) |
Net realized gain (loss) and unrealized appreciation/
depreciation on investments and foreign currency | | | (0.01 | ) | | | 0.83 | | | | (0.05 | ) | | | 0.57 | | | | 1.10 | | | | (0.31 | ) |
Total from investment operations | | | (0.02 | ) | | | 0.84 | | | | (0.05 | ) | | | 0.57 | | | | 1.10 | | | | (0.32 | ) |
LESS DISTRIBUTIONS FROM: | | | | | | | | | | | | | | | | | | | | | | | | |
Net investment income | | | — | | | | (0.01 | ) | | | — | | | | (0.02 | ) | | | — | | | | (0.01 | ) |
Net realized gains on investments | | | — | | | | (0.33 | ) | | | (0.25 | ) | | | (0.24 | ) | | | (0.05 | ) | | | (0.22 | ) |
Total distributions | | | — | | | | (0.34 | ) | | | (0.25 | ) | | | (0.26 | ) | | | (0.05 | ) | | | (0.23 | ) |
Paid-in capital from redemption fees (Note 4)2 | | | — | | | | — | | | | — | | | | — | | | | — | | | | — | |
Net Asset Value, end of period | | | $6.13 | | | | $6.15 | | | | $5.65 | | | | $5.95 | | | | $5.64 | | | | $4.59 | |
TOTAL RETURN | | | (0.33% | )3 | | | 15.16% | | | | (0.73% | ) | | | 10.11% | | | | 24.05% | | | | (6.45% | ) |
| | | | | | |
RATIOS/SUPPLEMENTAL DATA | | | | | | | | | | | | | | | | | | | | | | | | |
Net assets, end of period (in 000’s) | | | $133,614 | | | | $147,685 | | | | $127,774 | | | | $138,830 | | | | $141,247 | | | | $141,590 | |
Ratio of expenses to average net assets | | | 1.13% | 4 | | | 1.10% | | | | 1.11% | | | | 1.13% | | | | 1.16% | | | | 1.18% | |
Ratio of net investment income (loss) to average net assets | | | (0.50% | )4 | | | 0.18% | | | | 0.04% | | | | 0.02% | | | | 0.01% | | | | (0.18% | ) |
Portfolio turnover 5 | | | 15.25% | 3 | | | 20.36% | | | | 17.37% | | | | 46.20% | | | | 34.84% | | | | 30.13% | |
| | |
| INSTITUTIONAL CLASS | | Six-Month
Period Ended
June 30, 2016 (unaudited) | | | Year Ended Dec. 31 | |
| | | 2015 | | | 2014 | | | 2013 | | | 2012 | | | 2011 | |
Net Asset Value, beginning of period | | | $6.18 | | | | $5.68 | | | | $5.96 | | | | $5.67 | | | | $4.61 | | | | $5.14 | |
INCOME (LOSS) FROM INVESTMENT OPERATIONS: | | | | | | | | | | | | | | | | | | | | | | | | |
Net investment income (loss)1 | | | (0.01 | ) | | | 0.02 | | | | 0.05 | | | | — | 2 | | | — | 2 | | | 0.17 | |
Net realized gain (loss) and unrealized appreciation/
depreciation on investments and foreign currency | | | — | 2 | | | 0.83 | | | | (0.08 | ) | | | 0.56 | | | | 1.11 | | | | (0.47 | ) |
Total from investment operations | | | (0.01 | ) | | | 0.85 | | | | (0.03 | ) | | | 0.56 | | | | 1.11 | | | | (0.30 | ) |
LESS DISTRIBUTIONS FROM: | | | | | | | | | | | | | | | | | | | | | | | | |
Net investment income | | | — | | | | (0.02 | ) | | | — | | | | (0.03 | ) | | | — | | | | (0.01 | ) |
Net realized gains on investments | | | — | | | | (0.33 | ) | | | (0.25 | ) | | | (0.24 | ) | | | (0.05 | ) | | | (0.22 | ) |
Total distributions | | | — | | | | (0.35 | ) | | | (0.25 | ) | | | (0.27 | ) | | | (0.05 | ) | | | (0.23 | ) |
Paid-in capital from redemption fees (Note 4)2 | | | — | | | | — | | | | — | | | | — | | | | — | | | | — | |
Net Asset Value, end of period | | | $6.17 | | | | $6.18 | | | | $5.68 | | | | $5.96 | | | | $5.67 | | | | $4.61 | |
TOTAL RETURN | | | (0.16% | )3 | | | 15.27% | | | | (0.39% | ) | | | 9.87% | | | | 24.16% | | | | (6.05% | ) |
| | | | | | |
RATIOS/SUPPLEMENTAL DATA | | | | | | | | | | | | | | | | | | | | | | | | |
Net assets, end of period (in 000’s) | | | $30,256 | | | | $59,982 | | | | $91,431 | | | | $12,283 | | | | $8,597 | | | | $15,109 | |
Ratio of expenses to average net assets | | | 0.92% | 4 | | | 0.93% | | | | 0.93% | | | | 0.97% | | | | 1.00% | | | | 1.07% | |
Ratio of net investment income (loss) to average net assets | | | (0.31% | )4 | | | 0.28% | | | | 0.87% | | | | (0.03% | ) | | | (0.07% | ) | | | 3.37% | |
Portfolio turnover5 | | | 15.25% | 3 | | | 20.36% | | | | 17.37% | | | | 46.20% | | | | 34.84% | | | | 30.13% | |
| 1 | Calculated using the average daily shares method. |
| 2 | Less than $0.01 per share. |
| 5 | The portfolio turnover rate is calculated on the Fund as a whole without distinguishing between classes of share issued. |
See accompanying notes to financial statements.
Matthews Asia Small Companies Fund
The tables below set forth financial data for a share of beneficial interest outstanding throughout each period presented.
| | | | | | | | | | | | | | | | | | | | | | | | |
| INVESTOR CLASS | | Six-Month
Period Ended
June 30, 2016 (unaudited) | | | Year Ended Dec. 31 | |
| | | 2015 | | | 2014 | | | 2013 | | | 2012 | | | 2011 | |
Net Asset Value, beginning of period | | | $19.41 | | | | $21.46 | | | | $19.34 | | | | $18.13 | | | | $14.77 | | | | $21.16 | |
INCOME (LOSS) FROM INVESTMENT OPERATIONS: | | | | | | | | | | | | | | | | | | | | | | | | |
Net investment income (loss)1 | | | 0.03 | | | | 0.02 | | | | 0.09 | | | | 0.11 | | | | 0.17 | | | | 0.15 | |
Net realized gain (loss) and unrealized appreciation/
depreciation on investments and foreign currency | | | (0.16 | ) | | | (2.05 | ) | | | 2.11 | | | | 1.19 | | | | 3.36 | | | | (4.35 | ) |
Total from investment operations | | | (0.13 | ) | | | (2.03 | ) | | | 2.20 | | | | 1.30 | | | | 3.53 | | | | (4.20 | ) |
LESS DISTRIBUTIONS FROM: | | | | | | | | | | | | | | | | | | | | | | | | |
Net investment income | | | — | | | | (0.03 | ) | | | (0.08 | ) | | | (0.09 | ) | | | (0.09 | ) | | | (0.17 | ) |
Net realized gains on investments | | | — | | | | — | | | | — | | | | — | | | | (0.08 | ) | | | (2.04 | ) |
Total distributions | | | — | | | | (0.03 | ) | | | (0.08 | ) | | | (0.09 | ) | | | (0.17 | ) | | | (2.21 | ) |
Paid-in capital from redemption fees (Note 4) | | | — | 2 | | | 0.01 | | | | — | 2 | | | — | 2 | | | — | 2 | | | 0.02 | |
Net Asset Value, end of period | | | $19.28 | | | | $19.41 | | | | $21.46 | | | | $19.34 | | | | $18.13 | | | | $14.77 | |
TOTAL RETURN | | | (0.67% | )3 | | | (9.43% | ) | | | 11.39% | | | | 7.19% | | | | 23.92% | | | | (20.03% | ) |
| | | | | | |
RATIOS/SUPPLEMENTAL DATA | | | | | | | | | | | | | | | | | | | | | | | | |
Net assets, end of period (in 000’s) | | | $338,550 | | | | $387,747 | | | | $599,082 | | | | $407,352 | | | | $366,753 | | | | $258,944 | |
Ratio of expenses to average net assets before any reimbursement, waiver or recapture of expenses by Advisor and Administrator (Note 5) | | | 1.49% | 4 | | | 1.48% | | | | 1.47% | | | | 1.47% | | | | 1.50% | | | | 1.52% | |
Ratio of expenses to average net assets after any reimbursement, waiver or recapture of expenses by Advisor and Administrator | | | 1.48% | 4 | | | 1.47% | | | | 1.47% | | | | 1.47% | | | | 1.50% | | | | 1.52% | |
Ratio of net investment income (loss) to average net assets | | | 0.28% | 4 | | | 0.08% | | | | 0.44% | | | | 0.58% | | | | 1.06% | | | | 0.76% | |
Portfolio turnover | | | 19.85% | 3,5 | | | 48.29% | 5 | | | 21.70% | 5 | | | 37.01% | 5 | | | 27.95% | | | | 19.97% | |
| | | | | | | | | | | | | | | | |
| INSTITUTIONAL CLASS | | Six-Month
Period Ended
June 30, 2016 (unaudited) | | | Year Ended Dec. 31 | | | Period Ended Dec. 31, 20136 | |
| | | 2015 | | | 2014 | | |
Net Asset Value, beginning of period | | | $19.40 | | | | $21.46 | | | | $19.33 | | | | $19.44 | |
INCOME (LOSS) FROM INVESTMENT OPERATIONS: | | | | | | | | | | | | | | | | |
Net investment income (loss)1 | | | 0.05 | | | | 0.11 | | | | 0.15 | | | | 0.18 | |
Net realized gain (loss) and unrealized appreciation/
depreciation on investments and foreign currency | | | (0.16 | ) | | | (2.10 | ) | | | 2.10 | | | | (0.16 | ) |
Total from investment operations | | | (0.11 | ) | | | (1.99 | ) | | | 2.25 | | | | 0.02 | |
LESS DISTRIBUTIONS FROM: | | | | | | | | | | | | | | | | |
Net investment income | | | — | | | | (0.08 | ) | | | (0.12 | ) | | | (0.13 | ) |
Net realized gains on investments | | | — | | | | — | | | | — | | | | — | |
Total distributions | | | — | | | | (0.08 | ) | | | (0.12 | ) | | | (0.13 | ) |
Paid-in capital from redemption fees (Note 4) | | | — | 2 | | | 0.01 | | | | — | 2 | | | — | 2 |
Net Asset Value, end of period | | | $19.29 | | | | $19.40 | | | | $21.46 | | | | $19.33 | |
TOTAL RETURN | | | (0.57% | )3 | | | (9.23% | ) | | | 11.65% | | | | 0.13% | 3 |
| | | | |
RATIOS/SUPPLEMENTAL DATA | | | | | | | | | | | | | | | | |
Net assets, end of period (in 000’s) | | | $201,514 | | | | $222,168 | | | | $77,168 | | | | $44,769 | |
Ratio of expenses to average net assets before any reimbursement,
waiver or recapture of expenses by Advisor and Administrator
(Note 5) | | | 1.32% | 4 | | | 1.30% | | | | 1.27% | | | | 1.25% | 4 |
Ratio of expenses to average net assets after any reimbursement,
waiver or recapture of expenses by Advisor and Administrator | | | 1.25% | 4 | | | 1.26% | | | | 1.26% | | | | 1.25% | 4 |
Ratio of net investment income (loss) to average net assets | | | 0.53% | 4 | | | 0.53% | | | | 0.70% | | | | 1.39% | 4 |
Portfolio turnover5 | | | 19.85% | 3 | | | 48.29% | | | | 21.70% | | | | 37.01% | 3 |
| 1 | Calculated using the average daily shares method. |
| 2 | Less than $0.01 per share. |
| 5 | The portfolio turnover rate is calculated on the Fund as a whole without distinguishing between classes of shares issued. |
| 6 | Institutional Class commenced operations on April 30, 2013. |
See accompanying notes to financial statements.
| | | | |
| matthewsasia.com | 800.789.ASIA | | | 133 | |
Financial Highlights (continued)
Matthews China Small Companies Fund
The table below sets forth financial data for a share of beneficial interest outstanding throughout each period presented.
| | | | | | | | | | | | | | | | | | | | | | | | |
| INVESTOR CLASS | | Six-Month
Period Ended
June 30, 2016 (unaudited) | | | Year Ended Dec. 31 | | | Period Ended Dec. 31, 20111 | |
| | | 2015 | | | 2014 | | | 2013 | | | 2012 | | |
Net Asset Value, beginning of period | | | $8.79 | | | | $9.21 | | | | $9.89 | | | | $7.76 | | | | $7.04 | | | | $10.00 | |
INCOME (LOSS) FROM INVESTMENT OPERATIONS: | | | | | | | | | | | | | | | | | | | | | | | | |
Net investment income (loss)2 | | | 0.07 | | | | 0.08 | | | | 0.01 | | | | 0.02 | | | | 0.03 | | | | (0.02 | ) |
Net realized gain (loss) and unrealized appreciation/depreciation on investments and foreign currency | | | (0.59 | ) | | | 0.27 | | | | (0.33 | ) | | | 2.22 | | | | 0.68 | | | | (2.96 | ) |
Total from investment operations | | | (0.52 | ) | | | 0.35 | | | | (0.32 | ) | | | 2.24 | | | | 0.71 | | | | (2.98 | ) |
LESS DISTRIBUTIONS FROM: | | | | | | | | | | | | | | | | | | | | | | | | |
Net investment income | | | — | | | | (0.06 | ) | | | (0.02 | ) | | | (0.11 | ) | | | (0.02 | ) | | | (0.01 | ) |
Return of capital | | | — | | | | — | | | | (0.34 | ) | | | — | | | | — | | | | — | |
Net realized gains on investments | | | — | | | | (0.72 | ) | | | — | | | | — | | | | — | | | | — | |
Total distributions | | | — | | | | (0.78 | ) | | | (0.36 | ) | | | (0.11 | ) | | | (0.02 | ) | | | (0.01 | ) |
Paid-in capital from redemption fees (Note 4) | | | — | 3 | | | 0.01 | | | | — | 3 | | | — | 3 | | | 0.03 | | | | 0.03 | |
Net Asset Value, end of period | | | $8.27 | | | | $8.79 | | | | $9.21 | | | | $9.89 | | | | $7.76 | | | | $7.04 | |
TOTAL RETURN | | | (5.92% | )4 | | | 4.07% | | | | (3.33% | ) | | | 28.85% | | | | 10.53% | | | | (29.51% | )4 |
| | | | | | |
RATIOS/SUPPLEMENTAL DATA | | | | | | | | | | | | | | | | | | | | | | | | |
Net assets, end of period (in 000’s) | | | $18,431 | | | | $21,546 | | | | $22,068 | | | | $26,674 | | | | $10,266 | | | | $4,493 | |
Ratio of expenses to average net assets before any reimbursement, waiver or recapture of expenses by Advisor and Administrator (Note 5) | | | 2.01% | 5 | | | 2.10% | | | | 1.90% | | | | 2.04% | | | | 3.26% | | | | 5.32% | 5 |
Ratio of expenses to average net assets after any reimbursement,
waiver or recapture of expenses by Advisor and Administrator | | | 1.50% | 5 | | | 1.50% | | | | 1.67% | | | | 2.00% | | | | 2.00% | | | | 2.00% | 5 |
Ratio of net investment income (loss) to average net assets | | | 1.84% | 5 | | | 0.80% | | | | 0.14% | | | | 0.17% | | | | 0.40% | | | | (0.53% | )5 |
Portfolio turnover | | | 25.82% | 4 | | | 72.49% | | | | 32.42% | | | | 10.28% | | | | 34.01% | | | | 6.08% | 4 |
| 1 | Investor Class commenced operations on May 31, 2011. |
| 2 | Calculated using the average daily shares method. |
| 3 | Less than $0.01 per share. |
See accompanying notes to financial statements.
Notes to Financial Statements (unaudited)
Matthews Asia Funds (the “Trust”) is an open-end management investment company registered under the Investment Company Act of 1940, as amended (the “1940 Act”). The Trust currently issues eighteen separate series of shares (each a “Fund” and collectively, the “Funds”): Matthews Asia Strategic Income Fund, Matthews Asia Credit Opportunities Fund, Matthews Asian Growth and Income Fund, Matthews Asia Dividend Fund, Matthews China Dividend Fund, Matthews Asia Value Fund, Matthews Asia Focus Fund, Matthews Asia Growth Fund, Matthews Pacific Tiger Fund, Matthews Asia ESG Fund, Matthews Emerging Asia Fund, Matthews Asia Innovators Fund (formerly known as Matthews Asia Science and Technology Fund), Matthews China Fund, Matthews India Fund, Matthews Japan Fund, Matthews Korea Fund, Matthews Asia Small Companies Fund, and Matthews China Small Companies Fund. Each Fund except for Matthews China Small Companies Fund currently offers two classes of shares: Investor Class and Institutional Class. Matthews China Small Companies Fund currently offers only Investor Class shares. Each class of shares has identical voting, dividend, liquidation and other rights and the same terms and conditions, except each class may be subject to different class expenses as outlined in the relevant prospectus and each class has exclusive voting rights with respect to matters solely affecting such class.
| 2. | SIGNIFICANT ACCOUNTING POLICIES |
The following is a summary of significant accounting policies consistently followed by the Funds in preparation of their financial statements.
| A. | SECURITY VALUATION: The value of the Funds’ securities is based on market quotations for those securities, or on their fair value determined by the valuation policies approved by the Funds’ Board of Trustees (the “Board”). Market quotations and valuation information are provided by commercial pricing services or securities dealers that are independent of the Funds and Matthews International Capital Management, LLC (“Matthews”), in accordance with procedures established by the Funds’ Board. Foreign exchange-traded securities are valued as of the close of trading on the primary exchange on which they trade. Securities that trade in over-the-counter markets, including most debt securities (bonds), may be valued by other third-party vendors or by using indicative bid quotations from dealers or market makers, or other available market information. Market values for securities are determined based on quotations, market data or other information from the principal (or most advantageous) market on which the security is traded. Market quotations for equity securities used by the Funds include last reported sale prices, or, if such prices are not reported or available, bid and ask prices. Financial futures contracts traded on exchanges are valued at their settlement price. Foreign currency exchange contracts are valued at the mean between the bid and ask prices and are determined at the close of business on the New York Stock Exchange (“NYSE”). Interpolated values are derived when the settlement date of the contract is an interim date for which quotations are not available. The Funds may also utilize independent pricing services to assist them in determining a current market value for each security based on sources believed to be reliable. |
The Board has delegated the responsibility of making fair value determinations to the Funds’ Valuation Committee (the “Valuation Committee”) subject to the Funds’ pricing policies. When fair value pricing is employed, the prices of securities used by a Fund to calculate its Net Asset Value (“NAV”) may differ from any quoted or published prices for the same securities for that day. All fair value determinations are made subject to the Board’s oversight. Events affecting the value of foreign investments may occur between the time at which they are determined and when the Funds calculate their NAV, which is normally the close of trading on the NYSE. If such events render market quotations unreliable, and the impact of such events can be reasonably determined, the investments will be valued at their fair value in accordance with pricing policies. The fair value of a security held by the Funds may be determined using the services of third-party pricing services to assist in this process.
The books and records of the Funds are maintained in U.S. dollars. Transactions, portfolio securities, and assets and liabilities denominated in a foreign currency are translated and recorded in U.S. dollars at the prevailing exchange rate as of the close of trading on the NYSE. Translation gains or losses resulting from changes in the exchange rate during the reporting period and realized gains and losses on the settlement of foreign currency transactions are reported in the results of operations for the current period. The Funds do not isolate that portion of gains and losses on investments in equity securities that is due to changes in foreign exchange rate from that which is due to changes in market prices of securities.
Foreign securities held by the Funds may be traded on days and at times when the NYSE is closed. Accordingly, the NAV of the Funds may be significantly affected on days when shareholders have no access to the Funds.
| B. | FAIR VALUE MEASUREMENTS: In accordance with the guidance on fair value measurements and disclosures under generally accepted accounting principles in the United States (“U.S. GAAP”), the Funds disclose the fair value of their investments and derivative financial instruments in a hierarchy that prioritizes the inputs to valuation techniques used to measure the fair value. The hierarchy gives the highest priority to valuations based upon unadjusted quoted prices in active markets for identical assets or liabilities (Level 1 measurement) and the lowest priority to valuations based upon unobservable inputs that are significant to the valuation (Level 3 measurements). Various inputs are used in determining the fair value of investments and derivative financial instruments, which are as follows: |
Level 1: Quoted prices in active markets for identical securities.
Level 2: Other significant observable inputs (including quoted prices for similar securities, interest rates, prepayment speeds, credit risk, etc.).
Level 3: Significant unobservable inputs (including the Fund’s own assumptions in determining the fair value of investments and derivative financial instruments).
Level 3 securities consisted of equities that, as of June 30, 2016, were suspended from trading. As described in Note 2-A, these securities are valued based on their fair value as determined under the direction of the Board. The significant unobservable inputs, the methodology used for valuing such securities, and the characterization of such securities as Level 3 securities are not necessarily an indication of liquidity, or the risk associated with investing in these securities. A significant change in the unobservable inputs could result in a significantly lower or higher value in such Level 3 securities and could impact overall Fund performance. Level 2 equity securities consist primarily of securities that have been fair valued by third-party pricing services (see Note 2-A).
| | | | |
| matthewsasia.com | 800.789.ASIA | | | 135 | |
Notes to Financial Statements (unaudited) (continued)
The summary of inputs used to determine the fair valuation of the Fund’s investments as of June 30, 2016 is as follows:
| | | | | | | | | | | | | | | | | | | | | | | | | | | | |
| | | Matthews Asia
Strategic
Income Fund | | | Matthews Asia
Credit Opportunities
Fund | | | Matthews Asian
Growth and
Income Fund | | | Matthews Asia
Dividend Fund | | | Matthews Asia
Value Fund | | | Matthews Asia
Focus Fund | | | Matthews Asia
Growth Fund | |
| Assets: | | | | | | | | | | | | | | | | | | | | | | | | | | | | |
| Investments: | | | | | | | | | | | | | | | | | | | | | | | | | | | | |
Level 1: Quoted Prices | | | | | | | | | | | | | | | | | | | | | | | | | | | | |
Australia | | | $— | | | | $— | | | | $— | | | | $8,621,076 | | | | $— | | | | $— | | | | $— | |
China/Hong Kong | | | — | | | | — | | | | 166,447,355 | | | | 367,476,534 | | | | 58,927 | | | | 523,533 | | | | 45,700,155 | |
Indonesia | | | — | | | | — | | | | 55,719,636 | | | | 106,077,831 | | | | — | | | | — | | | | — | |
Israel | | | — | | | | — | | | | — | | | | — | | | | 29,120 | | | | — | | | | — | |
Malaysia | | | — | | | | — | | | | 45,731,286 | | | | — | | | | — | | | | — | | | | — | |
Singapore | | | — | | | | — | | | | — | | | | — | | | | 19,472 | | | | — | | | | — | |
Taiwan | | | — | | | | — | | | | 99,861,136 | | | | 200,094,992 | | | | — | | | | — | | | | — | |
United States | | | — | | | | — | | | | 51,178,362 | | | | — | | | | 42,720 | | | | 791,174 | | | | — | |
Level 2: Other Significant Observable Inputs | | | | | | | | | | | | | | | | | | | | | | | | | | | | |
Foreign Government Obligationsa | | | 15,274,873 | | | | 1,934,091 | | | | — | | | | — | | | | — | | | | — | | | | — | |
Non-Convertible Corporate Bondsa | | | 35,574,783 | | | | 7,504,271 | | | | — | | | | — | | | | — | | | | — | | | | — | |
Convertible Corporate Bondsa | | | 10,746,914 | | | | 2,293,065 | | | | 225,225,530 | | | | — | | | | — | | | | — | | | | — | |
Common Equities: | | | | | | | | | | | | | | | | | | | | | | | | | | | | |
Australia | | | — | | | | — | | | | 84,503,888 | | | | 109,467,969 | | | | — | | | | 282,998 | | | | 27,841,101 | |
Bangladesh | | | — | | | | — | | | | — | | | | — | | | | — | | | | — | | | | 12,679,036 | |
China/Hong Kong | | | — | | | | — | | | | 625,392,148 | | | | 1,040,867,034 | | | | 451,663 | | | | 3,393,105 | | | | 27,812,385 | |
India | | | — | | | | — | | | | — | | | | 118,998,163 | | | | — | | | | 346,411 | | | | 81,297,331 | |
Indonesia | | | — | | | | — | | | | 24,841,620 | | | | 147,021,509 | | | | — | | | | 481,545 | | | | 84,311,888 | |
Japan | | | — | | | | — | | | | 239,320,585 | | | | 1,457,965,767 | | | | 182,791 | | | | 362,720 | | | | 284,330,555 | |
Luxembourg | | | — | | | | — | | | | — | | | | 75,737,977 | | | | — | | | | — | | | | — | |
Malaysia | | | — | | | | — | | | | 142,709,266 | | | | — | | | | 56,922 | | | | 951,709 | | | | 6,038,837 | |
New Zealand | | | — | | | | — | | | | 68,916,114 | | | | 2,279,286 | | | | — | | | | — | | | | — | |
Norway | | | — | | | | — | | | | 44,188,258 | | | | — | | | | — | | | | — | | | | — | |
Pakistan | | | — | | | | — | | | | — | | | | — | | | | — | | | | — | | | | 7,561,765 | |
Philippines | | | — | | | | — | | | | 37,533,918 | | | | 73,183,811 | | | | — | | | | — | | | | 36,154,912 | |
Singapore | | | — | | | | — | | | | 438,940,259 | | | | 220,404,874 | | | | 119,808 | | | | 1,169,029 | | | | — | |
South Korea | | | — | | | | — | | | | 243,138,223 | | | | 276,153,041 | | | | 388,164 | | | | 1,020,098 | | | | 7,717,395 | |
Sri Lanka | | | — | | | | — | | | | — | | | | — | | | | — | | | | — | | | | 19,229,074 | |
Switzerland | | | — | | | | — | | | | — | | | | — | | | | 38,867 | | | | 280,557 | | | | — | |
Taiwan | | | — | | | | — | | | | 56,858,807 | | | | 83,509,660 | | | | 81,505 | | | | 398,136 | | | | 6,212,778 | |
Thailand | | | — | | | | — | | | | 47,304,465 | | | | 109,391,138 | | | | 17,378 | | | | 483,542 | | | | 7,266,624 | |
United Kingdom | | | — | | | | — | | | | — | | | | — | | | | 35,554 | | | | — | | | | — | |
Vietnam | | | — | | | | — | | | | 43,125,752 | | | | 86,529,408 | | | | — | | | | — | | | | 13,688,996 | |
Preferred Equities: | | | | | | | | | | | | | | | | | | | | | | | | | | | | |
South Korea | | | — | | | | — | | | | 112,109,167 | | | | 131,951,222 | | | | 199,055 | | | | — | | | | — | |
Total Market Value of Investments | | | $61,596,570 | | | | $11,731,427 | | | | $2,853,045,775 | | | | $4,615,731,292 | | | | $1,721,946 | | | | $10,484,557 | | | | $667,842,832 | |
| a | Industry, countries, or security types are disclosed on the Schedule of Investments. |
| | | | | | |
| | | | | Matthews Asia
Strategic Income
Fund | |
Derivative Financial Instruments1 | | | | | | |
Assets | | | | | | |
Level 2: | | Other Significant Observable Inputs | | | | |
| | Foreign Currency Exchange Contracts | | | $173,128 | |
| | | | | | |
Total Market Value of Derivative Financial Instruments | | | $173,128 | |
| 1 | Derivative financial instruments are foreign currency exchange contracts. Foreign currency exchange contracts are valued at the unrealized appreciation/depreciation on the instrument. |
| | | | | | | | | | | | | | | | | | | | | | | | |
| | | Matthews China
Dividend Fund | | | Matthews China Fund | | | Matthews India Fund | | | Matthews
Japan Fund | | | Matthews
Korea Fund | | | Matthews China Small
Companies Fund | |
| Assets: | | | | | | | | | | | | | | | | | | | | | | | | |
| Investments: | | | | | | | | | | | | | | | | | | | | | | | | |
Level 1: Quoted Prices | | | | | | | | | | | | | | | | | | | | | | | | |
Common Equities: | | | | | | | | | | | | | | | | | | | | | | | | |
Consumer Discretionary | | | $9,648,826 | | | | $36,068,015 | | | | $7,957,908 | | | | $— | | | | $— | | | | $1,129,486 | |
Financials | | | — | | | | — | | | | 13,729,275 | | | | — | | | | — | | | | — | |
Health Care | | | — | | | | — | | | | 73,178,560 | | | | — | | | | — | | | | 659,184 | |
Industrials | | | 341,424 | | | | — | | | | — | | | | — | | | | — | | | | 1,128,205 | |
Information Technology | | | 6,822,977 | | | | 56,194,998 | | | | 69,500,808 | | | | — | | | | — | | | | — | |
Telecommunication Services | | | 5,461,707 | | | | — | | | | — | | | | — | | | | 6,576,224 | | | | — | |
Level 2: Other Significant Observable Inputs | | | | | | | | | | | | | | | | | | | | | | | | |
Common Equities: | | | | | | | | | | | | | | | | | | | | | | | | |
Consumer Discretionary | | | 24,351,533 | | | | 20,222,840 | | | | 101,397,447 | | | | 649,431,516 | | | | 31,268,362 | | | | 4,284,332 | |
Consumer Staples | | | 14,754,286 | | | | 11,160,356 | | | | 326,540,094 | | | | 581,438,322 | | | | 21,570,544 | | | | 443,877 | |
Energy | | | 1,759,467 | | | | 27,855,766 | | | | — | | | | — | | | | 3,547,281 | | | | — | |
Financials | | | 31,060,035 | | | | 206,607,322 | | | | 406,931,069 | | | | 477,848,979 | | | | 26,025,046 | | | | 2,090,220 | |
Health Care | | | 7,204,802 | | | | 13,135,084 | | | | 143,301,430 | | | | 405,348,652 | | | | 8,693,557 | | | | 1,789,612 | |
Industrials | | | 24,533,011 | | | | 52,764,367 | | | | 150,472,317 | | | | 731,784,408 | | | | 5,176,430 | | | | 4,226,303 | |
Information Technology | | | 8,410,414 | | | | 85,943,065 | | | | 178,308,073 | | | | 350,295,976 | | | | 18,855,973 | | | | 1,522,619 | |
Materials | | | 7,264,177 | | | | 13,012,883 | | | | 71,723,065 | | | | 50,705,492 | | | | 4,873,772 | | | | — | |
Telecommunication Services | | | 9,808,786 | | | | 27,683,900 | | | | — | | | | — | | | | — | | | | — | |
Utilities | | | 3,298,974 | | | | 10,536,062 | | | | — | | | | — | | | | — | | | | — | |
Rights: | | | | | | | | | | | | | | | | | | | | | | | | |
Consumer Discretionary | | | 1,135 | | | | — | | | | — | | | | — | | | | — | | | | — | |
Preferred Equities: | | | | | | | | | | | | | | | | | | | | | | | | |
Consumer Discretionary | | | — | | | | — | | | | — | | | | — | | | | 3,499,209 | | | | — | |
Consumer Staples | | | — | | | | — | | | | — | | | | — | | | | 15,476,526 | | | | — | |
Energy | | | — | | | | — | | | | — | | | | — | | | | 2,260,043 | | | | — | |
Financials | | | — | | | | — | | | | — | | | | — | | | | 5,528,179 | | | | — | |
Information Technology | | | — | | | | — | | | | — | | | | — | | | | 10,731,683 | | | | — | |
Materials | | | — | | | | — | | | | — | | | | — | | | | 4,448,246 | | | | — | |
Level 3: Significant Unobservable Inputs | | | | | | | | | | | | | | | | | | | | | | | | |
Common Equities: | | | | | | | | | | | | | | | | | | | | | | | | |
Consumer Discretionary | | | — | | | | 11,542,467 | | | | — | | | | — | | | | — | | | | — | |
Information Technology | | | — | | | | — | | | | — | | | | — | | | | — | | | | 251 | |
Total Market Value of Investments | | | $154,721,554 | | | | $572,727,125 | | | | $1,543,040,046 | | | | $3,246,853,345 | | | | $168,531,075 | | | | $17,274,089 | |
| | | | |
| matthewsasia.com | 800.789.ASIA | | | 137 | |
Notes to Financial Statements (unaudited) (continued)
| | | | | | | | | | | | | | | | | | | | |
| | | Matthews Pacific Tiger Fund | | | Matthews
Asia ESG Fund | | | Matthews
Emerging Asia
Fund | | | Matthews Asia
Innovators Fund* | | | Matthews Asia Small Companies Fund | |
| Assets: | | | | | | | | | | | | | | | | | | | | |
| Investments: | | | | | | | | | | | | | | | | | | | | |
Level 1: Quoted Prices | | | | | | | | | | | | | | | | | | | | |
Common Equities: | | | | | | | | | | | | | | | | | | | | |
Bangladesh | | | $— | | | | $81,377 | | | | $5,355,657 | | | | $— | | | | $— | |
China/Hong Kong | | | 524,831,253 | | | | 203,808 | | | | — | | | | 22,649,319 | | | | 31,099,388 | |
India | | | — | | | | 85,134 | | | | 626,915 | | | | — | | | | — | |
Indonesia | | | 22,375,742 | | | | — | | | | 2,572,985 | | | | 2,452,254 | | | | 25,598,164 | |
Japan | | | — | | | | 108,323 | | | | — | | | | — | | | | — | |
Malaysia | | | 96,902,551 | | | | — | | | | — | | | | — | | | | — | |
Pakistan | | | — | | | | 114,773 | | | | 3,246,059 | | | | — | | | | — | |
Philippines | | | — | | | | — | | | | — | | | | — | | | | 8,183,629 | |
Sri Lanka | | | — | | | | 157,380 | | | | 310,244 | | | | — | | | | — | |
Thailand | | | — | | | | — | | | | — | | | | — | | | | 6,363,073 | |
United States | | | 83,433,024 | | | | — | | | | — | | | | 2,661,660 | | | | — | |
Vietnam | | | — | | | | — | | | | 16,970,785 | | | | — | | | | 4,599,072 | |
Warrants: | | | | | | | | | | | | | | | | | | | | |
Malaysia | | | 4,680,880 | | | | — | | | | — | | | | — | | | | — | |
Level 2: Other Significant Observable Inputs | | | | | | | | | | | | | | | | | | | | |
Common Equities: | | | | | | | | | | | | | | | | | | | | |
Australia | | | — | | | | 61,656 | | | | 1,265,736 | | | | — | | | | — | |
Bangladesh | | | — | | | | 70,751 | | | | 16,211,526 | | | | — | | | | — | |
China/Hong Kong | | | 1,491,754,224 | | | | 1,440,332 | | | | 8,615,956 | | | | 20,952,257 | | | | 114,005,067 | |
India | | | 1,394,825,830 | | | | 1,201,443 | | | | 14,840,930 | | | | 13,601,259 | | | | 72,845,393 | |
Indonesia | | | 446,762,735 | | | | 226,855 | | | | 10,461,226 | | | | 10,118,882 | | | | 7,658,061 | |
Japan | | | — | | | | 665,562 | | | | — | | | | — | | | | — | |
Luxembourg | | | — | | | | 175,639 | | | | — | | | | — | | | | — | |
Malaysia | | | 169,252,729 | | | | — | | | | — | | | | — | | | | 22,978,645 | |
Pakistan | | | — | | | | 161,331 | | | | 24,726,571 | | | | — | | | | — | |
Philippines | | | 216,018,353 | | | | 405,749 | | | | 6,255,466 | | | | 2,047,566 | | | | 10,633,839 | |
Singapore | | | 15,765,687 | | | | 416,508 | | | | 2,304,353 | | | | 8,233,292 | | | | 35,487,868 | |
South Korea | | | 1,048,318,333 | | | | 661,237 | | | | — | | | | 21,182,090 | | | | 73,148,435 | |
Sri Lanka | | | — | | | | — | | | | 10,791,276 | | | | — | | | | — | |
Switzerland | | | 179,364,422 | | | | — | | | | — | | | | — | | | | — | |
Taiwan | | | 426,898,918 | | | | 1,112,336 | | | | — | | | | 13,746,751 | | | | 79,914,600 | |
Thailand | | | 392,184,747 | | | | 231,188 | | | | 1,713,439 | | | | 5,181,022 | | | | 29,798,059 | |
Vietnam | | | 176,210,878 | | | | — | | | | 14,324,092 | | | | 2074606 | | | | — | |
Rights: | | | | | | | | | | | | | | | | | | | | |
Taiwan | | | — | | | | — | | | | — | | | | 12,921 | | | | — | |
Preferred Equities: | | | | | | | | | | | | | | | | | | | | |
South Korea | | | — | | | | — | | | | — | | | | 15,293,436 | | | | — | |
Level 3: Significant Unobservable Inputs | | | | | | | | | | | | | | | | | | | | |
Common Equities: | | | | | | | | | | | | | | | | | | | | |
China/Hong Kong | | | 4,674,302 | | | | — | | | | — | | | | — | | | | — | |
Pakistan | | | — | | | | — | | | | 272,577 | | | | — | | | | — | |
Total Market Value of Investments | | | $6,694,254,608 | | | | $7,581,382 | | | | $140,865,793 | | | | $140,207,315 | | | | $522,313,293 | |
| * | The Fund’s name changed from Matthews Asia Science and Technology Fund to Matthews Asia Innovators Fund on April 29, 2016. |
Foreign securities that are valued based on market quotations are categorized as Level 1 in the fair value hierarchy (see Note 2-B). Certain foreign securities may be fair valued by external pricing services when the Funds determine that events affecting the value of foreign securities which occur between the time at which they are determined and the close of trading on the NYSE render market quotations unreliable. Such fair valuations are typically categorized as Level 2 in the fair value hierarchy. The Funds’ policy is to recognize transfers in and transfers out as of the beginning of the reporting period. At June 30, 2016, the Funds utilized third party pricing services to fair value certain securities, some of which were different than the securities which had been valued by third party pricing services at December 31, 2015. As a result, certain securities held by the Funds were transferred from Level 2 into Level 1 and certain securities held by the Funds were transferred from Level 1 to Level 2 with beginning of period values as follows:
| | | | | | | | |
| | | Transfer to Level 1
from Level 2 | | | Transfer to Level 2
from Level 1 | |
| Matthews Asia Growth and Income Fund | | | $47,042,983 | | | | $— | |
| Matthews Asia Dividend Fund | | | 118,275,877 | | | | 32,808,738 | |
| Matthews China Dividend Fund | | | 3,933,589 | | | | — | |
| Matthews Asia Value Fund | | | — | | | | 40,811 | |
| Matthews Asia Growth Fund | | | — | | | | 43,943,254 | |
| Matthews Pacific Tiger Fund | | | 17,119,436 | | | | — | |
| Matthews Asia ESG Fund | | | 154,619 | | | | 261,575 | |
| Matthews Emerging Asia Fund | | | 6,628,747 | | | | 27,231,051 | |
| Matthews India Fund | | | — | | | | 37,587,012 | |
| Matthews Asia Small Companies Fund | | | 19,601,445 | | | | 25,959,102 | |
| Matthews China Small Companies Fund | | | 584,078 | | | | 488,609 | |
A reconciliation of Level 3 investments for which significant unobservable inputs were used to determine value are as follows:
| | | | | | | | | | | | | | | | |
| | | Matthews Pacific
Tiger Fund | | | Matthews Emerging Asia Fund | | | Matthews China Fund | | | Matthews China Small Companies
Fund | |
| | | Common Equities — China/Hong Kong | | | Common Equities —
Pakistan | | | Common Equities —
Financials | | | Common Equities —
Information Technology | |
| Balance as of 12/31/15 (market value) | | | $82,848,600 | | | | $— | | | | $20,510,781 | | | | $7,548 | |
| | | | |
| Accrued discounts/premiums | | | — | | | | — | | | | — | | | | — | |
| | | | |
| Realized gain/(loss) | | | — | | | | — | | | | 4,977,110 | | | | — | |
| | | | |
| Change in unrealized (depreciation) | | | 1,115 | | | | 25,377 | | | | (1,560,469 | ) | | | (7,297 | ) |
| | | | |
| Purchases | | | 4,673,187 | | | | 247,200 | | | | — | | | | — | |
| | | | |
| Sales | | | — | | | | — | | | | (25,487,891 | ) | | | — | |
| | | | |
| Transfers in to Level 3* | | | — | | | | — | | | | 13,102,936 | | | | — | |
| | | | |
| Transfers out of Level 3* | | | (82,848,600 | ) | | | — | | | | — | | | | — | |
| Balance as of 6/30/16 (market value) | | | $4,674,302 | | | | $272,577 | | | | $11,542,467 | | | | $251 | |
| Net change in unrealized appreciation/depreciation on Level 3 investments held as of 6/30/16** | | | $1,115 | | | | $25,377 | | | | ($1,560,469 | ) | | | ($7,297 | ) |
| * | The Fund’s policy is to recognize transfers in and transfers out as of the beginning of the reporting period. |
| ** | Included in the related amounts on the Statements of Operations. |
Certain foreign securities, for which market quotations are not readily available, may be fair valued and classified as either Level 2 or Level 3. When the underlying inputs include significant observable inputs obtained from sources independent of the Funds, the securities are classified as Level 2. These inputs include evaluated prices from the Funds’ pricing vendors, day-on-day price changes, primary and ancillary pricing sources, and other available independent market indicators of value. When the underlying inputs include significant unobservable inputs and reflect assumptions of market participants, the securities are classified as Level 3. As of June 30, 2016, the Funds that previously used quoted prices or observable inputs now also utilize significant unobservable inputs for certain securities that were suspended from trading. As a result, certain securities held by the Funds that were previously classified as Level 1 or Level 2 was transferred to Level 3. Certain securities held by the Funds that were suspended from trading and classified as Level 3 on December 31, 2015 subsequently resumed trading and were transferred from Level 3 to Level 1, Level 2 or were sold.
| | | | |
| matthewsasia.com | 800.789.ASIA | | | 139 | |
Notes to Financial Statements (unaudited) (continued)
The following table summarizes the valuation techniques used and unobservable inputs developed by the Valuation Committee to determine the fair value of certain, material Level 3 investments:
| | | | | | | | | | | | |
| | | Value | | | Valuation
Technique | | Unobservable
Input1 | | Range of
Unobservable
Inputs | |
| Matthews China Fund Assets: | | | | | | | | | | | | |
Common Equity | | | $11,542,467 | | | Last Price2 Multiplied by Proxy factor3 | | Proxy factor3 | | | Less than 10% | |
| 1 | Increase in unobservable input may result in a significant increase to value, while a decrease in unobservable input may result in a significant decrease to value. |
| 2 | Last Price could include closing price, last reported sales price, or last fair valued price as described in Note 2-A. |
| 3 | Proxy factor considers movement of the Shenzhen Stock Exchange Composite Index. |
| C. | BASIS OF CONSOLIDATION: The accompanying consolidated financial statements of Matthews China Fund and Matthews Asia Dividend Fund (the “Investing Funds”) includes the accounts of the Matthews CF-U Series and Matthews ADF-U Series (the “U Series Funds”), respectively. The U Series Funds are series of Matthews A Share Selections Fund, LLC, a Delaware limited liability company registered under the 1940 Act. All of the interests offered by U Series Funds are exclusively owned by the Investing Funds. The U Series Funds primarily invest in the stocks of Chinese companies listed on Mainland China Stock Exchanges, and traded and denominated in the currency of China, the Renminbi. To allow U Series Funds to invest in China A Shares Matthews has applied for and received a license from the China Securities Regulatory Commission as a Qualified Foreign Institutional Investor (“QFII”) and has been allocated by the State Administration of Foreign Exchange of China an initial quota of $100 million in June 2014, and an additional quota of $440 million in July 2015, representing the equivalent value in Renminbi of China A Shares that the Funds may purchase. Access to the quota will be subject to Matthews’ trade allocation procedures and access allocation procedures. The U Series Funds are subject to the same investment policies and restrictions that apply to Investing Funds. The net assets of Matthews CF-U Series and Matthews ADF-U Series at June 30, 2016, were $37,757,678 and $62,419,401, respectively. Intercompany accounts and transactions, if any, have been eliminated in the consolidation process. The U Series Funds are intended to be disregarded entities for the tax purposes. Therefore, no federal tax provision is required. Consolidated financial statements include expenses that are accrued for and paid by the Investing Funds. These include on-going operational costs as well as costs in connection with the launching of the U Series Funds (see offering cost, note 2-E). |
As of April 2015, certain Funds began investing in China A Shares via the Shanghai-Hong Kong Stock Connect, a securities trading and clearing linked program developed by the Hong Kong Exchanges and Clearing Limited, Shanghai Stock Exchange and China Securities Depository and Clearing Corporation Limited, with an aim to achieve mutual stock market access between mainland China and Hong Kong.
| D. | RISKS ASSOCIATED WITH NON-U.S. COMPANIES: Investments by the Funds in the securities of non-U.S. companies may involve investment risks not typically associated with investments in U.S. issuers. These risks include possible political, economic, social and religious instability, inadequate investor protection; changes in laws or regulations of countries within the Asia Pacific region (including both in countries where you invest, as well as in the broader region); international relations with other nations; natural disasters; corruption; and military activity. Foreign securities may be subject to greater fluctuations in price than securities of domestic corporations or the U.S. government. Foreign investing may also include the risk of expropriation or confiscatory taxation, limitation on the removal of funds or other assets, currency crises and exchange controls, the imposition of foreign withholding tax on the interest income payable on such instruments, the possible seizure or nationalization of foreign deposits or assets, or the adoption of other foreign government restrictions that might adversely affect the foreign securities held by the Funds. Additionally, Asia Pacific countries may utilize formal or informal currency exchange controls or “capital controls” that may limit the ability to repatriate investments or income or adversely affect the value of portfolio investments. The economies of many Asia Pacific countries differ from the economies of more developed countries in many respects, such as their rate of growth, inflation, capital reinvestment, resource self-sufficiency and dependence on other economies, financial system stability, the national balance of payments position and sensitivity to changes in global trade. Certain Asia Pacific countries are highly dependent upon and may be affected by developments in the economies of other countries. Non-U.S. companies are subject to different accounting, auditing, and financial reporting standards, practices, and requirements than U.S. companies. There is generally less government regulation of stock exchanges, brokers, and listed companies abroad than in the United States, which may result in less transparency with respect to a company’s operations, and make obtaining information about them more difficult (or such information may be unavailable). |
Foreign stock markets may not be as developed or efficient as those in the United States, and the absence of negotiated brokerage commissions in certain countries may result in higher brokerage fees. The time between the trade and settlement dates of securities transactions on foreign exchanges ranges from one day to four weeks or longer and may result in higher custody charges. Custodial arrangements may be less well developed than in the United States. Foreign securities are generally denominated and pay distributions in foreign currencies, exposing the Funds to changes in foreign currency exchange rates. Investing in any country in the Asia Pacific region will also entail risks specific and unique to that country, and these risks can be significant and change rapidly.
Changes in interest rates in each of the countries in which the Funds may invest, as well as interest rates in more-developed countries, may cause a decline in the market value of an investment. Generally, fixed income securities will decrease in value when interest rates rise and can be expected to rise in value when interest rates decline. As interest rates decline, debt issuers may repay or refinance their loans or obligations earlier than anticipated. The issuers of fixed income securities may, therefore, repay principal in advance. This would force the Funds to reinvest the proceeds from the principal prepayments at lower rates, which reduces the Funds’ income.
In February 2016, the State Administration of Foreign Exchange (“SAFE”) of China announced that all open-ended funds, such as the Matthews A Share Selections Fund, LLC, may repatriate any investment quota (including the proceeds of such investment quota) on a daily basis. Previously, repatriation by a QFII was limited to first a monthly, then a weekly, basis. As a result of this restriction, the Company sought and has been granted by the U.S. Securities and Exchange Commission an exemption (the “Exemptive Order”) from the provisions of Section 22(e) of the 1940 Act and Rule 22c-1 thereunder to the extent necessary to permit the Company to operate as an “extended payment fund.” As extended payment funds, the U Series Funds (see Note 2-C) will only redeem Interests on a periodic basis, which, pursuant to the Exemptive Order, shall be no less frequent than on one day each month.
| E. | OFFERING COSTS: Offering costs are amortized on a straight-line basis over one year from each Fund’s respective commencement of operations. In the event that any of the initial shares are redeemed during the period of amortization of the Fund’s offering costs, the redemption proceeds will be reduced by any such unamortized offering costs in the same proportion as the number of shares being redeemed bears to the number of those shares outstanding at the time of redemption. |
| F. | DISTRIBUTIONS TO SHAREHOLDERS: It is the policy of Matthews Asian Growth and Income Fund and Matthews China Dividend Fund to distribute net investment income on a semi-annual basis and capital gains, if any, annually. It is the policy of Matthews Asia Dividend Fund, Matthews Asia Strategic Income Fund and Matthews Asia Credit Opportunities Fund to distribute net investment income on a quarterly basis and capital gains, if any, annually. Each of the other Funds distributes a net investment income and capital gains, if any, annually. Distributions to shareholders are recorded on the ex-dividend date. Income and capital gain distributions are determined in accordance with income tax regulations which may differ from U.S. GAAP. |
The tax character of distributions paid for the fiscal year ended December 31, 2015 was as follows:
| | | | | | | | | | | | |
| YEAR ENDED DECEMBER 31, 2015 | | Ordinary Income | | | Net Long-Term
Capital Gains | | | Total Taxable
Distributions | |
| Matthews Asia Strategic Income Fund | | | $1,925,044 | | | | $— | | | | $1,925,044 | |
| Matthews Asian Growth and Income Fund | | | 89,571,608 | | | | 134,712,377 | | | | 224,283,985 | |
| Matthews Asia Dividend Fund | | | 93,118,771 | | | | 71,669,071 | | | | 164,787,842 | |
| Matthews China Dividend Fund | | | 4,110,069 | | | | 7,709,592 | | | | 11,819,661 | |
| Matthews Asia Value Fund | | | 2,329 | | | | — | | | | 2,329 | |
| Matthews Asia Focus Fund | | | 112,053 | | | | 61,165 | | | | 173,218 | |
| Matthews Pacific Tiger Fund | | | 131,749,094 | | | | 685,544,217 | | | | 817,293,311 | |
| Matthews Asia ESG Fund | | | 37,405 | | | | — | | | | 37,405 | |
| Matthews Emerging Asia Fund | | | 81,591 | | | | 432,972 | | | | 514,563 | |
| Matthews Asia Innovators Fund* | | | — | | | | 25,836,171 | | | | 25,836,171 | |
| Matthews China Fund | | | 10,545,675 | | | | 127,726,027 | | | | 138,271,702 | |
| Matthews India Fund | | | 1,967,432 | | | | 13,471,979 | | | | 15,439,411 | |
| Matthews Korea Fund | | | 956,216 | | | | 12,118,013 | | | | 13,074,229 | |
| Matthews Asia Small Companies Fund | | | 1,500,557 | | | | — | | | | 1,500,557 | |
| Matthews China Small Companies Fund | | | 162,446 | | | | 1,862,709 | | | | 2,025,155 | |
| * | The Fund’s name changed from Matthews Asia Science and Technology Fund to Matthews Asia Innovators Fund on April 29, 2016. |
| G. | INVESTMENT TRANSACTIONS AND INCOME: Securities transactions are accounted for on the date the securities are purchased or sold or on the following business day. Gains or losses on the sale of securities are determined on the identified cost basis. Interest income is recorded on the accrual basis. Dividend income is generally recorded on the ex-dividend date. Dividend income for certain issuers headquartered in countries which the Funds invest may not be recorded until approved by the shareholders (which may occur after the ex-dividend date) if, in the judgment of management, such dividends are not reasonably determined as of the ex-dividend date. Income and realized and unrealized gains or losses on investments are allocated to each class of shares based on its relative net assets. Interest income, including amortization and accretion of premiums and discounts on debt securities, is recognized daily on an accrual basis. For convertible securities, premiums attributable to the conversion feature are not amortized. |
The Funds may be subject to foreign taxation related to income received, capital gains on the sale of securities and certain foreign currency transactions in the foreign jurisdictions in which they invest. Foreign taxes, if any, are recorded based on the tax regulations and rates that exist in the foreign markets in which the Funds invest. When a capital gain tax is determined to apply, the Funds record an estimated deferred tax liability in an amount that may be payable if the securities were disposed of on the valuation date.
| H. | FUND EXPENSE ALLOCATIONS: The Funds account separately for the assets, liabilities and operations of each Fund. Direct expenses of each Fund or class are charged to that Fund or class while general expenses are allocated pro-rata among the Funds based on net assets or other appropriate methods. |
| I. | CASH, CASH OVERDRAFTS, AND FOREIGN CURRENCY: The U Series Funds are required by the local market to maintain a cash reserve. The cash reserve is based upon a fixed ratio of the QFII’s approved investment quota, which is defined as the amount remitted into its special renminbi (RMB) cash account. The fixed ratio is set at 0.08 percent for the Shanghai and 0.06 percent for the Shenzhen market. When any of the Funds’ cash balances are overdrawn, a Fund is charged an overdraft fee by the custodian of 1.00% above the 30-day LIBOR rate on outstanding balances. These amounts, if any, are included in “Other expenses” on the Statements of Operations. |
| J. | USE OF ESTIMATES: The preparation of financial statements in conformity with U.S. GAAP requires management to make estimates and assumptions that affect the amounts reported in the financial statements and accompanying notes. Actual results may differ from those estimates. |
| 3. | DERIVATIVE FINANCIAL INSTRUMENTS |
Each of the Matthews Asia Strategic Income Fund and the Matthews Asia Credit Opportunities Fund engages in derivative transactions for a variety of purposes, including managing interest rate, currency and credit exposure. In particular, each Fund may seek to take on currency exposure by using derivatives such as currency forwards, and the Matthews Asia Strategic Income Fund may also employ a currency overlay strategy in an effort to enhance returns and moderate volatility. Derivative financial instruments and transactions in which each Fund may engage include financial futures contracts and/or forward foreign currency exchange contracts. The currency overlay strategy involves long and short positions on one or more currencies. As a result, each Fund’s exposure to a currency could exceed the value of the Fund’s assets and the Fund could be exposed to currency risk whether or not it holds a bond or other instrument denominated in that currency. The gross notional value of derivative financial instruments and transactions could exceed the value of the Fund’s net assets, although the net market value of these instruments and transactions, on a marked-to-market basis, at most times, is expected to be substantially lower. The primary risks associated with the use of derivative financial instruments are: (i) Matthews may not correctly predict the direction of currency exchange rates, interest rates, security prices, or other economic factors; (ii) Matthews may not correctly predict changes in the value of derivative financial instruments and related underlying instruments or assets, which may result in disproportionately increased losses and/or reduced opportunities for gains; (iii) imperfect correlation between the change in market value of the securities held by a Fund and the price of financial futures contracts; (iv) the lack of, or a reduction in the liquidity of, any secondary market for the instrument, and the resulting inability to close the position (or exit the position) when desired; (v) losses, which are potentially unlimited, due to unanticipated market movements; (vi) the value of the instrument may change unfavorably due to movements in the value of the referenced foreign currencies; (vii) a Fund may suffer disproportionately heavy losses relative to the amount invested; (viii) changes in the value of the derivatives may not match or fully offset changes in the value of hedged or related portfolio securities, thereby failing to achieve the hedging or investment purpose for the derivative transaction; and (ix) the other party to the instrument may fail to fulfill its obligation.
| | | | |
| matthewsasia.com | 800.789.ASIA | | | 141 | |
Notes to Financial Statements (unaudited) (continued)
Financial Futures Contracts: Financial futures contracts are agreements between the Fund and a counterparty to buy or sell a specific quantity of an underlying instrument at a specified price and at a specified date. Depending on the terms of the particular contract, futures contracts are settled either through physical delivery of the underlying instrument on the settlement date or by payment of a cash settlement amount on settlement date. Pursuant to the contract, the Fund agrees to receive from or pay an amount of cash equal to the daily fluctuation in value of the contract. Such receipts or payments are known as variation margin and are recorded by the Fund as unrealized appreciation or depreciation. When the contract is closed, the Fund records a realized gain or loss equal to the difference between the value of the contract at the time it was opened and the value at the time it was closed.
Forward Foreign Currency Exchange Contracts: A forward foreign currency exchange contract is an agreement between two parties to buy and sell a currency at a set exchange rate on a future date. The contract is marked-to-market daily and the change in market value is recorded by the Fund as an unrealized gain or loss. When the contract is closed, the Fund records a realized gain or loss equal to the difference between the value at the time it was opened and the value at the time it was closed. The Matthews Asia Strategic Income Fund does not offset financial assets and financial liabilities on forward foreign currency contacts in the statement of assets and liabilities as they are not subject to netting arrangements.
Derivative Financial Instruments Categorized by Risk Exposure:
As of June 30, 2016, the fair values of derivative financial instruments were as follows:
| | | | | | |
| | | Statement of Assets and Liabilities Location | | Matthews Asia
Strategic Income
Fund | |
| | Asset Derivatives | | | | |
| Forward foreign currency exchange contracts | | Unrealized appreciation on forward foreign currency exchange contracts | | | $173,128 | |
| | | | | | |
| Total | | | | | $173,128 | |
| | | | | | |
For the period ended June 30, 2016, the effects of derivative financial instruments on the Statements of Operations were as follows:
| | | | | | |
| Derivative type | | Statement of Operations Location | | Matthews Asia
Strategic Income
Fund | |
Net Realized Gain (Loss) | | | | | | |
| Foreign currency contracts: | | | | | | |
Foreign currency exchange contracts | | Net realized gain (loss) on foreign currency related transactions | | | ($80,924 | ) |
| | | | | | |
Net Change in Unrealized Appreciation (Depreciation) | | | | | | |
| Foreign currency contracts: | | | | | | |
Foreign currency exchange contracts | | Net change in unrealized appreciation/depreciation on foreign currency related translations | | | ($123,446 | ) |
| | | | | | |
Notional amounts disclosed on the Matthews Asia Strategic Income Fund’s Schedule of Investments are indicative of the activity during the period which forward foreign currency contracts were held, January 1, 2016 - June 30, 2016.
| 4. | CAPITAL SHARE TRANSACTIONS |
Each Fund is authorized to issue an unlimited number of shares of beneficial interest with a par value of $0.001 per share.
| | | | | | | | | | | | | | | | |
| | | Six-Month Period Ended
June 30, 2016 (Unaudited) | | | Year Ended December 31, 2015 | |
| | | Shares | | | Amount | | | Shares | | | Amount | |
MATTHEWS ASIA STRATEGIC INCOME FUND | | | | | | | | | | | | | | | | |
Investor Class | | | | | | | | | | | | | | | | |
Shares sold | | | 598,248 | | | | $6,033,492 | | | | 1,323,678 | | | | $13,608,885 | |
Shares issued through reinvestment of distributions | | | 82,540 | | | | 844,847 | | | | 156,283 | | | | 1,568,876 | |
Shares redeemed | | | (770,348 | ) | | | (7,852,427 | ) | | | (2,031,972 | ) | | | (20,725,933 | ) |
Net increase (decrease) | | | (89,560 | ) | | | ($974,088 | ) | | | (552,011 | ) | | | ($5,548,172 | ) |
Institutional Class | | | | | | | | | | | | | | | | |
Shares sold | | | 35,582 | | | | $357,384 | | | | 514,725 | | | | $5,309,238 | |
Shares issued through reinvestment of distributions | | | 18,555 | | | | 189,715 | | | | 34,909 | | | | 350,189 | |
Shares redeemed | | | (99,158 | ) | | | (1,008,812 | ) | | | (205,825 | ) | | | (2,100,037 | ) |
Net increase (decrease) | | | (45,021 | ) | | | ($461,713 | ) | | | 343,809 | | | | $3,559,390 | |
MATTHEWS ASIA CREDIT OPPORTUNITIES FUND* | | | | | | | | | | | | | | | | |
Investor Class | | | | | | | | | | | | | | | | |
Shares sold | | | 764,269 | | | | $7,638,284 | | | | | | | | | |
Shares issued through reinvestment of distributions | | | 4,100 | | | | 41,038 | | | | | | | | | |
Shares redeemed | | | (395 | ) | | | (3,956 | ) | | | | | | | | |
Net increase (decrease) | | | 767,974 | | | | $7,675,366 | | | | | | | | | |
Institutional Class | | | | | | | | | | | | | | | | |
Shares sold | | | 501,000 | | | | $5,010,000 | | | | | | | | | |
Shares issued through reinvestment of distributions | | | 3,013 | | | | 30,130 | | | | | | | | | |
Shares redeemed | | | — | | | | — | | | | | | | | | |
Net increase (decrease) | | | 504,013 | | | | $5,040,130 | | | | | | | | | |
*InvestorClass and Institutional Class commencement of operations on April 29, 2016. | | | | | | | | | |
| | | | | | | | | | | | | | | | |
| | | Six-Month Period Ended
June 30, 2016 (Unaudited) | | | Year Ended December 31, 2015 | |
| | | Shares | | | Amount | | | Shares | | | Amount | |
MATTHEWS ASIAN GROWTH AND INCOME FUND | | | | | | | | | | | | | | | | |
Investor Class | | | | | | | | | | | | | | | | |
Shares sold | | | 11,916,369 | | | | $190,539,226 | | | | 25,916,582 | | | | $466,448,198 | |
Shares issued through reinvestment of distributions | | | 984,249 | | | | 16,495,895 | | | | 9,143,700 | | | | 150,474,022 | |
Shares redeemed | | | (20,789,848 | ) | | | (333,025,151 | ) | | | (76,976,258 | ) | | | (1,349,111,339 | ) |
Net increase (decrease) | | | (7,889,230 | ) | | | ($125,990,030 | ) | | | (41,915,976 | ) | | | ($732,189,119 | ) |
Institutional Class | | | | | | | | | | | | | | | | |
Shares sold | | | 11,283,997 | | | | $180,805,808 | | | | 11,883,290 | | | | $212,136,578 | |
Shares issued through reinvestment of distributions | | | 532,869 | | | | 8,920,235 | | | | 3,858,797 | | | | 63,544,851 | |
Shares redeemed | | | (7,371,674 | ) | | | (119,233,104 | ) | | | (30,034,472 | ) | | | (523,307,730 | ) |
Net increase (decrease) | | | 4,445,192 | | | | $70,492,939 | | | | (14,292,385 | ) | | | ($247,626,301 | ) |
MATTHEWS ASIA DIVIDEND FUND | | | | | | | | | | | | | | | | |
Investor Class | | | | | | | | | | | | | | | | |
Shares sold | | | 12,033,434 | | | | $184,268,777 | | | | 35,125,000 | | | | $570,435,753 | |
Shares issued through reinvestment of distributions | | | 1,882,815 | | | | 29,931,575 | | | | 5,242,086 | | | | 83,243,373 | |
Shares redeemed | | | (25,895,865 | ) | | | (389,185,020 | ) | | | (51,950,453 | ) | | | (827,708,599 | ) |
Net increase (decrease) | | | (11,979,616 | ) | | | ($174,984,668 | ) | | | (11,583,367 | ) | | | ($174,029,473 | ) |
Institutional Class | | | | | | | | | | | | | | | | |
Shares sold | | | 12,900,307 | | | | $195,740,274 | | | | 52,931,529 | | | | $860,637,014 | |
Shares issued through reinvestment of distributions | | | 1,024,429 | | | | 16,277,516 | | | | 2,615,057 | | | | 41,384,032 | |
Shares redeemed | | | (23,123,019 | ) | | | (352,626,436 | ) | | | (60,382,643 | ) | | | (945,927,066 | ) |
Net increase (decrease) | | | (9,198,283 | ) | | | ($140,608,646 | ) | | | (4,836,057 | ) | | | ($43,906,020 | ) |
MATTHEWS CHINA DIVIDEND FUND | | | | | | | | | | | | | | | | |
Investor Class | | | | | | | | | | | | | | | | |
Shares sold | | | 1,343,010 | | | | $17,472,513 | | | | 9,804,629 | | | | $151,536,779 | |
Shares issued through reinvestment of distributions | | | 164,081 | | | | 2,152,731 | | | | 724,059 | | | | 10,466,697 | |
Shares redeemed | | | (2,748,462 | ) | | | (35,354,826 | ) | | | (7,269,925 | ) | | | (106,195,533 | ) |
Net increase (decrease) | | | (1,241,371 | ) | | | ($15,729,582 | ) | | | 3,258,763 | | | | $55,807,943 | |
Institutional Class | | | | | | | | | | | | | | | | |
Shares sold | | | 1,294,998 | | | | $17,444,024 | | | | 1,122,001 | | | | $16,210,502 | |
Shares issued through reinvestment of distributions | | | 23,578 | | | | 309,349 | | | | 78,571 | | | | 1,153,826 | |
Shares redeemed | | | (990,753 | ) | | | (12,209,556 | ) | | | (2,376,571 | ) | | | (35,363,363 | ) |
Net increase (decrease) | | | 327,823 | | | | $5,543,817 | | | | (1,175,999 | ) | | | ($17,999,035 | ) |
MATTHEWS ASIA VALUE FUND* | | | | | | | | | | | | | | | | |
Investor Class | | | | | | | | | | | | | | | | |
Shares sold | | | 48,029 | | | | $466,791 | | | | 161,193 | | | | $1,602,501 | |
Shares issued through reinvestment of distributions | | | — | | | | — | | | | 179 | | | | 1,748 | |
Shares redeemed | | | (25,061 | ) | | | (246,207 | ) | | | (34 | ) | | | (333 | ) |
Net increase (decrease) | | | 22,968 | | | | $220,584 | | | | 161,338 | | | | $1,603,916 | |
Institutional Class | | | | | | | | | | | | | | | | |
Shares sold | | | — | | | | $— | | | | 14,500 | | | | $145,000 | |
Shares issued through reinvestment of distributions | | | — | | | | — | | | | 60 | | | | 581 | |
Shares redeemed | | | — | | | | — | | | | — | | | | — | |
Net increase (decrease) | | | — | | | | $— | | | | 14,560 | | | | $145,581 | |
MATTHEWS ASIA FOCUS FUND | | | | | | | | | | | | | | | | |
Investor Class | | | | | | | | | | | | | | | | |
Shares sold | | | 19,122 | | | | $173,245 | | | | 250,574 | | | | $2,466,477 | |
Shares issued through reinvestment of distributions | | | — | | | | — | | | | 8,502 | | | | 74,221 | |
Shares redeemed | | | (115,160 | ) | | | (1,041,587 | ) | | | (411,977 | ) | | | (3,802,344 | ) |
Net increase (decrease) | | | (96,038 | ) | | | ($868,342 | ) | | | (152,901 | ) | | | ($1,261,646 | ) |
Institutional Class | | | | | | | | | | | | | | | | |
Shares sold | | | 3,584 | | | | $30,000 | | | | 85,035 | | | | $790,900 | |
Shares issued through reinvestment of distributions | | | — | | | | — | | | | 11,279 | | | | 98,578 | |
Shares redeemed | | | (24,472 | ) | | | (210,584 | ) | | | (152,717 | ) | | | (1,345,220 | ) |
Net increase (decrease) | | | (20,888 | ) | | | ($180,584 | ) | | | (56,403 | ) | | | ($455,742 | ) |
*InvestorClass and Institutional Class commencement of operations on November 30, 2015. | | | | | | | | | |
| | | | |
| matthewsasia.com | 800.789.ASIA | | | 143 | |
Notes to Financial Statements (unaudited) (continued)
| | | | | | | | | | | | | | | | |
| | | Six-Month Period Ended
June 30, 2016 (Unaudited) | | | Year Ended December 31, 2015 | |
| | | Shares | | | Amount | | | Shares | | | Amount | |
MATTHEWS ASIA GROWTH FUND | | | | | | | | | | | | | | | | |
Investor Class | | | | | | | | | | | | | | | | |
Shares sold | | | 1,228,006 | | | | $25,268,032 | | | | 10,116,539 | | | | $220,731,758 | |
Shares issued through reinvestment of distributions | | | — | | | | — | | | | — | | | | — | |
Shares redeemed | | | (4,425,555 | ) | | | (90,876,866 | ) | | | (11,770,308 | ) | | | (246,526,119 | ) |
Net increase (decrease) | | | (3,197,549 | ) | | | ($65,608,834 | ) | | | (1,653,769 | ) | | | ($25,794,361 | ) |
Institutional Class | | | | | | | | | | | | | | | | |
Shares sold | | | 1,651,134 | | | | $34,238,620 | | | | 5,203,260 | | | | $112,251,892 | |
Shares issued through reinvestment of distributions | | | — | | | | — | | | | — | | | | — | |
Shares redeemed | | | (4,081,342 | ) | | | (82,690,730 | ) | | | (6,990,514 | ) | | | (146,485,176 | ) |
Net increase (decrease) | | | (2,430,208 | ) | | | ($48,452,110 | ) | | | (1,787,254 | ) | | | ($34,233,284 | ) |
MATTHEWS PACIFIC TIGER FUND | | | | | | | | | | | | | | | | |
Investor Class | | | | | | | | | | | | | | | | |
Shares sold | | | 7,052,018 | | | | $161,597,333 | | | | 18,629,799 | | | | $505,974,505 | |
Shares issued through reinvestment of distributions | | | — | | | | — | | | | 11,411,932 | | | | 263,383,421 | |
Shares redeemed | | | (14,871,794 | ) | | | (339,669,343 | ) | | | (29,132,577 | ) | | | (758,670,355 | ) |
Net increase (decrease) | | | (7,819,776 | ) | | | ($178,072,010 | ) | | | 909,154 | | | | $10,687,571 | |
Institutional Class | | | | | | | | | | | | | | | | |
Shares sold | | | 34,167,107 | | | | $787,598,185 | | | | 66,516,041 | | | | $1,778,275,629 | |
Shares issued through reinvestment of distributions | | | — | | | | — | | | | 11,636,136 | | | | 268,329,315 | |
Shares redeemed | | | (25,256,277 | ) | | | (575,401,969 | ) | | | (99,756,044 | ) | | | (2,521,022,303 | ) |
Net increase (decrease) | | | 8,910,830 | | | | $212,196,216 | | | | (21,603,867 | ) | | | ($474,417,359 | ) |
MATTHEWS ASIA ESG FUND* | | | | | | | | | | | | | | | | |
Investor Class | | | | | | | | | | | | | | | | |
Shares sold | | | 322,209 | | | | $2,779,145 | | | | 482,804 | | | | $4,562,170 | |
Shares issued through reinvestment of distributions | | | — | | | | — | | | | 1,806 | | | | 16,466 | |
Shares redeemed | | | (57,871 | ) | | | (494,942 | ) | | | (132,628 | ) | | | (1,222,043 | ) |
Net increase (decrease) | | | 264,338 | | | | $2,284,203 | | | | 351,982 | | | | $3,356,593 | |
Institutional Class | | | | | | | | | | | | | | | | |
Shares sold | | | 140,373 | | | | $1,209,925 | | | | 186,254 | | | | $1,805,130 | |
Shares issued through reinvestment of distributions | | | — | | | | — | | | | 2,307 | | | | 20,899 | |
Shares redeemed | | | — | | | | — | | | | (4,586 | ) | | | (41,516 | ) |
Net increase (decrease) | | | 140,373 | | | | $1,209,925 | | | | 183,975 | | | | $1,784,513 | |
MATTHEWS EMERGING ASIA FUND | | | | | | | | | | | | | | | | |
Investor Class | | | | | | | | | | | | | | | | |
Shares sold | | | 777,284 | | | | $8,926,203 | | | | 3,222,545 | | | | $37,424,394 | |
Shares issued through reinvestment of distributions | | | — | | | | — | | | | 29,906 | | | | 334,053 | |
Shares redeemed | | | (5,051,817 | ) | | | (55,056,945 | ) | | | (2,594,387 | ) | | | (29,676,907 | ) |
Net increase (decrease) | | | (4,274,533 | ) | | | ($46,130,742 | ) | | | 658,064 | | | | $8,081,540 | |
Institutional Class | | | | | | | | | | | | | | | | |
Shares sold | | | 2,100,266 | | | | $24,061,120 | | | | 4,382,373 | | | | $50,726,364 | |
Shares issued through reinvestment of distributions | | | — | | | | — | | | | 16,011 | | | | 179,162 | |
Shares redeemed | | | (765,227 | ) | | | (8,626,169 | ) | | | (1,342,327 | ) | | | (15,050,048 | ) |
Net increase (decrease) | | | 1,335,039 | | | | $15,434,951 | | | | 3,056,057 | | | | $35,855,478 | |
MATTHEWS ASIA INNOVATORS FUND** | | | | | | | | | | | | | | | | |
Investor Class | | | | | | | | | | | | | | | | |
Shares sold | | | 267,853 | | | | $3,054,781 | | | | 2,583,487 | | | | $36,194,231 | |
Shares issued through reinvestment of distributions | | | — | | | | — | | | | 1,321,498 | | | | 16,095,853 | |
Shares redeemed | | | (1,646,579 | ) | | | (18,583,902 | ) | | | (2,600,415 | ) | | | (35,098,196 | ) |
Net increase (decrease) | | | (1,378,726 | ) | | | ($15,529,121 | ) | | | 1,304,570 | | | | $17,191,888 | |
Institutional Class | | | | | | | | | | | | | | | | |
Shares sold | | | 271,585 | | | | $2,991,721 | | | | 248,176 | | | | $3,444,526 | |
Shares issued through reinvestment of distributions | | | — | | | | — | | | | 320,936 | | | | 3,915,412 | |
Shares redeemed | | | (5,554 | ) | | | (64,763 | ) | | | (2,079,401 | ) | | | (31,121,491 | ) |
Net increase (decrease) | | | 266,031 | | | | $2,926,958 | | | | (1,510,289 | ) | | | ($23,761,553 | ) |
| * | Investor Class and Institutional Class commencement of operations on April 30, 2015. |
| ** | The Fund’s name changed from Matthews Asia Science and Technology Fund to Matthews Asia Innovators Fund on April 29, 2016. |
| | | | | | | | | | | | | | | | |
| | | Six-Month Period Ended
June 30, 2016 (Unaudited) | | | Year Ended December 31, 2015 | |
| | | Shares | | | Amount | | | Shares | | | Amount | |
MATTHEWS CHINA FUND | | | | | | | | | | | | | | | | |
Investor Class | | | | | | | | | | | | | | | | |
Shares sold | | | 1,177,583 | | | | $18,702,208 | | | | 5,141,080 | | | | $120,488,105 | |
Shares issued through reinvestment of distributions | | | — | | | | — | | | | 6,355,104 | | | | 116,616,158 | |
Shares redeemed | | | (5,533,607 | ) | | | (87,981,059 | ) | | | (17,118,626 | ) | | | (385,888,737 | ) |
Net increase (decrease) | | | (4,356,024 | ) | | | ($69,278,851 | ) | | | (5,622,442 | ) | | | ($148,784,474 | ) |
Institutional Class | | | | | | | | | | | | | | | | |
Shares sold | | | 494,139 | | | | $7,689,004 | | | | 628,563 | | | | $14,774,529 | |
Shares issued through reinvestment of distributions | | | — | | | | — | | | | 234,182 | | | | 4,290,241 | |
Shares redeemed | | | (197,544 | ) | | | (3,161,572 | ) | | | (1,990,574 | ) | | | (45,026,079 | ) |
Net increase (decrease) | | | 296,595 | | | | $4,527,432 | | | | (1,127,829 | ) | | | ($25,961,309 | ) |
MATTHEWS INDIA FUND | | | | | | | | | | | | | | | | |
Investor Class | | | | | | | | | | | | | | | | |
Shares sold | | | 4,744,427 | | | | $119,530,074 | | | | 30,620,097 | | | | $867,318,320 | |
Shares issued through reinvestment of distributions | | | — | | | | — | | | | 408,995 | | | | 10,507,217 | |
Shares redeemed | | | (7,628,090 | ) | | | (191,390,982 | ) | | | (24,282,755 | ) | | | (667,371,469 | ) |
Net increase (decrease) | | | (2,883,663 | ) | | | ($71,860,908 | ) | | | 6,746,337 | | | | $210,454,068 | |
Institutional Class | | | | | | | | | | | | | | | | |
Shares sold | | | 6,010,885 | | | | $151,883,874 | | | | 9,976,872 | | | | $279,880,654 | |
Shares issued through reinvestment of distributions | | | — | | | | — | | | | 23,353 | | | | 601,584 | |
Shares redeemed | | | (874,212 | ) | | | (22,248,316 | ) | | | (768,413 | ) | | | (21,157,535 | ) |
Net increase (decrease) | | | 5,136,673 | | | | $129,635,558 | | | | 9,231,812 | | | | $259,324,703 | |
MATTHEWS JAPAN FUND | | | | | | | | | | | | | | | | |
Investor Class | | | | | | | | | | | | | | | | |
Shares sold | | | 61,140,805 | | | | $1,114,544,977 | | | | 53,437,657 | | | | $989,896,404 | |
Shares issued through reinvestment of distributions | | | — | | | | — | | | | — | | | | — | |
Shares redeemed | | | (24,192,395 | ) | | | (452,860,577 | ) | | | (13,073,985 | ) | | | (233,136,140 | ) |
Net increase (decrease) | | | 36,948,410 | | | | $661,684,400 | | | | 40,363,672 | | | | $756,760,264 | |
Institutional Class | | | | | | | | | | | | | | | | |
Shares sold | | | 31,154,048 | | | | $576,400,554 | | | | 25,203,856 | | | | $462,758,856 | |
Shares issued through reinvestment of distributions | | | — | | | | — | | | | — | | | | — | |
Shares redeemed | | | (4,168,110 | ) | | | (75,516,652 | ) | | | (2,491,900 | ) | | | (44,833,156 | ) |
Net increase (decrease) | | | 26,985,938 | | | | $500,883,902 | | | | 22,711,956 | | | | $417,925,700 | |
MATTHEWS KOREA FUND | | | | | | | | | | | | | | | | |
Investor Class | | | | | | | | | | | | | | | | |
Shares sold | | | 1,405,840 | | | | $8,350,668 | | | | 7,063,187 | | | | $45,732,771 | |
Shares issued through reinvestment of distributions | | | — | | | | — | | | | 1,247,048 | | | | 7,432,409 | |
Shares redeemed | | | (3,633,546 | ) | | | (21,489,637 | ) | | | (6,893,554 | ) | | | (42,613,047 | ) |
Net increase (decrease) | | | (2,227,706 | ) | | | ($13,138,969 | ) | | | 1,416,681 | | | | $10,552,133 | |
Institutional Class | | | | | | | | | | | | | | | | |
Shares sold | | | 3,014,795 | | | | $18,078,017 | | | | 1,949,647 | | | | $12,656,326 | |
Shares issued through reinvestment of distributions | | | — | | | | — | | | | 33,764 | | | | 202,244 | |
Shares redeemed | | | (7,815,125 | ) | | | (47,049,054 | ) | | | (8,378,869 | ) | | | (48,454,588 | ) |
Net increase (decrease) | | | (4,800,330 | ) | | | ($28,971,037 | ) | | | (6,395,458 | ) | | | ($35,596,018 | ) |
| | | | |
| matthewsasia.com | 800.789.ASIA | | | 145 | |
Notes to Financial Statements (unaudited) (continued)
| | | | | | | | | | | | | | | | |
| | | Six-Month Period Ended
June 30, 2016 (Unaudited) | | | Year Ended December 31, 2015 | |
| | | Shares | | | Amount | | | Shares | | | Amount | |
MATTHEWS ASIA SMALL COMPANIES FUND | | | | | | | | | | | | | | | | |
Investor Class | | | | | | | | | | | | | | | | |
Shares sold | | | 935,049 | | | | $17,345,828 | | | | 8,497,848 | | | | $182,977,362 | |
Shares issued through reinvestment of distributions | | | — | | | | — | | | | 23,288 | | | | 441,546 | |
Shares redeemed | | | (3,349,941 | ) | | | (62,505,240 | ) | | | (16,455,313 | ) | | | (348,268,552 | ) |
Net increase (decrease) | | | (2,414,892 | ) | | | ($45,159,412 | ) | | | (7,934,177 | ) | | | ($164,849,644 | ) |
Institutional Class | | | | | | | | | | | | | | | | |
Shares sold | | | 985,348 | | | | $17,948,951 | | | | 11,287,130 | | | | $246,873,661 | |
Shares issued through reinvestment of distributions | | | — | | | | — | | | | 47,417 | | | | 898,076 | |
Shares redeemed | | | (1,991,074 | ) | | | (36,158,710 | ) | | | (3,476,347 | ) | | | (67,815,813 | ) |
Net increase (decrease) | | | (1,005,726 | ) | | | ($18,209,759 | ) | | | 7,858,200 | | | | $179,955,924 | |
MATTHEWS CHINA SMALL COMPANIES FUND | | | | | | | | | | | | | | | | |
Investor Class | | | | | | | | | | | | | | | | |
Shares sold | | | 155,325 | | | | $1,245,759 | | | | 766,278 | | | | $7,633,873 | |
Shares issued through reinvestment of distributions | | | — | | | | — | | | | 202,804 | | | | 1,752,230 | |
Shares redeemed | | | (378,020 | ) | | | (3,098,500 | ) | | | (911,884 | ) | | | (8,642,334 | ) |
Net increase (decrease) | | | (222,695 | ) | | | ($1,852,741 | ) | | | 57,198 | | | | $743,769 | |
Currently, a 2.00% redemption fee will be assessed on the sale or exchange of shares of the Matthews Emerging Asia Fund, Matthews Asia Small Companies Fund and Matthews China Small Companies Fund (collectively, the “Covered Funds”) within 90 days after the date an investor purchases shares of the Covered Funds. The imposition of redemption fees pursuant to the Funds’ Short-Term Trading Redemption Fee Policy for the Covered Funds may assist the Covered Funds in discouraging market timing activity.
The redemption fee is imposed to discourage market timing and short-term buying and selling of shares of the Covered Funds, which can disrupt the management of the Covered Funds’ investment portfolios and may have detrimental effects on the Covered Funds and other shareholders, and to allocate the costs the Covered Funds incur as a result of short-term trading and market timing. This fee is payable directly to the Covered Funds.
To determine whether the redemption fee applies, the Covered Funds do not count the day that you purchased your shares, and first redeem the shares that you have held the longest.
The Covered Funds may grant an exemption from the redemption fee when the Covered Funds have previously received assurances that transactions do not involve a substantial risk of the type of harm that the policy is designed to avoid. The Covered Funds may also waive the imposition of redemption fees in certain circumstances. For more information on this policy, please see the Funds’ prospectuses. The redemption fees returned to the assets of the Funds are stated in the Statements of Changes in Net Assets.
| 5. | INVESTMENT ADVISORY FEES AND OTHER TRANSACTIONS WITH AFFILIATES |
Matthews, a registered investment advisor under the 1940 Act, provides the Funds with investment management services. Pursuant to the prior Investment Advisory Agreement dated August 13, 2004, as amended (the “Prior Advisory Agreement”) and the current Investment Advisory Agreement dated February 1, 2016, as amended (the “Current Advisory Agreement,” and together with the Prior Advisory Agreement, the “Advisory Agreement”), the Funds pay Matthews (i) for management and advisory services; and (ii) for certain administrative services, an annual fee as a percentage of average daily net assets. Under the Advisory Agreement each of the Funds, other than Matthews Asia Strategic Income Fund, Matthews Asia Credit Opportunities Fund, Matthews Emerging Asia Fund, Matthews Asia Small Companies Fund, and Matthews China Small Companies Fund (the “Family-Priced Funds”), pays Matthews 0.75% of their aggregate average daily net assets up to $2 billion, 0.6834% of their aggregate average daily net assets over $2 billion up to $5 billion, 0.65% of their aggregate average daily net assets over $5 billion up to $25 billion, 0.64% of their aggregate average daily net assets over $25 billion up to $30 billion, 0.63% of their aggregate average daily net assets over $30 billion up to $35 billion, 0.62% of their aggregate average daily net assets over $35 billion up to $40 billion, 0.61% of their aggregate average daily net assets over $40 billion up to $45 billion, and 0.60% of their aggregate average daily net assets over $45 billion. Each of the Matthews Asia Strategic Income Fund and Matthews Asia Credit Opportunities Fund pays Matthews an annual fee of 0.65% of such Fund’s annual average daily net assets pursuant to the Advisory Agreement. Each of the Matthews Emerging Asia Fund, Matthews Asia Small Companies Fund, and the Matthews China Small Companies Fund pays Matthews an annual fee of 1.00% of the average daily net assets of such Fund up to $1 billion and 0.95% of the average daily net assets of such Fund over $1 billion pursuant to the Advisory Agreement. Each Fund pays Matthews a monthly fee at the annual rate using the applicable management fee calculated based on the actual number of days of that month and based on the Fund’s average daily net asset value for the month.
Pursuant to a fee waiver letter agreement, effective as of September 1, 2014, between the Trust, on behalf of the Family-Priced Funds, and Matthews (as amended from time to time, the “Fee Waiver Agreement”), for each Family-Priced Fund, Matthews has agreed to waive a portion of the fee payable under the Advisory Agreement and a portion of the fee payable under the Administration and Shareholder Services Agreement, if any Family-Priced Fund’s average daily net assets are over $3 billion, as follows: for every $2.5 billion average daily net assets of a Family-Priced Fund that are over $3 billion, the fee rates that otherwise would be applied for calculating fees payable under the Advisory Agreement and the Administration and Shareholder Services Agreement for such Family-Priced Fund with respect to such excess average daily net assets will be each reduced by 0.01%, in each case without reducing such fee rate below 0.00%.
Under a written agreement between the Funds and Matthews (the “Operating Expense Agreement”), Matthews agrees to waive fees and reimburse expenses to a Fund if its expense ratio exceeds a certain percentage level. Effective April 29, 2016 for all Funds, except Matthews Asia Strategic Income Fund, Matthews Asia Credit Opportunities Fund, and Matthews China Small Companies Fund, this level is 1.25% for the Institutional Class. Matthews agrees to reduce the expense ratio by waiving an equal amount of non-class specific expenses for the Investor Class. Because certain expenses of the Investor Class may be higher than Institutional Class and class specific expenses may be waived solely for the Institutional Class, total annual Fund expenses for the Investor Class may exceed 1.25%. For Matthews Asia Strategic Income Fund and Matthews Asia Credit Opportunities Fund this level is 0.90% for the Institutional Class. Matthews agrees to reduce the expense ratio by waiving an equal amount of non-class expenses for the Investor Class. Because certain expenses of the Investor Class may be higher that the Institutional Class and class specific expenses may be waived solely for the Institutional Class, total annual Fund expenses for the Investor Class may exceed 0.90%. For Matthews China Small Companies Fund this level is 1.50% for the Investor Class. Prior to May 1, 2014 for Matthews Asia Innovators Fund, Matthews China Fund, Matthews India Fund, Matthews Japan Fund, Matthews Korea Fund, Matthews Asia Small Companies Fund and Matthews China Small Companies Fund, this level was 2.00%. For Matthews Asian Growth and Income Fund, Matthews Asia Growth Fund and Matthews Pacific Tiger Fund, this level was 1.90%. For Matthews Asia Dividend Fund and Matthews China Dividend Fund, this level was 1.50%. For Matthews Asia Strategic Income Fund, Matthews Asia Focus Fund and Matthews Emerging Asia Fund, Matthews agreed to waive fees and reimburse expenses to each Fund if its expense ratio exceeded 1.25%, 1.75%, and 2.00%, respectively, for the Institutional Class and agreed to reduce the expense ratio by an equal amount for the Investor Class. In turn, if a Fund’s expenses fall below the level noted within three years after Matthews has made such a reimbursement, the Fund may reimburse Matthews up to an amount of the recoupment available not to exceed the lesser of (i) the expense limitation applicable at the time of that fee waiver and/or expense reimbursement or (ii) the expense limitation in effect at the time of recoupment. For each Fund other than the Matthews Asia Value Fund and the Matthews Asia Credit Opportunities Fund, this agreement will continue through at least April 30, 2017 and may be extended for additional periods not exceeding one year. This agreement will continue through April 30, 2018 for the Matthews Asia Value Fund and the Matthews Asia Credit Opportunities Fund, and may be extended for additional periods not exceeding one year.
On June 30, 2016, the amounts subject to possible future recoupment under the expense limitation agreement are as follows:
| | | | | | | | | | | | | | | | |
| | | Expiring December 31, | |
| | | 2016 | | | 2017 | | | 2018 | | | 2019 | |
| Matthews Asia Strategic Income Fund | | | $41,268 | | | | $79,504 | | | | $113,621 | | | | $37,218 | |
| Matthews Asia Credit Opportunities Fund* | | | — | | | | — | | | | — | | | | 11,363 | |
| Matthews China Fund | | | — | | | | — | | | | — | | | | 1,868 | |
| Matthews Asia Value Fund | | | — | | | | — | | | | 41,278 | | | | 78,075 | |
| Matthews Asia Focus Fund | | | 87,951 | | | | 62,897 | | | | 87,252 | | | | 32,502 | |
| Matthews Asia Innovators Fund** | | | — | | | | — | | | | — | | | | 6,612 | |
| Matthews Asia ESG Fund | | | — | | | | — | | | | 183,986 | | | | 73,031 | |
| Matthews Emerging Asia Fund | | | 85,828 | | | | 152,283 | | | | 452,048 | | | | 220,456 | |
| Matthews Asia Small Companies Fund | | | — | | | | 15,270 | | | | 113,037 | | | | 83,760 | |
| Matthews China Small Companies Fund | | | 7,801 | | | | 63,212 | | | | 133,327 | | | | 48,816 | |
| * | Matthews Asia Credit Opportunities Fund commenced operations on April 29, 2016. |
| ** | The Fund’s name changed from Matthews Asia Science and Technology Fund to Matthews Asia Innovators Fund on April 29, 2016. |
Investment advisory fees charged, waived fees and reimbursed additional expenses for the six-month period ended June 30, 2016, were as follows:
| | | | | | | | | | | | |
| | | Gross Advisory Fees | | | Advisory Fees
Waived and
Reimbursed in
Excess of the
Expense Limitation | | | Net Advisory Fee/
(Reimbursement) | |
| Matthews Asia Strategic Income Fund | | | $201,344 | | | | ($37,218 | ) | | | $164,126 | |
| Matthews Asia Credit Opportunities Fund* | | | 12,844 | | | | (11,363 | ) | | | 1,481 | |
| Matthews Asian Growth and Income Fund | | | 9,493,005 | | | | — | | | | 9,493,005 | |
| Matthews Asia Dividend Fund | | | 15,129,583 | | | | (78,720 | ) | | | 15,050,863 | |
| Matthews China Dividend Fund | | | 507,135 | | | | — | | | | 507,135 | |
| Matthews Asia Value Fund | | | 6,010 | | | | (78,075 | ) | | | (72,065 | ) |
| Matthews Asia Focus Fund | | | 36,061 | | | | (32,502 | ) | | | 3,559 | |
| Matthews Asia Growth Fund | | | 2,270,246 | | | | — | | | | 2,270,246 | |
| Matthews Pacific Tiger Fund | | | 21,358,088 | | | | (220,772 | ) | | | 21,137,316 | |
| Matthews Asia ESG Fund | | | 21,642 | | | | (73,031 | ) | | | (51,389 | ) |
| Matthews Emerging Asia Fund | | | 706,895 | | | | (220,456 | ) | | | 486,439 | |
| Matthews Asia Innovators Fund** | | | 485,711 | | | | (6,612 | ) | | | 479,099 | |
| Matthews China Fund | | | 1,957,298 | | | | (1,868 | ) | | | 1,955,430 | |
| Matthews India Fund | | | 4,791,556 | | | | — | | | | 4,791,556 | |
| Matthews Japan Fund | | | 9,062,397 | | | | (2,893 | ) | | | 9,059,504 | |
| Matthews Korea Fund | | | 660,970 | | | | — | | | | 660,970 | |
| Matthews Asia Small Companies Fund | | | 2,735,151 | | | | (83,760 | ) | | | 2,651,391 | |
| Matthews China Small Companies Fund | | | 96,081 | | | | (48,816 | ) | | | 47,265 | |
| * | Matthews Asia Credit Opportunities Fund commenced operations on April 29, 2016. |
| ** | The Fund’s name changed from Matthews Asia Science and Technology Fund to Matthews Asia Innovators Fund on April 29, 2016. |
| | | | |
| matthewsasia.com | 800.789.ASIA | | | 147 | |
Notes to Financial Statements (unaudited) (continued)
Certain officers and Trustees of the Funds are also officers and directors of Matthews. All officers serve without compensation from the Funds. The Funds paid the Independent Trustees $508,500 in aggregate for regular compensation during the six-month period ended June 30, 2016.
The Funds have an Administration and Shareholder Services Agreement dated August 13, 2004, as amended (the “Shareholder Services Agreement” or “Services Agreement”), in which the Funds pay an annual administration and shareholder servicing fee to Matthews, as a percentage of the average daily net assets of each Fund in aggregate, computed and prorated on a daily basis. Under the Shareholder Services Agreement, the Funds in the aggregate pay Matthews 0.25% of their aggregate average daily net assets up to $2 billion, 0.1834% of their aggregate average daily net assets over $2 billion up to $5 billion, 0.15% of their aggregate average daily net assets over $5 billion up to $7.5 billion, 0.125% of their aggregate average daily net assets over $7.5 billion up to $15 billion, 0.11% of their aggregate average daily net assets over $15 billion up to $22.5 billion, 0.10% of their aggregate average daily net assets over $22.5 billion up to $25 billion, 0.09% of their aggregate average daily net assets over $25 billion up to $30 billion, 0.08% of their aggregate average daily net assets over $30 billion up to $35 billion, 0.07% of their aggregate average daily net assets over $35 billion up to $40 billion, 0.06% of their aggregate average daily net assets over $40 billion up to $45 billion, and 0.05% of their aggregate average daily net assets over $45 billion.
Administration and shareholder servicing fees charged, for the six-month period ended June 30, 2016, were as follows:
| | | | | | | | | | | | |
| | | Gross
Administration and
Shareholder
Servicing Fees | | | Administration and
Shareholder
Servicing Fees
Waived in Excess of
Expense Limitation | | | Net
Administration and
Shareholder
Servicing Fees | |
| Matthews Asia Strategic Income Fund | | | $44,747 | | | | $— | | | | $44,747 | |
| Matthews Asia Credit Opportunities Fund* | | | 2,826 | | | | — | | | | 2,826 | |
| Matthews Asian Growth and Income Fund | | | 2,061,834 | | | | — | | | | 2,061,834 | |
| Matthews Asia Dividend Fund | | | 3,286,060 | | | | (78,720 | ) | | | 3,207,340 | |
| Matthews China Dividend Fund | | | 110,187 | | | | — | | | | 110,187 | |
| Matthews Asia Value Fund | | | 1,305 | | | | — | | | | 1,305 | |
| Matthews Asia Focus Fund | | | 7,834 | | | | — | | | | 7,834 | |
| Matthews Asia Growth Fund | | | 493,247 | | | | — | | | | 493,247 | |
| Matthews Pacific Tiger Fund | | | 4,638,917 | | | | (220,772 | ) | | | 4,418,145 | |
| Matthews Asia ESG Fund | | | 4,694 | | | | — | | | | 4,694 | |
| Matthews Emerging Asia Fund | | | 102,214 | | | | — | | | | 102,214 | |
| Matthews Asia Innovators Fund** | | | 105,523 | | | | — | | | | 105,523 | |
| Matthews China Fund | | | 425,387 | | | | — | | | | 425,387 | |
| Matthews India Fund | | | 1,040,318 | | | | — | | | | 1,040,318 | |
| Matthews Japan Fund | | | 1,965,613 | | | | (2,893 | ) | | | 1,962,720 | |
| Matthews Korea Fund | | | 143,553 | | | | — | | | | 143,553 | |
| Matthews Asia Small Companies Fund | | | 395,233 | | | | — | | | | 395,233 | |
| Matthews China Small Companies Fund | | | 13,885 | | | | — | | | | 13,885 | |
| * | Matthews Asia Credit Opportunities Fund commenced operations on April 29, 2016. |
| ** | The Fund’s name changed from Matthews Asia Science and Technology Fund to Matthews Asia Innovators Fund on April 29, 2016. |
In addition to the fees paid to the Funds’ transfer agent, the Funds bear the cost of fees paid to certain service providers or intermediaries, including supermarkets, which provide transfer agency, record-keeping and shareholder servicing to certain shareholders. These fees are referred to as intermediary service fees on the statements of assets and liabilities as well as the statements of operations. Additional information concerning these services and fees is contained in the Funds’ prospectuses.
BNY Mellon Investment Servicing (US) Inc. (“BNY Mellon”), an indirect wholly owned subsidiary of The Bank of New York Mellon Corporation, serves as the Funds’ administrator, and in that capacity, performs various administrative and accounting services for each Fund. BNY Mellon also serves as the Funds’ transfer agent, dividend disbursing agent and registrar. An officer of BNY Mellon serves as Assistant Treasurer to the Funds. Total fees accrued by the Funds for administration and accounting services for the six-month period ended June 30, 2016 were as follows:
| | | | |
| | | Administration and
Accounting Fees | |
| Matthews Asia Strategic Income Fund | | | $2,485 | |
| Matthews Asia Credit Opportunities Fund* | | | 158 | |
| Matthews Asian Growth and Income Fund | | | 114,491 | |
| Matthews Asia Dividend Fund | | | 222,102 | |
| Matthews China Dividend Fund | | | 6,118 | |
| Matthews Asia Value Fund | | | 73 | |
| Matthews Asia Focus Fund | | | 435 | |
| Matthews Asia Growth Fund | | | 27,386 | |
| Matthews Pacific Tiger Fund | | | 257,604 | |
| Matthews Asia ESG Fund | | | 261 | |
| Matthews Emerging Asia Fund | | | 5,673 | |
| Matthews Asia Innovators Fund** | | | 5,859 | |
| Matthews China Fund | | | 60,904 | |
| Matthews India Fund | | | 57,794 | |
| Matthews Japan Fund | | | 109,244 | |
| Matthews Korea Fund | | | 7,972 | |
| Matthews Asia Small Companies Fund | | | 21,943 | |
| Matthews China Small Companies Fund | | | 771 | |
| * | Matthews Asia Credit Opportunities Fund commenced operations on April 29, 2016. |
| ** | The Fund’s name changed from Matthews Asia Science and Technology Fund to Matthews Asia Innovators Fund on April 29, 2016. |
Brown Brothers Harriman & Co. serves as the Funds’ custodian. Foreside Funds Distributors LLC, serves as the Funds’ distributor in the United States pursuant to an Underwriting Agreement. Matthews Asia Funds are distributed in Latin America by HMC Partners.
Cross trades for the six-month period ended June 30, 2016, were executed by the Funds pursuant to Rule 17a-7 under the 1940 Act. Cross trading is the buying or selling of portfolio securities between funds to which Matthews International Capital Management, LLC serves as investment advisor. At its regularly scheduled quarterly meetings, the Board reviews such transactions as of the most recent calendar quarter for compliance with the requirements and restrictions set forth by Rule 17a-7.
As of June 30, 2016, Matthews and its affiliates held 1,406,753 shares of the Matthews Asia Strategic Income Fund, representing approximately 23% of that Fund’s outstanding shares.
As of June 30, 2016, Matthews and its affiliates held 1,166,906 shares of the Matthews Asia Credit Opportunities Fund, representing approximately 92% of that Fund’s outstanding shares.
As of June 30, 2016, Matthews and its affiliates held 98,656 shares of the Matthews Asia Value Fund, representing approximately 50% of that Fund’s outstanding shares.
As of June 30, 2016, Matthews and its affiliates held 168,605 shares of the Matthews Asia Focus Fund, representing approximately 14% of that Fund’s outstanding shares.
As of June 30, 2016, Matthews and its affiliates held 337,109 shares of the Matthews Asia ESG Fund, representing approximately 36% of that Fund’s outstanding shares.
| | | | |
| matthewsasia.com | 800.789.ASIA | | | 149 | |
Notes to Financial Statements (unaudited) (continued)
The value of investment transactions made for affiliated and unaffiliated holdings for the six-month period ended June 30, 2016 were as follows:
| | | | | | | | | | | | | | | | |
| | | Affiliated Purchases | | | Proceeds from
Affiliated Sales | | | Unaffiliated Purchases | | | Proceeds from
Unaffiliated Sales | |
| Matthews Asia Strategic Income Fund | | | $— | | | | $— | | | | $22,832,765 | | | | $21,508,339 | |
| Matthews Asia Credit Opportunities Fund* | | | — | | | | — | | | | 11,615,393 | | | | — | |
| Matthews Asian Growth and Income Fund | | | — | | | | — | | | | 203,848,345 | | | | 363,072,347 | |
| Matthews Asia Dividend Fund | | | 19,131,159 | | | | 7,433,018 | | | | 498,175,816 | | | | 830,836,411 | |
| Matthews China Dividend Fund | | | — | | | | — | | | | 47,072,533 | | | | 62,707,293 | |
| Matthews Asia Value Fund | | | — | | | | — | | | | 499,205 | | | | 161,974 | |
| Matthews Asia Focus Fund | | | — | | | | — | | | | 762,302 | | | | 1,660,719 | |
| Matthews Asia Growth Fund | | | — | | | | — | | | | 43,861,049 | | | | 153,013,436 | |
| Matthews Pacific Tiger Fund | | | 83,687,081 | | | | 12,595,716 | | | | 30,812,896 | | | | 279,525,327 | |
| Matthews Asia ESG Fund | | | — | | | | — | | | | 2,974,393 | | | | 321,559 | |
| Matthews Emerging Asia Fund | | | 1,834,739 | | | | — | | | | 18,133,114 | | | | 55,363,965 | |
| Matthews Asia Innovators Fund** | | | — | | | | — | | | | 64,210,283 | | | | 74,293,756 | |
| Matthews China Fund | | | — | | | | — | | | | 293,965,908 | | | | 356,445,887 | |
| Matthews India Fund | | | 1,089,880 | | | | 1,583,334 | | | | 90,012,811 | | | | 78,812,835 | |
| Matthews Japan Fund | | | 27,758,580 | | | | 8,552,643 | | | | 1,549,413,077 | | | | 424,262,471 | |
| Matthews Korea Fund | | | — | | | | — | | | | 29,059,293 | | | | 59,767,413 | |
| Matthews Asia Small Companies Fund | | | — | | | | — | | | | 106,235,444 | | | | 167,330,456 | |
| Matthews China Small Companies Fund | | | — | | | | — | | | | 4,824,771 | | | | 7,245,666 | |
| * | Matthews Asia Credit Opportunities Fund commenced operations on April 29, 2016. |
| ** | The Fund’s name changed from Matthews Asia Science and Technology Fund to Matthews Asia Innovators Fund on April 29, 2016. |
| 7. | HOLDINGS OF 5% VOTING SHARES OF PORTFOLIO COMPANIES |
The 1940 Act defines “affiliated companies” to include investments in portfolio companies in which a fund owns 5% or more of the outstanding voting shares. During the six-month period ended June 30, 2016, the Funds below held 5% or more of the outstanding voting shares of the noted portfolio companies. During this period, other Funds in the Trust may also have held voting shares of the issuers at levels below 5%.
Investments in affiliates:
A summary of transactions in securities of issuers affiliated with a Fund for the six-month period ended June 30, 2016 is as follows:
| | | | | | | | | | | | | | | | | | | | | | | | | | | | |
| | | Shares Held at Dec. 31, 2015 | | | Shares
Purchased | | | Shares Sold | | | Shares Held at
June 30, 2016 | | | Value at June 30, 2016 | | | Dividend Income Jan. 1, 2016– June 30, 2016 | | | Net Realized Gain (Loss) Jan. 1, 2016– June 30, 2016 | |
| | | | | |
| MATTHEWS ASIA DIVIDEND FUND | | | | | | | | | | | | | | | | | | | | | |
| Name of Issuer: | | | | | | | | | | | | | | | | | | | | | | | | | | | | |
Anritsu Corp. | | | 7,564,500 | | | | 782,200 | | | | 437,200 | | | | 7,909,500 | | | | $45,642,823 | | | | $800,476 | | | | ($2,402,522 | ) |
Ascendas India Trust | | | 53,470,700 | | | | — | | | | — | | | | 53,470,700 | | | | 39,405,020 | | | | 1,077,298 | | | | — | |
Breville Group, Ltd. | | | 10,644,019 | | | | — | | | | — | | | | 10,644,019 | | | | 60,033,974 | | | | 1,147,658 | | | | — | |
CapitaLand Retail China Trust, REIT | | | 43,232,400 | | | | — | | | | — | | | | 43,232,400 | | | | 48,256,068 | | | | 1,617,870 | | | | — | |
China Machinery Engineering Corp. H Shares | | | 53,811,000 | | | | 2,781,000 | | | | — | | | | 56,592,000 | | | | 37,005,060 | | | | — | | | | — | |
Greatview Aseptic Packaging Co., Ltd.† | | | 109,030,000 | | | | — | | | | 87,117,000 | | | | 21,913,000 | | | | — | | | | — | | | | — | |
Minth Group, Ltd. | | | 59,535,000 | | | | — | | | | — | | | | 59,535,000 | | | | 192,231,571 | | | | 4,199,865 | | | | — | |
Sercomm Corp. | | | 11,111,000 | | | | 1,569,000 | | | | 503,000 | | | | 12,177,000 | | | | 27,329,251 | | | | — | | | | 22,640 | |
Spotless Group Holdings, Ltd. | | | 48,823,125 | | | | 9,587,962 | | | | — | | | | 58,411,087 | | | | 49,433,995 | | | | 1,560,995 | | | | — | |
Yuexiu Transport Infrastructure, Ltd. | | | 109,322,000 | | | | — | | | | 5,930,000 | | | | 103,392,000 | | | | 66,705,866 | | | | 2,252,045 | | | | 495,381 | |
| | | | | | | | | | | | | | | | | | | | |
Total Affiliates | | | | | | | | | | | | | | | | | | | $566,043,628 | | | | $12,656,207 | | | | ($1,884,501 | ) |
| | | | | | | | | | | | | | | | | | | | |
| | | | | |
| MATTHEWS PACIFIC TIGER FUND | | | | | | | | | | | | | | | | | | | | | |
| Name of Issuer: | | | | | | | | | | | | | | | | | | | | | | | | | | | | |
Cheil Worldwide, Inc. | | | 6,154,297 | | | | — | | | | — | | | | 6,154,297 | | | | $90,836,833 | | | | $— | | | | $— | |
Fuyao Glass Industry Group Co., Ltd. H Shares | | | 31,836,000 | | | | 3,000,000 | | | | — | | | | 34,836,000 | | | | 81,071,770 | | | | 3,599,251 | | | | — | |
Green Cross Corp. | | | 846,872 | | | | — | | | | 70,000 | | | | 776,872 | | | | 127,832,970 | | | | — | | | | 3,794,822 | |
Hyflux, Ltd.† | | | 43,084,530 | | | | — | | | | 7,893,800 | | | | 35,190,730 | | | | — | | | | — | | | | — | |
Synnex Technology International Corp. | | | 98,191,354 | | | | — | | | | — | | | | 98,191,354 | | | | 106,531,796 | | | | — | | | | — | |
Tata Power Co., Ltd. | | | 165,620,436 | | | | — | | | | — | | | | 165,620,436 | | | | 180,343,321 | | | | — | | | | — | |
| | | | | | | | | | | | | | | | | | | | |
Total Affiliates | | | | | | | | | | | | | | | | | | | $586,616,690 | | | | $3,599,251 | | | | $3,794,822 | |
| | | | | | | | | | | | | | | | | | | | |
| | | | | | | |
| MATTHEWS EMERGING ASIA FUND | | | | | | | | | | | | | | | | | | | | | | | | | | | | |
| Name of Issuer: | | | | | | | | | | | | | | | | | | | | | | | | | | | | |
National Seed JSC | | | 554,535 | | | | 425,050 | | | | — | | | | 979,585 | | | | $4,391,970 | | | | $— | | | | $— | |
| | | | | | | | | | | | | | | | | | | | |
Total Affiliates | | | | | | | | | | | | | | | | | | | $4,391,970 | | | | $— | | | | $— | |
| | | | | | | | | | | | | | | | | | | | |
| | | | | | | |
| MATTHEWS INDIA FUND | | | | | | | | | | | | | | | | | | | | | | | | | | | | |
| Name of Issuer: | | | | | | | | | | | | | | | | | | | | | | | | | | | | |
eClerx Services, Ltd. | | | 3,135,581 | | | | 53,094 | | | | 75,624 | | | | 3,113,051 | | | | $66,778,698 | | | | $— | | | | $384,650 | |
VST Industries, Ltd. | | | 1,215,704 | | | | — | | | | — | | | | 1,215,704 | | | | 30,694,195 | | | | — | | | | — | |
| | | | | | | | | | | | | | | | | | | | |
Total Affiliates | | | | | | | | | | | | | | | | | | | $97,472,893 | | | | $— | | | | $384,650 | |
| | | | | | | | | | | | | | | | | | | | |
| | | | | | | |
| MATTHEWS JAPAN FUND | | | | | | | | | | | | | | | | | | | | | | | | | | | | |
| Name of Issuer: | | | | | | | | | | | | | | | | | | | | | | | | | | | | |
AIT Corp.† | | | 1,130,300 | | | | — | | | | 1,103,700 | | | | 26,600 | | | | $— | | | | $— | | | | $— | |
Broadleaf Co., Ltd. | | | 753,800 | | | | 1,408,200 | | | | — | | | | 2,162,000 | | | | 19,925,737 | | | | 331,289 | | | | — | |
Daiken Medical Co., Ltd. | | | 1,755,200 | | | | — | | | | — | | | | 1,755,200 | | | | 13,349,807 | | | | 125,371 | | | | — | |
Doshisha Co., Ltd. | | | 1,643,200 | | | | 449,600 | | | | — | | | | 2,092,800 | | | | 40,205,827 | | | | 399,286 | | | | — | |
eGuarantee, Inc. | | | 841,800 | | | | 63,000 | | | | 104,800 | | | | 800,000 | | | | 25,442,790 | | | | 244,152 | | | | 1,527,506 | |
MORESCO Corp.† | | | 774,500 | | | | — | | | | 456,300 | | | | 318,200 | | | | — | | | | — | | | | — | |
Infomart Corp | | | — | | | | 3,737,500 | | | | — | | | | 3,737,500 | | | | 34,224,891 | | | | 193,084 | | | | — | |
N Field Co., Ltd. | | | 1,006,400 | | | | — | | | | 1,006,400 | | | | — | | | | — | | | | — | | | | — | |
Financial Products Group Co | | | 3,258,800 | | | | 2,020,400 | | | | 312,300 | | | | 4,966,900 | | | | 51,275,622 | | | | — | | | | 2,458,203 | |
Sac’s Bar Holdings, Inc. | | | 1,480,350 | | | | 330,000 | | | | — | | | | 1,810,350 | | | | 17,710,741 | | | | 387,932 | | | | — | |
TechnoPro Holdings, Inc. | | | 1,380,700 | | | | 931,300 | | | | — | | | | 2,312,000 | | | | 71,991,926 | | | | 1,245,423 | | | | — | |
Trancom Co., Ltd. | | | 429,400 | | | | 147,000 | | | | 28,900 | | | | 547,500 | | | | 36,137,592 | | | | 176,984 | | | | 887,193 | |
W-Scope Corp. | | | — | | | | 2,081,400 | ‡ | | | 81,800 | | | | 1,999,600 | | | | 47,302,919 | | | | — | | | | 1,776,100 | |
| | | | | | | | | | | | | | | | | | | | |
Total Affiliates | | | | | | | | | | | | | | | | | | | $357,567,852 | | | | $3,103,521 | | | | $6,649,002 | |
| | | | | | | | | | | | | | | | | | | | |
| | | | | | | |
| MATTHEWS ASIA SMALL COMPANIES FUND | | | | | | | | | | | | | | | | | | | | | | | | | | | | |
| Name of Issuer: | | | | | | | | | | | | | | | | | | | | | | | | | | | | |
FineTek Co., Ltd.† | | | 3,192,920 | | | | — | | | | 1,329,980 | | | | 1,862,940 | | | | $— | | | | $— | | | | $— | |
| | | | | | | | | | | | | | | | | | | | |
Total Affiliates | | | | | | | | | | | | | | | | | | | $— | | | | $— | | | | $— | |
| | | | | | | | | | | | | | | | | | | | |
| † | Issuer was not an affiliated company as of June 30, 2016. |
| ‡ | Includes stock split during the period. |
| | | | |
| matthewsasia.com | 800.789.ASIA | | | 151 | |
Notes to Financial Statements (unaudited) (continued)
| 8. | INCOME TAX INFORMATION INCOME AND WITHHOLDING TAXES |
It is the policy of the Funds to comply with all requirements of the Internal Revenue Code of 1986, as amended (“the Code”), applicable to regulated investment companies and to distribute substantially all of their taxable income to their shareholders. The Funds have met the requirements of the Code applicable to regulated investment companies for the year ended December 31, 2015. Therefore, no federal income tax provision is required.
Management has analyzed the Funds’ tax positions taken on federal income tax returns for all open tax years (current and prior three tax years), and has concluded that no provision for federal income tax is required in the Funds’ financial statements. The Funds’ federal and state income and federal excise tax returns for tax years for which the applicable statutes of limitations have not expired are subject to examination by the Internal Revenue Service and state departments of revenue.
Under current tax law, the Funds have elected to defer certain qualified late-year losses and recognize such losses in the year ending December 31, 2015.
| | | | |
| | | Late Year
Losses* | |
| Matthews Asia Strategic Income Fund | | | $179,842 | |
| Matthews Asian Growth and Income Fund | | | 366,546 | |
| Matthews Asia Dividend Fund | | | 32,923,665 | |
| Matthews China Dividend Fund | | | 87,749 | |
| Matthews China Fund | | | 2,902,517 | |
| * | The Funds have elected to defer certain qualified late-year losses and recognize such losses in the next fiscal year. |
As of December 31, 2015, the Funds have capital loss carryforwards available to offset future realized capital gains through the indicated expiration dates as follows:
| | | | | | | | | | | | | | | | | | | | |
| | | | | | | | | Amount With No Expiration* | | | | |
| LOSSES DEFERRED EXPIRING IN: | | 2016 | | | 2017 | | | Short-term
Losses | | | Long-term
Losses | | | Total | |
| Matthews Asia Strategic Income Fund | | | $— | | | | $— | | | | $1,535,532 | | | | $— | | | | $1,535,532 | |
| Matthews Asia Focus Fund | | | — | | | | — | | | | 128,568 | | | | 508,677 | | | | 637,245 | |
| Matthews Asia Growth Fund | | | — | | | | 19,506,205 | | | | — | | | | — | | | | 19,506,205 | |
| Matthews Asia ESG Fund | | | — | | | | — | | | | 29,988 | | | | — | | | | 29,988 | |
| Matthews Emerging Asia Fund | | | — | | | | — | | | | — | | | | 883,817 | | | | 883,817 | |
| Matthews Japan Fund | | | 20,727,478 | | | | 44,032,426 | | | | — | | | | — | | | | 64,759,904 | |
| Matthews Asia Small Companies Fund | | | — | | | | — | | | | 12,769,786 | | | | — | | | | 12,769,786 | |
| * | Post-Enactment Losses: Must be utilized prior to losses subject to expiration. |
Under the Regulated Investment Company Modernization Act of 2010, the Funds are permitted to carry forward capital losses incurred in taxable years beginning after December 22, 2010 for an unlimited period. However, any losses incurred during those future taxable years will be required to be utilized prior to any losses incurred in pre-enactment taxable years, which generally expire after eight years from when they are incurred. Additionally, post-enactment capital losses that are carried forward will retain their character as either short-term or long-term capital losses rather than being considered all short-term as under previous law.
Management has evaluated the impact of all subsequent events on the Funds through the date the financial statements were issued, and has determined that there were no subsequent events that require recognition or disclosure in the financial statements.
Approval of Investment Advisory Agreement (unaudited)
The Matthews Asia Credit Opportunities Fund (the “Fund”), which is a new series of the Trust, has retained Matthews International Capital Management, LLC (“Matthews”) to manage its assets pursuant to the Advisory Agreement, which has been approved by the Board of Trustees of the Fund, including the Independent Trustees. Following an initial term with respect to the Fund upon its commencement of operations, the Advisory Agreement continues in effect from year-to-year provided that the continuance is specifically approved at least annually by the vote of the holders of at least a majority of the outstanding shares of the Fund, or by the Board of Trustees, and, in either event, by a majority of the Independent Trustees of the Trust casting votes in person at a meeting called for that purpose.
At an in-person meeting held on February 23-24, 2016, the Board, including the Independent Trustees of the Trust, approved the Advisory Agreement, with respect to the Fund, for an initial term through August 31, 2017.
The Independent Trustees reviewed and discussed the information provided by Matthews at that and prior meetings. The Independent Trustees were assisted in their deliberations by their independent legal counsel. Below is a summary of the factors considered by the Board in approving the Advisory Agreement with respect to the Fund.
| T | The nature, extent and quality of the services to be provided by Matthews under the Advisory Agreement. The Trustees considered the experience and qualifications of the personnel at Matthews who would be responsible for providing services to the Fund and would be responsible for the daily management of the Fund’s portfolio. The Trustees noted that Matthews has continued to expand its professional staff at both senior and junior levels over the past several years, and has enjoyed relative stability of its senior executive and portfolio management. The Trustees noted Matthews’ on-going commitment to governance, compliance, risk and valuation practices. The Trustees viewed Matthews as well positioned to provide high quality services to the Fund under various market conditions, as demonstrated by the past volatile and challenging securities markets that have caused either contracting revenues or rapidly expanding assets at different times. The Trustees concluded that Matthews has the quality of personnel and other investment resources essential to performing its duties under the Advisory Agreement, and that the nature, overall quality, cost and extent of such management services are expected to be satisfactory and reliable. |
| T | The investment performance of Matthews. The Trustees are familiar with the short-term and long-term performance of other series of the Trust on both an absolute basis and in comparison to peer funds and benchmark indices. This is a new Fund without any prior performance. The Trustees also emphasized longer-term performance goals, which they believe are more important than short isolated periods for purposes of evaluating Matthews’ success in meeting Fund and shareholder objectives. The Trustees concluded that Matthews has the potential to generate acceptable long-term performance for the Fund. |
| T | The extent to which Matthews realizes economies of scale as the Fund grows larger and whether Fund investors benefit from any economies of scale. Because the Fund is new, it is not expected to recognize economies of scale for some time. The Trustees expect to monitor the Fund’s growth and evaluate economies of scale at future renewals of the Advisory Agreement in effect at that time. They expect that the Fund will benefit from existing economies of scale because of the family pricing of certain series of the Trust, including the Fund, including recently negotiated breakpoints. Additional fee reductions were adopted under the Administration and Shareholder Services Agreement for all series of the Trust for each increment of $5 billion of additional assets over $25 billion, with the lowest fee rate on assets over $45 billion. As a result, the Trustees remain satisfied about the extent to which economies of scale would be shared with the Fund and its shareholders. |
| T | The costs of the services to be provided by Matthews and others. The Trustees considered the proposed advisory fees and the expected total fees and expenses of the Fund in comparison to the advisory fees and other fees and expenses of other funds in the Trust, noting that the Fund does not have a fully suitable peer group for its specialty strategy. The Trustees noted the expense limitation that would apply to this Fund, and that the administrative fee would be based on the combined family pricing for the Trust. Also, the total expense ratio to be paid by investors in the Fund, which is most representative of an investor’s net experience, would be reasonable. |
| T | The profits to be realized by Matthews and its affiliates from the relationships with the Fund. The Trustees recognized that, as a new fund with expense limitations in place, it is unlikely that the Fund will generate profits for Matthews initially and may not do so until the Fund has experienced some significant growth. The Trustees also considered that the additional benefits expected to be derived by Matthews from its relationship with the Fund are limited solely to research benefits received in exchange for “soft dollars.” |
No single factor was determinative of the Board’s decision to approve the Advisory Agreement, but rather the Trustees based their determination on the total mix of information available to them. After considering the factors described above, the Board concluded that the terms of the advisory arrangement would be fair and reasonable to the Fund in light of the services that Matthews is expected to provide, and that the Fund’s shareholders are expected to receive reasonable value in return for the advisory fees paid. For these reasons, the approval of the Advisory Agreement with respect to the Fund would be in the best interests of the Fund and its shareholders.
The Advisory Agreement may be terminated by the Trustees on behalf of the Fund or by Matthews upon 60 days’ prior written notice without penalty. The Advisory Agreement will also terminate automatically in the event of its assignment, as defined in the 1940 Act.
| | | | |
| matthewsasia.com | 800.789.ASIA | | | 153 | |
| | |
Matthews Asia Funds | | |
| |
INVESTMENT ADVISOR Matthews International Capital Management, LLC Four Embarcadero Center, Suite 550 San Francisco, CA 94111 800.789.ASIA CUSTODIAN Brown Brothers Harriman & Co. 50 Milk Street Boston, MA 02109 | | ACCOUNT SERVICES Matthews Asia Funds P.O. Box 9791 Providence, RI 02940 800.789.ASIA LEGAL COUNSEL Paul Hastings LLP 55 Second Street, 24th Floor San Francisco, CA 94105 |

P.O. Box 9791 | Providence, RI 02940 | matthewsasia.com | 800.789.ASIA (2742)
Matthews Asia Funds are distributed in the United States by Foreside Funds Distributors LLC, Berwyn, Pennsylvania
Matthews Asia Funds are distributed in Latin America by HMC Partners

SAR-0616-262M
Not applicable.
| Item 3. | Audit Committee Financial Expert. |
Not applicable.
| Item 4. | Principal Accountant Fees and Services. |
Not applicable.
| Item 5. | Audit Committee of Listed Registrants. |
Not applicable.
| (a) | Schedule of Investments in securities of unaffiliated issuers as of the close of the reporting period is included as part of the report to shareholders filed under Item 1 of this form. |
| Item 7. | Disclosure of Proxy Voting Policies and Procedures for Closed-End Management Investment Companies. |
Not applicable.
| Item 8. | Portfolio Managers of Closed-End Management Investment Companies. |
Not applicable.
| Item 9. | Purchases of Equity Securities by Closed-End Management Investment Company and Affiliated Purchasers. |
Not applicable.
| Item 10. | Submission of Matters to a Vote of Security Holders. |
There have been no material changes to the procedures by which the shareholders may recommend nominees to the registrant’s board of directors, where those changes were implemented after the registrant last provided disclosure in response to the requirements of Item 407(c)(2)(iv) of Regulation S-K (17 CFR 229.407) (as required by Item 22(b)(15) of Schedule 14A (17 CFR 240.14a-101)), or this Item.
| Item 11. | Controls and Procedures. |
| | (a) | The registrant’s principal executive and principal financial officers, or persons performing similar functions, have concluded that the registrant’s disclosure controls and procedures (as defined in Rule 30a-3(c) under the Investment Company Act of 1940, as amended (the “1940 Act”) (17 CFR 270.30a-3(c))) are effective, as of a date within 90 days of the filing date of the report that includes the disclosure required by this paragraph, based on their evaluation of these controls and procedures required by Rule 30a-3(b) under the 1940 Act (17 CFR 270.30a-3(b)) and Rules 13a-15(b) or 15d-15(b) under the Securities Exchange Act of 1934, as amended (17 CFR 240.13a-15(b) or 240.15d-15(b)). |
| | (b) | There were no changes in the registrant’s internal control over financial reporting (as defined in Rule 30a-3(d) under the 1940 Act (17 CFR 270.30a-3(d))) that occurred during the registrant’s second fiscal quarter of the period covered by this report that has materially affected, or is reasonably likely to materially affect, the registrant’s internal control over financial reporting. |
| | (a)(2) | Certifications pursuant to Rule 30a-2(a) under the 1940 Act and Section 302 of the Sarbanes-Oxley Act of 2002 are attached hereto. |
| | (b) | Certifications pursuant to Rule 30a-2(b) under the 1940 Act and Section 906 of the Sarbanes-Oxley Act of 2002 are attached hereto. |
SIGNATURES
Pursuant to the requirements of the Securities Exchange Act of 1934 and the Investment Company Act of 1940, the registrant has duly caused this report to be signed on its behalf by the undersigned, thereunto duly authorized.
| | |
(Registrant) | | Matthews International Funds |
| | |
By (Signature and Title)* | | /s/ William J. Hackett |
| | William J. Hackett, President |
| | (principal executive officer) |
Pursuant to the requirements of the Securities Exchange Act of 1934 and the Investment Company Act of 1940, this report has been signed below by the following persons on behalf of the registrant and in the capacities and on the dates indicated.
| | |
By (Signature and Title)* | | /s/ William J. Hackett |
| | William J. Hackett, President |
| | (principal executive officer) |
| | |
By (Signature and Title)* | | /s/ Shai Malka |
| | Shai Malka, Treasurer |
| | (principal financial officer) |
| * | Print the name and title of each signing officer under his or her signature. |
