UNITED STATES
SECURITIES AND EXCHANGE COMMISSION
Washington, D.C. 20549
FORM N-CSR
CERTIFIED SHAREHOLDER REPORT OF REGISTERED
MANAGEMENT INVESTMENT COMPANIES
Investment Company Act file number 811-08510
Matthews International Funds
(Exact name of registrant as specified in charter)
Four Embarcadero Center, Suite 550
San Francisco, CA 94111
(Address of principal executive offices) (Zip code)
William J. Hackett, President
Four Embarcadero Center, Suite 550
San Francisco, CA 94111
(Name and address of agent for service)
Registrant’s telephone number, including area code: 415-788-7553
Date of fiscal year end: December 31
Date of reporting period: June 30, 2018
Form N-CSR is to be used by management investment companies to file reports with the Commission not later than 10 days after the transmission to stockholders of any report that is required to be transmitted to stockholders under Rule 30e-1 under the Investment Company Act of 1940 (17 CFR 270.30e-1). The Commission may use the information provided on Form N-CSR in its regulatory, disclosure review, inspection, and policymaking roles.
A registrant is required to disclose the information specified by Form N-CSR, and the Commission will make this information public. A registrant is not required to respond to the collection of information contained in Form N-CSR unless the Form displays a currently valid Office of Management and Budget (“OMB”) control number. Please direct comments concerning the accuracy of the information collection burden estimate and any suggestions for reducing the burden to Secretary, Securities and Exchange Commission, 450 Fifth Street, NW, Washington, DC 20549-0609. The OMB has reviewed this collection of information under the clearance requirements of 44 U.S.C. § 3507.
Item 1. Reports to Stockholders.
The Report to Shareholders is attached herewith.
Matthews Asia Funds | Semi-Annual Report
June 30, 2018 | matthewsasia.com
ASIA FIXED INCOME STRATEGIES
Matthews Asia Strategic Income Fund
Matthews Asia Credit Opportunities Fund
ASIA GROWTH AND INCOME STRATEGIES
Matthews Asian Growth and Income Fund
Matthews Asia Dividend Fund
Matthews China Dividend Fund
ASIA VALUE STRATEGY
Matthews Asia Value Fund
ASIA GROWTH STRATEGIES
Matthews Asia Focus Fund
Matthews Asia Growth Fund
Matthews Pacific Tiger Fund
Matthews Asia ESG Fund
Matthews Emerging Asia Fund
Matthews Asia Innovators Fund
Matthews China Fund
Matthews India Fund
Matthews Japan Fund
Matthews Korea Fund
ASIA SMALL COMPANY STRATEGIES
Matthews Asia Small Companies Fund
Matthews China Small Companies Fund

Investor Class Performance and Expenses (June 30, 2018)
| | | | | | | | | | | | | | | | | | | | | | | | | | | | |
| | | | | | Average Annual Total Return† | | | Inception
Date | | | Prospectus
Expense
Ratios* | | | Prospectus
Expense Ratios
after Fee Waiver
and Expense
Reimbursement* | |
| Investor Class | | 1 year | | | 5 years | | | 10 years | | | Since
Inception | |
ASIA FIXED INCOME STRATEGIES | | | | | | | | | | | | | | | | | | | | | | | | | | | | |
Asia Strategic Income Fund (MAINX) | | | -0.09% | | | | 3.83% | | | | n.a. | | | | 4.28% | | | | 11/30/11 | | | | 1.29% | | | | 1.15% | 1 |
Asia Credit Opportunities Fund (MCRDX) | | | -0.45% | | | | n.a. | | | | n.a. | | | | 4.39% | | | | 4/29/16 | | | | 1.86% | | | | 1.15% | 1 |
ASIA GROWTH AND INCOME STRATEGIES | | | | | | | | | | | | | | | | | | | | | | | | | | | | |
Asian Growth and Income Fund (MACSX) | | | -0.51% | | | | 2.51% | | | | 4.99% | | | | 9.06% | | | | 9/12/94 | | | | 1.07% | | | | 1.07% | |
Asia Dividend Fund (MAPIX) | | | 9.27% | | | | 8.22% | | | | 9.17% | | | | 9.62% | | | | 10/31/06 | | | | 1.03% | | | | 1.02% | 2 |
China Dividend Fund (MCDFX) | | | 21.22% | | | | 13.52% | | | | n.a. | | | | 11.60% | | | | 11/30/09 | | | | 1.19% | | | | 1.19% | |
ASIA VALUE STRATEGY | | | | | | | | | | | | | | | | | | | | | | | | | | | | |
Asia Value Fund (MAVRX) | | | 8.64% | | | | n.a. | | | | n.a. | | | | 13.91% | | | | 11/30/15 | | | | 2.32% | | | | 1.50% | 3 |
ASIA GROWTH STRATEGIES | | | | | | | | | | | | | | | | | | | | | | | | | | | | |
Asia Focus Fund (MAFSX) | | | 5.38% | | | | 4.93% | | | | n.a. | | | | 3.41% | | | | 4/30/13 | | | | 2.45% | | | | 1.50% | 3 |
Asia Growth Fund (MPACX) | | | 20.61% | | | | 9.55% | | | | 9.34% | | | | 10.05% | | | | 10/31/03 | | | | 1.12% | | | | 1.12% | |
Pacific Tiger Fund (MAPTX) | | | 10.15% | | | | 8.99% | | | | 8.77% | | | | 8.86% | | | | 9/12/94 | | | | 1.08% | | | | 1.06% | 2 |
Asia ESG Fund (MASGX) | | | 9.93% | | | | n.a. | | | | n.a. | | | | 5.85% | | | | 4/30/15 | | | | 2.65% | | | | 1.50% | 3 |
Emerging Asia Fund (MEASX) | | | -5.13% | | | | 8.67% | | | | n.a. | | | | 7.18% | | | | 4/30/13 | | | | 1.70% | | | | 1.48% | 3 |
Asia Innovators Fund (MATFX) | | | 19.09% | | | | 15.36% | | | | 10.32% | | | | 4.23% | | | | 12/27/99 | | | | 1.24% | | | | 1.24% | |
China Fund (MCHFX) | | | 22.37% | | | | 11.72% | | | | 7.10% | | | | 10.38% | | | | 2/19/98 | | | | 1.09% | | | | 1.09% | |
India Fund (MINDX) | | | 5.66% | | | | 17.06% | | | | 10.05% | | | | 11.87% | | | | 10/31/05 | | | | 1.09% | | | | 1.09% | |
Japan Fund (MJFOX) | | | 16.27% | | | | 11.73% | | | | 7.93% | | | | 6.69% | | | | 12/31/98 | | | | 0.95% | | | | 0.94% | 2 |
Korea Fund (MAKOX) | | | 0.00% | | | | 10.46% | | | | 7.95% | | | | 6.39% | | | | 1/3/95 | | | | 1.15% | | | | 1.15% | |
ASIA SMALL COMPANY STRATEGIES | | | | | | | | | | | | | | | | | | | | | | | | | | | | |
Asia Small Companies Fund (MSMLX) | | | 12.87% | | | | 5.90% | | | | n.a. | | | | 11.74% | | | | 9/15/08 | | | | 1.49% | | | | 1.46% | 3 |
China Small Companies Fund (MCSMX) | | | 36.21% | | | | 14.78% | | | | n.a. | | | | 7.36% | | | | 5/31/11 | | | | 2.34% | | | | 1.50% | 3 |
| * | These figures are from the Funds’ prospectus dated as of April 30, 2018, and may differ from the actual expense ratios for fiscal year 2018, as shown in the financial highlights section of this report. |
| † | Annualized performance for periods of at least one year, otherwise cumulative. |
| 1 | Matthews has contractually agreed (i) to waive fees and reimburse expenses to the extent needed to limit Total Annual Fund Operating Expenses (excluding Rule 12b-1 fees, taxes, interest, brokerage commissions, short sale dividend expenses, expenses incurred in connection with any merger or reorganization or extraordinary expenses such as litigation) of the Institutional Class to 0.90% first by waiving class specific expenses (i.e., shareholder service fees specific to a particular class) of the Institutional Class and then, to the extent necessary, by waiving non-class specific expenses of the Institutional Class, and (ii) if any Fund-wide expenses (i.e., expenses that apply to both the Institutional Class and the Investor Class) are waived for the Institutional Class to maintain the 0.90% expense limitation, to waive an equal amount (in annual percentage terms) of those same expenses for the Investor Class. The Total Annual Fund Operating Expenses After Fee Waiver and Expense Reimbursement for the Investor Class may vary from year to year and will in some years exceed 0.90%. If the operating expenses fall below the expense limitation in a year within three years after Matthews has made a waiver or reimbursement, the Fund may reimburse Matthews up to an amount that does not cause the expenses for that year to exceed the lesser of the (i) expense limitation applicable at the time of that fee waiver and/or expense reimbursement or (ii) the expense limitation in effect at the time of recoupment. This agreement will remain in place until April 30, 2019 and may be terminated at any time by the Board of Trustees on behalf of the Fund on 60 days’ written notice to Matthews. Matthews may decline to renew this agreement by written notice to the Trust at least 30 days before its annual expiration date. |
| 2 | Matthews has contractually agreed to waive a portion of its advisory fee and administrative and shareholder services fee if the Fund’s average daily net assets are over $3 billion, as follows: for every $2.5 billion average daily net assets of the Fund that are over $3 billion, the advisory fee rate and the administrative and shareholder services fee rate for the Fund with respect to such excess average daily net assets will be each reduced by 0.01%, in each case without reducing such fee rate below 0.00%. Any amount waived by Matthews pursuant to this agreement may not be recouped by Matthews. This agreement will remain in place until April 30, 2019 and may be terminated (i) at any time by the Board of Trustees upon 60 days’ prior written notice to Matthews; or (ii) by Matthews at the annual expiration date of the agreement upon 60 days’ prior written notice to the Trust, in each case without payment of any penalty. |
| 3 | Matthews has contractually agreed (i) to waive fees and reimburse expenses to the extent needed to limit Total Annual Fund Operating Expenses (excluding Rule 12b-1 fees, taxes, interest, brokerage commissions, short sale dividend expenses, expenses incurred in connection with any merger or reorganization or extraordinary expenses such as litigation) of the Institutional Class to 1.25% first by waiving class specific expenses (i.e., shareholder service fees specific to a particular class) of the Institutional Class and then, to the extent necessary, by waiving non-class specific expenses of the Institutional Class, and (ii) if any Fund-wide expenses (i.e., expenses that apply to both the Institutional Class and the Investor Class) are waived for the Institutional Class to maintain the 1.25% expense limitation, to waive an equal amount (in annual percentage terms) of those same expenses for the Investor Class. The Total Annual Fund Operating Expenses After Fee Waiver and Expense Reimbursement for the Investor Class may vary from year to year and will in some years exceed 1.25%. If the operating expenses fall below the expense limitation in a year within three years after Matthews has made a waiver or reimbursement, the Fund may reimburse Matthews up to an amount that does not cause the expenses for that year to exceed the lesser of (i) the expense limitation applicable at the time of that fee waiver and/or expense reimbursement or (ii) the expense limitation in effect at the time of recoupment. This agreement will remain in place until April 30, 2019 and may be terminated at any time by the Board of Trustees on behalf of the Fund on 60 days’ written notice to Matthews. Matthews may decline to renew this agreement by written notice to the Trust at least 30 days before its annual expiration date. |
Institutional Class Performance and Expenses (June 30, 2018)
| | | | | | | | | | | | | | | | | | | | | | | | | | | | |
| Institutional Class | | | | | Average Annual Total Return† | | | Inception
Date | | | Prospectus
Expense
Ratios* | | | Prospectus
Expense Ratios
after Fee Waiver
and Expense
Reimbursement* | |
| | 1 year | | | 5 years | | | 10 years | | | Since
Inception | |
ASIA FIXED INCOME STRATEGIES | | | | | | | | | | | | | | | | | | | | | | | | | | | | |
Asia Strategic Income Fund (MINCX) | | | 0.25% | | | | 4.09% | | | | n.a. | | | | 4.51% | | | | 11/30/11 | | | | 1.08% | | | | 0.90% | 1 |
Asia Credit Opportunities Fund (MICPX) | | | -0.27% | | | | n.a. | | | | n.a. | | | | 4.60% | | | | 4/29/16 | | | | 1.62% | | | | 0.90% | 1 |
ASIA GROWTH AND INCOME STRATEGIES | | | | | | | | | | | | | | | | | | | | | | | | | | | | |
Asian Growth and Income Fund (MICSX) | | | -0.40% | | | | 2.67% | | | | n.a. | | | | 4.03% | | | | 10/29/10 | | | | 0.93% | | | | 0.93% | |
Asia Dividend Fund (MIPIX) | | | 9.39% | | | | 8.35% | | | | n.a. | | | | 7.75% | | | | 10/29/10 | | | | 0.92% | | | | 0.91% | 2 |
China Dividend Fund (MICDX) | | | 21.40% | | | | 13.72% | | | | n.a. | | | | 10.61% | | | | 10/29/10 | | | | 1.04% | | | | 1.04% | |
ASIA VALUE STRATEGY | | | | | | | | | | | | | | | | | | | | | | | | | | | | |
Asia Value Fund (MAVAX) | | | 8.85% | | | | n.a. | | | | n.a. | | | | 14.19% | | | | 11/30/15 | | | | 2.08% | | | | 1.25% | 3 |
ASIA GROWTH STRATEGIES | | | | | | | | | | | | | | | | | | | | | | | | | | | | |
Asia Focus Fund (MIFSX) | | | 5.62% | | | | 5.20% | | | | n.a. | | | | 3.67% | | | | 4/30/13 | | | | 2.27% | | | | 1.25% | 3 |
Asia Growth Fund (MIAPX) | | | 20.82% | | | | 9.77% | | | | n.a. | | | | 8.53% | | | | 10/29/10 | | | | 0.93% | | | | 0.93% | |
Pacific Tiger Fund (MIPTX) | | | 10.32% | | | | 9.19% | | | | n.a. | | | | 6.77% | | | | 10/29/10 | | | | 0.91% | | | | 0.89% | 2 |
Asia ESG Fund (MISFX) | | | 10.28% | | | | n.a. | | | | n.a. | | | | 6.13% | | | | 4/30/15 | | | | 2.46% | | | | 1.25% | 3 |
Emerging Asia Fund (MIASX) | | | -4.91% | | | | 8.91% | | | | n.a. | | | | 7.41% | | | | 4/30/13 | | | | 1.52% | | | | 1.25% | 3 |
Asia Innovators Fund (MITEX) | | | 19.23% | | | | 15.57% | | | | n.a. | | | | 14.65% | | | | 4/30/13 | | | | 1.05% | | | | 1.05% | |
China Fund (MICFX) | | | 22.57% | | | | 11.88% | | | | n.a. | | | | 4.74% | | | | 10/29/10 | | | | 0.93% | | | | 0.93% | |
India Fund (MIDNX) | | | 5.84% | | | | 17.28% | | | | n.a. | | | | 6.71% | | | | 10/29/10 | | | | 0.89% | | | | 0.89% | |
Japan Fund (MIJFX) | | | 16.36% | | | | 11.85% | | | | n.a. | | | | 11.87% | | | | 10/29/10 | | | | 0.87% | | | | 0.86% | 2 |
Korea Fund (MIKOX) | | | 0.14% | | | | 10.63% | | | | n.a. | | | | 8.77% | | | | 10/29/10 | | | | 1.01% | | | | 1.01% | |
ASIA SMALL COMPANY STRATEGIES | | | | | | | | | | | | | | | | | | | | | | | | | | | | |
Asia Small Companies Fund (MISMX) | | | 13.07% | | | | 6.13% | | | | n.a. | | | | 5.20% | | | | 4/30/13 | | | | 1.35% | | | | 1.25% | 3 |
China Small Companies Fund (MICHX)4 | | | 36.36% | | | | 14.81% | | | | n.a. | | | | 7.38% | | | | 11/30/17 | | | | 2.09% | | | | 1.25% | 3 |
| * | These figures are from the Funds’ prospectus dated as of April 30, 2018, and may differ from the actual expense ratios for fiscal year 2018, as shown in the financial highlights section of this report. |
| † | Annualized performance for periods of at least one year, otherwise cumulative. |
| 1 | Matthews has contractually agreed (i) to waive fees and reimburse expenses to the extent needed to limit Total Annual Fund Operating Expenses (excluding Rule 12b-1 fees, taxes, interest, brokerage commissions, short sale dividend expenses, expenses incurred in connection with any merger or reorganization or extraordinary expenses such as litigation) of the Institutional Class to 0.90%. If the operating expenses fall below the expense limitation in a year within three years after Matthews has made a waiver or reimbursement, the Fund may reimburse Matthews up to an amount that does not cause the expenses for that year to exceed the lesser of the (i) expense limitation applicable at the time of that fee waiver and/or expense reimbursement or (ii) the expense limitation in effect at the time of recoupment. This agreement will remain in place until April 30, 2019 and may be terminated at any time by the Board of Trustees on behalf of the Fund on 60 days’ written notice to Matthews. Matthews may decline to renew this agreement by written notice to the Trust at least 30 days before its annual expiration date. |
| 2 | Matthews has contractually agreed to waive a portion of its advisory fee and administrative and shareholder services fee if the Fund’s average daily net assets are over $3 billion, as follows: for every $2.5 billion average daily net assets of the Fund that are over $3 billion, the advisory fee rate and the administrative and shareholder services fee rate for the Fund with respect to such excess average daily net assets will be each reduced by 0.01%, in each case without reducing such fee rate below 0.00%. Any amount waived by Matthews pursuant to this agreement may not be recouped by Matthews. This agreement will remain in place until April 30, 2019 and may be terminated (i) at any time by the Board of Trustees upon 60 days’ prior written notice to Matthews; or (ii) by Matthews at the annual expiration date of the agreement upon 60 days’ prior written notice to the Trust, in each case without payment of any penalty. |
| 3 | Matthews has contractually agreed to waive fees and reimburse expenses to the extent needed to limit Total Annual Fund Operating Expenses (excluding Rule 12b-1 fees, taxes, interest, brokerage commissions, short sale dividend expenses, expenses incurred in connection with any merger or reorganization or extraordinary expenses such as litigation) of the Institutional Class to 1.25%. If the operating expenses fall below the expense limitation in a year within three years after Matthews has made a waiver or reimbursement, the Fund may reimburse Matthews up to an amount that does not cause the expenses for that year to exceed the lesser of (i) the expense limitation applicable at the time of that fee waiver and/or expense reimbursement or (ii) the expense limitation in effect at the time of recoupment. This agreement will remain in place until April 30, 2019 and may be terminated at any time by the Board of Trustees on behalf of the Fund on 60 days’ written notice to Matthews. Matthews may decline to renew this agreement by written notice to the Trust at least 30 days before its annual expiration date. |
| 4 | Institutional Class Shares were first offered on November 30, 2017. For performance since that date, please see the Fund’s performance table in the report. Performance for the Institutional Class Shares prior to its inception represents the performance of the Investor Class. Performance differences between the Institutional Class and Investor Class may arise due to differences in fees charged to each class. |
Past Performance: All performance quoted in this report is past performance and is no guarantee of future results. Investment return and principal value will fluctuate with changing market conditions so that when redeemed, shares may be worth more or less than their original cost. Current performance may be lower or higher than the returns quoted. If certain of the Funds’ fees and expenses had not been waived, returns would have been lower. For the Funds’ most recent month-end performance, please call 800.789.ASIA (2742) or visit matthewsasia.com.
| | | | |
| matthewsasia.com | 800.789.ASIA | | | 2 | |

Contents
Cover photo: Beautiful garden with Chinese architectural bridge and reflection in the lake.
This report has been prepared for Matthews International Funds (d/b/a Matthews Asia Funds) shareholders. It is not authorized for distribution to prospective investors unless accompanied or preceded by a current Matthews Asia Funds prospectus, which contains more complete information about the Funds’ investment objectives, risks and expenses. Additional copies of the prospectus or summary prospectus may be obtained at matthewsasia.com. Please read the prospectus carefully before you invest or send money.
The views and opinions in this report were current as of June 30, 2018. They are not guarantees of performance or investment results and should not be taken as investment advice. Investment decisions reflect a variety of factors, and the managers reserve the right to change their views about individual stocks, sectors and the markets at any time. As a result, the views expressed should not be relied upon as a forecast of a Fund’s future investment intent. Current and future portfolio holdings are subject to risk.
Statements of fact are from sources considered reliable, but neither the Funds nor the Investment Advisor makes any representation or guarantee as to their completeness or accuracy.
Investment Risk: Mutual fund shares are not deposits or obligations of, or guaranteed by, any depositary institution. Shares are not insured by the FDIC, Federal Reserve Board or any government agency and are subject to investment risks, including possible loss of principal amount invested. Investing in international and emerging markets may involve additional risks, such as social and political instability, market illiquidity, exchange-rate fluctuations, a high level of volatility and limited regulation. Fixed income investments are subject to additional risks, including, but not limited to, interest rate, credit and inflation risks. In addition, single-country and sector funds may be subject to a higher degree of market risk than diversified funds because of a concentration in a specific industry, sector or geographic location. Investing in small and mid-size companies is more risky than investing in large companies as they may be more volatile and less liquid than larger companies. Please see the Funds’ prospectus and Statement of Additional Information for more risk disclosure.
Message to Shareholders from the Investment Advisor
Dear Valued Investors,
The past two quarters have been volatile and difficult for Asia’s markets. This has led to the usual calls to try and time the market—to jump the gun on monetary cycles and to second guess the headlines. I have always found this a dangerous game. At Matthews Asia, we have found patience to be a virtue at times like this. The headline clamor has been all about trade wars and politics. These, we are told, create an atmosphere of uncertainty within which it is difficult for markets to perform. “Expect more volatility,” the pundits cry. And by this they really mean: “Markets will likely fall!” The sentiment surrounding Asia, which never really turned wholly positive, has once again swung back to one of caution and suspicion.
I’ve never really liked this way of describing market movements, which seems to border on the metaphysical. Why would the trade scuffles do much from a broad macroeconomic perspective? It makes no sense. Certain industries could surely be impacted. But what may be bad for Chinese manufacturers could be good for those in Malaysia or Vietnam. It is too complex an issue to be treated in a binary way. Is it so complex that people are just throwing their hands up in the air and standing clear until the dust settles? Maybe. But that is potentially a costly move. The actual macroeconomic impact of tariffs is small and investors can largely sidestep it by owning domestically focused businesses. So if that indecision is really driving Asia’s stock markets down, it’s a bit of a giveaway to long-term investors right now. So is it really true that a swirling uncertainty of trade and politics is causing investors to be illogically nervous about Asia and selling out at ridiculous prices?
If only it were so simple. For then, we could easily take advantage. But I suspect there is a much simpler (and more concrete) explanation for the weakness in Asia’s markets: money. Or, rather, the increasing scarcity of money. The monetary cycle has turned. The U.S. Federal Reserve is intent on raising rates, even as the spread between longer- and shorter-dated bond yields narrows (the so-called “two-ten spread,” which now stands at just 0.31%).1 Are we barely one rate rise away from an inverted yield curve and an economic slowdown in the U.S.? The other central banks are not exactly leaning against the Fed’s tightening. You can make a case that the Bank of Japan is still pursuing looser money, yes; however, the European Central Bank has stayed pat, even as the European banking system continues to teeter on the brink. The share price of Deutsche Bank—an institution large enough to cause a systemic liquidity shock should it run into trouble—continues to hit new lows. The liquidity conditions in China are tightening, too. And peripheral nations such as Indonesia and the Philippines are already raising interest rates. These are real concerns for investors, as tighter money will impact nominal growth and feed into profit growth for listed companies and therefore impact their share prices. So, it is not illogical that markets are falling, nor is it due to some unspecified funk that investors have gotten into. It’s real and it’s calculated.
But that doesn’t mean we can’t take advantage of these calculated fears. How? What do we have that the price-setters in the market lack? Patience. I do not argue that investors that are selling are doing so illogically, but they are doing so with a shorter-term time horizon than we have. It is the marginal investor who sets the price, the investor who is most emotionally driven, the investor who palpably feels Greed and Fear. These emotions are amplified when you look at the short term. I have often thought their calculations are guided by the same kind of thought process that author Douglas Adams taught us was the key to flying: “You must learn how to throw yourself at the ground and miss.... Clearly, it is the second part, the missing, which presents the difficulties.” And for the marginal investors now, they are mostly concerned with trying to miss the ground. You have to focus elsewhere.
| 1 | Federal Reserve Bank of St. Louis |
I try to remember at times like this that monetary cycles are a “fluttering veil” that can hide or disguise the underlying real forces in an economy. So long as entrepreneurialism, investment, good governance flourishes underneath that veil, it will only temporarily be hidden from view. With that in mind, I do see opportunities arising for the patient investor. For the long-run secular trends in Asia all remain in place. These include high savings, productivity growth, infrastructure spending, openness to trade, and the pursuit of institutional and market reform. The medium-term cycle of credit, profits and wages has largely been subdued in Asia, with the exception of Japan. And so there are not really any cyclical excesses built up in the economic system—not to the extent that corporates are over-indebted or that political and class tensions are awoken, or that banking systems are stretched.
The medium- to long-term cycles both look favorable. It is only the monetary cycle that has brought what I see as a temporary halt to the macroeconomic tailwinds for the region. The focus on short-term rewards has also caused a great divergence in market prices, where those companies that are able to meet short-run expectations and feed those emotional desires have been bid up. Those companies that require patience have seen their share prices languish.
In the reversal of sentiment we have seen lately, therefore, I do believe that opportunities are arising for long-term investors. Parts of Southeast Asia appear to have been unnecessarily acutely sold down. Some of the bank stocks, while always the most vulnerable in a monetary cycle, look quite cheap. There are opportunities, too, in some of the companies that will patiently accumulate returns, as their stocks seem to be trading now at outright cheap valuations. Certainly, I find in my conversations with my investment team colleagues that they see real value and opportunities in some good-quality businesses. We don’t focus our attention trying to guess where the bottom of the market is. Rather, we continue to focus on the businesses that we believe will survive through the bad times and prosper in the good, and we take our opportunities where we find them.

Robert Horrocks, PhD
Chief Investment Officer
Matthews International Capital Management, LLC
| | | | |
| matthewsasia.com | 800.789.ASIA | | | 5 | |

| | | | |
| PORTFOLIO MANAGERS |
| Teresa Kong, CFA | | |
Lead Manager | | |
| Satya Patel | | Wei Zhang |
Co-Manager | | Co-Manager |
|
| FUND FACTS |
| | | Investor | | Institutional |
Ticker | | MAINX | | MINCX |
CUSIP | | 577125503 | | 577125602 |
Inception | | 11/30/11 | | 11/30/11 |
NAV | | $10.38 | | $10.38 |
Initial Investment | | $2,500 | | $100,000 |
Gross Expense Ratio1 | | 1.29% | | 1.08% |
After Fee Waiver and Reimbursement2 | | 1.15% | | 0.90% |
Portfolio Statistics | | | | |
Total # of Positions | | 45 |
Net Assets | | $116.7 million |
Modified Duration3 | | 2.74 |
Portfolio Turnover4 | | 36.58% |
Benchmark | | |
Markit iBoxx Asian Local Bond Index* |
OBJECTIVE
Total return over the long term with an emphasis on income.
STRATEGY
Under normal market conditions, the Fund seeks to achieve its investment objective by investing at least 80% of its net assets, which include borrowings for investment purposes, in income-producing securities including, but not limited to, dividend paying equity securities, and debt and debt-related instruments issued by governments, quasi-governmental entities, supra-national institutions, and companies in Asia. Asia consists of all countries and markets in Asia, such as China and India, and includes developed, emerging, and frontier countries and markets in the Asian region. Investments may be denominated in any currency, and may represent any part of a company’s capital structure from debt to equity or with features of both.
Matthews Asia Strategic Income Fund
Portfolio Manager Commentary (unaudited)
For the first half of 2018, the Matthews Asia Strategic Income Fund returned –3.49% (Investor Class) and –3.28% (Institutional Class) while its benchmark, the Markit iBoxx Asian Local Bond Index, returned –3.33%. For the quarter ending June 30, the Fund returned –5.26% (Investor Class) and –5.20% (Institutional Class) compared to the benchmark return of –4.31% over the same period.
Market Environment:
The key pillars for Asia’s strength were firmly in place as the year began, but some of these pillars looked increasingly fragile in the second quarter. Stability in the first quarter was followed by a notable return of volatility in the second quarter. While U.S. growth remains strong, European economic indicators surprised on the downside in the first quarter. Rising trade tensions between the U.S. and China also led to market swings.
On the interest rate front, volatility in rates markets led to a repricing of risk globally as investors demanded higher risk premiums. Strong economic data in the U.S. has increased rate hike expectations for the remainder of 2018 and 2019. As rates in the U.S. moved higher in the second quarter, interest rates in most Asian countries followed suit. The notable exception was China. The higher bond yields resulting from efforts by Chinese authorities to deleverage the financial system began easing earlier in the year and continued through June.
Asia high yield credit spreads are now significantly wider than historical averages. With the attractive value of Asia high yield relative to its U.S. and European counterparts, demand for Asia bonds may turn positive. It is important to put this mild depreciation in the context of the more severe sell-off in the currencies of emerging market countries such as Turkey, Brazil and South Africa—all of which experienced depreciation of more than 15% relative to the U.S. dollar in the second quarter.
After a stable first quarter, Asia high-yield credit spreads widened by 100 basis points (1.0%) in the second quarter, driven by issuers in China and Indonesia. Dispersion among dollar-denominated bonds increased, presenting an opportunity to identify attractive relative value. In this environment, security selection is paramount and we continued to move our portfolio into low duration, higher quality issuers where we believe we are well-compensated for the risk.
Performance Contributors and Detractors:
In the second quarter, among the biggest contributors to portfolio returns were our holdings in the bonds of Sprint Communications, KWG Property Holding and DFCC Bank in Sri Lanka. Sprint Communications, which is majority-owned by the Japanese firm Softbank, benefited from a renewed effort to merge the company with its rival, T-Mobile. The combined company would likely benefit from increased scale and lower leverage. The bonds of Chinese property developers have been under pressure this year as spreads have widened and credit conditions continued to be tight in onshore China. KWG is a high-quality developer with ample liquidity and solid prospects. DFCC Bank bonds mature in October this year and, given their short remaining life, we earned attractive carry with little price volatility by owning them.
The largest detractors in the second quarter were sub-investment grade Indonesian corporate bonds issued by Lippo Karawaci†, the convertible bonds of CP Foods, a
(continued)
| † | Lippo Karawaci is listed as Theta Capital Pte, Ltd. |
| * | The Index performance reflects the returns of the discontinued predecessor HSBC Asian Local Bond Index up to December 31, 2012 and the returns of the successor Markit iBoxx Asian Local Bond Index thereafter. |
| 1 | Prospectus expense ratios. |
| 2 | Matthews has contractually agreed (i) to waive fees and reimburse expenses to the extent needed to limit Total Annual Fund Operating Expenses (excluding Rule 12b-1 fees, taxes, interest, brokerage commissions, short sale dividend expenses, expenses incurred in connection with any merger or reorganization or extraordinary expenses such as litigation) of the Institutional Class to 0.90% first by waiving class specific expenses (i.e., shareholder service fees specific to a particular class) of the Institutional Class and then, to the extent necessary, by waiving non-class specific expenses of the Institutional Class, and (ii) if any Fund-wide expenses (i.e., expenses that apply to both the Institutional Class and the Investor Class) are waived for the Institutional Class to maintain the 0.90% expense limitation, to waive an equal amount (in annual percentage terms) of those same expenses for the Investor Class. The Total Annual Fund Operating Expenses After Fee Waiver and Expense Reimbursement for the Investor Class may vary from year to year and will in some years exceed 0.90%. If the operating expenses fall below the expense limitation in a year within three years after Matthews has made a waiver or reimbursement, the Fund may reimburse Matthews up to an amount that does not cause the expenses for that year to exceed the lesser of (i) the expense limitation applicable at the time of that fee waiver and/or expense reimbursement or (ii) the expense limitation in effect at the time of recoupment. This agreement will remain in place until April 30, 2019 and may be terminated at any time by the Board of Trustees on behalf of the Fund on 60 days’ written notice to Matthews. Matthews may decline to renew this agreement by written notice to the Trust at least 30 days before its annual expiration date. |
| 3 | Modified duration measures the percent change in value of the fixed income portion of the portfolio in response to a 1% change in interest rates. In a multi-currency denominated portfolio with sensitivities to different interest rate regimes, modified duration will not accurately reflect the change in value of the overall portfolio from a change in any one interest rate regime. |
| 4 | The lesser of fiscal year 2017 long-term purchase costs or sales proceeds divided by the average monthly market value of long-term securities. |
| | | | | | | | | | | | | | | | | | | | | | | | | | | | |
| | | | | | | | |
| PERFORMANCE AS OF JUNE 30, 2018 | | | | | | | | | | | | | | | | | | | | | |
| | | | | | | | | Average Annual Total Returns | | | | |
| | | 3 Months | | | YTD | | | 1 Year | | | 3 Years | | | 5 Years | | | Since
Inception | | | Inception
Date | |
| Investor Class (MAINX) | | | -5.26% | | | | -3.49% | | | | -0.09% | | | | 4.41% | | | | 3.83% | | | | 4.28% | | | | 11/30/11 | |
| Institutional Class (MINCX) | | | -5.20% | | | | -3.28% | | | | 0.25% | | | | 4.70% | | | | 4.09% | | | | 4.51% | | | | 11/30/11 | |
| Markit iBoxx Asian Local Bond Index5 | | | -4.31% | | | | -3.33% | | | | 0.88% | | | | 2.09% | | | | 1.56% | | | | 1.96% | | | | | |
| Lipper Emerging Markets Hard Currency Debt Funds Category Average6 | | | -5.29% | | | | -5.74% | | | | -2.20% | | | | 3.47% | | | | 2.47% | | | | 3.76% | | | | | |
Performance assumes reinvestment of all dividends and/or distributions before taxes. All performance quoted represents past performance and is no guarantee of future results. Investment return and principal value will fluctuate with market conditions so that when redeemed, shares may be worth more or less than their original cost. Current performance may be lower or higher than the return figures quoted. Returns would have been lower if certain of the Fund’s fees and expenses had not been waived. For the Fund’s most recent month-end performance visit matthewsasia.com.
| | | | | | | | | | | | | | | | | | | | | | | | | | | | | | | | | | | | | | | | | | | | |
| | | | | | | | | | |
| INCOME DISTRIBUTION HISTORY | | | | | | | | | | | | | | | | | | | | | | | | | | | | |
| | | 2018 | | | | | | 2017 | |
| | Q1 | | | Q2 | | | Q3 | | | Q4 | | | Total | | | | | | Q1 | | | Q2 | | | Q3 | | | Q4 | | | Total | |
| Investor (MAINX) | | $ | 0.12 | | | $ | 0.10 | | | | n.a. | | | | n.a. | | | | n.a. | | | | | | | $ | 0.07 | | | $ | 0.08 | | | $ | 0.13 | | | $ | 0.14 | | | $ | 0.42 | |
| Inst’l (MINCX) | | $ | 0.13 | | | $ | 0.11 | | | | n.a. | | | | n.a. | | | | n.a. | | | | | | | $ | 0.08 | | | $ | 0.08 | | | $ | 0.14 | | | $ | 0.15 | | | $ | 0.45 | |
Note: This table does not include capital gains distributions. Totals may differ by $0.02 due to rounding. For income distribution history, visit matthewsasia.com.
| | | | |
30-DAY YIELD: Investor Class: 4.15% (4.06% excluding waivers) Institutional Class: 4.41% (4.29% excluding waivers) The 30-Day Yield represents net investment income earned by the Fund over the 30-day period ended 6/30/2018, expressed as an annual percentage rate based on the Fund’s share price at the end of the 30-day period. The 30-Day Yield should be regarded as an estimate of the Fund’s rate of investment income, and it may not equal the Fund’s actual income distribution rate. Source: BNY Mellon Investment Servicing (US) Inc. | | | | YIELD TO WORST: 6.54% Yield to worst is the lowest yield that can be received on a bond assuming that the issuer does not default. It is calculated by utilizing the worst case assumptions for a bond with respect to certain income-reducing factors, including prepayment, call or sinking fund provisions. It does not represent the yield that an investor should expect to receive. Past yields are no guarantee of future yields. Source: FactSet Research Systems |
GROWTH OF A $10,000 INVESTMENT SINCE INCEPTION—INVESTOR CLASS
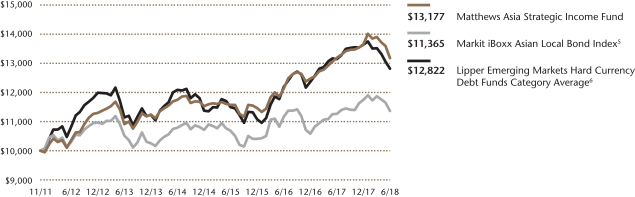
Plotted monthly. The performance data and graph do not reflect the deduction of taxes that a shareholder would pay on dividends, capital gains distributions or redemption of Fund shares. Values are in US$.
| | 5 | It is not possible to invest directly in an index. Source: Index data from HSBC, Markit iBoxx and Bloomberg; total return calculations performed by BNY Mellon Investment Servicing (US) Inc. Please see page 92 for index definitions. The Index performance reflects the returns of the discontinued predecessor HSBC Asian Local Bond Index up to December 31, 2012 and the returns of the successor Markit iBoxx Asian Local Bond Index thereafter. |
| | 6 | The Lipper Category Average does not reflect sales charges and is based on total return, including reinvestment of dividends and capital gains for the stated periods. |
| | | | | | | | |
| | | | |
| TOP TEN HOLDINGS | | | | | | | |
| | | Sector | | Currency | | % of Net Assets | |
| Ctrip.com International, Ltd., Cnv., 1.250%, 09/15/2022 | | Consumer Discretionary | | U.S. Dollar | | | 4.8% | |
| Debt and Asset Trading Corp., 1.000%, 10/10/2025 | | Financials | | U.S. Dollar | | | 4.2% | |
| Wanda Properties International Co., Ltd., 7.250%, 01/29/2024 | | Real Estate | | U.S. Dollar | | | 4.1% | |
| China Overseas Finance Investment Cayman V, Ltd., Cnv., 0.000%, 01/05/2023 | | Real Estate | | U.S. Dollar | | | 3.9% | |
| KWG Property Holding, Ltd., 6.000%, 09/15/2022 | | Real Estate | | U.S. Dollar | | | 3.6% | |
| Malaysia Government Investment Issue, 3.226%, 04/15/2020 | | Foreign Government Bonds | | Malaysian Ringgit | | | 3.5% | |
| Standard Chartered PLC, 6.500%, 12/29/2049 | | Financials | | U.S. Dollar | | | 3.1% | |
| LIC Housing Finance, Ltd., 7.830%, 09/25/2026 | | Financials | | Indian Rupee | | | 2.9% | |
| CIFI Holdings Group Co., Ltd., 6.875%, 04/23/2021 | | Real Estate | | U.S. Dollar | | | 2.7% | |
| Malaysia Government Investment Issue, 4.194%, 07/15/2022 | | Foreign Government Bonds | | Malaysian Ringgit | | | 2.6% | |
| % OF ASSETS IN TOP TEN | | | | | | | 35.4% | |
| | | | |
| matthewsasia.com | 800.789.ASIA | | | 7 | |
| | | | |
| |
| CURRENCY ALLOCATION (%)7,8 | |
| U.S. Dollar (USD) | | | 53.9 | |
| Chinese Renminbi (CNY) | | | 14.3 | |
| Malaysian Ringgit (MYR) | | | 7.2 | |
| Indian Rupee (INR) | | | 5.9 | |
| Indonesian Rupiah (IDR) | | | 4.7 | |
| Hong Kong Dollar (HKD) | | | 3.3 | |
| Vietnamese Dong (VND) | | | 1.7 | |
| South Korean Won (KRW) | | | 0.3 | |
| Cash and Other Assets, Less Liabilities | | | 8.6 | |
| | | | |
| |
| COUNTRY ALLOCATION (%)7,8,9 | |
| China/Hong Kong | | | 50.2 | |
| Indonesia | | | 11.4 | |
| Malaysia | | | 7.2 | |
| India | | | 5.9 | |
| Vietnam | | | 5.9 | |
| Sri Lanka | | | 4.0 | |
| Thailand | | | 2.5 | |
| Japan | | | 2.4 | |
| United States | | | 1.6 | |
| South Korea | | | 0.3 | |
| Cash and Other Assets, Less Liabilities | | | 8.6 | |
| | | | |
| |
| SECTOR ALLOCATION (%)7,8 | |
| Real Estate | | | 21.1 | |
| Financials | | | 19.3 | |
| Foreign Government Bonds | | | 15.3 | |
| Consumer Discretionary | | | 10.4 | |
| Utilities | | | 7.3 | |
| Energy | | | 5.6 | |
| Industrials | | | 4.3 | |
| Telecommunication Services | | | 3.9 | |
| Consumer Staples | | | 2.5 | |
| Information Technology | | | 1.7 | |
| Cash and Other Assets, Less Liabilities | | | 8.6 | |
Please note: Foreign Government Bonds category includes Supranationals.
| | | | |
| |
| ASSET TYPE BREAKDOWN (%)7,8 | |
| Non-Convertible Corporate Bonds | | | 53.3 | |
| Government Bonds | | | 19.4 | |
| Convertible Corporate Bonds | | | 18.7 | |
| Cash and Other Assets, Less Liabilities | | | 8.6 | |
| 7 | Source: FactSet Research Systems. Percentage values in data are rounded to the nearest tenth of one percent, so the values may not sum to 100% due to rounding. Percentage values may be derived from different data sources and may not be consistent with other Fund literature. |
| 8 | Cash and other assets may include forward currency exchange contracts and certain derivative instruments that have been marked-to-market. |
| 9 | Not all countries where the Fund may invest are included in the benchmark index. |
Matthews Asia Strategic Income Fund
Portfolio Manager Commentary (unaudited) (continued)
Thai company, and Indonesian government bonds. Lippo Karawaci is a property developer in Indonesia. Bonds performed poorly in the quarter as high yield spreads widened and the Indonesian central bank raised interest rates to help stabilize the Indonesian rupiah, potentially dampening property purchases in the country. CP Foods’ convertible bonds performed poorly as shares of its subsidiary CP All corrected on softer growth. Indonesian government bonds performed poorly as the Indonesian rupiah depreciated versus the dollar and rates moved higher.
Notable Portfolio Changes:
In the second quarter, we started a number of positions in local currency, high yield and convertible bonds. We selectively added to our local currency bond holdings. For instance, we invested in Malaysian government bonds and the dim sum bonds of Franshion, a leading property developer. As high yield spreads widened and expectations for rate hikes from the U.S. Federal Reserve increased, we added shorter duration bonds with mid-single digit yields, which we expect will have potentially limited interest rate sensitivity while earning reasonable returns. These include the bonds of Chinese companies like KWG Property and Tsinghua Unigroup, which we added after they fell in price. We also added the convertible bonds of companies like Zhongsheng Group, a leading Chinese auto-dealership, and China Overseas Land & Investment, a high quality Chinese property developer.
We also closed a handful of positions in the quarter. Notably, we decreased both our local currency exposure and duration in Indonesia and India. Both countries have relatively high beta currencies and saw rates move higher in the second quarter, and we proactively reduced risk in each. We also exercised our put on the convertible bonds of Saratoga Investama, an Indonesian holding company with stakes in leading Indonesian companies, as we saw limited upside in continuing to hold the bonds.
Outlook:
While we anticipate that Asia’s fixed income markets may remain volatile through the second half of 2018, we do believe that current prices have corrected to account for much of the uncertainty in the global environment. We expect U.S. rates to set the tone for local rates in Asia’s developed countries as the U.S. economic cycle gathers momentum and starts to create mild inflation. Recent Federal Reserve commentary has led to somewhat higher expectations for rate hikes in 2018 and 2019. We expect inflation to remain subdued in emerging economies such as India and Indonesia, offering insulation from the rising rate environment globally. The wild card is for tariffs, which can create inflation in the U.S.
We expect Asian currencies to rebound in the second half of the year as the U.S. dollar loses the strong momentum it displayed in the second quarter. One significant driver of dollar strength has been euro weakness. Some measures of Eurozone economic sentiment hit lows experienced during the Global Financial Crisis and Greek Crisis, so we think the euro is more likely to strengthen than weaken given the amount of negativity priced in.
Finally, Asia high yield spreads are now significantly wider than historical averages, with room to fall given default rates of less than 2%. With the attractive value of Asia high yield relative to its U.S. and European counterparts, we expect greater demand for Asia bonds. On the supply side, the move by Chinese regulators to limit offshore issuance to just refinancing of existing issues might create scarcity value. The relative value of Asia combined with little net new supply should drive spreads lower. Here, too, there is potential downside in the negative headlines associated with the inevitable rise of defaults in China. While we have consistently highlighted the need for more defaults to drive a more appropriate credit risk premia onshore, some investors might conflate the Chinese onshore corporate market, which we believe is expensive, with that of the Chinese offshore market, which already has experienced a substantial correction. In sum, we see value in U.S. dollar-denominated debt of Asia corporates because the valuation can be grounded in intrinsic value. As long as we maintain a long-term investment horizon of greater than three years, and experience no defaults, the total return potential for U.S. dollar bonds offers compelling investment opportunity at current levels.
Matthews Asia Strategic Income Fund
June 30, 2018
Schedule of Investmentsa (unaudited)
NON-CONVERTIBLE CORPORATE BONDS: 53.3%
| | | | | | | | |
| | | Face Amount* | | | Value | |
| CHINA/HONG KONG: 32.8% | |
Wanda Properties International Co., Ltd.
7.250%, 01/29/24b | | | 5,000,000 | | | | $4,787,500 | |
KWG Property Holding, Ltd.
6.000%, 09/15/22b | | | 4,500,000 | | | | 4,157,266 | |
Standard Chartered PLC
6.500%c, 04/02/20b,d | | | 3,700,000 | | | | 3,671,984 | |
CIFI Holdings Group Co., Ltd.
6.875%, 04/23/21b | | | 3,200,000 | | | | 3,159,376 | |
PetroChina Co., Ltd., Series A
3.030%, 01/19/21 | | | CNY 20,000,000 | | | | 2,900,068 | |
State Grid Corp. of China, Series B
3.150%, 11/14/21 | | | CNY 20,000,000 | | | | 2,877,681 | |
Tsinghua Unic, Ltd.
4.750%, 01/31/21b | | | 3,000,000 | | | | 2,845,389 | |
HSBC Holdings PLC
6.375%c, 03/30/25d | | | 2,500,000 | | | | 2,453,125 | |
PetroChina Co., Ltd.
3.150%, 03/03/21 | | | CNY 15,000,000 | | | | 2,163,185 | |
Unigroup International Holdings, Ltd.
6.000%, 12/10/20b | | | 2,000,000 | | | | 1,969,810 | |
China Southern Power Grid Co., Ltd.
3.140%, 03/11/21 | | | CNY 12,000,000 | | | | 1,750,838 | |
China National Petroleum Corp., Series INBK | | | | | |
4.690%, 01/11/22 | | | CNY 10,000,000 | | | | 1,518,168 | |
State Grid Corp. of China
3.750%, 11/11/20 | | | CNY 10,000,000 | | | | 1,478,387 | |
Huaneng Power International, Inc., Series A
3.480%, 06/13/21 | | | CNY 10,000,000 | | | | 1,464,322 | |
Franshion Brilliant, Ltd.
5.200%, 03/08/21b | | | CNY 7,000,000 | | | | 1,052,537 | |
| | | | | | | | |
Total China/Hong Kong | | | | | | | 38,249,636 | |
| | | | | | | | |
| | | | | | | | |
| INDONESIA: 6.6% | | | | | | | | |
Theta Capital Pte, Ltd.
6.750%, 10/31/26b | | | 3,500,000 | | | | 2,462,880 | |
Modernland Overseas Pte, Ltd.
6.950%, 04/13/24b | | | 1,900,000 | | | | 1,634,800 | |
Alam Synergy Pte, Ltd.
6.950%, 03/27/20e | | | 1,500,000 | | | | 1,357,500 | |
Theta Capital Pte, Ltd.
7.000%, 04/11/22b | | | 1,200,000 | | | | 957,521 | |
Listrindo Capital BV
4.950%, 09/14/26b | | | 1,000,000 | | | | 895,000 | |
Alam Synergy Pte, Ltd.
6.950%, 03/27/20b | | | 500,000 | | | | 452,500 | |
| | | | | | | | |
Total Indonesia | | | | | | | 7,760,201 | |
| | | | | | | | |
| | | | | | | | |
| INDIA: 5.9% | | | | | | | | |
LIC Housing Finance, Ltd., Series 309
7.830%, 09/25/26 | | | INR 240,000,000 | | | | 3,430,765 | |
Housing Development Finance Corp., Ltd., Series K-24 | |
8.950%, 03/21/23 | | | INR 100,000,000 | | | | 1,480,684 | |
Power Finance Corp., Ltd., Series 151A
7.470%, 09/16/21 | | | INR 90,000,000 | | | | 1,274,309 | |
Rural Electrification Corp., Ltd., Series 122
9.020%, 06/18/19 | | | INR 50,000,000 | | | | 738,238 | |
| | | | | | | | |
Total India | | | | | | | 6,923,996 | |
| | | | | | | | |
| | | | | | | | |
| | | Face Amount* | | | Value | |
| SRI LANKA: 4.0% | | | | | | | | |
DFCC Bank PLC
9.625%, 10/31/18b | | | 2,650,000 | | | | $2,685,801 | |
National Savings Bank
5.150%, 09/10/19b | | | 2,000,000 | | | | 1,970,800 | |
| | | | | | | | |
Total Sri Lanka | | | | | | | 4,656,601 | |
| | | | | | | | |
| | | | | | | | |
| JAPAN: 2.4% | | | | | | | | |
SoftBank Group Corp.
6.000%c, 07/19/23b,d | | | 3,150,000 | | | | 2,746,882 | |
| | | | | | | | |
Total Japan | | | | | | | 2,746,882 | |
| | | | | | | | |
| | | | | | | | |
| UNITED STATES: 1.6% | | | | | | | | |
Sprint Communications, Inc.
6.000%, 11/15/22 | | | 1,863,000 | | | | 1,846,699 | |
| | | | | | | | |
Total United States | | | | | | | 1,846,699 | |
| | | | | | | | |
| | | | | | | | |
| TOTAL NON-CONVERTIBLE CORPORATE BONDS | | | | 62,184,015 | |
| | | | | | | | |
(Cost $64,793,734) | | | | | | | | |
| | | | | | | | |
FOREIGN GOVERNMENT OBLIGATIONS: 19.4% | |
| MALAYSIA: 7.2% | | | | | | | | |
Malaysia Government Investment Issue | |
3.226%, 04/15/20 | | | MYR 16,600,000 | | | | 4,075,845 | |
Malaysia Government Investment Issue | |
4.194%, 07/15/22 | | | MYR 12,000,000 | | | | 2,993,652 | |
Malaysia Government Investment Issue | |
3.872%, 08/30/18 | | | MYR 5,500,000 | | | | 1,362,363 | |
| | | | | | | | |
Total Malaysia | | | | | | | 8,431,860 | |
| | | | | | | | |
| | | | | | | | |
| VIETNAM: 5.9% | | | | | | | | |
Debt and Asset Trading Corp.
1.000%, 10/10/25b | | | 6,969,000 | | | | 4,860,877 | |
Socialist Republic of Vietnam
5.200%, 01/12/22 | | | VND 43,000,000,000 | | | | 1,994,295 | |
| | | | | | | | |
Total Vietnam | | | | | | | 6,855,172 | |
| | | | | | | | |
| | | | | | | | |
| INDONESIA: 4.7% | | | | | | | | |
Indonesia Treasury Bond
8.375%, 03/15/24 | | | IDR 40,500,000,000 | | | | 2,887,003 | |
Indonesia Treasury Bond
7.875%, 04/15/19 | | | IDR 38,000,000,000 | | | | 2,658,409 | |
| | | | | | | | |
Total Indonesia | | | | | | | 5,545,412 | |
| | | | | | | | |
| | | | | | | | |
| CHINA/HONG KONG: 1.3% | | | | | | | | |
China Government Bond
3.550%, 12/12/21b | | | CNY 10,000,000 | | | | 1,497,682 | |
| | | | | | | | |
Total China/Hong Kong | | | | | | | 1,497,682 | |
| | | | | | | | |
| | | | | | | | |
| SOUTH KOREA: 0.3% | | | | | | | | |
Korea Treasury Bond
3.500%, 03/10/24 | | | KRW 400,000,000 | | | | 378,728 | |
| | | | | | | | |
Total South Korea | | | | | | | 378,728 | |
| | | | | | | | |
| | | | | | | | |
| TOTAL FOREIGN GOVERNMENT OBLIGATIONS | | | | 22,708,854 | |
| | | | | | | | |
(Cost $22,866,961) | | | | | | | | |
| | | | |
| matthewsasia.com | 800.789.ASIA | | | 9 | |
Matthews Asia Strategic Income Fund
June 30, 2018
Schedule of Investmentsa (unaudited) (continued)
CONVERTIBLE CORPORATE BONDS: 18.7%
| | | | | | | | |
| | | Face Amount* | | | Value | |
| CHINA/HONG KONG: 16.2% | | | | | | | | |
Ctrip.com International, Ltd., Cnv.
1.250%, 09/15/22 | | | 5,500,000 | | | | $5,644,485 | |
China Overseas Finance Investment Cayman V, Ltd., Cnv. | |
0.000%, 01/05/23b | | | 4,400,000 | | | | 4,609,000 | |
Harvest International Co., Cnv.
0.000%, 11/21/22b | | | HKD 22,000,000 | | | | 2,947,831 | |
Vipshop Holdings, Ltd., Cnv.
1.500%, 03/15/19 | | | 2,700,000 | | | | 2,659,770 | |
Johnson Electric Holdings, Ltd., Cnv.
| |
1.000%, 04/02/21b | | | 2,000,000 | | | | 2,132,500 | |
Zhongsheng Group Holdings, Ltd., Cnv. | |
0.000%, 05/23/23b | | | HKD 7,000,000 | | | | 888,874 | |
| | | | | | | | |
Total China/Hong Kong | | | | | | | 18,882,460 | |
| | | | | | | | |
| | | | | | | | |
| THAILAND: 2.5% | | | | | | | | |
CP Foods Holdings, Ltd., Cnv.
0.500%, 09/22/21b | | | 2,800,000 | | | | 2,947,000 | |
| | | | | | | | |
Total Thailand | | | | | | | 2,947,000 | |
| | | | | | | | |
| | | | | | | | |
| TOTAL CONVERTIBLE CORPORATE BONDS | | | | 21,829,460 | |
| | | | | | | | |
(Cost $22,071,504) | | | | | | | | |
| | | | | | | | |
| TOTAL INVESTMENTS: 91.4% | | | | | | | 106,722,329 | |
(Cost $109,732,199) | | | | | | | | |
| | | | | | | | |
CASH AND OTHER ASSETS,
LESS LIABILITIES: 8.6% | | | | | | | 9,979,358 | |
| | | | | | | | |
| | |
NET ASSETS: 100.0% | | | | | | | $116,701,687 | |
| | | | | | | | |
| a | Certain securities were fair valued under the valuation policies approved by the Board of Trustees (Note 2-A). |
| b | The securities may be resold to qualified foreign investors and foreign institutional buyers under Regulation S of the Securities Act of 1933. |
| c | Variable rate security. Security may be issued at a fixed coupon rate, which converts to a variable rate at a specified date. Rate shown is the rate in effect as of period end. |
| d | Perpetual security with no stated maturity date. First call date is disclosed. |
| e | Security exempt from registration under Rule 144A of the Securities Act of 1933, as amended. The security may be resold in transactions exempt from registration normally to qualified institutional buyers. The security has been determined to be liquid in accordance with procedures adopted by the Funds’ Board of Trustees. At June 30, 2018, the aggregate value is $1,357,500, which is 1.16% of net assets. |
| * | All Values in USD unless otherwise specified |
| CNY | Chinese Renminbi (Yuan) |
FORWARD FOREIGN CURRENCY EXCHANGE CONTRACTS
| | | | | | | | | | | | | | |
Currency
Purchased | | Currency Sold | | | Counterparty | | Settlement
Date | | | Unrealized
Appreciation
(Depreciation) | |
| USD 7,973,612 | | | SGD 10,714,940 | | | Merrill Lynch & Co., Inc. | | | 07/18/18 | | | | $106,547 | |
| USD 1,564,334 | | | INR 103,512,000 | | | Merrill Lynch & Co., Inc. | | | 07/30/18 | | | | 58,921 | |
| | | | | | | | | | | | | | |
| | | | | | | | | | | | | 165,468 | |
| | | | | | | | | | | | | | |
| THB 233,643,750 | | | USD 7,500,000 | | | Merrill Lynch & Co., Inc. | | | 07/11/18 | | | | (445,518 | ) |
| SGD 21,429,880 | | | USD 16,400,000 | | | Merrill Lynch & Co., Inc. | | | 07/18/18 | | | | (665,870 | ) |
| INR 103,512,000 | | | USD 1,600,000 | | | Merrill Lynch & Co., Inc. | | | 07/30/18 | | | | (94,586 | ) |
| KRW 8,146,440,000 | | | USD 7,600,000 | | | Merrill Lynch & Co., Inc. | | | 09/14/18 | | | | (267,482 | ) |
| | | | | | | | | | | | | | |
| | | | | | | | | | | | | (1,473,456 | ) |
| | | | | | | | | | | | | | |
Net Unrealized Depreciation | | | | | | | | | | | | | ($1,307,988 | ) |
| | | | | | | | | | | | | | |
See accompanying notes to financial statements.
| | | | |
| PORTFOLIO MANAGERS |
| Teresa Kong, CFA | | Satya Patel |
Lead Manager | | Lead Manager |
| | |
| FUND FACTS | | | | |
| | | Investor | | Institutional |
Ticker | | MCRDX | | MICPX |
CUSIP | | 577130677 | | 577130669 |
Inception | | 4/29/16 | | 4/29/16 |
NAV | | $9.93 | | $9.92 |
Initial Investment | | $2,500 | | $100,000 |
Gross Expense Ratio1 | | 1.86% | | 1.62% |
After Fee Waiver and Reimbursement2 | | 1.15% | | 0.90% |
Portfolio Statistics | | |
Total # of Positions | | 36 |
Net Assets | | $43.2 million |
Modified Duration3 | | 3.15 |
Portfolio Turnover4 | | 27.86% |
Benchmark | | | | |
J.P. Morgan Asia Credit Index |
OBJECTIVE
Total return over the long term.
STRATEGY
Under normal market conditions, the Fund seeks to achieve its investment objective by investing at least 80% of its net assets, which include borrowings for investment purposes, in debt and debt-related instruments issued by companies as well as governments, quasi-governmental entities, and supranational institutions in Asia. Debt and debt-related instruments typically include bonds, debentures, bills, securitized instruments (which are vehicles backed by pools of assets such as loans or other receivables), notes, certificates of deposit and other bank obligations, bank loans, senior secured bank debt, convertible debt securities, credit-linked notes, inflation linked instruments, repurchase agreements, payment-in-kind securities and derivative instruments with fixed income characteristics. Asia consists of all countries and markets in Asia, such as China and Indonesia, in addition to the developed, emerging, and frontier countries and markets in the Asian region.
Matthews Asia Credit Opportunities Fund
Portfolio Manager Commentary (unaudited)
For the first half of 2018, the Matthews Asia Credit Opportunities Fund returned –2.77% (Investor Class) and –2.75% (Institutional Class), while its benchmark, the J.P. Morgan Asia Credit Index (JACI), returned –2.55% over the same period. For the quarter ending June 30, the Fund returned –3.40% (Investor Class) and –3.45% (Institutional Class) compared to the benchmark return of –1.20%.
Market Environment:
The first half of the year was notable for the volatility in financial markets across the world. U.S. Treasury yields continued to move higher as the U.S. Federal Reserve raised interest rates. Continued solid economic data in the U.S., on the margin, has increased rate hike expectations for the remainder of 2018 and 2019. Meanwhile, concerns around trade wars, the reversal of investor flows and politics in Latin America led to a sell-off across emerging markets.
Asia’s credit markets were not immune to this volatility, and in the second quarter, Asian high yield credit spreads widened by 100 basis points (1.0%). Returns were largely negatively correlated to risk, with longest duration and highest spread bonds selling off the most. By country and sector, Chinese issuers came under pressure as policymakers onshore continued to keep credit markets tight, while Indonesian issuers were weak as the Indonesian central bank raised interest rates to combat depreciation in the Indonesian rupiah. The combination of rising interest rates and widening credit spreads created a challenging market environment in the second quarter.
Performance Contributors and Detractors:
Our holdings from China and Thailand were broadly positive performance contributors for the first half of the year. In the second quarter, the biggest contributors to portfolio returns were our holdings in the bonds of Chinese property developers KWG Property Holding and CIFI Holdings Group, as well as the bonds of DFCC Bank in Sri Lanka. The bonds of Chinese property developers have been under pressure this year as spreads have widened and credit conditions continued to be tight in onshore China. Both KWG and CIFI are high quality developers with ample liquidity and solid prospects. DFCC Bank bonds mature in October, and given their short remaining life, we earned attractive carry with little price volatility by owning them.
The largest detractors in the second quarter were sub-investment grade Indonesian corporate bonds issued by Lippo Karawaci and Modernland, and the convertible bonds of CP Foods, a Thai company. Lippo Karawaci and Modernland are both property developers in Indonesia. Bonds performed poorly in the quarter as high yield spreads widened, and the Indonesian central bank raised interest rates to help stabilize the rupiah, potentially dampening property purchases in the country. CP Foods’ convertible bonds performed poorly as its subsidiary CP All’s shares corrected on softer growth.
Notable Portfolio Changes:
In the second quarter, we started a number of new positions in high yield and convertible bonds. As high yield spreads widened and expectations for rate hikes
(continued)
| 1 | Prospectus expense ratios. |
| 2 | Matthews has contractually agreed (i) to waive fees and reimburse expenses to the extent needed to limit Total Annual Fund Operating Expenses (excluding Rule 12b-1 fees, taxes, interest, brokerage commissions, short sale dividend expenses, expenses incurred in connection with any merger or reorganization or extraordinary expenses such as litigation) of the Institutional Class to 0.90% first by waiving class specific expenses (i.e., shareholder service fees specific to a particular class) of the Institutional Class and then, to the extent necessary, by waiving non-class specific expenses of the Institutional Class, and (ii) if any Fund-wide expenses (i.e., expenses that apply to both the Institutional Class and the Investor Class) are waived for the Institutional Class to maintain the 0.90% expense limitation, to waive an equal amount (in annual percentage terms) of those same expenses for the Investor Class. The Total Annual Fund Operating Expenses After Fee Waiver and Expense Reimbursement for the Investor Class may vary from year to year and will in some years exceed 0.90%. If the operating expenses fall below the expense limitation in a year within three years after Matthews has made a waiver or reimbursement, the Fund may reimburse Matthews up to an amount that does not cause the expenses for that year to exceed the lesser of (i) the expense limitation applicable at the time of that fee waiver and/or expense reimbursement or (ii) the expense limitation in effect at the time of recoupment. This agreement will remain in place until April 30, 2019 and may be terminated at any time by the Board of Trustees on behalf of the Fund on 60 days’ written notice to Matthews. Matthews may decline to renew this agreement by written notice to the Trust at least 30 days before its annual expiration date. |
| 3 | Modified duration measures the percent change in value of the fixed income portion of the portfolio in response to a 1% change in interest rates. In a multi-currency denominated portfolio with sensitivities to different interest rate regimes, modified duration will not accurately reflect the change in value of the overall portfolio from a change in any one interest rate regime. |
| 4 | The lesser of fiscal year 2017 long-term purchase costs or sales proceeds divided by the average monthly market value of long-term securities. |
| | | | |
| matthewsasia.com | 800.789.ASIA | | | 11 | |
| | | | | | | | | | | | | | | | | | | | |
| | | | | |
| PERFORMANCE AS OF JUNE 30, 2018 | | | | | | | | | | | | |
| | | | | | | | | Average Annual
Total Retuns | | | | |
| | | 3 Months | | | YTD | | | 1 Year | | | Since
Inception | | | Inception
Date | |
| Investor Class (MCRDX) | | | -3.40% | | | | -2.77% | | | | -0.45% | | | | 4.39% | | | | 4/29/2016 | |
| Institutional Class (MICPX) | | | -3.45% | | | | -2.75% | | | | -0.27% | | | | 4.60% | | | | 4/29/2016 | |
| J.P. Morgan Asia Credit Index5 | | | -1.20% | | | | -2.55% | | | | -0.70% | | | | 2.06% | | | | | |
| Lipper Alternative Credit Focus Funds Cateory Average6 | | | -0.67% | | | | -0.46% | | | | 1.08% | | | | 8.51% | | | | | |
Performance assumes reinvestment of all dividends and/or distributions before taxes. All performance quoted represents past performance and is no guarantee of future results. Investment return and principal value will fluctuate with market conditions so that when redeemed, shares may be worth more or less than their original cost. Current performance may be lower or higher than the return figures quoted. Returns would have been lower if certain of the Fund’s fees and expenses had not been waived. For the Fund’s most recent month-end performance, visit matthewsasia.com.
| | | | | | | | | | | | | | | | | | | | | | | | | | | | | | | | | | | | | | | | | | | | |
| | | | |
| INCOME DISTRIBUTION HISTORY | | | | | | | | | |
| | | 2018 | | | | | | 2017 | |
| | Q1 | | | Q2 | | | Q3 | | | Q4 | | | Total | | | | | | Q1 | | | Q2 | | | Q3 | | | Q4 | | | Total | |
| Investor (MCRDX) | | $ | 0.09 | | | $ | 0.09 | | | | n.a. | | | | n.a. | | | | n.a. | | | | | | | $ | 0.12 | | | $ | 0.08 | | | $ | 0.14 | | | $ | 0.10 | | | $ | 0.43 | |
| Inst’l (MICPX) | | $ | 0.09 | | | $ | 0.09 | | | | n.a. | | | | n.a. | | | | n.a. | | | | | | | $ | 0.12 | | | $ | 0.08 | | | $ | 0.15 | | | $ | 0.10 | | | $ | 0.46 | |
Note: This table does not include capital gains distributions. Totals may differ by $0.02 due to rounding. For income distribution history, visit matthewsasia.com.
| | | | |
30-DAY YIELD: Investor Class: 4.07% (3.83% excluding waivers) Institutional Class: 4.33% (4.04% excluding waivers) The 30-Day Yield represents net investment income earned by the Fund over the 30-day period ended 6/30/18, expressed as an annual percentage rate based on the Fund’s share price at the end of the 30-day period. The 30-Day Yield should be regarded as an estimate of the Fund’s rate of investment income, and it may not equal the Fund’s actual income distribution rate. Source: BNY Mellon Investment Servicing (US) Inc. | | | | YIELD TO WORST: 6.75% Yield to worst is the lowest yield that can be received on a bond assuming that the issuer does not default. It is calculated by utilizing the worst case assumptions for a bond with respect to certain income-reducing factors, including prepayment, call or sinking fund provisions. It does not represent the yield that an investor should expect to receive. Past yields are no guarantee of future yields. Source: FactSet Research Systems |
GROWTH OF A $10,000 INVESTMENT SINCE INCEPTION—INVESTOR CLASS
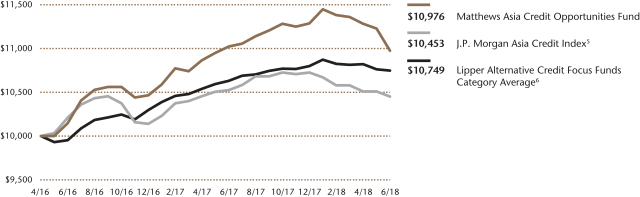
Plotted monthly. The performance data and graph do not reflect the deduction of taxes that a shareholder would pay on dividends, capital gains distributions, or redemption of Fund shares. Values are in US$.
| | 5 | It is not possible to invest directly in an index. Source: Index data from J.P. Morgan and Bloomberg; total return calculations performed by BNY Mellon Investment Servicing (US) Inc. Please see page 92 for index definition. |
| | 6 | The Lipper Category Average does not reflect sales charges and is based on total return, including reinvestment of dividends and capital gains for the stated periods. |
| | | | | | | | |
| | | | |
| TOP TEN HOLDINGS | | | | | | | |
| | | Sector | | Currency | | % of Net Assets | |
| Ctrip.com International, Ltd., Cnv., 1.250%, 09/15/2022 | | Consumer Discretionary | | U.S. Dollar | | | 4.4% | |
| Debt and Asset Trading Corp., 1.000%, 10/10/2025 | | Financials | | U.S. Dollar | | | 4.4% | |
| China Overseas Finance Investment Cayman V, Ltd., Cnv., 0.000%, 01/05/2023 | | Real Estate | | U.S. Dollar | | | 3.9% | |
| Wanda Properties International Co., Ltd., 7.250%, 01/29/2024 | | Real Estate | | U.S. Dollar | | | 3.4% | |
| Huaneng Power International, Inc., 3.480%, 06/13/2021 | | Utilities | | Chinese Renminbi | | | 3.4% | |
| Socialist Republic of Vietnam, 5.500%, 03/12/2028 | | Foreign Government Bonds | | U.S. Dollar | | | 3.3% | |
| Tsinghua Unic, Ltd., 4.750%, 01/31/2021 | | Industrials | | U.S. Dollar | | | 3.3% | |
| KWG Property Holding, Ltd., 6.000%, 09/15/2022 | | Real Estate | | U.S. Dollar | | | 3.2% | |
| SoftBank Group Corp., 6.000%, 07/19/2049 | | Telecom Services | | U.S. Dollar | | | 3.0% | |
| Standard Chartered PLC, 6.500%, 12/29/2049 | | Financials | | U.S. Dollar | | | 3.0% | |
| % OF ASSETS IN TOP TEN | | | | | | | 35.3% | |
Matthews Asia Credit Opportunities Fund
Portfolio Manager Commentary (unaudited) (continued)
from the U.S. Federal Reserve increased, we added shorter duration bonds with mid-single digit yields, which we expect will have limited interest rate sensitivity while earning reasonable returns. We opportunistically added bonds of Chinese property issuers such as KWG Property Holding and CIFI Holdings after they fell in price. We also added the convertible bonds of companies, including those of Johnson Electric, one of the largest producers of micro motors in China; Zhongsheng Group, a leading Chinese auto-dealership; and China Overseas Land & Investment, a high-quality Chinese property developer.
We also closed a handful of positions during the second quarter. We exercised our put on the convertible bonds of Saratoga Investama, an Indonesian holding company with stakes in leading Indonesian companies, as we saw limited upside in continuing to hold the bonds. Our bonds of China Hongqiao Group, the largest aluminum producer in the world, matured, while we sold bonds in Bangkok Dusit Medical, a hospital chain in Thailand.
Outlook:
In our view, Asian high yield bonds appear attractively valued, while U.S. and European high yield bonds appear overvalued. Credit spreads for Asia high yield bonds are almost 100 basis points (1.0%) higher than historic averages. In contrast, spreads for U.S. and European high yield bonds are about 200 basis points (2.0%) below average. In simple terms, Asian high yield bonds are compensating investors for taking credit risk, in our view, while U.S. and European high yield bonds are not.
To be sure, risks remain on the horizon. If a further slowdown in global growth materializes, we expect investor appetite for emerging markets to diminish. Any escalation in trade shocks or further outflows stemming from policy normalization in the U.S. also could put pressure on Asian fixed income markets. Finally, the demand for Asian credit from Chinese wealth managers might fall as the wealth management channels through which buyers purchase bonds are being more closely regulated.
While these risks could increase, we believe that much of this is already being priced in. We have been expecting volatility to rise over the course of 2018, and that was certainly the case in the second quarter. Asian credit markets will likely remain volatile in the second half of 2018, but we believe it is imperative that we continue to stay the course and not sell into the volatility. Based on our solvency and liquidity analysis, we do not expect any of the securities in the portfolio will default. As such, the relatively attractive yields in Asia offer a strong base for positive returns. A bond that starts with a 5% to 8% yield and has 25 basis points (0.25%) of credit spread compression, for example, could generate attractive returns for investors over the course of the year.
| | | | |
| |
| CURRENCY ALLOCATION (%)7,8 | |
| U.S. Dollar (USD) | | | 67.0 | |
| Chinese Renminbi (CNY) | | | 11.4 | |
| Hong Kong Dollar (HKD) | | | 3.3 | |
| Cash and Other Assets, Less Liabilities | | | 18.2 | |
| | | | |
| |
| COUNTRY ALLOCATION (%)7,8,9 | |
| China/Hong Kong | | | 47.9 | |
| Indonesia | | | 11.3 | |
| Vietnam | | | 8.6 | |
| Sri Lanka | | | 6.2 | |
| Japan | | | 3.0 | |
| Thailand | | | 1.9 | |
| Philippines | | | 1.9 | |
| United States | | | 1.0 | |
| Cash and Other Assets, Less Liabilities | | | 18.2 | |
| | | | |
| |
| SECTOR ALLOCATION (%)7,8 | |
| Real Estate | | | 21.9 | |
| Financials | | | 14.0 | |
| Consumer Discretionary | | | 10.2 | |
| Industrials | | | 9.1 | |
| Utilities | | | 8.1 | |
| Foreign Government Bonds | | | 6.2 | |
| Telecommunication Services | | | 6.0 | |
| Energy | | | 3.3 | |
| Consumer Staples | | | 1.9 | |
| Information Technology | | | 0.9 | |
| Cash and Other Assets, Less Liabilities | | | 18.2 | |
| | | | |
| |
| ASSET TYPE BREAKDOWN (%)7,8 | |
| Non-Convertible Corporate Bonds | | | 53.3 | |
| Convertible Corporate Bonds | | | 17.9 | |
| Government Bonds | | | 10.5 | |
| Cash and Other Assets, Less Liabilities | | | 18.2 | |
| 7 | Source: FactSet Research Systems. Percentage values in data are rounded to the nearest tenth of one percent, so the values may not sum to 100% due to rounding. Percentage values may be derived from different data sources and may not be consistent with other Fund literature. |
| 8 | Cash and other assets may include forward currency exchange contracts and certain derivative instruments that have been marked-to-market. |
| 9 | Not all countries where the Fund may invest are included in the benchmark index. |
| | | | |
| matthewsasia.com | 800.789.ASIA | | | 13 | |
Matthews Asia Credit Opportunities Fund
June 30, 2018
Schedule of Investmentsa (unaudited)
NON-CONVERTIBLE CORPORATE BONDS: 53.3%
| | | | | | | | |
| | | Face Amount* | | | Value | |
| CHINA/HONG KONG: 31.9% | | | | | | | | |
Wanda Properties International Co., Ltd. | | | | | | | | |
7.250%, 01/29/24b | | | 1,550,000 | | | | $1,484,125 | |
Huaneng Power International, Inc., Series A | | | | | | | | |
3.480%, 06/13/21 | | | CNY 10,000,000 | | | | 1,464,322 | |
Tsinghua Unic, Ltd. | | | | | | | | |
4.750%, 01/31/21b | | | 1,500,000 | | | | 1,422,694 | |
KWG Property Holding, Ltd. | | | | | | | | |
6.000%, 09/15/22b | | | 1,500,000 | | | | 1,385,756 | |
Standard Chartered PLC | | | | | | | | |
6.500%c, 04/02/20b,d | | | 1,300,000 | | | | 1,290,156 | |
HSBC Holdings PLC | | | | | | | | |
6.375%c, 03/30/25d | | | 1,100,000 | | | | 1,079,375 | |
CIFI Holdings Group Co., Ltd. | | | | | | | | |
6.875%, 04/23/21b | | | 1,000,000 | | | | 987,305 | |
Air China, Ltd. | | | | | | | | |
3.080%, 10/20/21 | | | CNY 6,000,000 | | | | 864,111 | |
KWG Property Holding, Ltd. | | | | | | | | |
8.975%, 01/14/19b | | | 800,000 | | | | 816,012 | |
PetroChina Co., Ltd., Series A | | | | | | | | |
3.030%, 01/19/21 | | | CNY 5,000,000 | | | | 725,017 | |
PetroChina Co., Ltd. | | | | | | | | |
3.150%, 03/03/21 | | | CNY 5,000,000 | | | | 721,062 | |
China Southern Power Grid Co., Ltd. | | | | | | | | |
3.140%, 03/11/21 | | | CNY 4,000,000 | | | | 583,613 | |
State Grid Corp. of China, Series B | | | | | | | | |
3.150%, 11/14/21 | | | CNY 4,000,000 | | | | 575,536 | |
Unigroup International Holdings, Ltd. | | | | | | | | |
6.000%, 12/10/20b | | | 400,000 | | | | 393,962 | |
| | | | | | | | |
Total China/Hong Kong | | | | | | | 13,793,046 | |
| | | | | | | | |
| | | | | | | | |
| INDONESIA: 11.3% | | | | | | | | |
Modernland Overseas Pte, Ltd. | | | | | | | | |
6.950%, 04/13/24b | | | 1,400,000 | | | | 1,204,589 | |
Listrindo Capital BV | | | | | | | | |
4.950%, 09/14/26b | | | 1,000,000 | | | | 895,000 | |
TBG Global Pte, Ltd. | | | | | | | | |
5.250%, 02/10/22b | | | 900,000 | | | | 879,456 | |
Theta Capital Pte, Ltd. | | | | | | | | |
6.750%, 10/31/26b | | | 1,200,000 | | | | 844,416 | |
Alam Synergy Pte, Ltd. | | | | | | | | |
6.950%, 03/27/20b | | | 900,000 | | | | 814,500 | |
Theta Capital Pte, Ltd. | | | | | | | | |
7.000%, 04/11/22b | | | 300,000 | | | | 239,380 | |
| | | | | | | | |
Total Indonesia | | | | | | | 4,877,341 | |
| | | | | | | | |
| | | | | | | | |
| SRI LANKA: 4.2% | | | | | | | | |
DFCC Bank PLC | | | | | | | | |
9.625%, 10/31/18b | | | 1,200,000 | | | | 1,216,212 | |
National Savings Bank | | | | | | | | |
8.875%, 09/18/18b | | | 600,000 | | | | 601,740 | |
| | | | | | | | |
Total Sri Lanka | | | | | | | 1,817,952 | |
| | | | | | | | |
| | | | | | | | |
| JAPAN: 3.0% | | | | | | | | |
SoftBank Group Corp. | | | | | | | | |
6.000%c, 07/19/23b,d | | | 1,500,000 | | | | 1,308,039 | |
| | | | | | | | |
Total Japan | | | | | | | 1,308,039 | |
| | | | | | | | |
| | | | | | | | |
| | | Face Amount* | | | Value | |
| PHILIPPINES: 1.9% | | | | | | | | |
ICTSI Treasury BV | | | | | | | | |
5.875%, 09/17/25b | | | 800,000 | | | | $827,601 | |
| | | | | | | | |
Total Philippines | | | | | | | 827,601 | |
| | | | | | | | |
| | | | | | | | |
| UNITED STATES: 1.0% | | | | | | | | |
Sprint Communications, Inc. | | | | | | | | |
6.000%, 11/15/22 | | | 420,000 | | | | 416,325 | |
| | | | | | | | |
Total United States | | | | | | | 416,325 | |
| | | | | | | | |
| | | | | | | | |
| TOTAL NON-CONVERTIBLE CORPORATE BONDS | | | | 23,040,304 | |
| | | | | | | | |
(Cost $24,235,792) | | | | | | | | |
| | | | | | | | |
CONVERTIBLE CORPORATE BONDS: 17.9% | | | | | |
| CHINA/HONG KONG: 16.0% | | | | | | | | |
Ctrip.com International, Ltd., Cnv. | | | | | | | | |
1.250%, 09/15/22 | | | 1,850,000 | | | | 1,898,599 | |
China Overseas Finance Investment Cayman V, Ltd., Cnv. | | | | | |
0.000%, 01/05/23b | | | 1,600,000 | | | | 1,676,000 | |
Vipshop Holdings, Ltd., Cnv. | | | | | | | | |
1.500%, 03/15/19 | | | 1,100,000 | | | | 1,083,610 | |
Harvest International Co., Cnv. | | | | | | | | |
0.000%, 11/21/22b | | | HKD 7,000,000 | | | | 937,946 | |
Johnson Electric Holdings, Ltd., Cnv. | | | | | | | | |
1.000%, 04/02/21b | | | 750,000 | | | | 799,688 | |
Zhongsheng Group Holdings, Ltd., Cnv. | | | | | | | | |
0.000%, 05/23/23b | | | HKD 4,000,000 | | | | 507,928 | |
| | | | | | | | |
Total China/Hong Kong | | | | | | | 6,903,771 | |
| | | | | | | | |
| | | | | | | | |
| THAILAND: 1.9% | | | | | | | | |
CP Foods Holdings, Ltd., Cnv. | | | | | | | | |
0.500%, 09/22/21b | | | 800,000 | | | | 842,000 | |
| | | | | | | | |
Total Thailand | | | | | | | 842,000 | |
| | | | | | | | |
| | | | | | | | |
| TOTAL CONVERTIBLE CORPORATE BONDS | | | | 7,745,771 | |
| | | | | | | | |
(Cost $7,844,937) | | | | | | | | |
| | | | | | | | |
FOREIGN GOVERNMENT OBLIGATIONS: 10.6% | | | | | |
| VIETNAM: 8.6% | | | | | | | | |
Debt and Asset Trading Corp. | | | | | | | | |
1.000%, 10/10/25b | | | 2,700,000 | | | | 1,883,250 | |
Socialist Republic of Vietnam | | | | | | | | |
5.500%, 03/12/28 | | | 1,470,000 | | | | 1,431,177 | |
Socialist Republic of Vietnam | | | | | | | | |
4.800%, 11/19/24b | | | 400,000 | | | | 397,059 | |
| | | | | | | | |
Total Vietnam | | | | | | | 3,711,486 | |
| | | | | | | | |
Matthews Asia Credit Opportunities Fund
June 30, 2018
Schedule of Investmentsa (unaudited) (continued)
FOREIGN GOVERNMENT OBLIGATIONS (continued)
| | | | | | | | |
| | | Face Amount* | | | Value | |
| SRI LANKA: 2.0% | | | | | | | | |
Sri Lanka Government Bond | | | | | | | | |
6.125%, 06/03/25b | | | 900,000 | | | | $840,990 | |
| | | | | | | | |
Total Sri Lanka | | | | | | | 840,990 | |
| | | | | | | | |
| | | | | | | | |
| TOTAL FOREIGN GOVERNMENT OBLIGATIONS | | | | 4,552,476 | |
| | | | | | | | |
(Cost $4,586,539) | | | | | | | | |
| | | | | | | | |
| TOTAL INVESTMENTS: 81.8% | | | | | | | 35,338,551 | |
(Cost $36,667,268) | | | | | | | | |
| | | | | | | | |
CASH AND OTHER ASSETS,
LESS LIABILITIES: 18.2% | | | | | | | 7,883,438 | |
| | | | | | | | |
| | |
NET ASSETS: 100.0% | | | | | | | $43,221,989 | |
| | | | | | | | |
| a | Certain securities were fair valued under the valuation policies approved by the Board of Trustees (Note 2-A). |
| b | The securities may be resold to qualified foreign investors and foreign institutional buyers under Regulation S of the Securities Act of 1933. |
| c | Variable rate security. Security may be issued at a fixed coupon rate, which converts to a variable rate at a specified date. Rate shown is the rate in effect as of period end. |
| d | Perpetual security with no stated maturity date. First call date is disclosed. |
| * | All Values in USD unless otherwise specified |
| CNY | Chinese Renminbi (Yuan) |
See accompanying notes to financial statements.
| | | | |
| matthewsasia.com | 800.789.ASIA | | | 15 | |

| | | | |
| PORTFOLIO MANAGERS |
| Robert J. Horrocks, PhD | | |
Lead Manager | | |
| Kenneth Lowe, CFA | | |
Lead Manager | | | | |
|
| FUND FACTS |
| | | Investor | | Institutional |
Ticker | | MACSX | | MICSX |
CUSIP | | 577130206 | | 577130842 |
Inception | | 9/12/94 | | 10/29/10 |
NAV | | $16.16 | | $16.13 |
Initial Investment | | $2,500 | | $100,000 |
Gross Expense Ratio1 | | 1.07% | | 0.93% |
Portfolio Statistics | | | | |
Total # of Positions | | 61 |
Net Assets | | $2.2 billion |
Weighted Average Market Cap | | $40.3 billion |
Portfolio Turnover2 | | 23.23% |
Benchmark | | |
MSCI AC Asia ex Japan Index |
OBJECTIVE
Long-term capital appreciation. The Fund also seeks to provide some current income.
STRATEGY
Under normal market conditions, the Fund seeks to achieve its investment objective by investing at least 80% of its total net assets, which include borrowings for investment purposes, in dividend-paying common stock, preferred stock and other equity securities, and convertible securities as well as fixed-income securities, of any duration or quality, of companies located in Asia, which consists of all countries and markets in Asia, including developed, emerging and frontier countries and markets in the Asian region.
Matthews Asian Growth and Income Fund
Portfolio Manager Commentary (unaudited)
For the first half of 2018, the Matthews Asian Growth and Income Fund returned –6.21% (Investor Class), and –6.12% (Institutional Class), while its benchmark, MSCI All Country Asia ex Japan Index, returned –4.65% over the same period. For the quarter ending June 30, the Fund returned –4.46% (Investor Class) and –4.42% (Institutional Class), while its benchmark returned –5.31%.
Market Environment:
Following the market correction and swift recovery in the first quarter of the year, volatility continued in the second quarter as asset values ended the period lower. The case for globally synchronized growth appears to have weakened amid concerns about European politics, tightening monetary conditions and rising tensions about a U.S. trade war with multiple countries.
President Trump’s belief that trade wars are “good and easy to win” has weighed on sentiment, specifically regarding China as the U.S. is set to enact the first wave of tariffs in July on US$34 billion of goods from the country. This number will rise over time and China has responded in kind, imposing its own tariffs on U.S. goods such as soybeans and beef. A continuation of such moves could result in significant economic damage. The quarter also saw tightening monetary conditions in China amid new rules in the US$15 trillion asset management industry, targeting deleveraging in riskier areas.
All of these factors led market participants to question valuations and earnings growth expectations. Risk assets such as Asian equities, credit and currencies dropped in value, with China and Taiwan holding up marginally better than other countries in the region.
Performance Contributors and Detractors:
As volatility returned, the portfolio had a reasonable second quarter, although it underperformed its benchmark in the first half due to a challenging January. The largest contributors in the first half came from our Australia holdings, including blood plasma derivatives manufacturer CSL. The company’s stock rallied in the second quarter on a guidance upgrade due to a strong flu season and as a competitor had a supply issue with a key product. Fellow health care company Resmed, a maker of sleep apnea devices, rose due to impressive earnings as its connected-care strategy gained traction. Macquarie Group was also strong as the company announced solid earnings and outlook across divisions on the maturation of infrastructure funds, the realization of principal investments and as the rise of volatility helped its markets business.
Elsewhere, a couple of the portfolio’s consumer holdings rose over the quarter. Newer holding Zhejiang Supor Cookware, a leading small-appliance maker in China, delivered 22% earnings growth for the second quarter despite fears of rising competition. Japan’s Kao also delivered steady performance as the company is restructuring its cosmetics division to better suit Chinese demand.
The largest detractor to performance over the half came from Chinese online games developer and platform NetEase. The company has suffered earnings downgrades as it reinvests cash into user acquisition and builds its e-commerce initiatives in private label and luxury goods. A couple of the portfolio’s telecom holdings also sputtered, with the worst of these being Bharti Infratel. Shares of the Indian tower company fell as consolidation in the wireless industry threatened tenancy ratios, a key driver of profitability.
Beyond this, a few of the Fund’s financial holdings struggled. Weak sentiment, foreign outflows and currency weakness hurt Indonesian holding Bank Rakyat,
(continued)
| 1 | Prospectus expense ratios. |
| 2 | The lesser of fiscal year 2017 long-term purchase costs or sales proceeds divided by the average monthly market value of long-term securities. |
| | | | | | | | | | | | | | | | | | | | | | | | | | | | | | | | |
| | |
| PERFORMANCE AS OF JUNE 30, 2018 | | | | |
| | | | | | | | | Average Annual Total Returns | | | | |
| | | 3 Months | | | YTD | | | 1 Year | | | 3 Years | | | 5 Years | | | 10 Years | | | Since
Inception | | | Inception
Date | |
| Investor Class (MACSX) | | | -4.46% | | | | -6.21% | | | | -0.51% | | | | 2.25% | | | | 2.51% | | | | 4.99% | | | | 9.06% | | | | 9/12/94 | |
| Institutional Class (MICSX) | | | -4.42% | | | | -6.12% | | | | -0.40% | | | | 2.39% | | | | 2.67% | | | | n.a. | | | | 4.03% | | | | 10/29/10 | |
| MSCI AC Asia ex Japan Index3 | | | -5.31% | | | | -4.65% | | | | 10.21% | | | | 7.32% | | | | 8.48% | | | | 6.10% | | | | 4.70% | 4 | | | | |
| Lipper Pacific Region Funds Category Average5 | | | -3.78% | | | | -3.74% | | | | 9.59% | | | | 7.07% | | | | 7.37% | | | | 4.62% | | | | 4.77% | 4 | | | | |
Performance assumes reinvestment of all dividends and/or distributions before taxes. All performance quoted represents past performance and is no guarantee of future results. Investment return and principal value will fluctuate with market conditions so that when redeemed, shares may be worth more or less than their original cost. Current performance may be lower or higher than the return figures quoted. Returns would have been lower if certain of the Fund’s fees and expenses had not been waived. For the Fund’s most recent month-end performance, visit matthewsasia.com.
| | | | | | | | | | | | | | | | | | | | | | | | | | | | |
| | | | | | | | |
| INCOME DISTRIBUTION HISTORY | | | | | | | | | | | | | | | | | | | | | |
| | | 2018 | | | | | | 2017 | |
| | | June | | | December | | | Total | | | | | | June | | | December | | | Total | |
| Investor (MACSX) | | $ | 0.22 | | | | n.a. | | | | n.a. | | | | | | | $ | 0.10 | | | $ | 0.36 | | | $ | 0.46 | |
| Inst’l (MICSX) | | $ | 0.24 | | | | n.a. | | | | n.a. | | | | | | | $ | 0.12 | | | $ | 0.37 | | | $ | 0.49 | |
Note: This table does not include capital gains distributions. Totals may differ by $0.01 due to rounding. For income distribution history, visit matthewsasia.com.
| | | | |
30-DAY YIELD: 2.12% (Investor Class) 2.28% (Institutional Class) The 30-Day Yield represents net investment income earned by the Fund over the 30-day period ended 6/30/18, expressed as an annual percentage rate based on the Fund’s share price at the end of the 30-day period. The 30-Day Yield should be regarded as an estimate of the Fund’s rate of investment income, and it may not equal the Fund’s actual income distribution rate. Source: BNY Mellon Investment Servicing (US) Inc. | | | | DIVIDEND YIELD: 3.62% The dividend yield (trailing) for the portfolio is the weighted average sum of the dividends paid by each equity security held by the Fund over the 12 months ended 6/30/18 divided by the current price of each equity as of 6/30/18. The annualized dividend yield for the Fund is for the equity-only portion of the portfolio. Please note that this is based on gross equity portfolio holdings and does not reflect the actual yield an investor in the Fund would receive. Past yields are no guarantee of future yields. Source: FactSet Research Systems, Bloomberg, MICM |
GROWTH OF A $10,000 INVESTMENT SINCE INCEPTION—INVESTOR CLASS
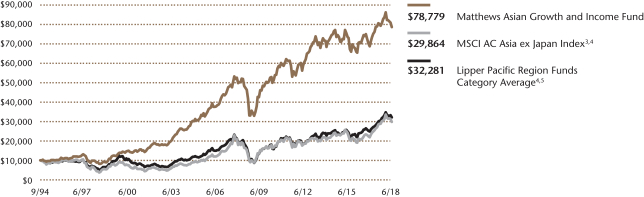
Plotted monthly. The performance data and graph do not reflect the deduction of taxes that a shareholder would pay on dividends, capital gains distributions or redemption of Fund shares. Values are in US$.
| | 3 | It is not possible to invest directly in an index. Source: Index data from Morgan Stanley Capital International and Bloomberg; total return calculations performed by BNY Mellon Investment Servicing (US) Inc. Please see page 92 for index definition. |
| | 4 | Calculated from 8/31/94. |
| | 5 | The Lipper Category Average does not reflect sales charges and is based on total return, including reinvestment of dividends and capital gains for the stated periods. |
| | | | | | | | |
| | | | |
| TOP TEN HOLDINGS6 | | | | | | | |
| | | Sector | | Country | | % of Net Assets | |
| AIA Group, Ltd. | | Financials | | China/Hong Kong | | | 3.6% | |
| United Overseas Bank, Ltd. | | Financials | | Singapore | | | 3.0% | |
| Taiwan Semiconductor Manufacturing Co., Ltd. | | Information Technology | | Taiwan | | | 2.9% | |
| Broadcom, Inc. | | Information Technology | | United States | | | 2.2% | |
| Jardine Matheson Holdings, Ltd. | | Industrials | | China/Hong Kong | | | 2.0% | |
| Samsung Electronics Co., Ltd. | | Information Technology | | South Korea | | | 2.0% | |
| CK Hutchison Holdings, Ltd. | | Industrials | | China/Hong Kong | | | 1.9% | |
| Advantech Co., Ltd. | | Information Technology | | Taiwan | | | 1.9% | |
| Johnson Electric Holdings, Ltd., Cnv., 1.000%, 04/02/2021 | | Industrials | | China/Hong Kong | | | 1.9% | |
| CapitaLand, Ltd., Cnv., 1.950%, 10/17/2023 | | Real Estate | | Singapore | | | 1.9% | |
| % OF ASSETS IN TOP TEN | | | | | | | 23.3% | |
| | 6 | Holdings may combine more than one security from same issuer and related depositary receipts. |
| | | | |
| matthewsasia.com | 800.789.ASIA | | | 17 | |
| | | | |
| |
| COUNTRY ALLOCATION (%)7,8 | |
| China/Hong Kong | | | 38.8 | |
| South Korea | | | 12.7 | |
| Singapore | | | 10.7 | |
| Taiwan | | | 6.3 | |
| Japan | | | 4.7 | |
| Indonesia | | | 4.4 | |
| India | | | 3.4 | |
| Australia | | | 3.0 | |
| Thailand | | | 2.5 | |
| United States | | | 2.2 | |
| Vietnam | | | 1.7 | |
| Malaysia | | | 1.6 | |
| Philippines | | | 1.6 | |
| New Zealand | | | 1.6 | |
| Norway | | | 1.5 | |
| Cash and Other Assets, Less Liabilities | | | 3.2 | |
| | | | |
| |
| SECTOR ALLOCATION (%)8 | |
| Financials | | | 19.3 | |
| Consumer Discretionary | | | 18.4 | |
| Industrials | | | 12.2 | |
| Information Technology | | | 12.1 | |
| Telecommunication Services | | | 11.5 | |
| Consumer Staples | | | 9.5 | |
| Real Estate | | | 8.0 | |
| Utilities | | | 3.5 | |
| Materials | | | 1.2 | |
| Health Care | | | 1.0 | |
| Cash and Other Assets, Less Liabilities | | | 3.2 | |
| | | | |
| |
| MARKET CAP EXPOSURE (%)8 | |
| Mega Cap (over $25B) | | | 41.8 | |
| Large Cap ($10B–$25B) | | | 15.6 | |
| Mid Cap ($3B–10B) | | | 27.0 | |
| Small Cap (under $3B) | | | 12.4 | |
| Cash and Other Assets, Less Liabilities | | | 3.2 | |
| | | | |
| |
| ASSET TYPE BREAKDOWN (%)8,9 | |
| Common Equities and ADRs | | | 83.9 | |
| Convertible Corporate Bonds | | | 11.2 | |
| Preferred Equities | | | 1.7 | |
| Cash and Other Assets, Less Liabilities | | | 3.2 | |
| 7 | Not all countries where the Fund may invest are included in the benchmark index. |
| 8 | Source: FactSet Research Systems. Percentage values in data are rounded to the nearest tenth of one percent, so the values may not sum to 100% due to rounding. Percentage values may be derived from different data sources and may not be consistent with other Fund literature. |
| 9 | Bonds are not included in the MSCI All Country Asia ex Japan Index. |
Matthews Asian Growth and Income Fund
Portfolio Manager Commentary (unaudited) (continued)
compounded by rumors that the bank would bail out a faltering Sharia bank. Bank of the Philippine Islands faced similar macroeconomic conditions as well as undergoing a share issuance. ING Life Insurance in Korea struggled despite good earnings growth as private equity owner’s MBK Partners looked to offload its stake.
Notable Portfolio Changes:
The second quarter was active for the portfolio with six new additions. Four of these were convertible bonds, including Qingdao Haier, Zhongsheng Group, China Overseas Land and Investment and LG Chem. The convertible bond market has witnessed some new issuance and terms have become more attractive. The commonality across all of these is that they are solid credits offering flat to positive yields and reasonable conversion premiums. In our view, the prospective risk-adjusted return, given such positive asymmetry in potential outcomes, is attractive amid such volatile markets.
Within equities, we added China’s leading dairy company, Inner Mongolia Yili Industrial Group. The company is an established leader that generates a healthy 20% return on capital, operates with a net cash balance sheet, and was trading at approximately 20x price-to-earnings ratio (P/E) and a 3% dividend yield. We believe that growth looks attractive from a combination of market share gains, growth in lower tier cities and new product launches. Elsewhere in China, we added Minth Group, an auto parts company specializing in structural parts, trims and decorative parts. The company is well-established with major auto brands and has a product set that is likely to benefit from the industry’s movement toward lighter weighting and new technologies. For this leader, we paid around 13x P/E and the stock also has a 3% dividend yield.
These new positions were funded through the sales of our holdings in CSL, British American Tobacco Malaysia, Brambles, Hyundai Motor and Glow Energy Public.
Outlook:
The list of reasons for investors to remain cautious is long and includes: tightening interest rates in the U.S.; the removal of quantitative easing; European political challenges; an ongoing trade war; high levels of leverage across corporates and households globally; tightening monetary conditions in China; and a fairly late cycle equity market.
These concerns, however, do not necessarily result in a significant decline in asset values. Market timing is certainly not our strongest suit and, in our opinion, the same could be said for the vast majority of capital allocators. We believe market timing should be ignored to focus on what is important–protecting and growing our client’s wealth over full market cycles. What these concerns are likely to produce is a sustained increase in volatility. Against that backdrop, the portfolio will look to both weather that volatility and take advantage of it. We will look to add those leaders that are sold off in line with others when they don’t deserve to be, particularly as growth in Asia is still plentiful. This will augment a portfolio that we firmly believe is already well-placed, trading at around 14.5x P/E and a 3.6% dividend yield for high quality companies capable of sustainable growth over the long term.
Matthews Asian Growth and Income Fund
June 30, 2018
Schedule of Investmentsa (unaudited)
COMMON EQUITIES: 83.9%
| | | | | | | | |
| | | Shares | | | Value | |
| CHINA/HONG KONG: 32.1% | | | | | | | | |
AIA Group, Ltd. | | | 9,066,200 | | | | $78,979,398 | |
Jardine Matheson Holdings, Ltd. | | | 696,200 | | | | 43,869,811 | |
CK Hutchison Holdings, Ltd. | | | 4,032,672 | | | | 42,689,958 | |
Guangdong Investment, Ltd. | | | 25,532,000 | | | | 40,407,849 | |
Techtronic Industries Co., Ltd. | | | 7,072,000 | | | | 39,277,130 | |
HSBC Holdings PLC ADR | | | 829,133 | | | | 39,085,330 | |
HKT Trust & HKT, Ltd. | | | 29,965,000 | | | | 38,223,777 | |
China Mobile, Ltd. ADR | | | 831,500 | | | | 36,910,285 | |
NetEase, Inc. ADR | | | 146,000 | | | | 36,889,820 | |
CLP Holdings, Ltd. | | | 3,392,200 | | | | 36,538,710 | |
Zhejiang Supor Cookware Co., Ltd. A Shares | | | 4,362,370 | | | | 33,765,565 | |
Inner Mongolia Yili Industrial Group Co., Ltd. A Shares | | | 7,522,575 | | | | 31,531,453 | |
Hang Lung Properties, Ltd. | | | 15,220,920 | | | | 31,264,910 | |
VTech Holdings, Ltd. | | | 2,704,000 | | | | 31,165,875 | |
Minth Group, Ltd. | | | 7,338,000 | | | | 31,037,623 | |
Jiangsu Expressway Co., Ltd. H Shares | | | 25,502,000 | | | | 30,367,364 | |
CK Asset Holdings, Ltd. | | | 3,725,172 | | | | 29,489,626 | |
Pacific Textiles Holdings, Ltd. | | | 33,267,000 | | | | 28,250,839 | |
Café de Coral Holdings, Ltd. | | | 9,730,000 | | | | 23,534,826 | |
| | | | | | | | |
Total China/Hong Kong | | | | | | | 703,280,149 | |
| | | | | | | | |
| | | | | | | | |
| SOUTH KOREA: 9.5% | | | | | | | | |
Samsung Electronics Co., Ltd. | | | 1,029,900 | | | | 43,142,081 | |
Coway Co., Ltd. | | | 468,779 | | | | 36,425,537 | |
ING Life Insurance Korea, Ltd.b,c | | | 946,537 | | | | 35,535,126 | |
KT&G Corp. | | | 358,010 | | | | 34,399,364 | |
Macquarie Korea Infrastructure Fund | | | 3,611,141 | | | | 29,031,694 | |
Kangwon Land, Inc. | | | 952,880 | | | | 22,360,542 | |
KEPCO Plant Service & Engineering Co., Ltd. | | | 206,351 | | | | 6,600,243 | |
| | | | | | | | |
Total South Korea | | | | | | | 207,494,587 | |
| | | | | | | | |
| | | | | | | | |
| SINGAPORE: 8.9% | | | | | | | | |
United Overseas Bank, Ltd. | | | 3,343,300 | | | | 65,524,445 | |
Singapore Technologies Engineering, Ltd. | | | 16,838,825 | | | | 40,588,848 | |
Ascendas REIT | | | 20,899,000 | | | | 40,471,799 | |
Singapore Telecommunications, Ltd. | | | 17,836,400 | | | | 40,270,978 | |
SIA Engineering Co., Ltd. | | | 3,366,200 | | | | 7,752,572 | |
| | | | | | | | |
Total Singapore | | | | | | | 194,608,642 | |
| | | | | | | | |
| | | | | | | | |
| TAIWAN: 6.3% | | | | | | | | |
Taiwan Semiconductor Manufacturing Co., Ltd. | | | 9,049,187 | | | | 64,258,995 | |
Advantech Co., Ltd. | | | 6,367,000 | | | | 41,926,113 | |
Taiwan Secom Co., Ltd. | | | 11,131,000 | | | | 32,706,003 | |
| | | | | | | | |
Total Taiwan | | | | | | | 138,891,111 | |
| | | | | | | | |
| | | | | | | | |
| JAPAN: 4.7% | | | | | | | | |
Japan Tobacco, Inc. | | | 1,247,700 | | | | 34,868,745 | |
KDDI Corp. | | | 1,255,800 | | | | 34,339,740 | |
Kao Corp. | | | 449,500 | | | | 34,261,600 | |
| | | | | | | | |
Total Japan | | | | | | | 103,470,085 | |
| | | | | | | | |
| | | | | | | | |
| | | | | | | | |
| | | Shares | | | Value | |
| INDONESIA: 4.4% | | | | | | | | |
PT Telekomunikasi Indonesia Persero ADR | | | 1,329,800 | | | | $34,588,098 | |
PT Bank Rakyat Indonesia Persero | | | 162,467,600 | | | | 32,134,619 | |
PT Matahari Department Store | | | 47,646,100 | | | | 29,181,084 | |
| | | | | | | | |
Total Indonesia | | | | | | | 95,903,801 | |
| | | | | | | | |
| | | | | | | | |
| INDIA: 3.4% | | | | | | | | |
Housing Development Finance Corp., Ltd. | | | 1,430,009 | | | | 39,846,603 | |
Bharti Infratel, Ltd. | | | 7,776,743 | | | | 34,175,281 | |
| | | | | | | | |
Total India | | | | | | | 74,021,884 | |
| | | | | | | | |
| | | | | | | | |
| AUSTRALIA: 3.0% | | | | | | | | |
Macquarie Group, Ltd. | | | 369,240 | | | | 33,651,150 | |
Domino’s Pizza Enterprises, Ltd. | | | 832,006 | | | | 32,132,553 | |
| | | | | | | | |
Total Australia | | | | | | | 65,783,703 | |
| | | | | | | | |
| | | | | | | | |
| UNITED STATES: 2.2% | | | | | | | | |
Broadcom, Inc. | | | 201,300 | | | | 48,843,432 | |
| | | | | | | | |
Total United States | | | | | | | 48,843,432 | |
| | | | | | | | |
| | | | | | | | |
| VIETNAM: 1.6% | | | | | | | | |
Vietnam Dairy Products JSC | | | 4,920,211 | | | | 36,290,620 | |
| | | | | | | | |
Total Vietnam | | | | | | | 36,290,620 | |
| | | | | | | | |
| | | | | | | | |
| PHILIPPINES: 1.6% | | | | | | | | |
Bank of the Philippine Islands | | | 21,614,124 | | | | 35,859,319 | |
| | | | | | | | |
Total Philippines | | | | | | | 35,859,319 | |
| | | | | | | | |
| | | | | | | | |
| NEW ZEALAND: 1.6% | | | | | | | | |
SKYCITY Entertainment Group, Ltd. | | | 12,980,494 | | | | 35,488,044 | |
| | | | | | | | |
Total New Zealand | | | | | | | 35,488,044 | |
| | | | | | | | |
| | | | | | | | |
| MALAYSIA: 1.6% | | | | | | | | |
Genting Malaysia BHD | | | 28,380,000 | | | | 34,270,274 | |
| | | | | | | | |
Total Malaysia | | | | | | | 34,270,274 | |
| | | | | | | | |
| | | | | | | | |
| NORWAY: 1.5% | | | | | | | | |
Telenor ASA | | | 1,629,213 | | | | 33,367,099 | |
| | | | | | | | |
Total Norway | | | | | | | 33,367,099 | |
| | | | | | | | |
| | | | | | | | |
| THAILAND: 1.5% | | | | | | | | |
Kasikornbank Public Co., Ltd. | | | 5,555,800 | | | | 32,503,194 | |
| | | | | | | | |
Total Thailand | | | | | | | 32,503,194 | |
| | | | | | | | |
| | | | | | | | |
TOTAL COMMON EQUITIES | | | | 1,840,075,944 | |
| | | | | | | | |
(Cost $1,757,803,941) | | | | | | | | |
| | | | | | | | |
| | | | |
| matthewsasia.com | 800.789.ASIA | | | 19 | |
Matthews Asian Growth and Income Fund
June 30, 2018
Schedule of Investmentsa (unaudited) (continued)
| | |
| CONVERTIBLE CORPORATE BONDS: 11.2% | | PREFERRED EQUITIES: 1.7% |
| | | | | | | | |
| | | Face Amount* | | | Value | |
| CHINA/HONG KONG: 6.8% | | | | | | | | |
Johnson Electric Holdings, Ltd., Cnv.
1.000%, 04/02/21c | | | 38,500,000 | | | | $41,050,625 | |
China Overseas Finance Investment Cayman V, Ltd., Cnv. | |
0.000%, 01/05/23c | | | 32,600,000 | | | | 34,148,500 | |
Zhongsheng Group Holdings, Ltd., Cnv.
| |
0.000%, 05/23/23c | | | HKD 219,000,000 | | | | 27,809,059 | |
Harvest International Co., Cnv.
0.000%, 11/21/22c | | | HKD 177,000,000 | | | | 23,716,637 | |
Haitian International Holdings, Ltd., Cnv.
| |
2.000%, 02/13/19c | | | 21,500,000 | | | | 21,311,875 | |
| | | | | | | | |
Total China/Hong Kong | | | | | | | 148,036,696 | |
| | | | | | | | |
| | | | | | | | |
| SINGAPORE: 1.9% | | | | | | | | |
CapitaLand, Ltd., Cnv.
1.950%, 10/17/23c | | | SGD 56,000,000 | | | | 40,741,284 | |
| | | | | | | | |
Total Singapore | | | | | | | 40,741,284 | |
| | | | | | | | |
| | | | | | | | |
| SOUTH KOREA: 1.5% | | | | | | | | |
LG Chem, Ltd., Series USD, Cnv.
0.000%, 04/16/21c | | | 27,600,000 | | | | 27,358,500 | |
Lotte Shopping Co., Ltd., Cnv. | | | | | |
0.000%, 04/04/23c | | | KRW 7,200,000 | | | | 6,613,728 | |
| | | | | | | | |
Total South Korea | | | | | | | 33,972,228 | |
| | | | | | | | |
| | | | | | | | |
| THAILAND: 1.0% | | | | | | | | |
Bangkok Dusit Medical Services Public Co., Ltd., Cnv.
| | | | | |
0.000%, 09/18/19c | | | THB 633,000,000 | | | | 22,736,795 | |
| | | | | | | | |
Total Thailand | | | | | | | 22,736,795 | |
| | | | | | | | |
| | | | | | | | |
| TOTAL CONVERTIBLE CORPORATE BONDS | | | | 245,487,003 | |
| | | | | | | | |
(Cost $250,443,520) | | | | | | | | |
| | | | | | | | |
| | | | | | | | |
| | | Shares | | | Value | |
| SOUTH KOREA: 1.7% | | | | | | | | |
LG Household & Health Care, Ltd., Pfd. | | | 55,428 | | | | $36,315,895 | |
| | | | | | | | |
Total South Korea | | | | | | | 36,315,895 | |
| | | | | | | | |
| | | | | | | | |
| TOTAL PREFERRED EQUITIES | | | | | | | 36,315,895 | |
| | | | | | | | |
(Cost $7,229,493) | | | | | | | | |
| | | | | | | | |
| TOTAL INVESTMENTS: 96.8% | | | | | | | 2,121,878,842 | |
(Cost $2,015,476,954) | | | | | | | | |
| | | | | | | | |
CASH AND OTHER ASSETS,
LESS LIABILITIES: 3.2% | | | | | | | 70,366,159 | |
| | | | | | | | |
| | |
NET ASSETS: 100.0% | | | | | | | $2,192,245,001 | |
| | | | | | | | |
| a | Certain securities were fair valued under the valuation policies approved by the Board of Trustees (Note 2-A). |
| b | Security exempt from registration under Rule 144A of the Securities Act of 1933, as amended. The security may be resold in transactions exempt from registration normally to qualified institutional buyers. The security has been determined to be liquid in accordance with procedures adopted by the Funds’ Board of Trustees. At June 30, 2018, the aggregate value is $35,535,126, which is 1.62% of net assets. |
| c | The securities may be resold to qualified foreign investors and foreign institutional buyers under Regulation S of the Securities Act of 1933. |
| * | All Values in USD unless otherwise specified |
| ADR | American Depositary Receipt |
| REIT | Real Estate Investment Trust |
See accompanying notes to financial statements.
| | | | |
| PORTFOLIO MANAGERS |
| Yu Zhang, CFA | | |
Lead Manager | | |
Robert Horrocks, PhD | | Vivek Tanneeru |
Co-Manager | | | | Co-Manager |
| Sherwood Zhang, CFA | | |
Co-Manager | | |
|
| FUND FACTS |
| | | Investor | | Institutional |
Ticker | | MAPIX | | MIPIX |
CUSIP | | 577125107 | | 577130750 |
Inception | | 10/31/06 | | 10/29/10 |
NAV | | $18.86 | | $18.85 |
Initial Investment | | $2,500 | | $100,000 |
Gross Expense Ratio1 | | 1.03% | | 0.92% |
After Fee Waiver and Reimbursement2 | | 1.02% | | 0.91% |
Portfolio Statistics |
Total # of Positions | | 70 |
Net Assets | | $7.1 billion |
Weighted Average Market Cap | | $43.5 billion |
Portfolio Turnover3 | | 28.11% |
Benchmark | | | | |
MSCI AC Asia Pacific Index |
OBJECTIVE
Total return with an emphasis on providing current income.
STRATEGY
Under normal market conditions, the Fund seeks to achieve its investment objective by investing at least 80% of its total net assets, which include borrowings for investment purposes, in dividend-paying equity securities of companies located in Asia. Asia consists of all countries and markets in Asia, and includes developed, emerging and frontier countries and markets in the Asian region. The Fund may also invest in convertible debt and equity securities.
Matthews Asia Dividend Fund
Portfolio Manager Commentary (unaudited)
For the first half of 2018, the Matthews Asia Dividend Fund returned –3.44% (Investor Class) and –3.39% (Institutional Class), while its benchmark, the MSCI All Country Asia Pacific Index, returned –3.22% over the same period. For the quarter ending June 30, the Fund returned –2.73% (Investor Class) and –2.69% (Institutional Class) compared to the benchmark return of –3.25%.
Market Environment:
Asian and global emerging markets suffered during the first half of 2018. Negative investor sentiment resulted from several factors including escalating trade tensions between China and the U.S.; seemingly tighter monetary conditions in China and other emerging markets; and the oscillation of North Korean denuclearization talks.
During the second quarter of the year, the specter of a tit-for-tat trade war between the U.S. and China rose significantly and rattled investor confidence. Recent macroeconomic data from China also started pointing to a potential slowdown in its economic growth induced by China’s financial deleveraging policy, another potential warning sign for the region. In addition, a rally in the U.S. dollar, together with a U.S. rate hike cycle and higher oil prices, further constrained the policy options of some Asian central banks, especially for the region’s more emerging economies of Southeast Asia as their growth models tend to be more susceptible to external shocks. Facing all these uncertainties, Asia’s equity markets struggled during the latter part of the year-to-date period.
Performance Contributors and Detractors:
During both the six-month and second-quarter periods, portfolio holdings from South Korea posed a significant drag on Fund returns.
The Fund’s holdings in Crystal International Group, a Hong Kong-based textile manufacturer, were among the top performance detractors. As one of the largest original equipment manufacturers of apparel in China, Crystal International supplies products to diversified global apparel brands, including Fast Retailing (Uniqlo), H&M, Levi’s and Gap Inc. During the second quarter, the company issued a downward revision of its 2018 earnings outlook for the first half of the year, citing unfavorable foreign currency movements and additional ramp-up costs from its newly expanded manufacturing capacity. This downward revision triggered a negative market reaction, and the stock was sold off aggressively. While we were surprised by this latest guidance, we viewed a significant part of this revision to be short-term and cyclical in nature. We felt the company’s long-term, competitive advantages—its manufacturing capability across multiple product categories and its lean supply-chain management—remained intact and believed the firm should support our investment thesis of being well-positioned to grow its business by gaining further market share. We felt the share price was a good value from which to continue adding to our position.
During the second quarter, a top performance contributor to the Fund was Hua Hong Semiconductor, a Chinese semiconductor foundry business. A major player in the mature eight-inch foundry segment, Hua Hong is currently benefiting from an industry-wide supply shortage for foundry capacity, creating an attractive pricing environment for the company. In addition, Hua Hong has consistently improved its product mix over the years, focusing more on higher average selling prices and higher-margin products. The firm’s stock price delivered strong returns
(continued)
| 1 | Prospectus expense ratios. |
| 2 | Matthews has contractually agreed to waive a portion of its advisory fee and administrative and shareholder services fee if the Fund’s average daily net assets are over $3 billion, as follows: for every $2.5 billion average daily net assets of the Fund that are over $3 billion, the advisory fee rate and the administrative and shareholder services fee rate for the Fund with respect to such excess average daily net assets will be each reduced by 0.01%, in each case without reducing such fee rate below 0.00%. Any amount waived by Matthews pursuant to this agreement may not be recouped by Matthews. This agreement will remain in place until April 30, 2019 and may be terminated (i) at any time by the Board of Trustees upon 60 days’ prior written notice to Matthews; or (ii) by Matthews at the annual expiration date of the agreement upon 60 days’ prior written notice to the Trust, in each case without payment of any penalty. |
| 3 | The lesser of fiscal year 2017 long-term purchase costs or sales proceeds divided by the average monthly market value of long-term securities. |
| | | | |
| matthewsasia.com | 800.789.ASIA | | | 21 | |
| | | | | | | | | | | | | | | | | | | | | | | | | | | | | | | | |
| | | | | | | | | |
| PERFORMANCE AS OF JUNE 30, 2018 | | | | | | | | | | | | | | | | | | | | | | | | |
| | | | | | | | | Average Annual Total Returns | | | | |
| | | 3 Months | | | YTD | | | 1 Year | | | 3 Years | | | 5 Years | | | 10 Years | | | Since
Inception | | | Inception
Date | |
| Investor Class (MAPIX) | | | -2.73% | | | | -3.44% | | | | 9.27% | | | | 7.68% | | | | 8.22% | | | | 9.17% | | | | 9.62% | | | | 10/31/06 | |
| Institutional Class (MIPIX) | | | -2.69% | | | | -3.39% | | | | 9.39% | | | | 7.79% | | | | 8.35% | | | | n.a. | | | | 7.75% | | | | 10/29/10 | |
| MSCI AC Asia Pacific Index4 | | | -3.25% | | | | -3.22% | | | | 10.25% | | | | 7.12% | | | | 7.76% | | | | 4.76% | | | | 4.69% | 5 | | | | |
| Lipper International Equity Income Funds Category Average6 | | | -3.46% | | | | -4.70% | | | | 3.28% | | | | 3.09% | | | | 3.99% | | | | 1.84% | | | | 2.62% | 5 | | | | |
Performance assumes reinvestment of all dividends and/or distributions before taxes. All performance quoted represents past performance and is no guarantee of future results. Investment return and principal value will fluctuate with market conditions so that when redeemed, shares may be worth more or less than their original cost. Current performance may be lower or higher than the return figures quoted. Returns would have been lower if certain of the Fund’s fees and expenses had not been waived. For the Fund’s most recent month-end performance, visit matthewsasia.com.
| | | | | | | | | | | | | | | | | | | | | | | | | | | | | | | | | | | | | | | | | | | | |
| | | | | | | | | | |
| INCOME DISTRIBUTION HISTORY | | | | | | | | | | | | | | | | | | | | | | | | | | | | |
| | | 2018 | | | | | | 2017 | |
| | | Q1 | | | Q2 | | | Q3 | | | Q4 | | | Total | | | | | | Q1 | | | Q2 | | | Q3 | | | Q4 | | | Total | |
| Investor (MAPIX) | | $ | 0.01 | | | $ | 0.19 | | | | n.a. | | | | n.a. | | | | n.a. | | | | | | | $ | 0.02 | | | $ | 0.15 | | | $ | 0.09 | | | $ | 0.43 | | | $ | 0.69 | |
| Inst’l (MIPIX) | | $ | 0.02 | | | $ | 0.20 | | | | n.a. | | | | n.a. | | | | n.a. | | | | | | | $ | 0.03 | | | $ | 0.15 | | | $ | 0.10 | | | $ | 0.43 | | | $ | 0.71 | |
Totals may differ by $0.01 due to rounding and a return of capital. For distribution history please visit matthewsasia.com.
| | | | |
30-DAY YIELD: 1.69% (Investor Class) 1.84% (Institutional Class) The 30-Day Yield represents net investment income earned by the Fund over the 30-day period ended 6/30/2018, expressed as an annual percentage rate based on the Fund’s share price at the end of the 30-day period. The 30-Day Yield should be regarded as an estimate of the Fund’s rate of investment income, and it may not equal the Fund’s actual income distribution rate. Source: BNY Mellon Investment Servicing (US) Inc. | | | | DIVIDEND YIELD: 2.89% The dividend yield (trailing) for the portfolio is the weighted average sum of the dividends paid by each equity security held by the Fund over the 12 months ended 6/30/2018 divided by the current price of each equity as of 6/30/2018. The annualized dividend yield for the Fund is for the equity-only portion of the portfolio. Please note that this is based on gross equity portfolio holdings and does not reflect the actual yield an investor in the Fund would receive. Past yields are no guarantee of future yields. Source: FactSet Research Systems, Bloomberg, MICM. |
GROWTH OF A $10,000 INVESTMENT SINCE INCEPTION—INVESTOR CLASS
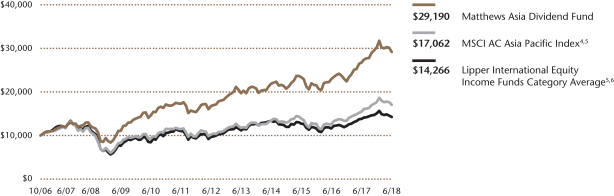
Plotted monthly. The performance data and graph do not reflect the deduction of taxes that a shareholder would pay on dividends, capital gains distributions or redemption of Fund shares. Values are in US$.
| | 4 | It is not possible to invest directly in an index. Source: Index data from Morgan Stanley Capital International and Bloomberg; total return calculations performed by BNY Mellon Investment Servicing (US) Inc. Please see page 92 for index definition. |
| | 5 | Calculated from 10/31/06. |
| | 6 | The Lipper Category Average does not reflect sales charges and is based on total return, including reinvestment of dividends and capital gains for the stated periods. |
| | | | | | | | |
| | | | |
| TOP TEN HOLDINGS7 | | | | | | | |
| | | Sector | | Country | | % of Net Assets | |
| Shenzhou International Group Holdings, Ltd. | | Consumer Discretionary | | China/Hong Kong | | | 4.5% | |
| Minth Group, Ltd. | | Consumer Discretionary | | China/Hong Kong | | | 3.7% | |
| HSBC Holdings PLC | | Financials | | China/Hong Kong | | | 3.1% | |
| China Construction Bank Corp. | | Financials | | China/Hong Kong | | | 3.1% | |
| China Petroleum & Chemical Corp. | | Energy | | China/Hong Kong | | | 3.0% | |
| Hyundai Mobis Co., Ltd. | | Consumer Discretionary | | South Korea | | | 2.9% | |
| China Gas Holdings, Ltd. | | Utilities | | China/Hong Kong | | | 2.5% | |
| Nitori Holdings Co., Ltd. | | Consumer Discretionary | | Japan | | | 2.5% | |
| LG Chem, Ltd., Pfd. | | Materials | | South Korea | | | 2.3% | |
| Taiwan Semiconductor Manufacturing Co., Ltd. | | Information Technology | | Taiwan | | | 2.2% | |
| % OF ASSETS IN TOP TEN | | | | | | | 29.8% | |
| | 7 | Holdings may combine more than one security from same issuer and related depositary receipts. |
Matthews Asia Dividend Fund
Portfolio Manager Commentary (unaudited) (continued)
during the quarter, as the market started to recognize the favorable industry trend and Hua Hong’s ability to deliver additional margin expansion. The company has been paying a modest 30% dividend payout, which we view as a reasonable balance between investing for future growth and returning cash to shareholders.
Notable Portfolio Changes:
One position we initiated during the quarter was Chongqing Brewery, a Chinese beer company listed on China’s domestic A-share market and that is 60%-owned by Carlsberg Group, a leading player in the global beer industry. After a period of significant business restructuring under Carlsberg’s ownership, Chongqing Brewery has re-emerged as a more efficiently run business. The company has been adapting well to the latest premiumization trend occurring among Chinese consumers by leveraging Carlsberg’s product portfolio and introducing more premium products to Chinese consumers. In addition, following years of consolidation, China’s top beer industry players today are shifting strategy from grabbing more market share to growing their profits. We view Chongqing Brewery as well-positioned to deliver on sustainable earnings growth, thanks to its successful product premiumization strategy and a more conducive industry structure. Carlsberg, as Chongqing’s controlling shareholder, has been adopting a high dividend payout policy for the Chinese firm, which we believe is likely to be maintained.
During the second quarter, we exited our position in Ping An Insurance because we felt valuations were no longer attractive. We used proceeds from the sale to purchase some new positions.
Outlook:
Uncertainties surrounding U.S.–China trade war rhetoric and a policy-induced economic slowdown in China, among other things, may continue to dampen investor sentiment toward Asian equities for the remainder of this year. We believe, however, that investors should look beyond the cloudy macro picture and focus instead on individual corporate business fundamentals. As dividend investors, we believe Asian companies are well-positioned to offer attractive dividend yields and sustainable dividend growth.
| | | | |
| |
| COUNTRY ALLOCATION (%)8,9 | |
| China/Hong Kong | | | 41.4 | |
| Japan | | | 25.4 | |
| South Korea | | | 11.8 | |
| Singapore | | | 4.5 | |
| India | | | 3.8 | |
| Taiwan | | | 3.2 | |
| Indonesia | | | 2.0 | |
| Australia | | | 1.9 | |
| Thailand | | | 1.4 | |
| Vietnam | | | 1.3 | |
| Bangladesh | | | 1.0 | |
| Philippines | | | 0.6 | |
| Cash and Other Assets, Less Liabilities | | | 1.6 | |
| | | | |
| SECTOR ALLOCATION (%)9 | |
| Consumer Discretionary | | | 22.6 | |
| Consumer Staples | | | 17.3 | |
| Financials | | | 15.3 | |
| Information Technology | | | 9.7 | |
| Telecommunication Services | | | 7.5 | |
| Utilities | | | 6.0 | |
| Industrials | | | 5.7 | |
| Materials | | | 4.6 | |
| Energy | | | 4.5 | |
| Health Care | | | 2.7 | |
| Real Estate | | | 2.4 | |
| Cash and Other Assets, Less Liabilities | | | 1.6 | |
| | | | |
| MARKET CAP EXPOSURE (%)9 | |
| Mega Cap (over $25B) | | | 30.1 | |
| Large Cap ($10B–$25B) | | | 24.1 | |
| Mid Cap ($3B–10B) | | | 25.6 | |
| Small Cap (under $3B) | | | 18.5 | |
| Cash and Other Assets, Less Liabilities | | | 1.6 | |
| 8 | Not all countries where the Fund may invest are included in the benchmark index. |
| 9 | Source: FactSet Research Systems. Percentage values in data are rounded to the nearest tenth of one percent, so the values may not sum to 100% due to rounding. Percentage values may be derived from different data sources and may not be consistent with other Fund literature. |
| | | | |
| matthewsasia.com | 800.789.ASIA | | | 23 | |
Matthews Asia Dividend Fund
June 30, 2018
Schedule of Investmentsa (unaudited)
COMMON EQUITIES: 94.3%
| | | | | | | | |
| | | Shares | | | Value | |
| CHINA/HONG KONG: 41.4% | | | | | | | | |
Shenzhou International Group Holdings, Ltd. | | | 25,854,000 | | | | $318,143,399 | |
Minth Group, Ltd.† | | | 62,069,000 | | | | 262,533,967 | |
China Construction Bank Corp. H Shares | | | 238,266,000 | | | | 218,023,260 | |
China Petroleum & Chemical Corp. H Shares | | | 215,920,000 | | | | 193,273,747 | |
HSBC Holdings PLC | | | 18,914,400 | | | | 176,963,327 | |
China Gas Holdings, Ltd. | | | 43,973,800 | | | | 176,299,605 | |
Hua Hong Semiconductor, Ltd.b,c | | | 40,482,000 | | | | 138,362,467 | |
Postal Savings Bank of China Co., Ltd. H Sharesb,c | | | 199,348,000 | | | | 129,408,933 | |
Sands China, Ltd. | | | 23,495,600 | | | | 125,264,161 | |
Sun Art Retail Group, Ltd. | | | 88,093,500 | | | | 114,924,324 | |
Huaneng Power International, Inc. H Shares | | | 161,530,000 | | | | 106,739,035 | |
China Resources Power Holdings Co., Ltd. | | | 58,218,000 | | | | 102,313,430 | |
Chongqing Brewery Co., Ltd. A Shares | | | 21,070,370 | | | | 87,841,190 | |
China Mobile, Ltd. | | | 9,372,500 | | | | 83,161,696 | |
Fanhua, Inc. ADR | | | 2,729,200 | | | | 77,782,200 | |
HKBN, Ltd. | | | 49,263,123 | | | | 75,779,192 | |
Fuyao Glass Industry Group Co., Ltd. H Sharesb,c | | | 21,248,000 | | | | 71,798,470 | |
Yuexiu Transport Infrastructure, Ltd.† | | | 97,328,000 | | | | 70,854,662 | |
Dairy Farm International Holdings, Ltd. | | | 7,861,300 | | | | 69,019,761 | |
Shanghai Jin Jiang International Hotels Group Co., Ltd. H Shares† | | | 166,126,000 | | | | 67,145,514 | |
Far East Horizon, Ltd. | | | 68,525,000 | | | | 66,351,871 | |
Crystal International Group, Ltd.b,c | | | 90,884,500 | | | | 63,198,553 | |
HSBC Holdings PLC ADR | | | 944,100 | | | | 44,504,874 | |
Café de Coral Holdings, Ltd. | | | 17,330,000 | | | | 41,917,629 | |
China Petroleum & Chemical Corp. ADR | | | 235,900 | | | | 21,193,256 | |
China Mobile, Ltd. ADR | | | 469,900 | | | | 20,858,861 | |
| | | | | | | | |
Total China/Hong Kong | | | | | | | 2,923,657,384 | |
| | | | | | | | |
| | | | | | | | |
| JAPAN: 25.5% | | | | | | | | |
Nitori Holdings Co., Ltd. | | | 1,126,600 | | | | 175,274,419 | |
Pigeon Corp. | | | 3,077,300 | | | | 149,547,990 | |
NTT DOCOMO, Inc. | | | 5,707,700 | | | | 145,445,713 | |
Japan Tobacco, Inc. | | | 5,130,600 | | | | 143,381,889 | |
Rohm Co., Ltd. | | | 1,663,100 | | | | 138,976,121 | |
Kao Corp. | | | 1,710,900 | | | | 130,407,501 | |
MISUMI Group, Inc. | | | 4,431,500 | | | | 128,933,674 | |
Anritsu Corp.† | | | 9,384,700 | | | | 128,488,779 | |
Hoya Corp. | | | 2,049,600 | | | | 116,271,734 | |
Seven & i Holdings Co., Ltd. | | | 2,510,300 | | | | 109,488,455 | |
Fuji Seal International, Inc. | | | 2,552,700 | | | | 90,431,042 | |
Eiken Chemical Co., Ltd.† | | | 3,337,200 | | | | 70,894,137 | |
Nifco, Inc. | | | 2,220,800 | | | | 68,630,938 | |
Mitsubishi Pencil Co., Ltd. | | | 2,628,400 | | | | 54,489,751 | |
Sumitomo Mitsui Financial Group, Inc. | | | 1,043,300 | | | | 40,694,957 | |
BELLSYSTEM24 Holdings, Inc. | | | 2,219,200 | | | | 38,631,367 | |
Mitsubishi UFJ Financial Group, Inc. | | | 6,616,800 | | | | 37,483,407 | |
Sohgo Security Services Co., Ltd. | | | 615,900 | | | | 28,976,661 | |
| | | | | | | | |
Total Japan | | | | | | | 1,796,448,535 | |
| | | | | | | | |
| | | | | | | | |
| | | | | | | | |
| | | Shares | | | Value | |
| SOUTH KOREA: 7.7% | | | | | | | | |
Hyundai Mobis Co., Ltd. | | | 1,086,117 | | | | $206,580,517 | |
BGF Retail Co., Ltd. | | | 816,439 | | | | 142,849,354 | |
Woori Bank | | | 5,472,430 | | | | 79,818,938 | |
Samsung Fire & Marine Insurance Co., Ltd. | | | 272,807 | | | | 64,639,055 | |
S-1 Corp. | | | 557,553 | | | | 48,426,317 | |
| | | | | | | | |
Total South Korea | | | | | | | 542,314,181 | |
| | | | | | | | |
| | | | | | | | |
| SINGAPORE: 4.5% | | | | | | | | |
United Overseas Bank, Ltd. | | | 7,406,100 | | | | 145,150,178 | |
CapitaLand, Ltd. | | | 32,225,000 | | | | 74,584,780 | |
CapitaLand Retail China Trust REIT† | | | 49,800,000 | | | | 55,510,351 | |
Ascendas India Trust† | | | 57,863,800 | | | | 42,893,533 | |
| | | | | | | | |
Total Singapore | | | | | | | 318,138,842 | |
| | | | | | | | |
| | | | | | | | |
| INDIA: 3.8% | | | | | | | | |
Bharti Infratel, Ltd. | | | 20,967,130 | | | | 92,141,089 | |
ITC, Ltd. | | | 20,701,500 | | | | 80,446,828 | |
Minda Industries, Ltd. | | | 3,327,962 | | | | 61,467,966 | |
Gujarat Pipavav Port, Ltd. | | | 21,381,946 | | | | 32,935,550 | |
| | | | | | | | |
Total India | | | | | | | 266,991,433 | |
| | | | | | | | |
| | | | | | | | |
| TAIWAN: 3.2% | | | | | | | | |
Taiwan Semiconductor Manufacturing Co., Ltd. ADR | | | 2,642,940 | | | | 96,625,886 | |
China Steel Chemical Corp.† | | | 14,747,000 | | | | 71,984,154 | |
Taiwan Semiconductor Manufacturing Co., Ltd. | | | 8,443,469 | | | | 59,957,743 | |
| | | | | | | | |
Total Taiwan | | | | | | | 228,567,783 | |
| | | | | | | | |
| | | | | | | | |
| INDONESIA: 2.0% | | | | | | | | |
PT United Tractors | | | 46,212,800 | | | | 101,756,581 | |
PT Cikarang Listrindob,c | | | 477,480,200 | | | | 39,317,979 | |
| | | | | | | | |
Total Indonesia | | | | | | | 141,074,560 | |
| | | | | | | | |
| | | | | | | | |
| AUSTRALIA: 1.9% | | | | | | | | |
Breville Group, Ltd.† | | | 12,185,538 | | | | 104,697,395 | |
Greencross, Ltd.† | | | 9,560,282 | | | | 31,683,378 | |
| | | | | | | | |
Total Australia | | | | | | | 136,380,773 | |
| | | | | | | | |
| | | | | | | | |
| THAILAND: 1.4% | | | | | | | | |
Thai Beverage Public Co., Ltd. | | | 189,041,400 | | | | 99,843,690 | |
| | | | | | | | |
Total Thailand | | | | | | | 99,843,690 | |
| | | | | | | | |
| | | | | | | | |
| VIETNAM: 1.3% | | | | | | | | |
Vietnam Dairy Products JSC | | | 12,514,488 | | | | 92,304,686 | |
| | | | | | | | |
Total Vietnam | | | | | | | 92,304,686 | |
| | | | | | | | |
| | | | | | | | |
| BANGLADESH: 1.0% | | | | | | | | |
GrameenPhone, Ltd. | | | 15,190,235 | | | | 70,722,541 | |
| | | | | | | | |
Total Bangladesh | | | | | | | 70,722,541 | |
| | | | | | | | |
| | | | | | | | |
| PHILIPPINES: 0.6% | | | | | | | | |
Globe Telecom, Inc. | | | 1,447,730 | | | | 41,776,441 | |
| | | | | | | | |
Total Philippines | | | | | | | 41,776,441 | |
| | | | | | | | |
| | | | | | | | |
| TOTAL COMMON EQUITIES | | | | | | | 6,658,220,849 | |
| | | | | | | | |
(Cost $5,490,909,149) | | | | | | | | |
Matthews Asia Dividend Fund
June 30, 2018
Schedule of Investmentsa (unaudited) (continued)
PREFERRED EQUITIES: 4.1%
| | | | | | | | |
| | | Shares | | | Value | |
| SOUTH KOREA: 4.1% | | | | | | | | |
LG Chem, Ltd., Pfd. | | | 909,328 | | | | $164,321,876 | |
Samsung Electronics Co., Ltd., Pfd. | | | 3,718,200 | | | | 125,559,530 | |
| | | | | | | | |
Total South Korea | | | | | | | 289,881,406 | |
| | | | | | | | |
| | | | | | | | |
| TOTAL PREFERRED EQUITIES | | | | | | | 289,881,406 | |
| | | | | | | | |
(Cost $186,686,731) | | | | | | | | |
| | | | | | | | |
| TOTAL INVESTMENTS: 98.4% | | | | | | | 6,948,102,255 | |
(Cost $5,677,595,880) | | | | | | | | |
| | | | | | | | |
CASH AND OTHER ASSETS,
LESS LIABILITIES: 1.6% | | | | | | | 113,024,114 | |
| | | | | | | | |
| | |
NET ASSETS: 100.0% | | | | | | | $7,061,126,369 | |
| | | | | | | | |
| a | Certain securities were fair valued under the valuation policies approved by the Board of Trustees (Note 2-A). |
| b | Security exempt from registration under Rule 144A of the Securities Act of 1933, as amended. The security may be resold in transactions exempt from registration normally to qualified institutional buyers. The security has been determined to be liquid in accordance with procedures adopted by the Funds’ Board of Trustees. At June 30, 2018, the aggregate value is $442,086,402, which is 6.26% of net assets. |
| c | The securities may be resold to qualified foreign investors and foreign institutional buyers under Regulation S of the Securities Act of 1933. |
| † | Affiliated Issuer, as defined under the Investment Company Act of 1940 (ownership of 5% or more of the outstanding voting securities of this issuer) |
| ADR | American Depositary Receipt |
| REIT | Real Estate Investment Trust |
See accompanying notes to financial statements.
| | | | |
| matthewsasia.com | 800.789.ASIA | | | 25 | |
| | | | |
| PORTFOLIO MANAGERS |
| Sherwood Zhang, CFA | | |
Lead Manager | | | | |
| Yu Zhang, CFA | | |
Co-Manager | | | | |
| | |
| FUND FACTS | | | | |
| | | Investor | | Institutional |
Ticker | | MCDFX | | MICDX |
CUSIP | | 577125305 | | 577130735 |
Inception | | 11/30/09 | | 10/29/10 |
NAV | | $17.82 | | $17.82 |
Initial Investment | | $2,500 | | $100,000 |
Gross Expense Ratio1 | | 1.19% | | 1.04% |
Portfolio Statistics | | |
Total # of Positions | | 55 |
Net Assets | | $348.0 million |
Weighted Average Market Cap | | $53.9 billion |
Portfolio Turnover2 | | 69.14% |
Benchmark | | | | |
MSCI China Index |
OBJECTIVE
Total return with an emphasis on providing current income.
STRATEGY
Under normal market conditions, the Fund seeks to achieve its investment objective by investing at least 80% of its total net assets, which include borrowings for investment purposes, in dividend-paying equity securities of companies located in China. China includes its administrative and other districts, such as Hong Kong. The Fund may also invest in convertible debt and equity securities.
Matthews China Dividend Fund
Portfolio Manager Commentary (unaudited)
For the first half of 2018, the Matthews China Dividend Fund returned 3.10% (Investor Class) and 3.19% (Institutional Class), outperforming its benchmark, the MSCI China Index, which fell –1.69%. For the quarter ending June 30, the Fund returned 1.14% (Investor Class) and 1.18% (Institutional Class), outperforming its benchmark, which dropped –3.44%.
Market Environment:
For much of the first half of the year, Chinese equity markets were marked by volatility amid some alarming headlines. There was muted response to the 2017 full year earnings reports for many Chinese companies, meanwhile, as the market already expected healthy earnings growth. In May, markets appeared encouraged by a possible deal between U.S. and China to avoid a trade war after a state visit to Washington by China’s Vice Premier Liu He. Global equity markets climbed further in June following the historic summit meeting between President Trump and North Korean leader Kim Jong Un in Singapore. China’s equity markets reversed into panic mode, however, when U.S.–China trade negotiations in Beijing did not bear fruit. With additional U.S. tariffs on US$50 billion of Chinese imports on the horizon, Chinese equities suffered heavy selling. Although China’s domestic A-share market received an initial boost from the inclusion by MSCI indices, it ultimately lagged behind overseas-listed Chinese equities during the second quarter—again highlighting the risks involved in investing in this young market.
Performance Contributors and Detractors:
During the first half of the year, our security selection in the financials and consumer discretionary sectors contributed most to the Fund’s outperformance versus its benchmark. Conversely, we continued to face challenges identifying health care sector firms that fit well with our investment criteria.
Hua Hong Semiconductor, a leading semiconductor foundry in China, was a top contributor to performance for the six month-period, amid sentiment that China would boost efforts to drive the growth of more domestically manufactured semiconductors following rising trade tensions with the U.S. In addition, a main competitor to Hua Hong raised its contract pricing significantly during this period, further exciting the market considering the industry’s tight capacity levels. China Maple Leaf Educational Systems, an operator of private schools in China, was the second-best performance contributor to Fund returns for the year-to-date period. In fact, the entire for-profit education industry has done well year to date as more clarity on newly created industry regulation was introduced.
On the flip side, WH Group, a pork producer with significant operations in both the U.S. and China, became a visible casualty of trade war rhetoric. Although the company does not import U.S. pork to China by any meaningful amount, Mexico is a major destination for its U.S. exports. As Mexico introduced additional tariffs targeting U.S. goods, including pork, U.S. pork prices declined further. This could depress the company’s profit margins for its U.S. business. We are closely monitoring this situation.
Notable Portfolio Changes:
During the second quarter, we initiated a position in SUNeVision, a data center operator based in Hong Kong. We believe demand for data centers will be very strong as businesses increasingly need these to locate their mission critical servers. These servers are used to transmit, store and analyze data that is undergoing explosive growth as consumers become increasingly reliant on smartphones and smart devices. As the largest data center owner in Hong Kong, SUNeVision should
(continued)
| 1 | Prospectus expense ratio. |
| 2 | The lesser of fiscal year 2017 long-term purchase costs or sales proceeds divided by the average monthly market value of long-term securities. |
| | | | | | | | | | | | | | | | | | | | | | | | | | | | |
| | |
| PERFORMANCE AS OF JUNE 30, 2018 | | | | |
| | | | | | | | | Average Annual Total Returns | | | | |
| | | 3 Months | | | YTD | | | 1 Year | | | 3 Year | | | 5 Year | | | Since
Inception | | | Inception
Date | |
| Investor Class (MCDFX) | | | 1.14% | | | | 3.10% | | | | 21.22% | | | | 10.23% | | | | 13.52% | | | | 11.60% | | | | 11/30/09 | |
| Institutional Class (MICDX) | | | 1.18% | | | | 3.19% | | | | 21.40% | | | | 10.42% | | | | 13.72% | | | | 10.61% | | | | 10/29/10 | |
| MSCI China Index3 | | | -3.44% | | | | -1.69% | | | | 21.42% | | | | 7.26% | | | | 12.32% | | | | 6.31% | 4 | | | | |
| Lipper China Region Funds Category Average5 | | | -4.74% | | | | -2.58% | | | | 15.90% | | | | 5.49% | | | | 10.32% | | | | 6.39% | 4 | | | | |
Performance assumes reinvestment of all dividends and/or distributions before taxes. All performance quoted represents past performance and is no guarantee of future results. Investment return and principal value will fluctuate with market conditions so that when redeemed, shares may be worth more or less than their original cost. Current performance may be lower or higher than the return figures quoted. For the Fund’s most recent month-end performance, visit matthewsasia.com.
| | | | | | | | | | | | | | | | | | | | | | | | | | | | |
| | | | | | |
| INCOME DISTRIBUTION HISTORY | | | | | | | | | | | | | | | | |
| | | 2018 | | | | | | 2017 | |
| | | June | | | December | | | Total | | | | | | June | | | December | | | Total | |
| Investor (MCDFX) | | $ | 0.34 | | | | n.a. | | | | n.a. | | | | | | | $ | 0.20 | | | $ | 0.29 | | | $ | 0.49 | |
| Inst’l (MICDX) | | $ | 0.36 | | | | n.a. | | | | n.a. | | | | | | | $ | 0.21 | | | $ | 0.30 | | | $ | 0.51 | |
Note: This table does not include capital gains distributions. Totals may differ by $0.01 due to rounding. For income distribution history, visit matthewsasia.com.
| | | | |
30-DAY YIELD: 1.58% (Investor Class) 1.78% (Institutional Class) The 30-Day Yield represents net investment income earned by the Fund over the 30-day period ended 6/30/18, expressed as an annual percentage rate based on the Fund’s share price at the end of the 30-day period. The 30-Day Yield should be regarded as an estimate of the Fund’s rate of investment income, and it may not equal the Fund’s actual income distribution rate. Source: BNY Mellon Investment Servicing (US) Inc. | | | | DIVIDEND YIELD: 3.30% The dividend yield (trailing) for the portfolio is the weighted average sum of the dividends paid by each equity security held by the Fund over the 12 months ended 6/30/18 divided by the current price of each equity as of 6/30/18. The annualized dividend yield for the Fund is for the equity-only portion of the portfolio. Please note that this is based on gross equity portfolio holdings and does not reflect the actual yield an investor in the Fund would receive. Past yields are no guarantee of future yields. Source: FactSet Research Systems, Bloomberg, MICM. |
GROWTH OF A $10,000 INVESTMENT SINCE INCEPTION—INVESTOR CLASS
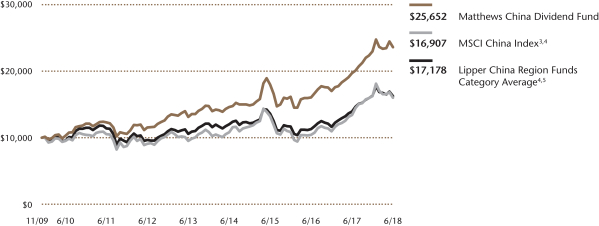
Plotted monthly. The performance data and graph do not reflect the deduction of taxes that a shareholder would pay on dividends, capital gains distributions or redemption of Fund shares. Values are in US$.
| | 3 | It is not possible to invest directly in an index. Source: Index data from Morgan Stanley Capital International and Bloomberg; total return calculations performed by BNY Mellon Investment Servicing (US) Inc. Please see page 92 for index definition. |
| | 4 | Calculated from 11/30/09. |
| | 5 | The Lipper Category Average does not reflect sales charges and is based on total return, including reinvestment of dividends and capital gains for the stated periods. |
| | | | | | | | |
| | | | |
| TOP TEN HOLDINGS6 | | | | | | | |
| | | Sector | | | | % of Net Assets | |
| Tencent Holdings, Ltd. | | Information Technology | | | | | 4.6% | |
| HKBN, Ltd. | | Telecom Services | | | | | 3.6% | |
| China Petroleum & Chemical Corp. | | Energy | | | | | 3.4% | |
| Postal Savings Bank of China Co., Ltd. | | Financials | | | | | 3.2% | |
| HSBC Holdings PLC | | Financials | | | | | 3.1% | |
| Altaba, Inc. | | Information Technology | | | | | 2.9% | |
| Hua Hong Semiconductor, Ltd. | | Information Technology | | | | | 2.6% | |
| Guangdong Provincial Expressway Development Co., Ltd. | | Industrials | | | | | 2.6% | |
| Sun Art Retail Group, Ltd. | | Consumer Staples | | | | | 2.6% | |
| Bank of China, Ltd. | | Financials | | | | | 2.6% | |
| % OF ASSETS IN TOP TEN | | | | | | | 31.2% | |
| | 6 | Holdings may combine more than one security from same issuer and related depositary receipts. |
| | | | |
| matthewsasia.com | 800.789.ASIA | | | 27 | |
| | | | |
| |
| COUNTRY ALLOCATION (%)7,8 | |
| China/Hong Kong | | | 90.7 | |
| Taiwan | | | 3.5 | |
| Singapore | | | 2.0 | |
| Cash and Other Assets, Less Liabilities | | | 3.8 | |
| | | | |
SECTOR ALLOCATION (%)8 | |
| Information Technology | | | 16.7 | |
| Financials | | | 15.7 | |
| Industrials | | | 11.9 | |
| Consumer Staples | | | 10.3 | |
| Consumer Discretionary | | | 9.4 | |
| Telecommunication Services | | | 7.9 | |
| Energy | | | 7.7 | |
| Health Care | | | 5.7 | |
| Real Estate | | | 3.9 | |
| Utilities | | | 3.8 | |
| Materials | | | 3.2 | |
| Cash and Other Assets, Less Liabilities | | | 3.8 | |
| | | | |
MARKET CAP EXPOSURE (%)8 | |
| Mega Cap (over $25B) | | | 29.9 | |
| Large Cap ($10B–$25B) | | | 6.2 | |
| Mid Cap ($3B–10B) | | | 10.9 | |
| Small Cap (under $3B) | | | 49.1 | |
| Cash and Other Assets, Less Liabilities | | | 3.8 | |
| 7 | Not all countries where the Fund may invest are included in the benchmark index. |
| 8 | Source: FactSet Research Systems. Percentage values in data are rounded to the nearest tenth of one percent, so the values may not sum to 100% due to rounding. Percentage values may be derived from different data sources and may not be consistent with other Fund literature. |
Matthews China Dividend Fund
Portfolio Manager Commentary (unaudited) (continued)
enjoy strong pricing power. We believe it benefits from the additional rental revenue from its newly completed data center. We also initiated a position in Sunny Friend Environmental Technology, a leading industrial and medical waste treatment company in Taiwan. We believe the company’s strong safety track record will help it to successfully duplicate its business model in China, where the potential market size is much bigger, and upstream customers such as semiconductor companies also experience strong growth.
During the second quarter, we meaningfully trimmed our exposure to holdings in China’s domestic A-share market. We exited our holdings in Midea Group, Shanghai International Airport and China International Travel Service. Although we like the business models of these companies, the high valuations for their stocks compelled us to take profits and deploy capital elsewhere.
Outlook:
The news flow around the prospects of a U.S.–China trade war is likely to weigh on markets over the near term. As we stated in our first-quarter commentary, this trade tussle could have broader economic and geopolitical implications. At this time, we are still cautiously optimistic about a resolution and have already seen many positive signs. Both Tesla and Ford, for example, have announced new investment commitments into China. In the case of Tesla, it would be the first time China allows a foreign car company to set up a wholly owned manufacturing facility on its mainland. For our strategy, we look for companies that can sustain and grow their earnings and dividends in this environment. Just like the executives making multi-billion dollar investment commitments in China, we also believe the potential return from the growth of a vast Chinese consumer market is too attractive to ignore.
Matthews China Dividend Fund
June 30, 2018
Schedule of Investmentsa (unaudited)
COMMON EQUITIES: 93.3%
| | | | | | | | |
| | | Shares | | | Value | |
| FINANCIALS: 15.7% | | | | | | | | |
Banks: 10.2% | |
Postal Savings Bank of China Co., Ltd. H Sharesb,c | | | 17,072,000 | | | | $11,082,475 | |
HSBC Holdings PLC | | | 1,146,400 | | | | 10,725,731 | |
Bank of China, Ltd. H Shares | | | 17,925,000 | | | | 8,889,453 | |
Dah Sing Financial Holdings, Ltd. | | | 849,600 | | | | 4,954,317 | |
| | | | | | | | |
| | | | | | | 35,651,976 | |
| | | | | | | | |
| | | | | | | | |
Insurance: 3.6% | |
Ping An Insurance Group Co. of China, Ltd. H Shares | | | 722,000 | | | | 6,611,841 | |
Fanhua, Inc. ADR | | | 211,000 | | | | 6,013,500 | |
| | | | | | | | |
| | | | | | | 12,625,341 | |
| | | | | | | | |
| | | | | | | | |
Capital Markets: 1.9% | | | | | | | | |
China International Capital Corp., Ltd. H Sharesb,c | | | 3,646,000 | | | | 6,463,628 | |
| | | | | | | | |
Total Financials | | | | | | | 54,740,945 | |
| | | | | | | | |
| | | | | | | | |
| INFORMATION TECHNOLOGY: 13.8% | | | | | | | | |
Internet Software & Services: 8.4% | | | | | | | | |
Tencent Holdings, Ltd. | | | 317,000 | | | | 15,918,283 | |
NetEase, Inc. ADR | | | 29,100 | | | | 7,352,697 | |
SUNeVision Holdings, Ltd. | | | 7,712,000 | | | | 4,556,328 | |
Wise Talent Information Technology Co., Ltd.d | | | 352,600 | | | | 1,460,627 | |
| | | | | | | | |
| | | | | | | 29,287,935 | |
| | | | | | | | |
| | | | | | | | |
Semiconductors & Semiconductor Equipment: 2.6% | |
Hua Hong Semiconductor, Ltd.b,c | | | 2,677,000 | | | | 9,149,655 | |
| | | | | | | | |
| | | | | | | | |
Software: 2.1% | | | | | | | | |
Shanghai Baosight Software Co., Ltd. B Shares | | | 3,849,918 | | | | 7,282,624 | |
| | | | | | | | |
| | | | | | | | |
IT Services: 0.7% | | | | | | | | |
Huifu Payment, Ltd.b,c,d | | | 2,737,200 | | | | 2,368,919 | |
| | | | | | | | |
Total Information Technology | | | | | | | 48,089,133 | |
| | | | | | | | |
| | | | | | | | |
| INDUSTRIALS: 11.9% | | | | | | | | |
Transportation Infrastructure: 4.5% | | | | | | | | |
Guangdong Provincial Expressway Development Co., Ltd. B Shares | | | 11,565,121 | | | | 9,130,596 | |
Xiamen International Airport Co., Ltd. A Shares | | | 2,117,010 | | | | 6,579,593 | |
| | | | | | | | |
| | | | | | | 15,710,189 | |
| | | | | | | | |
| | | | | | | | |
Commercial Services & Supplies: 3.1% | | | | | | | | |
A-Living Services Co., Ltd. H Sharesb,c,d | | | 3,010,250 | | | | 5,501,593 | |
Sunny Friend Environmental Technology Co., Ltd. | | | 758,000 | | | | 5,339,183 | |
| | | | | | | | |
| | | | | | | 10,840,776 | |
| | | | | | | | |
| | | | | | | | |
Marine: 1.4% | | | | | | | | |
SITC International Holdings Co., Ltd. | | | 4,173,000 | | | | 4,648,921 | |
| | | | | | | | |
| | | | | | | | |
Machinery: 1.3% | | | | | | | | |
Shanghai Mechanical and Electrical Industry Co., Ltd. B Shares | | | 2,456,659 | | | | 4,501,857 | |
| | | | | | | | |
| | | | | | | | |
Road & Rail: 1.1% | | | | | | | | |
Guangshen Railway Co., Ltd. H Shares | | | 6,096,000 | | | | 3,425,941 | |
Guangshen Railway Co., Ltd. ADR | | | 14,400 | | | | 404,928 | |
| | | | | | | | |
| | | | | | | 3,830,869 | |
| | | | | | | | |
| | | | | | | | |
| | | | | | | | |
| | | Shares | | | Value | |
Professional Services: 0.5% | | | | | | | | |
Sporton International, Inc. | | | 364,430 | | | | $1,767,284 | |
| | | | | | | | |
Total Industrials | | | | | | | 41,299,896 | |
| | | | | | | | |
| | | | | | | | |
| CONSUMER STAPLES: 10.3% | | | | | | | | |
Food Products: 3.9% | | | | | | | | |
WH Group, Ltd.b,c | | | 9,073,000 | | | | 7,341,750 | |
Nissin Foods Co., Ltd. | | | 10,830,000 | | | | 6,282,452 | |
| | | | | | | | |
| | | | | | | 13,624,202 | |
| | | | | | | | |
| | | | | | | | |
Food & Staples Retailing: 3.9% | | | | | | | | |
Sun Art Retail Group, Ltd. | | | 6,892,000 | | | | 8,991,111 | |
Shanghai Bailian Group Co., Ltd. B Shares | | | 3,839,821 | | | | 4,393,431 | |
| | | | | | | | |
| | | | | | | 13,384,542 | |
| | | | | | | | |
| | | | | | | | |
Personal Products: 1.4% | | | | | | | | |
Chlitina Holding, Ltd. | | | 516,000 | | | | 5,017,070 | |
| | | | | | | | |
| | | | | | | | |
Beverages: 1.1% | | | | | | | | |
Chongqing Brewery Co., Ltd. A Shares | | | 898,018 | | | | 3,743,787 | |
| | | | | | | | |
Total Consumer Staples | | | | | | | 35,769,601 | |
| | | | | | | | |
| | | | | | | | |
| CONSUMER DISCRETIONARY: 9.4% | | | | | | | | |
Textiles, Apparel & Luxury Goods: 4.6% | | | | | |
Nan Liu Enterprise Co., Ltd. | | | 887,000 | | | | 5,033,078 | |
Heilan Home Co., Ltd. A Shares | | | 2,040,888 | | | | 3,911,823 | |
Crystal International Group, Ltd.b,c | | | 5,330,500 | | | | 3,706,681 | |
Heilan Home Co., Ltd. A Shares | | | 1,841,024 | | | | 3,524,084 | |
| | | | | | | | |
| | | | | | | 16,175,666 | |
| | | | | | | | |
| | | | | | | | |
Hotels, Restaurants & Leisure: 3.2% | | | | | | | | |
Shanghai Jin Jiang International Hotels Group Co., Ltd. H Shares | | | 16,990,000 | | | | 6,867,091 | |
Xiabuxiabu Catering Management China Holdings Co., Ltd.b,c | | | 1,962,500 | | | | 4,285,450 | |
| | | | | | | | |
| | | | | | | 11,152,541 | |
| | | | | | | | |
| | | | | | | | |
Diversified Consumer Services: 1.6% | | | | | | | | |
China Maple Leaf Educational Systems, Ltd. | | | 3,016,000 | | | | 5,415,895 | |
| | | | | | | | |
Total Consumer Discretionary | | | | | | | 32,744,102 | |
| | | | | | | | |
| | | | | | | | |
| TELECOMMUNICATION SERVICES: 7.9% | | | | | | | | |
Diversified Telecommunication Services: 5.6% | | | | | |
HKBN, Ltd. | | | 8,090,457 | | | | 12,445,177 | |
CITIC Telecom International Holdings, Ltd. | | | 26,581,000 | | | | 6,965,553 | |
| | | | | | | | |
| | | | | | | 19,410,730 | |
| | | | | | | | |
| | | | | | | | |
Wireless Telecommunication Services: 2.3% | | | | | |
China Mobile, Ltd. ADR | | | 181,430 | | | | 8,053,678 | |
| | | | | | | | |
Total Telecommunication Services | | | | | | | 27,464,408 | |
| | | | | | | | |
| | | | | | | | |
| ENERGY: 7.7% | | | | | | | | |
Oil, Gas & Consumable Fuels: 7.7% | | | | | | | | |
China Petroleum & Chemical Corp. H Shares | | | 13,328,000 | | | | 11,930,125 | |
CNOOC, Ltd. | | | 4,048,000 | | | | 6,936,432 | |
Sinopec Kantons Holdings, Ltd. | | | 9,790,000 | | | | 4,616,542 | |
China Aviation Oil Singapore Corp., Ltd. | | | 2,938,500 | | | | 3,186,591 | |
| | | | | | | | |
Total Energy | | | | | | | 26,669,690 | |
| | | | | | | | |
| | | | | | | | |
| | | | |
| matthewsasia.com | 800.789.ASIA | | | 29 | |
Matthews China Dividend Fund
June 30, 2018
Schedule of Investmentsa (unaudited) (continued)
| | |
| COMMON EQUITIES (continued) | | CLOSED-END FUNDS: 2.9% |
| | | | | | | | |
| | | Shares | | | Value | |
| HEALTH CARE: 5.7% | | | | | | | | |
Health Care Providers & Services: 2.6% | | | | | | | | |
Universal Medical Financial & Technical Advisory Services Co., Ltd.b,c | | | 7,541,000 | | | | $5,990,781 | |
China National Accord Medicines Corp., Ltd. B Shares | | | 777,833 | | | | 3,114,069 | |
| | | | | | | | |
| | | | | | | 9,104,850 | |
| | | | | | | | |
| | | | | | | | |
Biotechnology: 1.7% | | | | | | | | |
Shanghai Haohai Biological Technology Co., Ltd. H Sharesb,c | | | 491,400 | | | | 3,066,769 | |
BBI Life Sciences Corp.c | | | 7,221,000 | | | | 2,880,587 | |
| | | | | | | | |
| | | | | | | 5,947,356 | |
| | | | | | | | |
| | | | | | | | |
Pharmaceuticals: 1.4% | | | | | | | | |
Tianjin ZhongXin Pharmaceutical Group Corp., Ltd. S Shares | | | 4,583,800 | | | | 4,802,232 | |
| | | | | | | | |
Total Health Care | | | | | | | 19,854,438 | |
| | | | | | | | |
| | | | | | | | |
| REAL ESTATE: 3.9% | | | | | | | | |
Equity REITs: 2.0% | | | | | | | | |
CapitaLand Retail China Trust REIT | | | 6,223,100 | | | | 6,936,676 | |
| | | | | | | | |
| | | | | | | | |
Real Estate Management & Development: 1.9% | |
Sun Hung Kai Properties, Ltd. | | | 447,000 | | | | 6,734,474 | |
| | | | | | | | |
Total Real Estate | | | | | | | 13,671,150 | |
| | | | | | | | |
| | | | | | | | |
| UTILITIES: 3.8% | | | | | | | | |
Independent Power and Renewable Electricity Producers: 2.3% | |
China Resources Power Holdings Co., Ltd. | | | 4,518,000 | | | | 7,940,020 | |
| | | | | | | | |
| | | | | | | | |
Gas Utilities: 1.5% | | | | | | | | |
China Gas Holdings, Ltd. | | | 1,303,000 | | | | 5,223,983 | |
| | | | | | | | |
Total Utilities | | | | | | | 13,164,003 | |
| | | | | | | | |
| | | | | | | | |
| MATERIALS: 3.2% | | | | | | | | |
Containers & Packaging: 3.2% | | | | | | | | |
Greatview Aseptic Packaging Co., Ltd. | | | 10,610,000 | | | | 6,329,000 | |
CPMC Holdings, Ltd. | | | 7,928,000 | | | | 4,886,642 | |
| | | | | | | | |
Total Materials | | | | | | | 11,215,642 | |
| | | | | | | | |
| | | | | | | | |
| TOTAL COMMON EQUITIES | | | | | | | 324,683,008 | |
| | | | | | | | |
(Cost $297,929,920) | | | | | | | | |
| | | | | | | | |
| | | | | | | | |
| | | Shares | | | Value | |
| INFORMATION TECHNOLOGY: 2.9% | | | | | | | | |
Internet Software & Services: 2.9% | | | | | | | | |
Altaba, Inc.d | | | 135,500 | | | | $9,919,955 | |
| | | | | | | | |
Total Information Technology | | | | | | | 9,919,955 | |
| | | | | | | | |
| | | | | | | | |
| TOTAL CLOSED-END FUNDS | | | | | | | 9,919,955 | |
| | | | | | | | |
(Cost $7,824,098) | | | | | | | | |
| | | | | | | | |
| TOTAL INVESTMENTS: 96.2% | | | | | | | 334,602,963 | |
(Cost $305,754,018) | | | | | | | | |
| | | | | | | | |
CASH AND OTHER ASSETS,
LESS LIABILITIES: 3.8% | | | | | | | 13,380,079 | |
| | | | | | | | |
| | |
NET ASSETS: 100.0% | | | | | | | $347,983,042 | |
| | | | | | | | |
| a | Certain securities were fair valued under the valuation policies approved by the Board of Trustees (Note 2-A). |
| b | Security exempt from registration under Rule 144A of the Securities Act of 1933, as amended. The security may be resold in transactions exempt from registration normally to qualified institutional buyers. The security has been determined to be liquid in accordance with procedures adopted by the Funds’ Board of Trustees. At June 30, 2018, the aggregate value is $58,957,701, which is 16.94% of net assets. |
| c | The securities may be resold to qualified foreign investors and foreign institutional buyers under Regulation S of the Securities Act of 1933. |
| d | Non-income producing security. |
| ADR | American Depositary Receipt |
| REIT | Real Estate Investment Trust |
See accompanying notes to financial statements.

| | | | |
| PORTFOLIO MANAGERS |
| Beini Zhou, CFA |
Lead Manager |
| Michael B. Han, CFA |
Co-Manager |
| | |
| FUND FACTS | | | | |
| | | Investor | | Institutional |
Ticker | | MAVRX | | MAVAX |
CUSIP | | 577130693 | | 577130685 |
Inception | | 11/30/15 | | 11/30/15 |
NAV | | $12.45 | | $12.37 |
Initial Investment | | $2,500 | | $100,000 |
Gross Expense Ratio1 | | 2.32% | | 2.08% |
After Fee Waiver and Reimbursement2 | | 1.50% | | 1.25% |
Portfolio Statistics | | | | |
Total # of Positions | | 48 |
Net Assets | | $35.8 million |
Weighted Average Market Cap | | $18.1 billion |
Portfolio Turnover3 | | 31.93% |
Benchmark | | | | |
MSCI AC Asia ex Japan Index |
OBJECTIVE
Long-term capital appreciation.
STRATEGY
Under normal market conditions, the Fund seeks to achieve its investment objective by investing at least 80% of its net assets, which include borrowings for investment purposes, in common stock, preferred stock and other equity securities, and convertible securities of companies located in Asia. The Fund seeks to create an investable universe of value companies that it believes trade at market values with discounts to their intrinsic value, have strong financial and market positions, have strong management and are oriented to creating value for their shareholders. Matthews assesses companies within this universe according to each of these factors.
Matthews Asia Value Fund
Portfolio Manager Commentary (unaudited)
For the first half of 2018, the Matthews Asia Value Fund returned –2.96% (Investor Class) and –2.83% (Institutional Class), while its benchmark, the MSCI All Country Asia ex Japan Index, fell –4.65% over the same period. For the quarter ending June 30, the Fund returned –3.79% (Investor Class) and –3.74% (Institutional Class), compared to the benchmark return of –5.31%.
Market Environment:
In the first half of the year, trade war rhetoric, rising interest rates, falling emerging market currencies and geopolitical tensions on the Korean peninsula dominated the news. The only apparent bright spot was the June summit between North Korean leader Kim Jong Un and U.S. President Donald Trump in Singapore, although denuclearization of North Korea is far from guaranteed, pending further negotiations. Following a buoyant run-up over the past year or so, the Asia ex Japan market dropped more than 5% in the second quarter, with most of the decline occurring in the second half of June. The Chinese renminbi (RMB) also depreciated sharply against the U.S. dollar in late June, dropping more than 5% in the second quarter.
Performance Contributors and Detractors:
The Fund outperformed its benchmark in both the first and second quarters of the year, due to stock selection and despite its significant exposure to South Korea, which was one of Asia’s worst performers in the first half of the year in U.S. dollar terms. The two biggest contributors to Fund performance in the second quarter were both in the consumer staples sector. Shares of Nissin Foods, the biggest premium instant noodle company in Hong Kong/China, jumped more than 30% in the quarter. It is the newly Hong Kong-listed subsidiary of Japan-based Nissin Foods Group. Its major competitors announced decent earnings in the instant noodle segment in the quarter, partly driven by a pricing increase. We believe this brought positive sentiment change toward Nissin, whose share price had been fairly depressed. We trimmed our position in the company in the quarter as its valuation discount narrowed.
Shares of Anhui Gujing Distillery, a leading local liquor company in China, did well in the second quarter after the company announced a big profit jump. We attended its annual shareholder meeting in the Anhui province in the second quarter (as the only U.S.-based investor). While we were there, we learned first-hand that it continues to upgrade its product mix toward premium products with higher retail selling prices. Along with containing its sales and marketing expenses, the company has managed to improve its formerly low operating margin substantially.
On the other hand, the biggest detractor to performance during the second quarter was China National Accord Medicines. It is a listed subsidiary of state-owned Sinopharm, one of the country’s three biggest pharmaceutical distributors. We initiated this position in Q3 last year. Since then, its share price has continued to decline. China has been implementing a new two-invoice system in the drug distribution industry to eliminate layers of middlemen in the supply chain. This has led to earnings pressure at National Accord in the short term. In the long run, we believe an industry leader like National Accord will benefit from market consolidation triggered by this two-invoice policy. We added to our position in the quarter at a high single-digit price-to-earnings ratio.
(continued)
| 1 | Prospectus expense ratios. |
| 2 | Matthews has contractually agreed (i) to waive fees and reimburse expenses to the extent needed to limit Total Annual Fund Operating Expenses (excluding Rule 12b-1 fees, taxes, interest, brokerage commissions, short sale dividend expenses, expenses incurred in connection with any merger or reorganization or extraordinary expenses such as litigation) of the Institutional Class to 1.25% first by waiving class specific expenses (i.e., shareholder service fees specific to a particular class) of the Institutional Class and then, to the extent necessary, by waiving non-class specific expenses of the Institutional Class, and (ii) if any Fund-wide expenses (i.e., expenses that apply to both the Institutional Class and the Investor Class) are waived for the Institutional Class to maintain the 1.25% expense limitation, to waive an equal amount (in annual percentage terms) of those same expenses for the Investor Class. The Total Annual Fund Operating Expenses After Fee Waiver and Expense Reimbursement for the Investor Class may vary from year to year and will in some years exceed 1.25%. If the operating expenses fall below the expense limitation in a year within three years after Matthews has made a waiver or reimbursement, the Fund may reimburse Matthews up to an amount that does not cause the expenses for that year to exceed the lesser of (i) the expense limitation applicable at the time of that fee waiver and/or expense reimbursement or (ii) the expense limitation in effect at the time of recoupment. This agreement will remain in place until April 30, 2019 and may be terminated at any time by the Board of Trustees on behalf of the Fund on 60 days’ written notice to Matthews. Matthews may decline to renew this agreement by written notice to the Trust at least 30 days before its annual expiration date. |
| 3 | The lesser of fiscal year 2017 long-term purchase costs or sales proceeds divided by the average monthly market value of long-term securities. |
| | | | |
| matthewsasia.com | 800.789.ASIA | | | 31 | |
| | | | | | | | | | | | | | | | | | | | |
| | | | | | |
| PERFORMANCE AS OF JUNE 30, 2018 | | | | | | | | | | | | | | | |
| | | | | | | | | Average Annual
Total Returns | | | | |
| | | 3 Months | | | YTD | | | 1 Year | | | Since Inception | | | Inception
Date | |
| Investor Class (MAVRX) | | | -3.79% | | | | -2.96% | | | | 8.64% | | | | 13.91% | | | | 11/30/15 | |
| Institutional Class (MAVAX) | | | -3.74% | | | | -2.83% | | | | 8.85% | | | | 14.19% | | | | 11/30/15 | |
| MSCI AC Asia ex Japan Index4 | | | -5.31% | | | | -4.65% | | | | 10.21% | | | | 14.75% | | | | | |
| Lipper Pacific Region Funds Category Average5 | | | -3.78% | | | | -3.74% | | | | 9.59% | | | | 11.94% | | | | | |
Performance assumes reinvestment of all dividends and/or distributions before taxes. All performance quoted represents past performance and is no guarantee of future results. Investment return and principal value will fluctuate with market conditions so that when redeemed, shares may be worth more or less than their original cost. Current performance may be lower or higher than the return figures quoted. Returns would have been lower if certain of the Fund’s fees and expenses had not been waived. For the Fund’s most recent month-end performance visit matthewsasia.com.
GROWTH OF A $10,000 INVESTMENT SINCE INCEPTION—INVESTOR CLASS
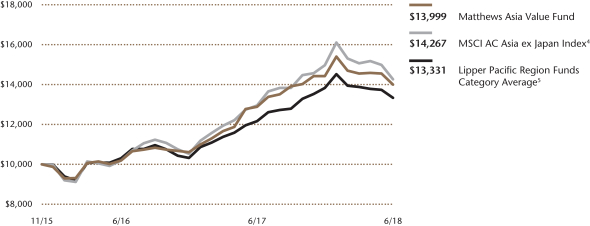
Plotted monthly. The performance data and graph do not reflect the deduction of taxes that a shareholder would pay on dividends, capital gain distributions or redemption of Fund shares. Values are in US$.
| | 4 | It is not possible to invest directly in an index. Source: Index data from Morgan Stanley Capital International and Bloomberg; total return calculations performed by BNY Mellon Investment Servicing (US) Inc. Please see page 92 for index definition. |
| | 5 | The Lipper Category Average does not reflect sales charges and is based on total return, including reinvestment of dividends and capital gains for the stated periods. |
| | | | | | | | |
| | | | |
| TOP TEN HOLDINGS6 | | | | | | | |
| | | Sector | | Country | | % of Net Assets | |
| China National Accord Medicines Corp., Ltd. | | Health Care | | China/Hong Kong | | | 5.0% | |
| Clear Media, Ltd. | | Consumer Discretionary | | China/Hong Kong | | | 4.3% | |
| MPHB Capital BHD | | Financials | | Malaysia | | | 4.2% | |
| CK Hutchison Holdings, Ltd. | | Industrials | | China/Hong Kong | | | 4.1% | |
| Samsung SDI Co., Ltd., Pfd. | | Information Technology | | South Korea | | | 4.0% | |
| YAMADA Consulting Group Co., Ltd. | | Industrials | | Japan | | | 2.9% | |
| Baidu, Inc. | | Information Technology | | China/Hong Kong | | | 2.6% | |
| Shinyoung Securities Co., Ltd. | | Financials | | South Korea | | | 2.6% | |
| Haw Par Corp., Ltd. | | Health Care | | Singapore | | | 2.6% | |
| Kwangju Bank Co., Ltd. | | Financials | | South Korea | | | 2.5% | |
| % OF ASSETS IN TOP TEN | | | | | | | 34.8% | |
| | 6 | Holdings may combine more than one security from same issuer and related depositary receipts. |
Matthews Asia Value Fund
Portfolio Manager Commentary (unaudited) (continued)
Clear Media was also a big detractor to performance in the quarter. Trading remains suspended for shares of Clear Media, the largest bus shelter advertising company in China, due to a past incident in which some junior-level employees misappropriated company funds. We commented on this company extensively last quarter. During the second quarter, we met with company management twice in Hong Kong and China. Though it is unknown when its shares will resume trading, we came away from our meetings feeling incrementally positive. There seems to be no further damage to the company beyond the misappropriation of approximately US$12 million (77 million RMB) already disclosed. Management is working hard, along with external consultants, to strengthen the company’s internal control processes to avoid any recurrence of such incidents. We believe Clear Media will emerge out of this incident as a better and more tightly managed company.
Notable Portfolio Changes:
We trimmed our positions in a couple of companies, such as Nissin Foods, when they neared our estimated intrinsic value. We also took advantage of the substantial market decline in the second half of June to add to several positions.
During a major market correction, we closely evaluated whether to add to some of our existing positions or to initiate new positions. We do not follow a formula and instead make case-by-case decisions. In general, we like to upgrade the overall quality of the portfolio during a market downturn, while keeping valuations approximately the same or lower.
During the second quarter, we initiated a position in China’s Huangshan Tourism Development. Huangshan, which means Yellow Mountain in Chinese, is also a famous tourist spot in eastern China. The mountain is in the Anhui province and attracts over three million visitors a year. The company is a local state-owned enterprise. Recent weak traffic along with potential government regulation of pricing for admission tickets to certain tourist spots has driven down its share price in the past year. We believe these negative factors have been more than discounted in the price of its B-shares, which we were able to acquire at less than 8x P/E ex cash. One thing to note is that it has not raised its admissions prices since early 2009. Yellow Mountain is poised to receive many more tourists for years to come, despite sometimes volatile tourist traffic from quarter to quarter. We view this investment as akin to buying Yellowstone National Park in the U.S. at a single-digit P/E.
Outlook:
The two biggest concerns for investors currently are the U.S.–China trade war and rising interest rates. On both fronts, we believe our portfolio is well-positioned. On the former, most of our holdings are either domestic in nature or have little exposure to China-U.S. trade. On the latter, all of the companies in our portfolio have strong balance sheets and thus we do not expect a direct negative impact if U.S. interest rates rise faster than expected later this year.
In fact, given our long-term investment horizon and double-digit level of cash in the portfolio, as value investors we welcome negative news resulting in more market dislocation in the near future. This opens opportunities to buy more shares, in either some of our existing positions or new companies, at a cheaper price. In the second quarter, we evaluated companies that will likely be affected by the U.S.–China trade war. We have put some of them on our watch list and established “buy” prices that are lower than their current share prices. We remain patient and ready to take advantage of buying opportunities if investor sentiment turns extremely negative.
| | | | |
| |
| COUNTRY ALLOCATION (%)7,8 | |
| China/Hong Kong | | | 31.9 | |
| South Korea | | | 28.8 | |
| Japan | | | 10.3 | |
| Malaysia | | | 5.8 | |
| Singapore | | | 4.7 | |
| Taiwan | | | 4.2 | |
| United States | | | 1.9 | |
| Switzerland | | | 1.1 | |
| Israel | | | 0.5 | |
| Cash and Other Assets, Less Liabilities | | | 10.9 | |
| | | | |
| |
| SECTOR ALLOCATION (%)8 | |
| Consumer Discretionary | | | 22.8 | |
| Industrials | | | 15.0 | |
| Financials | | | 13.0 | |
| Information Technology | | | 12.4 | |
| Health Care | | | 11.8 | |
| Consumer Staples | | | 7.1 | |
| Materials | | | 5.3 | |
| Telecommunication Services | | | 1.7 | |
| Cash and Other Assets, Less Liabilities | | | 10.9 | |
| | | | |
| |
| MARKET CAP EXPOSURE (%)8 | |
| Mega Cap (over $25B) | | | 14.9 | |
| Large Cap ($10B–$25B) | | | 5.5 | |
| Mid Cap ($3B–10B) | | | 11.4 | |
| Small Cap (under $3B) | | | 57.2 | |
| Cash and Other Assets, Less Liabilities | | | 10.9 | |
| 7 | Not all countries where the Fund may invest are included in the benchmark index. |
| 8 | Source: FactSet Research Systems. Percentage values in data are rounded to the nearest tenth of one percent, so the values may not sum to 100% due to rounding. Percentage values may be derived from different data sources and may not be consistent with other Fund literature. |
| | | | |
| matthewsasia.com | 800.789.ASIA | | | 33 | |
Matthews Asia Value Fund
June 30, 2018
Schedule of Investmentsa (unaudited)
COMMON EQUITIES: 80.0%
| | | | | | | | |
| | | Shares | | | Value | |
| CHINA/HONG KONG: 31.8% | | | | | |
China National Accord Medicines Corp., Ltd. B Shares | | | 443,400 | | | | $1,775,160 | |
Clear Media, Ltd.b | | | 2,291,000 | | | | 1,534,488 | |
CK Hutchison Holdings, Ltd. | | | 138,500 | | | | 1,466,164 | |
Baidu, Inc. ADRc | | | 3,900 | | | | 947,700 | |
COSCO SHIPPING International Hong Kong Co., Ltd. | | | 1,764,000 | | | | 669,367 | |
PW Medtech Group, Ltd.c | | | 3,366,000 | | | | 663,506 | |
Anhui Gujing Distillery Co., Ltd. B Shares | | | 103,100 | | | | 658,334 | |
Qualcomm, Inc. | | | 11,600 | | | | 650,992 | |
China Mobile, Ltd. | | | 70,500 | | | | 625,543 | |
Goldlion Holdings, Ltd. | | | 1,443,000 | | | | 590,398 | |
Huangshan Tourism Development Co., Ltd. B Shares | | | 463,187 | | | | 549,657 | |
Nissin Foods Co., Ltd. | | | 783,000 | | | | 454,216 | |
Texwinca Holdings, Ltd. | | | 1,004,000 | | | | 428,243 | |
Shandong Weigao Group Medical Polymer Co., Ltd. H Shares | | | 324,000 | | | | 228,751 | |
Jiangling Motors Corp., Ltd. B Shares | | | 127,779 | | | | 162,053 | |
| | | | | | | | |
Total China/Hong Kong | | | | | | | 11,404,572 | |
| | | | | | | | |
| | | | | | | | |
| SOUTH KOREA: 19.7% | | | | | |
Shinyoung Securities Co., Ltd. | | | 18,580 | | | | 946,363 | |
Kwangju Bank Co., Ltd. | | | 92,401 | | | | 885,946 | |
DGB Financial Group, Inc. | | | 80,420 | | | | 739,629 | |
Hyundai Greenfood Co., Ltd. | | | 54,192 | | | | 691,854 | |
Young Poong Corp. | | | 877 | | | | 630,804 | |
Samho Development Co., Ltd. | | | 126,275 | | | | 592,569 | |
Nice Information & Telecommunication, Inc. | | | 25,895 | | | | 584,527 | |
Geumhwa PSC Co., Ltd. | | | 17,460 | | | | 548,318 | |
Kangnam Jevisco Co., Ltd. | | | 20,282 | | | | 501,363 | |
CMS Edu Co., Ltd. | | | 63,533 | | | | 456,225 | |
Grand Korea Leisure Co., Ltd. | | | 12,298 | | | | 287,170 | |
Hy-Lok Corp. | | | 9,185 | | | | 210,800 | |
| | | | | | | | |
Total South Korea | | | | | | | 7,075,568 | |
| | | | | | | | |
| | | | | | | | |
| JAPAN: 10.3% | | | | | |
YAMADA Consulting Group Co., Ltd. | | | 36,300 | | | | 1,043,281 | |
Ohashi Technica, Inc. | | | 47,000 | | | | 772,183 | |
Honma Golf, Ltd.d,e | | | 623,000 | | | | 638,310 | |
Medikit Co., Ltd. | | | 8,400 | | | | 453,706 | |
Asante, Inc. | | | 21,800 | | | | 417,437 | |
San-A Co., Ltd. | | | 7,100 | | | | 350,679 | |
| | | | | | | | |
Total Japan | | | | | | | 3,675,596 | |
| | | | | | | | |
| | | | | | | | |
| MALAYSIA: 5.8% | | | | | |
MPHB Capital BHDc | | | 4,786,400 | | | | 1,518,751 | |
Genting BHD | | | 267,900 | | | | 557,331 | |
| | | | | | | | |
Total Malaysia | | | | | | | 2,076,082 | |
| | | | | | | | |
| | | | | | | | |
| SINGAPORE: 4.7% | | | | | |
Haw Par Corp., Ltd. | | | 93,200 | | | | 917,977 | |
Straits Trading Co., Ltd. | | | 507,200 | | | | 754,245 | |
| | | | | | | | |
Total Singapore | | | | | | | 1,672,222 | |
| | | | | | | | |
| | | | | | | | |
| | | | | | | | |
| | | Shares | | | Value | |
| TAIWAN: 4.2% | | | | | |
P-Duke Technology Co., Ltd. | | | 199,000 | | | | $460,284 | |
Tehmag Foods Corp. | | | 57,300 | | | | 392,468 | |
Lumax International Corp., Ltd. | | | 182,900 | | | | 379,491 | |
Faraday Technology Corp. | | | 143,000 | | | | 279,745 | |
| | | | | | | | |
Total Taiwan | | | | | | | 1,511,988 | |
| | | | | | | | |
| | | | | | | | |
| UNITED STATES: 1.9% | | | | | |
News Corp. Class B | | | 42,200 | | | | 668,870 | |
| | | | | | | | |
Total United States | | | | | | | 668,870 | |
| | | | | | | | |
| | | | | | | | |
| SWITZERLAND: 1.1% | | | | | |
Cie Financiere Richemont SA | | | 4,722 | | | | 399,172 | |
| | | | | | | | |
Total Switzerland | | | | | | | 399,172 | |
| | | | | | | | |
| | | | | | | | |
| ISRAEL: 0.5% | | | | | |
Taro Pharmaceutical Industries, Ltd.c | | | 1,700 | | | | 196,673 | |
| | | | | | | | |
Total Israel | | | | | | | 196,673 | |
| | | | | | | | |
| | | | | | | | |
| TOTAL COMMON EQUITIES | | | | 28,680,743 | |
| | | | | | | | |
(Cost $29,232,282) | | | | | | | | |
| | | | | | | | |
PREFERRED EQUITIES: 9.1% | | | | | | | | |
| SOUTH KOREA: 9.1% | | | | | |
Samsung SDI Co., Ltd., Pfd. | | | 17,132 | | | | 1,426,943 | |
Hyundai Motor Co., Ltd., 2nd Pfd. | | | 8,696 | | | | 707,807 | |
Samsung Electronics Co., Ltd., Pfd. | | | 16,600 | | | | 560,564 | |
Samsung Fire & Marine Insurance Co., Ltd., Pfd. | | | 3,409 | | | | 558,008 | |
| | | | | | | | |
Total South Korea | | | | | | | 3,253,322 | |
| | | | | | | | |
| | | | | | | | |
| TOTAL PREFERRED EQUITIES | | | | 3,253,322 | |
| | | | | | | | |
(Cost $3,144,128) | | | | | | | | |
| | | | | | | | |
| TOTAL INVESTMENTS: 89.1% | | | | 31,934,065 | |
(Cost $32,376,410) | | | | | | | | |
| | | | | | | | |
CASH AND OTHER ASSETS,
LESS LIABILITIES: 10.9% | | | | | | | 3,909,261 | |
| | | | | | | | |
| | |
NET ASSETS: 100.0% | | | | | | | $35,843,326 | |
| | | | | | | | |
| a | Certain securities were fair valued under the valuation policies approved by the Board of Trustees (Note 2-A). |
| b | Security is valued using significant unobservable inputs and is classified as Level 3 in the fair value hierarchy. |
| c | Non-income producing security. |
| d | Security exempt from registration under Rule 144A of the Securities Act of 1933, as amended. The security may be resold in transactions exempt from registration normally to qualified institutional buyers. The security has been determined to be liquid in accordance with procedures adopted by the Funds’ Board of Trustees. At June 30, 2018, the aggregate value is $638,310, which is 1.78% of net assets. |
| e | The securities may be resold to qualified foreign investors and foreign institutional buyers under Regulation S of the Securities Act of 1933. |
| ADR | American Depositary Receipt |
See accompanying notes to financial statements.

| | | | |
| PORTFOLIO MANAGERS |
| Kenneth Lowe, CFA | | |
Lead Manager | | | | |
| S. Joyce Li, CFA | | |
Co-Manager | | |
|
| FUND FACTS |
| | | Investor | | Institutional |
Ticker | | MAFSX | | MIFSX |
CUSIP | | 577125701 | | 577125800 |
Inception | | 4/30/13 | | 4/30/13 |
NAV | | $11.29 | | $11.36 |
Initial Investment | | $2,500 | | $100,000 |
Gross Expense Ratio1 | | 2.45% | | 2.27% |
After Fee Waiver and Reimbursement2 | | 1.50% | | 1.25% |
Portfolio Statistics |
Total # of Positions | | 33 |
Net Assets | | $8.4 million |
Weighted Average Market Cap | | $77.6 billion |
Portfolio Turnover3 | | 28.42% |
Benchmark |
MSCI AC Asia ex Japan Index |
OBJECTIVE
Long-term capital appreciation.
STRATEGY
Under normal market conditions, the Fund seeks to achieve its investment objective by investing at least 80% of its total assets, which include borrowings for investment purposes, in the common and preferred stocks of companies located in Asia excluding Japan, but including all other developed, emerging and frontier countries and markets in the Asian region. The Fund is currently expected to hold stocks of between 25 and 35 companies under normal market conditions.
Matthews Asia Focus Fund
Portfolio Manager Commentary (unaudited)
For the first half of 2018, the Matthews Asia Focus Fund returned –7.31% (Investor Class) and –7.19% (Institutional Class) while its benchmark, the MSCI All Country Asia ex Japan Index, returned –4.65%. For the quarter ending June 30, the Fund returned –4.73% (Investor Class) and –4.70% (Institutional Class) compared to the benchmark return of –5.31% over the same period.
Market Environment:
Following almost two years of extremely low volatility and strong equity market performance in Asia, the first half of the year was far choppier and markets ended lower. This can be attributed to a number of macroeconomic and policy-related factors. Monetary tightening in the U.S. through interest rate rises and a reduction of the U.S. Federal Reserve’s balance sheet has tightened U.S. dollar liquidity, while monetary conditions also tightened in China. Additionally, significant political risks re-emerged within Europe in the first half of the year. But the resumption of President Trump’s trade war rhetoric and planned tariffs swung sentiment into negative territory. This has focused on China in particular, with an initial US$34billion of tariffs to be imposed on imports from China in early July. This number will increase over time. China has responded in equal measure, resulting in an escalated trade war that is economically disruptive for all.
These factors have sparked concern that the globally synchronized growth environment of the past couple of years has passed. Asian equities and currencies have dropped significantly from their peaks in January, with the markets of China and Taiwan holding up marginally better than others.
Performance Contributors and Detractors:
During the first six months of 2018, the largest contributors to returns came from the portfolio’s holdings in Australia. The best performer, Macquarie Group, has diversified its business beyond investment banking to become a vertically integrated asset manager capable of delivering stable growth among Australian financial institutions through business cycles. The stock rallied as the market started to appreciate this business model transformation.
In addition, our holdings in the consumer staples sector contributed positively. Heineken Malaysia, a leader in Malaysia’s premium beer segment, performed strongly as it delivered above-market growth and benefited from the new government’s policies. Meanwhile, shares of Singaporean supermarket chain Sheng Siong Group gained as it offered earnings certainty amid market volatility with its store network optimization and defensive operating cash flow.
The largest detractor to relative returns during the first six months of 2018 came from holdings in the China/Hong Kong markets. Shares of NetEase, a Chinese online game company, declined as investors worried about the lack of new hit game titles and the firm’s investment in e-commerce. We think NetEase’s franchise value—as the second-largest online game platform in China—remains underappreciated. We also like management’s disciplined approach in developing a niche e-commerce strategy. More recently our holdings in Indonesia and the Philippines declined amid global emerging market volatility and foreign fund outflow. For instance, shares of Bank of the Philippine Islands declined to 1.9x price
(continued)
| 1 | Prospectus expense ratios. |
| 2 | Matthews has contractually agreed (i) to waive fees and reimburse expenses to the extent needed to limit Total Annual Fund Operating Expenses (excluding Rule 12b-1 fees, taxes, interest, brokerage commissions, short sale dividend expenses, expenses incurred in connection with any merger or reorganization or extraordinary expenses such as litigation) of the Institutional Class to 1.25% first by waiving class specific expenses (i.e., shareholder service fees specific to a particular class) of the Institutional Class and then, to the extent necessary, by waiving non-class specific expenses of the Institutional Class, and (ii) if any Fund-wide expenses (i.e., expenses that apply to both the Institutional Class and the Investor Class) are waived for the Institutional Class to maintain the 1.25% expense limitation, to waive an equal amount (in annual percentage terms) of those same expenses for the Investor Class. The Total Annual Fund Operating Expenses After Fee Waiver and Expense Reimbursement for the Investor Class may vary from year to year and will in some years exceed 1.25%. If the operating expenses fall below the expense limitation in a year within three years after Matthews has made a waiver or reimbursement, the Fund may reimburse Matthews up to an amount that does not cause the expenses for that year to exceed the lesser of (i) the expense limitation applicable at the time of that fee waiver and/or expense reimbursement or (ii) the expense limitation in effect at the time of recoupment. This agreement will remain in place until April 30, 2019 and may be terminated at any time by the Board of Trustees on behalf of the Fund on 60 days’ written notice to Matthews. Matthews may decline to renew this agreement by written notice to the Trust at least 30 days before its annual expiration date. |
| 3 | The lesser of fiscal year 2017 long-term purchase costs or sales proceeds divided by the average monthly market value of long-term securities. |
| | | | |
| matthewsasia.com | 800.789.ASIA | | | 35 | |
| | | | | | | | | | | | | | | | | | | | | | | | | | | | |
| | | | | | | | |
| PERFORMANCE AS OF JUNE 30, 2018 | | | | | | | | | | | | | | | | | | | | | |
| | | | | | | | | Average Annual Total Returns | | | | |
| | | 3 Months | | | YTD | | | 1 Year | | | 3 Years | | | 5 Years | | | Since
Inception | | | Inception
Date | |
| Investor Class (MAFSX) | | | -4.73% | | | | -7.31% | | | | 5.38% | | | | 5.70% | | | | 4.93% | | | | 3.41% | | | | 4/30/13 | |
| Institutional Class (MIFSX) | | | -4.70% | | | | -7.19% | | | | 5.62% | | | | 5.96% | | | | 5.20% | | | | 3.67% | | | | 4/30/13 | |
| MSCI AC Asia ex Japan Index4 | | | -5.31% | | | | -4.65% | | | | 10.21% | | | | 7.32% | | | | 8.48% | | | | 6.71% | | | | | |
| Lipper Pacific ex Japan Funds Category Average5 | | | -5.15% | | | | -4.63% | | | | 9.66% | | | | 6.37% | | | | 7.52% | | | | 5.62% | | | | | |
Performance assumes reinvestment of all dividends and/or distributions before taxes. All performance quoted represents past performance and is no guarantee of future results. Investment return and principal value will fluctuate with market conditions so that when redeemed, shares may be worth more or less than their original cost. Current performance may be lower or higher than the return figures quoted. Returns would have been lower if certain of the Fund’s fees and expenses had not been waived. For the Fund’s most recent month-end performance visit matthewsasia.com.
GROWTH OF A $10,000 INVESTMENT SINCE INCEPTION—INVESTOR CLASS
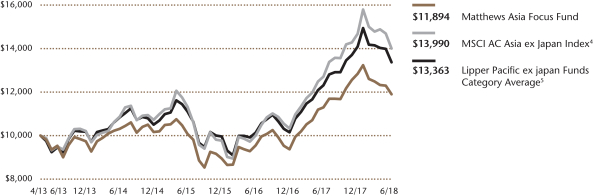
Plotted monthly. The performance data and graph do not reflect the deduction of taxes that a shareholder would pay on dividends, capital gain distributions or redemption of Fund shares. Values are in US$.
| | 4 | It is not possible to invest directly in an index. Source: Index data from Morgan Stanley Capital International and Bloomberg; total return calculations performed by BNY Mellon Investment Servicing (US) Inc. Please see page 92 for index definition. |
| | 5 | The Lipper Category Average does not reflect sales charges and is based on total return, including reinvestment of dividends and capital gains for the stated periods. |
| | | | | | | | |
| | | | |
| TOP TEN HOLDINGS6 | | | | | | | |
| | | Sector | | Country | | % of Net Assets | |
| AIA Group, Ltd. | | Financials | | China/Hong Kong | | | 7.2% | |
| Tencent Holdings, Ltd. | | Information Technology | | China/Hong Kong | | | 5.7% | |
| Broadcom, Inc. | | Information Technology | | United States | | | 3.5% | |
| Macquarie Group, Ltd. | | Financials | | Australia | | | 3.5% | |
| United Overseas Bank, Ltd. | | Financials | | Singapore | | | 3.4% | |
| Jardine Matheson Holdings, Ltd. | | Industrials | | China/Hong Kong | | | 3.4% | |
| Sheng Siong Group, Ltd. | | Consumer Staples | | Singapore | | | 3.3% | |
| Coway Co., Ltd. | | Consumer Discretionary | | South Korea | | | 3.2% | |
| Housing Development Finance Corp., Ltd. | | Financials | | India | | | 3.1% | |
| Taiwan Semiconductor Manufacturing Co., Ltd. | | Information Technology | | Taiwan | | | 3.1% | |
| % OF ASSETS IN TOP TEN | | | | | | | 39.4% | |
| | 6 | Holdings may combine more than one security from same issuer and related depositary receipts. |
Matthews Asia Focus Fund
Portfolio Manager Commentary (unaudited) (continued)
to book, their lowest valuation since 2010. We believe this strong franchise is now attractively valued, as its business is holding up well on measures including loan growth, nonperforming loan ratio and capital sufficiency.
Notable Portfolio Changes:
We added three new positions during the second quarter: ING Life Insurance Korea, Johnson Electric Holdings and JNBY Design.
ING Life Insurance Korea is a high-quality life insurance company in South Korea with a strong management team. Its solvency margin is significantly higher than its peers, making it well-positioned to gain market share amid tighter capital rules. The stock is attractively priced at 9x forward price-to-earnings ratio and offers a 6% dividend yield.
Hong Kong-listed Johnson Electric Holdings is a leading micro-motor maker that benefits from demand driven by the global trend of vehicle electrification. Market concerns of trade wars led to broad weakness in automotive parts manufacturers including Johnson Electric, even though the impact to the company is limited. At 5x enterprise value-to-EBITDA (Earnings Before Interest, Taxes, Depreciation and Amortization) and 8x forward price to earnings, Johnson Electric is undervalued for its long-term growth in our view.
Additionally, we initiated a position in JNBY Design, an emerging leader in the designer fashion industry in China. Through its successful social media marketing and customer analytics, JNBY Design rides on the tide of consumption upgrades in China and has built a large number of loyal customers, whose purchases accounted for 63% of its total retail sales in the fiscal year ending in June 2017.
During the second quarter, we exited our holding in Heineken Malaysia. The company operates in a duopolistic industry and benefits from the newly elected government’s plan to remove Malaysia’s goods and services tax (GST). However, after the recent rally, we believed its valuation fully reflected its moderate growth opportunities. In addition, we exited our holding in Tata Motors, which had disappointed investors with its sales performance and investment plans.
Outlook:
The reasons for caution in allocating capital have been increasing and are fairly plentiful at this late stage of the global equity market cycle. The reduction in U.S. dollar liquidity alongside rising autocracy, protectionism, trade wars, reasonably high valuations, significant leverage and the dangers of market dislocations perpetuated by the rise of passive investing are all concerning. Although these may not spark major market declines, particularly against a backdrop of seemingly solid economic growth, these are likely to contribute to a sustained rise in volatility.
For the Matthews Asia Focus Fund, this is an appealing backdrop. Not only is there still solid economic and corporate profit growth in Asia over both the short and long term, but this volatility may provide long-term investors with the ability to purchase shares of high-quality companies at attractive price points. We will look to take advantage of any dislocations to add to our stable of emerging and established leading companies, while the Fund was already trading by June 30 at an appealing 15.0x forward P/E after recent declines.
| | | | |
| |
| COUNTRY ALLOCATION (%)7,8 | |
| China/Hong Kong | | | 41.0 | |
| Singapore | | | 12.1 | |
| South Korea | | | 7.8 | |
| India | | | 6.0 | |
| Indonesia | | | 5.3 | |
| Taiwan | | | 5.2 | |
| United States | | | 3.5 | |
| Australia | | | 3.5 | |
| Switzerland | | | 3.1 | |
| Japan | | | 3.0 | |
| Thailand | | | 2.6 | |
| Malaysia | | | 2.5 | |
| Philippines | | | 2.5 | |
| Cash and Other Assets, Less Liabilities | | | 2.0 | |
| | | | |
SECTOR ALLOCATION (%)8 | |
| Financials | | | 29.4 | |
| Consumer Discretionary | | | 20.9 | |
| Information Technology | | | 19.6 | |
| Industrials | | | 11.2 | |
| Telecommunication Services | | | 8.2 | |
| Consumer Staples | | | 6.2 | |
| Real Estate | | | 2.3 | |
| Cash and Other Assets, Less Liabilities | | | 2.0 | |
| | | | |
MARKET CAP EXPOSURE (%)8 | |
| Mega Cap (over $25B) | | | 55.1 | |
| Large Cap ($10B–$25B) | | | 9.6 | |
| Mid Cap ($3B–10B) | | | 17.4 | |
| Small Cap (under $3B) | | | 15.8 | |
| Cash and Other Assets, Less Liabilities | | | 2.0 | |
| 7 | Not all countries where the Fund may invest are included in the benchmark index. |
| 8 | Source: FactSet Research Systems. Percentage values in data are rounded to the nearest tenth of one percent, so the values may not sum to 100% due to rounding. Percentage values may be derived from different data sources and may not be consistent with other Fund literature. |
| | | | |
| matthewsasia.com | 800.789.ASIA | | | 37 | |
Matthews Asia Focus Fund
June 30, 2018
Schedule of Investmentsa (unaudited)
COMMON EQUITIES: 98.0%
| | | | | | | | |
| | | Shares | | | Value | |
| CHINA/HONG KONG: 41.0% | | | | | | | | |
AIA Group, Ltd. | | | 69,200 | | | | $602,830 | |
Tencent Holdings, Ltd. | | | 9,500 | | | | 477,046 | |
Jardine Matheson Holdings, Ltd. | | | 4,500 | | | | 283,559 | |
Xiabuxiabu Catering Management China Holdings Co., Ltd.b,c | | | 118,500 | | | | 258,765 | |
CK Hutchison Holdings, Ltd. | | | 23,228 | | | | 245,892 | |
HSBC Holdings PLC | | | 24,800 | | | | 232,029 | |
NetEase, Inc. ADR | | | 900 | | | | 227,403 | |
China Mobile, Ltd. | | | 25,000 | | | | 221,824 | |
Hang Lung Group, Ltd. | | | 70,000 | | | | 195,999 | |
JNBY Design, Ltd.c | | | 84,000 | | | | 191,911 | |
Johnson Electric Holdings, Ltd. | | | 63,000 | | | | 183,467 | |
Zhejiang Supor Cookware Co., Ltd. A Shares | | | 21,700 | | | | 167,962 | |
Techtronic Industries Co., Ltd. | | | 28,500 | | | | 158,286 | |
| | | | | | | | |
Total China/Hong Kong | | | | | | | 3,446,973 | |
| | | | | | | | |
| | | | | | | | |
| SINGAPORE: 12.1% | | | | | | | | |
United Overseas Bank, Ltd. | | | 14,500 | | | | 284,182 | |
Sheng Siong Group, Ltd. | | | 354,100 | | | | 275,126 | |
Singapore Technologies Engineering, Ltd. | | | 96,000 | | | | 231,401 | |
Singapore Telecommunications, Ltd. | | | 99,000 | | | | 223,522 | |
| | | | | | | | |
Total Singapore | | | | | | | 1,014,231 | |
| | | | | | | | |
| | | | | | | | |
| SOUTH KOREA: 7.8% | | | | | | | | |
Coway Co., Ltd. | | | 3,428 | | | | 266,366 | |
Samsung Electronics Co., Ltd. | | | 5,200 | | | | 217,826 | |
ING Life Insurance Korea, Ltd.b,c | | | 4,472 | | | | 167,889 | |
| | | | | | | | |
Total South Korea | | | | | | | 652,081 | |
| | | | | | | | |
| | | | | | | | |
| INDIA: 6.0% | | | | | | | | |
Housing Development Finance Corp., Ltd. | | | 9,446 | | | | 263,209 | |
Bharti Infratel, Ltd. | | | 55,488 | | | | 243,845 | |
| | | | | | | | |
Total India | | | | | | | 507,054 | |
| | | | | | | | |
| | | | | | | | |
| INDONESIA: 5.3% | | | | | | | | |
PT Matahari Department Store | | | 401,000 | | | | 245,594 | |
PT Bank Rakyat Indonesia Persero | | | 1,004,100 | | | | 198,602 | |
| | | | | | | | |
Total Indonesia | | | | | | | 444,196 | |
| | | | | | | | |
| | | | | | | | |
| TAIWAN: 5.2% | | | | | | | | |
Taiwan Semiconductor Manufacturing Co., Ltd. | | | 37,000 | | | | 262,740 | |
Ennoconn Corp. | | | 12,000 | | | | 173,837 | |
| | | | | | | | |
Total Taiwan | | | | | | | 436,577 | |
| | | | | | | | |
| | | | | | | | |
| UNITED STATES: 3.5% | | | | | | | | |
Broadcom, Inc. | | | 1,200 | | | | 291,168 | |
| | | | | | | | |
Total United States | | | | | | | 291,168 | |
| | | | | | | | |
| | | | | | | | |
| AUSTRALIA: 3.5% | | | | | | | | |
Macquarie Group, Ltd. | | | 3,189 | | | | 290,633 | |
| | | | | | | | |
Total Australia | | | | | | | 290,633 | |
| | | | | | | | |
| | | | | | | | |
| SWITZERLAND: 3.1% | | | | | | | | |
Cie Financiere Richemont SA | | | 3,076 | | | | 260,028 | |
| | | | | | | | |
Total Switzerland | | | | | | | 260,028 | |
| | | | | | | | |
| | | | | | | | |
| | | | | | | | |
| | | Shares | | | Value | |
| JAPAN: 3.0% | | | | | | | | |
Japan Tobacco, Inc. | | | 8,900 | | | | $248,723 | |
| | | | | | | | |
Total Japan | | | | | | | 248,723 | |
| | | | | | | | |
| | | | | | | | |
| THAILAND: 2.6% | | | | | | | | |
Kasikornbank Public Co., Ltd. | | | 37,700 | | | | 220,557 | |
| | | | | | | | |
Total Thailand | | | | | | | 220,557 | |
| | | | | | | | |
| | | | | | | | |
| PHILIPPINES: 2.5% | | | | | | | | |
Bank of the Philippine Islands | | | 128,995 | | | | 214,011 | |
| | | | | | | | |
Total Philippines | | | | | | | 214,011 | |
| | | | | | | | |
| | | | | | | | |
| MALAYSIA: 2.4% | | | | | | | | |
Genting Malaysia BHD | | | 171,000 | | | | 206,491 | |
| | | | | | | | |
Total Malaysia | | | | | | | 206,491 | |
| | | | | | | | |
| | | | | | | | |
| TOTAL INVESTMENTS: 98.0% | | | | | | | 8,232,723 | |
(Cost $7,889,322) | | | | | | | | |
| | | | | | | | |
CASH AND OTHER ASSETS,
LESS LIABILITIES: 2.0% | | | | | | | 170,355 | |
| | | | | | | | |
| | |
NET ASSETS: 100.0% | | | | | | | $8,403,078 | |
| | | | | | | | |
| a | Certain securities were fair valued under the valuation policies approved by the Board of Trustees (Note 2-A). |
| b | Security exempt from registration under Rule 144A of the Securities Act of 1933, as amended. The security may be resold in transactions exempt from registration normally to qualified institutional buyers. The security has been determined to be liquid in accordance with procedures adopted by the Funds’ Board of Trustees. At June 30, 2018, the aggregate value is $426,654, which is 5.08% of net assets. |
| c | The securities may be resold to qualified foreign investors and foreign institutional buyers under Regulation S of the Securities Act of 1933. |
| ADR | American Depositary Receipt |
See accompanying notes to financial statements.
| | | | |
| PORTFOLIO MANAGERS |
| Taizo Ishida | | |
Lead Manager | | |
| Sharat Shroff, CFA | | |
Co-Manager | | |
|
| FUND FACTS |
| | | Investor | | Institutional |
Ticker | | MPACX | | MIAPX |
CUSIP | | 577130867 | | 577130776 |
Inception | | 10/31/03 | | 10/29/10 |
NAV | | $28.06 | | $28.29 |
Initial Investment | | $2,500 | | $100,000 |
Gross Expense Ratio1 | | 1.12% | | 0.93% |
Portfolio Statistics | | | | |
Total # of Positions | | | | 56 |
Net Assets | | | | $1.2 billion |
Weighted Average Market Cap | | $28.5 billion |
Portfolio Turnover2 | | | | 23.19% |
Benchmark |
MSCI AC Asia Pacific Index |
OBJECTIVE
Long-term capital appreciation.
STRATEGY
Under normal market conditions, the Fund seeks to achieve its investment objective by investing at least 80% of its total net assets, which include borrowings for investment purposes, in the common and preferred stocks of companies located in Asia. Asia consists of all countries and markets in Asia, and includes developed, emerging and frontier countries and markets in the Asian region. The Fund may also invest in the convertible securities, of any duration or quality, of Asian companies.
Matthews Asia Growth Fund
Portfolio Manager Commentary (unaudited)
For the first half of 2018, the Matthews Asia Growth Fund returned 2.97% (Investor Class) and 3.06% (Institutional Class), while its benchmark, the MSCI All Country Asia Pacific Index, fell –3.22% over the same period. For the quarter ending June 30, the Fund returned –2.47% (Investor Class) and –2.45% (Institutional Class), while its benchmark returned –3.25%.
Market Environment:
Asian and global emerging markets suffered during the first half of 2018. Negative investor sentiment arose from the confluence of escalating trade tensions between China and the United States; seemingly tighter monetary conditions in China and other emerging markets; and the oscillation of North Korean denuclearization talks. In addition, the flight to quality, a stronger U.S. dollar and higher energy prices exposed the vulnerabilities of some emerging market economies.
Chinese shares generated negative returns for the six months ending June 30. Trade disputes with the U.S. proved to be too large a risk for investors during the second quarter. However, resilient corporate earnings, a surprisingly stable renminbi and robust exports were positive contributors to China’s economic growth. Elsewhere, India’s equity market posted negative returns for the first half of the year. India faced macro headwinds during the second quarter as its reliance on energy imports and a deteriorating current account pressured the Indian rupee and raised inflation concerns. On a positive note, economic growth remained robust and corporate earnings momentum improved.
Japanese shares experienced a volatile quarter and generated negative returns during the first half of the year. Stock prices increased in April as overseas risks seemed to stabilize temporarily as tensions between the U.S. and North Korea faded and trade tensions with China appeared calmer. However, geopolitical tension picked up in May, causing volatility in global stocks, especially within sectors exposed to global trade. This pattern of volatility continued through June despite notably high return on equity (ROE) figures from Japanese companies.
Performance Contributors and Detractors:
During the first half of the year, the Fund outperformed its benchmark on both an absolute and relative basis. The top contributor to performance for the six-month period was Baozun, a Chinese e-commerce solutions firm that is becoming an essential partner to global brands conducting business online in China. The rising purchasing power of the Chinese consumer has contributed to the demand for Baozun’s services. Shenzhou International Group Holdings, a Chinese apparel manufacturer, was another top performer. In addition to making apparel for several leading global apparel brands, the firm has shrewdly expanded its focus to include the Chinese consumer. We expect the firm’s focus on China’s sizeable domestic apparel market to drive attractive growth rates.
Detractors from performance included Bank Rakyat Indonesia, a large bank in Indonesia specializing in small-scale lending. Its stock price fell on negative investor sentiment driven in part by rising interest rates in Indonesia as well as a broader decline among Indonesian equities. We believe, however, that the bank’s fundamentals remain solid and that its business may offer attractive long-term growth prospects. Another detractor from performance was PC Jeweller, an Indian jewelry manufacturer. Its shares lost close to three quarters of their value over the same period on unsubstantiated rumors that the company manipulated its financial data. We are closely monitoring both positions.
(continued)
| 1 | Prospectus expense ratios. |
| 2 | The lesser of fiscal year 2017 long-term purchase costs or sales proceeds divided by the average monthly market value of long-term securities. |
| | | | |
| matthewsasia.com | 800.789.ASIA | | | 39 | |
| | | | | | | | | | | | | | | | | | | | | | | | | | | | | | | | |
| | |
| PERFORMANCE AS OF JUNE 30, 2018 | | | | |
| | | | | | | | | Average Annual Total Returns | | | | |
| | | 3 Months | | | YTD | | | 1 Year | | | 3 Years | | | 5 Years | | | 10 Years | | | Since
Inception | | | Inception
Date | |
| Investor Class (MPACX) | | | -2.47% | | | | 2.97% | | | | 20.61% | | | | 11.48% | | | | 9.55% | | | | 9.34% | | | | 10.05% | | | | 10/31/03 | |
| Institutional Class (MIAPX) | | | -2.45% | | | | 3.06% | | | | 20.82% | | | | 11.69% | | | | 9.77% | | | | n.a. | | | | 8.53% | | | | 10/29/10 | |
| MSCI AC Asia Pacific Index3 | | | -3.25% | | | | -3.22% | | | | 10.25% | | | | 7.12% | | | | 7.76% | | | | 4.76% | | | | 7.47% | 4 | | | | |
| Lipper Pacific Region Funds Category Average5 | | | -3.78% | | | | -3.74% | | | | 9.59% | | | | 7.07% | | | | 7.37% | | | | 4.62% | | | | 7.87% | 4 | | | | |
Performance assumes reinvestment of all dividends and/or distributions before taxes. All performance quoted represents past performance and is no guarantee of future results. Investment return and principal value will fluctuate with market conditions so that when redeemed, shares may be worth more or less than their original cost. Current performance may be lower or higher than the return figures quoted. For the Fund’s most recent month-end performance, visit matthewsasia.com.
GROWTH OF A $10,000 INVESTMENT SINCE INCEPTION—INVESTOR CLASS
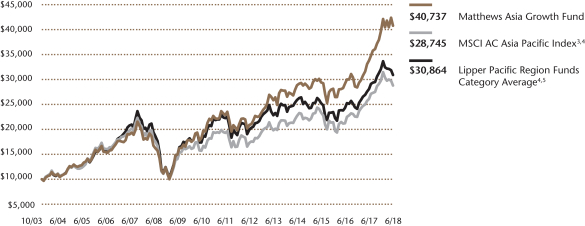
Plotted monthly. The performance data and graph do not reflect the deduction of taxes that a shareholder would pay on dividends, capital gains distributions or redemption of Fund shares. Values are in US$.
| | 3 | It is not possible to invest directly in an index. Source: Index data from Morgan Stanley Capital International and Bloomberg; total return calculations performed by BNY Mellon Investment Servicing (US) Inc. Please see page 92 for index definition. |
| | 4 | Calculated from 10/31/03. |
| | 5 | The Lipper Category Average does not reflect sales charges and is based on total return, including reinvestment of dividends and capital gains for the stated periods. |
| | | | | | | | |
| | | | |
| TOP TEN HOLDINGS6 | | | | | | | |
| | | Sector | | Country | | % of Net Assets | |
| Shenzhou International Group Holdings, Ltd. | | Consumer Discretionary | | China/Hong Kong | | | 4.8% | |
| Wuxi Biologics Cayman, Inc. | | Health Care | | China/Hong Kong | | | 4.0% | |
| Baozun, Inc. | | Information Technology | | China/Hong Kong | | | 3.8% | |
| M3, Inc. | | Health Care | | Japan | | | 3.8% | |
| Start Today Co., Ltd. | | Consumer Discretionary | | Japan | | | 3.4% | |
| HDFC Bank, Ltd. | | Financials | | India | | | 3.0% | |
| CSL, Ltd. | | Health Care | | Australia | | | 2.9% | |
| Sampath Bank PLC | | Financials | | Sri Lanka | | | 2.7% | |
| PT Bank Rakyat Indonesia Persero | | Financials | | Indonesia | | | 2.6% | |
| Nidec Corp. | | Industrials | | Japan | | | 2.6% | |
| % OF ASSETS IN TOP TEN | | | | | | | 33.6% | |
| | 6 | Holdings may combine more than one security from same issuer and related depositary receipts. |
Matthews Asia Growth Fund
Portfolio Manager Commentary (unaudited) (continued)
Notable Portfolio Changes:
During the second quarter, we initiated a position in Terumo, a Japanese medical device company. Valuations looked reasonable and we expect the company to have strong growth prospects over the next five years. In particular, we believe the company’s neurovascular business has a sharp focus and clear drivers of growth. As part of our fundamental research process, we met with the company’s management team during the quarter and were impressed with the quality of the leadership. We exited our position in Habib Bank, a multinational bank in Pakistan. We initiated the position more than three years ago with the aim of diversification and growth. The bank has faced macroeconomic headwinds specific to Pakistan, however, and made a few management missteps. We decided to sell the stock in order to deploy cash from the sale elsewhere.
Outlook:
Going into the third quarter, trade friction could dampen sentiment but there may be positive drivers. In Japan, Prime Minister Shinzo Abe is up for re-election in September and a competitive Japanese yen could support upward earnings revisions. Most importantly, the November midterm elections in the U.S. could incentivize the Trump administration to back off aggressive rhetoric regarding global trade and investment restrictions such that markets can take a breather from volatility.
U.S. and Chinese GDP growth remains robust and supportive of the global economy. Commodity prices are high enough to fund the budgets of cyclical exporters and regional currency valuations support foreign investment. In addition, local interest rates are high enough to compensate investors for risks and corporate earnings remain relatively strong, making current equity valuations attractive in our view. The strongest headwind seems to be uncertainty stemming from escalating trade tensions between the U.S. and China. While investor sentiment is weak, we believe the fundamental reasons for owning Asian equities are still intact. With share prices seeming to diverge from the positive fundamental trends we are seeing at the company level, current volatility may create buying opportunities for long-term investors.
| | | | |
| |
| COUNTRY ALLOCATION (%)7,8 | |
| Japan | | | 36.5 | |
| China/Hong Kong | | | 27.3 | |
| Indonesia | | | 7.8 | |
| India | | | 4.7 | |
| Australia | | | 4.3 | |
| Bangladesh | | | 3.3 | |
| Sri Lanka | | | 3.3 | |
| Vietnam | | | 1.6 | |
| Philippines | | | 1.3 | |
| Thailand | | | 1.2 | |
| Taiwan | | | 0.8 | |
| Cash and Other Assets, Less Liabilities | | | 7.9 | |
| | | | |
| |
| SECTOR ALLOCATION (%)8 | |
| Health Care | | | 28.6 | |
| Consumer Discretionary | | | 19.6 | |
| Financials | | | 12.9 | |
| Consumer Staples | | | 10.0 | |
| Information Technology | | | 8.6 | |
| Industrials | | | 8.0 | |
| Telecommunication Services | | | 1.9 | |
| Energy | | | 1.4 | |
| Materials | | | 1.2 | |
| Cash and Other Assets, Less Liabilities | | | 7.9 | |
| | | | |
| |
| MARKET CAP EXPOSURE (%)8 | |
| Mega Cap (over $25B) | | | 18.7 | |
| Large Cap ($10B–$25B) | | | 35.9 | |
| Mid Cap ($3B–10B) | | | 16.5 | |
| Small Cap (under $3B) | | | 21.1 | |
| Cash and Other Assets, Less Liabilities | | | 7.9 | |
| 7 | Not all countries where the Fund may invest are included in the benchmark index. |
| 8 | Source: FactSet Research Systems. Percentage values in data are rounded to the nearest tenth of one percent, so the values may not sum to 100% due to rounding. Percentage values may be derived from different data sources and may not be consistent with other Fund literature. |
| | | | |
| matthewsasia.com | 800.789.ASIA | | | 41 | |
Matthews Asia Growth Fund
June 30, 2018
Schedule of Investmentsa (unaudited)
COMMON EQUITIES: 92.1%
| | | | | | | | |
| | | Shares | | | Value | |
| JAPAN: 36.5% | | | | | |
M3, Inc. | | | 1,125,000 | | | | $44,739,281 | |
Start Today Co., Ltd. | | | 1,109,000 | | | | 40,124,264 | |
Nidec Corp. | | | 200,900 | | | | 30,052,567 | |
ORIX Corp. | | | 1,817,500 | | | | 28,647,624 | |
Terumo Corp. | | | 496,600 | | | | 28,429,309 | |
Pigeon Corp. | | | 544,900 | | | | 26,480,583 | |
Seria Co., Ltd. | | | 482,600 | | | | 23,128,350 | |
TechnoPro Holdings, Inc. | | | 359,200 | | | | 22,056,660 | |
SoftBank Group Corp. | | | 306,900 | | | | 21,915,162 | |
Nitori Holdings Co., Ltd. | | | 133,400 | | | | 20,754,134 | |
Sysmex Corp. | | | 195,700 | | | | 18,234,284 | |
PeptiDream, Inc.b | | | 411,000 | | | | 17,075,801 | |
Ariake Japan Co., Ltd. | | | 194,800 | | | | 16,767,763 | |
Harmonic Drive Systems, Inc. | | | 355,400 | | | | 15,000,282 | |
Nitto Denko Corp. | | | 184,700 | | | | 13,944,372 | |
FANUC Corp. | | | 63,400 | | | | 12,566,629 | |
Sosei Group Corp.b | | | 682,400 | | | | 10,963,709 | |
CYBERDYNE, Inc.b | | | 768,500 | | | | 8,984,812 | |
Komatsu, Ltd. | | | 288,200 | | | | 8,204,646 | |
Gunosy, Inc.b | | | 543,400 | | | | 6,988,790 | |
HEALIOS KKb | | | 380,100 | | | | 5,529,566 | |
Mercari, Inc.b | | | 99,200 | | | | 4,063,334 | |
| | | | | | | | |
Total Japan | | | | | | | 424,651,922 | |
| | | | | | | | |
| | | | | | | | |
| CHINA/HONG KONG: 27.3% | | | | | |
Shenzhou International Group Holdings, Ltd. | | | 4,532,000 | | | | 55,768,000 | |
Wuxi Biologics Cayman, Inc.b,c,d | | | 4,160,500 | | | | 46,153,030 | |
Baozun, Inc. ADRb | | | 818,500 | | | | 44,771,950 | |
Jiangsu Hengrui Medicine Co., Ltd. A Shares | | | 2,603,187 | | | | 29,672,764 | |
Alibaba Group Holding, Ltd. ADRb | | | 123,200 | | | | 22,857,296 | |
Huazhu Group, Ltd. ADR | | | 534,800 | | | | 22,456,252 | |
BeiGene, Ltd. ADRb | | | 117,600 | | | | 18,078,648 | |
Yunnan Hongxiang Yixintang Pharmaceutical Co., Ltd. A Shares | | | 3,201,296 | | | | 15,644,214 | |
Shanghai Haohai Biological Technology Co., Ltd. H Sharesc,d | | | 1,947,000 | | | | 12,150,997 | |
Yunnan Baiyao Group Co., Ltd. A Shares | | | 743,762 | | | | 11,971,586 | |
Genscript Biotech Corp. | | | 4,302,000 | | | | 11,763,691 | |
Tongda Group Holdings, Ltd. | | | 54,370,000 | | | | 10,988,276 | |
Baidu, Inc. ADRb | | | 44,600 | | | | 10,837,800 | |
Qudian, Inc. ADRb | | | 470,300 | | | | 4,166,858 | |
| | | | | | | | |
Total China/Hong Kong | | | | | | | 317,281,362 | |
| | | | | | | | |
| | | | | | | | |
| INDONESIA: 7.8% | | | | | |
PT Bank Rakyat Indonesia Persero | | | 155,115,800 | | | | 30,680,499 | |
PT Astra International | | | 44,275,300 | | | | 20,384,110 | |
PT Ace Hardware Indonesia | | | 154,466,000 | | | | 13,689,590 | |
PT Indofood CBP Sukses Makmur | | | 18,774,200 | | | | 11,599,714 | |
PT Mayora Indah | | | 47,580,700 | | | | 9,861,016 | |
PT Arwana Citramulia | | | 214,668,400 | | | | 5,063,358 | |
| | | | | | | | |
Total Indonesia | | | | | | | 91,278,287 | |
| | | | | | | | |
| | | | | | | | |
| INDIA: 4.7% | | | | | |
HDFC Bank, Ltd. | | | 1,148,086 | | | | 35,366,405 | |
ITC, Ltd. | | | 2,925,894 | | | | 11,370,137 | |
PC Jeweller, Ltd. | | | 3,698,554 | | | | 7,404,113 | |
| | | | | | | | |
Total India | | | | | | | 54,140,655 | |
| | | | | | | | |
| | | | | | | | |
| | | Shares | | | Value | |
| AUSTRALIA: 4.3% | | | | | |
CSL, Ltd. | | | 240,892 | | | | $34,289,326 | |
Oil Search, Ltd. | | | 2,481,915 | | | | 16,306,062 | |
| | | | | | | | |
Total Australia | | | | | | | 50,595,388 | |
| | | | | | | | |
| | | | | | | | |
| BANGLADESH: 3.3% | | | | | |
Square Pharmaceuticals, Ltd. | | | 7,198,924 | | | | 25,210,641 | |
BRAC Bank, Ltd.b | | | 15,589,353 | | | | 13,261,986 | |
| | | | | | | | |
Total Bangladesh | | | | | | | 38,472,627 | |
| | | | | | | | |
| | | | | | | | |
| SRI LANKA: 3.3% | | | | | |
Sampath Bank PLC†,b | | | 16,126,387 | | | | 30,877,498 | |
Lanka Orix Leasing Co. PLCb | | | 12,121,473 | | | | 7,542,420 | |
| | | | | | | | |
Total Sri Lanka | | | | | | | 38,419,918 | |
| | | | | | | | |
| | | | | | | | |
| VIETNAM: 1.6% | | | | | |
Vietnam Dairy Products JSC | | | 2,597,160 | | | | 19,156,200 | |
| | | | | | | | |
Total Vietnam | | | | | | | 19,156,200 | |
| | | | | | | | |
| | | | | | | | |
| PHILIPPINES: 1.3% | | | | | |
Jollibee Foods Corp. | | | 2,007,890 | | | | 9,899,806 | |
Emperador, Inc. | | | 37,942,500 | | | | 5,254,042 | |
| | | | | | | | |
Total Philippines | | | | | | | 15,153,848 | |
| | | | | | | | |
| | | | | | | | |
| THAILAND: 1.2% | | | | | |
Major Cineplex Group Public Co., Ltd. | | | 18,967,100 | | | | 14,076,208 | |
| | | | | | | | |
Total Thailand | | | | | | | 14,076,208 | |
| | | | | | | | |
| | | | | | | | |
| TAIWAN: 0.8% | | | | | | | | |
St. Shine Optical Co., Ltd. | | | 402,000 | | | | 9,178,238 | |
| | | | | | | | |
Total Taiwan | | | | | | | 9,178,238 | |
| | | | | | | | |
| | | | | | | | |
| TOTAL INVESTMENTS: 92.1% | | | | 1,072,404,653 | |
(Cost $769,283,675) | | | | | | | | |
| | | | | | | | |
CASH AND OTHER ASSETS,
LESS LIABILITIES: 7.9% | | | | | | | 91,422,156 | |
| | | | | | | | |
| | |
NET ASSETS: 100.0% | | | | | | | $1,163,826,809 | |
| | | | | | | | |
| a | Certain securities were fair valued under the valuation policies approved by the Board of Trustees (Note 2-A). |
| b | Non-income producing security. |
| c | Security exempt from registration under Rule 144A of the Securities Act of 1933, as amended. The security may be resold in transactions exempt from registration normally to qualified institutional buyers. The security has been determined to be liquid in accordance with procedures adopted by the Funds’ Board of Trustees. At June 30, 2018, the aggregate value is $58,304,027, which is 5.01% of net assets. |
| d | The securities may be resold to qualified foreign investors and foreign institutional buyers under Regulation S of the Securities Act of 1933. |
| † | Affiliated Issuer, as defined under the Investment Company Act of 1940 (ownership of 5% or more of the outstanding voting securities of this issuer) |
| ADR | American Depositary Receipt |
See accompanying notes to financial statements.
| | | | |
| PORTFOLIO MANAGERS |
| Sharat Shroff, CFA | | | | |
Lead Manager | | | | |
| Rahul Gupta | | | | |
Co-Manager | | | | |
| | |
| FUND FACTS | | | | |
| | | Investor | | Institutional |
Ticker | | MAPTX | | MIPTX |
CUSIP | | 577130107 | | 577130834 |
Inception | | 9/12/94 | | 10/29/10 |
NAV | | $29.95 | | $29.95 |
Initial Investment | | $2,500 | | $100,000 |
Gross Expense Ratio1 | | 1.08% | | 0.91% |
After Fee Waiver and Reimbursement2 | | 1.06% | | 0.89% |
Portfolio Statistics | | |
Total # of Positions | | 66 |
Net Assets | | $9.1 billion |
Weighted Average Market Cap | | $59.5 billion |
Portfolio Turnover3 | | | | 9.18% |
Benchmark |
MSCI AC Asia ex Japan Index |
OBJECTIVE
Long-term capital appreciation.
STRATEGY
Under normal market conditions, the Fund seeks to achieve its investment objective by investing at least 80% of its total net assets, which include borrowings for investment purposes, in the common and preferred stocks of companies located in Asia ex Japan, which consists of all countries and markets in Asia excluding Japan, but including all other developed, emerging and frontier countries and markets in the Asian region.
Matthews Pacific Tiger Fund
Portfolio Manager Commentary (unaudited)
For the first half of 2018, the Matthews Pacific Tiger Fund returned –5.40% (Investor Class) and –5.31% (Institutional Class), while its benchmark, the MSCI All Country Asia ex Japan Index, returned –4.65%. For the quarter ending June 30, the Fund returned –4.62% (Investor Class) and –4.56% (Institutional Class), while its benchmark returned –5.31%.
Market Environment:
Asian equities ended the first half of the year on a weak note. Market volatility continued during the second quarter as investors worried about global trade issues. Some markets were also affected by domestic concerns, including local politics and elections. Nonetheless, many Asian currencies proved resilient, especially when compared to other emerging market currencies. Exceptions to this trend included the Indonesian rupiah, Indian rupee and Philippine peso, which depreciated relative to the dollar.
Semiconductors were among the worst-performing sectors during the second quarter, despite being a top performer in the first quarter. Share prices among semiconductor manufacturers dropped amid concerns over decreasing demand for crypto currency and smartphones. This weakness chipped away at the luster that semiconductor stocks enjoyed during the first quarter.
India was one of the region’s better-performing equity markets during the first half of the year, though its currency depreciated. This dichotomy highlights a tussle between macro and micro viewpoints over India’s direction. Some macro factors are turning unfavorable for the Indian economy, while many individual companies remain optimistic about their prospects. Meanwhile, domestic Chinese markets experienced the sharpest drop in equity prices in the region during the first half of the year. The drop stemmed from trade concerns, as well as potential fallout from a government financial de-risking exercise that is being misconstrued as deleveraging. China, however, is no longer an export-oriented economy. Net exports accounted for only 3.4% of China’s GDP in 2017. Domestic consumption and a growing middle class continue to be the key drivers of China’s growth.
Performance Contributors and Detractors:
The Fund outperformed its benchmark on a relative basis during the second quarter, providing a bit of shelter against broader market declines. Stock selection contributed to the Fund’s favorable relative performance during the quarter, offsetting the negative allocation effect that was partly driven by large swings in currency for some south Asian economies. From a sectoral perspective, the strength within a few of the consumer-related holdings across the region was a key driver of returns during the quarter.
Turning to performance detractors, the Fund’s health care holdings faced headwinds during the quarter. Drug distributors in China struggled against a stricter regulatory environment and increasing financial costs as hospitals are extending payment terms to deal with their own inability to charge a markup on drug sales. In spite of some setbacks, we continue to believe in the long-term growth prospects for health care-related spending in China and across the region, but are also mindful of the expectations that are starting to be reflected in certain health care subsectors.
(continued)
| 1 | Prospectus expense ratios. |
| 2 | Matthews has contractually agreed to waive a portion of its advisory fee and administrative and shareholder services fee if the Fund’s average daily net assets are over $3 billion, as follows: for every $2.5 billion average daily net assets of the Fund that are over $3 billion, the advisory fee rate and the administrative and shareholder services fee rate for the Fund with respect to such excess average daily net assets will be each reduced by 0.01%, in each case without reducing such fee rate below 0.00%. Any amount waived by Matthews pursuant to this agreement may not be recouped by Matthews. This agreement will remain in place until April 30, 2019 and may be terminated (i) at any time by the Board of Trustees upon 60 days’ prior written notice to Matthews; or (ii) by Matthews at the annual expiration date of the agreement upon 60 days’ prior written notice to the Trust, in each case without payment of any penalty. |
| 3 | The lesser of fiscal year 2017 long-term purchase costs or sales proceeds divided by the average monthly market value of long-term securities. |
| | | | |
| matthewsasia.com | 800.789.ASIA | | | 43 | |
| | | | | | | | | | | | | | | | | | | | | | | | | | | | | | | | |
| | |
| PERFORMANCE AS OF JUNE 30, 2018 | | | | |
| | | | | | | | | Average Annual Total Returns | | | | |
| | | 3 Months | | | YTD | | | 1 Year | | | 3 Years | | | 5 Years | | | 10 Years | | | Since
Inception | | | Inception
Date | |
| Investor Class (MAPTX) | | | -4.62% | | | | -5.40% | | | | 10.15% | | | | 6.46% | | | | 8.99% | | | | 8.77% | | | | 8.86% | | | | 9/12/94 | |
| Institutional Class (MIPTX) | | | -4.56% | | | | -5.31% | | | | 10.32% | | | | 6.65% | | | | 9.19% | | | | n.a. | | | | 6.77% | | | | 10/29/10 | |
| MSCI AC Asia ex Japan Index4 | | | -5.31% | | | | -4.65% | | | | 10.21% | | | | 7.32% | | | | 8.48% | | | | 6.10% | | | | 4.70% | 5 | | | | |
| Lipper Pacific ex Japan Funds Category Average6 | | | -5.15% | | | | -4.63% | | | | 9.66% | | | | 6.37% | | | | 7.52% | | | | 5.52% | | | | 5.48% | 5 | | | | |
Performance assumes reinvestment of all dividends and/or distributions before taxes. All performance quoted represents past performance and is no guarantee of future results. Investment return and principal value will fluctuate with market conditions so that when redeemed, shares may be worth more or less than their original cost. Current performance may be lower or higher than the return figures quoted. Returns would have been lower if certain of the Fund’s fees and expenses had not been waived. For the Fund’s most recent month-end performance, visit matthewsasia.com.
GROWTH OF A $10,000 INVESTMENT SINCE INCEPTION—INVESTOR CLASS
Plotted monthly. The performance data and graph do not reflect the deduction of taxes that a shareholder would pay on dividends, capital gains distributions or redemption of Fund shares. Values are in US$.
| | 4 | It is not possible to invest directly in an index. Source: Index data from Morgan Stanley Capital International and Bloomberg; total return calculations performed by BNY Mellon Investment Servicing (US) Inc. Please see page 92 for index definition. |
| | 5 | Calculated from 8/31/94. |
| | 6 | The Lipper Category Average does not reflect sales charges and is based on total return, including reinvestment of dividends and capital gains for the stated periods. |
| | | | | | | | |
| | | | |
| TOP TEN HOLDINGS7 | | | | | | | |
| | | Sector | | Country | | % of Net Assets | |
| China Resources Beer Holdings Co., Ltd. | | Consumer Staples | | China/Hong Kong | | | 3.7% | |
| Kotak Mahindra Bank, Ltd. | | Financials | | India | | | 3.5% | |
| Ping An Insurance Group Co. of China, Ltd. | | Financials | | China/Hong Kong | | | 3.2% | |
| Baidu, Inc. | | Information Technology | | China/Hong Kong | | | 3.1% | |
| Tencent Holdings, Ltd. | | Information Technology | | China/Hong Kong | | | 2.9% | |
| Sinopharm Group Co., Ltd. | | Health Care | | China/Hong Kong | | | 2.9% | |
| President Chain Store Corp. | | Consumer Staples | | Taiwan | | | 2.7% | |
| Central Pattana Public Co., Ltd. | | Real Estate | | Thailand | | | 2.5% | |
| NAVER Corp. | | Information Technology | | South Korea | | | 2.5% | |
| Titan Co., Ltd. | | Consumer Discretionary | | India | | | 2.4% | |
| % OF ASSETS IN TOP TEN | | | | | | | 29.4% | |
| | 7 | Holdings may combine more than one security from same issuer and related depositary receipts. |
Matthews Pacific Tiger Fund
Portfolio Manager Commentary (unaudited) (continued)
Notable Portfolio Changes:
Market volatility created opportunities for rotating capital within the portfolio. We added to our position in Naver, an IT firm operating South Korea’s top search engine. A blip in sentiment around the stock during the second quarter caused a temporary price decline, and created a buying opportunity. Likewise, Inner Mongolia Yili Industrial Group, a producer of dairy products in China, suffered a pullback in its stock price with no real change to its long-term prospects, in our view, providing another attractive buying opportunity. We also exited our position in Astra International, an Indonesian conglomerate with a range of manufacturing operations, to fund the inclusion of two new small-cap holdings during the course of the first half.
Outlook:
In contrast to the robust confidence among consumers and corporations in parts of Asia, the region’s equities finished the first half on a soft note. We believe the health of many Asian economies remains sound. The continued expansion in wages and increasing household wealth is leading to rising aspirations for consumers, most notably in China. Elsewhere in the region, policymakers in India and Indonesia have sacrificed growth over the past few years to deal with longer-term structural issues, including current account deficits, fiscal deficits and persistent inflationary pressures. The more recent attempts at boosting growth are yielding mixed results, although there are some encouraging signs—particularly in India where businesses are finally seeing a more normalized economic environment following policy- and taxation-related changes over the past two years.
An oft-repeated concern within some parts of the investment community is the vulnerability of Asian businesses and economies to rising interest rates in the U.S. We believe Asian businesses, however, may be less affected by rising U.S. rates as sources of capital and liquidity for Asia’s businesses continue to expand and diversify. U.S. and European institutions traditionally may have played a larger role in providing capital and liquidity, but local institutions across Asia are starting to exert their presence more visibly, and policymakers are more amenable to releasing some of the built-up pressures through the exchange rate. The odds of a sharp and sudden shock in the face of rising rates have diminished, although the squeeze in availability of capital may weaken the ensuing recovery in growth.
Furthermore, the potential disruption from trade squabbles may lead to greater uncertainty about the investment outlook, thereby deferring private capital expenditure. Given our emphasis on service-oriented businesses catering to domestic demand, we expect the impact of global factors on our portfolio holdings to be somewhat muted. Worries about the global macro-economy and political developments have led to attractive valuations across many parts of Asia, in our view creating an opportunity to invest in the long-term growth of the region without undue risk.
| | | | |
| |
| COUNTRY ALLOCATION (%)8,9 | |
| China/Hong Kong | | | 37.2 | |
| India | | | 21.4 | |
| South Korea | | | 12.4 | |
| Taiwan | | | 5.5 | |
| Indonesia | | | 5.5 | |
| Thailand | | | 4.7 | |
| Malaysia | | | 4.5 | |
| Vietnam | | | 2.3 | |
| Philippines | | | 2.0 | |
| Switzerland | | | 2.0 | |
| United States | | | 1.9 | |
| Japan | | | 0.1 | |
| Cash and Other Assets, Less Liabilities | | | 0.5 | |
| | | | |
| |
| SECTOR ALLOCATION (%)9 | |
| Financials | | | 23.0 | |
| Consumer Staples | | | 21.9 | |
| Information Technology | | | 18.4 | |
| Consumer Discretionary | | | 8.9 | |
| Health Care | | | 8.1 | |
| Real Estate | | | 5.9 | |
| Industrials | | | 4.7 | |
| Utilities | | | 4.2 | |
| Telecommunication Services | | | 3.3 | |
| Materials | | | 1.0 | |
| Cash and Other Assets, Less Liabilities | | | 0.5 | |
| | | | |
| |
| MARKET CAP EXPOSURE (%)9 | |
| Mega Cap (over $25B) | | | 36.2 | |
| Large Cap ($10B–$25B) | | | 35.5 | |
| Mid Cap ($3B–10B) | | | 17.2 | |
| Small Cap (under $3B) | | | 10.6 | |
| Cash and Other Assets, Less Liabilities | | | 0.5 | |
| 8 | Not all countries where the Fund may invest are included in the benchmark index. |
| 9 | Source: FactSet Research Systems. Percentage values in data are rounded to the nearest tenth of one percent, so the values may not sum to 100% due to rounding. Percentage values may be derived from different data sources and may not be consistent with other Fund literature. |
| | | | |
| matthewsasia.com | 800.789.ASIA | | | 45 | |
Matthews Pacific Tiger Fund
June 30, 2018
Schedule of Investmentsa (unaudited)
COMMON EQUITIES: 99.5%
| | | | | | | | |
| | | Shares | | | Value | |
| CHINA/HONG KONG: 37.2% | | | | | |
China Resources Beer Holdings Co., Ltd. | | | 70,257,775 | | | | $340,220,240 | |
Ping An Insurance Group Co. of China, Ltd. H Shares | | | 31,734,000 | | | | 290,609,626 | |
Baidu, Inc. ADRb | | | 1,174,300 | | | | 285,354,900 | |
Tencent Holdings, Ltd. | | | 5,336,500 | | | | 267,974,497 | |
Sinopharm Group Co., Ltd. H Shares† | | | 66,146,400 | | | | 265,998,639 | |
AIA Group, Ltd. | | | 24,540,800 | | | | 213,785,004 | |
Alibaba Group Holding, Ltd. ADRb | | | 1,088,500 | | | | 201,949,405 | |
China Resources Land, Ltd. | | | 59,880,000 | | | | 201,140,268 | |
Dairy Farm International Holdings, Ltd. | | | 22,254,946 | | | | 195,391,482 | |
Inner Mongolia Yili Industrial Group Co., Ltd. A Shares | | | 43,795,646 | | | | 183,572,826 | |
China Mobile, Ltd. ADR | | | 3,853,926 | | | | 171,075,775 | |
Hong Kong Exchanges & Clearing, Ltd. | | | 5,403,000 | | | | 161,698,536 | |
Hengan International Group Co., Ltd. | | | 13,874,500 | | | | 133,082,200 | |
Yum China Holdings, Inc. | | | 3,084,410 | | | | 118,626,409 | |
Fuyao Glass Industry Group Co., Ltd. H Shares†,c,d | | | 33,726,400 | | | | 113,963,851 | |
Guotai Junan Securities Co., Ltd. H Sharesc,d | | | 39,600,000 | | | | 83,919,883 | |
Tasly Pharmaceutical Group Co., Ltd. A Shares | | | 21,587,691 | | | | 83,879,368 | |
Wise Talent Information Technology Co., Ltd.b | | | 8,838,800 | | | | 36,614,281 | |
Guangdong Advertising Group Co., Ltd. A Shares | | | 66,324,441 | | | | 32,264,433 | |
Fuyao Glass Industry Group Co., Ltd. A Shares | | | 3,589,387 | | | | 13,890,209 | |
Shandong Weigao Group Medical Polymer Co., Ltd. H Shares | | | 11,300,000 | | | | 7,978,063 | |
| | | | | | | | |
Total China/Hong Kong | | | | | | | 3,402,989,895 | |
| | | | | | | | |
| | | | | | | | |
| INDIA: 21.4% | | | | | |
Kotak Mahindra Bank, Ltd. | | | 16,123,409 | | | | 316,430,985 | |
Titan Co., Ltd. | | | 16,905,877 | | | | 216,873,450 | |
Tata Power Co., Ltd.† | | | 180,316,487 | | | | 192,888,779 | |
HDFC Bank, Ltd. | | | 6,223,409 | | | | 191,710,031 | |
Sun Pharmaceutical Industries, Ltd. | | | 20,654,758 | | | | 170,275,052 | |
ITC, Ltd. | | | 39,202,500 | | | | 152,342,429 | |
GAIL India, Ltd. | | | 30,362,492 | | | | 150,902,081 | |
Housing Development Finance Corp., Ltd. | | | 4,935,685 | | | | 137,530,798 | |
Container Corp. of India, Ltd. | | | 13,679,990 | | | | 130,279,148 | |
Dabur India, Ltd. | | | 21,117,482 | | | | 120,688,648 | |
Thermax, Ltd. | | | 5,310,034 | | | | 80,742,959 | |
United Spirits, Ltd.b | | | 6,778,030 | | | | 65,852,130 | |
Just Dial, Ltd.†,b | | | 3,557,718 | | | | 28,901,385 | |
| | | | | | | | |
Total India | | | | | | | 1,955,417,875 | |
| | | | | | | | |
| | | | | | | | |
| SOUTH KOREA: 12.4% | | | | | |
NAVER Corp. | | | 332,714 | | | | 227,677,770 | |
Samsung Electronics Co., Ltd. | | | 4,755,250 | | | | 199,195,435 | |
DB Insurance Co., Ltd.† | | | 3,570,463 | | | | 189,085,119 | |
Orion Holdings Corp.† | | | 5,666,538 | | | | 139,866,826 | |
Cheil Worldwide, Inc.† | | | 7,315,882 | | | | 135,487,900 | |
Green Cross Corp.† | | | 620,785 | | | | 115,059,342 | |
Amorepacific Corp. | | | 175,449 | | | | 50,787,970 | |
E-MART, Inc. | | | 190,749 | | | | 43,529,518 | |
S-1 Corp. | | | 396,277 | | | | 34,418,675 | |
| | | | | | | | |
Total South Korea | | | | | | | 1,135,108,555 | |
| | | | | | | | |
| | | | | | | | |
| | | Shares | | | Value | |
| TAIWAN: 5.5% | | | | | |
President Chain Store Corp. | | | 21,902,608 | | | | $248,187,745 | |
Synnex Technology International Corp.† | | | 95,449,921 | | | | 143,929,183 | |
Delta Electronics, Inc. | | | 31,251,182 | | | | 112,015,055 | |
| | | | | | | | |
Total Taiwan | | | | | | | 504,131,983 | |
| | | | | | | | |
| | | | | | | | |
| INDONESIA: 5.5% | | | | | |
PT Bank Central Asia | | | 100,580,000 | | | | 150,209,229 | |
PT Indofood CBP Sukses Makmur | | | 191,522,600 | | | | 118,332,995 | |
PT Telekomunikasi Indonesia Persero | | | 421,304,300 | | | | 110,337,413 | |
PT Surya Citra Media | | | 383,592,300 | | | | 55,008,831 | |
PT Perusahaan Gas Negara Persero | | | 298,485,100 | | | | 41,427,102 | |
PT Telekomunikasi Indonesia Persero ADR | | | 728,140 | | | | 18,938,922 | |
PT Mitra Keluarga Karyasehatd | | | 70,000,000 | | | | 9,183,531 | |
| | | | | | | | |
Total Indonesia | | | | | | | 503,438,023 | |
| | | | | | | | |
| | | | | | | | |
| THAILAND: 4.7% | | | | | |
Central Pattana Public Co., Ltd. | | | 108,969,000 | | | | 229,376,745 | |
Kasikornbank Public Co., Ltd. | | | 18,431,800 | | | | 107,831,881 | |
The Siam Cement Public Co., Ltd. | | | 7,522,950 | | | | 93,933,914 | |
| | | | | | | | |
Total Thailand | | | | | | | 431,142,540 | |
| | | | | | | | |
| | | | | | | | |
| MALAYSIA: 4.5% | | | | | |
Public Bank BHD | | | 32,488,394 | | | | 187,942,565 | |
Genting BHD | | | 62,634,875 | | | | 130,303,736 | |
IHH Healthcare BHD | | | 47,676,300 | | | | 72,062,064 | |
IHH Healthcare BHD | | | 11,543,000 | | | | 17,439,825 | |
| | | | | | | | |
Total Malaysia | | | | | | | 407,748,190 | |
| | | | | | | | |
| | | | | | | | |
| VIETNAM: 2.3% | | | | | |
Vietnam Dairy Products JSC | | | 28,634,534 | | | | 211,203,340 | |
| | | | | | | | |
Total Vietnam | | | | | | | 211,203,340 | |
| | | | | | | | |
| | | | | | | | |
| SWITZERLAND: 2.0% | | | | | |
DKSH Holding AG | | | 2,638,062 | | | | 185,465,381 | |
| | | | | | | | |
Total Switzerland | | | | | | | 185,465,381 | |
| | | | | | | | |
| | | | | | | | |
| PHILIPPINES: 2.0% | | | | | |
SM Prime Holdings, Inc. | | | 164,670,771 | | | | 110,926,221 | |
GT Capital Holdings, Inc. | | | 4,347,540 | | | | 74,132,410 | |
| | | | | | | | |
Total Philippines | | | | | | | 185,058,631 | |
| | | | | | | | |
| | | | | | | | |
| UNITED STATES: 1.9% | | | | | |
Cognizant Technology Solutions Corp. Class A | | | 2,186,600 | | | | 172,719,534 | |
| | | | | | | | |
Total United States | | | | | | | 172,719,534 | |
| | | | | | | | |
| | | | | | | | |
Matthews Pacific Tiger Fund
June 30, 2018
Schedule of Investmentsa (unaudited) (continued)
COMMON EQUITIES (continued)
| | | | | | | | |
| | | Shares | | | Value | |
| JAPAN: 0.1% | | | | | | | | |
LINE Corp. ADRb | | | 195,200 | | | | $8,016,864 | |
| | | | | | | | |
Total Japan | | | | | | | 8,016,864 | |
| | | | | | | | |
| | | | | | | | |
| TOTAL INVESTMENTS: 99.5% | | | | 9,102,440,811 | |
(Cost $6,199,508,260) | | | | | | | | |
| | | | | | | | |
CASH AND OTHER ASSETS,
LESS LIABILITIES: 0.5% | | | | 45,552,770 | |
| | | | | | | | |
| |
NET ASSETS: 100.0% | | | | $9,147,993,581 | |
| | | | | | | | |
| a | Certain securities were fair valued under the valuation policies approved by the Board of Trustees (Note 2-A). |
| b | Non-income producing security. |
| c | Security exempt from registration under Rule 144A of the Securities Act of 1933, as amended. The security may be resold in transactions exempt from registration normally to qualified institutional buyers. The security has been determined to be liquid in accordance with procedures adopted by the Funds’ Board of Trustees. At June 30, 2018, the aggregate value is $197,883,734, which is 2.16% of net assets. |
| d | The securities may be resold to qualified foreign investors and foreign institutional buyers under Regulation S of the Securities Act of 1933. |
| † | Affiliated Issuer, as defined under the Investment Company Act of 1940 (ownership of 5% or more of the outstanding voting securities of this issuer) |
| ADR | American Depositary Receipt |
See accompanying notes to financial statements.
| | | | |
| matthewsasia.com | 800.789.ASIA | | | 47 | |
| | | | |
| PORTFOLIO MANAGERS |
| Vivek Tanneeru | | |
Lead Manager | | |
| Winnie Chwang | | |
Co-Manager | | | | |
|
| FUND FACTS |
| | | Investor | | Institutional |
Ticker | | MASGX | | MISFX |
CUSIP | | 577130727 | | 577130719 |
Inception | | 4/30/15 | | 4/30/15 |
NAV | | $11.32 | | $11.28 |
Initial Investment | | $2,500 | | $100,000 |
Gross Expense Ratio1 | | 2.65% | | 2.46% |
After Fee Waiver and Reimbursement2 | | 1.50% | | 1.25% |
Portfolio Statistics | | | | |
Total # of Positions | | 62 |
Net Assets | | $21.0 million |
Weighted Average
Market Cap | | $14.4 billion |
Portfolio Turnover3 | | 28.82% |
Benchmark | | |
MSCI AC Asia ex Japan Index |
OBJECTIVE
Long-term capital appreciation.
STRATEGY
Under normal market conditions, the Fund seeks to achieve its investment objective by investing at least 80% of its total assets, which include borrowings for investment purposes, in the common and preferred stocks of companies of any market capitalization located in Asia that Matthews believes satisfy one or more of its environmental, social and governance (“ESG”) standards. Asia consists of all countries and markets in Asia and includes developed, emerging, and frontier countries and markets in the Asia region. The Fund may also invest in convertible securities and fixed-income securities, of any duration or quality, including high yield securities of Asian companies.
Matthews Asia ESG Fund
Portfolio Manager Commentary (unaudited)
For the first half of 2018, the Matthews Asia ESG Fund returned –2.08% (Investor Class) and –1.91% (Institutional Class) while its benchmark, the MSCI All Country Asia ex Japan Index, returned –4.65%. For the quarter ending June 30, the Fund returned –3.82% (Investor Class) and –3.76% (Institutional Class) while its benchmark returned –5.31%.
Market Environment:
Asia’s markets got off to a strong start in 2018, following a very strong 2017, but could not hold onto their gains as investors worried about a faster-than-expected rate-increase cycle by the U.S. Federal Reserve and a potential escalation of the U.S.–China trade war. India was a relative outperformer in the second quarter (down –0.6%) after an adverse first quarter (down about –7%), while Pakistan gave up all its strong gains (up 11%) during the first quarter and was down –20.5% during the second quarter. For the first half of 2018, Taiwan was the best performer (despite being down –0.6%), while the Philippines (down –21.2%) and Indonesia (down –18.4%) were the worst performers.
From a sector standpoint, health care, after two years of underperformance, did well during the first half of the year and was the best-performing sector (up 6.4%), while telecommunication services (down –12.2%) was the worst performer. From a currency perspective, the Japanese yen, a perceived safe haven currency, was the best-performing Asian currency (up 1.7%) for the first half of 2018, while the Indian rupee (down –6.7%) was the worst-performing currency alongside the Philippine peso (down –6.4%).
Performance Contributors and Detractors:
Stock selection in China/Hong Kong and India contributed positively and an overweight allocation to Bangladesh contributed negatively to the Fund’s relative performance during the first half of 2018. From a sector standpoint, the portfolio’s health care allocation and selection contributed positively as did consumer discretionary selection, while financials selection effects contributed negatively to relative performance.
At the stock level, Wuxi Biologics was the biggest contributor to Fund performance during the first half. The company is a vertically integrated Chinese contract development and manufacturing organization (CDMO) that enables cost- and time-efficient drug discovery, development and manufacturing of biologics. Wuxi Biologics plays an important role in speeding up the innovation cycle in the global biotech industry in general and the Chinese biotech industry in particular by helping both global majors as well as Chinese biotech startups through its scaled-up CDMO model. The company announced strong 2017 results and better-than-expected new customer contract acquisition, as well as faster migration of contracts into the higher value clinical trial stage from the pre-clinical trial stage.
Bank Rakyat Indonesia detracted from performance during the first half of the year. The stock sold off alongside the Indonesian equity market, which was the second-worst performing market in the benchmark. The Indonesian central bank raised the benchmark rates by 100 basis points (1%) in 2018 to defend the Indonesian rupiah. The market worried that this would have an adverse impact on
(continued)
| 1 | Prospectus expense ratios. |
| 2 | Matthews has contractually agreed (i) to waive fees and reimburse expenses to the extent needed to limit Total Annual Fund Operating Expenses (excluding Rule 12b-1 fees, taxes, interest, brokerage commissions, short sale dividend expenses, expenses incurred in connection with any merger or reorganization or extraordinary expenses such as litigation) of the Institutional Class to 1.25% first by waiving class specific expenses (i.e., shareholder service fees specific to a particular class) of the Institutional Class and then, to the extent necessary, by waiving non-class specific expenses of the Institutional Class, and (ii) if any Fund-wide expenses (i.e., expenses that apply to both the Institutional Class and the Investor Class) are waived for the Institutional Class to maintain the 1.25% expense limitation, to waive an equal amount (in annual percentage terms) of those same expenses for the Investor Class. The Total Annual Fund Operating Expenses After Fee Waiver and Expense Reimbursement for the Investor Class may vary from year to year and will in some years exceed 1.25%. If the operating expenses fall below the expense limitation in a year within three years after Matthews has made a waiver or reimbursement, the Fund may reimburse Matthews up to an amount that does not cause the expenses for that year to exceed the lesser of (i) the expense limitation applicable at the time of that fee waiver and/or expense reimbursement or (ii) the expense limitation in effect at the time of recoupment. This agreement will remain in place until April 30, 2019 and may be terminated at any time by the Board of Trustees on behalf of the Fund on 60 days’ written notice to Matthews. Matthews may decline to renew this agreement by written notice to the Trust at least 30 days before its annual expiration date. |
| 3 | The lesser of fiscal year 2017 long-term purchase costs or sales proceeds divided by the average monthly market value of long-term securities. |
| | | | | | | | | | | | | | | | | | | | | | | | |
| |
| PERFORMANCE AS OF JUNE 30, 2018 | |
| | | | | | | | | Average Annual Total Returns | | | | |
| | | 3 Months | | | YTD | | | 1 Year | | | 3 Year | | | Since
Inception | | | Inception
Date | |
| Investor Class (MASGX) | | | -3.82% | | | | -2.08% | | | | 9.93% | | | | 6.76% | | | | 5.85% | | | | 4/30/15 | |
| Institutional Class (MISFX) | | | -3.76% | | | | -1.91% | | | | 10.28% | | | | 7.06% | | | | 6.13% | | | | 4/30/15 | |
| MSCI AC Asia ex Japan Index4 | | | -5.31% | | | | -4.65% | | | | 10.21% | | | | 7.32% | | | | 4.80% | | | | | |
| Lipper Pacific Region Funds Category Average5 | | | -3.78% | | | | -3.74% | | | | 9.59% | | | | 7.07% | | | | 5.44% | | | | | |
Performance assumes reinvestment of all dividends and/or distributions before taxes. All performance quoted represents past performance and is no guarantee of future results. Investment return and principal value will fluctuate with market conditions so that when redeemed, shares may be worth more or less than their original cost. Current performance may be lower or higher than the return figures quoted. Returns would have been lower if certain of the Fund’s fees and expenses had not been waived. For the Fund’s most recent month-end performance visit matthewsasia.com.
GROWTH OF A $10,000 INVESTMENT SINCE INCEPTION—INVESTOR CLASS
Plotted Monthly. The performance data and graph do not reflect the deduction of taxes that a shareholder would pay on dividends, capital gain distributions or redemption of Fund shares. Values are in US$.
| | 4 | It is not possible to invest directly in an index. Source: Index data from Morgan Stanley Capital International; total return calculations performed by BNY Mellon Investment Servicing (US) Inc. Please see page 92 for index definition. |
| | 5 | The Lipper Category Average does not reflect sales charges and is based on total return, including reinvestment of dividends and capital gains for the stated periods. |
| | | | | | | | |
| | | | |
| TOP TEN HOLDINGS6 | | | | | | | |
| | | Sector | | Country | | % of Net Assets | |
| Samsung SDI Co., Ltd., Pfd. | | Information Technology | | South Korea | | | 5.9% | |
| Wuxi Biologics Cayman, Inc. | | Health Care | | China/Hong Kong | | | 3.7% | |
| Inner Mongolia Yili Industrial Group Co., Ltd. | | Consumer Staples | | China/Hong Kong | | | 3.4% | |
| PT Bank Rakyat Indonesia Persero | | Financials | | Indonesia | | | 3.0% | |
| BRAC Bank, Ltd. | | Financials | | Bangladesh | | | 3.0% | |
| Shriram City Union Finance, Ltd. | | Financials | | India | | | 3.0% | |
| Mahindra & Mahindra, Ltd. | | Consumer Discretionary | | India | | | 2.9% | |
| Taiwan Semiconductor Manufacturing Co., Ltd. | | Information Technology | | Taiwan | | | 2.8% | |
| Tsukui Corp. | | Health Care | | Japan | | | 2.5% | |
| Fuji Seal International, Inc. | | Materials | | Japan | | | 2.5% | |
| % OF ASSETS IN TOP TEN | | | | | | | 32.7% | |
| | 6 | Holdings may combine more than one security from same issuer and related depositary receipts. |
| | | | |
| matthewsasia.com | 800.789.ASIA | | | 49 | |
| | | | |
| | |
| COUNTRY ALLOCATION (%)7,8 | | | |
| China/Hong Kong | | | 21.6 | |
| India | | | 16.4 | |
| Japan | | | 16.1 | |
| South Korea | | | 13.1 | |
| Taiwan | | | 9.6 | |
| Bangladesh | | | 5.7 | |
| Indonesia | | | 4.6 | |
| Singapore | | | 3.7 | |
| Thailand | | | 3.0 | |
| Philippines | | | 1.8 | |
| Vietnam | | | 1.8 | |
| Pakistan | | | 1.7 | |
| Luxembourg | | | 0.9 | |
| Cash and Other Assets, Less Liabilities | | | 0.2 | |
| | | | |
| | |
| SECTOR ALLOCATION (%)8 | | | |
| Health Care | | | 19.1 | |
| Financials | | | 17.2 | |
| Industrials | | | 16.8 | |
| Information Technology | | | 14.0 | |
| Consumer Discretionary | | | 12.0 | |
| Consumer Staples | | | 8.7 | |
| Telecommunication Services | | | 5.6 | |
| Materials | | | 2.5 | |
| Utilities | | | 2.1 | |
| Real Estate | | | 1.8 | |
| Cash and Other Assets, Less Liabilities | | | 0.2 | |
| | | | |
| | |
| MARKET CAP EXPOSURE (%)8 | | | |
| Mega Cap (over $25B) | | | 12.2 | |
| Large Cap ($10B–$25B) | | | 24.4 | |
| Mid Cap ($3B–10B) | | | 13.0 | |
| Small Cap (under $3B) | | | 50.3 | |
| Cash and Other Assets, Less Liabilities | | | 0.2 | |
| 7 | Not all countries are included in the benchmark index. |
| 8 | Source: FactSet Research Systems. Percentage values in data are rounded to the nearest tenth of one percent, so the values may not sum to 100% due to rounding. Percentage values may be derived from different data sources and may not be consistent with other Fund literature. |
Matthews Asia ESG Fund
Portfolio Manager Commentary (unaudited) (continued)
the bank’s net interest margins in a potentially slowing loan demand growth environment. During second quarter, the market also worried that Bank Rakyat was interested in acquiring a smaller and less profitable sharia bank, which the bank denied. We remain positive about the company’s ability to continue to maintain its leadership in the profitable micro enterprise lending space over the long term and have used the share price weakness to add to our position.
Notable Portfolio Changes:
During the second quarter the portfolio added a position in Litalico, a Japanese company that specializes in providing support services to people with disabilities. Litalico has two business lines, one that transitions mental health patients into the labor market and a second one that provides assistance and after-school/day services to children with developmental problems. The company is a market leader in its businesses and drives positive outcomes for its clients. The company provides job skills to disabled people in order to prepare them to start work and Litalico also works with employers so that people can fit better within an organization’s work environment and stay employed longer. It has one of the industry’s highest rates of transition to regular employment and also a higher-than-industry-average six-month job retention rate of clients in the job transition business.
We exited some positions during the quarter on account of both profit-taking and also due to changes in the interest rate environment in Asia.
Outlook:
After a strong year of earnings growth in 2017, the prospect for continued earnings growth in Asia remains and stock valuations also remain largely supportive. If the current trade friction between the U.S. and China escalates, however, it might adversely impact this favorable assessment. In addition, we continue to watch for signs of higher volatility, due to factors such as a strong pickup in inflation, which might cause central banks to raise interest rates or reduce liquidity much faster than expected.
We continue to be confident in Asia’s ability to effectively address global ESG challenges through its leadership position in areas including electric vehicles, access to affordable health care and financial inclusion, among others. This leadership provides an encouraging backdrop for pursuing ESG-focused investing in Asia. We also find that investing in companies that are improving quality of life in Asia is a way to address the aspirations of the newly emergent and increasingly sophisticated middle class.
We also continue to employ a fundamental, bottom-up investment process and use any market dislocation in Asia as an opportunity to buy shares of what we consider to be high-quality companies with best-in-class ESG attributes at reasonable prices.
Matthews Asia ESG Fund
June 30, 2018
Schedule of Investmentsa (unaudited)
COMMON EQUITIES: 93.9%
| | | | | | | | |
| | | Shares | | | Value | |
| CHINA/HONG KONG: 21.6% | | | | | |
Wuxi Biologics Cayman, Inc.b,c,d | | | 70,000 | | | | $776,520 | |
Inner Mongolia Yili Industrial Group Co., Ltd. A Shares | | | 169,900 | | | | 712,149 | |
HKBN, Ltd. | | | 301,000 | | | | 463,015 | |
CSPC Pharmaceutical Group, Ltd. | | | 144,000 | | | | 432,404 | |
MTR Corp., Ltd. | | | 73,500 | | | | 405,988 | |
China Conch Venture Holdings, Ltd. | | | 86,500 | | | | 315,702 | |
Haier Electronics Group Co., Ltd. | | | 74,000 | | | | 252,467 | |
AIA Group, Ltd. | | | 26,400 | | | | 229,981 | |
Han’s Laser Technology Industry Group Co., Ltd. A Shares | | | 27,700 | | | | 221,370 | |
Contemporary Amperex Technology Co., Ltd. A Sharesc | | | 20,200 | | | | 219,400 | |
Hong Kong Exchanges & Clearing, Ltd. | | | 6,800 | | | | 203,507 | |
Guangdong Investment, Ltd. | | | 128,000 | | | | 202,577 | |
Beijing Urban Construction Design & Development Group Co., Ltd. H Sharesb,d | | | 231,000 | | | | 103,478 | |
| | | | | | | | |
Total China/Hong Kong | | | | | | | 4,538,558 | |
| | | | | | | | |
| | | | | | | | |
| INDIA: 16.4% | | | | | |
Shriram City Union Finance, Ltd. | | | 21,203 | | | | 626,563 | |
Mahindra & Mahindra, Ltd. | | | 46,002 | | | | 602,869 | |
Lupin, Ltd. | | | 37,959 | | | | 500,864 | |
Bharat Financial Inclusion, Ltd.c | | | 21,869 | | | | 369,791 | |
IndusInd Bank, Ltd. | | | 10,492 | | | | 296,165 | |
TeamLease Services, Ltd.c | | | 6,831 | | | | 295,416 | |
Ipca Laboratories, Ltd. | | | 27,668 | | | | 282,416 | |
Power Grid Corp. of India, Ltd. | | | 90,859 | | | | 247,898 | |
Syngene International, Ltd.b,d | | | 24,473 | | | | 217,953 | |
| | | | | | | | |
Total India | | | | | | | 3,439,935 | |
| | | | | | | | |
| | | | | | | | |
| JAPAN: 16.1% | | | | | |
Tsukui Corp. | | | 57,600 | | | | 519,520 | |
Fuji Seal International, Inc. | | | 14,600 | | | | 517,214 | |
Daikin Industries, Ltd. | | | 3,400 | | | | 406,344 | |
Sohgo Security Services Co., Ltd. | | | 8,500 | | | | 399,905 | |
Ain Holdings, Inc. | | | 3,700 | | | | 272,704 | |
Koa Corp. | | | 10,800 | | | | 270,427 | |
Sosei Group Corp.c | | | 16,400 | | | | 263,489 | |
LITALICO, Inc.c | | | 13,900 | | | | 252,537 | |
Bunka Shutter Co., Ltd. | | | 22,500 | | | | 190,680 | |
Koito Manufacturing Co., Ltd. | | | 2,600 | | | | 171,738 | |
Hoya Corp. | | | 2,300 | | | | 130,477 | |
| | | | | | | | |
Total Japan | | | | | | | 3,395,035 | |
| | | | | | | | |
| | | | | | | | |
| TAIWAN: 9.6% | | | | | |
Taiwan Semiconductor Manufacturing Co., Ltd. | | | 84,000 | | | | 596,491 | |
Sitronix Technology Corp. | | | 85,000 | | | | 327,099 | |
Zhen Ding Technology Holding, Ltd. | | | 138,000 | | | | 304,652 | |
Sporton International, Inc. | | | 43,429 | | | | 210,607 | |
Tehmag Foods Corp. | | | 29,100 | | | | 199,316 | |
Merry Electronics Co., Ltd. | | | 45,000 | | | | 195,444 | |
Merida Industry Co., Ltd. | | | 39,000 | | | | 194,885 | |
| | | | | | | | |
Total Taiwan | | | | | | | 2,028,494 | |
| | | | | | | | |
| | | | | | | | |
| | | Shares | | | Value | |
| SOUTH KOREA: 7.2% | | | | | |
Hanon Systems | | | 51,990 | | | | $494,543 | |
KT Skylife Co., Ltd. | | | 30,609 | | | | 376,124 | |
iMarketKorea, Inc. | | | 42,295 | | | | 262,041 | |
DGB Financial Group, Inc. | | | 22,915 | | | | 210,751 | |
Samjin Pharmaceutical Co., Ltd. | | | 4,243 | | | | 171,647 | |
| | | | | | | | |
Total South Korea | | | | | | | 1,515,106 | |
| | | | | | | | |
| | | | | | | | |
| BANGLADESH: 5.6% | | | | | |
BRAC Bank, Ltd.c | | | 744,177 | | | | 633,077 | |
Square Pharmaceuticals, Ltd. | | | 86,843 | | | | 304,124 | |
GrameenPhone, Ltd. | | | 53,986 | | | | 251,348 | |
| | | | | | | | |
Total Bangladesh | | | | | | | 1,188,549 | |
| | | | | | | | |
| | | | | | | | |
| INDONESIA: 4.6% | | | | | |
PT Bank Rakyat Indonesia Persero | | | 3,204,800 | | | | 633,880 | |
PT Arwana Citramulia | | | 8,739,500 | | | | 206,138 | |
PT BFI Finance Indonesia | | | 2,528,100 | | | | 119,966 | |
| | | | | | | | |
Total Indonesia | | | | | | | 959,984 | |
| | | | | | | | |
| | | | | | | | |
| SINGAPORE: 3.6% | | | | | |
SATS, Ltd. | | | 83,000 | | | | 304,025 | |
Delfi, Ltd. | | | 299,500 | | | | 275,582 | |
Raffles Medical Group, Ltd. | | | 255,800 | | | | 189,341 | |
| | | | | | | | |
Total Singapore | | | | | | | 768,948 | |
| | | | | | | | |
| | | | | | | | |
| THAILAND: 3.0% | | | | | |
Total Access Communication Public Co., Ltd. NVDR | | | 420,500 | | | | 465,681 | |
Kasikornbank Public Co., Ltd. NVDR | | | 28,100 | | | | 164,394 | |
| | | | | | | | |
Total Thailand | | | | | | | 630,075 | |
| | | | | | | | |
| | | | | | | | |
| VIETNAM: 1.8% | | | | | |
Nam Long Investment Corp. | | | 307,424 | | | | 372,799 | |
| | | | | | | | |
Total Vietnam | | | | | | | 372,799 | |
| | | | | | | | |
| | | | | | | | |
| PHILIPPINES: 1.8% | | | | | |
Puregold Price Club, Inc. | | | 425,430 | | | | 371,409 | |
| | | | | | | | |
Total Philippines | | | | | | | 371,409 | |
| | | | | | | | |
| | | | | | | | |
| PAKISTAN: 1.7% | | | | | |
Abbott Laboratories Pakistan, Ltd. | | | 40,700 | | | | 229,555 | |
Bank Alfalah, Ltd. | | | 276,500 | | | | 119,047 | |
| | | | | | | | |
Total Pakistan | | | | | | | 348,602 | |
| | | | | | | | |
| | | | | | | | |
| LUXEMBOURG: 0.9% | | | | | |
L’Occitane International SA | | | 110,250 | | | | 181,839 | |
| | | | | | | | |
Total Luxembourg | | | | | | | 181,839 | |
| | | | | | | | |
| | | | | | | | |
| TOTAL COMMON EQUITIES | | | | 19,739,333 | |
| | | | | | | | |
(Cost $17,583,922) | | | | | | | | |
| | | | |
| matthewsasia.com | 800.789.ASIA | | | 51 | |
Matthews Asia ESG Fund
June 30, 2018
Schedule of Investmentsa (unaudited) (continued)
PREFERRED EQUITIES: 5.9%
| | | | | | | | |
| | | Shares | | | Value | |
| SOUTH KOREA: 5.9% | | | | | |
Samsung SDI Co., Ltd., Pfd. | | | 14,921 | | | | $1,242,786 | |
| | | | | | | | |
Total South Korea | | | | | | | 1,242,786 | |
| | | | | | | | |
| | | | | | | | |
| TOTAL PREFERRED EQUITIES | | | | 1,242,786 | |
| | | | | | | | |
(Cost $938,210) | | | | | | | | |
| | | | | | | | |
| TOTAL INVESTMENTS: 99.8% | | | | 20,982,119 | |
(Cost $18,522,132) | | | | | | | | |
| | | | | | | | |
CASH AND OTHER ASSETS,
LESS LIABILITIES: 0.2% | | | | 41,745 | |
| | | | | | | | |
| |
NET ASSETS: 100.0% | | | | $21,023,864 | |
| | | | | | | | |
| a | Certain securities were fair valued under the valuation policies approved by the Board of Trustees (Note 2-A). |
| b | Security exempt from registration under Rule 144A of the Securities Act of 1933, as amended. The security may be resold in transactions exempt from registration normally to qualified institutional buyers. The security has been determined to be liquid in accordance with procedures adopted by the Funds’ Board of Trustees. At June 30, 2018, the aggregate value is $1,097,951, which is 5.22% of net assets. |
| c | Non-income producing security. |
| d | The securities may be resold to qualified foreign investors and foreign institutional buyers under Regulation S of the Securities Act of 1933. |
| NVDR | Non-voting Depositary Receipt |
See accompanying notes to financial statements.
| | | | |
| PORTFOLIO MANAGERS |
| Taizo Ishida | | Robert Harvey, CFA |
Lead Manager | | Lead Manager |
|
| FUND FACTS |
| | | Investor | | Institutional |
Ticker | | MEASX | | MIASX |
CUSIP | | 577125883 | | 577125875 |
Inception | | 4/30/13 | | 4/30/13 |
NAV | | $13.82 | | $13.88 |
Initial Investment | | $2,500 | | $100,000 |
Gross Expense Ratio1 | | 1.70% | | 1.52% |
After Fee Waiver and Reimbursement2 | | 1.48% | | 1.25% |
Portfolio Statistics |
Total # of Positions | | 77 |
Net Assets | | $491.5 million |
Weighted Average Market Cap | | $2.5 billion |
Portfolio Turnover3 | | 7.74% |
Benchmark |
MSCI Emerging Markets Asia Index |
Redemption Fee |
2% within first 90 calendar days of purchase |
OBJECTIVE
Long-term capital appreciation.
STRATEGY
Under normal market conditions, the Fund seeks to achieve its investment objective by investing at least 80% of its total assets, which include borrowings for investment purposes, in the common and preferred stocks of companies located in Asia excluding Japan, South Korea, Hong Kong and Singapore. The Fund may also invest in the convertible securities, of any duration or quality of companies located in Asia excluding Japan, South Korea, Hong Kong and Singapore. Under normal market conditions, the Fund is expected to invest a substantial portion of its net assets in the emerging countries and markets in the Asian region, including, but not limited to, Bangladesh, Cambodia, China (including Taiwan, but excluding Hong Kong), India, Indonesia, Laos, Malaysia, Mongolia, Myanmar, Pakistan, Papua New Guinea, Philippines, Sri Lanka, Thailand, and Vietnam.
Matthews Emerging Asia Fund
Portfolio Manager Commentary (unaudited)
For the first half of 2018, the Matthews Emerging Asia Fund returned –10.90% (Investor Class) and –10.85% (Institutional Class), while its benchmark, the MSCI Emerging Markets Asia Index, returned –4.93% over the same period. For the quarter ending June 30, the Fund returned –10.84% (Investor Class) and –10.80% (Institutional Class), while its benchmark returned –5.75%.
Market Environment:
Asian and global emerging markets (EM) suffered during the first half of 2018. Negative investor sentiment arose from the confluence of escalating U.S.–China trade tensions, seemingly tighter monetary conditions in China and other parts of EM and the oscillation of North Korean denuclearization talks. In addition, a stronger U.S. dollar and higher energy prices exposed the vulnerabilities of some emerging market economies.
Vietnam’s equity markets were down slightly during the first half of 2018, following a significant run-up in 2017. Vietnam’s economy remained stable in our view, however, with positive GDP growth and strong domestic consumption trends. Meanwhile, Pakistan’s equity markets were down sharply in the first half of the year. Worries about rising oil prices adding to Pakistan’s current account imbalance weighed on investor sentiment, as did upcoming election cycles. Indonesia’s equity markets also experienced significant declines during the first half. Indonesia faces both regional and presidential elections in the next 12 months, creating political uncertainty in the region, although we believe Indonesia’s economy remains well-positioned from an economic standpoint.
Elsewhere, India’s equity market was down in the first half of the year. Macro headwinds captured headlines in the second quarter as India’s reliance on energy imports and a deteriorating current account pressured the Indian rupee and brought inflation concerns to investors. On a positive note, economic growth remained robust in India and corporate earnings momentum showed improvement.
Performance Contributors and Detractors:
During the first half of the year, the Fund underperformed its benchmark. Part of the Fund’s underperformance was due to two stocks that experienced sharp sell-offs in the first and second quarters. Shares of Vakrangee, an Indian software company, lost nearly 69% of their value in the first six months of the year, driven down by unsubstantiated rumors of a stock price manipulation scheme. Meanwhile, shares of PC Jeweller, an Indian jewelry manufacturer, previously one of our better performers over the past few years, lost nearly 72% of their value over the same period on unsubstantiated rumors that it manipulated its financial data. We are monitoring both positions closely. Both securities now represent fairly low positions in the portfolio based on their lower share prices, so we will retain our shares until the rumors are clarified and/or we lose confidence in the firms. We believe both businesses offer value at this point and have interesting long-term prospects.
Despite a challenging first half for some of the Fund’s holdings, there were some notable bright spots in the portfolio. Berger Paints Bangladesh, a manufacturer of paints and varnishes, generated an over 31% return in the first six months, versus the broader Bangladesh equity market, which was down by more than –9% in the
(continued)
| 1 | Prospectus expense ratios. |
| 2 | Matthews has contractually agreed (i) to waive fees and reimburse expenses to the extent needed to limit Total Annual Fund Operating Expenses (excluding Rule 12b-1 fees, taxes, interest, brokerage commissions, short sale dividend expenses, expenses incurred in connection with any merger or reorganization or extraordinary expenses such as litigation) of the Institutional Class to 1.25% first by waiving class specific expenses (i.e., shareholder service fees specific to a particular class) of the Institutional Class and then, to the extent necessary, by waiving non-class specific expenses of the Institutional Class, and (ii) if any Fund-wide expenses (i.e., expenses that apply to both the Institutional Class and the Investor Class) are waived for the Institutional Class to maintain the 1.25% expense limitation, to waive an equal amount (in annual percentage terms) of those same expenses for the Investor Class. The Total Annual Fund Operating Expenses After Fee Waiver and Expense Reimbursement for the Investor Class may vary from year to year and will in some years exceed 1.25%. If the operating expenses fall below the expense limitation in a year within three years after Matthews has made a waiver or reimbursement, the Fund may reimburse Matthews up to an amount that does not cause the expenses for that year to exceed the lesser of (i) the expense limitation applicable at the time of that fee waiver and/or expense reimbursement or (ii) the expense limitation in effect at the time of recoupment. This agreement will remain in place until April 30, 2019 and may be terminated at any time by the Board of Trustees on behalf of the Fund on 60 days’ written notice to Matthews. Matthews may decline to renew this agreement by written notice to the Trust at least 30 days before its annual expiration date. |
| 3 | The lesser of fiscal year 2017 long-term purchase costs or sales proceeds divided by the average monthly market value of long-term securities. |
| | | | |
| matthewsasia.com | 800.789.ASIA | | | 53 | |
| | | | | | | | | | | | | | | | | | | | | | | | | | | | |
| | | |
| PERFORMANCE AS OF JUNE 30, 2018 | | | | | | | |
| | | | | | | | | Average Annual Total Returns | | | | |
| | | 3 Months | | | YTD | | | 1 Year | | | 3 Years | | | 5 Years | | | Since
Inception | | | Inception
Date | |
| Investor Class (MEASX) | | | -10.84% | | | | -10.90% | | | | -5.13% | | | | 7.12% | | | | 8.67% | | | | 7.18% | | | | 4/30/13 | |
| Institutional Class (MIASX) | | | -10.80% | | | | -10.85% | | | | -4.91% | | | | 7.35% | | | | 8.91% | | | | 7.41% | | | | 4/30/13 | |
| MSCI Emerging Markets Asia Index4 | | | -5.75% | | | | -4.93% | | | | 10.45% | | | | 7.67% | | | | 8.62% | | | | 6.91% | | | | | |
| Lipper Emerging Markets Funds Category Average5 | | | -8.85% | | | | -7.05% | | | | 6.10% | | | | 4.68% | | | | 4.12% | | | | 2.29% | | | | | |
Performance assumes reinvestment of all dividends and/or distributions before taxes. All performance quoted represents past performance and is no guarantee of future results. Investment return and principal value will fluctuate with market conditions so that when redeemed, shares may be worth more or less than their original cost. Current performance may be lower or higher than the return figures quoted. Returns would have been lower if certain of the Fund’s fees and expenses had not been waived. For the Fund’s most recent month-end performance visit matthewsasia.com.
GROWTH OF A $10,000 INVESTMENT SINCE INCEPTION—INVESTOR CLASS
Plotted monthly. The performance data and graph do not reflect the deduction of taxes that a shareholder would pay on dividends, capital gain distributions or redemption of Fund shares. Values are in US$.
| | 4 | It is not possible to invest directly in an index. Source: Index data from Morgan Stanley Capital International and Bloomberg; total return calculations performed by BNY Mellon Investment Servicing (US) Inc. Please see page 92 for index definition. |
| | 5 | The Lipper Category Average does not reflect sales charges and is based on total return, including reinvestment of dividends and capital gains for the stated periods. |
| | | | | | | | |
| | | | |
| TOP TEN HOLDINGS6 | | | | | | | |
| | | Sector | | Country | | % of Net Assets | |
| Sampath Bank PLC | | Financials | | Sri Lanka | | | 3.4% | |
| Tongda Group Holdings, Ltd. | | Information Technology | | China/Hong Kong | | | 3.2% | |
| Saigon Beer Alcohol Beverage Corp. | | Consumer Staples | | Vietnam | | | 2.9% | |
| British American Tobacco Bangladesh Co., Ltd. | | Consumer Staples | | Bangladesh | | | 2.6% | |
| Cosco Capital, Inc. | | Consumer Staples | | Philippines | | | 2.6% | |
| BRAC Bank, Ltd. | | Financials | | Bangladesh | | | 2.5% | |
| Phu Nhuan Jewelry JSC | | Consumer Discretionary | | Vietnam | | | 2.4% | |
| PT Bank Mandiri Persero | | Financials | | Indonesia | | | 2.4% | |
| Shenzhou International Group Holdings, Ltd. | | Consumer Discretionary | | China/Hong Kong | | | 2.4% | |
| PT Gudang Garam | | Consumer Staples | | Indonesia | | | 2.3% | |
| % OF ASSETS IN TOP TEN | | | | | | | 26.7% | |
| | 6 | Holdings may combine more than one security from same issuer and related depositary receipts. |
Matthews Emerging Asia Fund
Portfolio Manager Commentary (unaudited) (continued)
same period. Berger Paints has a strong management team and solid market position, benefiting from the strength of the local consumer in a fast-growing economy. Shenzhou International Group Holdings, a Chinese-based apparel company with operations in Vietnam, generated more than 30% in returns during the first six months, versus the broader offshore Chinese equity market, which was down –1.69% in the same period. Shenzhou International Group manufactures apparel for leading global brands and has been a strong performer.
Notable Portfolio Changes:
We added to positions selectively in the second quarter as we saw quite large moves in various markets. In Indonesia, we added to Gudang Garam, a leading cigarette manufacturer, and Ramayana Lestari Sentosa after currency concerns pushed the market lower. We also added to our two motor company positions in Pakistan, Indus Motor and PAK Suzuki Motor, as valuations became extremely attractive. We also added to our position in Tongda Group Holdings, a Hong Kong-based manufacturer of electronic components, after a steep correction, retaining the view that the company’s growth prospects remain attractive. During the quarter we also reduced our exposure to select positions as valuations rose materially. These sales included Shenzhou International and Vietnamese conglomerate Masan Group.
Outlook:
Going into the third quarter, we may see trade friction dampen sentiment but other positive factors may remain. U.S. and Chinese GDP growth remains robust and supportive of the global economy. Commodity prices are high enough to fund the budgets of cyclical exporters and regional currency valuations support foreign investment. In addition, local interest rates are probably high enough to compensate investors for risks and corporate earnings remain relatively strong, making current equity valuations attractive. The strongest headwind seems to be uncertainty derived from escalating U.S.–China trade tensions.
While investor sentiment is weak, the fundamental reasons for owning emerging Asian equities are still very much intact. As sentiment and share prices seem to diverge from the positive fundamental trends we are seeing at the company level, we believe the current volatility may create buying opportunities for long-term investors. We expect less-developed markets to shine over the long term as rising domestic demand for consumer goods and services has the potential to drive solid revenue and strong earnings growth.
| | | | |
| |
| COUNTRY ALLOCATION (%)7,8 | |
| Vietnam | | | 19.1 | |
| Indonesia | | | 15.5 | |
| Pakistan | | | 14.3 | |
| Bangladesh | | | 11.4 | |
| Sri Lanka | | | 9.3 | |
| China/Hong Kong | | | 8.4 | |
| India | | | 8.3 | |
| Philippines | | | 7.3 | |
| Australia | | | 0.6 | |
| Singapore | | | 0.6 | |
| Cash and Other Assets, Less Liabilities | | | 5.2 | |
| | | | |
| |
| SECTOR ALLOCATION (%)8 | |
| Consumer Staples | | | 28.4 | |
| Consumer Discretionary | | | 23.1 | |
| Financials | | | 17.9 | |
| Industrials | | | 6.0 | |
| Health Care | | | 5.5 | |
| Materials | | | 4.1 | |
| Information Technology | | | 3.7 | |
| Real Estate | | | 3.4 | |
| Energy | | | 1.4 | |
| Utilities | | | 1.2 | |
| Cash and Other Assets, Less Liabilities | | | 5.2 | |
| | | | |
| |
| MARKET CAP EXPOSURE (%)8 | |
| Mega Cap (over $25B) | | | 0.0 | |
| Large Cap ($10B–$25B) | | | 5.4 | |
| Mid Cap ($3B–10B) | | | 9.9 | |
| Small Cap (under $3B) | | | 79.5 | |
| Cash and Other Assets, Less Liabilities | | | 5.2 | |
| 7 | Not all countries where the Fund may invest are included in the benchmark index. |
| 8 | Source: FactSet Research Systems. Percentage values in data are rounded to the nearest tenth of one percent, so the values may not sum to 100% due to rounding. Percentage values may be derived from different data sources and may not be consistent with other Fund literature. |
| | | | |
| matthewsasia.com | 800.789.ASIA | | | 55 | |
Matthews Emerging Asia Fund
June 30, 2018
Schedule of Investmentsa (unaudited)
COMMON EQUITIES: 94.8%
| | | | | | | | |
| | | Shares | | | Value | |
| VIETNAM: 19.1% | | | | | |
Saigon Beer Alcohol Beverage Corp. | | | 1,462,000 | | | | $14,315,077 | |
Phu Nhuan Jewelry JSC | | | 3,095,524 | | | | 11,708,553 | |
Vinh Hoan Corp. | | | 4,421,900 | | | | 11,273,584 | |
Nam Long Investment Corp. | | | 8,711,871 | | | | 10,564,479 | |
Taisun International Holding Corp.† | | | 1,900,000 | | | | 8,693,442 | |
Masan Group Corp.b | | | 1,758,170 | | | | 6,040,521 | |
Thien Long Group Corp. | | | 1,320,805 | | | | 5,660,963 | |
Military Commercial Joint Stock Bank | | | 4,707,780 | | | | 5,356,102 | |
Mobile World Investment Corp. | | | 1,020,454 | | | | 5,059,339 | |
National Seed JSC† | | | 979,585 | | | | 4,731,841 | |
Tien Phong Plastic JSC | | | 1,861,224 | | | | 3,729,177 | |
Domesco Medical Import Export JSC | | | 867,970 | | | | 3,421,447 | |
Lix Detergent JSC | | | 1,254,405 | | | | 2,278,402 | |
Dinh Vu Port Investment & Development JSC | | | 517,520 | | | | 1,090,269 | |
| | | | | | | | |
Total Vietnam | | | | | | | 93,923,196 | |
| | | | | | | | |
| | | | | | | | |
| INDONESIA: 15.5% | | | | | |
PT Bank Mandiri Persero | | | 24,454,000 | | | | 11,699,483 | |
PT Gudang Garam | | | 2,425,300 | | | | 11,363,946 | |
PT Ramayana Lestari Sentosa | | | 99,165,900 | | | | 10,301,691 | |
PT Kino Indonesia | | | 62,128,100 | | | | 7,624,079 | |
PT Matahari Department Store | | | 11,013,200 | | | | 6,745,087 | |
PT Adira Dinamika Multi Finance | | | 11,372,900 | | | | 6,349,142 | |
PT Hexindo Adiperkasa | | | 22,802,000 | | | | 5,484,070 | |
PT Bank Tabungan Pensiunan Nasional Syariahb | | | 47,530,100 | | | | 5,257,167 | |
PT Mayora Indah | | | 24,273,200 | | | | 5,030,578 | |
PT BFI Finance Indonesia | | | 73,579,500 | | | | 3,491,560 | |
PT Catur Sentosa Adipranab | | | 70,131,000 | | | | 2,838,519 | |
| | | | | | | | |
Total Indonesia | | | | | | | 76,185,322 | |
| | | | | | | | |
| | | | | | | | |
| PAKISTAN: 14.3% | | | | | |
Indus Motor Co., Ltd. | | | 882,850 | | | | 10,332,943 | |
Hascol Petroleum, Ltd. | | | 3,121,700 | | | | 8,064,962 | |
PAK Suzuki Motor Co., Ltd. | | | 2,288,000 | | | | 7,410,897 | |
Shifa International Hospitals, Ltd.† | | | 2,783,351 | | | | 6,187,771 | |
K-Electric, Ltd.b | | | 122,221,500 | | | | 5,716,082 | |
ICI Pakistan, Ltd. | | | 763,850 | | | | 5,040,970 | |
GlaxoSmithKline Consumer Healthcare Pakistan, Ltd. | | | 1,258,357 | | | | 4,196,768 | |
The Searle Company, Ltd. | | | 1,452,834 | | | | 4,061,236 | |
Pakistan Petroleum, Ltd. | | | 2,127,300 | | | | 3,762,803 | |
United Bank, Ltd. | | | 2,660,200 | | | | 3,701,281 | |
Akzo Nobel Pakistan, Ltd. | | | 1,975,300 | | | | 3,037,522 | |
Habib Bank, Ltd. | | | 1,885,000 | | | | 2,583,280 | |
National Foods, Ltd. | | | 958,500 | | | | 2,517,513 | |
Meezan Bank, Ltd. | | | 3,472,560 | | | | 2,336,580 | |
Hum Network, Ltd. | | | 17,939,500 | | | | 1,193,647 | |
| | | | | | | | |
Total Pakistan | | | | | | | 70,144,255 | |
| | | | | | | | |
| | | | | | | | |
| | | | | | | | |
| | | Shares | | | Value | |
| BANGLADESH: 11.4% | | | | | |
British American Tobacco Bangladesh Co., Ltd. | | | 313,130 | | | | $12,932,630 | |
BRAC Bank, Ltd.b | | | 14,451,350 | | | | 12,293,878 | |
Square Pharmaceuticals, Ltd. | | | 2,796,774 | | | | 9,794,306 | |
Berger Paints Bangladesh, Ltd. | | | 557,044 | | | | 9,073,637 | |
The City Bank, Ltd. | | | 10,442,784 | | | | 4,192,336 | |
Marico Bangladesh, Ltd. | | | 289,217 | | | | 4,008,504 | |
Olympic Industries, Ltd. | | | 1,416,833 | | | | 3,791,988 | |
| | | | | | | | |
Total Bangladesh | | | | | | | 56,087,279 | |
| | | | | | | | |
| | | | | | | | |
| SRI LANKA: 9.3% | | | | | |
Sampath Bank PLCb | | | 8,599,412 | | | | 16,465,457 | |
Ceylon Cold Stores PLC | | | 1,387,119 | | | | 8,731,316 | |
John Keells Holdings PLC | | | 7,687,955 | | | | 7,163,445 | |
Lanka Orix Leasing Co. PLCb | | | 7,511,241 | | | | 4,673,766 | |
Teejay Lanka PLC | | | 18,872,680 | | | | 3,695,850 | |
Ceylon Tobacco Co. PLC | | | 379,231 | | | | 2,687,198 | |
Expolanka Holdings PLC | | | 94,231,424 | | | | 2,381,085 | |
| | | | | | | | |
Total Sri Lanka | | | | | | | 45,798,117 | |
| | | | | | | | |
| | | | | | | | |
| CHINA/HONG KONG: 8.4% | | | | | |
Tongda Group Holdings, Ltd. | | | 77,640,000 | | | | 15,691,185 | |
Shenzhou International Group Holdings, Ltd. | | | 939,000 | | | | 11,554,756 | |
Luk Fook Holdings International, Ltd. | | | 1,986,000 | | | | 8,203,736 | |
Red Star Macalline Group Corp., Ltd. H Sharesc,d | | | 2,429,000 | | | | 3,271,973 | |
Future Bright Holdings, Ltd. | | | 18,612,000 | | | | 2,562,068 | |
| | | | | | | | |
Total China/Hong Kong | | | | | | | 41,283,718 | |
| | | | | | | | |
| | | | | | | | |
| INDIA: 8.3% | | | | | |
Balkrishna Industries, Ltd. | | | 531,078 | | | | 8,084,110 | |
PC Jeweller, Ltd. | | | 3,094,879 | | | | 6,195,619 | |
Shriram Transport Finance Co., Ltd. | | | 268,352 | | | | 5,092,472 | |
Shriram City Union Finance, Ltd. | | | 153,789 | | | | 4,544,568 | |
Praj Industries, Ltd. | | | 3,594,497 | | | | 4,136,326 | |
Caplin Point Laboratories, Ltd. | | | 489,805 | | | | 3,052,294 | |
Supreme Industries, Ltd. | | | 178,934 | | | | 2,951,728 | |
Vakrangee, Ltd. | | | 2,626,038 | | | | 2,562,222 | |
VST Industries, Ltd. | | | 60,083 | | | | 2,545,295 | |
Kwality, Ltd. | | | 2,533,204 | | | | 844,420 | |
Poly Medicure, Ltd. | | | 234,582 | | | | 726,532 | |
| | | | | | | | |
Total India | | | | | | | 40,735,586 | |
| | | | | | | | |
| | | | | | | | |
| PHILIPPINES: 7.3% | | | | | |
Cosco Capital, Inc. | | | 112,863,600 | | | | 12,858,213 | |
San Miguel Food and Beverage, Inc. | | | 7,533,700 | | | | 8,441,753 | |
STI Education Systems Holdings, Inc. | | | 254,154,000 | | | | 5,429,064 | |
Emperador, Inc. | | | 33,504,400 | | | | 4,639,481 | |
Shakey’s Pizza Asia Ventures, Inc. | | | 18,868,100 | | | | 4,313,315 | |
| | | | | | | | |
Total Philippines | | | | | | | 35,681,826 | |
| | | | | | | | |
| | | | | | | | |
| AUSTRALIA: 0.6% | | | | | |
Oil Search, Ltd. | | | 467,309 | | | | 3,070,198 | |
| | | | | | | | |
Total Australia | | | | | | | 3,070,198 | |
| | | | | | | | |
| | | | | | | | |
Matthews Emerging Asia Fund
June 30, 2018
Schedule of Investmentsa (unaudited) (continued)
COMMON EQUITIES (continued)
| | | | | | | | |
| | | Shares | | | Value | |
| SINGAPORE: 0.6% | | | | | |
Yoma Strategic Holdings, Ltd. | | | 10,610,166 | | | | $2,876,729 | |
| | | | | | | | |
Total Singapore | | | | | | | 2,876,729 | |
| | | | | | | | |
| | | | | | | | |
| TOTAL INVESTMENTS: 94.8% | | | | 465,786,226 | |
(Cost $451,018,176) | | | | | | | | |
| | | | | | | | |
CASH AND OTHER ASSETS,
LESS LIABILITIES: 5.2% | | | | 25,707,331 | |
| | | | | | | | |
| |
NET ASSETS: 100.0% | | | | $491,493,557 | |
| | | | | | | | |
| a | Certain securities were fair valued under the valuation policies approved by the Board of Trustees (Note 2-A). |
| b | Non-income producing security. |
| c | Security exempt from registration under Rule 144A of the Securities Act of 1933, as amended. The security may be resold in transactions exempt from registration normally to qualified institutional buyers. The security has been determined to be liquid in accordance with procedures adopted by the Funds’ Board of Trustees. At June 30, 2018, the aggregate value is $3,271,973, which is 0.67% of net assets. |
| d | The securities may be resold to qualified foreign investors and foreign institutional buyers under Regulation S of the Securities Act of 1933. |
| † | Affiliated Issuer, as defined under the Investment Company Act of 1940 (ownership of 5% or more of the outstanding voting securities of this issuer) |
See accompanying notes to financial statements.
| | | | |
| matthewsasia.com | 800.789.ASIA | | | 57 | |
| | | | |
| PORTFOLIO MANAGERS |
| Michael J. Oh, CFA | | |
Lead Manager | | | | |
| Sunil Asnani | | Tiffany Hsiao, CFA |
Co-Manager | | Co-Manager |
| | |
| FUND FACTS | | | | |
| | | Investor | | Institutional |
Ticker | | MATFX | | MITEX |
CUSIP | | 577130883 | | 577125859 |
Inception | | 12/27/99 | | 4/30/13 |
NAV | | $14.38 | | $14.46 |
Initial Investment | | $2,500 | | $100,000 |
Gross Expense Ratio1 | | 1.24% | | 1.05% |
Portfolio Statistics | | | | |
Total # of Positions | | 47 |
Net Assets | | $295.3 million |
Weighted Average Market Cap | | $85.0 billion |
Portfolio Turnover2 | | 66.51% |
Benchmark | | | | |
MSCI AC Asia ex Japan Index |
OBJECTIVE
Long-term capital appreciation.
STRATEGY
Under normal market conditions, the Fund seeks to achieve its investment objective by investing at least 80% of its net assets, which include borrowings for investment purposes, in the common and preferred stocks of companies located in Asia that Matthews believes are innovators in their products, services, processes, business models, management, use of technology, or approach to creating, expanding or servicing their markets. Asia consists of all countries and markets in Asia, including developed, emerging, and frontier countries and markets in the Asian region.
Matthews Asia Innovators Fund
Portfolio Manager Commentary (unaudited)
For the first half of 2018, the Matthews Asia Innovators Fund returned 1.34% (Investor Class) and 1.40% (Institutional Class), while its benchmark, the MSCI All Country Asia ex Japan Index, fell –4.65% over the same period. For the quarter ending June 30, the Fund returned –2.71% (Investor Class) and –2.69% (Institutional Class), while its benchmark returned –5.31%.
Market Environment:
Asian and global emerging markets suffered during the first half of 2018. Negative investor sentiment arose from the confluence of escalating trade tensions between China and the United States, as well as seemingly tighter monetary conditions in China and other parts of emerging markets. In addition, the flight to quality, strengthening of the U.S. dollar and higher energy prices exposed the vulnerabilities of some emerging market economies.
Chinese shares generated negative returns for the six months ending June 30. Significant headwinds surrounding trade and tariff disputes with the U.S. proved to be too large a risk for many investors during this time. However, resilient corporate earnings, a surprisingly stable Chinese renminbi (RMB) and robust exports were positive contributors to China’s continued economic growth. Elsewhere, India’s equity market posted negative returns for the first half of the year. Macro headwinds captured headlines in the second quarter as India’s reliance on energy imports and a deteriorating current account pressured the Indian rupee and brought inflation concerns to investors. On a positive note, economic growth remained robust and corporate earnings momentum improved.
South Korea’s equities were among the Asia region’s weakest in the first half of the year as investors contemplated how trade talks between the U.S., China and Europe could affect Korean exports and how prospects of a potentially significant hike in the country’s minimum wage could affect corporate earnings. In June, U.S. President Donald Trump met with North Korean leader Kim Jong Un in a historic summit. The meeting reduced military tensions on the Korean peninsula, but had little impact on South Korea’s equity markets or currency exchange rates. South Korea’s domestic economy remains stable despite a rising unemployment rate and the country’s exports continued to support GDP growth.
Performance Contributors and Detractors:
The Fund outperformed its benchmark during the first half of the year. Holdings in the health care and consumer discretionary sectors, particularly in China, made the largest contributions to Fund performance. While China’s broader equity markets were down for the first half of the year, several of our individual holdings in China generated double-digit positive returns.
The China-based health care companies we held were purely domestic, so some investors may have seen them as being potentially less impacted by a trade war. Health care demand in China remains robust and we continue to see the growth of health care companies as part of a long-term, secular trend. The top two performing securities in the portfolio during the first half of the year were Jiangsu Hengrui Medicine and Wuxi Biologics. Jiangsu Hengrui Medicine is a leading drug manufacturer, while Wuxi Biolgogics is a leading provider of outsourcing services for clinical trials.
Within the consumer discretionary sector, China International Travel Service was among the Fund’s top performers during this period, demonstrating an increase in discretionary spending as household wealth rises in China. China International Travel Service offers package tours and operates duty-free shops. The duty-free shop concept is still relatively new in China, representing an attractive growth opportunity.
(continued)
| 1 | Prospectus expense ratios. |
| 2 | The lesser of fiscal year 2017 long-term purchase costs or sales proceeds divided by the average monthly market value of long-term securities. |
| | | | | | | | | | | | | | | | | | | | | | | | | | | | | | | | |
| | | | | |
| PERFORMANCE AS OF JUNE 30, 2018 | | | | | | | | | | | | | |
| | | | | | | | | Average Annual Total Returns | | | | |
| | | 3 Months | | | YTD | | | 1 Year | | | 3 Years | | | 5 Years | | | 10 Years | | | Since
Inception | | | Inception
Date | |
| Investor Class (MATFX) | | | -2.71% | | | | 1.34% | | | | 19.09% | | | | 10.61% | | | | 15.36% | | | | 10.32% | | | | 4.23% | | | | 12/27/1999 | |
| Institutional Class (MITEX) | | | -2.69% | | | | 1.40% | | | | 19.23% | | | | 10.80% | | | | 15.57% | | | | n.a. | | | | 14.65% | | | | 4/30/2013 | |
| MSCI AC Asia ex Japan Index3 | | | -5.31% | | | | -4.65% | | | | 10.21% | | | | 7.32% | | | | 8.48% | | | | 6.10% | | | | 6.60% | 4 | | | | |
| Lipper Pacific ex Japan Funds Category Average5 | | | -5.15% | | | | -4.63% | | | | 9.66% | | | | 6.37% | | | | 7.52% | | | | 5.52% | | | | 6.04% | 4 | | | | |
Performance assumes reinvestment of all dividends and/or distributions before taxes. All performance quoted represents past performance and is no guarantee of future results. Investment return and principal value will fluctuate with market conditions so that when redeemed, shares may be worth more or less than their original cost. Current performance may be lower or higher than the return figures quoted. For the Fund’s most recent month-end performance, visit matthewsasia.com.
GROWTH OF A $10,000 INVESTMENT SINCE INCEPTION—INVESTOR CLASS
Plotted monthly. The performance data and graph do not reflect the deduction of taxes that a shareholder would pay on dividends, capital gains distributions or redemption of Fund shares. Values are in US$.
| | 3 | It is not possible to invest directly in an index. Source: Index data from Morgan Stanley Capital International and Bloomberg; total return calculations performed by BNY Mellon Investment Servicing (US) Inc. Please see page 92 for index definition. |
| | 4 | Calculated from 12/31/99. |
| | 5 | The Lipper Category Average does not reflect sales charges and is based on total return, including reinvestment of dividends and capital gains for the stated periods. |
| | | | | | | | |
| | | | |
| TOP TEN HOLDINGS6 | | | | | | | |
| | | Sector | | Country | | % of Net Assets | |
| Alibaba Group Holding, Ltd. | | Information Technology | | China/Hong Kong | | | 4.7% | |
| HDFC Bank, Ltd. | | Financials | | India | | | 4.4% | |
| Tencent Holdings, Ltd. | | Information Technology | | China/Hong Kong | | | 4.0% | |
| Jiangsu Hengrui Medicine Co., Ltd. | | Health Care | | China/Hong Kong | | | 4.0% | |
| Ping An Insurance Group Co. of China, Ltd. | | Financials | | China/Hong Kong | | | 3.5% | |
| Orion Corp. | | Consumer Staples | | South Korea | | | 3.5% | |
| China International Travel Service Corp., Ltd. | | Consumer Discretionary | | China/Hong Kong | | | 3.3% | |
| Wuxi Biologics Cayman, Inc. | | Health Care | | China/Hong Kong | | | 3.0% | |
| AIA Group, Ltd. | | Financials | | China/Hong Kong | | | 2.9% | |
| LG Household & Health Care, Ltd. | | Consumer Staples | | South Korea | | | 2.9% | |
| % OF ASSETS IN TOP TEN | | | | | | | 36.2% | |
| | 6 | Holdings may combine more than one security from same issuer and related depositary receipts. |
| | | | |
| matthewsasia.com | 800.789.ASIA | | | 59 | |
| | | | |
| | |
| COUNTRY ALLOCATION (%)7,8 | | | |
| China/Hong Kong | | | 55.9 | |
| South Korea | | | 16.3 | |
| India | | | 11.2 | |
| Taiwan | | | 2.5 | |
| Singapore | | | 2.4 | |
| Vietnam | | | 2.3 | |
| Indonesia | | | 1.8 | |
| Bangladesh | | | 1.8 | |
| Thailand | | | 1.7 | |
| Philippines | | | 1.1 | |
| Japan | | | 0.4 | |
| Cash and Other Assets, Less Liabilities | | | 2.5 | |
| | | | |
| | |
| SECTOR ALLOCATION (%)8 | | | |
| Information Technology | | | 28.0 | |
| Financials | | | 25.1 | |
| Consumer Discretionary | | | 24.2 | |
| Health Care | | | 10.6 | |
| Consumer Staples | | | 8.5 | |
| Industrials | | | 1.0 | |
| Cash and Other Assets, Less Liabilities | | | 2.5 | |
| | | | |
| | |
| MARKET CAP EXPOSURE (%)8 | | | |
| Mega Cap (over $25B) | | | 45.3 | |
| Large Cap ($10B–$25B) | | | 23.0 | |
| Mid Cap ($3B–10B) | | | 13.1 | |
| Small Cap (under $3B) | | | 16.2 | |
| Cash and Other Assets, Less Liabilities | | | 2.5 | |
| | 7 | Not all countries are included in the benchmark index. |
| | 8 | Source: FactSet Research Systems. Percentage values in data are rounded to the nearest tenth of one percent, so the values may not sum to 100% due to rounding. Percentage values may be derived from different data sources and may not be consistent with other Fund literature. |
Matthews Asia Innovators Fund
Portfolio Manager Commentary (unaudited) (continued)
Detracting from performance were our holdings in the information technology (IT) sector. Naver, which operates South Korea’s largest search engine, had negative returns during the first half of the year, partly reflecting negative sentiment for South Korean equities in general. NetEase, a Chinese internet and gaming company, also delivered negative returns in the first half of the year due to worries about its ability to sustain market share. While remaining cautiously optimistic about their longer term prospects, we will continue to monitor these holdings carefully.
Notable Portfolio Changes:
There were no major changes to the portfolio during the second quarter. We took advantage of market volatility to rotate capital among our existing portfolio holdings. For example, as stock prices fell, we added to our holdings of a handful of quality companies that we believe have particularly robust business models. We also selectively trimmed from certain existing holdings that we believe may not have been positioned as well to weather additional market volatility.
Outlook:
As we enter the third quarter, we may see trade friction dampen sentiment, but other positive factors may exist. U.S. and Chinese GDP growth remains robust and supportive of the global economy. In addition, local interest rates are high enough to compensate investors for risks; and importantly, corporate earnings remain relatively strong, making current equity valuations relatively attractive. The strongest single headwind seems to be uncertainty derived from escalating U.S.–China trade tensions.
Importantly, we are proactively managing the portfolio to hedge against global trade war concerns, as well as other potentially negative macroeconomic factors. In general, we continue to look for domestically oriented companies that may be slightly less impacted by tariffs or rising oil prices. And we remain cautious about investing in companies that are more exposed to factors that are outside of their control, such as companies that may suffer a significant loss of business due to a rise in interest rates. With share prices seeming to diverge from the positive fundamental trends we are seeing at the company level, we believe current volatility may create opportunities for long-term investors. While investor sentiment remains weak, the fundamental reasons for owning innovative Asian companies serving domestic consumers with rising wealth are still intact.
Matthews Asia Innovators Fund
June 30, 2018
Schedule of Investmentsa (unaudited)
COMMON EQUITIES: 95.4%
| | | | | | | | |
| | | Shares | | | Value | |
| CHINA/HONG KONG: 55.9% | | | | | | | | |
Alibaba Group Holding, Ltd. ADRb | | | 74,600 | | | | $13,840,538 | |
Tencent Holdings, Ltd. | | | 237,100 | | | | 11,906,072 | |
Jiangsu Hengrui Medicine Co., Ltd. A Shares | | | 1,028,413 | | | | 11,722,499 | |
Ping An Insurance Group Co. of China, Ltd. H Shares | | | 1,132,000 | | | | 10,366,487 | |
China International Travel Service Corp., Ltd. A Shares | | | 1,002,025 | | | | 9,706,238 | |
Wuxi Biologics Cayman, Inc.b,c,d | | | 791,000 | | | | 8,774,678 | |
AIA Group, Ltd. | | | 996,200 | | | | 8,678,308 | |
GreenTree Hospitality Group, Ltd. ADRb | | | 465,505 | | | | 8,420,986 | |
JD.com, Inc. ADRb | | | 200,000 | | | | 7,790,000 | |
Ctrip.com International, Ltd. ADRb | | | 156,200 | | | | 7,439,806 | |
TAL Education Group ADRb | | | 183,200 | | | | 6,741,760 | |
NetEase, Inc. ADR | | | 25,700 | | | | 6,493,619 | |
CSPC Pharmaceutical Group, Ltd. | | | 2,112,000 | | | | 6,341,917 | |
Baozun, Inc. ADRb | | | 108,800 | | | | 5,951,360 | |
Midea Group Co., Ltd. A Shares | | | 739,109 | | | | 5,798,356 | |
Suofeiya Home Collection Co., Ltd. A Shares | | | 1,127,349 | | | | 5,461,257 | |
China Construction Bank Corp. H Shares | | | 5,874,000 | | | | 5,374,953 | |
Bilibili, Inc. ADRb | | | 347,000 | | | | 4,854,530 | |
Silergy Corp. | | | 178,000 | | | | 4,325,281 | |
BeiGene, Ltd. ADRb | | | 21,400 | | | | 3,289,822 | |
Shenzhen Inovance Technology Co., Ltd. A Shares | | | 599,722 | | | | 2,960,289 | |
Hangzhou Hikvision Digital Technology Co., Ltd. A Shares | | | 494,938 | | | | 2,762,609 | |
SUNeVision Holdings, Ltd. | | | 4,385,000 | | | | 2,590,702 | |
NBTM New Materials Group Co., Ltd. A Shares | | | 1,728,316 | | | | 2,542,052 | |
Wise Talent Information Technology Co., Ltd.b | | | 248,800 | | | | 1,030,641 | |
| | | | | | | | |
Total China/Hong Kong | | | | | | | 165,164,760 | |
| | | | | | | | |
| | | | | | | | |
| SOUTH KOREA: 14.2% | | | | | |
Orion Corp. | | | 77,013 | | | | 10,282,356 | |
LG Household & Health Care, Ltd. | | | 6,751 | | | | 8,459,493 | |
NAVER Corp. | | | 11,485 | | | | 7,859,240 | |
Hana Tour Service, Inc. | | | 97,399 | | | | 7,630,283 | |
Hanon Systems | | | 470,842 | | | | 4,478,773 | |
Cafe24 Corp.b | | | 19,194 | | | | 3,086,132 | |
| | | | | | | | |
Total South Korea | | | | | | | 41,796,277 | |
| | | | | | | | |
| | | | | | | | |
| INDIA: 11.2% | | | | | |
HDFC Bank, Ltd. | | | 422,241 | | | | 13,006,993 | |
Housing Development Finance Corp., Ltd. | | | 278,430 | | | | 7,758,335 | |
IndusInd Bank, Ltd. | | | 223,421 | | | | 6,306,650 | |
Britannia Industries, Ltd. | | | 34,455 | | | | 3,124,261 | |
Info Edge India, Ltd. | | | 172,029 | | | | 2,975,277 | |
| | | | | | | | |
Total India | | | | | | | 33,171,516 | |
| | | | | | | | |
| | | | | | | | |
| TAIWAN: 2.5% | | | | | |
Taiwan Semiconductor Manufacturing Co., Ltd. | | | 1,052,000 | | | | 7,470,335 | |
| | | | | | | | |
Total Taiwan | | | | | | | 7,470,335 | |
| | | | | | | | |
| | | | | | | | |
| SINGAPORE: 2.4% | | | | | |
DBS Group Holdings, Ltd. | | | 358,300 | | | | 6,967,868 | |
| | | | | | | | |
Total Singapore | | | | | | | 6,967,868 | |
| | | | | | | | |
| | | | | | | | |
| | | | | | | | |
| | | Shares | | | Value | |
| VIETNAM: 2.3% | | | | | |
Mobile World Investment Corp. | | | 737,470 | | | | $3,656,325 | |
Phu Nhuan Jewelry JSC | | | 458,250 | | | | 1,733,291 | |
Domesco Medical Import Export JSC | | | 325,220 | | | | 1,281,983 | |
| | | | | | | | |
Total Vietnam | | | | | | | 6,671,599 | |
| | | | | | | | |
| | | | | | | | |
| INDONESIA: 1.8% | | | | | |
PT Bank Mandiri Persero | | | 11,322,100 | | | | 5,416,812 | |
| | | | | | | | |
Total Indonesia | | | | | | | 5,416,812 | |
| | | | | | | | |
| | | | | | | | |
| BANGLADESH: 1.8% | | | | | |
BRAC Bank, Ltd.b | | | 6,201,632 | | | | 5,275,778 | |
| | | | | | | | |
Total Bangladesh | | | | | | | 5,275,778 | |
| | | | | | | | |
| | | | | | | | |
| THAILAND: 1.7% | | | | | |
Kasikornbank Public Co., Ltd. | | | 871,000 | | | | 5,095,626 | |
| | | | | | | | |
Total Thailand | | | | | | | 5,095,626 | |
| | | | | | | | |
| | | | | | | | |
| PHILIPPINES: 1.1% | | | | | |
Puregold Price Club, Inc. | | | 3,869,870 | | | | 3,378,473 | |
| | | | | | | | |
Total Philippines | | | | | | | 3,378,473 | |
| | | | | | | | |
| | | | | | | | |
| JAPAN: 0.5% | | | | | |
Mercari, Inc.b | | | 32,300 | | | | 1,323,041 | |
| | | | | | | | |
Total Japan | | | | | | | 1,323,041 | |
| | | | | | | | |
| | | | | | | | |
| TOTAL COMMON EQUITIES | | | | 281,732,085 | |
| | | | | | | | |
(Cost $232,834,707) | | | | | | | | |
| | | | | | | | |
PREFERRED EQUITIES: 2.1% | | | | | |
| SOUTH KOREA: 2.1% | | | | | |
Samsung Electronics Co., Ltd., Pfd. | | | 188,450 | | | | 6,363,749 | |
| | | | | | | | |
Total South Korea | | | | | | | 6,363,749 | |
| | | | | | | | |
| | | | | | | | |
| TOTAL PREFERRED EQUITIES | | | | 6,363,749 | |
| | | | | | | | |
(Cost $5,865,429) | | | | | | | | |
| | | | | | | | |
| TOTAL INVESTMENTS: 97.5% | | | | 288,095,834 | |
(Cost $238,700,136) | | | | | | | | |
| | | | | | | | |
CASH AND OTHER ASSETS,
LESS LIABILITIES: 2.5% | | | | 7,243,280 | |
| | | | | | | | |
| |
NET ASSETS: 100.0% | | | | $295,339,114 | |
| | | | | | | | |
| a | Certain securities were fair valued under the valuation policies approved by the Board of Trustees (Note 2-A). |
| b | Non-income producing security. |
| c | Security exempt from registration under Rule 144A of the Securities Act of 1933, as amended. The security may be resold in transactions exempt from registration normally to qualified institutional buyers. The security has been determined to be liquid in accordance with procedures adopted by the Funds’ Board of Trustees. At June 30, 2018, the aggregate value is $8,774,678, which is 2.97% of net assets. |
| d | The securities may be resold to qualified foreign investors and foreign institutional buyers under Regulation S of the Securities Act of 1933. |
| ADR | American Depositary Receipt |
See accompanying notes to financial statements.
| | | | |
| matthewsasia.com | 800.789.ASIA | | | 61 | |
| | | | |
| PORTFOLIO MANAGERS |
| Andrew Mattock, CFA | | |
Lead Manager | | |
| Henry Zhang, CFA | | Winnie Chwang |
Co-Manager | | Co-Manager |
| | |
| FUND FACTS | | | | |
| | | Investor | | Institutional |
Ticker | | MCHFX | | MICFX |
CUSIP | | 577130701 | | 577130818 |
Inception | | 2/19/98 | | 10/29/10 |
NAV | | $22.17 | | $22.15 |
Initial Investment | | $2,500 | | $100,000 |
Gross Expense Ratio1 | | 1.09% | | 0.93% |
Portfolio Statistics |
Total # of Positions | | 50 |
Net Assets | | $1.0 billion |
Weighted Average
Market Cap | | $151.0 billion |
Portfolio Turnover2 | | 78.74% |
Benchmark |
MSCI China Index |
OBJECTIVE
Long-term capital appreciation.
STRATEGY
Under normal market conditions, the Fund seeks to achieve its investment objective by investing at least 80% of its total net assets, which include borrowings for investment purposes, in the common and preferred stocks of companies located in China. China includes its administrative and other districts, such as Hong Kong.
Matthews China Fund
Portfolio Manager Commentary (unaudited)
For the first half of 2018, the Matthews China Fund was mostly flat, returning –0.14% (Investor Class) and –0.09% (Institutional Class), while its benchmark, the MSCI China Index, fell –1.69% over the same period. For the quarter ending June 30, the Fund returned –5.94% (Investor Class and Institutional Class), while its benchmark returned –3.44%.
Market Environment:
A global trade war, currency devaluation and rising interest rates have triggered high levels of concern for China investors. As a result, Chinese equity markets returned all the positive performance they experienced in January this year, ending the first half of 2018 in negative territory. Despite lingering global macro concerns, China is moving ahead with its micro agenda, deleveraging its financial system and placing tighter restrictions on its booming property market. This may derail short-term growth but seems to put the country in a better position economically longer term. Even in the face of this challenging environment, we see opportunities for market consolidation across many industries in China. In “old economy” and “new economy” sectors alike, a tougher operating environment enables market leaders to shine and capture profitability that might have once been eroded by intense competition. These factors may bode well for industrial profits.
Performance Contributors and Detractors:
The Fund outperformed its benchmark in the first half of 2018 thanks to both sector allocation and stock selection. During the second quarter, the information technology sector was the main cause for the Fund’s relative underperformance versus its benchmark, while the health care sector made the largest contribution to absolute performance.
Chinese telecommunications equipment producer ZTE was a major detractor to Fund performance during the quarter. The firm settled previous violations of a U.S. export ban by paying fines of US$1.4 billion. It also replaced its board of directors and senior management, reached an agreement with the U.S. Department of Commerce and said it would adopt compliance as the strategic cornerstone of its development. Although the settlement was a positive development, we believe ZTE continues to face uncertainties due to the business disruptions and its significant exposure to foreign suppliers and customers. We decided to exit this holding during the quarter. Software service provider Chinasoft International also declined as investors grew concerned about its business exposure to the telecommunications sector. We continue to hold this position because we believe the firm is a major beneficiary of the secular growth in IT outsourcing and cloud adoption.
Among the top individual contributors to Fund performance were Sino Biopharmaceutical, a leading Chinese pharmaceutical company, and China Gas Holdings, a major natural gas distributor. In addition to its diversified product portfolio and a robust pipeline, Sino Biopharmaceutical recently launched a new hepatitis drug and received approval from the China Food and Drug Administration for a major blockbuster oncology drug. China Gas Holdings delivered strong operational results because of the government’s increasingly stringent environmental control and continuous rural coal-to-gas conversion initiative.
Notable Portfolio Changes:
During the quarter, we initiated a position in Brilliance China Automotive, a joint-venture partner with BMW in China, as the stock valuation became attractive to us. Chinese auto stocks pulled back sharply after China announced some new policies toward foreign investment in the automotive sector and lowered tariffs for
(continued)
| 1 | Prospectus expense ratios. |
| 2 | The lesser of fiscal year 2017 long-term purchase costs or sales proceeds divided by the average monthly market value of long-term securities. |
| | | | | | | | | | | | | | | | | | | | | | | | | | | | | | | | |
| |
| PERFORMANCE AS OF JUNE 30, 2018 | |
| | | | | | | | | Average Annual Total Returns | | | | |
| | | 3 Months | | | YTD | | | 1 Year | | | 3 Years | | | 5 Years | | | 10 Years | | | Since
Inception | | | Inception
Date | |
| Investor Class (MCHFX) | | | -5.94% | | | | -0.14% | | | | 22.37% | | | | 9.33% | | | | 11.72% | | | | 7.10% | | | | 10.38% | | | | 2/19/98 | |
| Institutional Class (MICFX) | | | -5.94% | | | | -0.09% | | | | 22.57% | | | | 9.48% | | | | 11.88% | | | | n.a. | | | | 4.74% | | | | 10/29/10 | |
| MSCI China Index3 | | | -3.44% | | | | -1.69% | | | | 21.42% | | | | 7.26% | | | | 12.32% | | | | 6.21% | | | | 5.05% | 4 | | | | |
| Lipper China Region Funds Category Average5 | | | -4.74% | | | | -2.58% | | | | 15.90% | | | | 5.49% | | | | 10.32% | | | | 5.83% | | | | 7.93% | 4 | | | | |
Performance assumes reinvestment of all dividends and/or distributions before taxes. All performance quoted represents past performance and is no guarantee of future results. Investment return and principal value will fluctuate with market conditions so that when redeemed, shares may be worth more or less than their original cost. Current performance may be lower or higher than the return figures quoted. For the Fund’s most recent month-end performance, visit matthewsasia.com.
GROWTH OF A $10,000 INVESTMENT SINCE INCEPTION—INVESTOR CLASS
Plotted monthly. The performance data and graph do not reflect the deduction of taxes that a shareholder would pay on dividends, capital gains distributions or redemption of Fund shares. Values are in US$.
| | 3 | It is not possible to invest directly in an index. Source: Index data from Morgan Stanley Capital International and Bloomberg; total return calculations performed by BNY Mellon Investment Servicing (US) Inc. Please see page 92 for index definition. |
| | 4 | Calculated from 2/28/98. |
| | 5 | The Lipper Category Average does not reflect sales charges and is based on total return, including reinvestment of dividends and capital gains for the stated periods. |
| | | | | | | | |
| | | | |
| TOP TEN HOLDINGS6 | | | | | | | |
| | | Sector | | | | % of Net Assets | |
| Alibaba Group Holding, Ltd. | | Information Technology | | | | | 10.8% | |
| Tencent Holdings, Ltd. | | Information Technology | | | | | 9.3% | |
| China Construction Bank Corp. | | Financials | | | | | 4.0% | |
| Industrial & Commercial Bank of China, Ltd. | | Financials | | | | | 3.8% | |
| Agricultural Bank of China, Ltd. | | Financials | | | | | 3.7% | |
| AIA Group, Ltd. | | Financials | | | | | 3.4% | |
| Ping An Insurance Group Co. of China, Ltd. | | Financials | | | | | 3.3% | |
| Baidu, Inc. | | Information Technology | | | | | 3.1% | |
| China Life Insurance Co., Ltd. | | Financials | | | | | 2.7% | |
| China Petroleum & Chemical Corp. | | Energy | | | | | 2.6% | |
| % OF ASSETS IN TOP TEN | | | | | | | 46.7% | |
| | 6 | Holdings may combine more than one security from same issuer and related depositary receipts. |
| | | | |
| matthewsasia.com | 800.789.ASIA | | | 63 | |
| | | | |
| |
| COUNTRY ALLOCATION (%)7 | |
| China/Hong Kong | | | 98.4 | |
| Cash and Other Assets, Less Liabilities | | | 1.5 | |
| | | | |
| |
| SECTOR ALLOCATION (%)7 | |
| Information Technology | | | 30.8 | |
| Financials | | | 24.9 | |
| Consumer Discretionary | | | 10.8 | |
| Industrials | | | 5.7 | |
| Energy | | | 5.2 | |
| Materials | | | 5.1 | |
| Consumer Staples | | | 4.9 | |
| Real Estate | | | 4.2 | |
| Health Care | | | 3.2 | |
| Utilities | | | 2.8 | |
| Telecommunication Services | | | 1.1 | |
| Cash and Other Assets, Less Liabilities | | | 1.5 | |
| | | | |
| |
| MARKET CAP EXPOSURE (%)7 | |
| Mega Cap (over $25B) | | | 58.7 | |
| Large Cap ($10B–$25B) | | | 4.5 | |
| Mid Cap ($3B–10B) | | | 31.8 | |
| Small Cap (under $3B) | | | 3.5 | |
| Liabilities in Excess of Cash and Other Assets | | | 1.5 | |
| 7 | Source: FactSet Research Systems. Percentage values in data are rounded to the nearest tenth of one percent, so the values may not sum to 100% due to rounding. Percentage values may be derived from different data sources and may not be consistent with other Fund literature. |
Matthews China Fund
Portfolio Manager Commentary (unaudited) (continued)
imported cars and car components. We believe Brilliance China’s partnership with BMW continues to be strategic and mutually beneficial for both parties. Brilliance China should benefit from new model launches and achieve above-industry-average growth in the luxury car market. We also initiated a position in China Jushi, the largest global glass fiber producer. The company should benefit from its growing economies of scale, improving average selling prices and lowering unit costs.
Outlook:
At the end of the quarter, Chinese companies that generated more than 15% of their revenues from the U.S. accounted for less than 3% of the portfolio’s total exposure. This means that while trade tariffs imposed on China have dominated headlines and worried investors, our portfolio holdings rely more on the health of China’s domestic consumption and services-led economy. By most metrics, such as income growth and corporate profitability, these areas continue to trend positively. Amid current market uncertainty, we continue to focus on the corporate earnings growth story in China. The MSCI China Index—China’s broad equity market index—is expected to see high single digit earnings per share (EPS) growth this year and EPS growth in the mid-teens next year. Valuations for the index are also attractive at 11x price-to-earnings (P/E) this year, and 9x P/E next year. We remain cautiously optimistic about China’s growth outlook but remain mindful of the potential negative impacts should trade relations continue to deteriorate.
Matthews China Fund
June 30, 2018
Schedule of Investmentsa (unaudited)
COMMON EQUITIES: 98.5%
| | | | | | | | |
| | | Shares | | | Value | |
| INFORMATION TECHNOLOGY: 30.8% | | | | | |
Internet Software & Services: 25.8% | | | | | |
Alibaba Group Holding, Ltd. ADRb | | | 607,500 | | | | $112,709,475 | |
Tencent Holdings, Ltd. | | | 1,920,400 | | | | 96,433,659 | |
Baidu, Inc. ADRb | | | 133,400 | | | | 32,416,200 | |
SINA Corp.b | | | 124,800 | | | | 10,569,312 | |
YY, Inc. ADRb | | | 84,900 | | | | 8,529,903 | |
Baozun, Inc. ADRb | | | 149,241 | | | | 8,163,483 | |
| | | | | | | | |
| | | | | | | 268,822,032 | |
| | | | | | | | |
| | | | | | | | |
IT Services: 2.4% | | | | | |
Chinasoft International, Ltd. | | | 31,722,000 | | | | 24,665,161 | |
| | | | | | | | |
| | | | | | | | |
Electronic Equipment, Instruments & Components: 1.5% | |
AVIC Jonhon OptronicTechnology Co., Ltd. A Shares | | | 1,961,652 | | | | 11,510,617 | |
Zhejiang Dahua Technology Co., Ltd. A Shares | | | 1,345,386 | | | | 4,559,022 | |
| | | | | | | | |
| | | | | | | 16,069,639 | |
| | | | | | | | |
| | | | | | | | |
Semiconductors & Semiconductor Equipment: 1.1% | | | | | |
ASM Pacific Technology, Ltd. | | | 882,800 | | | | 11,126,395 | |
| | | | | | | | |
Total Information Technology | | | | | | | 320,683,227 | |
| | | | | | | | |
| | | | | | | | |
| FINANCIALS: 24.9% | | | | | |
Banks: 11.6% | | | | | |
China Construction Bank Corp. H Shares | | | 45,608,660 | | | | 41,733,813 | |
Industrial & Commercial Bank of China, Ltd. H Shares | | | 53,127,000 | | | | 39,624,253 | |
Agricultural Bank of China, Ltd. H Shares | | | 83,394,000 | | | | 38,922,409 | |
| | | | | | | | |
| | | | | | | 120,280,475 | |
| | | | | | | | |
| | | | | | | | |
Insurance: 9.4% | | | | | |
AIA Group, Ltd. | | | 4,076,600 | | | | 35,512,940 | |
Ping An Insurance Group Co. of China, Ltd. H Shares | | | 3,745,500 | | | | 34,300,068 | |
China Life Insurance Co., Ltd. H Shares | | | 10,993,000 | | | | 28,202,453 | |
| | | | | | | | |
| | | | | | | 98,015,461 | |
| | | | | | | | |
| | | | | | | | |
Capital Markets: 3.9% | | | | | |
Hong Kong Exchanges & Clearing, Ltd. | | | 485,600 | | | | 14,532,817 | |
CITIC Securities Co., Ltd. H Shares | | | 7,072,000 | | | | 14,060,213 | |
China International Capital Corp., Ltd. H Sharesc,d | | | 6,789,600 | | | | 12,036,601 | |
| | | | | | | | |
| | | | | | | 40,629,631 | |
| | | | | | | | |
Total Financials | | | | | | | 258,925,567 | |
| | | | | | | | |
| | | | | | | | |
| CONSUMER DISCRETIONARY: 10.8% | | | | | |
Hotels, Restaurants & Leisure: 2.6% | | | | | |
SJM Holdings, Ltd. | | | 11,848,000 | | | | 14,694,261 | |
Shangri-La Asia, Ltd. | | | 6,344,000 | | | | 11,884,979 | |
| | | | | | | | |
| | | | | | | 26,579,240 | |
| | | | | | | | |
| | | | | | | | |
Household Durables: 2.5% | | | | | |
Midea Group Co., Ltd. A Shares | | | 1,688,088 | | | | 13,243,154 | |
Gree Electric Appliances, Inc. of Zhuhai A Shares | | | 1,857,000 | | | | 13,170,499 | |
| | | | | | | | |
| | | | | | | 26,413,653 | |
| | | | | | | | |
| | | | | | | | |
Specialty Retail: 2.3% | | | | | |
Zhongsheng Group Holdings, Ltd. | | | 8,111,500 | | | | 24,285,919 | |
| | | | | | | | |
| | | | | | | | |
| | | | | | | | |
| | | Shares | | | Value | |
Automobiles: 2.1% | | | | | |
Brilliance China Automotive Holdings, Ltd. | | | 11,842,000 | | | | $21,247,018 | |
| | | | | | | | |
| | | | | | | | |
Internet & Direct Marketing Retail: 1.3% | | | | | |
JD.com, Inc. ADRb | | | 348,679 | | | | 13,581,047 | |
| | | | | | | | |
Total Consumer Discretionary | | | | | | | 112,106,877 | |
| | | | | | | | |
| | | | | | | | |
| INDUSTRIALS: 5.6% | | | | | |
Commercial Services & Supplies: 2.1% | | | | | |
China Everbright International, Ltd. | | | 16,886,000 | | | | 21,747,143 | |
| | | | | | | | |
| | | | | | | | |
Machinery: 1.0% | | | | | |
Han’s Laser Technology Industry Group Co., Ltd. A Shares | | | 1,356,596 | | | | 10,841,479 | |
| | | | | | | | |
| | | | | | | | |
Professional Services: 1.0% | | | | | |
51job, Inc. ADRb | | | 107,100 | | | | 10,457,244 | |
| | | | | | | | |
| | | | | | | | |
Building Products: 0.8% | | | | | |
Beijing New Building Materials PLC A Shares | | | 2,886,000 | | | | 8,034,198 | |
| | | | | | | | |
| | | | | | | | |
Transportation Infrastructure: 0.7% | | | | | |
Guangzhou Baiyun International Airport Co., Ltd. A Shares | | | 3,973,322 | | | | 7,819,729 | |
| | | | | | | | |
Total Industrials | | | | | | | 58,899,793 | |
| | | | | | | | |
| | | | | | | | |
| ENERGY: 5.2% | | | | | |
Oil, Gas & Consumable Fuels: 5.2% | | | | | |
China Petroleum & Chemical Corp. H Shares | | | 29,714,000 | | | | 26,597,518 | |
Yanzhou Coal Mining Co., Ltd. H Shares | | | 13,348,000 | | | | 17,381,750 | |
China Shenhua Energy Co., Ltd. H Shares | | | 4,129,000 | | | | 9,766,104 | |
| | | | | | | | |
Total Energy | | | | | | | 53,745,372 | |
| | | | | | | | |
| | | | | | | | |
| MATERIALS: 5.1% | | | | | |
Construction Materials: 3.5% | | | | | |
China National Building Material Co., Ltd. H Shares | | | 26,841,300 | | | | 26,418,745 | |
China Jushi Co., Ltd. A Shares | | | 6,705,477 | | | | 10,301,979 | |
| | | | | | | | |
| | | | | | | 36,720,724 | |
| | | | | | | | |
| | | | | | | | |
Metals & Mining: 1.6% | | | | | |
MMG, Ltd.b | | | 22,976,000 | | | | 15,995,424 | |
| | | | | | | | |
Total Materials | | | | | | | 52,716,148 | |
| | | | | | | | |
| | | | | | | | |
| CONSUMER STAPLES: 4.9% | | | | | |
Food Products: 3.3% | | | | | |
Inner Mongolia Yili Industrial Group Co., Ltd. A Shares | | | 4,310,997 | | | | 18,069,876 | |
Angel Yeast Co., Ltd. A Shares | | | 3,001,487 | | | | 16,090,741 | |
| | | | | | | | |
| | | | | | | 34,160,617 | |
| | | | | | | | |
| | | | | | | | |
Beverages: 1.6% | | | | | |
Wuliangye Yibin Co., Ltd. A Sharesb | | | 1,465,596 | | | | 16,719,346 | |
| | | | | | | | |
Total Consumer Staples | | | | | | | 50,879,963 | |
| | | | | | | | |
| | | | | | | | |
| REAL ESTATE: 4.2% | | | | | |
Real Estate Management & Development: 4.2% | | | | | |
China Resources Land, Ltd. | | | 5,402,000 | | | | 18,145,620 | |
Times China Holdings, Ltd. | | | 7,780,000 | | | | 11,484,287 | |
KWG Property Holding, Ltd. | | | 7,357,000 | | | | 9,189,279 | |
CIFI Holdings Group Co., Ltd. | | | 8,000,000 | | | | 5,067,619 | |
| | | | | | | | |
Total Real Estate | | | | | | | 43,886,805 | |
| | | | | | | | |
| | | | |
| matthewsasia.com | 800.789.ASIA | | | 65 | |
Matthews China Fund
June 30, 2018
Schedule of Investmentsa (unaudited) (continued)
COMMON EQUITIES (continued)
| | | | | | | | |
| | | Shares | | | Value | |
| HEALTH CARE: 3.1% | | | | | |
Pharmaceuticals: 2.1% | | | | | |
Sino Biopharmaceutical, Ltd. | | | 14,489,000 | | | | $22,127,702 | |
| | | | | | | | |
| | | | | | | | |
Health Care Technology: 1.0% | | | | | |
Ping An Healthcare and Technology Co., Ltd.b,c,d | | | 1,690,800 | | | | 10,775,466 | |
| | | | | | | | |
Total Health Care | | | | | | | 32,903,168 | |
| | | | | | | | |
| | | | | | | | |
| UTILITIES: 2.8% | | | | | | | | |
Water Utilities: 1.2% | | | | | |
Beijing Enterprises Water Group, Ltd. | | | 23,426,000 | | | | 12,738,219 | |
| | | | | | | | |
| | | | | | | | |
Independent Power and Renewable Electricity Producers: 1.0% | |
China Longyuan Power Group Corp., Ltd. H Shares | | | 12,470,000 | | | | 10,017,295 | |
| | | | | | | | |
| | | | | | | | |
Gas Utilities: 0.6% | | | | | |
China Gas Holdings, Ltd. | | | 1,618,800 | | | | 6,490,087 | |
| | | | | | | | |
Total Utilities | | | | | | | 29,245,601 | |
| | | | | | | | |
| | | | | | | | |
| TELECOMMUNICATION SERVICES: 1.1% | | | | | |
Wireless Telecommunication Services: 1.1% | | | | | |
China Mobile, Ltd. | | | 1,270,500 | | | | 11,273,079 | |
| | | | | | | | |
Total Telecommunication Services | | | | | | | 11,273,079 | |
| | | | | | | | |
| | | | | | | | |
| TOTAL INVESTMENTS: 98.5% | | | | 1,025,265,600 | |
(Cost $958,185,330) | | | | | | | | |
| | | | | | | | |
CASH AND OTHER ASSETS,
LESS LIABILITIES: 1.5% | | | | | | | 16,033,922 | |
| | | | | | | | |
| |
NET ASSETS: 100.0% | | | | $1,041,299,522 | |
| | | | | | | | |
| a | Certain securities were fair valued under the valuation policies approved by the Board of Trustees (Note 2-A). |
| b | Non-income producing security. |
| c | Security exempt from registration under Rule 144A of the Securities Act of 1933, as amended. The security may be resold in transactions exempt from registration normally to qualified institutional buyers. The security has been determined to be liquid in accordance with procedures adopted by the Funds’ Board of Trustees. At June 30, 2018, the aggregate value is $22,812,067, which is 2.19% of net assets. |
| d | The securities may be resold to qualified foreign investors and foreign institutional buyers under Regulation S of the Securities Act of 1933. |
| ADR | American Depositary Receipt |
See accompanying notes to financial statements.
| | | | |
| PORTFOLIO MANAGERS |
| Sunil Asnani | | |
Lead Manager | | |
| Sharat Shroff, CFA | | Peeyush Mittal |
Co-Manager | | Co-Manager |
|
| FUND FACTS |
| | | Investor | | Institutional |
Ticker | | MINDX | | MIDNX |
CUSIP | | 577130859 | | 577130768 |
Inception | | 10/31/05 | | 10/29/10 |
NAV | | $32.62 | | $32.84 |
Initial Investment | | $2,500 | | $100,000 |
Gross Expense Ratio1 | | 1.09% | | 0.89% |
Portfolio Statistics | | | | |
Total # of Positions | | 53 |
Net Assets | | $2.1 billion |
Weighted Average Market Cap | | $20.1 billion |
Portfolio Turnover2 | | 16.81% |
Benchmark | | |
S&P Bombay Stock Exchange 100 Index |
OBJECTIVE
Long-term capital appreciation.
STRATEGY
Under normal market conditions, the Fund seeks to achieve its investment objective by investing at least 80% of its total net assets, which include borrowings for investment purposes, in publicly traded common stocks, preferred stocks and convertible securities of companies located in India.
Matthews India Fund
Portfolio Manager Commentary (unaudited)
For the first half of 2018, the Matthews India Fund returned –4.93% (Investor Class) and –4.84% (Institutional Class) while its benchmark, the S&P Bombay Stock Exchange 100 Index, returned –6.44%. For the quarter ending June 30, the Fund returned –2.37% (Investor Class) and –2.32% (Institutional Class) while its benchmark returned –0.12%.
Market Environment:
During the first half of the year, India’s equity markets were less volatile in the second quarter compared to the first quarter. We continued to see investors shun small- and mid-cap stocks, however, in favor of larger-cap stocks.
Monetary policy tightening started in the second quarter with the Reserve Bank of India (RBI) increasing repo rates by 25 basis points (0.25%) at its June policy meeting. Rising oil prices and hardening inflation trends likely forced the RBI to act. An RBI inflation survey suggested that household expectations on future price increases have risen meaningfully over the past three months.
The Indian rupee depreciated by –5.05% against the U.S. dollar in the second quarter. Rising oil prices heightened fears around fiscal slippage. Investors also were wary that the government led by Prime Minister Narendra Modi would be forced to increase fiscal spending in rural India in order to woo voters as this is the last year of his five-year term. Recent announcements around sharp increases in minimum support prices for paddy (unmilled rice) confirmed those fears. Collections of the Goods and Services Tax (GST) continue to lag expectations, which has fueled further fiscal concerns.
Investors also were jittery about the Modi-wave losing steam. Modi’s party performance in the elections for the large southern state of Karnataka was behind expectations, creating speculation that Modi may not get a majority coalition in the next general elections in 2019.
Performance Contributors and Detractors:
For the six-month period, the portfolio’s higher allocation to small caps hurt performance, though this was partially mitigated by stock-specific factors within our mid- to large-cap holdings. For both the second quarter and year-to-date periods, the portfolio’s lower allocation to macro- and policy-driven sectors such as energy, utilities, telecom and metals also helped performance, though this was offset by relative underperformance by our consumer staples stocks and some small-cap health care stocks.
Our small-cap health care stocks held up well relative to peers in the benchmark in the first quarter of 2018, but the market was less discerning in the second quarter when it came to small-cap stocks. Given the relatively high valuations among small caps, we have been trimming our exposure to relatively expensive small caps over the years, except in the health care and information technology sectors, where we felt valuations still provided some upside.
Similar undercurrents within our consumer staples holdings hurt our portfolio performance in the second quarter, though stock-specific factors also were responsible for our relative underperformance. After the implementation of demonetization and GST in India, many domestic consumer companies’ underinvestments in their distribution systems—be it usage of technology and data analytics, or expanding direct retail reach—have come to light. One such holding has been Emami, whose excessive reliance on wholesalers to distribute its products did not augur well for its performance. The company seems to have learned its lesson and has tried to correct its mistakes. In the medium term, we expect that its performance could revert to normal.
(continued)
| 1 | Prospectus expense ratios. |
| 2 | The lesser of fiscal year 2017 long-term purchase costs or sales proceeds divided by the average monthly market value of long-term securities. |
| | | | |
| matthewsasia.com | 800.789.ASIA | | | 67 | |
| | | | | | | | | | | | | | | | | | | | | | | | | | | | | | | | |
| | | |
| PERFORMANCE AS OF JUNE 30, 2018 | | | | | | | |
| | | | | | | | | Average Annual Total Returns | | | | |
| | | 3 Months | | | YTD | | | 1 Year | | | 3 Years | | | 5 Years | | | 10 Years | | | Since
Inception | | | Inception
Date | |
| Investor Class (MINDX) | | | -2.37% | | | | -4.93% | | | | 5.66% | | | | 6.52% | | | | 17.06% | | | | 10.05% | | | | 11.87% | | | | 10/31/05 | |
| Institutional Class (MIDNX) | | | -2.32% | | | | -4.84% | | | | 5.84% | | | | 6.74% | | | | 17.28% | | | | n.a. | | | | 6.71% | | | | 10/29/10 | |
| S&P Bombay Stock Exchange 100 Index3 | | | -0.12% | | | | -6.44% | | | | 6.58% | | | | 7.90% | | | | 12.08% | | | | 6.92% | | | | 10.56% | 4 | | | | |
| Lipper India Region Funds Category Average5 | | | -3.55% | | | | -10.23% | | | | 2.42% | | | | 6.27% | | | | 12.59% | | | | 6.40% | | | | 8.91% | 4 | | | | |
Performance assumes reinvestment of all dividends and/or distributions before taxes. All performance quoted represents past performance and is no guarantee of future results. Investment return and principal value will fluctuate with market conditions so that when redeemed, shares may be worth more or less than their original cost. Current performance may be lower or higher than the return figures quoted. For the Fund’s most recent month-end performance, visit matthewsasia.com.
GROWTH OF A $10,000 INVESTMENT SINCE INCEPTION—INVESTOR CLASS
Plotted monthly. The performance data and graph do not reflect the deduction of taxes that a shareholder would pay on dividends, capital gains distributions or redemption of Fund shares. Values are in US$.
| | 3 | It is not possible to invest directly in an index. Source: Index data from S&P BSE 100 Index and Bloomberg; total return calculations performed by BNY Mellon Investment Servicing (US) Inc. Please see page 92 for index definition. |
| | 4 | Calculated from 10/31/05. |
| | 5 | The Lipper Category Average does not reflect sales charges and is based on total return, including reinvestment of dividends and capital gains for the stated periods. |
| | | | | | | | |
| | | | |
| TOP TEN HOLDINGS6 | | | | | | | |
| | | Sector | | | | % of Net Assets | |
| HDFC Bank, Ltd. | | Financials | | | | | 6.4% | |
| Suzuki Motor Corp. | | Consumer Discretionary | | | | | 6.4% | |
| Kotak Mahindra Bank, Ltd. | | Financials | | | | | 6.0% | |
| IndusInd Bank, Ltd. | | Financials | | | | | 5.9% | |
| Eicher Motors, Ltd. | | Industrials | | | | | 5.3% | |
| ITC, Ltd. | | Consumer Staples | | | | | 5.1% | |
| Housing Development Finance Corp., Ltd. | | Financials | | | | | 3.3% | |
| Dabur India, Ltd. | | Consumer Staples | | | | | 3.1% | |
| Shriram City Union Finance, Ltd. | | Financials | | | | | 2.6% | |
| Mphasis, Ltd. | | Information Technology | | | | | 2.5% | |
| % OF ASSETS IN TOP TEN | | | | | | | 46.6% | |
| | 6 | Holdings may combine more than one security from same issuer and related depositary receipts. |
Matthews India Fund
Portfolio Manager Commentary (unaudited) (continued)
Notable Portfolio Changes:
During the second quarter, we exited Bharat Financial Inclusion, a microfinance lender recently acquired by another of our holdings, IndusInd Bank. We also exited a couple of relatively smaller positions across the financials and technology sectors, where our conviction levels diminished over the years. We also added Natco Pharma, a pharmaceuticals company primarily focused on complex generic drugs for the U.S. market but that has recently turned its attention to India. The company’s share price has been generally expensive due to its performance but has corrected, in line with the shares of most health care companies. The near-term outlook on its earnings has also been a concern, given the lumpiness in its business. But we also view that as an opportunity for long-term investors like us to buy shares of a well-managed company.
Outlook:
India’s domestic economy is likely to strengthen in 2019. Disruptions related to demonetization, GST and real-estate reforms are largely over and demand for services and goods continues to recover gradually. Gross capital formation is also likely to pick up amid the government’s heightened focus on employment creation ahead of elections via infrastructure spending. Management teams have indicated that there are signs of private capital expenditure beginning to pick up.
We believe corporate earnings also should continue to recover in 2019, led by normalization in the consumer-related, pharmaceutical and financial sectors. However, consensus expectations for earnings growth seem highly optimistic. Valuations seem to be close to historical averages, though growth expectations remain high.
Oil prices can be a spoilsport. Oil constitutes a large part of India’s import basket and directly feeds into its current account balance. A sharp increase in oil prices beyond US$80 a barrel most likely would have an adverse impact on India’s currency and could lead to a sharp pick-up in inflation and cost of capital (in general). In the past, such an environment has not been kind to equity investors. Amid all this volatility and noise, we remain committed to our long-term and bottom-up investment approach.
| | | | |
| |
| COUNTRY ALLOCATION (%)7 | |
| India | | | 90.3 | |
| Japan | | | 6.4 | |
| United States | | | 2.2 | |
| Israel | | | 0.8 | |
| Cash and Other Assets, Less Liabilities | | | 0.4 | |
| | | | |
| |
| SECTOR ALLOCATION (%)7 | |
| Financials | | | 35.7 | |
| Consumer Staples | | | 18.0 | |
| Industrials | | | 12.1 | |
| Information Technology | | | 10.8 | |
| Consumer Discretionary | | | 9.2 | |
| Health Care | | | 9.1 | |
| Materials | | | 4.7 | |
| Cash and Other Assets, Less Liabilities | | | 0.4 | |
| | | | |
| |
| MARKET CAP EXPOSURE (%)7 | |
| Mega Cap (over $25B) | | | 30.9 | |
| Large Cap ($10B–$25B) | | | 22.0 | |
| Mid Cap ($3B–10B) | | | 16.0 | |
| Small Cap (under $3B) | | | 30.7 | |
| Cash and Other Assets, Less Liabilities | | | 0.4 | |
| 7 | Source: FactSet Research Systems. Percentage values in data are rounded to the nearest tenth of one percent, so the values may not sum to 100% due to rounding. Percentage values may be derived from different data sources and may not be consistent with other Fund literature. |
| | | | |
| matthewsasia.com | 800.789.ASIA | | | 69 | |
Matthews India Fund
June 30, 2018
Schedule of Investmentsa (unaudited)
COMMON EQUITIES: 99.6%
| | | | | | | | |
| | | Shares | | | Value | |
| FINANCIALS: 35.7% | | | | | | | | |
Banks: 22.4% | | | | | | | | |
HDFC Bank, Ltd. | | | 4,345,349 | | | | $133,857,022 | |
Kotak Mahindra Bank, Ltd. | | | 6,443,654 | | | | 126,460,340 | |
IndusInd Bank, Ltd. | | | 4,431,794 | | | | 125,099,142 | |
Yes Bank, Ltd. | | | 8,888,026 | | | | 44,164,900 | |
DCB Bank, Ltd. | | | 12,604,257 | | | | 30,425,027 | |
Axis Bank, Ltd. | | | 1,457,547 | | | | 10,881,888 | |
HDFC Bank, Ltd. ADR | | | 8,422 | | | | 884,478 | |
| | | | | | | | |
| | | | | | | 471,772,797 | |
| | | | | | | | |
| | | | | | | | |
Consumer Finance: 7.9% | | | | | | | | |
Shriram City Union Finance, Ltd. | | | 1,873,192 | | | | 55,354,073 | |
Cholamandalam Investment and Finance Co., Ltd. | | | 2,316,964 | | | | 51,163,868 | |
Bajaj Finance, Ltd. | | | 1,311,582 | | | | 44,054,775 | |
Sundaram Finance, Ltd. | | | 695,531 | | | | 16,237,823 | |
| | | | | | | | |
| | | | | | | 166,810,539 | |
| | | | | | | | |
| | | | | | | | |
Thrifts & Mortgage Finance: 3.8% | | | | | | | | |
Housing Development Finance Corp., Ltd. | | | 2,458,810 | | | | 68,513,713 | |
GRUH Finance, Ltd. | | | 2,756,737 | | | | 12,250,188 | |
| | | | | | | | |
| | | | | | | 80,763,901 | |
| | | | | | | | |
| | | | | | | | |
Capital Markets: 1.6% | | | | | | | | |
CRISIL, Ltd. | | | 1,271,030 | | | | 33,418,428 | |
| | | | | | | | |
Total Financials | | | | | | | 752,765,665 | |
| | | | | | | | |
| | | | | | | | |
| CONSUMER STAPLES: 18.0% | | | | | | | | |
Personal Products: 7.9% | | | | | | | | |
Dabur India, Ltd. | | | 11,252,176 | | | | 64,307,379 | |
Bajaj Corp., Ltd. | | | 6,253,908 | | | | 36,963,529 | |
Emami, Ltd. | | | 4,500,244 | | | | 34,794,588 | |
Marico, Ltd. | | | 6,222,328 | | | | 30,128,593 | |
| | | | | | | | |
| | | | | | | 166,194,089 | |
| | | | | | | | |
| | | | | | | | |
Tobacco: 7.4% | | | | | | | | |
ITC, Ltd. | | | 27,471,965 | | | | 106,757,117 | |
VST Industries, Ltd.† | | | 1,167,175 | | | | 49,445,018 | |
| | | | | | | | |
| | | | | | | 156,202,135 | |
| | | | | | | | |
| | | | | | | | |
Food Products: 2.7% | | | | | | | | |
Zydus Wellness, Ltd.b | | | 1,533,557 | | | | 29,991,822 | |
Nestle India, Ltd. | | | 181,400 | | | | 25,966,340 | |
| | | | | | | | |
| | | | | | | 55,958,162 | |
| | | | | | | | |
Total Consumer Staples | | | | | | | 378,354,386 | |
| | | | | | | | |
| | | | | | | | |
| INDUSTRIALS: 12.1% | | | | | | | | |
Machinery: 9.1% | | | | | | | | |
Eicher Motors, Ltd. | | | 266,539 | | | | 111,145,702 | |
AIA Engineering, Ltd. | | | 2,078,145 | | | | 45,581,008 | |
Ashok Leyland, Ltd. | | | 18,445,155 | | | | 33,913,943 | |
| | | | | | | | |
| | | | | | | 190,640,653 | |
| | | | | | | | |
| | | | | | | | |
Airlines: 1.8% | | | | | | | | |
InterGlobe Aviation, Ltd.c,d | | | 2,346,137 | | | | 37,306,916 | |
| | | | | | | | |
| | | | | | | | |
Air Freight & Logistics: 1.0% | | | | | | | | |
Blue Dart Express, Ltd. | | | 396,508 | | | | 21,164,596 | |
| | | | | | | | |
| | | | | | | | |
Road & Rail: 0.2% | | | | | | | | |
Container Corp. of India, Ltd. | | | 493,937 | | | | 4,703,928 | |
| | | | | | | | |
Total Industrials | | | | | | | 253,816,093 | |
| | | | | | | | |
| | | | | | | | |
| | | | | | | | |
| | | Shares | | | Value | |
| INFORMATION TECHNOLOGY: 10.8% | | | | | | | | |
IT Services: 8.6% | | | | | | | | |
Mphasis, Ltd. | | | 3,374,039 | | | | $53,389,036 | |
eClerx Services, Ltd.† | | | 2,547,368 | | | | 48,337,344 | |
Cognizant Technology Solutions Corp. Class A | | | 573,500 | | | | 45,300,765 | |
Tata Consultancy Services, Ltd. | | | 1,293,639 | | | | 34,889,675 | |
| | | | | | | | |
| | | | | | | 181,916,820 | |
| | | | | | | | |
| | | | | | | | |
Internet Software & Services: 2.2% | | | | | | | | |
Info Edge India, Ltd. | | | 2,614,054 | | | | 45,210,599 | |
| | | | | | | | |
Total Information Technology | | | | | | | 227,127,419 | |
| | | | | | | | |
| | | | | | | | |
| CONSUMER DISCRETIONARY: 9.2% | | | | | | | | |
Automobiles: 6.3% | | | | | | | | |
Suzuki Motor Corp. | | | 2,427,000 | | | | 133,747,405 | |
| | | | | | | | |
| | | | | | | | |
Household Durables: 2.6% | | | | | | | | |
Symphony, Ltd. | | | 1,927,475 | | | | 39,905,545 | |
LA Opala RG, Ltd. | | | 2,937,800 | | | | 10,177,740 | |
Dixon Technologies India, Ltd.b,d | | | 95,000 | | | | 4,065,771 | |
| | | | | | | | |
| | | | | | | 54,149,056 | |
| | | | | | | | |
| | | | | | | | |
Textiles, Apparel & Luxury Goods: 0.3% | | | | | | | | |
Page Industries, Ltd. | | | 9,355 | | | | 3,794,854 | |
Titan Co., Ltd. | | | 218,364 | | | | 2,801,236 | |
| | | | | | | | |
| | | | | | | 6,596,090 | |
| | | | | | | | |
Total Consumer Discretionary | | | | | | | 194,492,551 | |
| | | | | | | | |
| | | | | | | | |
| HEALTH CARE: 9.1% | | | | | | | | |
Pharmaceuticals: 8.6% | | | | | | | | |
Ajanta Pharma, Ltd.b | | | 2,992,070 | | | | 42,951,260 | |
Alembic Pharmaceuticals, Ltd. | | | 4,147,557 | | | | 30,476,968 | |
Natco Pharma, Ltd. | | | 2,096,417 | | | | 24,681,024 | |
Sun Pharmaceutical Industries, Ltd. | | | 2,959,885 | | | | 24,400,895 | |
Caplin Point Laboratories, Ltd. | | | 3,697,744 | | | | 23,043,054 | |
Eris Lifesciences, Ltd.b,c,d | | | 1,950,176 | | | | 19,490,833 | |
Taro Pharmaceutical Industries, Ltd.b | | | 137,412 | | | | 15,897,194 | |
| | | | | | | | |
| | | | | | | 180,941,228 | |
| | | | | | | | |
| | | | | | | | |
Health Care Equipment & Supplies: 0.5% | | | | | | | | |
Poly Medicure, Ltd. | | | 3,594,824 | | | | 11,133,645 | |
| | | | | | | | |
Total Health Care | | | | | | | 192,074,873 | |
| | | | | | | | |
| | | | | | | | |
| MATERIALS: 4.7% | | | | | | | | |
Chemicals: 4.5% | | | | | | | | |
Pidilite Industries, Ltd. | | | 1,800,000 | | | | 27,944,930 | |
UPL, Ltd. | | | 3,050,052 | | | | 27,574,349 | |
Castrol India, Ltd. | | | 6,307,813 | | | | 15,077,730 | |
Supreme Industries, Ltd. | | | 773,420 | | | | 12,758,477 | |
Asian Paints, Ltd. | | | 568,430 | | | | 10,492,252 | |
| | | | | | | | |
| | | | | | | 93,847,738 | |
| | | | | | | | |
| | | | | | | | |
Metals & Mining: 0.2% | | | | | | | | |
NMDC, Ltd. | | | 2,713,195 | | | | 4,279,223 | |
| | | | | | | | |
Total Materials | | | | | | | 98,126,961 | |
| | | | | | | | |
| | | | | | | | |
Matthews India Fund
June 30, 2018
Schedule of Investmentsa (unaudited) (continued)
COMMON EQUITIES (continued)
| | | | | | | | |
| | | | | | Value | |
| TOTAL INVESTMENTS: 99.6% | | | | | | | $2,096,757,948 | |
(Cost $1,568,680,971) | | | | | | | | |
| | | | | | | | |
CASH AND OTHER ASSETS,
LESS LIABILITIES: 0.4% | | | | | | | 9,020,308 | |
| | | | | | | | |
| | |
NET ASSETS: 100.0% | | | | | | | $2,105,778,256 | |
| | | | | | | | |
| a | Certain securities were fair valued under the valuation policies approved by the Board of Trustees (Note 2-A). |
| b | Non-income producing security. |
| c | Security exempt from registration under Rule 144A of the Securities Act of 1933, as amended. The security may be resold in transactions exempt from registration normally to qualified institutional buyers. The security has been determined to be liquid in accordance with procedures adopted by the Funds’ Board of Trustees. At June 30, 2018, the aggregate value is $56,797,749, which is 2.70% of net assets. |
| d | The securities may be resold to qualified foreign investors and foreign institutional buyers under Regulation S of the Securities Act of 1933. |
| † | Affiliated Issuer, as defined under the Investment Company Act of 1940 (ownership of 5% or more of the outstanding voting securities of this issuer) |
| ADR | American Depositary Receipt |
See accompanying notes to financial statements.
| | | | |
| matthewsasia.com | 800.789.ASIA | | | 71 | |
| | | | |
PORTFOLIO MANAGERS |
| Kenichi Amaki | | | | |
Lead Manager | | | | |
| Taizo Ishida | | | | |
Co-Manager | | | | |
|
| FUND FACTS |
| | | Investor | | Institutional |
Ticker | | MJFOX | | MIJFX |
CUSIP | | 577130800 | | 577130792 |
Inception | | 12/31/98 | | 10/29/10 |
NAV | | $24.14 | | $24.19 |
Initial Investment | | $2,500 | | $100,000 |
Gross Expense Ratio1 | | 0.95% | | 0.87% |
After Fee Waiver and Reimbursement2 | | 0.94% | | 0.86% |
Portfolio Statistics | | | | |
Total # of Positions | | 60 |
Net Assets | | $4.7 billion |
Weighted Average Market Cap | | $19.8 billion |
Portfolio Turnover3 | | 44.34% |
Benchmark |
MSCI Japan Index |
OBJECTIVE
Long-term capital appreciation.
STRATEGY
Under normal market conditions, the Fund seeks to achieve its investment objective by investing at least 80% of its total net assets, which include borrowings for investment purposes, in the common and preferred stocks of companies located in Japan.
Matthews Japan Fund*
Portfolio Manager Commentary (unaudited)
For the first half of 2018, the Matthews Japan Fund returned 0.08% (Investor Class) and 0.13% (Institutional Class), while its benchmark, the MSCI Japan Index, returned –1.85%. For the quarter ending June 30, the Fund returned –4.89% (Investor Class) and –4.91% (Institutional Class), underperforming its benchmark, which returned –2.80%.
Market Environment:
Following a somewhat euphoric rise in January and quick correction in February, Japan’s equity markets traded in a tight range before retreating toward the end of the second quarter. Tariff measures by the Trump administration signaled an escalation in trade war rhetoric and heightened uncertainty, resulting in a compression of valuations across global markets, including Japan. Foreign investors remained net sellers of Japanese equities, likely related to fund flows out of non-U.S. equities.
Japan’s first-quarter GDP figures, meanwhile, showed the economy shrank for the first time in two years on a quarter-on-quarter basis due to weak private residential investment, inventory drawdown and a slight decline in consumer spending. We expected this contraction and believe it is reasonable after the longest spate of growth in almost three decades.
Performance Contributors and Detractors:
For the year-to-date period, the Fund’s information technology and health care holdings did well, while our lack of exposure to utilities and telecommunication services posed a drag on performance. However, during the second quarter, the Fund’s underperformance versus its benchmark was largely due to stock selection, particularly in the industrials and health care sectors. Within industrials, shares of human resource solutions provider Persol Holdings corrected after the company announced weaker-than-expected guidance for the March 2019 fiscal year. Shares of automation-related companies such as CKD and Harmonic Drive also weakened as concerns have emerged about a cyclical peak in orders. In health care, shares of biopharmaceutical company PeptiDream declined after particularly strong performance in the previous quarter despite positive business developments for the company.
On the other hand, our positioning in the materials and financials sectors contributed positively to performance. Our lack of exposure to large-cap chemical and steel companies helped as tariff actions and rising oil prices compressed valuations in the materials sector. In financials, our core holding Tokio Marine, Japan’s leading non-life insurer, outperformed on the back of an improved earnings outlook combined with higher scope for shareholder returns in the form of dividends and share buybacks.
On an individual basis, fashion e-commerce company Start Today was the top performer as it announced its long-awaited entry into private label apparel. The company aims to deliver custom-made apparel using body size measurement data collected through their proprietary app. Conversely, shares of Ferrotec, a manufacturer of silicon wafers and components for semiconductor production equipment, corrected sharply as production at its Shanghai silicon wafer fab was temporarily halted to comply with environmental regulations.
(continued)
| * | The Matthews Japan Fund closed to most new investors effective after market closing on July 29, 2016, but will continue to accept investments from existing shareholders. |
| 1 | Prospectus expense ratios. |
| 2 | Matthews has contractually agreed to waive a portion of its advisory fee and administrative and shareholder services fee if the Fund’s average daily net assets are over $3 billion, as follows: for every $2.5 billion average daily net assets of the Fund that are over $3 billion, the advisory fee rate and the administrative and shareholder services fee rate for the Fund with respect to such excess average daily net assets will be each reduced by 0.01%, in each case without reducing such fee rate below 0.00%. Any amount waived by Matthews pursuant to this agreement may not be recouped by Matthews. This agreement will remain in place until April 30, 2019 and may be terminated (i) at any time by the Board of Trustees upon 60 days’ prior written notice to Matthews; or (ii) by Matthews at the annual expiration date of the agreement upon 60 days’ prior written notice to the Trust, in each case without payment of any penalty. |
| 3 | The lesser of fiscal year 2017 long-term purchase costs or sales proceeds divided by the average monthly market value of long-term securities. |
| | | | | | | | | | | | | | | | | | | | | | | | | | | | | | | | |
| | | |
| PERFORMANCE AS OF JUNE 30, 2018 | | | | | | | |
| | | | | | | | | Average Annual Total Returns | | | | |
| | | 3 Months | | | YTD | | | 1 Year | | | 3 Years | | | 5 Years | | | 10 Years | | | Since
Inception | | | Inception
Date | |
| Investor Class (MJFOX) | | | -4.89% | | | | 0.08% | | | | 16.27% | | | | 9.74% | | | | 11.73% | | | | 7.93% | | | | 6.69% | | | | 12/31/98 | |
| Institutional Class (MIJFX) | | | -4.91% | | | | 0.13% | | | | 16.36% | | | | 9.85% | | | | 11.85% | | | | n.a. | | | | 11.87% | | | | 10/29/10 | |
| MSCI Japan Index4 | | | -2.80% | | | | -1.85% | | | | 10.88% | | | | 6.60% | | | | 7.70% | | | | 3.78% | | | | 3.75% | 5 | | | | |
| Lipper Japanese Funds Category Average6 | | | -2.50% | | | | -2.40% | | | | 10.89% | | | | 8.00% | | | | 9.88% | | | | 6.59% | | | | 5.10% | 5 | | | | |
Performance assumes reinvestment of all dividends and/or distributions before taxes. All performance quoted represents past performance and is no guarantee of future results. Investment return and principal value will fluctuate with market conditions so that when redeemed, shares may be worth more or less than their original cost. Current performance may be lower or higher than the return figures quoted. For the Fund’s most recent month-end performance, visit matthewsasia.com.
GROWTH OF A $10,000 INVESTMENT SINCE INCEPTION—INVESTOR CLASS
Plotted monthly. The performance data and graph do not reflect the deduction of taxes that a shareholder would pay on dividends, capital gains distributions or redemption of Fund shares. Values are in US$.
| | 4 | It is not possible to invest directly in an index. Source: Index data from Morgan Stanley Capital International and Bloomberg; total return calculations performed by BNY Mellon Investment Servicing (US) Inc. Please see page 92 for index definitions. |
| | 5 | Calculated from 12/31/98. |
| | 6 | The Lipper Category Average does not reflect sales charges and is based on total return, including reinvestment of dividends and capital gains for the stated periods. |
| | | | | | | | |
| | | | |
| TOP TEN HOLDINGS7 | | | | | | | |
| | | Sector | | | | % of Net Assets | |
| Keyence Corp. | | Information Technology | | | | | 2.7% | |
| Nitori Holdings Co., Ltd. | | Consumer Discretionary | | | | | 2.7% | |
| Murata Manufacturing Co., Ltd. | | Information Technology | | | | | 2.7% | |
| Suzuki Motor Corp. | | Consumer Discretionary | | | | | 2.6% | |
| Mitsubishi UFJ Financial Group, Inc. | | Financials | | | | | 2.6% | |
| Nidec Corp. | | Industrials | | | | | 2.5% | |
| Asahi Intecc Co., Ltd. | | Health Care | | | | | 2.4% | |
| Tokio Marine Holdings, Inc. | | Financials | | | | | 2.4% | |
| Start Today Co., Ltd. | | Consumer Discretionary | | | | | 2.4% | |
| Kao Corp. | | Consumer Staples | | | | | 2.4% | |
| % OF ASSETS IN TOP TEN | | | | | | | 25.4% | |
| | 7 | Holdings may combine more than one security from same issuer and related depositary receipts. |
| | | | |
| matthewsasia.com | 800.789.ASIA | | | 73 | |
| | | | |
| |
| COUNTRY ALLOCATION (%)8 | |
| Japan | | | 98.0 | |
| Cash and Other Assets, Less Liabilities | | | 2.0 | |
| | | | |
| | |
| SECTOR ALLOCATION (%)8 | | | |
| Industrials | | | 25.5 | |
| Information Technology | | | 18.8 | |
| Consumer Discretionary | | | 13.6 | |
| Consumer Staples | | | 12.0 | |
| Health Care | | | 11.1 | |
| Financials | | | 6.7 | |
| Real Estate | | | 4.3 | |
| Materials | | | 3.9 | |
| Telecommunication Services | | | 2.1 | |
| Cash and Other Assets, Less Liabilities | | | 2.0 | |
| | | | |
| | |
| MARKET CAP EXPOSURE (%)8 | | | |
| Mega Cap (over $25B) | | | 31.4 | |
| Large Cap ($10B–$25B) | | | 17.5 | |
| Mid Cap ($3B–10B) | | | 32.3 | |
| Small Cap (under $3B) | | | 16.8 | |
| Cash and Other Assets, Less Liabilities | | | 2.0 | |
| 8 | Source: FactSet Research Systems. Percentage values in data are rounded to the nearest tenth of one percent, so the values may not sum to 100% due to rounding. Percentage values may be derived from different data sources and may not be consistent with other Fund literature. |
Matthews Japan Fund
Portfolio Manager Commentary (unaudited) (continued)
Notable Portfolio Changes:
During the quarter, we initiated a position in Terumo, a leading Japanese medical equipment company. Terumo saw growth accelerate for its neurovascular and access devices, which carry higher margins relative to corporate averages. The field of neurovascular treatments is an exciting area with new devices and procedures being developed to treat brain aneurysms and strokes. Terumo’s U.S. subsidiary Microvention, acquired back in 2006, is a major player in the neurovascular market. We also initiated a position in real estate technology company Tateru. Tateru’s main business is to plan and construct apartment buildings in urban areas for individual investors. Most of the sales and servicing is conducted through its app, allowing it to be more cost-efficient than brick-and-mortar competitors. Recently, it has expanded into room share-type properties that could benefit from the influx of foreign tourists.
To fund these positions, we exited our positions in Japan Tobacco, Sumitomo Mitsui Financial Group and Dai-ichi Life Holdings. Japan Tobacco lost market share in the domestic Japanese market as reduced-risk products, also known as heat-not-burn products, from Philip Morris International gained significant market share over the past several years. Japan Tobacco has released its own reduced-risk product but we deemed that it faced a significant hurdle to regain pricing power in the market. Sumitomo Mitsui Financial Group and Dai-ichi Life Holdings are two financials that we expected to benefit from rising interest rates in the U.S. Broader concerns about growth prospects, however, kept a lid on their stock prices and we decided that the funds could be better deployed elsewhere in companies with more attractive growth prospects.
Outlook:
We remain cautious about the outlook for Japanese equities. The biggest risk is with the Trump administration’s continued actions on trade. We believe a trade war is bad for all global market participants, including U.S. consumers and Japanese businesses. The most recent Bank of Japan quarterly Tankan survey results showed a downward revision in corporate earnings forecasts compared to the previous quarter, likely reflecting a heightened level of uncertainty among corporate managers. In addition, rising fixed costs and higher fuel costs also are expected to weigh on earnings.
However, the same survey results also showed an upward revision on capital expenditures as the near-term demand environment remains robust. The recent acceleration in wage growth amid record levels of employment gives us some encouragement regarding the outlook for the domestic economy. Wage growth combined with continued strength in business spending may drive an improvement in domestic growth. While we retain a generally cautious tone, we believe valuations in Japan have compressed to levels where equities are modestly attractive and reasonably priced.
Matthews Japan Fund
June 30, 2018
Schedule of Investmentsa (unaudited)
COMMON EQUITIES: 98.0%
| | | | | | | | |
| | | Shares | | | Value | |
| INDUSTRIALS: 25.5% | | | | | | | | |
Professional Services: 8.4% | | | | | | | | |
Recruit Holdings Co., Ltd. | | | 3,647,900 | | | | $100,750,111 | |
Persol Holdings Co., Ltd. | | | 3,724,100 | | | | 82,937,180 | |
TechnoPro Holdings, Inc. | | | 1,322,500 | | | | 81,208,052 | |
Nihon M&A Center, Inc. | | | 2,427,600 | | | | 70,333,508 | |
Outsourcing, Inc. | | | 2,981,000 | | | | 55,144,210 | |
| | | | | | | | |
| | | | | | | 390,373,061 | |
| | | | | | | | |
| | | | | | | | |
Machinery: 5.2% | | | | | | | | |
MINEBEA MITSUMI, Inc. | | | 3,248,000 | | | | 54,734,538 | |
MISUMI Group, Inc. | | | 1,767,700 | | | | 51,430,905 | |
Komatsu, Ltd. | | | 1,429,300 | | | | 40,690,147 | |
CKD Corp. | | | 2,199,400 | | | | 36,067,770 | |
SMC Corp. | | | 91,800 | | | | 33,607,137 | |
Harmonic Drive Systems, Inc. | | | 657,200 | | | | 27,738,282 | |
| | | | | | | | |
| | | | | | | 244,268,779 | |
| | | | | | | | |
| | | | | | | | |
Building Products: 4.2% | | | | | | | | |
Daikin Industries, Ltd. | | | 833,100 | | | | 99,566,361 | |
Aica Kogyo Co., Ltd. | | | 1,458,000 | | | | 51,115,653 | |
Sanwa Holdings Corp. | | | 4,497,900 | | | | 47,531,608 | |
| | | | | | | | |
| | | | | | | 198,213,622 | |
| | | | | | | | |
| | | | | | | | |
Electrical Equipment: 4.0% | | | | | | | | |
Nidec Corp. | | | 777,900 | | | | 116,365,814 | |
Mabuchi Motor Co., Ltd. | | | 1,451,200 | | | | 68,878,024 | |
| | | | | | | | |
| | | | | | | 185,243,838 | |
| | | | | | | | |
| | | | | | | | |
Trading Companies & Distributors: 2.0% | | | | | | | | |
Mitsui & Co., Ltd. | | | 5,573,400 | | | | 92,809,883 | |
| | | | | | | | |
| | | | | | | | |
Construction & Engineering: 1.7% | | | | | | | | |
Kyowa Exeo Corp. | | | 3,034,400 | | | | 79,407,717 | |
| | | | | | | | |
Total Industrials | | | | | | | 1,190,316,900 | |
| | | | | | | | |
| | | | | | | | |
| INFORMATION TECHNOLOGY: 18.8% | | | | | | | | |
Electronic Equipment, Instruments & Components: 8.6% | |
Keyence Corp. | | | 226,100 | | | | 127,523,690 | |
Murata Manufacturing Co., Ltd. | | | 749,500 | | | | 125,823,374 | |
Shimadzu Corp. | | | 2,993,700 | | | | 90,322,856 | |
Hitachi, Ltd. | | | 8,082,000 | | | | 56,937,558 | |
| | | | | | | | |
| | | | | | | 400,607,478 | |
| | | | | | | | |
| | | | | | | | |
Semiconductors & Semiconductor Equipment: 3.5% | |
Rohm Co., Ltd. | | | 787,900 | | | | 65,840,470 | |
Lasertec Corp. | | | 2,123,300 | | | | 59,494,025 | |
Ferrotec Holdings Corp.† | | | 2,533,500 | | | | 38,934,436 | |
| | | | | | | | |
| | | | | | | 164,268,931 | |
| | | | | | | | |
| | | | | | | | |
IT Services: 3.3% | | | | | | | | |
Otsuka Corp. | | | 2,073,200 | | | | 81,160,292 | |
ITOCHU Techno-Solutions Corp. | | | 4,071,100 | | | | 70,225,337 | |
| | | | | | | | |
| | | | | | | 151,385,629 | |
| | | | | | | | |
| | | | | | | | |
Internet Software & Services: 1.9% | | | | | | | | |
Infomart Corp. | | | 5,808,700 | | | | 77,015,348 | |
Mercari, Inc.b | | | 327,200 | | | | 13,402,448 | |
| | | | | | | | |
| | | | | | | 90,417,796 | |
| | | | | | | | |
| | | | | | | | |
| | | | | | | | |
| | | Shares | | | Value | |
Software: 1.5% | | | | | | | | |
Square Enix Holdings Co., Ltd. | | | 1,462,100 | | | | $71,689,849 | |
| | | | | | | | |
Total Information Technology | | | | | | | 878,369,683 | |
| | | | | | | | |
| | | | | | | | |
| CONSUMER DISCRETIONARY: 13.6% | | | | | | | | |
Auto Components: 3.0% | | | | | | | | |
Nifco, Inc. | | | 2,348,400 | | | | 72,574,250 | |
Denso Corp. | | | 1,337,800 | | | | 65,276,925 | |
| | | | | | | | |
| | | | | | | 137,851,175 | |
| | | | | | | | |
| | | | | | | | |
Multiline Retail: 2.9% | | | | | | | | |
Ryohin Keikaku Co., Ltd. | | | 211,600 | | | | 74,340,040 | |
Seria Co., Ltd. | | | 1,236,000 | | | | 59,234,647 | |
| | | | | | | | |
| | | | | | | 133,574,687 | |
| | | | | | | | |
| | | | | | | | |
Specialty Retail: 2.7% | | | | | | | | |
Nitori Holdings Co., Ltd. | | | 812,100 | | | | 126,345,070 | |
| | | | | | | | |
| | | | | | | | |
Automobiles: 2.6% | | | | | | | | |
Suzuki Motor Corp. | | | 2,243,300 | | | | 123,624,044 | |
| | | | | | | | |
| | | | | | | | |
Internet & Direct Marketing Retail: 2.4% | | | | | |
Start Today Co., Ltd. | | | 3,081,100 | | | | 111,475,987 | |
| | | | | | | | |
Total Consumer Discretionary | | | | | | | 632,870,963 | |
| | | | | | | | |
| | | | | | | | |
| CONSUMER STAPLES: 12.0% | | | | | | | | |
Personal Products: 4.7% | | | | | | | | |
Kao Corp. | | | 1,458,900 | | | | 111,199,662 | |
Kose Corp. | | | 504,500 | | | | 108,515,152 | |
| | | | | | | | |
| | | | | | | 219,714,814 | |
| | | | | | | | |
| | | | | | | | |
Food & Staples Retailing: 2.9% | | | | | | | | |
Tsuruha Holdings, Inc. | | | 569,300 | | | | 71,306,968 | |
San-A Co., Ltd. | | | 1,314,900 | | | | 64,944,810 | |
| | | | | | | | |
| | | | | | | 136,251,778 | |
| | | | | | | | |
| | | | | | | | |
Food Products: 1.7% | | | | | | | | |
Ariake Japan Co., Ltd. | | | 937,200 | | | | 80,671,190 | |
| | | | | | | | |
| | | | | | | | |
Household Products: 1.6% | | | | | | | | |
Pigeon Corp. | | | 1,512,700 | | | | 73,512,899 | |
| | | | | | | | |
| | | | | | | | |
Beverages: 1.1% | | | | | | | | |
Coca-Cola Bottlers Japan Holdings, Inc. | | | 1,277,100 | | | | 51,096,125 | |
| | | | | | | | |
Total Consumer Staples | | | | | | | 561,246,806 | |
| | | | | | | | |
| | | | | | | | |
| HEALTH CARE: 11.1% | | | | | | | | |
Health Care Equipment & Supplies: 6.6% | | | | | |
Asahi Intecc Co., Ltd. | | | 3,025,400 | | | | 114,227,256 | |
Sysmex Corp. | | | 1,181,300 | | | | 110,067,246 | |
Terumo Corp. | | | 1,502,200 | | | | 85,997,801 | |
| | | | | | | | |
| | | | | | | 310,292,303 | |
| | | | | | | | |
| | | | | | | | |
Health Care Technology: 2.1% | | | | | | | | |
M3, Inc. | | | 2,496,300 | | | | 99,273,481 | |
| | | | | | | | |
| | | | | | | | |
Biotechnology: 1.2% | | | | | | | | |
PeptiDream, Inc.b | | | 1,336,900 | | | | 55,544,133 | |
| | | | | | | | |
| | | | | | | | |
Health Care Providers & Services: 1.2% | | | | | | | | |
Japan Lifeline Co., Ltd. | | | 2,203,500 | | | | 54,021,324 | |
| | | | | | | | |
Total Health Care | | | | | | | 519,131,241 | |
| | | | | | | | |
| | | | | | | | |
| | | | |
| matthewsasia.com | 800.789.ASIA | | | 75 | |
Matthews Japan Fund
June 30, 2018
Schedule of Investmentsa (unaudited) (continued)
COMMON EQUITIES (continued)
| | | | | | | | |
| | | Shares | | | Value | |
| FINANCIALS: 6.7% | | | | | | | | |
Banks: 2.6% | | | | | | | | |
Mitsubishi UFJ Financial Group, Inc. | | | 21,514,600 | | | | $121,877,723 | |
| | | | | | | | |
| | | | | | | | |
Insurance: 2.4% | | | | | | | | |
Tokio Marine Holdings, Inc. | | | 2,433,100 | | | | 113,828,320 | |
| | | | | | | | |
| | | | | | | | |
Diversified Financial Services: 1.7% | | | | | | | | |
ORIX Corp. | | | 4,940,900 | | | | 77,878,979 | |
| | | | | | | | |
Total Financials | | | | | | | 313,585,022 | |
| | | | | | | | |
| | | | | | | | |
| REAL ESTATE: 4.3% | | | | | | | | |
Real Estate Management & Development: 4.3% | |
Relo Group, Inc. | | | 4,139,600 | | | | 109,062,128 | |
TATERU, Inc. | | | 2,887,800 | | | | 47,533,867 | |
KATITAS Co., Ltd. | | | 1,187,400 | | | | 42,088,509 | |
| | | | | | | | |
Total Real Estate | | | | | | | 198,684,504 | |
| | | | | | | | |
| | | | | | | | |
| MATERIALS: 3.9% | | | | | | | | |
Chemicals: 3.9% | | | | | | | | |
Shin-Etsu Chemical Co., Ltd. | | | 809,500 | | | | 71,939,010 | |
Nitto Denko Corp. | | | 812,800 | | | | 61,364,297 | |
Fuso Chemical Co., Ltd.† | | | 1,924,400 | | | | 49,542,667 | |
| | | | | | | | |
Total Materials | | | | | | | 182,845,974 | |
| | | | | | | | |
| | | | | | | | |
| | | | | | | | |
| | | Shares | | | Value | |
| TELECOMMUNICATION SERVICES: 2.1% | |
Wireless Telecommunication Services: 2.1% | |
SoftBank Group Corp. | | | 1,360,900 | | | | $97,179,353 | |
| | | | | | | | |
Total Telecommunication Services | | | | | | | 97,179,353 | |
| | | | | | | | |
| | | | | | | | |
| TOTAL INVESTMENTS: 98.0% | | | | | | | 4,574,230,446 | |
(Cost $3,745,244,411) | | | | | | | | |
| | | | | | | | |
CASH AND OTHER ASSETS,
LESS LIABILITIES: 2.0% | | | | | | | 91,365,329 | |
| | | | | | | | |
| | |
NET ASSETS: 100.0% | | | | | | | $4,665,595,775 | |
| | | | | | | | |
| a | Certain securities were fair valued under the valuation policies approved by the Board of Trustees (Note 2-A). |
| b | Non-income producing security. |
| † | Affiliated Issuer, as defined under the Investment Company Act of 1940 (ownership of 5% or more of the outstanding voting securities of this issuer) |
See accompanying notes to financial statements.
| | | | |
| PORTFOLIO MANAGERS |
| Michael J. Oh, CFA | | | | |
Lead Manager | | | | |
| Michael B. Han, CFA | | |
Co-Manager | | | | |
|
| FUND FACTS |
| | | Investor | | Institutional |
Ticker | | MAKOX | | MIKOX |
CUSIP | | 577130305 | | 577130826 |
Inception | | 1/3/95 | | 10/29/10 |
NAV | | $6.10 | | $6.14 |
Initial Investment | | $2,500 | | $100,000 |
Gross Expense Ratio1 | | 1.15% | | 1.01% |
Portfolio Statistics |
Total # of Positions | | 41 |
Net Assets | | $206.0 million |
Weighted Average
Market Cap | | $49.8 billion |
Portfolio Turnover2 | | 25.37% |
Benchmark |
Korea Composite Stock Price Index |
OBJECTIVE
Long-term capital appreciation.
STRATEGY
Under normal market conditions, the Fund seeks to achieve its investment objective by investing at least 80% of its total net assets, which include borrowings for investment purposes, in the common and preferred stocks of companies located in South Korea.
Matthews Korea Fund
Portfolio Manager Commentary (unaudited)
For the first half of 2018, the Matthews Korea Fund returned –11.72% (Investor Class) and –11.66% (Institutional Class), while its benchmark, the Korea Composite Stock Price Index, returned –9.13% over the same period. For the quarter ending June 30, the Fund returned –9.90% (Investor Class) and –9.84% (Institutional Class), while its benchmark returned –9.37%.
Market Environment:
South Korean equities underperformed other Asian equity markets during the first half of the year due to fears of increased regulatory risk and as investors contemplated how trade talks between the U.S., China and Europe could affect Korean exports. In early June, South Korea held regional elections for congress. The elections gave President Moon Jae In’s left-of-center political party, the Democratic Party of Korea, a clear majority in congress. The party is focused on increasing the minimum wage, improving corporate governance standards and regulating industries that may have monopolies. With control of both the executive and legislative branches, the party now has fairly wide latitude to pursue its legislative agenda. Investor sentiment darkened as fears of higher labor costs and forced break-ups of larger conglomerates clouded the landscape. Improved corporate governance standards will continue to benefit South Korea’s markets over the long term, but there could be some market disruptions in the short term as standards continue to be defined and implemented.
In June, U.S. President Donald Trump met with North Korean leader Kim Jong Un in a historic summit. The meeting reduced military tensions on the Korean peninsula, but had little impact on South Korea’s equity markets or currency exchange rates. The summit may have impacted South Korea’s regional elections, however, by reflecting favorably on President Moon’s party and giving him a clear congressional majority. In the meantime, South Korea’s domestic economy remains stable despite a rising unemployment rate and exports continue to support overall GDP growth.
Performance Contributors and Detractors:
The Fund underperformed its benchmark during the first half of the year. Against a backdrop of increased business regulation in South Korea, three of our bank holdings generated double-digit losses for the six-month period ending June 30. KB Financial Group, Hana Financial Group and Shinhan Financial Group all suffered from negative investor sentiment. Investors may expect mortgage lending to become subject to new regulations. Property prices have risen significantly in many housing markets and the government may try to enact stricter lending standards to help curb price appreciation and housing costs. Another security that underperformed during the first half of the year was Modetour Network. Tourism and travel outside the country was slow in the first half.
On the positive side, Kiwoom Securities generated double-digit positive returns in the first half. Kiwoom is South Korea’s top online brokerage company. The company’s innovative business model led to strong stock price gains over the first and second quarters. South Korea’s equity markets tend to be primarily driven by domestic investors, creating opportunities for Kiwoom, which has the largest market share of brokerage activities.
Notable Portfolio Changes:
During the second quarter, we exited our position in Innocean, the advertising arm of Hyundai Motor, on concerns of rising regulatory risks that the company may face. We also initiated a position in Cafe24, an innovative e-commerce platform provider. Cafe24 helps small and midsize merchandisers sell their products
(continued)
| 1 | Prospectus expense ratios. |
| 2 | The lesser of fiscal year 2017 long-term purchase costs or sales proceeds divided by the average monthly market value of long-term securities. |
| | | | |
| matthewsasia.com | 800.789.ASIA | | | 77 | |
| | | | | | | | | | | | | | | | | | | | | | | | | | | | | | | | |
| | | |
| PERFORMANCE AS OF JUNE 30, 2018 | | | | | | | |
| | | | | | | | | Average Annual Total Returns | | | | |
| | | 3 Months | | | YTD | | | 1 Year | | | 3 Years | | | 5 Years | | | 10 Years | | | Since
Inception | | | Inception
Date | |
| Investor Class (MAKOX) | | | -9.90% | | | | -11.72% | | | | 0.00% | | | | 5.74% | | | | 10.46% | | | | 7.95% | | | | 6.39% | | | | 01/03/95 | |
| Institutional Class (MIKOX) | | | -9.84% | | | | -11.66% | | | | 0.14% | | | | 5.88% | | | | 10.63% | | | | n.a. | | | | 8.77% | | | | 10/29/10 | |
| Korea Composite Stock Price Index3 | | | -9.37% | | | | -9.13% | | | | 1.61% | | | | 5.88% | | | | 6.73% | | | | 4.25% | | | | 3.59% | 4 | | | | |
| Lipper Pacific ex Japan Funds Category Average5 | | | -5.15% | | | | -4.63% | | | | 9.66% | | | | 6.37% | | | | 7.52% | | | | 5.52% | | | | 6.31% | 4 | | | | |
Performance assumes reinvestment of all dividends and/or distributions before taxes. All performance quoted represents past performance and is no guarantee of future results. Investment return and principal value will fluctuate with market conditions so that when redeemed, shares may be worth more or less than their original cost. Current performance may be lower or higher than the return figures quoted. For the Fund’s most recent month-end performance, visit matthewsasia.com.
GROWTH OF A $10,000 INVESTMENT SINCE INCEPTION—INVESTOR CLASS
Plotted monthly. The performance data and graph do not reflect the deduction of taxes that a shareholder would pay on dividends, capital gains distributions or redemption of Fund shares. Values are in US$.
| | 3 | Korea Composite Stock Price Index performance data may be readjusted periodically by the Korea Exchange due to certain factors, including the declaration of dividends. It is not possible to invest directly in an index. Source: Index data from Korea Composite Stock Price Index and Bloomberg; total return calculations performed by BNY Mellon Investment Servicing (US) Inc. Please see page 92 for index definition. |
| | 5 | The Lipper Category Average does not reflect sales charges and is based on total return, including reinvestment of dividends and capital gains for the stated periods. |
| | | | | | | | |
| | | | |
| TOP TEN HOLDINGS6 | | | | | | | |
| | | Sector | | | | % of Net Assets | |
| Samsung Electronics Co., Ltd., Pfd. | | Information Technology | | | | | 8.8% | |
| Samsung Electronics Co., Ltd. | | Information Technology | | | | | 4.4% | |
| Hyundai Motor Co., Ltd., 2nd Pfd. | | Consumer Discretionary | | | | | 4.2% | |
| POSCO | | Materials | | | | | 3.8% | |
| BGF Retail Co., Ltd. | | Consumer Staples | | | | | 3.8% | |
| Samsung Fire & Marine Insurance Co., Ltd., Pfd. | | Financials | | | | | 3.8% | |
| NAVER Corp. | | Information Technology | | | | | 3.7% | |
| LG Household & Health Care, Ltd., Pfd. | | Consumer Staples | | | | | 3.5% | |
| Hyundai Mobis Co., Ltd. | | Consumer Discretionary | | | | | 3.5% | |
| Modetour Network, Inc. | | Consumer Discretionary | | | | | 3.4% | |
| % OF ASSETS IN TOP TEN | | | | | | | 42.9% | |
| | 6 | Holdings may combine more than one security from same issuer and related depositary receipts. |
Matthews Korea Fund
Portfolio Manager Commentary (unaudited) (continued)
on major platforms such as Naver, South Korea’s top search engine. Cafe24 provides its clients with payment systems and advertising support. With existing operations in Japan and China, Cafe24 can leverage its insights and tools globally and may be well-positioned to capture continued growth in the e-commerce space.
Outlook:
We remain cautious in our outlook for South Korean equities. Rising regulatory risks domestically and escalating trade conflicts globally may continue to weigh on investor sentiment. South Korea is a net exporter, so we will keep an eye on holdings that may be impacted by trade worries. On a positive note, stock price valuations have come down quite a bit in the first half because of regulatory risk. If the regulatory environment turns out to be less restrictive than the market expects, there may be some buying opportunities. In addition, corporate governance and minority shareholder return policies are both areas where we continue to see improvement. Among our portfolio companies, awareness of corporate governance issues tends to be very high within management teams.
| | | | |
| |
| COUNTRY ALLOCATION (%)7 | |
| South Korea | | | 99.4 | |
| Cash and Other Assets, Less Liabilities | | | 0.6 | |
| | | | |
| |
| SECTOR ALLOCATION (%)7 | |
| Information Technology | | | 23.2 | |
| Financials | | | 19.1 | |
| Consumer Discretionary | | | 18.1 | |
| Consumer Staples | | | 14.7 | |
| Materials | | | 9.8 | |
| Health Care | | | 5.8 | |
| Energy | | | 3.9 | |
| Industrials | | | 2.9 | |
| Telecommunication Services | | | 1.9 | |
| Cash and Other Assets, Less Liabilities | | | 0.6 | |
| | | | |
| |
| MARKET CAP EXPOSURE (%)7 | |
| Mega Cap (over $25B) | | | 22.6 | |
| Large Cap ($10B-$25B) | | | 34.4 | |
| Mid Cap ($3B-10B) | | | 15.0 | |
| Small Cap (under $3B) | | | 27.4 | |
| Cash and Other Assets, Less Liabilities | | | 0.6 | |
| 7 | Source: FactSet Research Systems. Percentage values in data are rounded to the nearest tenth of one percent, so the values may not sum to 100% due to rounding. Percentage values may be derived from different data sources and may not be consistent with other Fund literature. |
| | | | |
| matthewsasia.com | 800.789.ASIA | | | 79 | |
Matthews Korea Fund
June 30, 2018
Schedule of Investmentsa (unaudited)
COMMON EQUITIES: 73.6%
| | | | | | | | |
| | | Shares | | | Value | |
| FINANCIALS: 15.3% | | | | | | | | |
Banks: 9.4% | | | | | | | | |
Hana Financial Group, Inc. | | | 174,901 | | | | $6,716,330 | |
KB Financial Group, Inc. | | | 141,911 | | | | 6,680,003 | |
Shinhan Financial Group Co., Ltd. | | | 157,263 | | | | 6,088,932 | |
| | | | | | | | |
| | | | | | | 19,485,265 | |
| | | | | | | | |
| | | | | | | | |
Capital Markets: 4.1% | | | | | | | | |
KIWOOM Securities Co., Ltd. | | | 55,513 | | | | 5,400,011 | |
Shinyoung Securities Co., Ltd. | | | 58,604 | | | | 2,984,965 | |
| | | | | | | | |
| | | | | | | 8,384,976 | |
| | | | | | | | |
| | | | | | | | |
Insurance: 1.8% | | | | | | | | |
DB Insurance Co., Ltd. | | | 70,346 | | | | 3,725,394 | |
| | | | | | | | |
Total Financials | | | | | | | 31,595,635 | |
| | | | | | | | |
| | | | | | | | |
| INFORMATION TECHNOLOGY: 14.5% | | | | | | | | |
Internet Software & Services: 4.7% | | | | | | | | |
NAVER Corp. | | | 11,007 | | | | 7,532,142 | |
Cafe24 Corp.b | | | 13,537 | | | | 2,176,564 | |
| | | | | | | | |
| | | | | | | 9,708,706 | |
| | | | | | | | |
| | | | | | | | |
Technology Hardware, Storage & Peripherals: 4.4% | |
Samsung Electronics Co., Ltd. | | | 216,950 | | | | 9,087,945 | |
| | | | | | | | |
| | | | | | | | |
Semiconductors & Semiconductor Equipment: 3.0% | | | | | |
Koh Young Technology, Inc. | | | 34,602 | | | | 3,163,304 | |
SK Hynix, Inc. | | | 38,180 | | | | 2,930,668 | |
| | | | | | | | |
| | | | | | | 6,093,972 | |
| | | | | | | | |
| | | | | | | | |
Electronic Equipment, Instruments & Components: 2.4% | |
Samsung SDI Co., Ltd. | | | 25,592 | | | | 4,908,761 | |
| | | | | | | | |
Total Information Technology | | | | | | | 29,799,384 | |
| | | | | | | | |
| | | | | | | | |
| CONSUMER DISCRETIONARY: 13.9% | | | | | | | | |
Auto Components: 5.5% | | | | | | | | |
Hyundai Mobis Co., Ltd. | | | 37,560 | | | | 7,143,949 | |
Hankook Tire Co., Ltd. | | | 108,711 | | | | 4,107,587 | |
| | | | | | | | |
| | | | | | | 11,251,536 | |
| | | | | | | | |
| | | | | | | | |
Specialty Retail: 3.8% | | | | | | | | |
LOTTE Himart Co., Ltd. | | | 71,382 | | | | 5,051,260 | |
Cuckoo Homesys Co., Ltd.b | | | 13,757 | | | | 2,736,598 | |
| | | | | | | | |
| | | | | | | 7,787,858 | |
| | | | | | | | |
| | | | | | | | |
Hotels, Restaurants & Leisure: 3.3% | | | | | | | | |
Modetour Network, Inc. | | | 282,982 | | | | 6,901,679 | |
| | | | | | | | |
| | | | | | | | |
Media: 1.3% | | | | | | | | |
Kakao M Corp. | | | 33,475 | | | | 2,701,818 | |
| | | | | | | | |
Total Consumer Discretionary | | | | | | | 28,642,891 | |
| | | | | | | | |
| | | | | | | | |
| CONSUMER STAPLES: 9.6% | | | | | | | | |
Food & Staples Retailing: 6.5% | | | | | | | | |
BGF Retail Co., Ltd. | | | 45,152 | | | | 7,900,081 | |
E-MART, Inc. | | | 24,250 | | | | 5,533,926 | |
| | | | | | | | |
| | | | | | | 13,434,007 | |
| | | | | | | | |
| | | | | | | | |
Food Products: 3.1% | | | | | | | | |
Orion Holdings Corp. | | | 234,003 | | | | 5,775,882 | |
Orion Corp. | | | 4,171 | | | | 556,889 | |
| | | | | | | | |
| | | | | | | 6,332,771 | |
| | | | | | | | |
Total Consumer Staples | | | | | | | 19,766,778 | |
| | | | | | | | |
| | | | | | | | |
| | | | | | | | |
| | | Shares | | | Value | |
| MATERIALS: 7.4% | | | | | | | | |
Metals & Mining: 5.0% | | | | | | | | |
POSCO | | | 26,841 | | | | $7,919,704 | |
Korea Zinc Co., Ltd. | | | 6,924 | | | | 2,398,247 | |
| | | | | | | | |
| | | | | | | 10,317,951 | |
| | | | | | | | |
| | | | | | | | |
Containers & Packaging: 2.4% | | | | | | | | |
Lock&Lock Co., Ltd. | | | 252,306 | | | | 5,026,228 | |
| | | | | | | | |
Total Materials | | | | | | | 15,344,179 | |
| | | | | | | | |
| | | | | | | | |
| HEALTH CARE: 5.8% | | | | | | | | |
Pharmaceuticals: 2.5% | | | | | | | | |
Yuhan Corp. | | | 14,241 | | | | 2,778,568 | |
DongKook Pharmaceutical Co., Ltd. | | | 41,758 | | | | 2,406,310 | |
| | | | | | | | |
| | | | | | | 5,184,878 | |
| | | | | | | | |
| | | | | | | | |
Health Care Equipment & Supplies: 1.9% | | | | | | | | |
Interojo Co., Ltd. | | | 123,685 | | | | 3,847,303 | |
| | | | | | | | |
| | | | | | | | |
Biotechnology: 1.4% | | | | | | | | |
Hugel, Inc.b | | | 6,511 | | | | 2,815,760 | |
| | | | | | | | |
Total Health Care | | | | | | | 11,847,941 | |
| | | | | | | | |
| | | | | | | | |
| INDUSTRIALS: 2.9% | | | | | | | | |
Commercial Services & Supplies: 1.6% | | | | | | | | |
S-1 Corp. | | | 38,951 | | | | 3,383,092 | |
| | | | | | | | |
| | | | | | | | |
Machinery: 1.3% | | | | | | | | |
Hyundai Construction Equipment Co., Ltd.b | | | 20,464 | | | | 2,592,732 | |
| | | | | | | | |
Total Industrials | | | | | | | 5,975,824 | |
| | | | | | | | |
| | | | | | | | |
| ENERGY: 2.3% | | | | | | | | |
Oil, Gas & Consumable Fuels: 2.3% | | | | | | | | |
SK Innovation Co., Ltd. | | | 18,540 | | | | 3,358,120 | |
S-Oil Corp. | | | 14,915 | | | | 1,464,682 | |
| | | | | | | | |
Total Energy | | | | | | | 4,822,802 | |
| | | | | | | | |
| | | | | | | | |
| TELECOMMUNICATION SERVICES: 1.9% | | | | | | | | |
Wireless Telecommunication Services: 1.9% | | | | | | | | |
SK Telecom Co., Ltd. ADR | | | 163,600 | | | | 3,815,152 | |
| | | | | | | | |
Total Telecommunication Services | | | | | | | 3,815,152 | |
| | | | | | | | |
| | | | | | | | |
| TOTAL COMMON EQUITIES | | | | | | | 151,610,586 | |
| | | | | | | | |
(Cost $119,520,729) | | | | | | | | |
| | | | | | | | |
PREFERRED EQUITIES: 25.8% | | | | | | | | |
| INFORMATION TECHNOLOGY: 8.8% | | | | | | | | |
Technology Hardware, Storage & Peripherals: 8.8% | | | | | |
Samsung Electronics Co., Ltd., Pfd. | | | 534,600 | | | | 18,052,855 | |
| | | | | | | | |
Total Information Technology | | | | | | | 18,052,855 | |
| | | | | | | | |
| | | | | | | | |
| CONSUMER STAPLES: 5.1% | | | | | | | | |
Personal Products: 5.1% | | | | | | | | |
LG Household & Health Care, Ltd., Pfd. | | | 11,018 | | | | 7,218,888 | |
AMOREPACIFIC Group, Pfd. | | | 68,932 | | | | 3,368,342 | |
| | | | | | | | |
Total Consumer Staples | | | | | | | 10,587,230 | |
| | | | | | | | |
| | | | | | | | |
Matthews Korea Fund
June 30, 2018
Schedule of Investmentsa (unaudited) (continued)
PREFERRED EQUITIES (continued)
| | | | | | | | |
| | | Shares | | | Value | |
| CONSUMER DISCRETIONARY: 4.2% | | | | | | | | |
Automobiles: 4.2% | | | | | | | | |
Hyundai Motor Co., Ltd., 2nd Pfd. | | | 105,899 | | | | $8,619,600 | |
| | | | | | | | |
Total Consumer Discretionary | | | | | | | 8,619,600 | |
| | | | | | | | |
| | | | | | | | |
| FINANCIALS: 3.8% | | | | | | | | |
Insurance: 3.8% | | | | | | | | |
Samsung Fire & Marine Insurance Co., Ltd., Pfd. | | | 47,588 | | | | 7,789,522 | |
| | | | | | | | |
Total Financials | | | | | | | 7,789,522 | |
| | | | | | | | |
| | | | | | | | |
| MATERIALS: 2.4% | | | | | | | | |
Chemicals: 2.4% | | | | | | | | |
LG Chem, Ltd., Pfd. | | | 27,091 | | | | 4,895,532 | |
| | | | | | | | |
Total Materials | | | | | | | 4,895,532 | |
| | | | | | | | |
| | | | | | | | |
| ENERGY: 1.5% | | | | | | | | |
Oil, Gas & Consumable Fuels: 1.5% | | | | | | | | |
S-Oil Corp., Pfd. | | | 37,562 | | | | 3,175,416 | |
| | | | | | | | |
Total Energy | | | | | | | 3,175,416 | |
| | | | | | | | |
| | | | | | | | |
| TOTAL PREFERRED EQUITIES | | | | | | | 53,120,155 | |
| | | | | | | | |
(Cost $36,081,589) | | | | | | | | |
| | | | | | | | |
| TOTAL INVESTMENTS: 99.4% | | | | | | | 204,730,741 | |
(Cost $155,602,318) | | | | | | | | |
| | | | | | | | |
CASH AND OTHER ASSETS,
LESS LIABILITIES: 0.6% | | | | | | | 1,266,329 | |
| | | | | | | | |
| | |
NET ASSETS: 100.0% | | | | | | | $205,997,070 | |
| | | | | | | | |
| a | Certain securities were fair valued under the valuation policies approved by the Board of Trustees (Note 2-A). |
| b | Non-income producing security. |
| ADR | American Depositary Receipt |
See accompanying notes to financial statements.
| | | | |
| matthewsasia.com | 800.789.ASIA | | | 81 | |

| | | | |
| PORTFOLIO MANAGERS |
| Lydia So, CFA | | |
Lead Manager | | |
Beini Zhou, CFA | | Tiffany Hsiao, CFA |
Co-Manager | | Co-Manager |
|
| FUND FACTS |
| | | Investor | | Institutional |
Ticker | | MSMLX | | MISMX |
CUSIP | | 577125206 | | 577125867 |
Inception | | 9/15/08 | | 4/30/13 |
NAV | | $22.65 | | $22.65 |
Initial Investment | | $2,500 | | $100,000 |
Gross Expense Ratio1 | | 1.49% | | 1.35% |
After Fee Waiver and Reimbursement2 | | 1.46% | | 1.25% |
Portfolio Statistics | | |
Total # of Positions | | 80 |
Net Assets | | $402.9 million |
Weighted Average
Market Cap | | $1.3 billion |
Portfolio Turnover3 | | 67.13% |
Benchmark | | |
MSCI AC Asia ex Japan Small Cap Index |
Redemption Fee | | |
2% within first 90 calendar days of purchase |
OBJECTIVE
Long-term capital appreciation.
STRATEGY
Under normal market conditions, the Fund seeks to achieve its investment objective by investing at least 80% of its total net assets, which include borrowings for investment purposes, in the common and preferred stocks of Small Companies located in Asia ex Japan, which consists of all countries and markets in Asia excluding Japan, but including all other developed, emerging and frontier countries and markets in the Asian region.
Matthews Asia Small Companies Fund
Portfolio Manager Commentary (unaudited)
For the first half of 2018, the Matthews Asia Small Companies Fund returned –1.05% (Investor Class) and –0.92% (Institutional Class), while its benchmark, the MSCI All Country Asia ex Japan Small Cap Index, returned –7.14%. For the quarter ending June 30, the Fund returned –2.92% (Investor Class) and –2.87% (Institutional Class), compared to the benchmark return of –6.73% over the same period.
Market Environment:
Asian markets were volatile early in the year and became relatively steady by April and May. Investor sentiment turned fragile, however, late in the second quarter due to several events. As anticipated, the U.S. Federal Reserve raised interest rates by 25 basis points (0.25%) in mid-June. Amid this rising rate environment, the strong U.S. dollar coupled with higher oil prices further pressured broader emerging market equities. Within Asia, Indonesia, India and the Philippines tend to be more vulnerable due to their relative dependence on foreign currencies that can affect trade deficits. Meanwhile, trade war rhetoric between the U.S. and China also caused further volatility for Chinese equities as concerns spread over the potential negative economic impact to global corporations. Lastly, after months of back and forth regarding bilateral U.S.-North Korea talks, the leaders of both countries held a summit meeting in June and signed an agreement to work toward nuclear denuclearization of the Korean Peninsula.
Performance Contributors and Detractors:
Our holdings from China and South Korea were broadly positive performance contributors for the first half of the year. During the second quarter, the portfolio’s Chinese and Indian holdings performed considerably better than holdings from elsewhere in the region, which suffered due to the challenging environment. Our stock selection in China and India also significantly contributed to both the portfolio’s absolute and relative performance for the second quarter. Indian pharmaceutical and chemical company Merck, for example, performed strongly due to improving fundamentals and asset divestment news at the parent company level.
By sector, several portfolio holdings in health care and information technology were bright spots due to company-specific factors during the uneasy second quarter. Chilisin Electronics, a Taiwan-based manufacturer and distributor of inductors and coils, performed robustly thanks to the company’s bold industry consolidation moves that may pave the way for future growth.
Some consumer discretionary and financials holdings were among the weakest performers within the portfolio for the second quarter. The stock prices of Hong Kong’s Guotai Junan International and Ho Chi Minh City Securities in Vietnam—both brokerage businesses—experienced sharp declines due to a high correlation between their profitability and the performance of capital markets. In addition, two of our largest detractors to performance for the second quarter were Valuetronics Holdings, a Hong Kong-based electronics manufacturing service provider, and Japan’s CKD, a manufacturer of factory automation equipment. Shares of both firms experienced sharp price corrections following pullbacks in revenue momentum in some segments of their businesses.
(continued)
| 1 | Prospectus expense ratios. |
| 2 | Matthews has contractually agreed (i) to waive fees and reimburse expenses to the extent needed to limit Total Annual Fund Operating Expenses (excluding Rule 12b-1 fees, taxes, interest, brokerage commissions, short sale dividend expenses, expenses incurred in connection with any merger or reorganization or extraordinary expenses such as litigation) of the Institutional Class to 1.25% first by waiving class specific expenses (i.e., shareholder service fees specific to a particular class) of the Institutional Class and then, to the extent necessary, by waiving non-class specific expenses of the Institutional Class, and (ii) if any Fund-wide expenses (i.e., expenses that apply to both the Institutional Class and the Investor Class) are waived for the Institutional Class to maintain the 1.25% expense limitation, to waive an equal amount (in annual percentage terms) of those same expenses for the Investor Class. The Total Annual Fund Operating Expenses After Fee Waiver and Expense Reimbursement for the Investor Class may vary from year to year and will in some years exceed 1.25%. If the operating expenses fall below the expense limitation in a year within three years after Matthews has made a waiver or reimbursement, the Fund may reimburse Matthews up to an amount that does not cause the expenses for that year to exceed the lesser of (i) the expense limitation applicable at the time of that fee waiver and/or expense reimbursement or (ii) the expense limitation in effect at the time of recoupment. This agreement will remain in place until April 30, 2019 and may be terminated at any time by the Board of Trustees on behalf of the Fund on 60 days’ written notice to Matthews. Matthews may decline to renew this agreement by written notice to the Trust at least 30 days before its annual expiration date. |
| 3 | The lesser of fiscal year 2017 long-term purchase costs or sales proceeds divided by the average monthly market value of long-term securities. |
| | | | | | | | | | | | | | | | | | | | | | | | | | | | |
| |
| PERFORMANCE AS OF JUNE 30, 2018 | |
| | | | | | | | | Average Annual Total Returns | | | | |
| | | 3 Months | | | YTD | | | 1 Year | | | 3 Years | | | 5 Years | | | Since
Inception | | | Inception
Date | |
| Investor Class (MSMLX) | | | -2.92% | | | | -1.05% | | | | 12.87% | | | | 2.87% | | | | 5.90% | | | | 11.74% | | | | 09/15/08 | |
| Institutional Class (MISMX) | | | -2.87% | | | | -0.92% | | | | 13.07% | | | | 3.10% | | | | 6.13% | | | | 5.20% | | | | 04/30/13 | |
| MSCI AC Asia ex Japan Small Cap Index4 | | | -6.73% | | | | -7.14% | | | | 6.91% | | | | 1.87% | | | | 5.19% | | | | 8.01% | 5 | | | | |
| Lipper Pacific ex Japan Funds Category Average6 | | | -5.15% | | | | -4.63% | | | | 9.66% | | | | 6.37% | | | | 7.52% | | | | 8.47% | 7 | | | | |
Performance assumes reinvestment of all dividends and/or distributions before taxes. All performance quoted represents past performance and is no guarantee of future results. Investment return and principal value will fluctuate with market conditions so that when redeemed, shares may be worth more or less than their original cost. Current performance may be lower or higher than the return figures quoted. Returns would have been lower if certain of the Fund’s fees and expenses had not been waived. For the Fund’s most recent month-end performance, visit matthewsasia.com.
GROWTH OF A $10,000 INVESTMENT SINCE INCEPTION—INVESTOR CLASS
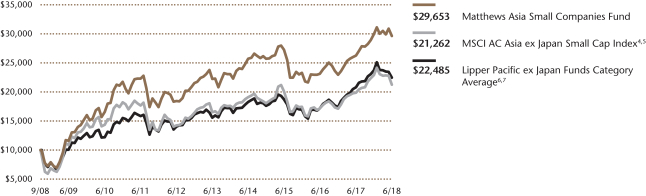
Plotted monthly. The performance data and graph do not reflect the deduction of taxes that a shareholder would pay on dividends, capital gains distributions or redemption of Fund shares. Values are in US$.
| | 4 | It is not possible to invest directly in an index. Source: Index data from Morgan Stanley Capital International and Bloomberg; total return calculations performed by BNY Mellon Investment Servicing (US) Inc. Please see page 92 for index definition. |
| | 5 | Calculated from 9/15/08. |
| | 6 | The Lipper Category Average does not reflect sales charges and is based on total return, including reinvestment of dividends and capital gains for the stated periods. |
| | 7 | Calculated from 9/30/08. |
| | | | | | | | |
| | | | |
| TOP TEN HOLDINGS8 | | | | | | | |
| | | Sector | | Country | | % of Net Assets | |
| Silergy Corp. | | Information Technology | | China/Hong Kong | | | 2.5% | |
| Vitasoy International Holdings, Ltd. | | Consumer Staples | | China/Hong Kong | | | 2.3% | |
| Shanghai Haohai Biological Technology Co., Ltd. | | Health Care | | China/Hong Kong | | | 2.0% | |
| A-Living Services Co., Ltd. | | Industrials | | China/Hong Kong | | | 2.0% | |
| Sunny Friend Environmental Technology Co., Ltd. | | Industrials | | Taiwan | | | 1.9% | |
| Times China Holdings, Ltd. | | Real Estate | | China/Hong Kong | | | 1.8% | |
| PT Bank Tabungan Pensiunan Nasional | | Financials | | Indonesia | | | 1.8% | |
| GRUH Finance, Ltd. | | Financials | | India | | | 1.8% | |
| Yeah1 Group Corp. | | Information Technology | | Vietnam | | | 1.8% | |
| BBI Life Sciences Corp. | | Health Care | | China/Hong Kong | | | 1.7% | |
| % OF ASSETS IN TOP TEN | | | | | | | 19.6% | |
| | 8 | Holdings may combine more than one security from same issuer and related depositary receipts. |
| | | | |
| matthewsasia.com | 800.789.ASIA | | | 83 | |
| | | | |
| |
| COUNTRY ALLOCATION (%)9,10 | |
| China/Hong Kong | | | 36.0 | |
| Taiwan | | | 13.4 | |
| India | | | 12.3 | |
| South Korea | | | 11.6 | |
| Thailand | | | 4.9 | |
| Indonesia | | | 4.1 | |
| Vietnam | | | 3.9 | |
| Japan | | | 3.3 | |
| Malaysia | | | 3.0 | |
| Philippines | | | 1.3 | |
| Australia | | | 1.3 | |
| United States | | | 1.1 | |
| Singapore | | | 0.9 | |
| Cash and Other Assets, Less Liabilities | | | 2.9 | |
| | | | |
| |
| SECTOR ALLOCATION (%)10 | |
| Information Technology | | | 23.0 | |
| Industrials | | | 15.4 | |
| Consumer Discretionary | | | 12.5 | |
| Health Care | | | 11.4 | |
| Consumer Staples | | | 10.1 | |
| Financials | | | 10.0 | |
| Materials | | | 6.3 | |
| Real Estate | | | 5.0 | |
| Energy | | | 3.3 | |
| Cash and Other Assets, Less Liabilities | | | 2.9 | |
| | | | |
| |
| MARKET CAP EXPOSURE (%)10,11 | |
| Mega Cap (over $25B) | | | 0.0 | |
| Large Cap ($10B–$25B) | | | 0.0 | |
| Mid Cap ($3B–10B) | | | 8.4 | |
| Small Cap (under $3B) | | | 88.7 | |
| Cash and Other Assets, Less Liabilities | | | 2.9 | |
| 9 | Not all countries where the Fund may invest are included in the benchmark index. |
| 10 | Source: FactSet Research Systems. Percentage values in data are rounded to the nearest tenth of one percent, so the values may not sum to 100% due to rounding. Percentage values may be derived from different data sources and may not be consistent with other Fund literature. |
| 11 | The Fund defines Small Companies as companies with market capitalization generally between $100 million and $3 billion or the largest company included in the Fund’s primary benchmark, the MSCI All Country Asia ex Japan Small Cap Index. |
Matthews Asia Small Companies Fund
Portfolio Manager Commentary (unaudited) (continued)
Notable Portfolio Changes:
During the second quarter, we exited several China positions for a variety of reasons. We shed our entire position in GDS Holdings, an independent data center operator, due to its robust share price run-up. As this company’s market capitalization reached mid-cap status, we opted to invest proceeds in other less richly priced companies. We also exited Lifetech Scientific as its share price rose sharply due to a recent change among its major shareholders. We believe that such large and sudden increases in valuations were not supported by fundamentals and chose to sell our stake and lock in profits. Unfortunately, not all of our holdings performed up to our expectations. We exited Beijing Urban Construction, a mass transit design and engineering company, due to our concerns over capital allocation decisions that we felt could compromise the company’s cash flow and profitability.
Additionally, we took profits by trimming other holdings in Taiwan and South Korea that had appreciated significantly in price. We exited our long-term holdings in Ultrajaya, an Indonesian UHT milk producer. Although we deem Ultrajaya as a reasonably well-run company, we are concerned that competition will intensify, which could lead to margin contraction.
We introduced over a dozen new companies to the portfolio as we find their long-term growth trajectories attractive and supported by favorable industry tailwinds. Saigon Cargo Service Corporation is one of Vietnam’s leading air cargo service providers. We believe the company is well-positioned to meet the growing air cargo handling throughputs in the country as trade volume grows. Similarly, we initiated a position in SUNeVision, one of Hong Kong’s leading independent data center operators. The company is well-positioned to capture the burgeoning data traffic in the region. After the recent correction of the share price, the risk-reward profile turned more favorable in our opinion.
Outlook:
Similar to what we observed during the first quarter, concerns over rising interest rates and dynamic geopolitical factors appear to have heightened market volatility. Such sentiment could persist for the remainder of 2018. Over the medium term, many Asian countries are poised to hold elections in the next 12 to 18 months, which can add to market uncertainty. While we are mindful of these challenges, we are encouraged by the earnings recovery thus far among many Asian corporations. We remain constructive on businesses that are well-positioned to address the needs of Asia’s evolving domestic demand from services to infrastructure to technologies. As we meet with corporate managers across Asia on our research trips, we find that many small-cap companies are at the forefront of delivering innovative products and solutions to households and businesses. Such a dynamic and expansive investment landscape is a reminder of how Asia’s entrepreneurialism has strived and progressed in the past decade. We look to continue uncovering attractive investment candidates that possess the attributes to grow and compound in size in a sustainable manner for the long run.
Matthews Asia Small Companies Fund
June 30, 2018
Schedule of Investmentsa (unaudited)
COMMON EQUITIES: 97.1%
| | | | | | | | |
| | | Shares | | | Value | |
| CHINA/HONG KONG: 36.0% | | | | | | | | |
Silergy Corp. | | | 413,000 | | | | $10,035,623 | |
Vitasoy International Holdings, Ltd. | | | 2,942,000 | | | | 9,400,306 | |
Shanghai Haohai Biological Technology Co., Ltd. H Sharesb,c | | | 1,271,200 | | | | 7,933,409 | |
A-Living Services Co., Ltd. H Sharesb,c,d | | | 4,307,000 | | | | 7,871,559 | |
Times China Holdings, Ltd. | | | 4,977,000 | | | | 7,346,696 | |
BBI Life Sciences Corp.c | | | 17,482,500 | | | | 6,974,084 | |
China BlueChemical, Ltd. H Shares | | | 18,124,000 | | | | 6,654,511 | |
Sinopec Kantons Holdings, Ltd. | | | 14,048,000 | | | | 6,624,432 | |
Precision Tsugami China Corp., Ltd.c,d | | | 5,523,000 | | | | 6,527,271 | |
China Aviation Oil Singapore Corp., Ltd. | | | 6,004,100 | | | | 6,511,014 | |
SITC International Holdings Co., Ltd. | | | 5,728,000 | | | | 6,381,265 | |
China Meidong Auto Holdings, Ltd. | | | 13,262,000 | | | | 5,990,521 | |
SUNeVision Holdings, Ltd. | | | 9,211,000 | | | | 5,441,952 | |
Yuzhou Properties Co., Ltd. | | | 9,136,000 | | | | 5,368,929 | |
Valuetronics Holdings, Ltd. | | | 10,056,500 | | | | 4,888,920 | |
Genscript Biotech Corp. | | | 1,708,000 | | | | 4,670,475 | |
Xin Point Holdings, Ltd.c | | | 6,965,000 | | | | 4,591,200 | |
Yihai International Holding, Ltd. | | | 2,391,000 | | | | 4,543,644 | |
China Youzan, Ltd.d | | | 36,424,000 | | | | 4,353,837 | |
Truly International Holdings, Ltd. | | | 21,980,000 | | | | 4,186,249 | |
Kingdee International Software Group Co., Ltd. | | | 3,928,000 | | | | 4,000,781 | |
Guotai Junan International Holdings, Ltd. | | | 18,178,000 | | | | 3,917,980 | |
Huifu Payment, Ltd.b,c,d | | | 4,498,800 | | | | 3,893,501 | |
TK Group Holdings, Ltd. | | | 3,536,000 | | | | 3,010,278 | |
AK Medical Holdings, Ltd.b,c | | | 4,148,000 | | | | 2,782,582 | |
Wise Talent Information Technology Co., Ltd.d | | | 281,000 | | | | 1,164,028 | |
| | | | | | | | |
Total China/Hong Kong | | | | | | | 145,065,047 | |
| | | | | | | | |
| | | | | | | | |
| TAIWAN: 13.4% | | | | | | | | |
Sunny Friend Environmental Technology Co., Ltd. | | | 1,071,000 | | | | 7,543,886 | |
ITEQ Corp. | | | 2,722,000 | | | | 6,340,882 | |
Taimide Tech, Inc. | | | 2,017,000 | | | | 5,514,011 | |
KS Terminals, Inc. | | | 3,225,000 | | | | 5,465,958 | |
Global PMX Co., Ltd. | | | 1,077,000 | | | | 5,343,810 | |
Great Tree Pharmacy Co., Ltd.† | | | 1,611,600 | | | | 4,550,373 | |
Chilisin Electronics Corp. | | | 749,000 | | | | 4,376,919 | |
Taiwan Paiho, Ltd. | | | 2,018,000 | | | | 4,244,452 | |
Advanced Ceramic X Corp. | | | 508,000 | | | | 4,210,943 | |
Tong Hsing Electronic Industries, Ltd. | | | 1,086,000 | | | | 3,762,804 | |
Kinik Co. | | | 1,112,000 | | | | 2,571,998 | |
| | | | | | | | |
Total Taiwan | | | | | | | 53,926,036 | |
| | | | | | | | |
| | | | | | | | |
| INDIA: 12.3% | | | | | | | | |
GRUH Finance, Ltd. | | | 1,597,731 | | | | 7,099,881 | |
Merck, Ltd. | | | 191,018 | | | | 6,642,467 | |
AIA Engineering, Ltd. | | | 288,085 | | | | 6,318,714 | |
Gabriel India, Ltd. | | | 2,703,670 | | | | 5,390,578 | |
Shriram City Union Finance, Ltd. | | | 177,315 | | | | 5,239,777 | |
Page Industries, Ltd. | | | 11,855 | | | | 4,808,978 | |
Cholamandalam Investment and Finance Co., Ltd. | | | 181,888 | | | | 4,016,503 | |
Syngene International, Ltd.b,c | | | 419,978 | | | | 3,740,269 | |
NIIT Technologies, Ltd. | | | 223,551 | | | | 3,582,956 | |
Natco Pharma, Ltd. | | | 224,026 | | | | 2,637,448 | |
| | | | | | | | |
Total India | | | | | | | 49,477,571 | |
| | | | | | | | |
| | | | | | | | |
| | | Shares | | | Value | |
| SOUTH KOREA: 11.6% | | | | | | | | |
Douzone Bizon Co., Ltd. | | | 117,418 | | | | $6,525,286 | |
Value Added Technology Co., Ltd. | | | 208,063 | | | | 6,252,808 | |
Incross Co., Ltd.d | | | 256,761 | | | | 6,202,768 | |
CLIO Cosmetics Co., Ltd. | | | 227,330 | | | | 5,794,118 | |
Cosmecca Korea Co., Ltd. | | | 164,975 | | | | 5,277,347 | |
Cafe24 Corp.d | | | 28,649 | | | | 4,606,366 | |
Enzychem Lifesciences Corp.d | | | 56,294 | | | | 4,283,976 | |
Hy-Lok Corp. | | | 179,393 | | | | 4,117,164 | |
Tongyang pile, Inc. | | | 879,667 | | | | 3,590,123 | |
| | | | | | | | |
Total South Korea | | | | | | | 46,649,956 | |
| | | | | | | | |
| | | | | | | | |
| THAILAND: 4.9% | | | | | | | | |
Plan B Media Public Co., Ltd. F Shares | | | 30,458,900 | | | | 5,601,585 | |
TOA Paint Thailand Public Co., Ltd. | | | 4,043,500 | | | | 4,639,223 | |
AP Thailand Public Co., Ltd. | | | 18,663,500 | | | | 4,585,476 | |
Rich Sport Public Co., Ltd. | | | 26,388,400 | | | | 3,954,644 | |
KGI Securities Thailand Public Co., Ltd. | | | 7,830,000 | | | | 901,386 | |
| | | | | | | | |
Total Thailand | | | | | | | 19,682,314 | |
| | | | | | | | |
| | | | | | | | |
| INDONESIA: 4.1% | | | | | | | | |
PT Bank Tabungan Pensiunan Nasional | | | 26,131,200 | | | | 7,290,460 | |
PT BFI Finance Indonesia | | | 88,195,000 | | | | 4,185,108 | |
PT Arwana Citramulia | | | 134,190,800 | | | | 3,165,142 | |
PT Puradelta Lestaric | | | 207,935,300 | | | | 1,854,938 | |
| | | | | | | | |
Total Indonesia | | | | | | | 16,495,648 | |
| | | | | | | | |
| | | | | | | | |
| VIETNAM: 3.9% | | | | | | | | |
Yeah1 Group Corp.d | | | 510,000 | | | | 7,086,264 | |
Saigon Cargo Service Corp. | | | 524,930 | | | | 4,216,177 | |
Ho Chi Minh City Securities Corp. | | | 1,434,300 | | | | 3,546,218 | |
Nam Long Investment Corp. | | | 870,634 | | | | 1,055,777 | |
| | | | | | | | |
Total Vietnam | | | | | | | 15,904,436 | |
| | | | | | | | |
| | | | | | | | |
| JAPAN: 3.3% | | | | | | | | |
CKD Corp. | | | 305,300 | | | | 5,006,588 | |
Honma Golf, Ltd.b,c | | | 4,125,000 | | | | 4,226,369 | |
Tri Chemical Laboratories, Inc. | | | 100,100 | | | | 3,970,838 | |
| | | | | | | | |
Total Japan | | | | | | | 13,203,795 | |
| | | | | | | | |
| | | | | | | | |
| MALAYSIA: 3.0% | | | | | | | | |
D&O Green Technologies BHD | | | 32,253,000 | | | | 5,662,739 | |
Bursa Malaysia BHD | | | 2,333,800 | | | | 4,246,793 | |
Karex BHD | | | 10,820,825 | | | | 2,193,468 | |
| | | | | | | | |
Total Malaysia | | | | | | | 12,103,000 | |
| | | | | | | | |
| | | | | | | | |
| PHILIPPINES: 1.3% | | | | | | | | |
Philippine Seven Corp. | | | 2,008,531 | | | | 5,436,428 | |
| | | | | | | | |
Total Philippines | | | | | | | 5,436,428 | |
| | | | | | | | |
| | | | | | | | |
| AUSTRALIA: 1.3% | | | | | | | | |
OZ Minerals, Ltd. | | | 733,498 | | | | 5,114,775 | |
| | | | | | | | |
Total Australia | | | | | | | 5,114,775 | |
| | | | | | | | |
| | | | | | | | |
| UNITED STATES: 1.1% | | | | | | | | |
Knowles Corp.d | | | 300,700 | | | | 4,600,710 | |
| | | | | | | | |
Total United States | | | | | | | 4,600,710 | |
| | | | | | | | |
| | | | |
| matthewsasia.com | 800.789.ASIA | | | 85 | |
Matthews Asia Small Companies Fund
June 30, 2018
Schedule of Investmentsa (unaudited) (continued)
COMMON EQUITIES (continued)
| | | | | | | | |
| | | Shares | | | Value | |
| SINGAPORE: 0.9% | | | | | | | | |
Delfi, Ltd. | | | 3,736,300 | | | | $3,437,925 | |
| | | | | | | | |
Total Singapore | | | | | | | 3,437,925 | |
| | | | | | | | |
| | | | | | | | |
| TOTAL COMMON EQUITIES | | | | | | | 391,097,641 | |
| | | | | | | | |
(Cost $369,288,746) | | | | | | | | |
| | | | | | | | |
RIGHTS: 0.0% | | | | | | | | |
| TAIWAN: 0.0% | | | | | | | | |
Great Tree Pharmacy Co., Ltd., Rights, expires 07/16/18†,d | | | 118,883 | | | | 93,913 | |
| | | | | | | | |
Total Taiwan | | | | | | | 93,913 | |
| | | | | | | | |
| | | | | | | | |
| TOTAL RIGHTS | | | | | | | 93,913 | |
| | | | | | | | |
(Cost $0) | | | | | | | | |
| | | | | | | | |
| TOTAL INVESTMENTS: 97.1% | | | | | | | 391,191,554 | |
(Cost $369,288,746) | | | | | | | | |
| | | | | | | | |
CASH AND OTHER ASSETS,
LESS LIABILITIES: 2.9% | | | | | | | 11,688,548 | |
| | | | | | | | |
| | |
NET ASSETS: 100.0% | | | | | | | $402,880,102 | |
| | | | | | | | |
| a | Certain securities were fair valued under the valuation policies approved by the Board of Trustees (Note 2-A). |
| b | Security exempt from registration under Rule 144A of the Securities Act of 1933, as amended. The security may be resold in transactions exempt from registration normally to qualified institutional buyers. The security has been determined to be liquid in accordance with procedures adopted by the Funds’ Board of Trustees. At June 30, 2018, the aggregate value is $30,447,689, which is 7.56% of net assets. |
| c | The securities may be resold to qualified foreign investors and foreign institutional buyers under Regulation S of the Securities Act of 1933. |
| d | Non-income producing security. |
| † | Affiliated Issuer, as defined under the Investment Company Act of 1940 (ownership of 5% or more of the outstanding voting securities of this issuer) |
See accompanying notes to financial statements.
| | | | |
| PORTFOLIO MANAGERS | | |
| Tiffany Hsiao, CFA | | | | |
Lead Manager | | | | |
| Kenichi Amaki | | | | |
Co-Manager | | | | |
| |
| FUND FACTS | | |
| | | Investor | | Institutional |
Ticker | | MCSMX | | MICHX |
CUSIP | | 577125404 | | 577125842 |
Inception | | 5/31/11 | | 11/30/17 |
NAV | | $12.96 | | $12.95 |
Initial Investment | | $2,500 | | $100,000 |
Gross Expense Ratio1 | | 2.34% | | 2.09% |
After Fee Waiver and Reimbursement2 | | 1.50% | | 1.25% |
Portfolio Statistics | | |
Total # of Positions | | 51 |
Net Assets | | $70.8 million |
Weighted Average Market Cap | | $1.9 billion |
Portfolio Turnover3 | | 67.22% |
Benchmark | | |
MSCI China Small Cap Index |
Redemption Fee | | |
2% within first 90 calendar days of purchase |
OBJECTIVE
Long-term capital appreciation.
STRATEGY
Under normal market conditions, the Fund seeks to achieve its investment objective by investing at least 80% of its total net assets, which include borrowings for investment purposes, in the common and preferred stocks of Small Companies located in China. China includes its administrative and other districts, such as Hong Kong.
Matthews China Small Companies Fund
Portfolio Manager Commentary (unaudited)
For the first half of 2018, the Matthews China Small Companies Fund returned 9.00% (Investor Class) and 9.10% (Institutional Class), outperforming its benchmark, the MSCI China Small Cap Index, which returned 0.91% over the same period. For the quarter ending June 30, the Fund returned 2.37% (Investor Class) and 2.37% (Institutional Class) while its benchmark fell –1.90%.
Market Environment:
Trade war tensions and geopolitical risks dominated headlines during the first half of the year, particularly in the second quarter. This negatively impacted Chinese equity markets in both performance and volatility. Fundamentally, however, China’s domestic consumption economy remains relatively unaffected. Home sales through the end of May 2018 increased more than 12% since last year, following an already high base in 2017. Retail sales and industrial production figures also continued to meet expectations in the second quarter. China’s central bank, the People’s Bank of China, also continued to be accommodative, tightening controls on riskier parts of the nation’s lending system.
From both a top-down and bottom-up perspective, we continue to anticipate sustainable growth in the Chinese economy and in corporate earnings. The market’s concerns over the rising cost of funding and escalating trade tensions should, in our view, have little impact on China’s smaller companies given their domestic focus and lower dependence on financial leverage.
Performance Contributors and Detractors:
For both the first half of the year and the second quarter, our strong stock selection in the information technology, materials and industrials sectors contributed most to the Fund’s outperformance versus the benchmark. The consumer discretionary sector was a laggard during both periods and our health care sector holdings were the top detractors to Fund performance in the second quarter.
Hua Hong Semiconductor, China’s second-largest foundry, and China Maple Leaf Education Systems, China’s largest international school operator, were among the top individual contributors to Fund performance in the second quarter. Hua Hong Semiconductor benefited from China’s accelerated plan to become self-sufficient in semiconductor production and also from favorable supply and demand dynamics. China Maple Leaf continued to execute well in the high-demand segment of consumer discretionary services. We believe both companies will continue to do well in China’s structural change toward intellectual property development and consumption upgrades.
Among the top detractors to Fund performance during the second quarter were Joy City Property, a leading mall developer in China that targets millennial consumers, and Precision Tsugami (China), a leading industrial automation tool maker. Joy City was impacted by negative sentiment toward the real estate sector, which has relatively higher financial leverage. Precision Tsugami was negatively impacted by fears of a factory automation slowdown related to escalating trade tensions. We believe both companies will continue to grow as Chinese consumers upgrade their consumption patterns and Chinese industrial firms seek higher productivity. We have not been fazed by the short-term volatility in the share prices for these two holdings.
(continued)
| 1 | Prospectus expense ratios. |
| 2 | Matthews has contractually agreed (i) to waive fees and reimburse expenses to the extent needed to limit Total Annual Fund Operating Expenses (excluding Rule 12b-1 fees, taxes, interest, brokerage commissions, short sale dividend expenses, expenses incurred in connection with any merger or reorganization or extraordinary expenses such as litigation) of the Institutional Class to 1.25% first by waiving class specific expenses (i.e., shareholder service fees specific to a particular class) of the Institutional Class and then, to the extent necessary, by waiving non-class specific expenses of the Institutional Class, and (ii) if any Fund-wide expenses (i.e., expenses that apply to both the Institutional Class and the Investor Class) are waived for the Institutional Class to maintain the 1.25% expense limitation, to waive an equal amount (in annual percentage terms) of those same expenses for the Investor Class. The Total Annual Fund Operating Expenses After Fee Waiver and Expense Reimbursement for the Investor Class may vary from year to year and will in some years exceed 1.25%. If the operating expenses fall below the expense limitation in a year within three years after Matthews has made a waiver or reimbursement, the Fund may reimburse Matthews up to an amount that does not cause the expenses for that year to exceed the lesser of (i) the expense limitation applicable at the time of that fee waiver and/or expense reimbursement or (ii) the expense limitation in effect at the time of recoupment. This agreement will remain in place until April 30, 2019 and may be terminated at any time by the Board of Trustees on behalf of the Fund on 60 days’ written notice to Matthews. Matthews may decline to renew this agreement by written notice to the Trust at least 30 days before its annual expiration date. |
| 3 | The lesser of fiscal year 2017 long-term purchase costs or sales proceeds divided by the average monthly market value of long-term securities. |
| | | | |
| matthewsasia.com | 800.789.ASIA | | | 87 | |
| | | | | | | | | | | | | | | | | | | | | | | | | | | | |
| | | | | | | | |
| PERFORMANCE AS OF JUNE 30, 2018 | | | | | | | | | | | | | | | | | | | | | |
Institutional Class Shares were first offered on November 30, 2017. Performance since that date was 15.85%. Performance for the Institutional Class
Shares prior to its inception represents the performance of the Investor Class. Performance differences between the Institutional Class and the
Investor Class may arise due to differences in fees charged to each class. | |
| | | | |
| | | | | | | | | Average Annual Total Returns | | | | |
| | | 3 Months | | | YTD | | | 1 Year | | | 3 Years | | | 5 Years | | | Since
Inception | | | Inception
date | |
| Investor Class (MCSMX) | | | 2.37% | | | | 9.00% | | | | 36.21% | | | | 13.52% | | | | 14.78% | | | | 7.36% | | | | 05/31/11 | |
| Institutional Class (MICHX) | | | 2.37% | | | | 9.10% | | | | 36.36% | | | | 13.57% | | | | 14.81% | | | | 7.38% | | | | 11/30/17 | |
| MSCI China Small Cap Index4 | | | -1.90% | | | | 0.91% | | | | 15.64% | | | | -1.56% | | | | 7.22% | | | | 2.08% | 5 | | | | |
| Lipper China Region Funds Category Average6 | | | -4.74% | | | | -2.58% | | | | 15.90% | | | | 5.49% | | | | 10.32% | | | | 5.05% | 5 | | | | |
Performance assumes reinvestment of all dividends and/or distributions before taxes. All performance quoted represents past performance and is no guarantee of future results. Investment return and principal value will fluctuate with market conditions so that when redeemed, shares may be worth more or less than their original cost. Current performance may be lower or higher than the return figures quoted. Returns would have been lower if certain of the Fund’s fees and expenses had not been waived. For the Fund’s most recent month-end performance, visit matthewsasia.com.
GROWTH OF A $10,000 INVESTMENT SINCE INCEPTION—INVESTOR CLASS
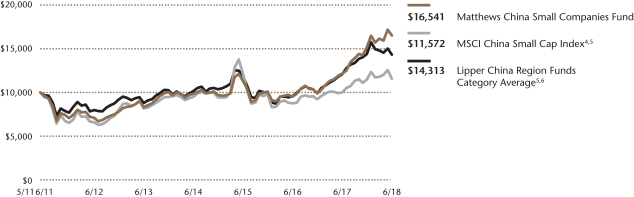
Plotted monthly. The performance data and graph do not reflect the deduction of taxes that a shareholder would pay on dividends, capital gains distributions or redemption of Fund shares. Values are in US$.
| | 4 | It is not possible to invest directly in an index. Source: Index data from Morgan Stanley Capital International and Bloomberg; total return calculations performed by BNY Mellon Investment Servicing (US) Inc. Please see page 92 for index definition. |
| | 6 | The Lipper Category Average does not reflect sales charges and is based on total return, including reinvestment of dividends and capital gains for the stated periods. |
| | | | | | | | |
| | | | |
| TOP TEN HOLDINGS7 | | | | | | | |
| | | Sector | | | | % of Net Assets | |
| Silergy Corp. | | Information Technology | | | | | 8.4% | |
| TK Group Holdings, Ltd. | | Industrials | | | | | 4.9% | |
| Sunny Friend Environmental Technology Co., Ltd. | | Industrials | | | | | 4.7% | |
| SITC International Holdings Co., Ltd. | | Industrials | | | | | 3.4% | |
| Shanghai Haohai Biological Technology Co., Ltd. | | Health Care | | | | | 2.9% | |
| Hua Hong Semiconductor, Ltd. | | Information Technology | | | | | 2.7% | |
| China Aviation Oil Singapore Corp., Ltd. | | Energy | | | | | 2.7% | |
| A-Living Services Co., Ltd. | | Industrials | | | | | 2.6% | |
| Baozun, Inc. | | Information Technology | | | | | 2.3% | |
| Joy City Property, Ltd. | | Real Estate | | | | | 2.3% | |
| % OF ASSETS IN TOP TEN | | | | | | | 36.9% | |
| | 7 | Holdings may combine more than one security from same issuer and related depositary receipts. |
Matthews China Small Companies Fund
Portfolio Manager Commentary (unaudited) (continued)
Notable Portfolio Changes:
During the second quarter we shed some “graduates” of our portfolio—stocks that did well during our holding period and saw their market capitalization exceed our typical small-cap range. China Resources Cement and KWG Property are two such examples of stocks that appreciated nicely due to strong earnings growth and valuations re-ratings. We continue to selectively add innovative companies to our portfolio, especially in the technology and consumer-related sectors. China’s small-cap universe continues to be a fertile hunting ground for finding cash flow-rich growth stocks at reasonable valuations, and we have been able to easily replace our “graduates” with attractive new holdings.
During the quarter, we initiated a position in Yihai International Holding, a leading hot pot soup base and condiments brand for both restaurants and retail consumers. We believe the company has strong growth visibility given the popularity of its associated hot pot restaurant chain and its rapidly growing new business in restaurant supplies.
Outlook:
We are still cautiously optimistic about China’s small-cap market despite heightened market volatility as we focus rigorously on the sound fundamentals of our portfolio companies. From a macro perspective, we continue to believe China has the ability to stabilize its economy through fiscal spending, interest rate adjustments and currency management. In addition, steps taken to correct China’s structural issues are continuing on the right track, despite the recent changes in presidential term limits. We are focused on seeking innovative and capital-efficient small companies that are relatively insulated from macroeconomic uncertainties. We will continue to seek companies with sustainable, quality earnings streams, strong cash flows and good balance sheets that can weather uncertain economic conditions. We believe sectors such as industrial automation, health care and technology are among the most attractive from a secular growth perspective.
| | | | |
| |
| COUNTRY ALLOCATION (%)8 | |
| China/Hong Kong | | | 87.7 | |
| Taiwan | | | 6.0 | |
| Japan | | | 2.1 | |
| Cash and Other Assets, Less Liabilities | | | 4.3 | |
| | | | |
| |
| SECTOR ALLOCATION (%)8 | |
| Information Technology | | | 24.0 | |
| Consumer Discretionary | | | 19.7 | |
| Industrials | | | 19.2 | |
| Health Care | | | 9.0 | |
| Materials | | | 8.2 | |
| Real Estate | | | 5.7 | |
| Energy | | | 4.6 | |
| Consumer Staples | | | 4.0 | |
| Financials | | | 1.3 | |
| Cash and Other Assets, Less Liabilities | | | 4.3 | |
| | | | |
| | |
| MARKET CAP EXPOSURE (%)8,9 | | | |
| Mega Cap (over $25B) | | | 0.0 | |
| Large Cap ($10B–$25B) | | | 0.0 | |
| Mid Cap ($3B–10B) | | | 13.9 | |
| Small Cap (under $3B) | | | 81.8 | |
| Cash and Other Assets, Less Liabilities | | | 4.3 | |
| 8 | Source: FactSet Research Systems. Percentage values in data are rounded to the nearest tenth of one percent, so the values may not sum to 100% due to rounding. Percentage values may be derived from different data sources and may not be consistent with other Fund literature. |
| 9 | The Fund defines Small Companies as companies with market capitalization generally between $100 million and $3 billion or the largest company included in the Fund’s primary benchmark, the MSCI China Small Cap Index. |
| | | | |
| matthewsasia.com | 800.789.ASIA | | | 89 | |
Matthews China Small Companies Fund
June 30, 2018
Schedule of Investmentsa (unaudited)
COMMON EQUITIES: 95.7%
| | | | | | | | |
| | | Shares | | | Value | |
| INFORMATION TECHNOLOGY: 24.0% | | | | | | | | |
Semiconductors & Semiconductor Equipment: 12.4% | |
Silergy Corp. | | | 245,000 | | | | $5,953,336 | |
Hua Hong Semiconductor, Ltd.b,c | | | 557,000 | | | | 1,903,757 | |
SG Micro Corp. A Sharesd | | | 50,497 | | | | 934,724 | |
| | | | | | | | |
| | | | | | | 8,791,817 | |
| | | | | | | | |
| | | | | | | | |
Internet Software & Services: 4.5% | | | | | | | | |
Baozun, Inc. ADRd | | | 30,300 | | | | 1,657,410 | |
SUNeVision Holdings, Ltd. | | | 1,963,000 | | | | 1,159,760 | |
Wise Talent Information Technology Co., Ltd.d | | | 89,400 | | | | 370,335 | |
| | | | | | | | |
| | | | | | | 3,187,505 | |
| | | | | | | | |
| | | | | | | | |
Electronic Equipment, Instruments & Components: 3.7% | |
China Youzan, Ltd.d | | | 10,300,000 | | | | 1,231,181 | |
Merry Electronics Co., Ltd. | | | 204,000 | | | | 886,013 | |
Truly International Holdings, Ltd. | | | 2,724,000 | | | | 518,805 | |
China High Precision Automation Group, Ltd.d,e | | | 195,000 | | | | 248 | |
| | | | | | | | |
| | | | | | | 2,636,247 | |
| | | | | | | | |
| | | | | | | | |
Software: 2.1% | | | | | | | | |
Kingdee International Software Group Co., Ltd. | | | 1,452,000 | | | | 1,478,904 | |
| | | | | | | | |
| | | | | | | | |
IT Services: 1.3% | | | | | | | | |
Huifu Payment, Ltd.b,c,d | | | 1,074,800 | | | | 930,189 | |
| | | | | | | | |
Total Information Technology | | | | | | | 17,024,662 | |
| | | | | | | | |
| | | | | | | | |
| CONSUMER DISCRETIONARY: 19.7% | | | | | | | | |
Diversified Consumer Services: 3.9% | | | | | | | | |
China Maple Leaf Educational Systems, Ltd. | | | 818,000 | | | | 1,468,900 | |
China Yuhua Education Corp., Ltd.b,c | | | 1,876,000 | | | | 1,327,239 | |
| | | | | | | | |
| | | | | | | 2,796,139 | |
| | | | | | | | |
| | | | | | | | |
Hotels, Restaurants & Leisure: 3.7% | | | | | | | | |
Xiabuxiabu Catering Management China Holdings Co., Ltd.b,c | | | 632,000 | | | | 1,380,079 | |
Future Bright Holdings, Ltd. | | | 5,832,000 | | | | 802,814 | |
Huangshan Tourism Development Co., Ltd. B Shares | | | 345,158 | | | | 409,594 | |
| | | | | | | | |
| | | | | | | 2,592,487 | |
| | | | | | | | |
| | | | | | | | |
Specialty Retail: 3.5% | | | | | | | | |
China Meidong Auto Holdings, Ltd. | | | 3,334,000 | | | | 1,505,987 | |
China ZhengTong Auto Services Holdings, Ltd. | | | 1,516,000 | | | | 1,006,393 | |
| | | | | | �� | | |
| | | | | | | 2,512,380 | |
| | | | | | | | |
| | | | | | | | |
Auto Components: 3.2% | | | | | | | | |
Xin Point Holdings, Ltd.c | | | 2,070,000 | | | | 1,364,506 | |
NBTM New Materials Group Co., Ltd. A Shares | | | 616,918 | | | | 907,379 | |
| | | | | | | | |
| | | | | | | 2,271,885 | |
| | | | | | | | |
| | | | | | | | |
Leisure Products: 2.1% | | | | | | | | |
Honma Golf, Ltd.b,c | | | 1,441,000 | | | | 1,476,412 | |
| | | | | | | | |
| | | | | | | | |
Textiles, Apparel & Luxury Goods: 1.8% | | | | | | | | |
JNBY Design, Ltd.c | | | 543,000 | | | | 1,240,569 | |
| | | | | | | | |
| | | | | | | | |
Household Durables: 1.5% | | | | | | | | |
Vatti Corp., Ltd. A Shares | | | 168,914 | | | | 621,662 | |
Vatti Corp., Ltd. A Shares | | | 118,100 | | | | 434,076 | |
| | | | | | | | |
| | | | | | | 1,055,738 | |
| | | | | | | | |
Total Consumer Discretionary | | | | | | | 13,945,610 | |
| | | | | | | | |
| | | | | | | | |
| | | Shares | | | Value | |
| INDUSTRIALS: 19.2% | | | | | | | | |
Commercial Services & Supplies: 8.9% | | | | | | | | |
Sunny Friend Environmental Technology Co., Ltd. | | | 473,000 | | | | $3,331,707 | |
A-Living Services Co., Ltd. H Sharesb,c,d | | | 1,017,750 | | | | 1,860,060 | |
Greentown Service Group Co., Ltd.c | | | 1,224,000 | | | | 1,107,968 | |
| | | | | | | | |
| | | | | | | 6,299,735 | |
| | | | | | | | |
| | | | | | | | |
Machinery: 6.9% | | | | | | | | |
TK Group Holdings, Ltd. | | | 4,084,000 | | | | 3,476,803 | |
Precision Tsugami China Corp., Ltd.c,d | | | 1,180,000 | | | | 1,394,565 | |
| | | | | | | | |
| | | | | | | 4,871,368 | |
| | | | | | | | |
| | | | | | | | |
Marine: 3.4% | | | | | | | | |
SITC International Holdings Co., Ltd. | | | 2,149,000 | | | | 2,394,088 | |
| | | | | | | | |
Total Industrials | | | | | | | 13,565,191 | |
| | | | | | | | |
| | | | | | | | |
| HEALTH CARE: 9.0% | | | | | | | | |
Biotechnology: 7.2% | | | | | | | | |
Shanghai Haohai Biological Technology Co., Ltd. H Sharesb,c | | | 328,300 | | | | 2,048,881 | |
BBI Life Sciences Corp.c | | | 3,286,500 | | | | 1,311,044 | |
BeiGene, Ltd. ADRd | | | 6,500 | | | | 999,245 | |
Amoy Diagnostics Co., Ltd. A Shares | | | 86,760 | | | | 729,109 | |
| | | | | | | | |
| | | | | | | 5,088,279 | |
| | | | | | | | |
| | | | | | | | |
Health Care Providers & Services: 1.0% | | | | | | | | |
C-MER Eye Care Holdings, Ltd.c,d | | | 680,000 | | | | 705,177 | |
| | | | | | | | |
| | | | | | | | |
Life Sciences Tools & Services: 0.8% | | | | | | | | |
Genscript Biotech Corp. | | | 214,000 | | | | 585,177 | |
| | | | | | | | |
Total Health Care | | | | | | | 6,378,633 | |
| | | | | | | | |
| | | | | | | | |
| MATERIALS: 8.2% | | | | | | | | |
Chemicals: 3.1% | | | | | | | | |
China BlueChemical, Ltd. H Shares | | | 4,318,000 | | | | 1,585,421 | |
Shanghai Putailai New Energy Technology Co., Ltd. A Shares | | | 67,200 | | | | 648,032 | |
| | | | | | | | |
| | | | | | | 2,233,453 | |
| | | | | | | | |
| | | | | | | | |
Containers & Packaging: 1.8% | | | | | | | | |
CPMC Holdings, Ltd. | | | 2,089,000 | | | | 1,287,613 | |
| | | | | | | | |
| | | | | | | | |
Metals & Mining: 1.7% | | | | | | | | |
MMG, Ltd.d | | | 1,696,000 | | | | 1,180,721 | |
| | | | | | | | |
| | | | | | | | |
Construction Materials: 1.6% | | | | | | | | |
Huaxin Cement Co., Ltd. B Shares | | | 835,586 | | | | 1,127,756 | |
| | | | | | | | |
Total Materials | | | | | | | 5,829,543 | |
| | | | | | | | |
| | | | | | | | |
| REAL ESTATE: 5.7% | | | | | | | | |
Real Estate Management & Development: 5.7% | | | | | |
Joy City Property, Ltd. | | | 12,784,000 | | | | 1,607,935 | |
Times China Holdings, Ltd. | | | 976,000 | | | | 1,440,702 | |
Yuzhou Properties Co., Ltd. | | | 1,700,000 | | | | 999,035 | |
| | | | | | | | |
Total Real Estate | | | | | | | 4,047,672 | |
| | | | | | | | |
| | | | | | | | |
| ENERGY: 4.6% | | | | | | | | |
Oil, Gas & Consumable Fuels: 4.6% | | | | | | | | |
China Aviation Oil Singapore Corp., Ltd. | | | 1,732,700 | | | | 1,878,988 | |
Sinopec Kantons Holdings, Ltd. | | | 2,892,000 | | | | 1,363,743 | |
| | | | | | | | |
Total Energy | | | | | | | 3,242,731 | |
| | | | | | | | |
| | | | | | | | |
Matthews China Small Companies Fund
June 30, 2018
Schedule of Investmentsa (unaudited) (continued)
COMMON EQUITIES (continued)
| | | | | | | | |
| | | Shares | | | Value | |
| CONSUMER STAPLES: 4.0% | | | | | | | | |
Food Products: 4.0% | | | | | | | | |
Yihai International Holding, Ltd. | | | 740,000 | | | | $1,406,230 | |
Jonjee Hi-Tech Industrial And Commercial Holding Co., Ltd. A Shares | | | 239,524 | | | | 1,009,298 | |
Jonjee Hi-Tech Industrial And Commercial Holding Co., Ltd. A Shares | | | 94,800 | | | | 399,992 | |
| | | | | | | | |
Total Consumer Staples | | | | | | | 2,815,520 | |
| | | | | | | | |
| | | | | | | | |
| FINANCIALS: 1.3% | | | | | | | | |
Banks: 1.3% | | | | | | | | |
Dah Sing Banking Group, Ltd. | | | 448,400 | | | | 938,253 | |
| | | | | | | | |
Total Financials | | | | | | | 938,253 | |
| | | | | | | | |
| | | | | | | | |
| TOTAL INVESTMENTS: 95.7% | | | | | | | 67,787,815 | |
(Cost $64,082,744) | | | | | | | | |
| | | | | | | | |
CASH AND OTHER ASSETS,
LESS LIABILITIES: 4.3% | | | | | | | 3,027,439 | |
| | | | | | | | |
| | |
NET ASSETS: 100.0% | | | | | | | $70,815,254 | |
| | | | | | | | |
| a | Certain securities were fair valued under the valuation policies approved by the Board of Trustees (Note 2-A). |
| b | Security exempt from registration under Rule 144A of the Securities Act of 1933, as amended. The security may be resold in transactions exempt from registration normally to qualified institutional buyers. The security has been determined to be liquid in accordance with procedures adopted by the Funds’ Board of Trustees. At June 30, 2018, the aggregate value is $10,926,617, which is 15.43% of net assets. |
| c | The securities may be resold to qualified foreign investors and foreign institutional buyers under Regulation S of the Securities Act of 1933. |
| d | Non-income producing security. |
| e | Security is valued using significant unobservable inputs and is classified as Level 3 in the fair value hierarchy. |
| ADR | American Depositary Receipt |
See accompanying notes to financial statements.
| | | | |
| matthewsasia.com | 800.789.ASIA | | | 91 | |
Index Definitions
The Markit iBoxx Asian Local Bond Index (ALBI) tracks the total return performance of a bond portfolio consisting of local-currency denominated, high quality and liquid bonds in Asia ex-Japan. The ALBI includes bonds from the following countries: China, Hong Kong, India, Indonesia, Malaysia, Philippines, Singapore, South Korea, Taiwan and Thailand.
The J.P. Morgan Asia Credit Index (JACI) tracks the total return performance of the Asia fixed-rate dollar bond market. JACI is a market cap-weighted index comprising sovereign, quasi-sovereign and corporate bonds and is partitioned by country, sector and credit rating. JACI includes bonds from the following countries: China, Hong Kong, India, Indonesia, Malaysia, Philippines, Singapore, South Korea and Thailand.
The MSCI All Country Asia ex Japan Index is a free float–adjusted market capitalization–weighted index of the stock markets of China, Hong Kong, India, Indonesia, Malaysia, Philippines, Singapore, South Korea, Taiwan and Thailand.
The MSCI All Country Asia Pacific Index is a free float–adjusted market capitalization–weighted index of the stock markets of Australia, China, Hong Kong, India, Indonesia, Japan, Malaysia, New Zealand, Philippines, Singapore, South Korea, Taiwan and Thailand.
The MSCI Emerging Markets (EM) Asia Index is a free float-adjusted market capitalization weighted index of the stock markets of China, India, Indonesia, Malaysia, Philippines, South Korea, Taiwan and Thailand.
The MSCI China Index is a free float–adjusted market capitalization–weighted index of Chinese equities that includes China-affiliated corporations and H shares listed on the Hong Kong
exchange, and B shares listed on the Shanghai and Shenzhen exchanges.
The S&P Bombay Stock Exchange (BSE) 100 Index is a free float–adjusted market capitalization–weighted index of the 100 stocks listed on the Bombay Stock Exchange.
The MSCI Japan Index is a free float–adjusted market capitalization–weighted index of Japanese equities listed in Japan.
The Korea Composite Stock Price Index (KOSPI) is a market capitalization–weighted index of all common stocks listed on the Korea Stock Exchange.
The MSCI All Country Asia ex Japan Small Cap Index is a free float–adjusted market capitalization–weighted small cap index of the stock markets of China, Hong Kong, India, Indonesia, Malaysia, Philippines, Singapore, South Korea, Taiwan and Thailand.
The MSCI China Small Cap Index is a free float–adjusted market capitalization–weighted small cap index of the Chinese equity securities markets, including H shares listed on the Hong Kong exchange, B shares listed on the Shanghai and Shenzhen exchanges, and Hong Kong-listed securities known as Red Chips (issued by entities owned by national or local governments in China) and P Chips (issued by companies controlled by individuals in China and deriving substantial revenues in China).
The MSCI All Country Asia Index is a free float–adjusted market capitalization–weighted index of the stock markets of China, Hong Kong, India, Indonesia, Japan, Malaysia, Philippines, Singapore, South Korea, Taiwan and Thailand.
Disclosures
Fund Holdings: The Fund holdings shown in this report are as of June 30, 2018. Holdings are subject to change at any time, so holdings shown in this report may not reflect current Fund holdings. The Funds file complete schedules of portfolio holdings with the U.S. Securities and Exchange Commission (the “SEC”) for the first and third quarters of each fiscal year on Form N-Q. The Funds’ Form N-Q is filed with the SEC within 60 days of the end of the quarter to which it relates, and is available on the SEC’s website at www.sec.gov. It may also be reviewed and copied at the Commission’s Public Reference Room in Washington, D.C. Information on the operation of the Public Reference Room may be obtained by calling 800.SEC.0330. Complete schedules of investments are also available without charge, upon request, from the Funds by calling us at 800.789.ASIA (2742).
Proxy Voting Record: The Funds’ Statement of Additional Information containing a description of the policies and procedures that the Funds have used to vote proxies relating to portfolio securities, along with each Fund’s proxy voting record relating to portfolio securities held during the most recent 12-month period ended June 30, is available upon request, at no charge, at the Funds’ website at matthewsasia.com or by calling 800.789.ASIA (2742), or on the SEC’s website at www.sec.gov.
Shareholder Reports and Prospectuses: To reduce the Funds’ expenses, we try to identify related shareholders in a household and send only one copy of the Funds’ prospectus and financial reports to that address. This process, called “householding,” will continue indefinitely unless you instruct us otherwise. At any time you may view the Funds’ current prospectus, summary prospectus and financial reports on our website. If you prefer to receive individual copies of the Funds’ prospectus or financial reports, please call us at 800.789.ASIA (2742).
Redemption Fee Policy: Through June 30, 2018, a 2.00% redemption fee was assessed on the sale or exchange of shares of the Matthews Emerging Asia Fund, Matthews Asia Small Companies Fund and Matthews China Small Companies Fund
(collectively, the “Covered Funds”) within 90 days after the date an investor purchases shares of the Covered Funds. The imposition of redemption fees pursuant to the Funds’ Short-Term Trading Redemption Fee Policy for the Covered Funds may assist the Covered Funds in discouraging market timing activity.
The redemption fee is also imposed to discourage short-term buying and selling of shares of the Covered Funds, which can disrupt the management of the Covered Funds’ investment portfolios and may have detrimental effects on the Covered Funds and other shareholders, and to allocate the costs the Covered Funds incur as a result of short-term trading and market timing. This fee is payable directly to the Covered Funds.
To determine whether the redemption fee applies, the Covered Funds do not count the day that shares were purchased, and first redeem the shares that have been held the longest.
The Covered Funds may grant exemptions from the redemption fee in certain circumstances. For more information on this policy, please see the Funds’ prospectus.
The Funds (or their agents) attempt to contact shareholders whom the Funds (or their agents) believe have violated the Funds’ policies and procedures related to short-term trading and market-timing activity, and notify them that they will no longer be permitted to buy (or exchange) shares of the Funds. When a shareholder has purchased shares of the Funds through an intermediary, the Funds may not be able to notify the shareholder of a violation of the Funds’ policies or that the Funds have taken steps to address the situation (for example, the Funds may be unable to notify a shareholder that his or her privileges to purchase or exchange shares of the Funds have been terminated). Nonetheless, additional purchase and exchange orders for such investors will not be accepted by the Funds.
The Funds may reject for any reason, or cancel as permitted or required by law, any purchase or exchange, including transactions deemed to represent excessive trading, at any time.
| | | | |
| matthewsasia.com | 800.789.ASIA | | | 93 | |
Disclosure of Fund Expenses (unaudited)
We believe it is important for you to understand the impact of fees regarding your investment. All mutual funds have operating expenses. As a shareholder of a mutual fund, you incur ongoing costs, which include costs for portfolio management, administrative services, and shareholder reports (like this one), among others. Operating expenses, which are deducted from a fund’s gross income, directly reduce the investment return of the fund. A fund’s operating expenses are expressed as a percentage of its average net assets. This figure is known as the expense ratio. The following examples are intended to help you understand the ongoing fees (in dollars) of investing in your fund and to compare these costs with those of other mutual funds. The examples are based on an investment of $1,000 made at the beginning of the period shown and held for the entire period.
This table illustrates your fund’s costs in two ways:
Actual Fund Return: This section helps you to estimate the actual operating expenses, after any applicable fee waivers, that you paid over the period. The “Ending Account Value” shown is derived from the fund’s actual return for the past six month period, the “Expense Ratio” column shows the period’s annualized expense ratio, and the “Operating Expenses Paid During Period” column shows the dollar amount that would have been paid by an investor who started with $1,000 in the fund at the beginning of the period. You may use the information here, together with your account value, to estimate the expenses that you paid over the period. To do so, simply divide your account value by $1,000 (for example, an
$8,600 account value divided by $1,000 = 8.6), then multiply the result by the number given for your fund in the first line under the heading entitled “Operating Expenses Paid During Period.”
Hypothetical 5% Return: This section is intended to help you compare your fund’s costs with those of other mutual funds. It assumes that the fund had an annual return of 5% before operating expenses, but that the expense ratio is unchanged. In this case, because the return used is not the fund’s actual return, the results do not apply to your investment. This example is useful in making comparisons to other mutual funds because the U.S. Securities and Exchange Commission requires all mutual funds to calculate expenses based on an assumed 5% annual return. You can assess your fund’s costs by comparing this hypothetical example with the hypothetical examples that appear in shareholder reports of other funds.
Please note that the operating expenses shown in the table are meant to highlight and help you compare your ongoing costs only and do not reflect any transactional costs such as sales charges (loads), redemption fees, or exchange fees.
Matthews Asia Funds does not charge any sales loads, exchange fees, or 12b-1 fees, but these may be present in other funds to which you compare this data. Therefore, the hypothetical portions of the table are useful in comparing ongoing costs only, and will not help you determine the relative total costs of owning different funds.
June 30, 2018
Disclosure of Fund Expenses (unaudited) (continued)
| | | | | | | | | | | | | | | | | | | | | | | | | | | | | | | | | | | | |
| | | INVESTOR CLASS | | | | | | INSTITUTIONAL CLASS | |
| | | Beginning
Account Value 1/1/18 | | | Ending
Account Value 6/30/18 | | | Expense
Ratio1 | | | Operating
Expenses
Paid During
Period
1/1/18–
6/30/182 | | | | | | Beginning
Account Value 1/1/18 | | | Ending
Account Value 6/30/18 | | | Expense
Ratio1 | | | Operating
Expenses
Paid During
Period
1/1/18–
6/30/182 | |
| ASIA FIXED INCOME STRATEGIES | | | | | | | | | | | | | | | | | | | | | | | | | | | | | | | | | | | | |
Matthews Asia Strategic Income Fund | | | | | | | | | | | | | | | | | | | | | | | | | | | | | | | | | |
Actual Fund Return | | | $1,000.00 | | | | $965.10 | | | | 1.15% | | | | $5.60 | | | | | | | | $1,000.00 | | | | $967.20 | | | | 0.90% | | | | $4.39 | |
Hypothetical 5% Returns | | | $1,000.00 | | | | $1,030.50 | | | | 1.15% | | | | $5.79 | | | | | | | | $1,000.00 | | | | $1,029.26 | | | | 0.90% | | | | $4.53 | |
Matthews Asia Credit Opportunities Fund | | | | | | | | | | | | | | | | | | | | | | | | | | | | | | | | | |
Actual Fund Return | | | $1,000.00 | | | | $972.30 | | | | 1.15% | | | | $5.62 | | | | | | | | $1,000.00 | | | | $972.50 | | | | 0.90% | | | | $4.40 | |
Hypothetical 5% Returns | | | $1,000.00 | | | | $1,030.50 | | | | 1.15% | | | | $5.79 | | | | | | | | $1,000.00 | | | | $1,029.26 | | | | 0.90% | | | | $4.53 | |
| | | | | | | | |
| ASIA GROWTH AND INCOME STRATEGIES | | | | | | | | | | | | | | | | | | | | | | | | | | | | | | | | | |
Matthews Asian Growth and Income Fund | | | | | | | | | | | | | | | | | | | | | | | | | | | | | | | | | |
Actual Fund Return | | | $1,000.00 | | | | $937.90 | | | | 1.10% | | | | $5.29 | | | | | | | | $1,000.00 | | | | $938.80 | | | | 0.93% | | | | $4.47 | |
Hypothetical 5% Returns | | | $1,000.00 | | | | $1,030.25 | | | | 1.10% | | | | $5.54 | | | | | | | | $1,000.00 | | | | $1,029.41 | | | | 0.93% | | | | $4.68 | |
Matthews Asia Dividend Fund | | | | | | | | | | | | | | | | | | | | | | | | | | | | | | | | | | | | |
Actual Fund Return | | | $1,000.00 | | | | $965.60 | | | | 0.99% | | | | $4.82 | | | | | | | | $1,000.00 | | | | $966.10 | | | | 0.89% | | | | $4.34 | |
Hypothetical 5% Returns | | | $1,000.00 | | | | $1,029.70 | | | | 0.99% | | | | $4.98 | | | | | | | | $1,000.00 | | | | $1,029.21 | | | | 0.89% | | | | $4.48 | |
Matthews China Dividend Fund | | | | | | | | | | | | | | | | | | | | | | | | | | | | | | | | | | | | |
Actual Fund Return | | | $1,000.00 | | | | $1,031.00 | | | | 1.11% | | | | $5.59 | | | | | | | | $1,000.00 | | | | $1,031.90 | | | | 0.97% | | | | $4.89 | |
Hypothetical 5% Returns | | | $1,000.00 | | | | $1,030.30 | | | | 1.11% | | | | $5.59 | | | | | | | | $1,000.00 | | | | $1,029.60 | | | | 0.97% | | | | $4.88 | |
| | | | | | | | | |
| ASIA VALUE STRATEGY | | | | | | | | | | | | | | | | | | | | | | | | | | | | | | | | | | | | |
Matthews Asia Value Fund | | | | | | | | | | | | | | | | | | | | | | | | | | | | | | | | | | | | |
Actual Fund Return | | | $1,000.00 | | | | $970.40 | | | | 1.50% | | | | $7.33 | | | | | | | | $1,000.00 | | | | $971.70 | | | | 1.25% | | | | $6.11 | |
Hypothetical 5% Returns | | | $1,000.00 | | | | $1,032.23 | | | | 1.50% | | | | $7.56 | | | | | | | | $1,000.00 | | | | $1,030.99 | | | | 1.25% | | | | $6.29 | |
| | | | | | | | | |
| ASIA GROWTH STRATEGIES | | | | | | | | | | | | | | | | | | | | | | | | | | | | | | | | | | | | |
Matthews Asia Focus Fund | | | | | | | | | | | | | | | | | | | | | | | | | | | | | | | | | | | | |
Actual Fund Return | | | $1,000.00 | | | | $926.90 | | | | 1.50% | | | | $7.17 | | | | | | | | $1,000.00 | | | | $928.10 | | | | 1.25% | | | | $5.98 | |
Hypothetical 5% Returns | | | $1,000.00 | | | | $1,032.23 | | | | 1.50% | | | | $7.56 | | | | | | | | $1,000.00 | | | | $1,030.99 | | | | 1.25% | | | | $6.29 | |
Matthews Asia Growth Fund | | | | | | | | | | | | | | | | | | | | | | | | | | | | | | | | | | | | |
Actual Fund Return | | | $1,000.00 | | | | $1,029.70 | | | | 1.07% | | | | $5.38 | | | | | | | | $1,000.00 | | | | $1,030.60 | | | | 0.90% | | | | $4.53 | |
Hypothetical 5% Returns | | | $1,000.00 | | | | $1,030.10 | | | | 1.07% | | | | $5.39 | | | | | | | | $1,000.00 | | | | $1,029.26 | | | | 0.90% | | | | $4.53 | |
Matthews Pacific Tiger Fund | | | | | | | | | | | | | | | | | | | | | | | | | | | | | | | | | | | | |
Actual Fund Return | | | $1,000.00 | | | | $946.00 | | | | 1.04% | | | | $5.02 | | | | | | | | $1,000.00 | | | | $946.90 | | | | 0.87% | | | | $4.20 | |
Hypothetical 5% Returns | | | $1,000.00 | | | | $1,029.95 | | | | 1.04% | | | | $5.23 | | | | | | | | $1,000.00 | | | | $1,029.11 | | | | 0.87% | | | | $4.38 | |
Matthews Asia ESG Fund | | | | | | | | | | | | | | | | | | | | | | | | | | | | | | | | | | | | |
Actual Fund Return | | | $1,000.00 | | | | $979.20 | | | | 1.50% | | | | $7.36 | | | | | | | | $1,000.00 | | | | $980.90 | | | | 1.25% | | | | $6.14 | |
Hypothetical 5% Returns | | | $1,000.00 | | | | $1,032.23 | | | | 1.50% | | | | $7.56 | | | | | | | | $1,000.00 | | | | $1,030.99 | | | | 1.25% | | | | $6.29 | |
Matthews Emerging Asia Fund | | | | | | | | | | | | | | | | | | | | | | | | | | | | | | | | | | | | |
Actual Fund Return | | | $1,000.00 | | | | $891.00 | | | | 1.49% | | | | $6.99 | | | | | | | | $1,000.00 | | | | $891.50 | | | | 1.25% | | | | $5.86 | |
Hypothetical 5% Returns | | | $1,000.00 | | | | $1,032.18 | | | | 1.49% | | | | $7.51 | | | | | | | | $1,000.00 | | | | $1,030.99 | | | | 1.25% | | | | $6.29 | |
Matthews Asia Innovators Fund | | | | | | | | | | | | | | | | | | | | | | | | | | | | | | | | | | | | |
Actual Fund Return | | | $1,000.00 | | | | $1,013.40 | | | | 1.12% | | | | $5.59 | | | | | | | | $1,000.00 | | | | $1,014.00 | | | | 0.96% | | | | $4.79 | |
Hypothetical 5% Returns | | | $1,000.00 | | | | $1,030.35 | | | | 1.12% | | | | $5.64 | | | | | | | | $1,000.00 | | | | $1,029.56 | | | | 0.96% | | | | $4.83 | |
Matthews China Fund | | | | | | | | | | | | | | | | | | | | | | | | | | | | | | | | | | | | |
Actual Fund Return | | | $1,000.00 | | | | $998.60 | | | | 1.05% | | | | $5.20 | | | | | | | | $1,000.00 | | | | $999.10 | | | | 0.88% | | | | $4.36 | |
Hypothetical 5% Returns | | | $1,000.00 | | | | $1,030.00 | | | | 1.05% | | | | $5.28 | | | | | | | | $1,000.00 | | | | $1,029.16 | | | | 0.88% | | | | $4.43 | |
Matthews India Fund | | | | | | | | | | | | | | | | | | | | | | | | | | | | | | | | | | | | |
Actual Fund Return | | | $1,000.00 | | | | $950.70 | | | | 1.07% | | | | $5.18 | | | | | | | | $1,000.00 | | | | $951.60 | | | | 0.88% | | | | $4.26 | |
Hypothetical 5% Returns | | | $1,000.00 | | | | $1,030.10 | | | | 1.07% | | | | $5.39 | | | | | | | | $1,000.00 | | | | $1,029.16 | | | | 0.88% | | | | $4.43 | |
| 1 | Annualized, based on the Fund’s most recent fiscal half-year expenses. |
| 2 | Operating expenses are equal to the Fund’s annualized expense ratio multiplied by the average account value over the period, multiplied by 181 days, then divided by 365. |
| | | | |
| matthewsasia.com | 800.789.ASIA | | | 95 | |
Disclosure of Fund Expenses (unaudited) (continued)
| | | | | | | | | | | | | | | | | | | | | | | | | | | | | | | | | | | | |
| | | INVESTOR CLASS | | | | | | INSTITUTIONAL CLASS | |
| | | Beginning
Account Value 1/1/18 | | | Ending
Account Value 6/30/18 | | | Expense
Ratio1 | | | Operating
Expenses
Paid During
Period
1/1/18–
6/30/182 | | | | | | Beginning
Account Value 1/1/18 | | | Ending
Account Value 6/30/18 | | | Expense
Ratio1 | | | Operating
Expenses
Paid During
Period
1/1/18–
6/30/182 | |
| ASIA GROWTH STRATEGIES (continued) | | | | | | | | | | | | | | | | | | | | | | | | | | | | | | | | | |
Matthews Japan Fund | | | | | | | | | | | | | | | | | | | | | | | | | | | | | | | | | | | | |
Actual Fund Return | | | $1,000.00 | | | | $1,000.80 | | | | 0.90% | | | | $4.46 | | | | | | | | $1,000.00 | | | | $1,001.30 | | | | 0.83% | | | | $4.12 | |
Hypothetical 5% Returns | | | $1,000.00 | | | | $1,029.26 | | | | 0.90% | | | | $4.53 | | | | | | | | $1,000.00 | | | | $1,028.91 | | | | 0.83% | | | | $4.18 | |
Matthews Korea Fund | | | | | | | | | | | | | | | | | | | | | | | | | | | | | | | | | | | | |
Actual Fund Return | | | $1,000.00 | | | | $882.80 | | | | 1.12% | | | | $5.23 | | | | | | | | $1,000.00 | | | | $883.40 | | | | 0.98% | | | | $4.58 | |
Hypothetical 5% Returns | | | $1,000.00 | | | | $1,030.35 | | | | 1.12% | | | | $5.64 | | | | | | | | $1,000.00 | | | | $1,029.65 | | | | 0.98% | | | | $4.93 | |
| | | | | | | | |
| ASIA SMALL COMPANY STRATEGIES | | | | | | | | | | | | | | | | | | | | | | | | | | | | | | | | | |
Matthews Asia Small Companies Fund | | | | | | | | | | | | | | | | | | | | | | | | | | | | | | | | | |
Actual Fund Return | | | $1,000.00 | | | | $989.50 | | | | 1.47% | | | | $7.25 | | | | | | | | $1,000.00 | | | | $990.80 | | | | 1.25% | | | | $6.17 | |
Hypothetical 5% Returns | | | $1,000.00 | | | | $1,032.08 | | | | 1.47% | | | | $7.41 | | | | | | | | $1,000.00 | | | | $1,030.99 | | | | 1.25% | | | | $6.29 | |
Matthews China Small Companies Fund | | | | | | | | | | | | | | | | | | | | | | | | | | | | | | | | | |
Actual Fund Return | | | $1,000.00 | | | | $1,090.00 | | | | 1.50% | | | | $7.77 | | | | | | | | $1,000.00 | | | | $1,091.00 | | | | 1.25% | | | | $6.48 | |
Hypothetical 5% Returns | | | $1,000.00 | | | | $1,032.23 | | | | 1.50% | | | | $7.56 | | | | | | | | $1,000.00 | | | | $1,030.99 | | | | 1.25% | | | | $6.29 | |
| 1 | Annualized, based on the Fund’s most recent fiscal half-year expenses. |
| 2 | Operating expenses are equal to the Fund’s annualized expense ratio multiplied by the average account value over the period, multiplied by 181 days, then divided by 365. |
(This Page Intentionally Left Blank)
| | | | |
| matthewsasia.com | 800.789.ASIA | | | 97 | |
Statements of Assets and Liabilities (unaudited)
| | | | | | | | | | | | |
| | | Matthews Asia
Strategic
Income Fund | | | Matthews Asia
Credit
Opportunities Fund | | | Matthews Asian
Growth and
Income Fund | |
ASSETS: | | | | | | | | | | | | |
Investments at value (A) (Note 2-A and 7): | | | | | | | | | | | | |
Unaffiliated issuers | | | $106,722,329 | | | | $35,338,551 | | | | $2,121,878,842 | |
Affiliated issuers | | | — | | | | — | | | | — | |
Cash | | | 5,643,951 | | | | 6,156,151 | | | | 29,338,418 | |
Cash pledged collateral for forward foreign currency exchange contracts | | | 1,170,000 | | | | — | | | | — | |
Segregated foreign currency at value | | | 21,946 | | | | 7,751 | | | | — | |
Foreign currency at value (B) | | | 158 | | | | 72 | | | | 663,785 | |
Dividends, interest and other receivable | | | 1,904,072 | | | | 590,984 | | | | 10,201,652 | |
Receivable for securities sold | | | 2,806,749 | | | | 1,053,305 | | | | 54,937,801 | |
Receivable for capital shares sold | | | 75,510 | | | | 135,883 | | | | 2,984,326 | |
Due from Advisor (Note 5) | | | — | | | | — | | | | — | |
Unrealized appreciation on forward foreign currency exchange contracts | | | 165,468 | | | | — | | | | — | |
Prepaid expenses and other assets | | | 20,276 | | | | 22,203 | | | | 17,119 | |
TOTAL ASSETS | | | 118,530,459 | | | | 43,304,900 | | | | 2,220,021,943 | |
LIABILITIES: | | | | | | | | | | | | |
Payable for securities purchased | | | — | | | | — | | | | 16,910,283 | |
Payable for capital shares redeemed | | | 214,975 | | | | 27,690 | | | | 8,496,164 | |
Unrealized depreciation on forward foreign currency exchange contracts | | | 1,473,456 | | | | — | | | | — | |
Deferred foreign capital gains tax liability (Note 2-F) | | | 52 | | | | — | | | | — | |
Due to Advisor (Note 5) | | | 52,895 | | | | 12,422 | | | | 1,240,424 | |
Administration and accounting fees payable (Note 5) | | | 1,550 | | | | 529 | | | | 31,068 | |
Administration and shareholder servicing fees payable (Note 5) | | | 12,366 | | | | 4,233 | | | | 242,234 | |
Custodian fees payable | | | 6,578 | | | | 203 | | | | 120,777 | |
Intermediary service fees payable (Note 5) | | | 26,902 | | | | 4,202 | | | | 572,138 | |
Professional fees payable | | | 31,800 | | | | 29,467 | | | | 54,335 | |
Transfer agent fees payable | | | 479 | | | | 100 | | | | 13,181 | |
Accrued other expenses payable | | | 7,719 | | | | 4,065 | | | | 96,338 | |
TOTAL LIABILITIES | | | 1,828,772 | | | | 82,911 | | | | 27,776,942 | |
NET ASSETS | | | $116,701,687 | | | | $43,221,989 | | | | $2,192,245,001 | |
NET ASSETS: | | | | | | | | | | | | |
Investor Class | | | $53,509,630 | | | | $10,550,402 | | | | $1,105,975,459 | |
Institutional Class | | | 63,192,057 | | | | 32,671,587 | | | | 1,086,269,542 | |
TOTAL | | | $116,701,687 | | | | $43,221,989 | | | | $2,192,245,001 | |
See accompanying notes to financial statements.
June 30, 2018
| | | | | | | | | | | | | | | | | | | | | | |
Matthews Asia
Dividend Fund | | | Matthews China
Dividend Fund | | | Matthews Asia
Value Fund | | | Matthews Asia
Focus Fund | | | Matthews Asia
Growth Fund | | | Matthews Pacific
Tiger Fund | |
| | | | | | | | | | | | | | | | | | | | | | |
| | | | | | | | | | | | | | | | | | | | | | |
| | $6,041,416,385 | | | | $334,602,963 | | | | $31,934,065 | | | | $8,232,723 | | | | $1,041,527,155 | | | | $7,777,259,787 | |
| | 906,685,870 | | | | — | | | | — | | | | — | | | | 30,877,498 | | | | 1,325,181,024 | |
| | 94,254,484 | | | | 11,448,456 | | | | 4,021,821 | | | | 182,983 | | | | 90,020,705 | | | | 26,000,466 | |
| | — | | | | — | | | | — | | | | — | | | | — | | | | — | |
| | 79,809 | | | | 15,100 | | | | — | | | | — | | | | — | | | | 152,617 | |
| | 14,835,057 | | | | 1,709,534 | | | | 31,015 | | | | 2,117 | | | | 241,656 | | | | 3,284,515 | |
| | 24,583,059 | | | | 1,957,550 | | | | 94,613 | | | | 35,459 | | | | 991,614 | | | | 33,058,239 | |
| | — | | | | — | | | | — | | | | — | | | | — | | | | 6,724,243 | |
| | 8,664,348 | | | | 470,494 | | | | 19,514 | | | | 20,000 | | | | 3,043,947 | | | | 28,216,568 | |
| | — | | | | — | | | | — | | | | 6,812 | | | | — | | | | — | |
| | — | | | | — | | | | — | | | | — | | | | — | | | | — | |
| | 91,438 | | | | 6,020 | | | | 14,914 | | | | 19,214 | | | | 12,588 | | | | 70,218 | |
| | 7,090,610,450 | | | | 350,210,117 | | | | 36,115,942 | | | | 8,499,308 | | | | 1,166,715,163 | | | | 9,199,947,677 | |
| | | | | | | | | | | | | | | | | | | | | | |
| | 8,319,988 | | | | 1,152,436 | | | | 174,817 | | | | 2 | | | | 48 | | | | 16,938,858 | |
| | 12,050,454 | | | | 738,651 | | | | 18,962 | | | | 49,238 | | | | 766,660 | | | | 16,248,505 | |
| | — | | | | — | | | | — | | | | — | | | | — | | | | — | |
| | 2,992,553 | | | | — | | | | — | | | | — | | | | 1,156,653 | | | | 11,084,867 | |
| | 3,933,392 | | | | 195,309 | | | | 18,046 | | | | — | | | | 641,816 | | | | 5,001,709 | |
| | 98,331 | | | | 4,759 | | | | 501 | | | | 119 | | | | 15,350 | | | | 126,285 | |
| | 727,030 | | | | 38,142 | | | | 3,936 | | | | 933 | | | | 125,357 | | | | 899,063 | |
| | 219,688 | | | | 9,870 | | | | 7,018 | | | | 6,255 | | | | 35,101 | | | | 490,817 | |
| | 836,261 | | | | 36,375 | | | | 9,715 | | | | — | | | | 67,427 | | | | 945,177 | |
| | 62,335 | | | | 32,379 | | | | 28,929 | | | | 31,123 | | | | 48,395 | | | | 90,488 | |
| | 111,576 | | | | 1,303 | | | | 98 | | | | 290 | | | | 2,978 | | | | 29,487 | |
| | 132,473 | | | | 17,851 | | | | 10,594 | | | | 8,270 | | | | 28,569 | | | | 98,840 | |
| | 29,484,081 | | | | 2,227,075 | | | | 272,616 | | | | 96,230 | | | | 2,888,354 | | | | 51,954,096 | |
| | $7,061,126,369 | | | | $347,983,042 | | | | $35,843,326 | | | | $8,403,078 | | | | $1,163,826,809 | | | | $9,147,993,581 | |
| | | | | | | | | | | | | | | | | | | | | | |
| | $3,440,767,214 | | | | $253,628,814 | | | | $32,175,686 | | | | $3,438,499 | | | | $642,683,138 | | | | $2,978,917,577 | |
| | 3,620,359,155 | | | | 94,354,228 | | | | 3,667,640 | | | | 4,964,579 | | | | 521,143,671 | | | | 6,169,076,004 | |
| | $7,061,126,369 | | | | $347,983,042 | | | | $35,843,326 | | | | $8,403,078 | | | | $1,163,826,809 | | | | $9,147,993,581 | |
| | | | |
| matthewsasia.com | 800.789.ASIA | | | 99 | |
Statements of Assets and Liabilities (unaudited) (continued)
| | | | | | | | | | | | |
| | | Matthews Asia
Strategic
Income Fund | | | Matthews Asia
Credit
Opportunities Fund | | | Matthews Asian
Growth and
Income Fund | |
SHARES OUTSTANDING: | | | | | �� | | | | | | | |
(shares of beneficial interest issued and outstanding, respectively, unlimited number of shares authorized with a $0.001 par value) | | | | | | | | | | | | |
Investor Class | | | 5,153,699 | | | | 1,062,812 | | | | 68,443,095 | |
Institutional Class | | | 6,089,607 | | | | 3,292,217 | | | | 67,325,482 | |
TOTAL | | | 11,243,306 | | | | 4,355,029 | | | | 135,768,577 | |
NET ASSET VALUE: | | | | | | | | | | | | |
Investor Class, offering price and redemption price | | | $10.38 | | | | $9.93 | | | | $16.16 | |
Institutional Class, offering price and redemption price | | | $10.38 | | | | $9.92 | | | | $16.13 | |
NET ASSETS CONSISTS OF: | | | | | | | | | | | | |
Capital paid-in | | | $122,110,202 | | | | $44,600,535 | | | | $1,888,074,669 | |
Undistributed (distribution in excess of) net investment income (loss) | | | (83,465 | ) | | | (8,876 | ) | | | (15,705,198 | ) |
Undistributed/accumulated net realized gain (loss) on investments, and foreign currency related transactions | | | (978,203 | ) | | | (39,075 | ) | | | 213,499,441 | |
Net unrealized appreciation (depreciation) on investments, foreign currency translations and foreign capital gains taxes | | | (4,346,847 | ) | | | (1,330,595 | ) | | | 106,376,089 | |
NET ASSETS | | | $116,701,687 | | | | $43,221,989 | | | | $2,192,245,001 | |
(A) Investments at cost: | | | | | | | | | | | | |
Unaffiliated Issuers | | | $109,732,199 | | | | $36,667,268 | | | | $2,015,476,954 | |
Affiliated Issuers | | | — | | | | — | | | | — | |
(B) Foreign Currency at Cost | | | $161 | | | | $73 | | | | $663,773 | |
See accompanying notes to financial statements.
June 30, 2018
| | | | | | | | | | | | | | | | | | | | | | |
Matthews Asia
Dividend Fund | | | Matthews China
Dividend Fund | | | Matthews Asia
Value Fund | | | Matthews Asia
Focus Fund | | | Matthews Asia
Growth Fund | | | Matthews Pacific
Tiger Fund | |
| | | | | | | | | | | | | | | | | | | | | | |
| | | | | | | | | | | | | | | | | | | | | | |
| | 182,472,869 | | | | 14,229,432 | | | | 2,584,925 | | | | 304,483 | | | | 22,903,019 | | | | 99,458,460 | |
| | 192,044,995 | | | | 5,293,546 | | | | 296,504 | | | | 436,852 | | | | 18,421,361 | | | | 205,950,720 | |
| | 374,517,864 | | | | 19,522,978 | | | | 2,881,429 | | | | 741,335 | | | | 41,324,380 | | | | 305,409,180 | |
| | | | | | | | | | | | | | | | | | | | | | |
| | $18.86 | | | | $17.82 | | | | $12.45 | | | | $11.29 | | | | $28.06 | | | | $29.95 | |
| | $18.85 | | | | $17.82 | | | | $12.37 | | | | $11.36 | | | | $28.29 | | | | $29.95 | |
| | | | | | | | | | | | | | | | | | | | | | |
| | $5,544,651,289 | | | | $292,001,342 | | | | $35,326,948 | | | | $7,217,442 | | | | $854,820,251 | | | | $5,866,009,553 | |
| | (34,508,547 | ) | | | (4,761,903 | ) | | | (337,264 | ) | | | 124,561 | | | | (4,644,254 | ) | | | 34,183,032 | |
|
283,553,875 |
| | | 31,947,729 | | | | 1,296,124 | | | | 718,061 | | | | 11,703,305 | | | | 356,158,565 | |
|
1,267,429,752 |
| | | 28,795,874 | | | | (442,482 | ) | | | 343,014 | | | | 301,947,507 | | | | 2,891,642,431 | |
| | $7,061,126,369 | | | | $347,983,042 | | | | $35,843,326 | | | | $8,403,078 | | | | $1,163,826,809 | | | | $9,147,993,581 | |
| | | | | | | | | | | | | | | | | | | | | | |
| | $5,009,267,511 | | | | $305,754,018 | | | | $32,376,410 | | | | $7,889,322 | | | | $744,378,686 | | | | $4,859,385,868 | |
| | 668,328,369 | | | | — | | | | — | | | | — | | | | 24,904,989 | | | | 1,340,122,392 | |
| | $14,868,952 | | | | $1,762,301 | | | | $31,013 | | | | $2,122 | | | | $242,241 | | | | $3,314,402 | |
| | | | |
| matthewsasia.com | 800.789.ASIA | | | 101 | |
Statements of Assets and Liabilities (unaudited) (continued)
| | | | | | | | | | | | |
| | |
Matthews Asia
ESG Fund | | | Matthews Emerging
Asia Fund | | | Matthews Asia
Innovators Fund | |
ASSETS: | | | | | | | | | | | | |
Investments at value (A) (Note 2-A and 7): | | | | | | | | | | | | |
Unaffiliated issuers | | | $20,982,119 | | | | $446,173,172 | | | | $288,095,834 | |
Affiliated issuers | | | — | | | | 19,613,054 | | | | — | |
Cash | | | 125,752 | | | | 24,802,587 | | | | 7,728,972 | |
Segregated foreign currency at value | | | 21 | | | | — | | | | — | |
Foreign currency at value (B) | | | 107,536 | | | | 2,771,064 | | | | 317,177 | |
Dividends, interest and other receivable | | | 48,147 | | | | 973,179 | | | | 580,171 | |
Receivable for securities sold | | | — | | | | — | | | | 1,442,930 | |
Receivable for capital shares sold | | | 72,464 | | | | 2,229,578 | | | | 1,678,806 | |
Prepaid expenses and other assets | | | 20,013 | | | | 30,561 | | | | 30,450 | |
TOTAL ASSETS | | | 21,356,052 | | | | 496,593,195 | | | | 299,874,340 | |
LIABILITIES: | | | | | | | | | | | | |
Payable for securities purchased | | | 142,325 | | | | 510,577 | | | | 2,952,445 | |
Payable for capital shares redeemed | | | 53,437 | | | | 796,934 | | | | 620,043 | |
Deferred foreign capital gains tax liability (Note 2-F) | | | 69,684 | | | | 3,185,666 | | | | 695,066 | |
Due to Advisor (Note 5) | | | 1,141 | | | | 325,421 | | | | 167,791 | |
Administration and accounting fees payable (Note 5) | | | 282 | | | | 6,846 | | | | 3,981 | |
Administration and shareholder servicing fees payable (Note 5) | | | 2,260 | | | | 53,958 | | | | 32,768 | |
Custodian fees payable | | | 11,116 | | | | 110,970 | | | | 20,129 | |
Intermediary service fees payable (Note 5) | | | 5,273 | | | | 49,446 | | | | — | |
Professional fees payable | | | 30,390 | | | | 36,695 | | | | 30,896 | |
Transfer agent fees payable | | | 78 | | | | 1,473 | | | | 1,086 | |
Accrued other expenses payable | | | 16,202 | | | | 21,652 | | | | 11,021 | |
TOTAL LIABILITIES | | | 332,188 | | | | 5,099,638 | | | | 4,535,226 | |
NET ASSETS | | | $21,023,864 | | | | $491,493,557 | | | | $295,339,114 | |
NET ASSETS: | | | | | | | | | | | | |
Investor Class | | | $12,505,956 | | | | $168,975,325 | | | | $213,593,185 | |
Institutional Class | | | 8,517,908 | | | | 322,518,232 | | | | 81,745,929 | |
TOTAL | | | $21,023,864 | | | | $491,493,557 | | | | $295,339,114 | |
See accompanying notes to financial statements.
June 30, 2018
| | | | | | | | | | | | | | | | | | | | | | |
Matthews
China Fund | | | Matthews
India Fund | | | Matthews
Japan Fund | | | Matthews
Korea Fund | | | Matthews Asia
Small Companies
Fund | | | Matthews China
Small Companies
Fund | |
| | | | | | | | | | | | | | | | | | | | | | |
| | | | | | | | | | | | | | | | | | | | | | |
| | $1,025,265,600 | | | | $1,998,975,586 | | | | $4,485,753,343 | | | | $204,730,741 | | | | $386,547,268 | | | | $67,787,815 | |
| | — | | | | 97,782,362 | | | | 88,477,103 | | | | — | | | | 4,644,286 | | | | — | |
| | 16,221,687 | | | | 5,729,670 | | | | 72,152,490 | | | | 2,434,232 | | | | 6,402,681 | | | | 3,033,445 | |
| | 37,267 | | | | — | | | | — | | | | — | | | | — | | | | 3,970 | |
| | 604,693 | | | | 8,154,969 | | | | 8,515,732 | | | | — | | | | 3,306,613 | | | | 3,828 | |
| | 5,398,691 | | | | 3,605,004 | | | | 4,292,400 | | | | 297,868 | | | | 1,134,525 | | | | 307,179 | |
| | — | | | | 12,425,494 | | | | 38,966,562 | | | | — | | | | 2,540,262 | | | | — | |
| | 1,845,170 | | | | 2,357,451 | | | | 12,295,964 | | | | 108,537 | | | | 91,983 | | | | 388,980 | |
| | 43,943 | | | | 38,389 | | | | 30,318 | | | | 17,322 | | | | 15,049 | | | | 27,166 | |
| | 1,049,417,051 | | | | 2,129,068,925 | | | | 4,710,483,912 | | | | 207,588,700 | | | | 404,682,667 | | | | 71,552,383 | |
| | | | | | | | | | | | | | | | | | | | | | |
| | 282 | | | | 5,132,402 | | | | 6,096,659 | | | | 1,287,975 | | | | 290,260 | | | | 40,442 | |
| | 7,044,521 | | | | 3,535,005 | | | | 35,075,248 | | | | 71,704 | | | | 200,301 | | | | 594,930 | |
| | — | | | | 12,664,204 | | | | — | | | | — | | | | 757,631 | | | | — | |
| | 614,427 | | | | 1,190,190 | | | | 2,616,764 | | | | 117,395 | | | | 319,657 | | | | 35,290 | |
| | 14,924 | | | | 29,879 | | | | 64,767 | | | | 2,959 | | | | 5,637 | | | | 858 | |
| | 119,969 | | | | 232,454 | | | | 498,777 | | | | 22,925 | | | | 44,721 | | | | 7,406 | |
| | 15,643 | | | | 160,595 | | | | 43,177 | | | | 8,307 | | | | 50,921 | | | | 11,671 | |
| | 81,078 | | | | 231,420 | | | | 270,221 | | | | 31,612 | | | | 61,384 | | | | 20,452 | |
| | 30,115 | | | | 42,180 | | | | 46,400 | | | | 26,790 | | | | 37,613 | | | | 19,684 | |
| | 8,756 | | | | 9,682 | | | | 15,004 | | | | 2,613 | | | | 2,102 | | | | 364 | |
| | 187,814 | | | | 62,658 | | | | 161,120 | | | | 19,350 | | | | 32,338 | | | | 6,032 | |
| | 8,117,529 | | | | 23,290,669 | | | | 44,888,137 | | | | 1,591,630 | | | | 1,802,565 | | | | 737,129 | |
| | $1,041,299,522 | | | | $2,105,778,256 | | | | $4,665,595,775 | | | | $205,997,070 | | | | $402,880,102 | | | | $70,815,254 | |
| | | | | | | | | | | | | | | | | | | | | | |
| | $899,849,049 | | | | $1,413,745,572 | | | | $2,496,898,638 | | | | $166,532,502 | | | | $191,005,776 | | | | $62,709,017 | |
| | 141,450,473 | | | | 692,032,684 | | | | 2,168,697,137 | | | | 39,464,568 | | | | 211,874,326 | | | | 8,106,237 | |
| | $1,041,299,522 | | | | $2,105,778,256 | | | | $4,665,595,775 | | | | $205,997,070 | | | | $402,880,102 | | | | $70,815,254 | |
| | | | |
| matthewsasia.com | 800.789.ASIA | | | 103 | |
Statements of Assets and Liabilities (unaudited) (continued)
| | | | | | | | | | | | |
| | |
Matthews Asia
ESG Fund | | | Matthews Emerging
Asia Fund | | | Matthews Asia
Innovators Fund | |
SHARES OUTSTANDING: | | | | | | | | | | | | |
(shares of beneficial interest issued and outstanding, respectively, unlimited number of shares authorized with a $0.001 par value) | | | | | | | | | | | | |
Investor Class | | | 1,104,550 | | | | 12,228,000 | | | | 14,856,364 | |
Institutional Class | | | 755,367 | | | | 23,232,379 | | | | 5,652,051 | |
TOTAL | | | 1,859,917 | | | | 35,460,379 | | | | 20,508,415 | |
NET ASSET VALUE: | | | | | | | | | | | | |
Investor Class, offering price and redemption price | | | $11.32 | | | | $13.82 | | | | $14.38 | |
Institutional Class, offering price and redemption price | | | $11.28 | | | | $13.88 | | | | $14.46 | |
NET ASSETS CONSISTS OF: | | | | | | | | | | | | |
Capital paid-in | | | $18,622,527 | | | | $471,048,016 | | | | $229,505,380 | |
Undistributed (distribution in excess of) net investment income (loss) | | | (337,894 | ) | | | 2,241,063 | | | | 1,484,437 | |
Undistributed/accumulated net realized gain (loss) on investments, and foreign currency related transactions | | | 350,176 | | | | 6,649,184 | | | | 15,659,857 | |
Net unrealized appreciation (depreciation) on investments, foreign currency translations and foreign capital gains taxes | | | 2,389,055 | | | | 11,555,294 | | | | 48,689,440 | |
NET ASSETS | | | $21,023,864 | | | | $491,493,557 | | | | $295,339,114 | |
(A) Investments at cost: | | | | | | | | | | | | |
Unaffiliated Issuers | | | $18,522,132 | | | | $430,558,206 | | | | $238,700,136 | |
Affiliated Issuers | | | — | | | | 20,459,970 | | | | — | |
(B) Foreign Currency at Cost | | | $108,358 | | | | $2,771,152 | | | | $317,177 | |
See accompanying notes to financial statements.
June 30, 2018
| | | | | | | | | | | | | | | | | | | | | | |
Matthews
China Fund | | | Matthews
India Fund | | | Matthews
Japan Fund | | | Matthews
Korea Fund | | | Matthews Asia
Small Companies
Fund | | | Matthews China
Small Companies
Fund | |
| | | | | | | | | | | | | | | | | | | | | | |
| | | | | | | | | | | | | | | | | | | | | | |
| | 40,595,177 | | | | 43,341,312 | | | | 103,439,224 | | | | 27,322,402 | | | | 8,432,819 | | | | 4,838,708 | |
| | 6,384,748 | | | | 21,072,877 | | | | 89,649,374 | | | | 6,431,780 | | | | 9,354,059 | | | | 625,885 | |
| | 46,979,925 | | | | 64,414,189 | | | | 193,088,598 | | | | 33,754,182 | | | | 17,786,878 | | | | 5,464,593 | |
| | | | | | | | | | | | | | | | | | | | | | |
| | $22.17 | | | | $32.62 | | | | $24.14 | | | | $6.10 | | | | $22.65 | | | | $12.96 | |
| | $22.15 | | | | $32.84 | | | | $24.19 | | | | $6.14 | | | | $22.65 | | | | $12.95 | |
| | | | | | | | | | | | | | | | | | | | | | |
| | $844,972,396 | | | | $1,447,162,050 | | | | $3,703,480,381 | | | | $138,288,707 | | | | $321,834,052 | | | | $60,355,466 | |
| | 1,051,956 | | | | (2,457,387 | ) | | | (14,492,812 | ) | | | (4,311,765 | ) | | | 646,323 | | | | 241,694 | |
|
128,193,869 |
| | | 145,795,804 | | | | 147,624,281 | | | | 22,899,857 | | | | 59,270,038 | | | | 6,513,386 | |
|
67,081,301 |
| | | 515,277,789 | | | | 828,983,925 | | | | 49,120,271 | | | | 21,129,689 | | | | 3,704,708 | |
| | $1,041,299,522 | | | | $2,105,778,256 | | | | $4,665,595,775 | | | | $205,997,070 | | | | $402,880,102 | | | | $70,815,254 | |
| | | | | | | | | | | | | | | | | | | | | | |
| | $958,185,330 | | | | $1,496,110,566 | | | | $3,625,315,555 | | | | $155,602,318 | | | | $365,051,040 | | | | $64,082,744 | |
| | — | | | | 72,570,405 | | | | 119,928,856 | | | | — | | | | 4,237,706 | | | | — | |
| | $604,614 | | | | $8,149,850 | | | | $8,522,866 | | | | $— | | | | $3,306,713 | | | | $3,907 | |
| | | | |
| matthewsasia.com | 800.789.ASIA | | | 105 | |
Statements of Operations (unaudited)
| | | | | | | | | | | | |
| | | Matthews Asia
Strategic
Income Fund | | | Matthews Asia
Credit
Opportunities Fund | | | Matthews Asian
Growth and
Income Fund | |
INVESTMENT INCOME: | | | | | | | | | | | | |
Dividends—Unaffiliated Issuers | | | $19,870 | | | | $14,040 | | | | $38,516,033 | |
Dividends—Affiliated Issuers (Note 7) | | | — | | | | — | | | | — | |
Interest—Unaffiliated Issuers | | | 2,803,621 | | | | 876,719 | | | | 1,817,350 | |
Foreign withholding tax | | | (71,860 | ) | | | (13,564 | ) | | | (2,958,742 | ) |
TOTAL INVESTMENT INCOME | | | 2,751,631 | | | | 877,195 | | | | 37,374,641 | |
EXPENSES: | | | | | | | | | | | | |
Investment advisory fees (Note 5) | | | 358,838 | | | | 120,616 | | | | 8,290,629 | |
Administration and accounting fees (Note 5) | | | 4,416 | | | | 1,485 | | | | 100,714 | |
Administration and shareholder servicing fees (Note 5) | | | 70,842 | | | | 23,813 | | | | 1,614,940 | |
Accounting out-of-pocket fees | | | 11,349 | | | | 7,845 | | | | 21,077 | |
Custodian fees | | | 30,362 | | | | 16,586 | | | | 460,043 | |
Printing fees | | | 6,308 | | | | 3,249 | | | | 103,593 | |
Intermediary service fees (Note 5) | | | 92,104 | | | | 18,001 | | | | 2,063,812 | |
Professional fees | | | 25,042 | | | | 21,764 | | | | 49,032 | |
Registration fees | | | 21,454 | | | | 16,692 | | | | 44,414 | |
Transfer agent fees | | | 2,159 | | | | 482 | | | | 39,166 | |
Trustees fees | | | 1,985 | | | | 633 | | | | 56,665 | |
Other expenses | | | 3,173 | | | | 1,457 | | | | 51,902 | |
TOTAL EXPENSES | | | 628,032 | | | | 232,623 | | | | 12,895,987 | |
Advisory fees waived and expenses waived or reimbursed (Note 5) | | | (46,533 | ) | | | (50,658 | ) | | | — | |
Administration fees waived (Note 5) | | | — | | | | — | | | | — | |
NET EXPENSES | | | 581,499 | | | | 181,965 | | | | 12,895,987 | |
NET INVESTMENT INCOME (LOSS) | | | 2,170,132 | | | | 695,230 | | | | 24,478,654 | |
| REALIZED AND UNREALIZED GAIN (LOSS) ON INVESTMENTS, FORWARD FOREIGN CURRENCY EXCHANGE CONTRACTS, FOREIGN CURRENCY RELATED TRANSACTIONS, AND FOREIGN CAPITAL GAINS TAXES: | | | | | | | | | | | | |
Net realized gain (loss) on investments—Unaffiliated Issuers | | | 120,663 | | | | (52,012 | ) | | | 139,719,772 | |
Net realized gain (loss) on investments—Affiliated Issuers | | | — | | | | — | | | | — | |
Net realized gain (loss) on forward foreign currency exchange contracts | | | 533,613 | | | | — | | | | — | |
Net realized foreign capital gains tax | | | (31,941 | ) | | | — | | | | — | |
Net realized gain (loss) on foreign currency related transactions | | | 132,746 | | | | 12,629 | | | | 9,618 | |
Net change in unrealized appreciation/depreciation on investments—Unaffiliated Issuers | | | (5,851,822 | ) | | | (1,818,409 | ) | | | (314,627,011 | ) |
Net change in unrealized appreciation/depreciation on investments—Affiliated Issuers | | | — | | | | — | | | | — | |
Net change in unrealized appreciation/depreciation forward foreign currency exchange contracts | | | (1,634,417 | ) | | | — | | | | — | |
Net change in deferred foreign capital gains taxes on unrealized appreciation | | | 72,903 | | | | — | | | | 136,584 | |
Net change in unrealized appreciation/depreciation on foreign currency related translations | | | (36,406 | ) | | | (2,418 | ) | | | (76,625 | ) |
Net realized and unrealized gain (loss) on investments, forward foreign currency exchange contracts, foreign currency related transactions, and foreign capital gains taxes | | | (6,694,661 | ) | | | (1,860,210 | ) | | | (174,837,662 | ) |
| | | |
NET INCREASE (DECREASE) IN NET ASSETS FROM OPERATIONS | | | ($4,524,529 | ) | | | ($1,164,980 | ) | | | ($150,359,008 | ) |
See accompanying notes to financial statements.
Six-Month Period Ended June 30, 2018
| | | | | | | | | | | | | | | | | | | | | | |
Matthews Asia
Dividend Fund | | | Matthews China
Dividend Fund | | | Matthews Asia
Value Fund | | | Matthews Asia
Focus Fund | | | Matthews Asia
Growth Fund | | | Matthews Pacific
Tiger Fund | |
| | | | | | | | | | | | | | | | | | | | | | |
| | $100,980,386 | | | | $7,081,595 | | | | $434,807 | | | | $140,903 | | | | $7,475,493 | | | | $72,324,490 | |
| | 16,089,111 | | | | — | | | | — | | | | — | | | | — | | | | 13,757,555 | |
| | — | | | | 1,093 | | | | — | | | | — | | | | — | | | | — | |
| | (7,782,753 | ) | | | (368,146 | ) | | | (29,499 | ) | | | (9,665 | ) | | | (706,859 | ) | | | (6,131,510 | ) |
| | 109,286,744 | | | | 6,714,542 | | | | 405,308 | | | | 131,238 | | | | 6,768,634 | | | | 79,950,535 | |
| | | | | | | | | | | | | | | | | | | | | | |
| | 23,802,726 | | | | 1,120,828 | | | | 114,854 | | | | 36,110 | | | | 3,492,709 | | | | 31,871,278 | |
| | 289,149 | | | | 13,616 | | | | 1,395 | | | | 439 | | | | 42,428 | | | | 387,166 | |
| | 4,637,377 | | | | 218,375 | | | | 22,379 | | | | 7,032 | | | | 680,575 | | | | 6,208,953 | |
| | 22,921 | | | | 17,381 | | | | 16,768 | | | | 14,788 | | | | 19,704 | | | | 22,969 | |
| | 963,619 | | | | 86,579 | | | | 29,287 | | | | 23,665 | | | | 242,238 | | | | 1,995,500 | |
| | 172,018 | | | | 15,650 | | | | 2,358 | | | | 2,234 | | | | 25,783 | | | | 165,867 | |
| | 4,178,983 | | | | 306,703 | | | | 38,973 | | | | 8,073 | | | | 681,825 | | | | 4,899,124 | |
| | 78,784 | | | | 25,824 | | | | 22,354 | | | | 24,328 | | | | 38,413 | | | | 104,638 | |
| | 118,397 | | | | 24,973 | | | | 22,264 | | | | 17,104 | | | | 33,085 | | | | 95,546 | |
| | 191,679 | | | | 5,778 | | | | 860 | | | | 1,206 | | | | 12,832 | | | | 78,831 | |
| | 139,661 | | | | 6,293 | | | | 557 | | | | 277 | | | | 18,562 | | | | 192,651 | |
| | 71,581 | | | | 5,262 | | | | 2,455 | | | | 2,580 | | | | 10,422 | | | | 88,665 | |
| | 34,666,895 | | | | 1,847,262 | | | | 274,504 | | | | 137,836 | | | | 5,298,576 | | | | 46,111,188 | |
| | (301,367 | ) | | | — | | | | (17,742 | ) | | | (64,062 | ) | | | — | | | | (633,657 | ) |
| | (301,367 | ) | | | — | | | | — | | | | — | | | | — | | | | (633,657 | ) |
| | 34,064,161 | | | | 1,847,262 | | | | 256,762 | | | | 73,774 | | | | 5,298,576 | | | | 44,843,874 | |
| | 75,222,583 | | | | 4,867,280 | | | | 148,546 | | | | 57,464 | | | | 1,470,058 | | | | 35,106,661 | |
| | | | | | | | | | | | | | | | | | | | | | |
| | 371,310,434 | | | | 27,130,965 | | | | 904,307 | | | | 1,395,853 | | | | (35,772 | ) | | | 199,345,515 | |
| | 3,145,410 | | | | — | | | | — | | | | — | | | | — | | | | 61,286 | |
|
— |
| | | — | | | | — | | | | — | | | | — | | | | — | |
| | — | | | | — | | | | — | | | | — | | | | — | | | | — | |
| | (1,260,050 | ) | | | 253,889 | | | | (4,135 | ) | | | (340 | ) | | | (302,058 | ) | | | (436,575 | ) |
| | (565,031,778 | ) | | | (22,785,999 | ) | | | (2,306,092 | ) | | | (2,147,516 | ) | |
|
16,680,237 |
| | | (576,983,203 | ) |
| | (141,039,868 | ) | |
|
— |
| | | — | | | | — | | | | 301,436 | | | | (173,612,415 | ) |
|
— |
| | | — | | | | — | | | | — | | | | — | | | | — | |
|
1,657,608 |
| | | — | | | | — | | | | 7,514 | | | | 695,399 | | | | (8,126,701 | ) |
| | (477,978 | ) | | | (202,060 | ) | | | (1,029 | ) | | | (526 | ) | | | (11,747 | ) | | | (473,814 | ) |
| | (331,696,222 | ) | |
|
4,396,795 |
| | | (1,406,949 | ) | | | (745,015 | ) | | | 17,327,495 | | | | (560,225,907 | ) |
| | | | | |
| | ($256,473,639 | ) | | | $9,264,075 | | | | ($1,258,403 | ) | | | ($687,551 | ) | | | $18,797,553 | | | | ($525,119,246 | ) |
| | | | |
| matthewsasia.com | 800.789.ASIA | | | 107 | |
Statements of Operations (unaudited) (continued)
| | | | | | | | | | | | |
| | |
Matthews Asia
ESG Fund | | | Matthews Emerging
Asia Fund | | | Matthews Asia
Innovators Fund | |
INVESTMENT INCOME: | | | | | | | | | | | | |
Dividends—Unaffiliated Issuers | | | $168,593 | | | | $6,269,477 | | | | $2,061,190 | |
Dividends—Affiliated Issuers (Note 7) | | | — | | | | 64,703 | | | | — | |
Foreign withholding tax | | | (18,303 | ) | | | (646,333 | ) | | | (199,782 | ) |
TOTAL INVESTMENT INCOME | | | 150,290 | | | | 5,687,847 | | | | 1,861,408 | |
EXPENSES: | | | | | | | | | | | | |
Investment advisory fees (Note 5) | | | 66,100 | | | | 2,562,890 | | | | 884,748 | |
Administration and accounting fees (Note 5) | | | 803 | | | | 20,503 | | | | 10,748 | |
Administration and shareholder servicing fees (Note 5) | | | 12,879 | | | | 328,824 | | | | 172,402 | |
Accounting out-of-pocket fees | | | 20,490 | | | | 23,277 | | | | 17,320 | |
Custodian fees | | | 38,108 | | | | 531,304 | | | | 88,983 | |
Printing fees | | | 2,249 | | | | 17,401 | | | | 9,876 | |
Intermediary service fees (Note 5) | | | 17,107 | | | | 319,529 | | | | 210,182 | |
Professional fees | | | 25,926 | | | | 30,755 | | | | 28,063 | |
Registration fees | | | 16,717 | | | | 42,903 | | | | 27,256 | |
Transfer agent fees | | | 492 | | | | 6,425 | | | | 10,164 | |
Trustees fees | | | 361 | | | | 9,521 | | | | 4,480 | |
Other expenses | | | 2,740 | | | | 6,088 | | | | 4,715 | |
TOTAL EXPENSES | | | 203,972 | | | | 3,899,420 | | | | 1,468,937 | |
Advisory fees waived and expenses waived or reimbursed (Note 5) | | | (63,683 | ) | | | (452,636 | ) | | | — | |
Administration fees waived (Note 5) | | | — | | | | — | | | | — | |
NET EXPENSES | | | 140,289 | | | | 3,446,784 | | | | 1,468,937 | |
NET INVESTMENT INCOME (LOSS) | | | 10,001 | | | | 2,241,063 | | | | 392,471 | |
| REALIZED AND UNREALIZED GAIN (LOSS) ON INVESTMENTS, FOREIGN CURRENCY RELATED TRANSACTIONS, AND FOREIGN CAPITAL GAINS TAXES: | | | | | | | | | | | | |
Net realized gain (loss) on investments—Unaffiliated Issuers | | | 75,958 | | | | 6,830,544 | | | | 10,272,177 | |
Net realized gain (loss) on investments—Affiliated Issuers | | | — | | | | — | | | | — | |
Net realized foreign capital gains tax | | | (4,758 | ) | | | (12,142 | ) | | | — | |
Net realized gain (loss) on foreign currency related transactions | | | (7,784 | ) | | | (176,806 | ) | | | (41,853 | ) |
Net change in unrealized appreciation/depreciation on investments—Unaffiliated Issuers | | | (566,851 | ) | | | (68,169,153 | ) | | | (9,630,147 | ) |
Net change in unrealized appreciation/depreciation on investments—Affiliated Issuers | | | — | | | | (1,162,517 | ) | | | — | |
Net change in deferred foreign capital gains taxes on unrealized appreciation | | | (2,419 | ) | | | 1,190,241 | | | | (279,432 | ) |
Net change in unrealized appreciation/depreciation on foreign currency related translations | | | (1,458 | ) | | | (24,062 | ) | | | (13,690 | ) |
Net realized and unrealized gain (loss) on investments, foreign currency related transactions, and foreign capital gains taxes | | | (507,312 | ) | | | (61,523,895 | ) | | | 307,055 | |
| | | |
NET INCREASE (DECREASE) IN NET ASSETS FROM OPERATIONS | | | ($497,311 | ) | | | ($59,282,832 | ) | | | $699,526 | |
See accompanying notes to financial statements.
Six-Month Period Ended June 30, 2018
| | | | | | | | | | | | | | | | | | | | | | |
Matthews
China Fund | | | Matthews
India Fund | | | Matthews
Japan Fund | | | Matthews
Korea Fund | | | Matthews Asia
Small Companies
Fund | | | Matthews China
Small Companies
Fund | |
| | | | | | | | | | | | | | | | | | | | | | |
| | $13,988,011 | | | | $9,101,490 | | | | $35,217,292 | | | | $1,214,235 | | | | $3,777,482 | | | | $716,263 | |
| | — | | | | — | | | | 485,030 | | | | — | | | | — | | | | — | |
| | (1,016,562 | ) | | | (99,825 | ) | | | (3,466,953 | ) | | | (195,409 | ) | | | (230,966 | ) | | | (33,012 | ) |
| | 12,971,449 | | | | 9,001,665 | | | | 32,235,369 | | | | 1,018,826 | | | | 3,546,516 | | | | 683,251 | |
| | | | | | | | | | | | | | | | | | | | | | |
| | 3,539,833 | | | | 7,476,206 | | | | 15,403,570 | | | | 721,469 | | | | 2,141,547 | | | | 255,813 | |
| | 43,001 | | | | 90,819 | | | | 187,118 | | | | 8,764 | | | | 17,132 | | | | 2,046 | |
| | 689,665 | | | | 1,456,516 | | | | 3,001,218 | | | | 140,557 | | | | 274,750 | | | | 32,837 | |
| | 16,781 | | | | 19,698 | | | | 21,335 | | | | 17,481 | | | | 23,539 | | | | 25,138 | |
| | 118,639 | | | | 521,226 | | | | 231,181 | | | | 40,016 | | | | 167,725 | | | | 62,902 | |
| | 44,258 | | | | 67,220 | | | | 164,485 | | | | 8,448 | | | | 15,564 | | | | 6,407 | |
| | 990,809 | | | | 1,585,741 | | | | 1,159,841 | | | | 196,588 | | | | 296,929 | | | | 60,732 | |
| | 28,856 | | | | 52,767 | | | | 57,507 | | | | 25,858 | | | | 33,816 | | | | 30,414 | |
| | 46,058 | | | | 43,983 | | | | 35,364 | | | | 20,440 | | | | 26,433 | | | | 18,539 | |
| | 36,098 | | | | 38,919 | | | | 59,743 | | | | 10,404 | | | | 8,152 | | | | 2,383 | |
| | 19,183 | | | | 45,551 | | | | 86,604 | | | | 4,502 | | | | 9,018 | | | | 748 | |
| | 10,802 | | | | 24,213 | | | | 42,032 | | | | 7,503 | | | | 7,849 | | | | 2,032 | |
| | 5,583,983 | | | | 11,422,859 | | | | 20,449,998 | | | | 1,202,030 | | | | 3,022,454 | | | | 499,991 | |
| | — | | | | — | | | | (85,130 | ) | | | — | | | | (123,849 | ) | | | (119,560 | ) |
| | — | | | | — | | | | (85,130 | ) | | | — | | | | — | | | | — | |
| | 5,583,983 | | | | 11,422,859 | | | | 20,279,738 | | | | 1,202,030 | | | | 2,898,605 | | | | 380,431 | |
| | 7,387,466 | | | | (2,421,194 | ) | | | 11,955,631 | | | | (183,204 | ) | | | 647,911 | | | | 302,820 | |
| | | | | | | | | | | | | | | | | | | | | | |
| | 126,551,667 | | | | 95,391,555 | | | | 121,189,758 | | | | 15,522,411 | | | | 49,533,096 | | | | 5,874,227 | |
| | — | | | | 577,674 | | | | — | | | | — | | | | — | | | | — | |
| | — | | | | (603,750 | ) | | | — | | | | — | | | | (677,116 | ) | | | — | |
| | (68,468 | ) | | | (838,638 | ) | | | (1,964,115 | ) | | | (35,702 | ) | | | (122,239 | ) | | | (1,965 | ) |
| | | | | |
| | (151,939,391 | ) | | | (178,128,166 | ) | | | (130,478,674 | ) | | | (42,652,652 | ) | | | (52,672,697 | ) | | | (3,197,056 | ) |
| | | | | |
| | — | | | | (24,470,616 | ) | | | (24,613,368 | ) | | | — | | | | 28,459 | | | | — | |
| | | | | |
| | — | | | | (3,205,296 | ) | | | — | | | | — | | | | (295,891 | ) | | | — | |
| | | | | |
| | (46,090 | ) | | | (28,900 | ) | | | 8,932 | | | | (21,958 | ) | | | (1,163 | ) | | | (366 | ) |
| | | | | |
| | (25,502,282 | ) | | | (111,306,137 | ) | | | (35,857,467 | ) | | | (27,187,901 | ) | | | (4,207,551 | ) | | | 2,674,840 | |
| | | | | |
| | ($18,114,816 | ) | | | ($113,727,331 | ) | | | ($23,901,836 | ) | | | ($27,371,105 | ) | | | ($3,559,640 | ) | | | $2,977,660 | |
| | | | |
| matthewsasia.com | 800.789.ASIA | | | 109 | |
Statements of Changes in Net Assets
| | | | | | | | |
| MATTHEWS ASIA STRATEGIC INCOME FUND | | Six-Month Period
Ended June 30, 2018
(unaudited) | | | Year Ended
December 31, 2017 | |
OPERATIONS: | | | | | | | | |
Net investment income (loss) | | | $2,170,132 | | | | $3,781,069 | |
Net realized gain (loss) on investments and foreign currency related transactions | | | 755,081 | | | | 443,332 | |
Net change in unrealized appreciation/depreciation on investments and foreign currency related translations | | | (7,522,645 | ) | | | 2,824,795 | |
Net change on foreign capital gains taxes on unrealized appreciation | | | 72,903 | | | | (56,325 | ) |
Net change in unrealized appreciation/depreciation on swaps | | | — | | | | 30,907 | |
Net increase (decrease) in net assets resulting from operations | | | (4,524,529 | ) | | | 7,023,778 | |
DISTRIBUTIONS TO SHAREHOLDERS FROM: | | | | | | | | |
Net investment income: | | | | | | | | |
Investor Class | | | (1,356,704 | ) | | | (2,199,871 | ) |
Institutional Class | | | (1,097,624 | ) | | | (1,075,141 | ) |
Net decrease in net assets resulting from distributions | | | (2,454,328 | ) | | | (3,275,012 | ) |
CAPITAL SHARE TRANSACTIONS (net) (Note 4) | | | 29,088,389 | | | | 22,036,526 | |
Total increase (decrease) in net assets | | | 22,109,532 | | | | 25,785,292 | |
NET ASSETS: | | | | | | | | |
Beginning of period | | | 94,592,155 | | | | 68,806,863 | |
End of period (including undistributed/(distributions in excess of) net investment income of ($83,465) and $200,731, respectively) | | | $116,701,687 | | | | $94,592,155 | |
| | |
| MATTHEWS ASIA CREDIT OPPORTUNITIES FUND | | Six-Month Period
Ended June 30, 2018
(unaudited) | | | Year Ended
December 31, 2017 | |
OPERATIONS: | | | | | | | | |
Net investment income (loss) | | | $695,230 | | | | $902,332 | |
Net realized gain (loss) on investments and foreign currency related transactions | | | (39,383 | ) | | | 233,717 | |
Net change in unrealized appreciation/depreciation on investments and foreign currency related translations | | | (1,820,827 | ) | | | 353,676 | |
Net change in unrealized appreciation/depreciation on swaps | | | — | | | | 7,727 | |
Net increase (decrease) in net assets resulting from operations | | | (1,164,980 | ) | | | 1,497,452 | |
DISTRIBUTIONS TO SHAREHOLDERS FROM: | | | | | | | | |
Net investment income: | | | | | | | | |
Investor Class | | | (204,910 | ) | | | (340,862 | ) |
Institutional Class | | | (499,196 | ) | | | (596,265 | ) |
Realized gains on investments: | | | | | | | | |
Investor Class | | | — | | | | (84,471 | ) |
Institutional Class | | | — | | | | (189,650 | ) |
Net decrease in net assets resulting from distributions | | | (704,106 | ) | | | (1,211,248 | ) |
CAPITAL SHARE TRANSACTIONS (net) (Note 4) | | | 13,399,334 | | | | 15,081,567 | |
Total increase (decrease) in net assets | | | 11,530,248 | | | | 15,367,771 | |
NET ASSETS: | | | | | | | | |
Beginning of period | | | 31,691,741 | | | | 16,323,970 | |
End of period (including undistributed/(distributions in excess of) net investment income of ($8,876) and $0, respectively) | | | $43,221,989 | | | | $31,691,741 | |
See accompanying notes to financial statements.
| | | | | | | | |
| MATTHEWS ASIAN GROWTH AND INCOME FUND | | Six-Month Period
Ended June 30, 2018
(unaudited) | | | Year Ended
December 31, 2017 | |
OPERATIONS: | | | | | | | | |
Net investment income (loss) | | | $24,478,654 | | | | $57,127,376 | |
Net realized gain (loss) on investments and foreign currency related transactions | | | 139,729,390 | | | | 118,819,624 | |
Net change in unrealized appreciation/depreciation on investments and foreign currency related translations | | | (314,703,636 | ) | | | 368,131,814 | |
Net change on foreign capital gains taxes on unrealized appreciation | | | 136,584 | | | | (136,584 | ) |
Net increase (decrease) in net assets resulting from operations | | | (150,359,008 | ) | | | 543,942,230 | |
DISTRIBUTIONS TO SHAREHOLDERS FROM: | | | | | | | | |
Net investment income: | | | | | | | | |
Investor Class | | | (15,027,965 | ) | | | (41,460,084 | ) |
Institutional Class | | | (16,015,531 | ) | | | (35,174,360 | ) |
Realized gains on investments: | | | | | | | | |
Investor Class | �� | | — | | | | (23,124,973 | ) |
Institutional Class | | | — | | | | (19,515,513 | ) |
Net decrease in net assets resulting from distributions | | | (31,043,496 | ) | | | (119,274,930 | ) |
CAPITAL SHARE TRANSACTIONS (net) (Note 4) | | | (472,265,952 | ) | | | (72,995,282 | ) |
REDEMPTION FEES | | | — | | | | 7 | |
Total increase (decrease) in net assets | | | (653,668,456 | ) | | | 351,672,025 | |
NET ASSETS: | | | | | | | | |
Beginning of period | | | 2,845,913,457 | | | | 2,494,241,432 | |
End of period (including distributions in excess of net investment income of ($15,705,198) and ($9,140,356), respectively) | | | $2,192,245,001 | | | | $2,845,913,457 | |
| | |
| MATTHEWS ASIA DIVIDEND FUND | | Six-Month Period
Ended June 30, 2018
(unaudited) | | | Year Ended
December 31, 2017 | |
OPERATIONS: | | | | | | | | |
Net investment income (loss) | | | $75,222,583 | | | | $102,427,133 | |
Net realized gain (loss) on investments and foreign currency related transactions | | | 373,195,794 | | | | 179,902,338 | |
Net change in unrealized appreciation/depreciation on investments and foreign currency related translations | | | (706,549,624 | ) | | | 1,439,899,346 | |
Net change on foreign capital gains taxes on unrealized appreciation | | | 1,657,608 | | | | (4,650,161 | ) |
Net increase (decrease) in net assets resulting from operations | | | (256,473,639 | ) | | | 1,717,578,656 | |
DISTRIBUTIONS TO SHAREHOLDERS FROM: | | | | | | | | |
Net investment income: | | | | | | | | |
Investor Class | | | (37,426,519 | ) | | | (123,635,282 | ) |
Institutional Class | | | (41,235,407 | ) | | | (113,776,897 | ) |
Realized gains on investments: | | | | | | | | |
Investor Class | | | — | | | | (75,762,388 | ) |
Institutional Class | | | — | | | | (68,303,579 | ) |
Net decrease in net assets resulting from distributions | | | (78,661,926 | ) | | | (381,478,146 | ) |
CAPITAL SHARE TRANSACTIONS (net) (Note 4) | | | 398,915,853 | | | | 976,358,238 | |
REDEMPTION FEES | | | — | | | | 374 | |
Total increase (decrease) in net assets | | | 63,780,288 | | | | 2,312,459,122 | |
NET ASSETS: | | | | | | | | |
Beginning of period | | | 6,997,346,081 | | | | 4,684,886,959 | |
End of period (including distributions in excess of net investment income of ($34,508,547) and ($31,069,204), respectively) | | | $7,061,126,369 | | | | $6,997,346,081 | |
See accompanying notes to financial statements.
| | | | |
| matthewsasia.com | 800.789.ASIA | | | 111 | |
Statements of Changes in Net Assets (continued)
| | | | | | | | |
| MATTHEWS CHINA DIVIDEND FUND | | Six-Month Period
Ended June 30, 2018
(unaudited) | | | Year Ended
December 31, 2017 | |
OPERATIONS: | | | | | | | | |
Net investment income (loss) | | | $4,867,280 | | | | $5,225,463 | |
Net realized gain (loss) on investments and foreign currency related transactions | | | 27,384,854 | | | | 23,957,987 | |
Net change in unrealized appreciation/depreciation on investments and foreign currency related translations | | | (22,988,059 | ) | | | 48,354,739 | |
Net increase (decrease) in net assets resulting from operations | | | 9,264,075 | | | | 77,538,189 | |
DISTRIBUTIONS TO SHAREHOLDERS FROM: | | | | | | | | |
Net investment income: | | | | | | | | |
Investor Class | | | (4,793,159 | ) | | | (6,366,143 | ) |
Institutional Class | | | (1,858,858 | ) | | | (1,342,316 | ) |
Realized gains on investments: | | | | | | | | |
Investor Class | | | — | | | | (16,273,463 | ) |
Institutional Class | | | — | | | | (3,383,594 | ) |
Net decrease in net assets resulting from distributions | | | (6,652,017 | ) | | | (27,365,516 | ) |
CAPITAL SHARE TRANSACTIONS (net) (Note 4) | | | 30,630,898 | | | | 76,410,254 | |
Total increase (decrease) in net assets | | | 33,242,956 | | | | 126,582,927 | |
NET ASSETS: | | | | | | | | |
Beginning of period | | | 314,740,086 | �� | | | 188,157,159 | |
End of period (including distributions in excess of net investment income of ($4,761,903) and ($2,977,166), respectively) | | | $347,983,042 | | | | $314,740,086 | |
| | |
| MATTHEWS ASIA VALUE FUND | | Six-Month Period
Ended June 30, 2018
(unaudited) | | | Year Ended
December 31, 2017 | |
OPERATIONS: | | | | | | | | |
Net investment income (loss) | | | $148,546 | | | | $168,044 | |
Net realized gain (loss) on investments and foreign currency related transactions | | | 900,172 | | | | 1,381,014 | |
Net change in unrealized appreciation/depreciation on investments and foreign currency related translations | | | (2,307,121 | ) | | | 1,774,677 | |
Net increase (decrease) in net assets resulting from operations | | | (1,258,403 | ) | | | 3,323,735 | |
DISTRIBUTIONS TO SHAREHOLDERS FROM: | | | | | | | | |
Net investment income: | | | | | | | | |
Investor Class | | | — | | | | (565,960 | ) |
Institutional Class | | | — | | | | (61,206 | ) |
Realized gains on investments: | | | | | | | | |
Investor Class | | | — | | | | (856,844 | ) |
Institutional Class | | | — | | | | (102,341 | ) |
Net decrease in net assets resulting from distributions | | | — | | | | (1,586,351 | ) |
CAPITAL SHARE TRANSACTIONS (net) (Note 4) | | | 6,367,749 | | | | 26,293,036 | |
Total increase (decrease) in net assets | | | 5,109,346 | | | | 28,030,420 | |
NET ASSETS: | | | | | | | | |
Beginning of period | | | 30,733,980 | | | | 2,703,560 | |
End of period (including distributions in excess of net investment income of ($337,264) and ($485,810), respectively) | | | $35,843,326 | | | | $30,733,980 | |
See accompanying notes to financial statements.
| | | | | | | | |
| MATTHEWS ASIA FOCUS FUND | | Six-Month Period
Ended June 30, 2018
(unaudited) | | | Year Ended
December 31, 2017 | |
OPERATIONS: | | | | | | | | |
Net investment income (loss) | | | $57,464 | | | | $140,651 | |
Net realized gain (loss) on investments and foreign currency related transactions | | | 1,395,513 | | | | 262,782 | |
Net change in unrealized appreciation/depreciation on investments and foreign currency related translations | | | (2,148,042 | ) | | | 3,355,299 | |
Net change on foreign capital gains taxes on unrealized appreciation | | | 7,514 | | | | (7,514 | ) |
Net increase (decrease) in net assets resulting from operations | | | (687,551 | ) | | | 3,751,218 | |
DISTRIBUTIONS TO SHAREHOLDERS FROM: | | | | | | | | |
Net investment income: | | | | | | | | |
Investor Class | | | — | | | | (47,315 | ) |
Institutional Class | | | — | | | | (89,956 | ) |
Net decrease in net assets resulting from distributions | | | — | | | | (137,271 | ) |
CAPITAL SHARE TRANSACTIONS (net) (Note 4) | | | (6,455,512 | ) | | | 1,823,093 | |
Total increase (decrease) in net assets | | | (7,143,063 | ) | | | 5,437,040 | |
NET ASSETS: | | | | | | | | |
Beginning of period | | | 15,546,141 | | | | 10,109,101 | |
End of period (including undistributed net investment income of $124,561 and $67,097, respectively) | | | $8,403,078 | | | | $15,546,141 | |
| | |
| MATTHEWS ASIA GROWTH FUND | | Six-Month Period
Ended June 30, 2018
(unaudited) | | | Year Ended
December 31, 2017 | |
OPERATIONS: | | | | | | | | |
Net investment income (loss) | | | $1,470,058 | | | | $1,602,747 | |
Net realized gain (loss) on investments and foreign currency related transactions | | | (337,830 | ) | | | 64,866,788 | |
Net change in unrealized appreciation/depreciation on investments and foreign currency related translations | | | 16,969,926 | | | | 172,387,587 | |
Net change on foreign capital gains taxes on unrealized appreciation | | | 695,399 | | | | (1,318,787 | ) |
Net increase (decrease) in net assets resulting from operations | | | 18,797,553 | | | | 237,538,335 | |
DISTRIBUTIONS TO SHAREHOLDERS FROM: | | | | | | | | |
Net investment income: | | | | | | | | |
Investor Class | | | — | | | | (3,030,603 | ) |
Institutional Class | | | — | | | | (2,036,373 | ) |
Realized gains on investments: | | | | | | | | |
Investor Class | | | — | | | | (34,198,017 | ) |
Institutional Class | | | — | | | | (17,869,896 | ) |
Net decrease in net assets resulting from distributions | | | — | | | | (57,134,889 | ) |
CAPITAL SHARE TRANSACTIONS (net) (Note 4) | | | 294,467,312 | | | | 54,693,413 | |
Total increase (decrease) in net assets | | | 313,264,865 | | | | 235,096,859 | |
NET ASSETS: | | | | | | | | |
Beginning of period | | | 850,561,944 | | | | 615,465,085 | |
End of period (including distributions in excess of net investment income of ($4,644,254) and ($6,114,312), respectively) | | | $1,163,826,809 | | | | $850,561,944 | |
See accompanying notes to financial statements.
| | | | |
| matthewsasia.com | 800.789.ASIA | | | 113 | |
Statements of Changes in Net Assets (continued)
| | | | | | | | |
| MATTHEWS PACIFIC TIGER FUND | | Six-Month Period
Ended June 30, 2018
(unaudited) | | | Year Ended
December 31, 2017 | |
OPERATIONS: | | | | | | | | |
Net investment income (loss) | | | $35,106,661 | | | | $60,409,177 | |
Net realized gain (loss) on investments and foreign currency related transactions | | | 198,970,226 | | | | 222,239,704 | |
Net change in unrealized appreciation/depreciation on investments and foreign currency related translations | | | (751,069,432 | ) | | | 2,432,709,872 | |
Net change on foreign capital gains taxes on unrealized appreciation | | | (8,126,701 | ) | | | (2,958,166 | ) |
Net increase (decrease) in net assets resulting from operations | | | (525,119,246 | ) | | | 2,712,400,587 | |
DISTRIBUTIONS TO SHAREHOLDERS FROM: | | | | | | | | |
Net investment income: | | | | | | | | |
Investor Class | | | — | | | | (18,058,687 | ) |
Institutional Class | | | — | | | | (43,981,805 | ) |
Realized gains on investments: | | | | | | | | |
Investor Class | | | — | | | | (22,999,068 | ) |
Institutional Class | | | — | | | | (44,087,593 | ) |
Net decrease in net assets resulting from distributions | | | — | | | | (129,127,153 | ) |
CAPITAL SHARE TRANSACTIONS (net) (Note 4) | | | (51,924,058 | ) | | | 489,072,525 | |
REDEMPTION FEES | | | — | | | | 55 | |
Total increase (decrease) in net assets | | | (577,043,304 | ) | | | 3,072,346,014 | |
NET ASSETS: | | | | | | | | |
Beginning of period | | | 9,725,036,885 | | | | 6,652,690,871 | |
End of period (including undistributed/(distributions in excess of) net investment income of $34,183,032 and ($923,629), respectively) | | | $9,147,993,581 | | | | $9,725,036,885 | |
| | |
| MATTHEWS ASIA ESG FUND | | Six-Month Period
Ended June 30, 2018
(unaudited) | | | Year Ended
December 31, 2017 | |
OPERATIONS: | | | | | | | | |
Net investment income (loss) | | | $10,001 | | | | $73,969 | |
Net realized gain (loss) on investments and foreign currency related transactions | | | 63,416 | | | | 589,052 | |
Net change in unrealized appreciation/depreciation on investments and foreign currency related translations | | | (568,309 | ) | | | 3,092,492 | |
Net change on foreign capital gains taxes on unrealized appreciation | | | (2,419 | ) | | | (47,151 | ) |
Net increase (decrease) in net assets resulting from operations | | | (497,311 | ) | | | 3,708,362 | |
DISTRIBUTIONS TO SHAREHOLDERS FROM: | | | | | | | | |
Net investment income: | | | | | | | | |
Investor Class | | | — | | | | (237,703 | ) |
Institutional Class | | | — | | | | (177,118 | ) |
Realized gains on investments: | | | | | | | | |
Investor Class | | | — | | | | (135,639 | ) |
Institutional Class | | | — | | | | (93,846 | ) |
Net decrease in net assets resulting from distributions | | | — | | | | (644,306 | ) |
CAPITAL SHARE TRANSACTIONS (net) (Note 4) | | | 3,466,080 | | | | 6,232,396 | |
REDEMPTION FEES | | | 1,216 | | | | — | |
Total increase (decrease) in net assets | | | 2,969,985 | | | | 9,296,452 | |
NET ASSETS: | | | | | | | | |
Beginning of period | | | 18,053,879 | | | | 8,757,427 | |
End of period (undistributed net investment loss/(distributions in excess of) net investment income ($337,894) and ($347,895), respectively) | | | $21,023,864 | | | | $18,053,879 | |
See accompanying notes to financial statements.
| | | | | | | | |
| MATTHEWS EMERGING ASIA FUND | | Six-Month Period
Ended June 30, 2018
(unaudited) | | | Year Ended
December 31, 2017 | |
OPERATIONS: | | | | | | | | |
Net investment income (loss) | | | $2,241,063 | | | | $2,115,876 | |
Net realized gain (loss) on investments and foreign currency related transactions | | | 6,641,596 | | | | 1,465,495 | |
Net change in unrealized appreciation/depreciation on investments and foreign currency related translations | | | (69,355,732 | ) | | | 56,666,449 | |
Net change on foreign capital gains taxes on unrealized appreciation | | | 1,190,241 | | | | (1,432,546 | ) |
Net increase (decrease) in net assets resulting from operations | | | (59,282,832 | ) | | | 58,815,274 | |
DISTRIBUTIONS TO SHAREHOLDERS FROM: | | | | | | | | |
Net investment income: | | | | | | | | |
Investor Class | | | — | | | | (586,858 | ) |
Institutional Class | | | — | | | | (1,117,042 | ) |
Realized gains on investments: | | | | | | | | |
Investor Class | | | — | | | | (742,351 | ) |
Institutional Class | | | — | | | | (913,243 | ) |
Net decrease in net assets resulting from distributions | | | — | | | | (3,359,494 | ) |
CAPITAL SHARE TRANSACTIONS (net) (Note 4) | | | 55,903,665 | | | | 198,378,112 | |
REDEMPTION FEES | | | 43,707 | | | | 107,142 | |
Total increase (decrease) in net assets | | | (3,335,460 | ) | | | 253,941,034 | |
NET ASSETS: | | | | | | | | |
Beginning of period | | | 494,829,017 | | | | 240,887,983 | |
End of period (including undistributed net investment income of $2,241,063 and $0, respectively) | | | $491,493,557 | | | | $494,829,017 | |
| | |
| MATTHEWS ASIA INNOVATORS FUND | | Six-Month Period
Ended June 30, 2018
(unaudited) | | | Year Ended
December 31, 2017 | |
OPERATIONS: | | | | | | | | |
Net investment income (loss) | | | $392,471 | | | | ($207,551 | ) |
Net realized gain (loss) on investments and foreign currency related transactions | | | 10,230,324 | | | | 14,409,121 | |
Net change in unrealized appreciation/depreciation on investments and foreign currency related translations | | | (9,643,837 | ) | | | 43,969,452 | |
Net change on foreign capital gains taxes on unrealized appreciation | | | (279,432 | ) | | | (397,832 | ) |
Net increase (decrease) in net assets resulting from operations | | | 699,526 | | | | 57,773,190 | |
DISTRIBUTIONS TO SHAREHOLDERS FROM: | | | | | | | | |
Net investment income: | | | | | | | | |
Investor Class | | | — | | | | (2,843,003 | ) |
Institutional Class | | | — | | | | (527,368 | ) |
Realized gains on investments: | | | | | | | | |
Investor Class | | | — | | | | (11,092,511 | ) |
Institutional Class | | | — | | | | (1,826,087 | ) |
Net decrease in net assets resulting from distributions | | | — | | | | (16,288,969 | ) |
CAPITAL SHARE TRANSACTIONS (net) (Note 4) | | | 88,351,133 | | | | 64,333,280 | |
Total increase (decrease) in net assets | | | 89,050,659 | | | | 105,817,501 | |
NET ASSETS: | | | | | | | | |
Beginning of period | | | 206,288,455 | | | | 100,470,954 | |
End of period (including undistributed net investment income of $1,484,437 and $1,091,966, respectively) | | | $295,339,114 | | | | $206,288,455 | |
See accompanying notes to financial statements.
| | | | |
| matthewsasia.com | 800.789.ASIA | | | 115 | |
Statements of Changes in Net Assets (continued)
| | | | | | | | |
| MATTHEWS CHINA FUND | | Six-Month Period
Ended June 30, 2018
(unaudited) | | | Year Ended
December 31, 2017 | |
OPERATIONS: | | | | | | | | |
Net investment income (loss) | | | $7,387,466 | | | | $5,476,621 | |
Net realized gain (loss) on investments and foreign currency related transactions | | | 126,483,199 | | | | 93,812,220 | |
Net change in unrealized appreciation/depreciation on investments and foreign currency related translations | | | (151,985,481 | ) | | | 206,141,171 | |
Net increase (decrease) in net assets resulting from operations | | | (18,114,816 | ) | | | 305,430,012 | |
DISTRIBUTIONS TO SHAREHOLDERS FROM: | | | | | | | | |
Net investment income: | | | | | | | | |
Investor Class | | | — | | | | (12,781,233 | ) |
Institutional Class | | | — | | | | (857,930 | ) |
Realized gains on investments: | | | | | | | | |
Investor Class | | | — | | | | (66,198,560 | ) |
Institutional Class | | | — | | | | (4,097,682 | ) |
Net decrease in net assets resulting from distributions | | | — | | | | (83,935,405 | ) |
CAPITAL SHARE TRANSACTIONS (net) (Note 4) | | | 153,931,333 | | | | 172,214,277 | |
REDEMPTION FEES | | | 16 | | | | — | |
Total increase (decrease) in net assets | | | 135,816,533 | | | | 393,708,884 | |
NET ASSETS: | | | | | | | | |
Beginning of period | | | 905,482,989 | | | | 511,774,105 | |
End of period (including undistributed/(distributions in excess of) net investment income of $1,051,956 and ($6,335,510), respectively) | | | $1,041,299,522 | | | | $905,482,989 | |
| | |
| MATTHEWS INDIA FUND | | Six-Month Period
Ended June 30, 2018
(unaudited) | | | Year Ended
December 31, 2017 | |
OPERATIONS: | | | | | | | | |
Net investment income (loss) | | | ($2,421,194 | ) | | | ($4,427,103 | ) |
Net realized gain (loss) on investments and foreign currency related transactions | | | 94,526,841 | | | | 69,824,307 | |
Net change in unrealized appreciation/depreciation on investments and foreign currency related translations | | | (202,627,682 | ) | | | 538,480,031 | |
Net change on foreign capital gains taxes on unrealized appreciation | | | (3,205,296 | ) | | | (9,458,908 | ) |
Net increase (decrease) in net assets resulting from operations | | | (113,727,331 | ) | | | 594,418,327 | |
DISTRIBUTIONS TO SHAREHOLDERS FROM: | | | | | | | | |
Net investment income: | | | | | | | | |
Institutional Class | | | — | | | | (624,793 | ) |
Realized gains on investments: | | | | | | | | |
Investor Class | | | — | | | | (20,884,465 | ) |
Institutional Class | | | — | | | | (11,544,040 | ) |
Net decrease in net assets resulting from distributions | | | — | | | | (33,053,298 | ) |
CAPITAL SHARE TRANSACTIONS (net) (Note 4) | | | (52,927,629 | ) | | | 192,857,560 | |
Total increase (decrease) in net assets | | | (166,654,960 | ) | | | 754,222,589 | |
NET ASSETS: | | | | | | | | |
Beginning of period | | | 2,272,433,216 | | | | 1,518,210,627 | |
End of period (including distributions in excess of net investment income of ($2,457,387) and ($36,193), respectively) | | | $2,105,778,256 | | | | $2,272,433,216 | |
See accompanying notes to financial statements.
| | | | | | | | |
| MATTHEWS JAPAN FUND | | Six-Month Period
Ended June 30, 2018
(unaudited) | | | Year Ended
December 31, 2017 | |
OPERATIONS: | | | | | | | | |
Net investment income (loss) | | | $11,955,631 | | | | $15,025,592 | |
Net realized gain (loss) on investments and foreign currency related transactions | | | 119,225,643 | | | | 89,972,198 | |
Net change in unrealized appreciation/depreciation on investments and foreign currency related translations | | | (155,083,110 | ) | | | 898,130,312 | |
Net increase (decrease) in net assets resulting from operations | | | (23,901,836 | ) | | | 1,003,128,102 | |
DISTRIBUTIONS TO SHAREHOLDERS FROM: | | | | | | | | |
Net investment income: | | | | | | | | |
Investor Class | | | — | | | | (17,075,382 | ) |
Institutional Class | | | — | | | | (17,097,356 | ) |
Realized gains on investments: | | | | | | | | |
Investor Class | | | — | | | | (63,332,483 | ) |
Institutional Class | | | — | | | | (58,184,089 | ) |
Net decrease in net assets resulting from distributions | | | — | | | | (155,689,310 | ) |
CAPITAL SHARE TRANSACTIONS (net) (Note 4) | | | 577,003,268 | | | | 276,866,712 | |
REDEMPTION FEES | | | 218 | | | | — | |
Total increase (decrease) in net assets | | | 553,101,650 | | | | 1,124,305,504 | |
NET ASSETS: | | | | | | | | |
Beginning of period | | | 4,112,494,125 | | | | 2,988,188,621 | |
End of period (including distributions in excess of net investment income of ($14,492,812) and ($26,448,443), respectively) | | | $4,665,595,775 | | | | $4,112,494,125 | |
| | |
| MATTHEWS KOREA FUND | | Six-Month Period
Ended June 30, 2018
(unaudited) | | | Year Ended
December 31, 2017 | |
OPERATIONS: | | | | | | | | |
Net investment income (loss) | | | ($183,204 | ) | | | $1,893,845 | |
Net realized gain (loss) on investments and foreign currency related transactions | | | 15,486,709 | | | | 13,644,251 | |
Net change in unrealized appreciation/depreciation on investments and foreign currency related translations | | | (42,674,610 | ) | | | 53,260,081 | |
Net increase (decrease) in net assets resulting from operations | | | (27,371,105 | ) | | | 68,798,177 | |
DISTRIBUTIONS TO SHAREHOLDERS FROM: | | | | | | | | |
Net investment income: | | | | | | | | |
Investor Class | | | — | | | | (7,705,028 | ) |
Institutional Class | | | — | | | | (1,296,962 | ) |
Realized gains on investments: | | | | | | | | |
Investor Class | | | — | | | | (8,595,183 | ) |
Institutional Class | | | — | | | | (1,380,384 | ) |
Net decrease in net assets resulting from distributions | | | — | | | | (18,977,557 | ) |
CAPITAL SHARE TRANSACTIONS (net) (Note 4) | | | 8,349,957 | | | | 25,009,807 | |
Total increase (decrease) in net assets | | | (19,021,148 | ) | | | 74,830,427 | |
NET ASSETS: | | | | | | | | |
Beginning of period | | | 225,018,218 | | | | 150,187,791 | |
End of period (including distributions in excess of net investment income of ($4,311,765) and ($4,128,561), respectively) | | | $205,997,070 | | | | $225,018,218 | |
See accompanying notes to financial statements.
| | | | |
| matthewsasia.com | 800.789.ASIA | | | 117 | |
Statements of Changes in Net Assets (continued)
| | | | | | | | |
| MATTHEWS ASIA SMALL COMPANIES FUND | | Six-Month Period
Ended June 30, 2018
(unaudited) | | | Year Ended
December 31, 2017 | |
OPERATIONS: | | | | | | | | |
Net investment income (loss) | | | $647,911 | | | | $877,973 | |
Net realized gain (loss) on investments and foreign currency related transactions | | | 48,733,741 | | | | 46,927,254 | |
Net change in unrealized appreciation/depreciation on investments and foreign currency related translations | | | (52,645,401 | ) | | | 63,650,293 | |
Net change on foreign capital gains taxes on unrealized appreciation | | | (295,891 | ) | | | (461,740 | ) |
Net increase (decrease) in net assets resulting from operations | | | (3,559,640 | ) | | | 110,993,780 | |
DISTRIBUTIONS TO SHAREHOLDERS FROM: | | | | | | | | |
Net investment income: | | | | | | | | |
Investor Class | | | — | | | | (842,375 | ) |
Institutional Class | | | — | | | | (1,420,106 | ) |
Realized gains on investments: | | | | | | | | |
Investor Class | | | — | | | | (14,961,651 | ) |
Institutional Class | | | — | | | | (16,856,653 | ) |
Net decrease in net assets resulting from distributions | | | — | | | | (34,080,785 | ) |
CAPITAL SHARE TRANSACTIONS (net) (Note 4) | | | (34,875,291 | ) | | | (64,823,384 | ) |
REDEMPTION FEES | | | 22,023 | | | | 16,089 | |
Total increase (decrease) in net assets | | | (38,412,908 | ) | | | 12,105,700 | |
NET ASSETS: | | | | | | | | |
Beginning of period | | | 441,293,010 | | | | 429,187,310 | |
End of period (including undistributed/(distributions in excess of) net investment income of $646,323 and ($1,588), respectively) | | | $402,880,102 | | | | $441,293,010 | |
| | |
| MATTHEWS CHINA SMALL COMPANIES FUND | | Six-Month Period
Ended June 30, 2018
(unaudited) | | | Year Ended
December 31, 2017 | |
OPERATIONS: | | | | | | | | |
Net investment income (loss) | | | $302,820 | | | | $144,568 | |
Net realized gain (loss) on investments and foreign currency related transactions | | | 5,872,262 | | | | 2,217,853 | |
Net change in unrealized appreciation/depreciation on investments and foreign currency related translations | | | (3,197,422 | ) | | | 7,138,457 | |
Net increase (decrease) in net assets resulting from operations | | | 2,977,660 | | | | 9,500,878 | |
DISTRIBUTIONS TO SHAREHOLDERS FROM: | | | | | | | | |
Net investment income: | | | | | | | | |
Investor Class | | | — | | | | (303,637 | ) |
Institutional Class | | | — | | | | (1,629 | ) |
Realized gains on investments: | | | | | | | | |
Investor Class | | | — | | | | (1,491,793 | ) |
Institutional Class | | | — | | | | (6,780 | ) |
Net decrease in net assets resulting from distributions | | | — | | | | (1,803,839 | ) |
CAPITAL SHARE TRANSACTIONS (net) (Note 4) | | | 32,131,651 | | | | 11,870,931 | |
REDEMPTION FEES | | | 20,820 | | | | 15,930 | |
Total increase (decrease) in net assets | | | 35,130,131 | | | | 19,583,900 | |
NET ASSETS: | | | | | | | | |
Beginning of period | | | 35,685,123 | | | | 16,101,223 | |
End of period (including undistributed/(distributions in excess of) net investment income of $241,694 and ($61,126), respectively) | | | $70,815,254 | | | | $35,685,123 | |
See accompanying notes to financial statements.
Financial Highlights
Matthews Asia Strategic Income Fund
The tables below set forth financial data for a share of beneficial interest outstanding throughout each period presented.
| | | | | | | | | | | | | | | | | | | | | | | | |
| |
| Six-Month
Period Ended
June 30, 2018
(unaudited) |
| | | Year Ended Dec. 31 | |
| INVESTOR CLASS | | 2017 | | | 2016 | | | 2015 | | | 2014 | | | 2013 | |
Net Asset Value, beginning of period | | | $10.98 | | | | $10.43 | | | | $9.96 | | | | $10.31 | | | | $10.42 | | | | $10.84 | |
INCOME (LOSS) FROM INVESTMENT OPERATIONS: | | | | | | | | | | | | | | | | | | | | | | | | |
Net investment income (loss)1 | | | 0.21 | | | | 0.51 | | | | 0.50 | | | | 0.47 | | | | 0.46 | | | | 0.40 | |
Net realized gain (loss) and unrealized appreciation/depreciation on investments, forward foreign currency exchange contracts, foreign currency related transactions, and foreign capital gains taxes | | | (0.59 | ) | | | 0.46 | | | | 0.38 | | | | (0.53 | ) | | | (0.19 | ) | | | (0.48 | ) |
Total from investment operations | | | (0.38 | ) | | | 0.97 | | | | 0.88 | | | | (0.06 | ) | | | 0.27 | | | | (0.08 | ) |
LESS DISTRIBUTIONS FROM: | | | | | | | | | | | | | | | | | | | | | | | | |
Net investment income | | | (0.22 | ) | | | (0.42 | ) | | | (0.41 | ) | | | (0.29 | ) | | | (0.38 | ) | | | (0.35 | ) |
Net realized gains on investments | | | — | | | | — | | | | — | | | | — | | | | — | | | | (0.01 | ) |
Total distributions | | | (0.22 | ) | | | (0.42 | ) | | | (0.41 | ) | | | (0.29 | ) | | | (0.38 | ) | | | (0.36 | ) |
Paid-in capital from redemption fees (Note 4) | | | — | | | | — | | | | — | | | | — | 2 | | | — | 2 | | | 0.02 | |
Net Asset Value, end of period | | | $10.38 | | | | $10.98 | | | | $10.43 | | | | $9.96 | | | | $10.31 | | | | $10.42 | |
TOTAL RETURN | | | (3.49% | )3 | | | 9.40% | | | | 8.85% | | | | (0.58% | ) | | | 2.54% | | | | (0.50% | ) |
| | | | | | |
RATIOS/SUPPLEMENTAL DATA | | | | | | | | | | | | | | | | | | | | | | | | |
Net assets, end of period (in 000’s) | | | $53,510 | | | | $63,437 | | | | $55,409 | | | | $51,130 | | | | $58,594 | | | | $38,051 | |
Ratio of expenses to average net assets before any reimbursement, waiver or recapture of expenses by Advisor and Administrator (Note 5) | | | 1.22% | 4 | | | 1.29% | | | | 1.33% | | | | 1.28% | | | | 1.27% | | | | 1.28% | |
Ratio of expenses to average net assets after any reimbursement, waiver or recapture of expenses by Advisor and Administrator | | | 1.15% | 4 | | | 1.15% | | | | 1.15% | | | | 1.12% | | | | 1.13% | | | | 1.20% | |
Ratio of net investment income (loss) to average net assets | | | 3.82% | 4 | | | 4.70% | | | | 4.85% | | | | 4.57% | | | | 4.36% | | | | 3.75% | |
Portfolio turnover5 | | | 25.49% | 3 | | | 36.58% | | | | 71.50% | | | | 50.09% | | | | 34.28% | | | | 48.71% | |
| | |
| |
| Six-Month
Period Ended
June 30, 2018
(unaudited) |
| | | Year Ended Dec. 31 | |
| INSTITUTIONAL CLASS | | 2017 | | | 2016 | | | 2015 | | | 2014 | | | 2013 | |
Net Asset Value, beginning of period | | | $10.97 | | | | $10.42 | | | | $9.96 | | | | $10.30 | | | | $10.42 | | | | $10.83 | |
INCOME (LOSS) FROM INVESTMENT OPERATIONS: | | | | | | | | | | | | | | | | | | | | | | | | |
Net investment income (loss)1 | | | 0.22 | | | | 0.53 | | | | 0.53 | | | | 0.49 | | | | 0.48 | | | | 0.42 | |
Net realized gain (loss) and unrealized appreciation/depreciation on investments, forward foreign currency exchange contracts, foreign currency related transactions, and foreign capital gains taxes | | | (0.57 | ) | | | 0.47 | | | | 0.36 | | | | (0.52 | ) | | | (0.20 | ) | | | (0.46 | ) |
Total from investment operations | | | (0.35 | ) | | | 1.00 | | | | 0.89 | | | | (0.03 | ) | | | 0.28 | | | | (0.04 | ) |
LESS DISTRIBUTIONS FROM: | | | | | | | | | | | | | | | | | | | | | | | | |
Net investment income | | | (0.24 | ) | | | (0.45 | ) | | | (0.43 | ) | | | (0.31 | ) | | | (0.40 | ) | | | (0.38 | ) |
Net realized gains on investments | | | — | | | | — | | | | — | | | | — | | | | — | | | | (0.01 | ) |
Total distributions | | | (0.24 | ) | | | (0.45 | ) | | | (0.43 | ) | | | (0.31 | ) | | | (0.40 | ) | | | (0.39 | ) |
Paid-in capital from redemption fees (Note 4) | | | — | | | | — | | | | — | | | | — | 2 | | | — | 2 | | | 0.02 | |
Net Asset Value, end of period | | | $10.38 | | | | $10.97 | | | | $10.42 | | | | $9.96 | | | | $10.30 | | | | $10.42 | |
TOTAL RETURN | | | (3.28% | )3 | | | 9.67% | | | | 9.02% | | | | (0.27% | ) | | | 2.64% | | | | (0.20% | ) |
| | | | | | |
RATIOS/SUPPLEMENTAL DATA | | | | | | | | | | | | | | | | | | | | | | | | |
Net assets, end of period (in 000’s) | | | $63,192 | | | | $31,155 | | | | $13,398 | | | | $11,001 | | | | $7,840 | | | | $7,662 | |
Ratio of expenses to average net assets before any reimbursement, waiver or recapture of expenses by Advisor and Administrator (Note 5) | | | 1.01% | 4 | | | 1.08% | | | | 1.12% | | | | 1.09% | | | | 1.07% | | | | 1.09% | |
Ratio of expenses to average net assets after any reimbursement, waiver or recapture of expenses by Advisor and Administrator | | | 0.90% | 4 | | | 0.90% | | | | 0.90% | | | | 0.90% | | | | 0.93% | | | | 1.00% | |
Ratio of net investment income (loss) to average net assets | | | 4.11% | 4 | | | 4.93% | | | | 5.13% | | | | 4.81% | | | | 4.55% | | | | 3.99% | |
Portfolio turnover5 | | | 25.49% | 3 | | | 36.58% | | | | 71.50% | | | | 50.09% | | | | 34.28% | | | | 48.71% | |
| 1 | Calculated using the average daily shares method. |
| 2 | Less than $0.01 per share. |
| 5 | The portfolio turnover rate is calculated on the Fund as a whole without distinguishing between classes of shares issued. |
See accompanying notes to financial statements.
| | | | |
| matthewsasia.com | 800.789.ASIA | | | 119 | |
Financial Highlights (continued)
Matthews Asia Credit Opportunities Fund
The tables below set forth financial data for a share of beneficial interest outstanding throughout each period presented.
| | | | | | | | | | | | |
| INVESTOR CLASS | | Six-Month
Period Ended
June 30, 2018
(unaudited) | | | Year Ended
Dec. 31, 2017 | | | Period Ended
Dec. 31, 20161 | |
Net Asset Value, beginning of period | | | $10.39 | | | | $10.13 | | | | $10.00 | |
INCOME (LOSS) FROM INVESTMENT OPERATIONS: | | | | | | | | | | | | |
Net investment income (loss)2 | | | 0.18 | | | | 0.44 | | | | 0.29 | |
Net realized gain (loss) and unrealized appreciation/depreciation on investments, swaps, and foreign currency related transactions | | | (0.46 | ) | | | 0.35 | | | | 0.18 | |
Total from investment operations | | | (0.28 | ) | | | 0.79 | | | | 0.47 | |
LESS DISTRIBUTIONS FROM: | | | | | | | | | | | | |
Net investment income | | | (0.18 | ) | | | (0.43 | ) | | | (0.32 | ) |
Net realized gains on investments | | | — | | | | (0.10 | ) | | | (0.02 | ) |
Total distributions | | | (0.18 | ) | | | (0.53 | ) | | | (0.34 | ) |
Net Asset Value, end of period | | | $9.93 | | | | $10.39 | | | | $10.13 | |
TOTAL RETURN | | | (2.77% | )3 | | | 7.86% | | | | 4.66% | 3 |
| | | | |
RATIOS/SUPPLEMENTAL DATA | | | | | | | | | | | | |
Net assets, end of period (in 000’s) | | | $10,550 | | | | $10,201 | | | | $10,119 | |
Ratio of expenses to average net assets before any reimbursement, waiver or recapture of expenses by Advisor and Administrator (Note 5) | | | 1.41% | 4 | | | 1.86% | | | | 2.24% | 4 |
Ratio of expenses to average net assets after any reimbursement, waiver or recapture of expenses by Advisor and Administrator | | | 1.15% | 4 | | | 1.15% | | | | 1.15% | 4 |
Ratio of net investment income (loss) to average net assets | | | 3.58% | 4 | | | 4.17% | | | | 4.12% | 4 |
Portfolio turnover5 | | | 15.02% | 3 | | | 27.86% | | | | 18.80% | 3 |
| | | | |
| INSTITUTIONAL CLASS | | Six-Month
Period Ended
June 30, 2018
(unaudited) | | | Year Ended
Dec. 31, 2017 | | | Period Ended
Dec. 31, 20161 | |
Net Asset Value, beginning of period | | | $10.39 | | | | $10.13 | | | | $10.00 | |
INCOME (LOSS) FROM INVESTMENT OPERATIONS: | | | | | | | | | | | | |
Net investment income (loss)2 | | | 0.20 | | | | 0.46 | | | | 0.30 | |
Net realized gain (loss) and unrealized appreciation/depreciation on investments, swaps, and foreign currency related transactions | | | (0.48 | ) | | | 0.36 | | | | 0.18 | |
Total from investment operations | | | (0.28 | ) | | | 0.82 | | | | 0.48 | |
LESS DISTRIBUTIONS FROM: | | | | | | | | | | | | |
Net investment income | | | (0.19 | ) | | | (0.46 | ) | | | (0.33 | ) |
Net realized gains on investments | | | — | | | | (0.10 | ) | | | (0.02 | ) |
Total distributions | | | (0.19 | ) | | | (0.56 | ) | | | (0.35 | ) |
Net Asset Value, end of period | | | $9.92 | | | | $10.39 | | | | $10.13 | |
TOTAL RETURN | | | (2.75% | )3 | | | 8.13% | | | | 4.82% | 3 |
| | | | |
RATIOS/SUPPLEMENTAL DATA | | | | | | | | | | | | |
Net assets, end of period (in 000’s) | | | $32,672 | | | | $21,491 | | | | $6,205 | |
Ratio of expenses to average net assets before any reimbursement, waiver or recapture of expenses by Advisor and Administrator (Note 5) | | | 1.18% | 4 | | | 1.62% | | | | 1.99% | 4 |
Ratio of expenses to average net assets after any reimbursement, waiver or recapture of expenses by Advisor and Administrator | | | 0.90% | 4 | | | 0.90% | | | | 0.90% | 4 |
Ratio of net investment income (loss) to average net assets | | | 3.83% | 4 | | | 4.45% | | | | 4.28% | 4 |
Portfolio turnover5 | | | 15.02% | 3 | | | 27.86% | | | | 18.80% | 3 |
| 1 | Commenced operations on April, 29 2016. |
| 2 | Calculated using the average daily shares method. |
| 5 | The portfolio turnover rate is calculated on the Fund as a whole without distinguishing between classes of shares issued. |
See accompanying notes to financial statements.
Matthews Asian Growth And Income Fund
The tables below set forth financial data for a share of beneficial interest outstanding throughout each period presented.
| | | | | | | | | | | | | | | | | | | | | | | | |
| |
| Six-Month
Period Ended
June 30, 2018
(unaudited) |
| | | Year Ended Dec. 31 | |
| INVESTOR CLASS | | 2017 | | | 2016 | | | 2015 | | | 2014 | | | 2013 | |
Net Asset Value, beginning of period | | | $17.46 | | | | $14.94 | | | | $16.03 | | | | $18.01 | | | | $18.91 | | | | $18.61 | |
INCOME (LOSS) FROM INVESTMENT OPERATIONS: | | | | | | | | | | | | | | | | | | | | | | | | |
Net investment income (loss)1 | | | 0.15 | | | | 0.33 | | | | 0.32 | | | | 0.39 | | | | 0.39 | | | | 0.41 | |
Net realized gain (loss) and unrealized appreciation/depreciation on investments and foreign currency related transactions | | | (1.23 | ) | | | 2.92 | | | | (0.06 | ) | | | (1.19 | ) | | | (0.50 | ) | | | 0.47 | |
Total from investment operations | | | (1.08 | ) | | | 3.25 | | | | 0.26 | | | | (0.80 | ) | | | (0.11 | ) | | | 0.88 | |
LESS DISTRIBUTIONS FROM: | | | | | | | | | | | | | | | | | | | | | | | | |
Net investment income | | | (0.22 | ) | | | (0.46 | ) | | | (0.48 | ) | | | (0.42 | ) | | | (0.35 | ) | | | (0.46 | ) |
Net realized gains on investments | | | — | | | | (0.27 | ) | | | (0.87 | ) | | | (0.76 | ) | | | (0.44 | ) | | | (0.12 | ) |
Total distributions | | | (0.22 | ) | | | (0.73 | ) | | | (1.35 | ) | | | (1.18 | ) | | | (0.79 | ) | | | (0.58 | ) |
Paid-in capital from redemption fees (Note 4) | | | — | | | | — | 2 | | | — | | | | — | 2 | | | — | 2 | | | — | 2 |
Net Asset Value, end of period | | | $16.16 | | | | $17.46 | | | | $14.94 | | | | $16.03 | | | | $18.01 | | | | $18.91 | |
TOTAL RETURN | | | (6.21% | )3 | | | 21.85% | | | | 1.34% | | | | (4.50% | ) | | | (0.65% | ) | | | 4.83% | |
| | | | | | |
RATIOS/SUPPLEMENTAL DATA | | | | | | | | | | | | | | | | | | | | | | | | |
Net assets, end of period (in 000’s) | | | $1,105,975 | | | | $1,535,746 | | | | $1,684,987 | | | | $2,045,435 | | | | $3,052,565 | | | | $3,278,586 | |
Ratio of expenses to average net assets before any reimbursement, waiver or recapture of expenses by Advisor and Administrator (Note 5) | | | 1.10% | 4 | | | 1.07% | | | | 1.09% | | | | 1.09% | | | | 1.08% | | | | 1.08% | |
Ratio of net investment income (loss) to average net assets | | | 1.80% | 4 | | | 1.95% | | | | 1.90% | | | | 2.17% | | | | 2.03% | | | | 2.14% | |
Portfolio turnover5 | | | 15.70% | 3 | | | 23.23% | | | | 15.64% | | | | 16.48% | | | | 16.79% | | | | 15.27% | |
| | |
| |
| Six-Month
Period Ended
June 30, 2018
(unaudited) |
| | | Year Ended Dec. 31 | |
| INSTITUTIONAL CLASS | | 2017 | | | 2016 | | | 2015 | | | 2014 | | | 2013 | |
Net Asset Value, beginning of period | | | $17.43 | | | | $14.92 | | | | $16.02 | | | | $18.00 | | | | $18.90 | | | | $18.60 | |
INCOME (LOSS) FROM INVESTMENT OPERATIONS: | | | | | | | | | | | | | | | | | | | | | | | | |
Net investment income (loss)1 | | | 0.18 | | | | 0.36 | | | | 0.34 | | | | 0.42 | | | | 0.42 | | | | 0.44 | |
Net realized gain (loss) and unrealized appreciation/depreciation on investments and foreign currency related transactions | | | (1.24 | ) | | | 2.91 | | | | (0.07 | ) | | | (1.19 | ) | | | (0.50 | ) | | | 0.48 | |
Total from investment operations | | | (1.06 | ) | | | 3.27 | | | | 0.27 | | | | (0.77 | ) | | | (0.08 | ) | | | 0.92 | |
LESS DISTRIBUTIONS FROM: | | | | | | | | | | | | | | | | | | | | | | | | |
Net investment income | | | (0.24 | ) | | | (0.49 | ) | | | (0.50 | ) | | | (0.45 | ) | | | (0.38 | ) | | | (0.50 | ) |
Net realized gains on investments | | | — | | | | (0.27 | ) | | | (0.87 | ) | | | (0.76 | ) | | | (0.44 | ) | | | (0.12 | ) |
Total distributions | | | (0.24 | ) | | | (0.76 | ) | | | (1.37 | ) | | | (1.21 | ) | | | (0.82 | ) | | | (0.62 | ) |
Paid-in capital from redemption fees (Note 4) | | | — | | | | — | 2 | | | — | | | | — | 2 | | | — | 2 | | | — | 2 |
Net Asset Value, end of period | | | $16.13 | | | | $17.43 | | | | $14.92 | | | | $16.02 | | | | $18.00 | | | | $18.90 | |
TOTAL RETURN | | | (6.12% | )3 | | | 22.00% | | | | 1.44% | | | | (4.33% | ) | | | (0.48% | ) | | | 5.04% | |
| | | | | | |
RATIOS/SUPPLEMENTAL DATA | | | | | | | | | | | | | | | | | | | | | | | | |
Net assets, end of period (in 000’s) | | | $1,086,270 | | | | $1,310,168 | | | | $809,254 | | | | $823,619 | | | | $1,182,690 | | | | $1,120,218 | |
Ratio of expenses to average net assets before any reimbursement, waiver or recapture of expenses by Advisor and Administrator (Note 5) | | | 0.93% | 4 | | | 0.93% | | | | 0.94% | | | | 0.92% | | | | 0.92% | | | | 0.93% | |
Ratio of net investment income (loss) to average net assets | | | 2.11% | 4 | | | 2.16% | | | | 2.06% | | | | 2.34% | | | | 2.19% | | | | 2.30% | |
Portfolio turnover5 | | | 15.70% | 3 | | | 23.23% | | | | 15.64% | | | | 16.48% | | | | 16.79% | | | | 15.27% | |
| 1 | Calculated using the average daily shares method. |
| 2 | Less than $0.01 per share. |
| 5 | The portfolio turnover rate is calculated on the Fund as a whole without distinguishing between classes of shares issued. |
See accompanying notes to financial statements.
| | | | |
| matthewsasia.com | 800.789.ASIA | | | 121 | |
Financial Highlights (continued)
Matthews Asia Dividend Fund
The tables below set forth financial data for a share of beneficial interest outstanding throughout each period presented.
| | | | | | | | | | | | | | | | | | | | | | | | |
| |
| Six-Month
Period Ended
June 30, 2018
(unaudited) |
| | | Year Ended Dec. 31 | |
| INVESTOR CLASS | | 2017 | | | 20161 | | | 20151 | | | 20141 | | | 2013 | |
Net Asset Value, beginning of period | | | $19.74 | | | | $15.52 | | | | $15.36 | | | | $15.26 | | | | $15.60 | | | | $14.58 | |
INCOME (LOSS) FROM INVESTMENT OPERATIONS: | | | | | | | | | | | | | | | | | | | | | | | | |
Net investment income (loss)2 | | | 0.20 | | | | 0.31 | | | | 0.28 | | | | 0.29 | | | | 0.30 | | | | 0.32 | |
Net realized gain (loss) and unrealized appreciation/depreciation on investments and foreign currency related transactions | | | (0.88 | ) | | | 5.02 | | | | 0.37 | | | | 0.31 | | | | (0.34 | ) | | | 1.30 | |
Total from investment operations | | | (0.68 | ) | | | 5.33 | | | | 0.65 | | | | 0.60 | | | | (0.04 | ) | | | 1.62 | |
LESS DISTRIBUTIONS FROM: | | | | | | | | | | | | | | | | | | | | | | | | |
Net investment income | | | (0.20 | ) | | | (0.69 | ) | | | (0.29 | ) | | | (0.27 | ) | | | (0.23 | ) | | | (0.60 | ) |
Net realized gains on investments | | | — | | | | (0.42 | ) | | | (0.11 | ) | | | (0.23 | ) | | | — | | | | — | |
Return of capital | | | — | | | | — | | | | (0.09 | ) | | | — | | | | (0.07 | ) | | | — | |
Total distributions | | | (0.20 | ) | | | (1.11 | ) | | | (0.49 | ) | | | (0.50 | ) | | | (0.30 | ) | | | (0.60 | ) |
Paid-in capital from redemption fees (Note 4) | | | — | | | | — | 3 | | | — | | | | — | 3 | | | — | 3 | | | — | 3 |
Net Asset Value, end of period | | | $18.86 | | | | $19.74 | | | | $15.52 | | | | $15.36 | | | | $15.26 | | | | $15.60 | |
TOTAL RETURN | | | (3.44% | )4 | | | 34.69% | | | | 4.13% | | | | 3.86% | | | | (0.32% | ) | | | 11.27% | |
| | | | | | |
RATIOS/SUPPLEMENTAL DATA | | | | | | | | | | | | | | | | | | | | | | | | |
Net assets, end of period (in 000’s) | | | $3,440,767 | | | | $3,713,276 | | | | $2,650,611 | | | | $2,757,910 | | | | $2,918,228 | | | | $3,669,690 | |
Ratio of expenses to average net assets before any reimbursement, waiver or recapture of expenses by Advisor and Administrator (Note 5) | | | 1.01% | 5 | | | 1.03% | | | | 1.06% | | | | 1.06% | | | | 1.06% | | | | 1.06% | |
Ratio of expenses to average net assets after any reimbursement, waiver or recapture of expenses by Advisor and Administrator | | | 0.99% | 5 | | | 1.02% | | | | 1.06% | | | | 1.05% | | | | 1.05% | | | | 1.06% | |
Ratio of net investment income (loss) to average net assets | | | 2.01% | 5 | | | 1.67% | | | | 1.79% | | | | 1.82% | | | | 1.89% | | | | 2.04% | |
Portfolio turnover6 | | | 18.03% | 4 | | | 28.11% | | | | 39.76% | | | | 35.98% | | | | 20.06% | | | | 14.06% | |
| | |
| |
| Six-Month
Period Ended
June 30, 2018
(unaudited) |
| | | Year Ended Dec. 31 | |
| INSTITUTIONAL CLASS | | 2017 | | | 20161 | | | 20151 | | | 20141 | | | 2013 | |
Net Asset Value, beginning of period | | | $19.73 | | | | $15.52 | | | | $15.35 | | | | $15.26 | | | | $15.59 | | | | $14.57 | |
INCOME (LOSS) FROM INVESTMENT OPERATIONS: | | | | | | | | | | | | | | | | | | | | | | | | |
Net investment income (loss)2 | | | 0.21 | | | | 0.33 | | | | 0.30 | | | | 0.32 | | | | 0.32 | | | | 0.34 | |
Net realized gain (loss) and unrealized appreciation/depreciation on investments and foreign currency related transactions | | | (0.87 | ) | | | 5.01 | | | | 0.38 | | | | 0.29 | | | | (0.33 | ) | | | 1.30 | |
Total from investment operations | | | (0.66 | ) | | | 5.34 | | | | 0.68 | | | | 0.61 | | | | (0.01 | ) | | | 1.64 | |
LESS DISTRIBUTIONS FROM: | | | | | | | | | | | | | | | | | | | | | | | | |
Net investment income | | | (0.22 | ) | | | (0.71 | ) | | | (0.31 | ) | | | (0.29 | ) | | | (0.25 | ) | | | (0.62 | ) |
Net realized gains on investments | | | — | | | | (0.42 | ) | | | (0.11 | ) | | | (0.23 | ) | | | — | | | | — | |
Return of capital | | | — | | | | — | | | | (0.09 | ) | | | — | | | | (0.07 | ) | | | — | |
Total distributions | | | (0.22 | ) | | | (1.13 | ) | | | (0.51 | ) | | | (0.52 | ) | | | (0.32 | ) | | | (0.62 | ) |
Paid-in capital from redemption fees (Note 4) | | | — | | | | — | 3 | | | — | | | | — | 3 | | | — | 3 | | | — | 3 |
Net Asset Value, end of period | | | $18.85 | | | | $19.73 | | | | $15.52 | | | | $15.35 | | | | $15.26 | | | | $15.59 | |
TOTAL RETURN | | | (3.39% | )4 | | | 34.77% | | | | 4.33% | | | | 3.93% | | | | (0.18% | ) | | | 11.43% | |
| | | | | | |
RATIOS/SUPPLEMENTAL DATA | | | | | | | | | | | | | | | | | | | | | | | | |
Net assets, end of period (in 000’s) | | | $3,620,359 | | | | $3,284,070 | | | | $2,034,276 | | | | $2,045,713 | | | | $2,107,371 | | | | $2,124,214 | |
Ratio of expenses to average net assets before any reimbursement, waiver or recapture of expenses by Advisor and Administrator (Note 5) | | | 0.90% | 5 | | | 0.92% | | | | 0.94% | | | | 0.93% | | | | 0.93% | | | | 0.93% | |
Ratio of expenses to average net assets after any reimbursement, waiver or recapture of expenses by Advisor and Administrator | | | 0.89% | 5 | | | 0.91% | | | | 0.93% | | | | 0.92% | | | | 0.93% | | | | 0.93% | |
Ratio of net investment income (loss) to average net assets | | | 2.16% | 5 | | | 1.81% | | | | 1.91% | | | | 1.98% | | | | 2.02% | | | | 2.17% | |
Portfolio turnover6 | | | 18.03% | 4 | | | 28.11% | | | | 39.76% | | | | 35.98% | | | | 20.06% | | | | 14.06% | |
| 1 | Consolidated Financial Highlights. See Note 2-C. |
| 2 | Calculated using the average daily shares method. |
| 3 | Less than $0.01 per share. |
| 6 | The portfolio turnover rate is calculated on the Fund as a whole without distinguishing between classes of shares issued. |
See accompanying notes to financial statements.
Matthews China Dividend Fund
The tables below set forth financial data for a share of beneficial interest outstanding throughout each period presented.
| | | | | | | | | | | | | | | | | | | | | | | | |
| |
| Six-Month
Period Ended
June 30, 2018
(unaudited) |
| | | Year Ended Dec. 31 | |
| INVESTOR CLASS | | 2017 | | | 2016 | | | 2015 | | | 2014 | | | 2013 | |
Net Asset Value, beginning of period | | | $17.61 | | | | $14.09 | | | | $13.79 | | | | $13.37 | | | | $13.74 | | | | $12.35 | |
INCOME (LOSS) FROM INVESTMENT OPERATIONS: | | | | | | | | | | | | | | | | | | | | | | | | |
Net investment income (loss)1 | | | 0.25 | | | | 0.35 | | | | 0.31 | | | | 0.29 | | | | 0.25 | | | | 0.25 | |
Net realized gain (loss) and unrealized appreciation/depreciation on investments and foreign currency related transactions | | | 0.30 | | | | 4.85 | | | | 0.47 | | | | 1.01 | | | | (0.12 | ) | | | 1.35 | |
Total from investment operations | | | 0.55 | | | | 5.20 | | | | 0.78 | | | | 1.30 | | | | 0.13 | | | | 1.60 | |
LESS DISTRIBUTIONS FROM: | | | | | | | | | | | | | | | | | | | | | | | | |
Net investment income | | | (0.34 | ) | | | (0.49 | ) | | | (0.28 | ) | | | (0.28 | ) | | | (0.36 | ) | | | (0.23 | ) |
Net realized gains on investments | | | — | | | | (1.19 | ) | | | (0.20 | ) | | | (0.60 | ) | | | (0.14 | ) | | | — | |
Total distributions | | | (0.34 | ) | | | (1.68 | ) | | | (0.48 | ) | | | (0.88 | ) | | | (0.50 | ) | | | (0.23 | ) |
Paid-in capital from redemption fees (Note 4) | | | — | | | | — | | | | — | | | | — | 2 | | | — | 2 | | | 0.02 | |
Net Asset Value, end of period | | | $17.82 | | | | $17.61 | | | | $14.09 | | | | $13.79 | | | | $13.37 | | | | $13.74 | |
TOTAL RETURN | | | 3.10% | 3 | | | 37.69% | | | | 5.70% | | | | 9.54% | | | | 0.93% | | | | 13.35% | |
| | | | | | |
RATIOS/SUPPLEMENTAL DATA | | | | | | | | | | | | | | | | | | | | | | | | |
Net assets, end of period (in 000’s) | | | $253,629 | | | | $260,593 | | | | $160,400 | | | | $165,514 | | | | $116,954 | | | | $125,965 | |
Ratio of expenses to average net assets before any reimbursement, waiver or recapture of expenses by Advisor and Administrator (Note 5) | | | 1.11% | 4 | | | 1.19% | | | | 1.22% | | | | 1.19% | | | | 1.19% | | | | 1.24% | |
Ratio of net investment income (loss) to average net assets | | | 2.79% | 4 | | | 2.12% | | | | 2.28% | | | | 1.97% | | | | 1.88% | | | | 1.94% | |
Portfolio turnover5 | | | 32.64% | 3 | | | 69.14% | | | | 72.96% | | | | 79.91% | | | | 25.43% | | | | 20.52% | |
| | |
| |
| Six-Month
Period Ended
June 30, 2018
(unaudited) |
| | | Year Ended Dec. 31 | |
| INSTITUTIONAL CLASS | | 2017 | | | 2016 | | | 2015 | | | 2014 | | | 2013 | |
Net Asset Value, beginning of period | | | $17.61 | | | | $14.09 | | | | $13.79 | | | | $13.37 | | | | $13.74 | | | | $12.34 | |
INCOME (LOSS) FROM INVESTMENT OPERATIONS: | | | | | | | | | | | | | | | | | | | | | | | | |
Net investment income (loss)1 | | | 0.29 | | | | 0.37 | | | | 0.29 | | | | 0.28 | | | | 0.28 | | | | 0.33 | |
Net realized gain (loss) and unrealized appreciation/depreciation on investments and foreign currency related transactions | | | 0.28 | | | | 4.85 | | | | 0.51 | | | | 1.04 | | | | (0.13 | ) | | | 1.32 | |
Total from investment operations | | | 0.57 | | | | 5.22 | | | | 0.80 | | | | 1.32 | | | | 0.15 | | | | 1.65 | |
LESS DISTRIBUTIONS FROM: | | | | | | | | | | | | | | | | | | | | | | | | |
Net investment income | | | (0.36 | ) | | | (0.51 | ) | | | (0.30 | ) | | | (0.30 | ) | | | (0.38 | ) | | | (0.26 | ) |
Net realized gains on investments | | | — | | | | (1.19 | ) | | | (0.20 | ) | | | (0.60 | ) | | | (0.14 | ) | | | — | |
Total distributions | | | (0.36 | ) | | | (1.70 | ) | | | (0.50 | ) | | | (0.90 | ) | | | (0.52 | ) | | | (0.26 | ) |
Paid-in capital from redemption fees (Note 4) | | | — | | | | — | | | | — | | | | — | 2 | | | — | 2 | | | 0.01 | |
Net Asset Value, end of period | | | $17.82 | | | | $17.61 | | | | $14.09 | | | | $13.79 | | | | $13.37 | | | | $13.74 | |
TOTAL RETURN | | | 3.19% | 3 | | | 37.88% | | | | 5.90% | | | | 9.71% | | | | 1.11% | | | | 13.72% | |
| | | | | | |
RATIOS/SUPPLEMENTAL DATA | | | | | | | | | | | | | | | | | | | | | | | | |
Net assets, end of period (in 000’s) | | | $94,354 | | | | $54,147 | | | | $27,758 | | | | $15,406 | | | | $30,662 | | | | $24,790 | |
Ratio of expenses to average net assets before any reimbursement, waiver or recapture of expenses by Advisor and Administrator (Note 5) | | | 0.97% | 4 | | | 1.04% | | | | 1.06% | | | | 1.00% | | | | 1.01% | | | | 1.08% | |
Ratio of net investment income (loss) to average net assets | | | 3.18% | 4 | | | 2.25% | | | | 2.09% | | | | 1.89% | | | | 2.06% | | | | 2.54% | |
Portfolio turnover5 | | | 32.64% | 3 | | | 69.14% | | | | 72.96% | | | | 79.91% | | | | 25.43% | | | | 20.52% | |
| 1 | Calculated using the average daily shares method. |
| 2 | Less than $0.01 per share. |
| 5 | The portfolio turnover rate is calculated on the Fund as a whole without distinguishing between classes of shares issued. |
See accompanying notes to financial statements.
| | | | |
| matthewsasia.com | 800.789.ASIA | | | 123 | |
Financial Highlights (continued)
Matthews Asia Value Fund
The tables below set forth financial data for a share of beneficial interest outstanding throughout each period presented.
| | | | | | | | | | | | | | | | |
| |
| Six-Month
Period Ended
June 30, 2018
(unaudited) |
| | | Year Ended Dec. 31 | | |
| Period Ended
Dec. 31, 20151 |
|
| INVESTOR CLASS | | 2017 | | | 2016 | |
Net Asset Value, beginning of period | | | $12.83 | | | | $9.96 | | | | $9.85 | | | | $10.00 | |
INCOME (LOSS) FROM INVESTMENT OPERATIONS: | | | | | | | | | | | | | | | | |
Net investment income (loss)2 | | | 0.05 | | | | 0.14 | | | | 0.09 | | | | 0.02 | |
Net realized gain (loss) and unrealized appreciation/depreciation on investments and foreign currency related transactions | | | (0.43 | ) | | | 3.45 | | | | 0.65 | | | | (0.16 | ) |
Total from investment operations | | | (0.38 | ) | | | 3.59 | | | | 0.74 | | | | (0.14 | ) |
LESS DISTRIBUTIONS FROM: | | | | | | | | | | | | | | | | |
Net investment income | | | — | | | | (0.29 | ) | | | (0.59 | ) | | | (0.01 | ) |
Net realized gains on investments | | | — | | | | (0.43 | ) | | | (0.04 | ) | | | — | |
Total distributions | | | — | | | | (0.72 | ) | | | (0.63 | ) | | | (0.01 | ) |
Net Asset Value, end of period | | | $12.45 | | | | $12.83 | | | | $9.96 | | | | $9.85 | |
TOTAL RETURN | | | (2.96% | )3 | | | 36.12% | | | | 7.43% | | | | (1.35% | )3 |
| | | | |
RATIOS/SUPPLEMENTAL DATA | | | | | | | | | | | | | | | | |
Net assets, end of period (in 000’s) | | | $32,176 | | | | $27,346 | | | | $2,548 | | | | $1,589 | |
Ratio of expenses to average net assets before any reimbursement, waiver or recapture of expenses by Advisor and Administrator (Note 5) | | | 1.60% | 4 | | | 2.32% | | | | 11.48% | | | | 36.42% | 4 |
Ratio of expenses to average net assets after any reimbursement, waiver or recapture of expenses by Advisor and Administrator | | | 1.50% | 4 | | | 1.50% | | | | 1.50% | | | | 1.50% | 4 |
Ratio of net investment income (loss) to average net assets | | | 0.83% | 4 | | | 1.10% | | | | 0.84% | | | | 2.70% | 4 |
Portfolio turnover5 | | | 7.19% | 3 | | | 31.93% | | | | 19.60% | | | | 10.80% | 3 |
| | | | |
| |
| Six-Month
Period Ended
June 30, 2018
(unaudited) |
| | | Year Ended Dec. 31 | | |
| Period Ended
Dec. 31, 20151 |
|
| INSTITUTIONAL CLASS | | 2017 | | | 2016 | |
Net Asset Value, beginning of period | | | $12.73 | | | | $9.85 | | | | $9.83 | | | | $10.00 | |
INCOME (LOSS) FROM INVESTMENT OPERATIONS: | | | | | | | | | | | | | | | | |
Net investment income (loss)2 | | | 0.07 | | | | 0.32 | | | | 0.10 | | | | 0.02 | |
Net realized gain (loss) and unrealized appreciation/depreciation on investments and foreign currency related transactions | | | (0.43 | ) | | | 3.25 | | | | 0.67 | | | | (0.15 | ) |
Total from investment operations | | | (0.36 | ) | | | 3.57 | | | | 0.77 | | | | (0.13 | ) |
LESS DISTRIBUTIONS FROM: | | | | | | | | | | | | | | | | |
Net investment income | | | — | | | | (0.26 | ) | | | (0.71 | ) | | | (0.04 | ) |
Net realized gains on investments | | | — | | | | (0.43 | ) | | | (0.04 | ) | | | — | |
Total distributions | | | — | | | | (0.69 | ) | | | (0.75 | ) | | | (0.04 | ) |
Net Asset Value, end of period | | | $12.37 | | | | $12.73 | | | | $9.85 | | | | $9.83 | |
TOTAL RETURN | | | (2.83% | )3 | | | 36.35% | | | | 7.72% | | | | (1.30% | )3 |
| | | | |
RATIOS/SUPPLEMENTAL DATA | | | | | | | | | | | | | | | | |
Net assets, end of period (in 000’s) | | | $3,668 | | | | $3,388 | | | | $155 | | | | $143 | |
Ratio of expenses to average net assets before any reimbursement, waiver or recapture of expenses by Advisor and Administrator (Note 5) | | | 1.36% | 4 | | | 2.08% | | | | 11.26% | | | | 36.17% | 4 |
Ratio of expenses to average net assets after any reimbursement, waiver or recapture of expenses by Advisor and Administrator | | | 1.25% | 4 | | | 1.25% | | | | 1.25% | | | | 1.25% | 4 |
Ratio of net investment income (loss) to average net assets | | | 1.05% | 4 | | | 2.59% | | | | 1.01% | | | | 2.41% | 4 |
Portfolio turnover5 | | | 7.19% | 3 | | | 31.93% | | | | 19.60% | | | | 10.80% | 3 |
| 1 | Commenced operations on November 30, 2015. |
| 2 | Calculated using the average daily shares method. |
| 5 | The portfolio turnover rate is calculated on the Fund as a whole without distinguishing between classes of shares issued. |
See accompanying notes to financial statements.
Matthews Asia Focus Fund
The tables below set forth financial data for a share of beneficial interest outstanding throughout each period presented.
| | | | | | | | | | | | | | | | | | | | | | | | |
| |
| Six-Month
Period Ended
June 30, 2018
(unaudited) |
| | | Year Ended Dec. 31 | | |
| Period Ended
Dec. 31, 20131 |
|
| INVESTOR CLASS | | 2017 | | | 2016 | | | 2015 | | | 2014 | |
Net Asset Value, beginning of period | | | $12.18 | | | | $8.98 | | | | $8.69 | | | | $10.01 | | | | $9.66 | | | | $10.00 | |
INCOME (LOSS) FROM INVESTMENT OPERATIONS: | | | | | | | | | | | | | | | | | | | | | | | | |
Net investment income (loss)2 | | | 0.07 | | | | 0.11 | | | | 0.10 | | | | 0.11 | | | | 0.09 | | | | 0.04 | |
Net realized gain (loss) and unrealized appreciation/depreciation on investments and foreign currency related transactions | | | (0.96 | ) | | | 3.21 | | | | 0.32 | | | | (1.31 | ) | | | 0.33 | | | | (0.30 | ) |
Total from investment operations | | | (0.89 | ) | | | 3.32 | | | | 0.42 | | | | (1.20 | ) | | | 0.42 | | | | (0.26 | ) |
LESS DISTRIBUTIONS FROM: | | | | | | | | | | | | | | | | | | | | | | | | |
Net investment income | | | — | | | | (0.12 | ) | | | (0.13 | ) | | | (0.07 | ) | | | (0.07 | ) | | | (0.08 | ) |
Net realized gains on investments | | | — | | | | — | | | | — | | | | (0.05 | ) | | | — | | | | — | |
Total distributions | | | — | | | | (0.12 | ) | | | (0.13 | ) | | | (0.12 | ) | | | (0.07 | ) | | | (0.08 | ) |
Paid-in capital from redemption fees (Note 4) | | | — | | | | — | | | | — | | | | — | 3 | | | — | 3 | | | — | 3 |
Net Asset Value, end of period | | | $11.29 | | | | $12.18 | | | | $8.98 | | | | $8.69 | | | | $10.01 | | | | $9.66 | |
TOTAL RETURN | | | (7.31% | )4 | | | 36.98% | | | | 4.82% | | | | (12.07% | ) | | | 4.38% | | | | (2.63% | )4 |
| | | | | | |
RATIOS/SUPPLEMENTAL DATA | | | | | | | | | | | | | | | | | | | | | | | | |
Net assets, end of period (in 000’s) | | | $3,438 | | | | $4,838 | | | | $4,713 | | | | $5,474 | | | | $7,839 | | | | $6,258 | |
Ratio of expenses to average net assets before any reimbursement, waiver or recapture of expenses by Advisor and Administrator (Note 5) | | | 2.62% | 5 | | | 2.45% | | | | 2.47% | | | | 2.07% | | | | 2.16% | | | | 3.50% | 5 |
Ratio of expenses to average net assets after any reimbursement, waiver or recapture of expenses by Advisor and Administrator | | | 1.50% | 5 | | | 1.50% | | | | 1.50% | | | | 1.50% | | | | 1.57% | | | | 1.71% | 5 |
Ratio of net investment income (loss) to average net assets | | | 1.22% | 5 | | | 1.01% | | | | 1.14% | | | | 1.08% | | | | 0.87% | | | | 0.64% | 5 |
Portfolio turnover6 | | | 14.84% | 4 | | | 28.42% | | | | 21.10% | | | | 23.60% | | | | 24.12% | | | | 16.23% | 4 |
| | | | |
| |
| Six-Month
Period Ended
June 30, 2018
(unaudited) |
| | | Year Ended Dec. 31 | | |
| Period Ended
Dec. 31, 20131 |
|
| INSTITUTIONAL CLASS | | 2017 | | | 2016 | | | 2015 | | | 2014 | |
Net Asset Value, beginning of period | | | $12.24 | | | | $8.99 | | | | $8.69 | | | | $10.04 | | | | $9.66 | | | | $10.00 | |
INCOME (LOSS) FROM INVESTMENT OPERATIONS: | | | | | | | | | | | | | | | | | | | | | | | | |
Net investment income (loss)2 | | | 0.06 | | | | 0.14 | | | | 0.13 | | | | 0.13 | | | | 0.10 | | | | 0.05 | |
Net realized gain (loss) and unrealized appreciation/depreciation on investments and foreign currency related transactions | | | (0.94 | ) | | | 3.21 | | | | 0.31 | | | | (1.33 | ) | | | 0.36 | | | | (0.30 | ) |
Total from investment operations | | | (0.88 | ) | | | 3.35 | | | | 0.44 | | | | (1.20 | ) | | | 0.46 | | | | (0.25 | ) |
LESS DISTRIBUTIONS FROM: | | | | | | | | | | | | | | | | | | | | | | | | |
Net investment income | | | — | | | | (0.10 | ) | | | (0.14 | ) | | | (0.10 | ) | | | (0.08 | ) | | | (0.09 | ) |
Net realized gains on investments | | | — | | | | — | | | | — | | | | (0.05 | ) | | | — | | | | — | |
Total distributions | | | — | | | | (0.10 | ) | | | (0.14 | ) | | | (0.15 | ) | | | (0.08 | ) | | | (0.09 | ) |
Paid-in capital from redemption fees (Note 4) | | | — | | | | — | | | | — | | | | — | 3 | | | — | 3 | | | — | 3 |
Net Asset Value, end of period | | | $11.36 | | | | $12.24 | | | | $8.99 | | | | $8.69 | | | | $10.04 | | | | $9.66 | |
TOTAL RETURN | | | (7.19% | )4 | | | 37.35% | | | | 5.05% | | | | (11.96% | ) | | | 4.77% | | | | (2.48% | )4 |
| | | | | | |
RATIOS/SUPPLEMENTAL DATA | | | | | | | | | | | | | | | | | | | | | | | | |
Net assets, end of period (in 000’s) | | | $4,965 | | | | $10,708 | | | | $5,397 | | | | $5,700 | | | | $7,148 | | | | $2,118 | |
Ratio of expenses to average net assets before any reimbursement, waiver or recapture of expenses by Advisor and Administrator (Note 5) | | | 2.45% | 5 | | | 2.27% | | | | 2.29% | | | | 1.91% | | | | 1.94% | | | | 3.32% | 5 |
Ratio of expenses to average net assets after any reimbursement, waiver or recapture of expenses by Advisor and Administrator | | | 1.25% | 5 | | | 1.25% | | | | 1.25% | | | | 1.25% | | | | 1.31% | | | | 1.50% | 5 |
Ratio of net investment income (loss) to average net assets | | | 0.94% | 5 | | | 1.28% | | | | 1.37% | | | | 1.30% | | | | 0.96% | | | | 0.79% | 5 |
Portfolio turnover6 | | | 14.84% | 4 | | | 28.42% | | | | 21.10% | | | | 23.60% | | | | 24.12% | | | | 16.23% | 4 |
| 1 | Commenced operations on April 30, 2013. |
| 2 | Calculated using the average daily shares method. |
| 3 | Less than $0.01 per share. |
| 6 | The portfolio turnover rate is calculated on the Fund as a whole without distinguishing between classes of shares issued. |
See accompanying notes to financial statements.
| | | | |
| matthewsasia.com | 800.789.ASIA | | | 125 | |
Financial Highlights (continued)
Matthews Asia Growth Fund
The tables below set forth financial data for a share of beneficial interest outstanding throughout each period presented.
| | | | | | | | | | | | | | | | | | | | | | | | |
| |
| Six-Month
Period Ended
June 30, 2018
(unaudited) |
| | | Year Ended Dec. 31 | |
| INVESTOR CLASS | | 2017 | | | 2016 | | | 2015 | | | 2014 | | | 2013 | |
Net Asset Value, beginning of period | | | $27.25 | | | | $21.05 | | | | $21.09 | | | | $21.10 | | | | $21.17 | | | | $18.02 | |
INCOME (LOSS) FROM INVESTMENT OPERATIONS: | | | | | | | | | | | | | | | | | | | | | | | | |
Net investment income (loss)1 | | | 0.03 | | | | 0.04 | | | | 0.06 | | | | 0.11 | | | | 0.12 | | | | 0.11 | |
Net realized gain (loss) and unrealized appreciation/depreciation on investments and foreign currency related transactions | | | 0.78 | | | | 8.14 | | | | 0.13 | | | | (0.12 | ) | | | 0.19 | | | | 3.37 | |
Total from investment operations | | | 0.81 | | | | 8.18 | | | | 0.19 | | | | (0.01 | ) | | | 0.31 | | | | 3.48 | |
LESS DISTRIBUTIONS FROM: | | | | | | | | | | | | | | | | | | | | | | | | |
Net investment income | | | — | | | | (0.16 | ) | | | (0.23 | ) | | | — | | | | (0.38 | ) | | | (0.33 | ) |
Net realized gains on investments | | | — | | | | (1.82 | ) | | | — | | | | — | | | | — | | | | — | |
Total distributions | | | — | | | | (1.98 | ) | | | (0.23 | ) | | | — | | | | (0.38 | ) | | | (0.33 | ) |
Paid-in capital from redemption fees (Note 4) | | | — | | | | — | | | | — | | | | — | 2 | | | — | 2 | | | — | 2 |
Net Asset Value, end of period | | | $28.06 | | | | $27.25 | | | | $21.05 | | | | $21.09 | | | | $21.10 | | | | $21.17 | |
TOTAL RETURN | | | 2.97% | 3 | | | 39.39% | | | | 0.92% | | | | (0.05% | ) | | | 1.49% | | | | 19.35% | |
| | | | | | |
RATIOS/SUPPLEMENTAL DATA | | | | | | | | | | | | | | | | | | | | | | | | |
Net assets, end of period (in 000’s) | | | $642,683 | | | | $554,309 | | | | $419,516 | | | | $526,969 | | | | $561,922 | | | | $558,407 | |
Ratio of expenses to average net assets | | | 1.07% | 4 | | | 1.12% | | | | 1.14% | | | | 1.11% | | | | 1.11% | | | | 1.12% | |
Ratio of net investment income (loss) to average net assets | | | 0.19% | 4 | | | 0.16% | | | | 0.30% | | | | 0.49% | | | | 0.55% | | | | 0.55% | |
Portfolio turnover5 | | | 2.72% | 3 | | | 23.19% | | | | 13.61% | | | | 29.51% | | | | 22.24% | | | | 10.77% | |
| | |
| |
| Six-Month
Period Ended
June 30, 2018
(unaudited) |
| | | Year Ended Dec. 31 | |
| INSTITUTIONAL CLASS | | 2017 | | | 2016 | | | 2015 | | | 2014 | | | 2013 | |
Net Asset Value, beginning of period | | | $27.45 | | | | $21.19 | | | | $21.24 | | | | $21.19 | | | | $21.26 | | | | $18.08 | |
INCOME (LOSS) FROM INVESTMENT OPERATIONS: | | | | | | | | | | | | | | | | | | | | | | | | |
Net investment income (loss)1 | | | 0.06 | | | | 0.09 | | | | 0.10 | | | | 0.16 | | | | 0.16 | | | | 0.15 | |
Net realized gain (loss) and unrealized appreciation/depreciation on investments and foreign currency related transactions | | | 0.78 | | | | 8.20 | | | | 0.13 | | | | (0.11 | ) | | | 0.19 | | | | 3.39 | |
Total from investment operations | | | 0.84 | | | | 8.29 | | | | 0.23 | | | | 0.05 | | | | 0.35 | | | | 3.54 | |
LESS DISTRIBUTIONS FROM: | | | | | | | | | | | | | | | | | | | | | | | | |
Net investment income | | | — | | | | (0.21 | ) | | | (0.28 | ) | | | — | | | | (0.42 | ) | | | (0.36 | ) |
Net realized gains on investments | | | — | | | | (1.82 | ) | | | — | | | | — | | | | — | | | | — | |
Total distributions | | | — | | | | (2.03 | ) | | | (0.28 | ) | | | — | | | | (0.42 | ) | | | (0.36 | ) |
Paid-in capital from redemption fees (Note 4) | | | — | | | | — | | | | — | | | | — | 2 | | | — | 2 | | | — | 2 |
Net Asset Value, end of period | | | $28.29 | | | | $27.45 | | | | $21.19 | | | | $21.24 | | | | $21.19 | | | | $21.26 | |
TOTAL RETURN | | | 3.06% | 3 | | | 39.64% | | | | 1.06% | | | | 0.24% | | | | 1.63% | | | | 19.63% | |
| | | | | | |
RATIOS/SUPPLEMENTAL DATA | | | | | | | | | | | | | | | | | | | | | | | | |
Net assets, end of period (in 000’s) | | | $521,144 | | | | $296,253 | | | | $195,949 | | | | $249,886 | | | | $287,262 | | | | $227,852 | |
Ratio of expenses to average net assets | | | 0.90% | 4 | | | 0.93% | | | | 0.96% | | | | 0.91% | | | | 0.91% | | | | 0.93% | |
Ratio of net investment income (loss) to average net assets | | | 0.40% | 4 | | | 0.35% | | | | 0.47% | | | | 0.72% | | | | 0.74% | | | | 0.73% | |
Portfolio turnover5 | | | 2.72% | 3 | | | 23.19% | | | | 13.61% | | | | 29.51% | | | | 22.24% | | | | 10.77% | |
| 1 | Calculated using the average daily shares method. |
| 2 | Less than $0.01 per share. |
| 5 | The portfolio turnover rate is calculated on the Fund as a whole without distinguishing between classes of shares issued. |
See accompanying notes to financial statements.
Matthews Pacific Tiger Fund
The tables below set forth financial data for a share of beneficial interest outstanding throughout each period presented.
| | | | | | | | | | | | | | | | | | | | | | | | |
| |
| Six-Month
Period Ended
June 30, 2018
(unaudited) |
| | | Year Ended Dec. 31 | |
| INVESTOR CLASS | | 2017 | | | 2016 | | | 2015 | | | 2014 | | | 2013 | |
Net Asset Value, beginning of period | | | $31.66 | | | | $22.92 | | | | $23.54 | | | | $26.57 | | | | $24.99 | | | | $24.42 | |
INCOME (LOSS) FROM INVESTMENT OPERATIONS: | | | | | | | | | | | | | | | | | | | | | | | | |
Net investment income (loss)1 | | | 0.10 | | | | 0.17 | | | | 0.11 | | | | 0.42 | | | | 0.14 | | | | 0.17 | |
Net realized gain (loss) and unrealized appreciation/depreciation on investments and foreign currency related transactions | | | (1.81 | ) | | | 8.96 | | | | (0.13 | ) | | | (0.82 | ) | | | 2.80 | | | | 0.72 | |
Total from investment operations | | | (1.71 | ) | | | 9.13 | | | | (0.02 | ) | | | (0.40 | ) | | | 2.94 | | | | 0.89 | |
LESS DISTRIBUTIONS FROM: | | | | | | | | | | | | | | | | | | | | | | | | |
Net investment income | | | — | | | | (0.17 | ) | | | (0.13 | ) | | | (0.42 | ) | | | (0.13 | ) | | | (0.16 | ) |
Net realized gains on investments | | | — | | | | (0.22 | ) | | | (0.47 | ) | | | (2.21 | ) | | | (1.23 | ) | | | (0.16 | ) |
Total distributions | | | — | | | | (0.39 | ) | | | (0.60 | ) | | | (2.63 | ) | | | (1.36 | ) | | | (0.32 | ) |
Paid-in capital from redemption fees (Note 4) | | | — | | | | — | 2 | | | — | | | | — | 2 | | | — | 2 | | | — | 2 |
Net Asset Value, end of period | | | $29.95 | | | | $31.66 | | | | $22.92 | | | | $23.54 | | | | $26.57 | | | | $24.99 | |
TOTAL RETURN | | | (5.40% | )3 | | | 39.96% | | | | (0.16% | ) | | | (1.30% | ) | | | 11.79% | | | | 3.63% | |
| | | | | | |
RATIOS/SUPPLEMENTAL DATA | | | | | | | | | | | | | | | | | | | | | | | | |
Net assets, end of period (in 000’s) | | | $2,978,918 | | | | $3,335,795 | | | | $2,445,183 | | | | $2,720,869 | | | | $3,047,077 | | | | $2,954,108 | |
Ratio of expenses to average net assets before any reimbursement, waiver or recapture of expenses by Advisor and Administrator (Note 5) | | | 1.06% | 4 | | | 1.08% | | | | 1.09% | | | | 1.09% | | | | 1.09% | | | | 1.09% | |
Ratio of expenses to average net assets after any reimbursement, waiver or recapture of expenses by Advisor and Administrator | | | 1.04% | 4 | | | 1.06% | | | | 1.08% | | | | 1.07% | | | | 1.08% | | | | 1.09% | |
Ratio of net investment income (loss) to average net assets | | | 0.63% | 4 | | | 0.63% | | | | 0.47% | | | | 1.53% | | | | 0.52% | | | | 0.67% | |
Portfolio turnover5 | | | 4.47% | 3 | | | 9.18% | | | | 5.73% | | | | 12.56% | | | | 11.38% | | | | 7.73% | |
| | |
| |
| Six-Month
Period Ended
June 30, 2018
(unaudited) |
| | | Year Ended Dec. 31 | |
| INSTITUTIONAL CLASS | | 2017 | | | 2016 | | | 2015 | | | 2014 | | | 2013 | |
Net Asset Value, beginning of period | | | $31.63 | | | | $22.90 | | | | $23.52 | | | | $26.56 | | | | $24.97 | | | | $24.41 | |
INCOME (LOSS) FROM INVESTMENT OPERATIONS: | | | | | | | | | | | | | | | | | | | | | | | | |
Net investment income (loss)1 | | | 0.12 | | | | 0.22 | | | | 0.16 | | | | 0.44 | | | | 0.18 | | | | 0.21 | |
Net realized gain (loss) and unrealized appreciation/depreciation on investments and foreign currency related transactions | | | (1.80 | ) | | | 8.95 | | | | (0.14 | ) | | | (0.80 | ) | | | 2.82 | | | | 0.71 | |
Total from investment operations | | | (1.68 | ) | | | 9.17 | | | | 0.02 | | | | (0.36 | ) | | | 3.00 | | | | 0.92 | |
LESS DISTRIBUTIONS FROM: | | | | | | | | | | | | | | | | | | | | | | | | |
Net investment income | | | — | | | | (0.22 | ) | | | (0.17 | ) | | | (0.47 | ) | | | (0.18 | ) | | | (0.20 | ) |
Net realized gains on investments | | | — | | | | (0.22 | ) | | | (0.47 | ) | | | (2.21 | ) | | | (1.23 | ) | | | (0.16 | ) |
Total distributions | | | — | | | | (0.44 | ) | | | (0.64 | ) | | | (2.68 | ) | | | (1.41 | ) | | | (0.36 | ) |
Paid-in capital from redemption fees (Note 4) | | | — | | | | — | 2 | | | — | | | | — | 2 | | | — | 2 | | | — | 2 |
Net Asset Value, end of period | | | $29.95 | | | | $31.63 | | | | $22.90 | | | | $23.52 | | | | $26.56 | | | | $24.97 | |
TOTAL RETURN | | | (5.31% | )3 | | | 40.17% | | | | 0.03% | | | | (1.15% | ) | | | 12.03% | | | | 3.78% | |
| | | | | | |
RATIOS/SUPPLEMENTAL DATA | | | | | | | | | | | | | | | | | | | | | | | | |
Net assets, end of period (in 000’s) | | | $6,169,076 | | | | $6,389,242 | | | | $4,207,508 | | | | $3,964,547 | | | | $5,049,643 | | | | $4,679,039 | |
Ratio of expenses to average net assets before any reimbursement, waiver or recapture of expenses by Advisor and Administrator (Note 5) | | | 0.89% | 4 | | | 0.91% | | | | 0.91% | | | | 0.91% | | | | 0.92% | | | | 0.92% | |
Ratio of expenses to average net assets after any reimbursement, waiver or recapture of expenses by Advisor and Administrator | | | 0.87% | 4 | | | 0.89% | | | | 0.90% | | | | 0.89% | | | | 0.91% | | | | 0.92% | |
Ratio of net investment income (loss) to average net assets | | | 0.78% | 4 | | | 0.80% | | | | 0.65% | | | | 1.61% | | | | 0.68% | | | | 0.83% | |
Portfolio turnover5 | | | 4.47% | 3 | | | 9.18% | | | | 5.73% | | | | 12.56% | | | | 11.38% | | | | 7.73% | |
| 1 | Calculated using the average daily shares method. |
| 2 | Less than $0.01 per share. |
| 5 | The portfolio turnover rate is calculated on the Fund as a whole without distinguishing between classes of shares issued. |
See accompanying notes to financial statements.
| | | | |
| matthewsasia.com | 800.789.ASIA | | | 127 | |
Financial Highlights (continued)
Matthews Asia ESG Fund
The tables below set forth financial data for a share of beneficial interest outstanding throughout each period presented.
| | | | | | | | | | | | | | | | |
| |
| Six-Month
Period Ended
June 30, 2018
(unaudited) |
| | | Year Ended Dec. 31 | | |
| Period Ended
Dec. 31, 20151 |
|
| INVESTOR CLASS | | 2017 | | | 2016 | |
Net Asset Value, beginning of period | | | $11.56 | | | | $8.97 | | | | $9.23 | | | | $10.00 | |
INCOME (LOSS) FROM INVESTMENT OPERATIONS: | | | | | | | | | | | | | | | | |
Net investment income (loss)2 | | | — | 3 | | | 0.05 | | | | 0.07 | | | | 0.02 | |
Net realized gain (loss) and unrealized appreciation/depreciation on investments and foreign currency related transactions | | | (0.24 | ) | | | 2.97 | | | | (0.20 | ) | | | (0.75 | ) |
Total from investment operations | | | (0.24 | ) | | | 3.02 | | | | (0.13 | ) | | | (0.73 | ) |
LESS DISTRIBUTIONS FROM: | | | | | | | | | | | | | | | | |
Net investment income | | | — | | | | (0.27 | ) | | | (0.13 | ) | | | (0.04 | ) |
Net realized gains on investments | | | — | | | | (0.16 | ) | | | — | | | | — | |
Total distributions | | | — | | | | (0.43 | ) | | | (0.13 | ) | | | (0.04 | ) |
Paid-in capital from redemption fees (Note 4) | | | — | 3 | | | — | | | | — | | | | — | |
Net Asset Value, end of period | | | $11.32 | | | | $11.56 | | | | $8.97 | | | | $9.23 | |
TOTAL RETURN | | | (2.08% | )4 | | | 33.79% | | | | (1.40% | ) | | | (7.30% | )4 |
| | | | |
RATIOS/SUPPLEMENTAL DATA | | | | | | | | | | | | | | | | |
Net assets, end of period (in 000’s) | | | $12,506 | | | | $10,695 | | | | $5,376 | | | | $3,248 | |
Ratio of expenses to average net assets before any reimbursement, waiver or recapture of expenses by Advisor and Administrator (Note 5) | | | 2.11% | 5 | | | 2.65% | | | | 3.54% | | | | 9.09% | 5 |
Ratio of expenses to average net assets after any reimbursement, waiver or recapture of expenses by Advisor and Administrator | | | 1.50% | 5 | | | 1.50% | | | | 1.48% | | | | 1.44% | 5 |
Ratio of net investment income (loss) to average net assets | | | —% | 5,6 | | | 0.45% | | | | 0.77% | | | | 0.25% | 5 |
Portfolio turnover7 | | | 7.22% | 4 | | | 28.82% | | | | 16.10% | | | | 21.72% | 4 |
| | | | |
| |
| Six-Month
Period Ended
June 30, 2018
(unaudited) |
| | | Year Ended Dec. 31 | | |
| Period Ended
Dec. 31, 20151 |
|
| INSTITUTIONAL CLASS | | 2017 | | | 2016 | |
Net Asset Value, beginning of period | | | $11.50 | | | | $8.92 | | | | $9.17 | | | | $10.00 | |
INCOME (LOSS) FROM INVESTMENT OPERATIONS: | | | | | | | | | | | | | | | | |
Net investment income (loss)2 | | | 0.01 | | | | 0.08 | | | | 0.09 | | | | 0.05 | |
Net realized gain (loss) and unrealized appreciation/depreciation on investments and foreign currency related transactions | | | (0.23 | ) | | | 2.95 | | | | (0.19 | ) | | | (0.77 | ) |
Total from investment operations | | | (0.22 | ) | | | 3.03 | | | | (0.10 | ) | | | (0.72 | ) |
LESS DISTRIBUTIONS FROM: | | | | | | | | | | | | | | | | |
Net investment income | | | — | | | | (0.29 | ) | | | (0.15 | ) | | | (0.11 | ) |
Net realized gains on investments | | | — | | | | (0.16 | ) | | | — | | | | — | |
Total distributions | | | — | | | | (0.45 | ) | | | (0.15 | ) | | | (0.11 | ) |
Paid-in capital from redemption fees (Note 4) | | | — | 3 | | | — | | | | — | | | | — | |
Net Asset Value, end of period | | | $11.28 | | | | $11.50 | | | | $8.92 | | | | $9.17 | |
TOTAL RETURN | | | (1.91% | )4 | | | 34.11% | | | | (1.16% | ) | | | (7.14% | )4 |
| | | | |
RATIOS/SUPPLEMENTAL DATA | | | | | | | | | | | | | | | | |
Net assets, end of period (in 000’s) | | | $8,518 | | | | $7,359 | | | | $3,382 | | | | $1,686 | |
Ratio of expenses to average net assets before any reimbursement, waiver or recapture of expenses by Advisor and Administrator (Note 5) | | | 1.92% | 5 | | | 2.46% | | | | 3.36% | | | | 8.90% | 5 |
Ratio of expenses to average net assets after any reimbursement, waiver or recapture of expenses by Advisor and Administrator | | | 1.25% | 5 | | | 1.25% | | | | 1.25% | | | | 1.25% | 5 |
Ratio of net investment income (loss) to average net assets | | | 0.24% | 5 | | | 0.71% | | | | 0.97% | | | | 0.75% | 5 |
Portfolio turnover7 | | | 7.22% | 4 | | | 28.82% | | | | 16.10% | | | | 21.72% | 4 |
| 1 | Commenced operations on April 30, 2015. |
| 2 | Calculated using the average daily shares method. |
| 3 | Less than $0.01 per share. |
| 7 | The portfolio turnover rate is calculated on the Fund as a whole without distinguishing between classes of shares issued. |
See accompanying notes to financial statements.
Matthews Emerging Asia Fund
The tables below set forth financial data for a share of beneficial interest outstanding throughout each period presented.
| | | | | | | | | | | | | | | | | | | | | | | | |
| |
| Six-Month
Period Ended
June 30, 2018
(unaudited) |
| | | Year Ended Dec. 31 | | |
| Period Ended
Dec. 31, 20131 |
|
| INVESTOR CLASS | | 2017 | | | 2016 | | | 2015 | | | 2014 | |
Net Asset Value, beginning of period | | | $15.51 | | | | $13.18 | | | | $11.27 | | | | $11.60 | | | | $9.93 | | | | $10.00 | |
INCOME (LOSS) FROM INVESTMENT OPERATIONS: | | | | | | | | | | | | | | | | | | | | | | | | |
Net investment income (loss)2 | | | 0.05 | | | | 0.07 | | | | 0.15 | | | | 0.04 | | | | 0.04 | | | | (0.01 | ) |
Net realized gain (loss) and unrealized appreciation/depreciation on investments and foreign currency related transactions | | | (1.74 | ) | | | 2.35 | | | | 2.01 | | | | (0.34 | ) | | | 1.69 | | | | (0.05 | ) |
Total from investment operations | | | (1.69 | ) | | | 2.42 | | | | 2.16 | | | | (0.30 | ) | | | 1.73 | | | | (0.06 | ) |
LESS DISTRIBUTIONS FROM: | | | | | | | | | | | | | | | | | | | | | | | | |
Net investment income | | | — | | | | (0.04 | ) | | | (0.13 | ) | | | — | 3 | | | (0.06 | ) | | | — | 3 |
Net realized gains on investments | | | — | | | | (0.05 | ) | | | (0.13 | ) | | | (0.03 | ) | | | — | | | | — | |
Return of capital | | | — | | | | — | | | | — | | | | — | | | | — | | | | (0.01 | ) |
Total distributions | | | — | | | | (0.09 | ) | | | (0.26 | ) | | | (0.03 | ) | | | (0.06 | ) | | | (0.01 | ) |
Paid-in capital from redemption fees (Note 4) | | | — | 3 | | | — | 3 | | | 0.01 | | | | — | 3 | | | — | 3 | | | — | 3 |
Net Asset Value, end of period | | | $13.82 | | | | $15.51 | | | | $13.18 | | | | $11.27 | | | | $11.60 | | | | $9.93 | |
TOTAL RETURN | | | (10.90% | )4 | | | 18.42% | | | | 19.25% | | | | (2.56% | ) | | | 17.39% | | | | (0.61% | )4 |
| | | | | | |
RATIOS/SUPPLEMENTAL DATA | | | | | | | | | | | | | | | | | | | | | | | | |
Net assets, end of period (in 000’s) | | | $168,975 | | | | $219,596 | | | | $145,164 | | | | $114,590 | | | | $110,363 | | | | $38,022 | |
Ratio of expenses to average net assets before any reimbursement, waiver or recapture of expenses by Advisor and Administrator (Note 5) | | | 1.63% | 5 | | | 1.70% | | | | 1.77% | | | | 1.75% | | | | 1.78% | | | | 2.39% | 5 |
Ratio of expenses to average net assets after any reimbursement, waiver or recapture of expenses by Advisor and Administrator | | | 1.49% | 5 | | | 1.48% | | | | 1.47% | | | | 1.50% | | �� | | 1.58% | | | | 1.98% | 5 |
Ratio of net investment income (loss) to average net assets | | | 0.70% | 5 | | | 0.49% | | | | 1.26% | | | | 0.33% | | | | 0.34% | | | | (0.08% | )5 |
Portfolio turnover6 | | | 6.34% | 4 | | | 7.74% | | | | 34.90% | | | | 12.14% | | | | 8.21% | | | | 1.66% | 4 |
| | | | |
| |
| Six-Month
Period Ended
June 30, 2018
(unaudited) |
| | | Year Ended Dec. 31 | | |
| Period Ended
Dec. 31, 20131 |
|
| INSTITUTIONAL CLASS | | 2017 | | | 2016 | | | 2015 | | | 2014 | |
Net Asset Value, beginning of period | | | $15.57 | | | | $13.22 | | | | $11.29 | | | | $11.60 | | | | $9.92 | | | | $10.00 | |
INCOME (LOSS) FROM INVESTMENT OPERATIONS: | | | | | | | | | | | | | | | | | | | | | | | | |
Net investment income (loss)2 | | | 0.07 | | | | 0.10 | | | | 0.21 | | | | 0.07 | | | | 0.06 | | | | 0.01 | |
Net realized gain (loss) and unrealized appreciation/depreciation on investments and foreign currency related transactions | | | (1.76 | ) | | | 2.37 | | | | 1.99 | | | | (0.34 | ) | | | 1.69 | | | | (0.07 | ) |
Total from investment operations | | | (1.69 | ) | | | 2.47 | | | | 2.20 | | | | (0.27 | ) | | | 1.75 | | | | (0.06 | ) |
LESS DISTRIBUTIONS FROM: | | | | | | | | | | | | | | | | | | | | | | | | |
Net investment income | | | — | | | | (0.07 | ) | | | (0.15 | ) | | | (0.01 | ) | | | (0.07 | ) | | | — | 3 |
Net realized gains on investments | | | — | | | | (0.05 | ) | | | (0.13 | ) | | | (0.03 | ) | | | — | | | | — | |
Return of capital | | | — | | | | — | | | | — | | | | — | | | | — | | | | (0.02 | ) |
Total distributions | | | — | | | | (0.12 | ) | | | (0.28 | ) | | | (0.04 | ) | | | (0.07 | ) | | | (0.02 | ) |
Paid-in capital from redemption fees (Note 4) | | | — | 3 | | | — | 3 | | | 0.01 | | | | — | 3 | | | — | 3 | | | — | 3 |
Net Asset Value, end of period | | | $13.88 | | | | $15.57 | | | | $13.22 | | | | $11.29 | | | | $11.60 | | | | $9.92 | |
TOTAL RETURN | | | (10.85% | )4 | | | 18.70% | | | | 19.61% | | | | (2.33% | ) | | | 17.68% | | | | (0.55% | )4 |
| | | | | | |
RATIOS/SUPPLEMENTAL DATA | | | | | | | | | | | | | | | | | | | | | | | | |
Net assets, end of period (in 000’s) | | | $322,518 | | | | $275,233 | | | | $95,724 | | | | $55,278 | | | | $21,350 | | | | $2,017 | |
Ratio of expenses to average net assets before any reimbursement, waiver or recapture of expenses by Advisor and Administrator (Note 5) | | | 1.45% | 5 | | | 1.52% | | | | 1.62% | | | | 1.57% | | | | 1.59% | | | | 2.21% | 5 |
Ratio of expenses to average net assets after any reimbursement, waiver or recapture of expenses by Advisor and Administrator | | | 1.25% | 5 | | | 1.25% | | | | 1.25% | | | | 1.25% | | | | 1.33% | | | | 1.75% | 5 |
Ratio of net investment income (loss) to average net assets | | | 0.99% | 5 | | | 0.70% | | | | 1.72% | | | | 0.65% | | | | 0.55% | | | | 0.19% | 5 |
Portfolio turnover6 | | | 6.34% | 4 | | | 7.74% | | | | 34.90% | | | | 12.14% | | | | 8.21% | | | | 1.66% | 4 |
| 1 | Commenced operations on April 30, 2013. |
| 2 | Calculated using the average daily shares method. |
| 3 | Less than $0.01 per share. |
| 6 | The portfolio turnover rate is calculated on the Fund as a whole without distinguishing between classes of shares issued. |
See accompanying notes to financial statements.
| | | | |
| matthewsasia.com | 800.789.ASIA | | | 129 | |
Financial Highlights (continued)
Matthews Asia Innovators Fund
The tables below set forth financial data for a share of beneficial interest outstanding throughout each period presented.
| | | | | | | | | | | | | | | | | | | | | | | | |
| |
| Six-Month
Period Ended
June 30, 2018
(unaudited) |
| | | Year Ended Dec. 31 | |
| INVESTOR CLASS | | 2017 | | | 2016 | | | 2015 | | | 2014 | | | 2013 | |
Net Asset Value, beginning of period | | | $14.19 | | | | $10.10 | | | | $12.32 | | | | $13.61 | | | | $12.59 | | | | $9.29 | |
INCOME (LOSS) FROM INVESTMENT OPERATIONS: | | | | | | | | | | | | | | | | | | | | | | | | |
Net investment income (loss)1 | | | 0.02 | | | | (0.02 | ) | | | (0.02 | ) | | | (0.05 | ) | | | — | 2 | | | 0.01 | |
Net realized gain (loss) and unrealized appreciation/depreciation on investments and foreign currency related transactions | | | 0.17 | | | | 5.31 | | | | (1.07 | ) | | | 0.64 | | | | 1.16 | | | | 3.30 | |
Total from investment operations | | | 0.19 | | | | 5.29 | | | | (1.09 | ) | | | 0.59 | | | | 1.16 | | | | 3.31 | |
LESS DISTRIBUTIONS FROM: | | | | | | | | | | | | | | | | | | | | | | | | |
Net investment income | | | — | | | | (0.24 | ) | | | — | | | | — | | | | (0.06 | ) | | | (0.01 | ) |
Net realized gains on investments | | | — | | | | (0.96 | ) | | | (1.13 | ) | | | (1.88 | ) | | | (0.08 | ) | | | — | |
Total distributions | | | — | | | | (1.20 | ) | | | (1.13 | ) | | | (1.88 | ) | | | (0.14 | ) | | | (0.01 | ) |
Net Asset Value, end of period | | | $14.38 | | | | $14.19 | | | | $10.10 | | | | $12.32 | | | | $13.61 | | | | $12.59 | |
TOTAL RETURN | | | 1.34% | 3 | | | 52.88% | | | | (9.10% | ) | | | 4.48% | | | | 9.24% | | | | 35.61% | |
| | | | | | |
RATIOS/SUPPLEMENTAL DATA | | | | | | | | | | | | | | | | | | | | | | | | |
Net assets, end of period (in 000’s) | | | $213,593 | | | | $175,331 | | | | $83,926 | | | | $129,763 | | | | $125,612 | | | | $111,751 | |
Ratio of expenses to average net assets | | | 1.12% | 4 | | | 1.24% | | | | 1.24% | | | | 1.18% | | | | 1.16% | | | | 1.18% | |
Ratio of expenses to average net assets after any reimbursement, waiver or recapture of expenses by Advisor and Administrator | | | 1.12% | 4 | | | 1.24% | | | | 1.24% | | | | 1.18% | | | | 1.16% | | | | 1.18% | |
Ratio of net investment income (loss) to average net assets | | | 0.23% | 4 | | | (0.18% | ) | | | (0.19% | ) | | | (0.33% | ) | | | (0.02% | ) | | | 0.07% | |
Portfolio turnover5 | | | 34.57% | 3 | | | 66.51% | | | | 92.25% | | | | 72.85% | | | | 62.99% | | | | 62.04% | |
| | | |
| |
| Six-Month
Period Ended
June 30, 2018
(unaudited) |
| | | Year Ended Dec. 31 | | |
| Period Ended
Dec. 31, 20136 |
|
| INSTITUTIONAL CLASS | | 2017 | | | 2016 | | | 2015 | | | 2014 | |
Net Asset Value, beginning of period | | | $14.26 | | | | $10.14 | | | | $12.34 | | | | $13.61 | | | | $12.58 | | | | $10.09 | |
INCOME (LOSS) FROM INVESTMENT OPERATIONS: | | | | | | | | | | | | | | | | | | | | | | | | |
Net investment income (loss)1 | | | 0.04 | | | | 0.01 | | | | 0.01 | | | | (0.02 | ) | | | 0.03 | | | | 0.04 | |
Net realized gain (loss) and unrealized appreciation/depreciation on investments and foreign currency related transactions | | | 0.16 | | | | 5.33 | | | | (1.08 | ) | | | 0.63 | | | | 1.17 | | | | 2.48 | |
Total from investment operations | | | 0.20 | | | | 5.34 | | | | (1.07 | ) | | | 0.61 | | | | 1.20 | | | | 2.52 | |
LESS DISTRIBUTIONS FROM: | | | | | | | | | | | | | | | | | | | | | | | | |
Net investment income | | | — | | | | (0.26 | ) | | | — | | | | — | | | | (0.09 | ) | | | (0.03 | ) |
Net realized gains on investments | | | — | | | | (0.96 | ) | | | (1.13 | ) | | | (1.88 | ) | | | (0.08 | ) | | | — | |
Total distributions | | | — | | | | (1.22 | ) | | | (1.13 | ) | | | (1.88 | ) | | | (0.17 | ) | | | (0.03 | ) |
Net Asset Value, end of period | | | $14.46 | | | | $14.26 | | | | $10.14 | | | | $12.34 | | | | $13.61 | | | | $12.58 | |
TOTAL RETURN | | | 1.40% | 3 | | | 53.18% | | | | (8.92% | ) | | | 4.63% | | | | 9.54% | | | | 24.99% | 3 |
| | | | | | | |
RATIOS/SUPPLEMENTAL DATA | | | | | | | | | | | | | | | | | | | | | | | | |
Net assets, end of period (in 000’s) | | | $81,746 | | | | $30,957 | | | | $16,545 | | | | $36,770 | | | | $61,088 | | | | $49,236 | |
Ratio of expenses to average net assets | | | 0.96% | 4 | | | 1.05% | | | | 1.01% | | | | 0.97% | | | | 0.95% | | | | 1.00% | 4 |
Ratio of net investment income (loss) to average net assets | | | 0.60% | 4 | | | 0.06% | | | | 0.06% | | | | (0.16% | ) | | | 0.21% | | | | 0.56% | 4 |
Portfolio turnover5 | | | 34.57% | 3 | | | 66.51% | | | | 92.25% | | | | 72.85% | | | | 62.99% | | | | 62.04% | 3 |
| 1 | Calculated using the average daily shares method. |
| 2 | Less than $0.01 per share. |
| 5 | The portfolio turnover rate is calculated on the Fund as a whole without distinguishing between classes of shares issued. |
| 6 | Commenced operations on April 30, 2013. |
See accompanying notes to financial statements.
Matthews China Fund
The tables below set forth financial data for a share of beneficial interest outstanding throughout each period presented.
| | | | | | | | | | | | | | | | | | | | | | | | |
| |
| Six-Month
Period Ended
June 30, 2018
(unaudited) |
| | | Year Ended Dec. 31 | |
| INVESTOR CLASS | | 2017 | | | 20161 | | | 20151 | | | 20141 | | | 2013 | |
Net Asset Value, beginning of period | | | $22.20 | | | | $15.47 | | | | $18.42 | | | | $21.46 | | | | $22.84 | | | | $23.47 | |
INCOME (LOSS) FROM INVESTMENT OPERATIONS: | | | | | | | | | | | | | | | | | | | | | | | | |
Net investment income (loss)2 | | | 0.15 | | | | 0.16 | | | | 0.21 | | | | 0.20 | | | | 0.24 | | | | 0.25 | |
Net realized gain (loss) and unrealized appreciation/depreciation on investments and foreign currency related transactions | | | (0.18 | ) | | | 8.86 | | | | (1.04 | ) | | | 0.30 | | | | (1.25 | ) | | | 1.33 | |
Total from investment operations | | | (0.03 | ) | | | 9.02 | | | | (0.83 | ) | | | 0.50 | | | | (1.01 | ) | | | 1.58 | |
LESS DISTRIBUTIONS FROM: | | | | | | | | | | | | | | | | | | | | | | | | |
Net investment income | | | — | | | | (0.37 | ) | | | (0.26 | ) | | | (0.21 | ) | | | (0.27 | ) | | | (0.26 | ) |
Net realized gains on investments | | | — | | | | (1.92 | ) | | | (1.29 | ) | | | (3.33 | ) | | | (0.10 | ) | | | (1.95 | ) |
Return of capital | | | — | | | | — | | | | (0.57 | ) | | | — | | | | — | | | | — | |
Total distributions | | | — | | | | (2.29 | ) | | | (2.12 | ) | | | (3.54 | ) | | | (0.37 | ) | | | (2.21 | ) |
Paid-in capital from redemption fees (Note 4) | | | — | 3 | | | — | | | | — | 3 | | | — | 3 | | | — | 3 | | | — | 3 |
Net Asset Value, end of period | | | $22.17 | | | | $22.20 | | | | $15.47 | | | | $18.42 | | | | $21.46 | | | | $22.84 | |
TOTAL RETURN | | | (0.14% | )4 | | | 59.37% | | | | (5.18% | ) | | | 2.41% | | | | (4.42% | ) | | | 6.84% | |
| | | | | | |
RATIOS/SUPPLEMENTAL DATA | | | | | | | | | | | | | | | | | | | | | | | | |
Net assets, end of period (in 000’s) | | | $899,849 | | | | $843,508 | | | | $495,900 | | | | $709,767 | | | | $947,740 | | | | $1,286,309 | |
Ratio of expenses to average net assets | | | 1.05% | 5 | | | 1.09% | | | | 1.18% | | | | 1.14% | | | | 1.11% | | | | 1.08% | |
Ratio of net investment income (loss) to average net assets | | | 1.30% | 5 | | | 0.78% | | | | 1.24% | | | | 0.89% | | | | 1.09% | | | | 1.06% | |
Portfolio turnover6 | | | 48.00% | 4 | | | 78.74% | | | | 83.82% | | | | 66.22% | | | | 10.23% | | | | 6.29% | |
| | |
| |
| Six-Month
Period Ended
June 30, 2018
(unaudited) |
| | | Year Ended Dec. 31 | |
| INSTITUTIONAL CLASS | | 2017 | | | 20161 | | | 20151 | | | 20141 | | | 2013 | |
Net Asset Value, beginning of period | | | $22.17 | | | | $15.44 | | | | $18.39 | | | | $21.44 | | | | $22.81 | | | | $23.45 | |
INCOME (LOSS) FROM INVESTMENT OPERATIONS: | | | | | | | | | | | | | | | | | | | | | | | | |
Net investment income (loss)2 | | | 0.25 | | | | 0.21 | | | | 0.22 | | | | 0.25 | | | | 0.28 | | | | 0.26 | |
Net realized gain (loss) and unrealized appreciation/depreciation on investments and foreign currency related transactions | | | (0.27 | ) | | | 8.84 | | | | (1.03 | ) | | | 0.27 | | | | (1.25 | ) | | | 1.36 | |
Total from investment operations | | | (0.02 | ) | | | 9.05 | | | | (0.81 | ) | | | 0.52 | | | | (0.97 | ) | | | 1.62 | |
LESS DISTRIBUTIONS FROM: | | | | | | | | | | | | | | | | | | | | | | | | |
Net investment income | | | — | | | | (0.40 | ) | | | (0.28 | ) | | | (0.24 | ) | | | (0.30 | ) | | | (0.31 | ) |
Net realized gains on investments | | | — | | | | (1.92 | ) | | | (1.29 | ) | | | (3.33 | ) | | | (0.10 | ) | | | (1.95 | ) |
Return of capital | | | — | | | | — | | | | (0.57 | ) | | | — | | | | — | | | | — | |
Total distributions | | | — | | | | (2.32 | ) | | | (2.14 | ) | | | (3.57 | ) | | | (0.40 | ) | | | (2.26 | ) |
Paid-in capital from redemption fees (Note 4) | | | — | 3 | | | — | | | | — | 3 | | | — | 3 | | | — | 3 | | | — | 3 |
Net Asset Value, end of period | | | $22.15 | | | | $22.17 | | | | $15.44 | | | | $18.39 | | | | $21.44 | | | | $22.81 | |
TOTAL RETURN | | | (0.09% | )4 | | | 59.71% | | | | (5.06% | ) | | | 2.50% | | | | (4.22% | ) | | | 6.97% | |
| | | | | | |
RATIOS/SUPPLEMENTAL DATA | | | | | | | | | | | | | | | | | | | | | | | | |
Net assets, end of period (in 000’s) | | | $141,450 | | | | $61,975 | | | | $15,874 | | | | $24,276 | | | | $52,478 | | | | $117,678 | |
Ratio of expenses to average net assets | | | 0.88% | 5 | | | 0.93% | | | | 1.03% | | | | 0.99% | | | | 0.95% | | | | 0.91% | |
Ratio of net investment income (loss) to average net assets | | | 2.13% | 5 | | | 0.99% | | | | 1.32% | | | | 1.09% | | | | 1.27% | | | | 1.13% | |
Portfolio turnover6 | | | 48.00% | 4 | | | 78.74% | | | | 83.82% | | | | 66.22% | | | | 10.23% | | | | 6.29% | |
| 1 | Consolidated Financial Highlights. See Note 2-C. |
| 2 | Calculated using the average daily shares method. |
| 3 | Less than $0.01 per share. |
| 6 | The portfolio turnover rate is calculated on the Fund as a whole without distinguishing between classes of shares issued. |
See accompanying notes to financial statements.
| | | | |
| matthewsasia.com | 800.789.ASIA | | | 131 | |
Financial Highlights (continued)
Matthews India Fund
The tables below set forth financial data for a share of beneficial interest outstanding throughout each period presented.
| | | | | | | | | | | | | | | | | | | | | | | | |
| |
| Six-Month
Period Ended
June 30, 2018
(unaudited) |
| | | Year Ended Dec. 31 | |
| INVESTOR CLASS | | 2017 | | | 2016 | | | 2015 | | | 2014 | | | 2013 | |
Net Asset Value, beginning of period | | | $34.31 | | | | $25.65 | | | | $26.43 | | | | $26.46 | | | | $16.28 | | | | $17.51 | |
INCOME (LOSS) FROM INVESTMENT OPERATIONS: | | | | | | | | | | | | | | | | | | | | | | | | |
Net investment income (loss)1 | | | (0.05 | ) | | | (0.09 | ) | | | 0.01 | | | | (0.05 | ) | | | 0.07 | | | | 0.08 | |
Net realized gain (loss) and unrealized appreciation/depreciation on investments and foreign currency related transactions | | | (1.64 | ) | | | 9.24 | | | | (0.33 | ) | | | 0.26 | | | | 10.29 | | | | (1.13 | ) |
Total from investment operations | | | (1.69 | ) | | | 9.15 | | | | (0.32 | ) | | | 0.21 | | | | 10.36 | | | | (1.05 | ) |
LESS DISTRIBUTIONS FROM: | | | | | | | | | | | | | | | | | | | | | | | | |
Net investment income | | | — | | | | — | | | | — | | | | (0.03 | ) | | | (0.05 | ) | | | (0.18 | ) |
Net realized gains on investments | | | — | | | | (0.49 | ) | | | (0.46 | ) | | | (0.23 | ) | | | (0.14 | ) | | | (0.01 | ) |
Total distributions | | | — | | | | (0.49 | ) | | | (0.46 | ) | | | (0.26 | ) | | | (0.19 | ) | | | (0.19 | ) |
Paid-in capital from redemption fees (Note 4) | | | — | | | | — | | | | — | | | | 0.02 | | | | 0.01 | | | | 0.01 | |
Net Asset Value, end of period | | | $32.62 | | | | $34.31 | | | | $25.65 | | | | $26.43 | | | | $26.46 | | | | $16.28 | |
TOTAL RETURN | | | (4.93% | )2 | | | 35.79% | | | | (1.23% | ) | | | 0.90% | | | | 63.71% | | | | (5.90% | ) |
| | | | | | |
RATIOS/SUPPLEMENTAL DATA | | | | | | | | | | | | | | | | | | | | | | | | |
Net assets, end of period (in 000’s) | | | $1,413,746 | | | | $1,484,045 | | | | $967,009 | | | | $1,151,948 | | | | $974,838 | | | | $427,861 | |
Ratio of expenses to average net assets | | | 1.07% | 3 | | | 1.09% | | | | 1.12% | | | | 1.11% | | | | 1.12% | | | | 1.13% | |
Ratio of net investment income (loss) to average net assets | | | (0.28% | )3 | | | (0.30% | ) | | | 0.02% | | | | (0.17% | ) | | | 0.32% | | | | 0.48% | |
Portfolio turnover4 | | | 11.93% | 2 | | | 16.81% | | | | 15.76% | | | | 9.51% | | | | 14.86% | | | | 8.70% | |
| | |
| |
| Six-Month
Period Ended
June 30, 2018
(unaudited) |
| | | Year Ended Dec. 31 | |
| INSTITUTIONAL CLASS | | 2017 | | | 2016 | | | 2015 | | | 2014 | | | 2013 | |
Net Asset Value, beginning of period | | | $34.51 | | | | $25.77 | | | | $26.49 | | | | $26.49 | | | | $16.31 | | | | $17.53 | |
INCOME (LOSS) FROM INVESTMENT OPERATIONS: | | | | | | | | | | | | | | | | | | | | | | | | |
Net investment income (loss)1 | | | (0.02 | ) | | | (0.03 | ) | | | 0.04 | | | | 0.01 | | | | 0.09 | | | | 0.10 | |
Net realized gain (loss) and unrealized appreciation/depreciation on investments and foreign currency related transactions | | | (1.65 | ) | | | 9.29 | | | | (0.30 | ) | | | 0.26 | | | | 10.29 | | | | (1.11 | ) |
Total from investment operations | | | (1.67 | ) | | | 9.26 | | | | (0.26 | ) | | | 0.27 | | | | 10.38 | | | | (1.01 | ) |
LESS DISTRIBUTIONS FROM: | | | | | | | | | | | | | | | | | | | | | | | | |
Net investment income | | | — | | | | (0.03 | ) | | | — | | | | (0.06 | ) | | | (0.08 | ) | | | (0.21 | ) |
Net realized gains on investments | | | — | | | | (0.49 | ) | | | (0.46 | ) | | | (0.23 | ) | | | (0.14 | ) | | | (0.01 | ) |
Total distributions | | | — | | | | (0.52 | ) | | | (0.46 | ) | | | (0.29 | ) | | | (0.22 | ) | | | (0.22 | ) |
Paid-in capital from redemption fees (Note 4) | | | — | | | | — | | | | — | | | | 0.02 | | | | 0.02 | | | | 0.01 | |
Net Asset Value, end of period | | | $32.84 | | | | $34.51 | | | | $25.77 | | | | $26.49 | | | | $26.49 | | | | $16.31 | |
TOTAL RETURN | | | (4.84% | )2 | | | 36.05% | | | | (1.00% | ) | | | 1.12% | | | | 63.80% | | | | (5.67% | ) |
| | | | | | |
RATIOS/SUPPLEMENTAL DATA | | | | | | | | | | | | | | | | | | | | | | | | |
Net assets, end of period (in 000’s) | | | $692,033 | | | | $788,388 | | | | $551,202 | | | | $353,879 | | | | $109,331 | | | | $3,234 | |
Ratio of expenses to average net assets | | | 0.88% | 3 | | | 0.89% | | | | 0.91% | | | | 0.90% | | | | 0.94% | | | | 0.95% | |
Ratio of net investment income (loss) to average net assets | | | (0.09% | )3 | | | (0.08% | ) | | | 0.16% | | | | 0.02% | | | | 0.38% | | | | 0.61% | |
Portfolio turnover4 | | | 11.93% | 2 | | | 16.81% | | | | 15.76% | | | | 9.51% | | | | 14.86% | | | | 8.70% | |
| 1 | Calculated using the average daily shares method. |
| 4 | The portfolio turnover rate is calculated on the Fund as a whole without distinguishing between classes of shares issued. |
See accompanying notes to financial statements.
Matthews Japan Fund
The tables below set forth financial data for a share of beneficial interest outstanding throughout each period presented.
| | | | | | | | | | | | | | | | | | | | | | | | |
| |
| Six-Month
Period Ended
June 30, 2018
(unaudited) |
| | | Year Ended Dec. 31 | |
| INVESTOR CLASS | | 2017 | | | 2016 | | | 2015 | | | 2014 | | | 2013 | |
Net Asset Value, beginning of period | | | $24.12 | | | | $18.83 | | | | $18.97 | | | | $15.70 | | | | $16.20 | | | | $12.27 | |
INCOME (LOSS) FROM INVESTMENT OPERATIONS: | | | | | | | | | | | | | | | | | | | | | | | | |
Net investment income (loss)1 | | | 0.06 | | | | 0.09 | | | | 0.08 | | | | 0.04 | | | | 0.05 | | | | 0.03 | |
Net realized gain (loss) and unrealized appreciation/depreciation on investments and foreign currency related transactions | | | (0.04 | ) | | | 6.13 | | | | (0.01 | ) | | | 3.23 | | | | (0.48 | ) | | | 4.12 | |
Total from investment operations | | | 0.02 | | | | 6.22 | | | | 0.07 | | | | 3.27 | | | | (0.43 | ) | | | 4.15 | |
LESS DISTRIBUTIONS FROM: | | | | | | | | | | | | | | | | | | | | | | | | |
Net investment income | | | — | | | | (0.20 | ) | | | (0.16 | ) | | | — | | | | (0.08 | ) | | | (0.24 | ) |
Net realized gains on investments | | | — | | | | (0.73 | ) | | | (0.05 | ) | | | — | | | | — | | | | — | |
Total distributions | | | — | | | | (0.93 | ) | | | (0.21 | ) | | | — | | | | (0.08 | ) | | | (0.24 | ) |
Paid-in capital from redemption fees (Note 4) | | | — | 2 | | | — | | | | — | | | | — | 2 | | | 0.01 | | | | 0.02 | |
Net Asset Value, end of period | | | $24.14 | | | | $24.12 | | | | $18.83 | | | | $18.97 | | | | $15.70 | | | | $16.20 | |
TOTAL RETURN | | | 0.08% | 3 | | | 33.14% | | | | 0.40% | | | | 20.83% | | | | (2.60% | ) | | | 34.03% | |
| | | | | | |
RATIOS/SUPPLEMENTAL DATA | | | | | | | | | | | | | | | | | | | | | | | | |
Net assets, end of period (in 000’s) | | | $2,496,899 | | | | $2,155,280 | | | | $1,685,872 | | | | $1,330,743 | | | | $467,854 | | | | $312,988 | |
Ratio of expenses to average net assets before any reimbursement, waiver or recapture of expenses by Advisor and Administrator (Note 5) | | | 0.90% | 4 | | | 0.95% | | | | 0.98% | | | | 0.99% | | | | 1.03% | | | | 1.10% | |
Ratio of expenses to average net assets after any reimbursement, waiver or recapture of expenses by Advisor and Administrator | | | 0.90% | 4 | | | 0.94% | | | | 0.98% | | | | 0.99% | | | | 1.03% | | | | 1.10% | |
Ratio of net investment income (loss) to average net assets | | | 0.49% | 4 | | | 0.40% | | | | 0.43% | | | | 0.22% | | | | 0.32% | | | | 0.19% | |
Portfolio turnover5 | | | 17.49% | 3 | | | 44.34% | | | | 55.15% | | | | 24.19% | | | | 42.52% | | | | 22.72% | |
| | |
| |
| Six-Month
Period Ended
June 30, 2018
(unaudited) |
| | | Year Ended Dec. 31 | |
| INSTITUTIONAL CLASS | | 2017 | | | 2016 | | | 2015 | | | 2014 | | | 2013 | |
Net Asset Value, beginning of period | | | $24.16 | | | | $18.86 | | | | $19.00 | | | | $15.71 | | | | $16.20 | | | | $12.26 | |
INCOME (LOSS) FROM INVESTMENT OPERATIONS: | | | | | | | | | | | | | | | | | | | | | | | | |
Net investment income (loss)1 | | | 0.07 | | | | 0.10 | | | | 0.10 | | | | 0.05 | | | | 0.09 | | | | 0.06 | |
Net realized gain (loss) and unrealized appreciation/depreciation on investments and foreign currency related transactions | | | (0.04 | ) | | | 6.14 | | | | — | 2 | | | 3.24 | | | | (0.50 | ) | | | 4.12 | |
Total from investment operations | | | 0.03 | | | | 6.24 | | | | 0.10 | | | | 3.29 | | | | (0.41 | ) | | | 4.18 | |
LESS DISTRIBUTIONS FROM: | | | | | | | | | | | | | | | | | | | | | | | | |
Net investment income | | | — | | | | (0.21 | ) | | | (0.19 | ) | | | — | | | | (0.09 | ) | | | (0.26 | ) |
Net realized gains on investments | | | — | | | | (0.73 | ) | | | (0.05 | ) | | | — | | | | — | | | | — | |
Total distributions | | | — | | | | (0.94 | ) | | | (0.24 | ) | | | — | | | | (0.09 | ) | | | (0.26 | ) |
Paid-in capital from redemption fees (Note 4) | | | — | 2 | | | — | | | | — | | | | — | 2 | | | 0.01 | | | | 0.02 | |
Net Asset Value, end of period | | | $24.19 | | | | $24.16 | | | | $18.86 | | | | $19.00 | | | | $15.71 | | | | $16.20 | |
TOTAL RETURN | | | 0.13% | 3 | | | 33.23% | | | | 0.51% | | | | 20.94% | | | | (2.47% | ) | | | 34.27% | |
| | | | | | |
RATIOS/SUPPLEMENTAL DATA | | | | | | | | | | | | | | | | | | | | | | | | |
Net assets, end of period (in 000’s) | | | $2,168,697 | | | | $1,957,214 | | | | $1,302,317 | | | | $618,583 | | | | $154,750 | | | | $59,702 | |
Ratio of expenses to average net assets before any reimbursement, waiver or recapture of expenses by Advisor and Administrator (Note 5) | | | 0.84% | 4 | | | 0.87% | | | | 0.88% | | | | 0.87% | | | | 0.90% | | | | 0.96% | |
Ratio of expenses to average net assets after any reimbursement, waiver or recapture of expenses by Advisor and Administrator | | | 0.83% | 4 | | | 0.86% | | | | 0.88% | | | | 0.87% | | | | 0.90% | | | | 0.96% | |
Ratio of net investment income (loss) to average net assets | | | 0.54% | 4 | | | 0.46% | | | | 0.54% | | | | 0.28% | | | | 0.58% | | | | 0.41% | |
Portfolio turnover5 | | | 17.49% | 3 | | | 44.34% | | | | 55.15% | | | | 24.19% | | | | 42.52% | | | | 22.72% | |
| 1 | Calculated using the average daily shares method. |
| 2 | Less than $0.01 per share. |
| 5 | The portfolio turnover rate is calculated on the Fund as a whole without distinguishing between classes of shares issued. |
See accompanying notes to financial statements.
| | | | |
| matthewsasia.com | 800.789.ASIA | | | 133 | |
Financial Highlights (continued)
Matthews Korea Fund
The tables below set forth financial data for a share of beneficial interest outstanding throughout each period presented.
| | | | | | | | | | | | | | | | | | | | | | | | |
| |
| Six-Month
Period Ended
June 30, 2018
(unaudited) |
| | | Year Ended Dec. 31 | |
| INVESTOR CLASS | | 2017 | | | 2016 | | | 2015 | | | 2014 | | | 2013 | |
Net Asset Value, beginning of period | | | $6.91 | | | | $5.25 | | | | $6.15 | | | | $5.65 | | | | $5.95 | | | | $5.64 | |
INCOME (LOSS) FROM INVESTMENT OPERATIONS: | | | | | | | | | | | | | | | | | | | | | | | | |
Net investment income (loss)1 | | | (0.01 | ) | | | 0.06 | | | | 0.02 | | | | 0.01 | | | | — | 2 | | | — | 2 |
Net realized gain (loss) and unrealized appreciation/depreciation on investments and foreign currency related transactions | | | (0.80 | ) | | | 2.22 | | | | (0.41 | ) | | | 0.83 | | | | (0.05 | ) | | | 0.57 | |
Total from investment operations | | | (0.81 | ) | | | 2.28 | | | | (0.39 | ) | | | 0.84 | | | | (0.05 | ) | | | 0.57 | |
LESS DISTRIBUTIONS FROM: | | | | | | | | | | | | | | | | | | | | | | | | |
Net investment income | | | — | | | | (0.29 | ) | | | (0.08 | ) | | | (0.01 | ) | | | — | | | | (0.02 | ) |
Net realized gains on investments | | | — | | | | (0.33 | ) | | | (0.43 | ) | | | (0.33 | ) | | | (0.25 | ) | | | (0.24 | ) |
Total distributions | | | — | | | | (0.62 | ) | | | (0.51 | ) | | | (0.34 | ) | | | (0.25 | ) | | | (0.26 | ) |
Paid-in capital from redemption fees (Note 4) | | | — | | | | — | | | | — | | | | — | 2 | | | — | 2 | | | — | 2 |
Net Asset Value, end of period | | | $6.10 | | | | $6.91 | | | | $5.25 | | | | $6.15 | | | | $5.65 | | | | $5.95 | |
TOTAL RETURN | | | (11.72% | )3 | | | 43.70% | | | | (6.32% | ) | | | 15.16% | | | | (0.73% | ) | | | 10.11% | |
| | | | | | |
RATIOS/SUPPLEMENTAL DATA | | | | | | | | | | | | | | | | | | | | | | | | |
Net assets, end of period (in 000’s) | | | $166,533 | | | | $192,431 | | | | $142,726 | | | | $147,685 | | | | $127,774 | | | | $138,830 | |
Ratio of expenses to average net assets | | | 1.12% | 4 | | | 1.15% | | | | 1.15% | | | | 1.10% | | | | 1.11% | | | | 1.13% | |
Ratio of net investment income (loss) to average net assets | | | (0.20% | )4 | | | 0.90% | | | | 0.41% | | | | 0.18% | | | | 0.04% | | | | 0.02% | |
Portfolio turnover5 | | | 16.85% | 3 | | | 25.37% | | | | 34.73% | | | | 20.36% | | | | 17.37% | | | | 46.20% | |
| | |
| |
| Six-Month
Period Ended
June 30, 2018
(unaudited) |
| | | Year Ended Dec. 31 | |
| INSTITUTIONAL CLASS | | 2017 | | | 2016 | | | 2015 | | | 2014 | | | 2013 | |
Net Asset Value, beginning of period | | | $6.95 | | | | $5.27 | | | | $6.18 | | | | $5.68 | | | | $5.96 | | | | $5.67 | |
INCOME (LOSS) FROM INVESTMENT OPERATIONS: | | | | | | | | | | | | | | | | | | | | | | | | |
Net investment income (loss)1 | | | — | 2 | | | 0.10 | | | | (0.02 | ) | | | 0.02 | | | | 0.05 | | | | — | 2 |
Net realized gain (loss) and unrealized appreciation/depreciation on investments and foreign currency related transactions | | | (0.81 | ) | | | 2.21 | | | | (0.37 | ) | | | 0.83 | | | | (0.08 | ) | | | 0.56 | |
Total from investment operations | | | (0.81 | ) | | | 2.31 | | | | (0.39 | ) | | | 0.85 | | | | (0.03 | ) | | | 0.56 | |
LESS DISTRIBUTIONS FROM: | | | | | | | | | | | | | | | | | | | | | | | | |
Net investment income | | | — | | | | (0.30 | ) | | | (0.09 | ) | | | (0.02 | ) | | | — | | | | (0.03 | ) |
Net realized gains on investments | | | — | | | | (0.33 | ) | | | (0.43 | ) | | | (0.33 | ) | | | (0.25 | ) | | | (0.24 | ) |
Total distributions | | | — | | | | (0.63 | ) | | | (0.52 | ) | | | (0.35 | ) | | | (0.25 | ) | | | (0.27 | ) |
Paid-in capital from redemption fees (Note 4) | | | — | | | | — | | | | — | | | | — | 2 | | | — | 2 | | | — | 2 |
Net Asset Value, end of period | | | $6.14 | | | | $6.95 | | | | $5.27 | | | | $6.18 | | | | $5.68 | | | | $5.96 | |
TOTAL RETURN | | | (11.66% | )3 | | | 44.11% | | | | (6.31% | ) | | | 15.27% | | | | (0.39% | ) | | | 9.87% | |
| | | | | | |
RATIOS/SUPPLEMENTAL DATA | | | | | | | | | | | | | | | | | | | | | | | | |
Net assets, end of period (in 000’s) | | | $39,465 | | | | $32,587 | | | | $7,462 | | | | $59,982 | | | | $91,431 | | | | $12,283 | |
Ratio of expenses to average net assets | | | 0.98% | 4 | | | 1.01% | | | | 0.97% | | | | 0.93% | | | | 0.93% | | | | 0.97% | |
Ratio of net investment income (loss) to average net assets | | | (0.01% | )4 | | | 1.51% | | | | (0.31% | ) | | | 0.28% | | | | 0.87% | | | | (0.03% | ) |
Portfolio turnover5 | | | 16.85% | 3 | | | 25.37% | | | | 34.73% | | | | 20.36% | | | | 17.37% | | | | 46.20% | |
| 1 | Calculated using the average daily shares method. |
| 2 | Less than $0.01 per share. |
| 5 | The portfolio turnover rate is calculated on the Fund as a whole without distinguishing between classes of shares issued. |
See accompanying notes to financial statements.
Matthews Asia Small Companies Fund
The tables below set forth financial data for a share of beneficial interest outstanding throughout each period presented.
| | | | | | | | | | | | | | | | | | | | | | | | |
| |
| Six-Month
Period Ended
June 30, 2018
(unaudited) |
| | | Year Ended Dec. 31 | |
| INVESTOR CLASS | | 2017 | | | 2016 | | | 2015 | | | 2014 | | | 2013 | |
Net Asset Value, beginning of period | | | $22.89 | | | | $19.05 | | | | $19.41 | | | | $21.46 | | | | $19.34 | | | | $18.13 | |
INCOME (LOSS) FROM INVESTMENT OPERATIONS: | | | | | | | | | | | | | | | | | | | | | | | | |
Net investment income (loss)1 | | | 0.02 | | | | 0.02 | | | | 0.09 | | | | 0.02 | | | | 0.09 | | | | 0.11 | |
Net realized gain (loss) and unrealized appreciation/depreciation on investments and foreign currency related transactions | | | (0.26 | ) | | | 5.68 | | | | (0.37 | ) | | | (2.05 | ) | | | 2.11 | | | | 1.19 | |
Total from investment operations | | | (0.24 | ) | | | 5.70 | | | | (0.28 | ) | | | (2.03 | ) | | | 2.20 | | | | 1.30 | |
LESS DISTRIBUTIONS FROM: | | | | | | | | | | | | | | | | | | | | | | | | |
Net investment income | | | — | | | | (0.10 | ) | | | (0.08 | ) | | | (0.03 | ) | | | (0.08 | ) | | | (0.09 | ) |
Net realized gains on investments | | | — | | | | (1.76 | ) | | | — | | | | — | | | | — | | | | — | |
Total distributions | | | — | | | | (1.86 | ) | | | (0.08 | ) | | | (0.03 | ) | | | (0.08 | ) | | | (0.09 | ) |
Paid-in capital from redemption fees (Note 4) | | | — | 2 | | | — | 2 | | | — | 2 | | | 0.01 | | | | — | 2 | | | — | 2 |
Net Asset Value, end of period | | | $22.65 | | | | $22.89 | | | | $19.05 | | | | $19.41 | | | | $21.46 | | | | $19.34 | |
TOTAL RETURN | | | (1.05% | )3 | | | 30.59% | | | | (1.44% | ) | | | (9.43% | ) | | | 11.39% | | | | 7.19% | |
| | | | | | |
RATIOS/SUPPLEMENTAL DATA | | | | | | | | | | | | | | | | | | | | | | | | |
Net assets, end of period (in 000’s) | | | $191,006 | | | | $208,339 | | | | $254,226 | | | | $387,747 | | | | $599,082 | | | | $407,352 | |
Ratio of expenses to average net assets before any reimbursement, waiver or recapture of expenses by Advisor and Administrator (Note 5) | | | 1.49% | 4 | | | 1.49% | | | | 1.49% | | | | 1.48% | | | | 1.47% | | | | 1.47% | |
Ratio of expenses to average net assets after any reimbursement, waiver or recapture of expenses by Advisor and Administrator | | | 1.47% | 4 | | | 1.46% | | | | 1.47% | | | | 1.47% | | | | 1.47% | | | | 1.47% | |
Ratio of net investment income (loss) to average net assets | | | 0.20% | 4 | | | 0.09% | | | | 0.45% | | | | 0.08% | | | | 0.44% | | | | 0.58% | |
Portfolio turnover5 | | | 43.17% | 3 | | | 67.13% | | | | 44.44% | | | | 48.29% | | | | 21.70% | | | | 37.01% | |
| | | |
| |
| Six-Month
Period Ended
June 30, 2018
(unaudited) |
| | | Year Ended Dec. 31 | | |
| Period Ended
Dec. 31, 20136 |
|
| INSTITUTIONAL CLASS | | 2017 | | | 2016 | | | 2015 | | | 2014 | |
Net Asset Value, beginning of period | | | $22.86 | | | | $19.03 | | | | $19.40 | | | | $21.46 | | | | $19.33 | | | | $19.44 | |
INCOME (LOSS) FROM INVESTMENT OPERATIONS: | | | | | | | | | | | | | | | | | | | | | | | | |
Net investment income (loss)1 | | | 0.05 | | | | 0.07 | | | | 0.12 | | | | 0.11 | | | | 0.15 | | | | 0.18 | |
Net realized gain (loss) and unrealized appreciation/depreciation on investments and foreign currency related transactions | | | (0.26 | ) | | | 5.67 | | | | (0.36 | ) | | | (2.10 | ) | | | 2.10 | | | | (0.16 | ) |
Total from investment operations | | | (0.21 | ) | | | 5.74 | | | | (0.24 | ) | | | (1.99 | ) | | | 2.25 | | | | 0.02 | |
LESS DISTRIBUTIONS FROM: | | | | | | | | | | | | | | | | | | | | | | | | |
Net investment income | | | — | | | | (0.15 | ) | | | (0.13 | ) | | | (0.08 | ) | | | (0.12 | ) | | | (0.13 | ) |
Net realized gains on investments | | | — | | | | (1.76 | ) | | | — | | | | — | | | | — | | | | — | |
Total distributions | | | — | | | | (1.91 | ) | | | (0.13 | ) | | | (0.08 | ) | | | (0.12 | ) | | | (0.13 | ) |
Paid-in capital from redemption fees (Note 4) | | | — | 2 | | | — | 2 | | | — | 2 | | | 0.01 | | | | — | 2 | | | — | 2 |
Net Asset Value, end of period | | | $22.65 | | | | $22.86 | | | | $19.03 | | | | $19.40 | | | | $21.46 | | | | $19.33 | |
TOTAL RETURN | | | (0.92% | )3 | | | 30.85% | | | | (1.24% | ) | | | (9.23% | ) | | | 11.65% | | | | 0.13% | 3 |
| | | | | | | |
RATIOS/SUPPLEMENTAL DATA | | | | | | | | | | | | | | | | | | | | | | | | |
Net assets, end of period (in 000’s) | | | $211,874 | | | | $232,954 | | | | $174,962 | | | | $222,168 | | | | $77,168 | | | | $44,769 | |
Ratio of expenses to average net assets before any reimbursement, waiver or recapture of expenses by Advisor and Administrator (Note 5) | | | 1.34% | 4 | | | 1.35% | | | | 1.34% | | | | 1.30% | | | | 1.27% | | | | 1.25% | 4 |
Ratio of expenses to average net assets after any reimbursement, waiver or recapture of expenses by Advisor and Administrator | | | 1.25% | 4 | | | 1.25% | | | | 1.25% | | | | 1.25% | | | | 1.26% | | | | 1.25% | 4 |
Ratio of net investment income (loss) to average net assets | | | 0.40% | 4 | | | 0.34% | | | | 0.64% | | | | 0.53% | | | | 0.70% | | | | 1.39% | 4 |
Portfolio turnover5 | | | 43.17% | 3 | | | 67.13% | | | | 44.44% | | | | 48.29% | | | | 21.70% | | | | 37.01% | 3 |
| 1 | Calculated using the average daily shares method. |
| 2 | Less than $0.01 per share. |
| 5 | The portfolio turnover rate is calculated on the Fund as a whole without distinguishing between classes of shares issued. |
| 6 | Commenced operations on April 30, 2013. |
See accompanying notes to financial statements.
| | | | |
| matthewsasia.com | 800.789.ASIA | | | 135 | |
Financial Highlights (continued)
Matthews China Small Companies Fund
The tables below set forth financial data for a share of beneficial interest outstanding throughout each period presented.
| | | | | | | | | | | | | | | | | | | | | | | | |
| |
| Six-Month
Period Ended
June 30, 2018
(unaudited) |
| | | Year Ended Dec. 31 | |
| INVESTOR CLASS | | 2017 | | | 2016 | | | 2015 | | | 2014 | | | 2013 | |
Net Asset Value, beginning of period | | | $11.89 | | | | $8.21 | | | | $8.79 | | | | $9.21 | | | | $9.89 | | | | $7.76 | |
INCOME (LOSS) FROM INVESTMENT OPERATIONS: | | | | | | | | | | | | | | | | | | | | | | | | |
Net investment income (loss)1 | | | 0.07 | | | | 0.07 | | | | 0.10 | | | | 0.08 | | | | 0.01 | | | | 0.02 | |
Net realized gain (loss) and unrealized appreciation/depreciation on investments and foreign currency related transactions | | | 0.99 | | | | 4.27 | | | | (0.28 | ) | | | 0.27 | | | | (0.33 | ) | | | 2.22 | |
Total from investment operations | | | 1.06 | | | | 4.34 | | | | (0.18 | ) | | | 0.35 | | | | (0.32 | ) | | | 2.24 | |
LESS DISTRIBUTIONS FROM: | | | | | | | | | | | | | | | | | | | | | | | | |
Net investment income | | | — | | | | (0.11 | ) | | | (0.03 | ) | | | (0.06 | ) | | | (0.02 | ) | | | (0.11 | ) |
Net realized gains on investments | | | — | | | | (0.56 | ) | | | (0.37 | ) | | | (0.72 | ) | | | — | | | | — | |
Return of capital | | | — | | | | — | | | | — | | | | — | | | | (0.34 | ) | | | — | |
Total distributions | | | — | | | | (0.67 | ) | | | (0.40 | ) | | | (0.78 | ) | | | (0.36 | ) | | | (0.11 | ) |
Paid-in capital from redemption fees (Note 4) | | | 0.01 | | | | 0.01 | | | | — | 2 | | | 0.01 | | | | — | 2 | | | — | 2 |
Net Asset Value, end of period | | | $12.96 | | | | $11.89 | | | | $8.21 | | | | $8.79 | | | | $9.21 | | | | $9.89 | |
TOTAL RETURN | | | 9.00% | 3 | | | 53.88% | | | | (2.35% | ) | | | 4.07% | | | | (3.33% | ) | | | 28.85% | |
| | | | | | |
RATIOS/SUPPLEMENTAL DATA | | | | | | | | | | | | | | | | | | | | | | | | |
Net assets, end of period (in 000’s) | | | $62,709 | | | | $35,209 | | | | $16,101 | | | | $21,546 | | | | $22,068 | | | | $26,674 | |
Ratio of expenses to average net assets before any reimbursement, waiver or recapture of expenses by Advisor and Administrator (Note 5) | | | 1.97% | 4 | | | 2.34% | | | | 2.24% | | | | 2.10% | | | | 1.90% | | | | 2.04% | |
Ratio of expenses to average net assets after any reimbursement, waiver or recapture of expenses by Advisor and Administrator | | | 1.50% | 4 | | | 1.50% | | | | 1.50% | | | | 1.50% | | | | 1.67% | | | | 2.00% | |
Ratio of net investment income (loss) to average net assets | | | 1.10% | 4 | | | 0.66% | | | | 1.17% | | | | 0.80% | | | | 0.14% | | | | 0.17% | |
Portfolio turnover5 | | | 49.94% | 3 | | | 67.22% | | | | 63.15% | | | | 72.49% | | | | 32.42% | | | | 10.28% | |
| | | | | | |
| INSTITUTIONAL CLASS | | | | | | | | | | | | | | Six-Month
Period Ended
June 30, 2018
(unaudited) | | | Period Ended
Dec. 31, 20176 | |
Net Asset Value, beginning of period | | | | | | | | | | | | | | | | | | | $11.87 | | | | $11.90 | |
INCOME (LOSS) FROM INVESTMENT OPERATIONS: | | | | | | | | | | | | | | | | | | | | | | | | |
Net investment income (loss)1 | | | | | | | | | | | | | | | | | | | 0.17 | | | | (0.01 | ) |
Net realized gain (loss) and unrealized appreciation/depreciation on investments and foreign currency related transactions | | | | | | | | | | | | | | | | | | | 0.90 | | | | 0.67 | |
Total from investment operations | | | | | | | | | | | | | | | | | | | 1.07 | | | | 0.66 | |
LESS DISTRIBUTIONS FROM: | | | | | | | | | | | | | | | | | | | | | | | | |
Net investment income | | | | | | | | | | | | | | | | | | | — | | | | (0.13 | ) |
Net realized gains on investments | | | | | | | | | | | | | | | | | | | — | | | | (0.56 | ) |
Total distributions | | | | | | | | | | | | | | | | | | | — | | | | (0.69 | ) |
Paid-in capital from redemption fees (Note 4) | | | | | | | | | | | | | | | | | | | 0.01 | | | | — | |
Net Asset Value, end of period | | | | | | | | | | | | | | | | | | | $12.95 | | | | $11.87 | |
TOTAL RETURN | | | | | | | | | | | | | | | | | | | 9.10% | 3 | | | 6.19% | 3 |
| | | | | | | |
RATIOS/SUPPLEMENTAL DATA | | | | | | | | | | | | | | | | | | | | | | | | |
Net assets, end of period (in 000’s) | | | | | | | | | | | | | | | | | | | $8,106 | | | | $476 | |
Ratio of expenses to average net assets before any reimbursement, waiver or recapture of expenses by Advisor and Administrator (Note 5) | | | | | | | | | | | | | | | | | | | 1.73% | 4 | | | 2.09% | 4 |
Ratio of expenses to average net assets after any reimbursement, waiver or recapture of expenses by Advisor and Administrator | | | | | | | | | | | | | | | | | | | 1.25% | 4 | | | 1.25% | 4 |
Ratio of net investment income (loss) to average net assets | | | | | | | | | | | | | | | | | | | 2.71% | 4 | | | (1.20% | )4 |
Portfolio turnover5 | | | | | | | | | | | | | | | | | | | 49.94% | 3 | | | 67.22% | 3 |
| 1 | Calculated using the average daily shares method. |
| 2 | Less than $0.01 per share. |
| 5 | The portfolio turnover rate is calculated on the Fund as a whole without distinguishing between classes of shares issued. |
| 6 | Commenced operations on November 30, 2017. |
See accompanying notes to financial statements.
(This Page Intentionally Left Blank)
| | | | |
| matthewsasia.com | 800.789.ASIA | | | 137 | |
Notes to Financial Statements (unaudited)
Matthews Asia Funds (the “Trust”) is an open-end management investment company registered under the Investment Company Act of 1940, as amended (the “1940 Act”). The Trust currently issues eighteen separate series of shares (each a “Fund”, and collectively, the “Funds”): Matthews Asia Strategic Income Fund, Matthews Asia Credit Opportunities Fund, Matthews Asian Growth and Income Fund, Matthews Asia Dividend Fund, Matthews China Dividend Fund, Matthews Asia Value Fund, Matthews Asia Focus Fund, Matthews Asia Growth Fund, Matthews Pacific Tiger Fund, Matthews Asia ESG Fund, Matthews Emerging Asia Fund, Matthews Asia Innovators Fund, Matthews China Fund, Matthews India Fund, Matthews Japan Fund, Matthews Korea Fund, Matthews Asia Small Companies Fund, and Matthews China Small Companies Fund. Each Fund currently offers two classes of shares: Investor Class and Institutional Class. Each class of shares has identical voting, dividend, liquidation and other rights and the same terms and conditions, except each class may be subject to different class expenses as outlined in the relevant prospectus and each class has exclusive voting rights with respect to matters solely affecting such class.
The Matthews Japan Fund closed to most new investors effective after market closing on July 29, 2016, but will continue to accept investments from existing shareholders.
| 2. | SIGNIFICANT ACCOUNTING POLICIES |
The following is a summary of significant accounting policies consistently followed by the Funds in preparation of their financial statements.
| A. | SECURITY VALUATION: The value of the Matthews Asia Funds’ (each a “Fund”, and collectively the “Funds” or the “Trust”) securities is based on market quotations for those securities, or on their fair value determined by the valuation policies approved by the Funds’ Board of Trustees (the “Board”). Market quotations and valuation information are provided by commercial pricing services or securities dealers that are independent of the Funds and Matthews International Capital Management, LLC (“Matthews”), in accordance with procedures established by the Funds’ Board. Foreign exchange-traded securities are valued as of the close of trading on the primary exchange on which they trade. Securities that trade in over-the-counter markets, including most debt securities (bonds), may be valued by other third-party vendors or by using indicative bid quotations from dealers or market makers, or other available market information. Market values for securities are determined based on quotations, market data or other information from the principal (or most advantageous) market on which the security is traded. Market quotations for equity securities used by the Funds include last reported sale prices, or, if such prices are not reported or available, bid and ask prices. Swap agreements are valued utilizing quotes received daily by the Funds’ pricing service or through brokers, which are derived using daily swap curves and models that incorporate a number of market data factors, such as discounted cash flows, trades and values of the underlying reference instruments. Foreign currency exchange contracts are valued at the mean between the bid and ask prices and are determined at the close of business on the New York Stock Exchange (“NYSE”). Interpolated values are derived when the settlement date of the contract is an interim date for which quotations are not available. The Funds may also utilize independent pricing services to assist them in determining a current market value for each security based on sources believed to be reliable. |
The Board has delegated to the Board’s Valuation Committee the responsibility for oversight of the fair valuation process under the Trust’s Valuation and Pricing Policy. The Board’s Valuation Committee, in turn, has delegated the determination of fair value prices under Matthews’ Valuation and Pricing Procedures to Matthews’ Valuation Committee (the “Valuation Committee”). The Board’s Valuation Committee will review and approve fair value determinations by Matthews’ Valuation Committee in accordance with the Valuation and Pricing Policy. When fair value pricing is employed, the prices of securities used by a Fund to calculate its Net Asset Value (“NAV”) may differ from any quoted or published prices for the same securities for that day. All fair value determinations are made subject to the Board’s oversight. Events affecting the value of foreign investments may occur between the time at which they are determined and when the Funds calculate their NAV, which is normally the close of trading on the NYSE. If such events render market quotations unreliable, and the impact of such events can be reasonably determined, the investments will be valued at their fair value in accordance with pricing policies. The fair value of a security held by the Funds may be determined using the services of third-party pricing services to assist in this process.
The books and records of the Funds are maintained in U.S. dollars. Transactions, portfolio securities, and assets and liabilities denominated in a foreign currency are translated and recorded in U.S. dollars at the prevailing exchange rate as of the close of trading on the NYSE. Translation gains or losses resulting from changes in the exchange rate during the reporting period and realized gains and losses on the settlement of foreign currency transactions are reported in the results of operations for the current period. The Funds isolate that portion of gains and losses on investments in fixed income securities that is due to changes in foreign exchange rate from that which is due to changes in market prices of securities.
Foreign securities held by the Funds may be traded on days and at times when the NYSE is closed. Accordingly, the value of the Funds may be significantly affected on days when shareholders have no access to the Funds.
| B. | FAIR VALUE MEASUREMENTS: In accordance with the guidance on fair value measurements and disclosures under generally accepted accounting principles in the United States (“U.S. GAAP”), the Funds disclose the fair value of their investments and derivative financial instruments in a hierarchy that prioritizes the inputs to valuation techniques used to measure the fair value. The hierarchy gives the highest priority to valuations based upon unadjusted quoted prices in active markets for identical assets or liabilities (Level 1 measurements) and the lowest priority to valuations based upon unobservable inputs that are significant to the valuation (Level 3 measurements). Various inputs are used in determining the fair value of investments and derivative financial instruments, which are as follows: |
Level 1: Quoted prices in active markets for identical securities.
Level 2: Other significant observable inputs (including quoted prices for similar securities, interest rates, prepayment speeds, credit risk, foreign exchange, etc.).
Level 3: Significant unobservable inputs (including the Funds’ own assumptions in determining the fair value of investments and derivative financial instruments).
The summary of inputs used to determine the fair valuation of the Funds’ investments and derivative financial instruments as of June 30, 2018 is as follows:
| | | | | | | | | | | | | | | | | | | | | | | | | | | | |
| | | Matthews Asia
Strategic
Income Fund | | | Matthews
Asia Credit
Opportunities
Fund | | | Matthews Asian
Growth and
Income Fund | | | Matthews Asia
Dividend Fund | | | Matthews Asia
Value Fund | | | Matthews Asia
Focus Fund | | | Matthews Asia
Growth Fund | |
| Assets: | | | | | | | | | | | | | | | | | | | | | | | | | | | | |
| Investments: | | | | | | | | | | | | | | | | | | | | | | | | | | | | |
Level 1: Quoted Prices | | | | | | | | | | | | | | | | | | | | | | | | | | | | |
Bangladesh | | | $— | | | | $— | | | | $— | | | | $— | | | | $— | | | | $— | | | | $38,472,627 | |
China/Hong Kong | | | — | | | | — | | | | 112,885,435 | | | | 164,339,191 | | | | 4,126,303 | | | | 227,403 | | | | 123,168,804 | |
Indonesia | | | — | | | | — | | | | 34,588,098 | | | | 39,317,979 | | | | — | | | | — | | | | 18,752,948 | |
Israel | | | — | | | | — | | | | — | | | | — | | | | 196,673 | | | | — | | | | — | |
Japan | | | — | | | | — | | | | — | | | | — | | | | 453,706 | | | | — | | | | 4,063,334 | |
Philippines | | | — | | | | — | | | | — | | | | 41,776,441 | | | | — | | | | — | | | | 5,254,042 | |
Singapore | | | — | | | | — | | | | — | | | | 42,893,533 | | | | 917,977 | | | | — | | | | — | |
South Korea | | | — | | | | — | | | | 65,457,231 | | | | 191,275,671 | | | | 1,642,250 | | | | 266,366 | | | | — | |
Sri Lanka | | | — | | | | — | | | | — | | | | — | | | | — | | | | — | | | | 38,419,918 | |
Taiwan | | | — | | | | — | | | | — | | | | 96,625,886 | | | | — | | | | — | | | | — | |
United States | | | — | | | | — | | | | 48,843,432 | | | | — | | | | 668,870 | | | | 291,168 | | | | — | |
Level 2: Other Significant Observable Inputs | | | | | | | | | | | | | | | | | | | | | | | | | | | | |
Foreign Government Obligationsa | | | 22,708,854 | | | | 4,552,476 | | | | — | | | | — | | | | — | | | | — | | | | — | |
Non-Convertible Corporate Bondsa | | | 62,184,015 | | | | 23,040,304 | | | | — | | | | — | | | | — | | | | — | | | | — | |
Convertible Corporate Bondsa | | | 21,829,460 | | | | 7,745,771 | | | | 245,487,003 | | | | — | | | | — | | | | — | | | | — | |
Common Equities: | | | | | | | | | | | | | | | | | | | | | | | | | | | | |
Australia | | | — | | | | — | | | | 65,783,703 | | | | 136,380,773 | | | | — | | | | 290,633 | | | | 50,595,388 | |
Bangladesh | | | — | | | | — | | | | — | | | | 70,722,541 | | | | — | | | | — | | | | — | |
China/Hong Kong | | | — | | | | — | | | | 590,394,714 | | | | 2,759,318,193 | | | | 5,743,781 | | | | 3,219,570 | | | | 194,112,558 | |
India | | | — | | | | — | | | | 74,021,884 | | | | 266,991,433 | | | | — | | | | 507,054 | | | | 54,140,655 | |
Indonesia | | | — | | | | — | | | | 61,315,703 | | | | 101,756,581 | | | | — | | | | 444,196 | | | | 72,525,339 | |
Japan | | | — | | | | — | | | | 103,470,085 | | | | 1,796,448,535 | | | | 3,221,890 | | | | 248,723 | | | | 420,588,588 | |
Malaysia | | | — | | | | — | | | | 34,270,274 | | | | — | | | | 2,076,082 | | | | 206,491 | | | | — | |
New Zealand | | | — | | | | — | | | | 35,488,044 | | | | — | | | | — | | | | — | | | | — | |
Norway | | | — | | | | — | | | | 33,367,099 | | | | — | | | | — | | | | — | | | | — | |
Philippines | | | — | | | | — | | | | 35,859,319 | | | | — | | | | — | | | | 214,011 | | | | 9,899,806 | |
Singapore | | | — | | | | — | | | | 194,608,642 | | | | 275,245,309 | | | | 754,245 | | | | 1,014,231 | | | | — | |
South Korea | | | — | | | | — | | | | 142,037,356 | | | | 351,038,510 | | | | 5,433,318 | | | | 385,715 | | | | — | |
Switzerland | | | — | | | | — | | | | — | | | | — | | | | 399,172 | | | | 260,028 | | | | — | |
Taiwan | | | — | | | | — | | | | 138,891,111 | | | | 131,941,897 | | | | 1,511,988 | | | | 436,577 | | | | 9,178,238 | |
Thailand | | | — | | | | — | | | | 32,503,194 | | | | 99,843,690 | | | | — | | | | 220,557 | | | | 14,076,208 | |
Vietnam | | | — | | | | — | | | | 36,290,620 | | | | 92,304,686 | | | | — | | | | — | | | | 19,156,200 | |
Preferred Equities: | | | | | | | | | | | | | | | | | | | | | | | | | | | | |
South Korea | | | — | | | | — | | | | 36,315,895 | | | | 289,881,406 | | | | 3,253,322 | | | | — | | | | — | |
Level 3: Significant Unobservable Inputs | | | | | | | | | | | | | | | | | | | | | | | | | | | | |
Common Equities: | | | | | | | | | | | | | | | | | | | | | | | | | | | | |
China/Hong Kong | | | — | | | | — | | | | — | | | | — | | | | 1,534,488 | | | | — | | | | — | |
Total Market Value of Investments | | | $106,722,329 | | | | $35,338,551 | | | | $2,121,878,842 | | | | $6,948,102,255 | | | | $31,934,065 | | | | $8,232,723 | | | | $1,072,404,653 | |
| a | Industry, countries, or security types are disclosed on the Schedule of Investments. |
| | | | |
| matthewsasia.com | 800.789.ASIA | | | 139 | |
Notes to Financial Statements (unaudited) (continued)
| | | | | | | | | | | | | | | | | | | | | | | | | | | | | | |
| | | | | | | | | | | | | | | | | | | | | | | Matthews Asia
Strategic
Income Fund | |
| Derivative Financial Instruments1 | | | | | | | | | | | | | | | | | | | | | | | | | | | | | | |
Assets | | | | | | | | | | | | | | | | | | | | | | | | | | | | | | |
| Level 2: Other Significant Observable Inputs | | | | | | | | | | | | | | | | | | | | | | | | | | | | | | |
Forward Foreign Currency Exchange Contracts | | | | | | | | | | | | | | | | | | | | | | | | | | | | | $165,468 | |
| | | | | | | | | | | | | | | | | | | | | | | | | | | | | | |
| | | | | | | | |
Liabilities | | | | | | | | | | | | | | | | | | | | | | | | | | | | | | |
| Level 2: Other Significant Observable Inputs | | | | | | | | | | | | | | | | | | | | | | | | | | | | | | |
Forward Foreign Currency Exchange Contracts | | | | | | | | | | | | | | | | | | | | | | | | | | | | | ($1,473,456 | ) |
| | | | | | | | | | | | | | | | | | | | | | | | | | | | | | |
| 1 | Derivative financial instruments are forward foreign currency exchange contracts. Forward foreign currency exchange contracts are valued at the unrealized appreciation/depreciation on the instrument. |
| | | | | | | | | | | | | | | | | | | | | | | | |
| | | Matthews China
Dividend Fund | | | Matthews
China Fund | | | Matthews
India Fund | | | Matthews
Japan Fund | | | Matthews
Korea Fund | | | Matthews
China Small
Companies
Fund | |
| Assets: | | | | | | | | | | | | | | | | | | | | | | | | |
| Investments: | | | | | | | | | | | | | | | | | | | | | | | | |
Level 1: Quoted Prices | | | | | | | | | | | | | | | | | | | | | | | | |
Common Equities: | | | | | | | | | | | | | | | | | | | | | | | | |
Consumer Discretionary | | | $5,033,078 | | | | $13,581,047 | | | | $— | | | | $— | | | | $— | | | | $802,814 | |
Consumer Staples | | | — | | | | — | | | | 79,436,840 | | | | — | | | | 7,900,081 | | | | — | |
Financials | | | 6,013,500 | | | | — | | | | 884,478 | | | | — | | | | — | | | | — | |
Health Care | | | 3,114,069 | | | | 10,775,466 | | | | 27,030,839 | | | | — | | | | — | | | | 999,245 | |
Industrials | | | 404,928 | | | | 10,457,244 | | | | — | | | | — | | | | 3,383,092 | | | | — | |
Information Technology | | | 11,182,243 | | | | 172,388,373 | | | | 93,638,109 | | | | 13,402,448 | | | | — | | | | 2,957,934 | |
Materials | | | 6,329,000 | | | | — | | | | — | | | | — | | | | — | | | | 648,032 | |
Telecommunication Services | | | 8,053,678 | | | | — | | | | — | | | | — | | | | 3,815,152 | | | | — | |
Closed-End Fund: | | | | | | | | | | | | | | | | | | | | | | | | |
Information Technology | | | 9,919,955 | | | | — | | | | — | | | | — | | | | — | | | | — | |
Level 2: Other Significant Observable Inputs | | | | | | | | | | | | | | | | | | | | | | | | |
Common Equities: | | | | | | | | | | | | | | | | | | | | | | | | |
Consumer Discretionary | | | 27,711,024 | | | | 98,525,830 | | | | 194,492,551 | | | | 632,870,963 | | | | 28,642,891 | | | | 13,142,796 | |
Consumer Staples | | | 35,769,601 | | | | 50,879,963 | | | | 298,917,546 | | | | 561,246,806 | | | | 11,866,697 | | | | 2,815,520 | |
Energy | | | 26,669,690 | | | | 53,745,372 | | | | — | | | | — | | | | 4,822,802 | | | | 3,242,731 | |
Financials | | | 48,727,445 | | | | 258,925,567 | | | | 751,881,187 | | | | 313,585,022 | | | | 31,595,635 | | | | 938,253 | |
Health Care | | | 16,740,369 | | | | 22,127,702 | | | | 165,044,034 | | | | 519,131,241 | | | | 11,847,941 | | | | 5,379,388 | |
Industrials | | | 40,894,968 | | | | 48,442,549 | | | | 253,816,093 | | | | 1,190,316,900 | | | | 2,592,732 | | | | 13,565,191 | |
Information Technology | | | 36,906,890 | | | | 148,294,854 | | | | 133,489,310 | | | | 864,967,235 | | | | 29,799,384 | | | | 14,066,480 | |
Materials | | | 4,886,642 | | | | 52,716,148 | | | | 98,126,961 | | | | 182,845,974 | | | | 15,344,179 | | | | 5,181,511 | |
Real Estate | | | 13,671,150 | | | | 43,886,805 | | | | — | | | | 198,684,504 | | | | — | | | | 4,047,672 | |
Telecommunication Services | | | 19,410,730 | | | | 11,273,079 | | | | — | | | | 97,179,353 | | | | — | | | | — | |
Utilities | | | 13,164,003 | | | | 29,245,601 | | | | — | | | | — | | | | — | | | | — | |
Preferred Equities: | | | | | | | | | | | | | | | | | | | | | | | | |
Consumer Discretionary | | | — | | | | — | | | | — | | | | — | | | | 8,619,600 | | | | — | |
Consumer Staples | | | — | | | | — | | | | — | | | | — | | | | 10,587,230 | | | | — | |
Energy | | | — | | | | — | | | | — | | | | — | | | | 3,175,416 | | | | — | |
Financials | | | — | | | | — | | | | — | | | | — | | | | 7,789,522 | | | | — | |
Information Technology | | | — | | | | — | | | | — | | | | — | | | | 18,052,855 | | | | — | |
Materials | | | — | | | | — | | | | — | | | | — | | | | 4,895,532 | | | | — | |
Level 3: Significant Unobservable Inputs | | | | | | | | | | | | | | | | | | | | | | | | |
Common Equities: | | | | | | | | | | | | | | | | | | | | | | | | |
Information Technology | | | — | | | | — | | | | — | | | | — | | | | — | | | | 248 | |
Total Market Value of Investments | | | $334,602,963 | | | | $1,025,265,600 | | | | $2,096,757,948 | | | | $4,574,230,446 | | | | $204,730,741 | | | | $67,787,815 | |
| | | | | | | | | | | | | | | | | | | | |
| | | Matthews Pacific
Tiger Fund | | | Matthews
Asia ESG
Fund | | | Matthews
Emerging Asia
Fund | | | Matthews Asia
Innovators
Fund | | | Matthews Asia
Small Companies
Fund | |
| Assets: | | | | | | | | | | | | | | | | | | | | |
| Investments: | | | | | | | | | | | | | | | | | | | | |
Level 1: Quoted Prices | | | | | | | | | | | | | | | | | | | | |
Common Equities: | | | | | | | | | | | | | | | | | | | | |
Bangladesh | | | $— | | | | $937,201.00 | | | | $52,295,291 | | | | $5,275,778.00 | | | | $— | |
China/Hong Kong | | | 1,079,619,409 | | | | 219,400 | | | | 2,562,068 | | | | 65,853,062 | | | | 5,057,529 | |
India | | | — | | | | — | | | | 5,834,049 | | | | — | | | | — | |
Indonesia | | | 28,122,453 | | | | 326,104 | | | | 17,936,388 | | | | — | | | | 7,350,250 | |
Japan | | | 8,016,864 | | | | — | | | | — | | | | 1,323,041 | | | | — | |
Luxembourg | | | — | | | | 181,839 | | | | — | | | | — | | | | — | |
Pakistan | | | — | | | | 348,602 | | | | 57,122,843 | | | | — | | | | — | |
Philippines | | | 74,132,410 | | | | — | | | | 35,681,826 | | | | — | | | | — | |
South Korea | | | 34,418,675 | | | | — | | | | — | | | | — | | | | — | |
Sri Lanka | | | — | | | | — | | | | 37,066,801 | | | | — | | | | — | |
United States | | | 172,719,534 | | | | — | | | | — | | | | — | | | | 4,600,710 | |
Vietnam | | | — | | | | — | | | | 28,515,272 | | | | 1,281,983 | | | | 11,302,441 | |
Level 2: Other Significant Observable Inputs | | | | | | | | | | | | | | | | | | | | |
Common Equities: | | | | | | | | | | | | | | | | | | | | |
Australia | | | — | | | | — | | | | 3,070,198 | | | | — | | | | 5,114,775 | |
Bangladesh | | | — | | | | 251,348 | | | | 3,791,988 | | | | — | | | | — | |
China/Hong Kong | | | 2,323,370,486 | | | | 4,319,158 | | | | 38,721,650 | | | | 99,311,698 | | | | 140,007,518 | |
India | | | 1,955,417,875 | | | | 3,439,935 | | | | 34,901,537 | | | | 33,171,516 | | | | 49,477,571 | |
Indonesia | | | 475,315,570 | | | | 633,880 | | | | 58,248,934 | | | | 5,416,812 | | | | 9,145,398 | |
Japan | | | — | | | | 3,395,035 | | | | — | | | | — | | | | 13,203,795 | |
Malaysia | | | 407,748,190 | | | | — | | | | — | | | | — | | | | 12,103,000 | |
Pakistan | | | — | | | | — | | | | 13,021,412 | | | | — | | | | — | |
Philippines | | | 110,926,221 | | | | 371,409 | | | | — | | | | 3,378,473 | | | | 5,436,428 | |
Singapore | | | — | | | | 768,948 | | | | 2,876,729 | | | | 6,967,868 | | | | 3,437,925 | |
South Korea | | | 1,100,689,880 | | | | 1,515,106 | | | | — | | | | 41,796,277 | | | | 46,649,956 | |
Sri Lanka | | | — | | | | — | | | | 8,731,316 | | | | — | | | | — | |
Switzerland | | | 185,465,381 | | | | — | | | | — | | | | — | | | | — | |
Taiwan | | | 504,131,983 | | | | 2,028,494 | | | | — | | | | 7,470,335 | | | | 53,926,036 | |
Thailand | | | 431,142,540 | | | | 630,075 | | | | — | | | | 5,095,626 | | | | 19,682,314 | |
Vietnam | | | 211,203,340 | | | | 372,799 | | | | 65,407,924 | | | | 5,389,616 | | | | 4,601,995 | |
Preferred Equities: | | | | | | | | | | | | | | | | | | | | |
South Korea | | | — | | | | 1,242,786 | | | | — | | | | 6,363,749 | | | | — | |
Rights: | | | | | | | | | | | | | | | | | | | | |
Taiwan | | | — | | | | — | | | | — | | | | — | | | | 93,913 | |
Total Market Value of Investments | | | $9,102,440,811 | | | | $20,982,119 | | | | $465,786,226 | | | | $288,095,834 | | | | $391,191,554 | |
Foreign securities that are valued based on market quotations are categorized as Level 1 in the fair value hierarchy. Certain foreign securities may be fair valued by external pricing services when the Funds determine that events affecting the value of foreign securities which occur between the time at which they are determined and the close of trading on the NYSE render market quotations unreliable. Such fair valuations are typically categorized as Level 2 in the fair value hierarchy. The Funds’ policy is to recognize transfers in and transfers out as of the beginning of the reporting period. At June 30, 2018, the Funds utilized third-party pricing services to fair value certain securities, some of which were different than the securities which had been valued by third-party pricing services at December 31, 2017. As a result, certain securities held by the Funds were transferred from Level 2 to Level 1 and certain securities held by the Funds were transferred from Level 1 to Level 2 with beginning of period values as follows:
| | | | | | | | |
| | | Transfer to Level 1
from Level 2 | | | Transfer to Level 2
from Level 1 | |
| Matthews Asian Growth and Income Fund | | | $41,014,908 | | | | $311,009,955 | |
| Matthews Asia Dividend Fund | | | — | | | | 811,075,390 | |
| Matthews China Dividend Fund | | | — | | | | 47,554,158 | |
| Matthews Asia Value Fund | | | 981,429 | | | | 6,112,107 | |
| Matthews Asia Focus Fund | | | 427,670 | | | | 1,275,305 | |
| Matthews Asia Growth Fund | | | 28,436,378 | | | | 66,004,128 | |
| Matthews Pacific Tiger Fund | | | 263,376,635 | | | | 1,622,397,034 | |
| Matthews Asia ESG Fund | | | 766,147 | | | | 3,708,730 | |
| Matthews Emerging Asia Fund | | | 63,516,914 | | | | 82,249,942 | |
| Matthews Asia Innovators Fund | | | 7,554,488 | | | | 19,531,426 | |
| Matthews China Fund | | | — | | | | 23,974,927 | |
| Matthews India Fund | | | 152,120,649 | | | | 512,950,575 | |
| Matthews Korea Fund | | | — | | | | 66,126,044 | |
| Matthews Asia Small Companies Fund | | | 2,935,268 | | | | 97,239,927 | |
| Matthews China Small Companies Fund | | | — | | | | 6,371,999 | |
| | | | |
| matthewsasia.com | 800.789.ASIA | | | 141 | |
Notes to Financial Statements (unaudited) (continued)
Level 3 securities consisted of equities that, as of June 30, 2018, were suspended from trading. As described in Note 2-A, these securities are valued based on their fair value as determined under the direction of the Board. The significant unobservable inputs, the methodology used for valuing such securities, and the characterization of such securities as Level 3 securities are not necessarily an indication of liquidity, or the risk associated with investing in these securities. A significant change in the unobservable inputs could result in a significantly lower or higher value in such Level 3 securities and could impact overall Fund performance.
A reconciliation of Level 3 investments for which significant unobservable inputs were used to determine value are as follows:
| | | | | | | | | | | | | | | | |
| | | Matthews
Asia Value
Fund | | | Matthews
Korea
Fund | | | Matthews
Asia Small
Companies Fund | | | Matthews China Small
Companies Fund | |
| | | Common
Equities —
China/
Hong Kong | | | Common
Equities —
Consumer
Discretionary | | | Common
Equities —
South Korea | | | Common
Equities —
Information
Technology | |
| Balance as of 12/31/17 (market value) | | | $— | | | | $2,158,539 | | | | $3,491,660 | | | | $250 | |
| | | | |
| Accrued discounts/premiums | | | — | | | | — | | | | — | | | | — | |
| | | | |
| Realized gain/(loss) | | | — | | | | — | | | | 1,368,937 | | | | — | |
| | | | |
| Change in unrealized appreciation/(depreciation) | | | (539,731 | ) | | | (407,564 | ) | | | 1,012,653 | | | | (2 | ) |
| | | | |
| Purchases | | | 1,058,819 | | | | — | | | | — | | | | — | |
| | | | |
| Sales | | | — | | | | (1,750,975 | ) | | | (5,873,250 | ) | | | — | |
| | | | |
| Transfers in to Level 3* | | | 1,015,400 | | | | — | | | | — | | | | — | |
| | | | |
| Transfer out of Level 3* | | | — | | | | — | | | | — | | | | — | |
| Balance as of 6/30/18 (market value) | | | $1,534,488 | | | | $— | | | | $— | | | | $248 | |
| Net change in unrealized appreciation/depreciation on Level 3 investments held as of 6/30/18** | | | ($539,731 | ) | | | $— | | | | $— | | | | ($2 | ) |
| * | The Funds’ policy is to recognize transfers in and transfers out as of the beginning of the reporting period. |
| ** | Included in the related amounts on the Statements of Operations. |
Certain foreign securities, for which market quotations are not readily available, may be fair valued and classified as either Level 2 or Level 3. When the underlying inputs include significant observable inputs obtained from sources independent of the Funds, the securities are classified as Level 2. These inputs include evaluated prices from the Funds’ pricing vendors, day-on-day price changes, primary and ancillary pricing sources, and other available independent market indicators of value. When the underlying inputs include significant unobservable inputs and reflect assumptions of market participants, the securities are classified as Level 3. As of June 30, 2018, the Funds that previously used quoted prices or observable inputs now also utilize significant unobservable inputs for certain securities that were suspended from trading. As a result, certain securities held by the Funds that were previously classified as Level 1 or Level 2 were transferred to Level 3. Certain securities held by the Funds that were suspended from trading and classified as Level 3 on December 31, 2017 subsequently resumed trading and were transferred from Level 3 to Level 1, Level 2 or were sold.
The following table summarizes the valuation techniques used and unobservable inputs developed by the Valuation Committee to determine the fair value of certain, material Level 3 investments:
| | | | | | | | | | | | |
| | | Value | | | Valuation
Technique | | Unobservable
Input1 | | Unobservable
Input — Proxy
Factor Price
Movement | |
| Matthews Asia Value Fund: | | | | | | | | | �� | | | |
Common Equity | | | $1,534,488 | | | Last Price2 Adjusted by Proxy factor3 | | Proxy factor3/Assessment of Company Specific Events | | | -9.86% | |
| 1 | Increase in unobservable input may result in a significant increase to value, while a decrease in unobservable input may result in a significant decrease to value. |
| 2 | Last Price could include closing price, last reported sales price, or last fair valued price as described in Note 2-A. |
| 3 | Proxy factor considers movement of The Hong Kong Hang Seng Index. |
| C. | BASIS OF CONSOLIDATION: The accompanying consolidated financial statements of Matthews China Fund and Matthews Asia Dividend Fund (the “Investing Funds”) for the 2014-2016 period include the accounts of the Matthews CF-U Series and Matthews ADF-U Series (the “U Series Funds”), respectively. The U Series Funds were series of Matthews A Share Selections Fund, LLC, a Delaware limited liability company registered under the 1940 Act. All of the interests offered by U Series Funds were exclusively owned by the Investing Funds. The U Series Funds primarily invested in the stocks of Chinese companies listed on Mainland China Stock Exchanges, and traded and denominated in the currency of China, the Renminbi. To allow U Series Funds to invest in China A Shares Matthews applied for and received a license from the China Securities Regulatory Commission as a Qualified Foreign Institutional Investor (“QFII”) and had been allocated by the State Administration of Foreign Exchange of China an initial quota of $100 million in June 2014, and an additional quota of $440 million in July 2015, representing the equivalent value in Renminbi of China A Shares that the Funds could purchase. Access to the quota was subject to Matthews’ trade allocation procedures and access allocation procedures. The U Series Funds were subject to the same investment policies and restrictions that apply to Investing Funds. Intercompany accounts and transactions, if any, have been eliminated in the consolidation process. The U Series Funds were intended to be disregarded entities for tax purposes. Therefore, no federal tax provision was required. Consolidated financial statements include expenses that are accrued for and paid by the Investing Funds. These include on-going operational costs as well as costs in connection with the launching of the U Series Funds. |
In September 2016, the Board of Directors of the Matthews A Share Selections Fund, LLC adopted resolutions authorizing the termination and liquidation of the Matthews A Share Selections Fund, LLC. Consequently, as of September 30, 2016, the U Series Funds sold their securities and effectively
ceased investment operations. The outstanding interests of each U Series Fund were redeemed by its respective Investing Fund. The Matthews A Share Selections Fund, LLC filed an initial application for deregistration as a registered investment company with the U.S. Securities and Exchange Commission in October 2016, which was subsequently granted in February 2017.
| D. | RISKS ASSOCIATED WITH NON-U.S. COMPANIES: Investments by the Funds in the securities of non-U.S. companies may involve investment risks not typically associated with investments in U.S. issuers. These risks include possible political, economic, social and religious instability, inadequate investor protection; changes in laws or regulations of countries within the Asia Pacific region (including in countries where the Funds may invest, as well as in the broader region); international relations with other nations; natural disasters; corruption; and military activity. Foreign securities may be subject to greater fluctuations in price than securities of domestic corporations or the U.S. government. Foreign investing may also include the risk of expropriation or confiscatory taxation, limitation on the removal of funds or other assets, currency crises and exchange controls, the imposition of foreign withholding tax on the interest income payable on such instruments, the possible seizure or nationalization of foreign deposits or assets, or the adoption of other foreign government restrictions that might adversely affect the foreign securities held by the Funds. Additionally, Asia Pacific countries may utilize formal or informal currency exchange controls or “capital controls” that may limit the ability to repatriate investments or income or adversely affect the value of portfolio investments. The economies of many Asia Pacific countries differ from the economies of more developed countries in many respects, such as their rate of growth, inflation, capital reinvestment, resource self-sufficiency and dependence on other economies, financial system stability, the national balance of payments position and sensitivity to changes in global trade. |
Certain Asia Pacific countries are highly dependent upon and may be affected by developments in the economies of other countries. Non-U.S. companies are subject to different accounting, auditing, and financial reporting standards, practices, and requirements than U.S. companies. There is generally less government regulation of stock exchanges, brokers, and listed companies abroad than in the United States, which may result in less transparency with respect to a company’s operations, and make obtaining information about them more difficult (or such information may be unavailable).
Foreign stock markets may not be as developed or efficient as those in the United States, and the absence of negotiated brokerage commissions in certain countries may result in higher brokerage fees. The time between the trade and settlement dates of securities transactions on foreign exchanges ranges from one day to four weeks or longer and may result in higher custody charges. Custodial arrangements may be less well developed than in the United States. Foreign securities are generally denominated and pay distributions in foreign currencies, exposing the Funds to changes in foreign currency exchange rates. Investing in any country in the Asia Pacific region will also entail risks specific and unique to that country, and these risks can be significant and change rapidly.
Changes in interest rates in each of the countries in which the Funds may invest, as well as interest rates in more-developed countries, may cause a decline in the market value of an investment. Generally, fixed income securities will decrease in value when interest rates rise and can be expected to rise in value when interest rates decline. As interest rates decline, debt issuers may repay or refinance their loans or obligations earlier than anticipated. The issuers of fixed income securities may, therefore, repay principal in advance. This would force the Funds to reinvest the proceeds from the principal prepayments at lower rates, which reduces the Funds’ income.
| E. | DISTRIBUTIONS TO SHAREHOLDERS: It is the policy of Matthews Asian Growth and Income Fund and Matthews China Dividend Fund to distribute net investment income on a semi-annual basis and capital gains, if any, annually. It is the policy of Matthews Asia Dividend Fund, Matthews Asia Strategic Income Fund and Matthews Asia Credit Opportunities Fund to distribute net investment income on a quarterly basis and capital gains, if any, annually. Each of the other Funds distributes a net investment income and capital gains, if any, annually. Distributions to shareholders are recorded on the ex-dividend date. Income and capital gain distributions are determined in accordance with income tax regulations which may differ from U.S. GAAP. |
The tax character of distributions paid for the fiscal year ended December 31, 2017 was as follows:
| | | | | | | | | | | | |
| YEAR ENDED DECEMBER 31, 2017 | | Ordinary
Income | | | Net Long-Term
Capital Gains | | | Total Taxable
Distributions | |
| Matthews Asia Strategic Income Fund | | | $3,275,012 | | | | $— | | | | $3,275,012 | |
| Matthews Asia Credit Opportunities Fund | | | 1,099,964 | | | | 111,284 | | | | 1,211,248 | |
| Matthews Asian Growth and Income Fund | | | 76,634,444 | | | | 42,640,486 | | | | 119,274,930 | |
| Matthews Asia Dividend Fund | | | 237,413,324 | | | | 144,064,822 | | | | 381,478,146 | |
| Matthews China Dividend Fund | | | 17,609,713 | | | | 12,048,945 | | | | 29,658,658 | |
| Matthews Asia Value Fund | | | 1,364,007 | | | | 265,211 | | | | 1,629,218 | |
| Matthews Asia Focus Fund | | | 137,271 | | | | — | | | | 137,271 | |
| Matthews Asia Growth Fund | | | 13,817,623 | | | | 45,847,848 | | | | 59,665,471 | |
| Matthews Pacific Tiger Fund | | | 74,772,355 | | | | 54,354,798 | | | | 129,127,153 | |
| Matthews Asia ESG Fund | | | 502,242 | | | | 142,064 | | | | 644,306 | |
| Matthews Emerging Asia Fund | | | 2,448,800 | | | | 910,694 | | | | 3,359,494 | |
| Matthews Asia Innovators Fund | | | 3,439,895 | | | | 13,051,975 | | | | 16,491,870 | |
| Matthews China Fund | | | 58,708,744 | | | | 33,489,520 | | | | 92,198,264 | |
| Matthews India Fund | | | 624,624 | | | | 32,428,674 | | | | 33,053,298 | |
| Matthews Japan Fund | | | 37,593,412 | | | | 118,095,898 | | | | 155,689,310 | |
| Matthews Korea Fund | | | 9,264,412 | | | | 10,189,013 | | | | 19,453,425 | |
| Matthews Asia Small Companies Fund | | | 15,911,087 | | | | 20,779,556 | | | | 36,690,643 | |
| Matthews China Small Companies Fund | | | 1,230,339 | | | | 842,837 | | | | 2,073,176 | |
| | | | |
| matthewsasia.com | 800.789.ASIA | | | 143 | |
Notes to Financial Statements (unaudited) (continued)
| F. | INVESTMENT TRANSACTIONS AND INCOME: Securities transactions are accounted for on the date the securities are purchased or sold or on the following business day. Financial statements reflect security transactions on trade date. Gains or losses on the sale of securities are determined on the identified cost basis. Interest income is recorded on the accrual basis. Interest income, including amortization and accretion of premiums and discounts on debt securities, is recognized daily on an accrual basis. Dividend income is generally recorded on the ex-dividend date net of any foreign taxes withheld at the source. Dividend income for certain issuers headquartered in countries which the Funds invest may not be recorded until approved by the shareholders (which may occur after the ex-dividend date) if, in the judgment of management, such dividends are not reasonably determined as of the ex-dividend date. Income and realized and unrealized gains or losses on investments are allocated to each class of shares based on its relative net assets. |
The Funds may be subject to foreign taxation related to income received, capital gains on the sale of securities and certain foreign currency transactions in the foreign jurisdictions in which they invest. Foreign taxes, if any, are recorded based on the tax regulations and rates that exist in the foreign markets in which the Funds invest. When a capital gain tax is determined to apply, the Funds record an estimated deferred tax liability in an amount that may be payable if the securities were disposed of on the valuation date.
| G. | FUND EXPENSE ALLOCATIONS: The Funds account separately for the assets, liabilities and operations of each Fund. Estimated expenses are accrued daily. Direct expenses of each Fund or class are charged to that Fund or class while general expenses are allocated pro-rata among the Funds based on net assets or other appropriate methods. |
| H. | CASH, CASH OVERDRAFTS, AND FOREIGN CURRENCY: QFII accounts (i.e., the accounts through which the QFII quota is accessed) are required by the local market to maintain a cash reserve. The cash reserve is based upon a fixed ratio of the QFII’s approved investment quota, which is defined as the amount remitted into its special Renminbi (RMB) cash account. These amounts, if any, are included in “Segregated foreign currency at value” on the Statements of Assets and Liabilities. The fixed ratio is set at 0.08 percent for the Shanghai and 0.06 percent for the Shenzhen market. When any of the Funds’ cash balances are overdrawn, a Fund is charged an overdraft fee by the custodian of 1.00% above the 30-day LIBOR rate on outstanding balances. These amounts, if any, are included in “Other expenses” on the Statements of Operations. |
| I. | USE OF ESTIMATES: The preparation of financial statements in conformity with U.S. GAAP requires management to make estimates and assumptions that affect the amounts reported in the financial statements and accompanying notes. Actual results may differ from those estimates. |
| J. | RECENT ACCOUNTING GUIDANCE: In March 2017, the Financial Accounting Standards Board issued amended guidance to shorten the amortization period for certain callable debt securities, held at premium. The guidance is effective for fiscal years and interim periods beginning after December 15, 2018. Adoption will have no effect on the funds’ net assets. Management is evaluating the impact, if any, of this guidance on the Funds’ results of operations and financial disclosures. |
| 3. | DERIVATIVE FINANCIAL INSTRUMENTS |
Each of the Matthews Asia Strategic Income Fund and the Matthews Asia Credit Opportunities Fund engages in derivative transactions for a variety of purposes, including managing interest rate, currency and credit exposure. Derivative transactions in which each Fund may engage include financial futures contracts, swaps and/or forward foreign currency exchange contracts.
Certain derivative transactions may result in each Fund’s exposure to a currency to exceed the value of the Fund’s assets and the Fund could be exposed to currency risk whether or not it holds a bond or other instrument denominated in that currency. The gross notional value of derivative financial instruments and transactions could exceed the value of the Fund’s net assets, although the net market value of these instruments and transactions, on a marked-to-market basis, at most times, is expected to be substantially lower.
The primary risks associated with the use of derivative financial instruments are: (i) Matthews may not correctly predict the direction of currency exchange rates, interest rates, security prices, or other economic factors; (ii) Matthews may not correctly predict changes in the value of derivative financial instruments and related underlying instruments or assets, which may result in disproportionately increased losses and/or reduced opportunities for gains; (iii) imperfect correlation between the change in market value of the securities held by a Fund and the price of financial futures contracts and credit default swaps contracts; (iv) the lack of, or a reduction in the liquidity of, any secondary market for the instrument, and the resulting inability to close the position (or exit the position) when desired; (v) losses, which are potentially unlimited, due to unanticipated market movements; (vi) the value of the instrument may change unfavorably due to movements in the value of the referenced foreign currencies; (vii) a Fund may suffer disproportionately heavy losses relative to the amount invested; (viii) changes in the value of the derivatives may not match or fully offset changes in the value of hedged or related portfolio securities, thereby failing to achieve the hedging or investment purpose for the derivative transaction; and (ix) the other party to the instrument may fail to fulfill its obligation.
Forward Foreign Currency Exchange Contracts: The Matthews Asia Strategic Income Fund enters into forward foreign currency exchange contracts to gain or reduce exposure to foreign currency exchange rate risk. A forward foreign currency exchange contract is an agreement between two parties to buy and sell a currency at a set exchange rate on a future date. The contract is marked-to-market daily and the change in market value is recorded by the Fund as an unrealized gain or loss. When the contract is closed, the Fund records a realized gain or loss equal to the difference between the value at the time it was opened and the value at the time it was closed. The Matthews Asia Strategic Income Fund does not offset financial assets and financial liabilities on forward foreign currency contacts in the Statements of Assets and Liabilities as they are not subject to netting arrangements. At June 30, 2018, the Matthews Asia Strategic Income Fund had $1,170,000 as cash collateral pledged for open forward foreign currency exchange contracts.
Swaps: The Matthews Asia Strategic Income Fund and the Matthews Asia Credit Opportunities Fund enter into swap contracts to manage exposure to issuers, markets and securities to reduce their risk exposure to defaults of corporate and/or sovereign issuers or to create exposure to corporate and/or sovereign issuers to which they are not otherwise exposed (credit risk). Such contracts are agreements between the Funds and a counterparty to make periodic net payments on a specified notional amount or a net payment upon termination. Swap agreements are privately negotiated in the OTC market and may be entered into as a bilateral contract (“OTC Swaps”) or centrally cleared (“centrally cleared swaps”).
For OTC swaps, any upfront premiums paid and any upfront fees received are shown as swap premiums paid and swap premiums received, respectively, in the Statements of Assets and Liabilities and amortized over the term of the contract. The daily fluctuation in market value is recorded as unrealized appreciation (depreciation) on OTC Swaps in the Statements of Assets and Liabilities. Payments received or paid are recorded in the Statements of Operations as realized gains or losses, respectively. When an OTC swap is terminated, a realized gain or loss is recorded in the Statements of Operations equal to the difference between the proceeds from (or cost of) the closing transaction and the Funds’ basis in the contract, if any. Generally, the basis of the contract is the amortized premium received or paid.
The Funds may buy credit default swaps on single-name issuers (corporate or sovereign), a combination or basket of single-name issuers or traded indexes. Credit default swaps are agreements in which the protection buyer pays fixed periodic payments to the seller in consideration for a promise from the protection seller to make a specific payment should a negative credit event take place with respect to the referenced entity (e.g., bankruptcy, failure to pay, obligation acceleration, repudiation, moratorium or restructuring). As a buyer, if an underlying credit event occurs, the Funds will either (i) receive from the seller an amount equal to the notional amount of the swap and deliver the referenced security or underlying securities comprising the index, or (ii) receive a net settlement of cash equal to the notional amount of the swap less the recovery value of the security or underlying securities comprising the index.
Counterparty Credit Risk: A derivative contract may suffer a mark to market loss if the value of the contract decreases due to an unfavorable change in the market rates or values of the underlying instrument. Losses can also occur if the counterparty does not perform under the contract.
A Fund’s risk of loss from counterparty credit risk on OTC derivatives is generally limited to the aggregate unrealized gain netted against any collateral held by such Fund.
With exchange traded futures and centrally cleared swaps, there is less counterparty credit risk to the Funds since the exchange or clearinghouse, as counterparty to such instruments, guarantees against a possible default. The clearinghouse stands between the buyer and the seller of the contract; therefore, the credit risk is limited to failure of the clearinghouse. While offset rights may exist under applicable law, a Fund does not have a contractual right of offset against a clearing broker or clearinghouse in the event of a default (including the bankruptcy or insolvency) of the clearing broker or clearinghouse. Additionally, credit risk exists in exchange traded futures and centrally cleared swaps with respect to initial and variation margin that is held in a clearing broker’s customer accounts. While clearing brokers are required to segregate customer margin from their own assets, in the event that a clearing broker becomes insolvent or goes into bankruptcy and at that time there is a shortfall in the aggregate amount of margin held by the clearing broker for all its clients, typically the shortfall would be allocated on a pro rata basis across all the clearing broker’s customers, potentially resulting in losses to the Funds.
In order to better define its contractual rights and to secure rights that will help the Funds mitigate their counterparty risk, a Fund may enter into an International Swaps and Derivatives Association, Inc. Master Agreement (“ISDA Master Agreement”) or similar agreement with its derivative contract counterparties. An ISDA Master Agreement is a bilateral agreement between each Fund and a counterparty that governs OTC derivatives and typically contains, among other things, collateral posting terms and netting provisions in the event of a default and/or termination event. Under an ISDA Master Agreement, each Fund may, under certain circumstances, offset with the counterparty certain derivative financial instruments’ payables and/ or receivables with collateral held and/or posted and create one single net payment. The provisions of the ISDA Master Agreement typically permit a single net payment in the event of default including the bankruptcy or insolvency of the counterparty. However, bankruptcy or insolvency laws of a particular jurisdiction may impose restrictions on or prohibitions against the right of offset in bankruptcy, insolvency or other events. In addition, certain ISDA Master Agreements allow counterparties to OTC derivatives to terminate derivative contracts prior to maturity in the event a Fund’s net assets decline by a stated percentage or the Fund fails to meet the terms of its ISDA Master Agreements, which would cause the Fund to accelerate payment of any net liability owed to the counterparty.
Collateral requirements: For derivatives traded under an ISDA Master Agreement, the collateral requirements are typically calculated by netting the mark to market amount for each transaction under such agreement and comparing that amount to the value of any collateral currently pledged by a Fund and the counterparty. Cash collateral that has been pledged to cover obligations of a Fund, if any, is reported separately on the Statements of Assets and Liabilities as cash pledged as collateral. Non-cash collateral pledged by a Fund, if any, is noted in the Schedules of Investments. No swaps were held by any Funds on June 30, 2018.
For financial reporting purposes, the Funds do not offset derivative assets and derivative liabilities that are subject to netting arrangements in the Statements of Assets and Liabilities.
Derivative Financial Instruments Categorized by Risk Exposure:
As of June 30, 2018, the fair values of derivative financial instruments were as follows:
| | | | | | |
| | | Statements of Assets and Liabilities Location | | Matthews Asia
Strategic Income
Fund | |
| | Asset Derivatives | | | | |
| | Unrealized appreciation on forward foreign | | | | |
| Forward foreign currency exchange contracts | | currency exchange contracts | | | $165,468 | |
| | | | | | |
| | |
| | Liability Derivatives | | | | |
| | Unrealized depreciation on forward foreign | | | | |
| | currency exchange contracts | | | ($1,473,456 | ) |
| | | | | | |
For the six-month period ended June 30, 2018, the effects of derivative financial instruments on the Statements of Operations were as follows:
| | | | | | |
Derivative type | | Statements of Operations Location | | Matthews Asia
Strategic Income
Fund | |
Net Realized Gain (Loss) | | | | | | |
| Foreign currency contracts: | | | | | | |
Forward foreign currency exchange contracts | | Net realized gain (loss) on forward foreign currency exchange contracts | | | $533,613 | |
| | | | | | |
| | |
Net Change In Unrealized Appreciation (Depreciation) | | | | | | |
| Foreign currency contracts: | | | | | | |
Forward foreign currency exchange contracts | | Net change in unrealized appreciation/ depreciation on forward foreign currency exchange contracts | | | ($1,634,417 | ) |
| | | | | | |
In regards to the forward foreign currency exchange contracts entered into by the Matthews Asia Strategic Income Fund, the average notional ending quarterly amounts purchased in USD were $9,436,661 and the average notional ending quarterly amounts sold in USD were $32,225,000.
| | | | |
| matthewsasia.com | 800.789.ASIA | | | 145 | |
Notes to Financial Statements (unaudited) (continued)
| 4. | CAPITAL SHARE TRANSACTIONS |
Each Fund is authorized to issue an unlimited number of shares of beneficial interest with a par value of $0.001 per share.
| | | | | | | | | | | | | | | | |
| | | Six-Month Period Ended June 30, 2018 (Unaudited) | | | Year Ended December 31, 2017 | |
| | | Shares | | | Amount | | | Shares | | | Amount | |
MATTHEWS ASIA STRATEGIC INCOME FUND | | | | | | | | | | | | | | | | |
Investor Class | | | | | | | | | | | | | | | | |
Shares sold | | | 2,254,002 | | | | $24,990,680 | | | | 2,471,612 | | | | $26,893,366 | |
Shares issued through reinvestment of distributions | | | 124,128 | | | | 1,347,302 | | | | 201,006 | | | | 2,186,689 | |
Shares redeemed | | | (3,002,108 | ) | | | (32,580,147 | ) | | | (2,206,966 | ) | | | (23,732,650 | ) |
Net increase (decrease) | | | (623,978 | ) | | | ($6,242,165 | ) | | | 465,652 | | | | $5,347,405 | |
Institutional Class | | | | | | | | | | | | | | | | |
Shares sold | | | 3,634,570 | | | | $39,524,843 | | | | 1,614,574 | | | | $17,337,778 | |
Shares issued through reinvestment of distributions | | | 75,428 | | | | 809,519 | | | | 53,679 | | | | 584,224 | |
Shares redeemed | | | (459,137 | ) | | | (5,003,808 | ) | | | (114,814 | ) | | | (1,232,881 | ) |
Net increase | | | 3,250,861 | | | | $35,330,554 | | | | 1,553,439 | | | | $16,689,121 | |
MATTHEWS ASIA CREDIT OPPORTUNITIES FUND | | | | | | | | | | | | | | | | |
Investor Class | | | | | | | | | | | | | | | | |
Shares sold | | | 442,255 | | | | $4,609,301 | | | | 752,191 | | | | $7,854,221 | |
Shares issued through reinvestment of distributions | | | 19,969 | | | | 204,618 | | | | 40,940 | | | | 425,058 | |
Shares redeemed | | | (380,926 | ) | | | (3,917,966 | ) | | | (810,572 | ) | | | (8,398,269 | ) |
Net increase (decrease) | | | 81,298 | | | | $895,953 | | | | (17,441 | ) | | | ($118,990 | ) |
Institutional Class | | | | | | | | | | | | | | | | |
Shares sold | | | 1,345,313 | | | | $13,767,336 | | | | 1,540,693 | | | | $16,092,601 | |
Shares issued through reinvestment of distributions | | | 30,013 | | | | 306,417 | | | | 27,293 | | | | 283,653 | |
Shares redeemed | | | (151,775 | ) | | | (1,570,372 | ) | | | (111,862 | ) | | | (1,175,697 | ) |
Net increase | | | 1,223,551 | | | | $12,503,381 | | | | 1,456,124 | | | | $15,200,557 | |
MATTHEWS ASIAN GROWTH AND INCOME FUND | | | | | | | | | | | | | | | | |
Investor Class | | | | | | | | | | | | | | | | |
Shares sold | | | 4,296,363 | | | | $74,395,278 | | | | 14,640,738 | | | | $241,575,990 | |
Shares issued through reinvestment of distributions | | | 868,991 | | | | 14,268,804 | | | | 3,602,819 | | | | 61,730,211 | |
Shares redeemed | | | (24,700,745 | ) | | | (424,582,292 | ) | | | (43,082,130 | ) | | | (721,414,206 | ) |
Net (decrease) | | | (19,535,391 | ) | | | ($335,918,210 | ) | | | (24,838,573 | ) | | | ($418,108,005 | ) |
Institutional Class | | | | | | | | | | | | | | | | |
Shares sold | | | 13,198,595 | | | | $227,660,235 | | | | 36,133,398 | | | | $604,837,817 | |
Shares issued through reinvestment of distributions | | | 953,909 | | | | 15,634,574 | | | | 3,077,228 | | | | 52,660,292 | |
Shares redeemed | | | (21,978,464 | ) | | | (379,642,551 | ) | | | (18,309,223 | ) | | | (312,385,386 | ) |
Net increase (decrease) | | | (7,825,960 | ) | | | ($136,347,742 | ) | | | 20,901,403 | | | | $345,112,723 | |
MATTHEWS ASIA DIVIDEND FUND | | | | | | | | | | | | | | | | |
Investor Class | | | | | | | | | | | | | | | | |
Shares sold | | | 25,717,121 | | | | $513,558,060 | | | | 46,067,788 | | | | $837,987,289 | |
Shares issued through reinvestment of distributions | | | 1,800,573 | | | | 34,856,019 | | | | 9,772,567 | | | | 187,636,316 | |
Shares redeemed | | | (33,182,750 | ) | | | (657,629,927 | ) | | | (38,470,520 | ) | | | (679,700,431 | ) |
Net increase (decrease) | | | (5,665,056 | ) | | | ($109,215,848 | ) | | | 17,369,835 | | | | $345,923,174 | |
Institutional Class | | | | | | | | | | | | | | | | |
Shares sold | | | 37,200,595 | | | | $738,892,909 | | | | 48,661,134 | | | | $863,508,784 | |
Shares issued through reinvestment of distributions | | | 1,932,439 | | | | 37,410,756 | | | | 7,450,686 | | | | 142,974,481 | |
Shares redeemed | | | (13,513,602 | ) | | | (268,171,964 | ) | | | (20,774,459 | ) | | | (376,048,201 | ) |
Net increase | | | 25,619,432 | | | | $508,131,701 | | | | 35,337,361 | | | | $630,435,064 | |
| | | | | | | | | | | | | | | | |
| | | Six-Month Period Ended June 30, 2018 (Unaudited) | | | Year Ended December 31, 2017 | |
| | | Shares | | | Amount | | | Shares | | | Amount | |
MATTHEWS CHINA DIVIDEND FUND | | | | | | | | | | | | | | | | |
Investor Class | | | | | | | | | | | | | | | | |
Shares sold | | | 3,093,474 | | | | $57,010,780 | | | | 5,731,788 | | | | $94,790,959 | |
Shares issued through reinvestment of distributions | | | 260,381 | | | | 4,699,883 | | | | 1,334,478 | | | | 22,238,460 | |
Shares redeemed | | | (3,925,510 | ) | | | (72,662,656 | ) | | | (3,649,309 | ) | | | (58,975,597 | ) |
Net increase (decrease) | | | (571,655 | ) | | | ($10,951,993 | ) | | | 3,416,957 | | | | $58,053,822 | |
Institutional Class | | | | | | | | | | | | | | | | |
Shares sold | | | 2,474,773 | | | | $46,216,101 | | | | 1,139,266 | | | | $19,168,584 | |
Shares issued through reinvestment of distributions | | | 102,860 | | | | 1,856,619 | | | | 283,364 | | | | 4,723,368 | |
Shares redeemed | | | (358,823 | ) | | | (6,489,829 | ) | | | (317,830 | ) | | | (5,535,520 | ) |
Net increase | | | 2,218,810 | | | | $41,582,891 | | | | 1,104,800 | | | | $18,356,432 | |
MATTHEWS ASIA VALUE FUND | | | | | | | | | | | | | | | | |
Investor Class | | | | | | | | | | | | | | | | |
Shares sold | | | 641,782 | | | | $8,427,183 | | | | 1,946,342 | | | | $23,869,389 | |
Shares issued through reinvestment of distributions | | | — | | | | — | | | | 111,073 | | | | 1,409,511 | |
Shares redeemed | | | (188,905 | ) | | | (2,467,366 | ) | | | (181,234 | ) | | | (2,270,540 | ) |
Net increase | | | 452,877 | | | | $5,959,817 | | | | 1,876,181 | | | | $23,008,360 | |
Institutional Class | | | | | | | | | | | | | | | | |
Shares sold | | | 87,192 | | | | $1,147,217 | | | | 247,950 | | | | $3,257,066 | |
Shares issued through reinvestment of distributions | | | — | | | | — | | | | 12,396 | | | | 156,066 | |
Shares redeemed | | | (56,847 | ) | | | (739,285 | ) | | | (9,941 | ) | | | (128,456 | ) |
Net increase | | | 30,345 | | | | $407,932 | | | | 250,405 | | | | $3,284,676 | |
MATTHEWS ASIA FOCUS FUND | | | | | | | | | | | | | | | | |
Investor Class | | | | | | | | | | | | | | | | |
Shares sold | | | 41,381 | | | | $507,467 | | | | 64,321 | | | | $704,275 | |
Shares issued through reinvestment of distributions | | | — | | | | — | | | | 3,983 | | | | 46,882 | |
Shares redeemed | | | (134,052 | ) | | | (1,604,063 | ) | | | (196,120 | ) | | | (2,150,907 | ) |
Net (decrease) | | | (92,671 | ) | | | ($1,096,596 | ) | | | (127,816 | ) | | | ($1,399,750 | ) |
Institutional Class | | | | | | | | | | | | | | | | |
Shares sold | | | 73,466 | | | | $880,000 | | | | 279,502 | | | | $3,274,793 | |
Shares issued through reinvestment of distributions | | | — | | | | — | | | | 7,611 | | | | 89,956 | |
Shares redeemed | | | (511,221 | ) | | | (6,238,916 | ) | | | (12,872 | ) | | | (141,906 | ) |
Net increase (decrease) | | | (437,755 | ) | | | ($5,358,916 | ) | | | 274,241 | | | | $3,222,843 | |
MATTHEWS ASIA GROWTH FUND | | | | | | | | | | | | | | | | |
Investor Class | | | | | | | | | | | | | | | | |
Shares sold | | | 6,850,740 | | | | $196,673,703 | | | | 4,079,531 | | | | $102,687,689 | |
Shares issued through reinvestment of distributions | | | — | | | | — | | | | 1,217,730 | | | | 31,490,493 | |
Shares redeemed | | | (4,292,271 | ) | | | (123,318,375 | ) | | | (4,883,819 | ) | | | (118,388,884 | ) |
Net increase | | | 2,558,469 | | | | $73,355,328 | | | | 413,442 | | | | $15,789,298 | |
Institutional Class | | | | | | | | | | | | | | | | |
Shares sold | | | 8,314,044 | | | | $240,878,005 | | | | 3,002,726 | | | | $76,546,224 | |
Shares issued through reinvestment of distributions | | | — | | | | — | | | | 471,874 | | | | 12,287,614 | |
Shares redeemed | | | (686,897 | ) | | | (19,766,021 | ) | | | (1,929,007 | ) | | | (49,929,723 | ) |
Net increase | | | 7,627,147 | | | | $221,111,984 | | | | 1,545,593 | | | | $38,904,115 | |
MATTHEWS PACIFIC TIGER FUND | | | | | | | | | | | | | | | | |
Investor Class | | | | | | | | | | | | | | | | |
Shares sold | | | 12,916,714 | | | | $411,771,976 | | | | 21,730,132 | | | | $599,219,782 | |
Shares issued through reinvestment of distributions | | | — | | | | — | | | | 1,299,802 | | | | 38,957,121 | |
Shares redeemed | | | (18,825,711 | ) | | | (589,482,359 | ) | | | (24,341,900 | ) | | | (662,177,549 | ) |
Net (decrease) | | | (5,908,997 | ) | | | ($177,710,383 | ) | | | (1,311,966 | ) | | | ($24,000,646 | ) |
Institutional Class | | | | | | | | | | | | | | | | |
Shares sold | | | 38,408,574 | | | | $1,211,515,570 | | | | 56,008,953 | | | | $1,551,287,735 | |
Shares issued through reinvestment of distributions | | | — | | | | — | | | | 1,955,641 | | | | 58,557,191 | |
Shares redeemed | | | (34,426,246 | ) | | | (1,085,729,245 | ) | | | (39,727,419 | ) | | | (1,096,771,755 | ) |
Net increase | | | 3,982,328 | | | | $125,786,325 | | | | 18,237,175 | | | | $513,073,171 | |
| | | | |
| matthewsasia.com | 800.789.ASIA | | | 147 | |
Notes to Financial Statements (unaudited) (continued)
| | | | | | | | | | | | | | | | |
| | | Six-Month Period Ended June 30, 2018 (Unaudited) | | | Year Ended December 31, 2017 | |
| | | Shares | | | Amount | | | Shares | | | Amount | |
MATTHEWS ASIA ESG FUND | | | | | | | | | | | | | | | | |
Investor Class | | | | | | | | | | | | | | | | |
Shares sold | | | 218,594 | | | | $2,561,583 | | | | 429,011 | | | | $4,551,575 | |
Shares issued through reinvestment of distributions | | | — | | | | — | | | | 33,239 | | | | 372,274 | |
Shares redeemed | | | (39,180 | ) | | | (458,460 | ) | | | (136,139 | ) | | | (1,448,047 | ) |
Net increase | | | 179,414 | | | | $2,103,123 | | | | 326,111 | | | | $3,475,802 | |
Institutional Class | | | | | | | | | | | | | | | | |
Shares sold | | | 128,151 | | | | $1,508,344 | | | | 369,352 | | | | $3,869,597 | |
Shares issued through reinvestment of distributions | | | — | | | | — | | | | 23,910 | | | | 266,353 | |
Shares redeemed | | | (12,734 | ) | | | (145,387 | ) | | | (132,288 | ) | | | (1,379,356 | ) |
Net increase | | | 115,417 | | | | $1,362,957 | | | | 260,974 | | | | $2,756,594 | |
MATTHEWS EMERGING ASIA FUND | | | | | | | | | | | | | | | | |
Investor Class | | | | | | | | | | | | | | | | |
Shares sold | | | 2,765,559 | | | | $41,797,156 | | | | 8,666,298 | | | | $123,504,046 | |
Shares issued through reinvestment of distributions | | | — | | | | — | | | | 85,107 | | | | 1,320,905 | |
Shares redeemed | | | (4,692,812 | ) | | | (70,522,640 | ) | | | (5,606,324 | ) | | | (80,014,289 | ) |
Net increase (decrease) | | | (1,927,253 | ) | | | ($28,725,484 | ) | | | 3,145,081 | | | | $44,810,662 | |
Institutional Class | | | | | | | | | | | | | | | | |
Shares sold | | | 7,508,510 | | | | $114,277,629 | | | | 11,622,115 | | | | $170,654,093 | |
Shares issued through reinvestment of distributions | | | — | | | | — | | | | 118,430 | | | | 1,843,997 | |
Shares redeemed | | | (1,957,085 | ) | | | (29,648,480 | ) | | | (1,300,786 | ) | | | (18,930,640 | ) |
Net increase | | | 5,551,425 | | | | $84,629,149 | | | | 10,439,759 | | | | $153,567,450 | |
MATTHEWS ASIA INNOVATORS FUND | | | | | | | | | | | | | | | | |
Investor Class | | | | | | | | | | | | | | | | |
Shares sold | | | 8,280,359 | | | | $122,026,633 | | | | 8,154,384 | | | | $110,598,339 | |
Shares issued through reinvestment of distributions | | | — | | | | — | | | | 986,202 | | | | 13,510,372 | |
Shares redeemed | | | (5,780,969 | ) | | | (85,836,997 | ) | | | (5,092,537 | ) | | | (66,640,478 | ) |
Net increase | | | 2,499,390 | | | | $36,189,636 | | | | 4,048,049 | | | | $57,468,233 | |
Institutional Class | | | | | | | | | | | | | | | | |
Shares sold | | | 3,973,066 | | | | $59,430,105 | | | | 1,210,987 | | | | $16,535,812 | |
Shares issued through reinvestment of distributions | | | — | | | | — | | | | 145,969 | | | | 2,009,294 | |
Shares redeemed | | | (491,516 | ) | | | (7,268,608 | ) | | | (817,521 | ) | | | (11,680,059 | ) |
Net increase | | | 3,481,550 | | | | $52,161,497 | | | | 539,435 | | | | $6,865,047 | |
MATTHEWS CHINA FUND | | | | | | | | | | | | | | | | |
Investor Class | | | | | | | | | | | | | | | | |
Shares sold | | | 10,668,429 | | | | $257,887,316 | | | | 10,522,294 | | | | $228,825,245 | |
Shares issued through reinvestment of distributions | | | — | | | | — | | | | 3,700,905 | | | | 76,608,446 | |
Shares redeemed | | | (8,067,083 | ) | | | (190,711,327 | ) | | | (8,287,540 | ) | | | (168,142,345 | ) |
Net increase | | | 2,601,346 | | | | $67,175,989 | | | | 5,935,659 | | | | $137,291,346 | |
Institutional Class | | | | | | | | | | | | | | | | |
Shares sold | | | 4,941,401 | | | | $118,096,767 | | | | 2,708,363 | | | | $55,763,860 | |
Shares issued through reinvestment of distributions | | | — | | | | — | | | | 200,924 | | | | 4,151,093 | |
Shares redeemed | | | (1,352,252 | ) | | | (31,341,423 | ) | | | (1,141,616 | ) | | | (24,992,022 | ) |
Net increase | | | 3,589,149 | | | | $86,755,344 | | | | 1,767,671 | | | | $34,922,931 | |
MATTHEWS INDIA FUND | | | | | | | | | | | | | | | | |
Investor Class | | | | | | | | | | | | | | | | |
Shares sold | | | 6,382,526 | | | | $217,760,480 | | | | 14,535,681 | | | | $444,075,766 | |
Shares issued through reinvestment of distributions | | | — | | | | — | | | | 578,888 | | | | 18,854,400 | |
Shares redeemed | | | (6,292,247 | ) | | | (212,435,140 | ) | | | (9,557,043 | ) | | | (292,422,842 | ) |
Net increase | | | 90,279 | | | | $5,325,340 | | | | 5,557,526 | | | | $170,507,324 | |
Institutional Class | | | | | | | | | | | | | | | | |
Shares sold | | | 4,556,932 | | | | $156,589,601 | | | | 10,938,379 | | | | $326,819,057 | |
Shares issued through reinvestment of distributions | | | — | | | | — | | | | 94,003 | | | | 3,078,591 | |
Shares redeemed | | | (6,327,828 | ) | | | (214,842,570 | ) | | | (9,578,020 | ) | | | (307,547,412 | ) |
Net increase (decrease) | | | (1,770,896 | ) | | | ($58,252,969 | ) | | | 1,454,362 | | | | $22,350,236 | |
| | | | | | | | | | | | | | | | |
| | | Six-Month Period Ended June 30, 2018 (Unaudited) | | | Year Ended December 31, 2017 | |
| | | Shares | | | Amount | | | Shares | | | Amount | |
MATTHEWS JAPAN FUND | | | | | | | | | | | | | | | | |
Investor Class | | | | | | | | | | | | | | | | |
Shares sold | | | 22,896,500 | | | | $575,589,979 | | | | 27,038,482 | | | | $577,083,165 | |
Shares issued through reinvestment of distributions | | | — | | | | — | | | | 3,303,132 | | | | 77,557,315 | |
Shares redeemed | | | (8,821,207 | ) | | | (220,497,732 | ) | | | (30,502,087 | ) | | | (650,099,638 | ) |
Net increase (decrease) | | | 14,075,293 | | | | $355,092,247 | | | | (160,473 | ) | | | $4,540,842 | |
Institutional Class | | | | | | | | | | | | | | | | |
Shares sold | | | 19,046,821 | | | | $480,954,033 | | | | 27,236,482 | | | | $598,412,144 | |
Shares issued through reinvestment of distributions | | | — | | | | — | | | | 731,710 | | | | 17,217,127 | |
Shares redeemed | | | (10,398,303 | ) | | | (259,043,012 | ) | | | (16,017,190 | ) | | | (343,303,401 | ) |
Net increase | | | 8,648,518 | | | | $221,911,021 | | | | 11,951,002 | | | | $272,325,870 | |
MATTHEWS KOREA FUND | | | | | | | | | | | | | | | | |
Investor Class | | | | | | | | | | | | | | | | |
Shares sold | | | 2,388,848 | | | | $16,154,213 | | | | 5,564,488 | | | | $34,796,556 | |
Shares issued through reinvestment of distributions | | | 13 | | | | 85 | | | | 2,324,365 | | | | 15,751,872 | |
Shares redeemed | | | (2,910,054 | ) | | | (19,754,634 | ) | | | (7,247,886 | ) | | | (46,248,343 | ) |
Net increase (decrease) | | | (521,193 | ) | | | ($3,600,336 | ) | | | 640,967 | | | | $4,300,085 | |
Institutional Class | | | | | | | | | | | | | | | | |
Shares sold | | | 2,364,570 | | | | $16,015,802 | | | | 3,283,807 | | | | $20,683,708 | |
Shares issued through reinvestment of distributions | | | — | | | | — | | | | 384,519 | | | | 2,621,405 | |
Shares redeemed | | | (620,109 | ) | | | (4,065,509 | ) | | | (395,768 | ) | | | (2,595,391 | ) |
Net increase | | | 1,744,461 | | | | $11,950,293 | | | | 3,272,558 | | | | $20,709,722 | |
MATTHEWS ASIA SMALL COMPANIES FUND | | | | | | | | | | | | | | | | |
Investor Class | | | | | | | | | | | | | | | | |
Shares sold | | | 785,796 | | | | $18,298,397 | | | | 1,344,836 | | | | $29,213,685 | |
Shares issued through reinvestment of distributions | | | — | | | | — | | | | 693,887 | | | | 14,856,114 | |
Shares redeemed | | | (1,456,227 | ) | | | (33,985,632 | ) | | | (6,279,829 | ) | | | (130,940,312 | ) |
Net (decrease) | | | (670,431 | ) | | | ($15,687,235 | ) | | | (4,241,106 | ) | | | ($86,870,513 | ) |
Institutional Class | | | | | | | | | | | | | | | | |
Shares sold | | | 610,879 | | | | $14,298,222 | | | | 2,953,870 | | | | $62,967,705 | |
Shares issued through reinvestment of distributions | | | — | | | | — | | | | 833,944 | | | | 17,829,734 | |
Shares redeemed | | | (1,446,603 | ) | | | (33,486,278 | ) | | | (2,791,566 | ) | | | (58,750,310 | ) |
Net increase (decrease) | | | (835,724 | ) | | | ($19,188,056 | ) | | | 996,248 | | | | $22,047,129 | |
MATTHEWS CHINA SMALL COMPANIES FUND | | | | | | | | | | | | | | | | |
Investor Class | | | | | | | | | | | | | | | | |
Shares sold | | | 2,606,763 | | | | $33,728,341 | | | | 1,951,872 | | | | $21,481,987 | |
Shares issued through reinvestment of distributions | | | — | | | | — | | | | 165,109 | | | | 1,778,217 | |
Shares redeemed | | | (728,828 | ) | | | (9,278,169 | ) | | | (1,116,609 | ) | | | (11,848,256 | ) |
Net increase | | | 1,877,935 | | | | $24,450,172 | | | | 1,000,372 | | | | $11,411,948 | |
Institutional Class* | | | | | | | | | | | | | | | | |
Shares sold | | | 587,990 | | | | $7,710,064 | | | | 39,317 | | | | $450,574 | |
Shares issued through reinvestment of distributions | | | — | | | | — | | | | 782 | | | | 8,409 | |
Shares redeemed | | | (2,204 | ) | | | (28,585 | ) | | | — | | | | — | |
Net increase | | | 585,786 | | | | $7,681,479 | | | | 40,099 | | | | $458,983 | |
| * | Institutional class commenced operations on November 30, 2017. |
Through June 30, 2018, a 2.00% redemption fee was assessed on the sale or exchange of shares of the Matthews Emerging Asia Fund, Matthews Asia Small Companies Fund and Matthews China Small Companies Fund (collectively, the “Covered Funds”) within 90 days after the date an investor purchases shares of the Covered Funds. The imposition of redemption fees pursuant to the Funds’ Short-Term Trading Redemption Fee Policy for the Covered Funds may assist the Covered Funds in discouraging market timing activity.
The redemption fee is imposed to discourage market timing and short-term buying and selling of shares of the Covered Funds, which can disrupt the management of the Covered Funds’ investment portfolios and may have detrimental effects on the Covered Funds and other shareholders, and to allocate the costs the Covered Funds incur as a result of short-term trading and market timing. This fee is payable directly to the Covered Funds.
To determine whether the redemption fee applies, the Covered Funds do not count the day that shares were purchased, and first redeem the shares that have been held the longest.
| | | | |
| matthewsasia.com | 800.789.ASIA | | | 149 | |
Notes to Financial Statements (unaudited) (continued)
The Covered Funds may grant an exemption from the redemption fee when the Covered Funds have previously received assurances that transactions do not involve a substantial risk of the type of harm that the policy is designed to avoid. The Covered Funds may also waive the imposition of redemption fees in certain circumstances. For more information on this policy, please see the Funds’ prospectuses. The redemption fees returned to the assets of the Funds are stated in the Statements of Changes in Net Assets.
The Funds (or their agents) attempt to contact shareholders whom the Funds (or their agents) believe have violated the Funds’ policies and procedures related to short-term trading and market-timing activity, and notify them that they will no longer be permitted to buy (or exchange) shares of the Funds. When a shareholder has purchased shares of the Funds through an intermediary, the Funds may not be able to notify the shareholder of a violation of the Funds’ policies or that the Funds have taken steps to address the situation (for example, the Funds may be unable to notify a shareholder that his or her privileges to purchase or exchange shares of the Funds have been terminated). Nonetheless, additional purchase and exchange orders for such investors will not be accepted by the Funds.
The Funds may reject for any reason, or cancel as permitted or required by law, any purchase or exchange, including transactions deemed to represent excessive trading, at any time.
| 5. | INVESTMENT ADVISORY FEES AND OTHER TRANSACTIONS WITH AFFILIATES |
Matthews, a registered investment advisor under the 1940 Act, provides the Funds with investment management services. Pursuant to the prior Investment Advisory Agreement dated August 13, 2004, as amended (the “Prior Advisory Agreement”) and the current Investment Advisory Agreement dated February 1, 2016, as amended (the “Current Advisory Agreement,” and together with the Prior Advisory Agreement, the “Advisory Agreement”), the Funds pay Matthews (i) for management and advisory services; and (ii) for certain administrative services, an annual fee as a percentage of average daily net assets. Under the Advisory Agreement each of the Funds, other than Matthews Asia Strategic Income Fund, Matthews Asia Credit Opportunities Fund, Matthews Emerging Asia Fund, Matthews Asia Small Companies Fund, and Matthews China Small Companies Fund (the “Family-Priced Funds”), pays Matthews 0.75% of their aggregate average daily net assets up to $2 billion, 0.6834% of their aggregate average daily net assets over $2 billion up to $5 billion, 0.65% of their aggregate average daily net assets over $5 billion up to $25 billion, 0.64% of their aggregate average daily net assets over $25 billion up to $30 billion, 0.63% of their aggregate average daily net assets over $30 billion up to $35 billion, 0.62% of their aggregate average daily net assets over $35 billion up to $40 billion, 0.61% of their aggregate average daily net assets over $40 billion up to $45 billion, and 0.60% of their aggregate average daily net assets over $45 billion. Each of the Matthews Asia Strategic Income Fund and Matthews Asia Credit Opportunities Fund pays Matthews an annual fee of 0.65% of such Fund’s annual average daily net assets pursuant to the Advisory Agreement. Each of the Matthews Emerging Asia Fund, Matthews Asia Small Companies Fund, and the Matthews China Small Companies Fund pays Matthews an annual fee of 1.00% of the average daily net assets of such Fund up to $1 billion and 0.95% of the average daily net assets of such Fund over $1 billion pursuant to the Advisory Agreement. Each Fund pays Matthews a monthly fee at the annual rate using the applicable management fee calculated based on the actual number of days of that month and based on the Fund’s average daily net asset value for the month.
Pursuant to a fee waiver letter agreement, effective as of September 1, 2014, between the Trust, on behalf of the Family-Priced Funds, and Matthews (as amended from time to time, the “Fee Waiver Agreement”), for each Family-Priced Fund, Matthews has agreed to waive a portion of the fee payable under the Advisory Agreement and a portion of the fee payable under the Administration and Shareholder Services Agreement, if any Family-Priced Fund’s average daily net assets are over $3 billion, as follows: for every $2.5 billion average daily net assets of a Family-Priced Fund that are over $3 billion, the fee rates that otherwise would be applied for calculating fees payable under the Advisory Agreement and the Administration and Shareholder Services Agreement for such Family-Priced Fund with respect to such excess average daily net assets will be each reduced by 0.01%, in each case without reducing such fee rate below 0.00%.
Under a written agreement between the Funds and Matthews (the “Operating Expense Agreement”), Matthews agrees to waive fees and reimburse expenses to a Fund if its expense ratio exceeds a certain percentage level. Effective November 30, 2017 for all Funds, except Matthews Asia Strategic Income Fund and the Matthews Asia Credit Opportunities Fund, this level is 1.25% for the Institutional Class. Matthews agrees to reduce the expense ratio by waiving an equal amount of non-class specific expenses for the Investor Class. Because certain expenses of the Investor Class may be higher than those of the Institutional Class and because class specific expenses may be waived solely for the Institutional Class, total annual Fund expenses for the Investor Class may exceed 1.25%. For Matthews Asia Strategic Income Fund and Matthews Asia Credit Opportunities Fund this level is 0.90% for the Institutional Class. Matthews agrees to reduce the expense ratio by waiving an equal amount of non-class specific expenses for the Investor Class. Because certain expenses of the Investor Class may be higher than those of the Institutional Class and because class specific expenses may be waived solely for the Institutional Class, total annual Fund expenses for the Investor Class may exceed 0.90%. In turn, if a Fund’s expenses fall below the level noted within three years after Matthews has made such a reimbursement, the Fund may reimburse Matthews up to an amount of the recoupment available not to exceed the lesser of (i) the expense limitation applicable at the time of that fee waiver and/or expense reimbursement or (ii) the expense limitation in effect at the time of recoupment. This agreement will continue through April 30, 2019, may be extended for additional periods not exceeding one year, and may be terminated at any time by the Board of Trustees on behalf of the Fund on 60 days’ written notice to Matthews. Matthews may decline to renew this agreement by written notice to the Trust at least 30 days before its annual expiration date.
On June 30, 2018, the amounts subject to possible future recoupment under the expense limitation agreement are as follows:
| | | | | | | | | | | | | | | | |
| | | Expiring December 31, | | | | |
| | | 2018 | | | 2019 | | | 2020 | | | 2021 | |
| Matthews Asia Strategic Income Fund | | | $113,621 | | | | $123,474 | | | | $121,164 | | | | $46,533 | |
| Matthews Asia Credit Opportunities Fund | | | — | | | | 110,447 | | | | 149,157 | | | | 50,658 | |
| Matthews Asia Value Fund | | | 41,279 | | | | 211,035 | | | | 119,683 | | | | 17,742 | |
| Matthews Asia Focus Fund | | | 87,252 | | | | 111,801 | | | | 119,705 | | | | 64,062 | |
| Matthews Asia ESG Fund | | | 183,986 | | | | 163,853 | | | | 156,429 | | | | 63,683 | |
| Matthews Emerging Asia Fund | | | 452,048 | | | | 553,167 | | | | 878,171 | | | | 452,636 | |
| Matthews Asia Small Companies Fund | | | 113,037 | | | | 252,008 | | | | 272,597 | | | | 123,849 | |
| Matthews China Small Companies Fund | | | 133,327 | | | | 142,295 | | | | 184,162 | | | | 119,560 | |
Investment advisory fees charged, waived fees and reimbursed additional expenses for the six-month period ended June 30, 2018, were as follows:
| | | | | | | | | | | | |
| | | Gross Advisory Fees | | | Advisory Fees
Waived and
Reimbursed in
Excess of the
Expense Limitation | | | Net Advisory Fee/
Reimbursement | |
| Matthews Asia Strategic Income Fund | | | $358,838 | | | | ($46,533 | ) | | | $312,305 | |
| Matthews Asia Credit Opportunities Fund | | | 120,616 | | | | (50,658 | ) | | | 69,958 | |
| Matthews Asian Growth and Income Fund | | | 8,290,629 | | | | — | | | | 8,290,629 | |
| Matthews Asia Dividend Fund | | | 23,802,726 | | | | (301,367 | ) | | | 23,501,359 | |
| Matthews China Dividend Fund | | | 1,120,828 | | | | — | | | | 1,120,828 | |
| Matthews Asia Value Fund | | | 114,854 | | | | (17,742 | ) | | | 97,112 | |
| Matthews Asia Focus Fund | | | 36,110 | | | | (64,062 | ) | | | (27,952 | ) |
| Matthews Asia Growth Fund | | | 3,492,709 | | | | — | | | | 3,492,709 | |
| Matthews Pacific Tiger Fund | | | 31,871,278 | | | | (633,657 | ) | | | 31,237,621 | |
| Matthews Asia ESG Fund | | | 66,100 | | | | (63,683 | ) | | | 2,417 | |
| Matthews Emerging Asia Fund | | | 2,562,890 | | | | (452,636 | ) | | | 2,110,254 | |
| Matthews Asia Innovators Fund | | | 884,748 | | | | — | | | | 884,748 | |
| Matthews China Fund | | | 3,539,833 | | | | — | | | | 3,539,833 | |
| Matthews India Fund | | | 7,476,206 | | | | — | | | | 7,476,206 | |
| Matthews Japan Fund | | | 15,403,570 | | | | (85,130 | ) | | | 15,318,440 | |
| Matthews Korea Fund | | | 721,469 | | | | — | | | | 721,469 | |
| Matthews Asia Small Companies Fund | | | 2,141,547 | | | | (123,849 | ) | | | 2,017,698 | |
| Matthews China Small Companies Fund | | | 255,813 | | | | (119,560 | ) | | | 136,253 | |
The Funds have an Administration and Shareholder Services Agreement dated August 13, 2004, as amended (the “Shareholder Services Agreement” or “Services Agreement”), in which the Funds pay an annual administration and shareholder servicing fee to Matthews, as a percentage of the average daily net assets of each Fund in aggregate, computed and prorated on a daily basis. Under the Shareholder Services Agreement, the Funds in the aggregate pay Matthews 0.25% of their aggregate average daily net assets up to $2 billion, 0.1834% of their aggregate average daily net assets over $2 billion up to $5 billion, 0.15% of their aggregate average daily net assets over $5 billion up to $7.5 billion, 0.125% of their aggregate average daily net assets over $7.5 billion up to $15 billion, 0.11% of their aggregate average daily net assets over $15 billion up to $22.5 billion, 0.10% of their aggregate average daily net assets over $22.5 billion up to $25 billion, 0.09% of their aggregate average daily net assets over $25 billion up to $30 billion, 0.08% of their aggregate average daily net assets over $30 billion up to $35 billion, 0.07% of their aggregate average daily net assets over $35 billion up to $40 billion, 0.06% of their aggregate average daily net assets over $40 billion up to $45 billion, and 0.05% of their aggregate average daily net assets over $45 billion.
Administration and shareholder servicing fees charged, for the six-month period ended June 30, 2018, were as follows:
| | | | | | | | | | | | |
| | | Gross
Administration and
Shareholder
Servicing Fees | | | Administration and
Shareholder
Servicing Fees
Waived in Excess of
Expense Limitation | | | Net
Administration and
Shareholder
Servicing Fees | |
| Matthews Asia Strategic Income Fund | | | $70,842 | | | | $— | | | | $70,842 | |
| Matthews Asia Credit Opportunities Fund | | | 23,813 | | | | — | | | | 23,813 | |
| Matthews Asian Growth and Income Fund | | | 1,614,940 | | | | — | | | | 1,614,940 | |
| Matthews Asia Dividend Fund | | | 4,637,377 | | | | (301,367 | ) | | | 4,336,010 | |
| Matthews China Dividend Fund | | | 218,375 | | | | — | | | | 218,375 | |
| Matthews Asia Value Fund | | | 22,379 | | | | — | | | | 22,379 | |
| Matthews Asia Focus Fund | | | 7,032 | | | | — | | | | 7,032 | |
| Matthews Asia Growth Fund | | | 680,575 | | | | — | | | | 680,575 | |
| Matthews Pacific Tiger Fund | | | 6,208,953 | | | | (633,657 | ) | | | 5,575,296 | |
| Matthews Asia ESG Fund | | | 12,879 | | | | — | | | | 12,879 | |
| Matthews Emerging Asia Fund | | | 328,824 | | | | — | | | | 328,824 | |
| Matthews Asia Innovators Fund | | | 172,402 | | | | — | | | | 172,402 | |
| Matthews China Fund | | | 689,665 | | | | — | | | | 689,665 | |
| Matthews India Fund | | | 1,456,516 | | | | — | | | | 1,456,516 | |
| | | | |
| matthewsasia.com | 800.789.ASIA | | | 151 | |
Notes to Financial Statements (unaudited) (continued)
| | | | | | | | | | | | |
| | | Gross
Administration and
Shareholder
Servicing Fees | | | Administration and
Shareholder
Servicing Fees
Waived in Excess of
Expense Limitation | | | Net
Administration and
Shareholder
Servicing Fees | |
| Matthews Japan Fund | | | $3,001,218 | | | | ($85,130 | ) | | | $2,916,088 | |
| Matthews Korea Fund | | | 140,557 | | | | — | | | | 140,557 | |
| Matthews Asia Small Companies Fund | | | 274,750 | | | | — | | | | 274,750 | |
| Matthews China Small Companies Fund | | | 32,837 | | | | — | | | | 32,837 | |
In addition to the fees paid to the Funds’ transfer agent, the Funds bear the cost of fees paid to certain service providers or intermediaries, including supermarkets, which provide transfer agency, record-keeping and shareholder servicing to certain shareholders. These fees are referred to as intermediary service fees on the Statements of Assets and Liabilities as well as the Statements of Operations. Additional information concerning these services and fees is contained in the Funds’ prospectuses.
BNY Mellon Investment Servicing (US) Inc. (“BNY Mellon”), an indirect wholly owned subsidiary of The Bank of New York Mellon Corporation, serves as the Funds’ administrator, and in that capacity, performs various administrative and accounting services for each Fund. BNY Mellon also serves as the Funds’ transfer agent, dividend disbursing agent and registrar. An officer of BNY Mellon serves as Assistant Treasurer to the Funds. Total fees accrued by the Funds for administration and accounting services for the six-month period ended June 30, 2018 were as follows:
| | | | |
| | | Administration and Accounting fees | |
| Matthews Asia Strategic Income Fund | | | $4,416 | |
| Matthews Asia Credit Opportunities Fund | | | 1,485 | |
| Matthews Asian Growth and Income Fund | | | 100,714 | |
| Matthews Asia Dividend Fund | | | 289,149 | |
| Matthews China Dividend Fund | | | 13,616 | |
| Matthews Asia Value Fund | | | 1,395 | |
| Matthews Asia Focus Fund | | | 439 | |
| Matthews Asia Growth Fund | | | 42,428 | |
| Matthews Pacific Tiger Fund | | | 387,166 | |
| Matthews Asia ESG Fund | | | 803 | |
| Matthews Emerging Asia Fund | | | 20,503 | |
| Matthews Asia Innovators Fund | | | 10,748 | |
| Matthews China Fund | | | 43,001 | |
| Matthews India Fund | | | 90,819 | |
| Matthews Japan Fund | | | 187,118 | |
| Matthews Korea Fund | | | 8,764 | |
| Matthews Asia Small Companies Fund | | | 17,132 | |
| Matthews China Small Companies Fund | | | 2,046 | |
Brown Brothers Harriman & Co. serves as the Funds’ custodian. Foreside Funds Distributors LLC, serves as the Funds’ distributor in the United States pursuant to an Underwriting Agreement. Matthews Asia Funds are distributed in Latin America by HMC Partners.
Cross trades for the six-months ended June 30, 2018, were executed by the Funds pursuant to Rule 17a-7 under the 1940 Act. Cross trading is the buying or selling of portfolio securities between funds to which Matthews International Capital Management, LLC serves as investment advisor. At its regularly scheduled quarterly meetings, the Board reviews such transactions as of the most recent calendar quarter for compliance with the requirements and restrictions set forth by Rule 17a-7. For the six-month period ended June 30, 2018, the purchase and sale transactions with an affiliated fund in compliance with Rule 17a-7 under the 1940 Act were as follows:
| | | | | | | | |
| | | Purchases | | | Sales | |
| Matthews Asia Dividend Fund | | | $506,605 | | | | $— | |
| Matthews China Dividend Fund | | | — | | | | 506,605 | |
As of June 30, 2018, Matthews and its affiliates held significant shares in the Funds as follows:
| | | | | | | | |
| | | Shares held by Matthews
and its Affiliates | | | Percentage of
Outstanding Shares | |
| Matthews Asia Strategic Income Fund | | | 1,288,645 | | | | 11% | |
| Matthews Asia Credit Opportunities Fund | | | 1,110,128 | | | | 25% | |
| Matthews Asia Focus Fund | | | 70,384 | | | | 9% | |
Certain officers and Trustees of the Funds are also officers and directors of Matthews. All officers serve without compensation from the Funds. The Funds paid the Independent Trustees $808,763 in aggregate for regular compensation during the six-month period ended June 30, 2018.
The value of investment transactions made for affiliated and unaffiliated holdings for the six-month period ended June 30, 2018 were as follows:
| | | | | | | | | | | | | | | | |
| | | Affiliated Purchases | | | Proceeds from Affiliated Sales | | | Unaffiliated Purchases | | | Proceeds from Unaffiliated Sales | |
| Matthews Asia Strategic Income Fund | | | $— | | | | $— | | | | $48,653,960 | | | | $25,911,197 | |
| Matthews Asia Credit Opportunities Fund | | | — | | | | — | | | | 14,056,904 | | | | 4,924,833 | |
| Matthews Asian Growth and Income Fund | | | — | | | | — | | | | 390,115,260 | | | | 855,164,760 | |
| Matthews Asia Dividend Fund | | | 215,969,155 | | | | 4,037,979 | | | | 1,356,988,782 | | | | 1,264,364,552 | |
| Matthews China Dividend Fund | | | — | | | | — | | | | 132,100,610 | | | | 106,586,670 | |
| Matthews Asia Value Fund | | | — | | | | — | | | | 8,455,250 | | | | 2,201,565 | |
| Matthews Asia Focus Fund | | | — | | | | — | | | | 1,612,056 | | | | 7,825,354 | |
| Matthews Asia Growth Fund | | | 5,480,091 | | | | — | | | | 266,066,723 | | | | 27,026,286 | |
| Matthews Pacific Tiger Fund | | | 62,291,729 | | | | 243,448 | | | | 514,927,217 | | | | 428,055,143 | |
| Matthews Asia ESG Fund | | | — | | | | — | | | | 5,002,223 | | | | 1,441,064 | |
| Matthews Emerging Asia Fund | | | 6,420,597 | | | | — | | | | 81,665,110 | | | | 31,011,651 | |
| Matthews Asia Innovators Fund | | | — | | | | — | | | | 177,653,463 | | | | 89,036,421 | |
| Matthews China Fund | | | — | | | | — | | | | 660,080,302 | | | | 501,140,278 | |
| Matthews India Fund | | | — | | | | 3,219,397 | | | | 269,613,807 | | | | 315,920,968 | |
| Matthews Japan Fund | | | 72,512,637 | | | | — | | | | 1,321,955,626 | | | | 791,966,186 | |
| Matthews Korea Fund | | | — | | | | — | | | | 48,825,130 | | | | 36,301,643 | |
| Matthews Asia Small Companies Fund | | | 299,496 | | | | — | | | | 177,571,142 | | | | 202,478,718 | |
| Matthews China Small Companies Fund | | | — | | | | — | | | | 55,431,965 | | | | 24,529,701 | |
| 7. | HOLDINGS OF 5% VOTING SHARES OF PORTFOLIO COMPANIES |
The 1940 Act defines “affiliated companies” to include investments in portfolio companies in which a fund owns 5% or more of the outstanding voting shares. During the six-month period ended June 30, 2018, the Funds below held 5% or more of the outstanding voting shares of the noted portfolio companies. During this period, other Funds in the Trust may also have held voting shares of the issuers at levels below 5%.
Investments in affiliates:
A summary of transactions in securities of issuers affiliated with a Fund for the six-month period ended June 30, 2018 is as follows:
| | | | | | | | | | | | | | | | | | | | | | | | | | | | | | | | |
| | | Shares Held at Dec. 31, 2017 | | | Shares Purchased | | | Shares Sold | | | Shares Held at June 30, 2018 | | | Value at June 30, 2018 | | | Dividend Income Jan. 1, 2018– June 30, 2018 | | | Net Realized Gain (Loss) Jan. 1, 2018– June 30, 2018 | | | Change in Unrealized Appreciation (Depreciation) | |
|
| MATTHEWS ASIA DIVIDEND FUND | |
| Name of Issuer: | | | | | | | | | | | | | | | | | | | | | | | | | | | | | | | | |
Anritsu Corp. | | | 9,384,700 | | | | — | | | | — | | | | 9,384,700 | | | | $128,488,779 | | | | $600,899 | | | | $— | | | | $22,839,379 | |
Ascendas India Trust | | | 53,470,700 | | | | 4,393,100 | | | | — | | | | 57,863,800 | | | | 42,893,533 | | | | 1,428,289 | | | | — | | | | (6,518,909 | ) |
Breville Group, Ltd. | | | 10,644,019 | | | | 1,541,519 | | | | — | | | | 12,185,538 | | | | 104,697,395 | | | | 1,291,815 | | | | — | | | | (12,750,328 | ) |
CapitaLand Retail China Trust REIT | | | 49,800,000 | | | | — | | | | — | | | | 49,800,000 | | | | 55,510,351 | | | | 312,864 | | | | — | | | | (4,810,409 | ) |
China Steel Chemical Corp. | | | — | | | | 14,747,000 | | | | — | | | | 14,747,000 | | | | 71,984,154 | | | | — | | | | — | | | | (2,041,414 | ) |
Eiken Chemical Co., Ltd. | | | 1,033,500 | | | | 2,303,700 | † | | | — | | | | 3,337,200 | | | | 70,894,137 | | | | 356,133 | | | | — | | | | (8,780,663 | ) |
Greencross, Ltd. | | | 3,825,449 | | | | 5,734,833 | | | | — | | | | 9,560,282 | | | | 31,683,378 | | | | 750,627 | | | | — | | | | (15,923,770 | ) |
Minth Group, Ltd. | | | 60,675,000 | | | | 2,048,000 | | | | 654,000 | | | | 62,069,000 | | | | 262,533,967 | | �� | | 6,726,674 | | | | 3,145,410 | | | | (111,878,781 | ) |
Shanghai Jin Jiang International Hotels Group Co., Ltd. H Shares | | | 44,450,000 | | | | 121,676,000 | | | | — | | | | 166,126,000 | | | | 67,145,514 | | | | 1,824,110 | | | | — | | | | (399,728 | ) |
Yuexiu Transport Infrastructure, Ltd. | | | 92,646,000 | | | | 4,682,000 | | | | — | | | | 97,328,000 | | | | 70,854,662 | | | | 2,797,700 | | | | — | | | | (775,245 | ) |
| | | | | | | | | | | | | | | | | | | | |
Total Affiliates | | | | | | | | | | | | | | | | | | | $906,685,870 | | | | $16,089,111 | | | | $3,145,410 | | | | ($141,039,868 | ) |
| | | | | | | | | | | | | | | | | | | | |
|
| MATTHEWS ASIA GROWTH FUND | |
| Name of Issuer: | | | | | | | | | | | | | | | | | | | | | | | | | | | | | | | | |
Sampath Bank PLC | | | 9,955,478 | | | | 6,170,909 | † | | | — | | | | 16,126,387 | | | | $30,877,498 | | | | $— | | | | $— | | | | $301,436 | |
| | | | |
| matthewsasia.com | 800.789.ASIA | | | 153 | |
Notes to Financial Statements (unaudited) (continued)
| | | | | | | | | | | | | | | | | | | | | | | | | | | | | | | | |
| | | Shares Held at Dec. 31, 2017 | | | Shares Purchased | | | Shares Sold | | | Shares Held at June 30, 2018 | | | Value at June 30, 2018 | | | Dividend Income Jan. 1, 2018– June 30, 2018 | | | Net Realized Gain (Loss) Jan. 1, 2018– June 30, 2018 | | | Change in Unrealized Appreciation (Depreciation) | |
|
| MATTHEWS PACIFIC TIGER FUND | |
| Name of Issuer: | | | | | | | | | | | | | | | | | | | | | | | | | | | | | | | | |
Cheil Worldwide, Inc. | | | 6,554,297 | | | | 761,585 | | | | — | | | | 7,315,882 | | | | $135,487,900 | | | | $3,891,615 | | | | $— | | | | ($8,232,306 | ) |
DB Insurance Co., Ltd. | | | 3,499,380 | | | | 71,086 | | | | — | | | | 3,570,463 | | | | 189,085,119 | | | | 6,287,950 | | | | — | | | | (47,507,859 | ) |
Fuyao Glass Industry Group Co., Ltd. H Shares | | | 32,976,400 | | | | 750,000 | | | | — | | | | 33,726,400 | | | | 113,963,851 | | | | 3,577,990 | | | | — | | | | (27,774,293 | ) |
Green Cross Corp. | | | 620,785 | | | | — | | | | — | | | | 620,785 | | | | 115,059,342 | | | | — | | | | — | | | | (15,878,669 | ) |
Just Dial, Ltd. | | | 3,557,718 | | | | — | | | | — | | | | 3,557,718 | | | | 28,901,385 | | | | — | | | | — | | | | (205,823 | ) |
Orion Holdings Corp. | | | 5,666,538 | | | | — | | | | — | | | | 5,666,538 | | | | 139,866,826 | | | | — | | | | — | | | | (1,194,534 | ) |
Sinopharm Group Co., Ltd. H Shares | | | 61,139,600 | | | | 5,006,800 | | | | — | | | | 66,146,400 | | | | 265,998,639 | | | | — | | | | — | | | | (19,158,019 | ) |
Synnex Technology International Corp. | | | 95,600,921 | | | | — | | | | 151,000 | | | | 95,449,921 | | | | 143,929,183 | | | | — | | | | 61,286 | | | | 14,079,880 | |
Tata Power Co., Ltd. | | | 164,620,436 | | | | 15,696,051 | | | | — | | | | 180,316,487 | | | | 192,888,779 | | | | — | | | | — | | | | (67,740,792 | ) |
| | | | | | | | | | | | | | | | | | | | |
Total Affiliates | | | | | | | | | | | | | | | | | | | $1,325,181,024 | | | | $13,757,555 | | | | $61,286 | | | | ($173,612,415 | ) |
| | | | | | | | | | | | | | | | | | | | |
|
| MATTHEWS EMERGING ASIA FUND | |
| Name of Issuer: | | | | | | | | | | | | | | | | | | | | | | | | | | | | | | | | |
National Seed JSC | | | 979,585 | | | | — | | | | — | | | | 979,585 | | | | $4,731,841 | | | | $64,703 | | | | $— | | | | $60,167 | |
Shifa International | | | | | | | | | | | | | | | | | | | | | | | | | | | | | | | | |
Hospitals, Ltd. | | | 2,519,051 | | | | 264,300 | | | | — | | | | 2,783,351 | | | | 6,187,771 | | | | — | | | | — | | | | (1,435,594 | ) |
Taisun International | | | | | | | | | | | | | | | | | | | | | | | | | | | | | | | | |
Holding Corp. | | | 654,000 | | | | 1,246,000 | | | | — | | | | 1,900,000 | | | | 8,693,442 | | | | — | | | | — | | | | 212,910 | |
| | | | | | | | | | | | | | | | | | | | |
Total Affiliates | | | | | | | | | | | | | | | | | | | $19,613,054 | | | | $64,703 | | | | $— | | | | ($1,162,517) | |
| | | | | | | | | | | | | | | | | | | | |
|
| MATTHEWS INDIA FUND | |
| Name of Issuer: | | | | | | | | | | | | | | | | | | | | | | | | | | | | | | | | |
eClerx Services, Ltd. | | | 2,701,931 | | | | — | | | | 154,563 | | | | 2,547,368 | | | | $48,337,344 | | | | $— | | | | $577,674 | | | | ($15,313,238 | ) |
VST Industries, Ltd. | | | 1,167,175 | | | | — | | | | — | | | | 1,167,175 | | | | 49,445,018 | | | | — | | | | — | | | | (9,157,378 | ) |
| | | | | | | | | | | | | | | | | | | | |
Total Affiliates | | | | | | | | | | | | | | | | | | | $97,782,362 | | | | $— | | | | $577,674 | | | | ($24,470,616 | ) |
| | | | | | | | | | | | | | | | | | | | |
|
| MATTHEWS JAPAN FUND | |
| Name of Issuer: | | | | | | | | | | | | | | | | | | | | | | | | | | | | | | | | |
Ferrotec Holdings Corp. | | | — | | | | 2,533,500 | | | | — | | | | 2,533,500 | | | | $38,934,436 | | | | $143,623 | | | | $— | | | | ($21,916,699 | ) |
Fuso Chemical Co., Ltd. | | | 1,496,900 | | | | 427,500 | | | | — | | | | 1,924,400 | | | | 49,542,667 | | | | 341,407 | | | | — | | | | (2,696,669 | ) |
Infomart Corp.†† | | | 7,697,300 | | | | — | | | | 1,888,600 | | | | 5,808,700 | | | | — | | | | — | | | | — | | | | — | |
TechnoPro Holdings, Inc.†† | | | 1,719,500 | | | | — | | | | 397,000 | | | | 1,322,500 | | | | — | | | | — | | | | — | | | | — | |
W-Scope Corp.†† | | | 2,047,600 | | | | — | | | | 2,047,600 | | | | — | | | | — | | | | — | | | | — | | | | — | |
| | | | | | | | | | | | | | | | | | | | |
Total Affiliates | | | | | | | | | | | | | | | | | | | $88,477,103 | | | | $485,030 | | | | $— | | | | ($24,613,368 | ) |
| | | | | | | | | | | | | | | | | | | | |
|
| MATTHEWS ASIA SMALL COMPANIES FUND | |
| Name of Issuer: | | | | | | | | | | | | | | | | | | | | | | | | | | | | | | | | |
Great Tree Pharmacy Co., Ltd. | | | 1,507,600 | | | | 104,000 | | | | — | | | | 1,611,600 | | | | $4,550,373 | | | | $— | | | | $— | | | | ($65,454 | ) |
Great Tree Pharmacy Co., Ltd., Rights | | | — | | | | 118,883 | | | | — | | | | 118,883 | | | | 93,913 | | | | — | | | | — | | | | 93,913 | |
| | | | | | | | | | | | | | | | | | | | |
Total Affiliates | | | | | | | | | | | | | | | | | | | $4,644,286 | | | | $— | | | | $— | | | | $28,459 | |
| | | | | | | | | | | | | | | | | | | | |
| † | Includes stock spin-off and stock dividend during the period. |
| †† | Issuer was not an affiliated company as of June 30, 2018. |
It is the policy of the Funds to comply with all requirements of the Internal Revenue Code of 1986, as amended (“the Code”), applicable to regulated investment companies and to distribute substantially all of their taxable income to their shareholders. The Funds have met the requirements of the Code applicable to regulated investment companies for the six-month period ended June 30, 2018. Therefore, no federal income tax provision is required.
Management has analyzed the Funds’ tax positions taken on federal income tax returns for all open tax years (current and prior three tax years), and has concluded that no provision for federal income tax is required in the Funds’ financial statements. The Funds’ federal and state income and federal excise tax returns for tax years for which the applicable statutes of limitations have not expired are subject to examination by the Internal Revenue Service and state departments of revenue.
Under current tax law, the Funds have elected to defer certain qualified late-year losses and recognize such losses in the year ending December 31, 2017:
| | | | |
| | | Late Year Losses* | |
| Matthews Asia Dividend Fund | | | $82,668,298 | |
| Matthews India Fund | | | 29,724 | |
| * | As permitted by the Internal Revenue Service, the Funds have elected to defer certain qualified late-year losses and recognize such losses in the next fiscal year. |
As of December 31, 2017, the Funds have capital loss carryforwards available to offset future realized capital gains through the indicated expiration dates as follows:
| | | | | | | | | | | | |
| | | Amount With No Expiration* | | | | |
| | | Short-term
Losses | | | Long-term
Losses | | | Total | |
| Matthews Asia Strategic Income Fund | | | $1,593,006 | | | | $53,342 | | | | $1,646,348 | |
| Matthews Asia Focus Fund | | | 110,658 | | | | 530,797 | | | | 641,455 | |
| * | Post-Enactment Losses: Must be utilized prior to losses subject to expiration. |
Under the Regulated Investment Company Modernization Act of 2010, the Funds are permitted to carry forward capital losses incurred in taxable years beginning after December 22, 2010 for an unlimited period. However, any losses incurred during those future taxable years will be required to be utilized prior to any losses incurred in pre-enactment taxable years, which generally expire after eight years from when they are incurred. Additionally, post-enactment capital losses that are carried forward will retain their character as either short-term or long-term capital losses rather than being considered all short-term as under previous law.
As of June 30, 2018, the tax cost of investments, including derivatives, and the related net unrealized appreciation and depreciation were as follows:
| | | | | | | | | | | | | | | | |
| | | Tax Cost | | | Gross
Unrealized
Appreciation | | | Gross
Unrealized
Depreciation | | | Net Unrealized
Appreciation
(Depreciation) | |
| Matthews Asia Strategic Income Fund | | | $109,732,199 | | | | $1,603,045 | | | | ($4,612,915 | ) | | | ($3,009,870 | ) |
| Matthews Asia Credit Opportunities Fund | | | 36,667,268 | | | | 197,933 | | | | (1,526,650 | ) | | | (1,328,717 | ) |
| Matthews Asian Growth and Income Fund | | | 2,015,476,954 | | | | 272,683,705 | | | | (166,281,817 | ) | | | 106,401,888 | |
| Matthews Asia Dividend Fund | | | 5,682,544,397 | | | | 1,554,903,829 | | | | (289,345,971 | ) | | | 1,265,557,858 | |
| Matthews China Dividend Fund | | | 305,836,216 | | | | 47,733,227 | | | | (18,966,480 | ) | | | 28,766,747 | |
| Matthews Asia Value Fund | | | 32,378,319 | | | | 2,265,676 | | | | (2,709,930 | ) | | | (444,254 | ) |
| Matthews Asia Focus Fund | | | 7,897,909 | | | | 1,025,151 | | | | (690,337 | ) | | | 334,814 | |
| Matthews Asia Growth Fund | | | 769,283,675 | | | | 377,394,260 | | | | (74,273,282 | ) | | | 303,120,978 | |
| Matthews Pacific Tiger Fund | | | 6,201,244,787 | | | | 3,373,171,084 | | | | (471,975,060 | ) | | | 2,901,196,024 | |
| Matthews Asia ESG Fund | | | 18,536,471 | | | | 3,624,412 | | | | (1,178,764 | ) | | | 2,445,648 | |
| Matthews Emerging Asia Fund | | | 451,018,177 | | | | 75,009,138 | | | | (60,241,089 | ) | | | 14,768,049 | |
| Matthews Asia Innovators Fund | | | 238,793,636 | | | | 53,992,890 | | | | (4,690,692 | ) | | | 49,302,198 | |
| Matthews China Fund | | | 964,353,280 | | | | 126,054,711 | | | | (65,142,391 | ) | | | 60,912,320 | |
| Matthews India Fund | | | 1,568,680,971 | | | | 590,822,979 | | | | (62,746,002 | ) | | | 528,076,977 | |
| Matthews Japan Fund | | | 3,748,305,135 | | | | 988,458,706 | | | | (162,533,395 | ) | | | 825,925,311 | |
| Matthews Korea Fund | | | 156,127,629 | | | | 52,715,206 | | | | (4,112,094 | ) | | | 48,603,112 | |
| Matthews Asia Small Companies Fund | | | 369,486,256 | | | | 68,727,284 | | | | (47,021,986 | ) | | | 21,705,298 | |
| Matthews China Small Companies Fund | | | 64,084,710 | | | | 7,789,891 | | | | (4,086,786 | ) | | | 3,703,105 | |
Management has evaluated the impact of all subsequent events on the Funds through the date the financial statements were issued, and has determined that there were no subsequent events that require recognition or disclosure in the financial statements.
| | | | |
| matthewsasia.com | 800.789.ASIA | | | 155 | |


| | |
| Matthews Asia Funds | | |
| |
INVESTMENT ADVISOR Matthews International Capital Management, LLC Four Embarcadero Center, Suite 550 San Francisco, CA 94111 800.789.ASIA CUSTODIAN Brown Brothers Harriman & Co. 50 Milk Street Boston, MA 02109 | | ACCOUNT SERVICES Matthews Asia Funds P.O. Box 9791 Providence, RI 02940 800.789.ASIA LEGAL COUNSEL Paul Hastings LLP 101 California Street, 48th Floor San Francisco, CA 94111 |

P.O. Box 9791 | Providence, RI 02940 | matthewsasia.com | 800.789.ASIA (2742)
Matthews Asia Funds are distributed in the United States by Foreside Funds Distributors LLC, Berwyn, Pennsylvania
Matthews Asia Funds are distributed in Latin America by HMC Partners

SAR-0618-235M
Item 2. Code of Ethics.
Not applicable.
Item 3. Audit Committee Financial Expert.
Not applicable.
Item 4. Principal Accountant Fees and Services.
Not applicable.
Item 5. Audit Committee of Listed Registrants.
Not applicable.
Item 6. Investments.
| (a) | Schedule of Investments in securities of unaffiliated issuers as of the close of the reporting period is included as part of the report to shareholders filed under Item 1 of this form. |
Item 7. Disclosure of Proxy Voting Policies and Procedures for Closed-End Management Investment Companies.
Not applicable.
Item 8. Portfolio Managers of Closed-End Management Investment Companies.
Not applicable.
Item 9. Purchases of Equity Securities by Closed-End Management Investment Company and Affiliated Purchasers.
Not applicable.
Item 10. Submission of Matters to a Vote of Security Holders.
There have been no material changes to the procedures by which the shareholders may recommend nominees to the registrant’s board of directors, where those changes were implemented after the registrant last provided disclosure in response to the requirements of Item 407(c)(2)(iv) of Regulation S-K (17 CFR 229.407) (as required by Item 22(b)(15) of Schedule 14A (17 CFR 240.14a-101)), or this Item.
Item 11. Controls and Procedures.
| | (a) | The registrant’s principal executive and principal financial officers, or persons performing similar functions, have concluded that the registrant’s disclosure controls and procedures (as defined in Rule 30a-3(c) under the Investment Company Act of 1940, as amended (the “1940 Act”) (17 CFR 270.30a-3(c))) are effective, as of a date within 90 days of the filing date of the report that includes the disclosure required by this paragraph, based on their evaluation of these controls and procedures required by Rule 30a-3(b) under the 1940 Act (17 CFR 270.30a-3(b)) and Rules 13a-15(b) or 15d-15(b) under the Securities Exchange Act of 1934, as amended (17 CFR 240.13a-15(b) or 240.15d-15(b)). |
| | (b) | There were no changes in the registrant’s internal control over financial reporting (as defined in Rule 30a-3(d) under the 1940 Act (17 CFR 270.30a-3(d))) that occurred during the period covered by this report that has materially affected, or is reasonably likely to materially affect, the registrant’s internal control over financial reporting. |
Item 12. Disclosure of Securities Lending Activities for Closed-End Management Investment Companies.
Not applicable.
Item 13. Exhibits.
| | (a)(2) | Certifications pursuant to Rule 30a-2(a) under the 1940 Act and Section 302 of the Sarbanes-Oxley Act of 2002 are attached hereto. |
| | (b) | Certifications pursuant to Rule 30a-2(b) under the 1940 Act and Section 906 of the Sarbanes-Oxley Act of 2002 are attached hereto. |
SIGNATURES
Pursuant to the requirements of the Securities Exchange Act of 1934 and the Investment Company Act of 1940, the registrant has duly caused this report to be signed on its behalf by the undersigned, thereunto duly authorized.
(Registrant) Matthews International Funds
By (Signature and Title)* /s/ William J. Hackett
William J. Hackett, President
(principal executive officer)
Date September 5, 2018
Pursuant to the requirements of the Securities Exchange Act of 1934 and the Investment Company Act of 1940, this report has been signed below by the following persons on behalf of the registrant and in the capacities and on the dates indicated.
By (Signature and Title)* /s/ William J. Hackett
William J. Hackett, President
(principal executive officer)
Date September 5, 2018
By (Signature and Title)* /s/ Shai Malka
Shai Malka, Treasurer
(principal financial officer)
Date September 5, 2018
| * | Print the name and title of each signing officer under his or her signature. |