UNITED STATES
SECURITIES AND EXCHANGE COMMISSION
Washington, D.C. 20549
FORMN-CSR
CERTIFIED SHAREHOLDER REPORT OF REGISTERED
MANAGEMENT INVESTMENT COMPANIES
Investment Company Act file number811-08510
Matthews International Funds
(Exact name of registrant as specified in charter)
Four Embarcadero Center, Suite 550
San Francisco, CA 94111
(Address of principal executive offices) (Zip code)
William J. Hackett, President
Four Embarcadero Center, Suite 550
San Francisco, CA 94111
(Name and address of agent for service)
Registrant’s telephone number, including area code:415-788-7553
Date of fiscal year end: December 31
Date of reporting period: June 30, 2019
FormN-CSR is to be used by management investment companies to file reports with the Commission not later than 10 days after the transmission to stockholders of any report that is required to be transmitted to stockholders under Rule30e-1 under the Investment Company Act of 1940 (17 CFR270.30e-1). The Commission may use the information provided on FormN-CSR in its regulatory, disclosure review, inspection, and policymaking roles.
A registrant is required to disclose the information specified by FormN-CSR, and the Commission will make this information public. A registrant is not required to respond to the collection of information contained in FormN-CSR unless the Form displays a currently valid Office of Management and Budget (“OMB”) control number. Please direct comments concerning the accuracy of the information collection burden estimate and any suggestions for reducing the burden to Secretary, Securities and Exchange Commission, 450 Fifth Street, NW, Washington, DC 20549-0609. The OMB has reviewed this collection of information under the clearance requirements of 44 U.S.C. § 3507.
| Item 1. | Reports to Stockholders. |
The Report to Shareholders is attached herewith.
Matthews Asia Funds | Semi-Annual Report
June 30, 2019 | matthewsasia.com
ASIA FIXED INCOME STRATEGIES
Matthews Asia Strategic Income Fund
Matthews Asia Credit Opportunities Fund
ASIA GROWTH AND INCOME STRATEGIES
Matthews Asian Growth and Income Fund
Matthews Asia Dividend Fund
Matthews China Dividend Fund
ASIA VALUE STRATEGY
Matthews Asia Value Fund
ASIA GROWTH STRATEGIES
Matthews Asia Growth Fund
Matthews Pacific Tiger Fund
Matthews Asia ESG Fund
Matthews Emerging Asia Fund
Matthews Asia Innovators Fund
Matthews China Fund
Matthews India Fund
Matthews Japan Fund
Matthews Korea Fund
ASIA SMALL COMPANY STRATEGIES
Matthews Asia Small Companies Fund
Matthews China Small Companies Fund

Beginning on January 1, 2021, as permitted by regulations adopted by the Securities and Exchange Commission, paper copies of the Funds’ annual andsemi-annual shareholder reports will no longer be sent by mail, unless you specifically request paper copies of the reports. Instead, the reports will be made available on the Funds’ website matthewsasia.com, and you will be notified by mail each time a report is posted and provided with a website link to access the report. If you already elected to receive shareholder reports electronically, you will not be affected by this change and you need not take any action. You may elect to receive shareholder reports and other communications from the Funds electronically anytime by contacting your financial intermediary (such as a broker-dealer or bank) or, if you are a direct investor, by calling 800.789.ASIA (2742).
You may elect to receive all future reports in paper free of charge. If you invest through a financial intermediary, you can contact your financial intermediary to request that you continue to receive paper copies of your shareholder reports. If you invest directly with a Fund, you can call 800.789.ASIA (2742) to let the Fund know you wish to continue receiving paper copies of your shareholder reports. Your election to receive reports in paper will apply to all Funds held in your account if you invest through your financial intermediary or all Funds held directly with Matthews Asia Funds.

Investor Class Performance and Expenses(June 30, 2019)
| | | | | | | | | | | | | | | | | | | | | | | | | | | | |
| Investor Class | | | | | Average Annual Total Return† | | | Inception
Date | | | Prospectus
Expense
Ratios* | | | Prospectus
Expense Ratios
after Fee Waiver
and Expense
Reimbursement* | |
| | 1 year | | | 5 years | | | 10 years | | | Since
Inception | |
ASIA FIXED INCOME STRATEGIES | | | | | | | | | | | | | | | | | | | | | | | | | | | | |
| | | | | | | |
Asia Strategic Income Fund (MAINX) | | | 7.76% | | | | 3.85% | | | | n.a. | | | | 4.73% | | | | 11/30/11 | | | | 1.15% | | | | 1.15% | 1 |
| | | | | | | |
Asia Credit Opportunities Fund (MCRDX) | | | 9.26% | | | | n.a. | | | | n.a. | | | | 5.90% | | | | 4/29/16 | | | | 1.37% | | | | 1.15% | 1 |
ASIA GROWTH AND INCOME STRATEGIES | | | | | | | | | | | | | | | | | | | | | | | | | | | | |
| | | | | | | |
Asian Growth and Income Fund (MACSX) | | | 7.20% | | | | 2.34% | | | | 7.08% | | | | 8.99% | | | | 9/12/94 | | | | 1.08% | | | | 1.08% | |
| | | | | | | |
Asia Dividend Fund (MAPIX) | | | -4.35% | | | | 4.96% | | | | 9.65% | | | | 8.45% | | | | 10/31/06 | | | | 1.02% | | | | 1.01% | 2 |
| | | | | | | |
China Dividend Fund (MCDFX) | | | 0.86% | | | | 11.07% | | | | n.a. | | | | 10.43% | | | | 11/30/09 | | | | 1.15% | | | | 1.15% | |
ASIA VALUE STRATEGY | | | | | | | | | | | | | | | | | | | | | | | | | | | | |
| | | | | | | |
Asia Value Fund (MAVRX) | | | -1.78% | | | | n.a. | | | | n.a. | | | | 9.29% | | | | 11/30/15 | | | | 1.77% | | | | 1.50% | 3 |
ASIA GROWTH STRATEGIES | | | | | | | | | | | | | | | | | | | | | | | | | | | | |
| | | | | | | |
Asia Growth Fund (MPACX) | | | -5.84% | | | | 5.91% | | | | 9.89% | | | | 8.96% | | | | 10/31/03 | | | | 1.10% | | | | 1.10% | |
| | | | | | | |
Pacific Tiger Fund (MAPTX) | | | 1.14% | | | | 5.95% | | | | 9.83% | | | | 8.54% | | | | 9/12/94 | | | | 1.07% | | | | 1.04% | 2 |
| | | | | | | |
Asia ESG Fund (MASGX) | | | 1.05% | | | | n.a. | | | | n.a. | | | | 4.68% | | | | 4/30/15 | | | | 2.20% | | | | 1.50% | 3 |
| | | | | | | |
Emerging Asia Fund (MEASX) | | | -9.06% | | | | 3.17% | | | | n.a. | | | | 4.36% | | | | 4/30/13 | | | | 1.66% | | | | 1.48% | 3 |
| | | | | | | |
Asia Innovators Fund (MATFX) | | | -4.36% | | | | 7.34% | | | | 12.51% | | | | 3.77% | | | | 12/27/99 | | | | 1.19% | | | | 1.19% | |
| | | | | | | |
China Fund (MCHFX) | | | -3.79% | | | | 8.43% | | | | 7.42% | | | | 9.68% | | | | 2/19/98 | | | | 1.10% | | | | 1.10% | |
| | | | | | | |
India Fund (MINDX) | | | -3.28% | | | | 8.43% | | | | 11.02% | | | | 10.68% | | | | 10/31/05 | | | | 1.09% | | | | 1.09% | |
| | | | | | | |
Japan Fund (MJFOX) | | | -9.27% | | | | 6.77% | | | | 9.54% | | | | 5.85% | | | | 12/31/98 | | | | 0.91% | | | | 0.91% | |
| | | | | | | |
Korea Fund (MAKOX) | | | -12.65% | | | | 2.41% | | | | 9.77% | | | | 5.53% | | | | 1/3/95 | | | | 1.14% | | | | 1.14% | |
ASIA SMALL COMPANY STRATEGIES | | | | | | | | | | | | | | | | | | | | | | | | | | | | |
| | | | | | | |
Asia Small Companies Fund (MSMLX) | | | -6.71% | | | | 1.45% | | | | 9.06% | | | | 9.89% | | | | 9/15/08 | | | | 1.51% | | | | 1.46% | 3 |
| | | | | | | |
China Small Companies Fund (MCSMX) | | | -10.36% | | | | 8.51% | | | | n.a. | | | | 4.99% | | | | 5/31/11 | | | | 1.97% | | | | 1.50% | 3 |
| † | Annualized performance for periods of at least one year, otherwise cumulative. |
| * | These figures are from the Funds’ prospectus dated as of April 30, 2019, and may differ from the actual expense ratios for fiscal year 2019, as shown in the financial highlights section of this report. |
| 1 | Matthews has contractually agreed (i) to waive fees and reimburse expenses to the extent needed to limit Total Annual Fund Operating Expenses (excluding Rule 12b-1 fees, taxes, interest, brokerage commissions, short sale dividend expenses, expenses incurred in connection with any merger or reorganization or extraordinary expenses such as litigation) of the Institutional Class to 0.90% first by waiving class specific expenses (i.e., shareholder service fees specific to a particular class) of the Institutional Class and then, to the extent necessary, by waiving non-class specific expenses of the Institutional Class, and (ii) if any Fund-wide expenses (i.e., expenses that apply to both the Institutional Class and the Investor Class) are waived for the Institutional Class to maintain the 0.90% expense limitation, to waive an equal amount (in annual percentage terms) of those same expenses for the Investor Class. The Total Annual Fund Operating Expenses After Fee Waiver and Expense Reimbursement for the Investor Class may vary from year to year and will in some years exceed 0.90%. Any amount waived with respect to the Fund pursuant to this agreement is not subject to recoupment. This agreement will remain in place until April 30, 2020 and may be terminated at any time by the Board of Trustees on behalf of the Fund on 60 days’ written notice to Matthews. Matthews may decline to renew this agreement by written notice to the Trust at least 30 days before its annual expiration date. |
| 2 | Matthews has contractually agreed to waive a portion of its advisory fee and administrative and shareholder services fee if the Fund’s average daily net assets are over $3 billion, as follows: for every $2.5 billion average daily net assets of the Fund that are over $3 billion, the advisory fee rate and the administrative and shareholder services fee rate for the Fund with respect to such excess average daily net assets will be each reduced by 0.01%, in each case without reducing such fee rate below 0.00%. Any amount waived by Matthews pursuant to this agreement may not be recouped by Matthews. This agreement will remain in place until April 30, 2020 and may be terminated (i) at any time by the Board of Trustees upon 60 days’ prior written notice to Matthews; or (ii) by Matthews at the annual expiration date of the agreement upon 60 days’ prior written notice to the Trust, in each case without payment of any penalty. |
| 3 | Matthews has contractually agreed (i) to waive fees and reimburse expenses to the extent needed to limit Total Annual Fund Operating Expenses (excluding Rule 12b-1 fees, taxes, interest, brokerage commissions, short sale dividend expenses, expenses incurred in connection with any merger or reorganization or extraordinary expenses such as litigation) of the Institutional Class to 1.25% first by waiving class specific expenses (i.e., shareholder service fees specific to a particular class) of the Institutional Class and then, to the extent necessary, by waiving non-class specific expenses of the Institutional Class, and (ii) if any Fund-wide expenses (i.e., expenses that apply to both the Institutional Class and the Investor Class) are waived for the Institutional Class to maintain the 1.25% expense limitation, to waive an equal amount (in annual percentage terms) of those same expenses for the Investor Class. The Total Annual Fund Operating Expenses After Fee Waiver and Expense Reimbursement for the Investor Class may vary from year to year and will in some years exceed 1.25%. If the operating expenses fall below the expense limitation in a year within three years after Matthews has made a waiver or reimbursement, the Fund may reimburse Matthews up to an amount that does not cause the expenses for that year to exceed the lesser of (i) the expense limitation applicable at the time of that fee waiver and/or expense reimbursement or (ii) the expense limitation in effect at the time of recoupment. This agreement will remain in place until April 30, 2020 and may be terminated at any time by the Board of Trustees on behalf of the Fund on 60 days’ written notice to Matthews. Matthews may decline to renew this agreement by written notice to the Trust at least 30 days before its annual expiration date. |
Institutional Class Performance and Expenses(June 30, 2019)
| | | | | | | | | | | | | | | | | | | | | | | | | | | | |
| Institutional Class | | | | | Average Annual Total Return† | | | Inception
Date | | | Prospectus
Expense
Ratios* | | | Prospectus
Expense Ratios
after Fee Waiver
and Expense
Reimbursement* | |
| | 1 year | | | 5 years | | | 10 years | | | Since
Inception | |
ASIA FIXED INCOME STRATEGIES | | | | | | | | | | | | | | | | | | | | | | | | | | | | |
| | | | | | | |
Asia Strategic Income Fund (MINCX) | | | 8.06% | | | | 4.12% | | | | n.a. | | | | 4.97% | | | | 11/30/11 | | | | 0.96% | | | | 0.90% | 1 |
| | | | | | | |
Asia Credit Opportunities Fund (MICPX) | | | 9.64% | | | | n.a. | | | | n.a. | | | | 6.16% | | | | 4/29/16 | | | | 1.18% | | | | 0.90% | 1 |
ASIA GROWTH AND INCOME STRATEGIES | | | | | | | | | | | | | | | | | | | | | | | | | | | | |
| | | | | | | |
Asian Growth and Income Fund (MICSX) | | | 7.34% | | | | 2.49% | | | | n.a. | | | | 4.41% | | | | 10/29/10 | | | | 0.93% | | | | 0.93% | |
| | | | | | | |
Asia Dividend Fund (MIPIX) | | | -4.25% | | | | 5.07% | | | | n.a. | | | | 6.29% | | | | 10/29/10 | | | | 0.91% | | | | 0.90% | 2 |
| | | | | | | |
China Dividend Fund (MICDX) | | | 0.99% | | | | 11.24% | | | | n.a. | | | | 9.46% | | | | 10/29/10 | | | | 1.01% | | | | 1.01% | |
ASIA VALUE STRATEGY | | | | | | | | | | | | | | | | | | | | | | | | | | | | |
| | | | | | | |
Asia Value Fund (MAVAX) | | | -1.48% | | | | n.a. | | | | n.a. | | | | 9.58% | | | | 11/30/15 | | | | 1.54% | | | | 1.25% | 3 |
ASIA GROWTH STRATEGIES | | | | | | | | | | | | | | | | | | | | | | | | | | | | |
| | | | | | | |
Asia Growth Fund (MIAPX) | | | -5.65% | | | | 6.11% | | | | n.a. | | | | 6.79% | | | | 10/29/10 | | | | 0.93% | | | | 0.93% | |
| | | | | | | |
Pacific Tiger Fund (MIPTX) | | | 1.31% | | | | 6.13% | | | | n.a. | | | | 6.12% | | | | 10/29/10 | | | | 0.90% | | | | 0.88% | 2 |
| | | | | | | |
Asia ESG Fund (MISFX) | | | 1.23% | | | | n.a. | | | | n.a. | | | | 4.93% | | | | 4/30/15 | | | | 2.01% | | | | 1.25% | 3 |
| | | | | | | |
Emerging Asia Fund (MIASX) | | | -8.76% | | | | 3.42% | | | | n.a. | | | | 4.61% | | | | 4/30/13 | | | | 1.50% | | | | 1.25% | 3 |
| | | | | | | |
Asia Innovators Fund (MITEX) | | | -4.11% | | | | 7.55% | | | | n.a. | | | | 11.38% | | | | 4/30/13 | | | | 1.02% | | | | 1.02% | |
| | | | | | | |
China Fund (MICFX) | | | -3.55% | | | | 8.60% | | | | n.a. | | | | 3.75% | | | | 10/29/10 | | | | 0.91% | | | | 0.91% | |
| | | | | | | |
India Fund (MIDNX) | | | -3.13% | | | | 8.64% | | | | n.a. | | | | 5.53% | | | | 10/29/10 | | | | 0.90% | | | | 0.90% | |
| | | | | | | |
Japan Fund (MIJFX) | | | -9.22% | | | | 6.86% | | | | n.a. | | | | 9.21% | | | | 10/29/10 | | | | 0.85% | | | | 0.85% | |
| | | | | | | |
Korea Fund (MIKOX) | | | -12.46% | | | | 2.59% | | | | n.a. | | | | 6.08% | | | | 10/29/10 | | | | 1.02% | | | | 1.02% | |
ASIA SMALL COMPANY STRATEGIES | | | | | | | | | | | | | | | | | | | | | | | | | | | | |
| | | | | | | |
Asia Small Companies Fund (MISMX) | | | -6.54% | | | | 1.67% | | | | n.a. | | | | 3.20% | | | | 4/30/13 | | | | 1.37% | | | | 1.25% | 3 |
| | | | | | | |
China Small Companies Fund (MICHX) | | | -10.08% | | | | n.a. | | | | n.a. | | | | 2.62% | | | | 11/30/17 | | | | 1.79% | | | | 1.25% | 3 |
| † | Annualized performance for periods of at least one year, otherwise cumulative. |
| * | These figures are from the Funds’ prospectus dated as of April 30, 2019, and may differ from the actual expense ratios for fiscal year 2019, as shown in the financial highlights section of this report. |
| 1 | Matthews has contractually agreed to waive fees and reimburse expenses to the extent needed to limit Total Annual Fund Operating Expenses (excluding Rule 12b-1 fees, taxes, interest, brokerage commissions, short sale dividend expenses, expenses incurred in connection with any merger or reorganization or extraordinary expenses such as litigation) of the Institutional Class to 0.90%. Any amount waived with respect to the Fund pursuant to this agreement is not subject to recoupment. This agreement will remain in place until April 30, 2020 and may be terminated at any time by the Board of Trustees on behalf of the Fund on 60 days’ written notice to Matthews. Matthews may decline to renew this agreement by written notice to the Trust at least 30 days before its annual expiration date. |
| 2 | Matthews has contractually agreed to waive a portion of its advisory fee and administrative and shareholder services fee if the Fund’s average daily net assets are over $3 billion, as follows: for every $2.5 billion average daily net assets of the Fund that are over $3 billion, the advisory fee rate and the administrative and shareholder services fee rate for the Fund with respect to such excess average daily net assets will be each reduced by 0.01%, in each case without reducing such fee rate below 0.00%. Any amount waived by Matthews pursuant to this agreement may not be recouped by Matthews. This agreement will remain in place until April 30, 2020 and may be terminated (i) at any time by the Board of Trustees upon 60 days’ prior written notice to Matthews; or (ii) by Matthews at the annual expiration date of the agreement upon 60 days’ prior written notice to the Trust, in each case without payment of any penalty. |
| 3 | Matthews has contractually agreed to waive fees and reimburse expenses to the extent needed to limit Total Annual Fund Operating Expenses (excluding Rule 12b-1 fees, taxes, interest, brokerage commissions, short sale dividend expenses, expenses incurred in connection with any merger or reorganization or extraordinary expenses such as litigation) of the Institutional Class to 1.25%. If the operating expenses fall below the expense limitation in a year within three years after Matthews has made a waiver or reimbursement, the Fund may reimburse Matthews up to an amount that does not cause the expenses for that year to exceed the lesser of (i) the expense limitation applicable at the time of that fee waiver and/or expense reimbursement or (ii) the expense limitation in effect at the time of recoupment. This agreement will remain in place until April 30, 2020 and may be terminated at any time by the Board of Trustees on behalf of the Fund on 60 days’ written notice to Matthews. Matthews may decline to renew this agreement by written notice to the Trust at least 30 days before its annual expiration date. |
Past Performance: All performance quoted in this report is past performance and is no guarantee of future results. Investment return and principal value will fluctuate with changing market conditions so that when redeemed, shares may be worth more or less than their original cost. Current performance may be lower or higher than the returns quoted. If certain of the Funds’ fees and expenses had not been waived, returns would have been lower. For the Funds’ most recent month-end performance, please call 800.789.ASIA (2742) or visit matthewsasia.com.
| | | | |
| matthewsasia.com | 800.789.ASIA | | | 2 | |

Contents
Cover photo: Chinese New Year lantern and gold coin decorations along the Hong Kong harbor.
This report has been prepared for Matthews International Funds (d/b/a Matthews Asia Funds) shareholders. It is not authorized for distribution to prospective investors unless accompanied or preceded by a current Matthews Asia Funds prospectus, which contains more complete information about the Funds’ investment objectives, risks and expenses. Additional copies of the prospectus or summary prospectus may be obtained at matthewsasia.com. Please read the prospectus carefully before you invest or send money.
The views and opinions in this report were current as of June 30, 2019. They are not guarantees of performance or investment results and should not be taken as investment advice. Investment decisions reflect a variety of factors, and the managers reserve the right to change their views about individual stocks, sectors and the markets at any time. As a result, the views expressed should not be relied upon as a forecast of a Fund’s future investment intent. Current and future portfolio holdings are subject to risk.
Statements of fact are from sources considered reliable, but neither the Funds nor the Investment Advisor makes any representation or guarantee as to their completeness or accuracy.
Investment Risk: Mutual fund shares are not deposits or obligations of, or guaranteed by, any depositary institution. Shares are not insured by the FDIC, Federal Reserve Board or any government agency and are subject to investment risks, including possible loss of principal amount invested. Investing in international and emerging markets may involve additional risks, such as social and political instability, market illiquidity, exchange-rate fluctuations, a high level of volatility and limited regulation. Fixed income investments are subject to additional risks, including, but not limited to, interest rate, credit and inflation risks. In addition, single-country and sector funds may be subject to a higher degree of market risk than diversified funds because of a concentration in a specific industry, sector or geographic location. Investing in small and mid-size companies is more risky than investing in large companies as they may be more volatile and less liquid than larger companies. Please see the Funds’ Prospectuses and Statement of Additional Information for more risk disclosure.
Message to Shareholders from the Investment Advisor
Dear Valued Investors,
In many respects, the environment for investment has not really improved markedly since the start of the year. Trade tensions linger. Global indicators have weakened. Political tensions have intensified. Only the U.S. remains a bright spot—that perfect mix of good economic growth numbers, low inflation and (hurrah!) potential interest rate cuts to boot.
All of this just drains the appetite of investors for Asia’s equity and bond markets. Everywhere I go, at every conference around the world it seems, Asia remains a top “intended” destination for new funds. And yet for the most part, industry flows suggest that few people are actually acting on their plans.
That is hardly surprising—Asia’s reputation for volatility, the conventional wisdom that it is an export economy, the reticence of Asia’s policymakers to stimulate in a strong dollar environment, and the supercharged (by tax breaks and low wage growth) earnings growth in the U.S. all inveigh against asset allocators making the courageous decision to move funds across the Pacific. After all, who wants to be courageous in this atmosphere? As one client with a flair for humorous exposition told me recently: “It neverfeels good to buy China.”
I think he was right. What we are up against is primarily sentiment. I don’t want to downplay the trade war, the earnings issue, or the growth environment. However, market reactions to tweets on trade are out of proportion to the actual effect on GDP and earnings. Valuations suggest that the current pro-capitalist/anti-labor policies can persist in the U.S. without an economic or political backlash, and a belief that Asia’s policymakers will remain tight-fisted on fiscal and monetary policy assumes a strong dollar regime will continue, which is at odds with the stated intention of the administration to reduce the trade deficit. It seems to me to just be a case of the market justifying “more of the same” and to follow the momentum trade.
That is fine. However, perhaps because of our focus on Asia, we see things slightly differently. We see the steady creep of China’s economic influence through ASEAN and Central Europe, even now, bringing in Italy and Greece into the fold. We see the adjustments being made at the corporate level to circumvent the tariffs imposed by the U.S., and we see the acceleration of the buildout of the manufacturing base in the region. We see a region, in short, adapting to circumstance: fluid, and dynamic. We see a region where borders are being broken down by closer economic cooperation, not built up by economic protectionism.
It’s hard to argue with momentum in the markets—the S&P 500 Index is making new highs as I write this. But it does increasingly feel to me as if pressures are building up to force an inflection in world markets. I doubt a severe recession is in the offing (though I worry about a long stagnation in Europe), but I do think that markets are going to be shaken out of their complacency. It has been a long expansion, after all, and there is little room for policy error. I guess I am not the only one to feel this way and hence, the reticence of people to buy.
For us, the trade issues have offered up opportunities. This is not because we believe there will be a rapid and total resolution—tension will rumble on between the U.S. and China for many a year—but because of the lack of proportion in market movements relative to actual effects of policy. These opportunities are predominantly in China and mostly, though not exclusively, in domestic-demand stocks that were somewhat inexplicably caught up in the weak market sentiment. Indeed, despite the breathless headlines at times and the gladiatorial nature of some of the language, we retain a cool posture.
One thing is clear in the data. The effects of tariffs so far have been: 1) to reduce the trade deficit between the U.S. and China; 2) to increase the trade deficit between the
U.S. and the rest of Asia (plus Mexico); and to raise the prices of tariffed goods versus non-tariffed goods in the U.S. My interpretation of this is that Chinese manufacturers with factories in ASEAN and Mexico have been running their factories there on extra shifts and the corresponding increase in costs and inefficiencies has been largely borne by the U.S. consumer. The longer-term effects are likely to be simply to accelerate Chinese investment in these areas. And thus, trade wars, far from being easy to win, are complex and unpredictable events with winners and losers that are very different from what the protagonists might expect.
We remain, therefore, wedded to our cause. We are aware of the global macroeconomic risks but we are not paralyzed by them. Indeed, for such complex issues as this, there is perhaps more insight to be gained by talking to the companies who are “at the coal face” rather than trying to divine big trends from newspaper headlines. We will continue to follow where the pursuit of profit opportunity leads us, to be guided by the decisions of entrepreneurs, not by the pronouncements of politicians, and to respect the price signals of the market.
There remains ample scope for corporates to grow profitably by meeting the needs of the domestic consumer. There is plenty of opportunity in economic and political cooperation with neighbors to drive down costs and ramp up efficiency in production and to improve the region’s living standards together. A few years ago, it might have seemed crazy that the U.S. would turn its back on globalization and that China would eagerly take up the role of champion of cross-border economic cooperation. But that is where we now are—the leadership of the global economy may already have passed from one superpower to the other.
With this strategic focus, the future of Asia looks bright beyond the headlines of the day—we continue to target investments in the domestic companies that are driving and profiting from the region’s creation of wealth.

Robert Horrocks, PhD
Chief Investment Officer
Matthews International Capital Management, LLC
| | | | |
| matthewsasia.com | 800.789.ASIA | | | 5 | |

| | | | |
| PORTFOLIO MANAGERS |
| |
| Teresa Kong, CFA | | |
Lead Manager | | |
| |
| Satya Patel | | Wei Zhang |
Co-Manager | | Co-Manager |
|
| FUND FACTS |
| | |
| | | Investor | | Institutional |
Ticker | | MAINX | | MINCX |
CUSIP | | 577125503 | | 577125602 |
Inception | | 11/30/11 | | 11/30/11 |
NAV | | $10.92 | | $10.93 |
Initial Investment | | $2,500 | | $100,000 |
Gross Expense Ratio1 | | 1.15% | | 0.96% |
After Fee Waiver and Reimbursement2 | | 1.15% | | 0.90% |
Portfolio Statistics | | | | |
Total # of Positions | | 36 |
Net Assets | | $113.6 million |
Modified Duration3 | | 5.2 |
Portfolio Turnover4 | | 82.32% |
Benchmark | | |
Markit iBoxx Asian Local Bond Index* |
OBJECTIVE
Total return over the long term with an emphasis on income.
STRATEGY
Under normal market conditions, the Fund seeks to achieve its investment objective by investing at least 80% of its net assets, which include borrowings for investment purposes, in income-producing securities including, but not limited to, dividend paying equity securities, and debt and debt-related instruments issued by governments, quasi-governmental entities, supra-national institutions, and companies in Asia. Asia consists of all countries and markets in Asia, such as China and India, and includes developed, emerging, and frontier countries and markets in the Asian region. Investments may be denominated in any currency, and may represent any part of a company’s capital structure from debt to equity or with features of both.
Matthews Asia Strategic Income Fund
Portfolio Manager Commentary (unaudited)
For the first half of 2019, the Matthews Asia Strategic Income Fund returned 8.39% (Investor Class) and 8.63% (Institutional Class), while its benchmark, the Markit iBoxx Asian Local Bond Index, returned 5.27%. For the quarter ending June 30, the Fund returned 2.56% (Investor Class) and 2.72% (Institutional Class) compared to the benchmark return of 2.11% over the same period.
Market Environment:
The combination of supportive central banks and positive trade news led to a constructive environment for Asian fixed income over the second quarter, with Asian credit, currencies and rates all performing positively. The U.S. Federal Reserve, the European Central Bank and emerging market central banks all moved in a dovish direction during the quarter, seemingly ending the momentum for higher rates around the world. Meanwhile, the G-20 Summit ended without an escalation in the U.S.–China trade war, at least temporarily removing the risk of a further tariff shock from the global economy.
While the quarter was positive overall, geopolitics led to unexpected volatility. The quarter began with a positive tone as data from the U.S. and China implied that fears of a synchronized growth slowdown may have been overdone. Optimism evaporated in early May, however, when President Trump threatened to raise tariffs on all Chinese imports, including consumer-related goods, and attempted to limit U.S. companies from doing business with Chinese tech giant Huawei. By the end of May, equities markets had relinquished most of their year-to-date gains.
For Asia credit, this caused high-yield spreads to widen by about 40 basis points during May and 35 basis points over the quarter. The rally in U.S. rates more than offset this modest spread widening, so total return from credit bonds was positive for the quarter.
Asian local rates generally followed U.S. rates lower over the quarter, albeit to a lesser degree. Asia currency returns were mixed, with some currencies such as the Thai baht, the Philippine peso and the Indonesian rupiah outperforming the U.S. dollar, while others, notably the Chinese renminbi, the Korean won, and the Malaysian ringgit underperforming the U.S. dollar.
Performance Contributors and Detractors:
During the first half and the second quarter, the biggest contributor to Fund performance was the portfolio’s overweight in Asian USD high-yield corporate bonds, which delivered positive performance. Within high-yield corporate bonds, the strongest contributors over the quarter included PT Perusahaan Listrik Negara, a government-owned Indonesian utility, Tata Steel (ABJA Investment Co.) and Indika Energy Capital III bonds. Our exposures to convertible bonds, including CP Foods Holdings, Weibo and Zhongsheng Group Holdings, also contributed strongly within corporate exposures. In addition, our exposure to the Vietnam government-backed Debt & Asset Trading Corp. contributed to outperformance.
The biggest detractors to our performance were our currency forward positions in the Korean won and the Chinese renminbi (RMB), both currencies that underperformed the U.S. dollar over the quarter. Other detractors to performance
(continued)
| * | The Index performance reflects the returns of the discontinued predecessor HSBC Asian Local Bond Index up to December 31, 2012 and the returns of the successor Markit iBoxx Asian Local Bond Index thereafter. |
| 1 | Prospectus expense ratios. |
| 2 | Matthews has contractually agreed (i) to waive fees and reimburse expenses to the extent needed to limit Total Annual Fund Operating Expenses (excluding Rule 12b-1 fees, taxes, interest, brokerage commissions, short sale dividend expenses, expenses incurred in connection with any merger or reorganization or extraordinary expenses such as litigation) of the Institutional Class to 0.90% first by waiving class specific expenses (i.e., shareholder service fees specific to a particular class) of the Institutional Class and then, to the extent necessary, by waiving non-class specific expenses of the Institutional Class, and (ii) if any Fund-wide expenses (i.e., expenses that apply to both the Institutional Class and the Investor Class) are waived for the Institutional Class to maintain the 0.90% expense limitation, to waive an equal amount (in annual percentage terms) of those same expenses for the Investor Class. The Total Annual Fund Operating Expenses After Fee Waiver and Expense Reimbursement for the Investor Class may vary from year to year and will in some years exceed 0.90%. Any amount waived with respect to the Fund pursuant to this agreement is not subject to recoupment. This agreement will remain in place until April 30, 2020 and may be terminated at any time by the Board of Trustees on behalf of the Fund on 60 days’ written notice to Matthews. Matthews may decline to renew this agreement by written notice to the Trust at least 30 days before its annual expiration date. |
| 3 | Modified duration measures the percent change in value of the fixed income portion of the portfolio in response to a 1% change in interest rates. In a multi-currency denominated portfolio with sensitivities to different interest rate regimes, modified duration will not accurately reflect the change in value of the overall portfolio from a change in any one interest rate regime. |
| 4 | The lesser of fiscal year 2018 long-term purchase costs or sales proceeds divided by the average monthly market value of long-term securities. |
| | | | | | | | | | | | | | | | | | | | | | | | | | | | |
| | | | | | | | |
| PERFORMANCE AS OF JUNE 30, 2019 | | | | | | | | | | | | | | | | | | | | | |
| | | | | | | | | Average Annual Total Returns | | | | |
| | | 3 Months | | | YTD | | | 1 Year | | | 3 Years | | | 5 Years | | | Since
Inception | | | Inception
Date | |
| Investor Class (MAINX) | | | 2.56% | | | | 8.39% | | | | 7.76% | | | | 5.38% | | | | 3.85% | | | | 4.73% | | | | 11/30/11 | |
| Institutional Class (MINCX) | | | 2.72% | | | | 8.63% | | | | 8.06% | | | | 5.69% | | | | 4.12% | | | | 4.97% | | | | 11/30/11 | |
| Markit iBoxx Asian Local Bond Index5 | | | 2.11% | | | | 5.27% | | | | 8.42% | | | | 3.33% | | | | 2.67% | | | | 2.79% | | | | | |
Performance assumes reinvestment of all dividends and/or distributions before taxes. All performance quoted represents past performance and is no guarantee of future results. Investment return and principal value will fluctuate with market conditions so that when redeemed, shares may be worth more or less than their original cost. Current performance may be lower or higher than the return figures quoted. Returns would have been lower if certain of the Fund’s fees and expenses had not been waived. For the Fund’s most recent month-end performance visit matthewsasia.com.
| | | | | | | | | | | | | | | | | | | | | | | | | | | | | | | | | | | | | | | | | | | | |
| | | | | | | | | | |
| INCOME DISTRIBUTION HISTORY | | | | | | | | | | | | | | | | | | | | | | | | | | | | |
| | | 2019 | | | | | | 2018 | |
| | Q1 | | | Q2 | | | Q3 | | | Q4 | | | Total | | | | | | Q1 | | | Q2 | | | Q3 | | | Q4 | | | Total | |
| Investor (MAINX) | | $ | 0.08 | | | $ | 0.10 | | | | n.a. | | | | n.a. | | | $ | 0.19 | | | | | | | $ | 0.12 | | | $ | 0.10 | | | $ | 0.07 | | | $ | 0.00 | | | $ | 0.29 | |
| Inst’l (MINCX) | | $ | 0.09 | | | $ | 0.11 | | | | n.a. | | | | n.a. | | | $ | 0.20 | | | | | | | $ | 0.13 | | | $ | 0.11 | | | $ | 0.08 | | | $ | 0.00 | | | $ | 0.31 | |
Note: This table does not include capital gains distributions. Totals may differ by $0.02 due to rounding. For income distribution history, visit matthewsasia.com.
| | | | |
| | | |
30-DAY YIELD: Investor Class: 4.38% (4.35% excluding waivers) Institutional Class: 4.63% (4.54% excluding waivers) The 30-Day Yield represents net investment income earned by the Fund over the 30-day period ended 6/30/19, expressed as an annual percentage rate based on the Fund’s share price at the end of the 30-day period. The 30-Day Yield should be regarded as an estimate of the Fund’s rate of investment income, and it may not equal the Fund’s actual income distribution rate. Source: BNY Mellon Investment Servicing (US) Inc. | | | | YIELD TO WORST: 5.08% Yield to worst is the lowest yield that can be received on a bond assuming that the issuer does not default. It is calculated by utilizing the worst case assumptions for a bond with respect to certain income-reducing factors, including prepayment, call or sinking fund provisions. It does not represent the yield that an investor should expect to receive. Past yields are no guarantee of future yields. Source: FactSet Research Systems |
GROWTH OF A HYPOTHETICAL $10,000 INVESTMENT SINCE INCEPTION—INVESTOR CLASS
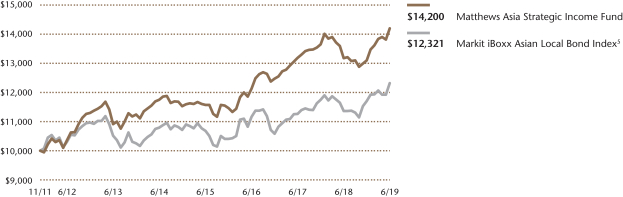
Plotted monthly. The performance data and graph do not reflect the deduction of taxes that a shareholder would pay on dividends, capital gains distributions or redemption of Fund shares. Values are in US$.
| | 5 | It is not possible to invest directly in an index. Source: Index data from HSBC, Markit iBoxx and Bloomberg; total return calculations performed by BNY Mellon Investment Servicing (US) Inc. Please see page 88 for index definitions. The Index performance reflects the returns of the discontinued predecessor HSBC Asian Local Bond Index up to December 31, 2012 and the returns of the successor Markit iBoxx Asian Local Bond Index thereafter. |
| | | | | | | | |
| | | | |
| TOP TEN HOLDINGS | | | | | | | |
| | | Sector | | Currency | | % of Net Assets | |
| Debt and Asset Trading Corp., 1.000%, 10/10/2025 | | Financials | | U.S. Dollar | | | 4.6% | |
| HSBC Holdings PLC, 6.375%, 12/29/2049 | | Financials | | U.S. Dollar | | | 4.5% | |
| Standard Chartered PLC, 6.500%, 12/29/2049 | | Financials | | U.S. Dollar | | | 4.4% | |
| Wanda Properties International Co., Ltd., 7.250%, 01/29/2024 | | Real Estate | | U.S. Dollar | | | 4.4% | |
| Sri Lanka Government Bond, 7.850%, 03/14/2029 | | Foreign Government Bonds | | U.S. Dollar | | | 4.1% | |
| SoftBank Group Corp., 6.000%, 07/19/2049 | | Communication Services | | U.S. Dollar | | | 4.1% | |
| Shriram Transport Finance Co., Ltd., 5.700%, 02/27/2022 | | Financials | | U.S. Dollar | | | 3.9% | |
| PB International BV, 7.625%, 01/26/2022 | | Consumer Discretionary | | U.S. Dollar | | | 3.9% | |
| CIFI Holdings Group Co., Ltd., 6.550%, 03/28/2024 | | Real Estate | | U.S. Dollar | | | 3.9% | |
| ABJA Investment Co. Pte, Ltd., 5.450%, 01/24/2028 | | Materials | | U.S. Dollar | | | 3.7% | |
| % OF ASSETS IN TOP TEN | | | | | | | 41.5% | |
| | | | |
| matthewsasia.com | 800.789.ASIA | | | 7 | |
| | | | |
| |
| CURRENCY ALLOCATION (%)6,7 | |
| US Dollar | | | 62.1 | |
| Singapore Dollar | | | 5.9 | |
| China Reminbi | | | 5.9 | |
| South Korean Won | | | 5.4 | |
| Indonesian Rupiah | | | 5.0 | |
| Thai Baht | | | 4.3 | |
| Indian Rupee | | | 4.1 | |
| Phillipines Peso | | | 3.5 | |
| Malaysian Ringgit | | | 2.1 | |
| Vietnam Dong | | | 1.7 | |
| | | | |
| |
| COUNTRY ALLOCATION (%)6,7,8 | |
| China/Hong Kong | | | 36.0 | |
| Indonesia | | | 18.8 | |
| India | | | 13.3 | |
| Vietnam | | | 6.3 | |
| Philippines | | | 5.9 | |
| Sri Lanka | | | 4.1 | |
| Japan | | | 4.1 | |
| Thailand | | | 3.1 | |
| Malaysia | | | 2.1 | |
| United States | | | 1.7 | |
| South Korea | | | 0.3 | |
| Cash and Other Assets, Less Liabilities | | | 4.5 | |
| | | | |
| |
| SECTOR ALLOCATION (%)6,7 | |
| Financials | | | 24.3 | |
| Real Estate | | | 20.7 | |
| Foreign Government Bonds | | | 16.5 | |
| Communication Services | | | 9.9 | |
| Utilities | | | 8.1 | |
| Consumer Discretionary | | | 3.9 | |
| Materials | | | 3.7 | |
| Consumer Staples | | | 3.1 | |
| Energy | | | 2.8 | |
| Industrials | | | 2.4 | |
| Cash and Other Assets, Less Liabilities | | | 4.5 | |
Please note: Foreign Government Bonds category includes Supranationals.
| | | | |
| |
| ASSET TYPE BREAKDOWN (%)6,7 | |
| Non-Convertible Corporate Bonds | | | 69.4 | |
| Government Bonds | | | 21.1 | |
| Convertible Corporate Bonds | | | 5.1 | |
| Cash and Other Assets, Less Liabilities | | | 4.5 | |
| 6 | Source: FactSet Research Systems. Percentage values in data are rounded to the nearest tenth of one percent, so the values may not sum to 100% due to rounding. Percentage values may be derived from different data sources and may not be consistent with other Fund literature. |
| 7 | Cash and other assets may include forward currency exchange contracts and certain derivative instruments that have been marked-to-market. |
| 8 | Not all countries where the Fund may invest are included in the benchmark index. |
Matthews Asia Strategic Income Fund
Portfolio Manager Commentary (unaudited) (continued)
included our convertible bond position in Ctrip.com International, Ltd., a Chinese online travel agency, as well as our holding in the RMB-denominated bonds of China Jinmao (Franshion Brilliant), a Chinese property developer.
Notable Portfolio Changes:
We made a number of changes to the portfolio in the second quarter, rotating out of shorter-duration bonds and bonds with higher equity beta, and adding longer-duration bonds and issues with asymmetric risk profiles.
Within corporate bonds, we initiated positions in two Indian issuers: Shriram Transport Finance, an Indian non-bank finance company that issued a U.S.-dollar bond with an attractive spread premium given the recent non-banking financial companies sector (NBFC) funding crisis; and Tata Steel (ABJA Investment), one of the world’s largest steel producers, where we gained exposure through a long-duration issue. We also initiated positions in two Chinese issuers: Logan Property Holdings, a top 20 developer that offered an attractive spread premium given its exposure to China’s Greater Bay Area, and to the technology firm Weibo via convertible bonds that were trading close to their lowest possible level, and which we saw as offering an asymmetric risk profile.
We increased overall duration in the portfolio to 4.5 years from 3.7 years by rotating out of short-duration bonds, including Aluminum Corporation of China (Chinalco Capital Holdings), Olam International and Krung Thai Bank Public, and also by adding longer-duration exposures. We also exited two bond holdings: Huaneng Hong Kong Capital and China Minmetals. Despite being perpetual bonds, they did not offer material duration due to the embedded fixed-to-floating coupon resets.
Outside of corporate bonds, we added to Indian duration via interest-rate swaps to take advantage of lower-than-expected growth and inflation in the country, which we expect to bring about rate cuts. We also added Malaysian government bond exposure given the country’s weak economy, attractive carry profile and as we believe the current market is underpricing the likelihood of rate cuts.
Finally on currency, we increased exposure to the U.S. dollar by cutting exposure to most Asian local currencies, with the Indian rupee and Malaysian ringgit being notable exceptions.
Outlook:
The U.S. and global economies both look to be late cycle, characterized by falling inflation and moderating GDP growth. Fed funds futures are pricing in two interest rate cuts by the Fed before the end of this year. Despite lackluster growth in the U.S., its equities continue to rally.
How is it possible that the bond markets are pricing such negativity while equities are so bullish? Our best explanation for this is that equity markets are pricing in perfect execution by the Fed. In other words, equities are expecting the Fed and other central banks to deliver sufficient rate cuts and loosen monetary policies to extend the current expansion.
Because few Asia government bond curves have fully priced in the dovish G-3 central banks, we maintain a long exposure to interest rate duration in Asia, where the bond markets have more room to rally. We expect that over the coming quarters, Asian central banks will become increasingly dovish, with their respective yield curves falling to price in more rate cuts. This means that even those central banks that may have been reluctant to cut should likely follow suit. We place the more-developed, lower-yielding countries like Thailand, South Korea and Malaysia solidly in that camp. Even the emerging Asian economies of India and Indonesia will have more room to cut rates given subdued domestic inflation.
Given our outlook, the biggest risk is that the equities markets are wrong. This would mean potential credit spread widening. However, in our base case, lower rates globally bodes well for credit spreads to remain stable.
Matthews Asia Strategic Income Fund
June 30, 2019
Schedule of Investmentsa(unaudited)
| | |
| NON-CONVERTIBLE CORPORATE BONDS: 69.4% | | |
| | | | | | | | |
| | | Face Amount* | | | Value | |
| | |
| CHINA/HONG KONG: 33.9% | | | | | | | | |
HSBC Holdings PLC 6.375%b, 03/30/25c | | | 4,900,000 | | | | $5,152,350 | |
| | |
Standard Chartered PLC
6.500%b, 04/02/20c,d | | | 4,950,000 | | | | 5,017,073 | |
| | |
Wanda Properties International Co., Ltd.
7.250%, 01/29/24d | | | 5,000,000 | | | | 4,981,250 | |
| | |
CIFI Holdings Group Co., Ltd.
6.550%, 03/28/24d | | | 4,500,000 | | | | 4,400,035 | |
| | |
Franshion Brilliant, Ltd.
5.750%b, 01/17/22c,d | | | 3,400,000 | | | | 3,231,578 | |
| | |
China Huaneng Group Co., Ltd.
3.950%, 04/21/26 | | | CNY 20,000,000 | | | | 2,862,712 | |
| | |
Logan Property Holdings Co., Ltd.
5.250%, 02/23/23d | | | 3,000,000 | | | | 2,862,354 | |
| | |
CITIC Telecom International Finance, Ltd.
6.100%, 03/05/25d | | | 2,300,000 | | | | 2,387,868 | |
| | |
KWG Group Holdings, Ltd.
5.875%, 11/10/24d | | | 2,600,000 | | | | 2,361,388 | |
| | |
KWG Group Holdings, Ltd.
7.875%, 09/01/23d | | | 2,050,000 | | | | 2,061,760 | |
| | |
CIFI Holdings Group Co., Ltd.
7.750%, 09/20/20d | | | CNY 12,000,000 | | | | 1,804,583 | |
| | |
Agricultural Bank of China, Ltd.
4.300%, 04/11/29d | | | CNY 10,000,000 | | | | 1,445,324 | |
| | | | | | | | |
Total China/Hong Kong | | | | | | | 38,568,275 | |
| | | | | | | | |
| | | | | | | | |
| | | |
| INDONESIA: 13.9% | | | | | | | | |
PB International BV 7.625%, 01/26/22d | | | 4,300,000 | | | | 4,452,483 | |
| | |
Listrindo Capital BV 4.950%, 09/14/26d | | | 3,500,000 | | | | 3,452,750 | |
| | |
Indika Energy Capital III Pte, Ltd.
5.875%, 11/09/24d | | | 3,300,000 | | | | 3,222,352 | |
| | |
PT Perusahaan Listrik Negara
5.250%, 05/15/47d | | | 2,700,000 | | | | 2,849,128 | |
| | |
Modernland Overseas Pte, Ltd.
6.950%, 04/13/24d | | | 1,900,000 | | | | 1,854,649 | |
| | | | | | | | |
Total Indonesia | | | | | | | 15,831,362 | |
| | | | | | | | |
| | | | | | | | |
| | | |
| INDIA: 13.3% | | | | | | | | |
Shriram Transport Finance Co., Ltd.
5.700%, 02/27/22d | | | 4,400,000 | | | | 4,457,030 | |
| | |
ABJA Investment Co. Pte, Ltd.
5.450%, 01/24/28d | | | 4,440,000 | | | | 4,249,860 | |
| | |
Housing Development Finance Corp., Ltd.
9.000%, 11/29/28 | | | INR 190,000,000 | | | | 2,872,557 | |
| | |
ICICI Bank UK PLC 5.375%b, 09/26/28d | | | SGD 2,750,000 | | | | 2,054,532 | |
| | |
Bajaj Finance, Ltd., Series 246
8.538%, 06/07/22 | | | INR 100,000,000 | | | | 1,461,039 | |
| | | | | | | | |
Total India | | | | | | | 15,095,018 | |
| | | | | | | | |
| | | | | | | | |
| | | |
| JAPAN: 4.1% | | | | | | | | |
SoftBank Group Corp.
6.000%b, 07/19/23c,d | | | 4,850,000 | | | | 4,631,750 | |
| | | | | | | | |
Total Japan | | | | | | | 4,631,750 | |
| | | | | | | | |
| | | | | | | | |
| | | |
| PHILIPPINES: 2.5% | | | | | | | | |
Royal Capital BV 4.875%b, 05/05/24c,d | | | 2,800,000 | | | | 2,775,500 | |
| | | | | | | | |
Total Philippines | | | | | | | 2,775,500 | |
| | | | | | | | |
| | | | | | | | |
| | | | | | | | |
| | | Face Amount* | | | Value | |
| | |
| UNITED STATES: 1.7% | | | | | | | | |
Sprint Communications, Inc.
6.000%, 11/15/22 | | | 1,863,000 | | | | $1,942,178 | |
| | | | | | | | |
Total United States | | | | | | | 1,942,178 | |
| | | | | | | | |
| | | | | | | | |
| | |
| TOTALNON-CONVERTIBLE CORPORATE BONDS | | | | 78,844,083 | |
| | | | | | | | |
(Cost $76,847,011) | | | | | | | | |
| | | | | | | | |
| | | | | | | | |
|
| FOREIGN GOVERNMENT OBLIGATIONS: 21.1% | |
| | | |
| VIETNAM: 6.3% | | | | | | | | |
Debt and Asset Trading Corp.
1.000%, 10/10/25d | | | 6,969,000 | | | | 5,209,328 | |
| | |
Vietnam Government Bond
5.200%, 01/12/22 | | | VND 43,000,000,000 | | | | 1,917,081 | |
| | | | | | | | |
Total Vietnam | | | | | | | 7,126,409 | |
| | | | | | | | |
| | | | | | | | |
| | | |
| INDONESIA: 4.9% | | | | | | | | |
Indonesia Government Bond
9.000%, 03/15/29 | | | IDR 38,000,000,000 | | | | 2,963,212 | |
| | |
Indonesia Government Bond
8.250%, 05/15/29 | | | IDR 34,550,000,000 | | | | 2,592,320 | |
| | | | | | | | |
Total Indonesia | | | | | | | 5,555,532 | |
| | | | | | | | |
| | | | | | | | |
| | | |
| SRI LANKA: 4.1% | | | | | | | | |
Sri Lanka Government Bond
7.850%, 03/14/29d | | | 4,500,000 | | | | 4,639,870 | |
| | | | | | | | |
Total Sri Lanka | | | | | | | 4,639,870 | |
| | | | | | | | |
| | | | | | | | |
| | | |
| PHILIPPINES: 3.4% | | | | | | | | |
Republic of Philippines
3.900%, 11/26/22 | | | PHP 123,000,000 | | | | 2,344,475 | |
| | |
Republic of Philippines
6.250%, 01/14/36 | | | PHP 70,000,000 | | | | 1,547,282 | |
| | | | | | | | |
Total Philippines | | | | | | | 3,891,757 | |
| | | | | | | | |
| | | | | | | | |
| | | |
| MALAYSIA: 2.1% | | | | | | | | |
Malaysia Government Bond
4.642%, 11/07/33 | | | MYR 9,000,000 | | | | 2,342,875 | |
| | | | | | | | |
Total Malaysia | | | | | | | 2,342,875 | |
| | | | | | | | |
| | | | | | | | |
| | | |
| SOUTH KOREA: 0.3% | | | | | | | | |
Korea Treasury Bond
3.500%, 03/10/24 | | | KRW 400,000,000 | | | | 377,298 | |
| | | | | | | | |
Total South Korea | | | | | | | 377,298 | |
| | | | | | | | |
| | | | | | | | |
| | |
| TOTAL FOREIGN GOVERNMENT OBLIGATIONS | | | | 23,933,741 | |
| | | | | | | | |
(Cost $23,021,276) | | | | | | | | |
| | | | | | | | |
|
CONVERTIBLE CORPORATE BONDS: 5.0% | |
| | | |
| THAILAND: 3.0% | | | | | | | | |
CP Foods Holdings, Ltd., Cnv.
0.500%, 09/22/21d | | | 2,800,000 | | | | 3,476,918 | |
| | | | | | | | |
Total Thailand | | | | | | | 3,476,918 | |
| | | | | | | | |
| | | | | | | | |
| | | | |
| matthewsasia.com | 800.789.ASIA | | | 9 | |
Matthews Asia Strategic Income Fund
June 30, 2019
Schedule of Investmentsa(unaudited) (continued)
CONVERTIBLE CORPORATE BONDS(continued)
| | | | | | | | |
| | | Face Amount* | | | Value | |
| | |
| CHINA/HONG KONG: 2.0% | | | | | | | | |
Weibo Corp., Cnv.
1.250%, 11/15/22 | | | 2,400,000 | | | | $2,265,666 | |
| | | | | | | | |
Total China/Hong Kong | | | | | | | 2,265,666 | |
| | | | | | | | |
| | | | | | | | |
| | |
| TOTAL CONVERTIBLE CORPORATE BONDS | | | | 5,742,584 | |
| | | | | | | | |
(Cost $ 5,067,936) | | | | | | | | |
| | | | | | | | |
| | | |
| TOTAL INVESTMENTS: 95.5% | | | | | | | 108,520,408 | |
(Cost $ 104,936,223) | | | | | | | | |
| | | | | | | | |
| | |
CASH AND OTHER ASSETS,
LESS LIABILITIES: 4.5% | | | | | | | 5,108,081 | |
| | | | | | | | |
| | |
NET ASSETS: 100.0% | | | | | | | $113,628,489 | |
| | | | | | | | |
| a | Certain securities were fair valued under the valuation policies approved by the Board of Trustees (Note2-A). |
| b | Security is afix-to-float security, which carries a fixed coupon until a certain date, upon which it switches to a floating rate. Reference rate and spread are provided if the rate is currently floating. |
| c | Perpetual security with no stated maturity date. First call date is disclosed. |
| d | The securities may be resold to qualified foreign investors and foreign institutional buyers under Regulation S of the Securities Act of 1933. |
| * | All Values in USD unless otherwise specified |
| CNY | Chinese Renminbi (Yuan) |
| 3M MYR-KLIBOR | Three Month Kuala Lumpur Interbank Offered Rate |
| 6M INR-MIBOR | Six Month Mumbai Inter-Bank Offered Rate |
| 6M THB-THBFIX | Six Month Thai Baht Interest Rate Fixing |
FORWARD FOREIGN CURRENCY EXCHANGE CONTRACTS
| | | | | | | | | | | | |
Currency Purchased | | Currency Sold | | Counterparty | | Settlement
Date | | | Unrealized
Appreciation
(Depreciation) | |
| CNY 33,648,300 | | USD 4,900,000 | | Merrill Lynch & Co., Inc. | | | 07/10/19 | | | | $1,014 | |
| IDR 36,000,000,000 | | USD 2,500,000 | | Merrill Lynch & Co., Inc. | | | 08/05/19 | | | | 36,733 | |
| KRW 1,174,350,000 | | USD 1,000,000 | | Merrill Lynch & Co., Inc. | | | 08/05/19 | | | | 15,835 | |
| THB 149,433,600 | | USD 4,800,000 | | Merrill Lynch & Co., Inc. | | | 08/05/19 | | | | 77,304 | |
| | | | | | | | | | | | |
| | | | | | | | | | | 130,886 | |
| | | | | | | | | | | | |
| USD 2,904,866 | | CNY 20,000,000 | | Merrill Lynch & Co., Inc. | | | 07/10/19 | | | | (8,217 | ) |
| USD 1,446,759 | | CNY 10,000,000 | | Merrill Lynch & Co., Inc. | | | 07/10/19 | | | | (9,782 | ) |
| SGD 8,509,410 | | USD 6,300,000 | | Merrill Lynch & Co., Inc. | | | 08/05/19 | | | | (6,387 | ) |
| KRW 10,075,320,000 | | USD 9,000,000 | | Merrill Lynch & Co., Inc. | | | 08/05/19 | | | | (284,654 | ) |
| USD 1,670,904 | | SGD 2,300,000 | | Merrill Lynch & Co., Inc. | | | 08/05/19 | | | | (30,190 | ) |
| USD 2,436,548 | | IDR 36,000,000,000 | | Merrill Lynch & Co., Inc. | | | 08/05/19 | | | | (100,184 | ) |
| USD 2,852,660 | | KRW 3,400,000,000 | | Merrill Lynch & Co., Inc. | | | 08/05/19 | | | | (88,406 | ) |
| USD 986,683 | | KRW 1,174,350,000 | | Merrill Lynch & Co., Inc. | | | 08/05/19 | | | | (29,152 | ) |
| | | | | | | | | | | | |
| | | | | | | | | | | (556,972 | ) |
| | | | | | | | | | | | |
Net Unrealized Depreciation | | | | | | | | | | | ($426,086 | ) |
| | | | | | | | | | | | |
OTC INTEREST RATE SWAPS
| | | | | | | | | | | | | | | | | | | | | | | | | | | | |
Floating Rate Paid by Fund | | Fixed Rate Received by Fund | | Counterparty | | Termination Date | | | Notional
Amount (000) | | | Value | | | Upfront
Premium
Paid
(Received) | | | Unrealized
Depreciation | |
| Rate | | Frequency | | Rate | | Frequency |
6M INR-MIBOR, (0.31)% | | Semi-annual | | 5.46% | | Semi-annual | | Bank of America, N.A. | | | 06/19/2024 | | | | INR 204,000 | | | | ($9,867 | ) | | | — | | | | ($9,867 | ) |
3M MYR-KLIBOR, 3.46% | | Quarterly | | 3.30% | | Quarterly | | Bank of America, N.A. | | | 06/19/2024 | | | | MYR 13,000 | | | | (9,076 | ) | | | — | | | | (9,076 | ) |
6M THB-THBFIX, 1.48% | | Semi-annual | | 1.61% | | Semi-annual | | Bank of America, N.A. | | | 06/21/2024 | | | | THB 281,000 | | | | (35,226 | ) | | | — | | | | (35,226 | ) |
| | | | | | | | | | | | | | | | | | | | |
Total | | | | | | | | | | | | | | | | | | | ($54,169 | ) | | | — | | | | ($54,169 | ) |
| | | | | | | | | | | | | | | | | | | | |
See accompanying notes to financial statements.
| | | | |
| PORTFOLIO MANAGERS |
| |
| Teresa Kong, CFA | | Satya Patel |
Lead Manager | | Lead Manager |
| | |
| FUND FACTS | | | | |
| | |
| | | Investor | | Institutional |
Ticker | | MCRDX | | MICPX |
CUSIP | | 577130677 | | 577130669 |
Inception | | 4/29/16 | | 4/29/16 |
NAV | | $10.47 | | $10.47 |
Initial Investment | | $2,500 | | $100,000 |
Gross Expense Ratio1 | | 1.37% | | 1.18% |
After Fee Waiver and Reimbursement2 | | 1.15% | | 0.90% |
Portfolio Statistics | | |
Total # of Positions | | 29 |
Net Assets | | $57.4 million |
Modified Duration3 | | 5.0 |
Portfolio Turnover4 | | 49.06% |
Benchmark | | | | |
J.P. Morgan Asia Credit Index |
OBJECTIVE
Total return over the long term.
STRATEGY
Under normal market conditions, the Fund seeks to achieve its investment objective by investing at least 80% of its net assets, which include borrowings for investment purposes, in debt and debt-related instruments issued by companies as well as governments, quasi-governmental entities, and supra-national institutions in Asia. Debt and debt-related instruments typically include bonds, debentures, bills, securitized instruments (which are vehicles backed by pools of assets such as loans or other receivables), notes, certificates of deposit and other bank obligations, bank loans, senior secured bank debt, convertible debt securities, exchangeable bonds, credit-linked notes, inflation-linked instruments, repurchase agreements, payment-in-kind securities and derivative instruments with fixed income characteristics. Asia consists of all countries and markets in Asia, such as China and Indonesia, in addition to the developed, emerging, and frontier countries and markets in the Asian region.
Matthews Asia Credit Opportunities Fund
Portfolio Manager Commentary (unaudited)
For the first half of 2019, the Matthews Asia Credit Opportunities Fund returned 9.39% (Investor Class) and 9.63% (Institutional Class) while its benchmark, the J.P. Morgan Asia Credit Index (JACI), returned 8.04%. For the quarter ending June 30, the Fund returned 3.16% (Investor Class) and 3.23% (Institutional Class) compared to the benchmark return of 3.00% over the same period.
Market Environment:
Asian credit markets enjoyed a positive first half, with high yield credit spreads peaking at 622 basis points (6.22%) in early January and ending June at 539 basis points (5.39%). The first quarter was characterized by a strong risk-on environment and spread tightening. Despite spreads widening modestly in the second quarter, the combination of falling U.S. interest rates and coupon income resulted in positive total returns for investors in the asset class.
The constructive environment for Asian credit over the period was largely due to supportive central banks around the world. The U.S. Federal Reserve, the European Central Bank and emerging market central banks all moved in a dovish direction, seemingly ending the momentum for higher rates around the world. Meanwhile, the G-20 Summit ended without an escalation of the U.S.–China trade war, at least temporarily removing the risk of a further tariff shock from the global economy.
While the second quarter was positive overall, geopolitics led to unexpected volatility in credit spreads. The quarter began with a continuation of the positive tone in risk markets from the first quarter, as data from the U.S. and China implied that fears of a synchronized growth slowdown may have been overdone. As the U.S.–China trade war flared up, however, spreads widened in May, before gradually tightening as the late-June G-20 summit approached.
Performance Contributors and Detractors:
During the first half and the second quarter, the biggest contributor to performance was the portfolio’s overweight allocation to Asian high yield bonds, which as a group outperformed in the risk-on environment. Within high yield corporate bonds, the strongest contributors over the quarter included Tata Steel (ABJA Investment), Lippo Karawaci (Theta Capital) and the Vietnam government-backed Debt and Asset Trading. Tata Steel performed well as it has moved toward a deleveraging plan following an unsuccessful merger of its European operations. Lippo Karawaci continues to execute on its turnaround plan, which includes raising new capital and increasing discipline around capital expenditures. Our exposure to convertible bonds, including Weibo and CP Foods Holdings as well as our positions in SoftBank Group and HSBC Holdings perpetual bonds, were also contributors.
The biggest detractors to performance were our positions in Indika (Indo Energy Finance II BV), our convertible bond positions in China Mengniu Dairy and Ctrip.com International, a Chinese online travel agency. The Indika bonds were sold during the quarter to buy longer-dated bonds of the same issuer, allowing us to extend our duration. The longer-dated Indika bonds were in fact among our highest contributors to returns in the quarter.
(continued)
| 1 | Prospectus expense ratios. |
| 2 | Matthews has contractually agreed (i) to waive fees and reimburse expenses to the extent needed to limit Total Annual Fund Operating Expenses (excluding Rule 12b-1 fees, taxes, interest, brokerage commissions, short sale dividend expenses, expenses incurred in connection with any merger or reorganization or extraordinary expenses such as litigation) of the Institutional Class to 0.90% first by waiving class specific expenses (i.e., shareholder service fees specific to a particular class) of the Institutional Class and then, to the extent necessary, by waiving non-class specific expenses of the Institutional Class, and (ii) if any Fund-wide expenses (i.e., expenses that apply to both the Institutional Class and the Investor Class) are waived for the Institutional Class to maintain the 0.90% expense limitation, to waive an equal amount (in annual percentage terms) of those same expenses for the Investor Class. The Total Annual Fund Operating Expenses After Fee Waiver and Expense Reimbursement for the Investor Class may vary from year to year and will in some years exceed 0.90%. Any amount waived with respect to the Fund pursuant to this agreement is not subject to recoupment. This agreement will remain in place until April 30, 2020 and may be terminated at any time by the Board of Trustees on behalf of the Fund on 60 days’ written notice to Matthews. Matthews may decline to renew this agreement by written notice to the Trust at least 30 days before its annual expiration date. |
| 3 | Modified duration measures the percent change in value of the fixed income portion of the portfolio in response to a 1% change in interest rates. In a multi-currency denominated portfolio with sensitivities to different interest rate regimes, modified duration will not accurately reflect the change in value of the overall portfolio from a change in any one interest rate regime. |
| 4 | The lesser of fiscal year 2018 long-term purchase costs or sales proceeds divided by the average monthly market value of long-term securities. |
| | | | |
| matthewsasia.com | 800.789.ASIA | | | 11 | |
| | | | | | | | | | | | | | | | | | | | | | | | |
| | | | | | | |
| PERFORMANCE AS OF JUNE 30, 2019 | | | | | | | | | | | | | | | | | | |
| | | | | | | | | Average Annual Total Retuns | | | | |
| | | 3 Months | | | YTD | | | 1 Year | | | 3 Years | | | Since Inception | | | Inception Date | |
| Investor Class (MCRDX) | | | 3.16% | | | | 9.39% | | | | 9.26% | | | | 5.73% | | | | 5.90% | | | | 4/29/2016 | |
| Institutional Class (MICPX) | | | 3.23% | | | | 9.63% | | | | 9.64% | | | | 6.02% | | | | 6.16% | | | | 4/29/2016 | |
| J.P. Morgan Asia Credit Index5 | | | 3.00% | | | | 8.04% | | | | 10.01% | | | | 4.04% | | | | 4.51% | | | | | |
Performance assumes reinvestment of all dividends and/or distributions before taxes. All performance quoted represents past performance and is no guarantee of future results.Investment return and principal value will fluctuate with market conditions so that when redeemed, shares may be worth moreor less than their original cost. Current performance may be lower or higher than the return figures quoted. Returns would have been lower if certain of the Fund’s fees and expenses had not been waived. For the Fund’s most recent month-endperformance, visit matthewsasia.com.
| | | | | | | | | | | | | | | | | | | | | | | | | | | | | | | | | | | | | | | | | | | | |
| | | | | | | | | | |
| INCOME DISTRIBUTION HISTORY | | | | | | | | | | | | | | | | | | | | | | | | | | | | |
| | | 2019 | | | | | | 2018 | |
| | | Q1 | | | Q2 | | | Q3 | | | Q4 | | | Total | | | | | | Q1 | | | Q2 | | | Q3 | | | Q4 | | | Total | |
| Investor (MCRDX) | | $ | 0.10 | | | $ | 0.10 | | | | n.a. | | | | n.a. | | | $ | 0.20 | | | | | | | $ | 0.09 | | | $ | 0.09 | | | $ | 0.06 | | | $ | 0.10 | | | $ | 0.33 | |
| Inst’l (MICPX) | | $ | 0.10 | | | $ | 0.11 | | | | n.a. | | | | n.a. | | | $ | 0.21 | | | | | | | $ | 0.09 | | | $ | 0.09 | | | $ | 0.06 | | | $ | 0.11 | | | $ | 0.36 | |
Note: This table does not include capital gains distributions. Totals may differ by $0.02 due to rounding. For income distribution history, visit matthewsasia.com.
| | | | |
| | | |
30-DAY YIELD: Investor Class: 4.85% (4.69% excluding waivers) Institutional Class: 5.10% (4.89% excluding waivers) The 30-Day Yield represents net investment income earned by the Fund over the 30-day period ended 6/30/19, expressed as an annual percentage rate based on the Fund’s share price at the end of the 30-day period. The 30-Day Yield should be regarded as an estimate of the Fund’s rate of investment income, and it may not equal the Fund’s actual income distribution rate. Source: BNY Mellon Investment Servicing (US) Inc. | | | | YIELD TO WORST: 5.93% Yield to worst is the lowest yield that can be received on a bond assuming that the issuer does not default. It is calculated by utilizing the worst case assumptions for a bond with respect to certain income-reducing factors, including prepayment, call or sinking fund provisions. It does not represent the yield that an investor should expect to receive. Past yields are no guarantee of future yields. Source: FactSet Research Systems |
GROWTH OF A HYPOTHETICAL $10,000 INVESTMENT SINCE INCEPTION—INVESTOR CLASS
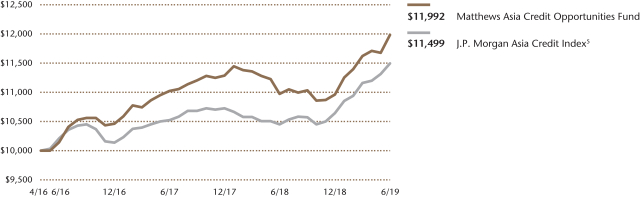
Plotted monthly. The performance data and graph do not reflect the deduction of taxes that a shareholder would pay on dividends, capital gains distributions, or redemption of Fund shares. Values are in US$.
| | 5 | It is not possible to invest directly in an index. Source: Index data from J.P. Morgan and Bloomberg; total return calculations performed by BNY Mellon Investment Servicing (US) Inc. Please see page 88 for index definition. |
| | | | | | | | |
| | | | |
| TOP TEN HOLDINGS | | | | | | | |
| | | Sector | | Currency | | % of Net Assets | |
| Franshion Brilliant, Ltd., 5.750%, 07/17/2067 | | Real Estate | | U.S. Dollar | | | 5.0% | |
| Debt and Asset Trading Corp., 1.000%, 10/10/2025 | | Financials | | U.S. Dollar | | | 4.9% | |
| Indika Energy Capital III Pte, Ltd., 5.875%, 11/09/2024 | | Energy | | U.S. Dollar | | | 4.9% | |
| Shriram Transport Finance Co., Ltd., 5.700%, 02/27/2022 | | Financials | | U.S. Dollar | | | 4.4% | |
| Pakistan Government Bond, 6.875%, 12/05/2027 | | Foreign Government Bonds | | U.S. Dollar | | | 4.4% | |
| HSBC Holdings PLC, 6.375%, 12/29/2049 | | Financials | | U.S. Dollar | | | 4.4% | |
| ABJA Investment Co. Pte, Ltd., 5.450%, 01/24/2028 | | Materials | | U.S. Dollar | | | 4.3% | |
| PB International BV, 7.625%, 01/26/2022 | | Consumer Discretionary | | U.S. Dollar | | | 4.3% | |
| Wanda Properties International Co., Ltd., 7.250%, 01/29/2024 | | Real Estate | | U.S. Dollar | | | 4.2% | |
| Standard Chartered PLC, 6.500%, 12/29/2049 | | Financials | | U.S. Dollar | | | 4.1% | |
| % OF ASSETS IN TOP TEN | | | | | | | 44.9% | |
Matthews Asia Credit Opportunities Fund
Portfolio Manager Commentary (unaudited) (continued)
Notable Portfolio Changes:
With weaker-than-expected economic data released in the U.S. leading to speculation about rate cuts by the Fed, we increased duration in the portfolio to 4.6 years from 3.5 years over the quarter. We achieved this both by rotating into longer duration issues of companies we already owned, such as CIFI Holdings Group and KWG Group Holdings, as well as by adding exposure to longer duration securities of other issuers, including the Indonesian state-owned enterprises INALUM (PT Indonesia Asahan Aluminium Perser) and PLN (PT Perusahaan Listrik Negara), both of which are investment grade-rated, thereby allowing us to add duration without taking on excessive spread duration.
New bonds added to the portfolio included Shriram Transport Finance, an Indian non-bank finance company that issued a USD bond with an attractive spread premium given the recent NBFCs funding crisis, and Pakistan Government Bonds, which are long-duration bonds of a high yield country under an IMF-led turnaround program.
In China, we initiated positions in two companies: China Jinmao (Franshion Brilliant, Ltd.) perpetual bonds, higher yielding bonds of a central SOE-backed property developer, and the technology firm Weibo, via convertible bonds trading close to their lowest possible level, which we see as offering an asymmetric risk profile.
We sold a number of bonds that had reached their price target and had limited upside for the portfolio. These included India’s Bharti Airtel, Krung Thai Bank Public in Thailand, Indonesia’s Tower Bersama (TBG Global), and in China, Chinalco Capital Holdings and China Minmetals. In addition, we sold several convertible bond holdings that were short duration and/or had reached our price target. These included China Mengniu Dairy, CP Foods Holdings, Ctrip.com International and Johnson Electric Holdings.
Outlook:
In our view, Asian high yield bonds continue to offer attractive value for long-term investors. Asian high yield credit spreads are 86 basis points (0.86%) above their historic averages and are about 132 basis points (1.32%) above U.S. high yield spreads at the index level. We think there is room for this relationship to tighten back closer to historical levels. Default rates in Asia have remained low and we believe could stay low in the medium term as interest costs and recession risks remain low. For many of the riskiest borrowers, refinancing has become easier in 2019 as investor risk appetite has returned. We believe this continues to be a key risk to monitor, and we prefer to invest in holdings that have taken steps to refinance upcoming maturities or improve their balance sheets in other ways to be resilient to further turmoil.
We continue to see value in Chinese property, particularly given the magnitude of the sell-off last year. Policymakers are incrementally easing restrictions on developers, pointing to an improving business environment in the second half of the year. We also see value in a number of sectors in Indonesia, including manufacturing and mining. With the momentum among developed and emerging market central banks shifting toward synchronized easing, we expect domestic business environments in Asia to be supportive in an environment of slowing global growth and trade.
To be sure, there continue to be risks on the horizon. If a further slowdown in global growth materializes, we expect investor appetite for emerging markets to diminish. Any re-escalation in trade shocks could also put pressure on Asian fixed income markets. If the Chinese economy deteriorates, corporate defaults will likely rise, and Asian credit could come under pressure. Our base case, however, remains a benign one, with most of the key global macro tail risks fading, with supportive central banks and Chinese economic growth to rebound.
| | | | |
| |
| CURRENCY ALLOCATION (%)6,7 | |
| US Dollar | | | 100.0 | |
| | | | |
| |
| COUNTRY ALLOCATION (%)6,7,8 | |
| China/Hong Kong | | | 31.6 | |
| Indonesia | | | 25.7 | |
| India | | | 8.7 | |
| Vietnam | | | 7.4 | |
| Sri Lanka | | | 4.8 | |
| Pakistan | | | 4.4 | |
| Australia | | | 3.8 | |
| Philippines | | | 3.6 | |
| Japan | | | 3.3 | |
| United States | | | 0.8 | |
| Cash and Other Assets, Less Liabilities | | | 5.9 | |
| | | | |
| |
| SECTOR ALLOCATION (%)6,7 | |
| Real Estate | | | 24.3 | |
| Financials | | | 21.7 | |
| Foreign Government Bonds | | | 11.6 | |
| Materials | | | 8.4 | |
| Communication Services | | | 7.6 | |
| Utilities | | | 7.6 | |
| Energy | | | 4.9 | |
| Consumer Discretionary | | | 4.3 | |
| Industrials | | | 3.6 | |
| Cash and Other Assets, Less Liabilities | | | 5.9 | |
| | | | |
| |
| ASSET TYPE BREAKDOWN (%)6,7 | |
| Non-Convertible Corporate Bonds | | | 74.9 | |
| Government Bonds | | | 16.6 | |
| Convertible Corporate Bonds | | | 2.6 | |
| Cash and Other Assets, Less Liabilities | | | 5.9 | |
| 6 | Source: FactSet Research Systems. Percentage values in data are rounded to the nearest tenth of one percent, so the values may not sum to 100% due to rounding. Percentage values may be derived from different data sources and may not be consistent with other Fund literature. |
| 7 | Cash and other assets may include forward currency exchange contracts and certain derivative instruments that have been marked-to-market. |
| 8 | Not all countries where the Fund may invest are included in the benchmark index. |
| | | | |
| matthewsasia.com | 800.789.ASIA | | | 13 | |
Matthews Asia Credit Opportunities Fund
June 30, 2019
Schedule of Investmentsa(unaudited)
| | |
| NON-CONVERTIBLE CORPORATE BONDS: 74.9% | | FOREIGN GOVERNMENT OBLIGATIONS: 16.6% |
| | | | | | | | |
| | | Face Amount* | | | Value | |
| | |
| CHINA/HONG KONG: 28.9% | | | | | | | | |
Franshion Brilliant, Ltd. 5.750%b, 01/17/22c,d | | | 3,000,000 | | | | $2,851,392 | |
| | |
HSBC Holdings PLC 6.375%b, 03/30/25c | | | 2,400,000 | | | | 2,523,600 | |
| | |
Wanda Properties International Co., Ltd.
7.250%, 01/29/24d | | | 2,400,000 | | | | 2,391,000 | |
| | |
Standard Chartered PLC 6.500%b, 04/02/20c,d | | | 2,350,000 | | | | 2,381,842 | |
| | |
CIFI Holdings Group Co., Ltd.
6.550%, 03/28/24d | | | 2,300,000 | | | | 2,248,907 | |
| | |
Logan Property Holdings Co., Ltd.
5.250%, 02/23/23d | | | 1,500,000 | | | | 1,431,177 | |
| | |
KWG Group Holdings, Ltd. 7.875%, 09/01/23d | | | 1,300,000 | | | | 1,307,458 | |
| | |
KWG Group Holdings, Ltd. 5.875%, 11/10/24d | | | 1,100,000 | | | | 999,049 | |
| | |
CITIC Telecom International Finance, Ltd.
6.100%, 03/05/25d | | | 462,000 | | | | 479,650 | |
| | | | | | | | |
Total China/Hong Kong | | | | | | | 16,614,075 | |
| | | | | | | | |
| | | | | | | | |
| | | |
| INDONESIA: 25.7% | | | | | | | | |
Indika Energy Capital III Pte, Ltd.
5.875%, 11/09/24d | | | 2,900,000 | | | | 2,831,764 | |
| | |
PB International BV 7.625%, 01/26/22d | | | 2,400,000 | | | | 2,485,107 | |
| | |
PT Indonesia Asahan Aluminium Perser
6.757%, 11/15/48d | | | 1,900,000 | | | | 2,334,443 | |
| | |
PT Perusahaan Listrik Negara
5.250%, 05/15/47d | | | 2,100,000 | | | | 2,215,988 | |
| | |
Listrindo Capital BV 4.950%, 09/14/26d | | | 2,200,000 | | | | 2,170,300 | |
| | |
Theta Capital Pte, Ltd. 6.750%, 10/31/26d | | | 1,500,000 | | | | 1,373,815 | |
| | |
Modernland Overseas Pte, Ltd.
6.950%, 04/13/24d | | | 1,400,000 | | | | 1,366,584 | |
| | | | | | | | |
Total Indonesia | | | | | | | 14,778,001 | |
| | | | | | | | |
| | | | | | | | |
| | | |
| INDIA: 8.7% | | | | | | | | |
Shriram Transport Finance Co., Ltd.
5.700%, 02/27/22d | | | 2,500,000 | | | | 2,532,404 | |
| | |
ABJA Investment Co. Pte, Ltd.
5.450%, 01/24/28d | | | 2,600,000 | | | | 2,488,656 | |
| | | | | | | | |
Total India | | | | | | | 5,021,060 | |
| | | | | | | | |
| | | | | | | | |
| | | |
| AUSTRALIA: 3.9% | | | | | | | | |
Australia & New Zealand Banking Group, Ltd. 6.750%b, 06/15/26c,d | | | 2,000,000 | | | | 2,207,500 | |
| | | | | | | | |
Total Australia | | | | | | | 2,207,500 | |
| | | | | | | | |
| | | | | | | | |
| | | |
| PHILIPPINES: 3.6% | | | | | | | | |
Royal Capital BV 4.875%b, 05/05/24c,d | | | 2,100,000 | | | | 2,081,625 | |
| | | | | | | | |
Total Philippines | | | | | | | 2,081,625 | |
| | | | | | | | |
| | | | | | | | |
| | | |
| JAPAN: 3.3% | | | | | | | | |
SoftBank Group Corp. 6.000%b, 07/19/23c,d | | | 2,000,000 | | | | 1,910,000 | |
| | | | | | | | |
Total Japan | | | | | | | 1,910,000 | |
| | | | | | | | |
| | | | | | | | |
| | | |
| UNITED STATES: 0.8% | | | | | | | | |
Sprint Communications, Inc.
6.000%, 11/15/22 | | | 420,000 | | | | 437,850 | |
| | | | | | | | |
Total United States | | | | | | | 437,850 | |
| | | | | | | | |
| | | | | | | | |
| | |
| TOTALNON-CONVERTIBLE CORPORATE BONDS | | | | 43,050,111 | |
| | | | | | | | |
(Cost $42,252,120) | | | | | | | | |
| | | | | | | | |
| | | | | | | | |
| | | Face Amount* | | | Value | |
| | |
| VIETNAM: 7.4% | | | | | | | | |
Debt and Asset Trading Corp.
1.000%, 10/10/25d | | | 3,800,000 | | | | $2,840,500 | |
| | |
Socialist Republic of Vietnam
5.500%, 03/12/28 | | | 1,410,000 | | | | 1,384,396 | |
| | | | | | | | |
Total Vietnam | | | | | | | 4,224,896 | |
| | | | | | | | |
| | | | | | | | |
| | | |
| SRI LANKA: 4.8% | | | | | | | | |
Sri Lanka Government Bond
7.850%, 03/14/29d | | | 1,000,000 | | | | 1,031,082 | |
| | |
Sri Lanka Government Bond
6.125%, 06/03/25d | | | 900,000 | | | | 877,325 | |
| | |
Sri Lanka Government Bond
6.850%, 11/03/25d | | | 850,000 | | | | 852,351 | |
| | | | | | | | |
Total Sri Lanka | | | | | | | 2,760,758 | |
| | | | | | | | |
| | | | | | | | |
| | | |
| PAKISTAN: 4.4% | | | | | | | | |
Pakistan Government Bond
6.875%, 12/05/27d | | | 2,500,000 | | | | 2,525,500 | |
| | | | | | | | |
Total Pakistan | | | | | | | 2,525,500 | |
| | | | | | | | |
| | | | | | | | |
| | |
| TOTAL FOREIGN GOVERNMENT OBLIGATIONS | | | | 9,511,154 | |
| | | | | | | | |
(Cost $9,417,338) | | | | | | | | |
| | | | | | | | |
| |
CONVERTIBLE CORPORATE BONDS: 2.6% | | | | | |
| | | |
| CHINA/HONG KONG: 2.6% | | | | | | | | |
Weibo Corp., Cnv. 1.250%, 11/15/22 | | | 1,600,000 | | | | 1,510,444 | |
| | | | | | | | |
Total China/Hong Kong | | | | | | | 1,510,444 | |
| | | | | | | | |
| | | | | | | | |
| | |
| TOTAL CONVERTIBLE CORPORATE BONDS | | | | 1,510,444 | |
| | | | | | | | |
(Cost $1,411,881) | | | | | | | | |
| | | | | | | | |
| | | |
| TOTAL INVESTMENTS: 94.1% | | | | | | | 54,071,709 | |
(Cost $53,081,339) | | | | | | | | |
| | | | | | | | |
| | |
CASH AND OTHER ASSETS,
LESS LIABILITIES: 5.9% | | | | | | | 3,373,363 | |
| | | | | | | | |
| | |
NET ASSETS: 100.0% | | | | | | | $57,445,072 | |
| | | | | | | | |
| a | Certain securities were fair valued under the valuation policies approved by the Board of Trustees (Note2-A). |
| b | Security is afix-to-float security, which carries a fixed coupon until a certain date, upon which it switches to a floating rate. Reference rate and spread are provided if the rate is currently floating. |
| c | Perpetual security with no stated maturity date. First call date is disclosed. |
| d | The securities may be resold to qualified foreign investors and foreign institutional buyers under Regulation S of the Securities Act of 1933. |
| * | All Values in USD unless otherwise specified |
See accompanying notes to financial statements.

| | | | |
| PORTFOLIO MANAGERS |
| |
| Robert J. Horrocks, PhD | | Kenneth Lowe, CFA |
Lead Manager | | Lead Manager |
| |
| John Paul Lech | | |
Co-Manager | | | | |
| | | | |
|
| FUND FACTS |
| | |
| | | Investor | | Institutional |
Ticker | | MACSX | | MICSX |
CUSIP | | 577130206 | | 577130842 |
Inception | | 9/12/94 | | 10/29/10 |
NAV | | $15.54 | | $15.51 |
Initial Investment | | $2,500 | | $100,000 |
Gross Expense Ratio1 | | 1.08% | | 0.93% |
Portfolio Statistics | | |
Total # of Positions | | 62 |
Net Assets | | $1.4 billion |
Weighted Average Market Cap | | $59.3 billion |
Portfolio Turnover2 | | 32.24% |
Benchmark | | |
MSCI AC Asia ex Japan Index |
OBJECTIVE
Long-term capital appreciation. The Fund also seeks to provide some current income.
STRATEGY
Under normal market conditions, the Fund seeks to achieve its investment objective by investing at least 80% of its net assets, which include borrowings for investment purposes, in dividend-paying common stock, preferred stock and other equity securities, and convertible securities as well as fixed-income securities, of any duration or quality, including high yield securities, of companies located in Asia, which consists of all countries and markets in Asia, including developed, emerging and frontier countries and markets in the Asian region.
Matthews Asian Growth and Income Fund
Portfolio Manager Commentary (unaudited)
For the first half of 2019, the Matthews Asian Growth and Income Fund returned 12.92% (Investor Class), and 13.02% (Institutional Class), while its benchmark, the MSCI All Country Asia ex Japan Index, returned 10.83%. For the quarter ending June 30, 2019, the Fund returned 2.07% (Investor Class and Institutional Class), while its benchmark returned –0.56%.
Market Environment:
The first half of the year delivered fairly strong performance for Asian equities, with the majority of these gains coming in the first quarter following poor performance in 2018. Concerns last year included a tightening of U.S. dollar liquidity, weakening economic growth and trade tensions between the U.S. and China, among others. This narrative changed somewhat during the first half, primarily regarding monetary policy as the U.S. Federal Reserve and other central banks across the globe moved from a gradual tightening of policy back toward a more dovish stance. This was helpful for risk assets and reduced any lingering funding pressures that may have existed. Trade tensions, on the other hand, were a moving target and a resolution appeared more likely at the start of 2019 than in recent months.
These geopolitical tensions drove an increase in volatility for Asian equities during the second quarter. That drove the Chinese market to being the region’s weakest performer during the quarter, while domestic demand-oriented countries in Southeast Asia delivered solid gains.
Performance Contributors and Detractors:
Despite our more conservative investment style and an equity market that delivered double-digit returns, the portfolio was ahead of its benchmark for the first half.
The largest driver of this positive performance for both the half and the quarter came from the portfolio’s holdings in China and Hong Kong. This included leaders in their fields such as pan-Asian life insurer AIA Group, which continues to be a significant holding for the Fund. The company gained from solid operating performance alongside excitement over greater access to mainland China as the government further opens up the financial sector. The portfolio’s increasing weight in China has largely come from our inclusion of more A-shares, and these have produced strong performance for the Fund. Over the quarter, Shanghai International Airport was the strongest contributor to returns as the company delivered impressive revenue growth on the back of rising passenger traffic and growing duty-free revenues—trends that we expect to continue.
Our holdings here are largely domestic demand-driven and over the half Chinese consumer companies generally helped our performance in the first half. Leading dairy company Yili Industrial rose on healthy first-quarter revenue growth as the company gained market share and expanded further into product extensions. Household appliance companies Midea Group and Zhejiang Supor were similarly robust as their respective brand power was highlighted in superior results to peers despite a slightly more challenging macroeconomic backdrop.
Elsewhere during the second quarter, a couple of the portfolio’s Singaporean holdings gained, with shares of Singapore Telecommunications rising as the company recovered from what has been a relatively difficult competitive environment in recent years. Shares of Singapore Technologies Engineering, the national defense contractor, also moved up on improving order flow across its aerospace, electronics and marine divisions.
(continued)
| 1 | Prospectus expense ratios. |
| 2 | The lesser of fiscal year 2018 long-term purchase costs or sales proceeds divided by the average monthly market value of long-term securities. |
| | | | |
| matthewsasia.com | 800.789.ASIA | | | 15 | |
| | | | | | | | | | | | | | | | | | | | | | | | | | | | | | | | |
| | | | | | | | | |
| PERFORMANCE AS OF JUNE 30, 2019 | | | | | | | | | | | | | | | | | | | | | | | | |
| | | | | | | | | Average Annual Total Returns | | | | |
| | | 3 Months | | | YTD | | | 1 Year | | | 3 Years | | | 5 Years | | | 10 Years | | | Since
Inception | | | Inception
Date | |
| Investor Class (MACSX) | | | 2.07% | | | | 12.92% | | | | 7.20% | | | | 5.07% | | | | 2.34% | | | | 7.08% | | | | 8.99% | | | | 9/12/94 | |
| Institutional Class (MICSX) | | | 2.07% | | | | 13.02% | | | | 7.34% | | | | 5.21% | | | | 2.49% | | | | n.a. | | | | 4.41% | | | | 10/29/10 | |
| MSCI AC Asia ex Japan Index3 | | | -0.56% | | | | 10.83% | | | | -0.18% | | | | 11.81% | | | | 5.14% | | | | 8.17% | | | | 4.50% | 4 | | | | |
Performance assumes reinvestment of all dividends and/or distributions before taxes. All performance quoted represents past performance and is no guarantee of future results. Investment return and principal value will fluctuate with market conditions so that when redeemed, shares may be worth more or less than their original cost. Current performance may be lower or higher than the return figures quoted. Returns would have been lower if certain of the Fund’s fees and expenses had not been waived. For the Fund’s most recent month-end performance, visit matthewsasia.com.
| | | | | | | | | | | | | | | | | | | | | | | | | | | | |
| | | | | | | | |
| INCOME DISTRIBUTION HISTORY | | | | | | | | | | | | | | | | | | | | | |
| | | 2019 | | | | | | 2018 | |
| | | June | | | December | | | Total | | | | | | June | | | December | | | Total | |
| Investor (MACSX) | | $ | 0.17 | | | | n.a. | | | $ | 0.17 | | | | | | | $ | 0.22 | | | $ | 0.10 | | | $ | 0.32 | |
| Inst’l (MICSX) | | $ | 0.18 | | | | n.a. | | | $ | 0.18 | | | | | | | $ | 0.24 | | | $ | 0.11 | | | $ | 0.35 | |
Note: This table does not include capital gains distributions. Totals may differ by $0.02 due to rounding. For income distribution history, visit matthewsasia.com.
| | | | |
| | | |
30-DAY YIELD: 1.60% (Investor Class) 1.74% (Institutional Class) The 30-Day Yield represents net investment income earned by the Fund over the 30-day period ended 6/30/19, expressed as an annual percentage rate based on the Fund’s share price at the end of the 30-day period. The 30-Day Yield should be regarded as an estimate of the Fund’s rate of investment income, and it may not equal the Fund’s actual income distribution rate. Source: BNY Mellon Investment Servicing (US) Inc. | | | | DIVIDEND YIELD: 3.21% The dividend yield (trailing) for the portfolio is the weighted average sum of the dividends paid by each equity security held by the Fund over the 12 months ended 6/30/19 divided by the current price of each equity as of 6/30/19. The annualized dividend yield for the Fund is for the equity-only portion of the portfolio. Please note that this is based on gross equity portfolio holdings and does not reflect the actual yield an investor in the Fund would receive. Past yields are no guarantee of future yields. Source: FactSet Research Systems, Bloomberg, MICM |
GROWTH OF A HYPOTHETICAL $10,000 INVESTMENT SINCE INCEPTION—INVESTOR CLASS
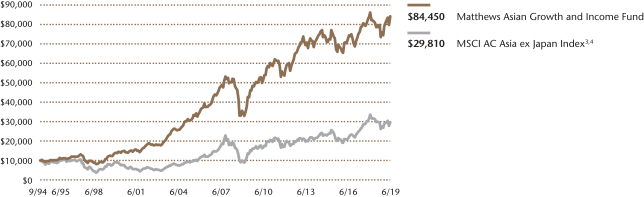
Plotted monthly. The performance data and graph do not reflect the deduction of taxes that a shareholder would pay on dividends, capital gains distributions or redemption of Fund shares. Values are in US$.
| | 3 | It is not possible to invest directly in an index. Source: Index data from Morgan Stanley Capital International and Bloomberg; total return calculations performed by BNY Mellon Investment Servicing (US) Inc. Please see page 88 for index definition. |
| | 4 | Calculated from 8/31/94. |
| | | | | | | | |
| | | | |
| TOP TEN HOLDINGS5 | | | | | | | |
| | | Sector | | Country | | % of Net Assets | |
| AIA Group, Ltd. | | Financials | | China/Hong Kong | | | 3.8% | |
| Taiwan Semiconductor Manufacturing Co., Ltd. | | Information Technology | | Taiwan | | | 3.4% | |
| Tencent Holdings, Ltd. | | Communication Services | | China/Hong Kong | | | 2.8% | |
| Samsung Electronics Co., Ltd. | | Information Technology | | South Korea | | | 2.5% | |
| Housing Development Finance Corp., Ltd. | | Financials | | India | | | 2.2% | |
| Singapore Telecommunications, Ltd. | | Communication Services | | Singapore | | | 2.1% | |
| United Overseas Bank, Ltd. | | Financials | | Singapore | | | 2.1% | |
| Macquarie Korea Infrastructure Fund | | Financials | | South Korea | | | 2.1% | |
| LG Household & Health Care, Ltd., Pfd. | | Consumer Staples | | South Korea | | | 2.0% | |
| Broadcom, Inc. | | Information Technology | | United States | | | 1.9% | |
| % OF ASSETS IN TOP TEN | | | | | | | 24.9% | |
| | 5 | Holdings may combine more than one security from same issuer and related depositary receipts. |
Matthews Asian Growth and Income Fund
Portfolio Manager Commentary (unaudited) (continued)
There were few detractors to performance during the half, but the largest of these was Bank of the Philippine Islands. Although we believe it to be a well-managed institution, recent results were disappointing due to rising costs. Hong Kong-based Pacific Textiles also fell as a major customer had weaker-than-expected orders. Over the quarter, the largest detractor to performance was South Korean water purification company Woongjin Coway. Concerns arose that the company may be forced to pay a royalty to its parent and may have overpaid for some assets.
Notable Portfolio Changes:
We initiated five new positions over the quarter. This included two new convertible bond holdings in Chinese internet company Weibo and Malaysian glove maker Top Glove. We believe that the former is a strong credit that was underpriced, offering us an attractive yield of around 5% on entry despite the company’s robust balance sheet and healthy cash generation. Top Glove offered a fairly attractive 4% yield at entry and was at only a 25% conversion premium. Our view is that the company still has attractive growth through capacity expansion as well as more technologically advanced production lines.
Within equities, we added three new holdings. The first of these was Fortune REIT, a real estate investment trust (REIT) company in Hong Kong that operates 16 neighborhood-oriented malls in the city. We think that the company has a conservative balance sheet, visible cash flows and growth opportunities through asset enhancement initiatives and rental reversions. This should provide the opportunity for an attractive blend of growth and income. In China, we increased our domestic demand oriented exposure through adding Yum China. We believe that this leading quick-service restaurant chain has an excellent management team that has the potential to grow sustainably through expanding its KFC store network and through improving Pizza Hut’s delivery capability. The stock was also reasonably valued at around 21x P/E upon our entry. Finally, we added consumer company Ace Hardware Indonesia. Similarly, this is a leading franchise whose track record is impressive. Although not cheap at about 24x P/E, it does provide a dividend yield of around 2% and we expect that management should be able to grow for many years through store expansion and category extensions.
These new positions were funded through exiting the convertible bonds of Huazhu Group, Bangkok Dusit Medical Services, Johnson Electric and Lotte Shopping as well as equity shares of KT&G.
Outlook:
The interplay of weakening growth, reasonably high debt levels, high levels of geopolitical tension but loosening monetary policy globally is likely to continue for the foreseeable future. Although there may be a trade deal between the U.S. and China, differing ideologies around politics and economics, in particular, are likely to continue to generate market volatility. Trade imbalances and protectionist policies remain a risk for markets and these have already played a role in creating what is a reasonably slow environment for economic growth globally.
For Asian companies in particular, we have witnessed a decline in earnings expectations, with a consensus that now anticipates earnings-per-share (EPS) growth to be in the low single-digit range for 2019. Although disappointing, this is at least still positive in the short term and is expected to bounce back next year. Valuations, however, are now less supportive than at the end of 2018.
From the portfolio’s standpoint, we believe this to be a fairly attractive environment. We believe our focus on quality investing with a long-term time horizon leaves us less susceptible to higher levels of volatility. Our view is that environments such as this, if accompanied by patience and discipline, can create some attractive opportunities to deploy capital. Further, the portfolio is already well-placed with an array of high-caliber companies at appealing valuations that we believe can deliver the opportunity for an attractive combination of growth and income.
| | | | |
| |
| COUNTRY ALLOCATION (%)6,7 | |
| China/Hong Kong | | | 39.8 | |
| Singapore | | | 10.8 | |
| South Korea | | | 10.7 | |
| Taiwan | | | 6.6 | |
| Australia | | | 5.3 | |
| United States | | | 3.4 | |
| India | | | 3.2 | |
| France | | | 3.2 | |
| Thailand | | | 2.9 | |
| Indonesia | | | 2.9 | |
| Japan | | | 2.4 | |
| Malaysia | | | 2.3 | |
| United Kingdom | | | 1.9 | |
| Philippines | | | 1.5 | |
| Vietnam | | | 1.2 | |
| Cash and Other Assets, Less Liabilities | | | 1.9 | |
| | | | |
| |
| SECTOR ALLOCATION (%)7 | |
| Financials | | | 21.0 | |
| Consumer Discretionary | | | 15.5 | |
| Information Technology | | | 12.6 | |
| Consumer Staples | | | 11.8 | |
| Industrials | | | 11.6 | |
| Communication Services | | | 11.5 | |
| Real Estate | | | 7.3 | |
| Materials | | | 3.0 | |
| Health Care | | | 2.5 | |
| Utilities | | | 1.4 | |
| Cash and Other Assets, Less Liabilities | | | 1.9 | |
| | | | |
| |
| MARKET CAP EXPOSURE (%)7 | |
| Mega Cap (over $25B) | | | 51.6 | |
| Large Cap ($10B–$25B) | | | 15.7 | |
| Mid Cap ($3B–10B) | | | 21.7 | |
| Small Cap (under $3B) | | | 9.2 | |
| Cash and Other Assets, Less Liabilities | | | 1.9 | |
| | | | |
| |
| ASSET TYPE BREAKDOWN (%)7,8 | |
| Common Equities and ADRs | | | 84.3 | |
| Convertible Corporate Bonds | | | 11.7 | |
| Preferred Equities | | | 2.0 | |
| Cash and Other Assets, Less Liabilities | | | 1.9 | |
| 6 | Not all countries where the Fund may invest are included in the benchmark index. |
| 7 | Source: FactSet Research Systems. Percentage values in data are rounded to the nearest tenth of one percent, so the values may not sum to 100% due to rounding. Percentage values may be derived from different data sources and may not be consistent with other Fund literature. |
| 8 | Bonds are not included in the MSCI All Country Asia ex Japan Index. |
| | | | |
| matthewsasia.com | 800.789.ASIA | | | 17 | |
Matthews Asian Growth and Income Fund
June 30, 2019
Schedule of Investmentsa(unaudited)
COMMON EQUITIES: 84.4%
| | | | | | | | |
| | | Shares | | | Value | |
| | |
| CHINA/HONG KONG: 34.0% | | | | | | | | |
AIA Group, Ltd. | | | 5,037,600 | | | | $54,400,553 | |
| | |
Tencent Holdings, Ltd. | | | 891,600 | | | | 40,335,466 | |
| | |
Techtronic Industries Co., Ltd. | | | 3,370,500 | | | | 25,820,834 | |
| | |
Shanghai International Airport Co., Ltd. A Shares | | | 2,017,375 | | | | 24,638,342 | |
| | |
CK Hutchison Holdings, Ltd. | | | 2,454,172 | | | | 24,207,338 | |
| | |
Inner Mongolia Yili Industrial Group Co., Ltd. A Shares | | | 4,816,875 | | | | 23,471,788 | |
| | |
Jiangsu Expressway Co., Ltd. H Shares | | | 15,674,000 | | | | 22,307,310 | |
| | |
Jardine Matheson Holdings, Ltd. | | | 353,100 | | | | 22,271,083 | |
| | |
HKT Trust & HKT, Ltd. | | | 13,920,000 | | | | 22,096,087 | |
| | |
Midea Group Co., Ltd. A Shares | | | 2,825,801 | | | | 21,409,157 | |
| | |
NetEase, Inc. ADR | | | 82,100 | | | | 20,998,717 | |
| | |
Jiangsu Yanghe Brewery Joint-Stock Co., Ltd. A Shares | | | 1,181,683 | | | | 20,965,300 | |
| | |
HSBC Holdings PLC ADR | | | 491,833 | | | | 20,529,109 | |
| | |
Zhejiang Supor Co., Ltd. A Shares | | | 1,853,470 | | | | 20,482,679 | |
| | |
CK Asset Holdings, Ltd. | | | 2,590,172 | | | | 20,291,611 | |
| | |
CLP Holdings, Ltd. | | | 1,801,200 | | | | 19,848,862 | |
| | |
Pacific Textiles Holdings, Ltd. | | | 24,255,000 | | | | 19,203,656 | |
| | |
Fortune, REIT | | | 11,459,000 | | | | 15,753,187 | |
| | |
Yum China Holdings, Inc. | | | 337,200 | | | | 15,578,640 | |
| | |
Minth Group, Ltd. | | | 5,740,000 | | | | 15,480,526 | |
| | |
China Mobile, Ltd. ADR | | | 284,200 | | | | 12,871,418 | |
| | | | | | | | |
Total China/Hong Kong | | | | | | | 482,961,663 | |
| | | | | | | | |
| | | | | | | | |
| | | |
| SINGAPORE: 9.1% | | | | | | | | |
Singapore Telecommunications, Ltd. | | | 11,375,800 | | | | 29,444,169 | |
| | |
United Overseas Bank, Ltd. | | | 1,518,600 | | | | 29,357,788 | |
| | |
Ascendas, REIT | | | 10,652,400 | | | | 24,580,118 | |
| | |
Singapore Technologies Engineering, Ltd. | | | 7,695,325 | | | | 23,569,108 | |
| | |
Venture Corp., Ltd. | | | 1,836,900 | | | | 22,178,154 | |
| | | | | | | | |
Total Singapore | | | | | | | 129,129,337 | |
| | | | | | | | |
| | | | | | | | |
| | | |
| SOUTH KOREA: 7.2% | | | | | | | | |
Samsung Electronics Co., Ltd. | | | 865,909 | | | | 35,260,110 | |
| | |
Macquarie Korea Infrastructure Fund | | | 2,862,946 | | | | 29,242,104 | |
| | |
Orange Life Insurance, Ltd.b,c | | | 725,855 | | | | 19,900,255 | |
| | |
Woongjin Coway Co., Ltd. | | | 269,756 | | | | 18,082,635 | |
| | | | | | | | |
Total South Korea | | | | | | | 102,485,104 | |
| | | | | | | | |
| | | | | | | | |
| | | |
| TAIWAN: 6.6% | | | | | | | | |
Taiwan Semiconductor Manufacturing Co., Ltd. | | | 6,372,187 | | | | 48,736,933 | |
| | |
Advantech Co., Ltd. | | | 2,806,000 | | | | 23,896,147 | |
| | |
Taiwan Secom Co., Ltd. | | | 7,519,000 | | | | 21,448,620 | |
| | | | | | | | |
Total Taiwan | | | | | | | 94,081,700 | |
| | | | | | | | |
| | | | | | | | |
| | | |
| AUSTRALIA: 5.3% | | | | | | | | |
Macquarie Group, Ltd. | | | 254,688 | | | | 22,465,035 | |
| | |
Orora, Ltd. | | | 9,511,447 | | | | 21,665,573 | |
| | |
CSL, Ltd. | | | 111,781 | | | | 16,926,314 | |
| | |
Domino’s Pizza Enterprises, Ltd. | | | 541,502 | | | | 14,310,740 | |
| | | | | | | | |
Total Australia | | | | | | | 75,367,662 | |
| | | | | | | | |
| | | | | | | | |
| | | | | | | | |
| | | Shares | | | Value | |
| | |
| UNITED STATES: 3.4% | | | | | | | | |
Broadcom, Inc. | | | 93,200 | | | | $26,828,552 | |
| | |
Cognizant Technology Solutions Corp. Class A | | | 349,400 | | | | 22,148,466 | |
| | | | | | | | |
Total United States | | | | | | | 48,977,018 | |
| | | | | | | | |
| | | | | | | | |
| | | |
| INDIA: 3.2% | | | | | | | | |
Housing Development Finance Corp., Ltd. | | | 979,513 | | | | 31,102,622 | |
| | |
Bharti Infratel, Ltd. | | | 3,801,128 | | | | 14,706,569 | |
| | | | | | | | |
Total India | | | | | | | 45,809,191 | |
| | | | | | | | |
| | | | | | | | |
| | | |
| FRANCE: 3.2% | | | | | | | | |
LVMH Moet Hennessy Louis Vuitton SE | | | 56,340 | | | | 23,951,576 | |
| | |
Pernod Ricard SA | | | 113,136 | | | | 20,836,990 | |
| | | | | | | | |
Total France | | | | | | | 44,788,566 | |
| | | | | | | | |
| | | | | | | | |
| | | |
| INDONESIA: 2.9% | | | | | | | | |
PT Bank Rakyat Indonesia Persero | | | 73,603,900 | | | | 22,723,371 | |
| | |
PT Ace Hardware Indonesia | | | 140,794,300 | | | | 18,040,037 | |
| | | | | | | | |
Total Indonesia | | | | | | | 40,763,408 | |
| | | | | | | | |
| | | | | | | | |
| | | |
| JAPAN: 2.4% | | | | | | | | |
Kao Corp. | | | 243,000 | | | | 18,541,962 | |
| | |
KDDI Corp. | | | 618,000 | | | | 15,726,053 | |
| | | | | | | | |
Total Japan | | | | | | | 34,268,015 | |
| | | | | | | | |
| | | | | | | | |
| | | |
| UNITED KINGDOM: 1.9% | | | | | | | | |
Prudential PLC | | | 1,227,872 | | | | 26,805,739 | |
| | | | | | | | |
Total United Kingdom | | | | | | | 26,805,739 | |
| | | | | | | | |
| | | | | | | | |
| | | |
| PHILIPPINES: 1.5% | | | | | | | | |
Bank of the Philippine Islands | | | 13,755,224 | | | | 21,082,037 | |
| | | | | | | | |
Total Philippines | | | | | | | 21,082,037 | |
| | | | | | | | |
| | | | | | | | |
| | | |
| THAILAND: 1.4% | | | | | | | | |
Kasikornbank Public Co., Ltd. | | | 3,282,300 | | | | 20,131,939 | |
| | | | | | | | |
Total Thailand | | | | | | | 20,131,939 | |
| | | | | | | | |
| | | | | | | | |
| | | |
| VIETNAM: 1.2% | | | | | | | | |
Vietnam Dairy Products JSC | | | 3,100,633 | | | | 16,382,838 | |
| | | | | | | | |
Total Vietnam | | | | | | | 16,382,838 | |
| | | | | | | | |
| | | | | | | | |
| | | |
| MALAYSIA: 1.1% | | | | | | | | |
Genting Malaysia BHD | | | 19,518,500 | | | | 15,315,738 | |
| | | | | | | | |
Total Malaysia | | | | | | | 15,315,738 | |
| | | | | | | | |
| | | | | | | | |
| | |
| TOTAL COMMON EQUITIES | | | 1,198,349,955 | |
| | | | | | | | |
(Cost $1,063,370,675) | | | | | | | | |
| | | | | | | | |
Matthews Asian Growth and Income Fund
June 30, 2019
Schedule of Investmentsa(unaudited) (continued)
| | |
| CONVERTIBLE CORPORATE BONDS: 11.7% | | PREFERRED EQUITIES: 2.0% |
| | | | | | | | |
| | | Face Amount* | | | Value | |
| | |
| CHINA/HONG KONG: 5.8% | | | | | | | | |
Zhongsheng Group Holdings, Ltd., Cnv. | | | | | |
0.000%, 05/23/23c | | | HKD 149,000,000 | | | | $19,424,271 | |
| | |
Harvest International Co., Cnv.
0.000%, 11/21/22c | | | HKD 150,000,000 | | | | 19,238,334 | |
|
China Overseas Finance Investment Cayman V, Ltd., Cnv. | |
0.000%, 01/05/23c | | | 17,000,000 | | | | 18,736,808 | |
|
China Mengniu Dairy Co., Ltd., Series 2319, Cnv. | |
0.000%, 06/05/22c | | | 17,000,000 | | | | 16,857,215 | |
| | |
Weibo Corp., Cnv. 1.250%, 11/15/22 | | | 8,083,000 | | | | 7,630,573 | |
| | | | | | | | |
Total China/Hong Kong | | | | | | | 81,887,201 | |
| | | | | | | | |
| | | | | | | | |
| | | |
| SINGAPORE: 1.7% | | | | | | | | |
| | |
CapitaLand, Ltd., Cnv.
1.950%, 10/17/23c | | | SGD 34,000,000 | | | | 24,724,983 | |
| | | | | | | | |
Total Singapore | | | | | | | 24,724,983 | |
| | | | | | | | |
| | | | | | | | |
| | | |
| THAILAND: 1.5% | | | | | | | | |
| | |
CP Foods Holdings, Ltd., Cnv.
0.500%, 09/22/21c | | | 17,200,000 | | | | 21,358,210 | |
| | | | | | | | |
Total Thailand | | | | | | | 21,358,210 | |
| | | | | | | | |
| | | | | | | | |
| | | |
| SOUTH KOREA: 1.4% | | | | | | | | |
| | |
LG Chem, Ltd., Cnv.
0.000%, 04/16/21c | | | 20,600,000 | | | | 20,681,863 | |
| | | | | | | | |
Total South Korea | | | | | | | 20,681,863 | |
| | | | | | | | |
| | | | | | | | |
| | | |
| MALAYSIA: 1.3% | | | | | | | | |
| | |
Top Glove Labuan, Ltd., Cnv.
2.000%, 03/01/24c | | | 18,076,000 | | | | 17,895,240 | |
| | | | | | | | |
Total Malaysia | | | | | | | 17,895,240 | |
| | | | | | | | |
| | | | | | | | |
| | |
| TOTAL CONVERTIBLE CORPORATE BONDS | | | | 166,547,497 | |
| | | | | | | | |
(Cost $165,180,443) | | | | | | | | |
| | | | | | | | |
| | | | | | | | |
| | | Shares | | | Value | |
| | |
| SOUTH KOREA: 2.0% | | | | | | | | |
LG Household & Health Care, Ltd., Pfd. | | | 41,042 | | | | $28,664,656 | |
| | | | | | | | |
Total South Korea | | | | | | | 28,664,656 | |
| | | | | | | | |
| | | | | | | | |
| | |
| TOTAL PREFERRED EQUITIES | | | | 28,664,656 | |
| | | | | | | | |
(Cost $11,577,044) | | | | | | | | |
| | | | | | | | |
| | |
| TOTAL INVESTMENTS: 98.1% | | | | 1,393,562,108 | |
(Cost $1,240,128,162) | | | | | | | | |
| | | | | | | | |
| |
CASH AND OTHER ASSETS,
LESS LIABILITIES: 1.9% | | | | 26,839,079 | |
| | | | | | | | |
| | |
NET ASSETS: 100.0% | | | | | | | $1,420,401,187 | |
| | | | | | | | |
| a | Certain securities were fair valued under the valuation policies approved by the Board of Trustees (Note2-A). |
| b | Security exempt from registration under Rule 144A of the Securities Act of 1933, as amended. The security may be resold in transactions exempt from registration normally to qualified institutional buyers. The security has been determined to be liquid in accordance with procedures adopted by the Funds’ Board of Trustees. At June 30, 2019, the aggregate value is $19,900,255, which is 1.40% of net assets. |
| c | The securities may be resold to qualified foreign investors and foreign institutional buyers under Regulation S of the Securities Act of 1933. |
| * | All Values in USD unless otherwise specified |
| ADR | American Depositary Receipt |
| REIT | Real Estate Investment Trust |
See accompanying notes to financial statements.
| | | | |
| matthewsasia.com | 800.789.ASIA | | | 19 | |
| | | | |
| PORTFOLIO MANAGERS |
| |
| Yu Zhang, CFA | | |
Lead Manager | | |
| |
| Robert Horrocks, PhD | | Vivek Tanneeru |
Co-Manager | | | | Co-Manager |
| |
| Sherwood Zhang, CFA | | |
Co-Manager | | |
|
| FUND FACTS |
| | |
| | | Investor | | Institutional |
Ticker | | MAPIX | | MIPIX |
CUSIP | | 577125107 | | 577130750 |
Inception | | 10/31/06 | | 10/29/10 |
NAV | | $16.83 | | $16.82 |
Initial Investment | | $2,500 | | $100,000 |
Gross Expense Ratio1 | | 1.02% | | 0.91% |
After Fee Waiver and Reimbursement2 | | 1.01% | | 0.90% |
Portfolio Statistics |
Total # of Positions | | 68 |
Net Assets | | $6.1 billion |
Weighted Average Market Cap | | $41.1 billion |
Portfolio Turnover3 | | 39.75% |
Benchmark | | | | |
MSCI AC Asia Pacific Index |
OBJECTIVE
Total return with an emphasis on providing current income.
STRATEGY
Under normal market conditions, the Fund seeks to achieve its investment objective by investing at least 80% of its net assets, which include borrowings for investment purposes, in dividend-paying equity securities of companies located in Asia. Asia consists of all countries and markets in Asia, and includes developed, emerging and frontier countries and markets in the Asian region. The Fund may also invest in convertible debt and equity securities of companies located in Asia.
Matthews Asia Dividend Fund
Portfolio Manager Commentary (unaudited)
For the first half of 2019, the Matthews Asia Dividend Fund returned 5.82% (Investor Class) and 5.88% (Institutional Class), while its benchmark, the MSCI All Country Asia Pacific Index, returned 10.71% over the same period. For the quarter ending June 30, the Fund returned –1.16% (Investor Class) and –1.19% (Institutional Class), while the benchmark returned 0.90%.
Market Environment:
After a strong rally in the first quarter of 2019, Asian equities were unable to sustain the positive momentum during the second quarter. A sudden collapse in U.S.–China trade negotiations weighed heavily on the market. Together with the renewed concerns over the strength of the global economy, market volatility spiked. It wasn’t until June when central banks globally stepped in to signal a readiness to support growth via monetary easing that Asia’s markets began to stabilize again.
Performance Contributors and Detractors:
The Fund’s underperformance year to date has disappointed. Our investment process, which involves a barbell-approach to investing in both higher-yielding dividend-paying stocks together with faster-growing dividend growth stocks, remains unchanged. However, poor stock selection drove the bulk of the Fund’s relative underperformance for the first half of the year. Consumer staples holdings were among the performance detractors. Known for their defensive business models with strong cash flow generation and steady dividend payments, these stocks traditionally have been positive return contributors. But as some of these businesses have begun facing certain structural changes—whether via market disruption brought by new product technologies, changing consumer preference or rising labor cost pressures from demographic changes and government policy intervention—the resilience of those businesses has somewhat eroded. As a result, their share prices languished during the period. This painful investment experience has led us to recognize the need to better emphasize identifying structural trends earlier on, to better foresee the investment implications and take more decisive action.
On the flip side, among the top performance contributors during the first half was our holding in Chongqing Brewery, a regional beer company listed in the onshore China A-share market. Our initial investment thesis of seeking a sustained profit margin improvement supported by an accelerating beer product “premiumization” trend in China and easing competition intensity whereby major beer brands are prioritizing profit improvement over market share gain, started to play out this year. In addition, the pending public listing of Budweiser’s Asia-Pacific beer business further attracted investor attention in the region’s beer industry. As a result, Chongqing Brewery, a well-run operation under the ownership of Carlsberg, is seeing positive share price movement.
Notable Portfolio Changes:
During the second quarter, we initiated a few new positions, one of which was Yunnan Hongxiang Yixintang Pharmaceutical Group, a drugstore chain in mainland China. One of China’s key health care reforms involves separating drug dispensing functions from Chinese hospitals, which should boost the prescription drug business at drug retailers and bring additional customer traffic for higher-margin, non-prescription drug businesses. At the same time, rising pharmacy quality-control standards and stricter tax compliance for running drugstore businesses also favor large-scale players over small, individual-store operators. This
(continued)
| 1 | Prospectus expense ratios. |
| 2 | Matthews has contractually agreed to waive a portion of its advisory fee and administrative and shareholder services fee if the Fund’s average daily net assets are over $3 billion, as follows: for every $2.5 billion average daily net assets of the Fund that are over $3 billion, the advisory fee rate and the administrative and shareholder services fee rate for the Fund with respect to such excess average daily net assets will be each reduced by 0.01%, in each case without reducing such fee rate below 0.00%. Any amount waived by Matthews pursuant to this agreement may not be recouped by Matthews. This agreement will remain in place until April 30, 2020 and may be terminated (i) at any time by the Board of Trustees upon 60 days’ prior written notice to Matthews; or (ii) by Matthews at the annual expiration date of the agreement upon 60 days’ prior written notice to the Trust, in each case without payment of any penalty. |
| 3 | The lesser of fiscal year 2018 long-term purchase costs or sales proceeds divided by the average monthly market value of long-term securities. |
| | | | | | | | | | | | | | | | | | | | | | | | | | | | | | | | |
| | | | | | | | | |
| PERFORMANCE AS OF JUNE 30, 2019 | | | | | | | | | | | | | | | | | | | | | | | | |
| | | | | | | | | Average Annual Total Returns | | | | |
| | | 3 Months | | | YTD | | | 1 Year | | | 3 Years | | | 5 Years | | | 10 Years | | | Since
Inception | | | Inception
Date | |
| Investor Class (MAPIX) | | | -1.16% | | | | 5.82% | | | | -4.35% | | | | 6.74% | | | | 4.96% | | | | 9.65% | | | | 8.45% | | | | 10/31/06 | |
| Institutional Class (MIPIX) | | | -1.19% | | | | 5.88% | | | | -4.25% | | | | 6.84% | | | | 5.07% | | | | n.a. | | | | 6.29% | | | | 10/29/10 | |
| MSCI AC Asia Pacific Index4 | | | 0.90% | | | | 10.71% | | | | -0.76% | | | | 10.40% | | | | 4.70% | | | | 7.36% | | | | 4.25% | 5 | | | | |
Performance assumes reinvestment of all dividends and/or distributions before taxes. All performance quoted represents past performance and is no guarantee of future results.Investment return and principal value will fluctuate with market conditions so that when redeemed, shares may be worth more or less than their original cost. Current performance may be lower or higher than the return figures quoted. Returns would have been lower if certain of the Fund’s fees and expenses had not been waived. For the Fund’s most recent month-end performance, visit matthewsasia.com.
| | | | | | | | | | | | | | | | | | | | | | | | | | | | | | | | | | | | | | | | | | | | |
| | | | | | | | | | |
| INCOME DISTRIBUTION HISTORY | | | | | | | | | | | | | | | | | | | | | | | | | | | | |
| | | 2019 | | | | | | 2018 | |
| | | Q1 | | | Q2 | | | Q3 | | | Q4 | | | Total | | | | | | Q1 | | | Q2 | | | Q3 | | | Q4 | | | Total | |
| Investor (MAPIX) | | $ | 0.03 | | | $ | 0.12 | | | | n.a. | | | | n.a. | | | $ | 0.15 | | | | | | | $ | 0.01 | | | $ | 0.19 | | | $ | 0.11 | | | $ | 0.00 | | | $ | 0.31 | |
| Inst’l (MIPIX) | | $ | 0.04 | | | $ | 0.12 | | | | n.a. | | | | n.a. | | | $ | 0.16 | | | | | | | $ | 0.02 | | | $ | 0.20 | | | $ | 0.11 | | | $ | 0.00 | | | $ | 0.33 | |
Note: This table does not include capital gains distributions. Totals may differ by $0.02 due to rounding and a return of capital. For distribution history please visit matthewsasia.com.
| | | | |
| | | |
30-DAY YIELD: Investor Class: 1.67% (1.66% excluding waivers) Institutional Class: 1.78% (1.77% excluding waivers) The 30-Day Yield represents net investment income earned by the Fund over the 30-day period ended 6/30/19, expressed as an annual percentage rate based on the Fund’s share price at the end of the 30-day period. The 30-Day Yield should be regarded as an estimate of the Fund’s rate of investment income, and it may not equal the Fund’s actual income distribution rate. Source: BNY Mellon Investment Servicing (US) Inc. | | | | DIVIDEND YIELD: 2.86% The dividend yield (trailing) for the portfolio is the weighted average sum of the dividends paid by each equity security held by the Fund over the 12 months ended 6/30/19 divided by the current price of each equity as of 6/30/19. The annualized dividend yield for the Fund is for the equity-only portion of the portfolio. Please note that this is based on gross equity portfolio holdings and does not reflect the actual yield an investor in the Fund would receive. Past yields are no guarantee of future yields. Source: FactSet Research Systems, Bloomberg, MICM. |
GROWTH OF A HYPOTHETICAL $10,000 INVESTMENT SINCE INCEPTION—INVESTOR CLASS
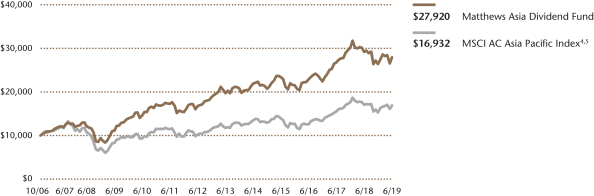
Plotted monthly. The performance data and graph do not reflect the deduction of taxes that a shareholder would pay on dividends, capital gains distributions or redemption of Fund shares. Values are in US$.
| | 4 | It is not possible to invest directly in an index. Source: Index data from Morgan Stanley Capital International and Bloomberg; total return calculations performed by BNY Mellon Investment Servicing (US) Inc. Please see page 88 for index definition. |
| | 5 | Calculated from 10/31/06. |
| | | | | | | | |
| | | | |
| TOP TEN HOLDINGS6 | | | | | | | |
| | | Sector | | Country | | % of Net Assets | |
| Shenzhou International Group Holdings, Ltd. | | Consumer Discretionary | | China/Hong Kong | | | 3.8% | |
| Hyundai Mobis Co., Ltd. | | Consumer Discretionary | | South Korea | | | 3.4% | |
| Taiwan Semiconductor Manufacturing Co., Ltd. | | Information Technology | | Taiwan | | | 3.3% | |
| Minth Group, Ltd. | | Consumer Discretionary | | China/Hong Kong | | | 3.1% | |
| Hoya Corp. | | Health Care | | Japan | | | 2.7% | |
| BGF Retail Co., Ltd. | | Consumer Staples | | South Korea | | | 2.6% | |
| Anritsu Corp. | | Information Technology | | Japan | | | 2.5% | |
| China Mobile, Ltd. | | Communication Services | | China/Hong Kong | | | 2.5% | |
| MISUMI Group, Inc. | | Industrials | | Japan | | | 2.4% | |
| Kao Corp. | | Consumer Staples | | Japan | | | 2.3% | |
| % OF ASSETS IN TOP TEN | | | | | | | 28.6% | |
| | 6 | Holdings may combine more than one security from same issuer and related depositary receipts. |
| | | | |
| matthewsasia.com | 800.789.ASIA | | | 21 | |
| | | | |
| |
| COUNTRY ALLOCATION (%)7,8 | |
| China/Hong Kong | | | 42.8 | |
| Japan | | | 22.7 | |
| South Korea | | | 11.2 | |
| Singapore | | | 5.3 | |
| Taiwan | | | 4.4 | |
| India | | | 2.3 | |
| Thailand | | | 1.9 | |
| Indonesia | | | 1.9 | |
| Philippines | | | 1.7 | |
| Australia | | | 1.6 | |
| Bangladesh | | | 1.1 | |
| Vietnam | | | 1.1 | |
| Cash and Other Assets, Less Liabilities | | | 2.0 | |
| | | | |
| SECTOR ALLOCATION (%)8 | |
| Consumer Discretionary | | | 20.6 | |
| Consumer Staples | | | 17.8 | |
| Financials | | | 13.5 | |
| Communication Services | | | 9.6 | |
| Industrials | | | 8.2 | |
| Information Technology | | | 7.7 | |
| Utilities | | | 4.7 | |
| Health Care | | | 4.3 | |
| Materials | | | 4.1 | |
| Real Estate | | | 3.9 | |
| Energy | | | 3.6 | |
| Cash and Other Assets, Less Liabilities | | | 2.0 | |
| | | | |
| MARKET CAP EXPOSURE (%)8 | |
| Mega Cap (over $25B) | | | 27.7 | |
| Large Cap ($10B–$25B) | | | 19.4 | |
| Mid Cap ($3B–10B) | | | 26.6 | |
| Small Cap (under $3B) | | | 24.3 | |
| Cash and Other Assets, Less Liabilities | | | 2.0 | |
| 7 | Not all countries where the Fund may invest are included in the benchmark index. |
| 8 | Source: FactSet Research Systems. Percentage values in data are rounded to the nearest tenth of one percent, so the values may not sum to 100% due to rounding. Percentage values may be derived from different data sources and may not be consistent with other Fund literature. |
Matthews Asia Dividend Fund
Portfolio Manager Commentary (unaudited) (continued)
could further speed up the overall drugstore industry consolidation—a long-term growth driver for leading players such as Yixintang. We believe the company is well-positioned to take advantage of this favorable industry trend. Operating a cash-generative drug retailing business model, with a modest 30% payout ratio, the company also has what we view as untapped potential to deliver significant growth in its dividends. During the first half of the year, we exited a few existing holdings such as China Resources Power, Japan Tobacco, and Nitori Holdings as their business fundamentals no longer supported our initial investment thesis.
Outlook:
As China and the U.S. restarted trade negotiations in early July, Asia’s markets seemed to experience temporary relief from tensions. The medium- to long-term outlook for these bilateral relations, however, is still cloudy given the structural differences between the two countries’ political systems and economic growth models. Despite this uncertainty, policymakers in both Asia and the U.S. have signaled a willingness to use policy-support measures to address any significant slowdown. In the meantime, with investor expectations now reset mostly due to macroeconomic concerns and on Asia’s equity valuations continuing to trade below long-term averages, we remain constructive that, from a bottom-up perspective, Asia’s markets currently offer attractive opportunities for long-term investors.
Matthews Asia Dividend Fund
June 30, 2019
Schedule of Investmentsa(unaudited)
COMMON EQUITIES: 95.0%
| | | | | | | | |
| | | Shares | | | Value | |
| | |
| CHINA/HONG KONG: 42.9% | | | | | | | | |
Shenzhou International Group Holdings, Ltd. | | | 16,551,200 | | | | $228,319,044 | |
| | |
Minth Group, Ltd.† | | | 69,311,000 | | | | 186,928,707 | |
| | |
China Construction Bank Corp. H Shares | | | 160,706,000 | | | | 138,529,202 | |
| | |
Chongqing Brewery Co., Ltd. A Shares | | | 19,996,770 | | | | 137,499,008 | |
| | |
AIA Group, Ltd. | | | 12,475,600 | | | | 134,722,792 | |
| | |
China Mobile, Ltd. | | | 14,531,500 | | | | 132,289,923 | |
| | |
China Merchants Bank Co., Ltd. H Shares | | | 25,783,000 | | | | 127,946,064 | |
| | |
China Petroleum & Chemical Corp. H Shares | | | 178,734,000 | | | | 121,757,146 | |
| | |
WH Group, Ltd.b,c | | | 119,822,000 | | | | 121,546,601 | |
| | |
China Gas Holdings, Ltd. | | | 28,746,800 | | | | 106,823,255 | |
| | |
HKBN, Ltd. | | | 56,401,123 | | | | 101,698,141 | |
| | |
Ping An Insurance Group Co. of China, Ltd. H Shares | | | 8,180,000 | | | | 98,363,487 | |
| | |
Huaneng Power International, Inc. H Shares | | | 156,780,000 | | | | 92,328,683 | |
| | |
Sun Art Retail Group, Ltd. | | | 85,088,500 | | | | 80,636,965 | |
| | |
Yuexiu Transport Infrastructure, Ltd.† | | | 97,328,000 | | | | 79,489,455 | |
| | |
China Education Group Holdings, Ltd.c | | | 49,804,000 | | | | 77,955,555 | |
| | |
Beijing Capital International Airport Co., Ltd. H Shares | | | 88,320,000 | | | | 77,401,264 | |
| | |
Fuyao Glass Industry Group Co., Ltd. H Sharesb,c | | | 23,075,200 | | | | 71,655,442 | |
| | |
Huaneng Lancang River Hydropower, Inc. A Shares | | | 111,137,793 | | | | 65,877,680 | |
| | |
Yixintang Pharmaceutical Group Co., Ltd. A Shares | | | 15,577,958 | | | | 64,779,970 | |
| | |
Melco Resorts & Entertainment, Ltd. ADR | | | 2,692,500 | | | | 58,481,100 | |
| | |
China East Education Holdings, Ltd.b,c,d | | | 40,040,000 | | | | 56,997,171 | |
| | |
Crystal International Group, Ltd.b,c | | | 118,408,500 | | | | 52,657,609 | |
| | |
Far East Horizon, Ltd. | | | 48,595,000 | | | | 49,704,168 | |
| | |
Café de Coral Holdings, Ltd. | | | 15,844,000 | | | | 47,137,966 | |
| | |
Hua Hong Semiconductor, Ltd.b,c | | | 19,254,000 | | | | 37,338,403 | |
| | |
Shanghai Jin Jiang International Hotels Group Co., Ltd. H Shares† | | | 122,102,000 | | | | 24,839,724 | |
| | |
China Mobile, Ltd. ADR | | | 458,000 | | | | 20,742,820 | |
| | |
China Petroleum & Chemical Corp. ADR | | | 79,100 | | | | 5,394,620 | |
| | |
Dairy Farm International Holdings, Ltd. | | | 116,900 | | | | 835,587 | |
| | | | | | | | |
Total China/Hong Kong | | | | | | | 2,600,677,552 | |
| | | | | | | | |
| | | | | | | | |
| | | |
| JAPAN: 22.6% | | | | | | | | |
Hoya Corp. | | | 2,145,100 | | | | 164,860,056 | |
| | |
Anritsu Corp.† | | | 8,806,500 | | | | 153,562,339 | |
| | |
MISUMI Group, Inc. | | | 5,869,600 | | | | 147,954,123 | |
| | |
Kao Corp. | | | 1,834,900 | | | | 140,010,891 | |
| | |
Pigeon Corp. | | | 3,077,300 | | | | 124,094,811 | |
| | |
NTT DoCoMo, Inc. | | | 5,221,100 | | | | 121,818,354 | |
| | |
BELLSYSTEM24 Holdings, Inc.† | | | 5,762,500 | | | | 79,845,707 | |
| | |
KATITAS Co., Ltd.† | | | 2,134,900 | | | | 79,538,069 | |
| | |
Nifco, Inc. | | | 2,943,300 | | | | 73,079,823 | |
| | |
Outsourcing, Inc. | | | 5,932,400 | | | | 72,376,063 | |
| | |
Fuji Seal International, Inc. | | | 2,296,900 | | | | 70,404,409 | |
| | |
Eiken Chemical Co., Ltd.† | | | 3,751,500 | | | | 59,526,577 | |
| | |
Mitsubishi Pencil Co., Ltd. | | | 2,628,400 | | | | 42,212,755 | |
| | |
MANI, INC. | | | 562,000 | | | | 36,165,185 | |
| | |
Rohm Co., Ltd. | | | 137,300 | | | | 9,250,710 | |
| | | | | | | | |
Total Japan | | | | | | | 1,374,699,872 | |
| | | | | | | | |
| | | | | | | | |
| | | Shares | | | Value | |
| | |
| SOUTH KOREA: 8.2% | | | | | | | | |
Hyundai Mobis Co., Ltd. | | | 1,011,216 | | | | $206,311,768 | |
| | |
BGF Retail Co., Ltd.† | | | 865,926 | | | | 158,238,761 | |
| | |
Samsung Fire & Marine Insurance Co., Ltd. | | | 310,982 | | | | 72,180,467 | |
| | |
Woori Financial Group, Inc. | | | 4,973,275 | | | | 60,523,347 | |
| | | | | | | | |
Total South Korea | | | | | | | 497,254,343 | |
| | | | | | | | |
| | | | | | | | |
| | | |
| SINGAPORE: 5.3% | | | | | | | | |
United Overseas Bank, Ltd. | | | 6,954,100 | | | | 134,437,638 | |
| | |
Ascendas India Trust† | | | 57,863,800 | | | | 58,163,169 | |
| | |
CapitaLand Retail China Trust, REIT | | | 49,800,000 | | | | 57,441,153 | |
| | |
CapitaLand Commercial Trust, REIT | | | 24,708,000 | | | | 39,649,017 | |
| | |
NetLink NBN Trustc | | | 48,877,500 | | | | 32,151,497 | |
| | | | | | | | |
Total Singapore | | | | | | | 321,842,474 | |
| | | | | | | | |
| | | | | | | | |
| | | |
| TAIWAN: 4.4% | | | | | | | | |
Taiwan Semiconductor Manufacturing Co., Ltd. | | | 13,740,469 | | | | 105,092,383 | |
| | |
Taiwan Semiconductor Manufacturing Co., Ltd. ADR | | | 2,362,340 | | | | 92,532,858 | |
| | |
China Steel Chemical Corp.† | | | 15,589,000 | | | | 67,558,380 | |
| | | | | | | | |
Total Taiwan | | | | | | | 265,183,621 | |
| | | | | | | | |
| | | | | | | | |
| | | |
| INDIA: 2.3% | | | | | | | | |
ITC, Ltd. | | | 18,225,998 | | | | 72,273,466 | |
| | |
Minda Industries, Ltd.† | | | 14,660,782 | | | | 67,586,347 | |
| | | | | | | | |
Total India | | | | | | | 139,859,813 | |
| | | | | | | | |
| | | | | | | | |
| | | |
| THAILAND: 1.9% | | | | | | | | |
Thai Beverage Public Co., Ltd. | | | 189,041,400 | | | | 116,047,947 | |
| | | | | | | | |
Total Thailand | | | | | | | 116,047,947 | |
| | | | | | | | |
| | | | | | | | |
| | | |
| INDONESIA: 1.9% | | | | | | | | |
PT United Tractors | | | 46,212,800 | | | | 92,205,939 | |
| | |
PT Cikarang Listrindob,c | | | 366,537,800 | | | | 22,576,608 | |
| | | | | | | | |
Total Indonesia | | | | | | | 114,782,547 | |
| | | | | | | | |
| | | | | | | | |
| | | |
| PHILIPPINES: 1.7% | | | | | | | | |
Globe Telecom, Inc. | | | 2,372,405 | | | | 104,740,511 | |
| | | | | | | | |
Total Philippines | | | | | | | 104,740,511 | |
| | | | | | | | |
| | | | | | | | |
| | | |
| AUSTRALIA: 1.6% | | | | | | | | |
Breville Group, Ltd.† | | | 8,308,554 | | | | 95,551,702 | |
| | | | | | | | |
Total Australia | | | | | | | 95,551,702 | |
| | | | | | | | |
| | | | | | | | |
| | | |
| BANGLADESH: 1.1% | | | | | | | | |
GrameenPhone, Ltd. | | | 16,109,639 | | | | 69,401,008 | |
| | | | | | | | |
Total Bangladesh | | | | | | | 69,401,008 | |
| | | | | | | | |
| | | | | | | | |
| | | |
| VIETNAM: 1.1% | | | | | | | | |
Vietnam Dairy Products JSC | | | 12,584,135 | | | | 66,490,887 | |
| | | | | | | | |
Total Vietnam | | | | | | | 66,490,887 | |
| | | | | | | | |
| | | | | | | | |
| | | |
| TOTAL COMMON EQUITIES | | | | | | | 5,766,532,277 | |
| | | | | | | | |
(Cost $4,918,863,757) | | | | | | | | |
| | | | |
| matthewsasia.com | 800.789.ASIA | | | 23 | |
Matthews Asia Dividend Fund
June 30, 2019
Schedule of Investmentsa(unaudited) (continued)
PREFERRED EQUITIES: 3.0%
| | | | | | | | |
| | | Shares | | | Value | |
| | |
| SOUTH KOREA: 3.0% | | | | | | | | |
LG Chem, Ltd., Pfd. | | | 654,186 | | | | $110,935,621 | |
| | |
Samsung Electronics Co., Ltd., Pfd. | | | 2,132,283 | | | | 70,715,805 | |
| | | | | | | | |
Total South Korea | | | | | | | 181,651,426 | |
| | | | | | | | |
| | | | | | | | |
| | | |
| TOTAL PREFERRED EQUITIES | | | | | | | 181,651,426 | |
| | | | | | | | |
(Cost $134,471,361) | | | | | | | | |
| | | | | | | | |
| | | |
| TOTAL INVESTMENTS: 98.0% | | | | | | | 5,948,183,703 | |
(Cost $5,053,335,118) | | | | | | | | |
| | | | | | | | |
| | |
CASH AND OTHER ASSETS,
LESS LIABILITIES: 2.0% | | | | | | | 118,345,262 | |
| | | | | | | | |
| | |
NET ASSETS: 100.0% | | | | | | | $6,066,528,965 | |
| | | | | | | | |
| a | Certain securities were fair valued under the valuation policies approved by the Board of Trustees (Note2-A). |
| b | Security exempt from registration under Rule 144A of the Securities Act of 1933, as amended. The security may be resold in transactions exempt from registration normally to qualified institutional buyers. The security has been determined to be liquid in accordance with procedures adopted by the Funds’ Board of Trustees. At June 30, 2019, the aggregate value is $362,771,834, which is 5.98% of net assets. |
| c | The securities may be resold to qualified foreign investors and foreign institutional buyers under Regulation S of the Securities Act of 1933. |
| d | Non-income producing security. |
| † | Affiliated Issuer, as defined under the Investment Company Act of 1940 (ownership of 5% or more of the outstanding voting securities of this issuer). |
| ADR | American Depositary Receipt |
| REIT | Real Estate Investment Trust |
See accompanying notes to financial statements.
| | | | |
| PORTFOLIO MANAGERS |
| |
| Sherwood Zhang, CFA | | |
Lead Manager | | | | |
| |
| Yu Zhang, CFA | | S. Joyce Li, CFA |
Co-Manager | | | | Co-Manager |
| | |
| FUND FACTS | | | | |
| | |
| | | Investor | | Institutional |
Ticker | | MCDFX | | MICDX |
CUSIP | | 577125305 | | 577130735 |
Inception | | 11/30/09 | | 10/29/10 |
NAV | | $16.29 | | $16.29 |
Initial Investment | | $2,500 | | $100,000 |
Gross Expense Ratio1 | | 1.15% | | 1.01% |
Portfolio Statistics | | |
Total # of Positions | | 48 |
Net Assets | | $378.7 million |
Weighted Average Market Cap | | $45.1 billion |
Portfolio Turnover2 | | 66.47% |
Benchmark | | | | |
MSCI China Index |
OBJECTIVE
Total return with an emphasis on providing current income.
STRATEGY
Under normal market conditions, the Fund seeks to achieve its investment objective by investing at least 80% of its net assets, which include borrowings for investment purposes, in dividend-paying equity securities of companies located in China. China includes its administrative and other districts, such as Hong Kong. The Fund may also invest in convertible debt and equity securities of companies located in China.
Matthews China Dividend Fund
Portfolio Manager Commentary (unaudited)
For the first half of 2019, the Matthews China Dividend Fund returned 15.51% (Investor Class) and 15.58% (Institutional Class), outperforming its benchmark, the MSCI China Index, which returned 13.08%. For the quarter ending June 30, the Fund returned –0.66% (Investor Class) and –0.60% (Institutional Class), while its benchmark returned –3.92%.
Market Environment:
Just as the market seemed to be optimistically anticipating successful U.S.–China negotiations early in the year, President Trump’s tweets presented new obstacles. China’s equity market consequently suffered in May as the U.S. threatened to impose tariffs on Chinese exports, and trade negotiations broke down. In addition, the U.S. government declared a ban on the sale of U.S. technology to Chinese telecommunication giant Huawei Technologies. Considering the sales revenue that Huawei generated for U.S. companies, the unprecedented ban highlighted to investors the heightened risk of a technology cold war between the two nations, and led many to wonder whether more Chinese companies could lose their access to critical U.S. technology and supply chain. Investors finally found some relief later in the second quarter after President Trump and President Xi met during the G-20 Summit in Japan, and agreed to resume negotiations and ease some restrictions on sales to Huawei.
Meanwhile, the outlook for U.S. monetary policy changed dramatically in May as the markets anticipated the U.S. Federal Reserve would shift from its path of gradually raising interest rates and begin cutting rates.
Performance Contributors and Detractors:
Huaxin Cement, a leading cement company based in central China, was the top contributor to Fund performance in the first half of the year. This little-known company is actually a majority-owned subsidiary of global cement leader LafargeHolcim, a Swiss multinational. Huaxin nearly quadrupled its dividends per share this year on the back of strong earnings growth, and we consider its B-shares to still be attractively priced compared to many peers listed in China’s A-share and H-share markets. Wuliangye Yibin, the leading high-end “baijiu” (Chinese white liquor) maker was the second-largest contributor during the first six months of the year as the company endeavored to close its product price gap with the top competitor Kweichow Moutai. Wuliangye Yibin recently launched a new version of its key product with some success, and has been warmly welcomed by investors.
China Everbright, a financial holding company, was the largest detractor to performance during the first half, as its earnings were hurt by a sharp drop in the stock of its subsidiary in 2018. We decided to exit the position.
During the first six months of the year, the Fund’s outperformance was driven by both sector allocation and security selection. Our stock selection among the consumer discretionary sector was the main performance detractor, but this was offset by strong sector allocation and stock selection in the consumer staples sector.
Notable Portfolio Changes:
During the quarter, we initiated a position in Yixintang Pharmaceutical, the leading pharmaceutical retail chain in southwestern China. We believe the company is well-positioned to grow revenues and earnings from China’s changing landscape of prescription drug distribution.
The Fund also participated in the Hong Kong IPO of China East Education Holdings during the quarter. China East Education is known for its strong niche in
(continued)
| 1 | Prospectus expense ratios. |
| 2 | The lesser of fiscal year 2018 long-term purchase costs or sales proceeds divided by the average monthly market value of long-term securities. |
| | | | |
| matthewsasia.com | 800.789.ASIA | | | 25 | |
| | | | | | | | | | | | | | | | | | | | | | | | | | | | |
| | |
| PERFORMANCE AS OF JUNE 30, 2019 | | | | |
| | | | | | | | | Average Annual Total Returns | | | | |
| | | 3 Months | | | YTD | | | 1 Year | | | 3 Year | | | 5 Year | | | Since
Inception | | | Inception
Date | |
| Investor Class (MCDFX) | | | -0.66% | | | | 15.51% | | | | 0.86% | | | | 15.15% | | | | 11.07% | | | | 10.43% | | | | 11/30/09 | |
| Institutional Class (MICDX) | | | -0.60% | | | | 15.58% | | | | 0.99% | | | | 15.31% | | | | 11.24% | | | | 9.46% | | | | 10/29/10 | |
| MSCI China Index3 | | | -3.92% | | | | 13.08% | | | | -6.55% | | | | 14.51% | | | | 7.58% | | | | 4.89% | 4 | | | | |
Performance assumes reinvestment of all dividends and/or distributions before taxes. All performance quoted represents past performance and is no guarantee of future results. Investment return and principal value will fluctuate with market conditions so that when redeemed, shares may be worth more or less than their original cost. Current performance may be lower or higher than the return figures quoted. For the Fund’s most recent month-end performance, visit matthewsasia.com.
| | | | | | | | | | | | | | | | | | | | | | | | | | | | |
| | | | | | |
| INCOME DISTRIBUTION HISTORY | | | | | | | | | | | | | | | | |
| | | 2019 | | | | | | 2018 | |
| | | June | | | December | | | Total | | | | | | June | | | December | | | Total | |
| Investor (MCDFX) | | $ | 0.24 | | | | n.a. | | | $ | 0.24 | | | | | | | $ | 0.34 | | | $ | 0.06 | | | $ | 0.40 | |
| Inst’l (MICDX) | | $ | 0.25 | | | | n.a. | | | $ | 0.25 | | | | | | | $ | 0.36 | | | $ | 0.07 | | | $ | 0.43 | |
Note: This table does not include capital gains distributions. Totals may differ by $0.02 due to rounding. For income distribution history, visit matthewsasia.com.
| | | | |
| | | |
30-DAY YIELD: 1.58% (Investor Class) 1.74% (Institutional Class) The 30-Day Yield represents net investment income earned by the Fund over the 30-day period ended 6/30/19, expressed as an annual percentage rate based on the Fund’s share price at the end of the 30-day period. The 30-Day Yield should be regarded as an estimate of the Fund’s rate of investment income, and it may not equal the Fund’s actual income distribution rate. Source: BNY Mellon Investment Servicing (US) Inc. | | | | DIVIDEND YIELD: 3.16% The dividend yield (trailing) for the portfolio is the weighted average sum of the dividends paid by each equity security held by the Fund over the 12 months ended 6/30/19 divided by the current price of each equity as of 6/30/19. The annualized dividend yield for the Fund is for the equity-only portion of the portfolio. Please note that this is based on gross equity portfolio holdings and does not reflect the actual yield an investor in the Fund would receive. Past yields are no guarantee of future yields. Source: FactSet Research Systems, Bloomberg, MICM. |
GROWTH OF A HYPOTHETICAL $10,000 INVESTMENT SINCE INCEPTION—INVESTOR CLASS
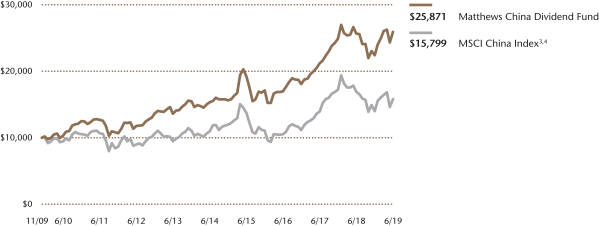
Plotted monthly. The performance data and graph do not reflect the deduction of taxes that a shareholder would pay on dividends, capital gains distributions or redemption of Fund shares. Values are in US$.
| | 3 | It is not possible to invest directly in an index. Source: Index data from Morgan Stanley Capital International and Bloomberg; total return calculations performed by BNY Mellon Investment Servicing (US) Inc. Please see page 88 for index definition. |
| | 4 | Calculated from 11/30/09. |
| | | | | | | | |
| | | | |
| TOP TEN HOLDINGS5 | | | | | | | |
| | | Sector | | | | % of Net Assets | |
| Tencent Holdings, Ltd. | | Communication Services | | | | | 4.7% | |
| China Merchants Bank Co., Ltd. | | Financials | | | | | 3.2% | |
| HKBN, Ltd. | | Communication Services | | | | | 3.1% | |
| Altaba, Inc. | | Consumer Discretionary | | | | | 3.0% | |
| CITIC Telecom International Holdings, Ltd. | | Communication Services | | | | | 2.8% | |
| New Oriental Education & Technology Group, Inc. | | Consumer Discretionary | | | | | 2.7% | |
| Huaxin Cement Co., Ltd. | | Materials | | | | | 2.7% | |
| China Petroleum & Chemical Corp. | | Energy | | | | | 2.5% | |
| China Mobile, Ltd. | | Communication Services | | | | | 2.4% | |
| Melco Resorts & Entertainment, Ltd. | | Consumer Discretionary | | | | | 2.4% | |
| % OF ASSETS IN TOP TEN | | | | | | | 29.5% | |
| | 5 | Holdings may combine more than one security from same issuer and related depositary receipts. |
Matthews China Dividend Fund
Portfolio Manager Commentary (unaudited) (continued)
culinary education, training chefs for the country’s booming dining industry, and it is continuing to research other professional services area for growth. We believe professional talent is critical for China to develop its service industry. As the government has underinvested in this area, private companies could add strong value.
We exited our position in HSBC Holdings due to changes in the interest rate outlook and a lack of strong earnings growth drivers for the group. In addition, we sold Fanhua, a leading Chinese insurance broker, as its rich valuations premium compared to leading insurance companies in China and Hong Kong appears unjustified.
Outlook:
Continuing market volatility, driven by uncertainty over U.S.–China trade negotiations, has been disruptive to fundamental investors like us, as our core competence lies in analyzing company financials and strategies, rather than reading the tea leaves of geopolitical developments. President Trump’s announcement following the G-20 meeting was fairly significant as it appeared that he has neither the interest nor intention of starting a new cold war with China. If this is indeed true, the Chinese equities market will again be driven by fundamentals and, we believe, current valuations are attractive and earnings appear quite positive.
| | | | |
| |
| COUNTRY ALLOCATION (%)6,7 | |
| China/Hong Kong | | | 91.8 | |
| Taiwan | | | 3.1 | |
| Singapore | | | 2.0 | |
| Cash and Other Assets, Less Liabilities | | | 3.1 | |
| | | | |
SECTOR ALLOCATION (%)7 | |
| Consumer Discretionary | | | 23.7 | |
| Consumer Staples | | | 14.2 | |
| Communication Services | | | 13.0 | |
| Financials | | | 9.2 | |
| Industrials | | | 8.1 | |
| Information Technology | | | 7.4 | |
| Real Estate | | | 6.1 | |
| Health Care | | | 4.6 | |
| Materials | | | 4.5 | |
| Utilities | | | 3.8 | |
| Energy | | | 2.5 | |
| Cash and Other Assets, Less Liabilities | | | 3.1 | |
| | | | |
MARKET CAP EXPOSURE (%)7 | |
| Mega Cap (over $25B) | | | 24.2 | |
| Large Cap ($10B–$25B) | | | 14.5 | |
| Mid Cap ($3B–10B) | | | 14.4 | |
| Small Cap (under $3B) | | | 43.7 | |
| Cash and Other Assets, Less Liabilities | | | 3.1 | |
| 6 | Not all countries where the Fund may invest are included in the benchmark index. |
| 7 | Source: FactSet Research Systems. Percentage values in data are rounded to the nearest tenth of one percent, so the values may not sum to 100% due to rounding. Percentage values may be derived from different data sources and may not be consistent with other Fund literature. |
| | | | |
| matthewsasia.com | 800.789.ASIA | | | 27 | |
Matthews China Dividend Fund
June 30, 2019
Schedule of Investmentsa(unaudited)
COMMON EQUITIES: 93.9%
| | | | | | | | |
| | | Shares | | | Value | |
| | |
| CONSUMER DISCRETIONARY: 20.7% | | | | | | | | |
Textiles, Apparel & Luxury Goods: 7.6% | |
JNBY Design, Ltd.b | | | 4,216,000 | | | | $7,743,486 | |
| | |
Lao Feng Xiang Co., Ltd. B Shares | | | 2,093,003 | | | | 7,336,873 | |
| | |
Nan Liu Enterprise Co., Ltd. | | | 1,144,000 | | | | 6,020,633 | |
| | |
Pacific Textiles Holdings, Ltd. | | | 6,504,000 | | | | 5,149,478 | |
| | |
Crystal International Group, Ltd.b,c | | | 5,330,500 | | | | 2,370,534 | |
| | | | | | | | |
| | | | | | | 28,621,004 | |
| | | | | | | | |
Diversified Consumer Services: 6.4% | | | | | | | | |
New Oriental Education & Technology Group, Inc. ADRd | | | 107,700 | | | | 10,401,666 | |
| | |
Hope Education Group Co., Ltd.b,c | | | 55,670,000 | | | | 7,934,898 | |
| | |
China East Education Holdings, Ltd.b,c,d | | | 4,036,500 | | | | 5,745,981 | |
| | | | | | | | |
| | | | | | | 24,082,545 | |
| | | | | | | | |
Hotels, Restaurants & Leisure: 4.7% | | | | | | | | |
Melco Resorts & Entertainment, Ltd. ADR | | | 410,300 | | | | 8,911,716 | |
| | |
Shanghai Jin Jiang International Hotels Group Co., Ltd. H Shares | | | 32,316,000 | | | | 6,574,180 | |
| | |
Haichang Ocean Park Holdings, Ltd.b,c,d | | | 14,458,000 | | | | 2,391,667 | |
| | | | | | | | |
| | | | | | | 17,877,563 | |
| | | | | | | | |
Automobiles: 2.0% | | | | | | | | |
Geely Automobile Holdings, Ltd. | | | 4,491,000 | | | | 7,700,417 | |
| | | | | | | | |
Total Consumer Discretionary | | | | | | | 78,281,529 | |
| | | | | | | | |
| | | | | | | | |
| | | |
| CONSUMER STAPLES: 14.2% | | | | | | | | |
Food Products: 5.9% | | | | | | | | |
Inner Mongolia Yili Industrial Group Co., Ltd. A Shares | | | 1,557,511 | | | | 7,589,478 | |
| | |
Nissin Foods Co., Ltd. | | | 10,492,000 | | | | 7,576,933 | |
| | |
WH Group, Ltd.b,c | | | 6,960,000 | | | | 7,060,176 | |
| | | | | | | | |
| | | | | | | 22,226,587 | |
| | | | | | | | |
Beverages: 4.4% | | | | | | | | |
Wuliangye Yibin Co., Ltd. A Shares | | | 492,749 | | | | 8,483,952 | |
| | |
Anhui Gujing Distillery Co., Ltd. B Shares | | | 954,693 | | | | 8,287,655 | |
| | | | | | | | |
| | | | | | | 16,771,607 | |
| | | | | | | | |
Food & Staples Retailing: 3.9% | | | | | | | | |
Sun Art Retail Group, Ltd. | | | 7,852,000 | | | | 7,441,211 | |
| | |
Yixintang Pharmaceutical Group Co., Ltd. A Shares | | | 1,747,600 | | | | 7,267,286 | |
| | | | | | | | |
| | | | | | | 14,708,497 | |
| | | | | | | | |
Total Consumer Staples | | | | | | | 53,706,691 | |
| | | | | | | | |
| | | | | | | | |
| | | |
| COMMUNICATION SERVICES: 13.0% | | | | | | | | |
Diversified Telecommunication Services: 5.9% | |
HKBN, Ltd. | | | 6,475,957 | | | | 11,676,944 | |
| | |
CITIC Telecom International Holdings, Ltd. | | | 27,051,000 | | | | 10,726,584 | |
| | | | | | | | |
| | | | | | | 22,403,528 | |
| | | | | | | | |
Interactive Media & Services: 4.7% | | | | | | | | |
Tencent Holdings, Ltd. | | | 391,800 | | | | 17,724,804 | |
| | | | | | | | |
| | | | | | | | |
Wireless Telecommunication Services: 2.4% | | | | | | | | |
China Mobile, Ltd. ADR | | | 198,930 | | | | 9,009,540 | |
| | | | | | | | |
Total Communication Services | | | | | | | 49,137,872 | |
| | | | | | | | |
| | | | | | | | |
| | | |
| FINANCIALS: 9.1% | | | | | | | | |
Capital Markets: 3.8% | | | | | | | | |
Hong Kong Exchanges & Clearing, Ltd. | | | 225,900 | | | | 7,983,327 | |
| | |
Shenwan Hongyuan Group Co., Ltd. H Sharesb,c,d | | | 18,637,282 | | | | 6,441,704 | |
| | | | | | | | |
| | | | | | | 14,425,031 | |
| | | | | | | | |
| | | | | | | | |
| | | Shares | | | Value | |
Banks: 3.2% | | | | | | | | |
China Merchants Bank Co., Ltd. H Shares | | | 2,442,500 | | | | $12,120,710 | |
| | | | | | | | |
Insurance: 2.1% | | | | | | | | |
Ping An Insurance Group Co. of China, Ltd. H Shares | | | 674,000 | | | | 8,104,767 | |
| | | | | | | | |
Total Financials | | | | | | | 34,650,508 | |
| | | | | | | | |
| | | | | | | | |
| | | |
| INDUSTRIALS: 8.1% | | | | | | | | |
Machinery: 3.9% | | | | | | | | |
Yangzijiang Shipbuilding Holdings, Ltd. | | | 6,601,300 | | | | 7,479,073 | |
| | |
Shanghai Mechanical and Electrical Industry Co., Ltd. B Shares | | | 4,326,069 | | | | 7,376,203 | |
| | | | | | | | |
| | | | | | | 14,855,276 | |
| | | | | | | | |
Transportation Infrastructure: 2.2% | | | | | | | | |
Guangdong Provincial Expressway Development Co., Ltd. B Shares | | | 10,498,218 | | | | 8,297,119 | |
| | | | | | | | |
| | | | | | | | |
Marine: 2.0% | | | | | | | | |
SITC International Holdings Co., Ltd. | | | 7,413,000 | | | | 7,569,559 | |
| | | | | | | | |
Total Industrials | | | | | | | 30,721,954 | |
| | | | | | | | |
| | | | | | | | |
| | | |
| INFORMATION TECHNOLOGY: 7.4% | | | | | | | | |
Software: 2.2% | | | | | | | | |
Shanghai Baosight Software Co., Ltd. B Shares | | | 4,527,403 | | | | 8,253,044 | |
| | | | | | | | |
| | | | | | | | |
IT Services: 2.1% | | | | | | | | |
SUNeVision Holdings, Ltd. | | | 9,201,000 | | | | 8,016,605 | |
| | | | | | | | |
| | | | | | | | |
Semiconductors & Semiconductor Equipment: 1.6% | | | | | |
Hua Hong Semiconductor, Ltd.b,c | | | 3,058,000 | | | | 5,930,240 | |
| | | | | | | | |
| | | | | | | | |
Electronic Equipment, Instruments & Components: 1.5% | | | | | |
Vivotek, Inc. | | | 1,421,000 | | | | 5,652,685 | |
| | | | | | | | |
Total Information Technology | | | | | | | 27,852,574 | |
| | | | | | | | |
| | | | | | | | |
| | | |
| REAL ESTATE: 6.0% | | | | | | | | |
Real Estate Management & Development: 4.0% | | | | | |
China Overseas Property Holdings, Ltd. | | | 14,845,000 | | | | 7,739,604 | |
| | |
Shanghai Lujiazui Finance & Trade Zone Development Co., Ltd. B Shares | | | 6,143,370 | | | | 7,436,390 | |
| | | | | | | | |
| | | | | | | 15,175,994 | |
| | | | | | | | |
Equity REITs: 2.0% | | | | | | | | |
CapitaLand Retail China Trust, REIT | | | 6,721,400 | | | | 7,752,710 | |
| | | | | | | | |
Total Real Estate | | | | | | | 22,928,704 | |
| | | | | | | | |
| | | | | | | | |
| | | |
| HEALTH CARE: 4.6% | | | | | | | | |
Pharmaceuticals: 1.7% | | | | | | | | |
Tianjin Zhongxin Pharmaceutical Group Corp., Ltd. S Shares | | | 6,837,100 | | | | 6,294,412 | |
| | | | | | | | |
| | | | | | | | |
Health Care Providers & Services: 1.6% | | | | | | | | |
Genertec Universal Medical Group Co., Ltd.b,c | | | 7,748,500 | | | | 6,198,276 | |
| | | | | | | | |
| | | | | | | | |
Biotechnology: 0.7% | | | | | | | | |
Shanghai Haohai Biological Technology Co., Ltd. H Sharesb,c | | | 491,400 | | | | 2,678,452 | |
| | | | | | | | |
| | | | | | | | |
Life Sciences Tools & Services: 0.6% | | | | | | | | |
BBI Life Sciences Corp.b | | | 7,861,000 | | | | 2,193,758 | |
| | | | | | | | |
Total Health Care | | | | | | | 17,364,898 | |
| | | | | | | | |
| | | | | | | | |
| | | |
| MATERIALS: 4.5% | | | | | | | | |
Construction Materials: 2.6% | | | | | | | | |
Huaxin Cement Co., Ltd. B Shares | | | 4,343,492 | | | | 10,067,441 | |
| | | | | | | | |
| | | | | | | | |
Matthews China Dividend Fund
June 30, 2019
Schedule of Investmentsa(unaudited) (continued)
| | |
| COMMON EQUITIES(continued) | | CLOSED-END FUNDS: 3.0% |
| | | | | | | | |
| | | Shares | | | Value | |
Containers & Packaging: 1.9% | | | | | | | | |
Greatview Aseptic Packaging Co., Ltd. | | | 12,346,000 | | | | $7,060,219 | |
| | | | | | | | |
Total Materials | | | | | | | 17,127,660 | |
| | | | | | | | |
| | | | | | | | |
| | | |
| UTILITIES: 3.8% | | | | | | | | |
Independent Power and Renewable Electricity Producers: 1.9% | |
Huaneng Lancang River Hydropower, Inc. A Shares | | | 12,398,442 | | | | 7,351,828 | |
| | | | | | | | |
| | | | | | | | |
Gas Utilities: 1.9% | | | | | | | | |
China Gas Holdings, Ltd. | | | 1,926,000 | | | | 7,157,026 | |
| | | | | | | | |
Total Utilities | | | | | | | 14,508,854 | |
| | | | | | | | |
| | | | | | | | |
| | | |
| ENERGY: 2.5% | | | | | | | | |
Oil, Gas & Consumable Fuels: 2.5% | | | | | | | | |
China Petroleum & Chemical Corp. H Shares | | | 13,758,000 | | | | 9,372,223 | |
| | | | | | | | |
Total Energy | | | | | | | 9,372,223 | |
| | | | | | | | |
| | | | | | | | |
| | | |
| TOTAL COMMON EQUITIES | | | | | | | 355,653,467 | |
| | | | | | | | |
(Cost $329,416,543) | | | | | | | | |
| | | | | | | | |
| | | Shares | | | Value | |
| | |
| CONSUMER DISCRETIONARY: 3.0% | | | | | | | | |
Internet & Direct Marketing Retail: 3.0% | | | | | | | | |
Altaba, Inc.d | | | 163,100 | | | | $11,314,247 | |
| | | | | | | | |
Total Consumer Discretionary | | | | | | | 11,314,247 | |
| | | | | | | | |
| | | | | | | | |
| | |
| TOTALCLOSED-END FUNDS | | | | 11,314,247 | |
| | | | | | | | |
(Cost $10,912,532) | | | | | | | | |
| | | | | | | | |
| | |
| TOTAL INVESTMENTS: 96.9% | | | | 366,967,714 | |
(Cost $340,329,075) | | | | | | | | |
| | | | | | | | |
| | |
CASH AND OTHER ASSETS,
LESS LIABILITIES: 3.1% | | | | | | | 11,702,207 | |
| | | | | | | | |
| | |
NET ASSETS: 100.0% | | | | | | | $378,669,921 | |
| | | | | | | | |
| a | Certain securities were fair valued under the valuation policies approved by the Board of Trustees (Note2-A). |
| b | The securities may be resold to qualified foreign investors and foreign institutional buyers under Regulation S of the Securities Act of 1933. |
| c | Security exempt from registration under Rule 144A of the Securities Act of 1933, as amended. The security may be resold in transactions exempt from registration normally to qualified institutional buyers. The security has been determined to be liquid in accordance with procedures adopted by the Funds’ Board of Trustees. At June 30, 2019, the aggregate value is $46,751,928, which is 12.35% of net assets. |
| d | Non-income producing security. |
| ADR | American Depositary Receipt |
| REIT | Real Estate Investment Trust |
See accompanying notes to financial statements.
| | | | |
| matthewsasia.com | 800.789.ASIA | | | 29 | |

| | | | |
| PORTFOLIO MANAGERS |
|
| Beini Zhou, CFA |
Lead Manager |
|
| Michael B. Han, CFA |
Co-Manager |
| | |
| FUND FACTS | | | | |
| | |
| | | Investor | | Institutional |
Ticker | | MAVRX | | MAVAX |
CUSIP | | 577130693 | | 577130685 |
Inception | | 11/30/15 | | 11/30/15 |
NAV | | $11.62 | | $11.55 |
Initial Investment | | $2,500 | | $100,000 |
Gross Expense Ratio1 | | 1.77% | | 1.54% |
After Fee Waiver and Reimbursement2 | | 1.50% | | 1.25% |
Portfolio Statistics | | | | |
Total # of Positions | | 34 |
Net Assets | | $25.0 million |
Weighted Average Market Cap | | $26.8 billion |
Portfolio Turnover3 | | 48.29% |
Benchmark | | | | |
MSCI AC Asia ex Japan Index |
OBJECTIVE
Long-term capital appreciation.
STRATEGY
Under normal market conditions, the Fund seeks to achieve its investment objective by investing at least 80% of its net assets, which include borrowings for investment purposes, in common stock, preferred stock and other equity securities, and convertible securities of companies located in Asia. The Fund seeks to create an investable universe of value companies that it believes trade at market values with discounts to their intrinsic value, have strong financial and market positions, have strong management and are oriented to creating value for their shareholders. Matthews assesses companies within this universe according to each of these factors.
Matthews Asia Value Fund
Portfolio Manager Commentary (unaudited)
For the first half of 2019, the Matthews Asia Value Fund returned 7.00% (Investor Class) and 7.14% (Institutional Class), while its benchmark, the MSCI All Country Asia ex Japan Index, returned 10.83% over the same period. For the quarter ending June 30, the Fund returned –1.61% (Investor Class) and –1.54% (Institutional Class), while its benchmark returned –0.56%.
Market Environment:
U.S.–China trade war news, a macroeconomic slowdown in major economies, including China, and geopolitical tension between the U.S. and Iran all added to global market uncertainty in recent months. Yet U.S. markets approached record highs in early July. Global equity investors seemed to perceive an alternate—far rosier—reality. The only logical reason that might bridge the dichotomy is low interest rates. The U.S. Federal Reserve seemed to make a 180-degree turn during the second quarter from its tightening stance in late 2018, apparently signaling a rate cut ahead.
Performance Contributors and Detractors:
The Fund lagged its benchmark during the first half of the year, primarily due to the lower beta of the overall portfolio composition as well as weak performance by South Korea’s market.
A top detractor during the year-to-date period was Clear Media, a holding that we have previously commented on extensively. The company is China’s dominant bus shelter advertising concessionaire. From late 2018 through the first half of 2019, China’s macroeconomic slowdown translated into an overall slowdown in ad spending across many sectors. Brand advertising, which is typically featured in bus shelters, was hit particularly hard. The firm had stated that it expects a double-digit decline in its top line for the first half of the year. This led to its recent share price weakness. We continue to hold Clear Media shares, however, as we believe company fundamentals should rebound once brand ad spending in China recovers.
Honma Golf, the Hong Kong-listed Japanese golf club and accessory company, was another major detractor during the first half of the year. The firm announced its March-end full-year results during the second quarter. Earnings were weaker than expected with full-year operating profits down by double digits year over year. We feel positive after meeting with management recently and learning of some high-profile new hires in various key positions, including the head of global supply chain. Along with these key hires, the firm has been making a concerted effort and taking a methodical approach to entering the U.S. market.
On a positive note, two Chinese stocks, Anhui Gujing Distillery and Huifu Payment, were among the top contributors during the first half of the year. Anhui Gujing is a well-known liquor brand in China, and is the provincial leader in Anhui province. Many of the liquor stocks in the industry reported solid growth in recent periods so the gains in growth were seen widely across the sector, which saw good share price performance in the first half.
Huifu Payment is a provider of merchant payment services in China, and is among the largest merchant acquirers targeting micro-merchants in the country. Its business model is akin to U.S. mobile payments company Square. Following the firm’s
(continued)
| 1 | Prospectus expense ratios. |
| 2 | Matthews has contractually agreed (i) to waive fees and reimburse expenses to the extent needed to limit Total Annual Fund Operating Expenses (excluding Rule 12b-1 fees, taxes, interest, brokerage commissions, short sale dividend expenses, expenses incurred in connection with any merger or reorganization or extraordinary expenses such as litigation) of the Institutional Class to 1.25% first by waiving class specific expenses (i.e., shareholder service fees specific to a particular class) of the Institutional Class and then, to the extent necessary, by waiving non-class specific expenses of the Institutional Class, and (ii) if any Fund-wide expenses (i.e., expenses that apply to both the Institutional Class and the Investor Class) are waived for the Institutional Class to maintain the 1.25% expense limitation, to waive an equal amount (in annual percentage terms) of those same expenses for the Investor Class. The Total Annual Fund Operating Expenses After Fee Waiver and Expense Reimbursement for the Investor Class may vary from year to year and will in some years exceed 1.25%. If the operating expenses fall below the expense limitation in a year within three years after Matthews has made a waiver or reimbursement, the Fund may reimburse Matthews up to an amount that does not cause the expenses for that year to exceed the lesser of (i) the expense limitation applicable at the time of that fee waiver and/or expense reimbursement or (ii) the expense limitation in effect at the time of recoupment. This agreement will remain in place until April 30, 2020 and may be terminated at any time by the Board of Trustees on behalf of the Fund on 60 days’ written notice to Matthews. Matthews may decline to renew this agreement by written notice to the Trust at least 30 days before its annual expiration date. |
| 3 | The lesser of fiscal year 2018 long-term purchase costs or sales proceeds divided by the average monthly market value of long-term securities. |
| | | | | | | | | | | | | | | | | | | | | | | | |
| | | | | | | |
| PERFORMANCE AS OF JUNE 30, 2019 | | | | | | | | | | | | | | | | | | |
| | | | | | | | | Average Annual Total Returns | | | | |
| | | 3 Months | | | YTD | | | 1 Year | | | 3 Years | | | Since Inception | | | Inception Date | |
| Investor Class (MAVRX) | | | -1.61% | | | | 7.00% | | | | -1.78% | | | | 10.52% | | | | 9.29% | | | | 11/30/15 | |
| Institutional Class (MAVAX) | | | -1.54% | | | | 7.14% | | | | -1.48% | | | | 10.80% | | | | 9.58% | | | | 11/30/15 | |
| MSCI AC Asia ex Japan Index4 | | | -0.56% | | | | 10.83% | | | | -0.18% | | | | 11.81% | | | | 10.37% | | | | | |
Performance assumes reinvestment of all dividends and/or distributions before taxes. All performance quoted represents past performance and is no guarantee of future results. Investment return and principal value will fluctuate with market conditions so that when redeemed, shares may be worth more or less than their original cost. Current performance may be lower or higher than the return figures quoted. Returns would have been lower if certain of the Fund’s fees and expenses had not been waived. For the Fund’s most recent month-end performance visit matthewsasia.com.
GROWTH OF A HYPOTHETICAL $10,000 INVESTMENT SINCE INCEPTION—INVESTOR CLASS
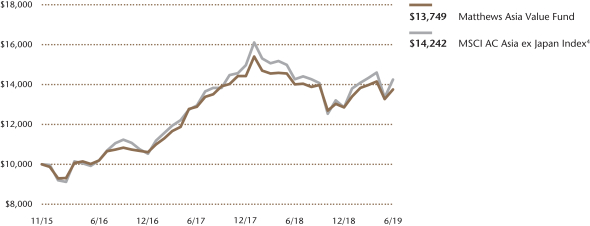
Plotted monthly. The performance data and graph do not reflect the deduction of taxes that a shareholder would pay on dividends, capital gain distributions or redemption of Fund shares. Values are in US$.
| | 4 | It is not possible to invest directly in an index. Source: Index data from Morgan Stanley Capital International and Bloomberg; total return calculations performed by BNY Mellon Investment Servicing (US) Inc. Please see page 88 for index definition. |
| | | | | | | | |
| | | | |
| TOP TEN HOLDINGS5 | | | | | | | |
| | | Sector | | Country | | % of Net Assets | |
| Naspers, Ltd. | | Consumer Discretionary | | China/Hong Kong | | | 7.9% | |
| China National Accord Medicines Corp., Ltd. | | Health Care | | China/Hong Kong | | | 6.5% | |
| CK Hutchison Holdings, Ltd. | | Industrials | | China/Hong Kong | | | 5.1% | |
| Samsung SDI Co., Ltd., Pfd. | | Information Technology | | South Korea | | | 4.4% | |
| Anhui Gujing Distillery Co., Ltd. | | Consumer Staples | | China/Hong Kong | | | 4.1% | |
| Huifu Payment, Ltd. | | Information Technology | | China/Hong Kong | | | 3.9% | |
| Shinyoung Securities Co., Ltd. | | Financials | | South Korea | | | 3.7% | |
| Haw Par Corp., Ltd. | | Health Care | | Singapore | | | 3.5% | |
| Geumhwa PSC Co., Ltd. | | Industrials | | South Korea | | | 3.4% | |
| Straits Trading Co., Ltd. | | Materials | | Singapore | | | 3.4% | |
| % OF ASSETS IN TOP TEN | | | | | | | 45.9% | |
| | 5 | Holdings may combine more than one security from same issuer and related depositary receipts. |
| | | | |
| matthewsasia.com | 800.789.ASIA | | | 31 | |
| | | | |
| |
| COUNTRY ALLOCATION (%)6,7 | |
| China/Hong Kong | | | 38.5 | |
| South Korea | | | 28.2 | |
| Japan | | | 12.7 | |
| Singapore | | | 6.9 | |
| Taiwan | | | 1.7 | |
| Malaysia | | | 1.6 | |
| United States | | | 1.3 | |
| India | | | 0.8 | |
| Indonesia | | | 0.6 | |
| Cash and Other Assets, Less Liabilities | | | 7.7 | |
| | | | |
| |
| SECTOR ALLOCATION (%)7 | |
| Consumer Discretionary | | | 18.9 | |
| Health Care | | | 15.6 | |
| Industrials | | | 14.7 | |
| Information Technology | | | 12.2 | |
| Communication Services | | | 9.1 | |
| Financials | | | 8.9 | |
| Consumer Staples | | | 7.7 | |
| Materials | | | 5.1 | |
| Cash and Other Assets, Less Liabilities | | | 7.7 | |
| | | | |
| |
| MARKET CAP EXPOSURE (%)7 | |
| Mega Cap (over $25B) | | | 21.6 | |
| Large Cap ($10B–$25B) | | | 10.8 | |
| Mid Cap ($3B–10B) | | | 13.3 | |
| Small Cap (under $3B) | | | 46.7 | |
| Cash and Other Assets, Less Liabilities | | | 7.7 | |
| 6 | Not all countries where the Fund may invest are included in the benchmark index. |
| 7 | Source: FactSet Research Systems. Percentage values in data are rounded to the nearest tenth of one percent, so the values may not sum to 100% due to rounding. Percentage values may be derived from different data sources and may not be consistent with other Fund literature. |
Matthews Asia Value Fund
Portfolio Manager Commentary (unaudited) (continued)
Hong Kong IPO last summer, we initiated a position in the company when its share price fell considerably after its listing. We believe Huifu Payment’s business model as well as its relationship with AliPay and Wechat Pay, two third-party digital payment giants affiliated with Alibaba and Tencent respectively, have not been well understood by the market. The fees that small merchants pay to accept non-cash payments for offline transactions in China are a mere fraction of that seen in the U.S. but recent regulatory action in China has led to rising fees. Barring a significant slowdown in China, we believe the firm should see solid growth over the next few years.
Notable Portfolio Changes:
We did not initiate any new positions during the second quarter. We did, however, add to some existing positions. We also exited a handful of holdings, including Nissin Food. Nissin Food is the China/Hong Kong subsidiary of the Japanese instant-noodle giant. The firm went public in Hong Kong in late 2017. We initiated the position in the same month after its poor initial public offering debut. The share price has done well since then and we sold out the position recently as it is now trading at around 10x Earnings Before Interest and Taxation (EBIT), in line with our estimated intrinsic value of the business.
We continued to consolidate the portfolio to fewer higher-quality holdings, and ended the quarter with 34 companies.
Outlook:
It is unclear what a market top would look like, but we believe we may be closer to a major market top given that Chinese coffee chain Luckin Coffee, which is less than two years old (and which is giving Starbucks China a run for its money), just went public and fetched a valuation close to US$5 billion. Never mind that its revenue was a little over US$100 million with more than US$200 million in operating losses last year.
The market, of course, is not dictated by wishful thinking. So, we remain undistracted by what we consider to be U.S.–China trade war noise. Trade deal or not in the near term, we do not think President Trump’s China deals will have much bearing on the long-term prospects of many of the quality businesses that we examine. Rather than discussing the trade war topic in meetings with management, we think it is a better use of time to further our understanding of what makes a company’s business model tick, relative to its competition. We firmly believe that it is the deep understanding of the latter rather than the former that will be a key long-term source of alpha that we seek to generate for our clients.
Matthews Asia Value Fund
June 30, 2019
Schedule of Investmentsa(unaudited)
| | | | | | | | |
| | | Shares | | | Value | |
| | |
| CHINA/HONG KONG: 38.5% | | | | | | | | |
Naspers, Ltd. N Shares | | | 8,200 | | | | $1,984,812 | |
| | |
China National Accord Medicines Corp., Ltd. B Shares | | | 462,107 | | | | 1,626,616 | |
| | |
CK Hutchison Holdings, Ltd. | | | 129,500 | | | | 1,277,356 | |
| | |
Anhui Gujing Distillery Co., Ltd. B Shares | | | 116,800 | | | | 1,013,937 | |
| | |
Huifu Payment, Ltd.b,c,d | | | 1,770,400 | | | | 970,423 | |
| | |
Clear Media, Ltd. | | | 1,393,000 | | | | 809,583 | |
| | |
China Mobile, Ltd. | | | 79,500 | | | | 723,741 | |
| | |
China Isotope & Radiation Corp. | | | 303,000 | | | | 715,061 | |
| | |
Shandong Weigao Group Medical Polymer Co., Ltd. H Shares | | | 296,000 | | | | 268,600 | |
| | |
Huangshan Tourism Development Co., Ltd. B Shares | | | 204,887 | | | | 216,853 | |
| | | | | | | | |
Total China/Hong Kong | | | | | | | 9,606,982 | |
| | | | | | | | |
| | | | | | | | |
| | | |
| SOUTH KOREA: 16.9% | | | | | | | | |
Shinyoung Securities Co., Ltd. | | | 17,510 | | | | 913,742 | |
| | |
Geumhwa PSC Co., Ltd. | | | 29,568 | | | | 858,721 | |
| | |
NAVER Corp. | | | 7,387 | | | | 730,064 | |
| | |
DGB Financial Group, Inc. | | | 91,987 | | | | 649,681 | |
| | |
Hyundai Greenfood Co., Ltd. | | | 55,158 | | | | 626,140 | |
| | |
Young Poong Corp. | | | 697 | | | | 434,625 | |
| | | | | | | | |
Total South Korea | | | | | | | 4,212,973 | |
| | | | | | | | |
| | | | | | | | |
| | | |
| JAPAN: 12.7% | | | | | | | | |
YAMADA Consulting Group Co., Ltd. | | | 31,300 | | | | 581,406 | |
| | |
Asante, Inc. | | | 29,700 | | | | 580,343 | |
| | |
Gakujo Co., Ltd. | | | 47,300 | | | | 523,260 | |
| | |
Honma Golf, Ltd.b,d | | | 491,500 | | | | 426,587 | |
| | |
Medikit Co., Ltd. | | | 7,400 | | | | 406,326 | |
| | |
Ohashi Technica, Inc. | | | 27,300 | | | | 359,767 | |
| | |
San-A Co., Ltd. | | | 7,100 | | | | 284,079 | |
| | | | | | | | |
Total Japan | | | | | | | 3,161,768 | |
| | | | | | | | |
| | | | | | | | |
| | | |
| SINGAPORE: 6.9% | | | | | | | | |
Haw Par Corp., Ltd. | | | 84,200 | | | | 878,717 | |
| | |
Straits Trading Co., Ltd. | | | 509,100 | | | | 843,137 | |
| | | | | | | | |
Total Singapore | | | | | | | 1,721,854 | |
| | | | | | | | |
| | | | | | | | |
| | | |
| TAIWAN: 1.7% | | | | | | | | |
P-Duke Technology Co., Ltd. | | | 145,000 | | | | 433,893 | |
| | | | | | | | |
Total Taiwan | | | | | | | 433,893 | |
| | | | | | | | |
| | | | | | | | |
| | | |
| MALAYSIA: 1.6% | | | | | | | | |
Genting BHD | | | 243,700 | | | | 399,556 | |
| | | | | | | | |
Total Malaysia | | | | | | | 399,556 | |
| | | | | | | | |
| | | | | | | | |
| | | |
| UNITED STATES: 1.3% | | | | | | | | |
Cognizant Technology Solutions Corp. Class A | | | 5,100 | | | | 323,289 | |
| | | | | | | | |
Total United States | | | | | | | 323,289 | |
| | | | | | | | |
| | | | | | | | |
| | | |
| INDIA: 0.8% | | | | | | | | |
Wipro, Ltd. | | | 48,962 | | | | 199,315 | |
| | | | | | | | |
Total India | | | | | | | 199,315 | |
| | | | | | | | |
| | | | | | | | |
| | | | | | | | |
| | | Shares | | | Value | |
| | |
| INDONESIA: 0.6% | | | | | | | | |
PT Mitra Pinasthika Mustika | | | 2,618,100 | | | | $158,533 | |
| | | | | | | | |
Total Indonesia | | | | | | | 158,533 | |
| | | | | | | | |
| | | | | | | | |
| | | |
| TOTAL COMMON EQUITIES | | | | | | | 20,218,163 | |
| | | | | | | | |
(Cost $20,467,640) | | | | | | | | |
| | | | | | | | |
| | |
PREFERRED EQUITIES: 11.3% | | | | | | | | |
| | | |
| SOUTH KOREA: 11.3% | | | | | | | | |
Samsung SDI Co., Ltd., Pfd. | | | 13,796 | | | | 1,091,394 | |
| | |
Samsung Fire & Marine Insurance Co., Ltd., Pfd. | | | 4,018 | | | | 666,183 | |
| | |
Hyundai Motor Co., Ltd., 2nd Pfd. | | | 8,095 | | | | 605,609 | |
| | |
Samsung Electronics Co., Ltd., Pfd. | | | 14,134 | | | | 468,745 | |
| | | | | | | | |
Total South Korea | | | | | | | 2,831,931 | |
| | | | | | | | |
| | | | | | | | |
| | | |
| TOTAL PREFERRED EQUITIES | | | | | | | 2,831,931 | |
| | | | | | | | |
(Cost $2,867,604) | | | | | | | | |
| | | | | | | | |
| | | |
| TOTAL INVESTMENTS: 92.3% | | | | | | | 23,050,094 | |
(Cost $23,335,244) | | | | | | | | |
| | | | | | | | |
| | |
CASH AND OTHER ASSETS,
LESS LIABILITIES: 7.7% | | | | | | | 1,921,255 | |
| | | | | | | | |
| | |
NET ASSETS: 100.0% | | | | | | | $24,971,349 | |
| | | | | | | | |
| a | Certain securities were fair valued under the valuation policies approved by the Board of Trustees (Note2-A). |
| b | Security exempt from registration under Rule 144A of the Securities Act of 1933, as amended. The security may be resold in transactions exempt from registration normally to qualified institutional buyers. The security has been determined to be liquid in accordance with procedures adopted by the Funds’ Board of Trustees. At June 30, 2019, the aggregate value is $1,397,010, which is 5.59% of net assets. |
| c | Non-income producing security. |
| d | The securities may be resold to qualified foreign investors and foreign institutional buyers under Regulation S of the Securities Act of 1933. |
See accompanying notes to financial statements.
| | | | |
| matthewsasia.com | 800.789.ASIA | | | 33 | |

| | | | |
| PORTFOLIO MANAGERS |
| |
| Taizo Ishida | | |
Lead Manager | | |
| |
Weihao Xu | | |
Co-Manager | | |
|
| FUND FACTS |
| | |
| | | Investor | | Institutional |
Ticker | | MPACX | | MIAPX |
CUSIP | | 577130867 | | 577130776 |
Inception | | 10/31/03 | | 10/29/10 |
NAV | | $26.04 | | $26.25 |
Initial Investment | | $2,500 | | $100,000 |
Gross Expense Ratio1 | | 1.10% | | 0.93% |
Portfolio Statistics | | | | |
Total # of Positions | | | | 62 |
Net Assets | | | | $1.1 billion |
Weighted Average Market Cap | | $30.9 billion |
Portfolio Turnover2 | | | | 12.12% |
Benchmark |
MSCI AC Asia Pacific Index |
OBJECTIVE
Long-term capital appreciation.
STRATEGY
Under normal market conditions, the Fund seeks to achieve its investment objective by investing at least 80% of its net assets, which include borrowings for investment purposes, in the common and preferred stocks of companies located in Asia. Asia consists of all countries and markets in Asia, and includes developed, emerging and frontier countries and markets in the Asian region. The Fund may also invest in the convertible securities, of any duration or quality, of Asian companies.
Matthews Asia Growth Fund
Portfolio Manager Commentary (unaudited)
For the first half of 2019, the Matthews Asia Growth Fund returned 15.78% (Investor Class) and 15.89% (Institutional Class), while its benchmark, the MSCI All Country Asia Pacific Index, returned 10.71% over the same period. For the quarter ending June 30, the Fund returned 1.28% (Investor Class) and 1.35% (Institutional Class), while the benchmark returned 0.90%.
Market Environment:
Asia’s capital markets rallied at the start of the year, led by Chinese equities. Volatility flared in May, followed by a rebound for equity prices in June. The dominant factors driving Asia’s capital markets over the short term were political, stemming from rhetoric around trade relations between the U.S. and China. Following the recent G-20 Summit, the tone of dialogue surrounding trade issues improved, even though negotiations provided few details and trade issues are likely to linger. Despite recent volatility, China’s domestic markets and the Hong Kong market were among the best-performing markets in Asia.
Japanese equities posted solid gains in the first half, even as global markets experienced swings in sentiment. Early this year, the U.S. Federal Reserve’s pause in rate hikes improved investor sentiment and Japan’s equity valuations came back from their lowest levels since the start of the Abenomics era. In May, however, trade friction between U.S. and China intensified, dampening Japanese export companies and Japan’s technology sector in particular. The Bank of Japan’s most recent Tankan Survey (announced July 1) showed further deterioration in the outlook among respondents within the manufacturing sector, reflecting weakness in exports, especially among semiconductor-related products.
Performance Contributors and Detractors:
The Fund outperformed its benchmark in the first half. The majority of the outperformance was generated during the first quarter, with performance largely flat in the second quarter. Our stock selection in China, the health care sector and small companies contributed to performance. Detractors included the Fund’s allocation to Sri Lanka, its underweight to information technology and stock selection in large companies.
At an individual stock level, Chinese health care stocks were among the Fund’s top contributors to performance in the first half. Health care demand in China remains robust and we continue to see the growth of domestic health care companies as part of a long-term, secular trend. Examples of our holdings in this sector include Jiangsu Hengrui Medicine, a leading Chinese drug manufacturer, and Wuxi Biologics, one of China’s largest providers of outsourcing services for clinical trials. Both companies were top contributors in the half. Meanwhile, Genscript Biotech, a Nanjing-based Chinese biotech company, is a leader in global gene synthesis and DNA synthesis services markets. Genscript was also a top contributor in the half.
A detractor from performance was Chinese search engine Baidu. As Chinese consumers increasingly move to other platforms to perform searches, Baidu could see its user base shrink. Valuations for Baidu are currently fairly low, so the stock could have upside potential if the company can rekindle its growth. We continue to evaluate and monitor the position.
Notable Portfolio Changes:
Recent IPOs provided us with opportunities to invest in Chinese health care companies. In the second quarter, we added positions in drug manufacturers Hansoh Pharmaceutical Group and NextCure. We also added a position in Chinese
(continued)
| 1 | Prospectus expense ratios. |
| 2 | The lesser of fiscal year 2018 long-term purchase costs or sales proceeds divided by the average monthly market value of long-term securities. |
| | | | | | | | | | | | | | | | | | | | | | | | | | | | | | |
| |
| PERFORMANCE AS OF JUNE 30, 2019 | |
| | | | | | | | Average Annual Total Returns | | | | |
| | | 3 Months | | YTD | | | 1 Year | | | 3 Years | | | 5 Years | | | 10 Years | | | Since Inception | | | Inception Date | |
| Investor Class (MPACX) | | 1.28% | | | 15.78% | | | | -5.84% | | | | 9.58% | | | | 5.91% | | | | 9.89% | | | | 8.96% | | | | 10/31/03 | |
| Institutional Class (MIAPX) | | 1.35% | | | 15.89% | | | | -5.65% | | | | 9.78% | | | | 6.11% | | | | n.a. | | | | 6.79% | | | | 10/29/10 | |
| MSCI AC Asia Pacific Index3 | | 0.90% | | | 10.71% | | | | -0.76% | | | | 10.40% | | | | 4.70% | | | | 7.36% | | | | 6.92% | 4 | | | | |
Performance assumes reinvestment of all dividends and/or distributions before taxes. All performance quoted represents past performance and is no guarantee of future results. Investment return and principal value will fluctuate with market conditions so that when redeemed, shares may be worth more or less than their original cost. Current performance may be lower or higher than the return figures quoted. For the Fund’s most recent month-end performance, visit matthewsasia.com.
GROWTH OF A HYPOTHETICAL $10,000 INVESTMENT SINCE INCEPTION—INVESTOR CLASS
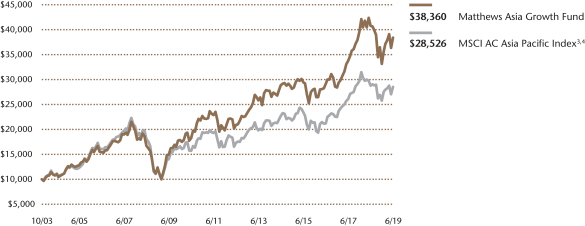
Plotted monthly. The performance data and graph do not reflect the deduction of taxes that a shareholder would pay on dividends, capital gains distributions or redemption of Fund shares. Values are in US$.
| | 3 | It is not possible to invest directly in an index. Source: Index data from Morgan Stanley Capital International and Bloomberg; total return calculations performed by BNY Mellon Investment Servicing (US) Inc. Please see page 88 for index definition. |
| | 4 | Calculated from 10/31/03. |
| | | | | | | | |
| | | | |
| TOP TEN HOLDINGS5 | | | | | | | |
| | | Sector | | Country | | % of Net Assets | |
| Shenzhou International Group Holdings, Ltd. | | Consumer Discretionary | | China/Hong Kong | | | 3.9% | |
| Baozun, Inc. | | Consumer Discretionary | | China/Hong Kong | | | 3.6% | |
| HDFC Bank, Ltd. | | Financials | | India | | | 3.6% | |
| PT Bank Rakyat Indonesia Persero | | Financials | | Indonesia | | | 3.6% | |
| CSL, Ltd. | | Health Care | | Australia | | | 3.3% | |
| M3, Inc. | | Health Care | | Japan | | | 3.0% | |
| Wuxi Biologics Cayman, Inc. | | Health Care | | China/Hong Kong | | | 3.0% | |
| Terumo Corp. | | Health Care | | Japan | | | 2.8% | |
| Sony Corp. | | Consumer Discretionary | | Japan | | | 2.7% | |
| Jiangsu Hengrui Medicine Co., Ltd. | | Health Care | | China/Hong Kong | | | 2.7% | |
| % OF ASSETS IN TOP TEN | | | | | | | 32.2% | |
| | 5 | Holdings may combine more than one security from same issuer and related depositary receipts. |
| | | | |
| matthewsasia.com | 800.789.ASIA | | | 35 | |
| | | | |
| |
| COUNTRY ALLOCATION (%)6,7 | |
| Japan | | | 37.9 | |
| China/Hong Kong | | | 30.7 | |
| Indonesia | | | 8.2 | |
| India | | | 4.9 | |
| Australia | | | 4.4 | |
| Bangladesh | | | 3.7 | |
| Sri Lanka | | | 2.1 | |
| Thailand | | | 1.6 | |
| Philippines | | | 1.5 | |
| Vietnam | | | 1.5 | |
| Taiwan | | | 1.0 | |
| United States | | | 0.6 | |
| Cash and Other Assets, Less Liabilities | | | 2.0 | |
| | | | |
| |
| SECTOR ALLOCATION (%)7 | |
| Health Care | | | 33.5 | |
| Consumer Discretionary | | | 21.4 | |
| Financials | | | 13.5 | |
| Consumer Staples | | | 8.9 | |
| Industrials | | | 8.4 | |
| Communication Services | | | 8.0 | |
| Information Technology | | | 2.4 | |
| Energy | | | 1.1 | |
| Materials | | | 0.8 | |
| Cash and Other Assets, Less Liabilities | | | 2.0 | |
| | | | |
| |
| MARKET CAP EXPOSURE (%)7 | |
| Mega Cap (over $25B) | | | 28.1 | |
| Large Cap ($10B–$25B) | | | 21.1 | |
| Mid Cap ($3B–10B) | | | 20.5 | |
| Small Cap (under $3B) | | | 28.2 | |
| Cash and Other Assets, Less Liabilities | | | 2.0 | |
| 6 | Not all countries where the Fund may invest are included in the benchmark index. |
| 7 | Source: FactSet Research Systems. Percentage values in data are rounded to the nearest tenth of one percent, so the values may not sum to 100% due to rounding. Percentage values may be derived from different data sources and may not be consistent with other Fund literature. |
Matthews Asia Growth Fund
Portfolio Manager Commentary (unaudited) (continued)
biopharma company Innovent Biologics. In China’s social media space, we added a position in Bilibili, an online platform for sharing short videos with a growing user base. Bilibili’s platform specifically caters to Gen Z, representing consumers age 24 and younger. Gen Z grew up using mobile devices and spends more for internet content than other groups. Turning to Japan, we initiated a position in SBI Holdings, the largest online broker and second-largest among all brokerages in Japan. Unlike competitors, SBI Holding’s core demographics are younger customers in their 30s and 40s, a customer base that is set to grow given Japan pensions are no longer sufficient enough to support retirement life. In Indonesia, we initiated a position in Bank Tabungan Pensiunan Nasi, a microlender with a niche market representing high growth potential.
In the second quarter, we exited positions in Japanese financial services provider Orix and Indonesian conglomerate Astra International. Both companies were long-term holdings that generated attractive returns over full market cycles. Both companies seem to be shifting into lower growth modes, however, so we exited the positions.
Outlook:
Looking ahead, economic signals appear somewhat mixed. On the positive side, interest rates are widely expected to ease or hold steady, while oil prices seem to remain in check. Both conditions are positive for Asia currencies. While trade tensions have temporarily softened, several issues remain unresolved and U.S. President Donald Trump’s negotiation style has been unpredictable. Against this backdrop of uncertainty, China’s policymakers have signaled a willingness to take a more proactive stance in using fiscal and monetary policy to support growth.
While Japanese equities experienced healthy gains in the first quarter, the macro environment remains muted and second quarter broad market equity returns were mixed. Underlying fundamentals are still on a downward path, and developments surrounding trade frictions remain unpredictable. We do not expect any dramatic outcomes or resolution of the current issues. On a positive note, corporate inventory levels have declined quickly in the past six months. Recent earnings results showed an earnings decline in many sectors but absolute profit levels remain higher than during past downturns.
Elsewhere in the region, elections in India and Indonesia resulted in wins for the incumbents, adding political stability to both countries. With elections concluded, reform cycles in both countries could get a boost.
Matthews Asia Growth Fund
June 30, 2019
Schedule of Investmentsa(unaudited)
COMMON EQUITIES: 98.0%
| | | | | | | | |
| | | Shares | | | Value | |
| | |
| JAPAN: 37.9% | | | | | | | | |
M3, Inc. | | | 1,843,300 | | | | $33,826,142 | |
| | |
Terumo Corp. | | | 1,041,400 | | | | 31,110,218 | |
| | |
Sony Corp. | | | 577,800 | | | | 30,363,375 | |
| | |
Nidec Corp. | | | 218,500 | | | | 30,007,696 | |
| | |
SoftBank Group Corp. | | | 613,800 | | | | 29,563,878 | |
| | |
Keyence Corp. | | | 43,800 | | | | 27,012,445 | |
| | |
Pigeon Corp. | | | 544,900 | | | | 21,973,569 | |
| | |
TechnoPro Holdings, Inc. | | | 399,800 | | | | 21,341,912 | |
| | |
PeptiDream, Inc.b | | | 411,000 | | | | 21,109,770 | |
| | |
Nitori Holdings Co., Ltd. | | | 133,400 | | | | 17,702,480 | |
| | |
Seria Co., Ltd. | | | 633,000 | | | | 14,641,631 | |
| | |
Mercari, Inc.b | | | 531,300 | | | | 14,153,197 | |
| | |
Japan Elevator Service Holdings Co., Ltd. | | | 555,100 | | | | 14,100,831 | |
| | |
Eisai Co., Ltd. | | | 238,500 | | | | 13,517,280 | |
| | |
Ariake Japan Co., Ltd. | | | 208,300 | | | | 13,179,763 | |
| | |
Sosei Group Corp.b | | | 550,900 | | | | 12,177,272 | |
| | |
FANUC Corp. | | | 63,400 | | | | 11,780,528 | |
| | |
SanBio Co., Ltd.b | | | 364,200 | | | | 11,731,016 | |
| | |
SBI Holdings, Inc. | | | 446,400 | | | | 11,087,789 | |
| | |
Sysmex Corp. | | | 153,200 | | | | 10,022,358 | |
| | |
HEALIOS KKb | | | 553,300 | | | | 9,238,371 | |
| | |
Nitto Denko Corp. | | | 184,700 | | | | 9,142,004 | |
| | |
Kyoritsu Maintenance Co., Ltd. | | | 176,400 | | | | 8,259,517 | |
| | |
CYBERDYNE, Inc.b | | | 768,500 | | | | 4,484,394 | |
| | |
Link And Motivation, Inc. | | | 564,400 | | | | 3,185,789 | |
| | | | | | | | |
Total Japan | | | | | | | 424,713,225 | |
| | | | | | | | |
| | | | | | | | |
| | | |
| CHINA/HONG KONG: 30.6% | | | | | | | | |
Shenzhou International Group Holdings, Ltd. | | | 3,155,000 | | | | 43,522,318 | |
| | |
Baozun, Inc. ADRb | | | 818,500 | | | | 40,810,410 | |
| | |
Wuxi Biologics Cayman, Inc.b,c,d | | | 3,693,000 | | | | 33,131,764 | |
| | |
Jiangsu Hengrui Medicine Co., Ltd. A Shares | | | 3,123,824 | | | | 30,063,350 | |
| | |
Genscript Biotech Corp.b | | | 11,934,000 | | | | 29,945,395 | |
| | |
BeiGene, Ltd. ADRb | | | 223,300 | | | | 27,678,035 | |
| | |
Huazhu Group, Ltd. ADR | | | 686,700 | | | | 24,892,875 | |
| | |
Alibaba Group Holding, Ltd. ADRb | | | 127,200 | | | | 21,554,040 | |
| | |
Tencent Music Entertainment Group ADRb | | | 920,200 | | | | 13,793,798 | |
| | |
Shenzhen Inovance Technology Co., Ltd. A Sharesb | | | 4,069,575 | | | | 13,600,582 | |
| | |
Autohome, Inc. ADRb | | | 145,500 | | | | 12,457,710 | |
| | |
Innovent Biologics, Inc.b,c,d | | | 3,500,500 | | | | 11,825,942 | |
| | |
Yixintang Pharmaceutical Group Co., Ltd. A Shares | | | 2,654,796 | | | | 11,039,804 | |
| | |
Shanghai Haohai Biological Technology Co., Ltd. H Sharesc,d | | | 1,873,800 | | | | 10,213,436 | |
| | |
Bilibili, Inc. ADRb | | | 592,100 | | | | 9,633,467 | |
| | |
Baidu, Inc. ADRb | | | 51,600 | | | | 6,055,776 | |
| | |
Hansoh Pharmaceutical Group Co., Ltd.b,c,d | | | 1,070,000 | | | | 2,828,514 | |
| | | | | | | | |
Total China/Hong Kong | | | | | | | 343,047,216 | |
| | | | | | | | |
| | | | | | | | |
| | | | | | | | |
| | | Shares | | | Value | |
| | |
| INDONESIA: 8.2% | | | | | | | | |
PT Bank Rakyat Indonesia Persero | | | 129,492,600 | | | | $39,977,615 | |
| | |
PT Bank Tabungan Pensiunan Nasional Syariahb | | | 89,471,600 | | | | 21,849,107 | |
| | |
PT Ace Hardware Indonesia | | | 82,006,700 | | | | 10,507,555 | |
| | |
PT Indofood CBP Sukses Makmur | | | 13,577,500 | | | | 9,759,116 | |
| | |
PT Mayora Indah | | | 54,105,900 | | | | 9,500,090 | |
| | | | | | | | |
Total Indonesia | | | | | | | 91,593,483 | |
| | | | | | | | |
| | | | | | | | |
| | | |
| INDIA: 4.9% | | | | | | | | |
HDFC Bank, Ltd. | | | 1,148,086 | | | | 40,666,637 | |
| | |
ITC, Ltd. | | | 2,925,894 | | | �� | 11,602,355 | |
| | |
PC Jeweller, Ltd. | | | 3,698,554 | | | | 2,425,263 | |
| | | | | | | | |
Total India | | | | | | | 54,694,255 | |
| | | | | | | | |
| | | | | | | | |
| | | |
| AUSTRALIA: 4.4% | | | | | | | | |
CSL, Ltd. | | | 240,892 | | | | 36,476,805 | |
| | |
Oil Search, Ltd. | | | 2,481,915 | | | | 12,376,911 | |
| | | | | | | | |
Total Australia | | | | | | | 48,853,716 | |
| | | | | | | | |
| | | | | | | | |
| | | |
| BANGLADESH: 3.7% | | | | | | | | |
Square Pharmaceuticals, Ltd. | | | 8,767,712 | | | | 27,292,287 | |
| | |
BRAC Bank, Ltd.b | | | 17,927,755 | | | | 14,105,003 | |
| | | | | | | | |
Total Bangladesh | | | | | | | 41,397,290 | |
| | | | | | | | |
| | | | | | | | |
| | | |
| SRI LANKA: 2.1% | | | | | | | | |
Sampath Bank PLC† | | | 21,899,216 | | | | 17,276,809 | |
| | |
LOLC Holdings PLCb | | | 12,121,473 | | | | 6,249,775 | |
| | | | | | | | |
Total Sri Lanka | | | | | | | 23,526,584 | |
| | | | | | | | |
| | | | | | | | |
| | | |
| THAILAND: 1.6% | | | | | | | | |
Major Cineplex Group Public Co., Ltd. | | | 18,967,100 | | | | 18,086,447 | |
| | | | | | | | |
Total Thailand | | | | | | | 18,086,447 | |
| | | | | | | | |
| | | | | | | | |
| | | |
| PHILIPPINES: 1.5% | | | | | | | | |
Jollibee Foods Corp. | | | 2,007,890 | | | | 11,045,979 | |
| | |
Emperador, Inc.b | | | 37,942,500 | | | | 5,657,865 | |
| | | | | | | | |
Total Philippines | | | | | | | 16,703,844 | |
| | | | | | | | |
| | | | | | | | |
| | | |
| VIETNAM: 1.5% | | | | | | | | |
Vietnam Dairy Products JSC | | | 3,116,592 | | | | 16,467,160 | |
| | | | | | | | |
Total Vietnam | | | | | | | 16,467,160 | |
| | | | | | | | |
| | | | | | | | |
| | | |
| TAIWAN: 1.0% | | | | | | | | |
St. Shine Optical Co., Ltd. | | | 630,000 | | | | 11,197,753 | |
| | | | | | | | |
Total Taiwan | | | | | | | 11,197,753 | |
| | | | | | | | |
| | | | | | | | |
| | | | |
| matthewsasia.com | 800.789.ASIA | | | 37 | |
Matthews Asia Growth Fund
June 30, 2019
Schedule of Investmentsa(unaudited) (continued)
| | | | | | | | |
| | | Shares | | | Value | |
| | |
| UNITED STATES: 0.6% | | | | | | | | |
NextCure, Inc.b | | | 450,000 | | | | $6,741,000 | |
| | | | | | | | |
Total United States | | | | | | | 6,741,000 | |
| | | | | | | | |
| | | | | | | | |
| | | |
| TOTAL INVESTMENTS: 98.0% | | | | | | | 1,097,021,973 | |
(Cost $877,988,873) | | | | | | | | |
| | | | | | | | |
| | |
CASH AND OTHER ASSETS,
LESS LIABILITIES: 2.0% | | | | | | | 22,806,092 | |
| | | | | | | | |
| | |
NET ASSETS: 100.0% | | | | | | | $1,119,828,065 | |
| | | | | | | | |
| a | Certain securities were fair valued under the valuation policies approved by the Board of Trustees (Note2-A). |
| b | Non-income producing security. |
| c | Security exempt from registration under Rule 144A of the Securities Act of 1933, as amended. The security may be resold in transactions exempt from registration normally to qualified institutional buyers. The security has been determined to be liquid in accordance with procedures adopted by the Funds’ Board of Trustees. At June 30, 2019, the aggregate value is $57,999,656, which is 5.18% of net assets. |
| d | The securities may be resold to qualified foreign investors and foreign institutional buyers under Regulation S of the Securities Act of 1933. |
| † | Affiliated Issuer, as defined under the Investment Company Act of 1940 (ownership of 5% or more of the outstanding voting securities of this issuer). |
| ADR | American Depositary Receipt |
See accompanying notes to financial statements.
| | | | |
| PORTFOLIO MANAGERS |
| | |
| Sharat Shroff, CFA | | | | |
Lead Manager | | | | |
| |
| Rahul Gupta | | Raymond Deng |
Co-Manager | | Co-Manager |
| | |
| FUND FACTS | | | | |
| | |
| | | Investor | | Institutional |
Ticker | | MAPTX | | MIPTX |
CUSIP | | 577130107 | | 577130834 |
Inception | | 9/12/94 | | 10/29/10 |
NAV | | $28.91 | | $28.90 |
Initial Investment | | $2,500 | | $100,000 |
Gross Expense Ratio1 | | 1.07% | | 0.90% |
After Fee Waiver and Reimbursement2 | | 1.04% | | 0.88% |
Portfolio Statistics | | |
Total # of Positions | | 63 |
Net Assets | | $9.2 billion |
Weighted Average Market Cap | | $72.0 billion |
Portfolio Turnover3 | | | | 11.48% |
Benchmark |
MSCI AC Asia ex Japan Index |
OBJECTIVE
Long-term capital appreciation.
STRATEGY
Under normal market conditions, the Fund seeks to achieve its investment objective by investing at least 80% of its net assets, which include borrowings for investment purposes, in the common and preferred stocks of companies located in Asia ex Japan, which consists of all countries and markets in Asia excluding Japan, but including all other developed, emerging and frontier countries and markets in the Asian region.
Matthews Pacific Tiger Fund
Portfolio Manager Commentary (unaudited)
For the first half of 2019, the Matthews Pacific Tiger Fund returned 7.63% (Investor Class) and 7.72% (Institutional Class), while its benchmark, the MSCI All Country Asia ex Japan Index, returned 10.83% over the same period. For the quarter ending June 30, 2019, the Fund returned 0.03% (Investor Class) and 0.10% (Institutional Class), while the benchmark returned –0.56%.
Market Environment:
The first half of the year felt like a roller-coaster ride for equity investors across the region. Asia’s capital markets rallied at the start of the year, led by Chinese equities. Volatility flared in May, followed by a rebound in equity prices in June. The dominant factors driving Asia capital markets over the short term were political, stemming from rhetoric around trade relations between the U.S. and China. Following the recent G-20 Summit, the tone of trade dialogue improved, even though negotiations provided few details and trade issues are likely to linger. On a positive note, China’s policymakers seem to be taking a more proactive stance in preparing China for a more uncertain macroeconomic environment. Despite recent volatility, China’s domestic markets and the Hong Kong market were among the best-performing markets in Asia.
Outside of China, Asian markets were generally positive, but seemed lackluster compared with China’s markets. Chinese equities returned roughly 14% year to date, while India and Indonesia’s equity markets each notched roughly 8% gains respectively for the same period. Currencies were somewhat stable with the exception of the Taiwanese dollar and the Korean won, which were more exposed to the tech cycle. Larger companies tended to do better, perhaps due to index flows, but also in their prospects for having slightly better earnings profiles than some smaller companies.
Contributors and Detractors:
The Fund lagged its benchmark in the first half. Several factors weighed on relative performance, one of the most significant being an overweight allocation to India. Our holdings in India are the natural outcome of our bottom-up stock selection process. The Indian companies in our portfolio embody, we believe, many attractive investment attributes and provide opportunities for finding uncorrelated earnings growth. In the short term, however, our Indian holdings caused performance to trail the benchmark.
From a sector standpoint, our holdings in communication services were also a detractor from relative performance. While the benchmark tends to be concentrated in a couple of big technology names in China, the Fund takes a more diversified approach to investing in Asia’s digital economy, seeking to spread our holdings across the region. One such holding is Naver, South Korea’s largest search engine. To expand its business beyond search advertising revenues, Naver is looking to diversify its business model to include gaming, e-commerce payments and cloud-based services. To achieve these goals, Naver is making near-term investments that weigh on its earnings profile. However, we continue to like the company’s long-term prospects.
For the most recent quarter, the Fund was slightly ahead of its benchmark. Strong stock selection, particularly in China, was a contributor to performance in the quarter. We continue to see increased investment opportunities in China, especially in China’s dynamic service sector, which we discuss in the next section.
(continued)
| 1 | Prospectus expense ratios. |
| 2 | Matthews has contractually agreed to waive a portion of its advisory fee and administrative and shareholder services fee if the Fund’s average daily net assets are over $3 billion, as follows: for every $2.5 billion average daily net assets of the Fund that are over $3 billion, the advisory fee rate and the administrative and shareholder services fee rate for the Fund with respect to such excess average daily net assets will be each reduced by 0.01%, in each case without reducing such fee rate below 0.00%. Any amount waived by Matthews pursuant to this agreement may not be recouped by Matthews. This agreement will remain in place until April 30, 2020 and may be terminated (i) at any time by the Board of Trustees upon 60 days’ prior written notice to Matthews; or (ii) by Matthews at the annual expiration date of the agreement upon 60 days’ prior written notice to the Trust, in each case without payment of any penalty. |
| 3 | The lesser of fiscal year 2018 long-term purchase costs or sales proceeds divided by the average monthly market value of long-term securities. |
| | | | |
| matthewsasia.com | 800.789.ASIA | | | 39 | |
| | | | | | | | | | | | | | | | | | | | | | | | | | | | | | | | |
| |
| PERFORMANCE AS OF JUNE 30, 2019 | |
| | | | | | | | | Average Annual Total Returns | | | | |
| | | 3 Months | | | YTD | | | 1 Year | | | 3 Years | | | 5 Years | | | 10 Years | | | Since
Inception | | | Inception
Date | |
| Investor Class (MAPTX) | | | 0.03% | | | | 7.63% | | | | 1.14% | | | | 8.72% | | | | 5.95% | | | | 9.83% | | | | 8.54% | | | | 9/12/94 | |
| Institutional Class (MIPTX) | | | 0.10% | | | | 7.72% | | | | 1.31% | | | | 8.91% | | | | 6.13% | | | | n.a. | | | | 6.12% | | | | 10/29/10 | |
| MSCI AC Asia ex Japan Index4 | | | -0.56% | | | | 10.83% | | | | -0.18% | | | | 11.81% | | | | 5.14% | | | | 8.17% | | | | 4.50% | 5 | | | | |
Performance assumes reinvestment of all dividends and/or distributions before taxes. All performance quoted represents past performance and is no guarantee of future results. Investment return and principal value will fluctuate with market conditions so that when redeemed, shares may be worth more or less than their original cost. Current performance may be lower or higher than the return figures quoted. Returns would have been lower if certain of the Fund’s fees and expenses had not been waived. For the Fund’s most recent month-end performance, visit matthewsasia.com.
GROWTH OF A HYPOTHETICAL $10,000 INVESTMENT SINCE INCEPTION—INVESTOR CLASS
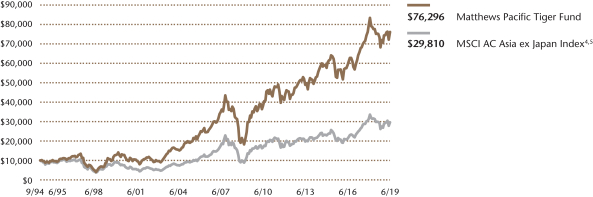
Plotted monthly. The performance data and graph do not reflect the deduction of taxes that a shareholder would pay on dividends, capital gains distributions or redemption of Fund shares. Values are in US$.
| | 4 | It is not possible to invest directly in an index. Source: Index data from Morgan Stanley Capital International and Bloomberg; total return calculations performed by BNY Mellon Investment Servicing (US) Inc. Please see page 88 for index definition. |
| | 5 | Calculated from 8/31/94. |
| | | | | | | | |
| | | | |
| TOP TEN HOLDINGS6 | | | | | | | |
| | | Sector | | Country | | % of Net Assets | |
| Ping An Insurance Group Co. of China, Ltd. | | Financials | | China/Hong Kong | | | 4.0% | |
| Inner Mongolia Yili Industrial Group Co., Ltd. | | Consumer Staples | | China/Hong Kong | | | 3.6% | |
| China Resources Land, Ltd. | | Real Estate | | China/Hong Kong | | | 3.6% | |
| Tencent Holdings, Ltd. | | Communication Services | | China/Hong Kong | | | 3.5% | |
| AIA Group, Ltd. | | Financials | | China/Hong Kong | | | 3.3% | |
| Alibaba Group Holding, Ltd. | | Consumer Discretionary | | China/Hong Kong | | | 3.2% | |
| China Resources Beer Holdings Co., Ltd. | | Consumer Staples | | China/Hong Kong | | | 2.9% | |
| NAVER Corp. | | Communication Services | | South Korea | | | 2.9% | |
| DKSH Holding AG | | Industrials | | Switzerland | | | 2.6% | |
| Kotak Mahindra Bank, Ltd. | | Financials | | India | | | 2.6% | |
| % OF ASSETS IN TOP TEN | | | | | | | 32.2% | |
| | 6 | Holdings may combine more than one security from same issuer and related depositary receipts. |
Matthews Pacific Tiger Fund
Portfolio Manager Commentary (unaudited) (continued)
Notable Portfolio Changes:
Recent IPOs provided opportunities for the Fund to invest in Chinese health care and education companies, sectors we believe are poised to benefit from rising incomes and domestic consumer spending. To fund new positions, we trimmed holdings in South Korea and Malaysia. Meanwhile, we also rotated capital within the portfolio. A few existing holdings experienced temporary aberrations in their earnings profiles, creating opportunities to add to high-conviction positions. Before committing additional capital, we conducted thorough due diligence to garner the confidence that any disruptions were short term in nature. Beyond China, we also added capital around the margins to holdings in Indonesia.
Outlook:
Media coverage of U.S. and China trade relations tends to focus on short-term developments. Investing with a long-term view, we try to ignore the noise and remain focused on the fundamentals that actually drive growth. We pay particular attention to company earnings, as well as secular trends we see on the ground. Amid current headlines, it is easy for investors to lose sight of the transformation that is taking place among China’s enormous middle class. Income growth has expanded rapidly from the eastern seaboard of China to the country’s vast interior. We expect consumers in less-developed urban centers to drive China’s economic growth for many years to come, so we continue to look for businesses that are geared toward that opportunity set.
Outside of China, recent elections in India and Indonesia resulted in wins for incumbents, adding a sense of political stability in both countries. With elections concluded, we are optimistic that reform cycles in both countries could get a boost. In the near term, an easing monetary environment may loosen some of the constraints on liquidity, and hence be a bit more supportive of growth. Inspired by the innovation and grit of Asia’s entrepreneurs, we will continue to look for opportunities across the market-cap spectrum, including small and medium-size enterprises. As always, we will invest in companies that we believe have sustainable growth prospects that harness the rising spending power of Asia’s middle class.
| | | | |
| |
| COUNTRY ALLOCATION (%)7,8 | |
| China/Hong Kong | | | 39.6 | |
| India | | | 19.0 | |
| South Korea | | | 10.8 | |
| Indonesia | | | 7.4 | |
| Thailand | | | 5.0 | |
| Taiwan | | | 4.6 | |
| Philippines | | | 2.6 | |
| Switzerland | | | 2.6 | |
| Malaysia | | | 2.1 | |
| United States | | | 1.8 | |
| Vietnam | | | 1.7 | |
| Japan | | | 0.6 | |
| Cash and Other Assets, Less Liabilities | | | 2.3 | |
| | | | |
| |
| SECTOR ALLOCATION (%)8 | |
| Financials | | | 26.3 | |
| Consumer Staples | | | 19.8 | |
| Communication Services | | | 15.2 | |
| Consumer Discretionary | | | 9.3 | |
| Real Estate | | | 7.4 | |
| Information Technology | | | 6.8 | |
| Industrials | | | 4.5 | |
| Health Care | | | 4.3 | |
| Utilities | | | 2.9 | |
| Materials | | | 1.3 | |
| Cash and Other Assets, Less Liabilities | | | 2.3 | |
| | | | |
| |
| MARKET CAP EXPOSURE (%)8 | |
| Mega Cap (over $25B) | | | 44.0 | |
| Large Cap ($10B–$25B) | | | 29.0 | |
| Mid Cap ($3B–10B) | | | 17.0 | |
| Small Cap (under $3B) | | | 7.7 | |
| Cash and Other Assets, Less Liabilities | | | 2.3 | |
| 7 | Not all countries where the Fund may invest are included in the benchmark index. |
| 8 | Source: FactSet Research Systems. Percentage values in data are rounded to the nearest tenth of one percent, so the values may not sum to 100% due to rounding. Percentage values may be derived from different data sources and may not be consistent with other Fund literature. |
| | | | |
| matthewsasia.com | 800.789.ASIA | | | 41 | |
Matthews Pacific Tiger Fund
June 30, 2019
Schedule of Investmentsa(unaudited)
COMMON EQUITIES: 97.7%
| | | | | | | | |
| | | Shares | | | Value | |
| | |
| CHINA/HONG KONG: 39.5% | | | | | | | | |
Ping An Insurance Group Co. of China, Ltd. H Shares | | | 30,234,000 | | | | $363,560,105 | |
| | |
Inner Mongolia Yili Industrial Group Co., Ltd. A Shares | | | 68,177,514 | | | | 332,217,077 | |
| | |
China Resources Land, Ltd. | | | 74,174,000 | | | | 326,572,216 | |
| | |
Tencent Holdings, Ltd. | | | 7,067,800 | | | | 319,743,166 | |
| | |
AIA Group, Ltd. | | | 27,718,000 | | | | 299,323,988 | |
| | |
Alibaba Group Holding, Ltd. ADRb | | | 1,709,800 | | | | 289,725,610 | |
| | |
China Resources Beer Holdings Co., Ltd. | | | 56,607,775 | | | | 268,933,693 | |
| | |
Hong Kong Exchanges & Clearing, Ltd. | | | 6,114,000 | | | | 216,069,327 | |
| | |
Yum China Holdings, Inc. | | | 3,721,510 | | | | 171,933,762 | |
| | |
China Mobile, Ltd. ADR | | | 3,604,226 | | | | 163,235,396 | |
| | |
Dairy Farm International Holdings, Ltd. | | | 22,254,946 | | | | 159,075,728 | |
| | |
Guotai Junan Securities Co., Ltd. H Sharesb,c,d,† | | | 82,304,600 | | | | 146,600,437 | |
| | |
Fuyao Glass Industry Group Co., Ltd. H Sharesc,d,† | | | 42,879,200 | | | | 133,152,824 | |
| | |
Kweichow Moutai Co., Ltd. A Shares | | | 917,973 | | | | 131,796,532 | |
| | |
Sinopharm Group Co., Ltd. H Shares | | | 26,574,800 | | | | 93,572,345 | |
| | |
iQIYI, Inc. ADRb | | | 3,754,400 | | | | 77,528,360 | |
| | |
Fuyao Glass Industry Group Co., Ltd. A Shares | | | 17,242,604 | | | | 57,177,673 | |
| | |
Wise Talent Information Technology Co., Ltd.b,d | | | 16,143,400 | | | | 42,777,933 | |
| | |
China East Education Holdings, Ltd.b,c,d | | | 18,000,000 | | | | 25,623,104 | |
| | |
Hansoh Pharmaceutical Group Co., Ltd.b,c,d | | | 6,230,000 | | | | 16,468,822 | |
| | | | | | | | |
Total China/Hong Kong | | | | | | | 3,635,088,098 | |
| | | | | | | | |
| | | | | | | | |
| | | |
| INDIA: 19.0% | | | | | | | | |
Kotak Mahindra Bank, Ltd. | | | 10,967,393 | | | | 234,691,669 | |
| | |
HDFC Bank, Ltd. | | | 6,223,409 | | | | 220,440,901 | |
| | |
Housing Development Finance Corp., Ltd. | | | 6,154,197 | | | | 195,415,131 | |
| | |
Tata Power Co., Ltd.† | | | 180,316,487 | | | | 180,304,311 | |
| | |
Titan Co., Ltd. | | | 9,015,327 | | | | 174,383,624 | |
| | |
ITC, Ltd. | | | 39,202,500 | | | | 155,453,795 | |
| | |
Sun Pharmaceutical Industries, Ltd. | | | 24,286,809 | | | | 141,153,627 | |
| | |
Container Corp. of India, Ltd. | | | 16,080,979 | | | | 132,755,885 | |
| | |
Dabur India, Ltd. | | | 21,117,482 | | | | 122,528,005 | |
| | |
GAIL India, Ltd. | | | 20,024,384 | | | | 90,474,546 | |
| | |
United Spirits, Ltd.b | | | 6,778,030 | | | | 57,437,259 | |
| | |
Just Dial, Ltd.b,† | | | 3,307,840 | | | | 36,462,147 | |
| | |
Thermax, Ltd. | | | 312,681 | | | | 4,793,209 | |
| | | | | | | | |
Total India | | | | | | | 1,746,294,109 | |
| | | | | | | | |
| | | | | | | | |
| | | |
| SOUTH KOREA: 10.8% | | | | | | | | |
NAVER Corp. | | | 2,670,205 | | | | 263,898,727 | |
| | |
Samsung Electronics Co., Ltd. | | | 4,755,250 | | | | 193,635,405 | |
| | |
DB Insurance Co., Ltd.† | | | 3,570,463 | | | | 183,370,247 | |
| | |
Cheil Worldwide, Inc.† | | | 5,852,726 | | | | 149,023,639 | |
| | |
Orion Holdings Corp.† | | | 5,656,566 | | | | 84,072,589 | |
| | |
E-Mart, Inc. | | | 377,002 | | | | 45,699,097 | |
| | |
S-1 Corp. | | | 483,483 | | | | 40,867,744 | |
| | |
Amorepacific Corp. | | | 175,449 | | | | 25,062,891 | |
| | |
Green Cross Corp. | | | 95,114 | | | | 10,026,227 | |
| | | | | | | | |
Total South Korea | | | | | | | 995,656,566 | |
| | | | | | | | |
| | | | | | | | |
| | | | | | | | |
| | | Shares | | | Value | |
| | |
| INDONESIA: 7.4% | | | | | | | | |
PT Bank Central Asia | | | 100,580,000 | | | | $213,438,421 | |
| | |
PT Telekomunikasi Indonesia Persero | | | 589,405,600 | | | | 172,746,344 | |
| | |
PT Indofood CBP Sukses Makmur | | | 181,522,600 | | | | 130,473,223 | |
| | |
PT Surya Citra Media | | | 533,163,200 | | | | 60,807,753 | |
| | |
PT Mitra Keluarga Karyasehatb,d | | | 383,065,700 | | | | 51,371,137 | |
| | |
PT Telekomunikasi Indonesia Persero ADR | | | 1,710,640 | | | | 50,019,114 | |
| | | | | | | | |
Total Indonesia | | | | | | | 678,855,992 | |
| | | | | | | | |
| | | | | | | | |
| | | |
| THAILAND: 5.0% | | | | | | | | |
Central Pattana Public Co., Ltd. | | | 94,089,000 | | | | 230,193,099 | |
| | |
The Siam Cement Public Co., Ltd. | | | 7,522,950 | | | | 115,792,323 | |
| | |
Kasikornbank Public Co., Ltd. | | | 18,431,800 | | | | 113,051,175 | |
| | | | | | | | |
Total Thailand | | | | | | | 459,036,597 | |
| | | | | | | | |
| | | | | | | | |
| | | |
| TAIWAN: 4.6% | | | | | | | | |
Delta Electronics, Inc. | | | 33,921,182 | | | | 172,402,441 | |
| | |
President Chain Store Corp. | | | 16,271,608 | | | | 157,474,027 | |
| | |
Synnex Technology International Corp. | | | 72,350,921 | | | | 90,992,688 | |
| | | | | | | | |
Total Taiwan | | | | | | | 420,869,156 | |
| | | | | | | | |
| | | | | | | | |
| | | |
| PHILIPPINES: 2.6% | | | | | | | | |
SM Prime Holdings, Inc. | | | 164,670,771 | | | | 119,265,680 | |
| | |
GT Capital Holdings, Inc. | | | 6,482,364 | | | | 119,008,394 | |
| | | | | | | | |
Total Philippines | | | | | | | 238,274,074 | |
| | | | | | | | |
| | | | | | | | |
| | | |
| SWITZERLAND: 2.6% | | | | | | | | |
DKSH Holding AG† | | | 4,039,869 | | | | 236,718,475 | |
| | | | | | | | |
Total Switzerland | | | | | | | 236,718,475 | |
| | | | | | | | |
| | | | | | | | |
| | | |
| MALAYSIA: 2.1% | | | | | | | | |
Public Bank BHD | | | 19,583,194 | | | | 109,046,413 | |
| | |
IHH Healthcare BHD | | | 47,676,300 | | | | 66,962,526 | |
| | |
IHH Healthcare BHD | | | 11,543,000 | | | | 16,048,916 | |
| | | | | | | | |
Total Malaysia | | | | | | | 192,057,855 | |
| | | | | | | | |
| | | | | | | | |
| | | |
| UNITED STATES: 1.8% | | | | | | | | |
Cognizant Technology Solutions Corp. Class A | | | 2,592,900 | | | | 164,363,931 | |
| | | | | | | | |
Total United States | | | | | | | 164,363,931 | |
| | | | | | | | |
| | | | | | | | |
| | | |
| VIETNAM: 1.7% | | | | | | | | |
Vietnam Dairy Products JSC | | | 28,991,060 | | | | 153,180,278 | |
| | | | | | | | |
Total Vietnam | | | | | | | 153,180,278 | |
| | | | | | | | |
| | | | | | | | |
| | | |
| JAPAN: 0.6% | | | | | | | | |
LINE Corp. ADRb | | | 2,094,000 | | | | 58,925,160 | |
| | | | | | | | |
Total Japan | | | | | | | 58,925,160 | |
| | | | | | | | |
| | | | | | | | |
| | | |
| TOTAL INVESTMENTS: 97.7% | | | | | | | 8,979,320,291 | |
(Cost $6,298,369,126) | | | | | | | | |
| | | | | | | | |
| | |
CASH AND OTHER ASSETS,
LESS LIABILITIES: 2.3% | | | | | | | 213,646,393 | |
| | | | | | | | |
| | |
NET ASSETS: 100.0% | | | | | | | $9,192,966,684 | |
| | | | | | | | |
Matthews Pacific Tiger Fund
June 30, 2019
Schedule of Investmentsa(unaudited) (continued)
| a | Certain securities were fair valued under the valuation policies approved by the Board of Trustees (Note2-A). |
| b | Non-income producing security. |
| c | Security exempt from registration under Rule 144A of the Securities Act of 1933, as amended. The security may be resold in transactions exempt from registration normally to qualified institutional buyers. The security has been determined to be liquid in accordance with procedures adopted by the Funds’ Board of Trustees. At June 30, 2019, the aggregate value is $321,845,187, which is 3.50% of net assets. |
| d | The securities may be resold to qualified foreign investors and foreign institutional buyers under Regulation S of the Securities Act of 1933. |
| † | Affiliated Issuer, as defined under the Investment Company Act of 1940 (ownership of 5% or more of the outstanding voting securities of this issuer). |
| ADR | American Depositary Receipt |
See accompanying notes to financial statements.
| | | | |
| matthewsasia.com | 800.789.ASIA | | | 43 | |
| | | | |
| PORTFOLIO MANAGERS |
| |
| Vivek Tanneeru | | |
Lead Manager | | |
| |
| Winnie Chwang | | |
Co-Manager | | | | |
|
| FUND FACTS |
| | |
| | | Investor | | Institutional |
Ticker | | MASGX | | MISFX |
CUSIP | | 577130727 | | 577130719 |
Inception | | 4/30/15 | | 4/30/15 |
NAV | | $10.94 | | $10.93 |
Initial Investment | | $2,500 | | $100,000 |
Gross Expense Ratio1 | | 2.20% | | 2.01% |
After Fee Waiver and Reimbursement2 | | 1.50% | | 1.25% |
Portfolio Statistics | | | | |
Total # of Positions | | 66 |
Net Assets | | $45.5 million |
Weighted Average
Market Cap | | $12.7 billion |
Portfolio Turnover3 | | 22.93% |
Benchmark | | |
MSCI AC Asia ex Japan Index |
OBJECTIVE
Long-term capital appreciation.
STRATEGY
Under normal market conditions, the Fund seeks to achieve its investment objective by investing at least 80% of its net assets, which include borrowings for investment purposes, in the common and preferred stocks of companies of any market capitalization located in Asia that Matthews believes satisfy one or more of its environmental, social and governance (“ESG”) standards. Asia consists of all countries and markets in Asia and includes developed, emerging, and frontier countries and markets in the Asia region. The Fund may also invest in convertible securities and fixed-income securities, of any duration or quality, including high yield securities, of Asian companies.
Matthews Asia ESG Fund
Portfolio Manager Commentary (unaudited)
For the first half of 2019, the Matthews Asia ESG Fund returned 9.62% (Investor Class) and 9.74% (Institutional Class), while its benchmark, the MSCI All Country Asia ex Japan Index, returned 10.83%. For the quarter ending June 30, 2019, the Matthews Asia ESG Fund returned –2.15% (Investor Class) and –2.06% (Institutional Class), while the benchmark returned –0.56%.
Market Environment:
Asia’s capital markets rallied at the start of the year, led by Chinese equities. Volatility flared in May, followed by a rebound for equity prices in June. The dominant factors driving Asia capital markets over the short term were political, stemming from rhetoric around trade relations between the U.S. and China and the resultant uncertainty.
The Thai baht was Asia’s top-performing currency relative to the U.S. dollar (up 6.17%) during the first half, while the Pakistani rupee was the worst (down –13.11%) for the same period. Currencies that appreciated relative to the dollar included the Japanese yen (up 1.83%), the Indonesian rupiah (up 1.79%) and the Indian rupee (up 1.79%). The Chinese renminbi was roughly flat (down –0.04%). Currencies that depreciated included the South Korean won (down –3.36%) and the Taiwan dollar (down –1.04%). Turning to financial markets, China’s equity markets, as represented by the MSCI China Index (up 14.02%), were the top performers in the region for the first half, despite trade tensions. Many other Asian equity markets also enjoyed gains in the period, including Taiwan, South Korea, Malaysia and Thailand.
From a sector perspective, real estate, consumer discretionary, information technology and financials were the top-performing sectors in the benchmark in the first half. In contrast, health care was the only sector with negative benchmark returns for the first half.
Performance Contributors and Detractors:
The Fund underperformed its benchmark during the first half of the year, particularly in the second quarter, which negated the Fund’s outperformance in the first quarter. This underperformance was largely due to the Fund’s higher allocation to small companies relative to the benchmark, and lower allocation to the region’s largest companies relative to the benchmark. During the period, Asian markets experienced a rally, disproportionately benefiting larger companies over smaller companies. The outperformance of larger companies may have been driven in part by flows into index funds. Over a full market cycle, having meaningful exposure to smaller companies can offer attractive opportunities for generating alpha, but this same exposure can cause periods of underperformance over the shorter term.
A contributor to performance during the period was New Oriental Education & Technology Group, a tutoring services company serving students in China. We initiated a position in this company in early 2019 after its stock price was beaten down toward the end of 2018 due to negative sentiment around government regulations for private education services providers and a general market sell-off. We believed the company had the scale and resources to comply with regulations, providing the company with a competitive edge over smaller players in the
(continued)
| 1 | Prospectus expense ratios. |
| 2 | Matthews has contractually agreed (i) to waive fees and reimburse expenses to the extent needed to limit Total Annual Fund Operating Expenses (excluding Rule 12b-1 fees, taxes, interest, brokerage commissions, short sale dividend expenses, expenses incurred in connection with any merger or reorganization or extraordinary expenses such as litigation) of the Institutional Class to 1.25% first by waiving class specific expenses (i.e., shareholder service fees specific to a particular class) of the Institutional Class and then, to the extent necessary, by waiving non-class specific expenses of the Institutional Class, and (ii) if any Fund-wide expenses (i.e., expenses that apply to both the Institutional Class and the Investor Class) are waived for the Institutional Class to maintain the 1.25% expense limitation, to waive an equal amount (in annual percentage terms) of those same expenses for the Investor Class. The Total Annual Fund Operating Expenses After Fee Waiver and Expense Reimbursement for the Investor Class may vary from year to year and will in some years exceed 1.25%. If the operating expenses fall below the expense limitation in a year within three years after Matthews has made a waiver or reimbursement, the Fund may reimburse Matthews up to an amount that does not cause the expenses for that year to exceed the lesser of (i) the expense limitation applicable at the time of that fee waiver and/or expense reimbursement or (ii) the expense limitation in effect at the time of recoupment. This agreement will remain in place until April 30, 2020 and may be terminated at any time by the Board of Trustees on behalf of the Fund on 60 days’ written notice to Matthews. Matthews may decline to renew this agreement by written notice to the Trust at least 30 days before its annual expiration date. |
| 3 | The lesser of fiscal year 2018 long-term purchase costs or sales proceeds divided by the average monthly market value of long-term securities. |
| | | | | | | | | | | | | | | | | | | | | | |
| |
| PERFORMANCE AS OF JUNE 30, 2019 | |
| | | | | | | | Average Annual Total Returns | | | | |
| | | 3 Months | | YTD | | | 1 Year | | | 3 Year | | | Since
Inception | | | Inception
Date | |
| Investor Class (MASGX) | | -2.15% | | | 9.62% | | | | 1.05% | | | | 9.80% | | | | 4.68% | | | | 4/30/15 | |
| Institutional Class (MISFX) | | -2.06% | | | 9.74% | | | | 1.23% | | | | 10.07% | | | | 4.93% | | | | 4/30/15 | |
| MSCI AC Asia ex Japan Index4 | | -0.56% | | | 10.83% | | | | -0.18% | | | | 11.81% | | | | 3.59% | | | | | |
Performance assumes reinvestment of all dividends and/or distributions before taxes. All performance quoted represents past performance and is no guarantee of future results. Investment return and principal value will fluctuate with market conditions so that when redeemed, shares may be worth more or less than their original cost. Current performance may be lower or higher than the return figures quoted. Returns would have been lower if certain of the Fund’s fees and expenses had not been waived. For the Fund’s most recent month-end performance visit matthewsasia.com.
GROWTH OF A HYPOTHETICAL $10,000 INVESTMENT SINCE INCEPTION—INVESTOR CLASS
Plotted Monthly. The performance data and graph do not reflect the deduction of taxes that a shareholder would pay on dividends, capital gain distributions or redemption of Fund shares. Values are in US$.
| | 4 | It is not possible to invest directly in an index. Source: Index data from Morgan Stanley Capital International; total return calculations performed by BNY Mellon Investment Servicing (US) Inc. Please see page 88 for index definition. |
| | | | | | | | |
| | | | |
| TOP TEN HOLDINGS5 | | | | | | | |
| | | Sector | | Country | | % of Net Assets | |
| Inner Mongolia Yili Industrial Group Co., Ltd. | | Consumer Staples | | China/Hong Kong | | | 5.0% | |
| Samsung SDI Co., Ltd., Pfd. | | Information Technology | | South Korea | | | 4.8% | |
| Shriram City Union Finance, Ltd. | | Financials | | India | | | 3.8% | |
| Bandhan Bank, Ltd. | | Financials | | India | | | 3.5% | |
| Unicharm Corp. | | Consumer Staples | | Japan | | | 3.4% | |
| IndusInd Bank, Ltd. | | Financials | | India | | | 3.0% | |
| Syngene International, Ltd. | | Health Care | | India | | | 2.5% | |
| PT Bank Rakyat Indonesia Persero | | Financials | | Indonesia | | | 2.5% | |
| MTR Corp., Ltd. | | Industrials | | China/Hong Kong | | | 2.5% | |
| BRAC Bank, Ltd. | | Financials | | Bangladesh | | | 2.4% | |
| % OF ASSETS IN TOP TEN | | | | | | | 33.4% | |
| | 5 | Holdings may combine more than one security from same issuer and related depositary receipts. |
| | | | |
| matthewsasia.com | 800.789.ASIA | | | 45 | |
| | | | |
| | |
| COUNTRY ALLOCATION (%)6,7 | | | |
| China/Hong Kong | | | 30.3 | |
| India | | | 18.6 | |
| Japan | | | 15.3 | |
| Taiwan | | | 8.0 | |
| South Korea | | | 7.9 | |
| Bangladesh | | | 5.1 | |
| Indonesia | | | 5.0 | |
| Singapore | | | 3.2 | |
| Thailand | | | 2.3 | |
| Philippines | | | 2.0 | |
| Vietnam | | | 1.2 | |
| Pakistan | | | 0.8 | |
| Cash and Other Assets, Less Liabilities | | | 0.3 | |
| | | | |
| | |
| SECTOR ALLOCATION (%)7 | | | |
| Financials | | | 19.0 | |
| Industrials | | | 17.6 | |
| Health Care | | | 16.2 | |
| Consumer Discretionary | | | 11.7 | |
| Consumer Staples | | | 11.3 | |
| Information Technology | | | 9.6 | |
| Communication Services | | | 8.6 | |
| Real Estate | | | 2.2 | |
| Materials | | | 1.9 | |
| Utilities | | | 1.6 | |
| Cash and Other Assets, Less Liabilities | | | 0.3 | |
| | | | |
| | |
| MARKET CAP EXPOSURE (%)7 | | | |
| Mega Cap (over $25B) | | | 13.5 | |
| Large Cap ($10B–$25B) | | | 25.4 | |
| Mid Cap ($3B–10B) | | | 19.1 | |
| Small Cap (under $3B) | | | 41.8 | |
| Cash and Other Assets, Less Liabilities | | | 0.3 | |
| 6 | Not all countries are included in the benchmark index. |
| 7 | Source: FactSet Research Systems. Percentage values in data are rounded to the nearest tenth of one percent, so the values may not sum to 100% due to rounding. Percentage values may be derived from different data sources and may not be consistent with other Fund literature. |
Matthews Asia ESG Fund
Portfolio Manager Commentary (unaudited) (continued)
industry. While New Oriental Education & Technology Group is a large company in the sector, we believe it still has considerable room to grow as its current market share is only a small slice of the overall opportunity set for private tutoring services in China’s largest, most economically developed cities. Less-developed urban centers in China present further growth opportunities. We believe there also is further upside from its online initiatives that work in conjunction with its offline classroom infrastructure.
A detractor during the period was Indian multinational tractor and automotive manufacturer Mahindra & Mahindra. The tractor side of its business has been a strong performer over the past few years, but that cycle has shifted on concerns over potentially lower rural income growth prospects due to an adverse monsoon season in India. Meanwhile, automotive sales in India have generally been weak, creating negative sentiment toward automakers in general. Mahindra & Mahindra’s auto sales have held up better than the large auto market in India, benefiting from the company’s introduction of three new passenger vehicles late in 2018. While the company’s stock price closed the period near an all-time low, we continue to like the company’s long-term prospects and have been opportunistically adding to the position.
Notable Portfolio Changes:
As mentioned in the contributors section, we added a position in New Oriental Education & Technology Group to the portfolio in the second quarter. Offering the potential for attractive growth, the company is a good match for the Fund’s objectives across many criteria. Education is a basic building block for economic progress, as well as an essential element for improving quality of life for Asia’s growing middle class.
Outlook:
Looking ahead, economic signals appear somewhat mixed. On the positive side, interest rates are widely expected to ease or hold steady, while oil prices seem to remain in check. Both conditions are positives for Asia currencies. While trade tensions have temporarily softened, several issues remain unresolved and U.S. President Donald Trump’s negotiation style is unpredictable. Against this backdrop of uncertainty, China’s policymakers have signaled a willingness to take a more proactive stance in using fiscal and monetary policy to support growth. Elsewhere in the region, elections in India and Indonesia resulted in wins for the incumbents, adding a sense of political stability in both countries. With elections concluded, reform cycles in both countries could get a boost.
While sentiment had improved considerably by the end of the volatile first half of 2019, macroeconomic risks remain and trade tensions could resurface. The Fund’s focus on high-quality companies has historically helped the portfolio weather bouts of volatility by providing an element of downside protection during market drops. In addition, our strong focus on investing in cash flow-generative companies also has created a lower volatility approach to growth investing in Asia. We continue to look for companies that can grow profits and cash flows sustainably, while improving economic, social or environmental outcomes across the region.
Matthews Asia ESG Fund
June 30, 2019
Schedule of Investmentsa(unaudited)
COMMON EQUITIES: 94.9%
| | | | | | | | |
| | | Shares | | | Value | |
| | |
| CHINA/HONG KONG: 30.3% | | | | | | | | |
Inner Mongolia Yili Industrial Group Co., Ltd. A Shares | | | 462,700 | | | | $2,254,656 | |
| | |
MTR Corp., Ltd. | | | 165,500 | | | | 1,114,782 | |
| | |
HKBN, Ltd. | | | 571,000 | | | | 1,029,583 | |
| | |
CSPC Pharmaceutical Group, Ltd. | | | 618,000 | | | | 996,741 | |
| | |
China Conch Venture Holdings, Ltd. | | | 282,000 | | | | 996,364 | |
| | |
New Oriental Education & Technology Group, Inc. ADRb | | | 10,300 | | | | 994,774 | |
| | |
Wuxi Biologics Cayman, Inc.b,c,d | | | 101,500 | | | | 910,608 | |
| | |
Hong Kong Exchanges & Clearing, Ltd. | | | 22,100 | | | | 781,016 | |
| | |
Haier Electronics Group Co., Ltd. | | | 258,000 | | | | 715,903 | |
| | |
Guangdong Investment, Ltd. | | | 312,000 | | | | 616,887 | |
| | |
Ping An Healthcare and Technology Co., Ltd.b,c,d | | | 139,800 | | | | 583,614 | |
| | |
Tencent Music Entertainment Group ADRb | | | 38,000 | | | | 569,620 | |
| | |
Xinyi Glass Holdings, Ltd. | | | 466,000 | | | | 489,512 | |
| | |
AIA Group, Ltd. | | | 36,800 | | | | 397,400 | |
| | |
Contemporary Amperex Technology Co., Ltd. A Sharesb | | | 38,300 | | | | 384,833 | |
| | |
Beijing Urban Construction Design & Development Group Co., Ltd. H Sharesc,d | | | 879,000 | | | | 267,806 | |
| | |
Han’s Laser Technology Industry Group Co., Ltd. A Shares | | | 45,775 | | | | 229,784 | |
| | |
58.com, Inc. ADRb | | | 3,500 | | | | 217,595 | |
| | |
Wise Talent Information Technology Co., Ltd.b,d | | | 80,800 | | | | 214,110 | |
| | | | | | | | |
Total China/Hong Kong | | | | | | | 13,765,588 | |
| | | | | | | | |
| | | | | | | | |
| | | |
| INDIA: 18.6% | | | | | | | | |
Shriram City Union Finance, Ltd. | | | 74,250 | | | | 1,742,513 | |
| | |
Bandhan Bank, Ltd.c,d | | | 205,001 | | | | 1,599,604 | |
| | |
IndusInd Bank, Ltd. | | | 67,634 | | | | 1,382,025 | |
| | |
Syngene International, Ltd.c,d | | | 236,604 | | | | 1,146,094 | |
| | |
Mahindra & Mahindra, Ltd. | | | 111,832 | | | | 1,061,556 | |
| | |
TeamLease Services, Ltd.b | | | 12,129 | | | | 517,460 | |
| | |
Lupin, Ltd. | | | 46,743 | | | | 511,090 | |
| | |
Ipca Laboratories, Ltd. | | | 16,712 | | | | 222,204 | |
| | |
Wipro, Ltd. | | | 48,684 | | | | 198,184 | |
| | |
Power Grid Corp. of India, Ltd. | | | 30,178 | | | | 90,471 | |
| | | | | | | | |
Total India | | | | | | | 8,471,201 | |
| | | | | | | | |
| | | | | | | | |
| | | |
| JAPAN: 15.3% | | | | | | | | |
Unicharm Corp. | | | 51,900 | | | | 1,564,710 | |
| | |
Tsukui Corp. | | | 194,500 | | | | 930,067 | |
| | |
Sohgo Security Services Co., Ltd. | | | 19,000 | | | | 878,222 | |
| | |
Fuji Seal International, Inc. | | | 27,900 | | | | 855,189 | |
| | |
LITALICO, Inc.b | | | 33,300 | | | | 582,099 | |
| | |
UT Group Co., Ltd. | | | 21,600 | | | | 528,463 | |
| | |
Sosei Group Corp.b | | | 21,300 | | | | 470,822 | |
| | |
Koa Corp. | | | 35,500 | | | | 462,002 | |
| | |
Bunka Shutter Co., Ltd. | | | 60,000 | | | | 455,532 | |
| | |
Career Co., Ltd. | | | 39,700 | | | | 219,250 | |
| | | | | | | | |
Total Japan | | | | | | | 6,946,356 | |
| | | | | | | | |
| | | | | | | | |
| | | | | | | | |
| | | Shares | | | Value | |
| | |
| TAIWAN: 8.0% | | | | | | | | |
Poya International Co., Ltd. | | | 62,000 | | | | $839,148 | |
| | |
Sporton International, Inc. | | | 140,903 | | | | 833,824 | |
| | |
Delta Electronics, Inc. | | | 121,000 | | | | 614,975 | |
| | |
Merida Industry Co., Ltd. | | | 76,000 | | | | 449,172 | |
| | |
Zhen Ding Technology Holding, Ltd. | | | 136,000 | | | | 435,095 | |
| | |
Taiwan Semiconductor Manufacturing Co., Ltd. | | | 56,000 | | | | 428,309 | |
| | |
Sitronix Technology Corp. | | | 11,000 | | | | 46,061 | |
| | | | | | | | |
Total Taiwan | | | | | | | 3,646,584 | |
| | | | | | | | |
| | | | | | | | |
| | | |
| BANGLADESH: 5.1% | | | | | | | | |
BRAC Bank, Ltd.b | | | 1,361,221 | | | | 1,070,967 | |
| | |
Square Pharmaceuticals, Ltd. | | | 224,957 | | | | 700,250 | |
| | |
GrameenPhone, Ltd. | | | 132,537 | | | | 570,975 | |
| | | | | | | | |
Total Bangladesh | | | | | | | 2,342,192 | |
| | | | | | | | |
| | | | | | | | |
| | | |
| INDONESIA: 5.0% | | | | | | | | |
PT Bank Rakyat Indonesia Persero | | | 3,706,400 | | | | 1,144,259 | |
| | |
PT Jaya Real Property | | | 12,125,100 | | | | 454,879 | |
| | |
PT Arwana Citramulia | | | 10,223,600 | | | | 362,518 | |
| | |
PT BFI Finance Indonesia | | | 7,542,100 | | | | 320,316 | |
| | | | | | | | |
Total Indonesia | | | | | | | 2,281,972 | |
| | | | | | | | |
| | | | | | | | |
| | | |
| SINGAPORE: 3.2% | | | | | | | | |
SATS, Ltd. | | | 164,400 | | | | 634,311 | |
| | |
Raffles Medical Group, Ltd. | | | 553,400 | | | | 425,515 | |
| | |
Delfi, Ltd. | | | 423,000 | | | | 406,430 | |
| | | | | | | | |
Total Singapore | | | | | | | 1,466,256 | |
| | | | | | | | |
| | | | | | | | |
| | | |
| SOUTH KOREA: 3.1% | | | | | | | | |
iMarketKorea, Inc. | | | 58,673 | | | | 597,936 | |
| | |
KT Skylife Co., Ltd. | | | 30,220 | | | | 276,164 | |
| | |
Hanon Systems | | | 21,106 | | | | 213,250 | |
| | |
DGB Financial Group, Inc. | | | 28,334 | | | | 200,116 | |
| | |
Samjin Pharmaceutical Co., Ltd. | | | 5,358 | | | | 139,449 | |
| | | | | | | | |
Total South Korea | | | | | | | 1,426,915 | |
| | | | | | | | |
| | | | | | | | |
| | | |
| THAILAND: 2.3% | | | | | | | | |
Total Access Communication Public Co., Ltd. NVDR | | | 609,300 | | | | 1,052,644 | |
| | | | | | | | |
Total Thailand | | | | | | | 1,052,644 | |
| | | | | | | | |
| | | | | | | | |
| | | |
| PHILIPPINES: 2.0% | | | | | | | | |
Puregold Price Club, Inc. | | | 1,041,230 | | | | 914,815 | |
| | | | | | | | |
Total Philippines | | | | | | | 914,815 | |
| | | | | | | | |
| | | | | | | | |
| | | |
| VIETNAM: 1.2% | | | | | | | | |
Nam Long Investment Corp. | | | 427,423 | | | | 534,333 | |
| | | | | | | | |
Total Vietnam | | | | | | | 534,333 | |
| | | | | | | | |
| | | | | | | | |
| | | |
| PAKISTAN: 0.8% | | | | | | | | |
Abbott Laboratories Pakistan, Ltd. | | | 117,150 | | | | 348,069 | |
| | | | | | | | |
Total Pakistan | | | | | | | 348,069 | |
| | | | | | | | |
| | | | | | | | |
| | | |
| TOTAL COMMON EQUITIES | | | | | | | 43,196,925 | |
| | | | | | | | |
(Cost $39,987,355) | | | | | | | | |
| | | | | | | | |
| | | | |
| matthewsasia.com | 800.789.ASIA | | | 47 | |
Matthews Asia ESG Fund
June 30, 2019
Schedule of Investmentsa(unaudited) (continued)
PREFERRED EQUITIES: 4.8%
| | | | | | | | |
| | | Shares | | | Value | |
| | |
| SOUTH KOREA: 4.8% | | | | | | | | |
Samsung SDI Co., Ltd., Pfd. | | | 27,361 | | | | $2,164,513 | |
| | | | | | | | |
Total South Korea | | | | | | | 2,164,513 | |
| | | | | | | | |
| | | | | | | | |
| | | |
| TOTAL PREFERRED EQUITIES | | | | | | | 2,164,513 | |
| | | | | | | | |
(Cost $ 1,955,650) | | | | | | | | |
| | | | | | | | |
| | | |
| TOTAL INVESTMENTS: 99.7% | | | | | | | 45,361,438 | |
(Cost $ 41,943,005) | | | | | | | | |
| | | | | | | | |
| | |
CASH AND OTHER ASSETS,
LESS LIABILITIES: 0.3% | | | | | | | 133,379 | |
| | | | | | | | |
| | |
NET ASSETS: 100.0% | | | | | | | $45,494,817 | |
| | | | | | | | |
| a | Certain securities were fair valued under the valuation policies approved by the Board of Trustees (Note2-A). |
| b | Non-income producing security. |
| c | Security exempt from registration under Rule 144A of the Securities Act of 1933, as amended. The security may be resold in transactions exempt from registration normally to qualified institutional buyers. The security has been determined to be liquid in accordance with procedures adopted by the Funds’ Board of Trustees. At June 30, 2019, the aggregate value is $4,507,726, which is 9.91% of net assets. |
| d | The securities may be resold to qualified foreign investors and foreign institutional buyers under Regulation S of the Securities Act of 1933. |
| ADR | American Depositary Receipt |
| NVDR | Non-voting Depositary Receipt |
See accompanying notes to financial statements.
| | | | |
| PORTFOLIO MANAGERS |
| |
| Taizo Ishida | | Robert Harvey, CFA |
Lead Manager | | Lead Manager |
|
| FUND FACTS |
| | |
| | | Investor | | Institutional |
Ticker | | MEASX | | MIASX |
CUSIP | | 577125883 | | 577125875 |
Inception | | 4/30/13 | | 4/30/13 |
NAV | | $12.29 | | $12.35 |
Initial Investment | | $2,500 | | $100,000 |
Gross Expense Ratio1 | | 1.66% | | 1.50% |
After Fee Waiver and Reimbursement2 | | 1.48% | | 1.25% |
Portfolio Statistics |
Total # of Positions | | 64 |
Net Assets | | $428.5 million |
Weighted Average Market Cap | | $2.5 billion |
Portfolio Turnover3 | | 26.09% |
Benchmark |
MSCI Emerging Markets Asia Index |
Redemption Fee |
2% within first 90 calendar days of purchase |
OBJECTIVE
Long-term capital appreciation.
STRATEGY
Under normal market conditions, the Fund seeks to achieve its investment objective by investing at least 80% of its net assets, which include borrowings for investment purposes, in the common and preferred stocks of companies located in Asia excluding Japan, South Korea, Hong Kong and Singapore. The Fund may also invest in the convertible securities, of any duration or quality, of companies located in Asia excluding Japan, South Korea, Hong Kong and Singapore. Under normal market conditions, the Fund is expected to invest a substantial portion of its net assets in the emerging countries and markets in the Asian region, including, but not limited to, Bangladesh, Cambodia, China (including Taiwan, but excluding Hong Kong), India, Indonesia, Laos, Malaysia, Mongolia, Myanmar, Pakistan, Papua New Guinea, Philippines, Sri Lanka, Thailand, and Vietnam.
Matthews Emerging Asia Fund
Portfolio Manager Commentary (unaudited)
For the first half of 2019, the Matthews Emerging Asia Fund returned –1.68% (Investor Class) and –1.52% (Institutional Class), while its benchmark, the MSCI Emerging Markets Asia Index, returned 9.87% over the same period. For the quarter ending June 30, 2019, the Matthews Emerging Asia Fund returned –6.47% (Investor Class) and –6.37% (Institutional Class), while the benchmark returned –1.13%.
Market Environment:
The first six months of 2019 were generally positive for Asian and emerging markets. China’s equity markets (up 13.08%) were the top performers in the region for the first half, despite trade tensions. Many other Asian equity markets also enjoyed gains in the period, including Taiwan, South Korea, Malaysia and Thailand. Pakistan’s equity market was the weakest performer in the region (down –13.82%).
As economic data in the U.S continued to soften, the U.S. Federal Reserve began to use language suggesting the potential for future rate cuts. The prospect of lower U.S. rates has provided support to Asian and emerging market currencies against the U.S. dollar as well as allowed emerging market central banks to ease monetary conditions supporting their economies.
Amid trade tensions in the period between the U.S. and China, many U.S. manufacturers that have traditionally operated in China looked to less-developed parts of Asia for opportunities to relocated operations. Vietnam, in particular, has received increased interest from companies looking to move production over the long term.
Performance Contributors and Detractors:
A significant detractor from performance in the first half of the year were the Fund’s holdings in Pakistan. Pakistan’s equity markets continued to suffer negative sentiment as its economy grappled with a weak currency, higher inflation, weaker growth and higher interest rates. But consumption continues apace in some areas of spending. The IMF also announced a financial-assistance package of US$6 billion to help the country stabilize its economy. Pakistan’s economy has gone through a dark tunnel, but with reforms it could, in our view, emerge stronger and more resilient.
A contributor to performance, meanwhile, was stock selection in Indonesia. Among the Fund’s top-performing securities, three were Indonesian financial companies. Bank Tabungan Pensiunan Nasional Syariah, Bank Mandiri and Adira Dinamika Multi Finance each generated double-digit returns in the first half. Bank Tabungan Pensiunan Nasional Syariah is a sharia commercial bank serving millions of low-income families in Indonesia, growing its revenues as incomes rise. Bank Mandiri is the largest bank in Indonesia, offering diversified lending and financial services. And Adira Dinamika Multi Finance provides consumer financing for motorcycles and cars.
Notable Portfolio Changes:
During the second quarter, we initiated a new position in Commercial Bank of Ceylon, a Sri Lankan bank with operations in Sri Lanka, Bangladesh and Maldives.
(continued)
| 1 | Prospectus expense ratios. |
| 2 | Matthews has contractually agreed (i) to waive fees and reimburse expenses to the extent needed to limit Total Annual Fund Operating Expenses (excluding Rule 12b-1 fees, taxes, interest, brokerage commissions, short sale dividend expenses, expenses incurred in connection with any merger or reorganization or extraordinary expenses such as litigation) of the Institutional Class to 1.25% first by waiving class specific expenses (i.e., shareholder service fees specific to a particular class) of the Institutional Class and then, to the extent necessary, by waiving non-class specific expenses of the Institutional Class, and (ii) if any Fund-wide expenses (i.e., expenses that apply to both the Institutional Class and the Investor Class) are waived for the Institutional Class to maintain the 1.25% expense limitation, to waive an equal amount (in annual percentage terms) of those same expenses for the Investor Class. The Total Annual Fund Operating Expenses After Fee Waiver and Expense Reimbursement for the Investor Class may vary from year to year and will in some years exceed 1.25%. If the operating expenses fall below the expense limitation in a year within three years after Matthews has made a waiver or reimbursement, the Fund may reimburse Matthews up to an amount that does not cause the expenses for that year to exceed the lesser of (i) the expense limitation applicable at the time of that fee waiver and/or expense reimbursement or (ii) the expense limitation in effect at the time of recoupment. This agreement will remain in place until April 30, 2020 and may be terminated at any time by the Board of Trustees on behalf of the Fund on 60 days’ written notice to Matthews. Matthews may decline to renew this agreement by written notice to the Trust at least 30 days before its annual expiration date. |
| 3 | The lesser of fiscal year 2018 long-term purchase costs or sales proceeds divided by the average monthly market value of long-term securities. |
| | | | |
| matthewsasia.com | 800.789.ASIA | | | 49 | |
| | | | | | | | | | | | | | | | | | | | | | | | | | | | |
| | |
| PERFORMANCE AS OF JUNE 30, 2019 | | | | |
| | | | | | | | | Average Annual Total Returns | | | | |
| | | 3 Months | | | YTD | | | 1 Year | | | 3 Years | | | 5 Years | | | Since
Inception | | | Inception
Date | |
| Investor Class (MEASX) | | | -6.47% | | | | -1.68% | | | | -9.06% | | | | 1.13% | | | | 3.17% | | | | 4.36% | | | | 4/30/13 | |
| Institutional Class (MIASX) | | | -6.37% | | | | -1.52% | | | | -8.76% | | | | 1.39% | | | | 3.42% | | | | 4.61% | | | | 4/30/13 | |
| MSCI Emerging Markets Asia Index4 | | | -1.13% | | | | 9.87% | | | | -1.95% | | | | 11.58% | | | | 4.85% | | | | 5.42% | | | | | |
Performance assumes reinvestment of all dividends and/or distributions before taxes. All performance quoted represents past performance and is no guarantee of future results. Investment return and principal value will fluctuate with market conditions so that when redeemed, shares may be worth more or less than their original cost. Current performance may be lower or higher than the return figures quoted. Returns would have been lower if certain of the Fund’s fees and expenses had not been waived. For the Fund’s most recent month-end performance visit matthewsasia.com.
GROWTH OF A HYPOTHETICAL $10,000 INVESTMENT SINCE INCEPTION—INVESTOR CLASS
Plotted monthly. The performance data and graph do not reflect the deduction of taxes that a shareholder would pay on dividends, capital gain distributions or redemption of Fund shares. Values are in US$.
| | 4 | It is not possible to invest directly in an index. Source: Index data from Morgan Stanley Capital International and Bloomberg; total return calculations performed by BNY Mellon Investment Servicing (US) Inc. Please see page 88 for index definition. |
| | | | | | | | |
| | | | |
| TOP TEN HOLDINGS5 | | | | | | | |
| | | Sector | | Country | | % of Net Assets | |
| British American Tobacco Bangladesh Co., Ltd. | | Consumer Staples | | Bangladesh | | | 3.3% | |
| Vinh Hoan Corp. | | Consumer Staples | | Vietnam | | | 3.2% | |
| Saigon Beer Alcohol Beverage Corp. | | Consumer Staples | | Vietnam | | | 3.2% | |
| Cosco Capital, Inc. | | Consumer Staples | | Philippines | | | 3.2% | |
| Phu Nhuan Jewelry JSC | | Consumer Discretionary | | Vietnam | | | 3.0% | |
| PT Bank Mandiri Persero | | Financials | | Indonesia | | | 3.0% | |
| Square Pharmaceuticals, Ltd. | | Health Care | | Bangladesh | | | 2.9% | |
| L&T Finance Holdings, Ltd. | | Financials | | India | | | 2.9% | |
| PT Kino Indonesia | | Consumer Staples | | Indonesia | | | 2.7% | |
| PT Bank Tabungan Pensiunan Nasional Syariah | | Financials | | Indonesia | | | 2.7% | |
| % OF ASSETS IN TOP TEN | | | | | | | 30.1% | |
| | 5 | Holdings may combine more than one security from same issuer and related depositary receipts. |
Matthews Emerging Asia Fund
Portfolio Manager Commentary (unaudited) (continued)
We also exited positions in The City Bank, a Bangladeshi private bank; Dinh Vu Port Investment, a Vietnamese port services provider; and Hum Network, a broadcasting company based in Pakistan. We used proceeds from the sales of these securities to rotate capital within the portfolio, selectively adding to companies with the most attractive valuations and long-term growth potential.
Outlook:
Looking ahead, geopolitical risks in the Middle East could lead to higher oil prices should tensions between Iran and the U.S. or U.K. escalate. Higher oil prices would present challenges for many emerging economies that import most of their energy. On a positive note, elections in India and Indonesia resulted in wins for the incumbents, adding a sense of political stability in both countries. With elections concluded, reform cycles in both countries could get a boost. Elsewhere, Vietnam continues to perform well, having a strong domestic economy and strong domestic demand. Also, we are seeing continued foreign direct investment in Vietnam, which could keep its economy in good stead. The Fund remains focused on the least-developed economies in Asia, which we believe have attractive structural growth potential over the long term.
| | | | |
| |
| COUNTRY ALLOCATION (%)6,7 | |
| Vietnam | | | 20.0 | |
| Indonesia | | | 19.3 | |
| Bangladesh | | | 12.5 | |
| Sri Lanka | | | 10.3 | |
| Pakistan | | | 10.2 | |
| Philippines | | | 9.0 | |
| India | | | 8.8 | |
| China/Hong Kong | | | 3.5 | |
| Australia | | | 0.9 | |
| Singapore | | | 0.7 | |
| Cash and Other Assets, Less Liabilities | | | 4.8 | |
| | | | |
| |
| SECTOR ALLOCATION (%)7 | |
| Consumer Staples | | | 30.4 | |
| Financials | | | 22.4 | |
| Consumer Discretionary | | | 19.3 | |
| Industrials | | | 7.2 | |
| Health Care | | | 5.9 | |
| Materials | | | 3.1 | |
| Information Technology | | | 3.0 | |
| Real Estate | | | 2.7 | |
| Energy | | | 1.2 | |
| Cash and Other Assets, Less Liabilities | | | 4.8 | |
| | | | |
| |
| MARKET CAP EXPOSURE (%)7 | |
| Mega Cap (over $25B) | | | 3.0 | |
| Large Cap ($10B–$25B) | | | 2.5 | |
| Mid Cap ($3B–10B) | | | 11.2 | |
| Small Cap (under $3B) | | | 78.5 | |
| Cash and Other Assets, Less Liabilities | | | 4.8 | |
| 6 | Not all countries where the Fund may invest are included in the benchmark index. |
| 7 | Source: FactSet Research Systems. Percentage values in data are rounded to the nearest tenth of one percent, so the values may not sum to 100% due to rounding. Percentage values may be derived from different data sources and may not be consistent with other Fund literature. |
| | | | |
| matthewsasia.com | 800.789.ASIA | | | 51 | |
Matthews Emerging Asia Fund
June 30, 2019
Schedule of Investmentsa(unaudited)
COMMON EQUITIES: 95.2%
| | | | | | | | |
| | | Shares | | | Value | |
| | |
| VIETNAM: 20.0% | | | | | | | | |
Vinh Hoan Corp. | | | 3,648,160 | | | | $13,790,939 | |
| | |
Saigon Beer Alcohol Beverage Corp. | | | 1,166,670 | | | | 13,775,662 | |
| | |
Phu Nhuan Jewelry JSC | | | 4,127,364 | | | | 12,952,499 | |
| | |
Nam Long Investment Corp. | | | 6,686,161 | | | | 8,358,556 | |
| | |
Taisun International Holding Corp.† | | | 2,127,000 | | | | 8,296,034 | |
| | |
Mobile World Investment Corp. | | | 1,360,605 | | | | 5,424,478 | |
| | |
Military Commercial Joint Stock Bank | | | 5,602,258 | | | | 5,032,683 | |
| | |
Domesco Medical Import Export JSC | | | 1,464,250 | | | | 4,523,750 | |
| | |
Vietnam National Seed Group JSC† | | | 1,126,522 | | | | 4,248,929 | |
| | |
Thien Long Group Corp. | | | 1,717,046 | | | | 4,127,185 | |
| | |
Tien Phong Plastic JSCb | | | 1,861,224 | | | | 2,715,366 | |
| | |
Lix Detergent JSC | | | 1,254,405 | | | | 2,314,500 | |
| | | | | | | | |
Total Vietnam | | | | | | | 85,560,581 | |
| | | | | | | | |
| | | | | | | | |
| | | |
| INDONESIA: 19.3% | | | | | | | | |
PT Bank Mandiri Persero | | | 22,312,800 | | | | 12,668,070 | |
| | |
PT Kino Indonesia | | | 57,504,900 | | | | 11,763,522 | |
| | |
PT Bank Tabungan Pensiunan Nasional Syariahb | | | 47,530,100 | | | | 11,606,926 | |
| | |
PT Gudang Garam | | | 2,005,200 | | | | 10,915,333 | |
| | |
PT Ramayana Lestari Sentosa | | | 99,165,900 | | | | 9,897,287 | |
| | |
PT Adira Dinamika Multi Finance | | | 12,164,900 | | | | 8,481,633 | |
| | |
PT Hexindo Adiperkasa | | | 22,802,000 | | | | 4,938,886 | |
| | |
PT Mayora Indah | | | 21,437,800 | | | | 3,764,118 | |
| | |
PT BFI Finance Indonesia | | | 73,579,500 | | | | 3,124,948 | |
| | |
PT Catur Sentosa Adiprana | | | 70,131,000 | | | | 2,915,005 | |
| | |
PT Matahari Department Store | | | 10,458,400 | | | | 2,555,014 | |
| | | | | | | | |
Total Indonesia | | | | | | | 82,630,742 | |
| | | | | | | | |
| | | | | | | | |
| | | |
| BANGLADESH: 12.5% | | | | | | | | |
British American Tobacco Bangladesh Co., Ltd. | | | 882,150 | | | | 14,099,909 | |
| | |
Square Pharmaceuticals, Ltd. | | | 4,057,147 | | | | 12,629,158 | |
| | |
Berger Paints Bangladesh, Ltd. | | | 519,834 | | | | 9,003,906 | |
| | |
BRAC Bank, Ltd.b | | | 11,427,267 | | | | 8,990,620 | |
| | |
Olympic Industries, Ltd. | | | 1,548,417 | | | | 4,373,615 | |
| | |
Marico Bangladesh, Ltd. | | | 239,603 | | | | 4,282,096 | |
| | | | | | | | |
Total Bangladesh | | | | | | | 53,379,304 | |
| | | | | | | | |
| | | | | | | | |
| | | |
| SRI LANKA: 10.3% | | | | | | | | |
Sampath Bank PLC | | | 13,699,337 | | | | 10,807,731 | |
| | |
John Keells Holdings PLC | | | 13,729,019 | | | | 10,789,058 | |
| | |
Teejay Lanka PLC | | | 29,116,858 | | | | 5,361,613 | |
| | |
Ceylon Cold Stores PLC | | | 1,376,891 | | | | 4,447,523 | |
| | |
LOLC Holdings PLCb | | | 7,511,241 | | | | 3,872,761 | |
| | |
Commercial Bank of Ceylon PLC | | | 6,298,901 | | | | 3,279,804 | |
| | |
Expolanka Holdings PLC | | | 94,231,424 | | | | 3,043,254 | |
| | |
Ceylon Tobacco Co. PLC | | | 361,292 | | | | 2,620,209 | |
| | | | | | | | |
Total Sri Lanka | | | | | | | 44,221,953 | |
| | | | | | | | |
| | | | | | | | |
| | | | | | | | |
| | | Shares | | | Value | |
| | |
| PAKISTAN: 10.2% | | | | | | | | |
PAK Suzuki Motor Co., Ltd.† | | | 5,826,000 | | | | $8,350,053 | |
| | |
Indus Motor Co., Ltd. | | | 1,084,910 | | | | 8,176,181 | |
| | |
Meezan Bank, Ltd. | | | 12,560,697 | | | | 6,853,148 | |
| | |
United Bank, Ltd. | | | 4,824,000 | | | | 4,450,461 | |
| | |
Shifa International Hospitals, Ltd.† | | | 2,783,351 | | | | 3,829,612 | |
| | |
GlaxoSmithKline Consumer Healthcare Pakistan, Ltd. | | | 2,770,557 | | | | 3,347,214 | |
| | |
ICI Pakistan, Ltd. | | | 936,350 | | | | 3,120,991 | |
| | |
Hascol Petroleum, Ltd. | | | 6,977,877 | | | | 2,997,320 | |
| | |
Pakistan Petroleum, Ltd. | | | 1,670,095 | | | | 1,511,468 | |
| | |
Akzo Nobel Pakistan, Ltd. | | | 1,975,300 | | | | 1,237,113 | |
| | | | | | | | |
Total Pakistan | | | | | | | 43,873,561 | |
| | | | | | | | |
| | | | | | | | |
| | | |
| PHILIPPINES: 9.0% | | | | | | | | |
Cosco Capital, Inc. | | | 102,051,200 | | | | 13,714,257 | |
| | |
Universal Robina Corp. | | | 3,030,400 | | | | 9,819,608 | |
| | |
Shakey’s Pizza Asia Ventures, Inc. | | | 22,796,200 | | | | 6,184,585 | |
| | |
Emperador, Inc.b | | | 30,712,800 | | | | 4,579,795 | |
| | |
STI Education Systems Holdings, Inc. | | | 296,157,000 | | | | 4,277,470 | |
| | | | | | | | |
Total Philippines | | | | | | | 38,575,715 | |
| | | | | | | | |
| | | | | | | | |
| | | |
| INDIA: 8.8% | | | | | | | | |
L&T Finance Holdings, Ltd. | | | 7,526,004 | | | | 12,551,341 | |
| | |
Vakrangee, Ltd. | | | 15,511,435 | | | | 7,597,393 | |
| | |
Praj Industries, Ltd. | | | 2,525,370 | | | | 5,144,155 | |
| | |
Shriram Transport Finance Co., Ltd. | | | 268,352 | | | | 4,200,300 | |
| | |
PC Jeweller, Ltd. | | | 6,189,535 | | | | 4,058,681 | |
| | |
Caplin Point Laboratories, Ltd. | | | 489,805 | | | | 3,202,289 | |
| | |
Poly Medicure, Ltd. | | | 343,725 | | | | 952,337 | |
| | | | | | | | |
Total India | | | | | | | 37,706,496 | |
| | | | | | | | |
| | | | | | | | |
| | | |
| CHINA/HONG KONG: 3.5% | | | | | | | | |
Luk Fook Holdings International, Ltd. | | | 2,797,000 | | | | 8,760,465 | |
| | |
Tongda Group Holdings, Ltd. | | | 69,640,000 | | | | 5,342,205 | |
| | |
Future Bright Holdings, Ltd. | | | 16,806,000 | | | | 924,716 | |
| | | | | | | | |
Total China/Hong Kong | | | | | | | 15,027,386 | |
| | | | | | | | |
| | | | | | | | |
| | | |
| AUSTRALIA: 0.9% | | | | | | | | |
Oil Search, Ltd. | | | 746,290 | | | | 3,721,628 | |
| | | | | | | | |
Total Australia | | | | | | | 3,721,628 | |
| | | | | | | | |
| | | | | | | | |
| | | |
| SINGAPORE: 0.7% | | | | | | | | |
Yoma Strategic Holdings, Ltd. | | | 10,610,166 | | | | 3,022,157 | |
| | | | | | | | |
Total Singapore | | | | | | | 3,022,157 | |
| | | | | | | | |
| | | | | | | | |
| | | |
| TOTAL INVESTMENTS: 95.2% | | | | | | | 407,719,523 | |
(Cost $445,813,418) | | | | | | | | |
| | | | | | | | |
| | |
CASH AND OTHER ASSETS,
LESS LIABILITIES: 4.8% | | | | | | | 20,767,701 | |
| | | | | | | | |
| | |
NET ASSETS: 100.0% | | | | | | | $428,487,224 | |
| | | | | | | | |
Matthews Emerging Asia Fund
June 30, 2019
Schedule of Investmentsa(unaudited) (continued)
| a | Certain securities were fair valued under the valuation policies approved by the Board of Trustees (Note2-A). |
| b | Non-income producing security. |
| † | Affiliated Issuer, as defined under the Investment Company Act of 1940 (ownership of 5% or more of the outstanding voting securities of this issuer). |
See accompanying notes to financial statements.
| | | | |
| matthewsasia.com | 800.789.ASIA | | | 53 | |
| | | | |
| PORTFOLIO MANAGERS |
| |
| Michael J. Oh, CFA | | |
Lead Manager | | | | |
| |
| Sunil Asnani | | Tiffany Hsiao, CFA |
Co-Manager | | Co-Manager |
| | |
| FUND FACTS | | | | |
| | |
| | | Investor | | Institutional |
Ticker | | MATFX | | MITEX |
CUSIP | | 577130883 | | 577125859 |
Inception | | 12/27/99 | | 4/30/13 |
NAV | | $13.41 | | $13.49 |
Initial Investment | | $2,500 | | $100,000 |
Gross Expense Ratio1 | | 1.19% | | 1.02% |
Portfolio Statistics | | | | |
Total # of Positions | | 43 |
Net Assets | | $292.3 million |
Weighted Average Market Cap | | $98.7 billion |
Portfolio Turnover2 | | 85.73% |
Benchmark | | | | |
MSCI AC Asia ex Japan Index |
OBJECTIVE
Long-term capital appreciation.
STRATEGY
Under normal market conditions, the Fund seeks to achieve its investment objective by investing at least 80% of its net assets, which include borrowings for investment purposes, in the common and preferred stocks of companies located in Asia that Matthews believes are innovators in their products, services, processes, business models, management, use of technology, or approach to creating, expanding or servicing their markets. Asia consists of all countries and markets in Asia, including developed, emerging, and frontier countries and markets in the Asian region.
Matthews Asia Innovators Fund
Portfolio Manager Commentary (unaudited)
For the first half of 2019, the Matthews Asia Innovators Fund returned 19.09% (Investor Class) and 19.17% (Institutional Class), while its benchmark, the MSCI All Country Asia ex Japan Index, returned 10.83% over the same period. For the quarter ending June 30, 2019, the Fund returned 1.67% (Investor Class) and 1.81% (Institutional Class), while the benchmark returned –0.56%.
Market Environment:
Asia’s capital markets rallied at the start of the year, led by Chinese equities. Volatility flared in May, followed by a rebound for equity prices in June. The dominant factors driving Asia capital markets over the short term were political, stemming from rhetoric around trade relations between the U.S. and China. Following the recent G-20 Summit, the tone of dialogue surrounding trade issues improved, even though negotiations provided few details and trade issues are likely to linger. Despite recent volatility, China’s domestic markets and the Hong Kong market were among the best-performing markets in Asia.
As economic data in the U.S continued to soften, the U.S. Federal Reserve began to use language suggesting the potential for future rate cuts. The prospect of lower U.S. rates provided support to Asian and emerging market currencies against the U.S. dollar as well as allowed emerging market central banks to ease monetary conditions to support their economies. While China’s policymakers have not yet rolled out significant stimulus, market participants seemed reassured by incremental shifts in policy support for economic growth.
Performance Contributors and Detractors:
The Fund outperformed its benchmark in the first half, as well as in the second quarter. An important contributor to performance was stock selection in China. When the U.S.–China trade negotiations faltered toward the end of 2018, we saw an opportunity to buy quality Chinese growth stocks at lower valuations. We took advantage of market conditions to concentrate our China holdings into fewer positions, while adding to some of our existing, higher-conviction names. This approach yielded strong results in the first half as Chinese equities rallied, outperforming the rest of Asia. A mild detractor from performance during the period, meanwhile, was stock selection in South Korea.
Among individual stocks, a major contributor during the first half was China International Travel Service, an operator of duty-free stores. With a dominant market position in duty-free stores in China, the company has been well-positioned to take advantage of several secular trends, including increased outbound Chinese travel, rising incomes and rising luxury sales. Consumers who used to make duty-free purchases abroad can now make them at home. The company’s focus on China’s domestic consumers provides attractive growth potential and we believe the company has demonstrated strong execution on its marketing plans.
In contrast, South Korean food producer Orion detracted from performance. The company’s stock price declined on slowing domestic sales growth, but we remain constructive on the company’s underlying business model. In addition to selling its products in South Korea, it also sells in Vietnam and Russia, where sales have been stronger. Orion’s product innovation remains sound and we continue to like the company’s long-term prospects, so we will continue to monitor and evaluate the position.
Notable Portfolio Changes:
During the second quarter, we added several new stocks to the portfolio. Among these new positions, Innovent Biologics is one of China’s largest biosimilar companies, with a strong pipeline of new products in development. We believe Innovent
(continued)
| 1 | Prospectus expense ratios. |
| 2 | The lesser of fiscal year 2018 long-term purchase costs or sales proceeds divided by the average monthly market value of long-term securities. |
| | | | | | | | | | | | | | | | | | | | | | | | | | | | | | | | |
| | | | |
| PERFORMANCE AS OF JUNE 30, 2019 | | | | | | | | | | |
| | | | | | | | | Average Annual Total Returns | | | | |
| | | 3 Months | | | YTD | | | 1 Year | | | 3 Years | | | 5 Years | | | 10 Years | | | Since Inception | | | Inception Date | |
| Investor Class (MATFX) | | | 1.67% | | | | 19.09% | | | | -4.36% | | | | 12.26% | | | | 7.34% | | | | 12.51% | | | | 3.77% | | | | 12/27/1999 | |
| Institutional Class (MITEX) | | | 1.81% | | | | 19.17% | | | | -4.11% | | | | 12.49% | | | | 7.55% | | | | n.a. | | | | 11.38% | | | | 4/30/2013 | |
| MSCI AC Asia ex Japan Index3 | | | -0.56% | | | | 10.83% | | | | -0.18% | | | | 11.81% | | | | 5.14% | | | | 8.17% | | | | 6.24% | 4 | | | | |
Performance assumes reinvestment of all dividends and/or distributions before taxes. All performance quoted represents past performance and is no guarantee of future results.Investment return and principal value will fluctuate with market conditions so that when redeemed, shares may be worth more or less than their original cost. Current performance may be lower or higher than the return figures quoted. For the Fund’s most recent month-end performance, visit matthewsasia.com.
GROWTH OF A HYPOTHETICAL $10,000 INVESTMENT SINCE INCEPTION—INVESTOR CLASS
Plotted monthly. The performance data and graph do not reflect the deduction of taxes that a shareholder would pay on dividends, capital gains distributions or redemption of Fund shares. Values are in US$.
| | 3 | It is not possible to invest directly in an index. Source: Index data from Morgan Stanley Capital International and Bloomberg; total return calculations performed by BNY Mellon Investment Servicing (US) Inc. Please see page 88 for index definition. |
| | 4 | Calculated from 12/31/99. |
| | | | | | | | |
| | | | |
| TOP TEN HOLDINGS5 | | | | | | | |
| | | Sector | | Country | | % of Net Assets | |
| Alibaba Group Holding, Ltd. | | Consumer Discretionary | | China/Hong Kong | | | 7.2% | |
| HDFC Bank, Ltd. | | Financials | | India | | | 5.8% | |
| Tencent Holdings, Ltd. | | Communication Services | | China/Hong Kong | | | 5.4% | |
| Ping An Insurance Group Co. of China, Ltd. | | Financials | | China/Hong Kong | | | 4.5% | |
| Jiangsu Yanghe Brewery Joint-Stock Co., Ltd. | | Consumer Staples | | China/Hong Kong | | | 3.9% | |
| China International Travel Service Corp., Ltd. | | Consumer Discretionary | | China/Hong Kong | | | 3.7% | |
| Jiangsu Hengrui Medicine Co., Ltd. | | Health Care | | China/Hong Kong | | | 3.7% | |
| AIA Group, Ltd. | | Financials | | China/Hong Kong | | | 3.4% | |
| Inner Mongolia Yili Industrial Group Co., Ltd. | | Consumer Staples | | China/Hong Kong | | | 3.1% | |
| PT Bank Rakyat Indonesia Persero | | Financials | | Indonesia | | | 3.0% | |
| % OF ASSETS IN TOP TEN | | | | | | | 43.7% | |
| | 5 | Holdings may combine more than one security from same issuer and related depositary receipts. |
| | | | |
| matthewsasia.com | 800.789.ASIA | | | 55 | |
| | | | |
| | |
| COUNTRY ALLOCATION (%)6,7 | | | |
| China/Hong Kong | | | 61.6 | |
| India | | | 11.9 | |
| South Korea | | | 10.2 | |
| Indonesia | | | 5.6 | |
| Bangladesh | | | 2.5 | |
| Vietnam | | | 2.4 | |
| Philippines | | | 1.4 | |
| Cash and Other Assets, Less Liabilities | | | 4.4 | |
| | | | |
| | |
| SECTOR ALLOCATION (%)7 | | | |
| Financials | | | 23.8 | |
| Consumer Discretionary | | | 19.0 | |
| Communication Services | | | 17.1 | |
| Health Care | | | 14.6 | |
| Consumer Staples | | | 14.0 | |
| Information Technology | | | 4.3 | |
| Real Estate | | | 2.8 | |
| Cash and Other Assets, Less Liabilities | | | 4.4 | |
| | | | |
| | |
| MARKET CAP EXPOSURE (%)7 | | | |
| Mega Cap (over $25B) | | | 55.8 | |
| Large Cap ($10B–$25B) | | | 10.3 | |
| Mid Cap ($3B–10B) | | | 15.3 | |
| Small Cap (under $3B) | | | 14.2 | |
| Cash and Other Assets, Less Liabilities | | | 4.4 | |
| | 6 | Not all countries are included in the benchmark index. |
| | 7 | Source: FactSet Research Systems. Percentage values in data are rounded to the nearest tenth of one percent, so the values may not sum to 100% due to rounding. Percentage values may be derived from different data sources and may not be consistent with other Fund literature. |
Matthews Asia Innovators Fund
Portfolio Manager Commentary (unaudited) (continued)
is well-positioned to capture market share in oncology treatments. Another new Chinese health care company, drug manufacturer Hansoh Pharmaceutical Group, is a recent IPO in China’s domestic A-share market. Hansoh focused on oncology, as well as other treatments. Turning to South Korea, we added pharmaceutical company Hugel, which continues to innovate, revamping its product line-up and channel strategies. During the second quarter, we exited several positions, including the Mumbai-based Induslnd Bank and Bangkok-based banking group Kasikornbank. In both cases, we were seeking to replace these holdings with higher quality, more innovative companies.
Outlook:
Looking ahead, we expect interest rates to ease or hold steady, while oil prices seem to remain in check. Both conditions are positives for Asia currencies. China’s policymakers also have signaled a willingness to take a more proactive stance in using fiscal and monetary policy to support growth. Elections in India and Indonesia resulted in wins for the incumbents, adding a sense of political stability in both countries. With elections concluded, reform cycles in both countries could get a boost.
Trade tensions between the U.S. and China present both risks and opportunities. While these tensions can disrupt markets over the short term, we believe they strengthen the case for investing in Asia equities over the long term. China is likely to become increasingly self-sufficient as it looks for ways to replace imports impacted by tariffs and is likely to create shifts in the competitive landscape in the process. Investing with a long-term view, we seek to take advantage of short-term market disruptions by buying quality growth companies at attractive valuations.
Innovative companies will continue to find ways to grow and prosper. Asia’s consumers enjoy rising income levels and consistently seek to upgrade their quality of life in areas from health care and education, to technology and consumer staples. The growing purchasing power of the Asian consumer creates attractive opportunities for long-term investors with a sharp focus on innovation.
Matthews Asia Innovators Fund
June 30, 2019
Schedule of Investmentsa(unaudited)
COMMON EQUITIES: 93.3%
| | | | | | | | |
| | | Shares | | | Value | |
| | |
| CHINA/HONG KONG: 61.7% | | | | | | | | |
Alibaba Group Holding, Ltd. ADRb | | | 124,300 | | | | $21,062,635 | |
| | |
Tencent Holdings, Ltd. | | | 350,300 | | | | 15,847,369 | |
| | |
Ping An Insurance Group Co. of China, Ltd. H Shares | | | 1,090,000 | | | | 13,107,115 | |
| | |
Jiangsu Yanghe Brewery Joint-Stock Co., Ltd. A Shares | | | 643,650 | | | | 11,419,573 | |
| | |
China International Travel Service Corp., Ltd. A Shares | | | 841,872 | | | | 10,876,208 | |
| | |
Jiangsu Hengrui Medicine Co., Ltd. A Shares | | | 1,118,055 | | | | 10,760,042 | |
| | |
AIA Group, Ltd. | | | 933,800 | | | | 10,084,015 | |
| | |
Inner Mongolia Yili Industrial Group Co., Ltd. A Shares | | | 1,877,336 | | | | 9,147,929 | |
| | |
China Resources Land, Ltd. | | | 1,870,000 | | | | 8,233,209 | |
| | |
Wuxi Biologics Cayman, Inc.b,c,d | | | 910,000 | | | | 8,164,069 | |
| | |
Momo, Inc. ADR | | | 177,900 | | | | 6,368,820 | |
| | |
Bilibili, Inc. ADRb | | | 383,600 | | | | 6,241,172 | |
| | |
Silergy Corp. | | | 307,000 | | | | 6,018,933 | |
| | |
58.com, Inc. ADRb | | | 85,000 | | | | 5,284,450 | |
| | |
Meituan Dianping Class Bb,d | | | 567,100 | | | | 4,981,013 | |
| | |
GreenTree Hospitality Group, Ltd. ADR | | | 371,077 | | | | 4,824,001 | |
| | |
Tencent Music Entertainment Group ADRb | | | 296,156 | | | | 4,439,379 | |
| | |
Genscript Biotech Corp.b | | | 1,510,000 | | | | 3,788,968 | |
| | |
Haidilao International Holding, Ltd.c,d | | | 890,000 | | | | 3,713,926 | |
| | |
BeiGene, Ltd. ADRb | | | 29,600 | | | | 3,668,920 | |
| | |
Innovent Biologics, Inc.b,c,d | | | 1,084,000 | | | | 3,662,140 | |
| | |
Midea Group Co., Ltd. A Shares | | | 407,821 | | | | 3,089,780 | |
| | |
iQIYI, Inc. ADRb | | | 123,300 | | | | 2,546,145 | |
| | |
Sun Art Retail Group, Ltd. | | | 1,606,000 | | | | 1,521,980 | |
| | |
Hansoh Pharmaceutical Group Co., Ltd.b,c,d | | | 542,000 | | | | 1,432,761 | |
| | | | | | | | |
Total China/Hong Kong | | | | | | | 180,284,552 | |
| | | | | | | | |
| | | | | | | | |
| | | |
| INDIA: 11.9% | | | | | | | | |
HDFC Bank, Ltd. | | | 478,904 | | | | 16,963,376 | |
| | |
Housing Development Finance Corp., Ltd. | | | 215,007 | | | | 6,827,149 | |
| | |
Info Edge India, Ltd. | | | 172,029 | | | | 5,606,484 | |
| | |
Kotak Mahindra Bank, Ltd. | | | 247,560 | | | | 5,297,546 | |
| | | | | | | | |
Total India | | | | | | | 34,694,555 | |
| | | | | | | | |
| | | | | | | | |
| | | |
| SOUTH KOREA: 7.9% | | | | | | | | |
LG Household & Health Care, Ltd. | | | 5,389 | | | | 6,137,885 | |
| | |
Orion Corp. | | | 73,241 | | | | 5,872,008 | |
| | |
Hugel, Inc.b | | | 10,869 | | | | 3,950,842 | |
| | |
Yuhan Corp. | | | 17,230 | | | | 3,650,232 | |
| | |
NAVER Corp. | | | 35,741 | | | | 3,532,315 | |
| | | | | | | | |
Total South Korea | | | | | | | 23,143,282 | |
| | | | | | | | |
| | | | | | | | |
| | | |
| INDONESIA: 5.6% | | | | | | | | |
PT Bank Rakyat Indonesia Persero | | | 28,877,400 | | | | 8,915,178 | |
| | |
PT Bank Tabungan Pensiunan Nasional Syariahb | | | 19,829,700 | | | | 4,842,444 | |
| | |
PT Mayora Indah | | | 15,221,400 | | | | 2,672,623 | |
| | | | | | | | |
Total Indonesia | | | | | | | 16,430,245 | |
| | | | | | | | |
| | | | | | | | |
| | | | | | | | |
| | | Shares | | | Value | |
| | |
| BANGLADESH: 2.4% | | | | | | | | |
Square Pharmaceuticals, Ltd. | | | 1,161,588 | | | | $3,615,811 | |
| | |
BRAC Bank, Ltd.b | | | 4,508,541 | | | | 3,547,181 | |
| | | | | | | | |
Total Bangladesh | | | | | | | 7,162,992 | |
| | | | | | | | |
| | | | | | | | |
| | | |
| VIETNAM: 2.4% | | | | | | | | |
Mobile World Investment Corp. | | | 983,293 | | | | 3,920,206 | |
| | |
Phu Nhuan Jewelry JSC | | | 960,253 | | | | 3,013,467 | |
| | | | | | | | |
Total Vietnam | | | | | | | 6,933,673 | |
| | | | | | | | |
| | | | | | | | |
| | | |
| PHILIPPINES: 1.4% | | | | | | | | |
Puregold Price Club, Inc. | | | 4,761,770 | | | | 4,183,646 | |
| | | | | | | | |
Total Philippines | | | | | | | 4,183,646 | |
| | | | | | | | |
| | | | | | | | |
| | | |
| TOTAL COMMON EQUITIES | | | | | | | 272,832,945 | |
| | | | | | | | |
(Cost $226,903,809) | | | | | | | | |
| | | | | | | | |
| | |
PREFERRED EQUITIES: 2.3% | | | | | | | | |
| | | |
| SOUTH KOREA: 2.3% | | | | | | | | |
Samsung Electronics Co., Ltd., Pfd. | | | 199,826 | | | | 6,627,102 | |
| | | | | | | | |
Total South Korea | | | | | | | 6,627,102 | |
| | | | | | | | |
| | | | | | | | |
| | | |
| TOTAL PREFERRED EQUITIES | | | | | | | 6,627,102 | |
| | | | | | | | |
(Cost $5,710,033) | | | | | | | | |
| | | | | | | | |
| | | |
| TOTAL INVESTMENTS: 95.6% | | | | | | | 279,460,047 | |
(Cost $232,613,842) | | | | | | | | |
| | | | | | | | |
| | |
CASH AND OTHER ASSETS,
LESS LIABILITIES: 4.4% | | | | | | | 12,858,940 | |
| | | | | | | | |
| | |
NET ASSETS: 100.0% | | | | | | | $292,318,987 | |
| | | | | | | | |
| a | Certain securities were fair valued under the valuation policies approved by the Board of Trustees (Note2-A). |
| b | Non-income producing security. |
| c | Security exempt from registration under Rule 144A of the Securities Act of 1933, as amended. The security may be resold in transactions exempt from registration normally to qualified institutional buyers. The security has been determined to be liquid in accordance with procedures adopted by the Funds’ Board of Trustees. At June 30, 2019, the aggregate value is $16,972,896, which is 5.81% of net assets. |
| d | The securities may be resold to qualified foreign investors and foreign institutional buyers under Regulation S of the Securities Act of 1933. |
| ADR | American Depositary Receipt |
See accompanying notes to financial statements.
| | | | |
| matthewsasia.com | 800.789.ASIA | | | 57 | |
| | | | |
| PORTFOLIO MANAGERS |
| |
| Andrew Mattock, CFA | | |
Lead Manager | | |
| |
| Winnie Chwang | | |
Co-Manager | | |
| | |
| FUND FACTS | | | | |
| | |
| | | Investor | | Institutional |
Ticker | | MCHFX | | MICFX |
CUSIP | | 577130701 | | 577130818 |
Inception | | 2/19/98 | | 10/29/10 |
NAV | | $17.57 | | $17.55 |
Initial Investment | | $2,500 | | $100,000 |
Gross Expense Ratio1 | | 1.10% | | 0.91% |
Portfolio Statistics |
Total # of Positions | | 46 |
Net Assets | | $863.5 million |
Weighted Average
Market Cap | | $158.3 billion |
Portfolio Turnover2 | | 96.98% |
Benchmarks |
MSCI China Index |
MSCI China All Shares Index |
OBJECTIVE
Long-term capital appreciation.
STRATEGY
Under normal market conditions, the Fund seeks to achieve its investment objective by investing at least 80% of its net assets, which include borrowings for investment purposes, in the common and preferred stocks of companies located in China. China includes its administrative and other districts, such as Hong Kong.
Matthews China Fund
Portfolio Manager Commentary (unaudited)
For the first half of 2019, the Matthews China Fund returned 22.27% (Investor Class) and 22.47% (Institutional Class), while its benchmark, the MSCI China Index, returned 13.08% over the same period. For the quarter ending June 30, 2019, the Matthews China Fund returned –1.46% (Investor Class) and –1.40% (Institutional Class), while the benchmark returned –3.92%.
Market Environment:
Chinese equities posted some of the strongest results in Asia in the first six months, even amid rising volatility during the second quarter. Equity prices rallied from January through April, then fell in May as trade-related uncertainty escalated. In June, equities regained a bit of ground as trade conflicts receded. While China’s policymakers have not yet rolled out significant stimulus, market participants seemed reassured by incremental shifts in policy support for economic growth. These efforts include a mild easing in credit policy, accommodative monetary policy and a fiscal policy that includes consumer-friendly tax cuts. Chinese corporate earnings remain relatively robust and valuations continue to be some of the most attractive within emerging markets. While the Chinese economy is slowing slightly, the government’s easing posture could help to mitigate some tail risks in the near term.
Performance Contributors and Detractors:
The Fund outperformed its benchmark in the first half, while also providing some downside protection during the volatile second quarter. From a sector perspective, stock selection in consumer staples, communication services, financials and real estate were all positive contributors to relative and absolute performance in the first half. The Fund’s holdings in the information technology sector were the only relative detractors in the half due to stock selection.
Among individual stocks, a strong contributor was Wuliangye Yibin. As the second-largest liquor company in China, Wuliangye Yibin specializes in manufacturing “baijiu,” a clear liquor made from grain. Demonstrating high return on invested capital, Wuliangye Yibin also enjoys improving earnings and a solid growth outlook. We believe the company has more room for expanding its profit margins relative to its largest peer. Wuliangye Yibin is introducing premium products into its line-up, which works in its favor and creates an opportunity to grow its overall market share. Consumer spending is an important theme for our bottom-up research process and we find Wuliangye Yibin to be a compelling long-term growth opportunity within the consumer staples sector.
Meanwhile, a detractor was Focus Media Information Technology, one of the largest outdoor advertising companies in China. Focus Media’s advertising capabilities include digital screens in the elevators of commercial buildings, as well as traditional billboards and outdoor poster boards. With access to hundreds of thousands of billboards and digital screens, Focus Media can easily deploy large-scale ad campaigns in China. Owing to softness in the general economy, however, advertising spending has slowed, hurting recent earnings and sending the stock price lower during the reporting period. Despite short-term weakness in its stock price, we continue to like the company’s long-term prospects. We believe it enjoys a strong competitive and dominant position and remains well-positioned for future growth.
Notable Portfolio Changes:
During the second quarter, we added two new positions, Luxshare Precision Industry and Lepu Medical Technology Beijing, both representing China’s domestic A-share market. Luxshare Precision Industry is a handset component maker
(continued)
| 1 | Prospectus expense ratios. |
| 2 | The lesser of fiscal year 2018 long-term purchase costs or sales proceeds divided by the average monthly market value of long-term securities. |
| | | | | | | | | | | | | | | | | | | | | | | | | | | | | | | | |
| |
| PERFORMANCE AS OF JUNE 30, 2019 | |
| | | | | | | | | Average Annual Total Returns | | | | |
| | | 3 Months | | | YTD | | | 1 Year | | | 3 Years | | | 5 Years | | | 10 Years | | | Since
Inception | | | Inception
Date | |
| Investor Class (MCHFX) | | | -1.46% | | | | 22.27% | | | | -3.79% | | | | 18.21% | | | | 8.43% | | | | 7.42% | | | | 9.68% | | | | 2/19/98 | |
| Institutional Class (MICFX) | | | -1.40% | | | | 22.47% | | | | -3.55% | | | | 18.45% | | | | 8.60% | | | | n.a. | | | | 3.75% | | | | 10/29/10 | |
| MSCI China Index3 | | | -3.92% | | | | 13.08% | | | | -6.55% | | | | 14.51% | | | | 7.58% | | | | 6.39% | | | | 4.47% | 4 | | | | |
| MSCI China All Shares Index3 | | | -3.76% | | | | 17.70% | | | | -2.39% | | | | 9.93% | | | | 8.00% | | | | 5.06% | | | | n.a. | 5 | | | | |
Performance assumes reinvestment of all dividends and/or distributions before taxes. All performance quoted represents past performance and is no guarantee of future results.Investment return and principal value will fluctuate with market conditions so that when redeemed, shares may be worth more or less than their original cost. Current performance may be lower or higher than the return figures quoted. For the Fund’s most recent month-end performance, visit matthewsasia.com.
GROWTH OF A HYPOTHETICAL $10,000 INVESTMENT SINCE INCEPTION—INVESTOR CLASS
Plotted monthly. The performance data and graph do not reflect the deduction of taxes that a shareholder would pay on dividends, capital gains distributions or redemption of Fund shares. Values are in US$.
| | 3 | It is not possible to invest directly in an index. Source: Index data from Morgan Stanley Capital International and Bloomberg; total return calculations performed by BNY Mellon Investment Servicing (US) Inc. Please see page 88 for index definition. |
| | 4 | Calculated from 2/28/98. |
| | 5 | Index performance data prior to 11/25/08 is not available. |
| | | | | | | | |
| | | | |
| TOP TEN HOLDINGS5 | | | | | | | |
| | | Sector | | | | % of Net Assets | |
| Alibaba Group Holding, Ltd. | | Consumer Discretionary | | | | | 10.9% | |
| Tencent Holdings, Ltd. | | Communication Services | | | | | 9.5% | |
| Ping An Insurance Group Co. of China, Ltd. | | Financials | | | | | 4.9% | |
| China Construction Bank Corp. | | Financials | | | | | 4.5% | |
| Industrial & Commercial Bank of China, Ltd. | | Financials | | | | | 4.5% | |
| New China Life Insurance Co., Ltd. | | Financials | | | | | 4.1% | |
| Agricultural Bank of China, Ltd. | | Financials | | | | | 3.8% | |
| AIA Group, Ltd. | | Financials | | | | | 3.3% | |
| China Resources Land, Ltd. | | Real Estate | | | | | 2.9% | |
| Wuliangye Yibin Co., Ltd. | | Consumer Staples | | | | | 2.8% | |
| % OF ASSETS IN TOP TEN | | | | | | | 51.2% | |
| | 5 | Holdings may combine more than one security from same issuer and related depositary receipts. |
| | | | |
| matthewsasia.com | 800.789.ASIA | | | 59 | |
| | | | |
| |
| COUNTRY ALLOCATION (%)6 | |
| China/Hong Kong | | | 94.9 | |
| Cash and Other Assets, Less Liabilities | | | 5.1 | |
| | | | |
| |
| SECTOR ALLOCATION (%)6 | |
| Financials | | | 30.6 | |
| Consumer Discretionary | | | 23.0 | |
| Communication Services | | | 14.6 | |
| Real Estate | | | 8.0 | |
| Consumer Staples | | | 6.6 | |
| Information Technology | | | 4.5 | |
| Health Care | | | 3.4 | |
| Materials | | | 2.4 | |
| Energy | | | 0.9 | |
| Industrials | | | 0.8 | |
| Cash and Other Assets, Less Liabilities | | | 5.1 | |
| | | | |
| |
| MARKET CAP EXPOSURE (%)6 | |
| Mega Cap (over $25B) | | | 64.0 | |
| Large Cap ($10B-$25B) | | | 10.8 | |
| Mid Cap ($3B-10B) | | | 17.3 | |
| Small Cap (under $3B) | | | 2.8 | |
| Cash and Other Assets, Less Liabilities | | | 5.1 | |
| 6 | Source: FactSet Research Systems. Percentage values in data are rounded to the nearest tenth of one percent, so the values may not sum to 100% due to rounding. Percentage values may be derived from different data sources and may not be consistent with other Fund literature. |
Matthews China Fund
Portfolio Manager Commentary (unaudited) (continued)
moving into new business areas by focusing on higher value manufacturing opportunities and diversifying its client base. The company demonstrates strong execution and its addressable market continues to expand. Lepu Medical Technology, a pharmaceutical and medical device company, has expanded its core business from medical stents to include cardiovascular drugs. Earlier this year, Lepu was also first to market with a new product line of biodegradable stents, designed to dissolve after use. The company projects attractive profit growth and is attractively valued. During the quarter, we exited a small position in China Shenhua Energy, as we saw little upside potential in coal prices, which remained the most important earnings catalyst for the company.
Outlook:
We are incrementally more positive in our outlook for China. Following the recent G-20 Summit, the tone of dialogue surrounding trade issues improved. Though negotiations provided few details, they likely represented the best outcome that the market could expect. Mindful of how fluid trade talks tend to be, we believe it is possible the upcoming 2020 U.S. presidential elections could put additional pressure on President Trump to negotiate. Skepticism around trade aside, Chinese corporate earnings continue to be among the strongest in emerging markets, albeit with a moderate slowdown in economic activity in China. Should the Chinese economy slow further, most market watchers expect Chinese policymakers to act swiftly to maintain economic stability.
We continue to find a lot of value in the current market, especially given frequent shifts in sentiment related to daily headlines. Investing with a long-term view, we ignore the noise and focus on the fundamentals that promote growth. We pay particular attention to company earnings, as well as secular trends we see on the ground. Amid the current news cycle, it is easy for investors to lose sight of the transformation that is taking place among China’s enormous middle class. Income growth has expanded rapidly from the eastern seaboard of China to the country’s vast interior. We expect consumers in less-developed urban centers to drive China’s economic growth for many years and look for businesses geared toward those opportunity sets.
Matthews China Fund
June 30, 2019
Schedule of Investmentsa(unaudited)
COMMON EQUITIES: 94.9%
| | | | | | | | |
| | | Shares | | | Value | |
| | |
| FINANCIALS: 30.6% | | | | | | | | |
Banks: 12.9% | | | | | | | | |
China Construction Bank Corp. H Shares | | | 45,327,660 | | | | $39,072,620 | |
| | |
Industrial & Commercial Bank of China, Ltd. H Shares | | | 53,423,000 | | | | 38,994,591 | |
| | |
Agricultural Bank of China, Ltd. H Shares | | | 78,928,000 | | | | 33,033,536 | |
| | | | | | | | |
| | | | | | | 111,100,747 | |
| | | | | | | | |
| | | | | | | | |
Insurance: 12.3% | | | | | | | | |
New China Life Insurance Co., Ltd. H Shares | | | 7,274,600 | | | | 35,397,289 | |
AIA Group, Ltd. | | | 2,625,200 | | | | 28,349,280 | |
| | |
Ping An Insurance Group Co. of China, Ltd. A Shares | | | 1,933,411 | | | | 24,991,582 | |
| | |
Ping An Insurance Group Co. of China, Ltd. H Shares | | | 1,457,000 | | | | 17,520,244 | |
| | | | | | | | |
| | | | | | | 106,258,395 | |
| | | | | | | | |
| | | | | | | | |
Capital Markets: 5.4% | | | | | | | | |
Hong Kong Exchanges & Clearing, Ltd. | | | 458,100 | | | | 16,189,296 | |
| | |
CITIC Securities Co., Ltd. H Shares | | | 7,671,000 | | | | 15,998,882 | |
| | |
China International Capital Corp., Ltd. H Sharesb,c | | | 7,311,600 | | | | 14,758,382 | |
| | | | | | | | |
| | | | | | | 46,946,560 | |
| | | | | | | | |
Total Financials | | | | | | | 264,305,702 | |
| | | | | | | | |
| | | | | | | | |
| | | |
| CONSUMER DISCRETIONARY: 23.0% | | | | | | | | |
Internet & Direct Marketing Retail: 14.0% | | | | | | | | |
Alibaba Group Holding, Ltd. ADRd | | | 555,300 | | | | 94,095,585 | |
| | |
Ctrip.com International, Ltd. ADRd | | | 386,900 | | | | 14,280,479 | |
| | |
JD.com, Inc. ADRd | | | 423,779 | | | | 12,836,266 | |
| | | | | | | | |
| | | | | | | 121,212,330 | |
| | | | | | | | |
| | | | | | | | |
Hotels, Restaurants & Leisure: 3.1% | | | | | | | | |
China International Travel Service Corp., Ltd. A Shares | | | 1,129,178 | | | | 14,587,936 | |
| | |
Galaxy Entertainment Group, Ltd. | | | 1,744,000 | | | | 11,731,889 | |
| | | | | | | | |
| | | | | | | 26,319,825 | |
| | | | | | | | |
| | | | | | | | |
Household Durables: 2.3% | | | | | | | | |
Midea Group Co., Ltd. A Shares | | | 2,606,891 | | | | 19,750,626 | |
| | | | | | | | |
| | | | | | | | |
Automobiles: 2.0% | | | | | | | | |
Brilliance China Automotive Holdings, Ltd. | | | 15,866,000 | | | | 17,546,067 | |
| | | | | | | | |
| | | | | | | | |
Specialty Retail: 1.6% | | | | | | | | |
Zhongsheng Group Holdings, Ltd. | | | 4,934,000 | | | | 13,757,201 | |
| | | | | | | | |
Total Consumer Discretionary | | | | | | | 198,586,049 | |
| | | | | | | | |
| | | | | | | | |
| | | |
| COMMUNICATION SERVICES: 14.6% | | | | | | | | |
Interactive Media & Services: 13.7% | | | | | | | | |
Tencent Holdings, Ltd. | | | 1,821,300 | | | | 82,394,554 | |
| | |
58.com, Inc. ADRd | | | 212,700 | | | | 13,223,559 | |
| | |
Momo, Inc. ADR | | | 242,300 | | | | 8,674,340 | |
| | |
YY, Inc. ADRd | | | 119,900 | | | | 8,355,831 | |
| | |
SINA Corp.d | | | 142,600 | | | | 6,150,338 | |
| | | | | | | | |
| | | | | | | 118,798,622 | |
| | | | | | | | |
| | | | | | | | |
Entertainment: 0.9% | | | | | | | | |
Tencent Music Entertainment Group ADRd | | | 290,700 | | | | 4,357,593 | |
| | |
iQIYI, Inc. ADRd | | | 148,600 | | | | 3,068,590 | |
| | | | | | | | |
| | | | | | | 7,426,183 | |
| | | | | | | | |
Total Communication Services | | | | | | | 126,224,805 | |
| | | | | | | | |
| | | | | | | | |
| | | Shares | | | Value | |
| | |
| REAL ESTATE: 8.0% | | | | | | | | |
Real Estate Management & Development: 8.0% | | | | | |
China Resources Land, Ltd. | | | 5,768,000 | | | | $25,395,267 | |
| | |
Times China Holdings, Ltd. | | | 9,295,000 | | | | 18,609,247 | |
| | |
CIFI Holdings Group Co., Ltd. | | | 21,900,000 | | | | 14,430,633 | |
| | |
China Overseas Property Holdings, Ltd. | | | 20,890,000 | | | | 10,891,232 | |
| | | | | | | | |
Total Real Estate | | | | | | | 69,326,379 | |
| | | | | | | | |
| | | | | | | | |
| | | |
| CONSUMER STAPLES: 6.6% | | | | | | | | |
Beverages: 5.0% | | | | | | | | |
Wuliangye Yibin Co., Ltd. A Shares | | | 1,410,347 | | | | 24,282,783 | |
| | |
Kweichow Moutai Co., Ltd. A Shares | | | 132,789 | | | | 19,064,972 | |
| | | | | | | | |
| | | | | | | 43,347,755 | |
| | | | | | | | |
| | | | | | | | |
Food Products: 1.6% | | | | | | | | |
Inner Mongolia Yili Industrial Group Co., Ltd. A Shares | | | 2,722,997 | | | | 13,268,687 | |
| | | | | | | | |
Total Consumer Staples | | | | | | | 56,616,442 | |
| | | | | | | | |
| | | | | | | | |
| | | |
| INFORMATION TECHNOLOGY: 4.5% | | | | | | | | |
Electronic Equipment, Instruments & Components: 2.8% | | | | | |
Luxshare Precision Industry Co., Ltd. A Shares | | | 2,520,340 | | | | 9,135,184 | |
| | |
AVIC Jonhon OptronicTechnology Co., Ltd. A Shares | | | 1,813,623 | | | | 8,848,497 | |
| | |
Kingboard Holdings, Ltd. | | | 2,409,500 | | | | 6,710,845 | |
| | | | | | | | |
| | | | | | | 24,694,526 | |
| | | | | | | | |
| | | | | | | | |
IT Services: 0.8% | | | | | | | | |
Chinasoft International, Ltd. | | | 14,170,000 | | | | 6,979,702 | |
| | | | | | | | |
| | | | | | | | |
Technology Hardware, Storage & Peripherals: 0.7% | | | | | |
Focus Media Information Technology Co., Ltd. A Shares | | | 7,504,767 | | | | 5,799,184 | |
| | | | | | | | |
| | | | | | | | |
Semiconductors & Semiconductor Equipment: 0.2% | | | | | |
ASM Pacific Technology, Ltd. | | | 148,100 | | | | 1,518,381 | |
| | | | | | | | |
Total Information Technology | | | | | | | 38,991,793 | |
| | | | | | | | |
| | | | | | | | |
| | | |
| HEALTH CARE: 3.5% | | | | | | | | |
Pharmaceuticals: 1.8% | | | | | | | | |
Sino Biopharmaceutical, Ltd. | | | 14,706,000 | | | | 15,045,349 | |
| | | | | | | | |
| | | | | | | | |
Health Care Equipment & Supplies: 1.0% | | | | | | | | |
Lepu Medical Technology Beijing Co., Ltd. A Shares | | | 2,634,606 | | | | 8,838,487 | |
| | | | | | | | |
| | | | | | | | |
Health Care Technology: 0.7% | | | | | | | | |
Ping An Healthcare and Technology Co., Ltd.b,c,d | | | 1,396,400 | | | | 5,829,464 | |
| | | | | | | | |
Total Health Care | | | | | | | 29,713,300 | |
| | | | | | | | |
| | | | | | | | |
| | | |
| MATERIALS: 2.4% | | | | | | | | |
Construction Materials: 1.7% | | | | | | | | |
| | |
Anhui Conch Cement Co., Ltd. A Shares | | | 2,202,329 | | | | 13,319,104 | |
| | |
China Jushi Co., Ltd. A Shares | | | 996,797 | | | | 1,385,630 | |
| | | | | | | | |
| | | | | | | 14,704,734 | |
| | | | | | | | |
Chemicals: 0.7% | | | | | | | | |
Wanhua Chemical Group Co., Ltd. A Shares | | | 969,634 | | | | 6,053,111 | |
| | | | | | | | |
Total Materials | | | | | | | 20,757,845 | |
| | | | | | | | |
| | | | | | | | |
| | | | |
| matthewsasia.com | 800.789.ASIA | | | 61 | |
Matthews China Fund
June 30, 2019
Schedule of Investmentsa(unaudited) (continued)
COMMON EQUITIES(continued)
| | | | | | | | |
| | | Shares | | | Value | |
| | |
| ENERGY: 0.9% | | | | | | | | |
Oil, Gas & Consumable Fuels: 0.9% | | | | | | | | |
China Petroleum & Chemical Corp. H Shares | | | 11,250,000 | | | | $7,663,723 | |
| | | | | | | | |
Total Energy | | | | | | | 7,663,723 | |
| | | | | | | | |
| | | | | | | | |
| | | |
| INDUSTRIALS: 0.8% | | | | | | | | |
Professional Services: 0.8% | | | | | | | | |
51job, Inc. ADRd | | | 94,400 | | | | 7,127,200 | |
| | | | | | | | |
Total Industrials | | | | | | | 7,127,200 | |
| | | | | | | | |
| | | | | | | | |
| | | |
| TOTAL INVESTMENTS: 94.9% | | | | | | | 819,313,238 | |
(Cost $797,202,659) | | | | | | | | |
| | | | | | | | |
| | |
CASH AND OTHER ASSETS,
LESS LIABILITIES: 5.1% | | | | | | | 44,139,077 | |
| | | | | | | | |
| | |
NET ASSETS: 100.0% | | | | | | | $863,452,315 | |
| | | | | | | | |
| a | Certain securities were fair valued under the valuation policies approved by the Board of Trustees (Note2-A). |
| b | Security exempt from registration under Rule 144A of the Securities Act of 1933, as amended. The security may be resold in transactions exempt from registration normally to qualified institutional buyers. The security has been determined to be liquid in accordance with procedures adopted by the Funds’ Board of Trustees. At June 30, 2019, the aggregate value is $20,587,846, which is 2.38% of net assets. |
| c | The securities may be resold to qualified foreign investors and foreign institutional buyers under Regulation S of the Securities Act of 1933. |
| d | Non-income producing security. |
| ADR | American Depositary Receipt |
See accompanying notes to financial statements.
| | | | |
| PORTFOLIO MANAGERS |
| |
| Sunil Asnani | | |
Lead Manager | | |
| |
| Sharat Shroff, CFA | | Peeyush Mittal |
Co-Manager | | Co-Manager |
|
| FUND FACTS |
| | |
| | | Investor | | Institutional |
Ticker | | MINDX | | MIDNX |
CUSIP | | 577130859 | | 577130768 |
Inception | | 10/31/05 | | 10/29/10 |
NAV | | $26.92 | | $27.18 |
Initial Investment | | $2,500 | | $100,000 |
Gross Expense Ratio1 | | 1.09% | | 0.90% |
Portfolio Statistics | | | | |
Total # of Positions | | 53 |
Net Assets | | $1.5 billion |
Weighted Average Market Cap | | $17.3 billion |
Portfolio Turnover2 | | 20.87% |
Benchmark | | |
S&P Bombay Stock Exchange 100 Index |
OBJECTIVE
Long-term capital appreciation.
STRATEGY
Under normal market conditions, the Fund seeks to achieve its investment objective by investing at least 80% of its net assets, which include borrowings for investment purposes, in publicly traded common stocks, preferred stocks and convertible securities of companies located in India.
Matthews India Fund
Portfolio Manager Commentary (unaudited)
For the first half of 2019, the Matthews India Fund returned 2.28% (Investor Class) and 2.34% (Institutional Class) while its benchmark, the S&P Bombay Stock Exchange 100 Index, returned 8.52%. For the quarter ending June 30, the Fund returned –3.06% (Investor Class) and –3.07% (Institutional Class), while its benchmark returned 1.78%.
Market Environment:
India’s equity markets were somewhat more volatile during the second quarter of the year compared to the first quarter. We continued to see investors pull funds out of small- and mid-capitalization stocks in favor of large capitalization stocks.
Earlier in the year, India’s general elections were conducted over seven phases, spanning about six weeks and concluding with the victory of Prime Minister Narendra Modi’s party by a decisive mandate. Stock market reaction after Modi’s party easily secured a majority in the lower house of parliament was relatively muted, suggesting that markets were already discounting Modi’s success.
The Reserve Bank of India (RBI), the country’s central bank, continued with monetary policy easing, cutting repo rates twice during the second quarter amid benign consumer inflation and a softer economic growth rate. The U.S. Federal Reserve indicated a more accommodative monetary policy stance and also allowed the RBI greater freedom to bring down policy rates.
India’s financials sector continued to witness tight liquidity on the back of solvency concerns for some non-banking financial (NBFC) firms. Lack of funding to NBFCs has negatively impacted asset financing across the country. This, in turn, has contributed to slowing GDP growth. Thus far, the central government has been averse to infusing capital in these failing NBFCs, a prudent decision in our view.
Performance Contributors and Detractors:
The Fund’s underperformance during both the second quarter and year-to-date periods could be attributed to a mix of challenges with stock selection and allocation. India’s small- and mid-cap equity markets had underperformed for quite some time and the portfolio’s higher allocation to these segments contributed to the relative underperformance versus the benchmark. Also, our exposure to a few banks with significant exposure to risky assets such as infrastructure leasing and financial services firms was a performance detractor. One such holding was Yes Bank. We had hoped that the bank’s change in management as well as increased scrutiny by the central bank would improve its governance and accounting transparency. However, it had brought forward hitherto undisclosed risk exposure, which led to the stock’s significant underperformance. While we believed the current management had the right intentions, we exited our position as we became more wary of the holding amid its crisis of liquidity and solvency. We also trimmed our exposure to IndusInd Bank, where the problem was less pronounced but our conviction in the management’s ability to deliver secular and profitable growth was shaken.
Another stock-specific challenge to the portfolio during the second quarter came from our position in Blue Dart Express, India’s leading express logistics provider. Blue Dart has not benefited enough from the growth in e-commerce, where it had underinvested in expanding its last-mile reach compared to certain start-up competitors. In recent quarters, the company began to try to rectify the situation by investing more toward this end, and this led to its underperformance. This was driven by a margin contraction, part of which we believe should recover.
(continued)
| 1 | Prospectus expense ratios. |
| 2 | The lesser of fiscal year 2018 long-term purchase costs or sales proceeds divided by the average monthly market value of long-term securities. |
| | | | |
| matthewsasia.com | 800.789.ASIA | | | 63 | |
| | | | | | | | | | | | | | | | | | | | | | | | | | | | | | | | |
| | | |
| PERFORMANCE AS OF JUNE 30, 2019 | | | | | | | |
| | | | | | | | | Average Annual Total Returns | | | | |
| | | 3 Months | | | YTD | | | 1 Year | | | 3 Years | | | 5 Years | | | 10 Years | | | Since
Inception | | | Inception
Date | |
| Investor Class (MINDX) | | | -3.06% | | | | 2.28% | | | | -3.28% | | | | 6.61% | | | | 8.43% | | | | 11.02% | | | | 10.68% | | | | 10/31/05 | |
| Institutional Class (MIDNX) | | | -3.07% | | | | 2.34% | | | | -3.13% | | | | 6.81% | | | | 8.64% | | | | n.a. | | | | 5.53% | | | | 10/29/10 | |
| S&P Bombay Stock Exchange 100 Index3 | | | 1.78% | | | | 8.52% | | | | 9.04% | | | | 12.87% | | | | 7.46% | | | | 8.06% | | | | 10.44% | 4 | | | | |
Performance assumes reinvestment of all dividends and/or distributions before taxes. All performance quoted represents past performance and is no guarantee of future results.Investment return and principal value will fluctuate with market conditions so that when redeemed, shares may be worth more or less than their original cost. Current performance may be lower or higher than the return figures quoted. For the Fund’s most recent month-end performance, visit matthewsasia.com.
GROWTH OF A HYPOTHETICAL $10,000 INVESTMENT SINCE INCEPTION—INVESTOR CLASS
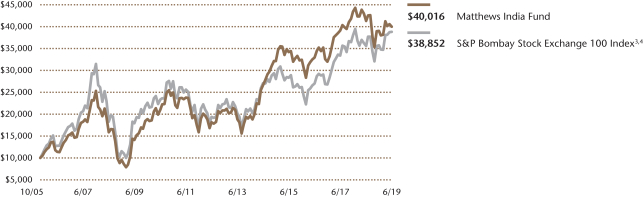
Plotted monthly. The performance data and graph do not reflect the deduction of taxes that a shareholder would pay on dividends, capital gains distributions or redemption of Fund shares. Values are in US$.
| | 3 | It is not possible to invest directly in an index. Source: Index data from S&P BSE 100 Index and Bloomberg; total return calculations performed by BNY Mellon Investment Servicing (US) Inc. Please see page 88 for index definition. |
| | 4 | Calculated from 10/31/05. |
| | | | | | | | |
| | | | |
| TOP TEN HOLDINGS5 | | | | | | | |
| | | Sector | | | | % of Net Assets | |
| HDFC Bank, Ltd. | | Financials | | | | | 6.0% | |
| Suzuki Motor Corp. | | Consumer Discretionary | | | | | 5.9% | |
| Eicher Motors, Ltd. | | Consumer Discretionary | | | | | 5.0% | |
| Kotak Mahindra Bank, Ltd. | | Financials | | | | | 4.5% | |
| VST Industries, Ltd. | | Consumer Staples | | | | | 4.0% | |
| Axis Bank, Ltd. | | Financials | | | | | 3.9% | |
| Cholamandalam Investment and Finance Co., Ltd. | | Financials | | | | | 3.8% | |
| Wipro, Ltd. | | Information Technology | | | | | 3.3% | |
| ITC, Ltd. | | Consumer Staples | | | | | 3.0% | |
| Shriram City Union Finance, Ltd. | | Financials | | | | | 2.9% | |
| % OF ASSETS IN TOP TEN | | | | | | | 42.3% | |
| | 5 | Holdings may combine more than one security from same issuer and related depositary receipts. |
Matthews India Fund
Portfolio Manager Commentary (unaudited) (continued)
The Fund’s underperformance in the second quarter was partly mitigated by our avoidance of energy stocks, and stock-specific factors within the communication services and health care sectors. Within communication services, we have avoided stressed media and telecom companies. Instead, we held Info Edge India, a profitable and growing internet company. Within health care, we initiated a new position in Syngene International, a leading clinical contract research organization that has been able to build a track record of quality outsourced custom research within small molecules. While Syngene is not immune to pricing pressures, its business is quite sticky and underpenetrated, leaving enough headroom for profitable growth.
Notable Portfolio Changes:
We exited Yes Bank and Emami during the second quarter. We had long held our position in Emami but had been trimming it over the years due to rich valuations amid deteriorating fundamentals. During the first half of the year, we sold out of the holding completely as we felt that the company’s internal systems and practices were not robust enough to deal with certain external shocks, including India’s demonetization program, the Goods and Services Tax and recent liquidity issues in the financial sector.
In addition to Syngene, we also initiated new positions in certain small-cap financial companies led by strong management in underpenetrated segments, and in Lupin, a transnational pharmaceutical firm. Lupin’s stock price underwent substantial correction due to certain FDA observations in its plants, which also affected its approval for new molecules in the U.S. market. The company has, however, increased its addressable market size within the domestic market using innovation and by building relationships with doctors using practices that are more sustainable and, in our view, it should be able to recover from its earnings slump in the near to medium term.
Outlook:
A primary challenge seems to be growth, not just in India but globally, and it would be simplistic to believe that India would be immune to the global events such as U.S.–China trade conflicts, Fed policy moves and economic slowdown. Given the backdrop, we believe that India’s central bank should continue to relax monetary policy and we expect Modi to continue pushing for reforms and policy stimulus to return the economy to a higher growth trajectory. Some specific initiatives include affordable housing, an “electricity-for-all” campaign and increasing farmer incomes through a multipronged approach of infrastructure spending, direct benefits transfer and farm productivity measures. Despite government efforts, weak monsoons in India can be a spoilsport. Monsoon rainfall across the country currently is far short of long-term averages, and if the trend continues it is likely to have a negative impact on farm productivity. That in turn would lead to a rise in food inflation. At a sector level, we expect the pricing pressures in overseas pharmaceutical companies to moderate. Within financials, we anticipate India’s liquidity woes to settle and find equilibrium as stronger NBFCs, banks and corporations take over, replacing weaker ones.
| | | | |
| |
| COUNTRY ALLOCATION (%)6 | |
| India | | | 91.2 | |
| Japan | | | 5.9 | |
| United States | | | 2.3 | |
| Cash and Other Assets, Less Liabilities | | | 0.5 | |
| | | | |
| |
| SECTOR ALLOCATION (%)6 | |
| Financials | | | 38.3 | |
| Consumer Discretionary | | | 13.7 | |
| Consumer Staples | | | 12.5 | |
| Information Technology | | | 12.2 | |
| Health Care | | | 11.1 | |
| Industrials | | | 6.6 | |
| Materials | | | 3.0 | |
| Communication Services | | | 2.0 | |
| Cash and Other Assets, Less Liabilities | | | 0.5 | |
| | | | |
| |
| MARKET CAP EXPOSURE (%)6 | |
| Mega Cap (over $25B) | | | 23.6 | |
| Large Cap ($10B–$25B) | | | 12.0 | |
| Mid Cap ($3B–10B) | | | 20.5 | |
| Small Cap (under $3B) | | | 43.3 | |
| Cash and Other Assets, Less Liabilities | | | 0.5 | |
| 6 | Source: FactSet Research Systems. Percentage values in data are rounded to the nearest tenth of one percent, so the values may not sum to 100% due to rounding. Percentage values may be derived from different data sources and may not be consistent with other Fund literature. |
| | | | |
| matthewsasia.com | 800.789.ASIA | | | 65 | |
Matthews India Fund
June 30, 2019
Schedule of Investmentsa(unaudited)
COMMON EQUITIES: 99.5%
| | | | | | | | |
| | | Shares | | | Value | |
| | |
| FINANCIALS: 38.3% | | | | | | | | |
Banks: 21.8% | | | | | | | | |
HDFC Bank, Ltd. | | | 2,483,613 | | | | $87,972,667 | |
| | |
Kotak Mahindra Bank, Ltd. | | | 3,092,902 | | | | 66,185,130 | |
| | |
Axis Bank, Ltd.b | | | 4,913,532 | | | | 57,537,242 | |
| | |
DCB Bank, Ltd. | | | 11,969,871 | | | | 41,122,740 | |
| | |
IndusInd Bank, Ltd. | | | 1,434,610 | | | | 29,314,659 | |
| | |
Bandhan Bank, Ltd.c,d | | | 3,589,314 | | | | 28,007,097 | |
| | |
AU Small Finance Bank, Ltd.c,d | | | 1,009,868 | | | | 10,302,488 | |
| | | | | | | | |
| | | | | | | 320,442,023 | |
| | | | | | | | |
| | | | | | | | |
Consumer Finance: 11.5% | | | | | | | | |
Cholamandalam Investment and Finance Co., Ltd. | | | 13,471,420 | | | | 55,740,211 | |
| | |
Shriram City Union Finance, Ltd. | | | 1,827,872 | | | | 42,896,835 | |
| | |
Bajaj Finance, Ltd. | | | 699,054 | | | | 37,270,216 | |
| | |
Sundaram Finance, Ltd. | | | 695,531 | | | | 16,844,377 | |
| | |
CreditAccess Grameen, Ltd.b | | | 2,032,000 | | | | 15,283,440 | |
| | | | | | | | |
| | | | | | | 168,035,079 | |
| | | | | | | | |
| | | | | | | | |
Thrifts & Mortgage Finance: 2.7% | | | | | | | | |
Aavas Financiers, Ltd.b | | | 1,174,534 | | | | 25,511,265 | |
| | |
Housing Development Finance Corp., Ltd. | | | 463,821 | | | | 14,727,777 | |
| | | | | | | | |
| | | | | | | 40,239,042 | |
| | | | | | | | |
| | | | | | | | |
Capital Markets: 2.3% | | | | | | | | |
CRISIL, Ltd. | | | 1,209,256 | | | | 26,063,099 | |
| | |
Indian Energy Exchange, Ltd.c,d | | | 3,497,308 | | | | 7,304,502 | |
| | | | | | | | |
| | | | | | | 33,367,601 | |
| | | | | | | | |
Total Financials | | | | | | | 562,083,745 | |
| | | | | | | | |
| | | | | | | | |
| | | |
| CONSUMER DISCRETIONARY: 13.7% | | | | | | | | |
Automobiles: 10.9% | | | | | | | | |
Suzuki Motor Corp. | | | 1,839,100 | | | | 86,522,548 | |
| | |
Eicher Motors, Ltd. | | | 266,539 | | | | 73,865,116 | |
| | | | | | | | |
| | | | | | | 160,387,664 | |
| | | | | | | | |
| | | | | | | | |
Household Durables: 2.8% | | | | | | | | |
Symphony, Ltd. | | | 1,821,995 | | | | 32,548,750 | |
| | |
LA Opala RG, Ltd. | | | 2,937,800 | | | | 8,254,483 | |
| | | | | | | | |
| | | | | | | 40,803,233 | |
| | | | | | | | |
Total Consumer Discretionary | | | | | | | 201,190,897 | |
| | | | | | | | |
| | | | | | | | |
| | | |
| CONSUMER STAPLES: 12.5% | | | | | | | | |
Tobacco: 7.0% | | | | | | | | |
VST Industries, Ltd.† | | | 1,167,175 | | | | 58,149,139 | |
| | |
ITC, Ltd. | | | 11,237,066 | | | | 44,559,519 | |
| | | | | | | | |
| | | | | | | 102,708,658 | |
| | | | | | | | |
| | | | | | | | |
Personal Products: 2.8% | | | | | | | | |
Bajaj Consumer Care, Ltd. | | | 6,084,114 | | | | 29,073,565 | |
| | |
Dabur India, Ltd. | | | 1,186,347 | | | | 6,883,431 | |
| | |
Marico, Ltd. | | | 1,003,404 | | | | 5,390,634 | |
| | | | | | | | |
| | | | | | | 41,347,630 | |
| | | | | | | | |
| | | | | | | | |
| | | | | | | | |
| | | Shares | | | Value | |
Food Products: 2.7% | | | | | | | | |
Zydus Wellness, Ltd. | | | 1,734,795 | | | | $33,624,660 | |
| | |
Nestle India, Ltd. | | | 30,163 | | | | 5,205,543 | |
| | | | | | | | |
| | | | | | | 38,830,203 | |
| | | | | | | | |
Total Consumer Staples | | | | | | | 182,886,491 | |
| | | | | | | | |
| | | | | | | | |
| | | |
| INFORMATION TECHNOLOGY: 12.2% | | | | | | | | |
IT Services: 11.7% | | | | | | | | |
Wipro, Ltd. | | | 12,047,428 | | | | 49,042,902 | |
| | |
NIIT Technologies, Ltd. | | | 1,831,786 | | | | 35,694,753 | |
| | |
Cognizant Technology Solutions Corp. Class A | | | 535,500 | | | | 33,945,345 | |
| | |
Mphasis, Ltd. | | | 1,464,076 | | | | 21,305,741 | |
| | |
eClerx Services, Ltd. | | | 1,786,518 | | | | 19,844,449 | |
| | |
Larsen & Toubro Infotech, Ltd.c,d | | | 302,596 | | | | 8,021,258 | |
| | |
Tata Consultancy Services, Ltd. | | | 137,397 | | | | 4,433,726 | |
| | | | | | | | |
| | | | | | | 172,288,174 | |
| | | | | | | | |
| | | | | | | | |
Software: 0.5% | | | | | | | | |
Tata Elxsi, Ltd. | | | 578,649 | | | | 7,418,464 | |
| | | | | | | | |
Total Information Technology | | | | | | | 179,706,638 | |
| | | | | | | | |
| | | | | | | | |
| | | |
| HEALTH CARE: 11.1% | | | | | | | | |
Pharmaceuticals: 8.8% | | | | | | | | |
Alembic Pharmaceuticals, Ltd. | | | 4,147,557 | | | | 30,567,387 | |
| | |
Caplin Point Laboratories, Ltd.† | | | 3,870,311 | | | | 25,303,651 | |
| | |
Ajanta Pharma, Ltd. | | | 1,804,060 | | | | 24,976,190 | |
| | |
Natco Pharma, Ltd. | | | 2,922,192 | | | | 22,652,429 | |
| | |
Lupin, Ltd. | | | 1,337,380 | | | | 14,622,977 | |
| | |
Eris Lifesciences, Ltd.b,c,d | | | 1,585,606 | | | | 11,713,879 | |
| | | | | | | | |
| | | | | | | 129,836,513 | |
| | | | | | | | |
| | | | | | | | |
Life Sciences Tools & Services: 1.6% | | | | | | | | |
Syngene International, Ltd.c,d | | | 4,785,970 | | | | 23,182,911 | |
| | | | | | | | |
| | | | | | | | |
Health Care Equipment & Supplies: 0.7% | | | | | | | | |
Poly Medicure, Ltd. | | | 3,594,824 | | | | 9,959,945 | |
| | | | | | | | |
Total Health Care | | | | | | | 162,979,369 | |
| | | | | | | | |
| | | | | | | | |
| | | |
| INDUSTRIALS: 6.6% | | | | | | | | |
Machinery: 3.3% | | | | | | | | |
AIA Engineering, Ltd.b | | | 992,659 | | | | 25,787,619 | |
| | |
Ashok Leyland, Ltd. | | | 18,445,155 | | | | 23,305,017 | |
| | | | | | | | |
| | | | | | | 49,092,636 | |
| | | | | | | | |
| | | | | | | | |
Airlines: 2.0% | | | | | | | | |
InterGlobe Aviation, Ltd.c,d | | | 1,312,651 | | | | 29,639,562 | |
| | | | | | | | |
| | | | | | | | |
Air Freight & Logistics: 1.3% | | | | | | | | |
Blue Dart Express, Ltd. | | | 475,939 | | | | 18,513,546 | |
| | | | | | | | |
Total Industrials | | | | | | | 97,245,744 | |
| | | | | | | | |
| | | | | | | | |
| | | |
| MATERIALS: 3.0% | | | | | | | | |
Chemicals: 2.7% | | | | | | | | |
UPL, Ltd. | | | 1,618,842 | | | | 21,987,307 | |
| | |
Castrol India, Ltd. | | | 5,743,813 | | | | 11,030,517 | |
| | |
Pidilite Industries, Ltd. | | | 322,373 | | | | 5,671,136 | |
| | |
Gulf Oil Lubricants India, Ltd. | | | 105,452 | | | | 1,313,959 | |
| | | | | | | | |
| | | | | | | 40,002,919 | |
| | | | | | | | |
| | | | | | | | |
Matthews India Fund
June 30, 2019
Schedule of Investmentsa(unaudited) (continued)
COMMON EQUITIES(continued)
| | | | | | | | |
| | | Shares | | | Value | |
Metals & Mining: 0.3% | | | | | | | | |
NMDC, Ltd. | | | 2,713,195 | | | | $4,437,718 | |
| | | | | | | | |
Total Materials | | | | | | | 44,440,637 | |
| | | | | | | | |
| | | | | | | | |
| | | |
| COMMUNICATION SERVICES: 2.1% | | | | | | | | |
Interactive Media & Services: 2.1% | | | | | | | | |
Info Edge India, Ltd. | | | 923,698 | | | | 30,103,632 | |
| | | | | | | | |
Total Communication Services | | | | | | | 30,103,632 | |
| | | | | | | | |
| | | | | | | | |
| | | |
| TOTAL INVESTMENTS: 99.5% | | | | | | | 1,460,637,153 | |
(Cost $1,291,453,321) | | | | | | | | |
| | | | | | | | |
| | |
CASH AND OTHER ASSETS,
LESS LIABILITIES: 0.5% | | | | | | | 8,058,539 | |
| | | | | | | | |
| | |
NET ASSETS: 100.0% | | | | | | | $1,468,695,692 | |
| | | | | | | | |
| a | Certain securities were fair valued under the valuation policies approved by the Board of Trustees (Note2-A). |
| b | Non-income producing security. |
| c | Security exempt from registration under Rule 144A of the Securities Act of 1933, as amended. The security may be resold in transactions exempt from registration normally to qualified institutional buyers. The security has been determined to be liquid in accordance with procedures adopted by the Funds’ Board of Trustees. At June 30, 2019, the aggregate value is $118,171,697, which is 8.05% of net assets. |
| d | The securities may be resold to qualified foreign investors and foreign institutional buyers under Regulation S of the Securities Act of 1933. |
| † | Affiliated Issuer, as defined under the Investment Company Act of 1940 (ownership of 5% or more of the outstanding voting securities of this issuer). |
See accompanying notes to financial statements.
| | | | |
| matthewsasia.com | 800.789.ASIA | | | 67 | |
| | | | |
PORTFOLIO MANAGERS |
| | |
| Taizo Ishida | | | | |
Lead Manager | | | | |
| | |
| Shuntaro Takeuchi | | | | |
Co-Manager | | | | |
|
| FUND FACTS |
| | |
| | | Investor | | Institutional |
Ticker | | MJFOX | | MIJFX |
CUSIP | | 577130800 | | 577130792 |
Inception | | 12/31/98 | | 10/29/10 |
NAV | | $21.08 | | $21.12 |
Initial Investment | | $2,500 | | $100,000 |
Gross Expense Ratio1 | | 0.91% | | 0.85% |
Portfolio Statistics | | | | |
Total # of Positions | | 53 |
Net Assets | | $2.7 billion |
Weighted Average Market Cap | | $22.7 billion |
Portfolio Turnover2 | | 46.11% |
Benchmark |
MSCI Japan Index |
OBJECTIVE
Long-term capital appreciation.
STRATEGY
Under normal market conditions, the Fund seeks to achieve its investment objective by investing at least 80% of its net assets, which include borrowings for investment purposes, in the common and preferred stocks of companies located in Japan.
Matthews Japan Fund
Portfolio Manager Commentary (unaudited)
For the first half of 2019, the Matthews Japan Fund returned 13.76% (Investor Class) and 13.73% (Institutional Class), while its benchmark, the MSCI Japan Index, returned 7.97% over the same period. For the quarter ending June 30, 2019, the Fund returned 0.96% (Investor Class) and 0.96% (Institutional Class), while its benchmark returned 1.05%.
Market Environment:
Japanese equities posted solid gains in the first half, even as global markets experienced swings in sentiment. Early this year, the U.S. Federal Reserve’s pause in rate hikes improved investor sentiment and Japan equity valuations came back from their lowest levels since the start of the Abenomics era. In May, however, trade friction between U.S. and China intensified, with tariff hikes and a temporary U.S. ban of Huawei products dampening export companies and the technology sector in particular.
The larger macro environment, meanwhile, continues to slow. Global manufacturing PMI for May came in at 49.8, its lowest level since October 2012. A reading of below 50 indicates a contraction of manufacturing activity. The Bank of Japan’s most recent Tankan Survey (announced July 1) showed further deterioration in the outlook among respondents within the manufacturing sector, reflecting the weakness of exports, especially among semiconductor-related products. Domestic consumption remained sluggish, and we expect this will continue with Japan’s consumption tax increasing in October to 10% from the current 8%.
Performance Contributors and Detractors:
The Fund’s outperformance during the first six months of the year was driven by strong stock selection among smaller and midsize companies, which make up roughly half of the portfolio. While index returns were largely driven by large-cap companies performing better than small caps, we were able to overcome the overall trend with stock selection. From a sector perspective, stock selection in information technology (IT), industrials and health care were positive contributors to performance. Our focus on productivity improvement through software, IT services and automation helped us capture attractive returns within the sector, despite the cyclical downturn in semiconductors and sluggish industrial production. Our holdings in the consumer discretionary sector, meanwhile, detracted from performance.
Turning to individual securities, Net One Systems was a strong contributor in the first half. The company is transforming from a hardware-centric business model to one that is maintenance- and service-oriented, experiencing margin expansion along the way. Telecom and venture capital firm SoftBank also contributed to performance. SoftBank’s share price rose following the announcement of a massive 600 billion yen (US$5.5 billion) stock buyback. The recent IPO of transportation network company Uber in the U.S. and other unicorn companies going public also spurred interest in other pre-IPO companies that SoftBank and its Vision Fund currently hold.
The largest detractor from performance was dollar-shop retailer Seria. Seria has long enjoyed much higher operating margins than its peers. Competition has intensified, however, while the overall retail environment remain sluggish. Home fashion goods retailer Ryohin Keikaku also was a detractor to performance, after the company reported fiscal year earnings below the guidance that was revised down only three months earlier. Although we believe in the long-term brand equity of the firm’s marquee products, we continue to monitor and evaluate its growth prospects and execution abilities.
(continued)
| 1 | Prospectus expense ratios. |
| 2 | The lesser of fiscal year 2018 long-term purchase costs or sales proceeds divided by the average monthly market value of long-term securities. |
| | | | | | | | | | | | | | | | | | | | | | | | | | | | | | | | |
| | | |
| PERFORMANCE AS OF JUNE 30, 2019 | | | | | | | |
| | | | | | | | | Average Annual Total Returns | | | | |
| | | 3 Months | | | YTD | | | 1 Year | | | 3 Years | | | 5 Years | | | 10 Years | | | Since Inception | | | Inception Date | |
| Investor Class (MJFOX) | | | 0.96% | | | | 13.76% | | | | -9.27% | | | | 4.53% | | | | 6.77% | | | | 9.54% | | | | 5.85% | | | | 12/31/98 | |
| Institutional Class (MIJFX) | | | 0.96% | | | | 13.73% | | | | -9.22% | | | | 4.61% | | | | 6.86% | | | | n.a. | | | | 9.21% | | | | 10/29/10 | |
| MSCI Japan Index3 | | | 1.05% | | | | 7.97% | | | | -3.83% | | | | 8.44% | | | | 4.82% | | | | 6.11% | | | | 3.36% | 4 | | | | |
Performance assumes reinvestment of all dividends and/or distributions before taxes. All performance quoted represents past performance and is no guarantee of future results. Investment return and principal value will fluctuate with market conditions so that when redeemed, shares may be worth more or less than their original cost. Current performance may be lower or higher than the return figures quoted. For the Fund’s most recent month-end performance, visit matthewsasia.com.
GROWTH OF A HYPOTHETICAL $10,000 INVESTMENT SINCE INCEPTION—INVESTOR CLASS
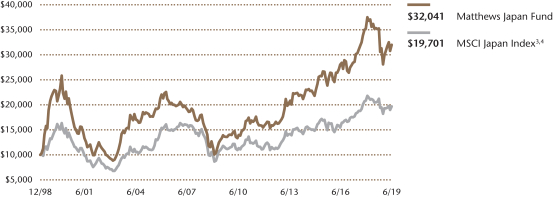
Plotted monthly. The performance data and graph do not reflect the deduction of taxes that a shareholder would pay on dividends, capital gains distributions or redemption of Fund shares. Values are in US$.
| | 3 | It is not possible to invest directly in an index. Source: Index data from Morgan Stanley Capital International and Bloomberg; total return calculations performed by BNY Mellon Investment Servicing (US) Inc. Please see page 88 for index definitions. |
| | 4 | Calculated from 12/31/98. |
| | | | | | | | |
| | | | |
| TOP TEN HOLDINGS5 | | | | | | | |
| | | Sector | | | | % of Net Assets | |
| Tokio Marine Holdings, Inc. | | Financials | | | | | 4.0% | |
| Terumo Corp. | | Health Care | | | | | 3.4% | |
| Nippon Telegraph & Telephone Corp. | | Communication Services | | | | | 3.4% | |
| Kyowa Exeo Corp. | | Industrials | | | | | 3.4% | |
| Keyence Corp. | | Information Technology | | | | | 3.4% | |
| ITOCHU Techno-Solutions Corp. | | Information Technology | | | | | 3.1% | |
| NET One Systems Co., Ltd. | | Information Technology | | | | | 2.9% | |
| Kao Corp. | | Consumer Staples | | | | | 2.7% | |
| SoftBank Group Corp. | | Communication Services | | | | | 2.7% | |
| Nidec Corp. | | Industrials | | | | | 2.6% | |
| % OF ASSETS IN TOP TEN | | | | | | | 31.6% | |
| | 5 | Holdings may combine more than one security from same issuer and related depositary receipts. |
| | | | |
| matthewsasia.com | 800.789.ASIA | | | 69 | |
| | | | |
| |
| COUNTRY ALLOCATION (%)6 | |
| Japan | | | 98.9 | |
| Cash and Other Assets, Less Liabilities | | | 1.1 | |
| | | | |
| | |
| SECTOR ALLOCATION (%)6 | | | |
| Industrials | | | 23.8 | |
| Information Technology | | | 18.7 | |
| Health Care | | | 14.8 | |
| Consumer Discretionary | | | 14.3 | |
| Consumer Staples | | | 9.1 | |
| Communication Services | | | 8.2 | |
| Financials | | | 6.3 | |
| Real Estate | | | 2.5 | |
| Materials | | | 1.1 | |
| Cash and Other Assets, Less Liabilities | | | 1.1 | |
| | | | |
| | |
| MARKET CAP EXPOSURE (%)6 | | | |
| Mega Cap (over $25B) | | | 31.5 | |
| Large Cap ($10B-$25B) | | | 15.5 | |
| Mid Cap ($3B-10B) | | | 26.0 | |
| Small Cap (under $3B) | | | 25.9 | |
| Cash and Other Assets, Less Liabilities | | | 1.1 | |
| 6 | Source: FactSet Research Systems. Percentage values in data are rounded to the nearest tenth of one percent, so the values may not sum to 100% due to rounding. Percentage values may be derived from different data sources and may not be consistent with other Fund literature. |
Matthews Japan Fund
Portfolio Manager Commentary (unaudited) (continued)
Notable Portfolio Changes:
During the half, we continued to reduce our exposure to cyclical stocks, taking advantage of the market rally in January. We reallocated the proceeds to higher-quality companies that were sold off toward the end of last year, which were trading at the lower end of their price range despite their ability to grow in a slower macro environment. We also conducted research on high-quality growth companies in cyclical sectors, but we still think it would be premature to build a substantial position in these sectors.
Regarding new positions, we initiated a position in Yahoo Japan. The company in May announced a corporate structure change resulting in Altaba and SoftBank Group selling out and Yahoo Japan coming under the umbrella of SoftBank’s domestic telecom business. The company can now focus on online ads and e-commerce, two bright spots of growth in Japan. We also initiated a position in SBI Holdings, the largest online broker and second-largest among all brokerages in Japan. Unlike its competitors where a majority of assets under management are held by clients in their 60s and 70s, SBI Holding’s core demographics are customers in their 30s and 40s, which is set to grow given that Japan pensions are no longer sufficient to support retirement life. And we initiated a position in Shionogi, a pharmaceutical company focused on small molecule drugs in infectious disease areas. During the quarter, we exited two positions—ORIX and Suzuki Motor—and found more compelling investment themes elsewhere.
Outlook:
While Japanese equities experienced healthy gains in the first quarter, the macro environment remained muted and second-quarter broad market equity returns were mixed. Underlying fundamentals are still on a downward path, and developments surrounding trade frictions remain unpredictable. We do not expect any dramatic outcomes or resolution of current issues. On a positive note, corporate inventory levels have declined quickly in the past six months. Recent earnings results showed an earnings decline in many sectors but absolute profit levels remain higher than during past downturns.
Additionally, given earnings growth no longer drives return-on-equity improvement, share buybacks by Japanese companies are at a record level, with many companies using their cash holdings to bolster equity performance. While valuations have risen a bit, they remain near the low end of their historical range. The MSCI Japan Index’s price-to-book ratio is now 1.20X, up from the lows of a 1.16X level at the end of 2018. While Japanese corporate earnings tend to be procyclical with higher earnings volatility than developed-market peers, we continue to believe the earnings capability of Japanese companies has improved meaningfully over the past economic cycle, driven by better corporate governance and a higher focus on capital efficiency.
Matthews Japan Fund
June 30, 2019
Schedule of Investmentsa(unaudited)
COMMON EQUITIES: 98.9%
| | | | | | | | |
| | | Shares | | | Value | |
| | |
| INDUSTRIALS: 23.9% | | | | | | | | |
Professional Services: 8.9% | | | | | | | | |
Recruit Holdings Co., Ltd. | | | 1,677,300 | | | | $56,159,178 | |
| | |
Persol Holdings Co., Ltd. | | | 2,244,200 | | | | 52,909,484 | |
| | |
Nihon M&A Center, Inc. | | | 2,148,800 | | | | 51,760,257 | |
| | |
TechnoPro Holdings, Inc. | | | 928,500 | | | | 49,564,696 | |
| | |
Outsourcing, Inc. | | | 2,255,100 | | | | 27,512,518 | |
| | | | | | | | |
| | | | | | | 237,906,133 | |
| | | | | | | | |
| | | | | | | | |
Building Products: 6.4% | | | | | | | | |
Daikin Industries, Ltd. | | | 498,300 | | | | 65,246,871 | |
| | |
Sanwa Holdings Corp. | | | 5,271,000 | | | | 56,814,127 | |
| | |
Aica Kogyo Co., Ltd. | | | 1,464,900 | | | | 49,101,807 | |
| | | | | | | | |
| | | | | | | 171,162,805 | |
| | | | | | | | |
| | | | | | | | |
Construction & Engineering: 3.4% | | | | | | | | |
Kyowa Exeo Corp. | | | 3,606,600 | | | | 90,001,037 | |
| | | | | | | | |
| | | | | | | | |
Electrical Equipment: 2.7% | | | | | | | | |
Nidec Corp. | | | 514,200 | | | | 70,617,654 | |
| | | | | | | | |
| | | | | | | | |
Machinery: 2.5% | | | | | | | | |
| | |
MISUMI Group, Inc. | | | 1,343,100 | | | | 33,855,319 | |
| | |
SMC Corp. | | | 87,800 | | | | 32,914,030 | |
| | | | | | | | |
| | | | | | | 66,769,349 | |
| | | | | | | | |
Total Industrials | | | | | | | 636,456,978 | |
| | | | | | | | |
| | | | | | | | |
| | | |
| INFORMATION TECHNOLOGY: 18.7% | | | | | | | | |
IT Services: 8.2% | | | | | | | | |
ITOCHU Techno-Solutions Corp. | | | 3,230,900 | | | | 83,060,850 | |
| | |
NET One Systems Co., Ltd. | | | 2,818,100 | | | | 77,932,131 | |
| | |
Otsuka Corp. | | | 1,416,400 | | | | 57,119,236 | |
| | | | | | | | |
| | | | | | | 218,112,217 | |
| | | | | | | | |
| | | | | | | | |
Electronic Equipment, Instruments & Components: 5.9% | |
Keyence Corp. | | | 145,000 | | | | 89,424,762 | |
| | |
Shimadzu Corp. | | | 1,482,500 | | | | 36,496,327 | |
| | |
Murata Manufacturing Co., Ltd. | | | 686,700 | | | | 30,915,736 | |
| | | | | | | | |
| | | | | | | 156,836,825 | |
| | | | | | | | |
| | | | | | | | |
Semiconductors & Semiconductor Equipment: 2.4% | |
Lasertec Corp. | | | 666,200 | | | | 26,421,381 | |
| | |
Rohm Co., Ltd. | | | 340,000 | | | | 22,907,803 | |
| | |
Disco Corp. | | | 86,200 | | | | 14,224,368 | |
| | | | | | | | |
| | | | | | | 63,553,552 | |
| | | | | | | | |
| | | | | | | | |
Software: 2.2% | | | | | | | | |
Infomart Corp. | | | 3,800,700 | | | | 59,569,180 | |
| | | | | | | | |
Total Information Technology | | | | | | | 498,071,774 | |
| | | | | | | | |
| | | | | | | | |
| | | |
| HEALTH CARE: 14.8% | | | | | | | | |
Health Care Equipment & Supplies: 7.7% | |
Terumo Corp. | | | 3,055,400 | | | | 91,275,361 | |
| | |
Asahi Intecc Co., Ltd. | | | 2,230,400 | | | | 55,133,519 | |
| | |
Nakanishi, Inc. | | | 1,834,800 | | | | 33,738,602 | |
| | |
Sysmex Corp. | | | 372,400 | | | | 24,362,441 | |
| | | | | | | | |
| | | | | | | 204,509,923 | |
| | | | | | | | |
| | | | | | | | |
Health Care Technology: 2.6% | | | | | | | | |
M3, Inc. | | | 3,781,600 | | | | 69,395,616 | |
| | | | | | | | |
| | | | | | | | |
| | | | | | | | |
| | | Shares | | | Value | |
Pharmaceuticals: 2.5% | | | | | | | | |
Shionogi & Co., Ltd. | | | 725,000 | | | | $41,892,561 | |
| | |
Eisai Co., Ltd. | | | 458,900 | | | | 26,008,720 | |
| | | | | | | | |
| | | | | | | 67,901,281 | |
| | | | | | | | |
| | | | | | | | |
Biotechnology: 2.0% | | | | | | | | |
PeptiDream, Inc.b | | | 1,042,100 | | | | 53,524,309 | |
| | | | | | | | |
Total Health Care | | | | | | | 395,331,129 | |
| | | | | | | | |
| | | | | | | | |
| | | |
| CONSUMER DISCRETIONARY: 14.3% | | | | | | | | |
Auto Components: 3.3% | | | | | | | | |
Nifco, Inc. | | | 2,051,600 | | | | 50,939,614 | |
| | |
Denso Corp. | | | 906,200 | | | | 38,210,927 | |
| | | | | | | | |
| | | | | | | 89,150,541 | |
| | | | | | | | |
| | | | | | | | |
Household Durables: 2.6% | | | | | | | | |
Sony Corp. | | | 1,324,000 | | | | 69,576,165 | |
| | | | | | | | |
| | | | | | | | |
Specialty Retail: 2.6% | | | | | | | | |
Nitori Holdings Co., Ltd. | | | 516,500 | | | | 68,540,713 | |
| | | | | | | | |
| | | | | | | | |
Distributors: 2.2% | | | | | | | | |
PALTAC Corp. | | | 1,068,200 | | | | 58,855,191 | |
| | | | | | | | |
| | | | | | | | |
Multiline Retail: 1.8% | | | | | | | | |
Seria Co., Ltd. | | | 1,504,700 | | | | 34,804,520 | |
| | |
Ryohin Keikaku Co., Ltd. | | | 74,100 | | | | 13,425,788 | |
| | | | | | | | |
| | | | | | | 48,230,308 | |
| | | | | | | | |
| | | | | | | | |
Hotels, Restaurants & Leisure: 1.2% | | | | | | | | |
Kyoritsu Maintenance Co., Ltd. | | | 683,600 | | | | 32,007,970 | |
| | | | | | | | |
| | | | | | | | |
Internet & Direct Marketing Retail: 0.6% | |
Mercari, Inc.b | | | 614,600 | | | | 16,372,210 | |
| | | | | | | | |
Total Consumer Discretionary | | | | | | | 382,733,098 | |
| | | | | | | | |
| | | | | | | | |
| | | |
| CONSUMER STAPLES: 9.1% | | | | | | | | |
Personal Products: 4.7% | | | | | | | | |
Kao Corp. | | | 957,100 | | | | 73,030,914 | |
| | |
Kose Corp. | | | 314,600 | | | | 53,098,800 | |
| | | | | | | | |
| | | | | | | 126,129,714 | |
| | | | | | | | |
| | | | | | | | |
Food Products: 1.7% | | | | | | | | |
Ariake Japan Co., Ltd. | | | 740,700 | | | | 46,866,301 | |
| | | | | | | | |
| | | | | | | | |
Household Products: 1.7% | | | | | | | | |
Pigeon Corp. | | | 1,107,700 | | | | 44,668,970 | |
| | | | | | | | |
| | | | | | | | |
Food & Staples Retailing: 1.0% | | | | | | | | |
San-A Co., Ltd. | | | 658,700 | | | | 26,355,317 | |
| | | | | | | | |
Total Consumer Staples | | | | | | | 244,020,302 | |
| | | | | | | | |
| | | | | | | | |
| | | |
| COMMUNICATION SERVICES: 8.2% | | | | | | | | |
Diversified Telecommunication Services: 3.4% | |
Nippon Telegraph & Telephone Corp. | | | 1,956,000 | | | | 91,129,463 | |
| | | | | | | | |
| | | | | | | | |
Wireless Telecommunication Services: 2.8% | |
SoftBank Group Corp. | | | 1,513,200 | | | | 72,883,773 | |
| | | | | | | | |
| | | | | | | | |
Interactive Media & Services: 1.5% | | | | | | | | |
Yahoo Japan Corp. | | | 13,680,100 | | | | 40,240,643 | |
| | | | | | | | |
| | | | | | | | |
| | | | |
| matthewsasia.com | 800.789.ASIA | | | 71 | |
Matthews Japan Fund
June 30, 2019
Schedule of Investmentsa(unaudited) (continued)
COMMON EQUITIES(continued)
| | | | | | | | |
| | | Shares | | | Value | |
Entertainment: 0.5% | | | | | | | | |
Nintendo Co., Ltd. | | | 38,400 | | | | $14,088,912 | |
| | | | | | | | |
Total Communication Services | | | | | | | 218,342,791 | |
| | | | | | | | |
| | | | | | | | |
| | | |
| FINANCIALS: 6.3% | | | | | | | | |
Insurance: 4.0% | | | | | | | | |
Tokio Marine Holdings, Inc. | | | 2,150,800 | | | | 107,917,177 | |
| | | | | | | | |
| | | | | | | | |
Capital Markets: 1.2% | | | | | | | | |
SBI Holdings, Inc. | | | 1,265,000 | | | | 31,420,369 | |
| | | | | | | | |
| | | | | | | | |
Banks: 1.1% | | | | | | | | |
Mitsubishi UFJ Financial Group, Inc. | | | 6,194,200 | | | | 29,502,818 | |
| | | | | | | | |
Total Financials | | | | | | | 168,840,364 | |
| | | | | | | | |
| | | | | | | | |
| | | |
| REAL ESTATE: 2.5% | | | | | | | | |
Real Estate Management & Development: 2.5% | | | | | |
Relo Group, Inc. | | | 2,686,500 | | | | 67,846,196 | |
| | | | | | | | |
Total Real Estate | | | | | | | 67,846,196 | |
| | | | | | | | |
| | | | | | | | |
| | | | | | | | |
| | | Shares | | | Value | |
| | |
| MATERIALS: 1.1% | | | | | | | | |
Chemicals: 1.1% | | | | | | | | |
Fuso Chemical Co., Ltd. | | | 1,470,500 | | | | $29,303,120 | |
| | | | | | | | |
Total Materials | | | | | | | 29,303,120 | |
| | | | | | | | |
| | | | | | | | |
| | | |
| TOTAL INVESTMENTS: 98.9% | | | | | | | 2,640,945,752 | |
(Cost $2,393,915,292) | | | | | | | | |
| | | | | | | | |
| | |
CASH AND OTHER ASSETS,
LESS LIABILITIES: 1.1% | | | | | | | 28,576,964 | |
| | | | | | | | |
| | |
NET ASSETS: 100.0% | | | | | | | $2,669,522,716 | |
| | | | | | | | |
| a | Certain securities were fair valued under the valuation policies approved by the Board of Trustees (Note2-A). |
| b | Non-income producing security. |
See accompanying notes to financial statements.
| | | | |
| PORTFOLIO MANAGERS |
| | |
| Michael J. Oh, CFA | | | | |
Lead Manager | | | | |
| |
| Elli Lee | | |
Co-Manager | | | | |
|
| FUND FACTS |
| | |
| | | Investor | | Institutional |
Ticker | | MAKOX | | MIKOX |
CUSIP | | 577130305 | | 577130826 |
Inception | | 1/3/95 | | 10/29/10 |
NAV | | $4.54 | | $4.58 |
Initial Investment | | $2,500 | | $100,000 |
Gross Expense Ratio1 | | 1.14% | | 1.02% |
Portfolio Statistics |
Total # of Positions | | 38 |
Net Assets | | $150.4 million |
Weighted Average
Market Cap | | $50.1 billion |
Portfolio Turnover2 | | 35.60% |
Benchmark |
Korea Composite Stock Price Index |
OBJECTIVE
Long-term capital appreciation.
STRATEGY
Under normal market conditions, the Fund seeks to achieve its investment objective by investing at least 80% of its net assets, which include borrowings for investment purposes, in the common and preferred stocks of companies located in South Korea.
Matthews Korea Fund
Portfolio Manager Commentary (unaudited)
For the first half of 2019, the Matthews Korea Fund returned –0.87% (Investor Class) and –0.65% (Institutional Class), while its benchmark, the Korea Composite Stock Price Index, returned 0.69% over the same period. For the quarter ending June 30, 2019, the Matthews Korea Fund returned –2.16% (Investor Class) and –1.93% (Institutional Class), while the benchmark returned –2.24%.
Market Environment:
South Korea’s equity market was mostly flat in the first half and lagged broader emerging markets as fears of a slowdown in global growth and trade conflicts weighed on sentiment. Exports represent a significant part of South Korea’s GDP, making its economy vulnerable to disruptions in export volume. In addition, corporate earnings were weak, causing valuations to appear more expensive than South Korea’s historical average. The Bank of Korea (BOK) is poised to lower rates to support its sluggish economy but most market participants expect a slow and measured response as the BOK seems content to wait out the U.S.–China trade negotiations before taking monetary action.
Performance Contributors and Detractors:
The Fund underperformed its benchmark in the first half, primarily due to our underweight in the information technology (IT) sector relative to the index. IT stocks rebounded and outperformed South Korea’s broader equity market in the first quarter of 2019, dampening our relative performance. Information technology makes up close to a third of the Korea Composite Stock Price Index, representing what we feel is a high level of concentration risk in a single sector for index-based strategies. As active managers, we seek to manage concentration risk by building a diversified portfolio from the bottom up. From a sector perspective, a contributor to performance was strong stock selection among our health care holdings. The health care sector benefits from a drug development pipeline, an aging domestic population and rising demand for lifestyle upgrades.
Turning to individual securities, Samsung Electronics was a contributor to performance in the first half. As one of the world’s largest supplier of memory chips, Samsung’s stock price rose in the first half on market expectations of a rebound in chip demand and prices. LG Household & Heath Care, a South Korean cosmetics and skin care company, also contributed to performance. A rise in the company’s stock price reflected its solid earnings growth and strong brand recognition. Hyundai Mobis, the parts and services arm of Hyundai Motors, also contributed to returns as a result of the company’s restructuring efforts and earnings recovery. Chat platform Kakao performed well after successfully building a strong customer base within the platform for an integrated payments system and gaining market share in digital advertising.
In contrast, South Korean confectionary maker Orion detracted from performance. Following the gradual easing of tensions between South Korea and China around the THAAD missile tests conducted by the U.S. in 2017, some investors hoped that Orion’s sales to Chinese consumers might regain ground. The recovery ended up being slower than expected and the company’s stock price declined. However, we remain constructive on the company’s underlying business with footprints across the region. Household product maker Lock&Lock’s share price was also volatile amid a restructuring process, but we expect the company to expand its addressable market and products and improve business efficiency. Meanwhile, e-commerce company Café24’s stock price suffered on an earnings miss on hiring, but we maintain a positive view as South Korea’s e-commerce market is still growing and Café 24 should benefit from growing demand in the sector.
(continued)
| 1 | Prospectus expense ratios. |
| 2 | The lesser of fiscal year 2018 long-term purchase costs or sales proceeds divided by the average monthly market value of long-term securities. |
| | | | |
| matthewsasia.com | 800.789.ASIA | | | 73 | |
| | | | | | | | | | | | | | | | | | | | | | | | | | | | | | | | |
| | | | | | | | | |
| PERFORMANCE AS OF JUNE 30, 2019 | | | | | | | | | | | | | | | | | | | | | | | | |
| | | | | | | | | Average Annual Total Returns | | | | |
| | | 3 Months | | | YTD | | | 1 Year | | | 3 Years | | | 5 Years | | | 10 Years | | | Since
Inception | | | Inception
Date | |
| Investor Class (MAKOX) | | | -2.16% | | | | -0.87% | | | | -12.65% | | | | 1.36% | | | | 2.41% | | | | 9.77% | | | | 5.53% | | | | 01/03/95 | |
| Institutional Class (MIKOX) | | | -1.93% | | | | -0.65% | | | | -12.46% | | | | 1.51% | | | | 2.59% | | | | n.a. | | | | 6.08% | | | | 10/29/10 | |
| Korea Composite Stock Price Index3 | | | -2.24% | | | | 0.69% | | | | -10.15% | | | | 4.48% | | | | 0.32% | | | | 6.99% | | | | 3.00% | 4 | | | | |
Performance assumes reinvestment of all dividends and/or distributions before taxes. All performance quoted represents past performance and is no guarantee of future results.Investment return and principal value will fluctuate with market conditions so that when redeemed, shares may be worth more or less than their original cost. Current performance may be lower or higher than the return figures quoted. For the Fund’s most recent month-end performance, visit matthewsasia.com.
GROWTH OF A HYPOTHETICAL $10,000 INVESTMENT SINCE INCEPTION—INVESTOR CLASS
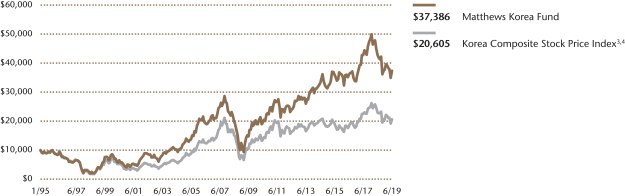
Plotted monthly. The performance data and graph do not reflect the deduction of taxes that a shareholder would pay on dividends, capital gains distributions or redemption of Fund shares. Values are in US$.
| | 3 | Korea Composite Stock Price Index performance data may be readjusted periodically by the Korea Exchange due to certain factors, including the declaration of dividends. It is not possible to invest directly in an index. Source: Index data from Korea Composite Stock Price Index and Bloomberg; total return calculations performed by BNY Mellon Investment Servicing (US) Inc. Please see page 88 for index definition. |
| | | | | | | | |
| | | | |
| TOP TEN HOLDINGS5 | | | | | | | |
| | | Sector | | | | % of Net Assets | |
| Samsung Electronics Co., Ltd., Pfd. | | Information Technology | | | | | 10.6% | |
| LG Household & Health Care, Ltd., Pfd. | | Consumer Staples | | | | | 5.0% | |
| Hyundai Mobis Co., Ltd. | | Consumer Discretionary | | | | | 4.9% | |
| Samsung Electronics Co., Ltd. | | Information Technology | | | | | 4.1% | |
| Samsung Fire & Marine Insurance Co., Ltd., Pfd. | | Financials | | | | | 3.9% | |
| BGF Retail Co., Ltd. | | Consumer Staples | | | | | 3.5% | |
| NAVER Corp. | | Communication Services | | | | | 3.4% | |
| Hyundai Motor Co., Ltd., 2nd Pfd. | | Consumer Discretionary | | | | | 3.3% | |
| Shinhan Financial Group Co., Ltd. | | Financials | | | | | 3.3% | |
| Yuhan Corp. | | Health Care | | | | | 2.9% | |
| % OF ASSETS IN TOP TEN | | | | | | | 44.9% | |
| | 5 | Holdings may combine more than one security from same issuer and related depositary receipts. |
Matthews Korea Fund
Portfolio Manager Commentary (unaudited) (continued)
Notable Portfolio Changes:
During the first half, we exited brick-and-mortar retailer E-Mart, which was getting squeezed by online competitors and saw declining same-store sales growth. Losing conviction in the company’s long-term prospects, we decided to exit the position. Meanwhile, we also exited electronics retailer Lotte Hi-Mart.
Outlook:
A high domestic minimum wage and slowing global trade both present near-term challenges for South Korea’s economy. Regionally, trade conflicts between Japan and South Korea have also begun to surface, driven by political concerns on both sides.
On a positive note, South Korea’s high minimum wage and aging population could encourage more businesses to invest in products and services that improve efficiency and productivity over time. It is early days for these efforts, but we are seeing examples of software as a service, a variation of cloud computing, gain traction as a way for companies to get more productivity out of their workforces. We also continue to see signs of improved corporate governance and shareholder-return policies, which is welcome news for long-term investors.
As South Korea’s overall economic picture remains mixed, we believe active security selection is essential to capturing the country’s long-term growth potential. As bottom-up investors, we look for companies that can grow organically without the assistance of strong macroeconomic tailwinds. We continue to look for companies that can benefit from domestic consumption within South Korea, as well as those companies headquartered in South Korea that are effectively competing and innovating in global markets.
| | | | |
| |
| COUNTRY ALLOCATION (%)6 | |
| South Korea | | | 96.3 | |
| Cash and Other Assets, Less Liabilities | | | 3.7 | |
| | | | |
| |
| SECTOR ALLOCATION (%)6 | |
| Information Technology | | | 20.7 | |
| Financials | | | 18.0 | |
| Consumer Staples | | | 16.4 | |
| Consumer Discretionary | | | 15.5 | |
| Health Care | | | 8.2 | |
| Materials | | | 7.8 | |
| Communication Services | | | 4.7 | |
| Energy | | | 2.7 | |
| Industrials | | | 2.2 | |
| Cash and Other Assets, Less Liabilities | | | 3.7 | |
| | | | |
| |
| MARKET CAP EXPOSURE (%)6 | |
| Mega Cap (over $25B) | | | 19.4 | |
| Large Cap ($10B–$25B) | | | 33.7 | |
| Mid Cap ($3B–10B) | | | 20.0 | |
| Small Cap (under $3B) | | | 23.1 | |
| Cash and Other Assets, Less Liabilities | | | 3.7 | |
| 6 | Source: FactSet Research Systems. Percentage values in data are rounded to the nearest tenth of one percent, so the values may not sum to 100% due to rounding. Percentage values may be derived from different data sources and may not be consistent with other Fund literature. |
| | | | |
| matthewsasia.com | 800.789.ASIA | | | 75 | |
Matthews Korea Fund
June 30, 2019
Schedule of Investmentsa(unaudited)
COMMON EQUITIES: 66.8%
| | | | | | | | |
| | | Shares | | | Value | |
| | |
| FINANCIALS: 14.1% | | | | | | | | |
Banks: 7.9% | | | | | | | | |
Shinhan Financial Group Co., Ltd. | | | 127,453 | | | | $4,957,168 | |
| | |
Hana Financial Group, Inc. | | | 120,567 | | | | 3,907,858 | |
| | |
KB Financial Group, Inc. | | | 74,426 | | | | 2,950,187 | |
| | | | | | | | |
| | | | | | | 11,815,213 | |
| | | | | | | | |
Capital Markets: 4.3% | | | | | | | | |
Kiwoom Securities Co., Ltd. | | | 46,919 | | | | 3,324,541 | |
| | |
Shinyoung Securities Co., Ltd. | | | 61,635 | | | | 3,216,362 | |
| | | | | | | | |
| | | | | | | 6,540,903 | |
| | | | | | | | |
Insurance: 1.9% | | | | | | | | |
DB Insurance Co., Ltd. | | | 54,341 | | | | 2,790,821 | |
| | | | | | | | |
Total Financials | | | | | | | 21,146,937 | |
| | | | | | | | |
| | | | | | | | |
| | | |
| CONSUMER DISCRETIONARY: 10.8% | | | | | | | | |
Auto Components: 6.8% | | | | | | | | |
Hyundai Mobis Co., Ltd. | | | 35,852 | | | | 7,314,649 | |
| | |
Hankook Tire & Technology Co., Ltd. | | | 94,882 | | | | 2,884,301 | |
| | | | | | | | |
| | | | | | | 10,198,950 | |
| | | | | | | | |
Specialty Retail: 2.2% | | | | | | | | |
Cuckoo Homesys Co., Ltd. | | | 75,570 | | | | 3,324,242 | |
| | | | | | | | |
Hotels, Restaurants & Leisure: 1.8% | | | | | | | | |
Modetour Network, Inc. | | | 155,140 | | | | 2,652,724 | |
| | | | | | | | |
Total Consumer Discretionary | | | | | | | 16,175,916 | |
| | | | | | | | |
| | | | | | | | |
| | | |
| CONSUMER STAPLES: 10.2% | | | | | | | | |
Food Products: 4.3% | | | | | | | | |
Orion Corp. | | | 52,951 | | | | 4,245,282 | |
| | |
Orion Holdings Corp. | | | 147,529 | | | | 2,192,699 | |
| | | | | | | | |
| | | | | | | 6,437,981 | |
| | | | | | | | |
Food & Staples Retailing: 3.5% | | | | | | | | |
BGF Retail Co., Ltd. | | | 28,862 | | | | 5,274,223 | |
| | | | | | | | |
Tobacco: 2.4% | | | | | | | | |
KT&G Corp. | | | 41,762 | | | | 3,563,776 | |
| | | | | | | | |
Total Consumer Staples | | | | | | | 15,275,980 | |
| | | | | | | | |
| | | | | | | | |
| | | |
| INFORMATION TECHNOLOGY: 10.1% | | | | | | | | |
Technology Hardware, Storage & Peripherals: 4.1% | | | | | |
Samsung Electronics Co., Ltd. | | | 150,616 | | | | 6,133,135 | |
| | | | | | | | |
Electronic Equipment, Instruments & Components: 2.7% | |
Samsung SDI Co., Ltd. | | | 19,888 | | | | 4,080,308 | |
| | | | | | | | |
Semiconductors & Semiconductor Equipment: 1.7% | | | | | |
Koh Young Technology, Inc. | | | 35,047 | | | | 2,526,604 | |
| | | | | | | | |
IT Services: 1.6% | | | | | |
Cafe24 Corp.b | | | 46,497 | | | | 2,479,527 | |
| | | | | | | | |
Total Information Technology | | | | | | | 15,219,574 | |
| | | | | | | | |
| | | | | | | | |
| | | |
| HEALTH CARE: 8.2% | | | | | | | | |
Pharmaceuticals: 4.5% | | | | | |
Yuhan Corp. | | | 20,558 | | | | 4,355,280 | |
| | |
DongKook Pharmaceutical Co., Ltd. | | | 46,758 | | | | 2,366,072 | |
| | | | | | | | |
| | | | | | | 6,721,352 | |
| | | | | | | | |
Biotechnology: 2.1% | | | | | |
Hugel, Inc.b | | | 8,908 | | | | 3,238,026 | |
| | | | | | | | |
Health Care Equipment & Supplies: 1.6% | | | | | |
Interojo Co., Ltd. | | | 108,571 | | | | 2,410,739 | |
| | | | | | | | |
Total Health Care | | | | | | | 12,370,117 | |
| | | | | | | | |
| | | | | | | | |
| | | | | | | | |
| | | Shares | | | Value | |
| | |
| MATERIALS: 5.1% | | | | | | | | |
Metals & Mining: 3.3% | | | | | |
POSCO | | | 17,598 | | | | $3,735,792 | |
| | |
Korea Zinc Co., Ltd. | | | 2,950 | | | | 1,216,727 | |
| | | | | | | | |
| | | | | | | 4,952,519 | |
| | | | | | | | |
Containers & Packaging: 1.8% | | | | | |
Lock&Lock Co., Ltd. | | | 200,431 | | | | 2,708,669 | |
| | | | | | | | |
Total Materials | | | | | | | 7,661,188 | |
| | | | | | | | |
| | | | | | | | |
| | | |
| COMMUNICATION SERVICES: 4.7% | | | | | | | | |
Interactive Media & Services: 4.7% | | | | | |
NAVER Corp. | | | 52,345 | | | | 5,173,303 | |
| | |
Kakao Corp. | | | 16,881 | | | | 1,924,189 | |
| | | | | | | | |
Total Communication Services | | | | | | | 7,097,492 | |
| | | | | | | | |
| | | | | | | | |
| | | |
| INDUSTRIALS: 2.2% | | | | | | | | |
Commercial Services & Supplies: 2.2% | | | | | |
S-1 Corp. | | | 39,273 | | | | 3,319,659 | |
| | | | | | | | |
Total Industrials | | | | | | | 3,319,659 | |
| | | | | | | | |
| | | | | | | | |
| | | |
| ENERGY: 1.4% | | | | | | | | |
Oil, Gas & Consumable Fuels: 1.4% | | | | | |
SK Innovation Co., Ltd. | | | 11,055 | | | | 1,523,819 | |
| | |
S-Oil Corp. | | | 8,335 | | | | 605,377 | |
| | | | | | | | |
Total Energy | | | | | | | 2,129,196 | |
| | | | | | | | |
| | | | | | | | |
| | | |
| TOTAL COMMON EQUITIES | | | | | | | 100,396,059 | |
| | | | | | | | |
(Cost $100,118,871) | | | | | | | | |
| | | | | | | | |
| | |
PREFERRED EQUITIES: 29.5% | | | | | | | | |
| | | |
| INFORMATION TECHNOLOGY: 10.6% | | | | | | | | |
Technology Hardware, Storage & Peripherals: 10.6% | | | | | |
Samsung Electronics Co., Ltd., Pfd. | | | 481,814 | | | | 15,979,054 | |
| | | | | | | | |
Total Information Technology | | | | | | | 15,979,054 | |
| | | | | | | | |
| | | | | | | | |
| | | |
| CONSUMER STAPLES: 6.2% | | | | | | | | |
Personal Products: 6.2% | | | | | | | | |
LG Household & Health Care, Ltd., Pfd. | | | 10,684 | | | | 7,461,946 | |
| | |
Amorepacific Corp., Pfd. | | | 25,584 | | | | 1,913,648 | |
| | | | | | | | |
Total Consumer Staples | | | | | | | 9,375,594 | |
| | | | | | | | |
| | | | | | | | |
| | | |
| CONSUMER DISCRETIONARY: 4.7% | | | | | | | | |
Automobiles: 4.7% | | | | | | | | |
Hyundai Motor Co., Ltd., 2nd Pfd. | | | 66,302 | | | | 4,960,236 | |
| | |
Hyundai Motor Co., Ltd., Pfd. | | | 31,477 | | | | 2,158,004 | |
| | | | | | | | |
Total Consumer Discretionary | | | | | | | 7,118,240 | |
| | | | | | | | |
| | | | | | | | |
| | | |
| FINANCIALS: 4.0% | | | | | | | | |
Insurance: 4.0% | | | | | | | | |
Samsung Fire & Marine Insurance Co., Ltd., Pfd. | | | 35,724 | | | | 5,923,023 | |
| | | | | | | | |
Total Financials | | | | | | | 5,923,023 | |
| | | | | | | | |
| | | | | | | | |
| | | |
| MATERIALS: 2.7% | | | | | | | | |
Chemicals: 2.7% | | | | | | | | |
LG Chem, Ltd., Pfd. | | | 23,841 | | | | 4,042,912 | |
| | | | | | | | |
Total Materials | | | | | | | 4,042,912 | |
| | | | | | | | |
| | | | | | | | |
Matthews Korea Fund
June 30, 2019
Schedule of Investmentsa(unaudited) (continued)
PREFERRED EQUITIES(continued)
| | | | | | | | |
| | | Shares | | | Value | |
| | |
| ENERGY: 1.3% | | | | | | | | |
Oil, Gas & Consumable Fuels: 1.3% | | | | | | | | |
S-Oil Corp., Pfd. | | | 37,310 | | | | $1,922,683 | |
| | | | | | | | |
Total Energy | | | | | | | 1,922,683 | |
| | | | | | | | |
| | | | | | | | |
| | | |
| TOTAL PREFERRED EQUITIES | | | | | | | 44,361,506 | |
| | | | | | | | |
(Cost $36,523,378) | | | | | | | | |
| | | | | | | | |
| | | |
| TOTAL INVESTMENTS: 96.3% | | | | | | | 144,757,565 | |
(Cost $136,642,249) | | | | | | | | |
| | | | | | | | |
| | |
CASH AND OTHER ASSETS,
LESS LIABILITIES: 3.7% | | | | | | | 5,620,429 | |
| | | | | | | | |
| | |
NET ASSETS: 100.0% | | | | | | | $150,377,994 | |
| | | | | | | | |
| a | Certain securities were fair valued under the valuation policies approved by the Board of Trustees (Note2-A). |
| b | Non-income producing security. |
See accompanying notes to financial statements.
| | | | |
| matthewsasia.com | 800.789.ASIA | | | 77 | |

| | | | |
| PORTFOLIO MANAGERS |
| |
| Lydia So, CFA | | |
Lead Manager | | |
| |
| Beini Zhou, CFA | | Tiffany Hsiao, CFA |
| Co-Manager | | Co-Manager |
|
| FUND FACTS |
| | |
| | | Investor | | Institutional |
Ticker | | MSMLX | | MISMX |
CUSIP | | 577125206 | | 577125867 |
Inception | | 9/15/08 | | 4/30/13 |
NAV | | $17.46 | | $17.43 |
Initial Investment | | $2,500 | | $100,000 |
Gross Expense Ratio1 | | 1.51% | | 1.37% |
After Fee Waiver and Reimbursement2 | | 1.46% | | 1.25% |
Portfolio Statistics | | |
Total # of Positions | | 70 |
Net Assets | | $191.6 million |
Weighted Average
Market Cap | | $1.4 billion |
Portfolio Turnover3 | | 69.79% |
Benchmark | | |
MSCI AC Asia ex Japan Small Cap Index |
Redemption Fee | | |
2% within first 90 calendar days of purchase |
OBJECTIVE
Long-term capital appreciation.
STRATEGY
Under normal market conditions, the Fund seeks to achieve its investment objective by investing at least 80% of its net assets, which include borrowings for investment purposes, in the common and preferred stocks of Small Companies located in Asia ex Japan, which consists of all countries and markets in Asia excluding Japan, but including all other developed, emerging and frontier countries and markets in the Asian region.
Matthews Asia Small Companies Fund
Portfolio Manager Commentary (unaudited)
For the first half of 2019, the Matthews Asia Small Companies Fund returned 12.65% (Investor Class) and 12.74% (Institutional Class), while its benchmark, the MSCI All Country Asia ex Japan Small Cap Index, returned 5.34%. For the quarter ending June 30, the Fund returned 2.89% (Investor Class) and 2.95% (Institutional Class), outperforming its benchmark, which returned –2.94%.
Market Environment:
Asia’s equity markets and investor sentiment were strong during the first four months of 2019 due to optimism over a resolution in trade talks between the U.S. and China. Developments took a negative turn, however, as President Trump threatened to impose certain tariffs on Chinese goods, as well as certain restrictions on the trading of technology products and services. China announced it would increase tariffs on U.S. goods in response. The escalated tensions led to immediate sell-offs in global markets. In addition, investors braced for the possibility that prolonged political and economic conflicts would weaken the global economy. Hopes for interest rate cuts by the U.S. Federal Reserve grew as recent economic data in the U.S. suggested that the economy might have softened, while investors awaited positive news from negotiations between Trump and President Xi during the late June G-20 summit.
Meanwhile, national elections in Indonesia and India concluded during the second quarter of 2019. As anticipated in Indonesia, President Joko Widodo (Jokowi) won by a wide margin. For his second-term agenda, it is expected that he will act rapidly on major policies aimed at improving efficiencies in the economy and conducive to attracting foreign direct investments (FDI). In India, a major overhang on its equity market was removed following its late May election, which saw a victorious ruling National Democratic Alliance (NDA) led by Prime Minister Narendra Modi.
Performance Contributors and Detractors:
During the first six months of 2019, the portfolio’s absolute return was largely driven by both our overweight and stock selection in China/Hong Kong. Favorable stock selection in South Korea, Taiwan and India were also key factors that helped propel solid absolute performance, especially amid the market sell-offs in the second quarter. For the first six months, our China/Hong Kong holdings Yihai International and Times China Holdings were key performance contributors. Yihai, a hotpot soup-based condiment manufacturer, registered a strong run-up thanks to solid earnings momentum. Likewise, real estate developer Times China impressed investors with solid earnings and project pipelines. However, some holdings in Vietnam and Malaysia were performance detractors due to an uncertain outlook that stemmed from negative corporate developments during the first half of 2019. Vietnam’s Yeah 1 Group, a media platform company, experienced operating issues with a subsidiary, which stood to adversely impact the company’s growth momentum. The company’s share price fell sharply and we exited the holding during the first half of the year.
By sector, our overweight and stock selection in health care, industrials and consumer staples were key drivers for our outperformance over the benchmark, while
(continued)
| 1 | Prospectus expense ratios. |
| 2 | Matthews has contractually agreed (i) to waive fees and reimburse expenses to the extent needed to limit Total Annual Fund Operating Expenses (excluding Rule 12b-1 fees, taxes, interest, brokerage commissions, short sale dividend expenses, expenses incurred in connection with any merger or reorganization or extraordinary expenses such as litigation) of the Institutional Class to 1.25% first by waiving class specific expenses (i.e., shareholder service fees specific to a particular class) of the Institutional Class and then, to the extent necessary, by waiving non-class specific expenses of the Institutional Class, and (ii) if any Fund-wide expenses (i.e., expenses that apply to both the Institutional Class and the Investor Class) are waived for the Institutional Class to maintain the 1.25% expense limitation, to waive an equal amount (in annual percentage terms) of those same expenses for the Investor Class. The Total Annual Fund Operating Expenses After Fee Waiver and Expense Reimbursement for the Investor Class may vary from year to year and will in some years exceed 1.25%. If the operating expenses fall below the expense limitation in a year within three years after Matthews has made a waiver or reimbursement, the Fund may reimburse Matthews up to an amount that does not cause the expenses for that year to exceed the lesser of (i) the expense limitation applicable at the time of that fee waiver and/or expense reimbursement or (ii) the expense limitation in effect at the time of recoupment. This agreement will remain in place until April 30, 2020 and may be terminated at any time by the Board of Trustees on behalf of the Fund on 60 days’ written notice to Matthews. Matthews may decline to renew this agreement by written notice to the Trust at least 30 days before its annual expiration date. |
| 3 | The lesser of fiscal year 2018 long-term purchase costs or sales proceeds divided by the average monthly market value of long-term securities. |
| | | | | | | | | | | | | | | | | | | | | | | | | | | | | | | | |
| | | | | | | | | |
| PERFORMANCE AS OF JUNE 30, 2019 | | | | | | | | | | | | | | | | | | | | | | | | |
| | | | | | | | | Average Annual Total Returns | | | | |
| | | 3 Months | | | YTD | | | 1 Year | | | 3 Years | | | 5 Years | | | 10 Years | | | Since
Inception | | | Inception
Date | |
| Investor Class (MSMLX) | | | 2.89% | | | | 12.65% | | | | -6.71% | | | | 6.15% | | | | 1.45% | | | | 9.06% | | | | 9.89% | | | | 09/15/08 | |
| Institutional Class (MISMX) | | | 2.95% | | | | 12.74% | | | | -6.54% | | | | 6.37% | | | | 1.67% | | | | n.a. | | | | 3.20% | | | | 04/30/13 | |
| MSCI AC Asia ex Japan Small Cap Index4 | | | -2.94% | | | | 5.34% | | | | -7.69% | | | | 4.58% | | | | 0.54% | | | | 6.08% | | | | 6.45% | 5 | | | | |
Performance assumes reinvestment of all dividends and/or distributions before taxes. All performance quoted represents past performance and is no guarantee of future results.Investment return and principal value will fluctuate with market conditions so that when redeemed, shares may be worth more or less than their original cost. Current performance may be lower or higher than the return figures quoted. Returns would have been lower if certain of the Fund’s fees and expenses had not been waived. For the Fund’s most recent month-end performance, visit matthewsasia.com.
GROWTH OF A HYPOTHETICAL $10,000 INVESTMENT SINCE INCEPTION—INVESTOR CLASS
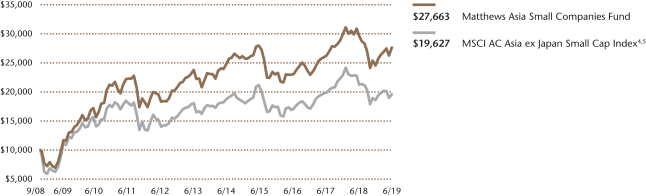
Plotted monthly. The performance data and graph do not reflect the deduction of taxes that a shareholder would pay on dividends, capital gains distributions or redemption of Fund shares. Values are in US$.
| | 4 | It is not possible to invest directly in an index. Source: Index data from Morgan Stanley Capital International and Bloomberg; total return calculations performed by BNY Mellon Investment Servicing (US) Inc. Please see page 88 for index definition. |
| | 5 | Calculated from 9/15/08. |
| | | | | | | | |
| | | | |
| TOP TEN HOLDINGS6 | | | | | | | |
| | | Sector | | Country | | % of Net Assets | |
| Silergy Corp. | | Information Technology | | China/Hong Kong | | | 3.5% | |
| Vitasoy International Holdings, Ltd. | | Consumer Staples | | China/Hong Kong | | | 2.7% | |
| Chief Telecom, Inc. | | Communication Services | | Taiwan | | | 2.1% | |
| Great Tree Pharmacy Co., Ltd. | | Consumer Staples | | Taiwan | | | 2.1% | |
| Sunny Friend Environmental Technology Co., Ltd. | | Industrials | | Taiwan | | | 2.0% | |
| PT Arwana Citramulia | | Industrials | | Indonesia | | | 1.9% | |
| BBI Life Sciences Corp. | | Health Care | | China/Hong Kong | | | 1.9% | |
| Taiwan Paiho, Ltd. | | Consumer Discretionary | | Taiwan | | | 1.9% | |
| Douzone Bizon Co., Ltd. | | Information Technology | | South Korea | | | 1.8% | |
| DCB Bank, Ltd. | | Financials | | India | | | 1.8% | |
| % OF ASSETS IN TOP TEN | | | | | | | 21.7% | |
| | 6 | Holdings may combine more than one security from same issuer and related depositary receipts. |
| | | | |
| matthewsasia.com | 800.789.ASIA | | | 79 | |
| | | | |
| |
| COUNTRY ALLOCATION (%)7,8 | |
| China/Hong Kong | | | 27.6 | |
| India | | | 14.7 | |
| Taiwan | | | 13.2 | |
| South Korea | | | 9.2 | |
| Thailand | | | 7.3 | |
| Indonesia | | | 5.9 | |
| Vietnam | | | 5.9 | |
| Malaysia | | | 2.6 | |
| Singapore | | | 1.5 | |
| Australia | | | 1.2 | |
| Philippines | | | 1.1 | |
| Japan | | | 1.1 | |
| Cash and Other Assets, Less Liabilities | | | 8.7 | |
| | | | |
| |
| SECTOR ALLOCATION (%)8 | |
| Information Technology | | | 17.9 | |
| Health Care | | | 13.4 | |
| Industrials | | | 12.6 | |
| Consumer Discretionary | | | 11.8 | |
| Financials | | | 10.0 | |
| Consumer Staples | | | 9.9 | |
| Materials | | | 5.9 | |
| Real Estate | | | 5.1 | |
| Communication Services | | | 4.7 | |
| Cash and Other Assets, Less Liabilities | | | 8.7 | |
| | | | |
| |
| MARKET CAP EXPOSURE (%)8,9 | |
| Mega Cap (over $25B) | | | 0.0 | |
| Large Cap ($10B–$25B) | | | 0.0 | |
| Mid Cap ($3B–10B) | | | 12.7 | |
| Small Cap (under $3B) | | | 78.6 | |
| Cash and Other Assets, Less Liabilities | | | 8.7 | |
| 7 | Not all countries where the Fund may invest are included in the benchmark index. |
| 8 | Source: FactSet Research Systems. Percentage values in data are rounded to the nearest tenth of one percent, so the values may not sum to 100% due to rounding. Percentage values may be derived from different data sources and may not be consistent with other Fund literature. |
| 9 | The Fund defines Small Companies as companies with market capitalization generally between $100 million and $3 billion or the largest company included in the Fund’s primary benchmark, the MSCI All Country Asia ex Japan Small Cap Index. |
Matthews Asia Small Companies Fund
Portfolio Manager Commentary (unaudited) (continued)
some holdings in the communication services sector lagged. Our health care holding, Procter & Gamble Health, performed strongly in the first half of the year thanks to stable demand in India for vitamin supplements and over-the-counter medicines. Within the information technology sector, South Korea’s Café24, ane-commerce platform enabler, experienced sharp drops in share price and contractions in valuations multiples. While the domestic business was growing well, investors were wary of its investment in overseas expansion plans that have eroded earnings in the short to medium term.
Notable Portfolio Changes:
During the second quarter, we initiated a few positions in China A-share holdings. One new such addition was application software firm Glodon, which focuses on construction engineering and project cost management verticals. We believe there will be a growing need for digitalization in China’s construction industry and are favorably disposed toward Glodon’s early mover advantage and willingness to make investments in cloud services. We also initiated a position in Innovent Biologics, a China-based biopharmaceutical company, during the market sell-off. Valuations became attractive while company fundamentals remained solid. We are constructive on the company’s long-term prospects, namely its drug pipeline and commercialization plans. We did, however, exit China Yuhua Education due to growing uncertainty over the company’s capital allocation decisions and acquisition strategy. In India, we exited auto parts maker Gabriel India due to lack of growth visibility as the end demand in the automobile market continued to soften. With the proceeds we selectively added to existing Indian holdings when we saw share price weakness to build up our positions.
In Indonesia, we initiated a position in Sarimelati Kencana, a master franchisee of Pizza Hut in Indonesia. While the company has been publicly listed for just over a year, it actually has been operating for decades. We like the company because it enjoys strong brand recognition and an ability to expand its store network methodically. We believe that the company is well-positioned to capture the demand of the country’s young demographic.
Outlook:
With major elections having concluded without surprising outcomes in Thailand, Indonesia, the Philippines and India, investors now seem likely to focus on corporate earnings and economic fundamentals. Trade tensions between the U.S. and China may continue to cause market volatility, but we believe that many domestically oriented businesses in Asia could present opportunities for long-term investors as their revenue streams are tied to structural growth in domestic demand propelled by digitization and connectivity. With this backdrop, we have built a portfolio of holdings that possess strong market positioning and sound financial health. We believe that they are well-positioned to grow with a niche focus. We are hopeful that there will be plenty of attractive investment opportunities for us to uncover as market expectations are not currently elevated.
Looking ahead, the trajectory of U.S.–China relations remains unpredictable as the two countries work through conflicts. We are mindful of challenges, such as the impact on consumer sentiment and corporate spending cycles. We remain constructive, however, on China’s solid prospects for transitioning its economy to one that is more service-oriented. We believe this will help mitigate external shocks. China continues to strengthen due to innovation occurring in its health care and technology sectors, as well as the expansion of its digital economy. In spite of an uncertain geopolitical backdrop, we continue to focus on selecting companies that possess the attributes that can lead them to grow and compound in size over the long term.
Matthews Asia Small Companies Fund
June 30, 2019
Schedule of Investmentsa(unaudited)
COMMON EQUITIES: 91.3%
| | | | | | | | |
| | | Shares | | | Value | |
| | |
| CHINA/HONG KONG: 27.7% | | | | | | | | |
Silergy Corp. | | | 341,000 | | | | $6,685,525 | |
| | |
Vitasoy International Holdings, Ltd. | | | 1,084,000 | | | | 5,212,928 | |
| | |
BBI Life Sciences Corp.b | | | 13,101,000 | | | | 3,656,077 | |
| | |
Huifu Payment, Ltd.b,c,d | | | 5,615,200 | | | | 3,077,903 | |
| | |
Yihai International Holding, Ltd. | | | 591,000 | | | | 3,066,036 | |
| | |
Kingdee International Software Group Co., Ltd. | | | 2,396,000 | | | | 2,595,552 | |
| | |
Times China Holdings, Ltd. | | | 1,277,000 | | | | 2,556,644 | |
| | |
Precision Tsugami China Corp., Ltd.b | | | 2,368,000 | | | | 2,535,005 | |
| | |
Genscript Biotech Corp.d | | | 1,008,000 | | | | 2,529,324 | |
| | |
SUNeVision Holdings, Ltd. | | | 2,752,000 | | | | 2,397,750 | |
| | |
SITC International Holdings Co., Ltd. | | | 2,187,000 | | | | 2,233,189 | |
| | |
Glodon Co., Ltd. A Shares | | | 434,100 | | | | 2,082,632 | |
| | |
China Isotope & Radiation Corp. | | | 881,200 | | | | 2,079,575 | |
| | |
Microport Scientific Corp. | | | 2,728,000 | | | | 2,028,119 | |
| | |
Midea Real Estate Holding, Ltd.b,c | | | 789,800 | | | | 2,018,757 | |
| | |
Shanghai Haohai Biological Technology Co., Ltd. H Sharesb,c | | | 361,100 | | | | 1,968,231 | |
| | |
Innovent Biologics, Inc.b,c,d | | | 524,000 | | | | 1,770,260 | |
| | |
Qutoutiao, Inc. ADRd | | | 405,900 | | | | 1,599,246 | |
| | |
China Beststudy Education Groupb,d | | | 3,892,000 | | | | 1,215,674 | |
| | |
Centre Testing International Group Co., Ltd. A Shares | | | 563,470 | | | | 887,340 | |
| | |
Joyoung Co., Ltd. A Shares | | | 262,602 | | | | 797,123 | |
| | | | | | | | |
Total China/Hong Kong | | | | | | | 52,992,890 | |
| | | | | | | | |
| | | | | | | | |
| | | |
| INDIA: 14.7% | | | | | | | | |
DCB Bank, Ltd. | | | 1,010,775 | | | | 3,472,538 | |
| | |
Procter & Gamble Health, Ltd. | | | 52,990 | | | | 3,157,202 | |
| | |
Galaxy Surfactants, Ltd.b | | | 174,051 | | | | 3,120,127 | |
| | |
Syngene International, Ltd.b,c | | | 643,288 | | | | 3,116,043 | |
| | |
NIIT Technologies, Ltd. | | | 138,666 | | | | 2,702,089 | |
| | |
Cholamandalam Investment and Finance Co., Ltd. | | | 623,643 | | | | 2,580,425 | |
| | |
AIA Engineering, Ltd.d | | | 78,841 | | | | 2,048,157 | |
| | |
ICICI Securities, Ltd.b,c | | | 635,977 | | | | 2,027,406 | |
| | |
Zydus Wellness, Ltd. | | | 67,887 | | | | 1,315,820 | |
| | |
M.M. Forgings, Ltd. | | | 168,660 | | | | 1,202,507 | |
| | |
Shankara Building Products, Ltd. | | | 173,576 | | | | 1,107,562 | |
| | |
Tube Investments of India, Ltd. | | | 183,110 | | | | 1,018,662 | |
| | |
Spencer’s Retail, Ltd.d | | | 608,513 | | | | 928,715 | |
| | |
Greaves Cotton, Ltd. | | | 189,266 | | | | 398,171 | |
| | | | | | | | |
Total India | | | | | | | 28,195,424 | |
| | | | | | | | |
| | | | | | | | |
| | | |
| TAIWAN: 13.2% | | | | | | | | |
Chief Telecom, Inc. | | | 612,000 | | | | 3,998,606 | |
| | |
Great Tree Pharmacy Co., Ltd. | | | 1,493,414 | | | | 3,971,918 | |
| | |
Sunny Friend Environmental Technology Co., Ltd. | | | 431,000 | | | | 3,838,653 | |
| | |
Taiwan Paiho, Ltd. | | | 1,261,000 | | | | 3,652,597 | |
| | |
Global PMX Co., Ltd. | | | 697,000 | | | | 2,802,419 | |
| | |
Advanced Ceramic X Corp. | | | 335,000 | | | | 2,605,609 | |
| | |
Alchip Technologies, Ltd. | | | 753,000 | | | | 2,256,299 | |
| | |
Kuobrothers Corp.† | | | 1,321,000 | | | | 2,232,892 | |
| | | | | | | | |
Total Taiwan | | | | | | | 25,358,993 | |
| | | | | | | | |
| | | | | | | | |
| | | | | | | | |
| | | Shares | | | Value | |
| | |
| SOUTH KOREA: 9.2% | | | | | | | | |
Douzone Bizon Co., Ltd. | | | 65,394 | | | | $3,532,351 | |
| | |
Value Added Technology Co., Ltd. | | | 110,822 | | | | 2,723,108 | |
| | |
Yuhan Corp. | | | 12,367 | | | | 2,619,990 | |
| | |
Tongyang Pile, Inc.d | | | 454,508 | | | | 2,348,772 | |
| | |
Cafe24 Corp.d | | | 32,517 | | | | 1,734,021 | |
| | |
Hy-Lok Corp. | | | 116,533 | | | | 1,725,817 | |
| | |
Cosmecca Korea Co., Ltd. | | | 91,586 | | | | 1,634,322 | |
| | |
Koentec Co., Ltd. | | | 132,128 | | | | 1,346,444 | |
| | | | | | | | |
Total South Korea | | | | | | | 17,664,825 | |
| | | | | | | | |
| | | | | | | | |
| | |
| THAILAND: 7.3% | | | | | | | | |
Plan B Media Public Co., Ltd. F Shares | | | 13,316,600 | | | | 3,389,178 | |
| | |
Rich Sport Public Co., Ltd. | | | 26,802,600 | | | | 3,204,023 | |
| | |
Humanica Public Co., Ltd. | | | 11,168,100 | | | | 2,878,176 | |
| | |
TOA Paint Thailand Public Co., Ltd. | | | 2,066,700 | | | | 2,459,189 | |
| | |
AP Thailand Public Co., Ltd. | | | 8,296,000 | | | | 2,123,402 | |
| | | | | | | | |
Total Thailand | | | | | | | 14,053,968 | |
| | | | | | | | |
| | | | | | | | |
| | | |
| VIETNAM: 5.9% | | | | | | | | |
Saigon Cargo Service Corp. | | | 482,000 | | | | 3,327,418 | |
| | |
Nam Long Investment Corp. | | | 2,402,294 | | | | 3,003,175 | |
| | |
FPT Digital Retail JSC | | | 968,070 | | | | 2,658,506 | |
| | |
Ho Chi Minh City Securities Corp. | | | 2,234,190 | | | | 2,244,490 | |
| | | | | | | | |
Total Vietnam | | | | | | | 11,233,589 | |
| | | | | | | | |
| | | | | | | | |
| | | |
| INDONESIA: 5.8% | | | | | | | | |
PT Arwana Citramulia | | | 103,521,400 | | | | 3,670,765 | |
| | |
PT BFI Finance Indonesia | | | 70,458,800 | | | | 2,992,410 | |
| | |
PT Bank Tabungan Pensiunan Nasional Syariahd | | | 11,081,900 | | | | 2,706,218 | |
| | |
PT Sarimelati Kencanab | | | 24,072,700 | | | | 1,857,317 | |
| | | | | | | | |
Total Indonesia | | | | | | | 11,226,710 | |
| | | | | | | | |
| | | | | | | | |
| | | |
| MALAYSIA: 2.6% | | | | | | | | |
Bursa Malaysia BHD | | | 1,904,500 | | | | 3,226,625 | |
| | |
D&O Green Technologies BHD | | | 14,023,700 | | | | 1,763,956 | |
| | | | | | | | |
Total Malaysia | | | | | | | 4,990,581 | |
| | | | | | | | |
| | | | | | | | |
| | | |
| SINGAPORE: 1.5% | | | | | | | | |
Delfi, Ltd. | | | 3,032,700 | | | | 2,913,902 | |
| | | | | | | | |
Total Singapore | | | | | | | 2,913,902 | |
| | | | | | | | |
| | | | | | | | |
| | | |
| AUSTRALIA: 1.2% | | | | | | | | |
OZ Minerals, Ltd. | | | 315,770 | | | | 2,235,200 | |
| | | | | | | | |
Total Australia | | | | | | | 2,235,200 | |
| | | | | | | | |
| | | | | | | | |
| | | |
| PHILIPPINES: 1.1% | | | | | | | | |
Wilcon Depot, Inc. | | | 6,312,200 | | | | 2,069,776 | |
| | | | | | | | |
Total Philippines | | | | | | | 2,069,776 | |
| | | | | | | | |
| | | | | | | | |
| | | | |
| matthewsasia.com | 800.789.ASIA | | | 81 | |
Matthews Asia Small Companies Fund
June 30, 2019
Schedule of Investmentsa(unaudited) (continued)
| | | | | | | | |
| | | Shares | | | Value | |
| | |
| JAPAN: 1.1% | | | | | | | | |
CKD Corp. | | | 200,900 | | | | $2,048,648 | |
| | | | | | | | |
Total Japan | | | | | | | 2,048,648 | |
| | | | | | | | |
| | | | | | | | |
| | | |
| TOTAL INVESTMENTS: 91.3% | | | | | | | 174,984,506 | |
| | |
(Cost $176,612,954) | | | | | | | | |
| | | | | | | | |
| | |
CASH AND OTHER ASSETS,
LESS LIABILITIES: 8.7% | | | | | | | 16,569,559 | |
| | | | | | | | |
| | |
NET ASSETS: 100.0% | | | | | | | $191,554,065 | |
| | | | | | | | |
| a | Certain securities were fair valued under the valuation policies approved by the Board of Trustees (Note2-A). |
| b | The securities may be resold to qualified foreign investors and foreign institutional buyers under Regulation S of the Securities Act of 1933. |
| c | Security exempt from registration under Rule 144A of the Securities Act of 1933, as amended. The security may be resold in transactions exempt from registration normally to qualified institutional buyers. The security has been determined to be liquid in accordance with procedures adopted by the Funds’ Board of Trustees. At June 30, 2019, the aggregate value is $13,978,600, which is 7.30% of net assets. |
| d | Non-income producing security. |
| † | Affiliated Issuer, as defined under the Investment Company Act of 1940 (ownership of 5% or more of the outstanding voting securities of this issuer). |
| ADR | American Depositary Receipt |
See accompanying notes to financial statements.
| | | | |
| PORTFOLIO MANAGERS | | |
| | |
| Tiffany Hsiao, CFA | | | | |
Lead Manager | | | | |
| | |
| Lydia So, CFA | | | | |
Co-Manager | | | | |
| |
| FUND FACTS | | |
| | |
| | | Investor | | Institutional |
Ticker | | MCSMX | | MICHX |
CUSIP | | 577125404 | | 577125842 |
Inception | | 5/31/11 | | 11/30/17 |
NAV | | $11.37 | | $11.40 |
Initial Investment | | $2,500 | | $100,000 |
Gross Expense Ratio1 | | 1.97% | | 1.79% |
After Fee Waiver and Reimbursement2 | | 1.50% | | 1.25% |
Portfolio Statistics | | |
Total # of Positions | | 48 |
Net Assets | | $73.0 million |
Weighted Average Market Cap | | $2.1 billion |
Portfolio Turnover3 | | 76.67% |
Benchmark | | |
MSCI China Small Cap Index |
Redemption Fee | | |
2% within first 90 calendar days of purchase |
OBJECTIVE
Long-term capital appreciation.
STRATEGY
Under normal market conditions, the Fund seeks to achieve its investment objective by investing at least 80% of its net assets, which include borrowings for investment purposes, in the common and preferred stocks of Small Companies located in China. China includes its administrative and other districts, such as Hong Kong.
Matthews China Small Companies Fund
Portfolio Manager Commentary (unaudited)
For the first half of 2019, the Matthews China Small Companies Fund returned 18.69% (Investor Class) and 18.87% (Institutional Class), outperforming its benchmark, the MSCI China Small Cap Index, which returned 7.99% over the same period. For the quarter ending June 30, the Fund was mostly flat at 0.80% (Investor Class) and 0.89% (Institutional Class), while its benchmark fell –6.09%.
Market Environment:
Global markets were heavily influenced by geopolitics in the second quarter of 2019 following a first-quarter recovery. In May, U.S. President Donald Trump’s decision to implement additional tariffs on Chinese imports surprised many market participants. All major indices in Hong Kong and China retreated from the first quarter’s strong gains, which had been driven in part by a recovery in investor sentiment over macroeconomic data and also market optimism that incremental fiscal and monetary stimulus policies would further lift consumer sentiment. Such optimistic assumptions were quickly reversed by trade fears in the second quarter. Longer term, we still expect structural growth in China’s economy—particularly among companies that benefit from an increase in domestic sourcing of key value-added components as the trade conflict may escalate.
From both a top-down and bottom-up perspective, we continue to anticipate long-term sustainable growth in the Chinese economy and in corporate earnings. The market’s concerns over escalating trade tensions should, in our view, have little impact on China’s smaller companies given their domestic focus and lower dependence on financial leverage.
Performance Contributors and Detractors:
During the second quarter of 2019, strong stock selection in the information technology and consumer staples sectors contributed most to the Fund’s outperformance versus the benchmark. The biggest drag on performance came from the health care sector due to poor stock selection.
Top contributors to Fund performance during the quarter included Yihai International Holding and Asia Cement China Holdings. Yihai International Holding manufactures and sells a leading hot pot soup base and condiment brand for both restaurants and consumers. We believe the company has strong growth visibility given the popularity of its restaurant chain and its rapidly growing new business in restaurant supplies. Asia Cement China Holdings is a subsidiary of Taiwan’s Asia Cement Corporation and a top producer of cement, concrete and other related products in China’s Jiangxi, Hubei and Sichuan provinces. The cement industry continues to benefit from supply-side reform due to higher environmental considerations in China. The cement business is also relatively insulated from trade conflicts given the difficulty in profitably transporting such materials over long distances.
TK Group Holdings, a plastics and mold manufacturer, was a top detractor to Fund performance during both the first half of the year and in the second quarter. TK Group shares underperformed the market in the first half because the company generates a significant portion of revenues from U.S.-based technology companies. We believe the mid- to long-term position of the company remains sound, however, as it
(continued)
| 1 | Prospectus expense ratios. |
| 2 | Matthews has contractually agreed (i) to waive fees and reimburse expenses to the extent needed to limit Total Annual Fund Operating Expenses (excluding Rule 12b-1 fees, taxes, interest, brokerage commissions, short sale dividend expenses, expenses incurred in connection with any merger or reorganization or extraordinary expenses such as litigation) of the Institutional Class to 1.25% first by waiving class specific expenses (i.e., shareholder service fees specific to a particular class) of the Institutional Class and then, to the extent necessary, by waiving non-class specific expenses of the Institutional Class, and (ii) if any Fund-wide expenses (i.e., expenses that apply to both the Institutional Class and the Investor Class) are waived for the Institutional Class to maintain the 1.25% expense limitation, to waive an equal amount (in annual percentage terms) of those same expenses for the Investor Class. The Total Annual Fund Operating Expenses After Fee Waiver and Expense Reimbursement for the Investor Class may vary from year to year and will in some years exceed 1.25%. If the operating expenses fall below the expense limitation in a year within three years after Matthews has made a waiver or reimbursement, the Fund may reimburse Matthews up to an amount that does not cause the expenses for that year to exceed the lesser of (i) the expense limitation applicable at the time of that fee waiver and/or expense reimbursement or (ii) the expense limitation in effect at the time of recoupment. This agreement will remain in place until April 30, 2020 and may be terminated at any time by the Board of Trustees on behalf of the Fund on 60 days’ written notice to Matthews. Matthews may decline to renew this agreement by written notice to the Trust at least 30 days before its annual expiration date. |
| 3 | The lesser of fiscal year 2018 long-term purchase costs or sales proceeds divided by the average monthly market value of long-term securities. |
| | | | |
| matthewsasia.com | 800.789.ASIA | | | 83 | |
| | | | | | | | | | | | | | | | | | | | | | | | | | | | |
| | | | | | | | |
| PERFORMANCE AS OF JUNE 30, 2019 | | | | | | | | | | | | | | | | | | | | | |
| | | | | | | | | Average Annual Total Returns | | | | |
| | | 3 Months | | | YTD | | | 1 Year | | | 3 Years | | | 5 Years | | | Since
Inception | | | Inception
date | |
| Investor Class (MCSMX) | | | 0.80% | | | | 18.69% | | | | -10.36% | | | | 15.99% | | | | 8.51% | | | | 4.99% | | | | 05/31/11 | |
| Institutional Class (MICHX) | | | 0.89% | | | | 18.87% | | | | -10.08% | | | | n.a. | | | | n.a. | | | | 2.62% | | | | 11/30/17 | |
| MSCI China Small Cap Index4 | | | -6.09% | | | | 7.99% | | | | -13.89% | | | | 4.47% | | | | 1.00% | | | | -0.04% | 5 | | | | |
Performance assumes reinvestment of all dividends and/or distributions before taxes. All performance quoted represents past performance and is no guarantee of future results.Investment return and principal value will fluctuate with market conditions so that when redeemed, shares may be worth more or less than their original cost. Current performance may be lower or higher than the return figures quoted. Returns would have been lower if certain of the Fund’s fees and expenses had not been waived. For the Fund’s most recent month-end performance, visit matthewsasia.com.
GROWTH OF A HYPOTHETICAL $10,000 INVESTMENT SINCE INCEPTION—INVESTOR CLASS
Plotted monthly. The performance data and graph do not reflect the deduction of taxes that a shareholder would pay on dividends, capital gains distributions or redemption of Fund shares. Values are in US$.
| | 4 | It is not possible to invest directly in an index. Source: Index data from Morgan Stanley Capital International and Bloomberg; total return calculations performed by BNY Mellon Investment Servicing (US) Inc. Please see page 88 for index definition. |
| | | | | | | | |
| | | | |
| TOP TEN HOLDINGS6 | | | | | | | |
| | | Sector | | | | % of Net Assets | |
| Silergy Corp. | | Information Technology | | | | | 8.2% | |
| SITC International Holdings Co., Ltd. | | Industrials | | | | | 5.2% | |
| Sunny Friend Environmental Technology Co., Ltd. | | Industrials | | | | | 5.1% | |
| Asia Cement China Holdings Corp. | | Materials | | | | | 3.9% | |
| Joy City Property, Ltd. | | Real Estate | | | | | 3.5% | |
| Yihai International Holding, Ltd. | | Consumer Staples | | | | | 3.5% | |
| SUNeVision Holdings, Ltd. | | Information Technology | | | | | 3.0% | |
| Greentown Service Group Co., Ltd. | | Industrials | | | | | 3.0% | |
| China Overseas Property Holdings, Ltd. | | Real Estate | | | | | 2.8% | |
| China Meidong Auto Holdings, Ltd. | | Consumer Discretionary | | | | | 2.6% | |
| % OF ASSETS IN TOP TEN | | | | | | | 40.8% | |
| | 6 | Holdings may combine more than one security from same issuer and related depositary receipts. |
Matthews China Small Companies Fund
Portfolio Manager Commentary (unaudited) (continued)
is included among new supply-chain planning outside of China. Ultimately, TK Group’s customers appear to care more about quality than additional costs due to the significant yield rate differences between good and bad producers.
Notable Portfolio Changes:
During the quarter, we initiated a position in Centre Testing International Group after tracking its operational turnaround for several years. Among non-state-owned enterprises in China, the company is the leading testing and inspections provider for environmental firms, food, consumer and industrial products and electronic materials. Due to changes in management that have driven higher returns on investment for existing assets, we expect strong free cash flow generation on top of rising structural demand to benefit shareholders.
We exited our position in Shanghai Putailai New Energy Technology during the quarter as we expect China’s electric vehicle material and equipment suppliers to have limited demand and pricing visibility after multiple rounds of subsidy cuts. In addition, a newly announced stimulus measure that will instead benefit internal combustion engine cars is likely to hurt electric vehicle demand.
Outlook:
We remain optimistic about China’s small-cap market amid heightened market volatility as we focus rigorously on the sound fundamentals of our portfolio companies. From a macroeconomic perspective, we believe China can stabilize its economy through fiscal spending, tax reform, interest rate adjustments and currency management. In addition, we believe that steps to correct China’s structural issues are on the right track, despite the near-term pains of a deleveraging economy. We are focused on finding innovative and capital-efficient small companies that are relatively insulated from macroeconomic uncertainties. We will continue to seek companies with sustainable, quality earnings streams, strong cash flows and good balance sheets that can weather uncertain economic conditions. We believe sectors such as industrial automation, health care and technology are among the most attractive from a secular growth perspective.
| | | | |
| |
| COUNTRY ALLOCATION (%)7 | |
| China/Hong Kong | | | 86.4 | |
| Taiwan | | | 6.2 | |
| Japan | | | 2.4 | |
| Cash and Other Assets, Less Liabilities | | | 5.0 | |
| | | | |
| |
| SECTOR ALLOCATION (%)7 | |
| Information Technology | | | 22.1 | |
| Industrials | | | 18.6 | |
| Health Care | | | 14.1 | |
| Consumer Discretionary | | | 12.1 | |
| Real Estate | | | 9.4 | |
| Consumer Staples | | | 7.5 | |
| Materials | | | 7.2 | |
| Energy | | | 4.1 | |
| Cash and Other Assets, Less Liabilities | | | 5.0 | |
| | | | |
| | |
| MARKET CAP EXPOSURE (%)7,8 | | | |
| Mega Cap (over $25B) | | | 0.0 | |
| Large Cap ($10B-$25B) | | | 0.0 | |
| Mid Cap ($3B-10B) | | | 17.7 | |
| Small Cap (under $3B) | | | 77.4 | |
| Cash and Other Assets, Less Liabilities | | | 5.0 | |
| 7 | Source: FactSet Research Systems. Percentage values in data are rounded to the nearest tenth of one percent, so the values may not sum to 100% due to rounding. Percentage values may be derived from different data sources and may not be consistent with other Fund literature. |
| 8 | The Fund defines Small Companies as companies with market capitalization generally between $100 million and $3 billion or the largest company included in the Fund’s primary benchmark, the MSCI China Small Cap Index. |
| | | | |
| matthewsasia.com | 800.789.ASIA | | | 85 | |
Matthews China Small Companies Fund
June 30, 2019
Schedule of Investmentsa(unaudited)
COMMON EQUITIES: 95.0%
| | | | | | | | |
| | | Shares | | | Value | |
| | |
| INFORMATION TECHNOLOGY: 22.1% | | | | | | | | |
Semiconductors & Semiconductor Equipment: 11.3% | | | | | |
Silergy Corp. | | | 307,000 | | | | $6,018,933 | |
| | |
Hua Hong Semiconductor, Ltd.b,c | | | 708,000 | | | | 1,372,992 | |
| | |
Alchip Technologies, Ltd. | | | 285,000 | | | | 853,978 | |
| | | | | | | | |
| | | | | | | 8,245,903 | |
| | | | | | | | |
IT Services: 4.4% | | | | | | | | |
SUNeVision Holdings, Ltd. | | | 2,505,000 | | | | 2,182,545 | |
| | |
GDS Holdings, Ltd. ADRd | | | 26,800 | | | | 1,006,876 | |
| | | | | | | | |
| | | | | | | 3,189,421 | |
| | | | | | | | |
Software: 3.8% | | | | | | | | |
Kingdee International Software Group Co., Ltd. | | | 1,326,000 | | | | 1,436,436 | |
| | |
Glodon Co., Ltd. A Shares | | | 144,600 | | | | 693,731 | |
| | |
Sangfor Technologies, Inc. A Shares | | | 52,406 | | | | 667,708 | |
| | | | | | | | |
| | | | | | | 2,797,875 | |
| | | | | | | | |
Electronic Equipment, Instruments & Components: 2.6% | | | | | |
China Youzan, Ltd.d | | | 30,672,000 | | | | 1,884,763 | |
| | |
China High Precision Automation Group, Ltd.d,e | | | 195,000 | | | | 249 | |
| | | | | | | | |
| | | | | | | 1,885,012 | |
| | | | | | | | |
Total Information Technology | | | | | | | 16,118,211 | |
| | | | | | | | |
| | | | | | | | |
| | | |
| INDUSTRIALS: 18.5% | | | | | | | | |
Commercial Services & Supplies: 8.0% | | | | | | | | |
Sunny Friend Environmental Technology Co., Ltd. | | | 415,000 | | | | 3,696,151 | |
| | |
Greentown Service Group Co., Ltd.c | | | 2,680,000 | | | | 2,165,600 | |
| | | | | | | | |
| | | | | | | 5,861,751 | |
| | | | | | | | |
Marine: 5.2% | | | | | | | | |
SITC International Holdings Co., Ltd. | | | 3,702,000 | | | | 3,780,185 | |
| | | | | | | | |
Machinery: 3.1% | | | | | | | | |
TK Group Holdings, Ltd. | | | 2,670,000 | | | | 1,317,825 | |
| | |
Precision Tsugami China Corp., Ltd.c | | | 877,000 | | | | 938,851 | |
| | | | | | | | |
| | | | | | | 2,256,676 | |
| | | | | | | | |
Professional Services: 2.2% | | | | | | | | |
Centre Testing International Group Co., Ltd. A Shares | | | 1,048,912 | | | | 1,651,804 | |
| | | | | | | | |
Total Industrials | | | | | | | 13,550,416 | |
| | | | | | | | |
| | | | | | | | |
| | | |
| HEALTH CARE: 14.1% | | | | | | | | |
Biotechnology: 7.5% | | | | | | | | |
Innovent Biologics, Inc.b,c,d | | | 414,000 | | | | 1,398,640 | |
| | |
Shanghai Haohai Biological Technology Co., Ltd. H Sharesb,c | | | 235,500 | | | | 1,283,629 | |
| | |
Zai Lab, Ltd. ADRd | | | 33,600 | | | | 1,171,632 | |
| | |
CStone Pharmaceuticalsb,c,d | | | 597,000 | | | | 880,402 | |
| | |
Amoy Diagnostics Co., Ltd. A Shares | | | 99,960 | | | | 763,201 | |
| | | | | | | | |
| | | | | | | 5,497,504 | |
| | | | | | | | |
Life Sciences Tools & Services: 2.3% | | | | | | | | |
Genscript Biotech Corp.d | | | 416,000 | | | | 1,043,848 | |
| | |
BBI Life Sciences Corp.c | | | 2,253,000 | | | | 628,742 | |
| | | | | | | | |
| | | | | | | 1,672,590 | |
| | | | | | | | |
Health Care Equipment & Supplies: 2.1% | | | | | | | | |
China Isotope & Radiation Corp. | | | 351,400 | | | | 829,281 | |
| | |
Microport Scientific Corp. | | | 990,000 | | | | 736,011 | |
| | | | | | | | |
| | | | | | | 1,565,292 | |
| | | | | | | | |
Health Care Providers & Services: 1.3% | | | | | | | | |
C-MER Eye Care Holdings, Ltd.c | | | 1,634,000 | | | | 913,583 | |
| | | | | | | | |
Pharmaceuticals: 0.9% | | | | | | | | |
CanSino Biologics, Inc. H Sharesb,c,d | | | 151,200 | | | | 644,541 | |
| | | | | | | | |
Total Health Care | | | | | | | 10,293,510 | |
| | | | | | | | |
| | | | | | | | |
| | | Shares | | | Value | |
| | |
| CONSUMER DISCRETIONARY: 12.1% | | | | | | | | |
Specialty Retail: 2.6% | | | | | | | | |
China Meidong Auto Holdings, Ltd. | | | 2,752,000 | | | | $1,916,469 | |
| | | | | | | | |
Leisure Products: 2.4% | | | | | | | | |
Honma Golf, Ltd.b,c | | | 2,016,500 | | | | 1,750,179 | |
| | | | | | | | |
Textiles, Apparel & Luxury Goods: 2.1% | | | | | | | | |
Pacific Textiles Holdings, Ltd. | | | 1,248,000 | | | | 988,092 | |
| | |
Chow Sang Sang Holdings International, Ltd. | | | 377,000 | | | | 555,949 | |
| | | | | | | | |
| | | | | | | 1,544,041 | |
| | | | | | | | |
Internet & Direct Marketing Retail: 1.8% | | | | | | | | |
Baozun, Inc. ADRd | | | 26,600 | | | | 1,326,276 | |
| | | | | | | | |
Diversified Consumer Services: 1.6% | | | | | | | | |
China Yuhua Education Corp., Ltd.b,c | | | 2,006,000 | | | | 875,217 | |
| | |
China Beststudy Education Groupc,d | | | 916,000 | | | | 286,114 | |
| | | | | | | | |
| | | | | | | 1,161,331 | |
| | | | | | | | |
Hotels, Restaurants & Leisure: 1.6% | | | | | | | | |
Huangshan Tourism Development Co., Ltd. B Shares | | | 900,596 | | | | 953,193 | |
| | |
Future Bright Holdings, Ltd. | | | 3,000,000 | | | | 165,069 | |
| | | | | | | | |
| | | | | | | 1,118,262 | |
| | | | | | | | |
Total Consumer Discretionary | | | | | | | 8,816,558 | |
| | | | | | | | |
| | | | | | | | |
| | | |
| REAL ESTATE: 9.4% | | | | | | | | |
Real Estate Management & Development: 9.4% | | | | | |
Joy City Property, Ltd. | | | 20,578,000 | | | | 2,581,158 | |
| | |
China Overseas Property Holdings, Ltd. | | | 3,895,000 | | | | 2,030,701 | |
| | |
Times China Holdings, Ltd. | | | 733,000 | | | | 1,467,518 | |
| | |
Midea Real Estate Holding, Ltd.b,c | | | 308,400 | | | | 788,282 | |
| | | | | | | | |
Total Real Estate | | | | | | | 6,867,659 | |
| | | | | | | | |
| | | | | | | | |
| | | |
| CONSUMER STAPLES: 7.5% | | | | | | | | |
Food Products: 6.0% | | | | | | | | |
Yihai International Holding, Ltd. | | | 488,000 | | | | 2,531,685 | |
| | |
JonjeeHi-Tech Industrial And Commercial Holding Co., Ltd. A Shares | | | 298,024 | | | | 1,859,685 | |
| | | | | | | | |
| | | | | | | 4,391,370 | |
| | | | | | | | |
Food & Staples Retailing: 1.5% | | | | | | | | |
Yixintang Pharmaceutical Group Co., Ltd. A Shares | | | 254,626 | | | | 1,058,846 | |
| | | | | | | | |
Total Consumer Staples | | | | | | | 5,450,216 | |
| | | | | | | | |
| | | | | | | | |
| | | |
| MATERIALS: 7.2% | | | | | | | | |
Construction Materials: 3.9% | | | | | | | | |
Asia Cement China Holdings Corp. | | | 1,775,000 | | | | 2,845,932 | |
| | | | | | | | |
Chemicals: 1.8% | | | | | | | | |
China BlueChemical, Ltd. H Shares | | | 4,890,000 | | | | 1,333,945 | |
| | | | | | | | |
Containers & Packaging: 1.5% | | | | | | | | |
CPMC Holdings, Ltd. | | | 2,791,000 | | | | 1,084,970 | |
| | | | | | | | |
Total Materials | | | | | | | 5,264,847 | |
| | | | | | | | |
| | | | | | | | |
Matthews China Small Companies Fund
June 30, 2019
Schedule of Investmentsa(unaudited) (continued)
COMMON EQUITIES(continued)
| | | | | | | | |
| | | Shares | | | Value | |
| | |
| ENERGY: 4.1% | | | | | | | | |
Oil, Gas & Consumable Fuels: 4.1% | | | | | | | | |
China Aviation Oil Singapore Corp., Ltd. | | | 1,637,100 | | | | $1,598,808 | |
Sinopec Kantons Holdings, Ltd. | | | 3,394,000 | | | | 1,419,226 | |
| | | | | | | | |
Total Energy | | | | | | | 3,018,034 | |
| | | | | | | | |
| | | | | | | | |
| | | |
| TOTAL INVESTMENTS: 95.0% | | | | | | | 69,379,451 | |
(Cost $68,385,492) | | | | | | | | |
| | | | | | | | |
| | |
CASH AND OTHER ASSETS,
LESS LIABILITIES: 5.0% | | | | | | | 3,613,686 | |
| | | | | | | | |
| | |
NET ASSETS: 100.0% | | | | | | | $72,993,137 | |
| | | | | | | | |
| a | Certain securities were fair valued under the valuation policies approved by the Board of Trustees (Note2-A). |
| b | Security exempt from registration under Rule 144A of the Securities Act of 1933, as amended. The security may be resold in transactions exempt from registration normally to qualified institutional buyers. The security has been determined to be liquid in accordance with procedures adopted by the Funds’ Board of Trustees. At June 30, 2019, the aggregate value is $8,993,881, which is 12.32% of net assets. |
| c | The securities may be resold to qualified foreign investors and foreign institutional buyers under Regulation S of the Securities Act of 1933. |
| d | Non-income producing security. |
| e | Security is valued using significant unobservable inputs and is classified as Level 3 in the fair value hierarchy. |
| ADR | American Depositary Receipt |
See accompanying notes to financial statements.
| | | | |
| matthewsasia.com | 800.789.ASIA | | | 87 | |
Index Definitions
TheMarkit iBoxx Asian Local Bond Index (ALBI)tracks the total return performance of a bond portfolio consisting of local currency denominated, high quality and liquid bonds in Asia ex Japan. The ALBI includes bonds from the following countries: China, Hong Kong, India, Indonesia, Malaysia, Philippines, Singapore, South Korea, Taiwan and Thailand.
TheJ.P. Morgan Asia Credit Index (JACI)tracks the total return performance of the Asia fixed-rate dollar bond market. JACI is a marketcapitalization-weighted index comprising sovereign, quasi-sovereign and corporate bonds and is partitioned by country, sector and credit rating. JACI includes bonds from the following countries: China, Hong Kong, India, Indonesia, Malaysia, Philippines, Singapore, South Korea and Thailand.
TheMSCI All Country Asia ex Japan Indexis a free float-adjusted market capitalization-weighted index of the stock markets of China, Hong Kong, India, Indonesia, Malaysia, Pakistan, Philippines, Singapore, South Korea, Taiwan and Thailand.
TheMSCI All Country Asia Pacific Indexis a free float-adjusted market capitalization-weighted index of the stock markets of Australia, China, Hong Kong, India, Indonesia, Japan, Malaysia, New Zealand, Pakistan, Philippines, Singapore, South Korea, Taiwan and Thailand.
TheMSCI China Indexis a free float-adjusted market capitalization-weighted index of Chinese equities that includes H shares listed on the Hong Kong exchange, B shares listed on the Shanghai and Shenzhen exchanges, Hong Kong-listed securities known as Red Chips (issued by entities owned by national or local governments in China) and P Chips (issued by companies controlled by individuals in China and deriving substantial revenues in China), and foreign listings (e.g., ADRs).
TheMSCI Emerging Markets (EM)Asia Index is a free float-adjusted market capitalization-weighted index of the stock
markets of China, India, Indonesia, Malaysia, Pakistan, Philippines, South Korea, Taiwan and Thailand.
TheMSCI China All Shares Index captures large and mid-cap representation across China A shares, B shares, H shares, Red Chips (issued by entities owned by national or local governments in China), P Chips (issued by companies controlled by individuals in China and deriving substantial revenues in China), and foreign listings (e.g., ADRs). The index aims to reflect the opportunity set of China share classes listed in Hong Kong, Shanghai, Shenzhen and outside of China.
TheS&P Bombay Stock Exchange (BSE)100 Index is a free float-adjusted market capitalization-weighted index of the 100 stocks listed on the Bombay Stock Exchange.
TheMSCI Japan Indexis a free float-adjusted market capitalization-weighted index of Japanese equities listed in Japan.
TheKorea Composite Stock Price Index (KOSPI)is a market capitalization-weighted index of all common stocks listed on the Korea Stock Exchange.
TheMSCI All Country Asia ex Japan Small Cap Indexis a free float-adjusted market capitalization-weighted small cap index of the stock markets of China, Hong Kong, India, Indonesia, Malaysia, Pakistan, Philippines, Singapore, South Korea, Taiwan and Thailand.
TheMSCI China Small Cap Indexis a free float-adjusted market capitalization-weighted small cap index of the Chinese equity securities markets, including H shares listed on the Hong Kong exchange, B shares listed on the Shanghai and Shenzhen exchanges, and Hong Kong-listed securities known as Red Chips (issued by entities owned by national or local governments in China) and P Chips (issued by companies controlled by individuals in China and deriving substantial revenues in China), and foreign listings (e.g., ADRs).
Disclosures
Fund Holdings:The Fund holdings shown in this report are as of June 30, 2019. Holdings are subject to change at any time, so holdings shown in this report may not reflect current Fund holdings. The Funds file complete schedules of portfolio holdings with the Securities and Exchange Commission (the “SEC”) for the first and third quarters of each fiscal year on FormN-PORT. The Funds’ FormsN-PORT are available on the SEC’s website at www.sec.gov. Complete schedules of investments are also available without charge, upon request, from the Funds by calling us at 800.789.ASIA (2742).
Proxy Voting Record:The Funds’ Statement of Additional Information containing a description of the policies and procedures that the Funds have used to vote proxies relating to portfolio securities, along with each Fund’s proxy voting record relating
to portfolio securities held during the most recent12-month period ended June 30, is available upon request, at no charge, at the Funds’ website at matthewsasia.com or by calling 800.789.ASIA (2742), or on the SEC’s website at www.sec.gov.
Shareholder Reports and Prospectuses:To reduce the Funds’ expenses, we try to identify related shareholders in a household and send only one copy of the Funds’ prospectus and financial reports to that address. This process, called “householding,” will continue indefinitely unless you instruct us otherwise. At any time you may view the Funds’ current prospectus, summary prospectus and financial reports on our website. If you prefer to receive individual copies of the Funds’ prospectus or financial reports, please call us at 800.789.ASIA (2742).
| | | | |
| matthewsasia.com | 800.789.ASIA | | | 89 | |
Disclosure of Fund Expenses(unaudited)
We believe it is important for you to understand the impact of fees regarding your investment. All mutual funds have operating expenses. As a shareholder of a mutual fund, you incur ongoing costs, which include costs for portfolio management, administrative services, and shareholder reports (like this one), among others. Operating expenses, which are deducted from a fund’s gross income, directly reduce the investment return of the fund. A fund’s operating expenses are expressed as a percentage of its average net assets. This figure is known as the expense ratio. The following examples are intended to help you understand the ongoing fees (in dollars) of investing in your fund and to compare these costs with those of other mutual funds. The examples are based on an investment of $1,000 made at the beginning of the period shown and held for the entire period.
This table illustrates your fund’s costs in two ways:
Actual Fund Return:This section helps you to estimate the actual operating expenses, after any applicable fee waivers, that you paid over the period. The “Ending Account Value” shown is derived from the fund’s actual return for the past six month period, the “Expense Ratio” column shows the period’s annualized expense ratio, and the “Operating Expenses Paid During Period” column shows the dollar amount that would have been paid by an investor who started with $1,000 in the fund at the beginning of the period. You may use the information here, together with your account value, to estimate the expenses that you paid over the period. To do so, simply divide your account
value by $1,000 (for example, an $8,600 account value divided by $1,000 = 8.6), then multiply the result by the number given for your fund in the first line under the heading entitled “Operating Expenses Paid During Period.”
Hypothetical 5% Return:This section is intended to help you compare your fund’s costs with those of other mutual funds. It assumes that the fund had an annual return of 5% before operating expenses, but that the expense ratio is unchanged. In this case, because the return used is not the fund’s actual return, the results do not apply to your investment. This example is useful in making comparisons to other mutual funds because the Securities and Exchange Commission requires all mutual funds to calculate expenses based on an assumed 5% annual return. You can assess your fund’s costs by comparing this hypothetical example with the hypothetical examples that appear in shareholder reports of other funds.
Please note that the operating expenses shown in the table are meant to highlight and help you compare your ongoing costs only and do not reflect any transactional costs such as sales charges (loads), redemption fees, or exchange fees.
Matthews Asia Funds does not charge any sales loads, exchange fees, or12b-1 fees, but these may be present in other funds to which you compare this data. Therefore, the hypothetical portions of the table are useful in comparing ongoing costs only, and will not help you determine the relative total costs of owning different funds.
June 30, 2019
Disclosure of Fund Expenses(unaudited) (continued)
| | | | | | | | | | | | | | | | | | | | | | | | | | | | | | | | | | | | |
| | | INVESTOR CLASS | | | | | | INSTITUTIONAL CLASS | |
| | | Beginning
Account
Value
1/1/19 | | | Ending
Account
Value
6/30/19 | | | Expense
Ratio1 | | | Operating
Expenses
Paid During
Period
1/1/19–
6/30/192 | | | | | | Beginning
Account Value 1/1/19 | | | Ending
Account Value 6/30/19 | | | Expense
Ratio1 | | | Operating
Expenses
Paid During
Period
1/1/19–
6/30/192 | |
| ASIA FIXED INCOME STRATEGIES | | | | | | | | | | | | | | | | | | | | | | | | | | | | | | | | | | | | |
Matthews Asia Strategic Income Fund | | | | | | | | | | | | | | | | | | | | | | | | | | | | | | | | | | | | |
Actual Fund Return | | | $1,000.00 | | | | $1,083.90 | | | | 1.15% | | | | $5.94 | | | | | | | | $1,000.00 | | | | $1,086.30 | | | | 0.90% | | | | $4.66 | |
Hypothetical 5% Returns | | | $1,000.00 | | | | $1,030.50 | | | | 1.15% | | | | $5.79 | | | | | | | | $1,000.00 | | | | $1,029.26 | | | | 0.90% | | | | $4.53 | |
Matthews Asia Credit Opportunities Fund | | | | | | | | | | | | | | | | | | | | | | | | | | | | | | | | | | | | |
Actual Fund Return | | | $1,000.00 | | | | $1,093.90 | | | | 1.15% | | | | $5.97 | | | | | | | | $1,000.00 | | | | $1,096.30 | | | | 0.90% | | | | $4.68 | |
Hypothetical 5% Returns | | | $1,000.00 | | | | $1,030.50 | | | | 1.15% | | | | $5.79 | | | | | | | | $1,000.00 | | | | $1,029.26 | | | | 0.90% | | | | $4.53 | |
| | | | | | | | | |
| ASIA GROWTH AND INCOME STRATEGIES | | | | | | | | | | | | | | | | | | | | | | | | | | | | | | | | | | | | |
Matthews Asian Growth and Income Fund | | | | | | | | | | | | | | | | | | | | | | | | | | | | | | | | | | | | |
Actual Fund Return | | | $1,000.00 | | | | $1,129.20 | | | | 1.10% | | | | $5.81 | | | | | | | | $1,000.00 | | | | $1,130.20 | | | | 0.96% | | | | $5.07 | |
Hypothetical 5% Returns | | | $1,000.00 | | | | $1,030.25 | | | | 1.10% | | | | $5.54 | | | | | | | | $1,000.00 | | | | $1,029.56 | | | | 0.96% | | | | $4.83 | |
Matthews Asia Dividend Fund | | | | | | | | | | | | | | | | | | | | | | | | | | | | | | | | | | | | |
Actual Fund Return | | | $1,000.00 | | | | $1,058.20 | | | | 1.02% | | | | $5.21 | | | | | | | | $1,000.00 | | | | $1,058.80 | | | | 0.92% | | | | $4.70 | |
Hypothetical 5% Returns | | | $1,000.00 | | | | $1,029.85 | | | | 1.02% | | | | $5.13 | | | | | | | | $1,000.00 | | | | $1,029.36 | | | | 0.92% | | | | $4.63 | |
Matthews China Dividend Fund | | | | | | | | | | | | | | | | | | | | | | | | | | | | | | | | | | | | |
Actual Fund Return | | | $1,000.00 | | | | $1,155.10 | | | | 1.12% | | | | $5.98 | | | | | | | | $1,000.00 | | | | $1,155.80 | | | | 1.00% | | | | $5.35 | |
Hypothetical 5% Returns | | | $1,000.00 | | | | $1,030.35 | | | | 1.12% | | | | $5.64 | | | | | | | | $1,000.00 | | | | $1,029.75 | | | | 1.00% | | | | $5.03 | |
| | | | | | | | | |
| ASIA VALUE STRATEGY | | | | | | | | | | | | | | | | | | | | | | | | | | | | | | | | | | | | |
Matthews Asia Value Fund | | | | | | | | | | | | | | | | | | | | | | | | | | | | | | | | | | | | |
Actual Fund Return | | | $1,000.00 | | | | $1,070.00 | | | | 1.50% | | | | $7.70 | | | | | | | | $1,000.00 | | | | $1,071.40 | | | | 1.25% | | | | $6.42 | |
Hypothetical 5% Returns | | | $1,000.00 | | | | $1,032.23 | | | | 1.50% | | | | $7.56 | | | | | | | | $1,000.00 | | | | $1,030.99 | | | | 1.25% | | | | $6.29 | |
| | | | | | | | | |
| ASIA GROWTH STRATEGIES | | | | | | | | | | | | | | | | | | | | | | | | | | | | | | | | | | | | |
Matthews Asia Growth Fund | | | | | | | | | | | | | | | | | | | | | | | | | | | | | | | | | | | | |
Actual Fund Return | | | $1,000.00 | | | | $1,157.80 | | | | 1.09% | | | | $5.83 | | | | | | | | $1,000.00 | | | | $1,158.90 | | | | 0.93% | | | | $4.98 | |
Hypothetical 5% Returns | | | $1,000.00 | | | | $1,030.20 | | | | 1.09% | | | | $5.49 | | | | | | | | $1,000.00 | | | | $1,029.41 | | | | 0.93% | | | | $4.68 | |
Matthews Pacific Tiger Fund | | | | | | | | | | | | | | | | | | | | | | | | | | | | | | | | | | | | |
Actual Fund Return | | | $1,000.00 | | | | $1,076.30 | | | | 1.05% | | | | $5.41 | | | | | | | | $1,000.00 | | | | $1,077.20 | | | | 0.90% | | | | $4.64 | |
Hypothetical 5% Returns | | | $1,000.00 | | | | $1,030.00 | | | | 1.05% | | | | $5.28 | | | | | | | | $1,000.00 | | | | $1,029.26 | | | | 0.90% | | | | $4.53 | |
Matthews Asia ESG Fund | | | | | | | | | | | | | | | | | | | | | | | | | | | | | | | | | | | | |
Actual Fund Return | | | $1,000.00 | | | | $1,096.20 | | | | 1.50% | | | | $7.80 | | | | | | | | $1,000.00 | | | | $1,097.40 | | | | 1.25% | | | | $6.50 | |
Hypothetical 5% Returns | | | $1,000.00 | | | | $1,032.23 | | | | 1.50% | | | | $7.56 | | | | | | | | $1,000.00 | | | | $1,030.99 | | | | 1.25% | | | | $6.29 | |
Matthews Emerging Asia Fund | | | | | | | | | | | | | | | | | | | | | | | | | | | | | | | | | | | | |
Actual Fund Return | | | $1,000.00 | | | | $983.20 | | | | 1.50% | | | | $7.38 | | | | | | | | $1,000.00 | | | | $984.80 | | | | 1.25% | | | | $6.15 | |
Hypothetical 5% Returns | | | $1,000.00 | | | | $1,032.23 | | | | 1.50% | | | | $7.56 | | | | | | | | $1,000.00 | | | | $1,030.99 | | | | 1.25% | | | | $6.29 | |
Matthews Asia Innovators Fund | | | | | | | | | | | | | | | | | | | | | | | | | | | | | | | | | | | | |
Actual Fund Return | | | $1,000.00 | | | | $1,190.90 | | | | 1.20% | | | | $6.52 | | | | | | | | $1,000.00 | | | | $1,191.70 | | | | 1.05% | | | | $5.71 | |
Hypothetical 5% Returns | | | $1,000.00 | | | | $1,030.75 | | | | 1.20% | | | | $6.04 | | | | | | | | $1,000.00 | | | | $1,030.00 | | | | 1.05% | | | | $5.28 | |
Matthews China Fund | | | | | | | | | | | | | | | | | | | | | | | | | | | | | | | | | | | | |
Actual Fund Return | | | $1,000.00 | | | | $1,222.70 | | | | 1.10% | | | | $6.06 | | | | | | | | $1,000.00 | | | | $1,224.70 | | | | 0.92% | | | | $5.07 | |
Hypothetical 5% Returns | | | $1,000.00 | | | | $1,030.25 | | | | 1.10% | | | | $5.54 | | | | | | | | $1,000.00 | | | | $1,029.36 | | | | 0.92% | | | | $4.63 | |
Matthews India Fund | | | | | | | | | | | | | | | | | | | | | | | | | | | | | | | | | | | | |
Actual Fund Return | | | $1,000.00 | | | | $1,022.80 | | | | 1.11% | | | | $5.57 | | | | | | | | $1,000.00 | | | | $1,023.40 | | | | 0.93% | | | | $4.67 | |
Hypothetical 5% Returns | | | $1,000.00 | | | | $1,030.30 | | | | 1.11% | | | | $5.59 | | | | | | | | $1,000.00 | | | | $1,029.41 | | | | 0.93% | | | | $4.68 | |
Matthews Japan Fund | | | | | | | | | | | | | | | | | | | | | | | | | | | | | | | | | | | | |
Actual Fund Return | | | $1,000.00 | | | | $1,137.60 | | | | 0.93% | | | | $4.93 | | | | | | | | $1,000.00 | | | | $1,137.30 | | | | 0.87% | | | | $4.61 | |
Hypothetical 5% Returns | | | $1,000.00 | | | | $1,029.41 | | | | 0.93% | | | | $4.68 | | | | | | | | $1,000.00 | | | | $1,029.11 | | | | 0.87% | | | | $4.38 | |
Matthews Korea Fund | | | | | | | | | | | | | | | | | | | | | | | | | | | | | | | | | | | | |
Actual Fund Return | | | $1,000.00 | | | | $991.30 | | | | 1.18% | | | | $5.83 | | | | | | | | $1,000.00 | | | | $993.50 | | | | 1.06% | | | | $5.24 | |
Hypothetical 5% Returns | | | $1,000.00 | | | | $1,030.65 | | | | 1.18% | | | | $5.94 | | | | | | | | $1,000.00 | | | | $1,030.05 | | | | 1.06% | | | | $5.34 | |
| 1 | Annualized, based on the Fund’s most recent fiscal half-year expenses. |
| 2 | Operating expenses are equal to the Fund’s annualized expense ratio multiplied by the average account value over the period, multiplied by 181 days, then divided by 365. |
| | | | |
| matthewsasia.com | 800.789.ASIA | | | 91 | |
June 30, 2019
Disclosure of Fund Expenses(unaudited) (continued)
| | | | | | | | | | | | | | | | | | | | | | | | | | | | | | | | | | | | |
| | | INVESTOR CLASS | | | | | | INSTITUTIONAL CLASS | |
| | | Beginning
Account
Value
1/1/19 | | | Ending
Account
Value
6/30/19 | | | Expense
Ratio1 | | | Operating
Expenses
Paid During
Period
1/1/19–
6/30/192 | | | | | | Beginning
Account Value 1/1/19 | | | Ending
Account Value 6/30/19 | | | Expense
Ratio1 | | | Operating
Expenses
Paid During
Period
1/1/19–
6/30/192 | |
| ASIA SMALL COMPANY STRATEGIES | | | | | | | | | | | | | | | | | | | | | | | | | | | | | | | | | | | | |
Matthews Asia Small Companies Fund | | | | | | | | | | | | | | | | | | | | | | | | | | | | | | | | | | | | |
Actual Fund Return | | | $1,000.00 | | | | $1,126.50 | | | | 1.50% | | | | $7.91 | | | | | | | | $1,000.00 | | | | $1,127.40 | | | | 1.25% | | | | $6.59 | |
Hypothetical 5% Returns | | | $1,000.00 | | | | $1,032.23 | | | | 1.50% | | | | $7.56 | | | | | | | | $1,000.00 | | | | $1,030.99 | | | | 1.25% | | | | $6.29 | |
Matthews China Small Companies Fund | | | | | | | | | | | | | | | | | | | | | | | | | | | | | | | | | | | | |
Actual Fund Return | | | $1,000.00 | | | | $1,186.90 | | | | 1.50% | | | | $8.13 | | | | | | | | $1,000.00 | | | | $1,188.70 | | | | 1.25% | | | | $6.78 | |
Hypothetical 5% Returns | | | $1,000.00 | | | | $1,032.23 | | | | 1.50% | | | | $7.56 | | | | | | | | $1,000.00 | | | | $1,030.99 | | | | 1.25% | | | | $6.29 | |
| 1 | Annualized, based on the Fund’s most recent fiscal half-year expenses. |
| 2 | Operating expenses are equal to the Fund’s annualized expense ratio multiplied by the average account value over the period, multiplied by 181 days, then divided by 365. |
| | |
| Statements of Assets and Liabilities(unaudited) | | June 30, 2019 |
| | | | | | | | | | | | |
| | | Matthews Asia
Strategic
Income Fund | | | Matthews Asia
Credit
Opportunities Fund | | | Matthews Asian
Growth and
Income Fund | |
| | | |
ASSETS: | | | | | | | | | | | | |
| | | |
Investments at value (A) (Note2-A and 7): | | | | | | | | | | | | |
| | | |
Unaffiliated issuers | | | $108,520,408 | | | | $54,071,709 | | | | $1,393,562,108 | |
| | | |
Cash | | | 3,126,849 | | | | 2,348,262 | | | | 22,375,224 | |
| | | |
Cash pledged collateral for forward foreign currency exchange contracts | | | 490,000 | | | | — | | | | — | |
| | | |
Segregated foreign currency at value | | | 20,337 | | | | 6,962 | | | | — | |
| | | |
Foreign currency at value (B) | | | 1,087 | | | | 122 | | | | 495,639 | |
| | | |
Dividends, interest and other receivable | | | 2,178,338 | | | | 1,005,508 | | | | 5,816,718 | |
| | | |
Receivable for securities sold | | | — | | | | 1,458,392 | | | | — | |
| | | |
Receivable for capital shares sold | | | 137,587 | | | | 21,475 | | | | 1,041,320 | |
| | | |
Unrealized appreciation on forward foreign currency exchange contracts | | | 130,886 | | | | — | | | | — | |
| | | |
Prepaid expenses | | | 17,651 | | | | 28,649 | | | | 31,165 | |
TOTAL ASSETS | | | 114,623,143 | | | | 58,941,079 | | | | 1,423,322,174 | |
| | | |
LIABILITIES: | | | | | | | | | | | | |
| | | |
Payable for securities purchased | | | — | | | | 1,357,805 | | | | — | |
| | | |
Payable for capital shares redeemed | | | 188,825 | | | | 61,116 | | | | 1,403,657 | |
| | | |
Unrealized depreciation on forward foreign currency exchange contracts | | | 556,972 | | | | — | | | | — | |
| | | |
Unrealized depreciation on swaps | | | 54,169 | | | | — | | | | — | |
| | | |
Deferred foreign capital gains tax liability (Note2-F) | | | 39,619 | | | | — | | | | — | |
| | | |
Due to Advisor (Note 5) | | | 44,627 | | | | 16,794 | | | | 758,231 | |
| | | |
Administration and accounting fees payable (Note 5) | | | 1,484 | | | | 735 | | | | 18,738 | |
| | | |
Administration and shareholder servicing fees payable (Note 5) | | | 12,793 | | | | 6,381 | | | | 158,572 | |
| | | |
Custodian fees payable | | | 5,381 | | | | 151 | | | | 112,565 | |
| | | |
Intermediary service fees payable (Note 5) | | | 39,814 | | | | 8,459 | | | | 315,413 | |
| | | |
Professional fees payable | | | 36,996 | | | | 34,821 | | | | 32,631 | |
| | | |
Transfer agent fees payable | | | 741 | | | | 171 | | | | 9,301 | |
| | | |
Accrued other expenses payable | | | 13,233 | | | | 9,574 | | | | 111,879 | |
TOTAL LIABILITIES | | | 994,654 | | | | 1,496,007 | | | | 2,920,987 | |
| | | |
NET ASSETS | | | $113,628,489 | | | | $57,445,072 | | | | $1,420,401,187 | |
| | | |
NET ASSETS: | | | | | | | | | | | | |
| | | |
Investor Class | | | $39,139,951 | | | | $11,264,207 | | | | $825,573,651 | |
| | | |
Institutional Class | | | 74,488,538 | | | | 46,180,865 | | | | 594,827,536 | |
TOTAL | | | $113,628,489 | | | | $57,445,072 | | | | $1,420,401,187 | |
See accompanying notes to financial statements.
| | | | |
| matthewsasia.com | 800.789.ASIA | | | 93 | |
| | |
| Statements of Assets and Liabilities(unaudited) (continued) | | June 30, 2019 |
| | | | | | | | | | | | |
| | | Matthews Asia
Strategic
Income Fund | | | Matthews Asia
Credit
Opportunities Fund | | | Matthews Asian
Growth and
Income Fund | |
SHARES OUTSTANDING: | | | | | | | | | | | | |
| | | |
(shares of beneficial interest issued and outstanding, respectively, unlimited number of shares authorized with a $0.001 par value) | | | | | | | | | | | | |
| | | |
Investor Class | | | 3,582,846 | | | | 1,075,705 | | | | 53,121,661 | |
| | | |
Institutional Class | | | 6,817,991 | | | | 4,410,655 | | | | 38,341,071 | |
TOTAL | | | 10,400,837 | | | | 5,486,360 | | | | 91,462,732 | |
| | | |
NET ASSET VALUE: | | | | | | | | | | | | |
Investor Class, offering price and redemption price | | | $10.92 | | | | $10.47 | | | | $15.54 | |
Institutional Class, offering price and redemption price | | | $10.93 | | | | $10.47 | | | | $15.51 | |
| | | |
NET ASSETS CONSISTS OF: | | | | | | | | | | | | |
| | | |
Capitalpaid-in | | | $113,404,380 | | | | $56,220,540 | | | | $1,251,198,066 | |
| | | |
Total distributable earnings/(accumulated loss) | | | 224,109 | | | | 1,224,532 | | | | 169,203,121 | |
NET ASSETS | | | $113,628,489 | | | | $57,445,072 | | | | $1,420,401,187 | |
| | | |
(A) Investments at cost: | | | | | | | | | | | | |
| | | |
Unaffiliated Issuers | | | $104,936,223 | | | | $53,081,339 | | | | $1,240,128,162 | |
| | | |
(B) Foreign Currency at Cost | | | $1,086 | | | | $124 | | | | $495,430 | |
See accompanying notes to financial statements.
| | |
| Statements of Assets and Liabilities(unaudited) (continued) | | June 30, 2019 |
| | | | | | | | | | | | |
| | | Matthews Asia
Dividend Fund | | | Matthews China
Dividend Fund | | | Matthews Asia
Value Fund | |
| | | |
ASSETS: | | | | | | | | | | | | |
| | | |
Investments at value (A) (Note2-A and 7): | | | | | | | | | | | | |
| | | |
Unaffiliated issuers | | | $4,837,354,766 | | | | $366,967,714 | | | | $23,050,094 | |
| | | |
Affiliated issuers | | | 1,110,828,937 | | | | — | | | | — | |
| | | |
Cash | | | 95,765,571 | | | | 13,400,130 | | | | 1,840,241 | |
| | | |
Segregated foreign currency at value | | | 163,639 | | | | 15,156 | | | | — | |
| | | |
Foreign currency at value (B) | | | 24,687,806 | | | | 410,370 | | | | 81,186 | |
| | | |
Dividends, interest and other receivable | | | 14,017,046 | | | | 829,261 | | | | 54,458 | |
| | | |
Receivable for securities sold | | | 33,043,851 | | | | 7,895 | | | | — | |
| | | |
Receivable for capital shares sold | | | 6,816,791 | | | | 827,243 | | | | 26,152 | |
| | | |
Prepaid expenses | | | 63,467 | | | | 31,421 | | | | 18,727 | |
TOTAL ASSETS | | | 6,122,741,874 | | | | 382,489,190 | | | | 25,070,858 | |
| | | |
LIABILITIES: | | | | | | | | | | | | |
| | | |
Payable for securities purchased | | | 30,634,434 | | | | 3,096,729 | | | | — | |
| | | |
Payable for capital shares redeemed | | | 15,304,381 | | | | 351,144 | | | | 15,846 | |
| | | |
Deferred foreign capital gains tax liability (Note2-F) | | | 4,942,899 | | | | — | | | | 8,014 | |
| | | |
Due to Advisor (Note 5) | | | 3,217,908 | | | | 198,041 | | | | 3,283 | |
| | | |
Administration and accounting fees payable (Note 5) | | | 80,519 | | | | 4,899 | | | | 356 | |
| | | |
Administration and shareholder servicing fees payable (Note 5) | | | 651,131 | | | | 41,440 | | | | 2,859 | |
| | | |
Custodian fees payable | | | 295,708 | | | | 14,445 | | | | 3,018 | |
| | | |
Intermediary service fees payable (Note 5) | | | 855,888 | | | | 40,156 | | | | 14,052 | |
| | | |
Professional fees payable | | | 25,525 | | | | 31,894 | | | | 27,950 | |
| | | |
Transfer agent fees payable | | | 19,932 | | | | 1,900 | | | | 337 | |
| | | |
Accrued other expenses payable | | | 184,584 | | | | 38,621 | | | | 23,794 | |
TOTAL LIABILITIES | | | 56,212,909 | | | | 3,819,269 | | | | 99,509 | |
| | | |
NET ASSETS | | | $6,066,528,965 | | | | $378,669,921 | | | | $24,971,349 | |
| | | |
NET ASSETS: | | | | | | | | | | | | |
| | | |
Investor Class | | | $2,710,989,835 | | | | $276,272,043 | | | | $18,897,260 | |
| | | |
Institutional Class | | | 3,355,539,130 | | | | 102,397,878 | | | | 6,074,089 | |
TOTAL | | | $6,066,528,965 | | | | $378,669,921 | | | | $24,971,349 | |
See accompanying notes to financial statements.
| | | | |
| matthewsasia.com | 800.789.ASIA | | | 95 | |
| | |
| Statements of Assets and Liabilities(unaudited) (continued) | | June 30, 2019 |
| | | | | | | | | | | | |
| | | Matthews Asia Dividend Fund | | | Matthews China
Dividend Fund | | | Matthews Asia
Value Fund | |
SHARES OUTSTANDING: | | | | | | | | | | | | |
| | | |
(shares of beneficial interest issued and outstanding, respectively, unlimited number of shares authorized with a $0.001 par value) | | | | | | | | | | | | |
| | | |
Investor Class | | | 161,112,601 | | | | 16,963,208 | | | | 1,626,144 | |
| | | |
Institutional Class | | | 199,467,818 | | | | 6,286,822 | | | | 526,022 | |
TOTAL | | | 360,580,419 | | | | 23,250,030 | | | | 2,152,166 | |
| | | |
NET ASSET VALUE: | | | | | | | | | | | | |
Investor Class, offering price and redemption price | | | $16.83 | | | | $16.29 | | | | $11.62 | |
Institutional Class, offering price and redemption price | | | $16.82 | | | | $16.29 | | | | $11.55 | |
| | | |
NET ASSETS CONSISTS OF: | | | | | | | | | | | | |
| | | |
Capitalpaid-in | | | $5,354,547,295 | | | | $358,716,357 | | | | $26,336,308 | |
| | | |
Total distributable earnings/(accumulated loss) | | | 711,981,670 | | | | 19,953,564 | | | | (1,364,959 | ) |
NET ASSETS | | | $6,066,528,965 | | | | $378,669,921 | | | | $24,971,349 | |
| | | |
(A) Investments at cost: | | | | | | | | | | | | |
| | | |
Unaffiliated Issuers | | | $4,149,256,869 | | | | $340,329,075 | | | | $23,335,244 | |
| | | |
Affiliated Issuers | | | 904,078,249 | | | | — | | | | — | |
| | | |
(B) Foreign Currency at Cost | | | $24,804,300 | | | | $410,336 | | | | $81,189 | |
See accompanying notes to financial statements.
| | |
| Statements of Assets and Liabilities(unaudited) (continued) | | June 30, 2019 |
| | | | | | | | | | | | |
| | | Matthews Asia
Growth Fund | | | Matthews Pacific
Tiger Fund | | | Matthews Asia
ESG Fund | |
| | | |
ASSETS: | | | | | | | | | | | | |
| | | |
Investments at value (A) (Note2-A and 7): | | | | | | | | | | | | |
| | | |
Unaffiliated issuers | | | $1,079,745,164 | | | | $7,829,615,622 | | | | $45,361,438 | |
| | | |
Affiliated issuers | | | 17,276,809 | | | | 1,149,704,669 | | | | — | |
| | | |
Cash | | | 29,269,038 | | | | 201,381,558 | | | | 533,846 | |
| | | |
Segregated foreign currency at value | | | — | | | | 170,946 | | | | 701 | |
| | | |
Foreign currency at value (B) | | | 238,444 | | | | 22,066,580 | | | | 116,252 | |
| | | |
Dividends, interest and other receivable | | | 866,406 | | | | 28,214,920 | | | | 129,917 | |
| | | |
Receivable for securities sold | | | — | | | | 9,419,119 | | | | — | |
| | | |
Receivable for capital shares sold | | | 1,295,098 | | | | 8,227,345 | | | | 27,939 | |
| | | |
Prepaid expenses | | | 34,811 | | | | 131,637 | | | | 23,899 | |
TOTAL ASSETS | | | 1,128,725,770 | | | | 9,248,932,396 | | | | 46,193,992 | |
| | | |
LIABILITIES: | | | | | | | | | | | | |
| | | |
Payable for securities purchased | | | 5,453,829 | | | | 102,095 | | | | 403,895 | |
| | | |
Payable for capital shares redeemed | | | 863,539 | | | | 15,813,464 | | | | 2,447 | |
| | | |
Deferred foreign capital gains tax liability (Note2-F) | | | 1,534,737 | | | | 32,766,180 | | | | 183,303 | |
| | | |
Due to Advisor (Note 5) | | | 597,623 | | | | 4,809,514 | | | | 17,230 | |
| | | |
Administration and accounting fees payable (Note 5) | | | 14,752 | | | | 120,510 | | | | 589 | |
| | | |
Administration and shareholder servicing fees payable (Note 5) | | | 125,047 | | | | 938,674 | | | | 5,044 | |
| | | |
Custodian fees payable | | | 68,303 | | | | 549,209 | | | | 17,204 | |
| | | |
Intermediary service fees payable (Note 5) | | | 163,086 | | | | 774,889 | | | | 10,152 | |
| | | |
Professional fees payable | | | 32,948 | | | | 39,148 | | | | 32,301 | |
| | | |
Transfer agent fees payable | | | 4,693 | | | | 18,695 | | | | 178 | |
| | | |
Accrued other expenses payable | | | 39,148 | | | | 33,334 | | | | 26,832 | |
TOTAL LIABILITIES | | | 8,897,705 | | | | 55,965,712 | | | | 699,175 | |
| | | |
NET ASSETS | | | $1,119,828,065 | | | | $9,192,966,684 | | | | $45,494,817 | |
| | | |
NET ASSETS: | | | | | | | | | | | | |
| | | |
Investor Class | | | $528,787,329 | | | | $2,811,333,085 | | | | $15,825,173 | |
| | | |
Institutional Class | | | 591,040,736 | | | | 6,381,633,599 | | | | 29,669,644 | |
TOTAL | | | $1,119,828,065 | | | | $9,192,966,684 | | | | $45,494,817 | |
See accompanying notes to financial statements.
| | | | |
| matthewsasia.com | 800.789.ASIA | | | 97 | |
| | |
| Statements of Assets and Liabilities(unaudited) (continued) | | June 30, 2019 |
| | | | | | | | | | | | |
| | | Matthews Asia
Growth Fund | | | Matthews Pacific
Tiger Fund | | | Matthews Asia
ESG Fund | |
SHARES OUTSTANDING: | | | | | | | | | | | | |
| | | |
(shares of beneficial interest issued and outstanding, respectively, unlimited number of shares authorized with a $0.001 par value) | | | | | | | | | | | | |
| | | |
Investor Class | | | 20,306,353 | | | | 97,253,645 | | | | 1,447,162 | |
| | | |
Institutional Class | | | 22,520,119 | | | | 220,846,251 | | | | 2,715,628 | |
TOTAL | | | 42,826,472 | | | | 318,099,896 | | | | 4,162,790 | |
| | | |
NET ASSET VALUE: | | | | | | | | | | | | |
Investor Class, offering price and redemption price | | | $26.04 | | | | $28.91 | | | | $10.94 | |
Institutional Class, offering price and redemption price | | | $26.25 | | | | $28.90 | | | | $10.93 | |
| | | |
NET ASSETS CONSISTS OF: | | | | | | | | | | | | |
| | | |
Capitalpaid-in | | | $896,187,007 | | | | $6,260,486,153 | | | | $42,456,879 | |
| | | |
Total distributable earnings/(accumulated loss) | | | 223,641,058 | | | | 2,932,480,531 | | | | 3,037,938 | |
NET ASSETS | | | $1,119,828,065 | | | | $9,192,966,684 | | | | $45,494,817 | |
| | | |
(A) Investments at cost: | | | | | | | | | | | | |
| | | |
Unaffiliated Issuers | | | $849,144,789 | | | | $4,932,460,673 | | | | $41,943,005 | |
| | | |
Affiliated Issuers | | | 28,844,084 | | | | 1,365,908,453 | | | | — | |
| | | |
(B) Foreign Currency at Cost | | | $238,602 | | | | $22,039,122 | | | | $116,958 | |
See accompanying notes to financial statements.
| | |
| Statements of Assets and Liabilities(unaudited) (continued) | | June 30, 2019 |
| | | | | | | | | | | | |
| | | Matthews Emerging
Asia Fund | | | Matthews Asia
Innovators Fund | | | Matthews China Fund | |
| | | |
ASSETS: | | | | | | | | | | | | |
| | | |
Investments at value (A) (Note2-A and 7): | | | | | | | | | | | | |
| | | |
Unaffiliated issuers | | | $382,994,895 | | | | $279,460,047 | | | | $819,313,238 | |
| | | |
Affiliated issuers | | | 24,724,628 | | | | — | | | | — | |
| | | |
Cash | | | 20,185,571 | | | | 10,467,743 | | | | 48,885,352 | |
| | | |
Segregated foreign currency at value | | | — | | | | 2,894 | | | | 34,943 | |
| | | |
Foreign currency at value (B) | | | 1,197,697 | | | | 3,189,056 | | | | 469,573 | |
| | | |
Dividends, interest and other receivable | | | 1,187,940 | | | | 423,216 | | | | 6,059,499 | |
| | | |
Receivable for securities sold | | | 1,890,179 | | | | 322,239 | | | | 720,279 | |
| | | |
Receivable for capital shares sold | | | 1,598,036 | | | | 132,160 | | | | 1,242,598 | |
| | | |
Prepaid expenses | | | 32,819 | | | | 28,171 | | | | 21,318 | |
TOTAL ASSETS | | | 433,811,765 | | | | 294,025,526 | | | | 876,746,800 | |
| | | |
LIABILITIES: | | | | | | | | | | | | |
| | | |
Payable for securities purchased | | | 553,727 | | | | 299,502 | | | | 11,337,862 | |
| | | |
Payable for capital shares redeemed | | | 1,091,741 | | | | 351,337 | | | | 997,881 | |
| | | |
Deferred foreign capital gains tax liability (Note2-F) | | | 2,752,846 | | | | 733,210 | | | | — | |
| | | |
Due to Advisor (Note 5) | | | 279,201 | | | | 152,478 | | | | 445,190 | |
| | | |
Administration and accounting fees payable (Note 5) | | | 5,763 | | | | 3,759 | | | | 11,066 | |
| | | |
Administration and shareholder servicing fees payable (Note 5) | | | 48,877 | | | | 31,909 | | | | 93,086 | |
| | | |
Custodian fees payable | | | 180,704 | | | | 28,781 | | | | 22,509 | |
| | | |
Foreign capital gains tax payable (Note2-F) | | | 263,784 | | | | — | | | | — | |
| | | |
Intermediary service fees payable (Note 5) | | | 72,401 | | | | 38,278 | | | | 105,570 | |
| | | |
Professional fees payable | | | 26,901 | | | | 30,821 | | | | 28,585 | |
| | | |
Transfer agent fees payable | | | 1,898 | | | | 2,956 | | | | 11,564 | |
| | | |
Accrued other expenses payable | | | 46,698 | | | | 33,508 | | | | 241,172 | |
TOTAL LIABILITIES | | | 5,324,541 | | | | 1,706,539 | | | | 13,294,485 | |
| | | |
NET ASSETS | | | $428,487,224 | | | | $292,318,987 | | | | $863,452,315 | |
| | | |
NET ASSETS: | | | | | | | | | | | | |
| | | |
Investor Class | | | $108,416,138 | | | | $174,601,920 | | | | $709,970,242 | |
| | | |
Institutional Class | | | 320,071,086 | | | | 117,717,067 | | | | 153,482,073 | |
TOTAL | | | $428,487,224 | | | | $292,318,987 | | | | $863,452,315 | |
See accompanying notes to financial statements.
| | | | |
| matthewsasia.com | 800.789.ASIA | | | 99 | |
| | |
| Statements of Assets and Liabilities(unaudited) (continued) | | June 30, 2019 |
| | | | | | | | | | | | |
| | | Matthews Emerging
Asia Fund | | | Matthews Asia
Innovators Fund | | | Matthews
China Fund | |
SHARES OUTSTANDING: | | | | | | | | | | | | |
| | | |
(shares of beneficial interest issued and outstanding, respectively, unlimited number of shares authorized with a $0.001 par value) | | | | | | | | | | | | |
| | | |
Investor Class | | | 8,818,240 | | | | 13,018,861 | | | | 40,403,281 | |
| | | |
Institutional Class | | | 25,923,473 | | | | 8,728,827 | | | | 8,745,387 | |
TOTAL | | | 34,741,713 | | | | 21,747,688 | | | | 49,148,668 | |
| | | |
NET ASSET VALUE: | | | | | | | | | | | | |
Investor Class, offering price and redemption price | | | $12.29 | | | | $13.41 | | | | $17.57 | |
Institutional Class, offering price and redemption price | | | $12.35 | | | | $13.49 | | | | $17.55 | |
| | | |
NET ASSETS CONSISTS OF: | | | | | | | | | | | | |
| | | |
Capitalpaid-in | | | $464,607,097 | | | | $247,953,183 | | | | $855,407,490 | |
| | | |
Total distributable earnings/(accumulated loss) | | | (36,119,873 | ) | | | 44,365,804 | | | | 8,044,825 | |
NET ASSETS | | | $428,487,224 | | | | $292,318,987 | | | | $863,452,315 | |
| | | |
(A) Investments at cost: | | | | | | | | | | | | |
| | | |
Unaffiliated Issuers | | | $408,343,262 | | | | $232,613,842 | | | | $797,202,659 | |
| | | |
Affiliated Issuers | | | 37,470,156 | | | | — | | | | — | |
| | | |
(B) Foreign Currency at Cost | | | $1,199,486 | | | | $3,231,348 | | | | $469,480 | |
See accompanying notes to financial statements.
| | |
| Statements of Assets and Liabilities(unaudited) (continued) | | June 30, 2019 |
| | | | | | | | | | | | |
| | | Matthews India
Fund | | | Matthews Japan
Fund | | | Matthews Korea
Fund | |
| | | |
ASSETS: | | | | | | | | | | | | |
| | | |
Investments at value (A) (Note2-A and 7): | | | | | | | | | | | | |
| | | |
Unaffiliated issuers | | | $1,377,184,363 | | | | $2,640,945,752 | | | | $144,757,565 | |
| | | |
Affiliated issuers | | | 83,452,790 | | | | — | | | | — | |
| | | |
Cash | | | 5,427,436 | | | | 30,001,250 | | | | 6,073,206 | |
| | | |
Foreign currency at value (B) | | | 7,919,711 | | | | 3,607,360 | | | | — | |
| | | |
Dividends, interest and other receivable | | | 3,139,681 | | | | 1,740,175 | | | | 345,940 | |
| | | |
Receivable for securities sold | | | 31,212,643 | | | | — | | | | 397 | |
| | | |
Receivable for capital shares sold | | | 5,957,603 | | | | 1,510,526 | | | | 219,785 | |
| | | |
Prepaid expenses | | | 26,655 | | | | 40,920 | | | | 22,551 | |
TOTAL ASSETS | | | 1,514,320,882 | | | | 2,677,845,983 | | | | 151,419,444 | |
| | | |
LIABILITIES: | | | | | | | | | | | | |
| | | |
Payable for securities purchased | | | 5,575,485 | | | | 3,762 | | | | 716,951 | |
| | | |
Payable for capital shares redeemed | | | 13,367,623 | | | | 5,915,792 | | | | 123,657 | |
| | | |
Deferred foreign capital gains tax liability (Note2-F) | | | 24,571,282 | | | | — | | | | — | |
| | | |
Due to Advisor (Note 5) | | | 827,594 | | | | 1,457,111 | | | | 79,338 | |
| | | |
Administration and accounting fees payable (Note 5) | | | 20,511 | | | | 36,536 | | | | 1,945 | |
| | | |
Administration and shareholder servicing fees payable (Note 5) | | | 173,203 | | | | 304,792 | | | | 16,597 | |
| | | |
Custodian fees payable | | | 157,923 | | | | 75,846 | | | | 9,878 | |
| | | |
Foreign capital gains tax payable (Note2-F) | | | 555,845 | | | | — | | | | — | |
| | | |
Intermediary service fees payable (Note 5) | | | 240,509 | | | | 366,010 | | | | 34,162 | |
| | | |
Professional fees payable | | | 36,354 | | | | 29,649 | | | | 27,775 | |
| | | |
Transfer agent fees payable | | | 12,499 | | | | 19,618 | | | | 3,382 | |
| | | |
Accrued other expenses payable | | | 86,362 | | | | 114,151 | | | | 27,765 | |
TOTAL LIABILITIES | | | 45,625,190 | | | | 8,323,267 | | | | 1,041,450 | |
| | | |
NET ASSETS | | | $1,468,695,692 | | | | $2,669,522,716 | | | | $150,377,994 | |
| | | |
NET ASSETS: | | | | | | | | | | | | |
| | | |
Investor Class | | | $1,095,537,667 | | | | $1,631,127,451 | | | | $120,885,724 | |
| | | |
Institutional Class | | | 373,158,025 | | | | 1,038,395,265 | | | | 29,492,270 | |
TOTAL | | | $1,468,695,692 | | | | $2,669,522,716 | | | | $150,377,994 | |
See accompanying notes to financial statements.
| | | | |
| matthewsasia.com | 800.789.ASIA | | | 101 | |
| | |
| Statements of Assets and Liabilities(unaudited) (continued) | | June 30, 2019 |
| | | | | | | | | | | | |
| | | Matthews India
Fund | | | Matthews Japan
Fund | | | Matthews Korea
Fund | |
SHARES OUTSTANDING: | | | | | | | | | | | | |
| | | |
(shares of beneficial interest issued and outstanding, respectively, unlimited number of shares authorized with a $0.001 par value) | | | | | | | | | | | | |
| | | |
Investor Class | | | 40,703,603 | | | | 77,377,316 | | | | 26,617,592 | |
| | | |
Institutional Class | | | 13,728,646 | | | | 49,157,682 | | | | 6,445,493 | |
TOTAL | | | 54,432,249 | | | | 126,534,998 | | | | 33,063,085 | |
| | | |
NET ASSET VALUE: | | | | | | | | | | | | |
Investor Class, offering price and redemption price | | | $26.92 | | | | $21.08 | | | | $4.54 | |
Institutional Class, offering price and redemption price | | | $27.18 | | | | $21.12 | | | | $4.58 | |
| | | |
NET ASSETS CONSISTS OF: | | | | | | | | | | | | |
| | | |
Capitalpaid-in | | | $1,177,782,270 | | | | $2,318,641,451 | | | | $134,926,558 | |
| | | |
Total distributable earnings/(accumulated loss) | | | 290,913,422 | | | | 350,881,265 | | | | 15,451,436 | |
NET ASSETS | | | $1,468,695,692 | | | | $2,669,522,716 | | | | $150,377,994 | |
| | | |
(A) Investments at cost: | | | | | | | | | | | | |
| | | |
Unaffiliated Issuers | | | $1,244,940,143 | | | | $2,393,915,292 | | | | $136,642,249 | |
| | | |
Affiliated Issuers | | | 46,513,178 | | | | — | | | | — | |
| | | |
(B) Foreign Currency at Cost | | | $7,917,876 | | | | $3,612,611 | | | | $— | |
See accompanying notes to financial statements.
| | |
| Statements of Assets and Liabilities(unaudited) (continued) | | June 30, 2019 |
| | | | | | | | |
| | | Matthews Asia
Small Companies
Fund | | | Matthews China
Small Companies
Fund | |
| | |
ASSETS: | | | | | | | | |
| | |
Investments at value (A) (Note2-A and 7): | | | | | | | | |
| | |
Unaffiliated issuers | | | $172,751,614 | | | | $69,379,451 | |
| | |
Affiliated issuers | | | 2,232,892 | | | | — | |
| | |
Cash | | | 12,307,081 | | | | 2,173,190 | |
| | |
Segregated foreign currency at value | | | — | | | | 3,898 | |
| | |
Foreign currency at value (B) | | | 3,809,499 | | | | 714,207 | |
| | |
Dividends, interest and other receivable | | | 563,090 | | | | 389,157 | |
| | |
Receivable for securities sold | | | 1,256,629 | | | | 504,601 | |
| | |
Receivable for capital shares sold | | | 602,345 | | | | 41,250 | |
| | |
Prepaid expenses | | | 19,957 | | | | 23,947 | |
TOTAL ASSETS | | | 193,543,107 | | | | 73,229,701 | |
| | |
LIABILITIES: | | | | | | | | |
| | |
Payable for securities purchased | | | 485,267 | | | | 30 | |
| | |
Payable for capital shares redeemed | | | 221,276 | | | | 82,741 | |
| | |
Deferred foreign capital gains tax liability (Note2-F) | | | 861,696 | | | | — | |
| | |
Due to Advisor (Note 5) | | | 137,949 | | | | 43,471 | |
| | |
Administration and accounting fees payable (Note 5) | | | 2,516 | | | | 957 | |
| | |
Administration and shareholder servicing fees payable (Note 5) | | | 21,296 | | | | 7,972 | |
| | |
Custodian fees payable | | | 85,518 | | | | 5,523 | |
| | |
Foreign capital gains tax payable (Note2-F) | | | 30,517 | | | | — | |
| | |
Intermediary service fees payable (Note 5) | | | 71,053 | | | | 32,877 | |
| | |
Professional fees payable | | | 27,480 | | | | 31,815 | |
| | |
Transfer agent fees payable | | | 2,534 | | | | 983 | |
| | |
Accrued other expenses payable | | | 41,940 | | | | 30,195 | |
TOTAL LIABILITIES | | | 1,989,042 | | | | 236,564 | |
| | |
NET ASSETS | | | $191,554,065 | | | | $72,993,137 | |
| | |
NET ASSETS: | | | | | | | | |
| | |
Investor Class | | | $116,482,216 | | | | $48,468,883 | |
| | |
Institutional Class | | | 75,071,849 | | | | 24,524,254 | |
TOTAL | | | $191,554,065 | | | | $72,993,137 | |
See accompanying notes to financial statements.
| | | | |
| matthewsasia.com | 800.789.ASIA | | | 103 | |
| | |
| Statements of Assets and Liabilities(unaudited) (continued) | | June 30, 2019 |
| | | | | | | | |
| | | Matthews Asia
Small Companies
Fund | | | Matthews China
Small Companies
Fund | |
SHARES OUTSTANDING: | | | | | | | | |
| | |
(shares of beneficial interest issued and outstanding, respectively, unlimited number of shares authorized with a $0.001 par value) | | | | | | | | |
| | |
Investor Class | | | 6,673,023 | | | | 4,262,223 | |
| | |
Institutional Class | | | 4,306,420 | | | | 2,151,440 | |
TOTAL | | | 10,979,443 | | | | 6,413,663 | |
| | |
NET ASSET VALUE: | | | | | | | | |
Investor Class, offering price and redemption price | | | $17.46 | | | | $11.37 | |
Institutional Class, offering price and redemption price | | | $17.43 | | | | $11.40 | |
| | |
NET ASSETS CONSISTS OF: | | | | | | | | |
| | |
Capitalpaid-in | | | $199,624,096 | | | | $72,148,839 | |
| | |
Total distributable earnings/(accumulated loss) | | | (8,070,031 | ) | | | 844,298 | |
NET ASSETS | | | $191,554,065 | | | | $72,993,137 | |
| | |
(A) Investments at cost: | | | | | | | | |
| | |
Unaffiliated Issuers | | | $174,386,822 | | | | $68,385,492 | |
| | |
Affiliated Issuers | | | 2,226,132 | | | | — | |
| | |
(B) Foreign Currency at Cost | | | $3,809,000 | | | | $710,372 | |
See accompanying notes to financial statements.
| | |
| Statements of Operations(unaudited) | | Six-Month Period Ended June 30, 2019 |
| | | | | | | | | | | | |
| | | Matthews Asia
Strategic Income Fund | | | Matthews Asia
Credit Opportunities Fund | | | Matthews Asian
Growth and Income Fund | |
| | | |
INVESTMENT INCOME: | | | | | | | | | | | | |
| | | |
Dividends—Unaffiliated Issuers | | | $16,004 | | | | $15,866 | | | | $20,848,768 | |
| | | |
Interest | | | 2,967,019 | | | | 1,326,711 | | | | 966,053 | |
| | | |
Foreign withholding tax | | | (49,574 | ) | | | (8,621 | ) | | | (1,376,374 | ) |
TOTAL INVESTMENT INCOME | | | 2,933,449 | | | | 1,333,956 | | | | 20,438,447 | |
| | | |
EXPENSES: | | | | | | | | | | | | |
| | | |
Investment advisory fees (Note 5) | | | 293,987 | | | | 134,281 | | | | 4,770,829 | |
| | | |
Administration and accounting fees (Note 5) | | | 4,276 | | | | 1,953 | | | | 57,599 | |
| | | |
Administration and shareholder servicing fees (Note 5) | | | 73,781 | | | | 33,691 | | | | 993,622 | |
| | | |
Accountingout-of-pocket fees | | | 11,729 | | | | 11,072 | | | | 24,870 | |
| | | |
Custodian fees | | | 19,691 | | | | 9,104 | | | | 239,523 | |
| | | |
Printing fees | | | 18,537 | | | | 15,313 | | | | 86,122 | |
| | | |
Intermediary service fees (Note 5) | | | 69,605 | | | | 21,181 | | | | 1,125,967 | |
| | | |
Professional fees | | | 32,542 | | | | 31,133 | | | | 40,393 | |
| | | |
Registration fees | | | 20,998 | | | | 20,559 | | | | 29,791 | |
| | | |
Transfer agent fees | | | 2,694 | | | | 637 | | | | 32,252 | |
| | | |
Trustees fees | | | 2,465 | | | | 1,026 | | | | 38,580 | |
| | | |
Other expenses | | | 5,777 | | | | 2,851 | | | | 32,488 | |
TOTAL EXPENSES | | | 556,082 | | | | 282,801 | | | | 7,472,036 | |
| | | |
Advisory fees waived and expenses waived or reimbursed (Note 5) | | | (25,859 | ) | | | (50,460 | ) | | | — | |
NET EXPENSES | | | 530,223 | | | | 232,341 | | | | 7,472,036 | |
| | | |
NET INVESTMENT INCOME (LOSS) | | | 2,403,226 | | | | 1,101,615 | | | | 12,966,411 | |
| | | |
| REALIZED AND UNREALIZED GAIN (LOSS) ON INVESTMENTS, FORWARD FOREIGN CURRENCY EXCHANGE CONTRACTS, FOREIGN CURRENCY RELATED TRANSACTIONS, SWAPS, AND FOREIGN CAPITAL GAINS TAXES: | | | | | | | | | | | | |
| | | |
Net realized gain (loss) on investments—Unaffiliated Issuers | | | 1,056,344 | | | | 873,350 | | | | 27,640,015 | |
| | | |
Net realized gain (loss) on forward foreign currency exchange contracts | | | 803,516 | | | | 728 | | | | — | |
| | | |
Net realized gain (loss) on swaps | | | 85,613 | | | | — | | | | — | |
| | | |
Net realized foreign capital gains tax | | | (13,103 | ) | | | — | | | | — | |
| | | |
Net realized gain (loss) on foreign currency related transactions | | | (366,194 | ) | | | 270 | | | | 122,451 | |
| | | |
Net change in unrealized appreciation/depreciation on investments—Unaffiliated Issuers | | | 5,989,522 | | | | 2,415,195 | | | | 135,477,089 | |
| | | |
Net change in unrealized appreciation/depreciation on forward foreign currency exchange contracts | | | (1,119,966 | ) | | | (728 | ) | | | — | |
| | | |
Net change in unrealized appreciation/depreciation on swaps | | | (54,169 | ) | | | — | | | | — | |
| | | |
Net change in deferred foreign capital gains taxes on unrealized appreciation | | | (39,522 | ) | | | — | | | | 243,880 | |
| | | |
Net change in unrealized appreciation/depreciation on foreign currency related translations | | | 2,430 | | | | (8 | ) | | | (37,585 | ) |
Net realized and unrealized gain (loss) on investments, forward foreign currency exchange contracts, foreign currency related transactions, and foreign capital gains taxes | | | 6,344,471 | | | | 3,288,807 | | | | 163,445,850 | |
| | | |
NET INCREASE (DECREASE) IN NET ASSETS FROM OPERATIONS | | | $8,747,697 | | | | $4,390,422 | | | | $176,412,261 | |
See accompanying notes to financial statements.
| | | | |
| matthewsasia.com | 800.789.ASIA | | | 105 | |
| | |
| Statements of Operations(unaudited) (continued) | | Six-Month Period Ended June 30, 2019 |
| | | | | | | | | | | | |
| | | Matthews Asia
Dividend Fund | | | Matthews China
Dividend Fund | | | Matthews Asia
Value Fund | |
| | | |
INVESTMENT INCOME: | | | | | | | | | | | | |
| | | |
Dividends—Unaffiliated Issuers | | | $73,302,942 | | | | $7,120,768 | | | | $460,950 | |
| | | |
Dividends—Affiliated Issuers (Note 7) | | | 16,638,091 | | | | — | | | | — | |
| | | |
Foreign withholding tax | | | (7,356,831 | ) | | | (366,103 | ) | | | (34,362 | ) |
TOTAL INVESTMENT INCOME | | | 82,584,202 | | | | 6,754,665 | | | | 426,588 | |
| | | |
EXPENSES: | | | | | | | | | | | | |
| | | |
Investment advisory fees (Note 5) | | | 20,275,181 | | | | 1,123,589 | | | | 89,587 | |
| | | |
Administration and accounting fees (Note 5) | | | 244,786 | | | | 13,566 | | | | 1,082 | |
| | | |
Administration and shareholder servicing fees (Note 5) | | | 4,222,455 | | | | 233,920 | | | | 18,649 | |
| | | |
Accountingout-of-pocket fees | | | 25,249 | | | | 21,948 | | | | 19,226 | |
| | | |
Custodian fees | | | 890,983 | | | | 80,930 | | | | 20,847 | |
| | | |
Printing fees | | | 166,982 | | | | 28,245 | | | | 13,492 | |
| | | |
Intermediary service fees (Note 5) | | | 3,504,758 | | | | 275,394 | | | | 25,275 | |
| | | |
Professional fees | | | 88,490 | | | | 27,319 | | | | 33,358 | |
| | | |
Registration fees | | | 90,027 | | | | 22,128 | | | | 19,364 | |
| | | |
Transfer agent fees | | | 67,807 | | | | 7,071 | | | | 1,358 | |
| | | |
Trustees fees | | | 148,771 | | | | 7,368 | | | | 619 | |
| | | |
Other expenses | | | 133,327 | | | | 7,696 | | | | 8,059 | |
TOTAL EXPENSES | | | 29,858,816 | | | | 1,849,174 | | | | 250,916 | |
| | | |
Advisory fees waived and expenses waived or reimbursed (Note 5) | | | (190,457 | ) | | | — | | | | (58,374 | ) |
| | | |
Administration fees waived (Note 5) | | | (190,457 | ) | | | — | | | | — | |
NET EXPENSES | | | 29,477,902 | | | | 1,849,174 | | | | 192,542 | |
| | | |
NET INVESTMENT INCOME (LOSS) | | | 53,106,300 | | | | 4,905,491 | | | | 234,046 | |
| | | |
| REALIZED AND UNREALIZED GAIN (LOSS) ON INVESTMENTS, FOREIGN CURRENCY RELATED TRANSACTIONS, AND FOREIGN CAPITAL GAINS TAXES: | | | | | | | | | | | | |
| | | |
Net realized gain (loss) on investments—Unaffiliated Issuers | | | (125,788,447 | ) | | | (2,299,658 | ) | | | (65,690 | ) |
| | | |
Net realized gain (loss) on investments—Affiliated Issuers | | | 20,692,688 | | | | — | | | | — | |
| | | |
Net realized gain (loss) on foreign currency related transactions | | | (167,994 | ) | | | (242,246 | ) | | | (1,159 | ) |
| | | |
Net change in unrealized appreciation/depreciation on investments—Unaffiliated Issuers | | | 348,595,599 | | | | 41,369,691 | | | | 1,433,487 | |
| | | |
Net change in unrealized appreciation/depreciation on investments—Affiliated Issuers | | | 38,894,459 | | | | — | | | | — | |
| | | |
Net change in deferred foreign capital gains taxes on unrealized appreciation | | | (132,568 | ) | | | — | | | | (3,911 | ) |
| | | |
Net change in unrealized appreciation/depreciation on foreign currency related translations | | | (136,234 | ) | | | 5,514 | | | | (273 | ) |
Net realized and unrealized gain (loss) on investments, foreign currency related transactions, and foreign capital gains taxes | | | 281,957,503 | | | | 38,833,301 | | | | 1,362,454 | |
| | | |
NET INCREASE (DECREASE) IN NET ASSETS FROM OPERATIONS | | | $335,063,803 | | | | $43,738,792 | | | | $1,596,500 | |
See accompanying notes to financial statements.
| | |
| Statements of Operations(unaudited) (continued) | | Six-Month Period Ended June 30, 2019 |
| | | | | | | | | | | | |
| | | Matthews Asia
Growth Fund | | | Matthews Pacific
Tiger Fund | | | Matthews Asia
ESG Fund | |
| | | |
INVESTMENT INCOME: | | | | | | | | | | | | |
| | | |
Dividends—Unaffiliated Issuers | | | $6,707,051 | | | | $70,342,808 | | | | $424,148 | |
| | | |
Dividends—Affiliated Issuers (Note 7) | | | 395,119 | | | | 23,641,165 | | | | — | |
| | | |
Foreign withholding tax | | | (673,960 | ) | | | (6,675,914 | ) | | | (44,379 | ) |
TOTAL INVESTMENT INCOME | | | 6,428,210 | | | | 87,308,059 | | | | 379,769 | |
| | | |
EXPENSES: | | | | | | | | | | | | |
| | | |
Investment advisory fees (Note 5) | | | 3,533,896 | | | | 29,514,343 | | | | 134,663 | |
| | | |
Administration and accounting fees (Note 5) | | | 42,666 | | | | 356,330 | | | | 1,626 | |
| | | |
Administration and shareholder servicing fees (Note 5) | | | 735,892 | | | | 6,146,970 | | | | 28,034 | |
| | | |
Accountingout-of-pocket fees | | | 22,539 | | | | 24,780 | | | | 24,364 | |
| | | |
Custodian fees | | | 237,965 | | | | 1,717,425 | | | | 46,961 | |
| | | |
Printing fees | | | 39,895 | | | | 148,648 | | | | 12,896 | |
| | | |
Intermediary service fees (Note 5) | | | 647,029 | | | | 4,513,760 | | | | 21,313 | |
| | | |
Professional fees | | | 34,448 | | | | 108,914 | | | | 28,931 | |
| | | |
Registration fees | | | 29,267 | | | | 100,664 | | | | 17,286 | |
| | | |
Transfer agent fees | | | 17,051 | | | | 66,222 | | | | 688 | |
| | | |
Trustees fees | | | 24,414 | | | | 207,285 | | | | 759 | |
| | | |
Other expenses | | | 20,354 | | | | 135,129 | | | | 6,492 | |
TOTAL EXPENSES | | | 5,385,416 | | | | 43,040,470 | | | | 324,013 | |
| | | |
Advisory fees waived and expenses waived or reimbursed (Note 5) | | | — | | | | (518,018 | ) | | | (53,794 | ) |
| | | |
Administration fees waived (Note 5) | | | — | | | | (518,018 | ) | | | — | |
NET EXPENSES | | | 5,385,416 | | | | 42,004,434 | | | | 270,219 | |
| | | |
NET INVESTMENT INCOME (LOSS) | | | 1,042,794 | | | | 45,303,625 | | | | 109,550 | |
| | | |
| REALIZED AND UNREALIZED GAIN (LOSS) ON INVESTMENTS, FOREIGN CURRENCY RELATED TRANSACTIONS, AND FOREIGN CAPITAL GAINS TAXES: | | | | | | | | | | | | |
| | | |
Net realized gain (loss) on investments—Unaffiliated Issuers | | | 7,903,200 | | | | 105,820,171 | | | | 24,399 | |
| | | |
Net realized gain (loss) on investments—Affiliated Issuers | | | — | | | | 21,756,218 | | | | — | |
| | | |
Net realized foreign capital gains tax | | | 889 | | | | (731,798 | ) | | | 278 | |
| | | |
Net realized gain (loss) on foreign currency related transactions | | | (43,455 | ) | | | (167,846 | ) | | | 1,768 | |
| | | |
Net change in unrealized appreciation/depreciation on investments—Unaffiliated Issuers | | | 148,807,806 | | | | 580,074,958 | | | | 3,204,154 | |
| | | |
Net change in unrealized appreciation/depreciation on investments—Affiliated Issuers | | | (7,382,357 | ) | | | (96,492,807 | ) | | | — | |
| | | |
Net change in deferred foreign capital gains taxes on unrealized appreciation | | | (776,521 | ) | | | (16,846,395 | ) | | | (150,045 | ) |
| | | |
Net change in unrealized appreciation/depreciation on foreign currency related translations | | | 1,545 | | | | (55,128 | ) | | | 869 | |
Net realized and unrealized gain (loss) on investments, foreign currency related transactions, and foreign capital gains taxes | | | 148,511,107 | | | | 593,357,373 | | | | 3,081,423 | |
| | | |
NET INCREASE (DECREASE) IN NET ASSETS FROM OPERATIONS | | | $149,553,901 | | | | $638,660,998 | | | | $3,190,973 | |
See accompanying notes to financial statements.
| | | | |
| matthewsasia.com | 800.789.ASIA | | | 107 | |
| | |
| Statements of Operations(unaudited) (continued) | | Six-Month Period Ended June 30, 2019 |
| | | | | | | | | | | | |
| | | Matthews Emerging
Asia Fund | | | Matthews Asia
Innovators Fund | | | Matthews
China Fund | |
| | | |
INVESTMENT INCOME: | | | | | | | | | | | | |
| | | |
Dividends—Unaffiliated Issuers | | | $6,730,077 | | | | $2,479,241 | | | | $11,351,157 | |
| | | |
Dividends—Affiliated Issuers (Note 7) | | | 164,272 | | | | — | | | | — | |
| | | |
Foreign withholding tax | | | (809,736 | ) | | | (164,705 | ) | | | (548,270 | ) |
TOTAL INVESTMENT INCOME | | | 6,084,613 | | | | 2,314,536 | | | | 10,802,887 | |
| | | |
EXPENSES: | | | | | | | | | | | | |
| | | |
Investment advisory fees (Note 5) | | | 2,142,828 | | | | 908,817 | | | | 2,629,864 | |
| | | |
Administration and accounting fees (Note 5) | | | 17,143 | | | | 10,972 | | | | 31,752 | |
| | | |
Administration and shareholder servicing fees (Note 5) | | | 295,692 | | | | 189,241 | | | | 547,412 | |
| | | |
Accountingout-of-pocket fees | | | 26,277 | | | | 18,789 | | | | 19,702 | |
| | | |
Custodian fees | | | 484,837 | | | | 126,653 | | | | 127,559 | |
| | | |
Printing fees | | | 27,478 | | | | 25,697 | | | | 58,853 | |
| | | |
Intermediary service fees (Note 5) | | | 249,442 | | | | 209,176 | | | | 693,864 | |
| | | |
Professional fees | | | 34,971 | | | | 29,811 | | | | 30,381 | |
| | | |
Registration fees | | | 33,772 | | | | 25,690 | | | | 38,911 | |
| | | |
Transfer agent fees | | | 6,927 | | | | 10,987 | | | | 41,988 | |
| | | |
Trustees fees | | | 10,244 | | | | 6,088 | | | | 18,290 | |
| | | |
Other expenses | | | 13,933 | | | | 9,137 | | | | 17,625 | |
TOTAL EXPENSES | | | 3,343,544 | | | | 1,571,058 | | | | 4,256,201 | |
| | | |
Advisory fees waived and expenses waived or reimbursed (Note 5) | | | (514,640 | ) | | | — | | | | — | |
NET EXPENSES | | | 2,828,904 | | | | 1,571,058 | | | | 4,256,201 | |
| | | |
NET INVESTMENT INCOME (LOSS) | | | 3,255,709 | | | | 743,478 | | | | 6,546,686 | |
| | | |
| REALIZED AND UNREALIZED GAIN (LOSS) ON INVESTMENTS, FOREIGN CURRENCY RELATED TRANSACTIONS, AND FOREIGN CAPITAL GAINS TAXES: | | | | | | | | | | | | |
| | | |
Net realized gain (loss) on investments—Unaffiliated Issuers | | | (965,053 | ) | | | (1,615,245 | ) | | | (727,345 | ) |
| | | |
Net realized foreign capital gains tax | | | (81,486 | ) | | | (80,243 | ) | | | — | |
| | | |
Net realized gain (loss) on foreign currency related transactions | | | (269,412 | ) | | | (36,555 | ) | | | (45,537 | ) |
| | | |
Net change in unrealized appreciation/depreciation on investments—Unaffiliated Issuers | | | (8,312,084 | ) | | | 47,707,040 | | | | 138,850,543 | |
| | | |
Net change in unrealized appreciation/depreciation on investments—Affiliated Issuers | | | (1,665,381 | ) | | | — | | | | — | |
| | | |
Net change in deferred foreign capital gains taxes on unrealized appreciation | | | (181,928 | ) | | | (312,183 | ) | | | — | |
| | | |
Net change in unrealized appreciation/depreciation on foreign currency related translations | | | (17,637 | ) | | | (51,870 | ) | | | 23,145 | |
Net realized and unrealized gain (loss) on investments, foreign currency related transactions, and foreign capital gains taxes | | | (11,492,981 | ) | | | 45,610,944 | | | | 138,100,806 | |
| | | |
NET INCREASE (DECREASE) IN NET ASSETS FROM OPERATIONS | | | ($8,237,272 | ) | | | $46,354,422 | | | | $144,647,492 | |
See accompanying notes to financial statements.
| | |
| Statements of Operations(unaudited) (continued) | | Six-Month Period Ended June 30, 2019 |
| | | | | | | | | | | | |
| | | Matthews
India Fund | | | Matthews
Japan Fund | | | Matthews
Korea Fund | |
| | | |
INVESTMENT INCOME: | | | | | | | | | | | | |
| | | |
Dividends—Unaffiliated Issuers | | | $6,686,402 | | | | $23,296,474 | | | | $236,953 | |
| | | |
Foreign withholding tax | | | (61,533 | ) | | | (2,232,794 | ) | | | (36,519 | ) |
TOTAL INVESTMENT INCOME | | | 6,624,869 | | | | 21,063,680 | | | | 200,434 | |
| | | |
EXPENSES: | | | | | | | | | | | | |
| | | |
Investment advisory fees (Note 5) | | | 5,111,917 | | | | 9,503,572 | | | | 501,506 | |
| | | |
Administration and accounting fees (Note 5) | | | 61,716 | | | | 114,738 | | | | 6,055 | |
| | | |
Administration and shareholder servicing fees (Note 5) | | | 1,064,771 | | | | 1,979,339 | | | | 104,450 | |
| | | |
Accountingout-of-pocket fees | | | 21,923 | | | | 23,725 | | | | 18,680 | |
| | | |
Custodian fees | | | 375,096 | | | | 153,935 | | | | 30,800 | |
| | | |
Printing fees | | | 72,024 | | | | 162,999 | | | | 17,857 | |
| | | |
Intermediary service fees (Note 5) | | | 1,225,716 | | | | 833,016 | | | | 137,219 | |
| | | |
Professional fees | | | 58,199 | | | | 52,841 | | | | 25,052 | |
| | | |
Registration fees | | | 45,512 | | | | 36,870 | | | | 17,384 | |
| | | |
Transfer agent fees | | | 44,138 | | | | 69,650 | | | | 11,987 | |
| | | |
Trustees fees | | | 38,828 | | | | 76,849 | | | | 3,850 | |
| | | |
Other expenses | | | 42,034 | | | | 47,000 | | | | 3,551 | |
TOTAL EXPENSES | | | 8,161,874 | | | | 13,054,534 | | | | 878,391 | |
NET EXPENSES | | | 8,161,874 | | | | 13,054,534 | | | | 878,391 | |
| | | |
NET INVESTMENT INCOME (LOSS) | | | (1,537,005 | ) | | | 8,009,146 | | | | (677,957 | ) |
| | | |
| REALIZED AND UNREALIZED GAIN (LOSS) ON INVESTMENTS, FOREIGN CURRENCY RELATED TRANSACTIONS, AND FOREIGN CAPITAL GAINS TAXES: | | | | | | | | | | | | |
| | | |
Net realized gain (loss) on investments—Unaffiliated Issuers | | | 46,110,444 | | | | 37,166,311 | | | | (38,841 | ) |
| | | |
Net realized foreign capital gains tax | | | (1,765,783 | ) | | | — | | | | — | |
| | | |
Net realized gain (loss) on foreign currency related transactions | | | (642,587 | ) | | | 562,969 | | | | (55,636 | ) |
| | | |
Net change in unrealized appreciation/depreciation on investments—Unaffiliated Issuers | | | (2,095,923 | ) | | | 332,581,724 | | | | (543,201 | ) |
| | | |
Net change in unrealized appreciation/depreciation on investments—Affiliated Issuers | | | 7,625,104 | | | | — | | | | — | |
| | | |
Net change in deferred foreign capital gains taxes on unrealized appreciation | | | (12,698,523 | ) | | | — | | | | — | |
| | | |
Net change in unrealized appreciation/depreciation on foreign currency related translations | | | (9,166 | ) | | | 620 | | | | (23,205 | ) |
Net realized and unrealized gain (loss) on investments, foreign currency related transactions, and foreign capital gains taxes | | | 36,523,566 | | | | 370,311,624 | | | | (660,883 | ) |
| | | |
NET INCREASE (DECREASE) IN NET ASSETS FROM OPERATIONS | | | $34,986,561 | | | | $378,320,770 | | | | ($1,338,840 | ) |
See accompanying notes to financial statements.
| | | | |
| matthewsasia.com | 800.789.ASIA | | | 109 | |
| | |
| Statements of Operations(unaudited) (continued) | | Six-Month Period Ended June 30, 2019 |
| | | | | | | | |
| | | Matthews Asia
Small Companies
Fund | | | Matthews China
Small Companies
Fund | |
| | |
INVESTMENT INCOME: | | | | | | | | |
| | |
Dividends—Unaffiliated Issuers | | | $2,487,313 | | | | $1,152,493 | |
| | |
Dividends—Affiliated Issuers (Note 7) | | | 63,100 | | | | — | |
| | |
Foreign withholding tax | | | (153,187 | ) | | | (17,237 | ) |
TOTAL INVESTMENT INCOME | | | 2,397,226 | | | | 1,135,256 | |
| | |
EXPENSES: | | | | | | | | |
| | |
Investment advisory fees (Note 5) | | | 957,806 | | | | 356,650 | |
| | |
Administration and accounting fees (Note 5) | | | 7,663 | | | | 2,853 | |
| | |
Administration and shareholder servicing fees (Note 5) | | | 132,194 | | | | 49,193 | |
| | |
Accountingout-of-pocket fees | | | 26,236 | | | | 21,243 | |
| | |
Custodian fees | | | 166,602 | | | | 22,643 | |
| | |
Printing fees | | | 21,685 | | | | 15,579 | |
| | |
Intermediary service fees (Note 5) | | | 182,460 | | | | 66,011 | |
| | |
Professional fees | | | 40,245 | | | | 25,199 | |
| | |
Registration fees | | | 22,708 | | | | 22,072 | |
| | |
Transfer agent fees | | | 8,613 | | | | 3,552 | |
| | |
Trustees fees | | | 5,744 | | | | 1,526 | |
| | |
Other expenses | | | 11,226 | | | | 2,640 | |
TOTAL EXPENSES | | | 1,583,182 | | | | 589,161 | |
| | |
Advisory fees waived and expenses waived or reimbursed (Note 5) | | | (237,652 | ) | | | (85,055 | ) |
NET EXPENSES | | | 1,345,530 | | | | 504,106 | |
| | |
NET INVESTMENT INCOME (LOSS) | | | 1,051,696 | | | | 631,150 | |
| | |
| REALIZED AND UNREALIZED GAIN (LOSS) ON INVESTMENTS, FOREIGN CURRENCY RELATED TRANSACTIONS, AND FOREIGN CAPITAL GAINS TAXES: | | | | | | | | |
| | |
Net realized gain (loss) on investments—Unaffiliated Issuers | | | (5,438,131 | ) | | | (757,142 | ) |
| | |
Net realized foreign capital gains tax | | | (568,550 | ) | | | — | |
| | |
Net realized gain (loss) on foreign currency related transactions | | | (32,719 | ) | | | (9,448 | ) |
| | |
Net change in unrealized appreciation/depreciation on investments—Unaffiliated Issuers | | | 27,931,130 | | | | 11,829,985 | |
| | |
Net change in unrealized appreciation/depreciation on investments—Affiliated Issuers | | | 11,572 | | | | — | |
| | |
Net change in deferred foreign capital gains taxes on unrealized appreciation | | | 135,147 | | | | — | |
| | |
Net change in unrealized appreciation/depreciation on foreign currency related translations | | | (6,459 | ) | | | (170 | ) |
Net realized and unrealized gain (loss) on investments, foreign currency related transactions, and foreign capital gains taxes | | | 22,031,990 | | | | 11,063,225 | |
| | |
NET INCREASE (DECREASE) IN NET ASSETS FROM OPERATIONS | | | $23,083,686 | | | | $11,694,375 | |
See accompanying notes to financial statements.
Statements of Changes in Net Assets
| | | | | | | | |
| MATTHEWS ASIA STRATEGIC INCOME FUND | | Six-Month Period
Ended June 30, 2019
(unaudited) | | | Year Ended
December 31, 2018 | |
| | |
OPERATIONS: | | | | | | | | |
| | |
Net investment income (loss) | | | $2,403,226 | | | | $4,279,959 | |
| | |
Net realized gain (loss) on investments and foreign currency related transactions | | | 1,566,176 | | | | (4,697,556 | ) |
| | |
Net change in unrealized appreciation/depreciation on investments and foreign currency related translations | | | 4,871,986 | | | | (4,886,159 | ) |
| | |
Net change on foreign capital gains taxes on unrealized appreciation | | | (39,522 | ) | | | 72,858 | |
| | |
Net change in unrealized appreciation/depreciation on swaps | | | (54,169 | ) | | | — | |
Net increase (decrease) in net assets resulting from operations | | | 8,747,697 | | | | (5,230,898 | ) |
| | |
DISTRIBUTIONS TO SHAREHOLDERS: | | | | | | | | |
| | |
Investor Class | | | (672,875 | ) | | | (1,482,265 | ) |
| | |
Institutional Class | | | (1,305,553 | ) | | | (1,402,339 | ) |
| | |
Return of Capital | | | | | | | | |
| | |
Investor Class | | | — | | | | (194,306 | ) |
| | |
Institutional Class | | | — | | | | (187,644 | ) |
Net decrease in net assets resulting from distributions | | | (1,978,428 | ) | | | (3,266,554 | ) |
CAPITAL SHARE TRANSACTIONS (net) (Note 4) | | | 6,144,037 | | | | 14,620,480 | |
Total increase (decrease) in net assets | | | 12,913,306 | | | | 6,123,028 | |
NET ASSETS: | | | | | | | | |
| | |
Beginning of period | | | 100,715,183 | | | | 94,592,155 | |
End of period | | | $113,628,489 | | | | $100,715,183 | |
| | |
| MATTHEWS ASIA CREDIT OPPORTUNITIES FUND | | Six-Month Period
Ended June 30, 2019
(unaudited) | | | Year Ended
December 31, 2018 | |
| | |
OPERATIONS: | | | | | | | | |
| | |
Net investment income (loss) | | | $1,101,615 | | | | $1,530,022 | |
| | |
Net realized gain (loss) on investments and foreign currency related transactions | | | 874,348 | | | | (807,786 | ) |
| | |
Net change in unrealized appreciation/depreciation on investments and foreign currency related translations | | | 2,414,459 | | | | (1,914,582 | ) |
Net increase (decrease) in net assets resulting from operations | | | 4,390,422 | | | | (1,192,346 | ) |
| | |
DISTRIBUTIONS TO SHAREHOLDERS: | | | | | | | | |
| | |
Investor Class | | | (207,612 | ) | | | (346,586 | ) |
| | |
Institutional Class | | | (845,107 | ) | | | (1,064,779 | ) |
Net decrease in net assets resulting from distributions | | | (1,052,719 | ) | | | (1,411,365 | ) |
CAPITAL SHARE TRANSACTIONS (net) (Note 4) | | | 14,354,401 | | | | 10,664,938 | |
Total increase (decrease) in net assets | | | 17,692,104 | | | | 8,061,227 | |
NET ASSETS: | | | | | | | | |
| | |
Beginning of period | | | 39,752,968 | | | | 31,691,741 | |
End of period | | | $57,445,072 | | | | $39,752,968 | |
See accompanying notes to financial statements.
| | | | |
| matthewsasia.com | 800.789.ASIA | | | 111 | |
Statements of Changes in Net Assets(continued)
| | | | | | | | |
| MATTHEWS ASIAN GROWTH AND INCOME FUND | | Six-Month Period
Ended June 30, 2019
(unaudited) | | | Year Ended
December 31, 2018 | |
| | |
OPERATIONS: | | | | | | | | |
| | |
Net investment income (loss) | | | $12,966,411 | | | | $45,280,897 | |
| | |
Net realized gain (loss) on investments and foreign currency related transactions | | | 27,762,466 | | | | 108,473,321 | |
| | |
Net change in unrealized appreciation/depreciation on investments and foreign currency related translations | | | 135,439,504 | | | | (403,082,443 | ) |
| | |
Net change on foreign capital gains taxes on unrealized appreciation | | | 243,880 | | | | (107,296 | ) |
Net increase (decrease) in net assets resulting from operations | | | 176,412,261 | | | | (249,435,521 | ) |
| | |
DISTRIBUTIONS TO SHAREHOLDERS: | | | | | | | | |
| | |
Investor Class | | | (9,207,478 | ) | | | (94,856,451 | ) |
| | |
Institutional Class | | | (7,050,399 | ) | | | (85,765,453 | ) |
Net decrease in net assets resulting from distributions | | | (16,257,877 | ) | | | (180,621,904 | ) |
CAPITAL SHARE TRANSACTIONS (net) (Note 4) | | | (135,444,570 | ) | | | (1,020,164,659 | ) |
Total increase (decrease) in net assets | | | 24,709,814 | | | | (1,450,222,084 | ) |
NET ASSETS: | | | | | | | | |
| | |
Beginning of period | | | 1,395,691,373 | | | | 2,845,913,457 | |
End of period | | | $1,420,401,187 | | | | $1,395,691,373 | |
| | |
| MATTHEWS ASIA DIVIDEND FUND | | Six-Month Period
Ended June 30, 2019
(unaudited) | | | Year Ended
December 31, 2018 | |
| | |
OPERATIONS: | | | | | | | | |
| | |
Net investment income (loss) | | | $53,106,300 | | | | $141,577,757 | |
| | |
Net realized gain (loss) on investments and foreign currency related transactions | | | (105,263,753 | ) | | | 403,086,377 | |
| | |
Net change in unrealized appreciation/depreciation on investments and foreign currency related translations | | | 387,353,824 | | | | (1,469,585,251 | ) |
| | |
Net change on foreign capital gains taxes on unrealized appreciation | | | (132,568 | ) | | | (160,170 | ) |
Net increase (decrease) in net assets resulting from operations | | | 335,063,803 | | | | (925,081,287 | ) |
| | |
DISTRIBUTIONS TO SHAREHOLDERS: | | | | | | | | |
| | |
Investor Class | | | (24,781,966 | ) | | | (211,389,650 | ) |
| | |
Institutional Class | | | (31,892,163 | ) | | | (237,144,125 | ) |
Net decrease in net assets resulting from distributions | | | (56,674,129 | ) | | | (448,533,775 | ) |
CAPITAL SHARE TRANSACTIONS (net) (Note 4) | | | 20,313,944 | | | | 144,094,328 | |
Total increase (decrease) in net assets | | | 298,703,618 | | | | (1,229,520,734 | ) |
NET ASSETS: | | | | | | | | |
| | |
Beginning of period | | | 5,767,825,347 | | | | 6,997,346,081 | |
End of period | | | $6,066,528,965 | | | | $5,767,825,347 | |
See accompanying notes to financial statements.
Statements of Changes in Net Assets(continued)
| | | | | | | | |
| MATTHEWS CHINA DIVIDEND FUND | | Six-Month Period
Ended June 30, 2019
(unaudited) | | | Year Ended
December 31, 2018 | |
| | |
OPERATIONS: | | | | | | | | |
| | |
Net investment income (loss) | | | $4,905,491 | | | | $7,726,552 | |
| | |
Net realized gain (loss) on investments and foreign currency related transactions | | | (2,541,904 | ) | | | 23,400,629 | |
| | |
Net change in unrealized appreciation/depreciation on investments and foreign currency related translations | | | 41,375,205 | | | | (66,519,586 | ) |
Net increase (decrease) in net assets resulting from operations | | | 43,738,792 | | | | (35,392,405 | ) |
| | |
DISTRIBUTIONS TO SHAREHOLDERS: | | | | | | | | |
| | |
Investor Class | | | (4,030,047 | ) | | | (21,468,293 | ) |
| | |
Institutional Class | | | (1,547,682 | ) | | | (8,057,266 | ) |
Net decrease in net assets resulting from distributions | | | (5,577,729 | ) | | | (29,525,559 | ) |
CAPITAL SHARE TRANSACTIONS (net) (Note 4) | | | 70,849,537 | | | | 19,837,199 | |
Total increase (decrease) in net assets | | | 109,010,600 | | | | (45,080,765 | ) |
NET ASSETS: | | | | | | | | |
| | |
Beginning of period | | | 269,659,321 | | | | 314,740,086 | |
End of period | | | $378,669,921 | | | | $269,659,321 | |
| | |
| MATTHEWS ASIA VALUE FUND | | Six-Month Period
Ended June 30, 2019
(unaudited) | | | Year Ended
December 31, 2018 | |
| | |
OPERATIONS: | | | | | | | | |
| | |
Net investment income (loss) | | | $234,046 | | | | $262,120 | |
| | |
Net realized gain (loss) on investments and foreign currency related transactions | | | (66,849 | ) | | | (126,184 | ) |
| | |
Net change in unrealized appreciation/depreciation on investments and foreign currency related translations | | | 1,433,214 | | | | (3,582,664 | ) |
| | |
Net change on foreign capital gains taxes on unrealized appreciation | | | (3,911 | ) | | | (4,103 | ) |
Net increase (decrease) in net assets resulting from operations | | | 1,596,500 | | | | (3,450,831 | ) |
| | |
DISTRIBUTIONS TO SHAREHOLDERS: | | | | | | | | |
| | |
Investor Class | | | — | | | | (795,360 | ) |
| | |
Institutional Class | | | — | | | | (257,755 | ) |
Net decrease in net assets resulting from distributions | | | — | | | | (1,053,115 | ) |
CAPITAL SHARE TRANSACTIONS (net) (Note 4) | | | 179,840 | | | | (3,035,025 | ) |
Total increase (decrease) in net assets | | | 1,776,340 | | | | (7,538,971 | ) |
NET ASSETS: | | | | | | | | |
| | |
Beginning of period | | | 23,195,009 | | | | 30,733,980 | |
End of period | | | $24,971,349 | | | | $23,195,009 | |
See accompanying notes to financial statements.
| | | | |
| matthewsasia.com | 800.789.ASIA | | | 113 | |
Statements of Changes in Net Assets(continued)
| | | | | | | | |
| MATTHEWS ASIA GROWTH FUND | | Six-Month Period
Ended June 30, 2019
(unaudited) | | | Year Ended
December 31, 2018 | |
| | |
OPERATIONS: | | | | | | | | |
| | |
Net investment income (loss) | | | $1,042,794 | | | | $827,153 | |
| | |
Net realized gain (loss) on investments and foreign currency related transactions | | | 7,860,634 | | | | 5,493,132 | |
| | |
Net change in unrealized appreciation/depreciation on investments and foreign currency related translations | | | 141,426,994 | | | | (208,530,498 | ) |
| | |
Net change on foreign capital gains taxes on unrealized appreciation | | | (776,521 | ) | | | 1,093,836 | |
Net increase (decrease) in net assets resulting from operations | | | 149,553,901 | | | | (201,116,377 | ) |
| | |
DISTRIBUTIONS TO SHAREHOLDERS: | | | | | | | | |
| | |
Investor Class | | | — | | | | (7,253,289 | ) |
| | |
Institutional Class | | | — | | | | (8,131,385 | ) |
Net decrease in net assets resulting from distributions | | | — | | | | (15,384,674 | ) |
CAPITAL SHARE TRANSACTIONS (net) (Note 4) | | | 39,940,608 | | | | 296,272,663 | |
Total increase (decrease) in net assets | | | 189,494,509 | | | | 79,771,612 | |
NET ASSETS: | | | | | | | | |
| | |
Beginning of period | | | 930,333,556 | | | | 850,561,944 | |
End of period | | | $1,119,828,065 | | | | $930,333,556 | |
| | |
| MATTHEWS PACIFIC TIGER FUND | | Six-Month Period
Ended June 30, 2019
(unaudited) | | | Year Ended
December 31, 2018 | |
| | |
OPERATIONS: | | | | | | | | |
| | |
Net investment income (loss) | | | $45,303,625 | | | | $82,597,259 | |
| | |
Net realized gain (loss) on investments and foreign currency related transactions | | | 126,676,745 | | | | 314,042,088 | |
| | |
Net change in unrealized appreciation/depreciation on investments and foreign currency related translations | | | 483,527,023 | | | | (1,456,251,388 | ) |
| | |
Net change on foreign capital gains taxes on unrealized appreciation | | | (16,846,395 | ) | | | (12,961,619 | ) |
Net increase (decrease) in net assets resulting from operations | | | 638,660,998 | | | | (1,072,573,660 | ) |
| | |
DISTRIBUTIONS TO SHAREHOLDERS: | | | | | | | | |
| | |
Investor Class | | | — | | | | (121,255,981 | ) |
| | |
Institutional Class | | | — | | | | (275,120,994 | ) |
Net decrease in net assets resulting from distributions | | | — | | | | (396,376,975 | ) |
CAPITAL SHARE TRANSACTIONS (net) (Note 4) | | | 247,071,483 | | | | 51,147,953 | |
Total increase (decrease) in net assets | | | 885,732,481 | | | | (1,417,802,682 | ) |
NET ASSETS: | | | | | | | | |
| | |
Beginning of period | | | 8,307,234,203 | | | | 9,725,036,885 | |
End of period | | | $9,192,966,684 | | | | $8,307,234,203 | |
See accompanying notes to financial statements.
Statements of Changes in Net Assets(continued)
| | | | | | | | |
| MATTHEWS ASIA ESG FUND | | Six-Month Period
Ended June 30, 2019
(unaudited) | | | Year Ended
December 31, 2018 | |
| | |
OPERATIONS: | | | | | | | | |
| | |
Net investment income (loss) | | | $109,550 | | | | $85,056 | |
| | |
Net realized gain (loss) on investments and foreign currency related transactions | | | 26,445 | | | | 614,957 | |
| | |
Net change in unrealized appreciation/depreciation on investments and foreign currency related translations | | | 3,205,023 | | | | (2,813,567 | ) |
| | |
Net change on foreign capital gains taxes on unrealized appreciation | | | (150,045 | ) | | | 34,007 | |
Net increase (decrease) in net assets resulting from operations | | | 3,190,973 | | | | (2,079,547 | ) |
| | |
DISTRIBUTIONS TO SHAREHOLDERS: | | | | | | | | |
| | |
Investor Class | | | — | | | | (389,328 | ) |
| | |
Institutional Class | | | — | | | | (560,925 | ) |
Net decrease in net assets resulting from distributions | | | — | | | | (950,253 | ) |
CAPITAL SHARE TRANSACTIONS (net) (Note 4) | | | 9,772,051 | | | | 17,507,714 | |
Total increase (decrease) in net assets | | | 12,963,024 | | | | 14,477,914 | |
NET ASSETS: | | | | | | | | |
| | |
Beginning of period | | | 32,531,793 | | | | 18,053,879 | |
End of period | | | $45,494,817 | | | | $32,531,793 | |
| | |
| MATTHEWS EMERGING ASIA FUND | | Six-Month Period
Ended June 30, 2019
(unaudited) | | | Year Ended
December 31, 2018 | |
| | |
OPERATIONS: | | | | | | | | |
| | |
Net investment income (loss) | | | $3,255,709 | | | | $4,233,785 | |
| | |
Net realized gain (loss) on investments and foreign currency related transactions | | | (1,315,951 | ) | | | 11,192,808 | |
| | |
Net change in unrealized appreciation/depreciation on investments and foreign currency related translations | | | (9,995,102 | ) | | | (112,214,332 | ) |
| | |
Net change on foreign capital gains taxes on unrealized appreciation | | | (181,928 | ) | | | 1,804,989 | |
Net increase (decrease) in net assets resulting from operations | | | (8,237,272 | ) | | | (94,982,750 | ) |
| | |
DISTRIBUTIONS TO SHAREHOLDERS: | | | | | | | | |
| | |
Investor Class | | | — | | | | (2,684,365 | ) |
| | |
Institutional Class | | | — | | | | (6,570,784 | ) |
Net decrease in net assets resulting from distributions | | | — | | | | (9,255,149 | ) |
CAPITAL SHARE TRANSACTIONS (net) (Note 4) | | | 61,502,783 | | | | (15,498,956 | ) |
REDEMPTION FEES | | | 46,952 | | | | 82,599 | |
Total increase (decrease) in net assets | | | 53,312,463 | | | | (119,654,256 | ) |
NET ASSETS: | | | | | | | | |
| | |
Beginning of period | | | 375,174,761 | | | | 494,829,017 | |
End of period | | | $428,487,224 | | | | $375,174,761 | |
See accompanying notes to financial statements.
| | | | |
| matthewsasia.com | 800.789.ASIA | | | 115 | |
Statements of Changes in Net Assets(continued)
| | | | | | | | |
| MATTHEWS ASIA INNOVATORS FUND | | Six-Month Period
Ended June 30, 2019
(unaudited) | | | Year Ended
December 31, 2018 | |
| | |
OPERATIONS: | | | | | | | | |
| | |
Net investment income (loss) | | | $743,478 | | | | ($103,238 | ) |
| | |
Net realized gain (loss) on investments and foreign currency related transactions | | | (1,732,043 | ) | | | 2,546,956 | |
| | |
Net change in unrealized appreciation/depreciation on investments and foreign currency related translations | | | 47,655,170 | | | | (59,878,788 | ) |
| | |
Net change on foreign capital gains taxes on unrealized appreciation | | | (312,183 | ) | | | (5,393 | ) |
Net increase (decrease) in net assets resulting from operations | | | 46,354,422 | | | | (57,440,463 | ) |
| | |
DISTRIBUTIONS TO SHAREHOLDERS: | | | | | | | | |
| | |
Investor Class | | | — | | | | (3,970,300 | ) |
| | |
Institutional Class | | | — | | | | (2,656,060 | ) |
Net decrease in net assets resulting from distributions | | | — | | | | (6,626,360 | ) |
CAPITAL SHARE TRANSACTIONS (net) (Note 4) | | | 1,746,710 | | | | 101,996,223 | |
Total increase (decrease) in net assets | | | 48,101,132 | | | | 37,929,400 | |
NET ASSETS: | | | | | | | | |
| | |
Beginning of period | | | 244,217,855 | | | | 206,288,455 | |
End of period | | | $292,318,987 | | | | $244,217,855 | |
| | |
| MATTHEWS CHINA FUND | | Six-Month Period
Ended June 30, 2019
(unaudited) | | | Year Ended
December 31, 2018 | |
| | |
OPERATIONS: | | | | | | | | |
| | |
Net investment income (loss) | | | $6,546,686 | | | | $9,876,601 | |
| | |
Net realized gain (loss) on investments and foreign currency related transactions | | | (772,882 | ) | | | 111,510,918 | |
| | |
Net change in unrealized appreciation/depreciation on investments and foreign currency related translations | | | 138,873,688 | | | | (335,815,337 | ) |
Net increase (decrease) in net assets resulting from operations | | | 144,647,492 | | | | (214,427,818 | ) |
| | |
DISTRIBUTIONS TO SHAREHOLDERS: | | | | | | | | |
| | |
Investor Class | | | — | | | | (109,557,899 | ) |
| | |
Institutional Class | | | — | | | | (9,475,103 | ) |
Net decrease in net assets resulting from distributions | | | — | | | | (119,033,002 | ) |
CAPITAL SHARE TRANSACTIONS (net) (Note 4) | | | 105,692,109 | | | | 41,090,545 | |
Total increase (decrease) in net assets | | | 250,339,601 | | | | (292,370,275 | ) |
NET ASSETS: | | | | | | | | |
| | |
Beginning of period | | | 613,112,714 | | | | 905,482,989 | |
End of period | | | $863,452,315 | | | | $613,112,714 | |
See accompanying notes to financial statements.
Statements of Changes in Net Assets(continued)
| | | | | | | | |
| MATTHEWS INDIA FUND | | Six-Month Period
Ended June 30, 2019
(unaudited) | | | Year Ended
December 31, 2018 | |
| | |
OPERATIONS: | | | | | | | | |
| | |
Net investment income (loss) | | | ($1,537,005 | ) | | | ($2,070,170 | ) |
| | |
Net realized gain (loss) on investments and foreign currency related transactions | | | 43,702,074 | | | | 331,211,413 | |
| | |
Net change in unrealized appreciation/depreciation on investments and foreign currency related translations | | | 5,520,015 | | | | (567,019,183 | ) |
| | |
Net change on foreign capital gains taxes on unrealized appreciation | | | (12,698,523 | ) | | | (2,413,851 | ) |
Net increase (decrease) in net assets resulting from operations | | | 34,986,561 | | | | (240,291,791 | ) |
| | |
DISTRIBUTIONS TO SHAREHOLDERS: | | | | | | | | |
| | |
Investor Class | | | — | | | | (159,591,192 | ) |
| | |
Institutional Class | | | — | | | | (75,460,576 | ) |
Net decrease in net assets resulting from distributions | | | — | | | | (235,051,768 | ) |
CAPITAL SHARE TRANSACTIONS (net) (Note 4) | | | (108,070,892 | ) | | | (255,309,634 | ) |
Total increase (decrease) in net assets | | | (73,084,331 | ) | | | (730,653,193 | ) |
NET ASSETS: | | | | | | | | |
| | |
Beginning of period | | | 1,541,780,023 | | | | 2,272,433,216 | |
End of period | | | $1,468,695,692 | | | | $1,541,780,023 | |
| | |
| MATTHEWS JAPAN FUND | | Six-Month Period
Ended June 30, 2019
(unaudited) | | | Year Ended
December 31, 2018 | |
| | |
OPERATIONS: | | | | | | | | |
| | |
Net investment income (loss) | | | $8,009,146 | | | | $18,472,839 | |
| | |
Net realized gain (loss) on investments and foreign currency related transactions | | | 37,729,280 | | | | 194,213,809 | |
| | |
Net change in unrealized appreciation/depreciation on investments and foreign currency related translations | | | 332,582,344 | | | | (1,069,641,926 | ) |
Net increase (decrease) in net assets resulting from operations | | | 378,320,770 | | | | (856,955,278 | ) |
| | |
DISTRIBUTIONS TO SHAREHOLDERS: | | | | | | | | |
| | |
Investor Class | | | — | | | | (71,970,442 | ) |
| | |
Institutional Class | | | — | | | | (51,381,225 | ) |
Net decrease in net assets resulting from distributions | | | — | | | | (123,351,667 | ) |
CAPITAL SHARE TRANSACTIONS (net) (Note 4) | | | (580,372,373 | ) | | | (260,612,861 | ) |
Total increase (decrease) in net assets | | | (202,051,603 | ) | | | (1,240,919,806 | ) |
NET ASSETS: | | | | | | | | |
| | |
Beginning of period | | | 2,871,574,319 | | | | 4,112,494,125 | |
End of period | | | $2,669,522,716 | | | | $2,871,574,319 | |
See accompanying notes to financial statements.
| | | | |
| matthewsasia.com | 800.789.ASIA | | | 117 | |
Statements of Changes in Net Assets(continued)
| | | | | | | | |
| MATTHEWS KOREA FUND | | Six-Month Period
Ended June 30, 2019
(unaudited) | | | Year Ended
December 31, 2018 | |
| | |
OPERATIONS: | | | | | | | | |
| | |
Net investment income (loss) | | | ($677,957 | ) | | | $1,887,805 | |
| | |
Net realized gain (loss) on investments and foreign currency related transactions | | | (94,477 | ) | | | 30,298,095 | |
| | |
Net change in unrealized appreciation/depreciation on investments and foreign currency related translations | | | (566,406 | ) | | | (83,113,064 | ) |
Net increase (decrease) in net assets resulting from operations | | | (1,338,840 | ) | | | (50,927,164 | ) |
| | |
DISTRIBUTIONS TO SHAREHOLDERS: | | | | | | | | |
| | |
Investor Class | | | — | | | | (19,838,627 | ) |
| | |
Institutional Class | | | — | | | | (2,831,158 | ) |
Net decrease in net assets resulting from distributions | | | — | | | | (22,669,785 | ) |
CAPITAL SHARE TRANSACTIONS (net) (Note 4) | | | 5,259,764 | | | | (4,964,199 | ) |
Total increase (decrease) in net assets | | | 3,920,924 | | | | (78,561,148 | ) |
NET ASSETS: | | | | | | | | |
| | |
Beginning of period | | | 146,457,070 | | | | 225,018,218 | |
End of period | | | $150,377,994 | | | | $146,457,070 | |
| | |
| MATTHEWS ASIA SMALL COMPANIES FUND | | Six-Month Period
Ended June 30, 2019
(unaudited) | | | Year Ended
December 31, 2018 | |
| | |
OPERATIONS: | | | | | | | | |
| | |
Net investment income (loss) | | | $1,051,696 | | | | $2,416,511 | |
| | |
Net realized gain (loss) on investments and foreign currency related transactions | | | (6,039,400 | ) | | | 32,060,275 | |
| | |
Net change in unrealized appreciation/depreciation on investments and foreign currency related translations | | | 27,936,243 | | | | (104,112,981 | ) |
| | |
Net change on foreign capital gains taxes on unrealized appreciation | | | 135,147 | | | | (535,103 | ) |
Net increase (decrease) in net assets resulting from operations | | | 23,083,686 | | | | (70,171,298 | ) |
| | |
DISTRIBUTIONS TO SHAREHOLDERS: | | | | | | | | |
| | |
Investor Class | | | — | | | | (22,501,099 | ) |
| | |
Institutional Class | | | — | | | | (18,262,086 | ) |
Net decrease in net assets resulting from distributions | | | — | | | | (40,763,185 | ) |
CAPITAL SHARE TRANSACTIONS (net) (Note 4) | | | (17,920,041 | ) | | | (144,037,484 | ) |
REDEMPTION FEES | | | — | | | | 69,377 | |
Total increase (decrease) in net assets | | | 5,163,645 | | | | (254,902,590 | ) |
NET ASSETS: | | | | | | | | |
| | |
Beginning of period | | | 186,390,420 | | | | 441,293,010 | |
End of period | | | $191,554,065 | | | | $186,390,420 | |
See accompanying notes to financial statements.
Statements of Changes in Net Assets(continued)
| | | | | | | | |
| | |
| MATTHEWS CHINA SMALL COMPANIES FUND | | Six-Month Period
Ended June 30, 2019
(unaudited) | | | Year Ended
December 31, 2018 | |
| | |
OPERATIONS: | | | | | | | | |
| | |
Net investment income (loss) | | | $631,150 | | | | $464,514 | |
| | |
Net realized gain (loss) on investments and foreign currency related transactions | | | (766,590 | ) | | | 1,508,682 | |
| | |
Net change in unrealized appreciation/depreciation on investments and foreign currency related translations | | | 11,829,815 | | | | (17,732,735 | ) |
Net increase (decrease) in net assets resulting from operations | | | 11,694,375 | | | | (15,759,539 | ) |
| | |
DISTRIBUTIONS TO SHAREHOLDERS: | | | | | | | | |
| | |
Investor Class | | | — | | | | (958,588 | ) |
| | |
Institutional Class | | | — | | | | (327,972 | ) |
Net decrease in net assets resulting from distributions | | | — | | | | (1,286,560 | ) |
CAPITAL SHARE TRANSACTIONS (net) (Note 4) | | | (1,180,893 | ) | | | 43,659,977 | |
REDEMPTION FEES | | | — | | | | 180,654 | |
Total increase (decrease) in net assets | | | 10,513,482 | | | | 26,794,532 | |
NET ASSETS: | | | | | | | | |
| | |
Beginning of period | | | 62,479,655 | | | | 35,685,123 | |
End of period | | | $72,993,137 | | | | $62,479,655 | |
See accompanying notes to financial statements.
| | | | |
| matthewsasia.com | 800.789.ASIA | | | 119 | |
Financial Highlights
Matthews Asia Strategic Income Fund
The tables below set forth financial data for a share of beneficial interest outstanding throughout each period presented.
| | | | | | | | | | | | | | | | | | | | | | | | |
| INVESTOR CLASS | | Six-Month
Period Ended June 30, 2019
(unaudited) | | | Year Ended Dec. 31 | |
| | 2018 | | | 2017 | | | 2016 | | | 2015 | | | 2014 | |
Net Asset Value, beginning of period | | | $10.25 | | | | $10.98 | | | | $10.43 | | | | $9.96 | | | | $10.31 | | | | $10.42 | |
INCOME (LOSS) FROM INVESTMENT OPERATIONS: | | | | | | | | | | | | | | | | | | | | | | | | |
Net investment income (loss)1 | | | 0.23 | | | | 0.40 | | | | 0.51 | | | | 0.50 | | | | 0.47 | | | | 0.46 | |
Net realized gain (loss) and unrealized appreciation/depreciation on investments, forward foreign currency exchange contracts, swaps, foreign currency related transactions, and foreign capital gains taxes | | | 0.63 | | | | (0.84 | ) | | | 0.46 | | | | 0.38 | | | | (0.53 | ) | | | (0.19 | ) |
Total from investment operations | | | 0.86 | | | | (0.44 | ) | | | 0.97 | | | | 0.88 | | | | (0.06 | ) | | | 0.27 | |
LESS DISTRIBUTIONS FROM: | | | | | | | | | | | | | | | | | | | | | | | | |
Net investment income | | | (0.19 | ) | | | (0.25 | ) | | | (0.42 | ) | | | (0.41 | ) | | | (0.29 | ) | | | (0.38 | ) |
Return of Capital | | | — | | | | (0.04 | ) | | | — | | | | — | | | | — | | | | — | |
Total distributions | | | (0.19 | ) | | | (0.29 | ) | | | (0.42 | ) | | | (0.41 | ) | | | (0.29 | ) | | | (0.38 | ) |
Paid-in capital from redemption fees (Note 4) | | | — | | | | — | | | | — | | | | — | | | | — | 2 | | | — | 2 |
Net Asset Value, end of period | | | $10.92 | | | | $10.25 | | | | $10.98 | | | | $10.43 | | | | $9.96 | | | | $10.31 | |
TOTAL RETURN | | | 8.39% | 3 | | | (4.05% | ) | | | 9.40% | | | | 8.85% | | | | (0.58% | ) | | | 2.54% | |
| | | | | | |
RATIOS/SUPPLEMENTAL DATA | | | | | | | | | | | | | | | | | | | | | | | | |
Net assets, end of period (in 000’s) | | | $39,140 | | | | $40,698 | | | | $63,437 | | | | $55,409 | | | | $51,130 | | | | $58,594 | |
Ratio of expenses to average net assets before any reimbursement, waiver or recapture of expenses by Advisor and Administrator (Note 5) | | | 1.16% | 4 | | | 1.23% | | | | 1.29% | | | | 1.33% | | | | 1.28% | | | | 1.27% | |
Ratio of expenses to average net assets after any reimbursement, waiver or recapture of expenses by Advisor and Administrator | | | 1.15% | 4 | | | 1.15% | | | | 1.15% | | | | 1.15% | | | | 1.12% | | | | 1.13% | |
Ratio of net investment income (loss) to average net assets | | | 4.32% | 4 | | | 3.76% | | | | 4.70% | | | | 4.85% | | | | 4.57% | | | | 4.36% | |
Portfolio turnover5 | | | 59.38% | 3 | | | 82.32% | | | | 36.58% | | | | 71.50% | | | | 50.09% | | | | 34.28% | |
| | |
| INSTITUTIONAL CLASS | | Six-Month Period Ended June 30, 2019 (unaudited) | | | Year Ended Dec. 31 | |
| | 2018 | | | 2017 | | | 2016 | | | 2015 | | | 2014 | |
Net Asset Value, beginning of period | | | $10.25 | | | | $10.97 | | | | $10.42 | | | | $9.96 | | | | $10.30 | | | | $10.42 | |
INCOME (LOSS) FROM INVESTMENT OPERATIONS: | | | | | | | | | | | | | | | | | | | | | | | | |
Net investment income (loss)1 | | | 0.24 | | | | 0.42 | | | | 0.53 | | | | 0.53 | | | | 0.49 | | | | 0.48 | |
Net realized gain (loss) and unrealized appreciation/depreciation on investments, forward foreign currency exchange contracts, swaps, foreign currency related transactions, and foreign capital gains taxes | | | 0.64 | | | | (0.83 | ) | | | 0.47 | | | | 0.36 | | | | (0.52 | ) | | | (0.20 | ) |
Total from investment operations | | | 0.88 | | | | (0.41 | ) | | | 1.00 | | | | 0.89 | | | | (0.03 | ) | | | 0.28 | |
LESS DISTRIBUTIONS FROM: | | | | | | | | | | | | | | | | | | | | | | | | |
Net investment income | | | (0.20 | ) | | | (0.27 | ) | | | (0.45 | ) | | | (0.43 | ) | | | (0.31 | ) | | | (0.40 | ) |
Return of Capital | | | — | | | | (0.04 | ) | | | — | | | | — | | | | — | | | | — | |
Total distributions | | | (0.20 | ) | | | (0.31 | ) | | | (0.45 | ) | | | (0.43 | ) | | | (0.31 | ) | | | (0.40 | ) |
Paid-in capital from redemption fees (Note 4) | | | — | | | | — | | | | — | | | | — | | | | — | 2 | | | — | 2 |
Net Asset Value, end of period | | | $10.93 | | | | $10.25 | | | | $10.97 | | | | $10.42 | | | | $9.96 | | | | $10.30 | |
TOTAL RETURN | | | 8.63% | 3 | | | (3.78% | ) | | | 9.67% | | | | 9.02% | | | | (0.27% | ) | | | 2.64% | |
| | | | | | |
RATIOS/SUPPLEMENTAL DATA | | | | | | | | | | | | | | | | | | | | | | | | |
Net assets, end of period (in 000’s) | | | $74,489 | | | | $60,017 | | | | $31,155 | | | | $13,398 | | | | $11,001 | | | | $7,840 | |
Ratio of expenses to average net assets before any reimbursement, waiver or recapture of expenses by Advisor and Administrator (Note 5) | | | 0.97% | 4 | | | 1.04% | | | | 1.08% | | | | 1.12% | | | | 1.09% | | | | 1.07% | |
Ratio of expenses to average net assets after any reimbursement, waiver or recapture of expenses by Advisor and Administrator | | | 0.90% | 4 | | | 0.90% | | | | 0.90% | | | | 0.90% | | | | 0.90% | | | | 0.93% | |
Ratio of net investment income (loss) to average net assets | | | 4.60% | 4 | | | 4.03% | | | | 4.93% | | | | 5.13% | | | | 4.81% | | | | 4.55% | |
Portfolio turnover5 | | | 59.38% | 3 | | | 82.32% | | | | 36.58% | | | | 71.50% | | | | 50.09% | | | | 34.28% | |
| 1 | Calculated using the average daily shares method. |
| 2 | Less than $0.01 per share. |
| 5 | The portfolio turnover rate is calculated on the Fund as a whole without distinguishing between classes of shares issued. |
See accompanying notes to financial statements.
Financial Highlights(continued)
Matthews Asia Credit Opportunities Fund
The tables below set forth financial data for a share of beneficial interest outstanding throughout each period presented.
| | | | | | | | | | | | | | | | |
| INVESTOR CLASS | | Six-Month
Period Ended June 30, 2019
(unaudited) | | | Year Ended Dec. 31 | | | Period Ended
Dec. 31, 20161 | |
| | 2018 | | | 2017 | |
Net Asset Value, beginning of period | | | $9.76 | | | | $10.39 | | | | $10.13 | | | | $10.00 | |
INCOME (LOSS) FROM INVESTMENT OPERATIONS: | | | | | | | | | | | | | | | | |
Net investment income (loss)2 | | | 0.22 | | | | 0.37 | | | | 0.44 | | | | 0.29 | |
Net realized gain (loss) and unrealized appreciation/depreciation on investments, swaps, and foreign currency related transactions | | | 0.69 | | | | (0.67 | ) | | | 0.35 | | | | 0.18 | |
Total from investment operations | | | 0.91 | | | | (0.30 | ) | | | 0.79 | | | | 0.47 | |
LESS DISTRIBUTIONS FROM: | | | | | | | | | | | | | | | | |
Net investment income | | | (0.20 | ) | | | (0.33 | ) | | | (0.43 | ) | | | (0.32 | ) |
Net realized gains on investments | | | — | | | | — | | | | (0.10 | ) | | | (0.02 | ) |
Total distributions | | | (0.20 | ) | | | (0.33 | ) | | | (0.53 | ) | | | (0.34 | ) |
Net Asset Value, end of period | | | $10.47 | | | | $9.76 | | | | $10.39 | | | | $10.13 | |
TOTAL RETURN | | | 9.39% | 3 | | | (2.88% | ) | | | 7.86% | | | | 4.66% | 3 |
| | | | |
RATIOS/SUPPLEMENTAL DATA | | | | | | | | | | | | | | | | |
Net assets, end of period (in 000’s) | | | $11,264 | | | | $8,668 | | | | $10,201 | | | | $10,119 | |
Ratio of expenses to average net assets before any reimbursement, waiver or recapture of expenses by Advisor and Administrator (Note 5) | | | 1.32% | 4 | | | 1.44% | | | | 1.86% | | | | 2.24% | 4 |
Ratio of expenses to average net assets after any reimbursement, waiver or recapture of expenses by Advisor and Administrator | | | 1.15% | 4 | | | 1.15% | | | | 1.15% | | | | 1.15% | 4 |
Ratio of net investment income (loss) to average net assets | | | 4.31% | 4 | | | 3.62% | | | | 4.17% | | | | 4.12% | 4 |
Portfolio turnover5 | | | 70.90% | 3 | | | 49.06% | | | | 27.86% | | | | 18.80% | 3 |
| | | |
| INSTITUTIONAL CLASS | | Six-Month Period Ended June 30, 2019 (unaudited) | | | Year Ended Dec. 31 | | | Period Ended Dec. 31, 20161 | |
| | 2018 | | | 2017 | |
Net Asset Value, beginning of period | | | $9.75 | | | | $10.39 | | | | $10.13 | | | | $10.00 | |
INCOME (LOSS) FROM INVESTMENT OPERATIONS: | | | | | | | | | | | | | | | | |
Net investment income (loss)2 | | | 0.23 | | | | 0.39 | | | | 0.46 | | | | 0.30 | |
Net realized gain (loss) and unrealized appreciation/depreciation on investments, swaps, and foreign currency related transactions | | | 0.70 | | | | (0.67 | ) | | | 0.36 | | | | 0.18 | |
Total from investment operations | | | 0.93 | | | | (0.28 | ) | | | 0.82 | | | | 0.48 | |
LESS DISTRIBUTIONS FROM: | | | | | | | | | | | | | | | | |
Net investment income | | | (0.21 | ) | | | (0.36 | ) | | | (0.46 | ) | | | (0.33 | ) |
Net realized gains on investments | | | — | | | | — | | | | (0.10 | ) | | | (0.02 | ) |
Total distributions | | | (0.21 | ) | | | (0.36 | ) | | | (0.56 | ) | | | (0.35 | ) |
Net Asset Value, end of period | | | $10.47 | | | | $9.75 | | | | $10.39 | | | | $10.13 | |
TOTAL RETURN | | | 9.63% | 3 | | | (2.75% | ) | | | 8.13% | | | | 4.82% | 3 |
| | | | |
RATIOS/SUPPLEMENTAL DATA | | | | | | | | | | | | | | | | |
Net assets, end of period (in 000’s) | | | $46,181 | | | | $31,085 | | | | $21,491 | | | | $6,205 | |
Ratio of expenses to average net assets before any reimbursement, waiver or recapture of expenses by Advisor and Administrator (Note 5) | | | 1.12% | 4 | | | 1.25% | | | | 1.62% | | | | 1.99% | 4 |
Ratio of expenses to average net assets after any reimbursement, waiver or recapture of expenses by Advisor and Administrator | | | 0.90% | 4 | | | 0.90% | | | | 0.90% | | | | 0.90% | 4 |
Ratio of net investment income (loss) to average net assets | | | 4.56% | 4 | | | 3.90% | | | | 4.45% | | | | 4.28% | 4 |
Portfolio turnover5 | | | 70.90% | 3 | | | 49.06% | | | | 27.86% | | | | 18.80% | 3 |
| 1 | Commenced operations on April, 29 2016. |
| 2 | Calculated using the average daily shares method. |
| 5 | The portfolio turnover rate is calculated on the Fund as a whole without distinguishing between classes of shares issued. |
See accompanying notes to financial statements.
| | | | |
| matthewsasia.com | 800.789.ASIA | | | 121 | |
Financial Highlights(continued)
Matthews Asian Growth And Income Fund
The tables below set forth financial data for a share of beneficial interest outstanding throughout each period presented.
| | | | | | | | | | | | | | | | | | | | | | | | |
| INVESTOR CLASS | | Six-Month Period Ended June 30, 2019 (unaudited) | | | Year Ended Dec. 31 | |
| | 2018 | | | 2017 | | | 2016 | | | 2015 | | | 2014 | |
Net Asset Value, beginning of period | | | $13.92 | | | | $17.46 | | | | $14.94 | | | | $16.03 | | | | $18.01 | | | | $18.91 | |
INCOME (LOSS) FROM INVESTMENT OPERATIONS: | | | | | | | | | | | | | | | | | | | | | | | | |
Net investment income (loss)1 | | | 0.13 | | | | 0.32 | | | | 0.33 | | | | 0.32 | | | | 0.39 | | | | 0.39 | |
Net realized gain (loss) and unrealized appreciation/depreciation on investments, foreign currency related transactions and foreign capital gains taxes | | | 1.66 | | | | (2.20 | ) | | | 2.92 | | | | (0.06 | ) | | | (1.19 | ) | | | (0.50 | ) |
Total from investment operations | | | 1.79 | | | | (1.88 | ) | | | 3.25 | | | | 0.26 | | | | (0.80 | ) | | | (0.11 | ) |
LESS DISTRIBUTIONS FROM: | | | | | | | | | | | | | | | | | | | | | | | | |
Net investment income | | | (0.17 | ) | | | (0.32 | ) | | | (0.46 | ) | | | (0.48 | ) | | | (0.42 | ) | | | (0.35 | ) |
Net realized gains on investments | | | — | | | | (1.34 | ) | | | (0.27 | ) | | | (0.87 | ) | | | (0.76 | ) | | | (0.44 | ) |
Total distributions | | | (0.17 | ) | | | (1.66 | ) | | | (0.73 | ) | | | (1.35 | ) | | | (1.18 | ) | | | (0.79 | ) |
Paid-in capital from redemption fees (Note 4) | | | — | | | | — | | | | — | 2 | | | — | | | | — | 2 | | | — | 2 |
Net Asset Value, end of period | | | $15.54 | | | | $13.92 | | | | $17.46 | | | | $14.94 | | | | $16.03 | | | | $18.01 | |
TOTAL RETURN | | | 12.92% | 3 | | | (10.96% | ) | | | 21.85% | | | | 1.34% | | | | (4.50% | ) | | | (0.65% | ) |
| | | | | | |
RATIOS/SUPPLEMENTAL DATA | | | | | | | | | | | | | | | | | | | | | | | | |
Net assets, end of period (in 000’s) | | | $825,574 | | | | $799,328 | | | | $1,535,746 | | | | $1,684,987 | | | | $2,045,435 | | | | $3,052,565 | |
Ratio of expenses to average net assets before any reimbursement, waiver or recapture of expenses by Advisor and Administrator (Note 5) | | | 1.10% | 4 | | | 1.08% | | | | 1.07% | | | | 1.09% | | | | 1.09% | | | | 1.08% | |
Ratio of net investment income (loss) to average net assets | | | 1.76% | 4 | | | 1.95% | | | | 1.95% | | | | 1.90% | | | | 2.17% | | | | 2.03% | |
Portfolio turnover5 | | | 10.26% | 3 | | | 32.24% | | | | 23.23% | | | | 15.64% | | | | 16.48% | | | | 16.79% | |
| | |
| INSTITUTIONAL CLASS | | Six-Month Period Ended June 30, 2019 (unaudited) | | | Year Ended Dec. 31 | |
| | 2018 | | | 2017 | | | 2016 | | | 2015 | | | 2014 | |
Net Asset Value, beginning of period | | | $13.89 | | | | $17.43 | | | | $14.92 | | | | $16.02 | | | | $18.00 | | | | $18.90 | |
INCOME (LOSS) FROM INVESTMENT OPERATIONS: | | | | | | | | | | | | | | | | | | | | | | | | |
Net investment income (loss)1 | | | 0.14 | | | | 0.35 | | | | 0.36 | | | | 0.34 | | | | 0.42 | | | | 0.42 | |
Net realized gain (loss) and unrealized appreciation/depreciation on investments, foreign currency related transactions and foreign capital gains taxes | | | 1.66 | | | | (2.20 | ) | | | 2.91 | | | | (0.07 | ) | | | (1.19 | ) | | | (0.50 | ) |
Total from investment operations | | | 1.80 | | | | (1.85 | ) | | | 3.27 | | | | 0.27 | | | | (0.77 | ) | | | (0.08 | ) |
LESS DISTRIBUTIONS FROM: | | | | | | | | | | | | | | | | | | | | | | | | |
Net investment income | | | (0.18 | ) | | | (0.35 | ) | | | (0.49 | ) | | | (0.50 | ) | | | (0.45 | ) | | | (0.38 | ) |
Net realized gains on investments | | | — | | | | (1.34 | ) | | | (0.27 | ) | | | (0.87 | ) | | | (0.76 | ) | | | (0.44 | ) |
Total distributions | | | (0.18 | ) | | | (1.69 | ) | | | (0.76 | ) | | | (1.37 | ) | | | (1.21 | ) | | | (0.82 | ) |
Paid-in capital from redemption fees (Note 4) | | | — | | | | — | | | | — | 2 | | | — | | | | — | 2 | | | — | 2 |
Net Asset Value, end of period | | | $15.51 | | | | $13.89 | | | | $17.43 | | | | $14.92 | | | | $16.02 | | | | $18.00 | |
TOTAL RETURN | | | 13.02% | 3 | | | (10.84% | ) | | | 22.00% | | | | 1.44% | | | | (4.33% | ) | | | (0.48% | ) |
| | | | | | |
RATIOS/SUPPLEMENTAL DATA | | | | | | | | | | | | | | | | | | | | | | | | |
Net assets, end of period (in 000’s) | | | $594,828 | | | | $596,364 | | | | $1,310,168 | | | | $809,254 | | | | $823,619 | | | | $1,182,690 | |
Ratio of expenses to average net assets before any reimbursement, waiver or recapture of expenses by Advisor and Administrator (Note 5) | | | 0.96% | 4 | | | 0.93% | | | | 0.93% | | | | 0.94% | | | | 0.92% | | | | 0.92% | |
Ratio of net investment income (loss) to average net assets | | | 1.86% | 4 | | | 2.14% | | | | 2.16% | | | | 2.06% | | | | 2.34% | | | | 2.19% | |
Portfolio turnover5 | | | 10.26% | 3 | | | 32.24% | | | | 23.23% | | | | 15.64% | | | | 16.48% | | | | 16.79% | |
| 1 | Calculated using the average daily shares method. |
| 2 | Less than $0.01 per share. |
| 5 | The portfolio turnover rate is calculated on the Fund as a whole without distinguishing between classes of shares issued. |
See accompanying notes to financial statements.
Financial Highlights(continued)
Matthews Asia Dividend Fund
The tables below set forth financial data for a share of beneficial interest outstanding throughout each period presented.
| | | | | | | | | | | | | | | | | | | | | | | | |
| INVESTOR CLASS | | Six-Month Period Ended June 30, 2019 (unaudited) | | | Year Ended Dec. 31 | |
| | 2018 | | | 2017 | | | 20161 | | | 20151 | | | 20141 | |
Net Asset Value, beginning of period | | | $16.05 | | | | $19.74 | | | | $15.52 | | | | $15.36 | | | | $15.26 | | | | $15.60 | |
INCOME (LOSS) FROM INVESTMENT OPERATIONS: | | | | | | | | | | | | | | | | | | | | | | | | |
Net investment income (loss)2 | | | 0.14 | | | | 0.37 | | | | 0.31 | | | | 0.28 | | | | 0.29 | | | | 0.30 | |
Net realized gain (loss) and unrealized appreciation/depreciation on investments, foreign currency related transactions and foreign capital gains taxes | | | 0.79 | | | | (2.83 | ) | | | 5.02 | | | | 0.37 | | | | 0.31 | | | | (0.34 | ) |
Total from investment operations | | | 0.93 | | | | (2.46 | ) | | | 5.33 | | | | 0.65 | | | | 0.60 | | | | (0.04 | ) |
LESS DISTRIBUTIONS FROM: | | | | | | | | | | | | | | | | | | | | | | | | |
Net investment income | | | (0.15 | ) | | | (0.31 | ) | | | (0.69 | ) | | | (0.29 | ) | | | (0.27 | ) | | | (0.23 | ) |
Net realized gains on investments | | | — | | | | (0.92 | ) | | | (0.42 | ) | | | (0.11 | ) | | | (0.23 | ) | | | — | |
Return of capital | | | — | | | | — | | | | — | | | | (0.09 | ) | | | — | | | | (0.07 | ) |
Total distributions | | | (0.15 | ) | | | (1.23 | ) | | | (1.11 | ) | | | (0.49 | ) | | | (0.50 | ) | | | (0.30 | ) |
Paid-in capital from redemption fees (Note 4) | | | — | | | | — | | | | — | 3 | | | — | | | | — | 3 | | | — | 3 |
Net Asset Value, end of period | | | $16.83 | | | | $16.05 | | | | $19.74 | | | | $15.52 | | | | $15.36 | | | | $15.26 | |
TOTAL RETURN | | | 5.82% | 4 | | | (12.72% | ) | | | 34.69% | | | | 4.13% | | | | 3.86% | | | | (0.32% | ) |
| | | | | | |
RATIOS/SUPPLEMENTAL DATA | | | | | | | | | | | | | | | | | | | | | | | | |
Net assets, end of period (in 000’s) | | | $2,710,990 | | | | $2,728,599 | | | | $3,713,276 | | | | $2,650,611 | | | | $2,757,910 | | | | $2,918,228 | |
Ratio of expenses to average net assets before any reimbursement, waiver or recapture of expenses by Advisor and Administrator (Note 5) | | | 1.03% | 5 | | | 1.02% | | | | 1.03% | | | | 1.06% | | | | 1.06% | | | | 1.06% | |
Ratio of expenses to average net assets after any reimbursement, waiver or recapture of expenses by Advisor and Administrator | | | 1.02% | 5 | | | 1.01% | | | | 1.02% | | | | 1.06% | | | | 1.05% | | | | 1.05% | |
Ratio of net investment income (loss) to average net assets | | | 1.65% | 5 | | | 1.97% | | | | 1.67% | | | | 1.79% | | | | 1.82% | | | | 1.89% | |
Portfolio turnover6 | | | 18.67% | 4 | | | 39.75% | | | | 28.11% | | | | 39.76% | | | | 35.98% | | | | 20.06% | |
| | |
| INSTITUTIONAL CLASS | | Six-Month
Period Ended June 30, 2019
(unaudited) | | | Year Ended Dec. 31 | |
| | 2018 | | | 2017 | | | 20161 | | | 20151 | | | 20141 | |
Net Asset Value, beginning of period | | | $16.04 | | | | $19.73 | | | | $15.52 | | | | $15.35 | | | | $15.26 | | | | $15.59 | |
INCOME (LOSS) FROM INVESTMENT OPERATIONS: | | | | | | | | | | | | | | | | | | | | | | | | |
Net investment income (loss)2 | | | 0.15 | | | | 0.39 | | | | 0.33 | | | | 0.30 | | | | 0.32 | | | | 0.32 | |
Net realized gain (loss) and unrealized appreciation/depreciation on investments, foreign currency related transactions and foreign capital gains taxes | | | 0.79 | | | | (2.83 | ) | | | 5.01 | | | | 0.38 | | | | 0.29 | | | | (0.33 | ) |
Total from investment operations | | | 0.94 | | | | (2.44 | ) | | | 5.34 | | | | 0.68 | | | | 0.61 | | | | (0.01 | ) |
LESS DISTRIBUTIONS FROM: | | | | | | | | | | | | | | | | | | | | | | | | |
Net investment income | | | (0.16 | ) | | | (0.33 | ) | | | (0.71 | ) | | | (0.31 | ) | | | (0.29 | ) | | | (0.25 | ) |
Net realized gains on investments | | | — | | | | (0.92 | ) | | | (0.42 | ) | | | (0.11 | ) | | | (0.23 | ) | | | — | |
Return of capital | | | — | | | | — | | | | — | | | | (0.09 | ) | | | — | | | | (0.07 | ) |
Total distributions | | | (0.16 | ) | | | (1.25 | ) | | | (1.13 | ) | | | (0.51 | ) | | | (0.52 | ) | | | (0.32 | ) |
Paid-in capital from redemption fees (Note 4) | | | — | | | | — | | | | — | 3 | | | — | | | | — | 3 | | | — | 3 |
Net Asset Value, end of period | | | $16.82 | | | | $16.04 | | | | $19.73 | | | | $15.52 | | | | $15.35 | | | | $15.26 | |
TOTAL RETURN | | | 5.88% | 4 | | | (12.64% | ) | | | 34.77% | | | | 4.33% | | | | 3.93% | | | | (0.18% | ) |
| | | | | | |
RATIOS/SUPPLEMENTAL DATA | | | | | | | | | | | | | | | | | | | | | | | | |
Net assets, end of period (in 000’s) | | | $3,355,539 | | | | $3,039,226 | | | | $3,284,070 | | | | $2,034,276 | | | | $2,045,713 | | | | $2,107,371 | |
Ratio of expenses to average net assets before any reimbursement, waiver or recapture of expenses by Advisor and Administrator (Note 5) | | | 0.93% | 5 | | | 0.91% | | | | 0.92% | | | | 0.94% | | | | 0.93% | | | | 0.93% | |
Ratio of expenses to average net assets after any reimbursement, waiver or recapture of expenses by Advisor and Administrator | | | 0.92% | 5 | | | 0.90% | | | | 0.91% | | | | 0.93% | | | | 0.92% | | | | 0.93% | |
Ratio of net investment income (loss) to average net assets | | | 1.81% | 5 | | | 2.09% | | | | 1.81% | | | | 1.91% | | | | 1.98% | | | | 2.02% | |
Portfolio turnover6 | | | 18.67% | 4 | | | 39.75% | | | | 28.11% | | | | 39.76% | | | | 35.98% | | | | 20.06% | |
| 1 | Consolidated Financial Highlights. See Note2-C. |
| 2 | Calculated using the average daily shares method. |
| 3 | Less than $0.01 per share. |
| 6 | The portfolio turnover rate is calculated on the Fund as a whole without distinguishing between classes of shares issued. |
See accompanying notes to financial statements.
| | | | |
| matthewsasia.com | 800.789.ASIA | | | 123 | |
Financial Highlights(continued)
Matthews China Dividend Fund
The tables below set forth financial data for a share of beneficial interest outstanding throughout each period presented.
| | | | | | | | | | | | | | | | | | | | | | | | |
| INVESTOR CLASS | | Six-Month
Period Ended June 30, 2019
(unaudited) | | | Year Ended Dec. 31 | |
| | 2018 | | | 2017 | | | 2016 | | | 2015 | | | 2014 | |
Net Asset Value, beginning of period | | | $14.32 | | | | $17.61 | | | | $14.09 | | | | $13.79 | | | | $13.37 | | | | $13.74 | |
INCOME (LOSS) FROM INVESTMENT OPERATIONS: | | | | | | | | | | | | | | | | | | | | | | | | |
Net investment income (loss)1 | | | 0.22 | | | | 0.41 | | | | 0.35 | | | | 0.31 | | | | 0.29 | | | | 0.25 | |
Net realized gain (loss) and unrealized appreciation/depreciation on investments and foreign currency related transactions | | | 1.99 | | | | (2.09 | ) | | | 4.85 | | | | 0.47 | | | | 1.01 | | | | (0.12 | ) |
Total from investment operations | | | 2.21 | | | | (1.68 | ) | | | 5.20 | | | | 0.78 | | | | 1.30 | | | | 0.13 | |
LESS DISTRIBUTIONS FROM: | | | | | | | | | | | | | | | | | | | | | | | | |
Net investment income | | | (0.24 | ) | | | (0.40 | ) | | | (0.49 | ) | | | (0.28 | ) | | | (0.28 | ) | | | (0.36 | ) |
Net realized gains on investments | | | — | | | | (1.21 | ) | | | (1.19 | ) | | | (0.20 | ) | | | (0.60 | ) | | | (0.14 | ) |
Total distributions | | | (0.24 | ) | | | (1.61 | ) | | | (1.68 | ) | | | (0.48 | ) | | | (0.88 | ) | | | (0.50 | ) |
Paid-in capital from redemption fees (Note 4) | | | — | | | | — | | | | — | | | | — | | | | — | 2 | | | — | 2 |
Net Asset Value, end of period | | | $16.29 | | | | $14.32 | | | | $17.61 | | | | $14.09 | | | | $13.79 | | | | $13.37 | |
TOTAL RETURN | | | 15.51% | 3 | | | (9.98% | ) | | | 37.69% | | | | 5.70% | | | | 9.54% | | | | 0.93% | |
| | | | | | |
RATIOS/SUPPLEMENTAL DATA | | | | | | | | | | | | | | | | | | | | | | | | |
Net assets, end of period (in 000’s) | | | $276,272 | | | | $196,626 | | | | $260,593 | | | | $160,400 | | | | $165,514 | | | | $116,954 | |
Ratio of expenses to average net assets before any reimbursement, waiver or recapture of expenses by Advisor and Administrator (Note 5) | | | 1.12% | 4 | | | 1.15% | | | | 1.19% | | | | 1.22% | | | | 1.19% | | | | 1.19% | |
Ratio of net investment income (loss) to average net assets | | | 2.83% | 4 | | | 2.33% | | | | 2.12% | | | | 2.28% | | | | 1.97% | | | | 1.88% | |
Portfolio turnover5 | | | 42.80% | 3 | | | 66.47% | | | | 69.14% | | | | 72.96% | | | | 79.91% | | | | 25.43% | |
| | |
| INSTITUTIONAL CLASS | | Six-Month
Period Ended June 30, 2019
(unaudited) | | | Year Ended Dec. 31 | |
| | 2018 | | | 2017 | | | 2016 | | | 2015 | | | 2014 | |
Net Asset Value, beginning of period | | | $14.32 | | | | $17.61 | | | | $14.09 | | | | $13.79 | | | | $13.37 | | | | $13.74 | |
INCOME (LOSS) FROM INVESTMENT OPERATIONS: | | | | | | | | | | | | | | | | | | | | | | | | |
Net investment income (loss)1 | | | 0.24 | | | | 0.42 | | | | 0.37 | | | | 0.29 | | | | 0.28 | | | | 0.28 | |
Net realized gain (loss) and unrealized appreciation/depreciation on investments and foreign currency related transactions | | | 1.98 | | | | (2.07 | ) | | | 4.85 | | | | 0.51 | | | | 1.04 | | | | (0.13 | ) |
Total from investment operations | | | 2.22 | | | | (1.65 | ) | | | 5.22 | | | | 0.80 | | | | 1.32 | | | | 0.15 | |
LESS DISTRIBUTIONS FROM: | | | | | | | | | | | | | | | | | | | | | | | | |
Net investment income | | | (0.25 | ) | | | (0.43 | ) | | | (0.51 | ) | | | (0.30 | ) | | | (0.30 | ) | | | (0.38 | ) |
Net realized gains on investments | | | — | | | | (1.21 | ) | | | (1.19 | ) | | | (0.20 | ) | | | (0.60 | ) | | | (0.14 | ) |
Total distributions | | | (0.25 | ) | | | (1.64 | ) | | | (1.70 | ) | | | (0.50 | ) | | | (0.90 | ) | | | (0.52 | ) |
Paid-in capital from redemption fees (Note 4) | | | — | | | | — | | | | — | | | | — | | | | — | 2 | | | — | 2 |
Net Asset Value, end of period | | | $16.29 | | | | $14.32 | | | | $17.61 | | | | $14.09 | | | | $13.79 | | | | $13.37 | |
TOTAL RETURN | | | 15.58% | 3 | | | (9.83% | ) | | | 37.88% | | | | 5.90% | | | | 9.71% | | | | 1.11% | |
| | | | | | |
RATIOS/SUPPLEMENTAL DATA | | | | | | | | | | | | | | | | | | | | | | | | |
Net assets, end of period (in 000’s) | | | $102,398 | | | | $73,033 | | | | $54,147 | | | | $27,758 | | | | $15,406 | | | | $30,662 | |
Ratio of expenses to average net assets before any reimbursement, waiver or recapture of expenses by Advisor and Administrator (Note 5) | | | 1.00% | 4 | | | 1.01% | | | | 1.04% | | | | 1.06% | | | | 1.00% | | | | 1.01% | |
Ratio of net investment income (loss) to average net assets | | | 3.09% | 4 | | | 2.44% | | | | 2.25% | | | | 2.09% | | | | 1.89% | | | | 2.06% | |
Portfolio turnover5 | | | 42.80% | 3 | | | 66.47% | | | | 69.14% | | | | 72.96% | | | | 79.91% | | | | 25.43% | |
| 1 | Calculated using the average daily shares method. |
| 2 | Less than $0.01 per share. |
| 5 | The portfolio turnover rate is calculated on the Fund as a whole without distinguishing between classes of shares issued. |
See accompanying notes to financial statements.
Financial Highlights(continued)
Matthews Asia Value Fund
The tables below set forth financial data for a share of beneficial interest outstanding throughout each period presented.
| | | | | | | | | | | | | | | | | | | | |
| INVESTOR CLASS | | Six-Month
Period Ended June 30, 2019
(unaudited) | | | Year Ended Dec. 31 | | | Period Ended
Dec. 31, 20151 | |
| | 2018 | | | 2017 | | | 2016 | |
Net Asset Value, beginning of period | | | $10.86 | | | | $12.83 | | | | $9.96 | | | | $9.85 | | | | $10.00 | |
INCOME (LOSS) FROM INVESTMENT OPERATIONS: | | | | | | | | | | | | | | | | | | | | |
Net investment income (loss)2 | | | 0.10 | | | | 0.10 | | | | 0.14 | | | | 0.09 | | | | 0.02 | |
Net realized gain (loss) and unrealized appreciation/depreciation on investments, foreign currency related transactions and foreign capital gains taxes | | | 0.66 | | | | (1.49 | ) | | | 3.45 | | | | 0.65 | | | | (0.16 | ) |
Total from investment operations | | | 0.76 | | | | (1.39 | ) | | | 3.59 | | | | 0.74 | | | | (0.14 | ) |
LESS DISTRIBUTIONS FROM: | | | | | | | | | | | | | | | | | | | | |
Net investment income | | | — | | | | (0.16 | ) | | | (0.29 | ) | | | (0.59 | ) | | | (0.01 | ) |
Net realized gains on investments | | | — | | | | (0.42 | ) | | | (0.43 | ) | | | (0.04 | ) | | | — | |
Total distributions | | | — | | | | (0.58 | ) | | | (0.72 | ) | | | (0.63 | ) | | | (0.01 | ) |
Net Asset Value, end of period | | | $11.62 | | | | $10.86 | | | | $12.83 | | | | $9.96 | | | | $9.85 | |
TOTAL RETURN | | | 7.00% | 3 | | | (10.93% | ) | | | 36.12% | | | | 7.43% | | | | (1.35% | )3 |
| | | | | |
RATIOS/SUPPLEMENTAL DATA | | | | | | | | | | | | | | | | | | | | |
Net assets, end of period (in 000’s) | | | $18,897 | | | | $16,326 | | | | $27,346 | | | | $2,548 | | | | $1,589 | |
Ratio of expenses to average net assets before any reimbursement, waiver or recapture of expenses by Advisor and Administrator (Note 5) | | | 1.92% | 4 | | | 1.77% | | | | 2.32% | | | | 11.48% | | | | 36.42% | 4 |
Ratio of expenses to average net assets after any reimbursement, waiver or recapture of expenses by Advisor and Administrator | | | 1.50% | 4 | | | 1.50% | | | | 1.50% | | | | 1.50% | | | | 1.50% | 4 |
Ratio of net investment income (loss) to average net assets | | | 1.71% | 4 | | | 0.81% | | | | 1.10% | | | | 0.84% | | | | 2.70% | 4 |
Portfolio turnover5 | | | 12.47% | 3 | | | 48.29% | | | | 31.93% | | | | 19.60% | | | | 10.80% | 3 |
| | | |
| INSTITUTIONAL CLASS | | Six-Month
Period Ended June 30, 2019
(unaudited) | | | Year Ended Dec. 31 | | | Period Ended
Dec. 31, 20151 | |
| | 2018 | | | 2017 | | | 2016 | |
Net Asset Value, beginning of period | | | $10.78 | | | | $12.73 | | | | $9.85 | | | | $9.83 | | | | $10.00 | |
INCOME (LOSS) FROM INVESTMENT OPERATIONS: | | | | | | | | | | | | | | | | | | | | |
Net investment income (loss)2 | | | 0.10 | | | | 0.14 | | | | 0.32 | | | | 0.10 | | | | 0.02 | |
Net realized gain (loss) and unrealized appreciation/depreciation on investments, foreign currency related transactions and foreign capital gains taxes | | | 0.67 | | | | (1.49 | ) | | | 3.25 | | | | 0.67 | | | | (0.15 | ) |
Total from investment operations | | | 0.77 | | | | (1.35 | ) | | | 3.57 | | | | 0.77 | | | | (0.13 | ) |
LESS DISTRIBUTIONS FROM: | | | | | | | | | | | | | | | | | | | | |
Net investment income | | | — | | | | (0.18 | ) | | | (0.26 | ) | | | (0.71 | ) | | | (0.04 | ) |
Net realized gains on investments | | | — | | | | (0.42 | ) | | | (0.43 | ) | | | (0.04 | ) | | | — | |
Total distributions | | | — | | | | (0.60 | ) | | | (0.69 | ) | | | (0.75 | ) | | | (0.04 | ) |
Net Asset Value, end of period | | | $11.55 | | | | $10.78 | | | | $12.73 | | | | $9.85 | | | | $9.83 | |
TOTAL RETURN | | | 7.14% | 3 | | | (10.65% | ) | | | 36.35% | | | | 7.72% | | | | (1.30% | )3 |
| | | | | |
RATIOS/SUPPLEMENTAL DATA | | | | | | | | | | | | | | | | | | | | |
Net assets, end of period (in 000’s) | | | $6,074 | | | | $6,869 | | | | $3,388 | | | | $155 | | | | $143 | |
Ratio of expenses to average net assets before any reimbursement, waiver or recapture of expenses by Advisor and Administrator (Note 5) | | | 1.71% | 4 | | | 1.54% | | | | 2.08% | | | | 11.26% | | | | 36.17% | 4 |
Ratio of expenses to average net assets after any reimbursement, waiver or recapture of expenses by Advisor and Administrator | | | 1.25% | 4 | | | 1.25% | | | | 1.25% | | | | 1.25% | | | | 1.25% | 4 |
Ratio of net investment income (loss) to average net assets | | | 1.78% | 4 | | | 1.18% | | | | 2.59% | | | | 1.01% | | | | 2.41% | 4 |
Portfolio turnover5 | | | 12.47% | 3 | | | 48.29% | | | | 31.93% | | | | 19.60% | | | | 10.80% | 3 |
| 1 | Commenced operations on November 30, 2015. |
| 2 | Calculated using the average daily shares method. |
| 5 | The portfolio turnover rate is calculated on the Fund as a whole without distinguishing between classes of shares issued. |
See accompanying notes to financial statements.
| | | | |
| matthewsasia.com | 800.789.ASIA | | | 125 | |
Financial Highlights(continued)
Matthews Asia Growth Fund
The tables below set forth financial data for a share of beneficial interest outstanding throughout each period presented.
| | | | | | | | | | | | | | | | | | | | | | | | |
| INVESTOR CLASS | | Six-Month
Period Ended
June 30, 2019 (unaudited) | | | Year Ended Dec. 31 | |
| | 2018 | | | 2017 | | | 2016 | | | 2015 | | | 2014 | |
Net Asset Value, beginning of period | | | $22.49 | | | | $27.25 | | | | $21.05 | | | | $21.09 | | | | $21.10 | | | | $21.17 | |
INCOME (LOSS) FROM INVESTMENT OPERATIONS: | | | | | | | | | | | | | | | | | | | | | | | | |
Net investment income (loss)1 | | | 0.01 | | | | — | 2 | | | 0.04 | | | | 0.06 | | | | 0.11 | | | | 0.12 | |
Net realized gain (loss) and unrealized appreciation/depreciation on investments, foreign currency related transactions and foreign capital gains taxes | | | 3.54 | | | | (4.41 | ) | | | 8.14 | | | | 0.13 | | | | (0.12 | ) | | | 0.19 | |
Total from investment operations | | | 3.55 | | | | (4.41 | ) | | | 8.18 | | | | 0.19 | | | | (0.01 | ) | | | 0.31 | |
LESS DISTRIBUTIONS FROM: | | | | | | | | | | | | | | | | | | | | | | | | |
Net investment income | | | — | | | | (0.03 | ) | | | (0.16 | ) | | | (0.23 | ) | | | — | | | | (0.38 | ) |
Net realized gains on investments | | | — | | | | (0.32 | ) | | | (1.82 | ) | | | — | | | | — | | | | — | |
Total distributions | | | — | | | | (0.35 | ) | | | (1.98 | ) | | | (0.23 | ) | | | — | | | | (0.38 | ) |
Paid-in capital from redemption fees (Note 4) | | | — | | | | — | | | | — | | | | — | | | | — | 2 | | | — | 2 |
Net Asset Value, end of period | | | $26.04 | | | | $22.49 | | | | $27.25 | | | | $21.05 | | | | $21.09 | | | | $21.10 | |
TOTAL RETURN | | | 15.78% | 3 | | | (16.25% | ) | | | 39.39% | | | | 0.92% | | | | (0.05% | ) | | | 1.49% | |
| | | | | | |
RATIOS/SUPPLEMENTAL DATA | | | | | | | | | | | | | | | | | | | | | | | | |
Net assets, end of period (in 000’s) | | | $528,787 | | | | $463,600 | | | | $554,309 | | | | $419,516 | | | | $526,969 | | | | $561,922 | |
Ratio of expenses to average net assets | | | 1.09% | 4 | | | 1.10% | | | | 1.12% | | | | 1.14% | | | | 1.11% | | | | 1.11% | |
Ratio of net investment income (loss) to average net assets | | | 0.11% | 4 | | | —% | 5 | | | 0.16% | | | | 0.30% | | | | 0.49% | | | | 0.55% | |
Portfolio turnover6 | | | 12.32% | 3 | | | 12.12% | | | | 23.19% | | | | 13.61% | | | | 29.51% | | | | 22.24% | |
| | |
| INSTITUTIONAL CLASS | | Six-Month
Period Ended
June 30, 2019 (unaudited) | | | Year Ended Dec. 31 | |
| | 2018 | | | 2017 | | | 2016 | | | 2015 | | | 2014 | |
Net Asset Value, beginning of period | | | $22.65 | | | | $27.45 | | | | $21.19 | | | | $21.24 | | | | $21.19 | | | | $21.26 | |
INCOME (LOSS) FROM INVESTMENT OPERATIONS: | | | | | | | | | | | | | | | | | | | | | | | | |
Net investment income (loss)1 | | | 0.03 | | | | 0.05 | | | | 0.09 | | | | 0.10 | | | | 0.16 | | | | 0.16 | |
Net realized gain (loss) and unrealized appreciation/depreciation on investments, foreign currency related transactions and foreign capital gains taxes | | | 3.57 | | | | (4.45 | ) | | | 8.20 | | | | 0.13 | | | | (0.11 | ) | | | 0.19 | |
Total from investment operations | | | 3.60 | | | | (4.40 | ) | | | 8.29 | | | | 0.23 | | | | 0.05 | | | | 0.35 | |
LESS DISTRIBUTIONS FROM: | | | | | | | | | | | | | | | | | | | | | | | | |
Net investment income | | | — | | | | (0.08 | ) | | | (0.21 | ) | | | (0.28 | ) | | | — | | | | (0.42 | ) |
Net realized gains on investments | | | — | | | | (0.32 | ) | | | (1.82 | ) | | | — | | | | — | | | | — | |
Total distributions | | | — | | | | (0.40 | ) | | | (2.03 | ) | | | (0.28 | ) | | | — | | | | (0.42 | ) |
Paid-in capital from redemption fees (Note 4) | | | — | | | | — | | | | — | | | | — | | | | — | 2 | | | — | 2 |
Net Asset Value, end of period | | | $26.25 | | | | $22.65 | | | | $27.45 | | | | $21.19 | | | | $21.24 | | | | $21.19 | |
TOTAL RETURN | | | 15.89% | 3 | | | (16.10% | ) | | | 39.64% | | | | 1.06% | | | | 0.24% | | | | 1.63% | |
| | | | | | |
RATIOS/SUPPLEMENTAL DATA | | | | | | | | | | | | | | | | | | | | | | | | |
Net assets, end of period (in 000’s) | | | $591,041 | | | | $466,733 | | | | $296,253 | | | | $195,949 | | | | $249,886 | | | | $287,262 | |
Ratio of expenses to average net assets | | | 0.93% | 4 | | | 0.93% | | | | 0.93% | | | | 0.96% | | | | 0.91% | | | | 0.91% | |
Ratio of net investment income (loss) to average net assets | | | 0.28% | 4 | | | 0.17% | | | | 0.35% | | | | 0.47% | | | | 0.72% | | | | 0.74% | |
Portfolio turnover6 | | | 12.32% | 3 | | | 12.12% | | | | 23.19% | | | | 13.61% | | | | 29.51% | | | | 22.24% | |
| 1 | Calculated using the average daily shares method. |
| 2 | Less than $0.01 per share. |
| 6 | The portfolio turnover rate is calculated on the Fund as a whole without distinguishing between classes of shares issued. |
See accompanying notes to financial statements.
Financial Highlights(continued)
Matthews Pacific Tiger Fund
The tables below set forth financial data for a share of beneficial interest outstanding throughout each period presented.
| | | | | | | | | | | | | | | | | | | | | | | | |
| INVESTOR CLASS | | Six-Month
Period Ended
June 30, 2019 (unaudited) | | | Year Ended Dec. 31 | |
| | 2018 | | | 2017 | | | 2016 | | | 2015 | | | 2014 | |
Net Asset Value, beginning of period | | | $26.86 | | | | $31.66 | | | | $22.92 | | | | $23.54 | | | | $26.57 | | | | $24.99 | |
INCOME (LOSS) FROM INVESTMENT OPERATIONS: | | | | | | | | | | | | | | | | | | | | | | | | |
Net investment income (loss)1 | | | 0.13 | | | | 0.24 | | | | 0.17 | | | | 0.11 | | | | 0.42 | | | | 0.14 | |
Net realized gain (loss) and unrealized appreciation/depreciation on investments, foreign currency related transactions and foreign capital gains taxes | | | 1.92 | | | | (3.75 | ) | | | 8.96 | | | | (0.13 | ) | | | (0.82 | ) | | | 2.80 | |
Total from investment operations | | | 2.05 | | | | (3.51 | ) | | | 9.13 | | | | (0.02 | ) | | | (0.40 | ) | | | 2.94 | |
LESS DISTRIBUTIONS FROM: | | | | | | | | | | | | | | | | | | | | | | | | |
Net investment income | | | — | | | | (0.21 | ) | | | (0.17 | ) | | | (0.13 | ) | | | (0.42 | ) | | | (0.13 | ) |
Net realized gains on investments | | | — | | | | (1.08 | ) | | | (0.22 | ) | | | (0.47 | ) | | | (2.21 | ) | | | (1.23 | ) |
Total distributions | | | — | | | | (1.29 | ) | | | (0.39 | ) | | | (0.60 | ) | | | (2.63 | ) | | | (1.36 | ) |
Paid-in capital from redemption fees (Note 4) | | | — | | | | — | | | | — | 2 | | | — | | | | — | 2 | | | — | 2 |
Net Asset Value, end of period | | | $28.91 | | | | $26.86 | | | | $31.66 | | | | $22.92 | | | | $23.54 | | | | $26.57 | |
TOTAL RETURN | | | 7.63% | 3 | | | (11.11% | ) | | | 39.96% | | | | (0.16% | ) | | | (1.30% | ) | | | 11.79% | |
| | | | | | |
RATIOS/SUPPLEMENTAL DATA | | | | | | | | | | | | | | | | | | | | | | | | |
Net assets, end of period (in 000’s) | | | $2,811,333 | | | | $2,618,155 | | | | $3,335,795 | | | | $2,445,183 | | | | $2,720,869 | | | | $3,047,077 | |
Ratio of expenses to average net assets before any reimbursement, waiver or recapture of expenses by Advisor and Administrator (Note 5) | | | 1.07% | 4 | | | 1.07% | | | | 1.08% | | | | 1.09% | | | | 1.09% | | | | 1.09% | |
Ratio of expenses to average net assets after any reimbursement, waiver or recapture of expenses by Advisor and Administrator | | | 1.05% | 4 | | | 1.04% | | | | 1.06% | | | | 1.08% | | | | 1.07% | | | | 1.08% | |
Ratio of net investment income (loss) to average net assets | | | 0.90% | 4 | | | 0.79% | | | | 0.63% | | | | 0.47% | | | | 1.53% | | | | 0.52% | |
Portfolio turnover5 | | | 8.66% | 3 | | | 11.48% | | | | 9.18% | | | | 5.73% | | | | 12.56% | | | | 11.38% | |
| | |
INSTITUTIONAL CLASS | | Six-Month
Period Ended
June 30, 2019 (unaudited) | | | Year Ended Dec. 31 | |
| | 2018 | | | 2017 | | | 2016 | | | 2015 | | | 2014 | |
Net Asset Value, beginning of period | | | $26.83 | | | | $31.63 | | | | $22.90 | | | | $23.52 | | | | $26.56 | | | | $24.97 | |
INCOME (LOSS) FROM INVESTMENT OPERATIONS: | | | | | | | | | | | | | | | | | | | | | | | | |
Net investment income (loss)1 | | | 0.15 | | | | 0.28 | | | | 0.22 | | | | 0.16 | | | | 0.44 | | | | 0.18 | |
Net realized gain (loss) and unrealized appreciation/depreciation on investments, foreign currency related transactions and foreign capital gains taxes | | | 1.92 | | | | (3.74 | ) | | | 8.95 | | | | (0.14 | ) | | | (0.80 | ) | | | 2.82 | |
Total from investment operations | | | 2.07 | | | | (3.46 | ) | | | 9.17 | | | | 0.02 | | | | (0.36 | ) | | | 3.00 | |
LESS DISTRIBUTIONS FROM: | | | | | | | | | | | | | | | | | | | | | | | | |
Net investment income | | | — | | | | (0.26 | ) | | | (0.22 | ) | | | (0.17 | ) | | | (0.47 | ) | | | (0.18 | ) |
Net realized gains on investments | | | — | | | | (1.08 | ) | | | (0.22 | ) | | | (0.47 | ) | | | (2.21 | ) | | | (1.23 | ) |
Total distributions | | | — | | | | (1.34 | ) | | | (0.44 | ) | | | (0.64 | ) | | | (2.68 | ) | | | (1.41 | ) |
Paid-in capital from redemption fees (Note 4) | | | — | | | | — | | | | — | 2 | | | — | | | | — | 2 | | | — | 2 |
Net Asset Value, end of period | | | $28.90 | | | | $26.83 | | | | $31.63 | | | | $22.90 | | | | $23.52 | | | | $26.56 | |
TOTAL RETURN | | | 7.72% | 3 | | | (10.94% | ) | | | 40.17% | | | | 0.03% | | | | (1.15% | ) | | | 12.03% | |
| | | | | | |
RATIOS/SUPPLEMENTAL DATA | | | | | | | | | | | | | | | | | | | | | | | | |
Net assets, end of period (in 000’s) | | | $6,381,634 | | | | $5,689,079 | | | | $6,389,242 | | | | $4,207,508 | | | | $3,964,547 | | | | $5,049,643 | |
Ratio of expenses to average net assets before any reimbursement, waiver or recapture of expenses by Advisor and Administrator (Note 5) | | | 0.92% | 4 | | | 0.90% | | | | 0.91% | | | | 0.91% | | | | 0.91% | | | | 0.92% | |
Ratio of expenses to average net assets after any reimbursement, waiver or recapture of expenses by Advisor and Administrator | | | 0.90% | 4 | | | 0.88% | | | | 0.89% | | | | 0.90% | | | | 0.89% | | | | 0.91% | |
Ratio of net investment income (loss) to average net assets | | | 1.07% | 4 | | | 0.95% | | | | 0.80% | | | | 0.65% | | | | 1.61% | | | | 0.68% | |
Portfolio turnover5 | | | 8.66% | 3 | | | 11.48% | | | | 9.18% | | | | 5.73% | | | | 12.56% | | | | 11.38% | |
| 1 | Calculated using the average daily shares method. |
| 2 | Less than $0.01 per share. |
| 5 | The portfolio turnover rate is calculated on the Fund as a whole without distinguishing between classes of shares issued. |
See accompanying notes to financial statements.
| | | | |
| matthewsasia.com | 800.789.ASIA | | | 127 | |
Financial Highlights(continued)
Matthews Asia ESG Fund
The tables below set forth financial data for a share of beneficial interest outstanding throughout each period presented.
| | | | | | | | | | | | | | | | | | | | |
| INVESTOR CLASS | | Six-Month
Period Ended
June 30, 2019 (unaudited) | | | Year Ended Dec. 31 | | | Period Ended Dec. 31, 20151 | |
| | 2018 | | | 2017 | | | 2016 | |
Net Asset Value, beginning of period | | | $9.98 | | | | $11.56 | | | | $8.97 | | | | $9.23 | | | | $10.00 | |
INCOME (LOSS) FROM INVESTMENT OPERATIONS: | | | | | | | | | | | | | | | | | | | | |
Net investment income (loss)2 | | | 0.02 | | | | 0.03 | | | | 0.05 | | | | 0.07 | | | | 0.02 | |
Net realized gain (loss) and unrealized appreciation/depreciation on investments, foreign currency related transactions and foreign capital gains taxes | | | 0.94 | | | | (1.16 | ) | | | 2.97 | | | | (0.20 | ) | | | (0.75 | ) |
Total from investment operations | | | 0.96 | | | | (1.13 | ) | | | 3.02 | | | | (0.13 | ) | | | (0.73 | ) |
LESS DISTRIBUTIONS FROM: | | | | | | | | | | | | | | | | | | | | |
Net investment income | | | — | | | | (0.02 | ) | | | (0.27 | ) | | | (0.13 | ) | | | (0.04 | ) |
Net realized gains on investments | | | — | | | | (0.43 | ) | | | (0.16 | ) | | | — | | | | — | |
Total distributions | | | — | | | | (0.45 | ) | | | (0.43 | ) | | | (0.13 | ) | | | (0.04 | ) |
Net Asset Value, end of period | | | $10.94 | | | | $9.98 | | | | $11.56 | | | | $8.97 | | | | $9.23 | |
TOTAL RETURN | | | 9.62% | 3 | | | (9.73% | ) | | | 33.79% | | | | (1.40% | ) | | | (7.30% | )3 |
| | | | | |
RATIOS/SUPPLEMENTAL DATA | | | | | | | | | | | | | | | | | | | | |
Net assets, end of period (in 000’s) | | | $15,825 | | | | $9,283 | | | | $10,695 | | | | $5,376 | | | | $3,248 | |
Ratio of expenses to average net assets before any reimbursement, waiver or recapture of expenses by Advisor and Administrator (Note 5) | | | 1.74% | 4 | | | 2.20% | | | | 2.65% | | | | 3.54% | | | | 9.09% | 4 |
Ratio of expenses to average net assets after any reimbursement, waiver or recapture of expenses by Advisor and Administrator | | | 1.50% | 4 | | | 1.50% | | | | 1.50% | | | | 1.48% | | | | 1.44% | 4 |
Ratio of net investment income (loss) to average net assets | | | 0.47% | 4 | | | 0.27% | | | | 0.45% | | | | 0.77% | | | | 0.25% | 4 |
Portfolio turnover5 | | | 8.64% | 3 | | | 22.93% | | | | 28.82% | | | | 16.10% | | | | 21.72% | 3 |
| | | |
INSTITUTIONAL CLASS | | Six-Month
Period Ended
June 30, 2019 (unaudited) | | | Year Ended Dec. 31 | | | Period Ended Dec. 31, 20151 | |
| | 2018 | | | 2017 | | | 2016 | |
Net Asset Value, beginning of period | | | $9.96 | | | | $11.50 | | | | $8.92 | | | | $9.17 | | | | $10.00 | |
INCOME (LOSS) FROM INVESTMENT OPERATIONS: | | | | | | | | | | | | | | | | | | | | |
Net investment income (loss)2 | | | 0.03 | | | | 0.06 | | | | 0.08 | | | | 0.09 | | | | 0.05 | |
Net realized gain (loss) and unrealized appreciation/depreciation on investments, foreign currency related transactions and foreign capital gains taxes | | | 0.94 | | | | (1.16 | ) | | | 2.95 | | | | (0.19 | ) | | | (0.77 | ) |
Total from investment operations | | | 0.97 | | | | (1.10 | ) | | | 3.03 | | | | (0.10 | ) | | | (0.72 | ) |
LESS DISTRIBUTIONS FROM: | | | | | | | | | | | | | | | | | | | | |
Net investment income | | | — | | | | (0.01 | ) | | | (0.29 | ) | | | (0.15 | ) | | | (0.11 | ) |
Net realized gains on investments | | | — | | | | (0.43 | ) | | | (0.16 | ) | | | — | | | | — | |
Total distributions | | | — | | | | (0.44 | ) | | | (0.45 | ) | | | (0.15 | ) | | | (0.11 | ) |
Net Asset Value, end of period | | | $10.93 | | | | $9.96 | | | | $11.50 | | | | $8.92 | | | | $9.17 | |
TOTAL RETURN | | | 9.74% | 3 | | | (9.52% | ) | | | 34.11% | | | | (1.16% | ) | | | (7.14% | )3 |
| | | | | |
RATIOS/SUPPLEMENTAL DATA | | | | | | | | | | | | | | | | | | | | |
Net assets, end of period (in 000’s) | | | $29,670 | | | | $23,249 | | | | $7,359 | | | | $3,382 | | | | $1,686 | |
Ratio of expenses to average net assets before any reimbursement, waiver or recapture of expenses by Advisor and Administrator (Note 5) | | | 1.53% | 4 | | | 2.01% | | | | 2.46% | | | | 3.36% | | | | 8.90% | 4 |
Ratio of expenses to average net assets after any reimbursement, waiver or recapture of expenses by Advisor and Administrator | | | 1.25% | 4 | | | 1.25% | | | | 1.25% | | | | 1.25% | | | | 1.25% | 4 |
Ratio of net investment income (loss) to average net assets | | | 0.57% | 4 | | | 0.55% | | | | 0.71% | | | | 0.97% | | | | 0.75% | 4 |
Portfolio turnover5 | | | 8.64% | 3 | | | 22.93% | | | | 28.82% | | | | 16.10% | | | | 21.72% | 3 |
| 1 | Commenced operations on April 30, 2015. |
| 2 | Calculated using the average daily shares method. |
| 5 | The portfolio turnover rate is calculated on the Fund as a whole without distinguishing between classes of shares issued. |
See accompanying notes to financial statements.
Financial Highlights(continued)
Matthews Emerging Asia Fund
The tables below set forth financial data for a share of beneficial interest outstanding throughout each period presented.
| | | | | | | | | | | | | | | | | | | | | | | | |
INVESTOR CLASS | | Six-Month
Period Ended
June 30, 2019 (unaudited) | | | Year Ended Dec. 31 | |
| | 2018 | | | 2017 | | | 2016 | | | 2015 | | | 2014 | |
Net Asset Value, beginning of period | | | $12.50 | | | | $15.51 | | | | $13.18 | | | | $11.27 | | | | $11.60 | | | | $9.93 | |
INCOME (LOSS) FROM INVESTMENT OPERATIONS: | | | | | | | | | | | | | | | | | | | | | | | | |
Net investment income (loss)1 | | | 0.08 | | | | 0.10 | | | | 0.07 | | | | 0.15 | | | | 0.04 | | | | 0.04 | |
Net realized gain (loss) and unrealized appreciation/depreciation on investments, foreign currency related transactions and foreign capital gains taxes | | | (0.29 | ) | | | (2.82 | ) | | | 2.35 | | | | 2.01 | | | | (0.34 | ) | | | 1.69 | |
Total from investment operations | | | (0.21 | ) | | | (2.72 | ) | | | 2.42 | | | | 2.16 | | | | (0.30 | ) | | | 1.73 | |
LESS DISTRIBUTIONS FROM: | | | | | | | | | | | | | | | | | | | | | | | | |
Net investment income | | | — | | | | (0.10 | ) | | | (0.04 | ) | | | (0.13 | ) | | | — | 2 | | | (0.06 | ) |
Net realized gains on investments | | | — | | | | (0.19 | ) | | | (0.05 | ) | | | (0.13 | ) | | | (0.03 | ) | | | — | |
Total distributions | | | — | | | | (0.29 | ) | | | (0.09 | ) | | | (0.26 | ) | | | (0.03 | ) | | | (0.06 | ) |
Paid-in capital from redemption fees (Note 4) | | | — | 2 | | | — | 2 | | | — | 2 | | | 0.01 | | | | — | 2 | | | — | 2 |
Net Asset Value, end of period | | | $12.29 | | | | $12.50 | | | | $15.51 | | | | $13.18 | | | | $11.27 | | | | $11.60 | |
TOTAL RETURN | | | (1.68% | )3 | | | (17.58% | ) | | | 18.42% | | | | 19.25% | | | | (2.56% | ) | | | 17.39% | |
| | | | | | |
RATIOS/SUPPLEMENTAL DATA | | | | | | | | | | | | | | | | | | | | | | | | |
Net assets, end of period (in 000’s) | | | $108,416 | | | | $118,505 | | | | $219,596 | | | | $145,164 | | | | $114,590 | | | | $110,363 | |
Ratio of expenses to average net assets before any reimbursement, waiver or recapture of expenses by Advisor and Administrator (Note 5) | | | 1.69% | 4 | | | 1.66% | | | | 1.70% | | | | 1.77% | | | | 1.75% | | | | 1.78% | |
Ratio of expenses to average net assets after any reimbursement, waiver or recapture of expenses by Advisor and Administrator | | | 1.50% | 4 | | | 1.48% | | | | 1.48% | | | | 1.47% | | | | 1.50% | | | | 1.58% | |
Ratio of net investment income (loss) to average net assets | | | 1.28% | 4 | | | 0.72% | | | | 0.49% | | | | 1.26% | | | | 0.33% | | | | 0.34% | |
Portfolio turnover5 | | | 2.36% | 3 | | | 26.09% | | | | 7.74% | | | | 34.90% | | | | 12.14% | | | | 8.21% | |
| | |
INSTITUTIONAL CLASS | | Six-Month
Period Ended
June 30, 2019 (unaudited) | | | Year Ended Dec. 31 | |
| | 2018 | | | 2017 | | | 2016 | | | 2015 | | | 2014 | |
Net Asset Value, beginning of period | | | $12.54 | | | | $15.57 | | | | $13.22 | | | | $11.29 | | | | $11.60 | | | | $9.92 | |
INCOME (LOSS) FROM INVESTMENT OPERATIONS: | | | | | | | | | | | | | | | | | | | | | | | | |
Net investment income (loss)1 | | | 0.10 | | | | 0.14 | | | | 0.10 | | | | 0.21 | | | | 0.07 | | | | 0.06 | |
Net realized gain (loss) and unrealized appreciation/depreciation on investments, foreign currency related transactions and foreign capital gains taxes | | | (0.29 | ) | | | (2.85 | ) | | | 2.37 | | | | 1.99 | | | | (0.34 | ) | | | 1.69 | |
Total from investment operations | | | (0.19 | ) | | | (2.71 | ) | | | 2.47 | | | | 2.20 | | | | (0.27 | ) | | | 1.75 | |
LESS DISTRIBUTIONS FROM: | | | | | | | | | | | | | | | | | | | | | | | | |
Net investment income | | | — | | | | (0.13 | ) | | | (0.07 | ) | | | (0.15 | ) | | | (0.01 | ) | | | (0.07 | ) |
Net realized gains on investments | | | — | | | | (0.19 | ) | | | (0.05 | ) | | | (0.13 | ) | | | (0.03 | ) | | | — | |
Total distributions | | | — | | | | (0.32 | ) | | | (0.12 | ) | | | (0.28 | ) | | | (0.04 | ) | | | (0.07 | ) |
Paid-in capital from redemption fees (Note 4) | | | — | 2 | | | — | 2 | | | — | 2 | | | 0.01 | | | | — | 2 | | | — | 2 |
Net Asset Value, end of period | | | $12.35 | | | | $12.54 | | | | $15.57 | | | | $13.22 | | | | $11.29 | | | | $11.60 | |
TOTAL RETURN | | | (1.52% | )3 | | | (17.41% | ) | | | 18.70% | | | | 19.61% | | | | (2.33% | ) | | | 17.68% | |
| | | | | | |
RATIOS/SUPPLEMENTAL DATA | | | | | | | | | | | | | | | | | | | | | | | | |
Net assets, end of period (in 000’s) | | | $320,071 | | | | $256,669 | | | | $275,233 | | | | $95,724 | | | | $55,278 | | | | $21,350 | |
Ratio of expenses to average net assets before any reimbursement, waiver or recapture of expenses by Advisor and Administrator (Note 5) | | | 1.51% | 4 | | | 1.50% | | | | 1.52% | | | | 1.62% | | | | 1.57% | | | | 1.59% | |
Ratio of expenses to average net assets after any reimbursement, waiver or recapture of expenses by Advisor and Administrator | | | 1.25% | 4 | | | 1.25% | | | | 1.25% | | | | 1.25% | | | | 1.25% | | | | 1.33% | |
Ratio of net investment income (loss) to average net assets | | | 1.61% | 4 | | | 0.97% | | | | 0.70% | | | | 1.72% | | | | 0.65% | | | | 0.55% | |
Portfolio turnover5 | | | 2.36% | 3 | | | 26.09% | | | | 7.74% | | | | 34.90% | | | | 12.14% | | | | 8.21% | |
| 1 | Calculated using the average daily shares method. |
| 2 | Less than $0.01 per share. |
| 5 | The portfolio turnover rate is calculated on the Fund as a whole without distinguishing between classes of shares issued. |
See accompanying notes to financial statements.
| | | | |
| matthewsasia.com | 800.789.ASIA | | | 129 | |
Financial Highlights(continued)
Matthews Asia Innovators Fund
The tables below set forth financial data for a share of beneficial interest outstanding throughout each period presented.
| | | | | | | | | | | | | | | | | | | | | | | | |
| INVESTOR CLASS | | Six-Month
Period Ended
June 30, 2019 (unaudited) | | | Year Ended Dec. 31 | |
| | 2018 | | | 2017 | | | 2016 | | | 2015 | | | 2014 | |
Net Asset Value, beginning of period | | | $11.26 | | | | $14.19 | | | | $10.10 | | | | $12.32 | | | | $13.61 | | | | $12.59 | |
INCOME (LOSS) FROM INVESTMENT OPERATIONS: | | | | | | | | | | | | | | | | | | | | | | | | |
Net investment income (loss)1 | | | 0.03 | | | | (0.01 | ) | | | (0.02 | ) | | | (0.02 | ) | | | (0.05 | ) | | | — | 2 |
Net realized gain (loss) and unrealized appreciation/depreciation on investments, foreign currency related transactions and foreign capital gains taxes | | | 2.12 | | | | (2.62 | ) | | | 5.31 | | | | (1.07 | ) | | | 0.64 | | | | 1.16 | |
Total from investment operations | | | 2.15 | | | | (2.63 | ) | | | 5.29 | | | | (1.09 | ) | | | 0.59 | | | | 1.16 | |
LESS DISTRIBUTIONS FROM: | | | | | | | | | | | | | | | | | | | | | | | | |
Net investment income | | | — | | | | (0.04 | ) | | | (0.24 | ) | | | — | | | | — | | | | (0.06 | ) |
Net realized gains on investments | | | — | | | | (0.26 | ) | | | (0.96 | ) | | | (1.13 | ) | | | (1.88 | ) | | | (0.08 | ) |
Total distributions | | | — | | | | (0.30 | ) | | | (1.20 | ) | | | (1.13 | ) | | | (1.88 | ) | | | (0.14 | ) |
Net Asset Value, end of period | | | $13.41 | | | | $11.26 | | | | $14.19 | | | | $10.10 | | | | $12.32 | | | | $13.61 | |
TOTAL RETURN | | | 19.09% | 3 | | | (18.62% | ) | | | 52.88% | | | | (9.10% | ) | | | 4.48% | | | | 9.24% | |
| | | | | | |
RATIOS/SUPPLEMENTAL DATA | | | | | | | | | | | | | | | | | | | | | | | | |
Net assets, end of period (in 000’s) | | | $174,602 | | | | $152,449 | | | | $175,331 | | | | $83,926 | | | | $129,763 | | | | $125,612 | |
Ratio of expenses to average net assets | | | 1.20% | 4 | | | 1.19% | | | | 1.24% | | | | 1.24% | | | | 1.18% | | | | 1.16% | |
Ratio of net investment income (loss) to average net assets | | | 0.46% | 4 | | | (0.07% | ) | | | (0.18% | ) | | | (0.19% | ) | | | (0.33% | ) | | | (0.02% | ) |
Portfolio turnover5 | | | 37.24% | 3 | | | 85.73% | | | | 66.51% | | | | 92.25% | | | | 72.85% | | | | 62.99% | |
| | |
INSTITUTIONAL CLASS | | Six-Month
Period Ended
June 30, 2019 (unaudited) | | | Year Ended Dec. 31 | |
| | 2018 | | | 2017 | | | 2016 | | | 2015 | | | 2014 | |
Net Asset Value, beginning of period | | | $11.32 | | | | $14.26 | | | | $10.14 | | | | $12.34 | | | | $13.61 | | | | $12.58 | |
INCOME (LOSS) FROM INVESTMENT OPERATIONS: | | | | | | | | | | | | | | | | | | | | | | | | |
Net investment income (loss)1 | | | 0.04 | | | | 0.01 | | | | 0.01 | | | | 0.01 | | | | (0.02 | ) | | | 0.03 | |
Net realized gain (loss) and unrealized appreciation/depreciation on investments, foreign currency related transactions and foreign capital gains taxes | | | 2.13 | | | | (2.62 | ) | | | 5.33 | | | | (1.08 | ) | | | 0.63 | | | | 1.17 | |
Total from investment operations | | | 2.17 | | | | (2.61 | ) | | | 5.34 | | | | (1.07 | ) | | | 0.61 | | | | 1.20 | |
LESS DISTRIBUTIONS FROM: | | | | | | | | | | | | | | | | | | | | | | | | |
Net investment income | | | — | | | | (0.07 | ) | | | (0.26 | ) | | | — | | | | — | | | | (0.09 | ) |
Net realized gains on investments | | | — | | | | (0.26 | ) | | | (0.96 | ) | | | (1.13 | ) | | | (1.88 | ) | | | (0.08 | ) |
Total distributions | | | — | | | | (0.33 | ) | | | (1.22 | ) | | | (1.13 | ) | | | (1.88 | ) | | | (0.17 | ) |
Net Asset Value, end of period | | | $13.49 | | | | $11.32 | | | | $14.26 | | | | $10.14 | | | | $12.34 | | | | $13.61 | |
TOTAL RETURN | | | 19.17% | 3 | | | (18.40% | ) | | | 53.18% | | | | (8.92% | ) | | | 4.63% | | | | 9.54% | |
| | | | | | |
RATIOS/SUPPLEMENTAL DATA | | | | | | | | | | | | | | | | | | | | | | | | |
Net assets, end of period (in 000’s) | | | $117,717 | | | | $91,769 | | | | $30,957 | | | | $16,545 | | | | $36,770 | | | | $61,088 | |
Ratio of expenses to average net assets | | | 1.05% | 4 | | | 1.02% | | | | 1.05% | | | | 1.01% | | | | 0.97% | | | | 0.95% | |
Ratio of net investment income (loss) to average net assets | | | 0.68% | 4 | | | 0.07% | | | | 0.06% | | | | 0.06% | | | | (0.16% | ) | | | 0.21% | |
Portfolio turnover5 | | | 37.24% | 3 | | | 85.73% | | | | 66.51% | | | | 92.25% | | | | 72.85% | | | | 62.99% | |
| 1 | Calculated using the average daily shares method. |
| 2 | Less than $0.01 per share. |
| 5 | The portfolio turnover rate is calculated on the Fund as a whole without distinguishing between classes of shares issued. |
See accompanying notes to financial statements.
Financial Highlights(continued)
Matthews China Fund
The tables below set forth financial data for a share of beneficial interest outstanding throughout each period presented.
| | | | | | | | | | | | | | | | | | | | | | | | |
INVESTOR CLASS | | Six-Month
Period Ended
June 30, 2019 (unaudited) | | | Year Ended Dec. 31 | |
| | 2018 | | | 2017 | | | 20161 | | | 20151 | | | 20141 | |
Net Asset Value, beginning of period | | | $14.37 | | | | $22.20 | | | | $15.47 | | | | $18.42 | | | | $21.46 | | | | $22.84 | |
INCOME (LOSS) FROM INVESTMENT OPERATIONS: | | | | | | | | | | | | | | | | | | | | | | | | |
Net investment income (loss)2 | | | 0.13 | | | | 0.21 | | | | 0.16 | | | | 0.21 | | | | 0.20 | | | | 0.24 | |
Net realized gain (loss) and unrealized appreciation/depreciation on investments and foreign currency related transactions | | | 3.07 | | | | (4.84 | ) | | | 8.86 | | | | (1.04 | ) | | | 0.30 | | | | (1.25 | ) |
Total from investment operations | | | 3.20 | | | | (4.63 | ) | | | 9.02 | | | | (0.83 | ) | | | 0.50 | | | | (1.01 | ) |
LESS DISTRIBUTIONS FROM: | | | | | | | | | | | | | | | | | | | | | | | | |
Net investment income | | | — | | | | (0.29 | ) | | | (0.37 | ) | | | (0.26 | ) | | | (0.21 | ) | | | (0.27 | ) |
Net realized gains on investments | | | — | | | | (2.91 | ) | | | (1.92 | ) | | | (1.29 | ) | | | (3.33 | ) | | | (0.10 | ) |
Return of capital | | | — | | | | — | | | | — | | | | (0.57 | ) | | | — | | | | — | |
Total distributions | | | — | | | | (3.20 | ) | | | (2.29 | ) | | | (2.12 | ) | | | (3.54 | ) | | | (0.37 | ) |
Paid-in capital from redemption fees (Note 4) | | | — | | | | — | | | | — | | | | — | 3 | | | — | 3 | | | — | 3 |
Net Asset Value, end of period | | | $17.57 | | | | $14.37 | | | | $22.20 | | | | $15.47 | | | | $18.42 | | | | $21.46 | |
TOTAL RETURN | | | 22.27% | 4 | | | (21.42% | ) | | | 59.37% | | | | (5.18% | ) | | | 2.41% | | | | (4.42% | ) |
| | | | | | |
RATIOS/SUPPLEMENTAL DATA | | | | | | | | | | | | | | | | | | | | | | | | |
Net assets, end of period (in 000’s) | | | $709,970 | | | | $566,456 | | | | $843,508 | | | | $495,900 | | | | $709,767 | | | | $947,740 | |
Ratio of expenses to average net assets | | | 1.10% | 5 | | | 1.10% | | | | 1.09% | | | | 1.18% | | | | 1.14% | | | | 1.11% | |
Ratio of net investment income (loss) to average net assets | | | 1.56% | 5 | | | 1.00% | | | | 0.78% | | | | 1.24% | | | | 0.89% | | | | 1.09% | |
Portfolio turnover6 | | | 31.90% | 4 | | | 96.98% | | | | 78.74% | | | | 83.82% | | | | 66.22% | | | | 10.23% | |
| | |
| INSTITUTIONAL CLASS | | Six-Month
Period Ended
June 30, 2019 (unaudited) | | | Year Ended Dec. 31 | |
| | 2018 | | | 2017 | | | 20161 | | | 20151 | | | 20141 | |
Net Asset Value, beginning of period | | | $14.33 | | | | $22.17 | | | | $15.44 | | | | $18.39 | | | | $21.44 | | | | $22.81 | |
INCOME (LOSS) FROM INVESTMENT OPERATIONS: | | | | | | | | | | | | | | | | | | | | | | | | |
Net investment income (loss)2 | | | 0.18 | | | | 0.33 | | | | 0.21 | | | | 0.22 | | | | 0.25 | | | | 0.28 | |
Net realized gain (loss) and unrealized appreciation/depreciation on investments and foreign currency related transactions | | | 3.04 | | | | (4.93 | ) | | | 8.84 | | | | (1.03 | ) | | | 0.27 | | | | (1.25 | ) |
Total from investment operations | | | 3.22 | | | | (4.60 | ) | | | 9.05 | | | | (0.81 | ) | | | 0.52 | | | | (0.97 | ) |
LESS DISTRIBUTIONS FROM: | | | | | | | | | | | | | | | | | | | | | | | | |
Net investment income | | | — | | | | (0.33 | ) | | | (0.40 | ) | | | (0.28 | ) | | | (0.24 | ) | | | (0.30 | ) |
Net realized gains on investments | | | — | | | | (2.91 | ) | | | (1.92 | ) | | | (1.29 | ) | | | (3.33 | ) | | | (0.10 | ) |
Return of capital | | | — | | | | — | | | | — | | | | (0.57 | ) | | | — | | | | — | |
Total distributions | | | — | | | | (3.24 | ) | | | (2.32 | ) | | | (2.14 | ) | | | (3.57 | ) | | | (0.40 | ) |
Paid-in capital from redemption fees (Note 4) | | | — | | | | — | | | | — | | | | — | 3 | | | — | 3 | | | — | 3 |
Net Asset Value, end of period | | | $17.55 | | | | $14.33 | | | | $22.17 | | | | $15.44 | | | | $18.39 | | | | $21.44 | |
TOTAL RETURN | | | 22.47% | 4 | | | (21.32% | ) | | | 59.71% | | | | (5.06% | ) | | | 2.50% | | | | (4.22% | ) |
| | | | | | |
RATIOS/SUPPLEMENTAL DATA | | | | | | | | | | | | | | | | | | | | | | | | |
Net assets, end of period (in 000’s) | | | $153,482 | | | | $46,657 | | | | $61,975 | | | | $15,874 | | | | $24,276 | | | | $52,478 | |
Ratio of expenses to average net assets | | | 0.92% | 5 | | | 0.91% | | | | 0.93% | | | | 1.03% | | | | 0.99% | | | | 0.95% | |
Ratio of net investment income (loss) to average net assets | | | 2.19% | 5 | | | 1.53% | | | | 0.99% | | | | 1.32% | | | | 1.09% | | | | 1.27% | |
Portfolio turnover6 | | | 31.90% | 4 | | | 96.98% | | | | 78.74% | | | | 83.82% | | | | 66.22% | | | | 10.23% | |
| 1 | Consolidated Financial Highlights. See Note2-C. |
| 2 | Calculated using the average daily shares method. |
| 3 | Less than $0.01 per share. |
| 6 | The portfolio turnover rate is calculated on the Fund as a whole without distinguishing between classes of shares issued. |
See accompanying notes to financial statements.
| | | | |
| matthewsasia.com | 800.789.ASIA | | | 131 | |
Financial Highlights(continued)
Matthews India Fund
The tables below set forth financial data for a share of beneficial interest outstanding throughout each period presented.
| | | | | | | | | | | | | | | | | | | | | | | | |
| INVESTOR CLASS | | Six-Month
Period Ended
June 30, 2019 (unaudited) | | | Year Ended Dec. 31 | |
| | 2018 | | | 2017 | | | 2016 | | | 2015 | | | 2014 | |
Net Asset Value, beginning of period | | | $26.32 | | | | $34.31 | | | | $25.65 | | | | $26.43 | | | | $26.46 | | | | $16.28 | |
INCOME (LOSS) FROM INVESTMENT OPERATIONS: | | | | | | | | | | | | | | | | | | | | | | | | |
Net investment income (loss)1 | | | (0.03 | ) | | | (0.05 | ) | | | (0.09 | ) | | | 0.01 | | | | (0.05 | ) | | | 0.07 | |
Net realized gain (loss) and unrealized appreciation/depreciation on investments, foreign currency related transactions and foreign capital gains taxes | | | 0.63 | | | | (3.60 | ) | | | 9.24 | | | | (0.33 | ) | | | 0.26 | | | | 10.29 | |
Total from investment operations | | | 0.60 | | | | (3.65 | ) | | | 9.15 | | | | (0.32 | ) | | | 0.21 | | | | 10.36 | |
LESS DISTRIBUTIONS FROM: | | | | | | | | | | | | | | | | | | | | | | | | |
Net investment income | | | — | | | | — | | | | — | | | | — | | | | (0.03 | ) | | | (0.05 | ) |
Net realized gains on investments | | | — | | | | (4.34 | ) | | | (0.49 | ) | | | (0.46 | ) | | | (0.23 | ) | | | (0.14 | ) |
Total distributions | | | — | | | | (4.34 | ) | | | (0.49 | ) | | | (0.46 | ) | | | (0.26 | ) | | | (0.19 | ) |
Paid-in capital from redemption fees (Note 4) | | | — | | | | — | | | | — | | | | — | | | | 0.02 | | | | 0.01 | |
Net Asset Value, end of period | | | $26.92 | | | | $26.32 | | | | $34.31 | | | | $25.65 | | | | $26.43 | | | | $26.46 | |
TOTAL RETURN | | | 2.28% | 2 | | | (10.09% | ) | | | 35.79% | | | | (1.23% | ) | | | 0.90% | | | | 63.71% | |
| | | | | | |
RATIOS/SUPPLEMENTAL DATA | | | | | | | | | | | | | | | | | | | | | | | | |
Net assets, end of period (in 000’s) | | | $1,095,538 | | | | $1,077,990 | | | | $1,484,045 | | | | $967,009 | | | | $1,151,948 | | | | $974,838 | |
Ratio of expenses to average net assets | | | 1.11% | 3 | | | 1.09% | | | | 1.09% | | | | 1.12% | | | | 1.11% | | | | 1.12% | |
Ratio of net investment income (loss) to average net assets | | | (0.25% | )3 | | | (0.16% | ) | | | (0.30% | ) | | | 0.02% | | | | (0.17% | ) | | | 0.32% | |
Portfolio turnover4 | | | 12.53% | 2 | | | 20.87% | | | | 16.81% | | | | 15.76% | | | | 9.51% | | | | 14.86% | |
| | |
| INSTITUTIONAL CLASS | | Six-Month
Period Ended
June 30, 2019 (unaudited) | | | Year Ended Dec. 31 | |
| | 2018 | | | 2017 | | | 2016 | | | 2015 | | | 2014 | |
Net Asset Value, beginning of period | | | $26.56 | | | | $34.51 | | | | $25.77 | | | | $26.49 | | | | $26.49 | | | | $16.31 | |
INCOME (LOSS) FROM INVESTMENT OPERATIONS: | | | | | | | | | | | | | | | | | | | | | | | | |
Net investment income (loss)1 | | | (0.01 | ) | | | 0.01 | | | | (0.03 | ) | | | 0.04 | | | | 0.01 | | | | 0.09 | |
Net realized gain (loss) and unrealized appreciation/depreciation on investments, foreign currency related transactions and foreign capital gains taxes | | | 0.63 | | | | (3.62 | ) | | | 9.29 | | | | (0.30 | ) | | | 0.26 | | | | 10.29 | |
Total from investment operations | | | 0.62 | | | | (3.61 | ) | | | 9.26 | | | | (0.26 | ) | | | 0.27 | | | | 10.38 | |
LESS DISTRIBUTIONS FROM: | | | | | | | | | | | | | | | | | | | | | | | | |
Net investment income | | | — | | | | — | | | | (0.03 | ) | | | — | | | | (0.06 | ) | | | (0.08 | ) |
Net realized gains on investments | | | — | | | | (4.34 | ) | | | (0.49 | ) | | | (0.46 | ) | | | (0.23 | ) | | | (0.14 | ) |
Total distributions | | | — | | | | (4.34 | ) | | | (0.52 | ) | | | (0.46 | ) | | | (0.29 | ) | | | (0.22 | ) |
Paid-in capital from redemption fees (Note 4) | | | — | | | | — | | | | — | | | | — | | | | 0.02 | | | | 0.02 | |
Net Asset Value, end of period | | | $27.18 | | | | $26.56 | | | | $34.51 | | | | $25.77 | | | | $26.49 | | | | $26.49 | |
TOTAL RETURN | | | 2.34% | 2 | | | (9.92% | ) | | | 36.05% | | | | (1.00% | ) | | | 1.12% | | | | 63.80% | |
| | | | | | |
RATIOS/SUPPLEMENTAL DATA | | | | | | | | | | | | | | | | | | | | | | | | |
Net assets, end of period (in 000’s) | | | $373,158 | | | | $463,790 | | | | $788,388 | | | | $551,202 | | | | $353,879 | | | | $109,331 | |
Ratio of expenses to average net assets | | | 0.93% | 3 | | | 0.90% | | | | 0.89% | | | | 0.91% | | | | 0.90% | | | | 0.94% | |
Ratio of net investment income (loss) to average net assets | | | (0.08% | )3 | | | 0.02% | | | | (0.08% | ) | | | 0.16% | | | | 0.02% | | | | 0.38% | |
Portfolio turnover4 | | | 12.53% | 2 | | | 20.87% | | | | 16.81% | | | | 15.76% | | | | 9.51% | | | | 14.86% | |
| 1 | Calculated using the average daily shares method. |
| 4 | The portfolio turnover rate is calculated on the Fund as a whole without distinguishing between classes of shares issued. |
See accompanying notes to financial statements.
Financial Highlights(continued)
Matthews Japan Fund
The tables below set forth financial data for a share of beneficial interest outstanding throughout each period presented.
| | | | | | | | | | | | | | | | | | | | | | | | |
| INVESTOR CLASS | | Six-Month
Period Ended
June 30, 2019 (unaudited) | | | Year Ended Dec. 31 | |
| | 2018 | | | 2017 | | | 2016 | | | 2015 | | | 2014 | |
Net Asset Value, beginning of period | | | $18.53 | | | | $24.12 | | | | $18.83 | | | | $18.97 | | | | $15.70 | | | | $16.20 | |
INCOME (LOSS) FROM INVESTMENT OPERATIONS: | | | | | | | | | | | | | | | | | | | | | | | | |
Net investment income (loss)1 | | | 0.06 | | | | 0.09 | | | | 0.09 | | | | 0.08 | | | | 0.04 | | | | 0.05 | |
Net realized gain (loss) and unrealized appreciation/depreciation on investments and foreign currency related transactions | | | 2.49 | | | | (4.91 | ) | | | 6.13 | | | | (0.01 | ) | | | 3.23 | | | | (0.48 | ) |
Total from investment operations | | | 2.55 | | | | (4.82 | ) | | | 6.22 | | | | 0.07 | | | | 3.27 | | | | (0.43 | ) |
LESS DISTRIBUTIONS FROM: | | | | | | | | | | | | | | | | | | | | | | | | |
Net investment income | | | — | | | | (0.06 | ) | | | (0.20 | ) | | | (0.16 | ) | | | — | | | | (0.08 | ) |
Net realized gains on investments | | | — | | | | (0.71 | ) | | | (0.73 | ) | | | (0.05 | ) | | | — | | | | — | |
Total distributions | | | — | | | | (0.77 | ) | | | (0.93 | ) | | | (0.21 | ) | | | — | | | | (0.08 | ) |
Paid-in capital from redemption fees (Note 4) | | | — | | | | — | | | | — | | | | — | | | | — | 2 | | | 0.01 | |
Net Asset Value, end of period | | | $21.08 | | | | $18.53 | | | | $24.12 | | | | $18.83 | | | | $18.97 | | | | $15.70 | |
TOTAL RETURN | | | 13.76% | 3 | | | (20.18% | ) | | | 33.14% | | | | 0.40% | | | | 20.83% | | | | (2.60% | ) |
| | | | | | |
RATIOS/SUPPLEMENTAL DATA | | | | | | | | | | | | | | | | | | | | | | | | |
Net assets, end of period (in 000’s) | | | $1,631,127 | | | | $1,704,102 | | | | $2,155,280 | | | | $1,685,872 | | | | $1,330,743 | | | | $467,854 | |
Ratio of expenses to average net assets before any reimbursement, waiver or recapture of expenses by Advisor and Administrator (Note 5) | | | 0.93% | 4 | | | 0.91% | | | | 0.95% | | | | 0.98% | | | | 0.99% | | | | 1.03% | |
Ratio of expenses to average net assets after any reimbursement, waiver or recapture of expenses by Advisor and Administrator | | | 0.93% | 4 | | | 0.91% | | | | 0.94% | | | | 0.98% | | | | 0.99% | | | | 1.03% | |
Ratio of net investment income (loss) to average net assets | | | 0.56% | 4 | | | 0.40% | | | | 0.40% | | | | 0.43% | | | | 0.22% | | | | 0.32% | |
Portfolio turnover5 | | | 11.33% | 3 | | | 46.11% | | | | 44.34% | | | | 55.15% | | | | 24.19% | | | | 42.52% | |
| | |
| INSTITUTIONAL CLASS | | Six-Month
Period Ended
June 30, 2019 (unaudited) | | | Year Ended Dec. 31 | |
| | 2018 | | | 2017 | | | 2016 | | | 2015 | | | 2014 | |
Net Asset Value, beginning of period | | | $18.57 | | | | $24.16 | | | | $18.86 | | | | $19.00 | | | | $15.71 | | | | $16.20 | |
INCOME (LOSS) FROM INVESTMENT OPERATIONS: | | | | | | | | | | | | | | | | | | | | | | | | |
Net investment income (loss)1 | | | 0.06 | | | | 0.11 | | | | 0.10 | | | | 0.10 | | | | 0.05 | | | | 0.09 | |
Net realized gain (loss) and unrealized appreciation/depreciation on investments and foreign currency related transactions | | | 2.49 | | | | (4.91 | ) | | | 6.14 | | | | — | 2 | | | 3.24 | | | | (0.50 | ) |
Total from investment operations | | | 2.55 | | | | (4.80 | ) | | | 6.24 | | | | 0.10 | | | | 3.29 | | | | (0.41 | ) |
LESS DISTRIBUTIONS FROM: | | | | | | | | | | | | | | | | | | | | | | | | |
Net investment income | | | — | | | | (0.08 | ) | | | (0.21 | ) | | | (0.19 | ) | | | — | | | | (0.09 | ) |
Net realized gains on investments | | | — | | | | (0.71 | ) | | | (0.73 | ) | | | (0.05 | ) | | | — | | | | — | |
Total distributions | | | — | | | | (0.79 | ) | | | (0.94 | ) | | | (0.24 | ) | | | — | | | | (0.09 | ) |
Paid-in capital from redemption fees (Note 4) | | | — | | | | — | | | | — | | | | — | | | | — | 2 | | | 0.01 | |
Net Asset Value, end of period | | | $21.12 | | | | $18.57 | | | | $24.16 | | | | $18.86 | | | | $19.00 | | | | $15.71 | |
TOTAL RETURN | | | 13.73% | 3 | | | (20.08% | ) | | | 33.23% | | | | 0.51% | | | | 20.94% | | | | (2.47% | ) |
| | | | | | |
RATIOS/SUPPLEMENTAL DATA | | | | | | | | | | | | | | | | | | | | | | | | |
Net assets, end of period (in 000’s) | | | $1,038,395 | | | | $1,167,472 | | | | $1,957,214 | | | | $1,302,317 | | | | $618,583 | | | | $154,750 | |
Ratio of expenses to average net assets before any reimbursement, waiver or recapture of expenses by Advisor and Administrator (Note 5) | | | 0.87% | 4 | | | 0.85% | | | | 0.87% | | | | 0.88% | | | | 0.87% | | | | 0.90% | |
Ratio of expenses to average net assets after any reimbursement, waiver or recapture of expenses by Advisor and Administrator | | | 0.87% | 4 | | | 0.84% | | | | 0.86% | | | | 0.88% | | | | 0.87% | | | | 0.90% | |
Ratio of net investment income (loss) to average net assets | | | 0.56% | 4 | | | 0.46% | | | | 0.46% | | | | 0.54% | | | | 0.28% | | | | 0.58% | |
Portfolio turnover5 | | | 11.33% | 3 | | | 46.11% | | | | 44.34% | | | | 55.15% | | | | 24.19% | | | | 42.52% | |
| 1 | Calculated using the average daily shares method. |
| 2 | Less than $0.01 per share. |
| 5 | The portfolio turnover rate is calculated on the Fund as a whole without distinguishing between classes of shares issued. |
See accompanying notes to financial statements.
| | | | |
| matthewsasia.com | 800.789.ASIA | | | 133 | |
Financial Highlights(continued)
Matthews Korea Fund
The tables below set forth financial data for a share of beneficial interest outstanding throughout each period presented.
| | | | | | | | | | | | | | | | | | | | | | | | |
| INVESTOR CLASS | | Six-Month
Period Ended June 30, 2019
(unaudited) | | | Year Ended Dec. 31 | |
| | 2018 | | | 2017 | | | 2016 | | | 2015 | | | 2014 | |
Net Asset Value, beginning of period | | | $4.58 | | | | $6.91 | | | | $5.25 | | | | $6.15 | | | | $5.65 | | | | $5.95 | |
INCOME (LOSS) FROM INVESTMENT OPERATIONS: | | | | | | | | | | | | | | | | | | | | | | | | |
Net investment income (loss)1 | | | (0.02 | ) | | | 0.06 | | | | 0.06 | | | | 0.02 | | | | 0.01 | | | | — | 2 |
Net realized gain (loss) and unrealized appreciation/depreciation on investments and foreign currency related transactions | | | (0.02 | ) | | | (1.61 | ) | | | 2.22 | | | | (0.41 | ) | | | 0.83 | | | | (0.05 | ) |
Total from investment operations | | | (0.04 | ) | | | (1.55 | ) | | | 2.28 | | | | (0.39 | ) | | | 0.84 | | | | (0.05 | ) |
LESS DISTRIBUTIONS FROM: | | | | | | | | | | | | | | | | | | | | | | | | |
Net investment income | | | — | | | | (0.13 | ) | | | (0.29 | ) | | | (0.08 | ) | | | (0.01 | ) | | | — | |
Net realized gains on investments | | | — | | | | (0.65 | ) | | | (0.33 | ) | | | (0.43 | ) | | | (0.33 | ) | | | (0.25 | ) |
Total distributions | | | — | | | | (0.78 | ) | | | (0.62 | ) | | | (0.51 | ) | | | (0.34 | ) | | | (0.25 | ) |
Paid-in capital from redemption fees (Note 4) | | | — | | | | — | | | | — | | | | — | | | | — | 2 | | | — | 2 |
Net Asset Value, end of period | | | $4.54 | | | | $4.58 | | | | $6.91 | | | | $5.25 | | | | $6.15 | | | | $5.65 | |
TOTAL RETURN | | | (0.87% | )3 | | | (22.21% | ) | | | 43.70% | | | | (6.32% | ) | | | 15.16% | | | | (0.73% | ) |
| | | | | | |
RATIOS/SUPPLEMENTAL DATA | | | | | | | | | | | | | | | | | | | | | | | | |
Net assets, end of period (in 000’s) | | | $120,886 | | | | $127,080 | | | | $192,431 | | | | $142,726 | | | | $147,685 | | | | $127,774 | |
Ratio of expenses to average net assets | | | 1.18% | 4 | | | 1.14% | | | | 1.15% | | | | 1.15% | | | | 1.10% | | | | 1.11% | |
Ratio of net investment income (loss) to average net assets | | | (0.93% | )4 | | | 1.01% | | | | 0.90% | | | | 0.41% | | | | 0.18% | | | | 0.04% | |
Portfolio turnover5 | | | 12.17% | 3 | | | 35.60% | | | | 25.37% | | | | 34.73% | | | | 20.36% | | | | 17.37% | |
| | |
| INSTITUTIONAL CLASS | | Six-Month
Period Ended June 30, 2019
(unaudited) | | | Year Ended Dec. 31 | |
| | 2018 | | | 2017 | | | 2016 | | | 2015 | | | 2014 | |
Net Asset Value, beginning of period | | | $4.61 | | | | $6.95 | | | | $5.27 | | | | $6.18 | | | | $5.68 | | | | $5.96 | |
INCOME (LOSS) FROM INVESTMENT OPERATIONS: | | | | | | | | | | | | | | | | | | | | | | | | |
Net investment income (loss)1 | | | (0.02 | ) | | | 0.04 | | | | 0.10 | | | | (0.02 | ) | | | 0.02 | | | | 0.05 | |
Net realized gain (loss) and unrealized appreciation/depreciation on investments and foreign currency related transactions | | | (0.01 | ) | | | (1.60 | ) | | | 2.21 | | | | (0.37 | ) | | | 0.83 | | | | (0.08 | ) |
Total from investment operations | | | (0.03 | ) | | | (1.56 | ) | | | 2.31 | | | | (0.39 | ) | | | 0.85 | | | | (0.03 | ) |
LESS DISTRIBUTIONS FROM: | | | | | | | | | | | | | | | | | | | | | | | | |
Net investment income | | | — | | | | (0.13 | ) | | | (0.30 | ) | | | (0.09 | ) | | | (0.02 | ) | | | — | |
Net realized gains on investments | | | — | | | | (0.65 | ) | | | (0.33 | ) | | | (0.43 | ) | | | (0.33 | ) | | | (0.25 | ) |
Total distributions | | | — | | | | (0.78 | ) | | | (0.63 | ) | | | (0.52 | ) | | | (0.35 | ) | | | (0.25 | ) |
Paid-in capital from redemption fees (Note 4) | | | — | | | | — | | | | — | | | | — | | | | — | 2 | | | — | 2 |
Net Asset Value, end of period | | | $4.58 | | | | $4.61 | | | | $6.95 | | | | $5.27 | | | | $6.18 | | | | $5.68 | |
TOTAL RETURN | | | (0.65% | )3 | | | (22.15% | ) | | | 44.11% | | | | (6.31% | ) | | | 15.27% | | | | (0.39% | ) |
| | | | | | |
RATIOS/SUPPLEMENTAL DATA | | | | | | | | | | | | | | | | | | | | | | | | |
Net assets, end of period (in 000’s) | | | $29,492 | | | | $19,377 | | | | $32,587 | | | | $7,462 | | | | $59,982 | | | | $91,431 | |
Ratio of expenses to average net assets | | | 1.06% | 4 | | | 1.02% | | | | 1.01% | | | | 0.97% | | | | 0.93% | | | | 0.93% | |
Ratio of net investment income (loss) to average net assets | | | (0.74% | )4 | | | 0.67% | | | | 1.51% | | | | (0.31% | ) | | | 0.28% | | | | 0.87% | |
Portfolio turnover5 | | | 12.17% | 3 | | | 35.60% | | | | 25.37% | | | | 34.73% | | | | 20.36% | | | | 17.37% | |
| 1 | Calculated using the average daily shares method. |
| 2 | Less than $0.01 per share. |
| 5 | The portfolio turnover rate is calculated on the Fund as a whole without distinguishing between classes of shares issued. |
See accompanying notes to financial statements.
Financial Highlights(continued)
Matthews Asia Small Companies Fund
The tables below set forth financial data for a share of beneficial interest outstanding throughout each period presented.
| | | | | | | | | | | | | | | | | | | | | | | | |
| INVESTOR CLASS | | Six-Month
Period Ended June 30, 2019
(unaudited) | | | Year Ended Dec. 31 | |
| | 2018 | | | 2017 | | | 2016 | | | 2015 | | | 2014 | |
Net Asset Value, beginning of period | | | $15.50 | | | | $22.89 | | | | $19.05 | | | | $19.41 | | | | $21.46 | | | | $19.34 | |
INCOME (LOSS) FROM INVESTMENT OPERATIONS: | | | | | | | | | | | | | | | | | | | | | | | | |
Net investment income (loss)1 | | | 0.08 | | | | 0.12 | | | | 0.02 | | | | 0.09 | | | | 0.02 | | | | 0.09 | |
Net realized gain (loss) and unrealized appreciation/depreciation on investments, foreign currency related transactions and foreign capital gains taxes | | | 1.88 | | | | (4.20 | ) | | | 5.68 | | | | (0.37 | ) | | | (2.05 | ) | | | 2.11 | |
Total from investment operations | | | 1.96 | | | | (4.08 | ) | | | 5.70 | | | | (0.28 | ) | | | (2.03 | ) | | | 2.20 | |
LESS DISTRIBUTIONS FROM: | | | | | | | | | | | | | | | | | | | | | | | | |
Net investment income | | | — | | | | (0.08 | ) | | | (0.10 | ) | | | (0.08 | ) | | | (0.03 | ) | | | (0.08 | ) |
Net realized gains on investments | | | — | | | | (3.23 | ) | | | (1.76 | ) | | | — | | | | — | | | | — | |
Total distributions | | | — | | | | (3.31 | ) | | | (1.86 | ) | | | (0.08 | ) | | | (0.03 | ) | | | (0.08 | ) |
Paid-in capital from redemption fees (Note 4) | | | — | | | | — | 2 | | | — | 2 | | | — | 2 | | | 0.01 | | | | — | 2 |
Net Asset Value, end of period | | | $17.46 | | | | $15.50 | | | | $22.89 | | | | $19.05 | | | | $19.41 | | | | $21.46 | |
TOTAL RETURN | | | 12.65% | 3 | | | (18.05% | ) | | | 30.59% | | | | (1.44% | ) | | | (9.43% | ) | | | 11.39% | |
| | | | | | |
RATIOS/SUPPLEMENTAL DATA | | | | | | | | | | | | | | | | | | | | | | | | |
Net assets, end of period (in 000’s) | | | $116,482 | | | | $111,456 | | | | $208,339 | | | | $254,226 | | | | $387,747 | | | | $599,082 | |
Ratio of expenses to average net assets before any reimbursement, waiver or recapture of expenses by Advisor and Administrator (Note 5) | | | 1.71% | 4 | | | 1.51% | | | | 1.49% | | | | 1.49% | | | | 1.48% | | | | 1.47% | |
Ratio of expenses to average net assets after any reimbursement, waiver or recapture of expenses by Advisor and Administrator | | | 1.50% | 4 | | | 1.46% | | | | 1.46% | | | | 1.47% | | | | 1.47% | | | | 1.47% | |
Ratio of net investment income (loss) to average net assets | | | 1.02% | 4 | | | 0.53% | | | | 0.09% | | | | 0.45% | | | | 0.08% | | | | 0.44% | |
Portfolio turnover5 | | | 26.22% | 3 | | | 69.79% | | | | 67.13% | | | | 44.44% | | | | 48.29% | | | | 21.70% | |
| | |
| INSTITUTIONAL CLASS | | Six-Month
Period Ended June 30, 2019
(unaudited) | | | Year Ended Dec. 31 | |
| | 2018 | | | 2017 | | | 2016 | | | 2015 | | | 2014 | |
Net Asset Value, beginning of period | | | $15.46 | | | | $22.86 | | | | $19.03 | | | | $19.40 | | | | $21.46 | | | | $19.33 | |
INCOME (LOSS) FROM INVESTMENT OPERATIONS: | | | | | | | | | | | | | | | | | | | | | | | | |
Net investment income (loss)1 | | | 0.10 | | | | 0.16 | | | | 0.07 | | | | 0.12 | | | | 0.11 | | | | 0.15 | |
Net realized gain (loss) and unrealized appreciation/depreciation on investments, foreign currency related transactions and foreign capital gains taxes | | | 1.87 | | | | (4.19 | ) | | | 5.67 | | | | (0.36 | ) | | | (2.10 | ) | | | 2.10 | |
Total from investment operations | | | 1.97 | | | | (4.03 | ) | | | 5.74 | | | | (0.24 | ) | | | (1.99 | ) | | | 2.25 | |
LESS DISTRIBUTIONS FROM: | | | | | | | | | | | | | | | | | | | | | | | | |
Net investment income | | | — | | | | (0.14 | ) | | | (0.15 | ) | | | (0.13 | ) | | | (0.08 | ) | | | (0.12 | ) |
Net realized gains on investments | | | — | | | | (3.23 | ) | | | (1.76 | ) | | | — | | | | — | | | | — | |
Total distributions | | | — | | | | (3.37 | ) | | | (1.91 | ) | | | (0.13 | ) | | | (0.08 | ) | | | (0.12 | ) |
Paid-in capital from redemption fees (Note 4) | | | — | | | | — | 2 | | | — | 2 | | | — | 2 | | | 0.01 | | | | — | 2 |
Net Asset Value, end of period | | | $17.43 | | | | $15.46 | | | | $22.86 | | | | $19.03 | | | | $19.40 | | | | $21.46 | |
TOTAL RETURN | | | 12.74% | 3 | | | (17.86% | ) | | | 30.85% | | | | (1.24% | ) | | | (9.23% | ) | | | 11.65% | |
| | | | | | |
RATIOS/SUPPLEMENTAL DATA | | | | | | | | | | | | | | | | | | | | | | | | |
Net assets, end of period (in 000’s) | | | $75,072 | | | | $74,935 | | | | $232,954 | | | | $174,962 | | | | $222,168 | | | | $77,168 | |
Ratio of expenses to average net assets before any reimbursement, waiver or recapture of expenses by Advisor and Administrator (Note 5) | | | 1.56% | 4 | | | 1.37% | | | | 1.35% | | | | 1.34% | | | | 1.30% | | | | 1.27% | |
Ratio of expenses to average net assets after any reimbursement, waiver or recapture of expenses by Advisor and Administrator | | | 1.25% | 4 | | | 1.25% | | | | 1.25% | | | | 1.25% | | | | 1.25% | | | | 1.26% | |
Ratio of net investment income (loss) to average net assets | | | 1.22% | 4 | | | 0.73% | | | | 0.34% | | | | 0.64% | | | | 0.53% | | | | 0.70% | |
Portfolio turnover5 | | | 26.22% | 3 | | | 69.79% | | | | 67.13% | | | | 44.44% | | | | 48.29% | | | | 21.70% | |
| 1 | Calculated using the average daily shares method. |
| 2 | Less than $0.01 per share. |
| 5 | The portfolio turnover rate is calculated on the Fund as a whole without distinguishing between classes of shares issued. |
See accompanying notes to financial statements.
| | | | |
| matthewsasia.com | 800.789.ASIA | | | 135 | |
Financial Highlights(continued)
Matthews China Small Companies Fund
The tables below set forth financial data for a share of beneficial interest outstanding throughout each period presented.
| | | | | | | | | | | | | | | | | | | | | | | | |
| INVESTOR CLASS | | Six-Month
Period Ended June 30, 2019
(unaudited) | | | Year Ended Dec. 31 | |
| | 2018 | | | 2017 | | | 2016 | | | 2015 | | | 2014 | |
Net Asset Value, beginning of period | | | $9.58 | | | | $11.89 | | | | $8.21 | | | | $8.79 | | | | $9.21 | | | | $9.89 | |
INCOME (LOSS) FROM INVESTMENT OPERATIONS: | | | | | | | | | | | | | | | | | | | | | | | | |
Net investment income (loss)1 | | | 0.09 | | | | 0.09 | | | | 0.07 | | | | 0.10 | | | | 0.08 | | | | 0.01 | |
Net realized gain (loss) and unrealized appreciation/depreciation on investments and foreign currency related transactions | | | 1.70 | | | | (2.23 | ) | | | 4.27 | | | | (0.28 | ) | | | 0.27 | | | | (0.33 | ) |
Total from investment operations | | | 1.79 | | | | (2.14 | ) | | | 4.34 | | | | (0.18 | ) | | | 0.35 | | | | (0.32 | ) |
LESS DISTRIBUTIONS FROM: | | | | | | | | | | | | | | | | | | | | | | | | |
Net investment income | | | — | | | | (0.05 | ) | | | (0.11 | ) | | | (0.03 | ) | | | (0.06 | ) | | | (0.02 | ) |
Net realized gains on investments | | | — | | | | (0.16 | ) | | | (0.56 | ) | | | (0.37 | ) | | | (0.72 | ) | | | — | |
Return of capital | | | — | | | | — | | | | — | | | | — | | | | — | | | | (0.34 | ) |
Total distributions | | | — | | | | (0.21 | ) | | | (0.67 | ) | | | (0.40 | ) | | | (0.78 | ) | | | (0.36 | ) |
Paid-in capital from redemption fees (Note 4) | | | — | | | | 0.04 | | | | 0.01 | | | | — | 2 | | | 0.01 | | | | — | 2 |
Net Asset Value, end of period | | | $11.37 | | | | $9.58 | | | | $11.89 | | | | $8.21 | | | | $8.79 | | | | $9.21 | |
TOTAL RETURN | | | 18.69% | 3 | | | (17.68% | ) | | | 53.88% | | | | (2.35% | ) | | | 4.07% | | | | (3.33% | ) |
| | | | | | |
RATIOS/SUPPLEMENTAL DATA | | | | | | | | | | | | | | | | | | | | | | | | |
Net assets, end of period (in 000’s) | | | $48,469 | | | | $41,740 | | | | $35,209 | | | | $16,101 | | | | $21,546 | | | | $22,068 | |
Ratio of expenses to average net assets before any reimbursement, waiver or recapture of expenses by Advisor and Administrator (Note 5) | | | 1.72% | 4 | | | 1.97% | | | | 2.34% | | | | 2.24% | | | | 2.10% | | | | 1.90% | |
Ratio of expenses to average net assets after any reimbursement, waiver or recapture of expenses by Advisor and Administrator | | | 1.50% | 4 | | | 1.50% | | | | 1.50% | | | | 1.50% | | | | 1.50% | | | | 1.67% | |
Ratio of net investment income (loss) to average net assets | | | 1.75% | 4 | | | 0.78% | | | | 0.66% | | | | 1.17% | | | | 0.80% | | | | 0.14% | |
Portfolio turnover5 | | | 28.30% | 3 | | | 76.67% | | | | 67.22% | | | | 63.15% | | | | 72.49% | | | | 32.42% | |
| | | | | | |
| INSTITUTIONAL CLASS | | Six-Month
Period Ended
June 30, 2019
(unaudited) | | | Year Ended
Dec. 31, 2018 | | | Period Ended
Dec. 31, 20176 | | | | | | | | | | |
Net Asset Value, beginning of period | | | $9.59 | | | | $11.87 | | | | $11.90 | | | | | | | | | | | | | |
INCOME (LOSS) FROM INVESTMENT OPERATIONS: | | | | | | | | | | | | | | | | | | | | | | | | |
Net investment income (loss)1 | | | 0.10 | | | | 0.11 | | | | (0.01 | ) | | | | | | | | | | | | |
Net realized gain (loss) and unrealized appreciation/depreciation on investments and foreign currency related transactions | | | 1.71 | | | | (2.21 | ) | | | 0.67 | | | | | | | | | | | | | |
Total from investment operations | | | 1.81 | | | | (2.10 | ) | | | 0.66 | | | | | | | | | | | | | |
LESS DISTRIBUTIONS FROM: | | | | | | | | | | | | | | | | | | | | | | | | |
Net investment income | | | — | | | | (0.05 | ) | | | (0.13 | ) | | | | | | | | | | | | |
Net realized gains on investments | | | — | | | | (0.16 | ) | | | (0.56 | ) | | | | | | | | | | | | |
Total distributions | | | — | | | | (0.21 | ) | | | (0.69 | ) | | | | | | | | | | | | |
Paid-in capital from redemption fees (Note 4) | | | — | | | | 0.03 | | | | — | | | | | | | | | | | | | |
Net Asset Value, end of period | | | $11.40 | | | | $9.59 | | | | $11.87 | | | | | | | | | | | | | |
TOTAL RETURN | | | 18.87% | 3 | | | (17.48% | ) | | | 6.19% | 3 | | | | | | | | | | | | |
| | | | | | |
RATIOS/SUPPLEMENTAL DATA | | | | | | | | | | | | | | | | | | | | | | | | |
Net assets, end of period (in 000’s) | | | $24,524 | | | | $20,740 | | | | $476 | | | | | | | | | | | | | |
Ratio of expenses to average net assets before any reimbursement, waiver or recapture of expenses by Advisor and Administrator (Note 5) | | | 1.53% | 4 | | | 1.79% | | | | 2.09% | 4 | | | | | | | | | | | | |
Ratio of expenses to average net assets after any reimbursement, waiver or recapture of expenses by Advisor and Administrator | | | 1.25% | 4 | | | 1.25% | | | | 1.25% | 4 | | | | | | | | | | | | |
Ratio of net investment income (loss) to average net assets | | | 1.80% | 4 | | | 1.05% | | | | (1.20% | )4 | | | | | | | | | | | | |
Portfolio turnover5 | | | 28.30% | 3 | | | 76.67% | | | | 67.22% | 3 | | | | | | | | | | | | |
| 1 | Calculated using the average daily shares method. |
| 2 | Less than $0.01 per share. |
| 5 | The portfolio turnover rate is calculated on the Fund as a whole without distinguishing between classes of shares issued. |
| 6 | Commenced operations on November 30, 2017. |
See accompanying notes to financial statements.
Notes to Financial Statements(unaudited)
Matthews Asia Funds (the “Trust”) is anopen-end management investment company registered under the Investment Company Act of 1940, as amended (the “1940 Act”). The Trust currently issues seventeen separate series of shares (each a “Fund”, and collectively, the “Funds”): Matthews Asia Strategic Income Fund, Matthews Asia Credit Opportunities Fund, Matthews Asian Growth and Income Fund, Matthews Asia Dividend Fund, Matthews China Dividend Fund, Matthews Asia Value Fund, Matthews Asia Growth Fund, Matthews Pacific Tiger Fund, Matthews Asia ESG Fund, Matthews Emerging Asia Fund, Matthews Asia Innovators Fund, Matthews China Fund, Matthews India Fund, Matthews Japan Fund, Matthews Korea Fund, Matthews Asia Small Companies Fund, and Matthews China Small Companies Fund. Each Fund currently offers two classes of shares: Investor Class and Institutional Class. Each class of shares has identical voting, dividend, liquidation and other rights and the same terms and conditions, except each class may be subject to different class expenses as outlined in the relevant prospectus and each class has exclusive voting rights with respect to matters solely affecting such class.
| 2. | SIGNIFICANT ACCOUNTING POLICIES |
The following is a summary of significant accounting policies consistently followed by the Funds in preparation of their financial statements.
| A. | SECURITY VALUATION: The value of the Trust’s securities is based on market quotations for those securities, or on their fair value determined by the valuation policies approved by the Funds’ Board of Trustees (the “Board”). Market quotations and valuation information are provided by commercial pricing services or securities dealers that are independent of the Funds and Matthews International Capital Management, LLC (“Matthews”), in accordance with procedures established by the Funds’ Board. Foreign exchange-traded securities are valued as of the close of trading on the primary exchange on which they trade. Securities that trade inover-the-counter markets, including most debt securities (bonds), may be valued by other third-party vendors or by using indicative bid quotations from dealers or market makers, or other available market information. Market values for securities are determined based on quotations, market data or other information from the principal (or most advantageous) market on which the security is traded. Market quotations for equity securities used by the Funds include last reported sale prices, or, if such prices are not reported or available, bid and ask prices. Swap agreements are valued utilizing quotes received daily by the Funds’ pricing service or through brokers, which are derived using daily swap curves and models that incorporate a number of market data factors, such as discounted cash flows, trades and values of the underlying reference instruments. Foreign currency exchange contracts are valued at the mean between the bid and ask prices and are determined at the close of business on the New York Stock Exchange (“NYSE”). Interpolated values are derived when the settlement date of the contract is an interim date for which quotations are not available. The Funds may also utilize independent pricing services to assist them in determining a current market value for each security based on sources believed to be reliable. |
The Board has delegated to the Board’s Valuation Committee the responsibility for oversight of the fair valuation process under the Trust’s Pricing and Valuation Policy. The Board’s Valuation Committee, in turn, has delegated the determination of fair value prices under Matthews’ Pricing and Valuation Procedures to Matthews’ Valuation Committee (the “Valuation Committee”). The Board’s Valuation Committee will review and approve fair value determinations by Matthews’ Valuation Committee in accordance with the Pricing and Valuation Policy. When fair value pricing is employed, the prices of securities used by a Fund to calculate its Net Asset Value (“NAV”) may differ from any quoted or published prices for the same securities for that day. All fair value determinations are made subject to the Board’s oversight. Events affecting the value of foreign investments may occur between the time at which they are determined and when the Funds calculate their NAV, which is normally the close of trading on the NYSE. If such events render market quotations unreliable, and the impact of such events can be reasonably determined, the investments will be valued at their fair value in accordance with pricing policies. The fair value of a security held by the Funds may be determined using the services of third-party pricing services to assist in this process.
The books and records of the Funds are maintained in U.S. dollars. Transactions, portfolio securities, and assets and liabilities denominated in a foreign currency are translated and recorded in U.S. dollars at the prevailing exchange rate as of the close of trading on the NYSE. Translation gains or losses resulting from changes in the exchange rate during the reporting period and realized gains and losses on the settlement of foreign currency transactions are reported in the results of operations for the current period. The Funds isolate that portion of gains and losses on investments in fixed income securities that is due to changes in foreign exchange rate from that which is due to changes in market prices of securities.
Foreign securities held by the Funds may be traded on days and at times when the NYSE is closed. Accordingly, the value of the Funds may be significantly affected on days when shareholders have no access to the Funds.
| B. | FAIR VALUE MEASUREMENTS: In accordance with the guidance on fair value measurements and disclosures under generally accepted accounting principles in the United States (“U.S. GAAP”), the Funds prioritize the determination of the fair value of their investments and derivative financial instruments using a hierarchy based on the inputs used to measure the fair value. |
The hierarchy and the inputs utilized are as follows:
Level 1: Quoted prices in active markets for identical securities (foreign securities that are valued based on market quotations).
Level 2: Other significant observable inputs. Certain foreign securities may be fair valued by Matthews using information such as quoted prices for similar securities, interest rates, prepayment speeds, credit risk, and foreign exchange. Additionally, external pricing services are used when the Funds determine that events affecting the value of foreign securities which occur between the time at which they are determined and the close of trading on the NYSE render market quotations unreliable.
Level 3: Significant unobservable inputs. As described in Note2-A, Level 3 securities are valued based on significant unobservable inputs as determined under the direction of the Board. Characterization of such securities as Level 3 securities are not necessarily an indication of their liquidity or the risk associated with investing in these securities. A significant change in the unobservable inputs could result in a significantly lower or higher value in such Level 3 securities and could impact overall Fund performance. Level 3 securities consisted of equities that, as of June 30, 2019, were suspended from trading.
| | | | |
| matthewsasia.com | 800.789.ASIA | | | 137 | |
Notes to Financial Statements(unaudited) (continued)
Levels for Multi-Country Funds (1 of 2):
Summary of inputs used to determine the fair valuation of multi-country Funds’ investments as of June 30, 2019.
| | | | | | | | | | | | | | | | | | | | | | | | |
| | | Matthews Asia
Strategic
Income Fund | | | Matthews Asia
Credit
Opportunities Fund | | | Matthews Asian
Growth and
Income Fund | | | Matthews Asia
Dividend Fund | | | Matthews Asia
Value Fund | | | Matthews Asia
Growth Fund | |
| Assets: | | | | | | | | | | | | | | | | | | | | | | | | |
| | | | | | |
| Investments: | | | | | | | | | | | | | | | | | | | | | | | | |
Level 1: Quoted Prices | | | | | | | | | | | | | | | | | | | | | | | | |
Common Equities: | | | | | | | | | | | | | | | | | | | | | | | | |
Bangladesh | | | $— | | | | $— | | | | $— | | | | $— | | | | $— | | | | $41,397,290 | |
China/Hong Kong | | | — | | | | — | | | | 92,073,971 | | | | 191,319,879 | | | | 809,583 | | | | 159,704,625 | |
Japan | | | — | | | | — | | | | — | | | | — | | | | 832,913 | | | | — | |
Philippines | | | — | | | | — | | | | — | | | | 104,740,511 | | | | — | | | | 5,657,865 | |
Singapore | | | — | | | | — | | | | — | | | | 90,314,666 | | | | 878,717 | | | | — | |
South Korea | | | — | | | | — | | | | 18,082,635 | | | | 230,419,228 | | | | 434,625 | | | | — | |
Sri Lanka | | | — | | | | — | | | | — | | | | — | | | | — | | | | 6,249,775 | |
Taiwan | | | — | | | | — | | | | 21,448,620 | | | | 92,532,858 | | | | — | | | | — | |
United States | | | — | | | | — | | | | 48,977,018 | | | | — | | | | 323,289 | | | | 6,741,000 | |
Level 2: Other Significant Observable Inputs | | | | | | | | | | | | | | | | | | | | | | | | |
Foreign Government Obligationsa | | | 23,933,741 | | | | 9,511,154 | | | | — | | | | — | | | | — | | | | — | |
Non-Convertible Corporate Bondsa | | | 78,844,083 | | | | 43,050,111 | | | | — | | | | — | | | | — | | | | — | |
Convertible Corporate Bondsa | | | 5,742,584 | | | | 1,510,444 | | | | 166,547,497 | | | | — | | | | — | | | | — | |
Common Equities: | | | | | | | | | | | | | | | | | | | | | | | | |
Australia | | | — | | | | — | | | | 75,367,662 | | | | 95,551,702 | | | | — | | | | 48,853,716 | |
Bangladesh | | | — | | | | — | | | | — | | | | 69,401,008 | | | | — | | | | — | |
China/Hong Kong | | | — | | | | — | | | | 390,887,692 | | | | 2,409,357,673 | | | | 8,797,399 | | | | 183,342,591 | |
France | | | — | | | | — | | | | 44,788,566 | | | | — | | | | — | | | | — | |
India | | | — | | | | — | | | | 45,809,191 | | | | 139,859,813 | | | | 199,315 | | | | 54,694,255 | |
Indonesia | | | — | | | | — | | | | 40,763,408 | | | | 114,782,547 | | | | 158,533 | | | | 91,593,483 | |
Japan | | | — | | | | — | | | | 34,268,015 | | | | 1,374,699,872 | | | | 2,328,855 | | | | 424,713,225 | |
Malaysia | | | — | | | | — | | | | 15,315,738 | | | | — | | | | 399,556 | | | | — | |
Philippines | | | — | | | | — | | | | 21,082,037 | | | | — | | | | — | | | | 11,045,979 | |
Singapore | | | — | | | | — | | | | 129,129,337 | | | | 231,527,808 | | | | 843,137 | | | | — | |
South Korea | | | — | | | | — | | | | 84,402,469 | | | | 266,835,115 | | | | 3,778,348 | | | | — | |
Sri Lanka | | | — | | | | — | | | | — | | | | — | | | | — | | | | 17,276,809 | |
Taiwan | | | — | | | | — | | | | 72,633,080 | | | | 172,650,763 | | | | 433,893 | | | | 11,197,753 | |
Thailand | | | — | | | | — | | | | 20,131,939 | | | | 116,047,947 | | | | — | | | | 18,086,447 | |
United Kingdom | | | — | | | | — | | | | 26,805,739 | | | | — | | | | — | | | | — | |
Vietnam | | | — | | | | — | | | | 16,382,838 | | | | 66,490,887 | | | | — | | | | 16,467,160 | |
Preferred Equities: | | | | | | | | | | | | | | | | | | | | | | | | |
South Korea | | | — | | | | — | | | | 28,664,656 | | | | 181,651,426 | | | | 2,831,931 | | | | — | |
Level 3: Significant Unobservable Inputs | | | — | | | | — | | | | — | | | | — | | | | — | | | | — | |
Total Market Value of Investments | | | $108,520,408 | | | | $54,071,709 | | | | $1,393,562,108 | | | | $5,948,183,703 | | | | $23,050,094 | | | | $1,097,021,973 | |
| a | Industry, countries, or security types are disclosed on the Schedule of Investments. |
Notes to Financial Statements(unaudited) (continued)
Levels for Multi-Country Funds (2 of 2):
Summary of inputs used to determine the fair valuation of multi-country Funds’ investments as of June 30, 2019.
| | | | | | | | | | | | | | | | | | | | |
| | | Matthews Pacific
Tiger Fund | | | Matthews
Asia ESG
Fund | | | Matthews
Emerging Asia
Fund | | | Matthews Asia
Innovators
Fund | | | Matthews Asia
Small Companies
Fund | |
| Assets: | | | | | | | | | | | | | | | | | | | | |
| | | | | |
| Investments: | | | | | | | | | | | | | | | | | | | | |
Level 1: Quoted Prices | | | | | | | | | | | | | | | | | | | | |
Common Equities: | | | | | | | | | | | | | | | | | | | | |
Bangladesh | | | $— | | | | $1,771,217 | | | | $— | | | | $7,162,992 | | | | $— | |
China/Hong Kong | | | 787,292,987 | | | | 2,263,905 | | | | 34,997,299 | | | | 55,868,283 | | | | 6,470,997 | |
India | | | — | | | | 2,253,603 | | | | 952,337 | | | | — | | | | 4,158,628 | |
Indonesia | | | 50,019,114 | | | | 775,195 | | | | 38,206,276 | | | | — | | | | 4,849,727 | |
Japan | | | 58,925,160 | | | | — | | | | — | | | | — | | | | — | |
Pakistan | | | — | | | | 348,069 | | | | 42,362,093 | | | | — | | | | — | |
Philippines | | | — | | | | — | | | | 15,041,850 | | | | — | | | | 2,069,776 | |
Singapore | | | — | | | | 406,430 | | | | — | | | | — | | | | 2,913,902 | |
South Korea | | | 373,261,630 | | | | — | | | | — | | | | — | | | | 1,725,817 | |
Sri Lanka | | | — | | | | — | | | | 33,414,222 | | | | — | | | | — | |
Taiwan | | | — | | | | — | | | | — | | | | — | | | | 2,232,892 | |
United States | | | 164,363,931 | | | | — | | | | — | | | | — | | | | — | |
Vietnam | | | — | | | | — | | | | 13,802,545 | | | | — | | | | 2,658,506 | |
Level 2: Other Significant Observable Inputs | | | | | | | | | | | | | | | | | | | | |
Common Equities: | | | | | | | | | | | | | | | | | | | | |
Australia | | | — | | | | — | | | | 3,721,628 | | | | — | | | | 2,235,200 | |
Bangladesh | | | — | | | | 570,975 | | | | 18,382,005 | | | | — | | | | — | |
China/Hong Kong | | | 2,847,795,111 | | | | 11,501,683 | | | | 15,027,386 | | | | 124,416,269 | | | | 46,521,893 | |
India | | | 1,746,294,109 | | | | 6,217,598 | | | | 36,754,159 | | | | 34,694,555 | | | | 24,036,796 | |
Indonesia | | | 628,836,878 | | | | 1,506,777 | | | | 44,424,466 | | | | 16,430,245 | | | | 6,376,983 | |
Japan | | | — | | | | 6,946,356 | | | | — | | | | — | | | | 2,048,648 | |
Malaysia | | | 192,057,855 | | | | — | | | | — | | | | — | | | | 4,990,581 | |
Pakistan | | | — | | | | — | | | | 1,511,468 | | | | — | | | | — | |
Philippines | | | 238,274,074 | | | | 914,815 | | | | 23,533,865 | | | | 4,183,646 | | | | — | |
Singapore | | | — | | | | 1,059,826 | | | | 3,022,157 | | | | — | | | | — | |
South Korea | | | 622,394,936 | | | | 1,426,915 | | | | — | | | | 23,143,282 | | | | 15,939,008 | |
Sri Lanka | | | — | | | | — | | | | 10,807,731 | | | | — | | | | — | |
Switzerland | | | 236,718,475 | | | | — | | | | — | | | | — | | | | — | |
Taiwan | | | 420,869,156 | | | | 3,646,584 | | | | — | | | | — | | | | 23,126,101 | |
Thailand | | | 459,036,597 | | | | 1,052,644 | | | | — | | | | — | | | | 14,053,968 | |
Vietnam | | | 153,180,278 | | | | 534,333 | | | | 71,758,036 | | | | 6,933,673 | | | | 8,575,083 | |
Preferred Equities: | | | | | | | | | | | | | | | | | | | | |
South Korea | | | — | | | | 2,164,513 | | | | — | | | | 6,627,102 | | | | — | |
Level 3: Significant Unobservable Inputs | | | — | | | | — | | | | — | | | | — | | | | — | |
Total Market Value of Investments | | | $8,979,320,291 | | | | $45,361,438 | | | | $407,719,523 | | | | $279,460,047 | | | | $174,984,506 | |
| | | | |
| matthewsasia.com | 800.789.ASIA | | | 139 | |
Notes to Financial Statements(unaudited) (continued)
Levels for Single Country Funds:
Summary of inputs used to determine the fair valuation of the single country Funds’ investments as of June 30, 2019.
| | | | | | | | | | | | | | | | | | | | | | | | |
| | | Matthews China
Dividend Fund | | | Matthews
China Fund | | | Matthews
India Fund | | | Matthews
Japan Fund | | | Matthews
Korea Fund | | | Matthews
China Small
Companies
Fund | |
| Assets: | | | | | | | | | | | | | | | | | | | | | | | | |
| | | | | | |
| Investments: | | | | | | | | | | | | | | | | | | | | | | | | |
Level 1: Quoted Prices | | | | | | | | | | | | | | | | | | | | | | | | |
Common Equities: | | | | | | | | | | | | | | | | | | | | | | | | |
Communication Services | | | $9,009,540 | | | | $43,830,251 | | | | $— | | | | $— | | | | $— | | | | $— | |
Consumer Discretionary | | | 25,059,363 | | | | 121,212,330 | | | | 8,254,483 | | | | — | | | | 2,884,301 | | | | 5,279,038 | |
Consumer Staples | | | — | | | | — | | | | — | | | | — | | | | 5,274,223 | | | | — | |
Financials | | | 6,441,704 | | | | — | | | | 94,471,199 | | | | — | | | | 2,790,821 | | | | — | |
Health Care | | | 2,193,758 | | | | — | | | | 36,296,801 | | | | — | | | | — | | | | 3,325,317 | |
Industrials | | | — | | | | 7,127,200 | | | | 18,513,546 | | | | — | | | | 3,319,659 | | | | — | |
Information Technology | | | — | | | | — | | | | 53,789,794 | | | | — | | | | — | | | | 1,674,584 | |
Materials | | | — | | | | — | | | | 1,313,959 | | | | — | | | | — | | | | — | |
Level 2: Other Significant Observable Inputs | | | | | | | | | | | | | | | | | | | | | | | | |
Common Equities: | | | | | | | | | | | | | | | | | | | | | | | | |
Communication Services | | | 40,128,332 | | | | 82,394,554 | | | | 30,103,632 | | | | 218,342,791 | | | | 7,097,492 | | | | — | |
Consumer Discretionary | | | 53,222,166 | | | | 77,373,719 | | | | 192,936,414 | | | | 382,733,098 | | | | 13,291,615 | | | | 3,537,520 | |
Consumer Staples | | | 53,706,691 | | | | 56,616,442 | | | | 182,886,491 | | | | 244,020,302 | | | | 10,001,757 | | | | 5,450,216 | |
Energy | | | 9,372,223 | | | | 7,663,723 | | | | — | | | | — | | | | 2,129,196 | | | | 3,018,034 | |
Financials | | | 28,208,804 | | | | 264,305,702 | | | | 467,612,546 | | | | 168,840,364 | | | | 18,356,116 | | | | — | |
Health Care | | | 15,171,140 | | | | 29,713,300 | | | | 126,682,568 | | | | 395,331,129 | | | | 12,370,117 | | | | 6,968,193 | |
Industrials | | | 30,721,954 | | | | — | | | | 78,732,198 | | | | 636,456,978 | | | | — | | | | 13,550,416 | |
Information Technology | | | 27,852,574 | | | | 38,991,793 | | | | 125,916,844 | | | | 498,071,774 | | | | 15,219,574 | | | | 14,443,378 | |
Materials | | | 17,127,660 | | | | 20,757,845 | | | | 43,126,678 | | | | 29,303,120 | | | | 7,661,188 | | | | 5,264,847 | |
Real Estate | | | 22,928,704 | | | | 69,326,379 | | | | — | | | | 67,846,196 | | | | — | | | | 6,867,659 | |
Utilities | | | 14,508,854 | | | | — | | | | — | | | | — | | | | — | | | | — | |
Preferred Equities: | | | | | | | | | | | | | | | | | | | | | | | | |
Consumer Discretionary | | | — | | | | — | | | | — | | | | — | | | | 7,118,240 | | | | — | |
Consumer Staples | | | — | | | | — | | | | — | | | | — | | | | 9,375,594 | | | | — | |
Energy | | | — | | | | — | | | | — | | | | — | | | | 1,922,683 | | | | — | |
Financials | | | — | | | | — | | | | — | | | | — | | | | 5,923,023 | | | | — | |
Information Technology | | | — | | | | — | | | | — | | | | — | | | | 15,979,054 | | | | — | |
Materials | | | — | | | | — | | | | — | | | | — | | | | 4,042,912 | | | | — | |
Level 3: Significant Unobservable Inputs | | | | | | | | | | | | | | | | | | | | | | | | |
Common Equities: | | | | | | | | | | | | | | | | | | | | | | | | |
Information Technology | | | — | | | | — | | | | — | | | | — | | | | — | | | | 249 | |
Total Market Value of Investments | | | $355,653,467 | | | | $819,313,238 | | | | $1,460,637,153 | | | | $2,640,945,752 | | | | $144,757,565 | | | | $69,379,451 | |
Levels for Derivative Financial Instruments:
Summary of inputs used to determine the fair valuation of the Funds’ derivative financial instruments as of June 30, 2019.
| | | | |
| | | Matthews Asia
Strategic
Income Fund | |
Derivative Financial Instruments1 | | | | |
Assets | | | | |
| Level 2: Other Significant Observable Inputs | | | | |
| |
Forward Foreign Currency Exchange Contracts | | | $130,886 | |
| | | | |
| |
Liabilities | | | | |
| Level 2: Other Significant Observable Inputs | | | | |
| |
Forward Foreign Currency Exchange Contracts | | | ($556,972) | |
| |
Interest Rate Swaps | | | (54,169) | |
| | | | |
| | | ($611,141) | |
| | | | |
| 1 | Derivative financial instruments are forward foreign currency exchange contracts and interest rate swaps. Forward foreign currency exchange contracts and interest rate swaps are valued at the unrealized appreciation/depreciation on the instruments. |
Notes to Financial Statements(unaudited) (continued)
Changes in the Balances of Level 3 Securities:
The Funds’ policy is to recognize transfers in and transfers out of Level 3 during the reporting period.
| | | | |
| | | Matthews China
Small Companies
Fund | |
| | | Common
Equities —
Information
Technology | |
| Balance as of 12/31/18 (market value) | | | $249 | |
| |
| Accrued discounts/premiums | | | — | |
| |
| Realized gain/(loss) | | | — | |
| |
| Change in unrealized appreciation/(depreciation) | | | — | |
| |
| Purchases | | | — | |
| |
| Sales | | | — | |
| |
| Transfers in to Level 3* | | | — | |
| |
| Transfer out of Level 3* | | | — | |
| Balance as of 6/30/19 (market value) | | | $249 | |
| Net change in unrealized appreciation/depreciation on Level 3 investments held as of 6/30/19** | | | $— | |
| * | The Funds’ policy is to recognize transfers in and transfers out as of the beginning of the reporting period. |
| ** | Included in the related amounts on the Statements of Operations. |
Certain foreign securities, for which market quotations are not readily available, may be fair valued and classified as either Level 2 or Level 3. When the underlying inputs include significant observable inputs obtained from sources independent of the Funds, the securities are classified as Level 2. These inputs include evaluated prices from the Funds’ pricing vendors,day-on-day price changes, primary and ancillary pricing sources, and other available independent market indicators of value. When the underlying inputs include significant unobservable inputs and reflect assumptions of market participants, the securities are classified as Level 3. Certain securities held by the Funds that were suspended from trading and classified as Level 3 on June 30, 2019 subsequently resumed trading and were transferred from Level 3 to Level 1, Level 2 or were sold.
| C. | BASIS OF CONSOLIDATION:The accompanying consolidated financial statements of Matthews China Fund and Matthews Asia Dividend Fund (the “Investing Funds”) for the 2014-2016 period include the accounts of the MatthewsCF-U Series and MatthewsADF-U Series (the “U Series Funds”), respectively. The U Series Funds were series of Matthews A Share Selections Fund, LLC, a Delaware limited liability company registered under the 1940 Act. All of the interests offered by U Series Funds were exclusively owned by the Investing Funds. The U Series Funds primarily invested in the stocks of Chinese companies listed on Mainland China Stock Exchanges, and traded and denominated in the currency of China, the Renminbi. To allow U Series Funds to invest in China A Shares Matthews applied for and received a license from the China Securities Regulatory Commission as a Qualified Foreign Institutional Investor (“QFII”) and had been allocated by the State Administration of Foreign Exchange of China an initial quota of $100 million in June 2014, and an additional quota of $440 million in July 2015, representing the equivalent value in Renminbi of China A Shares that the Funds could purchase. Access to the quota was subject to Matthews’ trade allocation procedures and access allocation procedures. The U Series Funds were subject to the same investment policies and restrictions that apply to Investing Funds. Intercompany accounts and transactions, if any, have been eliminated in the consolidation process. The U Series Funds were intended to be disregarded entities for tax purposes. Therefore, no federal tax provision was required. Consolidated financial statements include expenses that are accrued for and paid by the Investing Funds. These includeon-going operational costs as well as costs in connection with the launching of the U Series Funds. |
In September 2016, the Board of Directors of the Matthews A Share Selections Fund, LLC adopted resolutions authorizing the termination and liquidation of the Matthews A Share Selections Fund, LLC. Consequently, as of September 30, 2016, the U Series Funds sold their securities and effectively ceased investment operations. The outstanding interests of each U Series Fund were redeemed by its respective Investing Fund. The Matthews A Share Selections Fund, LLC filed an initial application for deregistration as a registered investment company with the U.S. Securities and Exchange Commission in October 2016, which was subsequently granted in February 2017.
| D. | RISKS ASSOCIATED WITHNON-U.S. COMPANIES:Investments by the Funds in the securities ofnon-U.S. companies may involve investment risks not typically associated with investments in U.S. issuers. These risks include possible political, economic, social and religious instability, inadequate investor protection; changes in laws or regulations of countries within the Asia Pacific region (including in countries where the Funds may invest, as well as in the broader region); international relations with other nations; natural disasters; corruption; and military activity. Foreign securities may be subject to greater fluctuations in price than securities of domestic corporations or the U.S. government. Foreign investing may also include the risk of expropriation or confiscatory taxation, limitation on the removal of funds or other assets, currency crises and exchange controls, the imposition of foreign withholding tax on the interest income payable on such instruments, the possible seizure or nationalization of foreign deposits or assets, or the adoption of other foreign government restrictions that might adversely affect the foreign securities held by the Funds. Additionally, Asia Pacific countries may utilize formal or informal currency exchange controls or “capital controls” that may limit the ability to repatriate investments or income or adversely affect the value of portfolio investments. The economies of many Asia Pacific countries differ from the economies of more developed countries in many respects, such as their rate of growth, inflation, capital reinvestment, resource self-sufficiency and dependence on other economies, financial system stability, the national balance of payments position and sensitivity to changes in global trade. |
Certain Asia Pacific countries are highly dependent upon and may be affected by developments in the economies of other countries.Non-U.S. companies are subject to different accounting, auditing, and financial reporting standards, practices, and requirements than U.S. companies. There is generally less government regulation of stock exchanges, brokers, and listed companies abroad than in the United States, which may result in less transparency with respect to a company’s operations, and make obtaining information about them more difficult (or such information may be unavailable).
Foreign stock markets may not be as developed or efficient as those in the United States, and the absence of negotiated brokerage commissions in certain countries may result in higher brokerage fees. The time between the trade and settlement dates of securities transactions on foreign exchanges
| | | | |
| matthewsasia.com | 800.789.ASIA | | | 141 | |
Notes to Financial Statements(unaudited) (continued)
ranges from one day to four weeks or longer and may result in higher custody charges. Custodial arrangements may be less well developed than in the United States. Foreign securities are generally denominated and pay distributions in foreign currencies, exposing the Funds to changes in foreign currency exchange rates. Investing in any country in the Asia Pacific region will also entail risks specific and unique to that country, and these risks can be significant and change rapidly.
Changes in interest rates in each of the countries in which the Funds may invest, as well as interest rates in more-developed countries, may cause a decline in the market value of an investment. Generally, fixed income securities will decrease in value when interest rates rise and can be expected to rise in value when interest rates decline. As interest rates decline, debt issuers may repay or refinance their loans or obligations earlier than anticipated. The issuers of fixed income securities may, therefore, repay principal in advance. This would force the Funds to reinvest the proceeds from the principal prepayments at lower rates, which reduces the Funds’ income.
| E. | DISTRIBUTIONS TO SHAREHOLDERS:It is the policy of Matthews Asian Growth and Income Fund and Matthews China Dividend Fund to distribute net investment income on a semi-annual basis and capital gains, if any, annually. It is the policy of Matthews Asia Dividend Fund, Matthews Asia Strategic Income Fund and Matthews Asia Credit Opportunities Fund to distribute net investment income on a quarterly basis and capital gains, if any, annually. Each of the other Funds distributes a net investment income and capital gains, if any, annually. Distributions to shareholders are recorded on theex-dividend date. Income and capital gain distributions are determined in accordance with income tax regulations which may differ from U.S. GAAP. |
The tax character of distributions paid for the fiscal year ended December 31, 2018 was as follows:
| | | | | | | | | | | | | | | | |
| YEAR ENDED DECEMBER 31, 2018 | | Ordinary Income | | | Net Long-Term
Capital Gains | | | Total Taxable
Distributions | | | Return of
Capital | |
| Matthews Asia Strategic Income Fund | | | $2,884,604 | | | | $— | | | | $2,884,604 | | | | $381,950 | |
| Matthews Asia Credit Opportunities Fund | | | 1,411,365 | | | | — | | | | 1,411,365 | | | | — | |
| Matthews Asian Growth and Income Fund | | | 46,680,045 | | | | 180,408,534 | | | | 227,088,579 | | | | — | |
| Matthews Asia Dividend Fund | | | 226,081,829 | | | | 266,855,532 | | | | 492,937,361 | | | | — | |
| Matthews China Dividend Fund | | | 11,590,471 | | | | 24,594,264 | | | | 36,184,735 | | | | — | |
| Matthews Asia Value Fund | | | 1,125,780 | | | | 159,629 | | | | 1,285,409 | | | | — | |
| Matthews Asia Growth Fund | | | 8,510,896 | | | | 6,873,778 | | | | 15,384,674 | | | | — | |
| Matthews Pacific Tiger Fund | | | 192,063,450 | | | | 248,646,631 | | | | 440,710,081 | | | | — | |
| Matthews Asia ESG Fund | | | 110,310 | | | | 861,827 | | | | 972,137 | | | | — | |
| Matthews Emerging Asia Fund | | | 3,675,977 | | | | 8,952,247 | | | | 12,628,224 | | | | — | |
| Matthews Asia Innovators Fund | | | 1,092,195 | | | | 8,851,877 | | | | 9,944,072 | | | | — | |
| Matthews China Fund | | | 9,777,889 | | | | 126,839,507 | | | | 136,617,396 | | | | — | |
| Matthews India Fund | | | — | | | | 279,269,366 | | | | 279,269,366 | | | | — | |
| Matthews Japan Fund | | | 19,888,292 | | | | 136,613,164 | | | | 156,501,456 | | | | — | |
| Matthews Korea Fund | | | 2,951,789 | | | | 24,410,239 | | | | 27,362,028 | | | | — | |
| Matthews Asia Small Companies Fund | | | 2,523,811 | | | | 43,064,299 | | | | 45,588,110 | | | | — | |
| Matthews China Small Companies Fund | | | 368,243 | | | | 2,204,423 | | | | 2,572,666 | | | | — | |
| F. | INVESTMENT TRANSACTIONS AND INCOME:Securities transactions are accounted for on the date the securities are purchased or sold or on the following business day. Financial statements reflect security transactions on trade date. Gains or losses on the sale of securities are determined on the identified cost basis. Interest income is recorded on the accrual basis. Interest income, including amortization and accretion of premiums and discounts on debt securities, is recognized daily on an accrual basis. For convertible securities, premiums attributable to the conversion feature are not amortized. Dividend income is generally recorded on theex-dividend date net of any foreign taxes withheld at the source. Dividend income for certain issuers headquartered in countries which the Funds invest may not be recorded until approved by the shareholders (which may occur after theex-dividend date) if, in the judgment of management, such dividends are not reasonably determined as of theex-dividend date. Income and realized and unrealized gains or losses on investments are allocated to each class of shares based on its relative net assets. |
The Funds may be subject to foreign taxation related to income received, capital gains on the sale of securities and certain foreign currency transactions in the foreign jurisdictions in which they invest. Foreign taxes, if any, are recorded based on the tax regulations and rates that exist in the foreign markets in which the Funds invest. Foreign taxes, if any, are recorded based on the tax regulations and rates that exist in the foreign markets in which the Funds invest. When a capital gain tax is determined to apply, the Funds record an estimated deferred tax liability in an amount that may be payable if the securities were disposed of on the valuation date.
| G. | FUND EXPENSE ALLOCATIONS:The Funds account separately for the assets, liabilities and operations of each Fund. Estimated expenses are accrued daily. Direct expenses of each Fund or class are charged to that Fund or class while general expenses are allocatedpro-rata among the Funds based on net assets or other appropriate methods. |
| H. | CASH, CASH OVERDRAFTS, AND FOREIGN CURRENCY:QFII accounts (i.e., the accounts through which the QFII quota is accessed) are required by the local market to maintain a cash reserve. The cash reserve is based upon a fixed ratio of the QFII’s approved investment quota, which is defined as the amount remitted into its special Renminbi (RMB) cash account. These amounts, if any, are included in “Segregated foreign currency at value” on the Statements of Assets and Liabilities. The fixed ratio is set at 0.08 percent for the Shanghai and 0.06 percent for the Shenzhen market. When any of the Funds’ cash balances are overdrawn, a Fund is charged an overdraft fee by the custodian of 1.00% above the30-day LIBOR rate on outstanding balances. These amounts, if any, are included in “Other expenses” on the Statements of Operations. |
| I. | USE OF ESTIMATES:The preparation of financial statements in conformity with U.S. GAAP requires management to make estimates and assumptions that affect the amounts reported in the financial statements and accompanying notes. Actual results may differ from those estimates. |
| J. | RECENT ACCOUNTING GUIDANCE:In March 2017, the Financial Accounting Standards Board issued amended guidance to shorten the amortization period for certain callable debt securities, held at premium. The guidance is effective for fiscal years and interim periods beginning after December 15, 2018. Adoption will have no effect on the Funds’ net assets. Management is evaluating the impact, if any, of this guidance on the Funds’ results of operations and financial disclosures. |
Notes to Financial Statements(unaudited) (continued)
On August 28, 2018, the FASB issued ASU2018-13, “Disclosure Framework—Changes to the Disclosure Requirements for Fair Value Measurement”, which amends the fair value measurement disclosure requirements under U.S. GAAP. The amendments of ASU2018-13 include new, eliminated, and modified disclosure requirements. In addition, the amendments clarify that materiality is an appropriate consideration of entities when evaluating disclosure requirements. The ASU is effective for all entities for fiscal years beginning after December 15, 2019, including interim periods therein. An entity is permitted to early adopt any eliminated or modified disclosures upon issuance of this ASU and delay adoption of the new disclosures until their effective date. As such, each Fund has early adopted the eliminated and modified disclosures, including the amount of and reasons for transfers between Level 1 and Level 2 of the fair value hierarchy, as permitted by this ASU. Management is currently evaluating the impact that the adoption of the new disclosures will have on the Funds’ financial statements.
| 3. | DERIVATIVE FINANCIAL INSTRUMENTS |
Each of the Matthews Asia Strategic Income Fund and the Matthews Asia Credit Opportunities Fund engages in derivative transactions for a variety of purposes, including managing interest rate, currency and credit exposure. Derivative transactions in which each Fund may engage include financial futures contracts, swaps and/or forward foreign currency exchange contracts.
Certain derivative transactions may result in each Fund’s exposure to a currency to exceed the value of the Fund’s assets and the Fund could be exposed to currency risk whether or not it holds a bond or other instrument denominated in that currency. The gross notional value of derivative financial instruments and transactions could exceed the value of the Fund’s net assets, although the net market value of these instruments and transactions, on amarked-to-market basis, at most times, is expected to be substantially lower.
The primary risks associated with the use of derivative financial instruments are: (i) Matthews may not correctly predict the direction of currency exchange rates, interest rates, security prices, or other economic factors; (ii) Matthews may not correctly predict changes in the value of derivative financial instruments and related underlying instruments or assets, which may result in disproportionately increased losses and/or reduced opportunities for gains; (iii) imperfect correlation between the change in market value of the securities held by a Fund and the price of financial futures contracts and credit default swaps contracts; (iv) the lack of, or a reduction in the liquidity of, any secondary market for the instrument, and the resulting inability to close the position (or exit the position) when desired; (v) losses, which are potentially unlimited, due to unanticipated market movements; (vi) the value of the instrument may change unfavorably due to movements in the value of the referenced foreign currencies; (vii) a Fund may suffer disproportionately heavy losses relative to the amount invested; (viii) changes in the value of the derivatives may not match or fully offset changes in the value of hedged or related portfolio securities, thereby failing to achieve the hedging or investment purpose for the derivative transaction; and (ix) the other party to the instrument may fail to fulfill its obligation.
Forward Foreign Currency Exchange Contracts:The Matthews Asia Strategic Income Fund and the Matthews Asia Credit Opportunities Fund enter into forward foreign currency exchange contracts to gain or reduce exposure to foreign currency exchange rate risk. A forward foreign currency exchange contract is an agreement between two parties to buy and sell a currency at a set exchange rate on a future date. The contract ismarked-to-market daily and the change in market value is recorded by the Fund as an unrealized gain or loss. When the contract is closed, the Fund records a realized gain or loss equal to the difference between the value at the time it was opened and the value at the time it was closed. The Matthews Asia Strategic Income Fund and the Matthews Asia Credit Opportunities Fund do not offset financial assets and financial liabilities on forward foreign currency contacts in the Statements of Assets and Liabilities as they are not subject to netting arrangements.
Swaps:The Matthews Asia Strategic Income Fund and the Matthews Asia Credit Opportunities Fund enter into swap contracts to manage exposure to issuers, markets and securities to reduce their risk exposure to defaults of corporate and/or sovereign issuers or to create exposure to corporate and/or sovereign issuers to which they are not otherwise exposed (credit risk). Such contracts are agreements between the Funds and a counterparty to make periodic net payments on a specified notional amount or a net payment upon termination. Swap agreements are privately negotiated in the OTC market and may be entered into as a bilateral contract (“OTC Swaps”) or centrally cleared (“centrally cleared swaps”).
For OTC swaps, any upfront premiums paid and any upfront fees received are shown as swap premiums paid and swap premiums received, respectively, in the Statements of Assets and Liabilities and amortized over the term of the contract. The daily fluctuation in market value is recorded as unrealized appreciation (depreciation) on OTC Swaps in the Statements of Assets and Liabilities. Payments received or paid are recorded in the Statements of Operations as realized gains or losses, respectively. When an OTC swap is terminated, a realized gain or loss is recorded in the Statements of Operations equal to the difference between the proceeds from (or cost of) the closing transaction and the Funds’ basis in the contract, if any. Generally, the basis of the contract is the amortized premium received or paid.
The Funds may enter into interest rate swaps to gain or reduce exposure to interest rates or to manage duration, the yield curve or interest rate (interest rate risk).
Interest rate swaps are agreements to exchange cash flows based on the difference between specified interest rates applied to a notional principal amount for a specified period of time. Risks related to the use of interest rate swaps include the potential for unanticipated movements in interest or currency rates, the possible failure of a counterparty to perform in accordance with the terms of the swap agreements and potential government regulation that could adversely affect the Funds’ swap investments.
Counterparty Credit Risk:A derivative contract may suffer a mark to market loss if the value of the contract decreases due to an unfavorable change in the market rates or values of the underlying instrument. Losses can also occur if the counterparty does not perform under the contract.
A Fund’s risk of loss from counterparty credit risk on OTC derivatives is generally limited to the aggregate unrealized gain netted against any collateral held by such Fund.
With exchange traded futures and centrally cleared swaps, there is less counterparty credit risk to the Funds since the exchange or clearinghouse, as counterparty to such instruments, guarantees against a possible default. The clearinghouse stands between the buyer and the seller of the contract; therefore, the credit risk is limited to failure of the clearinghouse. While offset rights may exist under applicable law, a Fund does not have a contractual right of offset against a clearing broker or clearinghouse in the event of a default (including the bankruptcy or insolvency) of the clearing broker or clearinghouse. Additionally, credit risk exists in exchange traded futures and centrally cleared swaps with respect to initial and variation margin that is held in a clearing broker’s customer accounts. While clearing brokers are required to segregate customer margin from their own assets, in the event that a clearing broker becomes insolvent or goes into bankruptcy and at that time there is a shortfall in the aggregate amount of margin held by the clearing broker for all its clients, typically the shortfall would be allocated on a pro rata basis across all the clearing broker’s customers, potentially resulting in losses to the Funds.
In order to better define its contractual rights and to secure rights that will help the Funds mitigate their counterparty risk, a Fund may enter into an International Swaps and Derivatives Association, Inc. Master Agreement (“ISDA Master Agreement”) or similar agreement with its derivative contract counterparties. An ISDA Master Agreement is a bilateral agreement between each Fund and a counterparty that governs OTC derivatives and typically contains, among other things, collateral posting terms and netting provisions in the event of a default and/or termination event. Under an ISDA
| | | | |
| matthewsasia.com | 800.789.ASIA | | | 143 | |
Notes to Financial Statements(unaudited) (continued)
Master Agreement, each Fund may, under certain circumstances, offset with the counterparty certain derivative financial instruments’ payables and/or receivables with collateral held and/or posted and create one single net payment. The provisions of the ISDA Master Agreement typically permit a single net payment in the event of default including the bankruptcy or insolvency of the counterparty. However, bankruptcy or insolvency laws of a particular jurisdiction may impose restrictions on or prohibitions against the right of offset in bankruptcy, insolvency or other events. In addition, certain ISDA Master Agreements allow counterparties to OTC derivatives to terminate derivative contracts prior to maturity in the event a Fund’s net assets decline by a stated percentage or the Fund fails to meet the terms of its ISDA Master Agreements, which would cause the Fund to accelerate payment of any net liability owed to the counterparty.
Collateral requirements:For derivatives traded under an ISDA Master Agreement, the collateral requirements are typically calculated by netting the mark to market amount for each transaction under such agreement and comparing that amount to the value of any collateral currently pledged by a Fund and the counterparty. Cash collateral that has been pledged to cover obligations of a Fund, if any, is reported separately on the Statements of Assets and Liabilities as cash pledged as collateral.Non-cash collateral pledged by a Fund, if any, is noted in the Schedules of Investments.
For financial reporting purposes, the Funds do not offset derivative assets and derivative liabilities that are subject to netting arrangements in the Statements of Assets and Liabilities.
The Funds have implemented the disclosure requirements pursuant to FASB Accounting Standards updateNo. 2011-11, Disclosures about Offsetting Assets and Liabilities, that requires disclosures to make financial statements that are prepared under U.S. GAAP more comparable to those prepared under International Financial Reporting Standards. Under this guidance the Funds disclose in the Statements of Assets and Liabilities both gross and net information about instruments and transactions eligible for offset such as instruments and transactions subject to an agreement similar to a master netting arrangement. In addition, the Funds disclose collateral received and posted in connection with master netting agreements or similar arrangements.
As of June 30, 2019, the Matthews Asia Strategic Income Fund had $54,169 in gross/net liabilities in the Statements of Assets and Liabilities for OTC derivatives with Bank of America, N.A. There was no collateral pledged or received by the Fund with this counterparty.
Derivative Financial Instruments Categorized by Risk Exposure:
As of June 30, 2019, the fair values of derivative financial instruments were as follows:
| | | | | | | | |
| | | Statements of Assets and Liabilities Location | | | | Matthews Asia
Strategic Income
Fund | |
| | Asset Derivatives | | | | | | |
| Forward foreign currency exchange contracts | | Unrealized appreciation on forward foreign | | | | | | |
| | currency exchange contracts | | | | | $130,886 | |
| | | | | | | | |
| | | |
| | Liability Derivatives | | | | | | |
| | Unrealized depreciation on forward foreign | | | | | | |
| | currency exchange contracts | | | | | ($556,972 | ) |
| OTC interest rate contracts | | Unrealized depreciation on interest rate contracts | | | | | (54,169 | ) |
| | | | | | | | |
| | Total | | | | | ($611,141 | ) |
| | | | | | | | |
For thesix-month period ended June 30, 2019, the effects of derivative financial instruments on the Statements of Operations were as follows:
| | | | | | | | | | |
| Derivative type | | Statements of Operations Location | | Matthews Asia
Strategic Income
Fund | | | Matthews Asia
Credit Opportunities
Fund | |
Net Realized Gain (Loss) | | | | | | | | | | |
| Foreign currency contracts: | | | | | | | | | | |
| | | |
Forward foreign currency exchange contracts | | Net realized gain (loss) on forward foreign | | | | | | | | |
| | currency exchange contracts | | | $803,516 | | | | $728 | |
| OTC interest rate swaps: | | | | | | | | | | |
| | | |
Interest rate contracts | | Net realized gain (loss) on swaps | | | 85,613 | | | | — | |
| | | | | | |
| | Total | | | $889,129 | | | | $728 | |
| | | | | | |
| | | |
Net Change In Unrealized Appreciation (Depreciation) | | | | | | | | | | |
| Foreign currency contracts: | | | | | | | | | | |
| | | |
Forward foreign currency exchange contracts | | Net change in unrealized appreciation/ | | | | | | | | |
| | depreciation on forward foreign currency | | | | | | | | |
| | exchange contracts | | | ($1,119,966 | ) | | | ($728 | ) |
| OTC interest rate swaps: | | | | | | | | | | |
| | | |
Interest rate contracts | | Net change in unrealized appreciation/ | | | | | | | | |
| | depreciation on swaps | | | (54,169 | ) | | | — | |
| | | | | | |
| | Total | | | ($1,174,135 | ) | | | ($728 | ) |
| | | | | | |
Forward foreign currency exchange contracts entered into by the Matthews Asia Strategic Income Fund, the average notional ending quarterly amounts purchased in USD were $6,149,210 and the average notional ending quarterly amounts sold in USD were $28,000,000. The Matthews Asia Strategic Income Fund held an Interest Rate Swap with a notional amount of 330,000,000 INR for the period 1/16/19 - 4/4/19. The notional amounts disclosed on the Matthews Asia Strategic Income Fund’s Schedule of Investments is indicative of the activity for the period June 18, 2019 - June 30, 2019 for Interest Rate Swaps.
Notes to Financial Statements(unaudited) (continued)
| 4. | CAPITAL SHARE TRANSACTIONS |
| | | | | | | | | | | | | | | | |
| | | Six-Month Period Ended
June 30, 2019 (Unaudited) | | | Year Ended December 31, 2018 | |
| | | Shares | | | Amount | | | Shares | | | Amount | |
MATTHEWS ASIA STRATEGIC INCOME FUND | | | | | | | | | | | | | | | | |
| | | | |
Investor Class | | | | | | | | | | | | | | | | |
| | | | |
Shares sold | | | 270,021 | | | | $2,891,100 | | | | 2,673,655 | | | | $29,287,179 | |
| | | | |
Shares issued through reinvestment of distributions | | | 62,343 | | | | 668,496 | | | | 155,200 | | | | 1,663,927 | |
| | | | |
Shares redeemed | | | (719,071 | ) | | | (7,655,617 | ) | | | (4,636,979 | ) | | | (49,347,994 | ) |
Net (decrease) | | | (386,707 | ) | | | ($4,096,021 | ) | | | (1,808,124 | ) | | | ($18,396,888 | ) |
Institutional Class | | | | | | | | | | | | | | | | |
| | | | |
Shares sold | | | 1,391,419 | | | | $14,760,614 | | | | 4,881,483 | | | | $52,321,637 | |
| | | | |
Shares issued through reinvestment of distributions | | | 104,681 | | | | 1,122,650 | | | | 114,737 | | | | 1,209,687 | |
| | | | |
Shares redeemed | | | (531,454 | ) | | | (5,643,206 | ) | | | (1,981,621 | ) | | | (20,513,956 | ) |
Net increase | | | 964,646 | | | | $10,240,058 | | | | 3,014,599 | | | | $33,017,368 | |
MATTHEWS ASIA CREDIT OPPORTUNITIES FUND | | | | | | | | | | | | | | | | |
| | | | |
Investor Class | | | | | | | | | | | | | | | | |
| | | | |
Shares sold | | | 321,588 | | | | $3,260,019 | | | | 621,546 | | | | $6,369,451 | |
| | | | |
Shares issued through reinvestment of distributions | | | 20,248 | | | | 207,612 | | | | 34,462 | | | | 346,195 | |
| | | | |
Shares redeemed | | | (154,523 | ) | | | (1,562,723 | ) | | | (749,130 | ) | | | (7,545,536 | ) |
Net increase (decrease) | | | 187,313 | | | | $1,904,908 | | | | (93,122 | ) | | | ($829,890 | ) |
Institutional Class | | | | | | | | | | | | | | | | |
| | | | |
Shares sold | | | 1,495,991 | | | | $15,205,043 | | | | 1,955,614 | | | | $19,773,740 | |
| | | | |
Shares issued through reinvestment of distributions | | | 61,014 | | | | 626,006 | | | | 70,100 | | | | 697,699 | |
| | | | |
Shares redeemed | | | (333,140 | ) | | | (3,381,556 | ) | | | (907,590 | ) | | | (8,976,611 | ) |
Net increase | | | 1,223,865 | | | | $12,449,493 | | | | 1,118,124 | | | | $11,494,828 | |
MATTHEWS ASIAN GROWTH AND INCOME FUND | | | | | | | | | | | | | | | | |
| | | | |
Investor Class | | | | | | | | | | | | | | | | |
| | | | |
Shares sold | | | 3,404,065 | | | | $50,165,861 | | | | 7,692,701 | | | | $124,999,548 | |
| | | | |
Shares issued through reinvestment of distributions | | | 576,457 | | | | 8,727,555 | | | | 6,291,585 | | | | 90,673,150 | |
| | | | |
Shares redeemed | | | (8,290,850 | ) | | | (124,294,136 | ) | | | (44,530,783 | ) | | | (727,925,822 | ) |
Net (decrease) | | | (4,310,328 | ) | | | ($65,400,720 | ) | | | (30,546,497 | ) | | | ($512,253,124 | ) |
Institutional Class | | | | | | | | | | | | | | | | |
| | | | |
Shares sold | | | 10,361,550 | | | | $153,536,916 | | | | 19,468,288 | | | | $325,288,280 | |
| | | | |
Shares issued through reinvestment of distributions | | | 450,370 | | | | 6,809,588 | | | | 5,846,765 | | | | 84,477,052 | |
| | | | |
Shares redeemed | | | (15,393,708 | ) | | | (230,390,354 | ) | | | (57,543,636 | ) | | | (917,676,867 | ) |
Net (decrease) | | | (4,581,788 | ) | | | ($70,043,850 | ) | | | (32,228,583 | ) | | | ($507,911,535 | ) |
MATTHEWS ASIA DIVIDEND FUND | | | | | | | | | | | | | | | | |
| | | | |
Investor Class | | | | | | | | | | | | | | | | |
| | | | |
Shares sold | | | 17,009,977 | | | | $284,885,655 | | | | 41,217,543 | | | | $788,692,238 | |
| | | | |
Shares issued through reinvestment of distributions | | | 1,400,669 | | | | 23,198,086 | | | | 11,593,833 | | | | 197,404,775 | |
| | | | |
Shares redeemed | | | (27,345,283 | ) | | | (458,152,335 | ) | | | (70,902,063 | ) | | | (1,313,499,842 | ) |
Net (decrease) | | | (8,934,637 | ) | | | ($150,068,594 | ) | | | (18,090,687 | ) | | | ($327,402,829 | ) |
Institutional Class | | | | | | | | | | | | | | | | |
| | | | |
Shares sold | | | 30,152,201 | | | | $507,569,029 | | | | 60,848,321 | | | | $1,153,786,170 | |
| | | | |
Shares issued through reinvestment of distributions | | | 1,749,772 | | | | 28,989,308 | | | | 13,060,327 | | | | 222,009,324 | |
| | | | |
Shares redeemed | | | (21,885,579 | ) | | | (366,175,799 | ) | | | (50,882,787 | ) | | | (904,298,337 | ) |
Net increase | | | 10,016,394 | | | | $170,382,538 | | | | 23,025,861 | | | | $471,497,157 | |
| | | | |
| matthewsasia.com | 800.789.ASIA | | | 145 | |
Notes to Financial Statements(unaudited) (continued)
| | | | | | | | | | | | | | | | |
| | | Six-Month Period Ended
June 30, 2019 (Unaudited) | | | Year Ended December 31, 2018 | |
| | | Shares | | | Amount | | | Shares | | | Amount | |
MATTHEWS CHINA DIVIDEND FUND | | | | | | | | | | | | | | | | |
| | | | |
Investor Class | | | | | | | | | | | | | | | | |
| | | | |
Shares sold | | | 5,670,155 | | | | $90,307,189 | | | | 5,966,861 | | | | $103,895,668 | |
| | | | |
Shares issued through reinvestment of distributions | | | 248,376 | | | | 3,899,398 | | | | 1,359,166 | | | | 20,830,044 | |
| | | | |
Shares redeemed | | | (2,690,161 | ) | | | (42,650,838 | ) | | | (8,392,276 | ) | | | (143,578,333 | ) |
Net increase (decrease) | | | 3,228,370 | | | | $51,555,749 | | | | (1,066,249 | ) | | | ($18,852,621 | ) |
Institutional Class | | | | | | | | | | | | | | | | |
| | | | |
Shares sold | | | 1,659,939 | | | | $26,849,887 | | | | 3,759,608 | | | | $67,020,667 | |
| | | | |
Shares issued through reinvestment of distributions | | | 98,335 | | | | 1,543,858 | | | | 525,095 | | | | 8,055,027 | |
| | | | |
Shares redeemed | | | (572,769 | ) | | | (9,099,957 | ) | | | (2,258,122 | ) | | | (36,385,874 | ) |
Net increase | | | 1,185,505 | | | | $19,293,788 | | | | 2,026,581 | | | | $38,689,820 | |
MATTHEWS ASIA VALUE FUND | | | | | | | | | | | | | | | | |
| | | | |
Investor Class | | | | | | | | | | | | | | | | |
| | | | |
Shares sold | | | 404,493 | | | | $4,652,557 | | | | 1,051,874 | | | | $13,252,147 | |
| | | | |
Shares issued through reinvestment of distributions | | | — | | | | — | | | | 72,411 | | | | 795,079 | |
| | | | |
Shares redeemed | | | (280,999 | ) | | | (3,217,495 | ) | | | (1,753,683 | ) | | | (21,328,776 | ) |
Net increase (decrease) | | | 123,494 | | | | $1,435,062 | | | | (629,398 | ) | | | ($7,281,550 | ) |
Institutional Class | | | | | | | | | | | | | | | | |
| | | | |
Shares sold | | | 314,802 | | | | $3,598,877 | | | | 466,954 | | | | $5,447,710 | |
| | | | |
Shares issued through reinvestment of distributions | | | — | | | | — | | | | 18,592 | | | | 202,462 | |
| | | | |
Shares redeemed | | | (425,733 | ) | | | (4,854,099 | ) | | | (114,752 | ) | | | (1,403,647 | ) |
Net increase (decrease) | | | (110,931 | ) | | | ($1,255,222 | ) | | | 370,794 | | | | $4,246,525 | |
MATTHEWS ASIA GROWTH FUND | | | | | | | | | | | | | | | | |
| | | | |
Investor Class | | | | | | | | | | | | | | | | |
| | | | |
Shares sold | | | 3,129,174 | | | | $77,878,648 | | | | 10,786,092 | | | | $298,040,265 | |
| | | | |
Shares issued through reinvestment of distributions | | | — | | | | — | | | | 261,406 | | | | 6,250,221 | |
| | | | |
Shares redeemed | | | (3,433,953 | ) | | | (85,358,800 | ) | | | (10,780,916 | ) | | | (285,324,564 | ) |
Net increase (decrease) | | | (304,779 | ) | | | ($7,480,152 | ) | | | 266,582 | | | | $18,965,922 | |
Institutional Class | | | | | | | | | | | | | | | | |
| | | | |
Shares sold | | | 3,981,112 | | | | $99,471,589 | | | | 13,280,478 | | | | $366,402,524 | |
| | | | |
Shares issued through reinvestment of distributions | | | — | | | | — | | | | 254,228 | | | | 6,121,801 | |
| | | | |
Shares redeemed | | | (2,066,577 | ) | | | (52,050,829 | ) | | | (3,723,336 | ) | | | (95,217,584 | ) |
Net increase | | | 1,914,535 | | | | $47,420,760 | | | | 9,811,370 | | | | $277,306,741 | |
MATTHEWS PACIFIC TIGER FUND | | | | | | | | | | | | | | | | |
| | | | |
Investor Class | | | | | | | | | | | | | | | | |
| | | | |
Shares sold | | | 10,257,728 | | | | $289,488,897 | | | | 23,880,091 | | | | $723,000,071 | |
| | | | |
Shares issued through reinvestment of distributions | | | — | | | | — | | | | 4,100,739 | | | | 110,309,880 | |
| | | | |
Shares redeemed | | | (10,469,220 | ) | | | (294,929,075 | ) | | | (35,883,150 | ) | | | (1,069,368,504 | ) |
Net (decrease) | | | (211,492 | ) | | | ($5,440,178 | ) | | | (7,902,320 | ) | | | ($236,058,553 | ) |
Institutional Class | | | | | | | | | | | | | | | | |
| | | | |
Shares sold | | | 34,205,193 | | | | $964,963,393 | | | | 73,569,231 | | | | $2,205,765,648 | |
| | | | |
Shares issued through reinvestment of distributions | | | — | | | | — | | | | 8,621,801 | | | | 231,581,567 | |
| | | | |
Shares redeemed | | | (25,382,096 | ) | | | (712,451,732 | ) | | | (72,136,270 | ) | | | (2,150,140,709 | ) |
Net increase | | | 8,823,097 | | | | $252,511,661 | | | | 10,054,762 | | | | $287,206,506 | |
MATTHEWS ASIA ESG FUND | | | | | | | | | | | | | | | | |
| | | | |
Investor Class | | | | | | | | | | | | | | | | |
| | | | |
Shares sold | | | 737,901 | | | | $8,006,774 | | | | 518,131 | | | | $5,764,694 | |
| | | | |
Shares issued through reinvestment of distributions | | | — | | | | — | | | | 39,314 | | | | 388,821 | |
| | | | |
Shares redeemed | | | (220,876 | ) | | | (2,292,955 | ) | | | (552,444 | ) | | | (5,766,903 | ) |
Net increase | | | 517,025 | | | | $5,713,819 | | | | 5,001 | | | | $386,612 | |
Institutional Class | | | | | | | | | | | | | | | | |
| | | | |
Shares sold | | | 500,669 | | | | $5,328,084 | | | | 1,862,932 | | | | $18,844,975 | |
| | | | |
Shares issued through reinvestment of distributions | | | — | | | | — | | | | 56,216 | | | | 554,851 | |
| | | | |
Shares redeemed | | | (119,489 | ) | | | (1,269,852 | ) | | | (224,650 | ) | | | (2,278,724 | ) |
Net increase | | | 381,180 | | | | $4,058,232 | | | | 1,694,498 | | | | $17,121,102 | |
Notes to Financial Statements(unaudited) (continued)
| | | | | | | | | | | | | | | | |
| | | Six-Month Period Ended
June 30, 2019 (Unaudited) | | | Year Ended December 31, 2018 | |
| | | Shares | | | Amount | | | Shares | | | Amount | |
MATTHEWS EMERGING ASIA FUND | | | | | | | | | | | | | | | | |
| | | | |
Investor Class | | | | | | | | | | | | | | | | |
| | | | |
Shares sold | | | 1,400,015 | | | | $18,035,883 | | | | 4,620,696 | | | | $65,897,785 | |
| | | | |
Shares issued through reinvestment of distributions | | | — | | | | — | | | | 212,377 | | | | 2,658,966 | |
| | | | |
Shares redeemed | | | (2,062,747 | ) | | | (26,406,315 | ) | | | (9,507,354 | ) | | | (133,149,866 | ) |
Net (decrease) | | | (662,732 | ) | | | ($8,370,432 | ) | | | (4,674,281 | ) | | | ($64,593,115 | ) |
Institutional Class | | | | | | | | | | | | | | | | |
| | | | |
Shares sold | | | 7,773,539 | | | | $99,853,546 | | | | 13,299,754 | | | | $190,322,581 | |
| | | | |
Shares issued through reinvestment of distributions | | | — | | | | — | | | | 477,196 | | | | 5,993,576 | |
| | | | |
Shares redeemed | | | (2,324,042 | ) | | | (29,980,331 | ) | | | (10,983,928 | ) | | | (147,221,998 | ) |
Net increase | | | 5,449,497 | | | | $69,873,215 | | | | 2,793,022 | | | | $49,094,159 | |
MATTHEWS ASIA INNOVATORS FUND | | | | | | | | | | | | | | | | |
| | | | |
Investor Class | | | | | | | | | | | | | | | | |
| | | | |
Shares sold | | | 2,533,698 | | | | $32,271,743 | | | | 10,925,559 | | | | $155,176,262 | |
| | | | |
Shares issued through reinvestment of distributions | | | — | | | | — | | | | 334,533 | | | | 3,867,195 | |
| | | | |
Shares redeemed | | | (3,052,075 | ) | | | (39,162,445 | ) | | | (10,079,828 | ) | | | (140,682,243 | ) |
Net increase (decrease) | | | (518,377 | ) | | | ($6,890,702 | ) | | | 1,180,264 | | | | $18,361,214 | |
Institutional Class | | | | | | | | | | | | | | | | |
| | | | |
Shares sold | | | 1,658,583 | | | | $21,824,445 | | | | 8,564,706 | | | | $117,389,330 | |
| | | | |
Shares issued through reinvestment of distributions | | | — | | | | — | | | | 219,506 | | | | 2,550,665 | |
| | | | |
Shares redeemed | | | (1,040,027 | ) | | | (13,187,033 | ) | | | (2,844,442 | ) | | | (36,304,986 | ) |
Net increase | | | 618,556 | | | | $8,637,412 | | | | 5,939,770 | | | | $83,635,009 | |
MATTHEWS CHINA FUND | | | | | | | | | | | | | | | | |
| | | | |
Investor Class | | | | | | | | | | | | | | | | |
| | | | |
Shares sold | | | 6,364,385 | | | | $107,768,354 | | | | 15,121,019 | | | | $340,339,102 | |
| | | | |
Shares issued through reinvestment of distributions | | | — | | | | — | | | | 7,011,755 | | | | 104,895,844 | |
| | | | |
Shares redeemed | | | (5,392,610 | ) | | | (90,437,893 | ) | | | (20,695,099 | ) | | | (427,936,552 | ) |
Net increase | | | 971,775 | | | | $17,330,461 | | | | 1,437,675 | | | | $17,298,394 | |
Institutional Class | | | | | | | | | | | | | | | | |
| | | | |
Shares sold | | | 6,103,539 | | | | $98,934,581 | | | | 6,614,792 | | | | $150,104,126 | |
| | | | |
Shares issued through reinvestment of distributions | | | — | | | | — | | | | 588,948 | | | | 8,792,993 | |
| | | | |
Shares redeemed | | | (614,714 | ) | | | (10,572,933 | ) | | | (6,742,777 | ) | | | (135,104,968 | ) |
Net increase | | | 5,488,825 | | | | $88,361,648 | | | | 460,963 | | | | $23,792,151 | |
MATTHEWS INDIA FUND | | | | | | | | | | | | | | | | |
| | | | |
Investor Class | | | | | | | | | | | | | | | | |
| | | | |
Shares sold | | | 5,798,714 | | | | $152,254,183 | | | | 10,324,568 | | | | $334,912,011 | |
| | | | |
Shares issued through reinvestment of distributions | | | — | | | | — | | | | 5,722,656 | | | | 144,439,816 | |
| | | | |
Shares redeemed | | | (6,045,925 | ) | | | (159,562,486 | ) | | | (18,347,443 | ) | | | (565,381,775 | ) |
Net (decrease) | | | (247,211 | ) | | | ($7,308,303 | ) | | | (2,300,219 | ) | | | ($86,029,948 | ) |
Institutional Class | | | | | | | | | | | | | | | | |
| | | | |
Shares sold | | | 2,214,392 | | | | $58,789,099 | | | | 6,465,401 | | | | $215,871,605 | |
| | | | |
Shares issued through reinvestment of distributions | | | — | | | | — | | | | 1,158,242 | | | | 29,500,413 | |
| | | | |
Shares redeemed | | | (5,946,833 | ) | | | (159,551,688 | ) | | | (13,006,329 | ) | | | (414,651,704 | ) |
Net (decrease) | | | (3,732,441 | ) | | | ($100,762,589 | ) | | | (5,382,686 | ) | | | ($169,279,686 | ) |
MATTHEWS JAPAN FUND | | | | | | | | | | | | | | | | |
| | | | |
Investor Class | | | | | | | | | | | | | | | | |
| | | | |
Shares sold | | | 11,055,072 | | | | $217,173,581 | | | | 35,434,821 | | | | $838,074,072 | |
| | | | |
Shares issued through reinvestment of distributions | | | — | | |
| —
|
| | | 3,537,698 | | | | 69,727,510 | |
| | | | |
Shares redeemed | | | (25,630,711 | ) | | | (526,089,605 | ) | | | (36,383,495 | ) | | | (791,989,983 | ) |
Net increase (decrease) | | | (14,575,639 | ) | | | ($308,916,024 | ) | | | 2,589,024 | | | | $115,811,599 | |
Institutional Class | | | | | | | | | | | | | | | | |
| | | | |
Shares sold | | | 8,701,605 | | | | $179,373,556 | | | | 28,126,973 | | | | $681,080,915 | |
| | | | |
Shares issued through reinvestment of distributions | | | — | | | | — | | | | 788,439 | | | | 15,563,790 | |
| | | | |
Shares redeemed | | | (22,428,614 | ) | | | (450,829,905 | ) | | | (47,031,577 | ) | | | (1,073,069,165 | ) |
Net (decrease) | | | (13,727,009 | ) | | | ($271,456,349 | ) | | | (18,116,165 | ) | | | ($376,424,460 | ) |
| | | | |
| matthewsasia.com | 800.789.ASIA | | | 147 | |
Notes to Financial Statements(unaudited) (continued)
| | | | | | | | | | | | | | | | |
| | | Six-Month Period Ended
June 30, 2019 (Unaudited) | | | Year Ended December 31, 2018 | |
| | | Shares | | | Amount | | | Shares | | | Amount | |
MATTHEWS KOREA FUND | | | | | | | | | | | | | | | | |
| | | | |
Investor Class | | | | | | | | | | | | | | | | |
| | | | |
Shares sold | | | 950,334 | | | | $4,414,943 | | | | 4,808,867 | | | | $28,840,215 | |
| | | | |
Shares issued through reinvestment of distributions | | | — | | | | — | | | | 4,259,343 | | | | 19,124,478 | |
| | | | |
Shares redeemed | | | (2,065,797 | ) | | | (9,547,199 | ) | | | (9,178,750 | ) | | | (52,897,760 | ) |
Net (decrease) | | | (1,115,463 | ) | | | ($5,132,256 | ) | | | (110,540 | ) | | | ($4,933,067 | ) |
Institutional Class | | | | | | | | | | | | | | | | |
| | | | |
Shares sold | | | 2,752,961 | | | | $12,709,569 | | | | 4,291,986 | | | | $26,760,451 | |
| | | | |
Shares issued through reinvestment of distributions | | | — | | | | — | | | | 605,040 | | | | 2,734,781 | |
| | | | |
Shares redeemed | | | (507,031 | ) | | | (2,317,549 | ) | | | (5,384,782 | ) | | | (29,526,364 | ) |
Net increase (decrease) | | | 2,245,930 | | | | $10,392,020 | | | | (487,756 | ) | | | ($31,132 | ) |
MATTHEWS ASIA SMALL COMPANIES FUND | | | | | | | | | | | | | | | | |
| | | | |
Investor Class | | | | | | | | | | | | | | | | |
| | | | |
Shares sold | | | 744,408 | | | | $12,246,014 | | | | 1,341,878 | | | | $28,839,901 | |
| | | | |
Shares issued through reinvestment of distributions | | | — | | | | — | | | | 1,344,976 | | | | 21,129,567 | |
| | | | |
Shares redeemed | | | (1,260,791 | ) | | | (21,181,782 | ) | | | (4,600,698 | ) | | | (92,122,082 | ) |
Net (decrease) | | | (516,383 | ) | | | ($8,935,768 | ) | | | (1,913,844 | ) | | | ($42,152,614 | ) |
Institutional Class | | | | | | | | | | | | | | | | |
| | | | |
Shares sold | | | 1,272,599 | | | | $21,124,747 | | | | 2,031,529 | | | | $42,209,221 | |
| | | | |
Shares issued through reinvestment of distributions | | | — | | | | — | | | | 1,164,500 | | | | 18,247,712 | |
| | | | |
Shares redeemed | | | (1,812,311 | ) | | | (30,109,020 | ) | | | (8,539,680 | ) | | | (162,341,803 | ) |
Net (decrease) | | | (539,712 | ) | | | ($8,984,273 | ) | | | (5,343,651 | ) | | | ($101,884,870 | ) |
MATTHEWS CHINA SMALL COMPANIES FUND | | | | | | | | | | | | | | | | |
| | | | |
Investor Class | | | | | | | | | | | | | | | | |
| | | | |
Shares sold | | | 1,044,531 | | | | $11,471,292 | | | | 4,586,645 | | | | $55,688,924 | |
| | | | |
Shares issued through reinvestment of distributions | | | — | | | | — | | | | 95,152 | | | | 942,955 | |
| | | | |
Shares redeemed | | | (1,140,562 | ) | | | (12,154,305 | ) | | | (3,284,316 | ) | | | (36,655,946 | ) |
Net increase (decrease) | | | (96,031 | ) | | | ($683,013 | ) | | | 1,397,481 | | | | $19,975,933 | |
Institutional Class | | | | | | | | | | | | | | | | |
| | | | |
Shares sold | | | 659,146 | | | | $6,987,941 | | | | 2,620,573 | | | | $28,921,075 | |
| | | | |
Shares issued through reinvestment of distributions | | | — | | | | — | | | | 32,751 | | | | 324,895 | |
| | | | |
Shares redeemed | | | (670,842 | ) | | | (7,485,821 | ) | | | (530,287 | ) | | | (5,561,926 | ) |
Net increase (decrease) | | | (11,696 | ) | | | ($497,880 | ) | | | 2,123,037 | | | | $23,684,044 | |
Through June 30, 2019, a 2.00% redemption fee was assessed on the sale or exchange of shares of the Matthews Emerging Asia Fund, Matthews Asia Small Companies Fund and Matthews China Small Companies Fund (collectively, the “Covered Funds”) within 90 days after the date an investor purchases shares of the Covered Funds. This fee is payable directly to the Covered Funds.
To determine whether the redemption fee applies, the Covered Funds do not count the day that shares were purchased, and first redeem the shares that have been held the longest.
The redemption fees returned to the assets of the Funds are stated in the Statements of Changes in Net Assets.
| 5. | INVESTMENT ADVISORY FEES AND OTHER TRANSACTIONS WITH AFFILIATES |
Matthews, a registered investment advisor under the 1940 Act, provides the Funds with investment management services. Pursuant to the prior Investment Advisory Agreement dated August 13, 2004, as amended (the “Prior Advisory Agreement”) and the current Investment Advisory Agreement dated February 1, 2016, as amended (the “Current Advisory Agreement,” and together with the Prior Advisory Agreement, the “Advisory Agreement”), the Funds pay Matthews (i) for management and advisory services; and (ii) for certain administrative services, an annual fee as a percentage of average daily net assets. Under the Advisory Agreement each of the Funds, other than Matthews Asia Strategic Income Fund, Matthews Asia Credit Opportunities Fund, Matthews Emerging Asia Fund, Matthews Asia Small Companies Fund, and Matthews China Small Companies Fund (the “Family-Priced Funds”), pays Matthews 0.75% of their aggregate average daily net assets up to $2 billion, 0.6834% of their aggregate average daily net assets over $2 billion up to $5 billion, 0.65% of their aggregate average daily net assets over $5 billion up to $25 billion, 0.64% of their aggregate average daily net assets over $25 billion up to $30 billion, 0.63% of their aggregate average daily net assets over $30 billion up to $35 billion, 0.62% of their aggregate average daily net assets over $35 billion up to $40 billion, 0.61% of their aggregate average daily net assets over $40 billion up to $45 billion, and 0.60% of their aggregate average daily net assets over $45 billion. Each of the Matthews Asia Strategic Income Fund and Matthews Asia Credit Opportunities Fund pays Matthews an annual fee of 0.55% of such Fund’s annual average daily net assets pursuant to the Advisory Agreement. Each of the Matthews Emerging Asia Fund, Matthews Asia Small Companies Fund, and the Matthews China Small Companies Fund pays Matthews an annual fee of 1.00% of the average daily net assets of such Fund up to $1 billion and 0.95% of the average daily net assets of such Fund over $1 billion pursuant to the Advisory Agreement. Each Fund pays Matthews a monthly fee at the annual rate using the applicable management fee calculated based on the actual number of days of that month and based on the Fund’s average daily net asset value for the month.
Notes to Financial Statements(unaudited) (continued)
Pursuant to a fee waiver letter agreement, effective as of September 1, 2014, between the Trust, on behalf of the Family-Priced Funds, and Matthews (as amended from time to time, the “Fee Waiver Agreement”), for each Family-Priced Fund, Matthews has agreed to waive a portion of the fee payable under the Advisory Agreement and a portion of the fee payable under the Administration and Shareholder Services Agreement, if any Family-Priced Fund’s average daily net assets are over $3 billion, as follows: for every $2.5 billion average daily net assets of a Family-Priced Fund that are over $3 billion, the fee rates that otherwise would be applied for calculating fees payable under the Advisory Agreement and the Administration and Shareholder Services Agreement for such Family-Priced Fund with respect to such excess average daily net assets will be each reduced by 0.01%, in each case without reducing such fee rate below 0.00%.
Investment advisory fees charged, waived fees and reimbursed additional expenses for thesix-month period ended June 30, 2019, were as follows:
| | | | | | | | | | | | |
| | | Gross Advisory Fees | | | Advisory Fees
Waived and
Reimbursed in
Excess of the
Expense Limitation | | | Net Advisory Fee/
Reimbursement | |
| Matthews Asia Strategic Income Fund | | | $293,987 | | | | ($25,859 | ) | | | $268,128 | |
| Matthews Asia Credit Opportunities Fund | | | 134,281 | | | | (50,460 | ) | | | 83,821 | |
| Matthews Asian Growth and Income Fund | | | 4,770,829 | | | | — | | | | 4,770,829 | |
| Matthews Asia Dividend Fund | | | 20,275,181 | | | | (190,457 | ) | | | 20,084,724 | |
| Matthews China Dividend Fund | | | 1,123,589 | | | | — | | | | 1,123,589 | |
| Matthews Asia Value Fund | | | 89,587 | | | | (58,374 | ) | | | 31,213 | |
| Matthews Asia Growth Fund | | | 3,533,896 | | | | — | | | | 3,533,896 | |
| Matthews Pacific Tiger Fund | | | 29,514,343 | | | | (518,018 | ) | | | 28,996,325 | |
| Matthews Asia ESG Fund | | | 134,663 | | | | (53,794 | ) | | | 80,869 | |
| Matthews Emerging Asia Fund | | | 2,142,828 | | | | (514,640 | ) | | | 1,628,188 | |
| Matthews Asia Innovators Fund | | | 908,817 | | | | — | | | | 908,817 | |
| Matthews China Fund | | | 2,629,864 | | | | — | | | | 2,629,864 | |
| Matthews India Fund | | | 5,111,917 | | | | — | | | | 5,111,917 | |
| Matthews Japan Fund | | | 9,503,572 | | | | — | | | | 9,503,572 | |
| Matthews Korea Fund | | | 501,506 | | | | — | | | | 501,506 | |
| Matthews Asia Small Companies Fund | | | 957,806 | | | | (237,652 | ) | | | 720,154 | |
| Matthews China Small Companies Fund | | | 356,650 | | | | (85,055 | ) | | | 271,595 | |
Under a written agreement between the Funds and Matthews (the “Operating Expense Agreement”), Matthews agrees to waive fees and reimburse expenses to a Fund if its expense ratio exceeds a certain percentage level. Effective November 30, 2017 for all Funds, except Matthews Asia Strategic Income Fund and the Matthews Asia Credit Opportunities Fund, this level is 1.25% for the Institutional Class. Matthews agrees to reduce the expense ratio by waiving an equal amount ofnon-class specific expenses for the Investor Class. Because certain expenses of the Investor Class may be higher than those of the Institutional Class and because class specific expenses may be waived solely for the Institutional Class, total annual Fund expenses for the Investor Class may exceed 1.25%. For Matthews Asia Strategic Income Fund and Matthews Asia Credit Opportunities Fund this level is 0.90% for the Institutional Class. Matthews agrees to reduce the expense ratio by waiving an equal amount ofnon-class specific expenses for the Investor Class. Because certain expenses of the Investor Class may be higher than those of the Institutional Class and because class specific expenses may be waived solely for the Institutional Class, total annual Fund expenses for the Investor Class may exceed 0.90%. In turn, if the expenses of a Fund, other than the Matthews Asia Strategic Income Fund and the Matthews Asia Credit Opportunities Fund, fall below the level noted within three years after Matthews has made such a reimbursement, the Fund may reimburse Matthews up to an amount of the recoupment available not to exceed the lesser of (i) the expense limitation applicable at the time of that fee waiver and/or expense reimbursement or (ii) the expense limitation in effect at the time of recoupment. For the Matthews Asia Strategic Income Fund and the Matthews Asia Credit Opportunities Fund, any amount waived is not subject to recoupment. This agreement will continue through April 30, 2020, may be extended for additional periods not exceeding one year, and may be terminated at any time by the Board of Trustees on behalf of the Fund on 60 days’ written notice to Matthews. Matthews may decline to renew this agreement by written notice to the Trust at least 30 days before its annual expiration date.
Waived Fees Subject to Possible Future Recoupment
On June 30, 2019, the amounts subject to possible future recoupment under the expense limitation agreement are as follows:
| | | | | | | | | | | | | | | | |
| | | Expiring December 31, | |
| | | 2019 | | | 2020 | | | 2021 | | | 2022 | |
| Matthews Asia Value Fund | | | $211,035 | | | | $119,683 | | | | $81,767 | | | | $58,374 | |
| Matthews Asia ESG Fund | | | 163,853 | | | | 156,429 | | | | 156,459 | | | | 53,794 | |
| Matthews Emerging Asia Fund | | | 553,167 | | | | 878,171 | | | | 1,073,964 | | | | 514,640 | |
| Matthews Asia Small Companies Fund | | | 252,008 | | | | 272,597 | | | | 308,001 | | | | 237,652 | |
| Matthews China Small Companies Fund | | | 142,295 | | | | 184,162 | | | | 275,220 | | | | 85,055 | |
Matthews Asian Growth and Income Fund, Matthews Asia Dividend Fund, Matthews China Dividend Fund, Matthews Asia Growth Fund, Matthews Pacific Tiger Fund, Matthews Asia Innovators Fund, Matthews China Fund, Matthews India Fund, Matthews Japan Fund and Matthews Korea Fund had no amounts available for recoupment and no amounts recouped during thesix-month period ended June 30, 2019.
The Funds have an Administration and Shareholder Services Agreement dated August 13, 2004, as amended (the “Shareholder Services Agreement” or “Services Agreement”), in which the Funds pay an annual administration and shareholder servicing fee to Matthews, as a percentage of the average daily net assets of each Fund in aggregate, computed and prorated on a daily basis. Under the Shareholder Services Agreement, the Funds in the aggregate pay Matthews 0.25% of their aggregate average daily net assets up to $2 billion, 0.1834% of their aggregate average daily net assets over $2 billion up to $5 billion, 0.15% of their aggregate average daily net assets over $5 billion up to $7.5 billion, 0.125% of their aggregate average daily
| | | | |
| matthewsasia.com | 800.789.ASIA | | | 149 | |
Notes to Financial Statements(unaudited) (continued)
net assets over $7.5 billion up to $15 billion, 0.11% of their aggregate average daily net assets over $15 billion up to $22.5 billion, 0.10% of their aggregate average daily net assets over $22.5 billion up to $25 billion, 0.09% of their aggregate average daily net assets over $25 billion up to $30 billion, 0.08% of their aggregate average daily net assets over $30 billion up to $35 billion, 0.07% of their aggregate average daily net assets over $35 billion up to $40 billion, 0.06% of their aggregate average daily net assets over $40 billion up to $45 billion, and 0.05% of their aggregate average daily net assets over $45 billion.
Administration and shareholder servicing fees charged, for thesix-month period ended June 30, 2019, were as follows:
| | | | | | | | | | | | |
| | | Gross
Administration and
Shareholder
Servicing Fees | | | Administration and
Shareholder
Servicing Fees
Waived in Excess of
Expense Limitation | | | Net
Administration and
Shareholder
Servicing Fees | |
| Matthews Asia Strategic Income Fund | | | $73,781 | | | | $— | | | | $73,781 | |
| Matthews Asia Credit Opportunities Fund | | | 33,691 | | | | — | | | | 33,691 | |
| Matthews Asian Growth and Income Fund | | | 993,622 | | | | — | | | | 993,622 | |
| Matthews Asia Dividend Fund | | | 4,222,455 | | | | (190,457 | ) | | | 4,031,998 | |
| Matthews China Dividend Fund | | | 233,920 | | | | — | | | | 233,920 | |
| Matthews Asia Value Fund | | | 18,649 | | | | — | | | | 18,649 | |
| Matthews Asia Growth Fund | | | 735,892 | | | | — | | | | 735,892 | |
| Matthews Pacific Tiger Fund | | | 6,146,970 | | | | (518,018 | ) | | | 5,628,952 | |
| Matthews Asia ESG Fund | | | 28,034 | | | | — | | | | 28,034 | |
| Matthews Emerging Asia Fund | | | 295,692 | | | | — | | | | 295,692 | |
| Matthews Asia Innovators Fund | | | 189,241 | | | | — | | | | 189,241 | |
| Matthews China Fund | | | 547,412 | | | | — | | | | 547,412 | |
| Matthews India Fund | | | 1,064,771 | | | | — | | | | 1,064,771 | |
| Matthews Japan Fund | | | 1,979,339 | | | | — | | | | 1,979,339 | |
| Matthews Korea Fund | | | 104,450 | | | | — | | | | 104,450 | |
| Matthews Asia Small Companies Fund | | | 132,194 | | | | — | | | | 132,194 | |
| Matthews China Small Companies Fund | | | 49,193 | | | | — | | | | 49,193 | |
In addition to the fees paid to the Funds’ transfer agent, the Funds bear the cost of fees paid to certain service providers or intermediaries, including supermarkets, which provide transfer agency, record-keeping and shareholder servicing to certain shareholders. These fees are referred to as intermediary service fees on the Statements of Assets and Liabilities as well as the Statements of Operations. Additional information concerning these services and fees is contained in the Funds’ prospectuses.
BNY Mellon Investment Servicing (US) Inc. (“BNY Mellon”), an indirect wholly owned subsidiary of The Bank of New York Mellon Corporation, serves as the Funds’ administrator, and in that capacity, performs various administrative and accounting services for each Fund. BNY Mellon also serves as the Funds’ transfer agent, dividend disbursing agent and registrar. An officer of BNY Mellon serves as Assistant Treasurer to the Funds. Total fees accrued by the Funds for administration and accounting services for thesix-month period ended June 30, 2019 were as follows:
| | | | |
| | | Administration and
Accounting fees | |
| Matthews Asia Strategic Income Fund | | | $4,276 | |
| Matthews Asia Credit Opportunities Fund | | | 1,953 | |
| Matthews Asian Growth and Income Fund | | | 57,599 | |
| Matthews Asia Dividend Fund | | | 244,786 | |
| Matthews China Dividend Fund | | | 13,566 | |
| Matthews Asia Value Fund | | | 1,082 | |
| Matthews Asia Growth Fund | | | 42,666 | |
| Matthews Pacific Tiger Fund | | | 356,330 | |
| Matthews Asia ESG Fund | | | 1,626 | |
| Matthews Emerging Asia Fund | | | 17,143 | |
| Matthews Asia Innovators Fund | | | 10,972 | |
| Matthews China Fund | | | 31,752 | |
| Matthews India Fund | | | 61,716 | |
| Matthews Japan Fund | | | 114,738 | |
| Matthews Korea Fund | | | 6,055 | |
| Matthews Asia Small Companies Fund | | | 7,663 | |
| Matthews China Small Companies Fund | | | 2,853 | |
Brown Brothers Harriman & Co. serves as the Funds’ custodian. Foreside Funds Distributors LLC, serves as the Funds’ distributor in the United States pursuant to an Underwriting Agreement. Matthews Asia Funds are distributed in Latin America by HMC Partners.
Notes to Financial Statements(unaudited) (continued)
As of June 30, 2019, Matthews and its affiliates held significant shares in the Funds as follows:
| | | | | | | | |
| | | Shares held by Matthews and its Affiliates | | | Percentage of
Outstanding Shares | |
| Matthews Asia Strategic Income Fund | | | 989,046 | | | | 10 | % |
| Matthews Asia Credit Opportunities Fund | | | 1,121,239 | | | | 20 | % |
| Matthews Asia ESG Fund | | | 1,042,250 | | | | 25 | % |
Certain officers and Trustees of the Funds are also officers and directors of Matthews. All officers serve without compensation from the Funds. The Funds paid the Independent Trustees $832,305 in aggregate for regular compensation during thesix-month period ended June 30, 2019.
The value of investment transactions made for affiliated and unaffiliated holdings for thesix-month period ended June 30, 2019 were as follows:
| | | | | | | | | | | | | | | | |
| | | Affiliated Purchases | | | Proceeds from
Affiliated Sales | | | Unaffiliated Purchases | | | Proceeds from
Unaffiliated Sales | |
| Matthews Asia Strategic Income Fund | | | $— | | | | $— | | | | $68,735,472 | | | | $62,009,166 | |
| Matthews Asia Credit Opportunities Fund | | | — | | | | — | | | | 45,450,494 | | | | 32,920,577 | |
| Matthews Asian Growth and Income Fund | | | — | | | | — | | | | 145,808,694 | | | | 318,158,299 | |
| Matthews Asia Dividend Fund | | | 81,890,814 | | | | 85,881,048 | | | | 1,046,022,189 | | | | 1,126,348,346 | |
| Matthews China Dividend Fund | | | — | | | | — | | | | 200,978,549 | | | | 139,429,274 | |
| Matthews Asia Value Fund | | | — | | | | — | | | | 6,408,562 | | | | 2,797,945 | |
| Matthews Asia Growth Fund | | | 3,939,095 | | | | — | | | | 171,629,389 | | | | 125,205,648 | |
| Matthews Pacific Tiger Fund | | | 180,731,838 | | | | 34,891,829 | | | | 692,888,793 | | | | 723,789,520 | |
| Matthews Asia ESG Fund | | | — | | | | — | | | | 17,667,695 | | | | 3,477,094 | |
| Matthews Emerging Asia Fund | | | 4,968,018 | | | | — | | | | 49,971,079 | | | | 9,822,495 | |
| Matthews Asia Innovators Fund | | | — | | | | — | | | | 100,079,352 | | | | 107,012,935 | |
| Matthews China Fund | | | — | | | | — | | | | 314,237,278 | | | | 245,116,406 | |
| Matthews India Fund | | | — | | | | — | | | | 194,157,492 | | | | 334,813,463 | |
| Matthews Japan Fund | | | — | | | | — | | | | 313,453,459 | | | | 885,145,203 | |
| Matthews Korea Fund | | | — | | | | — | | | | 24,222,793 | | | | 17,846,396 | |
| Matthews Asia Small Companies Fund | | | 1,385,644 | | | | — | | | | 45,793,973 | | | | 88,125,755 | |
| Matthews China Small Companies Fund | | | — | | | | — | | | | 22,326,255 | | | | 18,828,569 | |
| 7. | HOLDINGS OF 5% VOTING SHARES OF PORTFOLIO COMPANIES |
The 1940 Act defines “affiliated companies” to include investments in portfolio companies in which a fund owns 5% or more of the outstanding voting shares. During thesix-month period ended June 30, 2019, the Funds below held 5% or more of the outstanding voting shares of the noted portfolio companies. During this period, other Funds in the Trust may also have held voting shares of the issuers at levels below 5%.
Investments in affiliates:
A summary of transactions in securities of issuers affiliated with a Fund for thesix-month period ended June 30, 2019 is as follows:
| | | | | | | | | | | | | | | | | | | | | | | | | | | | | | | | |
| | | Shares Held at
Dec. 31, 2018 | | | Shares
Purchsed | | | Shares Sold | | | Shares Held at
June 30, 2019 | | | Value at June 30, 2019 | | | Dividend
Income Jan. 1, 2019–
June 30, 2019 | | | Net Realized
Gain (Loss)
Jan. 1, 2019–
June 30, 2019 | | | Change in
Unrealized
Appreciation
(Depreciation) | |
| | | | | |
| MATTHEWS ASIA DIVIDEND FUND | | | | | | | | | | | | | | | | | | | | | |
| | | | | | | | |
| Name of Issuer: | | | | | | | | | | | | | | | | | | | | | | | | | | | | | | | | |
| | | | | | | | |
Anritsu Corp. | | | 9,384,700 | | | | — | | | | 578,200 | | | | 8,806,500 | | | | $153,562,339 | | | | $967,572 | | | | $5,118,961 | | | | $30,110,001 | |
Ascendas India Trust | | | 57,863,800 | | | | — | | | | — | | | | 57,863,800 | | | | 58,163,169 | | | | 1,585,252 | | | | — | | | | 12,311,961 | |
Beijing Capital International Airport Co., Ltd.† | | | 94,084,000 | | | | 4,772,000 | | | | 10,536,000 | | | | 88,320,000 | | | | — | | | | — | | | | — | | | | — | |
BELLSYSTEM24 Holdings, Inc. | | | 5,597,000 | | | | 165,500 | | | | — | | | | 5,762,500 | | | | 79,845,707 | | | | 840,748 | | | | — | | | | 12,288,517 | |
BGF Retail Co., Ltd. | | | 961,660 | | | | — | | | | 95,734 | | | | 865,926 | | | | 158,238,761 | | | | 1,926,153 | | | | 2,832,547 | | | | (4,205,136 | ) |
Breville Group, Ltd. | | | 12,185,538 | | | | — | | | | 3,876,984 | | | | 8,308,554 | | | | 95,551,702 | | | | 1,511,211 | | | | 20,395,009 | | | | 31,252,196 | |
CapitaLand Retail China Trust, REIT† | | | 49,800,000 | | | | — | | | | — | | | | 49,800,000 | | | | — | | | | — | | | | — | | | | — | |
China Steel Chemical Corp. | | | 15,589,000 | | | | — | | | | — | | | | 15,589,000 | | | | 67,558,380 | | | | — | | | | — | | | | (2,385,590 | ) |
Eiken Chemical Co., Ltd. | | | 3,493,200 | | | | 258,300 | | | | — | | | | 3,751,500 | | | | 59,526,577 | | | | 483,564 | | | | — | | | | (21,540,543 | ) |
HKBN, Ltd.† | | | 56,401,123 | | | | — | | | | — | | | | 56,401,123 | | | | — | | | | — | | | | — | | | | — | |
KATITAS Co., Ltd. | | | — | | | | 2,134,900 | | | | — | | | | 2,134,900 | | | | 79,538,069 | | | | 408,413 | | | | — | | | | 10,640,899 | |
Minda Industries, Ltd. | | | 13,962,765 | | | | 698,017 | | | | — | | | | 14,660,782 | | | | 67,586,347 | | | | 91,792 | | | | — | | | | 184,920 | |
Minth Group, Ltd. | | | 68,147,000 | | | | 1,164,000 | | | | — | | | | 69,311,000 | | | | 186,928,707 | | | | 5,847,089 | | | | — | | | | (36,588,651 | ) |
Shanghai Jin Jiang International Hotels Group Co., Ltd. | | | 173,612,000 | | | | — | | | | 51,510,000 | | | | 122,102,000 | | | | 24,839,724 | | | | — | | | | (7,653,829 | ) | | | 1,171,138 | |
Yuexiu Transport Infrastructure, Ltd. | | | 97,328,000 | | | | — | | | | — | | | | 97,328,000 | | | | 79,489,455 | | | | 2,976,297 | | | | — | | | | 5,654,747 | |
| | | | | | | | | | | | | | | | | | | | |
Total Affiliates | | | | | | | | | | | | | | | | | | | $1,110,828,937 | | | | $16,638,091 | | | | $20,692,688 | | | | $38,894,459 | |
| | | | | | | | | | | | | | | | | | | | |
| | | | |
| matthewsasia.com | 800.789.ASIA | | | 151 | |
Notes to Financial Statements(unaudited) (continued)
| | | | | | | | | | | | | | | | | | | | | | | | | | | | | | | | |
| | | Shares Held at
Dec. 31, 2018 | | | Shares
Purchsed | | | Shares Sold | | | Shares Held at
June 30, 2019 | | | Value at June 30, 2019 | | | Dividend
Income Jan. 1, 2019–
June 30, 2019 | | | Net Realized
Gain (Loss)
Jan. 1, 2019–
June 30, 2019 | | | Change in
Unrealized
Appreciation
(Depreciation) | |
| | | | | |
| MATTHEWS ASIA GROWTH FUND | | | | | | | | | | | | | | | | | | | | | |
| | | | | | | | |
| Name of Issuer: | | | | | | | | | | | | | | | | | | | | | | | | | | | | | | | | |
| | | | | | | | |
Sampath Bank PLC | | | 16,126,387 | | | | 5,772,829 | †† | | | — | | | | 21,899,216 | | | | $17,276,809 | | | | $395,119 | | | | $— | | | | ($7,382,357 | ) |
| | | | | |
| MATTHEWS PACIFIC TIGER FUND | | | | | | | | | | | | | | | | | | | | | |
| | | | | | | | |
| Name of Issuer: | | | | | | | | | | | | | | | | | | | | | | | | | | | | | | | | |
| | | | | | | | |
Cheil Worldwide, Inc. | | | 7,315,882 | | | | — | | | | 1,463,156 | | | | 5,852,726 | | | | $149,023,639 | | | | $4,210,094 | | | | $21,493,517 | | | | $12,143,322 | |
DB Insurance Co., Ltd. | | | 3,570,463 | | | | — | | | | — | | | | 3,570,463 | | | | 183,370,247 | | | | 5,336,898 | | | | — | | | | (41,495,436 | ) |
DKSH Holding AG | | | 2,861,150 | | | | 1,178,719 | | | | — | | | | 4,039,869 | | | | 236,718,475 | | | | 4,182,133 | | | | — | | | | (30,773,338 | ) |
Fuyao Glass Industry Group Co., Ltd. | | | 34,726,400 | | | | 8,152,800 | | | | — | | | | 42,879,200 | | | | 133,152,824 | | | | 3,779,933 | | | | — | | | | (4,563,034 | ) |
Guotai Junan Securities Co., Ltd. | | | 43,100,000 | | | | 39,204,600 | | | | — | | | | 82,304,600 | | | | 146,600,437 | | | | — | | | | — | | | | (24,865,898 | ) |
Just Dial, Ltd. | | | 3,557,718 | | | | — | | | | 249,878 | | | | 3,307,840 | | | | 36,462,147 | | | | — | | | | 262,701 | | | | 13,471,029 | |
Orion Holdings Corp. | | | 5,656,566 | | | | — | | | | — | | | | 5,656,566 | | | | 84,072,589 | | | | 2,747,898 | | | | — | | | | (2,450,014 | ) |
Tata Power Co., Ltd. | | | 180,316,487 | | | | — | | | | — | | | | 180,316,487 | | | | 180,304,311 | | | | 3,384,209 | | | | — | | | | (17,959,438 | ) |
| | | | | | | | | | | | | | | | | | | | |
Total Affiliates | | | | | | | | | | | | | | | | | | | $1,149,704,669 | | | | $23,641,165 | | | | $21,756,218 | | | | ($96,492,807 | ) |
| | | | | | | | | | | | | | | | | | | | |
| | | | | |
| MATTHEWS EMERGING ASIA FUND | | | | | | | | | | | | | | | | | | | | | |
| | | | | | | | |
| Name of Issuer: | | | | | | | | | | | | | | | | | | | | | | | | | | | | | | | | |
| | | | | | | | |
PAK Suzuki Motor Co., Ltd. | | | 3,287,600 | | | | 2,538,400 | | | | — | | | | 5,826,000 | | | | $8,350,053 | | | | $91,438 | | | | $— | | | | ($742,624 | ) |
Shifa International Hospitals, Ltd. | | | 2,783,351 | | | | — | | | | — | | | | 2,783,351 | | | | 3,829,612 | | | | — | | | | — | | | | (309,720 | ) |
Taisun International Holding Corp. | | | 2,127,000 | | | | — | | | | — | | | | 2,127,000 | | | | 8,296,034 | | | | — | | | | — | | | | (490,895 | ) |
Vietnam National Seed Group JSC | | | 1,126,522 | | | | — | | | | — | | | | 1,126,522 | | | | 4,248,929 | | | | 72,834 | | | | — | | | | (122,142 | ) |
| | | | | | | | | | | | | | | | | | | | |
Total Affiliates | | | | | | | | | | | | | | | | | | | $24,724,628 | | | | $164,272 | | | | $— | | | | ($1,665,381 | ) |
| | | | | | | | | | | | | | | | | | | | |
| | | | | |
| MATTHEWS INDIA FUND | | | | | | | | | | | | | | | | | | | | | |
| | | | | | | | |
| Name of Issuer: | | | | | | | | | | | | | | | | | | | | | | | | | | | | | | | | |
| | | | | | | | |
Caplin Point Laboratories, Ltd. | | | 3,870,311 | | | | — | | | | — | | | | 3,870,311 | | | | $25,303,651 | | | | $— | | | | $— | | | | $4,145,801 | |
eClerx Services, Ltd.† | | | 2,390,594 | | | | — | | | | 604,076 | | | | 1,786,518 | | | | — | | | | — | | | | — | | | | — | |
VST Industries, Ltd. | | | 1,167,175 | | | | — | | | | — | | | | 1,167,175 | | | | 58,149,139 | | | | — | | | | — | | | | 3,479,303 | |
| | | | | | | | | | | | | | | | | | | | |
Total Affiliates | | | | | | | | | | | | | | | | | | | $83,452,790 | | | | $— | | | | $— | | | | $7,625,104 | |
| | | | | | | | | | | | | | | | | | | | |
| | | | | |
| MATTHEWS ASIA SMALL COMPANIES FUND | | | | | | | | | | | | | | | | | | | | | |
| | | | | | | | |
| Name of Issuer: | | | | | | | | | | | | | | | | | | | | | | | | | | | | | | | | |
| | | | | | | | |
Kuobrothers Corp. | | | 517,000 | | | | 804,000 | | | | — | | | | 1,321,000 | | | | $2,232,892 | | | | $63,100 | | | | $— | | | | $11,572 | |
| † | Issuer was not an affiliated company as of June 30, 2019. |
| †† | Includes stock dividend during the period. |
It is the policy of the Funds to comply with all requirements of the Internal Revenue Code of 1986, as amended (“the Code”), applicable to regulated investment companies and to distribute substantially all of their taxable income to their shareholders. The Funds have met the requirements of the Code applicable to regulated investment companies for thesix-month period ended June 30, 2019. Therefore, no federal income tax provision is required.
Management has analyzed the Funds’ tax positions taken on federal income tax returns for all open tax years (current and prior three tax years), and has concluded that no provision for federal income tax is required in the Funds’ financial statements. The Funds’ federal and state income and federal excise tax returns for tax years for which the applicable statutes of limitations have not expired are subject to examination by the Internal Revenue Service and state departments of revenue.
Notes to Financial Statements(unaudited) (continued)
Under current tax law, the Funds have elected to defer certain qualified late-year losses and recognize such losses in the year ending December 31, 2018:
| | | | |
| | | Late Year Losses* | |
| Matthews Asia Strategic Income Fund | | | (109,716 | ) |
| Matthews Asia Credit Opportunities Fund | | | (4,708 | ) |
| Matthews Asian Growth and Income Fund | | | (9,108,081 | ) |
| Matthews Asia Dividend Fund | | | (41,320,881 | ) |
| Matthews China Dividend Fund | | | (1,209,434 | ) |
| Matthews Asia Value Fund | | | (841,114 | ) |
| Matthews Asia Growth Fund | | | (1,448,783 | ) |
| Matthews Asia ESG Fund | | | (73,756 | ) |
| Matthews Emerging Asia Fund | | | (1,133,192 | ) |
| Matthews Asia Innovators Fund | | | (42,130 | ) |
| Matthews India Fund | | | (2,591,650 | ) |
| Matthews Korea Fund | | | (272,844 | ) |
| Matthews China Small Companies Fund | | | (47,359 | ) |
| * | As permitted by the Internal Revenue Service, the Funds have elected to defer certain qualified late-year losses and recognize such losses in the next fiscal year. |
As of December 31, 2018, the Funds have capital loss carryforwards available to offset future realized capital gains through the indicated expiration dates as follows:
| | | | | | | | | | | | |
| | | Amount With No Expiration | | | | |
| | | Short-term
Losses | | | Long-term
Losses | | | Total | |
| Matthews Asia Strategic Income Fund | | | $4,165,505 | | | | $146,893 | | | | $4,312,398 | |
| Matthews Asia Credit Opportunities Fund | | | 520,152 | | | | 163,234 | | | | 683,386 | |
Under the Regulated Investment Company Modernization Act of 2010, the Funds are permitted to carry forward capital losses incurred in taxable years beginning after December 22, 2010 for an unlimited period. However, any losses incurred during those future taxable years will be required to be utilized prior to any losses incurred inpre-enactment taxable years, which generally expire after eight years from when they are incurred. Additionally, post-enactment capital losses that are carried forward will retain their character as either short-term or long-term capital losses rather than being considered all short-term as under previous law.
As of June 30, 2019, the tax cost of investments, including derivatives, and the related net unrealized appreciation and depreciation were as follows:
| | | | | | | | | | | | | | | | |
| | | Tax Cost | | | Gross Unrealized Appreciation | | | Gross Unrealized Depreciation | | | Net Unrealized
Appreciation
(Depreciation) | |
| Matthews Asia Strategic Income Fund | | | $104,936,223 | | | | $3,915,135 | | | | ($330,950 | ) | | | $3,584,185 | |
| Matthews Asia Credit Opportunities Fund | | | 53,081,339 | | | | 1,211,515 | | | | (221,145 | ) | | | 990,370 | |
| Matthews Asian Growth and Income Fund | | | 1,241,343,180 | | | | 236,322,059 | | | | (84,103,131 | ) | | | 152,218,928 | |
| Matthews Asia Dividend Fund | | | 5,055,658,793 | | | | 1,266,003,286 | | | | (373,478,376 | ) | | | 892,524,910 | |
| Matthews China Dividend Fund | | | 340,613,087 | | | | 49,535,670 | | | | (23,181,043 | ) | | | 26,354,627 | |
| Matthews Asia Value Fund | | | 23,506,322 | | | | 1,743,981 | | | | (2,200,209 | ) | | | (456,228 | ) |
| Matthews Asia Growth Fund | | | 881,491,512 | | | | 312,806,948 | | | | (97,276,487 | ) | | | 215,530,461 | |
| Matthews Pacific Tiger Fund | | | 6,299,257,935 | | | | 3,268,256,820 | | | | (588,194,464 | ) | | | 2,680,062,356 | |
| Matthews Asia ESG Fund | | | 42,097,085 | | | | 5,410,223 | | | | (2,145,870 | ) | | | 3,264,353 | |
| Matthews Emerging Asia Fund | | | 450,179,317 | | | | 60,982,440 | | | | (103,442,234 | ) | | | (42,459,794 | ) |
| Matthews Asia Innovators Fund | | | 233,823,091 | | | | 51,124,680 | | | | (5,487,724 | ) | | | 45,636,956 | |
| Matthews China Fund | | | 809,790,950 | | | | 69,090,979 | | | | (59,568,691 | ) | | | 9,522,288 | |
| Matthews India Fund | | | 1,291,453,321 | | | | 309,637,374 | | | | (140,453,542 | ) | | | 169,183,832 | |
| Matthews Japan Fund | | | 2,399,092,383 | | | | 421,727,097 | | | | (179,873,728 | ) | | | 241,853,369 | |
| Matthews Korea Fund | | | 137,319,364 | | | | 18,841,063 | | | | (11,402,862 | ) | | | 7,438,201 | |
| Matthews Asia Small Companies Fund | | | 177,057,500 | | | | 23,463,497 | | | | (25,536,491 | ) | | | (2,072,994 | ) |
| Matthews China Small Companies Fund | | | 68,389,126 | | | | 9,428,788 | | | | (8,438,463 | ) | | | 990,325 | |
Management has evaluated the impact of all subsequent events on the Funds through the date the financial statements were issued, and has determined that there were no subsequent events that require recognition or disclosure in the financial statements.
| | | | |
| matthewsasia.com | 800.789.ASIA | | | 153 | |
| | |
| Matthews Asia Funds | | |
| |
INVESTMENT ADVISOR Matthews International Capital Management, LLC Four Embarcadero Center, Suite 550 San Francisco, CA 94111 800.789.ASIA CUSTODIAN Brown Brothers Harriman & Co. 50 Post Office Square Boston, MA 02110 | | ACCOUNT SERVICES Matthews Asia Funds P.O. Box 9791 Providence, RI 02940 800.789.ASIA LEGAL COUNSEL Paul Hastings LLP 101 California Street, 48th Floor San Francisco, CA 94111 |

P.O. Box 9791 | Providence, RI 02940 | matthewsasia.com | 800.789.ASIA (2742)
Matthews Asia Funds are distributed in the United States by Foreside Funds Distributors LLC, Berwyn, Pennsylvania
Matthews Asia Funds are distributed in Latin America by HMC Partners

SAR-0619
154
Not applicable.
| Item 3. | Audit Committee Financial Expert. |
Not applicable.
| Item 4. | Principal Accountant Fees and Services. |
Not applicable.
| Item 5. | Audit Committee of Listed Registrants. |
Not applicable.
| (a) | Schedule of Investments in securities of unaffiliated issuers as of the close of the reporting period is included as part of the report to shareholders filed under Item 1 of this form. |
| Item 7. | Disclosure of Proxy Voting Policies and Procedures forClosed-End Management Investment Companies. |
Not applicable.
| Item 8. | Portfolio Managers ofClosed-End Management Investment Companies. |
Not applicable.
| Item 9. | Purchases of Equity Securities byClosed-End Management Investment Company and Affiliated Purchasers. |
Not applicable.
| Item 10. | Submission of Matters to a Vote of Security Holders. |
There have been no material changes to the procedures by which the shareholders may recommend nominees to the registrant’s board of directors, where those changes were implemented after the registrant last provided disclosure in response to the requirements of Item 407(c)(2)(iv) of RegulationS-K (17 CFR 229.407) (as required by Item 22(b)(15) of Schedule 14A (17 CFR240.14a-101)), or this Item.
| Item 11. | Controls and Procedures. |
| | (a) | The registrant’s principal executive and principal financial officers, or persons performing similar functions, have concluded that the registrant’s disclosure controls and procedures (as defined in Rule30a-3(c) under the Investment Company Act of 1940, as amended (the “1940 Act”) (17 CFR270.30a-3(c))) are effective, as of a date within 90 days of the filing date of the report that includes the disclosure required by this paragraph, based on their evaluation of these controls and procedures required by Rule30a-3(b) under the 1940 Act (17 CFR270.30a-3(b)) and Rules13a-15(b) or15d-15(b) under the Securities Exchange Act of 1934, as amended (17 CFR240.13a-15(b) or240.15d-15(b)). |
| | (b) | There were no changes in the registrant’s internal control over financial reporting (as defined in Rule30a-3(d) under the 1940 Act (17 CFR270.30a-3(d))) that occurred during the period covered by this reportthat has materially affected, or is reasonably likely to materially affect, the registrant’s internal control over financial reporting. |
| Item 12. | Disclosure of Securities Lending Activities forClosed-End Management Investment Companies. |
Not applicable.
| | | | |
| | (a)(1) | | Not applicable. |
| | |
| | (a)(2) | | Certifications pursuant to Rule30a-2(a) under the 1940 Act and Section 302 of the Sarbanes-Oxley Act of 2002 are attached hereto. |
| | |
| | (a)(3) | | Not applicable. |
| | |
| | (a)(4) | | Not applicable. |
| | |
| | (b) | | Certifications pursuant to Rule30a-2(b) under the 1940 Act and Section 906 of the Sarbanes-Oxley Act of 2002 are attached hereto. |
SIGNATURES
Pursuant to the requirements of the Securities Exchange Act of 1934 and the Investment Company Act of 1940, the registrant has duly caused this report to be signed on its behalf by the undersigned, thereunto duly authorized.
| | |
| (Registrant) | | Matthews International Funds |
| |
| By (Signature and Title)* | | /s/ William J. Hackett |
| | William J. Hackett, President |
| | (principal executive officer) |
| |
| Date | | September 5, 2019 |
Pursuant to the requirements of the Securities Exchange Act of 1934 and the Investment Company Act of 1940, this report has been signed below by the following persons on behalf of the registrant and in the capacities and on the dates indicated.
| | |
| By (Signature and Title)* | | /s/ William J. Hackett |
| | William J. Hackett, President |
| | (principal executive officer) |
| |
| Date | | September 5, 2019 |
| |
| By (Signature and Title)* | | /s/ Shai Malka |
| | Shai Malka, Treasurer |
| | (principal financial officer) |
| |
| Date | | September 5, 2019 |
| * | Print the name and title of each signing officer under his or her signature. |