| | | |
| Vanguard® Tax-Managed Funds | | |
| | | |
| | | |
| | | |
| > Annual Report | | |
| | | |
| | | |
| | | |
| December 31, 2006 | | |
| | | |
| 
|
| | |
| | |
| Vanguard Tax-Managed Balanced Fund | |
| | |
| Vanguard Tax-Managed Growth and Income Fund | |
| | |
| Vanguard Tax-Managed Capital Appreciation Fund | |
| | |
| Vanguard Tax-Managed Small-Cap Fund | |
| | |
| Vanguard Tax-Managed International Fund | |
| | |
| | |
| | |
| | |
| | |
| | |
| | |
| | |
| | |
| | |
| | |
| | | | |
> | Vanguard Tax-Managed Fund returns ranged from 26.3% (Investor Shares) for the international portfolio to 9.1% for the balanced fund. |
> | Gains were strong across stock sectors, particularly among financials, telecommunication services, and commodities stocks. |
> | The funds have continued to avoid any taxable capital gain distributions to shareholders. |
Contents | |
| |
Your Fund’s Total Returns | 1 |
Chairman’s Letter | 2 |
Tax-Managed Balanced Fund | 8 |
Tax-Managed Growth and Income Fund | 16 |
Tax-Managed Capital Appreciation Fund | 26 |
Tax-Managed Small-Cap Fund | 36 |
Tax-Managed International Fund | 45 |
Your Fund’s After-Tax Returns | 58 |
About Your Fund’s Expenses | 60 |
Glossary | 62 |
Please note: The opinions expressed in this report are just that—informed opinions. They should not be considered promises or advice. Also, please keep in mind that the information and opinions cover the period through the date on the cover of this report. Of course, the risks of investing in your fund are spelled out in the prospectus.
Your Fund’s Total Returns
Fiscal Year Ended December 31, 2006 | |
| Total |
| Returns |
Vanguard Tax-Managed Balanced Fund | 9.1% |
Tax-Managed Balanced Composite Index1 | 9.6 |
Average Mixed-Asset Target Moderate Fund2 | 11.1 |
| |
Vanguard Tax-Managed Growth and Income Fund | |
Investor Shares | 15.7% |
Admiral™ Shares3 | 15.8 |
Institutional Shares4 | 15.8 |
S&P 500 Index | 15.8 |
Average Large-Cap Core Fund2 | 13.5 |
| |
Vanguard Tax-Managed Capital Appreciation Fund | |
Investor Shares | 14.4% |
Admiral Shares | 14.4 |
Institutional Shares | 14.5 |
Russell 1000 Index | 15.5 |
Average Multi-Cap Core Fund2 | 13.3 |
| |
Vanguard Tax-Managed Small-Cap Fund | |
Investor Shares | 14.2% |
Institutional Shares | 14.2 |
S&P SmallCap 600 Index | 15.1 |
Average Small-Cap Core Fund2 | 14.9 |
| |
Vanguard Tax-Managed International Fund | |
Investor Shares | 26.3% |
Institutional Shares | 26.4 |
MSCI EAFE Index | 26.3 |
Average International Fund2 | 24.8 |
1 50% Russell 1000 Index, 50% Lehman Brothers 7 Year Municipal Bond Index.
2 Derived from data provided by Lipper Inc.
3 A lower-cost class of shares available to many longtime shareholders and to those with significant investments in the fund.
4 This class of shares also carries low expenses and is available for a minimum investment of $5 million.
1

Chairman’s Letter
Dear Shareholder,
Calendar-year 2006 provided robust gains across stock markets, particularly outside the United States. Gains were more modest for bonds, given rising interest rates during the first half of the year. The returns of the Vanguard Tax-Managed Funds ranged from 9.1% for the Tax-Managed Balanced Fund to 26.3% for the Investor Shares of the Tax-Managed International Fund.
The funds met their tax-management objectives, as they have since their inceptions. From the Performance at a Glance chart on page 7, you can see that the funds’ managers, Vanguard’s Quantitative Equity and Fixed Income Groups, continued to avoid distributing capital gains, even after four consecutive years of positive stock performance. The funds’ managers used a variety of strategies to avoid realizing capital gains, yet strayed from a pure indexing strategy as little as possible. Some of the funds also focus on minimizing dividend income, which is taxable at 15% for most investors. For the year, this strategy hurt performance relative to several of the funds’ target indexes, because the highest-yielding stocks were the top performers in the market.
Strong second half pushed stocks to new high
Beginning in mid-July, stocks climbed steadily through the remainder of the year, with the Dow Jones Industrial Average setting a record high on December 27. For the year, the broad U.S. stock market gained 15.9%. Despite a soft housing
2
sector and ongoing troubles within the U.S. auto industry, the economy continued to grow and corporate profits remained strong.
For the year, small-capitalization stocks beat out large-cap issues, and value stocks outperformed their growth-oriented counterparts. International stocks continued to best domestic equities, particularly in emerging markets and Europe. A declining dollar further enhanced returns abroad for U.S.-based investors.
Bond returns remained modest as the Fed paused its rate hikes
The Federal Reserve Board extended its money-tightening campaign during the first half of the year, raising its target for the federal funds rate four times. The Fed then paused, leaving the target rate unchanged at 5.25% for the rest of the year, and inflation fears eased. Bond yields declined in the second half of the year, and short-term yields were higher than longer-term yields.
Fixed income returns for 2006 were modest, with the broad taxable bond market returning 4.3% and municipal bonds providing 4.8%.
All sectors notched gains; value segments were extra-strong
Returns were clustered between 14% and 16% for Vanguard Tax-Managed Small-Cap, Capital Appreciation, and Growth and Income Funds. These funds invest, respectively, in small-cap, large- and mid-cap, and large-cap stocks. In all three cases, returns were positive across all ten economic sectors encompassed by the funds.
Market Barometer | | | |
| | Average Annual Total Returns |
| Periods Ended December 31, 2006 |
| One Year | Three Years | Five Years |
Stocks | | | |
Russell 1000 Index (Large-caps) | 15.5% | 11.0% | 6.8% |
Russell 2000 Index (Small-caps) | 18.4 | 13.6 | 11.4 |
Dow Jones Wilshire 5000 Index (Entire market) | 15.9 | 11.5 | 7.6 |
MSCI All Country World Index ex USA (International) | 27.2 | 21.8 | 16.9 |
| | | |
Bonds | | | |
Lehman Aggregate Bond Index (Broad taxable market) | 4.3% | 3.7% | 5.1% |
Lehman Municipal Bond Index | 4.8 | 4.3 | 5.5 |
Citigroup 3-Month Treasury Bill Index | 4.8 | 3.0 | 2.3 |
| | | |
CPI | | | |
Consumer Price Index | 2.5% | 3.1% | 2.7% |
3
For the two funds in this group of three that focus on larger stocks, one of the strongest categories was financials stocks, which represented roughly one-fifth of the holdings in both Capital Appreciation and Growth and Income. Banks, brokerage firms, asset managers, real estate investment trusts (REITs), and commodity stock exchanges all turned in excellent performances. Not only did many of these companies produce record earnings, but they also benefited from an active market for mergers and acquisitions (M&As). Such activity often boosts the stocks of both acquired companies and those companies the market deems likely to be acquired.
The M&A theme also played out among companies in telecommunication services, the best-performing sector in both the Capital Appreciation and Growth and Income Funds. Merger partners BellSouth and AT&T were up 80% and 53%, respectively, and competitor Verizon rose 35%. Other strong gains came in the energy, utilities, and materials sectors. Health care and information technology were the weakest sectors, with gains in the single digits.
Within small-cap stocks, the industrials sector made the greatest contribution to returns. Many industrial companies benefited from a strong export market for goods ranging from air compressors, to lighting equipment, to refrigeration equipment. Within this category, defense contractors also performed well. Financials provided the second-largest contribution to returns, with REITs, insurance companies, and banks driving gains.
Turning to international markets, the Tax-Managed International Fund’s 26.3% gain (Investor Shares) reflected prospering economies across Europe. As in the United States, economic growth was strong and M&A activity was a factor. U.S. investors also benefited from the dollar’s decline against most major currencies, which boosts returns when gains are translated into U.S. dollars. For the year, the dollar was down 10.2% versus the euro and 12.2% against the British pound. After soaring in 2005, the Japanese economy cooled in 2006, hurting returns in that market.
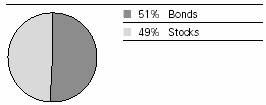
The Tax-Managed Balanced Fund’s 9.1% gain reflected its equal weighting between a stock index and a municipal bond index that returned 15.5% and 4.0%, respectively.
Funds start with advantages that grow each April
From the chart on page 5, you can see that each of the Tax-Managed Funds is ahead of the average return for peer funds within its category. This achievement reflects the skillful execution of a disciplined and broadly diversified tax-management strategy, as well as the funds’ low costs.
4
The chart shows only pre-tax returns. The funds’ performance advantage would widen on an after-tax basis because, unlike many peers, the funds have not generated capital gains distributions to shareholders. Taxes are due each April on any capital gain distribution that investors received in the prior year. Investors in Vanguard’s Tax-Managed Funds have never had to pay taxes for merely holding the fund—only when they sell shares that have appreciated. By keeping an eye on the tax consequences of each stock purchase or sale, Vanguard’s managers hope to continue this record for years to come.
Funds are structured to protect interests of long-term investors
The Vanguard Tax-Managed Funds charge a 1% fee to investors who redeem any portion of their investment within five
Total Returns | | |
Ten Years Ended December 31, 20061 | | |
| Average | Final Value of a $10,000 |
| Annual Return | Initial Investment |
Tax-Managed Balanced Fund | 7.2% | $20,130 |
Tax-Managed Balanced Composite Index2 | 7.3 | 20,194 |
Average Mixed-Asset Target Moderate Fund3 | 6.6 | 18,924 |
| | |
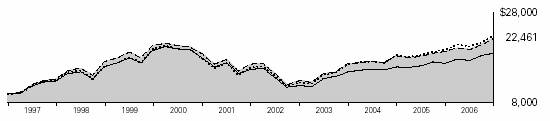
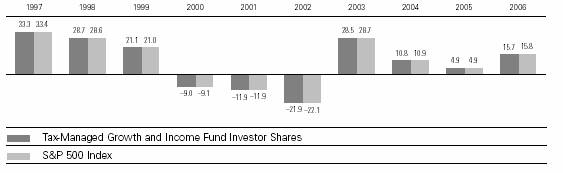
Tax-Managed Growth and Income Fund Investor Shares | 8.4% | $22,461 |
S&P 500 Index | 8.4 | 22,447 |
Average Large-Cap Core Fund3 | 6.7 | 19,050 |
| | |
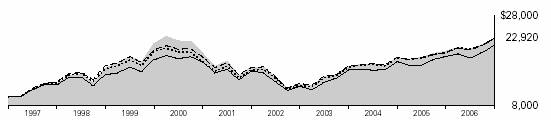
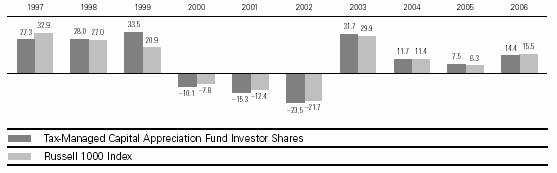
Tax-Managed Capital Appreciation Fund Investor Shares | 8.6% | $22,920 |
Russell 1000 Index | 8.6 | 22,914 |
Average Multi-Cap Core Fund3 | 7.9 | 21,468 |
| | |
Tax-Managed Small-Cap Fund Investor Shares | 13.7% | $27,042 |
S&P SmallCap 600 Index | 13.5 | 26,791 |
Average Small-Cap Core Fund3 | 13.6 | 26,910 |
| | |
Tax-Managed International Fund Investor Shares | 6.8% | $16,207 |
MSCI EAFE Index | 6.7 | 16,167 |
Average International Fund3 | 6.3 | 15,721 |
The figures shown represent past performance, which is not a guarantee of future results. (Current performance may be lower or higher than the performance data cited. For performance data current to the most recent month-end, visit our website at www.vanguard.com.) Note, too, that both investment returns and principal value can fluctuate widely, so an investor’s shares, when sold, could be worth more or less than their original cost.
1 Annualized returns are since inception for the Tax-Managed Small-Cap Fund (March 25, 1999) and the Tax-Managed International Fund (August 17, 1999).
2 50% Russell 1000 Index, 50% Lehman Brothers 7 Year Municipal Bond Index.
3 Derived from data provided by Lipper Inc.
5
years of opening a Tax-Managed Fund account. This policy benefits our investors in two ways:
• Any redemption fees are retained by the fund in order to offset transaction costs caused by redemptions.
• The penalty helps to screen out short-term investors, who increase transactions within the fund and make it more difficult to control the timing and tax consequences of sales from the portfolio.
Vanguard’s success as a mutual fund company turns on being a responsible caretaker of our clients’ money. That entails charging low fees for industry-leading products and encouraging responsible behavior: Invest for the long-term and remain diversified. This tax-managed group of funds is itself a diversified offering, and it can be used in combination with other Vanguard funds to design a portfolio that matches your own time horizon, risk tolerance, and investment goals.
Expense Ratios1 | |
Your fund compared with its peer group | |
| Expense |
Tax-Managed Fund | Ratio |
Balanced | 0.12% |
Average Mixed-Asset Target Moderate Fund | 1.15 |
Growth and Income | |
Investor Shares | 0.15% |
Admiral Shares | 0.10 |
Institutional Shares | 0.07 |
Average Large-Cap Core Fund | 1.41 |
Capital Appreciation | |
Investor Shares | 0.15% |
Admiral Shares | 0.10 |
Institutional Shares | 0.07 |
Average Multi-Cap Core Fund | 1.28 |
Small-Cap | |
Investor Shares | 0.14% |
Institutional Shares | 0.09 |
Average Small-Cap Core Fund | 1.53 |
International | |
Investor Shares | 0.20% |
Institutional Shares | 0.14 |
Average International Fund | 1.65 |
1 Fund expense ratios reflect the 12 months ended December 31, 2006. Peer-group expense ratios are derived from data provided by Lipper Inc. and capture information through year-end 2005.
6
Thank you for investing your assets with Vanguard.
Sincerely,

John J. Brennan
Chairman and Chief Executive Officer
January 18, 2007
Your Fund’s Performance at a Glance | | | | |
December 31, 2005–December 31, 2006 | | | | |
| | | Distributions Per Share |
| Starting | Ending | Income | Capital |
Tax-Managed Fund | Share Price | Share Price | Dividends | Gains |
Balanced | $18.88 | $20.02 | $0.550 | $0.000 |
Growth and Income | | | | |
Investor Shares | $27.15 | $30.87 | $0.511 | $0.000 |
Admiral Shares | 55.80 | 63.44 | 1.077 | 0.000 |
Institutional Shares | 27.15 | 30.87 | 0.534 | 0.000 |
Capital Appreciation | | | | |
Investor Shares | $29.80 | $33.62 | $0.472 | $0.000 |
Admiral Shares | 60.00 | 67.68 | 0.990 | 0.000 |
Institutional Shares | 29.81 | 33.63 | 0.500 | 0.000 |
Small-Cap | | | | |
Investor Shares | $22.70 | $25.72 | $0.194 | $0.000 |
Institutional Shares | 22.74 | 25.77 | 0.207 | 0.000 |
International | | | | |
Investor Shares | $11.48 | $14.16 | $0.336 | $0.000 |
Institutional Shares | 11.48 | 14.17 | 0.343 | 0.000 |
8
Tax-Managed Balanced Fund
Fund Profile
As of December 31, 2006
Total Fund Characteristics | |
| |
Yield | 2.6% |
Turnover Rate | 4% |
Expense Ratio | 0.12% |
Short-Term Reserves | 0% |
Total Fund Volatility Measures1 | |
| Fund Versus | Fund Versus |
| Composite Index2 | Broad Index3 |
R-Squared | 0.99 | 0.85 |
Beta | 1.00 | 0.47 |
Equity Characteristics | | | |
| | Comparative | Broad |
| Fund | Index4 | Index3 |
Number of Stocks | 599 | 987 | 4,964 |
Median Market Cap | $41.1B | $41.8B | $30.7B |
Price/Earnings Ratio | 17.3x | 17.5x | 18.0x |
Price/Book Ratio | 2.9x | 2.9x | 2.8x |
Dividend Yield | 1.5% | 1.8% | 1.7% |
Return on Equity | 18.9% | 18.8% | 17.8% |
Earnings Growth Rate | 20.2% | 18.6% | 18.5% |
Foreign Holdings | 0.0% | 0.0% | 1.1% |
Sector Diversification (% of equity portfolio) |
| | Comparative | Broad |
| Fund | Index4 | Index3 |
Consumer Discretionary | 12% | 11% | 12% |
Consumer Staples | 8 | 9 | 9 |
Energy | 9 | 9 | 9 |
Financials | 21 | 22 | 23 |
Health Care | 13 | 12 | 12 |
Industrials | 11 | 11 | 11 |
Information Technology | 17 | 15 | 15 |
Materials | 3 | 3 | 3 |
Telecommunication Services | 3 | 4 | 3 |
Utilities | 3 | 4 | 3 |
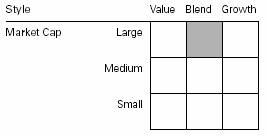
Equity Investment Focus

Ten Largest Stocks5 (% of equity portfolio) | |
| | |
ExxonMobil Corp. | integrated oil and gas | 3.4% |
General Electric Co. | industrial conglomerates | 2.6 |
Citigroup, Inc. | diversified financial services | 2.0 |
Microsoft Corp. | systems software | 1.9 |
Bank of America Corp. | diversified financial services | 1.6 |
The Procter & Gamble Co. | household products | 1.6 |
Johnson & Johnson | pharmaceuticals | 1.4 |
Cisco Systems, Inc. | communications equipment | 1.2 |
Pfizer Inc. | pharmaceuticals | 1.2 |
American International Group, Inc. | multi-line insurance | 1.1 |
Top Ten | | 18.0% |
Top Ten as % of Total Net Assets | 8.9% |
Fund Asset Allocation
1 For an explanation of R-squared, beta, and other terms used here, see the Glossary on pages 62–63.
2 50% Russell 1000 Index, 50% Lehman 7 Year Municipal Bond Index.
3 Dow Jones Wilshire 5000 Index.
4 Russell 1000 Index.
5 “Ten Largest Stocks” excludes any temporary cash investments and equity index products.
8
Tax-Managed Balanced Fund
Fixed Income Characteristics | | |
| | Comparative | Broad |
| Fund | Index1 | Index2 |
Number of Bonds | 146 | 4,117 | 39,486 |
Yield to Maturity | 3.8%3 | 3.7% | 3.9% |
Average Coupon | 5.1% | 5.1% | 5.0% |
Average Effective Maturity | 6.5 years | 6.9 years | 13.3 years |
Average Quality | AA+ | AAA | AA+ |
Average Duration | 5.2 years | 5.2 years | 6.1 years |
Distribution by Credit Quality (% of fixed income portfolio) | |
| |
AAA | 76% |
AA | 22 |
A | 1 |
BBB | 1 |
Distribution by Maturity (% of fixed income portfolio) | |
| |
Under 1 Year | 7% |
1–5 Years | 34 |
5–10 Years | 44 |
10–20 Years | 15 |
Fixed Income Investment Focus

Largest State Concentrations4 (% of fixed income portfolio) | |
| |
Ohio | 9% |
Massachusetts | 8 |
New York | 8 |
Texas | 8 |
New Jersey | 8 |
California | 5 |
South Carolina | 4 |
Tennessee | 4 |
Colorado | 4 |
Michigan | 4 |
Top Ten | 62% |
1 Lehman 7 Year Municipal Bond Index. |
2 Lehman Municipal Bond Index. |
3 Before expenses. |
4 “Largest State Concentrations” figures exclude any fixed income futures contracts. |
9
Tax-Managed Balanced Fund
Performance Summary
All of the returns in this report represent past performance, which is not a guarantee of future results that may be achieved by the fund. (Current performance may be lower or higher than the performance data cited. For performance data current to the most recent month-end, visit our website at www.vanguard.com.) Note, too, that both investment returns and principal value can fluctuate widely, so an investor’s shares, when sold, could be worth more or less than their original cost. The returns shown do not reflect taxes that a shareholder would pay on fund distributions or on the sale of fund shares.
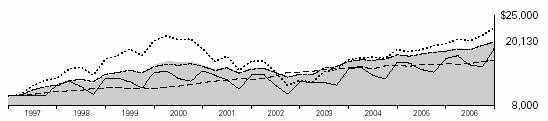
Cumulative Performance: December 31, 1996–December 31, 2006
Initial Investment of $10,000
| Average Annual Total Returns | Final Value |
| Periods Ended December 31, 2006 | of a $10,000 |
| One Year | Five Years | Ten Years | Investment |
Tax-Managed Balanced Fund | 9.09% | 5.91% | 7.25% | $20,130 |
Fee-Adjusted Returns1 | 8.02 | 5.91 | 7.25 | 20,130 |
Russell 1000 Index | 15.46 | 6.82 | 8.64 | 22,914 |
Lehman 7 Year Municipal Bond Index | 3.98 | 4.89 | 5.22 | 16,634 |
Tax-Managed Balanced Composite Index2 | 9.63 | 6.12 | 7.28 | 20,194 |
Average Mixed-Asset Target Moderate Fund3 | 11.06 | 6.19 | 6.59 | 18,924 |
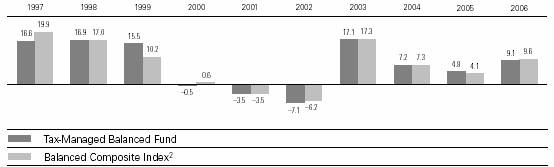
Fiscal-Year Total Returns (%): December 31, 1996–December 31, 2006
1 Reflective of the 1% fee assessed on redemptions of shares held in the fund for less than five years.
2 50% Russell 1000 Index, 50% Lehman 7 Year Municipal Bond Index.
3 Derived from data provided by Lipper Inc.
Note: See Financial Highlights table on page 13 for dividend and capital gains information.
10
Tax-Managed Balanced Fund
Financial Statements
The Statement of Net Assets—an integral part of the Financial Statements for Vanguard Tax-Managed Balanced Fund—is included as an insert to this report.
Statement of Operations
| Year Ended |
| December 31, 2006 |
| ($000) |
Investment Income | |
Income | |
Dividends | 4,927 |
Interest | 13,757 |
Total Income | 18,684 |
Expenses | |
The Vanguard Group—Note B | |
Investment Advisory Services | 66 |
Management and Administrative | 530 |
Marketing and Distribution | 105 |
Custodian Fees | 7 |
Auditing Fees | 21 |
Shareholders’ Reports | 11 |
Trustees’ Fees and Expenses | 1 |
Total Expenses | 741 |
Expenses Paid Indirectly—Note C | (11) |
Net Expenses | 730 |
Net Investment Income | 17,954 |
Realized Net Gain (Loss) on Investment Securities Sold | 5,417 |
Change in Unrealized Appreciation (Depreciation) of Investment Securities | 31,865 |
Net Increase (Decrease) in Net Assets Resulting from Operations | 55,236 |
11
Tax-Managed Balanced Fund
Statement of Changes in Net Assets
| Year Ended December 31, |
| 2006 | 2005 |
| ($000) | ($000) |
Increase (Decrease) in Net Assets | | |
Operations | | |
Net Investment Income | 17,954 | 15,359 |
Realized Net Gain (Loss) | 5,417 | 2,491 |
Change in Unrealized Appreciation (Depreciation) | 31,865 | 9,712 |
Net Increase (Decrease) in Net Assets Resulting from Operations | 55,236 | 27,562 |
Distributions | | |
Net Investment Income | (17,991) | (15,286) |
Realized Capital Gain | — | — |
Total Distributions | (17,991) | (15,286) |
Capital Share Transactions—Note F | | |
Issued | 54,013 | 70,173 |
Issued in Lieu of Cash Distributions | 15,248 | 12,950 |
Redeemed1 | (50,805) | (50,278) |
Net Increase (Decrease) from Capital Share Transactions | 18,456 | 32,845 |
Total Increase (Decrease) | 55,701 | 45,121 |
Net Assets | | |
Beginning of Period | 606,459 | 561,338 |
End of Period2 | 662,160 | 606,459 |
1 Net of redemption fees of $164,000 and $210,000.
2 Net Assets—End of Period includes undistributed (overdistributed) net investment income of ($837,000) and ($800,000).
12
Tax-Managed Balanced Fund
Financial Highlights
| | | Year Ended December 31, |
For a Share Outstanding Throughout Each Period | 2006 | 2005 | 2004 | 2003 | 2002 |
Net Asset Value, Beginning of Period | $18.88 | $18.49 | $17.72 | $15.54 | $17.18 |
Investment Operations | | | | | |
Net Investment Income | .54 | .496 | .481 | .42 | .44 |
Net Realized and Unrealized | | | | | |
Gain (Loss) on Investments2 | 1.15 | .380 | .77 | 2.20 | (1.65) |
Total from Investment Operations | 1.69 | .876 | 1.25 | 2.62 | (1.21) |
Distributions | | | | | |
Dividends from Net Investment Income3 | (.55) | (.486) | (.48) | (.44) | (.43) |
Distributions from Realized Capital Gains | — | — | — | — | — |
Total Distributions | (.55) | (.486) | (.48) | (.44) | (.43) |
Net Asset Value, End of Period | $20.02 | $18.88 | $18.49 | $17.72 | $15.54 |
| | | | | |
Total Return4 | 9.09% | 4.80% | 7.16% | 17.05% | –7.07% |
| | | | | |
Ratios/Supplemental Data | | | | | |
Net Assets, End of Period (Millions) | $662 | $606 | $561 | $498 | $416 |
Ratio of Total Expenses to | | | | | |
Average Net Assets | 0.12% | 0.12% | 0.12% | 0.17% | 0.18% |
Ratio of Net Investment Income to | | | | | |
Average Net Assets | 2.84% | 2.64% | 2.70%1 | 2.58% | 2.69% |
Portfolio Turnover Rate | 4% | 10% | 15% | 16% | 24% |
1 Net investment income per share and ratio of net investment income to average net assets include $.02 and 0.13%, respectively, resulting from a special dividend from Microsoft Corp. in November 2004.
2 Includes increases from redemption fees of $.00, $.01, $.01, $.01, and $.01.
3 For tax purposes, nontaxable dividends represent 74%, 76%, 73%, 77%, and 82% of dividends from net investment income.
4 Total returns do not reflect the 1% redemption fee on shares held less than five years or the 2% redemption fee assessed prior to September 14, 2005, on shares held less than one year.
See accompanying Notes, which are an integral part of the Financial Statements.
13
Tax-Managed Balanced Fund
Notes to Financial Statements
Vanguard Tax-Managed Balanced Fund is registered under the Investment Company Act of 1940 as an open-end investment company, or mutual fund. The fund invests in debt instruments of many municipal issuers; the issuers’ abilities to meet their obligations may be affected by economic and political developments in a specific state or region.
A. The following significant accounting policies conform to generally accepted accounting principles for U.S. mutual funds. The fund consistently follows such policies in preparing its financial statements.
1. Security Valuation: Securities are valued as of the close of trading on the New York Stock Exchange (generally 4:00 p.m. Eastern time) on the valuation date. Equity securities are valued at the latest quoted sales prices or official closing prices taken from the primary market in which each security trades; such securities not traded on the valuation date are valued at the mean of the latest quoted bid and asked prices. Bonds, and temporary cash investments acquired over 60 days to maturity, are valued using the latest bid prices or using valuations based on a matrix system (which considers such factors as security prices, yields, maturities, and ratings), both as furnished by independent pricing services. Other temporary cash investments are valued at amortized cost, which approximates market value. Securities for which market quotations are not readily available, or whose values have been materially affected by events occurring before the fund’s pricing time but after the close of the securities’ primary markets, are valued by methods deemed by the board of trustees to represent fair value.
2. Federal Income Taxes: The fund intends to continue to qualify as a regulated investment company and distribute all of its taxable income. Accordingly, no provision for federal income taxes is required in the financial statements.
3. Distributions: Distributions to shareholders are recorded on the ex-dividend date.
4. Other: Dividend income is recorded on the ex-dividend date. Interest income is accrued daily. Premiums and discounts on municipal bonds are amortized and accreted, respectively, to interest income over the lives of the respective securities. Security transactions are accounted for on the date securities are bought or sold. Costs used to determine realized gains (losses) on the sale of investment securities are those of the specific securities sold. Fees assessed on redemptions of capital shares are credited to paid-in capital.
B. The Vanguard Group furnishes at cost investment advisory, corporate management, administrative, marketing, and distribution services. The costs of such services are allocated to the fund under methods approved by the board of trustees. The fund has committed to provide up to 0.40% of its net assets in capital contributions to Vanguard. At December 31, 2006, the fund had contributed capital of $65,000 to Vanguard (included in Other Assets), representing 0.01% of the fund’s net assets and 0.06% of Vanguard’s capitalization. The fund’s trustees and officers are also directors and officers of Vanguard.
C. The fund’s investment advisor may direct new issue purchases, subject to obtaining the best price and execution, to underwriters who have agreed to rebate or credit to the fund part of the underwriting fees generated. Such rebates or credits are used solely to reduce the fund’s management and administrative expenses. The fund’s custodian bank has also agreed to reduce its fees when the fund maintains cash on deposit in the non-interest-bearing custody account. For the year ended December 31, 2006, these arrangements reduced the fund’s management and administrative expenses by $6,000 and custodian fees by $5,000.
14
Tax-Managed Balanced Fund
D. Distributions are determined on a tax basis and may differ from net investment income and realized capital gains for financial reporting purposes. Differences may be permanent or temporary. Permanent differences are reclassified among capital accounts in the financial statements to reflect their tax character. Temporary differences arise when certain items of income, expense, gain, or loss are recognized in different periods for financial statement and tax purposes; these differences will reverse at some time in the future. Differences in classification may also result from the treatment of short-term gains as ordinary income for tax purposes.
For tax purposes, at December 31, 2006, the fund had $131,000 of ordinary income available for distribution. The fund had available realized losses of $27,773,000 to offset future net capital gains of $2,594,000 through December 31, 2009, $15,836,000 through December 31, 2010, and $9,343,000 through December 31, 2011.
At December 31, 2006, the cost of investment securities for tax purposes was $503,750,000. Net unrealized appreciation of investment securities for tax purposes was $153,920,000, consisting of unrealized gains of $155,612,000 on securities that had risen in value since their purchase and $1,692,000 in unrealized losses on securities that had fallen in value since their purchase.
E. During the year ended December 31, 2006, the fund purchased $77,420,000 of investment securities and sold $26,700,000 of investment securities, other than temporary cash investments.
F. Capital shares issued and redeemed were:
| Year Ended December 31, |
| 2006 | 2005 |
| Shares | Shares |
| (000) | (000) |
Issued | 2,805 | 3,788 |
Issued in Lieu of Cash Distributions | 788 | 697 |
Redeemed | (2,640) | (2,721) |
Net Increase (Decrease) in Shares Outstanding | 953 | 1,764 |
G. In June 2006, the Financial Accounting Standards Board issued Interpretation No. 48 (“FIN 48”), “Accounting for Uncertainty in Income Taxes.” FIN 48 establishes the minimum threshold for recognizing, and a system for measuring, the benefits of tax-return positions in financial statements. FIN 48 will be effective for the fund’s fiscal year ending December 31, 2007. Management is in the process of analyzing the fund’s tax positions for purposes of implementing FIN 48; based on the analysis completed to date, management does not believe the adoption of FIN 48 will result in any material impact to the fund’s financial statements.
15
Tax-Managed Growth and Income Fund
Fund Profile
As of December 31, 2006
Portfolio Characteristics | | |
| | Comparative | Broad |
| Fund | Index1 | Index2 |
Number of Stocks | 506 | 500 | 4,964 |
Median Market Cap | $58.8B | $58.8B | $30.7B |
Price/Earnings Ratio | 17.1x | 17.1x | 18.0x |
Price/Book Ratio | 2.9x | 2.9x | 2.8x |
Yield | | 1.8% | 1.7% |
Investor Shares | 1.6% | | |
Admiral Shares | 1.7% | | |
Institutional Shares | 1.7% | | |
Return on Equity | 19.1% | 19.1% | 17.8% |
Earnings Growth Rate | 18.8% | 18.8% | 18.5% |
Foreign Holdings | 0.0% | 0.0% | 1.1% |
Turnover Rate | 6% | — | — |
Expense Ratio | | — | — |
Investor Shares | 0.15% | | |
Admiral Shares | 0.10% | | |
Institutional Shares | 0.07% | | |
Short-Term Reserves | 0% | — | — |
Volatility Measures3 | |
| Fund Versus | Fund Versus |
| Comparative Index1 | Broad Index2 |
R-Squared | 1.00 | 0.97 |
Beta | 1.00 | 0.88 |
Investment Focus
Sector Diversification (% of portfolio) | |
| | Comparative | Broad |
| Fund | Index1 | Index2 |
Consumer Discretionary | 11% | 11% | 12% |
Consumer Staples | 9 | 9 | 9 |
Energy | 10 | 10 | 9 |
Financials | 22 | 22 | 23 |
Health Care | 12 | 12 | 12 |
Industrials | 11 | 11 | 11 |
Information Technology | 15 | 15 | 15 |
Materials | 3 | 3 | 3 |
Telecommunication Services | 3 | 3 | 3 |
Utilities | 4 | 4 | 3 |
Ten Largest Holdings4 (% of total net assets) |
| | |
ExxonMobil Corp. | integrated oil and gas | 3.5% |
General Electric Co. | industrial conglomerates | 3.0 |
Citigroup, Inc. | diversified financial services | 2.1 |
Microsoft Corp. | systems software | 2.0 |
Bank of America Corp. | diversified financial services | 1.9 |
The Procter & Gamble Co. | household products | 1.6 |
Johnson & Johnson | pharmaceuticals | 1.5 |
Pfizer Inc. | pharmaceuticals | 1.5 |
American International Group, Inc. | multi-line insurance | 1.5 |
Altria Group, Inc. | tobacco | 1.4 |
Top Ten | | 20.0% |
1 S&P 500 Index.
2 Dow Jones Wilshire 5000 Index.
3 For an explanation of R-squared, beta, and other terms used here, see the Glossary on pages 62–63.
4 “Ten Largest Holdings” excludes any temporary cash investments and equity index products.
16
Tax-Managed Growth and Income Fund
Performance Summary
All of the returns in this report represent past performance, which is not a guarantee of future results that may be achieved by the fund. (Current performance may be lower or higher than the performance data cited. For performance data current to the most recent month-end, visit our website at www.vanguard.com.) Note, too, that both investment returns and principal value can fluctuate widely, so an investor’s shares, when sold, could be worth more or less than their original cost. The returns shown do not reflect taxes that a shareholder would pay on fund distributions or on the sale of fund shares.
Cumulative Performance: December 31, 1996–December 31, 2006
Initial Investment of $10,000
| Average Annual Total Returns | Final Value |
| Periods Ended December 31, 2006 | of a $10,000 |
| One Year | Five Years | Ten Years | Investment |
Tax-Managed Growth and Income Fund | | | | |
Investor Shares | 15.73% | 6.18% | 8.43% | $22,461 |
Fee-Adjusted Returns1 | 14.59 | 6.18 | 8.43 | 22,461 |
Dow Jones Wilshire 5000 Index | 15.87 | 7.65 | 8.67 | 22,961 |
S&P 500 Index | 15.79 | 6.19 | 8.42 | 22,447 |
Average Large-Cap Core Fund2 | 13.53 | 4.27 | 6.66 | 19,050 |
| | | | Final Value of |
| | Five | Since | a $100,000 |
| One Year | Years | Inception3 | Investment |
Tax-Managed Growth and Income Fund | | | | |
Admiral Shares | 15.77% | 6.23% | 6.65% | $139,149 |
Fee-Adjusted Returns1 | 14.63 | 6.23 | 6.65 | 139,149 |
Dow Jones Wilshire 5000 Index | 15.87 | 7.65 | 8.32 | 150,735 |
S&P 500 Index | 15.79 | 6.19 | 6.61 | 138,906 |
1 Reflective of the 1% fee assessed on redemptions of shares held in the fund for less than five years.
2 Derived from data provided by Lipper Inc.
3 November 12, 2001.
17
Tax-Managed Growth and Income Fund
| Average Annual Total Returns | |
| Periods Ended December 31, 2006 | Final Value of |
| One | Five | Since | a $5,000,000 |
| Year | Years | Inception1 | Investment |
Tax-Managed Growth and Income Fund | | | | |
Institutional Shares | 15.82% | 6.26% | 3.37% | $6,482,520 |
Fee-Adjusted Returns2 | 14.68 | 6.26 | 3.37 | 6,482,520 |
Dow Jones Wilshire 5000 Index | 15.87 | 7.65 | 4.46 | 7,036,200 |
S&P 500 Index | 15.79 | 6.19 | 3.28 | 6,438,269 |
Fiscal-Year Total Returns (%): December 31, 1996–December 31, 2006
1 March 4, 1999.
2 Reflective of the 1% fee assessed on redemptions of shares held for less than five years.
Note: See Financial Highlights tables on pages 21–23 for dividend and capital gains information.
18
Tax-Managed Growth and Income Fund
Financial Statements
The Statement of Net Assets—an integral part of the Financial Statements for Vanguard Tax-Managed Growth and Income Fund—is included as an insert to this report.
Statement of Operations
| Year Ended |
| December 31, 2006 |
| ($000) |
Investment Income | |
Income | |
Dividends | 54,326 |
Interest1 | 80 |
Total Income | 54,406 |
Expenses | |
The Vanguard Group—Note B | |
Investment Advisory Services | 66 |
Management and Administrative | |
Investor Shares | 928 |
Admiral Shares | 1,322 |
Institutional Shares | 148 |
Marketing and Distribution | |
Investor Shares | 149 |
Admiral Shares | 250 |
Institutional Shares | 59 |
Custodian Fees | 52 |
Auditing Fees | 22 |
Shareholders’ Reports | |
Investor Shares | 24 |
Admiral Shares | 5 |
Institutional Shares | — |
Trustees’ Fees and Expenses | 3 |
Total Expenses | 3,028 |
Net Investment Income | 51,378 |
Realized Net Gain (Loss) on Investment Securities Sold | 2,041 |
Change in Unrealized Appreciation (Depreciation) of Investment Securities | 368,009 |
Net Increase (Decrease) in Net Assets Resulting from Operations | 421,428 |
1 Interest income from an affiliated company of the fund was $68,000.
19
Tax-Managed Growth and Income Fund
Statement of Changes in Net Assets
| Year Ended December 31, |
| 2006 | 2005 |
| ($000) | ($000) |
Increase (Decrease) in Net Assets | | |
Operations | | |
Net Investment Income | 51,378 | 47,158 |
Realized Net Gain (Loss) | 2,041 | (34,119) |
Change in Unrealized Appreciation (Depreciation) | 368,009 | 112,439 |
Net Increase (Decrease) in Net Assets Resulting from Operations | 421,428 | 125,478 |
Distributions | | |
Net Investment Income | | |
Investor Shares | (13,535) | (18,610) |
Admiral Shares | (31,978) | (24,005) |
Institutional Shares | (6,367) | (5,290) |
Realized Capital Gain | | |
Investor Shares | — | — |
Admiral Shares | — | — |
Institutional Shares | — | — |
Total Distributions | (51,880) | (47,905) |
Capital Share Transactions—Note E | | |
Investor Shares | (122,838) | (617,688) |
Admiral Shares | 134,096 | 580,021 |
Institutional Shares | 42,048 | 28,881 |
Net Increase (Decrease) from Capital Share Transactions | 53,306 | (8,786) |
Total Increase (Decrease) | 422,854 | 68,787 |
Net Assets | | |
Beginning of Period | 2,683,971 | 2,615,184 |
End of Period1 | 3,106,825 | 2,683,971 |
1 Net Assets—End of Period includes undistributed (overdistributed) net investment income of ($3,721,000) and ($3,219,000).
20
Tax-Managed Growth and Income Fund
Financial Highlights
Investor Shares | | | | | |
| | | | | |
| | | Year Ended December 31, |
For a Share Outstanding Throughout Each Period | 2006 | 2005 | 2004 | 2003 | 2002 |
Net Asset Value, Beginning of Period | $27.15 | $26.36 | $24.23 | $19.15 | $24.93 |
Investment Operations | | | | | |
Net Investment Income | .504 | .467 | .471 | .34 | .313 |
Net Realized and Unrealized | | | | | |
Gain (Loss) on Investments2 | 3.727 | .801 | 2.13 | 5.08 | (5.768) |
Total from Investment Operations | 4.231 | 1.268 | 2.60 | 5.42 | (5.455) |
Distributions | | | | | |
Dividends from Net Investment Income | (.511) | (.478) | (.47) | (.34) | (.325) |
Distributions from Realized Capital Gains | — | — | — | — | — |
Total Distributions | (.511) | (.478) | (.47) | (.34) | (.325) |
Net Asset Value, End of Period | $30.87 | $27.15 | $26.36 | $24.23 | $19.15 |
| | | | | |
Total Return3 | 15.73% | 4.87% | 10.83% | 28.53% | –21.95% |
| | | | | |
Ratios/Supplemental Data | | | | | |
Net Assets, End of Period (Millions) | $784 | $806 | $1,395 | $1,321 | $1,077 |
Ratio of Total Expenses to | | | | | |
Average Net Assets | 0.15% | 0.14% | 0.14% | 0.17% | 0.17% |
Ratio of Net Investment Income to | | | | | |
Average Net Assets | 1.77% | 1.78% | 1.89%1 | 1.63% | 1.44% |
Portfolio Turnover Rate | 6% | 10% | 8% | 5% | 9% |
1 Net investment income per share and the ratio of net investment income to average net assets include $.08 and 0.31%, respectively, resulting from a special dividend from Microsoft Corp. in November 2004.
2 Includes increases from redemption fees of $.00, $.01, $.01, $.01, and $.03.
3 Total returns do not reflect the 1% redemption fee on shares held less than five years or the 2% redemption fee assessed prior to September 14, 2005, on shares held less than one year.
21
Tax-Managed Growth and Income Fund
Admiral Shares | | | | | |
| | | | | |
| | | Year Ended December 31, |
For a Share Outstanding Throughout Each Period | 2006 | 2005 | 2004 | 2003 | 2002 |
Net Asset Value, Beginning of Period | $55.80 | $54.17 | $49.80 | $39.35 | $51.24 |
Investment Operations | | | | | |
Net Investment Income | 1.069 | .989 | .991 | .733 | .673 |
Net Realized and Unrealized | | | | | |
Gain (Loss) on Investments2 | 7.648 | 1.645 | 4.37 | 10.443 | (11.870) |
Total from Investment Operations | 8.717 | 2.634 | 5.36 | 11.176 | (11.197) |
Distributions | | | | | |
Dividends from Net Investment Income | (1.077) | (1.004) | (.99) | (.726) | (.693) |
Distributions from Realized Capital Gains | — | — | — | — | — |
Total Distributions | (1.077) | (1.004) | (.99) | (.726) | (.693) |
Net Asset Value, End of Period | $63.44 | $55.80 | $54.17 | $49.80 | $39.35 |
| | | | | |
Total Return3 | 15.77% | 4.93% | 10.87% | 28.64% | –21.92% |
| | | | | |
Ratios/Supplemental Data | | | | | |
Net Assets, End of Period (Millions) | $1,935 | $1,575 | $954 | $777 | $520 |
Ratio of Total Expenses to | | | | | |
Average Net Assets | 0.10% | 0.10% | 0.10% | 0.11% | 0.11% |
Ratio of Net Investment Income to | | | | | |
Average Net Assets | 1.82% | 1.82% | 1.96%1 | 1.69% | 1.52% |
Portfolio Turnover Rate | 6% | 10% | 8% | 5% | 9% |
1 Net investment income per share and the ratio of net investment income to average net assets include $.16 and 0.31%, respectively, resulting from a special dividend from Microsoft Corp. in November 2004.
2 Includes increases from redemption fees of $.01, $.01, $.02, $.02, and $.05.
3 Total returns do not reflect the 1% redemption fee on shares held less than five years or the 2% redemption fee assessed prior to September 14, 2005, on shares held less than one year.
22
Tax-Managed Growth and Income Fund
Institutional Shares | | | | | |
| | | | | |
| | | Year Ended December 31, |
For a Share Outstanding Throughout Each Period | 2006 | 2005 | 2004 | 2003 | 2002 |
Net Asset Value, Beginning of Period | $27.15 | $26.36 | $24.24 | $19.15 | $24.93 |
Investment Operations | | | | | |
Net Investment Income | .527 | .485 | .4791 | .369 | .331 |
Net Realized and Unrealized | | | | | |
Gain (Loss) on Investments2 | 3.727 | .801 | 2.130 | 5.080 | (5.768) |
Total from Investment Operations | 4.254 | 1.286 | 2.609 | 5.449 | (5.437) |
Distributions | | | | | |
Dividends from Net Investment Income | (.534) | (.496) | (.489) | (.359) | (.343) |
Distributions from Realized Capital Gains | — | — | — | — | — |
Total Distributions | (.534) | (.496) | (.489) | (.359) | (.343) |
Net Asset Value, End of Period | $30.87 | $27.15 | $26.36 | $24.24 | $19.15 |
| | | | | |
Total Return3 | 15.82% | 4.94% | 10.87% | 28.69% | –21.88% |
| | | | | |
Ratios/Supplemental Data | | | | | |
Net Assets, End of Period (Millions) | $389 | $303 | $266 | $217 | $167 |
Ratio of Total Expenses to | | | | | |
Average Net Assets | 0.07% | 0.07% | 0.07% | 0.08% | 0.08% |
Ratio of Net Investment Income to | | | | | |
Average Net Assets | 1.85% | 1.85% | 1.97%1 | 1.72% | 1.54% |
Portfolio Turnover Rate | 6% | 10% | 8% | 5% | 9% |
1 Net investment income per share and the ratio of net investment income to average net assets include $.077 and 0.31%, respectively, resulting from a special dividend from Microsoft Corp. in November 2004.
2 Includes increases from redemption fees of $.00, $.01, $.01, $.01, and $.03.
3 Total returns do not reflect the 1% redemption fee on shares held less than five years or the 2% redemption fee assessed prior to September 14, 2005, on shares held less than one year.
See accompanying Notes, which are an integral part of the Financial Statements.
23
Tax-Managed Growth and Income Fund
Notes to Financial Statements
Vanguard Tax-Managed Growth and Income Fund is registered under the Investment Company Act of 1940 as an open-end investment company, or mutual fund. The fund offers three classes of shares: Investor Shares, Admiral Shares, and Institutional Shares. Investor Shares are available to any investor who meets the fund’s minimum purchase requirements. Admiral Shares are designed for investors who meet certain administrative, servicing, tenure, and account-size criteria. Institutional Shares are designed for investors who meet certain administrative and servicing criteria and invest a minimum of $5 million.
A. The following significant accounting policies conform to generally accepted accounting principles for U.S. mutual funds. The fund consistently follows such policies in preparing its financial statements.
1. Security Valuation: Securities are valued as of the close of trading on the New York Stock Exchange (generally 4:00 p.m. Eastern time) on the valuation date. Equity securities are valued at the latest quoted sales prices or official closing prices taken from the primary market in which each security trades; such securities not traded on the valuation date are valued at the mean of the latest quoted bid and asked prices. Securities for which market quotations are not readily available, or whose values have been materially affected by events occurring before the fund’s pricing time but after the close of the securities’ primary markets, are valued by methods deemed by the board of trustees to represent fair value. Investments in Vanguard Market Liquidity Fund are valued at that fund’s net asset value.
2. Federal Income Taxes: The fund intends to continue to qualify as a regulated investment company and distribute all of its taxable income. Accordingly, no provision for federal income taxes is required in the financial statements.
3. Distributions: Distributions to shareholders are recorded on the ex-dividend date.
4. Other: Dividend income is recorded on the ex-dividend date. Interest income includes income distributions received from Vanguard Market Liquidity Fund and is accrued daily. Security transactions are accounted for on the date securities are bought or sold. Costs used to determine realized gains (losses) on the sale of investment securities are those of the specific securities sold. Fees assessed on redemptions of capital shares are credited to paid-in capital.
Each class of shares has equal rights as to assets and earnings, except that each class separately bears certain class-specific expenses related to maintenance of shareholder accounts (included in Management and Administrative expenses) and shareholder reporting. Marketing and distribution expenses are allocated to each class of shares based on a method approved by the board of trustees. Income, other non-class-specific expenses, and gains and losses on investments are allocated to each class of shares based on its relative net assets.
B. The Vanguard Group furnishes at cost investment advisory, corporate management, administrative, marketing, and distribution services. The costs of such services are allocated to the fund under methods approved by the board of trustees. The fund has committed to provide up to 0.40% of its net assets in capital contributions to Vanguard. At December 31, 2006, the fund had contributed capital of $300,000 to Vanguard (included in Other Assets), representing 0.01% of the fund’s net assets and 0.30% of Vanguard’s capitalization. The fund’s trustees and officers are also directors and officers of Vanguard.
C. Distributions are determined on a tax basis and may differ from net investment income and realized capital gains for financial reporting purposes. Differences may be permanent or temporary. Permanent differences are reclassified among capital accounts in the financial statements to reflect their tax character. Temporary differences arise when certain items of income, expense, gain, or loss are recognized in different periods for financial statement and tax purposes; these differences will reverse at some time in the future. Differences in classification may also result from the treatment of short-term gains as ordinary income for tax purposes.
24
Tax-Managed Growth and Income Fund
For tax purposes, at December 31, 2006, the fund had $357,000 of ordinary income available for distribution. The fund had available realized losses of $442,807,000 to offset future net capital gains of $34,004,000 through December 31, 2008, $81,507,000 through December 31, 2009, $201,652,000 through December 31, 2010, $92,868,000 through December 31, 2011, $31,345,000 through December 31, 2013, and $1,431,000 through December 31, 2014.
At December 31, 2006, the cost of investment securities for tax purposes was $1,947,701,000. Net unrealized appreciation of investment securities for tax purposes was $1,163,287,000, consisting of unrealized gains of $1,197,220,000 on securities that had risen in value since their purchase and $33,933,000 in unrealized losses on securities that had fallen in value since their purchase.
D. During the year ended December 31, 2006, the fund purchased $217,468,000 of investment securities and sold $169,465,000 of investment securities, other than temporary cash investments.
E. Capital share transactions for each class of shares were:
| Year Ended December 31, |
| | 2006 | | 2005 |
| Amount | Shares | Amount | Shares |
| ($000) | (000) | ($000) | (000) |
Investor Shares | | | | |
Issued | 70,085 | 2,458 | 89,341 | 3,418 |
Issued in Lieu of Cash Distributions | 11,722 | 407 | 16,179 | 616 |
Redeemed1 | (204,645) | (7,168) | (723,208) | (27,273) |
Net Increase (Decrease)—Investor Shares | (122,838) | (4,303) | (617,688) | (23,239) |
Admiral Shares | | | | |
Issued | 206,113 | 3,509 | 653,973 | 11,983 |
Issued in Lieu of Cash Distributions | 25,316 | 426 | 18,694 | 343 |
Redeemed1 | (97,333) | (1,661) | (92,646) | (1,718) |
Net Increase (Decrease)—Admiral Shares | 134,096 | 2,274 | 580,021 | 10,608 |
Institutional Shares | | | | |
Issued | 55,863 | 1,933 | 33,835 | 1,274 |
Issued in Lieu of Cash Distributions | 4,524 | 157 | 3,620 | 137 |
Redeemed1 | (18,339) | (662) | (8,574) | (325) |
Net Increase (Decrease)—Institutional Shares | 42,048 | 1,428 | 28,881 | 1,086 |
F. In June 2006, the Financial Accounting Standards Board issued Interpretation No. 48 (“FIN 48”), “Accounting for Uncertainty in Income Taxes.” FIN 48 establishes the minimum threshold for recognizing, and a system for measuring, the benefits of tax-return positions in financial statements. FIN 48 will be effective for the fund’s fiscal year ending December 31, 2007. Management is in the process of analyzing the fund’s tax positions for purposes of implementing FIN 48; based on the analysis completed to date, management does not believe the adoption of FIN 48 will result in any material impact to the fund’s financial statements.
1 Net of redemption fees for 2006 and 2005 of $423,000 and $650,000, respectively (fund totals).
25
Tax-Managed Capital Appreciation Fund
Fund Profile
As of December 31, 2006
Portfolio Characteristics | | |
| | Comparative | Broad |
| Fund | Index1 | Index2 |
Number of Stocks | 636 | 987 | 4,964 |
Median Market Cap | $35.0B | $41.8B | $30.7B |
Price/Earnings Ratio | 17.4x | 17.5x | 18.0x |
Price/Book Ratio | 2.9x | 2.9x | 2.8x |
Yield | | 1.8% | 1.7% |
Investor Shares | 1.3% | | |
Admiral Shares | 1.4% | | |
Institutional Shares | 1.4% | | |
Return on Equity | 19.0% | 18.8% | 17.8% |
Earnings Growth Rate | 19.7% | 18.6% | 18.5% |
Foreign Holdings | 0.0% | 0.0% | 1.1% |
Turnover Rate | 5% | — | — |
Expense Ratio | | — | — |
Investor Shares | 0.15% | | |
Admiral Shares | 0.10% | | |
Institutional Shares | 0.07% | | |
Short-Term Reserves | 0% | — | — |
Volatility Measures3 | |
| Fund Versus | Fund Versus |
| Comparative Index1 | Broad Index2 |
R-Squared | 0.99 | 0.99 |
Beta | 1.07 | 0.98 |
Investment Focus
Sector Diversification (% of portfolio) | |
| | Comparative | Broad |
| Fund | Index1 | Index2 |
Consumer Discretionary | 12% | 11% | 12% |
Consumer Staples | 9 | 9 | 9 |
Energy | 9 | 9 | 9 |
Financials | 22 | 22 | 23 |
Health Care | 13 | 12 | 12 |
Industrials | 11 | 11 | 11 |
Information Technology | 15 | 15 | 15 |
Materials | 3 | 3 | 3 |
Telecommunication Services | 3 | 4 | 3 |
Utilities | 3 | 4 | 3 |
Ten Largest Holdings4 (% of total net assets) |
| | |
ExxonMobil Corp. | integrated oil and gas | 3.3% |
General Electric Co. | industrial conglomerates | 2.6 |
Citigroup, Inc. | diversified financial services | 1.9 |
Microsoft Corp. | systems software | 1.7 |
Bank of America Corp. | diversified financial services | 1.6 |
The Procter & Gamble Co. | household products | 1.5 |
Johnson & Johnson | pharmaceuticals | 1.4 |
Cisco Systems, Inc. | communications equipment | 1.2 |
Pfizer Inc. | pharmaceuticals | 1.2 |
American International Group, Inc. | multi-line insurance | 1.2 |
Top Ten | | 17.6% |
1 Russell 1000 Index.
2 Dow Jones Wilshire 5000 Index.
3 For an explanation of R-squared, beta, and other terms used here, see the Glossary on pages 62–63.
4 “Ten Largest Holdings” excludes any temporary cash investments and equity index products.
26
Tax-Managed Capital Appreciation Fund
Performance Summary
All of the returns in this report represent past performance, which is not a guarantee of future results that may be achieved by the fund. (Current performance may be lower or higher than the performance data cited. For performance data current to the most recent month-end, visit our website at www.vanguard.com.) Note, too, that both investment returns and principal value can fluctuate widely, so an investor’s shares, when sold, could be worth more or less than their original cost. The returns shown do not reflect taxes that a shareholder would pay on fund distributions or on the sale of fund shares.
Cumulative Performance: December 31, 1996–December 31, 2006
Initial Investment of $10,000
| Average Annual Total Returns | Final Value |
| Periods Ended December 31, 2006 | of a $10,000 |
| One Year | Five Years | Ten Years | Investment |
Tax-Managed Capital Appreciation Fund | | | | |
Investor Shares | 14.40% | 6.74% | 8.65% | $22,920 |
Fee-Adjusted Returns1 | 13.27 | 6.74 | 8.65 | 22,920 |
Dow Jones Wilshire 5000 Index | 15.87 | 7.65 | 8.67 | 22,961 |
Russell 1000 Index | 15.46 | 6.82 | 8.64 | 22,914 |
Average Multi-Cap Core Fund2 | 13.31 | 6.39 | 7.94 | 21,468 |
| | | | Final Value of |
| One | Five | Since | a $100,000 |
| Year | Years | Inception3 | Investment |
Tax-Managed Capital Appreciation Fund | | | | |
Admiral Shares | 14.44% | 6.80% | 7.48% | $144,856 |
Fee-Adjusted Returns1 | 13.32 | 6.80 | 7.48 | 144,856 |
Dow Jones Wilshire 5000 Index | 15.87 | 7.65 | 8.32 | 150,735 |
Russell 1000 Index | 15.46 | 6.82 | 7.31 | 143,684 |
1 Reflective of the 1% fee assessed on redemptions of shares held for less than five years.
2 Derived from data provided by Lipper Inc.
3 November 12, 2001.
27
Tax-Managed Capital Appreciation Fund
| Average Annual Total Returns | |
| Periods Ended December 31, 2006 | Final Value of |
| One | Five | Since | a $5,000,000 |
| Year | Years | Inception1 | Investment |
Tax-Managed Capital Appreciation Fund | | | | |
Institutional Shares | 14.49% | 6.83% | 4.22% | $6,914,785 |
Fee-Adjusted Returns2 | 13.36 | 6.83 | 4.22 | 6,914,785 |
Dow Jones Wilshire 5000 Index | 15.87 | 7.65 | 4.39 | 7,003,195 |
Russell 1000 Index | 15.46 | 6.82 | 3.77 | 6,685,126 |
Fiscal-Year Total Returns (%): December 31, 1996–December 31, 2006
1 February 24, 1999.
2 Reflective of the 1% fee assessed on redemptions of shares held for less than five years.
Note: See Financial Highlights tables on pages 31–33 for dividend and capital gains information.
28
Tax-Managed Capital Appreciation Fund
Financial Statements
The Statement of Net Assets—an integral part of the Financial Statements for Vanguard Tax-Managed Capital Appreciation Fund—is included as an insert to this report.
Statement of Operations
| Year Ended |
| December 31, 2006 |
| ($000) |
Investment Income | |
Income | |
Dividends | 60,695 |
Interest1 | 118 |
Total Income | 60,813 |
Expenses | |
The Vanguard Group—Note B | |
Investment Advisory Services | 74 |
Management and Administrative | |
Investor Shares | 1,006 |
Admiral Shares | 2,061 |
Institutional Shares | 100 |
Marketing and Distribution | |
Investor Shares | 160 |
Admiral Shares | 377 |
Institutional Shares | 29 |
Custodian Fees | 18 |
Auditing Fees | 22 |
Shareholders’ Reports | |
Investor Shares | 22 |
Admiral Shares | 8 |
Institutional Shares | — |
Trustees’ Fees and Expenses | 3 |
Total Expenses | 3,880 |
Net Investment Income | 56,933 |
Realized Net Gain (Loss) on Investment Securities Sold | 59,140 |
Change in Unrealized Appreciation (Depreciation) of Investment Securities | 385,292 |
Net Increase (Decrease) in Net Assets Resulting from Operations | 501,365 |
1 Interest income from an affiliated company of the fund was $118,000.
29
Tax-Managed Capital Appreciation Fund
Statement of Changes in Net Assets
| Year Ended December 31, |
| 2006 | 2005 |
| ($000) | ($000) |
Increase (Decrease) in Net Assets | | |
Operations | | |
Net Investment Income | 56,933 | 40,837 |
Realized Net Gain (Loss) | 59,140 | 5,891 |
Change in Unrealized Appreciation (Depreciation) | 385,292 | 191,693 |
Net Increase (Decrease) in Net Assets Resulting from Operations | 501,365 | 238,421 |
Distributions | | |
Net Investment Income | | |
Investor Shares | (11,552) | (10,082) |
Admiral Shares | (42,410) | (28,472) |
Institutional Shares | (3,220) | (2,552) |
Realized Capital Gain | | |
Investor Shares | — | — |
Admiral Shares | — | — |
Institutional Shares | — | — |
Total Distributions | (57,182) | (41,106) |
Capital Share Transactions—Note E | | |
Investor Shares | (124,968) | (812,241) |
Admiral Shares | 262,868 | 849,487 |
Institutional Shares | (10,718) | 90,644 |
Net Increase (Decrease) from Capital Share Transactions | 127,182 | 127,890 |
Total Increase (Decrease) | 571,365 | 325,205 |
Net Assets | | |
Beginning of Period | 3,420,245 | 3,095,040 |
End of Period1 | 3,991,610 | 3,420,245 |
1 Net Assets—End of Period includes undistributed (overdistributed) net investment income of ($3,947,000) and ($3,698,000).
30
Tax-Managed Capital Appreciation Fund
Financial Highlights
Investor Shares
| | | Year Ended December 31, |
For a Share Outstanding Throughout Each Period | 2006 | 2005 | 2004 | 2003 | 2002 |
Net Asset Value, Beginning of Period | $29.80 | $28.05 | $25.43 | $19.49 | $25.73 |
Investment Operations | | | | | |
Net Investment Income | .471 | .352 | .3651 | .238 | .196 |
Net Realized and Unrealized | | | | | |
Gain (Loss) on Investments2 | 3.821 | 1.752 | 2.622 | 5.940 | (6.231) |
Total from Investment Operations | 4.292 | 2.104 | 2.987 | 6.178 | (6.035) |
Distributions | | | | | |
Dividends from Net Investment Income | (.472) | (.354) | (.367) | (.238) | (.205) |
Distributions from Realized Capital Gains | — | — | — | — | — |
Total Distributions | (.472) | (.354) | (.367) | (.238) | (.205) |
Net Asset Value, End of Period | $33.62 | $29.80 | $28.05 | $25.43 | $19.49 |
| | | | | |
Total Return3 | 14.40% | 7.49% | 11.75% | 31.72% | –23.45% |
| | | | | |
Ratios/Supplemental Data | | | | | |
Net Assets, End of Period (Millions) | $832 | $857 | $1,596 | $1,466 | $1,154 |
Ratio of Total Expenses to | | | | | |
Average Net Assets | 0.15% | 0.14% | 0.14% | 0.17% | 0.17% |
Ratio of Net Investment Income to | | | | | |
Average Net Assets | 1.51% | 1.25% | 1.40%1 | 1.09% | 0.87% |
Portfolio Turnover Rate | 5% | 8% | 5% | 11% | 10% |
1 Net investment income per share and the ratio of net investment income to average net assets include $.061 and 0.24%, respectively, resulting from a special dividend from Microsoft Corp. in November 2004.
2 Includes increases from redemption fees of $.00, $.01, $.01, $.01, and $.02.
3 Total returns do not reflect the 1% redemption fee on shares held less than five years or the 2% redemption fee assessed prior to September 14, 2005, on shares held less than one year.
31
Tax-Managed Capital Appreciation Fund
Admiral Shares | | | | | |
| | | | | |
| | | Year Ended December 31, |
For a Share Outstanding Throughout Each Period | 2006 | 2005 | 2004 | 2003 | 2002 |
Net Asset Value, Beginning of Period | $60.00 | $56.46 | $51.20 | $39.24 | $51.79 |
Investment Operations | | | | | |
Net Investment Income | .99 | .729 | .7621 | .51 | .42 |
Net Realized and Unrealized | | | | | |
Gain (Loss) on Investments2 | 7.68 | 3.543 | 5.263 | 11.96 | (12.53) |
Total from Investment Operations | 8.67 | 4.272 | 6.025 | 12.47 | (12.11) |
Distributions | | | | | |
Dividends from Net Investment Income | (.99) | (.732) | (.765) | (.51) | (.44) |
Distributions from Realized Capital Gains | — | — | — | — | — |
Total Distributions | (.99) | (.732) | (.765) | (.51) | (.44) |
Net Asset Value, End of Period | $67.68 | $60.00 | $56.46 | $51.20 | $39.24 |
| | | | | |
Total Return3 | 14.44% | 7.56% | 11.77% | 31.80% | –23.38% |
| | | | | |
Ratios/Supplemental Data | | | | | |
Net Assets, End of Period (Millions) | $2,941 | $2,360 | $1,397 | $1,103 | $741 |
Ratio of Total Expenses to | | | | | |
Average Net Assets | 0.10% | 0.10% | 0.10% | 0.11% | 0.11% |
Ratio of Net Investment Income to | | | | | |
Average Net Assets | 1.56% | 1.29% | 1.47%1 | 1.16% | 0.95% |
Portfolio Turnover Rate | 5% | 8% | 5% | 11% | 10% |
1 Net investment income per share and the ratio of net investment income to average net assets include $.122 and 0.24%, respectively, resulting from a special dividend from Microsoft Corp. in November 2004.
2 Includes increases from redemption fees of $.01, $.01, $.01, $.02, and $.03.
3 Total returns do not reflect the 1% redemption fee on shares held less than five years or the 2% redemption fee assessed prior to September 14, 2005, on shares held less than one year.
32
Tax-Managed Capital Appreciation Fund
Institutional Shares | | | | | |
| | | | | |
| | | Year Ended December 31, |
For a Share Outstanding Throughout Each Period | 2006 | 2005 | 2004 | 2003 | 2002 |
Net Asset Value, Beginning of Period | $29.81 | $28.05 | $25.44 | $19.49 | $25.73 |
Investment Operations | | | | | |
Net Investment Income | .50 | .384 | .3751 | .267 | .216 |
Net Realized and Unrealized | | | | | |
Gain (Loss) on Investments2 | 3.82 | 1.752 | 2.622 | 5.940 | (6.231) |
Total from Investment Operations | 4.32 | 2.136 | 2.997 | 6.207 | (6.015) |
Distributions | | | | | |
Dividends from Net Investment Income | (.50) | (.376) | (.387) | (.257) | (.225) |
Distributions from Realized Capital Gains | — | — | — | — | — |
Total Distributions | (.50) | (.376) | (.387) | (.257) | (.225) |
Net Asset Value, End of Period | $33.63 | $29.81 | $28.05 | $25.44 | $19.49 |
| | | | | |
Total Return3 | 14.49% | 7.61% | 11.78% | 31.87% | –23.37% |
| | | | | |
Ratios/Supplemental Data | | | | | |
Net Assets, End of Period (Millions) | $218 | $204 | $102 | $104 | $106 |
Ratio of Total Expenses to | | | | | |
Average Net Assets | 0.07% | 0.07% | 0.07% | 0.08% | 0.08% |
Ratio of Net Investment Income to | | | | | |
Average Net Assets | 1.59% | 1.32% | 1.47%1 | 1.17% | 0.98% |
Portfolio Turnover Rate | 5% | 8% | 5% | 11% | 10% |
1 Net investment income per share and the ratio of net investment income to average net assets include $.061 and 0.24%, respectively, resulting from a special dividend from Microsoft Corp. in November 2004.
2 Includes increases from redemption fees of $.00, $.00, $.01, $.01, and $.02.
3 Total returns do not reflect the 1% redemption fee on shares held less than five years or the 2% redemption fee assessed prior to September 14, 2005, on shares held less than one year.
See accompanying Notes, which are an integral part of the Financial Statements.
33
Tax-Managed Capital Appreciation Fund
Notes to Financial Statements
Vanguard Tax-Managed Capital Appreciation Fund is registered under the Investment Company Act of 1940 as an open-end investment company, or mutual fund. The fund offers three classes of shares: Investor Shares, Admiral Shares, and Institutional Shares. Investor Shares are available to any investor who meets the fund’s minimum purchase requirements. Admiral Shares are designed for investors who meet certain administrative, servicing, tenure, and account-size criteria. Institutional Shares are designed for investors who meet certain administrative and servicing criteria and invest a minimum of $5 million.
A. The following significant accounting policies conform to generally accepted accounting principles for U.S. mutual funds. The fund consistently follows such policies in preparing its financial statements.
1. Security Valuation: Securities are valued as of the close of trading on the New York Stock Exchange (generally 4:00 p.m. Eastern time) on the valuation date. Equity securities are valued at the latest quoted sales prices or official closing prices taken from the primary market in which each security trades; such securities not traded on the valuation date are valued at the mean of the latest quoted bid and asked prices. Securities for which market quotations are not readily available, or whose values have been materially affected by events occurring before the fund’s pricing time but after the close of the securities’ primary markets, are valued by methods deemed by the board of trustees to represent fair value. Investments in Vanguard Market Liquidity Fund are valued at that fund’s net asset value.
2. Federal Income Taxes: The fund intends to continue to qualify as a regulated investment company and distribute all of its taxable income. Accordingly, no provision for federal income taxes is required in the financial statements.
3. Distributions: Distributions to shareholders are recorded on the ex-dividend date.
4. Other: Dividend income is recorded on the ex-dividend date. Interest income includes income distributions received from Vanguard Market Liquidity Fund and is accrued daily. Security transactions are accounted for on the date securities are bought or sold. Costs used to determine realized gains (losses) on the sale of investment securities are those of the specific securities sold. Fees assessed on redemptions of capital shares are credited to paid-in capital.
Each class of shares has equal rights as to assets and earnings, except that each class separately bears certain class-specific expenses related to maintenance of shareholder accounts (included in Management and Administrative expenses) and shareholder reporting. Marketing and distribution expenses are allocated to each class of shares based on a method approved by the board of trustees. Income, other non-class-specific expenses, and gains and losses on investments are allocated to each class of shares based on its relative net assets.
B. The Vanguard Group furnishes at cost investment advisory, corporate management, administrative, marketing, and distribution services. The costs of such services are allocated to the fund under methods approved by the board of trustees. The fund has committed to provide up to 0.40% of its net assets in capital contributions to Vanguard. At December 31, 2006, the fund had contributed capital of $387,000 to Vanguard (included in Other Assets), representing 0.01% of the fund’s net assets and 0.39% of Vanguard’s capitalization. The fund’s trustees and officers are also directors and officers of Vanguard.
C. Distributions are determined on a tax basis and may differ from net investment income and realized capital gains for financial reporting purposes. Differences may be permanent or temporary. Permanent differences are reclassified among capital accounts in the financial statements to reflect their tax character. Temporary differences arise when certain items of income, expense, gain, or loss are recognized in different periods for financial statement and tax purposes; these differences will reverse at some time in the future. Differences in classification may also result from the treatment of short-term gains as ordinary income for tax purposes.
34
Tax-Managed Capital Appreciation Fund
For tax purposes, at December 31, 2006, the fund had $681,000 of ordinary income available for distribution. The fund had available realized losses of $509,348,000 to offset future net capital gains of $239,522,000 through December 31, 2009, $106,018,000 through December 31, 2010, and $163,808,000 through December 31, 2011.
At December 31, 2006, the cost of investment securities for tax purposes was $2,263,742,000. Net unrealized appreciation of investment securities for tax purposes was $1,725,818,000, consisting of unrealized gains of $1,753,592,000 on securities that had risen in value since their purchase and $27,774,000 in unrealized losses on securities that had fallen in value since their purchase.
D. During the year ended December 31, 2006, the fund purchased $308,784,000 of investment securities and sold $183,759,000 of investment securities, other than temporary cash investments.
E. Capital share transactions for each class of shares were:
| Year Ended December 31, |
| | 2006 | | 2005 |
| Amount | Shares | Amount | Shares |
| ($000) | (000) | ($000) | (000) |
Investor Shares | | | | |
Issued | 85,007 | 2,726 | 132,702 | 4,704 |
Issued in Lieu of Cash Distributions | 10,331 | 306 | 8,922 | 297 |
Redeemed1 | (220,306) | (7,022) | (953,865) | (33,164) |
Net Increase (Decrease)—Investor Shares | (124,968) | (3,990) | (812,241) | (28,163) |
Admiral Shares | | | | |
Issued | 357,983 | 5,676 | 1,002,550 | 17,285 |
Issued in Lieu of Cash Distributions | 34,083 | 502 | 23,431 | 388 |
Redeemed1 | (129,198) | (2,054) | (176,494) | (3,084) |
Net Increase (Decrease)—Admiral Shares | 262,868 | 4,124 | 849,487 | 14,589 |
Institutional Shares | | | | |
Issued | 15,940 | 515 | 104,124 | 3,675 |
Issued in Lieu of Cash Distributions | 1,584 | 47 | 1,227 | 41 |
Redeemed1 | (28,242) | (910) | (14,707) | (521) |
Net Increase (Decrease)—Institutional Shares | (10,718) | (348) | 90,644 | 3,195 |
F. In June 2006, the Financial Accounting Standards Board issued Interpretation No. 48 (“FIN 48”), “Accounting for Uncertainty in Income Taxes.” FIN 48 establishes the minimum threshold for recognizing, and a system for measuring, the benefits of tax-return positions in financial statements. FIN 48 will be effective for the fund’s fiscal year ending December 31, 2007. Management is in the process of analyzing the fund’s tax positions for purposes of implementing FIN 48; based on the analysis completed to date, management does not believe the adoption of FIN 48 will result in any material impact to the fund’s financial statements.
1 Net of redemption fees for 2006 and 2005 of $468,000 and $610,000, respectively (fund totals).
35
Tax-Managed Small-Cap Fund
Fund Profile
As of December 31, 2006
Portfolio Characteristics | | |
| | Comparative | Broad |
| Fund | Index1 | Index2 |
Number of Stocks | 598 | 600 | 4,964 |
Median Market Cap | $1.3B | $1.3B | $30.7B |
Price/Earnings Ratio | 20.5x | 20.6x | 18.0x |
Price/Book Ratio | 2.4x | 2.3x | 2.8x |
Yield | | 0.9% | 1.7% |
Investor Shares | 0.8% | | |
Institutional Shares | 0.8% | | |
Return on Equity | 13.9% | 13.9% | 17.8% |
Earnings Growth Rate | 17.5% | 17.0% | 18.5% |
Foreign Holdings | 0.0% | 0.0% | 1.1% |
Turnover Rate | 42% | — | — |
Expense Ratio | | — | — |
Investor Shares | 0.14% | | |
Institutional Shares | 0.09% | | |
Short-Term Reserves | 0% | — | — |
Volatility Measures3 | |
| Fund Versus | Fund Versus |
| Comparative Index1 | Broad Index2 |
R-Squared | 1.00 | 0.81 |
Beta | 1.00 | 1.49 |
Investment Focus
Sector Diversification (% of portfolio) | |
| | Comparative | Broad |
| Fund | Index1 | Index2 |
Consumer Discretionary | 17% | 16% | 12% |
Consumer Staples | 4 | 4 | 9 |
Energy | 8 | 7 | 9 |
Financials | 15 | 17 | 23 |
Health Care | 12 | 12 | 12 |
Industrials | 17 | 17 | 11 |
Information Technology | 17 | 17 | 15 |
Materials | 5 | 5 | 3 |
Telecommunication Services | 0 | 0 | 3 |
Utilities | 5 | 5 | 3 |
Ten Largest Holdings4 (% of total net assets) |
| | |
The Manitowoc Co., Inc. | construction and farm machinery and heavy trucks | 0.6% |
Energen Corp. | gas utilities | 0.6 |
NVR, Inc. | homebuilding | 0.6 |
Frontier Oil Corp. | oil and gas refining and marketing | 0.6 |
Global Payments Inc. | data processing and outsourced services | 0.6 |
Veritas DGC Inc. | oil and gas equipment and services | 0.6 |
Cimarex Energy Co. | oil and gas exploration and production | 0.5 |
Southern Union Co. | gas utilities | 0.5 |
Cerner Corp. | health care technology | 0.5 |
Helix Energy Solutions Group, Inc. | oil and gas exploration and production | 0.5 |
Top Ten | | 5.6% |
1 S&P SmallCap 600 Index.
2 Dow Jones Wilshire 5000 Index.
3 For an explanation of R-squared, beta, and other terms used here, see the Glossary on pages 62–63.
4 “Ten Largest Holdings” excludes any temporary cash investments and equity index products.
36
Tax-Managed Small-Cap Fund
Performance Summary
All of the returns in this report represent past performance, which is not a guarantee of future results that may be achieved by the fund. (Current performance may be lower or higher than the performance data cited. For performance data current to the most recent month-end, visit our website at www.vanguard.com.) Note, too, that both investment returns and principal value can fluctuate widely, so an investor’s shares, when sold, could be worth more or less than their original cost. The returns shown do not reflect taxes that a shareholder would pay on fund distributions or on the sale of fund shares.
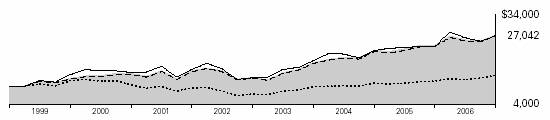
Cumulative Performance: March 25, 1999–December 31, 2006
Initial Investment of $10,000
| Average Annual Total Returns | |
| Periods Ended December 31, 2006 | Final Value |
| One | Five | Since | of a $10,000 |
| Year | Years | Inception1 | Investment |
Tax-Managed Small-Cap Fund | | | | |
Investor Shares | 14.15% | 12.35% | 13.66% | $27,042 |
Fee-Adjusted Returns2 | 13.02 | 12.35 | 13.66 | 27,042 |
Dow Jones Wilshire 5000 Index | 15.87 | 7.65 | 4.10 | 13,664 |
S&P SmallCap 600 Index | 15.12 | 12.49 | 13.52 | 26,791 |
Average Small-Cap Core Fund3 | 14.87 | 11.29 | 13.59 | 26,910 |
1 March 25, 1999.
2 Reflective of the 1% fee assessed on redemptions of shares held for less than five years.
3 Derived from data provided by Lipper Inc.
37
Tax-Managed Small-Cap Fund
| Average Annual Total Returns | |
| Periods Ended December 31, 2006 | Final Value of |
| One | Five | Since | a $5,000,000 |
| Year | Years | Inception1 | Investment |
Tax-Managed Small-Cap Fund | | | | |
Institutional Shares | 14.23% | 12.43% | 12.85% | $12,676,388 |
Fee-Adjusted Returns2 | 13.09 | 12.43 | 12.85 | 12,676,388 |
Dow Jones Wilshire 5000 Index | 15.87 | 7.65 | 3.56 | 6,544,003 |
S&P SmallCap 600 Index | 15.12 | 12.49 | 12.69 | 12,537,670 |
Fiscal-Year Total Returns (%): March 25, 1999–December 31, 2006

1 April 21, 1999.
2 Reflective of the 1% fee assessed on redemptions of shares held for less than five years.
Note: See Financial Highlights tables on pages 41 and 42 for dividend and capital gains information.
38
Tax-Managed Small-Cap Fund
Financial Statements
The Statement of Net Assets—an integral part of the Financial Statements for Vanguard Tax-Managed Small-Cap Fund—is included as an insert to this report.
Statement of Operations
| Year Ended |
| December 31, 2006 |
| ($000) |
Investment Income | |
Income | |
Dividends | 15,961 |
Interest1 | 98 |
Total Income | 16,059 |
Expenses | |
The Vanguard Group—Note B | |
Investment Advisory Services | 55 |
Management and Administrative | |
Investor Shares | 1,802 |
Institutional Shares | 59 |
Marketing and Distribution | |
Investor Shares | 279 |
Institutional Shares | 23 |
Custodian Fees | 68 |
Auditing Fees | 22 |
Shareholders’ Reports | |
Investor Shares | 20 |
Institutional Shares | — |
Trustees’ Fees and Expenses | 2 |
Total Expenses | 2,330 |
Net Investment Income | 13,729 |
Realized Net Gain (Loss) on Investment Securities Sold | 64,295 |
Change in Unrealized Appreciation (Depreciation) of Investment Securities | 146,889 |
Net Increase (Decrease) in Net Assets Resulting from Operations | 224,913 |
1 Interest income from an affiliated company of the fund was $98,000.
39
Tax-Managed Small-Cap Fund
Statement of Changes in Net Assets
| Year Ended December 31, |
| 2006 | 2005 |
| ($000) | ($000) |
Increase (Decrease) in Net Assets | | |
Operations | | |
Net Investment Income | 13,729 | 13,049 |
Realized Net Gain (Loss) | 64,295 | 16,073 |
Change in Unrealized Appreciation (Depreciation) | 146,889 | 80,864 |
Net Increase (Decrease) in Net Assets Resulting from Operations | 224,913 | 109,986 |
Distributions | | |
Net Investment Income | | |
Investor Shares | (13,148) | (12,546) |
Institutional Shares | (940) | (849) |
Realized Capital Gain | | |
Investor Shares | — | — |
Institutional Shares | — | — |
Total Distributions | (14,088) | (13,395) |
Capital Share Transactions—Note E | | |
Investor Shares | 100,595 | 83,202 |
Institutional Shares | 20,689 | 74,735 |
Net Increase (Decrease) from Capital Share Transactions | 121,284 | 157,937 |
Total Increase (Decrease) | 332,109 | 254,528 |
Net Assets | | |
Beginning of Period | 1,551,193 | 1,296,665 |
End of Period1 | 1,883,302 | 1,551,193 |
1 Net Assets—End of Period includes undistributed (overdistributed) net investment income of ($1,649,000) and ($1,290,000).
40
Tax-Managed Small-Cap Fund
Financial Highlights
Investor Shares | | | | | |
| | | | | |
| | | Year Ended December 31, |
For a Share Outstanding Throughout Each Period | 2006 | 2005 | 2004 | 2003 | 2002 |
Net Asset Value, Beginning of Period | $22.70 | $21.25 | $17.44 | $12.67 | $14.92 |
Investment Operations | | | | | |
Net Investment Income | .191 | .193 | .172 | .109 | .092 |
Net Realized and Unrealized | | | | | |
Gain (Loss) on Investments1 | 3.023 | 1.454 | 3.811 | 4.770 | (2.247) |
Total from Investment Operations | 3.214 | 1.647 | 3.983 | 4.879 | (2.155) |
Distributions | | | | | |
Dividends from Net Investment Income | (.194) | (.197) | (.173) | (.109) | (.095) |
Distributions from Realized Capital Gains | — | — | — | — | — |
Total Distributions | (.194) | (.197) | (.173) | (.109) | (.095) |
Net Asset Value, End of Period | $25.72 | $22.70 | $21.25 | $17.44 | $12.67 |
| | | | | |
Total Return2 | 14.15% | 7.74% | 22.84% | 38.51% | –14.44% |
| | | | | |
Ratios/Supplemental Data | | | | | |
Net Assets, End of Period (Millions) | $1,756 | $1,458 | $1,282 | $929 | $601 |
Ratio of Total Expenses to | | | | | |
Average Net Assets | 0.14% | 0.14% | 0.14% | 0.17% | 0.17% |
Ratio of Net Investment Income to | | | | | |
Average Net Assets | 0.78% | 0.92% | 0.96% | 0.77% | 0.68% |
Portfolio Turnover Rate3 | 42% | 20% | 19% | 21% | 21% |
1 Includes increases from redemption fees of $.01, $.01, $.01, $.01, and $.01.
2 Total returns do not reflect the 0.5% transaction fee on purchases through March 31, 2002, the 1% redemption fee on shares held less than five years, or the 2% redemption fee assessed prior to September 14, 2005, on shares held less than one year.
3 Excludes the value of portfolio securities received or delivered as a result of in-kind purchases or redemptions of the fund’s capital shares.
41
Tax-Managed Small-Cap Fund
Institutional Shares | | | | | |
| | | | | |
| | | Year Ended December 31, |
For a Share Outstanding Throughout Each Period | 2006 | 2005 | 2004 | 2003 | 2002 |
Net Asset Value, Beginning of Period | $22.74 | $21.28 | $17.47 | $12.68 | $14.92 |
Investment Operations | | | | | |
Net Investment Income | .209 | .213 | .178 | .134 | .105 |
Net Realized and Unrealized | | | | | |
Gain (Loss) on Investments1 | 3.028 | 1.454 | 3.811 | 4.770 | (2.247) |
Total from Investment Operations | 3.237 | 1.667 | 3.989 | 4.904 | (2.142) |
Distributions | | | | | |
Dividends from Net Investment Income | (.207) | (.207) | (.179) | (.114) | (.098) |
Distributions from Realized Capital Gains | — | — | — | — | — |
Total Distributions | (.207) | (.207) | (.179) | (.114) | (.098) |
Net Asset Value, End of Period | $25.77 | $22.74 | $21.28 | $17.47 | $12.68 |
| | | | | |
Total Return2 | 14.23% | 7.82% | 22.83% | 38.68% | –14.36% |
| | | | | |
Ratios/Supplemental Data | | | | | |
Net Assets, End of Period (Millions) | $128 | $94 | $15 | $12 | $29 |
Ratio of Total Expenses to | | | | | |
Average Net Assets | 0.09% | 0.09% | 0.09% | 0.10% | 0.10% |
Ratio of Net Investment Income to | | | | | |
Average Net Assets | 0.83% | 0.97% | 1.01% | 0.84% | 0.74% |
Portfolio Turnover Rate3 | 42% | 20% | 19% | 21% | 21% |
1 Includes increases from redemption fees of $.01, $.00, $.01, $.01, and $.01.
2 Total returns do not reflect the 0.5% transaction fee on purchases through March 31, 2002, the 1% redemption fee on shares held less than five years, or the 2% redemption fee assessed prior to September 14, 2005, on shares held less than one year.
3 Excludes the value of portfolio securities received or delivered as a result of in-kind purchases or redemptions of the fund’s capital shares. See accompanying Notes, which are an integral part of the Financial Statements.
42
Tax-Managed Small-Cap Fund
Notes to Financial Statements
Vanguard Tax-Managed Small-Cap Fund is registered under the Investment Company Act of 1940 as an open-end investment company, or mutual fund. The fund offers two classes of shares: Investor Shares and Institutional Shares. Investor Shares are available to any investor who meets the fund’s minimum purchase requirements. Institutional Shares are designed for investors who meet certain administrative and servicing criteria and invest a minimum of $5 million.
A. The following significant accounting policies conform to generally accepted accounting principles for U.S. mutual funds. The fund consistently follows such policies in preparing its financial statements.
1. Security Valuation: Securities are valued as of the close of trading on the New York Stock Exchange (generally 4:00 p.m. Eastern time) on the valuation date. Equity securities are valued at the latest quoted sales prices or official closing prices taken from the primary market in which each security trades; such securities not traded on the valuation date are valued at the mean of the latest quoted bid and asked prices. Securities for which market quotations are not readily available, or whose values have been materially affected by events occurring before the fund’s pricing time but after the close of the securities’ primary markets, are valued by methods deemed by the board of trustees to represent fair value. Investments in Vanguard Market Liquidity Fund are valued at that fund’s net asset value.
2. Federal Income Taxes: The fund intends to continue to qualify as a regulated investment company and distribute all of its taxable income. Accordingly, no provision for federal income taxes is required in the financial statements.
3. Distributions: Distributions to shareholders are recorded on the ex-dividend date.
4. Other: Dividend income is recorded on the ex-dividend date. Interest income includes income distributions received from Vanguard Market Liquidity Fund and is accrued daily. Security transactions are accounted for on the date securities are bought or sold. Costs used to determine realized gains (losses) on the sale of investment securities are those of the specific securities sold. Fees assessed on redemptions of capital shares are credited to paid-in capital.
Each class of shares has equal rights as to assets and earnings, except that each class separately bears certain class-specific expenses related to maintenance of shareholder accounts (included in Management and Administrative expenses) and shareholder reporting. Marketing and distribution expenses are allocated to each class of shares based on a method approved by the board of trustees. Income, other non-class-specific expenses, and gains and losses on investments are allocated to each class of shares based on its relative net assets.
B. The Vanguard Group furnishes at cost investment advisory, corporate management, administrative, marketing, and distribution services. The costs of such services are allocated to the fund under methods approved by the board of trustees. The fund has committed to provide up to 0.40% of its net assets in capital contributions to Vanguard. At December 31, 2006, the fund had contributed capital of $185,000 to Vanguard (included in Other Assets), representing 0.01% of the fund’s net assets and 0.18% of Vanguard’s capitalization. The fund’s trustees and officers are also directors and officers of Vanguard.
C. Distributions are determined on a tax basis and may differ from net investment income and realized capital gains for financial reporting purposes. Differences may be permanent or temporary. Permanent differences are reclassified among capital accounts in the financial statements to reflect their tax character. Temporary differences arise when certain items of income, expense, gain, or loss are recognized in different periods for financial statement and tax purposes; these differences will reverse at some time in the future. Differences in classification may also result from the treatment of short-term gains as ordinary income for tax purposes.
43
Tax-Managed Small-Cap Fund
During the year ended December 31, 2006, the fund realized $61,565,000 of net capital gains resulting from in-kind redemptions—in which shareholders exchanged fund shares for securities held by the fund rather than for cash. Because such gains are not taxable to the fund, and are not distributed to shareholders, they have been reclassified from accumulated net realized losses to paid-in capital.
For tax purposes, at December 31, 2006, the fund had $179,000 of ordinary income available for distribution. The fund had available realized losses of $2,167,000 to offset future net capital gains through December 31, 2011.
At December 31, 2006, the cost of investment securities for tax purposes was $1,179,433,000. Net unrealized appreciation of investment securities for tax purposes was $706,618,000, consisting of unrealized gains of $708,038,000 on securities that had risen in value since their purchase and $1,420,000 in unrealized losses on securities that had fallen in value since their purchase.
D. During the year ended December 31, 2006, the fund purchased $961,708,000 of investment securities and sold $837,720,000 of investment securities, other than temporary cash investments.
E. Capital share transactions for each class of shares were:
| Year Ended December 31, |
| | 2006 | | 2005 |
| Amount | Shares | Amount | Shares |
| ($000) | (000) | ($000) | (000) |
Investor Shares | | | | |
Issued | 285,353 | 11,437 | 227,656 | 10,622 |
Issued in Lieu of Cash Distributions | 10,601 | 409 | 10,411 | 454 |
Redeemed1 | (195,359) | (7,809) | (154,865) | (7,182) |
Net Increase (Decrease)—Investor Shares | 100,595 | 4,037 | 83,202 | 3,894 |
Institutional Shares | | | | |
Issued | 59,307 | 2,411 | 74,452 | 3,402 |
Issued in Lieu of Cash Distributions | 450 | 17 | 369 | 16 |
Redeemed1 | (39,068) | (1,594) | (86) | (4) |
Net Increase (Decrease)—Institutional Shares | 20,689 | 834 | 74,735 | 3,414 |
F. In June 2006, the Financial Accounting Standards Board issued Interpretation No. 48 (“FIN 48”), “Accounting for Uncertainty in Income Taxes.” FIN 48 establishes the minimum threshold for recognizing, and a system for measuring, the benefits of tax-return positions in financial statements. FIN 48 will be effective for the fund’s fiscal year ending December 31, 2007. Management is in the process of analyzing the fund’s tax positions for purposes of implementing FIN 48; based on the analysis completed to date, management does not believe the adoption of FIN 48 will result in any material impact to the fund’s financial statements.
1 Net of redemption fees for 2006 and 2005 of $599,000 and $574,000, respectively (fund totals).
44
Tax-Managed International Fund
Fund Profile
As of December 31, 2006
Portfolio Characteristics | | | |
| | Comparative | Broad |
| Fund | Index1 | Index2 |
Number of Stocks | 1,139 | 1,164 | 2,115 |
Turnover Rate | 4% | — | — |
Expense Ratio | | — | — |
Investor Shares | 0.20% | | |
Institutional Shares | 0.14% | | |
Short-Term Reserves | 0% | — | — |
Volatility Measures3 | |
| Fund Versus | Fund Versus |
| Comparative Index1 | Broad Index2 |
R-Squared | 0.99 | 0.97 |
Beta | 1.01 | 0.91 |
Sector Diversification (% of portfolio) | |
| | Comparative | Broad |
| Fund | Index1 | Index2 |
Consumer Discretionary | 12% | 11% | 11% |
Consumer Staples | 8 | 8 | 8 |
Energy | 7 | 9 | 10 |
Financials | 29 | 27 | 27 |
Health Care | 7 | 8 | 8 |
Industrials | 11 | 11 | 10 |
Information Technology | 6 | 9 | 9 |
Materials | 8 | 7 | 7 |
Telecommunication | | | |
Services | 6 | 5 | 5 |
Utilities | 6 | 5 | 5 |
Ten Largest Holdings4 (% of total net assets) |
| | |
Royal Dutch Shell PLC | integrated oil and gas | 1.8% |
BP PLC | integrated oil and gas | 1.7 |
HSBC Holdings PLC | diversified banks | 1.6 |
Toyota Motor Corp. | automobile manufacturers | 1.5 |
Total SA | integrated oil and gas | 1.2 |
GlaxoSmithKline PLC | pharmaceuticals | 1.2 |
Vodafone Group PLC | wireless telecommunication services | 1.1 |
Nestle SA (Registered) | packaged foods and meats | 1.1 |
Novartis AG (Registered) | pharmaceuticals | 1.0 |
Roche Holdings AG | pharmaceuticals | 1.0 |
Top Ten | | 13.2% |
Fund Allocation by Region
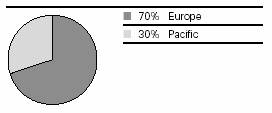
1 MSCI EAFE Index.
2 MSCI All Country World Index ex USA.
3 For an explanation of R-squared, beta, and other terms used here, see the Glossary on pages 62–63.
4 “Ten Largest Holdings” excludes any temporary cash investments and equity index products.
45
Tax-Managed International Fund
Market Diversification (% of portfolio) |
| | | Comparative | Broad |
| | Fund | Index1 | Index2 |
Europe | | | |
| United Kingdom | 24% | 24% | 19% |
| France | 10 | 10 | 8 |
| Germany | 7 | 7 | 6 |
| Switzerland | 7 | 7 | 5 |
| Italy | 4 | 4 | 3 |
| Netherlands | 4 | 3 | 3 |
| Spain | 4 | 4 | 3 |
| Sweden | 3 | 3 | 2 |
| Finland | 1 | 1 | 1 |
| Belgium | 1 | 1 | 1 |
| Norway | 1 | 1 | 1 |
| Ireland | 1 | 1 | 1 |
| Denmark | 1 | 1 | 1 |
| Greece | 1 | 1 | 1 |
| Austria | 1 | 1 | 0 |
| Subtotal | 70% | 69% | 55% |
Pacific | | | |
| Japan | 22% | 22% | 18% |
| Australia | 5 | 6 | 4 |
| Hong Kong | 2 | 2 | 1 |
| Singapore | 1 | 1 | 1 |
| Subtotal | 30% | 31% | 24% |
Emerging Markets | | | |
| Combined | 0% | — | 15% |
North America | | | |
| Canada | 0% | — | 6% |
1 MSCI EAFE Index.
2 MSCI All Country World Index ex USA.
46
Tax-Managed International Fund
Performance Summary
All of the returns in this report represent past performance, which is not a guarantee of future results that may be achieved by the fund. (Current performance may be lower or higher than the performance data cited. For performance data current to the most recent month-end, visit our website at www.vanguard.com.) Note, too, that both investment returns and principal value can fluctuate widely, so an investor’s shares, when sold, could be worth more or less than their original cost. The returns shown do not reflect taxes that a shareholder would pay on fund distributions or on the sale of fund shares.
Cumulative Performance: August 17, 1999–December 31, 2006
Initial Investment of $10,000

| Average Annual Total Returns | |
| Periods Ended December 31, 2006 | Final Value |
| One | Five | Since | of a $10,000 |
| Year | Years | Inception1 | Investment |
Tax-Managed International Fund | | | | |
Investor Shares | 26.27% | 15.08% | 6.77% | $16,207 |
Fee-Adjusted Returns2 | 25.04 | 15.08 | 6.77 | 16,207 |
MSCI All Country World Index ex USA | 27.16 | 16.87 | 8.26 | 17,947 |
MSCI EAFE Index | 26.34 | 14.98 | 6.73 | 16,167 |
Average International Fund3 | 24.84 | 13.66 | 6.33 | 15,721 |
1 August 17, 1999.
2 Reflective of the 1% fee assessed on redemptions of shares held for less than five years.
3 Derived from data provided by Lipper Inc.
47
Tax-Managed International Fund
| Average Annual Total Returns | |
| Periods Ended December 31, 2006 | Final Value of |
| One | Five | Since | a $5,000,000 |
| Year | Years | Inception1 | Investment |
Tax-Managed International Fund | | | | |
Institutional Shares | 26.42% | 15.18% | 8.00% | $7,928,712 |
Fee-Adjusted Returns2 | 25.18 | 15.18 | 8.00 | 7,928,712 |
MSCI All Country World Index ex USA | 27.16 | 16.87 | 9.58 | 8,648,329 |
MSCI EAFE Index | 26.34 | 14.98 | 7.94 | 7,901,381 |
Fiscal-Year Total Returns (%): August 17, 1999–December 31, 2006

1 January 4, 2001.
2 Reflective of the 1% fee assessed on redemptions of shares held for less than five years.
Note: See Financial Highlights tables on pages 51 and 52 for dividend and capital gains information.
48
Tax-Managed International Fund
Financial Statements
The Statement of Net Assets—an integral part of the Financial Statements for Vanguard Tax-Managed International Fund—is included as an insert to this report.
Statement of Operations | |
| |
| Year Ended |
| December 31, 2006 |
| ($000) |
Investment Income | |
Income | |
Dividends1 | 46,129 |
Interest2 | 58 |
Total Income | 46,187 |
Expenses | |
The Vanguard Group—Note B | |
Investment Advisory Services | 53 |
Management and Administrative—Investor Shares | 1,982 |
Management and Administrative—Institutional Shares | 196 |
Marketing and Distribution—Investor Shares | 227 |
Marketing and Distribution—Institutional Shares | 33 |
Custodian Fees | 460 |
Auditing Fees | 29 |
Shareholders’ Reports—Investor Shares | 10 |
Shareholders’ Reports—Institutional Shares | — |
Trustees’ Fees and Expenses | 1 |
Total Expenses | 2,991 |
Net Investment Income | 43,196 |
Realized Net Gain (Loss) | |
Investment Securities Sold | 6,301 |
Foreign Currencies | 398 |
Realized Net Gain (Loss) | 6,699 |
Change in Unrealized Appreciation (Depreciation) | |
Investment Securities | 322,565 |
Foreign Currencies | 95 |
Change in Unrealized Appreciation (Depreciation) | 322,660 |
Net Increase (Decrease) in Net Assets Resulting from Operations | 372,555 |
1 Dividends are net of foreign withholding taxes of $3,372,000.
2 Interest income from an affiliated company of the fund was $58,000.
49
Tax-Managed International Fund
Statement of Changes in Net Assets
| Year Ended December 31, |
| 2006 | 2005 |
| ($000) | ($000) |
Increase (Decrease) in Net Assets | | |
Operations | | |
Net Investment Income | 43,196 | 27,932 |
Realized Net Gain (Loss) | 6,699 | 1,949 |
Change in Unrealized Appreciation (Depreciation) | 322,660 | 124,148 |
Net Increase (Decrease) in Net Assets Resulting from Operations | 372,555 | 154,029 |
Distributions | | |
Net Investment Income | | |
Investor Shares | (37,760) | (24,521) |
Institutional Shares | (6,145) | (4,367) |
Realized Capital Gain | | |
Investor Shares | — | — |
Institutional Shares | — | — |
Total Distributions | (43,905) | (28,888) |
Capital Share Transactions—Note E | | |
Investor Shares | 223,171 | 187,101 |
Institutional Shares | 18,341 | 31,932 |
Net Increase (Decrease) from Capital Share Transactions | 241,512 | 219,033 |
Total Increase (Decrease) | 570,162 | 344,174 |
Net Assets | | |
Beginning of Period | 1,312,459 | 968,285 |
End of Period1 | 1,882,621 | 1,312,459 |
1 Net Assets—End of Period includes undistributed (overdistributed) net investment income of ($559,000) and ($343,000).
50
Tax-Managed International Fund
Financial Highlights
Investor Shares | | | | | |
| | | | | |
| | | Year Ended December 31, |
For a Share Outstanding Throughout Each Period | 2006 | 2005 | 2004 | 2003 | 2002 |
Net Asset Value, Beginning of Period | $11.48 | $10.33 | $8.76 | $6.43 | $7.79 |
Investment Operations | | | | | |
Net Investment Income | .331 | .246 | .201 | .158 | .14 |
Net Realized and Unrealized | | | | | |
Gain (Loss) on Investments1 | 2.685 | 1.161 | 1.571 | 2.325 | (1.36) |
Total from Investment Operations | 3.016 | 1.407 | 1.772 | 2.483 | (1.22) |
Distributions | | | | | |
Dividends from Net Investment Income | (.336) | (.257) | (.202) | (.153) | (.14) |
Distributions from Realized Capital Gains | — | — | — | — | — |
Total Distributions | (.336) | (.257) | (.202) | (.153) | (.14) |
Net Asset Value, End of Period | $14.16 | $11.48 | $10.33 | $8.76 | $6.43 |
| | | | | |
Total Return2 | 26.27% | 13.60% | 20.25% | 38.67% | –15.62% |
| | | | | |
Ratios/Supplemental Data | | | | | |
Net Assets, End of Period (Millions) | $1,624 | $1,119 | $825 | $514 | $334 |
Ratio of Total Expenses to | | | | | |
Average Net Assets | 0.20% | 0.20% | 0.23% | 0.28% | 0.31% |
Ratio of Net Investment Income to | | | | | |
Average Net Assets | 2.70% | 2.50% | 2.34% | 2.33% | 2.04% |
Portfolio Turnover Rate | 4% | 5% | 5% | 9% | 7% |
1 Includes increases from redemption fees of $.00, $.00, $.00, $.01, and $.01.
2 Total returns do not reflect the 0.25% transaction fee on purchases through March 31, 2002, the 1% redemption fee on shares held less than five years, or the 2% redemption fee assessed prior to September 14, 2005, on shares held less than one year.
51
Tax-Managed International Fund
Institutional Shares | | | | | |
| | | | | |
| | | Year Ended December 31, |
For a Share Outstanding Throughout Each Period | 2006 | 2005 | 2004 | 2003 | 2002 |
Net Asset Value, Beginning of Period | $11.48 | $10.33 | $8.77 | $6.43 | $7.79 |
Investment Operations | | | | | |
Net Investment Income | .348 | .253 | .198 | .17 | .148 |
Net Realized and Unrealized | | | | | |
Gain (Loss) on Investments1 | 2.685 | 1.161 | 1.571 | 2.33 | (1.361) |
Total from Investment Operations | 3.033 | 1.414 | 1.769 | 2.50 | (1.213) |
Distributions | | | | | |
Dividends from Net Investment Income | (.343) | (.264) | (.209) | (.16) | (.147) |
Distributions from Realized Capital Gains | — | — | — | — | — |
Total Distributions | (.343) | (.264) | (.209) | (.16) | (.147) |
Net Asset Value, End of Period | $14.17 | $11.48 | $10.33 | $8.77 | $6.43 |
| | | | | |
Total Return2 | 26.42% | 13.66% | 20.19% | 38.94% | –15.52% |
| | | | | |
Ratios/Supplemental Data | | | | | |
Net Assets, End of Period (Millions) | $258 | $193 | $143 | $102 | $47 |
Ratio of Total Expenses to | | | | | |
Average Net Assets | 0.14% | 0.14% | 0.15% | 0.17% | 0.20% |
Ratio of Net Investment Income to | | | | | |
Average Net Assets | 2.76% | 2.56% | 2.42% | 2.44% | 2.16% |
Portfolio Turnover Rate | 4% | 5% | 5% | 9% | 7% |
1 Includes increases from redemption fees of $.00, $.00, $.00, $.00, and $.01.
2 Total returns do not reflect the 0.25% transaction fee on purchases through March 31, 2002, the 1% redemption fee on shares held less than five years, or the 2% redemption fee assessed prior to September 14, 2005, on shares held less than one year.
See accompanying Notes, which are an integral part of the Financial Statements.
52
Tax-Managed International Fund
Notes to Financial Statements
Vanguard Tax-Managed International Fund is registered under the Investment Company Act of 1940 as an open-end investment company, or mutual fund. The fund offers two classes of shares: Investor Shares and Institutional Shares. Investor Shares are available to any investor who meets the fund’s minimum purchase requirements. Institutional Shares are designed for investors who meet certain administrative and servicing criteria and invest a minimum of $5 million. The fund invests in securities of foreign issuers, which may subject it to investment risks not normally associated with investing in securities of United States corporations.
A. The following significant accounting policies conform to generally accepted accounting principles for U.S. mutual funds. The fund consistently follows such policies in preparing its financial statements.
1. Security Valuation: Securities are valued as of the close of trading on the New York Stock Exchange (generally 4:00 p.m. Eastern time) on the valuation date. Equity securities are valued at the latest quoted sales prices or official closing prices taken from the primary market in which each security trades; such securities not traded on the valuation date are valued at the mean of the latest quoted bid and asked prices. Securities for which market quotations are not readily available, or whose values have been affected by events occurring before the fund’s pricing time but after the close of the securities’ primary markets, are valued at their fair values calculated according to procedures adopted by the board of trustees. These procedures include obtaining quotations from an independent pricing service, monitoring news to identify significant market- or security-specific events, and evaluating changes in the values of foreign market proxies (for example, ADRs, futures contracts, or exchange-traded funds) between the time the foreign markets close and the fund’s pricing time. When fair-value pricing is employed, the prices of securities used by a fund to calculate its net asset value may differ from quoted or published prices for the same securities. Investments in Vanguard Market Liquidity Fund are valued at that fund’s net asset value.
2. Foreign Currency: Securities and other assets and liabilities denominated in foreign currencies are translated into U.S. dollars at the exchange rates on the valuation date as employed by Morgan Stanley Capital International (MSCI) in the calculation of its indexes. As part of the fund’s fair value procedures, exchange rates may be adjusted if they change significantly before the fund’s pricing time but after the time at which the MSCI rates are determined (generally 11:00 a.m. Eastern time).
Realized gains (losses) and unrealized appreciation (depreciation) on investment securities include the effects of changes in exchange rates since the securities were purchased, combined with the effects of changes in security prices. Fluctuations in the value of other assets and liabilities resulting from changes in exchange rates are recorded as unrealized foreign currency gains (losses) until the asset or liability is settled in cash, when they are recorded as realized foreign currency gains (losses).
3. Federal Income Taxes: The fund intends to continue to qualify as a regulated investment company and distribute all of its taxable income. Accordingly, no provision for federal income taxes is required in the financial statements.
4. Distributions: Distributions to shareholders are recorded on the ex-dividend date.
5. Other: Dividend income is recorded on the ex-dividend date. Interest income includes income distributions received from Vanguard Market Liquidity Fund and is accrued daily. Security transactions are accounted for on the date securities are bought or sold. Costs used to determine realized gains (losses) on the sale of investment securities are those of the specific securities sold. Fees assessed on redemptions of capital shares are credited to paid-in capital.
53
Tax-Managed International Fund
Each class of shares has equal rights as to assets and earnings, except that each class separately bears certain class-specific expenses related to maintenance of shareholder accounts (included in Management and Administrative expenses) and shareholder reporting. Marketing and distribution expenses are allocated to each class of shares based on a method approved by the board of trustees. Income, other non-class-specific expenses, and gains and losses on investments are allocated to each class of shares based on its relative net assets.
B. The Vanguard Group furnishes at cost investment advisory, corporate management, administrative, marketing, and distribution services. The costs of such services are allocated to the fund under methods approved by the board of trustees. The fund has committed to provide up to 0.40% of its net assets in capital contributions to Vanguard. At December 31, 2006, the fund had contributed capital of $179,000 to Vanguard (included in Other Assets), representing 0.01% of the fund’s net assets and 0.18% of Vanguard’s capitalization. The fund’s trustees and officers are also directors and officers of Vanguard.
C. Distributions are determined on a tax basis and may differ from net investment income and realized capital gains for financial reporting purposes. Differences may be permanent or temporary. Permanent differences are reclassified among capital accounts in the financial statements to reflect their tax character. Temporary differences arise when certain items of income, expense, gain, or loss are recognized in different periods for financial statement and tax purposes; these differences will reverse at some time in the future. Differences in classification may also result from the treatment of short-term gains as ordinary income for tax purposes.
During the year ended December 31, 2006, the fund realized net foreign currency gains of $398,000, which increased distributable net income for tax purposes; accordingly, such gains have been reclassified from accumulated net realized losses to overdistributed net investment income. Certain of the fund’s investments are in securities considered to be “passive foreign investment companies,” for which any unrealized appreciation and/or realized gains are required to be included in distributable net income for tax purposes. The fund realized gains on the sale of passive foreign investment companies of $95,000, which have been included in 2006 taxable income; accordingly, such gains have been reclassified from accumulated net realized losses to overdistributed net investment income.
For tax purposes, at December 31, 2006, the fund had $584,000 of ordinary income available for distribution. The fund had available realized losses of $71,783,000 to offset future net capital gains of $2,247,000 through December 31, 2009, $37,123,000 through December 31, 2010, $27,239,000 through December 31, 2011, and $5,174,000 through December 31, 2012.
At December 31, 2006, the cost of investment securities for tax purposes was $1,250,685,000. Net unrealized appreciation of investment securities for tax purposes was $629,245,000, consisting of unrealized gains of $642,751,000 on securities that had risen in value since their purchase and $13,506,000 in unrealized losses on securities that had fallen in value since their purchase.
D. During the year ended December 31, 2006, the fund purchased $307,432,000 of investment securities and sold $68,284,000 of investment securities, other than temporary cash investments.
Tax-Managed International Fund
E. Capital share transactions for each class of shares were:
54
Tax-Managed International Fund
| | | Year Ended December 31, |
| | 2006 | | 2005 |
| Amount | Shares | Amount | Shares |
| ($000) | (000) | ($000) | (000) |
Investor Shares | | | | |
Issued | 251,022 | 19,618 | 226,831 | 21,539 |
Issued in Lieu of Cash Distributions | 30,239 | 2,133 | 20,386 | 1,760 |
Redeemed1 | (58,090) | (4,528) | (60,116) | (5,656) |
Net Increase (Decrease)—Investor Shares | 223,171 | 17,223 | 187,101 | 17,643 |
Institutional Shares | | | | |
Issued | 15,987 | 1,240 | 30,383 | 2,829 |
Issued in Lieu of Cash Distributions | 4,453 | 314 | 3,057 | 264 |
Redeemed1 | (2,099) | (156) | (1,508) | (147) |
Net Increase (Decrease)—Institutional Shares | 18,341 | 1,398 | 31,932 | 2,946 |
F. In June 2006, the Financial Accounting Standards Board issued Interpretation No. 48 (“FIN 48”), “Accounting for Uncertainty in Income Taxes.” FIN 48 establishes the minimum threshold for recognizing, and a system for measuring, the benefits of tax-return positions in financial statements. FIN 48 will be effective for the fund’s fiscal year ending December 31, 2007. Management is in the process of analyzing the fund’s tax positions for purposes of implementing FIN 48; based on the analysis completed to date, management does not believe the adoption of FIN 48 will result in any material impact to the fund’s financial statements.
1 Net of redemption fees for 2006 and 2005 of $290,000 and $264,000, respectively (fund totals).
55
Report of Independent Registered Public Accounting Firm
To the Trustees of Vanguard Tax-Managed Funds and Shareholders of Vanguard Tax-Managed Balanced Fund, Vanguard Tax-Managed Growth and Income Fund, Vanguard Tax-Managed Capital Appreciation Fund, Vanguard Tax-Managed Small-Cap Fund, and Vanguard Tax-Managed International Fund:
In our opinion, the statements of net assets appearing in the insert to this annual report and the accompanying related statements of operations and of changes in net assets and the financial highlights present fairly, in all material respects, the financial position of Vanguard Tax-Managed Balanced Fund, Vanguard Tax-Managed Growth and Income Fund, Vanguard Tax-Managed Capital Appreciation Fund, Vanguard Tax-Managed Small-Cap Fund, and Vanguard Tax-Managed International Fund (constituting Vanguard Tax-Managed Funds, hereafter referred to as the “Funds”) at December 31, 2006, the results of each of their operations for the year then ended, the changes in each of their net assets for each of the two years in the period then ended and the financial highlights for each of the five years in the period then ended, in conformity with accounting principles generally accepted in the United States of America. These financial statements and financial highlights (hereafter referred to as “financial statements”) are the responsibility of the Funds’ management; our responsibility is to express an opinion on these financial statements based on our audits. We conducted our audits of these financial statements in accordance with the standards of the Public Company Accounting Oversight Board (United States). Those standards require that we plan and perform the audit to obtain reasonable assurance about whether the financial statements are free of material misstatement. An audit includes examining, on a test basis, evidence supporting the amounts and disclosures in the financial statements, assessing the accounting principles used and significant estimates made by management, and evaluating the overall financial statement presentation. We believe that our audits, which included confirmation of securities at December 31, 2006 by correspondence with the custodian and by agreement to the underlying ownership records for Vanguard Market Liquidity Fund, provide a reasonable basis for our opinion.
PricewaterhouseCoopers LLP
Philadelphia, Pennsylvania
February 9, 2007
56
Special 2006 tax information (unaudited) for Vanguard Tax-Managed Funds
This information for the fiscal year ended December 31, 2006, is included pursuant to provisions of the Internal Revenue Code.
The Tax-Managed Balanced Fund designates 73.63% of its income dividends as exempt-interest dividends.
The funds distributed qualified dividend income to shareholders during the fiscal year as follows:
| Qualified Dividend Income |
Tax-Managed Fund | ($000) |
Balanced | 4,744 |
Growth and Income | 51,880 |
Capital Appreciation | 57,182 |
Small-Cap | 14,088 |
International | 43,905 |
For corporate shareholders, the percentage of investment income (dividend income plus short-term gains, if any) that qualifies for the dividends-received deduction is as follows:
Tax-Managed Fund | Percentage |
Balanced | 100%1 |
Growth and Income | 100 |
Capital Appreciation | 100 |
Small-Cap | 96 |
The Tax-Managed International Fund passed through to shareholders foreign source income of $49,459,000 and foreign taxes paid of $3,326,000. The pass-through of foreign taxes paid will affect only shareholders on the dividend record date in December 2006. Shareholders received more detailed information along with their Form 1099-DIV in January 2007.
1 The percentage applies only to the taxable ordinary income that has been reported on Form 1099-DIV.
57
Your Fund’s After-Tax Returns
The table on page 59 presents returns for your fund both before and after taxes. The after-tax returns are shown in two ways: (1) assuming that an investor owned the fund during the entire period and paid taxes on the fund’s distributions, and (2) assuming that an investor paid taxes on the fund’s distributions and sold all shares at the end of each period.
Calculations are based on the highest individual federal income tax and capital gains tax rates in effect at the times of the distributions and the hypothetical sales. State and local taxes were not considered. After-tax returns reflect any qualified dividend income. (In the example, returns after the sale of fund shares may be higher than those assuming no sale. This occurs when the sale would have produced a capital loss. The calculation assumes that the investor received a tax deduction for the loss.)
The table shows returns for Investor Shares only; returns for other share classes will differ. Please note that your actual after-tax returns will depend on your tax situation and may differ from those shown. Also note that if you own the fund in a tax-deferred account, such as an individual retirement account or a 401(k) plan, this information does not apply to you. Such accounts are not subject to current taxes.
Finally, keep in mind that a fund’s performance—whether before or after taxes—does not guarantee future results.
58
Average Annual Total Returns:1 | | | |
Periods Ended December 31, 2006 | | | |
| One | Five | Ten |
| Year | Years | Years2 |
Tax-Managed Balanced Fund | | | |
Returns Before Taxes | 8.02% | 5.91% | 7.25% |
Returns After Taxes on Distributions | 7.90 | 5.78 | 7.12 |
Returns After Taxes on Distributions and Sale of Fund Shares | 6.13 | 5.34 | 6.62 |
| | | |
Tax-Managed Growth and Income Fund | | | |
Returns Before Taxes | 14.59% | 6.18% | 8.43% |
Returns After Taxes on Distributions | 14.29 | 5.82 | 8.00 |
Returns After Taxes on Distributions and Sale of Fund Shares | 9.85 | 5.20 | 7.23 |
| | | |
Tax-Managed Capital Appreciation Fund | | | |
Returns Before Taxes | 13.27% | 6.74% | 8.65% |
Returns After Taxes on Distributions | 13.03 | 6.50 | 8.42 |
Returns After Taxes on Distributions and Sale of Fund Shares | 8.94 | 5.75 | 7.57 |
| | | |
Tax-Managed Small-Cap Fund | | | |
Returns Before Taxes | 13.02% | 12.35% | 13.66% |
Returns After Taxes on Distributions | 12.89 | 12.19 | 13.46 |
Returns After Taxes on Distributions and Sale of Fund Shares | 8.63 | 10.76 | 12.10 |
| | | |
Tax-Managed International Fund | | | |
Returns Before Taxes | 25.04% | 15.08% | 6.77% |
Returns After Taxes on Distributions | 24.74 | 14.75 | 6.42 |
Returns After Taxes on Distributions and Sale of Fund Shares | 17.00 | 13.22 | 5.78 |
1 All fund returns are adjusted to reflect fees. Each of the Vanguard Tax-Managed Funds assesses a 1% fee on redemptions of shares held in the fund for less than five years.
2 Since inception for the Tax-Managed Small-Cap Fund (March 25,1999) and the Tax-Managed International Fund (August 17,1999).
59
About Your Fund’s Expenses
As a shareholder of the fund, you incur ongoing costs, which include costs for portfolio management, administrative services, and shareholder reports (like this one), among others. Operating expenses, which are deducted from a fund’s gross income, directly reduce the investment return of the fund.
A fund’s expenses are expressed as a percentage of its average net assets. This figure is known as the expense ratio. The following examples are intended to help you understand the ongoing costs (in dollars) of investing in your fund and to compare these costs with those of other mutual funds. The examples are based on an investment of $1,000 made at the beginning of the period shown and held for the entire period.
The table on page 61 illustrates your fund’s costs in two ways:
• Based on actual fund return. This section helps you to estimate the actual expenses that you paid over the period. The “Ending Account Value” shown is derived from the fund’s actual return, and the third column shows the dollar amount that would have been paid by an investor who started with $1,000 in the fund. You may use the information here, together with the amount you invested, to estimate the expenses that you paid over the period.
To do so, simply divide your account value by $1,000 (for example, an $8,600 account value divided by $1,000 = 8.6), then multiply the result by the number given for your fund under the heading “Expenses Paid During Period.”
• Based on hypothetical 5% yearly return. This section is intended to help you compare your fund’s costs with those of other mutual funds. It assumes that the fund had a yearly return of 5% before expenses, but that the expense ratio is unchanged. In this case—because the return used is not the fund’s actual return—the results do not apply to your investment. The example is useful in making comparisons because the Securities and Exchange Commission requires all mutual funds to calculate expenses based on a 5% return. You can assess your fund’s costs by comparing this hypothetical example with the hypothetical examples that appear in shareholder reports of other funds.
Note that the expenses shown in the table are meant to highlight and help you compare ongoing costs only and do not reflect any transactional costs or account maintenance fees. They do not include your fund’s low-balance fee, which is described in the prospectus. If this fee were applied to your account, your costs would be higher. Your fund does not charge transaction fees, such as purchase or redemption fees, nor does it carry a “sales load.”
The calculations assume no shares were bought or sold during the period. Your actual costs may have been higher or lower, depending on the amount of your investment and the timing of any purchases or redemptions.
You can find more information about the fund’s expenses, including annual expense ratios, in the Financial Statements section of this report. For additional information on operating expenses and other shareholder costs, please refer to the appropriate fund prospectus.
60
Six Months Ended December 31, 2006 | | | |
| | | |
| Beginning | Ending | Expenses |
| Account Value | Account Value | Paid During |
Tax-Managed Fund | 6/30/2006 | 12/31/2006 | Period1 |
Based on Actual Fund Return | | | |
Balanced | $1,000.00 | $1,078.86 | $0.58 |
Growth and Income | | | |
Investor Shares | $1,000.00 | $1,126.98 | $0.75 |
Admiral Shares | 1,000.00 | 1,127.13 | 0.48 |
Institutional Shares | 1,000.00 | 1,127.43 | 0.32 |
Capital Appreciation | | | |
Investor Shares | $1,000.00 | $1,118.63 | $0.75 |
Admiral Shares | 1,000.00 | 1,119.06 | 0.48 |
Institutional Shares | 1,000.00 | 1,119.15 | 0.32 |
Small-Cap | | | |
Investor Shares | $1,000.00 | $1,063.60 | $0.68 |
Institutional Shares | 1,000.00 | 1,064.00 | 0.42 |
International | | | |
Investor Shares | $1,000.00 | $1,144.63 | $1.03 |
Institutional Shares | 1,000.00 | 1,145.07 | 0.70 |
Based on Hypothetical 5% Return | | | |
Balanced | $1,000.00 | $1,024.65 | $0.56 |
Growth and Income | | | |
Investor Shares | $1,000.00 | $1,024.50 | $0.71 |
Admiral Shares | 1,000.00 | 1,024.75 | 0.46 |
Institutional Shares | 1,000.00 | 1,024.90 | 0.31 |
Capital Appreciation | | | |
Investor Shares | $1,000.00 | $1,024.50 | $0.71 |
Admiral Shares | 1,000.00 | 1,024.75 | 0.46 |
Institutional Shares | 1,000.00 | 1,024.90 | 0.31 |
Small-Cap | | | |
Investor Shares | $1,000.00 | $1,024.55 | $0.66 |
Institutional Shares | 1,000.00 | 1,024.80 | 0.41 |
International | | | |
Investor Shares | $1,000.00 | $1,024.25 | $0.97 |
Institutional Shares | 1,000.00 | 1,024.55 | 0.66 |
1 The calculations are based on expenses incurred during the most recent six-month period. The funds’ annualized six-month expense ratios for that period are: for the Tax-Managed Balanced Fund, 0.11%; for the Tax-Managed Growth and Income Fund, 0.14% for Investor Shares, 0.09% for Admiral Shares, and 0.06% for Institutional Shares; for the Tax-Managed Capital Appreciation Fund, 0.14% for Investor Shares, 0.09% for Admiral Shares, and 0.06% for Institutional Shares; for the Tax-Managed Small-Cap Fund, 0.13% for Investor Shares and 0.08% for Institutional Shares; for the Tax-Managed International Fund, 0.19% for Investor Shares and 0.13% for Institutional Shares. The dollar amounts shown as “Expenses Paid” are equal to the annualized expense ratio multiplied by the average account value over the period, multiplied by the number of days in the most recent six-month period, then divided by the number of days in the most recent 12-month period.
61
Glossary
Average Coupon. The average interest rate paid on the fixed income securities held by a fund. It is expressed as a percentage of face value.
Average Duration. An estimate of how much the value of the bonds held by a fund will fluctuate in response to a change in interest rates. To see how the value could change, multiply the average duration by the change in rates. If interest rates rise by 1 percentage point, the value of the bonds in a fund with an average duration of five years would decline by about 5%. If rates decrease by a percentage point, the value would rise by 5%.
Average Effective Maturity. The average length of time until fixed income securities held by a fund reach maturity and are repaid, taking into consideration the possibility that the issuer may call the bond before its maturity date. The figure reflects the proportion of fund assets represented by each security; it also reflects any futures contracts held. In general, the longer the average effective maturity, the more a fund’s share price will fluctuate in response to changes in market interest rates.
Average Quality. An indicator of credit risk, this figure is the average of the ratings assigned to a fund’s fixed income holdings by credit-rating agencies. The agencies make their judgment after appraising an issuer’s ability to meet its obligations. Quality is graded on a scale, with Aaa or AAA indicating the most creditworthy bond issuers. U.S. Treasury securities are considered to have the highest credit quality.
Beta. A measure of the magnitude of a fund’s past share-price fluctuations in relation to the ups and downs of a given market index. The index is assigned a beta of 1.00. Compared with a given index, a fund with a beta of 1.20 typically would have seen its share price rise or fall by 12% when the index rose or fell by 10%. A fund’s beta should be reviewed in conjunction with its R-squared (see definition on the next page). The lower the R-squared, the less correlation there is between the fund and the index, and the less reliable beta is as an indicator of volatility.
Dividend Yield. The current, annualized rate of dividends paid on a share of stock, divided by its current share price. For a fund, the weighted average yield for stocks it holds. The index yield is based on the current annualized rate of dividends paid on stocks in the index.
Earnings Growth Rate. The average annual rate of growth in earnings over the past five years for the stocks now in a fund.
Expense Ratio. The percentage of a fund’s average net assets used to pay its annual administrative and advisory expenses. These expenses directly reduce returns to investors.
Foreign Holdings. The percentage of a fund represented by stocks or depositary receipts of companies based outside the United States.
Inception Date. The date on which the assets of a fund (or one of its share classes) are first invested in accordance with the fund’s investment objective. For funds with a subscription period, the inception date is the day after that period ends. Investment performance is measured from the inception date.
Largest State Concentrations. An indicator of diversification. The less concentrated a fund’s holdings of bonds, the less the fund will be hurt by any financial problems in a single state or region.
62
Median Market Cap. An indicator of the size of companies in which a fund invests; the midpoint of market capitalization (market price x shares outstanding) of a fund’s stocks, weighted by the proportion of the fund’s assets invested in each stock. Stocks representing half of the fund’s assets have market capitalizations above the median, and the rest are below it.
Price/Book Ratio. The share price of a stock divided by its net worth, or book value, per share. For a fund, the weighted average price/book ratio of the stocks it holds.
Price/Earnings Ratio. The ratio of a stock’s current price to its per-share earnings over the past year. For a fund, the weighted average P/E of the stocks it holds. P/E is an indicator of market expectations about corporate prospects; the higher the P/E, the greater the expectations for a company’s future growth.
R-Squared. A measure of how much of a fund’s past returns can be explained by the returns from the market in general, as measured by a given index. If a fund’s total returns were precisely synchronized with an index’s returns, its R-squared would be 1.00. If the fund’s returns bore no relationship to the index’s returns, its R-squared would be 0.
Return on Equity. The annual average rate of return generated by a company during the past five years for each dollar of shareholder’s equity (net income divided by shareholder’s equity). For a fund, the weighted average return on equity for the companies whose stocks it holds.
Short-Term Reserves. The percentage of a fund invested in highly liquid, short-term securities that can be readily converted to cash.
Turnover Rate. An indication of the fund’s trading activity. Funds with high turnover rates incur higher transaction costs and may be more likely to distribute capital gains (which may be taxable to investors). The turnover rate excludes in-kind transactions, which have minimal impact on costs.
Yield. A snapshot of a fund’s income from interest and dividends. The yield, expressed as a percentage of the fund’s net asset value, is based on income earned over the past 30 days and is annualized, or projected forward for the coming year. The index yield is based on the current annualized rate of income provided by securities in the index.
Yield to Maturity. The rate of return an investor would receive if the fixed income securities held by a fund were held to their maturity dates.
63
The People Who Govern Your Fund
The trustees of your mutual fund are there to see that the fund is operated and managed in your best interests since, as a shareholder, you are a part owner of the fund. Your fund’s trustees also serve on the board of directors of The Vanguard Group, Inc., which is owned by the Vanguard funds and provides services to them on an at-cost basis.
A majority of Vanguard’s board members are independent, meaning that they have no affiliation with Vanguard or the funds they oversee, apart from the sizable personal investments they have made as private individuals.
Our independent board members bring distinguished backgrounds in business, academia, and public service to their task of working with Vanguard officers to establish the policies and oversee the activities of the funds. Among board members’ responsibilities are selecting investment advisors for the funds; monitoring fund operations, performance, and costs; reviewing contracts; nominating and selecting new trustees/directors; and electing Vanguard officers.
Each trustee serves a fund until its termination; or until the trustee’s retirement, resignation, or death; or otherwise as specified in the fund’s organizational documents. Any trustee may be removed at a shareholders’ meeting by a vote representing two-thirds of the net asset value of all shares of the fund together with shares of other Vanguard funds organized within the same trust. The table on these two pages shows information for each trustee and executive officer of the fund. The mailing address of the trustees and officers is P.O. Box 876, Valley Forge, PA 19482.
Chairman of the Board, Chief Executive Officer, and Trustee |
| |
John J. Brennan1 | |
Born 1954 | Principal Occupation(s) During the Past Five Years: Chairman of the Board, Chief |
Trustee since May 1987; | Executive Officer, and Director/Trustee of The Vanguard Group, Inc., and of each |
Chairman of the Board and | of the investment companies served by The Vanguard Group. |
Chief Executive Officer | |
145 Vanguard Funds Overseen |
| |
Independent Trustees | |
| |
Charles D. Ellis | |
Born 1937 | Principal Occupation(s) During the Past Five Years: Applecore Partners (pro bono ventures |
Trustee since January 2001 | in education); Senior Advisor to Greenwich Associates (international business strategy |
145 Vanguard Funds Overseen | consulting); Successor Trustee of Yale University; Overseer of the Stern School of Business |
| at New York University; Trustee of the Whitehead Institute for Biomedical Research. |
| |
Rajiv L. Gupta | |
Born 1945 | Principal Occupation(s) During the Past Five Years: Chairman and Chief Executive Officer |
Trustee since December 20012 | of Rohm and Haas Co. (chemicals); Board Member of the American Chemistry Council; |
145 Vanguard Funds Overseen | Director of Tyco International, Ltd. (diversified manufacturing and services) (since 2005); |
| Trustee of Drexel University and of the Chemical Heritage Foundation. |
| |
Amy Gutmann | |
Born 1949 | Principal Occupation(s) During the Past Five Years: President of the University of |
Trustee since June 2006 | Pennsylvania since 2004; Professor in the School of Arts and Sciences, Annenberg School |
145 Vanguard Funds Overseen | for Communication, and Graduate School of Education of the University of Pennsylvania |
| since 2004; Provost (2001–2004) and Laurance S. Rockefeller Professor of Politics and the |
| University Center for Human Values (1990–2004), Princeton University; Director of Carnegie |
| Corporation of New York and of Philadelphia 2016 (since 2005) and of Schuylkill River |
| Development Corporation and Greater Philadelphia Chamber of Commerce (since 2004). |
JoAnn Heffernan Heisen | |
Born 1950 | Principal Occupation(s) During the Past Five Years: Corporate Vice President and Chief |
Trustee since July 1998 | Global Diversity Officer (since January 2006), Vice President and Chief Information |
145 Vanguard Funds Overseen | Officer (1997–2005), and Member of the Executive Committee of Johnson & Johnson |
| (pharmaceuticals/consumer products); Director of the University Medical Center at |
| Princeton and Women’s Research and Education Institute. |
| |
André F. Perold | |
Born 1952 | Principal Occupation(s) During the Past Five Years: George Gund Professor of Finance and |
Trustee since December 2004 | Banking, Harvard Business School (since 2000); Senior Associate Dean, Director of Faculty |
145 Vanguard Funds Overseen | Recruiting, and Chair of Finance Faculty, Harvard Business School; Director and Chairman |
| of UNX, Inc. (equities trading firm) (since 2003); Director of registered investment |
| companies advised by Merrill Lynch Investment Managers and affiliates (1985–2004), |
| Genbel Securities Limited (South African financial services firm) (1999–2003), Gensec |
| Bank (1999–2003), Sanlam, Ltd. (South African insurance company) (2001–2003), and |
| Stockback, Inc. (credit card firm) (2000–2002). |
| |
Alfred M. Rankin, Jr. | |
Born 1941 | Principal Occupation(s) During the Past Five Years: Chairman, President, Chief Executive |
Trustee since January 1993 | Officer, and Director of NACCO Industries, Inc. (forklift trucks/housewares/ lignite); |
145 Vanguard Funds Overseen | Director of Goodrich Corporation (industrial products/aircraft systems and services). |
| |
J. Lawrence Wilson | |
Born 1936 | Principal Occupation(s) During the Past Five Years: Retired Chairman and Chief Executive |
Trustee since April 1985 | Officer of Rohm and Haas Co. (chemicals); Director of Cummins Inc. (diesel engines), |
145 Vanguard Funds Overseen | MeadWestvaco Corp. (packaging products), and AmerisourceBergen Corp. (pharmaceutical |
| distribution); Trustee of Vanderbilt University and of Culver Educational Foundation. |
| |
Executive Officers1 | |
| |
Heidi Stam | |
Born 1956 | Principal Occupation(s) During the Past Five Years: Managing Director of the Vanguard |
Secretary since July 2005 | Group, Inc., since 2006; General Counsel of The Vanguard Group since 2005; Secretary of |
145 Vanguard Funds Overseen | The Vanguard Group, and of each of the investment companies served by The Vanguard |
| Group, since 2005; Principal of The Vanguard Group (1997-2006). |
| |
Thomas J. Higgins | |
Born 1957 | Principal Occupation(s) During the Past Five Years: Principal of The Vanguard Group, Inc.; |
Treasurer since July 1998 | Treasurer of each of the investment companies served by The Vanguard Group. |
145 Vanguard Funds Overseen | |
| |
Vanguard Senior Management Team |
| |
R. Gregory Barton | Kathleen C. Gubanich | Michael S. Miller |
Mortimer J. Buckley | Paul A. Heller | Ralph K. Packard |
James H. Gately | F. William McNabb, III | George U. Sauter |
| |
Founder | |
| |
John C. Bogle | |
Chairman and Chief Executive Officer, 1974–1996 |
1 Officers of the funds are “interested persons” as defined in the Investment Company Act of 1940.
2 December 2002 for Vanguard Equity Income Fund, Vanguard Growth Equity Fund, the Vanguard Municipal Bond Funds, and the Vanguard State Tax-Exempt Funds.
More information about the trustees is in the Statement of Additional Information, available from The Vanguard Group.
| 
|
| P.O. Box 2600 |
| Valley Forge, PA 19482-2600 |
Connect with Vanguard™ > www.vanguard.com
Fund Information > 800-662-7447 | Vanguard, Vanguard Tax-Managed Funds, Admiral, |
| Connect with Vanguard, and the ship logo are |
Direct Investor Account Services > 800-662-2739 | trademarks of The Vanguard Group, Inc. |
| |
Institutional Investor Services > 800-523-1036 | All other marks are the exclusive property of their |
| respective owners. |
Text Telephone for the | |
Hearing Impaired > 800-952-3335 | All comparative mutual fund data are from Lipper Inc. |
| or Morningstar, Inc., unless otherwise noted. |
| |
| |
This material may be used in conjunction | You can obtain a free copy of Vanguard’s proxy voting |
with the offering of shares of any Vanguard | guidelines by visiting our website, www.vanguard.com, |
fund only if preceded or accompanied by | and searching for “proxy voting guidelines,” or by calling |
the fund’s current prospectus. | Vanguard at 800-662-2739. They are also available from |
| the SEC’s website, www.sec.gov. In addition, you may |
| obtain a free report on how your fund voted the proxies for |
| securities it owned during the 12 months ended June 30. |
| To get the report, visit either www.vanguard.com |
| or www.sec.gov. |
| |
| You can review and copy information about your fund |
| at the SEC’s Public Reference Room in Washington, D.C. |
| To find out more about this public service, call the SEC |
| at 202-551-8090. Information about your fund is also |
| available on the SEC’s website, and you can receive |
| copies of this information, for a fee, by sending a |
| request in either of two ways: via e-mail addressed to |
| publicinfo@sec.gov or via regular mail addressed to the |
| Public Reference Section, Securities and Exchange |
| Commission, Washington, DC 20549-0102. |
| |
| |
| |
| © 2007 The Vanguard Group, Inc. |
| All rights reserved. |
| Vanguard Marketing Corporation, Distributor. |
| |
| Q872007 |
Item 4: Principal Accountant Fees and Services.
(a) Audit Fees.
(b) Audit-Related Fees.
Includes fees billed in connection with assurance and related services provided to the Registrant, The Vanguard Group, Inc., Vanguard Marketing Corporation, and other registered investment companies in the Vanguard Group.
(c) Tax Fees.
Includes fees billed in connection with tax compliance, planning and advice services provided to the Registrant, The Vanguard Group, Inc., Vanguard Marketing Corporation, and other registered investment companies in the Vanguard Group and related to income and excise taxes.
(d) All Other Fees.
Includes fees billed for services related to risk management and privacy matters. Services were provided to the Registrant, The Vanguard Group, Inc., Vanguard Marketing Corporation, and other registered investment companies in the Vanguard Group.
(e) (1) Pre-Approval Policies. The policy of the Registrant’s Audit Committee is to consider and, if appropriate, approve before the principal accountant is engaged for such services, all specific audit and non-audit services provided to: (1) the Registrant; (2) The Vanguard Group, Inc.; (3) other entities controlled by The Vanguard Group, Inc. that provide ongoing services to the Registrant; and (4) other registered investment companies in the Vanguard Group. In making a determination, the Audit Committee considers whether the services are consistent with maintaining the principal accountant’s independence.
In the event of a contingency situation in which the principal accountant is needed to provide services in between scheduled Audit Committee meetings, the Chairman of the Audit Committee would be called on to consider and, if appropriate, pre-approve audit or permitted non-audit services in an amount sufficient to complete services through the next Audit Committee meeting, and to determine if such services would be consistent with maintaining the accountant’s independence. At the next scheduled Audit Committee meeting, services and fees would be presented to the Audit Committee for formal consideration, and, if appropriate, approval by the entire Audit Committee. The Audit Committee would again consider whether such services and fees are consistent with maintaining the principal accountant’s independence.
The Registrant’s Audit Committee is informed at least annually of all audit and non-audit services provided by the principal accountant to the Vanguard complex, whether such services are provided to: (1) the Registrant; (2) The Vanguard Group, Inc.; (3) other entities controlled by The Vanguard Group, Inc. that provide ongoing services to the Registrant; or (4) other registered investment companies in the Vanguard Group.
(2) No percentage of the principal accountant’s fees or services were approved pursuant to the waiver provision of paragraph (c)(7)(i)(C) of Rule 2-01 of Regulation S-X.
(g) Aggregate Non-Audit Fees.
Includes fees billed for non-audit services provided to the Registrant, The Vanguard Group, Inc., Vanguard Marketing Corporation, and other registered investment companies in the Vanguard Group.
(h) For the most recent fiscal year, the Audit Committee has determined that the provision of all non-audit services was consistent with maintaining the principal accountant’s independence.
(a) Disclosure Controls and Procedures. The Principal Executive and Financial Officers concluded that the Registrant’s Disclosure Controls and Procedures are effective based on their evaluation of the Disclosure Controls and Procedures as of a date within 90 days of the filing date of this report.
(b) Internal Control Over Financial Reporting. There were no significant changes in Registrant’s internal control over financial reporting or in other factors that could significantly affect this control subsequent to the date of the evaluation, including any corrective actions with regard to significant deficiencies and material weaknesses.
(a) Code of Ethics.
(b) Certifications.
Pursuant to the requirements of the Securities Exchange Act of 1934 and the Investment Company Act of 1940, the registrant has duly caused this report to be signed on its behalf by the undersigned, thereunto duly authorized.
Pursuant to the requirements of the Securities Exchange Act of 1934 and the Investment Company Act of 1940, this report has been signed below by the following persons on behalf of the registrant and in the capacities and on the dates indicated.
* By Power of Attorney. See File Number 002-65955-99, filed on July 27, 2006. Incorporated by Reference.