
> | The Vanguard Tax-Managed Funds’ returns in 2008 ranged from –18.32% for the Tax-Managed Balanced Fund to –37.63% for the Tax-Managed Capital Appreciation Fund’s Investor Shares. |
> | The returns of all four funds were in line with those of their target benchmarks for the period. |
> | The funds continued to avoid making any taxable capital gain distributions to shareholders. |
Contents | |
| |
Your Fund’s Total Returns | 1 |
President’s Letter | 2 |
Tax-Managed Balanced Fund | 8 |
Tax-Managed Growth and Income Fund | 31 |
Tax-Managed Capital Appreciation Fund | 49 |
Tax-Managed Small-Cap Fund | 68 |
Your Fund’s After-Tax Returns | 88 |
About Your Fund’s Expenses | 89 |
Glossary | 91 |
Please note: The opinions expressed in this report are just that—informed opinions. They should not be considered promises or advice. Also, please keep in mind that the information and opinions cover the period through the date on the front of this report. Of course, the risks of investing in your fund are spelled out in the prospectus.
Your Fund’s Total Returns
Fiscal Year Ended December 31, 2008 | | |
| Ticker | Total |
| Symbol | Returns |
Vanguard Tax-Managed Balanced Fund | VTMFX | –18.32% |
Tax-Managed Balanced Composite Index1 | | –18.52 |
Average Mixed-Asset Target Moderate Fund2 | | –25.38 |
| | |
Vanguard Tax-Managed Growth and Income Fund | | |
Investor Shares | VTGIX | –37.04% |
Admiral™ Shares3 | VTGLX | –37.00 |
Institutional Shares4 | VTMIX | –36.98 |
S&P 500 Index | | –37.00 |
Average Large-Cap Core Fund2 | | –37.23 |
| | |
Vanguard Tax-Managed Capital Appreciation Fund | | |
Investor Shares | VMCAX | –37.63% |
Admiral Shares | VTCLX | –37.58 |
Institutional Shares | VTCIX | –37.57 |
Russell 1000 Index | | –37.60 |
Average Multi-Cap Core Fund2 | | –38.79 |
| | |
Vanguard Tax-Managed Small-Cap Fund | | |
Investor Shares | VTMSX | –30.82% |
Institutional Shares | VTSIX | –30.77 |
S&P SmallCap 600 Index | | –31.07 |
Average Small-Cap Core Fund2 | | –36.21 |
1 50% Russell 1000 Index, 50% Barclays Capital 7 Year Municipal Bond Index.
2 Derived from data provided by Lipper Inc.
3 A lower-cost class of shares available to many longtime shareholders and to those with significant investments in the fund.
4 This class of shares also carries low expenses and is available for a minimum investment of $5 million.
1

President’s Letter
Dear Shareholder,
The 12-month period ended December 31 was one of the worst in the history of the U.S. stock market. All ten equity sectors in the Vanguard Tax-Managed Funds included in this report finished the year in negative territory. Although bonds typically fared better than stocks, municipal bonds—which account for about half of Vanguard Tax-Managed Balanced Fund—were also down for the year. Despite dismal returns, the funds tracked their respective indexes for the fiscal period.
As they have since their inception dates, the funds continued to meet their tax-management objectives. From the Performance at a Glance chart on page 7, you can see that the funds’ managers, Vanguard’s Quantitative Equity and Fixed Income Groups, continued to avoid distributing capital gains that the funds had accrued in previous years. The funds’ managers use a variety of portfolio management strategies to avoid realizing capital gains while deviating as little as possible from a pure indexing strategy.
2
Global stock markets faced historic challenges
Problems that had festered in the financial markets for much of 2008 erupted in the year’s final months, leading to high-profile bankruptcies and government rescues. U.S. stocks fell sharply for the fourth quarter. For the full 12 months, the U.S. stock market returned about –37%, the worst calendar-year performance since 1931. The financial sector, the epicenter of the crisis, was hardest hit, but no sector was safe from the market’s violent downdraft.
Overseas, the news was worse. Stock markets outside the United States returned about –45%, as credit-market turmoil and economic distress reverberated worldwide.
Emerging markets fell especially hard, in part because of collapsing commodity prices, which put pressure on the group’s many natural-resource producers.
U.S. Treasuries provided a safe and liquid haven
Bonds provided shelter from the stock market turmoil, though strength was largely confined to U.S. Treasuries. Treasuries surged as investors bid up the highest-quality, most liquid securities. The Federal Reserve Board added fuel to the rally with repeated cuts in its target for the federal funds rate, a benchmark for short-term interest rates. At the start of 2008, the federal funds rate stood at 4.25%; by year-end, it was between 0.00% and 0.25%.
Market Barometer | |
| Average Annual Total Returns |
| Periods Ended December 31, 2008 |
| One Year | Three Years | Five Years |
Stocks | | | |
Russell 1000 Index (Large-caps) | –37.60% | –8.66% | –2.04% |
Russell 2000 Index (Small-caps) | –33.79 | –8.29 | –0.93 |
Dow Jones Wilshire 5000 Index (Entire market) | –37.34 | –8.43 | –1.67 |
MSCI All Country World Index ex USA (International) | –45.24 | –6.57 | 3.00 |
| | | |
Bonds | | | |
Barclays Capital U.S. Aggregate Bond Index | | | |
(Broad taxable market) | 5.24% | 5.51% | 4.65% |
Barclays Capital Municipal Bond Index | –2.47 | 1.86 | 2.71 |
Citigroup 3-Month Treasury Bill Index | 1.80 | 3.76 | 3.10 |
| | | |
CPI | | | |
Consumer Price Index | 0.09% | 2.22% | 2.67% |
3
U.S. government-backed mortgage securities also performed well, though corporate and municipal bonds struggled. For the full year, the broad taxable bond market returned 5.24%.
Negative returns across the board made for disappointing results
Stocks were down across all sectors, hurting returns for Vanguard’s domestic tax-managed funds. (We review the performance of Vanguard Tax-Managed International Fund in a separate report.) The Balanced Fund’s fixed income exposure helped the portfolio to perform better than the rest of the group; however, the fund finished down for the year, returning –18.32%. (The fund’s fixed income portion is invested in municipal securities, which lost value during the period.) Vanguard Tax-Managed Capital Appreciation Fund, down –37.63% for the year, was at the bottom of the pack.
Expense Ratios1 | |
Your Fund Compared With Its Peer Group | |
| Expense |
Tax-Managed Fund | Ratio |
Balanced | 0.12% |
Average Mixed-Asset Target Moderate Fund | 1.06 |
| |
Growth and Income | |
Investor Shares | 0.15% |
Admiral Shares | 0.09 |
Institutional Shares | 0.07 |
Average Large-Cap Core Fund | 1.29 |
| |
Capital Appreciation | |
Investor Shares | 0.15% |
Admiral Shares | 0.09 |
Institutional Shares | 0.07 |
Average Multi-Cap Core Fund | 1.27 |
| |
Small-Cap | |
Investor Shares | 0.13% |
Institutional Shares | 0.09 |
Average Small-Cap Core Fund | 1.47 |
1 The fund expense ratios shown are from the prospectus dated July 29, 2008. For the fiscal year ended December 31, 2008, the Tax-Managed Balanced Fund’s expense ratio was 0.13%. The Tax-Managed Growth and Income Fund’s expense ratios were 0.16% for Investor Shares, 0.10% for Admiral Shares, and 0.07% for Institutional Shares. The Tax-Managed Capital Appreciation Fund’s expense ratios were 0.16% for Investor Shares, 0.10% for Admiral Shares, and 0.07% for Institutional Shares. The Tax-Managed Small-Cap Fund’s expense ratios were 0.14% for Investor Shares and 0.09% for Institutional Shares. The peer-group expense ratios are derived from data provided by Lipper Inc. and capture information through year-end 2007.
4
In Vanguard Tax-Managed Balanced Fund, Tax-Managed Growth and Income Fund, and Tax-Managed Capital Appreciation Fund, the biggest declines stemmed from some of the funds’ largest sectors: financials, information technology, and energy. In the financial sector, continued fallout from the subprime-mortgage crisis crippled mortgage companies and big banks alike. In September, several of Wall Street’s largest financial institutions collapsed or required help from the government, causing the sector to drop even further.
The crisis in financials quickly spread to other sectors. Information technology companies felt the pinch as financial businesses—among the tech sector’s largest clients—reined in spending for the year.
As oil prices hit record highs early in 2008, energy companies were among the market’s top performers. However, when prices later plummeted, these companies’ stocks fell drastically, ending the year on a down note.
Total Returns | |
Ten Years Ended December 31, 20081 | |
| Average |
| Annual Return |
Tax-Managed Balanced Fund | 2.40% |
Tax-Managed Balanced Composite Index2 | 2.16 |
Average Mixed-Asset Target Moderate Fund3 | 1.17 |
Tax-Managed Growth and Income Fund Investor Shares | –1.40% |
S&P 500 Index | –1.38 |
Average Large-Cap Core Fund3 | –2.38 |
Tax-Managed Capital Appreciation Fund Investor Shares | –0.71% |
Russell 1000 Index | –1.09 |
Average Multi-Cap Core Fund3 | –0.61 |
Tax-Managed Small-Cap Fund Investor Shares | 6.68% |
S&P SmallCap 600 Index | 6.45 |
Average Small-Cap Core Fund3 | 5.58 |
The figures shown represent past performance, which is not a guarantee of future results. (Current performance may be lower or higher than the performance data cited. For performance data current to the most recent month-end, visit our website at ww.vanguard.com/performance.) Note, too, that both investment returns and principal value can fluctuate widely, so an investor’s shares, when sold, could be worth more or less than their original cost.
1 Annualized returns are since inception for the Tax-Managed Small-Cap Fund (March 25, 1999).
2 50% Russell 1000 Index, 50% Barclays Capital 7 Year Municipal Bond Index.
3 Derived from data provided by Lipper Inc.
5
Information technology stocks were also among the biggest detractors in Vanguard Tax-Managed Small-Cap Fund, which also suffered from significant losses in the consumer discretionary, industrials, and health care sectors.
Although there were no true bright spots for the year, a handful of industries finished with positive returns. In the consumer staples sector, brewers and supercenters performed well, and in the health care sector, several biotechnology companies and smaller pharmaceutical firms produced gains. In the consumer discretionary area of the market, educational services companies and automotive suppliers were up for the year.
The portfolios’ long-term records reflect the past year’s distress
Over the past decade, which included two of the worst bear markets on record, Vanguard’s U.S.-focused tax-managed funds produced average annual returns between 2.40%, for the Tax-Managed Balanced Fund, and –1.40%, for the Tax-Managed Growth and Income Fund. The Tax-Managed Small-Cap Fund hasn’t been around for quite ten years; it began operations in March 1999. In general, small-caps have outperformed since the fund’s inception, helping the fund to earn a long-term return of 6.68%.
The portfolios’ returns have stayed more or less in line with those of their benchmarks, a notable achievement in an otherwise disappointing period and a credit to Vanguard’s Quantitative Equity and Fixed Income Groups. The groups use a disciplined and broadly diversified tax-management strategy to manage the portfolios. Low operating costs make it easier for the advisors to stay on course with the funds’ benchmarks, even in extreme investment environments.
Although the absolute returns are hardly cause for excitement, the table shows that all but the Tax-Managed Capital Appreciation Fund produced higher returns than their peer groups. But the chart reflects only pre-tax returns. The funds’ relative performance is greater on an after-tax basis because the funds have not generated taxable distributions to shareholders. Capital gains distributions from mutual funds are subject to taxes when they are held in taxable accounts. We’re pleased that investors in our Tax-Managed Funds have never had to pay capital gains taxes if they have simply held their investments; they have been exposed to potential capital gains taxes only when redeeming appreciated shares. By managing each fund’s holdings with an eye on the tax consequences, our fund managers hope to continue this enviable tax-efficient performance for years to come.
6
The challenge for investors: Keep an eye on the future
To say the least, the investment environment was a difficult and challenging one in 2008, a year that brought extreme volatility to the financial markets and saw the world fall into a potentially deep recession. And the Tax-Managed Funds’ longer-term returns, which, in most cases, have trailed those of relatively low-risk fixed income investments, do little to salve the wounds.
In our view, however, the past year—and indeed the past decade—do not invalidate the long-term case for equities. We expect stocks to outperform less risky assets precisely because stocks can occasionally produce such dismal returns. Financial theory, affirmed by the historical evidence, dictates that investors need to be compensated for this risk.
With low expense ratios, a proven tax-management strategy, and a record of closely tracking their benchmarks, the Vanguard Tax-Managed Funds can help put your investment program in a position to benefit when the financial markets stage a recovery.
Thank you for entrusting your assets to Vanguard.
Sincerely,

F. William McNabb III
President and Chief Executive Officer
January 20, 2009
Your Fund’s Performance at a Glance | | | | |
December 31, 2007–December 31, 2008 | | | | |
| | | Distributions Per Share |
| Starting | Ending | Income | Capital |
Tax-Managed Fund | Share Price | Share Price | Dividends | Gains |
Balanced | $20.45 | $16.19 | $0.565 | $0.000 |
Growth and Income | | | | |
Investor Shares | $31.96 | $19.65 | $0.587 | $0.000 |
Admiral Shares | 65.69 | 40.39 | 1.236 | 0.000 |
Institutional Shares | 31.96 | 19.65 | 0.609 | 0.000 |
Capital Appreciation | | | | |
Investor Shares | $35.13 | $21.39 | $0.500 | $0.000 |
Admiral Shares | 70.70 | 43.04 | 1.044 | 0.000 |
Institutional Shares | 35.13 | 21.38 | 0.527 | 0.000 |
Small-Cap | | | | |
Investor Shares | $25.62 | $17.44 | $0.272 | $0.000 |
Institutional Shares | 25.66 | 17.47 | 0.281 | 0.000 |
7
Tax-Managed Balanced Fund
Fund Profile
As of December 31, 2008
Total Fund Characteristics | |
| |
Yield1 | 3.0% |
Turnover Rate | 19% |
Expense Ratio (12/31/2007)2 | 0.12% |
Short-Term Reserves | 0.0% |
Total Fund Volatility Measures3 | |
| Fund Versus | Fund Versus |
| Composite Index4 | Broad Index5 |
R-Squared | 0.99 | 0.91 |
Beta | 0.99 | 0.51 |
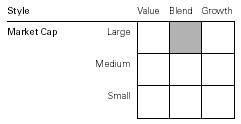
Equity Characteristics | | | |
| | Comparative | Broad |
| Fund | Index6 | Index5 |
Number of Stocks | 603 | 989 | 4,593 |
Median Market Cap | $27.6B | $32.7B | $25.3B |
Price/Earnings Ratio | 11.3x | 11.3x | 11.8x |
Price/Book Ratio | 1.8x | 1.7x | 1.7x |
Dividend Yield | 2.4% | 2.9% | 2.8% |
Return on Equity | 21.6% | 21.6% | 20.8% |
Earnings Growth Rate | 18.7% | 17.6% | 17.2% |
Foreign Holdings | 0.0% | 0.0% | 0.0% |
Sector Diversification (% of equity exposure) |
| | Comparative | Broad |
| Fund | Index6 | Index5 |
Consumer Discretionary | 8.6% | 8.9% | 8.9% |
Consumer Staples | 12.4 | 12.0 | 11.2 |
Energy | 12.3 | 12.8 | 12.4 |
Financials | 13.3 | 13.8 | 15.6 |
Health Care | 14.7 | 14.5 | 14.4 |
Industrials | 11.2 | 11.2 | 11.2 |
Information Technology | 15.7 | 15.5 | 15.2 |
Materials | 3.5 | 3.3 | 3.3 |
Telecommunication | | | |
Services | 3.8 | 3.6 | 3.4 |
Utilities | 4.5 | 4.4 | 4.4 |
Equity Investment Focus
Ten Largest Stocks7 (% of equity portfolio) | |
| | |
ExxonMobil Corp. | integrated oil | |
| and gas | 4.8% |
The Procter & Gamble Co. | household products | 2.1 |
AT&T Inc. | integrated | |
| telecommunication | |
| services | 1.9 |
Johnson & Johnson | pharmaceuticals | 1.8 |
General Electric Co. | industrial | |
| conglomerates | 1.7 |
Microsoft Corp. | systems software | 1.7 |
Chevron Corp. | integrated oil | |
| and gas | 1.6 |
Wal-Mart Stores, Inc. | hypermarkets and | |
| super centers | 1.4 |
JPMorgan Chase & Co. | diversified financial | |
| services | 1.3 |
Pfizer Inc. | pharmaceuticals | 1.2 |
Top Ten | | 19.5% |
Top Ten as % of Total Net Assets | 9.4% |
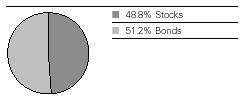
Fund Asset Allocation
1 30-day SEC yield. See the Glossary.
2 The expense ratio shown is from the prospectus dated July 29, 2008. For the fiscal year ended December 31, 2008, the expense ratio was 0.13%.
3 For an explanation of R-squared, beta, and other terms used here, see the Glossary.
4 50% Russell 1000 Index, 50% Barclays Capital 7 Year Municipal Bond Index.
5 Dow Jones Wilshire 5000 Index.
6 Russell 1000 Index.
7 The holdings listed exclude any temporary cash investments and equity index products.
8
Tax-Managed Balanced Fund
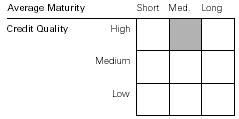
Fixed Income Characteristics | | |
| | Comparative | Broad |
| Fund | Index1 | Index2 |
Number of Bonds | 119 | 4,183 | 44,315 |
Yield to Maturity | 4.0%3 | 3.6% | 4.5% |
Average Coupon | 4.8% | 5.0% | 5.0% |
Average Effective | | | |
Maturity | 6.7 years | 7.0 years | 12.8 years |
Average Quality | AA | AA | AA |
Average Duration | 5.9 years | 5.5 years | 8.1 years |
Distribution by Credit Quality | |
(% of fixed income portfolio) | |
| |
AAA | 25.1% |
AA | 63.3 |
A | 9.1 |
BBB | 2.5 |
Distribution by Maturity | |
(% of fixed income portfolio) | |
| |
Under 1 Year | 9.2% |
1–5 Years | 35.5 |
5–10 Years | 36.3 |
10–20 Years | 19.0 |
Fixed Income Investment Focus
Largest State Concentrations4 (% of fixed income portfolio) | |
| |
New York | 13.0% |
Ohio | 9.2 |
Texas | 7.4 |
Massachusetts | 6.4 |
Arizona | 6.2 |
Florida | 5.4 |
California | 4.9 |
Colorado | 4.5 |
Missouri | 4.4 |
New Jersey | 3.4 |
Top Ten | 64.8% |
1 Barclays Capital 7 Year Municipal Bond Index.
2 Barclays Capital Municipal Bond Index.
3 Before expenses.
4 “Largest State Concentrations” figures exclude any fixed income futures contracts.
9
Tax-Managed Balanced Fund
Performance Summary
All of the returns in this report represent past performance, which is not a guarantee of future results that may be achieved by the fund. (Current performance may be lower or higher than the performance data cited. For performance data current to the most recent month-end, visit our website at www.vanguard.com/performance.) Note, too, that both investment returns and principal value can fluctuate widely, so an investor’s shares, when sold, could be worth more or less than their original cost. The returns shown do not reflect taxes that a shareholder would pay on fund distributions or on the sale of fund shares.
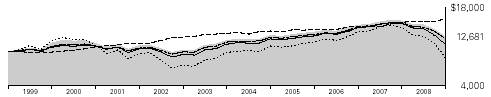
Cumulative Performance: December 31, 1998–December 31, 2008
Initial Investment of $10,000
| Average Annual Total Returns | Final Value |
| Periods Ended December 31, 2008 | of a $10,000 |
| One Year | Five Years | Ten Years | Investment |
Tax-Managed Balanced Fund1 | –18.32% | 1.01% | 2.40% | $12,681 |
Fee-Adjusted Returns2 | –19.12 | 1.01 | 2.40 | 12,681 |
Russell 1000 Index | –37.60 | –2.04 | –1.09 | 8,963 |
Barclays Capital 7 Year Municipal Bond Index | 4.59 | 3.69 | 4.80 | 15,981 |
Tax-Managed Balanced Composite Index3 | –18.52 | 1.03 | 2.16 | 12,383 |
Average Mixed-Asset Target Moderate Fund4 | –25.38 | –0.26 | 1.17 | 11,234 |
1 Total returns do not include the account service fee that may be applicable to certain accounts with balances below $10,000.
2 Reflective of the 1% fee assessed on redemptions of shares held in the fund for less than five years, but not of the account service fee that may be applicable to certain accounts below $10,000.
3 50% Russell 1000 Index, 50% Barclays Capital 7 Year Municipal Bond Index.
4 Derived from data provided by Lipper Inc.
10
Tax-Managed Balanced Fund
Fiscal-Year Total Returns (%): December 31, 1998–December 31, 2008
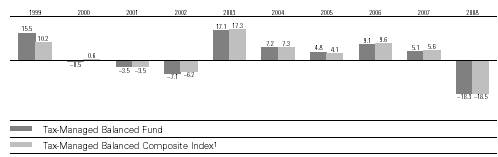
1 50% Russell 1000 Index, 50% Barclays Capital 7 Year Municipal Bond Index.
Note: See Financial Highlights table for dividend and capital gains information.
11
Tax-Managed Balanced Fund
Financial Statements
Statement of Net Assets
As of December 31, 2008
The fund provides a complete list of its holdings four times in each fiscal year, at the quarter-ends. For the second and fourth fiscal quarters, the lists appear in the fund’s semiannual and annual reports to shareholders. For the first and third fiscal quarters, the fund files the lists with the Securities and Exchange Commission on Form N-Q. Shareholders can look up the fund’s Forms N-Q on the SEC’s website at www.sec.gov. Forms N-Q may also be reviewed and copied at the SEC’s Public Reference Room (see the back cover of this report for further information).
| | | Market |
| | | Value• |
| | Shares | ($000) |
Common Stocks (48.5%) | | |
Consumer Discretionary (4.2%) | | |
| McDonald’s Corp. | 35,809 | 2,227 |
| Comcast Corp. Class A | 100,104 | 1,690 |
| The Walt Disney Co. | 69,650 | 1,580 |
| Lowe’s Cos., Inc. | 55,800 | 1,201 |
| Target Corp. | 30,700 | 1,060 |
| News Corp., Class A | 97,500 | 886 |
| Home Depot, Inc. | 36,899 | 850 |
| NIKE, Inc. Class B | 14,400 | 734 |
| Time Warner, Inc. | 72,989 | 734 |
* | Amazon.com, Inc. | 14,200 | 728 |
| Yum! Brands, Inc. | 21,400 | 674 |
| Staples, Inc. | 32,555 | 583 |
* | Apollo Group, Inc. Class A | 5,900 | 452 |
| TJX Cos., Inc. | 21,600 | 444 |
* | DIRECTV Group, Inc. | 18,971 | 435 |
| Marriott International, Inc. | | |
| Class A | 19,500 | 379 |
* | AutoZone Inc. | 2,700 | 377 |
* | Kohl’s Corp. | 9,800 | 355 |
* | Liberty Media Corp. | 17,648 | 309 |
| Best Buy Co., Inc. | 10,875 | 306 |
| Polo Ralph Lauren Corp. | 6,000 | 273 |
* | Starbucks Corp. | 28,800 | 273 |
* | Bed Bath & Beyond, Inc. | 10,500 | 267 |
* | Coach, Inc. | 12,800 | 266 |
| The Gap, Inc. | 19,725 | 264 |
| DeVry, Inc. | 4,600 | 264 |
| Hasbro, Inc. | 8,925 | 260 |
| Mattel, Inc. | 16,080 | 257 |
| Pulte Homes, Inc. | 23,100 | 253 |
| PetSmart, Inc. | 13,500 | 249 |
* | O’Reilly Automotive, Inc. | 8,000 | 246 |
| Sherwin-Williams Co. | 4,100 | 245 |
| Strayer Education, Inc. | 1,120 | 240 |
| BorgWarner, Inc. | 10,600 | 231 |
| International Speedway Corp. | 8,010 | 230 |
| | | Market |
| | | Value• |
| | Shares | ($000) |
| John Wiley & Sons Class A | 6,400 | 228 |
| Weight Watchers | | |
| International, Inc. | 7,600 | 224 |
| Darden Restaurants Inc. | 7,750 | 218 |
* | NVR, Inc. | 470 | 215 |
| Scripps Networks Interactive | 8,900 | 196 |
| Cablevision Systems | | |
| NY Group Class A | 10,594 | 178 |
| Tiffany & Co. | 6,700 | 158 |
| Black & Decker Corp. | 3,700 | 155 |
| RadioShack Corp. | 12,900 | 154 |
| Harley-Davidson, Inc. | 8,900 | 151 |
| Brinker International, Inc. | 13,375 | 141 |
| Starwood Hotels & | | |
| Resorts Worldwide, Inc. | 7,801 | 140 |
| WABCO Holdings Inc. | 8,833 | 140 |
| International Game | | |
| Technology | 11,600 | 138 |
* | Mohawk Industries, Inc. | 3,100 | 133 |
| Macy’s Inc. | 12,400 | 128 |
* | Toll Brothers, Inc. | 5,800 | 124 |
* | AutoNation, Inc. | 11,292 | 112 |
| Abercrombie & Fitch Co. | 4,300 | 99 |
* | DISH Network Corp. | 8,757 | 97 |
* | Brink’s Home Security | | |
| Holdings, Inc. | 4,300 | 94 |
| Gentex Corp. | 10,200 | 90 |
* | CarMax, Inc. | 11,406 | 90 |
| Centex Corp. | 8,100 | 86 |
* | Liberty Global, Inc. Series C | 5,446 | 83 |
| Barnes & Noble, Inc. | 5,400 | 81 |
* | Career Education Corp. | 4,500 | 81 |
* | Liberty Global, Inc. Class A | 5,015 | 80 |
| CBS Corp. | 9,413 | 77 |
| D. R. Horton, Inc. | 10,499 | 74 |
| Burger King Holdings Inc. | 2,600 | 62 |
* | Viacom Inc. Class B | 3,158 | 60 |
| Ross Stores, Inc. | 2,000 | 60 |
* | MGM Mirage, Inc. | 4,013 | 55 |
12
Tax-Managed Balanced Fund
| | | Market |
| | | Value• |
| | Shares | ($000) |
* | Discovery | | |
| Communications Inc. | | |
| Class A | 3,841 | 54 |
* | Discovery | | |
| Communications Inc. | | |
| Class C | 3,841 | 52 |
* | Saks Inc. | 10,200 | 45 |
| Hearst-Argyle Television Inc. | 7,100 | 43 |
| Virgin Media Inc. | 7,893 | 39 |
| Comcast Corp. Special | | |
| Class A | 2,322 | 38 |
* | Dollar Tree, Inc. | 750 | 31 |
* | Expedia, Inc. | 3,568 | 29 |
| Nordstrom, Inc. | 1,800 | 24 |
| Jones Apparel Group, Inc. | 3,600 | 21 |
| The McGraw-Hill Cos., Inc. | 700 | 16 |
| Limited Brands, Inc. | 1,424 | 14 |
| General Motors Corp. | 4,000 | 13 |
| Fortune Brands, Inc. | 300 | 12 |
| Foot Locker, Inc. | 1,600 | 12 |
* | Ascent Media Corp. | 384 | 8 |
* | HSN, Inc. | 940 | 7 |
* | Ticketmaster | | |
| Entertainment Inc. | 940 | 6 |
* | Interval Leisure Group, Inc. | 940 | 5 |
| Lennar Corp. Class B | 680 | 4 |
| E.W. Scripps Co. Class A | 1,400 | 3 |
| Newell Rubbermaid, Inc. | 218 | 2 |
* | Sirius XM Radio Inc. | 8,300 | 1 |
| | | 24,503 |
Consumer Staples (6.0%) | | |
| The Procter & Gamble Co. | 97,484 | 6,026 |
| Wal-Mart Stores, Inc. | 70,400 | 3,947 |
| The Coca-Cola Co. | 71,300 | 3,228 |
| PepsiCo, Inc. | 54,727 | 2,997 |
| Philip Morris | | |
| International Inc. | 59,700 | 2,598 |
| CVS Caremark Corp. | 52,498 | 1,509 |
| Kraft Foods Inc. | 33,916 | 911 |
| Costco Wholesale Corp. | 17,127 | 899 |
| General Mills, Inc. | 13,300 | 808 |
| Archer-Daniels-Midland Co. | 27,821 | 802 |
| Colgate-Palmolive Co. | 10,800 | 740 |
| The Kroger Co. | 26,100 | 689 |
| Altria Group, Inc. | 45,300 | 682 |
| Walgreen Co. | 27,000 | 666 |
| Kellogg Co. | 11,300 | 495 |
| Kimberly-Clark Corp. | 9,172 | 484 |
| Safeway, Inc. | 19,334 | 460 |
| J.M. Smucker Co. | 8,746 | 379 |
| Molson Coors Brewing Co. | | |
| Class B | 7,300 | 357 |
* | Smithfield Foods, Inc. | 24,700 | 347 |
* | Energizer Holdings, Inc. | 6,194 | 335 |
| | | Market |
| | | Value• |
| | Shares | ($000) |
| Sysco Corp. | 14,600 | 335 |
| Tyson Foods, Inc. | 37,731 | 330 |
| Brown-Forman Corp. Class B | 6,350 | 327 |
| Church & Dwight, Inc. | 5,500 | 309 |
| The Clorox Co. | 5,400 | 300 |
* | Constellation Brands, Inc. | | |
| Class A | 18,600 | 293 |
* | Hansen Natural Corp. | 8,300 | 278 |
* | Dr. Pepper | | |
| Snapple Group, Inc. | 17,100 | 278 |
| Lorillard, Inc. | 4,900 | 276 |
| The Estee Lauder Cos. Inc. | | |
| Class A | 8,800 | 272 |
* | Dean Foods Co. | 15,150 | 272 |
| Avon Products, Inc. | 11,300 | 272 |
| McCormick & Co., Inc. | 8,400 | 268 |
| Corn Products | | |
| International, Inc. | 9,107 | 263 |
| Alberto-Culver Co. | 10,250 | 251 |
| Del Monte Foods Co. | 33,300 | 238 |
| Hormel Foods Corp. | 7,100 | 221 |
| The Pepsi Bottling Group, Inc. | 9,300 | 209 |
| PepsiAmericas, Inc. | 10,100 | 206 |
* | Central European | | |
| Distribution Corp. | 9,100 | 179 |
* | NBTY, Inc. | 8,500 | 133 |
| Reynolds American Inc. | 3,002 | 121 |
* | BJ’s Wholesale Club, Inc. | 3,200 | 110 |
| Bunge Ltd. | 1,500 | 78 |
| Whole Foods Market, Inc. | 5,600 | 53 |
| H.J. Heinz Co. | 800 | 30 |
| Sara Lee Corp. | 500 | 5 |
| ConAgra Foods, Inc. | 100 | 2 |
| | | 35,268 |
Energy (6.0%) | | |
| ExxonMobil Corp. | 171,194 | 13,666 |
| Chevron Corp. | 62,633 | 4,633 |
| ConocoPhillips Co. | 42,287 | 2,190 |
| Schlumberger Ltd. | 28,867 | 1,222 |
| Occidental Petroleum Corp. | 19,004 | 1,140 |
| Devon Energy Corp. | 17,046 | 1,120 |
| Apache Corp. | 13,446 | 1,002 |
| Anadarko Petroleum Corp. | 18,892 | 728 |
| Hess Corp. | 12,800 | 687 |
| EOG Resources, Inc. | 10,200 | 679 |
* | National Oilwell Varco Inc. | 21,029 | 514 |
| XTO Energy, Inc. | 14,166 | 500 |
| Peabody Energy Corp. | 15,900 | 362 |
| Valero Energy Corp. | 15,268 | 330 |
| Noble Corp. | 14,800 | 326 |
| Noble Energy, Inc. | 6,500 | 320 |
| Range Resources Corp. | 9,150 | 315 |
* | Cameron International Corp. | 14,900 | 305 |
| ENSCO International, Inc. | 10,600 | 301 |
13
Tax-Managed Balanced Fund
| | | Market |
| | | Value• |
| | Shares | ($000) |
| Baker Hughes Inc. | 9,340 | 300 |
| Murphy Oil Corp. | 6,700 | 297 |
| Williams Cos., Inc. | 19,200 | 278 |
* | Nabors Industries, Inc. | 22,789 | 273 |
| Cabot Oil & Gas Corp. | 10,100 | 263 |
| Helmerich & Payne, Inc. | 10,700 | 243 |
* | Pride International, Inc. | 15,200 | 243 |
| Marathon Oil Corp. | 8,782 | 240 |
* | Newfield Exploration Co. | 12,100 | 239 |
| St. Mary Land & | | |
| Exploration Co. | 11,400 | 232 |
| Cimarex Energy Co. | 8,100 | 217 |
* | Forest Oil Corp. | 13,000 | 214 |
| Smith International, Inc. | 8,679 | 199 |
| CONSOL Energy, Inc. | 6,900 | 197 |
| W&T Offshore, Inc. | 11,400 | 163 |
* | FMC Technologies Inc. | 6,140 | 146 |
| BJ Services Co. | 12,200 | 142 |
| Pioneer Natural | | |
| Resources Co. | 7,500 | 121 |
| Arch Coal, Inc. | 7,000 | 114 |
* | Plains Exploration & | | |
| Production Co. | 4,748 | 110 |
| Rowan Cos., Inc. | 6,700 | 107 |
| Spectra Energy Corp. | 6,496 | 102 |
| Patterson-UTI Energy, Inc. | 8,502 | 98 |
| Tesoro Corp. | 6,752 | 89 |
* | Mariner Energy Inc. | 5,000 | 51 |
| Massey Energy Co. | 2,731 | 38 |
| Halliburton Co. | 1,364 | 25 |
| Diamond Offshore | | |
| Drilling, Inc. | 400 | 24 |
| El Paso Corp. | 2,400 | 19 |
* | Patriot Coal Corp. | 2,000 | 13 |
| Overseas Shipholding | | |
| Group Inc. | 100 | 4 |
| | | 35,141 |
Financials (6.4%) | | |
| JPMorgan Chase & Co. | 113,564 | 3,581 |
| Wells Fargo & Co. | 93,500 | 2,756 |
| Bank of America Corp. | 168,978 | 2,379 |
| The Goldman Sachs | | |
| Group, Inc. | 15,400 | 1,300 |
| U.S. Bancorp | 43,300 | 1,083 |
| Citigroup Inc. | 133,397 | 895 |
| AFLAC Inc. | 16,000 | 733 |
| State Street Corp. | 18,576 | 731 |
| Bank of New York | | |
| Mellon Corp. | 25,100 | 711 |
| Charles Schwab Corp. | 39,305 | 636 |
| PNC Financial | | |
| Services Group | 12,800 | 627 |
| Wachovia Corp. | 103,750 | 575 |
| Northern Trust Corp. | 11,000 | 574 |
| | | Market |
| | | Value• |
| | Shares | ($000) |
| Aon Corp. | 12,300 | 562 |
| Public Storage, Inc. REIT | 6,700 | 533 |
| American Express Co. | 28,233 | 524 |
| MetLife, Inc. | 14,665 | 511 |
| Franklin Resources Corp. | 7,500 | 478 |
| The Travelers Cos., Inc. | 9,589 | 433 |
| Unum Group | 23,000 | 428 |
| CME Group, Inc. | 2,039 | 424 |
| Hudson City Bancorp, Inc. | 26,200 | 418 |
| Loews Corp. | 14,500 | 410 |
| Prudential Financial, Inc. | 13,341 | 404 |
| Progressive Corp. of Ohio | 26,900 | 398 |
| The Chubb Corp. | 7,500 | 382 |
| Boston Properties, Inc. REIT | 6,800 | 374 |
| Torchmark Corp. | 8,000 | 358 |
| People’s United | | |
| Financial Inc. | 19,800 | 353 |
| W.R. Berkley Corp. | 11,150 | 346 |
| AMB Property Corp. REIT | 14,400 | 337 |
* | Leucadia National Corp. | 15,900 | 315 |
* | TD Ameritrade Holding Corp. | 21,800 | 311 |
| Plum Creek Timber Co. Inc. | | |
| REIT | 8,900 | 309 |
| The Allstate Corp. | 9,400 | 308 |
* | SLM Corp. | 33,600 | 299 |
| Moody’s Corp. | 14,700 | 295 |
| Discover Financial Services | 28,980 | 276 |
| M & T Bank Corp. | 4,800 | 276 |
| BlackRock, Inc. | 2,050 | 275 |
| Federal Realty | | |
| Investment Trust REIT | 4,400 | 273 |
| Jefferies Group, Inc. | 19,200 | 270 |
| HCC Insurance | | |
| Holdings, Inc. | 9,800 | 262 |
| The Hanover Insurance | | |
| Group Inc. | 6,100 | 262 |
* | Arch Capital Group Ltd. | 3,700 | 259 |
| BancorpSouth, Inc. | 10,900 | 255 |
| Lazard Ltd. Class A | 8,500 | 253 |
| Avalonbay Communities, Inc. | | |
| REIT | 4,100 | 248 |
| Brown & Brown, Inc. | 11,800 | 247 |
| Valley National Bancorp | 12,165 | 246 |
* | Reinsurance Group of | | |
| America, Inc. | 5,624 | 241 |
| Bank of Hawaii Corp. | 5,300 | 239 |
| Commerce Bancshares, Inc. | 5,419 | 238 |
| Janus Capital Group Inc. | 29,434 | 236 |
| Simon Property Group, Inc. | | |
| REIT | 4,400 | 234 |
| Cullen/Frost Bankers, Inc. | 4,600 | 233 |
| SEI Investments Co. | 14,800 | 232 |
| Morgan Stanley | 14,460 | 232 |
| Synovus Financial Corp. | 27,600 | 229 |
14
Tax-Managed Balanced Fund
| | | Market |
| | | Value• |
| | Shares | ($000) |
| City National Corp. | 4,700 | 229 |
| CapitalSource Inc. REIT | 49,129 | 227 |
* | The St. Joe Co. | 9,200 | 224 |
| Jones Lang LaSalle Inc. | 8,000 | 222 |
| Capital One Financial Corp. | 6,900 | 220 |
| Assurant, Inc. | 7,200 | 216 |
| Transatlantic Holdings, Inc. | 5,350 | 214 |
| Apartment Investment & | | |
| Management Co. | | |
| Class A REIT | 18,505 | 214 |
| Allied World Assurance | | |
| Holdings, Ltd. | 5,200 | 211 |
| StanCorp Financial | | |
| Group, Inc. | 5,000 | 209 |
* | CB Richard Ellis Group, Inc. | 47,150 | 204 |
| TFS Financial Corp. | 15,600 | 201 |
| Digital Realty Trust, Inc. REIT | 5,900 | 194 |
| First Citizens BancShares | | |
| Class A | 1,267 | 194 |
* | Markel Corp. | 630 | 188 |
| White Mountains Insurance | | |
| Group Inc. | 690 | 184 |
| Eaton Vance Corp. | 8,600 | 181 |
| American Financial | | |
| Group, Inc. | 7,650 | 175 |
* | AmeriCredit Corp. | 22,500 | 172 |
| Washington Federal Inc. | 11,100 | 166 |
| Wesco Financial Corp. | 570 | 164 |
* | Alleghany Corp. | 580 | 164 |
| BOK Financial Corp. | 4,040 | 163 |
| Raymond James | | |
| Financial, Inc. | 9,250 | 158 |
| Host Hotels & | | |
| Resorts Inc. REIT | 19,475 | 147 |
| Wilmington Trust Corp. | 6,187 | 138 |
| BB&T Corp. | 5,000 | 137 |
| Federated Investors, Inc. | 6,700 | 114 |
| The Principal Financial | | |
| Group, Inc. | 5,000 | 113 |
| BRE Properties Inc. | | |
| Class A REIT | 4,000 | 112 |
* | Tree.com, Inc. | 36,554 | 95 |
| American International | | |
| Group, Inc. | 58,306 | 92 |
| CNA Financial Corp. | 5,400 | 89 |
* | IntercontinentalExchange Inc. | 1,000 | 82 |
* | E*TRADE Financial Corp. | 65,300 | 75 |
| Legg Mason Inc. | 2,850 | 62 |
| MGIC Investment Corp. | 15,600 | 54 |
| RenaissanceRe Holdings Ltd. | 600 | 31 |
| Ameriprise Financial, Inc. | 1,180 | 28 |
* | MSCI, Inc.-Class A Shares | 900 | 16 |
| Astoria Financial Corp. | 900 | 15 |
* | Conseco, Inc. | 2,477 | 13 |
| | | Market |
| | | Value• |
| | Shares | ($000) |
| Taubman Co. REIT | 400 | 10 |
| Developers Diversified | | |
| Realty Corp. REIT | 1,000 | 5 |
| | | 37,729 |
Health Care (7.2%) | | |
| Johnson & Johnson | 86,532 | 5,177 |
| Pfizer Inc. | 198,110 | 3,508 |
| Abbott Laboratories | 50,500 | 2,695 |
* | Amgen Inc. | 38,424 | 2,219 |
* | Gilead Sciences, Inc. | 34,000 | 1,739 |
| Merck & Co., Inc. | 55,500 | 1,687 |
* | Genentech, Inc. | 17,364 | 1,440 |
| UnitedHealth Group Inc. | 48,174 | 1,281 |
| Wyeth | 32,700 | 1,227 |
| Bristol-Myers Squibb Co. | 46,500 | 1,081 |
| Schering-Plough Corp. | 62,500 | 1,064 |
* | Celgene Corp. | 17,000 | 940 |
| Medtronic, Inc. | 29,300 | 921 |
| Eli Lilly & Co. | 20,900 | 842 |
* | WellPoint Inc. | 18,125 | 764 |
* | Medco Health Solutions, Inc. | 17,662 | 740 |
* | Genzyme Corp. | 10,780 | 715 |
| Baxter International, Inc. | 12,700 | 681 |
| Aetna Inc. | 22,913 | 653 |
* | Thermo Fisher Scientific, Inc. | 17,903 | 610 |
| Allergan, Inc. | 14,300 | 577 |
* | Biogen Idec Inc. | 11,960 | 570 |
| Stryker Corp. | 14,049 | 561 |
| Cardinal Health, Inc. | 15,290 | 527 |
| McKesson Corp. | 13,200 | 511 |
* | Express Scripts Inc. | 8,400 | 462 |
| Quest Diagnostics, Inc. | 8,800 | 457 |
| C.R. Bard, Inc. | 4,900 | 413 |
* | Forest Laboratories, Inc. | 16,100 | 410 |
| CIGNA Corp. | 23,900 | 403 |
* | St. Jude Medical, Inc. | 12,168 | 401 |
| AmerisourceBergen Corp. | 10,048 | 358 |
* | Zimmer Holdings, Inc. | 8,470 | 342 |
* | Laboratory Corp. of | | |
| America Holdings | 5,200 | 335 |
| Becton, Dickinson & Co. | 4,684 | 320 |
| Covidien Ltd. | 8,800 | 319 |
| DENTSPL Y International Inc. | 10,900 | 308 |
| Omnicare, Inc. | 10,600 | 294 |
* | King Pharmaceuticals, Inc. | 26,900 | 286 |
* | Mylan Inc. | 27,950 | 276 |
| Pharmaceutical Product | | |
| Development, Inc. | 9,100 | 264 |
* | Humana Inc. | 6,500 | 242 |
* | Varian Medical Systems, Inc. | 6,700 | 235 |
| Beckman Coulter, Inc. | 5,300 | 233 |
| Techne Corp. | 3,500 | 226 |
| Perrigo Co. | 6,800 | 220 |
* | Millipore Corp. | 4,200 | 216 |
15
Tax-Managed Balanced Fund
| | | Market |
| | | Value• |
| | Shares | ($000) |
* | Hospira, Inc. | 8,060 | 216 |
* | Waters Corp. | 5,800 | 213 |
* | Endo Pharmaceuticals | | |
| Holdings, Inc. | 8,200 | 212 |
* | Warner Chilcott Ltd. | 13,900 | 201 |
| Universal Health Services | | |
| Class B | 5,300 | 199 |
* | Henry Schein, Inc. | 5,200 | 191 |
| PerkinElmer, Inc. | 13,300 | 185 |
| IMS Health, Inc. | 11,376 | 172 |
* | Lincare Holdings, Inc. | 5,700 | 153 |
* | Boston Scientific Corp. | 18,300 | 142 |
* | Patterson Companies, Inc. | 6,600 | 124 |
* | Watson Pharmaceuticals, Inc. | 2,600 | 69 |
* | Sepracor Inc. | 4,900 | 54 |
* | Health Net Inc. | 2,900 | 32 |
* | Covance, Inc. | 600 | 28 |
| Teva Pharmaceutical | | |
| Industries Ltd. | | |
| Sponsored ADR | 174 | 7 |
* | Abraxis BioScience | 62 | 4 |
| | | 41,952 |
Industrials (5.4%) | | |
| General Electric Co. | 302,509 | 4,901 |
| United Technologies Corp. | 24,876 | 1,333 |
| 3M Co. | 16,900 | 972 |
| Union Pacific Corp. | 18,318 | 876 |
| General Dynamics Corp. | 15,200 | 875 |
| United Parcel Service, Inc. | 15,200 | 838 |
| The Boeing Co. | 19,420 | 829 |
| FedEx Corp. | 12,800 | 821 |
| Lockheed Martin Corp. | 9,703 | 816 |
| Raytheon Co. | 13,400 | 684 |
| Danaher Corp. | 10,950 | 620 |
| Norfolk Southern Corp. | 12,600 | 593 |
| Waste Management, Inc. | 16,901 | 560 |
| Illinois Tool Works, Inc. | 14,600 | 512 |
| L-3 Communications | | |
| Holdings, Inc. | 6,500 | 479 |
| Emerson Electric Co. | 13,000 | 476 |
| C.H. Robinson | | |
| Worldwide Inc. | 8,269 | 455 |
| CSX Corp. | 13,800 | 448 |
| Caterpillar, Inc. | 10,000 | 447 |
| Precision Castparts Corp. | 7,357 | 438 |
| Fluor Corp. | 9,648 | 433 |
| ITT Industries, Inc. | 9,400 | 432 |
* | Jacobs Engineering | | |
| Group Inc. | 8,400 | 404 |
| Expeditors International of | | |
| Washington, Inc. | 11,500 | 383 |
| Southwest Airlines Co. | 42,418 | 366 |
| Republic Services, Inc. | | |
| Class A | 14,110 | 350 |
| Honeywell International Inc. | 10,600 | 348 |
| | | Market |
| | | Value• |
| | Shares | ($000) |
* | Quanta Services, Inc. | 16,900 | 335 |
| Burlington Northern | | |
| Santa Fe Corp. | 4,338 | 328 |
* | URS Corp. | 7,700 | 314 |
* | Foster Wheeler Ltd. | 13,400 | 313 |
| W.W. Grainger, Inc. | 3,800 | 300 |
| Roper Industries Inc. | 6,700 | 291 |
* | Stericycle, Inc. | 5,500 | 286 |
| Donaldson Co., Inc. | 8,400 | 283 |
| Fastenal Co. | 8,100 | 282 |
| Pall Corp. | 9,800 | 279 |
* | United Rentals, Inc. | 30,481 | 278 |
| Cummins Inc. | 10,224 | 273 |
| Rockwell Collins, Inc. | 6,900 | 270 |
* | Alliant Techsystems, Inc. | 3,144 | 270 |
| UTI Worldwide, Inc. | 18,700 | 268 |
| Flowserve Corp. | 5,200 | 268 |
| Northrop Grumman Corp. | 5,918 | 266 |
| The Dun & Bradstreet Corp. | 3,400 | 262 |
| Ametek, Inc. | 8,650 | 261 |
| Landstar System, Inc. | 6,625 | 255 |
* | Iron Mountain, Inc. | 10,175 | 252 |
* | Owens Corning Inc. | 14,530 | 251 |
* | Thomas & Betts Corp. | 10,400 | 250 |
| Valmont Industries, Inc. | 4,000 | 245 |
| Copa Holdings SA Class A | 8,000 | 242 |
| The Manitowoc Co., Inc. | 27,200 | 235 |
| J.B. Hunt Transport | | |
| Services, Inc. | 8,800 | 231 |
| The Toro Co. | 7,000 | 231 |
* | WESCO International, Inc. | 12,000 | 231 |
| Equifax, Inc. | 8,700 | 231 |
| IDEX Corp. | 9,500 | 229 |
| Trinity Industries, Inc. | 14,180 | 223 |
| Bucyrus International, Inc. | 12,000 | 222 |
* | AGCO Corp. | 9,200 | 217 |
* | Gardner Denver Inc. | 8,947 | 209 |
* | USG Corp. | 24,800 | 199 |
| MSC Industrial | | |
| Direct Co., Inc. Class A | 5,400 | 199 |
| Armstrong Worldwide | | |
| Industries, Inc. | 9,100 | 197 |
| SPX Corp. | 4,700 | 191 |
* | Spirit Aerosystems | | |
| Holdings Inc. | 18,600 | 189 |
| Robert Half | | |
| International, Inc. | 8,200 | 171 |
| Pentair, Inc. | 6,800 | 161 |
| Manpower Inc. | 4,300 | 146 |
| Graco, Inc. | 5,900 | 140 |
| The Brink’s Co. | 4,300 | 116 |
| Cintas Corp. | 4,550 | 106 |
| Deere & Co. | 2,500 | 96 |
| Ryder System, Inc. | 1,400 | 54 |
| Carlisle Co., Inc. | 1,400 | 29 |
16
Tax-Managed Balanced Fund
| | | Market |
| | | Value• |
| | Shares | ($000) |
| PACCAR, Inc. | 900 | 26 |
| Ingersoll-Rand Co. | 989 | 17 |
| John Bean | | |
| Technologies Corp. | 1,326 | 11 |
* | Avis Budget Group, Inc. | 393 | — |
| | | 31,918 |
Information Technology (7.6%) | | |
| Microsoft Corp. | 247,200 | 4,806 |
| International Business | | |
| Machines Corp. | 41,147 | 3,463 |
* | Cisco Systems, Inc. | 203,000 | 3,309 |
| Hewlett-Packard Co. | 85,012 | 3,085 |
* | Apple Inc. | 30,413 | 2,596 |
* | Google Inc. | 8,320 | 2,560 |
* | Oracle Corp. | 137,000 | 2,429 |
| Intel Corp. | 159,300 | 2,335 |
| QUALCOMM Inc. | 57,900 | 2,075 |
| Visa Inc. | 17,900 | 939 |
* | EMC Corp. | 84,400 | 884 |
| Texas Instruments, Inc. | 53,400 | 829 |
| Accenture Ltd. | 24,840 | 814 |
* | Dell Inc. | 74,500 | 763 |
* | eBay Inc. | 49,100 | 685 |
| Automatic Data | | |
| Processing, Inc. | 16,600 | 653 |
| Corning, Inc. | 67,200 | 640 |
| Applied Materials, Inc. | 61,751 | 625 |
* | Yahoo! Inc. | 49,400 | 603 |
| Western Union Co. | 37,714 | 541 |
| MasterCard, Inc. Class A | 3,580 | 512 |
* | Symantec Corp. | 31,262 | 423 |
| CA, Inc. | 21,130 | 391 |
* | Adobe Systems, Inc. | 17,000 | 362 |
* | Intuit, Inc. | 13,800 | 328 |
| Altera Corp. | 19,600 | 327 |
| Amphenol Corp. | 13,500 | 324 |
| Xerox Corp. | 40,600 | 324 |
| Xilinx, Inc. | 15,600 | 278 |
* | Fiserv, Inc. | 7,625 | 277 |
* | BMC Software, Inc. | 10,100 | 272 |
| Fidelity National Information | | |
| Services, Inc. | 16,400 | 267 |
| Paychex, Inc. | 9,850 | 259 |
* | Affiliated Computer | | |
| Services, Inc. Class A | 5,300 | 243 |
| Global Payments Inc. | 7,300 | 239 |
* | Broadcom Corp. | 13,350 | 227 |
| National | | |
| Semiconductor Corp. | 22,100 | 222 |
| Analog Devices, Inc. | 11,434 | 217 |
* | Citrix Systems, Inc. | 9,200 | 217 |
* | Agilent Technologies, Inc. | 13,144 | 205 |
* | Computer Sciences Corp. | 5,700 | 200 |
* | Autodesk, Inc. | 9,400 | 185 |
| | | Market |
| | | Value• |
| | Shares | ($000) |
* | Mettler-Toledo | | |
| International Inc. | 2,700 | 182 |
| Linear Technology Corp. | 8,200 | 181 |
* | NetApp, Inc. | 12,912 | 180 |
* | Compuware Corp. | 26,600 | 180 |
| Microchip Technology, Inc. | 8,800 | 172 |
* | Ingram Micro, Inc. Class A | 12,100 | 162 |
* | NVIDIA Corp. | 19,900 | 161 |
| AVX Corp. | 19,200 | 152 |
* | Avnet, Inc. | 8,100 | 147 |
| KLA-Tencor Corp. | 6,500 | 142 |
* | Arrow Electronics, Inc. | 7,500 | 141 |
* | LAM Research Corp. | 6,500 | 138 |
* | DST Systems, Inc. | 3,600 | 137 |
* | Electronic Arts Inc. | 8,143 | 131 |
* | Teradata Corp. | 8,336 | 124 |
| Molex, Inc. | 8,466 | 123 |
* | Lexmark International, Inc. | 4,500 | 121 |
* | NCR Corp. | 8,336 | 118 |
| Total System Services, Inc. | 7,400 | 104 |
| Intersil Corp. | 10,800 | 99 |
* | Tellabs, Inc. | 22,600 | 93 |
* | Synopsys, Inc. | 4,800 | 89 |
| Lender Processing | | |
| Services, Inc. | 2,750 | 81 |
| Harris Corp. | 2,100 | 80 |
* | Western Digital Corp. | 4,800 | 55 |
| Broadridge Financial | | |
| Solutions LLC | 4,275 | 54 |
* | LSI Corp. | 14,400 | 47 |
* | IAC/InterActiveCorp | 2,350 | 37 |
* | Integrated Device | | |
| Technology Inc. | 6,200 | 35 |
* | Teradyne, Inc. | 8,000 | 34 |
* | Advanced Micro | | |
| Devices, Inc. | 15,000 | 32 |
* | ADC | | |
| Telecommunications, Inc. | 5,528 | 30 |
* | Sun Microsystems, Inc. | 7,313 | 28 |
* | EchoStar Corp. | 1,751 | 26 |
* | Metavante Technologies | 1,600 | 26 |
* | Tech Data Corp. | 1,400 | 25 |
* | Convergys Corp. | 3,100 | 20 |
* | Novellus Systems, Inc. | 1,000 | 12 |
* | Seagate Technology Inc.– | | |
| Escrow | 6,090 | — |
| | | 44,632 |
Materials (1.7%) | | |
| Monsanto Co. | 20,108 | 1,415 |
| Newmont Mining Corp. | | |
| (Holding Co.) | 19,989 | 814 |
| Praxair, Inc. | 11,500 | 683 |
| Nucor Corp. | 10,400 | 480 |
17
Tax-Managed Balanced Fund
| | | Market |
| | | Value• |
| | Shares | ($000) |
| E.I. du Pont de | | |
| Nemours & Co. | 16,900 | 428 |
| The Mosaic Co. | 11,100 | 384 |
| Ecolab, Inc. | 10,000 | 352 |
| Sigma-Aldrich Corp. | 7,700 | 325 |
| Ball Corp. | 7,600 | 316 |
| Airgas, Inc. | 7,900 | 308 |
* | Crown Holdings, Inc. | 15,800 | 303 |
* | Owens-Illinois, Inc. | 11,059 | 302 |
| FMC Corp. | 6,700 | 300 |
| Schnitzer Steel | | |
| Industries, Inc. Class A | 7,800 | 294 |
* | Pactiv Corp. | 11,700 | 291 |
| Cliffs Natural Resources Inc. | 11,300 | 289 |
| CF Industries Holdings, Inc. | 5,400 | 265 |
| Celanese Corp. Series A | 21,000 | 261 |
* | Century Aluminum Co. | 26,100 | 261 |
| Nalco Holding Co. | 21,100 | 244 |
| Martin Marietta | | |
| Materials, Inc. | 2,286 | 222 |
| Dow Chemical Co. | 13,500 | 204 |
| Scotts Miracle-Gro Co. | 6,200 | 184 |
| Sealed Air Corp. | 11,800 | 176 |
| Reliance Steel & | | |
| Aluminum Co. | 8,500 | 169 |
| Alcoa Inc. | 14,588 | 164 |
| United States Steel Corp. | 4,300 | 160 |
| Freeport-McMoRan Copper | | |
| & Gold, Inc. Class B | 6,387 | 156 |
| Ashland, Inc. | 12,300 | 129 |
| Steel Dynamics, Inc. | 9,800 | 110 |
| Albemarle Corp. | 2,000 | 45 |
| Allegheny Technologies Inc. | 977 | 25 |
| Vulcan Materials Co. | 334 | 23 |
| Air Products & | | |
| Chemicals, Inc. | 400 | 20 |
| | | 10,102 |
Telecommunication Services (1.8%) | | |
| AT&T Inc. | 191,166 | 5,448 |
| Verizon Communications Inc. | 80,400 | 2,726 |
* | American Tower Corp. | | |
| Class A | 19,200 | 563 |
* | Crown Castle | | |
| International Corp. | 20,400 | 359 |
| Embarq Corp. | 6,858 | 247 |
| CenturyTel, Inc. | 8,275 | 226 |
* | SBA Communications Corp. | 13,400 | 219 |
* | U.S. Cellular Corp. | 4,950 | 214 |
| Telephone & | | |
| Data Systems, Inc. | 5,500 | 175 |
* | Leap Wireless | | |
| International, Inc. | 5,000 | 134 |
| Qwest Communications | | |
| International Inc. | 24,230 | 88 |
| | | Market |
| | | Value• |
| | Shares | ($000) |
| Telephone & | | |
| Data Systems, Inc.– | | |
| Special Common Shares | 3,000 | 84 |
| Windstream Corp. | 7,139 | 66 |
* | Clearwire Corp. | 13,175 | 65 |
* | Sprint Nextel Corp. | 30,868 | 56 |
| Frontier | | |
| Communications Corp. | 937 | 8 |
* | ESC Telecorp PCS | 11,488 | — |
| | | 10,678 |
Utilities (2.2%) | | |
| Exelon Corp. | 23,500 | 1,307 |
| FPL Group, Inc. | 16,600 | 835 |
| Entergy Corp. | 8,000 | 665 |
| FirstEnergy Corp. | 12,800 | 622 |
| PG&E Corp. | 15,400 | 596 |
| Southern Co. | 14,600 | 540 |
| Duke Energy Corp. | 33,992 | 510 |
| PPL Corp. | 16,500 | 506 |
| Sempra Energy | 11,867 | 506 |
| Edison International | 15,700 | 504 |
| Questar Corp. | 11,776 | 385 |
* | NRG Energy, Inc. | 15,600 | 364 |
| Allegheny Energy, Inc. | 10,011 | 339 |
* | AES Corp. | 40,600 | 335 |
| Equitable Resources, Inc. | 9,400 | 315 |
| Wisconsin Energy Corp. | 7,500 | 315 |
| MDU Resources Group, Inc. | 13,850 | 299 |
| Dominion Resources, Inc. | 8,308 | 298 |
* | Mirant Corp. | 15,454 | 292 |
| NSTAR | 7,900 | 288 |
| SCANA Corp. | 7,800 | 278 |
* | Reliant Energy, Inc. | 47,900 | 277 |
| Aqua America, Inc. | 13,200 | 272 |
| Northeast Utilities | 11,100 | 267 |
| NV Energy Inc. | 26,717 | 264 |
| Energen Corp. | 8,300 | 243 |
| CMS Energy Corp. | 24,001 | 242 |
| Integrys Energy Group, Inc. | 5,400 | 232 |
| CenterPoint Energy Inc. | 18,191 | 230 |
* | Calpine Corp. | 29,900 | 218 |
| American | | |
| Water Works Co., Inc. | 9,800 | 205 |
| Public Service Enterprise | | |
| Group, Inc. | 5,564 | 162 |
| Constellation Energy | | |
| Group, Inc. | 1,235 | 31 |
| NiSource, Inc. | 1,077 | 12 |
* | Dynegy, Inc. | 2,300 | 5 |
| | | 12,759 |
Total Common Stocks (Cost $255,829) | | 284,682 |
18
Tax-Managed Balanced Fund
| | | | Face | Market |
| | Maturity | | Amount | Value• |
| Coupon | Date | | ($000) | ($000) |
Tax-Exempt Municipal Bonds (50.8%) | | | | | |
Alaska (0.3%) | | | | | |
Matanuska-Susitna Borough AK GO | 5.500% | 3/1/12 | (1) | 1,695 | 1,780 |
| | | | | |
Arizona (3.2%) | | | | | |
Arizona Transp. Board Highway Rev. | 5.250% | 7/1/12 | (Prere.) | 1,965 | 2,187 |
Arizona Transp. Board Highway Rev. | 5.250% | 7/1/17 | | 2,215 | 2,353 |
Glendale AZ Trans. Excise Tax Rev. | 5.000% | 7/1/23 | (1) | 4,585 | 4,621 |
Phoenix AZ Civic Improvement Corp. | | | | | |
Water System Rev. | 5.500% | 7/1/15 | (1) | 5,525 | 5,893 |
Salt Verde Arizona Financial Project Rev. | 5.250% | 12/1/24 | | 5,000 | 3,515 |
| | | | | 18,569 |
California (2.5%) | | | | | |
California Public Works Board Lease Rev. | | | | | |
(Dept. of Corrections) | 5.000% | 9/1/11 | (2) | 1,535 | 1,554 |
California State Dept. of | | | | | |
Water Resources Power Supply Rev. | 5.500% | 5/1/14 | (2) | 4,065 | 4,350 |
California State Dept. of | | | | | |
Water Resources Power Supply Rev. | 5.500% | 5/1/15 | (2) | 3,000 | 3,193 |
Long Beach CA USD GO | 0.000% | 8/1/28 | (12) | 3,620 | 1,157 |
Los Angeles CA USD GO | 5.000% | 7/1/21 | (4) | 1,825 | 1,897 |
Oakland CA Redev. Agency (Central Dist.) | 5.000% | 9/1/21 | (2) | 3,000 | 2,385 |
| | | | | 14,536 |
Colorado (2.3%) | | | | | |
Colorado Dept. of Transp. Rev. | 5.250% | 12/15/13 | (2)(Prere.) | 3,750 | 4,301 |
Colorado Springs CO Util. System Rev. | 5.375% | 11/15/13 | | 2,775 | 2,949 |
E-470 Public Highway Auth. Colorado Rev. | 5.250% | 9/1/18 | (1) | 1,500 | 1,370 |
Univ. of Colorado Enterprise System Rev. | 5.000% | 6/1/23 | (1) | 5,025 | 4,845 |
| | | | | 13,465 |
Florida (2.7%) | | | | | |
Florida Board of Educ. Rev. (Lottery Rev.) | 5.000% | 7/1/16 | (2) | 5,000 | 5,380 |
Florida Hurricane Catastrophe Fund | | | | | |
Finance Corp. Rev. | 5.000% | 7/1/12 | | 3,565 | 3,637 |
Florida Turnpike Auth. Rev. | 5.250% | 7/1/09 | (1) | 485 | 492 |
Florida Turnpike Auth. Rev. | 5.250% | 7/1/10 | (1) | 825 | 835 |
Jacksonville FL Health Fac. Auth. Hosp. Rev. | | | | | |
VRDO | 1.100% | 1/2/09 | LOC | 1,900 | 1,900 |
Orange County FL Educ. Fac. Auth. Rev. | | | | | |
(Rollins College) VRDO | 1.100% | 1/2/09 | LOC | 300 | 300 |
Seminole County FL Water & Sewer Rev. | 5.000% | 10/1/23 | | 2,435 | 2,436 |
Tampa FL Health System Rev. | | | | | |
(Catholic Healthcare East) | 5.000% | 11/15/09 | (1) | 1,000 | 1,008 |
| | | | | 15,988 |
Georgia (1.1%) | | | | | |
Atlanta GA Airport Fac. Rev. | 5.750% | 1/1/13 | (1) | 3,370 | 3,484 |
Georgia Muni. Electric Power Auth. Rev. | 6.250% | 1/1/12 | (1) | 3,000 | 3,297 |
| | | | | 6,781 |
Hawaii (1.3%) | | | | | |
Hawaii GO | 5.875% | 10/1/10 | (1)(Prere.) | 1,870 | 2,015 |
Honolulu HI City & County GO | 5.000% | 7/1/19 | (4) | 2,000 | 2,128 |
Honolulu HI City & County GO | 5.000% | 7/1/20 | (4) | 3,205 | 3,352 |
| | | | | 7,495 |
19
Tax-Managed Balanced Fund
| | | Face | Market |
| | Maturity | Amount | Value• |
| Coupon | Date | ($000) | ($000) |
Illinois (1.0%) | | | | |
Chicago IL (City Colleges Improvement) GO | 0.000% | 1/1/12 (1) | 2,380 | 2,157 |
Illinois Sales Tax Rev. | 0.000% | 12/15/16 (2) | 5,000 | 3,562 |
| | | | 5,719 |
Indiana (1.2%) | | | | |
Indiana Health Fac. Auth. Finance Auth. Rev. | | | | |
(Clarian Health Obligation Group) | 5.000% | 2/15/25 | 3,290 | 2,419 |
Indiana Muni. Power Agency Rev. | 5.250% | 1/1/15 (1) | 4,440 | 4,688 |
| | | | 7,107 |
Louisiana (1.0%) | | | | |
Louisiana GO | 5.500% | 5/15/15 (1) | 2,665 | 2,790 |
Louisiana Public Fac. Auth. Rev. (Ochsner Clinic) | 5.000% | 5/15/16 | 3,260 | 3,056 |
| | | | 5,846 |
Maryland (0.6%) | | | | |
Baltimore MD Consolidated Public | | | | |
Improvement GO | 5.000% | 10/15/18 (2) | 1,365 | 1,453 |
Baltimore MD Consolidated Public | | | | |
Improvement GO | 5.000% | 10/15/19 (2) | 2,185 | 2,296 |
| | | | 3,749 |
Massachusetts (3.3%) | | | | |
Chelsea MA GO | 5.500% | 6/15/12 (2) | 735 | 745 |
Massachusetts Bay Transp. Auth. Rev. | 5.125% | 3/1/09 (Prere.) | 1,695 | 1,724 |
Massachusetts Bay Transp. Auth. Rev. | 5.500% | 7/1/25 (1) | 2,045 | 2,231 |
Massachusetts Bay Transp. Auth. Rev. | 5.500% | 7/1/26 (1) | 3,500 | 3,805 |
Massachusetts GO | 5.500% | 11/1/13 (1) | 2,000 | 2,263 |
Massachusetts Health & Educ. Fac. Auth. Rev. | | | | |
(Caregroup) | 5.000% | 7/1/28 | 2,000 | 1,382 |
Massachusetts Health & Educ. Fac. Auth. Rev. | | | | |
(Caritas Christi Obligated Group) | 6.500% | 7/1/12 | 1,880 | 1,905 |
Massachusetts Health & Educ. Fac. Auth. Rev. | | | | |
(Northeastern Univ.) | 5.000% | 10/1/17 (1) | 1,000 | 1,012 |
Massachusetts Water Pollution Abatement Trust | 5.250% | 8/1/21 | 1,805 | 1,963 |
Massachusetts Water Resources Auth. Rev. | 5.000% | 8/1/21 (2) | 2,135 | 2,208 |
| | | | 19,238 |
Michigan (1.6%) | | | | |
Mason MI Public School Dist. | | | | |
(School Building & Site) GO | 5.250% | 5/1/17 (4) | 1,850 | 2,019 |
Michigan Hosp. Finance Auth. Rev. | | | | |
(Ascension Health) PUT | 5.000% | 11/1/12 | 4,735 | 4,866 |
Michigan Muni. Bond Auth. Rev. | | | | |
(Clean Water Revolving Fund) | 5.875% | 10/1/10 (Prere.) | 2,110 | 2,285 |
| | | | 9,170 |
Minnesota (0.0%) | | | | |
Minnesota GO | 5.000% | 6/1/12 | 30 | 33 |
| | | | |
Mississippi (0.9%) | | | | |
Mississippi GO | 5.500% | 12/1/18 | 2,750 | 3,093 |
Mississippi GO | 5.500% | 12/1/19 | 2,000 | 2,243 |
| | | | 5,336 |
20
Tax-Managed Balanced Fund
| | | Face | Market |
| | Maturity | Amount | Value• |
| Coupon | Date | ($000) | ($000) |
Missouri (2.2%) | | | | |
Curators of the Univ. of Missouri System Fac. Rev. | 5.000% | 11/1/26 | 4,410 | 4,445 |
Missouri Health & Educ. Fac. Auth. | | | | |
(Washington Univ.) | 6.000% | 3/1/10 (Prere.) | 4,000 | 4,266 |
Missouri Health & Educ. Fac. Auth. Health Fac. Rev. | | | | |
(St. Luke’s Episcopal–Presbyterian Hosp.) | 5.500% | 12/1/15 (4) | 2,965 | 3,047 |
Missouri Highways & Transp. Comm. Road Rev. | 5.000% | 5/1/19 | 1,225 | 1,351 |
| | | | 13,109 |
Nevada (0.9%) | | | | |
Clark County NV School Dist. GO | 5.000% | 6/15/18 | 5,190 | 5,513 |
| | | | |
New Jersey (1.7%) | | | | |
New Jersey Transp. Corp. COP | 5.500% | 9/15/11 (2) | 3,000 | 3,122 |
New Jersey Transp. Trust Fund Auth. Rev. | 6.000% | 12/15/11 (1)(Prere.) | 625 | 704 |
New Jersey Transp. Trust Fund Auth. Rev. | 6.000% | 12/15/11 (1)(Prere.) | 330 | 372 |
New Jersey Transp. Trust Fund Auth. Rev. | 6.000% | 12/15/11 (1)(Prere.) | 1,440 | 1,623 |
New Jersey Transp. Trust Fund Auth. Rev. | 5.500% | 12/15/20 (1) | 4,000 | 4,184 |
| | | | 10,005 |
New York (6.6%) | | | | |
Erie County NY GO | 6.125% | 1/15/11 (1) | 610 | 649 |
Hempstead NY GO | 5.625% | 2/1/11 (3) | 685 | 687 |
Huntington NY GO | 6.700% | 2/1/10 (1) | 375 | 397 |
Long Island NY Power Auth. Electric System Rev. | 5.500% | 12/1/11 (2) | 3,000 | 3,202 |
Long Island NY Power Auth. Electric System Rev. | 5.500% | 12/1/12 (4)(ETM) | 2,000 | 2,256 |
Metro. New York Transp. Auth. Rev. | | | | |
(Dedicated Petroleum Tax) | 6.125% | 4/1/10 (3)(Prere.) | 2,110 | 2,243 |
New York City NY GO VRDO | 1.500% | 1/2/09 | 300 | 300 |
New York City NY Transitional Finance Auth. Rev. | 5.375% | 2/1/13 | 2,000 | 2,182 |
New York State Dormitory Auth. Rev. | | | | |
(Vassar Brothers Hosp.) | 5.100% | 7/1/10 (4) | 1,500 | 1,519 |
New York State Dormitory Auth. Rev. | | | | |
Non State Supported Debt | | | | |
(Mount Sinai School of Medicine of New | 5.000% | 7/1/23 (1) | 4,000 | 3,915 |
New York State Dormitory Auth. Rev. | | | | |
Non State Supported Debt | | | | |
(Mount Sinai School of Medicine of New | 5.000% | 7/1/24 (1) | 3,800 | 3,680 |
New York State Thruway Auth. Rev. | 5.000% | 1/1/21 (1) | 8,490 | 8,663 |
New York State Thruway Auth. Rev. | | | | |
(Service Contract) | 5.500% | 4/1/14 | 4,000 | 4,282 |
New York State Urban Dev. Corp. Rev. | | | | |
(Personal Income Tax) GO | 5.500% | 3/15/22 (1) | 2,030 | 2,227 |
Port Auth. of New York & | | | | |
New Jersey Special Obligation Rev. | | | | |
(Versatile Structure) VRDO | 0.950% | 1/2/09 | 2,600 | 2,600 |
| | | | 38,802 |
North Carolina (0.8%) | | | | |
North Carolina Eastern Muni. Power Agency Rev. | 5.125% | 1/1/14 | 2,400 | 2,390 |
North Carolina Infrastructure Financial Corp. | | | | |
COP Capital Improvements | 5.000% | 2/1/21 (4) | 2,000 | 2,066 |
| | | | 4,456 |
21
Tax-Managed Balanced Fund
| | | Face | Market |
| | Maturity | Amount | Value• |
| Coupon | Date | ($000) | ($000) |
Ohio (4.7%) | | | | |
Allen County OH Hosp. Fac. Rev. | | | | |
(Catholic Healthcare) VRDO | 1.000% | 1/2/09 LOC | 3,500 | 3,500 |
Buckeye OH Tobacco Settlement | | | | |
Financing Corp. Rev. | 5.125% | 6/1/24 | 1,545 | 1,027 |
Cleveland OH Public Power System Rev. | 5.000% | 11/15/20 (1) | 5,000 | 5,016 |
Lorain County OH Hosp. Fac. Rev. | | | | |
(Catholic Healthcare Partners) | 5.625% | 9/1/13 (1) | 1,775 | 1,796 |
Ohio Common Schools GO VRDO | 0.300% | 1/7/09 | 300 | 300 |
Ohio Higher Educ. Fac. Comm. Rev. | | | | |
(Kenyon College) VRDO | 1.200% | 1/2/09 | 2,000 | 2,000 |
Ohio Mental Health Capital Fac. Rev. | 5.000% | 8/1/11 (2) | 4,190 | 4,329 |
Ohio State Conservation Projects GO | 5.000% | 3/1/17 | 3,885 | 4,172 |
Ohio Water Dev. Auth. PCR | 5.000% | 6/1/17 | 5,000 | 5,405 |
| | | | 27,545 |
Oregon (0.4%) | | | | |
Oregon State Dept. Administrative Services | 5.750% | 4/1/09 (4)(Prere.) | 2,400 | 2,455 |
| | | | |
Pennsylvania (0.9%) | | | | |
Pennsylvania Turnpike Comm. | | | | |
Oil Franchise Tax Rev. | 5.250% | 12/1/09 (2)(ETM) | 420 | 426 |
Pennsylvania Turnpike Comm. | | | | |
Oil Franchise Tax Rev. | 5.250% | 12/1/09 (2) | 195 | 197 |
Pennsylvania Turnpike Comm. | | | | |
Oil Franchise Tax Rev. | 5.250% | 12/1/11 (2)(ETM) | 310 | 314 |
Pennsylvania Turnpike Comm. | | | | |
Oil Franchise Tax Rev. | 5.250% | 12/1/11 (2) | 30 | 30 |
Philadelphia PA School Dist. GO | 5.000% | 8/1/20 (2) | 3,500 | 3,520 |
Philadelphia PA Water & Waste Water Rev. | 6.250% | 8/1/09 (1) | 1,000 | 1,023 |
| | | | 5,510 |
Puerto Rico (1.0%) | | | | |
Puerto Rico Public Buildings Auth. Govt. Fac. Rev. | 5.250% | 7/1/14 (3) | 2,425 | 2,280 |
Puerto Rico Public Finance Corp. | 6.000% | 8/1/26 (4)(ETM) | 3,000 | 3,523 |
| | | | 5,803 |
South Carolina (1.5%) | | | | |
Piedmont SC Muni. Power Agency Rev. | 0.000% | 1/1/24 (1) | 4,000 | 1,400 |
South Carolina Jobs Econ. Dev. Auth. | | | | |
Hosp. Facs. Rev. (Palmetto Health) | 5.250% | 8/1/24 (4) | 1,700 | 1,528 |
South Carolina Transp. Infrastructure Rev. | 5.250% | 10/1/13 (2) | 5,700 | 6,129 |
| | | | 9,057 |
Tennessee (1.1%) | | | | |
Tennessee Energy Acquisition Corp. Gas Rev. | 5.000% | 9/1/16 | 7,500 | 6,222 |
| | | | |
Texas (3.8%) | | | | |
Austin TX Water & Wastewater System Rev. | 5.750% | 5/15/10 (1)(Prere.) | 2,200 | 2,335 |
Dallas TX Civic Center Refunding & | | | | |
Improvement Rev. | 4.600% | 8/15/09 (1) | 110 | 111 |
Dallas TX Civic Center Refunding & | | | | |
Improvement Rev. | 4.700% | 8/15/10 (1) | 815 | 825 |
Harris County TX Rev. | 5.000% | 8/15/22 | 3,005 | 3,025 |
North Harris County TX Regional Water Auth. Rev. | 5.125% | 12/15/25 | 3,000 | 2,874 |
22
Tax-Managed Balanced Fund
| | | Face | Market |
| | Maturity | Amount | Value• |
| Coupon | Date | ($000) | ($000) |
San Antonio TX Electric & Gas Rev. | 5.000% | 2/1/21 | 3,405 | 3,505 |
San Antonio TX Muni. Drain Util. System Rev. | 5.250% | 2/1/27 (1) | 3,635 | 3,644 |
San Antonio TX Water Rev. | 6.500% | 5/15/10 (1)(ETM) | 50 | 51 |
Southwest Texas Higher Educ. Auth. Inc. Rev. | | | | |
(Southern Methodist Univ.) | 5.000% | 10/1/16 (2) | 5,260 | 5,806 |
| | | | 22,176 |
Virginia (0.7%) | | | | |
Virginia Commonwealth Transp. Board Transp. Rev. | | | | |
(U.S. Route 58 Corridor) | 5.000% | 5/15/24 | 955 | 981 |
Virginia Public Building Auth. Rev. | 5.000% | 8/1/24 | 1,090 | 1,122 |
Virginia Public School Auth. Rev. | 5.000% | 8/1/20 | 2,000 | 2,142 |
| | | | 4,245 |
Washington (0.7%) | | | | |
Port of Seattle WA Rev. | 5.000% | 3/1/20 (1) | 3,000 | 3,027 |
Washington GO | 6.000% | 6/1/12 | 1,000 | 1,116 |
| | | | 4,143 |
Wisconsin (0.8%) | | | | |
Wisconsin GO | 5.750% | 5/1/11 (Prere.) | 1,355 | 1,483 |
Wisconsin GO | 5.750% | 5/1/11 (Prere.) | 1,340 | 1,466 |
Wisconsin GO | 5.000% | 5/1/22 | 1,560 | 1,619 |
| | | | 4,568 |
Total Tax-Exempt Municipal Bonds (Cost $303,958) | | | | 298,421 |
Total Investments (99.3%) (Cost $559,787) | | | | 583,103 |
Other Assets and Liabilities (0.7%) | | | | |
Other Assets | | | | 6,315 |
Liabilities | | | | (2,139) |
| | | | 4,176 |
Net Assets (100%) | | | | |
Applicable to 36,265,095 outstanding $.001 par value shares of | | | |
beneficial interest (unlimited authorization) | | | | 587,279 |
Net Asset Value Per Share | | | | $16.19 |
At December 31, 2008, net assets consisted of: | |
| Amount |
| ($000) |
Paid-in Capital | 602,821 |
Overdistributed Net Investment Income | (1,099) |
Accumulated Net Realized Losses | (37,759) |
Unrealized Appreciation (Depreciation) | 23,316 |
Net Assets | 587,279 |
• | See Note A in Notes to Financial Statements. |
* | Non-income-producing security. |
See accompanying Notes, which are an integral part of the Financial Statements.
A key to abbreviations and other references follows the Statement of Net Assets.
23
Tax-Managed Balanced Fund
Key to Abbreviations
ADR—American Depositary Receipt. |
ARS—Auction Rate Security. |
BAN—Bond Anticipation Note. |
COP—Certificate of Participation. |
CP—Commercial Paper. |
FR—Floating Rate. |
GAN—Grant Anticipation Note. |
GO—General Obligation Bond. |
IDA—Industrial Development Authority Bond. |
IDR—Industrial Development Revenue Bond. |
PCR—Pollution Control Revenue Bond. |
PUT—Put Option Obligation. |
RAN—Revenue Anticipation Note. |
REIT—Real Estate Investment Trust. |
TAN—Tax Anticipation Note. |
TOB—Tender Option Bond. |
TRAN—Tax Revenue Anticipation Note. |
UFSD—Union Free School District. |
USD—United School District. |
VRDO—Variable Rate Demand Obligation. |
(ETM)—Escrowed to Maturity. |
(Prere.)—Prerefunded. |
Scheduled principal and interest payments are guaranteed by: |
(1) MBIA (Municipal Bond Insurance Association). |
(2) AMBAC (Ambac Assurance Corporation). |
(3) FGIC (Financial Guaranty Insurance Company). |
(4) FSA (Financial Security Assurance). |
(5) BIGI (Bond Investors Guaranty Insurance). |
(6) Connie Lee Inc. |
(7) FHA (Federal Housing Authority). |
(8) CapMAC (Capital Markets Assurance Corporation). |
(9) American Capital Access Financial Guaranty Corporation. |
(10) XL Capital Assurance Inc. |
(11) CIFG (CDC IXIS Financial Guaranty). |
(12) Assured Guaranty Corp. |
(13) National Indemnity Co. (Berkshire Hathaway). |
The insurance does not guarantee the market value of the municipal bonds. |
LOC—Scheduled principal and interest payments are guaranteed by bank letter of credit.
24
Tax-Managed Balanced Fund
Statement of Operations
| Year Ended |
| December 31, 2008 |
| ($000) |
Investment Income | |
Income | |
Dividends | 5,892 |
Interest | 15,234 |
Security Lending | 11 |
Total Income | 21,137 |
Expenses | |
The Vanguard Group—Note B | |
Investment Advisory Services | 77 |
Management and Administrative | 628 |
Marketing and Distribution | 131 |
Custodian Fees | 3 |
Auditing Fees | 22 |
Shareholders’ Reports | 11 |
Trustees’ Fees and Expenses | 1 |
Total Expenses | 873 |
Expenses Paid Indirectly | (14) |
Net Expenses | 859 |
Net Investment Income | 20,278 |
Realized Net Gain (Loss) on Investment Securities Sold | (21,093) |
Change in Unrealized Appreciation (Depreciation) of Investment Securities | (133,875) |
Net Increase (Decrease) in Net Assets Resulting from Operations | (134,690) |
See accompanying Notes, which are an integral part of the Financial Statements.
25
Tax-Managed Balanced Fund
Statement of Changes in Net Assets
| Year Ended December 31, |
| 2008 | 2007 |
| ($000) | ($000) |
Increase (Decrease) in Net Assets | | |
Operations | | |
Net Investment Income | 20,278 | 20,068 |
Realized Net Gain (Loss) | (21,093) | 11,106 |
Change in Unrealized Appreciation (Depreciation) | (133,875) | 3,271 |
Net Increase (Decrease) in Net Assets Resulting from Operations | (134,690) | 34,445 |
Distributions | | |
Net Investment Income | (20,382) | (20,228) |
Realized Capital Gain | — | — |
Total Distributions | (20,382) | (20,228) |
Capital Share Transactions | | |
Issued | 74,123 | 74,389 |
Issued in Lieu of Cash Distributions | 17,178 | 16,991 |
Redeemed1 | (70,789) | (45,918) |
Net Increase (Decrease) from Capital Share Transactions | 20,512 | 45,462 |
Total Increase (Decrease) | (134,560) | 59,679 |
Net Assets | | |
Beginning of Period | 721,839 | 662,160 |
End of Period2 | 587,279 | 721,839 |
1 Net of redemption fees for 2008 and 2007 of $266,000 and $131,000, respectively.
2 Net Assets—End of Period includes undistributed (overdistributed) net investment income of ($1,099,000) and ($995,000).
See accompanying Notes, which are an integral part of the Financial Statements.
26
Tax-Managed Balanced Fund
Financial Highlights
For a Share Outstanding | Year Ended December 31, |
Throughout Each Period | 2008 | 2007 | 2006 | 2005 | 2004 |
Net Asset Value, Beginning of Period | $20.45 | $20.02 | $18.88 | $18.49 | $17.72 |
Investment Operations | | | | | |
Net Investment Income | .565 | .588 | .540 | .496 | .480 |
Net Realized and Unrealized Gain (Loss) | | | | | |
on Investments1 | (4.260) | .430 | 1.150 | .380 | .770 |
Total from Investment Operations | (3.695) | 1.018 | 1.690 | .876 | 1.250 |
Distributions | | | | | |
Dividends from Net Investment Income2 | (.565) | (.588) | (.550) | (.486) | (.480) |
Distributions from Realized Capital Gains | — | — | — | — | — |
Total Distributions | (.565) | (.588) | (.550) | (.486) | (.480) |
Net Asset Value, End of Period | $16.19 | $20.45 | $20.02 | $18.88 | $18.49 |
| | | | | |
Total Return3 | –18.32% | 5.11% | 9.09% | 4.80% | 7.16% |
| | | | | |
Ratios/Supplemental Data | | | | | |
Net Assets, End of Period (Millions) | $587 | $722 | $662 | $606 | $561 |
Ratio of Total Expenses to | | | | | |
Average Net Assets | 0.13% | 0.12% | 0.12% | 0.12% | 0.12% |
Ratio of Net Investment Income to | | | | | |
Average Net Assets | 3.01% | 2.86% | 2.84% | 2.64% | 2.70% |
Portfolio Turnover Rate | 19% | 10% | 4% | 10% | 15% |
1 Includes increases from redemption fees of $.01, $.00, $.00, $.01, and $.01.
2 For tax purposes, nontaxable dividends represent 72%, 73%, 74%, 76%, and 73% of dividends from net investment income.
3 Total returns do not reflect the 1% redemption fee on shares held less than five years; the 2% redemption fee assessed prior to September 14, 2005, on shares held less than one year; or the account service fee that may be applicable to certain accounts with balances below $10,000.
See accompanying Notes, which are an integral part of the Financial Statements.
27
Tax-Managed Balanced Fund
Notes to Financial Statements
Vanguard Tax-Managed Balanced Fund is registered under the Investment Company Act of 1940 as an open-end investment company, or mutual fund. The fund invests in debt instruments of many municipal issuers; the issuers’ abilities to meet their obligations may be affected by economic and political developments in a specific state or region.
A. The following significant accounting policies conform to generally accepted accounting principles for U.S. mutual funds. The fund consistently follows such policies in preparing its financial statements.
1. Security Valuation: Securities are valued as of the close of trading on the New York Stock Exchange (generally 4 p.m., Eastern time) on the valuation date. Equity securities are valued at the latest quoted sales prices or official closing prices taken from the primary market in which each security trades; such securities not traded on the valuation date are valued at the mean of the latest quoted bid and asked prices. Bonds, and temporary cash investments acquired over 60 days to maturity, are valued using the latest bid prices or using valuations based on a matrix system (which considers such factors as security prices, yields, maturities, and ratings), both as furnished by independent pricing services. Other temporary cash investments are valued at amortized cost, which approximates market value. Securities for which market quotations are not readily available, or whose values have been materially affected by events occurring before the fund’s pricing time but after the close of the securities’ primary markets, are valued by methods deemed by the board of trustees to represent fair value.
2. Federal Income Taxes: The fund intends to continue to qualify as a regulated investment company and distribute all of its taxable income. Management has analyzed the fund’s tax positions taken on federal income tax returns for all open tax years (tax years ended December 31, 2005–2008), and has concluded that no provision for federal income tax is required in the fund’s financial statements.
3. Distributions: Distributions to shareholders are recorded on the ex-dividend date.
4. Other: Dividend income is recorded on the ex-dividend date. Interest income is accrued daily. Premiums and discounts on debt securities purchased are amortized and accreted, respectively, to interest income over the lives of the respective securities. Security transactions are accounted for on the date securities are bought or sold. Costs used to determine realized gains (losses) on the sale of investment securities are those of the specific securities sold. Fees assessed on redemptions of capital shares are credited to paid-in-capital.
B. The Vanguard Group furnishes at cost investment advisory, corporate management, administrative, marketing, and distribution services. The costs of such services are allocated to the fund under methods approved by the board of trustees. The fund has committed to provide up to 0.40% of its net assets in capital contributions to Vanguard. At December 31, 2008, the fund had contributed capital of $155,000 to Vanguard (included in Other Assets), representing 0.03% of the fund’s net assets and 0.06% of Vanguard’s capitalization. The fund’s trustees and officers are also directors and officers of Vanguard.
C. The fund’s investment advisor may direct new issue purchases, subject to obtaining the best price and execution, to underwriters who have agreed to rebate or credit to the fund part of the underwriting fees generated. Such rebates or credits are used solely to reduce the fund’s management and administrative expenses. The fund’s custodian bank has also agreed to reduce its fees when the fund maintains cash on deposit in the non-interest-bearing custody account. For the year ended December 31, 2008, these arrangements reduced the fund’s management and administrative expenses by $11,000 and custodian fees by $3,000. The total expense reduction represented an effective annual rate of 0.00% of the fund’s average net assets.
28
Tax-Managed Balanced Fund
D. Distributions are determined on a tax basis and may differ from net investment income and realized capital gains for financial reporting purposes. Differences may be permanent or temporary. Permanent differences are reclassified among capital accounts in the financial statements to reflect their tax character. Temporary differences arise when certain items of income, expense, gain, or loss are recognized in different periods for financial statement and tax purposes; these differences will reverse at some time in the future. Differences in classification may also result from the treatment of short-term gains as ordinary income for tax purposes.
For tax purposes, at December 31, 2008, the fund had $76,000 of ordinary income available for distribution. The fund had available realized losses of $36,440,000 to offset future net capital gains of $7,309,000 through December 31, 2010, $9,343,000 through December 31, 2011, $7,026,000 through December 31, 2016, and $12,762,000 through December 31, 2017.
At December 31, 2008, the cost of investment securities for tax purposes was $561,105,000. Net unrealized appreciation of investment securities for tax purposes was $21,998,000, consisting of unrealized gains of $66,165,000 on securities that had risen in value since their purchase and $44,167,000 in unrealized losses on securities that had fallen in value since their purchase.
E. During the year ended December 31, 2008, the fund purchased $149,639,000 of investment securities and sold $124,630,000 of investment securities, other than U.S. government securities and temporary cash investments.
F. Capital shares issued and redeemed were:
| Year Ended December 31, |
| 2008 | 2007 |
| Shares | Shares |
| (000) | (000) |
Issued | 4,011 | 3,636 |
Issued in Lieu of Cash Distributions | 952 | 830 |
Redeemed | (3,987) | (2,246) |
Net Increase (Decrease) in Shares Outstanding | 976 | 2,220 |
G. In September 2006, the Financial Accounting Standards Board issued Statement of Financial Accounting Standards No. 157 (“FAS 157”), “Fair Value Measurements.” FAS 157 establishes a framework for measuring fair value and expands disclosures about fair value measurements in financial statements.
The various inputs that may be used to determine the value of the fund’s investments are summarized in three broad levels. The inputs or methodologies used for valuing securities are not necessarily an indication of the risk associated with investing in those securities.
Level 1—Quoted prices in active markets for identical securities.
Level 2—Other significant observable inputs (including quoted prices for similar securities, interest rates, prepayment speeds, credit risk, etc.).
Level 3—Significant unobservable inputs (including the fund’s own assumptions used to determine the fair value of investments).
29
Tax-Managed Balanced Fund
The following table summarizes the fund’s investments as of December 31, 2008, based on the inputs used to value them:
| Investments |
| in Securities |
Valuation Inputs | ($000) |
Level 1—Quoted prices | 284,682 |
Level 2—Other significant observable inputs | 298,421 |
Level 3—Significant unobservable inputs | — |
Total | 583,103 |
30
Tax-Managed Growth and Income Fund
Fund Profile
As of December 31, 2008
Portfolio Characteristics | | |
| | Comparative | Broad |
| Fund | Index1 | Index2 |
Number of Stocks | 509 | 500 | 4,593 |
Median Market Cap | $39.5B | $39.5B | $25.3B |
Price/Earnings Ratio | 11.3x | 11.3x | 11.8x |
Price/Book Ratio | 1.8x | 1.8x | 1.7x |
Yield3 | | 3.0% | 2.8% |
Investor Shares | 2.8% | | |
Admiral Shares | 2.9% | | |
Institutional Shares | 3.0% | | |
Return on Equity | 22.1% | 22.1% | 20.8% |
Earnings Growth Rate | 17.4% | 17.4% | 17.2% |
Foreign Holdings | 0.0% | 0.0% | 0.0% |
Turnover Rate | 8% | — | — |
Expense Ratio | | | |
(12/31/2007)4 | | — | — |
Investor Shares | 0.15% | | |
Admiral Shares | 0.09% | | |
Institutional Shares | 0.07% | | |
Short-Term Reserves | 0.0% | — | — |
Volatility Measures5 | | |
| Fund Versus | Fund Versus |
| Comparative Index1 | Broad Index2 |
R-Squared | 1.00 | 0.99 |
Beta | 1.00 | 0.95 |
Investment Focus
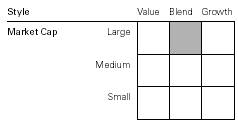
Sector Diversification (% of equity exposure) |
| | Comparative | Broad |
| Fund | Index1 | Index2 |
Consumer Discretionary | 8.4% | 8.4% | 8.9% |
Consumer Staples | 12.9 | 12.9 | 11.2 |
Energy | 13.3 | 13.3 | 12.4 |
Financials | 13.3 | 13.3 | 15.6 |
Health Care | 14.8 | 14.8 | 14.4 |
Industrials | 11.1 | 11.1 | 11.2 |
Information Technology | 15.2 | 15.3 | 15.2 |
Materials | 3.0 | 2.9 | 3.3 |
Telecommunication | | | |
Services | 3.8 | 3.8 | 3.4 |
Utilities | 4.2 | 4.2 | 4.4 |
Ten Largest Holdings6 (% of total net assets) |
| | |
ExxonMobil Corp. | integrated oil | |
| and gas | 5.2% |
The Procter & Gamble Co. | household products | 2.3 |
General Electric Co. | industrial | |
| conglomerates | 2.2 |
AT&T Inc. | integrated | |
| telecommunication | |
| services | 2.1 |
Johnson & Johnson | pharmaceuticals | 2.1 |
Chevron Corp. | integrated oil | |
| and gas | 1.9 |
Microsoft Corp. | systems software | 1.9 |
Wal-Mart Stores, Inc. | hypermarkets and | |
| super centers | 1.6 |
Pfizer Inc. | pharmaceuticals | 1.5 |
JPMorgan Chase & Co. | diversified financial | |
| services | 1.5 |
Top Ten | | 22.3% |
1 S&P 500 Index.
2 Dow Jones Wilshire 5000 Index.
3 30-day SEC yield for the fund; annualized dividend yield for the indexes. See the Glossary.
4 The expense ratios shown are from the prospectus dated July 29, 2008. For the fiscal year ended December 31, 2008, the fund’s expense ratios were 0.16% for Investor Shares, 0.10% for Admiral Shares, and 0.07% for Institutional Shares.
5 For an explanation of R-squared, beta, and other terms used here, see the Glossary.
6 The holdings listed exclude any temporary cash investments and equity index products.
31
Tax-Managed Growth and Income Fund
Performance Summary
All of the returns in this report represent past performance, which is not a guarantee of future results that may be achieved by the fund. (Current performance may be lower or higher than the performance data cited. For performance data current to the most recent month-end, visit our website at www.vanguard.com/performance.) Note, too, that both investment returns and principal value can fluctuate widely, so an investor’s shares, when sold, could be worth more or less than their original cost. The returns shown do not reflect taxes that a shareholder would pay on fund distributions or on the sale of fund shares.
Cumulative Performance: December 31, 1998–December 31, 2008
Initial Investment of $10,000

| Average Annual Total Returns | Final Value |
| Periods Ended December 31, 2008 | of a $10,000 |
| One Year | Five Years | Ten Years | Investment |
Tax-Managed Growth and Income Fund | | | | |
Investor Shares1 | –37.04% | –2.25% | –1.40% | $8,689 |
Fee-Adjusted Returns2 | –37.65 | –2.25 | –1.40 | 8,689 |
Dow Jones Wilshire 5000 Index | –37.34 | –1.67 | –0.63 | 9,388 |
S&P 500 Index | –37.00 | –2.19 | –1.38 | 8,700 |
Average Large-Cap Core Fund3 | –37.23 | –3.16 | –2.38 | 7,859 |
| | | | Final Value |
| | | Since | of a $100,000 |
| One Year | Five Years | Inception4 | Investment |
Tax-Managed Growth and Income Fund | | | | |
Admiral Shares | –37.00% | –2.20% | –1.09% | $92,458 |
Fee-Adjusted Returns2 | –37.61 | –2.20 | –1.09 | 92,458 |
Dow Jones Wilshire 5000 Index | –37.34 | –1.67 | –0.02 | 99,872 |
S&P 500 Index | –37.00 | –2.19 | –1.11 | 92,322 |
1 Total returns do not include the account service fee that may be applicable to certain accounts with balances below $10,000.
2 Reflective of the 1% fee assessed on redemptions of shares held in the fund for less than five years, but not of the account service fee that may be applicable to certain accounts below $10,000.
3 Derived from data provided by Lipper Inc.
4 Performance for the fund’s Admiral Shares and comparative standards is calculated since the Admiral Shares’ inception: November 12, 2001.
32
Tax-Managed Growth and Income Fund
| Average Annual Total Returns | |
| Periods Ended December 31, 2008 | Final Value of |
| | | Since | a $5,000,000 |
| One Year | Five Years | Inception1 | Investment |
Tax-Managed Growth and Income Fund | | | | |
Institutional Shares | –36.98% | –2.18% | –1.50% | $4,308,825 |
Fee-Adjusted Returns2 | –37.60 | –2.18 | –1.50 | 4,308,825 |
Dow Jones Wilshire 5000 Index | –37.34 | –1.67 | –0.71 | 4,661,976 |
S&P 500 Index | –37.00 | –2.19 | –1.57 | 4,279,097 |
Fiscal-Year Total Returns (%): December 31, 1998–December 31, 2008

1 Performance for the fund’s Institutional Shares and comparative standards is calculated since the Institutional Shares’ inception: March 4, 1999.
2 Reflective of the 1% fee assessed on redemptions of shares held in the fund for less than five years.
Note: See Financial Highlights tables for dividend and capital gains information.
33
Tax-Managed Growth and Income Fund
Financial Statements
Statement of Net Assets
As of December 31, 2008
The fund provides a complete list of its holdings four times in each fiscal year, at the quarter-ends. For the second and fourth fiscal quarters, the lists appear in the fund’s semiannual and annual reports to shareholders. For the first and third fiscal quarters, the fund files the lists with the Securities and Exchange Commission on Form N-Q. Shareholders can look up the fund’s Forms N-Q on the SEC’s website at www.sec.gov. Forms N-Q may also be reviewed and copied at the SEC’s Public Reference Room (see the back cover of this report for further information).
| | | Market |
| | | Value• |
| | Shares | ($000) |
Common Stocks (100.0%) | | |
Consumer Discretionary (8.4%) | | |
| McDonald’s Corp. | 267,175 | 16,616 |
| Comcast Corp. Class A | 685,692 | 11,574 |
| The Walt Disney Co. | 443,812 | 10,070 |
| Home Depot, Inc. | 406,452 | 9,357 |
| Time Warner, Inc. | 860,071 | 8,652 |
| Lowe’s Cos., Inc. | 351,388 | 7,562 |
| Target Corp. | 180,436 | 6,230 |
| News Corp., Class A | 551,244 | 5,011 |
| NIKE, Inc. Class B | 94,172 | 4,803 |
* | Amazon.com, Inc. | 77,021 | 3,950 |
| Yum! Brands, Inc. | 110,860 | 3,492 |
| Staples, Inc. | 171,040 | 3,065 |
* | DIRECTV Group, Inc. | 130,900 | 2,999 |
* | Viacom Inc. Class B | 145,136 | 2,766 |
* | Kohl’s Corp. | 72,971 | 2,642 |
| Johnson Controls, Inc. | 142,427 | 2,586 |
| Carnival Corp. | 104,667 | 2,546 |
| Best Buy Co., Inc. | 81,218 | 2,283 |
| TJX Cos., Inc. | 99,768 | 2,052 |
| Omnicom Group Inc. | 74,422 | 2,003 |
* | Apollo Group, Inc. Class A | 25,485 | 1,953 |
| H & R Block, Inc. | 81,098 | 1,843 |
| The McGraw-Hill Cos., Inc. | 75,479 | 1,750 |
* | Starbucks Corp. | 176,941 | 1,674 |
* | Coach, Inc. | 78,609 | 1,633 |
* | Bed Bath & Beyond, Inc. | 62,314 | 1,584 |
| The Gap, Inc. | 112,010 | 1,500 |
| Fortune Brands, Inc. | 35,920 | 1,483 |
| Genuine Parts Co. | 38,218 | 1,447 |
| Sherwin-Williams Co. | 23,534 | 1,406 |
| Mattel, Inc. | 86,016 | 1,376 |
| Marriott International, Inc. | | |
| Class A | 70,376 | 1,369 |
| CBS Corp. | 161,228 | 1,320 |
* | Ford Motor Co. | 573,937 | 1,314 |
* | AutoZone Inc. | 9,182 | 1,281 |
| | | Market |
| | | Value• |
| | Shares | ($000) |
| VF Corp. | 21,102 | 1,156 |
| J.C. Penney Co., Inc. | | |
| (Holding Co.) | 53,275 | 1,050 |
| Macy’s Inc. | 100,779 | 1,043 |
| Harley-Davidson, Inc. | 55,927 | 949 |
| Darden Restaurants Inc. | 33,311 | 939 |
| Family Dollar Stores, Inc. | 33,576 | 875 |
| Hasbro, Inc. | 29,705 | 866 |
* | GameStop Corp. Class A | 39,441 | 854 |
| International | | |
| Game Technology | 70,878 | 843 |
| Starwood Hotels & | | |
| Resorts Worldwide, Inc. | 43,908 | 786 |
| Whirlpool Corp. | 17,492 | 723 |
| Tiffany & Co. | 29,783 | 704 |
| Newell Rubbermaid, Inc. | 66,709 | 652 |
| Limited Brands, Inc. | 64,968 | 652 |
| The Stanley Works | 19,066 | 650 |
* | Wynn Resorts Ltd. | 14,853 | 628 |
| Polo Ralph Lauren Corp. | 13,435 | 610 |
| Black & Decker Corp. | 14,386 | 601 |
| Leggett & Platt, Inc. | 37,281 | 566 |
| Washington Post Co. | | |
| Class B | 1,448 | 565 |
| Pulte Homes, Inc. | 50,924 | 557 |
| Snap-On Inc. | 13,767 | 542 |
* | Sears Holdings Corp. | 13,388 | 520 |
| Nordstrom, Inc. | 38,536 | 513 |
| Abercrombie & Fitch Co. | 20,808 | 480 |
| Scripps Networks | | |
| Interactive | 21,761 | 479 |
| D. R. Horton, Inc. | 66,715 | 472 |
| General Motors Corp. | 145,916 | 467 |
* | Interpublic Group | | |
| of Cos., Inc. | 113,889 | 451 |
| Gannett Co., Inc. | 54,625 | 437 |
| Eastman Kodak Co. | 64,716 | 426 |
* | Expedia, Inc. | 49,826 | 411 |
| RadioShack Corp. | 30,356 | 362 |
34
Tax-Managed Growth and Income Fund
| | | Market |
| | | Value• |
| | Shares | ($000) |
* | The Goodyear Tire & | | |
| Rubber Co. | 58,443 | 349 |
| Centex Corp. | 30,206 | 321 |
| Lennar Corp. Class A | 34,569 | 300 |
* | Big Lots Inc. | 20,052 | 291 |
| Wyndham Worldwide Corp. | 43,196 | 283 |
* | AutoNation, Inc. | 25,449 | 251 |
| KB Home | 17,922 | 244 |
| Harman International | | |
| Industries, Inc. | 13,881 | 232 |
| New York Times Co. | | |
| Class A | 27,902 | 205 |
* | Office Depot, Inc. | 67,897 | 202 |
| Meredith Corp. | 8,925 | 153 |
| Jones Apparel Group, Inc. | 19,440 | 114 |
| Comcast Corp. Special | | |
| Class A | 4,732 | 76 |
* | Viacom Inc. Class A | 1,900 | 38 |
| CBS Corp. Class A | 1,900 | 16 |
| News Corp., Class B | 200 | 2 |
| | | 158,098 |
Consumer Staples (12.8%) | | |
| The Procter & Gamble Co. | 715,828 | 44,252 |
| Wal-Mart Stores, Inc. | 536,039 | 30,050 |
| The Coca-Cola Co. | 477,017 | 21,595 |
| Philip Morris | | |
| International Inc. | 484,975 | 21,101 |
| PepsiCo, Inc. | 372,334 | 20,393 |
| CVS Caremark Corp. | 344,339 | 9,896 |
| Kraft Foods Inc. | 352,193 | 9,456 |
| Colgate-Palmolive Co. | 120,948 | 8,290 |
| Altria Group, Inc. | 493,975 | 7,439 |
| Walgreen Co. | 237,294 | 5,854 |
| Costco Wholesale Corp. | 103,502 | 5,434 |
| Kimberly-Clark Corp. | 99,202 | 5,232 |
| General Mills, Inc. | 80,055 | 4,863 |
| Archer-Daniels-Midland Co. | 153,714 | 4,432 |
| The Kroger Co. | 156,347 | 4,129 |
| Sysco Corp. | 143,555 | 3,293 |
| H.J. Heinz Co. | 75,323 | 2,832 |
| Kellogg Co. | 60,373 | 2,647 |
| UST, Inc. | 35,481 | 2,462 |
| Avon Products, Inc. | 102,421 | 2,461 |
| Safeway, Inc. | 102,675 | 2,441 |
| Lorillard, Inc. | 40,406 | 2,277 |
| The Clorox Co. | 33,258 | 1,848 |
| ConAgra Foods, Inc. | 107,357 | 1,771 |
| Molson Coors Brewing Co. | | |
| Class B | 35,650 | 1,744 |
| Sara Lee Corp. | 170,158 | 1,666 |
| Reynolds American Inc. | 40,400 | 1,629 |
| Campbell Soup Co. | 49,322 | 1,480 |
| The Hershey Co. | 39,835 | 1,384 |
| J.M. Smucker Co. | 28,258 | 1,225 |
| | | Market |
| | | Value• |
| | Shares | ($000) |
| Brown-Forman Corp. | | |
| Class B | 23,530 | 1,212 |
| McCormick & Co., Inc. | 31,143 | 992 |
* | Dr. Pepper | | |
| Snapple Group, Inc. | 60,814 | 988 |
| Coca-Cola Enterprises, Inc. | 75,760 | 911 |
| The Estee Lauder Cos. Inc. | | |
| Class A | 27,937 | 865 |
| SUPERVALUE Inc. | 50,846 | 742 |
* | Constellation Brands, Inc. | | |
| Class A | 46,895 | 740 |
| The Pepsi Bottling | | |
| Group, Inc. | 32,686 | 736 |
* | Dean Foods Co. | 37,000 | 665 |
| Tyson Foods, Inc. | 72,451 | 635 |
| Whole Foods Market, Inc. | 33,756 | 319 |
| | | 242,381 |
Energy (13.3%) | | |
| ExxonMobil Corp. | 1,219,611 | 97,362 |
| Chevron Corp. | 487,068 | 36,028 |
| ConocoPhillips Co. | 357,427 | 18,515 |
| Schlumberger Ltd. | 286,782 | 12,139 |
| Occidental Petroleum Corp. | 194,180 | 11,649 |
| Devon Energy Corp. | 105,906 | 6,959 |
| Apache Corp. | 80,170 | 5,975 |
| XTO Energy, Inc. | 138,238 | 4,876 |
| Marathon Oil Corp. | 169,078 | 4,626 |
| Anadarko Petroleum Corp. | 109,986 | 4,240 |
| EOG Resources, Inc. | 59,761 | 3,979 |
| Halliburton Co. | 214,228 | 3,895 |
| Hess Corp. | 67,951 | 3,645 |
| Valero Energy Corp. | 123,660 | 2,676 |
* | National Oilwell Varco Inc. | 99,893 | 2,441 |
* | Southwestern Energy Co. | 82,200 | 2,381 |
| Baker Hughes Inc. | 73,610 | 2,361 |
| Spectra Energy Corp. | 146,436 | 2,305 |
| Chesapeake Energy Corp. | 129,491 | 2,094 |
| Noble Energy, Inc. | 41,355 | 2,035 |
| Murphy Oil Corp. | 45,631 | 2,024 |
| Williams Cos., Inc. | 138,835 | 2,010 |
* | Weatherford | | |
| International Ltd. | 162,972 | 1,763 |
| Peabody Energy Corp. | 63,980 | 1,456 |
| Noble Corp. | 63,348 | 1,397 |
| El Paso Corp. | 168,020 | 1,316 |
| Range Resources Corp. | 37,336 | 1,284 |
| CONSOL Energy, Inc. | 43,619 | 1,247 |
| Sunoco, Inc. | 27,988 | 1,216 |
| Smith International, Inc. | 52,486 | 1,201 |
* | Cameron International Corp. | 52,900 | 1,084 |
| ENSCO International, Inc. | 34,200 | 971 |
* | Nabors Industries, Inc. | 68,402 | 819 |
| BJ Services Co. | 69,760 | 814 |
| Cabot Oil & Gas Corp. | 24,689 | 642 |
35
Tax-Managed Growth and Income Fund
| | Market |
| | Value• |
| Shares | ($000) |
Pioneer Natural | | |
Resources Co. | 28,170 | 456 |
Tesoro Corp. | 33,334 | 439 |
Rowan Cos., Inc. | 27,086 | 431 |
Massey Energy Co. | 20,484 | 282 |
| | 251,033 |
Financials (13.3%) | | |
JPMorgan Chase & Co. | 894,830 | 28,214 |
Wells Fargo & Co. | 908,586 | 26,785 |
Bank of America Corp. | 1,201,596 | 16,918 |
U.S. Bancorp | 420,676 | 10,521 |
The Goldman Sachs | | |
Group, Inc. | 105,956 | 8,942 |
Citigroup Inc. | 1,306,534 | 8,767 |
Bank of New York | | |
Mellon Corp. | 275,147 | 7,795 |
MetLife, Inc. | 190,218 | 6,631 |
The Travelers Cos., Inc. | 140,146 | 6,335 |
American Express Co. | 278,094 | 5,159 |
AFLAC Inc. | 111,649 | 5,118 |
Merrill Lynch & Co., Inc. | 385,587 | 4,488 |
The Chubb Corp. | 85,217 | 4,346 |
The Allstate Corp. | 128,482 | 4,209 |
Morgan Stanley | 254,614 | 4,084 |
PNC Financial | | |
Services Group | 83,143 | 4,074 |
State Street Corp. | 103,560 | 4,073 |
BB&T Corp. | 132,448 | 3,637 |
Charles Schwab Corp. | 224,314 | 3,627 |
CME Group, Inc. | 16,051 | 3,340 |
Prudential Financial, Inc. | 101,641 | 3,076 |
Capital One Financial Corp. | 93,886 | 2,994 |
Marsh & | | |
McLennan Cos., Inc. | 123,250 | 2,991 |
Aon Corp. | 64,599 | 2,951 |
Simon Property Group, Inc. | | |
REIT | 54,077 | 2,873 |
Wachovia Corp. | 518,097 | 2,870 |
Northern Trust Corp. | 53,448 | 2,787 |
SunTrust Banks, Inc. | 85,099 | 2,514 |
Loews Corp. | 86,683 | 2,449 |
Progressive Corp. of Ohio | 161,993 | 2,399 |
Public Storage, Inc. REIT | 30,053 | 2,389 |
Franklin Resources Corp. | 36,326 | 2,317 |
T . Rowe Price Group Inc. | 61,880 | 2,193 |
Hudson City Bancorp, Inc. | 125,200 | 1,998 |
Vornado Realty Trust REIT | 32,922 | 1,987 |
Equity Residential REIT | 65,155 | 1,943 |
NYSE Euronext | 63,597 | 1,741 |
HCP , Inc. REIT | 60,546 | 1,681 |
Boston Properties, Inc. | | |
REIT | 29,003 | 1,595 |
People’s United | | |
Financial Inc. | 83,512 | 1,489 |
| | | Market |
| | | Value• |
| | Shares | ($000) |
| Unum Group | 79,520 | 1,479 |
* | IntercontinentalExchange Inc. | 17,234 | 1,421 |
| The Principal Financial | | |
| Group, Inc. | 62,318 | 1,407 |
| Plum Creek Timber Co. Inc. | | |
| REIT | 40,035 | 1,391 |
| Invesco, Ltd. | 92,386 | 1,334 |
| Regions Financial Corp. | 165,913 | 1,321 |
| Ameriprise Financial, Inc. | 52,142 | 1,218 |
| The Hartford Financial | | |
| Services Group Inc. | 72,624 | 1,192 |
| Lincoln National Corp. | 61,625 | 1,161 |
| Fifth Third Bancorp | 139,039 | 1,148 |
| Cincinnati Financial Corp. | 38,995 | 1,134 |
| Avalonbay | | |
| Communities, Inc. REIT | 18,415 | 1,116 |
| Discover Financial Services | 115,288 | 1,099 |
| M & T Bank Corp. | 18,620 | 1,069 |
| American International | | |
| Group, Inc. | 648,654 | 1,018 |
| KeyCorp | 118,722 | 1,012 |
| Kimco Realty Corp. REIT | 55,223 | 1,009 |
* | SLM Corp. | 112,204 | 999 |
| Host Hotels & Resorts Inc. | | |
| REIT | 125,948 | 953 |
| Moody’s Corp. | 46,660 | 937 |
| Torchmark Corp. | 20,346 | 909 |
| National City Corp. | 495,274 | 896 |
| ProLogis REIT | 63,918 | 888 |
| Marshall & Ilsley Corp. | 62,508 | 853 |
| Assurant, Inc. | 28,309 | 849 |
* | Leucadia National Corp. | 42,594 | 843 |
* | Nasdaq Stock Market Inc. | 32,535 | 804 |
| Legg Mason Inc. | 33,967 | 744 |
| Comerica, Inc. | 36,013 | 715 |
| Zions Bancorp | 27,833 | 682 |
| Huntington Bancshares Inc. | 87,628 | 671 |
| First Horizon National Corp. | 49,281 | 521 |
| CIT Group Inc. | 87,382 | 397 |
* | Sovereign Bancorp, Inc. | 131,458 | 392 |
| Federated Investors, Inc. | 21,495 | 365 |
| Janus Capital Group Inc. | 37,489 | 301 |
| XL Capital Ltd. Class A | 81,120 | 300 |
| Genworth Financial Inc. | 105,126 | 298 |
| Apartment Investment & | | |
| Management Co. | | |
| Class A REIT | 24,719 | 285 |
* | CB Richard Ellis Group, Inc. | 54,621 | 236 |
| MBIA, Inc. | 45,285 | 184 |
| American Capital Ltd. | 48,692 | 158 |
* | E*TRADE Financial Corp. | 135,249 | 156 |
| Developers Diversified | | |
| Realty Corp. REIT | 29,066 | 142 |
| | | 250,307 |
36
Tax-Managed Growth and Income Fund
| | | Market |
| | | Value• |
| | Shares | ($000) |
Health Care (14.8%) | | |
| Johnson & Johnson | 665,187 | 39,798 |
| Pfizer Inc. | 1,616,667 | 28,631 |
| Abbott Laboratories | 371,957 | 19,851 |
| Merck & Co., Inc. | 506,827 | 15,408 |
* | Amgen Inc. | 253,993 | 14,668 |
| Wyeth | 319,217 | 11,974 |
* | Gilead Sciences, Inc. | 220,560 | 11,279 |
| Bristol-Myers Squibb Co. | 474,599 | 11,034 |
| Eli Lilly & Co. | 239,847 | 9,659 |
| Medtronic, Inc. | 268,074 | 8,423 |
| Baxter International, Inc. | 148,608 | 7,964 |
| UnitedHealth Group Inc. | 289,521 | 7,701 |
| Schering-Plough Corp. | 389,679 | 6,636 |
* | Celgene Corp. | 109,779 | 6,069 |
* | WellPoint Inc. | 121,988 | 5,139 |
* | Medco Health | | |
| Solutions, Inc. | 119,402 | 5,004 |
| Covidien Ltd. | 120,691 | 4,374 |
* | Genzyme Corp. | 64,820 | 4,302 |
| Becton, Dickinson & Co. | 58,252 | 3,984 |
* | Thermo Fisher | | |
| Scientific, Inc. | 100,694 | 3,431 |
* | Biogen Idec Inc. | 69,908 | 3,330 |
* | Express Scripts Inc. | 59,288 | 3,260 |
| Aetna Inc. | 110,548 | 3,151 |
| Allergan, Inc. | 73,698 | 2,971 |
| Cardinal Health, Inc. | 86,159 | 2,970 |
* | Boston Scientific Corp. | 359,934 | 2,786 |
* | St. Jude Medical, Inc. | 82,405 | 2,716 |
| McKesson Corp. | 66,105 | 2,560 |
| Stryker Corp. | 57,998 | 2,317 |
* | Zimmer Holdings, Inc. | 53,728 | 2,172 |
| C.R. Bard, Inc. | 23,714 | 1,998 |
| Quest Diagnostics, Inc. | 37,954 | 1,970 |
* | Forest Laboratories, Inc. | 72,217 | 1,839 |
* | Laboratory Corp. of | | |
| America Holdings | 25,900 | 1,668 |
* | Humana Inc. | 40,359 | 1,505 |
| AmerisourceBergen Corp. | 37,372 | 1,333 |
* | Cephalon, Inc. | 16,372 | 1,261 |
* | DaVita, Inc. | 24,991 | 1,239 |
* | Intuitive Surgical, Inc. | 9,359 | 1,188 |
| CIGNA Corp. | 65,910 | 1,111 |
* | Varian Medical | | |
| Systems, Inc. | 29,949 | 1,049 |
* | Hospira, Inc. | 38,294 | 1,027 |
| DENTSPLY International Inc. | 35,953 | 1,015 |
* | Life Technologies Corp. | 41,279 | 962 |
* | Waters Corp. | 23,758 | 871 |
* | Mylan Inc. | 72,819 | 720 |
* | Millipore Corp. | 13,274 | 684 |
* | Watson | | |
| Pharmaceuticals, Inc. | 24,977 | 664 |
| | | Market |
| | | Value• |
| | Shares | ($000) |
| IMS Health, Inc. | 43,604 | 661 |
* | King Pharmaceuticals, Inc. | 58,932 | 626 |
* | Coventry Health Care Inc. | 35,880 | 534 |
* | Patterson Companies, Inc. | 22,140 | 415 |
| PerkinElmer, Inc. | 28,537 | 397 |
| Teva Pharmaceutical | | |
| Industries Ltd. | | |
| Sponsored ADR | 2,881 | 123 |
* | Tenet Healthcare Corp. | 96,817 | 111 |
| | | 278,533 |
Industrials (11.1%) | | |
| General Electric Co. | 2,518,273 | 40,796 |
| United Parcel Service, Inc. | 238,557 | 13,159 |
| United Technologies Corp. | 227,925 | 12,217 |
| 3M Co. | 166,063 | 9,555 |
| The Boeing Co. | 175,623 | 7,494 |
| Emerson Electric Co. | 183,860 | 6,731 |
| Lockheed Martin Corp. | 79,814 | 6,711 |
| Caterpillar, Inc. | 144,583 | 6,459 |
| Union Pacific Corp. | 121,420 | 5,804 |
| Honeywell International Inc. | 174,114 | 5,716 |
| General Dynamics Corp. | 93,392 | 5,378 |
| Burlington Northern | | |
| Santa Fe Corp. | 67,264 | 5,093 |
| Raytheon Co. | 96,955 | 4,949 |
| FedEx Corp. | 74,597 | 4,785 |
| Norfolk Southern Corp. | 88,724 | 4,174 |
| Deere & Co. | 102,300 | 3,920 |
| Waste Management, Inc. | 117,530 | 3,895 |
| Northrop Grumman Corp. | 78,354 | 3,529 |
| Danaher Corp. | 61,226 | 3,466 |
| Illinois Tool Works, Inc. | 94,339 | 3,307 |
| CSX Corp. | 94,546 | 3,070 |
| PACCAR, Inc. | 86,899 | 2,485 |
| Tyco International, Ltd. | 113,391 | 2,449 |
| C.H. Robinson | | |
| Worldwide Inc. | 40,522 | 2,230 |
| L-3 Communications | | |
| Holdings, Inc. | 28,677 | 2,116 |
| ITT Industries, Inc. | 43,502 | 2,001 |
| Precision Castparts Corp. | 33,483 | 1,992 |
| Eaton Corp. | 39,501 | 1,964 |
| Fluor Corp. | 43,508 | 1,952 |
| Republic Services, Inc. | | |
| Class A | 77,036 | 1,910 |
| Expeditors International of | | |
| Washington, Inc. | 50,800 | 1,690 |
| Parker Hannifin Corp. | 38,620 | 1,643 |
| Southwest Airlines Co. | 177,886 | 1,533 |
| Rockwell Collins, Inc. | 37,892 | 1,481 |
| Dover Corp. | 44,406 | 1,462 |
* | Jacobs Engineering | | |
| Group Inc. | 29,485 | 1,418 |
| Ingersoll-Rand Co. | 76,267 | 1,323 |
37
Tax-Managed Growth and Income Fund
| | | | Market |
| | | | Value• |
| | | Shares | ($000) |
| Cummins Inc. | | 48,284 | 1,291 |
| Pitney Bowes, Inc. | | 49,401 | 1,259 |
| W.W. Grainger, Inc. | | 15,583 | 1,229 |
| Cooper Industries, Inc. | | | |
| Class A | | 41,466 | 1,212 |
| Rockwell Automation, Inc. | | 34,133 | 1,100 |
| Goodrich Corp. | | 29,548 | 1,094 |
| Fastenal Co. | | 30,941 | 1,078 |
* | Stericycle, Inc. | | 20,474 | 1,066 |
| The Dun & Bradstreet Corp. | | 12,939 | 999 |
| Masco Corp. | | 86,119 | 959 |
| Avery Dennison Corp. | | 25,487 | 834 |
| Pall Corp. | | 28,395 | 807 |
| Equifax, Inc. | | 30,287 | 803 |
| Textron, Inc. | | 57,908 | 803 |
| Robert Half | | | |
| International, Inc. | | 37,401 | 779 |
| Cintas Corp. | | 31,702 | 736 |
| Flowserve Corp. | | 13,668 | 704 |
| R.R. Donnelley & Sons Co. | | 49,008 | 666 |
| Ryder System, Inc. | | 13,404 | 520 |
* | Monster Worldwide Inc. | | 29,382 | 355 |
| The Manitowoc Co., Inc. | | 31,000 | 268 |
* | Raytheon Co. | | | |
| Warrants Exp. 6/16/11 | | 2,287 | 36 |
| | | | 208,455 |
Information Technology (15.3%) | | | |
| Microsoft Corp. | 1,834,266 | 35,658 |
| International Business | | | |
�� | Machines Corp. | 322,084 | 27,107 |
* | Cisco Systems, Inc. | 1,403,792 | 22,882 |
| Hewlett-Packard Co. | | 587,165 | 21,308 |
| Intel Corp. | 1,333,555 | 19,550 |
* | Apple Inc. | | 213,089 | 18,187 |
* | Google Inc. | | 57,353 | 17,645 |
* | Oracle Corp. | | 939,185 | 16,652 |
| QUALCOMM Inc. | 396,912 | 14,221 |
* | EMC Corp. | 489,301 | 5,123 |
| Texas Instruments, Inc. | | 310,752 | 4,823 |
| Automatic Data | | | |
| Processing, Inc. | | 121,703 | 4,788 |
* | Dell Inc. | 414,912 | 4,249 |
* | Yahoo! Inc. | 332,700 | 4,059 |
* | eBay Inc. | | 257,100 | 3,589 |
| Corning, Inc. | 372,583 | 3,551 |
| Applied Materials, Inc. | | 321,655 | 3,258 |
* | Adobe Systems, Inc. | 127,290 | 2,710 |
* | Symantec Corp. | | 200,355 | 2,709 |
| MasterCard, Inc. Class A | | 17,363 | 2,482 |
| Western Union Co. | 171,522 | 2,460 |
| Motorola, Inc. | | 543,309 | 2,407 |
* | Juniper Networks, Inc. | | 126,489 | 2,215 |
| Paychex, Inc. | | 76,875 | 2,020 |
* | Intuit, Inc. | | 76,944 | 1,830 |
| | | Market |
| | | Value• |
| | Shares | ($000) |
* | Broadcom Corp. | 106,745 | 1,811 |
| Tyco Electronics Ltd. | 110,091 | 1,785 |
| CA, Inc. | 94,435 | 1,750 |
| Xerox Corp. | 208,135 | 1,659 |
* | Fiserv, Inc. | 38,391 | 1,396 |
| Analog Devices, Inc. | 70,117 | 1,334 |
* | Agilent Technologies, Inc. | 83,947 | 1,312 |
* | Computer Sciences Corp. | 36,214 | 1,273 |
* | Cognizant Technology | | |
| Solutions Corp. | 69,810 | 1,261 |
* | Electronic Arts Inc. | 77,055 | 1,236 |
| Harris Corp. | 32,300 | 1,229 |
* | BMC Software, Inc. | 45,185 | 1,216 |
* | McAfee Inc. | 34,716 | 1,200 |
| Altera Corp. | 71,591 | 1,196 |
| Linear Technology Corp. | 53,297 | 1,179 |
| Xilinx, Inc. | 65,886 | 1,174 |
* | NetApp, Inc. | 79,418 | 1,109 |
* | Affiliated Computer | | |
| Services, Inc. Class A | 23,500 | 1,080 |
* | Autodesk, Inc. | 54,433 | 1,070 |
* | NVIDIA Corp. | 128,581 | 1,038 |
* | Citrix Systems, Inc. | 43,400 | 1,023 |
| Amphenol Corp. | 42,303 | 1,014 |
* | VeriSign, Inc. | 46,631 | 890 |
| KLA-Tencor Corp. | 40,659 | 886 |
| Microchip Technology, Inc. | 43,639 | 852 |
* | FLIR Systems, Inc. | 26,941 | 826 |
* | salesforce.com, inc. | 25,333 | 811 |
* | MEMC Electronic | | |
| Materials, Inc. | 54,304 | 775 |
| Fidelity National | | |
| Information Services, Inc. | 45,401 | 739 |
* | Sun Microsystems, Inc. | 176,907 | 676 |
| Total System Services, Inc. | 47,244 | 661 |
* | Teradata Corp. | 42,579 | 631 |
* | Akamai Technologies, Inc. | 40,973 | 618 |
* | SanDisk Corp. | 54,485 | 523 |
* | Lexmark International, Inc. | 18,908 | 509 |
* | LSI Corp. | 154,552 | 508 |
| Molex, Inc. | 34,022 | 493 |
* | Micron Technology, Inc. | 183,009 | 483 |
| National | | |
| Semiconductor Corp. | 47,216 | 475 |
* | QLogic Corp. | 30,880 | 415 |
* | Compuware Corp. | 59,876 | 404 |
* | Tellabs, Inc. | 95,915 | 395 |
| Jabil Circuit, Inc. | 51,120 | 345 |
* | Novell, Inc. | 83,381 | 324 |
* | Advanced Micro | | |
| Devices, Inc. | 147,745 | 319 |
* | Novellus Systems, Inc. | 23,248 | 287 |
* | Convergys Corp. | 30,200 | 194 |
* | JDS Uniphase Corp. | 51,391 | 188 |
38
Tax-Managed Growth and Income Fund
| | | Market |
| | | Value• |
| | Shares | ($000) |
* | Teradyne, Inc. | 40,200 | 170 |
* | Ciena Corp. | 21,665 | 145 |
| | | 288,370 |
Materials (3.0%) | | |
| Monsanto Co. | 131,311 | 9,238 |
| E.I. du Pont de | | |
| Nemours & Co. | 216,331 | 5,473 |
| Newmont Mining Corp. | | |
| (Holding Co.) | 108,848 | 4,430 |
| Praxair, Inc. | 73,884 | 4,386 |
| Nucor Corp. | 75,240 | 3,476 |
| Dow Chemical Co. | 221,409 | 3,341 |
| Air Products & | | |
| Chemicals, Inc. | 50,362 | 2,532 |
| Freeport-McMoRan | | |
| Copper & Gold, Inc. | | |
| Class B | 90,515 | 2,212 |
| Alcoa Inc. | 191,596 | 2,157 |
| Rohm & Haas Co. | 29,957 | 1,851 |
| Vulcan Materials Co. | 26,360 | 1,834 |
| PPG Industries, Inc. | 39,404 | 1,672 |
| Weyerhaeuser Co. | 50,528 | 1,547 |
| Ecolab, Inc. | 40,260 | 1,415 |
| Sigma-Aldrich Corp. | 30,220 | 1,276 |
| International Paper Co. | 102,363 | 1,208 |
| United States Steel Corp. | 27,760 | 1,033 |
* | Owens-Illinois, Inc. | 34,938 | 955 |
| Ball Corp. | 22,787 | 948 |
* | Pactiv Corp. | 31,377 | 781 |
| CF Industries Holdings, Inc. | 13,489 | 663 |
| Allegheny Technologies Inc. | 23,100 | 590 |
| Bemis Co., Inc. | 24,050 | 569 |
| Sealed Air Corp. | 38,092 | 569 |
| International Flavors & | | |
| Fragrances, Inc. | 19,034 | 566 |
| Eastman Chemical Co. | 17,462 | 554 |
| MeadWestvaco Corp. | 41,199 | 461 |
| AK Steel Holding Corp. | 27,100 | 252 |
| Titanium Metals Corp. | 21,000 | 185 |
| | | 56,174 |
Telecommunication Services (3.8%) | | |
| AT&T Inc. | 1,412,924 | 40,268 |
| Verizon | | |
| Communications Inc. | 681,041 | 23,087 |
* | American Tower Corp. | | |
| Class A | 95,073 | 2,788 |
| Qwest Communications | | |
| International Inc. | 350,299 | 1,275 |
* | Sprint Nextel Corp. | 685,608 | 1,255 |
| Embarq Corp. | 34,185 | 1,229 |
| Windstream Corp. | 105,338 | 969 |
| | | Market |
| | | Value• |
| | Shares | ($000) |
| Frontier | | |
| Communications Corp. | 75,359 | 659 |
| CenturyTel, Inc. | 23,953 | 655 |
| | | 72,185 |
Utilities (4.2%) | | |
| Exelon Corp. | 157,683 | 8,769 |
| Southern Co. | 185,708 | 6,871 |
| Dominion Resources, Inc. | 139,328 | 4,994 |
| FPL Group, Inc. | 97,995 | 4,932 |
| Duke Energy Corp. | 303,350 | 4,553 |
| Entergy Corp. | 45,345 | 3,770 |
| FirstEnergy Corp. | 73,010 | 3,547 |
| Public Service Enterprise | | |
| Group, Inc. | 121,290 | 3,538 |
| PG&E Corp. | 86,498 | 3,348 |
| American Electric | | |
| Power Co., Inc. | 96,698 | 3,218 |
| PPL Corp. | 89,889 | 2,759 |
| Consolidated Edison Inc. | 65,582 | 2,553 |
| Edison International | 78,279 | 2,514 |
| Progress Energy, Inc. | 62,990 | 2,510 |
| Sempra Energy | 58,302 | 2,485 |
| Xcel Energy, Inc. | 107,474 | 1,994 |
| Ameren Corp. | 50,861 | 1,692 |
| DTE Energy Co. | 39,079 | 1,394 |
| Allegheny Energy, Inc. | 40,600 | 1,375 |
| Questar Corp. | 41,468 | 1,356 |
* | AES Corp. | 160,935 | 1,326 |
| Wisconsin Energy Corp. | 28,006 | 1,176 |
| Constellation Energy | | |
| Group, Inc. | 42,876 | 1,076 |
| Equitable Resources, Inc. | 31,384 | 1,053 |
| CenterPoint Energy Inc. | 82,988 | 1,047 |
| SCANA Corp. | 26,170 | 932 |
| Pepco Holdings, Inc. | 51,655 | 917 |
| Integrys Energy Group, Inc. | 18,253 | 785 |
| Pinnacle West Capital Corp. | 24,140 | 776 |
| NiSource, Inc. | 65,943 | 723 |
| TECO Energy, Inc. | 50,810 | 627 |
| CMS Energy Corp. | 54,281 | 548 |
| Nicor Inc. | 10,780 | 374 |
* | Dynegy, Inc. | 123,102 | 246 |
| | | 79,778 |
Total Common Stocks | | |
(Cost $1,798,263) | | 1,885,314 |
Other Assets and Liabilities (0.0%) | | |
Other Assets | | 22,984 |
Liabilities | | (22,696) |
| | | 288 |
Net Assets (100%) | | 1,885,602 |
39
Tax-Managed Growth and Income Fund
At December 31, 2008, net assets consisted of: |
| Amount |
| ($000) |
Paid-in Capital | 2,338,185 |
Overdistributed Net Investment Income | (4,497) |
Accumulated Net Realized Losses | (535,137) |
Unrealized Appreciation (Depreciation) | 87,051 |
Net Assets | 1,885,602 |
| |
Investor Shares—Net Assets | |
Applicable to 21,378,655 outstanding | |
$.001 par value shares of beneficial | |
interest (unlimited authorization) | 420,164 |
Net Asset Value Per Share— | |
Investor Shares | $19.65 |
| |
Admiral Shares—Net Assets | |
Applicable to 29,770,919 outstanding | |
$.001 par value shares of beneficial | |
interest (unlimited authorization) | 1,202,530 |
Net Asset Value Per Share— | |
Admiral Shares | $40.39 |
| |
Institutional Shares—Net Assets | |
Applicable to 13,376,198 outstanding | |
$.001 par value shares of beneficial | |
interest (unlimited authorization) | 262,908 |
Net Asset Value Per Share— | |
Institutional Shares | $19.65 |
• | See Note A in Notes to Financial Statements. |
* | Non-income-producing security. |
ADR—American Depositary Receipt.
REIT—Real Estate Investment Trust.
See accompanying Notes, which are an integral part of the Financial Statements.
40
Tax-Managed Growth and Income Fund
Statement of Operations
| Year Ended |
| December 31, 2008 |
| ($000) |
Investment Income | |
Income | |
Dividends | 62,990 |
Interest1 | 27 |
Security Lending | 9 |
Total Income | 63,026 |
Expenses | |
The Vanguard Group—Note B | |
Investment Advisory Services | 129 |
Management and Administrative—Investor Shares | 729 |
Management and Administrative—Admiral Shares | 1,129 |
Management and Administrative—Institutional Shares | 181 |
Marketing and Distribution—Investor Shares | 143 |
Marketing and Distribution—Admiral Shares | 466 |
Marketing and Distribution—Institutional Shares | 59 |
Custodian Fees | 53 |
Auditing Fees | 23 |
Shareholders’ Reports—Investor Shares | 29 |
Shareholders’ Reports—Admiral Shares | 4 |
Shareholders’ Reports—Institutional Shares | — |
Trustees’ Fees and Expenses | 4 |
Total Expenses | 2,949 |
Net Investment Income | 60,077 |
Realized Net Gain (Loss) on Investment Securities Sold | (128,307) |
Change in Unrealized Appreciation (Depreciation) of Investment Securities | (1,150,385) |
Net Increase (Decrease) in Net Assets Resulting from Operations | (1,218,615) |
1 Interest income from an affiliated company of the fund was $27,000.
See accompanying Notes, which are an integral part of the Financial Statements.
41
Tax-Managed Growth and Income Fund
Statement of Changes in Net Assets
| Year Ended December 31, |
| 2008 | 2007 |
| ($000) | ($000) |
Increase (Decrease) in Net Assets | | |
Operations | | |
Net Investment Income | 60,077 | 60,810 |
Realized Net Gain (Loss) | (128,307) | 35,978 |
Change in Unrealized Appreciation (Depreciation) | (1,150,385) | 74,149 |
Net Increase (Decrease) in Net Assets Resulting from Operations | (1,218,615) | 170,937 |
Distributions | | |
Net Investment Income | | |
Investor Shares | (13,020) | (13,730) |
Admiral Shares | (39,092) | (38,541) |
Institutional Shares | (8,873) | (8,409) |
Realized Capital Gain | | |
Investor Shares | — | — |
Admiral Shares | — | — |
Institutional Shares | — | — |
Total Distributions | (60,985) | (60,680) |
Capital Share Transactions | | |
Investor Shares | (42,518) | (72,742) |
Admiral Shares | (91,349) | 110,589 |
Institutional Shares | (22,548) | 66,688 |
Net Increase (Decrease) from Capital Share Transactions | (156,415) | 104,535 |
Total Increase (Decrease) | (1,436,015) | 214,792 |
Net Assets | | |
Beginning of Period | 3,321,617 | 3,106,825 |
End of Period1 | 1,885,602 | 3,321,617 |
1 Net Assets—End of Period includes undistributed (overdistributed) net investment income of ($4,497,000) and ($3,589,000).
See accompanying Notes, which are an integral part of the Financial Statements.
42
Tax-Managed Growth and Income Fund
Financial Highlights
Investor Shares | | | | | |
| | | | | |
For a Share Outstanding | Year Ended December 31, |
Throughout Each Period | 2008 | 2007 | 2006 | 2005 | 2004 |
Net Asset Value, Beginning of Period | $31.96 | $30.87 | $27.15 | $26.36 | $24.23 |
Investment Operations | | | | | |
Net Investment Income | .572 | .578 | .504 | .467 | .470 |
Net Realized and Unrealized Gain (Loss) | | | | | |
on Investments | (12.295) | 1.089 | 3.727 | .801 | 2.130 |
Total from Investment Operations | (11.723) | 1.667 | 4.231 | 1.268 | 2.600 |
Distributions | | | | | |
Dividends from Net Investment Income | (.587) | (.577) | (.511) | (.478) | (.470) |
Distributions from Realized Capital Gains | — | — | — | — | — |
Total Distributions | (.587) | (.577) | (.511) | (.478) | (.470) |
Net Asset Value, End of Period | $19.65 | $31.96 | $30.87 | $27.15 | $26.36 |
| | | | | |
Total Return1 | –37.04% | 5.39% | 15.73% | 4.87% | 10.83% |
| | | | | |
Ratios/Supplemental Data | | | | | |
Net Assets, End of Period (Millions) | $420 | $740 | $784 | $806 | $1,395 |
Ratio of Total Expenses to | | | | | |
Average Net Assets | 0.16% | 0.15% | 0.15% | 0.14% | 0.14% |
Ratio of Net Investment Income to | | | | | |
Average Net Assets | 2.13% | 1.80% | 1.77% | 1.78% | 1.89% |
Portfolio Turnover Rate | 8% | 5% | 6% | 10% | 8% |
1 Total returns do not reflect the 1% redemption fee on shares held less than five years; the 2% redemption fee assessed prior to September 14, 2005, on shares held less than one year; or the account service fee that may be applicable to certain accounts with balances below $10,000.
See accompanying Notes, which are an integral part of the Financial Statements.
43
Tax-Managed Growth and Income Fund
Financial Highlights
Admiral Shares | | | | | |
| | | | | |
For a Share Outstanding | Year Ended December 31, |
Throughout Each Period | 2008 | 2007 | 2006 | 2005 | 2004 |
Net Asset Value, Beginning of Period | $65.69 | $63.44 | $55.80 | $54.17 | $49.80 |
Investment Operations | | | | | |
Net Investment Income | 1.212 | 1.230 | 1.069 | .989 | .990 |
Net Realized and Unrealized Gain (Loss) | | | | | |
on Investments | (25.276) | 2.245 | 7.648 | 1.645 | 4.370 |
Total from Investment Operations | (24.064) | 3.475 | 8.717 | 2.634 | 5.360 |
Distributions | | | | | |
Dividends from Net Investment Income | (1.236) | (1.225) | (1.077) | (1.004) | (.990) |
Distributions from Realized Capital Gains | — | — | — | — | — |
Total Distributions | (1.236) | (1.225) | (1.077) | (1.004) | (.990) |
Net Asset Value, End of Period | $40.39 | $65.69 | $63.44 | $55.80 | $54.17 |
| | | | | |
Total Return1 | –37.00% | 5.47% | 15.77% | 4.93% | 10.87% |
| | | | | |
Ratios/Supplemental Data | | | | | |
Net Assets, End of Period (Millions) | $1,203 | $2,113 | $1,935 | $1,575 | $954 |
Ratio of Total Expenses to | | | | | |
Average Net Assets | 0.10% | 0.09% | 0.10% | 0.10% | 0.10% |
Ratio of Net Investment Income to | | | | | |
Average Net Assets | 2.19% | 1.86% | 1.82% | 1.82% | 1.96% |
Portfolio Turnover Rate | 8% | 5% | 6% | 10% | 8% |
1 Total returns do not reflect the 1% redemption fee on shares held less than five years or the 2% redemption fee assessed prior to September 14, 2005, on shares held less than one year.
See accompanying Notes, which are an integral part of the Financial Statements.
44
Tax-Managed Growth and Income Fund
Financial Highlights
Institutional Shares | | | | | |
| | | | | |
For a Share Outstanding | Year Ended December 31, |
Throughout Each Period | 2008 | 2007 | 2006 | 2005 | 2004 |
Net Asset Value, Beginning of Period | $31.96 | $30.87 | $27.15 | $26.36 | $24.24 |
Investment Operations | | | | | |
Net Investment Income | .598 | .604 | .527 | .485 | .479 |
Net Realized and Unrealized Gain (Loss) | | | | | |
on Investments | (12.299) | 1.089 | 3.727 | .801 | 2.130 |
Total from Investment Operations | (11.701) | 1.693 | 4.254 | 1.286 | 2.609 |
Distributions | | | | | |
Dividends from Net Investment Income | (.609) | (.603) | (.534) | (.496) | (.489) |
Distributions from Realized Capital Gains | — | — | — | — | — |
Total Distributions | (.609) | (.603) | (.534) | (.496) | (.489) |
Net Asset Value, End of Period | $19.65 | $31.96 | $30.87 | $27.15 | $26.36 |
| | | | | |
Total Return1 | –36.98% | 5.47% | 15.82% | 4.94% | 10.87% |
| | | | | |
Ratios/Supplemental Data | | | | | |
Net Assets, End of Period (Millions) | $263 | $469 | $389 | $303 | $266 |
Ratio of Total Expenses to | | | | | |
Average Net Assets | 0.07% | 0.07% | 0.07% | 0.07% | 0.07% |
Ratio of Net Investment Income to | | | | | |
Average Net Assets | 2.22% | 1.88% | 1.85% | 1.85% | 1.97% |
Portfolio Turnover Rate | 8% | 5% | 6% | 10% | 8% |
1 Total returns do not reflect the 1% redemption fee on shares held less than five years or the 2% redemption fee assessed prior to September 14, 2005, on shares held less than one year.
See accompanying Notes, which are an integral part of the Financial Statements.
45
Tax-Managed Growth and Income Fund
Notes to Financial Statements
Vanguard Tax-Managed Growth and Income Fund is registered under the Investment Company Act of 1940 as an open-end investment company, or mutual fund. The fund offers three classes of shares: Investor Shares, Admiral Shares, and Institutional Shares. Investor Shares are available to any investor who meets the fund’s minimum purchase requirements. Admiral Shares are designed for investors who meet certain administrative, service, tenure, and account-size criteria. Institutional Shares are designed for investors who meet certain administrative and service criteria and invest a minimum of $5 million.
A. The following significant accounting policies conform to generally accepted accounting principles for U.S. mutual funds. The fund consistently follows such policies in preparing its financial statements.
1. Security Valuation: Securities are valued as of the close of trading on the New York Stock Exchange (generally 4 p.m., Eastern time) on the valuation date. Equity securities are valued at the latest quoted sales prices or official closing prices taken from the primary market in which each security trades; such securities not traded on the valuation date are valued at the mean of the latest quoted bid and asked prices. Securities for which market quotations are not readily available, or whose values have been materially affected by events occurring before the fund’s pricing time but after the close of the securities’ primary markets, are valued by methods deemed by the board of trustees to represent fair value. Investments in Vanguard Market Liquidity Fund are valued at that fund’s net asset value.
2. Federal Income Taxes: The fund intends to continue to qualify as a regulated investment company and distribute all of its taxable income. Management has analyzed the fund’s tax positions taken on federal income tax returns for all open tax years (tax years ended December 31, 2005–2008), and has concluded that no provision for federal income tax is required in the fund’s financial statements.
3. Distributions: Distributions to shareholders are recorded on the ex-dividend date.
4. Security Lending: The fund may lend its securities to qualified institutional borrowers to earn additional income. Security loans are required to be secured at all times by collateral at least equal to the market value of securities loaned. The fund invests cash collateral received in Vanguard Market Liquidity Fund, and records a liability for the return of the collateral, during the period the securities are on loan. Security lending income represents the income earned on investing cash collateral, less expenses associated with the loan.
5. Other: Dividend income is recorded on the ex-dividend date. Interest income includes income distributions received from Vanguard Market Liquidity Fund and is accrued daily. Security transactions are accounted for on the date securities are bought or sold. Costs used to determine realized gains (losses) on the sale of investment securities are those of the specific securities sold. Fees assessed on redemptions of capital shares are credited to paid-in capital.
Each class of shares has equal rights as to assets and earnings, except that each class separately bears certain class-specific expenses related to maintenance of shareholder accounts (included in Management and Administrative expenses) and shareholder reporting. Marketing and distribution expenses are allocated to each class of shares based on a method approved by the board of trustees. Income, other non-class-specific expenses, and gains and losses on investments are allocated to each class of shares based on its relative net assets.
46
Tax-Managed Growth and Income Fund
B. The Vanguard Group furnishes at cost investment advisory, corporate management, administrative, marketing, and distribution services. The costs of such services are allocated to the fund under methods approved by the board of trustees. The fund has committed to provide up to 0.40% of its net assets in capital contributions to Vanguard. At December 31, 2008, the fund had contributed capital of $524,000 to Vanguard (included in Other Assets), representing 0.03% of the fund’s net assets and 0.21% of Vanguard’s capitalization. The fund’s trustees and officers are also directors and officers of Vanguard.
C. Distributions are determined on a tax basis and may differ from net investment income and realized capital gains for financial reporting purposes. Differences may be permanent or temporary. Permanent differences are reclassified among capital accounts in the financial statements to reflect their tax character. Temporary differences arise when certain items of income, expense, gain, or loss are recognized in different periods for financial statement and tax purposes; these differences will reverse at some time in the future. Differences in classification may also result from the treatment of short-term gains as ordinary income for tax purposes.
For tax purposes, at December 31, 2008, the fund had $461,000 of ordinary income available for distribution. The fund had available realized losses of $529,451,000 to offset future net capital gains of $78,029,000 through December 31, 2009, $201,652,000 through December 31, 2010, $92,868,000 through December 31, 2011, $31,345,000 through December 31, 2013, $1,431,000 through December 31, 2014, $67,505,000 through December 31, 2016, and $56,621,000 through December 31, 2017.
At December 31, 2008, the cost of investment securities for tax purposes was $1,803,949,000. Net unrealized appreciation of investment securities for tax purposes was $81,365,000, consisting of unrealized gains of $521,131,000 on securities that had risen in value since their purchase and $439,766,000 in unrealized losses on securities that had fallen in value since their purchase.
D. During the year ended December 31, 2008, the fund purchased $221,980,000 of investment securities and sold $378,247,000 of investment securities, other than temporary cash investments.
E. Capital share transactions for each class of shares were:
| | | Year Ended December 31, |
| | 2008 | | 2007 |
| Amount | Shares | Amount | Shares |
| ($000) | (000) | ($000) | (000) |
Investor Shares | | | | |
Issued | 70,052 | 2,859 | 73,362 | 2,292 |
Issued in Lieu of Cash Distributions | 11,463 | 465 | 12,000 | 371 |
Redeemed1 | (124,033) | (5,082) | (158,104) | (4,910) |
Net Increase (Decrease)—Investor Shares | (42,518) | (1,758) | (72,742) | (2,247) |
Admiral Shares | | | | |
Issued | 171,689 | 3,394 | 212,892 | 3,220 |
Issued in Lieu of Cash Distributions | 30,918 | 607 | 30,628 | 461 |
Redeemed1 | (293,956) | (6,401) | (132,931) | (2,008) |
Net Increase (Decrease)—Admiral Shares | (91,349) | (2,400) | 110,589 | 1,673 |
1 Net of redemption fees for 2008 and 2007 of $1,146,000 and $286,000, respectively (fund totals).
47
Tax-Managed Growth and Income Fund
| | | Year Ended December 31, |
| | 2008 | | 2007 |
| Amount | Shares | Amount | Shares |
| ($000) | (000) | ($000) | (000) |
Institutional Shares | | | | |
Issued | 48,307 | 1,970 | 68,637 | 2,135 |
Issued in Lieu of Cash Distributions | 5,473 | 222 | 5,852 | 181 |
Redeemed1 | (76,328) | (3,483) | (7,801) | (238) |
Net Increase (Decrease)—Institutional Shares | (22,548) | (1,291) | 66,688 | 2,078 |
1 | Net of redemption fees for 2008 and 2007 of $1,146,000 and $286,000, respectively (fund totals). |
F. In September 2006, the Financial Accounting Standards Board issued Statement of Financial Accounting Standards No. 157 (“FAS 157”), “Fair Value Measurements.” FAS 157 establishes a framework for measuring fair value and expands disclosures about fair value measurements in financial statements.
The various inputs that may be used to determine the value of the fund’s investments are summarized in three broad levels. The inputs or methodologies used for valuing securities are not necessarily an indication of the risk associated with investing in those securities.
Level 1—Quoted prices in active markets for identical securities.
Level 2—Other significant observable inputs (including quoted prices for similar securities, interest rates, prepayment speeds, credit risk, etc.).
Level 3—Significant unobservable inputs (including the fund’s own assumptions used to determine the fair value of investments).
At December 31, 2008, 100% of the fund’s investments were valued based on Level 1 inputs.
48
Tax-Managed Capital Appreciation Fund
Fund Profile
As of December 31, 2008
Portfolio Characteristics | | |
| | Comparative | Broad |
| Fund | Index1 | Index2 |
Number of Stocks | 626 | 989 | 4,593 |
Median Market Cap | $27.7B | $32.7B | $25.3B |
Price/Earnings Ratio | 11.3x | 11.3x | 11.8x |
Price/Book Ratio | 1.8x | 1.7x | 1.7x |
Yield3 | | 2.9% | 2.8% |
Investor Shares | 2.3% | | |
Admiral Shares | 2.3% | | |
Institutional Shares | 2.4% | | |
Return on Equity | 21.7% | 21.6% | 20.8% |
Earnings Growth Rate | 18.9% | 17.6% | 17.2% |
Foreign Holdings | 0.0% | 0.0% | 0.0% |
Turnover Rate | 8% | — | — |
Expense Ratio | | | |
(12/31/2007)4 | | — | — |
Investor Shares | 0.15% | | |
Admiral Shares | 0.09% | | |
Institutional Shares | 0.07% | | |
Short-Term Reserves | 0.0% | — | — |
Volatility Measures5 | | |
| Fund Versus | Fund Versus |
| Comparative Index1 | Broad Index2 |
R-Squared | 1.00 | 1.00 |
Beta | 1.02 | 1.00 |
Investment Focus
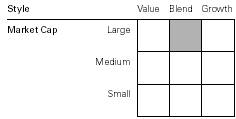
Sector Diversification (% of equity exposure) |
| | Comparative | Broad |
| Fund | Index1 | Index2 |
Consumer Discretionary | 9.0% | 8.9% | 8.9% |
Consumer Staples | 12.0 | 12.0 | 11.2 |
Energy | 12.8 | 12.8 | 12.4 |
Financials | 13.5 | 13.8 | 15.6 |
Health Care | 14.7 | 14.5 | 14.4 |
Industrials | 11.3 | 11.2 | 11.2 |
Information Technology | 15.6 | 15.5 | 15.2 |
Materials | 3.3 | 3.3 | 3.3 |
Telecommunication | | | |
Services | 3.6 | 3.6 | 3.4 |
Utilities | 4.2 | 4.4 | 4.4 |
Ten Largest Holdings6 (% of total net assets) |
| | |
ExxonMobil Corp. | integrated oil | |
| and gas | 4.8% |
The Procter & Gamble Co. | household products | 2.1 |
AT&T Inc. | integrated | |
| telecommunication | | |
| services | 1.8 |
Johnson & Johnson | pharmaceuticals | 1.8 |
General Electric Co. | industrial | |
| conglomerates | 1.8 |
Microsoft Corp. | systems software | 1.7 |
Chevron Corp. | integrated oil | |
| and gas | 1.7 |
Wal-Mart Stores, Inc. | hypermarkets and | |
| super centers | 1.4 |
JPMorgan Chase & Co. | diversified financial | |
| services | 1.3 |
International Business | | |
Machines Corp. | computer hardware | 1.2 |
Top Ten | | 19.6% |
1 Russell 1000 Index.
2 Dow Jones Wilshire 5000 Index.
3 30-day SEC yield for the fund; annualized dividend yield for the indexes. See the Glossary.
4 The expense ratios shown are from the prospectus dated July 29, 2008. For the fiscal year ended December 31, 2008, the fund’s expense ratios were 0.16% for Investor Shares, 0.10% for Admiral Shares, and 0.07% for Institutional Shares.
5 For an explanation of R-squared, beta, and other terms used here, see the Glossary.
6 The holdings listed exclude any temporary cash investments and equity index products.
49
Tax-Managed Capital Appreciation Fund
Performance Summary
All of the returns in this report represent past performance, which is not a guarantee of future results that may be achieved by the fund. (Current performance may be lower or higher than the performance data cited. For performance data current to the most recent month-end, visit our website at www.vanguard.com/performance.) Note, too, that both investment returns and principal value can fluctuate widely, so an investor’s shares, when sold, could be worth more or less than their original cost. The returns shown do not reflect taxes that a shareholder would pay on fund distributions or on the sale of fund shares.
Cumulative Performance: December 31, 1998–December 31, 2008
Initial Investment of $10,000
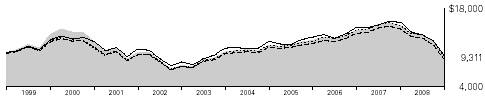
| Average Annual Total Returns | Final Value |
| Periods Ended December 31, 2008 | of a $10,000 |
| One Year | Five Years | Ten Years | Investment |
Tax-Managed Capital Appreciation Fund | | | | |
Investor Shares1 | –37.63% | –1.89% | –0.71% | $9,311 |
Fee-Adjusted Returns2 | –38.23 | –1.89 | –0.71 | 9,311 |
Dow Jones Wilshire 5000 Index | –37.34 | –1.67 | –0.63 | 9,388 |
Russell 1000 Index | –37.60 | –2.04 | –1.09 | 8,963 |
Average Multi-Cap Core Fund3 | –38.79 | –2.66 | –0.61 | 9,403 |
| | | | Final Value |
| | | Since | of a $100,000 |
| One Year | Five Years | Inception4 | Investment |
Tax-Managed Capital Appreciation Fund | | | | |
Admiral Shares | –37.58% | –1.84% | –0.58% | $95,942 |
Fee-Adjusted Returns2 | –38.19 | –1.84 | –0.58 | 95,942 |
Dow Jones Wilshire 5000 Index | –37.34 | –1.67 | –0.02 | 99,872 |
Russell 1000 Index | –37.60 | –2.04 | –0.74 | 94,841 |
1 Total returns do not include the account service fee that may be applicable to certain accounts with balances below $10,000.
2 Reflective of the 1% fee assessed on redemptions of shares held in the fund for less than five years, but not of the account service fee that may be applicable to certain accounts below $10,000.
3 Derived from data provided by Lipper Inc.
4 Performance for the fund’s Admiral Shares and comparative standards is calculated since the Admiral Shares’ inception: November 12, 2001.
50
Tax-Managed Capital Appreciation Fund
| Average Annual Total Returns | |
| Periods Ended December 31, 2008 | Final Value of |
| | | Since | a $5,000,000 |
| One Year | Five Years | Inception1 | Investment |
Tax-Managed Capital Appreciation Fund | | | | |
Institutional Shares | –37.57% | –1.82% | –0.88% | $4,581,280 |
Fee-Adjusted Returns2 | –38.18 | –1.82 | –0.88 | 4,581,280 |
Dow Jones Wilshire 5000 Index | –37.34 | –1.67 | –0.76 | 4,640,108 |
Russell 1000 Index | –37.60 | –2.04 | –1.26 | 4,412,627 |
Fiscal-Year Total Returns (%): December 31, 1998–December 31, 2008
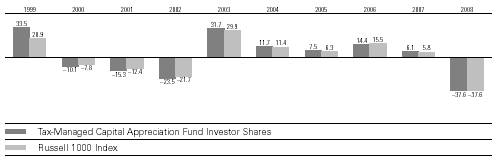
1 Performance for the fund’s Institutional Shares and comparative standards is calculated since the Institutional Shares’ inception: February 24, 1999.
2 Reflective of the 1% fee assessed on redemptions of shares held for less than five years.
Note: See Financial Highlights tables for dividend and capital gains information.
51
Tax-Managed Capital Appreciation Fund
Financial Statements
Statement of Net Assets
As of December 31, 2008
The fund provides a complete list of its holdings four times in each fiscal year, at the quarter-ends. For the second and fourth fiscal quarters, the lists appear in the fund’s semiannual and annual reports to shareholders. For the first and third fiscal quarters, the fund files the lists with the Securities and Exchange Commission on Form N-Q. Shareholders can look up the fund’s Forms N-Q on the SEC’s website at www.sec.gov. Forms N-Q may also be reviewed and copied at the SEC’s Public Reference Room (see the back cover of this report for further information).
| | | Market |
| | | Value• |
| | Shares | ($000) |
Common Stocks (100.0%) | | |
Consumer Discretionary (9.0%) | | |
| McDonald’s Corp. | 358,560 | 22,299 |
| The Walt Disney Co. | 654,136 | 14,842 |
| Comcast Corp. Class A | 769,193 | 12,984 |
| Time Warner, Inc. | 1,129,947 | 11,367 |
| Home Depot, Inc. | 480,000 | 11,050 |
| Lowe’s Cos., Inc. | 498,600 | 10,730 |
| Target Corp. | 282,500 | 9,755 |
| News Corp., Class A | 831,630 | 7,560 |
* | Amazon.com, Inc. | 127,700 | 6,548 |
| NIKE, Inc. Class B | 127,200 | 6,487 |
| Yum! Brands, Inc. | 202,860 | 6,390 |
* | DIRECTV Group, Inc. | 249,302 | 5,711 |
* | Apollo Group, Inc. Class A | 60,884 | 4,665 |
| Best Buy Co., Inc. | 153,550 | 4,316 |
| Johnson Controls, Inc. | 237,600 | 4,315 |
* | Kohl’s Corp. | 115,300 | 4,174 |
* | AutoZone Inc. | 25,000 | 3,487 |
* | Coach, Inc. | 160,900 | 3,342 |
| The Gap, Inc. | 246,487 | 3,300 |
* | Viacom Inc. Class B | 164,484 | 3,135 |
* | Starbucks Corp. | 322,352 | 3,049 |
* | Bed Bath & Beyond, Inc. | 118,717 | 3,018 |
| Hasbro, Inc. | 100,600 | 2,934 |
* | O’Reilly Automotive, Inc. | 93,848 | 2,885 |
| The McGraw-Hill Cos., Inc. | 122,900 | 2,850 |
* | Dollar Tree, Inc. | 67,734 | 2,831 |
| Marriott International, Inc. | | |
| Class A | 144,300 | 2,807 |
| DeVry, Inc. | 48,459 | 2,782 |
| Advance Auto Parts, Inc. | 82,402 | 2,773 |
* | Liberty Media Corp. | 158,124 | 2,764 |
| Darden Restaurants Inc. | 97,150 | 2,738 |
| Polo Ralph Lauren Corp. | 53,400 | 2,425 |
| PetSmart, Inc. | 125,600 | 2,317 |
| John Wiley & Sons Class A | 63,800 | 2,270 |
| BorgWarner, Inc. | 88,000 | 1,916 |
* | NVR, Inc. | 3,980 | 1,816 |
| | | Market |
| | | Value• |
| | Shares | ($000) |
| Black & Decker Corp. | 42,400 | 1,773 |
| Staples, Inc. | 94,495 | 1,693 |
| Starwood Hotels & | | |
| Resorts Worldwide, Inc. | 88,624 | 1,586 |
| International Game | | |
| Technology | 129,600 | 1,541 |
* | Mohawk Industries, Inc. | 34,700 | 1,491 |
| International | | |
| Speedway Corp. | 49,578 | 1,424 |
* | Toll Brothers, Inc. | 64,600 | 1,384 |
| Scripps Networks | | |
| Interactive | 62,170 | 1,368 |
| Omnicom Group Inc. | 50,600 | 1,362 |
| Weight Watchers I | | |
| nternational, Inc. | 45,200 | 1,330 |
* | AutoNation, Inc. | 130,380 | 1,288 |
| Centex Corp. | 120,300 | 1,280 |
* | CarMax, Inc. | 148,046 | 1,167 |
* | Liberty Global, Inc. | | |
| Series C | 75,207 | 1,142 |
| Pulte Homes, Inc. | 100,800 | 1,102 |
* | Career Education Corp. | 60,400 | 1,084 |
| Brinker International, Inc. | 102,750 | 1,083 |
* | Liberty Global, Inc. Class A | 67,398 | 1,073 |
| Washington Post Co. | | |
| Class B | 2,720 | 1,061 |
| Ross Stores, Inc. | 34,600 | 1,029 |
| Gentex Corp. | 116,252 | 1,026 |
| CBS Corp. | 120,331 | 985 |
| Harley-Davidson, Inc. | 56,800 | 964 |
| Cablevision Systems | | |
| NY Group Class A | 54,344 | 915 |
| D. R. Horton, Inc. | 126,366 | 893 |
| Barnes & Noble, Inc. | 57,300 | 859 |
* | Brink’s Home Security | | |
| Holdings, Inc. | 36,800 | 807 |
| Phillips-Van Heusen Corp. | 39,400 | 793 |
* | MGM Mirage, Inc. | 56,746 | 781 |
| Foot Locker, Inc. | 103,900 | 763 |
52
Tax-Managed Capital Appreciation Fund
| | | Market |
| | | Value• |
| | Shares | ($000) |
| American Eagle | | |
| Outfitters, Inc. | 75,991 | 711 |
* | Lamar Advertising Co. | | |
| Class A | 56,186 | 706 |
| WABCO Holdings Inc. | 44,400 | 701 |
| RadioShack Corp. | 58,000 | 693 |
| Macy’s Inc. | 56,800 | 588 |
| Mattel, Inc. | 36,032 | 577 |
* | Discovery | | |
| Communications Inc. | | |
| Class C | 43,037 | 576 |
| Abercrombie & Fitch Co. | 23,300 | 538 |
* | Saks Inc. | 116,900 | 512 |
| Lennar Corp. Class A | 54,600 | 473 |
| Nordstrom, Inc. | 32,300 | 430 |
| Jones Apparel Group, Inc. | 61,800 | 362 |
| Virgin Media Inc. | 62,269 | 311 |
* | Expedia, Inc. | 37,225 | 307 |
* | Sears Holdings Corp. | 7,200 | 280 |
| Harman International | | |
| Industries, Inc. | 13,400 | 224 |
| Comcast Corp. Special | | |
| Class A | 12,397 | 200 |
* | Viacom Inc. Class A | 6,844 | 138 |
* | Ascent Media Corp. | 4,303 | 94 |
* | Wynn Resorts Ltd. | 2,000 | 85 |
* | Liberty Media Corp.– | | |
| Capital Series A | 16,431 | 77 |
* | HSN, Inc. | 9,806 | 71 |
* | Hanesbrands Inc. | 5,575 | 71 |
* | Ticketmaster | | |
| Entertainment Inc. | 9,806 | 63 |
| CBS Corp. Class A | 6,844 | 56 |
| Lennar Corp. Class B | 8,300 | 54 |
* | Interval Leisure Group, Inc. | 9,806 | 53 |
| E.W. Scripps Co. Class A | 20,723 | 46 |
| | | 242,676 |
Consumer Staples (12.0%) | | |
| The Procter & Gamble Co. | 930,878 | 57,547 |
| Wal-Mart Stores, Inc. | 696,528 | 39,047 |
| The Coca-Cola Co. | 690,000 | 31,236 |
| PepsiCo, Inc. | 517,400 | 28,338 |
| Philip Morris | | |
| International Inc. | 555,800 | 24,183 |
| CVS Caremark Corp. | 499,554 | 14,357 |
| Costco Wholesale Corp. | 156,100 | 8,195 |
| Kraft Foods Inc. | 297,431 | 7,986 |
| Colgate-Palmolive Co. | 115,900 | 7,944 |
| Walgreen Co. | 307,300 | 7,581 |
| Archer-Daniels-Midland Co. | 257,273 | 7,417 |
| The Kroger Co. | 263,700 | 6,964 |
| Altria Group, Inc. | 358,000 | 5,391 |
| Safeway, Inc. | 170,462 | 4,052 |
| The Clorox Co. | 69,120 | 3,840 |
| | | Market |
| | | Value• |
| | Shares | ($000) |
| Campbell Soup Co. | 117,600 | 3,529 |
| Molson Coors Brewing Co. | | |
| Class B | 71,900 | 3,517 |
| Bunge Ltd. | 67,500 | 3,494 |
| Brown-Forman Corp. | | |
| Class B | 64,646 | 3,329 |
| Kimberly-Clark Corp. | 55,096 | 2,906 |
| The Hershey Co. | 81,300 | 2,824 |
| McCormick & Co., Inc. | 87,400 | 2,785 |
* | Constellation Brands, Inc. | | |
| Class A | 176,000 | 2,776 |
| The Estee Lauder Cos. Inc. | | |
| Class A | 88,200 | 2,731 |
| General Mills, Inc. | 44,400 | 2,697 |
| Church & Dwight, Inc. | 47,100 | 2,643 |
* | Dr. Pepper | | |
| Snapple Group, Inc. | 160,100 | 2,602 |
| Alberto-Culver Co. | 104,363 | 2,558 |
| Coca-Cola Enterprises, Inc. | 211,600 | 2,546 |
| The Pepsi Bottling | | |
| Group, Inc. | 112,212 | 2,526 |
* | Hansen Natural Corp. | 74,900 | 2,511 |
| Tyson Foods, Inc. | 286,463 | 2,509 |
| Hormel Foods Corp. | 77,100 | 2,396 |
* | Energizer Holdings, Inc. | 44,128 | 2,389 |
| Del Monte Foods Co. | 330,100 | 2,357 |
* | Dean Foods Co. | 130,200 | 2,340 |
| PepsiAmericas, Inc. | 109,330 | 2,226 |
| J.M. Smucker Co. | 49,024 | 2,126 |
| Corn Products | | |
| International, Inc. | 72,200 | 2,083 |
* | Smithfield Foods, Inc. | 141,335 | 1,989 |
| Kellogg Co. | 44,300 | 1,943 |
| Avon Products, Inc. | 59,300 | 1,425 |
* | NBTY, Inc. | 37,300 | 584 |
| Sara Lee Corp. | 44,600 | 437 |
| Whole Foods Market, Inc. | 32,840 | 310 |
| ConAgra Foods, Inc. | 11,200 | 185 |
| Sysco Corp. | 6,800 | 156 |
| Reynolds American Inc. | 106 | 4 |
| | | 325,511 |
Energy (12.8%) | | |
| ExxonMobil Corp. 1 | ,625,734 | 129,782 |
| Chevron Corp. | 605,838 | 44,814 |
| ConocoPhillips Co. | 434,630 | 22,514 |
| Schlumberger Ltd. | 312,000 | 13,207 |
| Occidental Petroleum Corp. | 190,339 | 11,418 |
| Devon Energy Corp. | 158,022 | 10,384 |
| Apache Corp. | 124,162 | 9,254 |
| XTO Energy, Inc. | 205,241 | 7,239 |
| Anadarko Petroleum Corp. | 179,316 | 6,913 |
| EOG Resources, Inc. | 96,900 | 6,452 |
| Hess Corp. | 116,300 | 6,238 |
| Baker Hughes Inc. | 124,580 | 3,995 |
53
Tax-Managed Capital Appreciation Fund
| | | | Market |
| | | | Value• |
| | | Shares | ($000) |
| Valero Energy Corp. | | 182,480 | 3,949 |
| Noble Energy, Inc. | | 79,600 | 3,918 |
* | Southwestern Energy Co. | | 134,200 | 3,888 |
* | National Oilwell Varco Inc. | | 151,690 | 3,707 |
| Williams Cos., Inc. | | 247,700 | 3,587 |
| Noble Corp. | | 147,300 | 3,249 |
| Peabody Energy Corp. | | 133,900 | 3,046 |
| Range Resources Corp. | | 88,500 | 3,043 |
| Halliburton Co. | | 158,200 | 2,876 |
| Diamond Offshore | | | |
| Drilling, Inc. | | 44,000 | 2,593 |
| ENSCO International, Inc. | | 91,200 | 2,589 |
| Chesapeake Energy Corp. | | 143,311 | 2,317 |
* | Cameron International Corp. | | 112,000 | 2,296 |
| Cabot Oil & Gas Corp. | | 87,535 | 2,276 |
| Marathon Oil Corp. | | 81,100 | 2,219 |
| Smith International, Inc. | | 91,300 | 2,090 |
| Cimarex Energy Co. | | 71,100 | 1,904 |
* | FMC Technologies Inc. | | 76,250 | 1,817 |
| St. Mary Land & | | | |
| Exploration Co. | | 89,400 | 1,816 |
| BJ Services Co. | | 147,100 | 1,717 |
* | Pride International, Inc. | | 106,400 | 1,700 |
| W&T Offshore, Inc. | | 117,985 | 1,690 |
* | Newfield Exploration Co. | | 80,300 | 1,586 |
* | Plains Exploration & | | | |
| Production Co. | | 66,760 | 1,551 |
| Helmerich & Payne, Inc. | | 63,157 | 1,437 |
| Southern Union Co. | | 105,700 | 1,378 |
| Rowan Cos., Inc. | | 80,600 | 1,282 |
| Spectra Energy Corp. | | 77,296 | 1,217 |
| Arch Coal, Inc. | | 73,400 | 1,196 |
* | Forest Oil Corp. | | 65,300 | 1,077 |
| Pioneer Natural | | | |
| Resources Co. | | 63,500 | 1,027 |
| CONSOL Energy, Inc. | | 33,900 | 969 |
* | Mariner Energy Inc. | | 88,252 | 900 |
* | Key Energy Services, Inc. | | 90,000 | 397 |
* | Unit Corp. | | 12,800 | 342 |
| Patterson-UTI Energy, Inc. | | 21,200 | 244 |
* | Patriot Coal Corp. | | 24,440 | 153 |
| Tesoro Corp. | | 7,100 | 93 |
* | Hercules Offshore, Inc. | | 2,300 | 11 |
| | | | 345,357 |
Financials (13.5%) | | | |
| JPMorgan Chase & Co. | | 1,079,621 | 34,040 |
| Wells Fargo & Co. | | 1,012,480 | 29,848 |
| Bank of America Corp. | | 1,447,979 | 20,388 |
| The Goldman Sachs | | | |
| Group, Inc. | | 139,830 | 11,800 |
| U.S. Bancorp | | 392,700 | 9,821 |
| AFLAC Inc. | | 186,400 | 8,545 |
| Citigroup Inc. | | 1,027,644 | 6,895 |
| State Street Corp. | | 161,878 | 6,367 |
| | | Market |
| | | Value• |
| | Shares | ($000) |
| Bank of New York | | |
| Mellon Corp. | 223,900 | 6,343 |
| American Express Co. | 331,300 | 6,146 |
| MetLife, Inc. | 175,820 | 6,129 |
| Charles Schwab Corp. | 377,200 | 6,099 |
| CME Group, Inc. | 26,001 | 5,411 |
| Capital One Financial Corp. | 158,900 | 5,067 |
| Prudential Financial, Inc. | 166,404 | 5,035 |
| Public Storage, Inc. REIT | 61,200 | 4,865 |
| Franklin Resources Corp. | 76,100 | 4,854 |
| Progressive Corp. of Ohio | 320,300 | 4,744 |
| The Travelers Cos., Inc. | 101,877 | 4,605 |
| Loews Corp. | 152,400 | 4,305 |
| Morgan Stanley | 264,800 | 4,247 |
| Hudson City Bancorp, Inc. | 264,702 | 4,225 |
| Wachovia Corp. | 760,782 | 4,215 |
| Unum Group | 206,200 | 3,835 |
| Plum Creek Timber Co. Inc. | | |
| REIT | 100,900 | 3,505 |
| The Allstate Corp. | 102,300 | 3,351 |
| T. Rowe Price Group Inc. | 92,978 | 3,295 |
| W.R. Berkley Corp. | 102,297 | 3,171 |
| People’s United | | |
| Financial Inc. | 174,014 | 3,103 |
| Torchmark Corp. | 68,100 | 3,044 |
| Ameriprise Financial, Inc. | 123,360 | 2,882 |
| Boston Properties, Inc. | | |
| REIT | 51,900 | 2,855 |
| Discover Financial Services | 287,700 | 2,742 |
| The Principal Financial | | |
| Group, Inc. | 120,400 | 2,717 |
* | Arch Capital Group Ltd. | 38,300 | 2,685 |
* | TD Ameritrade | | |
| Holding Corp. | 188,400 | 2,685 |
| HCC Insurance | | |
| Holdings, Inc. | 99,100 | 2,651 |
| Moody’s Corp. | 130,700 | 2,626 |
* | Markel Corp. | 8,620 | 2,577 |
| Commerce | | |
| Bancshares, Inc. | 57,767 | 2,539 |
* | Reinsurance Group of | | |
| America, Inc. | 58,819 | 2,519 |
| Brown & Brown, Inc. | 118,600 | 2,479 |
| M & T Bank Corp. | 42,600 | 2,446 |
| Cullen/Frost Bankers, Inc. | 47,600 | 2,412 |
| The Hanover Insurance | | |
| Group Inc. | 55,800 | 2,398 |
| StanCorp Financial | | |
| Group, Inc. | 56,500 | 2,360 |
* | Leucadia National Corp. | 117,400 | 2,325 |
* | SLM Corp. | 253,900 | 2,260 |
| Assurant, Inc. | 75,300 | 2,259 |
| Avalonbay | | |
| Communities, Inc. REIT | 37,200 | 2,254 |
54
Tax-Managed Capital Appreciation Fund
| | | Market |
| | | Value• |
| | Shares | ($000) |
| SEI Investments Co. | 143,370 | 2,252 |
| BlackRock, Inc. | 16,750 | 2,247 |
* | The St. Joe Co. | 90,600 | 2,203 |
| TFS Financial Corp. | 168,700 | 2,176 |
* | Alleghany Corp. | 7,641 | 2,155 |
| PNC Financial | | |
| Services Group | 42,995 | 2,107 |
| First Citizens BancShares | | |
| Class A | 13,442 | 2,054 |
| Kimco Realty Corp. REIT | 112,300 | 2,053 |
| City National Corp. | 42,000 | 2,045 |
* | Sovereign Bancorp, Inc. | 656,274 | 1,956 |
| AMB Property Corp. REIT | 82,700 | 1,937 |
| Jones Lang LaSalle Inc. | 69,100 | 1,914 |
| National City Corp. | 1,016,240 | 1,839 |
| Wesco Financial Corp. | 6,300 | 1,814 |
| Northern Trust Corp. | 34,773 | 1,813 |
| Eaton Vance Corp. | 86,202 | 1,811 |
| Host Hotels & Resorts Inc. | | |
| REIT | 238,898 | 1,808 |
| MGIC Investment Corp. | 518,244 | 1,803 |
| BOK Financial Corp. | 44,171 | 1,785 |
| Janus Capital Group Inc. | 220,500 | 1,771 |
| Transatlantic Holdings, Inc. | 44,114 | 1,767 |
| Lazard Ltd. Class A | 55,686 | 1,656 |
| Marshall & Ilsley Corp. | 119,600 | 1,631 |
| Douglas Emmett, Inc. REIT | 121,273 | 1,584 |
| Legg Mason Inc. | 72,200 | 1,582 |
| The Chubb Corp. | 30,900 | 1,576 |
* | Affiliated Managers | | |
| Group, Inc. | 36,800 | 1,543 |
| Merrill Lynch & Co., Inc. | 132,400 | 1,541 |
* | AmeriCredit Corp. | 201,500 | 1,539 |
| Raymond James | | |
| Financial, Inc. | 89,650 | 1,536 |
| First Horizon National Corp. | 139,115 | 1,470 |
| Zions Bancorp | 58,100 | 1,424 |
| Synovus Financial Corp. | 161,056 | 1,337 |
| Camden Property Trust | | |
| REIT | 42,400 | 1,329 |
| BB&T Corp. | 46,300 | 1,271 |
| Federated Investors, Inc. | 68,250 | 1,158 |
| CNA Financial Corp. | 69,500 | 1,143 |
| American International | | |
| Group, Inc. | 709,331 | 1,114 |
| Developers Diversified | | |
| Realty Corp. REIT | 228,157 | 1,113 |
| ProLogis REIT | 80,068 | 1,112 |
| New York Community | | |
| Bancorp, Inc. | 86,400 | 1,033 |
| White Mountains | | |
| Insurance Group Inc. | 3,828 | 1,023 |
| SunTrust Banks, Inc. | 33,800 | 998 |
| | | Market |
| | | Value• |
| | Shares | ($000) |
| Apartment Investment & | | |
| Management Co. | | |
| Class A REIT | 85,967 | 993 |
| Digital Realty Trust, Inc. | | |
| REIT | 28,440 | 934 |
| Bank of Hawaii Corp. | 20,100 | 908 |
* | CB Richard Ellis Group, Inc. | 207,400 | 896 |
| Webster Financial Corp. | 62,400 | 860 |
| iStar Financial Inc. REIT | 385,102 | 859 |
| The Hartford Financial | | |
| Services Group Inc. | 49,200 | 808 |
| SL Green Realty Corp. REIT | 30,400 | 787 |
| Aon Corp. | 16,400 | 749 |
| American Financial | | |
| Group, Inc. | 32,200 | 737 |
| Forest City Enterprise | | |
| Class A | 100,700 | 675 |
| CapitalSource Inc. REIT | 130,938 | 605 |
| BRE Properties Inc. | | |
| Class A REIT | 21,500 | 602 |
| Simon Property Group, Inc. | | |
| REIT | 10,561 | 561 |
| Federal Realty | | |
| Investment Trust REIT | 8,200 | 509 |
| Genworth Financial Inc. | 171,900 | 486 |
| NYSE Euronext | 17,500 | 479 |
* | E*TRADE Financial Corp. | 408,969 | 470 |
| Regions Financial Corp. | 49,934 | 397 |
| KeyCorp | 39,369 | 335 |
| Taubman Co. REIT | 11,300 | 288 |
| Fannie Mae | 310,000 | 236 |
| MBIA, Inc. | 57,000 | 232 |
| Invesco, Ltd. | 12,010 | 173 |
| Freddie Mac | 215,700 | 157 |
| Fifth Third Bancorp | 12,300 | 102 |
| BancorpSouth, Inc. | 4,000 | 93 |
* | Tree.com, Inc. | 30,277 | 79 |
| Wilmington Trust Corp. | 3,100 | 69 |
| Essex Property Trust, Inc. | | |
| REIT | 300 | 23 |
* | MF Global Ltd. | 7,600 | 16 |
| | | 364,110 |
Health Care (14.7%) | | |
| Johnson & Johnson | 810,598 | 48,498 |
| Pfizer Inc. | 1,857,860 | 32,903 |
| Abbott Laboratories | 407,600 | 21,754 |
* | Amgen Inc. | 363,025 | 20,965 |
| Merck & Co., Inc. | 537,200 | 16,331 |
* | Gilead Sciences, Inc. | 317,700 | 16,247 |
| Wyeth | 411,700 | 15,443 |
* | Genentech, Inc. | 162,900 | 13,506 |
| Schering-Plough Corp. | 600,200 | 10,221 |
| Bristol-Myers Squibb Co. | 424,600 | 9,872 |
55
Tax-Managed Capital Appreciation Fund
| | | Market |
| | | Value• |
| | Shares | ($000) |
| UnitedHealth Group Inc. | 367,662 | 9,780 |
* | WellPoint Inc. | 197,116 | 8,304 |
| Medtronic, Inc. | 263,600 | 8,282 |
* | Celgene Corp. | 149,500 | 8,264 |
* | Medco Health | | |
| Solutions, Inc. | 196,642 | 8,241 |
| Eli Lilly & Co. | 197,000 | 7,933 |
* | Genzyme Corp. | 107,700 | 7,148 |
| Baxter International, Inc. | 127,341 | 6,824 |
* | Biogen Idec Inc. | 126,561 | 6,028 |
* | Thermo Fisher | | |
| Scientific, Inc. | 169,493 | 5,775 |
| Aetna Inc. | 197,988 | 5,643 |
| Allergan, Inc. | 139,250 | 5,615 |
| Becton, Dickinson & Co. | 80,600 | 5,512 |
* | Express Scripts Inc. | 93,462 | 5,138 |
| Cardinal Health, Inc. | 145,512 | 5,016 |
* | St. Jude Medical, Inc. | 139,832 | 4,609 |
| Stryker Corp. | 109,200 | 4,362 |
| Quest Diagnostics, Inc. | 80,200 | 4,163 |
* | Forest Laboratories, Inc. | 163,100 | 4,154 |
* | Laboratory Corp. of | | |
| America Holdings | 61,100 | 3,935 |
| AmerisourceBergen Corp. | 99,200 | 3,537 |
| Covidien Ltd. | 91,750 | 3,325 |
* | Zimmer Holdings, Inc. | 81,170 | 3,281 |
* | Humana Inc. | 79,300 | 2,956 |
| DENTSPLY | | |
| International Inc. | 101,600 | 2,869 |
| McKesson Corp. | 73,424 | 2,844 |
* | Mylan Inc. | 262,137 | 2,592 |
* | Waters Corp. | 69,200 | 2,536 |
* | Millipore Corp. | 48,400 | 2,494 |
| C.R. Bard, Inc. | 29,300 | 2,469 |
* | Hospira, Inc. | 91,940 | 2,466 |
* | Henry Schein, Inc. | 67,200 | 2,466 |
| Pharmaceutical Product | | |
| Development, Inc. | 84,803 | 2,460 |
* | Endo Pharmaceuticals | | |
| Holdings, Inc. | 86,000 | 2,226 |
| CIGNA Corp. | 129,300 | 2,179 |
| Beckman Coulter, Inc. | 47,600 | 2,091 |
* | Watson | | |
| Pharmaceuticals, Inc. | 78,500 | 2,086 |
| IMS Health, Inc. | 135,552 | 2,055 |
| Teleflex Inc. | 37,000 | 1,854 |
* | Lincare Holdings, Inc. | 66,500 | 1,791 |
| PerkinElmer, Inc. | 124,804 | 1,736 |
| Perrigo Co. | 51,581 | 1,667 |
* | Boston Scientific Corp. | 207,945 | 1,609 |
| Universal Health Services | | |
| Class B | 40,800 | 1,533 |
* | Patterson Companies, Inc. | 73,530 | 1,379 |
* | Coventry Health Care Inc. | 81,025 | 1,206 |
| | | Market |
| | | Value• |
| | Shares | ($000) |
* | Life Technologies Corp. | 50,735 | 1,183 |
| Omnicare, Inc. | 40,900 | 1,135 |
* | Abraxis BioScience | 14,415 | 950 |
* | King Pharmaceuticals, Inc. | 89,119 | 946 |
* | Varian Medical | | |
| Systems, Inc. | 26,500 | 929 |
* | Health Net Inc. | 74,200 | 808 |
* | Sepracor Inc. | 58,700 | 644 |
* | Kinetic Concepts, Inc. | 31,000 | 595 |
* | DaVita, Inc. | 2,200 | 109 |
| Teva Pharmaceutical | | |
| Industries Ltd. | | |
| Sponsored ADR | 1,684 | 72 |
| | | 397,544 |
Industrials (11.3%) | | |
| General Electric Co. | 2,950,734 | 47,802 |
| United Technologies Corp. | 296,600 | 15,898 |
| The Boeing Co. | 236,770 | 10,103 |
| Lockheed Martin Corp. | 116,800 | 9,820 |
| 3M Co. | 154,200 | 8,873 |
| General Dynamics Corp. | 144,600 | 8,327 |
| United Parcel Service, Inc. | 147,300 | 8,125 |
| Caterpillar, Inc. | 171,100 | 7,643 |
| FedEx Corp. | 110,700 | 7,101 |
| Norfolk Southern Corp. | 148,200 | 6,973 |
| Danaher Corp. | 109,700 | 6,210 |
| Illinois Tool Works, Inc. | 175,200 | 6,141 |
| Union Pacific Corp. | 123,914 | 5,923 |
| CSX Corp. | 167,200 | 5,429 |
| Emerson Electric Co. | 142,400 | 5,213 |
| Waste Management, Inc. | 149,097 | 4,941 |
| C.H. Robinson | | |
| Worldwide Inc. | 84,400 | 4,644 |
| L-3 Communications | | |
| Holdings, Inc. | 60,700 | 4,478 |
| Raytheon Co. | 85,833 | 4,381 |
| Honeywell | | |
| International Inc. | 131,400 | 4,314 |
| ITT Industries, Inc. | 93,400 | 4,295 |
| PACCAR, Inc. | 149,110 | 4,265 |
| Precision Castparts Corp. | 70,000 | 4,164 |
| Burlington Northern | | |
| Santa Fe Corp. | 54,898 | 4,156 |
| Fluor Corp. | 91,300 | 4,097 |
| Deere & Co. | 104,800 | 4,016 |
| Expeditors International of | | |
| Washington, Inc. | 112,361 | 3,738 |
| Parker Hannifin Corp. | 85,200 | 3,624 |
| W.W. Grainger, Inc. | 45,400 | 3,579 |
| Southwest Airlines Co. | 413,387 | 3,563 |
* | Jacobs Engineering | | |
| Group Inc. | 70,300 | 3,381 |
| Rockwell Collins, Inc. | 85,600 | 3,346 |
| Northrop Grumman Corp. | 72,268 | 3,255 |
56
Tax-Managed Capital Appreciation Fund
| | | | Market |
| | | | Value• |
| | | Shares | ($000) |
* | Iron Mountain, Inc. | | 122,100 | 3,019 |
| Fastenal Co. | | 84,100 | 2,931 |
| Pall Corp. | | 99,500 | 2,829 |
| The Dun & Bradstreet Corp. | 36,200 | 2,795 |
* | Stericycle, Inc. | | 53,300 | 2,776 |
| Roper Industries Inc. | | 63,500 | 2,756 |
| Cummins Inc. | | 101,200 | 2,705 |
* | Alliant Techsystems, Inc. | | 31,400 | 2,693 |
* | Quanta Services, Inc. | | 135,200 | 2,677 |
| Donaldson Co., Inc. | | 74,700 | 2,514 |
| Equifax, Inc. | | 93,200 | 2,472 |
| Landstar System, Inc. | | 63,589 | 2,444 |
| Ametek, Inc. | | 80,800 | 2,441 |
| J.B. Hunt Transport | | | |
| Services, Inc. | | 91,300 | 2,398 |
| Flowserve Corp. | | 43,700 | 2,251 |
| MSC Industrial | | | |
| Direct Co., Inc. Class A | | 59,200 | 2,180 |
| Valmont Industries, Inc. | | 34,437 | 2,113 |
| IDEX Corp. | | 86,400 | 2,087 |
| The Toro Co. | | 57,400 | 1,894 |
| Manpower Inc. | | 54,600 | 1,856 |
| Robert Half | | | |
| International, Inc. | | 87,500 | 1,822 |
| The Manitowoc Co., Inc. | | 208,774 | 1,808 |
| Bucyrus International, Inc. | | 97,114 | 1,799 |
* | Foster Wheeler Ltd. | | 75,300 | 1,760 |
| Con-way, Inc. | | 64,200 | 1,708 |
| Cintas Corp. | | 70,766 | 1,644 |
| Joy Global Inc. | | 69,800 | 1,598 |
| SPX Corp. | | 37,400 | 1,517 |
| KBR Inc. | | 89,249 | 1,357 |
| Carlisle Co., Inc. | | 65,200 | 1,350 |
* | United Rentals, Inc. | | 133,100 | 1,214 |
| Lennox International Inc. | | 35,090 | 1,133 |
| UTI Worldwide, Inc. | | 77,587 | 1,113 |
| The Brink’s Co. | | 36,800 | 989 |
| Graco, Inc. | | 33,700 | 800 |
| Republic Services, Inc. | | | |
| Class A | | 19,512 | 484 |
| Ryder System, Inc. | | 3,600 | 140 |
| John Bean | | | |
| Technologies Corp. | | 16,470 | 135 |
* | Hertz Global Holdings Inc. | | 22,000 | 111 |
* | Raytheon Co. | | | |
| Warrants Exp. 6/16/11 | | 2,285 | 36 |
* | AMR Corp. | | 3,100 | 33 |
* | Avis Budget Group, Inc. | | 33,192 | 23 |
| | | | 304,223 |
Information Technology (15.6%) | | |
| Microsoft Corp. | | 2,376,500 | 46,199 |
| International Business | | | |
| Machines Corp. | | 394,058 | 33,164 |
* | Cisco Systems, Inc. | | 1,917,300 | 31,252 |
| | | Market |
| | | Value• |
| | Shares | ($000) |
| Hewlett-Packard Co. | 807,558 | 29,306 |
* | Apple Inc. | 289,000 | 24,666 |
* | Google Inc. | 78,100 | 24,027 |
* | Oracle Corp. | 1,296,734 | 22,991 |
| Intel Corp. | 1,539,200 | 22,565 |
| QUALCOMM Inc. | 415,720 | 14,895 |
| Visa Inc. | 168,798 | 8,853 |
* | EMC Corp. | 770,100 | 8,063 |
| Texas Instruments, Inc. | 480,500 | 7,457 |
* | Dell Inc. | 659,800 | 6,756 |
* | eBay Inc. | 430,569 | 6,011 |
* | Yahoo! Inc. | 483,600 | 5,900 |
| Applied Materials, Inc. | 553,100 | 5,603 |
* | Symantec Corp. | 376,453 | 5,090 |
| Western Union Co. | 336,295 | 4,823 |
| Corning, Inc. | 504,200 | 4,805 |
| MasterCard, Inc. Class A | 32,520 | 4,648 |
| CA, Inc. | 219,766 | 4,072 |
* | Adobe Systems, Inc. | 188,800 | 4,020 |
| Automatic Data | | |
| Processing, Inc. | 98,100 | 3,859 |
* | Intuit, Inc. | 142,600 | 3,392 |
| Altera Corp. | 199,147 | 3,328 |
* | Fiserv, Inc. | 89,450 | 3,253 |
* | Broadcom Corp. | 175,950 | 2,986 |
* | Computer Sciences Corp. | 78,900 | 2,773 |
| Linear Technology Corp. | 124,200 | 2,747 |
| Amphenol Corp. | 113,400 | 2,719 |
* | Affiliated Computer | | |
| Services, Inc. Class A | 58,400 | 2,684 |
* | Agilent Technologies, Inc. | 166,306 | 2,599 |
* | BMC Software, Inc. | 95,000 | 2,556 |
| Xerox Corp. | 305,400 | 2,434 |
| Fidelity National Information | | |
| Services, Inc. | 145,500 | 2,367 |
| Global Payments Inc. | 69,500 | 2,279 |
| Analog Devices, Inc. | 118,166 | 2,248 |
| KLA-Tencor Corp. | 100,800 | 2,196 |
| Accenture Ltd. | 66,200 | 2,171 |
* | Autodesk, Inc. | 109,588 | 2,153 |
* | Juniper Networks, Inc. | 119,000 | 2,084 |
* | Mettler-Toledo | | |
| International Inc. | 30,700 | 2,069 |
* | NetApp, Inc. | 144,963 | 2,025 |
* | QLogic Corp. | 150,000 | 2,016 |
* | Compuware Corp. | 294,562 | 1,988 |
* | Avnet, Inc. | 105,400 | 1,919 |
* | NVIDIA Corp. | 234,750 | 1,894 |
| Lender Processing | | |
| Services, Inc. | 61,250 | 1,804 |
* | LAM Research Corp. | 82,108 | 1,747 |
* | Arrow Electronics, Inc. | 91,500 | 1,724 |
* | Citrix Systems, Inc. | 71,356 | 1,682 |
* | Ingram Micro, Inc. Class A | 125,000 | 1,674 |
57
Tax-Managed Capital Appreciation Fund
| | | Market |
| | | Value• |
| | Shares | ($000) |
* | Synopsys, Inc. | 89,121 | 1,651 |
* | DST Systems, Inc. | 42,800 | 1,626 |
* | Western Digital Corp. | 136,500 | 1,563 |
| Molex, Inc. | 10 4,756 | 1,518 |
* | Teradata Corp. | 99,574 | 1,477 |
| Total System Services, Inc. | 104,059 | 1,457 |
* | Electronic Arts Inc. | 90,200 | 1,447 |
* | NCR Corp. | 99,574 | 1,408 |
* | Lexmark International, Inc. | 50,300 | 1,353 |
| Microchip Technology, Inc. | 65,100 | 1,271 |
| Xilinx, Inc. | 71,336 | 1,271 |
* | Tellabs, Inc. | 266,900 | 1,100 |
* | Tech Data Corp. | 55,510 | 990 |
| National | | |
| Semiconductor Corp. | 96,600 | 973 |
| Intersil Corp. | 85,600 | 787 |
| Broadridge | | |
| Financial Solutions LLC | 58,725 | 736 |
| Tyco Electronics Ltd. | 44,050 | 714 |
* | Metavante Technologies | 39,866 | 642 |
* | LSI Corp. | 180,700 | 595 |
* | Zebra Technologies Corp. | | |
| Class A | 27,257 | 552 |
* | Teradyne, Inc. | 110,200 | 465 |
| Paychex, Inc. | 17,685 | 465 |
* | IAC/InterActiveCorp | 24,515 | 386 |
| Motorola, Inc. | 53,430 | 237 |
| Harris Corp. | 4,300 | 164 |
* | Novellus Systems, Inc. | 13,100 | 162 |
* | Sun Microsystems, Inc. | 30,475 | 116 |
| | | 421,662 |
Materials (3.3%) | | |
| Monsanto Co. | 188,934 | 13,291 |
| Newmont Mining Corp. | | |
| (Holding Co.) | 181,186 | 7,374 |
| Praxair, Inc. | 123,700 | 7,343 |
| Nucor Corp. | 129,600 | 5,987 |
| E.I. du Pont de | | |
| Nemours & Co. | 160,300 | 4,056 |
| Sigma-Aldrich Corp. | 82,000 | 3,464 |
| Ecolab, Inc. | 97,200 | 3,417 |
| The Mosaic Co. | 93,600 | 3,239 |
* | Owens-Illinois, Inc. | 111,500 | 3,047 |
| Ball Corp. | 71,600 | 2,978 |
| Martin Marietta | | |
| Materials, Inc. | 30,600 | 2,971 |
* | Pactiv Corp. | 108,140 | 2,690 |
| Airgas, Inc. | 68,700 | 2,679 |
| FMC Corp. | 53,700 | 2,402 |
| Schnitzer Steel | | |
| Industries, Inc. Class A | 54,124 | 2,038 |
| Albemarle Corp. | 87,100 | 1,942 |
| Nalco Holding Co. | 166,700 | 1,924 |
| CF Industries Holdings, Inc. | 38,000 | 1,868 |
| | | Market |
| | | Value• |
| | Shares | ($000) |
| Scotts Miracle-Gro Co. | 62,099 | 1,846 |
| Freeport-McMoRan | | |
| Copper & Gold, Inc. | | |
| Class B | 72,954 | 1,783 |
| United States Steel Corp. | 47,600 | 1,771 |
| Sealed Air Corp. | 106,072 | 1,585 |
| Celanese Corp. Series A | 126,111 | 1,568 |
| Allegheny Technologies Inc. | 60,900 | 1,555 |
| Cytec Industries, Inc. | 51,800 | 1,099 |
| Reliance Steel & | | |
| Aluminum Co. | 46,300 | 923 |
| Cliffs Natural | | |
| Resources Inc. | 29,461 | 754 |
* | Intrepid Potash, Inc. | 31,300 | 650 |
| Dow Chemical Co. | 37,700 | 569 |
| Alcoa Inc. | 49,028 | 552 |
| Vulcan Materials Co. | 7,638 | 531 |
| Valspar Corp. | 23,400 | 423 |
| Packaging Corp. of America | 26,600 | 358 |
| Southern Copper Corp. | | |
| (U.S. Shares) | 21,000 | 337 |
| Air Products & | | |
| Chemicals, Inc. | 5,700 | 286 |
| Chemtura Corp. | 169,900 | 238 |
* | Crown Holdings, Inc. | 11,800 | 227 |
* | Domtar Corp. | 115,000 | 192 |
| | | 89,957 |
Telecommunication Services (3.6%) | | |
| AT&T Inc. | 1,749,979 | 49,874 |
| Verizon | | |
| Communications Inc. | 756,842 | 25,657 |
* | American Tower Corp. | | |
| Class A | 181,900 | 5,333 |
| Qwest Communications | | |
| International Inc. | 846,721 | 3,082 |
| Embarq Corp. | 84,843 | 3,051 |
* | Crown Castle | | |
| International Corp. | 148,800 | 2,616 |
| CenturyTel, Inc. | 68,300 | 1,867 |
| Telephone & | | |
| Data Systems, Inc. | 50,601 | 1,607 |
* | U.S. Cellular Corp. | 32,300 | 1,397 |
* | Sprint Nextel Corp. | 552,742 | 1,011 |
| Telephone & | | |
| Data Systems, Inc.– | | |
| Special Common Shares | 33,200 | 933 |
* | SBA | | |
| Communications Corp. | 52,823 | 862 |
| Frontier | | |
| Communications Corp. | 52,351 | 458 |
| Windstream Corp. | 20,957 | 193 |
* | Level 3 | | |
| Communications, Inc. | 119,100 | 83 |
| | | 98,024 |
58
Tax-Managed Capital Appreciation Fund
| | | Market |
| | | Value• |
| | Shares | ($000) |
Utilities (4.2%) | | |
| Exelon Corp. | 233,400 | 12,979 |
| Entergy Corp. | 77,000 | 6,401 |
| FPL Group, Inc. | 122,451 | 6,163 |
| PG&E Corp. | 147,000 | 5,690 |
| Sempra Energy | 113,336 | 4,831 |
| Edison International | 142,500 | 4,577 |
| Southern Co. | 121,500 | 4,495 |
| Allegheny Energy, Inc. | 101,089 | 3,423 |
* | NRG Energy, Inc. | 143,100 | 3,339 |
* | AES Corp. | 403,748 | 3,327 |
| Questar Corp. | 101,700 | 3,325 |
| Equitable Resources, Inc. | 96,200 | 3,227 |
| Wisconsin Energy Corp. | 73,200 | 3,073 |
| MDU Resources Group, Inc. | 137,050 | 2,958 |
| NSTAR | 81,000 | 2,956 |
| CenterPoint Energy Inc. | 223,800 | 2,824 |
| FirstEnergy Corp. | 55,900 | 2,716 |
* | Mirant Corp. | 141,698 | 2,674 |
| Northeast Utilities | 110,600 | 2,661 |
| Integrys Energy Group, Inc. | 61,481 | 2,642 |
| SCANA Corp. | 74,200 | 2,642 |
| Duke Energy Corp. | 163,592 | 2,456 |
| Aqua America, Inc. | 117,083 | 2,411 |
| Dominion Resources, Inc. | 67,086 | 2,404 |
| NV Energy Inc. | 234,683 | 2,321 |
| CMS Energy Corp. | 219,086 | 2,213 |
| Energen Corp. | 73,600 | 2,159 |
| Constellation Energy | | |
| Group, Inc. | 83,300 | 2,090 |
| American | | |
| Water Works Co., Inc. | 99,200 | 2,071 |
| Public Service Enterprise | | |
| Group, Inc. | 69,800 | 2,036 |
| DPL Inc. | 75,000 | 1,713 |
* | Dynegy, Inc. | 834,029 | 1,668 |
* | Reliant Energy, Inc. | 272,700 | 1,576 |
| UGI Corp. Holding Co. | 34,466 | 842 |
| NiSource, Inc. | 35,920 | 394 |
* | Calpine Corp. | 35,500 | 258 |
| | | 113,535 |
Total Common Stocks | | |
(Cost $2,489,217) | | 2,702,599 |
Other Assets and Liabilities (0.0%) | | |
Other Assets | | 26,417 |
Liabilities | | (26,077) |
| | | 340 |
Net Assets (100%) | | 2,702,939 |
At December 31, 2008, net assets consisted of: |
| Amount |
| ($000) |
Paid-in Capital | 3,061,572 |
Overdistributed Net Investment Income | (4,856) |
Accumulated Net Realized Losses | (567,159) |
Unrealized Appreciation (Depreciation) | 213,382 |
Net Assets | 2,702,939 |
| |
Investor Shares—Net Assets | |
Applicable to 22,117,341 outstanding | |
$.001 par value shares of beneficial | |
interest (unlimited authorization) | 473,058 |
Net Asset Value Per Share— | |
Investor Shares | $21.39 |
| |
Admiral Shares—Net Assets | |
Applicable to 47,521,012 outstanding | |
$.001 par value shares of beneficial | |
interest (unlimited authorization) | 2,045,311 |
Net Asset Value Per Share— | |
Admiral Shares | $43.04 |
| |
Institutional Shares—Net Assets | |
Applicable to 8,631,731 outstanding | |
$.001 par value shares of beneficial | |
interest (unlimited authorization) | 184,570 |
Net Asset Value Per Share— | |
Institutional Shares | $21.38 |
• | See Note A in Notes to Financial Statements. |
* | Non-income-producing security. |
ADR—American Depositary Receipt.
REIT—Real Estate Investment Trust.
See accompanying Notes, which are an integral part of the Financial Statements.
59
Tax-Managed Capital Appreciation Fund
Statement of Operations
| Year Ended |
| December 31, 2008 |
| ($000) |
Investment Income | |
Income | |
Dividends | 67,800 |
Interest1 | 78 |
Security Lending | 8 |
Total Income | 67,886 |
Expenses | |
The Vanguard Group—Note B | |
Investment Advisory Services | 148 |
Management and Administrative—Investor Shares | 857 |
Management and Administrative—Admiral Shares | 2,249 |
Management and Administrative—Institutional Shares | 89 |
Marketing and Distribution—Investor Shares | 129 |
Marketing and Distribution—Admiral Shares | 379 |
Marketing and Distribution—Institutional Shares | 72 |
Custodian Fees | 20 |
Auditing Fees | 23 |
Shareholders’ Reports—Investor Shares | 9 |
Shareholders’ Reports—Admiral Shares | 6 |
Shareholders’ Reports—Institutional Shares | — |
Trustees’ Fees and Expenses | 5 |
Total Expenses | 3,986 |
Net Investment Income | 63,900 |
Realized Net Gain (Loss) on Investment Securities Sold | (156,072) |
Change in Unrealized Appreciation (Depreciation) of Investment Securities | (1,592,772) |
Net Increase (Decrease) in Net Assets Resulting from Operations | (1,684,944) |
1 Interest income from an affiliated company of the fund was $78,000.
See accompanying Notes, which are an integral part of the Financial Statements.
60
Tax-Managed Capital Appreciation Fund
Statement of Changes in Net Assets
| Year Ended December 31, |
| 2008 | 2007 |
| ($000) | ($000) |
Increase (Decrease) in Net Assets | | |
Operations | | |
Net Investment Income | 63,900 | 67,014 |
Realized Net Gain (Loss) | (156,072) | 98,261 |
Change in Unrealized Appreciation (Depreciation) | (1,592,772) | 80,336 |
Net Increase (Decrease) in Net Assets Resulting from Operations | (1,684,944) | 245,611 |
Distributions | | |
Net Investment Income | | |
Investor Shares | (10,850) | (11,701) |
Admiral Shares | (48,923) | (51,242) |
Institutional Shares | (4,486) | (4,621) |
Realized Capital Gain | | |
Investor Shares | — | — |
Admiral Shares | — | — |
Institutional Shares | — | — |
Total Distributions | (64,259) | (67,564) |
Capital Share Transactions | | |
Investor Shares | (5,543) | (88,449) |
Admiral Shares | 86,970 | 209,970 |
Institutional Shares | 14,935 | 64,602 |
Net Increase (Decrease) from Capital Share Transactions | 96,362 | 186,123 |
Total Increase (Decrease) | (1,652,841) | 364,170 |
Net Assets | | |
Beginning of Period | 4,355,780 | 3,991,610 |
End of Period1 | 2,702,939 | 4,355,780 |
1 Net Assets—End of Period includes undistributed (overdistributed) net investment income of ($4,856,000) and ($4,497,000).
See accompanying Notes, which are an integral part of the Financial Statements.
61
Tax-Managed Capital Appreciation Fund
Financial Highlights
Investor Shares | | | | | |
| | | | | |
For a Share Outstanding | Year Ended December 31, |
Throughout Each Period | 2008 | 2007 | 2006 | 2005 | 2004 |
Net Asset Value, Beginning of Period | $35.13 | $33.62 | $29.80 | $28.05 | $25.43 |
Investment Operations | | | | | |
Net Investment Income | .498 | .530 | .471 | .352 | .365 |
Net Realized and Unrealized Gain (Loss) | | | | | |
on Investments | (13.738) | 1.513 | 3.821 | 1.752 | 2.622 |
Total from Investment Operations | (13.240) | 2.043 | 4.292 | 2.104 | 2.987 |
Distributions | | | | | |
Dividends from Net Investment Income | (.500) | (.533) | (.472) | (.354) | (.367) |
Distributions from Realized Capital Gains | — | — | — | — | — |
Total Distributions | (.500) | (.533) | (.472) | (.354) | (.367) |
Net Asset Value, End of Period | $21.39 | $35.13 | $33.62 | $29.80 | $28.05 |
| | | | | |
Total Return1 | –37.63% | 6.07% | 14.40% | 7.49% | 11.75% |
| | | | | |
Ratios/Supplemental Data | | | | | |
Net Assets, End of Period (Millions) | $473 | $782 | $832 | $857 | $1,596 |
Ratio of Total Expenses to | | | | | |
Average Net Assets | 0.16% | 0.15% | 0.15% | 0.14% | 0.14% |
Ratio of Net Investment Income to | | | | | |
Average Net Assets | 1.66% | 1.51% | 1.51% | 1.25% | 1.40% |
Portfolio Turnover Rate | 8% | 5% | 5% | 8% | 5% |
1 Total returns do not reflect the 1% redemption fee on shares held less than five years; the 2% redemption fee assessed prior to September 14, 2005, on shares held less than one year; or the account service fee that may be applicable to certain accounts with balances below $10,000.
See accompanying Notes, which are an integral part of the Financial Statements.
62
Tax-Managed Capital Appreciation Fund
Financial Highlights
Admiral Shares | | | | | |
| | | | | |
For a Share Outstanding | Year Ended December 31, |
Throughout Each Period | 2008 | 2007 | 2006 | 2005 | 2004 |
Net Asset Value, Beginning of Period | $70.70 | $67.68 | $60.00 | $56.46 | $51.20 |
Investment Operations | | | | | |
Net Investment Income | 1.040 | 1.113 | .990 | .729 | .762 |
Net Realized and Unrealized Gain (Loss) | | | | | |
on Investments | (27.656) | 3.026 | 7.680 | 3.543 | 5.263 |
Total from Investment Operations | (26.616) | 4.139 | 8.670 | 4.272 | 6.025 |
Distributions | | | | | |
Dividends from Net Investment Income | (1.044) | (1.119) | (.990) | (.732) | (.765) |
Distributions from Realized Capital Gains | — | — | — | — | — |
Total Distributions | (1.044) | (1.119) | (.990) | (.732) | (.765) |
Net Asset Value, End of Period | $43.04 | $70.70 | $67.68 | $60.00 | $56.46 |
| | | | | |
Total Return1 | –37.58% | 6.11% | 14.44% | 7.56% | 11.77% |
| | | | | |
Ratios/Supplemental Data | | | | | |
Net Assets, End of Period (Millions) | $2,045 | $3,283 | $2,941 | $2,360 | $1,397 |
Ratio of Total Expenses to | | | | | |
Average Net Assets | 0.10% | 0.09% | 0.10% | 0.10% | 0.10% |
Ratio of Net Investment Income to | | | | | |
Average Net Assets | 1.72% | 1.57% | 1.56% | 1.29% | 1.47% |
Portfolio Turnover Rate | 8% | 5% | 5% | 8% | 5% |
1 Total returns do not reflect the 1% redemption fee on shares held less than five years or the 2% redemption fee assessed prior to September 14, 2005, on shares held less than one year.
See accompanying Notes, which are an integral part of the Financial Statements.
63
Tax-Managed Capital Appreciation Fund
Financial Highlights
Institutional Shares | | | | | |
| | | | | |
For a Share Outstanding | Year Ended December 31, |
Throughout Each Period | 2008 | 2007 | 2006 | 2005 | 2004 |
Net Asset Value, Beginning of Period | $35.13 | $33.63 | $29.81 | $28.05 | $25.44 |
Investment Operations | | | | | |
Net Investment Income | .525 | .551 | .500 | .384 | .375 |
Net Realized and Unrealized Gain (Loss) | | | | | |
on Investments | (13.748) | 1.513 | 3.820 | 1.752 | 2.622 |
Total from Investment Operations | (13.223) | 2.064 | 4.320 | 2.136 | 2.997 |
Distributions | | | | | |
Dividends from Net Investment Income | (.527) | (.564) | (.500) | (.376) | (.387) |
Distributions from Realized Capital Gains | — | — | — | — | — |
Total Distributions | (.527) | (.564) | (.500) | (.376) | (.387) |
Net Asset Value, End of Period | $21.38 | $35.13 | $33.63 | $29.81 | $28.05 |
| | | | | |
Total Return1 | –37.57% | 6.13% | 14.49% | 7.61% | 11.78% |
| | | | | |
Ratios/Supplemental Data | | | | | |
Net Assets, End of Period (Millions) | $185 | $291 | $218 | $204 | $102 |
Ratio of Total Expenses to | | | | | |
Average Net Assets | 0.07% | 0.07% | 0.07% | 0.07% | 0.07% |
Ratio of Net Investment Income to | | | | | |
Average Net Assets | 1.75% | 1.59% | 1.59% | 1.32% | 1.47% |
Portfolio Turnover Rate | 8% | 5% | 5% | 8% | 5% |
1 Total returns do not reflect the 1% redemption fee on shares held less than five years or the 2% redemption fee assessed prior to September 14, 2005, on shares held less than one year.
See accompanying Notes, which are an integral part of the Financial Statements.
64
Tax-Managed Capital Appreciation Fund
Notes to Financial Statements
Vanguard Tax-Managed Capital Appreciation Fund is registered under the Investment Company Act of 1940 as an open-end investment company, or mutual fund. The fund offers three classes of shares: Investor Shares, Admiral Shares, and Institutional Shares. Investor Shares are available to any investor who meets the fund’s minimum purchase requirements. Admiral Shares are designed for investors who meet certain administrative, service, tenure, and account-size criteria. Institutional Shares are designed for investors who meet certain administrative and service criteria and invest a minimum of $5 million.
A. The following significant accounting policies conform to generally accepted accounting principles for U.S. mutual funds. The fund consistently follows such policies in preparing its financial statements.
1. Security Valuation: Securities are valued as of the close of trading on the New York Stock Exchange (generally 4 p.m., Eastern time) on the valuation date. Equity securities are valued at the latest quoted sales prices or official closing prices taken from the primary market in which each security trades; such securities not traded on the valuation date are valued at the mean of the latest quoted bid and asked prices. Securities for which market quotations are not readily available, or whose values have been materially affected by events occurring before the fund’s pricing time but after the close of the securities’ primary markets, are valued by methods deemed by the board of trustees to represent fair value. Investments in Vanguard Market Liquidity Fund are valued at that fund’s net asset value.
2. Federal Income Taxes: The fund intends to continue to qualify as a regulated investment company and distribute all of its taxable income. Management has analyzed the fund’s tax positions taken on federal income tax returns for all open tax years (tax years ended December 31, 2005–2008), and has concluded that no provision for federal income tax is required in the fund’s financial statements.
3. Distributions: Distributions to shareholders are recorded on the ex-dividend date.
4. Security Lending: The fund may lend its securities to qualified institutional borrowers to earn additional income. Security loans are required to be secured at all times by collateral at least equal to the market value of securities loaned. The fund invests cash collateral received in Vanguard Market Liquidity Fund, and records a liability for the return of the collateral, during the period the securities are on loan. Security lending income represents the income earned on investing cash collateral, less expenses associated with the loan.
5. Other: Dividend income is recorded on the ex-dividend date. Interest income includes income distributions received from Vanguard Market Liquidity Fund and is accrued daily. Security transactions are accounted for on the date securities are bought or sold. Costs used to determine realized gains (losses) on the sale of investment securities are those of the specific securities sold. Fees assessed on redemptions of capital shares are credited to paid-in capital.
Each class of shares has equal rights as to assets and earnings, except that each class separately bears certain class-specific expenses related to maintenance of shareholder accounts (included in Management and Administrative expenses) and shareholder reporting. Marketing and distribution expenses are allocated to each class of shares based on a method approved by the board of trustees. Income, other non-class-specific expenses, and gains and losses on investments are allocated to each class of shares based on its relative net assets.
65
Tax-Managed Capital Appreciation Fund
B. The Vanguard Group furnishes at cost investment advisory, corporate management, administrative, marketing, and distribution services. The costs of such services are allocated to the fund under methods approved by the board of trustees. The fund has committed to provide up to 0.40% of its net assets in capital contributions to Vanguard. At December 31, 2008, the fund had contributed capital of $723,000 to Vanguard (included in Other Assets), representing 0.03% of the fund’s net assets and 0.29% of Vanguard’s capitalization. The fund’s trustees and officers are also directors and officers of Vanguard.
C. Distributions are determined on a tax basis and may differ from net investment income and realized capital gains for financial reporting purposes. Differences may be permanent or temporary. Permanent differences are reclassified among capital accounts in the financial statements to reflect their tax character. Temporary differences arise when certain items of income, expense, gain, or loss are recognized in different periods for financial statement and tax purposes; these differences will reverse at some time in the future. Differences in classification may also result from the treatment of short-term gains as ordinary income for tax purposes.
For tax purposes, at December 31, 2008, the fund had $1,251,000 of ordinary income available for distribution. The fund had available realized losses of $555,088,000 to offset future net capital gains of $139,756,000 through December 31, 2009, $106,018,000 through December 31, 2010, $163,808,000 through December 31, 2011, $62,756,000 through December 31, 2016, and $82,750,000 through December 31, 2017.
At December 31, 2008, the cost of investment securities for tax purposes was $2,501,288,000. Net unrealized appreciation of investment securities for tax purposes was $201,311,000, consisting of unrealized gains of $719,862,000 on securities that had risen in value since their purchase and $518,551,000 in unrealized losses on securities that had fallen in value since their purchase.
D. During the year ended December 31, 2008, the fund purchased $405,516,000 of investment securities and sold $301,571,000 of investment securities, other than temporary cash investments.
E. Capital share transactions for each class of shares were:
| | | Year Ended December 31, |
| | 2008 | | 2007 |
| Amount | Shares | Amount | Shares |
| ($000) | (000) | ($000) | (000) |
Investor Shares | | | | |
Issued | 110,694 | 3,916 | 101,346 | 2,866 |
Issued in Lieu of Cash Distributions | 9,530 | 465 | 10,399 | 295 |
Redeemed1 | (125,767) | (4,531) | (200,194) | (5,646) |
Net Increase (Decrease)—Investor Shares | (5,543) | (150) | (88,449) | (2,485) |
Admiral Shares | | | | |
Issued | 356,002 | 6,182 | 353,092 | 4,963 |
Issued in Lieu of Cash Distributions | 38,125 | 925 | 40,477 | 570 |
Redeemed1 | (307,157) | (6,013) | (183,599) | (2,562) |
Net Increase (Decrease)—Admiral Shares | 86,970 | 1,094 | 209,970 | 2,971 |
1 Net of redemption fees for 2008 and 2007 of $1,036,000 and $374,000, respectively (fund totals).
66
Tax-Managed Capital Appreciation Fund
| | | Year Ended December 31, |
| | 2008 | | 2007 |
| Amount | Shares | Amount | Shares |
| ($000) | (000) | ($000) | (000) |
Institutional Shares | | | | |
Issued | 49,845 | 1,689 | 84,902 | 2,375 |
Issued in Lieu of Cash Distributions | 2,591 | 127 | 2,702 | 77 |
Redeemed1 | (37,501) | (1,471) | (23,002) | (652) |
Net Increase (Decrease)—Institutional Shares | 14,935 | 345 | 64,602 | 1,800 |
1 Net of redemption fees for 2008 and 2007 of $1,036,000 and $374,000, respectively (fund totals).
F. In September 2006, the Financial Accounting Standards Board issued Statement of Financial Accounting Standards No. 157 (“FAS 157”), “Fair Value Measurements.” FAS 157 establishes a framework for measuring fair value and expands disclosures about fair value measurements in financial statements.
The various inputs that may be used to determine the value of the fund’s investments are summarized in three broad levels. The inputs or methodologies used for valuing securities are not necessarily an indication of the risk associated with investing in those securities.
Level 1—Quoted prices in active markets for identical securities.
Level 2—Other significant observable inputs (including quoted prices for similar securities, interest rates, prepayment speeds, credit risk, etc.).
Level 3—Significant unobservable inputs (including the fund’s own assumptions used to determine the fair value of investments).
At December 31, 2008, 100% of the fund’s investments were valued based on Level 1 inputs.
67
Tax-Managed Small-Cap Fund
Fund Profile
As of December 31, 2008
Portfolio Characteristics | | |
| | Comparative | Broad |
| Fund | Index1 | Index2 |
Number of Stocks | 600 | 599 | 4,593 |
Median Market Cap | $0.9B | $0.9B | $25.3B |
Price/Earnings Ratio | 14.2x | 14.4x | 11.8x |
Price/Book Ratio | 1.4x | 1.3x | 1.7x |
Yield3 | | 1.7% | 2.8% |
Investor Shares | 1.5% | | |
Institutional Shares | 1.5% | | |
Return on Equity | 14.2% | 14.0% | 20.8% |
Earnings Growth Rate | 16.1% | 15.9% | 17.2% |
Foreign Holdings | 0.0% | 0.0% | 0.0 % |
Turnover Rate | 32% | — | — |
Expense Ratio | | | |
(12/31/2007)4 | | — | — |
Investor Shares | 0.13% | | |
Institutional Shares | 0.09% | | |
Short-Term Reserves | 0.3% | — | — |
Volatility Measures5 | |
| Fund Versus | Fund Versus |
| Comparative Index1 | Broad Index2 |
R-Squared | 1.00 | 0.88 |
Beta | 0.99 | 1.10 |
Investment Focus

Sector Diversification (% of equity exposure) |
| | Comparative | Broad |
| Fund | Index1 | Index2 |
Consumer Discretionary | 13.0% | 13.0% | 8.9% |
Consumer Staples | 3.6 | 3.6 | 11.2 |
Energy | 4.3 | 4.3 | 12.4 |
Financials | 20.1 | 20.7 | 15.6 |
Health Care | 13.9 | 13.8 | 14.4 |
Industrials | 19.4 | 18.9 | 11.2 |
Information Technology | 16.0 | 16.0 | 15.2 |
Materials | 3.9 | 3.9 | 3.3 |
Telecommunication | | | |
Services | 0.2 | 0.2 | 3.4 |
Utilities | 5.6 | 5.6 | 4.4 |
Ten Largest Holdings6 (% of total net assets) |
| | |
Piedmont | | |
Natural Gas, Inc. | gas utilities | 0.7% |
Itron, Inc. | electronic equipment | |
| and instruments | 0.7 |
Atmos Energy Corp. | gas utilities | 0.7 |
Watson Wyatt & Co. | human resource | |
Holdings | and employment | |
| services | 0.6 |
Landstar System, Inc. | trucking | 0.6 |
Immucor Inc. | health care supplies | 0.6 |
ProAssurance Corp. | property and | |
| casualty insurance | 0.5 |
CLARCOR Inc. | industrial machinery | 0.5 |
New Jersey | | |
Resources Corp. | gas utilities | 0.5 |
Panera Bread Co. | restaurants | 0.5 |
Top Ten | | 5.9% |
1 S&P SmallCap 600 Index.
2 Dow Jones Wilshire 5000 Index.
3 30-day SEC yield for the fund; annualized dividend yield for the indexes. See the Glossary.
4 The expense ratios shown are from the prospectus dated July 29, 2008. For the fiscal year ended December 31, 2008, the fund’s expense ratios were 0.14% for Investor Shares and 0.09% for Institutional Shares.
5 For an explanation of R-squared, beta, and other terms used here, see the Glossary.
6 The holdings listed exclude any temporary cash investments and equity index products.
68
Tax-Managed Small-Cap Fund
Performance Summary
All of the returns in this report represent past performance, which is not a guarantee of future results that may be achieved by the fund. (Current performance may be lower or higher than the performance data cited. For performance data current to the most recent month-end, visit our website at www.vanguard.com/performance.) Note, too, that both investment returns and principal value can fluctuate widely, so an investor’s shares, when sold, could be worth more or less than their original cost. The returns shown do not reflect taxes that a shareholder would pay on fund distributions or on the sale of fund shares.
Cumulative Performance: March 25,1999–December 31, 2008
Initial Investment of $10,000
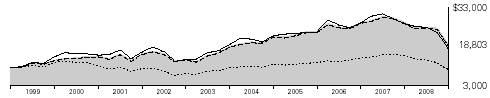
| Average Annual Total Returns | |
| Periods Ended December 31, 2008 | Final Value |
| | | Since | of a $10,000 |
| One Year | Five Years | Inception1 | Investment |
Tax-Managed Small-Cap Fund | | | | |
Investor Shares2 | –30.82% | 0.99% | 6.68% | $18,803 |
Fee-Adjusted Returns3 | –31.50 | 0.99 | 6.68 | 18,803 |
Dow Jones Wilshire 5000 Index | –37.34 | –1.67 | –1.01 | 9,053 |
S&P SmallCap 600 Index | –31.07 | 0.88 | 6.45 | 18,411 |
Average Small-Cap Core Fund4 | –36.21 | –1.78 | 5.58 | 16,994 |
| | | | Final Value of |
| | | Since | a $5,000,000 |
| One Year | Five Years | Inception1 | Investment |
Tax-Managed Small-Cap Fund Institutional Shares | –30.77% | 1.03% | 6.03% | $8,820,359 |
Fee-Adjusted Returns5 | –31.45 | 1.03 | 6.03 | 8,820,359 |
Dow Jones Wilshire 5000 Index | –37.34 | –1.67 | –1.46 | 4,335,861 |
S&P SmallCap 600 Index | –31.07 | 0.88 | 5.77 | 8,616,144 |
| | | | | |
1 Performance for the fund and its comparative standards is calculated since the following inception dates: March 25, 1999, for Investor Shares and April 21, 1999, for Institutional Shares.
2 Total returns do not include the account service fee that may be applicable to certain accounts with balances below $10,000.
3 Reflective of the 1% fee assessed on redemptions of shares held in the fund for less than five years, but not of the account service fee that may be applicable to certain accounts below $10,000.
4 Derived from data provided by Lipper Inc.
5 Reflective of the 1% fee assessed on redemptions of shares held for less than five years.
69
Tax-Managed Small-Cap Fund
Fiscal-Year Total Returns (%): March 25, 1999–December 31, 2008
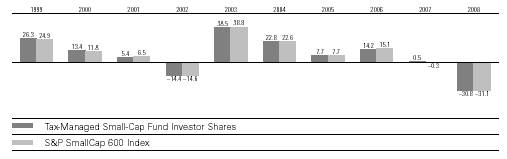
Note: See Financial Highlights tables for dividend and capital gains information.
70
Tax-Managed Small-Cap Fund
Financial Statements
Statement of Net Assets
As of December 31, 2008
The fund provides a complete list of its holdings four times in each fiscal year, at the quarter-ends. For the second and fourth fiscal quarters, the lists appear in the fund’s semiannual and annual reports to shareholders. For the first and third fiscal quarters, the fund files the lists with the Securities and Exchange Commission on Form N-Q. Shareholders can look up the fund’s Forms N-Q on the SEC’s website at www.sec.gov. Forms N-Q may also be reviewed and copied at the SEC’s Public Reference Room (see the back cover of this report for further information).
| | | Market |
| | | Value• |
| | Shares | ($000) |
Common Stocks (100.1%) | | |
Consumer Discretionary (13.0%) | | |
* | Panera Bread Co. | 128,755 | 6,726 |
| Aaron Rents, Inc. | 225,405 | 6,000 |
* | WMS Industries, Inc. | 210,266 | 5,656 |
* | Jack in the Box Inc. | 239,571 | 5,292 |
* | Tractor Supply Co. | 134,300 | 4,854 |
* | Carter’s, Inc. | 238,013 | 4,584 |
* | Deckers Outdoor Corp. | 55,186 | 4,408 |
| Hillenbrand Inc. | 261,070 | 4,355 |
| Wolverine World Wide, Inc. | 206,669 | 4,348 |
| Polaris Industries, Inc. | 136,450 | 3,909 |
| Pool Corp. | 202,136 | 3,632 |
* | Capella Education Co. | 59,663 | 3,506 |
* | The Gymboree Corp. | 123,179 | 3,214 |
* | Fossil, Inc. | 188,879 | 3,154 |
* | Sonic Corp. | 256,923 | 3,127 |
| Men’s Wearhouse, Inc. | 213,880 | 2,896 |
| OfficeMax, Inc. | 322,831 | 2,466 |
* | Iconix Brand Group Inc. | 248,763 | 2,433 |
* | JAKKS Pacific, Inc. | 116,241 | 2,398 |
* | CEC Entertainment Inc. | 96,379 | 2,337 |
* | Coinstar, Inc. | 119,330 | 2,328 |
* | The Children’s Place | | |
| Retail Stores, Inc. | 101,929 | 2,210 |
| The Buckle, Inc. | 99,622 | 2,174 |
* | P.F. Chang’s China Bistro, Inc. | 101,497 | 2,125 |
* | The Dress Barn, Inc. | 190,511 | 2,046 |
* | Jos. A. Bank Clothiers, Inc. | 76,829 | 2,009 |
| CKE Restaurants Inc. | 229,676 | 1,994 |
| Cracker Barrel Old Country | | |
| Store Inc. | 93,739 | 1,930 |
* | Hibbett Sports Inc. | 122,226 | 1,920 |
* | Buffalo Wild Wings Inc. | 74,461 | 1,910 |
| Cato Corp. Class A | 126,050 | 1,903 |
* | Pinnacle Entertainment, Inc. | 247,300 | 1,899 |
* | Live Nation, Inc. | 320,951 | 1,842 |
| NutriSystem, Inc. | 125,385 | 1,829 |
| | | Market |
| | | Value• |
| | Shares | ($000) |
* | Skechers U.S.A., Inc. | 141,127 | 1,809 |
| Fred’s, Inc. | 163,949 | 1,764 |
* | PetMed Express, Inc. | 99,938 | 1,762 |
| UniFirst Corp. | 58,296 | 1,731 |
* | Papa John’s | | |
| International, Inc. | 92,731 | 1,709 |
| Ethan Allen Interiors, Inc. | 117,976 | 1,695 |
* | Texas Roadhouse, Inc. | 218,530 | 1,694 |
* | Hot Topic, Inc. | 175,967 | 1,631 |
| National Presto | | |
| Industries, Inc. | 20,706 | 1,594 |
* | Jo-Ann Stores, Inc. | 102,378 | 1,586 |
| Brunswick Corp. | 371,579 | 1,564 |
* | Meritage Corp. | 126,918 | 1,545 |
* | Universal Technical | | |
| Institute Inc. | 88,097 | 1,513 |
| Arbitron Inc. | 113,230 | 1,504 |
| The Marcus Corp. | 90,960 | 1,476 |
* | Blue Nile Inc. | 60,190 | 1,474 |
| Brown Shoe Co., Inc. | 173,818 | 1,472 |
| Genesco, Inc. | 81,973 | 1,387 |
| Stage Stores, Inc. | 163,337 | 1,348 |
| Finish Line, Inc. | 233,939 | 1,310 |
| K-Swiss, Inc. | 112,167 | 1,279 |
* | Pre-Paid Legal Services, Inc. | 32,932 | 1,228 |
* | Peet’s Coffee & Tea Inc. | 52,033 | 1,210 |
* | HSN, Inc. | 165,764 | 1,205 |
* | Red Robin Gourmet | | |
| Burgers, Inc. | 66,473 | 1,119 |
* | Shuffle Master, Inc. | 225,237 | 1,117 |
| Group 1 Automotive, Inc. | 99,916 | 1,076 |
* | Ticketmaster | | |
| Entertainment Inc. | 166,103 | 1,066 |
| Superior Industries | | |
| International, Inc. | 100,298 | 1,055 |
| Liz Claiborne, Inc. | 403,794 | 1,050 |
* | California Pizza Kitchen, Inc. | 93,650 | 1,004 |
* | Quiksilver, Inc. | 507,852 | 934 |
* | Drew Industries, Inc. | 77,406 | 929 |
71
Tax-Managed Small-Cap Fund
| | | Market |
| | | Value• |
| | Shares | ($000) |
* | Cabela’s Inc. | 159,058 | 927 |
* | Universal Electronics, Inc. | 57,124 | 927 |
* | Interval Leisure Group, Inc. | 168,018 | 906 |
* | True Religion Apparel, Inc. | 71,312 | 887 |
* | Maidenform Brands, Inc. | 80,887 | 821 |
* | RC2 Corp. | 75,284 | 803 |
| The Pep Boys | | |
| (Manny, Moe & Jack) | 189,554 | 783 |
| Winnebago Industries, Inc. | 123,884 | 747 |
| Movado Group, Inc. | 79,032 | 742 |
* | Standard Pacific Corp. | 416,318 | 741 |
| Haverty Furniture Cos., Inc. | 78,632 | 734 |
| Christopher & Banks Corp. | 125,773 | 704 |
| DineEquity, Inc. | 58,335 | 674 |
* | Steak n Shake Co. | 106,881 | 636 |
* | Stamps.com Inc. | 64,130 | 630 |
* | Volcom, Inc. | 56,730 | 618 |
* | Charlotte Russe Holding Inc. | 95,256 | 618 |
| Skyline Corp. | 30,494 | 610 |
* | Midas Inc. | 57,840 | 607 |
* | Zumiez Inc. | 80,011 | 596 |
| M/I Homes, Inc. | 50,840 | 536 |
| Landry’s Restaurants, Inc. | 45,715 | 530 |
* | Sturm, Ruger & Co., Inc. | 88,371 | 528 |
| Sonic Automotive, Inc. | 125,766 | 501 |
* | Zale Corp. | 147,774 | 492 |
| Big 5 Sporting Goods Corp. | 94,425 | 492 |
| Oxford Industries, Inc. | 54,256 | 476 |
* | Tween Brands, Inc. | 109,684 | 474 |
| La-Z-Boy Inc. | 208,227 | 452 |
* | Monarch Casino & | | |
| Resort, Inc. | 38,352 | 447 |
* | Crocs, Inc. | 314,122 | 389 |
* | Ruby Tuesday, Inc. | 220,574 | 344 |
* | Audiovox Corp. | 67,193 | 337 |
| Spartan Motors, Inc. | 70,518 | 334 |
* | Perry Ellis International Corp. | 50,595 | 321 |
| E.W. Scripps Co. Class A | 127,255 | 281 |
* | Nautilus Inc. | 115,640 | 256 |
| Standard Motor | | |
| Products, Inc. | 58,651 | 203 |
* | Champion Enterprises, Inc. | 344,007 | 193 |
* | MarineMax, Inc. | 54,721 | 185 |
* | Russ Berrie and Co., Inc. | 59,831 | 178 |
| O’Charley’s Inc. | 87,504 | 175 |
| Arctic Cat, Inc. | 29,808 | 143 |
| Lithia Motors, Inc. | 42,374 | 138 |
* | Tuesday Morning Corp. | 82,692 | 135 |
* | Multimedia Games Inc. | 52,048 | 124 |
* | Stein Mart, Inc. | 104,235 | 118 |
| Bassett Furniture | | |
| Industries, Inc. | 32,651 | 109 |
| AH Belo Corp. | 34,546 | 75 |
| | | Market |
| | | Value• |
| | Shares | ($000) |
* | 4Kids Entertainment Inc. | 26,503 | 52 |
* | Ruth’s Hospitality Group Inc. | 27,572 | 38 |
| | | 177,021 |
Consumer Staples (3.6%) | | |
* | Chattem, Inc. | 79,501 | 5,687 |
| Casey’s General Stores, Inc. | 213,488 | 4,861 |
* | TreeHouse Foods Inc. | 133,430 | 3,635 |
* | Hain Celestial Group, Inc. | 170,639 | 3,257 |
* | United Natural Foods, Inc. | 178,990 | 3,190 |
| Lance, Inc. | 132,963 | 3,050 |
* | Green Mountain Coffee | | |
| Roasters, Inc. | 72,194 | 2,794 |
| Sanderson Farms, Inc. | 73,628 | 2,545 |
| Nash-Finch Co. | 54,049 | 2,426 |
| J & J Snack Foods Corp. | 59,178 | 2,123 |
| Spartan Stores, Inc. | 90,755 | 2,110 |
| WD-40 Co. | 70,363 | 1,990 |
* | Darling International, Inc. | 343,563 | 1,886 |
* | Central Garden & Pet Co. | | |
| Class A | 295,596 | 1,744 |
| Cal-Maine Foods, Inc. | 54,046 | 1,551 |
| Diamond Foods, Inc. | 69,875 | 1,408 |
| The Andersons, Inc. | 78,701 | 1,297 |
* | Boston Beer Co., Inc. | | |
| Class A | 40,112 | 1,139 |
* | Alliance One | | |
| International, Inc. | 342,097 | 1,006 |
* | The Great Atlantic & | | |
| Pacific Tea Co., Inc. | 112,866 | 708 |
| Mannatech, Inc. | 36,190 | 89 |
| | | 48,496 |
Energy (4.3%) | | |
* | SEACOR Holdings Inc. | 84,771 | 5,650 |
| St. Mary Land & | | |
| Exploration Co. | 261,223 | 5,305 |
| Penn Virginia Corp. | 176,843 | 4,594 |
| World Fuel Services Corp. | 123,400 | 4,566 |
* | Oil States International, Inc. | 209,716 | 3,920 |
* | Atwood Oceanics, Inc. | 234,490 | 3,583 |
* | Bristow Group, Inc. | 120,006 | 3,215 |
| Holly Corp. | 171,661 | 3,129 |
| CARBO Ceramics Inc. | 85,592 | 3,041 |
* | Dril-Quip, Inc. | 126,766 | 2,600 |
* | Swift Energy Co. | 131,622 | 2,212 |
| Lufkin Industries, Inc. | 63,569 | 2,193 |
* | Stone Energy Corp. | 148,978 | 1,642 |
* | Hornbeck Offshore | | |
| Services, Inc. | 98,750 | 1,614 |
* | TETRA Technologies, Inc. | 321,870 | 1,564 |
* | Petroleum | | |
| Development Corp. | 63,887 | 1,538 |
* | Basic Energy Services Inc. | 99,474 | 1,297 |
* | NATCO Group Inc. | 84,829 | 1,288 |
72
Tax-Managed Small-Cap Fund
| | | Market |
| | | Value• |
| | Shares | ($000) |
* | PetroQuest Energy, Inc. | 188,859 | 1,277 |
* | Pioneer Drilling Co. | 218,428 | 1,217 |
* | ION Geophysical Corp. | 354,405 | 1,216 |
* | Matrix Service Co. | 110,016 | 844 |
| Gulf Island Fabrication, Inc. | 55,606 | 801 |
* | Superior Well Services, Inc. | 69,503 | 695 |
| | | 59,001 |
Exchange-Traded Fund (1.4%) | | |
1 | Vanguard REIT ETF | 500,000 | 18,225 |
| | | |
Financials (18.8%) | | |
* | ProAssurance Corp. | 140,909 | 7,437 |
| UMB Financial Corp. | 123,734 | 6,080 |
| Susquehanna | | |
| Bancshares, Inc. | 361,714 | 5,755 |
| Home Properties, Inc. REIT | 134,729 | 5,470 |
| Greenhill & Co., Inc. | 76,506 | 5,338 |
| United Bankshares, Inc. | 158,825 | 5,276 |
| Prosperity Bancshares, Inc. | 172,337 | 5,099 |
| Selective Insurance Group | 221,702 | 5,084 |
| Old National Bancorp | 278,693 | 5,061 |
* | Stifel Financial Corp. | 108,143 | 4,958 |
| Zenith National | | |
| Insurance Corp. | 156,580 | 4,943 |
| National Penn | | |
| Bancshares Inc. | 336,912 | 4,889 |
| First Financial | | |
| Bankshares, Inc. | 87,332 | 4,822 |
| Glacier Bancorp, Inc. | 252,474 | 4,802 |
| R.L.I. Corp. | 74,962 | 4,585 |
| Hancock Holding Co. | 100,056 | 4,549 |
| Whitney Holdings Corp. | 271,608 | 4,343 |
| East West Bancorp, Inc. | 269,009 | 4,296 |
* | Signature Bank | 148,296 | 4,255 |
| Senior Housing | | |
| Properties Trust REIT | 237,250 | 4,251 |
* | Investment Technology | | |
| Group, Inc. | 182,330 | 4,143 |
| First Midwest Bancorp, Inc. | 205,673 | 4,107 |
| BioMed Realty Trust, Inc. | | |
| REIT | 332,960 | 3,902 |
| First Commonwealth | | |
| Financial Corp. | 307,121 | 3,802 |
| PrivateBancorp, Inc. | 116,430 | 3,779 |
| Umpqua Holdings Corp. | 250,916 | 3,631 |
| Extra Space Storage Inc. | | |
| REIT | 350,129 | 3,613 |
| S & T Bancorp, Inc. | 99,497 | 3,532 |
| First BanCorp Puerto Rico | 316,514 | 3,526 |
| Cash America | | |
| International Inc. | 123,139 | 3,368 |
| Community Bank | | |
| System, Inc. | 137,444 | 3,352 |
| | | Market |
| | | Value• |
| | Shares | ($000) |
| UCBH Holdings, Inc. | 471,967 | 3,247 |
| Delphi Financial Group, Inc. | 174,138 | 3,211 |
* | Navigators Group, Inc. | 56,220 | 3,087 |
| TrustCo Bank NY | 321,760 | 3,060 |
| United Fire & Casualty Co. | 94,698 | 2,942 |
| National Retail Properties | | |
| REIT | 165,524 | 2,845 |
| Infinity Property & | | |
| Casualty Corp. | 60,388 | 2,822 |
| Safety Insurance Group, Inc. | 68,403 | 2,603 |
| Brookline Bancorp, Inc. | 243,837 | 2,597 |
* | Piper Jaffray Cos., Inc. | 64,210 | 2,553 |
| Financial Federal Corp. | 109,342 | 2,544 |
| Tanger Factory Outlet | | |
| Centers, Inc. REIT | 66,397 | 2,498 |
| Tower Group, Inc. | 86,569 | 2,442 |
| optionsXpress Holdings Inc. | 181,963 | 2,431 |
| Bank Mutual Corp. | 204,412 | 2,359 |
| United Community | | |
| Banks, Inc. | 172,061 | 2,337 |
| Kilroy Realty Corp. REIT | 69,280 | 2,318 |
| SWS Group, Inc. | 115,502 | 2,189 |
| Mid-America Apartment | | |
| Communities, Inc. REIT | 58,681 | 2,181 |
* | Portfolio Recovery | | |
| Associates, Inc. | 64,116 | 2,170 |
| Entertainment | | |
| Properties Trust REIT | 69,649 | 2,076 |
| Wintrust Financial Corp. | 100,470 | 2,067 |
* | First Cash Financial | | |
| Services, Inc. | 104,290 | 1,988 |
| Sterling Financial Corp. | 221,915 | 1,953 |
| Sterling Bancshares, Inc. | 312,657 | 1,901 |
| EastGroup Properties, Inc. | | |
| REIT | 52,482 | 1,867 |
| Independent Bank Corp. | | |
| (MA) | 68,079 | 1,781 |
| Boston Private Financial | | |
| Holdings, Inc. | 256,525 | 1,755 |
| Stewart Information | | |
| Services Corp. | 73,269 | 1,721 |
| Tompkins Trustco, Inc. | 28,663 | 1,661 |
| Sovran Self Storage, Inc. | | |
| REIT | 46,066 | 1,658 |
* | Amerisafe Inc. | 79,232 | 1,627 |
| American Physicians | | |
| Capital, Inc. | 33,724 | 1,622 |
| First Financial Bancorp | 127,393 | 1,578 |
| Inland Real Estate Corp. | | |
| REIT | 121,151 | 1,573 |
| Home Bancshares Inc. | 56,954 | 1,535 |
| Post Properties, Inc. REIT | 92,666 | 1,529 |
| Dime Community | | |
| Bancshares | 111,506 | 1,483 |
73
Tax-Managed Small-Cap Fund
| | | Market |
| | | Value• |
| | Shares | ($000) |
* | Forestar Real Estate | | |
| Group, Inc. | 152,588 | 1,453 |
| Urstadt Biddle Properties | | |
| Class A REIT | 90,711 | 1,445 |
| PS Business Parks, Inc. REIT | 31,315 | 1,398 |
* | World Acceptance Corp. | 69,022 | 1,364 |
| The South Financial | | |
| Group, Inc. | 312,301 | 1,349 |
| Provident Bankshares Corp. | 132,321 | 1,278 |
| Central Pacific Financial Co. | 115,876 | 1,163 |
| Sterling Bancorp | 78,601 | 1,103 |
| Franklin Street | | |
| Properties Corp. REIT | 69,253 | 1,021 |
* | LaBranche & Co. Inc. | 212,754 | 1,019 |
| LTC Properties, Inc. REIT | 49,208 | 998 |
| Acadia Realty Trust REIT | 69,299 | 989 |
| LaSalle Hotel Properties REIT | 86,631 | 957 |
| Presidential Life Corp. | 95,485 | 944 |
| Nara Bancorp, Inc. | 91,929 | 904 |
| Colonial Properties Trust | | |
| REIT | 103,812 | 865 |
| Medical Properties Trust Inc. | | |
| REIT | 136,983 | 864 |
| Columbia Banking | | |
| System, Inc. | 71,575 | 854 |
| DiamondRock Hospitality Co. | | |
| REIT | 164,440 | 834 |
* | TradeStation Group, Inc. | 128,511 | 829 |
| Frontier Financial Corp. | 178,162 | 777 |
| Lexington Realty Trust REIT | 150,128 | 751 |
| Cascade Bancorp | 108,233 | 731 |
* | Guaranty Financial | | |
| Group, Inc. | 275,469 | 719 |
| Wilshire Bancorp Inc. | 78,577 | 713 |
| Cedar Shopping Centers, Inc. | | |
| REIT | 95,863 | 679 |
| Pennsylvania REIT | 89,021 | 663 |
| Parkway Properties Inc. REIT | 33,436 | 602 |
| National Financial | | |
| Partners Corp. | 168,653 | 513 |
| Kite Realty Group Trust REIT | 75,758 | 421 |
* | Rewards Network Inc. | 129,274 | 335 |
| Hanmi Financial Corp. | 156,430 | 322 |
| Independent Bank Corp. (MI) | 72,959 | 158 |
| Anchor Bancorp | | |
| Wisconsin Inc. | 52,297 | 144 |
| Corus Bankshares Inc. | 103,419 | 115 |
* | Flagstar Bancorp, Inc. | 134,531 | 95 |
| BankAtlantic Bancorp, Inc. | | |
| Class A | 14,176 | 82 |
* | Irwin Financial Corp. | 41,507 | 54 |
| | | 255,364 |
| | | Market |
| | | Value• |
| | Shares | ($000) |
Health Care (13.9%) | | |
* | Immucor Inc. | 296,421 | 7,879 |
* | Magellan Health | | |
| Services, Inc. | 170,111 | 6,662 |
* | AMERIGROUP Corp. | 222,535 | 6,569 |
| Owens & Minor, Inc. | 173,988 | 6,551 |
* | Pediatrix Medical Group, Inc. | 191,432 | 6,068 |
* | Haemonetics Corp. | 106,349 | 6,009 |
* | Cubist Pharmaceuticals, Inc. | 239,658 | 5,790 |
| West Pharmaceutical | | |
| Services, Inc. | 137,775 | 5,204 |
* | Regeneron | | |
| Pharmaceuticals, Inc. | 265,295 | 4,871 |
* | PSS World Medical, Inc. | 255,953 | 4,817 |
* | Amedisys Inc. | 113,729 | 4,702 |
| Mentor Corp. | 142,135 | 4,396 |
| Meridian Bioscience Inc. | 170,206 | 4,335 |
* | ViroPharma Inc. | 331,400 | 4,315 |
| Martek Biosciences Corp. | 139,377 | 4,225 |
* | Healthspring, Inc. | 209,616 | 4,186 |
* | Catalyst Health | | |
| Solutions, Inc. | 162,135 | 3,948 |
| Chemed Corp. | 94,858 | 3,773 |
* | Centene Corp. | 180,981 | 3,567 |
* | Gentiva Health Services, Inc. | 121,697 | 3,561 |
* | Dionex Corp. | 75,653 | 3,393 |
* | HMS Holdings Corp. | 105,397 | 3,322 |
* | Eclipsys Corp. | 229,339 | 3,254 |
| Cooper Cos., Inc. | 189,679 | 3,111 |
* | AmSurg Corp. | 132,750 | 3,098 |
| Datascope Corp. | 56,385 | 2,946 |
* | CONMED Corp. | 122,710 | 2,938 |
* | Integra LifeSciences | | |
| Holdings | 82,132 | 2,921 |
| Landauer, Inc. | 39,599 | 2,903 |
* | American Medical Systems | | |
| Holdings, Inc. | 311,386 | 2,799 |
* | Greatbatch, Inc. | 96,675 | 2,558 |
* | Phase Forward Inc. | 182,903 | 2,290 |
* | PAREXEL International Corp. | 235,829 | 2,290 |
* | LHC Group Inc. | 62,446 | 2,248 |
* | Merit Medical Systems, Inc. | 118,536 | 2,125 |
| Invacare Corp. | 135,990 | 2,111 |
* | PharMerica Corp. | 129,771 | 2,034 |
* | Par Pharmaceutical Cos. Inc. | 146,857 | 1,969 |
* | ICU Medical, Inc. | 53,760 | 1,782 |
* | Salix Pharmaceuticals, Ltd. | 199,270 | 1,760 |
* | Zoll Medical Corp. | 90,462 | 1,709 |
* | SurModics, Inc. | 65,320 | 1,651 |
* | Omnicell, Inc. | 134,047 | 1,637 |
* | inVentiv Health, Inc. | 141,311 | 1,631 |
* | Res-Care, Inc. | 108,519 | 1,630 |
* | Healthways, Inc. | 141,561 | 1,625 |
| Analogic Corp. | 56,885 | 1,552 |
74
Tax-Managed Small-Cap Fund
| | | Market |
| | | Value• |
| | Shares | ($000) |
* | Cyberonics, Inc. | 92,586 | 1,534 |
* | Abaxis, Inc. | 94,799 | 1,520 |
* | Natus Medical Inc. | 117,078 | 1,516 |
* | Kendle International Inc. | 56,858 | 1,462 |
* | MWI Veterinary Supply Inc. | 52,019 | 1,402 |
* | Symmetry Medical Inc. | 155,015 | 1,235 |
* | Odyssey Healthcare, Inc. | 130,414 | 1,206 |
* | RehabCare Group, Inc. | 76,984 | 1,167 |
* | CryoLife Inc. | 116,894 | 1,135 |
* | Savient Pharmaceuticals Inc. | 195,411 | 1,131 |
* | AMN Healthcare | | |
| Services, Inc. | 131,608 | 1,113 |
* | Noven Pharmaceuticals, Inc. | 98,747 | 1,086 |
* | Cross Country | | |
| Healthcare, Inc. | 123,105 | 1,082 |
* | Molina Healthcare Inc. | 56,733 | 999 |
* | Kensey Nash Corp. | 50,563 | 981 |
* | MedCath Corp. | 84,227 | 879 |
* | Palomar Medical | | |
| Technologies, Inc. | 69,228 | 798 |
* | CorVel Corp. | 35,021 | 770 |
* | Air Methods Corp. | 46,454 | 743 |
* | Enzo Biochem, Inc. | 119,192 | 583 |
* | ArthroCare Corp. | 115,764 | 552 |
* | ArQule, Inc. | 124,240 | 524 |
* | Cambrex Corp. | 104,006 | 481 |
| LCA-Vision Inc. | 64,700 | 266 |
* | Theragenics Corp. | 158,458 | 185 |
* | Osteotech, Inc. | 83,645 | 141 |
| | | 189,206 |
Industrials (19.4%) | | |
| Watson Wyatt & Co. | | |
| Holdings | 179,568 | 8,587 |
| Landstar System, Inc. | 220,790 | 8,485 |
| CLARCOR Inc. | 213,065 | 7,070 |
* | Teledyne Technologies, Inc. | 150,769 | 6,717 |
* | Moog Inc. | 179,814 | 6,576 |
| Lennox International Inc. | 197,835 | 6,388 |
| Curtiss-Wright Corp. | 189,210 | 6,318 |
* | EMCOR Group, Inc. | 275,886 | 6,188 |
* | Kirby Corp. | 225,320 | 6,165 |
* | Tetra Tech, Inc. | 251,780 | 6,080 |
| Acuity Brands, Inc. | 169,648 | 5,922 |
| Brady Corp. Class A | 221,858 | 5,314 |
| Regal-Beloit Corp. | 135,632 | 5,153 |
* | Gardner Denver Inc. | 219,500 | 5,123 |
| The Toro Co. | 149,947 | 4,948 |
| Kaydon Corp. | 143,234 | 4,920 |
* | Orbital Sciences Corp. | 247,200 | 4,828 |
* | Esterline Technologies Corp. | 125,112 | 4,741 |
| Watsco, Inc. | 119,048 | 4,571 |
| Valmont Industries, Inc. | 73,715 | 4,523 |
| Actuant Corp. | 235,538 | 4,480 |
| Skywest, Inc. | 239,892 | 4,462 |
| | | Market |
| | | Value• |
| | Shares | ($000) |
| Simpson Manufacturing Co. | 157,478 | 4,372 |
* | Hub Group, Inc. | 158,601 | 4,208 |
| Belden Inc. | 195,559 | 4,083 |
| Mueller Industries Inc. | 156,438 | 3,923 |
* | Geo Group Inc. | 216,173 | 3,898 |
| Knight Transportation, Inc. | 241,629 | 3,895 |
| Heartland Express, Inc. | 235,228 | 3,707 |
| Briggs & Stratton Corp. | 209,645 | 3,688 |
| ABM Industries Inc. | 186,266 | 3,548 |
| Baldor Electric Co. | 194,064 | 3,464 |
* | United Stationers, Inc. | 99,441 | 3,330 |
* | Old Dominion | | |
| Freight Line, Inc. | 116,265 | 3,309 |
| Arkansas Best Corp. | 106,605 | 3,210 |
| Watts Water | | |
| Technologies, Inc. | 124,209 | 3,102 |
* | AAR Corp. | 164,619 | 3,031 |
| Triumph Group, Inc. | 69,891 | 2,968 |
| Forward Air Corp. | 122,125 | 2,964 |
| Healthcare Services | | |
| Group, Inc. | 182,950 | 2,914 |
| Applied Industrial | | |
| Technology, Inc. | 153,421 | 2,903 |
| A.O. Smith Corp. | 96,091 | 2,837 |
* | Sykes Enterprises, Inc. | 142,263 | 2,720 |
| Barnes Group, Inc. | 182,005 | 2,639 |
* | Astec Industries, Inc. | 83,219 | 2,607 |
| Robbins & Myers, Inc. | 147,790 | 2,390 |
* | Ceradyne, Inc. | 112,063 | 2,276 |
* | Insituform Technologies Inc. | | |
| Class A | 113,924 | 2,243 |
| Viad Corp. | 86,909 | 2,150 |
* | Axsys Technologies, Inc. | 38,810 | 2,129 |
* | Mobile Mini, Inc. | 144,004 | 2,077 |
| Administaff, Inc. | 93,726 | 2,028 |
| Kaman Corp. Class A | 108,882 | 1,974 |
| CIRCOR International, Inc. | 71,447 | 1,965 |
* | II-VI, Inc. | 102,821 | 1,963 |
| Universal Forest | | |
| Products, Inc. | 71,969 | 1,937 |
* | EnPro Industries, Inc. | 86,247 | 1,858 |
* | Griffon Corp. | 197,129 | 1,839 |
| Cubic Corp. | 66,611 | 1,812 |
* | TrueBlue, Inc. | 186,240 | 1,782 |
| G & K Services, Inc. | | |
| Class A | 80,454 | 1,627 |
| Lindsay Manufacturing Co. | 50,805 | 1,615 |
| Quanex Building | | |
| Products Corp. | 163,056 | 1,528 |
| Tredegar Corp. | 82,491 | 1,500 |
| Heidrick & Struggles | | |
| International, Inc. | 69,553 | 1,498 |
| Albany International Corp. | 115,190 | 1,474 |
| Gibraltar Industries Inc. | 115,357 | 1,377 |
75
Tax-Managed Small-Cap Fund
| | | Market |
| | | Value• |
| | Shares | ($000) |
* | School Specialty, Inc. | 68,323 | 1,306 |
* | NCI Building Systems, Inc. | 80,039 | 1,305 |
* | ATC Technology Corp. | 86,782 | 1,270 |
| Apogee Enterprises, Inc. | 120,291 | 1,246 |
| Interface, Inc. | 245,262 | 1,138 |
| Applied Signal | | |
| Technology, Inc. | 55,936 | 1,004 |
| Cascade Corp. | 33,223 | 992 |
* | Consolidated Graphics, Inc. | 42,627 | 965 |
| Standex International Corp. | 47,945 | 951 |
| John Bean | | |
| Technologies Corp. | 115,176 | 941 |
* | GenCorp, Inc. | 211,955 | 780 |
* | On Assignment, Inc. | 129,187 | 732 |
| CDI Corp. | 55,879 | 723 |
| Bowne & Co., Inc. | 117,042 | 688 |
| Vicor Corp. | 86,146 | 569 |
* | Spherion Corp. | 237,224 | 524 |
| Wabash National Corp. | 113,474 | 511 |
* | Lydall, Inc. | 78,686 | 452 |
| Lawson Products, Inc. | 19,714 | 450 |
| The Standard Register Co. | 45,024 | 402 |
* | Clearwater Paper Corp. | 47,688 | 400 |
* | C & D Technologies, Inc. | 122,489 | 383 |
* | Volt Information | | |
| Sciences Inc. | 48,368 | 350 |
* | Magnatek, Inc. | 143,088 | 343 |
| | | 264,346 |
Information Technology (16.0%) | | |
* | Itron, Inc. | 144,744 | 9,226 |
* | Concur Technologies, Inc. | 178,889 | 5,871 |
* | CACI International, Inc. | 126,273 | 5,694 |
* | Varian Semiconductor | | |
| Equipment Associates, Inc. | 305,066 | 5,528 |
* | MICROS Systems, Inc. | 338,337 | 5,522 |
* | Informatica Corp. | 369,841 | 5,078 |
* | Comtech | | |
| Telecommunications Corp. | 104,112 | 4,770 |
* | Microsemi Corp. | 340,574 | 4,305 |
* | Arris Group Inc. | 519,595 | 4,131 |
* | Skyworks Solutions, Inc. | 700,959 | 3,883 |
* | Anixter International Inc. | 126,247 | 3,803 |
* | Tekelec | 279,219 | 3,725 |
* | j2 Global | | |
| Communications, Inc. | 184,640 | 3,700 |
* | Benchmark Electronics, Inc. | 275,766 | 3,522 |
* | CyberSource Corp. | 292,817 | 3,511 |
| Quality Systems, Inc. | 75,959 | 3,313 |
* | Progress Software Corp. | 169,032 | 3,256 |
* | MKS Instruments, Inc. | 207,235 | 3,065 |
* | FEI Co. | 154,730 | 2,918 |
* | Websense, Inc. | 187,804 | 2,811 |
* | Plexus Corp. | 165,861 | 2,811 |
| | | Market |
| | | Value• |
| | Shares | ($000) |
* | ViaSat, Inc. | 115,184 | 2,774 |
* | Cypress | | |
| Semiconductor Corp. | 619,352 | 2,768 |
* | Cymer, Inc. | 125,003 | 2,739 |
| MAXIMUS, Inc. | 77,388 | 2,717 |
* | Intermec, Inc. | 203,650 | 2,704 |
* | CSG Systems | | |
| International, Inc. | 149,023 | 2,603 |
* | Cabot Microelectronics Corp. | 98,770 | 2,575 |
| Take-Two Interactive | | |
| Software, Inc. | 328,952 | 2,487 |
* | EPIQ Systems, Inc. | 148,134 | 2,475 |
| Cognex Corp. | 167,050 | 2,472 |
| Blackbaud, Inc. | 183,102 | 2,472 |
* | Interwoven Inc. | 194,771 | 2,454 |
* | Hittite Microwave Corp. | 80,977 | 2,386 |
* | Synaptics Inc. | 139,655 | 2,313 |
* | Harmonic, Inc. | 403,660 | 2,265 |
* | ScanSource, Inc. | 111,929 | 2,157 |
* | Bankrate, Inc. | 56,495 | 2,147 |
* | Rogers Corp. | 77,082 | 2,141 |
* | ATMI, Inc. | 134,402 | 2,074 |
* | SPSS, Inc. | 76,886 | 2,073 |
* | Wright Express Corp. | 164,084 | 2,067 |
* | TriQuint Semiconductor, Inc. | 596,194 | 2,051 |
| United Online, Inc. | 331,444 | 2,012 |
* | DealerTrack Holdings Inc. | 168,879 | 2,008 |
| MTS Systems Corp. | 72,593 | 1,934 |
| Black Box Corp. | 71,930 | 1,879 |
* | Forrester Research, Inc. | 64,568 | 1,821 |
| Heartland Payment | | |
| Systems, Inc. | 103,647 | 1,814 |
* | Adaptec, Inc. | 516,169 | 1,703 |
* | EMS Technologies, Inc. | 64,897 | 1,679 |
| Park Electrochemical Corp. | 86,917 | 1,648 |
* | Checkpoint Systems, Inc. | 166,262 | 1,636 |
* | Manhattan Associates, Inc. | 102,297 | 1,617 |
* | NETGEAR, Inc. | 141,315 | 1,612 |
* | Brooks Automation, Inc. | 270,624 | 1,572 |
* | Standard Microsystem Corp. | 96,064 | 1,570 |
* | Littelfuse, Inc. | 93,341 | 1,549 |
* | JDA Software Group, Inc. | 117,964 | 1,549 |
* | Tyler Technologies, Inc. | 126,036 | 1,510 |
| Micrel, Inc. | 195,285 | 1,428 |
* | Avid Technology, Inc. | 127,284 | 1,389 |
* | Blue Coat Systems, Inc. | 165,234 | 1,388 |
* | Advanced Energy | | |
| Industries, Inc. | 138,977 | 1,383 |
| Daktronics, Inc. | 145,529 | 1,362 |
* | Insight Enterprises, Inc. | 195,101 | 1,346 |
* | Exar Corp. | 184,814 | 1,233 |
* | Ultratech, Inc. | 102,431 | 1,225 |
* | THQ Inc. | 290,540 | 1,217 |
* | Supertex, Inc. | 50,436 | 1,211 |
76
Tax-Managed Small-Cap Fund
| | | Market |
| | | Value• |
| | Shares | ($000) |
| Cohu, Inc. | 99,447 | 1,208 |
* | Actel Corp. | 100,568 | 1,179 |
* | Epicor Software Corp. | 244,873 | 1,175 |
* | FARO Technologies, Inc. | 66,819 | 1,127 |
| Methode Electronics, Inc. | | |
| Class A | 165,172 | 1,113 |
| Bel Fuse, Inc. Class B | 49,543 | 1,050 |
| InfoSpace, Inc. | 137,485 | 1,038 |
* | The Knot, Inc. | 122,963 | 1,023 |
* | Taleo Corp. Class A | 130,309 | 1,020 |
* | Ciber, Inc. | 210,382 | 1,012 |
* | Brightpoint, Inc. | 227,395 | 989 |
* | Newport Corp. | 140,788 | 955 |
* | DSP Group Inc. | 115,326 | 925 |
* | Stratasys, Inc. | 85,594 | 920 |
* | Digi International, Inc. | 112,521 | 913 |
* | SYNNEX Corp. | 79,564 | 901 |
* | Integral Systems, Inc. | 73,585 | 887 |
* | TTM Technologies, Inc. | 167,803 | 874 |
* | Diodes Inc. | 142,833 | 866 |
* | Electro Scientific | | |
| Industries, Inc. | 119,515 | 811 |
* | Veeco Instruments, Inc. | 126,107 | 800 |
| CTS Corp. | 134,918 | 743 |
* | Symmetricom Inc. | 170,175 | 672 |
* | Pericom | | |
| Semiconductor Corp. | 115,913 | 635 |
| Technitrol, Inc. | 181,437 | 631 |
* | Novatel Wireless, Inc. | 127,324 | 591 |
* | Smith Micro Software, Inc. | 104,296 | 580 |
* | Gerber Scientific, Inc. | 111,080 | 568 |
* | RadiSys Corp. | 102,060 | 564 |
* | Perficient, Inc. | 118,034 | 564 |
* | Kopin Corp. | 239,652 | 489 |
* | Mercury Computer | | |
| Systems, Inc. | 76,028 | 480 |
* | Phoenix Technologies Ltd. | 125,393 | 439 |
| Agilysys, Inc. | 102,241 | 439 |
| PC-Tel, Inc. | 64,704 | 425 |
* | Radiant Systems, Inc. | 125,227 | 422 |
* | Intevac, Inc. | 74,042 | 375 |
* | Hutchinson Technology, Inc. | 107,397 | 374 |
* | Rudolph Technologies, Inc. | 103,458 | 365 |
* | Kulicke & | | |
| Soffa Industries, Inc. | 179,960 | 306 |
* | Network Equipment | | |
| Technologies, Inc. | 102,979 | 297 |
* | Startek, Inc. | 54,225 | 241 |
* | LoJack Corp. | 52,186 | 215 |
* | Tollgrade | | |
| Communications, Inc. | 35,317 | 169 |
* | Sonic Solutions, Inc. | 88,323 | 155 |
| Keithley Instruments Inc. | 39,809 | 145 |
* | Axcelis Technologies, Inc. | 264,799 | 135 |
| | | Market |
| | | Value• |
| | Shares | ($000) |
* | Catapult | | |
| Communications Corp. | 19,649 | 129 |
| Gevity HR, Inc. | 72,793 | 110 |
| | | 217,696 |
Materials (3.9%) | | |
| Rock-Tenn Co. | 160,870 | 5,499 |
| Texas Industries, Inc. | 115,859 | 3,997 |
* | Calgon Carbon Corp. | 227,248 | 3,491 |
| Eagle Materials, Inc. | 184,703 | 3,400 |
| H.B. Fuller Co. | 204,368 | 3,292 |
| Arch Chemicals, Inc. | 105,804 | 2,758 |
* | OM Group, Inc. | 128,575 | 2,714 |
| Wausau Paper Corp. | 206,590 | 2,363 |
| Deltic Timber Corp. | 45,147 | 2,066 |
| AMCOL International Corp. | 96,326 | 2,018 |
| Balchem Corp. | 77,093 | 1,920 |
| A. Schulman Inc. | 111,015 | 1,887 |
| NewMarket Corp. | 52,183 | 1,822 |
| Zep, Inc. | 91,048 | 1,758 |
* | Century Aluminum Co. | 145,995 | 1,460 |
* | RTI International Metals, Inc. | 99,924 | 1,430 |
| Stepan Co. | 30,316 | 1,425 |
| Schweitzer-Mauduit | | |
| International, Inc. | 65,908 | 1,320 |
* | PolyOne Corp. | 404,336 | 1,274 |
* | Headwaters Inc. | 167,591 | 1,131 |
* | Brush Engineered | | |
| Materials Inc. | 80,596 | 1,025 |
| Myers Industries, Inc. | 120,990 | 968 |
| Quaker Chemical Corp. | 48,310 | 795 |
| Olympic Steel, Inc. | 37,560 | 765 |
| A.M. Castle & Co. | 63,665 | 690 |
* | Buckeye Technology, Inc. | 170,237 | 620 |
| Neenah Paper Inc. | 52,305 | 462 |
| Penford Corp. | 44,778 | 453 |
| Georgia Gulf Corp. | 151,707 | 162 |
| | | 52,965 |
Telecommunication Services (0.2%) | | |
* | General | | |
| Communication, Inc. | 174,491 | 1,411 |
| FairPoint | | |
| Communications, Inc. | 380,396 | 1,248 |
| | | 2,659 |
Utilities (5.6%) | | |
| Piedmont Natural Gas, Inc. | 308,584 | 9,773 |
| Atmos Energy Corp. | 384,088 | 9,103 |
| New Jersey Resources Corp. | 177,233 | 6,974 |
| Cleco Corp. | 253,463 | 5,787 |
| South Jersey Industries, Inc. | 124,954 | 4,979 |
| Northwest Natural Gas Co. | 111,220 | 4,919 |
| Southwest Gas Corp. | 184,806 | 4,661 |
| Avista Corp. | 229,679 | 4,451 |
| UniSource Energy Corp. | 149,284 | 4,383 |
77
Tax-Managed Small-Cap Fund
| | | Market |
| | | Value• |
| | Shares | ($000) |
| The Laclede Group, Inc. | 93,122 | 4,362 |
| ALLETE, Inc. | 110,870 | 3,578 |
* | El Paso Electric Co. | 189,843 | 3,434 |
| CH Energy Group, Inc. | 65,454 | 3,364 |
| UIL Holdings Corp. | 106,471 | 3,197 |
| American States Water Co. | 72,979 | 2,407 |
| Central Vermont Public | | |
| Service Corp. | 49,845 | 1,189 |
| | | 76,561 |
Total Common Stocks | | |
(Cost $1,515,734) | | 1,361,540 |
Temporary Cash Investment (0.3%) | | |
2 | Vanguard Market | | |
| Liquidity Fund, 1.378% | | |
| (Cost $4,536) | 4,536,091 | 4,536 |
Total Investments (100.4%) | | |
(Cost $1,520,270) | | 1,366,076 |
Other Assets and Liabilities (–0.4%) | | |
Other Assets | | 29,355 |
Liabilities | | (35,019) |
| | | (5,664) |
Net Assets (100%) | | 1,360,412 |
At December 31, 2008, net assets consisted of: |
| Amount |
| ($000) |
Paid-in Capital | 1,656,779 |
Overdistributed Net Investment Income | (2,440) |
Accumulated Net Realized Losses | (139,733) |
Unrealized Appreciation (Depreciation) | (154,194) |
Net Assets | 1,360,412 |
| |
Investor Shares—Net Assets | |
Applicable to 72,162,489 outstanding | |
$.001 par value shares of beneficial | |
interest (unlimited authorization) | 1,258,351 |
Net Asset Value Per Share— | |
Investor Shares | $17.44 |
| |
Institutional Shares—Net Assets | |
Applicable to 5,842,686 outstanding | |
$.001 par value shares of beneficial | |
interest (unlimited authorization) | 102,061 |
Net Asset Value Per Share— | |
Institutional Shares | $17.47 |
• | See Note A in Notes to Financial Statements. |
* | Non-income-producing security. |
1 Considered an affiliated company of the fund as the issuer is another member of The Vanguard Group.
2 Affiliated money market fund available only to Vanguard funds and certain trusts and accounts managed by Vanguard. Rate shown is the 7-day yield.
REIT—Real Estate Investment Trust.
See accompanying Notes, which are an integral part of the Financial Statements.
78
Tax-Managed Small-Cap Fund
Statement of Operations
| Year Ended |
| December 31, 2008 |
| ($000) |
Investment Income | |
Income | |
Dividends1 | 22,801 |
Interest1 | 61 |
Total Income | 22,862 |
Expenses | |
The Vanguard Group—Note B | |
Investment Advisory Services | 93 |
Management and Administrative—Investor Shares | 1,651 |
Management and Administrative—Institutional Shares | 79 |
Marketing and Distribution—Investor Shares | 438 |
Marketing and Distribution—Institutional Shares | 44 |
Custodian Fees | 19 |
Auditing Fees | 23 |
Shareholders’ Reports—Investor Shares | 15 |
Shareholders’ Reports—Institutional Shares | — |
Trustees’ Fees and Expenses | 2 |
Total Expenses | 2,364 |
Net Investment Income | 20,498 |
Realized Net Gain (Loss) | |
Investment Securities Sold1 | 96,863 |
Futures Contracts | 32 |
Realized Net Gain (Loss) | 96,895 |
Change in Unrealized Appreciation (Depreciation) of Investment Securities | (747,423) |
Net Increase (Decrease) in Net Assets Resulting from Operations | (630,030) |
1 Dividend income, interest income, and realized net gain (loss) from affiliated companies of the fund were $386,000, $61,000, and ($21,812,000), respectively.
See accompanying Notes, which are an integral part of the Financial Statements.
79
Tax-Managed Small-Cap Fund
Statement of Changes in Net Assets
| Year Ended December 31, |
| 2008 | 2007 |
| ($000) | ($000) |
Increase (Decrease) in Net Assets | | |
Operations | | |
Net Investment Income | 20,498 | 17,465 |
Realized Net Gain (Loss) | 96,895 | 107,257 |
Change in Unrealized Appreciation (Depreciation) | (747,423) | (113,587) |
Net Increase (Decrease) in Net Assets Resulting from Operations | (630,030) | 11,135 |
Distributions | | |
Net Investment Income | | |
Investor Shares | (19,336) | (16,119) |
Institutional Shares | (1,688) | (1,611) |
Realized Capital Gain | | |
Investor Shares | — | — |
Institutional Shares | — | — |
Total Distributions | (21,024) | (17,730) |
Capital Share Transactions | | |
Investor Shares | 53,676 | 41,062 |
Institutional Shares | (6,279) | 46,300 |
Net Increase (Decrease) from Capital Share Transactions | 47,397 | 87,362 |
Total Increase (Decrease) | (603,657) | 80,767 |
Net Assets | | |
Beginning of Period | 1,964,069 | 1,883,302 |
End of Period1 | 1,360,412 | 1,964,069 |
1 Net Assets—End of Period includes undistributed (overdistributed) net investment income of ($2,440,000) and ($1,914,000).
See accompanying Notes, which are an integral part of the Financial Statements.
80
Tax-Managed Small-Cap Fund
Financial Highlights
Investor Shares | | | | | |
| | | | | |
For a Share Outstanding | Year Ended December 31, |
Throughout Each Period | 2008 | 2007 | 2006 | 2005 | 2004 |
Net Asset Value, Beginning of Period | $25.62 | $25.72 | $22.70 | $21.25 | $17.44 |
Investment Operations | | | | | |
Net Investment Income | .266 | .229 | .191 | .193 | .172 |
Net Realized and Unrealized Gain (Loss) | | | | | |
on Investments1 | (8.174) | (.097) | 3.023 | 1.454 | 3.811 |
Total from Investment Operations | (7.908) | .132 | 3.214 | 1.647 | 3.983 |
Distributions | | | | | |
Dividends from Net Investment Income | (.272) | (.232) | (.194) | (.197) | (.173) |
Distributions from Realized Capital Gains | — | — | — | — | — |
Total Distributions | (.272) | (.232) | (.194) | (.197) | (.173) |
Net Asset Value, End of Period | $17.44 | $25.62 | $25.72 | $22.70 | $21.25 |
| | | | | |
Total Return2 | –30.82% | 0.51% | 14.15% | 7.74% | 22.84% |
| | | | | |
Ratios/Supplemental Data | | | | | |
Net Assets, End of Period (Millions) | $1,258 | $1,793 | $1,756 | $1,458 | $1,282 |
Ratio of Total Expenses to | | | | | |
Average Net Assets | 0.14% | 0.13% | 0.14% | 0.14% | 0.14% |
Ratio of Net Investment Income to | | | | | |
Average Net Assets | 1.16% | 0.86% | 0.78% | 0.92% | 0.96% |
Portfolio Turnover Rate3 | 32% | 53% | 42% | 20% | 19% |
1 Includes increases from redemption fees of $.01, $.01, $.01, $.01, and $.01.
2 Total returns do not reflect the 1% redemption fee on shares held less than five years; the 2% redemption fee assessed prior to September 14, 2005, on shares held less than one year; or the account service fee that may be applicable to certain accounts with balances below $10,000.
3 Excludes the value of portfolio securities received or delivered as a result of in-kind purchases or redemptions of the fund’s capital shares.
See accompanying Notes, which are an integral part of the Financial Statements.
81
Tax-Managed Small-Cap Fund
Financial Highlights
Institutional Shares | | | | | |
| | | | | |
For a Share Outstanding | Year Ended December 31, |
Throughout Each Period | 2008 | 2007 | 2006 | 2005 | 2004 |
Net Asset Value, Beginning of Period | $25.66 | $25.77 | $22.74 | $21.28 | $17.47 |
Investment Operations | | | | | |
Net Investment Income | .275 | .242 | .209 | .213 | .178 |
Net Realized and Unrealized Gain (Loss) | | | | | |
on Investments1 | (8.184) | (.108) | 3.028 | 1.454 | 3.811 |
Total from Investment Operations | (7.909) | .134 | 3.237 | 1.667 | 3.989 |
Distributions | | | | | |
Dividends from Net Investment Income | (.281) | (.244) | (.207) | (.207) | (.179) |
Distributions from Realized Capital Gains | — | — | — | — | — |
Total Distributions | (.281) | (.244) | (.207) | (.207) | (.179) |
Net Asset Value, End of Period | $17.47 | $25.66 | $25.77 | $22.74 | $21.28 |
| | | | | |
Total Return2 | –30.77% | 0.51% | 14.23% | 7.82% | 22.83% |
| | | | | |
Ratios/Supplemental Data | | | | | |
Net Assets, End of Period (Millions) | $102 | $171 | $128 | $94 | $15 |
Ratio of Total Expenses to | | | | | |
Average Net Assets | 0.09% | 0.09% | 0.09% | 0.09% | 0.09% |
Ratio of Net Investment Income to | | | | | |
Average Net Assets | 1.21% | 0.90% | 0.83% | 0.97% | 1.01% |
Portfolio Turnover Rate3 | 32% | 53% | 42% | 20% | 19% |
1 Includes increases from redemption fees of $.01, $.01, $.01, $.00, and $.01.
2 Total returns do not reflect the 1% redemption fee on shares held less than five years or the 2% redemption fee assessed prior to September 14, 2005, on shares held less than one year.
3 Excludes the value of portfolio securities received or delivered as a result of in-kind purchases or redemptions of the fund’s capital shares.
See accompanying Notes, which are an integral part of the Financial Statements.
82
Tax-Managed Small-Cap Fund
Notes to Financial Statements
Vanguard Tax-Managed Small-Cap Fund is registered under the Investment Company Act of 1940 as an open-end investment company, or mutual fund. The fund offers two classes of shares: Investor Shares and Institutional Shares. Investor Shares are available to any investor who meets the fund’s minimum purchase requirements. Institutional Shares are designed for investors who meet certain administrative and service criteria and invest a minimum of $5 million.
A. The following significant accounting policies conform to generally accepted accounting principles for U.S. mutual funds. The fund consistently follows such policies in preparing its financial statements.
1. Security Valuation: Securities are valued as of the close of trading on the New York Stock Exchange (generally 4 p.m., Eastern time) on the valuation date. Equity securities are valued at the latest quoted sales prices or official closing prices taken from the primary market in which each security trades; such securities not traded on the valuation date are valued at the mean of the latest quoted bid and asked prices. Securities for which market quotations are not readily available, or whose values have been materially affected by events occurring before the fund’s pricing time but after the close of the securities’ primary markets, are valued by methods deemed by the board of trustees to represent fair value. Investments in Vanguard Market Liquidity Fund are valued at that fund’s net asset value.
2. Futures Contracts: The fund uses index futures contracts to a limited extent, with the objectives of maintaining full exposure to the stock market, enhancing returns, maintaining liquidity, and minimizing transaction costs. The fund may purchase futures contracts to immediately invest incoming cash in the market, or sell futures in response to cash outflows, thereby simulating a fully invested position in the underlying index while maintaining a cash balance for liquidity. The fund may seek to enhance returns by using futures contracts instead of the underlying securities when futures are believed to be priced more attractively than the underlying securities. The primary risks associated with the use of futures contracts are imperfect correlation between changes in market values of stocks held by the fund and the prices of futures contracts, and the possibility of an illiquid market.
Futures contracts are valued at their quoted daily settlement prices. The aggregate principal amounts of the contracts are not recorded in the Statement of Net Assets. Fluctuations in the value of the contracts are recorded in the Statement of Net Assets as an asset (liability) and in the Statement of Operations as unrealized appreciation (depreciation) until the contracts are closed, when they are recorded as realized futures gains (losses).
3. Federal Income Taxes: The fund intends to continue to qualify as a regulated investment company and distribute all of its taxable income. Management has analyzed the fund’s tax positions taken on federal income tax returns for all open tax years (tax years ended December 31, 2005–2008), and has concluded that no provision for federal income tax is required in the fund’s financial statements.
4. Distributions: Distributions to shareholders are recorded on the ex-dividend date.
5. Other: Dividend income is recorded on the ex-dividend date. Interest income includes income distributions received from Vanguard Market Liquidity Fund and is accrued daily. Security transactions are accounted for on the date securities are bought or sold. Costs used to determine realized gains (losses) on the sale of investment securities are those of the specific securities sold. Fees assessed on redemptions of capital shares are credited to paid-in capital.
83
Tax-Managed Small-Cap Fund
Each class of shares has equal rights as to assets and earnings, except that each class separately bears certain class-specific expenses related to maintenance of shareholder accounts (included in Management and Administrative expenses) and shareholder reporting. Marketing and distribution expenses are allocated to each class of shares based on a method approved by the board of trustees. Income, other non-class-specific expenses, and gains and losses on investments are allocated to each class of shares based on its relative net assets.
B. The Vanguard Group furnishes at cost investment advisory, corporate management, administrative, marketing, and distribution services. The costs of such services are allocated to the fund under methods approved by the board of trustees. The fund has committed to provide up to 0.40% of its net assets in capital contributions to Vanguard. At December 31, 2008, the fund had contributed capital of $349,000 to Vanguard (included in Other Assets), representing 0.03% of the fund’s net assets and 0.14% of Vanguard’s capitalization. The fund’s trustees and officers are also directors and officers of Vanguard.
C. Distributions are determined on a tax basis and may differ from net investment income and realized capital gains for financial reporting purposes. Differences may be permanent or temporary. Permanent differences are reclassified among capital accounts in the financial statements to reflect their tax character. Temporary differences arise when certain items of income, expense, gain, or loss are recognized in different periods for financial statement and tax purposes; these differences are primarily attributed to tax deferral of losses on washsales and will reverse at some time in the future. Differences in classification may also result from the treatment of short-term gains as ordinary income for tax purposes.
During the year ended December 31, 2008, the fund realized $193,086,000 of net capital gains resulting from in-kind redemptions—in which shareholders exchanged fund shares for securities held by the fund rather than for cash. Because such gains are not taxable to the fund, and are not distributed to shareholders, they have been reclassified from accumulated net realized losses to paid-in capital.
For tax purposes, at December 31, 2008, the fund had $159,000 of ordinary income available for distribution. The fund had available realized losses of $123,667,000 to offset future net capital gains of $2,167,000 through December 31, 2011, $9,132,000 through December 31, 2015, $86,306,000 through December 31, 2016, and $26,062,000 through December 31, 2017.
At December 31, 2008, the cost of investment securities for tax purposes was $1,536,335,000. Net unrealized depreciation of investment securities for tax purposes was $170,259,000, consisting of unrealized gains of $149,620,000 on securities that had risen in value since their purchase and $319,879,000 in unrealized losses on securities that had fallen in value since their purchase.
D. During the year ended December 31, 2008, the fund purchased $930,213,000 of investment securities and sold $887,256,000 of investment securities, other than temporary cash investments.
84
Tax-Managed Small-Cap Fund
E. Capital share transactions for each class of shares were:
| | | Year Ended December 31, |
| | 2008 | | 2007 |
| Amount | Shares | Amount | Shares |
| ($000) | (000) | ($000) | (000) |
Investor Shares | | | | |
Issued | 520,702 | 22,445 | 446,451 | 16,708 |
Issued in Lieu of Cash Distributions | 15,709 | 940 | 13,098 | 507 |
Redeemed1 | (482,735) | (21,216) | (418,487) | (15,473) |
Net Increase (Decrease)—Investor Shares | 53,676 | 2,169 | 41,062 | 1,742 |
Institutional Shares | | | | |
Issued | 35,129 | 1,461 | 46,719 | 1,725 |
Issued in Lieu of Cash Distributions | 1,126 | 67 | 839 | 32 |
Redeemed1 | (42,534) | (2,347) | (1,258) | (48) |
Net Increase (Decrease)—Institutional Shares | (6,279) | (819) | 46,300 | 1,709 |
1 Net of redemption fees for 2008 and 2007 of $881,000 and $492,000, respectively (fund totals).
F. In September 2006, the Financial Accounting Standards Board issued Statement of Financial Accounting Standards No. 157 (“FAS 157”), “Fair Value Measurements.” FAS 157 establishes a framework for measuring fair value and expands disclosures about fair value measurements in financial statements.
The various inputs that may be used to determine the value of the fund’s investments are summarized in three broad levels. The inputs or methodologies used for valuing securities are not necessarily an indication of the risk associated with investing in those securities.
Level 1—Quoted prices in active markets for identical securities.
Level 2—Other significant observable inputs (including quoted prices for similar securities, interest rates, prepayment speeds, credit risk, etc.).
Level 3—Significant unobservable inputs (including the fund’s own assumptions used to determine the fair value of investments).
At December 31, 2008, 100% of the fund’s investments were valued based on Level 1 inputs.
85
Report of Independent Registered Public Accounting Firm
To the Trustees of Vanguard Tax-Managed Funds and the Shareholders of Vanguard Tax-Managed Balanced Fund, Vanguard Tax-Managed Growth and Income Fund, Vanguard Tax-Managed Capital Appreciation Fund and Vanguard Tax-Managed Small-Cap Fund:
In our opinion, the accompanying statements of net assets and the related statements of operations and of changes in net assets and the financial highlights present fairly, in all material respects, the financial position of Vanguard Tax-Managed Balanced Fund, Vanguard Tax-Managed Growth and Income Fund, Vanguard Tax-Managed Capital Appreciation Fund and Vanguard Tax-Managed Small-Cap Fund (constituting separate portfolios of Vanguard Tax-Managed Funds, hereafter referred to as the “Funds”) at December 31, 2008, the results of each of their operations for the year then ended, the changes in each of their net assets for each of the two years in the period then ended and the financial highlights for each of the five years in the period then ended, in conformity with accounting principles generally accepted in the United States of America. These financial statements and financial highlights (hereafter referred to as “financial statements”) are the responsibility of the Funds’ management; our responsibility is to express an opinion on these financial statements based on our audits. We conducted our audits of these financial statements in accordance with the standards of the Public Company Accounting Oversight Board (United States). Those standards require that we plan and perform the audit to obtain reasonable assurance about whether the financial statements are free of material misstatement. An audit includes examining, on a test basis, evidence supporting the amounts and disclosures in the financial statements, assessing the accounting principles used and significant estimates made by management, and evaluating the overall financial statement presentation. We believe that our audits, which included confirmation of securities at December 31, 2008 by correspondence with the custodian, and by agreement to the underlying ownership records of the Vanguard funds, provide a reasonable basis for our opinion.
PricewaterhouseCoopers LLP
Philadelphia, Pennsylvania
February 23, 2009
86
Special 2008 tax information (unaudited) for Vanguard Tax Managed Funds |
This information for the fiscal year ended December 31, 2008, is included pursuant to provisions of the Internal Revenue Code.
The Tax-Managed Balanced Fund designates 72.08% of its income dividends as exempt-interest dividends.
The funds distributed qualified dividend income to shareholders during the fiscal year as follows:
| Qualified Dividend Income |
Tax-Managed Fund | ($000) |
Balanced | 5,691 |
Growth and Income | 60,985 |
Capital Appreciation | 64,259 |
Small-Cap | 19,573 |
For corporate shareholders, the percentage of investment income (dividend income plus short-term gains, if any) that qualifies for the dividends-received deduction is as follows:
Tax-Managed Fund | Percentage |
Balanced | 99.2%1 |
Growth and Income | 100.0 |
Capital Appreciation | 100.0 |
Small-Cap | 96.8 |
1 The percentage applies only to the taxable ordinary income that has been reported on Form 1099-DIV.
87
Your Fund’s After-Tax Returns
This table presents returns for your fund both before and after taxes. The after-t ax returns are shown in two ways: (1) assuming that an investor owned the fund during the entire period and paid taxes on the fund’s distributions, and (2) assuming that an investor paid taxes on the fund’s distributions and sold all shares at the end of each period.
Calculations are based on the highest individual federal income tax and capital gains tax rates in effect at the times of the distributions and the hypothetical sales. State and local taxes were not considered. After-tax returns reflect any qualified dividend income. (In the example, returns after the sale of fund shares may be higher than those assuming no sale. This occurs when the sale would have produced a capital loss. The calculation assumes that the investor received a tax deduction for the loss.)
The table shows returns for Investor Shares only; returns for other share classes will differ. Please note that your actual after-t ax returns will depend on your tax situation and may differ from those shown. Also note that if you own the fund in a tax-deferred account, such as an individual retirement account or a 401(k) plan, this information does not apply to you. Such accounts are not subject to current taxes.
Finally, keep in mind that a fund’s performance—whether before or after taxes—does not guarantee future results.
Average Annual Total Returns1 | | | |
Periods Ended December 31, 2008 | | | |
| One | Five | Ten |
| Year | Years | Years2 |
Tax-Managed Balanced Fund | | | |
Returns Before Taxes | –19.12% | 1.01% | 2.40% |
Returns After Taxes on Distributions | –19.22 | 0.90 | 2.29 |
Returns After Taxes on Distributions and Sale of Fund Shares | –11.56 | 1.23 | 2.37 |
| | | |
Tax-Managed Growth and Income Fund Investor Shares | | | |
Returns Before Taxes | –37.65% | –2.25% | –1.40% |
Returns After Taxes on Distributions | –37.88 | –2.53 | –1.75 |
Returns After Taxes on Distributions and Sale of Fund Shares | –24.07 | –1.80 | –1.24 |
| | | |
Tax-Managed Capital Appreciation Fund Investor Shares | | | |
Returns Before Taxes | –38.23% | –1.89% | –0.71% |
Returns After Taxes on Distributions | –38.46 | –2.11 | –0.94 |
Returns After Taxes on Distributions and Sale of Fund Shares | –24.57 | –1.54 | –0.63 |
| | | |
Tax-Managed Small-Cap Fund Investor Shares | | | |
Returns Before Taxes | –31.50% | 0.99% | 6.68% |
Returns After Taxes on Distributions | –31.68 | 0.84 | 6.49 |
Returns After Taxes on Distributions and Sale of Fund Shares | –20.28 | 0.87 | 5.82 |
1 All fund returns are adjusted to reflect fees. Each of the Vanguard Tax-Managed Funds assesses a 1% fee on redemptions of shares held in the fund for less than five years. Total returns do not reflect the account service fee that may be applicable to certain accounts with balances below $10,000.
2 Since inception for the Tax-Managed Small-Cap Fund (March 25, 1999).
88
About Your Fund’s Expenses
As a shareholder of the fund, you incur ongoing costs, which include costs for portfolio management, administrative services, and shareholder reports (like this one), among others. Operating expenses, which are deducted from a fund’s gross income, directly reduce the investment return of the fund.
A fund’s expenses are expressed as a percentage of its average net assets. This figure is known as the expense ratio. The following examples are intended to help you understand the ongoing costs (in dollars) of investing in your fund and to compare these costs with those of other mutual funds. The examples are based on an investment of $1,000 made at the beginning of the period shown and held for the entire period.
The accompanying table illustrates your fund’s costs in two ways:
• Based on actual fund return. This section helps you to estimate the actual expenses that you paid over the period. The “Ending Account Value” shown is derived from the fund’s actual return, and the third column shows the dollar amount that would have been paid by an investor who started with $1,000 in the fund. You may use the information here, together with the amount you invested, to estimate the expenses that you paid over the period.
To do so, simply divide your account value by $1,000 (for example, an $8,600 account value divided by $1,000 = 8.6), then multiply the result by the number given for your fund under the heading “Expenses Paid During Period.”
• Based on hypothetical 5% yearly return. This section is intended to help you compare your fund’s costs with those of other mutual funds. It assumes that the fund had a yearly return of 5% before expenses, but that the expense ratio is unchanged. In this case—because the return used is not the fund’s actual return—the results do not apply to your investment. The example is useful in making comparisons because the Securities and Exchange Commission requires all mutual funds to calculate expenses based on a 5% return. You can assess your fund’s costs by comparing this hypothetical example with the hypothetical examples that appear in shareholder reports of other funds.
Note that the expenses shown in the table are meant to highlight and help you compare ongoing costs only and do not reflect transaction costs incurred by the fund for buying and selling securities. Further, the expenses do not include the 1% fee on redemptions of shares held for less than five years, nor do they include the account service fee described in the prospectus. If such fees were applied to your account, your costs would be higher. Your fund does not carry a “sales load.”
The calculations assume no shares were bought or sold during the period. Your actual costs may have been higher or lower, depending on the amount of your investment and the timing of any purchases or redemptions.
You can find more information about the fund’s expenses, including annual expense ratios, in the Financial Statements section of this report. For additional information on operating expenses and other shareholder costs, please refer to your fund’s current prospectus.
89
Six Months Ended December 31, 2008 | | | |
| Beginning | Ending | Expenses |
| Account Value | Account Value | Paid During |
Tax-Managed Fund | 6/30/2008 | 12/31/2008 | Period1 |
Based on Actual Fund Return | | | |
Balanced | $1,000.00 | $854.93 | $0.70 |
Growth and Income | | | |
Investor Shares | $1,000.00 | $715.06 | $0.78 |
Admiral Shares | 1,000.00 | 715.32 | 0.48 |
Institutional Shares | 1,000.00 | 715.42 | 0.30 |
Capital Appreciation | | | |
Investor Shares | $1,000.00 | $698.31 | $0.77 |
Admiral Shares | 1,000.00 | 698.52 | 0.47 |
Institutional Shares | 1,000.00 | 698.67 | 0.30 |
Small-Cap | | | |
Investor Shares | $1,000.00 | $743.61 | $0.66 |
Institutional Shares | 1,000.00 | 744.01 | 0.44 |
Based on Hypothetical 5% Yearly Return | | | |
Balanced | $1,000.00 | $1,024.45 | $0.77 |
Growth and Income | | | |
Investor Shares | $1,000.00 | $1,024.30 | $0.92 |
Admiral Shares | 1,000.00 | 1,024.65 | 0.56 |
Institutional Shares | 1,000.00 | 1,024.85 | 0.36 |
Capital Appreciation | | | |
Investor Shares | $1,000.00 | $1,024.30 | $0.92 |
Admiral Shares | 1,000.00 | 1,024.65 | 0.56 |
Institutional Shares | 1,000.00 | 1,024.85 | 0.36 |
Small-Cap | | | |
Investor Shares | $1,000.00 | $1,024.45 | $0.77 |
Institutional Shares | 1,000.00 | 1,024.70 | 0.51 |
1 The calculations are based on expenses incurred during the most recent six-month period. The funds’ annualized six-month expense ratios for that period are: for the Tax-Managed Balanced Fund, 0.15%; for the Tax-Managed Growth and Income Fund, 0.18% for Investor Shares, 0.11% for Admiral Shares, and 0.07% for Institutional Shares; for the Tax-Managed Capital Appreciation Fund, 0.18% for Investor Shares, 0.11% for Admiral Shares, and 0.07% for Institutional Shares; for the Tax-Managed Small-Cap Fund, 0.15% for Investor Shares and 0.10% for Institutional Shares. The dollar amounts shown as “Expenses Paid” are equal to the annualized expense ratio multiplied by the average account value over the period, multiplied by the number of days in the most recent six-month period, then divided by the number of days in the most recent 12-month period.
90
Glossary
Average Coupon. The average interest rate paid on the fixed income securities held by a fund. It is expressed as a percentage of face value.
Average Duration. An estimate of how much the value of the bonds held by a fund will fluctuate in response to a change in interest rates. To see how the value could change, multiply the average duration by the change in rates. If interest rates rise by 1 percentage point, the value of the bonds in a fund with an average duration of five years would decline by about 5%. If rates decrease by a percentage point, the value would rise by 5%.
Average Effective Maturity. The average length of time until fixed income securities held by a fund reach maturity and are repaid, taking into consideration the possibility that the issuer may call the bond before its maturity date. The figure reflects the proportion of fund assets represented by each security; it also reflects any futures contracts held. In general, the longer the average effective maturity, the more a fund’s share price will fluctuate in response to changes in market interest rates.
Average Quality. An indicator of credit risk, this figure is the average of the ratings assigned to a fund’s fixed income holdings by credit-rating agencies. The agencies make their judgment after appraising an issuer’s ability to meet its obligations. Quality is graded on a scale, with Aaa or AAA indicating the most creditworthy bond issuers. U.S. Treasury securities are considered to have the highest credit quality.
Beta. A measure of the magnitude of a fund’s past share-price fluctuations in relation to the ups and downs of a given market index. The index is assigned a beta of 1.00. Compared with a given index, a fund with a beta of 1.20 typically would have seen its share price rise or fall by 12% when the index rose or fell by 10%. For this report, beta is based on returns over the past 36 months for both the fund and the index. Note that a fund’s beta should be reviewed in conjunction with its R-squared (see definition). The lower the R-squared, the less correlation there is between the fund and the index, and the less reliable beta is as an indicator of volatility.
Dividend Yield. The current, annualized rate of dividends paid on a share of stock, divided by its current share price. For a fund, the weighted average yield for stocks it holds. The index yield is based on the current annualized rate of dividends paid on stocks in the index.
Earnings Growth Rate. The average annual rate of growth in earnings over the past five years for the stocks now in a fund.
Equity Exposure. A measure that reflects a fund’s investments in stocks and stock futures. Any holdings in short-term reserves are excluded.
Expense Ratio. The percentage of a fund’s average net assets used to pay its annual administrative and advisory expenses. These expenses directly reduce returns to investors.
Foreign Holdings. The percentage of a fund represented by stocks or depositary receipts of companies based outside the United States.
Inception Date. The date on which the assets of a fund (or one of its share classes) are first invested in accordance with the fund’s investment objective. For funds with a subscription period, the inception date is the day after that period ends. Investment performance is measured from the inception date.
Largest State Concentrations. An indicator of diversification. The less concentrated a fund’s holdings of bonds, the less the fund will be hurt by any financial problems in a single state or region.
91
Median Market Cap. An indicator of the size of companies in which a fund invests; the midpoint of market capitalization (market price x shares outstanding) of a fund’s stocks, weighted by the proportion of the fund’s assets invested in each stock. Stocks representing half of the fund’s assets have market capitalizations above the median, and the rest are below it.
Price/Book Ratio. The share price of a stock divided by its net worth, or book value, per share. For a fund, the weighted average price/book ratio of the stocks it holds.
Price/Earnings Ratio. The ratio of a stock’s current price to its per-share earnings over the past year. For a fund, the weighted average P/E of the stocks it holds. P/E is an indicator of market expectations about corporate prospects; the higher the P/E, the greater the expectations for a company’s future growth.
R-Squared. A measure of how much of a fund’s past returns can be explained by the returns from the market in general, as measured by a given index. If a fund’s total returns were precisely synchronized with an index’s returns, its R-squared would be 1.00. If the fund’s returns bore no relationship to the index’s returns, its R-squared would be 0. For this report, R-squared is based on returns over the past 36 months for both the fund and the index.
Return on Equity. The annual average rate of return generated by a company during the past five years for each dollar of shareholder’s equity (net income divided by shareholder’s equity). For a fund, the weighted average return on equity for the companies whose stocks it holds.
Short-Term Reserves. The percentage of a fund invested in highly liquid, short-term securities that can be readily converted to cash.
Turnover Rate. An indication of the fund’s trading activity. Funds with high turnover rates incur higher transaction costs and may be more likely to distribute capital gains (which may be taxable to investors). The turnover rate excludes in-kind transactions, which have minimal impact on costs.
Yield. A fund’s 30-day SEC yield is derived using a formula specified by the U.S. Securities and Exchange Commission. Under the formula, data related to the fund’s security holdings in the previous 30 days are used to calculate the fund’s hypothetical net income for that period, which is then annualized and divided by the fund’s estimated average net assets over the calculation period. For the purposes of this calculation, a security’s income is based on its current market yield to maturity (in the case of bonds) or its projected dividend yield (for stocks). Because the SEC yield represents hypothetical annualized income, it will differ—at times significantly—from the fund’s actual experience. As a result, the fund’s income distributions may be higher or lower than implied by the SEC yield.
Yield to Maturity. The rate of return an investor would receive if the fixed income securities held by a fund were held to their maturity dates.
92
This page intentionally left blank.
This page intentionally left blank.
This page intentionally left blank.
The People Who Govern Your Fund
The trustees of your mutual fund are there to see that the fund is operated and managed in your best interests since, as a shareholder, you are a part owner of the fund. Your fund’s trustees also serve on the board of directors of The Vanguard Group, Inc., which is owned by the Vanguard funds and provides services to them on an at-cost basis.
A majority of Vanguard’s board members are independent, meaning that they have no affiliation with Vanguard or the funds they oversee, apart from the sizable personal investments they have made as private individuals. The independent board members have distinguished backgrounds in business, academia, and public service. Each of the trustees and executive officers oversees 155 Vanguard funds.
The following table provides information for each trustee and executive officer of the fund. More information about the trustees is in the Statement of Additional Information, which can be obtained, without charge, by contacting Vanguard at 800-662-7447, or online at www.vanguard.com.
Chairman of the Board and Interested Trustee | Rajiv L. Gupta |
| Born 1945. Trustee Since December 2001.2 Principal |
| Occupation(s) During the Past Five Years: Chairman, |
John J. Brennan1 | President, and Chief Executive Officer of Rohm and |
Born 1954. Trustee Since May 1987. Chairman of | Haas Co. (chemicals); Board Member of the American |
the Board. Principal Occupation(s) During the Past Five | Chemistry Council; Director of Tyco International, Ltd. |
Years: Chairman of the Board and Director/Trustee of | (diversified manufacturing and services), since 2005. |
The Vanguard Group, Inc., and of each of the investment | |
companies served by The Vanguard Group; Chief | |
Executive Officer and President of The Vanguard Group | Amy Gutmann |
and of each of the investment companies served by The | Born 1949. Trustee Since June 2006. Principal |
Vanguard Group (1996–2008). | Occupation(s) During the Past Five Years: President of |
| the University of Pennsylvania since 2004; Professor in |
| the School of Arts and Sciences, Annenberg School for |
Independent Trustees | Communication, and Graduate School of Education of |
| the University of Pennsylvania since 2004; Provost |
| (2001–2004) and Laurance S. Rockefeller Professor of |
Charles D. Ellis | Politics and the University Center for Human Values |
Born 1937. Trustee Since January 2001. Principal | (1990–2004), Princeton University; Director of Carnegie |
Occupation(s) During the Past Five Years: Applecore | Corporation of New York since 2005 and of Schuylkill |
Partners (pro bono ventures in education); Senior | River Development Corporation and Greater Philadelphia |
Advisor to Greenwich Associates (international business | Chamber of Commerce since 2004; Trustee of the |
strategy consulting); Successor Trustee of Yale University; | National Constitution Center since 2007. |
Overseer of the Stern School of Business at New York | |
University; Trustee of the Whitehead Institute for | |
Biomedical Research. | JoAnn Heffernan Heisen |
| Born 1950. Trustee Since July 1998. Principal |
| Occupation(s) During the Past Five Years: Retired |
Emerson U. Fullwood | Corporate Vice President, Chief Global Diversity Officer, |
Born 1948. Trustee Since January 2008. Principal | and Member of the Executive Committee of Johnson & |
Occupation(s) During the Past Five Years: Retired | Johnson (pharmaceuticals/consumer products); Vice |
Executive Chief Staff and Marketing Officer for | President and Chief Information Officer (1997–2005) |
North America and Corporate Vice President of | of Johnson & Johnson; Director of the University |
Xerox Corporation (photocopiers and printers); | Medical Center at Princeton and Women’s Research |
Director of SPX Corporation (multi-industry | and Education Institute. |
manufacturing), of the United Way of Rochester, | |
and of the Boy Scouts of America. | |
André F. Perold | F. William McNabb III1 |
Born 1952. Trustee Since December 2004. Principal | Born 1957. Chief Executive Officer Since August 2008. |
Occupation(s) During the Past Five Years: George Gund | President Since March 2008. Principal Occupation(s) |
Professor of Finance and Banking, Senior Associate | During the Past Five Years: Chief Executive Officer, |
Dean, and Director of Faculty Recruiting, Harvard | Director, and President of The Vanguard Group, Inc., |
Business School; Director and Chairman of UNX, Inc. | since 2008; Chief Executive Officer and President of |
(equities trading firm); Chair of the Investment | each of the investment companies served by The |
Committee of HighVista Strategies LLC (private | Vanguard Group since 2008; Director of Vanguard |
investment firm) since 2005. | Marketing Corporation; Managing Director of The |
| Vanguard Group (1995–2008). |
| |
Alfred M. Rankin, Jr. | |
Born 1941. Trustee Since January 1993. Principal | Heidi Stam1 |
Occupation(s) During the Past Five Years: Chairman, | Born 1956. Secretary Since July 2005. Principal |
President, Chief Executive Officer, and Director of | Occupation(s) During the Past Five Years: Managing |
NACCO Industries, Inc. (forklift trucks/housewares/ | Director of The Vanguard Group, Inc., since 2006; |
lignite); Director of Goodrich Corporation (industrial | General Counsel of The Vanguard Group since 2005; |
products/aircraft systems and services). | Secretary of The Vanguard Group and of each of the |
| investment companies served by The Vanguard Group |
| since 2005; Director and Senior Vice President of |
J. Lawrence Wilson | Vanguard Marketing Corporation since 2005; Principal |
Born 1936. Trustee Since April 1985. Principal | of The Vanguard Group (1997–2006). |
Occupation(s) During the Past Five Years: Retired | |
Chairman and Chief Executive Officer of Rohm and | |
Haas Co. (chemicals); Director of Cummins Inc. (diesel | Vanguard Senior Management Team |
engines) and AmerisourceBergen Corp. (pharmaceutical | |
distribution); Trustee of Vanderbilt University and of | |
Culver Educational Foundation. | R. Gregory Barton | James M. Norris |
| Mortimer J. Buckley | Ralph K. Packard |
| Kathleen C. Gubanich | Glenn W. Reed |
Executive Officers | Paul A. Heller | George U. Sauter |
| Michael S. Miller | |
| |
Thomas J. Higgins1 | |
Born 1957. Chief Financial Officer Since September | Founder |
2008. Principal Occupation(s) During the Past Five | |
Years: Principal of The Vanguard Group, Inc.; Chief | |
Financial Officer of each of the investment companies | John C. Bogle |
served by The Vanguard Group since 2008; Treasurer | Chairman and Chief Executive Officer, 1974–1996 |
of each of the investment companies served by The | |
Vanguard Group (1998–2008). | |
| |
| |
Kathryn J. Hyatt1 | |
Born 1955. Treasurer Since November 2008. Principal | |
Occupation(s) During the Past Five Years: Principal of | |
The Vanguard Group, Inc.; Treasurer of each of the | |
investment companies served by The Vanguard | |
Group since 2008; Assistant Treasurer of each of the | |
investment companies served by The Vanguard Group | |
(1988–2008). | |
1 These individuals are “interested persons” as defined in the Investment Company Act of 1940.
2 December 2002 for Vanguard Equity Income Fund, Vanguard Growth Equity Fund, the Vanguard Municipal Bond Funds, and the Vanguard State Tax-Exempt Funds.
| 
|
| P.O. Box 2600 |
| Valley Forge, PA 19482-2600 |
Connect with Vanguard® > www.vanguard.com
Fund Information > 800-662-7447 | All comparative mutual fund data are from Lipper Inc. |
| or Morningstar, Inc., unless otherwise noted. |
Direct Investor Account Services > 800-662-2739 | |
| |
Institutional Investor Services > 800-523-1036 | You can obtain a free copy of Vanguard’s proxy voting |
| guidelines by visiting our website, www.vanguard.com, |
Text Telephone for People | and searching for “proxy voting guidelines,” or by |
With Hearing Impairment > 800-952-3335 | calling Vanguard at 800-662-2739. The guidelines are |
| also available from the SEC’s website, www.sec.gov. |
| In addition, you may obtain a free report on how your |
| fund voted the proxies for securities it owned during |
This material may be used in conjunction | the 12 months ended June 30. To get the report, visit |
with the offering of shares of any Vanguard | either www.vanguard.com or www.sec.gov. |
fund only if preceded or accompanied by | |
the fund’s current prospectus. | |
| You can review and copy information about your fund |
| at the SEC’s Public Reference Room in Washington, D.C. |
The funds or securities referred to herein are not | To find out more about this public service, call the SEC |
sponsored, endorsed, or promoted by MSCI, and MSCI | at 202-551-8090. Information about your fund is also |
bears no liability with respect to any such funds or | available on the SEC’s website, and you can receive |
securities. For any such funds or securities, the | copies of this information, for a fee, by sending a |
prospectus or the Statement of Additional Information | request in either of two ways: via e-mail addressed to |
contains a more detailed description of the limited | publicinfo@sec.gov or via regular mail addressed to the |
relationship MSCI has with The Vanguard Group and | Public Reference Section, Securities and Exchange |
any related funds. | Commission, Washington, DC 20549-0102. |
| |
| |
Russell is a trademark of The Frank Russell Company. | |
| |
| |
| |
| |
| |
| |
| |
| |
| © 2009 The Vanguard Group, Inc. |
| All rights reserved. |
| Vanguard Marketing Corporation, Distributor. |
| |
| Q870 022009 |
> | For the fiscal year ended December 31, 2008, Vanguard Tax-Managed International Fund (which has the same portfolio as the Europe Pacific ETF) returned about –41%. |
> | As with securities markets in the United States, the portfolio’s biggest problems stemmed from fallout in the financial sector. |
> | The fund has continued to avoid any taxable capital gain distributions to shareholders. |
Contents | |
| |
Your Fund’s Total Returns | 1 |
President’s Letter | 2 |
Fund Profile | 7 |
Performance Summary | 9 |
Financial Statements | 11 |
Your Fund’s After-Tax Returns | 32 |
About Your Fund’s Expenses | 33 |
Glossary | 35 |
Please note: The opinions expressed in this report are just that—informed opinions. They should not be considered promises or advice. Also, please keep in mind that the information and opinions cover the period through the date on the front of this report. Of course, the risks of investing in your fund are spelled out in the prospectus.
Your Fund’s Total Returns
Fiscal Year Ended December 31, 2008 | | |
| Ticker | Total |
| Symbol | Returns |
Vanguard Tax-Managed International Fund | | |
Investor Shares | VTMGX | –41.27% |
Institutional Shares1 | VTMNX | –41.27 |
Vanguard Europe Pacific ETF Shares2 | VEA | |
Market Price | | –40.57 |
Net Asset Value | | –41.25 |
MSCI EAFE Index | | –43.38 |
Average International Fund3 | | –44.24 |
Your Fund’s Performance at a Glance
December 31, 2007–December 31, 2008
| | | Distributions Per Share |
| Starting | Ending | Income | Capital |
| Share Price | Share Price | Dividends | Gains |
Vanguard Tax-Managed International Fund | | | | |
Investor Shares | $15.40 | $8.74 | $0.289 | $0.000 |
Institutional Shares | 15.41 | 8.74 | 0.295 | 0.000 |
Europe Pacific ETF Shares | 47.92 | 27.18 | 0.930 | 0.000 |
1 This class of shares carries lower expenses and is available for a minimum investment of $5 million.
2 Vanguard ETF™ Shares are traded on the NYSE Arca exchange and are available only through brokers. The table shows ETF returns based on both the NYSE Arca exchange market price and the net asset value for a share. U.S. Pat. No. 6,879,964 B2; 7,337,138.
3 Derived from data provided by Lipper Inc.
1

President’s Letter
Dear Shareholder,
As you know, 2008 was a difficult year for domestic and foreign stocks alike. All sectors and countries in the MSCI EAFE Index posted negative returns for the period. Vanguard Tax-Managed International Fund and its exchange-traded share class, Europe Pacific ETF, closely tracked the benchmark, resulting in Investor and Institutional Share returns of –41.27% and an ETF Share return of –41.25%. (The Total Returns chart on page 1 shows that the fund’s return slightly exceeded that of its benchmark. However, this doesn’t account for short-term discrepancies that arose from fair-value pricing, which is described more fully later in this letter.)
The fund met its tax-management objective, as it has since its inception date. The Performance at a Glance chart, also on page 1, shows that the fund’s manager, Vanguard’s Quantitative Equity Group, continued to avoid distributing capital gains that the fund accrued in previous years. The manager used a variety of portfolio management strategies to avoid realizing capital gains while deviating as little as possible from a pure indexing strategy.
Global stock markets faced historic challenges
Problems that had festered in the financial markets for much of 2008 erupted in the year’s final months, leading to high-profile
2
bankruptcies and government rescues. U.S. stocks lost about –23% for the fourth quarter. For the full 12 months, the U.S. stock market returned about –37%, the worst calendar-year performance since 1931. The financial sector, the epicenter of the crisis, was hardest hit, but no sector was safe from the market’s violent downdraft.
Overseas, the news was worse. Stock markets outside the United States returned about –45%, as credit-market turmoil and economic distress reverberated worldwide. Emerging markets fell especially hard, in part because of collapsing commodity prices, which put pressure on the group’s many natural-resource producers.
U.S. Treasuries provided a safe and liquid haven
Bonds provided shelter from the stock market turmoil, though strength was largely confined to U.S. Treasuries. Treasuries surged as investors bid up the highest-quality, most liquid securities. The Federal Reserve Board added fuel to the rally with repeated cuts in its target for the federal funds rate, a benchmark for short-term interest rates. At the start of 2008, the federal funds rate stood at 4.25%; by year-end, it was between 0.00% and 0.25%.
U.S. government-backed mortgage securities also performed well, though corporate and municipal bonds struggled. For the full year, the broad taxable bond market returned 5.24%.
Market Barometer | |
| Average Annual Total Returns |
| Periods Ended December 31, 2008 |
| One Year | Three Years | Five Years |
Stocks | | | |
MSCI All Country World Index ex USA (International) | –45.24% | –6.57% | 3.00% |
Russell 1000 Index (Large-caps) | –37.60 | –8.66 | –2.04 |
Russell 2000 Index (Small-caps) | –33.79 | –8.29 | –0.93 |
Dow Jones Wilshire 5000 Index (Entire market) | –37.34 | –8.43 | –1.67 |
| | | |
Bonds | | | |
Barclays Capital U.S. Aggregate Bond Index (Broad taxable market) | 5.24% | 5.51% | 4.65% |
Barclays Capital Municipal Bond Index | –2.47 | 1.86 | 2.71 |
Citigroup 3-Month Treasury Bill Index | 1.80 | 3.76 | 3.10 |
| | | |
CPI | | | |
Consumer Price Index | 0.09% | 2.22% | 2.67% |
| | | | |
3
Negative returns across the board made for disappointing results
During what turned out to be one of the worst years on record for the world’s stock markets, Vanguard Tax-Managed International Fund was no stranger to the widespread disruption, returning about –41% for the period. (As noted earlier, the fund’s return was slightly ahead of that of its target index for the past 12 months. This difference was mostly the result of fair-value pricing, which allows the fund to calculate its net asset value based on real-time developments not reflected in closing prices set in overseas markets that operate in different time zones. When fair-value pricing is used at the open or close of a reporting period, it may cause a temporary divergence between the return of a fund and that of its index, which doesn’t incorporate fair-value pricing. This discrepancy corrects itself when market prices reflect fair value, usually the next day.)
The fund posted negative results in all of the index’s countries and sectors for the 12 months. Holdings in overseas developed markets—which account for all of the fund’s assets—experienced problems similar to those in the United States.
Across virtually all markets, financial stocks had the biggest negative impact. Financials represented about a quarter of the fund’s assets and lost –55% worldwide, accounting for more than a one-third of the fund’s negative return. As in the United States,
Expense Ratios1 | |
Your Fund Compared With Its Peer Group | |
| Expense |
| Ratio |
Tax-Managed International Fund | |
Investor Shares | 0.15% |
Institutional Shares | 0.09% |
Europe Pacific ETF Shares | 0.12%2 |
Average International Fund | 1.48% |
1 The fund expense ratios shown are from the prospectus dated July 29, 2008. For the fiscal year ended December 31, 2008, the fund’s expense ratios were 0.15% for Investor Shares, 0.09% for Institutional Shares, and 0.11% for Europe Pacific ETF Shares. The peer-group expense ratio is derived from data provided by Lipper Inc. and captures information through year-end 2007.
4
subprime-mortgage crisis crippled mortgage companies and big banks alike.
The crisis in the financial sector quickly spread to other sectors. Consumer discretionary stocks—comprising almost 10% of both the fund and the index at year-end— took a big hit as consumers around the world reined in their spending for the year. Materials (–52%) and industrials (–44%) also suffered as development plans across the globe came to a halt.
Consumer staples (–31%), utilities (–28%), and health care (–19%) were the sectors least affected by the chaos. This wasn’t surprising, since these areas of the market usually tend to weather bear markets better.
The challenge for investors: Keep an eye on the future
The past 12 months have been an unsettling time for investors globally as they experienced the extreme volatility in the financial markets and saw the world fall into a potentially deep recession. Unfortunately, Vanguard Tax-Managed International Fund did not escape the market’s furor.
However, we believe that the past year does nothing to invalidate the long-term case for equities. Although no one can predict how long the global recession will last, we expect stocks to outperform less-risky assets in the long run precisely because stocks can occasionally produce
Total Returns | |
August 17, 1999,1 Through December 31, 2008 | |
| Average |
| Annual Return |
Tax-Managed International Fund Investor Shares | 0.60% |
MSCI EAFE Index | 0.21 |
Average International Fund2 | –0.15 |
The figures shown represent past performance, which is not a guarantee of future results. (Current performance may be lower or higher than the performance data cited. For performance data current to the most recent month-end, visit our website at www.vanguard.com/performance.) Note, too, that both investment returns and principal value can fluctuate widely, so an investor’s shares, when sold, could be worth more or less than their original cost.
1 Fund Inception.
2 Derived from data provided by Lipper Inc.
5
such dismal returns. Financial theory, affirmed by historical evidence, dictates that investors need to be compensated for this risk.
With its low expenses, proven tax-management strategy, and broad exposure to the international equity markets, the Tax-Managed International Fund can help put your investment program in a position to benefit when the financial markets stage a recovery.
Thank you for entrusting your assets to Vanguard.
Sincerely,

F. William McNabb III
President and Chief Executive Officer
January 20, 2009
Vanguard Europe Pacific ETF | | |
Premium/Discount: July 20, 20071–December 31, 2008 | | |
| | | | |
| Market Price Above or | Market Price Below |
| Equal to Net Asset Value | | Net Asset Value |
| Number | Percentage | Number | Percentage |
Basis Point Differential2 | of Days | of Total Days | of Days | of Total Days |
0–24.9 | 128 | 34.88% | 21 | 5.72% |
25–49.9 | 138 | 37.60 | 5 | 1.36 |
50–74.9 | 36 | 9.81 | 1 | 0.27 |
75–100.0 | 12 | 3.27 | 3 | 0.82 |
>100.0 | 20 | 5.45 | 3 | 0.82 |
Total | 334 | 91.01% | 33 | 8.99% |
1 Inception.
2 One basis point equals 1/100 of a percentage point.
6
Tax-Managed International Fund
Fund Profile
As of December 31, 2008
Portfolio Characteristics | | |
| | Comparative | Broad |
| Fund | Index1 | Index2 |
Number of Stocks | 971 | 989 | 1,827 |
Turnover Rate | 16% | — | — |
Expense Ratio | | | |
(12/31/2007)3 | | — | — |
Investor Shares | 0.15% | | |
Institutional Shares | 0.09% | | |
Europe Pacific | | | |
ETF Shares | 0.12%4 | | |
Short-Term Reserves | 0.0% | — | — |
Volatility Measures5 | |
| Fund Versus | Fund Versus |
| Comparative Index1 | Broad Index2 |
R-Squared | 0.98 | 0.96 |
Beta | 0.98 | 0.90 |
Sector Diversification (% of equity exposure) |
| | Comparative | Broad |
| Fund | Index1 | Index2 |
Consumer Discretionary | 9.7% | 9.6% | 8.4% |
Consumer Staples | 10.1 | 10.3 | 9.1 |
Energy | 8.6 | 8.5 | 10.8 |
Financials | 22.0 | 22.6 | 23.2 |
Health Care | 9.7 | 9.8 | 8.0 |
Industrials | 11.8 | 11.6 | 10.5 |
Information Technology | 5.3 | 5.1 | 6.0 |
Materials | 8.0 | 7.8 | 9.4 |
Telecommunication | | | |
Services | 7.1 | 7.0 | 7.9 |
Utilities | 7.7 | 7.7 | 6.7 |
Ten Largest Holdings6 (% of total net assets) |
| | |
Royal Dutch Shell PLC | integrated oil | |
| and gas | 2.1% |
Nestle SA (Registered) | packaged foods | |
| and meats | 1.9 |
BP PLC | integrated oil | |
| and gas | 1.9 |
HSBC Holdings PLC | diversified banks | 1.5 |
Novartis AG (Registered) | pharmaceuticals | 1.5 |
Total SA | integrated oil | |
| and gas | 1.5 |
Vodafone Group PLC | wireless | |
| telecommunication | |
| services | 1.4 |
Roche Holdings AG | pharmaceuticals | 1.4 |
GlaxoSmithKline PLC | pharmaceuticals | 1.2 |
Telefonica SA | integrated | |
| telecommunication | |
| services | 1.2 |
Top Ten | | 15.6% |
Fund Allocation by Region

1 MSCI EAFE Index.
2 MSCI All Country World Index ex USA.
3 The expense ratios shown are from the prospectus dated July 29, 2008. For the fiscal year ended December 31, 2008, the expense ratios were 0.15% for Investor Shares, 0.09% for Institutional Shares, and 0.11% for Europe Pacific ETF Shares.
4 Annualized.
5 For an explanation of R-squared, beta, and other terms used here, see the Glossary.
6 The holdings listed exclude any temporary cash investments and equity index products.
7
Tax-Managed International Fund
Market Diversification (% of equity exposure) |
| | Comparative | Broad |
| Fund | Index1 | Index2 |
Europe | | | |
United Kingdom | 20.0% | 19.9% | 15.2% |
France | 10.4 | 10.9 | 8.3 |
Germany | 8.8 | 8.7 | 6.7 |
Switzerland | 8.3 | 8.4 | 6.4 |
Spain | 4.6 | 4.5 | 3.5 |
Italy | 3.6 | 3.7 | 2.8 |
Netherlands | 2.5 | 2.4 | 1.9 |
Sweden | 2.0 | 2.0 | 1.5 |
Finland | 1.4 | 1.4 | 1.1 |
Other European | | | |
Markets | 3.9 | 3.6 | 2.8 |
Subtotal | 65.5% | 65.5% | 50.2% |
Pacific | | | |
Japan | 25.3% | 25.3% | 19.3% |
Australia | 6.0 | 6.0 | 4.6 |
Hong Kong | 2.0 | 2.0 | 1.5 |
Singapore | 1.1 | 1.1 | 0.8 |
Other Pacific Markets | 0.1 | 0.1 | 0.1 |
Subtotal | 34.5% | 34.5% | 26.3% |
Emerging Markets | | | |
Combined | — | — | 17.1% |
North America | | | |
Canada | — | — | 6.4% |
1 MSCI EAFE Index.
2 MSCI All Country World Index ex USA.
8
Tax-Managed International Fund
Performance Summary
All of the returns in this report represent past performance, which is not a guarantee of future results that may be achieved by the fund. (Current performance may be lower or higher than the performance data cited. For performance data current to the most recent month-end, visit our website at www.vanguard.com/performance.) Note, too, that both investment returns and principal value can fluctuate widely, so an investor’s shares, when sold, could be worth more or less than their original cost. The returns shown do not reflect taxes that a shareholder would pay on fund distributions or on the sale of fund shares.
Cumulative Performance: August 17,1999–December 31, 2008
Initial Investment of $10,000
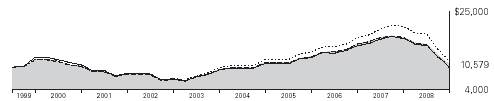
| Average Annual Total Returns | |
| Periods Ended December 31, 2008 | Final Value |
| | | Since | of a $10,000 |
| One Year | Five Years | Inception1 | Investment |
Tax-Managed International Fund Investor Shares2 | –41.27% | 2.40% | 0.60% | $10,579 |
Fee-Adjusted Returns3 | –41.84 | 2.40 | 0.60 | 10,579 |
MSCI All Country World Index ex USA | –45.24 | 3.00 | 1.51 | 11,510 |
MSCI EAFE Index | –43.38 | 1.66 | 0.21 | 10,198 |
Average International Fund4 | –44.24 | 1.16 | –0.15 | 9,856 |
| | | | Final Value of a |
| | | Since | $5,000,000 |
| One Year | Five Years | Inception1 | Investment |
Tax-Managed International Fund Institutional Shares | –41.27% | 2.44% | 0.44% | $5,178,408 |
Fee-Adjusted Returns5 | –41.84 | 2.44 | 0.44 | 5,178,408 |
MSCI All Country World Index ex USA | –45.24 | 3.00 | 1.31 | 5,546,692 |
MSCI EAFE Index | –43.38 | 1.66 | –0.07 | 4,973,600 |
1 Performance for the fund’s Investor Shares and its comparative standards is calculated since the following inception dates: August 17, 1999, for Investor Shares; January 4, 2001, for Institutional Shares.
2 Total returns do not include the account service fee that may be applicable to certain accounts with balances below $10,000.
3 Reflects the 1% fee assessed on redemptions of shares held in the fund for less than five years, but not the account service fee that may be applicable to certain accounts with balances below $10,000.
4 Derived from data provided by Lipper Inc.
5 Reflects the 1% fee assessed on redemptions of shares held in the fund for less than five years.
9
Tax-Managed International Fund
| Average Annual Total Returns | |
| Periods Ended December 31, 2008 | Final Value |
| | Since | of a $10,000 |
| One Year | Inception1 | Investment |
Europe Pacific ETF Shares Net Asset Value | –41.25% | –31.68% | $5,757 |
MSCI All Country World Index ex USA | –45.24 | –34.09 | 5,465 |
MSCI EAFE Index | –43.38 | –33.45 | 5,542 |
Cumulative Returns of ETF Shares: July 20, 2007–December 31, 2008 |
| | Cumulative |
| One Year | Since Inception1 |
Europe Pacific ETF Shares Market Price | –40.57% | –41.87% |
Europe Pacific ETF Shares Net Asset Value | –41.25 | –42.43 |
MSCI EAFE Index | –43.38 | –44.58 |
Fiscal-Year Total Returns (%): August 17, 1999–December 31, 2008
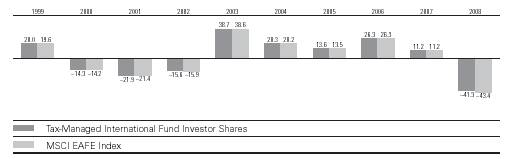
1 Performance for the fund’s Europe Pacific ETF Shares and comparative standards is calculated since the ETF Shares’ inception: July 20, 2007.
Note: See Financial Highlights tables for dividend and capital gains information.
10
Tax-Managed International Fund
Financial Statements
Statement of Net Assets
As of December 31, 2008
The fund provides a complete list of its holdings four times in each fiscal year, at the quarter-ends. For the second and fourth fiscal quarters, the lists appear in the fund’s semiannual and annual reports to shareholders. For the first and third fiscal quarters, the fund files the lists with the Securities and Exchange Commission on Form N-Q. Shareholders can look up the fund’s Forms N-Q on the SEC’s website at www.sec.gov. Forms N-Q may also be reviewed and copied at the SEC’s Public Reference Room (see the back cover of this report for further information).
| | Market |
| | Value• |
| Shares | ($000) |
Common Stocks (100.5%) | | |
Australia (6.0%) | | |
BHP Billiton Ltd. | 1,628,929 | 35,302 |
Westpac Banking | | |
Corp., Ltd. | 1,485,429 | 18,175 |
Commonwealth | | |
Bank of Australia | 693,945 | 14,566 |
National Australia Bank Ltd. | 886,003 | 13,288 |
Woolworths Ltd. | 600,714 | 11,427 |
Australia & New Zealand | | |
Bank Group Ltd. | 969,864 | 10,682 |
QBE Insurance Group Ltd. | 465,332 | 8,580 |
CSL Ltd. | 299,099 | 7,195 |
Woodside Petroleum Ltd. | 242,215 | 6,394 |
Telstra Corp. Ltd. | 2,140,958 | 5,847 |
Newcrest Mining Ltd. | 230,883 | 5,606 |
Origin Energy Ltd. | 440,575 | 5,069 |
Wesfarmers Ltd. | 317,631 | 4,090 |
Foster’s Group Ltd. | 986,757 | 3,872 |
Rio Tinto Ltd. | 140,832 | 3,850 |
Brambles Ltd. | 704,157 | 3,732 |
AMP Ltd. | 931,715 | 3,624 |
Santos Ltd. | 310,316 | 3,317 |
Macquarie Group, Ltd. | 140,568 | 2,910 |
Suncorp-Metway Ltd. | 483,909 | 2,910 |
Insurance Australia | | |
Group Ltd. | 998,649 | 2,776 |
AGL Energy Ltd. | 234,615 | 2,552 |
Transurban Group | 636,222 | 2,455 |
Australian Stock | | |
Exchange Ltd. | 91,077 | 2,172 |
Coca-Cola Amatil Ltd. | 313,464 | 2,055 |
Sonic Healthcare Ltd. | 197,147 | 2,049 |
Amcor Ltd. | 470,642 | 1,951 |
Orica Ltd. | 175,698 | 1,759 |
AXA Asia Pacific | | |
Holdings Ltd. | 458,148 | 1,624 |
Leighton Holdings Ltd. | 80,220 | 1,590 |
Metcash Ltd. | 494,849 | 1,546 |
Toll Holdings Ltd. | 346,119 | 1,526 |
| | Market |
| | Value• |
| Shares | ($000) |
Tabcorp Holdings Ltd. | 296,958 | 1,482 |
Computershare Ltd. | 263,643 | 1,470 |
Cochlear Ltd. | 33,201 | 1,312 |
Tatt’s Group, Ltd. | 639,569 | 1,274 |
Boral Ltd. | 348,896 | 1,153 |
Incitec Pivot Ltd. | 640,222 | 1,145 |
Lend Lease Corp. | 211,930 | 1,089 |
Qantas Airways Ltd. | 549,153 | 1,032 |
BlueScope Steel Ltd. | 407,388 | 1,021 |
Lion Nathan Ltd. | 173,930 | 1,019 |
CSR Ltd. | 782,880 | 988 |
WorleyParsons Ltd. | 92,259 | 939 |
Goodman Fielder Ltd. | 952,597 | 903 |
Bendigo Bank Ltd. | 109,885 | 867 |
James Hardie Industries NV | 257,043 | 859 |
Crown Ltd. | 195,820 | 837 |
Alumina Ltd. | 729,914 | 750 |
Wesfarmers, Ltd. Price | | |
Protected Shares | 54,884 | 706 |
Harvey Norman | | |
Holdings Ltd. | 364,423 | 690 |
Perpetual Trustees | | |
Australia Ltd. | 24,915 | 665 |
Sims Metal | | |
Management Ltd. | 49,434 | 617 |
John Fairfax Holdings Ltd. | 508,250 | 595 |
Aristocrat Leisure Ltd. | 194,745 | 541 |
OneSteel Ltd. | 295,488 | 521 |
Macquarie Airports Group | 297,349 | 511 |
Asciano Group | 435,652 | 473 |
OZ Minerals Ltd. | 1,025,514 | 401 |
Nufarm Ltd. | 46,340 | 349 |
Billabong International Ltd. | 55,078 | 309 |
Caltex Australia Ltd. | 44,220 | 228 |
Sims Metal | | |
Management Ltd. | 3,072 | 38 |
| | 219,275 |
Austria (0.3%) | | |
Telekom Austria AG | 180,342 | 2,637 |
OMV AG | 87,353 | 2,333 |
11
Tax-Managed International Fund
| | | Market |
| | | Value• |
| | Shares | ($000) |
| Erste Bank der | | |
| Oesterreichischen | | |
| Sparkassen AG | 97,702 | 2,286 |
| Oesterreichische | | |
| Elektrizitaetswirtschafts | | |
| AG Class A | 38,718 | 1,799 |
| Voestalpine AG | 42,610 | 925 |
| Raiffeisen International | | |
| Bank-Holding AG | 31,949 | 893 |
| Vienna Insurance Group | 23,954 | 836 |
| Wienerberger AG | 29,046 | 498 |
| Strabag SE | 17,762 | 417 |
| | | 12,624 |
Belgium (0.7%) | | |
| Anheuser-Busch InBev NV | 178,382 | 4,163 |
| Delhaize Group | 52,516 | 3,262 |
| Belgacom SA | 83,126 | 3,194 |
| KBC Bank & | | |
| Verzekerings Holding | 84,736 | 2,559 |
| Solvay SA | 32,501 | 2,425 |
| Colruyt NV | 9,386 | 2,027 |
| UCB SA | 61,391 | 2,012 |
| Umicore | 70,439 | 1,399 |
| Dexia | 301,584 | 1,374 |
| Fortis | 823,354 | 1,091 |
| Mobistar SA | 11,557 | 838 |
| KBC Ancora | 15,300 | 267 |
| | | 24,611 |
Brazil (0.0%) | | |
* | Anheuser-Busch InBev | | |
| NV (Brussels Shares) | 106,848 | 1 |
| | | |
Denmark (0.8%) | | |
| Novo Nordisk A/S | | |
| B Shares | 209,038 | 10,839 |
* | Vestas Wind Systems A/S | 88,944 | 5,261 |
| AP Moller-Maersk A/S | | |
| B Shares | 593 | 3,208 |
| Danske Bank A/S | 240,580 | 2,436 |
| Novozymes A/S | 17,474 | 1,409 |
| Carlsberg A/S B Shares | 40,186 | 1,320 |
| AP Moller-Maersk A/S | | |
| A Shares | 208 | 1,144 |
* | Topdanmark A/S | 8,390 | 1,104 |
| DSV A/S | 69,850 | 764 |
| Danisco A/S | 18,079 | 742 |
| FLS Industries A/S B Shares | 19,188 | 677 |
* | William Demant A/S | 15,800 | 665 |
| Trygvesta A/S | 9,805 | 621 |
| Coloplast A/S B Shares | 8,800 | 612 |
* | Jyske Bank A/S | 17,635 | 414 |
| | | 31,216 |
Finland (1.4%) | | |
| Nokia Oyj | 1,765,082 | 27,835 |
| Fortum Oyj | 210,604 | 4,600 |
| | | Market |
| | | Value• |
| | Shares | ($000) |
| Sampo Oyj A Shares | 220,160 | 4,188 |
| UPM-Kymmene Oyj | 202,661 | 2,611 |
| Stora Enso Oyj R Shares | 224,105 | 1,784 |
| Kone Oyj | 75,416 | 1,699 |
| Wartsila Oyj B Shares | 50,375 | 1,530 |
| Neste Oil Oyj | 86,048 | 1,302 |
| Pohjola Bank PLC | 66,215 | 925 |
| Elisa Oyj Class A | 52,643 | 921 |
| Nokian Renkaat Oyj | 70,818 | 809 |
| Kesko Oyj | 23,960 | 607 |
| Metso Oyj | 45,840 | 564 |
| Orion Oyj | 31,800 | 543 |
| Outokumpu Oyj A Shares | 44,600 | 533 |
| Rautaruuki Oyj | 29,370 | 515 |
| Sanoma Oyj | 28,549 | 373 |
| | | 51,339 |
France (10.5%) | | |
| Total SA | 988,616 | 54,621 |
| Sanofi-Aventis | 487,883 | 31,360 |
| Gaz de France | 509,395 | 25,410 |
| France Telecom SA | 850,010 | 23,809 |
| Vivendi SA | 544,037 | 17,820 |
| BNP Paribas SA | 381,688 | 16,557 |
| Axa | 720,619 | 16,254 |
| Groupe Danone | 203,368 | 12,348 |
| Carrefour SA | 295,401 | 11,475 |
| Societe Generale Class A | 220,026 | 11,218 |
| Air Liquide SA | 115,662 | 10,644 |
| L’Oreal SA | 114,067 | 10,004 |
| Vinci SA | 195,876 | 8,307 |
| Schneider Electric SA | 104,261 | 7,801 |
| LVMH Louis Vuitton | | |
| Moet Hennessy | 114,536 | 7,714 |
| Cie. de St. Gobain SA | 134,886 | 6,405 |
| Alstom | 101,050 | 6,052 |
| Pernod Ricard SA | 77,337 | 5,774 |
| Veolia Environnement | 181,348 | 5,748 |
| Unibail Co. | 32,212 | 4,836 |
| Bouygues SA | 113,289 | 4,830 |
| Credit Agricole SA | 427,056 | 4,820 |
| Electricite de France | 78,809 | 4,606 |
| Essilor International SA | 96,578 | 4,559 |
| Accor SA | 90,259 | 4,468 |
| Lafarge SA | 63,095 | 3,878 |
| Compagnie Generale | | |
| des Etablissements | | |
| Michelin SA | 71,898 | 3,817 |
| Hermes International | 27,031 | 3,803 |
| Vallourec SA | 26,206 | 2,994 |
| Cap Gemini SA | 69,209 | 2,689 |
| Lagardere S.C.A. | 60,932 | 2,488 |
* | Alcatel-Lucent | 1,131,806 | 2,462 |
| Pinault-Printemps- | | |
| Redoute SA | 36,589 | 2,407 |
| Renault SA | 88,754 | 2,328 |
| STMicroelectronics NV | 331,825 | 2,236 |
12
Tax-Managed International Fund
| | | Market |
| | | Value• |
| | Shares | ($000) |
* | Suez Environnement SA | 131,153 | 2,226 |
| Sodexho Alliance SA | 36,408 | 2,033 |
| Thales SA | 44,108 | 1,857 |
| Casino Guichard- | | |
| Perrachon SA | 23,351 | 1,788 |
| Publicis Groupe SA | 66,928 | 1,736 |
| Technip SA | 52,775 | 1,628 |
| Dassault Systemes SA | 34,365 | 1,566 |
| SCOR SA | 66,863 | 1,552 |
| CNP Assurances | 20,458 | 1,494 |
| Safran SA | 106,474 | 1,445 |
| PSA Peugeot Citroen | 73,461 | 1,262 |
| Christian Dior SA | 20,412 | 1,160 |
| Klepierre | 46,126 | 1,140 |
* | Compagnie Generale de | | |
| Geophysique SA | 73,385 | 1,104 |
| Neopost SA | 11,631 | 1,061 |
| Atos Origin SA | 41,557 | 1,051 |
| Air France | 79,834 | 1,035 |
| ICADE | 10,531 | 879 |
| Bureau Veritas SA | 20,730 | 838 |
| Eutelsat Communications | 33,097 | 786 |
| Aeroports de Paris (ADP) | 10,756 | 736 |
| Eiffage SA | 13,499 | 711 |
| Societe Television | | |
| Francaise 1 | 44,592 | 657 |
| Natixis | 365,361 | 651 |
| Valeo SA | 42,310 | 633 |
| Legrand SA | 32,752 | 630 |
| Societe des Autoroutes | | |
| Paris-Rhin-Rhone | 8,161 | 572 |
| Societe BIC SA | 9,572 | 553 |
| Zodiac SA | 15,075 | 553 |
| Imerys SA | 11,181 | 514 |
* | Iliad SA | 5,778 | 504 |
| M6 Metropole Television | 25,867 | 504 |
| Wendel Investissement | 9,644 | 485 |
| PagesJaunes SA | 46,770 | 463 |
| JCDecaux SA | 24,839 | 432 |
| Gecina SA | 5,710 | 399 |
| Eramet SLN | 1,846 | 362 |
| | | 383,542 |
Germany (8.9%) | | |
| E.On AG | 881,819 | 34,797 |
| Siemens AG | 402,889 | 30,480 |
| Allianz AG | 210,050 | 22,460 |
| Bayer AG | 354,276 | 20,745 |
| Deutsche Telekom AG | 1,317,301 | 20,015 |
| Volkswagen AG | 54,127 | 18,919 |
| RWE AG | 206,683 | 18,447 |
| BASF AG | 439,690 | 17,168 |
| Daimler AG (Registered) | 404,581 | 15,491 |
| Muenchener | | |
| Rueckversicherungs- | | |
| Gesellschaft AG | | |
| (Registered) | 96,026 | 14,981 |
| | | Market |
| | | Value• |
| | Shares | ($000) |
| SAP AG | 405,839 | 14,799 |
| Deutsche Bank AG | 252,760 | 10,045 |
| Deutsche Post AG | 404,973 | 6,883 |
| Deutsche Boerse AG | 91,563 | 6,657 |
* | Continental AG | | |
| Acceptance Line | 55,556 | 5,821 |
| Linde AG | 63,253 | 5,335 |
| ThyssenKrupp AG | 170,499 | 4,770 |
| Fresenius Medical Care AG | 90,178 | 4,166 |
| Bayerische Motoren | | |
| Werke AG | 129,547 | 3,997 |
| Adidas AG | 94,585 | 3,623 |
| K&S AG | 57,643 | 3,311 |
| Porsche AG | 41,917 | 3,297 |
| Commerzbank AG | 324,665 | 3,100 |
| Man AG | 50,867 | 2,867 |
| Volkswagen AG Pfd. | 52,393 | 2,838 |
| Henkel AG & Co. KGaA | 85,986 | 2,707 |
| Beiersdorf AG | 44,218 | 2,632 |
| Merck KGaA | 25,016 | 2,249 |
| Metro AG | 54,556 | 2,180 |
| Fresenius AG Pfd. | 31,078 | 1,833 |
| Salzgitter AG | 21,087 | 1,647 |
| TUI AG | 121,512 | 1,451 |
| Deutsche Lufthansa AG | 86,568 | 1,431 |
| Henkel KGaA | 49,243 | 1,290 |
| Celesio AG | 46,884 | 1,275 |
* | Q-Cells AG | 31,036 | 1,166 |
| RWE AG Pfd. | 14,505 | 1,100 |
| Deutsche Postbank AG | 46,414 | 1,010 |
| Solarworld AG | 43,100 | 969 |
| Fraport AG | 20,891 | 950 |
| Puma AG | 4,098 | 821 |
| Hochtief AG | 15,069 | 781 |
| Hannover | | |
| Rueckversicherung AG | 21,665 | 692 |
| Wacker Chemie AG | 5,806 | 625 |
* | Infineon Technologies AG | 390,889 | 529 |
| Hamburger Hafen und | | |
| Logistik AG | 15,677 | 527 |
| Fresenius AS | 10,129 | 514 |
| Hypo Real Estate | | |
| Holding AG | 96,680 | 429 |
| HeidelbergCement AG | 9,190 | 404 |
| Bayerische Motoren | | |
| Werke (BMW) | 19,971 | 392 |
* | United Internet AG | 41,606 | 378 |
| Continental AG | 1,520 | 62 |
| | | 325,056 |
Greece (0.5%) | | |
| National Bank of | | |
| Greece SA ADR | 869,834 | 3,314 |
�� | Hellenic Telecommunications | |
| Organization SA ADR | 395,427 | 3,286 |
| Greek Organization of | | |
| Football Prognostics | 86,662 | 2,506 |
13
Tax-Managed International Fund
| | | Market |
| | | Value• |
| | Shares | ($000) |
| Alpha Credit Bank SA | 145,958 | 1,372 |
| National Bank of Greece SA | 59,899 | 1,118 |
| Bank of Piraeus | 118,867 | 1,066 |
| EFG Eurobank Ergasias | 119,681 | 958 |
| GEA Group AG | 54,505 | 951 |
| Coca-Cola Hellenic | | |
| Bottling Co. SA | 61,910 | 905 |
| Marfin Financial Group SA | 217,409 | 883 |
| Public Power Corp. | 41,890 | 677 |
| Titan Cement Co. SA | 22,380 | 435 |
| Hellenic Telecommunications | |
| Organization SA | 21,242 | 355 |
| Hellenic Petroleum SA | 43,410 | 328 |
| | | 18,154 |
Hong Kong (2.0%) | | |
| CLP Holdings Ltd. | 979,932 | 6,662 |
| Cheung Kong Holdings Ltd. | 655,500 | 6,253 |
| Sun Hung Kai | | |
| Properties Ltd. | 666,064 | 5,605 |
| Hutchison Whampoa Ltd. | 1,044,512 | 5,273 |
| Hong Kong Exchanges & | | |
| Clearing Ltd. | 505,600 | 4,854 |
| Hang Seng Bank Ltd. | 363,143 | 4,794 |
| Hong Kong Electric | | |
| Holdings Ltd. | 676,100 | 3,806 |
| Esprit Holdings Ltd. | 528,472 | 3,011 |
| Hong Kong & | | |
| China Gas Co., Ltd. | 1,934,433 | 2,933 |
| Swire Pacific Ltd. | | |
| A Shares | 399,588 | 2,768 |
| Hang Lung Properties Ltd. | 1,084,810 | 2,382 |
| Henderson Land | | |
| Development Co. Ltd. | 588,006 | 2,199 |
| Li & Fung Ltd. | 1,214,835 | 2,099 |
| Wharf Holdings Ltd. | 674,741 | 1,868 |
| Boc Hong Kong | | |
| Holdings Ltd. | 1,425,500 | 1,632 |
| Bank of East Asia Ltd. | 737,149 | 1,555 |
| Wheelock and Co. Ltd. | 592,000 | 1,305 |
| MTR Corp. | 538,500 | 1,254 |
| Kerry Properties Ltd. | 408,500 | 1,099 |
| Hang Lung | | |
| Development Co., Ltd. | 335,000 | 1,023 |
| New World | | |
| Development Co., Ltd. | 957,750 | 981 |
| Shangri-La Asia Ltd. | 756,510 | 875 |
| Hopewell Holdings Ltd. | 257,000 | 853 |
| Sino Land Co. | 695,000 | 728 |
| Cheung Kong Infrastructure | | |
| Holdings Ltd. | 187,000 | 706 |
| PCCW Ltd. | 1,370,000 | 658 |
| Kingboard Chemical | | |
| Holdings Ltd. | 343,500 | 623 |
* | Mongolia | | |
| Energy Corp. Ltd. | 1,592,000 | 495 |
| Cathay Pacific Airways Ltd. | 415,770 | 470 |
| | | Market |
| | | Value• |
| | Shares | ($000) |
| Yue Yuen Industrial | | |
| (Holdings) Ltd. | 232,500 | 462 |
* | Foxconn International | | |
| Holdings Ltd. | 1,371,000 | 460 |
* | Genting International PLC | 1,395,000 | 440 |
| Wing Hang Bank Ltd. | 72,500 | 422 |
| NWS Holdings Ltd. | 274,000 | 410 |
| Hysan | | |
| Development Co., Ltd. | 245,000 | 398 |
| Television Broadcasts Ltd. | 95,000 | 311 |
| Hutchison | | |
| Telecommunications | | |
| International Ltd. | 996,000 | 269 |
* | Pacific Basin Shipping Ltd. | 542,000 | 250 |
| Lifestyle International | | |
| Holdings, Ltd. | 202,000 | 206 |
| ASM Pacific Technology Ltd. | 61,900 | 204 |
| Hong Kong Aircraft & | | |
| Engineering Co., Ltd. | 19,600 | 162 |
| Orient Overseas | | |
| International Ltd. | 69,300 | 155 |
| | | 72,913 |
Ireland (0.3%) | | |
| CRH PLC | 259,771 | 6,615 |
* | Elan Corp. PLC | 249,356 | 1,479 |
| Kerry Group PLC A Shares | 74,519 | 1,365 |
| Allied Irish Banks PLC | 441,634 | 1,062 |
| Bank of Ireland | 524,508 | 608 |
* | Ryanair Holdings PLC | 132,767 | 550 |
| Anglo Irish Bank Corp. PLC | 257,065 | 62 |
| | | 11,741 |
Italy (3.7%) | | |
| Eni SpA | 1,208,772 | 29,231 |
| Assicurazioni Generali SpA | 492,484 | 13,664 |
| UniCredit SpA | 5,288,078 | 13,511 |
| Intesa Sanpaolo SpA | 3,584,219 | 13,085 |
| Enel SpA | 2,015,123 | 13,045 |
| Telecom Italia SpA | 4,688,947 | 7,752 |
| Unione Di Banche | | |
| Italiane ScpA | 299,419 | 4,413 |
| Telecom Italia SpA RNC | 3,039,233 | 3,477 |
| Finmeccanica SpA | 205,604 | 3,200 |
| Banca Monte dei | | |
| Paschi di Siena SpA | 1,185,529 | 2,601 |
| Fiat SpA | 375,132 | 2,524 |
| Atlantia SpA | 125,282 | 2,362 |
| Terna SpA | 660,834 | 2,191 |
| Mediobanca Banca di | | |
| Credito Finanziaria SpA | 191,070 | 1,975 |
| Banco Popolare SpA | 248,978 | 1,774 |
| Saipem SpA | 101,434 | 1,739 |
| Mediaset SpA | 295,238 | 1,710 |
| Snam Rete Gas SpA | 301,536 | 1,693 |
| Parmalat SpA | 900,545 | 1,518 |
| Banca Popolare di | | |
| Milano SpA | 243,754 | 1,472 |
14
Tax-Managed International Fund
| | Market |
| | Value• |
| Shares | ($000) |
Alleanza Assicurazioni SpA | 158,983 | 1,313 |
Luxottica Group SpA | 52,123 | 958 |
Lottomatica SpA | 36,734 | 919 |
Fondiari-Sai SpA | 48,526 | 890 |
Intesa Sanpaolo SpA Non | | |
Convertible Risp. | 327,189 | 851 |
A2A SpA | 469,279 | 848 |
Pirelli & C. Accomandita | | |
per Azioni SpA | 2,025,917 | 769 |
Autogrill SpA | 90,191 | 694 |
Banca Carige SpA | 264,049 | 646 |
Italcementi SpA | 43,332 | 566 |
Prysmian SpA | 34,079 | 542 |
Mediolanum SpA | 102,661 | 448 |
Unipol Gruppo | | |
Finanziario SpA | 269,664 | 425 |
Saras SpA Raffinerie Sarde | 118,381 | 406 |
Unipol Gruppo | | |
Finanziario SpA Pfd. | 361,597 | 401 |
IFIL Investments SpA | 118,885 | 309 |
Bulgari SpA | 47,054 | 301 |
Italcementi SpA Risp. | 31,947 | 224 |
| | 134,447 |
Japan (25.3%) | | |
Toyota Motor Corp. | 1,269,687 | 41,939 |
Mitsubishi UFJ | | |
Financial Group | 5,098,539 | 32,019 |
Takeda | | |
Pharmaceutical Co. Ltd. | 378,594 | 19,717 |
Tokyo Electric Power Co. | 566,370 | 18,891 |
Nintendo Co. | 46,400 | 17,717 |
Honda Motor Co., Ltd. | 759,000 | 16,152 |
Canon, Inc. | 490,833 | 15,539 |
NTT DoCoMo, Inc. | 7,311 | 14,378 |
Sumitomo Mitsui | | |
Financial Group, Inc. | 3,076 | 13,315 |
Mizuho Financial Group, Inc. | 4,447 | 13,225 |
Seven and I | | |
Holdings Co., Ltd. | 380,420 | 13,065 |
Nippon Telegraph and | | |
Telephone Corp. | 2,382 | 12,791 |
East Japan Railway Co. | 1,561 | 12,181 |
Matsushita Electric | | |
Industrial Co., Ltd. | 864,153 | 10,614 |
Kansai Electric | | |
Power Co., Inc. | 356,550 | 10,319 |
Sony Corp. | 468,800 | 10,245 |
KDDI Corp. | 1,361 | 9,710 |
Millea Holdings, Inc. | 319,900 | 9,471 |
Chubu Electric Power Co. | 309,200 | 9,410 |
Mitsubishi Estate Co., Ltd. | 559,935 | 9,242 |
Astellas Pharma Inc. | 223,914 | 9,158 |
Shin-Etsu Chemical Co., Ltd. | 195,000 | 8,992 |
Mitsubishi Corp. | 630,250 | 8,920 |
Mitsui & Co., Ltd. | 829,000 | 8,515 |
Daiichi Sankyo Co., Ltd. | 333,963 | 7,891 |
| | Market |
| | Value• |
| Shares | ($000) |
Nippon Steel Corp. | 2,392,970 | 7,857 |
Kao Corp. | 245,401 | 7,448 |
Japan Tobacco, Inc. | 2,172 | 7,188 |
Nomura Holdings Inc. | 854,600 | 7,110 |
Mitsubishi Heavy | | |
Industries Ltd. | 1,504,000 | 6,716 |
Mitsui Fudosan Co., Ltd. | 397,000 | 6,613 |
Softbank Corp. | 362,300 | 6,574 |
JFE Holdings, Inc. | 245,000 | 6,506 |
Fanuc Co., Ltd. | 90,300 | 6,467 |
Central Japan Railway Co. | 738 | 6,395 |
Hitachi Ltd. | 1,622,000 | 6,290 |
Toshiba Corp. | 1,449,000 | 5,957 |
Kyocera Corp. | 79,500 | 5,751 |
Mitsubishi Electric Corp. | 912,000 | 5,711 |
Tokyo Gas Co., Ltd. | 1,121,000 | 5,678 |
Tohoku Electric Power Co. | 208,000 | 5,622 |
Komatsu Ltd. | 435,000 | 5,545 |
Fuji Photo Film Co., Ltd. | 238,100 | 5,311 |
Secom Co., Ltd. | 99,000 | 5,104 |
Kirin Brewery Co., Ltd. | 376,000 | 4,995 |
Eisai Co., Ltd. | 118,900 | 4,958 |
Kyushu Electric | | |
Power Co., Inc. | 186,300 | 4,942 |
Sumitomo Corp. | 534,800 | 4,739 |
Mitsui Sumitomo Insurance | | |
Group Holdings, Inc. | 148,564 | 4,721 |
Bridgestone Corp. | 303,431 | 4,548 |
Sumitomo Metal | | |
Industries Ltd. | 1,818,000 | 4,487 |
Fujitsu Ltd. | 883,000 | 4,290 |
Osaka Gas Co., Ltd. | 920,000 | 4,251 |
Ricoh Co. | 324,000 | 4,149 |
Murata | | |
Manufacturing Co., Ltd. | 105,400 | 4,129 |
T & D Holdings, Inc. | 95,490 | 4,038 |
Nissan Motor Co., Ltd. | 1,111,600 | 3,996 |
Sumitomo Trust & | | |
Banking Co., Ltd. | 676,000 | 3,993 |
West Japan Railway Co. | 859 | 3,911 |
Kubota Corp. | 536,000 | 3,878 |
Terumo Corp. | 82,600 | 3,866 |
Daiwa Securities Group Inc. | 636,000 | 3,815 |
Itochu Corp. | 754,000 | 3,801 |
Resona Holdings Inc. | 2,552 | 3,772 |
Shionogi & Co., Ltd. | 146,000 | 3,767 |
Keyence Corp. | 18,171 | 3,731 |
Sharp Corp. | 501,000 | 3,608 |
Kintetsu Corp. | 777,190 | 3,573 |
Ajinomoto Co., Inc. | 322,000 | 3,511 |
Fast Retailing Co., Ltd. | 23,900 | 3,504 |
Hoya Corp. | 199,000 | 3,473 |
Mitsui OSK Lines Ltd. | 556,000 | 3,433 |
Daikin Industries Ltd. | 130,500 | 3,429 |
Shizuoka Bank Ltd. | 294,000 | 3,414 |
Bank of Yokohama Ltd. | 578,000 | 3,407 |
15
Tax-Managed International Fund
| | Market |
| | Value• |
| Shares | ($000) |
Nippon Yusen Kabushiki | | |
Kaisha Co. | 544,000 | 3,351 |
Hankyu Corp. | 579,304 | 3,343 |
NEC Corp. | 978,400 | 3,307 |
Shiseido Co., Ltd. | 159,000 | 3,267 |
Toray Industries, Inc. | 637,000 | 3,239 |
Denso Corp. | 190,500 | 3,225 |
Dai-Nippon Printing Co., Ltd. | 291,000 | 3,214 |
Nippon Oil Corp. | 629,000 | 3,187 |
Inpex Holdings, Inc. | 399 | 3,178 |
Aeon Co., Ltd. | 313,073 | 3,150 |
Marubeni Corp. | 812,000 | 3,106 |
Yamada Denki Co., Ltd. | 44,100 | 3,080 |
Yahoo Japan Corp. | 7,458 | 3,058 |
Sompo Japan Insurance Inc. | 404,000 | 2,989 |
Tokyo Electron Ltd. | 83,000 | 2,919 |
Sumitomo Metal Mining Co. | 272,000 | 2,907 |
Asahi Glass Co., Ltd. | 506,035 | 2,882 |
SMC Corp. | 27,900 | 2,872 |
Chugoku Electric | | |
Power Co., Ltd. | 108,800 | 2,862 |
Sumitomo Electric | | |
Industries Ltd. | 360,800 | 2,791 |
Tokyu Corp. | 553,000 | 2,786 |
Sumitomo Realty & | | |
Development Co. | 184,000 | 2,764 |
Electric Power | | |
Development Co., Ltd. | 68,740 | 2,700 |
Odakyu Electric Railway Co. | 306,000 | 2,692 |
Sumitomo Chemical Co. | 779,000 | 2,668 |
Mitsubishi Chemical | | |
Holdings Corp. | 592,000 | 2,621 |
OJI Paper Co., Ltd. | 446,000 | 2,620 |
Asahi Breweries Ltd. | 151,100 | 2,610 |
Rohm Co., Ltd. | 51,100 | 2,578 |
Tobu Railway Co., Ltd. | 430,000 | 2,567 |
NTT Data Corp. | 629 | 2,532 |
Daiwa House | | |
Industry Co., Ltd. | 257,000 | 2,518 |
Hokkaido Electric | | |
Power Co., Ltd. | 99,100 | 2,503 |
Yamato Holdings Co., Ltd. | 189,000 | 2,469 |
Asahi Kasei Corp. | 559,000 | 2,465 |
Kobe Steel Ltd. | 1,317,000 | 2,418 |
Japan Steel Works Ltd. | 172,513 | 2,413 |
Mitsui Trust Holding Inc. | 490,100 | 2,408 |
Shikoku Electric Power | 71,000 | 2,392 |
Olympus Corp. | 116,000 | 2,320 |
Chiba Bank Ltd. | 370,000 | 2,312 |
Chugai | | |
Pharmaceutical Co., Ltd. | 118,400 | 2,300 |
Nidec Corp. | 58,600 | 2,290 |
Daito Trust | | |
Construction Co., Ltd. | 42,800 | 2,245 |
JS Group Corp. | 143,312 | 2,213 |
TDK Corp. | 59,000 | 2,178 |
| | | Market |
| | | Value• |
| | Shares | ($000) |
| Nippon Mining Holdings Inc. | 474,000 | 2,055 |
| Sekisui House Ltd. | 231,859 | 2,044 |
| Toppan Printing Co., Ltd. | 262,000 | 2,022 |
| Nikon Corp. | 168,000 | 2,015 |
| Dentsu Inc. | 1,027 | 2,004 |
| Keihin Electric Express | | |
| Railway Co., Ltd. | 225,000 | 1,985 |
| Lawson Inc. | 34,200 | 1,971 |
| Nipponkoa | | |
| Insurance Co., Ltd. | 251,000 | 1,951 |
| Ono Pharmaceutical Co., Ltd. | 37,500 | 1,951 |
| Joyo Bank Ltd. | 343,000 | 1,949 |
| Konica Minolta | | |
| Holdings, Inc. | 249,000 | 1,936 |
| Hokuriku Electric Power Co. | 68,300 | 1,930 |
* | Mitsubishi Motors Corp. | 1,398,000 | 1,913 |
| Suzuki Motor Corp. | 136,700 | 1,909 |
| Trend Micro Inc. | 53,500 | 1,878 |
| Ohbayashi Corp. | 304,000 | 1,815 |
| Nippon Express Co., Ltd. | 425,000 | 1,790 |
| Nippon Paper Group, Inc. | 451 | 1,780 |
| Furukawa Electric Co. | 364,000 | 1,775 |
| Keio Electric | | |
| Railway Co., Ltd. | 288,000 | 1,731 |
| Shimizu Corp. | 295,000 | 1,730 |
| Bank of Kyoto Ltd. | 154,000 | 1,725 |
| Tanabe Seiyaku Co., Ltd. | 114,000 | 1,719 |
| JGC Corp. | 113,000 | 1,690 |
| Oriental Land Co., Ltd. | 20,200 | 1,657 |
| Benesse Corp. | 37,100 | 1,622 |
| Hirose Electric Co., Ltd. | 15,900 | 1,607 |
| Rakuten, Inc. | 2,512 | 1,598 |
| Kajima Corp. | 451,000 | 1,587 |
| Nitto Denko Corp. | 80,300 | 1,536 |
| Nissin Food | | |
| Products Co., Ltd. | 44,000 | 1,532 |
| Sankyo Co., Ltd. | 30,300 | 1,527 |
| Toyo Seikan Kaisha Ltd. | 88,100 | 1,526 |
| Taisei Corp. | 551,000 | 1,518 |
| Kawasaki Heavy | | |
| Industries Ltd. | 752,000 | 1,517 |
| Hokuhoku | | |
| Financial Group, Inc. | 641,100 | 1,516 |
| Kuraray Co., Ltd. | 192,000 | 1,503 |
| Konami Corp. | 56,900 | 1,474 |
| NGK Insulators Ltd. | 129,000 | 1,461 |
| Toho Co., Ltd. | 67,000 | 1,441 |
| TonenGeneral Sekiyu K.K. | 143,000 | 1,432 |
| Aisin Seiki Co., Ltd. | 100,000 | 1,431 |
| Sekisui Chemical Co. | 229,000 | 1,428 |
| Omron Corp. | 105,500 | 1,416 |
| Kawasaki Kisen Kaisha Ltd. | 296,000 | 1,387 |
| Kyowa Hakko Kogyo Co. | 132,000 | 1,385 |
| Mitsubishi Materials Corp. | 547,000 | 1,383 |
| The Suruga Bank, Ltd. | 138,000 | 1,370 |
| The Hiroshima Bank, Ltd. | 310,200 | 1,356 |
16
Tax-Managed International Fund
| | | Market |
| | | Value• |
| | Shares | ($000) |
| Mitsui Chemicals, Inc. | 363,000 | 1,348 |
| SBI Holdings, Inc. | 8,685 | 1,340 |
| Teijin Ltd. | 468,000 | 1,328 |
| The Nishi-Nippon | | |
| City Bank, Ltd. | 455,000 | 1,322 |
| Takashimaya Co. | 173,860 | 1,320 |
| Gunma Bank Ltd. | 206,000 | 1,318 |
| Matsushita | | |
| Electric Works, Ltd. | 144,000 | 1,283 |
| Fukuoka | | |
| Financial Group, Inc. | 291,800 | 1,274 |
| The Hachijuni Bank Ltd. | 221,600 | 1,273 |
| Ibiden Co., Ltd. | 61,200 | 1,268 |
| Makita Corp. | 56,600 | 1,265 |
| Advantest Corp. | 77,600 | 1,264 |
| Sony Financial Holdings, Inc. | 331 | 1,262 |
| Sega Sammy Holdings Inc. | 107,288 | 1,250 |
| Toyota Tsusho Corp. | 115,993 | 1,248 |
| Namco Bandai Holdings Inc. | 113,800 | 1,246 |
| Credit Saison Co., Ltd. | 89,000 | 1,235 |
| Toho Gas Co., Ltd. | 182,000 | 1,200 |
* | Sanyo Electric Co., Ltd. | 641,000 | 1,198 |
| Uni-Charm Corp. | 15,800 | 1,188 |
| Nitori Co., Ltd. | 15,250 | 1,186 |
| Nippon Sheet | | |
| Glass Co., Ltd. | 354,000 | 1,171 |
| Kurita Water Industries Ltd. | 42,900 | 1,159 |
| The Iyo Bank, Ltd. | 93,000 | 1,157 |
| Yamaha Motor Co., Ltd. | 109,100 | 1,147 |
| Nomura Research | | |
| Institute, Ltd. | 59,700 | 1,138 |
| Sumitomo Heavy | | |
| Industries Ltd. | 274,000 | 1,095 |
| JSR Corp. | 96,500 | 1,085 |
* | Isetan Mitsukoshi | | |
| Holdings Ltd. | 124,340 | 1,072 |
| Hisamitsu | | |
| Pharmaceutical Co. Inc. | 25,700 | 1,050 |
| Nippon Meat Packers, Inc. | 69,000 | 1,049 |
| Ube Industries Ltd. | 372,000 | 1,044 |
| Acom Co., Ltd. | 24,559 | 1,037 |
| Nippon Electric | | |
| Glass Co., Ltd. | 195,500 | 1,031 |
| Promise Co., Ltd. | 40,117 | 1,017 |
| Amada Co., Ltd. | 208,000 | 1,011 |
| Toto Ltd. | 160,000 | 1,010 |
| Jupiter Telecommunications | | |
| Co., Ltd. | 971 | 1,010 |
| 77 Bank Ltd. | 185,000 | 1,006 |
| Shimano, Inc. | 25,300 | 995 |
| Seiko Epson Corp. | 62,500 | 994 |
| Taiheiyo Cement Corp. | 515,000 | 992 |
| FamilyMart Co., Ltd. | 22,700 | 985 |
| Toyo Suisan Kaisha, Ltd. | 34,000 | 979 |
| The Chugoku Bank, Ltd. | 62,000 | 957 |
| All Nippon Airways Co., Ltd. | 242,000 | 953 |
| | | Market |
| | | Value• |
| | Shares | ($000) |
| Marui Co., Ltd. | 159,800 | 933 |
| Stanley Electric Co. | 88,300 | 932 |
| Aioi Insurance Co., Ltd. | 178,000 | 930 |
| Tokyu Land Corp. | 239,000 | 915 |
| Shinsei Bank, Ltd. | 578,014 | 914 |
| Mitsubishi Gas | | |
| Chemical Co. | 222,000 | 910 |
| NSK Ltd. | 240,000 | 906 |
| Yamaha Corp. | 96,900 | 900 |
| Nisshin Seifun Group Inc. | 67,900 | 896 |
| Haseko Corp. | 837,422 | 892 |
| IHI Corp. | 699,000 | 891 |
| Yamaguchi | | |
| Financial Group, Inc. | 79,000 | 888 |
| Nisshin Steel Co. | 430,000 | 886 |
| Mitsubishi Rayon Co., Ltd. | 287,000 | 869 |
| Santen | | |
| Pharmaceutical Co., Ltd. | 28,700 | 867 |
| Kamigumi Co., Ltd. | 97,000 | 861 |
| Casio Computer Co. | 135,500 | 854 |
| Yokogawa Electric Corp. | 129,700 | 853 |
| JTEKT Corp. | 107,700 | 839 |
| Tsumura & Co. | 22,400 | 831 |
| Leopalace21 Corp. | 81,100 | 821 |
| Uny Co., Ltd. | 74,000 | 818 |
| Nippon Sanso Corp. | 105,000 | 810 |
| Showa Denko K.K. | 557,000 | 806 |
| Sumco Corp. | 63,060 | 800 |
| Tokyo Tatemono Co., Ltd. | 174,000 | 797 |
* | Japan Airlines System Co. | 337,000 | 794 |
| J. Front Retailing Co., Ltd. | 189,200 | 782 |
| Yakult Honsha Co., Ltd. | 36,400 | 778 |
| Susuken Co., Ltd. | 25,660 | 764 |
| THK Co., Inc. | 72,300 | 760 |
| Sojitz Holdings Corp. | 454,600 | 759 |
| Square Enix Co., Ltd. | 23,400 | 754 |
| Showa Shell Sekiyu K.K. | 75,200 | 745 |
| Yamazaki Baking Co., Ltd. | 48,000 | 738 |
| Shinko Securities Co., Ltd. | 334,000 | 732 |
| NTN Corp. | 240,000 | 725 |
| Cosmo Oil Co., Ltd. | 225,000 | 700 |
| Mizuho Trust & | | |
| Banking Co., Ltd. | 552,000 | 700 |
| Citizen Watch Co., Ltd. | 191,800 | 691 |
| Kaneka Corp. | 108,000 | 689 |
| Daihatsu Motor Co., Ltd. | 77,000 | 680 |
| Tokuyama Corp. | 80,000 | 678 |
| Sapporo Hokuyo | | |
| Holdings, Inc. | 176 | 677 |
| Kikkoman Corp. | 56,000 | 665 |
| Sapporo Holdings Ltd. | 104,000 | 658 |
| Dowa Mining Co., Ltd. | 175,000 | 646 |
| Keisei Electric | | |
| Railway Co., Ltd. | 103,000 | 643 |
| Mediceo Paltac | | |
| Holdings Co., Ltd. | 53,400 | 642 |
17
Tax-Managed International Fund
| | | Market |
| | | Value• |
| | Shares | ($000) |
| Shimamura Co., Ltd. | 8,200 | 633 |
| Mitsui Mining & | | |
| Smelting Co., Ltd. | 294,000 | 623 |
| Sumitomo Rubber | | |
| Industries Ltd. | 71,000 | 618 |
| Fuji Heavy Industries Ltd. | 223,000 | 612 |
| Isuzu Motors Ltd. | 474,000 | 612 |
| Oracle Corp. Japan | 14,000 | 606 |
| Takefuji Corp. | 73,470 | 602 |
| Mitsubishi UFJ Lease & | | |
| Finance Company Ltd. | 23,460 | 597 |
* | Seven Bank, Ltd. | 156 | 596 |
| Shimadzu Corp. | 93,000 | 585 |
| Mazda Motor Corp. | 341,000 | 578 |
| Ushio Inc. | 43,000 | 568 |
| Fuji Electric | | |
| Holdings Co., Ltd. | 376,000 | 566 |
| Meiji Dairies Corp. | 103,000 | 554 |
| Idemitsu Kosan Co. Ltd. | 8,409 | 541 |
| NGK Spark Plug Co. | 67,000 | 538 |
| Daicel Chemical | | |
| Industries Ltd. | 112,000 | 530 |
| Mitsubishi Logistics Corp. | 41,000 | 519 |
| Dai Nippon | | |
| Pharmaceutical Co., Ltd. | 55,000 | 515 |
| Brother Industries Ltd. | 86,100 | 513 |
| Alfresa Holdings Corp. | 10,700 | 512 |
| Hakuhodo DY Holdings Inc. | 9,260 | 505 |
| Coca-Cola West | | |
| Japan Co., Ltd. | 23,200 | 501 |
| Nissan Chemical | | |
| Industries, Ltd. | 51,000 | 494 |
| AEON Mall Co., Ltd. | 25,500 | 493 |
| USS Co., Ltd. | 8,810 | 467 |
| Mitsumi Electric Co., Ltd. | 26,600 | 465 |
| Hitachi Construction | | |
| Machinery Co. | 37,900 | 453 |
| Mabuchi Motor Co. | 10,900 | 451 |
| Nomura Real Estate | | |
| Holdings Inc. | 22,600 | 451 |
| Asics Corp. | 55,596 | 450 |
| Kinden Corp. | 48,000 | 434 |
| Minebea Co., Ltd. | 125,000 | 432 |
| Dai-Nippon Ink & | | |
| Chemicals, Inc. | 205,000 | 432 |
| Maruichi Steel Tube Ltd. | 15,100 | 421 |
| Ito En, Ltd. | 28,100 | 414 |
| Denki Kagaku Kogyo K.K. | 168,000 | 413 |
| Canon Sales Co. Inc. | 25,600 | 412 |
| Obic Co., Ltd. | 2,450 | 400 |
| Tosoh Corp. | 162,000 | 400 |
| Kansai Paint Co., Ltd. | 77,000 | 395 |
| Aeon Credit Service Co. Ltd. | 37,510 | 395 |
| Hitachi High- | | |
| Technologies Corp. | 24,451 | 391 |
| | | Market |
| | | Value• |
| | Shares | ($000) |
| Tokyo Steel | | |
| Manufacturing Co. | 36,900 | 387 |
| Mitsui Engineering & | | |
| Shipbuilding Co., Ltd. | 223,000 | 375 |
| Hitachi Chemical Co., Ltd. | 36,000 | 374 |
| Dowa Fire & Marine | | |
| Insurance Co. | 59,000 | 367 |
| JAFCO Co., Ltd. | 14,200 | 363 |
* | Elpida Memory Inc. | 56,700 | 350 |
| Yamato Kogyo Co., Ltd. | 12,700 | 343 |
| Nisshinbo Industries, Inc. | 45,000 | 343 |
| NOK Corp. | 48,200 | 339 |
| Toyoda Gosei Co., Ltd. | 28,700 | 338 |
| Yaskawa Electric Corp. | 83,000 | 335 |
| Matsui Securities Co., Ltd. | 40,100 | 335 |
| Onward Kashiyama Co., Ltd. | 42,000 | 335 |
* | DeNA Co., Ltd. | 101 | 327 |
| Fuji Television Network, Inc. | 228 | 326 |
| ABC-Mart Inc. | | |
| International Trading Corp. | 8,600 | 314 |
| Daido Steel Co., Ltd. | 97,000 | 294 |
| Alps Electric Co., Ltd. | 55,000 | 271 |
| NHK Spring Co. | 72,000 | 266 |
| Tokyo Broadcasting | | |
| System Holdings, Inc. | 16,200 | 247 |
| Hitachi Metals Ltd. | 53,000 | 246 |
| Itochu Techno-Science Corp. | 9,900 | 242 |
| Toyota Boshoku Corp. | 28,400 | 231 |
| Otsuka Corp. | 4,860 | 221 |
| Shinko Electric | | |
| Industries Co., Ltd. | 25,173 | 205 |
| Aozora Bank, Ltd. | 217,000 | 204 |
| Hikari Tsushin, Inc. | 8,500 | 161 |
| Hino Motors, Ltd. | 69,000 | 142 |
* | NEC Electronics Corp. | 12,100 | 114 |
| Osaka Titanium | | |
| Technologies Co. | 4,514 | 114 |
* | Dowa Mining Co., Ltd. | | |
| Rights Exp. 1/29/10 | 32,000 | 6 |
| | | 928,356 |
Luxembourg (0.4%) | | |
| ArcelorMittal (Paris Shares) | 406,170 | 9,894 |
| SES Global Fiduciary | | |
| Depositary Receipts | 109,554 | 2,134 |
* | Tenaris S.A. | 182,112 | 1,902 |
| Millicom International | | |
| Cellular SA | 26,214 | 1,251 |
| | | 15,181 |
Netherlands (2.5%) | | |
| Unilever NV | 757,837 | 18,459 |
| Koninklijke KPN NV | 840,302 | 12,277 |
| ING Groep NV | 951,091 | 10,519 |
| Koninklijke (Royal) Philips | | |
| Electronics NV | 472,375 | 9,412 |
| Koninklijke Ahold NV | 561,725 | 6,956 |
18
Tax-Managed International Fund
| | | Market |
| | | Value• |
| | Shares | ($000) |
| Akzo Nobel NV | 112,325 | 4,656 |
| Aegon NV | 705,062 | 4,473 |
| ASML Holding NV | 207,157 | 3,753 |
| TNT NV | 186,452 | 3,640 |
| Heineken NV | 95,530 | 2,939 |
| Reed Elsevier NV | 245,236 | 2,930 |
| European Aeronautic | | |
| Defence and Space Co. | 163,818 | 2,788 |
| Wolters Kluwer NV | 105,474 | 2,010 |
| Koninklijke DSM NV | 76,820 | 1,981 |
| Randstad Holding NV | 65,269 | 1,338 |
| Heineken Holding NV | 41,739 | 1,198 |
| Corio NV | 17,540 | 812 |
| SBM Offshore NV | 53,864 | 711 |
| Fugro NV | 21,855 | 631 |
| Koninklijke Boskalis | | |
| Westminster NV | 20,103 | 471 |
| SNS REAAL | 52,247 | 289 |
| | | 92,243 |
New Zealand (0.1%) | | |
| Telecom Corp. of | | |
| New Zealand Ltd. | 1,150,552 | 1,555 |
| Fletcher Building Ltd. | 245,619 | 832 |
| Contact Energy Ltd. | 99,329 | 430 |
| Auckland International | | |
| Airport Ltd. | 339,082 | 324 |
| Sky City Entertainment | | |
| Group Ltd. | 159,590 | 294 |
| | | 3,435 |
Norway (0.6%) | | |
| StatoilHydro ASA | 597,041 | 10,051 |
| Telenor ASA | 403,126 | 2,737 |
| Orkla ASA | 400,189 | 2,680 |
| Yara International ASA | 91,952 | 2,036 |
| Norsk Hydro ASA | 339,090 | 1,391 |
| Seadrill Ltd. | 142,059 | 1,165 |
| DnB NOR ASA | 275,480 | 1,100 |
| Aker Solutions ASA | 90,875 | 605 |
| Frontline Ltd. | 18,850 | 557 |
* | Renewable Energy Corp. AS | 50,174 | 484 |
| | | 22,806 |
Portugal (0.3%) | | |
| Electricidade de | | |
| Portugal SA | 1,004,159 | 3,796 |
| Portugal Telecom SGPS SA | 343,056 | 2,950 |
* | Banco Comercial | | |
| Portugues SA | 1,271,730 | 1,459 |
| Brisa-Auto Estradas de | | |
| Portugal SA | 112,059 | 844 |
| Banco Espirito Santo SA | 82,684 | 774 |
| Galp Energia, SGPS, SA | | |
| B shares | 70,963 | 716 |
| Cimpor-Cimento de | | |
| Portugal SA | 93,846 | 458 |
| | | Market |
| | | Value• |
| | Shares | ($000) |
| Jeronimo Martins, SGPS, SA | 77,037 | 430 |
| Zon Multimedia Servicos de | | |
| Telecomunicacoes e | | |
| Multimedia SGPS SA | 56,073 | 293 |
| | | 11,720 |
Singapore (1.1%) | | |
| Singapore | | |
| Telecommunications Ltd. | 3,938,290 | 7,059 |
| United Overseas Bank Ltd. | 608,504 | 5,531 |
| Oversea-Chinese | | |
| Banking Corp., Ltd. | 1,253,300 | 4,383 |
| DBS Group Holdings Ltd. | 610,082 | 3,619 |
| Singapore Airlines Ltd. | 315,710 | 2,497 |
| Capitaland Ltd. | 945,000 | 2,074 |
| Singapore Press | | |
| Holdings Ltd. | 817,250 | 1,782 |
| Singapore Exchange Ltd. | 453,000 | 1,623 |
| Keppel Corp., Ltd. | 490,276 | 1,497 |
| ComfortDelGro Corp. Ltd. | 1,145,000 | 1,166 |
| Fraser & Neave Ltd. | 558,650 | 1,162 |
| City Developments Ltd. | 192,000 | 864 |
| Singapore Technologies | | |
| Engineering Ltd. | 500,906 | 834 |
| DBS Group Holdings | | |
| Rights Expire 1/20/09 | 305,041 | 639 |
| Wilmar International Ltd. | 298,000 | 587 |
| Sembcorp Industries Ltd. | 354,660 | 582 |
| Noble Group Ltd. | 551,200 | 397 |
| United Overseas Land Ltd. | 238,750 | 374 |
| Parkway Holdings Ltd. | 395,760 | 345 |
| SembCorp Marine Ltd. | 286,600 | 340 |
| Jardine Cycle N Carriage Ltd. | 50,037 | 335 |
| Golden Agri-Resources Ltd. | 1,984,000 | 329 |
| Olam International Ltd. | 398,200 | 323 |
| Cosco Corp. Singapore Ltd. | 307,000 | 206 |
| Neptune Orient Lines Ltd. | 191,000 | 151 |
| | | 38,699 |
Spain (4.6%) | | |
| Telefonica SA | 1,963,433 | 44,536 |
| Banco Santander SA | 3,670,310 | 35,633 |
| Banco Bilbao Vizcaya | | |
| Argentaria SA | 1,654,797 | 20,605 |
| Iberdrola SA | 1,631,638 | 15,285 |
| Repsol YPF SA | 358,288 | 7,687 |
* | Union Fenosa, SA | 184,851 | 4,654 |
| Industria de Diseno | | |
| Textil SA | 85,133 | 3,810 |
| ACS, Actividades de | | |
| Contruccion y Servisios, SA | 72,055 | 3,362 |
| Banco Popular Espanol SA | 380,594 | 3,317 |
| Red Electrica de Espana SA | 58,493 | 2,996 |
| Banco de Sabadell SA | 356,860 | 2,455 |
| Abertis Infraestructuras SA | 130,760 | 2,355 |
| Acciona SA | 16,202 | 2,070 |
19
Tax-Managed International Fund
| | | Market |
| | | Value• |
| | Shares | ($000) |
| Gamesa Corporacion | | |
| Tecnologica SA | 101,870 | 1,867 |
| Gas Natural SDG SA | 66,253 | 1,812 |
| Enagas SA | 68,432 | 1,519 |
* | Iberdrola Renovables | 328,367 | 1,439 |
| Criteria Caixacorp SA | 327,675 | 1,314 |
| Acerinox SA | 79,179 | 1,293 |
| Cintra Concesiones de | | |
| Infraestructuras de | | |
| Transport SA | 141,318 | 1,078 |
| Grupo Ferrovial SA | 38,435 | 1,077 |
| Indra Sistemas, SA | 45,720 | 1,055 |
| Bankinter SA | 104,697 | 952 |
| Grifols SA | 50,456 | 888 |
| Mapfre SA | 255,599 | 876 |
| Zardoya Otis SA | 47,068 | 850 |
| Banco de Valencia SA | 77,596 | 834 |
| Fomento de Construc y | | |
| Contra SA | 23,259 | 777 |
* | EDP Renovaveis SA | 77,619 | 546 |
| Iberia (Linea Aerea Espana) | 166,184 | 471 |
| Gestevision Telecinco SA | 37,869 | 410 |
| Banco Santander SA | 41,527 | 382 |
| Sacyr Vallehermoso SA | 25,471 | 232 |
| | | 168,437 |
Sweden (2.0%) | | |
| Telefonaktiebolaget LM | | |
| Ericsson AB Class B | 1,456,403 | 11,474 |
| Hennes & Mauritz AB | | |
| B Shares | 253,296 | 10,181 |
| Nordea Bank AB | 1,037,074 | 7,470 |
| TeliaSonera AB | 1,132,097 | 5,761 |
| Svenska Handelsbanken | | |
| AB A Shares | 239,170 | 3,997 |
| Sandvik AB | 545,616 | 3,542 |
| Volvo AB B Shares | 565,200 | 3,250 |
| Atlas Copco AB A Shares | 362,514 | 3,223 |
| SKF AB B Shares | 219,280 | 2,255 |
| Skandinaviska Enskilda | | |
| Banken AB A Shares | 254,424 | 2,075 |
| Svenska Cellulosa AB | | |
| B Shares | 216,430 | 1,899 |
| Atlas Copco AB B Shares | 232,580 | 1,840 |
| Alfa Laval AB | 194,100 | 1,751 |
| Securitas AB B Shares | 193,140 | 1,643 |
| Skanska AB B Shares | 142,268 | 1,475 |
| Swedish Match AB | 98,231 | 1,433 |
| Assa Abloy AB | 118,200 | 1,389 |
| Scania AB B Shares | 135,086 | 1,389 |
| Electrolux AB Series B | 156,136 | 1,381 |
| Tele2 AB B Shares | 114,438 | 1,046 |
| Getinge AB B Shares | 84,900 | 1,041 |
| SSAB Svenskt Stal | | |
| AB Series A | 109,189 | 978 |
| Holmen AB | 37,796 | 956 |
| Volvo AB A Shares | 161,600 | 942 |
| Swedbank AB A Shares | 135,900 | 811 |
| | | Market |
| | | Value• |
| | Shares | ($000) |
| Husqvarna AB B Shares | 98,136 | 534 |
* | Lundin Petroleum AB | 69,500 | 377 |
| Modern Times Group | | |
| AB B Shares | 16,750 | 371 |
| SSAB Svenskt Stal | | |
| AB Series B | 25,908 | 218 |
* | Loomis AB B Shares | 8,509 | 53 |
| | | 74,755 |
Switzerland (8.4%) | | |
| Nestle SA (Registered) | 1,774,406 | 70,085 |
| Novartis AG (Registered) | 1,103,094 | 55,105 |
| Roche Holdings AG | 325,698 | 50,296 |
* | UBS AG | 1,363,793 | 19,792 |
| ABB Ltd. | 1,025,362 | 15,597 |
| Zurich Financial Services AG | 66,373 | 14,465 |
| Credit Suisse Group | | |
| (Registered) | 498,317 | 13,930 |
| Syngenta AG | 47,720 | 9,247 |
| Swiss Re (Registered) | 157,473 | 7,691 |
| Holcim Ltd. (Registered) | 94,009 | 5,428 |
* | Compagnie Financiere | | |
| Richemont SA | 257,465 | 4,893 |
| Swisscom AG | 12,377 | 4,005 |
| Julius Baer Holding, Ltd. | 82,210 | 3,178 |
| Synthes, Inc. | 23,143 | 2,927 |
| Swatch Group AG (Bearer) | 18,433 | 2,593 |
| Lonza AG (Registered) | 27,031 | 2,500 |
* | Actelion Ltd. | 38,122 | 2,151 |
| Givaudan SA | 2,521 | 1,987 |
| SGS Societe Generale de | | |
| Surveillance Holding SA | | |
| (Registered) | 1,799 | 1,877 |
| Swiss Life Holding | 23,899 | 1,653 |
| Geberit AG | 15,159 | 1,635 |
| Adecco SA (Registered) | 47,073 | 1,607 |
| Nobel Biocare Holding AG | 75,238 | 1,550 |
| Schindler Holding AG (Bearer | | |
| Participation Certificates) | 33,160 | 1,518 |
| Baloise Holdings AG | 18,942 | 1,427 |
| Kuehne & Nagel | | |
| International AG | 20,461 | 1,322 |
| Sulzer AG (Registered) | 19,882 | 1,144 |
| Sonova Holding AG | 17,805 | 1,079 |
| Swatch Group AG | | |
| (Registered) | 37,005 | 1,017 |
* | Logitech International SA | 64,295 | 1,007 |
| Lindt & Spruengli AG Regular | 43 | 923 |
* | OC Oerlikon Corp AG | 8,970 | 598 |
| Lindt & Spruengli AG | 305 | 569 |
| Straumann Holding AG | 3,192 | 564 |
| BKW FMB Energie AG | 5,746 | 554 |
* | Aryzta AG | | |
| (Switzerland Shares) | 14,834 | 476 |
* | Aryzta AG (Ireland Shares) | 14,448 | 464 |
| EFG International | 21,888 | 390 |
| | | 307,244 |
20
Tax-Managed International Fund
| | | Market |
| | | Value• |
| | Shares | ($000) |
United Kingdom (20.1%) | | |
| BP PLC | 8,689,203 | 68,069 |
| HSBC Holdings PLC | 5,586,394 | 55,485 |
| Vodafone Group PLC | 24,447,541 | 50,801 |
| GlaxoSmithKline PLC | 2,425,563 | 45,778 |
| Royal Dutch Shell PLC | | |
| Class A | 1,269,727 | 33,854 |
| Royal Dutch Shell PLC | | |
| Class B | 1,260,468 | 32,424 |
| AstraZeneca Group PLC | 673,992 | 27,982 |
| British American | | |
| Tobacco PLC | 879,451 | 23,282 |
| BG Group PLC | 1,553,996 | 21,828 |
| BHP Billiton PLC | 1,027,057 | 20,215 |
| Tesco PLC | 3,650,526 | 19,290 |
| Diageo PLC | 1,169,807 | 16,680 |
| Anglo American PLC | 612,826 | 14,513 |
| Unilever PLC | 597,496 | 13,928 |
| Imperial Tobacco Group PLC | 472,931 | 12,820 |
| National Grid Transco PLC | 1,141,911 | 11,451 |
| Standard Chartered PLC | 875,745 | 11,372 |
| Reckitt Benckiser | | |
| Group PLC | 280,979 | 10,685 |
| Rio Tinto PLC | 465,836 | 10,507 |
| Royal Dutch Shell | | |
| PLC Class A | | |
| (Amsterdam Shares) | 375,316 | 9,972 |
| Centrica PLC | 2,382,230 | 9,307 |
| BAE Systems PLC | 1,651,869 | 9,123 |
| Barclays PLC | 3,801,923 | 8,769 |
| BT Group PLC | 3,625,424 | 7,399 |
| Scottish & Southern | | |
| Energy PLC | 408,780 | 7,314 |
| SABMiller PLC | 424,510 | 7,234 |
| Prudential PLC | 1,165,002 | 7,177 |
| Aviva PLC | 1,242,468 | 7,145 |
| Royal Bank of Scotland | | |
| Group PLC | 8,100,649 | 6,051 |
| British Energy Group PLC | 508,558 | 5,783 |
| Lloyds Banking Group PLC | 2,851,386 | 5,477 |
| Cadbury PLC | 533,709 | 4,786 |
| Rolls-Royce Group PLC | 870,605 | 4,322 |
| Reed Elsevier PLC | 524,186 | 3,906 |
| Morrison Supermarkets PLC | 942,094 | 3,875 |
| British Sky Broadcasting | | |
| Group PLC | 540,713 | 3,875 |
| Shire Ltd. | 248,542 | 3,715 |
| Pearson PLC | 382,333 | 3,657 |
| Compass Group PLC | 720,139 | 3,645 |
| Tullow Oil PLC | 343,291 | 3,335 |
| Legal & General | | |
| Group PLC | 2,839,039 | 3,220 |
| Capita Group PLC | 292,260 | 3,182 |
* | WPP PLC | 532,320 | 3,159 |
| Experian Group Ltd. | 487,384 | 3,118 |
| Land Securities Group PLC | 222,677 | 3,038 |
| | | Market |
| | | Value• |
| | Shares | ($000) |
| United Utilities Group PLC | 325,037 | 2,995 |
| Man Group PLC | 842,623 | 2,942 |
| Xstrata PLC | 308,836 | 2,933 |
| HBOS PLC | 2,599,159 | 2,730 |
| Smith & Nephew PLC | 420,962 | 2,728 |
| International Power PLC | 758,279 | 2,682 |
| Royal & Sun Alliance | | |
| Insurance Group PLC | 1,290,387 | 2,609 |
| Marks & Spencer | | |
| Group PLC | 793,542 | 2,524 |
| Standard Life PLC | 851,749 | 2,523 |
| Smiths Group PLC | 187,636 | 2,447 |
| Kingfisher PLC | 1,146,298 | 2,292 |
| Cable and Wireless PLC | 975,100 | 2,238 |
| Severn Trent PLC | 122,329 | 2,151 |
| Old Mutual PLC | 2,532,555 | 2,066 |
| British Land Co., PLC | 248,733 | 2,022 |
| Thomson Reuters PLC | 87,480 | 1,978 |
| J. Sainsbury PLC | 405,000 | 1,961 |
| Wolseley PLC | 338,917 | 1,916 |
| Carnival PLC | 80,277 | 1,799 |
| Johnson Matthey PLC | 108,219 | 1,748 |
| The Sage Group PLC | 682,865 | 1,716 |
| Cobham PLC | 551,916 | 1,674 |
| Next PLC | 102,375 | 1,633 |
| Rexam PLC | 312,029 | 1,621 |
| Friends Provident PLC | 1,237,777 | 1,606 |
* | Cairn Energy PLC | 49,693 | 1,477 |
| Group 4 Securicor PLC | 485,499 | 1,467 |
| Associated British | | |
| Foods PLC | 136,227 | 1,455 |
| Bunzl PLC | 163,775 | 1,418 |
| Tate & Lyle PLC | 228,336 | 1,350 |
| Hammerson PLC | 161,196 | 1,267 |
| Serco Group PLC | 184,702 | 1,227 |
| ICAP PLC | 281,763 | 1,207 |
| FirstGroup PLC | 183,682 | 1,179 |
| ITV PLC | 1,887,380 | 1,105 |
| Drax Group PLC | 128,344 | 1,057 |
| Home Retail Group | 327,955 | 1,027 |
| United Business Media Ltd. | 136,421 | 1,023 |
| Whitbread PLC | 70,782 | 957 |
| Admiral Group PLC | 70,128 | 939 |
| Antofagasta PLC | 147,144 | 935 |
| Schroders PLC | 71,970 | 919 |
| Amec PLC | 123,769 | 907 |
| Balfour Beatty PLC | 178,022 | 874 |
| Hays PLC | 833,771 | 855 |
| LogicaCMG PLC | 825,526 | 842 |
| Tomkins PLC | 459,706 | 840 |
| 3i Group PLC | 207,254 | 824 |
| Lonmin PLC | 60,664 | 821 |
| Burberry Group PLC | 247,440 | 813 |
| InterContinental | | |
| Hotels Group PLC | 94,498 | 791 |
* | Invensys PLC | 291,283 | 747 |
21
Tax-Managed International Fund
| | Market |
| | Value• |
| Shares | ($000) |
Daily Mail and | | |
General Trust PLC | 179,117 | 717 |
Liberty International PLC | 99,860 | 702 |
Investec PLC | 166,926 | 699 |
TUI Travel PLC | 202,527 | 697 |
Ladbrokes PLC | 253,326 | 691 |
British Airways PLC | 251,496 | 675 |
IMI PLC | 158,392 | 638 |
Segro PLC | 175,497 | 635 |
Thomas Cook Group PLC | 241,377 | 626 |
GKN PLC | 399,443 | 564 |
Meggitt PLC | 234,929 | 554 |
Eurasian Natural | | |
Resources Corp. | 110,794 | 538 |
London Stock Exchange PLC | 64,194 | 489 |
Vedanta Resources PLC | 49,590 | 452 |
National Express Group PLC | 55,695 | 406 |
Stagecoach Group PLC | 192,527 | 402 |
The Berkeley Group | | |
Holdings PLC | 28,658 | 369 |
Kazakhmys PLC | 56,488 | 196 |
Carphone Warehouse PLC | 143,241 | 191 |
| | 736,646 |
Total Common Stocks | | |
(Cost $4,594,891) | | 3,684,441 |
Total Investments (100.5%) | | |
(Cost $4,594,891) | | 3,684,441 |
Other Assets and Liabilities (–0.5%) | | |
Other Assets | | 71,264 |
Liabilities | | (90,540) |
| | (19,276) |
Net Assets (100%) | | 3,665,165 |
At December 31, 2008, net assets consisted of: |
| Amount |
| ($000) |
Paid-in Capital | 4,872,767 |
Overdistributed Net Investment Income | (135) |
Accumulated Net Realized Losses | (296,995) |
Unrealized Appreciation (Depreciation) | |
Investment Securities | (910,450) |
Foreign Currencies | (22) |
Net Assets | 3,665,165 |
| |
Investor Shares—Net Assets | |
Applicable to 129,441,924 outstanding | |
$.001 par value shares of beneficial | |
interest (unlimited authorization) | 1,131,295 |
Net Asset Value Per Share— | |
Investor Shares | $8.74 |
| |
Institutional Shares—Net Assets | |
Applicable to 27,639,581 outstanding | |
$.001 par value shares of beneficial | |
interest (unlimited authorization) | 241,705 |
Net Asset Value Per Share— | |
Institutional Shares | $8.74 |
| |
ETF Shares—Net Assets | |
Applicable to 84,320,638 outstanding | |
$.001 par value shares of beneficial | |
interest (unlimited authorization) | 2,292,165 |
Net Asset Value Per Share— | |
ETF Shares | $27.18 |
• | See Note A in Notes to Financial Statements. |
* | Non-income-producing security. |
ADR—American Depositary Receipt.
See accompanying Notes, which are an integral part of the Financial Statements.
22
Tax-Managed International Fund
Statement of Operations
| Year Ended |
| December 31, 2008 |
| ($000) |
Investment Income | |
Income | |
Dividends1 | 122,611 |
Interest2 | 140 |
Total Income | 122,751 |
Expenses | |
The Vanguard Group—Note B | |
Investment Advisory Services | 128 |
Management and Administrative—Investor Shares | 1,537 |
Management and Administrative—Institutional Shares | 162 |
Management and Administrative—ETF Shares | 824 |
Marketing and Distribution—Investor Shares | 372 |
Marketing and Distribution—Institutional Shares | 126 |
Marketing and Distribution—ETF Shares | 306 |
Custodian Fees | 742 |
Auditing Fees | 32 |
Shareholders’ Reports—Investor Shares | 14 |
Shareholders’ Reports—Institutional Shares | 1 |
Shareholders’ Reports—ETF Shares | 32 |
Trustees’ Fees and Expenses | 4 |
Total Expenses | 4,280 |
Expenses Paid Indirectly | (42) |
Net Expenses | 4,238 |
Net Investment Income | 118,513 |
Realized Net Gain (Loss) | |
Investment Securities Sold | (248,068) |
Foreign Currencies | (1,150) |
Realized Net Gain (Loss) | (249,218) |
Change in Unrealized Appreciation (Depreciation) | |
Investment Securities | (1,665,677) |
Foreign Currencies | (57) |
Change in Unrealized Appreciation (Depreciation) | (1,665,734) |
Net Increase (Decrease) in Net Assets Resulting from Operations | (1,796,439) |
1 Dividends are net of foreign withholding taxes of $10,710,000.
2 Interest income from an affiliated company of the fund was $13,000.
See accompanying Notes, which are an integral part of the Financial Statements.
23
Tax-Managed International Fund
Statement of Changes in Net Assets
| Year Ended December 31, |
| 2008 | 2007 |
| ($000) | ($000) |
Increase (Decrease) in Net Assets | | |
Operations | | |
Net Investment Income | 118,513 | 65,055 |
Realized Net Gain (Loss) | (249,218) | 25,976 |
Change in Unrealized Appreciation (Depreciation) | (1,665,734) | 125,643 |
Net Increase (Decrease) in Net Assets Resulting from Operations | (1,796,439) | 216,674 |
Distributions | | |
Net Investment Income | | |
Investor Shares | (36,506) | (40,939) |
Institutional Shares | (8,403) | (12,416) |
ETF Shares | (73,729) | (12,799) |
Realized Capital Gain | | |
Investor Shares | — | — |
Institutional Shares | — | — |
ETF Shares | — | — |
Total Distributions | (118,638) | (66,154) |
Capital Share Transactions | | |
Investor Shares | 79,651 | 140,426 |
Institutional Shares | (77,177) | 293,768 |
ETF Shares | 2,441,432 | 669,001 |
Net Increase (Decrease) from Capital Share Transactions | 2,443,906 | 1,103,195 |
Total Increase (Decrease) | 528,829 | 1,253,715 |
Net Assets | | |
Beginning of Period | 3,136,336 | 1,882,621 |
End of Period1 | 3,665,165 | 3,136,336 |
1 Net Assets—End of Period includes undistributed (overdistributed) net investment income of ($135,000) and ($679,000).
See accompanying Notes, which are an integral part of the Financial Statements.
24
Tax-Managed International Fund
Financial Highlights
Investor Shares | | | | | |
| | | | | |
| Year Ended December 31, |
For a Share Outstanding Throughout Each Period | 2008 | 2007 | 2006 | 2005 | 2004 |
Net Asset Value, Beginning of Period | $15.40 | $14.16 | $11.48 | $10.33 | $8.76 |
Investment Operations | | | | | |
Net Investment Income | .290 | .332 | .331 | .246 | .201 |
Net Realized and Unrealized Gain (Loss) | | | | | |
on Investments | (6.661) | 1.244 | 2.685 | 1.161 | 1.571 |
Total from Investment Operations | (6.371) | 1.576 | 3.016 | 1.407 | 1.772 |
Distributions | | | | | |
Dividends from Net Investment Income | (.289) | (.336) | (.336) | (.257) | (.202) |
Distributions from Realized Capital Gains | — | — | — | — | — |
Total Distributions | (.289) | (.336) | (.336) | (.257) | (.202) |
Net Asset Value, End of Period | $8.74 | $15.40 | $14.16 | $11.48 | $10.33 |
| | | | | |
Total Return1 | –41.27% | 11.15% | 26.27% | 13.60% | 20.25% |
| | | | | |
Ratios/Supplemental Data | | | | | |
Net Assets, End of Period (Millions) | $1,131 | $1,915 | $1,624 | $1,119 | $825 |
Ratio of Total Expenses to Average Net Assets | 0.15% | 0.15% | 0.20% | 0.20% | 0.23% |
Ratio of Net Investment Income to | | | | | |
Average Net Assets | 3.47% | 2.71% | 2.70% | 2.50% | 2.34% |
Portfolio Turnover Rate2 | 16% | 6% | 4% | 5% | 5% |
1 Total returns do not reflect the 1% redemption fee on shares held less than five years; the 2% redemption fee assessed prior to September 14, 2005, on shares held less than one year; or the account service fee that may be applicable to certain accounts with balances below $10,000.
2 Excludes the value of portfolio securities received or delivered as a result of in-kind purchases or redemptions of the fund’s capital shares, including ETF Creation Units.
See accompanying Notes, which are an integral part of the Financial Statements.
25
Tax-Managed International Fund
Financial Highlights
Institutional Shares | | | | | |
| | | | | |
| | | Year Ended December 31, |
For a Share Outstanding Throughout Each Period | 2008 | 2007 | 2006 | 2005 | 2004 |
Net Asset Value, Beginning of Period | $15.41 | $14.17 | $11.48 | $10.33 | $8.77 |
Investment Operations | | | | | |
Net Investment Income | .296 | .341 | .348 | .253 | .198 |
Net Realized and Unrealized Gain (Loss) | | | | | |
on Investments | (6.671) | 1.244 | 2.685 | 1.161 | 1.571 |
Total from Investment Operations | (6.375) | 1.585 | 3.033 | 1.414 | 1.769 |
Distributions | | | | | |
Dividends from Net Investment Income | (.295) | (.345) | (.343) | (.264) | (.209) |
Distributions from Realized Capital Gains | — | — | — | — | — |
Total Distributions | (.295) | (.345) | (.343) | (.264) | (.209) |
Net Asset Value, End of Period | $8.74 | $15.41 | $14.17 | $11.48 | $10.33 |
| | | | | |
Total Return1 | –41.27% | 11.21% | 26.42% | 13.66% | 20.19% |
| | | | | |
Ratios/Supplemental Data | | | | | |
Net Assets, End of Period (Millions) | $242 | $568 | $258 | $193 | $143 |
Ratio of Total Expenses to Average Net Assets | 0.09% | 0.09% | 0.14% | 0.14% | 0.15% |
Ratio of Net Investment Income to | | | | | |
Average Net Assets | 3.53% | 2.77% | 2.76% | 2.56% | 2.42% |
Portfolio Turnover Rate2 | 16% | 6% | 4% | 5% | 5% |
1 Total returns do not reflect the 1% redemption fee on shares held less then five years or the 2% redemption fee assessed prior to September 14, 2005, on shares held less than one year.
2 Excludes the value of portfolio securities received or delivered as a result of in-kind purchases or redemptions of the fund’s capital shares, including ETF Creation Units.
See accompanying Notes, which are an integral part of the Financial Statements.
26
Tax-Managed International Fund
Financial Highlights
Europe Pacific ETF Shares | | |
| Year | July 20, |
| Ended | 20071 to |
| December 31, | Dec. 31, |
For a Share Outstanding Throughout Each Period | 2008 | 2007 |
Net Asset Value, Beginning of Period | $47.92 | $49.99 |
Investment Operations | | |
Net Investment Income | .934 | .204 |
Net Realized and Unrealized Gain (Loss) on Investments | (20.744) | (1.219) |
Total from Investment Operations | (19.810) | (1.015) |
Distributions | | |
Dividends from Net Investment Income | (.930) | (1.055) |
Distributions from Realized Capital Gains | — | — |
Total Distributions | (.930) | (1.055) |
Net Asset Value, End of Period | $27.18 | $47.92 |
| | |
Total Return | –41.25% | –2.02% |
| | |
Ratios/Supplemental Data | | |
Net Assets, End of Period (Millions) | $2,292 | $653 |
Ratio of Total Expenses to Average Net Assets | 0.11% | 0.12%2 |
Ratio of Net Investment Income to Average Net Assets | 3.51% | 2.74%2 |
Portfolio Turnover Rate3 | 16% | 6% |
1 Inception.
2 Annualized.
3 Excludes the value of portfolio securities received or delivered as a result of in-kind purchases or redemptions of the fund’s capital shares, including ETF Creation Units.
See accompanying Notes, which are an integral part of the Financial Statements.
27
Tax-Managed International Fund
Notes to Financial Statements
Vanguard Tax-Managed International Fund is registered under the Investment Company Act of 1940 as an open-end investment company, or mutual fund. The fund invests in securities of foreign issuers, which may subject it to investment risks not normally associated with investing in securities of U.S. corporations. The fund offers three classes of shares: Investor Shares, Institutional Shares, and ETF Shares. Investor Shares are available to any investor who meets the fund’s minimum purchase requirements. Institutional Shares are designed for investors who meet certain administrative and service criteria and invest a minimum of $5 million. ETF Shares, known as Vanguard Europe Pacific ETF Shares, are listed for trading on the NYSE Arca, Inc.; they can be purchased and sold through a broker.
A. The following significant accounting policies conform to generally accepted accounting principles for U.S. mutual funds. The fund consistently follows such policies in preparing its financial statements.
1. Security Valuation: Securities are valued as of the close of trading on the New York Stock Exchange (generally 4 p.m., Eastern time) on the valuation date. Equity securities are valued at the latest quoted sales prices or official closing prices taken from the primary market in which each security trades; such securities not traded on the valuation date are valued at the mean of the latest quoted bid and asked prices. Securities for which market quotations are not readily available, or whose values have been affected by events occurring before the fund’s pricing time but after the close of the securities’ primary markets, are valued at their fair values calculated according to procedures adopted by the board of trustees. These procedures include obtaining quotations from an independent pricing service, monitoring news to identify significant market- or security-specific events, and evaluating changes in the values of foreign market proxies (for example, ADRs, futures contracts, or exchange-traded funds), between the time the foreign markets close and the fund’s pricing time. When fair-value pricing is employed, the prices of securities used by a fund to calculate its net asset value may differ from quoted or published prices for the same securities. Investments in Vanguard Market Liquidity Fund are valued at that fund’s net asset value.
2. Foreign Currency: Securities and other assets and liabilities denominated in foreign currencies are translated into U.S. dollars using exchange rates obtained from an independent third party as of the fund’s pricing time on the valuation date. Realized gains (losses) and unrealized appreciation (depreciation) on investment securities include the effects of changes in exchange rates since the securities were purchased, combined with the effects of changes in security prices. Fluctuations in the value of other assets and liabilities resulting from changes in exchange rates are recorded as unrealized foreign currency gains (losses) until the assets or liabilities are settled in cash, at which time they are recorded as realized foreign currency gains (losses).
3. Federal Income Taxes: The fund intends to continue to qualify as a regulated investment company and distribute all of its taxable income. Management has analyzed the fund’s tax positions taken on federal income tax returns for all open tax years (tax years ended December 31, 2005–2008) and has concluded that no provision for federal income tax is required in the fund’s financial statements.
4. Distributions: Distributions to shareholders are recorded on the ex-dividend date.
5. Other: Dividend income is recorded on the ex-dividend date. Interest income includes income distributions received from Vanguard Market Liquidity Fund and is accrued daily. Security transactions are accounted for on the date securities are bought or sold. Costs used to determine realized gains (losses) on the sale of investment securities are those of the specific securities sold. Fees assessed on redemptions of capital shares are credited to paid-in capital.
28
Tax-Managed International Fund
Each class of shares has equal rights as to assets and earnings, except that each class separately bears certain class-specific expenses related to maintenance of shareholder accounts (included in Management and Administrative expenses) and shareholder reporting. Marketing and distribution expenses are allocated to each class of shares based on a method approved by the board of trustees. Income, other non-class-specific expenses, and gains and losses on investments are allocated to each class of shares based on its relative net assets.
B. The Vanguard Group furnishes at cost investment advisory, corporate management, administrative, marketing, and distribution services. The costs of such services are allocated to the fund under methods approved by the board of trustees. The fund has committed to provide up to 0.40% of its net assets in capital contributions to Vanguard. At December 31, 2008, the fund had contributed capital of $783,000 to Vanguard (included in Other Assets), representing 0.02% of the fund’s net assets and 0.31% of Vanguard’s capitalization. The fund’s trustees and officers are also directors and officers of Vanguard.
C. The fund’s custodian bank has agreed to reduce its fees when the fund maintains cash on deposit in the non-interest-bearing custody account. For the year ended December 31, 2008, custodian fee offset arrangements reduced the fund’s expenses by $42,000.
D. Distributions are determined on a tax basis and may differ from net investment income and realized capital gains for financial reporting purposes. Differences may be permanent or temporary. Permanent differences are reclassified among capital accounts in the financial statements to reflect their tax character. Temporary differences arise when certain items of income, expense, gain, or loss are recognized in different periods for financial statement and tax purposes; these differences will reverse at some time in the future. Differences in classification may also result from the treatment of short-term gains as ordinary income for tax purposes.
During the year ended December 31, 2008, the fund realized net foreign currency losses of $1,150,000, which decreased distributable net income for tax purposes; accordingly, such losses have been reclassified from accumulated net realized losses to undistributed net investment income. Certain of the fund’s investments are in securities considered to be “passive foreign investment companies,” for which any unrealized appreciation and/or realized gains are required to be included in distributable net income for tax purposes. During the year ended December 31, 2008, the fund realized gains on the sale of passive foreign investment companies of $1,819,000, which have been included in current and prior periods’ taxable income; accordingly, such gains have been reclassified from accumulated net realized losses to undistributed net investment income. Unrealized appreciation on the fund’s passive foreign investment company holdings at December 31, 2008, was $54,000.
For tax purposes, at December 31, 2008, the fund had $2,526,000 of ordinary income available for distribution. The fund had available realized losses of $296,961,000 to offset future net capital gains of $12,748,000 through December 31, 2010, $27,239,000 through December 31, 2011, $5,174,000 through December 31, 2012, $99,680,000 through December 31, 2016, and $152,120,000 through December 31, 2017.
At December 31, 2008, the cost of investment securities for tax purposes was $4,594,979,000. Net unrealized depreciation of investment securities for tax purposes was $910,538,000, consisting of unrealized gains of $104,963,000 on securities that had risen in value since their purchase and $1,015,501,000 in unrealized losses on securities that had fallen in value since their purchase.
E. During the year ended December 31, 2008, the fund purchased $3,000,371,000 of investment securities and sold $543,882,000 of investment securities, other than temporary cash investments.
29
Tax-Managed International Fund
F. Capital share transactions for each class of shares were:
| | | Year Ended December 31, |
| | 2008 | | 2007 |
| Amount | Shares | Amount | Shares |
| ($000) | (000) | ($000) | (000) |
Investor Shares | | | | |
Issued | 305,754 | 26,025 | 320,908 | 21,093 |
Issued in Lieu of Cash Distributions | 28,971 | 3,486 | 32,485 | 2,130 |
Redeemed1 | (255,074) | (24,427) | (212,967) | (13,611) |
Net Increase (Decrease)—Investor Shares | 79,651 | 5,084 | 140,426 | 9,612 |
Institutional Shares | | | | |
Issued | 80,348 | 5,969 | 290,944 | 18,477 |
Issued in Lieu of Cash Distributions | 6,027 | 723 | 9,670 | 633 |
Redeemed1 | (163,552) | (15,951) | (6,846) | (437) |
Net Increase (Decrease)—Institutional Shares | (77,177) | (9,259) | 293,768 | 18,673 |
ETF Shares | | | | |
Issued | 2,441,432 | 70,686 | 669,001 | 13,635 |
Issued in Lieu of Cash Distributions | — | — | — | — |
Redeemed1 | — | — | — | — |
Net Increase (Decrease)—ETF Shares | 2,441,432 | 70,686 | 669,001 | 13,635 |
1 Net of redemption fees for 2008 and 2007 of $1,382,000 and $473,000, respectively (fund totals).
G. In September 2006, the Financial Accounting Standards Board issued Statement of Financial Accounting Standards No. 157 (“FAS 157”), “Fair Value Measurements.” FAS 157 establishes a framework for measuring fair value and expands disclosures about fair value measurements in financial statements.
The various inputs that may be used to determine the value of the fund’s investments are summarized in three broad levels. The inputs or methodologies used for valuing securities are not necessarily an indication of the risk associated with investing in those securities.
Level 1—Quoted prices in active markets for identical securities.
Level 2—Other significant observable inputs (including quoted prices for similar securities, interest rates, prepayment speeds, credit risk, etc.).
Level 3—Significant unobservable inputs (including the fund’s own assumptions used to determine the fair value of investments).
The following table summarizes the fund’s investments as of December 31, 2008, based on the inputs used to value them:
| Investments |
| in Securities |
Valuation Inputs | ($000) |
Level 1—Quoted prices | 6,638 |
Level 2—Other significant observable inputs | 3,677,803 |
Level 3—Significant unobservable inputs | — |
Total | 3,684,441 |
30
Report of Independent Registered Public Accounting Firm
To the Trustees of Vanguard Tax-Managed Funds and the Shareholders of Vanguard Tax-Managed International Fund:
In our opinion, the accompanying statement of net assets and the related statements of operations and of changes in net assets and the financial highlights present fairly, in all material respects, the financial position of Vanguard Tax-Managed International Fund (constituting a separate portfolio of Vanguard Tax-Managed Funds, hereafter referred to as the “Fund”) at December 31, 2008, the result of its operations for the year then ended, the changes in its net assets for each of the two years in the period then ended and the financial highlights for each of the periods indicated, in conformity with accounting principles generally accepted in the United States of America. These financial statements and financial highlights (hereafter referred to as “financial statements”) are the responsibility of the Fund’s management; our responsibility is to express an opinion on these financial statements based on our audits. We conducted our audits of these financial statements in accordance with the standards of the Public Company Accounting Oversight Board (United States). Those standards require that we plan and perform the audit to obtain reasonable assurance about whether the financial statements are free of material misstatement. An audit includes examining, on a test basis, evidence supporting the amounts and disclosures in the financial statements, assessing the accounting principles used and significant estimates made by management, and evaluating the overall financial statement presentation. We believe that our audits, which included confirmation of securities at December 31, 2008 by correspondence with the custodian, and by agreement to the underlying ownership records for Vanguard Market Liquidity Fund, provide a reasonable basis for our opinion.
PricewaterhouseCoopers LLP
Philadelphia, Pennsylvania
February 23, 2009
Special 2008 tax information (unaudited) for Vanguard Tax-Managed International Fund |
This information for the fiscal year ended December 31, 2008, is included pursuant to provisions of the Internal Revenue Code.
The fund distributed $118,638,000 of qualified dividend income to shareholders during the fiscal year.
The fund passed through to shareholders foreign source income of $133,286,000 and foreign taxes paid of $10,680,000. The pass-through of foreign taxes paid affects only shareholders on the dividend record date in December 2008. Shareholders received more detailed information along with their Form 1099-DIV in January 2009.
31
Your Fund’s After-Tax Returns
This table presents returns for your fund both before and after taxes. The after-tax returns are shown in two ways: (1) assuming that an investor owned the fund during the entire period and paid taxes on the fund’s distributions, and (2) assuming that an investor paid taxes on the fund’s distributions and sold all shares at the end of each period.
Calculations are based on the highest individual federal income tax and capital gains tax rates in effect at the times of the distributions and the hypothetical sales. State and local taxes were not considered. After-tax returns reflect any qualified dividend income. (In the example, returns after the sale of fund shares may be higher than those assuming no sale. This occurs when the sale would have produced a capital loss. The calculation assumes that the investor received a tax deduction for the loss.)
The table shows returns for Investor Shares only; returns for other share classes will differ. Please note that your actual after-tax returns will depend on your tax situation and may differ from those shown. Also note that if you own the fund in a tax-deferred account, such as an individual retirement account or a 401(k) plan, this information does not apply to you. Such accounts are not subject to current taxes.
Finally, keep in mind that a fund’s performance—whether before or after taxes—does not guarantee future results.
Average Annual Total Returns: Tax-Managed International Fund Investor Shares1 |
Periods Ended December 31, 2008 | | | |
| One | Five | Since |
| Year | Years | Inception2 |
Returns Before Taxes | –41.84% | 2.40% | 0.60% |
Returns After Taxes on Distributions | –42.02 | 2.17 | 0.29 |
Returns After Taxes on Distributions and Sale of Fund Shares | –26.72 | 2.28 | 0.54 |
1 Total returns reflect the 1% fee assessed on redemptions of shares held in the fund for less than five years. Total returns do not reflect the account service fee that may be applicable to certain accounts with balances below $10,000.
2 Inception for Investor Shares, August 17, 1999.
32
About Your Fund’s Expenses
As a shareholder of the fund, you incur ongoing costs, which include costs for portfolio management, administrative services, and shareholder reports (like this one), among others. Operating expenses, which are deducted from a fund’s gross income, directly reduce the investment return of the fund.
A fund’s expenses are expressed as a percentage of its average net assets. This figure is known as the expense ratio. The following examples are intended to help you understand the ongoing costs (in dollars) of investing in your fund and to compare these costs with those of other mutual funds. The examples are based on an investment of $1,000 made at the beginning of the period shown and held for the entire period.
The accompanying table illustrates your fund’s costs in two ways:
• Based on actual fund return. This section helps you to estimate the actual expenses that you paid over the period. The “Ending Account Value” shown is derived from the fund’s actual return, and the third column shows the dollar amount that would have been paid by an investor who started with $1,000 in the fund. You may use the information here, together with the amount you invested, to estimate the expenses that you paid over the period.
To do so, simply divide your account value by $1,000 (for example, an $8,600 account value divided by $1,000 = 8.6), then multiply the result by the number given for your fund under the heading “Expenses Paid During Period.”
• Based on hypothetical 5% yearly return. This section is intended to help you compare your fund’s costs with those of other mutual funds. It assumes that the fund had a yearly return of 5% before expenses, but that the expense ratio is unchanged. In this case—because the return used is not the fund’s actual return—the results do not apply to your investment. The example is useful in making comparisons because the Securities and Exchange Commission requires all mutual funds to calculate expenses based on a 5% return. You can assess your fund’s costs by comparing this hypothetical example with the hypothetical examples that appear in shareholder reports of other funds.
Six Months Ended December 31, 2008 | | | |
| Beginning | Ending | Expenses |
| Account Value | Account Value | Paid During |
Tax-Managed International Fund | 6/30/2008 | 12/31/2008 | Period1 |
| | | |
Investor Shares | $1,000.00 | $657.04 | $0.67 |
Institutional Shares | 1,000.00 | 657.00 | 0.42 |
Europe Pacific ETF Shares | 1,000.00 | 657.13 | 0.46 |
| | | |
Investor Shares | $1,000.00 | $1,024.40 | $0.82 |
Institutional Shares | 1,000.00 | 1,024.70 | 0.51 |
Europe Pacific ETF Shares | 1,000.00 | 1,024.65 | 0.56 |
1 The calculations are based on expenses incurred during the most recent six-month period. The fund’s annualized six-month expense ratios for that period are: 0.16% for Investor Shares; 0.10% for Institutional Shares; and 0.11% for Europe Pacific ETF Shares. The dollar amounts shown as “Expenses Paid” are equal to the annualized expense ratio multiplied by the average account value over the period, multiplied by the number of days in the most recent six-month period, then divided by the number of days in the most recent 12-month period.
33
Note that the expenses shown in the table are meant to highlight and help you compare ongoing costs only and do not reflect transaction costs incurred by the fund for buying and selling securities. Further, the expenses do not include the 1% fee on redemptions of shares held for less than five years, nor do they include the account service fee described in the prospectus. If such fees were applied to your account, your costs would be higher. Your fund does not carry a “sales load.”
The calculations assume no shares were bought or sold during the period. Your actual costs may have been higher or lower, depending on the amount of your investment and the timing of any purchases or redemptions.
You can find more information about the fund’s expenses, including annual expense ratios, in the Financial Statements section of this report. For additional information on operating expenses and other shareholder costs, please refer to your fund’s current prospectus.
34
Glossary
Beta. A measure of the magnitude of a fund’s past share-price fluctuations in relation to the ups and downs of a given market index. The index is assigned a beta of 1.00. Compared with a given index, a fund with a beta of 1.20 typically would have seen its share price rise or fall by 12% when the index rose or fell by 10%. For this report, beta is based on returns over the past 36 months for both the fund and the index. Note that a fund’s beta should be reviewed in conjunction with its R-squared (see definition). The lower the R-squared, the less correlation there is between the fund and the index, and the less reliable beta is as an indicator of volatility.
Equity Exposure. A measure that reflects a fund’s investments in stocks and stock futures. Any holdings in short-term reserves are excluded.
Expense Ratio. The percentage of a fund’s average net assets used to pay its annual administrative and advisory expenses. These expenses directly reduce returns to investors.
Inception Date. The date on which the assets of a fund (or one of its share classes) are first invested in accordance with the fund’s investment objective. For funds with a subscription period, the inception date is the day after that period ends. Investment performance is measured from the inception date.
R-Squared. A measure of how much of a fund’s past returns can be explained by the returns from the market in general, as measured by a given index. If a fund’s total returns were precisely synchronized with an index’s returns, its R-squared would be 1.00. If the fund’s returns bore no relationship to the index’s returns, its R-squared would be 0. For this report, R-squared is based on returns over the past 36 months for both the fund and the index.
Short-Term Reserves. The percentage of a fund invested in highly liquid, short-term securities that can be readily converted to cash.
Turnover Rate. An indication of the fund’s trading activity. Funds with high turnover rates incur higher transaction costs and may be more likely to distribute capital gains (which may be taxable to investors). The turnover rate excludes in-kind transactions, which have minimal impact on costs.
35
The People Who Govern Your Fund
The trustees of your mutual fund are there to see that the fund is operated and managed in your best interests since, as a shareholder, you are a part owner of the fund. Your fund’s trustees also serve on the board of directors of The Vanguard Group, Inc., which is owned by the Vanguard funds and provides services to them on an at-cost basis.
A majority of Vanguard’s board members are independent, meaning that they have no affiliation with Vanguard or the funds they oversee, apart from the sizable personal investments they have made as private individuals. The independent board members have distinguished backgrounds in business, academia, and public service. Each of the trustees and executive officers oversees 155 Vanguard funds.
The following table provides information for each trustee and executive officer of the fund. More information about the trustees is in the Statement of Additional Information, which can be obtained, without charge, by contacting Vanguard at 800-662-7447, or online at www.vanguard.com.
Chairman of the Board and Interested Trustee | Rajiv L. Gupta |
| Born 1945. Trustee Since December 2001.2 Principal |
| Occupation(s) During the Past Five Years: Chairman, |
John J. Brennan1 | President, and Chief Executive Officer of Rohm and |
Born 1954. Trustee Since May 1987. Chairman of | Haas Co. (chemicals); Board Member of the American |
the Board. Principal Occupation(s) During the Past Five | Chemistry Council; Director of Tyco International, Ltd. |
Years: Chairman of the Board and Director/Trustee of | (diversified manufacturing and services), since 2005. |
The Vanguard Group, Inc., and of each of the investment | |
companies served by The Vanguard Group; Chief | |
Executive Officer and President of The Vanguard Group | Amy Gutmann |
and of each of the investment companies served by The | Born 1949. Trustee Since June 2006. Principal |
Vanguard Group (1996–2008). | Occupation(s) During the Past Five Years: President of |
| the University of Pennsylvania since 2004; Professor in |
| the School of Arts and Sciences, Annenberg School for |
Independent Trustees | Communication, and Graduate School of Education of |
| the University of Pennsylvania since 2004; Provost |
| (2001–2004) and Laurance S. Rockefeller Professor of |
Charles D. Ellis | Politics and the University Center for Human Values |
Born 1937. Trustee Since January 2001. Principal | (1990–2004), Princeton University; Director of Carnegie |
Occupation(s) During the Past Five Years: Applecore | Corporation of New York since 2005 and of Schuylkill |
Partners (pro bono ventures in education); Senior | River Development Corporation and Greater Philadelphia |
Advisor to Greenwich Associates (international business | Chamber of Commerce since 2004; Trustee of the |
strategy consulting); Successor Trustee of Yale University; | National Constitution Center since 2007. |
Overseer of the Stern School of Business at New York | |
University; Trustee of the Whitehead Institute for | |
Biomedical Research. | JoAnn Heffernan Heisen |
| Born 1950. Trustee Since July 1998. Principal |
| Occupation(s) During the Past Five Years: Retired |
Emerson U. Fullwood | Corporate Vice President, Chief Global Diversity Officer, |
Born 1948. Trustee Since January 2008. Principal | and Member of the Executive Committee of Johnson & |
Occupation(s) During the Past Five Years: Retired | Johnson (pharmaceuticals/consumer products); Vice |
Executive Chief Staff and Marketing Officer for | President and Chief Information Officer (1997–2005) |
North America and Corporate Vice President of | of Johnson & Johnson; Director of the University |
Xerox Corporation (photocopiers and printers); | Medical Center at Princeton and Women’s Research |
Director of SPX Corporation (multi-industry | and Education Institute. |
manufacturing), of the United Way of Rochester, | |
and of the Boy Scouts of America. | |
André F. Perold | F. William McNabb III1 |
Born 1952. Trustee Since December 2004. Principal | Born 1957. Chief Executive Officer Since August 2008. |
Occupation(s) During the Past Five Years: George Gund | President Since March 2008. Principal Occupation(s) |
Professor of Finance and Banking, Senior Associate | During the Past Five Years: Chief Executive Officer, |
Dean, and Director of Faculty Recruiting, Harvard | Director, and President of The Vanguard Group, Inc., |
Business School; Director and Chairman of UNX, Inc. | since 2008; Chief Executive Officer and President of |
(equities trading firm); Chair of the Investment | each of the investment companies served by The |
Committee of HighVista Strategies LLC (private | Vanguard Group since 2008; Director of Vanguard |
investment firm) since 2005. | Marketing Corporation; Managing Director of The |
| Vanguard Group (1995–2008). |
| |
Alfred M. Rankin, Jr. | |
Born 1941. Trustee Since January 1993. Principal | Heidi Stam1 |
Occupation(s) During the Past Five Years: Chairman, | Born 1956. Secretary Since July 2005. Principal |
President, Chief Executive Officer, and Director of | Occupation(s) During the Past Five Years: Managing |
NACCO Industries, Inc. (forklift trucks/housewares/ | Director of The Vanguard Group, Inc., since 2006; |
lignite); Director of Goodrich Corporation (industrial | General Counsel of The Vanguard Group since 2005; |
products/aircraft systems and services). | Secretary of The Vanguard Group and of each of the |
| investment companies served by The Vanguard Group |
| since 2005; Director and Senior Vice President of |
J. Lawrence Wilson | Vanguard Marketing Corporation since 2005; Principal |
Born 1936. Trustee Since April 1985. Principal | of The Vanguard Group (1997–2006). |
Occupation(s) During the Past Five Years: Retired | |
Chairman and Chief Executive Officer of Rohm and | |
Haas Co. (chemicals); Director of Cummins Inc. (diesel | Vanguard Senior Management Team |
engines) and AmerisourceBergen Corp. (pharmaceutical | |
distribution); Trustee of Vanderbilt University and of | |
Culver Educational Foundation. | R. Gregory Barton | James M. Norris |
| Mortimer J. Buckley | Ralph K. Packard |
| Kathleen C. Gubanich | Glenn W. Reed |
Executive Officers | Paul A. Heller | George U. Sauter |
| Michael S. Miller | |
| |
Thomas J. Higgins1 | |
Born 1957. Chief Financial Officer Since September | Founder |
2008. Principal Occupation(s) During the Past Five | |
Years: Principal of The Vanguard Group, Inc.; Chief | |
Financial Officer of each of the investment companies | John C. Bogle |
served by The Vanguard Group since 2008; Treasurer | Chairman and Chief Executive Officer, 1974–1996 |
of each of the investment companies served by The | |
Vanguard Group (1998–2008). | |
| |
| |
Kathryn J. Hyatt1 | |
Born 1955. Treasurer Since November 2008. Principal | |
Occupation(s) During the Past Five Years: Principal of | |
The Vanguard Group, Inc.; Treasurer of each of the | |
investment companies served by The Vanguard | |
Group since 2008; Assistant Treasurer of each of the | |
investment companies served by The Vanguard Group | |
(1988–2008). | |
1 These individuals are “interested persons” as defined in the Investment Company Act of 1940.
2 December 2002 for Vanguard Equity Income Fund, Vanguard Growth Equity Fund, the Vanguard Municipal Bond Funds, and the Vanguard State Tax-Exempt Funds.
| 
|
| P.O. Box 2600 |
| Valley Forge, PA 19482-2600 |
Connect with Vanguard® > www.vanguard.com
Fund Information > 800-662-7447 | All comparative mutual fund data are from Lipper Inc. |
| or Morningstar, Inc., unless otherwise noted. |
Direct Investor Account Services > 800-662-2739 | |
| You can obtain a free copy of Vanguard’s proxy voting |
Institutional Investor Services > 800-523-1036 | |
| guidelines by visiting our website, www.vanguard.com, |
Text Telephone for People | and searching for “proxy voting guidelines,” or by |
With Hearing Impairment > 800-952-3335 | calling Vanguard at 800-662-2739. The guidelines are |
| also available from the SEC’s website, www.sec.gov. |
| In addition, you may obtain a free report on how your |
| fund voted the proxies for securities it owned during |
This material may be used in conjunction | the 12 months ended June 30. To get the report, visit |
with the offering of shares of any Vanguard | either www.vanguard.com or www.sec.gov. |
fund only if preceded or accompanied by | |
the fund’s current prospectus. | |
| You can review and copy information about your fund |
| at the SEC’s Public Reference Room in Washington, D.C. |
The funds or securities referred to herein are not | To find out more about this public service, call the SEC |
sponsored, endorsed, or promoted by MSCI, and MSCI | at 202-551-8090. Information about your fund is also |
bears no liability with respect to any such funds or | available on the SEC’s website, and you can receive |
securities. For any such funds or securities, the | copies of this information, for a fee, by sending a |
prospectus or the Statement of Additional Information | request in either of two ways: via e-mail addressed to |
contains a more detailed description of the limited | publicinfo@sec.gov or via regular mail addressed to the |
relationship MSCI has with The Vanguard Group and | Public Reference Section, Securities and Exchange |
any related funds. | Commission, Washington, DC 20549-0102. |
| |
| |
Russell is a trademark of The Frank Russell Company. | |
| |
| |
| |
| |
| |
| |
| |
| |
| © 2009 The Vanguard Group, Inc. |
| All rights reserved. |
| Vanguard Marketing Corporation, Distributor. |
| |
| Q1270 022009 |
(a) Audit Fees.
Aggregate Audit Fees of Registered Investment Companies in the Vanguard Group.
(b) Audit-Related Fees.
Includes fees billed in connection with assurance and related services provided to the Registrant, The Vanguard Group, Inc., Vanguard Marketing Corporation, and other registered investment companies in the Vanguard Group.
(c) Tax Fees.
Includes fees billed in connection with tax compliance, planning and advice services provided to the Registrant, The Vanguard Group, Inc., Vanguard Marketing Corporation, and other registered investment companies in the Vanguard Group and related to income and excise taxes.
(d) All Other Fees.
Includes fees billed for services related to risk management and privacy matters. Services were provided to the Registrant, The Vanguard Group, Inc., Vanguard Marketing Corporation, and other registered investment companies in the Vanguard Group.
(e) (1) Pre-Approval Policies. The policy of the Registrant’s Audit Committee is to consider and, if appropriate, approve before the principal accountant is engaged for such services, all specific audit and non-audit services provided to: (1) the Registrant; (2) The Vanguard Group, Inc.; (3) other entities controlled by The Vanguard Group, Inc. that provide ongoing services to the Registrant; and (4) other registered investment companies in the Vanguard Group. In making a determination, the Audit Committee considers whether the services are consistent with maintaining the principal accountant’s independence.
In the event of a contingency situation in which the principal accountant is needed to provide services in between scheduled Audit Committee meetings, the Chairman of the Audit Committee would be called on to consider and, if appropriate, pre-approve audit or permitted non-audit services in an amount sufficient to complete services through the next Audit Committee meeting, and to determine if such services would be consistent with maintaining the accountant’s independence. At the next scheduled Audit Committee meeting, services and fees would be presented to the Audit Committee for formal consideration, and, if appropriate, approval by the entire Audit Committee. The Audit Committee would again consider whether such services and fees are consistent with maintaining the principal accountant’s independence.
The Registrant’s Audit Committee is informed at least annually of all audit and non-audit services provided by the principal accountant to the Vanguard complex, whether such services are provided to: (1) the Registrant; (2) The Vanguard Group, Inc.; (3) other entities controlled by The Vanguard Group, Inc. that provide ongoing services to the Registrant; or (4) other registered investment companies in the Vanguard Group.
(2) No percentage of the principal accountant’s fees or services were approved pursuant to the waiver provision of paragraph (c)(7)(i)(C) of Rule 2-01 of Regulation S-X.
(g) Aggregate Non-Audit Fees.
Includes fees billed for non-audit services provided to the Registrant, The Vanguard Group, Inc., Vanguard Marketing Corporation, and other registered investment companies in the Vanguard Group.
(h) For the most recent fiscal year, the Audit Committee has determined that the provision of all non-audit services was consistent with maintaining the principal accountant’s independence.
(a) Disclosure Controls and Procedures. The Principal Executive and Financial Officers concluded that the Registrant's Disclosure Controls and Procedures are effective based on their evaluation of the Disclosure Controls and Procedures as of a date within 90 days of the filing date of this report.
(b) Internal Control Over Financial Reporting. There were no significant changes in Registrant’s Internal Control Over Financial Reporting or in other factors that could significantly affect this control subsequent to the date of the evaluation, including any corrective actions with regard to significant deficiencies and material weaknesses.
Pursuant to the requirements of the Securities Exchange Act of 1934 and the Investment Company Act of 1940, the registrant has duly caused this report to be signed on its behalf by the undersigned, thereunto duly authorized.
Pursuant to the requirements of the Securities Exchange Act of 1934 and the Investment Company Act of 1940, this report has been signed below by the following persons on behalf of the registrant and in the capacities and on the dates indicated.
Heidi Stam, pursuant to a Power of Attorney filed on January 18, 2008, see file Number 2-29601, Incorporated by Reference; and pursuant to a Power of Attorney filed on September 26, 2008, see File Number 2-47371, Incorporated by Reference.