UNITED STATES
SECURITIES AND EXCHANGE COMMISSION
Washington, D.C. 20549
FORM N-CSR
CERTIFIED SHAREHOLDER REPORT
OF
REGISTERED MANAGEMENT INVESTMENT COMPANIES
| | |
| Investment Company Act file number: | 811-07175 |
| |
| Name of Registrant: | Vanguard Tax-Managed Funds |
| |
| Address of Registrant: | P.O. Box 2600 |
| | Valley Forge, PA 19482 |
| |
| Name and address of agent for service: | Heidi Stam, Esquire |
| | P.O. Box 876 |
| | Valley Forge, PA 19482 |
|
| Registrant’s telephone number, including area code: (610) 669-1000 |
| |
| Date of fiscal year end: December 31 | |
|
| Date of reporting period: January 1, 2010 – December 31, 2010 |
| |
| Item 1: Reports to Shareholders | |

|
| Vanguard Tax-Managed Funds® |
| Annual Report |
| December 31, 2010 |

|
| Vanguard Tax-Managed Balanced Fund |
| Vanguard Tax-Managed Growth and Income Fund |
| Vanguard Tax-Managed Capital Appreciation Fund |
| Vanguard Tax-Managed Small-Cap Fund |
|
> For the fiscal year ended December 31, 2010, returns for Vanguard’s domestic
Tax-Managed Funds ranged from about 9% for the Tax-Managed Balanced Fund
to about 26% for the Tax-Managed Small-Cap Fund.
> Although they aren’t bound by a strict indexing strategy, the three stock funds
posted returns consistent with those of their benchmarks. The Tax-Managed
Balanced Fund trailed its index by more than 1 percentage point, largely
because of turmoil in the municipal bond market late in the year.
> The funds distributed no capital gains, meeting their tax-management
objectives as they have since inception.
| |
| Contents | |
| Your Fund’s Total Returns. | 1 |
| Chairman’s Letter. | 2 |
| Tax-Managed Balanced Fund. | 9 |
| Tax-Managed Growth and Income Fund. | 44 |
| Tax-Managed Capital Appreciation Fund. | 62 |
| Tax-Managed Small-Cap Fund. | 81 |
| Your Fund’s After-Tax Returns. | 101 |
| About Your Fund’s Expenses. | 103 |
| Glossary. | 105 |
Please note: The opinions expressed in this report are just that—informed opinions. They should not be considered promises or advice.
Also, please keep in mind that the information and opinions cover the period through the date on the front of this report. Of course, the
risks of investing in your fund are spelled out in the prospectus.
See the Glossary for definitions of investment terms used in this report.
Cover photograph: Jean Maher.
Your Fund’s Total Returns
| |
| Fiscal Year Ended December 31, 2010 | |
| | Total |
| | Returns |
| Vanguard Tax-Managed Balanced Fund | 9.22% |
| Tax-Managed Balanced Composite Index | 10.81 |
| Mixed-Asset Target Allocation Moderate Funds Average | 11.41 |
| Tax-Managed Balanced Composite Index: Weighted 50% Russell 1000 Index and 50% Barclays Capital 7 Year Municipal Bond Index. |
| Mixed-Asset Target Allocation Moderate Funds Average: Derived from data provided by Lipper Inc. |
| |
| Vanguard Tax-Managed Growth and Income Fund | |
| Investor Shares | 14.90% |
| Admiral™ Shares | 14.99 |
| Institutional Shares | 15.04 |
| S&P 500 Index | 15.06 |
| Large-Cap Core Funds Average | 12.86 |
| Large-Cap Core Funds Average: Derived from data provided by Lipper Inc. |
| |
| Vanguard Tax-Managed Capital Appreciation Fund | |
| Investor Shares | 15.94% |
| Admiral™ Shares | 16.02 |
| Institutional Shares | 16.08 |
| Russell 1000 Index | 16.10 |
| Multi-Cap Core Funds Average | 15.55 |
| Multi-Cap Core Funds Average: Derived from data provided by Lipper Inc. |
| |
| Vanguard Tax-Managed Small-Cap Fund | |
| Investor Shares | 25.99% |
| Institutional Shares | 26.09 |
| S&P SmallCap 600 Index | 26.31 |
| Small-Cap Core Funds Average | 25.21 |
Small-Cap Core Funds Average: Derived from data provided by Lipper Inc.
Admiral Shares carry lower expenses and are available to investors who meet certain account-balance requirements. Institutional Shares are
available to certain institutional investors who meet specific administrative, service, and account-size criteria.
1

Chairman’s Letter
Dear Shareholder,
Global financial markets took a roller-coaster ride in 2010. Still, despite the many ups and downs, U.S. stocks ended the year with double-digit gains. Returns for Vanguard’s domestic Tax-Managed Funds ranged from about 9% for the Tax-Managed Balanced Fund to about 26% for the Tax-Managed Small-Cap Fund.
Three of the funds were on track with their respective benchmarks for the period. The Tax-Managed Balanced Fund trailed its index by more than 1 percentage point, a result of the fund’s slightly larger allocation to municipal bonds. Late in the year the municipal market experienced unusual volatility, which helped produce a gap between the return of the fund’s bond allocation and its index—a theoretical construct that may not accurately capture muni returns during volatile periods.
The funds met their tax-efficiency objective, as they have since their inception. In the Performance at a Glance chart on page 8, you can see that the funds’ advisors, Vanguard’s Quantitative Equity Group and Fixed Income Group, continued to avoid distributing capital gains to shareholders. The advisors used a variety of portfolio management strategies to avoid realizing capital gains while deviating as little as possible from a pure indexing strategy.
2
You may wish to review the table showing after-tax returns for the past one, five, and ten years that appears later in this report.
Stocks rallied as the forecast seemed to brighten
After a series of false starts, hesitations, and retreats, global stock markets finished 2010 with powerful gains. As the prospect of a double-dip recession faded, the broad U.S. stock market clambered higher, shrugging off high unemployment and distress in Europe’s debt markets to return 17.70%. Small- and mid-capitalization stocks did even better.
Outside the United States, gains were more muted, in part because Europe’s sovereign-debt challenges continued to reverberate through local stock markets.
Emerging markets were the best performers. Asia’s developed markets performed weakly, though the strength of the yen, the Australian dollar, and other regional currencies bolstered returns for U.S.-based investors.
The fixed income market reprised a familiar theme
Although U.S. Treasury securities rallied through the summer, total return tables were dominated by riskier bonds for the full 12 months, a pattern we also saw in 2009. Low interest rates and a sense that the economic recovery was gathering momentum prompted investors to seek higher yields in both high-quality and below-investment-grade corporate bonds. The broad U.S. bond market returned 6.54%. Late in the year, yields bounced
| | | |
| Market Barometer | | | |
| |
| | Average Annual Total Returns |
| | Periods Ended December 31, 2010 |
| | One | Three | Five |
| | Year | Years | Years |
| Stocks | | | |
| Russell 1000 Index (Large-caps) | 16.10% | -2.37% | 2.59% |
| Russell 2000 Index (Small-caps) | 26.86 | 2.22 | 4.47 |
| Dow Jones U.S. Total Stock Market Index | 17.70 | -1.56 | 3.17 |
| MSCI All Country World Index ex USA (International) | 11.60 | -4.58 | 5.29 |
| |
| Bonds | | | |
| Barclays Capital U.S. Aggregate Bond Index (Broad | | | |
| taxable market) | 6.54% | 5.90% | 5.80% |
| Barclays Capital Municipal Bond Index (Broad | | | |
| tax-exempt market) | 2.38 | 4.08 | 4.09 |
| Citigroup Three-Month U.S. Treasury Bill Index | 0.13 | 0.69 | 2.29 |
| |
| CPI | | | |
| Consumer Price Index | 1.50% | 1.43% | 2.18% |
3
off summer lows, putting pressure on bond prices. The dynamic was especially pronounced among municipal bonds.
As it has since December 2008, the Fed held its target for short-term interest rates near 0%, keeping the returns available from money market instruments, such as the 3-month Treasury bill, in the same neighborhood.
Gains in all stock sectors boosted the funds’ performance
In last year’s investment environment, Vanguard’s four domestic Tax-Managed Funds posted impressive results. (We review the performance of Vanguard Tax-Managed International Fund in a separate report.)
The Tax-Managed Small-Cap Fund led with a return of about 26%, as small-cap stocks generally performed significantly better than their larger counterparts. The Tax-Managed Capital Appreciation Fund, which invests in mid- and large-cap stocks, and the Tax-Managed Growth and Income Fund, which has investment characteristics similar to those of its benchmark, the Standard and Poor’s 500 Index, returned about 16% and 15%, respectively. The Tax-Managed Balanced Fund brought up the rear, returning about 9% for the year. The fund allocates a bit more than half of its assets to municipal bonds and the rest to mid- and large-cap stocks.
All industries benefited from the stock market’s broad-based recovery, and each of the four funds recorded gains in all ten
| | | | |
| Expense Ratios | | | | |
| Your Fund Compared With Its Peer Group | | | | |
| | Investor | Admiral | Institutional | Peer Group |
| | Shares | Shares | Shares | Average |
| Tax-Managed Balanced Fund | 0.15% | — | — | 0.95% |
| Tax-Managed Growth and Income Fund | 0.21 | 0.15% | 0.09% | 1.27 |
| Tax-Managed Capital Appreciation Fund | 0.21 | 0.15 | 0.09 | 1.20 |
| Tax-Managed Small-Cap Fund | 0.19 | — | 0.09 | 1.50 |
The fund expense ratios shown are from the prospectus dated April 26, 2010, and represent estimated costs for the current fiscal year. For the
fiscal year ended December 31, 2010, the funds’ expense ratios were: for the Tax-Managed Balanced Fund, 0.15%; for the Tax-Managed
Growth and Income Fund, 0.20% for Investor Shares, 0.12% for Admiral Shares, and 0.08% for Institutional Shares; for the Tax-Managed
Capital Appreciation Fund, 0.20% for Investor Shares, 0.12% for Admiral Shares, and 0.08% for Institutional Shares; and for the Tax-Managed
Small-Cap Fund, 0.18% for Investor Shares and 0.08% for Institutional Shares. Peer-group expense ratios are derived from data provided by
Lipper Inc. and capture information through year-end 2009.
Peer groups: For the Tax-Managed Balanced Fund, Mixed-Asset Target Allocation Moderate Funds; for the Tax-Managed Growth and Income
Fund, Large-Cap Core Funds; for the Tax-Managed Capital Appreciation Fund, Multi-Cap Core Funds; for the Tax-Managed Small-Cap Fund,
Small-Cap Core Funds.
4
market sectors for the year. The consumer discretionary sector was the top performer for all the funds as improved consumer sentiment helped boost a wide range of stocks, including holdings in media conglomerates, hotels, and restaurants. Retailers gained from a better-than-expected back-to-school season and signs that shoppers were opening their wallets as the holidays approached.
Stocks in the industrial sector were also strong performers in each of the four funds. High demand from emerging markets—most notably China, India, and Latin American countries—lifted equipment and machinery companies across the board.
Information technology stocks were important contributors to the performance of all four funds, most notably the Tax-Managed Small-Cap Fund. In the small-cap
| |
| Total Returns | |
| Ten Years Ended December 31, 2010 | |
| | Average |
| | Annual Return |
| Tax-Managed Balanced Fund | 3.68% |
| Tax-Managed Balanced Composite Index | 3.89 |
| Mixed-Asset Target Allocation Moderate Funds Average | 3.32 |
Tax-Managed Balanced Composite Index: Weighted 50% Russell 1000 Index and 50% Barclays Capital 7 Year Municipal Bond Index.
Mixed-Asset Target Allocation Moderate Funds Average: Derived from data provided by Lipper Inc.
| |
| Tax-Managed Growth and Income Fund Investor Shares | 1.37% |
| S&P 500 Index | 1.41 |
| Large-Cap Core Funds Average | -0.09 |
| Large-Cap Core Funds Average: Derived from data provided by Lipper Inc. | |
| Tax-Managed Capital Appreciation Fund Investor Shares | 1.50% |
| Russell 1000 Index | 1.83 |
| Multi-Cap Core Funds Average | 1.63 |
| Multi-Cap Core Funds Average: Derived from data provided by Lipper Inc. | |
| Tax-Managed Small-Cap Fund Investor Shares | 7.58% |
| S&P SmallCap 600 Index | 7.66 |
| Small-Cap Core Funds Average | 6.44 |
| Small-Cap Core Funds Average: Derived from data provided by Lipper Inc. |
The figures shown represent past performance, which is not a guarantee of future results. (Current performance may be lower or higher than the performance data cited. For performance data current to the most recent month-end, visit our website at vanguard.com/performance.) Note, too, that both investment returns and principal value can fluctuate widely, so an investor’s shares, when sold, could be worth more or less than their original cost.
5
arena, semiconductor, electronics equipment, and software companies were the most notable performers, while computer and peripheral companies led the way in the large-cap-focused funds.
To varying degrees, all four funds benefited from double-digit gains in the energy and financial sectors. In energy, gas companies rose on an increase in oil prices, while insurance companies, commercial banks, and real estate investment trusts were among the top-performing financial stocks. Holdings in the consumer staples sector also helped boost returns.
The Tax-Managed Balanced Fund’s performance largely reflected that of its composite benchmark: The Russell 1000 Index returned about 16% and the Barclays Capital 7 Year Municipal Bond Index returned almost 5%. Municipal bonds lagged the broad fixed income market for the period as investors sought higher yields from riskier corporate bonds.
Long-term performance has been competitive
For the decade ended December 31, 2010, Vanguard’s domestic Tax-Managed Funds have posted average annual returns ranging from about 8% for the Tax-Managed Small-Cap Fund to about 1% for the Tax-Managed Growth and Income Fund.
Although at first glance the funds’ ten-year returns may not appear impressive, keep in mind the turbulence of the period represented—a time that saw the stock market fall sharply in 2001 and 2002, as the late-1990s tech stock bubble deflated, and again during the trauma of the 2008–2009 financial crisis.
Over the past decade, all four funds have remained on target with their respective benchmarks. The advisors, Vanguard’s Quantitative Equity Group and Fixed Income Group, deserve credit for tracking the benchmarks closely—no easy feat during a period of such significant market swings—while also meeting the funds’ tax-management objectives. Unlike many of their peers, the Vanguard Tax-Managed Funds have never distributed taxable capital gains to shareholders. The advisors hope to continue this record for many years as they manage each fund’s holdings with tax consequences in mind.
Three of the funds have outperformed their respective peer groups over the ten-year period. The Tax-Managed Capital Appreciation Fund, the one exception, slightly trailed the average return of multi-cap core funds for the decade.
The funds’ ultra-low expenses undoubtedly have played a key role in this competitive long-term performance.
6
Stay focused on your goals, not on the markets’ ups and downs
The past few years have been a period of ups and downs for U.S. stocks, and investors have endured the bumpy ride. While these times have been nerve-racking, they have also been a good reminder not to let market swings influence your long-term investment strategy. Changes have been swift and unpredictable, with the potential to impose penalties on those who base their decisions on past performance.
Vanguard encourages you to create a long-term investment plan that includes a mix of stocks, bonds, and short-term investments that are appropriate for your goals and risk tolerance. Once your plan is in place, it’s important to stick with it regardless of market conditions.
Such a well-balanced portfolio can help cushion some of the market’s volatility while allowing you to participate in its long-term potential for growth. For the tax-conscious investor, Vanguard’s Tax-Managed Funds, with their proven tax efficiency and low expense ratios, can play a useful role in such a portfolio.
Thank you for entrusting your assets to Vanguard.
Sincerely,

F. William McNabb III
Chairman and Chief Executive Officer
January 13, 2011
7
| | | | |
| Your Fund’s Performance at a Glance | | | | |
| December 31, 2009 , Through December 31, 2010 | | | | |
| | | | Distributions Per Share |
| | Starting | Ending | Income | Capital |
| | Share Price | Share Price | Dividends | Gains |
| Vanguard Tax-Managed Balanced Fund | $18.75 | $19.96 | $0.496 | $0.000 |
| | | | |
| Vanguard Tax-Managed Growth and Income Fund | | | | |
| Investor Shares | $24.30 | $27.40 | $0.476 | $0.000 |
| Admiral Shares | 49.94 | 56.31 | 1.021 | 0.000 |
| Institutional Shares | 24.30 | 27.40 | 0.507 | 0.000 |
| | | | |
| Vanguard Tax-Managed Capital Appreciation Fund | | | | |
| Investor Shares | $27.19 | $31.09 | $0.434 | $0.000 |
| Admiral Shares | 54.72 | 62.56 | 0.924 | 0.000 |
| Institutional Shares | 27.19 | 31.09 | 0.471 | 0.000 |
| Vanguard Tax-Managed Small-Cap Fund | | | | |
| Investor Shares | $21.75 | $27.17 | $0.235 | $0.000 |
| Institutional Shares | 21.80 | 27.23 | 0.259 | 0.000 |
8
Tax-Managed Balanced Fund
Fund Profile
As of December 31, 2010
| | | |
| Equity and Portfolio Characteristics | |
| | | | DJ |
| | | Russell | U.S. Total |
| | | 1000 | Market |
| | Fund | Index | Index |
| Number of Stocks | 588 | 978 | 3,893 |
| Median Market Cap $35.1B | $37.1B | $29.6B |
| Price/Earnings Ratio | 17.7x | 17.4x | 18.3x |
| Price/Book Ratio | 2.2x | 2.2x | 2.2x |
| Return on Equity | 19.5% | 19.5% | 18.8% |
| Earnings Growth Rate | 7.1% | 6.2% | 6.2% |
| Dividend Yield | 1.5% | 1.8% | 1.7% |
| Foreign Holdings | 0.0% | 0.0% | 0.0% |
| Turnover Rate | 23% | — | — |
| Ticker Symbol | VTMFX | — | — |
| Expense Ratio1 | 0.15% | — | — |
| 30-Day SEC Yield | 1.94% | — | — |
| Short-Term Reserves | 0.0% | — | — |
| | | |
| Fixed Income Characteristics | | |
| | | Barclays | |
| | | 7 Year | Barclays |
| | | Municipal | Municipal |
| | Fund | Index | Bond Index |
| Number of Bonds | 540 | 4,778 | 46,336 |
| Yield to Maturity | | | |
| (before expenses) | 3.2% | 3.0% | 3.8% |
| Average Coupon | 4.6% | 4.9% | 5.0% |
| Average Duration | 5.7 years | 5.3 years | 8.5 years |
| Average Effective | | | |
| Maturity | 6.5 years | 7.0 years | 13.3 years |
| | |
| Total Fund Volatility Measures | |
| | | DJ |
| | Tax-Managed | U.S. Total |
| | Balanced | Market |
| | Comp Index | Index |
| R-Squared | 0.99 | 0.93 |
| Beta | 0.97 | 0.49 |
These measures show the degree and timing of the fund’s fluctuations compared with the indexes over 36 months.
| | |
| Ten Largest Stocks (% of equity portfolio) | |
| Exxon Mobil Corp. | Integrated Oil & Gas | 2.9% |
| Apple Inc. | Computer Hardware | 2.3 |
| Microsoft Corp. | Systems Software | 1.7 |
| General Electric Co. | Industrial Conglomerates | 1.6 |
| International Business Machines Corp. | IT Consulting & Other Services | 1.5 |
| Chevron Corp. | Integrated Oil & Gas | 1.3 |
| Procter & Gamble Co. | Household Products | 1.3 |
| JPMorgan Chase & Co. | Diversified Financial Services | 1.2 |
| Wells Fargo & Co. | Diversified Banks | 1.2 |
| Johnson & Johnson | Pharmaceuticals | 1.2 |
| Top Ten | | 16.2% |
| Top Ten as % of Total Net Assets | 7.8% |
The holdings listed exclude any temporary cash investments and equity index products.
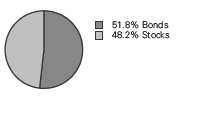
Fund Asset Allocation
1 The expense ratio shown is from the prospectus dated April 26, 2010, and represents estimated costs for the current fiscal year. For the fiscal year ended December 31, 2010, the expense ratio was 0.15%.
9
Tax-Managed Balanced Fund
| | | |
| Sector Diversification (% of equity exposure) |
| | | | DJ |
| | | Russell | U.S. Total |
| | | 1000 | Market |
| | Fund | Index | Index |
| Consumer | | | |
| Discretionary | 11.3% | 11.2% | 11.9% |
| Consumer Staples | 9.7 | 9.7 | 9.5 |
| Energy | 11.6 | 11.7 | 10.6 |
| Financials | 15.9 | 16.1 | 16.6 |
| Health Care | 11.3 | 11.2 | 10.7 |
| Industrials | 11.3 | 11.2 | 11.4 |
| Information | | | |
| Technology | 18.3 | 18.3 | 18.9 |
| Materials | 4.2 | 4.2 | 4.5 |
| Telecommunication | | | |
| Services | 2.9 | 3.0 | 2.7 |
| Utilities | 3.5 | 3.4 | 3.2 |
| |
| Distribution by Maturity (% of fixed income |
| portfolio) | |
| Under 1 Year | 8.6% |
| 1 - 3 Years | 16.7 |
| 3 - 5 Years | 14.7 |
| 5 - 10 Years | 46.3 |
| 10 - 20 Years | 13.5 |
| 20 - 30 Years | 0.2 |
| |
| Largest Area Concentrations (% of fixed income |
| portfolio) | |
| New York | 18.4% |
| California | 11.0 |
| Texas | 6.4 |
| Florida | 5.3 |
| Massachusetts | 4.4 |
| New Jersey | 4.4 |
| Georgia | 4.2 |
| Ohio | 3.9 |
| Puerto Rico | 3.7 |
| Pennsylvania | 3.4 |
| Top Ten | 65.1% |
| "Largest Area Concentration" figures exclude any fixed income futures contracts. |
| |
| Distribution by Credit Quality (% of fixed income portfolio) | |
| |
| AAA | 20.4% |
| AA | 54.8 |
| A | 21.7 |
| BBB | 2.6 |
| BB | 0.4 |
| Not Rated | 0.1 |
| For information about these ratings, see the Glossary entry for Credit Quality. |
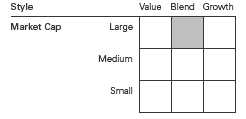
Equity Investment Focus
Fixed Income Investment Focus

10
Tax-Managed Balanced Fund
Performance Summary
All of the returns in this report represent past performance, which is not a guarantee of future results that may be achieved by the fund. (Current performance may be lower or higher than the performance data cited. For performance data current to the most recent month-end, visit our website at vanguard.com/performance.) Note, too, that both investment returns and principal value can fluctuate widely, so an investor’s shares, when sold, could be worth more or less than their original cost. The returns shown do not reflect taxes that a shareholder would pay on fund distributions or on the sale of fund shares.
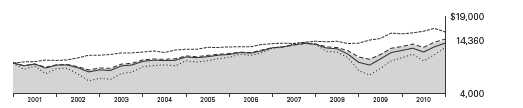
Cumulative Performance: December 31, 2000, Through December 31, 2010
Initial Investment of $10,000
| | | | | |
| | | Average Annual Total Returns | |
| | | Periods Ended December 31, 2010 | |
| | | | | | Final Value |
| | | One | Five | Ten | of a $10,000 |
| | | Year | Years | Years | Investment |
| | Tax-Managed Balanced Fund | 9.22% | 4.03% | 3.68% | $14,360 |
| | Fee-Adjusted Returns | 8.15 | 4.03 | 3.68 | 14,360 |
| •••••••• | Dow Jones U.S. Total Stock Market Index | 17.70 | 3.17 | 2.64 | 12,981 |
| - - - - - - | Barclays Capital Municipal Bond Index | 2.38 | 4.09 | 4.83 | 16,033 |
| – – – – | Tax-Managed Balanced Composite Index | 10.81 | 4.32 | 3.89 | 14,641 |
| | Mixed-Asset Target Allocation Moderate Funds Average | 11.41 | 3.51 | 3.32 | 13,867 |
Tax-Managed Balanced Composite Index: Weighted 50% Russell 1000 Index and 50% Barclays Capital 7 Year Municipal Bond Index.
Mixed-Asset Target Allocation Moderate Funds Average: Derived from data provided by Lipper Inc.
Fee-adjusted returns reflect the 1% fee on redemptions of shares held for less than five years.
See Financial Highlights for dividend and capital gains information.
11
Tax-Managed Balanced Fund
Fiscal-Year Total Returns (%): December 31, 2000, Through December 31, 2010
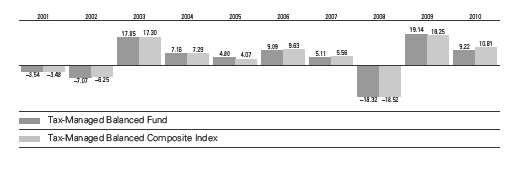
Fee-adjusted returns reflect the 1% fee on redemptions of shares held for less than five years.
12
Tax-Managed Balanced Fund
Financial Statements
Statement of Net Assets
As of December 31, 2010
The fund reports a complete list of its holdings in regulatory filings four times in each fiscal year, at the quarter-ends. For the second and fourth fiscal quarters, the lists appear in the fund’s semiannual and annual reports to shareholders. For the first and third fiscal quarters, the fund files the lists with the Securities and Exchange Commission on Form N-Q. Shareholders can look up the fund’s Forms N-Q on the SEC’s website at sec.gov. Forms N-Q may also be reviewed and copied at the SEC’s Public Reference Room (see the back cover of this report for further information).
| | | |
| | | | Market |
| | | | Value |
| | | Shares | ($000) |
| Common Stocks (48.1%) | | |
| Consumer Discretionary (5.4%) | | |
| * | Amazon.com Inc. | 10,834 | 1,950 |
| | McDonald’s Corp. | 24,559 | 1,885 |
| | Walt Disney Co. | 49,866 | 1,870 |
| | Comcast Corp. Class A | 80,645 | 1,772 |
| * | Ford Motor Co. | 96,900 | 1,627 |
| | Target Corp. | 23,645 | 1,422 |
| | Lowe’s Cos. Inc. | 46,415 | 1,164 |
| | Home Depot Inc. | 32,099 | 1,125 |
| * | DIRECTV Class A | 27,801 | 1,110 |
| | NIKE Inc. Class B | 12,047 | 1,029 |
| | News Corp. Class A | 64,100 | 933 |
| | Starbucks Corp. | 27,485 | 883 |
| | Viacom Inc. Class B | 22,231 | 881 |
| | Time Warner Cable Inc. | 13,274 | 876 |
| | Yum! Brands Inc. | 17,405 | 854 |
| | Time Warner Inc. | 25,796 | 830 |
| | Carnival Corp. | 16,650 | 768 |
| | TJX Cos. Inc. | 15,793 | 701 |
| | Staples Inc. | 29,898 | 681 |
| * | Kohl’s Corp. | 12,082 | 657 |
| | Coach Inc. | 11,770 | 651 |
| * | Bed Bath & Beyond Inc. | 11,700 | 575 |
| | Best Buy Co. Inc. | 15,075 | 517 |
| | Starwood Hotels & | | |
| | Resorts Worldwide Inc. | 8,307 | 505 |
| | Marriott International Inc. | | |
| | Class A | 11,968 | 497 |
| | Macy’s Inc. | 19,230 | 486 |
| | Virgin Media Inc. | 16,636 | 453 |
| * | O’Reilly Automotive Inc. | 7,344 | 444 |
| | Gap Inc. | 19,725 | 437 |
| | Ross Stores Inc. | 6,886 | 436 |
| | Harley-Davidson Inc. | 12,103 | 420 |
| | Advance Auto Parts Inc. | 5,903 | 390 |
| | Hasbro Inc. | 7,712 | 364 |
| | Polo Ralph Lauren Corp. | | |
| | Class A | 3,180 | 353 |
| | | |
| | Stanley Black & Decker Inc. | 5,227 | 349 |
| | PetSmart Inc. | 8,668 | 345 |
| | Scripps Networks | | |
| | Interactive Inc. Class A | 6,550 | 339 |
| | Expedia Inc. | 12,967 | 325 |
| * | BorgWarner Inc. | 4,476 | 324 |
| | Phillips-Van Heusen Corp. | 4,953 | 312 |
| * | Harman International | | |
| | Industries Inc. | 6,730 | 312 |
| | Gentex Corp. | 10,400 | 307 |
| * | Liberty Media Corp. - Starz | 4,555 | 303 |
| | Lennar Corp. Class A | 15,900 | 298 |
| | Tractor Supply Co. | 5,946 | 288 |
| | DeVry Inc. | 6,000 | 288 |
| * | DISH Network Corp. Class A | 14,557 | 286 |
| | Brinker International Inc. | 13,375 | 279 |
| | Johnson Controls Inc. | 6,900 | 264 |
| * | Apollo Group Inc. Class A | 6,500 | 257 |
| | Jarden Corp. | 8,200 | 253 |
| | John Wiley & Sons Inc. | | |
| | Class A | 5,453 | 247 |
| | Washington Post Co. Class B | 560 | 246 |
| | Aaron’s Inc. | 11,850 | 242 |
| | RadioShack Corp. | 12,521 | 231 |
| * | Liberty Global Inc. Class A | 6,532 | 231 |
| | Weight Watchers | | |
| | International Inc. | 5,993 | 225 |
| | Thor Industries Inc. | 6,588 | 224 |
| * | AutoZone Inc. | 800 | 218 |
| | Guess? Inc. | 4,600 | 218 |
| | Morningstar Inc. | 3,900 | 207 |
| | International | | |
| | Game Technology | 11,600 | 205 |
| * | Dollar General Corp. | 6,500 | 199 |
| | Wyndham Worldwide Corp. | 6,300 | 189 |
| * | Liberty Global Inc. | 5,446 | 185 |
| | Family Dollar Stores Inc. | 3,500 | 174 |
| | Strayer Education Inc. | 1,120 | 170 |
13
Tax-Managed Balanced Fund
| | | |
| | | | Market |
| | | | Value |
| | | Shares | ($000) |
| * | Discovery | | |
| | Communications Inc. | | |
| | Class A | 3,841 | 160 |
| | DR Horton Inc. | 13,399 | 160 |
| | Autoliv Inc. | 2,000 | 158 |
| | Omnicom Group Inc. | 3,200 | 147 |
| | Comcast Corp. Class A | | |
| | Special Shares | 6,476 | 135 |
| * | NVR Inc. | 180 | 124 |
| * | New York Times Co. Class A | 11,000 | 108 |
| * | Career Education Corp. | 4,500 | 93 |
| | International Speedway Corp. | | |
| | Class A | 3,399 | 89 |
| | Chico’s FAS Inc. | 7,000 | 84 |
| * | Liberty Media Corp. - Capital | 1,200 | 75 |
| | Newell Rubbermaid Inc. | 3,718 | 68 |
| * | MGM Resorts International | 4,013 | 60 |
| * | Toll Brothers Inc. | 2,000 | 38 |
| | Cablevision Systems Corp. | | |
| | Class A | 1,094 | 37 |
| | Wendy’s/Arby’s Group Inc. | | |
| | Class A | 7,800 | 36 |
| | CBS Corp. Class B | 1,600 | 30 |
| | Lennar Corp. Class B | 680 | 11 |
| | H&R Block Inc. | 500 | 6 |
| | Darden Restaurants Inc. | 50 | 2 |
| * | Krispy Kreme Doughnuts Inc. | | |
| | Warrants Exp. 03/02/2012 | 243 | — |
| | | | 39,707 |
| Consumer Staples (4.7%) | | |
| | Procter & Gamble Co. | 71,984 | 4,631 |
| | Coca-Cola Co. | 60,395 | 3,972 |
| | PepsiCo Inc. | 46,843 | 3,060 |
| | Wal-Mart Stores Inc. | 50,181 | 2,706 |
| | Philip Morris | | |
| | International Inc. | 42,400 | 2,482 |
| | CVS Caremark Corp. | 43,592 | 1,516 |
| | Colgate-Palmolive Co. | 16,235 | 1,305 |
| | Walgreen Co. | 31,218 | 1,216 |
| | Costco Wholesale Corp. | 15,017 | 1,084 |
| | Altria Group Inc. | 34,900 | 859 |
| | Kraft Foods Inc. | 27,116 | 854 |
| | Archer-Daniels-Midland Co. | 24,720 | 744 |
| | Mead Johnson Nutrition Co. | 8,738 | 544 |
| | Bunge Ltd. | 7,500 | 491 |
| | Estee Lauder Cos. Inc. | | |
| | Class A | 6,013 | 485 |
| | Safeway Inc. | 20,134 | 453 |
| | Dr Pepper Snapple Group Inc. | 11,762 | 414 |
| | Brown-Forman Corp. Class B | 5,851 | 407 |
| | JM Smucker Co. | 6,134 | 403 |
| | Molson Coors Brewing Co. | | |
| | Class B | 8,000 | 401 |
| | Coca-Cola Enterprises Inc. | 15,786 | 395 |
| | McCormick & Co. Inc. | 8,400 | 391 |
| | | |
| | Kroger Co. | 16,800 | 376 |
| * | Energizer Holdings Inc. | 4,894 | 357 |
| * | Constellation Brands Inc. | | |
| | Class A | 15,484 | 343 |
| | Clorox Co. | 5,400 | 342 |
| | Tyson Foods Inc. Class A | 19,227 | 331 |
| | Del Monte Foods Co. | 17,117 | 322 |
| | Church & Dwight Co. Inc. | 4,543 | 314 |
| | Alberto-Culver Co. Class B | 8,409 | 311 |
| | Hormel Foods Corp. | 5,973 | 306 |
| * | Smithfield Foods Inc. | 14,800 | 305 |
| * | Ralcorp Holdings Inc. | 4,600 | 299 |
| * | Green Mountain Coffee | | |
| | Roasters Inc. | 8,795 | 289 |
| | Corn Products | | |
| | International Inc. | 6,188 | 285 |
| * | Hansen Natural Corp. | 5,345 | 279 |
| | Herbalife Ltd. | 3,450 | 236 |
| * | Central European | | |
| | Distribution Corp. | 8,900 | 204 |
| * | Dean Foods Co. | 21,350 | 189 |
| | Kimberly-Clark Corp. | 2,772 | 175 |
| | General Mills Inc. | 4,900 | 174 |
| | Avon Products Inc. | 2,100 | 61 |
| | Sysco Corp. | 1,500 | 44 |
| * | BJ’s Wholesale Club Inc. | 900 | 43 |
| | | | 34,398 |
| Energy (5.6%) | | |
| | Exxon Mobil Corp. | 140,399 | 10,266 |
| | Chevron Corp. | 51,183 | 4,670 |
| | Schlumberger Ltd. | 31,867 | 2,661 |
| | ConocoPhillips | 34,087 | 2,321 |
| | Occidental Petroleum Corp. | 20,404 | 2,002 |
| | Apache Corp. | 11,914 | 1,421 |
| | Anadarko Petroleum Corp. | 16,685 | 1,271 |
| | Devon Energy Corp. | 15,038 | 1,181 |
| | EOG Resources Inc. | 9,428 | 862 |
| | Hess Corp. | 10,804 | 827 |
| | Noble Energy Inc. | 6,999 | 602 |
| | Halliburton Co. | 14,464 | 591 |
| * | Cameron International Corp. | 10,652 | 540 |
| * | Southwestern Energy Co. | 14,414 | 540 |
| | Murphy Oil Corp. | 6,700 | 499 |
| * | FMC Technologies Inc. | 5,615 | 499 |
| | Peabody Energy Corp. | 7,709 | 493 |
| | Pioneer Natural Resources Co. | 5,494 | 477 |
| * | Newfield Exploration Co. | 6,427 | 463 |
| | Range Resources Corp. | 9,566 | 430 |
| | EQT Corp. | 9,280 | 416 |
| * | Pride International Inc. | 12,024 | 397 |
| | Cimarex Energy Co. | 4,376 | 387 |
| * | Ultra Petroleum Corp. | 8,100 | 387 |
| * | Nabors Industries Ltd. | 16,090 | 377 |
| | Consol Energy Inc. | 7,605 | 371 |
| | Helmerich & Payne Inc. | 7,298 | 354 |
14
Tax-Managed Balanced Fund
| | | |
| | | | Market |
| | | | Value |
| | | Shares | ($000) |
| * | Forest Oil Corp. | 9,041 | 343 |
| * | Rowan Cos. Inc. | 9,794 | 342 |
| | Cabot Oil & Gas Corp. | 8,840 | 335 |
| | Diamond Offshore Drilling Inc. | 4,860 | 325 |
| | QEP Resources Inc. | 8,757 | 318 |
| | SM Energy Co. | 5,246 | 309 |
| * | McDermott International Inc. | 14,465 | 299 |
| | EXCO Resources Inc. | 15,400 | 299 |
| * | Superior Energy Services Inc. | 7,900 | 276 |
| | Frontier Oil Corp. | 15,200 | 274 |
| * | Continental Resources Inc. | 4,532 | 267 |
| * | Dresser-Rand Group Inc. | 6,113 | 260 |
| | SEACOR Holdings Inc. | 2,397 | 242 |
| * | SandRidge Energy Inc. | 30,400 | 223 |
| | National Oilwell Varco Inc. | 3,229 | 217 |
| * | Concho Resources Inc. | 2,200 | 193 |
| | Baker Hughes Inc. | 3,350 | 192 |
| | Patterson-UTI Energy Inc. | 8,502 | 183 |
| | Marathon Oil Corp. | 4,682 | 173 |
| * | Plains Exploration & | | |
| | Production Co. | 4,748 | 153 |
| | Massey Energy Co. | 2,400 | 129 |
| | El Paso Corp. | 8,566 | 118 |
| * | Alpha Natural Resources Inc. | 1,428 | 86 |
| | Chesapeake Energy Corp. | 2,100 | 54 |
| * | Denbury Resources Inc. | 1,400 | 27 |
| | | | 40,942 |
| Financials (7.7%) | | |
| | JPMorgan Chase & Co. | 103,001 | 4,369 |
| | Wells Fargo & Co. | 139,621 | 4,327 |
| * | Berkshire Hathaway Inc. | | |
| | Class B | 49,500 | 3,965 |
| | Bank of America Corp. | 289,717 | 3,865 |
| * | Citigroup Inc. | 620,011 | 2,933 |
| | Goldman Sachs Group Inc. | 15,485 | 2,604 |
| | Morgan Stanley | 44,360 | 1,207 |
| | US Bancorp | 43,300 | 1,168 |
| | Simon Property Group Inc. | 10,102 | 1,005 |
| | Aflac Inc. | 16,000 | 903 |
| | State Street Corp. | 18,069 | 837 |
| | American Express Co. | 17,933 | 770 |
| | Capital One Financial Corp. | 17,900 | 762 |
| | Bank of New York | | |
| | Mellon Corp. | 25,100 | 758 |
| | Franklin Resources Inc. | 6,075 | 676 |
| | Charles Schwab Corp. | 39,305 | 673 |
| | SunTrust Banks Inc. | 22,250 | 657 |
| | Equity Residential | 12,150 | 631 |
| | Public Storage | 5,851 | 593 |
| | Travelers Cos. Inc. | 10,589 | 590 |
| | Progressive Corp. | 28,397 | 564 |
| | Fifth Third Bancorp | 38,275 | 562 |
| | Loews Corp. | 14,324 | 557 |
| | Boston Properties Inc. | 6,281 | 541 |
| | | |
| | Hartford Financial Services | | |
| | Group Inc. | 20,400 | 540 |
| | Host Hotels & Resorts Inc. | 29,146 | 521 |
| | MetLife Inc. | 11,440 | 508 |
| | Discover Financial Services | 25,627 | 475 |
| | PNC Financial Services | | |
| | Group Inc. | 7,700 | 468 |
| | Lincoln National Corp. | 16,159 | 449 |
| * | IntercontinentalExchange Inc. | 3,700 | 441 |
| | Weyerhaeuser Co. | 22,357 | 423 |
| | Unum Group | 16,727 | 405 |
| * | CB Richard Ellis Group Inc. | | |
| | Class A | 18,997 | 389 |
| | SL Green Realty Corp. | 5,159 | 348 |
| | Legg Mason Inc. | 9,554 | 347 |
| | Torchmark Corp. | 5,740 | 343 |
| * | Arch Capital Group Ltd. | 3,866 | 340 |
| | Zions Bancorporation | 13,887 | 336 |
| | TD Ameritrade Holding Corp. | 16,661 | 316 |
| | Reinsurance Group of | | |
| | America Inc. Class A | 5,872 | 315 |
| | East West Bancorp Inc. | 16,100 | 315 |
| * | Markel Corp. | 830 | 314 |
| | Apartment Investment & | | |
| | Management Co. | 12,073 | 312 |
| | Federal Realty | | |
| | Investment Trust | 3,999 | 312 |
| | BlackRock Inc. | 1,622 | 309 |
| | Developers Diversified | | |
| | Realty Corp. | 21,800 | 307 |
| | Janus Capital Group Inc. | 23,600 | 306 |
| | Lazard Ltd. Class A | 7,700 | 304 |
| * | Forest City Enterprises Inc. | | |
| | Class A | 18,171 | 303 |
| | Jones Lang LaSalle Inc. | 3,612 | 303 |
| | Raymond James Financial Inc. | 9,250 | 302 |
| | Allied World Assurance Co. | | |
| | Holdings Ltd. | 5,048 | 300 |
| | Moody’s Corp. | 11,300 | 300 |
| | Allstate Corp. | 9,400 | 300 |
| * | MSCI Inc. Class A | 7,600 | 296 |
| | SEI Investments Co. | 12,147 | 289 |
| | RenaissanceRe Holdings Ltd. | 4,532 | 289 |
| | Alexandria Real Estate | | |
| | Equities Inc. | 3,900 | 286 |
| | HCC Insurance Holdings Inc. | 9,864 | 285 |
| | Brown & Brown Inc. | 11,800 | 282 |
| | Associated Banc-Corp | 18,600 | 282 |
| | Assurant Inc. | 7,200 | 277 |
| | Prudential Financial Inc. | 4,712 | 277 |
| * | Genworth Financial Inc. | | |
| | Class A | 20,900 | 275 |
| * | First Horizon National Corp. | 23,056 | 272 |
| * | MBIA Inc. | 22,375 | 268 |
| | Marshall & Ilsley Corp. | 38,700 | 268 |
15
Tax-Managed Balanced Fund
| | | |
| | | | Market |
| | | | Value |
| | | Shares | ($000) |
| | Digital Realty Trust Inc. | 5,143 | 265 |
| | Regions Financial Corp. | 36,100 | 253 |
| | Vornado Realty Trust | 3,000 | 250 |
| | Hospitality Properties Trust | 10,810 | 249 |
| | Douglas Emmett Inc. | 14,929 | 248 |
| | Jefferies Group Inc. | 9,300 | 248 |
| | American Financial Group Inc. | 7,650 | 247 |
| | Commerce Bancshares Inc. | 5,973 | 237 |
| | Hanover Insurance Group Inc. | 5,014 | 234 |
| * | Alleghany Corp. | 760 | 233 |
| | StanCorp Financial Group Inc. | 5,000 | 226 |
| * | Affiliated Managers Group Inc. | 2,200 | 218 |
| | Wesco Financial Corp. | 590 | 217 |
| * | St. Joe Co. | 9,900 | 216 |
| | BOK Financial Corp. | 4,040 | 216 |
| | WR Berkley Corp. | 7,203 | 197 |
| | Washington Federal Inc. | 11,100 | 188 |
| | First Citizens BancShares Inc. | | |
| | Class A | 946 | 179 |
| | Assured Guaranty Ltd. | 10,100 | 179 |
| | CME Group Inc. | 499 | 161 |
| | Comerica Inc. | 3,800 | 161 |
| | Kimco Realty Corp. | 8,469 | 153 |
| | BB&T Corp. | 5,800 | 152 |
| | TFS Financial Corp. | 15,600 | 141 |
| | KeyCorp | 13,318 | 118 |
| | White Mountains Insurance | | |
| | Group Ltd. | 320 | 107 |
| | Chubb Corp. | 1,400 | 84 |
| | Ameriprise Financial Inc. | 1,180 | 68 |
| | AMB Property Corp. | 2,000 | 63 |
| | Wilmington Trust Corp. | 14,600 | 63 |
| | ACE Ltd. | 900 | 56 |
| | Leucadia National Corp. | 1,200 | 35 |
| | AON Corp. | 600 | 28 |
| | BancorpSouth Inc. | 1,400 | 22 |
| | Taubman Centers Inc. | 400 | 20 |
| | Cullen/Frost Bankers Inc. | 200 | 12 |
| | People’s United Financial Inc. | 400 | 6 |
| | | | 56,164 |
| Health Care (5.4%) | | |
| | Johnson & Johnson | 68,087 | 4,211 |
| | Pfizer Inc. | 192,889 | 3,378 |
| | Merck & Co. Inc. | 71,921 | 2,592 |
| * | Amgen Inc. | 29,952 | 1,644 |
| | Abbott Laboratories | 31,700 | 1,519 |
| | UnitedHealth Group Inc. | 36,914 | 1,333 |
| * | Express Scripts Inc. | 19,268 | 1,042 |
| * | Gilead Sciences Inc. | 28,529 | 1,034 |
| * | Celgene Corp. | 16,762 | 991 |
| * | Medco Health Solutions Inc. | 15,245 | 934 |
| * | Thermo Fisher Scientific Inc. | 15,575 | 862 |
| | Medtronic Inc. | 23,200 | 861 |
| * | WellPoint Inc. | 14,426 | 820 |
| | | |
| | Allergan Inc. | 11,699 | 803 |
| * | Genzyme Corp. | 10,687 | 761 |
| | Bristol-Myers Squibb Co. | 27,395 | 725 |
| | Stryker Corp. | 12,549 | 674 |
| * | Biogen Idec Inc. | 9,610 | 644 |
| * | Agilent Technologies Inc. | 15,144 | 627 |
| * | St. Jude Medical Inc. | 14,185 | 606 |
| | Cardinal Health Inc. | 15,145 | 580 |
| | Aetna Inc. | 18,640 | 569 |
| * | Zimmer Holdings Inc. | 9,270 | 498 |
| | AmerisourceBergen Corp. | | |
| | Class A | 14,505 | 495 |
| | CIGNA Corp. | 13,423 | 492 |
| * | Life Technologies Corp. | 8,522 | 473 |
| * | Forest Laboratories Inc. | 14,709 | 470 |
| * | Laboratory Corp. of America | | |
| | Holdings | 5,291 | 465 |
| | CR Bard Inc. | 5,004 | 459 |
| * | Hospira Inc. | 8,060 | 449 |
| | McKesson Corp. | 6,232 | 439 |
| | Eli Lilly & Co. | 12,400 | 435 |
| * | Waters Corp. | 5,218 | 406 |
| | Quest Diagnostics Inc. | 7,345 | 396 |
| | Becton Dickinson and Co. | 4,684 | 396 |
| * | Mylan Inc. | 18,556 | 392 |
| * | DaVita Inc. | 5,600 | 389 |
| * | Watson Pharmaceuticals Inc. | 7,096 | 367 |
| | Beckman Coulter Inc. | 4,774 | 359 |
| | DENTSPLY International Inc. | 10,328 | 353 |
| | Baxter International Inc. | 6,800 | 344 |
| * | Endo Pharmaceuticals | | |
| | Holdings Inc. | 9,559 | 341 |
| | Universal Health Services Inc. | | |
| | Class B | 7,829 | 340 |
| | Perrigo Co. | 5,308 | 336 |
| * | King Pharmaceuticals Inc. | 23,196 | 326 |
| * | Mettler-Toledo | | |
| | International Inc. | 2,100 | 318 |
| | Omnicare Inc. | 12,300 | 312 |
| | PerkinElmer Inc. | 11,400 | 294 |
| * | Vertex Pharmaceuticals Inc. | 8,400 | 294 |
| * | Tenet Healthcare Corp. | 42,100 | 282 |
| | Techne Corp. | 4,200 | 276 |
| | Pharmaceutical Product | | |
| | Development Inc. | 10,100 | 274 |
| | Cooper Cos. Inc. | 4,584 | 258 |
| | Hill-Rom Holdings Inc. | 5,600 | 221 |
| * | CareFusion Corp. | 8,395 | 216 |
| | Patterson Cos. Inc. | 6,600 | 202 |
| * | Intuitive Surgical Inc. | 720 | 186 |
| | Covidien plc | 3,000 | 137 |
| * | Cephalon Inc. | 200 | 12 |
| | | | 39,912 |
16
Tax-Managed Balanced Fund
| | | |
| | | | Market |
| | | | Value |
| | | Shares | ($000) |
| Industrials (5.4%) | | |
| | General Electric Co. | 302,409 | 5,531 |
| | United Technologies Corp. | 24,876 | 1,958 |
| | Union Pacific Corp. | 16,218 | 1,503 |
| | 3M Co. | 16,900 | 1,459 |
| | Caterpillar Inc. | 11,400 | 1,068 |
| | Boeing Co. | 15,820 | 1,032 |
| | FedEx Corp. | 10,776 | 1,002 |
| | United Parcel Service Inc. | | |
| | Class B | 13,600 | 987 |
| | Danaher Corp. | 18,879 | 891 |
| | Cummins Inc. | 7,321 | 805 |
| | Precision Castparts Corp. | 5,252 | 731 |
| | Emerson Electric Co. | 12,100 | 692 |
| | Raytheon Co. | 14,149 | 656 |
| | Ingersoll-Rand plc | 13,100 | 617 |
| | Honeywell International Inc. | 10,900 | 579 |
| | CH Robinson Worldwide Inc. | 7,011 | 562 |
| | Fluor Corp. | 8,058 | 534 |
| | Expeditors International of | | |
| | Washington Inc. | 9,428 | 515 |
| | Southwest Airlines Co. | 36,067 | 468 |
| | WW Grainger Inc. | 3,332 | 460 |
| | ITT Corp. | 8,739 | 455 |
| | PACCAR Inc. | 7,800 | 448 |
| | Deere & Co. | 5,200 | 432 |
| | Republic Services Inc. | | |
| | Class A | 14,110 | 421 |
| | Fastenal Co. | 6,865 | 411 |
| | Textron Inc. | 17,319 | 409 |
| | Flowserve Corp. | 3,434 | 409 |
| * | Stericycle Inc. | 4,995 | 404 |
| | Bucyrus International Inc. | | |
| | Class A | 4,216 | 377 |
| * | Jacobs Engineering Group Inc. | 8,207 | 376 |
| | Rockwell Collins Inc. | 6,400 | 373 |
| | AMETEK Inc. | 9,294 | 365 |
| | Joy Global Inc. | 4,200 | 364 |
| | KBR Inc. | 11,904 | 363 |
| | Equifax Inc. | 9,900 | 352 |
| | Donaldson Co. Inc. | 5,956 | 347 |
| * | AGCO Corp. | 6,524 | 331 |
| * | WABCO Holdings Inc. | 5,415 | 330 |
| | Manpower Inc. | 5,250 | 330 |
| * | Navistar International Corp. | 5,550 | 321 |
| | JB Hunt Transport | | |
| | Services Inc. | 7,744 | 316 |
| | SPX Corp. | 4,299 | 307 |
| * | Thomas & Betts Corp. | 6,200 | 299 |
| * | Terex Corp. | 9,584 | 298 |
| * | Chicago Bridge & Iron Co. NV | 8,900 | 293 |
| | Wabtec Corp. | 5,500 | 291 |
| * | BE Aerospace Inc. | 7,800 | 289 |
| * | TransDigm Group Inc. | 4,000 | 288 |
| | Dun & Bradstreet Corp. | 3,400 | 279 |
| | | |
| * | Oshkosh Corp. | 7,900 | 278 |
| * | Quanta Services Inc. | 13,955 | 278 |
| * | Aecom Technology Corp. | 9,800 | 274 |
| * | URS Corp. | 6,559 | 273 |
| | Manitowoc Co. Inc. | 20,444 | 268 |
| | Copa Holdings SA Class A | 4,493 | 264 |
| * | Alliant Techsystems Inc. | 3,544 | 264 |
| | UTi Worldwide Inc. | 12,204 | 259 |
| | Con-way Inc. | 7,000 | 256 |
| * | WESCO International Inc. | 4,845 | 256 |
| | Robert Half International Inc. | 8,200 | 251 |
| | Pentair Inc. | 6,800 | 248 |
| | General Dynamics Corp. | 3,491 | 248 |
| | Covanta Holding Corp. | 14,400 | 248 |
| * | Shaw Group Inc. | 7,200 | 246 |
| | Gardner Denver Inc. | 3,577 | 246 |
| | Toro Co. | 3,959 | 244 |
| | Lennox International Inc. | 5,100 | 241 |
| | Valmont Industries Inc. | 2,711 | 241 |
| | CSX Corp. | 3,700 | 239 |
| * | Spirit Aerosystems | | |
| | Holdings Inc. Class A | 11,400 | 237 |
| | Landstar System Inc. | 5,788 | 237 |
| | Towers Watson & Co. | | |
| | Class A | 4,500 | 234 |
| | Armstrong World | | |
| | Industries Inc. | 5,403 | 232 |
| | Illinois Tool Works Inc. | 3,700 | 198 |
| | Iron Mountain Inc. | 7,546 | 189 |
| * | Babcock & Wilcox Co. | 7,232 | 185 |
| | Norfolk Southern Corp. | 2,300 | 145 |
| | MSC Industrial Direct Co. | | |
| | Class A | 2,100 | 136 |
| | Cintas Corp. | 4,550 | 127 |
| | Tyco International Ltd. | 2,600 | 108 |
| * | USG Corp. | 5,900 | 99 |
| | Ryder System Inc. | 1,400 | 74 |
| | Lockheed Martin Corp. | 703 | 49 |
| | L-3 Communications | | |
| | Holdings Inc. | 489 | 35 |
| | IDEX Corp. | 529 | 21 |
| | Pall Corp. | 400 | 20 |
| | Northrop Grumman Corp. | 118 | 8 |
| | | | 39,784 |
| Information Technology (8.8%) | | |
| * | Apple Inc. | 25,189 | 8,125 |
| | Microsoft Corp. | 214,456 | 5,988 |
| | International Business | | |
| | Machines Corp. | 35,997 | 5,283 |
| * | Google Inc. Class A | 7,019 | 4,169 |
| | Oracle Corp. | 110,310 | 3,453 |
| * | Cisco Systems Inc. | 164,908 | 3,336 |
| | Intel Corp. | 150,400 | 3,163 |
| | Hewlett-Packard Co. | 69,930 | 2,944 |
| | QUALCOMM Inc. | 43,900 | 2,173 |
17
Tax-Managed Balanced Fund
| | | |
| | | | Market |
| | | | Value |
| | | Shares | ($000) |
| * | EMC Corp. | 65,590 | 1,502 |
| | Visa Inc. Class A | 15,987 | 1,125 |
| * | eBay Inc. | 38,644 | 1,075 |
| | Corning Inc. | 54,167 | 1,047 |
| * | Dell Inc. | 61,135 | 828 |
| * | Motorola Inc. | 90,429 | 820 |
| * | Cognizant Technology | | |
| | Solutions Corp. Class A | 10,977 | 804 |
| * | Yahoo! Inc. | 48,174 | 801 |
| | Broadcom Corp. Class A | 18,243 | 794 |
| | Applied Materials Inc. | 53,080 | 746 |
| * | Juniper Networks Inc. | 19,800 | 731 |
| * | NetApp Inc. | 13,071 | 718 |
| * | Adobe Systems Inc. | 21,444 | 660 |
| | Texas Instruments Inc. | 19,446 | 632 |
| * | Symantec Corp. | 34,939 | 585 |
| * | Intuit Inc. | 11,638 | 574 |
| * | Citrix Systems Inc. | 8,328 | 570 |
| | Western Union Co. | 30,514 | 567 |
| | Analog Devices Inc. | 13,334 | 502 |
| | CA Inc. | 20,140 | 492 |
| | Altera Corp. | 13,770 | 490 |
| * | Fiserv Inc. | 8,147 | 477 |
| | Amphenol Corp. Class A | 8,332 | 440 |
| * | Autodesk Inc. | 11,308 | 432 |
| | Xilinx Inc. | 14,717 | 426 |
| * | BMC Software Inc. | 8,983 | 423 |
| | Fidelity National Information | | |
| | Services Inc. | 15,021 | 411 |
| | Computer Sciences Corp. | 8,200 | 407 |
| * | Lam Research Corp. | 7,700 | 399 |
| * | First Solar Inc. | 2,971 | 387 |
| | Activision Blizzard Inc. | 31,000 | 386 |
| * | Teradata Corp. | 9,036 | 372 |
| | KLA-Tencor Corp. | 9,592 | 371 |
| * | Atmel Corp. | 28,800 | 355 |
| | Factset Research | | |
| | Systems Inc. | 3,765 | 353 |
| | Global Payments Inc. | 6,760 | 312 |
| | Xerox Corp. | 26,155 | 301 |
| * | SAIC Inc. | 18,906 | 300 |
| | Solera Holdings Inc. | 5,600 | 287 |
| * | Marvell Technology | | |
| | Group Ltd. | 15,000 | 278 |
| | Accenture plc Class A | 5,700 | 276 |
| * | NVIDIA Corp. | 17,900 | 276 |
| | National Semiconductor Corp. | 18,971 | 261 |
| * | Fairchild Semiconductor | | |
| | International Inc. Class A | 16,325 | 255 |
| | DST Systems Inc. | 5,550 | 246 |
| | Tellabs Inc. | 35,248 | 239 |
| * | Lexmark International Inc. | | |
| | Class A | 4,500 | 157 |
| * | Ingram Micro Inc. | 7,800 | 149 |
| | Mastercard Inc. Class A | 594 | 133 |
| | | |
| | Automatic Data | | |
| | Processing Inc. | 2,274 | 105 |
| | AVX Corp. | 6,400 | 99 |
| | Harris Corp. | 2,100 | 95 |
| * | LSI Corp. | 14,400 | 86 |
| * | Salesforce.com Inc. | 603 | 80 |
| * | Tech Data Corp. | 1,400 | 62 |
| | National Instruments Corp. | 1,200 | 45 |
| * | Arrow Electronics Inc. | 700 | 24 |
| | Lender Processing | | |
| | Services Inc. | 800 | 24 |
| | | | 64,426 |
| Materials (2.0%) | | |
| | Freeport-McMoRan | | |
| | Copper & Gold Inc. | 14,697 | 1,765 |
| | Monsanto Co. | 16,208 | 1,129 |
| | Newmont Mining Corp. | 16,554 | 1,017 |
| | EI du Pont de Nemours & Co. | 14,900 | 743 |
| | Dow Chemical Co. | 17,400 | 594 |
| | Mosaic Co. | 7,248 | 553 |
| | Ecolab Inc. | 10,800 | 545 |
| | International Paper Co. | 18,943 | 516 |
| | CF Industries Holdings Inc. | 3,411 | 461 |
| | Sigma-Aldrich Corp. | 6,633 | 442 |
| | United States Steel Corp. | 7,300 | 426 |
| | Walter Energy Inc. | 3,100 | 396 |
| | Ball Corp. | 5,659 | 385 |
| | FMC Corp. | 4,759 | 380 |
| | Sherwin-Williams Co. | 4,100 | 343 |
| * | Crown Holdings Inc. | 10,241 | 342 |
| * | Owens-Illinois Inc. | 10,800 | 332 |
| | Praxair Inc. | 3,400 | 325 |
| | Nucor Corp. | 7,400 | 324 |
| | Reliance Steel & | | |
| | Aluminum Co. | 6,200 | 317 |
| | Airgas Inc. | 5,043 | 315 |
| | Cliffs Natural Resources Inc. | 4,000 | 312 |
| | Nalco Holding Co. | 9,549 | 305 |
| | Sealed Air Corp. | 11,800 | 300 |
| | Ashland Inc. | 5,198 | 264 |
| | Cytec Industries Inc. | 4,933 | 262 |
| | Scotts Miracle-Gro Co. | | |
| | Class A | 5,042 | 256 |
| * | Intrepid Potash Inc. | 6,803 | 254 |
| | Schnitzer Steel Industries Inc. | 3,579 | 238 |
| | Royal Gold Inc. | 4,200 | 229 |
| | Martin Marietta Materials Inc. | 2,286 | 211 |
| | Steel Dynamics Inc. | 9,800 | 179 |
| * | Titanium Metals Corp. | 9,700 | 167 |
| | Celanese Corp. Class A | 3,307 | 136 |
| | Albemarle Corp. | 2,000 | 112 |
| | Air Products & Chemicals Inc. | 500 | 45 |
| | Vulcan Materials Co. | 334 | 15 |
| | | | 14,935 |
18
Tax-Managed Balanced Fund
| | | |
| | | | Market |
| | | | Value |
| | | Shares | ($000) |
| Telecommunication Services (1.4%) | |
| | AT&T Inc. | 141,666 | 4,162 |
| | Verizon Communications Inc. | 67,900 | 2,429 |
| * | American Tower Corp. | | |
| | Class A | 15,649 | 808 |
| * | Crown Castle | | |
| | International Corp. | 12,967 | 568 |
| * | Sprint Nextel Corp. | 122,135 | 517 |
| * | NII Holdings Inc. | 9,651 | 431 |
| * | SBA Communications Corp. | | |
| | Class A | 8,118 | 332 |
| * | MetroPCS | | |
| | Communications Inc. | 20,300 | 256 |
| * | United States Cellular Corp. | 4,415 | 221 |
| | Telephone & | | |
| | Data Systems Inc. | 5,063 | 185 |
| | Frontier | | |
| | Communications Corp. | 16,298 | 159 |
| * | Clearwire Corp. Class A | 29,147 | 150 |
| | Telephone & | | |
| | Data Systems Inc. - | | |
| | Special Common Shares | 3,000 | 95 |
| * | tw telecom inc Class A | 3,500 | 60 |
| | | | 10,373 |
| Utilities (1.7%) | | |
| | NextEra Energy Inc. | 15,197 | 790 |
| | Dominion Resources Inc. | 17,908 | 765 |
| | PG&E Corp. | 14,635 | 700 |
| | Sempra Energy | 11,028 | 579 |
| | Edison International | 14,600 | 564 |
| | Entergy Corp. | 7,700 | 545 |
| | Xcel Energy Inc. | 21,000 | 495 |
| * | AES Corp. | 37,300 | 454 |
| | | |
| | Southern Co. | 11,000 | 420 |
| | Wisconsin Energy Corp. | 6,825 | 402 |
| | Northeast Utilities | 11,500 | 367 |
| | NSTAR | 8,242 | 348 |
| | Constellation Energy | | |
| | Group Inc. | 11,300 | 346 |
| | National Fuel Gas Co. | 4,966 | 326 |
| | CMS Energy Corp. | 17,403 | 324 |
| | Allegheny Energy Inc. | 13,311 | 323 |
| | UGI Corp. | 10,100 | 319 |
| * | GenOn Energy Inc. | 83,412 | 318 |
| | American Water | | |
| | Works Co. Inc. | 12,300 | 311 |
| * | Calpine Corp. | 23,010 | 307 |
| | MDU Resources Group Inc. | 14,804 | 300 |
| | Alliant Energy Corp. | 8,100 | 298 |
| | Aqua America Inc. | 13,200 | 297 |
| | ITC Holdings Corp. | 4,713 | 292 |
| * | NRG Energy Inc. | 14,924 | 292 |
| | NV Energy Inc. | 20,104 | 282 |
| | Energen Corp. | 5,830 | 281 |
| | Exelon Corp. | 5,200 | 216 |
| | DPL Inc. | 7,800 | 200 |
| | Ormat Technologies Inc. | 6,600 | 195 |
| | Public Service Enterprise | | |
| | Group Inc. | 5,564 | 177 |
| | Questar Corp. | 8,757 | 152 |
| | Great Plains Energy Inc. | 7,800 | 151 |
| | Duke Energy Corp. | 5,492 | 98 |
| | OGE Energy Corp. | 300 | 14 |
| | | | 12,248 |
| Total Common Stocks | | |
| (Cost $211,944) | | 352,889 |
19
Tax-Managed Balanced Fund
| | | | |
| | | | Face | Market |
| | | Maturity | Amount | Value |
| | Coupon | Date | ($000) | ($000) |
| Tax-Exempt Municipal Bonds (51.8%) | | | | |
| Alabama (0.1%) | | | | |
| Alabama Public School & College Authority Capital | | | | |
| Improvement Revenue | 5.000% | 12/1/21 | 500 | 539 |
| Alabama Public School & College Authority Capital | | | | |
| Improvement Revenue | 5.000% | 12/1/22 | 500 | 533 |
| | | | | 1,072 |
| Alaska (0.2%) | | | | |
| Matanuska-Susitna Borough AK GO | 5.500% | 3/1/12 (3) | 1,160 | 1,192 |
| |
| Arizona (1.6%) | | | | |
| Arizona Board Regents Arizona State University | | | | |
| System Revenue | 5.875% | 7/1/24 | 100 | 110 |
| Arizona COP | 5.000% | 10/1/18 (4) | 500 | 545 |
| Arizona Health Facilities Authority Revenue | | | | |
| (Banner Health) | 5.000% | 1/1/25 | 500 | 497 |
| Arizona School Facilities Board COP | 5.500% | 9/1/23 | 500 | 517 |
| Arizona School Facilities Board Revenue | | | | |
| (School Improvement) | 5.750% | 7/1/14 (2)(Prere.) | 500 | 574 |
| Arizona Transportation Board Excise Tax Revenue | | | | |
| (Maricopa County Regional Area) | 5.000% | 7/1/25 | 500 | 527 |
| Arizona Transportation Board Highway Revenue | 5.250% | 7/1/12 (Prere.) | 1,965 | 2,100 |
| Arizona Transportation Board Highway Revenue | 5.250% | 7/1/17 | 2,215 | 2,345 |
| Arizona Water Infrastructure Finance | | | | |
| Authority Revenue | 4.000% | 10/1/14 | 500 | 545 |
| Glendale AZ Industrial Development | | | | |
| Authority Revenue (Midwestern University) | 5.000% | 5/15/30 | 275 | 257 |
| Mesa AZ Utility System Revenue | 5.000% | 7/1/14 (14)(Prere.) | 500 | 566 |
| Phoenix AZ Civic Improvement Corp. | | | | |
| Airport Revenue | 5.000% | 7/1/24 | 300 | 301 |
| Phoenix AZ Civic Improvement Corp. | | | | |
| Airport Revenue | 5.000% | 7/1/26 | 545 | 540 |
| Phoenix AZ Civic Improvement Corp. | | | | |
| Airport Revenue (Light Rail Project) | 5.000% | 7/1/19 (2) | 780 | 825 |
| Phoenix AZ Civic Improvement Corp. | | | | |
| Water System Revenue | 5.000% | 7/1/21 (14) | 500 | 532 |
| Salt River Project Arizona Agricultural | | | | |
| Improvement & Power District Revenue | 5.000% | 1/1/28 | 750 | 773 |
| Salt Verde AZ Financial Project Revenue | 5.250% | 12/1/24 | 500 | 484 |
| | | | | 12,038 |
| California (5.7%) | | | | |
| Bay Area CA Infrastructure Financing | | | | |
| Authority Revenue | 5.000% | 8/1/17 (14) | 500 | 518 |
| Bay Area Toll Authority California Toll Bridge | | | | |
| Revenue (San Francisco Bay Area) | 5.000% | 4/1/25 | 500 | 519 |
| Bay Area Toll Authority California Toll Bridge | | | | |
| Revenue (San Francisco Bay Area) | 5.000% | 10/1/30 | 500 | 477 |
| California Department of Water Resources | | | | |
| Power Supply Revenue | 5.500% | 5/1/12 (Prere.) | 3,000 | 3,218 |
| California Department of Water Resources | | | | |
| Power Supply Revenue | 5.000% | 5/1/17 | 500 | 565 |
| California Department of Water Resources | | | | |
| Power Supply Revenue | 5.000% | 5/1/18 | 500 | 562 |
20
Tax-Managed Balanced Fund
| | | | |
| | | | Face | Market |
| | | Maturity | Amount | Value |
| | Coupon | Date | ($000) | ($000) |
| California Department of Water Resources | | | | |
| Power Supply Revenue | 5.000% | 5/1/18 | 500 | 562 |
| California Department of Water Resources | | | | |
| Power Supply Revenue | 5.000% | 5/1/19 | 500 | 557 |
| California Department of Water Resources | | | | |
| Power Supply Revenue | 5.000% | 5/1/20 | 575 | 637 |
| California Department of Water Resources | | | | |
| Water System Revenue (Central Valley Project) | 5.000% | 12/1/28 | 500 | 513 |
| California Economic Recovery Bonds GO | 5.000% | 7/1/14 (Prere.) | 205 | 231 |
| California Economic Recovery Bonds GO | 5.000% | 7/1/15 | 295 | 321 |
| California Economic Recovery Bonds GO | 5.000% | 7/1/18 | 500 | 554 |
| California Economic Recovery Bonds GO | 5.000% | 7/1/19 | 500 | 545 |
| California Economic Recovery Bonds GO | 5.000% | 7/1/20 | 500 | 534 |
| California Economic Recovery Bonds GO | 5.250% | 7/1/21 | 825 | 886 |
| California Economic Recovery Bonds GO | 5.000% | 7/1/22 | 500 | 517 |
| California GO | 5.250% | 10/1/13 (14) | 500 | 543 |
| California GO | 5.000% | 11/1/13 | 500 | 540 |
| California GO | 5.000% | 6/1/15 | 500 | 543 |
| California GO | 6.000% | 2/1/16 | 500 | 569 |
| California GO | 5.000% | 11/1/16 | 350 | 384 |
| California GO | 5.000% | 3/1/17 | 500 | 544 |
| California GO | 5.000% | 4/1/17 | 500 | 544 |
| California GO | 5.500% | 4/1/18 | 1,000 | 1,106 |
| California GO | 6.000% | 4/1/18 | 500 | 566 |
| California GO | 5.000% | 9/1/18 | 500 | 528 |
| California GO | 5.000% | 11/1/18 (3) | 500 | 532 |
| California GO | 5.000% | 6/1/19 (14) | 500 | 524 |
| California GO | 5.000% | 10/1/21 | 250 | 254 |
| California GO | 5.000% | 6/1/25 | 495 | 485 |
| California GO | 5.500% | 3/1/26 | 500 | 506 |
| California GO | 5.000% | 6/1/27 (14)(3) | 500 | 480 |
| California GO | 4.500% | 8/1/28 (2) | 485 | 424 |
| California GO | 5.750% | 4/1/29 | 500 | 509 |
| California GO | 5.000% | 9/1/29 (2) | 500 | 473 |
| California GO | 5.250% | 3/1/30 | 500 | 482 |
| California Health Facilities Financing | | | | |
| Authority Revenue (Catholic Healthcare West) | | | | |
| PUT | 5.000% | 7/1/14 | 500 | 548 |
| California Infrastructure & | | | | |
| Economic Development Bank Revenue | | | | |
| (Bay Area Toll Bridges Seismic Retrofit) | 5.000% | 1/1/28 (Prere.) | 500 | 545 |
| California Municipal Finance Authority Revenue | | | | |
| (University Of La Verne) | 6.125% | 6/1/30 | 500 | 486 |
| California Public Works Board Lease Revenue | | | | |
| (Department of Corrections) | 5.000% | 9/1/11 (2) | 1,535 | 1,540 |
| California State University Revenue Systemwide | 5.750% | 11/1/27 | 500 | 532 |
| California Statewide Communities Development | | | | |
| Authority Revenue (Kaiser Permanente) | 5.000% | 4/1/19 | 500 | 524 |
| California Statewide Communities Development | | | | |
| Authority Revenue | | | | |
| (Proposition 1A Receivables Program) | 5.000% | 6/15/13 | 500 | 530 |
| Golden State Tobacco | | | | |
| Securitization Corp. California | 4.500% | 6/1/27 | 995 | 762 |
| Los Angeles CA Community College District GO | 5.000% | 8/1/27 | 500 | 501 |
21
Tax-Managed Balanced Fund
| | | | |
| | | | Face | Market |
| | | Maturity | Amount | Value |
| | Coupon | Date | ($000) | ($000) |
| Los Angeles CA Department of Airports | | | | |
| International Airport Revenue | 5.000% | 5/15/27 | 500 | 491 |
| Los Angeles CA Department of Water & | | | | |
| Power Revenue | 5.000% | 7/1/24 | 500 | 525 |
| Los Angeles CA GO | 5.000% | 9/1/20 (14) | 500 | 531 |
| Los Angeles CA Unified School District GO | 5.000% | 7/1/21 (4) | 1,825 | 1,918 |
| Los Angeles CA Unified School District GO | 5.000% | 7/1/26 | 500 | 502 |
| Los Angeles CA Unified School District GO | 5.000% | 7/1/29 | 500 | 489 |
| Los Angeles CA Unified School District GO | 5.000% | 7/1/29 | 500 | 489 |
| Los Angeles CA Wastewater System Revenue | 5.000% | 6/1/29 | 500 | 503 |
| Los Angeles County CA Metropolitan | | | | |
| Transportation Authority Sales Tax Revenue | 5.000% | 7/1/19 | 560 | 636 |
| Roseville CA Natural Gas Financing Authority | | | | |
| Gas Revenue | 5.000% | 2/15/12 | 500 | 516 |
| Sacramento CA Municipal Utility District Revenue | 5.000% | 8/15/27 (4) | 500 | 501 |
| Sacramento County CA Airport Revenue | 5.625% | 7/1/29 | 500 | 509 |
| San Diego CA Public Facilities Financing Authority | | | | |
| Sewer Revenue | 5.000% | 5/15/28 | 500 | 511 |
| San Diego CA Public Facilities Financing Authority | | | | |
| Water Revenue | 5.250% | 8/1/28 | 500 | 517 |
| San Diego CA Unified School District GO | 0.000% | 7/1/27 | 500 | 178 |
| San Diego CA Unified School District GO | 5.500% | 7/1/27 (4) | 500 | 533 |
| San Diego CA Unified School District GO | 0.000% | 7/1/28 | 500 | 165 |
| San Diego CA Unified School District GO | 0.000% | 7/1/29 | 500 | 153 |
| San Francisco CA City & | | | | |
| County Earthquake Safety GO | 5.000% | 6/15/28 | 500 | 503 |
| San Francisco CA City & County International | | | | |
| Airport Revenue | 5.250% | 5/1/22 | 500 | 528 |
| San Jose CA Redevelopment Agency | | | | |
| Tax Allocation Revenue | 6.500% | 8/1/28 | 700 | 727 |
| University of California Revenue | 5.000% | 5/15/21 | 500 | 534 |
| University of California Revenue | 5.000% | 5/15/25 | 500 | 528 |
| University of California Revenue | 5.000% | 5/15/27 (14) | 500 | 510 |
| University of California Revenue | 5.000% | 5/15/28 (14)(3) | 500 | 507 |
| | | | | 41,724 |
| Colorado (1.3%) | | | | |
| Colorado Department of Transportation RAN | 5.250% | 12/15/13 (Prere.) | 3,750 | 4,218 |
| Colorado Department of Transportation RAN | 5.500% | 6/15/15 (14) | 500 | 580 |
| Colorado Springs CO Utility System Revenue | 5.000% | 11/15/25 | 500 | 529 |
| Denver CO City & County Airport Revenue | 5.000% | 11/15/26 | 430 | 432 |
| Denver CO City & County COP VRDO | 0.280% | 1/3/11 | 1,325 | 1,325 |
| Denver CO City & County School District No. 1 GO | 5.500% | 12/1/23 (14) | 500 | 584 |
| E-470 Public Highway Authority Colorado Revenue | 5.250% | 9/1/18 (14) | 1,500 | 1,534 |
| E-470 Public Highway Authority Colorado Revenue | 5.375% | 9/1/26 | 500 | 457 |
| | | | | 9,659 |
| Connecticut (0.8%) | | | | |
| Connecticut GO | 5.500% | 12/15/13 | 3,000 | 3,377 |
| Connecticut GO | 5.000% | 1/1/14 | 500 | 554 |
| Connecticut GO | 5.000% | 2/15/23 | 500 | 541 |
| Connecticut Special Tax Revenue | | | | |
| (Transportation Infrastructure) | 6.500% | 10/1/12 | 500 | 547 |
| Connecticut Special Tax Revenue | | | | |
| (Transportation Infrastructure) | 5.000% | 11/1/25 | 500 | 527 |
| | | | | 5,546 |
22
Tax-Managed Balanced Fund
| | | | |
| | | | Face | Market |
| | | Maturity | Amount | Value |
| | Coupon | Date | ($000) | ($000) |
| Delaware (0.2%) | | | | |
| Delaware GO | 5.000% | 10/1/20 | 500 | 580 |
| Delaware Transportation Authority Transportation | | | | |
| System Revenue | 5.000% | 7/1/19 | 500 | 577 |
| | | | | 1,157 |
| District of Columbia (0.2%) | | | | |
| District of Columbia GO | 5.000% | 6/1/21 (4) | 500 | 536 |
| District of Columbia Income Tax Revenue | 5.250% | 12/1/27 | 500 | 528 |
| Metropolitan Washington DC/VA Airports | | | | |
| Authority Airport System Revenue | 5.000% | 10/1/24 | 500 | 513 |
| | | | | 1,577 |
| Florida (2.8%) | | | | |
| Broward County FL Educational Facilities Authority | | | | |
| Revenue (Nova Southeastern University Project) | | | | |
| VRDO | 0.300% | 1/3/11 LOC | 2,100 | 2,100 |
| Citizens Property Insurance Corp. Florida Revenue | | | | |
| (High Risk Account) | 5.000% | 6/1/15 | 1,000 | 1,045 |
| Citizens Property Insurance Corp. Florida Revenue | | | | |
| (High Risk Account) | 5.250% | 6/1/17 | 435 | 454 |
| Citizens Property Insurance Corp. Florida Revenue | | | | |
| (High Risk Account) | 5.500% | 6/1/17 | 500 | 528 |
| Florida Board of Education Capital Outlay GO | 5.000% | 1/1/14 | 500 | 552 |
| Florida Board of Education Lottery Revenue | 5.000% | 7/1/16 (2) | 500 | 558 |
| Florida Board of Education Lottery Revenue | 5.000% | 7/1/18 | 500 | 558 |
| Florida Board of Education Public Education | | | | |
| Capital Outlay GO | 5.000% | 6/1/22 | 500 | 547 |
| Florida Board of Education Public Education | | | | |
| Capital Outlay GO | 5.000% | 6/1/24 | 500 | 528 |
| Florida Department of Environmental Protection & | | | | |
| Preservation Revenue | 5.000% | 7/1/15 (14) | 625 | 698 |
| Florida Hurricane Catastrophe Fund | | | | |
| Finance Corp. Revenue | 5.000% | 7/1/12 | 3,565 | 3,725 |
| Florida Turnpike Authority Revenue | 5.000% | 7/1/19 | 500 | 561 |
| Hillsborough County FL School Board | | | | |
| (Master Lease Program) COP VRDO | 0.280% | 1/3/11 LOC | 1,700 | 1,700 |
| Jacksonville FL Health Facilities Authority Hospital | | | | |
| Revenue (Baptist Medical Center Project) VRDO | 0.280% | 1/3/11 LOC | 300 | 300 |
| Miami-Dade County FL Aviation Revenue | | | | |
| (Miami International Airport) | 4.875% | 10/1/24 | 500 | 490 |
| Miami-Dade County FL Aviation Revenue | | | | |
| (Miami International Airport) | 5.000% | 10/1/30 | 585 | 549 |
| Miami-Dade County FL School Board COP | 5.000% | 11/1/22 (2) | 500 | 506 |
| 1 Miami-Dade County FL Special | | | | |
| Obligation Revenue TOB VRDO | 0.320% | 1/3/11 LOC | 600 | 600 |
| Miami-Dade County FL Water & Sewer Revenue | 5.000% | 10/1/26 (14) | 500 | 503 |
| Orange County FL Health Facilities Authority | | | | |
| Revenue (Nemours Foundation Project) | 5.000% | 1/1/19 | 500 | 546 |
| Orlando & Orange County FL Expressway | | | | |
| Authority Revenue | 5.000% | 7/1/30 | 500 | 482 |
| Orlando FL Utility Commission Water & | | | | |
| Electric Revenue | 5.250% | 10/1/13 (ETM) | 500 | 557 |
| Orlando FL Utility Commission Water & | | | | |
| Electric Revenue | 5.250% | 10/1/14 (ETM) | 500 | 570 |
23
Tax-Managed Balanced Fund
| | | | |
| | | | Face | Market |
| | | Maturity | Amount | Value |
| | Coupon | Date | ($000) | ($000) |
| Pinellas County FL Health Facilities Authority | | | | |
| Revenue (Baycare Health System) VRDO | 0.290% | 1/3/11 LOC | 1,600 | 1,600 |
| | | | | 20,257 |
| Georgia (2.2%) | | | | |
| Atlanta GA Airport Revenue | 5.750% | 1/1/13 (3) | 3,370 | 3,399 |
| Atlanta GA Airport Revenue | 5.000% | 1/1/20 | 500 | 526 |
| Atlanta GA Water & Wastewater Revenue | 5.750% | 11/1/27 (4) | 500 | 530 |
| Georgia GO | 5.000% | 10/1/13 | 500 | 555 |
| Georgia GO | 5.000% | 9/1/15 (Prere.) | 500 | 577 |
| Georgia GO | 5.000% | 4/1/16 | 500 | 580 |
| Georgia GO | 5.000% | 5/1/16 | 500 | 581 |
| Georgia GO | 5.000% | 7/1/16 | 500 | 582 |
| Georgia GO | 5.750% | 8/1/17 | 500 | 607 |
| Georgia GO | 5.000% | 7/1/22 | 500 | 558 |
| Georgia GO | 5.000% | 5/1/25 | 500 | 540 |
| Georgia Municipal Electric Power | | | | |
| Authority Revenue | 6.250% | 1/1/12 (14) | 3,000 | 3,157 |
| Georgia Road & Tollway Authority GAN | 5.000% | 6/1/14 | 500 | 556 |
| Georgia Road & Tollway Authority Revenue | 5.000% | 6/1/17 | 500 | 572 |
| Gwinnett County GA School District GO | 5.000% | 2/1/28 | 500 | 532 |
| Main Street Natural Gas Inc. Georgia Gas | | | | |
| Project Revenue | 5.000% | 3/15/16 | 590 | 629 |
| Main Street Natural Gas Inc. Georgia Gas | | | | |
| Project Revenue | 5.000% | 3/15/21 | 500 | 489 |
| Metropolitan Atlanta GA Rapid Transportation | | | | |
| Authority Georgia Sales Tax Revenue | 5.250% | 7/1/26 (14) | 500 | 542 |
| Milledgeville-Baldwin County GA Development | | | | |
| Authority Revenue (Georgia College & | | | | |
| State University Foundation) | 5.625% | 9/1/14 (Prere.) | 500 | 578 |
| | | | | 16,090 |
| Hawaii (0.5%) | | | | |
| Hawaii GO | 5.000% | 4/1/19 (2) | 500 | 557 |
| Hawaii GO | 5.000% | 3/1/26 (4) | 500 | 509 |
| Hawaii GO | 5.000% | 6/1/29 | 500 | 513 |
| Hawaii Pacific Health Revenue | 5.000% | 7/1/19 | 575 | 587 |
| Honolulu HI City & County GO | 5.000% | 7/1/20 (4) | 500 | 552 |
| Honolulu HI City & County GO | 5.000% | 12/1/30 | 310 | 316 |
| University of Hawaii Revenue | 5.000% | 10/1/27 | 500 | 519 |
| | | | | 3,553 |
| Illinois (1.6%) | | | | |
| Chicago IL (City Colleges Capital | | | | |
| Improvement Project) GO | 0.000% | 1/1/12 (3) | 2,380 | 2,343 |
| Chicago IL Board of Education GO | 5.250% | 12/1/24 (4) | 500 | 510 |
| Chicago IL Board of Education GO | 5.250% | 12/1/26 (4) | 500 | 501 |
| Chicago IL GO | 5.500% | 1/1/17 (4) | 500 | 553 |
| Chicago IL GO | 5.000% | 1/1/19 (2) | 500 | 518 |
| Chicago IL O’Hare International Airport Revenue | 5.000% | 1/1/24 (4) | 500 | 502 |
| Chicago IL O’Hare International Airport Revenue | 5.250% | 1/1/24 (14) | 500 | 508 |
| Cook County IL GO | 5.000% | 11/15/21 | 500 | 521 |
| Cook County IL GO | 5.000% | 11/15/28 | 500 | 484 |
| Illinois Finance Authority Revenue | | | | |
| (University of Chicago) VRDO | 0.320% | 1/7/11 | 1,200 | 1,200 |
| Illinois GO | 5.000% | 1/1/18 | 500 | 504 |
24
Tax-Managed Balanced Fund
| | | | |
| | | | Face | Market |
| | | Maturity | Amount | Value |
| | Coupon | Date | ($000) | ($000) |
| Illinois GO | 5.000% | 1/1/21 (4) | 500 | 493 |
| Illinois GO | 5.000% | 6/1/26 | 500 | 458 |
| Illinois Regional Transportation Authority Revenue | 6.250% | 7/1/23 (4) | 500 | 567 |
| Illinois Sales Tax Revenue | 5.500% | 6/15/17 (3) | 500 | 554 |
| Illinois Toll Highway Authority Revenue | 5.000% | 1/1/25 (4) | 500 | 501 |
| Illinois Toll Highway Authority Revenue | 5.000% | 1/1/28 | 500 | 482 |
| Metropolitan Pier & Exposition Authority Illinois | | | | |
| Dedicated Sales Tax Revenue | 0.000% | 6/15/19 (3) | 1,000 | 661 |
| Metropolitan Pier & Exposition Authority Illinois | | | | |
| Dedicated Sales Tax Revenue | 0.000% | 6/15/26 (4) | 500 | 197 |
| | | | | 12,057 |
| Indiana (0.4%) | | | | |
| Indiana Finance Authority Revenue | | | | |
| (State Revolving Fund) | 5.000% | 2/1/18 | 500 | 576 |
| Indiana Health & Educational Facility Financing | | | | |
| Authority Hospital Revenue | | | | |
| (Clarian Health Obligated Group) | 5.000% | 2/15/25 | 290 | 281 |
| Indiana Municipal Power Agency Revenue | 5.250% | 1/1/15 (14) | 500 | 532 |
| Indiana Office Building Commission Facilities | | | | |
| Revenue (New Castle Correctional Facility) | 5.250% | 7/1/19 (14) | 500 | 550 |
| Indiana Transportation Finance Authority | | | | |
| Highway Revenue | 5.000% | 12/1/12 (14) | 500 | 540 |
| Indiana University Student Fee Revenue | 5.000% | 8/1/23 | 100 | 107 |
| | | | | 2,586 |
| Iowa (0.0%) | | | | |
| Iowa Special Obligation Revenue (Ijobs Program) | 5.000% | 6/1/24 | 220 | 231 |
| |
| Kansas (0.5%) | | | | |
| Kansas Department of Transportation | | | | |
| Highway Revenue | 5.000% | 9/1/22 | 500 | 549 |
| Leavenworth County KS Unified School District GO | 4.500% | 9/1/19 (12) | 500 | 546 |
| University of Kansas Hospital Authority Health | | | | |
| Facilities Improvement Revenue | 5.000% | 9/1/16 | 1,250 | 1,403 |
| University of Kansas Hospital Authority Health | | | | |
| Facilities Improvement Revenue | 5.000% | 9/1/17 | 1,000 | 1,124 |
| Wichita KS Hospital Facilities Revenue | | | | |
| (Via Christi Health System Inc.) VRDO | 0.310% | 1/3/11 LOC | 200 | 200 |
| | | | | 3,822 |
| Kentucky (0.2%) | | | | |
| Kentucky Property & Building | | | | |
| Commission Revenue | 5.375% | 11/1/23 | 500 | 535 |
| Kentucky Property & Building | | | | |
| Commission Revenue | 5.000% | 11/1/26 (4) | 500 | 509 |
| Kentucky Turnpike Authority Economic | | | | |
| Development Road Revenue | | | | |
| (Revitalization Project) | 5.000% | 7/1/25 | 305 | 320 |
| | | | | 1,364 |
| Louisiana (0.5%) | | | | |
| Jefferson Parish LA Environmental Facilities & | | | | |
| Community Development Authority Revenue | 5.000% | 4/1/18 | 405 | 444 |
| Louisiana Citizens Property Insurance Corp. | | | | |
| Assessment Revenue | 5.000% | 6/1/22 (2) | 500 | 487 |
| Louisiana Gasoline & Fuel Tax Revenue | 5.000% | 5/1/31 (4) | 500 | 495 |
25
Tax-Managed Balanced Fund
| | | | |
| | | | Face | Market |
| | | Maturity | Amount | Value |
| | Coupon | Date | ($000) | ($000) |
| Louisiana GO | 5.000% | 5/1/18 (4) | 500 | 551 |
| Louisiana GO | 5.000% | 5/1/23 (4) | 500 | 523 |
| Louisiana Public Facilities Authority Revenue | | | | |
| (Ochsner Clinic Foundation Project) | 5.000% | 5/15/16 | 1,260 | 1,290 |
| | | | | 3,790 |
| Maine (0.1%) | | | | |
| Portland ME Airport Revenue | 5.000% | 1/1/20 (4) | 500 | 523 |
| |
| Maryland (0.9%) | | | | |
| Maryland Department of Transportation Revenue | 5.000% | 2/15/18 | 500 | 579 |
| Maryland GO | 5.000% | 8/1/15 (Prere.) | 500 | 576 |
| Maryland GO | 5.000% | 8/1/15 | 500 | 576 |
| Maryland GO | 5.250% | 3/1/17 | 500 | 591 |
| Maryland GO | 5.000% | 7/15/17 | 500 | 586 |
| Maryland GO | 5.000% | 11/1/19 | 1,000 | 1,165 |
| Maryland Transportation Authority Facilities | | | | |
| Projects Revenue | 5.000% | 7/1/15 (4) | 750 | 834 |
| Maryland Transportation Authority Facilities | | | | |
| Projects Revenue | 5.000% | 7/1/22 | 500 | 550 |
| Maryland Transportation Authority GAN | 5.250% | 3/1/20 | 500 | 577 |
| Montgomery County MD GO | 5.000% | 11/1/17 | 500 | 587 |
| | | | | 6,621 |
| Massachusetts (2.3%) | | | | |
| Massachusetts Bay Transportation Authority | | | | |
| Revenue Sales Tax | 5.000% | 7/1/18 (Prere.) | 500 | 584 |
| Massachusetts Bay Transportation Authority | | | | |
| Sales Tax Revenue | 5.500% | 7/1/26 (14) | 1,500 | 1,680 |
| Massachusetts Department of Transportation | | | | |
| Metropolitan Highway System Revenue | 5.000% | 1/1/23 | 500 | 519 |
| Massachusetts Development Finance Agency | | | | |
| Revenue (Boston College) | 5.000% | 7/1/19 | 500 | 560 |
| Massachusetts GO | 5.500% | 11/1/13 (3) | 2,000 | 2,240 |
| Massachusetts GO | 5.500% | 10/1/18 | 500 | 591 |
| Massachusetts GO | 5.000% | 7/1/20 | 500 | 560 |
| Massachusetts GO | 5.500% | 10/1/20 | 500 | 587 |
| Massachusetts GO | 5.250% | 8/1/23 | 500 | 565 |
| Massachusetts GO | 5.000% | 3/1/25 | 1,000 | 1,053 |
| Massachusetts GO | 5.000% | 3/1/26 | 1,000 | 1,046 |
| Massachusetts Health & Educational Facilities | | | | |
| Authority Revenue | | | | |
| (Caritas Christi Obligated Group) | 6.500% | 7/1/12 (ETM) | 975 | 1,026 |
| Massachusetts Health & Educational Facilities | | | | |
| Authority Revenue (Harvard University) | 5.000% | 12/15/28 | 500 | 528 |
| Massachusetts Health & Educational Facilities | | | | |
| Authority Revenue | | | | |
| (Henry Heywood Memorial Hospital) VRDO | 0.320% | 1/3/11 LOC | 1,000 | 1,000 |
| Massachusetts Health & Educational Facilities | | | | |
| Authority Revenue (MIT) | 5.250% | 7/1/28 | 500 | 562 |
| Massachusetts School Building Authority | | | | |
| Dedicated Sales Tax Revenue | 5.000% | 5/15/19 | 500 | 570 |
| Massachusetts School Building Authority | | | | |
| Dedicated Sales Tax Revenue | 5.000% | 8/15/27 (14) | 500 | 510 |
| Massachusetts School Building Authority | | | | |
| Dedicated Sales Tax Revenue | 5.000% | 8/15/30 (4) | 500 | 505 |
26
Tax-Managed Balanced Fund
| | | | |
| | | | Face | Market |
| | | Maturity | Amount | Value |
| | Coupon | Date | ($000) | ($000) |
| Massachusetts Special Obligation Dedicated | | | | |
| Tax Revenue | 5.500% | 1/1/26 (3) | 500 | 522 |
| Massachusetts Turnpike Authority Revenue | | | | |
| (Metropolitan Highway System) | 0.000% | 1/1/29 (14) | 300 | 103 |
| Massachusetts Water Pollution Abatement | | | | |
| Trust Revenue | 5.250% | 8/1/21 | 500 | 584 |
| Massachusetts Water Resources | | | | |
| Authority Revenue | 5.000% | 8/1/25 | 895 | 955 |
| | | | | 16,850 |
| Michigan (1.5%) | | | | |
| Detroit MI City School District GO | 5.250% | 5/1/28 (4) | 500 | 485 |
| Mason MI Public School District | | | | |
| (School Building & Site) GO | 5.250% | 5/1/17 (4) | 1,850 | 2,021 |
| Michigan Building Authority Revenue | 5.000% | 10/15/20 (4) | 500 | 532 |
| Michigan GO | 5.000% | 9/15/14 (4) | 500 | 550 |
| Michigan GO | 5.000% | 5/1/18 | 500 | 553 |
| Michigan GO | 5.500% | 11/1/25 | 595 | 625 |
| Michigan Hospital Finance Authority Revenue | | | | |
| (Ascension Health Credit Group) PUT | 5.000% | 11/1/12 | 4,735 | 5,041 |
| Michigan Trunk Line Revenue | 5.000% | 11/1/21 | 500 | 534 |
| Wayne County MI Airport Authority Revenue | | | | |
| (Detroit Metropolitan Wayne County Airport) | 5.000% | 12/1/16 | 500 | 536 |
| | | | | 10,877 |
| Minnesota (0.6%) | | | | |
| Chisago Lakes MN Independent | | | | |
| School District GO | 5.000% | 2/1/15 (4) | 500 | 564 |
| Minnesota GO | 5.000% | 6/1/13 | 500 | 549 |
| Minnesota GO | 5.000% | 11/1/14 | 500 | 568 |
| Minnesota GO | 5.000% | 8/1/19 | 500 | 581 |
| Minnesota GO | 5.000% | 8/1/21 | 500 | 563 |
| Minnesota Public Facilities Authority Revenue | | | | |
| (State Revolving Fund) | 5.000% | 3/1/15 | 500 | 570 |
| Southern Minnesota Municipal Power Agency | | | | |
| Power Supply System Revenue | 5.250% | 1/1/30 | 500 | 505 |
| University of Minnesota Revenue | 5.000% | 8/1/19 | 500 | 572 |
| | | | | 4,472 |
| Mississippi (0.1%) | | | | |
| Mississippi GO | 5.500% | 12/1/18 | 750 | 891 |
| |
| Missouri (1.0%) | | | | |
| Curators of the University of Missouri System | | | | |
| Facilities Revenue | 5.000% | 11/1/26 | 500 | 520 |
| Kansas City MO Water Revenue | 5.000% | 12/1/18 (13) | 500 | 574 |
| Missouri Health & Educational Facilities | | | | |
| Authority Health Facilities Revenue | | | | |
| (St. Luke’s Episcopal - Presbyterian Hospital) | 5.500% | 12/1/15 (4) | 2,965 | 3,022 |
| Missouri Health & Educational Facilities | | | | |
| Authority Revenue (St. Louis University) VRDO | 0.280% | 1/3/11 LOC | 1,400 | 1,400 |
| Missouri Highways & Transportation | | | | |
| Commission Road Revenue | 5.000% | 5/1/15 | 300 | 343 |
| Missouri Highways & Transportation | | | | |
| Commission Road Revenue | 5.000% | 5/1/17 | 500 | 582 |
27
Tax-Managed Balanced Fund
| | | | |
| | | | Face | Market |
| | | Maturity | Amount | Value |
| | Coupon | Date | ($000) | ($000) |
| Missouri Highways & Transportation | | | | |
| Commission Road Revenue | 5.000% | 5/1/23 | 500 | 546 |
| Missouri Highways & Transportation | | | | |
| Commission Road Revenue | 5.250% | 5/1/23 | 350 | 384 |
| | | | | 7,371 |
| Nevada (0.5%) | | | | |
| Clark County NV GO | 5.000% | 12/1/29 | 500 | 501 |
| Clark County NV Highway Improvement | | | | |
| Motor Vehicle Fuel Tax Revenue | 5.000% | 7/1/27 | 500 | 499 |
| Clark County NV Passenger Facility | | | | |
| Charge Revenue (Las Vegas McCarran | | | | |
| International Airport) | 4.500% | 7/1/20 | 455 | 459 |
| Clark County NV School District GO | 5.000% | 6/15/18 | 1,690 | 1,873 |
| Nevada Capital Improvement & | | | | |
| Cultural Affairs GO | 5.000% | 12/1/26 (3) | 500 | 508 |
| | | | | 3,840 |
| New Hampshire (0.1%) | | | | |
| Manchester NH General Airport Revenue | 5.000% | 1/1/17 | 500 | 537 |
| | | |
| New Jersey (2.3%) | | | | |
| Garden State Preservation Trust | | | | |
| New Jersey Revenue (Open Space & | | | | |
| Farmland Preservation) | 5.250% | 11/1/13 (4)(Prere.) | 875 | 978 |
| Garden State Preservation Trust | | | | |
| New Jersey Revenue (Open Space & | | | | |
| Farmland Preservation) | 0.000% | 11/1/21 (4) | 500 | 316 |
| Garden State Preservation Trust | | | | |
| New Jersey Revenue (Open Space & | | | | |
| Farmland Preservation) | 0.000% | 11/1/22 (4) | 500 | 298 |
| New Jersey Economic Development | | | | |
| Authority Revenue (Cigarette Tax) | 5.750% | 6/15/29 | 500 | 464 |
| New Jersey Economic Development | | | | |
| Authority Revenue (Motor Vehicle Surcharges) | 5.250% | 7/1/26 (14) | 500 | 502 |
| New Jersey Economic Development | | | | |
| Authority Revenue | | | | |
| (School Facilities Construction) | 5.000% | 9/1/13 (2)(Prere.) | 500 | 553 |
| New Jersey Economic Development | | | | |
| Authority Revenue | | | | |
| (School Facilities Construction) | 5.000% | 9/1/13 (2)(Prere.) | 500 | 553 |
| New Jersey Economic Development | | | | |
| Authority Revenue | | | | |
| (School Facilities Construction) | 5.000% | 9/1/14 | 500 | 547 |
| New Jersey Economic Development | | | | |
| Authority Revenue | | | | |
| (School Facilities Construction) | 5.250% | 3/1/26 | 500 | 507 |
| New Jersey Economic Development | | | | |
| Authority Revenue | | | | |
| (School Facilities Construction) | | | | |
| PUT | 5.000% | 9/1/14 (4) | 500 | 549 |
| New Jersey Economic Development | | | | |
| Authority Transportation Project | | | | |
| Sublease Revenue (New Jersey Transit Corp. | | | | |
| Light Rail Transit System Project) | 5.000% | 5/1/19 | 500 | 541 |
| New Jersey Equipment Lease Purchase COP | 5.000% | 6/15/18 | 530 | 570 |
28
Tax-Managed Balanced Fund
| | | | |
| | | | Face | Market |
| | | Maturity | Amount | Value |
| | Coupon | Date | ($000) | ($000) |
| New Jersey Equipment Lease Purchase COP | 5.000% | 6/15/19 | 500 | 531 |
| New Jersey GO | 5.250% | 7/15/15 (2) | 500 | 571 |
| New Jersey GO | 5.000% | 8/15/15 | 790 | 895 |
| New Jersey GO | 5.250% | 7/1/16 (14) | 500 | 576 |
| New Jersey GO | 5.250% | 7/15/18 (2) | 500 | 574 |
| New Jersey Higher Education Assistance | | | | |
| Authority Student Loan Revenue | 5.250% | 12/1/28 | 400 | 385 |
| New Jersey Transportation Corp. COP | 5.000% | 9/15/19 (4) | 500 | 518 |
| New Jersey Transportation Trust Fund | | | | |
| Authority Transportation System Revenue | 6.000% | 12/15/11 (Prere.) | 625 | 658 |
| New Jersey Transportation Trust Fund | | | | |
| Authority Transportation System Revenue | 5.250% | 6/15/14 (3)(Prere.) | 500 | 567 |
| New Jersey Transportation Trust Fund | | | | |
| Authority Transportation System Revenue | 5.500% | 12/15/20 (3) | 2,500 | 2,730 |
| New Jersey Transportation Trust Fund | | | | |
| Authority Transportation System Revenue | 0.000% | 12/15/26 (2) | 2,000 | 748 |
| New Jersey Transportation Trust Fund | | | | |
| Authority Transportation System Revenue | 0.000% | 12/15/31 | 600 | 154 |
| New Jersey Turnpike Authority Revenue | 5.000% | 1/1/22 | 500 | 527 |
| New Jersey Turnpike Authority Revenue | 5.500% | 1/1/25 (2) | 500 | 541 |
| Tobacco Settlement Financing Corp. | | | | |
| New Jersey Revenue | 5.000% | 6/1/18 | 500 | 485 |
| | | | | 16,838 |
| New Mexico (0.2%) | | | | |
| New Mexico Educational Assistance | | | | |
| Foundation Revenue | 5.000% | 12/1/19 | 500 | 549 |
| New Mexico Finance Authority | | | | |
| Transportation Revenue | 5.000% | 6/15/13 (2) | 500 | 548 |
| New Mexico Finance Authority | | | | |
| Transportation Revenue | 5.000% | 6/15/23 | 500 | 546 |
| | | | | 1,643 |
| New York (9.5%) | | | | |
| Erie County NY GO | 6.125% | 1/15/11 (3) | 610 | 611 |
| Erie County NY Industrial Development Agency | | | | |
| School Facility Revenue (Buffalo City | | | | |
| School District Project) | 5.000% | 5/1/18 | 500 | 552 |
| Erie County NY Industrial Development Agency | | | | |
| School Facility Revenue (Buffalo City | | | | |
| School District Project) | 5.000% | 5/1/19 | 500 | 547 |
| Long Island NY Power Authority Electric | | | | |
| System Revenue | 5.500% | 12/1/12 (4)(ETM) | 2,000 | 2,174 |
| Long Island NY Power Authority Electric | | | | |
| System Revenue | 5.000% | 12/1/17 | 630 | 696 |
| Long Island NY Power Authority Electric | | | | |
| System Revenue | 5.000% | 5/1/19 (14) | 500 | 534 |
| Long Island NY Power Authority Electric | | | | |
| System Revenue | 5.000% | 12/1/21 (14) | 500 | 523 |
| Long Island NY Power Authority Electric | | | | |
| System Revenue | 5.000% | 4/1/23 | 500 | 519 |
| Metropolitan New York Transportation | | | | |
| Authority Revenue | 5.250% | 11/15/21 (3) | 300 | 321 |
| Metropolitan New York Transportation | | | | |
| Authority Revenue | 5.000% | 11/15/23 | 500 | 513 |
29
Tax-Managed Balanced Fund
| | | | |
| | | | Face | Market |
| | | Maturity | Amount | Value |
| | Coupon | Date | ($000) | ($000) |
| Metropolitan New York Transportation | | | | |
| Authority Revenue | 5.250% | 11/15/30 | 500 | 502 |
| Metropolitan New York Transportation | | | | |
| Authority Revenue (Dedicated Petroleum Tax) | 5.250% | 11/15/24 | 600 | 634 |
| Metropolitan New York Transportation | | | | |
| Authority Revenue (Service Contract) | 5.500% | 7/1/15 | 500 | 566 |
| Metropolitan New York Transportation | | | | |
| Authority Revenue (Service Contract) | 5.750% | 1/1/17 (14) | 560 | 647 |
| Metropolitan New York Transportation | | | | |
| Authority Revenue (Transit Revenue) | 5.500% | 11/15/12 (14) | 1,000 | 1,074 |
| Metropolitan New York Transportation | | | | |
| Authority Revenue (Transit Revenue) | 5.500% | 11/15/14 (14) | 500 | 557 |
| Metropolitan New York Transportation | | | | |
| Authority Revenue (Transit Revenue) | 5.500% | 11/15/18 | 500 | 554 |
| Metropolitan New York Transportation | | | | |
| Authority Revenue (Transit Revenue) | 5.500% | 11/15/19 (14) | 500 | 530 |
| New York City NY GO | 5.500% | 6/1/13 (Prere.) | 500 | 555 |
| New York City NY GO | 5.250% | 8/1/13 | 500 | 550 |
| New York City NY GO | 5.750% | 8/1/13 | 500 | 534 |
| New York City NY GO | 5.750% | 8/1/13 (2) | 500 | 534 |
| New York City NY GO | 5.000% | 1/1/14 | 500 | 548 |
| New York City NY GO | 5.250% | 9/1/14 | 500 | 562 |
| New York City NY GO | 5.000% | 8/1/16 | 500 | 568 |
| New York City NY GO | 5.000% | 2/1/17 | 500 | 563 |
| New York City NY GO | 5.000% | 9/1/17 | 500 | 552 |
| New York City NY GO | 5.000% | 2/1/18 | 500 | 553 |
| New York City NY GO | 5.000% | 8/1/19 | 500 | 544 |
| New York City NY GO | 5.000% | 11/1/23 | 305 | 316 |
| New York City NY GO | 5.250% | 8/15/24 | 500 | 530 |
| New York City NY GO | 5.000% | 8/1/25 | 905 | 927 |
| New York City NY GO | 5.000% | 8/15/26 | 475 | 486 |
| New York City NY GO | 5.000% | 5/15/28 | 480 | 488 |
| New York City NY GO | 5.000% | 8/1/28 | 500 | 506 |
| New York City NY GO | 5.000% | 8/1/28 | 400 | 408 |
| New York City NY GO | 5.500% | 11/15/28 | 300 | 315 |
| New York City NY GO | 5.625% | 4/1/29 | 840 | 889 |
| New York City NY GO | 5.000% | 5/15/29 | 500 | 507 |
| New York City NY GO VRDO | 0.300% | 1/7/11 LOC | 1,300 | 1,300 |
| New York City NY Housing Development Corp. | | | | |
| Multi-Family Housing Revenue | 5.000% | 5/1/12 | 500 | 523 |
| New York City NY Municipal Water Finance | | | | |
| Authority Water & Sewer System Revenue | 5.000% | 6/15/15 | 250 | 284 |
| New York City NY Municipal Water Finance | | | | |
| Authority Water & Sewer System Revenue | 5.375% | 6/15/17 | 500 | 532 |
| New York City NY Municipal Water Finance | | | | |
| Authority Water & Sewer System Revenue | 0.000% | 6/15/18 | 750 | 586 |
| New York City NY Municipal Water Finance | | | | |
| Authority Water & Sewer System Revenue | 5.375% | 6/15/19 | 500 | 530 |
| New York City NY Municipal Water Finance | | | | |
| Authority Water & Sewer System Revenue | 5.000% | 6/15/27 | 500 | 517 |
| New York City NY Municipal Water Finance | | | | |
| Authority Water & Sewer System Revenue | 5.000% | 6/15/29 | 500 | 506 |
| New York City NY Municipal Water Finance | | | | |
| Authority Water & Sewer System Revenue | 4.750% | 6/15/30 | 255 | 253 |
30
Tax-Managed Balanced Fund
| | | | |
| | | | Face | Market |
| | | Maturity | Amount | Value |
| | Coupon | Date | ($000) | ($000) |
| New York City NY Sales Tax Asset | | | | |
| Receivable Corp. Revenue | 5.000% | 10/15/24 (14) | 500 | 520 |
| New York City NY Sales Tax Asset | | | | |
| Receivable Corp. Revenue | 5.000% | 10/15/26 (14) | 500 | 512 |
| New York City NY Transitional Finance | | | | |
| Authority Building Aid Revenue | 5.250% | 1/15/25 | 500 | 526 |
| New York City NY Transitional Finance | | | | |
| Authority Building Aid Revenue | 5.250% | 1/15/26 | 500 | 522 |
| New York City NY Transitional Finance | | | | |
| Authority Building Aid Revenue | 5.125% | 1/15/29 | 1,070 | 1,064 |
| New York City NY Transitional Finance | | | | |
| Authority Future Tax Revenue | 5.250% | 8/1/12 (Prere.) | 500 | 536 |
| New York City NY Transitional Finance | | | | |
| Authority Future Tax Revenue | 5.250% | 2/1/13 (Prere.) | 65 | 71 |
| New York City NY Transitional Finance | | | | |
| Authority Future Tax Revenue | 5.375% | 2/1/13 | 2,000 | 2,136 |
| New York City NY Transitional Finance | | | | |
| Authority Future Tax Revenue | 5.000% | 11/1/18 | 500 | 562 |
| New York City NY Transitional Finance | | | | |
| Authority Future Tax Revenue | 5.250% | 2/1/19 (14) | 435 | 467 |
| New York City NY Transitional Finance | | | | |
| Authority Future Tax Revenue | 5.000% | 11/1/23 | 500 | 529 |
| New York City NY Transitional Finance | | | | |
| Authority Future Tax Revenue | 5.000% | 11/1/24 | 500 | 526 |
| New York City NY Transitional Finance | | | | |
| Authority Future Tax Revenue | 5.000% | 11/1/25 | 500 | 523 |
| New York GO | 4.500% | 2/1/17 | 500 | 562 |
| New York GO | 4.500% | 2/1/18 | 500 | 559 |
| New York GO | 4.500% | 2/1/19 | 500 | 553 |
| New York State Dormitory Authority Lease | | | | |
| Revenue (City of New York Court Facilities) | 5.500% | 5/15/24 (2) | 500 | 535 |
| New York State Dormitory Authority Lease | | | | |
| Revenue (City of New York Court Facilities) | 5.500% | 5/15/27 (2) | 500 | 520 |
| New York State Dormitory Authority Lease | | | | |
| Revenue (Mental Health Services Facilities) | 5.000% | 8/15/21 | 500 | 535 |
| New York State Dormitory Authority Revenue | | | | |
| (City University System) | 5.000% | 7/1/24 | 400 | 414 |
| New York State Dormitory Authority Revenue | | | | |
| (Fordham University) | 5.000% | 7/1/25 (4) | 250 | 259 |
| New York State Dormitory Authority Revenue | | | | |
| (Memorial Sloan-Kettering Cancer Center) | 5.000% | 7/1/30 | 500 | 498 |
| New York State Dormitory Authority Revenue | | | | |
| (Mount Sinai Hospital Obligated Group) | 5.000% | 7/1/22 | 595 | 607 |
| New York State Dormitory Authority Revenue | | | | |
| (Mount Sinai Hospital Obligated Group) | 5.000% | 7/1/23 | 500 | 505 |
| New York State Dormitory Authority Revenue | | | | |
| (Mount Sinai School of Medicine of | | | | |
| New York University) | 5.000% | 7/1/18 | 325 | 351 |
| New York State Dormitory Authority Revenue | | | | |
| (Mount Sinai School of Medicine of | | | | |
| New York University) | 5.000% | 7/1/24 (14) | 500 | 497 |
| New York State Dormitory Authority Revenue | | | | |
| (New York Law School) VRDO | 0.280% | 1/7/11 LOC | 5,300 | 5,300 |
31
Tax-Managed Balanced Fund
| | | | |
| | | | Face | Market |
| | | Maturity | Amount | Value |
| | Coupon | Date | ($000) | ($000) |
| New York State Dormitory Authority Revenue | | | | |
| (New York University) | 6.000% | 7/1/19 (14) | 500 | 602 |
| New York State Dormitory Authority Revenue | | | | |
| (Personal Income Tax) | 5.000% | 3/15/28 | 500 | 513 |
| New York State Dormitory Authority Revenue | | | | |
| (Service Contract) | 5.000% | 7/1/22 | 500 | 527 |
| New York State Dormitory Authority Revenue | | | | |
| (The New School) | 5.250% | 7/1/30 | 500 | 500 |
| New York State Environmental Facilities Corp. | | | | |
| Revenue (State Clean Water & Drinking Water | | | | |
| Revolving Funds) | 5.000% | 6/15/22 | 500 | 536 |
| New York State Environmental Facilities Corp. | | | | |
| Revenue (State Clean Water & Drinking Water | | | | |
| Revolving Funds) | 5.000% | 6/15/24 | 365 | 392 |
| New York State Local Government | | | | |
| Assistance Corp. Revenue | 5.000% | 4/1/21 | 500 | 551 |
| New York State Thruway Authority Revenue | 5.000% | 1/1/20 (14) | 500 | 536 |
| New York State Thruway Authority Revenue | 5.000% | 1/1/21 (14) | 490 | 520 |
| New York State Thruway Authority Revenue | | | | |
| (Highway & Bridge Trust Fund) | 5.000% | 4/1/13 | 500 | 541 |
| New York State Thruway Authority Revenue | | | | |
| (Highway & Bridge Trust Fund) | 5.250% | 4/1/13 (2) | 500 | 545 |
| New York State Thruway Authority Revenue | | | | |
| (Highway & Bridge Trust Fund) | 5.500% | 4/1/14 (2) | 475 | 501 |
| New York State Thruway Authority Revenue | | | | |
| (Highway & Bridge Trust Fund) | 5.000% | 4/1/18 (2) | 500 | 551 |
| New York State Thruway Authority Revenue | | | | |
| (Highway & Bridge Trust Fund) | 5.000% | 4/1/24 | 500 | 522 |
| New York State Thruway Authority Revenue | | | | |
| (Highway & Bridge Trust Fund) | 5.000% | 4/1/25 (2) | 500 | 508 |
| New York State Thruway Authority Revenue | | | | |
| (Highway & Bridge Trust Fund) | 5.000% | 4/1/26 (2) | 500 | 507 |
| New York State Thruway Authority Revenue | | | | |
| (Service Contract) | 5.500% | 4/1/14 | 4,000 | 4,212 |
| New York State Urban | | | | |
| Development Corp. Revenue | 5.000% | 1/1/15 | 500 | 554 |
| New York State Urban | | | | |
| Development Corp. Revenue | 5.000% | 12/15/18 | 500 | 573 |
| New York State Urban | | | | |
| Development Corp. Revenue | | | | |
| (Personal Income Tax) | 5.500% | 3/15/22 (14) | 2,030 | 2,342 |
| New York State Urban | | | | |
| Development Corp. Revenue | | | | |
| (Personal Income Tax) | 5.000% | 12/15/25 | 1,500 | 1,569 |
| New York State Urban | | | | |
| Development Corp. Revenue (Service Contract) | 5.000% | 1/1/18 | 540 | 603 |
| Port Authority of New York & | | | | |
| New Jersey Revenue | 5.000% | 7/15/26 | 500 | 517 |
| Triborough Bridge & Tunnel Authority | | | | |
| New York Revenue | 5.250% | 11/15/15 | 500 | 570 |
| Triborough Bridge & Tunnel Authority | | | | |
| New York Revenue | 5.500% | 11/15/19 (14) | 500 | 581 |
32
Tax-Managed Balanced Fund
| | | | |
| | | | Face | Market |
| | | Maturity | Amount | Value |
| | Coupon | Date | ($000) | ($000) |
| Triborough Bridge & Tunnel Authority | | | | |
| New York Revenue | 5.500% | 11/15/21 (14) | 500 | 577 |
| Triborough Bridge & Tunnel Authority | | | | |
| New York Revenue | 5.000% | 11/15/25 | 500 | 522 |
| | | | | 69,681 |
| North Carolina (1.1%) | | | | |
| Mecklenburg County NC Public Facilities Corp. | | | | |
| Revenue (Annual Appropriation) | 5.000% | 3/1/26 | 500 | 524 |
| North Carolina Eastern Municipal Power | | | | |
| Agency Revenue | 5.125% | 1/1/14 | 2,400 | 2,557 |
| North Carolina Eastern Municipal Power | | | | |
| Agency Revenue | 5.000% | 1/1/26 | 500 | 499 |
| North Carolina GO | 5.000% | 6/1/19 | 500 | 582 |
| North Carolina Infrastructure Financial Corp. | | | | |
| Capital Improvements COP | 5.000% | 2/1/21 (4) | 2,000 | 2,135 |
| North Carolina Municipal Power Agency Revenue | 5.000% | 1/1/30 | 500 | 484 |
| Wake County NC GO | 5.000% | 3/1/22 | 400 | 459 |
| Wake County NC GO | 5.000% | 1/1/26 | 500 | 525 |
| | | | | 7,765 |
| Ohio (2.0%) | | | | |
| Allen County OH Hospital Facilities Revenue | | | | |
| (Catholic Healthcare Partners) VRDO | 0.290% | 1/3/11 LOC | 1,750 | 1,750 |
| American Municipal Power Ohio Inc. Revenue | | | | |
| (Hydroelectric Projects) | 5.250% | 2/15/18 | 500 | 551 |
| Buckeye Tobacco Settlement Financing | | | | |
| Authority Ohio Revenue | 5.125% | 6/1/24 | 1,930 | 1,486 |
| Cincinnati OH City School District GO | 5.250% | 12/1/26 (14) | 500 | 542 |
| Cleveland OH Public Power System Revenue | 5.000% | 11/15/20 (3) | 500 | 522 |
| Cuyahoga County OH Revenue | | | | |
| (Cleveland Clinic Health System | | | | |
| Obligated Group) VRDO | 0.280% | 1/3/11 | 1,865 | 1,865 |
| Huber Heights OH City School District GO | 4.750% | 12/1/26 | 500 | 496 |
| Ohio Common Schools GO VRDO | 0.300% | 1/7/11 | 300 | 300 |
| Ohio Conservation Projects GO | 5.000% | 3/1/17 | 1,885 | 2,063 |
| Ohio Major New State Infrastructure | | | | |
| Project Revenue | 5.000% | 12/15/14 | 500 | 562 |
| Ohio State University General Receipts Revenue | 5.000% | 12/1/16 | 500 | 568 |
| Ohio Turnpike Commission Turnpike Revenue | 5.500% | 2/15/15 (3) | 500 | 569 |
| Ohio Water Development Authority | | | | |
| Water Pollution Control Loan Fund Revenue | 5.000% | 6/1/17 | 3,000 | 3,347 |
| | | | | 14,621 |
| Oregon (0.1%) | | | | |
| Portland OR Sewer System Revenue | 5.000% | 6/15/22 (4) | 500 | 541 |
| |
| Pennsylvania (1.8%) | | | | |
| Allegheny County PA Hospital Development | | | | |
| Authority Revenue (University of Pittsburgh | | | | |
| Medical Center) | 5.000% | 5/15/18 | 500 | 549 |
| Beaver County PA Industrial Development | | | | |
| Authority Pollution Control Revenue | | | | |
| (FirstEnergy Nuclear Generation Corp. Project) | | | | |
| VRDO | 0.320% | 1/3/11 LOC | 2,500 | 2,500 |
33
Tax-Managed Balanced Fund
| | | | |
| | | | Face | Market |
| | | Maturity | Amount | Value |
| | Coupon | Date | ($000) | ($000) |
| Commonwealth Financing Authority | | | | |
| Pennsylvania Revenue | 5.000% | 6/1/25 (14) | 500 | 507 |
| Pennsylvania Economic Development Financing | | | | |
| Authority Solid Waste Disposal Revenue | | | | |
| (Waste Management Inc. Project) PUT | 3.700% | 5/1/15 | 750 | 744 |
| Pennsylvania GO | 5.000% | 9/1/14 (4) | 500 | 563 |
| Pennsylvania GO | 5.250% | 7/1/15 | 500 | 576 |
| Pennsylvania GO | 5.375% | 7/1/21 | 1,085 | 1,269 |
| Pennsylvania GO | 5.000% | 1/1/26 | 100 | 104 |
| Pennsylvania GO | 5.000% | 4/15/28 | 500 | 518 |
| Pennsylvania Higher Educational Facilities | | | | |
| Authority Revenue (St. Joseph’s University) | 5.000% | 11/1/24 | 200 | 205 |
| Pennsylvania Higher Educational Facilities | | | | |
| Authority Revenue (Trustees of the University | | | | |
| of Pennsylvania) | 5.000% | 9/1/28 | 500 | 518 |
| Pennsylvania Turnpike Commission | | | | |
| Oil Franchise Tax Revenue | 5.250% | 12/1/11 (ETM) | 310 | 311 |
| Pennsylvania Turnpike Commission Revenue | 5.000% | 12/1/21 | 345 | 361 |
| Pennsylvania Turnpike Commission Revenue | 5.000% | 6/1/29 | 1,050 | 1,022 |
| Philadelphia PA Airport Revenue | 5.000% | 6/15/15 | 505 | 551 |
| Philadelphia PA Municipal Authority Revenue | 6.375% | 4/1/29 | 500 | 518 |
| Philadelphia PA School District GO | 5.000% | 8/1/20 (2) | 500 | 515 |
| 2 Philadelphia PA School District GO | 5.250% | 9/1/22 | 500 | 517 |
| Philadelphia PA Water & Waste Water Revenue | 5.000% | 8/1/22 (4) | 560 | 589 |
| University of Pittsburgh of the Commonwealth | | | | |
| System of Higher Education | | | | |
| Pennsylvania Revenue | | | | |
| (University Capital Project) | 5.250% | 9/15/24 | 500 | 543 |
| | | | | 12,980 |
| Puerto Rico (1.9%) | | | | |
| Puerto Rico Electric Power Authority Revenue | 5.250% | 7/1/20 | 500 | 537 |
| Puerto Rico Electric Power Authority Revenue | 5.000% | 7/1/21 (14) | 500 | 511 |
| Puerto Rico Electric Power Authority Revenue | 5.500% | 7/1/21 | 500 | 532 |
| Puerto Rico Electric Power Authority Revenue | 5.250% | 7/1/22 (14) | 500 | 527 |
| Puerto Rico Electric Power Authority Revenue | 5.000% | 7/1/23 | 500 | 503 |
| Puerto Rico Electric Power Authority Revenue | 5.250% | 7/1/26 | 500 | 497 |
| Puerto Rico GO | 6.000% | 7/1/27 (14) | 500 | 514 |
| Puerto Rico Highway & Transportation | | | | |
| Authority Revenue | 5.250% | 7/1/22 (3) | 500 | 501 |
| Puerto Rico Highway & Transportation | | | | |
| Authority Revenue | 5.500% | 7/1/25 | 500 | 503 |
| Puerto Rico Infrastructure Financing Authority | | | | |
| Special Tax Revenue | 5.500% | 7/1/24 (2) | 500 | 507 |
| Puerto Rico Municipal Finance Agency GO | 5.250% | 8/1/22 (11) | 500 | 501 |
| Puerto Rico Public Buildings Authority | | | | |
| Government Facilities Revenue | 5.250% | 7/1/14 (3) | 2,425 | 2,574 |
| Puerto Rico Public Buildings Authority | | | | |
| Government Facilities Revenue | 5.500% | 7/1/18 (2) | 500 | 521 |
| Puerto Rico Public Buildings Authority | | | | |
| Government Facilities Revenue | 5.250% | 7/1/29 | 500 | 478 |
| Puerto Rico Public Finance Corp. Revenue | 6.000% | 8/1/26 (4)(ETM) | 3,000 | 3,663 |
| Puerto Rico Sales Tax Financing Corp. Revenue | 5.250% | 8/1/27 | 500 | 501 |
| Puerto Rico Sales Tax Financing Corp. Revenue | 5.250% | 8/1/30 | 500 | 489 |
| | | | | 13,859 |
34
Tax-Managed Balanced Fund
| | | | |
| | | | Face | Market |
| | | Maturity | Amount | Value |
| | Coupon | Date | ($000) | ($000) |
| South Carolina (0.7%) | | | | |
| Charleston SC Educational Excellence | | | | |
| Financing Corp. Revenue (Charleston County | | | | |
| School District, South Carolina Project) | 5.000% | 12/1/19 | 500 | 543 |
| Greenville County SC School District GO | 5.000% | 12/1/27 | 500 | 503 |
| Piedmont SC Municipal Power Agency Revenue | 0.000% | 1/1/24 (3) | 1,600 | 769 |
| South Carolina GO | 5.000% | 4/1/20 | 450 | 518 |
| South Carolina Jobs Economic Development | | | | |
| Authority Hospital Revenue (Palmetto Health) | 5.250% | 8/1/24 (4) | 1,700 | 1,742 |
| South Carolina Public Service Authority Revenue | 5.000% | 1/1/29 | 500 | 508 |
| South Carolina Transportation | | | | |
| Infrastructure Revenue | 5.250% | 10/1/13 (2) | 500 | 549 |
| | | | | 5,132 |
| Tennessee (0.6%) | | | | |
| Memphis TN Electric System Revenue | 5.000% | 12/1/17 | 500 | 576 |
| Memphis TN GO | 5.000% | 7/1/21 | 500 | 560 |
| Metropolitan Government of Nashville & | | | | |
| Davidson County TN GO | 5.000% | 7/1/21 | 500 | 563 |
| Metropolitan Government of Nashville & | | | | |
| Davidson County TN Health & Educational | | | | |
| Facilities Board Revenue (Vanderbilt University) | 5.000% | 10/1/15 | 350 | 400 |
| Shelby County TN GO | 5.000% | 4/1/19 | 500 | 576 |
| Tennessee Energy Acquisition Corp. Gas Revenue | 5.000% | 9/1/16 | 500 | 516 |
| Tennessee Energy Acquisition Corp. Gas Revenue | 5.250% | 9/1/17 | 500 | 512 |
| Tennessee Energy Acquisition Corp. Gas Revenue | 5.250% | 9/1/18 | 500 | 504 |
| Tennessee GO | 5.000% | 8/1/14 | 500 | 564 |
| | | | | 4,771 |
| Texas (3.3%) | | | | |
| Austin TX Combined Utility System Revenue | 0.000% | 5/15/18 (3) | 1,000 | 761 |
| Austin TX Water & Wastewater System Revenue | 5.000% | 11/15/24 | 275 | 289 |
| Board of Regents of the University of Texas | | | | |
| System Revenue Financing System Revenue | 5.000% | 8/15/18 | 500 | 576 |
| Central Texas Regional Mobility Authority Revenue | 5.750% | 1/1/25 | 500 | 492 |
| Cypress-Fairbanks TX Independent School District | | | | |
| Unlimited Tax Schoolhouse GO | 5.000% | 2/15/30 | 500 | 514 |
| Dallas TX Area Rapid Transit Revenue | 4.500% | 12/1/27 | 500 | 491 |
| Dallas TX GO | 5.000% | 2/15/15 | 500 | 566 |
| Dallas TX Independent School District GO | 5.000% | 8/15/14 | 500 | 562 |
| Dallas TX Waterworks & Sewer System Revenue | 5.000% | 10/1/15 (2) | 485 | 556 |
| Harris County TX Flood Control District GO | 5.250% | 10/1/18 | 435 | 509 |
| Harris County TX GO | 5.000% | 8/15/27 | 500 | 511 |
| Harris County TX Revenue | 5.000% | 10/1/23 | 500 | 542 |
| Houston TX GO | 5.000% | 3/1/20 | 500 | 554 |
| Houston TX Independent School District GO | 5.000% | 7/15/15 (4) | 500 | 570 |
| Houston TX Utility System Revenue | 5.125% | 5/15/28 (14) | 500 | 508 |
| Houston TX Utility System Revenue | 5.000% | 11/15/28 (4) | 500 | 512 |
| Lone Star College System Texas GO | 5.000% | 8/15/23 | 250 | 273 |
| Lower Colorado River Authority Texas Revenue | 5.750% | 5/15/28 | 500 | 517 |
| North East TX Independent School District GO | 5.250% | 2/1/22 | 500 | 573 |
| North Texas Tollway Authority System Revenue | 6.000% | 1/1/20 | 500 | 549 |
| North Texas Tollway Authority System Revenue | 6.000% | 1/1/25 | 500 | 519 |
| North Texas Tollway Authority System Revenue | 6.000% | 1/1/28 | 250 | 256 |
| SA Energy Acquisition Public Facility Corp. | | | | |
| Texas Gas Supply Revenue | 5.250% | 8/1/17 | 500 | 526 |

Tax-Managed Balanced Fund
| | | | |
| | | | Face | Market |
| | | Maturity | Amount | Value |
| | Coupon | Date | ($000) | ($000) |
| SA Energy Acquisition Public Facility Corp. | | | | |
| Texas Gas Supply Revenue | 5.500% | 8/1/19 | 500 | 523 |
| San Antonio TX Electric & Gas Systems Revenue | 5.000% | 2/1/19 | 500 | 573 |
| San Antonio TX Electric & Gas Systems Revenue | 5.000% | 2/1/21 | 905 | 972 |
| Southwest Texas Higher Education Authority Inc. | | | | |
| Revenue (Southern Methodist University Project) | 5.000% | 10/1/16 (2) | 260 | 299 |
| Texas A&M University System Revenue Financing | | | | |
| System Revenue | 5.000% | 5/15/26 | 500 | 526 |
| Texas Municipal Gas Acquisition & | | | | |
| Supply Corp. Revenue | 6.250% | 12/15/26 | 500 | 529 |
| Texas Municipal Power Agency Revenue | 0.000% | 9/1/15 (14) | 3,000 | 2,646 |
| Texas Public Finance Authority GO | 5.500% | 10/1/12 | 500 | 518 |
| Texas State University System Revenue | 5.000% | 3/15/26 | 500 | 524 |
| Texas Tech University System Revenue Financing | | | | |
| System Revenue | 5.000% | 2/15/28 | 500 | 515 |
| Texas Transportation Commission Revenue | 4.750% | 4/1/24 | 500 | 514 |
| Texas Transportation Commission Revenue | 5.000% | 4/1/25 | 500 | 525 |
| Texas Transportation Commission Revenue | 5.000% | 4/1/26 | 500 | 521 |
| Texas Water Financial Assistance GO | 5.000% | 8/1/24 | 500 | 533 |
| Texas Water Financial Assistance GO | 5.000% | 8/1/25 | 500 | 529 |
| Texas Water Financial Assistance GO | 5.000% | 8/1/26 | 500 | 525 |
| Texas Water Financial Assistance GO | 5.000% | 8/1/27 | 500 | 521 |
| University of Texas Permanent University | | | | |
| Fund Revenue | 5.250% | 7/1/22 | 500 | 576 |
| University of Texas System Revenue Financing | | | | |
| System Revenue | 5.000% | 8/15/21 | 500 | 569 |
| | | | | 24,164 |
| Utah (0.1%) | | | | |
| Intermountain Power Agency Utah Power | | | | |
| Supply Revenue | 5.250% | 7/1/21 | 500 | 527 |
| Utah GO | 5.000% | 7/1/16 | 500 | 582 |
| | | | | 1,109 |
| Virgin Islands (0.1%) | | | | |
| Virgin Islands Public Finance Authority Revenue | 5.000% | 10/1/29 | 500 | 466 |
| |
| Virginia (0.5%) | | | | |
| Fairfax County VA Public Improvement GO | 5.000% | 10/1/17 | 500 | 587 |
| Virginia Public Building Authority Revenue | 5.000% | 8/1/24 | 1,090 | 1,168 |
| Virginia Public School Authority Revenue | 5.000% | 8/1/13 | 500 | 551 |
| Virginia Public School Authority Revenue | 5.000% | 8/1/19 | 500 | 576 |
| Virginia Public School Authority Revenue | 5.000% | 8/1/19 | 500 | 575 |
| | | | | 3,457 |
| Washington (1.1%) | | | | |
| Energy Northwest Washington Electric Revenue | | | | |
| (Columbia Generating Station) | 5.000% | 7/1/20 | 500 | 570 |
| Energy Northwest Washington Electric Revenue | | | | |
| (Project No. 1) | 5.250% | 7/1/16 | 500 | 582 |
| Energy Northwest Washington Electric Revenue | | | | |
| (Project No. 1) | 5.000% | 7/1/17 | 500 | 578 |
| Energy Northwest Washington Electric Revenue | | | | |
| (Project No. 3) | 5.000% | 7/1/16 | 865 | 996 |
| Port of Seattle WA Revenue | 5.000% | 3/1/20 (14) | 665 | 689 |
| Seattle WA Municipal Light & Power Revenue | 5.000% | 2/1/26 | 500 | 524 |
36
Tax-Managed Balanced Fund
| | | | |
| | | | Face | Market |
| | | Maturity | Amount | Value |
| | Coupon | Date | ($000) | ($000) |
| Washington (Motor Vehicle Fuel Tax) GO | 5.000% | 7/1/23 | 425 | 457 |
| Washington (Motor Vehicle Fuel Tax) GO | 5.000% | 7/1/28 | 500 | 514 |
| Washington GO | 5.700% | 10/1/15 (4) | 500 | 539 |
| Washington GO | 5.000% | 2/1/16 | 500 | 573 |
| Washington GO | 0.000% | 6/1/20 (3) | 500 | 344 |
| Washington GO | 5.000% | 8/1/20 | 500 | 564 |
| Washington GO | 5.000% | 7/1/21 (4) | 500 | 531 |
| Washington GO | 5.000% | 7/1/21 | 500 | 549 |
| | | | | 8,010 |
| Wisconsin (0.6%) | | | | |
| Wisconsin GO | 5.750% | 5/1/11 (Prere.) | 1,340 | 1,364 |
| Wisconsin GO | 4.000% | 9/1/15 | 970 | 1,054 |
| Wisconsin GO | 5.000% | 5/1/22 | 1,060 | 1,144 |
| Wisconsin GO | 5.000% | 5/1/23 | 500 | 534 |
| Wisconsin Transportation Revenue | 5.250% | 7/1/14 (4) | 500 | 564 |
| | | | | 4,660 |
| Total Tax-Exempt Municipal Bonds (Cost $376,447) | | | | 379,394 |
| Total Investments (99.9%) (Cost $588,391) | | | | 732,283 |
| Other Assets and Liabilities (0.1%) | | | | |
| Other Assets | | | | 8,154 |
| Liabilities | | | | (7,432) |
| | | | | 722 |
| Net Assets (100%) | | | | |
| Applicable to 36,732,009 outstanding $.001 par value shares of | | | |
| beneficial interest (unlimited authorization) | | | | 733,005 |
| Net Asset Value Per Share | | | | $19.96 |
| |
| |
| At December 31, 2010, net assets consisted of: | | | | |
| | | | | Amount |
| | | | | ($000) |
| Paid-in Capital | | | | 612,390 |
| Overdistributed Net Investment Income | | | | (1,324) |
| Accumulated Net Realized Losses | | | | (21,953) |
| Unrealized Appreciation (Depreciation) | | | | 143,892 |
| Net Assets | | | | 733,005 |
See Note A in Notes to Financial Statements.
* Non-income-producing security.
1 Security exempt from registration under Rule 144A of the Securities Act of 1933. Such securities may be sold in transactions exempt from
registration, normally to qualified institutional buyers. At December 31, 2010, the value of this security represented 0.1% of net assets.
2 Security purchased on a when-issued or delayed-delivery basis for which the fund has not taken delivery as of December 31, 2010.
A key to abbreviations and other references follows the Statement of Net Assets.
See accompanying Notes, which are an integral part of the Financial Statements.
37
Tax-Managed Balanced Fund
Key to Abbreviations
ARS—Auction Rate Security.
BAN—Bond Anticipation Note.
COP—Certificate of Participation.
CP—Commercial Paper.
FR—Floating Rate.
GAN—Grant Anticipation Note.
GO—General Obligation Bond.
IDA—Industrial Development Authority Bond.
IDR—Industrial Development Revenue Bond.
PCR—Pollution Control Revenue Bond.
PUT—Put Option Obligation.
RAN—Revenue Anticipation Note.
TAN—Tax Anticipation Note.
TOB—Tender Option Bond.
TRAN—Tax Revenue Anticipation Note.
UFSD—Union Free School District.
USD—United School District.
VRDO—Variable Rate Demand Obligation.
VRDP—Variable Rate Demand Preferred.
(ETM)—Escrowed to Maturity.
(Prere.)—Prerefunded.
Scheduled principal and interest payments are guaranteed by:
(1) MBIA (Municipal Bond Investors Assurance).
(2) AMBAC (Ambac Assurance Corporation).
(3) FGIC (Financial Guaranty Insurance Company).
(4) AGM (Assured Guaranty Municipal Corporation).
(5) BIGI (Bond Investors Guaranty Insurance).
(6) Connie Lee Inc.
(7) FHA (Federal Housing Authority).
(8) CapMAC (Capital Markets Assurance Corporation).
(9) American Capital Access Financial Guaranty Corporation.
(10) XL Capital Assurance Inc.
(11) CIFG (CDC IXIS Financial Guaranty).
(12) Assured Guaranty Corp.
(13) Berkshire Hathaway Assurance Corp.
(14) National Public Finance Guarantee Corp.
The insurance does not guarantee the market value of the municipal bonds.
LOC—Scheduled principal and interest payments are guaranteed by bank letter of credit.
Tax-Managed Balanced Fund
Statement of Operations
| |
| | Year Ended |
| | December 31, 2010 |
| | ($000) |
| Investment Income | |
| Income | |
| Dividends | 5,752 |
| Interest | 13,275 |
| Total Income | 19,027 |
| Expenses | |
| The Vanguard Group—Note B | |
| Investment Advisory Services | 50 |
| Management and Administrative | 815 |
| Marketing and Distribution | 137 |
| Custodian Fees | 10 |
| Auditing Fees | 25 |
| Shareholders’ Reports | 8 |
| Trustees’ Fees and Expenses | 1 |
| Total Expenses | 1,046 |
| Net Investment Income | 17,981 |
| Realized Net Gain (Loss) on Investment Securities Sold | 23,695 |
| Change in Unrealized Appreciation (Depreciation) of Investment Securities | 19,847 |
| Net Increase (Decrease) in Net Assets Resulting from Operations | 61,523 |
See accompanying Notes, which are an integral part of the Financial Statements.
39
Tax-Managed Balanced Fund
Statement of Changes in Net Assets
| | |
| | Year Ended December 31, |
| | 2010 | 2009 |
| | ($000) | ($000) |
| Increase (Decrease) in Net Assets | | |
| Operations | | |
| Net Investment Income | 17,981 | 17,916 |
| Realized Net Gain (Loss) | 23,695 | (7,889) |
| Change in Unrealized Appreciation (Depreciation) | 19,847 | 100,729 |
| Net Increase (Decrease) in Net Assets Resulting from Operations | 61,523 | 110,756 |
| Distributions | | |
| Net Investment Income | (18,035) | (18,087) |
| Realized Capital Gain | — | — |
| Total Distributions | (18,035) | (18,087) |
| Capital Share Transactions | | |
| Issued | 55,542 | 54,143 |
| Issued in Lieu of Cash Distributions | 15,301 | 15,215 |
| Redeemed1 | (50,511) | (80,121) |
| Net Increase (Decrease) from Capital Share Transactions | 20,332 | (10,763) |
| Total Increase (Decrease) | 63,820 | 81,906 |
| Net Assets | | |
| Beginning of Period | 669,185 | 587,279 |
| End of Period2 | 733,005 | 669,185 |
| 1 Net of redemption fees for fiscal 2010 and 2009 of $176,000 and $168,000, respectively. | | |
| 2 Net Assets—End of Period includes undistributed (overdistributed) net investment income of ($1,324,000) and ($1,270,000). | |
See accompanying Notes, which are an integral part of the Financial Statements.
40
Tax-Managed Balanced Fund
Financial Highlights
| | | | | |
| For a Share Outstanding | | | Year Ended December 31, |
| Throughout Each Period | 2010 | 2009 | 2008 | 2007 | 2006 |
| Net Asset Value, Beginning of Period | $18.75 | $16.19 | $20.45 | $20.02 | $18.88 |
| Investment Operations | | | | | |
| Net Investment Income | .496 | .491 | .565 | .588 | .540 |
| Net Realized and Unrealized Gain (Loss) | | | | | |
| on Investments | 1.210 | 2.566 | (4.260) | .430 | 1.150 |
| Total from Investment Operations | 1.706 | 3.057 | (3.695) | 1.018 | 1.690 |
| Distributions | | | | | |
| Dividends from Net Investment Income1 | (.496) | (.497) | (.565) | (.588) | (.550) |
| Distributions from Realized Capital Gains | — | — | — | — | — |
| Total Distributions | (.496) | (.497) | (.565) | (.588) | (.550) |
| Net Asset Value, End of Period | $19.96 | $18.75 | $16.19 | $20.45 | $20.02 |
| |
| Total Return2 | 9.22% | 19.14% | -18.32% | 5.11% | 9.09% |
| |
| Ratios/Supplemental Data | | | | | |
| Net Assets, End of Period (Millions) | $733 | $669 | $587 | $722 | $662 |
| Ratio of Total Expenses to | | | | | |
| Average Net Assets | 0.15% | 0.15% | 0.13% | 0.12% | 0.12% |
| Ratio of Net Investment Income to | | | | | |
| Average Net Assets | 2.58% | 2.86% | 3.01% | 2.86% | 2.84% |
| Portfolio Turnover Rate | 23% | 27% | 19% | 10% | 4% |
| 1 For tax purposes, nontaxable dividends represent 70%, 69%, 72%, 73%, and 74% of dividends from net investment income. | |
| 2 Total returns do not include transaction or account service fees that may have applied in the periods shown. Fund prospectuses provide |
| information about any applicable transaction and account service fees. | | | | |
See accompanying Notes, which are an integral part of the Financial Statements.
41
Tax-Managed Balanced Fund
Notes to Financial Statements
Vanguard Tax-Managed Balanced Fund is registered under the Investment Company Act of 1940 as an open-end investment company, or mutual fund. The fund invests in debt instruments of many municipal issuers; the issuers’ abilities to meet their obligations may be affected by economic and political developments in a specific state or region.
A. The following significant accounting policies conform to generally accepted accounting principles for U.S. mutual funds. The fund consistently follows such policies in preparing its financial statements.
1. Security Valuation: Securities are valued as of the close of trading on the New York Stock Exchange (generally 4 p.m., Eastern time) on the valuation date. Equity securities are valued at the latest quoted sales prices or official closing prices taken from the primary market in which each security trades; such securities not traded on the valuation date are valued at the mean of the latest quoted bid and asked prices. Bonds, and temporary cash investments acquired over 60 days to maturity, are valued using the latest bid prices or using valuations based on a matrix system (which considers such factors as security prices, yields, maturities, and ratings), both as furnished by independent pricing services. Other temporary cash investments are valued at amortized cost, which approximates market value. Securities for which market quotations are not readily available, or whose values have been materially affected by events occurring before the fund’s pricing time but after the close of the securities’ primary markets, are valued by methods deemed by the board of trustees to represent fair value.
2. Federal Income Taxes: The fund intends to continue to qualify as a regulated investment company and distribute all of its income. Management has analyzed the fund’s tax positions taken for all open federal income tax years (December 31, 2007–2010), and has concluded that no provision for federal income tax is required in the fund’s financial statements.
3. Distributions: Distributions to shareholders are recorded on the ex-dividend date.
4. Other: Dividend income is recorded on the ex-dividend date. Interest income is accrued daily. Premiums and discounts on debt securities purchased are amortized and accreted, respectively, to interest income over the lives of the respective securities. Security transactions are accounted for on the date securities are bought or sold. Costs used to determine realized gains (losses) on the sale of investment securities are those of the specific securities sold. Fees assessed on redemptions of capital shares are credited to paid-in-capital.
B. The Vanguard Group furnishes at cost investment advisory, corporate management, administrative, marketing, and distribution services. The costs of such services are allocated to the fund under methods approved by the board of trustees. The fund has committed to provide up to 0.40% of its net assets in capital contributions to Vanguard. At December 31, 2010, the fund had contributed capital of $125,000 to Vanguard (included in Other Assets), representing 0.02% of the fund’s net assets and 0.05% of Vanguard’s capitalization. The fund’s trustees and officers are also directors and officers of Vanguard.
C. Various inputs may be used to determine the value of the fund’s investments. These inputs are summarized in three broad levels for financial statement purposes. The inputs or methodologies used to value securities are not necessarily an indication of the risk associated with investing in those securities.
42
Tax-Managed Balanced Fund
Level 1—Quoted prices in active markets for identical securities.
Level 2—Other significant observable inputs (including quoted prices for similar securities, interest rates, prepayment speeds, credit risk, etc.).
Level 3—Significant unobservable inputs (including the fund’s own assumptions used to determine the fair value of investments).
The following table summarizes the fund’s investments as of December 31, 2010, based on the inputs used to value them:
| | | |
| | Level 1 | Level 2 | Level 3 |
| Investments | ($000) | ($000) | ($000) |
| Common Stocks | 352,889 | — | — |
| Tax-Exempt Municipal Bonds | — | 379,394 | — |
| Total | 352,889 | 379,394 | — |
D. Distributions are determined on a tax basis and may differ from net investment income and realized capital gains for financial reporting purposes. Differences may be permanent or temporary. Permanent differences are reclassified among capital accounts in the financial statements to reflect their tax character. Temporary differences arise when certain items of income, expense, gain, or loss are recognized in different periods for financial statement and tax purposes; these differences will reverse at some time in the future. Differences in classification may also result from the treatment of short-term gains as ordinary income for tax purposes.
For tax purposes, at December 31, 2010, the fund had $55,000 of ordinary income available for distribution. The fund had available capital loss carryforwards totaling $21,953,000 to offset future net capital gains of $31,000 through December 31, 2016, and $21,922,000 through December 31, 2017.
At December 31, 2010, the cost of investment securities for tax purposes was $588,391,000. Net unrealized appreciation of investment securities for tax purposes was $143,892,000, consisting of unrealized gains of $153,674,000 on securities that had risen in value since their purchase and $9,782,000 in unrealized losses on securities that had fallen in value since their purchase.
E. During the year ended December 31, 2010, the fund purchased $166,071,000 of investment securities and sold $156,930,000 of investment securities, other than U.S. government securities and temporary cash investments.
F. Capital shares issued and redeemed were:
| | |
| | Year Ended December 31, |
| | 2010 | 2009 |
| | Shares | Shares |
| | (000) | (000) |
| Issued | 2,886 | 3,142 |
| Issued in Lieu of Cash Distributions | 794 | 870 |
| Redeemed | (2,635) | (4,590) |
| Net Increase (Decrease) in Shares Outstanding | 1,045 | (578) |
G. In preparing the financial statements as of December 31, 2010, management considered the impact of subsequent events for potential recognition or disclosure in these financial statements.
43
Tax-Managed Growth and Income Fund
Fund Profile
As of December 31, 2010
| | | |
| Share-Class Characteristics | | |
| | Investor | Admiral | Institutional |
| | Shares | Shares | Shares |
| Ticker Symbol | VTGIX | VTGLX | VTMIX |
| Expense Ratio1 | 0.21% | 0.15% | 0.09% |
| 30-Day SEC Yield | 1.44% | 1.52% | 1.56% |
| | | |
| Portfolio Characteristics | | |
| | | | DJ |
| | | | U.S. Total |
| | | S&P 500 | Market |
| | Fund | Index | Index |
| Number of Stocks | 503 | 500 | 3,893 |
| Median Market Cap $47.3B | $47.3B | $29.6B |
| Price/Earnings Ratio | 17.1x | 17.1x | 18.3x |
| Price/Book Ratio | 2.2x | 2.2x | 2.2x |
| Return on Equity | 20.2% | 20.2% | 18.8% |
| Earnings Growth Rate | 6.3% | 6.3% | 6.2% |
| Dividend Yield | 1.9% | 1.9% | 1.7% |
| Foreign Holdings | 0.0% | 0.0% | 0.0% |
| Turnover Rate | 6% | — | — |
| Short-Term Reserves | 0.1% | — | — |
| | | |
| Sector Diversification (% of equity exposure) |
| | | | DJ |
| | | | U.S. Total |
| | | S&P 500 | Market |
| | Fund | Index | Index |
| Consumer | | | |
| Discretionary | 10.6% | 10.6% | 11.9% |
| Consumer Staples | 10.6 | 10.6 | 9.5 |
| Energy | 12.0 | 12.0 | 10.6 |
| Financials | 16.1 | 16.1 | 16.6 |
| Health Care | 10.9 | 10.9 | 10.7 |
| Industrials | 10.9 | 11.0 | 11.4 |
| Information | | | |
| Technology | 18.8 | 18.7 | 18.9 |
| Materials | 3.7 | 3.7 | 4.5 |
| Telecommunication | | | |
| Services | 3.1 | 3.1 | 2.7 |
| Utilities | 3.3 | 3.3 | 3.2 |
| | |
| Volatility Measures | | |
| | | DJ |
| | | U.S. Total |
| | S&P 500 | Market |
| | Index | Index |
| R-Squared | 1.00 | 1.00 |
| Beta | 1.00 | 0.97 |
These measures show the degree and timing of the fund’s fluctuations compared with the indexes over 36 months.
| | |
| Ten Largest Holdings (% of total net assets) |
| Exxon Mobil Corp. | Integrated Oil & | |
| | Gas | 3.2% |
| Apple Inc. | Computer | |
| | Hardware | 2.6 |
| Microsoft Corp. | Systems Software | 1.8 |
| General Electric Co. | Industrial | |
| | Conglomerates | 1.7 |
| Chevron Corp. | Integrated Oil & | |
| | Gas | 1.6 |
| International Business | IT Consulting & | |
| Machines Corp. | Other Services | 1.6 |
| Procter & Gamble Co. | Household | |
| | Products | 1.6 |
| AT&T Inc. | Integrated | |
| | Telecommunication | |
| | Services | 1.5 |
| Johnson & Johnson | Pharmaceuticals | 1.5 |
| JPMorgan Chase & Co. | Diversified Financial | |
| | Services | 1.5 |
| Top Ten | | 18.6% |
| The holdings listed exclude any temporary cash investments and equity index products. |
Investment Focus
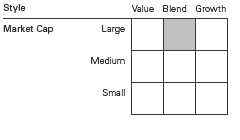
1 The expense ratios shown are from the prospectus dated April 26, 2010, and represent estimated costs for the current fiscal year. For the
fiscal year ended December 31, 2010, the expense ratios were 0.20% for Investor Shares, 0.12% for Admiral Shares, and 0.08% for
Institutional Shares.
44
Tax-Managed Growth and Income Fund
Performance Summary
All of the returns in this report represent past performance, which is not a guarantee of future results that may be achieved by the fund. (Current performance may be lower or higher than the performance data cited. For performance data current to the most recent month-end, visit our website at vanguard.com/performance.) Note, too, that both investment returns and principal value can fluctuate widely, so an investor’s shares, when sold, could be worth more or less than their original cost. The returns shown do not reflect taxes that a shareholder would pay on fund distributions or on the sale of fund shares.
Cumulative Performance: December 31, 2000, Through December 31, 2010
Initial Investment of $10,000
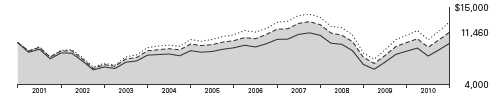
| | | | | |
| | | Average Annual Total Returns | |
| | | Periods Ended December 31, 2010 | |
| | | | | | Final Value |
| | | One | Five | Ten | of a $10,000 |
| | | Year | Years | Years | Investment |
| | Tax-Managed Growth and Income | | | | |
| | Fund Investor Shares | 14.90% | 2.22% | 1.37% | $11,460 |
| | Fee-Adjusted Returns | 13.77 | 2.22 | 1.37 | 11,460 |
| •••••••• | Dow Jones U.S. Total Stock Market | | | | |
| | Index | 17.70 | 3.17 | 2.64 | 12,981 |
| – – – – | S&P 500 Index | 15.06 | 2.29 | 1.41 | 11,507 |
| | Large-Cap Core Funds Average | 12.86 | 1.37 | -0.09 | 9,911 |
| Large-Cap Core Funds Average: Derived from data provided by Lipper Inc. |
Fee-adjusted returns reflect the 1% fee on redemptions of shares held for less than five years.
See Financial Highlights for dividend and capital gains information.
45
Tax-Managed Growth and Income Fund
| | | | |
| | Average Annual Total Returns | |
| | Periods Ended December 31, 2010 | |
| | | | Since | Final Value |
| | One | Five | Inception | of a $100,000 |
| | Year | Years | (11/12/2001) | Investment |
| Tax-Managed Growth and Income | | | | |
| Fund Admiral Shares | 14.99% | 2.28% | 3.30% | $134,535 |
| Fee-Adjusted Returns | 13.86 | 2.28 | 3.30 | 134,535 |
| Dow Jones U.S. Total Stock Market | | | | |
| Index | 17.70 | 3.17 | 4.69 | 152,041 |
| S&P 500 Index | 15.06 | 2.29 | 3.28 | 134,341 |
| "Since Inception" performance is calculated from the Admiral Shares’ inception date for both the fund and its comparative standards. |
| | | | |
| | | | | Final Value |
| | One | Five | Ten | of a $5,000,000 |
| | Year | Years | Years | Investment |
| Tax-Managed Growth and Income Fund | | | | |
| Institutional Shares | 15.04% | 2.32% | 1.46% | $5,782,621 |
| Fee-Adjusted Returns | 13.91 | 2.32 | 1.46 | 5,782,621 |
| Dow Jones U.S. Total Stock Market | | | | |
| Index | 17.70 | 3.17 | 2.64 | 6,490,386 |
| S&P 500 Index | 15.06 | 2.29 | 1.41 | 5,753,590 |
Fiscal-Year Total Returns (%): December 31, 2000, Through December 31, 2010
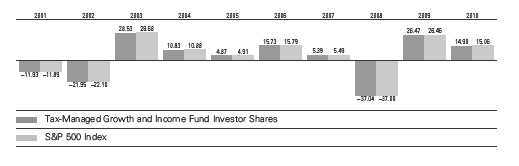
Fee-adjusted returns reflect the 1% fee on redemptions of shares held for less than five years.
46
Tax-Managed Growth and Income Fund
Financial Statements
Statement of Net Assets
As of December 31, 2010
The fund reports a complete list of its holdings in regulatory filings four times in each fiscal year, at the quarter-ends. For the second and fourth fiscal quarters, the lists appear in the fund’s semiannual and annual reports to shareholders. For the first and third fiscal quarters, the fund files the lists with the Securities and Exchange Commission on Form N-Q. Shareholders can look up the fund’s Forms N-Q on the SEC’s website at sec.gov. Forms N-Q may also be reviewed and copied at the SEC’s Public Reference Room (see the back cover of this report for further information).
| | | |
| | | | Market |
| | | | Value |
| | | Shares | ($000) |
| Common Stocks (100.0%) | | |
| Consumer Discretionary (10.6%) | |
| | McDonald’s Corp. | 215,147 | 16,515 |
| | Walt Disney Co. | 385,598 | 14,464 |
| * | Amazon.com Inc. | 72,145 | 12,986 |
| * | Ford Motor Co. | 763,796 | 12,824 |
| | Comcast Corp. Class A | 534,325 | 11,739 |
| | Home Depot Inc. | 333,714 | 11,700 |
| | Target Corp. | 144,436 | 8,685 |
| | Time Warner Inc. | 226,211 | 7,277 |
| | Lowe’s Cos. Inc. | 281,431 | 7,058 |
| * | DIRECTV Class A | 170,054 | 6,790 |
| | News Corp. Class A | 464,854 | 6,768 |
| | NIKE Inc. Class B | 77,974 | 6,661 |
| | Johnson Controls Inc. | 137,222 | 5,242 |
| | Viacom Inc. Class B | 123,303 | 4,884 |
| | Starbucks Corp. | 150,826 | 4,846 |
| | Time Warner Cable Inc. | 72,407 | 4,781 |
| | Yum! Brands Inc. | 95,684 | 4,693 |
| | Carnival Corp. | 87,840 | 4,050 |
| * | priceline.com Inc. | 10,023 | 4,005 |
| | TJX Cos. Inc. | 80,721 | 3,583 |
| | Staples Inc. | 147,460 | 3,358 |
| | Coach Inc. | 60,563 | 3,350 |
| * | Kohl’s Corp. | 59,513 | 3,234 |
| | Omnicom Group Inc. | 61,275 | 2,806 |
| | CBS Corp. Class B | 138,928 | 2,647 |
| * | Bed Bath & Beyond Inc. | 52,764 | 2,593 |
| | Marriott International Inc. | | |
| | Class A | 58,324 | 2,423 |
| * | Discovery | | |
| | Communications Inc. | | |
| | Class A | 58,100 | 2,423 |
| | Starwood Hotels & | | |
| �� | Resorts Worldwide Inc. | 38,611 | 2,347 |
| | Best Buy Co. Inc. | 67,278 | 2,307 |
| | McGraw-Hill Cos. Inc. | 62,869 | 2,289 |
| | Stanley Black & Decker Inc. | 33,811 | 2,261 |
| | Macy’s Inc. | 86,386 | 2,186 |
| | | |
| | Gap Inc. | 89,610 | 1,984 |
| | Fortune Brands Inc. | 31,020 | 1,869 |
| | Mattel Inc. | 73,346 | 1,865 |
| * | O’Reilly Automotive Inc. | 28,268 | 1,708 |
| | Harley-Davidson Inc. | 48,027 | 1,665 |
| | Cablevision Systems Corp. | | |
| | Class A | 48,968 | 1,657 |
| | Limited Brands Inc. | 53,868 | 1,655 |
| | Genuine Parts Co. | 32,098 | 1,648 |
| | Tiffany & Co. | 25,703 | 1,601 |
| | Wynn Resorts Ltd. | 15,393 | 1,598 |
| | JC Penney Co. Inc. | 48,375 | 1,563 |
| | Ross Stores Inc. | 24,643 | 1,559 |
| * | NetFlix Inc. | 8,849 | 1,555 |
| | VF Corp. | 17,642 | 1,520 |
| * | AutoZone Inc. | 5,532 | 1,508 |
| * | CarMax Inc. | 45,791 | 1,460 |
| | Polo Ralph Lauren Corp. | | |
| | Class A | 13,135 | 1,457 |
| | Nordstrom Inc. | 34,336 | 1,455 |
| | Whirlpool Corp. | 15,373 | 1,366 |
| | Darden Restaurants Inc. | 28,211 | 1,310 |
| | Hasbro Inc. | 27,705 | 1,307 |
| | Family Dollar Stores Inc. | 25,756 | 1,280 |
| | International | | |
| | Game Technology | 61,078 | 1,080 |
| | Newell Rubbermaid Inc. | 59,289 | 1,078 |
| | Wyndham Worldwide Corp. | 35,596 | 1,066 |
| * | Interpublic Group of Cos. Inc. | 99,909 | 1,061 |
| | Abercrombie & Fitch Co. | 18,028 | 1,039 |
| | Expedia Inc. | 41,226 | 1,034 |
| * | Apollo Group Inc. Class A | 26,005 | 1,027 |
| | Scripps Networks | | |
| | Interactive Inc. Class A | 18,381 | 951 |
| * | Urban Outfitters Inc. | 26,140 | 936 |
| | H&R Block Inc. | 62,883 | 749 |
| | Gannett Co. Inc. | 48,625 | 734 |
| | Comcast Corp. Class A | | |
| | Special Shares | 33,914 | 706 |
| * | GameStop Corp. Class A | 30,821 | 705 |
47
Tax-Managed Growth and Income Fund
| | | |
| | | | Market |
| | | | Value |
| | | Shares | ($000) |
| | DR Horton Inc. | 57,555 | 687 |
| | Leggett & Platt Inc. | 30,081 | 685 |
| * | Sears Holdings Corp. | 9,088 | 670 |
| * | Harman International | | |
| | Industries Inc. | 14,181 | 657 |
| | DeVry Inc. | 12,889 | 618 |
| | Lennar Corp. Class A | 32,569 | 611 |
| * | Goodyear Tire & Rubber Co. | 49,443 | 586 |
| * | Pulte Group Inc. | 69,607 | 523 |
| | Washington Post Co. Class B | 1,140 | 501 |
| * | Big Lots Inc. | 15,556 | 474 |
| | RadioShack Corp. | 23,356 | 432 |
| * | AutoNation Inc. | 12,949 | 365 |
| | Meredith Corp. | 7,325 | 254 |
| | | | 247,594 |
| Consumer Staples (10.6%) | | |
| | Procter & Gamble Co. | 570,170 | 36,679 |
| | Coca-Cola Co. | 472,981 | 31,108 |
| | Philip Morris | | |
| | International Inc. | 369,507 | 21,627 |
| | Wal-Mart Stores Inc. | 398,962 | 21,516 |
| | PepsiCo Inc. | 322,742 | 21,085 |
| | Kraft Foods Inc. | 355,734 | 11,209 |
| | Altria Group Inc. | 425,223 | 10,469 |
| | CVS Caremark Corp. | 276,841 | 9,626 |
| | Colgate-Palmolive Co. | 98,441 | 7,912 |
| | Walgreen Co. | 188,828 | 7,357 |
| | Costco Wholesale Corp. | 88,175 | 6,367 |
| | Kimberly-Clark Corp. | 82,949 | 5,229 |
| | General Mills Inc. | 130,314 | 4,638 |
| | Archer-Daniels-Midland Co. | 130,224 | 3,917 |
| | Sysco Corp. | 119,070 | 3,501 |
| | HJ Heinz Co. | 65,476 | 3,238 |
| | Kroger Co. | 129,777 | 2,902 |
| | Kellogg Co. | 51,793 | 2,646 |
| | Mead Johnson Nutrition Co. | 41,612 | 2,590 |
| | Avon Products Inc. | 87,343 | 2,538 |
| | Lorillard Inc. | 30,456 | 2,499 |
| | Sara Lee Corp. | 130,328 | 2,282 |
| | Reynolds American Inc. | 69,000 | 2,251 |
| | ConAgra Foods Inc. | 89,647 | 2,024 |
| | Estee Lauder Cos. Inc. | | |
| | Class A | 23,057 | 1,861 |
| | Clorox Co. | 28,428 | 1,799 |
| | Coca-Cola Enterprises Inc. | 69,160 | 1,731 |
| | Safeway Inc. | 76,010 | 1,709 |
| | Dr Pepper Snapple | | |
| | Group Inc. | 46,318 | 1,629 |
| | Molson Coors Brewing Co. | | |
| | Class B | 32,210 | 1,617 |
| | JM Smucker Co. | 24,428 | 1,604 |
| * | Whole Foods Market Inc. | 29,814 | 1,508 |
| | Hershey Co. | 31,535 | 1,487 |
| | Brown-Forman Corp. Class B | 21,150 | 1,472 |
| | | |
| | Campbell Soup Co. | 38,922 | 1,352 |
| | McCormick & Co. Inc. | 27,043 | 1,258 |
| | Tyson Foods Inc. Class A | 60,831 | 1,047 |
| * | Constellation Brands Inc. | | |
| | Class A | 36,015 | 798 |
| | Hormel Foods Corp. | 14,100 | 723 |
| | SUPERVALU Inc. | 44,046 | 424 |
| * | Dean Foods Co. | 37,100 | 328 |
| | | | 247,557 |
| Energy (12.0%) | | |
| | Exxon Mobil Corp. | 1,027,133 | 75,104 |
| | Chevron Corp. | 409,927 | 37,406 |
| | Schlumberger Ltd. | 277,860 | 23,201 |
| | ConocoPhillips | 299,176 | 20,374 |
| | Occidental Petroleum Corp. | 165,413 | 16,227 |
| | Apache Corp. | 77,747 | 9,270 |
| | Anadarko Petroleum Corp. | 100,888 | 7,684 |
| | Halliburton Co. | 185,211 | 7,562 |
| | Devon Energy Corp. | 88,071 | 6,915 |
| | National Oilwell Varco Inc. | 85,416 | 5,744 |
| | Marathon Oil Corp. | 144,648 | 5,356 |
| | Baker Hughes Inc. | 87,840 | 5,022 |
| | EOG Resources Inc. | 51,629 | 4,720 |
| | Hess Corp. | 61,211 | 4,685 |
| | Peabody Energy Corp. | 54,820 | 3,507 |
| | Chesapeake Energy Corp. | 133,235 | 3,452 |
| | Spectra Energy Corp. | 132,271 | 3,306 |
| | Noble Energy Inc. | 35,605 | 3,065 |
| | Williams Cos. Inc. | 119,055 | 2,943 |
| | Murphy Oil Corp. | 39,066 | 2,912 |
| | Valero Energy Corp. | 115,660 | 2,674 |
| * | Southwestern Energy Co. | 70,453 | 2,637 |
| * | Cameron International Corp. | 49,275 | 2,500 |
| | Consol Energy Inc. | 46,089 | 2,246 |
| * | FMC Technologies Inc. | 24,478 | 2,176 |
| | Pioneer Natural | | |
| | Resources Co. | 23,670 | 2,055 |
| | El Paso Corp. | 143,820 | 1,979 |
| * | Newfield Exploration Co. | 27,311 | 1,969 |
| * | Denbury Resources Inc. | 81,592 | 1,558 |
| | Range Resources Corp. | 32,486 | 1,461 |
| * | Nabors Industries Ltd. | 58,106 | 1,363 |
| | EQT Corp. | 30,304 | 1,359 |
| | QEP Resources Inc. | 35,768 | 1,299 |
| | Massey Energy Co. | 20,884 | 1,121 |
| | Helmerich & Payne Inc. | 21,687 | 1,051 |
| | Sunoco Inc. | 24,588 | 991 |
| | Diamond Offshore | | |
| | Drilling Inc. | 14,211 | 950 |
| * | Rowan Cos. Inc. | 25,886 | 904 |
| | Cabot Oil & Gas Corp. | 21,269 | 805 |
| * | Tesoro Corp. | 29,184 | 541 |
| | | | 280,094 |
48
Tax-Managed Growth and Income Fund
| | | |
| | | | Market |
| | | | Value |
| | | Shares | ($000) |
| Financials (16.1%) | | |
| | JPMorgan Chase & Co. | 796,207 | 33,775 |
| | Wells Fargo & Co. | 1,069,080 | 33,131 |
| * | Citigroup Inc. | 5,917,423 | 27,989 |
| | Bank of America Corp. | 2,054,245 | 27,404 |
| * | Berkshire Hathaway Inc. | | |
| | Class B | 317,899 | 25,467 |
| | Goldman Sachs Group Inc. | 104,204 | 17,523 |
| | US Bancorp | 390,804 | 10,540 |
| | American Express Co. | 213,398 | 9,159 |
| | Morgan Stanley | 308,438 | 8,393 |
| | MetLife Inc. | 184,545 | 8,201 |
| | Bank of New York | | |
| | Mellon Corp. | 252,523 | 7,626 |
| | PNC Financial Services | | |
| | Group Inc. | 107,080 | 6,502 |
| | Simon Property Group Inc. | 59,682 | 5,938 |
| | Prudential Financial Inc. | 98,796 | 5,800 |
| | Aflac Inc. | 95,939 | 5,414 |
| | Travelers Cos. Inc. | 93,589 | 5,214 |
| | State Street Corp. | 102,250 | 4,738 |
| | CME Group Inc. | 13,642 | 4,389 |
| | ACE Ltd. | 69,000 | 4,295 |
| | Capital One Financial Corp. | 92,986 | 3,958 |
| | BB&T Corp. | 141,183 | 3,712 |
| | Chubb Corp. | 62,176 | 3,708 |
| | Allstate Corp. | 109,576 | 3,493 |
| | Charles Schwab Corp. | 201,744 | 3,452 |
| | T Rowe Price Group Inc. | 52,170 | 3,367 |
| | Franklin Resources Inc. | 29,626 | 3,295 |
| | AON Corp. | 67,339 | 3,098 |
| | Marsh & | | |
| | McLennan Cos. Inc. | 110,400 | 3,018 |
| | SunTrust Banks Inc. | 102,099 | 3,013 |
| | Equity Residential | 57,895 | 3,008 |
| | Ameriprise Financial Inc. | 50,542 | 2,909 |
| | Public Storage | 28,489 | 2,889 |
| | Vornado Realty Trust | 33,257 | 2,771 |
| * | Berkshire Hathaway Inc. | | |
| | Class A | 23 | 2,770 |
| | HCP Inc. | 74,340 | 2,735 |
| | Northern Trust Corp. | 49,248 | 2,729 |
| | Progressive Corp. | 134,993 | 2,682 |
| | Loews Corp. | 64,357 | 2,504 |
| | Boston Properties Inc. | 28,583 | 2,461 |
| | Host Hotels & Resorts Inc. | 135,942 | 2,429 |
| | Hartford Financial Services | | |
| | Group Inc. | 90,729 | 2,403 |
| | Fifth Third Bancorp | 162,719 | 2,389 |
| | Invesco Ltd. | 94,216 | 2,267 |
| | Principal Financial Group Inc. | 65,118 | 2,120 |
| | M&T Bank Corp. | 24,309 | 2,116 |
| | Weyerhaeuser Co. | 108,973 | 2,063 |
| | Discover Financial Services | 110,778 | 2,053 |
| | AvalonBay Communities Inc. | 17,343 | 1,952 |
| | | |
| | Lincoln National Corp. | 64,625 | 1,797 |
| | Regions Financial Corp. | 256,113 | 1,793 |
| * | Intercontinental- | | |
| | Exchange Inc. | 14,914 | 1,777 |
| | Ventas Inc. | 31,958 | 1,677 |
| | ProLogis | 116,126 | 1,677 |
| * | American International | | |
| | Group Inc. | 28,572 | 1,646 |
| | NYSE Euronext | 53,337 | 1,599 |
| | KeyCorp | 179,560 | 1,589 |
| | Unum Group | 64,625 | 1,565 |
| | Comerica Inc. | 35,993 | 1,520 |
| | Kimco Realty Corp. | 82,523 | 1,489 |
| | XL Group plc Class A | 65,726 | 1,434 |
| | Health Care REIT Inc. | 29,666 | 1,413 |
| | Hudson City Bancorp Inc. | 107,019 | 1,363 |
| * | Genworth Financial Inc. | | |
| | Class A | 100,034 | 1,314 |
| * | SLM Corp. | 99,404 | 1,252 |
| | Plum Creek Timber Co. Inc. | 32,915 | 1,233 |
| * | CB Richard Ellis Group Inc. | | |
| | Class A | 59,321 | 1,215 |
| | Huntington Bancshares Inc. | 176,123 | 1,210 |
| | Leucadia National Corp. | 40,394 | 1,179 |
| | Legg Mason Inc. | 31,036 | 1,126 |
| | Moody’s Corp. | 41,740 | 1,108 |
| | People’s United Financial Inc. | 74,932 | 1,050 |
| | Cincinnati Financial Corp. | 32,995 | 1,046 |
| | Torchmark Corp. | 16,466 | 984 |
| | Zions Bancorporation | 36,340 | 881 |
| | Assurant Inc. | 21,709 | 836 |
| | Marshall & Ilsley Corp. | 108,008 | 747 |
| * | NASDAQ OMX Group Inc. | 30,395 | 721 |
| * | E*Trade Financial Corp. | 40,659 | 651 |
| * | First Horizon National Corp. | 53,224 | 627 |
| | Apartment Investment & | | |
| | Management Co. | 23,892 | 617 |
| | Federated Investors Inc. | | |
| | Class B | 18,895 | 494 |
| | Janus Capital Group Inc. | 37,389 | 485 |
| | | | 373,977 |
| Health Care (10.9%) | | |
| | Johnson & Johnson | 559,359 | 34,596 |
| | Pfizer Inc. | 1,631,598 | 28,569 |
| | Merck & Co. Inc. | 627,475 | 22,614 |
| | Abbott Laboratories | 314,843 | 15,084 |
| * | Amgen Inc. | 192,388 | 10,562 |
| | Bristol-Myers Squibb Co. | 348,566 | 9,230 |
| | Medtronic Inc. | 220,134 | 8,165 |
| | UnitedHealth Group Inc. | 224,317 | 8,100 |
| | Eli Lilly & Co. | 206,875 | 7,249 |
| | Baxter International Inc. | 118,621 | 6,005 |
| * | Gilead Sciences Inc. | 165,614 | 6,002 |
| * | Express Scripts Inc. | 107,465 | 5,809 |
| * | Celgene Corp. | 95,785 | 5,665 |
49
Tax-Managed Growth and Income Fund
| | | | |
| | | | | Market |
| | | | | Value |
| | | | Shares | ($000) |
| * | Medco Health Solutions Inc. | 86,575 | 5,304 |
| * | WellPoint Inc. | | 80,215 | 4,561 |
| * | Thermo Fisher Scientific Inc. | 81,017 | 4,485 |
| | Allergan Inc. | | 62,648 | 4,302 |
| | Becton Dickinson and Co. | 46,838 | 3,959 |
| * | Genzyme Corp. | | 52,632 | 3,747 |
| | Stryker Corp. | | 69,513 | 3,733 |
| | McKesson Corp. | | 51,535 | 3,627 |
| * | Biogen Idec Inc. | | 48,560 | 3,256 |
| * | St. Jude Medical Inc. | | 69,608 | 2,976 |
| * | Agilent Technologies Inc. | 70,547 | 2,923 |
| | Cardinal Health Inc. | | 70,959 | 2,718 |
| | Aetna Inc. | | 81,578 | 2,489 |
| * | Boston Scientific Corp. | 308,916 | 2,339 |
| * | Zimmer Holdings Inc. | | 40,218 | 2,159 |
| * | Life Technologies Corp. | 38,182 | 2,119 |
| * | Intuitive Surgical Inc. | | 8,007 | 2,064 |
| | CIGNA Corp. | | 55,520 | 2,035 |
| | AmerisourceBergen Corp. | | |
| | Class A | | 56,224 | 1,918 |
| * | Hospira Inc. | | 34,154 | 1,902 |
| * | Mylan Inc. | | 88,519 | 1,870 |
| * | Humana Inc. | | 34,162 | 1,870 |
| * | Forest Laboratories Inc. | 58,027 | 1,856 |
| * | Laboratory Corp. of | | | |
| | America Holdings | | 20,668 | 1,817 |
| | CR Bard Inc. | | 19,029 | 1,746 |
| * | Varian Medical Systems Inc. | 24,249 | 1,680 |
| | Quest Diagnostics Inc. | 28,842 | 1,557 |
| * | Waters Corp. | | 18,658 | 1,450 |
| * | Cerner Corp. | | 14,519 | 1,376 |
| * | DaVita Inc. | | 19,713 | 1,370 |
| * | Watson Pharmaceuticals Inc. | 25,477 | 1,316 |
| * | CareFusion Corp. | | 45,389 | 1,167 |
| | DENTSPLY International Inc. | 29,053 | 993 |
| * | Cephalon Inc. | | 15,432 | 952 |
| * | Coventry Health Care Inc. | 30,280 | 799 |
| * | Tenet Healthcare Corp. | 100,317 | 671 |
| | PerkinElmer Inc. | | 24,137 | 623 |
| | Patterson Cos. Inc. | | 19,940 | 611 |
| | | | | 253,990 |
| Industrials (10.9%) | | | |
| | General Electric Co. | 2,170,374 | 39,696 |
| | United Technologies Corp. | 188,000 | 14,799 |
| | United Parcel Service Inc. | | |
| | Class B | | 201,384 | 14,616 |
| | 3M Co. | | 145,543 | 12,560 |
| | Caterpillar Inc. | | 129,239 | 12,105 |
| | Boeing Co. | | 149,346 | 9,746 |
| | Union Pacific Corp. | | 100,540 | 9,316 |
| | Emerson Electric Co. | | 153,304 | 8,764 |
| | Honeywell International Inc. | 158,861 | 8,445 |
| | Deere & Co. | | 86,320 | 7,169 |
| | FedEx Corp. | | 64,097 | 5,962 |
| | | |
| | General Dynamics Corp. | 77,044 | 5,467 |
| | Illinois Tool Works Inc. | 101,161 | 5,402 |
| | Danaher Corp. | 109,488 | 5,165 |
| | CSX Corp. | 76,269 | 4,928 |
| | Norfolk Southern Corp. | 74,106 | 4,655 |
| | Cummins Inc. | 40,244 | 4,427 |
| | PACCAR Inc. | 74,239 | 4,263 |
| | Lockheed Martin Corp. | 60,199 | 4,209 |
| | Tyco International Ltd. | 99,772 | 4,134 |
| | Precision Castparts Corp. | 28,965 | 4,032 |
| | Northrop Grumman Corp. | 59,470 | 3,853 |
| | Waste Management Inc. | 97,234 | 3,585 |
| | Eaton Corp. | 34,379 | 3,490 |
| | Raytheon Co. | 71,995 | 3,336 |
| | Ingersoll-Rand plc | 66,100 | 3,113 |
| | Parker Hannifin Corp. | 32,790 | 2,830 |
| | CH Robinson Worldwide Inc. | 33,712 | 2,703 |
| | Fluor Corp. | 36,490 | 2,418 |
| | Expeditors International of | | |
| | Washington Inc. | 43,223 | 2,360 |
| | Goodrich Corp. | 25,568 | 2,252 |
| | Dover Corp. | 37,906 | 2,216 |
| | Rockwell Automation Inc. | 28,803 | 2,065 |
| | Southwest Airlines Co. | 151,836 | 1,971 |
| | ITT Corp. | 37,302 | 1,944 |
| | Rockwell Collins Inc. | 32,014 | 1,865 |
| | Republic Services Inc. | | |
| | Class A | 62,456 | 1,865 |
| | Fastenal Co. | 30,041 | 1,800 |
| | WW Grainger Inc. | 11,763 | 1,625 |
| | L-3 Communications | | |
| | Holdings Inc. | 22,977 | 1,620 |
| | Roper Industries Inc. | 19,140 | 1,463 |
| * | Stericycle Inc. | 17,464 | 1,413 |
| | Flowserve Corp. | 11,368 | 1,355 |
| | Textron Inc. | 55,708 | 1,317 |
| * | Jacobs Engineering | | |
| | Group Inc. | 25,545 | 1,171 |
| | Pall Corp. | 23,395 | 1,160 |
| | Iron Mountain Inc. | 41,155 | 1,029 |
| | Pitney Bowes Inc. | 41,281 | 998 |
| | Robert Half International Inc. | 30,301 | 927 |
| | Avery Dennison Corp. | 21,887 | 927 |
| | Masco Corp. | 72,919 | 923 |
| | Equifax Inc. | 25,067 | 892 |
| * | Quanta Services Inc. | 43,969 | 876 |
| | Dun & Bradstreet Corp. | 10,196 | 837 |
| | RR Donnelley & Sons Co. | 42,268 | 738 |
| | Cintas Corp. | 25,702 | 719 |
| | Snap-On Inc. | 11,767 | 666 |
| | Ryder System Inc. | 10,704 | 563 |
| * | Raytheon Co. Warrants | | |
| | Exp. 06/16/2011 | 2,287 | 20 |
| | | | 254,765 |
50
Tax-Managed Growth and Income Fund
| | | |
| | | | Market |
| | | | Value |
| | | Shares | ($000) |
| Information Technology (18.7%) | |
| * | Apple Inc. | 186,860 | 60,273 |
| | Microsoft Corp. | 1,533,623 | 42,819 |
| | International Business | | |
| | Machines Corp. | 253,042 | 37,136 |
| * | Google Inc. Class A | 50,807 | 30,178 |
| | Oracle Corp. | 788,473 | 24,679 |
| | Intel Corp. | 1,136,168 | 23,894 |
| * | Cisco Systems Inc. | 1,128,995 | 22,840 |
| | Hewlett-Packard Co. | 461,874 | 19,445 |
| | QUALCOMM Inc. | 329,413 | 16,303 |
| * | EMC Corp. | 419,601 | 9,609 |
| | Texas Instruments Inc. | 239,448 | 7,782 |
| | Visa Inc. Class A | 99,348 | 6,992 |
| * | eBay Inc. | 234,007 | 6,512 |
| | Corning Inc. | 318,290 | 6,149 |
| * | Dell Inc. | 342,572 | 4,642 |
| | Automatic Data | | |
| | Processing Inc. | 100,246 | 4,639 |
| * | Cognizant Technology | | |
| | Solutions Corp. Class A | 61,960 | 4,541 |
| | Mastercard Inc. Class A | 19,734 | 4,423 |
| * | Yahoo! Inc. | 265,851 | 4,421 |
| * | Motorola Inc. | 479,279 | 4,347 |
| * | NetApp Inc. | 73,818 | 4,057 |
| | Broadcom Corp. Class A | 92,995 | 4,050 |
| * | Juniper Networks Inc. | 106,783 | 3,942 |
| | Applied Materials Inc. | 272,295 | 3,826 |
| | Xerox Corp. | 281,820 | 3,246 |
| * | Adobe Systems Inc. | 103,730 | 3,193 |
| * | Salesforce.com Inc. | 24,023 | 3,171 |
| * | Intuit Inc. | 56,994 | 2,810 |
| * | Symantec Corp. | 158,352 | 2,651 |
| * | Citrix Systems Inc. | 38,403 | 2,627 |
| | Western Union Co. | 133,422 | 2,478 |
| * | SanDisk Corp. | 47,585 | 2,373 |
| | Analog Devices Inc. | 60,847 | 2,292 |
| | Altera Corp. | 63,821 | 2,271 |
| * | F5 Networks Inc. | 16,494 | 2,147 |
| | Paychex Inc. | 65,525 | 2,025 |
| | CA Inc. | 78,185 | 1,911 |
| | Amphenol Corp. Class A | 35,663 | 1,882 |
| * | NVIDIA Corp. | 118,581 | 1,826 |
| * | Red Hat Inc. | 38,927 | 1,777 |
| * | Fiserv Inc. | 30,167 | 1,767 |
| * | Autodesk Inc. | 46,233 | 1,766 |
| * | Akamai Technologies Inc. | 37,053 | 1,743 |
| * | BMC Software Inc. | 36,145 | 1,704 |
| * | Western Digital Corp. | 46,924 | 1,591 |
| | Linear Technology Corp. | 45,847 | 1,586 |
| | Computer Sciences Corp. | 31,484 | 1,562 |
| | Xilinx Inc. | 52,836 | 1,531 |
| | Fidelity National Information | | |
| | Services Inc. | 53,741 | 1,472 |
| * | McAfee Inc. | 31,100 | 1,440 |
| | | |
| * | First Solar Inc. | 11,033 | 1,436 |
| * | Micron Technology Inc. | 174,959 | 1,403 |
| * | Teradata Corp. | 34,059 | 1,402 |
| | KLA-Tencor Corp. | 34,159 | 1,320 |
| | Microchip Technology Inc. | 37,799 | 1,293 |
| | Harris Corp. | 26,020 | 1,179 |
| | VeriSign Inc. | 35,031 | 1,144 |
| * | Electronic Arts Inc. | 67,555 | 1,106 |
| * | FLIR Systems Inc. | 32,296 | 961 |
| * | Advanced Micro | | |
| | Devices Inc. | 116,145 | 950 |
| * | SAIC Inc. | 59,868 | 949 |
| | Jabil Circuit Inc. | 39,740 | 798 |
| * | LSI Corp. | 125,732 | 753 |
| | National | | |
| | Semiconductor Corp. | 48,616 | 669 |
| * | JDS Uniphase Corp. | 45,491 | 659 |
| | Molex Inc. | 28,022 | 637 |
| * | Monster Worldwide Inc. | 26,688 | 631 |
| * | Novellus Systems Inc. | 18,248 | 590 |
| * | Lexmark International Inc. | | |
| | Class A | 15,908 | 554 |
| * | Compuware Corp. | 45,476 | 531 |
| * | MEMC Electronic | | |
| | Materials Inc. | 46,504 | 524 |
| * | Teradyne Inc. | 36,700 | 515 |
| | Tellabs Inc. | 75,215 | 510 |
| | Total System Services Inc. | 33,098 | 509 |
| * | Novell Inc. | 72,081 | 427 |
| * | QLogic Corp. | 21,286 | 362 |
| | | | 434,153 |
| Materials (3.8%) | | |
| | Freeport-McMoRan | | |
| | Copper & Gold Inc. | 95,858 | 11,512 |
| | EI du Pont de | | |
| | Nemours & Co. | 185,914 | 9,273 |
| | Dow Chemical Co. | 236,394 | 8,070 |
| | Monsanto Co. | 109,414 | 7,620 |
| | Newmont Mining Corp. | 100,383 | 6,167 |
| | Praxair Inc. | 62,334 | 5,951 |
| | Air Products & | | |
| | Chemicals Inc. | 43,732 | 3,977 |
| | Alcoa Inc. | 207,903 | 3,200 |
| | Nucor Corp. | 64,290 | 2,817 |
| | PPG Industries Inc. | 33,224 | 2,793 |
| | International Paper Co. | 89,018 | 2,425 |
| | Ecolab Inc. | 47,179 | 2,379 |
| | Cliffs Natural Resources Inc. | 27,632 | 2,156 |
| | CF Industries Holdings Inc. | 14,489 | 1,958 |
| | United States Steel Corp. | 29,380 | 1,716 |
| | Sigma-Aldrich Corp. | 24,740 | 1,647 |
| | Sherwin-Williams Co. | 18,154 | 1,520 |
| | Eastman Chemical Co. | 14,622 | 1,229 |
| | Ball Corp. | 18,007 | 1,225 |
| | FMC Corp. | 14,664 | 1,171 |
Tax-Managed Growth and Income Fund
| | | |
| | | | Market |
| | | | Value |
| | | Shares | ($000) |
| | Vulcan Materials Co. | 26,230 | 1,164 |
| | Allegheny Technologies Inc. | 20,220 | 1,116 |
| * | Owens-Illinois Inc. | 33,185 | 1,019 |
| | Airgas Inc. | 15,097 | 943 |
| | International Flavors & | | |
| | Fragrances Inc. | 16,354 | 909 |
| | MeadWestvaco Corp. | 34,159 | 894 |
| | Sealed Air Corp. | 32,592 | 829 |
| | Bemis Co. Inc. | 21,950 | 717 |
| | AK Steel Holding Corp. | 22,200 | 363 |
| * | Titanium Metals Corp. | 18,600 | 320 |
| | | | 87,080 |
| Telecommunication Services (3.1%) | |
| | AT&T Inc. | 1,203,776 | 35,367 |
| | Verizon | | |
| | Communications Inc. | 575,696 | 20,598 |
| * | American Tower Corp. | | |
| | Class A | 81,179 | 4,192 |
| | CenturyLink Inc. | 61,865 | 2,856 |
| | Qwest Communications | | |
| | International Inc. | 354,315 | 2,696 |
| * | Sprint Nextel Corp. | 607,666 | 2,571 |
| | Frontier | | |
| | Communications Corp. | 202,006 | 1,966 |
| | Windstream Corp. | 98,658 | 1,375 |
| * | MetroPCS | | |
| | Communications Inc. | 53,328 | 674 |
| | | | 72,295 |
| Utilities (3.3%) | | |
| | Southern Co. | 171,103 | 6,541 |
| | Exelon Corp. | 134,686 | 5,608 |
| | Dominion Resources Inc. | 118,391 | 5,058 |
| | Duke Energy Corp. | 270,298 | 4,814 |
| | NextEra Energy Inc. | 84,718 | 4,405 |
| | PG&E Corp. | 79,581 | 3,807 |
| | American Electric | | |
| | Power Co. Inc. | 97,652 | 3,514 |
| | Public Service Enterprise | | |
| | Group Inc. | 103,034 | 3,278 |
| | Consolidated Edison Inc. | 59,332 | 2,941 |
| | Entergy Corp. | 36,835 | 2,609 |
| | PPL Corp. | 98,539 | 2,594 |
| | | | |
| | Progress Energy Inc. | | 59,540 | 2,589 |
| | Sempra Energy | | 48,952 | 2,569 |
| | Edison International | | 66,533 | 2,568 |
| | FirstEnergy Corp. | | 62,030 | 2,296 |
| | Xcel Energy Inc. | | 93,724 | 2,207 |
| * | AES Corp. | | 135,635 | 1,652 |
| | DTE Energy Co. | | 34,379 | 1,558 |
| | Wisconsin Energy Corp. | 23,921 | 1,408 |
| | Ameren Corp. | | 48,721 | 1,373 |
| | CenterPoint Energy Inc. | 86,088 | 1,353 |
| | Constellation Energy | | | |
| | Group Inc. | | 41,076 | 1,258 |
| | Oneok Inc. | | 21,662 | 1,202 |
| | Northeast Utilities | | 35,759 | 1,140 |
| | NiSource Inc. | | 56,443 | 995 |
| * | NRG Energy Inc. | | 50,374 | 984 |
| | SCANA Corp. | | 23,088 | 937 |
| | CMS Energy Corp. | | 50,220 | 934 |
| | Pinnacle West Capital Corp. | 22,140 | 918 |
| | Allegheny Energy Inc. | | 34,800 | 844 |
| | Pepco Holdings Inc. | | 45,755 | 835 |
| | TECO Energy Inc. | | 43,950 | 782 |
| | Integrys Energy Group Inc. | 15,773 | 765 |
| | Nicor Inc. | | 9,280 | 463 |
| | | | | 76,799 |
| Total Common Stocks | | | |
| (Cost $2,036,632) | | | 2,328,304 |
| Temporary Cash Investment (0.1%) | |
| Money Market Fund (0.1%) | | |
| 1 | Vanguard Market | | | |
| | Liquidity Fund, 0.211% | | | |
| | (Cost $1,542) | | 1,541,884 | 1,542 |
| Total Investments (100.1%) | | |
| (Cost $2,038,174) | | | 2,329,846 |
| Other Assets and Liabilities (-0.1%) | |
| Other Assets | | | 4,271 |
| Liabilities | | | (6,661) |
| | | | | (2,390) |
| Net Assets (100%) | | | 2,327,456 |
52
Tax-Managed Growth and Income Fund
| |
| At December 31, 2010, net assets consisted of: |
| | Amount |
| | ($000) |
| Paid-in Capital | 2,099,352 |
| Overdistributed Net Investment Income | (3,350) |
| Accumulated Net Realized Losses | (60,218) |
| Unrealized Appreciation (Depreciation) | 291,672 |
| Net Assets | 2,327,456 |
| |
| |
| Investor Shares—Net Assets | |
| Applicable to 17,847,029 outstanding | |
| $.001 par value shares of beneficial | |
| interest (unlimited authorization) | 489,007 |
| Net Asset Value Per Share— | |
| Investor Shares | $27.40 |
| |
| |
| Admiral Shares—Net Assets | |
| Applicable to 28,656,367 outstanding | |
| $.001 par value shares of beneficial | |
| interest (unlimited authorization) | 1,613,575 |
| Net Asset Value Per Share— | |
| Admiral Shares | $56.31 |
| |
| |
| Institutional Shares—Net Assets | |
| Applicable to 8,206,949 outstanding | |
| $.001 par value shares of beneficial | |
| interest (unlimited authorization) | 224,874 |
| Net Asset Value Per Share— | |
| Institutional Shares | $27.40 |
See Note A in Notes to Financial Statements.
* Non-income-producing security.
1 Affiliated money market fund available only to Vanguard funds and certain trusts and accounts managed by Vanguard. Rate shown is the
7-day yield.
REIT—Real Estate Investment Trust.
See accompanying Notes, which are an integral part of the Financial Statements.
53
Tax-Managed Growth and Income Fund
Statement of Operations
| |
| | Year Ended |
| | December 31, 2010 |
| | ($000) |
| Investment Income | |
| Income | |
| Dividends | 45,225 |
| Interest1 | 2 |
| Total Income | 45,227 |
| Expenses | |
| The Vanguard Group—Note B | |
| Investment Advisory Services | 204 |
| Management and Administrative—Investor Shares | 759 |
| Management and Administrative—Admiral Shares | 1,311 |
| Management and Administrative—Institutional Shares | 94 |
| Marketing and Distribution—Investor Shares | 93 |
| Marketing and Distribution—Admiral Shares | 265 |
| Marketing and Distribution—Institutional Shares | 43 |
| Custodian Fees | 57 |
| Auditing Fees | 26 |
| Shareholders’ Reports—Investor Shares | 9 |
| Shareholders’ Reports—Admiral Shares | 3 |
| Shareholders’ Reports—Institutional Shares | — |
| Trustees’ Fees and Expenses | 3 |
| Total Expenses | 2,867 |
| Net Investment Income | 42,360 |
| Realized Net Gain (Loss) on Investment Securities Sold | 29,493 |
| Change in Unrealized Appreciation (Depreciation) of Investment Securities | 234,852 |
| Net Increase (Decrease) in Net Assets Resulting from Operations | 306,705 |
| 1 Interest income from an affiliated company of the fund was $2,000. |
See accompanying Notes, which are an integral part of the Financial Statements.
54
Tax-Managed Growth and Income Fund
Statement of Changes in Net Assets
| | |
| | Year Ended December 31, |
| | 2010 | 2009 |
| | ($000) | ($000) |
| Increase (Decrease) in Net Assets | | |
| Operations | | |
| Net Investment Income | 42,360 | 45,962 |
| Realized Net Gain (Loss) | 29,493 | 445,426 |
| Change in Unrealized Appreciation (Depreciation) | 234,852 | (30,231) |
| Net Increase (Decrease) in Net Assets Resulting from Operations | 306,705 | 461,157 |
| Distributions | | |
| Net Investment Income | | |
| Investor Shares | (8,731) | (9,716) |
| Admiral Shares | (29,437) | (30,061) |
| Institutional Shares | (4,196) | (5,034) |
| Realized Capital Gain | | |
| Investor Shares | — | — |
| Admiral Shares | — | — |
| Institutional Shares | — | — |
| Total Distributions | (42,364) | (44,811) |
| Capital Share Transactions | | |
| Investor Shares | (46,196) | (33,993) |
| Admiral Shares | (35,245) | (17,864) |
| Institutional Shares | (873) | (104,662) |
| Net Increase (Decrease) from Capital Share Transactions | (82,314) | (156,519) |
| Total Increase (Decrease) | 182,027 | 259,827 |
| Net Assets | | |
| Beginning of Period | 2,145,429 | 1,885,602 |
| End of Period1 | 2,327,456 | 2,145,429 |
| 1 Net Assets—End of Period includes undistributed (overdistributed) net investment income of ($3,350,000) and ($3,346,000). |
See accompanying Notes, which are an integral part of the Financial Statements.
55
Tax-Managed Growth and Income Fund
Financial Highlights
| | | | | |
| Investor Shares | | | | | |
| |
| For a Share Outstanding | Year Ended December 31, |
| Throughout Each Period | 2010 | 2009 | 2008 | 2007 | 2006 |
| Net Asset Value, Beginning of Period | $24.30 | $19.65 | $31.96 | $30.87 | $27.15 |
| Investment Operations | | | | | |
| Net Investment Income | .474 | .490 | .572 | .578 | .504 |
| Net Realized and Unrealized Gain (Loss) | | | | | |
| on Investments | 3.102 | 4.640 | (12.295) | 1.089 | 3.727 |
| Total from Investment Operations | 3.576 | 5.130 | (11.723) | 1.667 | 4.231 |
| Distributions | | | | | |
| Dividends from Net Investment Income | (.476) | (.480) | (.587) | (.577) | (.511) |
| Distributions from Realized Capital Gains | — | — | — | — | — |
| Total Distributions | (.476) | (.480) | (.587) | (.577) | (.511) |
| Net Asset Value, End of Period | $27.40 | $24.30 | $19.65 | $31.96 | $30.87 |
| |
| Total Return1 | 14.90% | 26.47% | -37.04% | 5.39% | 15.73% |
| |
| Ratios/Supplemental Data | | | | | |
| Net Assets, End of Period (Millions) | $489 | $479 | $420 | $740 | $784 |
| Ratio of Total Expenses to | | | | | |
| Average Net Assets | 0.20% | 0.21% | 0.16% | 0.15% | 0.15% |
| Ratio of Net Investment Income to | | | | | |
| Average Net Assets | 1.90% | 2.34% | 2.13% | 1.80% | 1.77% |
| Portfolio Turnover Rate | 6% | 38% | 8% | 5% | 6% |
| 1 Total returns do not include transaction or account service fees that may have applied in the periods shown. Fund prospectuses provide |
| information about any applicable transaction and account service fees. |
See accompanying Notes, which are an integral part of the Financial Statements.
56
Tax-Managed Growth and Income Fund
Financial Highlights
| | | | | |
| Admiral Shares | | | | | |
| |
| For a Share Outstanding | Year Ended December 31, |
| Throughout Each Period | 2010 | 2009 | 2008 | 2007 | 2006 |
| Net Asset Value, Beginning of Period | $49.94 | $40.39 | $65.69 | $63.44 | $55.80 |
| Investment Operations | | | | | |
| Net Investment Income | 1.017 | 1.036 | 1.212 | 1.230 | 1.069 |
| Net Realized and Unrealized Gain (Loss) | | | | | |
| on Investments | 6.374 | 9.532 | (25.276) | 2.245 | 7.648 |
| Total from Investment Operations | 7.391 | 10.568 | (24.064) | 3.475 | 8.717 |
| Distributions | | | | | |
| Dividends from Net Investment Income | (1.021) | (1.018) | (1.236) | (1.225) | (1.077) |
| Distributions from Realized Capital Gains | — | — | — | — | — |
| Total Distributions | (1.021) | (1.018) | (1.236) | (1.225) | (1.077) |
| Net Asset Value, End of Period | $56.31 | $49.94 | $40.39 | $65.69 | $63.44 |
| |
| Total Return1 | 14.99% | 26.54% | -37.00% | 5.47% | 15.77% |
| |
| Ratios/Supplemental Data | | | | | |
| Net Assets, End of Period (Millions) | $1,614 | $1,466 | $1,203 | $2,113 | $1,935 |
| Ratio of Total Expenses to | | | | | |
| Average Net Assets | 0.12% | 0.15% | 0.10% | 0.09% | 0.10% |
| Ratio of Net Investment Income to | | | | | |
| Average Net Assets | 1.98% | 2.40% | 2.19% | 1.86% | 1.82% |
| Portfolio Turnover Rate | 6% | 38% | 8% | 5% | 6% |
| 1 Total returns do not include transaction fees that may have applied in the periods shown. Fund prospectuses provide information about any |
| applicable transaction fees. |
See accompanying Notes, which are an integral part of the Financial Statements.
57
Tax-Managed Growth and Income Fund
| | | | | |
| Financial Highlights | | | | | |
| |
| Institutional Shares | | | | | |
| |
| For a Share Outstanding | Year Ended December 31, |
| Throughout Each Period | 2010 | 2009 | 2008 | 2007 | 2006 |
| Net Asset Value, Beginning of Period | $24.30 | $19.65 | $31.96 | $30.87 | $27.15 |
| Investment Operations | | | | | |
| Net Investment Income | .506 | .515 | .598 | .604 | .527 |
| Net Realized and Unrealized Gain (Loss) | | | | | |
| on Investments | 3.101 | 4.642 | (12.299) | 1.089 | 3.727 |
| Total from Investment Operations | 3.607 | 5.157 | (11.701) | 1.693 | 4.254 |
| Distributions | | | | | |
| Dividends from Net Investment Income | (.507) | (.507) | (.609) | (.603) | (.534) |
| Distributions from Realized Capital Gains | — | — | — | — | — |
| Total Distributions | (.507) | (.507) | (.609) | (.603) | (.534) |
| Net Asset Value, End of Period | $27.40 | $24.30 | $19.65 | $31.96 | $30.87 |
| |
| Total Return1 | 15.04% | 26.63% | -36.98% | 5.47% | 15.82% |
| |
| Ratios/Supplemental Data | | | | | |
| Net Assets, End of Period (Millions) | $225 | $200 | $263 | $469 | $389 |
| Ratio of Total Expenses to | | | | | |
| Average Net Assets | 0.08% | 0.09% | 0.07% | 0.07% | 0.07% |
| Ratio of Net Investment Income to | | | | | |
| Average Net Assets | 2.02% | 2.46% | 2.22% | 1.88% | 1.85% |
| Portfolio Turnover Rate | 6% | 38% | 8% | 5% | 6% |
| 1 Total returns do not include transaction fees that may have applied in the periods shown. Fund prospectuses provide information about any |
| applicable transaction fees. |
See accompanying Notes, which are an integral part of the Financial Statements.
58
Tax-Managed Growth and Income Fund
Notes to Financial Statements
Vanguard Tax-Managed Growth and Income Fund is registered under the Investment Company Act of 1940 as an open-end investment company, or mutual fund. The fund offers three classes of shares: Investor Shares, Admiral Shares, and Institutional Shares. Investor Shares are available to any investor who meets the fund’s minimum purchase requirements. Admiral Shares and Institutional Shares are designed for investors who meet certain administrative, service, and account-size criteria.
A. The following significant accounting policies conform to generally accepted accounting principles for U.S. mutual funds. The fund consistently follows such policies in preparing its financial statements.
1. Security Valuation: Securities are valued as of the close of trading on the New York Stock Exchange (generally 4 p.m., Eastern time) on the valuation date. Equity securities are valued at the latest quoted sales prices or official closing prices taken from the primary market in which each security trades; such securities not traded on the valuation date are valued at the mean of the latest quoted bid and asked prices. Securities for which market quotations are not readily available, or whose values have been materially affected by events occurring before the fund’s pricing time but after the close of the securities’ primary markets, are valued by methods deemed by the board of trustees to represent fair value. Investments in Vanguard Market Liquidity Fund are valued at that fund’s net asset value.
2. Federal Income Taxes: The fund intends to continue to qualify as a regulated investment company and distribute all of its taxable income. Management has analyzed the fund’s tax positions taken for all open federal income tax years (December 31, 2007–2010), and has concluded that no provision for federal income tax is required in the fund’s financial statements.
3. Distributions: Distributions to shareholders are recorded on the ex-dividend date.
4. Other: Dividend income is recorded on the ex-dividend date. Interest income includes income distributions received from Vanguard Market Liquidity Fund and is accrued daily. Security transactions are accounted for on the date securities are bought or sold. Costs used to determine realized gains (losses) on the sale of investment securities are those of the specific securities sold. Fees assessed on redemptions of capital shares are credited to paid-in capital.
Each class of shares has equal rights as to assets and earnings, except that each class separately bears certain class-specific expenses related to maintenance of shareholder accounts (included in Management and Administrative expenses) and shareholder reporting. Marketing and distribution expenses are allocated to each class of shares based on a method approved by the board of trustees. Income, other non-class-specific expenses, and gains and losses on investments are allocated to each class of shares based on its relative net assets.
B. The Vanguard Group furnishes at cost investment advisory, corporate management, administrative, marketing, and distribution services. The costs of such services are allocated to the fund under methods approved by the board of trustees. The fund has committed to provide up to 0.40% of its net assets in capital contributions to Vanguard. At December 31, 2010, the fund had contributed capital of $385,000 to Vanguard (included in Other Assets), representing 0.02% of the fund’s net assets and 0.15% of Vanguard’s capitalization. The fund’s trustees and officers are also directors and officers of Vanguard.
C. Various inputs may be used to determine the value of the fund’s investments. These inputs are summarized in three broad levels for financial statement purposes. The inputs or methodologies used to value securities are not necessarily an indication of the risk associated with investing in those securities.
59
Tax-Managed Growth and Income Fund
Level 1—Quoted prices in active markets for identical securities.
Level 2—Other significant observable inputs (including quoted prices for similar securities, interest rates, prepayment speeds, credit risk, etc.).
Level 3—Significant unobservable inputs (including the fund’s own assumptions used to determine the fair value of investments).
At December 31, 2010, 100% of the fund’s investments were valued based on Level 1 inputs.
D. Distributions are determined on a tax basis and may differ from net investment income and realized capital gains for financial reporting purposes. Differences may be permanent or temporary. Permanent differences are reclassified among capital accounts in the financial statements to reflect their tax character. Temporary differences arise when certain items of income, expense, gain, or loss are recognized in different periods for financial statement and tax purposes; these differences will reverse at some time in the future. Differences in classification may also result from the treatment of short-term gains as ordinary income for tax purposes.
For tax purposes, at December 31, 2010, the fund had $261,000 of ordinary income available for distribution. The fund had available capital loss carryforwards totaling $49,308,000 to offset future net capital gains through December 31, 2016. In addition, the fund realized losses of $7,745,000 during the period from November 1, 2010, through December 31, 2010, which are deferred and will be treated as realized for tax purposes in fiscal 2011.
At December 31, 2010, the cost of investment securities for tax purposes was $2,041,338,000. Net unrealized appreciation of investment securities for tax purposes was $288,508,000, consisting of unrealized gains of $530,460,000 on securities that had risen in value since their purchase and $241,952,000 in unrealized losses on securities that had fallen in value since their purchase.
E. During the year ended December 31, 2010, the fund purchased $129,088,000 of investment securities and sold $211,027,000 of investment securities, other than temporary cash investments.
60
Tax-Managed Growth and Income Fund
F. Capital share transactions for each class of shares were:
| | | | |
| | Year Ended December 31, |
| | 2010 | 2009 |
| | Amount | Shares | Amount | Shares |
| | ($000) | (000) | ($000) | (000) |
| Investor Shares | | | | |
| Issued | 24,116 | 966 | 38,556 | 1,918 |
| Issued in Lieu of Cash Distributions | 7,770 | 308 | 8,650 | 406 |
| Redeemed1 | (78,082) | (3,142) | (81,199) | (3,988) |
| Net Increase (Decrease)—Investor Shares | (46,196) | (1,868) | (33,993) | (1,664) |
| Admiral Shares | | | | |
| Issued | 67,154 | 1,314 | 101,215 | 2,524 |
| Issued in Lieu of Cash Distributions | 23,036 | 444 | 23,319 | 532 |
| Redeemed1 | (125,435) | (2,457) | (142,398) | (3,471) |
| Net Increase (Decrease)—Admiral Shares | (35,245) | (699) | (17,864) | (415) |
| Institutional Shares | | | | |
| Issued | 26,919 | 1,121 | 3,198 | 175 |
| Issued in Lieu of Cash Distributions | 2,634 | 104 | 3,141 | 149 |
| Redeemed1 | (30,426) | (1,269) | (111,001) | (5,450) |
| Net Increase (Decrease)—Institutional Shares | (873) | (44) | (104,662) | (5,126) |
| 1 Net of redemption fees for fiscal 2010 and 2009 of $288,000 and $807,000, respectively (fund totals). |
G. In preparing the financial statements as of December 31, 2010, management considered the impact
of subsequent events for potential recognition or disclosure in these financial statements.
61
Tax-Managed Capital Appreciation Fund
Fund Profile
As of December 31, 2010
| | | |
| Share-Class Characteristics | | |
| | Investor | Admiral | Institutional |
| | Shares | Shares | Shares |
| Ticker Symbol | VMCAX | VTCLX | VTCIX |
| Expense Ratio1 | 0.21% | 0.15% | 0.09% |
| 30-Day SEC Yield | 1.15% | 1.23% | 1.27% |
| | | |
| Portfolio Characteristics | | |
| | | | DJ |
| | | Russell | U.S. Total |
| | | 1000 | Market |
| | Fund | Index | Index |
| Number of Stocks | 633 | 978 | 3,893 |
| Median Market Cap $35.3B | $37.1B | $29.6B |
| Price/Earnings Ratio | 17.6x | 17.4x | 18.3x |
| Price/Book Ratio | 2.2x | 2.2x | 2.2x |
| Return on Equity | 19.5% | 19.5% | 18.8% |
| Earnings Growth Rate | 6.7% | 6.2% | 6.2% |
| Dividend Yield | 1.6% | 1.8% | 1.7% |
| Foreign Holdings | 0.0% | 0.0% | 0.0% |
| Turnover Rate | 7% | — | — |
| Short-Term Reserves | 0.1% | — | — |
| | | |
| Sector Diversification (% of equity exposure) |
| | | | DJ |
| | | Russell | U.S. Total |
| | | 1000 | Market |
| | Fund | Index | Index |
| Consumer | | | |
| Discretionary | 11.4% | 11.2% | 11.9% |
| Consumer Staples | 10.0 | 9.7 | 9.5 |
| Energy | 11.6 | 11.7 | 10.6 |
| Financials | 15.8 | 16.1 | 16.6 |
| Health Care | 11.3 | 11.2 | 10.7 |
| Industrials | 11.4 | 11.2 | 11.4 |
| Information | | | |
| Technology | 18.4 | 18.3 | 18.9 |
| Materials | 4.0 | 4.2 | 4.5 |
| Telecommunication | | | |
| Services | 3.0 | 3.0 | 2.7 |
| Utilities | 3.1 | 3.4 | 3.2 |
| | |
| Volatility Measures | | |
| | | DJ |
| | | U.S. Total |
| | Russell 1000 | Market |
| | Index | Index |
| R-Squared | 1.00 | 1.00 |
| Beta | 1.00 | 0.99 |
| These measures show the degree and timing of the fund’s fluctuations compared with the indexes over 36 months. | |
| | |
| Ten Largest Holdings (% of total net assets) |
| Exxon Mobil Corp. | Integrated Oil & | |
| | Gas | 2.9% |
| Apple Inc. | Computer | |
| | Hardware | 2.3 |
| Microsoft Corp. | Systems Software | 1.5 |
| International Business | IT Consulting & | |
| Machines Corp. | Other Services | 1.5 |
| Procter & Gamble Co. | Household | |
| | Products | 1.5 |
| General Electric Co. | Industrial | |
| | Conglomerates | 1.4 |
| Chevron Corp. | Integrated Oil & | |
| | Gas | 1.4 |
| AT&T Inc. | Integrated | |
| | Telecommunication | |
| | Services | 1.4 |
| JPMorgan Chase & Co. | Diversified Financial | |
| | Services | 1.4 |
| Johnson & Johnson | Pharmaceuticals | 1.3 |
| Top Ten | | 16.6% |
| The holdings listed exclude any temporary cash investments and equity index products. |
Investment Focus
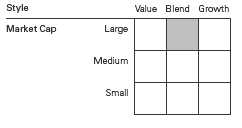
1 The expense ratios shown are from the prospectus dated April 26, 2010, and represent estimated costs for the current fiscal year. For the
fiscal year ended December 31, 2010, the expense ratios were 0.20% for Investor Shares, 0.12% for Admiral Shares, and 0.08% for
Institutional Shares.
62
Tax-Managed Capital Appreciation Fund
Performance Summary
All of the returns in this report represent past performance, which is not a guarantee of future results that may be achieved by the fund. (Current performance may be lower or higher than the performance data cited. For performance data current to the most recent month-end, visit our website at vanguard.com/performance.) Note, too, that both investment returns and principal value can fluctuate widely, so an investor’s shares, when sold, could be worth more or less than their original cost. The returns shown do not reflect taxes that a shareholder would pay on fund distributions or on the sale of fund shares.
Cumulative Performance: December 31, 2000, Through December 31, 2010
Initial Investment of $10,000
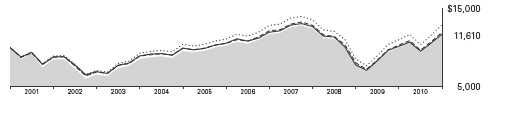
| | | | | |
| | | Average Annual Total Returns | |
| | | Periods Ended December 31, 2010 | |
| | | | | | Final Value |
| | | One | Five | Ten | of a $10,000 |
| | | Year | Years | Years | Investment |
| | Tax-Managed Capital Appreciation | | | | |
| | Fund Investor Shares | 15.94% | 2.52% | 1.50% | $11,610 |
| | Fee-Adjusted Returns | 14.80 | 2.52 | 1.50 | 11,610 |
| •••••••• | Dow Jones U.S. Total Stock Market | | | | |
| | Index | 17.70 | 3.17 | 2.64 | 12,981 |
| – – – – | Russell 1000 Index | 16.10 | 2.59 | 1.83 | 11,986 |
| | Multi-Cap Core Funds Average | 15.55 | 2.14 | 1.63 | 11,759 |
| Multi-Cap Core Funds Average: Derived from data provided by Lipper Inc. |
Fee-adjusted returns reflect the 1% fee on redemptions of shares held for less than five years.
See Financial Highlights for dividend and capital gains information.
63
Tax-Managed Capital Appreciation Fund
| | | | |
| | Average Annual Total Returns | |
| | Periods Ended December 31, 2010 | |
| | | | Since | Final Value |
| | One | Five | Inception | of a $100,000 |
| | Year | Years | (11/12/2001) | Investment |
| Tax-Managed Capital Appreciation | | | | |
| Fund Admiral Shares | 16.02% | 2.57% | 4.05% | $143,714 |
| Fee-Adjusted Returns | 14.87 | 2.57 | 4.05 | 143,714 |
| Dow Jones U.S. Total Stock Market | | | | |
| Index | 17.70 | 3.17 | 4.69 | 152,041 |
| Russell 1000 Index | 16.10 | 2.59 | 3.87 | 141,414 |
| "Since Inception" performance is calculated from the Admiral Shares’ inception date for both the fund and its comparative standards. |
| | | | |
| | | | | Final Value |
| | One | Five | Ten | of a $5,000,000 |
| | Year | Years | Years | Investment |
| Tax-Managed Capital Appreciation Fund | | | | |
| Institutional Shares | 16.08% | 2.61% | 1.60% | $5,858,358 |
| Fee-Adjusted Returns | 14.93 | 2.61 | 1.60 | 5,858,358 |
| Dow Jones U.S. Total Stock Market | | | | |
| Index | 17.70 | 3.17 | 2.64 | 6,490,386 |
| Russell 1000 Index | 16.10 | 2.59 | 1.83 | 5,993,037 |
Fiscal-Year Total Returns (%): December 31, 2000, Through December 31, 2010
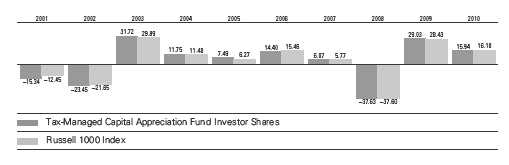
Fee-adjusted returns reflect the 1% fee on redemptions of shares held for less than five years.
64
Tax-Managed Capital Appreciation Fund
Financial Statements
Statement of Net Assets
As of December 31, 2010
The fund reports a complete list of its holdings in regulatory filings four times in each fiscal year, at the quarter-ends. For the second and fourth fiscal quarters, the lists appear in the fund’s semiannual and annual reports to shareholders. For the first and third fiscal quarters, the fund files the lists with the Securities and Exchange Commission on Form N-Q. Shareholders can look up the fund’s Forms N-Q on the SEC’s website at sec.gov. Forms N-Q may also be reviewed and copied at the SEC’s Public Reference Room (see the back cover of this report for further information).
| | | |
| | | | Market |
| | | | Value |
| | | Shares | ($000) |
| Common Stocks (100.0%) | | |
| Consumer Discretionary (11.4%) | |
| | McDonald’s Corp. | 306,260 | 23,508 |
| | Walt Disney Co. | 611,436 | 22,935 |
| * | Amazon.com Inc. | 112,400 | 20,232 |
| | Home Depot Inc. | 480,000 | 16,829 |
| * | Ford Motor Co. | 998,028 | 16,757 |
| | Comcast Corp. Class A | 755,371 | 16,595 |
| | Target Corp. | 243,300 | 14,630 |
| | Lowe’s Cos. Inc. | 498,600 | 12,505 |
| | Time Warner Inc. | 376,649 | 12,117 |
| | News Corp. Class A | 778,830 | 11,340 |
| * | DIRECTV Class A | 283,753 | 11,330 |
| | NIKE Inc. Class B | 127,200 | 10,865 |
| | Johnson Controls Inc. | 237,600 | 9,076 |
| | Starbucks Corp. | 274,352 | 8,815 |
| | Yum! Brands Inc. | 173,360 | 8,503 |
| | Coach Inc. | 127,900 | 7,074 |
| * | Kohl’s Corp. | 126,650 | 6,882 |
| | Viacom Inc. Class B | 171,033 | 6,775 |
| | Time Warner Cable Inc. | 94,542 | 6,243 |
| * | Bed Bath & Beyond Inc. | 119,717 | 5,884 |
| | Starwood Hotels & | | |
| | Resorts Worldwide Inc. | 89,818 | 5,459 |
| | Marriott International Inc. | | |
| | Class A | 125,975 | 5,233 |
| | Best Buy Co. Inc. | 141,084 | 4,838 |
| * | Liberty Media Corp. - | | |
| | Interactive | 302,926 | 4,777 |
| * | BorgWarner Inc. | 65,300 | 4,725 |
| | Gap Inc. | 211,887 | 4,691 |
| * | Las Vegas Sands Corp. | 100,440 | 4,615 |
| * | O’Reilly Automotive Inc. | 75,748 | 4,577 |
| | McGraw-Hill Cos. Inc. | 122,900 | 4,475 |
| * | AutoZone Inc. | 15,900 | 4,334 |
| * | Dollar Tree Inc. | 74,751 | 4,192 |
| * | Sirius XM Radio Inc. | 2,434,000 | 3,992 |
| * | CarMax Inc. | 125,043 | 3,986 |
| | Darden Restaurants Inc. | 83,850 | 3,894 |
| | | |
| | | | Market |
| | | | Value |
| | | Shares | ($000) |
| | Polo Ralph Lauren Corp. | | |
| | Class A | 34,500 | 3,827 |
| | Ross Stores Inc. | 60,296 | 3,814 |
| | Advance Auto Parts Inc. | 56,402 | 3,731 |
| | Hasbro Inc. | 77,100 | 3,638 |
| | Gentex Corp. | 116,252 | 3,436 |
| | PetSmart Inc. | 85,700 | 3,413 |
| * | Discovery | | |
| | Communications Inc. | 90,137 | 3,307 |
| | Scripps Networks | | |
| | Interactive Inc. Class A | 62,170 | 3,217 |
| | Expedia Inc. | 124,613 | 3,127 |
| | | |
| * | Interpublic Group of Cos. Inc. | 294,400 | 3,126 |
| * | MGM Resorts International | 208,690 | 3,099 |
| * | NVR Inc. | 4,440 | 3,068 |
| | Phillips-Van Heusen Corp. | 46,281 | 2,916 |
| | DeVry Inc. | 59,639 | 2,861 |
| * | Apollo Group Inc. Class A | 72,229 | 2,852 |
| * | Toll Brothers Inc. | 144,600 | 2,747 |
| * | AutoNation Inc. | 96,025 | 2,708 |
| | John Wiley & Sons Inc. | | |
| | Class A | 58,700 | 2,656 |
| * | Office Depot Inc. | 479,200 | 2,588 |
| * | Liberty Global Inc. | 75,207 | 2,549 |
| | CBS Corp. Class B | 127,174 | 2,423 |
| | Omnicom Group Inc. | 50,600 | 2,317 |
| | International | | |
| | Game Technology | 129,600 | 2,293 |
| * | Lamar Advertising Co. | | |
| | Class A | 56,186 | 2,238 |
| | Staples Inc. | 94,495 | 2,152 |
| | Brinker International Inc. | 102,750 | 2,145 |
| * | Harman International | | |
| | Industries Inc. | 43,600 | 2,019 |
| * | Mohawk Industries Inc. | 34,700 | 1,970 |
| | Harley-Davidson Inc. | 56,800 | 1,969 |
| | Cablevision Systems Corp. | | |
| | Class A | 54,344 | 1,839 |
| | Stanley Black & Decker Inc. | 26,745 | 1,788 |
65
Tax-Managed Capital Appreciation Fund
| | | |
| | | | Market |
| | | | Value |
| | | Shares | ($000) |
| | Virgin Media Inc. | 62,269 | 1,696 |
| | Weight Watchers | | |
| | International Inc. | 45,200 | 1,695 |
| * | Liberty Global Inc. Class A | 47,398 | 1,677 |
| | DR Horton Inc. | 126,366 | 1,508 |
| | Macy’s Inc. | 56,800 | 1,437 |
| * | Pulte Group Inc. | 187,674 | 1,411 |
| | Foot Locker Inc. | 70,600 | 1,385 |
| | Nordstrom Inc. | 32,300 | 1,369 |
| | Abercrombie & Fitch Co. | 23,300 | 1,343 |
| * | Career Education Corp. | 60,400 | 1,252 |
| * | Dollar General Corp. | 39,700 | 1,218 |
| * | Liberty Media Corp. - Starz | 16,392 | 1,090 |
| | RadioShack Corp. | 58,000 | 1,072 |
| * | Liberty Media Corp. - Capital | 16,431 | 1,028 |
| | Lennar Corp. Class A | 54,600 | 1,024 |
| | International Speedway Corp. | | |
| | Class A | 37,986 | 994 |
| | American Eagle | | |
| | Outfitters Inc. | 66,991 | 980 |
| | Mattel Inc. | 36,032 | 916 |
| | Aaron’s Inc. | 37,182 | 758 |
| | TJX Cos. Inc. | 12,976 | 576 |
| | Comcast Corp. Class A | | |
| | Special Shares | 26,219 | 546 |
| * | Sears Holdings Corp. | 7,200 | 531 |
| * | Madison Square Garden Inc. | | |
| | Class A | 13,586 | 350 |
| | Chico’s FAS Inc. | 28,340 | 341 |
| * | Education | | |
| | Management Corp. | 18,200 | 329 |
| * | Hanesbrands Inc. | 9,675 | 246 |
| | Washington Post Co. Class B | 520 | 229 |
| | Wynn Resorts Ltd. | 2,000 | 208 |
| * | priceline.com Inc. | 480 | 192 |
| | Lennar Corp. Class B | 8,300 | 129 |
| | Carnival Corp. | 2,000 | 92 |
| * | Krispy Kreme | | |
| | Doughnuts Inc. | | |
| | Warrants Exp. 03/02/2012 | 2,684 | 1 |
| | | | 426,139 |
| Consumer Staples (10.0%) | | |
| | Procter & Gamble Co. | 856,178 | 55,078 |
| | Coca-Cola Co. | 637,700 | 41,942 |
| | PepsiCo Inc. | 490,139 | 32,021 |
| | Wal-Mart Stores Inc. | 593,528 | 32,009 |
| | Philip Morris | | |
| | International Inc. | 494,509 | 28,944 |
| | CVS Caremark Corp. | 443,754 | 15,429 |
| | Walgreen Co. | 307,300 | 11,972 |
| | Costco Wholesale Corp. | 156,100 | 11,272 |
| | Kraft Foods Inc. | 348,826 | 10,991 |
| | Colgate-Palmolive Co. | 115,900 | 9,315 |
| | Altria Group Inc. | 369,663 | 9,101 |
| | Archer-Daniels-Midland Co. | 243,273 | 7,318 |
| | | | |
| | Kroger Co. | | 263,700 | 5,896 |
| | Estee Lauder Cos. Inc. | | |
| | Class A | | 60,000 | 4,842 |
| | Clorox Co. | | 69,120 | 4,374 |
| | Bunge Ltd. | | 62,800 | 4,115 |
| | Brown-Forman Corp. | | | |
| | Class B | | 57,846 | 4,027 |
| | Dr Pepper Snapple | | | |
| | Group Inc. | | 114,200 | 4,015 |
| | Safeway Inc. | | 170,462 | 3,834 |
| | Hershey Co. | | 81,300 | 3,833 |
| | Coca-Cola Enterprises Inc. | 153,000 | 3,830 |
| | Molson Coors Brewing Co. | | |
| | Class B | | 71,900 | 3,609 |
| | McCormick & Co. Inc. | | 76,100 | 3,541 |
| | Campbell Soup Co. | | 97,400 | 3,385 |
| * | Constellation Brands Inc. | | |
| | Class A | | 151,500 | 3,356 |
| | Church & Dwight Co. Inc. | 47,100 | 3,251 |
| | JM Smucker Co. | | 49,024 | 3,218 |
| * | Energizer Holdings Inc. | 44,128 | 3,217 |
| | Hormel Foods Corp. | | 62,600 | 3,209 |
| | Del Monte Foods Co. | | 169,460 | 3,186 |
| | General Mills Inc. | | 88,800 | 3,160 |
| * | Hansen Natural Corp. | | 60,300 | 3,152 |
| | Corn Products | | | |
| | International Inc. | | 67,200 | 3,091 |
| | Tyson Foods Inc. Class A | 177,944 | 3,064 |
| | Kimberly-Clark Corp. | | 46,540 | 2,934 |
| | Alberto-Culver Co. Class B | 77,514 | 2,871 |
| * | Green Mountain Coffee | | |
| | Roasters Inc. | | 86,509 | 2,843 |
| * | Smithfield Foods Inc. | | 135,135 | 2,788 |
| | Mead Johnson Nutrition Co. | 42,525 | 2,647 |
| | Kellogg Co. | | 44,300 | 2,263 |
| * | Ralcorp Holdings Inc. | | 29,009 | 1,886 |
| | Avon Products Inc. | | 59,300 | 1,723 |
| * | Whole Foods Market Inc. | 32,840 | 1,661 |
| * | Central European | | | |
| | Distribution Corp. | | 72,480 | 1,660 |
| * | Dean Foods Co. | | 122,475 | 1,083 |
| | Sara Lee Corp. | | 44,600 | 781 |
| | Sysco Corp. | | 17,111 | 503 |
| * | BJ’s Wholesale Club Inc. | 9,300 | 445 |
| | ConAgra Foods Inc. | | 11,200 | 253 |
| | Reynolds American Inc. | 212 | 7 |
| | | | | 372,945 |
| Energy (11.6%) | | | |
| | Exxon Mobil Corp. | 1,488,064 | 108,807 |
| | Chevron Corp. | | 582,638 | 53,166 |
| | Schlumberger Ltd. | | 375,599 | 31,363 |
| | ConocoPhillips | | 354,040 | 24,110 |
| | Occidental Petroleum Corp. | 190,339 | 18,672 |
| | Apache Corp. | | 128,217 | 15,287 |
| | Anadarko Petroleum Corp. | 172,516 | 13,139 |
66
Tax-Managed Capital Appreciation Fund
| | | |
| | | | Market |
| | | | Value |
| | | Shares | ($000) |
| | Devon Energy Corp. | 148,622 | 11,668 |
| | National Oilwell Varco Inc. | 153,541 | 10,326 |
| | Baker Hughes Inc. | 162,171 | 9,271 |
| | Hess Corp. | 109,600 | 8,389 |
| | EOG Resources Inc. | 88,300 | 8,072 |
| | Peabody Energy Corp. | 108,100 | 6,916 |
| | Noble Energy Inc. | 77,200 | 6,645 |
| | Halliburton Co. | 158,200 | 6,459 |
| | Williams Cos. Inc. | 247,700 | 6,123 |
| * | Cameron International Corp. | 114,002 | 5,783 |
| * | Southwestern Energy Co. | 148,800 | 5,570 |
| * | FMC Technologies Inc. | 60,050 | 5,339 |
| | Pioneer Natural | | |
| | Resources Co. | 56,337 | 4,891 |
| * | Newfield Exploration Co. | 66,098 | 4,766 |
| | Valero Energy Corp. | 182,480 | 4,219 |
| | Cimarex Energy Co. | 46,499 | 4,117 |
| | EQT Corp. | 90,900 | 4,076 |
| | QEP Resources Inc. | 103,165 | 3,746 |
| | Range Resources Corp. | 82,500 | 3,711 |
| * | Pride International Inc. | 106,400 | 3,511 |
| | Helmerich & Payne Inc. | 67,580 | 3,276 |
| * | Dresser-Rand Group Inc. | 73,355 | 3,124 |
| * | Concho Resources Inc. | 35,300 | 3,095 |
| | SM Energy Co. | 51,256 | 3,021 |
| | Marathon Oil Corp. | 81,100 | 3,003 |
| | Cabot Oil & Gas Corp. | 74,535 | 2,821 |
| * | Rowan Cos. Inc. | 80,600 | 2,814 |
| | Diamond Offshore | | |
| | Drilling Inc. | 39,700 | 2,655 |
| * | Continental Resources Inc. | 43,900 | 2,584 |
| | Arch Coal Inc. | 73,400 | 2,573 |
| | Southern Union Co. | 105,700 | 2,544 |
| * | Forest Oil Corp. | 65,300 | 2,479 |
| * | Plains Exploration & | | |
| | Production Co. | 66,760 | 2,146 |
| | Core Laboratories NV | 23,553 | 2,097 |
| | Consol Energy Inc. | 33,900 | 1,652 |
| * | SandRidge Energy Inc. | 191,814 | 1,404 |
| * | Denbury Resources Inc. | 69,943 | 1,335 |
| * | Quicksilver Resources Inc. | 47,270 | 697 |
| | Chesapeake Energy Corp. | 25,211 | 653 |
| * | Ultra Petroleum Corp. | 12,870 | 615 |
| * | Unit Corp. | 12,800 | 595 |
| | Patterson-UTI Energy Inc. | 21,200 | 457 |
| * | Superior Energy Services Inc. | 1,048 | 37 |
| | | | 433,819 |
| Financials (15.8%) | | |
| | JPMorgan Chase & Co. | 1,194,021 | 50,650 |
| * | Berkshire Hathaway Inc. | | |
| | Class B | 519,100 | 41,585 |
| | Wells Fargo & Co. | 1,236,508 | 38,319 |
| | Bank of America Corp. | 2,583,633 | 34,466 |
| * | Citigroup Inc. | 6,483,593 | 30,667 |
| | Goldman Sachs Group Inc. | 139,830 | 23,514 |
| | | |
| | American Express Co. | 331,300 | 14,219 |
| | US Bancorp | 392,700 | 10,591 |
| | Simon Property Group Inc. | 98,548 | 9,805 |
| | Aflac Inc. | 172,500 | 9,734 |
| | Prudential Financial Inc. | 161,904 | 9,505 |
| | State Street Corp. | 191,478 | 8,873 |
| | MetLife Inc. | 175,820 | 7,813 |
| | Franklin Resources Inc. | 60,400 | 6,717 |
| | Ameriprise Financial Inc. | 112,160 | 6,455 |
| | Charles Schwab Corp. | 377,200 | 6,454 |
| | SunTrust Banks Inc. | 216,990 | 6,403 |
| | Morgan Stanley | 235,000 | 6,394 |
| | T Rowe Price Group Inc. | 92,978 | 6,001 |
| | Public Storage | 58,200 | 5,903 |
| | Travelers Cos. Inc. | 101,877 | 5,676 |
| | Host Hotels & Resorts Inc. | 308,972 | 5,521 |
| | Progressive Corp. | 276,700 | 5,498 |
| | Fifth Third Bancorp | 368,920 | 5,416 |
| | Loews Corp. | 138,908 | 5,405 |
| | Boston Properties Inc. | 60,200 | 5,183 |
| | Discover Financial Services | 276,700 | 5,127 |
| | Capital One Financial Corp. | 117,800 | 5,014 |
| | Bank of New York | | |
| | Mellon Corp. | 161,006 | 4,862 |
| | CME Group Inc. | 14,701 | 4,730 |
| | AvalonBay Communities Inc. | 38,375 | 4,319 |
| | Lincoln National Corp. | 150,986 | 4,199 |
| | KeyCorp | 457,769 | 4,051 |
| | Unum Group | 166,800 | 4,040 |
| | Principal Financial | | |
| | Group Inc. | 120,400 | 3,920 |
| | Leucadia National Corp. | 129,219 | 3,771 |
| * | CB Richard Ellis Group Inc. | | |
| | Class A | 183,465 | 3,757 |
| * | Affiliated Managers | | |
| | Group Inc. | 36,800 | 3,651 |
| | PNC Financial Services | | |
| | Group Inc. | 57,731 | 3,505 |
| | SL Green Realty Corp. | 51,910 | 3,504 |
| | Plum Creek Timber Co. Inc. | 91,500 | 3,427 |
| | M&T Bank Corp. | 38,600 | 3,360 |
| | Torchmark Corp. | 55,500 | 3,316 |
| | TD Ameritrade | | |
| | Holding Corp. | 174,400 | 3,312 |
| | Allstate Corp. | 102,300 | 3,261 |
| | Hudson City Bancorp Inc. | 251,902 | 3,209 |
| | General Growth | | |
| | Properties Inc. | 207,171 | 3,207 |
| * | Arch Capital Group Ltd. | 36,000 | 3,170 |
| | Reinsurance Group of | | |
| | America Inc. Class A | 58,819 | 3,159 |
| | Zions Bancorporation | 129,284 | 3,133 |
| | Developers Diversified | | |
| | Realty Corp. | 216,364 | 3,049 |
| * | Markel Corp. | 7,930 | 2,999 |
67
Tax-Managed Capital Appreciation Fund
| | | |
| | | | Market |
| | | | Value |
| | | Shares | ($000) |
| | SEI Investments Co. | 123,770 | 2,944 |
| | Raymond James | | |
| | Financial Inc. | 89,650 | 2,932 |
| | Cullen/Frost Bankers Inc. | 47,600 | 2,909 |
| * | Popular Inc. | 925,168 | 2,905 |
| | Assurant Inc. | 75,300 | 2,901 |
| | Jones Lang LaSalle Inc. | 34,450 | 2,891 |
| | East West Bancorp Inc. | 146,400 | 2,862 |
| * | Forest City Enterprises Inc. | | |
| | Class A | 170,615 | 2,848 |
| | Brown & Brown Inc. | 118,600 | 2,839 |
| | WR Berkley Corp. | 102,297 | 2,801 |
| | BlackRock Inc. | 14,450 | 2,754 |
| | Hospitality Properties Trust | 119,270 | 2,748 |
| * | First Horizon National Corp. | 227,345 | 2,678 |
| | HCC Insurance Holdings Inc. | 91,600 | 2,651 |
| | White Mountains Insurance | | |
| | Group Ltd. | 7,891 | 2,648 |
| | Janus Capital Group Inc. | 203,766 | 2,643 |
| | Alexandria Real Estate | | |
| | Equities Inc. | 35,930 | 2,632 |
| | Apartment Investment & | | |
| | Management Co. | 101,043 | 2,611 |
| | Eaton Vance Corp. | 86,202 | 2,606 |
| | Associated Banc-Corp | 170,670 | 2,586 |
| | City National Corp. | 42,000 | 2,577 |
| * | St. Joe Co. | 115,813 | 2,531 |
| | Commerce Bancshares Inc. | 63,687 | 2,530 |
| | Douglas Emmett Inc. | 147,673 | 2,451 |
| | People’s United | | |
| | Financial Inc. | 174,014 | 2,438 |
| * | Alleghany Corp. | 7,596 | 2,327 |
| | Hanover Insurance | | |
| | Group Inc. | 49,600 | 2,317 |
| | Camden Property Trust | 42,400 | 2,289 |
| | StanCorp Financial | | |
| | Group Inc. | 50,600 | 2,284 |
| | Transatlantic Holdings Inc. | 44,114 | 2,277 |
| | Lazard Ltd. Class A | 55,686 | 2,199 |
| | BOK Financial Corp. | 38,571 | 2,060 |
| | Wesco Financial Corp. | 5,590 | 2,059 |
| | TFS Financial Corp. | 221,854 | 2,001 |
| | Northern Trust Corp. | 34,773 | 1,927 |
| * | NASDAQ OMX Group Inc. | 79,692 | 1,890 |
| * | CNA Financial Corp. | 69,500 | 1,880 |
| | Moody’s Corp. | 70,100 | 1,860 |
| * | American International | | |
| | Group Inc. | 32,021 | 1,845 |
| | Chubb Corp. | 30,900 | 1,843 |
| | First Citizens | | |
| | BancShares Inc. Class A | 9,642 | 1,823 |
| | Legg Mason Inc. | 47,500 | 1,723 |
| | Hartford Financial Services | | |
| | Group Inc. | 64,184 | 1,700 |
| | | |
| | New York Community | | |
| | Bancorp Inc. | 86,400 | 1,629 |
| | Federated Investors Inc. | | |
| | Class B | 56,200 | 1,471 |
| | Digital Realty Trust Inc. | 28,440 | 1,466 |
| * | CIT Group Inc. | 30,000 | 1,413 |
| | BB&T Corp. | 53,000 | 1,393 |
| * | Genworth Financial Inc. | | |
| | Class A | 96,700 | 1,271 |
| | AMB Property Corp. | 36,604 | 1,161 |
| * | Howard Hughes Corp. | 19,755 | 1,075 |
| | American Financial | | |
| | Group Inc. | 32,200 | 1,040 |
| | Bank of Hawaii Corp. | 20,100 | 949 |
| | BRE Properties Inc. | 21,500 | 935 |
| | Interactive Brokers | | |
| | Group Inc. | 51,335 | 915 |
| | AON Corp. | 16,400 | 755 |
| * | E*Trade Financial Corp. | 41,866 | 670 |
| | ACE Ltd. | 10,627 | 662 |
| | Federal Realty | | |
| | Investment Trust | 8,200 | 639 |
| | Wilmington Trust Corp. | 141,537 | 614 |
| | Taubman Centers Inc. | 11,300 | 570 |
| | Marshall & Ilsley Corp. | 49,700 | 344 |
| * | SLM Corp. | 24,200 | 305 |
| | Invesco Ltd. | 12,010 | 289 |
| | ProLogis | 18,393 | 266 |
| * | MBIA Inc. | 11,300 | 135 |
| | BancorpSouth Inc. | 4,000 | 64 |
| | Essex Property Trust Inc. | 300 | 34 |
| | | | 588,104 |
| Health Care (11.3%) | | |
| | Johnson & Johnson | 810,598 | 50,135 |
| | Pfizer Inc. | 2,052,484 | 35,939 |
| | Merck & Co. Inc. | 790,626 | 28,494 |
| | Abbott Laboratories | 407,600 | 19,528 |
| * | Amgen Inc. | 310,325 | 17,037 |
| | UnitedHealth Group Inc. | 367,662 | 13,276 |
| * | Gilead Sciences Inc. | 293,100 | 10,622 |
| | Bristol-Myers Squibb Co. | 374,041 | 9,905 |
| * | Celgene Corp. | 166,372 | 9,839 |
| * | Medco Health Solutions Inc. | 159,842 | 9,794 |
| | Medtronic Inc. | 263,600 | 9,777 |
| * | Express Scripts Inc. | 168,324 | 9,098 |
| * | Thermo Fisher Scientific Inc. | 156,106 | 8,642 |
| * | WellPoint Inc. | 149,716 | 8,513 |
| | Allergan Inc. | 114,530 | 7,865 |
| * | Genzyme Corp. | 101,900 | 7,255 |
| | Becton Dickinson and Co. | 80,600 | 6,812 |
| * | Biogen Idec Inc. | 98,861 | 6,629 |
| | Baxter International Inc. | 127,341 | 6,446 |
| * | Agilent Technologies Inc. | 151,106 | 6,260 |
| * | St. Jude Medical Inc. | 139,832 | 5,978 |
| | Stryker Corp. | 109,200 | 5,864 |
68
Tax-Managed Capital Appreciation Fund
| | | | |
| | | | | Market |
| | | | | Value |
| | | | Shares | ($000) |
| | Cardinal Health Inc. | | 145,512 | 5,575 |
| | Aetna Inc. | | 180,044 | 5,493 |
| | McKesson Corp. | | 73,424 | 5,168 |
| * | Life Technologies Corp. | 86,835 | 4,819 |
| | CIGNA Corp. | | 129,300 | 4,740 |
| | Eli Lilly & Co. | | 131,595 | 4,611 |
| * | Forest Laboratories Inc. | 142,600 | 4,560 |
| | AmerisourceBergen Corp. | | |
| | Class A | | 132,300 | 4,514 |
| * | Laboratory Corp. of | | | |
| | America Holdings | | 50,700 | 4,458 |
| * | Zimmer Holdings Inc. | | 81,170 | 4,357 |
| * | Humana Inc. | | 79,300 | 4,341 |
| * | Hospira Inc. | | 77,140 | 4,296 |
| | Quest Diagnostics Inc. | 76,800 | 4,145 |
| * | Waters Corp. | | 52,900 | 4,111 |
| * | Mylan Inc. | | 183,837 | 3,884 |
| * | Watson | | | |
| | Pharmaceuticals Inc. | | 70,000 | 3,615 |
| * | Mettler-Toledo | | | |
| | International Inc. | | 23,900 | 3,614 |
| | Beckman Coulter Inc. | | 47,600 | 3,581 |
| * | Henry Schein Inc. | | 55,100 | 3,383 |
| | DENTSPLY International Inc. | 98,300 | 3,359 |
| | Perrigo Co. | | 50,840 | 3,220 |
| * | Endo Pharmaceuticals | | | |
| | Holdings Inc. | | 87,900 | 3,139 |
| | Universal Health | | | |
| | Services Inc. Class B | 67,400 | 2,927 |
| | PerkinElmer Inc. | | 106,204 | 2,742 |
| | CR Bard Inc. | | 29,300 | 2,689 |
| | Pharmaceutical Product | | |
| | Development Inc. | | 84,803 | 2,302 |
| | Patterson Cos. Inc. | | 73,530 | 2,252 |
| * | Coventry Health Care Inc. | 81,025 | 2,139 |
| | Lincare Holdings Inc. | | 78,950 | 2,118 |
| * | Health Net Inc. | | 74,200 | 2,025 |
| * | King Pharmaceuticals Inc. | 143,843 | 2,021 |
| | Teleflex Inc. | | 37,000 | 1,991 |
| * | CareFusion Corp. | | 72,756 | 1,870 |
| * | Varian Medical Systems Inc. | 26,500 | 1,836 |
| * | Boston Scientific Corp. | 205,500 | 1,556 |
| | Covidien plc | | 29,700 | 1,356 |
| * | Kinetic Concepts Inc. | | 31,000 | 1,298 |
| * | Dendreon Corp. | | 35,345 | 1,234 |
| | Omnicare Inc. | | 40,900 | 1,038 |
| * | Amylin Pharmaceuticals Inc. | 47,800 | 703 |
| * | Cephalon Inc. | | 10,500 | 648 |
| * | DaVita Inc. | | 2,200 | 153 |
| | Techne Corp. | | 2,000 | 131 |
| | | | | 421,720 |
| Industrials (11.4%) | | | |
| | General Electric Co. | 2,917,272 | 53,357 |
| | United Technologies Corp. | 280,100 | 22,049 |
| | Boeing Co. | | 236,770 | 15,452 |
| | | |
| | 3M Co. | 154,200 | 13,307 |
| | Union Pacific Corp. | 123,914 | 11,482 |
| | Caterpillar Inc. | 118,195 | 11,070 |
| | United Parcel Service Inc. | | |
| | Class B | 147,300 | 10,691 |
| | FedEx Corp. | 110,700 | 10,296 |
| | CSX Corp. | 142,600 | 9,213 |
| | Danaher Corp. | 194,200 | 9,160 |
| | General Dynamics Corp. | 124,400 | 8,827 |
| | Illinois Tool Works Inc. | 163,500 | 8,731 |
| | Deere & Co. | 104,800 | 8,704 |
| | Cummins Inc. | 77,600 | 8,537 |
| | Norfolk Southern Corp. | 134,900 | 8,474 |
| | PACCAR Inc. | 142,910 | 8,206 |
| | Emerson Electric Co. | 142,400 | 8,141 |
| | Precision Castparts Corp. | 55,600 | 7,740 |
| | Honeywell International Inc. | 131,400 | 6,985 |
| | Parker Hannifin Corp. | 71,000 | 6,127 |
| | CH Robinson | | |
| | Worldwide Inc. | 76,100 | 6,102 |
| | Expeditors International of | | |
| | Washington Inc. | 101,061 | 5,518 |
| | Fluor Corp. | 81,200 | 5,380 |
| | Waste Management Inc. | 140,297 | 5,173 |
| | Lockheed Martin Corp. | 72,700 | 5,082 |
| | Northrop Grumman Corp. | 72,268 | 4,682 |
| | WW Grainger Inc. | 33,400 | 4,613 |
| | Southwest Airlines Co. | 351,687 | 4,565 |
| | Joy Global Inc. | 52,500 | 4,554 |
| | ITT Corp. | 87,100 | 4,539 |
| | Rockwell Collins Inc. | 73,700 | 4,294 |
| | Roper Industries Inc. | 54,700 | 4,181 |
| * | Stericycle Inc. | 51,108 | 4,136 |
| | Fastenal Co. | 69,000 | 4,134 |
| | Bucyrus International Inc. | | |
| | Class A | 44,739 | 4,000 |
| | Raytheon Co. | 85,833 | 3,978 |
| | AMETEK Inc. | 100,650 | 3,951 |
| | Flowserve Corp. | 33,000 | 3,934 |
| | Pall Corp. | 78,300 | 3,882 |
| | L-3 Communications | | |
| | Holdings Inc. | 54,000 | 3,806 |
| * | Jacobs Engineering | | |
| | Group Inc. | 77,700 | 3,563 |
| | Donaldson Co. Inc. | 60,000 | 3,497 |
| | Manpower Inc. | 54,600 | 3,427 |
| | Equifax Inc. | 93,200 | 3,318 |
| | JB Hunt Transport | | |
| | Services Inc. | 79,500 | 3,244 |
| * | WABCO Holdings Inc. | 51,941 | 3,165 |
| | IDEX Corp. | 76,800 | 3,004 |
| * | Terex Corp. | 96,066 | 2,982 |
| | Dun & Bradstreet Corp. | 36,200 | 2,972 |
| | MSC Industrial Direct Co. | | |
| | Class A | 44,700 | 2,892 |
69
Tax-Managed Capital Appreciation Fund
| | | | |
| | | | | Market |
| | | | | Value |
| | | | Shares | ($000) |
| | Iron Mountain Inc. | | 114,088 | 2,853 |
| * | Oshkosh Corp. | | 79,200 | 2,791 |
| | KBR Inc. | | 89,249 | 2,719 |
| * | Quanta Services Inc. | | 136,100 | 2,711 |
| | Robert Half International Inc. | 87,500 | 2,678 |
| | SPX Corp. | | 37,400 | 2,674 |
| | Valmont Industries Inc. | | 29,537 | 2,621 |
| * | Owens Corning | | 83,900 | 2,614 |
| | Carlisle Cos. Inc. | | 65,200 | 2,591 |
| * | CNH Global NV | | 53,400 | 2,549 |
| | Toro Co. | | 40,100 | 2,472 |
| * | Alliant Techsystems Inc. | | 33,100 | 2,464 |
| | Landstar System Inc. | | 59,289 | 2,427 |
| * | USG Corp. | | 143,460 | 2,414 |
| | Cintas Corp. | | 70,766 | 1,979 |
| * | Verisk Analytics Inc. Class A | 51,500 | 1,755 |
| | Wabtec Corp. | | 33,000 | 1,745 |
| | Con-way Inc. | | 46,800 | 1,712 |
| | Lennox International Inc. | | 35,090 | 1,659 |
| * | Navistar International Corp. | | 28,500 | 1,650 |
| | UTi Worldwide Inc. | | 77,587 | 1,645 |
| | Textron Inc. | | 61,020 | 1,443 |
| | Gardner Denver Inc. | | 19,846 | 1,366 |
| | Graco Inc. | | 27,658 | 1,091 |
| | Tyco International Ltd. | | 25,300 | 1,048 |
| | Manitowoc Co. Inc. | | 62,200 | 815 |
| | Republic Services Inc. | | | |
| | Class A | | 19,512 | 583 |
| | Ryder System Inc. | | 3,600 | 190 |
| * | AGCO Corp. | | 3,600 | 182 |
| * | KAR Auction Services Inc. | | 10,953 | 151 |
| * | TransDigm Group Inc. | | 1,380 | 99 |
| * | Raytheon Co. | | | |
| | Warrants Exp. 06/16/2011 | | 2,285 | 20 |
| | | | | 424,828 |
| Information Technology (18.4%) | |
| * | Apple Inc. | | 267,000 | 86,124 |
| | Microsoft Corp. | 2,063,000 | 57,599 |
| | International Business | | | |
| | Machines Corp. | | 381,958 | 56,056 |
| * | Google Inc. Class A | | 73,370 | 43,580 |
| | Oracle Corp. | 1,162,334 | 36,381 |
| * | Cisco Systems Inc. | 1,715,600 | 34,707 |
| | Hewlett-Packard Co. | | 710,258 | 29,902 |
| | Intel Corp. | 1,389,200 | 29,215 |
| | QUALCOMM Inc. | | 415,720 | 20,574 |
| * | EMC Corp. | | 677,500 | 15,515 |
| | Texas Instruments Inc. | | 417,800 | 13,578 |
| * | eBay Inc. | | 397,914 | 11,074 |
| | Visa Inc. Class A | | 157,298 | 11,071 |
| | Corning Inc. | | 504,200 | 9,741 |
| * | Yahoo! Inc. | | 508,500 | 8,456 |
| | Broadcom Corp. Class A | | 191,450 | 8,338 |
| | Mastercard Inc. Class A | | 35,790 | 8,021 |
| * | NetApp Inc. | | 137,963 | 7,582 |
| | | |
| | Xerox Corp. | 577,604 | 6,654 |
| * | Adobe Systems Inc. | 210,600 | 6,482 |
| * | Cognizant Technology | | |
| | Solutions Corp. Class A | 85,137 | 6,240 |
| * | Intuit Inc. | 124,185 | 6,122 |
| * | Symantec Corp. | 351,351 | 5,882 |
| | Applied Materials Inc. | 417,500 | 5,866 |
| | Western Union Co. | 309,895 | 5,755 |
| * | Dell Inc. | 415,500 | 5,630 |
| * | Citrix Systems Inc. | 80,756 | 5,524 |
| | Altera Corp. | 146,647 | 5,218 |
| | CA Inc. | 201,266 | 4,919 |
| * | NVIDIA Corp. | 307,244 | 4,732 |
| * | Autodesk Inc. | 123,788 | 4,729 |
| | Amphenol Corp. Class A | 89,500 | 4,724 |
| * | Fiserv Inc. | 78,050 | 4,571 |
| * | BMC Software Inc. | 96,600 | 4,554 |
| | Analog Devices Inc. | 118,166 | 4,451 |
| * | Juniper Networks Inc. | 119,000 | 4,393 |
| | Linear Technology Corp. | 124,200 | 4,296 |
| * | Teradata Corp. | 99,574 | 4,098 |
| | Fidelity National | | |
| | Information Services Inc. | 146,178 | 4,004 |
| * | Lam Research Corp. | 77,108 | 3,993 |
| | Computer Sciences Corp. | 78,900 | 3,913 |
| | KLA-Tencor Corp. | 100,800 | 3,895 |
| * | Western Digital Corp. | 114,100 | 3,868 |
| * | Avnet Inc. | 105,400 | 3,481 |
| * | LSI Corp. | 538,928 | 3,228 |
| * | Motorola Inc. | 347,230 | 3,149 |
| * | Arrow Electronics Inc. | 91,500 | 3,134 |
| | Global Payments Inc. | 66,817 | 3,088 |
| * | Atmel Corp. | 248,700 | 3,064 |
| * | Monster Worldwide Inc. | 128,680 | 3,041 |
| * | Compuware Corp. | 258,162 | 3,013 |
| | Accenture plc Class A | 61,413 | 2,978 |
| * | Fairchild Semiconductor | | |
| | International Inc. Class A | 179,958 | 2,809 |
| * | Tech Data Corp. | 55,510 | 2,444 |
| * | Synopsys Inc. | 89,121 | 2,398 |
| * | Ingram Micro Inc. | 125,000 | 2,386 |
| | Microchip Technology Inc. | 65,100 | 2,227 |
| * | QLogic Corp. | 129,000 | 2,196 |
| | Automatic Data | | |
| | Processing Inc. | 47,100 | 2,180 |
| | Xilinx Inc. | 71,336 | 2,067 |
| | DST Systems Inc. | 42,800 | 1,898 |
| * | SunPower Corp. Class A | 147,000 | 1,886 |
| | Tellabs Inc. | 266,900 | 1,810 |
| | Lender Processing | | |
| | Services Inc. | 61,250 | 1,808 |
| * | Lexmark International Inc. | | |
| | Class A | 50,300 | 1,751 |
| * | Cadence Design | | |
| | Systems Inc. | 205,607 | 1,698 |
| | Molex Inc. | 69,751 | 1,585 |
70
Tax-Managed Capital Appreciation Fund
| | | |
| | | | Market |
| | | | Value |
| | | Shares | ($000) |
| * | Teradyne Inc. | 110,200 | 1,547 |
| * | NCR Corp. | 99,574 | 1,530 |
| * | Electronic Arts Inc. | 90,200 | 1,477 |
| | National | | |
| | Semiconductor Corp. | 96,600 | 1,329 |
| | Broadridge Financial | | |
| | Solutions Inc. | 58,725 | 1,288 |
| | Total System Services Inc. | 74,759 | 1,150 |
| | Solera Holdings Inc. | 22,096 | 1,134 |
| * | Zebra Technologies Corp. | 27,257 | 1,035 |
| * | AOL Inc. | 34,240 | 812 |
| * | IAC/InterActiveCorp | 24,515 | 704 |
| * | Advanced Micro Devices Inc. | 81,100 | 663 |
| * | Novellus Systems Inc. | 13,100 | 423 |
| * | Novell Inc. | 71,475 | 423 |
| | Activision Blizzard Inc. | 32,800 | 408 |
| | Harris Corp. | 4,300 | 195 |
| | Intersil Corp. Class A | 10,400 | 159 |
| | | | 685,623 |
| Materials (4.0%) | | |
| | Freeport-McMoRan | | |
| | Copper & Gold Inc. | 147,454 | 17,708 |
| | Praxair Inc. | 108,400 | 10,349 |
| | Newmont Mining Corp. | 164,386 | 10,098 |
| | EI du Pont de | | |
| | Nemours & Co. | 160,300 | 7,996 |
| | Mosaic Co. | 76,300 | 5,826 |
| | Monsanto Co. | 82,434 | 5,741 |
| | Nucor Corp. | 129,600 | 5,679 |
| | Dow Chemical Co. | 163,340 | 5,576 |
| | CF Industries Holdings Inc. | 37,100 | 5,014 |
| | Ecolab Inc. | 97,200 | 4,901 |
| | United States Steel Corp. | 79,356 | 4,636 |
| | Sigma-Aldrich Corp. | 67,400 | 4,486 |
| | Celanese Corp. Class A | 98,011 | 4,035 |
| | Ball Corp. | 56,300 | 3,831 |
| | FMC Corp. | 47,400 | 3,787 |
| | Albemarle Corp. | 65,400 | 3,648 |
| * | Crown Holdings Inc. | 109,000 | 3,638 |
| * | Owens-Illinois Inc. | 113,800 | 3,494 |
| | Allegheny Technologies Inc. | 60,900 | 3,360 |
| | Nalco Holding Co. | 104,639 | 3,342 |
| | Cliffs Natural Resources Inc. | 42,761 | 3,336 |
| | Airgas Inc. | 51,500 | 3,217 |
| | Martin Marietta | | |
| | Materials Inc. | 30,600 | 2,823 |
| | Cytec Industries Inc. | 52,200 | 2,770 |
| | Sealed Air Corp. | 106,072 | 2,700 |
| | Scotts Miracle-Gro Co. | | |
| | Class A | 51,099 | 2,594 |
| * | Intrepid Potash Inc. | 67,785 | 2,528 |
| | Reliance Steel & | | |
| | Aluminum Co. | 46,300 | 2,366 |
| * | Titanium Metals Corp. | 126,910 | 2,180 |
| | | | |
| | Schnitzer Steel | | | |
| | Industries Inc. | | 23,426 | 1,555 |
| | Walter Energy Inc. | | 11,780 | 1,506 |
| | Royal Gold Inc. | | 20,686 | 1,130 |
| | Southern Copper Corp. | | 21,000 | 1,024 |
| | International Paper Co. | | 35,900 | 978 |
| | Valspar Corp. | | 23,400 | 807 |
| | Packaging Corp. of America | 26,600 | 687 |
| | Air Products & | | | |
| | Chemicals Inc. | | 5,700 | 518 |
| | | | | 149,864 |
| Telecommunication Services (3.0%) | |
| | AT&T Inc. | 1,749,979 | 51,414 |
| | Verizon | | | |
| | Communications Inc. | | 711,342 | 25,452 |
| * | American Tower Corp. | | | |
| | Class A | | 153,000 | 7,901 |
| * | Sprint Nextel Corp. | 1,329,656 | 5,624 |
| * | Crown Castle | | | |
| | International Corp. | | 125,800 | 5,514 |
| | CenturyLink Inc. | | 112,797 | 5,208 |
| * | SBA Communications Corp. | | |
| | Class A | | 52,823 | 2,163 |
| | Qwest Communications | | | |
| | International Inc. | | 215,164 | 1,637 |
| * | United States Cellular Corp. | 32,300 | 1,613 |
| | Telephone & Data | | | |
| | Systems Inc. | | 43,601 | 1,594 |
| | Frontier | | | |
| | Communications Corp. | | 126,223 | 1,228 |
| | Telephone & | | | |
| | Data Systems Inc. - | | | |
| | Special Common Shares | | 33,200 | 1,046 |
| * | Level 3 | | | |
| | Communications Inc. | | 669,207 | 656 |
| | | | | 111,050 |
| Utilities (3.1%) | | | |
| | Exelon Corp. | | 182,000 | 7,579 |
| | PG&E Corp. | | 145,600 | 6,966 |
| | NextEra Energy Inc. | | 122,451 | 6,366 |
| | Sempra Energy | | 107,736 | 5,654 |
| | Edison International | | 142,500 | 5,501 |
| | Entergy Corp. | | 77,000 | 5,454 |
| | Southern Co. | | 121,500 | 4,645 |
| * | AES Corp. | | 352,898 | 4,298 |
| | Wisconsin Energy Corp. | | 66,000 | 3,885 |
| | Northeast Utilities | | 110,600 | 3,526 |
| | CenterPoint Energy Inc. | | 223,800 | 3,518 |
| * | NRG Energy Inc. | | 171,115 | 3,344 |
| | CMS Energy Corp. | | 173,986 | 3,236 |
| | NSTAR | | 76,600 | 3,232 |
| * | Calpine Corp. | | 241,180 | 3,217 |
| | SCANA Corp. | | 74,200 | 3,013 |
| | Integrys Energy Group Inc. | | 61,481 | 2,982 |
71
Tax-Managed Capital Appreciation Fund
| | |
| | | Market |
| | | Value |
| | Shares | ($000) |
| Allegheny Energy Inc. | 122,939 | 2,980 |
| Duke Energy Corp. | 163,592 | 2,914 |
| Energen Corp. | 59,600 | 2,876 |
| Dominion Resources Inc. | 67,086 | 2,866 |
| NV Energy Inc. | 201,083 | 2,825 |
| MDU Resources Group Inc. | 137,050 | 2,778 |
| * GenOn Energy Inc. | 716,639 | 2,730 |
| Aqua America Inc. | 107,583 | 2,418 |
| ITC Holdings Corp. | 36,166 | 2,242 |
| Public Service Enterprise | | |
| Group Inc. | 69,800 | 2,220 |
| American Water | | |
| Works Co. Inc. | 87,200 | 2,205 |
| FirstEnergy Corp. | 55,900 | 2,069 |
| Questar Corp. | 115,800 | 2,016 |
| Ormat Technologies Inc. | 66,366 | 1,963 |
| DPL Inc. | 75,000 | 1,928 |
| National Fuel Gas Co. | 19,487 | 1,279 |
| UGI Corp. | 34,466 | 1,088 |
| NiSource Inc. | 35,920 | 633 |
| American Electric | | |
| Power Co. Inc. | 9,300 | 335 |
| | | 116,781 |
| Total Common Stocks | | |
| (Cost $2,779,161) | | 3,730,873 |
| Temporary Cash Investment (0.1%) | |
| Money Market Fund (0.1%) | | |
| 1 Vanguard Market | | |
| Liquidity Fund, 0.211% | | |
| (Cost $3,385) | 3,384,701 | 3,385 |
| Total Investments (100.1%) | | |
| (Cost $2,782,546) | | 3,734,258 |
| Other Assets and Liabilities (-0.1%) | |
| Other Assets | | 5,448 |
| Liabilities | | (9,031) |
| | | (3,583) |
| Net Assets (100%) | | 3,730,675 |
| |
| At December 31, 2010, net assets consisted of: |
| | Amount |
| | ($000) |
| Paid-in Capital | 2,921,370 |
| Overdistributed Net Investment Income | (4,741) |
| Accumulated Net Realized Losses | (137,666) |
| Unrealized Appreciation (Depreciation) | 951,712 |
| Net Assets | 3,730,675 |
| |
| |
| Investor Shares—Net Assets | |
| Applicable to 18,948,494 outstanding | |
| $.001 par value shares of beneficial | |
| interest (unlimited authorization) | 589,014 |
| Net Asset Value Per Share— | |
| Investor Shares | $31.09 |
| |
| |
| Admiral Shares—Net Assets | |
| Applicable to 45,711,389 outstanding | |
| $.001 par value shares of beneficial | |
| interest (unlimited authorization) | 2,859,891 |
| Net Asset Value Per Share— | |
| Admiral Shares | $62.56 |
| |
| |
| Institutional Shares—Net Assets | |
| Applicable to 9,064,153 outstanding | |
| $.001 par value shares of beneficial | |
| interest (unlimited authorization) | 281,770 |
| Net Asset Value Per Share— | |
| Institutional Shares | $31.09 |
See Note A in Notes to Financial Statements.
* Non-income-producing security.
1 Affiliated money market fund available only to Vanguard funds and certain trusts and accounts managed by Vanguard. Rate shown is the
7-day yield.
See accompanying Notes, which are an integral part of the Financial Statements.
72
Tax-Managed Capital Appreciation Fund
Statement of Operations
| |
| | Year Ended |
| | December 31, 2010 |
| | ($000) |
| Investment Income | |
| Income | |
| Dividends | 58,075 |
| Interest1 | 3 |
| Total Income | 58,078 |
| Expenses | |
| The Vanguard Group—Note B | |
| Investment Advisory Services | 266 |
| Management and Administrative—Investor Shares | 920 |
| Management and Administrative—Admiral Shares | 2,391 |
| Management and Administrative—Institutional Shares | 125 |
| Marketing and Distribution—Investor Shares | 113 |
| Marketing and Distribution—Admiral Shares | 463 |
| Marketing and Distribution—Institutional Shares | 44 |
| Custodian Fees | 42 |
| Auditing Fees | 26 |
| Shareholders’ Reports—Investor Shares | 9 |
| Shareholders’ Reports—Admiral Shares | 4 |
| Shareholders’ Reports—Institutional Shares | — |
| Trustees’ Fees and Expenses | 5 |
| Total Expenses | 4,408 |
| Net Investment Income | 53,670 |
| Realized Net Gain (Loss) on Investment Securities Sold | (74,140) |
| Change in Unrealized Appreciation (Depreciation) of Investment Securities | 539,562 |
| Net Increase (Decrease) in Net Assets Resulting from Operations | 519,092 |
| 1 Interest income from an affiliated company of the fund was $3,000. |
See accompanying Notes, which are an integral part of the Financial Statements.
73
| | |
| Tax-Managed Capital Appreciation Fund | | |
| |
| |
| Statement of Changes in Net Assets | | |
| |
| | Year Ended December 31, |
| | 2010 | 2009 |
| | ($000) | ($000) |
| Increase (Decrease) in Net Assets | | |
| Operations | | |
| Net Investment Income | 53,670 | 51,307 |
| Realized Net Gain (Loss) | (74,140) | 503,633 |
| Change in Unrealized Appreciation (Depreciation) | 539,562 | 198,768 |
| Net Increase (Decrease) in Net Assets Resulting from Operations | 519,092 | 753,708 |
| Distributions | | |
| Net Investment Income | | |
| Investor Shares | (8,130) | (8,348) |
| Admiral Shares | (41,753) | (38,731) |
| Institutional Shares | (4,226) | (3,674) |
| Realized Capital Gain | | |
| Investor Shares | — | — |
| Admiral Shares | — | — |
| Institutional Shares | — | — |
| Total Distributions | (54,109) | (50,753) |
| Capital Share Transactions | | |
| Investor Shares | (45,480) | (33,530) |
| Admiral Shares | (22,214) | (52,132) |
| Institutional Shares | 22,378 | (9,224) |
| Net Increase (Decrease) from Capital Share Transactions | (45,316) | (94,886) |
| Total Increase (Decrease) | 419,667 | 608,069 |
| Net Assets | | |
| Beginning of Period | 3,311,008 | 2,702,939 |
| End of Period1 | 3,730,675 | 3,311,008 |
1 Net Assets—End of Period includes undistributed (overdistributed) net investment income of ($4,741,000) and ($4,302,000).
See accompanying Notes, which are an integral part of the Financial Statements.
74
Tax-Managed Capital Appreciation Fund
Financial Highlights
| | | | | |
| Investor Shares | | | | | |
| |
| For a Share Outstanding | Year Ended December 31, |
| Throughout Each Period | 2010 | 2009 | 2008 | 2007 | 2006 |
| Net Asset Value, Beginning of Period | $27.19 | $21.39 | $35.13 | $33.62 | $29.80 |
| Investment Operations | | | | | |
| Net Investment Income | .431 | .410 | .498 | .530 | .471 |
| Net Realized and Unrealized Gain (Loss) | | | | | |
| on Investments | 3.903 | 5.799 | (13.738) | 1.513 | 3.821 |
| Total from Investment Operations | 4.334 | 6.209 | (13.240) | 2.043 | 4.292 |
| Distributions | | | | | |
| Dividends from Net Investment Income | (.434) | (.409) | (.500) | (.533) | (.472) |
| Distributions from Realized Capital Gains | — | — | — | — | — |
| Total Distributions | (.434) | (.409) | (.500) | (.533) | (.472) |
| Net Asset Value, End of Period | $31.09 | $27.19 | $21.39 | $35.13 | $33.62 |
| |
| Total Return1 | 15.94% | 29.03% | -37.63% | 6.07% | 14.40% |
| |
| Ratios/Supplemental Data | | | | | |
| Net Assets, End of Period (Millions) | $589 | $560 | $473 | $782 | $832 |
| Ratio of Total Expenses to | | | | | |
| Average Net Assets | 0.20% | 0.21% | 0.16% | 0.15% | 0.15% |
| Ratio of Net Investment Income to | | | | | |
| Average Net Assets | 1.51% | 1.74% | 1.66% | 1.51% | 1.51% |
| Portfolio Turnover Rate | 7% | 26% | 8% | 5% | 5% |
| 1 Total returns do not include transaction or account service fees that may have applied in the periods shown. Fund prospectuses provide |
| information about any applicable transaction and account service fees. |
See accompanying Notes, which are an integral part of the Financial Statements.
75
Tax-Managed Capital Appreciation Fund
Financial Highlights
| | | | | |
| Admiral Shares | | | | | |
| |
| For a Share Outstanding | Year Ended December 31, |
| Throughout Each Period | 2010 | 2009 | 2008 | 2007 | 2006 |
| Net Asset Value, Beginning of Period | $54.72 | $43.04 | $70.70 | $67.68 | $60.00 |
| Investment Operations | | | | | |
| Net Investment Income | .915 | .855 | 1.040 | 1.113 | .990 |
| Net Realized and Unrealized Gain (Loss) | | | | | |
| on Investments | 7.849 | 11.673 | (27.656) | 3.026 | 7.680 |
| Total from Investment Operations | 8.764 | 12.528 | (26.616) | 4.139 | 8.670 |
| Distributions | | | | | |
| Dividends from Net Investment Income | (.924) | (.848) | (1.044) | (1.119) | (.990) |
| Distributions from Realized Capital Gains | — | — | — | — | — |
| Total Distributions | (.924) | (.848) | (1.044) | (1.119) | (.990) |
| Net Asset Value, End of Period | $62.56 | $54.72 | $43.04 | $70.70 | $67.68 |
| |
| Total Return1 | 16.02% | 29.11% | -37.58% | 6.11% | 14.44% |
| |
| Ratios/Supplemental Data | | | | | |
| Net Assets, End of Period (Millions) | $2,860 | $2,526 | $2,045 | $3,283 | $2,941 |
| Ratio of Total Expenses to | | | | | |
| Average Net Assets | 0.12% | 0.15% | 0.10% | 0.09% | 0.10% |
| Ratio of Net Investment Income to | | | | | |
| Average Net Assets | 1.59% | 1.80% | 1.72% | 1.57% | 1.56% |
| Portfolio Turnover Rate | 7% | 26% | 8% | 5% | 5% |
| 1 Total returns do not include transaction fees that may have applied in the periods shown. Fund prospectuses provide information about any |
| applicable transaction fees. |
See accompanying Notes, which are an integral part of the Financial Statements.
76
Tax-Managed Capital Appreciation Fund
Financial Highlights
| | | | | |
| Institutional Shares | | | | | |
| |
| For a Share Outstanding | Year Ended December 31, |
| Throughout Each Period | 2010 | 2009 | 2008 | 2007 | 2006 |
| Net Asset Value, Beginning of Period | $27.19 | $21.38 | $35.13 | $33.63 | $29.81 |
| Investment Operations | | | | | |
| Net Investment Income | .466 | .439 | .525 | .551 | .500 |
| Net Realized and Unrealized Gain (Loss) | | | | | |
| on Investments | 3.905 | 5.806 | (13.748) | 1.513 | 3.820 |
| Total from Investment Operations | 4.371 | 6.245 | (13.223) | 2.064 | 4.320 |
| Distributions | | | | | |
| Dividends from Net Investment Income | (.471) | (.435) | (.527) | (.564) | (.500) |
| Distributions from Realized Capital Gains | — | — | — | — | — |
| Total Distributions | (.471) | (.435) | (.527) | (.564) | (.500) |
| Net Asset Value, End of Period | $31.09 | $27.19 | $21.38 | $35.13 | $33.63 |
| |
| Total Return1 | 16.08% | 29.21% | -37.57% | 6.13% | 14.49% |
| |
| Ratios/Supplemental Data | | | | | |
| Net Assets, End of Period (Millions) | $282 | $225 | $185 | $291 | $218 |
| Ratio of Total Expenses to | | | | | |
| Average Net Assets | 0.08% | 0.09% | 0.07% | 0.07% | 0.07% |
| Ratio of Net Investment Income to | | | | | |
| Average Net Assets | 1.63% | 1.86% | 1.75% | 1.59% | 1.59% |
| Portfolio Turnover Rate | 7% | 26% | 8% | 5% | 5% |
| 1 Total returns do not include transaction fees that may have applied in the periods shown. Fund prospectuses provide information about any |
| applicable transaction fees. |
See accompanying Notes, which are an integral part of the Financial Statements.
77
Tax-Managed Capital Appreciation Fund
Notes to Financial Statements
Vanguard Tax-Managed Capital Appreciation Fund is registered under the Investment Company Act of 1940 as an open-end investment company, or mutual fund. The fund offers three classes of shares: Investor Shares, Admiral Shares, and Institutional Shares. Investor Shares are available to any investor who meets the fund’s minimum purchase requirements. Admiral Shares and Institutional Shares are designed for investors who meet certain administrative, service, and account-size criteria.
A. The following significant accounting policies conform to generally accepted accounting principles for U.S. mutual funds. The fund consistently follows such policies in preparing its financial statements.
1. Security Valuation: Securities are valued as of the close of trading on the New York Stock Exchange (generally 4 p.m., Eastern time) on the valuation date. Equity securities are valued at the latest quoted sales prices or official closing prices taken from the primary market in which each security trades; such securities not traded on the valuation date are valued at the mean of the latest quoted bid and asked prices. Securities for which market quotations are not readily available, or whose values have been materially affected by events occurring before the fund’s pricing time but after the close of the securities’ primary markets, are valued by methods deemed by the board of trustees to represent fair value. Investments in Vanguard Market Liquidity Fund are valued at that fund’s net asset value.
2. Federal Income Taxes: The fund intends to continue to qualify as a regulated investment company and distribute all of its taxable income. Management has analyzed the fund’s tax positions taken for all open federal income tax years (December 31, 2007–2010), and has concluded that no provision for federal income tax is required in the fund’s financial statements.
3. Distributions: Distributions to shareholders are recorded on the ex-dividend date.
4. Other: Dividend income is recorded on the ex-dividend date. Interest income includes income distributions received from Vanguard Market Liquidity Fund and is accrued daily. Security transactions are accounted for on the date securities are bought or sold. Costs used to determine realized gains (losses) on the sale of investment securities are those of the specific securities sold. Fees assessed on redemptions of capital shares are credited to paid-in capital.
Each class of shares has equal rights as to assets and earnings, except that each class separately bears certain class-specific expenses related to maintenance of shareholder accounts (included in Management and Administrative expenses) and shareholder reporting. Marketing and distribution expenses are allocated to each class of shares based on a method approved by the board of trustees. Income, other non-class-specific expenses, and gains and losses on investments are allocated to each class of shares based on its relative net assets.
B. The Vanguard Group furnishes at cost investment advisory, corporate management, administrative, marketing, and distribution services. The costs of such services are allocated to the fund under methods approved by the board of trustees. The fund has committed to provide up to 0.40% of its net assets in capital contributions to Vanguard. At December 31, 2010, the fund had contributed capital of $617,000 to Vanguard (included in Other Assets), representing 0.02% of the fund’s net assets and 0.25% of Vanguard’s capitalization. The fund’s trustees and officers are also directors and officers of Vanguard.
C. Various inputs may be used to determine the value of the fund’s investments. These inputs are summarized in three broad levels for financial statement purposes. The inputs or methodologies used to value securities are not necessarily an indication of the risk associated with investing in those securities.
78
Tax-Managed Capital Appreciation Fund
Level 1—Quoted prices in active markets for identical securities.
Level 2—Other significant observable inputs (including quoted prices for similar securities, interest rates, prepayment speeds, credit risk, etc.).
Level 3—Significant unobservable inputs (including the fund’s own assumptions used to determine the fair value of investments).
At December 31, 2010, 100% of the fund’s investments were valued based on Level 1 inputs.
D. Distributions are determined on a tax basis and may differ from net investment income and realized capital gains for financial reporting purposes. Differences may be permanent or temporary. Permanent differences are reclassified among capital accounts in the financial statements to reflect their tax character. Temporary differences arise when certain items of income, expense, gain, or loss are recognized in different periods for financial statement and tax purposes; these differences will reverse at some time in the future. Differences in classification may also result from the treatment of short-term gains as ordinary income for tax purposes.
For tax purposes, at December 31, 2010, the fund had $446,000 of ordinary income available for distribution. The fund had available capital loss carryforwards totaling $134,312,000 to offset future net capital gains of $771,000 through December 31, 2011, $62,755,000 through December 31, 2016, and $70,786,000 through December 31, 2018.
At December 31, 2010, the cost of investment securities for tax purposes was $2,785,900,000. Net unrealized appreciation of investment securities for tax purposes was $948,358,000, consisting of unrealized gains of $1,069,950,000 on securities that had risen in value since their purchase and $121,592,000 in unrealized losses on securities that had fallen in value since their purchase.
E. During the year ended December 31, 2010, the fund purchased $237,964,000 of investment securities and sold $283,201,000 of investment securities, other than temporary cash investments.
79
Tax-Managed Capital Appreciation Fund
| | | | |
| F. Capital share transactions for each class of shares were: | | | |
| | Year Ended December 31, |
| | 2010 | 2009 |
| | Amount | Shares | Amount | Shares |
| | ($000) | (000) | ($000) | (000) |
| Investor Shares | | | | |
| Issued | 37,577 | 1,336 | 49,773 | 2,206 |
| Issued in Lieu of Cash Distributions | 7,111 | 229 | 7,346 | 271 |
| Redeemed1 | (90,168) | (3,219) | (90,649) | (3,992) |
| Net Increase (Decrease)—Investor Shares | (45,480) | (1,654) | (33,530) | (1,515) |
| Admiral Shares | | | | |
| Issued | 120,657 | 2,125 | 148,604 | 3,294 |
| Issued in Lieu of Cash Distributions | 32,472 | 520 | 30,074 | 551 |
| Redeemed1 | (175,343) | (3,090) | (230,810) | (5,209) |
| Net Increase (Decrease)—Admiral Shares | (22,214) | (445) | (52,132) | (1,364) |
| Institutional Shares | | | | |
| Issued | 22,531 | 793 | 22,720 | 973 |
| Issued in Lieu of Cash Distributions | 2,641 | 85 | 2,538 | 93 |
| Redeemed1 | (2,794) | (101) | (34,482) | (1,411) |
| Net Increase (Decrease)—Institutional Shares | 22,378 | 777 | (9,224) | (345) |
| 1 Net of redemption fees for fiscal 2010 and 2009 of $392,000 and $759,000, respectively (fund totals). |
G. In preparing the financial statements as of December 31, 2010, management considered the impact of subsequent events for potential recognition or disclosure in these financial statements.
80
Tax-Managed Small-Cap Fund
Fund Profile
As of December 31, 2010
| | |
| Share-Class Characteristics | |
| | Investor | Institutional |
| | Shares | Shares |
| Ticker Symbol | VTMSX | VTSIX |
| Expense Ratio1 | 0.19% | 0.09% |
| 30-Day SEC Yield | 0.74% | 0.84% |
| | | |
| Portfolio Characteristics | | |
| | | | DJ |
| | | S&P | U.S. Total |
| | | SmallCap | Market |
| | Fund | 600 Index | Index |
| Number of Stocks | 600 | 600 | 3,893 |
| Median Market Cap | $1.1B | $1.1B | $29.6B |
| Price/Earnings Ratio | 24.9x | 25.9x | 18.3x |
| Price/Book Ratio | 1.9x | 1.9x | 2.2x |
| Return on Equity | 11.3% | 11.0% | 18.8% |
| Earnings Growth Rate | 4.6% | 4.4% | 6.2% |
| Dividend Yield | 0.8% | 1.0% | 1.7% |
| Foreign Holdings | 0.0% | 0.0% | 0.0% |
| Turnover Rate | 46% | — | — |
| Short-Term Reserves | 0.2% | — | — |
| | | |
| Sector Diversification (% of equity exposure) |
| | | | DJ |
| | | S&P | U.S. Total |
| | | SmallCap | Market |
| | Fund 600 Index | Index |
| Consumer | | | |
| Discretionary | 14.9% | 14.7% | 11.9% |
| Consumer Staples | 3.4 | 3.4 | 9.5 |
| Energy | 5.4 | 5.4 | 10.6 |
| Financials | 18.5 | 18.9 | 16.6 |
| Health Care | 12.7 | 12.7 | 10.7 |
| Industrials | 16.3 | 16.2 | 11.4 |
| Information | | | |
| Technology | 19.8 | 19.7 | 18.9 |
| Materials | 4.6 | 4.6 | 4.5 |
| Telecommunication | | | |
| Services | 0.6 | 0.6 | 2.7 |
| Utilities | 3.8 | 3.8 | 3.2 |
| | |
| Volatility Measures | | |
| | | DJ |
| | U.S. Total |
| | S&P SmallCap | Market |
| | 600 Index | Index |
| R-Squared | 1.00 | 0.91 |
| Beta | 0.99 | 1.15 |
| These measures show the degree and timing of the fund’s fluctuations compared with the indexes over 36 months. |
| | |
| Ten Largest Holdings (% of total net assets) |
| |
| Oil States International | Oil & Gas | |
| Inc. | Equipment & | |
| | Services | 0.7% |
| Cypress Semiconductor | Semiconductors | |
| Corp. | | 0.6 |
| Varian Semiconductor | Semiconductor | |
| Equipment Associates | Equipment | |
| Inc. | | 0.6 |
| Salix Pharmaceuticals | Pharmaceuticals | |
| Ltd. | | 0.6 |
| Cooper Cos. Inc. | Health Care | |
| | Supplies | 0.5 |
| World Fuel Services | Oil & Gas Refining | |
| Corp. | & Marketing | 0.5 |
| Regeneron | Biotechnology | |
| Pharmaceuticals Inc. | | 0.5 |
| Stifel Financial Corp. | Investment Banking | |
| | & Brokerage | 0.5 |
| AMERIGROUP Corp. | Managed Health | |
| | Care | 0.5 |
| CLARCOR Inc. | Industrial | |
| | Machinery | 0.4 |
| Top Ten | | 5.4% |
| The holdings listed exclude any temporary cash investments and equity index products. |
Investment Focus
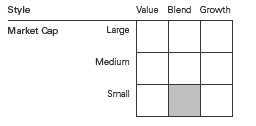
1 The expense ratios shown are from the prospectus dated April 26, 2010, and represent estimated costs for the current fiscal year. For the
fiscal year ended December 31, 2010, the expense ratios were 0.18% for Investor Shares and 0.08% for Institutional Shares.
81
Tax-Managed Small-Cap Fund
Performance Summary
All of the returns in this report represent past performance, which is not a guarantee of future results that may be achieved by the fund. (Current performance may be lower or higher than the performance data cited. For performance data current to the most recent month-end, visit our website at vanguard.com/performance.) Note, too, that both investment returns and principal value can fluctuate widely, so an investor’s shares, when sold, could be worth more or less than their original cost. The returns shown do not reflect taxes that a shareholder would pay on fund distributions or on the sale of fund shares.
Cumulative Performance: December 31, 2000, Through December 31, 2010
Initial Investment of $10,000
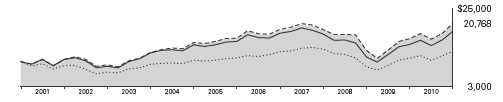
| | | | | |
| | | Average Annual Total Returns | |
| | | Periods Ended December 31, 2010 | |
| | | | | | Final Value |
| | | One | Five | Ten | of a $10,000 |
| | | Year | Years | Years | Investment |
| | Tax-Managed Small-Cap Fund Investor | | | | |
| | Shares | 25.99% | 4.66% | 7.58% | $20,768 |
| | Fee-Adjusted Returns | 24.74 | 4.66 | 7.58 | 20,768 |
| •••••••• | Dow Jones U.S. Total Stock Market | | | | |
| | Index | 17.70 | 3.17 | 2.64 | 12,981 |
| – – – – | S&P SmallCap 600 Index | 26.31 | 4.64 | 7.66 | 20,919 |
| | Small-Cap Core Funds Average | 25.21 | 3.42 | 6.44 | 18,661 |
| Small-Cap Core Funds Average: Derived from data provided by Lipper Inc. |
| | | | |
| | | | | Final Value |
| | One | Five | Ten | of a $5,000,000 |
| | Year | Years | Years | Investment |
| Tax-Managed Small-Cap Fund | | | | |
| Institutional Shares | 26.09% | 4.73% | 7.66% | $10,459,777 |
| Fee-Adjusted Returns | 24.84 | 4.73 | 7.66 | 10,459,777 |
| Dow Jones U.S. Total Stock Market | | | | |
| Index | 17.70 | 3.17 | 2.64 | 6,490,386 |
| S&P SmallCap 600 Index | 26.31 | 4.64 | 7.66 | 10,459,296 |
Fee-adjusted returns reflect the 1% fee on redemptions of shares held for less than five years.
See Financial Highlights for dividend and capital gains information.
82
Tax-Managed Small-Cap Fund
Fiscal-Year Total Returns (%): December 31, 2000, Through December 31, 2010
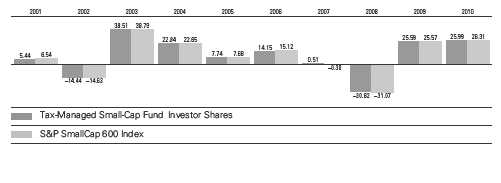
Fee-adjusted returns reflect the 1% fee on redemptions of shares held for less than five years.
83
Tax-Managed Small-Cap Fund
Financial Statements
Statement of Net Assets
As of December 31, 2010
The fund reports a complete list of its holdings in regulatory filings four times in each fiscal year, at the quarter-ends. For the second and fourth fiscal quarters, the lists appear in the fund’s semiannual and annual reports to shareholders. For the first and third fiscal quarters, the fund files the lists with the Securities and Exchange Commission on Form N-Q. Shareholders can look up the fund’s Forms N-Q on the SEC’s website at sec.gov. Forms N-Q may also be reviewed and copied at the SEC’s Public Reference Room (see the back cover of this report for further information).
| | | |
| | | | Market |
| | | | Value |
| | | Shares | ($000) |
| Common Stocks (100.0%) | | |
| Consumer Discretionary (14.9%) | |
| * | Coinstar Inc. | 133,421 | 7,530 |
| * | Live Nation | | |
| | Entertainment Inc. | 627,659 | 7,168 |
| * | Carter’s Inc. | 242,399 | 7,153 |
| | Brunswick Corp. | 372,955 | 6,989 |
| * | Jo-Ann Stores Inc. | 110,980 | 6,683 |
| | Wolverine World Wide Inc. | 205,140 | 6,540 |
| * | OfficeMax Inc. | 357,890 | 6,335 |
| * | CROCS Inc. | 366,760 | 6,279 |
| * | Iconix Brand Group Inc. | 306,047 | 5,910 |
| | Men’s Wearhouse Inc. | 222,085 | 5,548 |
| | Hillenbrand Inc. | 263,671 | 5,487 |
| * | Childrens Place Retail | | |
| | Stores Inc. | 109,482 | 5,435 |
| | Cracker Barrel Old Country | | |
| | Store Inc. | 98,678 | 5,405 |
| * | HSN Inc. | 163,059 | 4,996 |
| * | Jack in the Box Inc. | 225,973 | 4,775 |
| | Arbitron Inc. | 114,045 | 4,735 |
| | Pool Corp. | 209,865 | 4,730 |
| * | JOS A Bank Clothiers Inc. | 116,967 | 4,716 |
| | PF Chang’s China Bistro Inc. | 96,977 | 4,699 |
| * | Capella Education Co. | 70,009 | 4,661 |
| | Monro Muffler Brake Inc. | 127,849 | 4,422 |
| * | Hibbett Sports Inc. | 117,783 | 4,346 |
| * | Texas Roadhouse Inc. | | |
| | Class A | 246,213 | 4,227 |
| | Group 1 Automotive Inc. | 99,888 | 4,171 |
| | Buckle Inc. | 110,290 | 4,166 |
| * | Steven Madden Ltd. | 96,999 | 4,047 |
| | Finish Line Inc. Class A | 225,540 | 3,877 |
| * | Helen of Troy Ltd. | 129,217 | 3,843 |
| * | Genesco Inc. | 102,365 | 3,838 |
| * | Cabela’s Inc. | 170,525 | 3,709 |
| * | Pinnacle Entertainment Inc. | 259,376 | 3,636 |
| * | Ruby Tuesday Inc. | 274,851 | 3,590 |
| * | Blue Nile Inc. | 60,368 | 3,445 |
| | | |
| | | | Market |
| | | | Value |
| | | Shares | ($000) |
| | Cato Corp. Class A | 125,307 | 3,435 |
| * | CEC Entertainment Inc. | 87,591 | 3,401 |
| * | Buffalo Wild Wings Inc. | 77,201 | 3,385 |
| * | BJ’s Restaurants Inc. | 94,909 | 3,363 |
| * | DineEquity Inc. | 65,092 | 3,214 |
| * | Meritage Homes Corp. | 136,486 | 3,030 |
| | PEP Boys-Manny | | |
| | Moe & Jack | 223,755 | 3,005 |
| * | Skechers U.S.A. Inc. | | |
| | Class A | 143,756 | 2,875 |
| * | Liz Claiborne Inc. | 401,495 | 2,875 |
| * | American Public | | |
| | Education Inc. | 76,705 | 2,856 |
| * | Quiksilver Inc. | 552,564 | 2,801 |
| * | Interval Leisure Group Inc. | 172,447 | 2,783 |
| | Stage Stores Inc. | 155,677 | 2,699 |
| * | Sonic Corp. | 263,704 | 2,669 |
| * | Shuffle Master Inc. | 229,404 | 2,627 |
| | Brown Shoe Co. Inc. | 187,511 | 2,612 |
| * | Pre-Paid Legal Services Inc. | 41,869 | 2,523 |
| * | Lumber Liquidators | | |
| | Holdings Inc. | 99,671 | 2,483 |
| * | Biglari Holdings Inc. | 6,047 | 2,480 |
| | Ethan Allen Interiors Inc. | 122,862 | 2,458 |
| * | True Religion Apparel Inc. | 108,755 | 2,421 |
| | Nutrisystem Inc. | 114,137 | 2,400 |
| * | Zumiez Inc. | 88,600 | 2,381 |
| * | Papa John’s International Inc. | 85,377 | 2,365 |
| * | Maidenform Brands Inc. | 98,327 | 2,337 |
| | Fred’s Inc. Class A | 167,585 | 2,306 |
| * | Peet’s Coffee & Tea Inc. | 54,877 | 2,291 |
| | Callaway Golf Co. | 275,761 | 2,225 |
| * | Jakks Pacific Inc. | 117,431 | 2,140 |
| | Superior Industries | | |
| | International Inc. | 99,243 | 2,106 |
| * | RC2 Corp. | 92,908 | 2,023 |
| * | La-Z-Boy Inc. | 222,622 | 2,008 |
| | Sonic Automotive Inc. | | |
| | Class A | 150,771 | 1,996 |
84
Tax-Managed Small-Cap Fund
| | | |
| | | | Market |
| | | | Value |
| | | Shares | ($000) |
| | Universal Technical | | |
| | Institute Inc. | 89,248 | 1,965 |
| * | Standard Pacific Corp. | 424,592 | 1,953 |
| * | Winnebago Industries Inc. | 125,070 | 1,901 |
| | Drew Industries Inc. | 81,837 | 1,859 |
| * | Corinthian Colleges Inc. | 355,000 | 1,850 |
| * | California Pizza Kitchen Inc. | 105,496 | 1,823 |
| | PetMed Express Inc. | 98,011 | 1,746 |
| * | Universal Electronics Inc. | 58,384 | 1,656 |
| | Oxford Industries Inc. | 59,800 | 1,531 |
| * | K-Swiss Inc. Class A | 116,004 | 1,447 |
| * | Red Robin Gourmet | | |
| | Burgers Inc. | 67,064 | 1,440 |
| | Big 5 Sporting Goods Corp. | 93,098 | 1,422 |
| | Volcom Inc. | 73,613 | 1,389 |
| | Lithia Motors Inc. Class A | 92,624 | 1,324 |
| * | EW Scripps Co. Class A | 130,327 | 1,323 |
| | Sturm Ruger & Co. Inc. | 82,215 | 1,257 |
| * | M/I Homes Inc. | 79,917 | 1,229 |
| | Marcus Corp. | 92,584 | 1,229 |
| | HOT Topic Inc. | 191,515 | 1,201 |
| * | Movado Group Inc. | 73,162 | 1,181 |
| * | Perry Ellis International Inc. | 42,651 | 1,172 |
| | Standard Motor | | |
| | Products Inc. | 84,347 | 1,156 |
| | Stein Mart Inc. | 116,001 | 1,073 |
| | Haverty Furniture Cos. Inc. | 80,026 | 1,039 |
| * | Kirkland’s Inc. | 67,672 | 949 |
| | Christopher & Banks Corp. | 153,453 | 944 |
| * | MarineMax Inc. | 95,825 | 896 |
| | Spartan Motors Inc. | 141,795 | 863 |
| * | Tuesday Morning Corp. | 156,247 | 825 |
| | Blyth Inc. | 23,568 | 813 |
| * | Coldwater Creek Inc. | 253,000 | 802 |
| * | Kid Brands Inc. | 93,129 | 796 |
| | Skyline Corp. | 29,810 | 777 |
| * | Arctic Cat Inc. | 52,701 | 772 |
| * | Audiovox Corp. Class A | 80,543 | 695 |
| * | Multimedia Games Inc. | 119,051 | 664 |
| * | Ruth’s Hospitality | | |
| | Group Inc. | 133,075 | 616 |
| * | Monarch Casino & | | |
| | Resort Inc. | 49,032 | 613 |
| * | O’Charleys Inc. | 81,570 | 587 |
| * | Midas Inc. | 54,295 | 440 |
| * | Zale Corp. | 101,210 | 431 |
| | | | 301,313 |
| Consumer Staples (3.4%) | | |
| * | TreeHouse Foods Inc. | 148,765 | 7,601 |
| * | United Natural Foods Inc. | 199,636 | 7,323 |
| | Casey’s General Stores Inc. | 159,060 | 6,762 |
| | Diamond Foods Inc. | 92,634 | 4,926 |
| * | Hain Celestial Group Inc. | 181,341 | 4,907 |
| * | Darling International Inc. | 348,215 | 4,624 |
| | | | |
| * | Boston Beer Co. Inc. | | | |
| | Class A | | 38,315 | 3,644 |
| | Snyders-Lance Inc. | | 146,941 | 3,444 |
| | Sanderson Farms Inc. | | 81,604 | 3,195 |
| | J&J Snack Foods Corp. | 60,703 | 2,928 |
| | WD-40 Co. | | 71,016 | 2,861 |
| | Andersons Inc. | | 78,217 | 2,843 |
| * | Central Garden and Pet Co. | | |
| | Class A | | 237,973 | 2,351 |
| | Nash Finch Co. | | 51,573 | 2,192 |
| | Cal-Maine Foods Inc. | | 57,006 | 1,800 |
| * | Medifast Inc. | | 57,546 | 1,662 |
| | Spartan Stores Inc. | | 96,754 | 1,640 |
| * | Alliance One | | | |
| | International Inc. | | 376,923 | 1,598 |
| | Calavo Growers Inc. | | 51,371 | 1,184 |
| * | Seneca Foods Corp. Class A | 39,042 | 1,053 |
| | | | | 68,538 |
| Energy (5.4%) | | | |
| * | Oil States International Inc. | 212,300 | 13,606 |
| | World Fuel Services Corp. | 285,842 | 10,336 |
| | SEACOR Holdings Inc. | 89,350 | 9,032 |
| | CARBO Ceramics Inc. | | 79,744 | 8,257 |
| | Lufkin Industries Inc. | | 126,821 | 7,912 |
| | Holly Corp. | | 185,611 | 7,567 |
| * | Bristow Group Inc. | | 153,083 | 7,248 |
| * | Swift Energy Co. | | 175,241 | 6,861 |
| * | ION Geophysical Corp. | 641,703 | 5,442 |
| * | Stone Energy Corp. | | 204,961 | 4,569 |
| * | Petroleum | | | |
| | Development Corp. | | 97,003 | 4,095 |
| * | Tetra Technologies Inc. | 323,327 | 3,838 |
| | Penn Virginia Corp. | | 193,583 | 3,256 |
| | Contango Oil & Gas Co. | 54,710 | 3,169 |
| * | Gulfport Energy Corp. | | 132,291 | 2,864 |
| * | Hornbeck Offshore | | | |
| | Services Inc. | | 99,759 | 2,083 |
| * | Pioneer Drilling Co. | | 232,537 | 2,049 |
| * | Petroquest Energy Inc. | 238,117 | 1,793 |
| | Gulf Island Fabrication Inc. | 61,681 | 1,738 |
| * | Basic Energy Services Inc. | 99,021 | 1,632 |
| * | Matrix Service Co. | | 111,912 | 1,363 |
| * | Seahawk Drilling Inc. | | 51,595 | 462 |
| | | | | 109,172 |
| Exchange-Traded Fund (3.5%) | | |
| 1 | Vanguard REIT ETF | 1,300,000 | 71,981 |
| |
| Financials (15.0%) | | | |
| * | Stifel Financial Corp. | | 148,273 | 9,199 |
| * | Signature Bank | | 170,788 | 8,539 |
| * | ProAssurance Corp. | | 129,830 | 7,868 |
| | Delphi Financial Group Inc. | 228,973 | 6,604 |
| | Umpqua Holdings Corp. | 483,312 | 5,887 |
| * | Ezcorp Inc. Class A | | 208,886 | 5,667 |
85
Tax-Managed Small-Cap Fund
| | | |
| | | | Market |
| | | | Value |
| | | Shares | ($000) |
| * | Portfolio Recovery | | |
| | Associates Inc. | 72,157 | 5,426 |
| | Susquehanna | | |
| | Bancshares Inc. | 547,746 | 5,302 |
| | UMB Financial Corp. | 126,297 | 5,231 |
| | BioMed Realty Trust Inc. | 277,034 | 5,167 |
| | Wintrust Financial Corp. | 145,333 | 4,800 |
| | United Bankshares Inc. | 162,682 | 4,750 |
| | National Retail | | |
| | Properties Inc. | 178,153 | 4,721 |
| | Old National Bancorp | 396,770 | 4,718 |
| | Glacier Bancorp Inc. | 305,198 | 4,612 |
| | Cash America | | |
| | International Inc. | 124,866 | 4,611 |
| | First Financial Bancorp | 246,249 | 4,551 |
| | Entertainment | | |
| | Properties Trust | 98,006 | 4,533 |
| | First Financial | | |
| | Bankshares Inc. | 88,014 | 4,505 |
| | Tower Group Inc. | 175,976 | 4,501 |
| | Mid-America Apartment | | |
| | Communities Inc. | 70,600 | 4,482 |
| | Tanger Factory | | |
| | Outlet Centers | 86,083 | 4,407 |
| | Home Properties Inc. | 79,347 | 4,403 |
| | Hancock Holding Co. | 125,084 | 4,360 |
| | Selective Insurance | | |
| | Group Inc. | 225,518 | 4,093 |
| | Kilroy Realty Corp. | 111,383 | 4,062 |
| | LaSalle Hotel Properties | 151,009 | 3,987 |
| * | First Cash Financial | | |
| | Services Inc. | 128,583 | 3,985 |
| | DiamondRock | | |
| | Hospitality Co. | 328,471 | 3,942 |
| | Community Bank | | |
| | System Inc. | 141,022 | 3,916 |
| | Whitney Holding Corp. | 273,896 | 3,876 |
| | Post Properties Inc. | 103,122 | 3,743 |
| | RLI Corp. | 69,808 | 3,670 |
| | First Midwest Bancorp Inc. | 313,192 | 3,608 |
| | NBT Bancorp Inc. | 146,429 | 3,536 |
| * | World Acceptance Corp. | 66,515 | 3,512 |
| | Columbia Banking | | |
| | System Inc. | 165,888 | 3,494 |
| | Provident Financial | | |
| | Services Inc. | 219,876 | 3,327 |
| * | Texas Capital | | |
| | Bancshares Inc. | 155,502 | 3,308 |
| | Infinity Property & | | |
| | Casualty Corp. | 53,343 | 3,297 |
| | Extra Space Storage Inc. | 185,941 | 3,235 |
| | Interactive Brokers | | |
| | Group Inc. | 179,943 | 3,207 |
| | Colonial Properties Trust | 175,600 | 3,170 |
| | Sterling Bancshares Inc. | 433,771 | 3,045 |
| | | |
| | Horace Mann | | |
| | Educators Corp. | 168,326 | 3,037 |
| | Safety Insurance Group Inc. | 63,781 | 3,034 |
| * | Forestar Group Inc. | 152,423 | 2,942 |
| | Employers Holdings Inc. | 167,876 | 2,934 |
| * | Investment Technology | | |
| | Group Inc. | 178,999 | 2,930 |
| | Healthcare Realty Trust Inc. | 136,700 | 2,894 |
| | optionsXpress Holdings Inc. | 179,455 | 2,812 |
| | First Commonwealth | | |
| | Financial Corp. | 393,213 | 2,784 |
| | Brookline Bancorp Inc. | 252,482 | 2,739 |
| * | Navigators Group Inc. | 52,710 | 2,654 |
| | National Penn | | |
| | Bancshares Inc. | 329,235 | 2,644 |
| | Medical Properties | | |
| | Trust Inc. | 239,181 | 2,590 |
| | Independent Bank Corp. | 90,789 | 2,456 |
| * | National Financial | | |
| | Partners Corp. | 182,945 | 2,451 |
| | EastGroup Properties Inc. | 57,807 | 2,446 |
| | PrivateBancorp Inc. Class A | 169,382 | 2,436 |
| | Bank of the Ozarks Inc. | 55,883 | 2,423 |
| | City Holding Co. | 66,262 | 2,401 |
| | S&T Bancorp Inc. | 105,647 | 2,387 |
| * | Piper Jaffray Cos. | 66,510 | 2,328 |
| | Saul Centers Inc. | 47,497 | 2,249 |
| | PS Business Parks Inc. | 39,839 | 2,220 |
| | Sovran Self Storage Inc. | 58,738 | 2,162 |
| | Boston Private Financial | | |
| | Holdings Inc. | 325,235 | 2,130 |
| | Franklin Street | | |
| | Properties Corp. | 147,137 | 2,097 |
| | Simmons First | | |
| | National Corp. Class A | 73,486 | 2,094 |
| | Trustco Bank Corp. NY | 329,275 | 2,088 |
| | Home Bancshares Inc. | 93,350 | 2,056 |
| | United Fire & Casualty Co. | 91,279 | 2,037 |
| | Lexington Realty Trust | 250,446 | 1,991 |
| | Pennsylvania Real Estate | | |
| | Investment Trust | 118,729 | 1,725 |
| | Dime Community | | |
| | Bancshares Inc. | 118,181 | 1,724 |
| | Wilmington Trust Corp. | 385,000 | 1,671 |
| * | Nara Bancorp Inc. | 162,647 | 1,597 |
| | LTC Properties Inc. | 56,415 | 1,584 |
| | Acadia Realty Trust | 85,934 | 1,567 |
| | Inland Real Estate Corp. | 163,221 | 1,436 |
| * | AMERISAFE Inc. | 80,132 | 1,402 |
| | Tompkins Financial Corp. | 35,407 | 1,387 |
| * | eHealth Inc. | 93,960 | 1,333 |
| | Sterling Bancorp | 115,245 | 1,207 |
| * | TradeStation Group Inc. | 174,341 | 1,177 |
| | Urstadt Biddle | | |
| | Properties Inc. Class A | 50,437 | 981 |
86
Tax-Managed Small-Cap Fund
| | | |
| | | | Market |
| | | | Value |
| | | Shares | ($000) |
| | Universal Health Realty | | |
| | Income Trust | 26,620 | 972 |
| | Presidential Life Corp. | 91,776 | 911 |
| | Stewart Information | | |
| | Services Corp. | 78,948 | 910 |
| | Parkway Properties Inc. | 47,978 | 841 |
| * | Hanmi Financial Corp. | 655,415 | 754 |
| | Kite Realty Group Trust | 139,316 | 754 |
| | Cedar Shopping | | |
| | Centers Inc. | 102,929 | 647 |
| | SWS Group Inc. | 125,701 | 635 |
| | Wilshire Bancorp Inc. | 83,138 | 633 |
| * | First BanCorp | 1,357,221 | 624 |
| * | LaBranche & Co. Inc. | 161,426 | 581 |
| * | Pinnacle Financial | | |
| | Partners Inc. | 31,734 | 431 |
| | Bank Mutual Corp. | 67,502 | 323 |
| * | United Community | | |
| | Banks Inc. | 141,803 | 277 |
| | | | 303,387 |
| Health Care (12.7%) | | |
| * | Salix Pharmaceuticals Ltd. | 243,410 | 11,430 |
| | Cooper Cos. Inc. | 192,413 | 10,841 |
| * | Regeneron | | |
| | Pharmaceuticals Inc. | 303,188 | 9,954 |
| * | AMERIGROUP Corp. | 208,902 | 9,175 |
| * | Dionex Corp. | 72,543 | 8,561 |
| * | Catalyst Health | | |
| | Solutions Inc. | 164,956 | 7,669 |
| * | HMS Holdings Corp. | 115,275 | 7,466 |
| * | Magellan Health | | |
| | Services Inc. | 141,285 | 6,680 |
| * | Haemonetics Corp. | 104,448 | 6,599 |
| * | Healthspring Inc. | 242,159 | 6,424 |
| | Chemed Corp. | 95,865 | 6,088 |
| * | American Medical | | |
| | Systems Holdings Inc. | 321,805 | 6,069 |
| | West Pharmaceutical | | |
| | Services Inc. | 140,847 | 5,803 |
| * | Par Pharmaceutical | | |
| | Cos. Inc. | 149,013 | 5,738 |
| * | Viropharma Inc. | 328,753 | 5,694 |
| | Quality Systems Inc. | 80,806 | 5,642 |
| * | Align Technology Inc. | 287,554 | 5,619 |
| * | Cubist Pharmaceuticals Inc. | 249,727 | 5,344 |
| * | Centene Corp. | 207,837 | 5,267 |
| * | PSS World Medical Inc. | 232,962 | 5,265 |
| * | Parexel International Corp. | 245,746 | 5,217 |
| * | Martek Biosciences Corp. | 141,807 | 4,439 |
| | Invacare Corp. | 136,530 | 4,118 |
| * | Amedisys Inc. | 121,955 | 4,085 |
| * | Integra LifeSciences | | |
| | Holdings Corp. | 85,754 | 4,056 |
| | Meridian Bioscience Inc. | 171,685 | 3,976 |
| * | Neogen Corp. | 95,953 | 3,937 |
| | | |
| * | Gentiva Health Services Inc. | 127,411 | 3,389 |
| * | Zoll Medical Corp. | 90,977 | 3,387 |
| * | MWI Veterinary Supply Inc. | 52,158 | 3,294 |
| * | Savient | | |
| | Pharmaceuticals Inc. | 288,067 | 3,209 |
| * | Cyberonics Inc. | 102,144 | 3,168 |
| * | CONMED Corp. | 119,756 | 3,165 |
| * | Hanger Orthopedic | | |
| | Group Inc. | 137,824 | 2,920 |
| * | Amsurg Corp. Class A | 131,100 | 2,747 |
| * | IPC The Hospitalist Co. Inc. | 69,452 | 2,709 |
| | Analogic Corp. | 54,332 | 2,690 |
| * | Air Methods Corp. | 47,487 | 2,672 |
| * | Abaxis Inc. | 95,181 | 2,556 |
| * | RehabCare Group Inc. | 106,556 | 2,525 |
| * | Greatbatch Inc. | 99,682 | 2,407 |
| | Landauer Inc. | 39,635 | 2,377 |
| * | Bio-Reference Labs Inc. | 104,533 | 2,319 |
| | Computer Programs & | | |
| | Systems Inc. | 46,857 | 2,195 |
| * | Emergent Biosolutions Inc. | 91,712 | 2,152 |
| * | Omnicell Inc. | 139,405 | 2,014 |
| * | LHC Group Inc. | 67,083 | 2,012 |
| * | Molina Healthcare Inc. | 71,340 | 1,987 |
| * | Merit Medical Systems Inc. | 120,565 | 1,909 |
| * | ICU Medical Inc. | 50,211 | 1,833 |
| * | Natus Medical Inc. | 123,175 | 1,747 |
| * | Healthways Inc. | 146,620 | 1,636 |
| * | Affymetrix Inc. | 304,880 | 1,534 |
| * | PharMerica Corp. | 127,064 | 1,455 |
| * | Genoptix Inc. | 75,268 | 1,432 |
| * | Symmetry Medical Inc. | 153,847 | 1,423 |
| | Ensign Group Inc. | 56,309 | 1,400 |
| * | Corvel Corp. | 28,632 | 1,384 |
| * | Almost Family Inc. | 35,282 | 1,355 |
| * | eResearchTechnology Inc. | 183,907 | 1,352 |
| | Cantel Medical Corp. | 53,751 | 1,258 |
| * | Palomar Medical | | |
| | Technologies Inc. | 79,709 | 1,133 |
| * | Medcath Corp. | 80,482 | 1,123 |
| * | Hi-Tech Pharmacal Co. Inc. | 43,761 | 1,092 |
| * | Kensey Nash Corp. | 36,651 | 1,020 |
| * | AMN Healthcare | | |
| | Services Inc. | 163,007 | 1,001 |
| * | Arqule Inc. | 159,438 | 936 |
| * | SurModics Inc. | 74,536 | 885 |
| * | Cross Country | | |
| | Healthcare Inc. | 98,383 | 833 |
| * | Kendle International Inc. | 62,559 | 681 |
| * | CryoLife Inc. | 122,614 | 665 |
| * | Cambrex Corp. | 128,093 | 662 |
| * | Enzo Biochem Inc. | 89,065 | 470 |
| * | LCA-Vision Inc. | 81,404 | 468 |
| | | | 257,737 |
87
Tax-Managed Small-Cap Fund
| | | |
| | | | Market |
| | | | Value |
| | | Shares | ($000) |
| Industrials (16.3%) | | |
| | CLARCOR Inc. | 212,363 | 9,108 |
| * | Esterline | | |
| | Technologies Corp. | 126,294 | 8,663 |
| | Toro Co. | 131,815 | 8,125 |
| * | EMCOR Group Inc. | 280,088 | 8,117 |
| | Actuant Corp. Class A | 287,546 | 7,654 |
| * | Moog Inc. Class A | 191,255 | 7,612 |
| | Belden Inc. | 198,202 | 7,298 |
| | Brady Corp. Class A | 221,818 | 7,234 |
| * | Teledyne Technologies Inc. | 152,627 | 6,711 |
| * | Geo Group Inc. | 270,997 | 6,683 |
| * | Tetra Tech Inc. | 260,206 | 6,521 |
| | Curtiss-Wright Corp. | 193,930 | 6,438 |
| * | United Stationers Inc. | 97,849 | 6,244 |
| | Triumph Group Inc. | 69,411 | 6,206 |
| | Kaydon Corp. | 141,221 | 5,751 |
| * | Old Dominion Freight | | |
| | Line Inc. | 177,073 | 5,665 |
| * | HUB Group Inc. Class A | 157,853 | 5,547 |
| | AO Smith Corp. | 141,445 | 5,386 |
| | Mueller Industries Inc. | 160,255 | 5,240 |
| | ABM Industries Inc. | 198,902 | 5,231 |
| | Applied Industrial | | |
| | Technologies Inc. | 159,298 | 5,174 |
| | Simpson | | |
| | Manufacturing Co. Inc. | 166,537 | 5,148 |
| | Robbins & Myers Inc. | 139,080 | 4,976 |
| | Knight Transportation Inc. | 261,787 | 4,974 |
| * | II-VI Inc. | 107,015 | 4,961 |
| * | AAR Corp. | 165,797 | 4,554 |
| | Watts Water | | |
| | Technologies Inc. Class A | 124,061 | 4,539 |
| | Healthcare Services | | |
| | Group Inc. | 278,829 | 4,537 |
| * | Insituform Technologies Inc. | | |
| | Class A | 165,255 | 4,381 |
| | ESCO Technologies Inc. | 112,648 | 4,263 |
| | Interface Inc. Class A | 270,241 | 4,229 |
| | Briggs & Stratton Corp. | 213,812 | 4,210 |
| * | Orbital Sciences Corp. | 243,987 | 4,180 |
| | Barnes Group Inc. | 192,028 | 3,969 |
| | Skywest Inc. | 233,201 | 3,643 |
| * | EnPro Industries Inc. | 87,556 | 3,639 |
| * | SYKES Enterprises Inc. | 172,656 | 3,498 |
| | Forward Air Corp. | 122,798 | 3,485 |
| | Heartland Express Inc. | 215,285 | 3,449 |
| | Unifirst Corp. | 62,397 | 3,435 |
| * | TrueBlue Inc. | 187,548 | 3,374 |
| * | Ceradyne Inc. | 105,773 | 3,335 |
| | American Science & | | |
| | Engineering Inc. | 37,979 | 3,237 |
| | Kaman Corp. | 109,830 | 3,193 |
| | Universal Forest | | |
| | Products Inc. | 81,317 | 3,163 |
| | | |
| | Lindsay Corp. | 53,013 | 3,151 |
| | Cubic Corp. | 66,615 | 3,141 |
| | Allegiant Travel Co. Class A | 63,234 | 3,114 |
| | CIRCOR International Inc. | 72,859 | 3,080 |
| * | Mobile Mini Inc. | 155,470 | 3,061 |
| | Quanex Building | | |
| | Products Corp. | 160,244 | 3,040 |
| | Arkansas Best Corp. | 107,725 | 2,954 |
| | National Presto | | |
| | Industries Inc. | 22,297 | 2,899 |
| | Badger Meter Inc. | 63,894 | 2,825 |
| | Albany International Corp. | 118,158 | 2,799 |
| | Administaff Inc. | 94,416 | 2,766 |
| * | Astec Industries Inc. | 85,124 | 2,759 |
| * | Griffon Corp. | 193,829 | 2,469 |
| | G&K Services Inc. Class A | 79,583 | 2,460 |
| | John Bean | | |
| | Technologies Corp. | 119,990 | 2,415 |
| * | Kelly Services Inc. Class A | 120,630 | 2,268 |
| * | Exponent Inc. | 59,151 | 2,220 |
| * | SFN Group Inc. | 224,803 | 2,194 |
| | Viad Corp. | 86,042 | 2,192 |
| * | Dycom Industries Inc. | 148,030 | 2,183 |
| | Applied Signal | | |
| | Technology Inc. | 57,542 | 2,180 |
| | Heidrick & Struggles | | |
| | International Inc. | 74,939 | 2,147 |
| | Comfort Systems USA Inc. | 162,853 | 2,145 |
| | AZZ Inc. | 53,262 | 2,131 |
| * | Consolidated Graphics Inc. | 43,390 | 2,101 |
| | Encore Wire Corp. | 81,518 | 2,044 |
| | Tredegar Corp. | 98,339 | 1,906 |
| | Cascade Corp. | 39,274 | 1,857 |
| * | Dolan Co. | 131,121 | 1,825 |
| | Federal Signal Corp. | 265,430 | 1,821 |
| * | Gibraltar Industries Inc. | 130,079 | 1,765 |
| * | Aerovironment Inc. | 64,192 | 1,722 |
| | Apogee Enterprises Inc. | 119,898 | 1,615 |
| | Standex International Corp. | 53,681 | 1,606 |
| | AAON Inc. | 51,414 | 1,450 |
| | Vicor Corp. | 84,217 | 1,381 |
| * | Orion Marine Group Inc. | 115,643 | 1,341 |
| * | GenCorp Inc. | 251,166 | 1,299 |
| * | On Assignment Inc. | 156,526 | 1,276 |
| * | Powell Industries Inc. | 37,991 | 1,249 |
| | CDI Corp. | 55,656 | 1,035 |
| * | NCI Building Systems Inc. | 72,377 | 1,013 |
| * | School Specialty Inc. | 62,312 | 868 |
| * | Lydall Inc. | 74,000 | 596 |
| * | Volt Information | | |
| | Sciences Inc. | 50,911 | 440 |
| | Lawson Products Inc. | 17,114 | 426 |
| | Standard Register Co. | 55,783 | 190 |
| | | | 330,399 |
88
Tax-Managed Small-Cap Fund
| | | |
| | | | Market |
| | | | Value |
| | | Shares | ($000) |
| Information Technology (19.8%) | |
| * | Cypress | | |
| | Semiconductor Corp. | 677,162 | 12,582 |
| * | Varian Semiconductor | | |
| | Equipment Associates Inc. | 311,159 | 11,504 |
| * | Microsemi Corp. | 351,690 | 8,054 |
| * | Progress Software Corp. | 182,246 | 7,713 |
| * | TriQuint Semiconductor Inc. | 658,839 | 7,702 |
| * | Viasat Inc. | 171,628 | 7,622 |
| * | Wright Express Corp. | 160,894 | 7,401 |
| * | Veeco Instruments Inc. | 168,251 | 7,228 |
| | Anixter International Inc. | 118,921 | 7,103 |
| * | CACI International Inc. | | |
| | Class A | 127,935 | 6,832 |
| * | Hittite Microwave Corp. | 103,324 | 6,307 |
| * | Arris Group Inc. | 523,224 | 5,871 |
| * | Cymer Inc. | 125,293 | 5,647 |
| * | j2 Global | | |
| | Communications Inc. | 192,103 | 5,561 |
| * | Blue Coat Systems Inc. | 181,178 | 5,412 |
| * | Plexus Corp. | 171,393 | 5,303 |
| * | CommVault Systems Inc. | 182,323 | 5,218 |
| * | MKS Instruments Inc. | 212,918 | 5,214 |
| * | Netgear Inc. | 150,410 | 5,066 |
| | Cognex Corp. | 168,725 | 4,964 |
| * | JDA Software Group Inc. | 176,511 | 4,942 |
| | Blackbaud Inc. | 184,920 | 4,789 |
| | MAXIMUS Inc. | 72,550 | 4,758 |
| | Power Integrations Inc. | 117,483 | 4,716 |
| * | Tessera Technologies Inc. | 212,552 | 4,708 |
| * | Taleo Corp. Class A | 169,411 | 4,684 |
| * | Benchmark Electronics Inc. | 256,834 | 4,664 |
| * | Take-Two Interactive | | |
| | Software Inc. | 358,854 | 4,392 |
| | Littelfuse Inc. | 93,175 | 4,385 |
| * | Rofin-Sinar | | |
| | Technologies Inc. | 120,072 | 4,255 |
| * | FEI Co. | 161,018 | 4,252 |
| * | Synaptics Inc. | 143,844 | 4,226 |
| * | Diodes Inc. | 151,485 | 4,089 |
| * | Cabot | | |
| | Microelectronics Corp. | 97,563 | 4,044 |
| * | Scansource Inc. | 112,939 | 3,603 |
| * | Websense Inc. | 177,175 | 3,588 |
| * | DTS Inc. | 72,298 | 3,546 |
| * | Harmonic Inc. | 413,426 | 3,543 |
| * | Ebix Inc. | 147,707 | 3,496 |
| * | Tekelec | 290,665 | 3,462 |
| * | Checkpoint Systems Inc. | 167,982 | 3,452 |
| * | DealerTrack Holdings Inc. | 171,573 | 3,443 |
| * | Netscout Systems Inc. | 148,354 | 3,414 |
| | Comtech | | |
| | Telecommunications Corp. | 117,039 | 3,246 |
| * | SYNNEX Corp. | 100,234 | 3,127 |
| * | Sourcefire Inc. | 118,104 | 3,062 |
| | | |
| * | MicroStrategy Inc. Class A | 35,763 | 3,057 |
| * | Sonic Solutions Inc. | 203,594 | 3,054 |
| * | LogMeIn Inc. | 68,561 | 3,040 |
| * | DG FastChannel Inc. | 103,182 | 2,980 |
| * | Bottomline | | |
| | Technologies Inc. | 134,243 | 2,914 |
| | Black Box Corp. | 75,226 | 2,880 |
| * | Stratasys Inc. | 87,837 | 2,867 |
| * | OSI Systems Inc. | 78,740 | 2,863 |
| * | Manhattan Associates Inc. | 93,221 | 2,847 |
| * | Standard | | |
| | Microsystems Corp. | 95,566 | 2,755 |
| * | TTM Technologies Inc. | 184,119 | 2,745 |
| | Micrel Inc. | 210,437 | 2,734 |
| * | CSG Systems | | |
| | International Inc. | 143,745 | 2,723 |
| * | Newport Corp. | 156,735 | 2,722 |
| * | Synchronoss | | |
| | Technologies Inc. | 101,729 | 2,717 |
| * | Compellent | | |
| | Technologies Inc. | 98,041 | 2,705 |
| * | Radiant Systems Inc. | 137,198 | 2,685 |
| * | Volterra | | |
| | Semiconductor Corp. | 114,713 | 2,657 |
| * | ATMI Inc. | 133,229 | 2,657 |
| | Park Electrochemical Corp. | 88,210 | 2,646 |
| * | Insight Enterprises Inc. | 197,525 | 2,599 |
| * | Rogers Corp. | 67,671 | 2,588 |
| * | Intermec Inc. | 204,040 | 2,583 |
| * | TeleTech Holdings Inc. | 124,037 | 2,554 |
| * | Monolithic Power | | |
| | Systems Inc. | 151,939 | 2,510 |
| | Heartland Payment | | |
| | Systems Inc. | 162,607 | 2,507 |
| * | Brooks Automation Inc. | 275,538 | 2,499 |
| * | Brightpoint Inc. | 284,266 | 2,482 |
| | United Online Inc. | 368,308 | 2,431 |
| | iGate Corp. | 123,059 | 2,426 |
| | MTS Systems Corp. | 64,312 | 2,409 |
| * | comScore Inc. | 107,964 | 2,409 |
| | Daktronics Inc. | 149,463 | 2,379 |
| * | RightNow Technologies Inc. | 99,709 | 2,360 |
| * | FARO Technologies Inc. | 69,332 | 2,277 |
| * | Advanced Energy | | |
| | Industries Inc. | 163,973 | 2,237 |
| * | Tyler Technologies Inc. | 106,464 | 2,210 |
| | Forrester Research Inc. | 62,595 | 2,209 |
| * | Avid Technology Inc. | 124,041 | 2,166 |
| * | Kulicke & Soffa | | |
| | Industries Inc. | 300,289 | 2,162 |
| | Methode Electronics Inc. | 158,336 | 2,054 |
| * | Ultratech Inc. | 103,171 | 2,051 |
| * | Smith Micro Software Inc. | 128,260 | 2,019 |
| * | Epicor Software Corp. | 196,871 | 1,988 |
| | EPIQ Systems Inc. | 140,900 | 1,935 |
Tax-Managed Small-Cap Fund
| | | |
| | | | Market |
| | | | Value |
| | | Shares | ($000) |
| * | Mercury Computer | | |
| | Systems Inc. | 102,217 | 1,879 |
| * | Ceva Inc. | 88,921 | 1,823 |
| * | THQ Inc. | 287,082 | 1,740 |
| | Cohu Inc. | 101,227 | 1,678 |
| * | Sigma Designs Inc. | 117,886 | 1,670 |
| * | Electro Scientific | | |
| | Industries Inc. | 101,596 | 1,629 |
| | CTS Corp. | 145,985 | 1,615 |
| * | Perficient Inc. | 128,410 | 1,605 |
| * | Oplink Communications Inc. | 82,967 | 1,532 |
| * | Interactive Intelligence Inc. | 56,202 | 1,470 |
| * | Ciber Inc. | 289,913 | 1,357 |
| * | Intevac Inc. | 95,998 | 1,345 |
| * | Supertex Inc. | 55,437 | 1,340 |
| * | Symmetricom Inc. | 188,669 | 1,338 |
| * | Exar Corp. | 189,034 | 1,319 |
| * | EMS Technologies Inc. | 65,846 | 1,302 |
| * | Novatel Wireless Inc. | 135,098 | 1,290 |
| * | Knot Inc. | 129,635 | 1,281 |
| * | Infospace Inc. | 154,176 | 1,280 |
| * | Super Micro Computer Inc. | 104,984 | 1,212 |
| | Bel Fuse Inc. Class B | 50,554 | 1,208 |
| * | Digi International Inc. | 107,407 | 1,192 |
| * | Pericom | | |
| | Semiconductor Corp. | 107,492 | 1,180 |
| * | Kopin Corp. | 281,371 | 1,171 |
| * | Rudolph Technologies Inc. | 134,404 | 1,106 |
| * | Liquidity Services Inc. | 73,506 | 1,033 |
| * | Pulse Electronics Corp. | 179,799 | 957 |
| * | Radisys Corp. | 103,775 | 924 |
| * | Gerber Scientific Inc. | 108,242 | 852 |
| * | DSP Group Inc. | 100,958 | 822 |
| * | NCI Inc. Class A | 34,075 | 783 |
| * | Integral Systems Inc. | 76,115 | 754 |
| | Stamps.com Inc. | 51,179 | 678 |
| * | Network Equipment | | |
| | Technologies Inc. | 129,692 | 600 |
| * | LoJack Corp. | 79,285 | 512 |
| * | PC-Tel Inc. | 81,332 | 488 |
| * | Agilysys Inc. | 77,673 | 437 |
| * | Tollgrade | | |
| | Communications Inc. | 44,768 | 415 |
| * | Hutchinson Technology Inc. | 103,926 | 386 |
| * | StarTek Inc. | 51,919 | 263 |
| | | | 401,948 |
| Materials (4.6%) | | |
| | Texas Industries Inc. | 117,697 | 5,388 |
| | Eagle Materials Inc. | 186,559 | 5,270 |
| * | OM Group Inc. | 130,343 | 5,019 |
| * | PolyOne Corp. | 394,026 | 4,921 |
| | Schweitzer-Mauduit | | |
| | International Inc. | 76,924 | 4,840 |
| | HB Fuller Co. | 207,688 | 4,262 |
| | Balchem Corp. | 120,116 | 4,061 |
| | | |
| | Arch Chemicals Inc. | 106,631 | 4,044 |
| * | Clearwater Paper Corp. | 48,850 | 3,825 |
| * | Century Aluminum Co. | 239,126 | 3,714 |
| * | Calgon Carbon Corp. | 239,361 | 3,619 |
| | Buckeye Technologies Inc. | 166,192 | 3,492 |
| * | STR Holdings Inc. | 174,138 | 3,483 |
| * | RTI International Metals Inc. | 126,958 | 3,425 |
| | AMCOL International Corp. | 107,384 | 3,329 |
| * | Brush Engineered | | |
| | Materials Inc. | 86,124 | 3,328 |
| | Kaiser Aluminum Corp. | 62,741 | 3,143 |
| | A Schulman Inc. | 133,916 | 3,065 |
| | Deltic Timber Corp. | 45,327 | 2,554 |
| | Stepan Co. | 33,117 | 2,526 |
| * | KapStone Paper and | | |
| | Packaging Corp. | 162,330 | 2,484 |
| | Quaker Chemical Corp. | 48,155 | 2,007 |
| | Zep Inc. | 92,979 | 1,848 |
| | Wausau Paper Corp. | 209,271 | 1,802 |
| * | LSB Industries Inc. | 69,696 | 1,691 |
| | Myers Industries Inc. | 150,962 | 1,470 |
| * | AM Castle & Co. | 72,263 | 1,330 |
| | Neenah Paper Inc. | 63,313 | 1,246 |
| * | Headwaters Inc. | 259,796 | 1,190 |
| | Olympic Steel Inc. | 39,447 | 1,131 |
| * | Penford Corp. | 44,149 | 270 |
| | American Vanguard Corp. | 17,869 | 153 |
| | | | 93,930 |
| Telecommunication Services (0.6%) | |
| | NTELOS Holdings Corp. | 126,256 | 2,405 |
| * | General | | |
| | Communication Inc. | | |
| | Class A | 167,336 | 2,118 |
| * | Neutral Tandem Inc. | 141,734 | 2,047 |
| * | Cbeyond Inc. | 131,974 | 2,017 |
| | USA Mobility Inc. | 94,649 | 1,682 |
| | Atlantic Tele-Network Inc. | 38,656 | 1,482 |
| | | | 11,751 |
| Utilities (3.8%) | | |
| | Piedmont Natural | | |
| | Gas Co. Inc. | 303,097 | 8,475 |
| | New Jersey | | |
| | Resources Corp. | 173,471 | 7,478 |
| | Southwest Gas Corp. | 191,894 | 7,037 |
| | South Jersey | | |
| | Industries Inc. | 125,670 | 6,638 |
| | UIL Holdings Corp. | 212,728 | 6,373 |
| | Unisource Energy Corp. | 153,753 | 5,510 |
| | Avista Corp. | 234,351 | 5,278 |
| | Northwest Natural Gas Co. | 112,489 | 5,227 |
| * | El Paso Electric Co. | 179,645 | 4,946 |
| | Allete Inc. | 131,381 | 4,895 |
| | NorthWestern Corp. | 152,717 | 4,403 |
| | Laclede Group Inc. | 94,892 | 3,467 |
90
Tax-Managed Small-Cap Fund
| | |
| | | Market |
| | | Value |
| | Shares | ($000) |
| CH Energy Group Inc. | 67,210 | 3,286 |
| American States Water Co. | 79,490 | 2,740 |
| Central Vermont Public | | |
| Service Corp. | 53,732 | 1,175 |
| | | 76,928 |
| Total Common Stocks | | |
| (Cost $1,511,530) | | 2,027,084 |
| Temporary Cash Investment (0.2%) | |
| Money Market Fund (0.2%) | | |
| 2 Vanguard Market | | |
| Liquidity Fund, 0.211% | | |
| (Cost $3,576) | 3,576,341 | 3,576 |
| Total Investments (100.2%) | | |
| (Cost $1,515,106) | | 2,030,660 |
| Other Assets and Liabilities (-0.2%) | |
| Other Assets | | 2,700 |
| Liabilities | | (6,766) |
| | | (4,066) |
| Net Assets (100%) | | 2,026,594 |
| |
| At December 31, 2010, net assets consisted of: |
| | Amount |
| | ($000) |
| Paid-in Capital | 1,613,209 |
| Overdistributed Net Investment Income | (3,043) |
| Accumulated Net Realized Losses | (99,126) |
| Unrealized Appreciation (Depreciation) | 515,554 |
| Net Assets | 2,026,594 |
| |
| |
| Investor Shares—Net Assets | |
| Applicable to 69,174,343 outstanding | |
| $.001 par value shares of beneficial | |
| interest (unlimited authorization) | 1,879,486 |
| Net Asset Value Per Share— | |
| Investor Shares | $27.17 |
| |
| |
| Institutional Shares—Net Assets | |
| Applicable to 5,402,636 outstanding | |
| $.001 par value shares of beneficial | |
| interest (unlimited authorization) | 147,108 |
| Net Asset Value Per Share— | |
| Institutional Shares | $27.23 |
See Note A in Notes to Financial Statements.
* Non-income-producing security.
1 Considered an affiliated company of the fund as the issuer is another member of The Vanguard Group.
2 Affiliated money market fund available only to Vanguard funds and certain trusts and accounts managed by Vanguard. Rate shown is the
7-day yield.
REIT—Real Estate Investment Trust.
See accompanying Notes, which are an integral part of the Financial Statements.
91
Tax-Managed Small-Cap Fund
Statement of Operations
| |
| | Year Ended |
| | December 31, 2010 |
| | ($000) |
| Investment Income | |
| Income | |
| Dividends1 | 20,316 |
| Interest1 | 5 |
| Total Income | 20,321 |
| Expenses | |
| The Vanguard Group—Note B | |
| Investment Advisory Services | 178 |
| Management and Administrative—Investor Shares | 2,339 |
| Management and Administrative—Institutional Shares | 49 |
| Marketing and Distribution—Investor Shares | 366 |
| Marketing and Distribution—Institutional Shares | 29 |
| Custodian Fees | 37 |
| Auditing Fees | 26 |
| Shareholders’ Reports—Investor Shares | 12 |
| Shareholders’ Reports—Institutional Shares | 1 |
| Trustees’ Fees and Expenses | 2 |
| Total Expenses | 3,039 |
| Net Investment Income | 17,282 |
| Realized Net Gain (Loss) on Investment Securities Sold1 | 81,408 |
| Change in Unrealized Appreciation (Depreciation) of Investment Securities | 320,986 |
| Net Increase (Decrease) in Net Assets Resulting from Operations | 419,676 |
| 1 Dividend income, interest income, and realized net gain (loss) from affiliated companies of the fund were $7,000, $5,000, and $11,131,000, |
| respectively. |
See accompanying Notes, which are an integral part of the Financial Statements.
92
Tax-Managed Small-Cap Fund
Statement of Changes in Net Assets
| | |
| | Year Ended December 31, |
| | 2010 | 2009 |
| | ($000) | ($000) |
| Increase (Decrease) in Net Assets | | |
| Operations | | |
| Net Investment Income | 17,282 | 11,045 |
| Realized Net Gain (Loss) | 81,408 | (23,922) |
| Change in Unrealized Appreciation (Depreciation) | 320,986 | 348,762 |
| Net Increase (Decrease) in Net Assets Resulting from Operations | 419,676 | 335,885 |
| Distributions | | |
| Net Investment Income | | |
| Investor Shares | (16,144) | (10,627) |
| Institutional Shares | (1,390) | (769) |
| Realized Capital Gain | | |
| Investor Shares | — | — |
| Institutional Shares | — | — |
| Total Distributions | (17,534) | (11,396) |
| Capital Share Transactions | | |
| Investor Shares | (22,404) | (28,534) |
| Institutional Shares | 20,389 | (29,900) |
| Net Increase (Decrease) from Capital Share Transactions | (2,015) | (58,434) |
| Total Increase (Decrease) | 400,127 | 266,055 |
| Net Assets | | |
| Beginning of Period | 1,626,467 | 1,360,412 |
| End of Period1 | 2,026,594 | 1,626,467 |
| 1 Net Assets—End of Period includes undistributed (overdistributed) net investment income of ($3,043,000) and ($2,791,000). |
See accompanying Notes, which are an integral part of the Financial Statements.
93
Tax-Managed Small-Cap Fund
Financial Highlights
| | | | | |
| Investor Shares | | | | | |
| |
| For a Share Outstanding | Year Ended December 31, |
| Throughout Each Period | 2010 | 2009 | 2008 | 2007 | 2006 |
| Net Asset Value, Beginning of Period | $21.75 | $17.44 | $25.62 | $25.72 | $22.70 |
| Investment Operations | | | | | |
| Net Investment Income | .231 | .146 | .266 | .229 | .191 |
| Net Realized and Unrealized Gain (Loss) | | | | | |
| on Investments1 | 5.424 | 4.316 | (8.174) | (.097) | 3.023 |
| Total from Investment Operations | 5.655 | 4.462 | (7.908) | .132 | 3.214 |
| Distributions | | | | | |
| Dividends from Net Investment Income | (.235) | (.152) | (.272) | (.232) | (.194) |
| Distributions from Realized Capital Gains | — | — | — | — | — |
| Total Distributions | (.235) | (.152) | (.272) | (.232) | (.194) |
| Net Asset Value, End of Period | $27.17 | $21.75 | $17.44 | $25.62 | $25.72 |
| |
| Total Return2 | 25.99% | 25.59% | -30.82% | 0.51% | 14.15% |
| |
| Ratios/Supplemental Data | | | | | |
| Net Assets, End of Period (Millions) | $1,879 | $1,527 | $1,258 | $1,793 | $1,756 |
| Ratio of Total Expenses to | | | | | |
| Average Net Assets | 0.18% | 0.19% | 0.14% | 0.13% | 0.14% |
| Ratio of Net Investment Income to | | | | | |
| Average Net Assets | 0.98% | 0.79% | 1.16% | 0.86% | 0.78% |
| Portfolio Turnover Rate3 | 46% | 37% | 32% | 53% | 42% |
| 1 Includes increases from redemption fees of $.00, $.01, $.01, $.01, and $.01. |
| 2 Total returns do not include transaction or account service fees that may have applied in the periods shown. Fund prospectuses provide |
| information about any applicable transaction and account service fees. |
| 3 Excludes the value of portfolio securities received or delivered as a result of in-kind purchases or redemptions of the fund’s capital shares. |
See accompanying Notes, which are an integral part of the Financial Statements.
94
Tax-Managed Small-Cap Fund
Financial Highlights
| | | | | |
| Institutional Shares | | | | | |
| |
| For a Share Outstanding | Year Ended December 31, |
| Throughout Each Period | 2010 | 2009 | 2008 | 2007 | 2006 |
| Net Asset Value, Beginning of Period | $21.80 | $17.47 | $25.66 | $25.77 | $22.74 |
| Investment Operations | | | | | |
| Net Investment Income | .257 | .161 | .275 | .242 | .209 |
| Net Realized and Unrealized Gain (Loss) | | | | | |
| on Investments1 | 5.432 | 4.337 | (8.184) | (.108) | 3.028 |
| Total from Investment Operations | 5.689 | 4.498 | (7.909) | .134 | 3.237 |
| Distributions | | | | | |
| Dividends from Net Investment Income | (.259) | (.168) | (.281) | (.244) | (.207) |
| Distributions from Realized Capital Gains | — | — | — | — | — |
| Total Distributions | (.259) | (.168) | (.281) | (.244) | (.207) |
| Net Asset Value, End of Period | $27.23 | $21.80 | $17.47 | $25.66 | $25.77 |
| |
| Total Return2 | 26.09% | 25.75% | -30.77% | 0.51% | 14.23% |
| |
| Ratios/Supplemental Data | | | | | |
| Net Assets, End of Period (Millions) | $147 | $99 | $102 | $171 | $128 |
| Ratio of Total Expenses to | | | | | |
| Average Net Assets | 0.08% | 0.09% | 0.09% | 0.09% | 0.09% |
| Ratio of Net Investment Income to | | | | | |
| Average Net Assets | 1.08% | 0.89% | 1.21% | 0.90% | 0.83% |
| Portfolio Turnover Rate3 | 46% | 37% | 32% | 53% | 42% |
| 1 Includes increases from redemption fees of $.00, $.02, $.01, $.01, and $.01. |
| 2 Total returns do not include transaction fees that may have applied in the periods shown. Fund prospectuses provide information about any |
| applicable transaction fees. |
| 3 Excludes the value of portfolio securities received or delivered as a result of in-kind purchases or redemptions of the fund’s capital shares. |
See accompanying Notes, which are an integral part of the Financial Statements.
95
Tax-Managed Small-Cap Fund
Notes to Financial Statements
Vanguard Tax-Managed Small-Cap Fund is registered under the Investment Company Act of 1940 as an open-end investment company, or mutual fund. The fund offers two classes of shares: Investor Shares and Institutional Shares. Investor Shares are available to any investor who meets the fund’s minimum purchase requirements. Institutional Shares are designed for investors who meet certain administrative, service, and account-size criteria.
A. The following significant accounting policies conform to generally accepted accounting principles for U.S. mutual funds. The fund consistently follows such policies in preparing its financial statements.
1. Security Valuation: Securities are valued as of the close of trading on the New York Stock Exchange (generally 4 p.m., Eastern time) on the valuation date. Equity securities are valued at the latest quoted sales prices or official closing prices taken from the primary market in which each security trades; such securities not traded on the valuation date are valued at the mean of the latest quoted bid and asked prices. Securities for which market quotations are not readily available, or whose values have been materially affected by events occurring before the fund’s pricing time but after the close of the securities’ primary markets, are valued by methods deemed by the board of trustees to represent fair value. Investments in Vanguard Market Liquidity Fund are valued at that fund’s net asset value.
2. Federal Income Taxes: The fund intends to continue to qualify as a regulated investment company and distribute all of its taxable income. Management has analyzed the fund’s tax positions taken for all open federal income tax years (December 31, 2007–2010), and has concluded that no provision for federal income tax is required in the fund’s financial statements.
3. Distributions: Distributions to shareholders are recorded on the ex-dividend date.
4. Other: Dividend income is recorded on the ex-dividend date. Interest income includes income distributions received from Vanguard Market Liquidity Fund and is accrued daily. Security transactions are accounted for on the date securities are bought or sold. Costs used to determine realized gains (losses) on the sale of investment securities are those of the specific securities sold. Fees assessed on redemptions of capital shares are credited to paid-in capital.
Each class of shares has equal rights as to assets and earnings, except that each class separately bears certain class-specific expenses related to maintenance of shareholder accounts (included in Management and Administrative expenses) and shareholder reporting. Marketing and distribution expenses are allocated to each class of shares based on a method approved by the board of trustees. Income, other non-class-specific expenses, and gains and losses on investments are allocated to each class of shares based on its relative net assets.
B. The Vanguard Group furnishes at cost investment advisory, corporate management, administrative, marketing, and distribution services. The costs of such services are allocated to the fund under methods approved by the board of trustees. The fund has committed to provide up to 0.40% of its net assets in capital contributions to Vanguard. At December 31, 2010, the fund had contributed capital of $331,000 to Vanguard (included in Other Assets), representing 0.02% of the fund’s net assets and 0.13% of Vanguard’s capitalization. The fund’s trustees and officers are also directors and officers of Vanguard.
C. Various inputs may be used to determine the value of the fund’s investments. These inputs are summarized in three broad levels for financial statement purposes. The inputs or methodologies used to value securities are not necessarily an indication of the risk associated with investing in those
96
Tax-Managed Small-Cap Fund
Level 1—Quoted prices in active markets for identical securities.
Level 2—Other significant observable inputs (including quoted prices for similar securities, interest rates, prepayment speeds, credit risk, etc.).
Level 3—Significant unobservable inputs (including the fund’s own assumptions used to determine the fair value of investments).
At December 31, 2010, 100% of the fund’s investments were valued based on Level 1 inputs.
D. Distributions are determined on a tax basis and may differ from net investment income and realized capital gains for financial reporting purposes. Differences may be permanent or temporary. Permanent differences are reclassified among capital accounts in the financial statements to reflect their tax character. Temporary differences arise when certain items of income, expense, gain, or loss are recognized in different periods for financial statement and tax purposes; these differences will reverse at some time in the future. Differences in classification may also result from the treatment of short-term gains as ordinary income for tax purposes.
During the year ended December 31, 2010, the fund realized $16,879,000 of net capital gains resulting from in-kind redemptions—in which shareholders exchanged fund shares for securities held by the fund rather than for cash. Because such gains are not taxable to the fund, and are not distributed to shareholders, they have been reclassified from accumulated net realized losses to paid-in capital.
For tax purposes, at December 31, 2010, the fund had $40,000 of ordinary income available for distribution. The fund had available capital loss carryforwards totaling $95,599,000 to offset future net capital gains of $40,927,000 through December 31, 2016 and $54,672,000 through December 31, 2017.
At December 31, 2010, the cost of investment securities for tax purposes was $1,518,632,000. Net unrealized appreciation of investment securities for tax purposes was $512,028,000, consisting of unrealized gains of $569,512,000 on securities that had risen in value since their purchase and $57,484,000 in unrealized losses on securities that had fallen in value since their purchase.
E. During the year ended December 31, 2010, the fund purchased $843,828,000 of investment securities and sold $845,054,000 of investment securities, other than temporary cash investments.
97
Tax-Managed Small-Cap Fund
F. Capital share transactions for each class of shares were:
| | | | |
| | Year Ended December 31, |
| | | 2010 | | 2009 |
| | Amount | Shares | Amount | Shares |
| | ($000) | (000) | ($000) | (000) |
| Investor Shares | | | | |
| Issued | 105,382 | 4,463 | 105,058 | 6,047 |
| Issued in Lieu of Cash Distributions | 13,025 | 475 | 8,601 | 396 |
| Redeemed1 | (140,811) | (5,969) | (142,193) | (8,400) |
| Net Increase (Decrease)—Investor Shares | (22,404) | (1,031) | (28,534) | (1,957) |
| Institutional Shares | | | | |
| Issued | 59,059 | 2,276 | 12,280 | 712 |
| Issued in Lieu of Cash Distributions | 824 | 30 | 562 | 26 |
| Redeemed1 | (39,494) | (1,462) | (42,742) | (2,022) |
| Net Increase (Decrease)—Institutional Shares | 20,389 | 844 | (29,900) | (1,284) |
| 1 Net of redemption fees for fiscal 2010 and 2009 of $339,000 and $893,000, respectively (fund totals). |
G. In preparing the financial statements as of December 31, 2010, management considered the impact of subsequent events for potential recognition or disclosure in these financial statements.
98
Report of Independent Registered
Public Accounting Firm
To the Trustees of Vanguard Tax-Managed Funds and the Shareholders of Vanguard Tax-Managed Balanced Fund, Vanguard Tax-Managed Growth and Income Fund, Vanguard Tax-Managed Capital Appreciation Fund and Vanguard Tax-Managed Small-Cap Fund:
In our opinion, the accompanying statements of net assets and the related statements of operations and of changes in net assets and the financial highlights present fairly, in all material respects, the financial position of Vanguard Tax-Managed Balanced Fund, Vanguard Tax-Managed Growth and Income Fund, Vanguard Tax-Managed Capital Appreciation Fund and Vanguard Tax-Managed Small-Cap Fund (constituting separate portfolios of Vanguard Tax-Managed Funds, hereafter referred to as the “Funds”) at December 31, 2010, the results of each of their operations for the year then ended, the changes in each of their net assets for each of the two years in the period then ended and the financial highlights for each of the five years in the period then ended, in conformity with accounting principles generally accepted in the United States of America. These financial statements and financial highlights (hereafter referred to as “financial statements”) are the responsibility of the Funds’ management; our responsibility is to express an opinion on these financial statements based on our audits. We conducted our audits of these financial statements in accordance with the standards of the Public Company Accounting Oversight Board (United States). Those standards require that we plan and perform the audit to obtain reasonable assurance about whether the financial statements are free of material misstatement. An audit includes examining, on a test basis, evidence supporting the amounts and disclosures in the financial statements, assessing the accounting principles used and significant estimates made by management, and evaluating the overall financial statement presentation.
We believe that our audits, which included confirmation of securities at December 31, 2010 by correspondence with the custodian and by agreement to the underlying ownership records of Vanguard Market Liquidity Fund, provide a reasonable basis for our opinion.
PricewaterhouseCoopers LLP
Philadelphia, Pennsylvania
February 8, 2011

Special 2010 tax information (unaudited) for Vanguard Tax-Managed Funds
This information for the fiscal year ended December 31, 2010, is included pursuant to
provisions of the Internal Revenue Code.
The Tax-Managed Balanced Fund designates 69.76% of its income dividends as
exempt-interest dividends.
The funds distributed qualified dividend income to shareholders during the fiscal year as follows:
| |
| | Qualified Dividend Income |
| Tax-Managed Fund | ($000) |
| Balanced | 5,454 |
| Growth and Income | 42,364 |
| Capital Appreciation | 54,109 |
| Small-Cap | 17,534 |
For corporate shareholders, percentage of investment income (dividend income plus short-term gains, if any) that qualifies for the dividends-received deduction is as follows:
| |
| Tax-Managed Fund | Percentage |
| Balanced | 100.0%1 |
| Growth and Income | 100.0 |
| Capital Appreciation | 100.0 |
| Small-Cap | 100.0 |
| 1 The percentage applies only to the taxable ordinary income that has been reported on Form 1099-DIV. |
100
Your Fund’s After-Tax Returns
This table presents returns for your fund both before and after taxes. The after-tax returns are shown in two ways: (1) assuming that an investor owned the fund during the entire period and paid taxes on the fund’s distributions, and (2) assuming that an investor paid taxes on the fund’s distributions and sold all shares at the end of each period.
Calculations are based on the highest individual federal income tax and capital gains tax rates in effect at the times of the distributions and the hypothetical sales. State and local taxes were not considered. After-tax returns reflect any qualified dividend income . (In the example, returns after the sale of fund shares may be higher than those assuming no sale. This occurs when the sale would have produced a capital loss. The calculation assumes that the investor received a tax deduction for the loss.) The table shows returns for Investor Shares only; returns for other share classes will differ. Please note that your actual after-tax returns will depend on your tax situation and may differ from those shown. Also note that if you own the fund in a tax-deferred account, such as an individual retirement account or a 401(k) plan, this information does not apply to you. Such accounts are not subject to current taxes.
Finally, keep in mind that a fund’s performance—whether before or after taxes—does not guarantee future results.
Average Annual Total Returns: Tax-Managed Funds
Periods Ended December 31, 2010
| | | |
| | One | Five | Ten |
| | Year | Years | Years |
| Tax-Managed Balanced Fund | | | |
| Returns Before Taxes | 8.15% | 4.03% | 3.68% |
| Returns After Taxes on Distributions | 8.04 | 3.91 | 3.56 |
| Returns After Taxes on Distributions and Sale of Fund Shares | 6.12 | 3.74 | 3.42 |
| |
| | One | Five | Ten |
| | Year | Years | Years |
| Tax-Managed Growth and Income Fund Investor Shares | | | |
| Returns Before Taxes | 13.77% | 2.22% | 1.37% |
| Returns After Taxes on Distributions | 13.45 | 1.91 | 1.03 |
| Returns After Taxes on Distributions and Sale of Fund Shares | 9.33 | 1.87 | 1.07 |
| |
| | One | Five | Ten |
| | Year | Years | Years |
| Tax-Managed Capital Appreciation Fund Investor Shares | | | |
| Returns Before Taxes | 14.80% | 2.52% | 1.50% |
| Returns After Taxes on Distributions | 14.56 | 2.27 | 1.26 |
| Returns After Taxes on Distributions and Sale of Fund Shares | 9.94 | 2.13 | 1.22 |
All returns are adjusted to reflect the 1% fee on redemptions of shares held for less than five years.
101
Average Annual Total Returns: Tax-Managed Funds
Periods Ended December 31, 2010
| | | |
| | One | Five | Ten |
| | Year | Years | Years |
| Tax-Managed Small-Cap Fund Investor Shares | | | |
| Returns Before Taxes | 24.74% | 4.66% | 7.58% |
| Returns After Taxes on Distributions | 24.58 | 4.51 | 7.41 |
| Returns After Taxes on Distributions and Sale of Fund Shares | 16.30 | 3.98 | 6.65 |
All returns are adjusted to reflect the 1% fee on redemptions of shares held for less than five years.
102
About Your Fund’s Expenses
As a shareholder of the fund, you incur ongoing costs, which include costs for portfolio management, administrative services, and shareholder reports (like this one), among others. Operating expenses, which are deducted from a fund’s gross income, directly reduce the investment return of the fund.
A fund’s expenses are expressed as a percentage of its average net assets. This figure is known as the expense ratio. The following examples are intended to help you understand the ongoing costs (in dollars) of investing in your fund and to compare these costs with those of other mutual funds. The examples are based on an investment of $1,000 made at the beginning of the period shown and held for the entire period.
The accompanying table illustrates your fund’s costs in two ways:
• Based on actual fund return. This section helps you to estimate the actual expenses that you paid over the period. The ”Ending Account Value“ shown is derived from the fund‘s actual return, and the third column shows the dollar amount that would have been paid by an investor who started with $1,000 in the fund. You may use the information here, together with the amount you invested, to estimate the expenses that you paid over the period.
To do so, simply divide your account value by $1,000 (for example, an $8,600 account value divided by $1,000 = 8.6), then multiply the result by the number given for your fund under the heading ”Expenses Paid During Period.“
• Based on hypothetical 5% yearly return. This section is intended to help you compare your fund‘s costs with those of other mutual funds. It assumes that the fund had a yearly return of 5% before expenses, but that the expense ratio is unchanged. In this case—because the return used is not the fund’s actual return—the results do not apply to your investment. The example is useful in making comparisons because the Securities and Exchange Commission requires all mutual funds to calculate expenses based on a 5% return. You can assess your fund’s costs by comparing this hypothetical example with the hypothetical examples that appear in shareholder reports of other funds.
Note that the expenses shown in the table are meant to highlight and help you compare ongoing costs only and do not reflect transaction costs incurred by the fund for buying and selling securities. Further, the expenses do not include the 1% fee on redemptions of shares held for less than five years, nor do they include the account service fee described in the prospectus. If such fees were applied to your account, your costs would be higher. Your fund does not carry a “sales load.” The calculations assume no shares were bought or sold during the period. Your actual costs may have been higher or lower, depending on the amount of your investment and the timing of any purchases or redemptions.
You can find more information about the fund’s expenses, including annual expense ratios, in the Financial Statements section of this report. For additional information on operating expenses and other shareholder costs, please refer to your fund’s current prospectus.
103
| | | |
| Six Months Ended December 31, 2010 | | | |
| | Beginning | Ending | Expenses |
| | Account Value | Account Value | Paid During |
| | 6/30/2010 | 12/31/2010 | Period |
| Based on Actual Fund Return | | | |
| Tax-Managed Balanced Fund | $1,000.00 | $1,111.08 | $0.80 |
| Tax-Managed Growth and Income Fund | | | |
| Investor Shares | $1,000.00 | $1,231.81 | $1.13 |
| Admiral Shares | 1,000.00 | 1,232.30 | 0.68 |
| Institutional Shares | 1,000.00 | 1,232.60 | 0.45 |
| Tax-Managed Capital Appreciation Fund | | | |
| Investor Shares | $1,000.00 | $1,242.45 | $1.13 |
| Admiral Shares | 1,000.00 | 1,242.62 | 0.68 |
| Institutional Shares | 1,000.00 | 1,242.85 | 0.45 |
| Tax-Managed Small-Cap Fund | | | |
| Investor Shares | $1,000.00 | $1,271.44 | $1.03 |
| Institutional Shares | 1,000.00 | 1,271.79 | 0.46 |
| Based on Hypothetical 5% Yearly Return | | | |
| Tax-Managed Balanced Fund | $1,000.00 | $1,024.45 | $0.77 |
| Tax-Managed Growth and Income Fund | | | |
| Investor Shares | $1,000.00 | $1,024.20 | $1.02 |
| Admiral Shares | 1,000.00 | 1,024.60 | 0.61 |
| Institutional Shares | 1,000.00 | 1,024.80 | 0.41 |
| Tax-Managed Capital Appreciation Fund | | | |
| Investor Shares | $1,000.00 | $1,024.20 | $1.02 |
| Admiral Shares | 1,000.00 | 1,024.60 | 0.61 |
| Institutional Shares | 1,000.00 | 1,024.80 | 0.41 |
| Tax-Managed Small-Cap Fund | | | |
| Investor Shares | $1,000.00 | $1,024.30 | $0.92 |
| Institutional Shares | 1,000.00 | 1,024.80 | 0.41 |
The calculations are based on expenses incurred in the most recent six-month period. The funds’ annualized six-month expense ratios for that
period are: for the Tax-Managed Balanced Fund, 0.15%; for the Tax-Managed Growth and Income Fund, 0.20% for Investor Shares, 0.12% for
Admiral Shares, and 0.08% for Institutional Shares; for the Tax-Managed Capital Appreciation Fund, 0.20% for Investor Shares, 0.12% for
Admiral Shares, and 0.08% for Institutional Shares; and for the Tax-Managed Small-Cap Fund, 0.18% for Investor Shares and 0.08% for
Institutional Shares. The dollar amounts shown as “Expenses Paid” are equal to the annualized expense ratio multiplied by the average
account value over the period, multiplied by the number of days in the most recent six-month period, then divided by the number of days in
the most recent 12-month period.
104
Glossary
30-Day SEC Yield. A fund’s 30-day SEC yield is derived using a formula specified by the U.S. Securities and Exchange Commission. Under the formula, data related to the fund’s security holdings in the previous 30 days are used to calculate the fund’s hypothetical net income for that period, which is then annualized and divided by the fund’s estimated average net assets over the calculation period. For the purposes of this calculation, a security’s income is based on its current market yield to maturity (in the case of bonds) or its projected dividend yield (for stocks). Because the SEC yield represents hypothetical annualized income, it will differ—at times significantly—from the fund’s actual experience. As a result, the fund’s income distributions may be higher or lower than implied by the SEC yield.
Average Coupon. The average interest rate paid on the fixed income securities held by a fund. It is expressed as a percentage of face value.
Average Duration. An estimate of how much the value of the bonds held by a fund will fluctuate in response to a change in interest rates. To see how the value could change, multiply the average duration by the change in rates. If interest rates rise by 1 percentage point, the value of the bonds in a fund with an average duration of five years would decline by about 5%. If rates decrease by a percentage point, the value would rise by 5%.
Average Effective Maturity. The average length of time until fixed income securities held by a fund reach maturity and are repaid, taking into consideration the possibility that the issuer may call the bond before its maturity date. The figure reflects the proportion of fund assets represented by each security; it also reflects any futures contracts held. In general, the longer the average effective maturity, the more a fund’s share price will fluctuate in response to changes in market interest rates.
Beta. A measure of the magnitude of a fund’s past share-price fluctuations in relation to the ups and downs of a given market index. The index is assigned a beta of 1.00. Compared with a given index, a fund with a beta of 1.20 typically would have seen its share price rise or fall by 12% when the index rose or fell by 10%. For this report, beta is based on returns over the past 36 months for both the fund and the index. Note that a fund’s beta should be reviewed in conjunction with its R-squared (see definition). The lower the R-squared, the less correlation there is between the fund and the index, and the less reliable beta is as an indicator of volatility.
Credit Quality. The credit ratings assigned to fixed income securities are an indicator of risk. They represent a rating agency’s assessment of the issuer’s ability to meet its obligations. For this report, credit-quality ratings for each issue are obtained from Moody’s Investors Service and Standard & Poor’s, and the higher rating for each issue is used.
Dividend Yield. The current, annualized rate of dividends paid on a share of stock, divided by its current share price. For a fund, the weighted average yield for stocks it holds. The index yield is based on the current annualized rate of dividends paid on stocks in the index.
Earnings Growth Rate. The average annual rate of growth in earnings over the past five years for the stocks now in a fund.
Equity Exposure. A measure that reflects a fund’s investments in stocks and stock futures. Any holdings in short-term reserves are excluded.
105
Expense Ratio. The percentage of a fund’s average net assets used to pay its annual administrative and advisory expenses. These expenses directly reduce returns to investors.
Foreign Holdings. The percentage of a fund represented by stocks or depositary receipts of companies based outside the United States.
Inception Date. The date on which the assets of a fund (or one of its share classes) are first invested in accordance with the fund’s investment objective. For funds with a subscription period, the inception date is the day after that period ends. Investment performance is measured from the inception date.
Largest Area Concentrations. An indicator of diversification. The less concentrated a fund’s holdings of bonds, the less the fund will be hurt by any financial problems in a single state or region.
Median Market Cap. An indicator of the size of companies in which a fund invests; the midpoint of market capitalization (market price x shares outstanding) of a fund’s stocks, weighted by the proportion of the fund’s assets invested in each stock. Stocks representing half of the fund’s assets have market capitalizations above the median, and the rest are below it.
Price/Book Ratio. The share price of a stock divided by its net worth, or book value, per share. For a fund, the weighted average price/book ratio of the stocks it holds.
Price/Earnings Ratio. The ratio of a stock’s current price to its per-share earnings over the past year. For a fund, the weighted average P/E of the stocks it holds. P/E is an indicator of market expectations about corporate prospects; the higher the P/E, the greater the expectations for a company’s future growth.
R-Squared. A measure of how much of a fund’s past returns can be explained by the returns from the market in general, as measured by a given index. If a fund’s total returns were precisely synchronized with an index’s returns, its R-squared would be 1.00. If the fund’s returns bore no relationship to the index’s returns, its R-squared would be 0. For this report, R-squared is based on returns over the past 36 months for both the fund and the index.
Return on Equity. The annual average rate of return generated by a company during the past five years for each dollar of shareholder’s equity (net income divided by shareholder’s equity). For a fund, the weighted average return on equity for the companies whose stocks it holds.
Short-Term Reserves. The percentage of a fund invested in highly liquid, short-term securities that can be readily converted to cash.
Turnover Rate. An indication of the fund’s trading activity. Funds with high turnover rates incur higher transaction costs and may be more likely to distribute capital gains (which may be taxable to investors). The turnover rate excludes in-kind transactions, which have minimal impact on costs.
Yield to Maturity. The rate of return an investor would receive if the fixed income securities held by a fund were held to their maturity dates.
106
This page intentionally left blank.
The People Who Govern Your Fund
The trustees of your mutual fund are there to see that the fund is operated and managed in your best interests since, as a shareholder, you are a part owner of the fund. Your fund’s trustees also serve on the board of directors of The Vanguard Group, Inc., which is owned by the Vanguard funds and provides services to them on an at-cost basis.
A majority of Vanguard’s board members are independent, meaning that they have no affiliation with Vanguard or the funds they oversee, apart from the sizable personal investments they have made as private individuals. The independent board members have distinguished backgrounds in business, academia, and public service. Each of the trustees and executive officers oversees 179 Vanguard funds.
The following table provides information for each trustee and executive officer of the fund. More information about the trustees is in the Statement of Additional Information, which can be obtained, without charge, by contacting Vanguard at 800-662-7447, or online at vanguard.com.
| |
| Interested Trustee1 | Amy Gutmann |
| | Born 1949. Trustee Since June 2006. Principal |
| F. William McNabb III | Occupation(s) During the Past Five Years: President |
| Born 1957. Trustee Since July 2009. Chairman of the | of the University of Pennsylvania; Christopher H. |
| Board. Principal Occupation(s) During the Past Five | Browne Distinguished Professor of Political Science |
| Years: Chairman of the Board of The Vanguard Group, | in the School of Arts and Sciences with secondary |
| Inc., and of each of the investment companies served | appointments at the Annenberg School for Commu- |
| by The Vanguard Group, since January 2010; Director | nication and the Graduate School of Education |
| of The Vanguard Group since 2008; Chief Executive | of the University of Pennsylvania; Director of |
| Officer and President of The Vanguard Group and of | Carnegie Corporation of New York, Schuylkill River |
| each of the investment companies served by The | Development Corporation, and Greater Philadelphia |
| Vanguard Group since 2008; Director of Vanguard | Chamber of Commerce; Trustee of the National |
| Marketing Corporation; Managing Director of The | Constitution Center; Chair of the Presidential |
| Vanguard Group (1995–2008) . | Commission for the Study of Bioethical Issues. |
| |
| | JoAnn Heffernan Heisen |
| Independent Trustees | Born 1950. Trustee Since July 1998. Principal |
| | Occupation(s) During the Past Five Years: Corporate |
| Emerson U. Fullwood | Vice President and Chief Global Diversity Officer |
| Born 1948. Trustee Since January 2008. Principal | since 2006 (retired 2008) and Member of the |
| Occupation(s) During the Past Five Years: Executive | Executive Committee (retired 2008) of Johnson & |
| Chief Staff and Marketing Officer for North America | Johnson (pharmaceuticals/consumer products); Vice |
| and Corporate Vice President (retired 2008) of Xerox | President and Chief Information Officer of Johnson & |
| Corporation (document management products and | Johnson (1997–2005); Director of the University |
| services); Director of SPX Corporation (multi-industry | Medical Center at Princeton and Women’s Research |
| manufacturing), the United Way of Rochester, | and Education Institute; Member of the Advisory |
| Amerigroup Corporation (managed health care), | Board of the Maxwell School of Citizenship and Public |
| the University of Rochester Medical Center, and | Affairs at Syracuse University. |
| Monroe Community College Foundation. | |
| | F. Joseph Loughrey |
| Rajiv L. Gupta | Born 1949. Trustee Since October 2009. Principal |
| Born 1945. Trustee Since December 2001.2 | Occupation(s) During the Past Five Years: President |
| Principal Occupation(s) During the Past Five Years: | and Chief Operating Officer since 2005 (retired 2009) |
| Chairman and Chief Executive Officer (retired 2009) | and Vice Chairman of the Board (2008–2009) of |
| and President (2006–2008) of Rohm and Haas Co. | Cummins Inc. (industrial machinery); Director of |
| (chemicals); Director of Tyco International, Ltd. | SKF AB (industrial machinery), Hillenbrand, Inc. |
| (diversified manufacturing and services) and Hewlett- | (specialized consumer services), Sauer-Danfoss Inc. |
| Packard Co. (electronic computer manufacturing); | (machinery), the Lumina Foundation for Education, |
| Trustee of The Conference Board; Member of the | and Oxfam America; Chairman of the Advisory |
| Board of Managers of Delphi Automotive LLP | Council for the College of Arts and Letters at the |
| (automotive components) . | University of Notre Dame. |
| | |
| André F. Perold | Kathryn J. Hyatt | |
| Born 1952. Trustee Since December 2004. Principal | Born 1955. Treasurer Since November 2008. Principal |
| Occupation(s) During the Past Five Years: George | Occupation(s) During the Past Five Years: Principal |
| Gund Professor of Finance and Banking at the Harvard | of The Vanguard Group, Inc.; Treasurer of each of |
| Business School; Chair of the Investment Committee | the investment companies served by The Vanguard |
| of HighVista Strategies LLC (private investment firm) . | Group since 2008; Assistant Treasurer of each of the |
| | investment companies served by The Vanguard Group |
| Alfred M. Rankin, Jr. | (1988–2008) . | |
| Born 1941. Trustee Since January 1993. Principal | | |
| Occupation(s) During the Past Five Years: Chairman, | Heidi Stam | |
| President, and Chief Executive Officer of NACCO | Born 1956. Secretary Since July 2005. Principal |
| Industries, Inc. (forklift trucks/housewares/lignite); | Occupation(s) During the Past Five Years: Managing |
| Director of Goodrich Corporation (industrial products/ | Director of The Vanguard Group, Inc., since 2006; |
| aircraft systems and services); Chairman of the | General Counsel of The Vanguard Group since 2005; |
| Federal Reserve Bank of Cleveland; Trustee of The | Secretary of The Vanguard Group and of each of the |
| Cleveland Museum of Art. | investment companies served by The Vanguard Group |
| | since 2005; Director and Senior Vice President of |
| Peter F. Volanakis | Vanguard Marketing Corporation since 2005; |
| Born 1955. Trustee Since July 2009. Principal | Principal of The Vanguard Group (1997–2006). |
| Occupation(s) During the Past Five Years: President | | |
| since 2007 and Chief Operating Officer since 2005 | | |
| of Corning Incorporated (communications equipment); | Vanguard Senior Management Team |
| President of Corning Technologies (2001–2005); | | |
| Director of Corning Incorporated and Dow Corning; | R. Gregory Barton | Michael S. Miller |
| Trustee of the Corning Incorporated Foundation and | Mortimer J. Buckley | James M. Norris |
| the Corning Museum of Glass; Overseer of the | Kathleen C. Gubanich | Glenn W. Reed |
| Amos Tuck School of Business Administration at | Paul A. Heller | George U. Sauter |
| Dartmouth College. | | |
| |
| | Chairman Emeritus and Senior Advisor |
| Executive Officers | | |
| | John J. Brennan | |
| Glenn Booraem | Chairman, 1996–2009 | |
| Born 1967. Controller Since July 2010. Principal | Chief Executive Officer and President, 1996–2008 |
| Occupation(s) During the Past Five Years: Principal | | |
| of The Vanguard Group, Inc.; Controller of each of | | |
| the investment companies served by The Vanguard | Founder | |
| Group since 2010; Assistant Controller of each of | | |
| the investment companies served by The Vanguard | John C. Bogle | |
| Group (2001–2010) . | Chairman and Chief Executive Officer, 1974–1996 |
| |
| Thomas J. Higgins | | |
| Born 1957. Chief Financial Officer Since September | | |
| 2008. Principal Occupation(s) During the Past Five | | |
| Years: Principal of The Vanguard Group, Inc.; Chief | | |
| Financial Officer of each of the investment companies | | |
| served by The Vanguard Group since 2008; Treasurer | | |
| of each of the investment companies served by The | | |
| Vanguard Group (1998–2008) . | | |
1 Mr. McNabb is considered an “interested person,” as defined in the Investment Company Act of 1940, because he is an officer of the
Vanguard funds.
2 December 2002 for Vanguard Equity Income Fund, Vanguard Growth Equity Fund, the Vanguard Municipal Bond Funds, and the
Vanguard State Tax-Exempt Funds.

| |
| | P.O. Box 2600 |
| | Valley Forge, PA 19482-2600 |
| |
| |
| |
| Connect with Vanguard® > vanguard.com | |
| |
| |
| |
| Fund Information > 800-662-7447 | |
| Direct Investor Account Services > 800-662-2739 | |
| Institutional Investor Services > 800-523-1036 | |
| Text Telephone for People | |
| With Hearing Impairment > 800-749-7273 | |
| |
| This material may be used in conjunction | |
| with the offering of shares of any Vanguard | |
| fund only if preceded or accompanied by | |
| the fund’s current prospectus. | |
| |
| All comparative mutual fund data are from Lipper Inc. or | |
| Morningstar, Inc., unless otherwise noted. | |
| |
| You can obtain a free copy of Vanguard’s proxy voting | |
| guidelines by visiting vanguard.com/proxyreporting or by | |
| calling Vanguard at 800-662-2739. The guidelines are | |
| also available from the SEC’s website, sec.gov. In | |
| addition, you may obtain a free report on how your fund | |
| voted the proxies for securities it owned during the 12 | |
| months ended June 30. To get the report, visit either | |
| vanguard.com/proxyreporting or sec.gov. | |
| |
| You can review and copy information about your fund at | |
| the SEC’s Public Reference Room in Washington, D.C. To | |
| find out more about this public service, call the SEC at | |
| 202-551-8090. Information about your fund is also | |
| available on the SEC’s website, and you can receive | |
| copies of this information, for a fee, by sending a | |
| request in either of two ways: via e-mail addressed to | |
| publicinfo@sec.gov or via regular mail addressed to the | |
| Public Reference Section, Securities and Exchange | |
| Commission, Washington, DC 20549-1520. | |
| |
| |
| | © 2011 The Vanguard Group, Inc. |
| | All rights reserved. |
| | Vanguard Marketing Corporation, Distributor. |
| |
| | Q870 022011 |

|
| Vanguard Tax-Managed International |
| Fund Annual Report |
|
| December 31, 2010 |

|
| Investor Shares |
| Institutional Shares |
| Vanguard Europe Pacific ETF Shares |
|
> During 2010, Vanguard Tax-Managed International Fund—including the Europe Pacific ETF—returned about 8%.
> European and Pacific-region stocks contributed about equally to the fund’s return.
> Industrials and materials were top-performing sectors in both regions; financial stocks fell in Europe but posted solid returns in the Pacific region.
| |
| Contents | |
| Your Fund’s Total Returns. | 1 |
| Chairman’s Letter. | 2 |
| Fund Profile. | 8 |
| Performance Summary. | 10 |
| Financial Statements. | 12 |
| Your Fund’s After-Tax Returns. | 35 |
| About Your Fund’s Expenses. | 36 |
| Glossary. | 38 |
 Tax-Managed International Fund Tax-Managed International Fund |
Please note: The opinions expressed in this report are just that—informed opinions. They should not be considered promises or advice. Also, please keep in mind that the information and opinions cover the period through the date on the front of this report. Of course, the risks of investing in your fund are spelled out in the prospectus.
See the Glossary for definitions of investment terms used in this report.
Cover photograph: Jean Maher.
Your Fund’s Total Returns
| |
| Fiscal Year Ended December 31, 2010 | |
| | Total |
| | Returns |
| Vanguard Tax-Managed International Fund | |
| Investor Shares | 8.36% |
| Institutional Shares | 8.55 |
| Europe Pacific ETF Shares | |
| Market Price | 8.43 |
| Net Asset Value | 8.47 |
| MSCI EAFE Index | 7.75 |
| International Funds Average | 10.82 |
| International Funds Average: Derived from data provided by Lipper Inc. | |
Institutional Shares are available to certain institutional investors who meet specific administrative, service, and account-size criteria. The Vanguard ETF® Shares shown are traded on the NYSE Arca exchange and are available only through brokers. The table provides ETF returns based on both the NYSE Arca market price and the net asset value for a share. U.S. Pat. No. 6,879,964 B2; 7,337,138.
For the ETF Shares, the market price is determined by the midpoint of the bid-offer spread as of the closing time of the New York Stock Exchange (generally 4 p.m., Eastern time). The net asset value is also determined as of the NYSE closing time. For more information about how the ETF Shares' market prices have compared with their net asset value, visit vanguard.com, select your ETF, and then select the Price and Performance tab. The ETF premium/discount analysis there shows the percentages of days on which the ETF Shares' market price was above or below the NAV.
Your Fund’s Performance at a Glance
December 31, 2009 , Through December 31, 2010
| | | | |
| | | | Distributions Per Share |
| | Starting | Ending | Income | Capital |
| | Share Price | Share Price | Dividends | Gains |
| Vanguard Tax-Managed International Fund | | | | |
| Investor Shares | $10.95 | $11.58 | $0.282 | $0.000 |
| Institutional Shares | 10.96 | 11.60 | 0.293 | 0.000 |
| Europe Pacific ETF Shares | 34.06 | 36.04 | 0.897 | 0.000 |
1

Chairman’s Letter
Dear Shareholder,
The global economy improved during 2010, although it remains fragile. The more optimistic climate and outlook helped international stocks to bounce back strongly from their disappointing performance in the first half of the year. For the full year, Vanguard Tax-Managed International Fund returned more than 8% for all share classes, including the Europe Pacific ETF.
The year’s results reflected a strong return from Pacific-region stocks. Although the performance of the region’s markets was muted, currency differences boosted the gains for U.S.-based investors. In Europe, the situation was inverted, as solid local market returns were diminished for U.S. investors by the dollar’s climb against the euro.
The Tax-Managed International Fund closely tracked the performance of the MSCI EAFE Index but finished with a slightly higher total return. The difference largely reflected fair-value pricing (for an explanation, please see page 6). The fund trailed the average return of peer-group international funds. Many of these funds invest in emerging markets, which performed strongly during the year, while the Tax-Managed International Fund invests only in developed markets.
2
During the year, the fund’s advisor, Vanguard Quantitative Equity Group, continued to avoid distributing taxable gains to shareholders. A table showing the fund’s after-tax returns for the past one, five, and ten years appears later in this report.
Stocks rallied as the forecast seemed to brighten
After a series of false starts, hesitations, and retreats, global stock markets finished 2010 with powerful gains. As the prospect of a double-dip recession faded, the broad U.S. stock market clambered higher, shrugging off high unemployment and distress in Europe’s debt markets to return 17.70%. Small- and mid-capitalization stocks did even better.
Outside the United States, gains were more muted, in part because Europe’s sovereign debt challenges continued to reverberate through local stock markets. Emerging markets were the best performers. Asia’s developed markets performed weakly, though the strength of the yen, the Australian dollar, and other regional currencies bolstered returns for U.S.-based investors.
The fixed income market reprised a familiar theme
Although U.S. Treasury securities rallied through the summer, total return tables were dominated by riskier bonds for the full 12 months, a pattern we also saw in 2009. Low interest rates and a sense that the economic recovery was gathering
| | | |
| Market Barometer | | | |
| |
| | Average Annual Total Returns |
| | Periods Ended December 31, 2010 |
| | One | Three | Five |
| | Year | Years | Years |
| Stocks | | | |
| Russell 1000 Index (Large-caps) | 16.10% | -2.37% | 2.59% |
| Russell 2000 Index (Small-caps) | 26.86 | 2.22 | 4.47 |
| Dow Jones U.S. Total Stock Market Index | 17.70 | -1.56 | 3.17 |
| MSCI All Country World Index ex USA (International) | 11.60 | -4.58 | 5.29 |
| |
| Bonds | | | |
| Barclays Capital U.S. Aggregate Bond Index (Broad | | | |
| taxable market) | 6.54% | 5.90% | 5.80% |
| Barclays Capital Municipal Bond Index (Broad | | | |
| tax-exempt market) | 2.38 | 4.08 | 4.09 |
| Citigroup Three-Month U.S. Treasury Bill Index | 0.13 | 0.69 | 2.29 |
| |
| CPI | | | |
| Consumer Price Index | 1.50% | 1.43% | 2.18% |
3
momentum prompted investors to seek higher yields in both high-quality and below-investment-grade corporate bonds. The broad U.S. bond market returned 6.54%. Late in the year, yields bounced off summer lows, putting pressure on bond prices. The dynamic was especially pronounced among municipal bonds.
As it has since December 2008, the Fed held its target for short-term interest rates near 0%, keeping the returns available from money market instruments, such as the 3-month Treasury bill, in the same neighborhood.
Europe and the Pacific region contributed equally to return
The global stock market took investors for a bumpy ride in 2010. Shareholders in Vanguard Tax-Managed International Fund—which aims to track the performance of developed markets outside of North America—felt nearly every bounce.
The fund’s performance for the year reflected two different market and economic environments. The first half of 2010 was disappointing globally as worries over the possibilities of debt defaults by Greece, and possibly other countries, and of a double-dip U.S. recession roiled the markets. Stocks worldwide rebounded
| | | | |
| Expense Ratios | | | | |
| Your Fund Compared With Its Peer Group | | | | |
| | | | Europe | |
| | | | Pacific | |
| | Investor | Institutional | ETF | Peer Group |
| | Shares | Shares | Shares | Average |
| Tax-Managed International Fund | 0.20% | 0.10% | 0.15% | 1.44% |
The fund expense ratios shown are from the prospectus dated April 26, 2010, and represent estimated costs for the current fiscal year. For the
fiscal year ended December 31, 2010, the fund’s expense ratios were 0.18% for Investor Shares, 0.08% for Institutional Shares, and 0.12%
for Europe Pacific ETF Shares. The peer-group expense ratio is derived from data provided by Lipper Inc. and captures information through
year-end 2009.
Peer group: International Funds.
4
strongly in the second half, pushing returns into positive territory despite new sovereign debt concerns, now with Ireland in the spotlight.
The European worries abated somewhat as governments took steps to shore up finances, including conducting confidence-building bank “stress tests.” In the United States, the Federal Reserve hinted at and then began a massive stimulus plan. Meanwhile, the prospects for economic growth in the United States and Europe seemed to improve.
The European and Pacific regions contributed about equally to the fund’s return, even though its assets were split about two-thirds and one-third, respectively, between them. Markets
in the United Kingdom (+9%) and Japan (+15%)—the fund’s largest country holdings by far—were each responsible for about two percentage points of its roughly 8% total return.
Sweden and Switzerland, the other major European contributors, returned 35% and 13%, respectively. Stocks in Germany, financially the strongest nation on the Continent, gained 10%, while those in France, representing the fund’s second-largest European holding, hurt returns (–3%).
Stocks of countries associated with Europe’s debt crisis were among the major detractors. These included Spain (–22%) and Italy (–15%), which saw major declines in their financial stocks. Greek stocks took
Total Returns
Ten Years Ended December 31, 2010
| |
| | Average |
| | Annual Return |
| Tax-Managed International Fund Investor Shares | 3.64% |
| MSCI EAFE Index | 3.50 |
| International Funds Average | 3.08 |
| International Funds Average: Derived from data provided by Lipper Inc. |
The figures shown represent past performance, which is not a guarantee of future results. (Current performance may be lower or higher than the performance data cited. For performance data current to the most recent month-end, visit our website at vanguard.com/performance.) Note, too, that both investment returns and principal value can fluctuate widely, so an investor’s shares, when sold, could be worth more or less than their original cost.
5
the most substantial tumble (–46%), even as the country began implementing austerity measures. But the small Greek stock market had limited impact on overall portfolio performance. Small stockholdings in financially stressed Ireland (–16%) and Portugal (–12%) had even less noticeable effects.
Perhaps reflecting a somewhat more promising economic outlook, the best-performing European sectors were industrial, consumer discretionary, and materials stocks, which are sensitive to the rhythms of the business cycle. Close behind were consumer staples. Financials were the laggards.
In the Pacific region, all of the countries represented in the fund added to its return. The industrial sector, followed by information technology, drove much of Japan’s contribution. Mining companies in the materials sector powered Australia’s upswing. In Hong Kong, the financial sector led—indeed, unlike in Europe, the Pacific region’s financial sector as a whole turned in a positive performance.
The fund’s long-term returns show consistent results
Despite the gains of the past two years, the fund’s longer-term record is still influenced by the unusually severe stock plunges that came earlier, especially in
| Investment insight | |
| A note on fair-value pricing |
| The reported return of a fund that tracks an index sometimes may diverge from |
| the index’s return a bit more than would be expected. This may be the result of |
| a fair-value pricing adjustment. |
| |
| These adjustments, which are required by the Securities and Exchange |
| Commission, address pricing discrepancies that may arise because of time-zone |
| differences among global stock markets. Foreign stocks may trade on exchanges |
| that close many hours before a fund’s closing share price is calculated in the |
| United States, generally at 4 p.m., Eastern time. In the hours between the foreign |
| close and the U.S. close, the value of these foreign securities may change—because |
| of company-specific announcements or market-wide developments, for example. |
| Such price changes are not immediately reflected in international index values. |
| |
| Fair-value pricing takes such changes into account in calculating the fund’s daily net |
| asset value, thus ensuring that the NAV doesn’t include “stale” prices. The result can |
| be a temporary divergence between the return of the fund and that of its benchmark |
| index—a difference that usually corrects itself when the foreign markets reopen. |
6
2008. This is all too obvious when you examine the table of ten-year returns on page 5. The table also shows, however, that regardless of the market turbulence of the past decade, the portfolio has fulfilled its strategy of closely tracking the performance of the MSCI EAFE Index while providing a tax-efficient return. Indeed, since its inception in 1999, the fund has never distributed capital gains to shareholders.
The portfolio’s low operating costs have contributed to its ability to capture so much of the index’s return. Another key factor is the expertise and dedication of the fund’s advisor, Vanguard Quantitative Equity Group, whose professionals have developed sophisticated techniques for managing portfolios and trading stocks based on more than 30 years of index-tracking experience.
Diversifying your portfolio is important in curbing risk
The past year’s variation in performance from region to region highlights the value of a diversified portfolio. Markets around the globe may be affected by similar events, but their response to those shifts often differs. Our research suggests that, over time, those differences can become more pronounced. As the impact of a worldwide shock such as the recent financial crisis recedes, stock markets once again take their cues from developments in local economies, enhancing the risk-return properties of a globally diversified portfolio.
That’s why we encourage you to build a portfolio that holds a broad mix of stocks—including international equities—and bonds that is tailored to match your risk profile and time horizon. It is always difficult to predict with certainty how future economic developments will play out around the globe. But a time-tested way to meet those challenges is to hold a well-diversified portfolio while keeping costs—including, of course, taxes—low. Vanguard Tax-Managed International Fund can play a role in such an investing strategy.
As always, thank you for entrusting your assets to Vanguard.
Sincerely,

F. William McNabb III
Chairman and Chief Executive Officer
January 18, 2011
7
Tax-Managed International Fund
Fund Profile
As of December 31, 2010
| | | |
| Share-Class Characteristics | |
| |
| | | | Europe |
| | | | Pacific |
| | Investor | Institutional | ETF |
| | Shares | Shares | Shares |
| Ticker Symbol | VTMGX | VTMNX | VEA |
| |
| Expense Ratio1 | 0.20% | 0.10% | 0.15% |
| | | |
| Portfolio Characteristics | | |
| | | | MSCI AC |
| | | MSCI | World |
| | | EAFE | Index |
| | Fund | Index | ex USA |
| Number of Stocks | 946 | 969 | 1,864 |
| Median Market Cap $35.7B | $35.6B | $30.3B |
| Price/Earnings Ratio | 15.5x | 15.6x | 15.7x |
| Price/Book Ratio | 1.6x | 1.6x | 1.7x |
| Return on Equity | 17.5% | 17.5% | 18.3% |
| Earnings Growth Rate | 0.6% | 0.6% | 4.4% |
| Dividend Yield | 2.9% | 3.0% | 2.7% |
| Turnover Rate | 6% | — | — |
| Short-Term Reserves | 0.1% | — | — |
| | | |
| Sector Diversification (% of equity exposure) |
| | | | MSCI AC |
| | | MSCI | World |
| | | EAFE | Index |
| | Fund | Index | ex USA |
| Consumer | | | |
| Discretionary | 10.6% | 10.5% | 9.1% |
| Consumer Staples | 10.1 | 10.0 | 8.7 |
| Energy | 7.9 | 7.9 | 10.9 |
| Financials | 23.0 | 23.8 | 24.6 |
| Health Care | 8.2 | 8.2 | 5.9 |
| Industrials | 12.9 | 12.7 | 10.9 |
| Information | | | |
| Technology | 5.1 | 5.0 | 6.7 |
| Materials | 11.6 | 11.5 | 13.2 |
| Telecommunication | | | |
| Services | 5.5 | 5.4 | 5.7 |
| Utilities | 5.1 | 5.0 | 4.3 |
| | |
| Volatility Measures | | |
| | MSCI | MSCI AC |
| | EAFE | World Index |
| | Index | ex USA |
| R-Squared | 0.98 | 0.97 |
| Beta | 1.03 | 0.98 |
These measures show the degree and timing of the fund’s
fluctuations compared with the indexes over 36 months.
| | |
| Ten Largest Holdings (% of total net assets) |
| | |
| BHP Billiton Ltd. | Diversified Metals & Mining | 2.2% |
| Royal Dutch Shell plc Class A | Integrated Oil & Gas | 1.9 |
| Nestle SA | Packaged Foods & Meats | 1.8 |
| HSBC Holdings plc | Diversified Banks | 1.6 |
| Vodafone Group PLC | Wireless Telecommunication Services | 1.3 |
| BP plc | Integrated Oil & Gas | 1.2 |
| Novartis AG | Pharmaceuticals | 1.1 |
| Total SA | Integrated Oil & Gas | 1.0 |
| Toyota Motor Corp. | Automobile Manufacturers | 1.0 |
| Roche Holding AG | Pharmaceuticals | 0.9 |
| Top Ten | | 14.0% |
| The holdings listed exclude any temporary cash investments and equity index products. |
Allocation by Region (% of equity exposure)
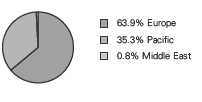
1 The expense ratios shown are from the prospectus dated April 26, 2010, and represent estimated costs for the current fiscal year. For the
fiscal year ended December 31, 2010, the expense ratios were 0.18% for Investor Shares, 0.08% for Institutional Shares, and 0.12% for
Europe Pacific ETF Shares.
8
Tax-Managed International Fund
| | | |
| Market Diversification (% of equity exposure) |
| | | | MSCI AC |
| | | MSCI | World |
| | | EAFE | Index |
| | Fund | Index | ex USA |
| Europe | | | |
| United Kingdom | 21.4% | 21.3% | 14.5% |
| France | 9.6 | 9.5 | 6.5 |
| Germany | 8.3 | 8.2 | 5.6 |
| Switzerland | 8.1 | 8.0 | 5.4 |
| Spain | 3.3 | 3.3 | 2.2 |
| Sweden | 3.2 | 3.2 | 2.2 |
| Italy | 2.6 | 2.6 | 1.8 |
| Netherlands | 2.5 | 2.5 | 1.7 |
| Finland | 1.1 | 1.1 | 0.7 |
| Denmark | 1.0 | 1.0 | 0.7 |
| Other | 2.8 | 2.9 | 2.0 |
| Subtotal | 63.9% | 63.6% | 43.3% |
| Pacific | | | |
| Japan | 22.0% | 22.1% | 14.9% |
| Australia | 8.6 | 8.8 | 6.0 |
| Hong Kong | 2.9 | 2.9 | 1.9 |
| Singapore | 1.7 | 1.7 | 1.2 |
| Other | 0.1 | 0.1 | 0.1 |
| Subtotal | 35.3% | 35.6% | 24.1% |
| Emerging Markets | 0.0% | 0.0% | 24.1% |
| Middle East | 0.8% | 0.0% | 0.5% |
| North America | 0.0% | 0.0% | 8.0% |
9
Tax-Managed International Fund
Performance Summary
All of the returns in this report represent past performance, which is not a guarantee of future results that may be achieved by the fund. (Current performance may be lower or higher than the performance data cited. For performance data current to the most recent month-end, visit our website at vanguard.com/performance.) Note, too, that both investment returns and principal value can fluctuate widely, so an investor’s shares, when sold, could be worth more or less than their original cost. The returns shown do not reflect taxes that a shareholder would pay on fund distributions or on the sale of fund shares.
Cumulative Performance: December 31, 2000, Through December 31, 2010
Initial Investment of $10,000
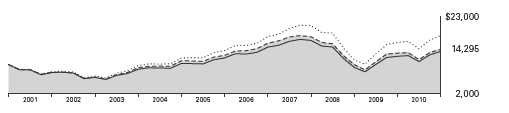
| | | | | |
| | | Average Annual Total Returns | |
| | | Periods Ended December 31, 2010 | |
| | | | | | Final Value |
| | | One | Five | Ten | of a $10,000 |
| | | Year | Years | Years | Investment |
| | Tax-Managed International Fund | | | | |
| | Investor Shares | 8.36% | 2.76% | 3.64% | $14,295 |
| | Fee-Adjusted Returns | 7.30 | 2.76 | 3.64 | 14,295 |
| •••••••• | MSCI All Country World Index ex USA | 11.60 | 5.29 | 5.97 | 17,862 |
| – – – – | MSCI EAFE Index | 7.75 | 2.46 | 3.50 | 14,108 |
| | International Funds Average | 10.82 | 2.82 | 3.08 | 13,549 |
| International Funds Average: Derived from data provided by Lipper Inc. |
| | | | |
| | | | Since | Final Value |
| | One | Five | Inception | of a $5,000,000 |
| | Year | Years | (1/4/2001) | Investment |
| Tax-Managed International Fund | | | | |
| Institutional Shares | 8.55% | 2.86% | 3.75% | $7,221,532 |
| Fee-Adjusted Returns | 7.49 | 2.86 | 3.75 | 7,221,532 |
| MSCI All Country World Index ex USA | 11.60 | 5.29 | 5.82 | 8,798,888 |
| MSCI EAFE Index | 7.75 | 2.46 | 3.52 | 7,061,956 |
| "Since Inception" performance is calculated from the Institutional Shares’ inception date for both the fund and its comparative standards. |
Fee-adjusted returns reflect the 1% fee on redemptions of shares held for less than five years.
See Financial Highlights for dividend and capital gains information.
10
Tax-Managed International Fund
| | | |
| | Average Annual Total Returns | |
| | Periods Ended December 31, 2010 | |
| | | Since | Final Value |
| | One | Inception | of a $10,000 |
| | Year | (7/20/2007) | Investment |
| Europe Pacific | | | |
| ETF Shares Net Asset Value | 8.47% | -6.22% | $8,014 |
| MSCI All Country World Index ex USA | 11.60 | -4.05 | 8,670 |
| MSCI EAFE Index | 7.75 | -6.71 | 7,869 |
| "Since Inception" performance is calculated from the ETF Shares’ inception date for both the fund and its comparative standards. |
| | |
| Cumulative Returns of ETF Shares: July 20, 2007, Through December 31, 2010 |
| | | Since |
| | One | Inception |
| | Year | (7/20/2007) |
| Europe Pacific | | |
| ETF Shares Market Price | 8.43% | -19.77% |
| Europe Pacific | | |
| ETF Shares Net Asset Value | 8.47 | -19.86 |
| MSCI EAFE Index | 7.75 | -21.31 |
| "Since Inception" performance is calculated from the ETF Shares’ inception date for both the fund and its comparative standard. |
Fiscal-Year Total Returns (%): December 31, 2000, Through December 31, 2010
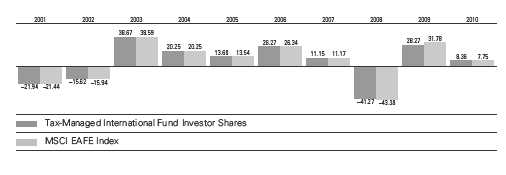
Fee-adjusted returns reflect the 1% fee on redemptions of shares held for less than five years.
11
Tax-Managed International Fund
Financial Statements
Statement of Net Assets
As of December 31, 2010
The fund reports a complete list of its holdings in regulatory filings four times in each fiscal year, at the quarter-ends. For the second and fourth fiscal quarters, the lists appear in the fund’s semiannual and annual reports to shareholders. For the first and third fiscal quarters, the fund files the lists with the Securities and Exchange Commission on Form N-Q. Shareholders can look up the fund’s Forms N-Q on the SEC’s website at sec.gov. Forms N-Q may also be reviewed and copied at the SEC’s Public Reference Room (see the back cover of this report for further information).
| | | |
| | | | Market |
| | | | Value |
| | | Shares | ($000) |
| Common Stocks (100.0%) | | |
| Australia (8.6%) | | |
| | BHP Billiton Ltd. | 2,211,856 | 103,080 |
| | Commonwealth Bank | | |
| | of Australia | 1,020,294 | 53,132 |
| | Westpac Banking Corp. | 1,970,160 | 44,857 |
| | Australia & New Zealand | | |
| | Banking Group Ltd. | 1,680,436 | 40,226 |
| | National Australia | | |
| | Bank Ltd. | 1,406,123 | 34,190 |
| | Rio Tinto Ltd. | 289,495 | 25,406 |
| | Woolworths Ltd. | 819,431 | 22,678 |
| | Wesfarmers Ltd. | 665,549 | 21,851 |
| | Newcrest Mining Ltd. | 481,505 | 20,016 |
| | Woodside Petroleum Ltd. | 406,016 | 17,725 |
| | CSL Ltd. | 369,264 | 13,738 |
| | QBE Insurance Group Ltd. | 696,518 | 12,964 |
| | Origin Energy Ltd. | 600,337 | 10,259 |
| | Macquarie Group Ltd. | 234,123 | 8,879 |
| | Telstra Corp. Ltd. | 2,953,082 | 8,443 |
| | Santos Ltd. | 565,914 | 7,636 |
| | AMP Ltd. | 1,406,237 | 7,626 |
| | Suncorp Group Ltd. | 860,645 | 7,596 |
| | Foster’s Group Ltd. | 1,299,755 | 7,572 |
| | Brambles Ltd. | 959,551 | 7,005 |
| | Orica Ltd. | 248,168 | 6,343 |
| | Amcor Ltd. | 846,891 | 5,861 |
| | Insurance Australia | | |
| | Group Ltd. | 1,464,081 | 5,828 |
| * | Fortescue Metals | | |
| | Group Ltd. | 771,534 | 5,183 |
| | AGL Energy Ltd. | 314,646 | 4,916 |
| | ASX Ltd. | 125,396 | 4,844 |
| | Transurban Group | 913,409 | 4,806 |
| | Incitec Pivot Ltd. | 1,172,645 | 4,764 |
| | AXA Asia Pacific | | |
| | Holdings Ltd. | 721,605 | 4,670 |
| | Alumina Ltd. | 1,698,449 | 4,327 |
| | Coca-Cola Amatil Ltd. | 386,489 | 4,307 |
| | | |
| | OZ Minerals Ltd. | 2,297,597 | 4,067 |
| | WorleyParsons Ltd. | 137,761 | 3,781 |
| | Computershare Ltd. | 325,259 | 3,593 |
| | TABCORP Holdings Ltd. | 486,882 | 3,548 |
| * | Asciano Ltd. | 2,109,077 | 3,451 |
| | Lend Lease Group | 387,070 | 3,425 |
| | Cochlear Ltd. | 41,501 | 3,424 |
| | Sonic Healthcare Ltd. | 267,575 | 3,188 |
| | BlueScope Steel Ltd. | 1,352,908 | 3,116 |
| | Wesfarmers Ltd. | | |
| | Price Protected Shares | 93,546 | 3,101 |
| | Leighton Holdings Ltd. | 97,073 | 3,066 |
| * | QR National Ltd. | 1,011,982 | 2,853 |
| | Toll Holdings Ltd. | 471,092 | 2,771 |
| | Crown Ltd. | 316,769 | 2,681 |
| | Sims Metal | | |
| | Management Ltd. | 120,252 | 2,651 |
| | Tatts Group Ltd. | 989,667 | 2,619 |
| | Boral Ltd. | 527,867 | 2,617 |
| | Bendigo and | | |
| | Adelaide Bank Ltd. | 238,109 | 2,430 |
| * | Paladin Energy Ltd. | 475,738 | 2,403 |
| | OneSteel Ltd. | 900,845 | 2,392 |
| | Metcash Ltd. | 565,124 | 2,380 |
| * | James Hardie Industries | | |
| | SE | 327,942 | 2,279 |
| * | Qantas Airways Ltd. | 822,181 | 2,141 |
| | Fairfax Media Ltd. | 1,398,730 | 2,010 |
| | CSR Ltd. | 1,165,194 | 2,006 |
| | MacArthur Coal Ltd. | 123,955 | 1,631 |
| | Goodman Fielder Ltd. | 1,119,779 | 1,544 |
| | Caltex Australia Ltd. | 98,370 | 1,449 |
| | Ramsay Health Care Ltd. | 72,954 | 1,332 |
| | Harvey Norman | | |
| | Holdings Ltd. | 416,464 | 1,255 |
| | SP AusNet | 1,269,676 | 1,132 |
| | Billabong International Ltd. | 127,462 | 1,065 |
| | Newcrest Mining Ltd. | | |
| | ADR | 22,953 | 955 |
12
Tax-Managed International Fund
| | | |
| | | | Market |
| | | | Value |
| | | Shares | ($000) |
| | MAp Group | 289,224 | 886 |
| | Sims Metal | | |
| | Management Ltd. ADR | 3,072 | 67 |
| | | | 614,037 |
| Austria (0.3%) | | |
| | Erste Group Bank AG | 126,359 | 5,987 |
| | OMV AG | 105,883 | 4,430 |
| | Voestalpine AG | 69,155 | 3,321 |
| | Telekom Austria AG | 231,572 | 3,277 |
| | Verbund AG | 56,927 | 2,135 |
| | Raiffeisen Bank | | |
| | International AG | 35,181 | 1,946 |
| | Vienna Insurance Group | | |
| | AG Wiener Versicherung | | |
| | Gruppe | 30,371 | 1,589 |
| | | | 22,685 |
| Belgium (0.9%) | | |
| | Anheuser-Busch InBev NV | 478,304 | 27,437 |
| | Delhaize Group SA | 68,822 | 5,109 |
| | Solvay SA Class A | 40,709 | 4,358 |
| | Umicore | 80,889 | 4,228 |
| * | KBC Groep NV | 112,826 | 3,859 |
| | Belgacom SA | 105,396 | 3,555 |
| | Ageas | 1,389,234 | 3,188 |
| | Colruyt SA | 53,920 | 2,753 |
| | Bekaert SA | 22,852 | 2,633 |
| | UCB SA | 71,838 | 2,476 |
| * | Dexia SA | 463,496 | 1,616 |
| | Mobistar SA | 20,875 | 1,360 |
| | | | 62,572 |
| Denmark (1.0%) | | |
| | Novo Nordisk A/S Class B | 271,526 | 30,719 |
| | AP Moller - Maersk A/S | | |
| | Class B | 877 | 7,973 |
| * | Danske Bank A/S | 299,829 | 7,721 |
| | Carlsberg A/S Class B | 70,877 | 7,144 |
| * | Vestas Wind Systems A/S | 135,252 | 4,302 |
| | Novozymes A/S | 27,727 | 3,885 |
| | AP Moller - Maersk A/S | 357 | 3,158 |
| | DSV A/S | 124,350 | 2,768 |
| | Coloplast A/S Class B | 14,275 | 1,948 |
| * | William Demant Holding | | |
| | A/S | 17,513 | 1,300 |
| | Tryg A/S | 17,910 | 830 |
| | | | 71,748 |
| Finland (1.1%) | | |
| | Nokia Oyj | 2,425,489 | 25,224 |
| | Fortum Oyj | 292,971 | 8,872 |
| | Sampo Oyj | 278,190 | 7,468 |
| | Kone Oyj Class B | 104,058 | 5,802 |
| | UPM-Kymmene Oyj | 321,116 | 5,715 |
| | Metso Oyj | 75,893 | 4,262 |
| | Wartsila Oyj | 53,468 | 4,090 |
| | | |
| | Stora Enso Oyj | 378,351 | 3,909 |
| | Nokian Renkaat Oyj | 74,006 | 2,730 |
| | Kesko Oyj Class B | 39,860 | 1,870 |
| | Outokumpu Oyj | 91,284 | 1,699 |
| | Elisa Oyj | 71,792 | 1,569 |
| | Neste Oil Oyj | 95,844 | 1,539 |
| | Rautaruukki Oyj | 58,459 | 1,378 |
| | Pohjola Bank plc | 104,494 | 1,258 |
| | Sanoma Oyj | 54,376 | 1,184 |
| | Orion Oyj Class B | 43,772 | 962 |
| | | | 79,531 |
| France (9.6%) | | |
| | Total SA | 1,365,020 | 72,989 |
| | Sanofi-Aventis SA | 678,374 | 43,662 |
| | BNP Paribas | 619,838 | 39,630 |
| | GDF Suez | 792,747 | 28,583 |
| | LVMH Moet Hennessy | | |
| | Louis Vuitton SA | 157,059 | 25,970 |
| | France Telecom SA | 1,203,701 | 25,287 |
| | Danone | 377,838 | 23,850 |
| | Schneider Electric SA | 157,742 | 23,744 |
| | Air Liquide SA | 183,712 | 23,352 |
| | Societe Generale | 411,449 | 22,226 |
| | Vivendi SA | 801,864 | 21,753 |
| | ArcelorMittal | 549,578 | 20,997 |
| | AXA SA | 1,106,600 | 18,492 |
| | L’Oreal SA | 155,667 | 17,377 |
| | Carrefour SA | 389,252 | 16,113 |
| | Vinci SA | 284,556 | 15,546 |
| | Cie de St-Gobain | 252,576 | 13,060 |
| | Pernod-Ricard SA | 129,320 | 12,221 |
| | Unibail-Rodamco SE | 59,595 | 11,846 |
| | Cie Generale d’Optique | | |
| | Essilor International SA | 133,024 | 8,604 |
| | Lafarge SA | 132,216 | 8,333 |
| | Cie Generale des | | |
| | Etablissements Michelin | | |
| | Class B | 111,524 | 8,037 |
| | Credit Agricole SA | 620,916 | 7,926 |
| | PPR | 49,547 | 7,919 |
| | Vallourec SA | 72,767 | 7,681 |
| * | Renault SA | 126,289 | 7,380 |
| | Bouygues SA | 153,503 | 6,651 |
| | EDF SA | 160,155 | 6,603 |
| | Alstom SA | 135,492 | 6,520 |
| | Veolia Environnement SA | 220,937 | 6,492 |
| | Technip SA | 65,691 | 6,096 |
| * | European Aeronautic | | |
| | Defence and Space Co. | | |
| | NV | 254,831 | 5,970 |
| | Christian Dior SA | 40,977 | 5,884 |
| | Cap Gemini SA | 98,765 | 4,635 |
| | SES SA | 191,821 | 4,586 |
| * | Alcatel-Lucent | 1,539,885 | 4,523 |
13
Tax-Managed International Fund
| | | |
| | | | Market |
| | | | Value |
| | | Shares | ($000) |
| | STMicroelectronics NV | 426,309 | 4,451 |
| | Sodexo | 62,756 | 4,347 |
| | Publicis Groupe SA | 82,644 | 4,329 |
| | Accor SA | 92,892 | 4,156 |
| * | Peugeot SA | 102,379 | 3,905 |
| | Legrand SA | 94,934 | 3,888 |
| | Suez Environnement Co. | 183,746 | 3,811 |
| | Safran SA | 103,663 | 3,689 |
| | Casino Guichard Perrachon | | |
| | SA | 37,291 | 3,653 |
| | Lagardere SCA | 80,653 | 3,338 |
| | Dassault Systemes SA | 40,658 | 3,081 |
| * | Cie Generale de | | |
| | Geophysique-Veritas | 97,604 | 2,991 |
| | Groupe Eurotunnel SA | 308,290 | 2,724 |
| * | Natixis | 558,016 | 2,621 |
| | Bureau Veritas SA | 34,277 | 2,611 |
| | SCOR SE | 100,578 | 2,566 |
| | Klepierre | 65,937 | 2,391 |
| * | Edenred | 97,491 | 2,318 |
| | Eutelsat Communications | 59,874 | 2,201 |
| | Thales SA | 60,936 | 2,143 |
| | CNP Assurances | 105,649 | 1,914 |
| * | Air France-KLM | 98,136 | 1,798 |
| * | Atos Origin SA | 32,599 | 1,745 |
| | ICADE | 16,613 | 1,703 |
| | Fonciere Des Regions | 17,065 | 1,658 |
| | Hermes International | 7,793 | 1,640 |
| | Neopost SA | 18,471 | 1,617 |
| | Gecina SA | 13,852 | 1,531 |
| | Imerys SA | 21,874 | 1,466 |
| | Aeroports de Paris | 17,471 | 1,386 |
| | Societe BIC SA | 15,614 | 1,348 |
| | Eramet | 3,736 | 1,287 |
| | Iliad SA | 11,207 | 1,224 |
| | Societe Television | | |
| | Francaise 1 | 69,220 | 1,208 |
| * | JCDecaux SA | 35,156 | 1,087 |
| | Eiffage SA | 22,965 | 1,018 |
| | Metropole Television SA | 39,238 | 954 |
| | PagesJaunes Groupe | 92,119 | 841 |
| | BioMerieux | 7,772 | 770 |
| | | | 681,947 |
| Germany (8.3%) | | |
| | Siemens AG | 531,654 | 66,116 |
| | BASF SE | 593,963 | 47,586 |
| | Bayer AG | 535,100 | 39,821 |
| * | Daimler AG | 583,556 | 39,641 |
| | E.ON AG | 1,166,425 | 35,761 |
| | Allianz SE | 291,335 | 34,751 |
| | Deutsche Bank AG | 602,390 | 31,626 |
| | SAP AG | 556,950 | 28,517 |
| | Deutsche Telekom AG | 1,841,605 | 23,834 |
| | | |
| | Muenchener | | |
| | Rueckversicherungs AG | 122,539 | 18,632 |
| | RWE AG | 272,295 | 18,258 |
| | Volkswagen AG Prior Pfd. | 110,568 | 18,048 |
| | Bayerische Motoren | | |
| | Werke AG | 214,878 | 16,996 |
| | Linde AG | 109,977 | 16,702 |
| | Deutsche Post AG | 553,233 | 9,422 |
| | ThyssenKrupp AG | 220,491 | 9,196 |
| | Adidas AG | 137,266 | 8,964 |
| | Deutsche Boerse AG | 128,416 | 8,907 |
| | MAN SE | 69,787 | 8,345 |
| | Fresenius Medical Care | | |
| | AG & Co. KGaA | 127,104 | 7,336 |
| | Henkel AG & Co. | | |
| | KGaA Prior Pfd. | 117,730 | 7,328 |
| * | Infineon Technologies AG | 712,765 | 6,670 |
| | K&S AG | 87,863 | 6,648 |
| | Metro AG | 84,358 | 6,113 |
| | HeidelbergCement AG | 90,025 | 5,672 |
| | Porsche Automobil Holding | | |
| | SE Prior Pfd. | 58,954 | 4,727 |
| | Fresenius SE Prior Pfd. | 54,045 | 4,648 |
| | Henkel AG & Co. KGaA | 86,409 | 4,473 |
| | Lanxess AG | 49,919 | 3,940 |
| | Beiersdorf AG | 67,751 | 3,771 |
| * | Commerzbank AG | 479,116 | 3,581 |
| | Merck KGaA | 41,607 | 3,344 |
| * | Deutsche Lufthansa AG | 148,284 | 3,238 |
| * | QIAGEN NV | 152,312 | 3,001 |
| | GEA Group AG | 100,730 | 2,922 |
| | Volkswagen AG | 20,198 | 2,876 |
| | Hochtief AG | 31,047 | 2,642 |
| * | Continental AG | 32,470 | 2,589 |
| | Salzgitter AG | 29,529 | 2,292 |
| | Bayerische Motoren | | |
| | Werke AG Prior Pfd. | 37,448 | 1,933 |
| | Hannover | | |
| | Rueckversicherung AG | 34,350 | 1,850 |
| | Wacker Chemie AG | 10,451 | 1,829 |
| | Fraport AG | | |
| | Frankfurt Airport Services | | |
| | Worldwide | 26,998 | 1,711 |
| * | Brenntag AG | 16,089 | 1,645 |
| * | TUI AG | 104,284 | 1,469 |
| * | Kabel Deutschland Holding | | |
| | AG | 31,098 | 1,464 |
| | RWE AG Prior Pfd. | 22,605 | 1,456 |
| | Celesio AG | 55,211 | 1,381 |
| | Fresenius SE | 16,240 | 1,368 |
| | Axel Springer AG | 8,334 | 1,367 |
| | Puma AG Rudolf | | |
| | Dassler Sport | 3,919 | 1,299 |
14
Tax-Managed International Fund
| | | |
| | | | Market |
| | | | Value |
| | | Shares | ($000) |
| | ProSiebenSat.1 Media AG | | |
| | Prior Pfd. | 42,998 | 1,296 |
| | Suedzucker AG | 46,567 | 1,249 |
| | United Internet AG | 72,469 | 1,184 |
| | | | 591,435 |
| Greece (0.2%) | | |
| | National Bank of Greece | | |
| | SA ADR | 2,122,435 | 3,566 |
| | Coca Cola Hellenic | | |
| | Bottling Co. SA | 111,917 | 2,911 |
| | OPAP SA | 133,835 | 2,325 |
| | National Bank of | | |
| | Greece SA | 224,607 | 1,834 |
| | Bank of | | |
| | Cyprus Public Co. Ltd. | 500,720 | 1,735 |
| * | Alpha Bank AE | 308,469 | 1,574 |
| | Hellenic | | |
| | Telecommunications | | |
| | Organization SA ADR | 345,359 | 1,383 |
| * | EFG Eurobank Ergasias SA | 210,880 | 1,063 |
| | Public Power Corp. SA | 72,430 | 1,046 |
| | Hellenic | | |
| | Telecommunications | | |
| | Organization SA | 21,242 | 175 |
| | | | 17,612 |
| Hong Kong (2.9%) | | |
| | Sun Hung Kai | | |
| | Properties Ltd. | 928,064 | 15,396 |
| | Hong Kong Exchanges | | |
| | and Clearing Ltd. | 667,300 | 15,128 |
| * | AIA Group Ltd. | 5,127,645 | 14,413 |
| | Hutchison Whampoa Ltd. | 1,394,512 | 14,344 |
| | Cheung Kong Holdings Ltd. | 914,500 | 14,092 |
| | CLP Holdings Ltd. | 1,255,432 | 10,193 |
| | Li & Fung Ltd. | 1,526,835 | 8,858 |
| | Swire Pacific Ltd. Class A | 514,088 | 8,446 |
| | Hang Seng Bank Ltd. | 502,943 | 8,263 |
| | BOC Hong Kong | | |
| | Holdings Ltd. | 2,328,000 | 7,916 |
| | Hang Lung Properties Ltd. | 1,613,810 | 7,542 |
| | Wharf Holdings Ltd. | 928,741 | 7,140 |
| | Hong Kong & | | |
| | China Gas Co. Ltd. | 2,892,776 | 6,815 |
| | Hongkong Electric | | |
| | Holdings Ltd. | 944,100 | 5,951 |
| | Henderson Land | | |
| | Development Co. Ltd. | 736,006 | 5,013 |
| | Bank of East Asia Ltd. | 1,051,463 | 4,399 |
| | Esprit Holdings Ltd. | 803,928 | 3,824 |
| | Hang Lung Group Ltd. | 534,000 | 3,508 |
| | MTR Corp. | 929,000 | 3,380 |
| * | Sands China Ltd. | 1,461,600 | 3,213 |
| | New World | | |
| | Development Ltd. | 1,706,750 | 3,202 |
| | | |
| | Sino Land Co. Ltd. | 1,675,000 | 3,129 |
| | Wheelock & Co. Ltd. | 715,000 | 2,891 |
| | Kerry Properties Ltd. | 528,000 | 2,749 |
| | Shangri-La Asia Ltd. | 936,510 | 2,540 |
| | Wynn Macau Ltd. | 1,039,600 | 2,326 |
| | Hysan | | |
| | Development Co. Ltd. | 491,000 | 2,310 |
| | Cathay Pacific Airways Ltd. | 787,770 | 2,173 |
| | Wing Hang Bank Ltd. | 123,000 | 1,700 |
| | Yue Yuen Industrial | | |
| | Holdings Ltd. | 448,000 | 1,611 |
| | SJM Holdings Ltd. | 887,000 | 1,407 |
| | ASM Pacific | | |
| | Technology Ltd. | 110,900 | 1,400 |
| | Orient Overseas | | |
| | International Ltd. | 139,300 | 1,350 |
| * | Foxconn International | | |
| | Holdings Ltd. | 1,825,000 | 1,274 |
| | Hopewell Holdings Ltd. | 397,500 | 1,247 |
| | Cheung Kong | | |
| | Infrastructure | | |
| | Holdings Ltd. | 259,000 | 1,186 |
| | PCCW Ltd. | 2,596,000 | 1,148 |
| | NWS Holdings Ltd. | 721,500 | 1,095 |
| | Lifestyle International | | |
| | Holdings Ltd. | 332,500 | 818 |
| * | Henderson Land | | |
| | Development Co. Ltd. | | |
| | Warrants Exp. 06/01/2011 | 138,201 | 32 |
| | | | 203,422 |
| Ireland (0.2%) | | |
| | CRH plc | 458,073 | 9,539 |
| | Kerry Group plc Class A | 93,855 | 3,143 |
| * | Elan Corp. plc | 354,880 | 2,009 |
| | Ryanair Holdings plc | 255,030 | 1,289 |
| * | Governor & Co. of the | | |
| | Bank of Ireland | 1,987,375 | 992 |
| * | Anglo Irish Bank Corp. Ltd. | 257,065 | 75 |
| | | | 17,047 |
| Israel (0.8%) | | |
| | Teva Pharmaceutical | | |
| | Industries Ltd. | 605,165 | 31,560 |
| | Israel Chemicals Ltd. | 299,017 | 5,131 |
| | Bank Leumi Le-Israel BM | 759,342 | 3,900 |
| * | Bank Hapoalim BM | 687,414 | 3,586 |
| | Bezeq The Israeli | | |
| | Telecommunication | | |
| | Corp. Ltd. | 1,059,368 | 3,232 |
| * | Israel Corp. Ltd. | 1,367 | 1,662 |
| * | NICE Systems Ltd. | 35,606 | 1,243 |
| * | Israel Discount Bank Ltd. | | |
| | Class A | 494,279 | 1,128 |
| | Cellcom Israel Ltd. | | |
| | (Registered) | 34,630 | 1,126 |
15
Tax-Managed International Fund
| | | |
| | | | Market |
| | | | Value |
| | | Shares | ($000) |
| | Partner | | |
| | Communications Co. Ltd. | 48,274 | 979 |
| | Elbit Systems Ltd. | 17,474 | 934 |
| * | Makhteshim-Agan | | |
| | Industries Ltd. | 174,001 | 895 |
| | Mizrahi Tefahot Bank Ltd. | 67,120 | 740 |
| | Delek Group Ltd. | 2,749 | 710 |
| | | | 56,826 |
| Italy (2.6%) | | |
| | ENI SPA | 1,684,849 | 37,072 |
| | Enel SPA | 4,271,059 | 21,486 |
| | UniCredit SPA | 8,788,122 | 18,291 |
| | Assicurazioni Generali SPA | 762,171 | 14,568 |
| | Intesa Sanpaolo SPA | | |
| | (Registered) | 5,021,484 | 13,705 |
| | Fiat SPA | 502,171 | 10,426 |
| | Saipem SPA | 168,109 | 8,333 |
| | Telecom Italia SPA | | |
| | (Registered) | 6,179,387 | 8,049 |
| | Tenaris SA | 308,548 | 7,597 |
| | Telecom Italia SPA | | |
| | (Bearer) | 4,078,881 | 4,457 |
| | Snam Rete Gas SPA | 863,188 | 4,315 |
| | Terna Rete Elettrica | | |
| | Nazionale SPA | 889,382 | 3,774 |
| | Unione di Banche Italiane | | |
| | SCPA | 403,108 | 3,551 |
| | Atlantia SPA | 162,646 | 3,334 |
| | Parmalat SPA | 1,193,701 | 3,287 |
| | Finmeccanica SPA | 278,286 | 3,179 |
| | Mediaset SPA | 462,545 | 2,812 |
| | Mediobanca SPA | 306,030 | 2,740 |
| | Luxottica Group SPA | 64,843 | 1,990 |
| * | Enel Green Power SPA | 919,621 | 1,951 |
| | Banco Popolare SC | 415,986 | 1,896 |
| * | Banca Monte dei Paschi | | |
| | di Siena SPA | 1,590,311 | 1,823 |
| | Prysmian SPA | 101,486 | 1,736 |
| | Exor SPA | 48,170 | 1,596 |
| | Intesa Sanpaolo SPA | | |
| | (Bearer) | 620,595 | 1,486 |
| | Pirelli & C SPA | 174,592 | 1,418 |
| * | Autogrill SPA | 87,191 | 1,239 |
| | Banca Carige SPA | 454,777 | 958 |
| | A2A SPA | 591,515 | 817 |
| | | | 187,886 |
| Japan (22.0%) | | |
| | Toyota Motor Corp. | 1,781,618 | 70,213 |
| | Mitsubishi UFJ Financial | | |
| | Group Inc. | 8,225,144 | 44,397 |
| | Honda Motor Co. Ltd. | 1,048,139 | 41,412 |
| | Canon Inc. | 731,333 | 37,605 |
| | Sumitomo Mitsui Financial | | |
| | Group Inc. | 869,458 | 30,817 |
| | | |
| Mizuho Financial | | |
| Group Inc. | 13,250,421 | 24,882 |
| Takeda | | |
| Pharmaceutical Co. Ltd. | 482,294 | 23,718 |
| Sony Corp. | 651,800 | 23,336 |
| Mitsubishi Corp. | 860,286 | 23,211 |
| Tokyo Electric | | |
| Power Co. Inc. | 921,870 | 22,501 |
| FANUC Corp. | 125,500 | 19,204 |
| Nintendo Co. Ltd. | 64,900 | 18,968 |
| Mitsui & Co. Ltd. | 1,127,700 | 18,575 |
| Komatsu Ltd. | 616,500 | 18,574 |
| Softbank Corp. | 526,800 | 18,183 |
| Panasonic Corp. | 1,275,153 | 18,023 |
| NTT DoCoMo Inc. | 9,942 | 17,333 |
| Hitachi Ltd. | 2,934,758 | 15,597 |
| Nippon Telegraph & | | |
| Telephone Corp. | 338,400 | 15,426 |
| Nissan Motor Co. Ltd. | 1,598,600 | 15,138 |
| Nomura Holdings Inc. | 2,297,177 | 14,591 |
| Shin-Etsu | | |
| Chemical Co. Ltd. | 267,500 | 14,432 |
| East Japan Railway Co. | 221,800 | 14,408 |
| Mitsubishi Estate Co. Ltd. | 770,935 | 14,263 |
| Toshiba Corp. | 2,613,000 | 14,196 |
| Tokio Marine Holdings Inc. | 470,100 | 13,980 |
| Mitsubishi Electric Corp. | 1,269,000 | 13,274 |
| Seven & | | |
| I Holdings Co. Ltd. | 492,820 | 13,125 |
| Kansai Electric | | |
| Power Co. Inc. | 491,550 | 12,134 |
| Nippon Steel Corp. | 3,346,970 | 12,003 |
| Astellas Pharma Inc. | 291,014 | 11,072 |
| Mitsui Fudosan Co. Ltd. | 555,000 | 11,041 |
| KDDI Corp. | 1,906 | 11,003 |
| Japan Tobacco Inc. | 2,947 | 10,893 |
| FUJIFILM Holdings Corp. | 301,700 | 10,878 |
| Kyocera Corp. | 106,600 | 10,842 |
| JFE Holdings Inc. | 302,700 | 10,506 |
| Denso Corp. | 305,200 | 10,503 |
| Chubu Electric | | |
| Power Co. Inc. | 425,200 | 10,449 |
| Sumitomo Corp. | 735,700 | 10,368 |
| ITOCHU Corp. | 991,000 | 9,996 |
| JX Holdings Inc. | 1,417,050 | 9,599 |
| Daiichi Sankyo Co. Ltd. | 436,663 | 9,547 |
| Kao Corp. | 354,701 | 9,543 |
| Murata | | |
| Manufacturing Co. Ltd. | 133,600 | 9,336 |
| MS&AD Insurance Group | | |
| Holdings | 340,033 | 8,497 |
| Fujitsu Ltd. | 1,221,000 | 8,468 |
| Central Japan Railway Co. | 995 | 8,326 |
| Bridgestone Corp. | 427,831 | 8,244 |
16
Tax-Managed International Fund
| | | |
| | | | Market |
| | | | Value |
| | | Shares | ($000) |
| | Inpex Corp. | 1,401 | 8,190 |
| | Dai-ichi Life | | |
| | Insurance Co. Ltd. | 4,976 | 8,061 |
| | Keyence Corp. | 27,708 | 8,003 |
| | Kirin Holdings Co. Ltd. | 557,000 | 7,798 |
| | Asahi Glass Co. Ltd. | 667,035 | 7,766 |
| | Marubeni Corp. | 1,100,000 | 7,709 |
| | Mitsubishi Heavy | | |
| | Industries Ltd. | 2,006,000 | 7,517 |
| | Tokyo Gas Co. Ltd. | 1,675,000 | 7,425 |
| | Nidec Corp. | 73,000 | 7,369 |
| | Kubota Corp. | 771,000 | 7,271 |
| | Tokyo Electron Ltd. | 113,100 | 7,128 |
| | Hoya Corp. | 285,200 | 6,903 |
| | Sumitomo Electric | | |
| | Industries Ltd. | 496,900 | 6,874 |
| | Sharp Corp. | 663,000 | 6,811 |
| * | NKSJ Holdings Inc. | 900,800 | 6,615 |
| | Secom Co. Ltd. | 139,000 | 6,575 |
| | Ricoh Co. Ltd. | 441,000 | 6,437 |
| | Tohoku Electric | | |
| | Power Co. Inc. | 282,900 | 6,305 |
| | Terumo Corp. | 111,500 | 6,260 |
| | SMC Corp. | 35,800 | 6,116 |
| | Sumitomo Metal | | |
| | Mining Co. Ltd. | 348,000 | 6,068 |
| | Eisai Co. Ltd. | 167,400 | 6,054 |
| | Sumitomo Trust & | | |
| | Banking Co. Ltd. | 949,000 | 5,951 |
| | Sumitomo Realty & | | |
| | Development Co. Ltd. | 242,000 | 5,763 |
| | Daiwa Securities | | |
| | Group Inc. | 1,114,000 | 5,720 |
| | Toray Industries Inc. | 952,000 | 5,681 |
| | Kyushu Electric | | |
| | Power Co. Inc. | 251,600 | 5,639 |
| | Mitsubishi Chemical | | |
| | Holdings Corp. | 826,500 | 5,589 |
| | Daikin Industries Ltd. | 156,500 | 5,534 |
| | TDK Corp. | 79,500 | 5,510 |
| | Fast Retailing Co. Ltd. | 34,700 | 5,510 |
| | Asahi Kasei Corp. | 821,000 | 5,346 |
| | Mitsui OSK Lines Ltd. | 761,000 | 5,162 |
| | Nitto Denko Corp. | 109,800 | 5,155 |
| | Sumitomo | | |
| | Chemical Co. Ltd. | 1,049,000 | 5,155 |
| | Sumitomo Metal | | |
| | Industries Ltd. | 2,087,000 | 5,122 |
| | Suzuki Motor Corp. | 206,600 | 5,077 |
| | Dai Nippon | | |
| | Printing Co. Ltd. | 372,800 | 5,062 |
| | Osaka Gas Co. Ltd. | 1,298,000 | 5,037 |
| | Aeon Co. Ltd. | 399,473 | 4,990 |
| | Shiseido Co. Ltd. | 227,300 | 4,955 |
| | | |
| | NEC Corp. | 1,646,400 | 4,931 |
| | Asahi Breweries Ltd. | 247,600 | 4,784 |
| | Ajinomoto Co. Inc. | 454,000 | 4,721 |
| | Aisin Seiki Co. Ltd. | 128,400 | 4,529 |
| | T&D Holdings Inc. | 178,540 | 4,509 |
| | Olympus Corp. | 146,100 | 4,404 |
| | Rohm Co. Ltd. | 67,000 | 4,362 |
| | Nikon Corp. | 215,800 | 4,361 |
| | Nippon Yusen KK | 977,000 | 4,306 |
| | West Japan Railway Co. | 1,150 | 4,297 |
| | Kobe Steel Ltd. | 1,671,000 | 4,227 |
| | Bank of Yokohama Ltd. | 817,000 | 4,217 |
| | Rakuten Inc. | 4,798 | 4,019 |
| | Odakyu Electric | | |
| | Railway Co. Ltd. | 431,000 | 4,010 |
| | Daiwa House | | |
| | Industry Co. Ltd. | 324,000 | 3,973 |
| | Shionogi & Co. Ltd. | 200,800 | 3,961 |
| | Yahoo Japan Corp. | 10,059 | 3,892 |
| | Yamato Holdings Co. Ltd. | 270,300 | 3,838 |
| | Shizuoka Bank Ltd. | 414,000 | 3,811 |
| * | Otsuka Holdings Co. Ltd. | 154,300 | 3,805 |
| * | Mitsubishi Motors Corp. | 2,613,000 | 3,790 |
| | Yamada Denki Co. Ltd. | 55,510 | 3,780 |
| | Sekisui House Ltd. | 372,859 | 3,761 |
| | JS Group Corp. | 168,812 | 3,707 |
| | Chugoku Electric | | |
| | Power Co. Inc. | 181,800 | 3,694 |
| | Hankyu Hanshin | | |
| | Holdings Inc. | 781,304 | 3,625 |
| | Omron Corp. | 137,100 | 3,617 |
| | Tokyu Corp. | 786,000 | 3,599 |
| | Daito Trust | | |
| | Construction Co. Ltd. | 52,200 | 3,571 |
| | Toppan Printing Co. Ltd. | 390,000 | 3,553 |
| | Dentsu Inc. | 113,600 | 3,514 |
| | Isuzu Motors Ltd. | 774,000 | 3,501 |
| | Kintetsu Corp. | 1,108,190 | 3,466 |
| | Nippon Electric | | |
| | Glass Co. Ltd. | 240,500 | 3,456 |
| | Konica Minolta | | |
| | Holdings Inc. | 333,000 | 3,445 |
| | Kuraray Co. Ltd. | 237,500 | 3,394 |
| | Chiba Bank Ltd. | 522,000 | 3,388 |
| | Kawasaki Heavy | | |
| | Industries Ltd. | 965,000 | 3,238 |
| | JGC Corp. | 149,000 | 3,233 |
| | Makita Corp. | 78,100 | 3,181 |
| | Tobu Railway Co. Ltd. | 559,000 | 3,138 |
| | Shikoku Electric | | |
| | Power Co. Inc. | 106,700 | 3,137 |
| | Unicharm Corp. | 75,700 | 3,009 |
| | NTT Data Corp. | 867 | 2,993 |
| | Fuji Heavy Industries Ltd. | 382,000 | 2,949 |
17
Tax-Managed International Fund
| | | |
| | | | Market |
| | | | Value |
| | | Shares | ($000) |
| | NGK Insulators Ltd. | 180,000 | 2,927 |
| * | Yamaha Motor Co. Ltd. | 178,400 | 2,898 |
| | Mazda Motor Corp. | 1,001,000 | 2,858 |
| | Keikyu Corp. | 321,000 | 2,834 |
| | Chugai | | |
| | Pharmaceutical Co. Ltd. | 154,600 | 2,834 |
| | OJI Paper Co. Ltd. | 586,000 | 2,831 |
| | Oriental Land Co. Ltd. | 30,400 | 2,815 |
| | Chuo Mitsui Trust | | |
| | Holdings Inc. | 674,100 | 2,788 |
| | Keio Corp. | 407,000 | 2,775 |
| | Teijin Ltd. | 643,000 | 2,740 |
| | NSK Ltd. | 304,000 | 2,737 |
| | Ibiden Co. Ltd. | 87,100 | 2,735 |
| | Mitsubishi Tanabe | | |
| | Pharma Corp. | 162,000 | 2,734 |
| | Toyota Tsusho Corp. | 151,393 | 2,654 |
| | Hokkaido Electric | | |
| | Power Co. Inc. | 129,500 | 2,647 |
| | Nippon Express Co. Ltd. | 588,000 | 2,643 |
| | Sega Sammy Holdings Inc. | 138,388 | 2,627 |
| | Hokuriku Electric | | |
| | Power Co. | 106,800 | 2,625 |
| | Isetan Mitsukoshi | | |
| | Holdings Ltd. | 224,740 | 2,607 |
| | Electric Power | | |
| | Development Co. Ltd. | 80,840 | 2,534 |
| | Hirose Electric Co. Ltd. | 22,500 | 2,531 |
| | Sumitomo Heavy | | |
| | Industries Ltd. | 386,000 | 2,472 |
| | Advantest Corp. | 109,500 | 2,465 |
| * | Mitsubishi Materials Corp. | 767,000 | 2,440 |
| | JSR Corp. | 128,400 | 2,386 |
| | Kurita Water | | |
| | Industries Ltd. | 74,800 | 2,351 |
| | Resona Holdings Inc. | 392,400 | 2,341 |
| | Japan Steel Works Ltd. | 224,513 | 2,341 |
| | Benesse Holdings Inc. | 50,000 | 2,303 |
| | Trend Micro Inc. | 69,200 | 2,276 |
| | TonenGeneral Sekiyu KK | 202,000 | 2,206 |
| | Bank of Kyoto Ltd. | 229,000 | 2,167 |
| | Sekisui Chemical Co. Ltd. | 302,000 | 2,163 |
| | SBI Holdings Inc. | 14,170 | 2,139 |
| | IHI Corp. | 959,000 | 2,131 |
| | Lawson Inc. | 42,990 | 2,125 |
| | Kawasaki Kisen Kaisha Ltd. | 487,000 | 2,123 |
| | Obayashi Corp. | 461,000 | 2,119 |
| | Sankyo Co. Ltd. | 37,300 | 2,104 |
| | Sony Financial | | |
| | Holdings Inc. | 514 | 2,072 |
| | Joyo Bank Ltd. | 468,000 | 2,054 |
| | Amada Co. Ltd. | 253,000 | 2,053 |
| | Daihatsu Motor Co. Ltd. | 134,000 | 2,052 |
| | Toyo Seikan Kaisha Ltd. | 108,100 | 2,050 |
| | Brother Industries Ltd. | 138,600 | 2,048 |
| | | |
| | Hisamitsu | | |
| | Pharmaceutical Co. Inc. | 48,600 | 2,045 |
| | Mitsubishi Gas | | |
| | Chemical Co. Inc. | 287,000 | 2,032 |
| | Furukawa Electric Co. Ltd. | 453,000 | 2,029 |
| | Nitori Holdings Co. Ltd. | 23,100 | 2,021 |
| | Shimano Inc. | 39,500 | 2,005 |
| | Mitsui Chemicals Inc. | 561,000 | 2,002 |
| | Fukuoka Financial | | |
| | Group Inc. | 461,800 | 2,001 |
| | Stanley Electric Co. Ltd. | 106,700 | 1,986 |
| | Showa Denko KK | 878,000 | 1,972 |
| | THK Co. Ltd. | 86,100 | 1,971 |
| | Dena Co. Ltd. | 54,800 | 1,965 |
| | Kyowa Hakko Kirin Co. Ltd. | 188,000 | 1,933 |
| | Nippon Paper Group Inc. | 73,600 | 1,929 |
| | Shimizu Corp. | 439,000 | 1,872 |
| | NTN Corp. | 351,000 | 1,854 |
| | MEIJI Holdings Co. Ltd. | 40,754 | 1,841 |
| * | All Nippon | | |
| | Airways Co. Ltd. | 493,317 | 1,838 |
| | Hokuhoku Financial | | |
| | Group Inc. | 899,100 | 1,825 |
| | Taisei Corp. | 771,000 | 1,800 |
| | Credit Saison Co. Ltd. | 109,800 | 1,794 |
| | Tokyu Land Corp. | 355,000 | 1,778 |
| | Hachijuni Bank Ltd. | 317,600 | 1,771 |
| | JTEKT Corp. | 150,600 | 1,769 |
| | Nissin Foods | | |
| | Holdings Co. Ltd. | 49,300 | 1,766 |
| | Santen | | |
| | Pharmaceutical Co. Ltd. | 50,100 | 1,739 |
| | Seiko Epson Corp. | 95,100 | 1,728 |
| | NGK Spark Plug Co. Ltd. | 111,000 | 1,698 |
| | Ube Industries Ltd. | 556,000 | 1,667 |
| | Kajima Corp. | 625,000 | 1,659 |
| | Takashimaya Co. Ltd. | 193,860 | 1,658 |
| | Idemitsu Kosan Co. Ltd. | 15,609 | 1,656 |
| | Yakult Honsha Co. Ltd. | 57,200 | 1,646 |
| | Mitsubishi UFJ Lease & | | |
| | Finance Co. Ltd. | 41,600 | 1,644 |
| | Nippon Meat Packers Inc. | 126,000 | 1,644 |
| | Gunma Bank Ltd. | 298,000 | 1,633 |
| | Hiroshima Bank Ltd. | 382,200 | 1,609 |
| | Sojitz Corp. | 730,700 | 1,599 |
| | Nippon Sheet | | |
| | Glass Co. Ltd. | 593,000 | 1,592 |
| | Aeon Mall Co. Ltd. | 58,800 | 1,575 |
| | Nishi-Nippon City Bank Ltd. | 518,000 | 1,568 |
| | Namco Bandai | | |
| | Holdings Inc. | 145,500 | 1,561 |
| | Sysmex Corp. | 22,200 | 1,537 |
| | Konami Corp. | 72,400 | 1,533 |
| | J Front Retailing Co. Ltd. | 277,200 | 1,512 |
18
Tax-Managed International Fund
| | | |
| | | | Market |
| | | | Value |
| | | Shares | ($000) |
| | Jupiter Telecommunications | | |
| | Co. Ltd. | 1,431 | 1,503 |
| | Yamaha Corp. | 120,800 | 1,493 |
| | GS Yuasa Corp. | 216,000 | 1,491 |
| | TOTO Ltd. | 206,000 | 1,490 |
| | NOK Corp. | 71,700 | 1,488 |
| | Suruga Bank Ltd. | 157,000 | 1,458 |
| | Keisei Electric | | |
| | Railway Co. Ltd. | 218,000 | 1,453 |
| | 77 Bank Ltd. | 271,000 | 1,433 |
| | Hamamatsu Photonics KK | 38,800 | 1,416 |
| | Mitsui Engineering & | | |
| | Shipbuilding Co. Ltd. | 531,000 | 1,402 |
| | Mitsui Mining & | | |
| | Smelting Co. Ltd. | 425,000 | 1,399 |
| | Nisshin Seifun Group Inc. | 110,400 | 1,399 |
| | UNY Co. Ltd. | 138,500 | 1,396 |
| | Hitachi Construction | | |
| | Machinery Co. Ltd. | 58,400 | 1,395 |
| | Fuji Electric | | |
| | Holdings Co. Ltd. | 449,000 | 1,393 |
| | Casio Computer Co. Ltd. | 172,400 | 1,385 |
| | Cosmo Oil Co. Ltd. | 423,000 | 1,383 |
| | FamilyMart Co. Ltd. | 36,300 | 1,367 |
| | Marui Group Co. Ltd. | 168,200 | 1,367 |
| | Dowa Holdings Co. Ltd. | 204,600 | 1,338 |
| | Tsumura & Co. | 41,200 | 1,333 |
| | Denki Kagaku Kogyo KK | 281,000 | 1,332 |
| | Nomura Research | | |
| | Institute Ltd. | 59,700 | 1,328 |
| | Tokyo Tatemono Co. Ltd. | 287,000 | 1,324 |
| | Taiyo Nippon Sanso Corp. | 150,000 | 1,322 |
| | Nomura Real Estate | | |
| | Holdings Inc. | 71,871 | 1,305 |
| | Yokogawa Electric Corp. | 162,300 | 1,287 |
| | Toho Co. Ltd. | 79,700 | 1,279 |
| | Citizen Holdings Co. Ltd. | 185,500 | 1,274 |
| * | Sumco Corp. | 89,260 | 1,272 |
| * | Elpida Memory Inc. | 109,589 | 1,269 |
| | Showa Shell Sekiyu KK | 138,600 | 1,268 |
| | Sumitomo Rubber | | |
| | Industries Ltd. | 121,600 | 1,266 |
| | Minebea Co. Ltd. | 201,000 | 1,262 |
| | Rinnai Corp. | 20,600 | 1,257 |
| | Miraca Holdings Inc. | 31,000 | 1,246 |
| | Yamaguchi Financial | | |
| | Group Inc. | 123,000 | 1,240 |
| | Yaskawa Electric Corp. | 131,000 | 1,235 |
| | Toho Gas Co. Ltd. | 247,000 | 1,234 |
| | Chugoku Bank Ltd. | 102,000 | 1,232 |
| | Mizuho Securities Co. Ltd. | 430,000 | 1,227 |
| | Nisshin Steel Co. Ltd. | 551,000 | 1,224 |
| | Kamigumi Co. Ltd. | 146,000 | 1,223 |
| | Kansai Paint Co. Ltd. | 126,000 | 1,218 |
| | | |
| | NHK Spring Co. Ltd. | 112,000 | 1,215 |
| | Hitachi Chemical Co. Ltd. | 58,500 | 1,207 |
| | Shimamura Co. Ltd. | 13,000 | 1,205 |
| | Toyo Suisan Kaisha Ltd. | 54,000 | 1,200 |
| | Suzuken Co. Ltd. | 39,160 | 1,195 |
| | Sapporo Hokuyo | | |
| | Holdings Inc. | 254,900 | 1,192 |
| | Kaneka Corp. | 171,000 | 1,183 |
| | Ushio Inc. | 60,400 | 1,148 |
| | Hitachi Metals Ltd. | 95,000 | 1,137 |
| | Nabtesco Corp. | 53,000 | 1,128 |
| | Shimadzu Corp. | 145,000 | 1,124 |
| | Daicel Chemical | | |
| | Industries Ltd. | 154,000 | 1,122 |
| | Iyo Bank Ltd. | 138,000 | 1,102 |
| | Mitsubishi Logistics Corp. | 83,000 | 1,101 |
| | Koito | | |
| | Manufacturing Co. Ltd. | 70,712 | 1,100 |
| | Oracle Corp. Japan | 22,100 | 1,084 |
| | Asics Corp. | 84,596 | 1,084 |
| | Air Water Inc. | 82,805 | 1,056 |
| | Toyoda Gosei Co. Ltd. | 44,100 | 1,033 |
| | USS Co. Ltd. | 12,630 | 1,032 |
| | Dainippon Sumitomo | | |
| | Pharma Co. Ltd. | 112,500 | 1,022 |
| | Nissan Chemical | | |
| | Industries Ltd. | 79,000 | 1,020 |
| | Hakuhodo DY Holdings Inc. | 17,410 | 995 |
| | Alfresa Holdings Corp. | 22,400 | 994 |
| | Kikkoman Corp. | 88,000 | 984 |
| | McDonald’s Holdings Co. | | |
| | Japan Ltd. | 38,000 | 953 |
| | MediPal Holdings Corp. | 84,700 | 933 |
| | Daido Steel Co. Ltd. | 159,000 | 932 |
| | Tosoh Corp. | 287,000 | 930 |
| | Tokuyama Corp. | 179,000 | 924 |
| | Hitachi | | |
| | High-Technologies Corp. | 38,651 | 902 |
| | Aeon Credit | | |
| | Service Co. Ltd. | 62,210 | 876 |
| | Chiyoda Corp. | 87,809 | 871 |
| | Yamazaki Baking Co. Ltd. | 69,000 | 832 |
| * | Mizuho Trust & | | |
| | Banking Co. Ltd. | 802,000 | 827 |
| | Toyota Boshoku Corp. | 46,900 | 825 |
| | Mitsumi Electric Co. Ltd. | 43,600 | 798 |
| | Obic Co. Ltd. | 3,830 | 787 |
| | Hino Motors Ltd. | 145,000 | 783 |
| | Nisshinbo Holdings Inc. | 71,000 | 776 |
| | Mabuchi Motor Co. Ltd. | 14,900 | 767 |
| * | Shinsei Bank Ltd. | 578,014 | 753 |
| | Otsuka Corp. | 10,760 | 733 |
| | Aozora Bank Ltd. | 346,000 | 714 |
| | Kinden Corp. | 72,000 | 664 |
19
Tax-Managed International Fund
| | | |
| | | | Market |
| | | | Value |
| | | Shares | ($000) |
| | Yamato Kogyo Co. Ltd. | 22,000 | 662 |
| | Matsui Securities Co. Ltd. | 91,100 | 646 |
| | Sapporo Holdings Ltd. | 142,000 | 642 |
| | Square Enix | | |
| | Holdings Co. Ltd. | 35,600 | 630 |
| | Fuji Media Holdings Inc. | 399 | 629 |
| * | Gree Inc. | 45,900 | 583 |
| | Tokyo Steel | | |
| | Manufacturing Co. Ltd. | 53,300 | 580 |
| | Itochu | | |
| | Techno-Solutions Corp. | 14,900 | 558 |
| | Coca-Cola West Co. Ltd. | 30,000 | 544 |
| | Maruichi Steel Tube Ltd. | 25,300 | 537 |
| | Senshu Ikeda | | |
| | Holdings Inc. | 361,300 | 515 |
| | ABC-Mart Inc. | 13,900 | 496 |
| | Ito En Ltd. | 28,100 | 467 |
| | Canon Marketing | | |
| | Japan Inc. | 29,200 | 415 |
| | Shinko Electric | | |
| | Industries Co. Ltd. | 30,973 | 346 |
| | | | 1,570,550 |
| Netherlands (2.5%) | | |
| | Unilever NV | 1,055,758 | 33,066 |
| * | ING Groep NV | 2,488,754 | 24,375 |
| | Koninklijke Philips | | |
| | Electronics NV | 641,009 | 19,729 |
| | Koninklijke KPN NV | 1,027,564 | 15,067 |
| | ASML Holding NV | 282,783 | 10,888 |
| | Koninklijke Ahold NV | 784,158 | 10,400 |
| | Akzo Nobel NV | 152,750 | 9,541 |
| | Heineken NV | 163,139 | 8,033 |
| | TNT NV | 250,456 | 6,649 |
| * | Aegon NV | 1,042,990 | 6,410 |
| | Koninklijke DSM NV | 103,244 | 5,908 |
| | Reed Elsevier NV | 437,258 | 5,435 |
| | Wolters Kluwer NV | 188,106 | 4,141 |
| * | Randstad Holding NV | 75,564 | 4,009 |
| | Fugro NV | 43,864 | 3,626 |
| | Heineken Holding NV | 71,996 | 3,143 |
| | Corio NV | 38,491 | 2,481 |
| | SBM Offshore NV | 107,230 | 2,415 |
| | Koninklijke Vopak NV | 44,316 | 2,103 |
| | Koninklijke Boskalis | | |
| | Westminster NV | 41,075 | 1,969 |
| | Delta Lloyd NV | 56,793 | 1,150 |
| | | | 180,538 |
| New Zealand (0.1%) | | |
| | Fletcher Building Ltd. | 376,487 | 2,250 |
| | Telecom Corp. of | | |
| | New Zealand Ltd. | 1,329,503 | 2,241 |
| | Sky City Entertainment | | |
| | Group Ltd. | 448,576 | 1,135 |
| | | |
| | Auckland International | | |
| | Airport Ltd. | 568,589 | 968 |
| | Contact Energy Ltd. | 198,348 | 966 |
| | | | 7,560 |
| Norway (0.9%) | | |
| | Statoil ASA | 727,552 | 17,396 |
| | Telenor ASA | 543,748 | 8,895 |
| | DnB NOR ASA | 610,716 | 8,625 |
| | Yara International ASA | 125,652 | 7,342 |
| | Seadrill Ltd. | 184,444 | 6,316 |
| | Orkla ASA | 513,288 | 5,026 |
| | Norsk Hydro ASA | 600,943 | 4,444 |
| | Aker Solutions ASA | 111,262 | 1,906 |
| * | Renewable Energy Corp. | | |
| | ASA | 322,428 | 994 |
| | | | 60,944 |
| Portugal (0.3%) | | |
| | Portugal Telecom | | |
| | SGPS SA | 390,741 | 4,478 |
| | EDP - Energias de | | |
| | Portugal SA | 1,264,952 | 4,228 |
| | Galp Energia SGPS SA | | |
| | Class B | 132,032 | 2,542 |
| | Jeronimo Martins | | |
| | SGPS SA | 118,637 | 1,816 |
| | Banco Comercial | | |
| | Portugues SA | 2,010,802 | 1,570 |
| | Banco Espirito Santo SA | 376,680 | 1,454 |
| * | EDP Renovaveis SA | 171,955 | 1,001 |
| | Brisa Auto-Estradas de | | |
| | Portugal SA | 119,537 | 837 |
| | Cimpor Cimentos de | | |
| | Portugal SGPS SA | 114,790 | 781 |
| | | | 18,707 |
| Singapore (1.7%) | | |
| | Oversea-Chinese | | |
| | Banking Corp. Ltd. | 1,666,300 | 12,852 |
| | DBS Group Holdings Ltd. | 1,138,123 | 12,726 |
| | Singapore | | |
| | Telecommunications Ltd. | 5,318,290 | 12,661 |
| | United Overseas Bank Ltd. | 814,504 | 11,579 |
| | Keppel Corp. Ltd. | 801,276 | 7,083 |
| * | Genting Singapore plc | 3,787,000 | 6,490 |
| | CapitaLand Ltd. | 1,828,000 | 5,297 |
| | Wilmar International Ltd. | 1,191,000 | 5,245 |
| | Singapore Airlines Ltd. | 398,710 | 4,766 |
| | Singapore Exchange Ltd. | 634,000 | 4,165 |
| | Fraser and Neave Ltd. | 728,650 | 3,644 |
| | City Developments Ltd. | 357,000 | 3,505 |
| | Singapore Press | | |
| | Holdings Ltd. | 1,117,250 | 3,475 |
| | Noble Group Ltd. | 1,916,890 | 3,246 |
20
Tax-Managed International Fund
| | | |
| | | | Market |
| | | | Value |
| | | Shares | ($000) |
| | Golden | | |
| | Agri-Resources Ltd. | 4,947,831 | 3,095 |
| | Singapore Technologies | | |
| | Engineering Ltd. | 1,015,906 | 2,712 |
| | Olam International Ltd. | 1,006,200 | 2,469 |
| | SembCorp Industries Ltd. | 596,660 | 2,393 |
| | Jardine Cycle & | | |
| | Carriage Ltd. | 73,037 | 2,086 |
| | SembCorp Marine Ltd. | 486,600 | 2,039 |
| | ComfortDelGro Corp. Ltd. | 1,597,000 | 1,932 |
| | Keppel Land Ltd. | 509,000 | 1,909 |
| * | Global Logistic | | |
| | Properties Ltd. | 912,000 | 1,538 |
| | Yangzijiang Shipbuilding | | |
| | Holdings Ltd. | 936,000 | 1,396 |
| | UOL Group Ltd. | 372,750 | 1,384 |
| | Cosco Corp. Singapore Ltd. | 799,000 | 1,336 |
| * | Neptune Orient Lines Ltd. | 509,250 | 867 |
| | StarHub Ltd. | 327,000 | 673 |
| * | Golden Agri-Resources Ltd. | |
| | Warrants Exp. 07/23/2012 | 236,188 | 44 |
| | | | 122,607 |
| Spain (3.3%) | | |
| | Telefonica SA | 2,654,548 | 60,841 |
| | Banco Santander SA | 5,315,057 | 56,858 |
| | Banco Bilbao Vizcaya | | |
| | Argentaria SA | 2,772,588 | 28,367 |
| | Iberdrola SA | 2,600,828 | 20,245 |
| | Repsol YPF SA | 477,873 | 13,434 |
| | Inditex SA | 135,296 | 10,167 |
| | ACS Actividades de | | |
| | Construccion y | | |
| | Servicios SA | 86,943 | 4,099 |
| | Abertis Infraestructuras SA | 201,743 | 3,656 |
| | Red Electrica Corp. SA | 74,031 | 3,504 |
| | Gas Natural SDG SA | 207,783 | 3,213 |
| | Criteria Caixacorp SA | 581,251 | 3,117 |
| | Ferrovial SA | 302,159 | 3,029 |
| | Banco Popular Espanol SA | 584,876 | 3,028 |
| | Banco de Sabadell SA | 640,859 | 2,536 |
| * | Amadeus IT Holding SA | 118,567 | 2,501 |
| | Iberdrola Renovables SA | 601,213 | 2,145 |
| | Enagas | 106,433 | 2,137 |
| * | Iberia Lineas Aereas de | | |
| | Espana SA | 320,292 | 1,380 |
| | Gestevision Telecinco SA | 121,078 | 1,339 |
| | Acerinox SA | 75,312 | 1,331 |
| | Acciona SA | 18,508 | 1,319 |
| | Mapfre SA | 466,888 | 1,307 |
| | Bankinter SA | 213,143 | 1,191 |
| | Indra Sistemas SA | 68,223 | 1,174 |
| | Zardoya Otis SA | 80,028 | 1,133 |
| | Grifols SA | 76,426 | 1,049 |
| | | |
| | Fomento de | | |
| | Construcciones y | | |
| | Contratas SA | 31,760 | 840 |
| | Banco de Valencia SA | 118,661 | 524 |
| | | | 235,464 |
| Sweden (3.2%) | | |
| | Nordea Bank AB | 2,105,705 | 22,905 |
| | Telefonaktiebolaget LM | | |
| | Ericsson Class B | 1,959,734 | 22,720 |
| | Hennes & Mauritz AB | | |
| | Class B | 664,894 | 22,154 |
| * | Volvo AB Class B | 900,269 | 15,866 |
| | Sandvik AB | 679,135 | 13,257 |
| | TeliaSonera AB | 1,513,159 | 12,017 |
| | Atlas Copco AB Class A | 452,949 | 11,439 |
| | Svenska Handelsbanken | | |
| | AB Class A | 332,141 | 10,621 |
| | SKF AB | 273,149 | 7,798 |
| | Skandinaviska Enskilda | | |
| | Banken AB Class A | 915,818 | 7,650 |
| * | Swedbank AB Class A | 450,556 | 6,303 |
| | Atlas Copco AB Class B | 271,521 | 6,149 |
| | Svenska Cellulosa AB | | |
| | Class B | 375,661 | 5,934 |
| | Assa Abloy AB Class B | 195,025 | 5,504 |
| | Millicom International | | |
| | Cellular SA | 54,718 | 5,254 |
| | Alfa Laval AB | 240,333 | 5,076 |
| | Skanska AB Class B | 249,077 | 4,940 |
| | Electrolux AB Class B | 170,081 | 4,828 |
| | Scania AB Class B | 199,458 | 4,593 |
| | Swedish Match AB | 149,286 | 4,328 |
| | Tele2 AB | 196,143 | 4,071 |
| | Boliden AB | 184,335 | 3,757 |
| | Hexagon AB Class B | 158,635 | 3,408 |
| | Kinnevik Investment AB | | |
| | Class B | 155,755 | 3,173 |
| | Getinge AB | 149,974 | 3,141 |
| | Ratos AB | 79,527 | 2,942 |
| | Securitas AB Class B | 246,706 | 2,890 |
| | SSAB AB Class A | 137,704 | 2,322 |
| | Modern Times Group AB | | |
| | Class B | 32,652 | 2,164 |
| | Husqvarna AB | 243,765 | 2,038 |
| | Holmen AB | 50,548 | 1,665 |
| | | | 230,907 |
| Switzerland (8.1%) | | |
| | Nestle SA | 2,235,369 | 131,364 |
| | Novartis AG | 1,362,668 | 80,464 |
| | Roche Holding AG | 453,872 | 66,741 |
| * | UBS AG | 2,345,040 | 38,622 |
| | ABB Ltd. | 1,421,029 | 31,827 |
| | Credit Suisse Group AG | 729,735 | 29,481 |
21
Tax-Managed International Fund
| | | |
| | | | Market |
| | | | Value |
| | | Shares | ($000) |
| | Zurich Financial Services | | |
| | AG | 94,656 | 24,589 |
| | Cie Financiere Richemont | | |
| | SA | 339,569 | 20,030 |
| | Syngenta AG | 61,700 | 18,143 |
| * | Transocean Ltd. | 202,632 | 14,002 |
| | Swiss Reinsurance Co. Ltd. | 230,407 | 12,399 |
| | Holcim Ltd. | 160,321 | 12,170 |
| | Swatch Group AG (Bearer) | 20,317 | 9,087 |
| | Swisscom AG | 15,503 | 6,836 |
| | Julius Baer Group Ltd. | 131,499 | 6,176 |
| | Geberit AG | 25,600 | 5,938 |
| | SGS SA | 3,478 | 5,856 |
| | Givaudan SA | 5,321 | 5,762 |
| | Synthes Inc. | 37,534 | 5,082 |
| | Adecco SA | 76,195 | 5,012 |
| | Kuehne & Nagel | | |
| | International AG | 34,161 | 4,768 |
| | Sonova Holding AG | 30,930 | 3,999 |
| | Schindler Holding AG | | |
| | (Bearer) | 32,746 | 3,886 |
| * | Actelion Ltd. | 68,081 | 3,740 |
| | Baloise Holding AG | 32,458 | 3,167 |
| | Swiss Life Holding AG | 21,163 | 3,062 |
| | Sika AG | 1,342 | 2,955 |
| | Lonza Group AG | 33,243 | 2,673 |
| | Swatch Group AG | | |
| | (Registered) | 30,354 | 2,457 |
| * | GAM Holding AG | 146,329 | 2,426 |
| | Lindt & Spruengli AG | 74 | 2,389 |
| * | Logitech International SA | 123,677 | 2,359 |
| * | Aryzta AG | 43,185 | 2,001 |
| | Lindt & Spruengli AG | 591 | 1,790 |
| | Schindler Holding AG | | |
| | (Registered) | 12,186 | 1,463 |
| | Straumann Holding AG | 5,943 | 1,365 |
| * | Aryzta AG | 14,448 | 679 |
| | | | 574,760 |
| United Kingdom (21.4%) | | |
| | HSBC Holdings plc | 11,350,253 | 116,489 |
| | Vodafone Group plc | 34,050,916 | 89,765 |
| | BP plc | 12,034,032 | 89,076 |
| | Royal Dutch Shell plc | | |
| | Class A | 2,112,683 | 70,836 |
| | Rio Tinto plc | 931,367 | 66,669 |
| | GlaxoSmithKline plc | 3,353,673 | 65,311 |
| | Royal Dutch Shell plc | | |
| | Class B | 1,731,381 | 57,575 |
| | BHP Billiton plc | 1,417,760 | 57,279 |
| | British American | | |
| | Tobacco plc | 1,286,417 | 49,692 |
| | Anglo American plc | 847,122 | 44,502 |
| | BG Group plc | 2,173,033 | 44,266 |
| | AstraZeneca plc | 920,682 | 42,136 |
| | | |
| | Standard Chartered plc | 1,495,274 | 40,536 |
| | Tesco plc | 5,109,309 | 34,023 |
| | Xstrata plc | 1,317,105 | 31,342 |
| | Barclays plc | 7,412,598 | 30,764 |
| | Diageo plc | 1,624,480 | 30,225 |
| * | Lloyds Banking | | |
| | Group plc | 26,433,370 | 27,402 |
| | Unilever plc | 820,935 | 25,322 |
| | Reckitt Benckiser | | |
| | Group plc | 391,205 | 21,613 |
| | SABMiller plc | 608,546 | 21,529 |
| | Imperial Tobacco | | |
| | Group plc | 661,588 | 20,423 |
| | National Grid plc | 2,267,127 | 19,678 |
| | Prudential plc | 1,650,339 | 17,314 |
| | Centrica plc | 3,327,594 | 17,314 |
| | BT Group plc | 5,069,814 | 14,460 |
| | Rolls-Royce Group plc | 1,214,253 | 11,881 |
| | Scottish & | | |
| | Southern Energy plc | 602,217 | 11,552 |
| | BAE Systems plc | 2,225,795 | 11,513 |
| | Aviva plc | 1,829,944 | 11,296 |
| | Tullow Oil plc | 564,365 | 11,192 |
| | Compass Group plc | 1,180,499 | 10,759 |
| | WPP plc | 800,051 | 9,932 |
| | Shire plc | 369,975 | 8,958 |
| | British Sky Broadcasting | | |
| | Group plc | 752,063 | 8,681 |
| | Pearson plc | 534,074 | 8,452 |
| | Experian plc | 671,590 | 8,400 |
| * | Royal Bank of | | |
| | Scotland Group plc | 11,497,544 | 7,091 |
| | Old Mutual plc | 3,614,348 | 6,990 |
| | International Power plc | 1,002,322 | 6,893 |
| | Reed Elsevier plc | 805,044 | 6,829 |
| | Kingfisher plc | 1,571,184 | 6,500 |
| | Antofagasta plc | 254,071 | 6,456 |
| | Smith & Nephew plc | 587,691 | 6,231 |
| | Legal & General Group plc | 3,902,265 | 5,935 |
| * | Cairn Energy plc | 898,409 | 5,923 |
| * | Wolseley plc | 181,188 | 5,825 |
| | Marks & | | |
| | Spencer Group plc | 995,707 | 5,766 |
| | Royal Dutch Shell plc | | |
| | Class A | | |
| | (Amsterdam shares) | 167,144 | 5,560 |
| | WM Morrison | | |
| | Supermarkets plc | 1,318,467 | 5,532 |
| | Man Group plc | 1,183,367 | 5,510 |
| | ARM Holdings plc | 797,942 | 5,469 |
| | Land Securities Group plc | 511,752 | 5,421 |
| | Carnival plc | 112,756 | 5,267 |
| | Standard Life plc | 1,515,040 | 5,138 |
| | Smiths Group plc | 259,837 | 5,072 |
22
Tax-Managed International Fund
| | | |
| | | | Market |
| | | | Value |
| | | Shares | ($000) |
| | Burberry Group plc | 278,285 | 4,911 |
| | British Land Co. plc | 590,416 | 4,867 |
| | J Sainsbury plc | 815,364 | 4,810 |
| | Randgold Resources Ltd. | 55,605 | 4,605 |
| | Johnson Matthey plc | 142,840 | 4,570 |
| | Capita Group plc | 409,814 | 4,476 |
| | RSA Insurance Group plc | 2,183,249 | 4,286 |
| | United Utilities Group plc | 457,609 | 4,251 |
| | Petrofac Ltd. | 165,448 | 4,128 |
| | AMEC plc | 223,726 | 4,040 |
| | Aggreko plc | 172,458 | 4,007 |
| | Associated British | | |
| | Foods plc | 215,505 | 3,995 |
| | Sage Group plc | 889,536 | 3,816 |
| | Severn Trent plc | 161,914 | 3,759 |
| | Resolution Ltd. | 990,828 | 3,640 |
| | G4S plc | 888,283 | 3,539 |
| | Next plc | 113,945 | 3,534 |
| | Weir Group plc | 126,270 | 3,523 |
| | Intercontinental Hotels | | |
| | Group plc | 174,514 | 3,423 |
| | 3i Group plc | 659,578 | 3,403 |
| * | Lonmin plc | 105,722 | 3,268 |
| | ICAP plc | 384,359 | 3,227 |
| | Kazakhmys plc | 126,243 | 3,218 |
| | Hammerson plc | 486,619 | 3,185 |
| | Admiral Group plc | 133,351 | 3,167 |
| * | Autonomy Corp. plc | 133,416 | 3,152 |
| | Invensys plc | 550,198 | 3,054 |
| | Whitbread plc | 106,566 | 2,995 |
| | Vedanta Resources plc | 73,085 | 2,895 |
| | Fresnillo plc | 109,836 | 2,886 |
| | Rexam plc | 537,887 | 2,805 |
| | Inmarsat plc | 262,935 | 2,777 |
| * | ITV plc | 2,491,223 | 2,743 |
| | Intertek Group plc | 96,542 | 2,681 |
| | Serco Group plc | 300,250 | 2,617 |
| | Investec plc | 312,848 | 2,588 |
| | Eurasian Natural | | |
| | Resources Corp. plc | 156,468 | 2,584 |
| | Bunzl plc | 225,411 | 2,542 |
| | | |
| | Schroders plc | 79,165 | 2,305 |
| | Segro plc | 511,833 | 2,302 |
| | Cobham plc | 718,538 | 2,294 |
| | Capital Shopping Centres | | |
| | Group plc | 314,019 | 2,057 |
| | Balfour Beatty plc | 405,880 | 1,993 |
| | Babcock International | | |
| | Group plc | 202,804 | 1,815 |
| * | British Airways plc | 421,727 | 1,805 |
| | Thomas Cook Group plc | 604,939 | 1,798 |
| | Firstgroup plc | 276,599 | 1,728 |
| * | Essar Energy plc | 186,386 | 1,699 |
| | Cable & Wireless | | |
| | Worldwide plc | 1,569,901 | 1,619 |
| | Home Retail Group plc | 511,448 | 1,518 |
| | London Stock Exchange | | |
| | Group plc | 101,138 | 1,332 |
| | TUI Travel plc | 319,242 | 1,235 |
| | | | 1,531,032 |
| Total Common Stocks | | |
| (Cost $6,623,065) | | 7,139,817 |
| Temporary Cash Investment (0.1%) | |
| Money Market Fund (0.1%) | | |
| 1 | Vanguard Market | | |
| | Liquidity Fund, 0.211% | | |
| | (Cost $8,138) | 8,137,659 | 8,138 |
| Total Investments (100.1%) | | |
| (Cost $6,631,203) | | 7,147,955 |
| Other Assets and Liabilities (-0.1%) | |
| Other Assets | | 9,115 |
| Liabilities | | (14,562) |
| | | | (5,447) |
| Net Assets (100%) | | 7,142,508 |
23
Tax-Managed International Fund
| |
| At December 31, 2010, net assets consisted of: |
| | Amount |
| | ($000) |
| Paid-in Capital | 7,063,044 |
| Overdistributed Net Investment Income | (5,506) |
| Accumulated Net Realized Losses | (431,803) |
| Unrealized Appreciation (Depreciation) | |
| Investment Securities | 516,752 |
| Foreign Currencies | 21 |
| Net Assets | 7,142,508 |
| |
| |
| Investor Shares—Net Assets | |
| Applicable to 127,371,352 outstanding | |
| $.001 par value shares of beneficial | |
| interest (unlimited authorization) | 1,475,569 |
| Net Asset Value Per Share— | |
| Investor Shares | $11.58 |
| |
| |
| Institutional Shares—Net Assets | |
| Applicable to 21,781,281 outstanding | |
| $.001 par value shares of beneficial | |
| interest (unlimited authorization) | 252,574 |
| Net Asset Value Per Share— | |
| Institutional Shares | $11.60 |
| |
| |
| ETF Shares—Net Assets | |
| Applicable to 150,222,481 outstanding | |
| $.001 par value shares of beneficial | |
| interest (unlimited authorization) | 5,414,365 |
| Net Asset Value Per Share— | |
| ETF Shares | $36.04 |
See Note A in Notes to Financial Statements.
* Non-income-producing security.
1 Affiliated money market fund available only to Vanguard funds and certain trusts and accounts managed by Vanguard. Rate shown is the
7-day yield.
ADR—American Depositary Receipt.
See accompanying Notes, which are an integral part of the Financial Statements.
24
Tax-Managed International Fund
Statement of Operations
| |
| | Year Ended |
| | December 31, 2010 |
| | ($000) |
| Investment Income | |
| Income | |
| Dividends1 | 176,245 |
| Interest2 | 6 |
| Total Income | 176,251 |
| Expenses | |
| The Vanguard Group—Note B | |
| Investment Advisory Services | 393 |
| Management and Administrative—Investor Shares | 1,895 |
| Management and Administrative—Institutional Shares | 73 |
| Management and Administrative—ETF Shares | 3,015 |
| Marketing and Distribution—Investor Shares | 272 |
| Marketing and Distribution—Institutional Shares | 50 |
| Marketing and Distribution—ETF Shares | 1,314 |
| Custodian Fees | 854 |
| Auditing Fees | 34 |
| Shareholders’ Reports—Investor Shares | 7 |
| Shareholders’ Reports—Institutional Shares | — |
| Shareholders’ Reports—ETF Shares | 98 |
| Trustees’ Fees and Expenses | 8 |
| Total Expenses | 8,013 |
| Net Investment Income | 168,238 |
| Realized Net Gain (Loss) | |
| Investment Securities Sold | 287,998 |
| Foreign Currencies | 618 |
| Realized Net Gain (Loss) | 288,616 |
| Change in Unrealized Appreciation (Depreciation) | |
| Investment Securities | 101,846 |
| Foreign Currencies | 193 |
| Change in Unrealized Appreciation (Depreciation) | 102,039 |
| Net Increase (Decrease) in Net Assets Resulting from Operations | 558,893 |
| 1 Dividends are net of foreign withholding taxes of $15,151,000. |
| 2 Interest income from an affiliated company of the fund was $6,000. |
See accompanying Notes, which are an integral part of the Financial Statements.
25
Tax-Managed International Fund
Statement of Changes in Net Assets
| | |
| | Year Ended December 31, |
| | 2010 | 2009 |
| | ($000) | ($000) |
| Increase (Decrease) in Net Assets | | |
| Operations | | |
| Net Investment Income | 168,238 | 133,507 |
| Realized Net Gain (Loss) | 288,616 | (192,276) |
| Change in Unrealized Appreciation (Depreciation) | 102,039 | 1,325,206 |
| Net Increase (Decrease) in Net Assets Resulting from Operations | 558,893 | 1,266,437 |
| Distributions | | |
| Net Investment Income | | |
| Investor Shares | (35,288) | (32,472) |
| Institutional Shares | (6,263) | (5,265) |
| ETF Shares | (129,223) | (102,044) |
| Realized Capital Gain | | |
| Investor Shares | — | — |
| Institutional Shares | — | — |
| ETF Shares | — | — |
| Total Distributions | (170,774) | (139,781) |
| Capital Share Transactions | | |
| Investor Shares | (11,713) | 772 |
| Institutional Shares | 24,551 | (64,053) |
| ETF Shares | 757,013 | 1,255,998 |
| Net Increase (Decrease) from Capital Share Transactions | 769,851 | 1,192,717 |
| Total Increase (Decrease) | 1,157,970 | 2,319,373 |
| Net Assets | | |
| Beginning of Period | 5,984,538 | 3,665,165 |
| End of Period1 | 7,142,508 | 5,984,538 |
| 1 Net Assets—End of Period includes undistributed (overdistributed) net investment income of ($5,506,000) and ($3,597,000). |
See accompanying Notes, which are an integral part of the Financial Statements.
26
Tax-Managed International Fund
Financial Highlights
| | | | | |
| Investor Shares | | | | | |
| |
| For a Share Outstanding | Year Ended December 31, |
| Throughout Each Period | 2010 | 2009 | 2008 | 2007 | 2006 |
| Net Asset Value, Beginning of Period | $10.95 | $8.74 | $15.40 | $14.16 | $11.48 |
| Investment Operations | | | | | |
| Net Investment Income | .278 | .2771 | .290 | .332 | .331 |
| Net Realized and Unrealized Gain (Loss) | | | | | |
| on Investments | .634 | 2.190 | (6.661) | 1.244 | 2.685 |
| Total from Investment Operations | .912 | 2.467 | (6.371) | 1.576 | 3.016 |
| Distributions | | | | | |
| Dividends from Net Investment Income | (.282) | (.257) | (.289) | (.336) | (.336) |
| Distributions from Realized Capital Gains | — | — | — | — | — |
| Total Distributions | (.282) | (.257) | (.289) | (.336) | (.336) |
| Net Asset Value, End of Period | $11.58 | $10.95 | $8.74 | $15.40 | $14.16 |
| |
| Total Return2 | 8.36% | 28.27% | -41.27% | 11.15% | 26.27% |
| |
| Ratios/Supplemental Data | | | | | |
| Net Assets, End of Period (Millions) | $1,476 | $1,409 | $1,131 | $1,915 | $1,624 |
| Ratio of Total Expenses to | | | | | |
| Average Net Assets | 0.18% | 0.20% | 0.15% | 0.15% | 0.20% |
| Ratio of Net Investment Income to | | | | | |
| Average Net Assets | 2.70% | 2.87% | 3.47% | 2.71% | 2.70% |
| Portfolio Turnover Rate3 | 6% | 9% | 16% | 6% | 4% |
| 1 Calculated based on average shares outstanding. |
| 2 Total returns do not include transaction or account service fees that may have applied in the periods shown. Fund prospectuses provide |
| information about any applicable transaction and account service fees. |
| 3 Excludes the value of portfolio securities received or delivered as a result of in-kind purchases or redemptions of the fund’s capital shares, |
| including ETF Creation Units. |
See accompanying Notes, which are an integral part of the Financial Statements.
27
Tax-Managed International Fund
Financial Highlights
| | | | | |
| Institutional Shares | | | | | |
| |
| For a Share Outstanding | Year Ended December 31, |
| Throughout Each Period | 2010 | 2009 | 2008 | 2007 | 2006 |
| Net Asset Value, Beginning of Period | $10.96 | $8.74 | $15.41 | $14.17 | $11.48 |
| Investment Operations | | | | | |
| Net Investment Income | .289 | .2881 | .296 | .341 | .348 |
| Net Realized and Unrealized Gain (Loss) | | | | | |
| on Investments | .644 | 2.197 | (6.671) | 1.244 | 2.685 |
| Total from Investment Operations | .933 | 2.485 | (6.375) | 1.585 | 3.033 |
| Distributions | | | | | |
| Dividends from Net Investment Income | (.293) | (.265) | (.295) | (.345) | (.343) |
| Distributions from Realized Capital Gains | — | — | — | — | — |
| Total Distributions | (.293) | (.265) | (.295) | (.345) | (.343) |
| Net Asset Value, End of Period | $11.60 | $10.96 | $8.74 | $15.41 | $14.17 |
| |
| Total Return2 | 8.55% | 28.48% | -41.27% | 11.21% | 26.42% |
| |
| Ratios/Supplemental Data | | | | | |
| Net Assets, End of Period (Millions) | $253 | $219 | $242 | $568 | $258 |
| Ratio of Total Expenses to | | | | | |
| Average Net Assets | 0.08% | 0.10% | 0.09% | 0.09% | 0.14% |
| Ratio of Net Investment Income to | | | | | |
| Average Net Assets | 2.80% | 2.97% | 3.53% | 2.77% | 2.76% |
| Portfolio Turnover Rate3 | 6% | 9% | 16% | 6% | 4% |
| 1 Calculated based on average shares outstanding. |
| 2 Total returns do not include transaction fees that may have applied in the periods shown. Fund prospectuses provide information about any |
| applicable transaction fees. |
| 3 Excludes the value of portfolio securities received or delivered as a result of in-kind purchases or redemptions of the fund’s capital shares, |
| including ETF Creation Units. |
See accompanying Notes, which are an integral part of the Financial Statements.
28
Tax-Managed International Fund
Financial Highlights
| | | | |
| Europe Pacific ETF Shares | | | | |
| | | | | July 20, |
| | | | | 20071 to |
| | Year Ended December 31, | Dec. 31, |
| For a Share Outstanding Throughout Each Period | 2010 | 2009 | 2008 | 2007 |
| Net Asset Value, Beginning of Period | $34.06 | $27.18 | $47.92 | $49.99 |
| Investment Operations | | | | |
| Net Investment Income | .887 | .8602 | .934 | .204 |
| Net Realized and Unrealized Gain (Loss) on Investments | 1.990 | 6.836 | (20.744) | (1.219) |
| Total from Investment Operations | 2.877 | 7.696 | (19.810) | (1.015) |
| Distributions | | | | |
| Dividends from Net Investment Income | (.897) | (.816) | (.930) | (1.055) |
| Distributions from Realized Capital Gains | — | — | — | — |
| Total Distributions | (.897) | (.816) | (.930) | (1.055) |
| Net Asset Value, End of Period | $36.04 | $34.06 | $27.18 | $47.92 |
| |
| Total Return | 8.47% | 28.34% | -41.25% | -2.02% |
| |
| Ratios/Supplemental Data | | | | |
| Net Assets, End of Period (Millions) | $5,414 | $4,356 | $2,292 | $653 |
| Ratio of Total Expenses to Average Net Assets | 0.12% | 0.15% | 0.11% | 0.12%3 |
| Ratio of Net Investment Income to Average Net Assets | 2.76% | 2.92% | 3.51% | 2.74%3 |
| Portfolio Turnover Rate4 | 6% | 9% | 16% | 6% |
| 1 Inception. |
| 2 Calculated based on average shares outstanding. |
| 3 Annualized. |
| 4 Excludes the value of portfolio securities received or delivered as a result of in-kind purchases or redemptions of the fund’s capital shares, |
| including ETF Creation Units. |
See accompanying Notes, which are an integral part of the Financial Statements.
29
Tax-Managed International Fund
Notes to Financial Statements
Vanguard Tax-Managed International Fund is registered under the Investment Company Act of 1940 as an open-end investment company, or mutual fund. The fund invests in securities of foreign issuers, which may subject it to investment risks not normally associated with investing in securities of U.S. corporations. The fund offers three classes of shares: Investor Shares, Institutional Shares, and ETF Shares. Investor Shares are available to any investor who meets the fund’s minimum purchase requirements. Institutional Shares are designed for investors who meet certain administrative, service, and account-size criteria. ETF Shares, known as Vanguard Europe Pacific ETF Shares, are listed for trading on the NYSE Arca, Inc.; they can be purchased and sold through a broker.
A. The following significant accounting policies conform to generally accepted accounting principles for U.S. mutual funds. The fund consistently follows such policies in preparing its financial statements.
1. Security Valuation: Securities are valued as of the close of trading on the New York Stock Exchange (generally 4 p.m., Eastern time) on the valuation date. Equity securities are valued at the latest quoted sales prices or official closing prices taken from the primary market in which each security trades; such securities not traded on the valuation date are valued at the mean of the latest quoted bid and asked prices. Securities for which market quotations are not readily available, or whose values have been affected by events occurring before the fund’s pricing time but after the close of the securities’ primary markets, are valued at their fair values calculated according to procedures adopted by the board of trustees. These procedures include obtaining quotations from an independent pricing service, monitoring news to identify significant market- or security-specific events, and evaluating changes in the values of foreign market proxies (for example, ADRs, futures contracts, or exchange-traded funds), between the time the foreign markets close and the fund’s pricing time. When fair-value pricing is employed, the prices of securities used by a fund to calculate its net asset value may differ from quoted or published prices for the same securities. Investments in Vanguard Market Liquidity Fund are valued at that fund’s net asset value.
2. Foreign Currency: Securities and other assets and liabilities denominated in foreign currencies are translated into U.S. dollars using exchange rates obtained from an independent third party as of the fund’s pricing time on the valuation date. Realized gains (losses) and unrealized appreciation (depreciation) on investment securities include the effects of changes in exchange rates since the securities were purchased, combined with the effects of changes in security prices. Fluctuations in the value of other assets and liabilities resulting from changes in exchange rates are recorded as unrealized foreign currency gains (losses) until the assets or liabilities are settled in cash, at which time they are recorded as realized foreign currency gains (losses).
3. Federal Income Taxes: The fund intends to continue to qualify as a regulated investment company and distribute all of its taxable income. Management has analyzed the fund’s tax positions taken for all open federal income tax years (December 31, 2007–2010), and has concluded that no provision for federal income tax is required in the fund’s financial statements.
4. Distributions: Distributions to shareholders are recorded on the ex-dividend date.
30
Tax-Managed International Fund
5. Other: Dividend income is recorded on the ex-dividend date. Interest income includes income distributions received from Vanguard Market Liquidity Fund and is accrued daily. Security transactions are accounted for on the date securities are bought or sold. Costs used to determine realized gains (losses) on the sale of investment securities are those of the specific securities sold. Fees assessed on redemptions of capital shares are credited to paid-in capital.
Each class of shares has equal rights as to assets and earnings, except that each class separately bears certain class-specific expenses related to maintenance of shareholder accounts (included in Management and Administrative expenses) and shareholder reporting. Marketing and distribution expenses are allocated to each class of shares based on a method approved by the board of trustees. Income, other non-class-specific expenses, and gains and losses on investments are allocated to each class of shares based on its relative net assets.
B. The Vanguard Group furnishes at cost investment advisory, corporate management, administrative, marketing, and distribution services. The costs of such services are allocated to the fund under methods approved by the board of trustees. The fund has committed to provide up to 0.40% of its net assets in capital contributions to Vanguard. At December 31, 2010, the fund had contributed capital of $1,128,000 to Vanguard (included in Other Assets), representing 0.02% of the fund’s net assets and 0.45% of Vanguard’s capitalization. The fund’s trustees and officers are also directors and officers of Vanguard.
C. Various inputs may be used to determine the value of the fund’s investments. These inputs are summarized in three broad levels for financial statement purposes. The inputs or methodologies used to value securities are not necessarily an indication of the risk associated with investing in those securities.
Level 1—Quoted prices in active markets for identical securities.
Level 2—Other significant observable inputs (including quoted prices for similar securities, interest rates, prepayment speeds, credit risk, etc.).
Level 3—Significant unobservable inputs (including the fund’s own assumptions used to determine the fair value of investments).
The following table summarizes the fund’s investments as of December 31, 2010, based on the inputs used to value them:
| | | |
| | Level 1 | Level 2 | Level 3 |
| Investments | ($000) | ($000) | ($000) |
| Common Stocks | 5,971 | 7,133,771 | 75 |
| Temporary Cash Investments | 8,138 | — | — |
| Total | 14,109 | 7,133,771 | 75 |
31
Tax-Managed International Fund
The following table summarizes changes in investments valued based on Level 3 inputs during the year ended December 31, 2010:
| |
| | Investments in |
| | Common Stocks |
| Amount Valued Based on Level 3 Inputs | ($000) |
| Balance as of December 31, 2009 | 80 |
| Change in Unrealized Appreciation (Depreciation) | (5) |
| Balance as of December 31, 2010 | 75 |
D. Distributions are determined on a tax basis and may differ from net investment income and realized capital gains for financial reporting purposes. Differences may be permanent or temporary. Permanent differences are reclassified among capital accounts in the financial statements to reflect their tax character. Temporary differences arise when certain items of income, expense, gain, or loss are recognized in different periods for financial statement and tax purposes; these differences will reverse at some time in the future. Differences in classification may also result from the treatment of short-term gains as ordinary income for tax purposes.
During the year ended December 31, 2010, the fund realized net foreign currency gains of $618,000, which increased distributable net income for tax purposes; accordingly, such gains have been reclassified from accumulated net realized losses to overdistributed net investment income.
During the year ended December 31, 2010, the fund realized $172,345,000 of net capital gains resulting from in-kind redemptions—in which shareholders exchanged fund shares for securities held by the fund rather than for cash. Because such gains are not taxable to the fund, and are not distributed to shareholders, they have been reclassified from accumulated net realized losses to paid-in capital.
For tax purposes, at December 31, 2010, the fund had $2,248,000 of ordinary income available for distribution. The fund had available capital loss carryforwards totaling $431,803,000 to offset future net capital gains of $92,787,000 through December 31, 2016, and $339,016,000 through December 31, 2017.
At December 31, 2010, the cost of investment securities for tax purposes was $6,631,203,000. Net unrealized appreciation of investment securities for tax purposes was $516,752,000, consisting of unrealized gains of $1,057,469,000 on securities that had risen in value since their purchase and $540,717,000 in unrealized losses on securities that had fallen in value since their purchase.
32
Tax-Managed International Fund
E. During the year ended December 31, 2010, the fund purchased $1,584,913,000 of investment securities and sold $818,360,000 of investment securities, other than temporary cash investments.
F. Capital share transactions for each class of shares were:
| | | | |
| | Year Ended December 31, |
| | 2010 | 2009 |
| | Amount | Shares | Amount | Shares |
| | ($000) | (000) | ($000) | (000) |
| Investor Shares | | | | |
| Issued | 110,270 | 10,303 | 125,159 | 14,090 |
| Issued in Lieu of Cash Distributions | 27,785 | 2,426 | 26,118 | 2,418 |
| Redeemed1 | (149,768) | (14,095) | (150,505) | (17,213) |
| Net Increase (Decrease)—Investor Shares | (11,713) | (1,366) | 772 | (705) |
| Institutional Shares | | | | |
| Issued | 93,918 | 8,828 | 13,419 | 1,577 |
| Issued in Lieu of Cash Distributions | 4,669 | 407 | 3,723 | 345 |
| Redeemed1 | (74,036) | (7,475) | (81,195) | (9,541) |
| Net Increase (Decrease)—Institutional Shares | 24,551 | 1,760 | (64,053) | (7,619) |
| ETF Shares | | | | |
| Issued | 1,181,384 | 35,340 | 1,367,568 | 47,062 |
| Issued in Lieu of Cash Distributions | — | — | — | — |
| Redeemed1 | (424,371) | (13,000) | (111,570) | (3,500) |
| Net Increase (Decrease)—ETF Shares | 757,013 | 22,340 | 1,255,998 | 43,562 |
| 1 Net of redemption fees for fiscal 2010 and 2009 of $957,000 and $931,000, respectively (fund totals). |
G. In preparing the financial statements as of December 31, 2010, management considered the impact of subsequent events for potential recognition or disclosure in these financial statements.
33
Report of Independent Registered Public Accounting Firm
To the Trustees of Vanguard Tax-Managed Funds and the Shareholders of Vanguard Tax-Managed International Fund:
In our opinion, the accompanying statement of net assets and the related statements of operations and of changes in net assets and the financial highlights present fairly, in all material respects, the financial position of Vanguard Tax-Managed International Fund (constituting a separate portfolio of Vanguard Tax-Managed Funds, hereafter referred to as the “Fund”) at December 31, 2010, the results of its operations for the year then ended, the changes in its net assets for each of the two years in the period then ended and the financial highlights for each of the periods indicated, in conformity with accounting principles generally accepted in the United States of America. These financial statements and financial highlights (hereafter referred to as “financial statements”) are the responsibility of the Fund’s management; our responsibility is to express an opinion on these financial statements based on our audits. We conducted our audits of these financial statements in accordance with the standards of the Public Company Accounting Oversight Board (United States). Those standards require that we plan and perform the audit to obtain reasonable assurance about whether the financial statements are free of material misstatement. An audit includes examining, on a test basis, evidence supporting the amounts and disclosures in the financial statements, assessing the accounting principles used and significant estimates made by management, and evaluating the overall financial statement presentation. We believe that our audits, which included confirmation of securities at December 31, 2010 by correspondence with the custodian and by agreement to the underlying ownership records of Vanguard Market Liquidity Fund, provide a reasonable basis for our opinion.
PricewaterhouseCoopers LLP
Philadelphia, Pennsylvania
February 8, 2011
Special 2010 tax information (unaudited) for Vanguard Tax-Managed International Fund
This information for the fiscal year ended December 31, 2010, is included pursuant to provisions of
the Internal Revenue Code.
The fund distributed $170,774,000 of qualified dividend income to shareholders during the fiscal year.
The fund designates to shareholders foreign source income of $191,318,000 and foreign taxes
paid of $15,121,000. Shareholders will receive more detailed information with their Form 1099-DIV
in January 2011 to determine the calendar-year amounts to be included on their 2010 tax returns.
34
Your Fund’s After-Tax Returns
This table presents returns for your fund both before and after taxes. The after-tax returns are shown in two ways: (1) assuming that an investor owned the fund during the entire period and paid taxes on the fund’s distributions, and (2) assuming that an investor paid taxes on the fund’s distributions and sold all shares at the end of each period.
Calculations are based on the highest individual federal income tax and capital gains tax rates in effect at the times of the distributions and the hypothetical sales. State and local taxes were not considered. After-tax returns reflect any qualified dividend income . (In the example, returns after the sale of fund shares may be higher than those assuming no sale. This occurs when the sale would have produced a capital loss. The calculation assumes that the investor received a tax deduction for the loss.) The table shows returns for Investor Shares only; returns for other share classes will differ. Please note that your actual after-tax returns will depend on your tax situation and may differ from those shown. Also note that if you own the fund in a tax-deferred account, such as an individual retirement account or a 401(k) plan, this information does not apply to you. Such accounts are not subject to current taxes.
Finally, keep in mind that a fund’s performance—whether before or after taxes—does not guarantee future results.
Average Annual Total Returns: Tax-Managed International Fund Investor Shares
Periods Ended December 31, 2010
| | One | Five | Ten |
| | Year | Years | Years |
| Returns Before Taxes | 7.30% | 2.76% | 3.64% |
| Returns After Taxes on Distributions | 7.06 | 2.52 | 3.34 |
| Returns After Taxes on Distributions and Sale of Fund Shares | 5.41 | 2.49 | 3.16 |
All returns are adjusted to reflect the 1% fee on redemptions of shares held for less than five years.
35
About Your Fund’s Expenses
As a shareholder of the fund, you incur ongoing costs, which include costs for portfolio management, administrative services, and shareholder reports (like this one), among others. Operating expenses, which are deducted from a fund’s gross income, directly reduce the investment return of the fund.
A fund’s expenses are expressed as a percentage of its average net assets. This figure is known as the expense ratio. The following examples are intended to help you understand the ongoing costs (in dollars) of investing in your fund and to compare these costs with those of other mutual funds. The examples are based on an investment of $1,000 made at the beginning of the period shown and held for the entire period.
The accompanying table illustrates your fund’s costs in two ways:
• Based on actual fund return. This section helps you to estimate the actual expenses that you paid over the period. The ”Ending Account Value“ shown is derived from the fund‘s actual return, and the third column shows the dollar amount that would have been paid by an investor who started with $1,000 in the fund. You may use the information here, together with the amount you invested, to estimate the expenses that you paid over the period.
To do so, simply divide your account value by $1,000 (for example, an $8,600 account value divided by $1,000 = 8.6), then multiply the result by the number given for your fund under the heading ”Expenses Paid During Period.“
• Based on hypothetical 5% yearly return. This section is intended to help you compare your fund‘s costs with those of other mutual funds. It assumes that the fund had a yearly return of 5% before expenses, but that the expense ratio is unchanged. In this case—because the return used is not the fund’s actual return—the results do not apply to your investment. The example is useful in making comparisons because the Securities and Exchange Commission requires all mutual funds to calculate expenses based on a 5% return. You can assess your fund’s costs by comparing this hypothetical example with the hypothetical examples that appear in shareholder reports of other funds.
Note that the expenses shown in the table are meant to highlight and help you compare ongoing costs only and do not reflect transaction costs incurred by the fund for buying and selling securities. Further, the expenses do not include the 1% fee on redemptions of shares held for less than five years, nor do they include the account service fee described in the prospectus. If such fees were applied to your account, your costs would be higher. Your fund does not carry a “sales load.” The calculations assume no shares were bought or sold during the period. Your actual costs may have been higher or lower, depending on the amount of your investment and the timing of any purchases or redemptions.
You can find more information about the fund’s expenses, including annual expense ratios, in the Financial Statements section of this report. For additional information on operating expenses and other shareholder costs, please refer to your fund’s current prospectus.
36
| | | |
| Six Months Ended December 31, 2010 | | | |
| | Beginning | Ending | Expenses |
| | Account Value | Account Value | Paid During |
| Tax-Managed International Fund | 6/30/2010 | 12/31/2010 | Period |
| Based on Actual Fund Return | | | |
| Investor Shares | $1,000.00 | $1,255.23 | $1.02 |
| Institutional Shares | 1,000.00 | 1,257.11 | 0.46 |
| Europe Pacific ETF Shares | 1,000.00 | 1,255.85 | 0.51 |
| Based on Hypothetical 5% Yearly Return | | | |
| Investor Shares | $1,000.00 | $1,024.30 | $0.92 |
| Institutional Shares | 1,000.00 | 1,024.80 | 0.41 |
| Europe Pacific ETF Shares | 1,000.00 | 1,024.75 | 0.46 |
The calculations are based on expenses incurred in the most recent six-month period. The fund’s annualized six-month expense ratios for that
period are 0.18% for Investor Shares, 0.08% for Institutional Shares, and 0.09% for Europe Pacific ETF Shares. The dollar amounts shown as
“Expenses Paid” are equal to the annualized expense ratio multiplied by the average account value over the period, multiplied by the number
of days in the most recent six-month period, then divided by the number of days in the most recent 12-month period.
37
Glossary
Beta. A measure of the magnitude of a fund’s past share-price fluctuations in relation to the ups and downs of a given market index. The index is assigned a beta of 1.00. Compared with a given index, a fund with a beta of 1.20 typically would have seen its share price rise or fall by 12% when the index rose or fell by 10%. For this report, beta is based on returns over the past 36 months for both the fund and the index. Note that a fund’s beta should be reviewed in conjunction with its R-squared (see definition). The lower the R-squared, the less correlation there is between the fund and the index, and the less reliable beta is as an indicator of volatility.
Dividend Yield. Dividend income earned by stocks, expressed as a percentage of the aggregate market value (or of net asset value, for a fund). The yield is determined by dividing the amount of the annual dividends by the aggregate value (or net asset value) at the end of the period. For a fund, the dividend yield is based solely on stock holdings and does not include any income produced by other investments.
Earnings Growth Rate. The average annual rate of growth in earnings over the past five years for the stocks now in a fund.
Equity Exposure. A measure that reflects a fund’s investments in stocks and stock futures. Any holdings in short-term reserves are excluded.
Expense Ratio. The percentage of a fund’s average net assets used to pay its annual administrative and advisory expenses. These expenses directly reduce returns to investors.
Inception Date. The date on which the assets of a fund (or one of its share classes) are first invested in accordance with the fund’s investment objective. For funds with a subscription period, the inception date is the day after that period ends. Investment performance is measured from the inception date.
Median Market Cap. An indicator of the size of companies in which a fund invests; the midpoint of market capitalization (market price x shares outstanding) of a fund’s stocks, weighted by the proportion of the fund’s assets invested in each stock. Stocks representing half of the fund’s assets have market capitalizations above the median, and the rest are below it.
Price/Book Ratio. The share price of a stock divided by its net worth, or book value, per share. For a fund, the weighted average price/book ratio of the stocks it holds.
Price/Earnings Ratio. The ratio of a stock’s current price to its per-share earnings over the past year. For a fund, the weighted average P/E of the stocks it holds. P/E is an indicator of market expectations about corporate prospects; the higher the P/E, the greater the expectations for a company’s future growth.
R-Squared. A measure of how much of a fund’s past returns can be explained by the returns from the market in general, as measured by a given index. If a fund’s total returns were precisely synchronized with an index’s returns, its R-squared would be 1.00. If the fund’s returns bore no relationship to the index’s returns, its R-squared would be 0. For this report, R-squared is based on returns over the past 36 months for both the fund and the index.
Return on Equity. The annual average rate of return generated by a company during the past five years for each dollar of shareholder’s equity (net income divided by shareholder’s equity). For a fund, the weighted average return on equity for the companies whose stocks it holds.
38
Short-Term Reserves. The percentage of a fund invested in highly liquid, short-term securities that can be readily converted to cash.
Turnover Rate. An indication of the fund’s trading activity. Funds with high turnover rates incur higher transaction costs and may be more likely to distribute capital gains (which may be taxable to investors). The turnover rate excludes in-kind transactions, which have minimal impact on costs.
39
The People Who Govern Your Fund
The trustees of your mutual fund are there to see that the fund is operated and managed in your best interests since, as a shareholder, you are a part owner of the fund. Your fund’s trustees also serve on the board of directors of The Vanguard Group, Inc., which is owned by the Vanguard funds and provides services to them on an at-cost basis.
A majority of Vanguard’s board members are independent, meaning that they have no affiliation with Vanguard or the funds they oversee, apart from the sizable personal investments they have made as private individuals. The independent board members have distinguished backgrounds in business, academia, and public service. Each of the trustees and executive officers oversees 179 Vanguard funds.
The following table provides information for each trustee and executive officer of the fund. More information about the trustees is in the Statement of Additional Information, which can be obtained, without charge, by contacting Vanguard at 800-662-7447, or online at vanguard.com.
| |
| Interested Trustee1 | Amy Gutmann |
| | Born 1949. Trustee Since June 2006. Principal |
| F. William McNabb III | Occupation(s) During the Past Five Years: President |
| Born 1957. Trustee Since July 2009. Chairman of the | of the University of Pennsylvania; Christopher H. |
| Board. Principal Occupation(s) During the Past Five | Browne Distinguished Professor of Political Science |
| Years: Chairman of the Board of The Vanguard Group, | in the School of Arts and Sciences with secondary |
| Inc., and of each of the investment companies served | appointments at the Annenberg School for Commu- |
| by The Vanguard Group, since January 2010; Director | nication and the Graduate School of Education |
| of The Vanguard Group since 2008; Chief Executive | of the University of Pennsylvania; Director of |
| Officer and President of The Vanguard Group and of | Carnegie Corporation of New York, Schuylkill River |
| each of the investment companies served by The | Development Corporation, and Greater Philadelphia |
| Vanguard Group since 2008; Director of Vanguard | Chamber of Commerce; Trustee of the National |
| Marketing Corporation; Managing Director of The | Constitution Center; Chair of the Presidential |
| Vanguard Group (1995–2008) . | Commission for the Study of Bioethical Issues. |
| |
| | JoAnn Heffernan Heisen |
| Independent Trustees | Born 1950. Trustee Since July 1998. Principal |
| | Occupation(s) During the Past Five Years: Corporate |
| Emerson U. Fullwood | Vice President and Chief Global Diversity Officer |
| Born 1948. Trustee Since January 2008. Principal | since 2006 (retired 2008) and Member of the |
| Occupation(s) During the Past Five Years: Executive | Executive Committee (retired 2008) of Johnson & |
| Chief Staff and Marketing Officer for North America | Johnson (pharmaceuticals/consumer products); Vice |
| and Corporate Vice President (retired 2008) of Xerox | President and Chief Information Officer of Johnson & |
| Corporation (document management products and | Johnson (1997–2005); Director of the University |
| services); Director of SPX Corporation (multi-industry | Medical Center at Princeton and Women’s Research |
| manufacturing), the United Way of Rochester, | and Education Institute; Member of the Advisory |
| Amerigroup Corporation (managed health care), | Board of the Maxwell School of Citizenship and Public |
| the University of Rochester Medical Center, and | Affairs at Syracuse University. |
| Monroe Community College Foundation. | |
| | F. Joseph Loughrey |
| Rajiv L. Gupta | Born 1949. Trustee Since October 2009. Principal |
| Born 1945. Trustee Since December 2001.2 | Occupation(s) During the Past Five Years: President |
| Principal Occupation(s) During the Past Five Years: | and Chief Operating Officer since 2005 (retired 2009) |
| Chairman and Chief Executive Officer (retired 2009) | and Vice Chairman of the Board (2008–2009) of |
| and President (2006–2008) of Rohm and Haas Co. | Cummins Inc. (industrial machinery); Director of |
| (chemicals); Director of Tyco International, Ltd. | SKF AB (industrial machinery), Hillenbrand, Inc. |
| (diversified manufacturing and services) and Hewlett- | (specialized consumer services), Sauer-Danfoss Inc. |
| Packard Co. (electronic computer manufacturing); | (machinery), the Lumina Foundation for Education, |
| Trustee of The Conference Board; Member of the | and Oxfam America; Chairman of the Advisory |
| Board of Managers of Delphi Automotive LLP | Council for the College of Arts and Letters at the |
| (automotive components) . | University of Notre Dame. |
| | |
| André F. Perold | Kathryn J. Hyatt | |
| Born 1952. Trustee Since December 2004. Principal | Born 1955. Treasurer Since November 2008. Principal |
| Occupation(s) During the Past Five Years: George | Occupation(s) During the Past Five Years: Principal |
| Gund Professor of Finance and Banking at the Harvard | of The Vanguard Group, Inc.; Treasurer of each of |
| Business School; Chair of the Investment Committee | the investment companies served by The Vanguard |
| of HighVista Strategies LLC (private investment firm) . | Group since 2008; Assistant Treasurer of each of the |
| | investment companies served by The Vanguard Group |
| Alfred M. Rankin, Jr. | (1988–2008) . | |
| Born 1941. Trustee Since January 1993. Principal | | |
| Occupation(s) During the Past Five Years: Chairman, | Heidi Stam | |
| President, and Chief Executive Officer of NACCO | Born 1956. Secretary Since July 2005. Principal |
| Industries, Inc. (forklift trucks/housewares/lignite); | Occupation(s) During the Past Five Years: Managing |
| Director of Goodrich Corporation (industrial products/ | Director of The Vanguard Group, Inc., since 2006; |
| aircraft systems and services); Chairman of the | General Counsel of The Vanguard Group since 2005; |
| Federal Reserve Bank of Cleveland; Trustee of The | Secretary of The Vanguard Group and of each of the |
| Cleveland Museum of Art. | investment companies served by The Vanguard Group |
| | since 2005; Director and Senior Vice President of |
| Peter F. Volanakis | Vanguard Marketing Corporation since 2005; |
| Born 1955. Trustee Since July 2009. Principal | Principal of The Vanguard Group (1997–2006). |
| Occupation(s) During the Past Five Years: President | | |
| since 2007 and Chief Operating Officer since 2005 | | |
| of Corning Incorporated (communications equipment); | Vanguard Senior Management Team |
| President of Corning Technologies (2001–2005); | | |
| Director of Corning Incorporated and Dow Corning; | R. Gregory Barton | Michael S. Miller |
| Trustee of the Corning Incorporated Foundation and | Mortimer J. Buckley | James M. Norris |
| the Corning Museum of Glass; Overseer of the | Kathleen C. Gubanich | Glenn W. Reed |
| Amos Tuck School of Business Administration at | Paul A. Heller | George U. Sauter |
| Dartmouth College. | | |
| |
| | Chairman Emeritus and Senior Advisor |
| Executive Officers | | |
| | John J. Brennan | |
| Glenn Booraem | Chairman, 1996–2009 | |
| Born 1967. Controller Since July 2010. Principal | Chief Executive Officer and President, 1996–2008 |
| Occupation(s) During the Past Five Years: Principal | | |
| of The Vanguard Group, Inc.; Controller of each of | | |
| the investment companies served by The Vanguard | | |
| Group since 2010; Assistant Controller of each of | Founder | |
| the investment companies served by The Vanguard | John C. Bogle | |
| Group (2001–2010) . | Chairman and Chief Executive Officer, 1974–1996 |
| |
| Thomas J. Higgins | | |
| Born 1957. Chief Financial Officer Since September | | |
| 2008. Principal Occupation(s) During the Past Five | | |
| Years: Principal of The Vanguard Group, Inc.; Chief | | |
| Financial Officer of each of the investment companies | | |
| served by The Vanguard Group since 2008; Treasurer | | |
| of each of the investment companies served by The | | |
| Vanguard Group (1998–2008) . | | |
1 Mr. McNabb is considered an “interested person,” as defined in the Investment Company Act of 1940, because he is an officer of the
Vanguard funds.
2 December 2002 for Vanguard Equity Income Fund, Vanguard Growth Equity Fund, the Vanguard Municipal Bond Funds, and the
Vanguard State Tax-Exempt Funds.

| |
| | P.O. Box 2600 |
| | Valley Forge, PA 19482-2600 |
| |
| |
| |
| Connect with Vanguard® > vanguard.com | |
| |
| |
| |
| Fund Information > 800-662-7447 | |
| Direct Investor Account Services > 800-662-2739 | |
| Institutional Investor Services > 800-523-1036 | |
| Text Telephone for People | |
| With Hearing Impairment > 800-749-7273 | |
| |
| This material may be used in conjunction | |
| with the offering of shares of any Vanguard | |
| fund only if preceded or accompanied by | |
| the fund’s current prospectus. | |
| |
| All comparative mutual fund data are from Lipper Inc. or | |
| Morningstar, Inc., unless otherwise noted. | |
| |
| You can obtain a free copy of Vanguard’s proxy voting | |
| guidelines by visiting vanguard.com/proxyreporting or by | |
| calling Vanguard at 800-662-2739. The guidelines are | |
| also available from the SEC’s website, sec.gov. In | |
| addition, you may obtain a free report on how your fund | |
| voted the proxies for securities it owned during the 12 | |
| months ended June 30. To get the report, visit either | |
| vanguard.com/proxyreporting or sec.gov. | |
| |
| You can review and copy information about your fund at | |
| the SEC’s Public Reference Room in Washington, D.C. To | |
| find out more about this public service, call the SEC at | |
| 202-551-8090. Information about your fund is also | |
| available on the SEC’s website, and you can receive | |
| copies of this information, for a fee, by sending a | |
| request in either of two ways: via e-mail addressed to | |
| publicinfo@sec.gov or via regular mail addressed to the | |
| Public Reference Section, Securities and Exchange | |
| Commission, Washington, DC 20549-1520. | |
| |
| |
| | © 2011 The Vanguard Group, Inc. |
| | All rights reserved. |
| | Vanguard Marketing Corporation, Distributor. |
| |
| | Q1270 022011 |
Item 2: Code of Ethics. The Registrant has adopted a code of ethics that applies to the Registrant’s principal executive officer, principal financial officer, principal accounting officer or controller or persons performing similar functions. The Code of Ethics was amended during the reporting period covered by this report to make certain technical, non-material changes.
Item 3: Audit Committee Financial Expert. The following members of the Audit Committee have been determined by the Registrant’s Board of Trustees to be Audit Committee Financial Experts serving on its Audit Committee, and to be independent: Charles D. Ellis, Rajiv L. Gupta, JoAnn Heffernan Heisen, André F. Perold, and Alfred M. Rankin, Jr.
Item 4: Principal Accountant Fees and Services.
(a) Audit Fees.
Audit Fees of the Registrant
Fiscal Year Ended December 31, 2010: $137,000
Fiscal Year Ended December 31, 2009: $122,000
Aggregate Audit Fees of Registered Investment Companies in the Vanguard Group.
Fiscal Year Ended December 31, 2010: $3,607,060
Fiscal Year Ended December 31, 2009: $3,354,640
(b) Audit-Related Fees.
Fiscal Year Ended December 31, 2010: $791,350
Fiscal Year Ended December 31, 2009: $876,210
Includes fees billed in connection with assurance and related services provided to the Registrant, The Vanguard Group, Inc., Vanguard Marketing Corporation, and other registered investment companies in the Vanguard Group.
(c) Tax Fees.
Fiscal Year Ended December 31, 2010: $336,090
Fiscal Year Ended December 31, 2009: $423,070
Includes fees billed in connection with tax compliance, planning and advice services provided to the Registrant, The Vanguard Group, Inc., Vanguard Marketing Corporation, and other registered investment companies in the Vanguard Group and related to income and excise taxes.
(d) All Other Fees.
Fiscal Year Ended December 31, 2010: $16,000
Fiscal Year Ended December 31, 2009: $0
Includes fees billed for services related to risk management and privacy matters. Services were provided to the Registrant, The Vanguard Group, Inc., Vanguard Marketing Corporation, and other registered investment companies in the Vanguard Group.
(e) (1) Pre-Approval Policies. The policy of the Registrant’s Audit Committee is to consider and, if appropriate, approve before the principal accountant is engaged for such services, all specific audit and non-audit services provided to: (1) the Registrant; (2) The Vanguard Group, Inc.; (3) other entities controlled by The Vanguard Group, Inc. that provide ongoing services to the Registrant; and (4) other registered investment companies in the Vanguard Group. In making a determination, the Audit Committee considers whether the services are consistent with maintaining the principal accountant’s independence.
In the event of a contingency situation in which the principal accountant is needed to provide services in between scheduled Audit Committee meetings, the Chairman of the Audit Committee would be called on to consider and, if appropriate, pre-approve audit or permitted non-audit services in an amount sufficient to complete services through the next Audit Committee meeting, and to determine if such services would be consistent with maintaining the accountant’s independence. At the next scheduled Audit Committee meeting, services and fees would be presented to the Audit Committee for formal consideration, and, if appropriate, approval by the entire Audit Committee. The Audit Committee would again consider whether such services and fees are consistent with maintaining the principal accountant’s independence.
The Registrant’s Audit Committee is informed at least annually of all audit and non-audit services provided by the principal accountant to the Vanguard complex, whether such services are provided to: (1) the Registrant; (2) The Vanguard Group, Inc.; (3) other entities controlled by The Vanguard Group, Inc. that provide ongoing services to the Registrant; or (4) other registered investment companies in the Vanguard Group.
(2) No percentage of the principal accountant’s fees or services were approved pursuant to the waiver provision of paragraph (c)(7)(i)(C) of Rule 2-01 of Regulation S-X.
(f) For the most recent fiscal year, over 50% of the hours worked under the principal accountant’s engagement were not performed by persons other than full-time, permanent employees of the principal accountant.
(g) Aggregate Non-Audit Fees.
Fiscal Year Ended December 31, 2010: $352,090
Fiscal Year Ended December 31, 2009: $423,070
Includes fees billed for non-audit services provided to the Registrant, The Vanguard Group, Inc., Vanguard Marketing Corporation, and other registered investment companies in the Vanguard Group.
(h) For the most recent fiscal year, the Audit Committee has determined that the provision of all non-audit services was consistent with maintaining the principal accountant’s independence.
Item 5: Audit Committee of Listed Registrants.
The Registrant is a listed issuer as defined in Rule 10A-3 under the Securities Exchange Act of 1934 (“Exchange Act”). The Registrant has a separately-designated standing audit committee established in accordance with Section 3(a)(58)(A) of the Exchange Act. The Registrant’s audit committee members are: Emerson U. Fullwood, Rajiv L. Gupta, Amy Gutmann, JoAnn Heffernan Heisen, F. Joseph Loughrey, André F. Perold, Alfred M. Rankin, Jr., and Peter F. Volanakis.
Item 6: Investments.
Not Applicable.
Item 7: Disclosure of Proxy Voting Policies and Procedures for Closed-End Management Investment Companies.
Not Applicable.
Item 8: Portfolio Managers of Closed-End Management Investment Companies.
Not Applicable.
Item 9: Purchase of Equity Securities by Closed-End Management Investment Company and Affiliated Purchasers.
Not Applicable.
Item 10: Submission of Matters to a Vote of Security Holders.
Not Applicable.
Item 11: Controls and Procedures.
(a) Disclosure Controls and Procedures. The Principal Executive and Financial Officers concluded that the Registrant's Disclosure Controls and Procedures are effective based on their evaluation of the Disclosure Controls and Procedures as of a date within 90 days of the filing date of this report.
(b) Internal Control Over Financial Reporting. There were no significant changes in Registrant’s Internal Control Over Financial Reporting or in other factors that could significantly affect this control subsequent to the date of the evaluation, including any corrective actions with regard to significant deficiencies and material weaknesses.
Item 12: Exhibits.
(a) Code of Ethics.
(b) Certifications.
Pursuant to the requirements of the Securities Exchange Act of 1934 and the Investment Company Act of 1940, the registrant has duly caused this report to be signed on its behalf by the undersigned, thereunto duly authorized.
| |
| | VANGUARD TAX-MANAGED FUNDS |
| |
| |
| BY: | /s/ F. WILLIAM MCNABB III* |
| F. WILLIAM MCNABB III |
| CHIEF EXECUTIVE OFFICER |
| |
| Date: February 17, 2011 |
Pursuant to the requirements of the Securities Exchange Act of 1934 and the Investment Company Act of 1940, this report has been signed below by the following persons on behalf of the registrant and in the capacities and on the dates indicated.
| |
| | VANGUARD TAX-MANAGED FUNDS |
| |
| BY: | /s/ F. WILLIAM MCNABB III* |
| F. WILLIAM MCNABB III |
| CHIEF EXECUTIVE OFFICER |
|
| Date: February 17, 2011 |
| |
| | VANGUARD TAX-MANAGED FUNDS |
| |
| BY: | /s/ THOMAS J. HIGGINS* |
| | THOMAS J. HIGGINS |
| CHIEF FINANCIAL OFFICER |
| |
| Date: February 17, 2011 |
* By: /s/ Heidi Stam
Heidi Stam, pursuant to a Power of Attorney filed on April 26, 2010, see file Number 33-53683, Incorporated by Reference.