UNITED STATES
SECURITIES AND EXCHANGE COMMISSION
Washington, D.C. 20549
FORM N-CSR
CERTIFIED SHAREHOLDER REPORT
OF
REGISTERED MANAGEMENT INVESTMENT COMPANIES
Investment Company Act file number: 811-07175
Name of Registrant: Vanguard Tax-Managed Funds
Address of Registrant:
P.O. Box 2600
Valley Forge, PA 19482
Name and address of agent for service:
Heidi Stam, Esquire
P.O. Box 876
Valley Forge, PA 19482
Registrant’s telephone number, including area code: (610) 669-1000
Date of fiscal year end: December 31
Date of reporting period: January 1, 2011 – December 31, 2011
Item 1: Reports to Shareholders
 |
|
| Annual Report | December 31, 2011 |
| |
| Vanguard Tax-Managed Funds® |
| |
| Vanguard Tax-Managed Balanced Fund |
| Vanguard Tax-Managed Growth and Income Fund |
| Vanguard Tax-Managed Capital Appreciation Fund |
| Vanguard Tax-Managed Small-Cap Fund |
> For the fiscal year ended December 31, 2011, Vanguard Tax-Managed Balanced Fund returned nearly 6%. Admiral Shares of Vanguard’s three domestic tax-managed stock funds returned between 1% and 2%.
> Although not bound by a strict indexing strategy, the three stock funds posted returns consistent with those of their benchmark indexes. The Tax-Managed Balanced Fund trailed its index by about 1 percentage point.
> The funds distributed no capital gains, meeting their tax-management objectives as they have since inception.
| |
| Contents | |
| Your Fund’s Total Returns. | 1 |
| Chairman’s Letter. | 2 |
| Tax-Managed Balanced Fund. | 9 |
| Tax-Managed Growth and Income Fund. | 48 |
| Tax-Managed Capital Appreciation Fund. | 65 |
| Tax-Managed Small-Cap Fund. | 84 |
| Your Fund’s After-Tax Returns. | 104 |
| About Your Fund’s Expenses. | 106 |
| Glossary. | 108 |
Please note: The opinions expressed in this report are just that—informed opinions. They should not be considered promises or advice. Also, please keep in mind that the information and opinions cover the period through the date on the front of this report. Of course, the risks of investing in your fund are spelled out in the prospectus.
See the Glossary for definitions of investment terms used in this report.
About the cover: Vanguard was named for the HMS Vanguard, flagship of British Admiral Horatio Nelson. A ship—whose performance and safety depend on the work of all hands—has served as a fitting metaphor for the Vanguard crew as we strive to help clients reach their financial goals.
Your Fund’s Total Returns
| |
| Fiscal Year Ended December 31, 2011 | |
| |
| | Total |
| | Returns |
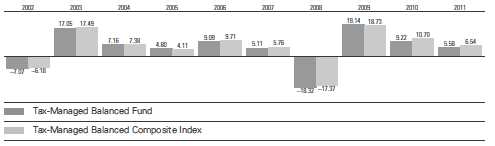
| Vanguard Tax-Managed Balanced Fund | 5.58% |
| Tax-Managed Balanced Composite Index | 6.54 |
| Mixed-Asset Target Allocation Moderate Funds Average | 0.31 |
| Tax-Managed Balanced Composite Index: Weighted 50% Russell 1000 Index and 50% Barclays Capital 7 Year Municipal Bond Index. | |
| Mixed-Asset Target Allocation Moderate Funds Average: Derived from data provided by Lipper Inc. | |
| | |
| Vanguard Tax-Managed Growth and Income Fund | |
| Admiral™ Shares | 2.00% |
| Institutional Shares | 2.05 |
| S&P 500 Index | 2.11 |
| Large-Cap Core Funds Average | -0.72 |
| Large-Cap Core Funds Average: Derived from data provided by Lipper Inc. | |
| | |
| Vanguard Tax-Managed Capital Appreciation Fund | |
| Admiral Shares | 1.38% |
| Institutional Shares | 1.39 |
| Russell 1000 Index | 1.50 |
| Multi-Cap Core Funds Average | -2.68 |
| Multi-Cap Core Funds Average: Derived from data provided by Lipper Inc. | |
| | |
| Vanguard Tax-Managed Small-Cap Fund | |
| Admiral Shares | 1.22% |
| Institutional Shares | 1.26 |
| S&P SmallCap 600 Index | 1.02 |
| Small-Cap Core Funds Average | -3.67 |
| Small-Cap Core Funds Average: Derived from data provided by Lipper Inc. | |
| Institutional Shares are available to certain institutional investors who meet specific administrative, service, and account-size criteria. |
1

Chairman’s Letter
Dear Shareholder,
Vanguard’s domestic tax-managed funds weathered extreme volatility to deliver modest gains for the 12 months ended December 31. The Tax-Managed Balanced Fund had the highest return of the group, nearly 6%, as the fund benefited from strength in its tax-exempt municipal bond holdings. Returns for Admiral Shares of the stock funds—Tax-Managed Growth and Income, Tax-Managed Capital Appreciation, and Tax-Managed Small-Cap—fell in a narrow range of between 1% and 2%. Those seemingly unremarkable results masked a roller-coaster of a year, which ended with U.S. stocks about where they started.
The funds met their tax-management objective, as they have since their inception. In the Performance at a Glance chart on page 8, you can see that the funds’ advisors, Vanguard’s Quantitative Equity Group and Fixed Income Group, continued to avoid distributing capital gains to shareholders. The advisors used a variety of portfolio management strategies to accomplish this while deviating as little as possible from a pure indexing strategy.
You may wish to review the table showing after-tax returns for the past one, five, and ten years that appears later in this report.
2
Big dramas and small numbers in the U.S. stock market
The broad U.S. stock market finished 2011 with a modestly positive return, a result that seems surprisingly low-key in light of the economic and political dramas that monopolized investors’ attention for much of the year.
Stock prices rallied and retreated as early optimism about the global economic outlook traded places with anxiety about Europe’s debt crisis and the contentious negotiations in Washington over raising the U.S. debt ceiling to avoid default. The policymaking strife prompted Standard & Poor’s to downgrade the U.S. credit rating. (Vanguard’s confidence in the full faith and credit of the U.S. Treasury remains unshaken.) By year-end, stock prices were again on the rise, with investors refocused on signs of economic improvement.
International stock prices finished the year with a double-digit decline. The weaker performance of stocks outside the United States reflected the greater economic and financial challenges in Europe, Japan’s struggles with natural and nuclear disaster, and skittishness about emerging markets.
As yields fell, bonds delivered unexpectedly strong returns
Bond returns were also a surprise, mainly because so little was expected of them. At the end of 2010, bond yields hovered
| | | |
| Market Barometer | | | |
| |
| | | Average Annual Total Returns |
| | | Periods Ended December 31, 2011 |
| | One | Three | Five |
| | Year | Years | Years |
| Stocks | | | |
| Russell 1000 Index (Large-caps) | 1.50% | 14.81% | -0.02% |
| Russell 2000 Index (Small-caps) | -4.18 | 15.63 | 0.15 |
| Dow Jones U.S. Total Stock Market Index | 0.52 | 15.24 | 0.28 |
| MSCI All Country World Index ex USA (International) | -13.71 | 10.70 | -2.92 |
| |
| Bonds | | | |
| Barclays Capital U.S. Aggregate Bond Index (Broad | | | |
| taxable market) | 7.84% | 6.77% | 6.50% |
| Barclays Capital Municipal Bond Index (Broad | | | |
| tax-exempt market) | 10.70 | 8.57 | 5.22 |
| Citigroup Three-Month U.S. Treasury Bill Index | 0.08 | 0.11 | 1.36 |
| |
| CPI | | | |
| Consumer Price Index | 2.96% | 2.39% | 2.26% |
3
near historical lows, suggesting that the scope for further declines—and rallies in bond prices—was limited. During 2011, however, rates moved lower still as investors sought shelter from stock market turmoil. The broad U.S. bond market returned 7.84%. Municipal bonds, which were battered at the end of 2010, produced even stronger returns than taxable bonds in 2011.
The returns of the 3-month U.S. Treasury bill and other money market instruments approached 0%, which was consistent with the Federal Reserve Board’s interest rate policy but nevertheless a disappointment for savers.
Funds extend gains, saved by late recovery
For the third straight year, Vanguard’s four domestic tax-managed funds posted positive results. (We review the performance of Vanguard Tax-Managed International Fund in a separate report.) But 2011’s advance was far more modest than those of the previous two years; in fact, only a fourth-quarter rally saved the funds from negative returns.
The Tax-Managed Balanced Fund’s return of nearly 6% was significantly ahead of the average return of peer funds but trailed that of its benchmark index by a little less than 1 percentage point. All of
| | | |
| Expense Ratios | | | |
| Your Fund Compared With Its Peer Group | | | |
| | Admiral | Institutional | Peer Group |
| | Shares | Shares | Average |
| Tax-Managed Balanced Fund | 0.15% | — | 0.97% |
| Tax-Managed Growth and Income Fund | 0.12 | 0.08% | 1.26 |
| Tax-Managed Capital Appreciation Fund | 0.12 | 0.08 | 1.18 |
| Tax-Managed Small-Cap Fund | 0.18 | 0.08 | 1.38 |
The fund expense ratios shown are from the prospectus dated July 15, 2011, and represent estimated costs for the current fiscal year. For the fiscal year ended December 31, 2011, the funds’ expense ratios were: for the Tax-Managed Balanced Fund, 0.12%; for the Tax-Managed Growth and Income Fund, 0.12% for Admiral Shares and 0.08% for Institutional Shares; for the Tax-Managed Capital Appreciation Fund, 0.12% for Admiral Shares and 0.08% for Institutional Shares; and for the Tax-Managed Small-Cap Fund, 0.12% for Admiral Shares and 0.08% for Institutional Shares. Peer group expense ratios are derived from data provided by Lipper Inc. and capture information through year-end 2010.
Peer groups: For the Tax-Managed Balanced Fund, Mixed-Asset Target Allocation Moderate Funds; for the Tax-Managed Growth and Income Fund, Large-Cap Core Funds; for the Tax-Managed Capital Appreciation Fund, Multi-Cap Core Funds; and for the Tax-Managed Small-Cap Fund, Small-Cap Core Funds.
4
the benchmark’s bonds have maturities of between six and eight years, and these performed exceptionally well in 2011. Your fund holds bonds with a more diversified range of maturities and, hence, underperformed.
On the whole, municipal bonds had an unusually strong year, generally outperforming both taxable bonds and stocks. The muni market was snapping back from a difficult 2010, when fears about states’ finances had put pressure on bond prices. At the end of 2011,
| |
| Total Returns | |
| Ten Years Ended December 31, 2011 | |
| | Average |
| | Annual Return |
| Tax-Managed Balanced Fund | 4.63% |
| Tax-Managed Balanced Composite Index | 5.16 |
| Mixed-Asset Target Allocation Moderate Funds Average | 3.78 |
| Tax-Managed Balanced Composite Index: Weighted 50% Russell 1000 Index and 50% Barclays Capital 7 Year Municipal Bond Index. |
| Mixed-Asset Target Allocation Moderate Funds Average: Derived from data provided by Lipper Inc. | |
| |
| Tax-Managed Growth and Income Fund Admiral Shares | 2.92% |
| S&P 500 Index | 2.92 |
| Large-Cap Core Funds Average | 1.45 |
| Large-Cap Core Funds Average: Derived from data provided by Lipper Inc. | |
| |
| Tax-Managed Capital Appreciation Fund Admiral Shares | 3.40% |
| Russell 1000 Index | 3.34 |
| Multi-Cap Core Funds Average | 2.65 |
| Multi-Cap Core Funds Average: Derived from data provided by Lipper Inc. | |
| |
| Tax-Managed Small-Cap Fund Admiral Shares | 7.14% |
| S&P SmallCap 600 Index | 7.09 |
| Small-Cap Core Funds Average | 5.38 |
| Small-Cap Core Funds Average: Derived from data provided by Lipper Inc. | |
The figures shown represent past performance, which is not a guarantee of future results. (Current performance may be lower or higher than the performance data cited. For performance data current to the most recent month-end, visit our website at vanguard.com/performance.) Note, too, that both investment returns and principal value can fluctuate widely, so an investor’s shares, when sold, could be worth more or less than their original cost.
5
the balanced fund had a little more than one-half of its assets in muni bonds. The remainder was invested mostly in large-capitalization stocks, which advanced just slightly.
Not surprisingly, the two tax-managed funds devoted to large-cap stocks had modest gains for the year. The Tax-Managed Growth and Income Fund returned 2.00% and the Tax-Managed Capital Appreciation Fund returned 1.38% (returns cited are for Admiral Shares). Both results were in line with their respective indexes and significantly better than peer funds’ average returns, which were negative.
For both of the large-cap funds, consumer staples and health care were bright spots. Those two sectors are considered “defensive,” meaning demand for their products and services is expected to stay stable even if the economy slows. The funds saw gains in shares of discount retailers, pharmaceutical firms, and tobacco companies. The weakest performer was the financial sector, which was troubled by a host of problems, including continuing home mortgage defaults and concerns about the fallout from Europe’s debt crisis.
The Tax-Managed Small-Cap Fund returned 1.22% for Admiral Shares. As with its large-cap counterparts, the fund’s performance was in line with that of its index and considerably better than the average return of its peers. Health care and utilities were the standout sectors. Industrials and information technology were notably weak; shares of everything from trucking companies to software firms declined in the face of worries about the economic outlook.
Long-term performance has been competitive
For the decade ended December 31, 2011, Vanguard’s domestic tax-managed funds have posted average annual returns ranging from nearly 3% for the Tax-Managed Growth and Income Fund to about 7% for the Tax-Managed Small-Cap Fund. At first glance, these results aren’t especially impressive, but all four of the funds outpaced the average returns of their respective peers. It’s also important to keep in mind the challenges of the past decade—from the aftermath of the bursting of the dot-com bubble to, more recently, the European debt crisis.
Vanguard’s Quantitative Equity Group and Fixed Income Group deserve credit for the funds’ success at both tracking their benchmark indexes and meeting their tax-management objectives. Unlike many of their peers, the Vanguard Tax-Managed Funds have never distributed taxable capital gains to shareholders. The advisors hope to continue this record for many years as they manage each fund’s holdings with tax consequences in mind.
6
Stay focused on what you can control
As I mentioned, the past year—and the past decade, for that matter—have been volatile, and it’s natural to feel some anxiety as a result of what we’ve experienced. But rather than worry about the market’s gyrations, which you can’t control, it’s more constructive to focus instead on what you can control. This point was underscored by a recent Vanguard research paper, Penny Saved, Penny Earned, which can be found at vanguard.com/research. The study showed that retirement investors have a greater likelihood of reaching their goals if they increase their savings rate and their savings time horizon rather than simply counting on the possibility of higher portfolio returns.
As always, Vanguard encourages you to create a long-term investment plan that includes a mix of stocks, bonds, and short-term investments that are appropriate for your goals and risk tolerance. A well-balanced portfolio can help cushion some of the market’s volatility while allowing you to participate in its long-term potential for growth. For the tax-conscious investor, Vanguard’s Tax-Managed Funds, with their proven tax efficiency and low expense ratios, can play a useful role in such a plan.
Thank you for entrusting your assets to Vanguard.
Sincerely,

F. William McNabb III
Chairman and Chief Executive Officer
January 19, 2012
7
| | | | |
| Your Fund’s Performance at a Glance | | | | |
| December 31, 2010 , Through December 31, 2011 | | | | |
| | | | Distributions Per Share |
| | Starting | Ending | Income | Capital |
| | Share Price | Share Price | Dividends | Gains |
| Vanguard Tax-Managed Balanced Fund | $19.96 | $20.55 | $0.514 | $0.000 |
| Vanguard Tax-Managed Growth and Income | | | | |
| Fund | | | | |
| Admiral Shares | $56.31 | $56.33 | $1.102 | $0.000 |
| Institutional Shares | 27.40 | 27.41 | 0.548 | 0.000 |
| Vanguard Tax-Managed Capital Appreciation | | | | |
| Fund | | | | |
| Admiral Shares | $62.56 | $62.36 | $1.070 | $0.000 |
| Institutional Shares | 31.09 | 30.98 | 0.545 | 0.000 |
| Vanguard Tax-Managed Small-Cap Fund | | | | |
| Admiral Shares | $27.17 | $27.26 | $0.244 | $0.000 |
| Institutional Shares | 27.23 | 27.33 | 0.245 | 0.000 |
8
Tax-Managed Balanced Fund
Fund Profile
As of December 31, 2011
| | | |
| Equity and Portfolio Characteristics | |
| | | | DJ |
| | | Russell | U.S. Total |
| | | 1000 | Market |
| | Fund | Index | Index |
| Number of Stocks | 656 | 980 | 3,745 |
| Median Market Cap $33.0B | $37.4B | $31.3B |
| Price/Earnings Ratio | 14.8x | 14.5x | 15.0x |
| Price/Book Ratio | 2.1x | 2.1x | 2.1x |
| Return on Equity | 19.5% | 19.7% | 19.0% |
| Earnings Growth Rate | 7.9% | 7.2% | 7.1% |
| Dividend Yield | 1.8% | 2.1% | 2.0% |
| Foreign Holdings | 0.0% | 0.0% | 0.0% |
| Turnover Rate | 12% | — | — |
| Ticker Symbol | VTMFX | — | — |
| Expense Ratio1 | 0.15% | — | — |
| 30-Day SEC Yield | 1.94% | — | — |
| Short-Term Reserves | 0.0% | — | — |
| | | |
| Fixed Income Characteristics | | |
| | | Barclays | |
| | | 7 Year | Barclays |
| | | Municipal | Municipal |
| | Fund | Index Bond Index |
| Number of Bonds | 655 | 4,860 | 46,025 |
| Yield to Maturity | | | |
| (before expenses) | 2.1% | 1.8% | 2.8% |
| Average Coupon | 4.8% | 4.9% | 4.9% |
| Average Duration | 5.4 years | 4.9 years | 8.1 years |
| Average Effective | | | |
| Maturity | 5.6 years | 7.0 years | 13.5 years |
| | |
| Total Fund Volatility Measures | |
| | | DJ |
| | Tax-Managed | U.S. Total |
| | Balanced | Market |
| | Comp Index | Index |
| R-Squared | 0.99 | 0.94 |
| Beta | 0.95 | 0.46 |
These measures show the degree and timing of the fund’s fluctuations compared with the indexes over 36 months.
| | |
| Ten Largest Stocks (% of equity portfolio) | |
| Exxon Mobil Corp. | Integrated Oil & | |
| | Gas | 3.1% |
| Apple Inc. | Computer | |
| | Hardware | 3.0 |
| International Business | IT Consulting & | |
| Machines Corp. | Other Services | 1.8 |
| Chevron Corp. | Integrated Oil & | |
| | Gas | 1.5 |
| Procter & Gamble Co. | Household | |
| | Products | 1.5 |
| Johnson & Johnson | Pharmaceuticals | 1.4 |
| Microsoft Corp. | Systems Software | 1.4 |
| General Electric Co. | Industrial | |
| | Conglomerates | 1.3 |
| Google Inc. Class A | Internet Software & | |
| | Services | 1.3 |
| AT&T Inc. | Integrated | |
| | Telecommunication | |
| | Services | 1.2 |
| Top Ten | | 17.5% |
| Top Ten as % of Total Net Assets | 8.3% |
The holdings listed exclude any temporary cash investments and equity index products.
Fund Asset Allocation

1 The expense ratio shown is from the prospectus dated July 15, 2011, and represents estimated costs for the current fiscal year. For the fiscal year ended December 31, 2011, the expense ratio was 0.12%.
9
Tax-Managed Balanced Fund
| | | |
| Sector Diversification (% of equity exposure) |
| | | | DJ |
| | | Russell | U.S. Total |
| | | 1000 | Market |
| | Fund | Index | Index |
| Consumer | | | |
| Discretionary | 11.6% | 11.5% | 12.2% |
| Consumer Staples | 10.9 | 10.5 | 10.6 |
| Energy | 11.7 | 11.7 | 10.8 |
| Financials | 14.2 | 14.3 | 15.0 |
| Health Care | 11.7 | 11.8 | 11.4 |
| Industrials | 10.8 | 10.9 | 11.1 |
| Information | | | |
| Technology | 18.4 | 18.4 | 18.7 |
| Materials | 4.0 | 4.0 | 4.1 |
| Telecommunication | | | |
| Services | 2.7 | 2.9 | 2.5 |
| Utilities | 4.0 | 4.0 | 3.6 |
| |
| Distribution by Maturity (% of fixed income |
| portfolio) | |
| Under 1 Year | 9.8% |
| 1 - 3 Years | 12.9 |
| 3 - 5 Years | 19.9 |
| 5 - 10 Years | 52.1 |
| 10 - 20 Years | 5.3 |
| |
| Largest Area Concentrations (% of fixed income |
| portfolio) | |
| New York | 19.2% |
| California | 12.3 |
| Texas | 6.9 |
| New Jersey | 5.6 |
| Massachusetts | 4.6 |
| Illinois | 4.5 |
| Georgia | 3.8 |
| Pennsylvania | 3.4 |
| Florida | 3.3 |
| Arizona | 3.3 |
| Top Ten | 66.9% |
"Largest Area Concentration" figures exclude any fixed income futures contracts.
| |
| Distribution by Credit Quality (% of fixed | |
| income portfolio) | |
| AAA | 20.0% |
| AA | 53.3 |
| A | 22.4 |
| BBB | 3.6 |
| BB | 0.4 |
| Not Rated | 0.3 |
For information about these ratings, see the Glossary entry for Credit Quality.
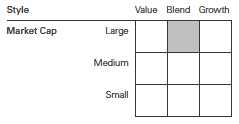
Equity Investment Focus
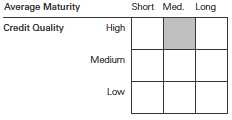
Fixed Income Investment Focus
10
Tax-Managed Balanced Fund
Performance Summary
All of the returns in this report represent past performance, which is not a guarantee of future results that may be achieved by the fund. (Current performance may be lower or higher than the performance data cited. For performance data current to the most recent month-end, visit our website at vanguard.com/performance.) Note, too, that both investment returns and principal value can fluctuate widely, so an investor’s shares, when sold, could be worth more or less than their original cost. The returns shown do not reflect taxes that a shareholder would pay on fund distributions or on the sale of fund shares.
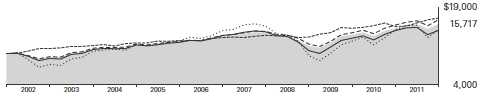
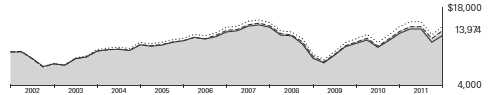
Cumulative Performance: December 31, 2001, Through December 31, 2011
Initial Investment of $10,000
| | | | |
| | | Average Annual Total Returns | |
| | Periods Ended December 31, 2011 | |
| | | | | Final Value |
| | One | Five | Ten | of a $10,000 |
| | Year | Years | Years | Investment |
| Tax-Managed Balanced Fund | 5.58% | 3.36% | 4.63% | $15,717 |
| Dow Jones U.S. Total Stock Market | | | | |
| Index | 0.52 | 0.28 | 3.90 | 14,657 |
| Barclays Capital Municipal Bond | | | | |
| Index | 10.70 | 5.22 | 5.38 | 16,883 |
| |
| Tax-Managed Balanced Composite | | | | |
| Index | 6.54 | 4.12 | 5.16 | 16,544 |
| Mixed-Asset Target Allocation | | | | |
| Moderate Funds Average | 0.31 | 1.44 | 3.78 | 14,495 |
Tax-Managed Balanced Composite Index: Weighted 50% Russell 1000 Index and 50% Barclays Capital 7 Year Municipal Bond Index.
Mixed-Asset Target Allocation Moderate Funds Average: Derived from data provided by Lipper Inc.
See Financial Highlights for dividend and capital gains information.
11
Tax-Managed Balanced Fund
Fiscal-Year Total Returns (%): December 31, 2001, Through December 31, 2011
12
Tax-Managed Balanced Fund
Financial Statements
Statement of Net Assets
As of December 31, 2011
The fund reports a complete list of its holdings in regulatory filings four times in each fiscal year, at the quarter-ends. For the second and fourth fiscal quarters, the lists appear in the fund’s semiannual and annual reports to shareholders. For the first and third fiscal quarters, the fund files the lists with the Securities and Exchange Commission on Form N-Q. Shareholders can look up the fund’s Forms N-Q on the SEC’s website at sec.gov. Forms N-Q may also be reviewed and copied at the SEC’s Public Reference Room (see the back cover of this report for further information).
| | | |
| | | | Market |
| | | | Value |
| | | Shares | ($000) |
| Common Stocks (48.4%) | | |
| Consumer Discretionary (5.6%) | | |
| | McDonald’s Corp. | 30,774 | 3,088 |
| | Walt Disney Co. | 60,366 | 2,264 |
| * | Amazon.com Inc. | 11,502 | 1,991 |
| | Comcast Corp. Class A | 74,045 | 1,756 |
| | News Corp. Class A | 80,051 | 1,428 |
| | Home Depot Inc. | 33,799 | 1,421 |
| * | Ford Motor Co. | 115,700 | 1,245 |
| | Starbucks Corp. | 26,263 | 1,208 |
| | NIKE Inc. Class B | 12,447 | 1,199 |
| * | DIRECTV Class A | 26,818 | 1,147 |
| | Target Corp. | 22,045 | 1,129 |
| | Lowe’s Cos. Inc. | 42,215 | 1,071 |
| | Time Warner Inc. | 25,796 | 932 |
| | TJX Cos. Inc. | 14,293 | 923 |
| | Yum! Brands Inc. | 15,505 | 915 |
| | Viacom Inc. Class B | 19,127 | 869 |
| | Time Warner Cable Inc. | 11,243 | 715 |
| | Coach Inc. | 11,520 | 703 |
| * | priceline.com Inc. | 1,278 | 598 |
| | Macy’s Inc. | 18,494 | 595 |
| * | Bed Bath & Beyond Inc. | 10,100 | 585 |
| | Kohl’s Corp. | 11,385 | 562 |
| | Carnival Corp. | 16,650 | 543 |
| * | O’Reilly Automotive Inc. | 6,562 | 525 |
| | Ross Stores Inc. | 10,904 | 518 |
| * | Dollar Tree Inc. | 6,044 | 502 |
| | Harley-Davidson Inc. | 12,290 | 478 |
| | Ralph Lauren Corp. Class A | 3,273 | 452 |
| | Starwood Hotels & Resorts | | |
| | Worldwide Inc. | 9,307 | 446 |
| * | AutoZone Inc. | 1,351 | 439 |
| | CBS Corp. Class B | 15,500 | 421 |
| | Staples Inc. | 29,898 | 415 |
| | Marriott International Inc. | | |
| | Class A | 13,683 | 399 |
| | Family Dollar Stores Inc. | 6,866 | 396 |
| | | |
| | | | Market |
| | | | Value |
| | | Shares | ($000) |
| * | Liberty Media Corp. - | | |
| | Liberty Capital Class A | 5,004 | 391 |
| | Virgin Media Inc. | 18,136 | 388 |
| | PetSmart Inc. | 7,424 | 381 |
| | DISH Network Corp. Class A | 13,305 | 379 |
| | Gap Inc. | 19,725 | 366 |
| | Johnson Controls Inc. | 11,700 | 366 |
| | Advance Auto Parts Inc. | 5,064 | 353 |
| | Best Buy Co. Inc. | 15,075 | 352 |
| * | Apollo Group Inc. Class A | 6,500 | 350 |
| | International Game | | |
| | Technology | 19,767 | 340 |
| | Tractor Supply Co. | 4,757 | 334 |
| | Lear Corp. | 8,200 | 326 |
| | PVH Corp. | 4,583 | 323 |
| | Gentex Corp. | 10,743 | 318 |
| | DR Horton Inc. | 24,122 | 304 |
| | Scripps Networks | | |
| | Interactive Inc. Class A | 7,068 | 300 |
| | Lennar Corp. Class A | 15,023 | 295 |
| * | General Motors Co. | 14,400 | 292 |
| * | BorgWarner Inc. | 4,476 | 285 |
| | Harman International | | |
| | Industries Inc. | 7,407 | 282 |
| | Jarden Corp. | 9,292 | 278 |
| * | Liberty Global Inc. Class A | 6,532 | 268 |
| * | Dollar General Corp. | 6,500 | 267 |
| | Abercrombie & Fitch Co. | 5,400 | 264 |
| | Brinker International Inc. | 9,637 | 258 |
| | DeVry Inc. | 6,600 | 254 |
| | Aaron’s Inc. | 9,511 | 254 |
| | Royal Caribbean Cruises Ltd. | 10,147 | 251 |
| | Hasbro Inc. | 7,712 | 246 |
| | Morningstar Inc. | 4,028 | 239 |
| | Wyndham Worldwide Corp. | 6,300 | 238 |
| | Wendy’s Co. | 43,670 | 234 |
| * | NVR Inc. | 340 | 233 |
| * | Las Vegas Sands Corp. | 5,400 | 231 |
| | John Wiley & Sons Inc. | | |
| | Class A | 5,118 | 227 |
13
Tax-Managed Balanced Fund
| | | |
| | | | Market |
| | | | Value |
| | | Shares | ($000) |
| * | Liberty Global Inc. | 5,446 | 215 |
| | Washington Post Co. Class B | 560 | 211 |
| | Dillard’s Inc. Class A | 4,413 | 198 |
| | Weight Watchers | | |
| | International Inc. | 3,433 | 189 |
| | Expedia Inc. | 6,191 | 180 |
| | Service Corp. International | 14,900 | 159 |
| * | Discovery Communications | | |
| | Inc. Class A | 3,841 | 157 |
| * | TripAdvisor Inc. | 6,191 | 156 |
| | Comcast Corp. | 6,476 | 153 |
| | Omnicom Group Inc. | 3,200 | 143 |
| | Guess? Inc. | 4,600 | 137 |
| * | Panera Bread Co. Class A | 900 | 127 |
| | Chico’s FAS Inc. | 7,000 | 78 |
| | Polaris Industries Inc. | 1,200 | 67 |
| | RadioShack Corp. | 6,887 | 67 |
| | Newell Rubbermaid Inc. | 3,718 | 60 |
| * | MGM Resorts International | 4,013 | 42 |
| * | Toll Brothers Inc. | 2,000 | 41 |
| * | Career Education Corp. | 4,500 | 36 |
| * | Liberty Interactive Corp. | | |
| | Class A | 2,138 | 35 |
| * | Marriott Vacations Worldwide | | |
| | Corp. | 1,368 | 23 |
| * | AMC Networks Inc. Class A | 573 | 21 |
| | Autoliv Inc. | 400 | 21 |
| | Cablevision Systems Corp. | | |
| | Class A | 1,094 | 16 |
| | Tiffany & Co. | 200 | 13 |
| | Signet Jewelers Ltd. | 300 | 13 |
| * | Netflix Inc. | 177 | 12 |
| | Lennar Corp. Class B | 680 | 11 |
| | H&R Block Inc. | 500 | 8 |
| | Darden Restaurants Inc. | 50 | 2 |
| * | Krispy Kreme Doughnuts Inc. | | |
| | Warrants Exp. 3/2/2012 | 243 | — |
| | | | 44,936 |
| Consumer Staples (5.3%) | | |
| | Procter & Gamble Co. | 85,349 | 5,694 |
| | Coca-Cola Co. | 61,082 | 4,274 |
| | Philip Morris International | | |
| | Inc. | 47,494 | 3,727 |
| | Wal-Mart Stores Inc. | 55,649 | 3,326 |
| | PepsiCo Inc. | 49,690 | 3,297 |
| | CVS Caremark Corp. | 41,792 | 1,704 |
| | Kraft Foods Inc. | 42,037 | 1,571 |
| | Colgate-Palmolive Co. | 16,335 | 1,509 |
| | Altria Group Inc. | 42,900 | 1,272 |
| | Costco Wholesale Corp. | 15,117 | 1,260 |
| | Walgreen Co. | 28,118 | 930 |
| | Archer-Daniels-Midland Co. | 26,273 | 751 |
| | Mead Johnson Nutrition Co. | 8,513 | 585 |
| | General Mills Inc. | 14,314 | 578 |
| | | |
| | | | Market |
| | | | Value |
| | | Shares | ($000) |
| | Estee Lauder Cos. Inc. | | |
| | Class A | 4,959 | 557 |
| | Sara Lee Corp. | 27,335 | 517 |
| | Whole Foods Market Inc. | 6,800 | 473 |
| | Hershey Co. | 7,600 | 470 |
| | JM Smucker Co. | 5,851 | 457 |
| | Brown-Forman Corp. | | |
| | Class B | 5,592 | 450 |
| | Dr Pepper Snapple Group | | |
| | Inc. | 11,332 | 447 |
| | Safeway Inc. | 20,134 | 424 |
| | Bunge Ltd. | 7,330 | 419 |
| | Kroger Co. | 17,300 | 419 |
| | Coca-Cola Enterprises Inc. | 16,186 | 417 |
| | Church & Dwight Co. Inc. | 8,655 | 396 |
| | McCormick & Co. Inc. | 7,747 | 391 |
| | Tyson Foods Inc. Class A | 18,810 | 388 |
| * | Hansen Natural Corp. | 4,119 | 380 |
| * | Energizer Holdings Inc. | 4,665 | 362 |
| | Molson Coors Brewing Co. | | |
| | Class B | 8,300 | 361 |
| | Clorox Co. | 5,400 | 359 |
| | Campbell Soup Co. | 10,400 | 346 |
| | Herbalife Ltd. | 6,627 | 342 |
| * | Ralcorp Holdings Inc. | 3,999 | 342 |
| * | Smithfield Foods Inc. | 13,356 | 324 |
| | Corn Products International | | |
| | Inc. | 5,986 | 315 |
| | Beam Inc. | 6,000 | 307 |
| | Hormel Foods Corp. | 10,492 | 307 |
| | Kimberly-Clark Corp. | 4,172 | 307 |
| * | Constellation Brands Inc. | | |
| | Class A | 14,687 | 304 |
| * | Dean Foods Co. | 24,302 | 272 |
| * | Green Mountain Coffee | | |
| | Roasters Inc. | 5,629 | 253 |
| | Flowers Foods Inc. | 11,400 | 216 |
| | Sysco Corp. | 1,500 | 44 |
| | Avon Products Inc. | 2,100 | 37 |
| | | | 41,881 |
| Energy (5.7%) | | |
| | Exxon Mobil Corp. | 140,515 | 11,910 |
| | Chevron Corp. | 54,632 | 5,813 |
| | ConocoPhillips | 33,812 | 2,464 |
| | Schlumberger Ltd. | 32,667 | 2,232 |
| | Occidental Petroleum Corp. | 20,404 | 1,912 |
| | Anadarko Petroleum Corp. | 17,490 | 1,335 |
| | Apache Corp. | 13,714 | 1,242 |
| | National Oilwell Varco Inc. | 15,529 | 1,056 |
| | EOG Resources Inc. | 10,028 | 988 |
| | Devon Energy Corp. | 13,457 | 834 |
| | El Paso Corp. | 30,394 | 808 |
| | Halliburton Co. | 20,764 | 717 |
| | Hess Corp. | 12,604 | 716 |
14
Tax-Managed Balanced Fund
| | | |
| | | | Market |
| | | | Value |
| | | Shares | ($000) |
| | Noble Energy Inc. | 6,999 | 661 |
| * | FMC Technologies Inc. | 11,186 | 584 |
| * | Cameron International Corp. | 10,952 | 539 |
| | Pioneer Natural Resources | | |
| | Co. | 5,719 | 512 |
| | Marathon Petroleum Corp. | 15,241 | 507 |
| | Range Resources Corp. | 8,046 | 498 |
| * | Southwestern Energy Co. | 14,631 | 467 |
| | Cabot Oil & Gas Corp. | 5,776 | 438 |
| | Peabody Energy Corp. | 11,809 | 391 |
| | EQT Corp. | 6,997 | 383 |
| | Murphy Oil Corp. | 6,700 | 373 |
| | Kinder Morgan Inc. | 11,525 | 371 |
| | Helmerich & Payne Inc. | 6,215 | 363 |
| | Cimarex Energy Co. | 5,776 | 358 |
| | QEP Resources Inc. | 12,125 | 355 |
| | SM Energy Co. | 4,572 | 334 |
| * | Oil States International Inc. | 4,098 | 313 |
| | Diamond Offshore Drilling | | |
| | Inc. | 5,660 | 313 |
| * | Dresser-Rand Group Inc. | 6,122 | 306 |
| | Energen Corp. | 5,830 | 292 |
| | Consol Energy Inc. | 7,605 | 279 |
| * | Nabors Industries Ltd. | 16,090 | 279 |
| * | Continental Resources Inc. | 4,164 | 278 |
| * | Newfield Exploration Co. | 7,327 | 276 |
| * | Ultra Petroleum Corp. | 9,300 | 276 |
| * | Rowan Cos. Inc. | 8,883 | 269 |
| | CARBO Ceramics Inc. | 2,108 | 260 |
| | Marathon Oil Corp. | 8,482 | 248 |
| | Baker Hughes Inc. | 4,550 | 221 |
| * | SEACOR Holdings Inc. | 2,397 | 213 |
| * | Concho Resources Inc. | 2,200 | 206 |
| | Southern Union Co. | 4,834 | 204 |
| | HollyFrontier Corp. | 8,292 | 194 |
| * | Kosmos Energy Ltd. | 14,997 | 184 |
| * | SandRidge Energy Inc. | 21,613 | 176 |
| * | Plains Exploration & | | |
| | Production Co. | 4,748 | 174 |
| * | Superior Energy Services | | |
| | Inc. | 6,121 | 174 |
| | Patterson-UTI Energy Inc. | 8,502 | 170 |
| * | Whiting Petroleum Corp. | 3,600 | 168 |
| | EXCO Resources Inc. | 13,311 | 139 |
| * | McDermott International Inc. | 11,085 | 128 |
| * | Forest Oil Corp. | 9,041 | 123 |
| * | Alpha Natural Resources Inc. | 3,888 | 79 |
| | Chesapeake Energy Corp. | 2,100 | 47 |
| * | Denbury Resources Inc. | 1,400 | 21 |
| | Spectra Energy Corp. | 500 | 15 |
| | | | 45,186 |
| Financials (6.9%) | | |
| * | Berkshire Hathaway Intc. | | |
| | Class B | 54,777 | 4,179 |
| | Wells Fargo & Co. | 137,921 | 3,801 |
| | | |
| | | | Market |
| | | | Value |
| | | Shares | ($000) |
| | JPMorgan Chase & Co. | 109,301 | 3,634 |
| | Citigroup Inc. | 91,992 | 2,420 |
| | Bank of America Corp. | 327,417 | 1,820 |
| | American Express Co. | 34,259 | 1,616 |
| | Goldman Sachs Group Inc. | 15,385 | 1,391 |
| | Simon Property Group Inc. | 10,078 | 1,299 |
| | US Bancorp | 43,300 | 1,171 |
| | American Tower Corporation | 15,173 | 910 |
| | Capital One Financial Corp. | 18,292 | 774 |
| | Public Storage | 5,672 | 763 |
| | State Street Corp. | 18,069 | 728 |
| | Equity Residential | 11,950 | 681 |
| | Morgan Stanley | 44,360 | 671 |
| | Aon Corp. | 14,000 | 655 |
| | Travelers Cos. Inc. | 10,589 | 627 |
| | Boston Properties Inc. | 6,181 | 616 |
| | Discover Financial Services | 23,829 | 572 |
| | Franklin Resources Inc. | 5,925 | 569 |
| | Loews Corp. | 14,816 | 558 |
| | Progressive Corp. | 28,397 | 554 |
| | AvalonBay Communities Inc. | 4,000 | 522 |
| | Bank of New York Mellon | | |
| | Corp. | 25,100 | 500 |
| | Host Hotels & Resorts Inc. | 33,599 | 496 |
| | Fifth Third Bancorp | 38,275 | 487 |
| | SunTrust Banks Inc. | 25,529 | 452 |
| | PNC Financial Services | | |
| | Group Inc. | 7,700 | 444 |
| | Charles Schwab Corp. | 39,305 | 443 |
| * | IntercontinentalExchange | | |
| | Inc. | 3,671 | 443 |
| | General Growth Properties | | |
| | Inc. | 29,100 | 437 |
| | Weyerhaeuser Co. | 22,357 | 417 |
| | MetLife Inc. | 12,940 | 403 |
| | Aflac Inc. | 8,800 | 381 |
| | Moody’s Corp. | 11,300 | 381 |
| | SL Green Realty Corp. | 5,659 | 377 |
| | Lincoln National Corp. | 18,630 | 362 |
| | Regions Financial Corp. | 83,215 | 358 |
| | Unum Group | 16,727 | 352 |
| | Federal Realty Investment | | |
| | Trust | 3,819 | 347 |
| * | Affiliated Managers Group | | |
| | Inc. | 3,584 | 344 |
| | Digital Realty Trust Inc. | 5,143 | 343 |
| * | CBRE Group Inc. Class A | 22,073 | 336 |
| | Torchmark Corp. | 7,648 | 332 |
| | Hartford Financial Services | | |
| | Group Inc. | 20,400 | 331 |
| * | Arch Capital Group Ltd. | 8,850 | 329 |
| * | Markel Corp. | 771 | 320 |
| | RenaissanceRe Holdings Ltd. | 4,298 | 320 |
| | WR Berkley Corp. | 9,243 | 318 |
| | Camden Property Trust | 4,800 | 299 |
15
Tax-Managed Balanced Fund
| | | |
| | | | Market |
| | | | Value |
| | | Shares | ($000) |
| | Alexandria Real Estate | | |
| | Equities Inc. | 4,300 | 297 |
| | Assurant Inc. | 7,200 | 296 |
| | Leucadia National Corp. | 12,900 | 293 |
| | Reinsurance Group of | | |
| | America Inc. Class A | 5,570 | 291 |
| | American International | | |
| | Group Inc. | 12,500 | 290 |
| | East West Bancorp Inc. | 14,669 | 290 |
| * | MSCI Inc. Class A | 8,734 | 288 |
| | Jones Lang LaSalle Inc. | 4,612 | 282 |
| | American Financial Group Inc. | 7,650 | 282 |
| | Comerica Inc. | 10,900 | 281 |
| | First Horizon National Corp. | 34,040 | 272 |
| | HCC Insurance Holdings Inc. | 9,864 | 271 |
| | Raymond James Financial Inc. | 8,734 | 270 |
| * | First Republic Bank | 8,800 | 269 |
| | Legg Mason Inc. | 11,154 | 268 |
| | Allied World Assurance Co. | | |
| | Holdings AG | 4,248 | 267 |
| * | NASDAQ OMX Group Inc. | 10,873 | 266 |
| | Assured Guaranty Ltd. | 20,094 | 264 |
| | Brown & Brown Inc. | 11,661 | 264 |
| | Zions Bancorporation | 16,151 | 263 |
| | TD Ameritrade Holding Corp. | 16,661 | 261 |
| | Apartment Investment & | | |
| | Management Co. | 11,376 | 261 |
| | DDR Corp. | 21,407 | 260 |
| * | MBIA Inc. | 22,375 | 259 |
| | CapitalSource Inc. | 38,614 | 259 |
| | Allstate Corp. | 9,400 | 258 |
| | Associated Banc-Corp | 22,727 | 254 |
| | Douglas Emmett Inc. | 13,834 | 252 |
| * | Forest City Enterprises Inc. | | |
| | Class A | 20,713 | 245 |
| | White Mountains Insurance | | |
| | Group Ltd. | 538 | 244 |
| | Commerce Bancshares Inc. | 6,271 | 239 |
| | Prudential Financial Inc. | 4,712 | 236 |
| | Vornado Realty Trust | 3,000 | 231 |
| | First Citizens BancShares | | |
| | Inc. Class A | 1,317 | 230 |
| * | Howard Hughes Corp. | 5,200 | 230 |
| | Essex Property Trust Inc. | 1,600 | 225 |
| * | St. Joe Co. | 15,200 | 223 |
| | BOK Financial Corp. | 4,040 | 222 |
| | Alleghany Corp. | 775 | 221 |
| * | LPL Investment Holdings Inc. | 7,100 | 217 |
| | SEI Investments Co. | 12,147 | 211 |
| * | American Capital Ltd. | 31,200 | 210 |
| | Lazard Ltd. Class A | 7,700 | 201 |
| | CNA Financial Corp. | 7,493 | 200 |
| | Huntington Bancshares Inc. | 35,900 | 197 |
| | Washington Federal Inc. | 13,900 | 194 |
| | StanCorp Financial Group Inc. | 5,000 | 184 |
| | | |
| | | | Market |
| | | | Value |
| | | Shares | ($000) |
| | Hanover Insurance Group Inc. | 5,014 | 175 |
| | BRE Properties Inc. | 3,400 | 172 |
| | ACE Ltd. | 2,100 | 147 |
| | BB&T Corp. | 5,800 | 146 |
| * | TFS Financial Corp. | 15,600 | 140 |
| | Kimco Realty Corp. | 8,469 | 138 |
| * | Genworth Financial Inc. | | |
| | Class A | 20,900 | 137 |
| | KeyCorp | 17,518 | 135 |
| | Transatlantic Holdings Inc. | 2,400 | 131 |
| | BlackRock Inc. | 722 | 129 |
| | Jefferies Group Inc. | 9,300 | 128 |
| | CME Group Inc. | 499 | 122 |
| | Chubb Corp. | 1,400 | 97 |
| * | Green Dot Corp. Class A | 2,400 | 75 |
| | Hospitality Properties Trust | 3,122 | 72 |
| | Ameriprise Financial Inc. | 1,180 | 59 |
| | M&T Bank Corp. | 750 | 57 |
| | ProLogis Inc. | 2,000 | 57 |
| * | CIT Group Inc. | 1,200 | 42 |
| | City National Corp. | 900 | 40 |
| * | E*Trade Financial Corp. | 3,200 | 25 |
| | Taubman Centers Inc. | 400 | 25 |
| | Cullen/Frost Bankers Inc. | 200 | 11 |
| | People’s United Financial Inc. | 400 | 5 |
| | | | 54,936 |
| Health Care (5.7%) | | |
| | Johnson & Johnson | 83,844 | 5,498 |
| | Pfizer Inc. | 209,390 | 4,531 |
| | Merck & Co. Inc. | 76,921 | 2,900 |
| | Abbott Laboratories | 41,200 | 2,317 |
| | UnitedHealth Group Inc. | 32,213 | 1,633 |
| | Amgen Inc. | 24,055 | 1,545 |
| | Bristol-Myers Squibb Co. | 36,160 | 1,274 |
| * | Gilead Sciences Inc. | 27,601 | 1,130 |
| * | Celgene Corp. | 16,412 | 1,109 |
| | Allergan Inc. | 11,409 | 1,001 |
| * | Biogen Idec Inc. | 8,811 | 970 |
| | WellPoint Inc. | 13,626 | 903 |
| | Medtronic Inc. | 23,200 | 887 |
| * | Medco Health Solutions Inc. | 15,153 | 847 |
| * | Express Scripts Inc. | 18,476 | 826 |
| | McKesson Corp. | 9,636 | 751 |
| * | Intuitive Surgical Inc. | 1,590 | 736 |
| | Eli Lilly & Co. | 16,600 | 690 |
| | Aetna Inc. | 15,855 | 669 |
| * | Thermo Fisher Scientific Inc. | 14,767 | 664 |
| | Stryker Corp. | 13,149 | 654 |
| | Cardinal Health Inc. | 13,245 | 538 |
| * | Agilent Technologies Inc. | 14,807 | 517 |
| | Cigna Corp. | 11,962 | 502 |
| * | Zimmer Holdings Inc. | 9,070 | 485 |
| * | Mylan Inc. | 22,356 | 480 |
| | St. Jude Medical Inc. | 13,835 | 475 |
| | Humana Inc. | 5,400 | 473 |
16
Tax-Managed Balanced Fund
| | | |
| | | | Market |
| | | | Value |
| | | Shares | ($000) |
| | AmerisourceBergen Corp. | | |
| | Class A | 12,706 | 473 |
| | Quest Diagnostics Inc. | 8,019 | 466 |
| * | Laboratory Corp. of America | | |
| | Holdings | 5,191 | 446 |
| * | Forest Laboratories Inc. | 14,719 | 445 |
| | Perrigo Co. | 4,428 | 431 |
| * | Watson Pharmaceuticals Inc. | 6,664 | 402 |
| | CR Bard Inc. | 4,565 | 390 |
| * | Life Technologies Corp. | 10,017 | 390 |
| * | Varian Medical Systems Inc. | 5,800 | 389 |
| * | Waters Corp. | 5,118 | 379 |
| * | DaVita Inc. | 4,800 | 364 |
| | Baxter International Inc. | 7,100 | 351 |
| | Omnicare Inc. | 9,293 | 320 |
| | DENTSPLY International Inc. | 9,083 | 318 |
| * | Endo Pharmaceuticals | | |
| | Holdings Inc. | 9,069 | 313 |
| * | Vertex Pharmaceuticals Inc. | 9,400 | 312 |
| * | Mettler-Toledo International | | |
| | Inc. | 2,100 | 310 |
| * | Hospira Inc. | 9,860 | 299 |
| | Cooper Cos. Inc. | 3,984 | 281 |
| | Universal Health Services | | |
| | Inc. Class B | 7,217 | 280 |
| | Techne Corp. | 3,800 | 259 |
| | Hill-Rom Holdings Inc. | 7,522 | 253 |
| | PerkinElmer Inc. | 12,100 | 242 |
| * | HCA Holdings Inc. | 10,844 | 239 |
| * | Warner Chilcott plc Class A | 15,109 | 229 |
| | Covidien plc | 4,800 | 216 |
| * | Tenet Healthcare Corp. | 42,100 | 216 |
| * | CareFusion Corp. | 8,395 | 213 |
| * | Bio-Rad Laboratories Inc. | | |
| | Class A | 2,100 | 202 |
| | Patterson Cos. Inc. | 6,600 | 195 |
| * | Illumina Inc. | 5,800 | 177 |
| * | Alexion Pharmaceuticals Inc. | 2,086 | 149 |
| | Becton Dickinson and Co. | 1,684 | 126 |
| * | Pharmasset Inc. | 936 | 120 |
| * | Edwards Lifesciences Corp. | 919 | 65 |
| * | Cerner Corp. | 505 | 31 |
| | | | 45,296 |
| Industrials (5.2%) | | |
| | General Electric Co. | 284,909 | 5,103 |
| | United Technologies Corp. | 24,876 | 1,818 |
| | Union Pacific Corp. | 16,326 | 1,730 |
| | 3M Co. | 16,900 | 1,381 |
| | Caterpillar Inc. | 13,100 | 1,187 |
| | Boeing Co. | 15,820 | 1,160 |
| | United Parcel Service Inc. | | |
| | Class B | 14,000 | 1,025 |
| | FedEx Corp. | 11,776 | 983 |
| | Danaher Corp. | 20,651 | 971 |
| | Precision Castparts Corp. | 5,552 | 915 |
| | | |
| | | | Market |
| | | | Value |
| | | Shares | ($000) |
| | Honeywell International Inc. | 12,900 | 701 |
| | Raytheon Co. | 14,149 | 685 |
| | Goodrich Corp. | 5,400 | 668 |
| | Cummins Inc. | 7,321 | 644 |
| | CSX Corp. | 29,700 | 625 |
| | Fastenal Co. | 13,325 | 581 |
| | Emerson Electric Co. | 12,100 | 564 |
| | CH Robinson Worldwide Inc. | 7,611 | 531 |
| | WW Grainger Inc. | 2,732 | 511 |
| | Fluor Corp. | 9,058 | 455 |
| | Roper Industries Inc. | 5,110 | 444 |
| | Deere & Co. | 5,600 | 433 |
| | Expeditors International of | | |
| | Washington Inc. | 10,266 | 421 |
| | Ingersoll-Rand plc | 13,100 | 399 |
| | AMETEK Inc. | 9,467 | 399 |
| | Joy Global Inc. | 5,219 | 391 |
| | Republic Services Inc. | | |
| | Class A | 14,110 | 389 |
| | Southwest Airlines Co. | 44,357 | 380 |
| * | Stericycle Inc. | 4,798 | 374 |
| | Flowserve Corp. | 3,671 | 365 |
| | Textron Inc. | 19,211 | 355 |
| | Rockwell Collins Inc. | 6,400 | 354 |
| | Stanley Black & Decker Inc. | 5,227 | 353 |
| | Donaldson Co. Inc. | 5,143 | 350 |
| | Equifax Inc. | 8,958 | 347 |
| * | Jacobs Engineering Group | | |
| | Inc. | 8,495 | 345 |
| * | TransDigm Group Inc. | 3,510 | 336 |
| * | Quanta Services Inc. | 15,495 | 334 |
| | Pall Corp. | 5,800 | 331 |
| | JB Hunt Transport Services | | |
| | Inc. | 7,310 | 329 |
| | KBR Inc. | 11,596 | 323 |
| | Gardner Denver Inc. | 4,188 | 323 |
| | Wabtec Corp. | 4,453 | 312 |
| * | BE Aerospace Inc. | 8,011 | 310 |
| | Towers Watson & Co. | | |
| | Class A | 5,100 | 306 |
| | Chicago Bridge & Iron | | |
| | Co. NV | 8,058 | 305 |
| * | AGCO Corp. | 6,937 | 298 |
| | MSC Industrial Direct Co. | | |
| | Inc. Class A | 4,100 | 293 |
| | PACCAR Inc. | 7,800 | 292 |
| * | Babcock & Wilcox Co. | 11,919 | 288 |
| * | Thomas & Betts Corp. | 5,256 | 287 |
| * | Fortune Brands Home & | | |
| | Security Inc. | 16,325 | 278 |
| * | WABCO Holdings Inc. | 6,296 | 273 |
| | Landstar System Inc. | 5,685 | 272 |
| * | Spirit Aerosystems Holdings | | |
| | Inc. Class A | 13,000 | 270 |
| | Nordson Corp. | 6,550 | 270 |
17
Tax-Managed Balanced Fund
| | | |
| | | | Market |
| | | | Value |
| | | Shares | ($000) |
| * | URS Corp. | 7,607 | 267 |
| * | WESCO International Inc. | 5,019 | 266 |
| | Trinity Industries Inc. | 8,800 | 265 |
| | Valmont Industries Inc. | 2,911 | 264 |
| | Waste Connections Inc. | 7,800 | 259 |
| * | Shaw Group Inc. | 9,600 | 258 |
| | Regal-Beloit Corp. | 5,000 | 255 |
| | Dun & Bradstreet Corp. | 3,400 | 254 |
| | Toro Co. | 4,159 | 252 |
| * | Navistar International Corp. | 6,646 | 252 |
| * | AECOM Technology Corp. | 12,134 | 250 |
| * | Huntington Ingalls | | |
| | Industries Inc. | 7,819 | 245 |
| | Manitowoc Co. Inc. | 26,500 | 244 |
| | SPX Corp. | 3,997 | 241 |
| * | Armstrong World Industries | | |
| | Inc. | 5,403 | 237 |
| | Robert Half International Inc. | 8,200 | 233 |
| | General Dynamics Corp. | 3,491 | 232 |
| | Pentair Inc. | 6,800 | 226 |
| | Xylem Inc. | 8,738 | 224 |
| | Alliant Techsystems Inc. | 3,886 | 222 |
| * | CNH Global NV | 6,000 | 216 |
| | UTi Worldwide Inc. | 16,212 | 215 |
| | Copa Holdings SA Class A | 3,638 | 213 |
| | Covanta Holding Corp. | 14,400 | 197 |
| | Norfolk Southern Corp. | 2,700 | 197 |
| * | Air Lease Corp. | 8,000 | 190 |
| | Manpower Inc. | 5,250 | 188 |
| | Illinois Tool Works Inc. | 3,700 | 173 |
| | Cintas Corp. | 4,550 | 158 |
| | Lockheed Martin Corp. | 1,503 | 122 |
| | Tyco International Ltd. | 2,600 | 121 |
| | ITT Corp. | 4,369 | 84 |
| | Exelis Inc. | 8,738 | 79 |
| * | Oshkosh Corp. | 3,547 | 76 |
| | Ryder System Inc. | 1,400 | 74 |
| * | Delta Air Lines Inc. | 9,100 | 74 |
| | Con-way Inc. | 2,465 | 72 |
| | L-3 Communications | | |
| | Holdings Inc. | 489 | 33 |
| * | United Continental | | |
| | Holdings Inc. | 1,200 | 23 |
| | IDEX Corp. | 529 | 20 |
| | Northrop Grumman Corp. | 118 | 7 |
| | | | 41,845 |
| Information Technology (8.9%) | | |
| * | Apple Inc. | 28,144 | 11,398 |
| | International Business | | |
| | Machines Corp. | 36,747 | 6,757 |
| | Microsoft Corp. | 203,956 | 5,295 |
| * | Google Inc. Class A | 7,772 | 5,020 |
| | Intel Corp. | 151,400 | 3,671 |
| | Cisco Systems Inc. | 172,215 | 3,114 |
| | Oracle Corp. | 121,190 | 3,109 |
| | | |
| | | | Market |
| | | | Value |
| | | Shares | ($000) |
| | Qualcomm Inc. | 45,700 | 2,500 |
| | Visa Inc. Class A | 17,624 | 1,789 |
| | Hewlett-Packard Co. | 65,489 | 1,687 |
| * | EMC Corp. | 68,136 | 1,468 |
| | Mastercard Inc. Class A | 3,750 | 1,398 |
| * | eBay Inc. | 39,444 | 1,196 |
| * | Dell Inc. | 59,801 | 875 |
| * | Yahoo! Inc. | 50,666 | 817 |
| | Corning Inc. | 58,977 | 766 |
| * | Cognizant Technology | | |
| | Solutions Corp. Class A | 11,698 | 752 |
| | Accenture plc Class A | 13,600 | 724 |
| | Texas Instruments Inc. | 23,446 | 682 |
| | Intuit Inc. | 12,524 | 659 |
| | Broadcom Corp. Class A | 21,143 | 621 |
| * | Adobe Systems Inc. | 21,296 | 602 |
| | Motorola Solutions Inc. | 12,867 | 596 |
| | Applied Materials Inc. | 53,080 | 568 |
| | Altera Corp. | 15,152 | 562 |
| * | NetApp Inc. | 15,271 | 554 |
| * | Symantec Corp. | 33,239 | 520 |
| * | Citrix Systems Inc. | 8,154 | 495 |
| | Analog Devices Inc. | 13,696 | 490 |
| * | Motorola Mobility Holdings | | |
| | Inc. | 12,600 | 489 |
| | Western Union Co. | 25,665 | 469 |
| | KLA-Tencor Corp. | 9,012 | 435 |
| * | Fiserv Inc. | 7,371 | 433 |
| | Xilinx Inc. | 13,429 | 431 |
| * | Juniper Networks Inc. | 20,600 | 420 |
| | Amphenol Corp. Class A | 9,096 | 413 |
| | Fidelity National Information | | |
| | Services Inc. | 15,481 | 412 |
| * | Teradata Corp. | 8,251 | 400 |
| | CA Inc. | 19,407 | 392 |
| | VeriSign Inc. | 10,728 | 383 |
| * | Autodesk Inc. | 11,608 | 352 |
| * | Alliance Data Systems Corp. | 3,377 | 351 |
| | Activision Blizzard Inc. | 26,460 | 326 |
| * | BMC Software Inc. | 9,883 | 324 |
| | Avago Technologies Ltd. | 11,135 | 321 |
| | Global Payments Inc. | 6,714 | 318 |
| | FLIR Systems Inc. | 11,769 | 295 |
| | Factset Research Systems | | |
| | Inc. | 3,299 | 288 |
| * | Lam Research Corp. | 7,700 | 285 |
| | Solera Holdings Inc. | 6,390 | 285 |
| * | SAIC Inc. | 22,806 | 280 |
| * | Synopsys Inc. | 10,000 | 272 |
| * | NVIDIA Corp. | 17,900 | 248 |
| | National Instruments Corp. | 9,411 | 244 |
| * | Atmel Corp. | 28,800 | 233 |
| | Automatic Data Processing | | |
| | Inc. | 4,274 | 231 |
| | DST Systems Inc. | 5,030 | 229 |
18
Tax-Managed Balanced Fund
| | | |
| | | | Market |
| | | | Value• |
| | | Shares | ($000) |
| | Total System Services Inc. | 11,700 | 229 |
| | Xerox Corp. | 26,155 | 208 |
| * | Marvell Technology Group | | |
| | Ltd. | 15,000 | 208 |
| * | Fairchild Semiconductor | | |
| | International Inc. Class A | 16,325 | 197 |
| | Computer Sciences Corp. | 8,200 | 194 |
| | Lexmark International Inc. | | |
| | Class A | 5,300 | 175 |
| | Maxim Integrated Products | | |
| | Inc. | 5,500 | 143 |
| | Tellabs Inc. | 35,248 | 142 |
| * | Ingram Micro Inc. | 7,800 | 142 |
| | Linear Technology Corp. | 4,000 | 120 |
| * | Salesforce.com Inc. | 1,103 | 112 |
| * | First Solar Inc. | 2,971 | 100 |
| * | LSI Corp. | 14,400 | 86 |
| | AVX Corp. | 6,400 | 82 |
| | Harris Corp. | 2,100 | 76 |
| * | Tech Data Corp. | 1,400 | 69 |
| | IAC/InterActiveCorp | 1,500 | 64 |
| * | Arrow Electronics Inc. | 700 | 26 |
| * | Freescale Semiconductor | | |
| | Holdings I Ltd. | 1,600 | 20 |
| | Lender Processing Services | | |
| | Inc. | 800 | 12 |
| | | | 70,649 |
| Materials (1.9%) | | |
| | Monsanto Co. | 16,208 | 1,136 |
| | Freeport-McMoRan | | |
| | Copper & Gold Inc. | 29,394 | 1,081 |
| | Newmont Mining Corp. | 16,554 | 993 |
| | EI du Pont de Nemours & | | |
| | Co. | 15,728 | 720 |
| | Mosaic Co. | 12,048 | 608 |
| | Ecolab Inc. | 9,400 | 543 |
| | Dow Chemical Co. | 17,400 | 500 |
| | CF Industries Holdings Inc. | 3,312 | 480 |
| | LyondellBasell Industries NV | | |
| | Class A | 13,538 | 440 |
| | Alcoa Inc. | 49,200 | 426 |
| | Sigma-Aldrich Corp. | 6,780 | 424 |
| | Praxair Inc. | 3,600 | 385 |
| | Ball Corp. | 10,718 | 383 |
| | Celanese Corp. Class A | 8,640 | 383 |
| | FMC Corp. | 4,399 | 379 |
| | Airgas Inc. | 4,819 | 376 |
| | Sherwin-Williams Co. | 4,100 | 366 |
| | Vulcan Materials Co. | 9,034 | 356 |
| * | Crown Holdings Inc. | 10,541 | 354 |
| | International Paper Co. | 10,743 | 318 |
| | Walter Energy Inc. | 5,107 | 309 |
| | Royal Gold Inc. | 4,571 | 308 |
| | | |
| | | | Market |
| | | | Value• |
| | | Shares | ($000) |
| * | WR Grace & Co. | 6,600 | 303 |
| | Reliance Steel & Aluminum | | |
| | Co. | 6,200 | 302 |
| | Ashland Inc. | 5,198 | 297 |
| | Nucor Corp. | 7,400 | 293 |
| * | Owens-Illinois Inc. | 14,600 | 283 |
| | Cliffs Natural Resources Inc. | 4,384 | 273 |
| | Cytec Industries Inc. | 5,833 | 261 |
| | Silgan Holdings Inc. | 6,306 | 244 |
| | Scotts Miracle-Gro Co. | | |
| | Class A | 5,042 | 235 |
| | Westlake Chemical Corp. | 5,700 | 229 |
| * | Solutia Inc. | 12,000 | 207 |
| | Sealed Air Corp. | 11,800 | 203 |
| | Schnitzer Steel Industries | | |
| | Inc. | 4,207 | 178 |
| | Martin Marietta Materials | | |
| | Inc. | 2,286 | 172 |
| * | Intrepid Potash Inc. | 6,803 | 154 |
| | Titanium Metals Corp. | 9,700 | 145 |
| | Albemarle Corp. | 2,800 | 144 |
| | Temple-Inland Inc. | 2,802 | 89 |
| | United States Steel Corp. | 1,659 | 44 |
| | Air Products & Chemicals | | |
| | Inc. | 500 | 43 |
| * | Rockwood Holdings Inc. | 900 | 35 |
| | | | 15,402 |
| Telecommunication Services (1.3%) | |
| | AT&T Inc. | 157,466 | 4,762 |
| | Verizon Communications | | |
| | Inc. | 76,300 | 3,061 |
| * | Crown Castle International | | |
| | Corp. | 13,267 | 594 |
| * | SBA Communications Corp. | | |
| | Class A | 8,011 | 344 |
| * | NII Holdings Inc. | 14,251 | 304 |
| * | tw telecom inc Class A | 14,900 | 289 |
| * | Sprint Nextel Corp. | 122,135 | 286 |
| * | United States Cellular Corp. | 5,015 | 219 |
| * | MetroPCS Communications | | |
| | Inc. | 21,500 | 187 |
| | Telephone & Data Systems | | |
| | Inc. | 7,107 | 184 |
| | CenturyLink Inc. | 2,600 | 97 |
| | Telephone & Data Systems | | |
| | Inc. (Special Common | | |
| | Shares) | 3,000 | 71 |
| * | Clearwire Corp. Class A | 10,263 | 20 |
| | | | 10,418 |
| Utilities (1.9%) | | |
| | Southern Co. | 29,442 | 1,363 |
| | NextEra Energy Inc. | 15,197 | 925 |
| | Consolidated Edison Inc. | 11,880 | 737 |
19
Tax-Managed Balanced Fund
| | | |
| | | | Market |
| | | | Value |
| | | Shares | ($000) |
| | Dominion Resources Inc. | 13,408 | 712 |
| | FirstEnergy Corp. | 14,278 | 632 |
| | PG&E Corp. | 14,635 | 603 |
| | Edison International | 14,208 | 588 |
| | Xcel Energy Inc. | 21,000 | 580 |
| | Sempra Energy | 10,529 | 579 |
| | Entergy Corp. | 7,700 | 562 |
| | ONEOK Inc. | 5,592 | 485 |
| | Wisconsin Energy Corp. | 12,732 | 445 |
| * | AES Corp. | 35,469 | 420 |
| | Constellation Energy Group | | |
| | Inc. | 10,099 | 401 |
| | Northeast Utilities | 10,794 | 389 |
| * | Calpine Corp. | 23,010 | 376 |
| | CMS Energy Corp. | 16,627 | 367 |
| | OGE Energy Corp. | 6,393 | 363 |
| | American Water Works Co. | | |
| | Inc. | 11,328 | 361 |
| | Alliant Energy Corp. | 7,713 | 340 |
| | NSTAR | 7,142 | 335 |
| | | |
| | | | Market |
| | | | Value |
| | | Shares | ($000 |
| | Exelon Corp. | 7,400 | 321 |
| | MDU Resources Group Inc. | 14,804 | 318 |
| | NV Energy Inc. | 19,087 | 312 |
| | ITC Holdings Corp. | 4,070 | 309 |
| | National Fuel Gas Co. | 5,501 | 306 |
| | Duke Energy Corp. | 13,392 | 295 |
| | Questar Corp. | 14,533 | 289 |
| | UGI Corp. | 9,552 | 281 |
| * | NRG Energy Inc. | 15,424 | 279 |
| | Aqua America Inc. | 12,483 | 275 |
| | AGL Resources Inc. | 6,000 | 254 |
| * | GenOn Energy Inc. | 83,412 | 218 |
| | Public Service Enterprise | | |
| | Group Inc. | 5,564 | 184 |
| | Great Plains Energy Inc. | 7,800 | 170 |
| | American Electric Power | | |
| | Co. Inc. | 300 | 12 |
| | | | 15,386 |
| Total Common Stocks | | |
| (Cost $254,961) | | 385,935 |
| | | | |
| | | | Face | Market |
| | | Maturity | Amount | Value |
| | Coupon | Date | ($000) | ($000) |
| Tax-Exempt Municipal Bonds (51.1%) | | | | |
| Alabama (0.1%) | | | | |
| Alabama Public School & College | | | | |
| Authority Capital Improvement Revenue | 5.000% | 12/1/21 | 500 | 582 |
| Alabama Public School & College Authority | | | | |
| Capital Improvement Revenue | 5.000% | 12/1/22 | 500 | 577 |
| | | | | 1,159 |
| Alaska (0.1%) | | | | |
| Matanuska-Susitna Borough AK GO | 5.500% | 3/1/12 (3) | 595 | 599 |
| |
| Arizona (1.7%) | | | | |
| Arizona Board Regents Arizona State | | | | |
| University System Revenue | 5.875% | 7/1/24 | 100 | 118 |
| Arizona COP | 5.000% | 10/1/18 (4) | 500 | 588 |
| Arizona Health Facilities Authority Revenue | | | | |
| (Banner Health) | 5.000% | 1/1/25 | 500 | 537 |
| Arizona School Facilities Board COP | 5.500% | 9/1/23 | 500 | 568 |
| Arizona School Facilities Board Revenue | | | | |
| (School Improvement) | 5.750% | 7/1/14 (Prere.) | 500 | 562 |
| Arizona Transportation Board Excise Tax | | | | |
| Revenue (Maricopa County Regional Area) | 5.000% | 7/1/24 | 500 | 592 |
| Arizona Transportation Board Excise Tax | | | | |
| Revenue (Maricopa County Regional Area) | 5.000% | 7/1/25 | 500 | 558 |
| Arizona Transportation Board Highway Revenue | 5.250% | 7/1/12 (Prere.) | 2,215 | 2,271 |
| Arizona Transportation Board Highway Revenue | 5.250% | 7/1/12 (Prere.) | 1,965 | 2,014 |
20
Tax-Managed Balanced Fund
| | | | |
| | | | Face | Market |
| | | Maturity | Amount | Value |
| | Coupon | Date | ($000) | ($000) |
| Arizona Water Infrastructure Finance Authority | | | | |
| Revenue | 4.000% | 10/1/14 | 500 | 547 |
| Glendale AZ Industrial Development Authority | | | | |
| Revenue (Midwestern University) | 5.000% | 5/15/30 | 275 | 285 |
| Mesa AZ Utility System Revenue | 5.000% | 7/1/14 (Prere.) | 500 | 556 |
| Phoenix AZ Civic Improvement Corp. | | | | |
| Airport Revenue | 5.000% | 7/1/24 | 300 | 336 |
| Phoenix AZ Civic Improvement Corp. | | | | |
| Airport Revenue (Light Rail Project) | 5.000% | 7/1/19 (2) | 780 | 854 |
| Phoenix AZ Civic Improvement Corp. | | | | |
| Water System Revenue | 5.000% | 7/1/21 (14) | 500 | 554 |
| Salt River Project Arizona Agricultural | | | | |
| Improvement & Power District Revenue | 5.000% | 1/1/28 | 750 | 838 |
| Salt Verde AZ Financial Project Revenue | 5.250% | 12/1/24 | 500 | 503 |
| University Medical Center Corp. Arizona | | | | |
| Hospital Revenue | 5.000% | 7/1/19 | 500 | 549 |
| Yavapai County AZ Industrial Development | | | | |
| Authority Hospital Facility Revenue | | | | |
| (Northern Arizona Healthcare System) | 5.250% | 10/1/22 | 500 | 583 |
| | | | | 13,413 |
| California (6.3%) | | | | |
| Bay Area CA Infrastructure Financing | | | | |
| Authority Revenue | 5.000% | 8/1/17 (14) | 500 | 541 |
| Bay Area Toll Authority California Toll Bridge | | | | |
| Revenue (San Francisco Bay Area) | 5.000% | 4/1/25 | 500 | 563 |
| Bay Area Toll Authority California Toll Bridge | | | | |
| Revenue (San Francisco Bay Area) | 5.000% | 10/1/30 | 500 | 538 |
| California Department of Water Resources | | | | |
| Power Supply Revenue | 5.500% | 5/1/12 (Prere.) | 3,000 | 3,082 |
| California Department of Water Resources | | | | |
| Power Supply Revenue | 5.000% | 5/1/16 | 500 | 585 |
| California Department of Water Resources | | | | |
| Power Supply Revenue | 5.000% | 5/1/17 | 500 | 600 |
| California Department of Water Resources | | | | |
| Power Supply Revenue | 5.000% | 5/1/18 | 500 | 611 |
| California Department of Water Resources | | | | |
| Power Supply Revenue | 5.000% | 5/1/18 | 500 | 611 |
| California Department of Water Resources | | | | |
| Power Supply Revenue | 5.000% | 5/1/19 | 500 | 619 |
| California Department of Water Resources | | | | |
| Power Supply Revenue | 5.000% | 5/1/20 | 575 | 718 |
| California Department of Water Resources | | | | |
| Water System Revenue (Central Valley Project) | 5.000% | 12/1/28 | 500 | 556 |
| California Economic Recovery Bonds GO | 5.000% | 7/1/14 (Prere.) | 205 | 228 |
| California Economic Recovery Bonds GO | 5.000% | 7/1/15 | 295 | 324 |
| California Economic Recovery Bonds GO | 5.000% | 7/1/18 | 500 | 605 |
| California Economic Recovery Bonds GO | 5.000% | 7/1/19 | 500 | 611 |
| California Economic Recovery Bonds GO | 5.000% | 7/1/20 | 500 | 606 |
| California Economic Recovery Bonds GO | 5.250% | 7/1/21 | 500 | 611 |
| California Economic Recovery Bonds GO | 5.000% | 7/1/22 | 500 | 562 |
| California Educational Facilities Authority | | | | |
| Revenue (University of San Francisco) | 6.125% | 10/1/30 | 500 | 575 |
| California GO | 5.250% | 10/1/13 (14) | 500 | 540 |
| California GO | 5.000% | 11/1/13 | 500 | 539 |
| California GO | 5.000% | 6/1/15 | 500 | 556 |
21
Tax-Managed Balanced Fund
| | | | |
| | | | Face | Market |
| | | Maturity | Amount | Value |
| | Coupon | Date | ($000) | ($000) |
| California GO | 6.000% | 2/1/16 | 500 | 593 |
| California GO | 5.000% | 11/1/16 | 350 | 409 |
| California GO | 5.000% | 3/1/17 | 500 | 585 |
| California GO | 5.000% | 4/1/17 | 500 | 586 |
| California GO | 5.500% | 4/1/18 | 500 | 607 |
| California GO | 6.000% | 4/1/18 | 500 | 621 |
| California GO | 5.000% | 9/1/18 | 500 | 569 |
| California GO | 5.000% | 11/1/18 (3) | 500 | 585 |
| California GO | 5.000% | 6/1/19 (14) | 500 | 575 |
| California GO | 5.000% | 10/1/21 | 250 | 282 |
| California GO | 5.000% | 6/1/25 | 495 | 533 |
| California GO | 5.500% | 3/1/26 | 500 | 559 |
| California GO | 5.000% | 6/1/27 (14) | 500 | 531 |
| California GO | 5.000% | 9/1/27 | 500 | 530 |
| California GO | 4.500% | 8/1/28 (2) | 485 | 496 |
| California GO | 5.750% | 4/1/29 | 500 | 566 |
| California GO | 5.000% | 9/1/29 (2) | 500 | 519 |
| California GO | 5.250% | 3/1/30 | 500 | 542 |
| California GO | 5.250% | 9/1/30 | 500 | 548 |
| California Health Facilities Financing Authority | | | | |
| Revenue (Catholic Healthcare West) PUT | 5.000% | 7/1/14 | 500 | 549 |
| California Health Facilities Financing Authority | | | | |
| Revenue (Cedars-Sinai Medical Center) | 5.000% | 8/15/17 | 500 | 578 |
| California Health Facilities Financing Authority | | | | |
| Revenue (Rady Children’s Hospital) | 5.000% | 8/15/31 | 500 | 510 |
| California Health Facilities Financing Authority | | | | |
| Revenue (Sutter Health) | 5.500% | 8/15/26 | 500 | 568 |
| California Infrastructure & Economic | | | | |
| Development Bank Revenue (Bay Area | | | | |
| Toll Bridges Seismic Retrofit) | 5.000% | 1/1/28 (Prere.) | 500 | 637 |
| 1 California Infrastructure & Economic | | | | |
| Development Bank Revenue (Bay Area | | | | |
| Toll Bridges Seismic Retrofit) TOB VRDO | 0.070% | 1/3/12 (ETM) | 100 | 100 |
| California Municipal Finance Authority | | | | |
| Revenue (University of La Verne) | 6.125% | 6/1/30 | 500 | 530 |
| California Public Works Board Lease Revenue | | | | |
| (Judicial Council Projects) | 5.125% | 12/1/29 | 250 | 259 |
| California State University Revenue Systemwide | 5.750% | 11/1/27 | 500 | 571 |
| California State University Revenue Systemwide | 5.250% | 11/1/29 | 300 | 330 |
| California Statewide Communities Development | | | | |
| Authority Revenue (Kaiser Permanente) | 5.000% | 4/1/19 | 500 | 595 |
| California Statewide Communities Development | | | | |
| Authority Revenue (Proposition 1A | | | | |
| Receivables Program) | 5.000% | 6/15/13 | 500 | 530 |
| Golden State Tobacco Securitization Corp. | | | | |
| California | 4.500% | 6/1/27 | 500 | 412 |
| Los Angeles CA Community College District GO | 5.000% | 8/1/27 | 500 | 546 |
| Los Angeles CA Department of Airports | | | | |
| International Airport Revenue | 5.000% | 5/15/27 | 500 | 555 |
| Los Angeles CA Department of Water & | | | | |
| Power Revenue | 5.000% | 7/1/24 | 500 | 579 |
| Los Angeles CA GO | 5.000% | 9/1/20 (14) | 500 | 546 |
| Los Angeles CA Unified School District GO | 5.000% | 7/1/21 (4) | 1,825 | 2,089 |
| Los Angeles CA Unified School District GO | 5.000% | 7/1/26 | 500 | 554 |
| Los Angeles CA Unified School District GO | 5.000% | 7/1/29 | 500 | 543 |
22
Tax-Managed Balanced Fund
| | | | |
| | | | Face | Market |
| | | Maturity | Amount | Value |
| | Coupon | Date | ($000) | ($000) |
| Los Angeles CA Unified School District GO | 5.000% | 7/1/29 | 500 | 543 |
| Los Angeles CA Wastewater System Revenue | 5.000% | 6/1/29 | 500 | 546 |
| Los Angeles County CA Metropolitan | | | | |
| Transportation Authority Sales Tax Revenue | 5.000% | 7/1/19 | 560 | 693 |
| 1 Palomar Pomerado Health System California | | | | |
| Revenue GO TOB VRDO | 0.100% | 1/6/12 (12) | 300 | 300 |
| Roseville CA Natural Gas Financing Authority | | | | |
| Gas Revenue | 5.000% | 2/15/12 | 500 | 503 |
| Sacramento CA Municipal Utility District Revenue | 5.000% | 8/15/27 (4) | 500 | 546 |
| Sacramento County CA Airport Revenue | 5.625% | 7/1/29 | 500 | 540 |
| San Diego CA Community College District GO | 5.000% | 8/1/31 | 500 | 552 |
| San Diego CA Public Facilities Financing | | | | |
| Authority Sewer Revenue | 5.000% | 5/15/28 | 500 | 549 |
| San Diego CA Public Facilities Financing | | | | |
| Authority Water Revenue | 5.250% | 8/1/28 | 500 | 567 |
| San Diego CA Unified School District GO | 0.000% | 7/1/27 | 500 | 222 |
| San Diego CA Unified School District GO | 5.500% | 7/1/27 (4) | 500 | 604 |
| San Diego CA Unified School District GO | 0.000% | 7/1/28 | 500 | 207 |
| San Diego CA Unified School District GO | 0.000% | 7/1/29 | 500 | 195 |
| San Diego County CA Regional Airport | | | | |
| Authority Revenue | 5.000% | 7/1/30 (4) | 500 | 527 |
| San Francisco CA City & County Earthquake | | | | |
| Safety GO | 5.000% | 6/15/28 | 500 | 564 |
| San Francisco CA City & County International | | | | |
| Airport Revenue | 5.250% | 5/1/22 | 500 | 584 |
| San Francisco CA City & County International | | | | |
| Airport Revenue | 5.000% | 5/1/30 | 500 | 541 |
| San Francisco CA City & County Public | | | | |
| Utilities Commission Water Revenue | 5.500% | 11/1/30 | 500 | 574 |
| San Jose CA Redevelopment Agency | | | | |
| Tax Allocation Revenue | 6.500% | 8/1/28 | 700 | 728 |
| University of California Revenue | 5.000% | 5/15/21 | 500 | 554 |
| University of California Revenue | 5.000% | 5/15/25 | 500 | 558 |
| University of California Revenue | 5.000% | 5/15/27 (14) | 500 | 548 |
| University of California Revenue | 5.000% | 5/15/28 (14) | 500 | 546 |
| Whittier CA Health Facility Revenue | | | | |
| (Presbyterian Intercommunity Hospital) VRDO | 0.070% | 1/6/12 LOC | 1,200 | 1,200 |
| | | | | 50,089 |
| Colorado (1.1%) | | | | |
| Colorado Department of Transportation RAN | 5.250% | 12/15/13 (Prere.) | 3,750 | 4,099 |
| Colorado Department of Transportation RAN | 5.500% | 6/15/15 (14) | 500 | 580 |
| Colorado Health Facilities Authority Revenue | | | | |
| (Catholic Health Initiatives) | 5.250% | 2/1/31 | 500 | 529 |
| Denver CO City & County Airport Revenue | 5.000% | 11/15/26 | 430 | 476 |
| Denver CO City & County COP VRDO | 0.070% | 1/4/12 | 805 | 805 |
| E-470 Public Highway Authority | | | | |
| Colorado Revenue | 5.250% | 9/1/18 (14) | 1,500 | 1,601 |
| E-470 Public Highway Authority | | | | |
| Colorado Revenue | 5.375% | 9/1/26 | 500 | 504 |
| | | | | 8,594 |
| Connecticut (1.2%) | | | | |
| Connecticut GO | 5.500% | 12/15/13 | 3,000 | 3,297 |
| Connecticut GO | 5.000% | 1/1/14 | 500 | 545 |
| Connecticut GO | 5.000% | 11/1/14 | 500 | 561 |
23
Tax-Managed Balanced Fund
| | | | |
| | | | Face | Market |
| | | Maturity | Amount | Value |
| | Coupon | Date | ($000) | ($000) |
| Connecticut GO | 5.000% | 12/1/14 | 500 | 563 |
| Connecticut GO | 5.000% | 11/1/16 | 410 | 489 |
| Connecticut Health & Educational Facilities | | | | |
| Authority Revenue (Hartford Healthcare) | 5.000% | 7/1/26 | 500 | 531 |
| Connecticut Health & Educational Facilities | | | | |
| Authority Revenue (Yale University) VRDO | 0.010% | 1/6/12 | 2,100 | 2,100 |
| Connecticut Special Tax Revenue | | | | |
| (Transportation Infrastructure) | 6.500% | 10/1/12 | 500 | 523 |
| Connecticut Special Tax Revenue | | | | |
| (Transportation Infrastructure) | 5.000% | 2/1/16 | 110 | 128 |
| Connecticut Special Tax Revenue | | | | |
| (Transportation Infrastructure) | 5.000% | 11/1/25 | 500 | 568 |
| | | | | 9,305 |
| Delaware (0.1%) | | | | |
| Delaware GO | 5.000% | 10/1/20 | 500 | 639 |
| |
| District of Columbia (0.3%) | | | | |
| District of Columbia GO | 5.000% | 6/1/21 (4) | 500 | 575 |
| District of Columbia Income Tax Revenue | 5.250% | 12/1/27 | 500 | 581 |
| District of Columbia Income Tax Revenue | 5.000% | 12/1/30 | 500 | 559 |
| Metropolitan Washington DC/VA Airports | | | | |
| Authority Airport System Revenue | 5.000% | 10/1/24 | 500 | 575 |
| | | | | 2,290 |
| Florida (1.7%) | | | | |
| Broward County FL Airport System Revenue | 5.375% | 10/1/29 | 500 | 546 |
| Citizens Property Insurance Corp. | | | | |
| Florida Revenue (Coastal Account) | 5.000% | 6/1/15 | 1,000 | 1,079 |
| Citizens Property Insurance Corp. | | | | |
| Florida Revenue (Coastal Account) | 5.250% | 6/1/17 | 435 | 486 |
| Citizens Property Insurance Corp. | | | | |
| Florida Revenue (Coastal Account) | 5.500% | 6/1/17 | 500 | 565 |
| Florida Board of Education Capital Outlay GO | 5.000% | 1/1/14 | 500 | 545 |
| Florida Board of Education Lottery Revenue | 5.000% | 7/1/16 (2) | 500 | 569 |
| Florida Board of Education Lottery Revenue | 5.000% | 7/1/18 | 500 | 602 |
| Florida Board of Education Public Education | | | | |
| Capital Outlay GO | 5.000% | 6/1/22 | 500 | 601 |
| Florida Board of Education Public Education | | | | |
| Capital Outlay GO | 5.000% | 6/1/24 | 500 | 566 |
| Florida Department of Environmental | | | | |
| Protection & Preservation Revenue | 5.000% | 7/1/15 (14) | 625 | 706 |
| Florida Turnpike Authority Revenue | 5.000% | 7/1/19 | 500 | 611 |
| Jacksonville FL Health Facilities Authority | | | | |
| Hospital Revenue (Baptist Medical Center | | | | |
| Project) VRDO | 0.060% | 1/3/12 LOC | 200 | 200 |
| Miami-Dade County FL Aviation Revenue | | | | |
| (Miami International Airport) | 4.875% | 10/1/24 | 500 | 539 |
| Miami-Dade County FL Aviation Revenue | | | | |
| (Miami International Airport) | 5.000% | 10/1/30 | 585 | 609 |
| Miami-Dade County FL School Board COP | 5.000% | 11/1/22 (2) | 500 | 533 |
| Miami-Dade County FL Water & Sewer Revenue | 5.000% | 10/1/26 (14) | 500 | 544 |
| Orange County FL Health Facilities Authority | | | | |
| Revenue (Nemours Foundation Project) | 5.000% | 1/1/19 | 500 | 588 |
| Orange County FL School Board COP VRDO | 0.100% | 1/6/12 LOC | 1,300 | 1,300 |
24
Tax-Managed Balanced Fund
| | | | |
| | | | Face | Market |
| | | Maturity | Amount | Value |
| | Coupon | Date | ($000) | ($000) |
| Orlando & Orange County FL Expressway | | | | |
| Authority Revenue | 5.000% | 7/1/30 | 500 | 538 |
| Orlando FL Utility Commission | | | | |
| Water & Electric Revenue | 5.250% | 10/1/13 (ETM) | 500 | 542 |
| Orlando FL Utility Commission | | | | |
| Water & Electric Revenue | 5.250% | 10/1/14 (ETM) | 500 | 564 |
| Tohopekaliga FL Water Authority | | | | |
| Utility System Revenue | 5.750% | 10/1/30 | 500 | 584 |
| | | | | 13,417 |
| Georgia (1.9%) | | | | |
| Atlanta GA Airport Revenue | 5.000% | 1/1/16 | 525 | 595 |
| Atlanta GA Airport Revenue | 5.000% | 1/1/20 | 500 | 597 |
| Atlanta GA Water & Wastewater Revenue | 5.750% | 11/1/27 (4) | 500 | 616 |
| DeKalb County GA Water & Sewer Revenue | 5.250% | 10/1/31 | 500 | 553 |
| Georgia GO | 5.000% | 10/1/13 | 500 | 541 |
| Georgia GO | 4.000% | 1/1/15 | 575 | 633 |
| Georgia GO | 5.000% | 9/1/15 (Prere.) | 500 | 577 |
| Georgia GO | 5.000% | 4/1/16 | 500 | 588 |
| Georgia GO | 5.000% | 5/1/16 | 500 | 590 |
| Georgia GO | 5.000% | 7/1/16 | 400 | 474 |
| Georgia GO | 5.000% | 7/1/16 | 500 | 593 |
| Georgia GO | 5.750% | 8/1/17 | 500 | 630 |
| Georgia GO | 5.000% | 7/1/22 | 500 | 607 |
| Georgia GO | 5.000% | 5/1/25 | 500 | 592 |
| Georgia Municipal Electric Power | | | | |
| Authority Revenue | 6.250% | 1/1/12 (14) | 3,000 | 3,000 |
| Georgia Road & Tollway Authority GAN | 5.000% | 6/1/14 | 500 | 552 |
| Georgia Road & Tollway Authority Revenue | 5.000% | 6/1/17 | 500 | 598 |
| Gwinnett County GA School District GO | 5.000% | 2/1/28 | 500 | 610 |
| Main Street Natural Gas Inc. Georgia | | | | |
| Gas Project Revenue | 5.000% | 3/15/16 | 590 | 646 |
| Main Street Natural Gas Inc. Georgia | | | | |
| Gas Project Revenue | 5.000% | 3/15/21 | 500 | 502 |
| Milledgeville-Baldwin County GA | | | | |
| Development Authority Revenue (Georgia | | | | |
| College & State University Foundation) | 5.625% | 9/1/14 (Prere.) | 500 | 573 |
| Municipal Electric Authority Georgia | | | | |
| Revenue (Project One) | 5.250% | 1/1/17 | 105 | 123 |
| Private Colleges & University Authority of | | | | |
| Georgia Revenue (Emory University) | 5.000% | 9/1/28 | 500 | 564 |
| | | | | 15,354 |
| Hawaii (0.6%) | | | | |
| Hawaii GO | 5.750% | 2/1/15 (4) | 500 | 576 |
| Hawaii GO | 5.000% | 4/1/19 (2) | 500 | 591 |
| Hawaii GO | 5.000% | 6/1/29 | 500 | 571 |
| Hawaii GO | 5.000% | 12/1/29 | 500 | 576 |
| Hawaii Pacific Health Revenue | 5.000% | 7/1/19 | 575 | 623 |
| Honolulu HI City & County GO | 5.000% | 7/1/20 (4) | 500 | 586 |
| Honolulu HI City & County GO | 5.000% | 12/1/30 | 310 | 348 |
| Honolulu HI City & County GO | 5.250% | 8/1/31 | 500 | 576 |
| University of Hawaii Revenue | 5.000% | 10/1/27 | 500 | 563 |
| | | | | 5,010 |
25
Tax-Managed Balanced Fund
| | | | |
| | | | Face | Market |
| | | Maturity | Amount | Value |
| | Coupon | Date | ($000) | ($000) |
| Illinois (2.3%) | | | | |
| Chicago IL (City Colleges Capital | | | | |
| Improvement Project) GO | 0.000% | 1/1/12 (3) | 2,380 | 2,380 |
| Chicago IL Board of Education GO | 5.250% | 12/1/24 (4) | 500 | 547 |
| Chicago IL Board of Education GO | 5.250% | 12/1/26 (4) | 500 | 538 |
| Chicago IL GO | 5.000% | 12/1/16 (2) | 500 | 573 |
| Chicago IL GO | 5.500% | 1/1/17 (4) | 500 | 582 |
| Chicago IL GO | 5.000% | 1/1/19 (2) | 500 | 554 |
| Chicago IL GO VRDO | 0.080% | 1/3/12 | 1,025 | 1,025 |
| Chicago IL GO VRDO | 0.080% | 1/3/12 | 2,260 | 2,260 |
| Chicago IL Metropolitan Water Reclamation | | | | |
| District GO | 5.000% | 12/1/31 | 500 | 562 |
| Chicago IL O’Hare International Airport Revenue | 5.250% | 1/1/15 (14) | 155 | 171 |
| Chicago IL O’Hare International Airport Revenue | 5.250% | 1/1/17 (14) | 370 | 425 |
| Chicago IL O’Hare International Airport Revenue | 5.000% | 1/1/24 (4) | 500 | 547 |
| Chicago IL O’Hare International Airport Revenue | 5.250% | 1/1/24 (14) | 500 | 540 |
| Cook County IL GO | 5.000% | 11/15/21 | 500 | 561 |
| Cook County IL GO | 5.000% | 11/15/28 | 500 | 529 |
| Cook County IL GO | 5.250% | 11/15/28 | 500 | 542 |
| Illinois Finance Authority Revenue | | | | |
| (Trinity Health Corp.) | 5.000% | 12/1/30 | 500 | 511 |
| Illinois GO | 5.000% | 1/1/18 | 500 | 570 |
| Illinois GO | 5.000% | 1/1/21 (4) | 500 | 557 |
| Illinois GO | 5.000% | 6/1/26 | 500 | 521 |
| Illinois Regional Transportation Authority | | | | |
| Revenue | 6.250% | 7/1/23 (4) | 500 | 662 |
| Illinois Sales Tax Revenue | 5.500% | 6/15/17 (3) | 500 | 599 |
| Illinois Toll Highway Authority Revenue | 5.000% | 1/1/25 (4) | 500 | 535 |
| Illinois Toll Highway Authority Revenue | 5.000% | 1/1/28 | 500 | 543 |
| Metropolitan Pier & Exposition Authority | | | | |
| Illinois Dedicated Sales Tax Revenue | 0.000% | 6/15/19 (3) | 1,000 | 767 |
| Metropolitan Pier & Exposition Authority | | | | |
| Illinois Dedicated Sales Tax Revenue | 0.000% | 6/15/26 (4) | 500 | 249 |
| Railsplitter Tobacco Settlement Authority | | | | |
| Illinois Tobacco Settlement Revenue | 6.000% | 6/1/28 | 400 | 431 |
| | | | | 18,281 |
| Indiana (0.3%) | | | | |
| Indiana Finance Authority Revenue | | | | |
| (State Revolving Fund) | 5.000% | 2/1/18 | 500 | 608 |
| Indiana Health & Educational Facility Financing | | | | |
| Authority Hospital Revenue (Clarian Health | | | | |
| Obligated Group) | 5.000% | 2/15/25 | 290 | 299 |
| Indiana Municipal Power Agency Revenue | 5.250% | 1/1/15 (14) | 500 | 520 |
| Indiana Office Building Commission Facilities | | | | |
| Revenue (New Castle Correctional Facility) | 5.250% | 7/1/19 (14) | 500 | 605 |
| Indiana Transportation Finance Authority | | | | |
| Highway Revenue | 5.000% | 12/1/12 (14) | 500 | 522 |
| Indiana University Student Fee Revenue | 5.000% | 8/1/23 | 100 | 116 |
| | | | | 2,670 |
| Iowa (0.0%) | | | | |
| Iowa Special Obligation Revenue | | | | |
| (Ijobs Program) | 5.000% | 6/1/24 | 220 | 258 |
26
Tax-Managed Balanced Fund
| | | | |
| | | | Face | Market |
| | | Maturity | Amount | Value |
| | Coupon | Date | ($000) | ($000) |
| Kansas (0.5%) | | | | |
| Kansas Department of Transportation | | | | |
| Highway Revenue | 5.000% | 9/1/22 | 500 | 592 |
| Leavenworth County KS Unified | | | | |
| School District GO | 4.500% | 9/1/19 (12) | 500 | 587 |
| University of Kansas Hospital Authority | | | | |
| Health Facilities Improvement Revenue | 5.000% | 9/1/16 | 1,250 | 1,443 |
| University of Kansas Hospital Authority | | | | |
| Health Facilities Improvement Revenue | 5.000% | 9/1/17 | 900 | 1,032 |
| Wichita KS Hospital Facilities Revenue | | | | |
| (Via Christi Health System Inc.) | 5.000% | 11/15/29 | 500 | 525 |
| | | | | 4,179 |
| Kentucky (0.2%) | | | | |
| Kentucky Property & Building Commission | | | | |
| Revenue | 5.250% | 10/1/15 (4) | 150 | 172 |
| Kentucky Property & Building Commission | | | | |
| Revenue | 5.375% | 11/1/23 | 500 | 578 |
| Kentucky Property & Building Commission | | | | |
| Revenue | 5.000% | 11/1/26 (4) | 500 | 549 |
| Kentucky Turnpike Authority Economic | | | | |
| Development Road Revenue (Revitalization | | | | |
| Project) | 5.000% | 7/1/25 | 305 | 344 |
| | | | | 1,643 |
| Louisiana (0.5%) | | | | |
| Jefferson Parish LA Environmental Facilities & | | | | |
| Community Development Authority Revenue | 5.000% | 4/1/18 | 405 | 475 |
| Louisiana Citizens Property Insurance Corp. | | | | |
| Assessment Revenue | 5.000% | 6/1/22 (2) | 500 | 522 |
| Louisiana Gasoline & Fuel Tax Revenue | 5.000% | 5/1/31 (4) | 500 | 529 |
| Louisiana GO | 5.000% | 5/1/18 (4) | 500 | 578 |
| Louisiana GO | 5.000% | 5/1/23 (4) | 500 | 567 |
| Louisiana Public Facilities Authority Revenue | | | | |
| (Ochsner Clinic Foundation Project) | 5.000% | 5/15/16 | 1,260 | 1,372 |
| | | | | 4,043 |
| Maine (0.1%) | | | | |
| Portland ME Airport Revenue | 5.000% | 1/1/20 (4) | 500 | 592 |
| |
| Maryland (1.2%) | | | | |
| Howard County MD GO | 5.000% | 8/15/24 | 200 | 246 |
| Maryland Department of Transportation | | | | |
| Revenue | 5.000% | 2/15/18 | 500 | 615 |
| Maryland GO | 5.000% | 3/1/15 | 550 | 625 |
| Maryland GO | 5.250% | 3/1/15 | 500 | 573 |
| Maryland GO | 5.000% | 8/1/15 (Prere.) | 500 | 575 |
| Maryland GO | 5.000% | 8/1/15 | 500 | 576 |
| Maryland GO | 5.000% | 11/1/16 | 105 | 126 |
| Maryland GO | 5.000% | 7/15/17 | 610 | 743 |
| Maryland GO | 5.000% | 8/1/17 | 500 | 610 |
| Maryland GO | 5.000% | 3/15/22 | 500 | 605 |
| Maryland Transportation Authority Facilities | | | | |
| Projects Revenue | 5.000% | 7/1/15 (4) | 750 | 829 |
| Maryland Transportation Authority Facilities | | | | |
| Projects Revenue | 5.000% | 7/1/22 | 500 | 613 |
| Maryland Transportation Authority GAN | 5.000% | 3/1/16 | 465 | 546 |
27
Tax-Managed Balanced Fund
| | | | |
| | | | Face | Market |
| | | Maturity | Amount | Value |
| | Coupon | Date | ($000) | ($000) |
| Maryland Transportation Authority GAN | 5.250% | 3/1/16 | 150 | 178 |
| Maryland Transportation Authority GAN | 5.250% | 3/1/20 | 500 | 625 |
| Montgomery County MD GO | 5.000% | 7/1/17 | 500 | 609 |
| Montgomery County MD GO | 5.000% | 11/1/17 | 500 | 614 |
| Prince Georges County MD GO | 5.000% | 9/15/23 | 500 | 623 |
| | | | | 9,931 |
| Massachusetts (2.4%) | | | | |
| Massachusetts Bay Transportation Authority | | | | |
| Sales Tax Revenue | 5.000% | 7/1/18 (Prere.) | 500 | 627 |
| Massachusetts Bay Transportation Authority | | | | |
| Sales Tax Revenue | 5.250% | 7/1/22 | 480 | 619 |
| Massachusetts Bay Transportation Authority | | | | |
| Sales Tax Revenue | 5.500% | 7/1/26 (14) | 400 | 519 |
| Massachusetts Bay Transportation Authority | | | | |
| Sales Tax Revenue | 5.250% | 7/1/28 | 500 | 625 |
| Massachusetts College Building Authority | | | | |
| Revenue | 5.250% | 5/1/29 | 445 | 501 |
| Massachusetts Department of Transportation | | | | |
| Metropolitan Highway System Revenue | 5.000% | 1/1/23 | 500 | 574 |
| Massachusetts Development Finance Agency | | | | |
| Revenue (Emerson College) | 5.500% | 1/1/30 | 350 | 368 |
| Massachusetts Development Finance Agency | | | | |
| Revenue (UMASS Memorial Medical Center) | 5.125% | 7/1/26 | 500 | 514 |
| Massachusetts GO | 5.500% | 11/1/13 (3) | 2,000 | 2,187 |
| Massachusetts GO | 5.000% | 5/1/14 | 500 | 552 |
| Massachusetts GO | 5.000% | 8/1/14 | 500 | 557 |
| Massachusetts GO | 5.000% | 8/1/15 | 500 | 574 |
| Massachusetts GO | 5.500% | 11/1/16 | 500 | 606 |
| Massachusetts GO | 5.500% | 10/1/18 | 500 | 633 |
| Massachusetts GO | 5.000% | 7/1/20 | 500 | 626 |
| Massachusetts GO | 5.000% | 8/1/20 | 500 | 629 |
| Massachusetts GO | 5.500% | 10/1/20 | 500 | 650 |
| Massachusetts GO | 5.250% | 8/1/23 | 500 | 644 |
| Massachusetts GO | 5.000% | 3/1/26 | 500 | 584 |
| Massachusetts GO | 5.000% | 4/1/29 | 500 | 571 |
| Massachusetts Health & Educational Facilities | | | | |
| Authority Revenue (Caritas Christi Obligated | | | | |
| Group) | 6.500% | 7/1/12 (ETM) | 505 | 519 |
| Massachusetts Health & Educational Facilities | | | | |
| Authority Revenue (Harvard University) | 5.000% | 12/15/28 | 500 | 580 |
| Massachusetts Health & Educational Facilities | | | | |
| Authority Revenue (Lahey Clinic Medical | | | | |
| Center) | 5.000% | 8/15/15 (14) | 500 | 551 |
| Massachusetts School Building Authority | | | | |
| Dedicated Sales Tax Revenue | 5.000% | 5/15/19 | 500 | 621 |
| Massachusetts School Building Authority | | | | |
| Dedicated Sales Tax Revenue | 5.000% | 8/15/27 (14) | 500 | 543 |
| Massachusetts School Building Authority | | | | |
| Dedicated Sales Tax Revenue | 5.000% | 8/15/30 (4) | 500 | 543 |
| Massachusetts Special Obligation Dedicated | | | | |
| Tax Revenue | 5.500% | 1/1/26 (3) | 500 | 595 |
| Massachusetts Turnpike Authority Revenue | | | | |
| (Metropolitan Highway System) | 0.000% | 1/1/29 (14) | 300 | 131 |
28
Tax-Managed Balanced Fund
| | | | |
| | | | Face | Market |
| | | Maturity | Amount | Value |
| | Coupon | Date | ($000) | ($000) |
| Massachusetts Water Pollution Abatement | | | | |
| Trust Revenue | 5.250% | 8/1/21 | 500 | 650 |
| Massachusetts Water Resources Authority | | | | |
| Revenue | 5.000% | 8/1/25 | 895 | 1,049 |
| | | | | 18,942 |
| Michigan (0.8%) | | | | |
| Detroit MI City School District GO | 5.250% | 5/1/28 (4) | 500 | 526 |
| Mason MI Public School District | | | | |
| (School Building & Site) GO | 5.250% | 5/1/17 (4) | 1,850 | 2,007 |
| Michigan Building Authority Revenue | 5.000% | 10/15/20 (4) | 500 | 587 |
| Michigan GO | 5.000% | 9/15/14 (4) | 500 | 551 |
| Michigan GO | 5.000% | 5/1/18 | 500 | 598 |
| Michigan GO | 5.500% | 11/1/25 | 595 | 688 |
| Michigan Trunk Line Revenue | 5.000% | 11/1/21 | 500 | 598 |
| Wayne County MI Airport Authority Revenue | | | | |
| (Detroit Metropolitan Wayne County Airport) | 5.000% | 12/1/16 | 500 | 555 |
| | | | | 6,110 |
| Minnesota (0.7%) | | | | |
| Chisago Lakes MN Independent | | | | |
| School District GO | 5.000% | 2/1/15 (4) | 500 | 564 |
| Minnesota GO | 5.000% | 6/1/13 | 500 | 533 |
| Minnesota GO | 5.000% | 11/1/14 | 500 | 563 |
| Minnesota GO | 5.000% | 8/1/15 | 500 | 576 |
| Minnesota GO | 5.000% | 8/1/19 | 500 | 630 |
| Minnesota GO | 5.000% | 8/1/21 | 500 | 619 |
| Minnesota Public Facilities Authority Revenue | | | | |
| (State Revolving Fund) | 5.000% | 3/1/15 | 500 | 567 |
| Southern Minnesota Municipal Power Agency | | | | |
| Power Supply System Revenue | 5.250% | 1/1/30 | 500 | 548 |
| University of Minnesota Revenue | 5.000% | 8/1/19 | 500 | 617 |
| University of Minnesota Revenue | 5.250% | 12/1/29 | 500 | 586 |
| | | | | 5,803 |
| Mississippi (0.1%) | | | | |
| Mississippi GO | 5.500% | 12/1/18 | 750 | 951 |
| |
| Missouri (0.3%) | | | | |
| Curators of the University of Missouri System | | | | |
| Facilities Revenue | 5.000% | 11/1/26 | 500 | 561 |
| Missouri Highways & Transportation | | | | |
| Commission Road Revenue | 5.000% | 5/1/15 | 300 | 343 |
| Missouri Highways & Transportation | | | | |
| Commission Road Revenue | 5.000% | 5/1/17 | 500 | 604 |
| Missouri Highways & Transportation | | | | |
| Commission Road Revenue | 5.000% | 5/1/23 | 500 | 586 |
| Missouri Highways & Transportation | | | | |
| Commission Road Revenue | 5.250% | 5/1/23 | 350 | 411 |
| | | | | 2,505 |
| Nevada (0.5%) | | | | |
| Clark County NV GO | 5.000% | 12/1/29 | 500 | 538 |
| Clark County NV Highway Improvement | | | | |
| Motor Vehicle Fuel Tax Revenue | 5.000% | 7/1/27 | 500 | 543 |
| Clark County NV Passenger Facility Charge | | | | |
| Revenue (Las Vegas McCarran | | | | |
| International Airport) | 5.000% | 7/1/15 | 155 | 174 |
29
Tax-Managed Balanced Fund
| | | | |
| | | | Face | Market |
| | | Maturity | Amount | Value |
| | Coupon | Date | ($000) | ($000) |
| Clark County NV Passenger Facility Charge | | | | |
| Revenue (Las Vegas McCarran International | | | | |
| Airport) | 4.500% | 7/1/20 | 455 | 513 |
| Clark County NV School District GO | 5.000% | 6/15/18 | 1,690 | 1,985 |
| Nevada Capital Improvement & Cultural | | | | |
| Affairs GO | 5.000% | 12/1/26 (3) | 500 | 544 |
| | | | | 4,297 |
| New Hampshire (0.1%) | | | | |
| Manchester NH General Airport Revenue | 5.000% | 1/1/17 | 500 | 560 |
| |
| New Jersey (2.9%) | | | | |
| Garden State Preservation Trust New Jersey | | | | |
| Revenue (Open Space & Farmland | | | | |
| Preservation) | 5.250% | 11/1/13 (Prere.) | 875 | 953 |
| Garden State Preservation Trust New Jersey | | | | |
| Revenue (Open Space & Farmland | | | | |
| Preservation) | 0.000% | 11/1/21 (4) | 500 | 359 |
| Garden State Preservation Trust New Jersey | | | | |
| Revenue (Open Space & Farmland | | | | |
| Preservation) | 0.000% | 11/1/22 (4) | 500 | 340 |
| New Jersey Economic Development Authority | | | | |
| Revenue (Cigarette Tax) | 5.750% | 6/15/29 | 500 | 515 |
| New Jersey Economic Development Authority | | | | |
| Revenue (Motor Vehicle Surcharges) | 5.250% | 7/1/26 (14) | 500 | 575 |
| New Jersey Economic Development Authority | | | | |
| Revenue (New Jersey Transit Light Rail Transit | | | | |
| System Project) | 5.000% | 5/1/17 | 500 | 585 |
| New Jersey Economic Development Authority | | | | |
| Revenue (School Facilities Construction) | 5.000% | 9/1/13 (Prere.) | 500 | 539 |
| New Jersey Economic Development Authority | | | | |
| Revenue (School Facilities Construction) | 5.000% | 9/1/13 (Prere.) | 500 | 539 |
| New Jersey Economic Development Authority | | | | |
| Revenue (School Facilities Construction) | 5.000% | 9/1/14 | 500 | 550 |
| New Jersey Economic Development Authority | | | | |
| Revenue (School Facilities Construction) | 5.250% | 12/15/15 (14) | 400 | 458 |
| New Jersey Economic Development Authority | | | | |
| Revenue (School Facilities Construction) | 5.250% | 3/1/26 | 500 | 545 |
| New Jersey Economic Development Authority | | | | |
| Revenue (School Facilities Construction) PUT | 5.000% | 9/1/14 (4) | 500 | 543 |
| New Jersey Economic Development Authority | | | | |
| Transportation Project Sublease Revenue | | | | |
| (New Jersey Transit Corp. Light Rail Transit | | | | |
| System Project) | 5.000% | 5/1/19 | 500 | 588 |
| New Jersey Equipment Lease Purchase COP | 5.000% | 6/15/16 | 425 | 467 |
| New Jersey Equipment Lease Purchase COP | 5.000% | 6/15/18 | 530 | 591 |
| New Jersey Equipment Lease Purchase COP | 5.000% | 6/15/19 | 500 | 555 |
| New Jersey GO | 5.250% | 7/15/15 (2) | 500 | 576 |
| New Jersey GO | 5.000% | 8/15/15 | 790 | 905 |
| New Jersey GO | 5.250% | 7/1/16 (14) | 500 | 592 |
| New Jersey GO | 5.250% | 7/15/18 (2) | 500 | 618 |
| New Jersey Health Care Facilities Financing | | | | |
| Authority Revenue (Hackensack University | | | | |
| Medical Center) | 5.000% | 1/1/19 | 500 | 550 |
| New Jersey Higher Education Assistance | | | | |
| Authority Student Loan Revenue | 5.000% | 12/1/16 | 245 | 277 |
30
Tax-Managed Balanced Fund
| | | | |
| | | | Face | Market |
| | | Maturity | Amount | Value |
| | Coupon | Date | ($000) | ($000) |
| New Jersey Higher Education Assistance | | | | |
| Authority Student Loan Revenue | 5.250% | 12/1/28 | 400 | 426 |
| New Jersey Sports & Exposition Authority | | | | |
| Revenue | 5.000% | 9/1/16 | 200 | 228 |
| New Jersey Transportation Corp. COP | 5.500% | 9/15/15 (2) | 200 | 225 |
| New Jersey Transportation Corp. COP | 5.000% | 9/15/19 (4) | 500 | 537 |
| New Jersey Transportation Trust Fund | | | | |
| Authority Transportation System Revenue | 5.250% | 6/15/14 (Prere.) | 500 | 557 |
| New Jersey Transportation Trust Fund | | | | |
| Authority Transportation System Revenue | 5.250% | 12/15/14 (14) | 500 | 559 |
| New Jersey Transportation Trust Fund | | | | |
| Authority Transportation System Revenue | 5.250% | 12/15/15 (2) | 170 | 194 |
| New Jersey Transportation Trust Fund | | | | |
| Authority Transportation System Revenue | 5.500% | 12/15/15 (14) | 200 | 230 |
| New Jersey Transportation Trust Fund | | | | |
| Authority Transportation System Revenue | 5.000% | 12/15/16 | 275 | 318 |
| New Jersey Transportation Trust Fund | | | | |
| Authority Transportation System Revenue | 5.500% | 12/15/20 (3) | 2,500 | 3,062 |
| New Jersey Transportation Trust Fund | | | | |
| Authority Transportation System Revenue | 0.000% | 12/15/26 (2) | 2,000 | 939 |
| New Jersey Transportation Trust Fund | | | | |
| Authority Transportation System Revenue | 5.500% | 6/15/31 | 500 | 561 |
| New Jersey Turnpike Authority Revenue | 5.000% | 1/1/22 | 500 | 573 |
| New Jersey Turnpike Authority Revenue | 5.500% | 1/1/25 (2) | 500 | 613 |
| Newark NJ GO | 5.000% | 10/1/19 | 500 | 587 |
| Tobacco Settlement Financing Corp. | | | | |
| New Jersey Revenue | 5.000% | 6/1/18 | 500 | 513 |
| Tobacco Settlement Financing Corp. | | | | |
| New Jersey Revenue | 4.500% | 6/1/23 | 335 | 316 |
| Tobacco Settlement Financing Corp. | | | | |
| New Jersey Revenue | 5.000% | 6/1/29 | 235 | 186 |
| | | | | 22,844 |
| New Mexico (0.2%) | | | | |
| New Mexico Educational Assistance | | | | |
| Foundation Revenue | 5.000% | 12/1/19 | 500 | 604 |
| New Mexico Finance Authority | | | | |
| Transportation Revenue | 5.000% | 6/15/13 (2) | 500 | 533 |
| New Mexico Finance Authority | | | | |
| Transportation Revenue | 5.000% | 6/15/23 | 500 | 602 |
| | | | | 1,739 |
| New York (9.8%) | | | | |
| Erie County NY Industrial Development Agency | | | | |
| School Facility Revenue (Buffalo City School | | | | |
| District Project) | 5.000% | 5/1/15 | 500 | 563 |
| Erie County NY Industrial Development Agency | | | | |
| School Facility Revenue (Buffalo City School | | | | |
| District Project) | 5.000% | 5/1/18 | 500 | 596 |
| Erie County NY Industrial Development Agency | | | | |
| School Facility Revenue (Buffalo City School | | | | |
| District Project) | 5.000% | 5/1/19 | 500 | 600 |
| Erie County NY Industrial Development Agency | | | | |
| School Facility Revenue (Buffalo City School | | | | |
| District Project) | 5.250% | 5/1/31 | 500 | 553 |
| Long Island NY Power Authority Electric | | | | |
| System Revenue | 5.500% | 12/1/12 (ETM) | 2,000 | 2,096 |
31
Tax-Managed Balanced Fund
| | | | |
| | | | Face | Market |
| | | Maturity | Amount | Value |
| | Coupon | Date | ($000) | ($000) |
| Long Island NY Power Authority Electric | | | | |
| System Revenue | 5.000% | 5/1/14 | 410 | 447 |
| Long Island NY Power Authority Electric | | | | |
| System Revenue | 5.000% | 12/1/17 | 630 | 729 |
| Long Island NY Power Authority Electric | | | | |
| System Revenue | 5.000% | 5/1/19 (14) | 500 | 569 |
| Long Island NY Power Authority Electric | | | | |
| System Revenue | 5.000% | 12/1/21 (14) | 500 | 563 |
| Long Island NY Power Authority Electric | | | | |
| System Revenue | 5.000% | 4/1/23 | 500 | 569 |
| Metropolitan New York Transportation | | | | |
| Authority Revenue | 5.250% | 11/15/21 (3) | 300 | 365 |
| Metropolitan New York Transportation | | | | |
| Authority Revenue | 5.000% | 11/15/23 | 500 | 553 |
| Metropolitan New York Transportation | | | | |
| Authority Revenue | 5.250% | 11/15/30 | 500 | 546 |
| Metropolitan New York Transportation | | | | |
| Authority Revenue (Dedicated Petroleum Tax) | 5.250% | 11/15/24 | 600 | 696 |
| Metropolitan New York Transportation | | | | |
| Authority Revenue (Service Contract) | 5.500% | 7/1/15 | 500 | 571 |
| Metropolitan New York Transportation | | | | |
| Authority Revenue (Service Contract) | 5.750% | 1/1/17 (14) | 560 | 673 |
| Metropolitan New York Transportation | | | | |
| Authority Revenue (Service Contract) | 5.750% | 1/1/17 | 210 | 252 |
| Metropolitan New York Transportation | | | | |
| Authority Revenue (Transit Revenue) | 5.500% | 11/15/14 (14) | 500 | 562 |
| Metropolitan New York Transportation | | | | |
| Authority Revenue (Transit Revenue) | 5.500% | 11/15/18 | 600 | 681 |
| Metropolitan New York Transportation | | | | |
| Authority Revenue (Transit Revenue) | 5.500% | 11/15/19 (14) | 500 | 517 |
| New York City NY GO | 5.750% | 8/1/12 (Prere.) | 20 | 21 |
| New York City NY GO | 5.500% | 6/1/13 (Prere.) | 500 | 537 |
| New York City NY GO | 5.250% | 8/1/13 | 500 | 538 |
| New York City NY GO | 5.750% | 8/1/13 | 480 | 495 |
| New York City NY GO | 5.750% | 8/1/13 | 500 | 516 |
| New York City NY GO | 5.000% | 1/1/14 | 500 | 544 |
| New York City NY GO | 5.250% | 9/1/14 | 500 | 559 |
| New York City NY GO | 5.000% | 2/1/16 | 105 | 121 |
| New York City NY GO | 5.000% | 8/1/16 | 500 | 584 |
| New York City NY GO | 5.000% | 2/1/17 | 500 | 590 |
| New York City NY GO | 5.000% | 9/1/17 | 500 | 565 |
| New York City NY GO | 5.000% | 2/1/18 | 500 | 591 |
| New York City NY GO | 5.000% | 8/1/19 | 500 | 589 |
| New York City NY GO | 5.000% | 8/1/23 (14) | 500 | 554 |
| New York City NY GO | 5.000% | 11/1/23 | 305 | 335 |
| New York City NY GO | 5.250% | 8/15/24 | 500 | 577 |
| New York City NY GO | 5.000% | 8/1/25 | 905 | 1,004 |
| New York City NY GO | 5.000% | 8/15/26 | 475 | 532 |
| New York City NY GO | 5.000% | 5/15/28 | 480 | 531 |
| New York City NY GO | 5.000% | 8/1/28 | 400 | 448 |
| New York City NY GO | 5.000% | 8/1/28 | 500 | 556 |
| New York City NY GO | 5.500% | 11/15/28 | 300 | 344 |
| New York City NY GO | 5.625% | 4/1/29 | 840 | 972 |
| New York City NY GO | 5.000% | 5/15/29 | 500 | 549 |
32
Tax-Managed Balanced Fund
| | | | |
| | | | Face | Market |
| | | Maturity | Amount | Value |
| | Coupon | Date | ($000) | ($000) |
| New York City NY GO | 5.000% | 8/1/31 | 365 | 404 |
| New York City NY GO VRDO | 0.060% | 1/6/12 LOC | 1,300 | 1,300 |
| New York City NY Health & Hospital Corp. | | | | |
| Revenue (Health System) | 5.000% | 2/15/30 | 500 | 528 |
| New York City NY Housing Development Corp. | | | | |
| Multi-Family Housing Revenue | 5.000% | 5/1/12 | 500 | 506 |
| New York City NY Municipal Water Finance | | | | |
| Authority Water & Sewer System Revenue | 5.375% | 6/15/12 (Prere.) | 110 | 113 |
| New York City NY Municipal Water Finance | | | | |
| Authority Water & Sewer System Revenue | 5.000% | 6/15/15 | 250 | 285 |
| New York City NY Municipal Water Finance | | | | |
| Authority Water & Sewer System Revenue | 5.375% | 6/15/17 | 390 | 399 |
| New York City NY Municipal Water Finance | | | | |
| Authority Water & Sewer System Revenue | 0.000% | 6/15/18 | 750 | 665 |
| New York City NY Municipal Water Finance | | | | |
| Authority Water & Sewer System Revenue | 5.375% | 6/15/19 | 500 | 511 |
| New York City NY Municipal Water Finance | | | | |
| Authority Water & Sewer System Revenue | 5.000% | 6/15/27 | 500 | 561 |
| New York City NY Municipal Water Finance | | | | |
| Authority Water & Sewer System Revenue | 5.000% | 6/15/29 | 500 | 553 |
| New York City NY Municipal Water Finance | | | | |
| Authority Water & Sewer System Revenue | 4.750% | 6/15/30 | 255 | 273 |
| New York City NY Municipal Water Finance | | | | |
| Authority Water & Sewer System Revenue | 5.000% | 6/15/30 | 500 | 553 |
| New York City NY Municipal Water Finance | | | | |
| Authority Water & Sewer System Revenue | 5.000% | 6/15/31 | 500 | 555 |
| New York City NY Sales Tax Asset Receivable | | | | |
| Corp. Revenue | 5.000% | 10/15/24 (14) | 500 | 549 |
| New York City NY Sales Tax Asset Receivable | | | | |
| Corp. Revenue | 5.000% | 10/15/26 (14) | 500 | 548 |
| New York City NY Transitional Finance | | | | |
| Authority Building Aid Revenue | 5.250% | 1/15/25 | 500 | 573 |
| New York City NY Transitional Finance | | | | |
| Authority Building Aid Revenue | 5.250% | 1/15/26 | 500 | 568 |
| New York City NY Transitional Finance | | | | |
| Authority Building Aid Revenue | 5.125% | 1/15/29 | 1,070 | 1,183 |
| New York City NY Transitional Finance | | | | |
| Authority Future Tax Revenue | 5.250% | 8/1/12 (Prere.) | 500 | 515 |
| New York City NY Transitional Finance | | | | |
| Authority Future Tax Revenue | 5.250% | 2/1/13 (Prere.) | 500 | 527 |
| New York City NY Transitional Finance | | | | |
| Authority Future Tax Revenue | 5.375% | 2/1/13 | 2,000 | 2,062 |
| New York City NY Transitional Finance | | | | |
| Authority Future Tax Revenue | 5.000% | 11/1/18 | 500 | 598 |
| New York City NY Transitional Finance | | | | |
| Authority Future Tax Revenue | 5.000% | 8/1/22 | 280 | 321 |
| New York City NY Transitional Finance | | | | |
| Authority Future Tax Revenue | 5.000% | 11/1/23 | 500 | 577 |
| New York City NY Transitional Finance | | | | |
| Authority Future Tax Revenue | 5.000% | 11/1/24 | 500 | 572 |
| New York City NY Transitional Finance | | | | |
| Authority Future Tax Revenue | 5.000% | 11/1/25 | 500 | 568 |
| New York City NY Transitional Finance | | | | |
| Authority Future Tax Revenue | 5.250% | 2/1/30 | 500 | 577 |
33
Tax-Managed Balanced Fund
| | | | |
| | | | Face | Market |
| | | Maturity | Amount | Value |
| | Coupon | Date | ($000) | ($000) |
| New York City NY Transitional Finance | | | | |
| Authority Future Tax Revenue | 5.000% | 2/1/31 | 500 | 560 |
| New York GO | 4.500% | 2/1/17 | 500 | 582 |
| New York GO | 4.500% | 2/1/18 | 500 | 590 |
| New York GO | 4.500% | 2/1/19 | 500 | 595 |
| New York GO | 5.000% | 2/15/30 | 315 | 358 |
| New York Metropolitan Transportation | | | | |
| Authority Revenue | 5.000% | 11/15/30 | 500 | 539 |
| New York State Dormitory Authority Lease | | | | |
| Revenue (City of New York Court Facilities) | 5.500% | 5/15/24 (2) | 500 | 614 |
| New York State Dormitory Authority Lease | | | | |
| Revenue (City of New York Court Facilities) | 5.500% | 5/15/27 (2) | 500 | 604 |
| New York State Dormitory Authority Lease | | | | |
| Revenue (Mental Health Services Facilities) | 5.000% | 8/15/15 | 100 | 113 |
| New York State Dormitory Authority Lease | | | | |
| Revenue (Mental Health Services Facilities) | 5.000% | 8/15/21 | 500 | 601 |
| New York State Dormitory Authority Revenue | | | | |
| (City University System) | 5.000% | 7/1/24 | 400 | 459 |
| New York State Dormitory Authority Revenue | | | | |
| (Fordham University) | 5.000% | 7/1/25 (4) | 250 | 276 |
| New York State Dormitory Authority Revenue | | | | |
| (Memorial Sloan-Kettering Cancer Center) | 5.000% | 7/1/30 | 500 | 528 |
| New York State Dormitory Authority Revenue | | | | |
| (Mount Sinai Hospital Obligated Group) | 5.000% | 7/1/22 | 595 | 655 |
| New York State Dormitory Authority Revenue | | | | |
| (Mount Sinai Hospital Obligated Group) | 5.000% | 7/1/23 | 500 | 546 |
| New York State Dormitory Authority Revenue | | | | |
| (Mount Sinai School of Medicine of | | | | |
| New York University) | 5.000% | 7/1/18 | 325 | 378 |
| New York State Dormitory Authority Revenue | | | | |
| (Mount Sinai School of Medicine of | | | | |
| New York University) | 5.000% | 7/1/24 (14) | 500 | 534 |
| New York State Dormitory Authority Revenue | | | | |
| (New York University) | 6.000% | 7/1/19 (14) | 500 | 644 |
| New York State Dormitory Authority Revenue | | | | |
| (North Shore - Long Island Jewish Obligated | | | | |
| Group) | 5.000% | 5/1/26 | 500 | 533 |
| New York State Dormitory Authority Revenue | | | | |
| (Personal Income Tax) | 5.000% | 2/15/15 | 165 | 186 |
| New York State Dormitory Authority Revenue | | | | |
| (Personal Income Tax) | 5.000% | 3/15/28 | 500 | 554 |
| New York State Dormitory Authority Revenue | | | | |
| (School Districts Financing Program) | 5.000% | 10/1/20 | 500 | 592 |
| New York State Dormitory Authority Revenue | | | | |
| (School Districts Financing Program) | 5.000% | 10/1/21 (4) | 390 | 463 |
| New York State Dormitory Authority Revenue | | | | |
| (Service Contract) | 5.000% | 7/1/16 | 275 | 317 |
| New York State Dormitory Authority Revenue | | | | |
| (Service Contract) | 5.000% | 7/1/22 | 500 | 579 |
| New York State Dormitory Authority Revenue | | | | |
| (The New School) | 5.250% | 7/1/30 | 500 | 538 |
| New York State Environmental Facilities Corp. | | | | |
| Revenue (State Clean Water & Drinking | | | | |
| Water Revolving Funds) | 5.000% | 6/15/22 | 500 | 573 |
34
Tax-Managed Balanced Fund
| | | | |
| | | | Face | Market |
| | | Maturity | Amount | Value |
| | Coupon | Date | ($000) | ($000) |
| New York State Environmental Facilities Corp. | | | | |
| Revenue (State Clean Water & Drinking Water | | | | |
| Revolving Funds) | 5.000% | 6/15/24 | 365 | 429 |
| New York State Local Government Assistance | | | | |
| Corp. Revenue | 5.000% | 4/1/21 | 500 | 600 |
| New York State Local Government Assistance | | | | |
| Corp. Revenue VRDO | 0.060% | 1/6/12 | 1,200 | 1,200 |
| New York State Thruway Authority Revenue | 5.000% | 1/1/15 (14) | 550 | 608 |
| New York State Thruway Authority Revenue | 5.000% | 1/1/20 (14) | 500 | 589 |
| New York State Thruway Authority Revenue | 5.000% | 1/1/21 (14) | 490 | 572 |
| New York State Thruway Authority Revenue | | | | |
| (Highway & Bridge Trust Fund) | 5.000% | 4/1/13 | 500 | 529 |
| New York State Thruway Authority Revenue | | | | |
| (Highway & Bridge Trust Fund) | 5.250% | 4/1/13 (2) | 500 | 531 |
| New York State Thruway Authority Revenue | | | | |
| (Highway & Bridge Trust Fund) | 5.500% | 4/1/14 (2) | 475 | 481 |
| New York State Thruway Authority Revenue | | | | |
| (Highway & Bridge Trust Fund) | 5.000% | 4/1/18 (2) | 500 | 563 |
| New York State Thruway Authority Revenue | | | | |
| (Highway & Bridge Trust Fund) | 5.000% | 4/1/24 | 500 | 569 |
| New York State Thruway Authority Revenue | | | | |
| (Highway & Bridge Trust Fund) | 5.000% | 4/1/25 (2) | 500 | 559 |
| New York State Thruway Authority Revenue | | | | |
| (Highway & Bridge Trust Fund) | 5.000% | 4/1/26 (2) | 500 | 548 |
| New York State Thruway Authority Revenue | | | | |
| (Personal Income Tax) | 5.000% | 3/15/16 | 225 | 262 |
| New York State Thruway Authority Revenue | | | | |
| (Personal Income Tax) | 5.000% | 3/15/19 | 500 | 615 |
| New York State Thruway Authority Revenue | | | | |
| (Personal Income Tax) | 5.000% | 3/15/20 | 500 | 619 |
| New York State Thruway Authority Revenue | | | | |
| (Personal Income Tax) | 5.000% | 3/15/22 (4) | 385 | 426 |
| New York State Thruway Authority Revenue | | | | |
| (Service Contract) | 5.500% | 4/1/14 | 4,000 | 4,050 |
| New York State Urban Development Corp. | | | | |
| Revenue | 5.000% | 12/15/14 | 100 | 113 |
| New York State Urban Development Corp. | | | | |
| Revenue | 5.000% | 1/1/15 | 500 | 563 |
| New York State Urban Development Corp. | | | | |
| Revenue | 5.000% | 12/15/15 | 400 | 462 |
| New York State Urban Development Corp. | | | | |
| Revenue | 5.000% | 12/15/18 | 500 | 615 |
| New York State Urban Development Corp. | | | | |
| Revenue (Personal Income Tax) | 5.000% | 12/15/15 | 275 | 318 |
| New York State Urban Development Corp. | | | | |
| Revenue (Personal Income Tax) | 5.500% | 3/15/22 (14) | 530 | 691 |
| New York State Urban Development Corp. | | | | |
| Revenue (Personal Income Tax) | 5.000% | 12/15/25 | 1,500 | 1,706 |
| New York State Urban Development Corp. | | | | |
| Revenue (Service Contract) | 5.000% | 1/1/18 | 540 | 640 |
| Port Authority of New York & New Jersey | | | | |
| Revenue | 5.000% | 7/15/26 | 500 | 551 |
| Triborough Bridge & Tunnel Authority | | | | |
| New York Revenue | 5.250% | 11/15/15 | 500 | 583 |
35
Tax-Managed Balanced Fund
| | | | |
| | | | Face | Market |
| | | Maturity | Amount | Value |
| | Coupon | Date | ($000) | ($000) |
| Triborough Bridge & Tunnel Authority | | | | |
| New York Revenue | 5.500% | 11/15/19 (14) | 500 | 624 |
| Triborough Bridge & Tunnel Authority | | | | |
| New York Revenue | 5.500% | 11/15/21 (14) | 500 | 636 |
| Triborough Bridge & Tunnel Authority | | | | |
| New York Revenue | 5.000% | 11/15/25 | 500 | 556 |
| Westchester County NY GO | 5.000% | 7/1/20 | 500 | 639 |
| | | | | 78,255 |
| North Carolina (1.0%) | | | | |
| Mecklenburg County NC Public Facilities Corp. | | | | |
| Revenue (Annual Appropriation) | 5.000% | 3/1/26 | 500 | 570 |
| North Carolina Capital Improvement Revenue | 5.000% | 5/1/19 | 555 | 685 |
| North Carolina Capital Improvement Revenue | 5.000% | 5/1/29 | 500 | 562 |
| North Carolina Eastern Municipal Power | | | | |
| Agency Revenue | 5.125% | 1/1/14 | 2,400 | 2,499 |
| North Carolina Eastern Municipal Power | | | | |
| Agency Revenue | 5.000% | 1/1/26 | 500 | 542 |
| North Carolina Infrastructure Financial Corp. | | | | |
| Capital Improvements COP | 5.000% | 2/1/21 (4) | 2,000 | 2,285 |
| North Carolina Municipal Power Agency Revenue | 5.000% | 1/1/30 | 500 | 537 |
| Wake County NC GO | 5.000% | 3/1/22 | 400 | 514 |
| Wake County NC Public Improvement GO | 5.000% | 3/1/16 | 100 | 117 |
| | | | | 8,311 |
| Ohio (1.4%) | | | | |
| American Municipal Power Ohio Inc. | | | | |
| Revenue (Hydroelectric Projects) | 5.250% | 2/15/18 | 500 | 587 |
| Butler County OH Hospital Facilities Revenue | | | | |
| (Kettering Health Network) | 5.250% | 4/1/31 | 500 | 515 |
| Cincinnati OH City School District GO | 5.250% | 12/1/26 (14) | 500 | 614 |
| Cleveland OH Public Power System Revenue | 5.000% | 11/15/20 (3) | 500 | 552 |
| Kent State University OH Revenue | 5.000% | 5/1/23 (12) | 500 | 569 |
| Ohio Conservation Projects GO | 5.000% | 3/1/17 | 1,885 | 2,052 |
| Ohio GO | 5.000% | 9/15/19 | 260 | 297 |
| Ohio Major New State Infrastructure | | | | |
| Project Revenue | 5.000% | 12/15/14 | 500 | 562 |
| Ohio Major New State Infrastructure | | | | |
| Project Revenue | 5.000% | 12/15/15 | 550 | 634 |
| Ohio State University General Receipts Revenue | 5.000% | 12/1/16 | 500 | 594 |
| Ohio Turnpike Commission Turnpike Revenue | 5.500% | 2/15/15 (3) | 500 | 571 |
| Ohio Turnpike Commission Turnpike Revenue | 5.000% | 2/15/31 | 500 | 544 |
| Ohio Water Development Authority Water | | | | |
| Pollution Control Loan Fund Revenue | 5.000% | 6/1/14 (Prere.) | 2,365 | 2,621 |
| Ohio Water Development Authority Water | | | | |
| Pollution Control Loan Fund Revenue | 5.000% | 6/1/14 (Prere.) | 635 | 697 |
| | | | | 11,409 |
| Oklahoma (0.1%) | | | | |
| 2 Oklahoma City OK GO | 5.000% | 3/1/24 | 525 | 635 |
| Oklahoma Turnpike Authority Revenue | 5.000% | 1/1/31 | 300 | 335 |
| | | | | 970 |
| Oregon (0.1%) | | | | |
| Oregon Department of Administrative Services | | | | |
| Lottery Revenue | 5.250% | 4/1/31 | 500 | 576 |
| Portland OR Sewer System Revenue | 5.000% | 6/15/22 (4) | 500 | 585 |
| | | | | 1,161 |
36
Tax-Managed Balanced Fund
| | | | |
| | | | Face | Market |
| | | Maturity | Amount | Value |
| | Coupon | Date | ($000) | ($000) |
| Pennsylvania (1.8%) | | | | |
| Allegheny County PA Higher Education Building | | | | |
| Authority University Revenue (Duquesne | | | | |
| University) | 5.500% | 3/1/29 | 325 | 356 |
| Allegheny County PA Hospital Development | | | | |
| Authority Revenue (University of | | | | |
| Pittsburgh Medical Center) | 5.000% | 5/15/18 | 500 | 584 |
| Allegheny County PA Port Authority Revenue | 5.750% | 3/1/29 | 500 | 567 |
| Central Bradford PA Progress Authority Revenue | | | | |
| (Guthrie Healthcare System) | 5.500% | 12/1/31 | 500 | 537 |
| Commonwealth Financing Authority | | | | |
| Pennsylvania Revenue | 5.000% | 6/1/25 (14) | 500 | 527 |
| Pennsylvania Economic Development Financing | | | | |
| Authority Solid Waste Disposal Revenue | | | | |
| (Waste Management Inc. Project) PUT | 3.700% | 5/1/15 | 750 | 786 |
| Pennsylvania GO | 5.000% | 9/1/14 (4) | 500 | 559 |
| Pennsylvania GO | 5.000% | 5/1/15 | 405 | 462 |
| Pennsylvania GO | 5.250% | 7/1/15 | 500 | 578 |
| Pennsylvania GO | 5.000% | 3/1/16 | 100 | 117 |
| Pennsylvania GO | 5.000% | 7/1/16 | 120 | 142 |
| Pennsylvania GO | 5.000% | 11/15/17 | 500 | 608 |
| Pennsylvania GO | 5.375% | 7/1/21 | 500 | 648 |
| Pennsylvania GO | 5.000% | 8/1/22 | 500 | 578 |
| Pennsylvania GO | 5.000% | 1/1/26 | 100 | 112 |
| Pennsylvania GO | 5.000% | 4/15/28 | 500 | 576 |
| Pennsylvania Higher Educational Facilities | | | | |
| Authority Revenue (St. Joseph’s University) | 5.000% | 11/1/24 | 200 | 222 |
| Pennsylvania Higher Educational Facilities | | | | |
| Authority Revenue (Trustees of the | | | | |
| University of Pennsylvania) | 5.000% | 9/1/28 | 500 | 564 |
| Pennsylvania State University Revenue | 5.000% | 3/1/25 | 500 | 567 |
| Pennsylvania Turnpike Commission Revenue | 5.000% | 12/1/21 | 345 | 395 |
| Pennsylvania Turnpike Commission Revenue | 5.000% | 6/1/29 | 1,050 | 1,112 |
| Philadelphia PA Airport Revenue | 5.000% | 6/15/15 | 505 | 559 |
| Philadelphia PA Municipal Authority Revenue | 6.375% | 4/1/29 | 500 | 542 |
| Philadelphia PA School District GO | 5.000% | 8/1/20 (2) | 500 | 539 |
| Philadelphia PA School District GO | 5.250% | 9/1/22 | 500 | 566 |
| Philadelphia PA Water & Waste Water Revenue | 5.000% | 8/1/22 (4) | 560 | 653 |
| University of Pittsburgh of the Commonwealth | | | | |
| System of Higher Education Pennsylvania | | | | |
| Revenue (University Capital Project) | 5.250% | 9/15/24 | 500 | 595 |
| | | | | 14,051 |
| Puerto Rico (1.5%) | | | | |
| Puerto Rico Electric Power Authority Revenue | 5.250% | 7/1/20 | 500 | 571 |
| Puerto Rico Electric Power Authority Revenue | 5.000% | 7/1/21 (14) | 500 | 535 |
| Puerto Rico Electric Power Authority Revenue | 5.500% | 7/1/21 | 500 | 558 |
| Puerto Rico Electric Power Authority Revenue | 5.250% | 7/1/22 (14) | 500 | 571 |
| Puerto Rico Electric Power Authority Revenue | 5.000% | 7/1/23 | 500 | 528 |
| Puerto Rico Electric Power Authority Revenue | 5.250% | 7/1/26 | 500 | 532 |
| Puerto Rico GO | 6.000% | 7/1/27 (14) | 500 | 538 |
| Puerto Rico Highway & Transportation | | | | |
| Authority Revenue | 5.250% | 7/1/22 (3) | 500 | 542 |
| Puerto Rico Highway & Transportation | | | | |
| Authority Revenue | 5.500% | 7/1/25 | 500 | 544 |
37
Tax-Managed Balanced Fund
| | | | |
| | | | Face | Market |
| | | Maturity | Amount | Value |
| | Coupon | Date | ($000) | ($000) |
| Puerto Rico Infrastructure Financing | | | | |
| Authority Special Tax Revenue | 5.500% | 7/1/24 (2) | 500 | 542 |
| Puerto Rico Municipal Finance Agency GO | 5.250% | 8/1/22 (11) | 500 | 541 |
| Puerto Rico Public Buildings Authority | | | | |
| Government Facilities Revenue | 5.250% | 7/1/14 (3) | 2,425 | 2,600 |
| Puerto Rico Public Buildings Authority | | | | |
| Government Facilities Revenue | 5.500% | 7/1/18 (2) | 500 | 557 |
| Puerto Rico Public Buildings Authority | | | | |
| Government Facilities Revenue | 5.250% | 7/1/29 | 500 | 504 |
| Puerto Rico Public Finance Corp. Revenue | 6.000% | 8/1/26 (ETM) | 1,000 | 1,368 |
| Puerto Rico Sales Tax Financing Corp. Revenue | 5.250% | 8/1/27 | 500 | 540 |
| Puerto Rico Sales Tax Financing Corp. Revenue | 5.250% | 8/1/30 | 500 | 530 |
| | | | | 12,101 |
| South Carolina (0.6%) | | | | |
| Charleston SC Educational Excellence Financing | | | | |
| Corp. Revenue (Charleston County | | | | |
| School District, South Carolina Project) | 5.000% | 12/1/19 | 500 | 571 |
| Greenville County SC School District GO | 5.000% | 12/1/27 | 500 | 539 |
| Piedmont SC Municipal Power Agency Revenue | 0.000% | 1/1/24 (3) | 1,600 | 929 |
| South Carolina GO | 5.000% | 4/1/20 | 450 | 573 |
| South Carolina Jobs Economic Development | | | | |
| Authority Hospital Revenue (Palmetto Health) | 5.250% | 8/1/24 (4) | 500 | 532 |
| South Carolina Public Service Authority Revenue | 5.000% | 1/1/16 | 130 | 151 |
| South Carolina Public Service Authority Revenue | 5.000% | 1/1/29 | 500 | 548 |
| South Carolina Transportation Infrastructure | | | | |
| Revenue | 5.250% | 10/1/13 (2) | 500 | 539 |
| | | | | 4,382 |
| Tennessee (0.7%) | | | | |
| Memphis TN Electric System Revenue | 5.000% | 12/1/17 | 500 | 606 |
| Memphis TN GO | 5.000% | 7/1/21 | 500 | 617 |
| Memphis TN GO | 5.000% | 5/1/30 | 500 | 564 |
| Metropolitan Government of Nashville & | | | | |
| Davidson County TN GO | 5.000% | 7/1/21 | 500 | 620 |
| Metropolitan Government of Nashville & | | | | |
| Davidson County TN Health & Educational | | | | |
| Facilities Board Revenue (Vanderbilt University) | 5.000% | 10/1/15 | 350 | 404 |
| Shelby County TN GO | 5.000% | 4/1/19 (ETM) | 100 | 125 |
| Shelby County TN GO | 5.000% | 4/1/19 | 400 | 498 |
| Tennessee Energy Acquisition Corp. | | | | |
| Gas Revenue | 5.000% | 9/1/16 | 500 | 510 |
| Tennessee Energy Acquisition Corp. | | | | |
| Gas Revenue | 5.250% | 9/1/17 | 500 | 513 |
| Tennessee Energy Acquisition Corp. | | | | |
| Gas Revenue | 5.250% | 9/1/18 | 500 | 509 |
| Tennessee GO | 5.000% | 8/1/14 | 500 | 558 |
| | | | | 5,524 |
| Texas (3.5%) | | | | |
| Austin TX Combined Utility System Revenue | 0.000% | 5/15/18 (3) | 1,000 | 829 |
| Austin TX Water & Wastewater System Revenue | 5.000% | 11/15/24 | 275 | 322 |
| Board of Regents of the University of Texas | | | | |
| System Revenue Financing System Revenue | 5.000% | 8/15/18 | 500 | 617 |
| Central Texas Regional Mobility Authority | | | | |
| Revenue | 5.750% | 1/1/25 | 500 | 525 |
38
Tax-Managed Balanced Fund
| | | | |
| | | | Face | Market |
| | | Maturity | Amount | Value |
| | Coupon | Date | ($000) | ($000) |
| Clifton TX Higher Education Finance Corp. | | | | |
| Revenue (Baylor University) | 5.250% | 3/1/29 | 200 | 226 |
| Cypress-Fairbanks TX Independent School | | | | |
| District Unlimited Tax Schoolhouse GO | 5.000% | 2/15/30 | 500 | 551 |
| Dallas TX Area Rapid Transit Sales Tax Revenue | 4.500% | 12/1/27 | 500 | 534 |
| Dallas TX GO | 5.000% | 2/15/15 | 500 | 566 |
| Dallas TX Independent School District GO | 5.000% | 8/15/14 | 500 | 559 |
| Dallas TX Independent School District GO | 5.000% | 2/15/23 | 485 | 594 |
| Dallas TX Waterworks & Sewer System Revenue | 5.000% | 10/1/15 (2) | 485 | 561 |
| Dallas-Fort Worth TX International Airport | | | | |
| Revenue | 5.000% | 11/1/16 | 515 | 599 |
| Harris County TX Flood Control District GO | 5.250% | 10/1/18 | 435 | 543 |
| Harris County TX GO | 5.000% | 10/1/23 | 500 | 595 |
| Harris County TX Health Facilities Development | | | | |
| Corp. Hospital Revenue (Baylor College of | | | | |
| Medicine) VRDO | 0.060% | 1/3/12 LOC | 825 | 825 |
| Harris County TX Health Facilities Development | | | | |
| Corp. Revenue (St. Luke’s Episcopal Hospital) | | | | |
| VRDO | 0.070% | 1/3/12 | 800 | 800 |
| Harris County TX Toll Road Revenue | 5.000% | 8/15/27 | 500 | 565 |
| Houston TX GO | 5.000% | 3/1/20 | 500 | 609 |
| Houston TX Independent School District GO | 5.000% | 7/15/15 (4) | 500 | 573 |
| Houston TX Utility System Revenue | 5.125% | 5/15/28 (14) | 500 | 534 |
| Houston TX Utility System Revenue | 5.000% | 11/15/28 (4) | 500 | 546 |
| Houston TX Utility System Revenue | 5.250% | 11/15/30 | 500 | 567 |
| Lone Star College System Texas GO | 5.000% | 8/15/23 | 250 | 305 |
| Lower Colorado River Authority Texas Revenue | 5.750% | 5/15/28 | 500 | 544 |
| North East TX Independent School District GO | 5.250% | 2/1/22 | 500 | 645 |
| North Texas Tollway Authority System Revenue | 6.000% | 1/1/20 | 500 | 595 |
| North Texas Tollway Authority System Revenue | 6.000% | 1/1/25 | 500 | 568 |
| North Texas Tollway Authority System Revenue | 6.000% | 1/1/28 | 250 | 283 |
| North Texas Tollway Authority System Revenue | 5.500% | 9/1/28 | 500 | 574 |
| SA Energy Acquisition Public Facility Corp. | | | | |
| Texas Gas Supply Revenue | 5.250% | 8/1/17 | 500 | 520 |
| SA Energy Acquisition Public Facility Corp. | | | | |
| Texas Gas Supply Revenue | 5.500% | 8/1/19 | 500 | 520 |
| San Antonio TX Electric & Gas Systems Revenue | 5.000% | 2/1/19 | 500 | 620 |
| San Antonio TX Electric & Gas Systems Revenue | 5.000% | 2/1/21 | 905 | 1,026 |
| Southwest Texas Higher Education Authority Inc. | | | | |
| Revenue (Southern Methodist University | | | | |
| Project) | 5.000% | 10/1/16 (2) | 260 | 303 |
| Tarrant County TX Cultural Education Facilities | | | | |
| Finance Corp. Revenue (Texas Health | | | | |
| Resources) | 5.000% | 2/15/26 | 500 | 529 |
| Texas A&M University System Revenue | | | | |
| Financing System Revenue | 5.000% | 5/15/26 | 500 | 572 |
| Texas Municipal Power Agency Revenue | 0.000% | 9/1/15 (14) | 1,500 | 1,422 |
| Texas Public Finance Authority Revenue | | | | |
| (Unemployment Compensation) | 5.000% | 7/1/14 | 500 | 555 |
| Texas Public Finance Authority Revenue | | | | |
| (Unemployment Compensation) | 5.000% | 1/1/18 | 500 | 563 |
| Texas Tech University System Revenue | | | | |
| Financing System Revenue | 5.000% | 2/15/28 | 500 | 560 |
| Texas Transportation Commission Revenue | 4.750% | 4/1/24 | 500 | 562 |
| Texas Transportation Commission Revenue | 5.000% | 4/1/25 | 500 | 565 |
39
Tax-Managed Balanced Fund
| | | | |
| | | | Face | Market |
| | | Maturity | Amount | Value |
| | Coupon | Date | ($000) | ($000) |
| Texas Transportation Commission Revenue | 5.000% | 4/1/26 | 500 | 562 |
| Texas Water Financial Assistance GO | 5.000% | 8/1/24 | 500 | 592 |
| Texas Water Financial Assistance GO | 5.000% | 8/1/25 | 500 | 588 |
| Texas Water Financial Assistance GO | 5.000% | 8/1/27 | 500 | 561 |
| University of Texas Permanent University Fund | | | | |
| Revenue | 5.250% | 7/1/22 | 500 | 652 |
| University of Texas System Revenue Financing | | | | |
| System Revenue | 5.000% | 8/15/21 | 500 | 636 |
| | | | | 28,062 |
| Utah (0.3%) | | | | |
| Central Utah Water Conservancy District GO | 5.000% | 4/1/30 | 500 | 566 |
| Intermountain Power Agency Utah Power | | | | |
| Supply Revenue | 5.250% | 7/1/21 | 500 | 527 |
| Utah GO | 5.000% | 7/1/16 | 500 | 593 |
| Utah GO | 5.000% | 7/1/16 | 500 | 593 |
| | | | | 2,279 |
| Virgin Islands (0.1%) | | | | |
| Virgin Islands Public Finance Authority Revenue | 5.000% | 10/1/29 | 500 | 510 |
| |
| Virginia (0.2%) | | | | |
| Fairfax County VA Public Improvement GO | 5.000% | 10/1/17 | 500 | 613 |
| Virginia Public School Authority Revenue | 5.000% | 8/1/13 | 500 | 537 |
| Virginia Public School Authority Revenue | 5.000% | 8/1/19 | 500 | 625 |
| | | | | 1,775 |
| Washington (1.1%) | | | | |
| Energy Northwest Washington Electric Revenue | | | | |
| (Columbia Generating Station) | 5.000% | 7/1/20 | 500 | 624 |
| Energy Northwest Washington Electric Revenue | | | | |
| (Project No. 1) | 5.250% | 7/1/16 | 500 | 595 |
| Energy Northwest Washington Electric Revenue | | | | |
| (Project No. 1) | 5.000% | 7/1/17 | 500 | 602 |
| Energy Northwest Washington Electric | | | | |
| Revenue (Project No. 3) | 5.000% | 7/1/15 | 100 | 115 |
| Energy Northwest Washington Electric Revenue | | | | |
| (Project No. 3) | 5.000% | 7/1/16 | 865 | 1,019 |
| Port of Seattle WA Revenue | 5.000% | 3/1/20 (14) | 665 | 729 |
| University of Washington Revenue | 5.000% | 4/1/31 | 335 | 376 |
| Washington (Motor Vehicle Fuel Tax) GO | 5.000% | 7/1/23 | 425 | 493 |
| Washington (Motor Vehicle Fuel Tax) GO | 5.000% | 7/1/28 | 500 | 563 |
| Washington GO | 5.700% | 10/1/15 (4) | 410 | 444 |
| Washington GO | 5.000% | 2/1/16 | 500 | 582 |
| Washington GO | 0.000% | 6/1/20 (3) | 500 | 402 |
| Washington GO | 5.000% | 8/1/20 | 500 | 627 |
| Washington GO | 5.000% | 7/1/21 (4) | 500 | 573 |
| Washington GO | 5.000% | 7/1/21 | 500 | 593 |
| | | | | 8,337 |
| Wisconsin (0.7%) | | | | |
| Wisconsin Annual Appropriation Revenue | 5.625% | 5/1/28 | 460 | 527 |
| Wisconsin GO | 4.000% | 9/1/15 | 970 | 1,071 |
| Wisconsin GO | 5.000% | 5/1/16 | 500 | 587 |
| Wisconsin GO | 5.000% | 5/1/16 (4) | 600 | 681 |
| Wisconsin GO | 5.000% | 5/1/23 | 500 | 578 |
40
Tax-Managed Balanced Fund
| | | | |
| | | | Face | Market |
| | | Maturity | Amount | Value |
| | Coupon | Date | ($000) | ($000) |
| Wisconsin Health & Educational Facilities | | | | |
| Authority Revenue (Meriter Hospital Inc. | | | | |
| Project) VRDO | 0.110% | 1/3/12 LOC | 1,180 | 1,180 |
| Wisconsin Transportation Revenue | 5.250% | 7/1/14 (4) | 500 | 559 |
| | | | | 5,183 |
| Total Tax-Exempt Municipal Bonds (Cost $382,350) | | | | 407,527 |
| Total Investments (99.5%) (Cost $637,311) | | | | 793,462 |
| Other Assets and Liabilities (0.5%) | | | | |
| Other Assets | | | | 7,726 |
| Liabilities | | | | (3,851) |
| | | | | 3,875 |
| Net Assets (100%) | | | | |
| Applicable to 38,796,058 outstanding $.001 par value shares of | | | |
| beneficial interest (unlimited authorization) | | | | 797,337 |
| Net Asset Value Per Share | | | | $20.55 |
| |
| At December 31, 2011, net assets consisted of: | |
| | Amount |
| | ($000) |
| Paid-in Capital | 654,634 |
| Overdistributed Net Investment Income | (1,190) |
| Accumulated Net Realized Losses | (12,258) |
| Unrealized Appreciation (Depreciation) | 156,151 |
| Net Assets | 797,337 |
See Note A in Notes to Financial Statements.
* Non-income-producing security.
1 Security exempt from registration under Rule 144A of the Securities Act of 1933. Such securities may be sold in transactions exempt from registration, normally to qualified institutional buyers. At December 31, 2011, the aggregate value of these securities was $400,000, representing 0.1% of net assets.
2 Security purchased on a when-issued or delayed-delivery basis for which the fund has not taken delivery as of December 31, 2011.
A key to abbreviations and other references follows the Statement of Net Assets.
See accompanying Notes, which are an integral part of the Financial Statements.
41
Tax-Managed Balanced Fund
Key to Abbreviations
ARS—Auction Rate Security.
BAN—Bond Anticipation Note.
COP—Certificate of Participation.
CP—Commercial Paper.
FR—Floating Rate.
GAN—Grant Anticipation Note.
GO—General Obligation Bond.
PUT—Put Option Obligation.
RAN—Revenue Anticipation Note.
TAN—Tax Anticipation Note.
TOB—Tender Option Bond.
TRAN—Tax Revenue Anticipation Note.
VRDO—Variable Rate Demand Obligation.
VRDP—Variable Rate Demand Preferred.
(ETM)—Escrowed to Maturity.
(Prere.)—Prerefunded.
Scheduled principal and interest payments are guaranteed by:
(1) MBIA (Municipal Bond Investors Assurance).
(2) AMBAC (Ambac Assurance Corporation).
(3) FGIC (Financial Guaranty Insurance Company).
(4) AGM (Assured Guaranty Municipal Corporation).
(5) BIGI (Bond Investors Guaranty Insurance).
(6) Connie Lee Inc.
(7) FHA (Federal Housing Authority).
(8) CapMAC (Capital Markets Assurance Corporation).
(9) American Capital Access Financial Guaranty Corporation.
(10) XL Capital Assurance Inc.
(11) CIFG (CDC IXIS Financial Guaranty).
(12) Assured Guaranty Corporation.
(13) Berkshire Hathaway Assurance Corporation.
(14) National Public Finance Guarantee Corporation.
The insurance does not guarantee the market value of the municipal bonds.
LOC—Scheduled principal and interest payments are guaranteed by bank letter of credit.
42
Tax-Managed Balanced Fund
| |
| Statement of Operations | |
| |
| | Year Ended |
| | December 31, 2011 |
| | ($000) |
| Investment Income | |
| Income | |
| Dividends | 6,149 |
| Interest | 14,188 |
| Total Income | 20,337 |
| Expenses | |
| The Vanguard Group—Note B | |
| Investment Advisory Services | 53 |
| Management and Administrative | 674 |
| Marketing and Distribution | 136 |
| Custodian Fees | 11 |
| Auditing Fees | 27 |
| Shareholders’ Reports | 9 |
| Trustees’ Fees and Expenses | 1 |
| Total Expenses | 911 |
| Net Investment Income | 19,426 |
| Realized Net Gain (Loss) on Investment Securities Sold | 9,695 |
| Change in Unrealized Appreciation (Depreciation) of Investment Securities | 12,259 |
| Net Increase (Decrease) in Net Assets Resulting from Operations | 41,380 |
See accompanying Notes, which are an integral part of the Financial Statements.
43
Tax-Managed Balanced Fund
| | |
| Statement of Changes in Net Assets | | |
| |
| | Year Ended December 31, |
| | 2011 | 2010 |
| | ($000) | ($000) |
| Increase (Decrease) in Net Assets | | |
| Operations | | |
| Net Investment Income | 19,426 | 17,981 |
| Realized Net Gain (Loss) | 9,695 | 23,695 |
| Change in Unrealized Appreciation (Depreciation) | 12,259 | 19,847 |
| Net Increase (Decrease) in Net Assets Resulting from Operations | 41,380 | 61,523 |
| Distributions | | |
| Net Investment Income | (19,292) | (18,035) |
| Realized Capital Gain | — | — |
| Total Distributions | (19,292) | (18,035) |
| Capital Share Transactions | | |
| Issued | 84,410 | 55,542 |
| Issued in Lieu of Cash Distributions | 16,324 | 15,301 |
| Redeemed1 | (58,490) | (50,511) |
| Net Increase (Decrease) from Capital Share Transactions | 42,244 | 20,332 |
| Total Increase (Decrease) | 64,332 | 63,820 |
| Net Assets | | |
| Beginning of Period | 733,005 | 669,185 |
| End of Period2 | 797,337 | 733,005 |
1 Net of redemption fees for fiscal 2011 and 2010 of $39,000 and $176,000, respectively. Effective April 28, 2011, the redemption fee was eliminated.
2 Net Assets—End of Period includes undistributed (overdistributed) net investment income of ($1,190,000) and ($1,324,000).
See accompanying Notes, which are an integral part of the Financial Statements.
44
Tax-Managed Balanced Fund
Financial Highlights
| | | | | |
| For a Share Outstanding | | | Year Ended December 31, |
| Throughout Each Period | 2011 | 2010 | 2009 | 2008 | 2007 |
| Net Asset Value, Beginning of Period | $19.96 | $18.75 | $16.19 | $20.45 | $20.02 |
| Investment Operations | | | | | |
| Net Investment Income | .519 | .496 | .491 | .565 | .588 |
| Net Realized and Unrealized Gain (Loss) | | | | | |
| on Investments | .585 | 1.210 | 2.566 | (4.260) | .430 |
| Total from Investment Operations | 1.104 | 1.706 | 3.057 | (3.695) | 1.018 |
| Distributions | | | | | |
| Dividends from Net Investment Income1 | (.514) | (.496) | (.497) | (.565) | (.588) |
| Distributions from Realized Capital Gains | — | — | — | — | — |
| Total Distributions | (.514) | (.496) | (.497) | (.565) | (.588) |
| Net Asset Value, End of Period | $20.55 | $19.96 | $18.75 | $16.19 | $20.45 |
| |
| Total Return2 | 5.58% | 9.22% | 19.14% | -18.32% | 5.11% |
| |
| Ratios/Supplemental Data | | | | | |
| Net Assets, End of Period (Millions) | $797 | $733 | $669 | $587 | $722 |
| Ratio of Total Expenses to | | | | | |
| Average Net Assets | 0.12% | 0.15% | 0.15% | 0.13% | 0.12% |
| Ratio of Net Investment Income to | | | | | |
| Average Net Assets | 2.55% | 2.58% | 2.86% | 3.01% | 2.86% |
| Portfolio Turnover Rate | 12% | 23% | 27% | 19% | 10% |
1 For tax purposes, nontaxable dividends represent 70%, 70%, 69%, 72%, and 73% of dividends from net investment income.
2 Total returns do not include transaction or account service fees that may have applied in the periods shown. Fund prospectuses provide information about any applicable transaction and account service fees.
See accompanying Notes, which are an integral part of the Financial Statements.
45
Tax-Managed Balanced Fund
Notes to Financial Statements
Vanguard Tax-Managed Balanced Fund is registered under the Investment Company Act of 1940 as an open-end investment company, or mutual fund. The fund invests in debt instruments of many municipal issuers; the issuers’ abilities to meet their obligations may be affected by economic and political developments in a specific state or region.
A. The following significant accounting policies conform to generally accepted accounting principles for U.S. mutual funds. The fund consistently follows such policies in preparing its financial statements.
1. Security Valuation: Securities are valued as of the close of trading on the New York Stock Exchange (generally 4 p.m., Eastern time) on the valuation date. Equity securities are valued at the latest quoted sales prices or official closing prices taken from the primary market in which each security trades; such securities not traded on the valuation date are valued at the mean of the latest quoted bid and asked prices. Bonds, and temporary cash investments acquired over 60 days to maturity, are valued using the latest bid prices or using valuations based on a matrix system (which considers such factors as security prices, yields, maturities, and ratings), both as furnished by independent pricing services. Other temporary cash investments are valued at amortized cost, which approximates market value. Securities for which market quotations are not readily available, or whose values have been materially affected by events occurring before the fund’s pricing time but after the close of the securities’ primary markets, are valued by methods deemed by the board of trustees to represent fair value.
2. Federal Income Taxes: The fund intends to continue to qualify as a regulated investment company and distribute all of its income. Management has analyzed the fund’s tax positions taken for all open federal income tax years (December 31, 2008–2011), and has concluded that no provision for federal income tax is required in the fund’s financial statements.
3. Distributions: Distributions to shareholders are recorded on the ex-dividend date.
4. Other: Dividend income is recorded on the ex-dividend date. Interest income is accrued daily. Premiums and discounts on debt securities purchased are amortized and accreted, respectively, to interest income over the lives of the respective securities. Security transactions are accounted for on the date securities are bought or sold. Costs used to determine realized gains (losses) on the sale of investment securities are those of the specific securities sold. Fees assessed on redemptions of capital shares are credited to paid-in-capital.
B. The Vanguard Group furnishes at cost investment advisory, corporate management, administrative, marketing, and distribution services. The costs of such services are allocated to the fund under methods approved by the board of trustees. The fund has committed to provide up to 0.40% of its net assets in capital contributions to Vanguard. At December 31, 2011, the fund had contributed capital of $127,000 to Vanguard (included in Other Assets), representing 0.02% of the fund’s net assets and 0.05% of Vanguard’s capitalization. The fund’s trustees and officers are also directors and officers of Vanguard.
C. Various inputs may be used to determine the value of the fund’s investments. These inputs are summarized in three broad levels for financial statement purposes. The inputs or methodologies used to value securities are not necessarily an indication of the risk associated with investing in those securities.
Level 1—Quoted prices in active markets for identical securities.
Level 2—Other significant observable inputs (including quoted prices for similar securities, interest rates, prepayment speeds, credit risk, etc.).
Level 3—Significant unobservable inputs (including the fund’s own assumptions used to determine the fair value of investments).
46
Tax-Managed Balanced Fund
The following table summarizes the market value of the fund’s investments as of December 31, 2011, based on the inputs used to value them:
| | | |
| | Level 1 | Level 2 | Level 3 |
| Investments | ($000) | ($000) | ($000) |
| Common Stocks | 385,935 | — | — |
| Tax-Exempt Municipal Bonds | — | 407,527 | — |
| Total | 385,935 | 407,527 | — |
D. Distributions are determined on a tax basis and may differ from net investment income and realized capital gains for financial reporting purposes. Differences may be permanent or temporary. Permanent differences are reclassified among capital accounts in the financial statements to reflect their tax character. Temporary differences arise when certain items of income, expense, gain, or loss are recognized in different periods for financial statement and tax purposes; these differences will reverse at some time in the future. Differences in classification may also result from the treatment of short-term gains as ordinary income for tax purposes.
For tax purposes, at December 31, 2011, the fund had $156,000 of ordinary income available for distribution. The fund had available capital loss carryforwards totaling $12,258,000 to offset future net capital gains through December 31, 2017.
At December 31, 2011, the cost of investment securities for tax purposes was $637,311,000. Net unrealized appreciation of investment securities for tax purposes was $156,151,000, consisting of unrealized gains of $170,162,000 on securities that had risen in value since their purchase and $14,011,000 in unrealized losses on securities that had fallen in value since their purchase.
E. During the year ended December 31, 2011, the fund purchased $140,858,000 of investment securities and sold $88,897,000 of investment securities, other than temporary cash investments.
F. Capital shares issued and redeemed were:
| | |
| | Year Ended December 31, |
| | 2011 | 2010 |
| | Shares | Shares |
| | (000) | (000) |
| Issued | 4,149 | 2,886 |
| Issued in Lieu of Cash Distributions | 802 | 794 |
| Redeemed | (2,887) | (2,635) |
| Net Increase (Decrease) in Shares Outstanding | 2,064 | 1,045 |
G. In preparing the financial statements as of December 31, 2011, management considered the impact of subsequent events for potential recognition or disclosure in these financial statements.
47
Tax-Managed Growth and Income Fund
Fund Profile
As of December 31, 2011
| | |
| Share-Class Characteristics | |
| | Admiral | Institutional |
| | Shares | Shares |
| Ticker Symbol | VTGLX | VTMIX |
| Expense Ratio1 | 0.12% | 0.08% |
| 30-Day SEC Yield | 2.12% | 2.16% |
| | | |
| Portfolio Characteristics | | |
| | | | DJ |
| | | | U.S. Total |
| | | S&P 500 | Market |
| | Fund | Index | Index |
| Number of Stocks | 502 | 500 | 3,745 |
| Median Market Cap | $52.0B | $52.0B | $31.3B |
| Price/Earnings Ratio | 14.2x | 14.1x | 15.0x |
| Price/Book Ratio | 2.1x | 2.1x | 2.1x |
| Return on Equity | 20.8% | 20.6% | 19.0% |
| Earnings Growth Rate | 7.4% | 7.4% | 7.1% |
| Dividend Yield | 2.2% | 2.2% | 2.0% |
| Foreign Holdings | 0.0% | 0.0% | 0.0% |
| Turnover Rate | 6% | — | — |
| Short-Term Reserves | 0.0% | — | — |
| | | |
| Sector Diversification (% of equity exposure) |
| | | | DJ |
| | | | U.S. Total |
| | | S&P 500 | Market |
| | Fund | Index | Index |
| Consumer | | | |
| Discretionary | 10.7% | 10.7% | 12.2% |
| Consumer Staples | 11.5 | 11.5 | 10.6 |
| Energy | 12.3 | 12.3 | 10.8 |
| Financials | 13.6 | 13.6 | 15.0 |
| Health Care | 11.9 | 11.8 | 11.4 |
| Industrials | 10.7 | 10.7 | 11.1 |
| Information | | | |
| Technology | 18.9 | 19.0 | 18.7 |
| Materials | 3.5 | 3.5 | 4.1 |
| Telecommunication | | | |
| Services | 3.0 | 3.0 | 2.5 |
| Utilities | 3.9 | 3.9 | 3.6 |
| | |
| Volatility Measures | | |
| | | DJ |
| | | U.S. Total |
| | S&P 500 | Market |
| | Index | Index |
| R-Squared | 1.00 | 0.99 |
| Beta | 1.00 | 0.97 |
These measures show the degree and timing of the fund’s fluctuations compared with the indexes over 36 months.
| | |
| Ten Largest Holdings (% of total net assets) |
| Exxon Mobil Corp. | Integrated Oil & | |
| | Gas | 3.6% |
| Apple Inc. | Computer | |
| | Hardware | 3.3 |
| International Business | IT Consulting & | |
| Machines Corp. | Other Services | 1.9 |
| Chevron Corp. | Integrated Oil & | |
| | Gas | 1.9 |
| Microsoft Corp. | Systems Software | 1.7 |
| General Electric Co. | Industrial | |
| | Conglomerates | 1.7 |
| Procter & Gamble Co. | Household | |
| | Products | 1.6 |
| AT&T Inc. | Integrated | |
| | Telecommunication | |
| | Services | 1.6 |
| Johnson & Johnson | Pharmaceuticals | 1.6 |
| Pfizer Inc. | Pharmaceuticals | 1.5 |
| Top Ten | | 20.4% |
The holdings listed exclude any temporary cash investments and equity index products.
Investment Focus

1 The expense ratios shown are from the prospectus dated July 15, 2011, and represent estimated costs for the current fiscal year. For the fiscal year ended December 31, 2011, the expense ratios were 0.12% for Admiral Shares and 0.08% for Institutional Shares.
48
Tax-Managed Growth and Income Fund
Performance Summary
All of the returns in this report represent past performance, which is not a guarantee of future results that may be achieved by the fund. (Current performance may be lower or higher than the performance data cited. For performance data current to the most recent month-end, visit our website at vanguard.com/performance.) Note, too, that both investment returns and principal value can fluctuate widely, so an investor’s shares, when sold, could be worth more or less than their original cost. The returns shown do not reflect taxes that a shareholder would pay on fund distributions or on the sale of fund shares.
Cumulative Performance: December 31, 2001, Through December 31, 2011
Initial Investment of $10,000
| | | | |
| | | Average Annual Total Returns | |
| | Periods Ended December 31, 2011 | |
| | | | | Final Value |
| | One | Five | Ten | of a $10,000 |
| | Year | Years | Years | Investment |
| Tax-Managed Growth and Income | | | | |
| Fund Admiral Shares | 2.00% | -0.28% | 2.92% | $13,340 |
| Dow Jones U.S. Total Stock Market | | | | |
| Index | 0.52 | 0.28 | 3.90 | 14,657 |
| S&P 500 Index | 2.11 | -0.25 | 2.92 | 13,335 |
| Large-Cap Core Funds Average | -0.72 | -1.20 | 1.45 | 11,546 |
| Large-Cap Core Funds Average: Derived from data provided by Lipper Inc. |
| | | | |
| | | | | Final Value |
| | One | Five | Ten | of a $5,000,000 |
| | Year | Years | Years | Investment |
| Tax-Managed Growth and Income Fund | | | | |
| Institutional Shares | 2.05% | -0.24% | 2.96% | $6,693,360 |
| Dow Jones U.S. Total Stock Market Index | 0.52 | 0.28 | 3.90 | 7,328,259 |
| S&P 500 Index | 2.11 | -0.25 | 2.92 | 6,667,591 |
See Financial Highlights for dividend and capital gains information.
49
Tax-Managed Growth and Income Fund
Fiscal-Year Total Returns (%): December 31, 2001, Through December 31, 2011
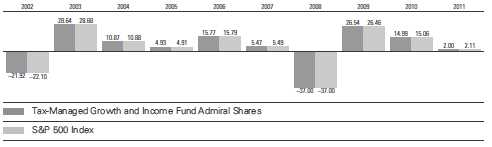
50
Tax-Managed Growth and Income Fund
Financial Statements
Statement of Net Assets
As of December 31, 2011
The fund reports a complete list of its holdings in regulatory filings four times in each fiscal year, at the quarter-ends. For the second and fourth fiscal quarters, the lists appear in the fund’s semiannual and annual reports to shareholders. For the first and third fiscal quarters, the fund files the lists with the Securities and Exchange Commission on Form N-Q. Shareholders can look up the fund’s Forms N-Q on the SEC’s website at sec.gov. Forms N-Q may also be reviewed and copied at the SEC’s Public Reference Room (see the back cover of this report for further information).
| | | |
| | | | Market |
| | | | Value |
| | | Shares | ($000) |
| Common Stocks (100.0%) | | |
| Consumer Discretionary (10.7%) | |
| | McDonald’s Corp. | 203,747 | 20,442 |
| | Walt Disney Co. | 357,898 | 13,421 |
| | Home Depot Inc. | 307,114 | 12,911 |
| * | Amazon.com Inc. | 72,485 | 12,547 |
| | Comcast Corp. Class A | 508,968 | 12,068 |
| * | Ford Motor Co. | 757,096 | 8,146 |
| | News Corp. Class A | 436,854 | 7,793 |
| | Time Warner Inc. | 199,311 | 7,203 |
| | NIKE Inc. Class B | 73,974 | 7,129 |
| | Target Corp. | 133,836 | 6,855 |
| | Starbucks Corp. | 148,426 | 6,829 |
| | Lowe’s Cos. Inc. | 249,631 | 6,336 |
| * | DIRECTV Class A | 140,754 | 6,019 |
| | Yum! Brands Inc. | 91,684 | 5,410 |
| | Viacom Inc. Class B | 110,203 | 5,004 |
| | TJX Cos. Inc. | 75,221 | 4,856 |
| * | priceline.com Inc. | 9,913 | 4,636 |
| | Johnson Controls Inc. | 135,822 | 4,246 |
| | Time Warner Cable Inc. | 63,607 | 4,044 |
| | Coach Inc. | 58,263 | 3,556 |
| | CBS Corp. Class B | 130,528 | 3,543 |
| | Carnival Corp. | 90,240 | 2,945 |
| * | Bed Bath & Beyond Inc. | 47,864 | 2,775 |
| | Macy’s Inc. | 83,786 | 2,696 |
| | McGraw-Hill Cos. Inc. | 58,469 | 2,629 |
| | Kohl’s Corp. | 50,513 | 2,493 |
| | Omnicom Group Inc. | 54,975 | 2,451 |
| | VF Corp. | 17,342 | 2,202 |
| | Ross Stores Inc. | 45,986 | 2,186 |
| * | Discovery Communications | | |
| | Inc. Class A | 52,700 | 2,159 |
| * | Chipotle Mexican Grill Inc. | | |
| | Class A | 6,228 | 2,103 |
| * | O’Reilly Automotive Inc. | 25,568 | 2,044 |
| | Limited Brands Inc. | 49,168 | 1,984 |
| * | Dollar Tree Inc. | 23,758 | 1,975 |
| | Staples Inc. | 139,260 | 1,934 |
| | Genuine Parts Co. | 31,098 | 1,903 |
| | | |
| | | | Market |
| | | | Value |
| | | Shares | ($000) |
| | Mattel Inc. | 67,446 | 1,872 |
| | Starwood Hotels & Resorts | | |
| | Worldwide Inc. | 38,311 | 1,838 |
| * | AutoZone Inc. | 5,572 | 1,811 |
| | Harley-Davidson Inc. | 46,327 | 1,801 |
| | Ralph Lauren Corp. Class A | 12,835 | 1,772 |
| | Wynn Resorts Ltd. | 15,693 | 1,734 |
| | Tiffany & Co. | 25,203 | 1,670 |
| | Nordstrom Inc. | 32,136 | 1,598 |
| | Marriott International Inc. | | |
| | Class A | 53,224 | 1,553 |
| * | BorgWarner Inc. | 21,901 | 1,396 |
| * | CarMax Inc. | 44,891 | 1,368 |
| | Best Buy Co. Inc. | 58,478 | 1,367 |
| | Family Dollar Stores Inc. | 23,356 | 1,347 |
| | Gap Inc. | 69,010 | 1,280 |
| * | Apollo Group Inc. Class A | 23,005 | 1,239 |
| | Darden Restaurants Inc. | 26,211 | 1,195 |
| | Wyndham Worldwide Corp. | 30,196 | 1,142 |
| | International Game | | |
| | Technology | 58,978 | 1,014 |
| | JC Penney Co. Inc. | 28,275 | 994 |
| | H&R Block Inc. | 58,383 | 953 |
| | Newell Rubbermaid Inc. | 57,789 | 933 |
| | Interpublic Group of Cos. Inc. | 91,709 | 892 |
| | Abercrombie & Fitch Co. | 17,128 | 837 |
| | Scripps Networks Interactive | | |
| | Inc. Class A | 19,281 | 818 |
| | Comcast Corp. | 33,914 | 799 |
| * | Netflix Inc. | 11,099 | 769 |
| | Hasbro Inc. | 23,105 | 737 |
| | Whirlpool Corp. | 15,073 | 715 |
| | DR Horton Inc. | 55,355 | 698 |
| * | Goodyear Tire & Rubber Co. | 48,343 | 685 |
| * | GameStop Corp. Class A | 27,421 | 662 |
| | Leggett & Platt Inc. | 27,981 | 645 |
| | Gannett Co. Inc. | 47,625 | 637 |
| | Cablevision Systems Corp. | | |
| | Class A | 44,468 | 632 |
| | Lennar Corp. Class A | 31,769 | 624 |
| * | Urban Outfitters Inc. | 22,040 | 607 |
51
Tax-Managed Growth and Income Fund
| | | |
| | | | Market |
| | | | Value |
| | | Shares | ($000) |
| | Expedia Inc. | 18,913 | 549 |
| | Harman International | | |
| | Industries Inc. | 13,781 | 524 |
| * | Big Lots Inc. | 12,856 | 485 |
| * | TripAdvisor Inc. | 18,913 | 477 |
| | DeVry Inc. | 12,289 | 473 |
| * | PulteGroup Inc. | 66,207 | 418 |
| | Washington Post Co. | | |
| | Class B | 990 | 373 |
| * | AutoNation Inc. | 9,349 | 345 |
| * | Sears Holdings Corp. | 7,688 | 244 |
| * | Orchard Supply Hardware | | |
| | Stores Corp. Class A | 347 | 3 |
| * | Orchard Supply Hardware | | |
| | Stores Corp. Pfd. | 347 | — |
| | | | 241,998 |
| Consumer Staples (11.5%) | | |
| | Procter & Gamble Co. | 548,070 | 36,562 |
| | Coca-Cola Co. | 452,535 | 31,664 |
| | Philip Morris International | | |
| | Inc. | 346,107 | 27,163 |
| | Wal-Mart Stores Inc. | 347,862 | 20,788 |
| | PepsiCo Inc. | 311,342 | 20,658 |
| | Kraft Foods Inc. | 352,134 | 13,156 |
| | Altria Group Inc. | 409,723 | 12,148 |
| | CVS Caremark Corp. | 259,341 | 10,576 |
| | Colgate-Palmolive Co. | 96,441 | 8,910 |
| | Costco Wholesale Corp. | 86,275 | 7,188 |
| | Walgreen Co. | 177,428 | 5,866 |
| | Kimberly-Clark Corp. | 78,549 | 5,778 |
| | General Mills Inc. | 128,114 | 5,177 |
| | Archer-Daniels-Midland Co. | 133,224 | 3,810 |
| | HJ Heinz Co. | 63,776 | 3,446 |
| | Sysco Corp. | 117,470 | 3,445 |
| | Lorillard Inc. | 26,856 | 3,062 |
| | Kroger Co. | 119,177 | 2,886 |
| | Reynolds American Inc. | 67,300 | 2,788 |
| | Mead Johnson Nutrition Co. | 40,512 | 2,784 |
| | Estee Lauder Cos. Inc. | | |
| | Class A | 22,257 | 2,500 |
| | Kellogg Co. | 49,393 | 2,498 |
| | Sara Lee Corp. | 118,128 | 2,235 |
| | Whole Foods Market Inc. | 31,914 | 2,221 |
| | ConAgra Foods Inc. | 82,647 | 2,182 |
| | Hershey Co. | 30,635 | 1,893 |
| | JM Smucker Co. | 22,628 | 1,769 |
| | Clorox Co. | 26,228 | 1,746 |
| | Dr Pepper Snapple Group | | |
| | Inc. | 42,618 | 1,683 |
| | Brown-Forman Corp. | | |
| | Class B | 20,050 | 1,614 |
| | Coca-Cola Enterprises Inc. | 62,260 | 1,605 |
| | Beam Inc. | 31,120 | 1,594 |
| | Avon Products Inc. | 85,543 | 1,494 |
| | Safeway Inc. | 67,810 | 1,427 |
| | | |
| | | | Market |
| | | | Value |
| | | Shares | ($000) |
| | Molson Coors Brewing Co. | | |
| | Class B | 31,410 | 1,368 |
| | McCormick & Co. Inc. | 26,343 | 1,328 |
| | Tyson Foods Inc. Class A | 58,131 | 1,200 |
| | Campbell Soup Co. | 35,630 | 1,184 |
| | Hormel Foods Corp. | 27,400 | 803 |
| * | Constellation Brands Inc. | | |
| | Class A | 34,515 | 713 |
| * | Dean Foods Co. | 36,100 | 404 |
| | SUPERVALU Inc. | 42,646 | 346 |
| | | | 261,662 |
| Energy (12.3%) | | |
| | Exxon Mobil Corp. | 954,833 | 80,932 |
| | Chevron Corp. | 396,827 | 42,222 |
| | ConocoPhillips | 264,576 | 19,280 |
| | Schlumberger Ltd. | 267,360 | 18,263 |
| | Occidental Petroleum Corp. | 161,813 | 15,162 |
| | Anadarko Petroleum Corp. | 99,188 | 7,571 |
| | Apache Corp. | 76,547 | 6,934 |
| | Halliburton Co. | 183,311 | 6,326 |
| | National Oilwell Varco Inc. | 84,416 | 5,739 |
| | EOG Resources Inc. | 53,529 | 5,273 |
| | Devon Energy Corp. | 80,571 | 4,995 |
| | Baker Hughes Inc. | 86,840 | 4,224 |
| | Marathon Oil Corp. | 140,448 | 4,111 |
| | El Paso Corp. | 153,520 | 4,079 |
| | Spectra Energy Corp. | 129,471 | 3,981 |
| | Williams Cos. Inc. | 117,655 | 3,885 |
| | Hess Corp. | 59,411 | 3,375 |
| | Noble Energy Inc. | 35,005 | 3,304 |
| | Chesapeake Energy Corp. | 131,235 | 2,925 |
| * | FMC Technologies Inc. | 47,356 | 2,473 |
| * | Cameron International Corp. | 48,875 | 2,404 |
| | Marathon Petroleum Corp. | 71,024 | 2,364 |
| | Valero Energy Corp. | 111,660 | 2,350 |
| * | Southwestern Energy Co. | 69,353 | 2,215 |
| | Pioneer Natural Resources | | |
| | Co. | 24,470 | 2,190 |
| | Murphy Oil Corp. | 38,566 | 2,150 |
| | Range Resources Corp. | 31,186 | 1,932 |
| | Peabody Energy Corp. | 54,020 | 1,789 |
| | Consol Energy Inc. | 45,389 | 1,666 |
| | EQT Corp. | 29,904 | 1,638 |
| | Cabot Oil & Gas Corp. | 20,869 | 1,584 |
| | Noble Corp. | 50,151 | 1,516 |
| | Helmerich & Payne Inc. | 21,487 | 1,254 |
| * | Denbury Resources Inc. | 78,992 | 1,193 |
| | QEP Resources Inc. | 35,068 | 1,027 |
| * | Newfield Exploration Co. | 26,311 | 993 |
| * | Nabors Industries Ltd. | 56,906 | 987 |
| * | Alpha Natural Resources Inc. | 43,709 | 893 |
| | Sunoco Inc. | 21,388 | 877 |
| | Diamond Offshore Drilling | | |
| | Inc. | 13,711 | 758 |
52
Tax-Managed Growth and Income Fund
| | | |
| | | | Market |
| | | | Value |
| | | Shares | ($000) |
| * | Rowan Cos. Inc. | 24,786 | 752 |
| * | Tesoro Corp. | 28,684 | 670 |
| | | | 278,256 |
| Financials (13.6%) | | |
| | Wells Fargo & Co. | 1,050,880 | 28,962 |
| | JPMorgan Chase & Co. | 756,907 | 25,167 |
| * | Berkshire Hathaway Inc. | | |
| | Class B | 315,799 | 24,095 |
| | Citigroup Inc. | 582,362 | 15,322 |
| | Bank of America Corp. | 2,020,645 | 11,235 |
| | US Bancorp | 380,204 | 10,285 |
| | American Express Co. | 201,398 | 9,500 |
| | Goldman Sachs Group Inc. | 98,004 | 8,862 |
| | Simon Property Group Inc. | 58,482 | 7,541 |
| | MetLife Inc. | 210,645 | 6,568 |
| | PNC Financial Services | | |
| | Group Inc. | 104,780 | 6,043 |
| | Travelers Cos. Inc. | 82,189 | 4,863 |
| | Bank of New York Mellon | | |
| | Corp. | 242,023 | 4,819 |
| | Prudential Financial Inc. | 94,196 | 4,721 |
| | ACE Ltd. | 67,100 | 4,705 |
| | American Tower | | |
| | Corporation | 78,279 | 4,698 |
| | Morgan Stanley | 296,238 | 4,482 |
| | Aflac Inc. | 92,939 | 4,021 |
| | State Street Corp. | 98,150 | 3,956 |
| | Capital One Financial Corp. | 91,786 | 3,882 |
| | Chubb Corp. | 55,476 | 3,840 |
| | Public Storage | 28,189 | 3,790 |
| | BlackRock Inc. | 19,953 | 3,556 |
| | BB&T Corp. | 138,883 | 3,496 |
| | Marsh & McLennan Cos. | | |
| | Inc. | 107,200 | 3,390 |
| | Equity Residential | 58,995 | 3,364 |
| | HCP Inc. | 81,140 | 3,362 |
| | CME Group Inc. | 13,232 | 3,224 |
| | Ventas Inc. | 57,358 | 3,162 |
| | Aon Corp. | 64,339 | 3,011 |
| | Boston Properties Inc. | 29,483 | 2,936 |
| | T Rowe Price Group Inc. | 50,370 | 2,869 |
| | Vornado Realty Trust | 36,757 | 2,825 |
| | Franklin Resources Inc. | 28,926 | 2,779 |
| | Allstate Corp. | 100,776 | 2,762 |
| * | Berkshire Hathaway Inc. | | |
| | Class A | 23 | 2,639 |
| | Discover Financial Services | 109,378 | 2,625 |
| | ProLogis Inc. | 91,470 | 2,615 |
| | AvalonBay Communities | | |
| | Inc. | 18,843 | 2,461 |
| | Charles Schwab Corp. | 214,843 | 2,419 |
| | Progressive Corp. | 123,093 | 2,402 |
| | Fifth Third Bancorp | 183,919 | 2,339 |
| | Loews Corp. | 60,857 | 2,291 |
| | Ameriprise Financial Inc. | 45,142 | 2,241 |
| | Host Hotels & Resorts Inc. | 141,242 | 2,086 |
| | | |
| | | | Market |
| | | | Value |
| | | Shares | ($000) |
| | Health Care REIT Inc. | 37,966 | 2,070 |
| | American International | | |
| | Group Inc. | 87,072 | 2,020 |
| | Weyerhaeuser Co. | 106,573 | 1,990 |
| | M&T Bank Corp. | 25,009 | 1,909 |
| | Northern Trust Corp. | 47,948 | 1,902 |
| | SunTrust Banks Inc. | 106,999 | 1,894 |
| | Invesco Ltd. | 90,216 | 1,812 |
| * | IntercontinentalExchange | | |
| | Inc. | 14,514 | 1,750 |
| | Principal Financial Group | | |
| | Inc. | 60,818 | 1,496 |
| | KeyCorp | 189,260 | 1,455 |
| | Hartford Financial Services | | |
| | Group Inc. | 89,229 | 1,450 |
| | NYSE Euronext | 52,037 | 1,358 |
| | SLM Corp. | 101,204 | 1,356 |
| | Kimco Realty Corp. | 80,823 | 1,313 |
| | Moody’s Corp. | 38,940 | 1,311 |
| | XL Group plc Class A | 63,926 | 1,264 |
| | Unum Group | 58,325 | 1,229 |
| | Plum Creek Timber Co. Inc. | 32,215 | 1,178 |
| | Lincoln National Corp. | 60,025 | 1,166 |
| | Regions Financial Corp. | 249,713 | 1,074 |
| | Comerica Inc. | 39,893 | 1,029 |
| * | CBRE Group Inc. Class A | 64,621 | 984 |
| | Cincinnati Financial Corp. | 32,195 | 981 |
| | Huntington Bancshares Inc. | 171,123 | 939 |
| | People’s United Financial | | |
| | Inc. | 71,932 | 924 |
| | Leucadia National Corp. | 39,294 | 894 |
| | Torchmark Corp. | 20,199 | 876 |
| | Assurant Inc. | 18,209 | 748 |
| | Hudson City Bancorp Inc. | 104,119 | 651 |
| * | Genworth Financial Inc. | | |
| | Class A | 97,134 | 636 |
| * | NASDAQ OMX Group Inc. | 25,195 | 618 |
| | Legg Mason Inc. | 24,636 | 592 |
| | Zions Bancorporation | 36,340 | 592 |
| | Apartment Investment & | | |
| | Management Co. | 23,892 | 547 |
| | First Horizon National Corp. | 51,824 | 415 |
| * | E*Trade Financial Corp. | 50,359 | 401 |
| | Federated Investors Inc. | | |
| | Class B | 18,495 | 280 |
| | | | 309,315 |
| Health Care (11.8%) | | |
| | Johnson & Johnson | 544,159 | 35,686 |
| | Pfizer Inc. | 1,531,798 | 33,148 |
| | Merck & Co. Inc. | 607,075 | 22,887 |
| | Abbott Laboratories | 310,243 | 17,445 |
| | Bristol-Myers Squibb Co. | 337,766 | 11,903 |
| | UnitedHealth Group Inc. | 212,317 | 10,760 |
| | Amgen Inc. | 158,100 | 10,152 |
| | Eli Lilly & Co. | 203,015 | 8,437 |
| | Medtronic Inc. | 210,334 | 8,045 |
53
Tax-Managed Growth and Income Fund
| | | |
| | | | Market |
| | | | Value |
| | | Shares | ($000) |
| * | Gilead Sciences Inc. | 149,514 | 6,120 |
| * | Celgene Corp. | 88,385 | 5,975 |
| | Baxter International Inc. | 112,421 | 5,563 |
| | Allergan Inc. | 60,748 | 5,330 |
| * | Biogen Idec Inc. | 48,360 | 5,322 |
| | WellPoint Inc. | 69,415 | 4,599 |
| | Covidien plc | 96,200 | 4,330 |
| * | Express Scripts Inc. | 96,865 | 4,329 |
| * | Medco Health Solutions Inc. | 77,075 | 4,308 |
| | McKesson Corp. | 48,935 | 3,812 |
| * | Intuitive Surgical Inc. | 7,787 | 3,605 |
| * | Thermo Fisher Scientific Inc. | 75,317 | 3,387 |
| | Stryker Corp. | 64,813 | 3,222 |
| | Becton Dickinson and Co. | 42,838 | 3,201 |
| | Aetna Inc. | 72,278 | 3,049 |
| | Humana Inc. | 32,562 | 2,853 |
| | Cardinal Health Inc. | 68,759 | 2,792 |
| * | Agilent Technologies Inc. | 69,047 | 2,412 |
| | Cigna Corp. | 56,888 | 2,389 |
| | St. Jude Medical Inc. | 63,608 | 2,182 |
| | AmerisourceBergen Corp. | | |
| | Class A | 51,524 | 1,916 |
| * | Zimmer Holdings Inc. | 35,618 | 1,903 |
| * | Mylan Inc. | 85,319 | 1,831 |
| | Quest Diagnostics Inc. | 31,342 | 1,820 |
| | Perrigo Co. | 18,602 | 1,810 |
| * | Cerner Corp. | 28,938 | 1,772 |
| * | Laboratory Corp. of | | |
| | America Holdings | 19,768 | 1,699 |
| * | Edwards Lifesciences Corp. | 22,843 | 1,615 |
| * | Forest Laboratories Inc. | 53,227 | 1,611 |
| * | Boston Scientific Corp. | 295,616 | 1,579 |
| * | Watson Pharmaceuticals | | |
| | Inc. | 25,477 | 1,537 |
| * | Varian Medical Systems Inc. | 22,449 | 1,507 |
| | CR Bard Inc. | 17,129 | 1,465 |
| * | DaVita Inc. | 18,713 | 1,419 |
| * | Life Technologies Corp. | 35,682 | 1,388 |
| * | Waters Corp. | 17,758 | 1,315 |
| * | CareFusion Corp. | 44,989 | 1,143 |
| * | Hospira Inc. | 32,754 | 995 |
| | DENTSPLY International Inc. | 28,353 | 992 |
| * | Coventry Health Care Inc. | 28,780 | 874 |
| | Patterson Cos. Inc. | 17,440 | 515 |
| | PerkinElmer Inc. | 22,637 | 453 |
| * | Tenet Healthcare Corp. | 86,017 | 441 |
| | | | 268,843 |
| Industrials (10.7%) | | |
| | General Electric Co. | 2,103,074 | 37,666 |
| | United Parcel Service Inc. | | |
| | Class B | 192,284 | 14,073 |
| | United Technologies Corp. | 180,600 | 13,200 |
| | Caterpillar Inc. | 128,839 | 11,673 |
| | 3M Co. | 139,543 | 11,405 |
| | Boeing Co. | 148,146 | 10,866 |
| | | |
| | | | Market |
| | | | Value |
| | | Shares | ($000) |
| | Union Pacific Corp. | 96,140 | 10,185 |
| | Honeywell International Inc. | 154,061 | 8,373 |
| | Emerson Electric Co. | 146,504 | 6,826 |
| | Deere & Co. | 82,456 | 6,378 |
| | Danaher Corp. | 113,388 | 5,334 |
| | FedEx Corp. | 63,197 | 5,278 |
| | Norfolk Southern Corp. | 67,006 | 4,882 |
| | Precision Castparts Corp. | 28,665 | 4,724 |
| | General Dynamics Corp. | 71,044 | 4,718 |
| | Illinois Tool Works Inc. | 96,361 | 4,501 |
| | CSX Corp. | 209,507 | 4,412 |
| | Tyco International Ltd. | 92,072 | 4,301 |
| | Lockheed Martin Corp. | 52,899 | 4,280 |
| | Cummins Inc. | 38,444 | 3,384 |
| | Raytheon Co. | 68,982 | 3,337 |
| | Goodrich Corp. | 24,868 | 3,076 |
| | Northrop Grumman Corp. | 52,070 | 3,045 |
| | Waste Management Inc. | 91,834 | 3,004 |
| | Eaton Corp. | 66,658 | 2,902 |
| | PACCAR Inc. | 71,439 | 2,677 |
| | Fastenal Co. | 58,682 | 2,559 |
| | Parker Hannifin Corp. | 30,090 | 2,294 |
| | CH Robinson Worldwide Inc. | 32,612 | 2,276 |
| | Stanley Black & Decker Inc. | 33,611 | 2,272 |
| | WW Grainger Inc. | 12,063 | 2,258 |
| | Dover Corp. | 36,806 | 2,137 |
| | Rockwell Automation Inc. | 28,203 | 2,069 |
| | Ingersoll-Rand plc | 62,100 | 1,892 |
| | Expeditors International of | | |
| | Washington Inc. | 42,423 | 1,738 |
| | Republic Services Inc. | | |
| | Class A | 62,656 | 1,726 |
| | Cooper Industries plc | 31,500 | 1,706 |
| | Fluor Corp. | 33,790 | 1,698 |
| | Rockwell Collins Inc. | 30,114 | 1,667 |
| | Roper Industries Inc. | 19,140 | 1,663 |
| | Joy Global Inc. | 20,989 | 1,574 |
| | Southwest Airlines Co. | 155,336 | 1,330 |
| * | Stericycle Inc. | 17,064 | 1,330 |
| | L-3 Communications | | |
| | Holdings Inc. | 19,877 | 1,325 |
| | Pall Corp. | 22,895 | 1,308 |
| | Iron Mountain Inc. | 36,755 | 1,132 |
| | Flowserve Corp. | 11,068 | 1,099 |
| * | Jacobs Engineering Group | | |
| | Inc. | 25,445 | 1,033 |
| | Textron Inc. | 55,008 | 1,017 |
| | Xylem Inc. | 36,800 | 945 |
| | Equifax Inc. | 24,267 | 940 |
| * | Quanta Services Inc. | 41,969 | 904 |
| | Robert Half International Inc. | 28,401 | 808 |
| | Cintas Corp. | 22,102 | 769 |
| | Pitney Bowes Inc. | 39,981 | 741 |
| | Masco Corp. | 70,719 | 741 |
| | Dun & Bradstreet Corp. | 9,796 | 733 |
| | Avery Dennison Corp. | 21,187 | 608 |
54
Tax-Managed Growth and Income Fund
| | | |
| | | | Market |
| | | | Value |
| | | Shares | ($000) |
| | Snap-on Inc. | 11,467 | 580 |
| | Ryder System Inc. | 10,104 | 537 |
| | RR Donnelley & Sons Co. | 37,068 | 535 |
| | | | 242,444 |
| Information Technology (19.0%) | |
| * | Apple Inc. | 185,150 | 74,986 |
| | International Business | | |
| | Machines Corp. | 234,842 | 43,183 |
| | Microsoft Corp. | 1,491,423 | 38,717 |
| * | Google Inc. Class A | 50,337 | 32,513 |
| | Intel Corp. | 1,014,268 | 24,596 |
| | Oracle Corp. | 783,773 | 20,104 |
| | Cisco Systems Inc. | 1,070,795 | 19,360 |
| | Qualcomm Inc. | 334,813 | 18,314 |
| | Visa Inc. Class A | 101,248 | 10,280 |
| | Hewlett-Packard Co. | 395,874 | 10,198 |
| * | EMC Corp. | 406,401 | 8,754 |
| | Mastercard Inc. Class A | 21,234 | 7,916 |
| * | eBay Inc. | 228,807 | 6,940 |
| | Accenture plc Class A | 127,734 | 6,799 |
| | Texas Instruments Inc. | 227,548 | 6,624 |
| | Automatic Data | | |
| | Processing Inc. | 97,346 | 5,258 |
| * | Dell Inc. | 304,772 | 4,459 |
| | Corning Inc. | 312,990 | 4,062 |
| * | Yahoo! Inc. | 247,551 | 3,993 |
| * | Cognizant Technology | | |
| | Solutions Corp. Class A | 60,260 | 3,875 |
| | Intuit Inc. | 59,294 | 3,118 |
| | Broadcom Corp. Class A | 96,895 | 2,845 |
| | Applied Materials Inc. | 260,295 | 2,788 |
| * | Adobe Systems Inc. | 97,930 | 2,768 |
| * | Salesforce.com Inc. | 27,023 | 2,742 |
| | Motorola Solutions Inc. | 57,068 | 2,642 |
| | TE Connectivity Ltd. | 84,700 | 2,609 |
| * | NetApp Inc. | 71,518 | 2,594 |
| | Altera Corp. | 63,921 | 2,371 |
| * | SanDisk Corp. | 47,785 | 2,351 |
| * | Symantec Corp. | 147,052 | 2,301 |
| | Western Union Co. | 123,422 | 2,254 |
| * | Citrix Systems Inc. | 37,103 | 2,253 |
| | Xerox Corp. | 276,220 | 2,199 |
| * | Juniper Networks Inc. | 104,783 | 2,139 |
| | Analog Devices Inc. | 59,447 | 2,127 |
| * | Motorola Mobility | | |
| | Holdings Inc. | 52,709 | 2,045 |
| | Paychex Inc. | 64,225 | 1,934 |
| * | NVIDIA Corp. | 121,981 | 1,691 |
| | Xilinx Inc. | 52,536 | 1,684 |
| * | F5 Networks Inc. | 15,794 | 1,676 |
| * | Fiserv Inc. | 28,067 | 1,649 |
| * | Teradata Corp. | 33,359 | 1,618 |
| | KLA-Tencor Corp. | 33,159 | 1,600 |
| * | Red Hat Inc. | 38,327 | 1,582 |
| | Amphenol Corp. Class A | 33,063 | 1,501 |
| | CA Inc. | 73,685 | 1,489 |
| | | |
| | | | Market |
| | | | Value |
| | | Shares | ($000) |
| * | Western Digital Corp. | 46,824 | 1,449 |
| | Microchip Technology Inc. | 38,299 | 1,403 |
| * | Autodesk Inc. | 45,433 | 1,378 |
| * | Electronic Arts Inc. | 66,355 | 1,367 |
| | Linear Technology Corp. | 45,247 | 1,359 |
| | Fidelity National Information | | |
| | Services Inc. | 48,241 | 1,283 |
| * | Micron Technology Inc. | 196,659 | 1,237 |
| * | Akamai Technologies Inc. | 35,653 | 1,151 |
| | VeriSign Inc. | 31,731 | 1,133 |
| * | BMC Software Inc. | 33,945 | 1,113 |
| | Harris Corp. | 23,020 | 830 |
| | FLIR Systems Inc. | 30,996 | 777 |
| | Computer Sciences Corp. | 30,784 | 729 |
| | Jabil Circuit Inc. | 36,740 | 722 |
| * | LSI Corp. | 113,232 | 674 |
| * | SAIC Inc. | 54,768 | 673 |
| | Molex Inc. | 27,322 | 652 |
| | Total System Services Inc. | 32,398 | 634 |
| * | Advanced Micro Devices | | |
| | Inc. | 115,945 | 626 |
| * | Novellus Systems Inc. | 13,148 | 543 |
| * | Teradyne Inc. | 36,700 | 500 |
| * | JDS Uniphase Corp. | 45,491 | 475 |
| | Lexmark International Inc. | | |
| | Class A | 14,208 | 470 |
| * | First Solar Inc. | 11,633 | 393 |
| | | | 431,072 |
| Materials (3.5%) | | |
| | EI du Pont de Nemours & | | |
| | Co. | 184,014 | 8,424 |
| | Monsanto Co. | 106,714 | 7,477 |
| | Freeport-McMoRan | | |
| | Copper & Gold Inc. | 188,816 | 6,946 |
| | Dow Chemical Co. | 235,394 | 6,770 |
| | Praxair Inc. | 59,734 | 6,386 |
| | Newmont Mining Corp. | 98,483 | 5,910 |
| | Air Products & Chemicals | | |
| | Inc. | 41,932 | 3,572 |
| | Ecolab Inc. | 59,779 | 3,456 |
| | Mosaic Co. | 59,315 | 2,991 |
| | International Paper Co. | 87,118 | 2,579 |
| | PPG Industries Inc. | 30,724 | 2,565 |
| | Nucor Corp. | 63,090 | 2,496 |
| | CF Industries Holdings Inc. | 12,989 | 1,883 |
| | Alcoa Inc. | 212,003 | 1,834 |
| | Cliffs Natural Resources | | |
| | Inc. | 28,532 | 1,779 |
| | Sherwin-Williams Co. | 17,154 | 1,531 |
| | Sigma-Aldrich Corp. | 23,940 | 1,495 |
| | FMC Corp. | 13,964 | 1,201 |
| | Ball Corp. | 32,514 | 1,161 |
| | Eastman Chemical Co. | 27,344 | 1,068 |
| | Airgas Inc. | 13,597 | 1,062 |
| | Vulcan Materials Co. | 25,930 | 1,020 |
| | MeadWestvaco Corp. | 33,759 | 1,011 |
55
Tax-Managed Growth and Income Fund
| | | |
| | | | Market |
| | | | Value |
| | | Shares | ($000) |
| | Allegheny Technologies Inc. | 21,020 | 1,005 |
| | International Flavors & | | |
| | Fragrances Inc. | 16,054 | 842 |
| | United States Steel Corp. | 28,480 | 754 |
| | Sealed Air Corp. | 38,392 | 661 |
| * | Owens-Illinois Inc. | 32,485 | 630 |
| | Bemis Co. Inc. | 20,650 | 621 |
| | Titanium Metals Corp. | 16,600 | 249 |
| | | | 79,379 |
| Telecommunication Services (3.0%) | |
| | AT&T Inc. | 1,180,876 | 35,710 |
| | Verizon Communications | | |
| | Inc. | 563,896 | 22,623 |
| | CenturyLink Inc. | 122,889 | 4,571 |
| * | Sprint Nextel Corp. | 596,766 | 1,396 |
| | Windstream Corp. | 116,658 | 1,370 |
| | Frontier Communications | | |
| | Corp. | 197,606 | 1,018 |
| * | MetroPCS | | |
| | Communications Inc. | 57,928 | 503 |
| | | | 67,191 |
| Utilities (3.9%) | | |
| | Southern Co. | 171,803 | 7,953 |
| | Dominion Resources Inc. | 113,491 | 6,024 |
| | Duke Energy Corp. | 265,498 | 5,841 |
| | Exelon Corp. | 131,986 | 5,724 |
| | NextEra Energy Inc. | 84,118 | 5,121 |
| | American Electric Power | | |
| | Co. Inc. | 96,152 | 3,972 |
| | FirstEnergy Corp. | 83,508 | 3,699 |
| | Consolidated Edison Inc. | 58,332 | 3,618 |
| | PPL Corp. | 115,139 | 3,387 |
| | PG&E Corp. | 80,781 | 3,330 |
| | Public Service Enterprise | | |
| | Group Inc. | 100,734 | 3,325 |
| | Progress Energy Inc. | 58,640 | 3,285 |
| | Edison International | 64,933 | 2,688 |
| | Xcel Energy Inc. | 96,524 | 2,668 |
| | Sempra Energy | 47,752 | 2,626 |
| | Entergy Corp. | 35,135 | 2,567 |
| | DTE Energy Co. | 33,579 | 1,828 |
| | ONEOK Inc. | 20,462 | 1,774 |
| | CenterPoint Energy Inc. | 84,888 | 1,705 |
| | Wisconsin Energy Corp. | 46,042 | 1,610 |
| | Ameren Corp. | 48,521 | 1,608 |
| | Constellation Energy | | |
| | Group Inc. | 40,076 | 1,590 |
| * | AES Corp. | 128,435 | 1,521 |
| | NiSource Inc. | 55,743 | 1,327 |
| | |
| | | Market |
| | | Value |
| | Shares | ($000) |
| Northeast Utilities | 35,059 | 1,265 |
| CMS Energy Corp. | 50,520 | 1,116 |
| Pinnacle West Capital Corp. | 21,640 | 1,043 |
| SCANA Corp. | 22,888 | 1,031 |
| AGL Resources Inc. | 23,189 | 980 |
| Pepco Holdings Inc. | 45,155 | 917 |
| Integrys Energy Group Inc. | 15,473 | 838 |
| * NRG Energy Inc. | 45,874 | 831 |
| TECO Energy Inc. | 42,750 | 818 |
| | | 87,630 |
| Total Investments (100.0%) | | |
| (Cost $1,948,880) | | 2,267,790 |
| Other Assets and Liabilities (0.0%) | |
| Other Assets | | 7,031 |
| Liabilities | | (6,349) |
| | | 682 |
| Net Assets (100%) | | 2,268,472 |
| |
| At December 31, 2011, net assets consisted of: |
| | Amount |
| | ($000) |
| Paid-in Capital | 2,041,132 |
| Overdistributed Net Investment Income | (3,241) |
| Accumulated Net Realized Losses | (88,329) |
| Unrealized Appreciation (Depreciation) | 318,910 |
| Net Assets | 2,268,472 |
| |
| Admiral Shares—Net Assets | |
| Applicable to 35,527,675 outstanding | |
| $.001 par value shares of beneficial | |
| interest (unlimited authorization) | 2,001,303 |
| Net Asset Value Per Share— | |
| Admiral Shares | $56.33 |
| |
| Institutional Shares—Net Assets | |
| Applicable to 9,746,636 outstanding | |
| $.001 par value shares of beneficial | |
| interest (unlimited authorization) | 267,169 |
| Net Asset Value Per Share— | |
| Institutional Shares | $27.41 |
See Note A in Notes to Financial Statements.
* Non-income-producing security.
REIT—Real Estate Investment Trust.
See accompanying Notes, which are an integral part of the Financial Statements.
56
Tax-Managed Growth and Income Fund
| |
| Statement of Operations | |
| |
| | Year Ended |
| | December 31, 2011 |
| | ($000) |
| Investment Income | |
| Income | |
| Dividends | 47,856 |
| Interest1 | 2 |
| Total Income | 47,858 |
| Expenses | |
| The Vanguard Group—Note B | |
| Investment Advisory Services | 285 |
| Management and Administrative—Investor Shares | 243 |
| Management and Administrative—Admiral Shares | 1,516 |
| Management and Administrative—Institutional Shares | 121 |
| Marketing and Distribution—Investor Shares | 45 |
| Marketing and Distribution—Admiral Shares | 422 |
| Marketing and Distribution—Institutional Shares | 43 |
| Custodian Fees | 56 |
| Auditing Fees | 28 |
| Shareholders’ Reports—Admiral Shares | 29 |
| Shareholders’ Reports—Institutional Shares | — |
| Trustees’ Fees and Expenses | 2 |
| Total Expenses | 2,790 |
| Net Investment Income | 45,068 |
| Realized Net Gain (Loss) on Investment Securities Sold | (28,111) |
| Change in Unrealized Appreciation (Depreciation) of Investment Securities | 27,238 |
| Net Increase (Decrease) in Net Assets Resulting from Operations | 44,195 |
| 1 Interest income from an affiliated company of the fund was $2,000. | |
See accompanying Notes, which are an integral part of the Financial Statements.
57
Tax-Managed Growth and Income Fund
| | |
| Statement of Changes in Net Assets | | |
| |
| | Year Ended December 31, |
| | 2011 | 2010 |
| | ($000) | ($000) |
| Increase (Decrease) in Net Assets | | |
| Operations | | |
| Net Investment Income | 45,068 | 42,360 |
| Realized Net Gain (Loss) | (28,111) | 29,493 |
| Change in Unrealized Appreciation (Depreciation) | 27,238 | 234,852 |
| Net Increase (Decrease) in Net Assets Resulting from Operations | 44,195 | 306,705 |
| Distributions | | |
| Net Investment Income | | |
| Investor Shares | (2,110) | (8,731) |
| Admiral Shares | (37,797) | (29,437) |
| Institutional Shares | (5,052) | (4,196) |
| Realized Capital Gain | | |
| Investor Shares | — | — |
| Admiral Shares | — | — |
| Institutional Shares | — | — |
| Total Distributions | (44,959) | (42,364) |
| Capital Share Transactions | | |
| Investor Shares | (521,190) | (46,196) |
| Admiral Shares | 418,062 | (35,245) |
| Institutional Shares | 44,908 | (873) |
| Net Increase (Decrease) from Capital Share Transactions | (58,220) | (82,314) |
| Total Increase (Decrease) | (58,984) | 182,027 |
| Net Assets | | |
| Beginning of Period | 2,327,456 | 2,145,429 |
| End of Period1 | 2,268,472 | 2,327,456 |
| 1 Net Assets—End of Period includes undistributed (overdistributed) net investment income of ($3,241,000) and ($3,350,000). | |
See accompanying Notes, which are an integral part of the Financial Statements.
58
Tax-Managed Growth and Income Fund
Financial Highlights
| | | | | |
| Investor Shares | | | | | |
| January 1, | | |
| 2011, to | | |
| For a Share Outstanding | May 13, | Year Ended December 31, |
| Throughout Each Period | 20111 | 2010 | 2009 | 2008 | 2007 |
| Net Asset Value, Beginning of Period | $27.40 | $24.30 | $19.65 | $31.96 | $30.87 |
| Investment Operations | | | | | |
| Net Investment Income | .174 | .474 | .490 | .572 | .578 |
| Net Realized and Unrealized Gain (Loss) | | | | | |
| on Investments | 1.756 | 3.102 | 4.640 | (12.295) | 1.089 |
| Total from Investment Operations | 1.930 | 3.576 | 5.130 | (11.723) | 1.667 |
| Distributions | | | | | |
| Dividends from Net Investment Income | (.120) | (.476) | (.480) | (.587) | (.577) |
| Distributions from Realized Capital Gains | — | — | — | — | — |
| Total Distributions | (.120) | (.476) | (.480) | (.587) | (.577) |
| Net Asset Value, End of Period | $29.211 | $27.40 | $24.30 | $19.65 | $31.96 |
| |
| Total Return2 | 7.05% | 14.90% | 26.47% | -37.04% | 5.39% |
| |
| Ratios/Supplemental Data | | | | | |
| Net Assets, End of Period (Millions) | $— | $489 | $479 | $420 | $740 |
| Ratio of Total Expenses to | | | | | |
| Average Net Assets | 0.17% | 0.20% | 0.21% | 0.16% | 0.15% |
| Ratio of Net Investment Income to | | | | | |
| Average Net Assets | 1.73% | 1.90% | 2.34% | 2.13% | 1.80% |
| Portfolio Turnover Rate | 6% | 6% | 38% | 8% | 5% |
The expense ratio and net income ratio for the current period have been annualized.
1 Net asset value as of May 13, 2011, at which date the Investor Shares were converted to Admiral Shares.
2 Total returns do not include transaction or account service fees that may have applied in the periods shown. Fund prospectuses provide information about any applicable transaction and account service fees.
See accompanying Notes, which are an integral part of the Financial Statements.
59
Tax-Managed Growth and Income Fund
Financial Highlights
| | | | | |
| Admiral Shares | | | | | |
| |
| For a Share Outstanding | | | Year Ended December 31, |
| Throughout Each Period | 2011 | 2010 | 2009 | 2008 | 2007 |
| Net Asset Value, Beginning of Period | $56.31 | $49.94 | $40.39 | $65.69 | $63.44 |
| Investment Operations | | | | | |
| Net Investment Income | 1.104 | 1.017 | 1.036 | 1.212 | 1.230 |
| Net Realized and Unrealized Gain (Loss) | | | | | |
| on Investments | .018 | 6.374 | 9.532 | (25.276) | 2.245 |
| Total from Investment Operations | 1.122 | 7.391 | 10.568 | (24.064) | 3.475 |
| Distributions | | | | | |
| Dividends from Net Investment Income | (1.102) | (1.021) | (1.018) | (1.236) | (1.225) |
| Distributions from Realized Capital Gains | — | — | — | — | — |
| Total Distributions | (1.102) | (1.021) | (1.018) | (1.236) | (1.225) |
| Net Asset Value, End of Period | $56.33 | $56.31 | $49.94 | $40.39 | $65.69 |
| |
| Total Return1 | 2.00% | 14.99% | 26.54% | -37.00% | 5.47% |
| |
| Ratios/Supplemental Data | | | | | |
| Net Assets, End of Period (Millions) | $2,001 | $1,614 | $1,466 | $1,203 | $2,113 |
| Ratio of Total Expenses to | | | | | |
| Average Net Assets | 0.12% | 0.12% | 0.15% | 0.10% | 0.09% |
| Ratio of Net Investment Income to | | | | | |
| Average Net Assets | 1.93% | 1.98% | 2.40% | 2.19% | 1.86% |
| Portfolio Turnover Rate | 6% | 6% | 38% | 8% | 5% |
1 Total returns do not include transaction fees that may have applied in the periods shown. Fund prospectuses provide information about any applicable transaction fees.
See accompanying Notes, which are an integral part of the Financial Statements.
60
Tax-Managed Growth and Income Fund
Financial Highlights
| | | | | |
| Institutional Shares | | | | | |
| |
| For a Share Outstanding | | | Year Ended December 31, |
| Throughout Each Period | 2011 | 2010 | 2009 | 2008 | 2007 |
| Net Asset Value, Beginning of Period | $27.40 | $24.30 | $19.65 | $31.96 | $30.87 |
| Investment Operations | | | | | |
| Net Investment Income | .549 | .506 | .515 | .598 | .604 |
| Net Realized and Unrealized Gain (Loss) | | | | | |
| on Investments | .009 | 3.101 | 4.642 | (12.299) | 1.089 |
| Total from Investment Operations | .558 | 3.607 | 5.157 | (11.701) | 1.693 |
| Distributions | | | | | |
| Dividends from Net Investment Income | (.548) | (.507) | (.507) | (.609) | (.603) |
| Distributions from Realized Capital Gains | — | — | — | — | — |
| Total Distributions | (.548) | (.507) | (.507) | (.609) | (.603) |
| Net Asset Value, End of Period | $27.41 | $27.40 | $24.30 | $19.65 | $31.96 |
| |
| Total Return1 | 2.05% | 15.04% | 26.63% | -36.98% | 5.47% |
| |
| Ratios/Supplemental Data | | | | | |
| Net Assets, End of Period (Millions) | $267 | $225 | $200 | $263 | $469 |
| Ratio of Total Expenses to | | | | | |
| Average Net Assets | 0.08% | 0.08% | 0.09% | 0.07% | 0.07% |
| Ratio of Net Investment Income to | | | | | |
| Average Net Assets | 1.97% | 2.02% | 2.46% | 2.22% | 1.88% |
| Portfolio Turnover Rate | 6% | 6% | 38% | 8% | 5% |
1 Total returns do not include transaction fees that may have applied in the periods shown. Fund prospectuses provide information about any applicable transaction fees.
See accompanying Notes, which are an integral part of the Financial Statements.
61
Tax-Managed Growth and Income Fund
Notes to Financial Statements
Vanguard Tax-Managed Growth and Income Fund is registered under the Investment Company Act of 1940 as an open-end investment company, or mutual fund. The fund offers two classes of shares: Admiral Shares and Institutional Shares. Admiral Shares and Institutional Shares are designed for investors who meet certain administrative, service, and account-size criteria. Prior to May 14, 2011, the fund offered Investor Shares. Effective at the close of business on May 13, 2011, the Investor Shares were converted to Admiral Shares.
A. The following significant accounting policies conform to generally accepted accounting principles for U.S. mutual funds. The fund consistently follows such policies in preparing its financial statements.
1. Security Valuation: Securities are valued as of the close of trading on the New York Stock Exchange (generally 4 p.m., Eastern time) on the valuation date. Equity securities are valued at the latest quoted sales prices or official closing prices taken from the primary market in which each security trades; such securities not traded on the valuation date are valued at the mean of the latest quoted bid and asked prices. Securities for which market quotations are not readily available, or whose values have been materially affected by events occurring before the fund’s pricing time but after the close of the securities’ primary markets, are valued by methods deemed by the board of trustees to represent fair value. Investments in Vanguard Market Liquidity Fund are valued at that fund’s net asset value.
2. Federal Income Taxes: The fund intends to continue to qualify as a regulated investment company and distribute all of its taxable income. Management has analyzed the fund’s tax positions taken for all open federal income tax years (December 31, 2008–2011), and has concluded that no provision for federal income tax is required in the fund’s financial statements.
3. Distributions: Distributions to shareholders are recorded on the ex-dividend date.
4. Other: Dividend income is recorded on the ex-dividend date. Interest income includes income distributions received from Vanguard Market Liquidity Fund and is accrued daily. Security transactions are accounted for on the date securities are bought or sold. Costs used to determine realized gains (losses) on the sale of investment securities are those of the specific securities sold. Fees assessed on redemptions of capital shares are credited to paid-in capital.
Each class of shares has equal rights as to assets and earnings, except that each class separately bears certain class-specific expenses related to maintenance of shareholder accounts (included in Management and Administrative expenses) and shareholder reporting. Marketing and distribution expenses are allocated to each class of shares based on a method approved by the board of trustees. Income, other non-class-specific expenses, and gains and losses on investments are allocated to each class of shares based on its relative net assets.
B. The Vanguard Group furnishes at cost investment advisory, corporate management, administrative, marketing, and distribution services. The costs of such services are allocated to the fund under methods approved by the board of trustees. The fund has committed to provide up to 0.40% of its net assets in capital contributions to Vanguard. At December 31, 2011, the fund had contributed capital of $368,000 to Vanguard (included in Other Assets), representing 0.02% of the fund’s net assets and 0.15% of Vanguard’s capitalization. The fund’s trustees and officers are also directors and officers of Vanguard.
62
Tax-Managed Growth and Income Fund
C. Various inputs may be used to determine the value of the fund’s investments. These inputs are summarized in three broad levels for financial statement purposes. The inputs or methodologies used to value securities are not necessarily an indication of the risk associated with investing in those securities.
Level 1—Quoted prices in active markets for identical securities.
Level 2—Other significant observable inputs (including quoted prices for similar securities, interest rates, prepayment speeds, credit risk, etc.).
Level 3—Significant unobservable inputs (including the fund’s own assumptions used to determine the fair value of investments).
At December 31, 2011, 100% of the market value of the fund’s investments was based on Level 1 inputs.
D. Distributions are determined on a tax basis and may differ from net investment income and realized capital gains for financial reporting purposes. Differences may be permanent or temporary. Permanent differences are reclassified among capital accounts in the financial statements to reflect their tax character. Temporary differences arise when certain items of income, expense, gain, or loss are recognized in different periods for financial statement and tax purposes; these differences will reverse at some time in the future. Differences in classification may also result from the treatment of short-term gains as ordinary income for tax purposes.
For tax purposes, at December 31, 2011, the fund had $321,000 of ordinary income available for distribution. The fund had available capital losses totaling $82,173,000 to offset future net capital gains. Of this amount, $49,308,000 may be used to offset future net capital gains through December 31, 2016. Capital losses of $32,865,000 realized beginning in fiscal 2011 may be carried forward indefinitely but must be used before any expiring loss carryforwards.
At December 31, 2011, the cost of investment securities for tax purposes was $1,955,037,000. Net unrealized appreciation of investment securities for tax purposes was $312,753,000, consisting of unrealized gains of $590,227,000 on securities that had risen in value since their purchase and $277,474,000 in unrealized losses on securities that had fallen in value since their purchase.
E. During the year ended December 31, 2011, the fund purchased $131,256,000 of investment securities and sold $188,979,000 of investment securities, other than temporary cash investments.
63
Tax-Managed Growth and Income Fund
F. Capital share transactions for each class of shares were:
| | | | |
| | | | Year Ended December 31, |
| | | 2011 | | 2010 |
| | Amount | Shares | Amount | Shares |
| | ($000) | (000) | ($000) | (000) |
| Investor Shares | | | | |
| Issued | 9,282 | 325 | 24,116 | 966 |
| Issued in Lieu of Cash Distributions | 1,877 | 65 | 7,770 | 308 |
| Redeemed1,2 | (532,349) | (18,237) | (78,082) | (3,142) |
| Net Increase (Decrease)—Investor Shares | (521,190) | (17,847) | (46,196) | (1,868) |
| Admiral Shares | | | | |
| Issued2 | 578,240 | 9,701 | 67,154 | 1,314 |
| Issued in Lieu of Cash Distributions | 30,196 | 537 | 23,036 | 444 |
| Redeemed1 | (190,374) | (3,366) | (125,435) | (2,457) |
| Net Increase (Decrease)—Admiral Shares | 418,062 | 6,872 | (35,245) | (699) |
| Institutional Shares | | | | |
| Issued | 54,768 | 1,918 | 26,919 | 1,121 |
| Issued in Lieu of Cash Distributions | 3,509 | 128 | 2,634 | 104 |
| Redeemed1 | (13,369) | (506) | (30,426) | (1,269) |
| Net Increase (Decrease)—Institutional Shares | 44,908 | 1,540 | (873) | (44) |
1 Net of redemption fees for fiscal 2011 and 2010 of $66,000 and $288,000, respectively (fund totals). Effective April 28, 2011, the redemption fee was eliminated.
2 Investor shares redeemed and Admiral Shares issued reflect $510,049,000 from the conversion of 17,461,000 Investor Shares to 8,497,000 Admiral Shares at the close of business on May 13, 2011.
G. In preparing the financial statements as of December 31, 2011, management considered the impact of subsequent events for potential recognition or disclosure in these financial statements.
64
Tax-Managed Capital Appreciation Fund
Fund Profile
As of December 31, 2011
| | |
| Share-Class Characteristics | |
| | Admiral | Institutional |
| | Shares | Shares |
| Ticker Symbol | VTCLX | VTCIX |
| Expense Ratio1 | 0.12% | 0.08% |
| 30-Day SEC Yield | 1.83% | 1.87% |
| | | |
| Portfolio Characteristics | | |
| | | | DJ |
| | | Russell | U.S. Total |
| | | 1000 | Market |
| | Fund | Index | Index |
| Number of Stocks | 625 | 980 | 3,745 |
| Median Market Cap | $35.3B | $37.4B | $31.3B |
| Price/Earnings Ratio | 14.4x | 14.5x | 15.0x |
| Price/Book Ratio | 2.1x | 2.1x | 2.1x |
| Return on Equity | 19.9% | 19.7% | 19.0% |
| Earnings Growth Rate | 7.3% | 7.2% | 7.1% |
| Dividend Yield | 1.9% | 2.1% | 2.0% |
| Foreign Holdings | 0.0% | 0.0% | 0.0% |
| Turnover Rate | 2% | — | — |
| Short-Term Reserves | 0.1% | — | — |
| | | |
| Sector Diversification (% of equity exposure) |
| | | | DJ |
| | | Russell | U.S. Total |
| | | 1000 | Market |
| | Fund | Index | Index |
| Consumer | | | |
| Discretionary | 12.0% | 11.5% | 12.2% |
| Consumer Staples | 10.7 | 10.5 | 10.6 |
| Energy | 11.9 | 11.7 | 10.8 |
| Financials | 14.0 | 14.3 | 15.0 |
| Health Care | 11.8 | 11.8 | 11.4 |
| Industrials | 10.9 | 10.9 | 11.1 |
| Information | | | |
| Technology | 18.6 | 18.4 | 18.7 |
| Materials | 4.0 | 4.0 | 4.1 |
| Telecommunication | | | |
| Services | 2.8 | 2.9 | 2.5 |
| Utilities | 3.3 | 4.0 | 3.6 |
| | |
| Volatility Measures | | |
| | | DJ |
| | Russell | U.S. Total |
| | 1000 | Market |
| | Index | Index |
| R-Squared | 1.00 | 1.00 |
| Beta | 1.00 | 0.99 |
These measures show the degree and timing of the fund’s fluctuations compared with the indexes over 36 months.
| | |
| Ten Largest Holdings (% of total net assets) |
| Exxon Mobil Corp. | Integrated Oil & | |
| | Gas | 3.3% |
| Apple Inc. | Computer | |
| | Hardware | 3.0 |
| International Business | IT Consulting & | |
| Machines Corp. | Other Services | 1.8 |
| Chevron Corp. | Integrated Oil & | |
| | Gas | 1.7 |
| Procter & Gamble Co. | Household | |
| | Products | 1.5 |
| Microsoft Corp. | Systems Software | 1.5 |
| Johnson & Johnson | Pharmaceuticals | 1.5 |
| AT&T Inc. | Integrated | |
| | Telecommunication | |
| | Services | 1.5 |
| General Electric Co. | Industrial | |
| | Conglomerates | 1.4 |
| Google Inc. Class A | Internet Software & | |
| | Services | 1.3 |
| Top Ten | | 18.5% |
The holdings listed exclude any temporary cash investments and equity index products.
Investment Focus

1 The expense ratios shown are from the prospectus dated July 15, 2011, and represent estimated costs for the current fiscal year. For the fiscal year ended December 31, 2011, the expense ratios were 0.12% for Admiral Shares and 0.08% for Institutional Shares.
65
Tax-Managed Capital Appreciation Fund
Performance Summary
All of the returns in this report represent past performance, which is not a guarantee of future results that may be achieved by the fund. (Current performance may be lower or higher than the performance data cited. For performance data current to the most recent month-end, visit our website at vanguard.com/performance.) Note, too, that both investment returns and principal value can fluctuate widely, so an investor’s shares, when sold, could be worth more or less than their original cost. The returns shown do not reflect taxes that a shareholder would pay on fund distributions or on the sale of fund shares.
Cumulative Performance: December 31, 2001, Through December 31, 2011
Initial Investment of $10,000
| | | | |
| | | Average Annual Total Returns | |
| | Periods Ended December 31, 2011 | |
| | | | | Final Value |
| | One | Five | Ten | of a $10,000 |
| | Year | Years | Years | Investment |
| Tax-Managed Capital Appreciation | | | | |
| Fund Admiral Shares | 1.38% | 0.12% | 3.40% | $13,974 |
| Dow Jones U.S. Total Stock Market | | | | |
| Index | 0.52 | 0.28 | 3.90 | 14,657 |
| Russell 1000 Index | 1.50 | -0.02 | 3.34 | 13,896 |
| Multi-Cap Core Funds Average | -2.68 | -0.93 | 2.65 | 12,991 |
| Multi-Cap Core Funds Average: Derived from data provided by Lipper Inc. |
| | | | |
| | | | | Final Value |
| | One | Five | Ten | of a $5,000,000 |
| | Year | Years | Years | Investment |
| Tax-Managed Capital Appreciation Fund | | | | |
| Institutional Shares | 1.39% | 0.15% | 3.44% | $7,009,326 |
| Dow Jones U.S. Total Stock Market Index | 0.52 | 0.28 | 3.90 | 7,328,259 |
| Russell 1000 Index | 1.50 | -0.02 | 3.34 | 6,947,953 |
See Financial Highlights for dividend and capital gains information.
66
Tax-Managed Capital Appreciation Fund
Fiscal-Year Total Returns (%): December 31, 2001, Through December 31, 2011
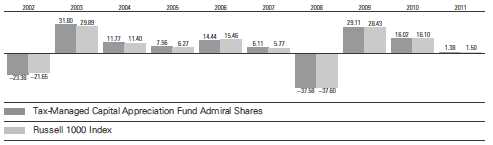
67
Tax-Managed Capital Appreciation Fund
Financial Statements
Statement of Net Assets
As of December 31, 2011
The fund reports a complete list of its holdings in regulatory filings four times in each fiscal year, at the quarter-ends. For the second and fourth fiscal quarters, the lists appear in the fund’s semiannual and annual reports to shareholders. For the first and third fiscal quarters, the fund files the lists with the Securities and Exchange Commission on Form N-Q. Shareholders can look up the fund’s Forms N-Q on the SEC’s website at sec.gov. Forms N-Q may also be reviewed and copied at the SEC’s Public Reference Room (see the back cover of this report for further information).
| | | |
| | | | Market |
| | | | Value |
| | | Shares | ($000) |
| Common Stocks (100.0%) | | |
| Consumer Discretionary (12.0%) | |
| | McDonald’s Corp. | 306,260 | 30,727 |
| | Walt Disney Co. | 588,436 | 22,066 |
| | Home Depot Inc. | 480,000 | 20,179 |
| * | Amazon.com Inc. | 110,900 | 19,197 |
| | Comcast Corp. Class A | 755,371 | 17,910 |
| | News Corp. Class A | 763,830 | 13,627 |
| * | Ford Motor Co. | 1,209,933 | 13,019 |
| | Time Warner Inc. | 339,649 | 12,275 |
| | Starbucks Corp. | 259,352 | 11,933 |
| | Target Corp. | 232,300 | 11,898 |
| | NIKE Inc. Class B | 123,200 | 11,873 |
| | Lowe’s Cos. Inc. | 447,600 | 11,360 |
| * | DIRECTV Class A | 250,109 | 10,695 |
| | Yum! Brands Inc. | 168,360 | 9,935 |
| | Viacom Inc. Class B | 171,033 | 7,767 |
| | Johnson Controls Inc. | 237,600 | 7,427 |
| | Coach Inc. | 115,100 | 7,026 |
| * | Bed Bath & Beyond Inc. | 105,315 | 6,105 |
| | Time Warner Cable Inc. | 94,542 | 6,010 |
| | Kohl’s Corp. | 112,150 | 5,535 |
| | McGraw-Hill Cos. Inc. | 122,900 | 5,527 |
| | Ross Stores Inc. | 113,592 | 5,399 |
| * | Dollar Tree Inc. | 59,269 | 4,926 |
| * | O’Reilly Automotive Inc. | 61,448 | 4,913 |
| * | Liberty Interactive Corp. | | |
| | Class A | 291,926 | 4,734 |
| * | AutoZone Inc. | 13,300 | 4,322 |
| | Starwood Hotels & | | |
| | Resorts Worldwide Inc. | 89,818 | 4,309 |
| * | Las Vegas Sands Corp. | 100,440 | 4,292 |
| | Ralph Lauren Corp. Class A | 30,800 | 4,253 |
| | Gap Inc. | 211,887 | 3,930 |
| * | CarMax Inc. | 128,143 | 3,906 |
| * | Apollo Group Inc. Class A | 72,229 | 3,891 |
| * | Sirius XM Radio Inc. | 2,129,000 | 3,875 |
| | Darden Restaurants Inc. | 83,850 | 3,822 |
| * | BorgWarner Inc. | 58,100 | 3,703 |
| | | |
| | | | Market |
| | | | Value |
| | | Shares | ($000) |
| | PetSmart Inc. | 72,000 | 3,693 |
| | Advance Auto Parts Inc. | 52,802 | 3,677 |
| | Marriott International Inc. | | |
| | Class A | 125,975 | 3,675 |
| * | General Motors Co. | 174,675 | 3,541 |
| | CBS Corp. Class B | 127,174 | 3,451 |
| * | Discovery Communications | | |
| | Inc. | 90,137 | 3,398 |
| * | Dollar General Corp. | 81,700 | 3,361 |
| | Best Buy Co. Inc. | 141,084 | 3,297 |
| | PVH Corp. | 46,281 | 3,262 |
| | Gentex Corp. | 107,252 | 3,174 |
| * | NVR Inc. | 4,440 | 3,046 |
| * | Liberty Global Inc. | 75,207 | 2,972 |
| * | Toll Brothers Inc. | 144,600 | 2,953 |
| | Interpublic Group of Cos. | | |
| | Inc. | 294,400 | 2,864 |
| | Brinker International Inc. | 102,750 | 2,750 |
| * | PulteGroup Inc. | 432,549 | 2,729 |
| | Scripps Networks | | |
| | Interactive Inc. Class A | 62,170 | 2,637 |
| | Hasbro Inc. | 77,100 | 2,459 |
| * | Liberty Media Corp. - | | |
| | Liberty Capital Class A | 30,877 | 2,410 |
| | John Wiley & Sons Inc. | | |
| | Class A | 53,700 | 2,384 |
| * | AutoNation Inc. | 62,525 | 2,305 |
| | Omnicom Group Inc. | 50,600 | 2,256 |
| | International Game | | |
| | Technology | 129,600 | 2,229 |
| | Harley-Davidson Inc. | 56,800 | 2,208 |
| * | MGM Resorts International | 208,690 | 2,177 |
| | DeVry Inc. | 55,239 | 2,124 |
| * | Mohawk Industries Inc. | 34,700 | 2,077 |
| | Weight Watchers | | |
| | International Inc. | 36,200 | 1,991 |
| * | priceline.com Inc. | 4,220 | 1,974 |
| | Macy’s Inc. | 56,800 | 1,828 |
| | Expedia Inc. | 62,306 | 1,808 |
| * | Liberty Global Inc. Class A | 42,398 | 1,740 |
68
Tax-Managed Capital Appreciation Fund
| | | |
| | | | Market |
| | | | Value |
| | | Shares | ($000) |
| | Foot Locker Inc. | 70,600 | 1,683 |
| | Harman International | | |
| | Industries Inc. | 43,600 | 1,658 |
| | Nordstrom Inc. | 32,300 | 1,606 |
| | DR Horton Inc. | 126,366 | 1,593 |
| * | TripAdvisor Inc. | 62,306 | 1,571 |
| * | Lamar Advertising Co. | | |
| | Class A | 56,186 | 1,545 |
| | TJX Cos. Inc. | 21,976 | 1,418 |
| | Virgin Media Inc. | 62,269 | 1,331 |
| | Staples Inc. | 94,495 | 1,312 |
| | Abercrombie & Fitch Co. | 23,300 | 1,138 |
| | Lennar Corp. Class A | 54,600 | 1,073 |
| | American Eagle Outfitters | | |
| | Inc. | 66,991 | 1,024 |
| | Aaron’s Inc. | 37,182 | 992 |
| | Cablevision Systems Corp. | | |
| | Class A | 54,344 | 773 |
| | Comcast Corp. | 26,219 | 618 |
| | RadioShack Corp. | 58,000 | 563 |
| * | AMC Networks Inc. Class A | 13,586 | 510 |
| * | Education Management | | |
| | Corp. | 18,200 | 509 |
| * | GameStop Corp. Class A | 20,430 | 493 |
| * | Career Education Corp. | 60,400 | 481 |
| * | Sears Holdings Corp. | 14,700 | 467 |
| * | Hanesbrands Inc. | 18,286 | 400 |
| * | Madison Square Garden Co. | | |
| | Class A | 13,586 | 389 |
| | Mattel Inc. | 12,557 | 349 |
| | Chico’s FAS Inc. | 28,340 | 316 |
| | Wynn Resorts Ltd. | 2,000 | 221 |
| * | Marriott Vacations | | |
| | Worldwide Corp. | 12,597 | 216 |
| | Washington Post Co. Class B | 520 | 196 |
| | Carnival Corp. | 5,800 | 189 |
| | Lennar Corp. Class B | 8,300 | 129 |
| * | Orchard Supply Hardware | | |
| | Stores Corp. Class A | 663 | 5 |
| * | Orchard Supply Hardware | | |
| | Stores Corp. Pfd. | 663 | — |
| * | Krispy Kreme Doughnuts Inc. | | |
| | Warrants Exp. 3/2/2012 | 2,684 | — |
| | | | 433,584 |
| Consumer Staples (10.7%) | | |
| | Procter & Gamble Co. | 816,178 | 54,447 |
| | Coca-Cola Co. | 586,300 | 41,023 |
| | Philip Morris International | | |
| | Inc. | 491,809 | 38,597 |
| | Wal-Mart Stores Inc. | 533,028 | 31,854 |
| | PepsiCo Inc. | 475,139 | 31,525 |
| | CVS Caremark Corp. | 430,754 | 17,566 |
| | Kraft Foods Inc. | 348,826 | 13,032 |
| | Costco Wholesale Corp. | 146,000 | 12,165 |
| | Altria Group Inc. | 404,863 | 12,004 |
| | | |
| | | | Market |
| | | | Value |
| | | Shares | ($000) |
| | Colgate-Palmolive Co. | 115,900 | 10,708 |
| | Walgreen Co. | 307,300 | 10,159 |
| | Archer-Daniels-Midland Co. | 243,273 | 6,958 |
| | Kroger Co. | 248,700 | 6,024 |
| | Estee Lauder Cos. Inc. | | |
| | Class A | 49,400 | 5,549 |
| | Hershey Co. | 75,300 | 4,652 |
| | Dr Pepper Snapple Group | | |
| | Inc. | 114,200 | 4,509 |
| | Clorox Co. | 66,120 | 4,401 |
| | Brown-Forman Corp. | | |
| | Class B | 54,646 | 4,400 |
| * | Hansen Natural Corp. | 43,300 | 3,990 |
| | Church & Dwight Co. Inc. | 86,200 | 3,944 |
| | Coca-Cola Enterprises Inc. | 153,000 | 3,944 |
| | McCormick & Co. Inc. | 76,100 | 3,837 |
| | JM Smucker Co. | 49,024 | 3,832 |
| | Tyson Foods Inc. Class A | 177,944 | 3,673 |
| | Bunge Ltd. | 62,800 | 3,592 |
| | General Mills Inc. | 88,800 | 3,588 |
| | Safeway Inc. | 170,462 | 3,587 |
| * | Energizer Holdings Inc. | 44,128 | 3,419 |
| | Corn Products International | | |
| | Inc. | 62,700 | 3,297 |
| * | Smithfield Foods Inc. | 135,135 | 3,281 |
| | Campbell Soup Co. | 97,400 | 3,238 |
| | Kimberly-Clark Corp. | 43,340 | 3,188 |
| * | Constellation Brands Inc. | | |
| | Class A | 151,500 | 3,131 |
| | Molson Coors Brewing Co. | | |
| | Class B | 71,900 | 3,131 |
| | Hormel Foods Corp. | 105,200 | 3,081 |
| | Mead Johnson Nutrition Co. | 42,525 | 2,923 |
| * | Ralcorp Holdings Inc. | 29,009 | 2,480 |
| * | Green Mountain Coffee | | |
| | Roasters Inc. | 52,509 | 2,355 |
| | Whole Foods Market Inc. | 32,840 | 2,285 |
| * | Dean Foods Co. | 122,475 | 1,372 |
| | Kellogg Co. | 22,800 | 1,153 |
| | Avon Products Inc. | 59,300 | 1,036 |
| | Sara Lee Corp. | 44,600 | 844 |
| | Sysco Corp. | 17,111 | 502 |
| | ConAgra Foods Inc. | 11,200 | 296 |
| | | | 384,572 |
| Energy (12.0%) | | |
| | Exxon Mobil Corp. | 1,404,564 | 119,051 |
| | Chevron Corp. | 582,638 | 61,993 |
| | Schlumberger Ltd. | 375,599 | 25,657 |
| | ConocoPhillips | 315,926 | 23,022 |
| | Occidental Petroleum | | |
| | Corp. | 190,339 | 17,835 |
| | Anadarko Petroleum Corp. | 164,623 | 12,566 |
| | Apache Corp. | 126,217 | 11,433 |
| | National Oilwell Varco Inc. | 146,541 | 9,963 |
| | Devon Energy Corp. | 145,622 | 9,029 |
69
Tax-Managed Capital Appreciation Fund
| | | |
| | | | Market |
| | | | Value |
| | | Shares | ($000) |
| | EOG Resources Inc. | 88,300 | 8,698 |
| | Williams Cos. Inc. | 232,200 | 7,667 |
| | Baker Hughes Inc. | 150,671 | 7,329 |
| | Noble Energy Inc. | 72,000 | 6,796 |
| | Hess Corp. | 109,600 | 6,225 |
| * | FMC Technologies Inc. | 107,100 | 5,594 |
| | Halliburton Co. | 158,200 | 5,459 |
| * | Cameron International | | |
| | Corp. | 109,002 | 5,362 |
| | Pioneer Natural Resources | | |
| | Co. | 56,337 | 5,041 |
| * | Southwestern Energy Co. | 145,700 | 4,654 |
| | Range Resources Corp. | 72,800 | 4,509 |
| | Cabot Oil & Gas Corp. | 54,335 | 4,124 |
| | Valero Energy Corp. | 182,480 | 3,841 |
| | EQT Corp. | 67,900 | 3,720 |
| | Peabody Energy Corp. | 108,100 | 3,579 |
| | Southern Union Co. | 81,700 | 3,440 |
| | Helmerich & Payne Inc. | 57,980 | 3,384 |
| * | Concho Resources Inc. | 35,300 | 3,309 |
| | SM Energy Co. | 43,156 | 3,155 |
| * | Dresser-Rand Group Inc. | 61,355 | 3,062 |
| | QEP Resources Inc. | 103,165 | 3,023 |
| * | Continental Resources Inc. | 43,900 | 2,929 |
| | Energen Corp. | 56,100 | 2,805 |
| * | Denbury Resources Inc. | 184,776 | 2,790 |
| | Marathon Oil Corp. | 92,900 | 2,719 |
| | Cimarex Energy Co. | 43,499 | 2,693 |
| | Core Laboratories NV | 23,553 | 2,684 |
| * | Rowan Cos. Inc. | 85,600 | 2,596 |
| * | Newfield Exploration Co. | 66,098 | 2,494 |
| * | Plains Exploration & | | |
| | Production Co. | 66,760 | 2,451 |
| | Diamond Offshore Drilling | | |
| | Inc. | 39,700 | 2,194 |
| * | SandRidge Energy Inc. | 262,914 | 2,145 |
| | Marathon Petroleum Corp. | 46,450 | 1,546 |
| | Consol Energy Inc. | 33,900 | 1,244 |
| * | Quicksilver Resources Inc. | 177,860 | 1,193 |
| * | Nabors Industries Ltd. | 67,300 | 1,167 |
| | Arch Coal Inc. | 73,400 | 1,065 |
| * | Forest Oil Corp. | 65,300 | 885 |
| * | Tesoro Corp. | 26,500 | 619 |
| * | Unit Corp. | 12,800 | 594 |
| | Chesapeake Energy Corp. | 25,211 | 562 |
| | Patterson-UTI Energy Inc. | 21,200 | 424 |
| * | Ultra Petroleum Corp. | 12,870 | 381 |
| | El Paso Corp. | 8,700 | 231 |
| * | Superior Energy Services | | |
| | Inc. | 1,048 | 30 |
| | | | 430,961 |
| Financials (13.9%) | | |
| * | Berkshire Hathaway Inc. | | |
| | Class B | 516,891 | 39,439 |
| | JPMorgan Chase & Co. | 1,170,021 | 38,903 |
| | | |
| | | | Market |
| | | | Value |
| | | Shares | ($000) |
| | Wells Fargo & Co. | 1,236,508 | 34,078 |
| | Citigroup Inc. | 681,300 | 17,925 |
| | American Express Co. | 331,300 | 15,627 |
| | Bank of America Corp. | 2,583,633 | 14,365 |
| | Simon Property Group Inc. | 98,548 | 12,707 |
| | Goldman Sachs Group Inc. | 139,830 | 12,645 |
| | US Bancorp | 392,700 | 10,623 |
| | American Tower | | |
| | Corporation | 145,800 | 8,749 |
| | Prudential Financial Inc. | 161,904 | 8,115 |
| | State Street Corp. | 191,478 | 7,718 |
| | Aflac Inc. | 172,500 | 7,462 |
| | Public Storage | 55,200 | 7,422 |
| | Travelers Cos. Inc. | 101,877 | 6,028 |
| | Boston Properties Inc. | 60,200 | 5,996 |
| | Franklin Resources Inc. | 58,200 | 5,591 |
| | Discover Financial Services | 230,700 | 5,537 |
| | MetLife Inc. | 175,820 | 5,482 |
| | Progressive Corp. | 276,700 | 5,398 |
| | Ameriprise Financial Inc. | 107,660 | 5,344 |
| | T Rowe Price Group Inc. | 92,978 | 5,295 |
| | Loews Corp. | 138,908 | 5,230 |
| | AvalonBay Communities | | |
| | Inc. | 38,375 | 5,012 |
| | Capital One Financial Corp. | 117,800 | 4,982 |
| | Fifth Third Bancorp | 368,920 | 4,693 |
| | Host Hotels & Resorts Inc. | 308,972 | 4,564 |
| | Charles Schwab Corp. | 377,200 | 4,247 |
| | SunTrust Banks Inc. | 216,990 | 3,841 |
| | General Growth Properties | | |
| | Inc. | 252,757 | 3,796 |
| | Morgan Stanley | 238,900 | 3,615 |
| | CME Group Inc. | 14,701 | 3,582 |
| | M&T Bank Corp. | 46,286 | 3,533 |
| * | Affiliated Managers Group | | |
| | Inc. | 36,800 | 3,531 |
| | KeyCorp | 457,769 | 3,520 |
| | Unum Group | 166,800 | 3,514 |
| * | Arch Capital Group Ltd. | 92,500 | 3,444 |
| | PNC Financial Services | | |
| | Group Inc. | 59,631 | 3,439 |
| | Torchmark Corp. | 78,750 | 3,417 |
| * | CIT Group Inc. | 97,000 | 3,382 |
| | Plum Creek Timber Co. Inc. | 91,500 | 3,345 |
| | Bank of New York Mellon | | |
| | Corp. | 167,906 | 3,343 |
| | SL Green Realty Corp. | 49,410 | 3,293 |
| * | Markel Corp. | 7,930 | 3,288 |
| | WR Berkley Corp. | 94,897 | 3,264 |
| | Assurant Inc. | 75,300 | 3,092 |
| * | CBRE Group Inc. Class A | 202,690 | 3,085 |
| | Reinsurance Group of | | |
| | America Inc. Class A | 58,819 | 3,073 |
| | Principal Financial Group | | |
| | Inc. | 120,400 | 2,962 |
70
Tax-Managed Capital Appreciation Fund
| | | |
| | | | Market |
| | | | Value |
| | | Shares | ($000) |
| | Lincoln National Corp. | 150,986 | 2,932 |
| | White Mountains Insurance | | |
| | Group Ltd. | 6,391 | 2,898 |
| | East West Bancorp Inc. | 145,700 | 2,878 |
| | Allstate Corp. | 102,300 | 2,804 |
| * | NASDAQ OMX Group Inc. | 114,092 | 2,796 |
| | Raymond James Financial | | |
| | Inc. | 89,650 | 2,776 |
| | Hospitality Properties Trust | 119,270 | 2,741 |
| | TD Ameritrade Holding | | |
| | Corp. | 174,400 | 2,729 |
| | Douglas Emmett Inc. | 147,673 | 2,694 |
| | Brown & Brown Inc. | 118,600 | 2,684 |
| | Leucadia National Corp. | 116,219 | 2,643 |
| | Camden Property Trust | 42,400 | 2,639 |
| | DDR Corp. | 216,364 | 2,633 |
| | BlackRock Inc. | 14,450 | 2,576 |
| | Commerce Bancshares Inc. | 66,871 | 2,549 |
| | HCC Insurance Holdings | | |
| | Inc. | 91,600 | 2,519 |
| | Cullen/Frost Bankers Inc. | 47,600 | 2,519 |
| | Alexandria Real Estate | | |
| | Equities Inc. | 35,930 | 2,478 |
| | Transatlantic Holdings Inc. | 44,114 | 2,414 |
| | Moody’s Corp. | 70,100 | 2,361 |
| * | Forest City Enterprises Inc. | | |
| | Class A | 197,534 | 2,335 |
| | Apartment Investment & | | |
| | Management Co. | 101,043 | 2,315 |
| | People’s United Financial | | |
| | Inc. | 174,014 | 2,236 |
| | Alleghany Corp. | 7,747 | 2,210 |
| * | St. Joe Co. | 148,188 | 2,172 |
| | SEI Investments Co. | 123,770 | 2,147 |
| | Chubb Corp. | 30,900 | 2,139 |
| | BOK Financial Corp. | 38,571 | 2,119 |
| * | American Capital Ltd. | 313,600 | 2,111 |
| | Jones Lang LaSalle Inc. | 34,450 | 2,110 |
| | Zions Bancorporation | 129,284 | 2,105 |
| | Eaton Vance Corp. | 86,202 | 2,038 |
| * | TFS Financial Corp. | 221,854 | 1,988 |
| * | Howard Hughes Corp. | 44,909 | 1,984 |
| | Associated Banc-Corp | 170,670 | 1,906 |
| | Digital Realty Trust Inc. | 28,440 | 1,896 |
| | StanCorp Financial Group | | |
| | Inc. | 50,600 | 1,860 |
| | CNA Financial Corp. | 69,500 | 1,859 |
| | City National Corp. | 42,000 | 1,856 |
| | First Horizon National Corp. | 227,345 | 1,819 |
| | Hanover Insurance Group | | |
| | Inc. | 49,600 | 1,734 |
| | First Citizens BancShares | | |
| | Inc. Class A | 9,642 | 1,687 |
| | SLM Corp. | 123,245 | 1,651 |
| | | |
| | | | Market |
| | | | Value |
| | | Shares | ($000) |
| | American International | | |
| | Group Inc. | 69,471 | 1,612 |
| | Hudson City Bancorp Inc. | 251,902 | 1,574 |
| * | Popular Inc. | 1,109,593 | 1,542 |
| | Lazard Ltd. Class A | 55,686 | 1,454 |
| | Northern Trust Corp. | 34,773 | 1,379 |
| | BB&T Corp. | 53,000 | 1,334 |
| | Janus Capital Group Inc. | 203,766 | 1,286 |
| | ProLogis Inc. | 44,814 | 1,281 |
| | American Financial Group | | |
| | Inc. | 32,200 | 1,188 |
| | ACE Ltd. | 16,602 | 1,164 |
| | Legg Mason Inc. | 47,500 | 1,142 |
| | BRE Properties Inc. | 21,500 | 1,085 |
| | New York Community | | |
| | Bancorp Inc. | 86,400 | 1,069 |
| | Hartford Financial Services | | |
| | Group Inc. | 64,184 | 1,043 |
| | Bank of Hawaii Corp. | 20,100 | 894 |
| | Aon Corp. | 16,400 | 768 |
| | Interactive Brokers Group | | |
| | Inc. | 51,335 | 767 |
| | Federal Realty Investment | | |
| | Trust | 8,200 | 744 |
| | Taubman Centers Inc. | 11,300 | 702 |
| * | Genworth Financial Inc. | | |
| | Class A | 96,700 | 633 |
| * | E*Trade Financial Corp. | 74,916 | 596 |
| | Invesco Ltd. | 12,010 | 241 |
| * | MBIA Inc. | 11,300 | 131 |
| | Essex Property Trust Inc. | 300 | 42 |
| | | | 503,747 |
| Health Care (11.8%) | | |
| | Johnson & Johnson | 801,298 | 52,549 |
| | Pfizer Inc. | 2,052,484 | 44,416 |
| | Merck & Co. Inc. | 790,626 | 29,807 |
| | Abbott Laboratories | 407,600 | 22,919 |
| | UnitedHealth Group Inc. | 344,662 | 17,467 |
| | Amgen Inc. | 234,487 | 15,056 |
| | Bristol-Myers Squibb Co. | 327,241 | 11,532 |
| * | Gilead Sciences Inc. | 270,600 | 11,076 |
| * | Celgene Corp. | 160,919 | 10,878 |
| | Medtronic Inc. | 263,600 | 10,083 |
| | Allergan Inc. | 108,530 | 9,522 |
| * | Biogen Idec Inc. | 85,361 | 9,394 |
| | WellPoint Inc. | 128,616 | 8,521 |
| * | Medco Health Solutions | | |
| | Inc. | 147,742 | 8,259 |
| * | Express Scripts Inc. | 168,324 | 7,522 |
| * | Thermo Fisher Scientific | | |
| | Inc. | 147,706 | 6,642 |
| | Aetna Inc. | 157,144 | 6,630 |
| | Eli Lilly & Co. | 155,695 | 6,471 |
| | Humana Inc. | 72,800 | 6,378 |
| | Baxter International Inc. | 127,341 | 6,301 |
71
Tax-Managed Capital Appreciation Fund
| | | |
| | | | Market |
| | | | Value |
| | | Shares | ($000) |
| | Becton Dickinson and Co. | 80,600 | 6,022 |
| | Cardinal Health Inc. | 145,512 | 5,909 |
| | McKesson Corp. | 73,424 | 5,720 |
| | Stryker Corp. | 109,200 | 5,428 |
| * | Agilent Technologies Inc. | 151,706 | 5,299 |
| | Cigna Corp. | 118,300 | 4,969 |
| | St. Jude Medical Inc. | 139,832 | 4,796 |
| | AmerisourceBergen Corp. | | |
| | Class A | 127,300 | 4,734 |
| * | Mylan Inc. | 218,137 | 4,681 |
| | Perrigo Co. | 44,840 | 4,363 |
| * | Laboratory Corp. of | | |
| | America Holdings | 50,700 | 4,359 |
| * | Forest Laboratories Inc. | 143,600 | 4,345 |
| * | Zimmer Holdings Inc. | 81,170 | 4,336 |
| | Quest Diagnostics Inc. | 72,800 | 4,227 |
| * | Watson Pharmaceuticals | | |
| | Inc. | 63,283 | 3,819 |
| * | Waters Corp. | 49,900 | 3,695 |
| * | Henry Schein Inc. | 55,100 | 3,550 |
| * | Life Technologies Corp. | 86,835 | 3,379 |
| | DENTSPLY International | | |
| | Inc. | 93,300 | 3,265 |
| * | Mettler-Toledo | | |
| | International Inc. | 22,100 | 3,264 |
| * | Endo Pharmaceuticals | | |
| | Holdings Inc. | 87,900 | 3,035 |
| | Universal Health Services | | |
| | Inc. Class B | 67,400 | 2,619 |
| | CR Bard Inc. | 29,300 | 2,505 |
| * | Coventry Health Care Inc. | 81,025 | 2,461 |
| * | Hospira Inc. | 77,140 | 2,343 |
| | Teleflex Inc. | 37,000 | 2,268 |
| * | Health Net Inc. | 74,200 | 2,257 |
| | Patterson Cos. Inc. | 73,530 | 2,171 |
| | PerkinElmer Inc. | 106,204 | 2,124 |
| | Lincare Holdings Inc. | 78,950 | 2,030 |
| * | CareFusion Corp. | 72,756 | 1,849 |
| * | Varian Medical Systems | | |
| | Inc. | 26,500 | 1,779 |
| | Covidien plc | 33,900 | 1,526 |
| | Omnicare Inc. | 40,900 | 1,409 |
| * | Boston Scientific Corp. | 205,500 | 1,097 |
| * | Vertex Pharmaceuticals | | |
| | Inc. | 28,588 | 949 |
| * | Dendreon Corp. | 111,295 | 846 |
| * | Amylin Pharmaceuticals | | |
| | Inc. | 47,800 | 544 |
| * | DaVita Inc. | 2,200 | 167 |
| | Techne Corp. | 2,000 | 137 |
| | | | 425,699 |
| Industrials (10.9%) | | |
| | General Electric Co. | 2,917,272 | 52,248 |
| | United Technologies Corp. | 280,100 | 20,473 |
| | Boeing Co. | 236,770 | 17,367 |
| | | |
| | | | Market |
| | | | Value |
| | | Shares | ($000) |
| | Union Pacific Corp. | 123,914 | 13,127 |
| | 3M Co. | 154,200 | 12,603 |
| | Caterpillar Inc. | 128,295 | 11,624 |
| | United Parcel Service Inc. | | |
| | Class B | 147,300 | 10,781 |
| | Norfolk Southern Corp. | 128,000 | 9,326 |
| | FedEx Corp. | 110,700 | 9,245 |
| | Danaher Corp. | 194,200 | 9,135 |
| | Precision Castparts Corp. | 52,100 | 8,586 |
| | CSX Corp. | 398,800 | 8,399 |
| | General Dynamics Corp. | 124,400 | 8,261 |
| | Deere & Co. | 104,800 | 8,106 |
| | Illinois Tool Works Inc. | 163,500 | 7,637 |
| | Honeywell International Inc. | 131,400 | 7,142 |
| | Cummins Inc. | 75,400 | 6,637 |
| | Emerson Electric Co. | 142,400 | 6,634 |
| | Fastenal Co. | 132,000 | 5,757 |
| | PACCAR Inc. | 142,910 | 5,355 |
| | CH Robinson Worldwide | | |
| | Inc. | 74,090 | 5,170 |
| | Parker Hannifin Corp. | 67,500 | 5,147 |
| | WW Grainger Inc. | 27,000 | 5,054 |
| | Waste Management Inc. | 140,297 | 4,589 |
| | Roper Industries Inc. | 51,700 | 4,491 |
| | Raytheon Co. | 88,118 | 4,263 |
| | Northrop Grumman Corp. | 72,268 | 4,226 |
| | Expeditors International of | | |
| | Washington Inc. | 101,061 | 4,139 |
| | Rockwell Collins Inc. | 73,700 | 4,081 |
| | Fluor Corp. | 81,200 | 4,080 |
| | AMETEK Inc. | 94,650 | 3,985 |
| | Pall Corp. | 69,300 | 3,961 |
| | Joy Global Inc. | 52,500 | 3,936 |
| * | Stericycle Inc. | 48,408 | 3,772 |
| | L-3 Communications | | |
| | Holdings Inc. | 54,000 | 3,601 |
| | Donaldson Co. Inc. | 51,600 | 3,513 |
| | Equifax Inc. | 87,200 | 3,378 |
| | JB Hunt Transport Services | | |
| | Inc. | 73,500 | 3,313 |
| | Flowserve Corp. | 33,000 | 3,278 |
| * | Jacobs Engineering Group | | |
| | Inc. | 80,100 | 3,250 |
| * | Quanta Services Inc. | 150,500 | 3,242 |
| | Southwest Airlines Co. | 351,687 | 3,010 |
| | MSC Industrial Direct Co. | | |
| | Inc. Class A | 41,700 | 2,984 |
| | Carlisle Cos. Inc. | 65,200 | 2,888 |
| | Landstar System Inc. | 59,289 | 2,841 |
| | Dun & Bradstreet Corp. | 36,200 | 2,709 |
| | IDEX Corp. | 71,845 | 2,666 |
| * | WABCO Holdings Inc. | 60,541 | 2,627 |
| | Valmont Industries Inc. | 27,537 | 2,500 |
| | Robert Half International Inc. | 87,500 | 2,490 |
| | KBR Inc. | 89,249 | 2,487 |
72
Tax-Managed Capital Appreciation Fund
| | | |
| | | | Market |
| | | | Value |
| | | Shares | ($000) |
| | Cintas Corp. | 70,766 | 2,463 |
| | Toro Co. | 40,100 | 2,432 |
| * | Owens Corning | 83,900 | 2,410 |
| | Wabtec Corp. | 33,000 | 2,308 |
| | Lockheed Martin Corp. | 28,020 | 2,267 |
| | SPX Corp. | 37,400 | 2,254 |
| | Xylem Inc. | 87,100 | 2,238 |
| * | Verisk Analytics Inc. | | |
| | Class A | 51,500 | 2,067 |
| | Manpower Inc. | 54,600 | 1,952 |
| * | CNH Global NV | 53,400 | 1,922 |
| | Alliant Techsystems Inc. | 33,100 | 1,892 |
| | Stanley Black & Decker Inc. | 26,745 | 1,808 |
| | Iron Mountain Inc. | 57,536 | 1,772 |
| * | Oshkosh Corp. | 79,200 | 1,693 |
| * | Navistar International Corp. | 42,383 | 1,605 |
| | Gardner Denver Inc. | 19,846 | 1,529 |
| | Con-way Inc. | 46,800 | 1,365 |
| * | Terex Corp. | 99,066 | 1,338 |
| | Lennox International Inc. | 35,090 | 1,184 |
| | Tyco International Ltd. | 25,300 | 1,182 |
| | Graco Inc. | 27,658 | 1,131 |
| | Textron Inc. | 61,020 | 1,128 |
| | UTi Worldwide Inc. | 77,587 | 1,031 |
| | ITT Corp. | 43,550 | 842 |
| | Exelis Inc. | 87,100 | 788 |
| | Manitowoc Co. Inc. | 62,200 | 572 |
| | Republic Services Inc. | | |
| | Class A | 19,512 | 538 |
| * | Huntington Ingalls | | |
| | Industries Inc. | 12,044 | 377 |
| | Ryder System Inc. | 3,600 | 191 |
| * | AGCO Corp. | 3,600 | 155 |
| * | KAR Auction Services Inc. | 10,953 | 148 |
| * | TransDigm Group Inc. | 1,380 | 132 |
| | | | 394,828 |
| Information Technology (18.6%) | |
| * | Apple Inc. | 264,500 | 107,123 |
| | International Business | | |
| | Machines Corp. | 350,858 | 64,516 |
| | Microsoft Corp. | 2,063,000 | 53,555 |
| * | Google Inc. Class A | 74,078 | 47,847 |
| | Intel Corp. | 1,303,330 | 31,606 |
| | Cisco Systems Inc. | 1,660,600 | 30,024 |
| | Oracle Corp. | 1,143,334 | 29,327 |
| | Qualcomm Inc. | 415,720 | 22,740 |
| | Hewlett-Packard Co. | 632,423 | 16,291 |
| | Visa Inc. Class A | 157,298 | 15,970 |
| * | EMC Corp. | 661,500 | 14,249 |
| | Mastercard Inc. Class A | 35,790 | 13,343 |
| * | eBay Inc. | 387,868 | 11,764 |
| | Texas Instruments Inc. | 389,800 | 11,347 |
| * | Yahoo! Inc. | 494,700 | 7,980 |
| * | Cognizant Technology | | |
| | Solutions Corp. Class A | 112,037 | 7,205 |
| | | |
| | | | Market |
| | | | Value |
| | | Shares | ($000) |
| | Intuit Inc. | 124,760 | 6,561 |
| | Corning Inc. | 504,200 | 6,545 |
| * | Dell Inc. | 415,500 | 6,079 |
| * | Adobe Systems Inc. | 213,200 | 6,027 |
| | Broadcom Corp. Class A | 203,950 | 5,988 |
| | Western Union Co. | 298,095 | 5,443 |
| | Altera Corp. | 140,647 | 5,218 |
| * | Symantec Corp. | 325,551 | 5,095 |
| * | NetApp Inc. | 137,963 | 5,004 |
| * | Citrix Systems Inc. | 80,756 | 4,904 |
| | Accenture plc Class A | 88,713 | 4,722 |
| | Xerox Corp. | 577,604 | 4,598 |
| | Applied Materials Inc. | 417,500 | 4,471 |
| * | Fiserv Inc. | 74,550 | 4,379 |
| | KLA-Tencor Corp. | 90,600 | 4,371 |
| | Analog Devices Inc. | 118,166 | 4,228 |
| | CA Inc. | 201,266 | 4,069 |
| | Amphenol Corp. Class A | 89,500 | 4,062 |
| * | Teradata Corp. | 83,374 | 4,044 |
| | Fidelity National Information | | |
| | Services Inc. | 146,178 | 3,887 |
| | Linear Technology Corp. | 124,200 | 3,730 |
| * | Autodesk Inc. | 120,488 | 3,654 |
| * | NVIDIA Corp. | 255,244 | 3,538 |
| * | Western Digital Corp. | 114,100 | 3,531 |
| * | Avnet Inc. | 105,400 | 3,277 |
| | Global Payments Inc. | 66,817 | 3,166 |
| * | Arrow Electronics Inc. | 84,500 | 3,161 |
| * | BMC Software Inc. | 91,600 | 3,003 |
| * | LSI Corp. | 488,428 | 2,906 |
| * | Lam Research Corp. | 77,108 | 2,855 |
| * | Tech Data Corp. | 55,510 | 2,743 |
| | Automatic Data Processing | | |
| | Inc. | 47,100 | 2,544 |
| * | Juniper Networks Inc. | 119,000 | 2,429 |
| * | Synopsys Inc. | 89,121 | 2,424 |
| | Microchip Technology Inc. | 65,100 | 2,385 |
| * | Cadence Design Systems | | |
| | Inc. | 221,607 | 2,305 |
| | Motorola Solutions Inc. | 49,604 | 2,296 |
| | Xilinx Inc. | 71,336 | 2,287 |
| * | Ingram Micro Inc. | 125,000 | 2,274 |
| * | Compuware Corp. | 258,162 | 2,148 |
| * | Atmel Corp. | 248,700 | 2,014 |
| | DST Systems Inc. | 42,800 | 1,948 |
| * | QLogic Corp. | 129,000 | 1,935 |
| | Computer Sciences Corp. | 78,900 | 1,870 |
| * | Electronic Arts Inc. | 90,200 | 1,858 |
| * | Fairchild Semiconductor | | |
| | International Inc. Class A | 147,958 | 1,781 |
| * | Motorola Mobility Holdings | | |
| | Inc. | 43,403 | 1,684 |
| | Lexmark International Inc. | | |
| | Class A | 50,300 | 1,663 |
| * | NCR Corp. | 99,574 | 1,639 |
73
Tax-Managed Capital Appreciation Fund
| | | |
| | | | Market |
| | | | Value |
| | | Shares | ($000) |
| * | Teradyne Inc. | 110,200 | 1,502 |
| | Total System Services Inc. | 74,759 | 1,462 |
| * | Monster Worldwide Inc. | 183,258 | 1,453 |
| | Broadridge Financial | | |
| | Solutions Inc. | 58,725 | 1,324 |
| | Tellabs Inc. | 266,900 | 1,078 |
| | IAC/InterActiveCorp | 24,515 | 1,044 |
| | Solera Holdings Inc. | 22,096 | 984 |
| * | Zebra Technologies Corp. | 27,257 | 975 |
| | Lender Processing Services | | |
| | Inc. | 61,250 | 923 |
| | Molex Inc. | 24,751 | 591 |
| * | Novellus Systems Inc. | 13,100 | 541 |
| * | AOL Inc. | 34,240 | 517 |
| * | Advanced Micro Devices Inc. | 81,100 | 438 |
| | Activision Blizzard Inc. | 32,800 | 404 |
| * | Micron Technology Inc. | 56,400 | 355 |
| | Harris Corp. | 4,300 | 155 |
| | Intersil Corp. Class A | 10,400 | 109 |
| * | SunPower Corp. Class A | 8,218 | 51 |
| | | | 671,536 |
| Materials (4.0%) | | |
| | Praxair Inc. | 105,400 | 11,267 |
| | Freeport-McMoRan | | |
| | Copper & Gold Inc. | 294,908 | 10,850 |
| | Newmont Mining Corp. | 164,386 | 9,865 |
| | EI du Pont de | | |
| | Nemours & Co. | 160,300 | 7,338 |
| | Ecolab Inc. | 116,139 | 6,714 |
| | Monsanto Co. | 82,434 | 5,776 |
| | Dow Chemical Co. | 178,640 | 5,138 |
| | Nucor Corp. | 129,600 | 5,128 |
| | LyondellBasell Industries | | |
| | NV Class A | 142,000 | 4,614 |
| | CF Industries Holdings Inc. | 31,800 | 4,610 |
| | Sigma-Aldrich Corp. | 63,400 | 3,960 |
| | Ball Corp. | 107,100 | 3,824 |
| | FMC Corp. | 44,400 | 3,820 |
| | Airgas Inc. | 48,100 | 3,756 |
| | Celanese Corp. Class A | 82,811 | 3,666 |
| | Mosaic Co. | 71,400 | 3,601 |
| * | Crown Holdings Inc. | 103,000 | 3,459 |
| | Albemarle Corp. | 60,400 | 3,111 |
| | Allegheny Technologies Inc. | 60,900 | 2,911 |
| * | Owens-Illinois Inc. | 140,900 | 2,731 |
| | Cliffs Natural Resources Inc. | 42,761 | 2,666 |
| * | Solutia Inc. | 148,400 | 2,564 |
| | Cytec Industries Inc. | 54,300 | 2,424 |
| | Scotts Miracle-Gro Co. | | |
| | Class A | 51,099 | 2,386 |
| * | Rockwood Holdings Inc. | 58,800 | 2,315 |
| | Martin Marietta Materials | | |
| | Inc. | 30,600 | 2,308 |
| | Reliance Steel & Aluminum | | |
| | Co. | 46,300 | 2,254 |
| | | |
| | | | Market |
| | | | Value |
| | | Shares | ($000) |
| * | Allied Nevada Gold Corp. | 73,800 | 2,235 |
| | United States Steel Corp. | 79,356 | 2,100 |
| | Titanium Metals Corp. | 139,110 | 2,084 |
| | Sealed Air Corp. | 106,072 | 1,825 |
| * | Intrepid Potash Inc. | 79,685 | 1,803 |
| | Schnitzer Steel Industries | | |
| | Inc. | 41,475 | 1,754 |
| | Royal Gold Inc. | 20,686 | 1,395 |
| * | Molycorp Inc. | 49,700 | 1,192 |
| | International Paper Co. | 35,900 | 1,063 |
| | Valspar Corp. | 23,400 | 912 |
| * | WR Grace & Co. | 15,800 | 725 |
| | Walter Energy Inc. | 11,780 | 713 |
| | Packaging Corp. of America | 26,600 | 671 |
| | Southern Copper Corp. | 21,000 | 634 |
| | Air Products & Chemicals | | |
| | Inc. | 5,700 | 486 |
| | | | 142,648 |
| Telecommunication Services (2.8%) | |
| | AT&T Inc. | 1,734,979 | 52,466 |
| | Verizon Communications | | |
| | Inc. | 711,342 | 28,539 |
| * | Crown Castle International | | |
| | Corp. | 130,600 | 5,851 |
| | CenturyLink Inc. | 94,364 | 3,510 |
| * | Sprint Nextel Corp. | 1,239,656 | 2,901 |
| * | SBA Communications | | |
| | Corp. Class A | 52,823 | 2,269 |
| * | United States Cellular Corp. | 32,300 | 1,409 |
| | Telephone & Data Systems | | |
| | Inc. | 43,601 | 1,129 |
| | Telephone & Data Systems | | |
| | Inc. (Special Common | | |
| | Shares) | 33,200 | 791 |
| * | Level 3 Communications | | |
| | Inc. | 44,613 | 758 |
| | Frontier Communications | | |
| | Corp. | 126,223 | 650 |
| | | | 100,273 |
| Utilities (3.3%) | | |
| | Exelon Corp. | 182,000 | 7,893 |
| | NextEra Energy Inc. | 122,451 | 7,455 |
| | FirstEnergy Corp. | 137,900 | 6,109 |
| | PG&E Corp. | 145,600 | 6,002 |
| | Edison International | 142,500 | 5,900 |
| | Southern Co. | 124,900 | 5,782 |
| | Sempra Energy | 104,036 | 5,722 |
| | Entergy Corp. | 77,000 | 5,625 |
| | Wisconsin Energy Corp. | 125,000 | 4,370 |
| | CenterPoint Energy Inc. | 213,800 | 4,295 |
| * | AES Corp. | 359,398 | 4,255 |
| | Northeast Utilities | 110,600 | 3,989 |
| * | Calpine Corp. | 241,180 | 3,939 |
| | CMS Energy Corp. | 173,986 | 3,842 |
74
Tax-Managed Capital Appreciation Fund
| | | |
| | | | Market |
| | | | Value |
| | | Shares | ($000) |
| | Duke Energy Corp. | 163,592 | 3,599 |
| | NSTAR | 76,600 | 3,597 |
| | Dominion Resources Inc. | 67,086 | 3,561 |
| | SCANA Corp. | 74,200 | 3,344 |
| | Integrys Energy Group Inc. | 61,481 | 3,331 |
| | NV Energy Inc. | 201,083 | 3,288 |
| * | NRG Energy Inc. | 166,215 | 3,012 |
| | MDU Resources Group Inc. | 137,050 | 2,941 |
| | American Water Works Co. | | |
| | Inc. | 87,200 | 2,778 |
| | ITC Holdings Corp. | 36,166 | 2,744 |
| | Aqua America Inc. | 107,583 | 2,372 |
| | Public Service Enterprise | | |
| | Group Inc. | 69,800 | 2,304 |
| | Questar Corp. | 115,800 | 2,300 |
| * | GenOn Energy Inc. | 869,429 | 2,269 |
| | National Fuel Gas Co. | 19,487 | 1,083 |
| | UGI Corp. | 34,466 | 1,013 |
| | NiSource Inc. | 35,920 | 855 |
| | American Electric Power | | |
| | Co. Inc. | 9,300 | 384 |
| | | | 119,953 |
| Total Common Stocks | | |
| (Cost $2,757,149) | | 3,607,801 |
| Temporary Cash Investment (0.1%) | |
| Money Market Fund (0.1%) | | |
| 1 | Vanguard Market | | |
| | Liquidity Fund, 0.110% | | |
| | (Cost $2,251) | 2,251,000 | 2,251 |
| Total Investments (100.1%) | | |
| (Cost $2,759,400) | | 3,610,052 |
| Other Assets and Liabilities (-0.1%) | |
| Other Assets | | 7,354 |
| Liabilities | | (10,050) |
| | | | (2,696) |
| Net Assets (100%) | | 3,607,356 |
| |
| December 31, 2011, net assets consisted of: |
| | Amount |
| | ($000) |
| Paid-in Capital | 2,806,826 |
| Overdistributed Net Investment Income | (4,433) |
| Accumulated Net Realized Losses | (45,689) |
| Unrealized Appreciation (Depreciation) | 850,652 |
| Net Assets | 3,607,356 |
| |
| Admiral Shares—Net Assets | |
| Applicable to 53,006,470 outstanding | |
| $.001 par value shares of beneficial | |
| interest (unlimited authorization) | 3,305,450 |
| Net Asset Value Per Share— | |
| Admiral Shares | $62.36 |
| |
| Institutional Shares—Net Assets | |
| Applicable to 9,743,888 outstanding | |
| $.001 par value shares of beneficial | |
| interest (unlimited authorization) | 301,906 |
| Net Asset Value Per Share— | |
| Institutional Shares | $30.98 |
See Note A in Notes to Financial Statements.
* Non-income-producing security.
1 Affiliated money market fund available only to Vanguard funds and certain trusts and accounts managed by Vanguard. Rate shown is the 7-day yield.
See accompanying Notes, which are an integral part of the Financial Statements.
75
Tax-Managed Capital Appreciation Fund
| |
| Statement of Operations | |
| |
| | Year Ended |
| | December 31, 2011 |
| | ($000) |
| Investment Income | |
| Income | |
| Dividends | 66,050 |
| Interest1 | 4 |
| Total Income | 66,054 |
| Expenses | |
| The Vanguard Group—Note B | |
| Investment Advisory Services | 378 |
| Management and Administrative—Investor Shares | 302 |
| Management and Administrative—Admiral Shares | 2,746 |
| Management and Administrative—Institutional Shares | 151 |
| Marketing and Distribution—Investor Shares | 56 |
| Marketing and Distribution—Admiral Shares | 665 |
| Marketing and Distribution—Institutional Shares | 47 |
| Custodian Fees | 53 |
| Auditing Fees | 28 |
| Shareholders’ Reports—Admiral Shares | 39 |
| Shareholders’ Reports—Institutional Shares | — |
| Trustees’ Fees and Expenses | 4 |
| Total Expenses | 4,469 |
| Net Investment Income | 61,585 |
| Realized Net Gain (Loss) on Investment Securities Sold | 91,977 |
| Change in Unrealized Appreciation (Depreciation) of Investment Securities | (101,060) |
| Net Increase (Decrease) in Net Assets Resulting from Operations | 52,502 |
| 1 Interest income from an affiliated company of the fund was $4,000. | |
See accompanying Notes, which are an integral part of the Financial Statements.
76
Tax-Managed Capital Appreciation Fund
| | |
| Statement of Changes in Net Assets | | |
| |
| | Year Ended December 31, |
| | 2011 | 2010 |
| | ($000) | ($000) |
| Increase (Decrease) in Net Assets | | |
| Operations | | |
| Net Investment Income | 61,585 | 53,670 |
| Realized Net Gain (Loss) | 91,977 | (74,140) |
| Change in Unrealized Appreciation (Depreciation) | (101,060) | 539,562 |
| Net Increase (Decrease) in Net Assets Resulting from Operations | 52,502 | 519,092 |
| Distributions | | |
| Net Investment Income | | |
| Investor Shares | (76) | (8,130) |
| Admiral Shares | (55,947) | (41,753) |
| Institutional Shares | (5,254) | (4,226) |
| Realized Capital Gain | | |
| Investor Shares | — | — |
| Admiral Shares | — | — |
| Institutional Shares | — | — |
| Total Distributions | (61,277) | (54,109) |
| Capital Share Transactions | | |
| Investor Shares | (632,954) | (45,480) |
| Admiral Shares | 497,531 | (22,214) |
| Institutional Shares | 20,879 | 22,378 |
| Net Increase (Decrease) from Capital Share Transactions | (114,544) | (45,316) |
| Total Increase (Decrease) | (123,319) | 419,667 |
| Net Assets | | |
| Beginning of Period | 3,730,675 | 3,311,008 |
| End of Period1 | 3,607,356 | 3,730,675 |
| 1 Net Assets—End of Period includes undistributed (overdistributed) net investment income of ($4,433,000) and ($4,741,000). | |
See accompanying Notes, which are an integral part of the Financial Statements.
77
Tax-Managed Capital Appreciation Fund
Financial Highlights
| | | | | |
| Investor Shares | | | | | |
| January 1, | | |
| 2011, to | | |
| For a Share Outstanding | May 13, | Year Ended December 31, |
| Throughout Each Period | 20111 | 2010 | 2009 | 2008 | 2007 |
| Net Asset Value, Beginning of Period | $31.09 | $27.19 | $21.39 | $35.13 | $33.62 |
| Investment Operations | | | | | |
| Net Investment Income | .162 | .431 | .410 | .498 | .530 |
| Net Realized and Unrealized Gain (Loss) | | | | | |
| on Investments | 2.152 | 3.903 | 5.799 | (13.738) | 1.513 |
| Total from Investment Operations | 2.314 | 4.334 | 6.209 | (13.240) | 2.043 |
| Distributions | | | | | |
| Dividends from Net Investment Income | (.004) | (.434) | (.409) | (.500) | (.533) |
| Distributions from Realized Capital Gains | — | — | — | — | — |
| Total Distributions | (.004) | (.434) | (.409) | (.500) | (.533) |
| Net Asset Value, End of Period | $33.401 | $31.09 | $27.19 | $21.39 | $35.13 |
| |
| Total Return2 | 7.44% | 15.94% | 29.03% | -37.63% | 6.07% |
| |
| Ratios/Supplemental Data | | | | | |
| Net Assets, End of Period (Millions) | $— | $589 | $560 | $473 | $782 |
| Ratio of Total Expenses to | | | | | |
| Average Net Assets | 0.17% | 0.20% | 0.21% | 0.16% | 0.15% |
| Ratio of Net Investment Income to | | | | | |
| Average Net Assets | 1.42% | 1.51% | 1.74% | 1.66% | 1.51% |
| Portfolio Turnover Rate | 2% | 7% | 26% | 8% | 5% |
The expense ratio and net income ratio for the current period have been annualized.
1 Net asset value as of May 13, 2011, at which date the Investor Shares were converted to Admiral Shares.
2 Total returns do not include transaction or account service fees that may have applied in the periods shown. Fund prospectuses provide information about any applicable transaction and account service fees.
See accompanying Notes, which are an integral part of the Financial Statements.
78
Tax-Managed Capital Appreciation Fund
Financial Highlights
| | | | | |
| Admiral Shares | | | | | |
| |
| For a Share Outstanding | | | Year Ended December 31, |
| Throughout Each Period | 2011 | 2010 | 2009 | 2008 | 2007 |
| Net Asset Value, Beginning of Period | $62.56 | $54.72 | $43.04 | $70.70 | $67.68 |
| Investment Operations | | | | | |
| Net Investment Income | 1.072 | .915 | .855 | 1.040 | 1.113 |
| Net Realized and Unrealized Gain (Loss) | | | | | |
| on Investments | (.202) | 7.849 | 11.673 | (27.656) | 3.026 |
| Total from Investment Operations | .870 | 8.764 | 12.528 | (26.616) | 4.139 |
| Distributions | | | | | |
| Dividends from Net Investment Income | (1.070) | (.924) | (.848) | (1.044) | (1.119) |
| Distributions from Realized Capital Gains | — | — | — | — | — |
| Total Distributions | (1.070) | (.924) | (.848) | (1.044) | (1.119) |
| Net Asset Value, End of Period | $62.36 | $62.56 | $54.72 | $43.04 | $70.70 |
| |
| Total Return1 | 1.38% | 16.02% | 29.11% | -37.58% | 6.11% |
| |
| Ratios/Supplemental Data | | | | | |
| Net Assets, End of Period (Millions) | $3,305 | $2,860 | $2,526 | $2,045 | $3,283 |
| Ratio of Total Expenses to | | | | | |
| Average Net Assets | 0.12% | 0.12% | 0.15% | 0.10% | 0.09% |
| Ratio of Net Investment Income to | | | | | |
| Average Net Assets | 1.65% | 1.59% | 1.80% | 1.72% | 1.57% |
| Portfolio Turnover Rate | 2% | 7% | 26% | 8% | 5% |
1 Total returns do not include transaction fees that may have applied in the periods shown. Fund prospectuses provide information about any applicable transaction fees.
See accompanying Notes, which are an integral part of the Financial Statements.
79
Tax-Managed Capital Appreciation Fund
Financial Highlights
| | | | | |
| Institutional Shares | | | | | |
| |
| For a Share Outstanding | | | Year Ended December 31, |
| Throughout Each Period | 2011 | 2010 | 2009 | 2008 | 2007 |
| Net Asset Value, Beginning of Period | $31.09 | $27.19 | $21.38 | $35.13 | $33.63 |
| Investment Operations | | | | | |
| Net Investment Income | .548 | .466 | .439 | .525 | .551 |
| Net Realized and Unrealized Gain (Loss) | | | | | |
| on Investments | (.113) | 3.905 | 5.806 | (13.748) | 1.513 |
| Total from Investment Operations | .435 | 4.371 | 6.245 | (13.223) | 2.064 |
| Distributions | | | | | |
| Dividends from Net Investment Income | (.545) | (.471) | (.435) | (.527) | (.564) |
| Distributions from Realized Capital Gains | — | — | — | — | — |
| Total Distributions | (.545) | (.471) | (.435) | (.527) | (.564) |
| Net Asset Value, End of Period | $30.98 | $31.09 | $27.19 | $21.38 | $35.13 |
| |
| Total Return1 | 1.39% | 16.08% | 29.21% | -37.57% | 6.13% |
| |
| Ratios/Supplemental Data | | | | | |
| Net Assets, End of Period (Millions) | $302 | $282 | $225 | $185 | $291 |
| Ratio of Total Expenses to | | | | | |
| Average Net Assets | 0.08% | 0.08% | 0.09% | 0.07% | 0.07% |
| Ratio of Net Investment Income to | | | | | |
| Average Net Assets | 1.69% | 1.63% | 1.86% | 1.75% | 1.59% |
| Portfolio Turnover Rate | 2% | 7% | 26% | 8% | 5% |
1 Total returns do not include transaction fees that may have applied in the periods shown. Fund prospectuses provide information about any applicable transaction fees.
See accompanying Notes, which are an integral part of the Financial Statements.
80
Tax-Managed Capital Appreciation Fund
Notes to Financial Statements
Vanguard Tax-Managed Capital Appreciation Fund is registered under the Investment Company Act of 1940 as an open-end investment company, or mutual fund. The fund offers two classes of shares: Admiral Shares and Institutional Shares. Admiral Shares and Institutional Shares are designed for investors who meet certain administrative, service, and account-size criteria. Prior to May 14, 2011, the fund offered Investor Shares. Effective at the close of business on May 13, 2011, the Investor Shares were converted to Admiral Shares.
A. The following significant accounting policies conform to generally accepted accounting principles for U.S. mutual funds. The fund consistently follows such policies in preparing its financial statements.
1. Security Valuation: Securities are valued as of the close of trading on the New York Stock Exchange (generally 4 p.m., Eastern time) on the valuation date. Equity securities are valued at the latest quoted sales prices or official closing prices taken from the primary market in which each security trades; such securities not traded on the valuation date are valued at the mean of the latest quoted bid and asked prices. Securities for which market quotations are not readily available, or whose values have been materially affected by events occurring before the fund’s pricing time but after the close of the securities’ primary markets, are valued by methods deemed by the board of trustees to represent fair value. Investments in Vanguard Market Liquidity Fund are valued at that fund’s net asset value.
2. Federal Income Taxes: The fund intends to continue to qualify as a regulated investment company and distribute all of its taxable income. Management has analyzed the fund’s tax positions taken for all open federal income tax years (December 31, 2008–2011), and has concluded that no provision for federal income tax is required in the fund’s financial statements.
3. Distributions: Distributions to shareholders are recorded on the ex-dividend date.
4. Other: Dividend income is recorded on the ex-dividend date. Interest income includes income distributions received from Vanguard Market Liquidity Fund and is accrued daily. Security transactions are accounted for on the date securities are bought or sold. Costs used to determine realized gains (losses) on the sale of investment securities are those of the specific securities sold. Fees assessed on redemptions of capital shares are credited to paid-in capital.
Each class of shares has equal rights as to assets and earnings, except that each class separately bears certain class-specific expenses related to maintenance of shareholder accounts (included in Management and Administrative expenses) and shareholder reporting. Marketing and distribution expenses are allocated to each class of shares based on a method approved by the board of trustees. Income, other non-class-specific expenses, and gains and losses on investments are allocated to each class of shares based on its relative net assets.
B. The Vanguard Group furnishes at cost investment advisory, corporate management, administrative, marketing, and distribution services. The costs of such services are allocated to the fund under methods approved by the board of trustees. The fund has committed to provide up to 0.40% of its net assets in capital contributions to Vanguard. At December 31, 2011, the fund had contributed capital of $587,000 to Vanguard (included in Other Assets), representing 0.02% of the fund’s net assets and 0.23% of Vanguard’s capitalization. The fund’s trustees and officers are also directors and officers of Vanguard.
81
Tax-Managed Capital Appreciation Fund
C. Various inputs may be used to determine the value of the fund’s investments. These inputs are summarized in three broad levels for financial statement purposes. The inputs or methodologies used to value securities are not necessarily an indication of the risk associated with investing in those securities.
Level 1—Quoted prices in active markets for identical securities.
Level 2—Other significant observable inputs (including quoted prices for similar securities, interest rates, prepayment speeds, credit risk, etc.).
Level 3—Significant unobservable inputs (including the fund’s own assumptions used to determine the fair value of investments).
At December 31, 2011, 100% of the market value of the fund’s investments was based on Level 1 inputs.
D. Distributions are determined on a tax basis and may differ from net investment income and realized capital gains for financial reporting purposes. Differences may be permanent or temporary. Permanent differences are reclassified among capital accounts in the financial statements to reflect their tax character. Temporary differences arise when certain items of income, expense, gain, or loss are recognized in different periods for financial statement and tax purposes; these differences will reverse at some time in the future. Differences in classification may also result from the treatment of short-term gains as ordinary income for tax purposes.
For tax purposes, at December 31, 2011, the fund had $721,000 of ordinary income available for distribution. The fund had available capital loss carryforwards totaling $45,689,000 to offset future net capital gains through December 31, 2018.
At December 31, 2011, the cost of investment securities for tax purposes was $2,759,400,000. Net unrealized appreciation of investment securities for tax purposes was $850,652,000, consisting of unrealized gains of $1,064,788,000 on securities that had risen in value since their purchase and $214,136,000 in unrealized losses on securities that had fallen in value since their purchase.
E. During the year ended December 31, 2011, the fund purchased $77,428,000 of investment securities and sold $188,836,000 of investment securities, other than temporary cash investments.
82
Tax-Managed Capital Appreciation Fund
F. Capital share transactions for each class of shares were:
| | | | |
| | | | Year Ended December 31, |
| | | 2011 | | 2010 |
| | Amount | Shares | Amount | Shares |
| | ($000) | (000) | ($000) | (000) |
| Investor Shares | | | | |
| Issued | 19,204 | 593 | 37,577 | 1,336 |
| Issued in Lieu of Cash Distributions | 66 | 2 | 7,111 | 229 |
| Redeemed1,2 | (652,224) | (19,543) | (90,168) | (3,219) |
| Net Increase (Decrease)—Investor Shares | (632,954) | (18,948) | (45,480) | (1,654) |
| Admiral Shares | | | | |
| Issued2 | 754,793 | 11,363 | 120,657 | 2,125 |
| Issued in Lieu of Cash Distributions | 44,170 | 704 | 32,472 | 520 |
| Redeemed1 | (301,432) | (4,772) | (175,343) | (3,090) |
| Net Increase (Decrease)—Admiral Shares | 497,531 | 7,295 | (22,214) | (445) |
| Institutional Shares | | | | |
| Issued | 33,090 | 1,065 | 22,531 | 793 |
| Issued in Lieu of Cash Distributions | 3,139 | 101 | 2,641 | 85 |
| Redeemed1 | (15,350) | (486) | (2,794) | (101) |
| Net Increase (Decrease)—Institutional Shares | 20,879 | 680 | 22,378 | 777 |
1 Net of redemption fees for fiscal 2011 and 2010 of $112,000 and $392,000, respectively (fund totals). Effective April 28, 2011, the redemption fee was eliminated.
2 Investor Shares redeemed and Admiral Shares issued reflect $624,890,000 from the conversion of 18,707,000 Investor Shares to 9,293,000 Admiral Shares at the close of business on May 13, 2011.
G. In preparing the financial statements as of December 31, 2011, management considered the impact of subsequent events for potential recognition or disclosure in these financial statements.
83
Tax-Managed Small-Cap Fund
Fund Profile
As of December 31, 2011
| | |
| Share-Class Characteristics | |
| | Admiral | Institutional |
| | Shares | Shares |
| Ticker Symbol | VTMSX | VTSIX |
| Expense Ratio1 | 0.18% | 0.08% |
| 30-Day SEC Yield | 1.10% | 1.12% |
| | | |
| Portfolio Characteristics | | |
| | | | DJ |
| | | S&P | U.S. Total |
| | | SmallCap | Market |
| | Fund | 600 Index | Index |
| Number of Stocks | 600 | 600 | 3,745 |
| Median Market Cap | $1.1B | $1.1B | $31.3B |
| Price/Earnings Ratio | 19.7x | 20.3x | 15.0x |
| Price/Book Ratio | 1.7x | 1.7x | 2.1x |
| Return on Equity | 10.9% | 10.7% | 19.0% |
| Earnings Growth Rate | 3.9% | 3.5% | 7.1% |
| Dividend Yield | 1.1% | 1.2% | 2.0% |
| Foreign Holdings | 0.0% | 0.0% | 0.0% |
| Turnover Rate | 40% | — | — |
| Short-Term Reserves | 0.0% | — | — |
| | | |
| Sector Diversification (% of equity exposure) |
| | | | DJ |
| | | S&P | U.S. Total |
| | | SmallCap | Market |
| | Fund | 600 Index | Index |
| Consumer | | | |
| Discretionary | 15.2% | 15.2% | 12.2% |
| Consumer Staples | 4.4 | 4.4 | 10.6 |
| Energy | 4.1 | 4.0 | 10.8 |
| Financials | 19.9 | 19.6 | 15.0 |
| Health Care | 11.2 | 11.3 | 11.4 |
| Industrials | 15.3 | 15.6 | 11.1 |
| Information | | | |
| Technology | 19.7 | 19.7 | 18.7 |
| Materials | 5.0 | 5.0 | 4.1 |
| Telecommunication | | | |
| Services | 0.6 | 0.6 | 2.5 |
| Utilities | 4.6 | 4.6 | 3.6 |
| | |
| Volatility Measures | | |
| | | DJ |
| | | U.S. Total |
| | S&P SmallCap | Market |
| | 600 Index | Index |
| R-Squared | 1.00 | 0.91 |
| Beta | 1.00 | 1.22 |
These measures show the degree and timing of the fund’s fluctuations compared with the indexes over 36 months.
| | |
| Ten Largest Holdings (% of total net assets) |
| Healthspring Inc. | Managed Health | |
| | Care | 0.8% |
| Salix Pharmaceuticals | | |
| Ltd. | Pharmaceuticals | 0.6 |
| Questcor | | |
| Pharmaceuticals Inc. | Pharmaceuticals | 0.6 |
| Piedmont Natural Gas | | |
| Co. Inc. | Gas Utilities | 0.5 |
| ProAssurance Corp. | Property & Casualty | |
| | Insurance | 0.5 |
| Cubist Pharmaceuticals | | |
| Inc. | Biotechnology | 0.5 |
| Delphi Financial Group | Life & Health | |
| Inc. | Insurance | 0.5 |
| TreeHouse Foods Inc. | Packaged Foods & | |
| | Meats | 0.5 |
| Robbins & Myers Inc. | Industrial | |
| | Machinery | 0.5 |
| Wright Express Corp. | Data Processing & | |
| | Outsourced | |
| | Services | 0.5 |
| Top Ten | | 5.5% |
The holdings listed exclude any temporary cash investments and equity index products.
Investment Focus
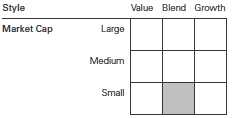
1 The expense ratios shown are from the prospectus dated July 15, 2011, and represent estimated costs for the current fiscal year. For the fiscal year ended December 31, 2011, the expense ratios were 0.12% for Admiral Shares and 0.08% for Institutional Shares.
84
Tax-Managed Small-Cap Fund
Performance Summary
All of the returns in this report represent past performance, which is not a guarantee of future results that may be achieved by the fund. (Current performance may be lower or higher than the performance data cited. For performance data current to the most recent month-end, visit our website at vanguard.com/performance.) Note, too, that both investment returns and principal value can fluctuate widely, so an investor’s shares, when sold, could be worth more or less than their original cost. The returns shown do not reflect taxes that a shareholder would pay on fund distributions or on the sale of fund shares.
Cumulative Performance: December 31, 2001, Through December 31, 2011
Initial Investment of $10,000
| | | | |
| | | Average Annual Total Returns | |
| | Periods Ended December 31, 2011 | |
| | | | | Final Value |
| | One | Five | Ten | of a $10,000 |
| | Year | Years | Years | Investment |
| Tax-Managed Small-Cap Fund | | | | |
| Admiral Shares | 1.22% | 2.18% | 7.14% | $19,937 |
| Dow Jones U.S. Total Stock Market | | | | |
| Index | 0.52 | 0.28 | 3.90 | 14,657 |
| S&P SmallCap 600 Index | 1.02 | 1.94 | 7.09 | 19,834 |
| Small-Cap Core Funds Average | -3.67 | -0.15 | 5.38 | 16,895 |
| Small-Cap Core Funds Average: Derived from data provided by Lipper Inc. |
| | | | |
| | | | | Final Value |
| | One | Five | Ten | of a $5,000,000 |
| | Year | Years | Years | Investment |
| Tax-Managed Small-Cap Fund Institutional | | | | |
| Shares | 1.26% | 2.24% | 7.22% | $10,036,231 |
| Dow Jones U.S. Total Stock Market Index | 0.52 | 0.28 | 3.90 | 7,328,259 |
| S&P SmallCap 600 Index | 1.02 | 1.94 | 7.09 | 9,917,138 |
See Financial Highlights for dividend and capital gains information.
85
Tax-Managed Small-Cap Fund
Fiscal-Year Total Returns (%): December 31, 2001, Through December 31, 2011
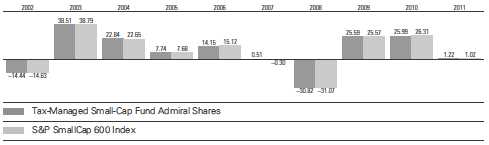
86
Tax-Managed Small-Cap Fund
Financial Statements
Statement of Net Assets
As of December 31, 2011
The fund reports a complete list of its holdings in regulatory filings four times in each fiscal year, at the quarter-ends. For the second and fourth fiscal quarters, the lists appear in the fund’s semiannual and annual reports to shareholders. For the first and third fiscal quarters, the fund files the lists with the Securities and Exchange Commission on Form N-Q. Shareholders can look up the fund’s Forms N-Q on the SEC’s website at sec.gov. Forms N-Q may also be reviewed and copied at the SEC’s Public Reference Room (see the back cover of this report for further information).
| | | |
| | | | Market |
| | | | Value |
| | | Shares | ($000) |
| Common Stocks (100.0%) | | |
| Consumer Discretionary (15.1%) | |
| * | Carter’s Inc. | 222,109 | 8,842 |
| | Wolverine World Wide Inc. | 210,823 | 7,514 |
| | Men’s Wearhouse Inc. | 224,451 | 7,274 |
| | Brunswick Corp. | 391,237 | 7,066 |
| * | Genesco Inc. | 106,132 | 6,553 |
| | Pool Corp. | 207,952 | 6,259 |
| * | Coinstar Inc. | 134,987 | 6,161 |
| | Hillenbrand Inc. | 274,071 | 6,117 |
| * | JOS A Bank Clothiers Inc. | 121,995 | 5,948 |
| * | Crocs Inc. | 392,927 | 5,804 |
| * | Steven Madden Ltd. | 167,214 | 5,769 |
| * | Childrens Place Retail | | |
| | Stores Inc. | 108,583 | 5,768 |
| * | Buffalo Wild Wings Inc. | 80,516 | 5,436 |
| * | Live Nation Entertainment | | |
| | Inc. | 648,590 | 5,390 |
| * | Select Comfort Corp. | 246,779 | 5,353 |
| * | Iconix Brand Group Inc. | 323,879 | 5,276 |
| | Monro Muffler Brake Inc. | 135,051 | 5,239 |
| * | Hibbett Sports Inc. | 115,458 | 5,216 |
| | Group 1 Automotive Inc. | 99,255 | 5,141 |
| * | Vitamin Shoppe Inc. | 128,387 | 5,120 |
| | Cracker Barrel Old Country | | |
| | Store Inc. | 100,632 | 5,073 |
| | Buckle Inc. | 118,581 | 4,846 |
| * | Cabela’s Inc. | 189,946 | 4,828 |
| * | BJ’s Restaurants Inc. | 106,259 | 4,816 |
| | Finish Line Inc. Class A | 226,295 | 4,364 |
| * | Helen of Troy Ltd. | 136,268 | 4,183 |
| | Arbitron Inc. | 120,279 | 4,139 |
| * | Jack in the Box Inc. | 192,690 | 4,027 |
| * | True Religion Apparel Inc. | 112,866 | 3,903 |
| | Texas Roadhouse Inc. | | |
| | Class A | 259,341 | 3,864 |
| * | Liz Claiborne Inc. | 415,284 | 3,584 |
| * | Peet’s Coffee & Tea Inc. | 56,755 | 3,557 |
| * | iRobot Corp. | 118,490 | 3,537 |
| | | |
| | | | Market |
| | | | Value |
| | | Shares | ($000) |
| * | American Public Education | | |
| | Inc. | 78,422 | 3,394 |
| | Cato Corp. Class A | 130,208 | 3,151 |
| | Ryland Group Inc. | 195,232 | 3,077 |
| * | Papa John’s International | | |
| | Inc. | 80,827 | 3,046 |
| | PF Chang’s China Bistro Inc. | 93,256 | 2,883 |
| | CEC Entertainment Inc. | 83,356 | 2,872 |
| * | DineEquity Inc. | 67,751 | 2,860 |
| * | Meritage Homes Corp. | 123,316 | 2,860 |
| | Sturm Ruger & Co. Inc. | 84,464 | 2,826 |
| * | Shuffle Master Inc. | 237,786 | 2,787 |
| * | Pinnacle Entertainment Inc. | 272,454 | 2,768 |
| | Oxford Industries Inc. | 60,911 | 2,748 |
| * | La-Z-Boy Inc. | 228,606 | 2,720 |
| | Ethan Allen Interiors Inc. | 114,123 | 2,706 |
| * | Zumiez Inc. | 96,042 | 2,666 |
| | PEP Boys-Manny | | |
| | Moe & Jack | 231,665 | 2,548 |
| | Fred’s Inc. Class A | 169,355 | 2,469 |
| * | Blue Nile Inc. | 59,178 | 2,419 |
| * | Interval Leisure Group Inc. | 174,920 | 2,381 |
| * | Biglari Holdings Inc. | 6,289 | 2,316 |
| * | Capella Education Co. | 63,045 | 2,273 |
| | Sonic Automotive Inc. | | |
| | Class A | 152,848 | 2,264 |
| * | Lumber Liquidators | | |
| | Holdings Inc. | 122,883 | 2,170 |
| * | Career Education Corp. | 263,414 | 2,099 |
| | Lithia Motors Inc. Class A | 94,547 | 2,067 |
| * | Drew Industries Inc. | 83,960 | 2,060 |
| * | Marriott Vacations | | |
| | Worldwide Corp. | 117,786 | 2,021 |
| * | Skechers U.S.A. Inc. | | |
| | Class A | 162,666 | 1,972 |
| * | Quiksilver Inc. | 538,378 | 1,944 |
| * | Ruby Tuesday Inc. | 278,738 | 1,923 |
| * | Maidenform Brands Inc. | 104,928 | 1,920 |
| | Stage Stores Inc. | 133,328 | 1,852 |
| * | Sonic Corp. | 272,903 | 1,837 |
87
Tax-Managed Small-Cap Fund
| | | |
| | | | Market |
| | | | Value |
| | | Shares | ($000) |
| * | Boyd Gaming Corp. | 238,698 | 1,781 |
| | Harte-Hanks Inc. | 194,700 | 1,770 |
| | Superior Industries | | |
| | International Inc. | 105,497 | 1,745 |
| * | OfficeMax Inc. | 380,213 | 1,726 |
| | Standard Motor Products | | |
| | Inc. | 85,849 | 1,721 |
| | Brown Shoe Co. Inc. | 184,242 | 1,640 |
| | Jakks Pacific Inc. | 113,395 | 1,600 |
| | Callaway Golf Co. | 288,559 | 1,596 |
| | Nutrisystem Inc. | 123,048 | 1,591 |
| * | Rue21 Inc. | 68,988 | 1,490 |
| * | Digital Generation Inc. | 121,016 | 1,443 |
| * | Standard Pacific Corp. | 449,899 | 1,431 |
| | Movado Group Inc. | 76,805 | 1,396 |
| * | Red Robin Gourmet | | |
| | Burgers Inc. | 49,177 | 1,362 |
| | Blyth Inc. | 22,822 | 1,296 |
| | HOT Topic Inc. | 185,802 | 1,228 |
| * | Arctic Cat Inc. | 54,040 | 1,219 |
| * | Universal Technical | | |
| | Institute Inc. | 94,532 | 1,208 |
| | Marcus Corp. | 89,334 | 1,126 |
| * | Universal Electronics Inc. | 66,082 | 1,115 |
| * | EW Scripps Co. Class A | 136,975 | 1,097 |
| | Big 5 Sporting Goods Corp. | 97,108 | 1,014 |
| * | Kirkland’s Inc. | 73,169 | 973 |
| * | Multimedia Games Holding | | |
| | Co. Inc. | 121,047 | 961 |
| * | Winnebago Industries Inc. | 129,481 | 956 |
| | PetMed Express Inc. | 90,142 | 936 |
| | Haverty Furniture Cos. Inc. | 84,647 | 929 |
| * | Stein Mart Inc. | 123,541 | 841 |
| * | Ruth’s Hospitality Group Inc. | 154,592 | 768 |
| * | Perry Ellis International Inc. | 54,007 | 768 |
| * | VOXX International Corp. | | |
| | Class A | 85,252 | 720 |
| | Spartan Motors Inc. | 149,182 | 718 |
| * | MarineMax Inc. | 104,010 | 678 |
| * | Tuesday Morning Corp. | 192,624 | 665 |
| * | Midas Inc. | 64,108 | 551 |
| * | Monarch Casino & Resort | | |
| | Inc. | 51,560 | 525 |
| * | M/I Homes Inc. | 52,496 | 504 |
| * | O’Charleys Inc. | 86,431 | 474 |
| * | Zale Corp. | 114,808 | 437 |
| | Lincoln Educational | | |
| | Services Corp. | 54,792 | 433 |
| * | Corinthian Colleges Inc. | 198,391 | 430 |
| * | Coldwater Creek Inc. | 328,276 | 387 |
| | Christopher & Banks Corp. | 161,549 | 378 |
| * | K-Swiss Inc. Class A | 121,167 | 354 |
| * | School Specialty Inc. | 12,565 | 31 |
| | | | 303,878 |
| | | |
| | | | Market |
| | | | Value |
| | | Shares | ($000) |
| Consumer Staples (4.4%) | | |
| * | TreeHouse Foods Inc. | 157,406 | 10,291 |
| | Casey’s General Stores Inc. | 167,244 | 8,615 |
| * | United Natural Foods Inc. | 213,157 | 8,528 |
| * | Hain Celestial Group Inc. | 192,782 | 7,067 |
| * | Darling International Inc. | 514,072 | 6,832 |
| | B&G Foods Inc. Class A | 209,268 | 5,037 |
| | Snyders-Lance Inc. | 206,255 | 4,641 |
| | Sanderson Farms Inc. | 82,603 | 4,141 |
| * | Boston Beer Co. Inc. | | |
| | Class A | 36,627 | 3,976 |
| | Andersons Inc. | 81,275 | 3,548 |
| | J&J Snack Foods Corp. | 63,354 | 3,376 |
| | Diamond Foods Inc. | 97,089 | 3,133 |
| | WD-40 Co. | 69,702 | 2,817 |
| * | Prestige Brands Holdings | | |
| | Inc. | 221,611 | 2,498 |
| | Cal-Maine Foods Inc. | 63,107 | 2,308 |
| | Spartan Stores Inc. | 101,694 | 1,881 |
| | Nash Finch Co. | 53,808 | 1,575 |
| * | Central Garden and Pet | | |
| | Co. Class A | 187,939 | 1,564 |
| | Calavo Growers Inc. | 55,224 | 1,418 |
| | Inter Parfums Inc. | 72,050 | 1,121 |
| * | Alliance One International | | |
| | Inc. | 392,928 | 1,069 |
| * | Seneca Foods Corp. | | |
| | Class A | 40,960 | 1,058 |
| * | Medifast Inc. | 60,594 | 831 |
| | | | 87,325 |
| Energy (4.1%) | | |
| | Lufkin Industries Inc. | 133,939 | 9,016 |
| * | SEACOR Holdings Inc. | 95,210 | 8,470 |
| | Bristow Group Inc. | 157,883 | 7,482 |
| * | Gulfport Energy Corp. | 195,717 | 5,764 |
| * | Stone Energy Corp. | 214,754 | 5,665 |
| * | Swift Energy Co. | 186,335 | 5,538 |
| * | Hornbeck Offshore | | |
| | Services Inc. | 149,223 | 4,629 |
| * | Petroleum Development | | |
| | Corp. | 104,443 | 3,667 |
| * | Approach Resources Inc. | 117,041 | 3,442 |
| * | ION Geophysical Corp. | 561,369 | 3,441 |
| * | Contango Oil & Gas Co. | 55,645 | 3,237 |
| * | Tetra Technologies Inc. | 339,513 | 3,171 |
| * | Pioneer Drilling Co. | 271,608 | 2,629 |
| * | Exterran Holdings Inc. | 284,528 | 2,589 |
| * | GeoResources Inc. | 87,615 | 2,568 |
| * | Basic Energy Services Inc. | 129,583 | 2,553 |
| | Gulf Island Fabrication Inc. | 63,775 | 1,863 |
| * | Petroquest Energy Inc. | 250,285 | 1,652 |
| * | OYO Geospace Corp. | 20,432 | 1,580 |
| | Overseas Shipholding | | |
| | Group Inc. | 115,736 | 1,265 |
88
Tax-Managed Small-Cap Fund
| | | |
| | | | Market |
| | | | Value |
| | | Shares | ($000) |
| * | Matrix Service Co. | 114,693 | 1,083 |
| | Penn Virginia Corp. | 127,434 | 674 |
| | | | 81,978 |
| Exchange-Traded Fund (3.8%) | |
| 1 | Vanguard REIT ETF | 1,324,430 | 76,817 |
| |
| Financials (16.2%) | | |
| | ProAssurance Corp. | 133,861 | 10,685 |
| | Delphi Financial Group Inc. | 238,387 | 10,561 |
| * | Stifel Financial Corp. | 236,197 | 7,570 |
| | FNB Corp. | 612,359 | 6,926 |
| | Umpqua Holdings Corp. | 502,333 | 6,224 |
| | BioMed Realty Trust Inc. | 338,482 | 6,120 |
| | Cash America International | | |
| | Inc. | 128,875 | 6,009 |
| | Susquehanna Bancshares | | |
| | Inc. | 687,186 | 5,759 |
| | United Bankshares Inc. | 198,163 | 5,602 |
| | Tanger Factory Outlet | | |
| | Centers | 190,166 | 5,576 |
| | Northwest Bancshares Inc. | 428,827 | 5,335 |
| | RLI Corp. | 73,044 | 5,322 |
| | UMB Financial Corp. | 141,751 | 5,280 |
| | Mid-America Apartment | | |
| | Communities Inc. | 81,842 | 5,119 |
| * | Portfolio Recovery | | |
| | Associates Inc. | 75,089 | 5,070 |
| * | Ezcorp Inc. Class A | 192,209 | 5,069 |
| * | Texas Capital Bancshares | | |
| | Inc. | 165,154 | 5,055 |
| | Extra Space Storage Inc. | 207,699 | 5,033 |
| | Kilroy Realty Corp. | 128,337 | 4,886 |
| | Post Properties Inc. | 111,265 | 4,864 |
| | Old National Bancorp | 415,708 | 4,843 |
| * | World Acceptance Corp. | 63,639 | 4,677 |
| | First Financial Bankshares | | |
| | Inc. | 138,749 | 4,638 |
| * | First Cash Financial | | |
| | Services Inc. | 131,248 | 4,605 |
| | National Penn Bancshares | | |
| | Inc. | 541,598 | 4,571 |
| | Community Bank System | | |
| | Inc. | 162,373 | 4,514 |
| | Entertainment Properties | | |
| | Trust | 102,520 | 4,481 |
| | Prospect Capital Corp. | 481,756 | 4,475 |
| | LaSalle Hotel Properties | 182,893 | 4,428 |
| | Wintrust Financial Corp. | 156,606 | 4,393 |
| | First Financial Bancorp | 257,140 | 4,279 |
| | Selective Insurance Group | | |
| | Inc. | 237,959 | 4,219 |
| | Colonial Properties Trust | 192,273 | 4,011 |
| * | Financial Engines Inc. | 171,369 | 3,827 |
| | Glacier Bancorp Inc. | 317,499 | 3,819 |
| | | |
| | | | Market |
| | | | Value |
| | | Shares | ($000) |
| | Bank of the Ozarks Inc. | 125,220 | 3,710 |
| | DiamondRock Hospitality | | |
| | Co. | 369,085 | 3,558 |
| | Tower Group Inc. | 174,069 | 3,511 |
| | Columbia Banking System | | |
| | Inc. | 174,159 | 3,356 |
| | First Midwest Bancorp Inc. | 327,926 | 3,322 |
| | NBT Bancorp Inc. | 145,134 | 3,212 |
| * | BBCN Bancorp Inc. | 337,850 | 3,193 |
| | Healthcare Realty Trust Inc. | 170,904 | 3,177 |
| | Provident Financial | | |
| | Services Inc. | 237,139 | 3,175 |
| | Infinity Property & | | |
| | Casualty Corp. | 51,642 | 2,930 |
| | Cousins Properties Inc. | 455,899 | 2,922 |
| | PrivateBancorp Inc. Class A | 263,990 | 2,899 |
| | PacWest Bancorp | 148,603 | 2,816 |
| | Employers Holdings Inc. | 153,333 | 2,774 |
| | Boston Private Financial | | |
| | Holdings Inc. | 342,797 | 2,722 |
| | Safety Insurance Group Inc. | 67,063 | 2,715 |
| | Brookline Bancorp Inc. | 308,187 | 2,601 |
| | Sovran Self Storage Inc. | 60,774 | 2,593 |
| | Oritani Financial Corp. | 202,991 | 2,592 |
| | EastGroup Properties Inc. | 59,566 | 2,590 |
| | Independent Bank Corp. | 94,183 | 2,570 |
| | Interactive Brokers Group | | |
| | Inc. | 171,021 | 2,555 |
| | Home Bancshares Inc. | 98,108 | 2,542 |
| | First Commonwealth | | |
| | Financial Corp. | 464,453 | 2,443 |
| * | National Financial Partners | | |
| | Corp. | 180,645 | 2,442 |
| * | Pinnacle Financial Partners | | |
| | Inc. | 150,763 | 2,435 |
| | S&T Bancorp Inc. | 124,214 | 2,428 |
| | Horace Mann Educators | | |
| | Corp. | 176,304 | 2,417 |
| | Medical Properties Trust | | |
| | Inc. | 244,702 | 2,415 |
| | Meadowbrook Insurance | | |
| | Group Inc. | 222,853 | 2,380 |
| * | Forestar Group Inc. | 155,311 | 2,350 |
| | Trustco Bank Corp. NY | 412,097 | 2,312 |
| * | Navigators Group Inc. | 48,040 | 2,291 |
| | PS Business Parks Inc. | 40,647 | 2,253 |
| | City Holding Co. | 65,704 | 2,227 |
| | Lexington Realty Trust | 294,330 | 2,205 |
| | Simmons First National | | |
| | Corp. Class A | 76,331 | 2,075 |
| | LTC Properties Inc. | 66,794 | 2,061 |
| * | Encore Capital Group Inc. | 95,400 | 2,028 |
| * | Investment Technology | | |
| | Group Inc. | 178,226 | 1,927 |
| | Acadia Realty Trust | 93,357 | 1,880 |
89
Tax-Managed Small-Cap Fund
| | | |
| | | | Market |
| | | | Value |
| | | Shares | ($000) |
| * | AMERISAFE Inc. | 80,063 | 1,861 |
| | Saul Centers Inc. | 51,843 | 1,836 |
| | United Fire & Casualty Co. | 90,828 | 1,833 |
| | Franklin Street Properties | | |
| | Corp. | 158,858 | 1,581 |
| | Dime Community | | |
| | Bancshares Inc. | 125,051 | 1,576 |
| * | Piper Jaffray Cos. | 68,628 | 1,386 |
| | Tompkins Financial Corp. | 35,571 | 1,370 |
| | Inland Real Estate Corp. | 174,114 | 1,325 |
| * | eHealth Inc. | 88,074 | 1,295 |
| | Pennsylvania Real Estate | | |
| | Investment Trust | 122,730 | 1,281 |
| | Sterling Bancorp | 139,570 | 1,206 |
| | Calamos Asset | | |
| | Management Inc. Class A | 90,729 | 1,135 |
| | Universal Health Realty | | |
| | Income Trust | 28,606 | 1,116 |
| * | Hanmi Financial Corp. | 138,511 | 1,025 |
| | Stewart Information | | |
| | Services Corp. | 87,505 | 1,011 |
| * | Wilshire Bancorp Inc. | 268,556 | 975 |
| | Presidential Life Corp. | 95,515 | 954 |
| | Urstadt Biddle Properties | | |
| | Inc. Class A | 52,394 | 947 |
| | SWS Group Inc. | 131,747 | 905 |
| | Getty Realty Corp. | 59,615 | 832 |
| | Bank Mutual Corp. | 206,652 | 657 |
| | Kite Realty Group Trust | 142,768 | 644 |
| * | United Community Banks | | |
| | Inc. | 84,866 | 593 |
| | Cedar Realty Trust Inc. | 127,221 | 548 |
| | Parkway Properties Inc. | 49,359 | 487 |
| * | First BanCorp | 19,584 | 68 |
| | | | 324,896 |
| Health Care (11.2%) | | |
| * | Healthspring Inc. | 293,005 | 15,981 |
| * | Salix Pharmaceuticals Ltd. | 259,074 | 12,397 |
| * | Questcor Pharmaceuticals | | |
| | Inc. | 273,980 | 11,392 |
| * | Cubist Pharmaceuticals Inc. | 268,722 | 10,647 |
| * | Centene Corp. | 221,182 | 8,757 |
| * | Viropharma Inc. | 309,332 | 8,473 |
| * | Align Technology Inc. | 299,840 | 7,114 |
| * | Haemonetics Corp. | 109,008 | 6,673 |
| | Quality Systems Inc. | 172,384 | 6,377 |
| * | Zoll Medical Corp. | 97,077 | 6,133 |
| * | Magellan Health Services | | |
| | Inc. | 122,989 | 6,084 |
| | West Pharmaceutical | | |
| | Services Inc. | 148,497 | 5,635 |
| * | PSS World Medical Inc. | 230,141 | 5,567 |
| * | PAREXEL International | | |
| | Corp. | 260,404 | 5,401 |
| | | |
| | | | Market |
| | | | Value |
| | | Shares | ($000) |
| * | Par Pharmaceutical Cos. | | |
| | Inc. | 156,832 | 5,133 |
| | Chemed Corp. | 87,386 | 4,475 |
| * | Medicines Co. | 231,753 | 4,320 |
| * | Air Methods Corp. | 49,572 | 4,186 |
| * | MWI Veterinary Supply Inc. | 55,631 | 3,696 |
| * | Cyberonics Inc. | 108,944 | 3,650 |
| * | Amsurg Corp. Class A | 137,992 | 3,593 |
| | Meridian Bioscience Inc. | 180,956 | 3,409 |
| * | SonoSite Inc. | 61,226 | 3,298 |
| * | IPC The Hospitalist Co. Inc. | 72,083 | 3,296 |
| * | Neogen Corp. | 103,540 | 3,172 |
| * | CONMED Corp. | 121,877 | 3,129 |
| | Analogic Corp. | 53,315 | 3,056 |
| * | Molina Healthcare Inc. | 124,189 | 2,773 |
| * | Hanger Orthopedic Group | | |
| | Inc. | 147,050 | 2,748 |
| * | Kindred Healthcare Inc. | 228,726 | 2,692 |
| * | Integra LifeSciences | | |
| | Holdings Corp. | 86,602 | 2,670 |
| * | Abaxis Inc. | 94,603 | 2,618 |
| | Computer Programs & | | |
| | Systems Inc. | 49,013 | 2,505 |
| * | Merit Medical Systems Inc. | 185,548 | 2,483 |
| * | ICU Medical Inc. | 53,730 | 2,418 |
| * | Omnicell Inc. | 146,067 | 2,413 |
| * | NuVasive Inc. | 185,569 | 2,336 |
| * | Greatbatch Inc. | 103,037 | 2,277 |
| | Landauer Inc. | 41,662 | 2,146 |
| | Invacare Corp. | 140,198 | 2,144 |
| * | PharMerica Corp. | 131,059 | 1,989 |
| * | Emergent Biosolutions Inc. | 109,041 | 1,836 |
| * | Bio-Reference Labs Inc. | 110,126 | 1,792 |
| | Ensign Group Inc. | 72,579 | 1,778 |
| * | Hi-Tech Pharmacal Co. Inc. | 44,664 | 1,737 |
| | Cantel Medical Corp. | 58,713 | 1,640 |
| * | Corvel Corp. | 28,563 | 1,477 |
| * | Arqule Inc. | 238,892 | 1,347 |
| * | Symmetry Medical Inc. | 162,927 | 1,302 |
| * | Affymetrix Inc. | 310,944 | 1,272 |
| * | Amedisys Inc. | 114,846 | 1,253 |
| * | Natus Medical Inc. | 111,239 | 1,049 |
| * | SurModics Inc. | 65,088 | 954 |
| * | Cambrex Corp. | 132,274 | 950 |
| * | eResearchTechnology Inc. | 195,242 | 916 |
| * | LHC Group Inc. | 70,810 | 909 |
| * | AMN Healthcare Services | | |
| | Inc. | 181,030 | 802 |
| * | Palomar Medical | | |
| | Technologies Inc. | 85,712 | 797 |
| * | Savient Pharmaceuticals | | |
| | Inc. | 316,796 | 706 |
| * | Kensey Nash Corp. | 35,319 | 678 |
| * | Healthways Inc. | 91,601 | 628 |
| * | CryoLife Inc. | 127,380 | 611 |
90
Tax-Managed Small-Cap Fund
| | | |
| | | | Market |
| | | | Value |
| | | Shares | ($000) |
| * | Almost Family Inc. | 35,011 | 580 |
| * | Gentiva Health Services Inc. | 77,847 | 525 |
| * | Cross Country Healthcare Inc. | 80,556 | 447 |
| * | Enzo Biochem Inc. | 24,851 | 56 |
| | | | 225,298 |
| Industrials (15.3%) | | |
| | Robbins & Myers Inc. | 200,881 | 9,753 |
| * | Teledyne Technologies Inc. | 161,747 | 8,872 |
| * | Moog Inc. Class A | 197,499 | 8,676 |
| * | Old Dominion Freight Line | | |
| | Inc. | 207,132 | 8,395 |
| | Toro Co. | 134,583 | 8,164 |
| | EMCOR Group Inc. | 292,489 | 7,842 |
| | Brady Corp. Class A | 229,979 | 7,260 |
| | Curtiss-Wright Corp. | 204,691 | 7,232 |
| | AO Smith Corp. | 170,483 | 6,840 |
| | Actuant Corp. Class A | 301,370 | 6,838 |
| | Belden Inc. | 203,384 | 6,769 |
| | Applied Industrial | | |
| | Technologies Inc. | 183,231 | 6,444 |
| | Mueller Industries Inc. | 167,623 | 6,440 |
| | United Stationers Inc. | 186,258 | 6,065 |
| | Simpson Manufacturing | | |
| | Co. Inc. | 177,338 | 5,969 |
| * | Tetra Tech Inc. | 274,417 | 5,925 |
| * | EnerSys | 208,232 | 5,408 |
| * | HUB Group Inc. Class A | 164,614 | 5,338 |
| | Healthcare Services Group | | |
| | Inc. | 294,126 | 5,203 |
| | Barnes Group Inc. | 205,515 | 4,955 |
| * | Geo Group Inc. | 273,432 | 4,580 |
| * | II-VI Inc. | 240,349 | 4,413 |
| | ABM Industries Inc. | 210,797 | 4,347 |
| | Watts Water Technologies | | |
| | Inc. Class A | 126,854 | 4,340 |
| | Kaydon Corp. | 140,852 | 4,296 |
| | Knight Transportation Inc. | 257,478 | 4,027 |
| | Forward Air Corp. | 124,653 | 3,995 |
| | Unifirst Corp. | 67,552 | 3,833 |
| * | Orbital Sciences Corp. | 257,804 | 3,746 |
| | Franklin Electric Co. Inc. | 83,061 | 3,618 |
| | Heartland Express Inc. | 251,436 | 3,593 |
| * | Allegiant Travel Co. Class A | 66,355 | 3,539 |
| | Briggs & Stratton Corp. | 218,572 | 3,386 |
| | ESCO Technologies Inc. | 117,365 | 3,378 |
| | AAR Corp. | 171,584 | 3,289 |
| | Tennant Co. | 82,743 | 3,216 |
| | Kaman Corp. | 115,219 | 3,148 |
| * | Dycom Industries Inc. | 147,885 | 3,094 |
| | Cubic Corp. | 69,865 | 3,045 |
| | Lindsay Corp. | 55,416 | 3,042 |
| * | EnPro Industries Inc. | 91,313 | 3,011 |
| | Interface Inc. Class A | 254,664 | 2,939 |
| | Albany International Corp. | 123,682 | 2,859 |
| * | Ceradyne Inc. | 105,673 | 2,830 |
| | | |
| | | | Market |
| | | | Value |
| | | Shares | ($000) |
| * | Astec Industries Inc. | 87,690 | 2,824 |
| | SkyWest Inc. | 221,468 | 2,788 |
| * | SYKES Enterprises Inc. | 174,430 | 2,732 |
| * | Mobile Mini Inc. | 154,905 | 2,703 |
| | CIRCOR International Inc. | 76,115 | 2,688 |
| * | Exponent Inc. | 57,814 | 2,658 |
| | American Science & | | |
| | Engineering Inc. | 38,939 | 2,652 |
| * | Navigant Consulting Inc. | 231,945 | 2,646 |
| | Universal Forest Products | | |
| | Inc. | 85,730 | 2,646 |
| * | Aegion Corp. Class A | 170,974 | 2,623 |
| | AZZ Inc. | 55,229 | 2,510 |
| | Insperity Inc. | 97,967 | 2,483 |
| * | TrueBlue Inc. | 176,420 | 2,449 |
| | Quanex Building Products | | |
| | Corp. | 162,379 | 2,439 |
| * | Aerovironment Inc. | 77,332 | 2,434 |
| | G&K Services Inc. Class A | 82,639 | 2,406 |
| | Encore Wire Corp. | 85,233 | 2,208 |
| | Arkansas Best Corp. | 111,816 | 2,155 |
| | Resources Connection Inc. | 196,652 | 2,083 |
| | National Presto Industries | | |
| | Inc. | 21,112 | 1,976 |
| | John Bean Technologies | | |
| | Corp. | 126,612 | 1,946 |
| | Standex International Corp. | 56,170 | 1,919 |
| * | Consolidated Graphics Inc. | 39,178 | 1,891 |
| * | Gibraltar Industries Inc. | 134,828 | 1,882 |
| | Griffon Corp. | 205,393 | 1,875 |
| * | On Assignment Inc. | 162,377 | 1,815 |
| | Cascade Corp. | 38,339 | 1,808 |
| | Comfort Systems USA Inc. | 166,013 | 1,780 |
| | Heidrick & Struggles | | |
| | International Inc. | 79,721 | 1,717 |
| | Kelly Services Inc. Class A | 124,799 | 1,707 |
| | AAON Inc. | 83,307 | 1,707 |
| | Viad Corp. | 89,067 | 1,557 |
| | Apogee Enterprises Inc. | 126,495 | 1,551 |
| * | GenCorp Inc. | 264,807 | 1,409 |
| * | Powell Industries Inc. | 39,963 | 1,250 |
| | Federal Signal Corp. | 279,575 | 1,160 |
| * | Dolan Co. | 136,060 | 1,159 |
| * | NCI Building Systems Inc. | 89,420 | 972 |
| * | Orion Marine Group Inc. | 121,920 | 811 |
| | CDI Corp. | 58,412 | 807 |
| * | Lydall Inc. | 77,161 | 732 |
| | Vicor Corp. | 88,737 | 706 |
| | Lawson Products Inc. | 18,693 | 288 |
| | Standard Register Co. | 57,634 | 134 |
| | | | 306,638 |
| Information Technology (19.7%) | |
| * | Wright Express Corp. | 169,909 | 9,223 |
| * | Viasat Inc. | 185,564 | 8,558 |
| * | CommVault Systems Inc. | 190,038 | 8,118 |
91
Tax-Managed Small-Cap Fund
| | | |
| | | | Market |
| | | | Value |
| | | Shares | ($000) |
| * | Anixter International Inc. | 121,684 | 7,257 |
| * | Taleo Corp. Class A | 181,388 | 7,018 |
| * | FEI Co. | 163,992 | 6,688 |
| * | Cymer Inc. | 133,998 | 6,668 |
| | Cognex Corp. | 184,678 | 6,610 |
| * | CACI International Inc. | | |
| | Class A | 115,881 | 6,480 |
| | MKS Instruments Inc. | 229,956 | 6,397 |
| * | Microsemi Corp. | 380,867 | 6,380 |
| | MAXIMUS Inc. | 146,602 | 6,062 |
| * | Hittite Microwave Corp. | 122,534 | 6,051 |
| * | JDA Software Group Inc. | 186,567 | 6,043 |
| | j2 Global Inc. | 204,500 | 5,755 |
| * | Arris Group Inc. | 514,783 | 5,570 |
| * | Netgear Inc. | 164,549 | 5,524 |
| * | Progress Software Corp. | 279,523 | 5,409 |
| | Blackbaud Inc. | 189,190 | 5,241 |
| * | Cardtronics Inc. | 191,943 | 5,194 |
| * | Take-Two Interactive | | |
| | Software Inc. | 380,254 | 5,152 |
| * | DealerTrack Holdings Inc. | 182,071 | 4,963 |
| * | RightNow Technologies Inc. | 112,887 | 4,824 |
| * | Blue Coat Systems Inc. | 186,420 | 4,744 |
| * | Cabot Microelectronics | | |
| | Corp. | 98,469 | 4,653 |
| * | Cirrus Logic Inc. | 279,122 | 4,424 |
| | Littelfuse Inc. | 101,439 | 4,360 |
| * | Scansource Inc. | 119,396 | 4,298 |
| * | Synaptics Inc. | 140,600 | 4,239 |
| * | OSI Systems Inc. | 86,577 | 4,223 |
| | Heartland Payment | | |
| | Systems Inc. | 172,952 | 4,213 |
| * | Plexus Corp. | 151,138 | 4,138 |
| * | Sourcefire Inc. | 125,843 | 4,075 |
| | Power Integrations Inc. | 122,486 | 4,062 |
| * | GT Advanced | | |
| | Technologies Inc. | 557,789 | 4,038 |
| * | MicroStrategy Inc. Class A | 35,653 | 3,862 |
| * | Tessera Technologies Inc. | 225,005 | 3,769 |
| * | Bottomline Technologies | | |
| | Inc. | 158,370 | 3,669 |
| * | Manhattan Associates Inc. | 90,350 | 3,657 |
| * | LogMeIn Inc. | 92,853 | 3,579 |
| * | Synchronoss Technologies | | |
| | Inc. | 117,584 | 3,552 |
| * | Veeco Instruments Inc. | 170,353 | 3,543 |
| * | TriQuint Semiconductor | | |
| | Inc. | 726,340 | 3,537 |
| * | Diodes Inc. | 162,182 | 3,454 |
| * | SYNNEX Corp. | 112,586 | 3,429 |
| * | Benchmark Electronics Inc. | 252,252 | 3,398 |
| * | FARO Technologies Inc. | 73,232 | 3,369 |
| * | Liquidity Services Inc. | 88,675 | 3,272 |
| * | Brightpoint Inc. | 300,697 | 3,235 |
| * | Tyler Technologies Inc. | 107,226 | 3,229 |
| | | |
| | | | Market |
| | | | Value |
| | | Shares | ($000) |
| * | Websense Inc. | 170,926 | 3,201 |
| * | Ceva Inc. | 103,433 | 3,130 |
| | Ebix Inc. | 136,446 | 3,015 |
| * | Tekelec | 272,507 | 2,978 |
| * | comScore Inc. | 140,388 | 2,976 |
| * | Kulicke & Soffa Industries | | |
| | Inc. | 319,320 | 2,954 |
| * | Insight Enterprises Inc. | 191,602 | 2,930 |
| | Brooks Automation Inc. | 283,844 | 2,915 |
| * | Rofin-Sinar Technologies | | |
| | Inc. | 125,647 | 2,871 |
| | MTS Systems Corp. | 69,488 | 2,832 |
| * | Stratasys Inc. | 92,890 | 2,825 |
| * | Ultratech Inc. | 113,873 | 2,798 |
| * | ATMI Inc. | 139,682 | 2,798 |
| * | Volterra Semiconductor | | |
| | Corp. | 107,777 | 2,760 |
| * | Netscout Systems Inc. | 152,621 | 2,686 |
| * | Rogers Corp. | 70,935 | 2,615 |
| * | LivePerson Inc. | 208,118 | 2,612 |
| * | Standard Microsystems | | |
| | Corp. | 100,327 | 2,585 |
| * | Harmonic Inc. | 511,226 | 2,577 |
| | Comtech | | |
| | Telecommunications Corp. | 89,596 | 2,564 |
| * | Higher One Holdings Inc. | 137,738 | 2,540 |
| * | Monotype Imaging | | |
| | Holdings Inc. | 158,832 | 2,476 |
| * | TTM Technologies Inc. | 225,776 | 2,475 |
| * | Digital River Inc. | 164,241 | 2,467 |
| | OPNET | 65,232 | 2,392 |
| | Park Electrochemical Corp. | 91,025 | 2,332 |
| * | Newport Corp. | 165,303 | 2,250 |
| * | Forrester Research Inc. | 65,259 | 2,215 |
| | Micrel Inc. | 218,977 | 2,214 |
| | Black Box Corp. | 78,784 | 2,209 |
| * | CSG Systems International | | |
| | Inc. | 149,909 | 2,205 |
| | United Online Inc. | 392,039 | 2,133 |
| * | iGate Corp. | 132,855 | 2,090 |
| * | Advanced Energy | | |
| | Industries Inc. | 193,230 | 2,073 |
| * | DTS Inc. | 73,343 | 1,998 |
| * | Checkpoint Systems Inc. | 179,146 | 1,960 |
| * | Monolithic Power Systems | | |
| | Inc. | 129,896 | 1,958 |
| | Badger Meter Inc. | 66,471 | 1,956 |
| * | Entropic Communications | | |
| | Inc. | 381,028 | 1,947 |
| * | Measurement Specialties | | |
| | Inc. | 66,534 | 1,860 |
| * | InfoSpace Inc. | 168,301 | 1,850 |
| * | Super Micro Computer Inc. | 116,924 | 1,833 |
| * | Mercury Computer | | |
| | Systems Inc. | 136,167 | 1,810 |
92
Tax-Managed Small-Cap Fund
| | | |
| | | | Market |
| | | | Value |
| | | Shares | ($000) |
| * | TeleTech Holdings Inc. | 111,189 | 1,801 |
| | EPIQ Systems Inc. | 141,721 | 1,703 |
| * | Electro Scientific Industries | | |
| | Inc. | 108,342 | 1,569 |
| | Daktronics Inc. | 161,814 | 1,549 |
| * | Intermec Inc. | 225,627 | 1,548 |
| * | Interactive Intelligence | | |
| | Group Inc. | 63,408 | 1,453 |
| * | Stamps.com Inc. | 55,516 | 1,451 |
| * | Oplink Communications Inc. | 85,222 | 1,404 |
| | CTS Corp. | 152,344 | 1,402 |
| * | Nanometrics Inc. | 75,116 | 1,384 |
| | Methode Electronics Inc. | 166,320 | 1,379 |
| * | Perficient Inc. | 136,497 | 1,366 |
| * | Rudolph Technologies Inc. | 142,739 | 1,322 |
| * | Exar Corp. | 201,017 | 1,307 |
| * | Digi International Inc. | 113,311 | 1,265 |
| | Cohu Inc. | 108,576 | 1,232 |
| * | CIBER Inc. | 319,255 | 1,232 |
| * | Virtusa Corp. | 82,699 | 1,197 |
| * | Kopin Corp. | 299,634 | 1,163 |
| * | STR Holdings Inc. | 140,885 | 1,159 |
| * | XO Group Inc. | 125,946 | 1,050 |
| * | Symmetricom Inc. | 190,196 | 1,025 |
| * | Supertex Inc. | 54,298 | 1,025 |
| * | Sigma Designs Inc. | 143,028 | 858 |
| | Bel Fuse Inc. Class B | 45,490 | 853 |
| * | Pericom Semiconductor | | |
| | Corp. | 109,399 | 833 |
| * | Avid Technology Inc. | 97,459 | 831 |
| * | Intevac Inc. | 102,967 | 762 |
| * | Rubicon Technology Inc. | 79,206 | 744 |
| | PC-Tel Inc. | 85,128 | 582 |
| * | DSP Group Inc. | 105,722 | 551 |
| * | Agilysys Inc. | 68,719 | 546 |
| | Pulse Electronics Corp. | 189,288 | 530 |
| * | Radisys Corp. | 103,730 | 525 |
| * | Novatel Wireless Inc. | 145,482 | 455 |
| * | THQ Inc. | 308,692 | 235 |
| * | NCI Inc. Class A | 14,016 | 163 |
| | | | 394,525 |
| Materials (5.0%) | | |
| | Buckeye Technologies Inc. | 172,147 | 5,757 |
| | Balchem Corp. | 127,052 | 5,151 |
| | Eagle Materials Inc. | 197,245 | 5,061 |
| | HB Fuller Co. | 215,973 | 4,991 |
| | Schweitzer-Mauduit | | |
| | International Inc. | 70,872 | 4,710 |
| | PolyOne Corp. | 396,322 | 4,578 |
| | AK Steel Holding Corp. | 484,735 | 4,004 |
| * | Calgon Carbon Corp. | 249,318 | 3,917 |
| | Texas Industries Inc. | 123,111 | 3,789 |
| * | Clearwater Paper Corp. | 99,761 | 3,552 |
| | | |
| | | | Market |
| | | | Value |
| | | Shares | ($000) |
| | Kaiser Aluminum Corp. | 69,785 | 3,202 |
| * | OM Group Inc. | 142,485 | 3,190 |
| | Koppers Holdings Inc. | 90,805 | 3,120 |
| * | RTI International Metals Inc. | 133,685 | 3,103 |
| | AMCOL International Corp. | 109,890 | 2,951 |
| | Stepan Co. | 36,486 | 2,925 |
| | Haynes International Inc. | 53,279 | 2,909 |
| | Deltic Timber Corp. | 47,698 | 2,880 |
| * | Kraton Performance | | |
| | Polymers Inc. | 140,746 | 2,857 |
| | A Schulman Inc. | 128,326 | 2,718 |
| * | KapStone Paper and | | |
| | Packaging Corp. | 172,115 | 2,709 |
| | Tredegar Corp. | 103,323 | 2,296 |
| * | LSB Industries Inc. | 81,423 | 2,282 |
| | Quaker Chemical Corp. | 56,829 | 2,210 |
| * | Materion Corp. | 90,193 | 2,190 |
| * | Century Aluminum Co. | 238,665 | 2,031 |
| | Myers Industries Inc. | 146,259 | 1,805 |
| | Wausau Paper Corp. | 217,944 | 1,800 |
| | Neenah Paper Inc. | 66,737 | 1,490 |
| | Hawkins Inc. | 39,500 | 1,456 |
| | American Vanguard Corp. | 103,449 | 1,380 |
| | Zep Inc. | 98,394 | 1,376 |
| | Olympic Steel Inc. | 41,054 | 957 |
| * | AM Castle & Co. | 75,467 | 714 |
| * | Headwaters Inc. | 276,738 | 614 |
| | | | 100,675 |
| Telecommunication Services (0.6%) | |
| * | Cincinnati Bell Inc. | 854,963 | 2,591 |
| | Atlantic Tele-Network Inc. | 40,961 | 1,599 |
| * | General Communication | | |
| | Inc. Class A | 152,272 | 1,491 |
| | USA Mobility Inc. | 99,413 | 1,379 |
| | NTELOS Holdings Corp. | 66,838 | 1,362 |
| * | Neutral Tandem Inc. | 102,089 | 1,091 |
| | Lumos Networks Corp. | 66,839 | 1,025 |
| * | Cbeyond Inc. | 94,863 | 760 |
| | | | 11,298 |
| Utilities (4.6%) | | |
| | Piedmont Natural Gas Co. | | |
| | Inc. | 316,491 | 10,754 |
| | New Jersey Resources | | |
| | Corp. | 182,151 | 8,962 |
| | Southwest Gas Corp. | 201,493 | 8,561 |
| | UIL Holdings Corp. | 221,197 | 7,824 |
| | South Jersey Industries Inc. | 131,857 | 7,491 |
| | Avista Corp. | 256,060 | 6,593 |
| | El Paso Electric Co. | 175,771 | 6,089 |
| | Unisource Energy Corp. | 161,938 | 5,979 |
| | Allete Inc. | 141,429 | 5,937 |
| | NorthWestern Corp. | 159,037 | 5,692 |
| | Northwest Natural Gas Co. | 117,165 | 5,616 |
93
Tax-Managed Small-Cap Fund
| | |
| | | Market |
| | | Value |
| | Shares | ($000) |
| Laclede Group Inc. | 98,399 | 3,982 |
| CH Energy Group Inc. | 64,981 | 3,794 |
| American States Water Co. | 82,518 | 2,880 |
| Central Vermont Public | | |
| Service Corp. | 59,439 | 2,086 |
| | | 92,240 |
| Total Investments (100.0%) | | |
| (Cost $1,584,662) | | 2,005,568 |
| Other Assets and Liabilities (0.0%) | |
| Other Assets | | 9,741 |
| Liabilities | | (9,675) |
| | | 66 |
| Net Assets (100%) | | 2,005,634 |
| |
| At December 31, 2011, net assets consisted of: |
| | Amount |
| | ($000) |
| Paid-in Capital | 1,624,517 |
| Overdistributed Net Investment Income | (2,888) |
| Accumulated Net Realized Losses | (36,901) |
| Unrealized Appreciation (Depreciation) | 420,906 |
| Net Assets | 2,005,634 |
| |
| Admiral Shares—Net Assets | |
| Applicable to 68,114,898 outstanding | |
| $.001 par value shares of beneficial | |
| interest (unlimited authorization) | 1,857,115 |
| Net Asset Value Per Share— | |
| Admiral Shares | $27.26 |
| |
| Institutional Shares—Net Assets | |
| Applicable to 5,433,565 outstanding | |
| $.001 par value shares of beneficial | |
| interest (unlimited authorization) | 148,519 |
| Net Asset Value Per Share— | |
| Institutional Shares | $27.33 |
See Note A in Notes to Financial Statements.
* Non-income-producing security.
1 Considered an affiliated company of the fund as the issuer is another member of The Vanguard Group. REIT—Real Estate Investment Trust.
See accompanying Notes, which are an integral part of the Financial Statements.
94
Tax-Managed Small-Cap Fund
| |
| Statement of Operations | |
| |
| | Year Ended |
| | December 31, 2011 |
| | ($000) |
| Investment Income | |
| Income | |
| Dividends1 | 20,334 |
| Interest1 | 5 |
| Total Income | 20,339 |
| Expenses | |
| The Vanguard Group—Note B | |
| Investment Advisory Services | 146 |
| Management and Administrative—Admiral Shares | 1,584 |
| Management and Administrative—Institutional Shares | 60 |
| Marketing and Distribution—Admiral Shares | 424 |
| Marketing and Distribution—Institutional Shares | 41 |
| Custodian Fees | 61 |
| Auditing Fees | 28 |
| Shareholders’ Reports—Admiral Shares | 19 |
| Shareholders’ Reports—Institutional Shares | — |
| Trustees’ Fees and Expenses | 2 |
| Total Expenses | 2,365 |
| Net Investment Income | 17,974 |
| Realized Net Gain (Loss) on Investment Securities Sold1 | 103,170 |
| Change in Unrealized Appreciation (Depreciation) of Investment Securities | (94,648) |
| Net Increase (Decrease) in Net Assets Resulting from Operations | 26,496 |
1 Dividend income, interest income, and realized net gain (loss) from affiliated companies of the fund were $683,000, $4,000, and $5,666,000, respectively.
See accompanying Notes, which are an integral part of the Financial Statements.
95
Tax-Managed Small-Cap Fund
| | |
| Statement of Changes in Net Assets | | |
| |
| | Year Ended December 31, |
| | 2011 | 2010 |
| | ($000) | ($000) |
| Increase (Decrease) in Net Assets | | |
| Operations | | |
| Net Investment Income | 17,974 | 17,282 |
| Realized Net Gain (Loss) | 103,170 | 81,408 |
| Change in Unrealized Appreciation (Depreciation) | (94,648) | 320,986 |
| Net Increase (Decrease) in Net Assets Resulting from Operations | 26,496 | 419,676 |
| Distributions | | |
| Net Investment Income | | |
| Admiral Shares1 | (16,493) | (16,144) |
| Institutional Shares | (1,326) | (1,390) |
| Realized Capital Gain | | |
| Admiral Shares1 | — | — |
| Institutional Shares | — | — |
| Total Distributions | (17,819) | (17,534) |
| Capital Share Transactions | | |
| Admiral Shares1 | (28,775) | (22,404) |
| Institutional Shares | (862) | 20,389 |
| Net Increase (Decrease) from Capital Share Transactions | (29,637) | (2,015) |
| Total Increase (Decrease) | (20,960) | 400,127 |
| Net Assets | | |
| Beginning of Period | 2,026,594 | 1,626,467 |
| End of Period2 | 2,005,634 | 2,026,594 |
1 Investor Shares were renamed Admiral Shares as of the close of business on May 13, 2011. Prior period’s Distributions and Capital Share Transactions are for the Investor class.
2 Net Assets—End of Period includes undistributed (overdistributed) net investment income of ($2,888,000) and ($3,043,000).
See accompanying Notes, which are an integral part of the Financial Statements.
96
Tax-Managed Small-Cap Fund
Financial Highlights
| | | | | |
| Admiral Shares | | | | | |
| |
| For a Share Outstanding | | | Year Ended December 31, |
| Throughout Each Period | 2011 | 2010 | 2009 | 2008 | 2007 |
| Net Asset Value, Beginning of Period | $27.17 | $21.75 | $17.44 | $25.62 | $25.72 |
| Investment Operations | | | | | |
| Net Investment Income | .245 | .231 | .146 | .266 | .229 |
| Net Realized and Unrealized Gain (Loss) | | | | | |
| on Investments1 | .089 | 5.424 | 4.316 | (8.174) | (.097) |
| Total from Investment Operations | .334 | 5.655 | 4.462 | (7.908) | .132 |
| Distributions | | | | | |
| Dividends from Net Investment Income | (.244) | (.235) | (.152) | (.272) | (.232) |
| Distributions from Realized Capital Gains | — | — | — | — | — |
| Total Distributions | (.244) | (.235) | (.152) | (.272) | (.232) |
| Net Asset Value, End of Period | $27.26 | $27.17 | $21.75 | $17.44 | $25.62 |
| |
| Total Return2 | 1.22% | 25.99% | 25.59% | -30.82% | 0.51% |
| |
| Ratios/Supplemental Data | | | | | |
| Net Assets, End of Period (Millions) | $1,857 | $1,879 | $1,527 | $1,258 | $1,793 |
| Ratio of Total Expenses to | | | | | |
| Average Net Assets | 0.12% | 0.18% | 0.19% | 0.14% | 0.13% |
| Ratio of Net Investment Income to | | | | | |
| Average Net Assets | 0.88% | 0.98% | 0.79% | 1.16% | 0.86% |
| Portfolio Turnover Rate3 | 40% | 46% | 37% | 32% | 53% |
Investor Shares were renamed Admiral Shares as of the close of business on May 13, 2011. Prior periods’ Financial Highlights are for the Investor class.
1 Includes increases from redemption fees of $0.00, $0.00, $0.01, $0.01, and $0.01.
2 Total returns do not include transaction or account service fees that may have applied in the periods shown. Fund prospectuses provide information about any applicable transaction and account service fees.
3 Excludes the value of portfolio securities received or delivered as a result of in-kind purchases or redemptions of the fund’s capital shares.
See accompanying Notes, which are an integral part of the Financial Statements.
97
Tax-Managed Small-Cap Fund
Financial Highlights
| | | | | |
| Institutional Shares | | | | | |
| |
| For a Share Outstanding | | | Year Ended December 31, |
| Throughout Each Period | 2011 | 2010 | 2009 | 2008 | 2007 |
| Net Asset Value, Beginning of Period | $27.23 | $21.80 | $17.47 | $25.66 | $25.77 |
| Investment Operations | | | | | |
| Net Investment Income | .257 | .257 | .161 | .275 | .242 |
| Net Realized and Unrealized Gain (Loss) | | | | | |
| on Investments1 | .088 | 5.432 | 4.337 | (8.184) | (.108) |
| Total from Investment Operations | .345 | 5.689 | 4.498 | (7.909) | .134 |
| Distributions | | | | | |
| Dividends from Net Investment Income | (.245) | (.259) | (.168) | (.281) | (.244) |
| Distributions from Realized Capital Gains | — | — | — | — | — |
| Total Distributions | (.245) | (.259) | (.168) | (.281) | (.244) |
| Net Asset Value, End of Period | $27.33 | $27.23 | $21.80 | $17.47 | $25.66 |
| |
| Total Return2 | 1.26% | 26.09% | 25.75% | -30.77% | 0.51% |
| |
| Ratios/Supplemental Data | | | | | |
| Net Assets, End of Period (Millions) | $149 | $147 | $99 | $102 | $171 |
| Ratio of Total Expenses to | | | | | |
| Average Net Assets | 0.08% | 0.08% | 0.09% | 0.09% | 0.09% |
| Ratio of Net Investment Income to | | | | | |
| Average Net Assets | 0.92% | 1.08% | 0.89% | 1.21% | 0.90% |
| Portfolio Turnover Rate3 | 40% | 46% | 37% | 32% | 53% |
1 Includes increases from redemption fees of $0.00, $0.00, $0.02, $0.01, and $0.01.
2 Total returns do not include transaction fees that may have applied in the periods shown. Fund prospectuses provide information about any applicable transaction fees.
3 Excludes the value of portfolio securities received or delivered as a result of in-kind purchases or redemptions of the fund’s capital shares.
See accompanying Notes, which are an integral part of the Financial Statements.
98
Tax-Managed Small-Cap Fund
Notes to Financial Statements
Vanguard Tax-Managed Small-Cap Fund is registered under the Investment Company Act of 1940 as an open-end investment company, or mutual fund. The fund offers two classes of shares: Admiral Shares and Institutional Shares. Admiral Shares are available to any investor who meets the fund’s minimum purchase requirements. Institutional Shares are designed for investors who meet certain administrative, service, and account-size criteria. Prior to May 14, 2011, the fund offered Investor Shares. Effective at the close of business on May 13, 2011, Investor Shares were renamed Admiral Shares.
A. The following significant accounting policies conform to generally accepted accounting principles for U.S. mutual funds. The fund consistently follows such policies in preparing its financial statements.
1. Security Valuation: Securities are valued as of the close of trading on the New York Stock Exchange (generally 4 p.m., Eastern time) on the valuation date. Equity securities are valued at the latest quoted sales prices or official closing prices taken from the primary market in which each security trades; such securities not traded on the valuation date are valued at the mean of the latest quoted bid and asked prices. Securities for which market quotations are not readily available, or whose values have been materially affected by events occurring before the fund’s pricing time but after the close of the securities’ primary markets, are valued by methods deemed by the board of trustees to represent fair value. Investments in Vanguard Market Liquidity Fund are valued at that fund’s net asset value.
2. Federal Income Taxes: The fund intends to continue to qualify as a regulated investment company and distribute all of its taxable income. Management has analyzed the fund’s tax positions taken for all open federal income tax years (December 31, 2008–2011), and has concluded that no provision for federal income tax is required in the fund’s financial statements.
3. Distributions: Distributions to shareholders are recorded on the ex-dividend date.
4. Other: Dividend income is recorded on the ex-dividend date. Interest income includes income distributions received from Vanguard Market Liquidity Fund and is accrued daily. Security transactions are accounted for on the date securities are bought or sold. Costs used to determine realized gains (losses) on the sale of investment securities are those of the specific securities sold. Fees assessed on redemptions of capital shares are credited to paid-in capital.
Each class of shares has equal rights as to assets and earnings, except that each class separately bears certain class-specific expenses related to maintenance of shareholder accounts (included in Management and Administrative expenses) and shareholder reporting. Marketing and distribution expenses are allocated to each class of shares based on a method approved by the board of trustees. Income, other non-class-specific expenses, and gains and losses on investments are allocated to each class of shares based on its relative net assets.
B. The Vanguard Group furnishes at cost investment advisory, corporate management, administrative, marketing, and distribution services. The costs of such services are allocated to the fund under methods approved by the board of trustees. The fund has committed to provide up to 0.40% of its net assets in capital contributions to Vanguard. At December 31, 2011, the fund had contributed capital of $323,000 to Vanguard (included in Other Assets), representing 0.02% of the fund’s net assets and 0.13% of Vanguard’s capitalization. The fund’s trustees and officers are also directors and officers of Vanguard.
99
Tax-Managed Small-Cap Fund
C. Various inputs may be used to determine the value of the fund’s investments. These inputs are summarized in three broad levels for financial statement purposes. The inputs or methodologies used to value securities are not necessarily an indication of the risk associated with investing in those securities.
Level 1—Quoted prices in active markets for identical securities.
Level 2—Other significant observable inputs (including quoted prices for similar securities, interest rates, prepayment speeds, credit risk, etc.).
Level 3—Significant unobservable inputs (including the fund’s own assumptions used to determine the fair value of investments).
At December 31, 2011, 100% of the market value of the fund’s investments was based on Level 1 inputs.
D. Distributions are determined on a tax basis and may differ from net investment income and realized capital gains for financial reporting purposes. Differences may be permanent or temporary. Permanent differences are reclassified among capital accounts in the financial statements to reflect their tax character. Temporary differences arise when certain items of income, expense, gain, or loss are recognized in different periods for financial statement and tax purposes; these differences will reverse at some time in the future. Differences in classification may also result from the treatment of short-term gains as ordinary income for tax purposes.
During the year ended December 31, 2011, the fund realized $40,945,000 of net capital gains resulting from in-kind redemptions—in which shareholders exchanged fund shares for securities held by the fund rather than for cash. Because such gains are not taxable to the fund, and are not distributed to shareholders, they have been reclassified from accumulated net realized losses to paid-in capital.
For tax purposes, at December 31, 2011, the fund had $151,000 of ordinary income available for distribution. The fund had available capital loss carryforwards totaling $33,436,000 to offset future net capital gains through December 31, 2017.
At December 31, 2011, the cost of investment securities for tax purposes was $1,588,126,000. Net unrealized appreciation of investment securities for tax purposes was $417,442,000, consisting of unrealized gains of $509,467,000 on securities that had risen in value since their purchase and $92,025,000 in unrealized losses on securities that had fallen in value since their purchase.
E. During the year ended December 31, 2011, the fund purchased $890,455,000 of investment securities and sold $919,032,000 of investment securities, other than temporary cash investments.
100
Tax-Managed Small-Cap Fund
F. Capital share transactions for each class of shares were:
| | | | |
| | | | Year Ended December 31, |
| | | 2011 | | 2010 |
| | Amount | Shares | Amount | Shares |
| | ($000) | (000) | ($000) | (000) |
| Admiral Shares1 | | | | |
| Issued | 106,650 | 3,914 | 105,382 | 4,463 |
| Issued in Lieu of Cash Distributions | 13,005 | 472 | 13,025 | 475 |
| Redeemed2 | (148,430) | (5,445) | (140,811) | (5,969) |
| Net Increase (Decrease)—Admiral Shares | (28,775) | (1,059) | (22,404) | (1,031) |
| Institutional Shares | | | | |
| Issued | 73,943 | 2,772 | 59,059 | 2,276 |
| Issued in Lieu of Cash Distributions | 748 | 27 | 824 | 30 |
| Redeemed2 | (75,553) | (2,768) | (39,494) | (1,462) |
| Net Increase (Decrease)—Institutional Shares | (862) | 31 | 20,389 | 844 |
1 Investor Shares were renamed Admiral Shares as of the close of business on May 13, 2011. Prior period’s capital share transactions are for the Investor class.
2 Net of redemption fees for fiscal 2011 and 2010 of $105,000 and $339,000, respectively (fund totals). Effective April 28, 2011, the redemption fee was eliminated.
G. In preparing the financial statements as of December 31, 2011, management considered the impact of subsequent events for potential recognition or disclosure in these financial statements.
101
Report of Independent Registered Public Accounting Firm
To the Trustees of Vanguard Tax-Managed Funds and the Shareholders of Vanguard Tax-Managed Balanced Fund, Vanguard Tax-Managed Growth and Income Fund, Vanguard Tax-Managed Capital Appreciation Fund and Vanguard Tax-Managed Small-Cap Fund: In our opinion, the accompanying statements of net assets and the related statements of operations and of changes in net assets and the financial highlights present fairly, in all material respects, the financial position of Vanguard Tax-Managed Balanced Fund, Vanguard Tax-Managed Growth and Income Fund, Vanguard Tax-Managed Capital Appreciation Fund and Vanguard Tax-Managed Small-Cap Fund (constituting separate portfolios of Vanguard Tax-Managed Funds, hereafter referred to as the “Funds”) at December 31, 2011, the results of each of their operations for the year then ended, the changes in each of their net assets for each of the two years in the period then ended and the financial highlights for each of the periods indicated, in conformity with accounting principles generally accepted in the United States of America. These financial statements and financial highlights (hereafter referred to as “financial statements”) are the responsibility of the Funds’ management; our responsibility is to express an opinion on these financial statements based on our audits. We conducted our audits of these financial statements in accordance with the standards of the Public Company Accounting Oversight Board (United States). Those standards require that we plan and perform the audit to obtain reasonable assurance about whether the financial statements are free of material misstatement. An audit includes examining, on a test basis, evidence supporting the amounts and disclosures in the financial statements, assessing the accounting principles used and significant estimates made by management, and evaluating the overall financial statement presentation.
We believe that our audits, which included confirmation of securities at December 31, 2011 by correspondence with the custodian and by agreement to the underlying ownership records of Vanguard Market Liquidity Fund, provide a reasonable basis for our opinion.
PricewaterhouseCoopers LLP
Philadelphia, Pennsylvania
February 15, 2012
102
Special 2011 tax information (unaudited) for Vanguard Tax-Managed Funds
This information for the fiscal year ended December 31, 2011, is included pursuant to provisions of the Internal Revenue Code.
The Tax-Managed Balanced Fund designates 69.77% of its income dividends as exempt-interest dividends.
The funds distributed qualified dividend income to shareholders during the fiscal year as follows:
| |
| | Qualified Dividend Income |
| Fund | ($000) |
| Tax-Managed Balanced Fund | 5,832 |
| Tax-Managed Growth and Income Fund | 44,959 |
| Tax-Managed Capital Appreciation Fund | 61,277 |
| Tax-Managed Small-Cap Fund | 17,819 |
For corporate shareholders, the percentage of investment income (dividend income plus short-term gains, if any) that qualifies for the dividends-received deduction is as follows:
| |
| Fund | Percentage |
| Tax-Managed Balanced Fund | 99.6%1 |
| Tax-Managed Growth and Income Fund | 100.0 |
| Tax-Managed Capital Appreciation Fund | 100.0 |
| Tax-Managed Small-Cap Fund | 93.1 |
| 1 The percentage applies only to the taxable ordinary income that has been reported on Form 1099-DIV. |
103
Your Fund’s After-Tax Returns
This table presents returns for your fund both before and after taxes. The after-tax returns are shown in two ways: (1) assuming that an investor owned the fund during the entire period and paid taxes on the fund’s distributions, and (2) assuming that an investor paid taxes on the fund’s distributions and sold all shares at the end of each period.
Calculations are based on the highest individual federal income tax and capital gains tax rates in effect at the times of the distributions and the hypothetical sales. State and local taxes were not considered. After-tax returns reflect any qualified dividend income. (In the example, returns after the sale of fund shares may be higher than those assuming no sale. This occurs when the sale would have produced a capital loss. The calculation assumes that the investor received a tax deduction for the loss.) The table shows returns for Admiral Shares only; returns for other share classes will differ. Please note that your actual after-tax returns will depend on your tax situation and may differ from those shown. Also note that if you own the fund in a tax-deferred account, such as an individual retirement account or a 401(k) plan, this information does not apply to you. Such accounts are not subject to current taxes. Finally, keep in mind that a fund’s performance—whether before or after taxes—does not guarantee future results.
| | | |
| Average Annual Total Returns: Tax-Managed Funds | | | |
| Periods Ended December 31, 2011 | | | |
| | One | Five | Ten |
| | Year | Years | Years |
| Tax-Managed Balanced Fund | | | |
| Returns Before Taxes | 5.58% | 3.36% | 4.63% |
| Returns After Taxes on Distributions | 5.46 | 3.23 | 4.50 |
| Returns After Taxes on Distributions and Sale of Fund Shares | 4.42 | 3.14 | 4.26 |
| |
| | One | Five | Ten |
| | Year | Years | Years |
| Tax-Managed Growth and Income Fund Admiral Shares | | | |
| Returns Before Taxes | 2.00% | -0.28% | 2.92% |
| Returns After Taxes on Distributions | 1.71 | -0.59 | 2.59 |
| Returns After Taxes on Distributions and Sale of Fund Shares | 1.70 | -0.26 | 2.45 |
| |
| | One | Five | Ten |
| | Year | Years | Years |
| Tax-Managed Capital Appreciation Fund Admiral Shares | | | |
| Returns Before Taxes | 1.38% | 0.12% | 3.40% |
| Returns After Taxes on Distributions | 1.12 | -0.15 | 3.15 |
| Returns After Taxes on Distributions and Sale of Fund Shares | 1.24 | 0.07 | 2.90 |
104
| | | |
| | One | Five | Ten |
| Average Annual Total Returns: Tax-Managed Funds | Year | Years | Years |
| Periods Ended December 31, 2011 | | | |
| Tax-Managed Small-Cap Fund Admiral Shares | | | |
| Returns Before Taxes | 1.22% | 2.18% | 7.14% |
| Returns After Taxes on Distributions | 1.09 | 2.02 | 6.98 |
| Returns After Taxes on Distributions and Sale of Fund Shares | 0.97 | 1.83 | 6.26 |
105
About Your Fund’s Expenses
As a shareholder of the fund, you incur ongoing costs, which include costs for portfolio management, administrative services, and shareholder reports (like this one), among others. Operating expenses, which are deducted from a fund’s gross income, directly reduce the investment return of the fund.
A fund’s expenses are expressed as a percentage of its average net assets. This figure is known as the expense ratio. The following examples are intended to help you understand the ongoing costs (in dollars) of investing in your fund and to compare these costs with those of other mutual funds. The examples are based on an investment of $1,000 made at the beginning of the period shown and held for the entire period.
The accompanying table illustrates your fund’s costs in two ways:
• Based on actual fund return. This section helps you to estimate the actual expenses that you paid over the period. The ”Ending Account Value“ shown is derived from the fund‘s actual return, and the third column shows the dollar amount that would have been paid by an investor who started with $1,000 in the fund. You may use the information here, together with the amount you invested, to estimate the expenses that you paid over the period.
To do so, simply divide your account value by $1,000 (for example, an $8,600 account value divided by $1,000 = 8.6), then multiply the result by the number given for your fund under the heading ”Expenses Paid During Period.“
• Based on hypothetical 5% yearly return. This section is intended to help you compare your fund‘s costs with those of other mutual funds. It assumes that the fund had a yearly return of 5% before expenses, but that the expense ratio is unchanged. In this case—because the return used is not the fund’s actual return—the results do not apply to your investment. The example is useful in making comparisons because the Securities and Exchange Commission requires all mutual funds to calculate expenses based on a 5% return. You can assess your fund’s costs by comparing this hypothetical example with the hypothetical examples that appear in shareholder reports of other funds.
Note that the expenses shown in the table are meant to highlight and help you compare ongoing costs only and do not reflect transaction costs incurred by the fund for buying and selling securities. Further, the expenses do not include any purchase, redemption, or account service fees described in the fund prospectus. If such fees were applied to your account, your costs would be higher. Your fund does not carry a “sales load.”
The calculations assume no shares were bought or sold during the period. Your actual costs may have been higher or lower, depending on the amount of your investment and the timing of any purchases or redemptions.
You can find more information about the fund’s expenses, including annual expense ratios, in the Financial Statements section of this report. For additional information on operating expenses and other shareholder costs, please refer to your fund’s current prospectus.
106
| | | |
| Six Months Ended December 31, 2011 | | | |
| | Beginning | Ending | Expenses |
| | Account Value | Account Value | Paid During |
| | 6/30/2011 | 12/31/2011 | Period |
| Based on Actual Fund Return | | | |
| Tax-Managed Balanced Fund | $1,000.00 | $1,003.31 | $0.56 |
| Tax-Managed Growth and Income Fund | | | |
| Admiral Shares | $1,000.00 | $962.53 | $0.59 |
| Institutional Shares | 1,000.00 | 962.81 | 0.40 |
| Tax-Managed Capital Appreciation Fund | | | |
| Admiral Shares | $1,000.00 | $952.02 | $0.59 |
| Institutional Shares | 1,000.00 | 952.19 | 0.39 |
| Tax-Managed Small-Cap Fund | | | |
| Admiral Shares | $1,000.00 | $940.16 | $0.49 |
| Institutional Shares | 1,000.00 | 940.30 | 0.39 |
| Based on Hypothetical 5% Yearly Return | | | |
| Tax-Managed Balanced Fund | $1,000.00 | $1024.65 | $0.56 |
| Tax-Managed Growth and Income Fund | | | |
| Admiral Shares | $1,000.00 | $1,024.60 | $0.61 |
| Institutional Shares | 1,000.00 | 1,024.80 | 0.41 |
| Tax-Managed Capital Appreciation Fund | | | |
| Admiral Shares | $1,000.00 | $1,024.60 | $0.61 |
| Institutional Shares | 1,000.00 | 1,024.80 | 0.41 |
| Tax-Managed Small-Cap Fund | | | |
| Admiral Shares | $1,000.00 | $1,024.70 | $0.51 |
| Institutional Shares | 1,000.00 | 1,024.80 | 0.41 |
The calculations are based on expenses incurred in the most recent six-month period. The funds’ annualized six-month expense ratios for that period are: for the Tax-Managed Balanced Fund, 0.11%; for the Tax-Managed Growth and Income Fund, 0.12% for Admiral Shares and 0.08% for Institutional Shares; for the Tax-Managed Capital Appreciation Fund, 0.12% for Admiral Shares and 0.08% for Institutional Shares; and for the Tax-Managed Small-Cap Fund, 0.10% for Admiral Shares and 0.08% for Institutional Shares. The dollar amounts shown as “Expenses Paid” are equal to the annualized expense ratio multiplied by the average account value over the period, multiplied by the number of days in the most recent six-month period, then divided by the number of days in the most recent 12-month period.
107
Glossary
30-Day SEC Yield. A fund’s 30-day SEC yield is derived using a formula specified by the U.S. Securities and Exchange Commission. Under the formula, data related to the fund’s security holdings in the previous 30 days are used to calculate the fund’s hypothetical net income for that period, which is then annualized and divided by the fund’s estimated average net assets over the calculation period. For the purposes of this calculation, a security’s income is based on its current market yield to maturity (for bonds), its actual income (for asset-backed securities), or its projected dividend yield (for stocks). Because the SEC yield represents hypothetical annualized income, it will differ—at times significantly—from the fund’s actual experience. As a result, the fund’s income distributions may be higher or lower than implied by the SEC yield.
Average Coupon. The average interest rate paid on the fixed income securities held by a fund. It is expressed as a percentage of face value.
Average Duration. An estimate of how much the value of the bonds held by a fund will fluctuate in response to a change in interest rates. To see how the value could change, multiply the average duration by the change in rates. If interest rates rise by 1 percentage point, the value of the bonds in a fund with an average duration of five years would decline by about 5%. If rates decrease by a percentage point, the value would rise by 5%.
Average Effective Maturity. The average length of time until fixed income securities held by a fund reach maturity and are repaid, taking into consideration the possibility that the issuer may call the bond before its maturity date. The figure reflects the proportion of fund assets represented by each security; it also reflects any futures contracts held. In general, the longer the average effective maturity, the more a fund’s share price will fluctuate in response to changes in market interest rates.
Beta. A measure of the magnitude of a fund’s past share-price fluctuations in relation to the ups and downs of a given market index. The index is assigned a beta of 1.00. Compared with a given index, a fund with a beta of 1.20 typically would have seen its share price rise or fall by 12% when the index rose or fell by 10%. For this report, beta is based on returns over the past 36 months for both the fund and the index. Note that a fund’s beta should be reviewed in conjunction with its R-squared (see definition). The lower the R-squared, the less correlation there is between the fund and the index, and the less reliable beta is as an indicator of volatility.
Credit Quality. For Vanguard tax-exempt bond funds, credit-quality ratings are measured on a scale that generally ranges from AAA (highest) to D (lowest). “Not Rated” is used to classify securities for which a rating is not available. Credit-quality ratings are obtained from Moody’s and S&P, and the higher rating for each issue is used.
Dividend Yield. The current, annualized rate of dividends paid on a share of stock, divided by its current share price. For a fund, the weighted average yield for stocks it holds. The index yield is based on the current annualized rate of dividends paid on stocks in the index.
Earnings Growth Rate. The average annual rate of growth in earnings over the past five years for the stocks now in a fund.
Equity Exposure. A measure that reflects a fund’s investments in stocks and stock futures. Any holdings in short-term reserves are excluded.
108
Expense Ratio. A fund’s total annual operating expenses expressed as a percentage of the fund’s average net assets. The expense ratio includes management and administrative expenses, but does not include the transaction costs of buying and selling portfolio securities.
Foreign Holdings. The percentage of a fund represented by securities or depositary receipts of companies based outside the United States.
Inception Date. The date on which the assets of a fund (or one of its share classes) are first invested in accordance with the fund’s investment objective. For funds with a subscription period, the inception date is the day after that period ends. Investment performance is measured from the inception date.
Largest Area Concentrations. An indicator of diversification. The less concentrated a fund’s holdings of bonds, the less the fund will be hurt by any financial problems in a single state or region.
Median Market Cap. An indicator of the size of companies in which a fund invests; the midpoint of market capitalization (market price x shares outstanding) of a fund’s stocks, weighted by the proportion of the fund’s assets invested in each stock. Stocks representing half of the fund’s assets have market capitalizations above the median, and the rest are below it.
Price/Book Ratio. The share price of a stock divided by its net worth, or book value, per share. For a fund, the weighted average price/book ratio of the stocks it holds.
Price/Earnings Ratio. The ratio of a stock’s current price to its per-share earnings over the past year. For a fund, the weighted average P/E of the stocks it holds. P/E is an indicator of market expectations about corporate prospects; the higher the P/E, the greater the expectations for a company’s future growth.
R-Squared. A measure of how much of a fund’s past returns can be explained by the returns from the market in general, as measured by a given index. If a fund’s total returns were precisely synchronized with an index’s returns, its R-squared would be 1.00. If the fund’s returns bore no relationship to the index’s returns, its R-squared would be 0. For this report, R-squared is based on returns over the past 36 months for both the fund and the index.
Return on Equity. The annual average rate of return generated by a company during the past five years for each dollar of shareholder’s equity (net income divided by shareholder’s equity). For a fund, the weighted average return on equity for the companies whose stocks it holds.
Short-Term Reserves. The percentage of a fund invested in highly liquid, short-term securities that can be readily converted to cash.
Turnover Rate. An indication of the fund’s trading activity. Funds with high turnover rates incur higher transaction costs and may be more likely to distribute capital gains (which may be taxable to investors). The turnover rate excludes in-kind transactions, which have minimal impact on costs.
Yield to Maturity. The rate of return an investor would receive if the fixed income securities held by a fund were held to their maturity dates.
109
This page intentionally left blank.
This page intentionally left blank.
The People Who Govern Your Fund
The trustees of your mutual fund are there to see that the fund is operated and managed in your best interests since, as a shareholder, you are a part owner of the fund. Your fund’s trustees also serve on the board of directors of The Vanguard Group, Inc., which is owned by the Vanguard funds and provides services to them on an at-cost basis.
A majority of Vanguard’s board members are independent, meaning that they have no affiliation with Vanguard or the funds they oversee, apart from the sizable personal investments they have made as private individuals. The independent board members have distinguished backgrounds in business, academia, and public service. Each of the trustees and executive officers oversees 180 Vanguard funds.
The following table provides information for each trustee and executive officer of the fund. More information about the trustees is in the Statement of Additional Information, which can be obtained, without charge, by contacting Vanguard at 800-662-7447, or online at vanguard.com.
| |
| Interested Trustee1 | and President (2006–2008) of Rohm and Haas Co. |
| | (chemicals); Director of Tyco International, Ltd. |
| F. William McNabb III | (diversified manufacturing and services) and Hewlett- |
| Born 1957. Trustee Since July 2009. Chairman of the | Packard Co. (electronic computer manufacturing); |
| Board. Principal Occupation(s) During the Past Five | Senior Advisor at New Mountain Capital; Trustee |
| Years: Chairman of the Board of The Vanguard Group, | of The Conference Board; Member of the Board of |
| Inc., and of each of the investment companies served | Managers of Delphi Automotive LLP (automotive |
| by The Vanguard Group, since January 2010; Director | components). |
| of The Vanguard Group since 2008; Chief Executive | |
| Officer and President of The Vanguard Group and of | Amy Gutmann |
| each of the investment companies served by The | Born 1949. Trustee Since June 2006. Principal |
| Vanguard Group since 2008; Director of Vanguard | Occupation(s) During the Past Five Years: President |
| Marketing Corporation; Managing Director of The | of the University of Pennsylvania; Christopher H. |
| Vanguard Group (1995–2008). | Browne Distinguished Professor of Political Science |
| | in the School of Arts and Sciences with secondary |
| | appointments at the Annenberg School for Commu- |
| Independent Trustees | nication and the Graduate School of Education |
| | of the University of Pennsylvania; Director of |
| Emerson U. Fullwood | Carnegie Corporation of New York, Schuylkill River |
| Born 1948. Trustee Since January 2008. Principal | Development Corporation, and Greater Philadelphia |
| Occupation(s) During the Past Five Years: Executive | Chamber of Commerce; Trustee of the National |
| Chief Staff and Marketing Officer for North America | Constitution Center; Chair of the Presidential |
| and Corporate Vice President (retired 2008) of Xerox | Commission for the Study of Bioethical Issues. |
| Corporation (document management products and | |
| services); Executive in Residence and 2010 | JoAnn Heffernan Heisen |
| Distinguished Minett Professor at the Rochester | Born 1950. Trustee Since July 1998. Principal |
| Institute of Technology; Director of SPX Corporation | Occupation(s) During the Past Five Years: Corporate |
| (multi-industry manufacturing), the United Way of | Vice President and Chief Global Diversity Officer |
| Rochester, Amerigroup Corporation (managed health | (retired 2008) and Member of the Executive |
| care), the University of Rochester Medical Center, | Committee (1997–2008) of Johnson & Johnson |
| Monroe Community College Foundation, and North | (pharmaceuticals/consumer products); Director of |
| Carolina A&T University. | Skytop Lodge Corporation (hotels), the University |
| | Medical Center at Princeton, the Robert Wood |
| Rajiv L. Gupta | Johnson Foundation, and the Center for Work Life |
| Born 1945. Trustee Since December 2001.2 | Policy; Member of the Advisory Board of the |
| Principal Occupation(s) During the Past Five Years: | Maxwell School of Citizenship and Public Affairs |
| Chairman and Chief Executive Officer (retired 2009) | at Syracuse University. |
| | |
| F. Joseph Loughrey | Thomas J. Higgins | |
| Born 1949. Trustee Since October 2009. Principal | Born 1957. Chief Financial Officer Since September |
| Occupation(s) During the Past Five Years: President | 2008. Principal Occupation(s) During the Past Five |
| and Chief Operating Officer (retired 2009) and Vice | Years: Principal of The Vanguard Group, Inc.; Chief |
| Chairman of the Board (2008–2009) of Cummins Inc. | Financial Officer of each of the investment companies |
| (industrial machinery); Director of SKF AB (industrial | served by The Vanguard Group since 2008; Treasurer |
| machinery), Hillenbrand, Inc. (specialized consumer | of each of the investment companies served by The |
| services), the Lumina Foundation for Education, and | Vanguard Group (1998–2008). |
| Oxfam America; Chairman of the Advisory Council | | |
| for the College of Arts and Letters and Member | Kathryn J. Hyatt | |
| of the Advisory Board to the Kellogg Institute for | Born 1955. Treasurer Since November 2008. Principal |
| International Studies at the University of Notre Dame. | Occupation(s) During the Past Five Years: Principal |
| | of The Vanguard Group, Inc.; Treasurer of each of |
| André F. Perold | the investment companies served by The Vanguard |
| Born 1952. Trustee Since December 2004. Principal | Group since 2008; Assistant Treasurer of each of the |
| Occupation(s) During the Past Five Years: George | investment companies served by The Vanguard Group |
| Gund Professor of Finance and Banking at the Harvard | (1988–2008). | |
| Business School (retired July 2011); Chief Investment | | |
| Officer and co-Managing Partner of HighVista | Heidi Stam | |
| Strategies LLC (private investment firm); Director of | Born 1956. Secretary Since July 2005. Principal |
| Rand Merchant Bank; Overseer of the Museum of | Occupation(s) During the Past Five Years: Managing |
| Fine Arts Boston. | Director of The Vanguard Group, Inc., since 2006; |
| | General Counsel of The Vanguard Group since 2005; |
| Alfred M. Rankin, Jr. | Secretary of The Vanguard Group and of each of the |
| Born 1941. Trustee Since January 1993. Principal | investment companies served by The Vanguard Group |
| Occupation(s) During the Past Five Years: Chairman, | since 2005; Director and Senior Vice President of |
| President, and Chief Executive Officer of NACCO | Vanguard Marketing Corporation since 2005; |
| Industries, Inc. (forklift trucks/housewares/lignite); | Principal of The Vanguard Group (1997–2006). |
| Director of Goodrich Corporation (industrial products/ | | |
| aircraft systems and services) and the National | | |
| Association of Manufacturers; Chairman of the | Vanguard Senior Management Team |
| Federal Reserve Bank of Cleveland; Vice Chairman | | |
| of University Hospitals of Cleveland; President of | R. Gregory Barton | Chris D. McIsaac |
| the Board of The Cleveland Museum of Art. | Mortimer J. Buckley | Michael S. Miller |
| | Kathleen C. Gubanich | James M. Norris |
| Peter F. Volanakis | Paul A. Heller | Glenn W. Reed |
| Born 1955. Trustee Since July 2009. Principal | Martha G. King | George U. Sauter |
| Occupation(s) During the Past Five Years: President | | |
| and Chief Operating Officer (retired 2010) of Corning | | |
| Incorporated (communications equipment); Director of | Chairman Emeritus and Senior Advisor |
| Corning Incorporated (2000–2010) and Dow Corning | | |
| (2001–2010); Overseer of the Amos Tuck School of | John J. Brennan | |
| Business Administration at Dartmouth College. | Chairman, 1996–2009 | |
| | Chief Executive Officer and President, 1996–2008 |
| |
| Executive Officers | | |
| | Founder | |
| Glenn Booraem | | |
| Born 1967. Controller Since July 2010. Principal | John C. Bogle | |
| Occupation(s) During the Past Five Years: Principal | Chairman and Chief Executive Officer, 1974–1996 |
| of The Vanguard Group, Inc.; Controller of each of | | |
| the investment companies served by The Vanguard | | |
| Group since 2010; Assistant Controller of each of | | |
| the investment companies served by The Vanguard | | |
| Group (2001–2010). | | |
1 Mr. McNabb is considered an “interested person,” as defined in the Investment Company Act of 1940, because he is an officer of the Vanguard funds.
2 December 2002 for Vanguard Equity Income Fund, Vanguard Growth Equity Fund, the Vanguard Municipal Bond Funds, and the Vanguard State Tax-Exempt Funds.
|  |
| P.O. Box 2600 |
| Valley Forge, PA 19482-2600 |
Connect with Vanguard® > vanguard.com
| |
| Fund Information > 800-662-7447 | |
| Direct Investor Account Services > 800-662-2739 | |
| Institutional Investor Services > 800-523-1036 | |
| Text Telephone for People | |
| With Hearing Impairment > 800-749-7273 | |
| |
| This material may be used in conjunction | |
| with the offering of shares of any Vanguard | |
| fund only if preceded or accompanied by | |
| the fund’s current prospectus. | |
| |
| All comparative mutual fund data are from Lipper Inc. or | |
| Morningstar, Inc., unless otherwise noted. | |
| |
| You can obtain a free copy of Vanguard’s proxy voting | |
| guidelines by visiting vanguard.com/proxyreporting or by | |
| calling Vanguard at 800-662-2739. The guidelines are | |
| also available from the SEC’s website, sec.gov. In | |
| addition, you may obtain a free report on how your fund | |
| voted the proxies for securities it owned during the 12 | |
| months ended June 30. To get the report, visit either | |
| vanguard.com/proxyreporting or sec.gov. | |
| |
| You can review and copy information about your fund at | |
| the SEC’s Public Reference Room in Washington, D.C. To | |
| find out more about this public service, call the SEC at | |
| 202-551-8090. Information about your fund is also | |
| available on the SEC’s website, and you can receive | |
| copies of this information, for a fee, by sending a | |
| request in either of two ways: via e-mail addressed to | |
| publicinfo@sec.gov or via regular mail addressed to the | |
| Public Reference Section, Securities and Exchange | |
| Commission, Washington, DC 20549-1520. | |
| | © 2012 The Vanguard Group, Inc. |
| | All rights reserved. |
| | Vanguard Marketing Corporation, Distributor. |
| |
| | Q870 022012 |
 |
| |
| Annual Report | December 31, 2011 |
| |
| Vanguard Tax-Managed |
| International Fund |
| |
| Including Vanguard MSCI EAFE ETF |
> For the fiscal year ended December 31, 2011, Vanguard Tax-Managed International Fund––including Vanguard MSCI EAFE ETF––returned about –13% as global stock markets faced a myriad of economic and political obstacles.
> Among major markets, stocks in Japan, France, Germany, and Australia were most responsible for the fund’s decline.
> The financials, materials, and industrials sectors were among the worst performers, while health care was the best.
| |
| Contents | |
| Your Fund’s Total Returns. | 1 |
| Chairman’s Letter. | 2 |
| Fund Profile. | 8 |
| Performance Summary. | 10 |
| Financial Statements. | 13 |
| Your Fund’s After-Tax Returns. | 27 |
| About Your Fund’s Expenses. | 28 |
| Glossary. | 30 |
Please note: The opinions expressed in this report are just that—informed opinions. They should not be considered promises or advice. Also, please keep in mind that the information and opinions cover the period through the date on the front of this report. Of course, the risks of investing in your fund are spelled out in the prospectus.
See the Glossary for definitions of investment terms used in this report.
About the cover: Vanguard was named for the HMS Vanguard, flagship of British Admiral Horatio Nelson. A ship—whose performance and safety depend on the work of all hands—has served as a fitting metaphor for the Vanguard crew as we strive to help clients reach their financial goals.
Your Fund’s Total Returns
| |
| Fiscal Year Ended December 31, 2011 | |
| |
| | Total |
| | Returns |
| Vanguard Tax-Managed International Fund | |
| Admiral™ Shares | -12.51% |
| Institutional Shares | -12.62 |
| MSCI EAFE ETF Shares | |
| Market Price | -12.30 |
| Net Asset Value | -12.57 |
| MSCI EAFE Index | -12.14 |
| International Funds Average | -13.49 |
| International Funds Average: Derived from data provided by Lipper Inc. | |
Institutional Shares are available to certain institutional investors who meet specific administrative, service, and account-size criteria. The Vanguard ETF® Shares shown are traded on the NYSE Arca exchange and are available only through brokers. The table provides ETF returns based on both the NYSE Arca market price and the net asset value for a share. U.S. Pat. No. 6,879,964 B2; 7,337,138; 7,720,749; 7,925,573.
For the ETF Shares, the market price is determined by the midpoint of the bid-offer spread as of the closing time of the New York Stock Exchange (generally 4 p.m., Eastern time). The net asset value is also determined as of the NYSE closing time. For more information about how the ETF Shares' market prices have compared with their net asset value, visit vanguard.com, select your ETF, and then select the Price and Performance tab. The ETF premium/discount analysis there shows the percentages of days on which the ETF Shares' market price was above or below the NAV.
| | | | |
| Your Fund’s Performance at a Glance | | | | |
| December 31, 2010 , Through December 31, 2011 | | | | |
| | | | Distributions Per Share |
| | Starting | Ending | Income | Capital |
| | Share Price | Share Price | Dividends | Gains |
| Vanguard Tax-Managed International Fund | | | | |
| Admiral Shares | $11.58 | $9.79 | $0.338 | $0.000 |
| Institutional Shares | 11.60 | 9.79 | 0.344 | 0.000 |
| MSCI EAFE ETF Shares | 36.04 | 30.44 | 1.058 | 0.000 |
1

Chairman’s Letter
Dear Shareholder,
International stocks, which withstood a series of challenges through the first half of the fiscal year, finally succumbed as the bad news escalated in the second half. For the 12 months ended December 31, 2011, Vanguard Tax-Managed International Fund returned about –13% for all share classes, including Vanguard MSCI EAFE ETF.
The fund’s return was close to that of its benchmark, the MSCI EAFE Index. The result would have been even closer if not for a small divergence that was related to fair-value pricing policies required by the Securities and Exchange Commission. (See the box on page 6 for an explanation of fair-value pricing.) The fund’s return was a bit higher than the average return of competitor international funds, many of which were hurt by their exposure to emerging markets. Your fund invests in the stocks of developed nations, which didn’t decline as sharply as emerging markets stocks.
During the year, the fund’s advisor, Vanguard Quantitative Equity Group, continued to avoid distributing taxable gains to shareholders. A table showing the fund’s after-tax returns appears later in this report.
2
International stocks off sharply, U.S. stock market ekes out gain
International stock prices finished the year with a double-digit decline, in contrast with a modestly positive return for U.S. stocks. The weaker performance of stocks outside the United States reflected the greater economic and financial challenges in Europe, Japan’s struggles with natural and nuclear disaster, and skittishness about emerging markets.
In the United States, stock prices rallied and retreated as early optimism about the global economic outlook traded places with anxiety about Europe’s debt crisis and the contentious negotiations in Washington over raising the U.S. debt ceiling to avoid default. The policymaking strife prompted Standard & Poor’s to downgrade the U.S. credit rating. (Vanguard’s confidence in the full faith and credit of the U.S. Treasury remains unshaken.) By year-end, stock prices were again on the rise, with investors refocused on signs of economic improvement.
As yields fell, bonds delivered unexpectedly strong returns
Bond returns were also a surprise, mainly because so little was expected of them. At the end of 2010, bond yields hovered near historical lows, suggesting that the scope for further declines—and rallies in bond prices—was limited. During 2011, however, rates moved lower still as investors sought
| | | |
| Market Barometer | | | |
| |
| | | Average Annual Total Returns |
| | | Periods Ended December 31, 2011 |
| | One | Three | Five |
| | Year | Years | Years |
| Stocks | | | |
| Russell 1000 Index (Large-caps) | 1.50% | 14.81% | -0.02% |
| Russell 2000 Index (Small-caps) | -4.18 | 15.63 | 0.15 |
| Dow Jones U.S. Total Stock Market Index | 0.52 | 15.24 | 0.28 |
| MSCI All Country World Index ex USA (International) | -13.71 | 10.70 | -2.92 |
| |
| Bonds | | | |
| Barclays Capital U.S. Aggregate Bond Index (Broad | | | |
| taxable market) | 7.84% | 6.77% | 6.50% |
| Barclays Capital Municipal Bond Index (Broad | | | |
| tax-exempt market) | 10.70 | 8.57 | 5.22 |
| Citigroup Three-Month U.S. Treasury Bill Index | 0.08 | 0.11 | 1.36 |
| |
| CPI | | | |
| Consumer Price Index | 2.96% | 2.39% | 2.26% |
3
shelter from stock market turmoil. The broad U.S. bond market returned 7.84%. Municipal bonds, which were battered at the end of 2010, produced even stronger returns than taxable bonds in 2011.
The returns of the 3-month U.S. Treasury bill and other money market instruments approached 0%, which was consistent with the Federal Reserve Board’s interest rate policy but nevertheless a disappointment for savers.
For developed markets, weakness across sectors, countries
Vanguard Tax-Managed International Fund has a pair of missions. The fund takes an index-oriented approach as it attempts to track the MSCI EAFE Index. And, as its name suggests, the fund also considers the effects of taxable dividend income and strives to help maximize the funds after-tax return.
As I mentioned earlier, the fund was successful in both capturing the index’s return and avoiding the distribution of any taxable gains. Of course, that doesn’t mean the overall result wasn’t a disappointment for investors during a turbulent fiscal year for the developed markets of Europe and the Pacific region. The fund consists of about two-thirds European stocks and one-third stocks from the Pacific region. While the regions faced different types of challenges, the results for both were double-digit declines: nearly –14% for the Pacific region and about –10% for Europe.
| | | | |
| Expense Ratios | | | | |
| Your Fund Compared With Its Peer Group | | | | |
| | | | MSCI | |
| | | | EAFE | |
| | Admiral | Institutional | ETF | Peer Group |
| | Shares | Shares | Shares | Average |
| Tax-Managed International Fund | 0.18% | 0.08% | 0.12% | 1.42% |
The fund expense ratios shown are from the prospectuses dated May 13, 2011 (for ETF Shares), and July 15, 2011 (for Admiral and Institutional Shares). They represent estimated costs for the current fiscal year. For the fiscal year ended December 31, 2011, the fund’s expense ratios were 0.12% for Admiral Shares, 0.08% for Institutional Shares, and 0.12% for MSCI EAFE ETF Shares. The peer-group expense ratio is derived from data provided by Lipper Inc. and captures information through year-end 2010.
Peer group: International Funds.
4
Currency fluctuations had a mixed effect on the fund’s performance. The dollar rose about 3% against the euro and most other developed-market currencies, diminishing market returns for U.S. investors. Although Japan experienced major setbacks, the yen rose about 5% against the dollar, lifting market returns for U.S. investors.
Europe’s sovereign-debt crisis intensified through the spring and summer, triggering a broad sell-off of European stocks. Seven of the ten industry sectors posted negative returns, with financials, materials, and industrials stocks among the worst performers. The United Kingdom, Europe’s largest country by market capitalization, held up better than most with a return of about –2%, but France, Germany, Italy,
Sweden, the Netherlands, and Spain were among the larger countries that suffered double-digit declines.
Financial stocks were hit particularly hard as European banks struggled under government debt. Although the problems originated in Greece, banks across Europe were caught in the downdraft, particularly major institutions in the United Kingdom, France, Switzerland, Germany, Spain, and Italy.
Japan, the Pacific region’s largest country by market capitalization, weighed most on performance after March’s devastating earthquake, tsunami, and nuclear crisis. While Japan’s companies began to recover from the disaster as the year continued,
| |
| Total Returns | |
| Ten Years Ended December 31, 2011 | |
| | Average |
| | Annual Return |
| Tax-Managed International Fund Admiral Shares | 4.83% |
| MSCI EAFE Index | 4.67 |
| International Funds Average | 4.13 |
| International Funds Average: Derived from data provided by Lipper Inc. | |
The figures shown represent past performance, which is not a guarantee of future results. (Current performance may be lower or higher than the performance data cited. For performance data current to the most recent month-end, visit our website at vanguard.com/performance.) Note, too, that both investment returns and principal value can fluctuate widely, so an investor’s shares, when sold, could be worth more or less than their original cost.
5
|
| Investment insight |
| A note on fair-value pricing |
| The reported return of a fund that |
| tracks an index sometimes may |
| diverge from the index’s return a bit |
| more than would be expected. This |
| may be the result of a fair-value |
| pricing adjustment. |
| |
| These adjustments, which are |
| required by the Securities and |
| Exchange Commission, address |
| pricing discrepancies that may arise |
| because of time-zone differences |
| among global stock markets. Foreign |
| stocks may trade on exchanges that |
| close many hours before a fund’s |
| closing share price is calculated in the |
| United States, generally at 4 p.m., |
| Eastern time. In the hours between |
| the foreign close and the U.S. close, |
| the value of these foreign securities |
| may change—because of company- |
| specific announcements or market- |
| wide developments, for example. |
| Such price changes are not imme- |
| diately reflected in international |
| index values. |
| |
| Fair-value pricing takes such changes |
| into account in calculating the fund’s |
| daily net asset value, thus ensuring |
| that the NAV doesn’t include “stale” |
| prices. The result can be a temporary |
| divergence between the return of the |
| fund and that of its benchmark |
| index—a difference that usually |
| corrects itself when the foreign |
| markets reopen. |
the country finished the year with a return of about –14%. The declines were widespread, with financials, consumer discretionary, and information technology stocks the chief detractors. Australia’s materials sector was another trouble spot as global demand waned for the nation’s commodity exports, mostly in the mining industry. Financial stocks in Hong Kong and Singapore also hurt returns.
Good news was hard to find in the developed international markets, but the health care, consumer staples, and energy sectors managed positive—albeit single-digit—returns. The only countries that avoided a negative performance were Ireland and New Zealand, but because of their small weightings they were no match for the losses of their peers.
Positive long-term results in a demanding decade
Despite facing problems of every sort over the past decade, developed-market stocks have managed a respectable long-term record. For the ten years ended December 31, 2011, Vanguard Tax-Managed International Fund has posted an average annual return of 4.83% for Admiral Shares while adhering to its tax-management objective and closely following the performance of the benchmark MSCI EAFE Index.
This performance is a credit to the fund’s advisor, Vanguard Quantitative Equity Group, whose professionals have decades of experience and have developed advanced portfolio construction, trading,
6
and tax-management techniques. The fund also benefits from low operating costs, which allow shareholders to capture more of the markets’ returns.
From international markets, an opportunity for diversification
As we’ve seen over the last year, the risk involved in holding international stocks is based in harsh reality. Natural disasters and geopolitical problems, while not unique to international stocks, can send those markets into a tailspin. At the same time, the rebounds, when they occur, can be significant and worth the wait. Also, because international stocks often behave differently from their U.S. counterparts––and from region to region––they can help to diversify your portfolio, a crucial benefit in times like these.
These are among the reasons Vanguard encourages long-term investors to hold international and domestic equities in addition to other asset classes. The best way to do that is to construct a diversified and balanced portfolio tailored to your specific goals, time horizon, and appetite for risk.
Vanguard Tax-Managed International Fund, with its proven tax efficiency, broad exposure to developed countries, and low costs, can play an important role as a long-term international equity holding.
As always, thank you for entrusting your assets to Vanguard.
Sincerely,

F. William McNabb III
Chairman and Chief Executive Officer
January 19, 2012
7
Tax-Managed International Fund
Fund Profile
As of December 31, 2011
| | | |
| Share-Class Characteristics | |
| |
| | | | MSCI |
| | | | EAFE |
| | Admiral | Institutional | ETF |
| | Shares | Shares | Shares |
| Ticker Symbol | VTMGX | VTMNX | VEA |
| Expense Ratio1 | 0.18% | 0.08% | 0.12% |
| | | |
| Portfolio Characteristics | | |
| | | | MSCI AC |
| | | MSCI | World |
| | | EAFE | Index |
| | Fund | Index | ex USA |
| Number of Stocks | 898 | 925 | 1,841 |
| Median Market Cap | $31.4B | $31.3B | $26.2B |
| Price/Earnings Ratio | 11.7x | 11.7x | 11.6x |
| Price/Book Ratio | 1.3x | 1.3x | 1.4x |
| Return on Equity | 17.4% | 17.3% | 17.7% |
| Earnings Growth Rate | -1.2% | -1.2% | 2.8% |
| Dividend Yield | 3.8% | 3.8% | 3.5% |
| Turnover Rate | 5% | — | — |
| Short-Term Reserves | 0.0% | — | — |
| | | |
| Sector Diversification (% of equity exposure) |
| | | | MSCI AC |
| | | MSCI | World |
| | | EAFE | Index |
| | Fund | Index | ex USA |
| Consumer | | | |
| Discretionary | 10.1% | 10.0% | 9.0% |
| Consumer Staples | 11.6 | 11.5 | 10.1 |
| Energy | 9.2 | 9.2 | 11.8 |
| Financials | 20.7 | 21.4 | 22.9 |
| Health Care | 10.0 | 10.0 | 7.2 |
| Industrials | 12.7 | 12.5 | 10.5 |
| Information | | | |
| Technology | 4.8 | 4.7 | 6.3 |
| Materials | 10.2 | 10.1 | 11.7 |
| Telecommunication | | | |
| Services | 6.1 | 6.1 | 6.4 |
| Utilities | 4.6 | 4.5 | 4.1 |
| | |
| Volatility Measures | | |
| | MSCI | MSCI AC |
| | EAFE | World Index |
| | Index | ex USA |
| R-Squared | 0.98 | 0.97 |
| Beta | 1.05 | 1.03 |
These measures show the degree and timing of the fund’s fluctuations compared with the indexes over 36 months.
| | |
| Ten Largest Holdings (% of total net assets) |
| Royal Dutch Shell PLC | Integrated Oil & | |
| | Gas | 2.5% |
| Nestle SA | Packaged Foods & | |
| | Meats | 2.0 |
| BHP Billiton | Diversified Metals | |
| | & Mining | 1.9 |
| Vodafone Group plc | Wireless | |
| | Telecommunication | |
| | Services | 1.5 |
| HSBC Holdings plc | Diversified Banks | 1.4 |
| BP plc | Integrated Oil & | |
| | Gas | 1.4 |
| Novartis AG | Pharmaceuticals | 1.4 |
| Roche Holding AG | Pharmaceuticals | 1.3 |
| GlaxoSmithKline plc | Pharmaceuticals | 1.2 |
| Total SA | Integrated Oil & | |
| | Gas | 1.1 |
| Top Ten | | 15.7% |
The holdings listed exclude any temporary cash investments and equity index products.
Allocation by Region (% of equity exposure)

1 The expense ratios shown are from the prospectuses dated May 13, 2011 (for ETF Shares), and July 15, 2011 (for Admiral and Institutional Shares). They represent estimated costs for the current fiscal year. For the fiscal year ended December 31, 2011, the expense ratios were 0.12% for Admiral Shares, 0.08% for Institutional Shares, and 0.12% for MSCI EAFE ETF Shares.
8
Tax-Managed International Fund
| | | |
| Market Diversification (% of equity exposure) |
| | | | MSCI AC |
| | | MSCI | World |
| | | EAFE | Index |
| | Fund | Index | ex USA |
| Europe | | | |
| United Kingdom | 23.4% | 23.3% | 15.9% |
| France | 9.1 | 9.1 | 6.2 |
| Switzerland | 8.6 | 8.6 | 5.9 |
| Germany | 7.9 | 7.8 | 5.4 |
| Spain | 3.3 | 3.3 | 2.2 |
| Sweden | 3.1 | 3.1 | 2.1 |
| Netherlands | 2.5 | 2.5 | 1.7 |
| Italy | 2.3 | 2.3 | 1.6 |
| Denmark | 1.0 | 1.1 | 0.7 |
| Other | 3.4 | 3.5 | 2.4 |
| Subtotal | 64.6% | 64.6% | 44.1% |
| Pacific | | | |
| Japan | 21.6% | 21.6% | 14.7% |
| Australia | 8.5 | 8.6 | 5.9 |
| Hong Kong | 2.8 | 2.8 | 1.9 |
| Singapore | 1.7 | 1.7 | 1.1 |
| Other | 0.1 | 0.1 | 0.1 |
| Subtotal | 34.7% | 34.8% | 23.7% |
| Emerging Markets | 0.0% | 0.0% | 23.4% |
| North America | 0.0% | 0.0% | 8.4% |
| Middle East | 0.7% | 0.6% | 0.4% |
9
Tax-Managed International Fund
Performance Summary
All of the returns in this report represent past performance, which is not a guarantee of future results that may be achieved by the fund. (Current performance may be lower or higher than the performance data cited. For performance data current to the most recent month-end, visit our website at vanguard.com/performance.) Note, too, that both investment returns and principal value can fluctuate widely, so an investor’s shares, when sold, could be worth more or less than their original cost. The returns shown do not reflect taxes that a shareholder would pay on fund distributions or on the sale of fund shares.
Cumulative Performance: December 31, 2001, Through December 31, 2011
Initial Investment of $10,000
| | | |
| | Average Annual Total Returns | |
| | Periods Ended December 31, 2011 | |
| | | Since | Final Value |
| | One | Inception | of a $10,000 |
| | Year | (7/20/2007) | Investment |
| MSCI EAFE ETF Shares Net Asset | | | |
| Value | -12.57% | -7.68% | $7,007 |
| MSCI EAFE ETF Shares Market Price | -12.30 | -7.60 | 7,036 |
| MSCI All Country World Index ex | | | |
| USA | -13.33 | -6.22 | 7,515 |
| MSCI EAFE Index | -12.14 | -7.96 | 6,913 |
| International Funds Average | -13.49 | -7.75 | 6,985 |
International Funds Average: Derived from data provided by Lipper Inc.
"Since Inception" performance is calculated from the ETF Shares’ inception date for both the fund and its comparative standards.
Vanguard fund returns do not reflect the 2% fee on redemptions of shares held for less than two months. The fee does not apply to ETF Shares.
See Financial Highlights for dividend and capital gains information.
10
Tax-Managed International Fund
| | | | |
| | | Average Annual Total Returns | |
| | Periods Ended December 31, 2011 | |
| | | | | Final Value |
| | One | Five | Ten | of a $10,000 |
| | Year | Years | Years | Investment |
| Tax-Managed International Fund Admiral | | | | |
| Shares | -12.51% | -4.51% | 4.83% | $16,021 |
| MSCI All Country World Index ex USA | -13.33 | -2.48 | 6.76 | 19,231 |
| MSCI EAFE Index | -12.14 | -4.72 | 4.67 | 15,779 |
| | | | |
| | | | | Final Value |
| | One | Five | Ten | of a $5,000,000 |
| | Year | Years | Years | Investment |
| Tax-Managed International Fund Institutional | | | | |
| Shares | -12.62% | -4.46% | 4.90% | $8,066,598 |
| MSCI All Country World Index ex USA | -13.33 | -2.48 | 6.76 | 9,615,251 |
| MSCI EAFE Index | -12.14 | -4.72 | 4.67 | 7,889,233 |
| | |
| Cumulative Returns of ETF Shares:July 20, 2007 , Through December 31, 2011 | |
| | | Since |
| | One | Inception |
| | Year | (7/20/2007) |
| MSCI EAFE | �� | |
| ETF Shares Market Price | -12.30% | -29.64% |
| MSCI EAFE | | |
| ETF Shares Net Asset Value | -12.57 | -29.93 |
| MSCI EAFE Index | -12.14 | -30.87 |
| "Since Inception" performance is calculated from the ETF Shares’ inception date for both the fund and its comparative standards. |
Vanguard fund returns do not reflect the 2% fee on redemptions of shares held for less than two months. The fee does not apply to ETF Shares.
11
Tax-Managed International Fund
Fiscal-Year Total Returns (%): December 31, 2001, Through December 31, 2011

Vanguard fund returns do not reflect the 2% fee on redemptions of shares held for less than two months. The fee does not apply to ETF Shares.
12
Tax-Managed International Fund
Financial Statements
Statement of Net Assets—Investments Summary
As of December 31, 2011
This Statement summarizes the fund’s holdings by asset type. Details are reported for each of the fund’s 50 largest individual holdings and for investments that, in total for any issuer, represent more than 1% of the fund’s net assets. The total value of smaller holdings is reported as a single amount within each category.
The fund reports a complete list of its holdings in regulatory filings four times in each fiscal year, at the quarter-ends. For the second and fourth fiscal quarters, the complete listing of the fund’s holdings is available electronically on vanguard.com and on the Securities and Exchange Commission’s website (sec.gov), or you can have it mailed to you without charge by calling 800-662-7447. For the first and third fiscal quarters, the fund files the lists with the SEC on Form N-Q. Shareholders can look up the fund’s Forms N-Q on the SEC’s website. Forms N-Q may also be reviewed and copied at the SEC’s Public Reference Room (see the back cover of this report for further information).
| | | |
| | | Market | Percentage |
| | | Value | of Net |
| | Shares | ($000) | Assets |
| Common Stocks | | | |
| Australia | | | |
| BHP Billiton Ltd. | 2,774,655 | 97,942 | 1.2% |
| Commonwealth Bank of Australia | 1,339,896 | 67,305 | 0.8% |
| Westpac Banking Corp. | 2,607,193 | 53,224 | 0.7% |
| Australia & New Zealand Banking Group Ltd. | 2,264,121 | 47,422 | 0.6% |
| National Australia Bank Ltd. | 1,897,650 | 45,205 | 0.6% |
| Australia—Other † | | 364,142 | 4.6% |
| | | 675,240 | 8.5% |
| |
| Austria † | | 18,754 | 0.2% |
| |
| Belgium | | | |
| Anheuser-Busch InBev NV | 688,588 | 42,027 | 0.5% |
| Belgium—Other † | | 33,305 | 0.4% |
| | | 75,332 | 0.9% |
| Denmark | | | |
| Novo Nordisk A/S Class B | 359,067 | 41,251 | 0.5% |
| Denmark—Other † | | 42,141 | 0.5% |
| | | 83,392 | 1.0% |
| |
| Finland † | | 66,254 | 0.8% |
| |
| France | | | |
| Total SA | 1,780,047 | 90,833 | 1.1% |
| Sanofi | 964,120 | 70,476 | 0.9% |
| BNP Paribas SA | 817,043 | 31,816 | 0.4% |
| France—Other † | | 529,483 | 6.7% |
| | | 722,608 | 9.1% |
13
Tax-Managed International Fund
| | | |
| | | Market | Percentage |
| | | Value | of Net |
| | Shares | ($000) | Assets |
| Germany | | | |
| Siemens AG | 693,324 | 66,335 | 0.8% |
| BASF SE | 774,530 | 53,922 | 0.7% |
| Bayer AG | 694,309 | 44,341 | 0.6% |
| SAP AG | 775,794 | 41,033 | 0.5% |
| Allianz SE | 382,856 | 36,565 | 0.5% |
| Daimler AG | 765,080 | 33,517 | 0.4% |
| E.ON AG | 1,522,672 | 32,814 | 0.4% |
| Germany—Other † | | 317,063 | 4.0% |
| | | 625,590 | 7.9% |
| |
| Greece † | | 6,758 | 0.1% |
| |
| 1Hong Kong | | | |
| Hang Seng Bank Ltd. | 639,243 | 7,572 | 0.1% |
| Orient Overseas International Ltd. | 149,800 | 871 | 0.0% |
| Hong Kong—Other † | | 214,908 | 2.7% |
| | | 223,351 | 2.8% |
| |
| Ireland † | | 22,965 | 0.3% |
| |
| Israel | | | |
| Teva Pharmaceutical Industries Ltd. | 793,538 | 32,033 | 0.4% |
| Israel—Other † | | 20,070 | 0.2% |
| | | 52,103 | 0.6% |
| Italy | | | |
| ENI SPA | 2,029,128 | 41,836 | 0.5% |
| Italy—Other † | | 138,111 | 1.8% |
| | | 179,947 | 2.3% |
| Japan | | | |
| Toyota Motor Corp. | 2,323,418 | 76,829 | 1.0% |
| Mitsubishi UFJ Financial Group Inc. | 10,746,344 | 45,494 | 0.6% |
| Canon Inc. | 948,733 | 41,751 | 0.5% |
| Honda Motor Co. Ltd. | 1,364,339 | 41,559 | 0.5% |
| Sumitomo Mitsui Financial Group Inc. | 1,135,458 | 31,489 | 0.4% |
| Chugai Pharmaceutical Co. Ltd. | 200,400 | 3,303 | 0.1% |
| Daihatsu Motor Co. Ltd. | 174,000 | 3,094 | 0.0% |
| Hino Motors Ltd. | 145,000 | 878 | 0.0% |
| Japan—Other † | | 1,474,553 | 18.5% |
| | | 1,718,950 | 21.6% |
| Netherlands | | | |
| Unilever NV | 1,374,590 | 47,264 | 0.6% |
| Netherlands—Other † | | 150,467 | 1.9% |
| | | 197,731 | 2.5% |
| |
| New Zealand † | | 9,375 | 0.1% |
| |
| Norway † | | 73,748 | 0.9% |
| |
| Portugal † | | 17,479 | 0.2% |
14
Tax-Managed International Fund
| | | |
| | | Market | Percentage |
| | | Value | of Net |
| | Shares | ($000) | Assets |
| Singapore † | | 132,405 | 1.7% |
| |
| Spain | | | |
| Telefonica SA | 3,462,169 | 59,647 | 0.8% |
| Banco Santander SA | 7,115,266 | 53,754 | 0.7% |
| Banco Bilbao Vizcaya Argentaria SA | 3,873,012 | 33,363 | 0.4% |
| Spain—Other † | | 113,000 | 1.4% |
| | | 259,764 | 3.3% |
| |
| Sweden † | | 244,232 | 3.1% |
| |
| 1Switzerland | | | |
| Nestle SA | 2,775,490 | 159,378 | 2.0% |
| Novartis AG | 1,963,246 | 112,088 | 1.4% |
| Roche Holding AG | 591,328 | 100,004 | 1.3% |
| UBS AG | 3,075,758 | 36,487 | 0.5% |
| ABB Ltd. | 1,852,970 | 34,810 | 0.4% |
| Switzerland—Other † | | 242,156 | 3.0% |
| | | 684,923 | 8.6% |
| United Kingdom | | | |
| Vodafone Group plc | 42,770,330 | 119,249 | 1.5% |
| HSBC Holdings plc | 15,007,160 | 114,566 | 1.4% |
| BP plc | 15,938,023 | 113,532 | 1.4% |
| Royal Dutch Shell plc Class A | 2,969,039 | 108,933 | 1.4% |
| GlaxoSmithKline plc | 4,271,268 | 97,326 | 1.2% |
| Royal Dutch Shell plc Class B | 2,259,855 | 85,961 | 1.1% |
| British American Tobacco plc | 1,664,960 | 78,987 | 1.0% |
| BG Group plc | 2,841,270 | 60,700 | 0.8% |
| Rio Tinto plc | 1,172,421 | 57,269 | 0.7% |
| AstraZeneca plc | 1,133,389 | 52,354 | 0.7% |
| BHP Billiton plc | 1,759,863 | 51,451 | 0.6% |
| Diageo plc | 2,113,211 | 46,174 | 0.6% |
| Standard Chartered plc | 1,992,492 | 43,581 | 0.6% |
| TESCO plc | 6,691,884 | 41,870 | 0.5% |
| Anglo American plc | 1,101,732 | 40,698 | 0.5% |
| Unilever plc | 1,080,897 | 36,247 | 0.5% |
| Imperial Tobacco Group plc | 856,879 | 32,425 | 0.4% |
| Royal Dutch Shell plc Class A | 67,103 | 2,446 | 0.0% |
| United Kingdom—Other † | | 675,793 | 8.5% |
| | | 1,859,562 | 23.4% |
| Total Investments (Cost $8,961,127) | | 7,950,463 | 99.9% |
| Other Assets and Liabilities | | | |
| Other Assets | | 31,633 | 0.4% |
| Liabilities | | (24,057) | (0.3%) |
| | | 7,576 | 0.1% |
| Net Assets | | 7,958,039 | 100.0% |
15
Tax-Managed International Fund
| |
| At December 31, 2011, net assets consisted of: | |
| | Amount |
| | ($000) |
| Paid-in Capital | 9,404,894 |
| Overdistributed Net Investment Income | (6,226) |
| Accumulated Net Realized Losses | (429,734) |
| Unrealized Appreciation (Depreciation) | |
| Investment Securities | (1,010,664) |
| Foreign Currencies | (231) |
| Net Assets | 7,958,039 |
| |
| Admiral Shares—Net Assets | |
| Applicable to 125,577,336 outstanding $.001 par value shares of | |
| beneficial interest (unlimited authorization) | 1,229,047 |
| Net Asset Value Per Share—Admiral Shares | $9.79 |
| |
| Institutional Shares—Net Assets | |
| Applicable to 29,980,558 outstanding $.001 par value shares of | |
| beneficial interest (unlimited authorization) | 293,649 |
| Net Asset Value Per Share—Institutional Shares | $9.79 |
| |
| ETF Shares—Net Assets | |
| Applicable to 211,423,713 outstanding $.001 par value shares of | |
| beneficial interest (unlimited authorization) | 6,435,343 |
| Net Asset Value Per Share—ETF Shares | $30.44 |
See Note A in Notes to Financial Statements.
† Represents the aggregate value, by category, of securities that are not among the 50 largest holdings and, in total for any issuer, represent 1% or less of net assets.
1 Certain of the fund’s securities are exempt from registration under Rule 144A of the Securities Act of 1933. Such securities may be sold in transactions exempt from registration, normally to qualified institutional buyers. At December 31, 2011 the aggregate value of these securities was $10,968,000, representing 0.1% of net assets.
See accompanying Notes, which are an integral part of the Financial Statements.
16
Tax-Managed International Fund
| |
| Statement of Operations | |
| |
| | Year Ended |
| | December 31, 2011 |
| | ($000) |
| Investment Income | |
| Income | |
| Dividends1 | 278,437 |
| Interest2 | 27 |
| Total Income | 278,464 |
| Expenses | |
| The Vanguard Group—Note B | |
| Investment Advisory Services | 576 |
| Management and Administrative—Admiral Shares | 1,060 |
| Management and Administrative—Institutional Shares | 93 |
| Management and Administrative—ETF Shares | 4,629 |
| Marketing and Distribution—Admiral Shares | 334 |
| Marketing and Distribution—Institutional Shares | 77 |
| Marketing and Distribution—ETF Shares | 1,787 |
| Custodian Fees | 915 |
| Auditing Fees | 36 |
| Shareholders’ Reports—Admiral Shares | 52 |
| Shareholders’ Reports—Institutional Shares | — |
| Shareholders’ Reports—ETF Shares | 61 |
| Trustees’ Fees and Expenses | 7 |
| Total Expenses | 9,627 |
| Net Investment Income | 268,837 |
| Realized Net Gain (Loss) | |
| Investment Securities Sold | 94,182 |
| Foreign Currencies | (1,444) |
| Realized Net Gain (Loss) | 92,738 |
| Change in Unrealized Appreciation (Depreciation) | |
| Investment Securities | (1,527,416) |
| Foreign Currencies | (252) |
| Change in Unrealized Appreciation (Depreciation) | (1,527,668) |
| Net Increase (Decrease) in Net Assets Resulting from Operations | (1,166,093) |
| 1 Dividends are net of foreign withholding taxes of $22,494,000. |
| 2 Interest income from an affiliated company of the fund was $27,000. |
See accompanying Notes, which are an integral part of the Financial Statements.
17
Tax-Managed International Fund
| | |
| Statement of Changes in Net Assets | | |
| |
| | Year Ended December 31, |
| | 2011 | 2010 |
| | ($000) | ($000) |
| Increase (Decrease) in Net Assets | | |
| Operations | | |
| Net Investment Income | 268,837 | 168,238 |
| Realized Net Gain (Loss) | 92,738 | 288,616 |
| Change in Unrealized Appreciation (Depreciation) | (1,527,668) | 102,039 |
| Net Increase (Decrease) in Net Assets Resulting from Operations | (1,166,093) | 558,893 |
| Distributions | | |
| Net Investment Income | | |
| Admiral Shares1 | (41,602) | (35,288) |
| Institutional Shares | (9,198) | (6,263) |
| ETF Shares | (217,331) | (129,223) |
| Realized Capital Gain | | |
| Admiral Shares1 | — | — |
| Institutional Shares | — | — |
| ETF Shares | — | — |
| Total Distributions | (268,131) | (170,774) |
| Capital Share Transactions | | |
| Admiral Shares1 | (22,043) | (11,713) |
| Institutional Shares | 88,145 | 24,551 |
| ETF Shares | 2,183,653 | 757,013 |
| Net Increase (Decrease) from Capital Share Transactions | 2,249,755 | 769,851 |
| Total Increase (Decrease) | 815,531 | 1,157,970 |
| Net Assets | | |
| Beginning of Period | 7,142,508 | 5,984,538 |
| End of Period2 | 7,958,039 | 7,142,508 |
1 Investor Shares were renamed Admiral Shares as of the close of business on May 13, 2011. Prior period’s Distributions and Capital Share Transactions are for the Investor class.
2 Net Assets—End of Period includes undistributed (overdistributed) net investment income of ($6,226,000) and ($5,506,000).
See accompanying Notes, which are an integral part of the Financial Statements.
18
Tax-Managed International Fund
Financial Highlights
| | | | | |
| Admiral Shares | | | | | |
| |
| For a Share Outstanding | | | Year Ended December 31, |
| Throughout Each Period | 2011 | 2010 | 2009 | 2008 | 2007 |
| Net Asset Value, Beginning of Period | $11.58 | $10.95 | $8.74 | $15.40 | $14.16 |
| Investment Operations | | | | | |
| Net Investment Income | .342 | .278 | .2771 | .290 | .332 |
| Net Realized and Unrealized Gain (Loss) | | | | | |
| on Investments | (1.794) | .634 | 2.190 | (6.661) | 1.244 |
| Total from Investment Operations | (1.452) | .912 | 2.467 | (6.371) | 1.576 |
| Distributions | | | | | |
| Dividends from Net Investment Income | (.338) | (.282) | (.257) | (.289) | (.336) |
| Distributions from Realized Capital Gains | — | — | — | — | — |
| Total Distributions | (.338) | (.282) | (.257) | (.289) | (.336) |
| Net Asset Value, End of Period | $9.79 | $11.58 | $10.95 | $8.74 | $15.40 |
| |
| Total Return2 | -12.51% | 8.36% | 28.27% | -41.27% | 11.15% |
| |
| Ratios/Supplemental Data | | | | | |
| Net Assets, End of Period (Millions) | $1,229 | $1,476 | $1,409 | $1,131 | $1,915 |
| Ratio of Total Expenses to | | | | | |
| Average Net Assets | 0.12% | 0.18% | 0.20% | 0.15% | 0.15% |
| Ratio of Net Investment Income to | | | | | |
| Average Net Assets | 3.31% | 2.70% | 2.87% | 3.47% | 2.71% |
| Portfolio Turnover Rate3 | 5% | 6% | 9% | 16% | 6% |
Investor Shares were renamed Admiral Shares as of the close of business on May 13, 2011. Prior periods’ Financial Highlights are for the Investor class.
1 Calculated based on average shares outstanding.
2 Total returns do not include transaction or account service fees that may have applied in the periods shown. Fund prospectuses provide information about any applicable transaction and account service fees.
3 Excludes the value of portfolio securities received or delivered as a result of in-kind purchases or redemptions of the fund’s capital shares, including ETF Creation Units.
See accompanying Notes, which are an integral part of the Financial Statements.
19
Tax-Managed International Fund
Financial Highlights
| | | | | |
| Institutional Shares | | | | | |
| |
| For a Share Outstanding | | | Year Ended December 31, |
| Throughout Each Period | 2011 | 2010 | 2009 | 2008 | 2007 |
| Net Asset Value, Beginning of Period | $11.60 | $10.96 | $8.74 | $15.41 | $14.17 |
| Investment Operations | | | | | |
| Net Investment Income | .347 | .289 | .2881 | .296 | .341 |
| Net Realized and Unrealized Gain (Loss) | | | | | |
| on Investments | (1.813) | .644 | 2.197 | (6.671) | 1.244 |
| Total from Investment Operations | (1.466) | .933 | 2.485 | (6.375) | 1.585 |
| Distributions | | | | | |
| Dividends from Net Investment Income | (.344) | (.293) | (.265) | (.295) | (.345) |
| Distributions from Realized Capital Gains | — | — | — | — | — |
| Total Distributions | (.344) | (.293) | (.265) | (.295) | (.345) |
| Net Asset Value, End of Period | $9.79 | $11.60 | $10.96 | $8.74 | $15.41 |
| |
| Total Return2 | -12.62% | 8.55% | 28.48% | -41.27% | 11.21% |
| |
| Ratios/Supplemental Data | | | | | |
| Net Assets, End of Period (Millions) | $294 | $253 | $219 | $242 | $568 |
| Ratio of Total Expenses to | | | | | |
| Average Net Assets | 0.08% | 0.08% | 0.10% | 0.09% | 0.09% |
| Ratio of Net Investment Income to | | | | | |
| Average Net Assets | 3.35% | 2.80% | 2.97% | 3.53% | 2.77% |
| Portfolio Turnover Rate3 | 5% | 6% | 9% | 16% | 6% |
1 Calculated based on average shares outstanding.
2 Total returns do not include transaction fees that may have applied in the periods shown. Fund prospectuses provide information about any applicable transaction fees.
3 Excludes the value of portfolio securities received or delivered as a result of in-kind purchases or redemptions of the fund’s capital shares, including ETF Creation Units.
See accompanying Notes, which are an integral part of the Financial Statements.
20
Tax-Managed International Fund
Financial Highlights
| | | | | |
| MSCI EAFE ETF Shares | | | | | |
| | | | | | July 20, |
| | | | | | 20071 to |
| For a Share Outstanding | Year Ended December 31, | Dec. 31, |
| Throughout Each Period | 2011 | 2010 | 2009 | 2008 | 2007 |
| Net Asset Value, Beginning of Period | $36.04 | $34.06 | $27.18 | $47.92 | $49.99 |
| Investment Operations | | | | | |
| Net Investment Income | 1.067 | .887 | .8602 | .934 | .204 |
| Net Realized and Unrealized Gain (Loss) | | | | | |
| on Investments | (5.609) | 1.990 | 6.836 | (20.744) | (1.219) |
| Total from Investment Operations | (4.542) | 2.877 | 7.696 | (19.810) | (1.015) |
| Distributions | | | | | |
| Dividends from Net Investment Income | (1.058) | (.897) | (.816) | (.930) | (1.055) |
| Distributions from Realized Capital Gains | — | — | — | — | — |
| Total Distributions | (1.058) | (.897) | (.816) | (.930) | (1.055) |
| Net Asset Value, End of Period | $30.44 | $36.04 | $34.06 | $27.18 | $47.92 |
| |
| Total Return | -12.57% | 8.47% | 28.34% | -41.25% | -2.02% |
| |
| Ratios/Supplemental Data | | | | | |
| Net Assets, End of Period (Millions) | $6,435 | $5,414 | $4,356 | $2,292 | $653 |
| Ratio of Total Expenses to | | | | | |
| Average Net Assets | 0.12% | 0.12% | 0.15% | 0.11% | 0.12%3 |
| Ratio of Net Investment Income to | | | | | |
| Average Net Assets | 3.31% | 2.76% | 2.92% | 3.51% | 2.74%3 |
| Portfolio Turnover Rate4 | 5% | 6% | 9% | 16% | 6% |
1 Inception.
2 Calculated based on average shares outstanding.
3 Annualized.
4 Excludes the value of portfolio securities received or delivered as a result of in-kind purchases or redemptions of the fund’s capital shares, including ETF Creation Units.
See accompanying Notes, which are an integral part of the Financial Statements.
21
Tax-Managed International Fund
Notes to Financial Statements
Vanguard Tax-Managed International Fund is registered under the Investment Company Act of 1940 as an open-end investment company, or mutual fund. The fund invests in securities of foreign issuers, which may subject it to investment risks not normally associated with investing in securities of U.S. corporations. The fund offers three classes of shares: Admiral Shares, Institutional Shares, and ETF Shares. Admiral Shares are available to any investor who meets the funds’s minimum purchase requirements. Institutional Shares are designed for investors who meet certain administrative, service, and account-size criteria. ETF Shares, known as Vanguard MSCI EAFE ETF Shares, are listed for trading on the NYSE Arca, Inc.; they can be purchased and sold through a broker. Prior to May 14, 2011, the fund offered Investor Shares. Effective at the close of business on May 13, 2011, the Investor Shares were renamed Admiral Shares.
A. The following significant accounting policies conform to generally accepted accounting principles for U.S. mutual funds. The fund consistently follows such policies in preparing its financial statements.
1. Security Valuation: Securities are valued as of the close of trading on the New York Stock Exchange (generally 4 p.m., Eastern time) on the valuation date. Equity securities are valued at the latest quoted sales prices or official closing prices taken from the primary market in which each security trades; such securities not traded on the valuation date are valued at the mean of the latest quoted bid and asked prices. Securities for which market quotations are not readily available, or whose values have been affected by events occurring before the fund’s pricing time but after the close of the securities’ primary markets, are valued at their fair values calculated according to procedures adopted by the board of trustees. These procedures include obtaining quotations from an independent pricing service, monitoring news to identify significant market- or security-specific events, and evaluating changes in the values of foreign market proxies (for example, ADRs, futures contracts, or exchange-traded funds), between the time the foreign markets close and the fund’s pricing time. When fair-value pricing is employed, the prices of securities used by a fund to calculate its net asset value may differ from quoted or published prices for the same securities. Investments in Vanguard Market Liquidity Fund are valued at that fund’s net asset value.
2. Foreign Currency: Securities and other assets and liabilities denominated in foreign currencies are translated into U.S. dollars using exchange rates obtained from an independent third party as of the fund’s pricing time on the valuation date. Realized gains (losses) and unrealized appreciation (depreciation) on investment securities include the effects of changes in exchange rates since the securities were purchased, combined with the effects of changes in security prices. Fluctuations in the value of other assets and liabilities resulting from changes in exchange rates are recorded as unrealized foreign currency gains (losses) until the assets or liabilities are settled in cash, at which time they are recorded as realized foreign currency gains (losses).
3. Federal Income Taxes: The fund intends to continue to qualify as a regulated investment company and distribute all of its taxable income. Management has analyzed the fund’s tax positions taken for all open federal income tax years (December 31, 2008–2011), and has concluded that no provision for federal income tax is required in the fund’s financial statements.
4. Distributions: Distributions to shareholders are recorded on the ex-dividend date.
5. Other: Dividend income is recorded on the ex-dividend date. Interest income includes income distributions received from Vanguard Market Liquidity Fund and is accrued daily. Security transactions are accounted for on the date securities are bought or sold. Costs used to determine realized gains (losses) on the sale of investment securities are those of the specific securities sold. Fees assessed on redemptions of capital shares are credited to paid-in capital.
22
Tax-Managed International Fund
Each class of shares has equal rights as to assets and earnings, except that each class separately bears certain class-specific expenses related to maintenance of shareholder accounts (included in Management and Administrative expenses) and shareholder reporting. Marketing and distribution expenses are allocated to each class of shares based on a method approved by the board of trustees. Income, other non-class-specific expenses, and gains and losses on investments are allocated to each class of shares based on its relative net assets.
B. The Vanguard Group furnishes at cost investment advisory, corporate management, administrative, marketing, and distribution services. The costs of such services are allocated to the fund under methods approved by the board of trustees. The fund has committed to provide up to 0.40% of its net assets in capital contributions to Vanguard. At December 31, 2011, the fund had contributed capital of $1,313,000 to Vanguard (included in Other Assets), representing 0.02% of the fund’s net assets and 0.53% of Vanguard’s capitalization. The fund’s trustees and officers are also directors and officers of Vanguard.
C. Various inputs may be used to determine the value of the fund’s investments. These inputs are summarized in three broad levels for financial statement purposes. The inputs or methodologies used to value securities are not necessarily an indication of the risk associated with investing in those securities.
Level 1—Quoted prices in active markets for identical securities.
Level 2—Other significant observable inputs (including quoted prices for similar securities, interest rates, prepayment speeds, credit risk, etc.).
Level 3—Significant unobservable inputs (including the fund’s own assumptions used to determine the fair value of investments).
The following table summarizes the market value of the fund’s investments as of December 31, 2011, based on the inputs used to value them:
| | | |
| | Level 1 | Level 2 | Level 3 |
| Investments | ($000) | ($000) | ($000) |
| Common Stocks | 3,634 | 7,946,829 | — |
The following table summarizes changes in investments valued based on Level 3 inputs during the year ended December 31, 2011. Transfers into or out of Level 3 are recognized based on values as of the date of transfer.
| |
| | Investments in |
| | Common Stocks |
| Amount Valued Based on Level 3 Inputs | ($000) |
| Balance as of December 31, 2010 | 75 |
| Change in Unrealized Appreciation (Depreciation) | (75) |
| Balance as of December 31, 2011 | — |
23
Tax-Managed International Fund
D. Distributions are determined on a tax basis and may differ from net investment income and realized capital gains for financial reporting purposes. Differences may be permanent or temporary. Permanent differences are reclassified among capital accounts in the financial statements to reflect their tax character. Temporary differences arise when certain items of income, expense, gain, or loss are recognized in different periods for financial statement and tax purposes; these differences will reverse at some time in the future. Differences in classification may also result from the treatment of short-term gains as ordinary income for tax purposes.
During the year ended December 31, 2011, the fund realized net foreign currency losses of $1,444,000, which decreased distributable net income for tax purposes; accordingly, such losses have been reclassified from accumulated net realized losses to overdistributed net investment income.
During the year ended December 31, 2011, the fund realized $92,095,000 of net capital gains resulting from in-kind redemptions—in which shareholders exchanged fund shares for securities held by the fund rather than for cash. Because such gains are not taxable to the fund, and are not distributed to shareholders, they have been reclassified from accumulated net realized losses to paid-in capital.
For tax purposes, at December 31, 2011, the fund had $2,416,000 of ordinary income available for distribution. The fund had available capital loss carryforwards totaling $429,605,000 to offset future net capital gains of $90,589,000 through December 31, 2016, and $339,016,000 through December 31, 2017.
At December 31, 2011, the cost of investment securities for tax purposes was $8,961,255,000. Net unrealized depreciation of investment securities for tax purposes was $1,010,792,000, consisting of unrealized gains of $531,650,000 on securities that had risen in value since their purchase and $1,542,442,000 in unrealized losses on securities that had fallen in value since their purchase.
E. During the year ended December 31, 2011, the fund purchased $2,918,729,000 of investment securities and sold $681,422,000 of investment securities, other than temporary cash investments.
24
Tax-Managed International Fund
F. Capital share transactions for each class of shares were:
| | | | |
| | | | Year Ended December 31, |
| | | 2011 | | 2010 |
| | Amount | Shares | Amount | Shares |
| | ($000) | (000) | ($000) | (000) |
| Admiral Shares1 | | | | |
| Issued | 1,634,445 | 136,031 | 110,270 | 10,303 |
| Issued in Lieu of Cash Distributions | 32,302 | 3,328 | 27,785 | 2,426 |
| Redeemed2 | (1,688,790) | (141,153) | (149,768) | (14,095) |
| Net Increase (Decrease)—Admiral Shares | (22,043) | (1,794) | (11,713) | (1,366) |
| Institutional Shares | | | | |
| Issued | 94,698 | 8,648 | 93,918 | 8,828 |
| Issued in Lieu of Cash Distributions | 7,529 | 775 | 4,669 | 407 |
| Redeemed2 | (14,082) | (1,224) | (74,036) | (7,475) |
| Net Increase (Decrease)—Institutional Shares | 88,145 | 8,199 | 24,551 | 1,760 |
| ETF Shares | | | | |
| Issued | 2,453,259 | 69,201 | 1,181,384 | 35,340 |
| Issued in Lieu of Cash Distributions | — | — | — | — |
| Redeemed2 | (269,606) | (8,000) | (424,371) | (13,000) |
| Net Increase (Decrease)—ETF Shares | 2,183,653 | 61,201 | 757,013 | 22,340 |
1 Investor Shares were renamed Admiral Shares as of the close of business on May 13, 2011. The prior period’s capital share transactions are for the Investor class.
2 Net of redemption fees for fiscal 2011 and 2010 of $155,000 and $957,000 respectively (fund totals).
G. In preparing the financial statements as of December 31, 2011, management considered the impact of subsequent events for potential recognition or disclosure in these financial statements.
25
Report of Independent Registered Public Accounting Firm
To the Trustees of Vanguard Tax-Managed Funds and the Shareholders of Vanguard Tax-Managed International Fund:
In our opinion, the accompanying statement of net assets–investments summary and the related statements of operations and of changes in net assets and the financial highlights present fairly, in all material respects, the financial position of Vanguard Tax-Managed International Fund (constituting a separate portfolio of Vanguard Tax-Managed Funds, hereafter referred to as the “Fund”) at December 31, 2011, the results of its operations for the year then ended, the changes in its net assets for each of the two years in the period then ended and the financial highlights for each of the periods indicated, in conformity with accounting principles generally accepted in the United States of America. These financial statements and financial highlights (hereafter referred to as “financial statements”) are the responsibility of the Fund’s management; our responsibility is to express an opinion on these financial statements based on our audits. We conducted our audits of these financial statements in accordance with the standards of the Public Company Accounting Oversight Board (United States). Those standards require that we plan and perform the audit to obtain reasonable assurance about whether the financial statements are free of material misstatement. An audit includes examining, on a test basis, evidence supporting the amounts and disclosures in the financial statements, assessing the accounting principles used and significant estimates made by management, and evaluating the overall financial statement presentation.
We believe that our audits, which included confirmation of securities at December 31, 2011 by correspondence with the custodian, provide a reasonable basis for our opinion.
PricewaterhouseCoopers LLP
Philadelphia, Pennsylvania
February 16, 2012
Special 2011 tax information (unaudited) for Vanguard Tax-Managed International Fund
This information for the fiscal year ended December 31, 2011, is included pursuant to provisions of the Internal Revenue Code.
The fund distributed $268,131,000 of qualified dividend income to shareholders during the fiscal year
The fund designates to shareholders foreign source income of $301,435,000 and foreign taxes paid of $22,434,000. Shareholders will receive more detailed information with their Form 1099-DIV in January 2012 to determine the calendar-year amounts to be included on their 2011 tax returns.
26
Your Fund’s After-Tax Returns
This table presents returns for your fund both before and after taxes. The after-tax returns are shown in two ways: (1) assuming that an investor owned the fund during the entire period and paid taxes on the fund’s distributions, and (2) assuming that an investor paid taxes on the fund’s distributions and sold all shares at the end of each period.
Calculations are based on the highest individual federal income tax and capital gains tax rates in effect at the times of the distributions and the hypothetical sales. State and local taxes were not considered. After-tax returns reflect any qualified dividend income. (In the example, returns after the sale of fund shares may be higher than those assuming no sale. This occurs when the sale would have produced a capital loss. The calculation assumes that the investor received a tax deduction for the loss.)
The table shows returns for ETF Shares only; returns for other share classes will differ. Please note that your actual after-tax returns will depend on your tax situation and may differ from those shown. Also note that if you own the fund in a tax-deferred account, such as an individual retirement account or a 401(k) plan, this information does not apply to you. Such accounts are not subject to current taxes.
Finally, keep in mind that a fund’s performance—whether before or after taxes—does not guarantee future results.
| | |
| Average Annual Total Returns: MSCI EAFE ETF Shares | | |
| Periods Ended December 31, 2011 | | |
| | | Since |
| | One | Inception |
| | Year | (7/20/2007) |
| Returns Before Taxes | -12.57% | -7.68% |
| Returns After Taxes on Distributions | -12.85 | -7.95 |
| Returns After Taxes on Distributions and Sale of Fund Shares | -7.42 | -6.21 |
Returns do not include the 2% fee on redemptions of shares held for less than two months.
27
About Your Fund’s Expenses
As a shareholder of the fund, you incur ongoing costs, which include costs for portfolio management, administrative services, and shareholder reports (like this one), among others. Operating expenses, which are deducted from a fund’s gross income, directly reduce the investment return of the fund.
A fund’s expenses are expressed as a percentage of its average net assets. This figure is known as the expense ratio. The following examples are intended to help you understand the ongoing costs (in dollars) of investing in your fund and to compare these costs with those of other mutual funds. The examples are based on an investment of $1,000 made at the beginning of the period shown and held for the entire period.
The accompanying table illustrates your fund’s costs in two ways:
• Based on actual fund return. This section helps you to estimate the actual expenses that you paid over the period. The ”Ending Account Value“ shown is derived from the fund‘s actual return, and the third column shows the dollar amount that would have been paid by an investor who started with $1,000 in the fund. You may use the information here, together with the amount you invested, to estimate the expenses that you paid over the period.
To do so, simply divide your account value by $1,000 (for example, an $8,600 account value divided by $1,000 = 8.6), then multiply the result by the number given for your fund under the heading ”Expenses Paid During Period.“
• Based on hypothetical 5% yearly return. This section is intended to help you compare your fund‘s costs with those of other mutual funds. It assumes that the fund had a yearly return of 5% before expenses, but that the expense ratio is unchanged. In this case—because the return used is not the fund’s actual return—the results do not apply to your investment. The example is useful in making comparisons because the Securities and Exchange Commission requires all mutual funds to calculate expenses based on a 5% return. You can assess your fund’s costs by comparing this hypothetical example with the hypothetical examples that appear in shareholder reports of other funds.
Note that the expenses shown in the table are meant to highlight and help you compare ongoing costs only and do not reflect transaction costs incurred by the fund for buying and selling securities. Further, the expenses do not include any purchase, redemption, or account service fees described in the fund prospectus. If such fees were applied to your account, your costs would be higher. Your fund does not carry a “sales load.”
The calculations assume no shares were bought or sold during the period. Your actual costs may have been higher or lower, depending on the amount of your investment and the timing of any purchases or redemptions.
You can find more information about the fund’s expenses, including annual expense ratios, in the Financial Statements section of this report. For additional information on operating expenses and other shareholder costs, please refer to your fund’s current prospectus.
28
| | | |
| Six Months Ended December 31, 2011 | | | |
| | Beginning | Ending | Expenses |
| | Account Value | Account Value | Paid During |
| Tax-Managed International Fund | 6/30/2011 | 12/31/2011 | Period |
| Based on Actual Fund Return | | | |
| Admiral Shares | $1,000.00 | $831.56 | $0.37 |
| Institutional Shares | 1,000.00 | 831.27 | 0.32 |
| MSCI EAFE ETF Shares | 1,000.00 | 831.16 | 0.46 |
| Based on Hypothetical 5% Yearly Return | | | |
| Admiral Shares | $1,000.00 | $1,024.80 | $0.41 |
| Institutional Shares | 1,000.00 | 1,024.85 | 0.36 |
| MSCI EAFE ETF Shares | 1,000.00 | 1,024.70 | 0.51 |
The calculations are based on expenses incurred in the most recent six-month period. The fund’s annualized six-month expense ratios for that period are 0.08% for Admiral Shares, 0.07% for Institutional Shares, and 0.10% for MSCI EAFE ETF Shares. The dollar amounts shown as “Expenses Paid” are equal to the annualized expense ratio multiplied by the average account value over the period, multiplied by the number of days in the most recent six-month period, then divided by the number of days in the most recent 12-month period.
29
Glossary
Beta. A measure of the magnitude of a fund’s past share-price fluctuations in relation to the ups and downs of a given market index. The index is assigned a beta of 1.00. Compared with a given index, a fund with a beta of 1.20 typically would have seen its share price rise or fall by 12% when the index rose or fell by 10%. For this report, beta is based on returns over the past 36 months for both the fund and the index. Note that a fund’s beta should be reviewed in conjunction with its R-squared (see definition). The lower the R-squared, the less correlation there is between the fund and the index, and the less reliable beta is as an indicator of volatility.
Dividend Yield. Dividend income earned by stocks, expressed as a percentage of the aggregate market value (or of net asset value, for a fund). The yield is determined by dividing the amount of the annual dividends by the aggregate value (or net asset value) at the end of the period. For a fund, the dividend yield is based solely on stock holdings and does not include any income produced by other investments.
Earnings Growth Rate. The average annual rate of growth in earnings over the past five years for the stocks now in a fund.
Equity Exposure. A measure that reflects a fund’s investments in stocks and stock futures. Any holdings in short-term reserves are excluded.
Expense Ratio. A fund’s total annual operating expenses expressed as a percentage of the fund’s average net assets. The expense ratio includes management and administrative expenses, but does not include the transaction costs of buying and selling portfolio securities.
Inception Date. The date on which the assets of a fund (or one of its share classes) are first invested in accordance with the fund’s investment objective. For funds with a subscription period, the inception date is the day after that period ends. Investment performance is measured from the inception date.
Median Market Cap. An indicator of the size of companies in which a fund invests; the midpoint of market capitalization (market price x shares outstanding) of a fund’s stocks, weighted by the proportion of the fund’s assets invested in each stock. Stocks representing half of the fund’s assets have market capitalizations above the median, and the rest are below it.
Price/Book Ratio. The share price of a stock divided by its net worth, or book value, per share. For a fund, the weighted average price/book ratio of the stocks it holds.
Price/Earnings Ratio. The ratio of a stock’s current price to its per-share earnings over the past year. For a fund, the weighted average P/E of the stocks it holds. P/E is an indicator of market expectations about corporate prospects; the higher the P/E, the greater the expectations for a company’s future growth.
R-Squared. A measure of how much of a fund’s past returns can be explained by the returns from the market in general, as measured by a given index. If a fund’s total returns were precisely synchronized with an index’s returns, its R-squared would be 1.00. If the fund’s returns bore no relationship to the index’s returns, its R-squared would be 0. For this report, R-squared is based on returns over the past 36 months for both the fund and the index.
30
Return on Equity. The annual average rate of return generated by a company during the past five years for each dollar of shareholder’s equity (net income divided by shareholder’s equity). For a fund, the weighted average return on equity for the companies whose stocks it holds.
Short-Term Reserves. The percentage of a fund invested in highly liquid, short-term securities that can be readily converted to cash.
Turnover Rate. An indication of the fund’s trading activity. Funds with high turnover rates incur higher transaction costs and may be more likely to distribute capital gains (which may be taxable to investors). The turnover rate excludes in-kind transactions, which have minimal impact on costs.
31
The People Who Govern Your Fund
The trustees of your mutual fund are there to see that the fund is operated and managed in your best interests since, as a shareholder, you are a part owner of the fund. Your fund’s trustees also serve on the board of directors of The Vanguard Group, Inc., which is owned by the Vanguard funds and provides services to them on an at-cost basis.
A majority of Vanguard’s board members are independent, meaning that they have no affiliation with Vanguard or the funds they oversee, apart from the sizable personal investments they have made as private individuals. The independent board members have distinguished backgrounds in business, academia, and public service. Each of the trustees and executive officers oversees 180 Vanguard funds.
The following table provides information for each trustee and executive officer of the fund. More information about the trustees is in the Statement of Additional Information, which can be obtained, without charge, by contacting Vanguard at 800-662-7447, or online at vanguard.com.
| |
| Interested Trustee1 | and President (2006–2008) of Rohm and Haas Co. |
| | (chemicals); Director of Tyco International, Ltd. |
| F. William McNabb III | (diversified manufacturing and services) and Hewlett- |
| Born 1957. Trustee Since July 2009. Chairman of the | Packard Co. (electronic computer manufacturing); |
| Board. Principal Occupation(s) During the Past Five | Senior Advisor at New Mountain Capital; Trustee |
| Years: Chairman of the Board of The Vanguard Group, | of The Conference Board; Member of the Board of |
| Inc., and of each of the investment companies served | Managers of Delphi Automotive LLP (automotive |
| by The Vanguard Group, since January 2010; Director | components). |
| of The Vanguard Group since 2008; Chief Executive | |
| Officer and President of The Vanguard Group and of | Amy Gutmann |
| each of the investment companies served by The | Born 1949. Trustee Since June 2006. Principal |
| Vanguard Group since 2008; Director of Vanguard | Occupation(s) During the Past Five Years: President |
| Marketing Corporation; Managing Director of The | of the University of Pennsylvania; Christopher H. |
| Vanguard Group (1995–2008). | Browne Distinguished Professor of Political Science |
| | in the School of Arts and Sciences with secondary |
| | appointments at the Annenberg School for Commu- |
| Independent Trustees | nication and the Graduate School of Education |
| | of the University of Pennsylvania; Director of |
| Emerson U. Fullwood | Carnegie Corporation of New York, Schuylkill River |
| Born 1948. Trustee Since January 2008. Principal | Development Corporation, and Greater Philadelphia |
| Occupation(s) During the Past Five Years: Executive | Chamber of Commerce; Trustee of the National |
| Chief Staff and Marketing Officer for North America | Constitution Center; Chair of the Presidential |
| and Corporate Vice President (retired 2008) of Xerox | Commission for the Study of Bioethical Issues. |
| Corporation (document management products and | |
| services); Executive in Residence and 2010 | JoAnn Heffernan Heisen |
| Distinguished Minett Professor at the Rochester | Born 1950. Trustee Since July 1998. Principal |
| Institute of Technology; Director of SPX Corporation | Occupation(s) During the Past Five Years: Corporate |
| (multi-industry manufacturing), the United Way of | Vice President and Chief Global Diversity Officer |
| Rochester, Amerigroup Corporation (managed health | (retired 2008) and Member of the Executive |
| care), the University of Rochester Medical Center, | Committee (1997–2008) of Johnson & Johnson |
| Monroe Community College Foundation, and North | (pharmaceuticals/consumer products); Director of |
| Carolina A&T University. | Skytop Lodge Corporation (hotels), the University |
| | Medical Center at Princeton, the Robert Wood |
| Rajiv L. Gupta | Johnson Foundation, and the Center for Work Life |
| Born 1945. Trustee Since December 2001.2 | Policy; Member of the Advisory Board of the |
| Principal Occupation(s) During the Past Five Years: | Maxwell School of Citizenship and Public Affairs |
| Chairman and Chief Executive Officer (retired 2009) | at Syracuse University. |
| | |
| F. Joseph Loughrey | Thomas J. Higgins | |
| Born 1949. Trustee Since October 2009. Principal | Born 1957. Chief Financial Officer Since September |
| Occupation(s) During the Past Five Years: President | 2008. Principal Occupation(s) During the Past Five |
| and Chief Operating Officer (retired 2009) and Vice | Years: Principal of The Vanguard Group, Inc.; Chief |
| Chairman of the Board (2008–2009) of Cummins Inc. | Financial Officer of each of the investment companies |
| (industrial machinery); Director of SKF AB (industrial | served by The Vanguard Group since 2008; Treasurer |
| machinery), Hillenbrand, Inc. (specialized consumer | of each of the investment companies served by The |
| services), the Lumina Foundation for Education, and | Vanguard Group (1998–2008). |
| Oxfam America; Chairman of the Advisory Council | | |
| for the College of Arts and Letters and Member | Kathryn J. Hyatt | |
| of the Advisory Board to the Kellogg Institute for | Born 1955. Treasurer Since November 2008. Principal |
| International Studies at the University of Notre Dame. | Occupation(s) During the Past Five Years: Principal |
| | of The Vanguard Group, Inc.; Treasurer of each of |
| André F. Perold | the investment companies served by The Vanguard |
| Born 1952. Trustee Since December 2004. Principal | Group since 2008; Assistant Treasurer of each of the |
| Occupation(s) During the Past Five Years: George | investment companies served by The Vanguard Group |
| Gund Professor of Finance and Banking at the Harvard | (1988–2008). | |
| Business School (retired July 2011); Chief Investment | | |
| Officer and co-Managing Partner of HighVista | Heidi Stam | |
| Strategies LLC (private investment firm); Director of | Born 1956. Secretary Since July 2005. Principal |
| Rand Merchant Bank; Overseer of the Museum of | Occupation(s) During the Past Five Years: Managing |
| Fine Arts Boston. | Director of The Vanguard Group, Inc., since 2006; |
| | General Counsel of The Vanguard Group since 2005; |
| Alfred M. Rankin, Jr. | Secretary of The Vanguard Group and of each of the |
| Born 1941. Trustee Since January 1993. Principal | investment companies served by The Vanguard Group |
| Occupation(s) During the Past Five Years: Chairman, | since 2005; Director and Senior Vice President of |
| President, and Chief Executive Officer of NACCO | Vanguard Marketing Corporation since 2005; |
| Industries, Inc. (forklift trucks/housewares/lignite); | Principal of The Vanguard Group (1997–2006). |
| Director of Goodrich Corporation (industrial products/ | | |
| aircraft systems and services) and the National | | |
| Association of Manufacturers; Chairman of the | Vanguard Senior Management Team |
| Federal Reserve Bank of Cleveland; Vice Chairman | | |
| of University Hospitals of Cleveland; President of | R. Gregory Barton | Chris D. McIsaac |
| the Board of The Cleveland Museum of Art. | Mortimer J. Buckley | Michael S. Miller |
| | Kathleen C. Gubanich | James M. Norris |
| Peter F. Volanakis | Paul A. Heller | Glenn W. Reed |
| Born 1955. Trustee Since July 2009. Principal | Martha G. King | George U. Sauter |
| Occupation(s) During the Past Five Years: President | | |
| and Chief Operating Officer (retired 2010) of Corning | | |
| Incorporated (communications equipment); Director of | Chairman Emeritus and Senior Advisor |
| Corning Incorporated (2000–2010) and Dow Corning | | |
| (2001–2010); Overseer of the Amos Tuck School of | John J. Brennan | |
| Business Administration at Dartmouth College. | Chairman, 1996–2009 | |
| | Chief Executive Officer and President, 1996–2008 |
| |
| Executive Officers | | |
| | Founder | |
| Glenn Booraem | | |
| Born 1967. Controller Since July 2010. Principal | John C. Bogle | |
| Occupation(s) During the Past Five Years: Principal | Chairman and Chief Executive Officer, 1974–1996 |
| of The Vanguard Group, Inc.; Controller of each of | | |
| the investment companies served by The Vanguard | | |
| Group since 2010; Assistant Controller of each of | | |
| the investment companies served by The Vanguard | | |
| Group (2001–2010). | | |
1 Mr. McNabb is considered an “interested person,” as defined in the Investment Company Act of 1940, because he is an officer of the Vanguard funds.
2 December 2002 for Vanguard Equity Income Fund, Vanguard Growth Equity Fund, the Vanguard Municipal Bond Funds, and the Vanguard State Tax-Exempt Funds.
|  |
| P.O. Box 2600 |
| Valley Forge, PA 19482-2600 |
Connect with Vanguard® > vanguard.com
| |
| Fund Information > 800-662-7447 | |
| Direct Investor Account Services > 800-662-2739 | |
| Institutional Investor Services > 800-523-1036 | |
| Text Telephone for People | |
| With Hearing Impairment > 800-749-7273 | |
| |
| This material may be used in conjunction | |
| with the offering of shares of any Vanguard | |
| fund only if preceded or accompanied by | |
| the fund’s current prospectus. | |
| |
| All comparative mutual fund data are from Lipper Inc. or | |
| Morningstar, Inc., unless otherwise noted. | |
| |
| You can obtain a free copy of Vanguard’s proxy voting | |
| guidelines by visiting vanguard.com/proxyreporting or by | |
| calling Vanguard at 800-662-2739. The guidelines are | |
| also available from the SEC’s website, sec.gov. In | |
| addition, you may obtain a free report on how your fund | |
| voted the proxies for securities it owned during the 12 | |
| months ended June 30. To get the report, visit either | |
| vanguard.com/proxyreporting or sec.gov. | |
| |
| You can review and copy information about your fund at | |
| the SEC’s Public Reference Room in Washington, D.C. To | |
| find out more about this public service, call the SEC at | |
| 202-551-8090. Information about your fund is also | |
| available on the SEC’s website, and you can receive | |
| copies of this information, for a fee, by sending a | |
| request in either of two ways: via e-mail addressed to | |
| publicinfo@sec.gov or via regular mail addressed to the | |
| Public Reference Section, Securities and Exchange | |
| Commission, Washington, DC 20549-1520. | |
| | © 2012 The Vanguard Group, Inc. |
| | All rights reserved. |
| | Vanguard Marketing Corporation, Distributor. |
| |
| | Q1270 022012 |
Item 2: Code of Ethics. The Registrant has adopted a code of ethics that applies to the Registrant’s principal executive officer, principal financial officer, principal accounting officer or controller or persons performing similar functions. The Code of Ethics was amended during the reporting period covered by this report to make certain technical, non-material changes.
Item 3: Audit Committee Financial Expert. The following members of the Audit Committee have been determined by the Registrant’s Board of Trustees to be Audit Committee Financial Experts serving on its Audit Committee, and to be independent: Charles D. Ellis, Rajiv L. Gupta, JoAnn Heffernan Heisen, André F. Perold, and Alfred M. Rankin, Jr.
Item 4: Principal Accountant Fees and Services.
(a) Audit Fees.
Audit Fees of the Registrant
Fiscal Year Ended December 31, 2011: $147,000
Fiscal Year Ended December 31, 2010: $137,000
Aggregate Audit Fees of Registered Investment Companies in the Vanguard Group.
Fiscal Year Ended December 31, 2011: $3,978,540
Fiscal Year Ended December 31, 2010: $3,607,060
(b) Audit-Related Fees.
Fiscal Year Ended December 31, 2011: $1,341,750
Fiscal Year Ended December 31, 2010: $791,350
Includes fees billed in connection with assurance and related services provided to the Registrant, The Vanguard Group, Inc., Vanguard Marketing Corporation, and other registered investment companies in the Vanguard Group.
(c) Tax Fees.
Fiscal Year Ended December 31, 2011: $373,830
Fiscal Year Ended December 31, 2010: $336,090
Includes fees billed in connection with tax compliance, planning and advice services provided to the Registrant, The Vanguard Group, Inc., Vanguard Marketing Corporation, and other registered investment companies in the Vanguard Group and related to income and excise taxes.
(d) All Other Fees.
Fiscal Year Ended December 31, 2011: $16,000 Fiscal Year Ended December 31, 2010: $16,000
Includes fees billed for services related to risk management and privacy matters. Services were provided to the Registrant, The Vanguard Group, Inc., Vanguard Marketing Corporation, and other registered investment companies in the Vanguard Group.
(e) (1) Pre-Approval Policies. The policy of the Registrant’s Audit Committee is to consider and, if appropriate, approve before the principal accountant is engaged for such services, all specific audit and non-audit services provided to: (1) the Registrant; (2) The Vanguard Group, Inc.; (3) other entities controlled by The Vanguard Group, Inc. that provide ongoing services to the Registrant; and (4) other registered investment companies in the Vanguard Group. In making a determination, the Audit Committee considers whether the services are consistent with maintaining the principal accountant’s independence.
In the event of a contingency situation in which the principal accountant is needed to provide services in between scheduled Audit Committee meetings, the Chairman of the Audit Committee would be called on to consider and, if appropriate, pre-approve audit or permitted non-audit services in an amount sufficient to complete services through the next Audit Committee meeting, and to determine if such services would be consistent with maintaining the accountant’s independence. At the next scheduled Audit Committee meeting, services and fees would be presented to the Audit Committee for formal consideration, and, if appropriate, approval by the entire Audit Committee. The Audit Committee would again consider whether such services and fees are consistent with maintaining the principal accountant’s independence.
The Registrant’s Audit Committee is informed at least annually of all audit and non-audit services provided by the principal accountant to the Vanguard complex, whether such services are provided to: (1) the Registrant; (2) The Vanguard Group, Inc.; (3) other entities controlled by The Vanguard Group, Inc. that provide ongoing services to the Registrant; or (4) other registered investment companies in the Vanguard Group.
(2) No percentage of the principal accountant’s fees or services were approved pursuant to the waiver provision of paragraph (c)(7)(i)(C) of Rule 2-01 of Regulation S-X.
(f) For the most recent fiscal year, over 50% of the hours worked under the principal accountant’s engagement were not performed by persons other than full-time, permanent employees of the principal accountant.
(g) Aggregate Non-Audit Fees.
Fiscal Year Ended December 31, 2011: $389,830
Fiscal Year Ended December 31, 2010: $352,090
Includes fees billed for non-audit services provided to the Registrant, The Vanguard Group, Inc., Vanguard Marketing Corporation, and other registered investment companies in the Vanguard Group.
(h) For the most recent fiscal year, the Audit Committee has determined that the provision of all non-audit services was consistent with maintaining the principal accountant’s independence.
Item 5: Audit Committee of Listed Registrants.
The Registrant is a listed issuer as defined in rule 10A-3 under the Securities Exchange Act of 1934 (“Exchange Act”). The Registrant has a separately-designated standing audit committee established in accordance with Section 3(a)(58)(A) of the Exchange Act. The Registrant’s audit committee members are: Emerson U. Fullwood, Rajiv L. Gupta, Amy Gutmann, JoAnn Heffernan Heisen, F. Joseph Loughrey, André F. Perold, Alfred M. Rankin, Jr., and Peter F. Volanakis.
Item 6: Investments.
Not Applicable.
Item 7: Disclosure of Proxy Voting Policies and Procedures for Closed-End Management Investment Companies.
Not Applicable.
Item 8: Portfolio Managers of Closed-End Management Investment Companies.
Not Applicable.
Item 9: Purchase of Equity Securities by Closed-End Management Investment Company and Affiliated Purchasers.
Not Applicable.
Item 10: Submission of Matters to a Vote of Security Holders.
Not Applicable.
Item 11: Controls and Procedures.
(a) Disclosure Controls and Procedures. The Principal Executive and Financial Officers concluded that the Registrant's Disclosure Controls and Procedures are effective based on their evaluation of the Disclosure Controls and Procedures as of a date within 90 days of the filing date of this report.
(b) Internal Control Over Financial Reporting. There were no significant changes in Registrant’s Internal Control Over Financial Reporting or in other factors that could significantly affect this control subsequent to the date of the evaluation, including any corrective actions with regard to significant deficiencies and material weaknesses.
Item 12: Exhibits.
(a) Code of Ethics.
(b) Certifications.
Pursuant to the requirements of the Securities Exchange Act of 1934 and the Investment Company Act of 1940, the registrant has duly caused this report to be signed on its behalf by the undersigned, thereunto duly authorized.
| |
| | VANGUARD TAX-MANAGED FUNDS |
| |
| By: | /s/ F. WILLIAM MCNABB III* |
| | F. WILLIAM MCNABB III |
| | CHIEF EXECUTIVE OFFICER |
| |
| Date: February 21, 2012 |
Pursuant to the requirements of the Securities Exchange Act of 1934 and the Investment Company Act of 1940, this report has been signed below by the following persons on behalf of the registrant and in the capacities and on the dates indicated.
| |
| | VANGUARD TAX-MANAGED FUNDS |
| |
| By: | /s/ F. WILLIAM MCNABB III* |
| | F. WILLIAM MCNABB III |
| | CHIEF EXECUTIVE OFFICER |
| |
| Date: February 21, 2012 |
| |
| | VANGUARD TAX-MANAGED FUNDS |
| |
| By: | /s/ THOMAS J. HIGGINS* |
| | THOMAS J. HIGGINS |
| | CHIEF FINANCIAL OFFICER |
| |
| Date: February 21, 2012 |
* By: /s/ Heidi Stam
Heidi Stam, pursuant to a Power of Attorney filed on November 28, 2011 see file Number 33-23444,
Incorporated by Reference.