UNITED STATES
SECURITIES AND EXCHANGE COMMISSION
Washington, D.C. 20549
FORM N-CSR
CERTIFIED SHAREHOLDER REPORT
OF
REGISTERED MANAGEMENT INVESTMENT COMPANIES
| | |
| Investment Company Act file number: | 811-07175 |
Name of Registrant: | Vanguard Tax-Managed Funds |
Address of Registrant: | P.O. Box 2600 |
| | Valley Forge, PA 19482 |
Name and address of agent for service: | Heidi Stam, Esquire |
| | P.O. Box 876 |
| | Valley Forge, PA 19482 |
Registrant’s telephone number, including area code: (610) 669-1000 |
Date of fiscal year end: December 31 | |
Date of reporting period: January 1, 2015 – December 31, 2015 |
Item 1: Reports to Shareholders | |

Annual Report | December 31, 2015
Vanguard Tax-Managed Funds®
Vanguard Tax-Managed Balanced Fund
Vanguard Tax-Managed Capital Appreciation Fund
Vanguard Tax-Managed Small-Cap Fund
Vanguard’s Principles for Investing Success
We want to give you the best chance of investment success. These principles, grounded in Vanguard’s research and experience, can put you on the right path.
Goals. Create clear, appropriate investment goals.
Balance. Develop a suitable asset allocation using broadly diversified funds. Cost. Minimize cost.
Discipline. Maintain perspective and long-term discipline.
A single theme unites these principles: Focus on the things you can control.
We believe there is no wiser course for any investor.
| |
| Contents | |
| Your Fund’s Total Returns. | 1 |
| Chairman’s Letter. | 2 |
| Tax-Managed Balanced Fund. | 9 |
| Tax-Managed Capital Appreciation Fund. | 73 |
| Tax-Managed Small-Cap Fund. | 94 |
| Your Fund’s After-Tax Returns. | 117 |
| About Your Fund’s Expenses. | 118 |
| Glossary. | 120 |
Please note: The opinions expressed in this report are just that—informed opinions. They should not be considered promises or advice.
Also, please keep in mind that the information and opinions cover the period through the date on the front of this report. Of course, the
risks of investing in your fund are spelled out in the prospectus.
See the Glossary for definitions of investment terms used in this report.
About the cover: Pictured is a sailing block on the Brilliant, a 1932 schooner docked in Mystic, Connecticut. A type of pulley, the
sailing block helps coordinate the setting of the sails. At Vanguard, the intricate coordination of technology and people allows
us to help millions of clients around the world reach their financial goals.
Your Fund’s Total Returns
| |
| Fiscal Year Ended December 31, 2015 | |
| | Total |
| | Returns |
| Vanguard Tax-Managed Balanced Fund | 2.35% |
| Tax-Managed Balanced Composite Index | 2.19 |
| Mixed-Asset Target Allocation Moderate Funds Average | -2.26 |
| For a benchmark description, see the Glossary. | |
| Mixed-Asset Target Allocation Moderate Funds Average: Derived from data provided by Lipper, a Thomson Reuters Company. | |
| Vanguard Tax-Managed Capital Appreciation Fund | |
| Admiral™ Shares | 1.68% |
| Institutional Shares | 1.71 |
| Russell 1000 Index | 0.92 |
| Multi-Cap Core Funds Average | -2.29 |
| Multi-Cap Core Funds Average: Derived from data provided by Lipper, a Thomson Reuters Company. | |
| Vanguard Tax-Managed Small-Cap Fund | |
| Admiral Shares | -1.85% |
| Institutional Shares | -1.80 |
| S&P SmallCap 600 Index | -1.97 |
| Small-Cap Core Funds Average | -5.21 |
Small-Cap Core Funds Average: Derived from data provided by Lipper, a Thomson Reuters Company.
Admiral Shares carry lower expenses and are available to investors who meet certain account-balance requirements. Institutional Shares are
available to certain institutional investors who meet specific administrative, service, and account-size criteria.
Your Fund’s Performance at a Glance
December 31, 2014, Through December 31, 2015
| | | | |
| | | | Distributions Per Share |
| | Starting | Ending | | |
| | Share | Share | Income | Capital |
| | Price | Price | Dividends | Gains |
| Vanguard Tax-Managed Balanced Fund | $26.79 | $26.86 | $0.554 | $0.000 |
| Vanguard Tax-Managed Capital Appreciation Fund | | | | |
| Admiral Shares | $103.82 | $103.75 | $1.752 | $0.000 |
| Institutional Shares | 51.59 | 51.55 | 0.891 | 0.000 |
| Vanguard Tax-Managed Small-Cap Fund | | | | |
| Admiral Shares | $45.78 | $44.37 | $0.560 | $0.000 |
| Institutional Shares | 45.88 | 44.47 | 0.580 | 0.000 |
1

Chairman’s Letter
Dear Shareholder,
The year ended December 31, 2015, was a tumultuous one for the world’s financial markets. Not immune to the volatility, the broad U.S. stock market navigated a bumpy road to slight gains. Growth stocks outpaced their value counterparts, while large-capitalization stocks exceeded mid-caps and small-caps. Among U.S. bonds, tax-exempt issues were some of the standout performers.
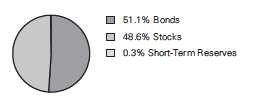
Against this backdrop, Vanguard Tax-Managed Balanced Fund—which is invested about 50% in stocks and about 50% in tax-exempt bonds—returned 2.35% for the 12 months. Vanguard Tax-Managed Capital Appreciation Fund, which invests in large- and mid-cap stocks, returned 1.68%. Reflecting weakness in small-cap stocks, Vanguard Tax-Managed Small-Cap Fund returned –1.85%. (All returns are for Admiral Shares.)
The funds’ returns were consistent with those of their benchmark indexes. As they did in 2014, each of the funds posted results that were notably better than the average returns of their peers.
The funds also continued to meet their tax-management objective, as they have since their inception. You may wish to review the table later in this report that shows the funds’ after-tax returns for the past one, five, and ten years.
2
Despite troubles, U.S. stocks eked out a seventh year of gains
U.S. stocks returned 0.48% for the year ended December 31, 2015. Although the broad market recorded its worst performance since 2008, it still posted gains for the seventh straight calendar year when dividends are factored into returns.
Stocks rose modestly over the first half of the year but slid in August and September as concerns mounted that China’s economic slowdown would spread globally. Falling oil and commodity prices also affected economies and markets across the world for better or worse. Central banks in Europe and Asia bolstered their stimulus efforts against weak growth and low inflation. And in December, the Federal Reserve ended months of uncertainty when it raised the target for short-term interest rates to 0.25%–0.5%.
International stocks returned about –5%, restrained by the U.S. dollar’s strength against many foreign currencies. Emerging markets fared the worst.
U.S. bonds ended the year with a slender advance
The broad U.S. taxable bond market returned 0.55% for the 12 months; income accounted for the modestly positive result. The yield of the 10-year Treasury note ended December at 2.30%, up from 2.19% a year earlier. (Bond prices and yields move in opposite directions.)
| | | |
| Market Barometer | | | |
| |
| | Average Annual Total Returns |
| | Periods Ended December 31, 2015 |
| | One | Three | Five |
| | Year | Years | Years |
| Stocks | | | |
| Russell 1000 Index (Large-caps) | 0.92% | 15.01% | 12.44% |
| Russell 2000 Index (Small-caps) | -4.41 | 11.65 | 9.19 |
| Russell 3000 Index (Broad U.S. market) | 0.48 | 14.74 | 12.18 |
| FTSE All-World ex US Index (International) | -4.72 | 2.04 | 1.48 |
| |
| Bonds | | | |
| Barclays U.S. Aggregate Bond Index (Broad taxable market) | 0.55% | 1.44% | 3.25% |
| Barclays Municipal Bond Index (Broad tax-exempt market) | 3.30 | 3.16 | 5.35 |
| Citigroup Three-Month U.S. Treasury Bill Index | 0.03 | 0.02 | 0.04 |
| |
| CPI | | | |
| Consumer Price Index | 0.73% | 1.00% | 1.53% |
3
Investors focused on the Fed’s stance on short-term interest rates and alternately embraced or avoided safe-haven assets depending on the stock market’s strength.
International bond markets (as measured by the Barclays Global Aggregate Index ex USD) returned –6.02%, reduced by the dollar’s strength against many foreign currencies. Without this currency effect, returns were modestly positive.
Although the Fed raised its target for short-term interest rates in mid-December to 0.25%–0.5%, returns for money market funds and savings accounts remained limited by the 0%–0.25% levels in place for much of the past seven years.
Tax-exempt bonds were in favor, while small-cap stocks were not
Vanguard’s three tax-managed funds share a tax-efficient objective, while offering exposure to different areas of the market. The funds’ advisors—Vanguard’s Equity Index Group and Fixed Income Group—use various portfolio management strategies to minimize the funds’ taxable gains, while deviating as little as possible from an indexing strategy.
In 2015, the Tax-Managed Balanced Fund benefited from its exposure to tax-exempt municipal bonds, which generally fared better than their taxable counterparts. The fund’s bond portion returned about 3%, more than 2 percentage points ahead of the broad U.S. taxable bond market.
| | | |
| Expense Ratios | | | |
| Your Fund Compared With Its Peer Group | | | |
| |
| | Admiral | Institutional | Peer Group |
| | Shares | Shares | Average |
| Tax-Managed Balanced Fund | 0.12% | — | 0.88% |
| Tax-Managed Capital Appreciation Fund | 0.12 | 0.08% | 1.21 |
| Tax-Managed Small-Cap Fund | 0.12 | 0.08 | 1.29 |
The fund expense ratios shown are from the prospectus dated April 29, 2015, and represent estimated costs for the current fiscal year. For the
fiscal year ended December 31, 2015, the funds’ expense ratios were: for the Tax-Managed Balanced Fund, 0.11%; for the Tax-Managed
Capital Appreciation Fund, 0.11% for Admiral Shares and 0.07% for Institutional Shares; and for the Tax-Managed Small-Cap Fund, 0.11% for
Admiral Shares and 0.07% for Institutional Shares. Peer group expense ratios are derived from data provided by Lipper, a Thomson Reuters
Company, and capture information through year-end 2014.
Peer groups: For the Tax-Managed Balanced Fund, Mixed-Asset Target Allocation Moderate Funds; for the Tax-Managed Capital Appreciation
Fund, Multi-Cap Core Funds; and for the Tax-Managed Small-Cap Fund, Small-Cap Core Funds.
4
Muni bonds had also fared well in 2014 as some states have shown improvement in their financial situations.
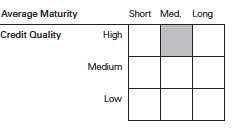
The fixed income portion of the balanced fund is concentrated in high-quality municipal securities with an average maturity expected to be between 7 and 12 years. At least three-quarters of the municipal bonds purchased by the fund will be rated in one of the top three credit-rating categories, as determined by an independent bond-rating agency.
On the equity side, the Tax-Managed Balanced Fund also got a lift from its exposure to some of the largest U.S. stocks. The equity portion of the fund closely follows the Russell 1000 Index, which includes the biggest U.S. corporations as well as some mid-cap stocks.
A handful of “mega-cap” stocks recorded outsized gains in 2015, a trend that also helped the Tax-Managed Capital Appreciation Fund. That fund, too, tracks the performance of the Russell 1000
| |
| Total Returns | |
| Ten Years Ended December 31, 2015 | |
| | Average |
| | Annual Return |
| Tax-Managed Balanced Fund | 6.25% |
| Tax-Managed Balanced Composite Index | 6.51 |
| Mixed-Asset Target Allocation Moderate Funds Average | 4.52 |
| For a benchmark description, see the Glossary. |
| Mixed-Asset Target Allocation Moderate Funds Average: Derived from data provided by Lipper, a Thomson Reuters Company. |
| |
| |
| Tax-Managed Capital Appreciation Fund Admiral Shares | 7.43% |
| Russell 1000 Index | 7.40 |
| Multi-Cap Core Funds Average | 5.81 |
| Multi-Cap Core Funds Average: Derived from data provided by Lipper, a Thomson Reuters Company. |
| |
| Tax-Managed Small-Cap Fund Admiral Shares | 8.05% |
| S&P SmallCap 600 Index | 8.01 |
| Small-Cap Core Funds Average | 5.81 |
| Small-Cap Core Funds Average: Derived from data provided by Lipper, a Thomson Reuters Company. |
The figures shown represent past performance, which is not a guarantee of future results. (Current performance may be
lower or higher than the performance data cited. For performance data current to the most recent month-end, visit our
website at vanguard.com/performance.) Note, too, that both investment returns and principal value can fluctuate widely, so
an investor’s shares, when sold, could be worth more or less than their original cost.
5
Index. While giant stocks found favor, small- and mid-cap stocks were, for the most part, out of favor. The Tax-Managed Small-Cap Fund, which tracks the performance of the S&P SmallCap 600 Index, ended with its first negative annual return since 2008.
As an experienced investor knows, various market segments frequently swap leadership positions from one period to another. It’s impossible to know for certain which category—small-cap, mid-cap, large-cap, value, growth, domestic, international—may be the top-performer in any given year. This alternating leadership is one of the reasons that we counsel that broad global diversification is generally the best course for investors.
Over the past decade, the funds outshined peers
For the ten years ended December 31, 2015, Vanguard’s tax-managed funds posted average annual returns ranging from about 6% for the Balanced Fund
| Vanguard’s outlook for investors: Not bearish, but cautious |
| |
| In Vanguard’s recently published global economic and investment outlook, Global Chief |
| Economist Joseph Davis and his team discuss various market and economic events 2016 |
| may bring, along with challenges and opportunities for investors. |
| |
| Our forecast includes “frustratingly fragile” economic growth and more modest long-term |
| returns from the global stock and bond markets. The report cautions that for the decade ending |
| 2025, returns for a balanced portfolio are likely to be moderately below historical averages. |
| |
| Our simulations indicate that the average annualized returns of a 60% equity/40% bond |
| portfolio for the decade are most likely to be centered in the 3%–5% range after inflation, |
| below the actual average after-inflation return of 5.5% for the same portfolio since 1926. |
| |
| Even so, Vanguard’s steadfast belief in its principles for investing success—focusing on clear |
| goals, a suitable asset allocation, low costs, and long-term discipline—remains unchanged. |
| |
| For more information about our expectations and the probability of various outcomes, see |
| Vanguard’s Economic and Investment Outlook, available at vanguard.com/research. |
| |
| |
| IMPORTANT: The projections or other information generated by the Vanguard Capital Markets Model® (VCMM) |
| regarding the likelihood of various investment outcomes are hypothetical in nature, do not reflect actual investment |
| results, and are not guarantees of future results. Distribution of return outcomes from VCMM, derived from |
| 10,000 simulations for U.S. equity returns and fixed income returns. Simulations as of September 30, 2015. |
| Results from the model may vary with each use and over time. For more information, please see page 7. |
6
to about 8% for the Small-Cap Fund. These returns were in line with the funds’ benchmarks, and all three funds outpaced the average returns of their peers.
Vanguard’s Equity Index Group and Fixed Income Group deserve credit for the funds’ success in delivering results in line with their indexes and meeting their tax-management objectives. Unlike many of their peers, our tax-managed funds have never distributed capital gains to shareholders. We believe the advisors will continue this record, as they manage each fund with tax consequences in mind.
To reach your long-term goals, be realistic and try to save more
Although there have been times when it felt as if stocks and bonds were riding a roller coaster, the markets have generally risen in recent years. The broad global stock market in particular has posted some impressive gains since its turnaround began in 2009.
But 2015 served as a reminder that markets aren’t always favorable. The U.S. stock and bond markets were barely positive, and international stocks and unhedged bonds finished in the red.
In Vanguard’s recently updated long-term look at the economy and markets, our global economists explain why they expect economic growth to remain “frustratingly fragile,” and why their outlook for stock and bond markets is the most guarded since 2006. (For more details, see the box on page 6 and Vanguard’s Economic and Investment Outlook, available at vanguard.com/research.)
IMPORTANT: The projections or other information generated by the Vanguard Capital Markets Model (VCMM)
regarding the likelihood of various investment outcomes are hypothetical in nature, do not reflect actual
investment results, and are not guarantees of future results. VCMM results will vary with each use and over time.
The VCMM projections are based on a statistical analysis of historical data. Future returns may behave differently from the
historical patterns captured in the VCMM. More important, the VCMM may be underestimating extreme negative scenarios
unobserved in the historical period on which the model estimation is based.
The VCMM is a proprietary financial simulation tool developed and maintained by Vanguard’s primary investment research
and advice teams. The model forecasts distributions of future returns for a wide array of broad asset classes. Those asset
classes include U.S. and international equity markets, several maturities of the U.S. Treasury and corporate fixed income
markets, international fixed income markets, U.S. money markets, commodities, and certain alternative investment
strategies. The theoretical and empirical foundation for the VCMM is that the returns of various asset classes reflect the
compensation investors require for bearing different types of systematic risk (beta). At the core of the model are estimates
of the dynamic statistical relationship between risk factors and asset returns, obtained from statistical analysis based on
available monthly financial and economic data from as early as 1960. Using a system of estimated equations, the model
then applies a Monte Carlo simulation method to project the estimated interrelationships among risk factors and asset
classes as well as uncertainty and randomness over time. The model generates a large set of simulated outcomes for
each asset class over several time horizons. Forecasts are obtained by computing measures of central tendency in these
simulations. Results produced by the tool will vary with each use and over time.
7
Given these muted expectations, what’s the best course of action? I’ve often encouraged shareholders to focus on the things they can control. That advice holds true today.
Consider saving more than you think you may need. That’s one way you can prepare for the volatility that may lie ahead, particularly as markets adjust to changes in policies from the Fed and other central banks.
And, as always, investors would be well-served to follow Vanguard’s principles for investing success:
• Goals. Create clear, appropriate investment goals.
• Balance. Develop a suitable asset allocation using broadly diversified funds.
• Cost. Minimize cost.
• Discipline. Maintain perspective and long-term discipline.
As with saving, each of these principles is within your control, and focusing on them can keep you on the right path.
As always, thank you for investing with Vanguard.
Sincerely,

F. William McNabb III
Chairman and Chief Executive Officer
January 19, 2016
Tax-Managed Balanced Fund
Fund Profile
As of December 31, 2015
| | | |
| Equity and Portfolio Characteristics | |
| | | | DJ |
| | | Russell | U.S. Total |
| | | 1000 | Market |
| | Fund | Index | FA Index |
| Number of Stocks | 756 | 1,033 | 3,960 |
| Median Market Cap | $59.1B | $60.5B | $51.4B |
| Price/Earnings Ratio | 21.3x | 21.2x | 21.9x |
| Price/Book Ratio | 2.7x | 2.7x | 2.7x |
| Return on Equity | 17.7% | 17.8% | 17.2% |
| Earnings Growth | | | |
| Rate | 9.9% | 9.4% | 9.5% |
| Dividend Yield | 1.9% | 2.1% | 2.1% |
| Foreign Holdings | 0.0% | 0.0% | 0.0% |
| Turnover Rate | 9% | — | — |
| Ticker Symbol | VTMFX | — | — |
| Expense Ratio1 | 0.12% | — | — |
| 30-Day SEC Yield | 1.72% | — | — |
| Short-Term Reserves | 0.3% | — | — |
| | | |
| Fixed Income Characteristics | | |
| |
| | | Barclays | Barclays |
| | | 1-15 Year | Municipal |
| | | Municipal | Bond |
| | Fund | Index | Index |
| Number of Bonds | 1,391 | 38,905 | 47,819 |
| Yield to Maturity | | | |
| (before expenses) | 1.8% | 1.8% | 2.1% |
| Average Coupon | 4.5% | 4.8% | 4.8% |
| Average Duration | 4.8 years | 4.7 years | 6.2 years |
| Average Stated | | | |
| Maturity | 8.5 years | 8.0 years | 13.1 years |
| | |
| Total Fund Volatility Measures | |
| | | DJ |
| | Tax-Managed | U.S. Total |
| | Balanced | Market |
| | Comp Index | FA Index |
| R-Squared | 1.00 | 0.92 |
| Beta | 0.98 | 0.47 |
| These measures show the degree and timing of the fund’s fluctuations compared with the indexes over 36 months. |
| | |
| Ten Largest Stocks (% of equity portfolio) | |
| Apple Inc. | Computer | |
| | Technology | 3.0% |
| Alphabet Inc. | Computer Services | |
| | Software & Systems | 2.3 |
| Microsoft Corp. | Computer Services | |
| | Software & Systems | 2.2 |
| Exxon Mobil Corp. | Oil: Integrated | 1.6 |
| General Electric Co. | Diversified | |
| | Manufacturing | |
| | Operations | 1.4 |
| Johnson & Johnson | Pharmaceuticals | 1.4 |
| Amazon.com Inc. | Diversified Retail | 1.3 |
| Berkshire Hathaway Inc. Insurance: Multi-Line | 1.3 |
| Wells Fargo & Co. | Banks: Diversified | 1.2 |
| Facebook Inc. | Computer Services | |
| | Software & Systems | 1.2 |
| Top Ten | | 16.9% |
| Top Ten as % of Total Net Assets | 8.2% |
| The holdings listed exclude any temporary cash investments and equity index products. |
Fund Asset Allocation
1 The expense ratio shown is from the prospectus dated April 29, 2015, and represents estimated costs for the current fiscal year. For the fiscal year
ended December 31, 2015, the expense ratio was 0.11%.
9
Tax-Managed Balanced Fund
| | | |
| Sector Diversification (% of equity exposure) |
| | | | DJ |
| | | Russell | U.S. Total |
| | | 1000 | Market |
| | Fund | Index | FA Index |
| Consumer | | | |
| Discretionary | 14.9% | 14.8% | 14.7% |
| Consumer Staples | 8.3 | 8.3 | 7.9 |
| Energy | 6.2 | 6.3 | 5.9 |
| Financial Services | 19.6 | 19.7 | 20.3 |
| Health Care | 14.4 | 14.5 | 14.7 |
| Materials & | | | |
| Processing | 3.7 | 3.5 | 3.7 |
| Producer Durables | 10.4 | 10.7 | 10.6 |
| Technology | 17.2 | 17.0 | 17.0 |
| Utilities | 5.3 | 5.2 | 5.2 |
| |
| Distribution by Credit Quality (% of fixed | |
| income portfolio) | |
| AAA | 23.8% |
| AA | 50.4 |
| A | 18.1 |
| BBB | 6.3 |
| BB | 0.7 |
| Not Rated | 0.7 |
Credit-quality ratings are obtained from Moody's and S&P, and the higher rating for each issue is shown. "Not Rated" is used to
classify securities for which a rating is not available. Not rated securities include a fund's investment in Vanguard Market Liquidity
Fund or Vanguard Municipal Cash Management Fund, each of which invests in high-quality money market instruments and may
serve as a cash management vehicle for the Vanguard funds,
trusts, and accounts. For more information about these ratings, see
the Glossary entry for Credit Quality.
Equity Investment Focus

Fixed Income Investment Focus
| |
| Distribution by Average Stated Maturity | |
| (% of fixed income portfolio) | |
| Under 1 Year | 11.5% |
| 1 - 3 Years | 9.9 |
| 3 - 5 Years | 11.7 |
| 5 - 10 Years | 27.3 |
| 10 - 20 Years | 38.9 |
| 20 - 30 Years | 0.7 |
| |
| Largest Area Concentrations (% of fixed income |
| portfolio) | |
| New York | 14.7% |
| California | 14.7 |
| Texas | 9.0 |
| Illinois | 5.6 |
| Pennsylvania | 5.4 |
| Maryland | 4.2 |
| Florida | 3.9 |
| Massachusetts | 3.5 |
| New Jersey | 3.2 |
| Washington | 2.9 |
| Top Ten | 67.1% |
| "Largest Area Concentration" figures exclude any fixed income futures contracts. |
10
Tax-Managed Balanced Fund
Performance Summary
All of the returns in this report represent past performance, which is not a guarantee of future results that may be achieved by the fund. (Current performance may be lower or higher than the performance data cited. For performance data current to the most recent month-end, visit our website at vanguard.com/performance.) Note, too, that both investment returns and principal value can fluctuate widely, so an investor’s shares, when sold, could be worth more or less than their original cost. The returns shown do not reflect taxes that a shareholder would pay on fund distributions or on the sale of fund shares.
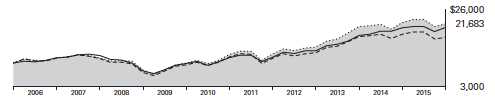
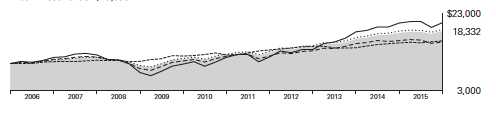
Cumulative Performance: December 31, 2005, Through December 31, 2015
Initial Investment of $10,000
| | | | | |
| | | Average Annual Total Returns | |
| | | Periods Ended December 31, 2015 | |
| | | | | | Final Value |
| | | One | Five | Ten | of a $10,000 |
| | | Year | Years | Years | Investment |
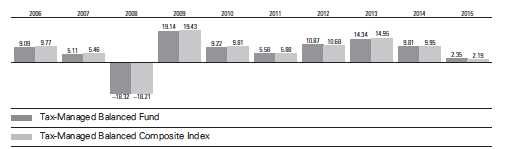
| | Tax-Managed Balanced Fund | 2.35% | 8.51% | 6.25% | $18,332 |
| | Tax-Managed Balanced Composite | | | | |
| •••••••• | Index | 2.19 | 8.64 | 6.51 | 18,791 |
| – – – – | Mixed-Asset Target Allocation | | | | |
| | Moderate Funds Average | -2.26 | 5.54 | 4.52 | 15,561 |
| - - - - - - | Barclays Municipal Bond Index | 3.30 | 5.35 | 4.72 | 15,853 |
| | Dow Jones U.S. Total Stock Market | | | | |
| | Float Adjusted Index | 0.44 | 12.14 | 7.48 | 20,563 |
| For a benchmark description, see the Glossary. |
| Mixed-Asset Target Allocation Moderate Funds Average: Derived from data provided by Lipper, a Thomson Reuters Company. |
See Financial Highlights for dividend and capital gains information.
11
Tax-Managed Balanced Fund
Fiscal-Year Total Returns (%): December 31, 2005, Through December 31, 2015
For a benchmark description, see the Glossary.
12
Tax-Managed Balanced Fund
Financial Statements
Statement of Net Assets
As of December 31, 2015
The fund reports a complete list of its holdings in regulatory filings four times in each fiscal year, at the quarter-ends. For the second and fourth fiscal quarters, the lists appear in the fund’s semiannual and annual reports to shareholders. For the first and third fiscal quarters, the fund files the lists with the Securities and Exchange Commission on Form N-Q. Shareholders can look up the fund’s Forms N-Q on the SEC’s website at sec.gov. Forms N-Q may also be reviewed and copied at the SEC’s Public Reference Room (see the back cover of this report for further information).
| | | |
| | | | Market |
| | | | Value• |
| | | Shares | ($000) |
| Common Stocks (47.9%) | | |
| Consumer Discretionary (7.1%) | | |
| * | Amazon.com Inc. | 22,922 | 15,493 |
| | Walt Disney Co. | 96,366 | 10,126 |
| | Home Depot Inc. | 74,699 | 9,879 |
| | Comcast Corp. Class A | 139,421 | 7,868 |
| | McDonald’s Corp. | 49,874 | 5,892 |
| | Wal-Mart Stores Inc. | 95,949 | 5,882 |
| | Starbucks Corp. | 89,026 | 5,344 |
| | NIKE Inc. Class B | 80,628 | 5,039 |
| | Costco Wholesale Corp. | 28,857 | 4,660 |
| * | Priceline Group Inc. | 3,456 | 4,406 |
| | Lowe’s Cos. Inc. | 55,715 | 4,237 |
| * | Netflix Inc. | 28,809 | 3,295 |
| | Twenty-First Century Fox | | |
| | Inc. Class A | 112,951 | 3,068 |
| | Time Warner Inc. | 47,196 | 3,052 |
| | TJX Cos. Inc. | 41,786 | 2,963 |
| | Time Warner Cable Inc. | 14,143 | 2,625 |
| * | eBay Inc. | 86,443 | 2,375 |
| * | O’Reilly Automotive Inc. | 8,072 | 2,046 |
| | Ford Motor Co. | 142,400 | 2,006 |
| | Johnson Controls Inc. | 47,900 | 1,892 |
| | CBS Corp. Class B | 39,413 | 1,858 |
| | Ross Stores Inc. | 33,708 | 1,814 |
| * | Tesla Motors Inc. | 7,270 | 1,745 |
| | Target Corp. | 23,945 | 1,739 |
| * | AutoZone Inc. | 2,341 | 1,737 |
| | General Motors Co. | 50,500 | 1,718 |
| | Dollar General Corp. | 22,000 | 1,581 |
| | Estee Lauder Cos. Inc. | | |
| | Class A | 17,818 | 1,569 |
| | Royal Caribbean Cruises Ltd. | 15,347 | 1,553 |
| * | Dollar Tree Inc. | 19,796 | 1,529 |
| | Yum! Brands Inc. | 19,005 | 1,388 |
| * | Liberty Interactive Corp. | | |
| | QVC Group Class A | 49,138 | 1,342 |
| * | Jarden Corp. | 23,257 | 1,328 |
| * | DISH Network Corp. | | |
| | Class A | 23,055 | 1,318 |
| | | |
| | Expedia Inc. | 10,576 | 1,315 |
| | Marriott International Inc. | | |
| | Class A | 18,383 | 1,232 |
| * | MGM Resorts International | 53,013 | 1,204 |
| | Newell Rubbermaid Inc. | 27,118 | 1,195 |
| | DR Horton Inc. | 37,242 | 1,193 |
| | Advance Auto Parts Inc. | 7,904 | 1,190 |
| | Tractor Supply Co. | 13,714 | 1,173 |
| | Lear Corp. | 9,400 | 1,155 |
| * | Sirius XM Holdings Inc. | 281,880 | 1,147 |
| | BorgWarner Inc. | 26,232 | 1,134 |
| | Fortune Brands Home & | | |
| | Security Inc. | 19,825 | 1,100 |
| | Carnival Corp. | 19,950 | 1,087 |
| | Hanesbrands Inc. | 36,400 | 1,071 |
| | Lennar Corp. Class A | 21,403 | 1,047 |
| | Signet Jewelers Ltd. | 8,400 | 1,039 |
| | Starwood Hotels & Resorts | | |
| | Worldwide Inc. | 14,307 | 991 |
| | News Corp. Class A | 74,167 | 991 |
| | Hilton Worldwide Holdings | | |
| | Inc. | 46,050 | 985 |
| * | Mohawk Industries Inc. | 5,120 | 970 |
| | Harley-Davidson Inc. | 20,990 | 953 |
| * | Toll Brothers Inc. | 27,440 | 914 |
| | PVH Corp. | 12,303 | 906 |
| * | Visteon Corp. | 7,900 | 905 |
| | Domino’s Pizza Inc. | 8,020 | 892 |
| | Macy’s Inc. | 25,294 | 885 |
| * | NVR Inc. | 530 | 871 |
| | Lamar Advertising Co. | | |
| | Class A | 14,400 | 864 |
| | Wyndham Worldwide Corp. | 11,500 | 836 |
| * | Discovery Communications | | |
| | Inc. | 32,941 | 831 |
| | Gentex Corp. | 50,770 | 813 |
| | Scripps Networks | | |
| | Interactive Inc. Class A | 14,568 | 804 |
| | Coach Inc. | 24,420 | 799 |
| | CST Brands Inc. | 20,266 | 793 |
| * | Bed Bath & Beyond Inc. | 16,400 | 791 |
13
Tax-Managed Balanced Fund
| | | |
| | | | Market |
| | | | Value• |
| | | Shares | ($000) |
| | Harman International | | |
| | Industries Inc. | 8,207 | 773 |
| * | Starz | 23,024 | 771 |
| | Service Corp. International | 29,400 | 765 |
| * | Avis Budget Group Inc. | 20,919 | 759 |
| * | WABCO Holdings Inc. | 7,296 | 746 |
| * | Chipotle Mexican Grill Inc. | | |
| | Class A | 1,540 | 739 |
| | Thor Industries Inc. | 12,600 | 708 |
| * | Fossil Group Inc. | 18,679 | 683 |
| | Dunkin’ Brands Group Inc. | 15,292 | 651 |
| | Dillard’s Inc. Class A | 9,453 | 621 |
| | Wendy’s Co. | 57,670 | 621 |
| | Polaris Industries Inc. | 7,200 | 619 |
| * | TripAdvisor Inc. | 6,391 | 545 |
| | Kohl’s Corp. | 11,385 | 542 |
| | Aaron’s Inc. | 23,311 | 522 |
| | Brinker International Inc. | 10,837 | 520 |
| | Gap Inc. | 20,985 | 518 |
| * | Liberty Media Corp. | 13,608 | 518 |
| * | MSG Networks Inc. | 23,640 | 492 |
| * | Vista Outdoor Inc. | 10,772 | 479 |
| * | Liberty Media Corp. Class A | 11,947 | 469 |
| | Ralph Lauren Corp. Class A | 3,973 | 443 |
| | John Wiley & Sons Inc. | | |
| | Class A | 9,618 | 433 |
| * | Liberty Ventures Class A | 9,144 | 413 |
| * | Charter Communications | | |
| | Inc. Class A | 2,140 | 392 |
| | Omnicom Group Inc. | 4,800 | 363 |
| | Las Vegas Sands Corp. | 7,100 | 311 |
| | Viacom Inc. Class B | 7,227 | 297 |
| * | Panera Bread Co. Class A | 1,500 | 292 |
| * | Liberty Broadband Corp. | 4,681 | 243 |
| * | Discovery Communications | | |
| | Inc. Class A | 6,841 | 183 |
| * | Norwegian Cruise Line | | |
| | Holdings Ltd. | 2,800 | 164 |
| * | Liberty Broadband Corp. | | |
| | Class A | 2,986 | 154 |
| | Outfront Media Inc. | 6,329 | 138 |
| * | Murphy USA Inc. | 2,175 | 132 |
| * | Under Armour Inc. Class A | 1,400 | 113 |
| | L Brands Inc. | 1,000 | 96 |
| * | AMC Networks Inc. Class A | 1,073 | 80 |
| | Viacom Inc. Class A | 1,500 | 66 |
| * | LKQ Corp. | 1,900 | 56 |
| * | Ulta Salon Cosmetics & | | |
| | Fragrance Inc. | 300 | 56 |
| | Wynn Resorts Ltd. | 700 | 48 |
| * | Tempur Sealy International | | |
| | Inc. | 600 | 42 |
| * | Sally Beauty Holdings Inc. | 1,200 | 33 |
| * | CarMax Inc. | 600 | 32 |
| * | Live Nation Entertainment | | |
| | Inc. | 1,300 | 32 |
| | | |
| * | AutoNation Inc. | 500 | 30 |
| | Lennar Corp. Class B | 680 | 27 |
| * | Madison Square Garden Co. | | |
| | Class A | 166 | 27 |
| * | Hyatt Hotels Corp. Class A | 500 | 24 |
| * | Cabela’s Inc. | 500 | 23 |
| * | Hertz Global Holdings Inc. | 1,500 | 21 |
| * | Sears Holdings Corp. | 900 | 19 |
| * | Urban Outfitters Inc. | 800 | 18 |
| | H&R Block Inc. | 500 | 17 |
| | Cablevision Systems Corp. | | |
| | Class A | 394 | 13 |
| * | Pandora Media Inc. | 900 | 12 |
| | | | 176,347 |
| Consumer Staples (4.0%) | | |
| | Procter & Gamble Co. | 163,249 | 12,964 |
| | Coca-Cola Co. | 227,964 | 9,793 |
| | Philip Morris International | | |
| | Inc. | 93,694 | 8,237 |
| | PepsiCo Inc. | 77,790 | 7,773 |
| | Altria Group Inc. | 109,080 | 6,350 |
| | CVS Health Corp. | 63,392 | 6,198 |
| | Mondelez International Inc. | | |
| | Class A | 99,137 | 4,445 |
| | Walgreens Boots Alliance | | |
| | Inc. | 52,178 | 4,443 |
| | Colgate-Palmolive Co. | 56,370 | 3,755 |
| | Kroger Co. | 68,000 | 2,844 |
| | Kraft Heinz Co. | 25,859 | 1,882 |
| | Constellation Brands Inc. | | |
| | Class A | 12,887 | 1,836 |
| * | Monster Beverage Corp. | 10,838 | 1,614 |
| | Dr Pepper Snapple Group | | |
| | Inc. | 16,632 | 1,550 |
| | Archer-Daniels-Midland Co. | 42,173 | 1,547 |
| | Tyson Foods Inc. Class A | 27,910 | 1,489 |
| | Mead Johnson Nutrition Co. | 17,213 | 1,359 |
| | Molson Coors Brewing Co. | | |
| | Class B | 14,200 | 1,334 |
| | Clorox Co. | 10,000 | 1,268 |
| | Hormel Foods Corp. | 15,892 | 1,257 |
| | Brown-Forman Corp. | | |
| | Class B | 12,088 | 1,200 |
| | JM Smucker Co. | 9,651 | 1,190 |
| | Hershey Co. | 13,200 | 1,178 |
| | Coca-Cola Enterprises Inc. | 23,586 | 1,161 |
| | McCormick & Co. Inc. | 13,547 | 1,159 |
| | Church & Dwight Co. Inc. | 13,255 | 1,125 |
| | Reynolds American Inc. | 23,400 | 1,080 |
| | Bunge Ltd. | 14,930 | 1,019 |
| | Ingredion Inc. | 10,086 | 967 |
| | Kimberly-Clark Corp. | 7,252 | 923 |
| | Keurig Green Mountain Inc. | 8,829 | 794 |
| * | Herbalife Ltd. | 14,627 | 784 |
| * | WhiteWave Foods Co. | | |
| | Class A | 20,066 | 781 |
14
Tax-Managed Balanced Fund
| | | |
| | | | Market |
| | | | Value• |
| | | Shares | ($000) |
| * | Edgewell Personal Care Co. | 9,665 | 758 |
| * | Sprouts Farmers Market Inc. | 27,800 | 739 |
| * | Hain Celestial Group Inc. | 13,600 | 549 |
| | Whole Foods Market Inc. | 12,800 | 429 |
| * | Rite Aid Corp. | 38,359 | 301 |
| | General Mills Inc. | 5,114 | 295 |
| | Energizer Holdings Inc. | 6,965 | 237 |
| | | | 98,607 |
| Energy (3.0%) | | |
| | Exxon Mobil Corp. | 246,415 | 19,208 |
| | Chevron Corp. | 106,732 | 9,602 |
| | Schlumberger Ltd. | 65,467 | 4,566 |
| | EOG Resources Inc. | 36,156 | 2,560 |
| | Phillips 66 | 26,406 | 2,160 |
| | Halliburton Co. | 59,825 | 2,036 |
| | ConocoPhillips | 41,692 | 1,947 |
| | Marathon Petroleum Corp. | 33,682 | 1,746 |
| | Pioneer Natural Resources | | |
| | Co. | 12,589 | 1,578 |
| | Baker Hughes Inc. | 33,150 | 1,530 |
| | Anadarko Petroleum Corp. | 31,490 | 1,530 |
| | Valero Energy Corp. | 20,100 | 1,421 |
| | Occidental Petroleum Corp. | 20,404 | 1,380 |
| * | Cameron International Corp. | 20,752 | 1,312 |
| * | Concho Resources Inc. | 13,580 | 1,261 |
| | Apache Corp. | 27,914 | 1,241 |
| | Hess Corp. | 23,404 | 1,135 |
| | Kinder Morgan Inc. | 71,383 | 1,065 |
| | Noble Energy Inc. | 31,198 | 1,027 |
| * | FMC Technologies Inc. | 33,436 | 970 |
| | Cimarex Energy Co. | 10,176 | 910 |
| | EQT Corp. | 16,797 | 876 |
| * | Newfield Exploration Co. | 25,227 | 821 |
| | Cabot Oil & Gas Corp. | 46,204 | 817 |
| | Devon Energy Corp. | 24,854 | 795 |
| | World Fuel Services Corp. | 18,200 | 700 |
| * | Antero Resources Corp. | 29,520 | 644 |
| | Williams Cos. Inc. | 24,520 | 630 |
| | Energen Corp. | 15,330 | 628 |
| | Nabors Industries Ltd. | 66,010 | 562 |
| * | Continental Resources Inc. | 24,028 | 552 |
| | QEP Resources Inc. | 40,598 | 544 |
| | Rowan Cos. plc Class A | 30,883 | 523 |
| | Tesoro Corp. | 4,800 | 506 |
| | HollyFrontier Corp. | 12,492 | 498 |
| * | Gulfport Energy Corp. | 18,700 | 459 |
| | Patterson-UTI Energy Inc. | 30,402 | 458 |
| | Superior Energy Services | | |
| | Inc. | 33,921 | 457 |
| | Helmerich & Payne Inc. | 7,915 | 424 |
| * | Rice Energy Inc. | 36,400 | 397 |
| | California Resources Corp. | 145,861 | 340 |
| | ONEOK Inc. | 13,384 | 330 |
| * | WPX Energy Inc. | 57,000 | 327 |
| | SM Energy Co. | 15,472 | 304 |
| | National Oilwell Varco Inc. | 7,929 | 266 |
| | | |
| * | Cheniere Energy Inc. | 4,800 | 179 |
| | Murphy Oil Corp. | 6,700 | 150 |
| | Range Resources Corp. | 5,962 | 147 |
| * | First Solar Inc. | 1,400 | 92 |
| * | SolarCity Corp. | 1,300 | 66 |
| * | SunPower Corp. Class A | 800 | 24 |
| * | SunEdison Inc. | 3,300 | 17 |
| * | NOW Inc. | 882 | 14 |
| | Restaurant Brands | | |
| | International LP | 189 | 7 |
| | Marathon Oil Corp. | 282 | 4 |
| | | | 73,743 |
| Financial Services (9.4%) | | |
| * | Berkshire Hathaway Inc. | | |
| | Class B | 112,677 | 14,878 |
| | Wells Fargo & Co. | 252,159 | 13,707 |
| | JPMorgan Chase & Co. | 198,001 | 13,074 |
| | Bank of America Corp. | 610,417 | 10,273 |
| | Citigroup Inc. | 184,843 | 9,566 |
| | Visa Inc. Class A | 117,615 | 9,121 |
| | MasterCard Inc. Class A | 59,600 | 5,803 |
| | American International | | |
| | Group Inc. | 81,900 | 5,075 |
| | Goldman Sachs Group Inc. | 27,235 | 4,909 |
| | Simon Property Group Inc. | 20,528 | 3,991 |
| | American Express Co. | 52,659 | 3,662 |
| * | PayPal Holdings Inc. | 84,924 | 3,074 |
| | Morgan Stanley | 95,760 | 3,046 |
| | American Tower | | |
| | Corporation | 28,473 | 2,760 |
| | Charles Schwab Corp. | 81,305 | 2,677 |
| | US Bancorp | 55,400 | 2,364 |
| | Public Storage | 8,972 | 2,222 |
| | PNC Financial Services | | |
| | Group Inc. | 22,900 | 2,183 |
| | Equity Residential | 26,750 | 2,183 |
| | Capital One Financial Corp. | 28,392 | 2,049 |
| | Aon plc | 21,940 | 2,023 |
| * | Synchrony Financial | 65,425 | 1,990 |
| | AvalonBay Communities Inc. | 10,200 | 1,878 |
| | Chubb Corp. | 13,600 | 1,804 |
| | Allstate Corp. | 28,400 | 1,763 |
| * | Fiserv Inc. | 18,742 | 1,714 |
| | Crown Castle International | | |
| | Corp. | 19,667 | 1,700 |
| | SunTrust Banks Inc. | 38,929 | 1,668 |
| | MetLife Inc. | 34,240 | 1,651 |
| | Boston Properties Inc. | 12,781 | 1,630 |
| | Vornado Realty Trust | 16,000 | 1,599 |
| | Equinix Inc. | 5,196 | 1,571 |
| | Hartford Financial Services | | |
| | Group Inc. | 34,200 | 1,486 |
| | Bank of New York Mellon | | |
| | Corp. | 34,932 | 1,440 |
| | Progressive Corp. | 44,997 | 1,431 |
| | Essex Property Trust Inc. | 5,973 | 1,430 |
15
Tax-Managed Balanced Fund
| | | |
| | | | Market |
| | | | Value• |
| | | Shares | ($000) |
| | Moody’s Corp. | 14,200 | 1,425 |
| | Intercontinental Exchange | | |
| | Inc. | 5,531 | 1,417 |
| | General Growth Properties | | |
| | Inc. | 51,800 | 1,410 |
| | Equifax Inc. | 12,188 | 1,357 |
| * | Markel Corp. | 1,493 | 1,319 |
| | Fidelity National Information | | |
| | Services Inc. | 21,481 | 1,302 |
| | Discover Financial Services | 24,229 | 1,299 |
| | Loews Corp. | 33,575 | 1,289 |
| * | Alliance Data Systems Corp. | 4,587 | 1,269 |
| | BlackRock Inc. | 3,512 | 1,196 |
| | Travelers Cos. Inc. | 10,589 | 1,195 |
| * | CBRE Group Inc. Class A | 34,193 | 1,182 |
| | Extra Space Storage Inc. | 13,300 | 1,173 |
| | SL Green Realty Corp. | 10,359 | 1,170 |
| | Lincoln National Corp. | 22,830 | 1,147 |
| | First Republic Bank | 17,240 | 1,139 |
| | Ameriprise Financial Inc. | 10,680 | 1,137 |
| | KeyCorp | 84,218 | 1,111 |
| | Global Payments Inc. | 17,028 | 1,099 |
| * | Arch Capital Group Ltd. | 15,730 | 1,097 |
| | Prologis Inc. | 25,200 | 1,082 |
| | Federal Realty Investment | | |
| | Trust | 7,319 | 1,069 |
| * | Signature Bank | 6,880 | 1,055 |
| * | Alleghany Corp. | 2,173 | 1,039 |
| | Voya Financial Inc. | 27,959 | 1,032 |
| | Total System Services Inc. | 20,700 | 1,031 |
| | Weyerhaeuser Co. | 34,166 | 1,024 |
| | MSCI Inc. Class A | 14,134 | 1,020 |
| | Jones Lang LaSalle Inc. | 6,352 | 1,015 |
| | SEI Investments Co. | 19,347 | 1,014 |
| * | E*TRADE Financial Corp. | 34,200 | 1,014 |
| | Torchmark Corp. | 17,622 | 1,007 |
| | T. Rowe Price Group Inc. | 14,000 | 1,001 |
| | Huntington Bancshares Inc. | 89,700 | 992 |
| | FactSet Research Systems | | |
| | Inc. | 6,019 | 979 |
| * | SVB Financial Group | 8,120 | 966 |
| | Equity LifeStyle Properties | | |
| | Inc. | 14,000 | 933 |
| | Comerica Inc. | 22,300 | 933 |
| | Franklin Resources Inc. | 25,275 | 931 |
| | Nasdaq Inc. | 15,873 | 923 |
| | East West Bancorp Inc. | 22,169 | 921 |
| * | Realogy Holdings Corp. | 24,970 | 916 |
| | Zions Bancorporation | 33,251 | 908 |
| | RenaissanceRe Holdings Ltd. | 7,918 | 896 |
| | WR Berkley Corp. | 16,293 | 892 |
| * | Forest City Enterprises Inc. | | |
| | Class A | 40,493 | 888 |
| | Assurant Inc. | 11,000 | 886 |
| | TD Ameritrade Holding Corp. | 25,261 | 877 |
| | StanCorp Financial Group Inc. | 7,620 | 868 |
| | | |
| | State Street Corp. | 13,069 | 867 |
| | Regions Financial Corp. | 90,215 | 866 |
| | Welltower Inc. | 12,700 | 864 |
| | Unum Group | 25,927 | 863 |
| | CIT Group Inc. | 21,600 | 858 |
| * | Howard Hughes Corp. | 7,540 | 853 |
| | White Mountains Insurance | | |
| | Group Ltd. | 1,166 | 847 |
| | Everest Re Group Ltd. | 4,600 | 842 |
| | Douglas Emmett Inc. | 26,334 | 821 |
| * | Equity Commonwealth | 29,230 | 811 |
| | CBOE Holdings Inc. | 12,400 | 805 |
| | Synovus Financial Corp. | 24,642 | 798 |
| | Taubman Centers Inc. | 10,300 | 790 |
| | Fifth Third Bancorp | 38,275 | 769 |
| | Reinsurance Group of | | |
| | America Inc. Class A | 8,970 | 767 |
| | American Homes 4 Rent | | |
| | Class A | 45,840 | 764 |
| | Assured Guaranty Ltd. | 28,594 | 756 |
| | Apartment Investment & | | |
| | Management Co. | 18,776 | 752 |
| | Interactive Brokers Group | | |
| | Inc. | 17,220 | 751 |
| | Commerce Bancshares Inc. | 17,312 | 736 |
| | Brown & Brown Inc. | 22,461 | 721 |
| | First Horizon National Corp. | 49,640 | 721 |
| | Host Hotels & Resorts Inc. | 46,699 | 716 |
| | Post Properties Inc. | 12,000 | 710 |
| | Associated Banc-Corp | 37,727 | 707 |
| | TFS Financial Corp. | 36,600 | 689 |
| * | Genworth Financial Inc. | | |
| | Class A | 181,930 | 679 |
| * | Affiliated Managers Group | | |
| | Inc. | 4,184 | 668 |
| | Morningstar Inc. | 8,288 | 666 |
| | Raymond James Financial | | |
| | Inc. | 11,434 | 663 |
| | Hanover Insurance Group | | |
| | Inc. | 7,614 | 619 |
| | Popular Inc. | 21,800 | 618 |
| | McGraw Hill Financial Inc. | 6,100 | 601 |
| | TCF Financial Corp. | 42,000 | 593 |
| | Dun & Bradstreet Corp. | 5,700 | 592 |
| | Lazard Ltd. Class A | 12,825 | 577 |
| | Tanger Factory Outlet | | |
| | Centers Inc. | 17,300 | 566 |
| | Legg Mason Inc. | 14,354 | 563 |
| | Leucadia National Corp. | 30,733 | 534 |
| | Aflac Inc. | 8,800 | 527 |
| | Prudential Financial Inc. | 6,312 | 514 |
| | Allied World Assurance Co. | | |
| | Holdings AG | 13,344 | 496 |
| | Brixmor Property Group Inc. | 19,000 | 491 |
| | DDR Corp. | 29,107 | 490 |
| | ACE Ltd. | 3,800 | 444 |
16
Tax-Managed Balanced Fund
| | | |
| | | | Market |
| | | | Value• |
| | | Shares | ($000) |
| | LPL Financial Holdings Inc. | 10,200 | 435 |
| | WP Glimcher Inc. | 34,741 | 369 |
| | Ventas Inc. | 6,500 | 367 |
| | CNA Financial Corp. | 8,693 | 306 |
| * | Ally Financial Inc. | 15,700 | 293 |
| | Retail Properties of America | | |
| | Inc. | 19,700 | 291 |
| | HCP Inc. | 7,300 | 279 |
| | CME Group Inc. | 2,895 | 262 |
| | Care Capital Properties Inc. | 8,325 | 255 |
| | ProAssurance Corp. | 5,000 | 243 |
| | BOK Financial Corp. | 4,040 | 242 |
| | BB&T Corp. | 5,800 | 219 |
| | Annaly Capital Management | | |
| | Inc. | 19,500 | 183 |
| * | FleetCor Technologies Inc. | 1,200 | 172 |
| | Marsh & McLennan Cos. | | |
| | Inc. | 2,900 | 161 |
| * | Santander Consumer USA | | |
| | Holdings Inc. | 9,400 | 149 |
| | FNF Group | 3,247 | 113 |
| | Plum Creek Timber Co. Inc. | 1,800 | 86 |
| | Hospitality Properties Trust | 3,122 | 82 |
| * | First Data Corp. Class A | 4,500 | 72 |
| * | Vantiv Inc. Class A | 900 | 43 |
| * | CoreLogic Inc. | 1,000 | 34 |
| | Navient Corp. | 2,200 | 25 |
| | Gaming and Leisure | | |
| | Properties Inc. | 900 | 25 |
| | Cullen/Frost Bankers Inc. | 200 | 12 |
| * | Zillow Group Inc. | 400 | 9 |
| | Macerich Co. | 100 | 8 |
| | People’s United Financial Inc. | 400 | 6 |
| * | Zillow Group Inc. Class A | 200 | 5 |
| | | | 232,331 |
| Health Care (6.9%) | | |
| | Johnson & Johnson | 165,044 | 16,953 |
| | Pfizer Inc. | 351,487 | 11,346 |
| | Gilead Sciences Inc. | 87,442 | 8,848 |
| | Merck & Co. Inc. | 152,621 | 8,061 |
| * | Allergan plc | 23,083 | 7,213 |
| | Amgen Inc. | 43,155 | 7,005 |
| | Medtronic plc | 89,310 | 6,870 |
| | UnitedHealth Group Inc. | 53,313 | 6,272 |
| | Bristol-Myers Squibb Co. | 86,260 | 5,934 |
| * | Celgene Corp. | 47,124 | 5,644 |
| | AbbVie Inc. | 92,499 | 5,480 |
| * | Biogen Inc. | 13,791 | 4,225 |
| | Eli Lilly & Co. | 48,500 | 4,087 |
| * | Express Scripts Holding Co. | 44,249 | 3,868 |
| | Thermo Fisher Scientific Inc. | 25,767 | 3,655 |
| | Abbott Laboratories | 74,600 | 3,350 |
| | McKesson Corp. | 14,436 | 2,847 |
| * | Alexion Pharmaceuticals Inc. | 14,686 | 2,801 |
| * | Regeneron Pharmaceuticals | | |
| | Inc. | 5,160 | 2,801 |
| | | |
| | Cigna Corp. | 18,741 | 2,742 |
| | Aetna Inc. | 22,455 | 2,428 |
| | Anthem Inc. | 16,126 | 2,249 |
| | Stryker Corp. | 22,549 | 2,096 |
| * | Vertex Pharmaceuticals Inc. | 16,400 | 2,064 |
| * | Boston Scientific Corp. | 110,540 | 2,038 |
| | Zoetis Inc. | 39,980 | 1,916 |
| | Humana Inc. | 10,600 | 1,892 |
| * | Illumina Inc. | 9,650 | 1,852 |
| * | HCA Holdings Inc. | 27,304 | 1,847 |
| | Perrigo Co. plc | 12,279 | 1,777 |
| | AmerisourceBergen Corp. | | |
| | Class A | 16,306 | 1,691 |
| * | Cerner Corp. | 27,310 | 1,643 |
| | Zimmer Biomet Holdings | | |
| | Inc. | 13,970 | 1,433 |
| | St. Jude Medical Inc. | 22,035 | 1,361 |
| | CR Bard Inc. | 6,765 | 1,282 |
| | Agilent Technologies Inc. | 30,407 | 1,271 |
| * | DaVita HealthCare Partners | | |
| | Inc. | 17,800 | 1,241 |
| * | Laboratory Corp. of America | | |
| | Holdings | 9,781 | 1,209 |
| | Cardinal Health Inc. | 13,245 | 1,182 |
| | Universal Health Services | | |
| | Inc. Class B | 9,347 | 1,117 |
| | DENTSPLY International Inc. | 17,283 | 1,052 |
| * | BioMarin Pharmaceutical Inc. | 9,600 | 1,006 |
| | PerkinElmer Inc. | 17,800 | 954 |
| * | Mylan NV | 17,600 | 952 |
| * | Endo International plc | 15,469 | 947 |
| | Cooper Cos. Inc. | 6,963 | 934 |
| | Baxalta Inc. | 23,700 | 925 |
| * | Intuitive Surgical Inc. | 1,690 | 923 |
| * | QIAGEN NV | 32,000 | 885 |
| | Becton Dickinson and Co. | 5,558 | 856 |
| * | Mallinckrodt plc | 10,075 | 752 |
| * | Quintiles Transnational | | |
| | Holdings Inc. | 10,600 | 728 |
| | Bio-Techne Corp. | 7,000 | 630 |
| * | Varian Medical Systems Inc. | 7,780 | 629 |
| | Hill-Rom Holdings Inc. | 13,022 | 626 |
| | Patterson Cos. Inc. | 13,300 | 601 |
| | Quest Diagnostics Inc. | 8,019 | 570 |
| * | Incyte Corp. | 4,800 | 521 |
| * | Premier Inc. Class A | 13,780 | 486 |
| * | Charles River Laboratories | | |
| | International Inc. | 5,500 | 442 |
| * | Intrexon Corp. | 13,700 | 413 |
| | Baxter International Inc. | 9,200 | 351 |
| * | Tenet Healthcare Corp. | 10,925 | 331 |
| * | Edwards Lifesciences Corp. | 2,638 | 208 |
| * | Alkermes plc | 2,300 | 183 |
| * | Intercept Pharmaceuticals | | |
| | Inc. | 450 | 67 |
| * | Centene Corp. | 800 | 53 |
17
Tax-Managed Balanced Fund
| | | |
| | | | Market |
| | | | Value• |
| | | Shares | ($000) |
| * | Health Net Inc. | 700 | 48 |
| * | United Therapeutics Corp. | 300 | 47 |
| * | Hologic Inc. | 1,200 | 46 |
| * | VCA Inc. | 800 | 44 |
| * | Sirona Dental Systems Inc. | 400 | 44 |
| * | Jazz Pharmaceuticals plc | 300 | 42 |
| * | Align Technology Inc. | 600 | 40 |
| * | Alnylam Pharmaceuticals Inc. | 400 | 38 |
| * | Veeva Systems Inc. Class A | 1,300 | 37 |
| * | MEDNAX Inc. | 500 | 36 |
| * | athenahealth Inc. | 200 | 32 |
| * | Henry Schein Inc. | 200 | 32 |
| * | Alere Inc. | 800 | 31 |
| * | LifePoint Health Inc. | 400 | 29 |
| * | Allscripts Healthcare | | |
| | Solutions Inc. | 1,900 | 29 |
| * | IDEXX Laboratories Inc. | 400 | 29 |
| * | Medivation Inc. | 600 | 29 |
| * | Seattle Genetics Inc. | 600 | 27 |
| * | Envision Healthcare Holdings | | |
| | Inc. | 800 | 21 |
| * | Community Health Systems | | |
| | Inc. | 600 | 16 |
| * | Brookdale Senior Living Inc. | 800 | 15 |
| | | | 171,328 |
| Materials & Processing (1.8%) | | |
| | EI du Pont de Nemours & | | |
| | Co. | 49,128 | 3,272 |
| | Dow Chemical Co. | 54,287 | 2,795 |
| | Monsanto Co. | 26,908 | 2,651 |
| | Precision Castparts Corp. | 10,560 | 2,450 |
| | Ecolab Inc. | 17,900 | 2,047 |
| | Sherwin-Williams Co. | 6,460 | 1,677 |
| | PPG Industries Inc. | 15,100 | 1,492 |
| | Praxair Inc. | 12,852 | 1,316 |
| | Vulcan Materials Co. | 13,244 | 1,258 |
| | LyondellBasell Industries | | |
| | NV Class A | 13,538 | 1,176 |
| | Ingersoll-Rand plc | 20,400 | 1,128 |
| | Ball Corp. | 15,418 | 1,121 |
| | Celanese Corp. Class A | 16,040 | 1,080 |
| | Airgas Inc. | 7,619 | 1,054 |
| | Newmont Mining Corp. | 54,666 | 983 |
| | Sealed Air Corp. | 21,500 | 959 |
| | Martin Marietta Materials Inc. | 6,786 | 927 |
| * | WR Grace & Co. | 9,200 | 916 |
| * | Crown Holdings Inc. | 18,041 | 915 |
| | Valspar Corp. | 10,800 | 896 |
| | Lennox International Inc. | 6,900 | 862 |
| | CF Industries Holdings Inc. | 19,560 | 798 |
| | Hexcel Corp. | 16,800 | 780 |
| | Valmont Industries Inc. | 6,711 | 711 |
| | NewMarket Corp. | 1,820 | 693 |
| | Southern Copper Corp. | 24,900 | 650 |
| | Owens Corning | 13,800 | 649 |
| | Westlake Chemical Corp. | 11,800 | 641 |
| | | |
| | Ashland Inc. | 6,198 | 637 |
| | Eagle Materials Inc. | 10,400 | 628 |
| * | Owens-Illinois Inc. | 35,800 | 624 |
| | Albemarle Corp. | 10,400 | 583 |
| | Silgan Holdings Inc. | 10,642 | 572 |
| | FMC Corp. | 14,398 | 563 |
| | Alcoa Inc. | 49,000 | 484 |
| * | Armstrong World Industries | | |
| | Inc. | 10,403 | 476 |
| | Reliance Steel & Aluminum | | |
| | Co. | 7,600 | 440 |
| | Tahoe Resources Inc. | 43,199 | 375 |
| | Freeport-McMoRan Inc. | 51,194 | 347 |
| | Royal Gold Inc. | 9,200 | 336 |
| | Scotts Miracle-Gro Co. | | |
| | Class A | 5,042 | 325 |
| | Nucor Corp. | 7,400 | 298 |
| | Fastenal Co. | 4,725 | 193 |
| | International Paper Co. | 4,943 | 186 |
| | Eastman Chemical Co. | 2,640 | 178 |
| | Air Products & Chemicals Inc. | 1,200 | 156 |
| | Mosaic Co. | 5,600 | 155 |
| | WestRock Co. | 3,000 | 137 |
| * | USG Corp. | 5,000 | 121 |
| | Chemours Co. | 4,945 | 27 |
| | | | 43,738 |
| Producer Durables (5.0%) | | |
| | General Electric Co. | 548,621 | 17,090 |
| | United Technologies Corp. | 50,576 | 4,859 |
| | Boeing Co. | 29,120 | 4,210 |
| | 3M Co. | 25,500 | 3,841 |
| | Danaher Corp. | 38,251 | 3,553 |
| | Honeywell International Inc. | 34,000 | 3,521 |
| | Union Pacific Corp. | 43,852 | 3,429 |
| | FedEx Corp. | 20,136 | 3,000 |
| | Delta Air Lines Inc. | 54,700 | 2,773 |
| | Accenture plc Class A | 23,200 | 2,424 |
| | Southwest Airlines Co. | 51,517 | 2,218 |
| | United Parcel Service Inc. | | |
| | Class B | 22,500 | 2,165 |
| | Automatic Data Processing | | |
| | Inc. | 22,574 | 1,913 |
| * | United Continental Holdings | | |
| | Inc. | 32,650 | 1,871 |
| | CSX Corp. | 65,000 | 1,687 |
| | Lockheed Martin Corp. | 7,743 | 1,681 |
| | Roper Technologies Inc. | 8,710 | 1,653 |
| * | Verisk Analytics Inc. Class A | 17,340 | 1,333 |
| | General Dynamics Corp. | 9,191 | 1,263 |
| | Raytheon Co. | 10,049 | 1,251 |
| | Rockwell Collins Inc. | 13,500 | 1,246 |
| | AMETEK Inc. | 22,900 | 1,227 |
| | Textron Inc. | 28,711 | 1,206 |
| * | TransDigm Group Inc. | 5,240 | 1,197 |
| | Towers Watson & Co. | | |
| | Class A | 8,620 | 1,107 |
18
Tax-Managed Balanced Fund
| | | |
| | | | Market |
| | | | Value• |
| | | Shares | ($000) |
| * | Waters Corp. | 8,218 | 1,106 |
| | Cintas Corp. | 11,870 | 1,081 |
| | American Airlines Group Inc. | 24,700 | 1,046 |
| * | Mettler-Toledo International | | |
| | Inc. | 3,020 | 1,024 |
| | Caterpillar Inc. | 15,000 | 1,019 |
| | Waste Connections Inc. | 18,050 | 1,017 |
| * | Spirit AeroSystems Holdings | | |
| | Inc. Class A | 20,100 | 1,006 |
| | Xerox Corp. | 94,355 | 1,003 |
| | Expeditors International of | | |
| | Washington Inc. | 21,466 | 968 |
| | Xylem Inc. | 26,439 | 965 |
| | Norfolk Southern Corp. | 11,400 | 964 |
| | CH Robinson Worldwide Inc. | 15,511 | 962 |
| | Allegion plc | 14,433 | 951 |
| | Huntington Ingalls Industries | | |
| | Inc. | 7,469 | 947 |
| | Orbital ATK Inc. | 10,586 | 946 |
| | Wabtec Corp. | 13,265 | 943 |
| * | Stericycle Inc. | 7,784 | 939 |
| | AO Smith Corp. | 12,100 | 927 |
| | IDEX Corp. | 11,729 | 899 |
| | JB Hunt Transport Services | | |
| | Inc. | 12,010 | 881 |
| | Kansas City Southern | 11,600 | 866 |
| | Cummins Inc. | 9,721 | 856 |
| * | Jacobs Engineering Group | | |
| | Inc. | 20,195 | 847 |
| | BWX Technologies Inc. | 26,319 | 836 |
| | Carlisle Cos. Inc. | 9,400 | 834 |
| | Flowserve Corp. | 19,513 | 821 |
| | WW Grainger Inc. | 3,982 | 807 |
| | B/E Aerospace Inc. | 18,690 | 792 |
| | Fluor Corp. | 16,458 | 777 |
| | Toro Co. | 10,518 | 769 |
| | Air Lease Corp. Class A | 22,500 | 753 |
| | ITT Corp. | 20,469 | 743 |
| * | AECOM | 24,734 | 743 |
| | Landstar System Inc. | 12,535 | 735 |
| | Nordson Corp. | 11,450 | 735 |
| | Republic Services Inc. | | |
| | Class A | 16,510 | 726 |
| | AGCO Corp. | 15,837 | 719 |
| | Chicago Bridge & Iron Co. | | |
| | NV | 18,388 | 717 |
| | FLIR Systems Inc. | 25,500 | 716 |
| | Trinity Industries Inc. | 29,700 | 713 |
| | Manitowoc Co. Inc. | 45,670 | 701 |
| | Oshkosh Corp. | 17,747 | 693 |
| | Triumph Group Inc. | 17,259 | 686 |
| | Robert Half International Inc. | 14,500 | 684 |
| * | Quanta Services Inc. | 32,695 | 662 |
| | ADT Corp. | 20,000 | 660 |
| | Regal Beloit Corp. | 11,200 | 655 |
| | KBR Inc. | 38,382 | 649 |
| | | |
| * | HD Supply Holdings Inc. | 21,300 | 640 |
| * | Babcock & Wilcox | | |
| | Enterprises Inc. | 30,559 | 638 |
| * | United Rentals Inc. | 8,600 | 624 |
| | Emerson Electric Co. | 11,700 | 560 |
| | Lincoln Electric Holdings Inc. | 10,723 | 556 |
| | Ryder System Inc. | 9,400 | 534 |
| | Stanley Black & Decker Inc. | 4,927 | 526 |
| * | Keysight Technologies Inc. | 17,803 | 504 |
| | Pentair plc | 10,087 | 500 |
| | ManpowerGroup Inc. | 5,650 | 476 |
| * | WESCO International Inc. | 9,919 | 433 |
| | Deere & Co. | 5,600 | 427 |
| | National Instruments Corp. | 14,511 | 416 |
| | L-3 Communications | | |
| | Holdings Inc. | 3,289 | 393 |
| | Donaldson Co. Inc. | 13,286 | 381 |
| | Paychex Inc. | 6,600 | 349 |
| | Illinois Tool Works Inc. | 3,700 | 343 |
| | Northrop Grumman Corp. | 1,800 | 340 |
| | MSC Industrial Direct Co. | | |
| | Inc. Class A | 5,300 | 298 |
| | SPX Corp. | 24,497 | 229 |
| | Covanta Holding Corp. | 14,400 | 223 |
| | Eaton Corp. plc | 3,900 | 203 |
| | Copa Holdings SA Class A | 3,638 | 176 |
| | Lexmark International Inc. | | |
| | Class A | 5,300 | 172 |
| * | SPX FLOW Inc. | 5,597 | 156 |
| * | Middleby Corp. | 1,000 | 108 |
| * | Spirit Airlines Inc. | 2,559 | 102 |
| | Kennametal Inc. | 3,000 | 58 |
| * | Genpact Ltd. | 1,700 | 43 |
| * | CoStar Group Inc. | 200 | 41 |
| * | IHS Inc. Class A | 300 | 36 |
| * | Old Dominion Freight Line | | |
| | Inc. | 500 | 30 |
| * | Zebra Technologies Corp. | 400 | 28 |
| * | Kirby Corp. | 400 | 21 |
| * | Genesee & Wyoming Inc. | | |
| | Class A | 300 | 16 |
| | | | 122,787 |
| Technology (8.2%) | | |
| | Apple Inc. | 335,515 | 35,316 |
| | Microsoft Corp. | 471,356 | 26,151 |
| * | Facebook Inc. Class A | 130,860 | 13,696 |
| * | Alphabet Inc. Class A | 17,432 | 13,562 |
| * | Alphabet Inc. | 17,770 | 13,485 |
| | Intel Corp. | 279,400 | 9,625 |
| | International Business | | |
| | Machines Corp. | 54,403 | 7,487 |
| | Oracle Corp. | 188,690 | 6,893 |
| | Cisco Systems Inc. | 246,715 | 6,700 |
| | QUALCOMM Inc. | 85,800 | 4,289 |
| * | salesforce.com inc | 43,832 | 3,436 |
| | EMC Corp. | 119,136 | 3,059 |
19
Tax-Managed Balanced Fund
| | | |
| | | | Market |
| | | | Value• |
| | | Shares | ($000) |
| * | Adobe Systems Inc. | 31,396 | 2,949 |
| | Avago Technologies Ltd. | | |
| | Class A | 18,035 | 2,618 |
| | Broadcom Corp. Class A | 40,543 | 2,344 |
| * | Cognizant Technology | | |
| | Solutions Corp. Class A | 38,296 | 2,299 |
| | Texas Instruments Inc. | 41,746 | 2,288 |
| * | Yahoo! Inc. | 63,266 | 2,104 |
| | Intuit Inc. | 19,124 | 1,846 |
| | Activision Blizzard Inc. | 47,560 | 1,841 |
| | Applied Materials Inc. | 91,880 | 1,715 |
| | NVIDIA Corp. | 50,100 | 1,651 |
| | Amphenol Corp. Class A | 27,542 | 1,439 |
| | Hewlett Packard Enterprise | | |
| | Co. | 90,073 | 1,369 |
| | Corning Inc. | 71,577 | 1,308 |
| * | Electronic Arts Inc. | 19,000 | 1,306 |
| | Motorola Solutions Inc. | 19,028 | 1,303 |
| * | Autodesk Inc. | 20,858 | 1,271 |
| * | SBA Communications Corp. | | |
| | Class A | 11,911 | 1,252 |
| | Lam Research Corp. | 14,800 | 1,175 |
| * | Citrix Systems Inc. | 15,428 | 1,167 |
| | Skyworks Solutions Inc. | 15,100 | 1,160 |
| | Juniper Networks Inc. | 41,600 | 1,148 |
| * | VeriSign Inc. | 12,228 | 1,068 |
| | HP Inc. | 90,073 | 1,066 |
| | Analog Devices Inc. | 18,996 | 1,051 |
| | Symantec Corp. | 48,539 | 1,019 |
| * | LinkedIn Corp. Class A | 4,500 | 1,013 |
| | Xilinx Inc. | 21,429 | 1,007 |
| | CDK Global Inc. | 19,458 | 924 |
| | NetApp Inc. | 33,571 | 891 |
| | Ingram Micro Inc. | 28,100 | 854 |
| | Avnet Inc. | 19,900 | 853 |
| | Teradyne Inc. | 41,000 | 848 |
| * | Cadence Design Systems | | |
| | Inc. | 39,700 | 826 |
| * | Synopsys Inc. | 18,000 | 821 |
| | DST Systems Inc. | 7,030 | 802 |
| * | Micron Technology Inc. | 56,000 | 793 |
| | Amdocs Ltd. | 14,500 | 791 |
| | Sabre Corp. | 27,200 | 761 |
| | Atmel Corp. | 86,400 | 744 |
| | Brocade Communications | | |
| | Systems Inc. | 73,800 | 678 |
| | Solera Holdings Inc. | 12,190 | 668 |
| | IAC/InterActiveCorp | 11,100 | 667 |
| | Dolby Laboratories Inc. | | |
| | Class A | 19,500 | 656 |
| * | NCR Corp. | 26,400 | 646 |
| * | CommScope Holding Co. | | |
| | Inc. | 23,454 | 607 |
| | SanDisk Corp. | 7,200 | 547 |
| * | Twitter Inc. | 22,600 | 523 |
| | Western Digital Corp. | 8,400 | 504 |
| | | |
| | Computer Sciences Corp. | 15,000 | 490 |
| * | Viavi Solutions Inc. | 74,300 | 453 |
| | CSRA Inc. | 15,000 | 450 |
| | Linear Technology Corp. | 7,300 | 310 |
| * | ON Semiconductor Corp. | 28,800 | 282 |
| | Maxim Integrated Products | | |
| | Inc. | 5,500 | 209 |
| * | Teradata Corp. | 7,736 | 204 |
| * | Arrow Electronics Inc. | 3,300 | 179 |
| | CA Inc. | 5,007 | 143 |
| * | Qorvo Inc. | 2,400 | 122 |
| * | Palo Alto Networks Inc. | 400 | 70 |
| * | IPG Photonics Corp. | 500 | 45 |
| * | Gartner Inc. | 400 | 36 |
| * | SolarWinds Inc. | 600 | 35 |
| * | ServiceNow Inc. | 400 | 35 |
| * | Red Hat Inc. | 400 | 33 |
| * | Fortinet Inc. | 1,000 | 31 |
| * | IMS Health Holdings Inc. | 1,200 | 31 |
| * | Splunk Inc. | 500 | 29 |
| * | F5 Networks Inc. | 300 | 29 |
| * | Tableau Software Inc. | | |
| | Class A | 300 | 28 |
| * | ANSYS Inc. | 300 | 28 |
| * | ARRIS Group Inc. | 900 | 28 |
| * | NetSuite Inc. | 300 | 25 |
| * | Workday Inc. Class A | 300 | 24 |
| * | EchoStar Corp. Class A | 600 | 24 |
| * | VeriFone Systems Inc. | 800 | 22 |
| * | Akamai Technologies Inc. | 400 | 21 |
| * | PTC Inc. | 600 | 21 |
| * | Zynga Inc. Class A | 7,300 | 20 |
| * | Rackspace Hosting Inc. | 700 | 18 |
| * | Groupon Inc. Class A | 4,600 | 14 |
| * | FireEye Inc. | 600 | 12 |
| * | Lumentum Holdings Inc. | 520 | 11 |
| * | VMware Inc. Class A | 200 | 11 |
| | | | 204,403 |
| Utilities (2.5%) | | |
| | AT&T Inc. | 351,489 | 12,095 |
| | Verizon Communications | | |
| | Inc. | 232,000 | 10,723 |
| | Duke Energy Corp. | 48,030 | 3,429 |
| | NextEra Energy Inc. | 31,197 | 3,241 |
| | Southern Co. | 64,700 | 3,027 |
| | Dominion Resources Inc. | 42,808 | 2,896 |
| | PG&E Corp. | 36,135 | 1,922 |
| | Sempra Energy | 19,829 | 1,864 |
| | American Electric Power | | |
| | Co. Inc. | 28,800 | 1,678 |
| | Edison International | 26,508 | 1,570 |
| * | Level 3 Communications | | |
| | Inc. | 27,910 | 1,517 |
| | Exelon Corp. | 51,500 | 1,430 |
| | WEC Energy Group Inc. | 27,832 | 1,428 |
20
Tax-Managed Balanced Fund
| | | |
| | | | Market |
| | | | Value• |
| | | Shares | ($000) |
| | American Water Works | | |
| | Co. Inc. | 19,828 | 1,185 |
| * | T-Mobile US Inc. | 28,700 | 1,123 |
| | Public Service Enterprise | | |
| | Group Inc. | 28,200 | 1,091 |
| | CMS Energy Corp. | 30,127 | 1,087 |
| | ITC Holdings Corp. | 25,410 | 997 |
| | Aqua America Inc. | 30,878 | 920 |
| | NiSource Inc. | 46,200 | 901 |
| | AES Corp. | 90,069 | 862 |
| | UGI Corp. | 24,978 | 843 |
| * | Calpine Corp. | 55,310 | 800 |
| | Alliant Energy Corp. | 12,113 | 756 |
| | Xcel Energy Inc. | 21,000 | 754 |
| | AGL Resources Inc. | 11,200 | 715 |
| | | |
| | OGE Energy Corp. | 26,686 | 702 |
| | Telephone & Data | | |
| | Systems Inc. | 26,130 | 677 |
| * | United States Cellular Corp. | 16,115 | 658 |
| | National Fuel Gas Co. | 14,901 | 637 |
| | Questar Corp. | 26,733 | 521 |
| | Consolidated Edison Inc. | 6,400 | 411 |
| | TECO Energy Inc. | 10,600 | 282 |
| | FirstEnergy Corp. | 6,700 | 213 |
| | MDU Resources Group Inc. | 9,950 | 182 |
| | NRG Energy Inc. | 7,824 | 92 |
| | | | 63,229 |
| Total Common Stocks | | |
| (Cost $771,720) | | 1,186,513 |
| | | | |
| | | | Face | Market |
| | | Maturity | Amount | Value• |
| | Coupon | Date | ($000) | ($000) |
| Tax-Exempt Municipal Bonds (50.5%) | | | | |
| Alabama (0.1%) | | | | |
| Alabama 21st Century Authority Tobacco | | | | |
| Settlement Revenue | 5.000% | 6/1/20 | 500 | 569 |
| Alabama Incentives Financing Authority | | | | |
| Special Obligation Revenue | 5.000% | 9/1/32 | 380 | 432 |
| Alabama Public School & College Authority | | | | |
| Capital Improvement Revenue | 5.000% | 12/1/17 (Prere.) | 500 | 539 |
| Alabama Public School & College Authority | | | | |
| Capital Improvement Revenue | 5.000% | 12/1/17 (Prere.) | 500 | 539 |
| Jefferson County AL Sewer Revenue | 5.000% | 10/1/23 | 500 | 560 |
| Jefferson County AL Sewer Revenue | 0.000% | 10/1/25 (4) | 500 | 340 |
| | | | | 2,979 |
| Alaska (0.0%) | | | | |
| Alaska Housing Finance Corp. General | | | | |
| Housing Revenue | 5.000% | 12/1/29 | 500 | 586 |
| |
| Arizona (1.5%) | | | | |
| Arizona Board of Regents Arizona State | | | | |
| University System Revenue | 5.000% | 7/1/30 | 675 | 813 |
| Arizona Board Regents Arizona State | | | | |
| University System COP | 5.000% | 7/1/22 (14) | 1,500 | 1,587 |
| Arizona Board Regents Arizona State | | | | |
| University System Revenue | 5.875% | 7/1/18 (Prere.) | 100 | 112 |
| Arizona COP | 5.000% | 10/1/18 (4) | 500 | 551 |
| Arizona Health Facilities Authority Revenue | | | | |
| (Banner Health) | 5.000% | 1/1/25 | 500 | 538 |
| Arizona School Facilities Board COP | 5.500% | 9/1/18 (Prere.) | 500 | 559 |
| Arizona Transportation Board Excise Tax Revenue | 5.000% | 7/1/21 | 2,240 | 2,661 |
| Arizona Transportation Board Excise Tax Revenue | 5.000% | 7/1/23 | 1,955 | 2,400 |
| Arizona Transportation Board Excise Tax Revenue | 5.000% | 7/1/24 | 2,000 | 2,475 |
| Arizona Transportation Board Excise Tax Revenue | | | | |
| (Maricopa County Regional Area) | 5.000% | 7/1/17 (Prere.) | 500 | 532 |
21
| | | | |
| Tax-Managed Balanced Fund | | | | |
| |
| |
| |
| | | | Face | Market |
| | | Maturity | Amount | Value• |
| | Coupon | Date | ($000) | ($000) |
| Arizona Transportation Board Excise Tax | | | | |
| Revenue (Maricopa County Regional Area) | 5.000% | 7/1/20 (Prere.) | 500 | 582 |
| Arizona Transportation Board Highway Revenue | 5.000% | 7/1/22 | 2,005 | 2,422 |
| Arizona Transportation Board Highway Revenue | 5.000% | 7/1/32 | 500 | 587 |
| Chandler AZ GO | 5.000% | 7/1/23 | 1,000 | 1,232 |
| Glendale AZ Industrial Development Authority | | | | |
| Revenue (Midwestern University) | 5.000% | 5/15/30 | 275 | 307 |
| Glendale AZ Senior Excise Tax Revenue | 5.000% | 7/1/18 | 1,100 | 1,204 |
| Maricopa County AZ School District No. 28 | | | | |
| (Kyrene Elementary) GO | 4.000% | 7/1/19 | 900 | 986 |
| Mesa AZ Excise Tax Revenue | 5.000% | 7/1/27 | 2,500 | 2,642 |
| Phoenix AZ Civic Improvement Corp. Airport | | | | |
| Revenue | 5.000% | 7/1/24 | 300 | 344 |
| Phoenix AZ Civic Improvement Corp. Water | | | | |
| System Revenue | 5.000% | 7/1/26 | 2,500 | 3,068 |
| Pima County AZ Sewer Revenue | 5.000% | 7/1/20 | 500 | 579 |
| Regional Public Transportation Authority Arizona | | | | |
| Excise Tax Revenue (Maricopa County Public | | | | |
| Transportation) | 5.250% | 7/1/24 | 1,000 | 1,256 |
| Salt River Project Arizona Agricultural | | | | |
| Improvement & Power District Revenue | 5.000% | 1/1/16 (Prere.) | 2,000 | 2,000 |
| Salt River Project Arizona Agricultural | | | | |
| Improvement & Power District Revenue | 5.000% | 1/1/28 | 750 | 831 |
| Salt River Project Arizona Agricultural | | | | |
| Improvement & Power District Revenue | 5.000% | 12/1/28 | 500 | 592 |
| Salt River Project Arizona Agricultural | | | | |
| Improvement & Power District Revenue | 5.000% | 12/1/29 | 2,000 | 2,362 |
| Salt Verde AZ Financial Corp. Gas Revenue | 5.250% | 12/1/24 | 870 | 1,035 |
| Salt Verde AZ Financial Corp. Gas Revenue | 5.250% | 12/1/28 | 510 | 614 |
| University Medical Center Corp. Arizona | | | | |
| Hospital Revenue | 5.000% | 7/1/19 (ETM) | 500 | 566 |
| Yavapai County AZ Industrial Development | | | | |
| Authority Hospital Facility Revenue (Northern | | | | |
| Arizona Healthcare System) | 5.250% | 10/1/22 | 500 | 587 |
| | | | | 36,024 |
| Arkansas (0.0%) | | | | |
| Rogers AR Sales & Use Tax Revenue | 2.125% | 11/1/29 | 440 | 441 |
| |
| California (7.4%) | | | | |
| ABAG Finance Authority for Nonprofit Corps. | | | | |
| California Revenue (Episcopal Senior | | | | |
| Communities) | 5.000% | 7/1/22 | 500 | 571 |
| ABAG Finance Authority for Nonprofit Corps. | | | | |
| California Revenue (Jackson Laboratory) | 5.000% | 7/1/21 | 760 | 881 |
| Alameda CA Corridor Transportation Authority | | | | |
| Revenue | 5.300% | 10/1/23 (2) | 200 | 214 |
| Alameda CA Corridor Transportation Authority | | | | |
| Revenue | 0.000% | 10/1/30 (2) | 740 | 403 |
| Alameda CA Corridor Transportation Authority | | | | |
| Revenue | 0.000% | 10/1/32 (14) | 1,650 | 878 |
| Bay Area Toll Authority California Toll Bridge | | | | |
| Revenue (San Francisco Bay Area) | 5.000% | 4/1/16 (Prere.) | 500 | 506 |
| Bay Area Toll Authority California Toll Bridge | | | | |
| Revenue (San Francisco Bay Area) | 5.000% | 10/1/30 | 500 | 573 |
22
| | | | |
| Tax-Managed Balanced Fund | | | | |
| |
| |
| |
| | | | Face | Market |
| | | Maturity | Amount | Value• |
| | Coupon | Date | ($000) | ($000) |
| Bay Area Toll Authority California Toll Bridge | | | | |
| Revenue (San Francisco Bay Area) | 5.000% | 4/1/31 | 500 | 587 |
| Bay Area Toll Authority California Toll Bridge | | | | |
| Revenue (San Francisco Bay Area) | 5.000% | 4/1/31 | 1,000 | 1,166 |
| 1 Bay Area Toll Authority California Toll Bridge | | | | |
| Revenue (San Francisco Bay Area) PUT | 0.610% | 4/1/20 | 1,000 | 994 |
| Bay Area Toll Authority California Toll Bridge | | | | |
| Revenue (San Francisco Bay Area) PUT | 1.875% | 4/1/20 | 1,500 | 1,523 |
| 1 Bay Area Toll Authority California Toll Bridge | | | | |
| Revenue (San Francisco Bay Area) PUT | 0.710% | 4/1/21 | 1,000 | 992 |
| 1 Bay Area Toll Authority California Toll Bridge | | | | |
| Revenue (San Francisco Bay Area) PUT | 0.910% | 5/1/23 | 1,000 | 984 |
| Brea CA Public Financing Authority Tax | | | | |
| Allocation Revenue | 7.000% | 9/1/23 | 1,105 | 1,172 |
| California Department of Water Resources | | | | |
| Power Supply Revenue | 5.000% | 5/1/16 | 500 | 508 |
| California Department of Water Resources | | | | |
| Power Supply Revenue | 5.000% | 5/1/17 | 500 | 529 |
| California Department of Water Resources | | | | |
| Power Supply Revenue | 5.000% | 5/1/18 | 165 | 181 |
| California Department of Water Resources | | | | |
| Power Supply Revenue | 5.000% | 5/1/18 | 500 | 548 |
| California Department of Water Resources | | | | |
| Power Supply Revenue | 5.000% | 5/1/20 | 575 | 668 |
| California Department of Water Resources | | | | |
| Water System Revenue (Central Valley Project) | 5.000% | 6/1/18 (Prere.) | 480 | 527 |
| California Department of Water Resources | | | | |
| Water System Revenue (Central Valley Project) | 5.000% | 12/1/24 | 500 | 631 |
| California Department of Water Resources | | | | |
| Water System Revenue (Central Valley Project) | 5.000% | 12/1/28 | 20 | 22 |
| California Economic Recovery GO | 5.000% | 7/1/16 (Prere.) | 500 | 512 |
| California Economic Recovery GO | 5.000% | 7/1/18 (ETM) | 390 | 429 |
| California Economic Recovery GO | 5.000% | 7/1/18 (ETM) | 110 | 121 |
| California Economic Recovery GO | 5.000% | 7/1/19 (ETM) | 500 | 568 |
| † California Economic Recovery GO | 5.000% | 7/1/19 (Prere.) | 500 | 568 |
| California Economic Recovery GO | 5.250% | 7/1/19 (Prere.) | 315 | 361 |
| California Economic Recovery GO | 5.250% | 7/1/19 (Prere.) | 185 | 212 |
| California Educational Facilities Authority | | | | |
| Revenue (University of San Francisco) | 6.125% | 10/1/30 | 500 | 613 |
| California GO | 6.000% | 2/1/16 | 500 | 502 |
| California GO | 5.000% | 9/1/16 (Prere.) | 500 | 515 |
| California GO | 5.000% | 9/1/16 (Prere.) | 500 | 515 |
| California GO | 5.000% | 11/1/16 | 350 | 363 |
| California GO | 5.000% | 3/1/17 | 500 | 525 |
| California GO | 6.000% | 4/1/18 | 500 | 557 |
| California GO | 5.000% | 11/1/18 (14) | 500 | 540 |
| California GO | 5.000% | 6/1/19 (14) | 500 | 531 |
| California GO | 5.000% | 2/1/20 | 500 | 574 |
| California GO | 5.000% | 10/1/20 | 2,000 | 2,343 |
| California GO | 5.000% | 9/1/21 | 500 | 598 |
| California GO | 5.000% | 10/1/21 | 250 | 259 |
| California GO | 5.000% | 12/1/22 | 1,635 | 2,002 |
| California GO | 5.000% | 10/1/23 | 1,000 | 1,233 |
| California GO | 5.000% | 11/1/23 | 1,155 | 1,425 |
| California GO | 5.000% | 11/1/25 | 2,000 | 2,476 |
| California GO | 5.000% | 12/1/25 | 1,000 | 1,223 |
23
| | | | |
| Tax-Managed Balanced Fund | | | | |
| |
| |
| |
| | | | Face | Market |
| | | Maturity | Amount | Value• |
| | Coupon | Date | ($000) | ($000) |
| California GO | 5.500% | 3/1/26 | 500 | 548 |
| California GO | 5.000% | 6/1/27 (14) | 500 | 530 |
| California GO | 4.500% | 8/1/27 | 85 | 89 |
| California GO | 5.000% | 2/1/28 | 690 | 824 |
| California GO | 4.500% | 8/1/28 (2) | 725 | 755 |
| California GO | 5.750% | 4/1/29 | 500 | 576 |
| California GO | 5.000% | 9/1/29 | 495 | 545 |
| California GO | 5.000% | 9/1/29 (2) | 500 | 504 |
| California GO | 5.000% | 10/1/29 | 3,500 | 3,798 |
| California GO | 5.000% | 11/1/29 | 1,700 | 2,051 |
| California GO | 5.250% | 3/1/30 | 500 | 580 |
| California GO | 5.250% | 9/1/30 | 500 | 590 |
| California GO | 5.000% | 2/1/32 | 500 | 582 |
| California GO | 5.000% | 6/1/32 | 370 | 392 |
| California GO | 5.000% | 10/1/32 | 1,875 | 2,228 |
| California GO PUT | 4.000% | 12/1/17 | 2,400 | 2,508 |
| California Health Facilities Financing Authority | | | | |
| Revenue (Adventist Health System/West) | 5.000% | 3/1/23 | 1,000 | 1,197 |
| California Health Facilities Financing Authority | | | | |
| Revenue (Catholic Healthcare West) | 5.250% | 3/1/22 | 300 | 355 |
| California Health Facilities Financing Authority | | | | |
| Revenue (Cedars-Sinai Medical Center) | 5.000% | 8/15/17 | 500 | 534 |
| California Health Facilities Financing Authority | | | | |
| Revenue (Children’s Hospital of Los Angeles) | 5.000% | 11/15/23 | 1,000 | 1,131 |
| California Health Facilities Financing Authority | | | | |
| Revenue (Lucile Salter Packard Children’s | | | | |
| Hospital at Stanford) | 5.000% | 8/15/20 | 325 | 380 |
| California Health Facilities Financing Authority | | | | |
| Revenue (Rady Children’s Hospital) | 5.000% | 8/15/31 | 965 | 1,114 |
| California Health Facilities Financing Authority | | | | |
| Revenue (Sutter Health) | 5.500% | 8/15/26 | 500 | 594 |
| California Health Facilities Financing Authority | | | | |
| Revenue (Sutter Health) | 5.000% | 8/15/30 | 110 | 120 |
| California Infrastructure & Economic | | | | |
| Development Bank Revenue (Bay Area Toll | | | | |
| Bridges Seismic Retrofit) | 5.000% | 1/1/28 (Prere.) | 500 | 652 |
| California Municipal Finance Authority Revenue | | | | |
| (Anaheim Electric Utility Distribution System) | 5.000% | 10/1/30 | 965 | 1,169 |
| California Municipal Finance Authority Revenue | | | | |
| (University of La Verne) | 6.125% | 6/1/30 | 500 | 573 |
| California Public Works Board Lease Revenue | | | | |
| (Davidson Library) | 5.000% | 3/1/23 (Prere.) | 20 | 25 |
| California Public Works Board Lease Revenue | | | | |
| (Department of Corrections) | 5.000% | 6/1/22 | 1,000 | 1,209 |
| California Public Works Board Lease Revenue | | | | |
| (Department of Corrections) | 5.000% | 6/1/27 | 1,000 | 1,191 |
| California Public Works Board Lease Revenue | | | | |
| (Judicial Council Projects) | 5.000% | 10/1/26 | 1,000 | 1,217 |
| California Public Works Board Lease Revenue | | | | |
| (Judicial Council Projects) | 5.000% | 3/1/28 | 300 | 358 |
| California Public Works Board Lease Revenue | | | | |
| (Judicial Council Projects) | 5.125% | 12/1/29 | 250 | 296 |
| California Public Works Board Lease Revenue | | | | |
| (Regents of The University of California) | 5.000% | 10/1/16 (Prere.) | 100 | 103 |
| California Public Works Board Lease Revenue | | | | |
| (Regents of The University of California) | 5.000% | 10/1/16 (Prere.) | 40 | 41 |
24
| | | | |
| Tax-Managed Balanced Fund | | | | |
| |
| |
| |
| | | | Face | Market |
| | | Maturity | Amount | Value• |
| | Coupon | Date | ($000) | ($000) |
| California Public Works Board Lease Revenue | | | | |
| (Regents of The University of California) | 5.000% | 3/1/18 (Prere.) | 200 | 218 |
| California Public Works Board Lease Revenue | | | | |
| (Regents of The University of California) | 5.000% | 4/1/19 (Prere.) | 70 | 79 |
| California Public Works Board Lease Revenue | | | | |
| (Regents of The University of California) | 5.000% | 4/1/19 (Prere.) | 120 | 135 |
| California Public Works Board Lease Revenue | | | | |
| (Regents of The University of California) | 5.000% | 12/1/21 (Prere.) | 35 | 42 |
| California Public Works Board Lease Revenue | | | | |
| (Various Capital Projects) | 5.000% | 5/1/19 | 1,000 | 1,125 |
| California Public Works Board Lease Revenue | | | | |
| (Various Capital Projects) | 5.000% | 12/1/21 (Prere.) | 25 | 30 |
| California Public Works Board Lease Revenue | | | | |
| (Various Capital Projects) | 5.375% | 3/1/23 | 1,000 | 1,168 |
| California Public Works Board Lease Revenue | | | | |
| (Various Capital Projects) | 5.000% | 11/1/31 | 1,000 | 1,175 |
| California Public Works Board Lease Revenue | | | | |
| (Various Capital Projects) | 5.000% | 4/1/32 | 350 | 404 |
| California State University Systemwide Revenue | 5.750% | 11/1/27 | 500 | 574 |
| California State University Systemwide Revenue | 5.250% | 11/1/29 | 300 | 340 |
| California State University Systemwide Revenue | 5.000% | 11/1/30 | 1,000 | 1,176 |
| California State University Systemwide Revenue | 5.000% | 11/1/34 | 2,000 | 2,363 |
| California Statewide Communities Development | | | | |
| Authority Revenue (Buck Institute for Age | | | | |
| Research) | 3.000% | 11/15/16 | 250 | 255 |
| California Statewide Communities Development | | | | |
| Authority Revenue (Buck Institute for Age | | | | |
| Research) | 4.000% | 11/15/17 | 275 | 290 |
| California Statewide Communities Development | | | | |
| Authority Revenue (Kaiser Permanente) | 5.250% | 8/1/31 | 1,500 | 1,538 |
| Chabot-Las Positas CA Community College | | | | |
| District GO | 5.000% | 8/1/31 | 1,000 | 1,163 |
| Chaffey CA Community College District GO | 5.000% | 6/1/23 | 840 | 1,030 |
| Chino CA Public Financing Authority Special | | | | |
| Tax Revenue | 5.000% | 9/1/30 (4) | 800 | 925 |
| Chula Vista CA Municipal Financing Authority | | | | |
| Special Tax Revenue | 5.500% | 9/1/27 | 970 | 1,144 |
| Citrus CA Community College District GO | 0.000% | 8/1/34 | 1,000 | 771 |
| Colton CA Public Financing Authority Electric | | | | |
| Revenue | 5.000% | 4/1/28 | 500 | 571 |
| Contra Costa CA Community College District GO | 5.000% | 8/1/31 | 1,000 | 1,187 |
| Contra Costa CA Municipal Water District | | | | |
| Revenue | 5.000% | 10/1/33 | 1,000 | 1,164 |
| Corona-Norco CA Unified School District Special | | | | |
| Tax Revenue (Community Facilities District | | | | |
| No. 98-1) | 5.000% | 9/1/22 | 970 | 1,142 |
| Foothill/Eastern Transportation Corridor Agency | | | | |
| California Toll Road Revenue | 0.000% | 1/15/29 | 1,390 | 1,124 |
| Gavilan CA Joint Community College District GO | 5.000% | 8/1/28 | 1,000 | 1,219 |
| Golden State Tobacco Securitization Corp. | | | | |
| California Revenue | 5.000% | 6/1/33 | 1,500 | 1,757 |
| La Quinta CA Redevelopment Agency Tax | | | | |
| Allocation Revenue | 5.000% | 9/1/26 | 1,500 | 1,721 |
| La Verne CA (Brethren Hillcrest Homes) COP | 5.000% | 5/15/26 | 350 | 390 |
| Long Beach CA Finance Authority Natural Gas | | | | |
| Purchase Revenue | 5.250% | 11/15/19 | 75 | 84 |
25
| | | | |
| Tax-Managed Balanced Fund | | | | |
| |
| |
| |
| | | | Face | Market |
| | | Maturity | Amount | Value• |
| | Coupon | Date | ($000) | ($000) |
| Long Beach CA Finance Authority Natural Gas | | | | |
| Purchase Revenue | 5.250% | 11/15/23 | 330 | 388 |
| Long Beach CA Unified School District GO | 0.000% | 8/1/24 (12) | 1,290 | 1,037 |
| Los Angeles CA Community College District GO | 5.000% | 8/1/16 (Prere.) | 1,045 | 1,073 |
| Los Angeles CA Community College District GO | 5.000% | 8/1/18 (Prere.) | 500 | 552 |
| Los Angeles CA Community College District GO | 5.000% | 8/1/22 | 1,000 | 1,219 |
| Los Angeles CA Community College District GO | 5.000% | 8/1/29 | 1,300 | 1,583 |
| Los Angeles CA Community College District GO | 4.000% | 8/1/32 | 1,000 | 1,097 |
| Los Angeles CA Department of Airports | | | | |
| International Airport Revenue | 5.000% | 5/15/27 | 500 | 576 |
| Los Angeles CA Department of Water & Power | | | | |
| Revenue | 5.000% | 7/1/24 | 500 | 565 |
| Los Angeles CA Municipal Improvement Corp. | | | | |
| Lease Revenue (Police Headquarters Facility) | 4.750% | 1/1/31 (14) | 1,175 | 1,212 |
| Los Angeles CA Unified School District GO | 5.000% | 7/1/17 (Prere.) | 1,825 | 1,941 |
| Los Angeles CA Unified School District GO | 5.000% | 7/1/20 | 1,700 | 1,983 |
| Los Angeles CA Unified School District GO | 4.500% | 7/1/22 (4) | 1,535 | 1,622 |
| Los Angeles CA Unified School District GO | 4.500% | 7/1/24 (4) | 1,500 | 1,583 |
| Los Angeles CA Unified School District GO | 5.000% | 7/1/26 | 500 | 565 |
| Los Angeles CA Unified School District GO | 4.500% | 1/1/28 (14) | 745 | 781 |
| Los Angeles CA Unified School District GO | 5.000% | 7/1/29 | 500 | 564 |
| Los Angeles CA Unified School District GO | 5.000% | 7/1/29 | 500 | 564 |
| Los Angeles CA Unified School District GO | 4.750% | 7/1/32 (4) | 1,475 | 1,553 |
| Los Angeles CA Unified School District GO | 5.000% | 7/1/32 (4) | 650 | 687 |
| Los Angeles CA Wastewater System Revenue | 5.000% | 6/1/29 | 500 | 561 |
| Los Angeles County CA Metropolitan | | | | |
| Transportation Authority Sales Tax Revenue | 5.000% | 7/1/19 | 560 | 636 |
| Los Angeles County CA Public Works Financing | | | | |
| Authority Lease Revenue | 5.000% | 9/1/16 (Prere.) | 1,500 | 1,546 |
| Los Angeles County CA Public Works Financing | | | | |
| Authority Lease Revenue | 5.000% | 8/1/26 | 500 | 586 |
| Los Angeles County CA Redevelopment Authority | | | | |
| Tax Allocation Revenue (Hollywood/North | | | | |
| Hollywood Redevelopment Project) | 5.000% | 7/1/20 | 1,500 | 1,736 |
| Marysville CA Revenue (Fremont-Rideout Health | | | | |
| Group) | 5.250% | 1/1/24 | 600 | 683 |
| 1 Metropolitan Water District of Southern | | | | |
| California Revenue PUT | 0.390% | 3/27/18 | 1,585 | 1,577 |
| Milpitas CA Redevelopment Agency Successor | | | | |
| Agency Tax Allocation Revenue | 5.000% | 9/1/31 | 1,130 | 1,352 |
| Newport Mesa CA Unified School District GO | 0.000% | 8/1/30 | 630 | 397 |
| Oakland CA Redevelopment Agency Tax | | | | |
| Allocation Revenue (Central District Project) | 5.000% | 9/1/22 | 500 | 594 |
| Oakland CA Unified School District GO | 5.000% | 8/1/25 (4) | 1,500 | 1,831 |
| Orange County CA Development Agency Tax | | | | |
| Allocation Revenue (Santa Ana Heights Project) | 5.000% | 3/1/21 | 1,170 | 1,351 |
| Orange County CA Transportation Authority Toll | | | | |
| Road Revenue | 5.000% | 8/15/29 | 1,250 | 1,461 |
| Palomar CA Community College District GO | 4.750% | 5/1/17 (Prere.) | 1,600 | 1,687 |
| Palomar Pomerado Health California GO | 0.000% | 8/1/22 (14) | 1,000 | 844 |
| Palomar Pomerado Health California GO | 0.000% | 8/1/26 (12) | 1,040 | 722 |
| Palomar Pomerado Health California GO | 0.000% | 8/1/32 (12) | 700 | 371 |
| Perris CA Public Financing Authority Tax | | | | |
| Allocation Revenue | 5.000% | 10/1/21 | 1,085 | 1,271 |
| Poway CA Unified School District GO | 5.000% | 8/1/24 | 1,750 | 2,177 |
26
| | | | |
| Tax-Managed Balanced Fund | | | | |
| |
| |
| |
| | | | Face | Market |
| | | Maturity | Amount | Value• |
| | Coupon | Date | ($000) | ($000) |
| Rancho Mirage CA Joint Powers Financing | | | | |
| Authority Revenue (Eisenhower Medical Center) | 5.000% | 7/1/16 | 100 | 102 |
| Riverside County CA Transportation Commission | | | | |
| Sales Tax Revenue | 5.250% | 6/1/29 | 1,000 | 1,221 |
| Riverside County CA Transportation Commission | | | | |
| Toll Revenue | 0.000% | 6/1/30 | 2,415 | 1,195 |
| Roseville CA Natural Gas Financing Authority | | | | |
| Gas Revenue | 5.000% | 2/15/16 | 100 | 100 |
| Roseville CA Natural Gas Financing Authority | | | | |
| Gas Revenue | 5.000% | 2/15/23 | 140 | 160 |
| Roseville CA Natural Gas Financing Authority | | | | |
| Gas Revenue | 5.000% | 2/15/25 | 245 | 283 |
| Sacramento CA City Financing Authority Revenue | 5.000% | 12/1/22 (15) | 750 | 901 |
| Sacramento CA Municipal Utility District | | | | |
| Financing Authority Revenue (Cosumnes | | | | |
| Project) | 5.125% | 7/1/16 (Prere.) | 1,000 | 1,024 |
| Sacramento CA Municipal Utility District Revenue | 5.000% | 8/15/27 (4) | 500 | 549 |
| Sacramento CA Regional Transit District Farebox | | | | |
| Revenue | 5.000% | 3/1/23 | 500 | 566 |
| Sacramento County CA Airport Revenue | 5.625% | 7/1/29 | 500 | 551 |
| Sacramento County CA Sanitation Districts | | | | |
| Financing Authority Revenue | 5.000% | 8/1/25 | 435 | 548 |
| Sacramento County CA Sanitation Districts | | | | |
| Financing Authority Revenue | 5.000% | 8/1/27 | 575 | 712 |
| San Bernardino County CA Transportation | | | | |
| Authority Revenue | 5.000% | 3/1/31 | 500 | 580 |
| San Diego CA Community College District GO | 5.000% | 8/1/29 | 1,000 | 1,199 |
| San Diego CA Community College District GO | 5.000% | 8/1/31 | 500 | 583 |
| San Diego CA Public Facilities Financing | | | | |
| Authority Sewer Revenue | 5.000% | 5/15/28 | 500 | 559 |
| San Diego CA Public Facilities Financing | | | | |
| Authority Water Revenue | 5.250% | 8/1/28 | 500 | 578 |
| San Diego CA Unified School District GO | 0.000% | 7/1/27 | 500 | 353 |
| San Diego CA Unified School District GO | 5.000% | 7/1/27 | 1,130 | 1,391 |
| San Diego CA Unified School District GO | 5.500% | 7/1/27 (4) | 500 | 657 |
| San Diego CA Unified School District GO | 0.000% | 7/1/28 | 500 | 340 |
| San Diego CA Unified School District GO | 0.000% | 7/1/29 | 500 | 324 |
| San Diego CA Unified School District GO | 0.000% | 7/1/30 | 100 | 61 |
| San Diego County CA Regional Airport | | | | |
| Authority Revenue | 5.000% | 7/1/30 (4) | 500 | 571 |
| San Diego County CA Regional Transportation | | | | |
| Commission Sales Tax Revenue | 5.000% | 4/1/31 | 560 | 654 |
| San Diego County CA Water Authority Revenue | 5.000% | 5/1/28 | 1,000 | 1,231 |
| 2 San Diego County CA Water Authority Revenue | | | | |
| COP TOB VRDO | 0.010% | 1/7/16 | 3,000 | 3,000 |
| San Francisco CA Bay Area Rapid Transit | | | | |
| District GO | 5.000% | 8/1/30 | 1,520 | 1,871 |
| San Francisco CA Bay Area Rapid Transit | | | | |
| District Sales Tax Revenue | 4.000% | 7/1/21 | 350 | 399 |
| San Francisco CA City & County (Earthquake | | | | |
| Safety & Emergency Response) GO | 5.000% | 6/15/20 (Prere.) | 500 | 584 |
| San Francisco CA City & County International | | | | |
| Airport Revenue | 5.250% | 5/1/22 | 500 | 565 |
| San Francisco CA City & County International | | | | |
| Airport Revenue | 5.000% | 5/1/27 | 225 | 266 |
27
| | | | |
| Tax-Managed Balanced Fund | | | | |
| |
| |
| |
| | | | Face | Market |
| | | Maturity | Amount | Value• |
| | Coupon | Date | ($000) | ($000) |
| San Francisco CA City & County International | | | | |
| Airport Revenue | 5.000% | 5/1/30 | 500 | 576 |
| San Francisco CA City & County Public Utilities | | | | |
| Commission Water Revenue | 5.500% | 11/1/30 | 500 | 596 |
| San Francisco CA City & County Public Utilities | | | | |
| Commission Water Revenue | 5.000% | 11/1/32 | 1,000 | 1,198 |
| San Francisco CA City & County Public Utilities | | | | |
| Commission Water Revenue | 5.000% | 11/1/34 | 1,245 | 1,445 |
| San Francisco CA City & County Redevelopment | | | | |
| Financing Authority Tax Allocation Revenue | | | | |
| (Mission Bays Redevelopment Project) | 5.000% | 8/1/16 | 600 | 615 |
| San Francisco CA City & County Unified School | | | | |
| District GO | 4.000% | 6/15/32 | 965 | 1,023 |
| San Jose CA Airport Revenue | 5.000% | 3/1/27 | 500 | 592 |
| San Jose CA Redevelopment Agency Tax | | | | |
| Allocation Revenue | 5.000% | 8/1/19 (14) | 1,000 | 1,016 |
| San Jose CA Redevelopment Agency Tax | | | | |
| Allocation Revenue | 6.500% | 8/1/28 | 700 | 763 |
| Southern California Public Power Authority | | | | |
| Revenue (Milford Wind Corridor Phase I Project) | 5.000% | 7/1/26 | 1,000 | 1,142 |
| State Center California Community College | | | | |
| District GO | 5.000% | 8/1/17 (Prere.) | 1,000 | 1,067 |
| State Center California Community College | | | | |
| District GO | 5.000% | 8/1/29 | 1,000 | 1,209 |
| Turlock CA Public Financing Authority Water | | | | |
| Revenue | 4.750% | 5/1/32 | 2,000 | 2,144 |
| University of California Revenue | 4.750% | 5/15/16 (Prere.) | 155 | 159 |
| University of California Revenue | 5.000% | 5/15/16 (Prere.) | 500 | 514 |
| University of California Revenue | 5.000% | 5/15/16 (Prere.) | 500 | 514 |
| University of California Revenue | 5.000% | 5/15/17 (Prere.) | 500 | 534 |
| University of California Revenue | 5.000% | 5/15/23 | 1,000 | 1,180 |
| University of California Revenue | 5.000% | 5/15/23 | 1,000 | 1,236 |
| University of California Revenue | 5.000% | 5/15/28 | 1,000 | 1,204 |
| University of California Revenue | 5.000% | 5/15/28 | 1,000 | 1,229 |
| University of California Revenue | 4.000% | 5/15/33 | 1,000 | 1,084 |
| University of California Revenue PUT | 5.000% | 5/15/23 | 3,625 | 4,448 |
| West Contra Costa CA Unified School District GO | 5.000% | 8/1/28 | 1,185 | 1,407 |
| | | | | 183,387 |
| Colorado (0.5%) | | | | |
| Adams County CO COP | 5.000% | 12/1/31 | 650 | 769 |
| Board of Governors of the Colorado State | | | | |
| University System Enterprise Revenue | 5.000% | 3/1/23 | 300 | 364 |
| Colorado (UCDHSC Fitzsimons Academic | | | | |
| Projects) COP | 5.000% | 11/1/21 | 500 | 588 |
| Colorado Health Facilities Authority Revenue | | | | |
| (Catholic Health Initiatives) | 5.250% | 2/1/31 | 2,500 | 2,792 |
| Colorado Health Facilities Authority Revenue | | | | |
| (Covenant Retirement Community Inc.) | 5.000% | 12/1/27 | 500 | 541 |
| Colorado Springs CO Utility System Revenue | 5.000% | 11/15/28 | 500 | 590 |
| Denver CO City & County Airport Revenue | 5.000% | 11/15/20 | 500 | 582 |
| Denver CO City & County Airport Revenue | 5.000% | 11/15/26 | 430 | 489 |
| E-470 Public Highway Authority Colorado | | | | |
| Revenue | 5.250% | 9/1/18 (14) | 1,500 | 1,641 |
| E-470 Public Highway Authority Colorado | | | | |
| Revenue | 0.000% | 9/1/23 (14) | 1,000 | 808 |
28
| | | | |
| Tax-Managed Balanced Fund | | | | |
| |
| |
| |
| | | | Face | Market |
| | | Maturity | Amount | Value• |
| | Coupon | Date | ($000) | ($000) |
| E-470 Public Highway Authority Colorado | | | | |
| Revenue | 5.375% | 9/1/26 | 1,000 | 1,124 |
| Regional Transportation District of Colorado COP | 5.000% | 6/1/24 | 1,010 | 1,149 |
| Regional Transportation District of Colorado COP | 5.000% | 6/1/25 | 1,000 | 1,134 |
| University of Colorado Enterprise System | | | | |
| Revenue | 5.000% | 6/1/29 | 500 | 586 |
| | | | | 13,157 |
| Connecticut (0.6%) | | | | |
| Connecticut GO | 5.000% | 11/1/16 | 410 | 425 |
| Connecticut GO | 5.000% | 4/15/21 | 500 | 584 |
| Connecticut GO | 5.000% | 11/15/22 | 1,935 | 2,322 |
| Connecticut GO | 5.000% | 4/15/24 | 500 | 588 |
| Connecticut GO | 5.000% | 9/1/26 | 1,000 | 1,198 |
| Connecticut GO | 5.000% | 4/15/28 | 500 | 583 |
| Connecticut GO | 5.000% | 3/1/32 | 2,950 | 3,416 |
| Connecticut GO | 5.000% | 10/15/32 | 705 | 819 |
| Connecticut Health & Educational Facilities | | | | |
| Authority Revenue (Hartford Healthcare) | 5.000% | 7/1/26 | 500 | 563 |
| Connecticut Special Tax Revenue | | | | |
| (Transportation Infrastructure) | 5.000% | 2/1/16 | 110 | 110 |
| Connecticut Special Tax Revenue | | | | |
| (Transportation Infrastructure) | 5.000% | 9/1/23 | 1,000 | 1,221 |
| Connecticut Special Tax Revenue | | | | |
| (Transportation Infrastructure) | 5.000% | 11/1/25 | 500 | 549 |
| Hartford CT GO | 5.000% | 4/1/30 | 435 | 492 |
| University of Connecticut GO | 5.000% | 2/15/27 | 635 | 767 |
| University of Connecticut GO | 5.000% | 2/15/28 | 510 | 613 |
| | | | | 14,250 |
| Delaware (0.1%) | | | | |
| Delaware GO | 5.000% | 2/1/19 | 600 | 673 |
| Delaware GO | 5.000% | 7/1/20 | 600 | 700 |
| Delaware GO | 5.000% | 10/1/20 | 700 | 822 |
| | | | | 2,195 |
| District of Columbia (0.2%) | | | | |
| District of Columbia GO | 5.000% | 6/1/21 (4) | 500 | 539 |
| District of Columbia Hospital Revenue | | | | |
| (Children’s Hospital Obligated Group) | 5.000% | 7/15/35 | 1,000 | 1,147 |
| District of Columbia Income Tax Revenue | 5.000% | 12/1/26 | 655 | 766 |
| District of Columbia Income Tax Revenue | 5.250% | 12/1/27 | 500 | 572 |
| District of Columbia Income Tax Revenue | 5.000% | 12/1/30 | 500 | 573 |
| Metropolitan Washington DC/VA Airports | | | | |
| Authority Airport System Revenue | 5.000% | 10/1/24 | 500 | 576 |
| | | | | 4,173 |
| Florida (2.0%) | | | | |
| Brevard County FL Health Facilities Authority | | | | |
| Revenue (Health First Inc. Project) | 5.000% | 4/1/16 (Prere.) | 530 | 536 |
| Brevard County FL School Board COP | 5.000% | 7/1/25 | 1,000 | 1,180 |
| Broward County FL Airport System Revenue | 5.000% | 10/1/28 | 400 | 459 |
| Broward County FL Airport System Revenue | 5.375% | 10/1/29 | 500 | 568 |
| Broward County FL Airport System Revenue | 5.500% | 10/1/31 | 1,000 | 1,195 |
| Citizens Property Insurance Corp. Florida | | | | |
| Revenue (Coastal Account) | 5.250% | 6/1/17 | 435 | 461 |
| Citizens Property Insurance Corp. Florida | | | | |
| Revenue (Coastal Account) | 5.500% | 6/1/17 | 1,295 | 1,377 |
29
| | | | |
| Tax-Managed Balanced Fund | | | | |
| |
| |
| |
| | | | Face | Market |
| | | Maturity | Amount | Value• |
| | Coupon | Date | ($000) | ($000) |
| Citizens Property Insurance Corp. Florida | | | | |
| Revenue (Coastal Account) | 5.000% | 6/1/20 | 1,000 | 1,135 |
| Citizens Property Insurance Corp. Florida | | | | |
| Revenue (Personal Lines Account/Commercial | | | | |
| Lines Account) | 5.000% | 6/1/20 | 450 | 514 |
| Florida Board of Education Lottery Revenue | 5.000% | 7/1/16 (2) | 245 | 249 |
| Florida Board of Education Lottery Revenue | 5.000% | 7/1/18 | 500 | 549 |
| Florida Board of Education Public Education | | | | |
| Capital Outlay GO | 4.000% | 6/1/16 | 300 | 305 |
| Florida Board of Education Public Education | | | | |
| Capital Outlay GO | 4.500% | 6/1/16 (Prere.) | 300 | 308 |
| Florida Board of Education Public Education | | | | |
| Capital Outlay GO | 5.000% | 6/1/19 | 220 | 249 |
| Florida Board of Education Public Education | | | | |
| Capital Outlay GO | 5.000% | 6/1/19 | 1,585 | 1,793 |
| Florida Board of Education Public Education | | | | |
| Capital Outlay GO | 5.000% | 6/1/21 | 750 | 891 |
| Florida Board of Education Public Education | | | | |
| Capital Outlay GO | 5.000% | 6/1/21 | 1,270 | 1,508 |
| Florida Board of Education Public Education | | | | |
| Capital Outlay GO | 5.000% | 6/1/22 | 500 | 567 |
| Florida Board of Education Public Education | | | | |
| Capital Outlay GO | 5.000% | 6/1/22 | 1,245 | 1,507 |
| Florida Board of Education Public Education | | | | |
| Capital Outlay GO | 5.000% | 6/1/24 | 500 | 535 |
| Florida Board of Education Public Education | | | | |
| Capital Outlay GO | 5.000% | 6/1/24 | 600 | 738 |
| Florida Department of Transportation GO | 5.000% | 7/1/19 | 545 | 618 |
| Florida Turnpike Authority Revenue | 5.000% | 7/1/19 | 500 | 566 |
| Fort Myers FL Improvement Revenue | 4.750% | 12/1/16 (Prere.) | 70 | 73 |
| Fort Myers FL Improvement Revenue | 4.750% | 12/1/31 (14) | 30 | 31 |
| Hillsborough County FL Industrial Development | | | | |
| Authority Hospital Revenue (Tampa General | | | | |
| Hospital Project) | 5.000% | 10/1/28 | 500 | 568 |
| Jacksonville FL Electric Authority Electric | | | | |
| System Revenue VRDO | 0.010% | 1/7/16 | 1,200 | 1,200 |
| Jacksonville FL Electric Authority Water & | | | | |
| Sewer Revenue | 5.000% | 10/1/31 | 500 | 576 |
| Jacksonville FL Special Revenue | 5.000% | 10/1/28 | 1,000 | 1,186 |
| Jacksonville FL Special Revenue | 5.000% | 10/1/32 | 500 | 582 |
| Lakeland FL Educational Facilities Revenue | | | | |
| (Florida Southern College Project) | 5.000% | 9/1/31 | 880 | 951 |
| Miami Beach FL Health Facilities Authority | | | | |
| Revenue (Mount Sinai Medical Center) | 5.000% | 11/15/27 | 1,000 | 1,139 |
| Miami Beach FL Resort Tax Revenue | 5.000% | 9/1/34 | 1,000 | 1,162 |
| Miami-Dade County FL Aviation Revenue | | | | |
| (Miami International Airport) | 4.875% | 10/1/24 | 500 | 564 |
| Miami-Dade County FL Aviation Revenue | | | | |
| (Miami International Airport) | 5.000% | 10/1/30 | 585 | 648 |
| Miami-Dade County FL Aviation Revenue | | | | |
| (Miami International Airport) | 5.000% | 10/1/30 | 1,000 | 1,168 |
| Miami-Dade County FL Health Facilities Authority | | | | |
| Hospital Revenue (Miami Children’s Hospital) | 5.000% | 8/1/25 | 1,000 | 1,149 |
| Miami-Dade County FL School Board COP | 5.000% | 11/1/16 (Prere.) | 640 | 664 |
| Miami-Dade County FL School Board COP | 5.000% | 11/1/16 (Prere.) | 115 | 119 |
| Miami-Dade County FL School Board COP | 5.000% | 11/1/16 (Prere.) | 1,300 | 1,348 |
30
| | | | |
| Tax-Managed Balanced Fund | | | | |
| |
| |
| |
| | | | Face | Market |
| | | Maturity | Amount | Value• |
| | Coupon | Date | ($000) | ($000) |
| Miami-Dade County FL Seaport Revenue | 5.750% | 10/1/28 | 1,500 | 1,801 |
| Miami-Dade County FL Special Obligation | | | | |
| Revenue | 5.000% | 10/1/24 | 1,000 | 1,179 |
| Miami-Dade County FL Special Obligation | | | | |
| Revenue | 5.000% | 10/1/30 | 500 | 579 |
| Miami-Dade County FL Water & Sewer Revenue | 5.000% | 10/1/17 (Prere.) | 500 | 536 |
| Orange County FL Health Facilities Authority | | | | |
| Revenue (Nemours Foundation Project) | 5.000% | 1/1/19 | 500 | 555 |
| Orlando & Orange County FL Expressway | | | | |
| Authority Revenue | 5.000% | 7/1/30 | 500 | 566 |
| Osceola County FL Expressway System | | | | |
| Revenue (Poinciana Parkway Project) | 0.000% | 10/1/19 | 815 | 724 |
| Osceola County FL Expressway System | | | | |
| Revenue (Poinciana Parkway Project) | 0.000% | 10/1/20 | 1,270 | 1,078 |
| Palm Beach County FL Health Facilities | | | | |
| Authority Hospital Revenue (BRRH Corp. | | | | |
| Obligated Group) | 5.000% | 12/1/25 | 540 | 627 |
| Palm Beach County FL School Board COP | 5.000% | 8/1/29 | 1,520 | 1,796 |
| Palm Beach County FL School Board COP | 5.000% | 8/1/32 | 1,500 | 1,743 |
| Polk County FL Constitutional Fuel Tax Revenue | 5.000% | 12/1/16 (Prere.) | 590 | 614 |
| St. Johns County FL Water & Sewer Revenue | 0.000% | 6/1/24 | 1,110 | 903 |
| Sumter County FL Industrial Development | | | | |
| Authority Hospital Revenue (Central Florida | | | | |
| Health Alliance Project) | 4.000% | 7/1/16 | 265 | 269 |
| Sunshine State Governmental Financing | | | | |
| Commission Florida Revenue (Miami Dade | | | | |
| County Program) | 5.000% | 9/1/26 | 1,000 | 1,178 |
| Tampa FL Cigarette Tax Allocation Revenue | | | | |
| (H. Lee Moffitt Cancer Center Project) | 5.000% | 9/1/26 | 200 | 231 |
| Tampa FL Health System Revenue (BayCare | | | | |
| Health System) | 5.000% | 11/15/33 | 1,535 | 1,739 |
| Tampa FL Hospital Revenue | 5.000% | 7/1/23 | 750 | 861 |
| Tohopekaliga FL Water Authority Utility System | | | | |
| Revenue | 5.750% | 10/1/30 | 500 | 610 |
| | | | | 48,525 |
| Georgia (0.9%) | | | | |
| Athens-Clarke County GA Unified Government | | | | |
| Water & Sewerage Revenue | 4.000% | 1/1/32 | 1,000 | 1,090 |
| Atlanta GA Airport Revenue | 5.000% | 1/1/16 | 525 | 525 |
| Atlanta GA Airport Revenue | 5.000% | 1/1/33 | 2,000 | 2,306 |
| Atlanta GA Development Authority Revenue | 5.000% | 7/1/29 | 1,000 | 1,189 |
| Atlanta GA Water & Wastewater Revenue | 5.000% | 11/1/25 | 1,250 | 1,559 |
| Atlanta GA Water & Wastewater Revenue | 5.750% | 11/1/27 (4) | 500 | 669 |
| Burke County GA Development Authority | | | | |
| Pollution Control Revenue (Georgia Power Co. | | | | |
| Plant Vogtle Project) PUT | 1.750% | 6/1/17 | 500 | 505 |
| Cobb County GA Kennestone Hospital Authority | | | | |
| Revenue | 5.000% | 4/1/24 | 400 | 470 |
| DeKalb County GA Water & Sewer Revenue | 5.250% | 10/1/31 | 500 | 588 |
| Georgia GO | 5.000% | 4/1/16 | 500 | 506 |
| Georgia GO | 5.000% | 5/1/16 | 500 | 508 |
| Georgia GO | 5.000% | 7/1/16 | 500 | 512 |
| Georgia GO | 5.000% | 7/1/16 | 400 | 409 |
| Georgia GO | 5.750% | 8/1/17 | 500 | 540 |
| Georgia GO | 5.000% | 2/1/20 | 1,375 | 1,586 |
| Georgia GO | 5.000% | 7/1/22 | 500 | 565 |
31
| | | | |
| Tax-Managed Balanced Fund | | | | |
| |
| |
| |
| | | | Face | Market |
| | | Maturity | Amount | Value• |
| | Coupon | Date | ($000) | ($000) |
| Georgia GO | 5.000% | 5/1/25 | 500 | 559 |
| Georgia Road & Tollway Authority Revenue | 5.000% | 6/1/17 | 650 | 688 |
| Gwinnett County GA School District GO | 5.000% | 2/1/17 (ETM) | 500 | 523 |
| Gwinnett County GA School District GO | 5.000% | 2/1/28 | 500 | 618 |
| Main Street Natural Gas Inc. Georgia Gas | | | | |
| Project Revenue | 5.000% | 3/15/16 | 590 | 595 |
| Main Street Natural Gas Inc. Georgia Gas | | | | |
| Project Revenue | 5.125% | 9/15/16 | 80 | 82 |
| Main Street Natural Gas Inc. Georgia Gas | | | | |
| Project Revenue | 5.250% | 9/15/18 | 100 | 110 |
| Main Street Natural Gas Inc. Georgia Gas | | | | |
| Project Revenue | 5.000% | 3/15/19 | 395 | 432 |
| Main Street Natural Gas Inc. Georgia Gas | | | | |
| Project Revenue | 5.000% | 3/15/21 | 500 | 566 |
| Main Street Natural Gas Inc. Georgia Gas | | | | |
| Project Revenue | 5.000% | 3/15/22 | 400 | 457 |
| Municipal Electric Authority Georgia Revenue | 5.000% | 1/1/35 | 1,500 | 1,730 |
| Municipal Electric Authority Georgia Revenue | | | | |
| (Combined Cycle Project) | 5.000% | 11/1/17 | 365 | 392 |
| Municipal Electric Authority Georgia Revenue | | | | |
| (Project One) | 5.250% | 1/1/17 | 525 | 549 |
| Private Colleges & University Authority of | | | | |
| Georgia Revenue (Emory University) | 5.000% | 9/1/28 | 500 | 565 |
| | | | | 21,393 |
| Guam (0.1%) | | | | |
| Guam Government Waterworks Authority | | | | |
| Water & Waste Water System Revenue | 5.250% | 7/1/23 | 1,000 | 1,180 |
| Guam Government Waterworks Authority | | | | |
| Water & Waste Water System Revenue | 5.250% | 7/1/33 | 1,305 | 1,464 |
| Guam International Airport Authority Revenue | 5.000% | 10/1/21 | 350 | 405 |
| | | | | 3,049 |
| Hawaii (0.8%) | | | | |
| Hawaii Department of Budget & Finance | | | | |
| Special Purpose Revenue (Hawaii Pacific | | | | |
| Health Obligated Group) | 5.000% | 7/1/19 | 250 | 280 |
| Hawaii Department of Budget & Finance | | | | |
| Special Purpose Revenue (Hawaii Pacific | | | | |
| Health Obligated Group) | 5.000% | 7/1/20 | 300 | 344 |
| Hawaii Department of Budget & Finance | | | | |
| Special Purpose Revenue (Hawaii Pacific | | | | |
| Health Obligated Group) | 5.000% | 7/1/21 | 400 | 467 |
| Hawaii GO | 5.000% | 4/1/17 (Prere.) | 55 | 58 |
| Hawaii GO | 5.000% | 4/1/17 (Prere.) | 445 | 469 |
| Hawaii GO | 5.000% | 6/1/19 (Prere.) | 285 | 322 |
| Hawaii GO | 5.000% | 12/1/21 | 375 | 448 |
| Hawaii GO | 5.000% | 8/1/24 | 1,765 | 2,187 |
| Hawaii GO | 5.000% | 8/1/25 | 1,500 | 1,847 |
| Hawaii GO | 5.000% | 10/1/25 | 1,445 | 1,815 |
| Hawaii GO | 5.000% | 6/1/29 | 215 | 241 |
| Hawaii GO | 5.000% | 8/1/29 | 1,500 | 1,806 |
| Hawaii GO | 5.000% | 12/1/29 | 500 | 587 |
| Hawaii Pacific Health Revenue | 5.000% | 7/1/19 | 575 | 641 |
| Honolulu HI City & County GO | 5.000% | 7/1/17 (Prere.) | 500 | 532 |
| Honolulu HI City & County GO | 5.000% | 10/1/20 | 2,050 | 2,397 |
| Honolulu HI City & County GO | 5.000% | 10/1/28 | 1,000 | 1,229 |
| Honolulu HI City & County GO | 5.000% | 12/1/30 | 310 | 359 |
32
| | | | |
| Tax-Managed Balanced Fund | | | | |
| |
| |
| |
| | | | Face | Market |
| | | Maturity | Amount | Value• |
| | Coupon | Date | ($000) | ($000) |
| Honolulu HI City & County GO | 5.250% | 8/1/31 | 500 | 587 |
| Honolulu HI City & County GO | 5.250% | 8/1/33 | 1,245 | 1,459 |
| Honolulu HI City & County Wastewater | | | | |
| System Revenue | 5.000% | 7/1/30 | 2,000 | 2,421 |
| University of Hawaii Revenue | 5.000% | 10/1/27 | 500 | 559 |
| | | | | 21,055 |
| Idaho (0.0%) | | | | |
| Idaho Health Facilities Authority Revenue | | | | |
| (Trinity Health Group) | 6.125% | 12/1/18 (Prere.) | 105 | 120 |
| |
| Illinois (2.8%) | | | | |
| Chicago IL Board of Education GO | 5.250% | 12/1/17 (14) | 775 | 811 |
| Chicago IL Board of Education GO | 5.000% | 12/1/18 (2) | 295 | 297 |
| Chicago IL Board of Education GO | 5.000% | 12/1/19 (14) | 210 | 223 |
| Chicago IL Board of Education GO | 5.250% | 12/1/21 (14) | 500 | 543 |
| Chicago IL Board of Education GO | 5.000% | 12/1/22 | 1,500 | 1,441 |
| Chicago IL Board of Education GO | 5.000% | 12/1/24 (4) | 100 | 102 |
| Chicago IL Board of Education GO | 5.250% | 12/1/24 (4) | 500 | 522 |
| Chicago IL Board of Education GO | 5.250% | 12/1/26 (12) | 500 | 519 |
| Chicago IL Board of Education GO | 4.750% | 12/1/29 (4) | 105 | 106 |
| Chicago IL Board of Education GO | 4.750% | 12/1/31 (4) | 50 | 50 |
| Chicago IL Board of Education GO | 5.250% | 12/1/35 | 1,000 | 898 |
| Chicago IL GO | 5.000% | 12/1/16 (2) | 500 | 508 |
| Chicago IL GO | 5.500% | 1/1/17 (4) | 500 | 514 |
| Chicago IL GO | 5.000% | 1/1/19 (2) | 500 | 510 |
| Chicago IL Metropolitan Water Reclamation | | | | |
| District GO | 5.000% | 12/1/31 | 500 | 571 |
| Chicago IL Motor Fuel Tax Revenue | 5.000% | 1/1/16 | 200 | 200 |
| Chicago IL Motor Fuel Tax Revenue | 5.000% | 1/1/17 | 200 | 205 |
| Chicago IL Motor Fuel Tax Revenue | 5.000% | 1/1/18 | 200 | 208 |
| Chicago IL Motor Fuel Tax Revenue | 5.000% | 1/1/19 | 250 | 263 |
| Chicago IL Motor Fuel Tax Revenue | 5.000% | 1/1/20 | 300 | 318 |
| Chicago IL Motor Fuel Tax Revenue | 5.000% | 1/1/22 | 300 | 321 |
| Chicago IL O’Hare International Airport Revenue | 5.250% | 1/1/17 (14) | 370 | 387 |
| Chicago IL O’Hare International Airport Revenue | 5.000% | 1/1/24 (4) | 500 | 536 |
| Chicago IL O’Hare International Airport Revenue | 5.250% | 1/1/24 (14) | 500 | 500 |
| Chicago IL O’Hare International Airport Revenue | 5.250% | 1/1/24 | 200 | 233 |
| Chicago IL O’Hare International Airport Revenue | 5.000% | 1/1/25 | 1,000 | 1,203 |
| Chicago IL O’Hare International Airport Revenue | 5.500% | 1/1/26 | 1,000 | 1,164 |
| Chicago IL O’Hare International Airport Revenue | 5.000% | 1/1/29 (14) | 1,500 | 1,500 |
| Chicago IL O’Hare International Airport Revenue | 5.000% | 1/1/29 | 1,000 | 1,164 |
| Chicago IL O’Hare International Airport Revenue | 5.000% | 1/1/31 | 1,000 | 1,153 |
| Chicago IL O’Hare International Airport Revenue | 5.000% | 1/1/32 | 500 | 559 |
| Chicago IL O’Hare International Airport Revenue | 5.000% | 1/1/33 (14) | 1,540 | 1,540 |
| Chicago IL O’Hare International Airport Revenue | 5.000% | 1/1/33 (4) | 2,525 | 2,683 |
| Chicago IL O’Hare International Airport Revenue | 5.000% | 1/1/33 | 1,000 | 1,145 |
| Chicago IL O’Hare International Airport Revenue | 4.750% | 1/1/34 (4) | 50 | 53 |
| Chicago IL Park District GO | 5.000% | 1/1/19 | 1,115 | 1,211 |
| Chicago IL Park District GO | 5.000% | 1/1/19 | 750 | 815 |
| Chicago IL Wastewater Transmission Revenue | 5.000% | 1/1/29 | 1,350 | 1,504 |
| Chicago IL Waterworks Revenue | 5.000% | 11/1/30 | 1,000 | 1,116 |
| Chicago IL Waterworks Revenue | 5.000% | 11/1/36 (2) | 1,000 | 1,012 |
| Cook County IL GO | 5.000% | 11/15/21 | 500 | 544 |
| Cook County IL GO | 5.000% | 11/15/28 | 500 | 537 |
| Cook County IL GO | 5.250% | 11/15/28 | 500 | 544 |
| Cook County IL GO | 4.750% | 11/15/30 (2) | 200 | 202 |
33
| | | | |
| Tax-Managed Balanced Fund | | | | |
| |
| |
| |
| | | | Face | Market |
| | | Maturity | Amount | Value• |
| | Coupon | Date | ($000) | ($000) |
| Illinois Finance Authority Revenue (Advocate | | | | |
| Health Care Network) | 5.000% | 8/1/26 | 1,500 | 1,792 |
| Illinois Finance Authority Revenue (Advocate | | | | |
| Health Care Network) | 5.000% | 8/1/33 | 2,550 | 2,921 |
| Illinois Finance Authority Revenue (Art Institute | | | | |
| of Chicago) | 4.000% | 3/1/16 | 500 | 503 |
| Illinois Finance Authority Revenue (Ascension | | | | |
| Health Credit Group) | 5.000% | 11/15/32 | 500 | 562 |
| Illinois Finance Authority Revenue (Centegra | | | | |
| Health System) | 5.000% | 9/1/29 | 1,300 | 1,440 |
| Illinois Finance Authority Revenue (Northwestern | | | | |
| Community Hospital) | 5.750% | 8/15/30 | 95 | 110 |
| Illinois Finance Authority Revenue (OSF | | | | |
| Healthcare System) | 4.000% | 5/15/16 | 450 | 455 |
| Illinois Finance Authority Revenue (Rehabilitation | | | | |
| Institute of Chicago) | 5.500% | 7/1/28 | 2,000 | 2,315 |
| Illinois Finance Authority Revenue (Rush | | | | |
| University Medical Center) | 5.000% | 11/15/33 | 1,000 | 1,154 |
| Illinois Finance Authority Revenue (Trinity Health | | | | |
| Corp.) | 5.000% | 12/1/30 | 500 | 566 |
| Illinois Finance Authority Revenue (University | | | | |
| of Chicago) | 5.000% | 7/1/17 (Prere.) | 1,100 | 1,169 |
| Illinois Finance Authority Revenue (University | | | | |
| of Chicago) | 5.000% | 10/1/29 | 500 | 568 |
| Illinois Finance Authority Revenue (University | | | | |
| of Chicago) | 5.000% | 10/1/35 | 1,000 | 1,150 |
| Illinois GO | 5.000% | 1/1/17 | 330 | 342 |
| Illinois GO | 5.000% | 1/1/18 | 500 | 526 |
| Illinois GO | 5.000% | 1/1/20 (4) | 200 | 220 |
| Illinois GO | 5.000% | 8/1/20 | 305 | 333 |
| Illinois GO | 5.000% | 1/1/21 (4) | 710 | 779 |
| Illinois GO | 5.000% | 8/1/21 | 500 | 548 |
| Illinois GO | 5.500% | 7/1/24 | 1,000 | 1,130 |
| Illinois GO | 5.000% | 8/1/24 | 1,000 | 1,086 |
| Illinois GO | 5.000% | 6/1/26 | 500 | 513 |
| Illinois GO | 5.250% | 2/1/30 | 1,900 | 2,069 |
| Illinois GO | 5.250% | 7/1/31 | 1,000 | 1,080 |
| Illinois GO | 5.000% | 9/1/31 | 3,000 | 3,094 |
| Illinois Regional Transportation Authority Revenue | 6.250% | 7/1/23 (4) | 500 | 630 |
| Illinois Sales Tax Revenue | 5.500% | 6/15/17 (3) | 500 | 533 |
| Illinois Toll Highway Authority Revenue | 5.000% | 7/1/16 (Prere.) | 500 | 512 |
| Illinois Toll Highway Authority Revenue | 5.000% | 1/1/28 | 500 | 554 |
| Illinois Toll Highway Authority Revenue | 5.000% | 1/1/30 | 1,000 | 1,152 |
| Illinois Toll Highway Authority Revenue | 5.000% | 1/1/32 | 500 | 571 |
| Illinois Toll Highway Authority Revenue | 5.000% | 1/1/36 | 1,000 | 1,159 |
| Kane McHenry Cook & DeKalb County IL Unit | | | | |
| School District GO | 5.000% | 1/1/18 | 1,000 | 1,075 |
| Metropolitan Pier & Exposition Authority Illinois | | | | |
| Dedicated Sales Tax Revenue | 0.000% | 6/15/19 (14) | 1,120 | 1,026 |
| Metropolitan Pier & Exposition Authority Illinois | | | | |
| Dedicated Sales Tax Revenue | 0.000% | 6/15/21 (14) | 1,000 | 843 |
| Metropolitan Pier & Exposition Authority Illinois | | | | |
| Dedicated Sales Tax Revenue | 0.000% | 6/15/26 (4) | 500 | 334 |
| Metropolitan Pier & Exposition Authority Illinois | | | | |
| Dedicated Sales Tax Revenue | 0.000% | 6/15/27 (4) | 250 | 159 |
34
| | | | |
| Tax-Managed Balanced Fund | | | | |
| |
| |
| |
| | | | Face | Market |
| | | Maturity | Amount | Value• |
| | Coupon | Date | ($000) | ($000) |
| Metropolitan Pier & Exposition Authority Illinois | | | | |
| Dedicated Sales Tax Revenue | 0.000% | 12/15/31 (14) | 290 | 145 |
| Railsplitter Tobacco Settlement Authority Illinois | | | | |
| Tobacco Settlement Revenue | 5.250% | 6/1/20 | 1,215 | 1,388 |
| Railsplitter Tobacco Settlement Authority Illinois | | | | |
| Tobacco Settlement Revenue | 5.500% | 6/1/23 | 1,060 | 1,239 |
| Railsplitter Tobacco Settlement Authority Illinois | | | | |
| Tobacco Settlement Revenue | 6.000% | 6/1/28 | 400 | 477 |
| Romeoville IL Revenue (Lewis University Project) | 5.000% | 10/1/28 | 1,000 | 1,139 |
| Will County IL Community High School District | | | | |
| No. 210 (Lincoln-Way) GO | 5.000% | 1/1/30 | 500 | 562 |
| Will County IL Community High School District | | | | |
| No. 210 (Lincoln-Way) GO | 0.000% | 1/1/33 | 750 | 354 |
| | | | | 70,712 |
| Indiana (0.6%) | | | | |
| Indiana Bond Bank Special Program Gas Revenue | 5.250% | 10/15/16 | 250 | 259 |
| Indiana Finance Authority Highway Revenue | 4.500% | 12/1/23 (14) | 2,500 | 2,589 |
| Indiana Finance Authority Hospital Revenue | | | | |
| (Indiana University Health Obligated Group) | 5.000% | 12/1/22 | 1,100 | 1,322 |
| Indiana Finance Authority Hospital Revenue | | | | |
| (Indiana University Health Obligated Group) | 5.000% | 12/1/33 | 1,390 | 1,610 |
| Indiana Finance Authority Revenue (Community | | | | |
| Foundation of Northwest Indiana Obligated | | | | |
| Group) | 5.000% | 3/1/25 | 690 | 781 |
| Indiana Finance Authority Revenue | | | | |
| (Marquette Project) | 5.000% | 3/1/24 | 1,645 | 1,849 |
| Indiana Finance Authority Revenue | | | | |
| (Marquette Project) | 5.000% | 3/1/25 | 650 | 733 |
| Indiana Finance Authority Revenue | | | | |
| (Stadium Project) | 5.250% | 2/1/30 | 1,000 | 1,210 |
| Indiana Finance Authority Revenue | | | | |
| (State Revolving Fund) | 5.000% | 2/1/18 | 500 | 543 |
| Indiana Finance Authority Revenue | | | | |
| (State Revolving Fund) | 5.000% | 2/1/32 | 500 | 580 |
| Indiana Finance Authority Wastewater Utility | | | | |
| Revenue (CWA Authority Project) | 5.000% | 10/1/32 | 500 | 568 |
| Indiana Health & Educational Facility Financing | | | | |
| Authority Hospital Revenue (Clarian Health | | | | |
| Obligated Group) | 5.000% | 2/15/25 | 290 | 292 |
| 3 Indiana Municipal Power Agency Revenue | 5.000% | 1/1/34 | 1,415 | 1,659 |
| Indiana Office Building Commission Facilities | | | | |
| Revenue (New Castle Correctional Facility) | 5.250% | 7/1/19 (14) | 500 | 567 |
| Indiana University Student Fee Revenue | 5.000% | 8/1/18 (Prere.) | 100 | 110 |
| Indiana University Student Fee Revenue | 5.000% | 6/1/19 | 445 | 503 |
| Richmond IN Hospital Authority Revenue | | | | |
| (Reid Hospital & Health Care Services Inc.) | 5.000% | 1/1/24 | 700 | 824 |
| | | | | 15,999 |
| Iowa (0.1%) | | | | |
| Iowa Finance Authority Midwestern Disaster | | | | |
| Area Revenue (Iowa Fertilizer Co. Project) | 5.000% | 12/1/19 | 750 | 793 |
| Iowa Finance Authority Midwestern Disaster | | | | |
| Area Revenue (Iowa Fertilizer Co. Project) | 5.500% | 12/1/22 | 1,750 | 1,846 |
| Iowa Special Obligation Revenue (Ijobs Program) | 5.000% | 6/1/24 | 220 | 246 |
| | | | | 2,885 |
35
| | | | |
| Tax-Managed Balanced Fund | | | | |
| |
| |
| |
| | | | Face | Market |
| | | Maturity | Amount | Value• |
| | Coupon | Date | ($000) | ($000) |
| Kansas (0.5%) | | | | |
| Kansas Department of Transportation Highway | | | | |
| Revenue | 5.000% | 9/1/18 (Prere.) | 500 | 553 |
| Kansas Department of Transportation Highway | | | | |
| Revenue | 5.000% | 9/1/20 | 1,000 | 1,170 |
| Kansas Department of Transportation Highway | | | | |
| Revenue | 5.000% | 9/1/25 | 500 | 621 |
| Kansas Department of Transportation Highway | | | | |
| Revenue | 5.000% | 9/1/26 | 700 | 865 |
| Kansas Development Finance Authority Hospital | | | | |
| Revenue (Adventist Health System/Sunbelt | | | | |
| Obligated Group) | 5.000% | 11/15/24 | 100 | 107 |
| Kansas Development Finance Authority Revenue | 5.000% | 5/1/25 | 1,335 | 1,590 |
| Kansas Development Finance Authority Revenue | 5.000% | 5/1/27 | 1,585 | 1,865 |
| Kansas Development Finance Authority Revenue | 5.000% | 4/1/32 | 1,325 | 1,523 |
| Leavenworth County KS Unified School | | | | |
| District GO | 4.500% | 9/1/19 (12) | 500 | 558 |
| University of Kansas Hospital Authority Health | | | | |
| Facilities Improvement Revenue | 5.000% | 9/1/16 (Prere.) | 45 | 46 |
| University of Kansas Hospital Authority Health | | | | |
| Facilities Improvement Revenue | 5.000% | 9/1/16 | 1,250 | 1,287 |
| University of Kansas Hospital Authority Health | | | | |
| Facilities Improvement Revenue | 5.000% | 9/1/17 | 855 | 879 |
| Wichita KS Hospital Facilities Revenue | | | | |
| (Via Christi Health System Inc.) | 5.000% | 11/15/21 (Prere.) | 500 | 601 |
| Wyandotte County/Kansas City KS Unified | | | | |
| Government Utility System Revenue | 5.000% | 9/1/23 | 500 | 594 |
| | | | | 12,259 |
| Kentucky (0.4%) | | | | |
| Kentucky Economic Development Finance | | | | |
| Authority Health System Revenue (Norton | | | | |
| Healthcare Inc. & Affiliates) | 0.000% | 10/1/25 (14) | 1,140 | 823 |
| Kentucky Economic Development Finance | | | | |
| Authority Hospital Revenue (Baptist Healthcare | | | | |
| System Obligated Group) | 5.625% | 8/15/27 | 1,200 | 1,312 |
| Kentucky Municipal Power Agency Power | | | | |
| System Revenue | 5.000% | 9/1/29 (14) | 1,000 | 1,157 |
| Kentucky Property & Building Commission | | | | |
| Revenue | 5.375% | 11/1/23 | 500 | 557 |
| Kentucky Property & Building Commission | | | | |
| Revenue | 5.000% | 11/1/26 (4) | 500 | 547 |
| Kentucky Public Transportation Infrastructure | | | | |
| Authority Toll Revenue (Downtown Crossing | | | | |
| Project) BAN | 0.000% | 7/1/21 | 1,325 | 1,107 |
| Kentucky Public Transportation Infrastructure | | | | |
| Authority Toll Revenue (Downtown Crossing | | | | |
| Project) BAN | 0.000% | 7/1/22 | 810 | 644 |
| Kentucky Turnpike Authority Economic | | | | |
| Development Road Revenue (Revitalization | | | | |
| Project) | 4.000% | 7/1/17 | 500 | 524 |
| Kentucky Turnpike Authority Economic | | | | |
| Development Road Revenue (Revitalization | | | | |
| Project) | 5.000% | 7/1/18 | 2,255 | 2,473 |
| Kentucky Turnpike Authority Economic | | | | |
| Development Road Revenue (Revitalization | | | | |
| Project) | 5.000% | 7/1/25 | 305 | 341 |
36
| | | | |
| Tax-Managed Balanced Fund | | | | |
| |
| |
| |
| | | | Face | Market |
| | | Maturity | Amount | Value• |
| | Coupon | Date | ($000) | ($000) |
| Kentucky Turnpike Authority Economic | | | | |
| Development Road Revenue (Revitalization | | | | |
| Project) | 5.000% | 7/1/28 | 1,000 | 1,190 |
| | | | | 10,675 |
| Louisiana (0.4%) | | | | |
| Bossier City LA Utilities Revenue | 5.000% | 10/1/22 | 500 | 600 |
| Bossier City LA Utilities Revenue | 5.000% | 10/1/23 | 500 | 606 |
| Jefferson Parish LA Environmental Facilities & | | | | |
| Community Development Authority Revenue | 5.000% | 4/1/18 | 405 | 439 |
| Louisiana Citizens Property Insurance Corp. | | | | |
| Assessment Revenue | 5.000% | 6/1/16 (Prere.) | 500 | 509 |
| Louisiana Gasoline & Fuel Tax Revenue | 5.000% | 5/1/16 (Prere.) | 500 | 508 |
| Louisiana GO | 5.000% | 5/1/16 (Prere.) | 500 | 508 |
| Louisiana GO | 5.000% | 5/1/16 (Prere.) | 500 | 508 |
| Louisiana Public Facilities Authority Revenue | | | | |
| (Ochsner Clinic Foundation Project) | 5.000% | 5/15/16 (ETM) | 345 | 351 |
| Louisiana Public Facilities Authority Revenue | | | | |
| (Ochsner Clinic Foundation Project) | 5.000% | 5/15/16 | 915 | 929 |
| Louisiana State University Revenue | 5.000% | 7/1/23 | 400 | 482 |
| New Orleans LA GO | 5.000% | 12/1/31 | 500 | 550 |
| New Orleans LA GO | 5.125% | 12/1/33 (17) | 1,645 | 1,751 |
| New Orleans LA Sewage Service Revenue | 5.000% | 6/1/24 | 900 | 1,077 |
| New Orleans LA Sewage Service Revenue | 5.000% | 6/1/27 | 500 | 588 |
| St. Charles Parish LA Gulf Opportunity Zone | | | | |
| Revenue (Valero Energy Corp.) PUT | 4.000% | 6/1/22 | 1,000 | 1,074 |
| | | | | 10,480 |
| Maine (0.2%) | | | | |
| Maine Health & Higher Educational Facilities | | | | |
| Authority Revenue (Bowdoin College) VRDO | 0.010% | 1/7/16 LOC | 4,100 | 4,100 |
| Portland ME Airport Revenue | 5.000% | 1/1/20 (4) | 500 | 562 |
| | | | | 4,662 |
| Maryland (2.1%) | | | | |
| Baltimore County MD GO | 5.000% | 8/1/21 | 1,435 | 1,715 |
| Baltimore MD Consolidated Public | | | | |
| Improvement GO | 5.000% | 10/15/28 | 650 | 778 |
| Baltimore MD Project Revenue | 5.000% | 7/1/24 | 2,000 | 2,466 |
| Howard County MD GO | 5.000% | 2/15/22 | 750 | 884 |
| Howard County MD GO | 5.000% | 8/15/24 | 200 | 236 |
| Maryland Department of Transportation Revenue | 5.000% | 2/15/18 | 500 | 543 |
| Maryland Department of Transportation Revenue | 5.000% | 2/15/19 | 1,955 | 2,192 |
| Maryland Department of Transportation Revenue | 5.000% | 2/15/20 | 1,090 | 1,258 |
| Maryland Department of Transportation Revenue | 4.000% | 12/15/29 | 1,365 | 1,527 |
| Maryland GO | 5.000% | 8/1/16 (Prere.) | 450 | 462 |
| Maryland GO | 5.000% | 11/1/16 | 105 | 109 |
| Maryland GO | 5.000% | 3/15/17 | 500 | 526 |
| Maryland GO | 5.000% | 7/15/17 | 610 | 650 |
| Maryland GO | 5.000% | 8/1/17 | 500 | 534 |
| Maryland GO | 5.250% | 8/15/17 | 500 | 536 |
| Maryland GO | 5.250% | 3/1/18 | 200 | 219 |
| Maryland GO | 5.000% | 3/1/19 | 1,200 | 1,347 |
| Maryland GO | 5.000% | 3/15/19 (Prere.) | 500 | 561 |
| Maryland GO | 5.250% | 8/1/20 | 1,000 | 1,179 |
| Maryland GO | 4.000% | 8/1/21 | 1,000 | 1,138 |
| Maryland GO | 5.000% | 8/1/21 | 870 | 1,014 |
| Maryland GO | 5.000% | 8/1/22 | 1,500 | 1,827 |
37
| | | | |
| Tax-Managed Balanced Fund | | | | |
| |
| |
| |
| | | | Face | Market |
| | | Maturity | Amount | Value• |
| | Coupon | Date | ($000) | ($000) |
| Maryland GO | 5.000% | 8/1/22 | 1,500 | 1,827 |
| Maryland GO | 4.000% | 8/1/23 | 2,390 | 2,778 |
| Maryland GO | 5.000% | 8/1/23 | 2,500 | 3,095 |
| Maryland GO | 4.000% | 8/1/26 | 1,970 | 2,243 |
| Maryland Health & Higher Educational Facilities | | | | |
| Authority Revenue (Anne Arundel Health | | | | |
| System) | 5.000% | 7/1/27 | 500 | 571 |
| Maryland Health & Higher Educational Facilities | | | | |
| Authority Revenue (Johns Hopkins Health | | | | |
| System Obligated Group) | 5.000% | 7/1/24 | 500 | 594 |
| 1 Maryland Health & Higher Educational Facilities | | | | |
| Authority Revenue (Johns Hopkins Health | | | | |
| System Obligated Group) PUT | 1.313% | 11/15/16 | 2,000 | 2,009 |
| Maryland Health & Higher Educational Facilities | | | | |
| Authority Revenue (Loyola University) | 5.000% | 10/1/16 | 575 | 594 |
| Maryland Health & Higher Educational Facilities | | | | |
| Authority Revenue (Maryland Institute College | | | | |
| of Art) | 5.000% | 6/1/20 | 500 | 565 |
| Maryland Health & Higher Educational Facilities | | | | |
| Authority Revenue (Meritus Medical Center, Inc.) | 5.000% | 7/1/33 | 1,215 | 1,353 |
| Maryland Health & Higher Educational Facilities | | | | |
| Authority Revenue VRDO | 0.010% | 1/7/16 LOC | 8,400 | 8,400 |
| Maryland Transportation Authority Facilities | | | | |
| Projects Revenue | 5.000% | 7/1/22 | 500 | 560 |
| Maryland Transportation Authority GAN | 5.000% | 3/1/16 | 465 | 469 |
| Maryland Transportation Authority GAN | 5.250% | 3/1/16 | 585 | 590 |
| Maryland Transportation Authority GAN | 5.250% | 3/1/18 | 700 | 766 |
| Maryland Transportation Authority GAN | 5.250% | 3/1/20 | 500 | 562 |
| Maryland Water Quality Financing Administration | | | | |
| Bay Restoration Revolving Loan Fund Revenue | 5.000% | 3/1/24 | 1,620 | 2,006 |
| Montgomery County MD GO | 5.000% | 7/1/17 | 500 | 532 |
| Montgomery County MD GO | 5.000% | 11/1/17 | 500 | 538 |
| Prince Georges County MD GO | 5.000% | 9/15/23 | 500 | 592 |
| | | | | 52,345 |
| Massachusetts (1.8%) | | | | |
| Boston MA GO | 5.000% | 4/1/20 | 780 | 904 |
| Massachusetts Bay Transportation Authority | | | | |
| Sales Tax Revenue | 5.000% | 7/1/18 (Prere.) | 500 | 550 |
| Massachusetts Bay Transportation Authority | | | | |
| Sales Tax Revenue | 5.250% | 7/1/22 | 480 | 589 |
| Massachusetts Bay Transportation Authority | | | | |
| Sales Tax Revenue | 5.500% | 7/1/26 (14) | 400 | 522 |
| Massachusetts Bay Transportation Authority | | | | |
| Sales Tax Revenue | 5.250% | 7/1/28 | 500 | 651 |
| Massachusetts Bay Transportation Authority | | | | |
| Sales Tax Revenue | 5.000% | 7/1/31 | 915 | 1,179 |
| Massachusetts College Building Authority | | | | |
| Revenue | 5.000% | 5/1/16 (Prere.) | 500 | 508 |
| Massachusetts College Building Authority | | | | |
| Revenue | 4.000% | 5/1/17 | 650 | 678 |
| Massachusetts College Building Authority | | | | |
| Revenue | 5.250% | 5/1/29 | 445 | 497 |
| Massachusetts Department of Transportation | | | | |
| Metropolitan Highway System Revenue | 5.000% | 1/1/23 | 500 | 571 |
| Massachusetts Development Finance Agency | | | | |
| Revenue (Emerson College) | 5.500% | 1/1/30 | 450 | 504 |
38
| | | | |
| Tax-Managed Balanced Fund | | | | |
| |
| |
| |
| | | | Face | Market |
| | | Maturity | Amount | Value• |
| | Coupon | Date | ($000) | ($000) |
| Massachusetts Development Finance Agency | | | | |
| Revenue (Harvard University) | 5.000% | 1/1/20 | 355 | 409 |
| Massachusetts Development Finance Agency | | | | |
| Revenue (Lahey Clinic Obligated Group) | 5.000% | 8/15/25 | 750 | 860 |
| Massachusetts Development Finance Agency | | | | |
| Revenue (Lahey Clinic Obligated Group) | 5.000% | 8/15/26 | 500 | 571 |
| Massachusetts Development Finance Agency | | | | |
| Revenue (Lahey Clinic Obligated Group) | 5.000% | 8/15/27 | 600 | 684 |
| Massachusetts Development Finance Agency | | | | |
| Revenue (Milford Regional Medical Center) | 5.000% | 7/15/17 | 300 | 313 |
| Massachusetts Development Finance Agency | | | | |
| Revenue (Milford Regional Medical Center) | 5.000% | 7/15/18 | 200 | 213 |
| Massachusetts Development Finance Agency | | | | |
| Revenue (UMass Memorial Medical Center) | 5.125% | 7/1/26 | 720 | 798 |
| Massachusetts Educational Financing Authority | | | | |
| Education Loan Revenue | 5.500% | 1/1/22 | 300 | 339 |
| Massachusetts GO | 4.750% | 8/1/16 (Prere.) | 500 | 513 |
| Massachusetts GO | 5.500% | 11/1/16 | 500 | 521 |
| Massachusetts GO | 5.250% | 8/1/17 (Prere.) | 800 | 856 |
| Massachusetts GO | 5.500% | 10/1/18 | 500 | 561 |
| Massachusetts GO | 5.000% | 7/1/20 | 500 | 569 |
| Massachusetts GO | 5.000% | 8/1/20 | 500 | 583 |
| Massachusetts GO | 5.250% | 8/1/20 | 300 | 353 |
| Massachusetts GO | 5.500% | 10/1/20 | 500 | 597 |
| Massachusetts GO | 5.500% | 10/1/20 (14) | 500 | 597 |
| Massachusetts GO | 5.000% | 8/1/22 | 1,000 | 1,212 |
| Massachusetts GO | 5.250% | 8/1/23 | 500 | 624 |
| Massachusetts GO | 0.770% | 11/1/25 | 1,380 | 1,337 |
| Massachusetts GO | 5.000% | 3/1/26 | 500 | 558 |
| Massachusetts GO | 5.000% | 7/1/26 | 1,375 | 1,733 |
| Massachusetts GO | 5.000% | 4/1/29 | 500 | 580 |
| Massachusetts GO | 4.000% | 11/1/30 | 1,980 | 2,173 |
| 1 Massachusetts GO PUT | 0.310% | 8/1/17 | 1,000 | 999 |
| Massachusetts Health & Educational Facilities | | | | |
| Authority Revenue (Harvard University) | 5.000% | 12/15/28 | 500 | 575 |
| Massachusetts Health & Educational Facilities | | | | |
| Authority Revenue (Partners Healthcare System) | | | | |
| VRDO | 0.010% | 1/7/16 | 4,700 | 4,700 |
| Massachusetts Health & Educational Facilities | | | | |
| Authority Revenue (Wellesley College) VRDO | 0.010% | 1/7/16 | 2,800 | 2,800 |
| Massachusetts Port Authority Revenue | 5.000% | 7/1/17 | 415 | 441 |
| Massachusetts School Building Authority | | | | |
| Dedicated Sales Tax Revenue | 5.000% | 5/15/19 | 500 | 564 |
| Massachusetts School Building Authority | | | | |
| Dedicated Sales Tax Revenue | 5.000% | 10/15/20 | 225 | 263 |
| Massachusetts School Building Authority | | | | |
| Dedicated Sales Tax Revenue | 5.000% | 5/15/21 | 900 | 1,066 |
| Massachusetts School Building Authority | | | | |
| Dedicated Sales Tax Revenue | 5.000% | 8/15/23 | 495 | 603 |
| Massachusetts School Building Authority | | | | |
| Dedicated Sales Tax Revenue | 5.000% | 8/15/31 | 1,500 | 1,816 |
| Massachusetts School Building Authority | | | | |
| Dedicated Sales Tax Revenue | 4.000% | 8/15/32 | 600 | 655 |
| Massachusetts School Building Authority | | | | |
| Dedicated Sales Tax Revenue | 5.000% | 8/15/34 | 1,000 | 1,196 |
39
| | | | |
| Tax-Managed Balanced Fund | | | | |
| |
| |
| |
| | | | Face | Market |
| | | Maturity | Amount | Value• |
| | Coupon | Date | ($000) | ($000) |
| Massachusetts Special Obligation Dedicated | | | | |
| Tax Revenue | 5.500% | 1/1/26 (14) | 500 | 632 |
| Massachusetts Turnpike Authority Revenue | | | | |
| (Metropolitan Highway System) | 0.000% | 1/1/29 (14) | 300 | 212 |
| Massachusetts Water Pollution Abatement | | | | |
| Trust Revenue | 5.000% | 8/1/19 | 240 | 273 |
| Massachusetts Water Pollution Abatement | | | | |
| Trust Revenue | 5.250% | 8/1/20 | 200 | 236 |
| Massachusetts Water Pollution Abatement | | | | |
| Trust Revenue | 5.250% | 8/1/21 | 500 | 604 |
| Massachusetts Water Pollution Abatement | | | | |
| Trust Revenue | 5.250% | 8/1/30 | 625 | 822 |
| Massachusetts Water Resources Authority | | | | |
| Revenue | 5.000% | 8/1/25 | 895 | 1,040 |
| | | | | 44,204 |
| Michigan (1.1%) | | | | |
| Birmingham MI City School District GO | 5.000% | 5/1/22 | 740 | 890 |
| Dearborn MI School District GO | 5.000% | 5/1/34 | 1,200 | 1,377 |
| Detroit MI City School District GO | 5.250% | 5/1/28 (4) | 500 | 590 |
| Detroit MI Sewage Disposal System Revenue | 7.000% | 7/1/27 (4) | 1,000 | 1,170 |
| Detroit MI Water & Sewerage Department | | | | |
| Sewage Disposal System Revenue | 5.000% | 7/1/22 | 370 | 432 |
| Detroit MI Water & Sewerage Department | | | | |
| Sewage Disposal System Revenue | 5.000% | 7/1/23 | 1,025 | 1,186 |
| Detroit MI Water & Sewerage Department | | | | |
| Sewage Disposal System Revenue | 5.000% | 7/1/32 | 1,000 | 1,104 |
| Michigan Building Authority Revenue | 5.000% | 10/15/20 (4) | 500 | 567 |
| Michigan Finance Authority Hospital Revenue | | | | |
| Bonds (Trinity Health Credit Group) | 5.000% | 12/1/35 | 920 | 1,023 |
| Michigan Finance Authority Revenue | 5.000% | 10/1/22 | 500 | 579 |
| Michigan Finance Authority Revenue | | | | |
| (Detroit Water & Sewer) | 5.000% | 7/1/23 (4) | 1,000 | 1,188 |
| Michigan Finance Authority Revenue | | | | |
| (Detroit Water & Sewer) | 5.000% | 7/1/28 | 750 | 861 |
| Michigan Finance Authority Revenue | | | | |
| (Detroit Water & Sewer) | 5.000% | 7/1/29 | 1,500 | 1,722 |
| Michigan Finance Authority Revenue | | | | |
| (Detroit Water & Sewer) | 5.000% | 7/1/33 | 1,000 | 1,128 |
| Michigan Finance Authority Revenue | | | | |
| (Sparrow Obligated Group) | 5.000% | 11/15/27 | 500 | 561 |
| Michigan Finance Authority Revenue | | | | |
| (State Clean Water Revolving Fund) | 5.000% | 10/1/27 | 1,000 | 1,182 |
| Michigan Finance Authority Revenue | | | | |
| (State Clean Water Revolving Fund) | 5.000% | 10/1/31 | 500 | 582 |
| Michigan Finance Authority Revenue | | | | |
| (Unemployment Obligation Assessment) | 5.000% | 1/1/18 | 500 | 541 |
| Michigan Finance Authority Revenue | | | | |
| (Unemployment Obligation Assessment) | 5.000% | 1/1/22 | 2,000 | 2,161 |
| Michigan GO | 5.000% | 5/1/18 | 500 | 547 |
| Michigan GO | 5.500% | 11/1/25 | 595 | 667 |
| Michigan State University Revenue | 5.000% | 8/15/20 | 1,040 | 1,210 |
| Michigan Trunk Line Revenue | 5.000% | 11/1/21 | 500 | 567 |
| Royal Oak MI Hospital Finance Authority | | | | |
| Hospital Revenue (William Beaumont Hospital) | 5.000% | 9/1/25 | 1,400 | 1,635 |
| 1 University of Michigan Revenue PUT | 0.440% | 4/2/18 | 1,000 | 993 |
| Wayne County MI Airport Authority Revenue | 5.000% | 12/1/30 | 1,300 | 1,508 |
40
| | | | |
| Tax-Managed Balanced Fund | | | | |
| |
| |
| |
| | | | Face | Market |
| | | Maturity | Amount | Value• |
| | Coupon | Date | ($000) | ($000) |
| Wayne County MI Airport Authority Revenue | | | | |
| (Detroit Metropolitan Wayne County Airport) | 5.000% | 12/1/16 | 500 | 520 |
| Wayne County MI Airport Authority Revenue | | | | |
| (Detroit Metropolitan Wayne County Airport) | 4.500% | 12/1/25 (14) | 1,000 | 1,052 |
| | | | | 27,543 |
| Minnesota (0.4%) | | | | |
| Minneapolis MN Special School District No. 1 | | | | |
| COP | 5.000% | 2/1/26 | 1,855 | 2,192 |
| Minnesota GO | 5.000% | 10/1/17 (ETM) | 10 | 11 |
| Minnesota GO | 5.000% | 10/1/17 | 490 | 526 |
| Minnesota GO | 5.000% | 8/1/19 | 500 | 568 |
| Minnesota GO | 5.000% | 11/1/20 | 325 | 373 |
| Minnesota GO | 5.000% | 8/1/21 | 500 | 567 |
| Minnesota GO | 5.000% | 8/1/22 | 1,305 | 1,587 |
| Minnesota GO | 5.000% | 8/1/25 | 1,500 | 1,900 |
| Southern Minnesota Municipal Power Agency | | | | |
| Power Supply System Revenue | 5.250% | 1/1/19 (Prere.) | 500 | 561 |
| University of Minnesota Revenue | 5.000% | 8/1/19 | 500 | 567 |
| University of Minnesota Revenue | 5.250% | 12/1/29 | 500 | 588 |
| | | | | 9,440 |
| Mississippi (0.5%) | | | | |
| DeSoto County MS School District GO | 5.000% | 5/1/19 | 370 | 417 |
| Mississippi Business Finance Corp. Gulf | | | | |
| Opportunity Zone Industrial Development | | | | |
| Revenue (Chevron USA Inc. Project) VRDO | 0.010% | 1/4/16 | 6,400 | 6,400 |
| Mississippi GO | 5.500% | 12/1/18 | 750 | 846 |
| Mississippi GO | 5.000% | 10/1/19 | 2,000 | 2,280 |
| Mississippi GO | 5.000% | 11/1/29 | 1,000 | 1,219 |
| Mississippi State University Educational Building | | | | |
| Corp. Revenue | 5.000% | 8/1/32 | 1,000 | 1,162 |
| | | | | 12,324 |
| Missouri (0.4%) | | | | |
| Missouri Health & Educational Facilities | | | | |
| Authority Educational Facilities Revenue | | | | |
| (St. Louis College of Pharmacy Project) | 5.000% | 5/1/30 | 500 | 547 |
| Missouri Health & Educational Facilities | | | | |
| Authority Educational Facilities Revenue | | | | |
| (St. Louis College of Pharmacy Project) | 5.000% | 5/1/34 | 880 | 951 |
| Missouri Health & Educational Facilities | | | | |
| Authority Health Facilities Revenue | | | | |
| (SSM Health System) | 5.000% | 6/1/25 | 1,000 | 1,200 |
| Missouri Health & Educational Facilities | | | | |
| Authority Revenue (Mercy Health) | 5.000% | 11/15/34 | 1,500 | 1,691 |
| Missouri Health & Educational Facilities | | | | |
| Authority Revenue (Mercy Health) VRDO | 0.707% | 6/1/31 (2) | 500 | 455 |
| Missouri Highways & Transportation | | | | |
| Commission Road Revenue | 5.000% | 5/1/17 | 500 | 529 |
| Missouri Highways & Transportation | | | | |
| Commission Road Revenue | 5.250% | 5/1/17 (Prere.) | 350 | 371 |
| Missouri Highways & Transportation | | | | |
| Commission Road Revenue | 5.000% | 2/1/23 | 600 | 736 |
| Missouri Highways & Transportation | | | | |
| Commission Road Revenue | 5.000% | 5/1/23 | 500 | 559 |
41
| | | | |
| Tax-Managed Balanced Fund | | | | |
| |
| |
| |
| | | | Face | Market |
| | | Maturity | Amount | Value• |
| | Coupon | Date | ($000) | ($000) |
| Missouri Joint Municipal Electric Utility | | | | |
| Commission Power Project Revenue | | | | |
| (Iatan 2 Project) | 5.000% | 12/1/34 | 1,400 | 1,611 |
| St. Louis MO Parking Revenue | 5.000% | 12/15/23 (4) | 690 | 827 |
| St. Louis MO Sewer & Wastewater Revenue | 5.000% | 5/1/36 | 1,000 | 1,193 |
| | | | | 10,670 |
| Nebraska (0.3%) | | | | |
| Central Plains Energy Project Nebraska Gas | | | | |
| Project Revenue (Project No. 1) | 5.250% | 12/1/18 | 160 | 177 |
| Central Plains Energy Project Nebraska Gas | | | | |
| Supply Revenue PUT | 5.000% | 12/1/19 | 2,000 | 2,268 |
| Lincoln County NE Hospital Authority No. 1 | | | | |
| Hospital Revenue (Great Plains Regional | | | | |
| Medical Center Project) | 5.000% | 11/1/23 | 750 | 852 |
| Lincoln NE Electric System Revenue | 5.000% | 9/1/25 | 400 | 479 |
| Municipal Energy Agency of Nebraska Power | | | | |
| Supply System Revenue | 5.000% | 4/1/31 | 345 | 389 |
| Nebraska Public Power District Revenue | 5.000% | 1/1/30 | 1,000 | 1,153 |
| Nebraska Public Power District Revenue | 5.000% | 1/1/32 | 1,500 | 1,730 |
| | | | | 7,048 |
| Nevada (0.7%) | | | | |
| Carson City NV Hospital Revenue | | | | |
| (Carson Tahoe Regional Medical Center) | 5.000% | 9/1/33 | 1,500 | 1,625 |
| Clark County NV GO | 5.000% | 12/1/29 | 500 | 566 |
| Clark County NV GO | 5.000% | 7/1/33 | 1,000 | 1,157 |
| Clark County NV Highway Improvement | | | | |
| Motor Vehicle Fuel Tax Revenue | 5.000% | 7/1/27 | 500 | 561 |
| Clark County NV Passenger Facility Charge | | | | |
| Revenue (Las Vegas McCarran International | | | | |
| Airport) | 4.500% | 7/1/20 | 455 | 509 |
| Clark County NV School District GO | 5.000% | 6/15/18 | 1,690 | 1,819 |
| Clark County NV School District GO | 5.000% | 6/15/22 | 2,000 | 2,145 |
| Clark County NV School District GO | 5.000% | 6/15/23 | 1,175 | 1,259 |
| Nevada Capital Improvement & Cultural | | | | |
| Affairs GO | 5.000% | 12/1/17 (Prere.) | 500 | 540 |
| Nevada GO | 5.000% | 4/1/22 | 1,710 | 2,055 |
| Nevada GO | 5.000% | 11/1/23 | 1,465 | 1,802 |
| Nevada GO | 5.000% | 11/1/25 | 1,015 | 1,261 |
| Reno NV Health Facility Revenue (Dignity Health | | | | |
| Obligated Group) | 5.250% | 7/1/31 | 1,100 | 1,148 |
| | | | | 16,447 |
| New Hampshire (0.2%) | | | | |
| Manchester NH General Airport Revenue | 5.000% | 1/1/17 | 500 | 517 |
| New Hampshire Health & Education Facilities | | | | |
| Authority Hospital Revenue (Catholic Medical | | | | |
| Center of Manchester) | 5.000% | 7/1/16 (Prere.) | 1,885 | 1,929 |
| New Hampshire Health & Education Facilities | | | | |
| Authority Hospital Revenue (Catholic Medical | | | | |
| Center of Manchester) | 5.000% | 7/1/32 | 855 | 868 |
| New Hampshire Health & Education Facilities | | | | |
| Authority Revenue (Southern New Hampshire | | | | |
| Medical Center) | 5.000% | 10/1/32 | 1,865 | 1,968 |
| New Hampshire Municipal Bond Bank Revenue | 5.000% | 8/15/16 | 115 | 118 |
| | | | | 5,400 |
42
| | | | |
| Tax-Managed Balanced Fund | | | | |
| |
| |
| |
| | | | Face | Market |
| | | Maturity | Amount | Value• |
| | Coupon | Date | ($000) | ($000) |
| New Jersey (1.6%) | | | | |
| Garden State Preservation Trust New Jersey | | | | |
| Revenue (Open Space & Farmland Preservation) | 0.000% | 11/1/21 (4) | 500 | 446 |
| Garden State Preservation Trust New Jersey | | | | |
| Revenue (Open Space & Farmland Preservation) | 0.000% | 11/1/22 (4) | 500 | 432 |
| Jersey City NJ GO | 5.000% | 3/1/21 | 480 | 550 |
| Morris County NJ Improvement Authority | | | | |
| School District Revenue (Morris Hills Regional | | | | |
| District Project) | 5.000% | 10/1/23 | 495 | 605 |
| New Jersey COP | 5.250% | 6/15/30 | 465 | 496 |
| New Jersey Economic Development Authority | | | | |
| Revenue | 5.000% | 6/15/21 | 1,000 | 1,098 |
| New Jersey Economic Development Authority | | | | |
| Revenue (Cigarette Tax) | 5.000% | 6/15/19 | 700 | 755 |
| New Jersey Economic Development Authority | | | | |
| Revenue (Cigarette Tax) | 5.000% | 6/15/26 | 1,500 | 1,615 |
| New Jersey Economic Development Authority | | | | |
| Revenue (Motor Vehicle Surcharges) | 5.250% | 7/1/26 (14) | 500 | 589 |
| New Jersey Economic Development Authority | | | | |
| Revenue (School Facilities Construction) | 5.250% | 9/1/24 | 300 | 326 |
| New Jersey Economic Development Authority | | | | |
| Revenue (School Facilities Construction) | 5.000% | 3/1/28 | 2,095 | 2,247 |
| New Jersey Economic Development Authority | | | | |
| Revenue(New Jersey Transit Light Rail Transit | | | | |
| System Project) | 5.000% | 5/1/17 | 500 | 521 |
| New Jersey Economic Development Authority | | | | |
| Sublease Revenue (New Jersey Transit Corp. | | | | |
| Light Rail Transit System Project) | 5.000% | 5/1/18 | 500 | 529 |
| New Jersey Economic Development Authority | | | | |
| Sublease Revenue (New Jersey Transit Corp. | | | | |
| Light Rail Transit System Project) | 5.000% | 5/1/19 | 500 | 537 |
| New Jersey Educational Facilities Authority | | | | |
| Revenue (University Medical & Dentistry) | 6.500% | 6/1/19 (Prere.) | 195 | 229 |
| New Jersey GO | 5.250% | 7/1/16 (14) | 500 | 512 |
| New Jersey GO | 5.000% | 8/1/16 | 440 | 452 |
| New Jersey GO | 5.250% | 7/15/18 (2) | 500 | 545 |
| New Jersey GO | 5.000% | 8/15/19 | 750 | 835 |
| New Jersey Health Care Facilities Financing | | | | |
| Authority Lease Revenue (Greystone Park | | | | |
| Psychiatric Hospital Project) | 5.000% | 9/15/24 | 500 | 550 |
| New Jersey Health Care Facilities Financing | | | | |
| Authority Revenue (Barnabas Health) | 5.000% | 7/1/18 | 250 | 270 |
| New Jersey Health Care Facilities Financing | | | | |
| Authority Revenue (Barnabas Health) | 5.000% | 7/1/22 | 1,000 | 1,169 |
| New Jersey Health Care Facilities Financing | | | | |
| Authority Revenue (Barnabas Health) | 5.000% | 7/1/25 | 900 | 1,032 |
| New Jersey Health Care Facilities Financing | | | | |
| Authority Revenue (Hackensack University | | | | |
| Medical Center) | 5.000% | 1/1/18 (4) | 385 | 413 |
| New Jersey Health Care Facilities Financing | | | | |
| Authority Revenue (Hackensack University | | | | |
| Medical Center) | 5.000% | 1/1/19 | 500 | 543 |
| New Jersey Health Care Facilities Financing | | | | |
| Authority Revenue (Meridian Health System | | | | |
| Obligated Group) | 5.000% | 7/1/21 | 640 | 750 |
43
| | | | |
| Tax-Managed Balanced Fund | | | | |
| |
| |
| |
| | | | Face | Market |
| | | Maturity | Amount | Value• |
| | Coupon | Date | ($000) | ($000) |
| New Jersey Higher Education Assistance | | | | |
| Authority Student Loan Revenue | 5.000% | 12/1/16 | 245 | 254 |
| New Jersey Higher Education Assistance | | | | |
| Authority Student Loan Revenue | 5.250% | 12/1/28 | 300 | 315 |
| New Jersey Sports & Exposition Authority | | | | |
| Revenue | 5.000% | 9/1/16 | 200 | 205 |
| New Jersey Transportation Trust Fund Authority | | | | |
| Transportation Program Revenue | 5.250% | 6/15/33 | 1,500 | 1,632 |
| New Jersey Transportation Trust Fund Authority | | | | |
| Transportation System Revenue | 5.000% | 12/15/16 | 275 | 285 |
| New Jersey Transportation Trust Fund Authority | | | | |
| Transportation System Revenue | 5.500% | 12/15/17 (4) | 150 | 161 |
| New Jersey Transportation Trust Fund Authority | | | | |
| Transportation System Revenue | 5.500% | 12/15/18 (4) | 1,135 | 1,253 |
| New Jersey Transportation Trust Fund Authority | | | | |
| Transportation System Revenue | 5.000% | 12/15/19 | 650 | 704 |
| New Jersey Transportation Trust Fund Authority | | | | |
| Transportation System Revenue | 5.250% | 12/15/19 | 500 | 548 |
| New Jersey Transportation Trust Fund Authority | | | | |
| Transportation System Revenue | 5.500% | 12/15/20 (14) | 2,500 | 2,841 |
| New Jersey Transportation Trust Fund Authority | | | | |
| Transportation System Revenue | 5.250% | 12/15/21 (14) | 245 | 280 |
| New Jersey Transportation Trust Fund Authority | | | | |
| Transportation System Revenue | 5.500% | 12/15/21 (12) | 150 | 175 |
| New Jersey Transportation Trust Fund Authority | | | | |
| Transportation System Revenue | 5.500% | 12/15/23 | 605 | 693 |
| New Jersey Transportation Trust Fund Authority | | | | |
| Transportation System Revenue | 5.000% | 12/15/24 | 1,000 | 1,111 |
| New Jersey Transportation Trust Fund Authority | | | | |
| Transportation System Revenue | 0.000% | 12/15/26 (2) | 2,000 | 1,261 |
| New Jersey Transportation Trust Fund Authority | | | | |
| Transportation System Revenue | 5.500% | 6/15/31 | 500 | 548 |
| New Jersey Transportation Trust Fund Authority | | | | |
| Transportation System Revenue | 5.000% | 6/15/32 | 700 | 746 |
| New Jersey Transportation Trust Fund Authority | | | | |
| Transportation System Revenue | 5.250% | 6/15/32 | 1,000 | 1,095 |
| New Jersey Turnpike Authority Revenue | 5.000% | 1/1/22 | 500 | 550 |
| New Jersey Turnpike Authority Revenue | 5.000% | 1/1/31 | 1,000 | 1,150 |
| New Jersey Turnpike Authority Revenue | 5.000% | 1/1/32 | 1,000 | 1,136 |
| South Jersey Transportation Authority | | | | |
| New Jersey Transportation System Revenue | 5.000% | 11/1/25 | 500 | 554 |
| Tobacco Settlement Financing Corp. | | | | |
| New Jersey Revenue | 5.000% | 6/1/18 | 1,500 | 1,583 |
| Tobacco Settlement Financing Corp. | | | | |
| New Jersey Revenue | 5.000% | 6/1/19 | 100 | 105 |
| Tobacco Settlement Financing Corp. | | | | |
| New Jersey Revenue | 0.000% | 6/1/41 | 7,100 | 1,803 |
| Tobacco Settlement Financing Corp. | | | | |
| New Jersey Revenue | 0.000% | 6/1/41 | 1,000 | 244 |
| West Deptford Township NJ GO | 5.000% | 7/1/27 (4) | 635 | 669 |
| | | | | 39,947 |
| New Mexico (0.2%) | | | | |
| Farmington NM Pollution Control Revenue | | | | |
| (Arizona Public Service Co. Four Corners Project) | 4.700% | 9/1/24 | 1,750 | 1,933 |
| New Mexico Educational Assistance Foundation | | | | |
| Revenue | 5.000% | 12/1/19 | 500 | 570 |
44
| | | | |
| Tax-Managed Balanced Fund | | | | |
| |
| |
| |
| | | | Face | Market |
| | | Maturity | Amount | Value• |
| | Coupon | Date | ($000) | ($000) |
| New Mexico Finance Authority Transportation | | | | |
| Revenue | 5.000% | 6/15/23 | 500 | 572 |
| New Mexico Hospital Equipment Loan Council | | | | |
| Hospital System Revenue (Presbyterian | | | | |
| Healthcare Services) | 5.000% | 8/1/28 | 1,350 | 1,619 |
| | | | | 4,694 |
| New York (7.4%) | | | | |
| Erie County NY Industrial Development Agency | | | | |
| School Facility Revenue (Buffalo City School | | | | |
| District Project) | 5.000% | 5/1/18 | 500 | 546 |
| Erie County NY Industrial Development Agency | | | | |
| School Facility Revenue (Buffalo City School | | | | |
| District Project) | 5.000% | 5/1/19 | 500 | 562 |
| Erie County NY Industrial Development Agency | | | | |
| School Facility Revenue (Buffalo City School | | | | |
| District Project) | 5.250% | 5/1/31 | 500 | 581 |
| Long Island NY Power Authority Electric | | | | |
| System Revenue | 5.000% | 12/1/17 | 630 | 656 |
| Long Island NY Power Authority Electric | | | | |
| System Revenue | 5.000% | 12/1/18 (14) | 400 | 415 |
| Long Island NY Power Authority Electric | | | | |
| System Revenue | 5.250% | 4/1/19 | 400 | 449 |
| Long Island NY Power Authority Electric | | | | |
| System Revenue | 5.000% | 5/1/19 (14) | 500 | 517 |
| Long Island NY Power Authority Electric | | | | |
| System Revenue | 5.000% | 4/1/23 | 575 | 623 |
| Long Island NY Power Authority Electric | | | | |
| System Revenue | 5.000% | 9/1/24 | 45 | 53 |
| 1 Long Island NY Power Authority Electric | | | | |
| System Revenue PUT | 0.821% | 11/1/18 | 1,000 | 995 |
| Monroe County NY Industrial Development | | | | |
| Corp. Mortgage Revenue (Unity Hospital | | | | |
| Rochester Project) | 5.500% | 8/15/23 | 825 | 829 |
| Nassau County NY GO | 5.000% | 4/1/23 | 1,000 | 1,187 |
| Nassau County NY Interim Finance Authority | | | | |
| Sales Tax Revenue VRDO | 0.010% | 1/6/16 | 6,300 | 6,300 |
| New York City NY GO | 5.000% | 2/1/16 | 105 | 105 |
| New York City NY GO | 5.000% | 8/1/16 (Prere.) | 5 | 5 |
| New York City NY GO | 5.000% | 8/1/16 | 500 | 513 |
| New York City NY GO | 5.000% | 2/1/17 (Prere.) | 5 | 5 |
| New York City NY GO | 5.000% | 2/1/17 | 500 | 523 |
| New York City NY GO | 5.250% | 8/1/17 | 700 | 749 |
| New York City NY GO | 5.000% | 2/1/18 | 495 | 518 |
| New York City NY GO | 5.250% | 8/15/18 (Prere.) | 40 | 44 |
| New York City NY GO | 5.000% | 8/1/19 | 500 | 533 |
| New York City NY GO | 5.000% | 8/1/19 | 1,500 | 1,699 |
| New York City NY GO | 5.000% | 8/1/19 | 1,065 | 1,206 |
| New York City NY GO | 5.000% | 8/1/20 | 2,935 | 3,408 |
| New York City NY GO | 5.250% | 9/1/20 | 1,000 | 1,109 |
| New York City NY GO | 5.000% | 8/1/21 | 515 | 612 |
| New York City NY GO | 5.000% | 8/1/21 | 2,000 | 2,376 |
| New York City NY GO | 5.000% | 8/1/22 | 500 | 604 |
| New York City NY GO | 5.000% | 10/1/22 | 500 | 598 |
| New York City NY GO | 5.000% | 8/1/23 | 1,505 | 1,844 |
| New York City NY GO | 5.000% | 8/1/23 | 380 | 457 |
| New York City NY GO | 5.250% | 8/15/24 | 460 | 507 |
45
| | | | |
| Tax-Managed Balanced Fund | | | | |
| |
| |
| |
| | | | Face | Market |
| | | Maturity | Amount | Value• |
| | Coupon | Date | ($000) | ($000) |
| New York City NY GO | 5.000% | 8/1/25 | 750 | 884 |
| New York City NY GO | 5.000% | 8/1/25 | 1,510 | 1,889 |
| New York City NY GO | 5.000% | 8/1/26 | 1,000 | 1,211 |
| New York City NY GO | 5.000% | 8/1/26 | 500 | 598 |
| New York City NY GO | 5.000% | 8/15/26 | 475 | 519 |
| 1 New York City NY GO | 0.410% | 8/1/27 | 2,000 | 1,997 |
| New York City NY GO | 5.000% | 5/15/28 | 480 | 535 |
| New York City NY GO | 5.000% | 8/1/28 | 400 | 462 |
| New York City NY GO | 5.000% | 8/1/28 | 495 | 508 |
| New York City NY GO | 5.500% | 11/15/28 | 300 | 336 |
| New York City NY GO | 5.625% | 4/1/29 | 840 | 949 |
| New York City NY GO | 5.000% | 5/15/29 | 500 | 556 |
| New York City NY GO | 5.000% | 8/1/30 | 1,000 | 1,201 |
| New York City NY GO | 5.000% | 3/1/31 | 1,340 | 1,587 |
| New York City NY GO | 5.000% | 8/1/31 | 365 | 425 |
| New York City NY GO | 4.500% | 8/1/35 (2) | 1,500 | 1,505 |
| New York City NY Health & Hospital Corp. | | | | |
| Revenue (Health System) | 5.000% | 2/15/24 | 1,500 | 1,694 |
| New York City NY Health & Hospital Corp. | | | | |
| Revenue (Health System) | 5.000% | 2/15/30 | 500 | 553 |
| New York City NY Housing Development Corp. | | | | |
| Multi-Family Housing Revenue | 5.250% | 7/1/29 | 1,000 | 1,190 |
| New York City NY Housing Development Corp. | | | | |
| Multi-Family Housing Revenue PUT | 2.950% | 2/1/26 | 1,000 | 1,005 |
| New York City NY Municipal Water Finance | | | | |
| Authority Water & Sewer System Revenue | 5.000% | 6/15/16 (Prere.) | 500 | 511 |
| New York City NY Municipal Water Finance | | | | |
| Authority Water & Sewer System Revenue | 0.000% | 6/15/18 | 750 | 727 |
| New York City NY Municipal Water Finance | | | | |
| Authority Water & Sewer System Revenue | 5.000% | 6/15/27 | 500 | 558 |
| New York City NY Municipal Water Finance | | | | |
| Authority Water & Sewer System Revenue | 5.000% | 6/15/27 | 1,200 | 1,475 |
| New York City NY Municipal Water Finance | | | | |
| Authority Water & Sewer System Revenue | 4.750% | 6/15/30 | 255 | 275 |
| New York City NY Municipal Water Finance | | | | |
| Authority Water & Sewer System Revenue | 5.000% | 6/15/30 | 500 | 572 |
| New York City NY Municipal Water Finance | | | | |
| Authority Water & Sewer System Revenue | 5.000% | 6/15/31 | 500 | 577 |
| New York City NY Municipal Water Finance | | | | |
| Authority Water & Sewer System Revenue | | | | |
| VRDO | 0.010% | 1/4/16 | 1,700 | 1,700 |
| New York City NY Municipal Water Finance | | | | |
| Authority Water & Sewer System Revenue | | | | |
| VRDO | 0.010% | 1/4/16 | 300 | 300 |
| New York City NY Municipal Water Finance | | | | |
| Authority Water & Sewer System Revenue | | | | |
| VRDO | 0.010% | 1/4/16 | 600 | 600 |
| New York City NY Transitional Finance Authority | | | | |
| Building Aid Revenue | 5.000% | 7/15/24 | 500 | 600 |
| New York City NY Transitional Finance Authority | | | | |
| Building Aid Revenue | 5.250% | 1/15/25 | 500 | 559 |
| New York City NY Transitional Finance Authority | | | | |
| Building Aid Revenue | 5.250% | 1/15/26 | 500 | 559 |
| New York City NY Transitional Finance Authority | | | | |
| Building Aid Revenue | 5.000% | 7/15/28 | 1,730 | 2,099 |
46
| | | | |
| Tax-Managed Balanced Fund | | | | |
| |
| |
| |
| | | | Face | Market |
| | | Maturity | Amount | Value• |
| | Coupon | Date | ($000) | ($000) |
| New York City NY Transitional Finance Authority | | | | |
| Building Aid Revenue | 5.125% | 1/15/29 | 1,070 | 1,190 |
| New York City NY Transitional Finance Authority | | | | |
| Building Aid Revenue | 5.000% | 7/15/29 | 2,000 | 2,410 |
| New York City NY Transitional Finance Authority | | | | |
| Building Aid Revenue | 5.000% | 7/15/32 | 250 | 289 |
| New York City NY Transitional Finance Authority | | | | |
| Future Tax Revenue | 5.000% | 8/1/16 (Prere.) | 280 | 287 |
| New York City NY Transitional Finance Authority | | | | |
| Future Tax Revenue | 5.000% | 5/1/17 (Prere.) | 330 | 349 |
| New York City NY Transitional Finance Authority | | | | |
| Future Tax Revenue | 5.000% | 5/1/17 (Prere.) | 335 | 354 |
| New York City NY Transitional Finance Authority | | | | |
| Future Tax Revenue | 5.000% | 5/1/17 (Prere.) | 330 | 349 |
| New York City NY Transitional Finance Authority | | | | |
| Future Tax Revenue | 5.000% | 5/1/17 (Prere.) | 660 | 697 |
| New York City NY Transitional Finance Authority | | | | |
| Future Tax Revenue | 5.000% | 2/1/18 (ETM) | 200 | 217 |
| New York City NY Transitional Finance Authority | | | | |
| Future Tax Revenue | 5.000% | 11/1/18 | 170 | 180 |
| New York City NY Transitional Finance Authority | | | | |
| Future Tax Revenue | 5.000% | 11/1/18 | 1,000 | 1,109 |
| New York City NY Transitional Finance Authority | | | | |
| Future Tax Revenue | 5.000% | 11/1/23 | 165 | 174 |
| New York City NY Transitional Finance Authority | | | | |
| Future Tax Revenue | 5.000% | 11/1/24 | 170 | 179 |
| New York City NY Transitional Finance Authority | | | | |
| Future Tax Revenue | 5.000% | 11/1/25 | 340 | 358 |
| New York City NY Transitional Finance Authority | | | | |
| Future Tax Revenue | 5.000% | 11/1/25 | 400 | 476 |
| New York City NY Transitional Finance Authority | | | | |
| Future Tax Revenue | 5.000% | 11/1/28 | 1,325 | 1,634 |
| New York City NY Transitional Finance Authority | | | | |
| Future Tax Revenue | 5.000% | 5/1/29 | 850 | 1,016 |
| New York City NY Transitional Finance Authority | | | | |
| Future Tax Revenue | 5.000% | 2/1/30 | 500 | 592 |
| New York City NY Transitional Finance Authority | | | | |
| Future Tax Revenue | 5.250% | 2/1/30 | 500 | 585 |
| New York City NY Transitional Finance Authority | | | | |
| Future Tax Revenue | 5.000% | 2/1/31 | 500 | 578 |
| New York City NY Transitional Finance Authority | | | | |
| Future Tax Revenue | 5.000% | 5/1/31 | 300 | 352 |
| New York City NY Transitional Finance Authority | | | | |
| Future Tax Revenue | 5.000% | 11/1/31 | 500 | 593 |
| New York City NY Transitional Finance Authority | | | | |
| Future Tax Revenue | 5.000% | 8/1/32 | 1,250 | 1,487 |
| New York City NY Transitional Finance Authority | | | | |
| Future Tax Revenue | 5.000% | 11/1/32 | 500 | 591 |
| New York City NY Transitional Finance Authority | | | | |
| Future Tax Revenue | 5.000% | 11/1/32 | 1,500 | 1,803 |
| New York City NY Transitional Finance Authority | | | | |
| Future Tax Revenue | 5.000% | 8/1/34 | 1,450 | 1,712 |
| New York City NY Transitional Finance Authority | | | | |
| Future Tax Revenue | 5.000% | 11/1/34 | 1,500 | 1,789 |
| New York City NY Transitional Finance Authority | | | | |
| Future Tax Revenue | 5.000% | 11/1/35 | 1,725 | 2,049 |
47
| | | | |
| Tax-Managed Balanced Fund | | | | |
| |
| |
| |
| | | | Face | Market |
| | | Maturity | Amount | Value• |
| | Coupon | Date | ($000) | ($000) |
| New York Liberty Development Corp. Revenue | 5.000% | 11/15/31 | 1,000 | 1,149 |
| New York Liberty Development Corp. Revenue | | | | |
| (7 World Trade Center Project) | 5.000% | 9/15/31 | 1,000 | 1,169 |
| New York Metropolitan Transportation Authority | | | | |
| Revenue | 5.000% | 11/15/21 | 210 | 251 |
| New York Metropolitan Transportation Authority | | | | |
| Revenue | 5.250% | 11/15/21 (14) | 300 | 362 |
| New York Metropolitan Transportation Authority | | | | |
| Revenue | 5.000% | 11/15/23 | 500 | 538 |
| New York Metropolitan Transportation Authority | | | | |
| Revenue | 5.000% | 11/15/27 (14) | 110 | 118 |
| New York Metropolitan Transportation Authority | | | | |
| Revenue | 5.000% | 11/15/28 | 500 | 544 |
| New York Metropolitan Transportation Authority | | | | |
| Revenue | 5.000% | 11/15/30 | 500 | 583 |
| New York Metropolitan Transportation Authority | | | | |
| Revenue | 5.000% | 11/15/30 | 500 | 589 |
| New York Metropolitan Transportation Authority | | | | |
| Revenue | 5.250% | 11/15/30 | 500 | 586 |
| New York Metropolitan Transportation Authority | | | | |
| Revenue | 5.000% | 11/15/31 | 300 | 312 |
| New York Metropolitan Transportation Authority | | | | |
| Revenue | 5.000% | 11/15/32 | 500 | 579 |
| New York Metropolitan Transportation Authority | | | | |
| Revenue | 5.000% | 11/15/33 | 1,500 | 1,747 |
| New York Metropolitan Transportation Authority | | | | |
| Revenue (Dedicated Petroleum Tax) | 5.250% | 11/15/24 | 600 | 689 |
| New York Metropolitan Transportation Authority | | | | |
| Revenue (Dedicated Tax Fund) | 5.000% | 11/15/16 (Prere.) | 500 | 520 |
| New York Metropolitan Transportation Authority | | | | |
| Revenue (Service Contract) | 5.750% | 1/1/17 (14) | 560 | 589 |
| New York Metropolitan Transportation Authority | | | | |
| Revenue (Transit Revenue) | 5.500% | 11/15/18 | 375 | 401 |
| New York Metropolitan Transportation Authority | | | | |
| Revenue (Transit Revenue) | 5.000% | 11/15/31 | 1,165 | 1,357 |
| 1 New York Metropolitan Transportation Authority | | | | |
| Revenue PUT | 0.370% | 11/15/17 | 1,500 | 1,489 |
| New York Metropolitan Transportation Authority | | | | |
| Revenue VRDO | 0.010% | 1/7/16 LOC | 4,800 | 4,800 |
| New York State Dormitory Authority Lease | | | | |
| Revenue (City of New York Court Facilities) | 5.500% | 5/15/24 (2) | 500 | 628 |
| New York State Dormitory Authority Lease | | | | |
| Revenue (City of New York Court Facilities) | 5.500% | 5/15/27 (2) | 500 | 642 |
| New York State Dormitory Authority Lease | | | | |
| Revenue (Mental Health Services Facilities) | 5.000% | 8/15/21 | 500 | 580 |
| New York State Dormitory Authority Revenue | | | | |
| (City University System) | 5.000% | 7/1/24 | 400 | 462 |
| New York State Dormitory Authority Revenue | | | | |
| (Fordham University) | 5.000% | 7/1/25 (12) | 250 | 272 |
| New York State Dormitory Authority Revenue | | | | |
| (Icahn School of Medicine at Mount Sinai) | 5.000% | 7/1/28 | 1,000 | 1,167 |
| New York State Dormitory Authority Revenue | | | | |
| (Icahn School of Medicine at Mount Sinai) | 5.000% | 7/1/32 | 1,000 | 1,146 |
| New York State Dormitory Authority Revenue | | | | |
| (Memorial Sloan-Kettering Cancer Center) | 5.000% | 7/1/30 | 500 | 511 |
48
| | | | |
| Tax-Managed Balanced Fund | | | | |
| |
| |
| |
| | | | Face | Market |
| | | Maturity | Amount | Value• |
| | Coupon | Date | ($000) | ($000) |
| New York State Dormitory Authority Revenue | | | | |
| (Mount Sinai Hospital Obligated Group) | 5.000% | 7/1/23 | 500 | 577 |
| New York State Dormitory Authority Revenue | | | | |
| (Mount Sinai School of Medicine of New York | | | | |
| University) | 5.000% | 7/1/17 (Prere.) | 500 | 531 |
| New York State Dormitory Authority Revenue | | | | |
| (New York University Hospitals Center) | 5.000% | 7/1/20 | 1,735 | 1,771 |
| New York State Dormitory Authority Revenue | | | | |
| (New York University) | 6.000% | 7/1/19 (14) | 500 | 579 |
| New York State Dormitory Authority Revenue | | | | |
| (North Shore - Long Island Jewish Obligated | | | | |
| Group) | 5.000% | 5/1/26 | 500 | 563 |
| New York State Dormitory Authority Revenue | | | | |
| (Personal Income Tax) | 5.000% | 2/15/17 | 500 | 524 |
| New York State Dormitory Authority Revenue | | | | |
| (Personal Income Tax) | 5.000% | 3/15/20 | 200 | 225 |
| New York State Dormitory Authority Revenue | | | | |
| (Personal Income Tax) | 5.000% | 2/15/22 (Prere.) | 170 | 206 |
| New York State Dormitory Authority Revenue | | | | |
| (Personal Income Tax) | 5.000% | 2/15/22 (Prere.) | 160 | 193 |
| New York State Dormitory Authority Revenue | | | | |
| (Personal Income Tax) | 5.000% | 2/15/23 | 830 | 995 |
| New York State Dormitory Authority Revenue | | | | |
| (Personal Income Tax) | 5.000% | 3/15/23 | 1,500 | 1,827 |
| New York State Dormitory Authority Revenue | | | | |
| (Personal Income Tax) | 5.000% | 2/15/24 | 840 | 1,007 |
| New York State Dormitory Authority Revenue | | | | |
| (Personal Income Tax) | 5.000% | 12/15/26 | 500 | 607 |
| New York State Dormitory Authority Revenue | | | | |
| (Personal Income Tax) | 5.000% | 3/15/28 | 500 | 540 |
| New York State Dormitory Authority Revenue | | | | |
| (Personal Income Tax) | 5.000% | 3/15/30 | 2,000 | 2,384 |
| New York State Dormitory Authority Revenue | | | | |
| (Personal Income Tax) | 5.000% | 3/15/32 | 500 | 581 |
| New York State Dormitory Authority Revenue | | | | |
| (Personal Income Tax) | 5.000% | 2/15/33 | 300 | 348 |
| New York State Dormitory Authority Revenue | | | | |
| (Personal Income Tax) | 5.000% | 3/15/34 | 2,000 | 2,341 |
| New York State Dormitory Authority Revenue | | | | |
| (School Districts Financing Program) | 5.000% | 10/1/20 | 500 | 581 |
| New York State Dormitory Authority Revenue | | | | |
| (School Districts Financing Program) | 5.000% | 10/1/21 (4) | 390 | 463 |
| New York State Dormitory Authority Revenue | | | | |
| (Service Contract) | 5.000% | 7/1/16 | 275 | 281 |
| New York State Dormitory Authority Revenue | | | | |
| (Service Contract) | 5.000% | 7/1/22 | 500 | 566 |
| New York State Dormitory Authority Revenue | | | | |
| (The New School) | 5.250% | 7/1/30 | 500 | 567 |
| New York State Dormitory Authority Sales Tax | | | | |
| Revenue | 5.000% | 3/15/21 | 1,135 | 1,341 |
| New York State Dormitory Authority Sales Tax | | | | |
| Revenue | 5.000% | 3/15/24 | 1,820 | 2,257 |
| New York State Dormitory Authority Sales Tax | | | | |
| Revenue | 5.000% | 3/15/25 | 1,270 | 1,596 |
| New York State Dormitory Authority Sales Tax | | | | |
| Revenue | 5.000% | 3/15/35 | 1,420 | 1,692 |
49
| | | | |
| Tax-Managed Balanced Fund | | | | |
| |
| |
| |
| | | | Face | Market |
| | | Maturity | Amount | Value• |
| | Coupon | Date | ($000) | ($000) |
| New York State Environmental Facilities Corp. | | | | |
| Revenue (State Clean Water & Drinking Water | | | | |
| Revolving Funds) | 5.000% | 6/15/22 | 500 | 531 |
| New York State Environmental Facilities Corp. | | | | |
| Revenue (State Clean Water & Drinking Water | | | | |
| Revolving Funds) | 5.000% | 6/15/24 | 365 | 422 |
| New York State Environmental Facilities Corp. | | | | |
| Revenue (State Clean Water & Drinking Water | | | | |
| Revolving Funds) | 5.000% | 6/15/25 | 500 | 603 |
| New York State GO | 4.500% | 2/1/17 | 500 | 522 |
| New York State GO | 4.500% | 2/1/18 | 500 | 538 |
| New York State GO | 4.500% | 2/1/19 | 500 | 554 |
| New York State GO | 5.000% | 2/15/30 | 315 | 365 |
| New York State Local Government Assistance | | | | |
| Corp. Revenue | 5.000% | 4/1/21 | 500 | 571 |
| New York State Thruway Authority Revenue | 5.000% | 1/1/20 (14) | 500 | 539 |
| New York State Thruway Authority Revenue | 5.000% | 1/1/21 (14) | 490 | 528 |
| New York State Thruway Authority Revenue | 5.000% | 1/1/30 | 500 | 579 |
| New York State Thruway Authority Revenue | 5.000% | 1/1/32 (14) | 600 | 642 |
| New York State Thruway Authority Revenue | | | | |
| (Highway & Bridge Trust Fund) | 5.000% | 4/1/17 (Prere.) | 500 | 527 |
| New York State Thruway Authority Revenue | | | | |
| (Highway & Bridge Trust Fund) | 5.000% | 4/1/24 | 500 | 552 |
| New York State Thruway Authority Revenue | | | | |
| (Personal Income Tax) | 5.000% | 3/15/16 | 225 | 227 |
| New York State Thruway Authority Revenue | | | | |
| (Personal Income Tax) | 5.000% | 3/15/19 | 500 | 562 |
| New York State Thruway Authority Revenue | | | | |
| (Personal Income Tax) | 5.000% | 3/15/20 | 500 | 576 |
| New York State Thruway Authority Revenue | | | | |
| (Personal Income Tax) | 5.000% | 3/15/25 | 500 | 593 |
| New York State Urban Development Corp. | | | | |
| Revenue | 5.000% | 12/15/18 | 500 | 557 |
| New York State Urban Development Corp. | | | | |
| Revenue (Personal Income Tax) | 5.000% | 3/15/18 | 1,890 | 2,056 |
| New York State Urban Development Corp. | | | | |
| Revenue (Personal Income Tax) | 5.000% | 3/15/18 | 1,000 | 1,088 |
| New York State Urban Development Corp. | | | | |
| Revenue (Personal Income Tax) | 5.000% | 12/15/18 | 600 | 668 |
| New York State Urban Development Corp. | | | | |
| Revenue (Personal Income Tax) | 5.500% | 3/15/22 (14) | 530 | 652 |
| New York State Urban Development Corp. | | | | |
| Revenue (Personal Income Tax) | 5.000% | 3/15/24 | 1,325 | 1,630 |
| New York State Urban Development Corp. | | | | |
| Revenue (Personal Income Tax) | 5.000% | 12/15/25 | 1,500 | 1,621 |
| New York State Urban Development Corp. | | | | |
| Revenue (Personal Income Tax) | 5.000% | 3/15/26 | 2,000 | 2,440 |
| New York State Urban Development Corp. | | | | |
| Revenue (Personal Income Tax) | 5.000% | 3/15/31 | 2,000 | 2,346 |
| New York State Urban Development Corp. | | | | |
| Revenue (Personal Income Tax) | 5.000% | 3/15/31 | 1,420 | 1,711 |
| New York State Urban Development Corp. | | | | |
| Revenue (Personal Income Tax) | 5.000% | 3/15/33 | 1,485 | 1,726 |
| New York State Urban Development Corp. | | | | |
| Revenue (Service Contract) | 5.000% | 1/1/18 | 540 | 584 |
50
| | | | |
| Tax-Managed Balanced Fund | | | | |
| |
| |
| |
| | | | Face | Market |
| | | Maturity | Amount | Value• |
| | Coupon | Date | ($000) | ($000) |
| Port Authority of New York & New Jersey | | | | |
| Revenue | 5.000% | 7/15/26 | 500 | 549 |
| Port Authority of New York & New Jersey | | | | |
| Revenue | 5.000% | 9/1/26 | 1,750 | 2,137 |
| Port Authority of New York & New Jersey | | | | |
| Revenue | 5.000% | 5/1/28 | 1,250 | 1,422 |
| Port Authority of New York & New Jersey | | | | |
| Revenue | 5.000% | 10/15/29 | 1,000 | 1,222 |
| Port Authority of New York & New Jersey | | | | |
| Revenue | 5.000% | 10/15/35 | 1,000 | 1,187 |
| Suffolk County NY Economic Development Corp. | | | | |
| Revenue (Catholic Health Services) | 5.000% | 7/1/21 | 1,545 | 1,789 |
| Suffolk County NY Economic Development Corp. | | | | |
| Revenue (Catholic Health Services) | 5.000% | 7/1/27 | 1,370 | 1,560 |
| Tobacco Settlement Financing Corp. New York | | | | |
| Revenue | 5.000% | 6/1/22 | 500 | 510 |
| Triborough Bridge & Tunnel Authority New York | | | | |
| Revenue | 5.000% | 11/15/25 | 500 | 551 |
| Triborough Bridge & Tunnel Authority New York | | | | |
| Revenue | 5.000% | 11/15/34 | 2,000 | 2,389 |
| Utility Debt Securitization Authority New York | | | | |
| Revenue | 5.000% | 12/15/33 | 1,600 | 1,915 |
| Utility Debt Securitization Authority New York | | | | |
| Revenue | 5.000% | 12/15/34 | 1,000 | 1,209 |
| Utility Debt Securitization Authority New York | | | | |
| Revenue | 5.000% | 12/15/35 | 1,945 | 2,343 |
| Utility Debt Securitization Authority New York | | | | |
| Revenue | 5.000% | 12/15/36 | 2,450 | 2,939 |
| Westchester County NY GO | 5.000% | 7/1/20 (ETM) | 55 | 64 |
| Westchester County NY GO | 5.000% | 7/1/20 | 445 | 520 |
| Westchester County NY Health Care Corp. | | | | |
| Revenue | 5.000% | 11/1/30 | 500 | 557 |
| | | | | 183,539 |
| North Carolina (0.9%) | | | | |
| Cary NC Combined Enterprise System Revenue | 5.000% | 12/1/27 | 500 | 603 |
| Charlotte NC Water & Sewer System Revenue | 5.000% | 12/1/20 | 235 | 277 |
| Durham County NC GO | 5.000% | 4/1/20 | 685 | 793 |
| Mecklenburg County NC GO | 5.000% | 3/1/17 | 500 | 526 |
| Mecklenburg County NC Public Facilities Corp. | | | | |
| Revenue (Annual Appropriation) | 5.000% | 3/1/19 (Prere.) | 500 | 561 |
| North Carolina Capital Improvement Revenue | 5.000% | 5/1/19 | 555 | 624 |
| North Carolina Capital Improvement Revenue | 5.000% | 5/1/29 | 500 | 571 |
| North Carolina Eastern Municipal Power Agency | | | | |
| Power Systems Revenue | 6.000% | 1/1/18 (ETM) | 510 | 561 |
| North Carolina Eastern Municipal Power Agency | | | | |
| Power Systems Revenue | 5.000% | 1/1/19 (Prere.) | 500 | 559 |
| North Carolina GAN | 5.000% | 3/1/25 | 1,000 | 1,219 |
| North Carolina GAN | 5.000% | 3/1/27 | 1,000 | 1,194 |
| North Carolina GO | 5.000% | 3/1/17 | 520 | 547 |
| North Carolina GO | 5.000% | 3/1/18 | 500 | 543 |
| North Carolina GO | 5.000% | 5/1/18 | 1,500 | 1,642 |
| North Carolina GO | 5.000% | 6/1/19 | 2,000 | 2,264 |
| North Carolina GO | 5.000% | 3/1/20 | 275 | 318 |
| North Carolina GO | 4.000% | 6/1/20 | 500 | 560 |
| North Carolina GO | 5.000% | 5/1/22 | 250 | 303 |
51
| | | | |
| Tax-Managed Balanced Fund | | | | |
| |
| |
| |
| | | | Face | Market |
| | | Maturity | Amount | Value• |
| | Coupon | Date | ($000) | ($000) |
| North Carolina Infrastructure Financial Corp. | | | | |
| Capital Improvements COP | 5.000% | 2/1/17 (Prere.) | 2,000 | 2,094 |
| North Carolina Medical Care Commission Health | | | | |
| Care Facilities Revenue (Vidant Health) | 5.000% | 6/1/21 | 1,000 | 1,158 |
| North Carolina Medical Care Commission | | | | |
| Hospital Revenue (Southeastern Regional | | | | |
| Medical Center) | 5.000% | 6/1/24 | 600 | 680 |
| North Carolina Municipal Power Agency No. 1 | | | | |
| Revenue (Catawba Electric) | 5.000% | 1/1/30 | 500 | 550 |
| Orange County NC Public Facilities Co. Revenue | 5.000% | 10/1/24 | 500 | 598 |
| 1 University of North Carolina University System | | | | |
| Revenue PUT | 0.913% | 12/1/17 | 1,100 | 1,104 |
| Wake County NC GO | 4.000% | 2/1/18 | 695 | 740 |
| Wake County NC GO | 5.000% | 3/1/18 | 500 | 544 |
| Wake County NC Public Improvement GO | 5.000% | 3/1/16 | 100 | 101 |
| | | | | 21,234 |
| Ohio (1.2%) | | | | |
| Allen County OH Hospital Facilities Revenue | | | | |
| (Catholic Healthcare Partners) | 5.000% | 9/1/16 | 500 | 515 |
| American Municipal Power Ohio Inc. Revenue | | | | |
| (Fremont Energy Center Project) | 5.250% | 2/15/27 | 570 | 669 |
| American Municipal Power Ohio Inc. Revenue | | | | |
| (Hydroelectric Projects) | 5.250% | 2/15/18 | 500 | 543 |
| Buckeye Tobacco Settlement Financing Authority | | | | |
| Ohio Revenue | 5.000% | 6/1/16 | 200 | 203 |
| Buckeye Tobacco Settlement Financing Authority | | | | |
| Ohio Revenue | 5.000% | 6/1/17 | 190 | 200 |
| Butler County OH Hospital Facilities Revenue | | | | |
| (Kettering Health Network) | 5.250% | 4/1/31 | 500 | 555 |
| Butler County OH Hospital Facilities Revenue | | | | |
| (UC Health) | 5.250% | 11/1/29 | 435 | 502 |
| Cleveland OH Airport System Revenue | 5.000% | 1/1/16 (2) | 250 | 250 |
| Cleveland OH Airport System Revenue | 5.250% | 1/1/18 (2) | 260 | 280 |
| Cleveland OH Airport System Revenue | 5.000% | 1/1/31 (4) | 500 | 516 |
| Cleveland OH Public Power System Revenue | 5.000% | 11/15/16 (Prere.) | 265 | 275 |
| Cleveland OH Public Power System Revenue | 5.000% | 11/15/20 (14) | 235 | 243 |
| Cleveland OH Water Revenue | 4.000% | 1/1/18 | 2,415 | 2,565 |
| Columbus OH GO | 5.000% | 7/1/25 | 535 | 642 |
| Columbus OH Sewer Revenue | 5.000% | 6/1/30 | 1,500 | 1,852 |
| Cuyahoga County OH Excise Tax Revenue | | | | |
| (Sports Facilities Improvement Project) | 5.000% | 12/1/25 | 500 | 598 |
| Cuyahoga County OH Sales Tax Revenue | 5.000% | 12/1/27 | 1,000 | 1,218 |
| Fairfield County OH Hospital Facilities Revenue | | | | |
| (Fairfield Medical Center) | 5.125% | 6/15/33 | 615 | 673 |
| Franklin County OH Convention Facilities | | | | |
| Authority Revenue | 5.000% | 12/1/20 | 1,000 | 1,166 |
| Franklin County OH Convention Facilities | | | | |
| Authority Revenue | 5.000% | 12/1/28 | 1,680 | 2,004 |
| Greater Cleveland OH Regional Transit Authority | | | | |
| Sales Tax Revenue | 5.000% | 12/1/18 | 350 | 388 |
| Hamilton County OH Economic Development | | | | |
| Revenue (University of Cincinnati Lessee Project) | 5.000% | 6/1/16 (Prere.) | 1,225 | 1,249 |
| Hamilton County OH Hospital Facilities Revenue | | | | |
| (UC Health) | 5.000% | 2/1/21 | 200 | 228 |
| Kent State University Ohio Revenue | 5.000% | 5/1/23 (12) | 500 | 555 |
52
| | | | |
| Tax-Managed Balanced Fund | | | | |
| |
| |
| |
| | | | Face | Market |
| | | Maturity | Amount | Value• |
| | Coupon | Date | ($000) | ($000) |
| Lucas County OH Hospital Revenue (ProMedica | | | | |
| Healthcare Obligated Group) | 5.000% | 11/15/26 | 500 | 576 |
| Lucas County OH Hospital Revenue (ProMedica | | | | |
| Healthcare Obligated Group) | 5.250% | 11/15/27 | 1,500 | 1,746 |
| Ohio Building Authority Revenue (Administration | | | | |
| Building Fund) | 5.000% | 10/1/20 | 100 | 117 |
| Ohio Capital Facilities Lease-Appropriation | | | | |
| Revenue (Mental Health Facilities Improvement | | | | |
| Fund Projects) | 5.000% | 2/1/22 | 750 | 895 |
| Ohio Common Schools GO | 5.000% | 6/15/16 (Prere.) | 750 | 766 |
| Ohio GO | 5.000% | 3/15/16 (Prere.) | 260 | 263 |
| Ohio GO | 5.000% | 8/1/23 | 500 | 606 |
| Ohio GO | 5.000% | 8/1/24 | 500 | 621 |
| Ohio Higher Education GO | 5.000% | 8/1/17 | 770 | 821 |
| Ohio Higher Education GO | 5.000% | 8/1/21 | 500 | 595 |
| Ohio Higher Educational Facility Commission | | | | |
| Revenue (Case Western Reserve University | | | | |
| Project) | 5.000% | 12/1/22 | 550 | 667 |
| Ohio Higher Educational Facility Commission | | | | |
| Revenue (University of Dayton Project) | 5.000% | 12/1/16 (Prere.) | 1,000 | 1,041 |
| Ohio State University General Receipts Revenue | 5.000% | 12/1/16 (ETM) | 30 | 31 |
| Ohio State University General Receipts Revenue | 5.000% | 12/1/16 | 470 | 489 |
| Ohio Turnpike Commission Turnpike Revenue | 5.500% | 2/15/20 (14) | 1,000 | 1,166 |
| Ohio Turnpike Commission Turnpike Revenue | 5.000% | 2/15/28 | 1,000 | 1,157 |
| Ohio Turnpike Commission Turnpike Revenue | 5.000% | 2/15/31 | 500 | 563 |
| Ohio Water Development Authority Pollution | | | | |
| Control Revenue (Water Quality) | 5.250% | 6/1/19 | 435 | 495 |
| Penta Career Center Ohio COP | 5.250% | 4/1/23 | 125 | 147 |
| | | | | 30,651 |
| Oklahoma (0.1%) | | | | |
| Oklahoma City OK GO | 5.000% | 3/1/24 | 525 | 612 |
| Oklahoma Turnpike Authority Revenue | 5.000% | 1/1/31 | 300 | 342 |
| University of Oklahoma Revenue | 5.000% | 7/1/31 | 475 | 550 |
| | | | | 1,504 |
| Oregon (0.3%) | | | | |
| Deschutes & Jefferson Counties OR School | | | | |
| District No. 2J GO | 0.000% | 6/15/31 | 750 | 463 |
| Multnomah County OR School District GO | 5.000% | 6/15/19 | 1,680 | 1,901 |
| Oregon Department of Administrative Services | | | | |
| Lottery Revenue | 5.000% | 4/1/25 | 1,370 | 1,679 |
| Oregon Department of Administrative Services | | | | |
| Lottery Revenue | 5.250% | 4/1/31 | 500 | 584 |
| Oregon Facilities Authority Revenue | | | | |
| (PeaceHealth) | 5.000% | 11/15/16 | 150 | 156 |
| Oregon Facilities Authority Revenue | | | | |
| (PeaceHealth) | 5.000% | 11/15/17 | 250 | 268 |
| Oregon GO | 5.000% | 5/1/23 | 500 | 601 |
| Portland OR GO | 5.000% | 6/15/20 | 1,725 | 2,007 |
| Portland OR Sewer System Revenue | 5.000% | 6/15/22 (4) | 500 | 546 |
| | | | | 8,205 |
| Pennsylvania (2.7%) | | | | |
| Allegheny County PA Higher Education Building | | | | |
| Authority University Revenue (Duquesne | | | | |
| University) | 5.500% | 3/1/29 | 325 | 370 |
53
| | | | |
| Tax-Managed Balanced Fund | | | | |
| |
| |
| |
| | | | Face | Market |
| | | Maturity | Amount | Value• |
| | Coupon | Date | ($000) | ($000) |
| Allegheny County PA Hospital Development | | | | |
| Authority Revenue (University of Pittsburgh | | | | |
| Medical Center) | 5.000% | 5/15/18 | 500 | 546 |
| Allegheny County PA Hospital Development | | | | |
| Authority Revenue (University of Pittsburgh | | | | |
| Medical Center) | 0.940% | 2/1/21 | 870 | 869 |
| Allegheny County PA Hospital Development | | | | |
| Authority Revenue (University of Pittsburgh | | | | |
| Medical Center) | 5.375% | 8/15/29 | 210 | 235 |
| Allegheny County PA Port Authority Revenue | 5.750% | 3/1/29 | 500 | 592 |
| Allentown PA Neighborhood Improvement Zone | | | | |
| Development Authority Tax Revenue | 5.000% | 5/1/24 | 1,000 | 1,121 |
| Beaver County PA Industrial Development | | | | |
| Authority Pollution Control Revenue | | | | |
| (FirstEnergy Generation Project) PUT | 2.500% | 6/1/17 | 500 | 502 |
| Central Bradford PA Progress Authority Revenue | | | | |
| (Guthrie Healthcare System) | 5.500% | 12/1/31 | 500 | 586 |
| Chester County PA GO | 5.000% | 11/15/31 | 750 | 894 |
| Dallas PA Area Muni Authority University | | | | |
| Revenue (Misericordia University Project) | 4.000% | 5/1/17 | 415 | 427 |
| Delaware County PA Authority Hospital Revenue | | | | |
| (Crozer-Keystone Obligated Group) | 5.000% | 12/15/31 | 945 | 970 |
| East Hempfield Township PA Industrial | | | | |
| Development Authority Revenue | | | | |
| (Millersville University Student Housing Project) | 5.000% | 7/1/29 | 1,000 | 1,074 |
| Emmaus PA General Authority Revenue VRDO | 0.020% | 1/7/16 LOC | 1,400 | 1,400 |
| Lancaster County PA Hospital Authority Health | | | | |
| Center Revenue (Masonic Homes Project) | | | | |
| VRDO | 0.010% | 1/4/16 LOC | 2,200 | 2,200 |
| Lower Merion PA School District GO | 5.000% | 9/1/18 | 1,500 | 1,656 |
| Monroeville PA Finance Authority Revenue | | | | |
| (UPMC Health System) | 5.000% | 2/15/19 | 500 | 558 |
| Montgomery County PA Higher Education & | | | | |
| Health Authority Hospital Revenue | | | | |
| (Abington Memorial Hospital) | 5.000% | 6/1/31 | 500 | 556 |
| Montgomery County PA Higher Education & | | | | |
| Health Authority Revenue (Arcadia University) | 3.000% | 4/1/16 | 200 | 201 |
| Montgomery County PA Industrial Development | | | | |
| Authority Health Services Revenue | | | | |
| (Albert Einstein Healthcare Network) | 5.000% | 1/15/23 | 1,015 | 1,137 |
| Montgomery County PA Industrial Development | | | | |
| Authority Retirement Community Revenue | | | | |
| (ACTS Retirement- Life Communities Obligated | | | | |
| Group) | 5.000% | 11/15/25 | 1,250 | 1,369 |
| Northampton County PA General Purpose | | | | |
| Authority Hospital Revenue (St. Luke’s | | | | |
| Hospital Project) | 5.250% | 8/15/22 | 2,000 | 2,186 |
| Pennsylvania Economic Development Financing | | | | |
| Authority Health System Revenue | | | | |
| (Albert Einstein Healthcare Network) | 6.250% | 10/15/19 (Prere.) | 1,000 | 1,151 |
| Pennsylvania Economic Development Financing | | | | |
| Authority Unemployment Compensation | | | | |
| Revenue | 4.000% | 1/1/18 | 750 | 796 |
| Pennsylvania Economic Development Financing | | | | |
| Authority Unemployment Compensation | | | | |
| Revenue | 5.000% | 1/1/21 | 1,330 | 1,470 |
54
| | | | |
| Tax-Managed Balanced Fund | | | | |
| |
| |
| |
| | | | Face | Market |
| | | Maturity | Amount | Value• |
| | Coupon | Date | ($000) | ($000) |
| Pennsylvania GO | 5.000% | 1/1/16 (Prere.) | 100 | 100 |
| Pennsylvania GO | 5.000% | 3/1/16 | 100 | 101 |
| Pennsylvania GO | 5.000% | 7/1/16 | 120 | 123 |
| Pennsylvania GO | 5.000% | 7/1/16 | 400 | 409 |
| Pennsylvania GO | 5.000% | 8/1/17 (Prere.) | 500 | 533 |
| Pennsylvania GO | 5.000% | 7/1/20 | 500 | 576 |
| Pennsylvania GO | 5.375% | 7/1/21 | 500 | 597 |
| Pennsylvania GO | 5.000% | 11/15/22 | 500 | 589 |
| Pennsylvania GO | 5.000% | 8/15/24 | 1,000 | 1,216 |
| Pennsylvania GO | 5.000% | 4/15/28 | 500 | 554 |
| Pennsylvania GO | 4.000% | 8/15/30 (4) | 1,000 | 1,091 |
| Pennsylvania GO | 5.000% | 10/15/32 | 1,000 | 1,163 |
| Pennsylvania Higher Educational Facilities | | | | |
| Authority Revenue (Foundation for Indiana | | | | |
| University of Pennsylvania Student Housing) | 5.000% | 7/1/17 (10) | 500 | 509 |
| Pennsylvania Higher Educational Facilities | | | | |
| Authority Revenue (Philadelphia University) | 5.000% | 6/1/19 | 740 | 811 |
| Pennsylvania Higher Educational Facilities | | | | |
| Authority Revenue (Philadelphia University) | 5.500% | 6/1/20 | 1,000 | 1,015 |
| Pennsylvania Higher Educational Facilities | | | | |
| Authority Revenue (Slippery Rock University | | | | |
| Foundation) | 4.500% | 7/1/28 (10) | 1,090 | 1,093 |
| Pennsylvania Higher Educational Facilities | | | | |
| Authority Revenue (St. Joseph’s University) | 5.000% | 11/1/24 | 200 | 227 |
| Pennsylvania Higher Educational Facilities | | | | |
| Authority Revenue (Temple University) | 5.000% | 4/1/32 | 500 | 569 |
| Pennsylvania Higher Educational Facilities | | | | |
| Authority Revenue (Trustees of the University | | | | |
| of Pennsylvania) | 5.000% | 9/1/19 (Prere.) | 500 | 569 |
| Pennsylvania State University Revenue | 5.000% | 3/1/25 | 500 | 570 |
| Pennsylvania State University Revenue | 5.000% | 8/15/27 | 1,000 | 1,073 |
| Pennsylvania Turnpike Commission Oil Franchise | | | | |
| Tax Revenue | 5.000% | 12/1/24 | 1,000 | 1,203 |
| Pennsylvania Turnpike Commission Revenue | 5.000% | 6/1/16 (Prere.) | 1,000 | 1,019 |
| 1 Pennsylvania Turnpike Commission Revenue | 0.990% | 12/1/21 | 1,215 | 1,210 |
| Pennsylvania Turnpike Commission Revenue | 5.000% | 12/1/21 | 345 | 388 |
| Pennsylvania Turnpike Commission Revenue | 5.000% | 12/1/27 | 1,000 | 1,188 |
| Pennsylvania Turnpike Commission Revenue | 5.000% | 6/1/29 | 1,050 | 1,157 |
| Pennsylvania Turnpike Commission Revenue | 5.000% | 12/1/29 | 1,250 | 1,415 |
| Pennsylvania Turnpike Commission Revenue | 5.000% | 12/1/30 | 1,330 | 1,488 |
| Pennsylvania Turnpike Commission Revenue | 5.000% | 12/1/32 | 2,000 | 2,313 |
| Philadelphia PA Airport Revenue | 5.000% | 6/15/23 | 1,120 | 1,255 |
| 3 Philadelphia PA Authority for Industrial | | | | |
| Development Revenue (Temple University) | 5.000% | 4/1/24 | 1,000 | 1,206 |
| 3 Philadelphia PA Authority for Industrial | | | | |
| Development Revenue (Temple University) | 5.000% | 4/1/27 | 1,000 | 1,195 |
| Philadelphia PA Gas Works Revenue | 5.000% | 10/1/17 (Prere.) | 1,000 | 1,072 |
| Philadelphia PA GO | 5.000% | 8/1/26 | 1,885 | 2,263 |
| Philadelphia PA Hospitals & Higher Education | | | | |
| Facilities Authority Hospital Revenue | | | | |
| (Temple University Health System Obligated | | | | |
| Group) | 6.250% | 7/1/23 | 500 | 525 |
| Philadelphia PA Hospitals & Higher Education | | | | |
| Facilities Authority Hospital Revenue | | | | |
| (Temple University Health System Obligated | | | | |
| Group) | 5.500% | 7/1/30 | 245 | 251 |
55
| | | | |
| Tax-Managed Balanced Fund | | | | |
| |
| |
| |
| | | | Face | Market |
| | | Maturity | Amount | Value• |
| | Coupon | Date | ($000) | ($000) |
| Philadelphia PA Municipal Authority Revenue | 6.375% | 4/1/29 | 500 | 564 |
| Philadelphia PA School District GO | 5.000% | 9/1/21 | 1,035 | 1,160 |
| Philadelphia PA School District GO | 5.250% | 9/1/22 | 500 | 565 |
| Philadelphia PA School District GO | 5.000% | 9/1/31 | 940 | 1,061 |
| Philadelphia PA School District GO VRDO | 0.010% | 1/7/16 LOC | 4,500 | 4,500 |
| Philadelphia PA Water & Waste Water Revenue | 5.000% | 8/1/22 (4) | 560 | 635 |
| Philadelphia PA Water & Waste Water Revenue | 5.000% | 7/1/26 | 1,000 | 1,193 |
| St. Mary Hospital Authority Pennsylvania Health | | | | |
| System Revenue (Catholic Health Initiatives) | 5.000% | 11/15/26 | 1,000 | 1,137 |
| University of Pittsburgh of the Commonwealth | | | | |
| System of Higher Education Pennsylvania | | | | |
| Revenue (University Capital Project) | 5.250% | 9/15/24 | 500 | 573 |
| West Shore PA Area Authority Hospital Revenue | | | | |
| (Holy Spirit Hospital of the Sisters of Christian | | | | |
| Charity Project) | 6.250% | 1/1/31 | 80 | 95 |
| | | | | 66,985 |
| Puerto Rico (0.1%) | | | | |
| Puerto Rico Electric Power Authority Revenue | 5.000% | 7/1/21 (14) | 500 | 500 |
| Puerto Rico Highway & Transportation Authority | | | | |
| Revenue | 5.250% | 7/1/21 (13)(3) | 500 | 580 |
| Puerto Rico Public Finance Corp. Revenue | 6.000% | 8/1/26 (ETM) | 1,000 | 1,336 |
| | | | | 2,416 |
| South Carolina (0.5%) | | | | |
| Charleston SC Educational Excellence Financing | | | | |
| Corp. Revenue (Charleston County School | | | | |
| District, South Carolina Project) | 5.000% | 12/1/16 (Prere.) | 500 | 520 |
| Charleston SC Educational Excellence Financing | | | | |
| Corp. Revenue (Charleston County School | | | | |
| District, South Carolina Project) | 5.000% | 12/1/23 | 500 | 613 |
| Columbia SC Waterworks & Sewer System | | | | |
| Revenue | 5.000% | 2/1/27 | 250 | 290 |
| Florence County SC School District GO | 5.000% | 3/1/18 | 1,000 | 1,087 |
| Greenville County SC School District GO | 5.000% | 12/1/27 | 500 | 519 |
| Myrtle Beach SC Hospitality Fee Revenue | 5.000% | 6/1/25 | 1,000 | 1,193 |
| Piedmont SC Municipal Power Agency Revenue | 0.000% | 1/1/24 (14) | 1,600 | 1,302 |
| South Carolina Association of Governmental | | | | |
| Organizations Educational Facilities Corp. | | | | |
| Revenue (Pickens School District) | 5.000% | 12/1/26 | 1,420 | 1,699 |
| South Carolina GO | 5.000% | 4/1/20 | 450 | 521 |
| South Carolina Jobs Economic Development | | | | |
| Authority Hospital Revenue (Palmetto Health) | 5.250% | 8/1/24 (4) | 500 | 542 |
| South Carolina Jobs Economic Development | | | | |
| Authority Hospital Revenue (Palmetto Health) | 5.250% | 8/1/26 | 1,000 | 1,153 |
| South Carolina Public Service Authority Revenue | 5.000% | 1/1/16 (ETM) | 130 | 130 |
| South Carolina Public Service Authority Revenue | 5.000% | 1/1/29 | 500 | 547 |
| York County SC School District GO (Fort Mill | | | | |
| School District No. 4) | 5.000% | 3/1/18 | 1,365 | 1,483 |
| | | | | 11,599 |
| South Dakota (0.1%) | | | | |
| Educational Enhancement Funding Corp. South | | | | |
| Dakota Tobacco Settlement Revenue | 5.000% | 6/1/25 | 2,000 | 2,294 |
56
| | | | |
| Tax-Managed Balanced Fund | | | | |
| |
| |
| |
| | | | Face | Market |
| | | Maturity | Amount | Value• |
| | Coupon | Date | ($000) | ($000) |
| Tennessee (0.9%) | | | | |
| Chattanooga TN Electric System Revenue | 5.000% | 9/1/31 | 1,000 | 1,213 |
| Chattanooga TN Health Educational & Housing | | | | |
| Facility Board Revenue (Catholic Health | | | | |
| Initiatives) | 5.000% | 1/1/33 | 1,500 | 1,652 |
| Chattanooga-Hamilton County TN Hospital | | | | |
| Authority Hospital Revenue | 5.000% | 10/1/27 | 1,000 | 1,138 |
| Knox County TN GO | 5.000% | 4/1/18 | 1,000 | 1,091 |
| Memphis TN Electric System Revenue | 5.000% | 12/1/17 | 500 | 539 |
| Memphis TN GO | 5.000% | 5/1/30 | 500 | 577 |
| Metropolitan Government of Nashville & | | | | |
| Davidson County TN GO | 5.000% | 7/1/21 | 625 | 724 |
| Metropolitan Government of Nashville & | | | | |
| Davidson County TN Health & Educational | | | | |
| Facilities Board Revenue | | | | |
| (Blakeford at Green Hills) | 5.000% | 7/1/27 | 500 | 544 |
| Metropolitan Government of Nashville & | | | | |
| Davidson County TN Water & Sewer Revenue | 5.000% | 7/1/20 | 500 | 579 |
| Shelby County TN GO | 5.000% | 3/1/19 | 500 | 561 |
| Shelby County TN GO | 5.000% | 4/1/19 (ETM) | 100 | 113 |
| Shelby County TN GO | 5.000% | 4/1/19 | 400 | 450 |
| Tennessee Energy Acquisition Corp. Gas Revenue | 5.000% | 9/1/16 | 500 | 514 |
| Tennessee Energy Acquisition Corp. Gas Revenue | 5.000% | 2/1/17 | 250 | 260 |
| Tennessee Energy Acquisition Corp. Gas Revenue | 5.250% | 9/1/17 | 500 | 534 |
| Tennessee Energy Acquisition Corp. Gas Revenue | 5.250% | 9/1/18 | 725 | 796 |
| Tennessee Energy Acquisition Corp. Gas Revenue | 5.250% | 9/1/22 | 1,115 | 1,318 |
| Tennessee Energy Acquisition Corp. Gas Revenue | 5.000% | 2/1/24 | 1,500 | 1,745 |
| Tennessee Energy Acquisition Corp. Gas Revenue | 5.250% | 9/1/24 | 375 | 445 |
| Tennessee Energy Acquisition Corp. Gas Revenue | 5.000% | 2/1/25 | 715 | 838 |
| Tennessee Energy Acquisition Corp. Gas Revenue | 5.250% | 9/1/26 | 585 | 699 |
| Tennessee Energy Acquisition Corp. Gas Revenue | 5.000% | 2/1/27 | 1,000 | 1,173 |
| Tennessee GO | 5.000% | 8/1/20 | 625 | 730 |
| Tennessee GO | 5.000% | 8/1/21 | 1,490 | 1,781 |
| Tennessee GO | 5.000% | 8/1/22 | 1,475 | 1,798 |
| | | | | 21,812 |
| Texas (4.5%) | | | | |
| Arlington TX GO | 5.000% | 8/15/19 | 1,920 | 2,175 |
| Arlington TX Independent School District GO | 5.000% | 2/15/24 | 1,355 | 1,674 |
| Austin TX Combined Utility System Revenue | 0.000% | 5/15/18 (14) | 1,000 | 975 |
| Austin TX Community College District Public | | | | |
| Facilities Corp. Lease Revenue | 5.000% | 8/1/27 | 1,000 | 1,202 |
| Austin TX Water & Wastewater System Revenue | 5.000% | 11/15/21 | 500 | 596 |
| Austin TX Water & Wastewater System Revenue | 5.000% | 11/15/24 | 275 | 313 |
| Central Texas Regional Mobility Authority | | | | |
| Revenue | 0.000% | 1/1/25 | 100 | 72 |
| Central Texas Regional Mobility Authority | | | | |
| Revenue | 5.750% | 1/1/25 | 500 | 556 |
| Central Texas Regional Mobility Authority | | | | |
| Revenue | 0.000% | 1/1/26 | 180 | 123 |
| Central Texas Regional Mobility Authority | | | | |
| Revenue | 5.000% | 1/1/30 | 800 | 920 |
| Central Texas Regional Mobility Authority | | | | |
| Revenue | 5.000% | 1/1/33 | 500 | 550 |
| Clifton TX Higher Education Finance Corp. | | | | |
| Revenue (Baylor University) | 5.250% | 3/1/29 | 200 | 230 |
57
| | | | |
| Tax-Managed Balanced Fund | | | | |
| |
| |
| |
| | | | Face | Market |
| | | Maturity | Amount | Value• |
| | Coupon | Date | ($000) | ($000) |
| Cypress-Fairbanks TX Independent School | | | | |
| District GO | 5.000% | 2/15/17 (Prere.) | 455 | 477 |
| Cypress-Fairbanks TX Independent School | | | | |
| District GO | 5.000% | 2/15/25 | 500 | 582 |
| Cypress-Fairbanks TX Independent School | | | | |
| District GO | 5.000% | 2/15/30 | 45 | 47 |
| Dallas TX Area Rapid Transit Sales Tax Revenue | 4.500% | 12/1/27 | 500 | 532 |
| Dallas TX Area Rapid Transit Sales Tax Revenue | 5.000% | 12/1/27 | 500 | 598 |
| Dallas TX Independent School District GO | 5.000% | 2/15/23 | 485 | 570 |
| Dallas TX Waterworks & Sewer System Revenue | 5.000% | 10/1/17 | 200 | 215 |
| Dallas TX Waterworks & Sewer System Revenue | 5.000% | 10/1/21 | 1,090 | 1,303 |
| Dallas TX Waterworks & Sewer System Revenue | 5.000% | 10/1/22 | 330 | 393 |
| Dallas-Fort Worth TX International Airport | | | | |
| Revenue | 5.000% | 11/1/16 | 515 | 534 |
| Dallas-Fort Worth TX International Airport | | | | |
| Revenue | 5.250% | 11/1/29 | 1,000 | 1,184 |
| Eagle Mountain & Saginaw TX Independent | | | | |
| School District GO | 4.550% | 8/15/16 (Prere.) | 705 | 723 |
| Eagle Mountain & Saginaw TX Independent | | | | |
| School District GO | 4.550% | 8/15/37 (4) | 795 | 810 |
| El Paso TX Water & Sewer Revenue | 5.000% | 3/1/22 | 765 | 918 |
| Fort Worth TX Water & Sewer Revenue | 5.000% | 2/15/25 | 450 | 524 |
| Grand Parkway Transportation Corp. Texas | | | | |
| System Toll Revenue | 0.000% | 10/1/30 | 1,550 | 1,303 |
| Harris County TX Flood Control District GO | 5.250% | 10/1/18 | 435 | 486 |
| Harris County TX GO | 5.000% | 10/1/17 | 1,000 | 1,072 |
| Harris County TX GO | 5.000% | 10/1/23 | 500 | 566 |
| Harris County TX GO | 5.000% | 10/1/23 | 300 | 356 |
| Harris County TX GO | 5.000% | 8/15/32 | 1,000 | 1,185 |
| Harris County TX Health Facilities Development | | | | |
| Corp. Revenue (Methodist Hospital System) | | | | |
| VRDO | 0.010% | 1/4/16 | 1,000 | 1,000 |
| Harris County TX Sports Authority Revenue | 5.000% | 11/15/22 | 945 | 1,105 |
| 1 Harris County TX Toll Road Revenue | 0.790% | 8/15/18 | 1,000 | 1,001 |
| Harris County TX Toll Road Revenue | 5.000% | 8/15/27 | 500 | 562 |
| Harris County TX Toll Road Revenue | 5.000% | 8/15/32 | 500 | 575 |
| Houston TX Airport System Revenue | 5.000% | 7/1/19 (14) | 1,000 | 1,061 |
| Houston TX Airport System Revenue | 5.000% | 7/1/26 (14) | 3,000 | 3,162 |
| Houston TX GO | 5.000% | 3/1/18 | 1,650 | 1,793 |
| Houston TX GO | 5.000% | 3/1/20 | 500 | 563 |
| Houston TX Hotel Occupancy Tax & Special | | | | |
| Revenue (Convention & Entertainment Facilities) | 5.000% | 9/1/24 | 1,000 | 1,198 |
| Houston TX Independent School District GO | 5.000% | 2/15/20 | 1,105 | 1,271 |
| Houston TX Utility System Revenue | 5.000% | 11/15/17 (Prere.) | 380 | 409 |
| Houston TX Utility System Revenue | 5.000% | 5/15/25 | 1,000 | 1,225 |
| Houston TX Utility System Revenue | 5.000% | 11/15/28 (4) | 120 | 128 |
| 1 Houston TX Utility System Revenue PUT | 0.610% | 8/1/16 | 1,000 | 1,000 |
| 1 Houston TX Utility System Revenue PUT | 0.910% | 5/1/20 | 1,000 | 996 |
| Irving TX Independent School District GO | 5.000% | 2/15/21 | 1,500 | 1,766 |
| Katy TX Independent School District GO | 5.000% | 2/15/20 | 2,000 | 2,096 |
| Lake Travis TX Independent School District GO | 5.000% | 2/15/32 | 500 | 579 |
| Lamar TX Consolidated Independent School | | | | |
| District GO | 5.000% | 2/15/25 | 1,245 | 1,554 |
| Laredo TX Community College District GO | 5.000% | 8/1/25 | 1,000 | 1,214 |
| Lone Star College System Texas GO | 5.000% | 8/15/19 (Prere.) | 250 | 284 |
58
| | | | |
| Tax-Managed Balanced Fund | | | | |
| |
| |
| |
| | | | Face | Market |
| | | Maturity | Amount | Value• |
| | Coupon | Date | ($000) | ($000) |
| Lower Colorado River Authority Texas | | | | |
| Transmission Contract Revenue | | | | |
| (LCRA Transmission Services Corp.) | 5.000% | 5/15/28 | 1,150 | 1,355 |
| Lubbock TX GO | 5.000% | 2/15/23 | 500 | 602 |
| Mesquite TX Health Facilities Development | | | | |
| Corp. Retirement Facility Revenue | | | | |
| (Christian Care CentersInc. Project) | 5.000% | 2/15/24 | 350 | 380 |
| New Hope TX Cultural Education Facilities | | | | |
| FinanceCorp. First Mortgage Revenue | | | | |
| (Morningside Ministries Project) | 6.250% | 1/1/33 | 1,640 | 1,836 |
| New Hope TX Cultural Education Facilities | | | | |
| FinanceCorp. Student Housing Revenue | | | | |
| (Tarleton State University Project) | 4.000% | 4/1/17 | 245 | 251 |
| New Hope TX Cultural Education Facilities | | | | |
| FinanceCorp. Student Housing Revenue | | | | |
| (Tarleton State University Project) | 4.000% | 4/1/19 | 495 | 515 |
| New Hope TX Cultural Education Facilities | | | | |
| FinanceCorp. Student Housing Revenue | | | | |
| (Tarleton State University Project) | 5.000% | 4/1/23 | 200 | 221 |
| New Hope TX Cultural Education Facilities | | | | |
| FinanceCorp. Student Housing Revenue | | | | |
| (Tarleton State University Project) | 5.000% | 4/1/24 | 210 | 232 |
| New Hope TX Cultural Education Facilities | | | | |
| FinanceCorp. Student Housing Revenue | | | | |
| (Tarleton State University Project) | 5.000% | 4/1/25 | 240 | 266 |
| North East TX Independent School District GO | 5.250% | 2/1/22 | 500 | 608 |
| North Texas Tollway Authority System Revenue | 6.000% | 1/1/18 (Prere.) | 440 | 483 |
| North Texas Tollway Authority System Revenue | 6.000% | 1/1/18 (Prere.) | 440 | 483 |
| North Texas Tollway Authority System Revenue | 6.000% | 1/1/20 | 60 | 65 |
| North Texas Tollway Authority System Revenue | 6.250% | 2/1/23 | 1,400 | 1,607 |
| North Texas Tollway Authority System Revenue | 6.000% | 1/1/25 | 60 | 66 |
| North Texas Tollway Authority System Revenue | 6.000% | 1/1/28 | 250 | 283 |
| North Texas Tollway Authority System Revenue | 5.500% | 9/1/28 | 500 | 598 |
| North Texas Tollway Authority System Revenue | 5.000% | 1/1/29 | 1,000 | 1,187 |
| North Texas Tollway Authority System Revenue | 5.000% | 1/1/30 | 500 | 580 |
| North Texas Tollway Authority System Revenue | 5.000% | 1/1/31 | 500 | 577 |
| North Texas Tollway Authority System Revenue | 5.000% | 1/1/32 | 1,740 | 2,022 |
| North Texas Tollway Authority System Revenue | 5.000% | 1/1/33 | 1,500 | 1,736 |
| North Texas Tollway Authority System Revenue | 5.000% | 1/1/34 | 1,575 | 1,816 |
| Northwest Independent School District Texas GO | 5.000% | 2/15/26 | 1,000 | 1,239 |
| 3 Pasadena TX GO | 4.000% | 2/15/28 | 1,000 | 1,110 |
| SA Energy Acquisition Public Facility Corp. | | | | |
| Texas Gas Supply Revenue | 5.250% | 8/1/17 | 500 | 532 |
| SA Energy Acquisition Public Facility Corp. | | | | |
| Texas Gas Supply Revenue | 5.500% | 8/1/19 | 500 | 565 |
| Sam Rayburn TX Municipal Power Agency | | | | |
| Revenue | 5.000% | 10/1/19 | 210 | 236 |
| San Antonio TX Electric & Gas Systems Revenue | 5.000% | 2/1/16 (Prere.) | 905 | 909 |
| San Antonio TX Electric & Gas Systems Revenue | 5.000% | 2/1/19 | 500 | 559 |
| San Antonio TX Electric & Gas Systems Revenue | 5.000% | 2/1/21 | 500 | 590 |
| San Antonio TX GO | 5.000% | 8/1/20 | 125 | 146 |
| San Antonio TX GO | 5.000% | 2/1/22 | 1,000 | 1,173 |
| San Antonio TX GO | 5.000% | 2/1/24 | 500 | 579 |
| San Antonio TX GO | 5.000% | 2/1/26 | 1,000 | 1,234 |
| 1 San Antonio TX Water Revenue PUT | 0.690% | 11/1/16 | 1,000 | 1,000 |
| 1 San Antonio TX Water Revenue PUT | 0.410% | 11/1/17 | 1,500 | 1,492 |
59
| | | | |
| Tax-Managed Balanced Fund | | | | |
| |
| |
| |
| | | | Face | Market |
| | | Maturity | Amount | Value• |
| | Coupon | Date | ($000) | ($000) |
| Southwest Texas Higher Education Authority | | | | |
| Inc. Revenue (Southern Methodist University | | | | |
| Project) | 5.000% | 10/1/16 (2) | 260 | 269 |
| Spring Branch TX Independent School District GO | 5.000% | 2/1/20 | 1,000 | 1,149 |
| Spring TX Independent School District GO | 5.000% | 8/15/32 | 1,000 | 1,210 |
| Tarrant County TX Cultural Education Facilities | | | | |
| Finance Corp. Hospital Revenue (Methodist | | | | |
| Hospitals of Dallas) | 5.250% | 10/1/31 | 1,000 | 1,182 |
| Tarrant County TX Cultural Education Facilities | | | | |
| Finance Corp. Revenue (CHRISTUS Health) | 6.250% | 7/1/28 (12) | 325 | 367 |
| Tarrant County TX Cultural Education Facilities | | | | |
| Finance Corp. Revenue (Texas Health | | | | |
| Resources) | 5.000% | 2/15/26 | 1,735 | 1,812 |
| Texas A&M University System Revenue | | | | |
| Financing System Revenue | 5.000% | 5/15/26 | 500 | 560 |
| Texas GO | 4.000% | 4/1/18 | 400 | 427 |
| Texas GO | 5.000% | 10/1/22 | 1,000 | 1,218 |
| Texas GO | 5.000% | 10/1/27 | 1,400 | 1,701 |
| Texas GO | 5.000% | 10/1/28 | 1,330 | 1,608 |
| Texas GO | 5.000% | 8/1/31 | 500 | 586 |
| Texas Municipal Gas Acquisition & Supply | | | | |
| Corp. Revenue | 5.250% | 12/15/17 | 550 | 591 |
| Texas Municipal Gas Acquisition & Supply | | | | |
| Corp. Revenue | 5.250% | 12/15/21 | 240 | 281 |
| Texas Municipal Gas Acquisition & Supply | | | | |
| Corp. Revenue | 5.000% | 12/15/22 | 405 | 474 |
| Texas Municipal Gas Acquisition & Supply | | | | |
| Corp. Revenue | 5.000% | 12/15/23 | 380 | 442 |
| Texas Municipal Gas Acquisition & Supply | | | | |
| Corp. Revenue | 5.250% | 12/15/23 | 190 | 225 |
| Texas Municipal Gas Acquisition & Supply | | | | |
| Corp. Revenue | 5.250% | 12/15/24 | 495 | 588 |
| Texas Municipal Gas Acquisition & Supply | | | | |
| Corp. Revenue | 5.000% | 12/15/25 | 2,185 | 2,511 |
| Texas Public Finance Authority Revenue | | | | |
| (Texas Southern University) | 5.000% | 11/1/21 (15) | 1,000 | 1,130 |
| Texas Public Finance Authority Revenue | | | | |
| (Unemployment Compensation) | 4.000% | 1/1/18 | 1,000 | 1,018 |
| Texas Tech University System Financing | | | | |
| System Revenue | 5.000% | 2/15/28 | 500 | 549 |
| Texas Transportation Commission GO | 5.000% | 10/1/22 | 1,175 | 1,431 |
| Texas Transportation Commission Mobility | | | | |
| Fund GO | 5.000% | 10/1/21 | 1,500 | 1,793 |
| Texas Transportation Commission Mobility | | | | |
| Fund GO | 5.000% | 10/1/29 | 1,500 | 1,838 |
| 1 Texas Transportation Commission Mobility | | | | |
| Fund GO PUT | 0.390% | 10/1/18 | 1,500 | 1,487 |
| Texas Transportation Commission Revenue | 4.750% | 4/1/16 (Prere.) | 500 | 506 |
| Texas Transportation Commission Revenue | 5.000% | 4/1/16 (Prere.) | 500 | 506 |
| Texas Transportation Commission Revenue | 5.000% | 4/1/16 (Prere.) | 500 | 506 |
| Texas Turnpike Authority Central Texas | | | | |
| Turnpike System Revenue | 0.000% | 8/15/20 (ETM) | 285 | 266 |
| Texas Turnpike Authority Central Texas | | | | |
| Turnpike System Revenue | 0.000% | 8/15/20 (2) | 525 | 483 |
| Texas Water Financial Assistance GO | 5.000% | 8/1/24 | 500 | 549 |
| Texas Water Financial Assistance GO | 5.000% | 8/1/25 | 500 | 548 |
60
| | | | |
| Tax-Managed Balanced Fund | | | | |
| |
| |
| |
| | | | Face | Market |
| | | Maturity | Amount | Value• |
| | Coupon | Date | ($000) | ($000) |
| Texas Water Financial Assistance GO | 5.000% | 8/1/27 | 500 | 548 |
| University of Texas Permanent University Fund | | | | |
| Revenue | 5.000% | 7/1/19 | 1,225 | 1,389 |
| University of Texas System Revenue Financing | | | | |
| System Revenue | 4.750% | 2/15/17 (Prere.) | 820 | 856 |
| University of Texas System Revenue Financing | | | | |
| System Revenue | 5.000% | 8/15/19 | 325 | 370 |
| University of Texas System Revenue Financing | | | | |
| System Revenue | 5.000% | 8/15/21 | 500 | 597 |
| University of Texas System Revenue Financing | | | | |
| System Revenue | 4.750% | 8/15/30 | 1,180 | 1,228 |
| Williamson County TX GO | 5.000% | 2/15/23 | 230 | 276 |
| | | | | 112,514 |
| Utah (0.3%) | | | | |
| Central Utah Water Conservancy District GO | 5.000% | 4/1/30 | 500 | 576 |
| Utah Associated Municipal Power Systems | | | | |
| Revenue (Horse Butte Wind Project) | 5.000% | 9/1/32 | 350 | 396 |
| Utah GO | 5.000% | 7/1/16 | 615 | 629 |
| Utah GO | 5.000% | 7/1/16 | 500 | 511 |
| Utah GO | 4.500% | 7/1/19 | 2,000 | 2,236 |
| Utah GO | 5.000% | 7/1/19 | 615 | 698 |
| Utah Transit Authority Sales Tax Revenue | 5.000% | 6/15/26 | 1,000 | 1,253 |
| | | | | 6,299 |
| Virgin Islands (0.1%) | | | | |
| Virgin Islands Public Finance Authority Revenue | 5.000% | 10/1/20 | 1,660 | 1,864 |
| Virgin Islands Public Finance Authority Revenue | 5.000% | 10/1/29 | 500 | 543 |
| | | | | 2,407 |
| Virginia (0.8%) | | | | |
| Arlington County VA GO | 5.000% | 8/1/17 | 750 | 800 |
| Arlington County VA GO | 5.000% | 8/15/19 | 1,535 | 1,748 |
| Arlington County VA GO | 5.000% | 8/1/23 | 600 | 725 |
| Chesapeake VA Toll Road Revenue | 5.000% | 7/15/21 | 500 | 572 |
| Chesterfield County VA GO | 5.000% | 1/1/22 | 900 | 1,083 |
| Fairfax County VA GO | 4.000% | 10/1/19 | 2,000 | 2,213 |
| Fairfax County VA GO | 5.000% | 10/1/23 | 1,255 | 1,558 |
| Fairfax County VA GO | 5.000% | 10/1/24 | 1,365 | 1,718 |
| Fairfax County VA Public Improvement GO | 5.000% | 10/1/17 | 500 | 537 |
| Fairfax County VA Public Improvement GO | 5.000% | 4/1/21 | 300 | 356 |
| Fairfax County VA Water Authority Revenue | 5.000% | 4/1/25 | 500 | 598 |
| Norfolk VA Water Revenue | 5.000% | 11/1/31 | 500 | 584 |
| Roanoke VA Economic Development Authority | | | | |
| Hospital Revenue (Carilion Clinic Obligated | | | | |
| Group) | 5.000% | 7/1/30 | 500 | 562 |
| Virginia College Building Authority Educational | | | | |
| Facilities Revenue (21st Century College & | | | | |
| Equipment Programs) | 5.000% | 2/1/17 | 200 | 209 |
| Virginia College Building Authority Educational | | | | |
| Facilities Revenue (Public Higher Education | | | | |
| Financing Program) | 5.000% | 9/1/19 | 1,570 | 1,783 |
| Virginia College Building Authority Educational | | | | |
| Facilities Revenue (Public Higher Education | | | | |
| Financing Program) | 5.000% | 9/1/22 | 355 | 430 |
61
| | | | |
| Tax-Managed Balanced Fund | | | | |
| |
| |
| |
| | | | Face | Market |
| | | Maturity | Amount | Value• |
| | Coupon | Date | ($000) | ($000) |
| Virginia Public Building Authority Public Facilities | | | | |
| Revenue | 5.000% | 8/1/19 | 1,495 | 1,695 |
| Virginia Public School Authority Revenue | 5.000% | 8/1/19 | 500 | 567 |
| Virginia Public School Authority Revenue | 4.000% | 8/1/20 | 1,700 | 1,902 |
| | | | | 19,640 |
| Washington (1.5%) | | | | |
| Energy Northwest Washington Electric Revenue | | | | |
| (Columbia Generating Station) | 5.000% | 7/1/20 | 500 | 580 |
| Energy Northwest Washington Electric Revenue | | | | |
| (Columbia Generating Station) | 5.000% | 7/1/31 | 1,200 | 1,446 |
| Energy Northwest Washington Electric Revenue | | | | |
| (Project No. 1) | 5.250% | 7/1/16 | 1,000 | 1,024 |
| Energy Northwest Washington Electric Revenue | | | | |
| (Project No. 1) | 5.000% | 7/1/17 | 500 | 531 |
| Energy Northwest Washington Electric Revenue | | | | |
| (Project No. 3) | 5.000% | 7/1/16 | 865 | 885 |
| King County WA GO | 5.000% | 1/1/19 | 150 | 168 |
| King County WA GO | 5.000% | 7/1/20 | 1,250 | 1,456 |
| King County WA GO | 5.000% | 1/1/24 | 500 | 591 |
| King County WA Sewer Revenue | 5.000% | 1/1/20 | 1,000 | 1,145 |
| Port of Seattle WA Revenue | 5.000% | 8/1/29 | 250 | 292 |
| Seattle WA GO | 5.000% | 6/1/21 | 1,000 | 1,184 |
| Seattle WA Water System Revenue | 5.000% | 5/1/19 | 1,460 | 1,643 |
| Snohomish County WA School District No. 201 GO | 5.250% | 12/1/26 | 1,760 | 1,964 |
| University of Washington Revenue | 5.000% | 4/1/31 | 335 | 383 |
| Washington (Motor Vehicle Fuel Tax) GO | 5.000% | 7/1/17 (Prere.) | 500 | 532 |
| Washington (Motor Vehicle Fuel Tax) GO | 5.000% | 7/1/18 (Prere.) | 425 | 467 |
| Washington (Motor Vehicle Fuel Tax) GO | 5.000% | 7/1/23 | 375 | 443 |
| Washington (Motor Vehicle Fuel Tax) GO | 5.000% | 7/1/27 | 1,000 | 1,220 |
| Washington (Motor Vehicle Fuel Tax) GO | 4.000% | 7/1/31 | 1,500 | 1,625 |
| Washington Economic Development Finance | | | | |
| Authority Lease Revenue (Washington | | | | |
| Biomedical Research Properties 2) | 5.000% | 6/1/25 | 1,080 | 1,331 |
| Washington GO | 5.000% | 2/1/16 | 500 | 502 |
| Washington GO | 5.000% | 7/1/16 (Prere.) | 500 | 512 |
| Washington GO | 5.000% | 7/1/17 | 200 | 213 |
| Washington GO | 5.000% | 7/1/18 (Prere.) | 500 | 550 |
| Washington GO | 5.000% | 7/1/18 | 675 | 742 |
| Washington GO | 0.000% | 6/1/20 (14) | 500 | 468 |
| Washington GO | 5.000% | 7/1/20 | 1,000 | 1,162 |
| Washington GO | 5.000% | 8/1/20 | 500 | 568 |
| Washington GO | 5.000% | 7/1/22 | 1,350 | 1,634 |
| Washington GO | 5.000% | 7/1/23 | 1,000 | 1,228 |
| Washington GO | 5.000% | 7/1/25 | 500 | 597 |
| Washington GO | 5.000% | 7/1/25 | 1,500 | 1,849 |
| Washington GO | 5.000% | 8/1/27 | 1,000 | 1,233 |
| Washington GO | 5.000% | 2/1/32 | 500 | 584 |
| Washington Health Care Facilities Authority | | | | |
| Revenue (Central Washington Health Services | | | | |
| Association) | 5.000% | 7/1/30 | 1,760 | 1,966 |
| Washington Health Care Facilities Authority | | | | |
| Revenue (Providence Health & Services) | 5.000% | 10/1/31 (14) | 2,000 | 2,057 |
| Washington Health Care Facilities Authority | | | | |
| Revenue (Providence Health & Services) | 5.000% | 10/1/33 | 880 | 994 |
| Washington State University General Revenue | 5.000% | 10/1/31 | 500 | 587 |
| | | | | 36,356 |
62
| | | | |
| Tax-Managed Balanced Fund | | | | |
| |
| |
| |
| | | | Face | Market |
| | | Maturity | Amount | Value• |
| | Coupon | Date | ($000) | ($000) |
| West Virginia (0.0%) | | | | |
| West Virginia Hospital Finance Authority Hospital | | | | |
| Revenue (Charleston Area Medical Center Inc.) | 5.125% | 9/1/23 | 1,000 | 1,097 |
| |
| Wisconsin (0.6%) | | | | |
| Milwaukee WI GO | 4.000% | 3/15/19 | 1,000 | 1,085 |
| Milwaukee WI GO | 4.000% | 3/15/20 | 1,000 | 1,105 |
| Wisconsin Annual Appropriation Revenue | 5.625% | 5/1/28 | 460 | 521 |
| Wisconsin GO | 5.000% | 5/1/16 | 500 | 508 |
| Wisconsin GO | 5.000% | 5/1/18 (Prere.) | 500 | 547 |
| Wisconsin GO | 5.000% | 5/1/19 | 1,335 | 1,504 |
| Wisconsin GO | 5.000% | 5/1/20 | 1,000 | 1,158 |
| Wisconsin GO | 5.000% | 5/1/21 | 750 | 889 |
| Wisconsin GO | 5.000% | 5/1/24 | 500 | 599 |
| Wisconsin GO | 5.000% | 5/1/26 | 2,210 | 2,638 |
| Wisconsin Health & Educational Facilities | | | | |
| Authority Revenue (Aspirus, Inc. Obligated | | | | |
| Group) | 5.000% | 8/15/25 | 1,570 | 1,830 |
| Wisconsin Health & Educational Facilities | | | | |
| Authority Revenue (Marquette University) | 5.000% | 10/1/30 | 500 | 570 |
| Wisconsin Public Power System Power Supply | | | | |
| System Revenue | 5.000% | 7/1/32 | 500 | 573 |
| Wisconsin Transportation Revenue | 5.000% | 7/1/23 | 500 | 609 |
| | | | | 14,136 |
| Total Tax-Exempt Municipal Bonds (Cost $1,200,640) | | | 1,251,756 |
| Total Investments (98.4%) (Cost $1,972,360) | | | | 2,438,269 |
| |
| | | | | Amount |
| | | | | ($000) |
| Other Assets and Liabilities (1.6%) | | | | |
| Other Assets | | | | |
| Investment in Vanguard | | | | 206 |
| Receivables for Investment Securities Sold | | | | 6 |
| Receivables for Accrued Income | | | | 16,249 |
| Receivables for Capital Shares Issued | | | | 10,695 |
| Other Assets | | | | 35,970 |
| Total Other Assets | | | | 63,126 |
| Liabilities | | | | |
| Payables for Investment Securities Purchased | | | | (18,948) |
| Payables for Capital Shares Redeemed | | | | (1,467) |
| Payables to Vanguard | | | | (1,429) |
| Other Liabilities | | | | (1,461) |
| Total Liabilities | | | | (23,305) |
| Net Assets (100%) | | | | |
| Applicable to 92,273,011 outstanding $.001 par value shares of | | | |
| beneficial interest (unlimited authorization) | | | | 2,478,090 |
| Net Asset Value Per Share | | | | $26.86 |
63
| |
| Tax-Managed Balanced Fund | |
| |
| |
| |
| At December 31, 2015, net assets consisted of: | |
| | Amount |
| | ($000) |
| Paid-in Capital | 2,016,784 |
| Overdistributed Net Investment Income | (950) |
| Accumulated Net Realized Losses | (3,643) |
| Unrealized Appreciation (Depreciation) | |
| Investment Securities | 465,909 |
| Futures Contracts | (10) |
| Net Assets | 2,478,090 |
• See Note A in Notes to Financial Statements.
* Non-income-producing security.
† Security with a value of $341,000 has been segregated as initial margin for open futures contracts.
1 Adjustable-rate security.
2 Security exempt from registration under Rule 144A of the Securities Act of 1933. Such securities may be sold in transactions exempt from
registration, normally to qualified institutional buyers. At December 31, 2015, the value of this security represented 0.1% of net assets.
3 Security purchased on a when-issued or delayed-delivery basis for which the fund has not taken delivery as of December 31, 2015.
A key to abbreviations and other references follows the Statement of Net Assets.
See accompanying Notes, which are an integral part of the Financial Statements.
64
Tax-Managed Balanced Fund
Key to Abbreviations
ARS—Auction Rate Security.
BAN—Bond Anticipation Note.
COP—Certificate of Participation.
CP—Commercial Paper.
FR—Floating Rate.
GAN—Grant Anticipation Note.
GO—General Obligation Bond.
PILOT—Payments in Lieu of Taxes.
PUT—Put Option Obligation.
RAN—Revenue Anticipation Note.
TAN—Tax Anticipation Note.
TOB—Tender Option Bond.
TRAN—Tax Revenue Anticipation Note.
VRDO—Variable Rate Demand Obligation.
VRDP—Variable Rate Demand Preferred.
(ETM)—Escrowed to Maturity.
(Prere.)—Prerefunded.
Scheduled principal and interest payments are guaranteed by:
(1) MBIA (Municipal Bond Investors Assurance).
(2) AMBAC (Ambac Assurance Corporation).
(3) FGIC (Financial Guaranty Insurance Company).
(4) AGM (Assured Guaranty Municipal Corporation).
(5) BIGI (Bond Investors Guaranty Insurance).
(6) Connie Lee Inc.
(7) FHA (Federal Housing Authority).
(8) CapMAC (Capital Markets Assurance Corporation).
(9) American Capital Access Financial Guaranty Corporation.
(10) XL Capital Assurance Inc.
(11) CIFG (CDC IXIS Financial Guaranty).
(12) AGC (Assured Guaranty Corporation).
(13) BHAC (Berkshire Hathaway Assurance Corporation).
(14) NPFG (National Public Finance Guarantee Corporation).
(15) BAM (Build America Mutual Assurance Company).
(16) MAC (Municipal Assurance Corporation).
(17) RAA (Radian Asset Assurance Inc.).
The insurance does not guarantee the market value of the municipal bonds.
LOC—Scheduled principal and interest payments are guaranteed by bank letter of credit.
65
Tax-Managed Balanced Fund
Statement of Operations
| |
| | Year Ended |
| | December 31, 2015 |
| | ($000) |
| Investment Income | |
| Income | |
| Dividends | 18,430 |
| Interest | 30,140 |
| Total Income | 48,570 |
| Expenses | |
| The Vanguard Group—Note B | |
| Investment Advisory Services | 156 |
| Management and Administrative | 1,934 |
| Marketing and Distribution | 213 |
| Custodian Fees | 27 |
| Auditing Fees | 32 |
| Shareholders’ Reports | 33 |
| Trustees’ Fees and Expenses | 2 |
| Total Expenses | 2,397 |
| Net Investment Income | 46,173 |
| Realized Net Gain (Loss) | |
| Investment Securities Sold | 6,675 |
| Futures Contracts | 168 |
| Realized Net Gain (Loss) | 6,843 |
| Change in Unrealized Appreciation (Depreciation) | |
| Investment Securities | (4,460) |
| Futures Contracts | (10) |
| Change in Unrealized Appreciation (Depreciation) | (4,470) |
| Net Increase (Decrease) in Net Assets Resulting from Operations | 48,546 |
See accompanying Notes, which are an integral part of the Financial Statements.
66
Tax-Managed Balanced Fund
Statement of Changes in Net Assets
| | |
| | Year Ended December 31, |
| | 2015 | 2014 |
| | ($000) | ($000) |
| Increase (Decrease) in Net Assets | | |
| Operations | | |
| Net Investment Income | 46,173 | 35,322 |
| Realized Net Gain (Loss) | 6,843 | (4,111) |
| Change in Unrealized Appreciation (Depreciation) | (4,470) | 122,292 |
| Net Increase (Decrease) in Net Assets Resulting from Operations | 48,546 | 153,503 |
| Distributions | | |
| Net Investment Income | (46,224) | (34,862) |
| Realized Capital Gain | — | — |
| Total Distributions | (46,224) | (34,862) |
| Capital Share Transactions | | |
| Issued | 762,424 | 478,055 |
| Issued in Lieu of Cash Distributions | 39,524 | 29,911 |
| Redeemed | (237,271) | (116,048) |
| Net Increase (Decrease) from Capital Share Transactions | 564,677 | 391,918 |
| Total Increase (Decrease) | 566,999 | 510,559 |
| Net Assets | | |
| Beginning of Period | 1,911,091 | 1,400,532 |
| End of Period1 | 2,478,090 | 1,911,091 |
| 1 Net Assets—End of Period includes undistributed (overdistributed) net investment income of ($950,000) and ($899,000). |
See accompanying Notes, which are an integral part of the Financial Statements.
67
Tax-Managed Balanced Fund
Financial Highlights
| | | | | |
| For a Share Outstanding | Year Ended December 31, |
| Throughout Each Period | 2015 | 2014 | 2013 | 2012 | 2011 |
| Net Asset Value, Beginning of Period | $26.79 | $24.90 | $22.25 | $20.55 | $19.96 |
| Investment Operations | | | | | |
| Net Investment Income | . 557 | .547 | .517 | .525 | .519 |
| Net Realized and Unrealized Gain (Loss) | | | | | |
| on Investments | . 067 | 1.879 | 2.647 | 1.696 | .585 |
| Total from Investment Operations | . 624 | 2.426 | 3.164 | 2.221 | 1.104 |
| Distributions | | | | | |
| Dividends from Net Investment Income1 | (. 554) | (.536) | (.514) | (.521) | (.514) |
| Distributions from Realized Capital Gains | — | — | — | — | — |
| Total Distributions | (. 554) | (.536) | (.514) | (.521) | (.514) |
| Net Asset Value, End of Period | $26.86 | $26.79 | $24.90 | $22.25 | $20.55 |
| |
| Total Return2 | 2.35% | 9.81% | 14.34% | 10.87% | 5.58% |
| |
| Ratios/Supplemental Data | | | | | |
| Net Assets, End of Period (Millions) | $2,478 | $1,911 | $1,401 | $1,015 | $797 |
| Ratio of Total Expenses to Average Net Assets | 0.11% | 0.12% | 0.12% | 0.12% | 0.12% |
| Ratio of Net Investment Income to | | | | | |
| Average Net Assets | 2.11% | 2.15% | 2.21% | 2.43% | 2.55% |
| Portfolio Turnover Rate | 9% | 8% | 9% | 7% | 12% |
1 For tax purposes, nontaxable dividends represent 62%, 64%, 63%, 62%, and 70% of dividends from net investment income.
2 Total returns do not include transaction or account service fees that may have applied in the periods shown. Fund prospectuses provide
information about any applicable transaction and account service fees.
See accompanying Notes, which are an integral part of the Financial Statements.
68
Tax-Managed Balanced Fund
Notes to Financial Statements
Vanguard Tax-Managed Balanced Fund is registered under the Investment Company Act of 1940 as an open-end investment company, or mutual fund. The fund invests in debt instruments of many municipal issuers; the issuers’ abilities to meet their obligations may be affected by economic and political developments in a specific state or region.
A. The following significant accounting policies conform to generally accepted accounting principles for U.S. investment companies. The fund consistently follows such policies in preparing its financial statements.
1. Security Valuation: Securities are valued as of the close of trading on the New York Stock Exchange (generally 4 p.m., Eastern time) on the valuation date. Equity securities are valued at the latest quoted sales prices or official closing prices taken from the primary market in which each security trades; such securities not traded on the valuation date are valued at the mean of the latest quoted bid and asked prices. Bonds, and temporary cash investments acquired over 60 days to maturity, are valued using the latest bid prices or using valuations based on a matrix system (which considers such factors as security prices, yields, maturities, and ratings), both as furnished by independent pricing services. Other temporary cash investments are valued at amortized cost, which approximates market value. Securities for which market quotations are not readily available, or whose values have been materially affected by events occurring before the fund’s pricing time but after the close of the securities’ primary markets, are valued by methods deemed by the board of trustees to represent fair value.
2. Futures Contracts: The fund uses futures contracts to invest in fixed income asset classes with greater efficiency and lower cost than is possible through direct investment, to add value when these instruments are attractively priced, or to adjust sensitivity to changes in interest rates. The fund also uses index futures contracts to a limited extent, with the objective of maintaining full exposure to the stock market while maintaining liquidity. The fund may purchase or sell futures contracts to achieve a desired level of investment, whether to accommodate portfolio turnover or cash flows from capital share transactions. The primary risks associated with the use of futures contracts are imperfect correlation between changes in market values of bonds held by the fund and the prices of futures contracts, and the possibility of an illiquid market. Counterparty risk involving futures is mitigated because a regulated clearinghouse is the counterparty instead of the clearing broker. To further mitigate counterparty risk, the fund trades futures contracts on an exchange, monitors the financial strength of its clearing brokers and clearinghouse, and has entered into clearing agreements with its clearing brokers. The clearinghouse imposes initial margin requirements to secure the fund’s performance and requires daily settlement of variation margin representing changes in the market value of each contract.
Futures contracts are valued at their quoted daily settlement prices. The aggregate settlement values of the contracts are not recorded in the Statement of Net Assets. Fluctuations in the value of the contracts are recorded in the Statement of Net Assets as an asset (liability) and in the Statement of Operations as unrealized appreciation (depreciation) until the contracts are closed, when they are recorded as realized futures gains (losses).
During the year ended December 31, 2015, the fund’s average investments in long and short futures contracts represented less than 1% and 0% of net assets, respectively, based on the average of aggregate settlement values at each quarter-end during the period.
3. Federal Income Taxes: The fund intends to continue to qualify as a regulated investment company and distribute all of its income. Management has analyzed the fund’s tax positions taken for all open federal income tax years (December 31, 2012–2015), and has concluded that no provision for federal income tax is required in the fund’s financial statements.
69
Tax-Managed Balanced Fund
4. Distributions: Distributions to shareholders are recorded on the ex-dividend date.
5. Credit Facility: The fund and certain other funds managed by The Vanguard Group (“Vanguard”) participate in a $3 billion committed credit facility provided by a syndicate of lenders pursuant to a credit agreement that may be renewed annually; each fund is individually liable for its borrowings, if any, under the credit facility. Borrowings may be utilized for temporary and emergency purposes, and are subject to the fund’s regulatory and contractual borrowing restrictions. The participating funds are charged administrative fees and an annual commitment fee of 0.06% of the undrawn amount of the facility; these fees are allocated to the funds based on a method approved by the fund’s board of trustees and included in Management and Administrative expenses on the fund’s Statement of Operations. Any borrowings under this facility bear interest at a rate equal to the higher of the federal funds rate or LIBOR reference rate plus an agreed-upon spread.
The fund had no borrowings outstanding at December 31, 2015, or at any time during the period then ended.
6. Other: Dividend income is recorded on the ex-dividend date. Interest income is accrued daily. Premiums and discounts on debt securities purchased are amortized and accreted, respectively, to interest income over the lives of the respective securities. Security transactions are accounted for on the date securities are bought or sold. Costs used to determine realized gains (losses) on the sale of investment securities are those of the specific securities sold.
B. In accordance with the terms of a Funds’ Service Agreement (the “FSA”) between Vanguard and the fund, Vanguard furnishes to the fund investment advisory, corporate management, administrative, marketing, and distribution services at Vanguard’s cost of operations (as defined by the FSA). These costs of operations are allocated to the fund based on methods and guidelines approved by the board of trustees. Vanguard does not require reimbursement in the current period for certain costs of operations (such as deferred compensation/benefits and risk/insurance costs); the fund’s liability for these costs of operations is included in Payables to Vanguard on the Statement of Net Assets.
Upon the request of Vanguard, the fund may invest up to 0.40% of its net assets as capital in Vanguard. At December 31, 2015, the fund had contributed to Vanguard capital in the amount of $206,000, representing 0.01% of the fund’s net assets and 0.08% of Vanguard’s capitalization. The fund’s trustees and officers are also directors and employees, respectively, of Vanguard.
C. Various inputs may be used to determine the value of the fund’s investments. These inputs are summarized in three broad levels for financial statement purposes. The inputs or methodologies used to value securities are not necessarily an indication of the risk associated with investing in those securities.
Level 1—Quoted prices in active markets for identical securities.
Level 2—Other significant observable inputs (including quoted prices for similar securities, interest rates, prepayment speeds, credit risk, etc.).
Level 3—Significant unobservable inputs (including the fund’s own assumptions used to determine the fair value of investments).
70
Tax-Managed Balanced Fund
The following table summarizes the market value of the fund’s investments as of December 31, 2015, based on the inputs used to value them:
| | | |
| | Level 1 | Level 2 | Level 3 |
| Investments | ($000) | ($000) | ($000) |
| Common Stocks | 1,186,513 | — | — |
| Tax-Exempt Municipal Bonds | — | 1,251,756 | — |
| Futures Contracts—Assets1 | 27 | — | — |
| Total | 1,186,540 | 1,251,756 | — |
| 1 Represents variation margin on the last day of the reporting period. |
D. At December 31, 2015, the aggregate settlement value of open futures contracts and the related unrealized appreciation (depreciation) were:
| | | | |
| | | | ($000) |
| | | | Aggregate | |
| | | Number of | Settlement | Unrealized |
| | | Long (Short) | Value | Appreciation |
| Futures Contracts | Expiration | Contracts | Long (Short) | (Depreciation) |
| 5-Year U.S. Treasury Note | March 2016 | 21 | 2,485 | (7) |
| 2-Year U.S. Treasury Note | March 2016 | 9 | 1,955 | (3) |
| | | | | (10) |
Unrealized appreciation (depreciation) on open futures contracts is required to be treated as realized gain (loss) for tax purposes.
E. Distributions are determined on a tax basis and may differ from net investment income and realized capital gains for financial reporting purposes. Differences may be permanent or temporary. Permanent differences are reclassified among capital accounts in the financial statements to reflect their tax character. Temporary differences arise when certain items of income, expense, gain, or loss are recognized in different periods for financial statement and tax purposes. These differences will reverse at some time in the future. Differences in classification may also result from the treatment of short-term gains as ordinary income for tax purposes.
Certain of the fund’s investments are in securities considered to be passive foreign investment companies, for which any unrealized appreciation and/or realized gains are required to be included in distributable net investment income for tax purposes. Passive foreign investment companies held at December 31, 2015, had unrealized appreciation of $17,000, all of which has been distributed and is reflected in the balance of overdistributed net investment income.
During the year ended December 31, 2015, the fund realized $4,911,000 of net capital gains resulting from in-kind redemptions—in which shareholders exchanged fund shares for securities held by the fund rather than for cash. Because such gains are not taxable to the fund, and are not distributed to shareholders, they have been reclassified from accumulated net realized losses to paid-in capital.
For tax purposes, at December 31, 2015, the fund had $337,000 of ordinary income available for distribution. The fund used capital loss carryforwards of $1,922,000 to offset taxable capital gains realized during the year ended December 31, 2015. At December 31, 2015, the fund had available capital losses totaling $3,653,000 to offset future net capital gains. Of this amount, $1,449,000 is
71
Tax-Managed Balanced Fund
subject to expiration on December 31, 2017. Capital losses of $2,204,000 realized beginning in fiscal 2011 may be carried forward indefinitely under the Regulated Investment Company Modernization Act of 2010, but must be used before any expiring loss carryforwards.
At December 31, 2015, the cost of investment securities for tax purposes was $1,972,377,000. Net unrealized appreciation of investment securities for tax purposes was $465,892,000, consisting of unrealized gains of $479,935,000 on securities that had risen in value since their purchase and $14,043,000 in unrealized losses on securities that had fallen in value since their purchase.
F. During the year ended December 31, 2015, the fund purchased $775,477,000 of investment securities and sold $198,354,000 of investment securities, other than U.S. government securities and temporary cash investments. Sales include $10,909,000 in connection with in-kind redemptions of the fund’s capital shares.
G. Capital shares issued and redeemed were:
| | |
| | Year Ended December 31, |
| | 2015 | 2014 |
| | Shares | Shares |
| | (000) | (000) |
| Issued | 28,278 | 18,435 |
| Issued in Lieu of Cash Distributions | 1,475 | 1,141 |
| Redeemed | (8,821) | (4,485) |
| Net Increase (Decrease) in Shares Outstanding | 20,932 | 15,091 |
H. Management has determined that no material events or transactions occurred subsequent to December 31, 2015, that would require recognition or disclosure in these financial statements.
72
Tax-Managed Capital Appreciation Fund
Fund Profile
As of December 31, 2015
| | |
| Share-Class Characteristics | |
| |
| | Admiral | Institutional |
| | Shares | Shares |
| Ticker Symbol | VTCLX | VTCIX |
| Expense Ratio1 | 0.12% | 0.08% |
| 30-Day SEC Yield | 1.70% | 1.74% |
| | | |
| Portfolio Characteristics | | |
| | | | DJ |
| | | Russell | U.S. Total |
| | | 1000 | Market |
| | Fund | Index | FA Index |
| Number of Stocks | 687 | 1,033 | 3,960 |
| Median Market Cap | $56.0B | $60.5B | $51.4B |
| Price/Earnings Ratio | 21.3x | 21.2x | 21.9x |
| Price/Book Ratio | 2.8x | 2.7x | 2.7x |
| Return on Equity | 18.1% | 17.8% | 17.2% |
| Earnings Growth | | | |
| Rate | 10.0% | 9.4% | 9.5% |
| Dividend Yield | 1.8% | 2.1% | 2.1% |
| Foreign Holdings | 0.0% | 0.0% | 0.0% |
| Turnover Rate | 10% | — | — |
| Short-Term Reserves | 0.2% | — | — |
| | |
| Volatility Measures | | |
| | | DJ |
| | Russell | U.S. Total |
| | 1000 | Market |
| | Index | FA Index |
| R-Squared | 1.00 | 1.00 |
| Beta | 1.01 | 1.00 |
These measures show the degree and timing of the fund’s fluctuations compared with the indexes over 36 months.
| | |
| Ten Largest Holdings (% of total net assets) |
| Apple Inc. | Computer | |
| | Technology | 3.0% |
| Alphabet Inc. | Computer Services | |
| | Software & Systems | 2.3 |
| Microsoft Corp. | Computer Services | |
| | Software & Systems | 2.1 |
| Exxon Mobil Corp. | Oil: Integrated | 1.6 |
| Amazon.com Inc. | Diversified Retail | 1.3 |
| Johnson & Johnson | Pharmaceuticals | 1.3 |
| Berkshire Hathaway Inc. Insurance: Multi-Line | 1.3 |
| Wells Fargo & Co. | Banks: Diversified | 1.2 |
| Facebook Inc. | Computer Services | |
| | Software & Systems | 1.2 |
| General Electric Co. | Diversified | |
| | Manufacturing | |
| | Operations | 1.1 |
| Top Ten | | 16.4% |
The holdings listed exclude any temporary cash investments and equity index products.
1 The expense ratios shown are from the prospectus dated April 29, 2015, and represent estimated costs for the current fiscal year. For the fiscal
year ended December 31, 2015, the expense ratios were 0.11% for Admiral Shares and 0.07% for Institutional Shares.
73
Tax-Managed Capital Appreciation Fund
| | | |
| Sector Diversification (% of equity exposure) |
| | | | DJ |
| | | Russell | U.S. Total |
| | | 1000 | Market |
| | Fund | Index | FA Index |
| Consumer | | | |
| Discretionary | 15.2% | 14.8% | 14.7% |
| Consumer Staples | 8.4 | 8.3 | 7.9 |
| Energy | 5.9 | 6.3 | 5.9 |
| Financial Services | 20.3 | 19.7 | 20.3 |
| Health Care | 14.6 | 14.5 | 14.7 |
| Materials & | | | |
| Processing | 3.6 | 3.5 | 3.7 |
| Producer Durables | 10.5 | 10.7 | 10.6 |
| Technology | 17.3 | 17.0 | 17.0 |
| Utilities | 4.2 | 5.2 | 5.2 |
Investment Focus
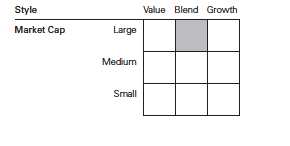
74
Tax-Managed Capital Appreciation Fund
Performance Summary
All of the returns in this report represent past performance, which is not a guarantee of future results that may be achieved by the fund. (Current performance may be lower or higher than the performance data cited. For performance data current to the most recent month-end, visit our website at vanguard.com/performance.) Note, too, that both investment returns and principal value can fluctuate widely, so an investor’s shares, when sold, could be worth more or less than their original cost. The returns shown do not reflect taxes that a shareholder would pay on fund distributions or on the sale of fund shares.
Cumulative Performance: December 31, 2005, Through December 31, 2015
Initial Investment of $10,000
| | | | | |
| | | Average Annual Total Returns | |
| | | Periods Ended December 31, 2015 | |
| | | | | | Final Value |
| | | One | Five | Ten | of a $10,000 |
| | | Year | Years | Years | Investment |
| | Tax-Managed Capital Appreciation Fund | | | | |
| | Admiral Shares | 1.68% | 12.52% | 7.43% | $20,481 |
| •••••••• | Russell 1000 Index | 0.92 | 12.44 | 7.40 | 20,427 |
| – – – – | Multi-Cap Core Funds Average | -2.29 | 9.61 | 5.81 | 17,587 |
| | Dow Jones U.S. Total Stock Market | | | | |
| | Float Adjusted Index | 0.44 | 12.14 | 7.48 | 20,563 |
| Multi-Cap Core Funds Average: Derived from data provided by Lipper, a Thomson Reuters Company. |
| | | | |
| | | | | Final Value |
| | One | Five | Ten | of a $5,000,000 |
| | Year | Years | Years | Investment |
| Tax-Managed Capital Appreciation Fund | | | | |
| Institutional Shares | 1.71% | 12.56% | 7.47% | $10,279,050 |
| |
| Russell 1000 Index | 0.92 | 12.44 | 7.40 | 10,213,379 |
| Dow Jones U.S. Total Stock Market Float | | | | |
| Adjusted Index | 0.44 | 12.14 | 7.48 | 10,281,716 |
See Financial Highlights for dividend and capital gains information.
75
Tax-Managed Capital Appreciation Fund
Fiscal-Year Total Returns (%): December 31, 2005, Through December 31, 2015
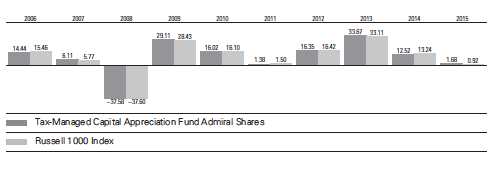
76
Tax-Managed Capital Appreciation Fund
Financial Statements
Statement of Net Assets
As of December 31, 2015
The fund reports a complete list of its holdings in regulatory filings four times in each fiscal year, at the quarter-ends. For the second and fourth fiscal quarters, the lists appear in the fund’s semiannual and annual reports to shareholders. For the first and third fiscal quarters, the fund files the lists with the Securities and Exchange Commission on Form N-Q. Shareholders can look up the fund’s Forms N-Q on the SEC’s website at sec.gov. Forms N-Q may also be reviewed and copied at the SEC’s Public Reference Room (see the back cover of this report for further information).
| | | |
| | | | Market |
| | | | Value• |
| | | Shares | ($000) |
| Common Stocks (99.7%)1 | | |
| Consumer Discretionary (15.1%) | |
| * | Amazon.com Inc. | 128,921 | 87,136 |
| | Walt Disney Co. | 581,615 | 61,116 |
| | Home Depot Inc. | 444,632 | 58,803 |
| | Comcast Corp. Class A | 779,543 | 43,990 |
| | McDonald’s Corp. | 305,458 | 36,087 |
| | Starbucks Corp. | 543,907 | 32,651 |
| | NIKE Inc. Class B | 485,126 | 30,320 |
| | Wal-Mart Stores Inc. | 486,850 | 29,844 |
| | Lowe’s Cos. Inc. | 356,464 | 27,106 |
| | Costco Wholesale Corp. | 163,802 | 26,454 |
| * | Priceline Group Inc. | 16,558 | 21,111 |
| | Time Warner Inc. | 304,549 | 19,695 |
| | Twenty-First Century Fox | | |
| | Inc. Class A | 664,661 | 18,052 |
| | Time Warner Cable Inc. | 94,294 | 17,500 |
| | Ford Motor Co. | 1,206,764 | 17,003 |
| * | O’Reilly Automotive Inc. | 50,715 | 12,852 |
| | TJX Cos. Inc. | 175,703 | 12,459 |
| * | AutoZone Inc. | 16,547 | 12,276 |
| * | eBay Inc. | 439,383 | 12,074 |
| | Yum! Brands Inc. | 158,793 | 11,600 |
| | Ross Stores Inc. | 206,043 | 11,087 |
| | Johnson Controls Inc. | 278,258 | 10,988 |
| | Royal Caribbean Cruises | | |
| | Ltd. | 104,526 | 10,579 |
| | General Motors Co. | 298,701 | 10,159 |
| | Estee Lauder Cos. Inc. | | |
| | Class A | 112,006 | 9,863 |
| * | Netflix Inc. | 84,010 | 9,609 |
| * | Dollar Tree Inc. | 123,414 | 9,530 |
| | Target Corp. | 121,980 | 8,857 |
| | Expedia Inc. | 64,761 | 8,050 |
| * | Liberty Interactive Corp. | | |
| | QVC Group Class A | 286,006 | 7,814 |
| | Marriott International Inc. | | |
| | Class A | 115,272 | 7,728 |
| | Advance Auto Parts Inc. | 50,569 | 7,611 |
| | | |
| | CBS Corp. Class B | 160,745 | 7,576 |
| * | Mohawk Industries Inc. | 39,995 | 7,575 |
| * | MGM Resorts | | |
| | International | 324,047 | 7,362 |
| | Starwood Hotels & | | |
| | Resorts Worldwide Inc. | 105,468 | 7,307 |
| * | Sirius XM Holdings Inc. | 1,741,850 | 7,089 |
| * | CarMax Inc. | 130,899 | 7,065 |
| | Viacom Inc. Class B | 170,585 | 7,021 |
| | DR Horton Inc. | 217,897 | 6,979 |
| | Interpublic Group of Cos. | | |
| | Inc. | 293,629 | 6,836 |
| | Hanesbrands Inc. | 231,336 | 6,808 |
| | BorgWarner Inc. | 154,637 | 6,685 |
| * | NVR Inc. | 4,039 | 6,636 |
| | Goodyear Tire & Rubber | | |
| | Co. | 199,270 | 6,510 |
| | Fortune Brands Home & | | |
| | Security Inc. | 112,839 | 6,263 |
| * | Norwegian Cruise Line | | |
| | Holdings Ltd. | 100,107 | 5,866 |
| * | Tempur Sealy International | | |
| | Inc. | 83,132 | 5,857 |
| * | TripAdvisor Inc. | 67,080 | 5,719 |
| | Lennar Corp. Class A | 116,668 | 5,706 |
| * | Tesla Motors Inc. | 23,646 | 5,675 |
| | Dollar General Corp. | 77,907 | 5,599 |
| * | Visteon Corp. | 47,836 | 5,477 |
| * | WABCO Holdings Inc. | 53,401 | 5,461 |
| | Harley-Davidson Inc. | 119,289 | 5,415 |
| * | Panera Bread Co. Class A | 26,797 | 5,220 |
| | Hasbro Inc. | 76,898 | 5,180 |
| | Lamar Advertising Co. | | |
| | Class A | 85,566 | 5,132 |
| * | Bed Bath & Beyond Inc. | 104,740 | 5,054 |
| | Gentex Corp. | 309,742 | 4,959 |
| | Darden Restaurants Inc. | 76,878 | 4,893 |
| * | Toll Brothers Inc. | 145,278 | 4,838 |
| * | Discovery | | |
| | Communications Inc. | 182,132 | 4,593 |
77
Tax-Managed Capital Appreciation Fund
| | | |
| | | | Market |
| | | | Value• |
| | | Shares | ($000) |
| | Foot Locker Inc. | 70,415 | 4,583 |
| | News Corp. Class A | 341,101 | 4,557 |
| * | Vista Outdoor Inc. | 99,539 | 4,430 |
| | CST Brands Inc. | 111,035 | 4,346 |
| | Brinker International Inc. | 88,019 | 4,221 |
| | Carnival Corp. | 77,300 | 4,211 |
| | PulteGroup Inc. | 232,719 | 4,147 |
| | Harman International | | |
| | Industries Inc. | 43,486 | 4,097 |
| | Omnicom Group Inc. | 50,468 | 3,818 |
| | Dillard’s Inc. Class A | 57,041 | 3,748 |
| * | Hyatt Hotels Corp. Class A | 78,614 | 3,696 |
| | Aaron’s Inc. | 164,043 | 3,673 |
| | Gap Inc. | 148,158 | 3,660 |
| * | AutoNation Inc. | 60,765 | 3,625 |
| * | Liberty Ventures Class A | 78,210 | 3,528 |
| | Ralph Lauren Corp. Class A | 30,719 | 3,425 |
| | Scripps Networks | | |
| | Interactive Inc. Class A | 59,322 | 3,275 |
| | Kohl’s Corp. | 68,670 | 3,271 |
| * | Under Armour Inc. Class A | 39,895 | 3,216 |
| | PVH Corp. | 40,304 | 2,968 |
| | KAR Auction Services Inc. | 71,765 | 2,657 |
| * | Liberty Media Corp. | 63,986 | 2,437 |
| | John Wiley & Sons Inc. | | |
| | Class A | 53,559 | 2,412 |
| | Macy’s Inc. | 56,651 | 1,982 |
| | Las Vegas Sands Corp. | 41,977 | 1,840 |
| | Nordstrom Inc. | 32,216 | 1,605 |
| * | Liberty Media Corp. Class A | 31,993 | 1,256 |
| * | Starz | 36,182 | 1,212 |
| * | AMC Networks Inc. Class A | 16,144 | 1,206 |
| * | Jarden Corp. | 19,332 | 1,104 |
| * | Liberty Broadband Corp. | 20,793 | 1,078 |
| | Hilton Worldwide Holdings | | |
| | Inc. | 41,699 | 892 |
| * | Madison Square Garden Co. | | |
| | Class A | 5,381 | 871 |
| | Coach Inc. | 25,832 | 846 |
| | GameStop Corp. Class A | 20,376 | 571 |
| | Best Buy Co. Inc. | 15,718 | 479 |
| | Cablevision Systems Corp. | | |
| | Class A | 14,905 | 475 |
| * | Liberty Broadband Corp. | | |
| | Class A | 7,998 | 413 |
| * | MSG Networks Inc. | 16,144 | 336 |
| | Lennar Corp. Class B | 8,278 | 333 |
| * | Ulta Salon Cosmetics & | | |
| | Fragrance Inc. | 1,696 | 314 |
| * | Charter Communications | | |
| | Inc. Class A | 1,097 | 201 |
| * | Murphy USA Inc. | 3,291 | 200 |
| * | LKQ Corp. | 6,683 | 198 |
| * | Sally Beauty Holdings Inc. | 6,383 | 178 |
| | | |
| * | Live Nation Entertainment | | |
| | Inc. | 6,683 | 164 |
| * | DISH Network Corp. | | |
| | Class A | 2,593 | 148 |
| * | Chipotle Mexican Grill Inc. | | |
| | Class A | 299 | 143 |
| | Nielsen Holdings plc | 2,992 | 139 |
| | Wynn Resorts Ltd. | 1,979 | 137 |
| * | Urban Outfitters Inc. | 4,588 | 104 |
| | Staples Inc. | 9,471 | 90 |
| * | Discovery Communications | | |
| | Inc. Class A | 1,858 | 50 |
| | | | 990,926 |
| Consumer Staples (8.4%) | | |
| | Procter & Gamble Co. | 796,387 | 63,241 |
| | Coca-Cola Co. | 1,142,799 | 49,095 |
| | PepsiCo Inc. | 467,910 | 46,754 |
| | CVS Health Corp. | 398,354 | 38,947 |
| | Philip Morris International | | |
| | Inc. | 425,691 | 37,423 |
| | Mondelez International Inc. | | |
| | Class A | 655,207 | 29,379 |
| | Altria Group Inc. | 467,814 | 27,231 |
| | Walgreens Boots Alliance | | |
| | Inc. | 301,508 | 25,675 |
| | Colgate-Palmolive Co. | 344,193 | 22,930 |
| | Kroger Co. | 442,239 | 18,499 |
| | Constellation Brands Inc. | | |
| | Class A | 86,792 | 12,363 |
| * | Monster Beverage Corp. | 73,208 | 10,905 |
| | Dr Pepper Snapple Group | | |
| | Inc. | 109,413 | 10,197 |
| | Tyson Foods Inc. Class A | 174,127 | 9,286 |
| | Clorox Co. | 71,931 | 9,123 |
| | Archer-Daniels-Midland Co. | 242,636 | 8,900 |
| | Keurig Green Mountain Inc. | 93,197 | 8,386 |
| | Hormel Foods Corp. | 104,924 | 8,297 |
| | Brown-Forman Corp. | | |
| | Class B | 83,084 | 8,249 |
| | Mead Johnson Nutrition | | |
| | Co. | 100,876 | 7,964 |
| | Kraft Heinz Co. | 105,916 | 7,706 |
| | Molson Coors Brewing Co. | | |
| | Class B | 81,612 | 7,665 |
| | Coca-Cola Enterprises Inc. | 152,599 | 7,514 |
| | JM Smucker Co. | 59,696 | 7,363 |
| | Church & Dwight Co. Inc. | 83,967 | 7,127 |
| | Kimberly-Clark Corp. | 54,621 | 6,953 |
| | McCormick & Co. Inc. | 80,916 | 6,923 |
| | Hershey Co. | 72,410 | 6,464 |
| * | WhiteWave Foods Co. | | |
| | Class A | 148,949 | 5,796 |
| | Ingredion Inc. | 58,056 | 5,564 |
| | General Mills Inc. | 88,567 | 5,107 |
| | Campbell Soup Co. | 97,145 | 5,105 |
78
Tax-Managed Capital Appreciation Fund
| | | |
| | | | Market |
| | | | Value• |
| | | Shares | ($000) |
| * | Edgewell Personal Care Co. | 47,651 | 3,734 |
| | Whole Foods Market Inc. | 86,508 | 2,898 |
| | Reynolds American Inc. | 53,988 | 2,492 |
| | Energizer Holdings Inc. | 49,691 | 1,692 |
| | Kellogg Co. | 22,740 | 1,643 |
| | Bunge Ltd. | 20,905 | 1,427 |
| | Sysco Corp. | 17,066 | 700 |
| | ConAgra Foods Inc. | 11,171 | 471 |
| * | Rite Aid Corp. | 23,338 | 183 |
| | Nu Skin Enterprises Inc. | | |
| | Class A | 990 | 38 |
| | | | 547,409 |
| Energy (5.9%) | | |
| | Exxon Mobil Corp. | 1,302,991 | 101,568 |
| | Chevron Corp. | 647,246 | 58,226 |
| | Valero Energy Corp. | 204,502 | 14,460 |
| | EOG Resources Inc. | 203,232 | 14,387 |
| | Phillips 66 | 157,549 | 12,888 |
| | Marathon Petroleum Corp. | 245,294 | 12,716 |
| | ConocoPhillips | 246,485 | 11,508 |
| | Anadarko Petroleum Corp. | 236,495 | 11,489 |
| | Pioneer Natural Resources | | |
| | Co. | 76,747 | 9,623 |
| | Schlumberger Ltd. | 118,044 | 8,234 |
| * | Cameron International | | |
| | Corp. | 125,872 | 7,955 |
| | Tesoro Corp. | 74,629 | 7,864 |
| | Devon Energy Corp. | 244,422 | 7,822 |
| | Occidental Petroleum | | |
| | Corp. | 110,502 | 7,471 |
| * | Concho Resources Inc. | 80,021 | 7,431 |
| | EQT Corp. | 119,404 | 6,225 |
| | Cimarex Energy Co. | 69,035 | 6,170 |
| | Marathon Oil Corp. | 486,557 | 6,126 |
| * | FMC Technologies Inc. | 191,158 | 5,545 |
| * | Newfield Exploration Co. | 162,508 | 5,291 |
| | Cabot Oil & Gas Corp. | 279,082 | 4,937 |
| | Baker Hughes Inc. | 104,062 | 4,802 |
| * | Continental Resources Inc. | 191,144 | 4,392 |
| | TerraForm Power Inc. | | |
| | Class A | 347,400 | 4,370 |
| | World Fuel Services Corp. | 111,153 | 4,275 |
| | California Resources Corp. | 1,834,704 | 4,275 |
| | Hess Corp. | 85,076 | 4,124 |
| | Rowan Cos. plc Class A | 237,434 | 4,025 |
| | Patterson-UTI Energy Inc. | 264,344 | 3,986 |
| * | NOW Inc. | 251,778 | 3,983 |
| | SM Energy Co. | 199,385 | 3,920 |
| | Noble Energy Inc. | 112,038 | 3,689 |
| | Williams Cos. Inc. | 128,263 | 3,296 |
| | Helmerich & Payne Inc. | 57,828 | 3,097 |
| | Halliburton Co. | 86,474 | 2,944 |
| | Energen Corp. | 44,813 | 1,837 |
| | National Oilwell Varco Inc. | 48,157 | 1,613 |
| | | |
| | Columbia Pipeline Group | | |
| | Inc. | 35,344 | 707 |
| * | WPX Energy Inc. | 57,400 | 329 |
| | | | 387,600 |
| Financial Services (20.2%) | | |
| * | Berkshire Hathaway Inc. | | |
| | Class B | 629,468 | 83,115 |
| | Wells Fargo & Co. | 1,447,201 | 78,670 |
| | JPMorgan Chase & Co. | 1,108,211 | 73,175 |
| | Bank of America Corp. | 3,609,209 | 60,743 |
| | Visa Inc. Class A | 679,163 | 52,669 |
| | Citigroup Inc. | 865,466 | 44,788 |
| | MasterCard Inc. Class A | 359,587 | 35,009 |
| | American International | | |
| | Group Inc. | 490,658 | 30,406 |
| | Simon Property Group Inc. | 112,524 | 21,879 |
| | American Express Co. | 299,713 | 20,845 |
| | Goldman Sachs Group Inc. | 109,514 | 19,738 |
| * | PayPal Holdings Inc. | 489,644 | 17,725 |
| | US Bancorp | 400,249 | 17,079 |
| | American Tower | | |
| | Corporation | 172,262 | 16,701 |
| | Charles Schwab Corp. | 476,310 | 15,685 |
| | Public Storage | 57,988 | 14,364 |
| | PNC Financial Services | | |
| | Group Inc. | 145,778 | 13,894 |
| | Prudential Financial Inc. | 161,480 | 13,146 |
| | Intercontinental Exchange | | |
| | Inc. | 49,741 | 12,747 |
| | McGraw Hill Financial Inc. | 124,394 | 12,263 |
| * | Fiserv Inc. | 133,350 | 12,196 |
| | Crown Castle | | |
| | International Corp. | 138,260 | 11,953 |
| | Aon plc | 127,944 | 11,798 |
| | Travelers Cos. Inc. | 101,610 | 11,468 |
| * | Synchrony Financial | 372,473 | 11,327 |
| | Equity Residential | 137,697 | 11,235 |
| | State Street Corp. | 164,546 | 10,919 |
| | Discover Financial | | |
| | Services | 201,671 | 10,814 |
| | Aflac Inc. | 172,048 | 10,306 |
| | SunTrust Banks Inc. | 234,674 | 10,053 |
| | Boston Properties Inc. | 76,135 | 9,710 |
| | Equinix Inc. | 31,674 | 9,578 |
| | Ameriprise Financial Inc. | 87,730 | 9,336 |
| | AvalonBay Communities | | |
| | Inc. | 46,654 | 8,590 |
| | Essex Property Trust Inc. | 35,754 | 8,560 |
| | General Growth | | |
| | Properties Inc. | 313,061 | 8,518 |
| | Progressive Corp. | 267,199 | 8,497 |
| | Capital One Financial Corp. | 117,492 | 8,481 |
| | Global Payments Inc. | 130,492 | 8,418 |
| | Equifax Inc. | 73,806 | 8,220 |
| * | Markel Corp. | 9,152 | 8,084 |
79
Tax-Managed Capital Appreciation Fund
| | | |
| | | | Market |
| | | | Value• |
| | | Shares | ($000) |
| | Fidelity National | | |
| | Information Services Inc. | 130,136 | 7,886 |
| | MSCI Inc. Class A | 108,778 | 7,846 |
| * | E*TRADE Financial Corp. | 256,705 | 7,609 |
| | Fifth Third Bancorp | 367,954 | 7,396 |
| | Morgan Stanley | 230,130 | 7,320 |
| * | CBRE Group Inc. Class A | 209,440 | 7,242 |
| | Lincoln National Corp. | 143,609 | 7,218 |
| | Moody’s Corp. | 69,916 | 7,015 |
| | Extra Space Storage Inc. | 79,491 | 7,012 |
| | SL Green Realty Corp. | 61,958 | 7,000 |
| | Nasdaq Inc. | 114,591 | 6,666 |
| | Federal Realty Investment | | |
| | Trust | 45,503 | 6,648 |
| | First Republic Bank | 100,593 | 6,645 |
| | Chubb Corp. | 50,035 | 6,637 |
| * | Arch Capital Group Ltd. | 95,050 | 6,630 |
| | T. Rowe Price Group Inc. | 92,734 | 6,630 |
| | Total System Services Inc. | 130,815 | 6,515 |
| | SEI Investments Co. | 123,446 | 6,469 |
| | Jones Lang LaSalle Inc. | 40,072 | 6,406 |
| | KeyCorp | 484,896 | 6,396 |
| * | Signature Bank | 41,591 | 6,379 |
| | Allstate Corp. | 102,032 | 6,335 |
| | Weyerhaeuser Co. | 208,666 | 6,256 |
| | Franklin Resources Inc. | 165,765 | 6,103 |
| | Assurant Inc. | 75,103 | 6,049 |
| | TD Ameritrade Holding | | |
| | Corp. | 173,943 | 6,038 |
| | Torchmark Corp. | 102,705 | 5,871 |
| | Equity LifeStyle Properties | | |
| | Inc. | 87,632 | 5,842 |
| | Raymond James Financial | | |
| | Inc. | 99,615 | 5,775 |
| | StanCorp Financial Group | | |
| | Inc. | 50,467 | 5,747 |
| * | Alleghany Corp. | 11,928 | 5,701 |
| | MetLife Inc. | 118,231 | 5,700 |
| | East West Bancorp Inc. | 134,347 | 5,583 |
| | M&T Bank Corp. | 45,940 | 5,567 |
| | CIT Group Inc. | 140,193 | 5,566 |
| | Unum Group | 166,363 | 5,538 |
| | Apartment Investment & | | |
| | Management Co. | 137,659 | 5,510 |
| | WR Berkley Corp. | 97,340 | 5,329 |
| | Loews Corp. | 138,417 | 5,315 |
| | Bank of New York Mellon | | |
| | Corp. | 128,486 | 5,296 |
| * | SVB Financial Group | 44,449 | 5,285 |
| | Host Hotels & Resorts Inc. | 341,077 | 5,232 |
| | Zions Bancorporation | 190,494 | 5,200 |
| | Taubman Centers Inc. | 67,784 | 5,200 |
| | Reinsurance Group of | | |
| | America Inc. Class A | 59,865 | 5,121 |
| | TFS Financial Corp. | 271,707 | 5,116 |
| | | |
| | Principal Financial Group | | |
| | Inc. | 113,203 | 5,092 |
| | White Mountains Insurance | | |
| | Group Ltd. | 6,997 | 5,085 |
| | CME Group Inc. | 55,803 | 5,056 |
| * | Forest City Enterprises Inc. | | |
| | Class A | 229,923 | 5,042 |
| | Douglas Emmett Inc. | 159,287 | 4,967 |
| | BlackRock Inc. | 14,412 | 4,908 |
| * | Affiliated Managers Group | | |
| | Inc. | 30,470 | 4,868 |
| | Prologis Inc. | 109,238 | 4,688 |
| | Plum Creek Timber Co. Inc. | 97,544 | 4,655 |
| | First Horizon National Corp. | 319,056 | 4,633 |
| | Brown & Brown Inc. | 143,190 | 4,596 |
| | Commerce Bancshares Inc. | 106,502 | 4,531 |
| | Post Properties Inc. | 76,000 | 4,496 |
| | American Financial Group | | |
| | Inc. | 61,876 | 4,460 |
| | American Homes 4 Rent | | |
| | Class A | 266,002 | 4,432 |
| * | Howard Hughes Corp. | 38,797 | 4,390 |
| | Interactive Brokers Group | | |
| | Inc. | 99,805 | 4,352 |
| | Popular Inc. | 149,720 | 4,243 |
| | Alexandria Real Estate | | |
| | Equities Inc. | 45,311 | 4,094 |
| | Hanover Insurance Group | | |
| | Inc. | 49,470 | 4,024 |
| * | CoreLogic Inc. | 116,540 | 3,946 |
| | Brixmor Property Group Inc. | 149,607 | 3,863 |
| | Dun & Bradstreet Corp. | 36,105 | 3,752 |
| | DDR Corp. | 215,798 | 3,634 |
| * | Santander Consumer USA | | |
| | Holdings Inc. | 228,703 | 3,625 |
| * | Four Corners Property | | |
| | Trust Inc. | 147,005 | 3,552 |
| | Jack Henry & Associates | | |
| | Inc. | 44,874 | 3,503 |
| * | Alliance Data Systems Corp. | 12,168 | 3,365 |
| | Camden Property Trust | 42,289 | 3,246 |
| | Associated Banc-Corp | 170,223 | 3,192 |
| | Broadridge Financial | | |
| | Solutions Inc. | 58,571 | 3,147 |
| | Hospitality Properties Trust | 118,958 | 3,111 |
| | Retail Properties of | | |
| | America Inc. | 208,809 | 3,084 |
| | Cullen/Frost Bankers Inc. | 47,475 | 2,849 |
| | Eaton Vance Corp. | 85,976 | 2,788 |
| | Hartford Financial Services | | |
| | Group Inc. | 64,016 | 2,782 |
| | Lazard Ltd. Class A | 55,540 | 2,500 |
| | CNA Financial Corp. | 69,318 | 2,437 |
| | ACE Ltd. | 20,847 | 2,436 |
| | BOK Financial Corp. | 38,470 | 2,300 |
80
Tax-Managed Capital Appreciation Fund
| | | |
| | | | Market |
| | | | Value• |
| | | Shares | ($000) |
| | Digital Realty Trust Inc. | 28,365 | 2,145 |
| | BB&T Corp. | 52,861 | 1,999 |
| | Legg Mason Inc. | 47,376 | 1,859 |
| | Leucadia National Corp. | 102,441 | 1,781 |
| | Navient Corp. | 122,899 | 1,407 |
| | Northern Trust Corp. | 19,000 | 1,370 |
| | Bank of Hawaii Corp. | 20,047 | 1,261 |
| | FNF Group | 25,361 | 879 |
| * | Realogy Holdings Corp. | 22,588 | 828 |
| * | SLM Corp. | 122,128 | 796 |
| | Iron Mountain Inc. | 28,819 | 778 |
| | People’s United Financial | | |
| | Inc. | 42,503 | 686 |
| | WP Glimcher Inc. | 48,397 | 513 |
| * | First Data Corp. Class A | 26,325 | 422 |
| | Invesco Ltd. | 11,979 | 401 |
| * | Vantiv Inc. Class A | 4,688 | 222 |
| | Western Union Co. | 11,594 | 208 |
| * | FleetCor Technologies Inc. | 1,197 | 171 |
| * | RMR Group Inc. Class A | 1,974 | 28 |
| | | | 1,322,020 |
| Health Care (14.6%) | | |
| | Johnson & Johnson | 813,961 | 83,610 |
| | Gilead Sciences Inc. | 510,701 | 51,678 |
| | Pfizer Inc. | 1,480,030 | 47,775 |
| * | Allergan plc | 138,694 | 43,342 |
| | Amgen Inc. | 264,069 | 42,866 |
| | Bristol-Myers Squibb Co. | 590,522 | 40,622 |
| | UnitedHealth Group Inc. | 327,801 | 38,562 |
| | Merck & Co. Inc. | 655,233 | 34,609 |
| * | Celgene Corp. | 286,807 | 34,348 |
| * | Biogen Inc. | 84,605 | 25,919 |
| | Medtronic plc | 334,590 | 25,737 |
| | AbbVie Inc. | 409,685 | 24,270 |
| * | Express Scripts Holding | | |
| | Co. | 272,679 | 23,835 |
| | Thermo Fisher Scientific | | |
| | Inc. | 153,428 | 21,764 |
| | Eli Lilly & Co. | 253,075 | 21,324 |
| | Abbott Laboratories | 406,533 | 18,257 |
| * | Regeneron | | |
| | Pharmaceuticals Inc. | 31,691 | 17,204 |
| * | Alexion Pharmaceuticals | | |
| | Inc. | 88,361 | 16,855 |
| | Cigna Corp. | 112,006 | 16,390 |
| | Aetna Inc. | 145,044 | 15,682 |
| | Anthem Inc. | 111,523 | 15,551 |
| | McKesson Corp. | 73,247 | 14,446 |
| | Becton Dickinson and Co. | 88,238 | 13,597 |
| * | Vertex Pharmaceuticals | | |
| | Inc. | 107,916 | 13,579 |
| | Cardinal Health Inc. | 145,131 | 12,956 |
| | Humana Inc. | 69,617 | 12,427 |
| * | Boston Scientific Corp. | 617,668 | 11,390 |
| | Zoetis Inc. | 235,283 | 11,275 |
| | | |
| | AmerisourceBergen Corp. | | |
| | Class A | 106,321 | 11,027 |
| | Baxalta Inc. | 274,720 | 10,722 |
| | Perrigo Co. plc | 70,812 | 10,246 |
| | Stryker Corp. | 108,914 | 10,122 |
| * | Incyte Corp. | 88,883 | 9,639 |
| | Zimmer Biomet Holdings | | |
| | Inc. | 88,957 | 9,126 |
| * | Henry Schein Inc. | 53,559 | 8,472 |
| | St. Jude Medical Inc. | 131,487 | 8,122 |
| | CR Bard Inc. | 41,889 | 7,935 |
| * | Alkermes plc | 91,062 | 7,228 |
| | Universal Health Services | | |
| | Inc. Class B | 60,242 | 7,198 |
| | Agilent Technologies Inc. | 161,313 | 6,744 |
| * | Laboratory Corp. of | | |
| | America Holdings | 53,769 | 6,648 |
| * | Mallinckrodt plc | 84,790 | 6,328 |
| | DENTSPLY International | | |
| | Inc. | 102,349 | 6,228 |
| | PerkinElmer Inc. | 109,217 | 5,851 |
| | Baxter International Inc. | 153,049 | 5,839 |
| * | QIAGEN NV | 209,153 | 5,783 |
| | Cooper Cos. Inc. | 40,612 | 5,450 |
| * | Health Net Inc. | 77,896 | 5,333 |
| * | Quintiles Transnational | | |
| | Holdings Inc. | 76,692 | 5,266 |
| | Teleflex Inc. | 39,303 | 5,166 |
| | Quest Diagnostics Inc. | 72,609 | 5,165 |
| * | Bruker Corp. | 209,124 | 5,075 |
| * | Seattle Genetics Inc. | 111,807 | 5,018 |
| * | Charles River Laboratories | | |
| | International Inc. | 57,862 | 4,652 |
| | Bio-Techne Corp. | 49,978 | 4,498 |
| | Patterson Cos. Inc. | 73,337 | 3,316 |
| * | Varian Medical Systems Inc. | 29,921 | 2,418 |
| * | Illumina Inc. | 7,727 | 1,483 |
| * | Medivation Inc. | 29,430 | 1,423 |
| * | Alnylam Pharmaceuticals Inc. | 13,893 | 1,308 |
| * | Mylan NV | 16,800 | 908 |
| * | Intuitive Surgical Inc. | 1,027 | 561 |
| * | DaVita HealthCare Partners | | |
| | Inc. | 6,682 | 466 |
| * | Community Health Systems | | |
| | Inc. | 11,491 | 305 |
| * | United Therapeutics Corp. | 1,895 | 297 |
| * | Centene Corp. | 4,388 | 289 |
| * | Edwards Lifesciences Corp. | 3,590 | 284 |
| * | BioMarin Pharmaceutical Inc. | 2,593 | 272 |
| * | VCA Inc. | 4,488 | 247 |
| * | Hologic Inc. | 6,084 | 235 |
| * | athenahealth Inc. | 1,297 | 209 |
| * | Sirona Dental Systems Inc. | 1,895 | 208 |
| * | HCA Holdings Inc. | 3,000 | 203 |
| * | MEDNAX Inc. | 2,793 | 200 |
81
Tax-Managed Capital Appreciation Fund
| | | |
| | | | Market |
| | | | Value• |
| | | Shares | ($000) |
| * | Premier Inc. Class A | 5,585 | 197 |
| * | Bio-Rad Laboratories Inc. | | |
| | Class A | 1,396 | 194 |
| * | Align Technology Inc. | 2,892 | 190 |
| * | Cerner Corp. | 3,092 | 186 |
| * | LifePoint Health Inc. | 2,493 | 183 |
| * | Veeva Systems Inc. Class A | 6,184 | 178 |
| * | IDEXX Laboratories Inc. | 2,394 | 175 |
| * | Alere Inc. | 3,989 | 156 |
| * | Brookdale Senior Living Inc. | 8,378 | 155 |
| * | Jazz Pharmaceuticals plc | 997 | 140 |
| * | Envision Healthcare | | |
| | Holdings Inc. | 4,289 | 111 |
| * | Tenet Healthcare Corp. | 3,291 | 100 |
| | | | 955,348 |
| Materials & Processing (3.6%) | | |
| | Monsanto Co. | 153,650 | 15,138 |
| | Precision Castparts Corp. | 60,521 | 14,041 |
| | Ecolab Inc. | 114,931 | 13,146 |
| | EI du Pont de Nemours & | | |
| | Co. | 185,480 | 12,353 |
| | PPG Industries Inc. | 122,056 | 12,061 |
| | LyondellBasell Industries | | |
| | NV Class A | 132,552 | 11,519 |
| | Praxair Inc. | 103,229 | 10,571 |
| | Sherwin-Williams Co. | 40,026 | 10,391 |
| | Dow Chemical Co. | 187,416 | 9,648 |
| | Vulcan Materials Co. | 90,180 | 8,564 |
| | Ball Corp. | 100,000 | 7,273 |
| | Celanese Corp. Class A | 100,352 | 6,757 |
| | Airgas Inc. | 47,286 | 6,541 |
| | Sealed Air Corp. | 143,108 | 6,383 |
| | Martin Marietta Materials | | |
| | Inc. | 45,721 | 6,245 |
| * | WR Grace & Co. | 58,735 | 5,849 |
| | CF Industries Holdings Inc. | 142,925 | 5,833 |
| * | Crown Holdings Inc. | 112,809 | 5,719 |
| | Valspar Corp. | 66,728 | 5,535 |
| | FMC Corp. | 132,396 | 5,181 |
| | Fastenal Co. | 125,670 | 5,130 |
| | Lennox International Inc. | 39,798 | 4,971 |
| | Owens Corning | 104,712 | 4,925 |
| * | Platform Specialty | | |
| | Products Corp. | 347,838 | 4,463 |
| | Westlake Chemical Corp. | 75,530 | 4,103 |
| * | Owens-Illinois Inc. | 229,404 | 3,996 |
| * | Armstrong World Industries | | |
| | Inc. | 85,793 | 3,923 |
| | Southern Copper Corp. | 138,325 | 3,613 |
| | Albemarle Corp. | 64,008 | 3,585 |
| | Scotts Miracle-Gro Co. | | |
| | Class A | 50,965 | 3,288 |
| | Nucor Corp. | 66,660 | 2,686 |
| | Reliance Steel & Aluminum | | |
| | Co. | 46,179 | 2,674 |
| | | |
| | Valmont Industries Inc. | 23,575 | 2,499 |
| | Newmont Mining Corp. | 123,371 | 2,219 |
| | Mosaic Co. | 67,922 | 1,874 |
| | Packaging Corp. of | | |
| | America | 26,530 | 1,673 |
| | International Paper Co. | 35,806 | 1,350 |
| | Eastman Chemical Co. | 14,014 | 946 |
| | Air Products & Chemicals | | |
| | Inc. | 5,685 | 740 |
| | Freeport-McMoRan Inc. | 38,450 | 260 |
| | Hexcel Corp. | 3,495 | 162 |
| | | | 237,828 |
| Producer Durables (10.5%) | | |
| | General Electric Co. | 2,413,684 | 75,186 |
| | Boeing Co. | 236,150 | 34,145 |
| | United Technologies Corp. | 279,366 | 26,839 |
| | Union Pacific Corp. | 303,341 | 23,721 |
| | 3M Co. | 153,796 | 23,168 |
| | Danaher Corp. | 230,114 | 21,373 |
| | Delta Air Lines Inc. | 350,480 | 17,766 |
| | FedEx Corp. | 115,409 | 17,195 |
| | General Dynamics Corp. | 121,082 | 16,632 |
| | Honeywell International | | |
| | Inc. | 142,214 | 14,729 |
| | United Parcel Service Inc. | | |
| | Class B | 146,914 | 14,138 |
| | Northrop Grumman Corp. | 72,079 | 13,609 |
| | Southwest Airlines Co. | 313,714 | 13,509 |
| | Illinois Tool Works Inc. | 140,830 | 13,052 |
| | Accenture plc Class A | 111,658 | 11,668 |
| * | United Continental | | |
| | Holdings Inc. | 182,820 | 10,476 |
| | Norfolk Southern Corp. | 123,743 | 10,467 |
| | CSX Corp. | 388,779 | 10,089 |
| | Raytheon Co. | 80,703 | 10,050 |
| | Roper Technologies Inc. | 51,568 | 9,787 |
| | Lockheed Martin Corp. | 42,134 | 9,149 |
| * | Verisk Analytics Inc. | | |
| | Class A | 98,845 | 7,599 |
| | AMETEK Inc. | 140,910 | 7,551 |
| * | TransDigm Group Inc. | 32,778 | 7,488 |
| | Waste Management Inc. | 139,930 | 7,468 |
| * | Mettler-Toledo | | |
| | International Inc. | 21,543 | 7,306 |
| | Textron Inc. | 170,187 | 7,150 |
| * | Waters Corp. | 53,011 | 7,134 |
| | Emerson Electric Co. | 142,027 | 6,793 |
| | Rockwell Collins Inc. | 73,507 | 6,785 |
| | PACCAR Inc. | 142,536 | 6,756 |
| | Cummins Inc. | 75,202 | 6,619 |
| | Parker-Hannifin Corp. | 67,323 | 6,529 |
| | L-3 Communications | | |
| | Holdings Inc. | 53,859 | 6,437 |
| | Cintas Corp. | 70,581 | 6,426 |
| | Deere & Co. | 82,699 | 6,307 |
82
Tax-Managed Capital Appreciation Fund
| | | |
| | | | Market |
| | | | Value• |
| | | Shares | ($000) |
| | Expeditors International of | | |
| | Washington Inc. | 136,458 | 6,154 |
| | Xerox Corp. | 576,091 | 6,124 |
| * | Stericycle Inc. | 49,678 | 5,991 |
| * | Spirit AeroSystems | | |
| | Holdings Inc. Class A | 116,164 | 5,816 |
| | Huntington Ingalls | | |
| | Industries Inc. | 44,882 | 5,693 |
| | JB Hunt Transport Services | | |
| | Inc. | 76,653 | 5,623 |
| | Wabtec Corp. | 78,912 | 5,612 |
| | IDEX Corp. | 71,657 | 5,490 |
| | WW Grainger Inc. | 26,929 | 5,456 |
| | Orbital ATK Inc. | 59,413 | 5,308 |
| * | HD Supply Holdings Inc. | 171,190 | 5,141 |
| * | Jacobs Engineering Group | | |
| | Inc. | 121,938 | 5,115 |
| | Carlisle Cos. Inc. | 56,352 | 4,998 |
| | Toro Co. | 65,927 | 4,817 |
| | FLIR Systems Inc. | 164,474 | 4,617 |
| | ManpowerGroup Inc. | 54,457 | 4,590 |
| * | Babcock & Wilcox | | |
| | Enterprises Inc. | 219,357 | 4,578 |
| | BWX Technologies Inc. | 143,592 | 4,562 |
| | AGCO Corp. | 98,672 | 4,479 |
| * | Spirit Airlines Inc. | 110,214 | 4,392 |
| | Landstar System Inc. | 73,919 | 4,335 |
| | Towers Watson & Co. | | |
| | Class A | 33,113 | 4,254 |
| | Manitowoc Co. Inc. | 275,244 | 4,225 |
| | Robert Half International | | |
| | Inc. | 87,271 | 4,114 |
| * | SPX FLOW Inc. | 145,162 | 4,051 |
| | Automatic Data Processing | | |
| | Inc. | 46,977 | 3,980 |
| * | Zebra Technologies Corp. | 53,417 | 3,721 |
| | Flowserve Corp. | 87,321 | 3,674 |
| * | Genpact Ltd. | 136,024 | 3,398 |
| * | Copart Inc. | 88,368 | 3,359 |
| | Xylem Inc. | 86,872 | 3,171 |
| | Oshkosh Corp. | 80,546 | 3,145 |
| | Donaldson Co. Inc. | 102,930 | 2,950 |
| | Stanley Black & Decker Inc. | 26,675 | 2,847 |
| * | Middleby Corp. | 24,147 | 2,605 |
| | Caterpillar Inc. | 36,169 | 2,458 |
| | CH Robinson Worldwide | | |
| | Inc. | 39,260 | 2,435 |
| | MSC Industrial Direct Co. | | |
| | Inc. Class A | 41,591 | 2,340 |
| * | Keysight Technologies Inc. | 78,098 | 2,213 |
| | Terex Corp. | 113,694 | 2,101 |
| | Graco Inc. | 27,585 | 1,988 |
| | Allison Transmission | | |
| | Holdings Inc. | 68,106 | 1,763 |
| | ITT Corp. | 45,312 | 1,646 |
| | | |
| | Lexmark International Inc. | | |
| | Class A | 50,168 | 1,628 |
| | Eaton Corp. plc | 29,816 | 1,552 |
| | SPX Corp. | 161,627 | 1,508 |
| * | Old Dominion Freight | | |
| | Line Inc. | 16,275 | 961 |
| | Republic Services Inc. | | |
| | Class A | 19,461 | 856 |
| | KBR Inc. | 26,380 | 446 |
| | ADT Corp. | 12,617 | 416 |
| | Pentair plc | 6,054 | 300 |
| | Ryder System Inc. | 5,145 | 292 |
| * | CoStar Group Inc. | 997 | 206 |
| | Fluor Corp. | 3,387 | 160 |
| * | IHS Inc. Class A | 1,097 | 130 |
| | | | 684,880 |
| Technology (17.2%) | | |
| | Apple Inc. | 1,838,250 | 193,494 |
| | Microsoft Corp. | 2,450,445 | 135,951 |
| * | Facebook Inc. Class A | 735,312 | 76,958 |
| * | Alphabet Inc. Class A | 98,008 | 76,251 |
| * | Alphabet Inc. | 100,117 | 75,977 |
| | Intel Corp. | 1,262,769 | 43,502 |
| | International Business | | |
| | Machines Corp. | 300,070 | 41,296 |
| | Oracle Corp. | 1,071,056 | 39,126 |
| | Cisco Systems Inc. | 1,391,566 | 37,788 |
| | Texas Instruments Inc. | 388,779 | 21,309 |
| * | salesforce.com inc | 256,528 | 20,112 |
| | QUALCOMM Inc. | 401,182 | 20,053 |
| | EMC Corp. | 763,796 | 19,614 |
| * | Adobe Systems Inc. | 199,377 | 18,730 |
| * | Cognizant Technology | | |
| | Solutions Corp. Class A | 254,277 | 15,262 |
| | Broadcom Corp. Class A | 255,080 | 14,749 |
| * | Yahoo! Inc. | 407,016 | 13,537 |
| | Hewlett Packard | | |
| | Enterprise Co. | 823,466 | 12,517 |
| | Intuit Inc. | 126,328 | 12,191 |
| | NVIDIA Corp. | 343,642 | 11,326 |
| | Activision Blizzard Inc. | 292,233 | 11,312 |
| | Avago Technologies Ltd. | | |
| | Class A | 66,867 | 9,706 |
| | Corning Inc. | 476,948 | 8,719 |
| | Amphenol Corp. Class A | 164,882 | 8,612 |
| | Symantec Corp. | 387,199 | 8,131 |
| | Juniper Networks Inc. | 288,671 | 7,967 |
| * | Autodesk Inc. | 129,049 | 7,863 |
| * | SBA Communications | | |
| | Corp. Class A | 74,817 | 7,861 |
| * | Citrix Systems Inc. | 103,385 | 7,821 |
| | Lam Research Corp. | 96,691 | 7,679 |
| | Analog Devices Inc. | 117,857 | 6,520 |
| | KLA-Tencor Corp. | 90,363 | 6,267 |
| | Applied Materials Inc. | 334,722 | 6,249 |
83
Tax-Managed Capital Appreciation Fund
| | | |
| | | | Market |
| | | | Value• |
| | | Shares | ($000) |
| | Western Digital Corp. | 98,142 | 5,893 |
| | CDK Global Inc. | 122,985 | 5,838 |
| * | Cadence Design Systems | | |
| | Inc. | 270,549 | 5,630 |
| | Linear Technology Corp. | 123,875 | 5,261 |
| | Avnet Inc. | 121,357 | 5,199 |
| * | Synopsys Inc. | 112,893 | 5,149 |
| | CSRA Inc. | 171,193 | 5,136 |
| | Brocade Communications | | |
| | Systems Inc. | 531,505 | 4,879 |
| | DST Systems Inc. | 42,688 | 4,869 |
| * | Arrow Electronics Inc. | 89,465 | 4,847 |
| | Ingram Micro Inc. | 159,516 | 4,846 |
| * | Micron Technology Inc. | 341,460 | 4,835 |
| | NetApp Inc. | 181,187 | 4,807 |
| * | VeriFone Systems Inc. | 167,572 | 4,695 |
| * | Teradata Corp. | 168,471 | 4,451 |
| | Teradyne Inc. | 214,981 | 4,444 |
| | Atmel Corp. | 488,769 | 4,208 |
| * | Zynga Inc. Class A | 1,563,607 | 4,191 |
| * | ON Semiconductor Corp. | 399,850 | 3,919 |
| | Dolby Laboratories Inc. | | |
| | Class A | 115,619 | 3,891 |
| | Xilinx Inc. | 71,149 | 3,342 |
| | CA Inc. | 112,969 | 3,226 |
| | Computer Sciences Corp. | 78,693 | 2,572 |
| | Motorola Solutions Inc. | 36,113 | 2,472 |
| * | NCR Corp. | 99,313 | 2,429 |
| | HP Inc. | 140,594 | 1,665 |
| | IAC/InterActiveCorp | 24,451 | 1,468 |
| | Microchip Technology Inc. | 31,318 | 1,458 |
| * | Viavi Solutions Inc. | 193,298 | 1,177 |
| | Harris Corp. | 13,192 | 1,146 |
| * | VeriSign Inc. | 10,278 | 898 |
| | Amdocs Ltd. | 11,926 | 651 |
| | Solera Holdings Inc. | 10,373 | 569 |
| | Skyworks Solutions Inc. | 5,034 | 387 |
| * | Palo Alto Networks Inc. | 1,995 | 351 |
| * | Electronic Arts Inc. | 4,887 | 336 |
| * | SolarWinds Inc. | 4,488 | 264 |
| * | Red Hat Inc. | 3,192 | 264 |
| * | ServiceNow Inc. | 2,892 | 250 |
| * | Tableau Software Inc. | | |
| | Class A | 2,493 | 235 |
| * | Fortinet Inc. | 7,281 | 227 |
| | Sabre Corp. | 8,079 | 226 |
| * | LinkedIn Corp. Class A | 997 | 224 |
| * | ANSYS Inc. | 2,294 | 212 |
| * | Gartner Inc. | 2,294 | 208 |
| * | IPG Photonics Corp. | 2,294 | 205 |
| * | Splunk Inc. | 3,291 | 194 |
| * | NetSuite Inc. | 2,094 | 177 |
| * | IMS Health Holdings Inc. | 6,682 | 170 |
| * | CommScope Holding Co. | | |
| | Inc. | 6,483 | 168 |
| | | |
| * | PTC Inc. | 4,688 | 162 |
| * | Workday Inc. Class A | 1,995 | 159 |
| * | ARRIS Group Inc. | 4,688 | 143 |
| * | Akamai Technologies Inc. | 2,693 | 142 |
| * | F5 Networks Inc. | 1,396 | 135 |
| * | EchoStar Corp. Class A | 2,893 | 113 |
| * | Rackspace Hosting Inc. | 4,389 | 111 |
| | | | 1,129,574 |
| Utilities (4.2%) | | |
| | AT&T Inc. | 1,489,480 | 51,253 |
| | Verizon Communications | | |
| | Inc. | 853,799 | 39,463 |
| | NextEra Energy Inc. | 177,366 | 18,427 |
| | PG&E Corp. | 215,322 | 11,453 |
| | Sempra Energy | 116,293 | 10,933 |
| | WEC Energy Group Inc. | 197,715 | 10,145 |
| | Edison International | 162,053 | 9,595 |
| * | Level 3 Communications | | |
| | Inc. | 163,042 | 8,863 |
| | Eversource Energy | 172,324 | 8,801 |
| | Duke Energy Corp. | 111,437 | 7,955 |
| * | T-Mobile US Inc. | 185,031 | 7,238 |
| | Southern Co. | 152,473 | 7,134 |
| | American Water Works | | |
| | Co. Inc. | 116,961 | 6,988 |
| | CMS Energy Corp. | 190,309 | 6,866 |
| | ITC Holdings Corp. | 145,796 | 5,722 |
| | Aqua America Inc. | 183,347 | 5,464 |
| | NiSource Inc. | 276,148 | 5,388 |
| | UGI Corp. | 154,170 | 5,205 |
| | Atmos Energy Corp. | 81,774 | 5,155 |
| | Dominion Resources Inc. | 72,717 | 4,919 |
| | SCANA Corp. | 80,289 | 4,857 |
| | DTE Energy Co. | 56,072 | 4,496 |
| | CenterPoint Energy Inc. | 228,227 | 4,190 |
| | Telephone & Data | | |
| | Systems Inc. | 159,389 | 4,127 |
| * | United States Cellular Corp. | 93,934 | 3,833 |
| | American Electric Power | | |
| | Co. Inc. | 60,441 | 3,522 |
| | Consolidated Edison Inc. | 43,984 | 2,827 |
| * | Calpine Corp. | 190,326 | 2,754 |
| | Questar Corp. | 115,459 | 2,249 |
| | Entergy Corp. | 20,347 | 1,391 |
| | AES Corp. | 85,950 | 822 |
| | NRG Energy Inc. | 52,351 | 616 |
| | Alliant Energy Corp. | 7,700 | 481 |
| | Exelon Corp. | 7,192 | 200 |
| | FirstEnergy Corp. | 2,955 | 94 |
| | Frontier Communications | | |
| | Corp. | 5 | — |
| | | | 273,426 |
| Total Common Stocks | | |
| (Cost $3,308,372) | | 6,529,011 |
84
Tax-Managed Capital Appreciation Fund
| | |
| | | Market |
| | | Value• |
| | Shares | ($000) |
| Temporary Cash Investments (0.5%)1 | |
| Money Market Fund (0.5%) | |
| 2 Vanguard Market | | |
| Liquidity Fund, | | |
| 0.363% | 31,185,713 | 31,186 |
| |
| | Face | |
| | Amount | |
| | ($000) | |
| U.S. Government and Agency Obligations (0.0%) |
| 3 United States Treasury | |
| Bill, 0.536%, 6/9/16 | 2,000 | 1,996 |
| Total Temporary Cash Investments | |
| (Cost $33,181) | | 33,182 |
| Total Investments (100.2%) | |
| (Cost $3,341,553) | | 6,562,193 |
| |
| | | Amount |
| | | ($000) |
| Other Assets and Liabilities (-0.2%) | |
| Other Assets | | |
| Investment in Vanguard | | 577 |
| Receivables for Accrued Income | 7,835 |
| Receivables for Capital Shares Issued | 3,508 |
| Other Assets | | 327 |
| Total Other Assets | | 12,247 |
| Liabilities | | |
| Payables for Investment Securities | |
| Purchased | | (12,676) |
| Payables for Capital Shares Redeemed | (1,207) |
| Payables to Vanguard | | (4,966) |
| Other Liabilities | | (9,052) |
| Total Liabilities | | (27,901) |
| Net Assets (100%) | | 6,546,539 |
| |
| At December 31, 2015, net assets consisted of: |
| | Amount |
| | ($000) |
| Paid-in Capital | 3,381,793 |
| Overdistributed Net Investment Income | (3,205) |
| Accumulated Net Realized Losses | (52,755) |
| Unrealized Appreciation (Depreciation) | |
| Investment Securities | 3,220,640 |
| Futures Contracts | 66 |
| Net Assets | 6,546,539 |
| |
| |
| Admiral Shares—Net Assets | |
| Applicable to 57,659,359 outstanding | |
| $.001 par value shares of beneficial | |
| interest (unlimited authorization) | 5,982,250 |
| Net Asset Value Per Share— | |
| Admiral Shares | $103.75 |
| |
| |
| Institutional Shares—Net Assets | |
| Applicable to 10,945,587 outstanding | |
| $.001 par value shares of beneficial | |
| interest (unlimited authorization) | 564,289 |
| Net Asset Value Per Share— | |
| Institutional Shares | $51.55 |
• See Note A in Notes to Financial Statements.
* Non-income-producing security.
1 The fund invests a portion of its cash reserves in equity markets through the use of index futures contracts. After giving effect to futures
investments, the fund’s effective common stock and temporary cash investment positions represent 100.0% and 0.2%, respectively,
of net assets.
2 Affiliated money market fund available only to Vanguard funds and certain trusts and accounts managed by Vanguard. Rate shown is the
7-day yield.
3 Securities with a value of $1,098,000 have been segregated as initial margin for open futures contracts.
See accompanying Notes, which are an integral part of the Financial Statements.
85
Tax-Managed Capital Appreciation Fund
Statement of Operations
| |
| | Year Ended |
| | December 31, 2015 |
| | ($000) |
| Investment Income | |
| Income | |
| Dividends | 116,609 |
| Interest1 | 12 |
| Total Income | 116,621 |
| Expenses | |
| The Vanguard Group—Note B | |
| Investment Advisory Services | 1,106 |
| Management and Administrative—Admiral Shares | 4,884 |
| Management and Administrative—Institutional Shares | 263 |
| Marketing and Distribution—Admiral Shares | 475 |
| Marketing and Distribution—Institutional Shares | 22 |
| Custodian Fees | 46 |
| Auditing Fees | 33 |
| Shareholders’ Reports—Admiral Shares | 34 |
| Shareholders’ Reports—Institutional Shares | — |
| Trustees’ Fees and Expenses | 4 |
| Total Expenses | 6,867 |
| Net Investment Income | 109,754 |
| Realized Net Gain (Loss) | |
| Investment Securities Sold | 15,552 |
| Futures Contracts | (100) |
| Realized Net Gain (Loss) | 15,452 |
| Change in Unrealized Appreciation (Depreciation) | |
| Investment Securities | (19,704) |
| Futures Contracts | 66 |
| Change in Unrealized Appreciation (Depreciation) | (19,638) |
| Net Increase (Decrease) in Net Assets Resulting from Operations | 105,568 |
| 1 Interest income from an affiliated company of the fund was $12,000. |
See accompanying Notes, which are an integral part of the Financial Statements.
86
Tax-Managed Capital Appreciation Fund
Statement of Changes in Net Assets
| | |
| | Year Ended December 31, |
| | 2015 | 2014 |
| | ($000) | ($000) |
| Increase (Decrease) in Net Assets | | |
| Operations | | |
| Net Investment Income | 109,754 | 97,763 |
| Realized Net Gain (Loss) | 15,452 | 7,504 |
| Change in Unrealized Appreciation (Depreciation) | (19,638) | 593,212 |
| Net Increase (Decrease) in Net Assets Resulting from Operations | 105,568 | 698,479 |
| Distributions | | |
| Net Investment Income | | |
| Admiral Shares | (99,464) | (88,550) |
| Institutional Shares | (9,671) | (8,399) |
| Realized Capital Gain | | |
| Admiral Shares | — | — |
| Institutional Shares | — | — |
| Total Distributions | (109,135) | (96,949) |
| Capital Share Transactions | | |
| Admiral Shares | 224,643 | 169,239 |
| Institutional Shares | 35,081 | 11,250 |
| Net Increase (Decrease) from Capital Share Transactions | 259,724 | 180,489 |
| Total Increase (Decrease) | 256,157 | 782,019 |
| Net Assets | | |
| Beginning of Period | 6,290,382 | 5,508,363 |
| End of Period1 | 6,546,539 | 6,290,382 |
| 1 Net Assets—End of Period includes undistributed (overdistributed) net investment income of ($3,205,000) and ($3,831,000). |
See accompanying Notes, which are an integral part of the Financial Statements.
87
Tax-Managed Capital Appreciation Fund
Financial Highlights
| | | | | |
| Admiral Shares | | | | | |
| |
| For a Share Outstanding | Year Ended December 31, |
| Throughout Each Period | 2015 | 2014 | 2013 | 2012 | 2011 |
| Net Asset Value, Beginning of Period | $103.82 | $93.70 | $71.17 | $62.36 | $62.56 |
| Investment Operations | | | | | |
| Net Investment Income | 1.764 | 1.633 | 1.414 | 1.384 | 1.072 |
| Net Realized and Unrealized Gain (Loss) | | | | | |
| on Investments | (. 082) | 10.103 | 22.537 | 8.806 | (.202) |
| Total from Investment Operations | 1.682 | 11.736 | 23.951 | 10.190 | .870 |
| Distributions | | | | | |
| Dividends from Net Investment Income | (1.752) | (1.616) | (1.421) | (1.380) | (1.070) |
| Distributions from Realized Capital Gains | — | — | — | — | — |
| Total Distributions | (1.752) | (1.616) | (1.421) | (1.380) | (1.070) |
| Net Asset Value, End of Period | $103.75 | $103.82 | $93.70 | $71.17 | $62.36 |
| |
| Total Return1 | 1.68% | 12.52% | 33.67% | 16.35% | 1.38% |
| |
| Ratios/Supplemental Data | | | | | |
| Net Assets, End of Period (Millions) | $5,982 | $5,760 | $5,040 | $3,702 | $3,305 |
| Ratio of Total Expenses to Average Net Assets | 0.11% | 0.12% | 0.12% | 0.12% | 0.12% |
| Ratio of Net Investment Income to | | | | | |
| Average Net Assets | 1.69% | 1.66% | 1.71% | 1.96% | 1.65% |
| Portfolio Turnover Rate | 10%2 | 6% | 4% | 3% | 2% |
1 Total returns do not include transaction or account service fees that may have applied in the periods shown. Fund prospectuses provide
information about any applicable transaction and account service fees.
2 Excludes the value of portfolio securities received or delivered as a result of in-kind purchases or redemptions of the fund’s capital shares.
See accompanying Notes, which are an integral part of the Financial Statements.
88
Tax-Managed Capital Appreciation Fund
Financial Highlights
| | | | | |
| Institutional Shares | | | | | |
| |
| For a Share Outstanding | Year Ended December 31, |
| Throughout Each Period | 2015 | 2014 | 2013 | 2012 | 2011 |
| Net Asset Value, Beginning of Period | $51.59 | $46.56 | $35.36 | $30.98 | $31.09 |
| Investment Operations | | | | | |
| Net Investment Income | . 897 | .830 | .719 | .702 | .548 |
| Net Realized and Unrealized Gain (Loss) | | | | | |
| on Investments | (. 046) | 5.022 | 11.203 | 4.379 | (.113) |
| Total from Investment Operations | . 851 | 5.852 | 11.922 | 5.081 | .435 |
| Distributions | | | | | |
| Dividends from Net Investment Income | (.891) | (. 822) | (.722) | (.701) | (.545) |
| Distributions from Realized Capital Gains | — | — | — | — | — |
| Total Distributions | (. 891) | (. 822) | (.722) | (.701) | (.545) |
| Net Asset Value, End of Period | $51.55 | $51.59 | $46.56 | $35.36 | $30.98 |
| |
| Total Return1 | 1.71% | 12.56% | 33.73% | 16.41% | 1.39% |
| |
| Ratios/Supplemental Data | | | | | |
| Net Assets, End of Period (Millions) | $564 | $530 | $468 | $317 | $302 |
| Ratio of Total Expenses to Average Net Assets | 0.07% | 0.08% | 0.08% | 0.08% | 0.08% |
| Ratio of Net Investment Income to | | | | | |
| Average Net Assets | 1.73% | 1.70% | 1.75% | 2.00% | 1.69% |
| Portfolio Turnover Rate | 10%2 | 6% | 4% | 3% | 2% |
1 Total returns do not include transaction fees that may have applied in the periods shown. Fund prospectuses provide information about any
applicable transaction fees.
2 Excludes the value of portfolio securities received or delivered as a result of in-kind purchases or redemptions of the fund’s capital shares.
See accompanying Notes, which are an integral part of the Financial Statements.
89
Tax-Managed Capital Appreciation Fund
Notes to Financial Statements
Vanguard Tax-Managed Capital Appreciation Fund is registered under the Investment Company Act of 1940 as an open-end investment company, or mutual fund. The fund offers two classes of shares: Admiral Shares and Institutional Shares. Admiral Shares and Institutional Shares are designed for investors who meet certain administrative, service, and account-size criteria.
A. The following significant accounting policies conform to generally accepted accounting principles for U.S. investment companies. The fund consistently follows such policies in preparing its financial statements.
1. Security Valuation: Securities are valued as of the close of trading on the New York Stock Exchange (generally 4 p.m., Eastern time) on the valuation date. Equity securities are valued at the latest quoted sales prices or official closing prices taken from the primary market in which each security trades; such securities not traded on the valuation date are valued at the mean of the latest quoted bid and asked prices. Securities for which market quotations are not readily available, or whose values have been materially affected by events occurring before the fund’s pricing time but after the close of the securities’ primary markets, are valued by methods deemed by the board of trustees to represent fair value. Investments in Vanguard Market Liquidity Fund are valued at that fund’s net asset value. Temporary cash investments acquired over 60 days to maturity are valued using the latest bid prices or using valuations based on a matrix system (which considers such factors as security prices, yields, maturities, and ratings), both as furnished by independent pricing services. Other temporary cash investments are valued at amortized cost, which approximates market value.
2. Futures Contracts: The fund uses index futures contracts to a limited extent, with the objective of maintaining full exposure to the stock market while maintaining liquidity. The fund may purchase or sell futures contracts to achieve a desired level of investment, whether to accommodate portfolio turnover or cash flows from capital share transactions. The primary risks associated with the use of futures contracts are imperfect correlation between changes in market values of stocks held by the fund and the prices of futures contracts, and the possibility of an illiquid market. Counterparty risk involving futures is mitigated because a regulated clearinghouse is the counterparty instead of the clearing broker. To further mitigate counterparty risk, the fund trades futures contracts on an exchange, monitors the financial strength of its clearing brokers and clearinghouse, and has entered into clearing agreements with its clearing brokers. The clearinghouse imposes initial margin requirements to secure the fund’s performance and requires daily settlement of variation margin representing changes in the market value of each contract.
Futures contracts are valued at their quoted daily settlement prices. The aggregate settlement values of the contracts are not recorded in the Statement of Net Assets. Fluctuations in the value of the contracts are recorded in the Statement of Net Assets as an asset (liability) and in the Statement of Operations as unrealized appreciation (depreciation) until the contracts are closed, when they are recorded as realized futures gains (losses).
During the year ended December 31, 2015, the fund’s average investments in long and short futures contracts represented less than 1% and 0% of net assets, respectively, based on the average of aggregate settlement values at each quarter-end during the period.
3. Federal Income Taxes: The fund intends to continue to qualify as a regulated investment company and distribute all of its taxable income. Management has analyzed the fund’s tax positions taken for all open federal income tax years (December 31, 2012–2015), and has concluded that no provision for federal income tax is required in the fund’s financial statements.
4. Distributions: Distributions to shareholders are recorded on the ex-dividend date.
90
Tax-Managed Capital Appreciation Fund
5. Credit Facility: The fund and certain other funds managed by The Vanguard Group (“Vanguard”) participate in a $3 billion committed credit facility provided by a syndicate of lenders pursuant to a credit agreement that may be renewed annually; each fund is individually liable for its borrowings, if any, under the credit facility. Borrowings may be utilized for temporary and emergency purposes, and are subject to the fund’s regulatory and contractual borrowing restrictions. The participating funds are charged administrative fees and an annual commitment fee of 0.06% of the undrawn amount of the facility; these fees are allocated to the funds based on a method approved by the fund’s board of trustees and included in Management and Administrative expenses on the fund’s Statement of Operations. Any borrowings under this facility bear interest at a rate equal to the higher of the federal funds rate or LIBOR reference rate plus an agreed-upon spread.
The fund had no borrowings outstanding at December 31, 2015, or at any time during the period then ended.
6. Other: Dividend income is recorded on the ex-dividend date. Interest income includes income distributions received from Vanguard Market Liquidity Fund and is accrued daily. Premiums and discounts on debt securities purchased are amortized and accreted, respectively, to interest income over the lives of the respective securities. Security transactions are accounted for on the date securities are bought or sold. Costs used to determine realized gains (losses) on the sale of investment securities are those of the specific securities sold.
Each class of shares has equal rights as to assets and earnings, except that each class separately bears certain class-specific expenses related to maintenance of shareholder accounts (included in Management and Administrative expenses) and shareholder reporting. Marketing and distribution expenses are allocated to each class of shares based on a method approved by the board of trustees. Income, other non-class-specific expenses, and gains and losses on investments are allocated to each class of shares based on its relative net assets.
B. In accordance with the terms of a Funds’ Service Agreement (the “FSA”) between Vanguard and the fund, Vanguard furnishes to the fund investment advisory, corporate management, administrative, marketing, and distribution services at Vanguard’s cost of operations (as defined by the FSA). These costs of operations are allocated to the fund based on methods and guidelines approved by the board of trustees. Vanguard does not require reimbursement in the current period for certain costs of operations (such as deferred compensation/benefits and risk/insurance costs); the fund’s liability for these costs of operations is included in Payables to Vanguard on the Statement of Net Assets.
Upon the request of Vanguard, the fund may invest up to 0.40% of its net assets as capital in Vanguard. At December 31, 2015, the fund had contributed to Vanguard capital in the amount of $577,000, representing 0.01% of the fund’s net assets and 0.23% of Vanguard’s capitalization. The fund’s trustees and officers are also directors and employees, respectively, of Vanguard.
C. Various inputs may be used to determine the value of the fund’s investments. These inputs are summarized in three broad levels for financial statement purposes. The inputs or methodologies used to value securities are not necessarily an indication of the risk associated with investing in those securities.
Level 1—Quoted prices in active markets for identical securities.
Level 2—Other significant observable inputs (including quoted prices for similar securities, interest rates, prepayment speeds, credit risk, etc.).
Level 3—Significant unobservable inputs (including the fund’s own assumptions used to determine the fair value of investments).
91
Tax-Managed Capital Appreciation Fund
The following table summarizes the market value of the fund’s investments as of December 31, 2015, based on the inputs used to value them:
| | | |
| | Level 1 | Level 2 | Level 3 |
| Investments | ($000) | ($000) | ($000) |
| Common Stocks | 6,529,011 | — | — |
| Temporary Cash Investments | 31,186 | 1,996 | — |
| Futures Contracts—Liabilities1 | (170) | — | — |
| Total | 6,560,027 | 1,996 | — |
| 1 Represents variation margin on the last day of the reporting period. |
D. At December 31, 2015, the aggregate settlement value of open futures contracts and the related unrealized appreciation (depreciation) were:
| | | | |
| | | | ($000) |
| | | | Aggregate | |
| | | Number of | Settlement | Unrealized |
| | | Long (Short) | Value | Appreciation |
| Futures Contracts | Expiration | Contracts | Long (Short) | (Depreciation) |
| E-mini S&P 500 Index | March 2016 | 177 | 18,013 | 66 |
Unrealized appreciation (depreciation) on open futures contracts is required to be treated as realized gain (loss) for tax purposes.
E. Distributions are determined on a tax basis and may differ from net investment income and realized capital gains for financial reporting purposes. Differences may be permanent or temporary. Permanent differences are reclassified among capital accounts in the financial statements to reflect their tax character. Temporary differences arise when certain items of income, expense, gain, or loss are recognized in different periods for financial statement and tax purposes. These differences will reverse at some time in the future. Differences in classification may also result from the treatment of short-term gains as ordinary income for tax purposes.
Certain of the fund’s investments are in securities considered to be passive foreign investment companies, for which any unrealized appreciation and/or realized gains are required to be included in distributable net income for tax purposes. During the year ended December 31, 2015, the fund realized gains on the sale of passive foreign investment companies of $7,000, which have been included in current and prior periods’ taxable income; accordingly, such gains have been reclassified from accumulated net realized losses to overdistributed net investment income.
During the year ended December 31, 2015, the fund realized $42,390,000 of net capital gains resulting from in-kind redemptions—in which shareholders exchanged fund shares for securities held by the fund rather than for cash. Because such gains are not taxable to the fund, and are not distributed to shareholders, they have been reclassified from accumulated net realized losses to paid-in capital.
For tax purposes, at December 31, 2015, the fund had $1,346,000 of ordinary income available for distribution. The fund used capital loss carryforwards of $5,450,000 to offset taxable capital gains realized during the year ended December 31, 2015. At December 31, 2015, the fund had available capital losses totaling $52,688,000 to offset future net capital gains. Of this amount, $8,140,000
92
Tax-Managed Capital Appreciation Fund
is subject to expiration on December 31, 2018. Capital losses of $44,548,000 realized beginning in fiscal 2011 may be carried forward indefinitely under the Regulated Investment Company Modernization Act of 2010, but must be used before any expiring loss carryforwards.
At December 31, 2015, the cost of investment securities for tax purposes was $3,341,553,000. Net unrealized appreciation of investment securities for tax purposes was $3,220,640,000, consisting of unrealized gains of $3,241,440,000 on securities that had risen in value since their purchase and $20,800,000 in unrealized losses on securities that had fallen in value since their purchase.
F. During the year ended December 31, 2015, the fund purchased $953,022,000 of investment securities and sold $703,158,000 of investment securities, other than temporary cash investments. Purchases and sales include $0 and $72,631,000, respectively, in connection with in-kind purchases and redemptions of the fund’s capital shares.
G. Capital share transactions for each class of shares were:
| | | | |
| | Year Ended December 31, |
| | 2015 | 2014 |
| | Amount | Shares | Amount | Shares |
| | ($000) | (000) | ($000) | (000) |
| Admiral Shares | | | | |
| Issued | 504,114 | 4,799 | 316,759 | 3,230 |
| Issued in Lieu of Cash Distributions | 74,719 | 742 | 67,420 | 647 |
| Redeemed | (354,190) | (3,364) | (214,940) | (2,184) |
| Net Increase (Decrease) —Admiral Shares | 224,643 | 2,177 | 169,239 | 1,693 |
| Institutional Shares | | | | |
| Issued | 52,150 | 986 | 19,129 | 387 |
| Issued in Lieu of Cash Distributions | 5,518 | 110 | 4,704 | 91 |
| Redeemed | (22,587) | (433) | (12,583) | (252) |
| Net Increase (Decrease) —Institutional Shares | 35,081 | 663 | 11,250 | 226 |
H. Management has determined that no material events or transactions occurred subsequent to December 31, 2015, that would require recognition or disclosure in these financial statements.
93
Tax-Managed Small-Cap Fund
Fund Profile
As of December 31, 2015
| | |
| Share-Class Characteristics | |
| |
| | Admiral | Institutional |
| | Shares | Shares |
| Ticker Symbol | VTMSX | VTSIX |
| Expense Ratio1 | 0.12% | 0.08% |
| 30-Day SEC Yield | 1.34% | 1.38% |
| | | |
| Portfolio Characteristics | | |
| | | | DJ |
| | | S&P | U.S. Total |
| | | SmallCap | Market |
| | Fund | 600 Index | FA Index |
| Number of Stocks | 603 | 601 | 3,960 |
| Median Market Cap | $1.5B | $1.5B | $51.4B |
| Price/Earnings Ratio | 25.9x | 26.1x | 21.9x |
| Price/Book Ratio | 2.1x | 2.0x | 2.7x |
| Return on Equity | 11.3% | 11.0% | 17.2% |
| Earnings Growth | | | |
| Rate | 9.5% | 9.7% | 9.5% |
| Dividend Yield | 1.3% | 1.5% | 2.1% |
| Foreign Holdings | 0.0% | 0.0% | 0.0% |
| Turnover Rate | 33% | — | — |
| Short-Term Reserves | 0.1% | — | — |
| | |
| Volatility Measures | | |
| | | DJ |
| | | U.S. Total |
| | S&P SmallCap | Market |
| | 600 Index | FA Index |
| R-Squared | 1.00 | 0.73 |
| Beta | 0.99 | 1.05 |
| These measures show the degree and timing of the fund’s fluctuations compared with the indexes over 36 months. |
| | |
| Ten Largest Holdings (% of total net assets) |
| Piedmont Natural Gas | | |
| Co. Inc. | Gas Utilities | 0.7% |
| ABIOMED Inc. | Health Care | |
| | Equipment | 0.6 |
| Heartland Payment | Data Processing & | |
| Systems Inc. | Outsourced Services | 0.6 |
| Pool Corp. | Distributors | 0.6 |
| Curtiss-Wright Corp. | Aerospace & | |
| | Defense | 0.5 |
| EMCOR Group Inc. | Construction & | |
| | Engineering | 0.5 |
| PrivateBancorp Inc. | Regional Banks | 0.5 |
| Microsemi Corp. | Semiconductors | 0.5 |
| Blackbaud Inc. | Application Software | 0.5 |
| Take-Two Interactive | Home Entertainment | |
| Software Inc. | Software | 0.5 |
| Top Ten | | 5.5% |
| The holdings listed exclude any temporary cash investments and equity index products. |
1 The expense ratios shown are from the prospectus dated April 29, 2015, and represent estimated costs for the current fiscal year. For the fiscal
year ended December 31, 2015, the expense ratios were 0.11% for Admiral Shares and 0.07% for Institutional Shares.
94
Tax-Managed Small-Cap Fund
| | | |
| Sector Diversification (% of equity exposure) |
| | | | DJ |
| | | S&P | U.S. Total |
| | | SmallCap | Market |
| | Fund | 600 Index | FA Index |
| Consumer | | | |
| Discretionary | 13.9% | 13.9% | 13.4% |
| Consumer Staples | 2.8 | 2.8 | 8.8 |
| Energy | 2.7 | 2.5 | 5.9 |
| Financials | 24.6 | 24.4 | 18.2 |
| Health Care | 13.5 | 13.5 | 14.8 |
| Industrials | 16.8 | 16.8 | 10.5 |
| Information | | | |
| Technology | 16.4 | 16.6 | 20.0 |
| Materials | 4.4 | 4.5 | 3.1 |
| Telecommunication | | | |
| Services | 0.9 | 0.9 | 2.2 |
| Utilities | 4.0 | 4.1 | 3.1 |
Investment Focus
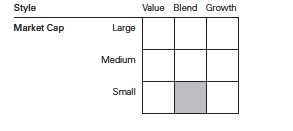
95
Tax-Managed Small-Cap Fund
Performance Summary
All of the returns in this report represent past performance, which is not a guarantee of future results that may be achieved by the fund. (Current performance may be lower or higher than the performance data cited. For performance data current to the most recent month-end, visit our website at vanguard.com/performance.) Note, too, that both investment returns and principal value can fluctuate widely, so an investor’s shares, when sold, could be worth more or less than their original cost. The returns shown do not reflect taxes that a shareholder would pay on fund distributions or on the sale of fund shares.
Cumulative Performance: December 31, 2005, Through December 31, 2015
Initial Investment of $10,000
| | | | | |
| | | Average Annual Total Returns | |
| | | Periods Ended December 31, 2015 | |
| | | | | | Final Value |
| | | One | Five | Ten | of a $10,000 |
| | | Year | Years | Years | Investment |
| | Tax-Managed Small-Cap Fund Admiral | | | | |
| | Shares | -1.85% | 11.54% | 8.05% | $21,683 |
| •••••••• | S&P SmallCap 600 Index | -1.97 | 11.48 | 8.01 | 21,600 |
| – – – – | Small-Cap Core Funds Average | -5.21 | 8.25 | 5.81 | 17,583 |
| | Dow Jones U.S. Total Stock Market | | | | |
| | Float Adjusted Index | 0.44 | 12.14 | 7.48 | 20,563 |
| Small-Cap Core Funds Average: Derived from data provided by Lipper, a Thomson Reuters Company. |
| | | | |
| | | | | Final Value |
| | One | Five | Ten | of a $5,000,000 |
| | Year | Years | Years | Investment |
| Tax-Managed Small-Cap Fund Institutional | | | | |
| Shares | -1.80% | 11.58% | 8.11% | $10,900,140 |
| |
| S&P SmallCap 600 Index | -1.97 | 11.48 | 8.01 | 10,799,990 |
| Dow Jones U.S. Total Stock Market Float | | | | |
| Adjusted Index | 0.44 | 12.14 | 7.48 | 10,281,716 |
See Financial Highlights for dividend and capital gains information.
96
Tax-Managed Small-Cap Fund
Fiscal-Year Total Returns (%): December 31, 2005, Through December 31, 2015
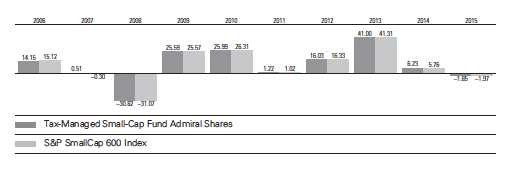
97
Tax-Managed Small-Cap Fund
Financial Statements
Statement of Net Assets
As of December 31, 2015
The fund reports a complete list of its holdings in regulatory filings four times in each fiscal year, at the quarter-ends. For the second and fourth fiscal quarters, the lists appear in the fund’s semiannual and annual reports to shareholders. For the first and third fiscal quarters, the fund files the lists with the Securities and Exchange Commission on Form N-Q. Shareholders can look up the fund’s Forms N-Q on the SEC’s website at sec.gov. Forms N-Q may also be reviewed and copied at the SEC’s Public Reference Room (see the back cover of this report for further information).
| | | |
| | | | Market |
| | | | Value• |
| | | Shares | ($000) |
| Common Stocks (99.6%)1 | | |
| Consumer Discretionary (13.8%) | |
| | Pool Corp. | 252,006 | 20,357 |
| * | Helen of Troy Ltd. | 160,466 | 15,124 |
| | Lithia Motors Inc. Class A | 137,807 | 14,700 |
| | Texas Roadhouse Inc. | | |
| | Class A | 364,150 | 13,026 |
| | Monro Muffler Brake Inc. | 182,426 | 12,080 |
| * | Pinnacle Entertainment Inc. | 357,855 | 11,136 |
| | Gannett Co. Inc. | 673,525 | 10,972 |
| | Core-Mark Holding Co. Inc. | 130,508 | 10,694 |
| * | Steven Madden Ltd. | 343,440 | 10,379 |
| * | G-III Apparel Group Ltd. | 233,497 | 10,335 |
| | Wolverine World Wide Inc. | 613,544 | 10,252 |
| * | Five Below Inc. | 318,400 | 10,221 |
| | Papa John’s International | | |
| | Inc. | 182,333 | 10,187 |
| | Group 1 Automotive Inc. | 131,999 | 9,992 |
| | Marriott Vacations | | |
| | Worldwide Corp. | 173,555 | 9,884 |
| * | Gentherm Inc. | 206,020 | 9,765 |
| | Sonic Corp. | 301,857 | 9,753 |
| * | Boyd Gaming Corp. | 474,808 | 9,434 |
| * | Dorman Products Inc. | 176,959 | 8,400 |
| | Drew Industries Inc. | 137,616 | 8,379 |
| | DineEquity Inc. | 95,738 | 8,106 |
| * | Express Inc. | 468,763 | 8,100 |
| * | Genesco Inc. | 137,943 | 7,839 |
| * | Popeyes Louisiana Kitchen | | |
| | Inc. | 127,816 | 7,477 |
| * | Meritage Homes Corp. | 217,357 | 7,388 |
| | La-Z-Boy Inc. | 300,848 | 7,347 |
| | Children’s Place Inc. | 128,002 | 7,066 |
| | Caleres Inc. | 256,377 | 6,876 |
| * | Select Comfort Corp. | 316,964 | 6,786 |
| * | TopBuild Corp. | 218,200 | 6,714 |
| | Sturm Ruger & Co. Inc. | 109,722 | 6,541 |
| * | iRobot Corp. | 172,629 | 6,111 |
| | EW Scripps Co. Class A | 315,073 | 5,986 |
| | | |
| * | Pep Boys-Manny Moe & | | |
| | Jack | 315,404 | 5,807 |
| | Cato Corp. Class A | 154,460 | 5,687 |
| * | Vitamin Shoppe Inc. | 173,580 | 5,676 |
| | Scholastic Corp. | 146,786 | 5,660 |
| * | Tumi Holdings Inc. | 335,827 | 5,585 |
| | Oxford Industries Inc. | 85,651 | 5,466 |
| * | BJ’s Restaurants Inc. | 119,178 | 5,181 |
| | Finish Line Inc. Class A | 282,419 | 5,106 |
| * | Red Robin Gourmet | | |
| | Burgers Inc. | 81,314 | 5,020 |
| | Buckle Inc. | 159,750 | 4,917 |
| | Callaway Golf Co. | 515,695 | 4,858 |
| | Sonic Automotive Inc. | | |
| | Class A | 204,689 | 4,659 |
| | Bob Evans Farms Inc. | 119,806 | 4,654 |
| * | Universal Electronics Inc. | 88,312 | 4,535 |
| | Standard Motor Products | | |
| | Inc. | 118,849 | 4,522 |
| * | Crocs Inc. | 436,391 | 4,469 |
| * | Francesca’s Holdings Corp. | 252,786 | 4,401 |
| * | Hibbett Sports Inc. | 144,462 | 4,369 |
| * | Scientific Games Corp. | | |
| | Class A | 469,256 | 4,209 |
| | Outerwall Inc. | 114,393 | 4,180 |
| | Ethan Allen Interiors Inc. | 148,812 | 4,140 |
| * | Strayer Education Inc. | 61,829 | 3,717 |
| | Nutrisystem Inc. | 165,060 | 3,572 |
| * | Motorcar Parts of America | | |
| | Inc. | 104,992 | 3,550 |
| * | M/I Homes Inc. | 161,645 | 3,543 |
| | Interval Leisure Group Inc. | 225,422 | 3,519 |
| * | Regis Corp. | 248,546 | 3,517 |
| | Fred’s Inc. Class A | 204,451 | 3,347 |
| | Ruth’s Hospitality Group | | |
| | Inc. | 206,283 | 3,284 |
| | Winnebago Industries Inc. | 161,104 | 3,206 |
| * | Lumber Liquidators | | |
| | Holdings Inc. | 184,411 | 3,201 |
| | Capella Education Co. | 64,056 | 2,961 |
98
Tax-Managed Small-Cap Fund
| | | |
| | | | Market |
| | | | Value• |
| | | Shares | ($000) |
| * | MarineMax Inc. | 153,107 | 2,820 |
| * | FTD Cos. Inc. | 103,223 | 2,701 |
| | Movado Group Inc. | 102,530 | 2,636 |
| * | Unifi Inc. | 91,954 | 2,589 |
| * | Tuesday Morning Corp. | 396,104 | 2,575 |
| | Haverty Furniture Cos. Inc. | 115,368 | 2,473 |
| | Superior Industries | | |
| | International Inc. | 134,128 | 2,471 |
| * | Blue Nile Inc. | 66,082 | 2,454 |
| * | Installed Building Products | | |
| | Inc. | 95,606 | 2,374 |
| * | Barnes & Noble Education | | |
| | Inc. | 220,573 | 2,195 |
| * | Ruby Tuesday Inc. | 381,004 | 2,099 |
| | Stage Stores Inc. | 225,706 | 2,056 |
| | Marcus Corp. | 107,895 | 2,047 |
| | PetMed Express Inc. | 116,033 | 1,989 |
| * | Biglari Holdings Inc. | 5,945 | 1,937 |
| * | Zumiez Inc. | 120,740 | 1,826 |
| * | American Public Education | | |
| | Inc. | 94,652 | 1,761 |
| | Barnes & Noble Inc. | 173,884 | 1,515 |
| * | Career Education Corp. | 393,666 | 1,429 |
| | Kirkland’s Inc. | 96,749 | 1,403 |
| * | Perry Ellis International Inc. | 71,807 | 1,323 |
| | Arctic Cat Inc. | 78,993 | 1,294 |
| * | Monarch Casino & Resort | | |
| | Inc. | 56,035 | 1,273 |
| | Men’s Wearhouse Inc. | 79,778 | 1,171 |
| | Big 5 Sporting Goods Corp. | 112,587 | 1,125 |
| | Stein Mart Inc. | 163,167 | 1,098 |
| | Harte-Hanks Inc. | 273,748 | 887 |
| | Universal Technical | | |
| | Institute Inc. | 178,985 | 834 |
| * | VOXX International Corp. | | |
| | Class A | 135,452 | 712 |
| * | Sizmek Inc. | 15,351 | 56 |
| * | Iconix Brand Group Inc. | 6,152 | 42 |
| | | | 511,090 |
| Consumer Staples (2.8%) | | |
| | B&G Foods Inc. | 328,532 | 11,505 |
| * | Darling Ingredients Inc. | 980,943 | 10,320 |
| | Snyder’s-Lance Inc. | 297,959 | 10,220 |
| | J&J Snack Foods Corp. | 84,497 | 9,858 |
| | Sanderson Farms Inc. | 115,851 | 8,981 |
| | WD-40 Co. | 87,623 | 8,644 |
| | Cal-Maine Foods Inc. | 180,912 | 8,383 |
| | Universal Corp. | 139,324 | 7,813 |
| * | Diamond Foods Inc. | 151,099 | 5,825 |
| | Andersons Inc. | 155,585 | 4,921 |
| | SpartanNash Co. | 220,761 | 4,777 |
| | Calavo Growers Inc. | 82,778 | 4,056 |
| * | Central Garden & Pet Co. | | |
| | Class A | 241,801 | 3,289 |
| | Inter Parfums Inc. | 97,249 | 2,317 |
| | | |
| | Medifast Inc. | 61,662 | 1,873 |
| * | Seneca Foods Corp. | | |
| | Class A | 44,080 | 1,277 |
| * | Central Garden & Pet Co. | 862 | 12 |
| | | | 104,071 |
| Energy (2.6%) | | |
| * | PDC Energy Inc. | 239,237 | 12,770 |
| * | Carrizo Oil & Gas Inc. | 422,735 | 12,505 |
| | US Silica Holdings Inc. | 375,415 | 7,032 |
| | Bristow Group Inc. | 253,813 | 6,574 |
| * | SEACOR Holdings Inc. | 113,477 | 5,964 |
| * | Synergy Resources Corp. | 627,887 | 5,350 |
| | Green Plains Inc. | 227,232 | 5,204 |
| * | TETRA Technologies Inc. | 657,701 | 4,946 |
| * | Exterran Corp. | 249,985 | 4,012 |
| * | Helix Energy Solutions | | |
| | Group Inc. | 697,265 | 3,668 |
| * | Matrix Service Co. | 165,992 | 3,409 |
| * | Newpark Resources Inc. | 604,372 | 3,191 |
| | Tesco Corp. | 373,738 | 2,706 |
| * | Bonanza Creek Energy Inc. | 434,998 | 2,292 |
| * | Unit Corp. | 184,475 | 2,251 |
| * | Archrock Inc. | 294,380 | 2,214 |
| * | REX American Resources | | |
| | Corp. | 40,878 | 2,210 |
| * | Bill Barrett Corp. | 454,826 | 1,787 |
| * | Northern Oil and Gas Inc. | 430,158 | 1,660 |
| | Tidewater Inc. | 175,698 | 1,223 |
| | CARBO Ceramics Inc. | 70,474 | 1,212 |
| * | Cloud Peak Energy Inc. | 502,610 | 1,045 |
| * | Hornbeck Offshore | | |
| | Services Inc. | 103,410 | 1,028 |
| * | Gulfmark Offshore Inc. | 214,012 | 999 |
| * | Contango Oil & Gas Co. | 127,649 | 818 |
| | Gulf Island Fabrication Inc. | 73,664 | 771 |
| * | Stone Energy Corp. | 121,862 | 523 |
| * | Era Group Inc. | 35,801 | 399 |
| * | Geospace Technologies | | |
| | Corp. | 8,363 | 118 |
| * | Basic Energy Services Inc. | 21,659 | 58 |
| * | Pioneer Energy Services | | |
| | Corp. | 8,547 | 19 |
| * | Rex Energy Corp. | 17,282 | 18 |
| | | | 97,976 |
| Financials (20.6%) | | |
| | PrivateBancorp Inc. | 447,141 | 18,342 |
| | ProAssurance Corp. | 345,829 | 16,783 |
| * | Texas Capital Bancshares | | |
| | Inc. | 310,709 | 15,355 |
| | Interactive Brokers Group | | |
| | Inc. | 338,131 | 14,742 |
| | Home BancShares Inc. | 349,207 | 14,150 |
| | United Bankshares Inc. | 375,657 | 13,895 |
| | Wintrust Financial Corp. | 281,978 | 13,682 |
99
Tax-Managed Small-Cap Fund
| | | |
| | | | Market |
| | | | Value• |
| | | Shares | ($000) |
| | FNB Corp. | 1,008,857 | 13,458 |
| | RLI Corp. | 214,360 | 13,237 |
| | MB Financial Inc. | 408,545 | 13,225 |
| | Evercore Partners Inc. | | |
| | Class A | 225,031 | 12,167 |
| | Glacier Bancorp Inc. | 451,300 | 11,973 |
| | American Equity | | |
| | Investment Life Holding | | |
| | Co. | 484,466 | 11,642 |
| | UMB Financial Corp. | 246,551 | 11,477 |
| | First Financial Bankshares | | |
| | Inc. | 374,067 | 11,286 |
| | Sterling Bancorp | 692,901 | 11,239 |
| | GEO Group Inc. | 387,832 | 11,212 |
| | Columbia Banking System | | |
| | Inc. | 333,437 | 10,840 |
| | Selective Insurance Group | | |
| | Inc. | 320,611 | 10,766 |
| | National Penn Bancshares | | |
| | Inc. | 837,582 | 10,327 |
| | Community Bank System | | |
| | Inc. | 252,996 | 10,105 |
| | Pinnacle Financial Partners | | |
| | Inc. | 196,429 | 10,089 |
| | Financial Engines Inc. | 298,845 | 10,062 |
| | EPR Properties | 171,805 | 10,042 |
| * | PRA Group Inc. | 287,498 | 9,973 |
| | Acadia Realty Trust | 290,639 | 9,635 |
| | Old National Bancorp | 710,247 | 9,631 |
| | CVB Financial Corp. | 538,148 | 9,105 |
| | Healthcare Realty Trust | | |
| | Inc. | 313,121 | 8,868 |
| | Simmons First National | | |
| | Corp. Class A | 166,034 | 8,527 |
| | Astoria Financial Corp. | 535,521 | 8,488 |
| | First Midwest Bancorp Inc. | 454,686 | 8,380 |
| | BBCN Bancorp Inc. | 454,795 | 7,831 |
| | Northwest Bancshares Inc. | 581,557 | 7,787 |
| | Medical Properties Trust | | |
| | Inc. | 668,653 | 7,696 |
| | Horace Mann Educators | | |
| | Corp. | 230,317 | 7,642 |
| | NBT Bancorp Inc. | 266,047 | 7,417 |
| * | BofI Holding Inc. | 334,164 | 7,034 |
| | Independent Bank Corp. | 151,070 | 7,028 |
| | Westamerica | | |
| | Bancorporation | 149,993 | 7,012 |
| | Talmer Bancorp Inc. | | |
| | Class A | 381,064 | 6,901 |
| | LegacyTexas Financial | | |
| | Group Inc. | 274,159 | 6,859 |
| | United Community Banks | | |
| | Inc. | 333,903 | 6,508 |
| | First Financial Bancorp | 352,427 | 6,368 |
| | Kite Realty Group Trust | 243,550 | 6,315 |
| | | |
| | First Commonwealth | | |
| | Financial Corp. | 692,179 | 6,278 |
| | HFF Inc. Class A | 201,183 | 6,251 |
| | Provident Financial | | |
| | Services Inc. | 310,018 | 6,247 |
| | DiamondRock Hospitality | | |
| | Co. | 643,826 | 6,213 |
| | Boston Private Financial | | |
| | Holdings Inc. | 527,481 | 5,982 |
| | Education Realty Trust Inc. | 157,833 | 5,979 |
| * | First Cash Financial | | |
| | Services Inc. | 159,648 | 5,976 |
| | S&T Bancorp Inc. | 190,212 | 5,862 |
| | PS Business Parks Inc. | 65,764 | 5,750 |
| | Cousins Properties Inc. | 605,837 | 5,713 |
| | EastGroup Properties Inc. | 100,549 | 5,591 |
| | Infinity Property & Casualty | | |
| | Corp. | 66,581 | 5,475 |
| | AMERISAFE Inc. | 106,340 | 5,413 |
| | Banner Corp. | 117,221 | 5,376 |
| | Wilshire Bancorp Inc. | 461,814 | 5,334 |
| * | Navigators Group Inc. | 61,104 | 5,242 |
| | Retail Opportunity | | |
| | Investments Corp. | 282,811 | 5,062 |
| | LTC Properties Inc. | 116,533 | 5,027 |
| | CoreSite Realty Corp. | 87,881 | 4,985 |
| | Pennsylvania REIT | 227,431 | 4,974 |
| | Cash America International | | |
| | Inc. | 163,709 | 4,903 |
| | Lexington Realty Trust | 611,682 | 4,893 |
| | Employers Holdings Inc. | 178,532 | 4,874 |
| | United Fire Group Inc. | 124,964 | 4,787 |
| | Virtus Investment Partners | | |
| | Inc. | 40,249 | 4,728 |
| | Brookline Bancorp Inc. | 404,273 | 4,649 |
| | Cardinal Financial Corp. | 200,705 | 4,566 |
| | Stewart Information | | |
| | Services Corp. | 122,231 | 4,563 |
| * | Walker & Dunlop Inc. | 156,703 | 4,515 |
| | Hanmi Financial Corp. | 188,052 | 4,461 |
| | American Assets Trust Inc. | 115,513 | 4,430 |
| | Greenhill & Co. Inc. | 154,413 | 4,418 |
| * | Green Dot Corp. Class A | 268,663 | 4,411 |
| | Ameris Bancorp | 128,560 | 4,370 |
| * | Encore Capital Group Inc. | 147,850 | 4,299 |
| | Universal Insurance | | |
| | Holdings Inc. | 183,034 | 4,243 |
| | Safety Insurance Group Inc. | 73,943 | 4,169 |
| | Central Pacific Financial | | |
| | Corp. | 189,261 | 4,167 |
| | Chesapeake Lodging Trust | 164,776 | 4,146 |
| | City Holding Co. | 89,948 | 4,105 |
| * | LendingTree Inc. | 44,755 | 3,996 |
| | Tompkins Financial Corp. | 70,576 | 3,963 |
| * | Piper Jaffray Cos. | 95,700 | 3,866 |
100
Tax-Managed Small-Cap Fund
| | | |
| | | | Market |
| | | | Value• |
| | | Shares | ($000) |
| | Parkway Properties Inc. | 246,565 | 3,854 |
| | Southside Bancshares Inc. | 159,813 | 3,839 |
| | Oritani Financial Corp. | 224,332 | 3,701 |
| | Investment Technology | | |
| | Group Inc. | 213,946 | 3,641 |
| | Sabra Health Care REIT Inc. | 176,964 | 3,580 |
| * | First NBC Bank Holding Co. | 91,416 | 3,418 |
| | TrustCo Bank Corp. NY | 541,555 | 3,325 |
| | OFG Bancorp | 443,408 | 3,246 |
| * | INTL. FCStone Inc. | 93,821 | 3,139 |
| | Northfield Bancorp Inc. | 188,879 | 3,007 |
| | Summit Hotel Properties | | |
| | Inc. | 249,775 | 2,985 |
| | Inland Real Estate Corp. | 277,194 | 2,944 |
| | Dime Community | | |
| | Bancshares Inc. | 168,186 | 2,942 |
| | Capstead Mortgage Corp. | 320,203 | 2,799 |
| * | Four Corners Property | | |
| | Trust Inc. | 110,005 | 2,658 |
| * | First BanCorp | 809,217 | 2,630 |
| | Government Properties | | |
| | Income Trust | 154,920 | 2,459 |
| * | World Acceptance Corp. | 61,079 | 2,266 |
| | Saul Centers Inc. | 42,908 | 2,200 |
| | Universal Health Realty | | |
| | Income Trust | 43,111 | 2,156 |
| * | Forestar Group Inc. | 189,046 | 2,068 |
| | HCI Group Inc. | 57,636 | 2,009 |
| | Bank Mutual Corp. | 249,162 | 1,943 |
| * | EZCORP Inc. Class A | 386,966 | 1,931 |
| | Agree Realty Corp. | 53,709 | 1,825 |
| | Urstadt Biddle Properties | | |
| | Inc. Class A | 87,645 | 1,686 |
| | Cedar Realty Trust Inc. | 218,929 | 1,550 |
| | Getty Realty Corp. | 90,321 | 1,549 |
| | United Insurance Holdings | | |
| | Corp. | 90,330 | 1,545 |
| | CareTrust REIT Inc. | 131,121 | 1,436 |
| | Calamos Asset | | |
| | Management Inc. Class A | 123,569 | 1,196 |
| * | eHealth Inc. | 103,817 | 1,036 |
| * | Enova International Inc. | 51,999 | 344 |
| | Franklin Street Properties | | |
| | Corp. | 22,386 | 232 |
| | | | 760,492 |
| Health Care (13.4%) | | |
| * | ABIOMED Inc. | 227,924 | 20,577 |
| * | Impax Laboratories Inc. | 395,153 | 16,897 |
| * | Prestige Brands Holdings | | |
| | Inc. | 313,101 | 16,118 |
| * | Medidata Solutions Inc. | 324,482 | 15,994 |
| * | NuVasive Inc. | 284,202 | 15,378 |
| * | Medicines Co. | 407,232 | 15,206 |
| | Chemed Corp. | 100,511 | 15,057 |
| * | Nektar Therapeutics | 807,540 | 13,607 |
| | | |
| | Cantel Medical Corp. | 209,062 | 12,991 |
| * | Neogen Corp. | 215,987 | 12,208 |
| * | Integra LifeSciences | | |
| | Holdings Corp. | 173,009 | 11,727 |
| * | Ligand Pharmaceuticals Inc. | 105,325 | 11,419 |
| * | Masimo Corp. | 265,767 | 11,032 |
| * | MedAssets Inc. | 354,349 | 10,964 |
| * | Acorda Therapeutics Inc. | 247,838 | 10,603 |
| * | Magellan Health Inc. | 155,876 | 9,611 |
| * | Haemonetics Corp. | 297,384 | 9,588 |
| * | ICU Medical Inc. | 82,894 | 9,349 |
| * | Natus Medical Inc. | 190,832 | 9,169 |
| * | Air Methods Corp. | 205,205 | 8,604 |
| * | AMN Healthcare Services | | |
| | Inc. | 276,347 | 8,581 |
| * | Cambrex Corp. | 178,443 | 8,403 |
| * | Greatbatch Inc. | 143,959 | 7,558 |
| | Select Medical Holdings | | |
| | Corp. | 627,137 | 7,469 |
| * | Amedisys Inc. | 187,961 | 7,391 |
| * | Depomed Inc. | 391,199 | 7,092 |
| * | Emergent BioSolutions Inc. | 175,750 | 7,032 |
| | CONMED Corp. | 159,500 | 7,026 |
| | Abaxis Inc. | 122,104 | 6,799 |
| * | Lannett Co. Inc. | 165,509 | 6,640 |
| * | Omnicell Inc. | 211,852 | 6,584 |
| * | HMS Holdings Corp. | 523,702 | 6,462 |
| * | PharMerica Corp. | 180,852 | 6,330 |
| | Ensign Group Inc. | 272,948 | 6,177 |
| | Kindred Healthcare Inc. | 518,277 | 6,173 |
| | Analogic Corp. | 73,461 | 6,068 |
| * | ExamWorks Group Inc. | 224,888 | 5,982 |
| * | Cynosure Inc. Class A | 128,665 | 5,747 |
| * | Repligen Corp. | 197,518 | 5,588 |
| * | Momenta Pharmaceuticals | | |
| | Inc. | 370,972 | 5,505 |
| * | MiMedx Group Inc. | 578,232 | 5,418 |
| * | HealthEquity Inc. | 196,644 | 4,930 |
| | Meridian Bioscience Inc. | 235,633 | 4,835 |
| * | Merit Medical Systems Inc. | 252,384 | 4,692 |
| | Aceto Corp. | 173,381 | 4,678 |
| * | Luminex Corp. | 213,601 | 4,569 |
| * | Affymetrix Inc. | 437,125 | 4,411 |
| | Quality Systems Inc. | 256,874 | 4,141 |
| * | Supernus Pharmaceuticals | | |
| | Inc. | 259,881 | 3,493 |
| * | Providence Service Corp. | 74,220 | 3,482 |
| | US Physical Therapy Inc. | 64,440 | 3,459 |
| * | LHC Group Inc. | 75,315 | 3,411 |
| * | Vascular Solutions Inc. | 94,669 | 3,256 |
| * | Inogen Inc. | 80,853 | 3,241 |
| | Phibro Animal Health Corp. | | |
| | Class A | 105,140 | 3,168 |
| * | Albany Molecular Research | | |
| | Inc. | 155,733 | 3,091 |
101
Tax-Managed Small-Cap Fund
| | | |
| | | | Market |
| | | | Value• |
| | | Shares | ($000) |
| * | Anika Therapeutics Inc. | 80,800 | 3,083 |
| * | Cross Country Healthcare | | |
| | Inc. | 186,472 | 3,056 |
| | Computer Programs & | | |
| | Systems Inc. | 61,417 | 3,055 |
| * | Hanger Inc. | 185,604 | 3,053 |
| * | HealthStream Inc. | 134,192 | 2,952 |
| * | CorVel Corp. | 67,045 | 2,945 |
| | Invacare Corp. | 167,885 | 2,920 |
| * | ANI Pharmaceuticals Inc. | 57,271 | 2,584 |
| * | Enanta Pharmaceuticals Inc. | 75,823 | 2,504 |
| * | Healthways Inc. | 172,324 | 2,218 |
| * | Spectrum Pharmaceuticals | | |
| | Inc. | 349,314 | 2,106 |
| * | Almost Family Inc. | 46,285 | 1,769 |
| | Landauer Inc. | 53,074 | 1,747 |
| * | AngioDynamics Inc. | 143,768 | 1,745 |
| * | Adeptus Health Inc. Class A | 29,602 | 1,614 |
| | CryoLife Inc. | 144,999 | 1,563 |
| * | SurModics Inc. | 76,950 | 1,560 |
| * | Sagent Pharmaceuticals Inc. | 81,514 | 1,297 |
| | | | 496,752 |
| Industrials (16.8%) | | |
| | Curtiss-Wright Corp. | 270,649 | 18,539 |
| | EMCOR Group Inc. | 383,974 | 18,446 |
| | EnerSys | 272,213 | 15,225 |
| | Healthcare Services Group | | |
| | Inc. | 406,773 | 14,184 |
| * | Moog Inc. Class A | 223,104 | 13,520 |
| * | Dycom Industries Inc. | 191,416 | 13,391 |
| | Allegiant Travel Co. Class A | 79,277 | 13,305 |
| * | On Assignment Inc. | 271,847 | 12,219 |
| * | Hawaiian Holdings Inc. | 306,083 | 10,814 |
| | Matson Inc. | 252,889 | 10,781 |
| | Hillenbrand Inc. | 360,935 | 10,694 |
| | Barnes Group Inc. | 297,695 | 10,535 |
| | Matthews International | | |
| | Corp. Class A | 181,466 | 9,699 |
| | Tetra Tech Inc. | 371,677 | 9,671 |
| | Korn/Ferry International | 284,261 | 9,432 |
| * | WageWorks Inc. | 203,984 | 9,255 |
| | UniFirst Corp. | 87,398 | 9,107 |
| | Applied Industrial | | |
| | Technologies Inc. | 221,690 | 8,976 |
| | ABM Industries Inc. | 313,535 | 8,926 |
| | Knight Transportation Inc. | 362,967 | 8,795 |
| | Mueller Industries Inc. | 323,804 | 8,775 |
| | Actuant Corp. Class A | 360,664 | 8,641 |
| | Mobile Mini Inc. | 268,685 | 8,364 |
| | John Bean Technologies | | |
| | Corp. | 164,154 | 8,180 |
| | Watts Water Technologies | | |
| | Inc. Class A | 163,854 | 8,139 |
| | AZZ Inc. | 146,418 | 8,136 |
| | Brink’s Co. | 278,874 | 8,048 |
| | | |
| | Simpson Manufacturing | | |
| | Co. Inc. | 234,663 | 8,014 |
| | Universal Forest Products | | |
| | Inc. | 114,234 | 7,810 |
| | Exponent Inc. | 153,166 | 7,651 |
| | Forward Air Corp. | 175,753 | 7,559 |
| | Essendant Inc. | 227,224 | 7,387 |
| * | SPX FLOW Inc. | 264,478 | 7,382 |
| | Apogee Enterprises Inc. | 165,478 | 7,200 |
| | G&K Services Inc. Class A | 113,307 | 7,127 |
| | Interface Inc. Class A | 371,370 | 7,108 |
| * | Hub Group Inc. Class A | 203,163 | 6,694 |
| | Kaman Corp. | 155,661 | 6,353 |
| | Brady Corp. Class A | 276,048 | 6,344 |
| * | Atlas Air Worldwide | | |
| | Holdings Inc. | 153,228 | 6,334 |
| | Insperity Inc. | 130,635 | 6,290 |
| * | TrueBlue Inc. | 242,372 | 6,243 |
| * | American Woodmark Corp. | 77,779 | 6,221 |
| | Comfort Systems USA Inc. | 215,305 | 6,119 |
| | Albany International Corp. | 166,718 | 6,094 |
| | Standex International Corp. | 73,128 | 6,081 |
| | Franklin Electric Co. Inc. | 224,179 | 6,060 |
| | Heartland Express Inc. | 354,364 | 6,031 |
| | EnPro Industries Inc. | 136,376 | 5,979 |
| | Tennant Co. | 106,097 | 5,969 |
| | Cubic Corp. | 122,088 | 5,769 |
| * | Aerojet Rocketdyne | | |
| | Holdings Inc. | 364,867 | 5,714 |
| | Federal Signal Corp. | 359,655 | 5,701 |
| | SkyWest Inc. | 298,765 | 5,682 |
| | AAON Inc. | 240,918 | 5,594 |
| | ESCO Technologies Inc. | 151,935 | 5,491 |
| * | TASER International Inc. | 314,353 | 5,435 |
| | Lindsay Corp. | 73,637 | 5,331 |
| | AAR Corp. | 193,178 | 5,079 |
| * | Navigant Consulting Inc. | 289,917 | 4,656 |
| * | Chart Industries Inc. | 251,320 | 4,514 |
| | US Ecology Inc. | 123,292 | 4,493 |
| | General Cable Corp. | 331,263 | 4,449 |
| | Harsco Corp. | 562,452 | 4,432 |
| | Quanex Building Products | | |
| | Corp. | 212,423 | 4,429 |
| | Encore Wire Corp. | 118,074 | 4,379 |
| * | Aegion Corp. Class A | 226,195 | 4,368 |
| | Astec Industries Inc. | 107,028 | 4,356 |
| | Griffon Corp. | 244,247 | 4,348 |
| | Briggs & Stratton Corp. | 249,943 | 4,324 |
| * | Gibraltar Industries Inc. | 167,561 | 4,263 |
| | CIRCOR International Inc. | 96,660 | 4,074 |
| | ArcBest Corp. | 183,465 | 3,924 |
| * | UTi Worldwide Inc. | 554,666 | 3,899 |
| | Resources Connection Inc. | 233,724 | 3,819 |
| * | Engility Holdings Inc. | 111,570 | 3,624 |
| * | Lydall Inc. | 97,910 | 3,474 |
102
Tax-Managed Small-Cap Fund
| | | |
| | | | Market |
| | | | Value• |
| | | Shares | ($000) |
| * | Saia Inc. | 153,302 | 3,411 |
| | Greenbrier Cos. Inc. | 103,917 | 3,390 |
| * | Aerovironment Inc. | 113,716 | 3,351 |
| * | PGT Inc. | 278,279 | 3,170 |
| * | Echo Global Logistics Inc. | 153,811 | 3,136 |
| | Viad Corp. | 107,719 | 3,041 |
| | SPX Corp. | 312,859 | 2,919 |
| | Kelly Services Inc. Class A | 168,912 | 2,728 |
| | Heidrick & Struggles | | |
| | International Inc. | 98,222 | 2,674 |
| * | MYR Group Inc. | 122,608 | 2,527 |
| | Marten Transport Ltd. | 140,816 | 2,492 |
| | National Presto Industries | | |
| | Inc. | 28,130 | 2,331 |
| * | Veritiv Corp. | 55,521 | 2,011 |
| * | DXP Enterprises Inc. | 84,028 | 1,916 |
| | American Science & | | |
| | Engineering Inc. | 41,004 | 1,697 |
| | Powell Industries Inc. | 62,557 | 1,628 |
| * | Republic Airways Holdings | | |
| | Inc. | 296,339 | 1,165 |
| * | Vicor Corp. | 107,588 | 981 |
| | CDI Corp. | 123,265 | 833 |
| * | Roadrunner Transportation | | |
| | Systems Inc. | 21,045 | 198 |
| | Celadon Group Inc. | 10,988 | 109 |
| | Titan International Inc. | 24,040 | 95 |
| * | Orion Marine Group Inc. | 14,841 | 62 |
| | | | 619,333 |
| Information Technology (16.4%) | |
| | Heartland Payment | | |
| | Systems Inc. | 214,742 | 20,362 |
| * | Microsemi Corp. | 561,138 | 18,287 |
| | Blackbaud Inc. | 270,464 | 17,813 |
| * | Take-Two Interactive | | |
| | Software Inc. | 486,288 | 16,942 |
| * | ViaSat Inc. | 257,104 | 15,686 |
| | Littelfuse Inc. | 128,651 | 13,767 |
| | Monolithic Power | | |
| | Systems Inc. | 210,425 | 13,406 |
| * | CACI International Inc. | | |
| | Class A | 140,309 | 13,018 |
| * | Electronics For Imaging | | |
| | Inc. | 270,608 | 12,648 |
| | MKS Instruments Inc. | 309,254 | 11,133 |
| * | Cirrus Logic Inc. | 368,937 | 10,895 |
| * | Anixter International Inc. | 166,123 | 10,032 |
| * | Sanmina Corp. | 476,537 | 9,807 |
| * | LogMeIn Inc. | 142,488 | 9,561 |
| * | OSI Systems Inc. | 107,705 | 9,549 |
| * | Stamps.com Inc. | 86,581 | 9,490 |
| * | MicroStrategy Inc. Class A | 52,395 | 9,394 |
| * | Coherent Inc. | 140,608 | 9,155 |
| * | Cardtronics Inc. | 257,508 | 8,665 |
| * | Viavi Solutions Inc. | 1,372,236 | 8,357 |
| | | |
| | Tessera Technologies Inc. | 277,938 | 8,341 |
| | Power Integrations Inc. | 170,173 | 8,276 |
| * | ExlService Holdings Inc. | 183,785 | 8,257 |
| * | Rovi Corp. | 491,781 | 8,193 |
| * | Synchronoss Technologies | | |
| | Inc. | 232,026 | 8,174 |
| * | Itron Inc. | 221,743 | 8,023 |
| * | Rambus Inc. | 679,313 | 7,873 |
| * | comScore Inc. | 190,105 | 7,823 |
| * | NETGEAR Inc. | 183,553 | 7,693 |
| * | Semtech Corp. | 390,170 | 7,382 |
| * | Progress Software Corp. | 306,557 | 7,357 |
| | CSG Systems International | | |
| | Inc. | 195,381 | 7,030 |
| | Methode Electronics Inc. | 219,418 | 6,984 |
| * | Sykes Enterprises Inc. | 226,853 | 6,983 |
| * | Plexus Corp. | 195,471 | 6,826 |
| | NIC Inc. | 343,308 | 6,756 |
| * | Advanced Energy | | |
| | Industries Inc. | 236,969 | 6,690 |
| * | Virtusa Corp. | 157,207 | 6,499 |
| * | Benchmark Electronics Inc. | 312,652 | 6,463 |
| * | Cabot Microelectronics | | |
| | Corp. | 142,292 | 6,230 |
| * | Bottomline Technologies | | |
| | de Inc. | 209,098 | 6,216 |
| * | QLogic Corp. | 500,795 | 6,110 |
| * | Insight Enterprises Inc. | 240,550 | 6,043 |
| | Ebix Inc. | 182,380 | 5,980 |
| | MTS Systems Corp. | 90,564 | 5,743 |
| * | Constant Contact Inc. | 192,305 | 5,623 |
| * | Ruckus Wireless Inc. | 515,233 | 5,518 |
| * | Rogers Corp. | 103,485 | 5,337 |
| * | II-VI Inc. | 287,433 | 5,335 |
| * | Kulicke & Soffa Industries | | |
| | Inc. | 453,560 | 5,293 |
| | Monotype Imaging | | |
| | Holdings Inc. | 223,250 | 5,278 |
| * | Diodes Inc. | 229,644 | 5,277 |
| * | Super Micro Computer Inc. | 212,879 | 5,218 |
| * | ScanSource Inc. | 161,462 | 5,202 |
| | ADTRAN Inc. | 293,957 | 5,062 |
| | Badger Meter Inc. | 82,664 | 4,843 |
| * | Lumentum Holdings Inc. | 219,068 | 4,824 |
| * | Veeco Instruments Inc. | 230,013 | 4,729 |
| * | Rofin-Sinar Technologies | | |
| | Inc. | 161,352 | 4,321 |
| | Brooks Automation Inc. | 399,647 | 4,268 |
| * | CalAmp Corp. | 209,640 | 4,178 |
| * | Fabrinet | 173,468 | 4,132 |
| * | Ixia | 331,634 | 4,122 |
| | ManTech International | | |
| | Corp. Class A | 129,853 | 3,927 |
| * | Newport Corp. | 225,438 | 3,578 |
| * | Ultratech Inc. | 176,995 | 3,508 |
103
Tax-Managed Small-Cap Fund
| | | |
| | | | Market |
| | | | Value• |
| | | Shares | ($000) |
| * | Mercury Systems Inc. | 186,773 | 3,429 |
| | CTS Corp. | 193,378 | 3,411 |
| * | Perficient Inc. | 193,785 | 3,318 |
| * | Interactive Intelligence | | |
| | Group Inc. | 100,863 | 3,169 |
| | TeleTech Holdings Inc. | 109,496 | 3,056 |
| * | ePlus Inc. | 32,612 | 3,041 |
| * | Monster Worldwide Inc. | 518,427 | 2,971 |
| * | FARO Technologies Inc. | 98,472 | 2,907 |
| * | VASCO Data Security | | |
| | International Inc. | 169,815 | 2,841 |
| * | CEVA Inc. | 118,467 | 2,767 |
| * | Rudolph Technologies Inc. | 189,280 | 2,692 |
| * | TTM Technologies Inc. | 379,138 | 2,468 |
| * | Blucora Inc. | 250,530 | 2,455 |
| | Epiq Systems Inc. | 184,870 | 2,416 |
| * | Harmonic Inc. | 574,389 | 2,338 |
| * | XO Group Inc. | 145,279 | 2,333 |
| * | Nanometrics Inc. | 151,696 | 2,297 |
| * | DTS Inc. | 96,813 | 2,186 |
| | Forrester Research Inc. | 75,421 | 2,148 |
| * | DHI Group Inc. | 233,241 | 2,139 |
| * | LivePerson Inc. | 305,686 | 2,063 |
| | Comtech | | |
| | Telecommunications Corp. | 95,128 | 1,911 |
| | Daktronics Inc. | 217,978 | 1,901 |
| * | Exar Corp. | 298,446 | 1,829 |
| | Park Electrochemical Corp. | 119,698 | 1,803 |
| | Checkpoint Systems Inc. | 276,544 | 1,734 |
| * | Digi International Inc. | 149,821 | 1,705 |
| * | Tangoe Inc. | 201,333 | 1,689 |
| | Cohu Inc. | 137,836 | 1,664 |
| * | Ciber Inc. | 416,923 | 1,463 |
| * | DSP Group Inc. | 129,484 | 1,222 |
| | Bel Fuse Inc. Class B | 63,732 | 1,102 |
| * | Liquidity Services Inc. | 159,139 | 1,034 |
| * | Agilysys Inc. | 100,099 | 1,000 |
| * | Kopin Corp. | 356,418 | 969 |
| * | QuinStreet Inc. | 223,607 | 959 |
| * | Electro Scientific | | |
| | Industries Inc. | 89,610 | 465 |
| | Black Box Corp. | 4,395 | 42 |
| | | | 604,422 |
| Materials (4.4%) | | |
| | Balchem Corp. | 183,297 | 11,144 |
| | KapStone Paper and | | |
| | Packaging Corp. | 489,547 | 11,059 |
| | HB Fuller Co. | 301,939 | 11,012 |
| | Kaiser Aluminum Corp. | 107,022 | 8,953 |
| | Schweitzer-Mauduit | | |
| | International Inc. | 181,822 | 7,635 |
| | Innospec Inc. | 137,712 | 7,479 |
| * | Headwaters Inc. | 420,569 | 7,095 |
| * | Stillwater Mining Co. | 731,091 | 6,265 |
| | Neenah Paper Inc. | 93,855 | 5,859 |
| | Quaker Chemical Corp. | 75,675 | 5,847 |
| | | |
| * | Boise Cascade Co. | 224,480 | 5,731 |
| | A Schulman Inc. | 184,604 | 5,656 |
| | Stepan Co. | 112,202 | 5,575 |
| | Calgon Carbon Corp. | 311,070 | 5,366 |
| * | Clearwater Paper Corp. | 114,644 | 5,220 |
| | PH Glatfelter Co. | 247,488 | 4,564 |
| * | Flotek Industries Inc. | 342,814 | 3,922 |
| | Deltic Timber Corp. | 64,236 | 3,781 |
| | Materion Corp. | 128,041 | 3,585 |
| | Innophos Holdings Inc. | 118,656 | 3,439 |
| * | Kraton Performance | | |
| | Polymers Inc. | 194,496 | 3,231 |
| * | AK Steel Holding Corp. | 1,369,065 | 3,067 |
| | Wausau Paper Corp. | 284,369 | 2,909 |
| | Rayonier Advanced | | |
| | Materials Inc. | 282,335 | 2,764 |
| | Haynes International Inc. | 75,333 | 2,764 |
| * | Koppers Holdings Inc. | 132,318 | 2,415 |
| | American Vanguard Corp. | 156,675 | 2,195 |
| | Tredegar Corp. | 161,073 | 2,194 |
| | Globe Specialty Metals Inc. | 194,894 | 2,095 |
| | Myers Industries Inc. | 153,267 | 2,041 |
| | FutureFuel Corp. | 132,750 | 1,792 |
| * | Century Aluminum Co. | 403,593 | 1,784 |
| | Hawkins Inc. | 47,236 | 1,690 |
| | Olympic Steel Inc. | 66,666 | 772 |
| * | LSB Industries Inc. | 23,461 | 170 |
| | SunCoke Energy Inc. | 46,911 | 163 |
| | TimkenSteel Corp. | 3,585 | 30 |
| * | Intrepid Potash Inc. | 3,608 | 11 |
| | | | 161,274 |
| Other (3.9%) | | |
| 2 | Vanguard REIT ETF | 1,800,000 | 143,514 |
| * | Gerber Scientific Inc. CVR | 110,699 | — |
| | | | 143,514 |
| Telecommunication Services (0.9%) | |
| | Consolidated | | |
| | Communications | | |
| | Holdings Inc. | 284,139 | 5,953 |
| * | 8x8 Inc. | 504,865 | 5,781 |
| | Atlantic Tele-Network Inc. | 58,217 | 4,554 |
| * | Cincinnati Bell Inc. | 1,198,534 | 4,315 |
| * | Iridium Communications | | |
| | Inc. | 507,131 | 4,265 |
| * | General Communication | | |
| | Inc. Class A | 185,389 | 3,667 |
| | Spok Holdings Inc. | 125,804 | 2,305 |
| * | Lumos Networks Corp. | 119,786 | 1,341 |
| | | | 32,181 |
| Utilities (4.0%) | | |
| | Piedmont Natural Gas Co. | | |
| | Inc. | 464,037 | 26,459 |
| | New Jersey Resources | | |
| | Corp. | 493,735 | 16,274 |
| | Southwest Gas Corp. | 274,167 | 15,123 |
104
Tax-Managed Small-Cap Fund
| | | | |
| | | | | Market |
| | | | | Value• |
| | | | Shares | ($000) |
| | NorthWestern Corp. | | 275,148 | 14,927 |
| | Laclede Group Inc. | | 237,397 | 14,104 |
| | ALLETE Inc. | | 264,753 | 13,457 |
| | Avista Corp. | | 342,206 | 12,104 |
| | South Jersey Industries | | |
| | Inc. | | 422,382 | 9,934 |
| | El Paso Electric Co. | | 245,703 | 9,460 |
| | American States Water Co. | 224,919 | 9,435 |
| | Northwest Natural Gas Co. | 162,505 | 8,224 |
| | | | | 149,501 |
| Total Common Stocks | | | |
| (Cost $2,656,210) | | | 3,680,606 |
| Temporary Cash Investments (0.7%)1 | |
| Money Market Fund (0.6%) | | |
| 3 | Vanguard Market | | | |
| | Liquidity Fund, | | | |
| | 0.363% | 23,131,981 | 23,132 |
| |
| | | | Face | |
| | | | Amount | |
| | | | ($000) | |
| U.S. Government and Agency Obligations (0.1%) |
| 4 | Federal Home Loan Bank | | |
| | Discount Notes, | | | |
| | 0.360%, 3/4/16 | | 100 | 100 |
| 4 | Federal Home Loan Bank | | |
| | Discount Notes, | | | |
| | 0.235%, 3/23/16 | | 500 | 499 |
| 4,5 | Federal Home Loan Bank | | |
| | Discount Notes, | | | |
| | 0.260%, 4/27/16 | | 500 | 499 |
| 6 | Freddie Mac Discount | | |
| | Notes, 0.220%, 3/30/16 | 500 | 500 |
| 5 | United States Treasury | | |
| | Bill, 0.536%, 6/9/16 | 1,000 | 998 |
| | | | | 2,596 |
| Total Temporary Cash Investments | |
| (Cost $25,729) | | | 25,728 |
| Total Investments (100.3%) | | |
| (Cost $2,681,939) | | | 3,706,334 |
| |
| | Amount |
| | ($000) |
| Other Assets and Liabilities (-0.3%) | |
| Other Assets | |
| Investment in Vanguard | 333 |
| Receivables for Investment Securities Sold 2,081 |
| Receivables for Accrued Income | 3,680 |
| Receivables for Capital Shares Issued | 7,841 |
| Other Assets | 70 |
| Total Other Assets | 14,005 |
| Liabilities | |
| Payables for Investment Securities | |
| Purchased | (21,548) |
| Payables for Capital Shares Redeemed | (1,206) |
| Payables to Vanguard | (2,613) |
| Other Liabilities | (201) |
| Total Liabilities | (25,568) |
| Net Assets (100%) | 3,694,771 |
| |
| At December 31, 2015, net assets consisted of: |
| | Amount |
| | ($000) |
| Paid-in Capital | 2,781,654 |
| Overdistributed Net Investment Income | (2,238) |
| Accumulated Net Realized Losses | (108,982) |
| Unrealized Appreciation (Depreciation) | |
| Investment Securities | 1,024,395 |
| Futures Contracts | (58) |
| Net Assets | 3,694,771 |
105
| |
| Tax-Managed Small-Cap Fund | |
| |
| |
| |
| |
| | Amount |
| | ($000) |
| Admiral Shares—Net Assets | |
| Applicable to 77,048,365 outstanding | |
| $.001 par value shares of beneficial | |
| interest (unlimited authorization) | 3,418,833 |
| Net Asset Value Per Share— | |
| Admiral Shares | $44.37 |
| |
| | Amount |
| | ($000) |
| Institutional Shares—Net Assets | |
| Applicable to 6,204,813 outstanding | |
| $.001 par value shares of beneficial | |
| interest (unlimited authorization) | 275,938 |
| Net Asset Value Per Share— | |
| Institutional Shares | $44.47 |
• See Note A in Notes to Financial Statements.
* Non-income-producing security.
1 The fund invests a portion of its cash reserves in equity markets through the use of index futures contracts. After giving effect to futures
investments, the fund’s effective common stock and temporary cash investment positions represent 100.0% and 0.3%, respectively,
of net assets.
2 Considered an affiliated company of the fund as the issuer is another member of The Vanguard Group.
3 Affiliated money market fund available only to Vanguard funds and certain trusts and accounts managed by Vanguard. Rate shown is the
7-day yield.
4 The issuer operates under a congressional charter; its securities are generally neither guaranteed by the U.S. Treasury nor backed by the full
faith and credit of the U.S. government.
5 Securities with a value of $799,000 have been segregated as initial margin for open futures contracts.
6 The issuer was placed under federal conservatorship in September 2008; since that time, its daily operations have been managed by the
Federal Housing Finance Agency and it receives capital from the U.S. Treasury, as needed to maintain a positive net worth, in exchange for
senior preferred stock.
REIT—Real Estate Investment Trust.
See accompanying Notes, which are an integral part of the Financial Statements.
106
Tax-Managed Small-Cap Fund
Statement of Operations
| |
| | Year Ended |
| | December 31, 2015 |
| | ($000) |
| Investment Income | |
| Income | |
| Dividends1 | 49,180 |
| Interest1 | 32 |
| Total Income | 49,212 |
| Expenses | |
| The Vanguard Group—Note B | |
| Investment Advisory Services | 574 |
| Management and Administrative—Admiral Shares | 2,788 |
| Management and Administrative—Institutional Shares | 114 |
| Marketing and Distribution—Admiral Shares | 303 |
| Marketing and Distribution—Institutional Shares | 15 |
| Custodian Fees | 96 |
| Auditing Fees | 34 |
| Shareholders’ Reports—Admiral Shares | 29 |
| Shareholders’ Reports—Institutional Shares | 3 |
| Trustees’ Fees and Expenses | 2 |
| Total Expenses | 3,958 |
| Net Investment Income | 45,254 |
| Realized Net Gain (Loss) | |
| Investment Securities Sold1 | 237,408 |
| Futures Contracts | (1,152) |
| Realized Net Gain (Loss) | 236,256 |
| Change in Unrealized Appreciation (Depreciation) | |
| Investment Securities | (352,515) |
| Futures Contracts | 130 |
| Change in Unrealized Appreciation (Depreciation) | (352,385) |
| Net Increase (Decrease) in Net Assets Resulting from Operations | (70,875) |
| 1 Dividend income, interest income, and realized net gain (loss) from affiliated companies of the fund were $1,354,000, $30,000, and ($8,767,000), respectively. |
See accompanying Notes, which are an integral part of the Financial Statements.
107
Tax-Managed Small-Cap Fund
Statement of Changes in Net Assets
| | |
| | Year Ended December 31, |
| | 2015 | 2014 |
| | ($000) | ($000) |
| Increase (Decrease) in Net Assets | | |
| Operations | | |
| Net Investment Income | 45,254 | 36,610 |
| Realized Net Gain (Loss) | 236,256 | 245,731 |
| Change in Unrealized Appreciation (Depreciation) | (352,385) | (65,106) |
| Net Increase (Decrease) in Net Assets Resulting from Operations | (70,875) | 217,235 |
| Distributions | | |
| Net Investment Income | | |
| Admiral Shares | (42,190) | (33,432) |
| Institutional Shares | (3,501) | (2,536) |
| Realized Capital Gain | | |
| Admiral Shares | — | — |
| Institutional Shares | — | — |
| Total Distributions | (45,691) | (35,968) |
| Capital Share Transactions | | |
| Admiral Shares | 144,254 | 69,925 |
| Institutional Shares | 48,450 | (13,029) |
| Net Increase (Decrease) from Capital Share Transactions | 192,704 | 56,896 |
| Total Increase (Decrease) | 76,138 | 238,163 |
| Net Assets | | |
| Beginning of Period | 3,618,633 | 3,380,470 |
| End of Period1 | 3,694,771 | 3,618,633 |
| 1 Net Assets—End of Period includes undistributed (overdistributed) net investment income of ($2,238,000) and ($1,801,000). |
See accompanying Notes, which are an integral part of the Financial Statements.
108
Tax-Managed Small-Cap Fund
Financial Highlights
| | | | | |
| Admiral Shares | | | | | |
| |
| For a Share Outstanding | Year Ended December 31, |
| Throughout Each Period | 2015 | 2014 | 2013 | 2012 | 2011 |
| Net Asset Value, Beginning of Period | $45.78 | $43.53 | $31.16 | $27.26 | $27.17 |
| Investment Operations | | | | | |
| Net Investment Income | . 556 | . 463 | .383 | .479 | .245 |
| Net Realized and Unrealized Gain (Loss) | | | | | |
| on Investments | (1.406) | 2.242 | 12.389 | 3.885 | .089 |
| Total from Investment Operations | (. 850) | 2.705 | 12.772 | 4.364 | .334 |
| Distributions | | | | | |
| Dividends from Net Investment Income | (.560) | (.455) | (.402) | (.464) | (.244) |
| Distributions from Realized Capital Gains | — | — | — | — | — |
| Total Distributions | (. 560) | (. 455) | (.402) | (.464) | (.244) |
| Net Asset Value, End of Period | $44.37 | $45.78 | $43.53 | $31.16 | $27.26 |
| |
| Total Return1 | -1.85% | 6.23% | 41.00% | 16.03% | 1.22% |
| |
| Ratios/Supplemental Data | | | | | |
| Net Assets, End of Period (Millions) | $3,419 | $3,382 | $3,143 | $2,132 | $1,857 |
| Ratio of Total Expenses to Average Net Assets | 0.11% | 0.12% | 0.12% | 0.12% | 0.12% |
| Ratio of Net Investment Income to | | | | | |
| Average Net Assets | 1.21% | 1.06% | 1.05% | 1.59% | 0.88% |
| Portfolio Turnover Rate2 | 33% | 40% | 31% | 42% | 40% |
Investor Shares were renamed Admiral Shares as of the close of business on May 13, 2011. Prior periods’ Financial Highlights are for the
Investor Class.
1 Total returns do not include transaction or account service fees that may have applied in the periods shown. Fund prospectuses provide
information about any applicable transaction and account service fees.
2 Excludes the value of portfolio securities received or delivered as a result of in-kind purchases or redemptions of the fund’s capital shares.
See accompanying Notes, which are an integral part of the Financial Statements.
109
Tax-Managed Small-Cap Fund
Financial Highlights
| | | | | |
| Institutional Shares | | | | | |
| |
| For a Share Outstanding | Year Ended December 31, |
| Throughout Each Period | 2015 | 2014 | 2013 | 2012 | 2011 |
| Net Asset Value, Beginning of Period | $45.88 | $43.63 | $31.22 | $27.33 | $27.23 |
| Investment Operations | | | | | |
| Net Investment Income | . 576 | .481 | .398 | .492 | .257 |
| Net Realized and Unrealized Gain (Loss) | | | | | |
| on Investments | (1.406) | 2.242 | 12.428 | 3.888 | .088 |
| Total from Investment Operations | (. 830) | 2.723 | 12.826 | 4.380 | .345 |
| Distributions | | | | | |
| Dividends from Net Investment Income | (.580) | (.473) | (.416) | (.490) | (.245) |
| Distributions from Realized Capital Gains | — | — | — | — | — |
| Total Distributions | (. 580) | (.473) | (.416) | (.490) | (.245) |
| Net Asset Value, End of Period | $44.47 | $45.88 | $43.63 | $31.22 | $27.33 |
| |
| Total Return1 | -1.80% | 6.26% | 41.09% | 16.05% | 1.26% |
| |
| Ratios/Supplemental Data | | | | | |
| Net Assets, End of Period (Millions) | $276 | $236 | $237 | $175 | $149 |
| Ratio of Total Expenses to Average Net Assets | 0.07% | 0.08% | 0.08% | 0.08% | 0.08% |
| Ratio of Net Investment Income to | | | | | |
| Average Net Assets | 1.25% | 1.10% | 1.09% | 1.63% | 0.92% |
| Portfolio Turnover Rate2 | 33% | 40% | 31% | 42% | 40% |
1 Total returns do not include transaction fees that may have applied in the periods shown. Fund prospectuses provide information about any applicable transaction fees.
2 Excludes the value of portfolio securities received or delivered as a result of in-kind purchases or redemptions of the fund’s capital shares.
See accompanying Notes, which are an integral part of the Financial Statements.
110
Tax-Managed Small-Cap Fund
Notes to Financial Statements
Vanguard Tax-Managed Small-Cap Fund is registered under the Investment Company Act of 1940 as an open-end investment company, or mutual fund. The fund offers two classes of shares: Admiral Shares and Institutional Shares. Admiral Shares and Institutional Shares are designed for investors who meet certain administrative, service, and account-size criteria.
A. The following significant accounting policies conform to generally accepted accounting principles for U.S. investment companies. The fund consistently follows such policies in preparing its financial statements.
1. Security Valuation: Securities are valued as of the close of trading on the New York Stock Exchange (generally 4 p.m., Eastern time) on the valuation date. Equity securities are valued at the latest quoted sales prices or official closing prices taken from the primary market in which each security trades; such securities not traded on the valuation date are valued at the mean of the latest quoted bid and asked prices. Securities for which market quotations are not readily available, or whose values have been materially affected by events occurring before the fund’s pricing time but after the close of the securities’ primary markets, are valued by methods deemed by the board of trustees to represent fair value. Investments in Vanguard Market Liquidity Fund are valued at that fund’s net asset value. Temporary cash investments acquired over 60 days to maturity are valued using the latest bid prices or using valuations based on a matrix system (which considers such factors as security prices, yields, maturities, and ratings), both as furnished by independent pricing services. Other temporary cash investments are valued at amortized cost, which approximates market value.
2. Futures Contracts: The fund uses index futures contracts to a limited extent, with the objective of maintaining full exposure to the stock market while maintaining liquidity. The fund may purchase or sell futures contracts to achieve a desired level of investment, whether to accommodate portfolio turnover or cash flows from capital share transactions. The primary risks associated with the use of futures contracts are imperfect correlation between changes in market values of stocks held by the fund and the prices of futures contracts, and the possibility of an illiquid market. Counterparty risk involving futures is mitigated because a regulated clearinghouse is the counterparty instead of the clearing broker. To further mitigate counterparty risk, the fund trades futures contracts on an exchange, monitors the financial strength of its clearing brokers and clearinghouse, and has entered into clearing agreements with its clearing brokers. The clearinghouse imposes initial margin requirements to secure the fund’s performance and requires daily settlement of variation margin representing changes in the market value of each contract.
Futures contracts are valued at their quoted daily settlement prices. The aggregate settlement values of the contracts are not recorded in the Statement of Net Assets. Fluctuations in the value of the contracts are recorded in the Statement of Net Assets as an asset (liability) and in the Statement of Operations as unrealized appreciation (depreciation) until the contracts are closed, when they are recorded as realized futures gains (losses).
During the year ended December 31, 2015, the fund’s average investments in long and short futures contracts represented less than 1% and 0% of net assets, respectively, based on the average of aggregate settlement values at each quarter-end during the period.
3. Federal Income Taxes: The fund intends to continue to qualify as a regulated investment company and distribute all of its taxable income. Management has analyzed the fund’s tax positions taken for all open federal income tax years (December 31, 2012–2015), and has concluded that no provision for federal income tax is required in the fund’s financial statements.
4. Distributions: Distributions to shareholders are recorded on the ex-dividend date.
111
Tax-Managed Small-Cap Fund
5. Credit Facility: The fund and certain other funds managed by The Vanguard Group (“Vanguard”) participate in a $3 billion committed credit facility provided by a syndicate of lenders pursuant to a credit agreement that may be renewed annually; each fund is individually liable for its borrowings, if any, under the credit facility. Borrowings may be utilized for temporary and emergency purposes, and are subject to the fund’s regulatory and contractual borrowing restrictions. The participating funds are charged administrative fees and an annual commitment fee of 0.06% of the undrawn amount of the facility; these fees are allocated to the funds based on a method approved by the fund’s board of trustees and included in Management and Administrative expenses on the fund’s Statement of Operations. Any borrowings under this facility bear interest at a rate equal to the higher of the federal funds rate or LIBOR reference rate plus an agreed-upon spread.
The fund had no borrowings outstanding at December 31, 2015, or at any time during the period then ended.
6. Other: Dividend income is recorded on the ex-dividend date. Interest income includes income distributions received from Vanguard Market Liquidity Fund and is accrued daily. Premiums and discounts on debt securities purchased are amortized and accreted, respectively, to interest income over the lives of the respective securities. Security transactions are accounted for on the date securities are bought or sold. Costs used to determine realized gains (losses) on the sale of investment securities are those of the specific securities sold.
Each class of shares has equal rights as to assets and earnings, except that each class separately bears certain class-specific expenses related to maintenance of shareholder accounts (included in Management and Administrative expenses) and shareholder reporting. Marketing and distribution expenses are allocated to each class of shares based on a method approved by the board of trustees. Income, other non-class-specific expenses, and gains and losses on investments are allocated to each class of shares based on its relative net assets.
B. In accordance with the terms of a Funds’ Service Agreement (the “FSA”) between Vanguard and the fund, Vanguard furnishes to the fund investment advisory, corporate management, administrative, marketing, and distribution services at Vanguard’s cost of operations (as defined by the FSA). These costs of operations are allocated to the fund based on methods and guidelines approved by the board of trustees. Vanguard does not require reimbursement in the current period for certain costs of operations (such as deferred compensation/benefits and risk/insurance costs); the fund’s liability for these costs of operations is included in Payables to Vanguard on the Statement of Net Assets.
Upon the request of Vanguard, the fund may invest up to 0.40% of its net assets as capital in Vanguard. At December 31, 2015, the fund had contributed to Vanguard capital in the amount of $333,000, representing 0.01% of the fund’s net assets and 0.13% of Vanguard’s capitalization. The fund’s trustees and officers are also directors and employees, respectively, of Vanguard.
C. Various inputs may be used to determine the value of the fund’s investments. These inputs are summarized in three broad levels for financial statement purposes. The inputs or methodologies used to value securities are not necessarily an indication of the risk associated with investing in those securities.
Level 1—Quoted prices in active markets for identical securities.
Level 2—Other significant observable inputs (including quoted prices for similar securities, interest rates, prepayment speeds, credit risk, etc.).
Level 3—Significant unobservable inputs (including the fund’s own assumptions used to determine the fair value of investments).
112
Tax-Managed Small-Cap Fund
The following table summarizes the market value of the fund’s investments as of December 31, 2015, based on the inputs used to value them:
| | | |
| | Level 1 | Level 2 | Level 3 |
| Investments | ($000) | ($000) | ($000) |
| Common Stocks | 3,680,606 | — | — |
| Temporary Cash Investments | 23,132 | 2,596 | — |
| Futures Contracts—Liabilities1 | (139) | — | — |
| Total | 3,703,599 | 2,596 | — |
| 1 Represents variation margin on the last day of the reporting period. |
D. At December 31, 2015, the aggregate settlement value of open futures contracts and the related unrealized appreciation (depreciation) were:
| | | | |
| | | | ($000) |
| | | | Aggregate | |
| | | Number of | Settlement | Unrealized |
| | | Long (Short) | Value | Appreciation |
| Futures Contracts | Expiration | Contracts | Long (Short) | (Depreciation) |
| E-mini Russell 2000 Index | March 2015 | 125 | 14,144 | (58) |
Unrealized appreciation (depreciation) on open futures contracts is required to be treated as realized gain (loss) for tax purposes.
E. Distributions are determined on a tax basis and may differ from net investment income and realized capital gains for financial reporting purposes. Differences may be permanent or temporary. Permanent differences are reclassified among capital accounts in the financial statements to reflect their tax character. Temporary differences arise when certain items of income, expense, gain, or loss are recognized in different periods for financial statement and tax purposes. These differences will reverse at some time in the future. Differences in classification may also result from the treatment of short-term gains as ordinary income for tax purposes.
During the year ended December 31, 2015, the fund realized $329,135,000 of net capital gains resulting from in-kind redemptions—in which shareholders exchanged fund shares for securities held by the fund rather than for cash. Because such gains are not taxable to the fund, and are not distributed to shareholders, they have been reclassified from accumulated net realized losses to paid-in capital.
For tax purposes, at December 31, 2015, the fund had $139,000 of ordinary income available for distribution. At December 31, 2015, the fund had available capital losses totaling $109,040,000 to offset future net capital gains. Of this amount, $6,546,000 is subject to expiration on December 31, 2017. Capital losses of $102,494,000 realized beginning in fiscal 2011 may be carried forward indefinitely under the Regulated Investment Company Modernization Act of 2010, but must be used before any expiring loss carryforwards.
At December 31, 2015, the cost of investment securities for tax purposes was $2,681,939,000. Net unrealized appreciation of investment securities for tax purposes was $1,024,395,000, consisting of unrealized gains of $1,116,548,000 on securities that had risen in value since their purchase and $92,153,000 in unrealized losses on securities that had fallen in value since their purchase.
113
Tax-Managed Small-Cap Fund
F. During the year ended December 31, 2015, the fund purchased $1,927,657,000 of investment securities and sold $1,728,854,000 of investment securities, other than temporary cash investments. Purchases and sales include $225,888,000 and $512,307,000, respectively, in connection with in-kind purchases and redemptions of the fund’s capital shares.
G. Capital share transactions for each class of shares were:
| | | | |
| | Year Ended December 31, |
| | | 2015 | | 2014 |
| | Amount | Shares | Amount | Shares |
| | ($000) | (000) | ($000) | (000) |
| Admiral Shares | | | | |
| Issued | 909,724 | 19,669 | 674,454 | 15,455 |
| Issued in Lieu of Cash Distributions | 32,367 | 729 | 25,881 | 574 |
| Redeemed | (797,837) | (17,234) | (630,410) | (14,360) |
| Net Increase (Decrease) —Admiral Shares | 144,254 | 3,164 | 69,925 | 1,669 |
| Institutional Shares | | | | |
| Issued | 73,480 | 1,586 | 16,798 | 386 |
| Issued in Lieu of Cash Distributions | 2,113 | 48 | 1,407 | 31 |
| Redeemed | (27,143) | (577) | (31,234) | (702) |
| Net Increase (Decrease) —Institutional Shares | 48,450 | 1,057 | (13,029) | (285) |
H. Management has determined that no material events or transactions occurred subsequent to December 31, 2015, that would require recognition or disclosure in these financial statements.
114
Report of Independent Registered
Public Accounting Firm
To the Board of Trustees of Vanguard Tax-Managed Funds and the Shareholders of Vanguard Tax-Managed Balanced Fund, Vanguard Tax-Managed Capital Appreciation Fund and Vanguard Tax-Managed Small-Cap Fund: In our opinion, the accompanying statements of net assets and the related statements of operations and of changes in net assets and the financial highlights present fairly, in all material respects, the financial position of Vanguard Tax-Managed Balanced Fund, Vanguard Tax-Managed Capital Appreciation Fund and Vanguard Tax-Managed Small-Cap Fund (constituting separate portfolios of Vanguard Tax-Managed Funds, hereafter referred to as the “Funds”) at December 31, 2015, the results of each of their operations for the year then ended, the changes in each of their net assets for each of the two years in the period then ended, and the financial highlights for each of the five years in the period then ended, in conformity with accounting principles generally accepted in the United States of America. These financial statements and financial highlights (hereafter referred to as “financial statements”) are the responsibility of the Funds’ management. Our responsibility is to express an opinion on these financial statements based on our audits. We conducted our audits of these financial statements in accordance with the standards of the Public Company Accounting Oversight Board (United States). Those standards require that we plan and perform the audit to obtain reasonable assurance about whether the financial statements are free of material misstatement. An audit includes examining, on a test basis, evidence supporting the amounts and disclosures in the financial statements, assessing the accounting principles used and significant estimates made by management, and evaluating the overall financial statement presentation.
We believe that our audits, which included confirmation of securities at December 31, 2015 by correspondence with the custodians and brokers, by agreement to the underlying ownership records of the transfer agent and the application of alternative auditing procedures where securities purchased had not been received, provide a reasonable basis for our opinion.
/s/PricewaterhouseCoopers LLP
Philadelphia, Pennsylvania
February 16, 2016
115

Special 2015 tax information (unaudited) for Vanguard Tax-Managed Funds
This information for the fiscal year ended December 31, 2015, is included pursuant to provisions of
the Internal Revenue Code.
The Tax-Managed Balanced Fund designates 62% of its income dividends as exempt-interest
dividends.
The funds distributed qualified dividend income to shareholders during the fiscal year as follows:
| |
| Fund | ($000) |
| Tax-Managed Balanced Fund | 17,542 |
| Tax-Managed Capital Appreciation Fund | 109,135 |
| Tax-Managed Small-Cap Fund | 41,789 |
For corporate shareholders, the percentage of investment income (dividend income plus short-term gains, if any) that qualifies for the dividends-received deduction is as follows:
| |
| Fund | Percentage |
| Tax-Managed Balanced Fund | 96.8%1 |
| Tax-Managed Capital Appreciation Fund | 100.0 |
| Tax-Managed Small-Cap Fund | 93.5 |
| 1 The percentage applies only to the taxable ordinary income that has been reported on Form 1099-DIV. |
116
Your Fund’s After-Tax Returns
This table presents returns for your fund both before and after taxes. The after-tax returns are shown in two ways: (1) assuming that an investor owned the fund during the entire period and paid taxes on the fund’s distributions, and (2) assuming that an investor paid taxes on the fund’s distributions and sold all shares at the end of each period.
Calculations are based on the highest individual federal income tax and capital gains tax rates in effect at the times of the distributions and the hypothetical sales. State and local taxes were not considered. After-tax returns reflect any qualified dividend income. (In the example, returns after the sale of fund shares may be higher than those assuming no sale. This occurs when the sale would have produced a capital loss. The calculation assumes that the investor received a tax deduction for the loss.) The table shows returns for one share class only; returns for other share classes will differ. Please note that your actual after-tax returns will depend on your tax situation and may differ from those shown. Also note that if you own the fund in a tax-deferred account, such as an individual retirement account or a 401(k) plan, this information does not apply to you. Such accounts are not subject to current taxes.
Finally, keep in mind that a fund’s performance—whether before or after taxes—does not guarantee future results.
Average Annual Total Returns: Tax-Managed Funds
Periods Ended December 31, 2015
| | | |
| | One | Five | Ten |
| | Year | Years | Years |
| Tax-Managed Balanced Fund | | | |
| Returns Before Taxes | 2.35% | 8.51% | 6.25% |
| Returns After Taxes on Distributions | 2.16 | 8.34 | 6.10 |
| Returns After Taxes on Distributions and Sale of Fund Shares | 2.04 | 7.05 | 5.37 |
| | | |
| | One | Five | Ten |
| | Year | Years | Years |
| Tax-Managed Capital Appreciation Fund Admiral Shares | | | |
| Returns Before Taxes | 1.68% | 12.52% | 7.43% |
| Returns After Taxes on Distributions | 1.26 | 12.15 | 7.12 |
| Returns After Taxes on Distributions and Sale of Fund Shares | 1.27 | 10.02 | 6.03 |
| | | |
| | One | Five | Ten |
| | Year | Years | Years |
| Tax-Managed Small-Cap Fund Admiral Shares | | | |
| Returns Before Taxes | -1.85% | 11.54% | 8.05% |
| Returns After Taxes on Distributions | -2.17 | 11.28 | 7.84 |
| Returns After Taxes on Distributions and Sale of Fund Shares | -0.83 | 9.21 | 6.56 |
117
About Your Fund’s Expenses
As a shareholder of the fund, you incur ongoing costs, which include costs for portfolio management, administrative services, and shareholder reports (like this one), among others. Operating expenses, which are deducted from a fund’s gross income, directly reduce the investment return of the fund.
A fund’s expenses are expressed as a percentage of its average net assets. This figure is known as the expense ratio. The following examples are intended to help you understand the ongoing costs (in dollars) of investing in your fund and to compare these costs with those of other mutual funds. The examples are based on an investment of $1,000 made at the beginning of the period shown and held for the entire period.
The accompanying table illustrates your fund’s costs in two ways:
• Based on actual fund return. This section helps you to estimate the actual expenses that you paid over the period. The ”Ending Account Value“ shown is derived from the fund‘s actual return, and the third column shows the dollar amount that would have been paid by an investor who started with $1,000 in the fund. You may use the information here, together with the amount you invested, to estimate the expenses that you paid over the period.
To do so, simply divide your account value by $1,000 (for example, an $8,600 account value divided by $1,000 = 8.6), then multiply the result by the number given for your fund under the heading ”Expenses Paid During Period.“
• Based on hypothetical 5% yearly return. This section is intended to help you compare your fund‘s costs with those of other mutual funds. It assumes that the fund had a yearly return of 5% before expenses, but that the expense ratio is unchanged. In this case—because the return used is not the fund’s actual return—the results do not apply to your investment. The example is useful in making comparisons because the Securities and Exchange Commission requires all mutual funds to calculate expenses based on a 5% return. You can assess your fund’s costs by comparing this hypothetical example with the hypothetical examples that appear in shareholder reports of other funds.
Note that the expenses shown in the table are meant to highlight and help you compare ongoing costs only and do not reflect transaction costs incurred by the fund for buying and selling securities. Further, the expenses do not include any purchase, redemption, or account service fees described in the fund prospectus. If such fees were applied to your account, your costs would be higher. Your fund does not carry a “sales load.”
The calculations assume no shares were bought or sold during the period. Your actual costs may have been higher or lower, depending on the amount of your investment and the timing of any purchases or redemptions.
You can find more information about the fund’s expenses, including annual expense ratios, in the Financial Statements section of this report. For additional information on operating expenses and other shareholder costs, please refer to your fund’s current prospectus.
118
| | | |
| Six Months Ended December 31, 2015 | | | |
| | Beginning | Ending | Expenses |
| | Account Value | Account Value | Paid During |
| | 6/30/2015 | 12/31/2015 | Period |
| Based on Actual Fund Return | | | |
| Tax-Managed Balanced Fund | $1,000.00 | $1,011.19 | $0.61 |
| Tax-Managed Capital Appreciation Fund | | | |
| Admiral Shares | $1,000.00 | $993.17 | $0.60 |
| Institutional Shares | 1,000.00 | 993.41 | 0.40 |
| Tax-Managed Small-Cap Fund | | | |
| Admiral Shares | $1,000.00 | $942.38 | $0.59 |
| Institutional Shares | 1,000.00 | 942.53 | 0.39 |
| Based on Hypothetical 5% Yearly Return | | | |
| Tax-Managed Balanced Fund | $1,000.00 | $1,024.60 | $0.61 |
| Tax-Managed Capital Appreciation Fund | | | |
| Admiral Shares | $1,000.00 | $1,024.60 | $0.61 |
| Institutional Shares | 1,000.00 | 1,024.80 | 0.41 |
| Tax-Managed Small-Cap Fund | | | |
| Admiral Shares | $1,000.00 | $1,024.60 | $0.61 |
| Institutional Shares | 1,000.00 | 1,024.80 | 0.41 |
The calculations are based on expenses incurred in the most recent six-month period. The funds’ annualized six-month expense ratios for that
period are: for the Tax-Managed Balanced Fund, 0.12%; for the Tax-Managed Capital Appreciation Fund, 0.12% for Admiral Shares and
0.08% for Institutional Shares; and for the Tax-Managed Small-Cap Fund, 0.12% for Admiral Shares and 0.08% for Institutional Shares. The
dollar amounts shown as “Expenses Paid” are equal to the annualized expense ratio multiplied by the average account value over the period,
multiplied by the number of days in the most recent six-month period, then divided by the number of days in the most recent 12-month period
(184/365).
119
Glossary
30-Day SEC Yield. A fund’s 30-day SEC yield is derived using a formula specified by the U.S. Securities and Exchange Commission. Under the formula, data related to the fund’s security holdings in the previous 30 days are used to calculate the fund’s hypothetical net income for that period, which is then annualized and divided by the fund’s estimated average net assets over the calculation period. For the purposes of this calculation, a security’s income is based on its current market yield to maturity (for bonds), its actual income (for asset-backed securities), or its projected dividend yield (for stocks). Because the SEC yield represents hypothetical annualized income, it will differ—at times significantly—from the fund’s actual experience. As a result, the fund’s income distributions may be higher or lower than implied by the SEC yield.
Average Coupon. The average interest rate paid on the fixed income securities held by a fund. It is expressed as a percentage of face value.
Average Duration. An estimate of how much the value of the bonds held by a fund will fluctuate in response to a change in interest rates. To see how the value could change, multiply the average duration by the change in rates. If interest rates rise by 1 percentage point, the value of the bonds in a fund with an average duration of five years would decline by about 5%. If rates decrease by a percentage point, the value would rise by 5%.
Average Stated Maturity. The average length of time until fixed income securities held by a fund reach maturity and are repaid using the maturity date of the security. The figure reflects the proportion of fund assets represented by each security; it also reflects any futures contracts held. In general, the longer the average stated maturity, the more a fund’s share price will fluctuate in response to changes in market interest rates.
Beta. A measure of the magnitude of a fund’s past share-price fluctuations in relation to the ups and downs of a given market index. The index is assigned a beta of 1.00. Compared with a given index, a fund with a beta of 1.20 typically would have seen its share price rise or fall by 12% when the index rose or fell by 10%. For this report, beta is based on returns over the past 36 months for both the fund and the index. Note that a fund’s beta should be reviewed in conjunction with its R-squared (see definition). The lower the R-squared, the less correlation there is between the fund and the index, and the less reliable beta is as an indicator of volatility.
Credit Quality. Credit-quality ratings are measured on a scale that generally ranges from AAA (highest) to D (lowest). Credit-quality ratings are obtained from Moody’s and S&P, and the higher rating for each issue is used. ”Not Rated” is used to classify securities for which a rating is not available. Not rated securities include a fund’s investment in Vanguard Market Liquidity Fund or Vanguard Municipal Cash Management Fund, each of which invests in high-quality money market instruments and may serve as a cash management vehicle for the Vanguard funds, trusts, and accounts.
Dividend Yield. The current, annualized rate of dividends paid on a share of stock, divided by its current share price. For a fund, the weighted average yield for stocks it holds. The index yield is based on the current annualized rate of dividends paid on stocks in the index.
Earnings Growth Rate. The average annual rate of growth in earnings over the past five years for the stocks now in a fund.
120
Equity Exposure. A measure that reflects a fund’s investments in stocks and stock futures. Any holdings in short-term reserves are excluded.
Expense Ratio. A fund’s total annual operating expenses expressed as a percentage of the fund’s average net assets. The expense ratio includes management and administrative expenses, but does not include the transaction costs of buying and selling portfolio securities.
Foreign Holdings. The percentage of a fund represented by securities or depositary receipts of companies based outside the United States.
Inception Date. The date on which the assets of a fund (or one of its share classes) are first invested in accordance with the fund’s investment objective. For funds with a subscription period, the inception date is the day after that period ends. Investment performance is measured from the inception date.
Largest Area Concentrations. An indicator of diversification. The less concentrated a fund’s holdings of bonds, the less the fund will be hurt by any financial problems in a single state or region.
Median Market Cap. An indicator of the size of companies in which a fund invests; the midpoint of market capitalization (market price x shares outstanding) of a fund’s stocks, weighted by the proportion of the fund’s assets invested in each stock. Stocks representing half of the fund’s assets have market capitalizations above the median, and the rest are below it.
Price/Book Ratio. The share price of a stock divided by its net worth, or book value, per share. For a fund, the weighted average price/book ratio of the stocks it holds.
Price/Earnings Ratio. The ratio of a stock’s current price to its per-share earnings over the past year. For a fund, the weighted average P/E of the stocks it holds. P/E is an indicator of market expectations about corporate prospects; the higher the P/E, the greater the expectations for a company’s future growth.
R-Squared. A measure of how much of a fund’s past returns can be explained by the returns from the market in general, as measured by a given index. If a fund’s total returns were precisely synchronized with an index’s returns, its R-squared would be 1.00. If the fund’s returns bore no relationship to the index’s returns, its R-squared would be 0. For this report, R-squared is based on returns over the past 36 months for both the fund and the index.
Return on Equity. The annual average rate of return generated by a company during the past five years for each dollar of shareholder’s equity (net income divided by shareholder’s equity). For a fund, the weighted average return on equity for the companies whose stocks it holds.
Short-Term Reserves. The percentage of a fund invested in highly liquid, short-term securities that can be readily converted to cash.
Turnover Rate. An indication of the fund’s trading activity. Funds with high turnover rates incur higher transaction costs and may be more likely to distribute capital gains (which may be taxable to investors). The turnover rate excludes in-kind transactions, which have minimal impact on costs.
Yield to Maturity. The rate of return an investor would receive if the fixed income securities held by a fund were held to their maturity dates.
121
Benchmark Information
Tax-Managed Balanced Composite Index: Weighted 50% Russell 1000 Index and 50% Barclays 7
Year Municipal Bond Index through January 31, 2002, and 50% Russell 1000 Index and 50%
Barclays 1–15 Year Municipal Bond Index thereafter.
122
This page intentionally left blank.
The People Who Govern Your Fund
The trustees of your mutual fund are there to see that the fund is operated and managed in your best interests since, as a shareholder, you are a part owner of the fund. Your fund’s trustees also serve on the board of directors of The Vanguard Group, Inc., which is owned by the Vanguard funds and provides services to them on an at-cost basis.
A majority of Vanguard’s board members are independent, meaning that they have no affiliation with Vanguard or the funds they oversee, apart from the sizable personal investments they have made as private individuals. The independent board members have distinguished backgrounds in business, academia, and public service. Each of the trustees and executive officers oversees 194 Vanguard funds.
The following table provides information for each trustee and executive officer of the fund. More information about the trustees is in the Statement of Additional Information, which can be obtained, without charge, by contacting Vanguard at 800-662-7447, or online at vanguard.com.
| |
| InterestedTrustee1 | Rajiv L. Gupta |
| | Born 1945. Trustee Since December 2001.2 Principal |
| F. William McNabb III | Occupation(s) During the Past Five Years and Other |
| Born 1957. Trustee Since July 2009. Chairman of | Experience: Chairman and Chief Executive Officer |
| the Board. Principal Occupation(s) During the Past | (retired 2009) and President (2006–2008) of |
| Five Years and Other Experience: Chairman of the | Rohm and Haas Co. (chemicals); Director of Tyco |
| Board of The Vanguard Group, Inc., and of each of | International PLC (diversified manufacturing and |
| the investment companies served by The Vanguard | services), Hewlett-Packard Co. (electronic computer |
| Group, since January 2010; Director of The Vanguard | manufacturing), and Delphi Automotive PLC |
| Group since 2008; Chief Executive Officer and | (automotive components); Senior Advisor at New |
| President of The Vanguard Group, and of each of | Mountain Capital. |
| the investment companies served by The Vanguard | |
| Group, since 2008; Director of Vanguard Marketing | Amy Gutmann |
| Corporation; Managing Director of The Vanguard | Born 1949. Trustee Since June 2006. Principal |
| Group (1995–2008). | Occupation(s) During the Past Five Years and |
| | Other Experience: President of the University of |
| IndependentTrustees | Pennsylvania; Christopher H. Browne Distinguished |
| | Professor of Political Science, School of Arts and |
| Emerson U. Fullwood | Sciences, and Professor of Communication, Annenberg |
| Born 1948. Trustee Since January 2008. Principal | School for Communication, with secondary faculty |
| Occupation(s) During the Past Five Years and | appointments in the Department of Philosophy, School |
| Other Experience: Executive Chief Staff and | of Arts and Sciences, and at the Graduate School of |
| Marketing Officer for North America and Corporate | Education, University of Pennsylvania; Trustee of the |
| Vice President (retired 2008) of Xerox Corporation | National Constitution Center; Chair of the Presidential |
| (document management products and services); | Commission for the Study of Bioethical Issues. |
| Executive in Residence and 2009–2010 Distinguished | |
| Minett Professor at the Rochester Institute of | JoAnn Heffernan Heisen |
| Technology; Director of SPX Corporation (multi-industry | Born 1950. Trustee Since July 1998. Principal |
| manufacturing), the United Way of Rochester, the | Occupation(s) During the Past Five Years and |
| University of Rochester Medical Center, Monroe | Other Experience: Corporate Vice President and |
| Community College Foundation, and North Carolina | Chief Global Diversity Officer (retired 2008) and |
| A&T University. | Member of the Executive Committee (1997–2008) |
| | of Johnson & Johnson (pharmaceuticals/medical |
| | devices/consumer products); Director of Skytop |
| | Lodge Corporation (hotels) and the Robert Wood |
| | Johnson Foundation; Member of the Advisory |
| | Board of the Institute for Women’s Leadership |
| | at Rutgers University. |
| | |
| F. Joseph Loughrey | Executive Officers | |
| Born 1949. Trustee Since October 2009. Principal | | |
| Occupation(s) During the Past Five Years and Other | Glenn Booraem | |
| Experience: President and Chief Operating Officer | Born 1967. Treasurer Since May 2015. Principal |
| (retired 2009) of Cummins Inc. (industrial machinery); | Occupation(s) During the Past Five Years and |
| Chairman of the Board of Hillenbrand, Inc. (specialized | Other Experience: Principal of The Vanguard Group, |
| consumer services), and of Oxfam America; Director | Inc.; Treasurer of each of the investment companies |
| of SKF AB (industrial machinery), Hyster-Yale Materials | served by The Vanguard Group; Controller of each of |
| Handling, Inc. (forklift trucks), the Lumina Foundation | the investment companies served by The Vanguard |
| for Education, and the V Foundation for Cancer | Group (2010–2015); Assistant Controller of each of |
| Research; Member of the Advisory Council for the | the investment companies served by The Vanguard |
| College of Arts and Letters and of the Advisory Board | Group (2001–2010). | |
| to the Kellogg Institute for International Studies, both | | |
| at the University of Notre Dame. | Thomas J. Higgins | |
| Born 1957. Chief Financial Officer Since September |
| Mark Loughridge | 2008. Principal Occupation(s) During the Past Five |
| Born 1953. Trustee Since March 2012. Principal | Years and Other Experience: Principal of The Vanguard |
| Occupation(s) During the Past Five Years and Other | Group, Inc.; Chief Financial Officer of each of the |
| Experience: Senior Vice President and Chief Financial | investment companies served by The Vanguard Group; |
| Officer (retired 2013) at IBM (information technology | Treasurer of each of the investment companies served |
| services); Fiduciary Member of IBM’s Retirement Plan | by The Vanguard Group (1998–2008). |
| Committee (2004–2013); Director of the Dow Chemical | | |
| Company; Member of the Council on Chicago Booth. | Peter Mahoney | |
| Born 1974. Controller Since May 2015. Principal |
| Scott C. Malpass | Occupation(s) During the Past Five Years and |
| Born 1962. Trustee Since March 2012. Principal | Other Experience: Head of Global Fund Accounting |
| Occupation(s) During the Past Five Years and Other | at The Vanguard Group, Inc.; Controller of each of the |
| Experience: Chief Investment Officer and Vice | investment companies served by The Vanguard Group; |
| President at the University of Notre Dame; Assistant | Head of International Fund Services at The Vanguard |
| Professor of Finance at the Mendoza College of | Group (2008–2014). | |
| Business at Notre Dame; Member of the Notre Dame | | |
| 403(b) Investment Committee; Board Member of | Heidi Stam | |
| TIFF Advisory Services, Inc., and Catholic Investment | Born 1956. Secretary Since July 2005. Principal |
| Services, Inc. (investment advisors); Member of | Occupation(s) During the Past Five Years and Other |
| the Investment Advisory Committee of Major | Experience: Managing Director of The Vanguard |
| League Baseball. | Group, Inc.; General Counsel of The Vanguard Group; |
| Secretary of The Vanguard Group and of each of the |
| André F. Perold | investment companies served by The Vanguard Group; |
| Born 1952. Trustee Since December 2004. Principal | Director and Senior Vice President of Vanguard |
| Occupation(s) During the Past Five Years and Other | Marketing Corporation. | |
| Experience: George Gund Professor of Finance and | | |
| Banking, Emeritus at the Harvard Business School | Vanguard Senior ManagementTeam |
| (retired 2011); Chief Investment Officer and Managing | Mortimer J. Buckley | Chris D. McIsaac |
| Partner of HighVista Strategies LLC (private investment | Kathleen C. Gubanich | James M. Norris |
| firm); Director of Rand Merchant Bank; Overseer of | Paul A. Heller | Thomas M. Rampulla |
| the Museum of Fine Arts Boston. | Martha G. King | Glenn W. Reed |
| John T. Marcante | Karin A. Risi |
| Peter F. Volanakis | | |
| Born 1955. Trustee Since July 2009. Principal | | |
| Occupation(s) During the Past Five Years and Other | Chairman Emeritus and Senior Advisor |
| Experience: President and Chief Operating Officer | John J. Brennan | |
| (retired 2010) of Corning Incorporated (communications | Chairman, 1996–2009 | |
| equipment); Trustee of Colby-Sawyer College; | Chief Executive Officer and President, 1996–2008 |
| Member of the Advisory Board of the Norris Cotton | | |
| Cancer Center and of the Advisory Board of the | | |
| Parthenon Group (strategy consulting). | Founder | |
| | John C. Bogle | |
| | Chairman and Chief Executive Officer, 1974–1996 |
1 Mr. McNabb is considered an “interested person,” as defined in the Investment Company Act of 1940, because he is an officer of the Vanguard funds.
2 December 2002 for Vanguard Equity Income Fund, the Vanguard Municipal Bond Funds, and the Vanguard State Tax-Exempt Funds.
|  |
| | P.O. Box 2600 |
| | Valley Forge, PA 19482-2600 |
| |
| |
| |
| Connect with Vanguard® > vanguard.com |
| |
| |
| |
| Fund Information > 800-662-7447 | |
| Direct Investor Account Services > 800-662-2739 | |
| Institutional Investor Services > 800-523-1036 | |
| Text Telephone for People | |
| Who Are Deaf or Hard of Hearing> 800-749-7273 | |
| |
| This material may be used in conjunction | |
| with the offering of shares of any Vanguard | |
| fund only if preceded or accompanied by | |
| the fund’s current prospectus. | |
| |
| All comparative mutual fund data are from Lipper, a | |
| Thomson Reuters Company, or Morningstar, Inc., unless | |
| otherwise noted. | |
| |
| You can obtain a free copy of Vanguard’s proxy voting | |
| guidelines by visiting vanguard.com/proxyreporting or by | |
| calling Vanguard at 800-662-2739. The guidelines are | |
| also available from the SEC’s website, sec.gov. In | |
| addition, you may obtain a free report on how your fund | |
| voted the proxies for securities it owned during the 12 | |
| months ended June 30. To get the report, visit either | |
| vanguard.com/proxyreporting or sec.gov. | |
| |
| You can review and copy information about your fund at | |
| the SEC’s Public Reference Room in Washington, D.C. To | |
| find out more about this public service, call the SEC at | |
| 202-551-8090. Information about your fund is also | |
| available on the SEC’s website, and you can receive | |
| copies of this information, for a fee, by sending a | |
| request in either of two ways: via email addressed to | |
| publicinfo@sec.gov or via regular mail addressed to the | |
| Public Reference Section, Securities and Exchange | |
| Commission, Washington, DC 20549-1520. | |
| |
| | © 2016 The Vanguard Group, Inc. |
| | All rights reserved. |
| | Vanguard Marketing Corporation, Distributor. |
| |
| | Q1030 022016 |

Annual Report | December 31, 2015
Vanguard Developed Markets Index Fund
Vanguard’s Principles for Investing Success
We want to give you the best chance of investment success. These principles, grounded in Vanguard’s research and experience, can put you on the right path.
Goals. Create clear, appropriate investment goals.
Balance. Develop a suitable asset allocation using broadly diversified funds. Cost. Minimize cost.
Discipline. Maintain perspective and long-term discipline.
A single theme unites these principles: Focus on the things you can control.
We believe there is no wiser course for any investor.
| |
| Contents | |
| Your Fund’s Total Returns. | 1 |
| Chairman’s Letter. | 2 |
| Fund Profile. | 9 |
| Performance Summary. | 11 |
| Financial Statements. | 14 |
| Your Fund’s After-Tax Returns. | 36 |
| About Your Fund’s Expenses. | 37 |
| Glossary. | 39 |
Please note: The opinions expressed in this report are just that—informed opinions. They should not be considered promises or advice.
Also, please keep in mind that the information and opinions cover the period through the date on the front of this report. Of course, the
risks of investing in your fund are spelled out in the prospectus.
See the Glossary for definitions of investment terms used in this report.
About the cover: Pictured is a sailing block on the Brilliant, a 1932 schooner docked in Mystic, Connecticut. A type of pulley, the
sailing block helps coordinate the setting of the sails. At Vanguard, the intricate coordination of technology and people allows
us to help millions of clients around the world reach their financial goals.
Your Fund’s Total Returns
| |
| Fiscal Year Ended December 31, 2015 | |
| | Total |
| | Returns |
| Vanguard Developed Markets Index Fund | |
| Investor Shares | -0.29% |
| FTSE Developed Markets ETF Shares | |
| Market Price | -0.38 |
| Net Asset Value | -0.21 |
| Admiral™ Shares | -0.18 |
| Institutional Shares | -0.17 |
| Institutional Plus Shares | -0.21 |
| Spliced Developed ex US Index | -0.28 |
| International Funds Average | -1.32 |
International Funds Average: Derived from data provided by Lipper, a Thomson Reuters Company.
Admiral Shares carry lower expenses and are available to investors who meet certain account-balance requirements. Institutional Shares and
Institutional Plus Shares are available to certain institutional investors who meet specific administrative, service, and account-size criteria.
The Vanguard ETF® Shares shown are traded on the NYSE Arca exchange and are available only through brokers. The table provides ETF
returns based on both the NYSE Arca market price and the net asset value for a share. U.S. Pat. Nos. 6,879,964; 7,337,138; 7,720,749;
7,925,573; 8,090,646; and 8,417,623.
For the ETF Shares, the market price is determined by the midpoint of the bid-offer spread as of the closing time of the New York Stock
Exchange (generally 4 p.m., Eastern time). The net asset value is also determined as of the NYSE closing time. For more information about
how the ETF Shares' market prices have compared with their net asset value, visit vanguard.com, select your ETF, and then select the Price
and Performance tab. The ETF premium/discount analysis there shows the percentages of days on which the ETF Shares' market price was
above or below the NAV.
| | | | |
| Your Fund’s Performance at a Glance | | | | |
| December 31, 2014, Through December 31, 2015 | | | | |
| | | | Distributions Per Share |
| | Starting | Ending | | |
| | Share | Share | Income | Capital |
| | Price | Price | Dividends | Gains |
| Vanguard Developed Markets Index Fund | | | | |
| Investor Shares | $9.42 | $9.15 | $0.255 | $0.000 |
| FTSE Developed Markets ETF Shares | 37.85 | 36.75 | 1.071 | 0.000 |
| Admiral Shares | 12.17 | 11.82 | 0.344 | 0.000 |
| Institutional Shares | 12.18 | 11.83 | 0.346 | 0.000 |
| Institutional Plus Shares | 19.05 | 18.49 | 0.545 | 0.000 |
1

Chairman’s Letter
Dear Shareholder,
The year ended December 31, 2015, was a volatile one for the world’s equity markets. Both domestic and international markets struggled late in the period.
The strength of the U.S. dollar further hindered results of international stocks, which, as a whole, lost ground.
Although results varied dramatically from country to country, stocks of developed economies generally held up better than those of emerging-market economies.
For the 12 months, Vanguard Developed Markets Index Fund returned –0.29% for Investor Shares, closely tracking the performance of its benchmark index. Peer funds, on average, returned –1.32%.
If you hold this fund in a taxable account, you may wish to review the after-tax returns that appear later in this report.
We have completed phase one of the fund’s benchmark transition
Before discussing the markets and fund performance a bit more, I’d like to update you on important changes to further broaden your fund’s diversification. I first wrote to you about these changes at the end of the semiannual reporting period.
Your fund is switching to a new benchmark index, which will expand the fund’s reach to include small-capitalization stocks as well as the large- and mid-cap stocks it already invests in. It will also add exposure to Canadian stocks.
2
In late December, we completed the first phase of the two-phase benchmark transition. This means that your fund has shifted from tracking the FTSE Developed ex North America Index to the FTSE Developed All Cap ex US Transition Index.
We’ll complete the second phase over about six months, at which time the fund will track the FTSE Developed All Cap ex US Index. By proceeding gradually, we are reducing costs associated with trading large amounts of securities in a short period. FTSE will continue to supply monthly updates of the transition index’s composition at ftse.com/vanguard.
Despite troubles, U.S. stocks eked out a seventh year of gains
U.S. stocks returned 0.48% for the 12 months ended December 31, 2015. Although the broad market recorded its worst performance since 2008, it still posted gains for the seventh straight calendar year when dividends are factored into returns. International stocks returned about –5%, with emerging markets faring the worst.
Stocks slid in August and September as concerns mounted that China’s economic slowdown would spread globally. Falling oil and commodity prices also affected economies and markets across the world, for better or worse. Central banks in Europe and Asia bolstered their stimulus
| | | |
| Market Barometer | | | |
| |
| | Average Annual Total Returns |
| | Periods Ended December 31, 2015 |
| | One | Three | Five |
| | Year | Years | Years |
| Stocks | | | |
| Russell 1000 Index (Large-caps) | 0.92% | 15.01% | 12.44% |
| Russell 2000 Index (Small-caps) | -4.41 | 11.65 | 9.19 |
| Russell 3000 Index (Broad U.S. market) | 0.48 | 14.74 | 12.18 |
| FTSE All-World ex US Index (International) | -4.72 | 2.04 | 1.48 |
| |
| Bonds | | | |
| Barclays U.S. Aggregate Bond Index (Broad taxable market) | 0.55% | 1.44% | 3.25% |
| Barclays Municipal Bond Index (Broad tax-exempt market) | 3.30 | 3.16 | 5.35 |
| Citigroup Three-Month U.S. Treasury Bill Index | 0.03 | 0.02 | 0.04 |
| |
| CPI | | | |
| Consumer Price Index | 0.73% | 1.00% | 1.53% |
3
efforts against weak growth and low inflation. And in December, the Federal Reserve ended months of uncertainty when it raised the target for short-term interest rates to 0.25%–0.5%.
U.S. bonds ended the year with a slender advance
The broad U.S. taxable bond market returned 0.55% for the 12 months; income accounted for the modestly positive result. The yield of the 10-year Treasury note ended December at 2.30%, up from 2.19% a year earlier. (Bond prices and yields move in opposite directions.)
Investors focused on the Fed’s stance on short-term interest rates and alternately embraced or avoided safe-haven assets depending on the stock market’s strength.
International bond markets (as measured by the Barclays Global Aggregate Index ex USD) returned –6.02%, reduced by the dollar’s strength against many foreign currencies. Without this currency effect, returns were modestly positive.
Although the Fed raised its target for short-term interest rates in mid-December, returns for money market funds and savings accounts remained limited by the 0%–0.25% levels in place for much of the past seven years.
China woes and currency effects hindered the fund’s performance
Your fund provides low-cost, diversified exposure to large-, mid-, and small-cap companies in developed markets outside the United States. We believe the fund
| | | | | | |
| Expense Ratios | | | | | | |
| Your Fund Compared With Its Peer Group | | | | | | |
| |
| | | FTSE | | | | |
| | | Developed | | | | |
| | | Markets | | | | Peer |
| | Investor | ETF | Admiral | Institutional | Institutional | Group |
| | Shares | Shares | Shares | Shares | Plus Shares | Average |
| Developed Markets Index Fund | 0.20% | 0.09% | 0.09% | 0.07% | 0.06% | 1.39% |
The fund expense ratios shown are from the prospectus dated April 29, 2015, and represent estimated costs for the current fiscal year. For the
fiscal year ended December 31, 2015, the fund’s expense ratios were 0.20% for Investor Shares, 0.09% for FTSE Developed Markets ETF
Shares, 0.09% for Admiral Shares, 0.07% for Institutional Shares, and 0.06% for Institutional Plus Shares. The peer-group expense ratio is
derived from data provided by Lipper, a Thomson Reuters Company, and captures information through year-end 2014.
Peer group: International Funds.
4
can play a role in a broadly diversified portfolio for long-term investors. This long-term aspect is important because the fund’s focus on non-U.S. stocks can leave it more vulnerable to volatility than a domestic fund.
That volatility was very much on display in the past year. The fund recorded a solid advance through the first half, but lost ground in the second amid the concerns about China mentioned earlier in this letter.
Part of the reason why the slowdown in China is of such significance is that many countries depend on exporting commodities to the world’s most populous country. Australia, which has benefited in previous years from China’s voracious appetite for commodities, saw its stocks retreat in 2015, and this hurt the fund’s overall return.
Another significant factor affecting the fund’s performance was the strength of the U.S. dollar relative to other currencies, including the euro. European stocks, which in aggregate are the largest region represented in your fund, were pushed into negative territory by currency effects.
Japan, the fund’s largest single country holding, was a notable exception to the downward trend in equity performance. Extraordinary central bank stimulus aimed at reviving Japan’s economy helped propel that country’s stocks sharply higher.
| |
| Total Returns | |
| Ten Years Ended December 31, 2015 | |
| | Average |
| | Annual Return |
| Developed Markets Index Fund Admiral Shares | 3.17% |
| Spliced Developed ex US Index | 3.09 |
| International Funds Average | 2.73 |
For a benchmark description, see the Glossary.
International Funds Average: Derived from data provided by Lipper, a Thomson Reuters Company.
The figures shown represent past performance, which is not a guarantee of future results. (Current performance may be
lower or higher than the performance data cited. For performance data current to the most recent month-end, visit our
website at vanguard.com/performance.) Note, too, that both investment returns and principal value can fluctuate widely, so
an investor’s shares, when sold, could be worth more or less than their original cost.
5
Among the industry sectors represented in the fund, consumer goods and health care turned in the strongest results. Not surprisingly, given the plunge in oil and other commodity prices, oil and gas and basic materials were the two worst-performing sectors.
Despite muted 10-year returns, diversification’s benefits endure
For the ten years through December 31, 2015, the Developed Market Index Fund’s average annual return was 3.17% for Admiral Shares. The fund’s result was in line with its benchmark index and exceeded the average return of peer funds.
The fund’s success in tracking its benchmark is a testament to the skill of its advisor, Vanguard Equity Index Group. The group relies on its proven portfolio management strategies to produce benchmark-tracking returns regardless of external market conditions. At the same time, the fund’s low costs help you keep more of the market’s returns.
| Vanguard’s outlook for investors: Not bearish, but cautious |
| |
| In Vanguard’s recently published global economic and investment outlook, Global Chief |
| Economist Joseph Davis and his team discuss various market and economic events 2016 |
| may bring, along with challenges and opportunities for investors. |
| |
| Our forecast includes “frustratingly fragile” economic growth and more modest long-term |
| returns from the global stock and bond markets. The report cautions that for the decade ending |
| 2025, returns for a balanced portfolio are likely to be moderately below historical averages. |
| |
| Our simulations indicate that the average annualized returns of a 60% equity/40% bond |
| portfolio for the decade are most likely to be centered in the 3%–5% range after inflation, |
| below the actual average after-inflation return of 5.5% for the same portfolio since 1926. |
| |
| Even so, Vanguard’s steadfast belief in its principles for investing success—focusing on clear |
| goals, a suitable asset allocation, low costs, and long-term discipline—remains unchanged. |
| |
| For more information about our expectations and the probability of various outcomes, see |
| Vanguard’s Economic and Investment Outlook, available at vanguard.com/research. |
| |
| |
| IMPORTANT: The projections or other information generated by the Vanguard Capital Markets Model® (VCMM) |
| regarding the likelihood of various investment outcomes are hypothetical in nature, do not reflect actual investment |
| results, and are not guarantees of future results. Distribution of return outcomes from VCMM, derived from |
| 10,000 simulations for U.S. equity returns and fixed income returns. Simulations as of September 30, 2015. |
| Results from the model may vary with each use and over time. For more information, please see page 7. |
6
Although developed markets returns were disappointing in this period, we continue to see great value in broad global diversification. A portfolio that includes both U.S. and international stocks and other asset classes can provide some cushion for investors to weather the inevitable variations in global market performance.
To reach your long-term goals, be realistic and try to save more
Although there have been times when it felt as if stocks and bonds were riding a roller coaster, the markets have generally risen in recent years. The broad global stock market in particular has posted some impressive gains since its turnaround began in 2009.
But 2015 served as a reminder that markets aren’t always favorable. The U.S. stock and bond markets were barely positive, and international stocks and unhedged bonds finished in the red.
In Vanguard’s recently updated long-term look at the economy and markets, our global economists explain why they expect economic growth to remain “frustratingly fragile,” and why their outlook for stock and bond markets is the most guarded since 2006. (For more details, see the box on page 6 and Vanguard’s Economic and Investment Outlook, available at vanguard.com/research.)
Given these muted expectations, what’s the best course of action? I’ve often encouraged shareholders to focus on the things they can control. That advice holds true today.
IMPORTANT: The projections or other information generated by the Vanguard Capital Markets Model (VCMM)
regarding the likelihood of various investment outcomes are hypothetical in nature, do not reflect actual
investment results, and are not guarantees of future results. VCMM results will vary with each use and over time.
The VCMM projections are based on a statistical analysis of historical data. Future returns may behave differently from the
historical patterns captured in the VCMM. More important, the VCMM may be underestimating extreme negative scenarios
unobserved in the historical period on which the model estimation is based.
The VCMM is a proprietary financial simulation tool developed and maintained by Vanguard’s primary investment research
and advice teams. The model forecasts distributions of future returns for a wide array of broad asset classes. Those asset
classes include U.S. and international equity markets, several maturities of the U.S. Treasury and corporate fixed income
markets, international fixed income markets, U.S. money markets, commodities, and certain alternative investment
strategies. The theoretical and empirical foundation for the VCMM is that the returns of various asset classes reflect the
compensation investors require for bearing different types of systematic risk (beta). At the core of the model are estimates
of the dynamic statistical relationship between risk factors and asset returns, obtained from statistical analysis based on
available monthly financial and economic data from as early as 1960. Using a system of estimated equations, the model
then applies a Monte Carlo simulation method to project the estimated interrelationships among risk factors and asset
classes as well as uncertainty and randomness over time. The model generates a large set of simulated outcomes for
each asset class over several time horizons. Forecasts are obtained by computing measures of central tendency in these
simulations. Results produced by the tool will vary with each use and over time.
7
Consider saving more than you think you may need. That’s one way you can prepare for the volatility that may lie ahead, particularly as markets adjust to changes in policies from the Fed and other central banks.
And, as always, investors would be well-served to follow Vanguard’s principles for investing success:
• Goals. Create clear, appropriate investment goals.
• Balance. Develop a suitable asset allocation using broadly diversified funds.
• Cost. Minimize cost.
• Discipline. Maintain perspective and long-term discipline.
As with saving, each of these principles is within your control, and focusing on them can keep you on the right path.
As always, thank you for investing with Vanguard.
Sincerely,

F. William McNabb III
Chairman and Chief Executive Officer
January 19, 2016
8
Developed Markets Index Fund
Fund Profile
As of December 31, 2015
| | | | | |
| Share-Class Characteristics | | | | | |
| |
| | Investor | | Admiral | Institutional | Institutional |
| | Shares | ETF Shares | Shares | Shares | Plus Shares |
| Ticker Symbol | VDVIX | VEA | VTMGX | VTMNX | VDIPX |
| Expense Ratio1 | 0.20% | 0.09% | 0.09% | 0.07% | 0.06% |
| | | |
| Portfolio Characteristics | | |
| | | FTSE | |
| | | Developed | FTSE |
| | | All Cap | Global |
| | | ex US | All Cap |
| | | Transition | ex US |
| | Fund | Index | Index |
| Number of Stocks | 3,701 | 3,733 | 5,721 |
| Median Market Cap | $29.6B | $30.6B | $21.7B |
| Price/Earnings Ratio | 18.2x | 18.0x | 18.1x |
| Price/Book Ratio | 1.6x | 1.6x | 1.6x |
| Return on Equity | 14.4% | 14.4% | 14.7% |
| Earnings Growth | | | |
| Rate | 10.6% | 10.7% | 11.3% |
| Dividend Yield | 3.0% | 3.0% | 2.9% |
| Turnover Rate | 3% | — | — |
| Short-Term Reserves | 0.1% | — | — |
| | | |
| Sector Diversification (% of equity exposure) |
| | | FTSE | |
| | | Developed | FTSE |
| | | All Cap | Global |
| | | ex US | All Cap |
| | | Transition | ex US |
| | Fund | Index | Index |
| Basic Materials | 6.4% | 6.4% | 6.5% |
| Consumer Goods | 19.5 | 19.7 | 16.6 |
| Consumer Services | 8.6 | 8.5 | 8.9 |
| Financials | 24.8 | 24.7 | 26.3 |
| Health Care | 10.5 | 10.6 | 8.7 |
| Industrials | 13.9 | 13.8 | 14.1 |
| Oil & Gas | 4.6 | 4.5 | 5.6 |
| Technology | 3.8 | 3.7 | 5.4 |
| Telecommunications | 4.4 | 4.5 | 4.5 |
| Utilities | 3.5 | 3.6 | 3.4 |
| | |
| Volatility Measures | | |
| |
| | | FTSE Global |
| | | All Cap |
| | Spliced Dev | ex US |
| | ex US Index | Index |
| R-Squared | 0.98 | 0.95 |
| Beta | 0.98 | 0.99 |
These measures show the degree and timing of the fund’s fluctuations compared with the indexes over 36 months.
| | |
| Ten Largest Holdings (% of total net assets) |
| Nestle SA | Food Products | 1.7% |
| Roche Holding AG | Pharmaceuticals | 1.4 |
| Novartis AG | Pharmaceuticals | 1.3 |
| Toyota Motor Corp. | Automobiles | 1.2 |
| HSBC Holdings plc | Banks | 1.1 |
| Royal Dutch Shell plc | Integrated Oil & Gas | 1.0 |
| Samsung Electronics Co. Consumer | |
| Ltd. | Electronics | 1.0 |
| Unilever | Personal Products | 0.9 |
| Novo Nordisk A/S | Pharmaceuticals | 0.8 |
| Commonwealth Bank of | | |
| Australia | Banks | 0.8 |
| Top Ten | | 11.2% |
| The holdings listed exclude any temporary cash investments and equity index products. |
Allocation by Region (% of portfolio)
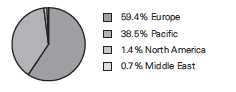
1 The expense ratios shown are from the prospectus dated April 29, 2015, and represent estimated costs for the current fiscal year. For the fiscal
year ended December 31, 2015, the expense ratios were 0.20% for Investor Shares, 0.09% for FTSE Developed Markets ETF Shares, 0.09% for
Admiral Shares, 0.07% for Institutional Shares, and 0.06% for Instituional Plus Shares.
9
Developed Markets Index Fund
| | | |
| Market Diversification (% of equity exposure) |
| | | FTSE | |
| | | Developed | FTSE |
| | | All Cap | Global |
| | | ex US | All Cap |
| | | Transition | ex US |
| | Fund | Index | Index |
| Europe | | | |
| United Kingdom | 18.5% | 18.5% | 14.6% |
| France | 8.5 | 8.4 | 6.3 |
| Switzerland | 8.4 | 8.5 | 6.3 |
| Germany | 8.3 | 8.3 | 6.3 |
| Spain | 2.9 | 2.9 | 2.2 |
| Netherlands | 2.7 | 2.7 | 2.1 |
| Sweden | 2.6 | 2.7 | 2.2 |
| Italy | 2.2 | 2.2 | 1.9 |
| Denmark | 1.8 | 1.8 | 1.4 |
| Belgium | 1.4 | 1.3 | 1.1 |
| Other | 2.1 | 2.3 | 1.9 |
| Subtotal | 59.4% | 59.6% | 46.3% |
| Pacific | | | |
| Japan | 23.3% | 23.4% | 18.2% |
| Australia | 6.5 | 6.4 | 5.0 |
| South Korea | 4.0 | 4.0 | 3.3 |
| Hong Kong | 3.3 | 3.3 | 2.6 |
| Singapore | 1.2 | 1.2 | 1.0 |
| Other | 0.2 | 0.2 | 0.2 |
| Subtotal | 38.5% | 38.5% | 30.3% |
| Emerging Markets | 0.0% | 0.0% | 17.0% |
| North America | | | |
| Canada | 1.2% | 1.2% | 5.8% |
| United States | 0.2 | 0.0 | 0.0 |
| Subtotal | 1.4% | 1.2% | 5.8% |
| Middle East | 0.7% | 0.7% | 0.6% |
10
Developed Markets Index Fund
Performance Summary
All of the returns in this report represent past performance, which is not a guarantee of future results that may be achieved by the fund. (Current performance may be lower or higher than the performance data cited. For performance data current to the most recent month-end, visit our website at vanguard.com/performance.) Note, too, that both investment returns and principal value can fluctuate widely, so an investor’s shares, when sold, could be worth more or less than their original cost. The returns shown do not reflect taxes that a shareholder would pay on fund distributions or on the sale of fund shares.
Cumulative Performance: July 20, 2007, Through December 31, 2015
Initial Investment of $10,000
| | | | | |
| | | Average Annual Total Returns | |
| | | Periods Ended December 31, 2015 | |
| |
| | | | | Since | Final Value |
| | | One | Five | Inception | of a $10,000 |
| | | Year | Years | (7/20/2007) | Investment |
| |
| | FTSE Developed Markets ETF Shares | | | | |
| | Net Asset Value | -0.21% | 3.57% | -0.55% | $9,548 |
| | FTSE Developed Markets ETF Shares | | | | |
| | Market Price | -0.38 | 3.47 | -0.58 | 9,517 |
| |
| •••••••• | Spliced Developed ex US Index | -0.28 | 3.72 | -0.68 | 9,443 |
| |
| |
| – – – – | International Funds Average | -1.32 | 2.64 | -0.99 | 9,197 |
| | FTSE Global All Cap ex US Index | -4.29 | 1.51 | -0.66 | 9,454 |
For a benchmark description, see the Glossary.
International Funds Average: Derived from data provided by Lipper, a Thomson Reuters Company.
"Since Inception" performance is calculated from the ETF Shares’ inception date for both the fund and its comparative standards.
| | | |
| | | Since | Final Value |
| | One | Inception | of a $10,000 |
| | Year | (12/19/2013) | Investment |
| Developed Markets Index Fund Investor | | | |
| Shares | -0.29% | -1.44% | $9,710 |
| Spliced Developed ex US Index | -0.28 | -1.04 | 9,791 |
| FTSE Global All Cap ex US Index | -4.29 | -2.45 | 9,509 |
| "Since Inception" performance is calculated from the Investor Shares’ inception date for both the fund and its comparative standards. |
See Financial Highlights for dividend and capital gains information.
11
Developed Markets Index Fund
| | | | |
| | Average Annual Total Returns | |
| | Periods Ended December 31, 2015 | |
| |
| | | | | Final Value |
| | One | Five | Ten | of a $10,000 |
| | Year | Years | Years | Investment |
| Developed Markets Index Fund Admiral | | | | |
| Shares | -0.18% | 3.58% | 3.17% | $13,659 |
| Spliced Developed ex US Index | -0.28 | 3.72 | 3.09 | 13,551 |
| FTSE Global All Cap ex US Index | -4.29 | 1.51 | 3.64 | 14,291 |
| | | | |
| | | | | Final Value |
| | One | Five | Ten | of a $5,000,000 |
| | Year | Years | Years | Investment |
| Developed Markets Index Fund Institutional | | | | |
| Shares | -0.17% | 3.59% | 3.22% | $6,865,796 |
| |
| Spliced Developed ex US Index | -0.28 | 3.72 | 3.09 | 6,775,588 |
| |
| FTSE Global All Cap ex US Index | -4.29 | 1.51 | 3.64 | 7,145,669 |
| | | |
| | | Since | Final Value |
| | One | Inception | of a $100,000,000 |
| | Year | (4/1/2014) | Investment |
| Developed Markets Index Fund Institutional | | | |
| Plus Shares | -0.21% | -3.98% | $93,132,260 |
| Spliced Developed ex US Index | -0.28 | -3.49 | 93,968,330 |
| FTSE Global All Cap ex US Index | -4.29 | -5.12 | 91,202,476 |
| "Since Inception" performance is calculated from the Institutional Plus Shares’ inception date for both the fund and its comparative standards. |
| | | |
| Cumulative Returns of ETF Shares: July 20, 2007, Through December 31, 2015 | | |
| | | | Since |
| | One | Five | Inception |
| | Year | Years | (7/20/2007) |
| FTSE Developed Markets ETF Shares Market Price | -0.38% | 18.62% | -4.83% |
| FTSE Developed Markets ETF Shares Net Asset | | | |
| Value | -0.21 | 19.15 | -4.52 |
| Spliced Developed ex US Index | -0.28 | 20.01 | -5.57 |
| "Since Inception" performance is calculated from the ETF Shares’ inception date for both the fund and its comparative standards. |
12
Developed Markets Index Fund
Fiscal-Year Total Returns (%): July 20, 2007, Through December 31, 2015
For a benchmark description, see the Glossary.
13
Developed Markets Index Fund
Financial Statements
Statement of Net Assets—Investments Summary
As of December 31, 2015
This Statement summarizes the fund’s holdings by asset type. Details are reported for each of the fund’s 50 largest individual holdings and for investments that, in total for any issuer, represent more than 1% of the fund’s net assets. The total value of smaller holdings is reported as a single amount within each category.
The fund reports a complete list of its holdings in regulatory filings four times in each fiscal year, at the quarter-ends. For the second and fourth fiscal quarters, the complete listing of the fund’s holdings is available electronically on vanguard.com and on the Securities and Exchange Commission’s website (sec.gov), or you can have it mailed to you without charge by calling 800-662-7447. For the first and third fiscal quarters, the fund files the lists with the SEC on Form N-Q. Shareholders can look up the fund’s Forms N-Q on the SEC’s website. Forms N-Q may also be reviewed and copied at the SEC’s Public Reference Room (see the back cover of this report for further information).
| | | |
| | | Market | Percentage |
| | | Value• | of Net |
| | Shares | ($000) | Assets |
| Common Stocks | | | |
| Australia | | | |
| Commonwealth Bank of Australia | 6,596,351 | 407,818 | 0.8% |
| Westpac Banking Corp. | 13,001,150 | 315,147 | 0.6% |
| Australia & New Zealand Banking Group Ltd. | 11,254,253 | 227,110 | 0.4% |
| National Australia Bank Ltd. | 10,158,845 | 221,686 | 0.4% |
| 1 Australia—Other † | | 2,239,930 | 4.2% |
| | | 3,411,691 | 6.4% |
| |
| Austria † | | 100,525 | 0.2% |
| |
| Belgium | | | |
| Anheuser-Busch InBev SA/NV | 3,120,090 | 388,289 | 0.7% |
| Belgium—Other † | | 328,811 | 0.6% |
| | | 717,100 | 1.3% |
| |
| Canada † | | 647,905 | 1.2% |
| |
| Denmark | | | |
| Novo Nordisk A/S Class B | 7,208,503 | 417,359 | 0.8% |
| Denmark—Other † | | 527,112 | 1.0% |
| | | 944,471 | 1.8% |
| |
| Finland † | | 474,274 | 0.9% |
| |
| France | | | |
| Sanofi | 4,404,647 | 375,374 | 0.7% |
| TOTAL SA | 8,071,080 | 361,840 | 0.7% |
| BNP Paribas SA | 3,789,155 | 214,381 | 0.4% |
| AXA SA | 7,499,390 | 204,911 | 0.4% |
| 1 France—Other † | | 3,319,327 | 6.2% |
| | | 4,475,833 | 8.4% |
14
| | | |
| Developed Markets Index Fund | | | |
| |
| |
| |
| | | Market | Percentage |
| | | Value• | of Net |
| | Shares | ($000) | Assets |
| Germany | | | |
| Bayer AG | 3,226,473 | 402,958 | 0.7% |
| Allianz SE | 1,766,775 | 311,445 | 0.6% |
| Daimler AG | 3,711,917 | 310,147 | 0.6% |
| Siemens AG | 3,066,875 | 296,709 | 0.6% |
| SAP SE | 3,467,777 | 275,181 | 0.5% |
| BASF SE | 3,583,885 | 273,015 | 0.5% |
| * Deutsche Telekom AG | 12,289,306 | 220,725 | 0.4% |
| 1 Germany—Other † | | 2,310,257 | 4.3% |
| | | 4,400,437 | 8.2% |
| |
| Greece † | | 19,857 | 0.0% |
| |
| Hong Kong | | | |
| AIA Group Ltd. | 46,826,118 | 279,790 | 0.5% |
| 1 Hong Kong—Other † | | 1,504,056 | 2.8% |
| | | 1,783,846 | 3.3% |
| |
| Ireland † | | 160,282 | 0.3% |
| |
| Israel | | | |
| Teva Pharmaceutical Industries Ltd. | 3,666,921 | 239,233 | 0.4% |
| Israel—Other † | | 145,948 | 0.3% |
| | | 385,181 | 0.7% |
| |
| 1Italy † | | 1,189,924 | 2.2% |
| |
| Japan | | | |
| Toyota Motor Corp. | 10,452,674 | 643,665 | 1.2% |
| Mitsubishi UFJ Financial Group Inc. | 54,036,917 | 334,718 | 0.6% |
| Honda Motor Co. Ltd. | 6,958,493 | 222,404 | 0.4% |
| Mizuho Financial Group Inc. | 96,168,257 | 192,337 | 0.4% |
| Japan—Other † | | 10,973,833 | 20.5% |
| | | 12,366,957 | 23.1% |
| Netherlands | | | |
| Unilever NV | 6,073,506 | 264,553 | 0.5% |
| ING Groep NV | 15,008,021 | 203,060 | 0.4% |
| 1 Netherlands—Other † | | 977,345 | 1.8% |
| | | 1,444,958 | 2.7% |
| |
| New Zealand † | | 113,856 | 0.2% |
| |
| 1Norway † | | 289,517 | 0.5% |
| |
| Portugal † | | 80,919 | 0.2% |
| |
| 1Singapore † | | 640,455 | 1.2% |
| |
| South Korea | | | |
| Samsung Electronics Co. Ltd. | 311,723 | 332,478 | 0.6% |
| South Korea—Other † | | 1,786,993 | 3.4% |
| | | 2,119,471 | 4.0% |
15
| | | | | |
| Developed Markets Index Fund | | | | |
| |
| |
| |
| | | | | Market | Percentage |
| | | | | Value• | of Net |
| | | | Shares | ($000) | Assets |
| Spain | | | | |
| | Banco Santander SA | | 55,770,416 | 274,357 | 0.5% |
| 1 | Spain—Other † | | | 1,246,318 | 2.3% |
| | | | | 1,520,675 | 2.8% |
| |
| 1Sweden † | | | 1,417,157 | 2.7% |
| |
| Switzerland | | | | |
| | Nestle SA | | 12,149,820 | 901,945 | 1.7% |
| | Roche Holding AG | | 2,691,906 | 745,950 | 1.4% |
| | Novartis AG | | 8,330,377 | 716,573 | 1.3% |
| | UBS Group AG | | 13,690,057 | 265,580 | 0.5% |
| 1 | Switzerland—Other † | | | 1,892,087 | 3.5% |
| | | | | 4,522,135 | 8.4% |
| United Kingdom | | | | |
| | HSBC Holdings plc | | 75,627,962 | 597,027 | 1.1% |
| | British American Tobacco plc | | 7,220,019 | 400,959 | 0.8% |
| | GlaxoSmithKline plc | | 19,005,387 | 383,832 | 0.7% |
| | BP plc | | 70,775,423 | 367,800 | 0.7% |
| | Royal Dutch Shell plc Class A | | 15,074,802 | 341,434 | 0.6% |
| | Vodafone Group plc | | 103,038,698 | 334,132 | 0.6% |
| | AstraZeneca plc | | 4,930,679 | 333,056 | 0.6% |
| | Diageo plc | | 9,711,063 | 265,189 | 0.5% |
| | Lloyds Banking Group plc | | 239,104,787 | 257,277 | 0.5% |
| | Reckitt Benckiser Group plc | | 2,485,263 | 229,954 | 0.4% |
| | BT Group plc | | 32,427,055 | 225,161 | 0.4% |
| | Prudential plc | | 9,922,553 | 223,551 | 0.4% |
| | SABMiller plc | | 3,665,234 | 219,270 | 0.4% |
| | Royal Dutch Shell plc Class B | | 9,490,159 | 216,291 | 0.4% |
| | Barclays plc | | 65,106,154 | 209,563 | 0.4% |
| | National Grid plc | | 14,589,762 | 201,217 | 0.4% |
| | Unilever plc | | 4,675,723 | 200,553 | 0.4% |
| | Imperial Tobacco Group plc | | 3,726,143 | 196,807 | 0.4% |
| | BG Group plc | | 13,217,641 | 191,602 | 0.4% |
| 1 | United Kingdom—Other † | | | 4,416,278 | 8.2% |
| | | | | 9,810,953 | 18.3% |
| Total Common Stocks (Cost $52,830,528) | | | 53,038,379 | 99.0%2 |
| |
| | | Coupon | | | |
| Temporary Cash Investments | | | | |
| Money Market Fund | | | | |
| 3,4 | Vanguard Market Liquidity Fund | 0.363% | 840,518,811 | 840,519 | 1.5% |
| |
| 5,6U.S. Government and Agency Obligations † | | | 99,460 | 0.2% |
| Total Temporary Cash Investments (Cost $940,005) | | | 939,979 | 1.7%2 |
| 7Total Investments (Cost $53,770,533) | | | 53,978,358 | 100.7% |
16
Developed Markets Index Fund
| | |
| | | Percentage |
| | Amount | of Net |
| | ($000) | Assets |
| Other Assets and Liabilities | | |
| Other Assets | | |
| Investment in Vanguard | 4,683 | |
| Receivables for Investment Securities Sold | 6,175 | |
| Receivables for Accrued Income | 128,253 | |
| Receivables for Capital Shares Issued | 92,339 | |
| Other Assets | 45,264 | |
| Total Other Assets | 276,714 | 0.5% |
| Liabilities | | |
| Payables for Investment Securities Purchased | (3,630) | |
| Collateral for Securities on Loan | (537,516) | |
| Payables for Capital Shares Redeemed | (71,745) | |
| Payables to Vanguard | (22,248) | |
| Other Liabilities | (24,735) | |
| Total Liabilities | (659,874) | (1.2%) |
| Net Assets | 53,595,198 | 100.0% |
| |
| At December 31, 2015, net assets consisted of: | |
| | Amount |
| | ($000) |
| Paid-in Capital | 54,523,728 |
| Overdistributed Net Investment Income | (28,115) |
| Accumulated Net Realized Losses | (1,106,217) |
| Unrealized Appreciation (Depreciation) | |
| Investment Securities | 207,825 |
| Futures Contracts | 10,145 |
| Forward Currency Contracts | (6,359) |
| Foreign Currencies | (5,809) |
| Net Assets | 53,595,198 |
| |
| |
| Investor Shares—Net Assets | |
| Applicable to 113,692,940 outstanding $.001 par value shares of | |
| beneficial interest (unlimited authorization) | 1,039,975 |
| Net Asset Value Per Share—Investor Shares | $9.15 |
| |
| |
| ETF Shares—Net Assets | |
| Applicable to 796,962,493 outstanding $.001 par value shares of | |
| beneficial interest (unlimited authorization) | 29,287,676 |
| Net Asset Value Per Share—ETF Shares | $36.75 |
| |
| |
| Admiral Shares—Net Assets | |
| Applicable to 670,419,166 outstanding $.001 par value shares of | |
| beneficial interest (unlimited authorization) | 7,921,417 |
| Net Asset Value Per Share—Admiral Shares | $11.82 |
17
| |
| Developed Markets Index Fund | |
| |
| |
| |
| | Amount |
| | ($000) |
| Institutional Shares—Net Assets | |
| Applicable to 684,128,199 outstanding $.001 par value shares of | |
| beneficial interest (unlimited authorization) | 8,093,122 |
| Net Asset Value Per Share—Institutional Shares | $11.83 |
| |
| Institutional Plus Shares—Net Assets | |
| Applicable to 392,207,506 outstanding $.001 par value shares of | |
| beneficial interest (unlimited authorization) | 7,253,008 |
| Net Asset Value Per Share—Institutional Plus Shares | $18.49 |
• See Note A in Notes to Financial Statements.
* Non-income-producing security.
† Represents the aggregate value, by category, of securities that are not among the 50 largest holdings and, in total for any issuer,
represent 1% or less of net assets.
1 Certain of the fund’s securities are exempt from registration under Rule 144A of the Securities Act of 1933. Such securities may be sold
in transactions exempt from registration, normally to qualified institutional buyers. At December 31, 2015, the aggregate value of these
securities was $132,047,000, representing 0.2% of net assets.
2 The fund invests a portion of its cash reserves in equity markets through the use of index futures contracts. After giving effect to futures
investments, the fund’s effective common stock and temporary cash investment positions represent 99.9% and 0.8%, respectively,
of net assets.
3 Includes $537,516,000 of collateral received for securities on loan.
4 Affiliated money market fund available only to Vanguard funds and certain trusts and accounts managed by Vanguard. Rate shown is
the 7-day yield.
5 Securities with a value of $30,965,000 have been segregated as initial margin for open futures contracts.
6 Securities with a value of $8,005,000 have been segregated as collateral for open forward currency contracts.
7 The total value of securities on loan is $503,221,000.
See accompanying Notes, which are an integral part of the Financial Statements.
18
Developed Markets Index Fund
Statement of Operations
| |
| | Year Ended |
| | December 31, 2015 |
| | ($000) |
| Investment Income | |
| Income | |
| Dividends1 | 1,456,119 |
| Interest2 | 665 |
| Securities Lending | 39,975 |
| Total Income | 1,496,759 |
| Expenses | |
| The Vanguard Group—Note B | |
| Investment Advisory Services | 3,524 |
| Management and Administrative—Investor Shares | 1,953 |
| Management and Administrative—ETF Shares | 16,087 |
| Management and Administrative—Admiral Shares | 4,204 |
| Management and Administrative—Institutional Shares | 3,748 |
| Management and Administrative—Institutional Plus Shares | 2,612 |
| Marketing and Distribution—Investor Shares | 249 |
| Marketing and Distribution—ETF Shares | 2,847 |
| Marketing and Distribution—Admiral Shares | 921 |
| Marketing and Distribution—Institutional Shares | 512 |
| Marketing and Distribution—Institutional Plus Shares | 339 |
| Custodian Fees | 5,393 |
| Auditing Fees | 55 |
| Shareholders’ Reports—Investor Shares | 20 |
| Shareholders’ Reports—ETF Shares | 657 |
| Shareholders’ Reports—Admiral Shares | 58 |
| Shareholders’ Reports—Institutional Shares | 25 |
| Shareholders’ Reports—Institutional Plus Shares | 4 |
| Trustees’ Fees and Expenses | 31 |
| Total Expenses | 43,239 |
| Net Investment Income | 1,453,520 |
| Realized Net Gain (Loss) | |
| Investment Securities Sold | 610,202 |
| Futures Contracts | (9,667) |
| Foreign Currencies and Forward Currency Contracts | (27,344) |
| Realized Net Gain (Loss) | 573,191 |
| Change in Unrealized Appreciation (Depreciation) | |
| Investment Securities | (2,519,008) |
| Futures Contracts | 2,600 |
| Foreign Currencies and Forward Currency Contracts | (3,326) |
| Change in Unrealized Appreciation (Depreciation) | (2,519,734) |
| Net Increase (Decrease) in Net Assets Resulting from Operations | (493,023) |
1 Dividends are net of foreign withholding taxes of $76,357,000.
2 Interest income from an affiliated company of the fund was $574,000.
See accompanying Notes, which are an integral part of the Financial Statements.
19
Developed Markets Index Fund
Statement of Changes in Net Assets
| | |
| | Year Ended December 31, |
| | 2015 | 2014 |
| | ($000) | ($000) |
| Increase (Decrease) in Net Assets | | |
| Operations | | |
| Net Investment Income | 1,453,520 | 1,297,290 |
| Realized Net Gain (Loss) | 573,191 | 151,536 |
| Change in Unrealized Appreciation (Depreciation) | (2,519,734) | (4,259,597) |
| Net Increase (Decrease) in Net Assets Resulting from Operations | (493,023) | (2,810,771) |
| Distributions | | |
| Net Investment Income | | |
| Investor Shares | (31,768) | (35,479) |
| ETF Shares | (765,004) | (771,236) |
| Admiral Shares | (202,028) | (165,209) |
| Institutional Shares | (226,831) | (200,275) |
| Institutional Plus Shares | (199,383) | (139,232) |
| Realized Capital Gain | | |
| Investor Shares | — | — |
| ETF Shares | — | — |
| Admiral Shares | — | — |
| Institutional Shares | — | — |
| Institutional Plus Shares | — | — |
| Total Distributions | (1,425,014) | (1,311,431) |
| Capital Share Transactions | | |
| Investor Shares | (268,886) | 1,460,710 |
| ETF Shares | 6,197,663 | 7,338,607 |
| Admiral Shares | 2,148,455 | 4,563,205 |
| Institutional Shares | 623,195 | 7,942,013 |
| Institutional Plus Shares | 1,597,860 | 6,469,745 |
| Net Increase (Decrease) from Capital Share Transactions | 10,298,287 | 27,774,280 |
| Total Increase (Decrease) | 8,380,250 | 23,652,078 |
| Net Assets | | |
| Beginning of Period | 45,214,948 | 21,562,870 |
| End of Period1 | 53,595,198 | 45,214,948 |
| 1 Net Assets—End of Period includes undistributed (overdistributed) net investment income of ($28,115,000) and ($41,949,000). |
See accompanying Notes, which are an integral part of the Financial Statements.
20
Developed Markets Index Fund
Financial Highlights
| | | |
| Investor Shares | | | |
| | | | Dec. 19, |
| | Year Ended | 20131 to |
| | December 31, | Dec. 31, |
| For a Share Outstanding Throughout Each Period | 2015 | 2014 | 2013 |
| Net Asset Value, Beginning of Period | $9.42 | $10.34 | $10.00 |
| Investment Operations | | | |
| Net Investment Income | . 261 | . 337 | .008 |
| Net Realized and Unrealized Gain (Loss) on Investments | (.276) | (. 919) | . 332 |
| Total from Investment Operations | (. 015) | (. 582) | .340 |
| Distributions | | | |
| Dividends from Net Investment Income | (.255) | (.338) | — |
| Distributions from Realized Capital Gains | — | — | — |
| Total Distributions | (. 255) | (. 338) | — |
| Net Asset Value, End of Period | $9.15 | $9.42 | $10.34 |
| |
| Total Return2 | -0.29% | -5.82% | 3.40% |
| |
| Ratios/Supplemental Data | | | |
| Net Assets, End of Period (Millions) | $1,040 | $1,331 | $0.1 |
| Ratio of Total Expenses to Average Net Assets | 0.20% | 0.20% | 0.20%3 |
| Ratio of Net Investment Income to Average Net Assets | 2.73% | 3.22% | 2.80%3 |
| Portfolio Turnover Rate 4 | 3% | 4% | 13% |
1 Inception.
2 Total returns do not include account service fees that may have applied in the periods shown. Fund prospectuses provide information about
any applicable account service fees.
3 Annualized.
4 Excludes the value of portfolio securities received or delivered as a result of in-kind purchases or redemptions of the fund’s capital shares,
including ETF Creation Units.
See accompanying Notes, which are an integral part of the Financial Statements.
21
Developed Markets Index Fund
Financial Highlights
| | | | | |
| FTSE Developed Markets ETF Shares | | | | | |
| |
| For a Share Outstanding | Year Ended December 31, |
| Throughout Each Period | 2015 | 2014 | 2013 | 2012 | 2011 |
| Net Asset Value, Beginning of Period | $37.85 | $41.53 | $35.02 | $30.44 | $36.04 |
| Investment Operations | | | | | |
| Net Investment Income | 1.096 | 1.395 | 1.099 | 1.035 | 1.067 |
| Net Realized and Unrealized Gain (Loss) | | | | | |
| on Investments | (1.125) | (3.681) | 6.494 | 4.591 | (5.609) |
| Total from Investment Operations | (.029) | (2.286) | 7.593 | 5.626 | (4.542) |
| Distributions | | | | | |
| Dividends from Net Investment Income | (1.071) | (1.394) | (1.083) | (1.046) | (1.058) |
| Distributions from Realized Capital Gains | — | — | — | — | — |
| Total Distributions | (1.071) | (1.394) | (1.083) | (1.046) | (1.058) |
| Net Asset Value, End of Period | $36.75 | $37.85 | $41.53 | $35.02 | $30.44 |
| |
| Total Return | -0.21% | -5.71% | 22.12% | 18.60% | -12.57% |
| |
| Ratios/Supplemental Data | | | | | |
| Net Assets, End of Period (Millions) | $29,288 | $24,155 | $19,021 | $10,979 | $6,435 |
| Ratio of Total Expenses to Average Net Assets | 0.09% | 0.09% | 0.09% | 0.10% | 0.12% |
| Ratio of Net Investment Income to | | | | | |
| Average Net Assets | 2.84% | 3.33% | 2.91% | 3.40% | 3.31% |
| Portfolio Turnover Rate1 | 3% | 4% | 13% | 7% | 5% |
1 Excludes the value of portfolio securities received or delivered as a result of in-kind purchases or redemptions of the fund’s capital shares,
including ETF Creation Units.
See accompanying Notes, which are an integral part of the Financial Statements.
22
Developed Markets Index Fund
Financial Highlights
| | | | | |
| Admiral Shares | | | | | |
| |
| For a Share Outstanding | Year Ended December 31, |
| Throughout Each Period | 2015 | 2014 | 2013 | 2012 | 2011 |
| Net Asset Value, Beginning of Period | $12.17 | $13.35 | $11.26 | $9.79 | $11.58 |
| Investment Operations | | | | | |
| Net Investment Income | . 352 | . 450 | .353 | .332 | .342 |
| Net Realized and Unrealized Gain (Loss) | | | | | |
| on Investments | (. 358) | (1.180) | 2.085 | 1.474 | (1.794) |
| Total from Investment Operations | (. 006) | (.730) | 2.438 | 1.806 | (1.452) |
| Distributions | | | | | |
| Dividends from Net Investment Income | (.344) | (.450) | (.348) | (.336) | (.338) |
| Distributions from Realized Capital Gains | — | — | — | — | — |
| Total Distributions | (. 344) | (.450) | (.348) | (.336) | (.338) |
| Net Asset Value, End of Period | $11.82 | $12.17 | $13.35 | $11.26 | $9.79 |
| |
| Total Return1 | -0.18% | -5.66% | 22.06% | 18.56% | -12.51% |
| |
| Ratios/Supplemental Data | | | | | |
| Net Assets, End of Period (Millions) | $7,921 | $6,068 | $2,060 | $1,425 | $1,229 |
| Ratio of Total Expenses to Average Net Assets | 0.09% | 0.09% | 0.09% | 0.10% | 0.12% |
| Ratio of Net Investment Income to | | | | | |
| Average Net Assets | 2.84% | 3.33% | 2.91% | 3.40% | 3.31% |
| Portfolio Turnover Rate2 | 3% | 4% | 13% | 7% | 5% |
The fund’s original Investor Shares were renamed Admiral Shares as of the close of business on May 13, 2011. The Investor Shares
recommenced on December 19, 2013, and are presented separately.
1 Total returns do not include transaction or account service fees that may have applied in the periods shown. Fund prospectuses provide
information about any applicable transaction and account service fees.
2 Excludes the value of portfolio securities received or delivered as a result of in-kind purchases or redemptions of the fund’s capital shares,
including ETF Creation Units.
See accompanying Notes, which are an integral part of the Financial Statements.
23
Developed Markets Index Fund
Financial Highlights
| | | | | |
| Institutional Shares | | | | | |
| |
| For a Share Outstanding | Year Ended December 31, |
| Throughout Each Period | 2015 | 2014 | 2013 | 2012 | 2011 |
| Net Asset Value, Beginning of Period | $12.18 | $13.37 | $11.27 | $9.79 | $11.60 |
| Investment Operations | | | | | |
| Net Investment Income | . 354 | .452 | .356 | .336 | .347 |
| Net Realized and Unrealized Gain (Loss) | | | | | |
| on Investments | (. 358) | (1.190) | 2.094 | 1.483 | (1.813) |
| Total from Investment Operations | (. 004) | (.738) | 2.450 | 1.819 | (1.466) |
| Distributions | | | | | |
| Dividends from Net Investment Income | (.346) | (.452) | (.350) | (.339) | (.344) |
| Distributions from Realized Capital Gains | — | — | — | — | — |
| Total Distributions | (. 346) | (.452) | (.350) | (.339) | (.344) |
| Net Asset Value, End of Period | $11.83 | $12.18 | $13.37 | $11.27 | $9.79 |
| |
| Total Return1 | -0.17% | -5.72% | 22.15% | 18.70% | -12.62% |
| |
| Ratios/Supplemental Data | | | | | |
| Net Assets, End of Period (Millions) | $8,093 | $7,743 | $482 | $332 | $294 |
| Ratio of Total Expenses to Average Net Assets | 0.07% | 0.07% | 0.07% | 0.07% | 0.08% |
| Ratio of Net Investment Income to | | | | | |
| Average Net Assets | 2.86% | 3.35% | 2.93% | 3.43% | 3.35% |
| Portfolio Turnover Rate2 | 3% | 4% | 13% | 7% | 5% |
1 Total returns do not include transaction fees that may have applied in the periods shown. Fund prospectuses provide information about any
applicable transaction fees.
2 Excludes the value of portfolio securities received or delivered as a result of in-kind purchases or redemptions of the fund’s capital shares,
including ETF Creation Units.
See accompanying Notes, which are an integral part of the Financial Statements.
24
Developed Markets Index Fund
Financial Highlights
| | |
| Institutional Plus Shares | | |
| | Year | April 1, |
| | Ended | 20141 to |
| | Dec. 31, | Dec. 31, |
| For a Share Outstanding Throughout Each Period | 2015 | 2014 |
| Net Asset Value, Beginning of Period | $19.05 | $20.90 |
| Investment Operations | | |
| Net Investment Income | . 558 | .438 |
| Net Realized and Unrealized Gain (Loss) on Investments | (.573) | (1.798) |
| Total from Investment Operations | (.015) | (1.360) |
| Distributions | | |
| Dividends from Net Investment Income | (.545) | (.490) |
| Distributions from Realized Capital Gains | — | — |
| Total Distributions | (. 545) | (.490) |
| Net Asset Value, End of Period | $18.49 | $19.05 |
| |
| Total Return | -0.21% | -6.67% |
| |
| Ratios/Supplemental Data | | |
| Net Assets, End of Period (Millions) | $7,253 | $5,918 |
| Ratio of Total Expenses to Average Net Assets | 0.06% | 0.06%2 |
| Ratio of Net Investment Income to Average Net Assets | 2.87% | 2.92%2 |
| Portfolio Turnover Rate 3 | 3% | 4% |
1 Inception.
2 Annualized.
3 Excludes the value of portfolio securities received or delivered as a result of in-kind purchases or redemptions of the fund’s capital shares,
including ETF Creation Units.
See accompanying Notes, which are an integral part of the Financial Statements.
25
Developed Markets Index Fund
Notes to Financial Statements
Vanguard Developed Markets Index Fund (formerly known as Vanguard Tax-Managed International Fund) is registered under the Investment Company Act of 1940 as an open-end investment company, or mutual fund. The fund invests in securities of foreign issuers, which may subject it to investment risks not normally associated with investing in securities of U.S. corporations. The fund offers five classes of shares: Investor Shares, ETF Shares, Admiral Shares, Institutional Shares, and Institutional Plus Shares. Investor Shares are available to any investor who meets the fund’s minimum purchase requirements. ETF Shares are listed for trading on NYSE Arca; they can be purchased and sold through a broker. Admiral Shares, Institutional Shares, and Institutional Plus Shares are designed for investors who meet certain administrative, service, and account-size criteria.
A. The following significant accounting policies conform to generally accepted accounting principles for U.S. investment companies. The fund consistently follows such policies in preparing its financial statements.
1. Security Valuation: Securities are valued as of the close of trading on the New York Stock Exchange (generally 4 p.m., Eastern time) on the valuation date. Equity securities are valued at the latest quoted sales prices or official closing prices taken from the primary market in which each security trades; such securities not traded on the valuation date are valued at the mean of the latest quoted bid and asked prices. Securities for which market quotations are not readily available, or whose values have been affected by events occurring before the fund’s pricing time but after the close of the securities’ primary markets, are valued at their fair values calculated according to procedures adopted by the board of trustees. These procedures include obtaining quotations from an independent pricing service, monitoring news to identify significant market- or security-specific events, and evaluating changes in the values of foreign market proxies (for example, ADRs, futures contracts, or exchange-traded funds), between the time the foreign markets close and the fund’s pricing time. When fair-value pricing is employed, the prices of securities used by a fund to calculate its net asset value may differ from quoted or published prices for the same securities. Investments in Vanguard Market Liquidity Fund are valued at that fund’s net asset value. Temporary cash investments acquired over 60 days to maturity are valued using the latest bid prices or using valuations based on a matrix system (which considers such factors as security prices, yields, maturities, and ratings), both as furnished by independent pricing services. Other temporary cash investments are valued at amortized cost, which approximates market value.
2. Foreign Currency: Securities and other assets and liabilities denominated in foreign currencies are translated into U.S. dollars using exchange rates obtained from an independent third party as of the fund’s pricing time on the valuation date. Realized gains (losses) and unrealized appreciation (depreciation) on investment securities include the effects of changes in exchange rates since the securities were purchased, combined with the effects of changes in security prices. Fluctuations in the value of other assets and liabilities resulting from changes in exchange rates are recorded as unrealized foreign currency gains (losses) until the assets or liabilities are settled in cash, at which time they are recorded as realized foreign currency gains (losses).
3. Futures and Forward Currency Contracts: The fund uses index futures contracts to a limited extent, with the objectives of maintaining full exposure to the stock market, enhancing returns, maintaining liquidity, and minimizing transaction costs. The fund may purchase futures contracts to immediately invest incoming cash in the market, or sell futures in response to cash outflows, thereby simulating a
26
Developed Markets Index Fund
fully invested position in the underlying index while maintaining a cash balance for liquidity. The fund may seek to enhance returns by using futures contracts instead of the underlying securities when futures are believed to be priced more attractively than the underlying securities. The primary risks associated with the use of futures contracts are imperfect correlation between changes in market values of stocks held by the fund and the prices of futures contracts, and the possibility of an illiquid market. Counterparty risk involving futures is mitigated because a regulated clearinghouse is the counterparty instead of the clearing broker. To further mitigate counterparty risk, the fund trades futures contracts on an exchange, monitors the financial strength of its clearing brokers and clearing-house, and has entered into clearing agreements with its clearing brokers. The clearinghouse imposes initial margin requirements to secure the fund’s performance and requires daily settlement of variation margin representing changes in the market value of each contract.
The fund also enters into forward currency contracts to provide the appropriate currency exposure related to any open futures contracts. The fund’s risks in using these contracts include movement in the values of the foreign currencies relative to the U.S. dollar and the ability of the counterparties to fulfill their obligations under the contracts. The fund mitigates its counterparty risk by entering into forward currency contracts only with a diverse group of prequalified counterparties, monitoring their financial strength, entering into master netting arrangements with its counterparties, and requiring its counterparties to transfer collateral as security for their performance. The master netting arrangements provide that, in the event of a counterparty’s default (including bankruptcy), the fund may terminate the forward currency contracts, determine the net amount owed by either party in accordance with its master netting arrangements, and sell or retain any collateral held up to the net amount owed to the fund under the master netting arrangements. The forward currency contracts contain provisions whereby a counterparty may terminate open contracts if the fund’s net assets decline below a certain level, triggering a payment by the fund if the fund is in a net liability position at the time of the termination. The payment amount would be reduced by any collateral the fund has pledged. Any assets pledged as collateral for open contracts are noted in the Statement of Net Assets. The value of collateral received or pledged is compared daily to the value of the forward currency contracts exposure with each counterparty, and any difference, if in excess of a specified minimum transfer amount, is adjusted and settled within two business days.
Futures contracts are valued at their quoted daily settlement prices. Forward currency contracts are valued at their quoted daily prices obtained from an independent third party, adjusted for currency risk based on the expiration date of each contract. The aggregate settlement values and notional amounts of the contracts are not recorded in the Statement of Net Assets. Fluctuations in the value of the contracts are recorded in the Statement of Net Assets as an asset (liability) and in the Statement of Operations as unrealized appreciation (depreciation) until the contracts are closed, when they are recorded as realized gains (losses) on futures or forward currency contracts.
During the year ended December 31, 2015, the fund’s average investments in long and short futures contracts represented less than 1% and 0% of net assets, respectively, based on the average of aggregate settlement values at each quarter-end during the period. The fund’s average investment in forward currency contracts represented 1% of net assets, based on the average of notional amounts at each quarter-end during the period.
27
Developed Markets Index Fund
4. Federal Income Taxes: The fund intends to continue to qualify as a regulated investment company and distribute all of its taxable income. Management has analyzed the fund’s tax positions taken for all open federal income tax years (December 31, 2012–2015), and has concluded that no provision for federal income tax is required in the fund’s financial statements.
5. Distributions: Distributions to shareholders are recorded on the ex-dividend date.
6. Securities Lending: To earn additional income, the fund lends its securities to qualified institutional borrowers. Security loans are subject to termination by the fund at any time and are required to be secured at all times by collateral in an amount at least equal to the market value of securities loaned. Daily market fluctuations could cause the value of loaned securities to be more or less than the value of the collateral received. When this occurs, the collateral is adjusted and settled on the next business day. The fund further mitigates its counterparty risk by entering into securities lending transactions only with a diverse group of prequalified counterparties, monitoring their financial strength, and entering into master securities lending agreements with its counterparties. The master securities lending agreements provide that, in the event of a counterparty’s default (including bankruptcy), the fund may terminate any loans with that borrower, determine the net amount owed, and sell or retain the collateral up to the net amount owed to the fund; however, such actions may be subject to legal proceedings. While collateral mitigates counterparty risk, in the absence of a default the fund may experience delays and costs in recovering the securities loaned. The fund invests cash collateral received in Vanguard Market Liquidity Fund, and records a liability in the Statement of Net Assets for the return of the collateral, during the period the securities are on loan. Securities lending income represents fees charged to borrowers plus income earned on invested cash collateral, less expenses associated with the loan.
7. Credit Facility: The fund and certain other funds managed by The Vanguard Group (“Vanguard”) participate in a $3 billion committed credit facility provided by a syndicate of lenders pursuant to a credit agreement that may be renewed annually; each fund is individually liable for its borrowings, if any, under the credit facility. Borrowings may be utilized for temporary and emergency purposes, and are subject to the fund’s regulatory and contractual borrowing restrictions. The participating funds are charged administrative fees and an annual commitment fee of 0.06% of the undrawn amount of the facility; these fees are allocated to the funds based on a method approved by the fund’s board of trustees and included in Management and Administrative expenses on the fund’s Statement of Operations. Any borrowings under this facility bear interest at a rate equal to the higher of the federal funds rate or LIBOR reference rate plus an agreed-upon spread.
The fund had no borrowings outstanding at December 31, 2015, or at any time during the period then ended.
8. Other: Dividend income is recorded on the ex-dividend date. Interest income includes income distributions received from Vanguard Market Liquidity Fund and is accrued daily. Premiums and discounts on debt securities purchased are amortized and accreted, respectively, to interest income over the lives of the respective securities. Security transactions are accounted for on the date securities are bought or sold. Costs used to determine realized gains (losses) on the sale of investment securities are those of the specific securities sold.
28
Developed Markets Index Fund
Each class of shares has equal rights as to assets and earnings, except that each class separately bears certain class-specific expenses related to maintenance of shareholder accounts (included in Management and Administrative expenses) and shareholder reporting. Marketing and distribution expenses are allocated to each class of shares based on a method approved by the board of trustees. Income, other non-class-specific expenses, and gains and losses on investments are allocated to each class of shares based on its relative net assets.
B. In accordance with the terms of a Funds’ Service Agreement (the “FSA”) between Vanguard and the fund, Vanguard furnishes to the fund investment advisory, corporate management, administrative, marketing, and distribution services at Vanguard’s cost of operations (as defined by the FSA). These costs of operations are allocated to the fund based on methods and guidelines approved by the board of trustees. Vanguard does not require reimbursement in the current period for certain costs of operations (such as deferred compensation/benefits and risk/insurance costs); the fund’s liability for these costs of operations is included in Payables to Vanguard on the Statement of Net Assets.
Upon the request of Vanguard, the fund may invest up to 0.40% of its net assets as capital in Vanguard. At December 31, 2015, the fund had contributed to Vanguard capital in the amount of $4,683,000, representing 0.01% of the fund’s net assets and 1.87% of Vanguard’s capitalization. The fund’s trustees and officers are also directors and employees, respectively, of Vanguard.
C. Various inputs may be used to determine the value of the fund’s investments. These inputs are summarized in three broad levels for financial statement purposes. The inputs or methodologies used to value securities are not necessarily an indication of the risk associated with investing in those securities.
Level 1—Quoted prices in active markets for identical securities.
Level 2—Other significant observable inputs (including quoted prices for similar securities, interest rates, prepayment speeds, credit risk, etc.).
Level 3—Significant unobservable inputs (including the fund’s own assumptions used to determine the fair value of investments).
The following table summarizes the market value of the fund’s investments as of December 31, 2015, based on the inputs used to value them:
| | | |
| | Level 1 | Level 2 | Level 3 |
| Investments | ($000) | ($000) | ($000) |
| Common Stocks | 719,227 | 52,319,152 | — |
| Temporary Cash Investments | 840,519 | 99,460 | — |
| Futures Contracts—Liabilities1 | (1,830) | — | — |
| Forward Currency Contracts—Assets | — | 12,174 | — |
| Forward Currency Contracts—Liabilities | — | (18,533) | — |
| Total | 1,557,916 | 52,412,253 | — |
| 1 Represents variation margin on the last day of the reporting period. |
29
Developed Markets Index Fund
D. At December 31, 2015, the fair values of derivatives were reflected in the Statement of Net Assets as follows:
| | | |
| | | Foreign | |
| | Equity | Exchange | |
| | Contracts | Contracts | Total |
| Statement of Net Assets Caption | ($000) | ($000) | ($000) |
| Other Assets | — | 12,174 | 12,174 |
| Other Liabilities | (1,830) | (18,533) | (20,363) |
Realized net gain (loss) and the change in unrealized appreciation (depreciation) on derivatives for the year ended December 31, 2015, were:
| | | |
| | | Foreign | |
| | Equity | Exchange | |
| | Contracts | Contracts | Total |
| Realized Net Gain (Loss) on Derivatives | ($000) | ($000) | ($000) |
| Futures Contracts | (9,667) | — | (9,667) |
| Forward Currency Contracts | — | (12,507) | (12,507) |
| Realized Net Gain (Loss) on Derivatives | (9,667) | (12,507) | (22,174) |
| |
| Change in Unrealized Appreciation (Depreciation) on Derivatives | | | |
| Futures Contracts | 2,600 | — | 2,600 |
| Forward Currency Contracts | — | (2,364) | (2,364) |
| Change in Unrealized Appreciation (Depreciation) on Derivatives | 2,600 | (2,364) | 236 |
At December 31, 2015, the aggregate settlement value of open futures contracts and the related unrealized appreciation (depreciation) were:
| | | | |
| | | | ($000) |
| | | | Aggregate | |
| | | Number of | Settlement | Unrealized |
| | | Long (Short) | Value | Appreciation |
| Futures Contracts | Expiration | Contracts | Long (Short) | (Depreciation) |
| Dow Jones EUROSTOXX 50 Index | March 2016 | 4,219 | 150,418 | 2,788 |
| E-mini S&P 500 Index | March 2016 | 1,112 | 113,168 | 15 |
| FTSE 100 Index | March 2016 | 1,057 | 96,560 | 4,490 |
| Topix Index | March 2016 | 685 | 88,120 | (201) |
| S&P ASX 200 Index | March 2016 | 457 | 43,698 | 3,053 |
| | | | | 10,145 |
Unrealized appreciation (depreciation) on open Dow Jones EUROSTOXX 50 Index, E-mini S&P 500 Index, and FTSE 100 Index futures contracts is required to be treated as realized gain (loss) for tax purposes.
30
Developed Markets Index Fund
At December 31, 2015, the fund had open forward currency contracts to receive and deliver currencies as follows. Unrealized appreciation (depreciation) on open forward currency contracts is treated as realized gain (loss) for tax purposes.
| | | | | | |
| | | | | | | Unrealized |
| | Contract | | | | | Appreciation |
| | Settlement | | | Contract Amount (000) | (Depreciation) |
| Counterparty | Date | | Receive | | Deliver | ($000) |
| BNP Paribas | 3/23/2016 | EUR | 319,843 | USD | 353,767 | (5,422) |
| Bank of America, N.A. | 3/23/2016 | GBP | 157,058 | USD | 237,946 | (6,378) |
| Bank of America, N.A. | 3/15/2016 | JPY | 16,983,589 | USD | 138,077 | 3,489 |
| BNP Paribas | 3/15/2016 | JPY | 12,106,543 | USD | 98,456 | 2,457 |
| JPMorgan Chase Bank, N.A. | 3/22/2016 | AUD | 127,847 | USD | 91,310 | 1,473 |
| Goldman Sachs International | 3/23/2016 | EUR | 41,703 | USD | 47,933 | (2,514) |
| Goldman Sachs International | 3/15/2016 | JPY | 5,418,000 | USD | 44,852 | 310 |
| Morgan Stanley Capital Services LLC | 3/22/2016 | AUD | 24,865 | USD | 17,740 | 305 |
| Citibank, N.A. | 3/15/2016 | USD | 153,348 | JPY | 18,630,535 | (1,946) |
| JPMorgan Chase Bank, N.A. | 3/23/2016 | USD | 107,704 | EUR | 99,110 | (237) |
| Citibank, N.A. | 3/23/2016 | USD | 78,928 | GBP | 52,966 | 834 |
| Goldman Sachs International | 3/22/2016 | USD | 69,764 | AUD | 98,252 | (1,540) |
| Credit Suisse International | 3/23/2016 | USD | 47,557 | EUR | 41,703 | 2,137 |
| BNP Paribas | 3/23/2016 | USD | 45,329 | EUR | 41,834 | (233) |
| BNP Paribas | 3/23/2016 | USD | 42,997 | EUR | 39,217 | 285 |
| BNP Paribas | 3/23/2016 | USD | 35,605 | GBP | 23,899 | 369 |
| JPMorgan Chase Bank, N.A. | 3/23/2016 | USD | 26,991 | GBP | 17,993 | 464 |
| BNP Paribas | 3/15/2016 | USD | 20,935 | JPY | 2,534,195 | (189) |
| JPMorgan Chase Bank, N.A. | 3/23/2016 | USD | 6,717 | EUR | 6,139 | 32 |
| JPMorgan Chase Bank, N.A. | 3/15/2016 | USD | 6,627 | JPY | 802,480 | (62) |
| UBS AG | 3/23/2016 | USD | 2,412 | GBP | 1,627 | 13 |
| JPMorgan Chase Bank, N.A. | 3/22/2016 | USD | 891 | AUD | 1,244 | (12) |
| Morgan Stanley Capital Services LLC | 3/23/2016 | USD | 147 | EUR | 129 | 6 |
| | | | | | | (6,359) |
| AUD—Australian dollar. |
| EUR—Euro. |
| GBP—British pound. |
| JPY—Japanese yen. |
| USD—U.S. dollar. |
At December 31, 2015, the counterparty had deposited in segregated accounts securities with a value of $1,888,000 in connection with amounts due to the fund for open forward currency contracts.
31
Developed Markets Index Fund
E. Distributions are determined on a tax basis and may differ from net investment income and realized capital gains for financial reporting purposes. Differences may be permanent or temporary. Permanent differences are reclassified among capital accounts in the financial statements to reflect their tax character. Temporary differences arise when certain items of income, expense, gain, or loss are recognized in different periods for financial statement and tax purposes. These differences will reverse at some time in the future. Differences in classification may also result from the treatment of short-term gains as ordinary income for tax purposes.
During the year ended December 31, 2015, the fund realized net foreign currency losses of $14,837,000, which decreased distributable net income for tax purposes; accordingly, such losses have been reclassified from accumulated net realized losses to overdistributed net investment income. Certain of the fund’s investments are in securities considered to be passive foreign investment companies, for which any unrealized appreciation and/or realized gains are required to be included in distributable net income for tax purposes. During the year ended December 31, 2015, the fund sold passive foreign investment companies with unrealized gains that had been either included in the fund’s current and prior periods’ taxable income, or distributed by the acquired fund prior to merger and included in unrealized appreciation on securities acquired by merger in April 2014 (see Note H). Accordingly, $7,838,000 has been reclassified from accumulated net realized losses to overdistributed net investment income, and $7,673,000 has been reclassified from overdistributed net investment income to paid-in capital. Passive foreign investment companies held at December 31, 2015, had unrealized appreciation of $66,903,000, of which $24,599,000 has been distributed and is reflected in the balance of overdistributed net investment income, and $42,304,000 represents the unrealized appreciation at merger date on lots acquired by merger in April 2014 and still held at December 31, 2015.
During the year ended December 31, 2015, the fund realized $548,502,000 of net capital gains resulting from in-kind redemptions—in which shareholders exchanged fund shares for securities held by the fund rather than for cash. Because such gains are not taxable to the fund, and are not distributed to shareholders, they have been reclassified from accumulated net realized losses to paid-in capital.
For tax purposes, at December 31, 2015, the fund had $16,611,000 of ordinary income available for distribution. The fund used capital loss carryforwards of $28,455,000 to offset taxable capital gains realized during the year ended December 31, 2015. At December 31, 2015, the fund had available capital losses totaling $1,105,283,000 to offset future net capital gains. Of this amount, $781,597,000 is subject to expiration dates; $408,342,000 may be used to offset future net capital gains through December 31, 2016, and $373,255,000 through December 31, 2017. Capital losses of $323,686,000 realized beginning in fiscal 2011 may be carried forward indefinitely under the Regulated Investment Company Modernization Act of 2010, but must be used before any expiring loss carryforwards. Capital loss carryforwards of $820,581,000 expired on December 31, 2015; accordingly, such losses have been reclassified from accumulated net realized losses to paid-in capital.
At December 31, 2015, the cost of investment securities for tax purposes was $53,837,436,000. Net unrealized appreciation of investment securities for tax purposes was $140,922,000, consisting of unrealized gains of $6,799,298,000 on securities that had risen in value since their purchase and $6,658,376,000 in unrealized losses on securities that had fallen in value since their purchase.
F. During the year ended December 31, 2015, the fund purchased $13,052,965,000 of investment securities and sold $2,960,716,000 of investment securities, other than temporary cash investments. Purchases and sales include $5,563,926,000 and $1,312,690,000, respectively, in connection with in-kind purchases and redemptions of the fund’s capital shares.
32
Developed Markets Index Fund
| | | | |
| G. Capital share transactions for each class of shares were: | | | |
| | Year Ended December 31, |
| | 2015 | 2014 |
| | Amount | Shares | Amount | Shares |
| | ($000) | (000) | ($000) | (000) |
| Investor Shares | | | | |
| Issued | 268,560 | 27,677 | 230,538 | 22,845 |
| Issued in Connection with Acquisition of | | | | |
| Vanguard Developed Markets Index Fund1 | — | — | 1,677,834 | 163,039 |
| Issued in Lieu of Cash Distributions | 27,012 | 2,775 | 30,334 | 2,969 |
| Redeemed | (564,458) | (58,066) | (477,996) | (47,556) |
| Net Increase (Decrease)—Investor Shares | (268,886) | (27,614) | 1,460,710 | 141,297 |
| ETF Shares | | | | |
| Issued | 7,251,525 | 184,779 | 7,338,607 | 180,138 |
| Issued in Lieu of Cash Distributions | — | — | — | — |
| Redeemed | (1,053,862) | (26,000) | — | — |
| Net Increase (Decrease)—ETF Shares | 6,197,663 | 158,779 | 7,338,607 | 180,138 |
| Admiral Shares | | | | |
| Issued | 3,752,835 | 302,174 | 2,081,872 | 160,055 |
| Issued in Connection with Acquisition of | | | | |
| Vanguard Developed Markets Index Fund1 | — | — | 3,262,803 | 245,296 |
| Issued in Lieu of Cash Distributions | 169,469 | 13,576 | 139,153 | 10,618 |
| Redeemed | (1,773,849) | (143,937) | (920,623) | (71,618) |
| Net Increase (Decrease) —Admiral Shares | 2,148,455 | 171,813 | 4,563,205 | 344,351 |
| Institutional Shares | | | | |
| Issued | 2,562,273 | 205,112 | 2,221,853 | 171,218 |
| Issued in Connection with Acquisition of | | | | |
| Vanguard Developed Markets Index Fund1 | — | — | 7,326,183 | 550,218 |
| Issued in Lieu of Cash Distributions | 210,738 | 16,858 | 183,800 | 13,958 |
| Redeemed | (2,149,816) | (173,400) | (1,789,823) | (135,930) |
| Net Increase (Decrease) —Institutional Shares | 623,195 | 48,570 | 7,942,013 | 599,464 |
| Institutional Plus Shares2 | | | | |
| Issued | 2,687,702 | 136,253 | 1,913,447 | 92,578 |
| Issued in Connection with Acquisition of | | | | |
| Vanguard Developed Markets Index Fund1 | — | — | 5,176,319 | 248,740 |
| Issued in Lieu of Cash Distributions | 189,239 | 9,680 | 134,325 | 6,537 |
| Redeemed | (1,279,081) | (64,434) | (754,346) | (37,147) |
| Net Increase (Decrease) —Institutional Plus Shares | 1,597,860 | 81,499 | 6,469,745 | 310,708 |
1 Effective April 4, 2014, Vanguard Developed Markets Index Fund merged into Vanguard Tax-Managed International Fund, and the combined fund was renamed Vanguard Developed Markets Index Fund.
2 Inception was April 1, 2014, for Institutional Plus Shares.
33
Developed Markets Index Fund
H. On April 4, 2014, the Vanguard Tax-Managed International Fund acquired all of the net assets of Vanguard Developed Markets Index Fund pursuant to a plan of reorganization approved by the funds’ board of trustees on September 26, 2013. The purpose of the transaction was to combine two funds with similar investment strategies. The acquisition was accomplished by a tax-free exchange of 1,207,293,000 shares of Vanguard Tax-Managed International Fund for the 930,508,000 shares of Vanguard Developed Markets Index Fund outstanding on April 4, 2014. Each class of shares of Vanguard Developed Markets Index Fund was exchanged for the like class of shares of Vanguard Tax-Managed International Fund. Vanguard Developed Markets Index Fund’s net assets of $17,443,139,000, including $3,320,421,000 of unrealized appreciation, were combined with Vanguard Tax-Managed International Fund’s net assets of $24,394,239,000, resulting in combined net assets of $41,837,378,000 on April 4, 2014. Immediately following the merger, Vanguard Tax-Managed International Fund was renamed Vanguard Developed Markets Index Fund.
I. Management has determined that no material events or transactions occurred subsequent to December 31, 2015, that would require recognition or disclosure in these financial statements.
34
Report of Independent Registered
Public Accounting Firm
To the Board of Trustees of Vanguard Tax-Managed Funds and the Shareholders of Vanguard Developed Markets Index Fund: In our opinion, the accompanying statement of net assets—investments summary and the related statements of operations and of changes in net assets and the financial highlights present fairly, in all material respects, the financial position of Vanguard Developed Markets Index Fund (constituting a separate portfolio of Vanguard Tax-Managed Funds, hereafter referred to as the “Fund”) at December 31, 2015, the results of its operations for the year then ended, the changes in its net assets for each of the two years in the period then ended, and the financial highlights for each of the periods indicated, in conformity with accounting principles generally accepted in the United States of America. These financial statements and financial highlights (hereafter referred to as “financial statements”) are the responsibility of the Fund’s management. Our responsibility is to express an opinion on these financial statements based on our audits. We conducted our audits of these financial statements in accordance with the standards of the Public Company Accounting Oversight Board (United States). Those standards require that we plan and perform the audit to obtain reasonable assurance about whether the financial statements are free of material misstatement. An audit includes examining, on a test basis, evidence supporting the amounts and disclosures in the financial statements, assessing the accounting principles used and significant estimates made by management, and evaluating the overall financial statement presentation.
We believe that our audits, which included confirmation of securities at December 31, 2015 by correspondence with the custodian and brokers, by agreement to the underlying ownership records of the transfer agent and the application of alternative auditing procedures where securities purchased had not been received, provide a reasonable basis for our opinion.
/s/PricewaterhouseCoopers LLP
Philadelphia, Pennsylvania
February 16, 2016
Special 2015 tax information (unaudited) for Vanguard Developed Markets Index Fund
This information for the fiscal year ended December 31, 2015, is included pursuant to provisions
of the Internal Revenue Code.
The fund distributed $1,158,535,000 of qualified dividend income to shareholders during the
fiscal year.
The fund designates to shareholders foreign source income of $1,310,159,000 and foreign taxes paid
of $73,280,000. Shareholders will receive more detailed information with their Form 1099-DIV in
January 2016 to determine the calendar-year amounts to be included on their 2015 tax returns.
35
Your Fund’s After-Tax Returns
This table presents returns for your fund both before and after taxes. The after-tax returns are shown in two ways: (1) assuming that an investor owned the fund during the entire period and paid taxes on the fund’s distributions, and (2) assuming that an investor paid taxes on the fund’s distributions and sold all shares at the end of each period.
Calculations are based on the highest individual federal income tax and capital gains tax rates in effect at the times of the distributions and the hypothetical sales. State and local taxes were not considered. After-tax returns reflect any qualified dividend income. (In the example, returns after the sale of fund shares may be higher than those assuming no sale. This occurs when the sale would have produced a capital loss. The calculation assumes that the investor received a tax deduction for the loss.) The table shows returns for one share class only; returns for other share classes will differ. Please note that your actual after-tax returns will depend on your tax situation and may differ from those shown. Also note that if you own the fund in a tax-deferred account, such as an individual retirement account or a 401(k) plan, this information does not apply to you. Such accounts are not subject to current taxes.
Finally, keep in mind that a fund’s performance—whether before or after taxes—does not guarantee future results.
| | | |
| Average Annual Total Returns: FTSE Developed Markets ETF Shares | | |
| Periods Ended December 31, 2015 | | | |
| |
| | | | Since |
| | One | Five | Inception |
| | Year | Years | (7/20/2007) |
| Returns Before Taxes | -0.21% | 3.57% | -0.55% |
| Returns After Taxes on Distributions | -0.88 | 2.99 | -0.98 |
| Returns After Taxes on Distributions and Sale of Fund Shares | 0.44 | 2.90 | -0.22 |
36
About Your Fund’s Expenses
As a shareholder of the fund, you incur ongoing costs, which include costs for portfolio management, administrative services, and shareholder reports (like this one), among others. Operating expenses, which are deducted from a fund’s gross income, directly reduce the investment return of the fund.
A fund’s expenses are expressed as a percentage of its average net assets. This figure is known as the expense ratio. The following examples are intended to help you understand the ongoing costs (in dollars) of investing in your fund and to compare these costs with those of other mutual funds. The examples are based on an investment of $1,000 made at the beginning of the period shown and held for the entire period.
The accompanying table illustrates your fund’s costs in two ways:
• Based on actual fund return. This section helps you to estimate the actual expenses that you paid over the period. The ”Ending Account Value“ shown is derived from the fund‘s actual return, and the third column shows the dollar amount that would have been paid by an investor who started with $1,000 in the fund. You may use the information here, together with the amount you invested, to estimate the expenses that you paid over the period.
To do so, simply divide your account value by $1,000 (for example, an $8,600 account value divided by $1,000 = 8.6), then multiply the result by the number given for your fund under the heading ”Expenses Paid During Period.“
• Based on hypothetical 5% yearly return. This section is intended to help you compare your fund‘s costs with those of other mutual funds. It assumes that the fund had a yearly return of 5% before expenses, but that the expense ratio is unchanged. In this case—because the return used is not the fund’s actual return—the results do not apply to your investment. The example is useful in making comparisons because the Securities and Exchange Commission requires all mutual funds to calculate expenses based on a 5% return. You can assess your fund’s costs by comparing this hypothetical example with the hypothetical examples that appear in shareholder reports of other funds.
Note that the expenses shown in the table are meant to highlight and help you compare ongoing costs only and do not reflect transaction costs incurred by the fund for buying and selling securities. Further, the expenses do not include any purchase, redemption, or account service fees described in the fund prospectus. If such fees were applied to your account, your costs would be higher. Your fund does not carry a “sales load.”
The calculations assume no shares were bought or sold during the period. Your actual costs may have been higher or lower, depending on the amount of your investment and the timing of any purchases or redemptions.
You can find more information about the fund’s expenses, including annual expense ratios, in the Financial Statements section of this report. For additional information on operating expenses and other shareholder costs, please refer to your fund’s current prospectus.
37
| | | |
| Six Months Ended December 31, 2015 | | | |
| | Beginning | Ending | Expenses |
| | Account Value | Account Value | Paid During |
| Developed Markets Index Fund | 6/30/2015 | 12/31/2015 | Period |
| Based on Actual Fund Return | | | |
| Investor Shares | $1,000.00 | $935.29 | $0.98 |
| FTSE Developed Markets ETF Shares | 1,000.00 | 935.87 | 0.44 |
| Admiral Shares | 1,000.00 | 936.10 | 0.44 |
| Institutional Shares | 1,000.00 | 936.23 | 0.34 |
| Institutional Plus Shares | 1,000.00 | 935.84 | 0.29 |
| Based on Hypothetical 5% Yearly Return | | | |
| Investor Shares | $1,000.00 | $1,024.20 | $1.02 |
| FTSE Developed Markets ETF Shares | 1,000.00 | 1,024.75 | 0.46 |
| Admiral Shares | 1,000.00 | 1,024.75 | 0.46 |
| Institutional Shares | 1,000.00 | 1,024.85 | 0.36 |
| Institutional Plus Shares | 1,000.00 | 1,024.90 | 0.31 |
The calculations are based on expenses incurred in the most recent six-month period. The fund’s annualized six-month expense ratios for that
period are 0.20% for Investor Shares, 0.09% for FTSE Developed Markets ETF Shares, 0.09% for Admiral Shares, 0.07% for Institutional
Shares, and 0.06% for Institutional Plus Shares. The dollar amounts shown as “Expenses Paid” are equal to the annualized expense ratio
multiplied by the average account value over the period, multiplied by the number of days in the most recent six-month period, then divided
by the number of days in the most recent 12-month period (184/365).
38
Glossary
Beta. A measure of the magnitude of a fund’s past share-price fluctuations in relation to the ups and downs of a given market index. The index is assigned a beta of 1.00. Compared with a given index, a fund with a beta of 1.20 typically would have seen its share price rise or fall by 12% when the index rose or fell by 10%. For this report, beta is based on returns over the past 36 months for both the fund and the index. Note that a fund’s beta should be reviewed in conjunction with its R-squared (see definition). The lower the R-squared, the less correlation there is between the fund and the index, and the less reliable beta is as an indicator of volatility.
Dividend Yield. Dividend income earned by stocks, expressed as a percentage of the aggregate market value (or of net asset value, for a fund). The yield is determined by dividing the amount of the annual dividends by the aggregate value (or net asset value) at the end of the period. For a fund, the dividend yield is based solely on stock holdings and does not include any income produced by other investments.
Earnings Growth Rate. The average annual rate of growth in earnings over the past five years for the stocks now in a fund.
Equity Exposure. A measure that reflects a fund’s investments in stocks and stock futures. Any holdings in short-term reserves are excluded.
Expense Ratio. A fund’s total annual operating expenses expressed as a percentage of the fund’s average net assets. The expense ratio includes management and administrative expenses, but does not include the transaction costs of buying and selling portfolio securities.
Inception Date. The date on which the assets of a fund (or one of its share classes) are first invested in accordance with the fund’s investment objective. For funds with a subscription period, the inception date is the day after that period ends. Investment performance is measured from the inception date.
Median Market Cap. An indicator of the size of companies in which a fund invests; the midpoint of market capitalization (market price x shares outstanding) of a fund’s stocks, weighted by the proportion of the fund’s assets invested in each stock. Stocks representing half of the fund’s assets have market capitalizations above the median, and the rest are below it.
Price/Book Ratio. The share price of a stock divided by its net worth, or book value, per share. For a fund, the weighted average price/book ratio of the stocks it holds.
Price/Earnings Ratio. The ratio of a stock’s current price to its per-share earnings over the past year. For a fund, the weighted average P/E of the stocks it holds. P/E is an indicator of market expectations about corporate prospects; the higher the P/E, the greater the expectations for a company’s future growth.
R-Squared. A measure of how much of a fund’s past returns can be explained by the returns from the market in general, as measured by a given index. If a fund’s total returns were precisely synchronized with an index’s returns, its R-squared would be 1.00. If the fund’s returns bore no relationship to the index’s returns, its R-squared would be 0. For this report, R-squared is based on returns over the past 36 months for both the fund and the index.
39
Return on Equity. The annual average rate of return generated by a company during the past five years for each dollar of shareholder’s equity (net income divided by shareholder’s equity). For a fund, the weighted average return on equity for the companies whose stocks it holds.
Short-Term Reserves. The percentage of a fund invested in highly liquid, short-term securities that can be readily converted to cash.
Turnover Rate. An indication of the fund’s trading activity. Funds with high turnover rates incur higher transaction costs and may be more likely to distribute capital gains (which may be taxable to investors). The turnover rate excludes in-kind transactions, which have minimal impact on costs.
Benchmark Information
Spliced Developed ex US Index: MSCI EAFE Index through May 28, 2013; FTSE Developed ex
North America Index through December 20, 2015; FTSE Developed All Cap ex US Transition Index
thereafter. Benchmark returns are adjusted for withholding taxes.
40
This page intentionally left blank.
This page intentionally left blank.
This page intentionally left blank.
The People Who Govern Your Fund
The trustees of your mutual fund are there to see that the fund is operated and managed in your best interests since, as a shareholder, you are a part owner of the fund. Your fund’s trustees also serve on the board of directors of The Vanguard Group, Inc., which is owned by the Vanguard funds and provides services to them on an at-cost basis.
A majority of Vanguard’s board members are independent, meaning that they have no affiliation with Vanguard or the funds they oversee, apart from the sizable personal investments they have made as private individuals. The independent board members have distinguished backgrounds in business, academia, and public service. Each of the trustees and executive officers oversees 194 Vanguard funds.
The following table provides information for each trustee and executive officer of the fund. More information about the trustees is in the Statement of Additional Information, which can be obtained, without charge, by contacting Vanguard at 800-662-7447, or online at vanguard.com.
| |
| InterestedTrustee1 | Rajiv L. Gupta |
| | Born 1945. Trustee Since December 2001.2 Principal |
| F. William McNabb III | Occupation(s) During the Past Five Years and Other |
| Born 1957. Trustee Since July 2009. Chairman of | Experience: Chairman and Chief Executive Officer |
| the Board. Principal Occupation(s) During the Past | (retired 2009) and President (2006–2008) of |
| Five Years and Other Experience: Chairman of the | Rohm and Haas Co. (chemicals); Director of Tyco |
| Board of The Vanguard Group, Inc., and of each of | International PLC (diversified manufacturing and |
| the investment companies served by The Vanguard | services), Hewlett-Packard Co. (electronic computer |
| Group, since January 2010; Director of The Vanguard | manufacturing), and Delphi Automotive PLC |
| Group since 2008; Chief Executive Officer and | (automotive components); Senior Advisor at New |
| President of The Vanguard Group, and of each of | Mountain Capital. |
| the investment companies served by The Vanguard | |
| Group, since 2008; Director of Vanguard Marketing | Amy Gutmann |
| Corporation; Managing Director of The Vanguard | Born 1949. Trustee Since June 2006. Principal |
| Group (1995–2008). | Occupation(s) During the Past Five Years and |
| | Other Experience: President of the University of |
| IndependentTrustees | Pennsylvania; Christopher H. Browne Distinguished |
| | Professor of Political Science, School of Arts and |
| Emerson U. Fullwood | Sciences, and Professor of Communication, Annenberg |
| Born 1948. Trustee Since January 2008. Principal | School for Communication, with secondary faculty |
| Occupation(s) During the Past Five Years and | appointments in the Department of Philosophy, School |
| Other Experience: Executive Chief Staff and | of Arts and Sciences, and at the Graduate School of |
| Marketing Officer for North America and Corporate | Education, University of Pennsylvania; Trustee of the |
| Vice President (retired 2008) of Xerox Corporation | National Constitution Center; Chair of the Presidential |
| (document management products and services); | Commission for the Study of Bioethical Issues. |
| Executive in Residence and 2009–2010 Distinguished | |
| Minett Professor at the Rochester Institute of | JoAnn Heffernan Heisen |
| Technology; Director of SPX Corporation (multi-industry | Born 1950. Trustee Since July 1998. Principal |
| manufacturing), the United Way of Rochester, the | Occupation(s) During the Past Five Years and |
| University of Rochester Medical Center, Monroe | Other Experience: Corporate Vice President and |
| Community College Foundation, and North Carolina | Chief Global Diversity Officer (retired 2008) and |
| A&T University. | Member of the Executive Committee (1997–2008) |
| | of Johnson & Johnson (pharmaceuticals/medical |
| | devices/consumer products); Director of Skytop |
| | Lodge Corporation (hotels) and the Robert Wood |
| | Johnson Foundation; Member of the Advisory |
| | Board of the Institute for Women’s Leadership |
| | at Rutgers University. |
| | |
| F. Joseph Loughrey | Executive Officers | |
| Born 1949. Trustee Since October 2009. Principal | | |
| Occupation(s) During the Past Five Years and Other | Glenn Booraem | |
| Experience: President and Chief Operating Officer | Born 1967. Treasurer Since May 2015. Principal |
| (retired 2009) of Cummins Inc. (industrial machinery); | Occupation(s) During the Past Five Years and |
| Chairman of the Board of Hillenbrand, Inc. (specialized | Other Experience: Principal of The Vanguard Group, |
| consumer services), and of Oxfam America; Director | Inc.; Treasurer of each of the investment companies |
| of SKF AB (industrial machinery), Hyster-Yale Materials | served by The Vanguard Group; Controller of each of |
| Handling, Inc. (forklift trucks), the Lumina Foundation | the investment companies served by The Vanguard |
| for Education, and the V Foundation for Cancer | Group (2010–2015); Assistant Controller of each of |
| Research; Member of the Advisory Council for the | the investment companies served by The Vanguard |
| College of Arts and Letters and of the Advisory Board | Group (2001–2010). | |
| to the Kellogg Institute for International Studies, both | | |
| at the University of Notre Dame. | Thomas J. Higgins | |
| Born 1957. Chief Financial Officer Since September |
| Mark Loughridge | 2008. Principal Occupation(s) During the Past Five |
| Born 1953. Trustee Since March 2012. Principal | Years and Other Experience: Principal of The Vanguard |
| Occupation(s) During the Past Five Years and Other | Group, Inc.; Chief Financial Officer of each of the |
| Experience: Senior Vice President and Chief Financial | investment companies served by The Vanguard Group; |
| Officer (retired 2013) at IBM (information technology | Treasurer of each of the investment companies served |
| services); Fiduciary Member of IBM’s Retirement Plan | by The Vanguard Group (1998–2008). |
| Committee (2004–2013); Director of the Dow Chemical | | |
| Company; Member of the Council on Chicago Booth. | Peter Mahoney | |
| Born 1974. Controller Since May 2015. Principal |
| Scott C. Malpass | Occupation(s) During the Past Five Years and |
| Born 1962. Trustee Since March 2012. Principal | Other Experience: Head of Global Fund Accounting |
| Occupation(s) During the Past Five Years and Other | at The Vanguard Group, Inc.; Controller of each of the |
| Experience: Chief Investment Officer and Vice | investment companies served by The Vanguard Group; |
| President at the University of Notre Dame; Assistant | Head of International Fund Services at The Vanguard |
| Professor of Finance at the Mendoza College of | Group (2008–2014). | |
| Business at Notre Dame; Member of the Notre Dame | | |
| 403(b) Investment Committee; Board Member of | Heidi Stam | |
| TIFF Advisory Services, Inc., and Catholic Investment | Born 1956. Secretary Since July 2005. Principal |
| Services, Inc. (investment advisors); Member of | Occupation(s) During the Past Five Years and Other |
| the Investment Advisory Committee of Major | Experience: Managing Director of The Vanguard |
| League Baseball. | Group, Inc.; General Counsel of The Vanguard Group; |
| Secretary of The Vanguard Group and of each of the |
| André F. Perold | investment companies served by The Vanguard Group; |
| Born 1952. Trustee Since December 2004. Principal | Director and Senior Vice President of Vanguard |
| Occupation(s) During the Past Five Years and Other | Marketing Corporation. | |
| Experience: George Gund Professor of Finance and | | |
| Banking, Emeritus at the Harvard Business School | Vanguard Senior ManagementTeam |
| (retired 2011); Chief Investment Officer and Managing | Mortimer J. Buckley | Chris D. McIsaac |
| Partner of HighVista Strategies LLC (private investment | Kathleen C. Gubanich | James M. Norris |
| firm); Director of Rand Merchant Bank; Overseer of | Paul A. Heller | Thomas M. Rampulla |
| the Museum of Fine Arts Boston. | Martha G. King | Glenn W. Reed |
| John T. Marcante | Karin A. Risi |
| Peter F. Volanakis | | |
| Born 1955. Trustee Since July 2009. Principal | | |
| Occupation(s) During the Past Five Years and Other | Chairman Emeritus and Senior Advisor |
| Experience: President and Chief Operating Officer | John J. Brennan | |
| (retired 2010) of Corning Incorporated (communications | Chairman, 1996–2009 | |
| equipment); Trustee of Colby-Sawyer College; | Chief Executive Officer and President, 1996–2008 |
| Member of the Advisory Board of the Norris Cotton | | |
| Cancer Center and of the Advisory Board of the | | |
| Parthenon Group (strategy consulting). | Founder | |
| | John C. Bogle | |
| | Chairman and Chief Executive Officer, 1974–1996 |
1 Mr. McNabb is considered an “interested person,” as defined in the Investment Company Act of 1940, because he is an officer of the Vanguard funds.
2 December 2002 for Vanguard Equity Income Fund, the Vanguard Municipal Bond Funds, and the Vanguard State Tax-Exempt Funds.
|  |
| | P.O. Box 2600 |
| | Valley Forge, PA 19482-2600 |
| |
| |
| |
| Connect with Vanguard® > vanguard.com |
| |
| |
| |
| Fund Information > 800-662-7447 | |
| |
| Direct Investor Account Services > 800-662-2739 | London Stock Exchange Group companies include FTSE |
| Institutional Investor Services > 800-523-1036 | International Limited (”FTSE”), Frank Russell Company |
| | (”Russell”), MTS Next Limited (”MTS”), and FTSE TMX |
| Text Telephone for People | Global Debt Capital Markets Inc. (”FTSE TMX”). All |
| Who Are Deaf or Hard of Hearing> 800-749-7273 | rights reserved. ”FTSE®”, ”Russell®”, ”MTS®”, ”FTSE |
| This material may be used in conjunction | TMX®” and ”FTSE Russell” and other service marks |
| | and trademarks related to the FTSE or Russell indexes |
| with the offering of shares of any Vanguard | are trademarks of the London Stock Exchange Group |
| fund only if preceded or accompanied by | companies and are used by FTSE, MTS, FTSE TMX and |
| the fund’s current prospectus. | Russell under licence. All information is provided for |
| | information purposes only. No responsibility or liability |
| All comparative mutual fund data are from Lipper, a | can be accepted by the London Stock Exchange Group |
| Thomson Reuters Company, or Morningstar, Inc., unless | companies nor its licensors for any errors or for any |
| otherwise noted. | loss from use of this publication. Neither the London |
| You can obtain a free copy of Vanguard’s proxy voting | Stock Exchange Group companies nor any of its |
| guidelines by visiting vanguard.com/proxyreporting or by | licensors make any claim, prediction, warranty or |
| calling Vanguard at 800-662-2739. The guidelines are | representation whatsoever, expressly or impliedly, |
| also available from the SEC’s website, sec.gov. In | either as to the results to be obtained from the use of |
| addition, you may obtain a free report on how your fund | the FTSE Indexes or the fitness or suitability of the |
| voted the proxies for securities it owned during the 12 | Indexes for any particular purpose to which they might |
| months ended June 30. To get the report, visit either | be put. |
| vanguard.com/proxyreporting or sec.gov. | The Industry Classification Benchmark (”ICB”) is owned |
| You can review and copy information about your fund at | by FTSE. FTSE does not accept any liability to any |
| the SEC’s Public Reference Room in Washington, D.C. To | person for any loss or damage arising out of any error |
| find out more about this public service, call the SEC at | or omission in the ICB. |
| 202-551-8090. Information about your fund is also | |
| available on the SEC’s website, and you can receive | |
| copies of this information, for a fee, by sending a | |
| request in either of two ways: via email addressed to | |
| publicinfo@sec.gov or via regular mail addressed to the | |
| Public Reference Section, Securities and Exchange | |
| Commission, Washington, DC 20549-1520. | |
| |
| | © 2016 The Vanguard Group, Inc. |
| | All rights reserved. |
| | Vanguard Marketing Corporation, Distributor. |
| |
| | Q1270 022016 |
Item 2: Code of Ethics. The Registrant has adopted a code of ethics that applies to the Registrant’s principal executive officer, principal financial officer, principal accounting officer or controller or persons performing similar functions. The Code of Ethics was amended during the reporting period covered by this report to make certain technical, non-material changes.
Item 3: Audit Committee Financial Expert. The following members of the Audit Committee have been determined by the Registrant’s Board of Trustees to be Audit Committee Financial Experts serving on its Audit Committee, and to be independent: Rajiv L. Gupta, Amy Gutmann, JoAnn Heffernan Heisen, F. Joseph Loughrey, Mark Loughridge, Scott C. Malpass, and André F. Perold.
Item 4: Principal Accountant Fees and Services.
(a) Audit Fees.
Audit Fees of the Registrant
Fiscal Year Ended December 31, 2015: $154,000
Fiscal Year Ended December 31, 2014: $148,000
Aggregate Audit Fees of Registered Investment Companies in the Vanguard Group.
Fiscal Year Ended December 31, 2015: $7,000,200
Fiscal Year Ended December 31, 2014: $6,605,127
Includes fees billed in connection with audits of the Registrant, other registered investment companies in the Vanguard complex, The Vanguard Group, Inc. and Vanguard Marketing Corporation.
(b) Audit-Related Fees.
Fiscal Year Ended December 31, 2015: $2,899,096
Fiscal Year Ended December 31, 2014: $2,176,479
Includes fees billed in connection with assurance and related services provided to the Registrant, other registered investment companies in the Vanguard complex, The Vanguard Group, Inc., and Vanguard Marketing Corporation.
(c) Tax Fees.
Fiscal Year Ended December 31, 2015: $353,389
Fiscal Year Ended December 31, 2014: $316,869
Includes fees billed in connection with tax compliance, planning, and advice services provided to the Registrant, other registered investment companies in the Vanguard complex, The Vanguard Group, Inc., and Vanguard Marketing Corporation.
(d) All Other Fees.
Fiscal Year Ended December 31, 2015: $202,313
Fiscal Year Ended December 31, 2014: $198,163
Includes fees billed for services related to tax reported information provided to the Registrant, other registered investment companies in the Vanguard complex, The Vanguard Group, Inc., and Vanguard Marketing Corporation.
(e) (1) Pre-Approval Policies. The policy of the Registrant’s Audit Committee is to consider and, if appropriate, approve before the principal accountant is engaged for such services, all specific audit and non-audit services provided to: the Registrant, other registered investment companies in the Vanguard complex, The Vanguard Group, Inc., and entities controlled by The Vanguard Group, Inc. that provide ongoing services to the Registrant. In making a determination, the Audit Committee considers whether the services are consistent with maintaining the principal accountant’s independence.
In the event of a contingency situation in which the principal accountant is needed to provide services in between scheduled Audit Committee meetings, the Chairman of the Audit Committee would be called on to consider and, if appropriate, pre-approve audit or permitted non-audit services in an amount sufficient to complete services through the next Audit Committee meeting, and to determine if such services would be consistent with maintaining the accountant’s independence. At the next scheduled Audit Committee meeting, services and fees would be presented to the Audit Committee for formal consideration, and, if appropriate, approval by the entire Audit Committee. The Audit Committee would again consider whether such services and fees are consistent with maintaining the principal accountant’s independence.
The Registrant’s Audit Committee is informed at least annually of all audit and non-audit services provided by the principal accountant to the Vanguard complex, whether such services are provided to: the Registrant, other registered investment companies in the Vanguard complex, The Vanguard Group, Inc., or other entities controlled by The Vanguard Group, Inc. that provide ongoing services to the Registrant.
(2) No percentage of the principal accountant’s fees or services were approved pursuant to the waiver provision of paragraph (c)(7)(i)(C) of Rule 2-01 of Regulation S-X.
(f) For the most recent fiscal year, over 50% of the hours worked under the principal accountant’s engagement were not performed by persons other than full-time, permanent employees of the principal accountant.
(g) Aggregate Non-Audit Fees.
Fiscal Year Ended December 31, 2015: $555,702
Fiscal Year Ended December 31, 2014: $515,032
Includes fees billed for non-audit services provided to the Registrant, other registered investment companies in the Vanguard complex, The Vanguard Group, Inc., and Vanguard Marketing Corporation.
(h) For the most recent fiscal year, the Audit Committee has determined that the provision of all non-audit services was consistent with maintaining the principal accountant’s independence.
Item 5: Audit Committee of Listed Registrants.
The Registrant is a listed issuer as defined in rule 10A-3 under the Securities Exchange Act of 1934 (“Exchange Act”). The Registrant has a separately-designated standing audit committee established in accordance with Section 3(a)(58)(A) of the Exchange Act. The Registrant’s audit committee members are: Emerson U. Fullwood, Rajiv L. Gupta, Amy Gutmann, JoAnn Heffernan Heisen, F. Joseph Loughrey, Mark Loughridge, Scott C. Malpass, André F. Perold, and Peter F. Volanakis.
Item 6: Investments.
| | |
| Vanguard® Developed Markets Index Fund | | |
| Schedule of Investments | | |
| December 31, 2015 | | |
| |
| | | Market |
| | | Value |
| | Shares | ($000) |
| |
| Common Stocks (99.0%)1 | | |
| Australia (6.4%) | | |
| Commonwealth Bank of Australia | 6,596,351 | 407,818 |
| Westpac Banking Corp. | 13,001,150 | 315,147 |
| Australia & New Zealand Banking Group Ltd. | 11,254,253 | 227,110 |
| National Australia Bank Ltd. | 10,158,845 | 221,686 |
| BHP Billiton Ltd. | 12,457,084 | 160,318 |
| CSL Ltd. | 1,821,281 | 138,855 |
| Wesfarmers Ltd. | 4,324,175 | 130,366 |
| Woolworths Ltd. | 4,917,582 | 87,251 |
| Macquarie Group Ltd. | 1,185,787 | 70,938 |
| Telstra Corp. Ltd. | 16,699,159 | 67,861 |
| Scentre Group | 19,955,077 | 60,527 |
| Woodside Petroleum Ltd. | 2,789,253 | 58,112 |
| Transurban Group | 7,416,496 | 56,217 |
| Rio Tinto Ltd. | 1,650,828 | 53,387 |
| Westfield Corp. | 7,487,807 | 51,516 |
| Brambles Ltd. | 6,023,367 | 50,445 |
| QBE Insurance Group Ltd. | 5,300,121 | 48,206 |
| AMP Ltd. | 11,290,838 | 47,574 |
| Amcor Ltd. | 4,583,329 | 44,528 |
| Suncorp Group Ltd. | 4,989,130 | 43,805 |
| Insurance Australia Group Ltd. | 9,458,001 | 37,984 |
| AGL Energy Ltd. | 2,634,472 | 34,473 |
| Goodman Group | 6,817,858 | 30,895 |
| Caltex Australia Ltd. | 1,046,329 | 28,600 |
| * Newcrest Mining Ltd. | 2,978,000 | 28,179 |
| Vicinity Centres | 13,844,315 | 28,086 |
| APA Group | 4,328,848 | 27,239 |
| Stockland | 9,126,376 | 27,092 |
| Aurizon Holdings Ltd. | 7,947,808 | 25,231 |
| Ramsay Health Care Ltd. | 505,606 | 24,862 |
| GPT Group | 6,830,075 | 23,654 |
| ASX Ltd. | 754,115 | 23,201 |
| Origin Energy Ltd. | 6,722,110 | 22,739 |
| Asciano Ltd. | 3,545,514 | 22,541 |
| Oil Search Ltd. | 4,552,380 | 22,158 |
| James Hardie Industries plc | 1,719,448 | 21,679 |
| LendLease Group | 2,017,946 | 20,820 |
| Mirvac Group | 14,437,439 | 20,668 |
| Dexus Property Group | 3,766,050 | 20,428 |
| Sonic Healthcare Ltd. | 1,574,841 | 20,390 |
| Sydney Airport | 4,248,400 | 19,553 |
| Incitec Pivot Ltd. | 6,595,992 | 18,848 |
| Aristocrat Leisure Ltd. | 2,446,716 | 18,066 |
| Tatts Group Ltd. | 5,621,745 | 17,848 |
| Treasury Wine Estates Ltd. | 2,829,213 | 16,987 |
| Medibank Pvt Ltd. | 10,578,635 | 16,495 |
| Santos Ltd. | 6,142,765 | 16,361 |
| Orica Ltd. | 1,442,797 | 16,165 |
| Computershare Ltd. | 1,909,497 | 16,068 |
| * South32 Ltd. | 20,774,247 | 15,959 |
| Cochlear Ltd. | 222,253 | 15,380 |
| Bendigo & Adelaide Bank Ltd. | 1,748,873 | 15,128 |
| SEEK Ltd. | 1,327,888 | 14,780 |
| Bank of Queensland Ltd. | 1,423,360 | 14,358 |
| Challenger Ltd. | 2,202,838 | 13,883 |
| Coca-Cola Amatil Ltd. | 2,038,860 | 13,748 |
| Crown Resorts Ltd. | 1,480,692 | 13,383 |
| Healthscope Ltd. | 6,832,886 | 13,167 |
| Boral Ltd. | 3,001,686 | 12,834 |
| * Star Entertainment Grp Ltd. | 3,154,818 | 11,576 |
| Qantas Airways Ltd. | 3,884,962 | 11,515 |
1
| | | |
| Vanguard® Developed Markets Index Fund | | |
| Schedule of Investments | | |
| December 31, 2015 | | |
| |
| | | | Market |
| | | | Value |
| | | Shares | ($000) |
| | Tabcorp Holdings Ltd. | 3,184,283 | 10,842 |
| | Ansell Ltd. | 599,270 | 9,287 |
| | TPG Telecom Ltd. | 1,237,736 | 8,862 |
| ^ | Fortescue Metals Group Ltd. | 6,234,679 | 8,390 |
| ^ | REA Group Ltd. | 202,181 | 8,044 |
| | Alumina Ltd. | 9,565,672 | 7,983 |
| | IOOF Holdings Ltd. | 1,151,823 | 7,931 |
| | Orora Ltd. | 4,675,933 | 7,594 |
| | AusNet Services | 6,878,827 | 7,405 |
| | Iluka Resources Ltd. | 1,649,358 | 7,296 |
| | DuluxGroup Ltd. | 1,493,933 | 7,188 |
| | BlueScope Steel Ltd. | 2,238,904 | 7,148 |
| | CIMIC Group Ltd. | 388,903 | 6,822 |
| ^ | Flight Centre Travel Group Ltd. | 215,331 | 6,210 |
| | Fairfax Media Ltd. | 9,318,133 | 6,198 |
| | Harvey Norman Holdings Ltd. | 2,040,264 | 6,168 |
| | Adelaide Brighton Ltd. | 1,749,413 | 6,014 |
| | Recall Holdings Ltd. | 1,195,152 | 6,012 |
| | Perpetual Ltd. | 167,709 | 5,645 |
| | ALS Ltd. | 1,979,872 | 5,388 |
| | Platinum Asset Management Ltd. | 898,261 | 5,249 |
| | Macquarie Atlas Roads Group | 1,614,074 | 4,756 |
| | Downer EDI Ltd. | 1,667,303 | 4,337 |
| | Shopping Centres Australasia Property Group | 2,750,699 | 4,245 |
| *,^ | Metcash Ltd. | 3,597,556 | 4,200 |
| | Nufarm Ltd. | 683,129 | 4,126 |
| | CSR Ltd. | 1,940,689 | 4,051 |
| | Sims Metal Management Ltd. | 653,128 | 3,418 |
| | OZ Minerals Ltd. | 1,165,950 | 3,409 |
| | WorleyParsons Ltd. | 872,882 | 2,928 |
| | DUET Group | 1,276,335 | 2,114 |
| | Seven West Media Ltd. | 3,528,291 | 1,976 |
| | Domino's Pizza Enterprises Ltd. | 33,777 | 1,409 |
| | New Hope Corp. Ltd. | 948,907 | 1,271 |
| *,^ | Whitehaven Coal Ltd. | 2,334,246 | 1,178 |
| | Magellan Financial Group Ltd. | 58,001 | 1,140 |
| | BT Investment Management Ltd. | 111,481 | 1,037 |
| | carsales.com Ltd. | 119,451 | 1,012 |
| | Veda Group Ltd. | 453,805 | 921 |
| | Investa Office Fund | 307,682 | 891 |
| | M2 Group Ltd. | 98,021 | 811 |
| ^ | JB Hi-Fi Ltd. | 54,243 | 768 |
| | Sirtex Medical Ltd. | 25,138 | 728 |
| | Qube Holdings Ltd. | 382,418 | 664 |
| | Northern Star Resources Ltd. | 321,488 | 654 |
| | Super Retail Group Ltd. | 78,201 | 646 |
| | GrainCorp Ltd. Class A | 99,558 | 622 |
| | nib holdings Ltd. | 240,802 | 614 |
| | Charter Hall Group | 184,521 | 606 |
| | BWP Trust | 263,257 | 603 |
| | Vocus Communications Ltd. | 110,283 | 601 |
| | Cromwell Property Group | 787,512 | 600 |
| | Navitas Ltd. | 174,852 | 591 |
| | IRESS Ltd. | 79,539 | 576 |
| | InvoCare Ltd. | 63,999 | 557 |
| | G8 Education Ltd. | 209,378 | 541 |
| | Charter Hall Retail REIT | 176,296 | 533 |
| | Mantra Group Ltd. | 143,989 | 527 |
| | Evolution Mining Ltd. | 498,071 | 506 |
| | Aveo Group | 214,232 | 488 |
| | Nine Entertainment Co. Holdings Ltd. | 346,941 | 478 |
| | Spotless Group Holdings Ltd. | 585,572 | 459 |
| | Primary Health Care Ltd. | 269,067 | 455 |
| | Premier Investments Ltd. | 43,720 | 449 |
2
| | | |
| Vanguard® Developed Markets Index Fund | | |
| Schedule of Investments | | |
| December 31, 2015 | | |
| |
| | | | Market |
| | | | Value |
| | | Shares | ($000) |
| * | Mayne Pharma Group Ltd. | 419,205 | 428 |
| | Automotive Holdings Group Ltd. | 130,107 | 426 |
| | Independence Group NL | 231,290 | 424 |
| | Ardent Leisure Group | 246,348 | 403 |
| | ARB Corp. Ltd. | 33,835 | 395 |
| | Abacus Property Group | 170,095 | 394 |
| | Myer Holdings Ltd. | 444,254 | 384 |
| * | Burson Group Ltd. | 125,228 | 382 |
| | Pact Group Holdings Ltd. | 103,669 | 376 |
| | Sigma Pharmaceuticals Ltd. | 594,081 | 372 |
| | Estia Health Ltd. | 70,239 | 371 |
| | Bega Cheese Ltd. | 68,664 | 369 |
| | Brickworks Ltd. | 32,075 | 367 |
| | Breville Group Ltd. | 66,811 | 361 |
| | Sandfire Resources NL | 84,865 | 344 |
| | Regis Resources Ltd. | 200,989 | 340 |
| | Genworth Mortgage Insurance Australia Ltd. | 169,766 | 338 |
| | SAI Global Ltd. | 108,676 | 330 |
| | FlexiGroup Ltd. | 150,362 | 328 |
| | Transpacific Industries Group Ltd. | 570,263 | 326 |
| | Japara Healthcare Ltd. | 135,579 | 314 |
| | Regis Healthcare Ltd. | 73,947 | 313 |
| *,2 | MYOB Group Ltd. | 131,552 | 311 |
| | iSentia Group Ltd. | 87,443 | 307 |
| | Steadfast Group Ltd. | 264,209 | 299 |
| * | Syrah Resources Ltd. | 105,488 | 297 |
| | OzForex Group Ltd. | 122,445 | 291 |
| | GUD Holdings Ltd. | 47,286 | 291 |
| | Technology One Ltd. | 80,280 | 288 |
| | Australian Pharmaceutical Industries Ltd. | 204,287 | 286 |
| | McMillan Shakespeare Ltd. | 29,300 | 282 |
| * | Pacific Brands Ltd. | 494,088 | 282 |
| * | Broadspectrum Ltd. | 276,863 | 280 |
| | Gateway Lifestyle | 125,869 | 277 |
| | Cover-More Group Ltd. | 168,355 | 270 |
| | Tassal Group Ltd. | 78,715 | 268 |
| * | Costa Group Holdings Ltd. | 134,273 | 265 |
| | Retail Food Group Ltd. | 78,789 | 264 |
| | Village Roadshow Ltd. | 48,523 | 261 |
| | Southern Cross Media Group Ltd. | 310,477 | 256 |
| | Beach Energy Ltd. | 713,821 | 254 |
| ^ | GWA Group Ltd. | 176,712 | 253 |
| | Select Harvests Ltd. | 40,096 | 247 |
| | Asaleo Care Ltd. | 208,613 | 241 |
| | Programmed Maintenance Services Ltd. | 132,595 | 238 |
| | Monadelphous Group Ltd. | 49,458 | 235 |
| | Greencross Ltd. | 46,287 | 225 |
| | Mineral Resources Ltd. | 75,439 | 218 |
| * | NEXTDC Ltd. | 121,350 | 211 |
| | Altium Ltd. | 61,310 | 207 |
| * | Australian Agricultural Co. Ltd. | 211,669 | 206 |
| * | Virgin Australia Holdings Ltd. | 623,306 | 206 |
| | Growthpoint Properties Australia Ltd. | 90,373 | 202 |
| | Seven Group Holdings Ltd. | 50,322 | 201 |
| | Folkestone Education Trust | 115,264 | 190 |
| * | Ten Network Holdings Ltd. | 1,528,618 | 188 |
| * | Saracen Mineral Holdings Ltd. | 411,526 | 184 |
| * | APN News & Media Ltd. | 480,240 | 182 |
| | Western Areas Ltd. | 111,960 | 181 |
| * | Mesoblast Ltd. | 134,250 | 179 |
| | National Storage REIT | 157,593 | 176 |
| * | iProperty Group Ltd. | 61,271 | 175 |
| | Ingenia Communities Group | 80,525 | 174 |
| * | Highfield Resources Ltd. | 142,540 | 168 |
3
| | | |
| Vanguard® Developed Markets Index Fund | | |
| Schedule of Investments | | |
| December 31, 2015 | | |
| |
| | | | Market |
| | | | Value |
| | | Shares | ($000) |
| * | UGL Ltd. | 92,432 | 162 |
| | UXC Ltd. | 183,084 | 162 |
| | TFS Corp. Ltd. | 137,597 | 158 |
| | Virtus Health Ltd. | 33,280 | 157 |
| | Webjet Ltd. | 38,495 | 154 |
| | Credit Corp. Group Ltd. | 19,904 | 150 |
| | Hotel Property Investments | 75,791 | 147 |
| * | Karoon Gas Australia Ltd. | 113,961 | 146 |
| * | Liquefied Natural Gas Ltd. | 251,645 | 145 |
| | GDI Property Group | 226,366 | 141 |
| * | Lynas Corp. Ltd. | 1,921,525 | 137 |
| * | Paladin Energy Ltd. | 792,146 | 137 |
| | Cabcharge Australia Ltd. | 62,195 | 134 |
| | Thorn Group Ltd. | 83,956 | 132 |
| | Ainsworth Game Technology Ltd. | 79,331 | 132 |
| | Tox Free Solutions Ltd. | 64,100 | 131 |
| | Reject Shop Ltd. | 15,884 | 126 |
| | STW Communications Group Ltd. | 194,138 | 113 |
| * | Billabong International Ltd. | 63,022 | 112 |
| | Slater & Gordon Ltd. | 185,825 | 110 |
| | RCR Tomlinson Ltd. | 64,736 | 103 |
| * | Drillsearch Energy Ltd. | 220,361 | 98 |
| * | AWE Ltd. | 268,137 | 97 |
| | Astro Japan Property Group | 26,180 | 96 |
| | Cedar Woods Properties Ltd. | 31,322 | 92 |
| * | Infigen Energy | 275,694 | 88 |
| | SMS Management & Technology Ltd. | 40,310 | 88 |
| | Decmil Group Ltd. | 114,511 | 87 |
| * | Starpharma Holdings Ltd. | 159,652 | 87 |
| | ERM Power Ltd. | 73,331 | 84 |
| | Acrux Ltd. | 150,716 | 82 |
| | Capitol Health Ltd. | 386,744 | 78 |
| | Beadell Resources Ltd. | 759,163 | 78 |
| | Cash Converters International Ltd. | 197,399 | 75 |
| * | Senex Energy Ltd. | 732,051 | 74 |
| * | Perseus Mining Ltd. | 310,567 | 74 |
| *,^ | Mount Gibson Iron Ltd. | 539,406 | 71 |
| | Watpac Ltd. | 93,170 | 70 |
| * | Arrium Ltd. | 1,639,341 | 69 |
| | Cardno Ltd. | 81,214 | 68 |
| | MACA Ltd. | 127,313 | 67 |
| * | Horizon Oil Ltd. | 1,083,336 | 62 |
| * | Resolute Mining Ltd. | 341,623 | 62 |
| * | Kingsgate Consolidated Ltd. | 179,802 | 48 |
| * | Sundance Energy Australia Ltd. | 372,680 | 46 |
| * | BGP Holdings PLC | 7,179,555 | — |
| | | | 3,411,691 |
| Austria (0.2%) | | |
| * | Erste Group Bank AG | 1,122,017 | 35,108 |
| | OMV AG | 558,696 | 15,859 |
| | ANDRITZ AG | 283,751 | 13,810 |
| | voestalpine AG | 440,314 | 13,468 |
| * | Raiffeisen Bank International AG | 452,126 | 6,626 |
| | Vienna Insurance Group AG Wiener Versicherung Gruppe | 148,754 | 4,069 |
| | Telekom Austria AG | 314,530 | 1,722 |
| * | IMMOFINANZ AG | 568,325 | 1,291 |
| | Wienerberger AG | 65,744 | 1,218 |
| | CA Immobilien Anlagen AG | 41,575 | 760 |
| | BUWOG AG | 34,887 | 757 |
| | Oesterreichische Post AG | 19,442 | 710 |
| | Verbund AG | 47,351 | 610 |
| | Mayr Melnhof Karton AG | 4,885 | 606 |
| * | Conwert Immobilien Invest SE | 36,498 | 557 |
| | UNIQA Insurance Group AG | 65,480 | 534 |
4
| | | |
| Vanguard® Developed Markets Index Fund | | |
| Schedule of Investments | | |
| December 31, 2015 | | |
| |
| | | | Market |
| | | | Value |
| | | Shares | ($000) |
| | Zumtobel Group AG | 15,565 | 392 |
| | Lenzing AG | 4,741 | 357 |
| | Schoeller-Bleckmann Oilfield Equipment AG | 6,287 | 345 |
| | RHI AG | 15,443 | 302 |
| | Strabag SE | 11,018 | 282 |
| | S IMMO AG | 28,156 | 251 |
| | Flughafen Wien AG | 2,487 | 236 |
| | EVN AG | 20,615 | 235 |
| | Semperit AG Holding | 5,452 | 184 |
| | Palfinger AG | 4,203 | 120 |
| | Kapsch TrafficCom AG | 2,855 | 116 |
| | | | 100,525 |
| Belgium (1.3%) | | |
| | Anheuser-Busch InBev SA/NV | 3,120,090 | 388,289 |
| | KBC Groep NV | 1,074,342 | 67,175 |
| | UCB SA | 475,393 | 42,911 |
| | Delhaize Group | 399,548 | 38,887 |
| | Ageas | 815,521 | 37,852 |
| ^ | Solvay SA Class A | 273,713 | 29,213 |
| | Groupe Bruxelles Lambert SA | 314,228 | 26,888 |
| | Proximus SADP | 559,214 | 18,197 |
| | Umicore SA | 423,735 | 17,770 |
| | Colruyt SA | 257,985 | 13,272 |
| * | Telenet Group Holding NV | 190,663 | 10,304 |
| | bpost SA | 386,567 | 9,485 |
| | Ackermans & van Haaren NV | 14,519 | 2,133 |
| | Ontex Group NV | 38,858 | 1,382 |
| | Cofinimmo SA | 12,293 | 1,313 |
| * | Galapagos NV | 18,896 | 1,167 |
| | Euronav NV | 72,526 | 998 |
| | Warehouses De Pauw CVA | 8,464 | 747 |
| | Elia System Operator SA/NV | 16,056 | 747 |
| | Melexis NV | 12,385 | 675 |
| | Gimv NV | 13,000 | 655 |
| | Befimmo SA | 10,573 | 631 |
| | Bekaert SA | 20,397 | 629 |
| * | AGFA-Gevaert NV | 99,892 | 568 |
| | D'ieteren SA/NV | 15,116 | 565 |
| | Cie d'Entreprises CFE | 4,761 | 564 |
| | KBC Ancora | 10,954 | 462 |
| * | Tessenderlo Chemie NV (Voting Shares) | 14,176 | 423 |
| | Ion Beam Applications | 11,158 | 410 |
| * | Mobistar SA | 16,686 | 405 |
| | Barco NV | 5,401 | 361 |
| | Kinepolis Group NV | 7,679 | 345 |
| | Econocom Group SA/NV | 35,450 | 328 |
| *,^ | Nyrstar (Voting Shares) | 184,726 | 320 |
| | Van de Velde NV | 4,098 | 280 |
| * | BHF Kleinwort Benson Group | 44,751 | 278 |
| | Wereldhave Belgium NV | 1,491 | 178 |
| | EVS Broadcast Equipment SA | 4,960 | 156 |
| | Fagron | 17,965 | 137 |
| | | | 717,100 |
| Canada (1.2%) | | |
| | Royal Bank of Canada | 829,500 | 44,451 |
| | Toronto-Dominion Bank | 1,033,400 | 40,508 |
| | Bank of Nova Scotia | 680,500 | 27,526 |
| | Canadian National Railway Co. | 391,400 | 21,880 |
| | Suncor Energy Inc. | 802,500 | 20,716 |
| | Bank of Montreal | 353,900 | 19,970 |
| * | Valeant Pharmaceuticals International Inc. | 174,500 | 17,726 |
| | Manulife Financial Corp. | 1,084,900 | 16,261 |
| | Enbridge Inc. | 468,900 | 15,588 |
| | Brookfield Asset Management Inc. Class A | 491,700 | 15,511 |
5
| | |
| Vanguard® Developed Markets Index Fund | | |
| Schedule of Investments | | |
| December 31, 2015 | | |
| |
| | | Market |
| | | Value |
| | Shares | ($000) |
| ^ Canadian Imperial Bank of Commerce | 220,200 | 14,512 |
| Gildan Activewear Inc. | 483,600 | 13,749 |
| Canadian Natural Resources Ltd. | 603,600 | 13,183 |
| ^ TransCanada Corp. | 387,200 | 12,645 |
| BCE Inc. | 300,000 | 11,591 |
| Sun Life Financial Inc. | 336,300 | 10,487 |
| Canadian Pacific Railway Ltd. | 77,000 | 9,835 |
| Alimentation Couche-Tard Inc. Class B | 216,700 | 9,539 |
| Magna International Inc. | 214,100 | 8,683 |
| Potash Corp. of Saskatchewan Inc. | 457,000 | 7,827 |
| Thomson Reuters Corp. | 196,200 | 7,431 |
| Rogers Communications Inc. Class B | 199,600 | 6,884 |
| ^ Agrium Inc. | 76,200 | 6,810 |
| Loblaw Cos. Ltd. | 126,800 | 5,988 |
| * CGI Group Inc. Class A | 145,200 | 5,813 |
| Cenovus Energy Inc. | 458,700 | 5,801 |
| * Fairfax Financial Holdings Ltd. | 12,100 | 5,744 |
| Smart REIT | 250,000 | 5,455 |
| National Bank of Canada | 185,600 | 5,407 |
| Goldcorp Inc. | 455,500 | 5,264 |
| Barrick Gold Corp. | 641,500 | 4,747 |
| Imperial Oil Ltd. | 145,000 | 4,724 |
| Intact Financial Corp. | 72,500 | 4,646 |
| ^ Pembina Pipeline Corp. | 203,800 | 4,441 |
| Restaurant Brands International Inc. (Toronto Shares) | 115,900 | 4,335 |
| Fortis Inc. | 153,400 | 4,147 |
| Great-West Lifeco Inc. | 165,300 | 4,125 |
| Power Corp. of Canada | 191,600 | 4,007 |
| Franco-Nevada Corp. | 85,900 | 3,930 |
| Shaw Communications Inc. Class B | 224,800 | 3,867 |
| Metro Inc. | 132,300 | 3,704 |
| Concordia Healthcare Corp. | 90,545 | 3,700 |
| Constellation Software Inc. | 8,800 | 3,669 |
| Dollarama Inc. | 60,800 | 3,513 |
| Canadian Tire Corp. Ltd. Class A | 39,400 | 3,365 |
| Saputo Inc. | 139,500 | 3,337 |
| ^ Crescent Point Energy Corp. | 276,700 | 3,224 |
| Open Text Corp. | 67,123 | 3,218 |
| Agnico Eagle Mines Ltd. | 119,700 | 3,146 |
| TELUS Corp. | 112,300 | 3,105 |
| Onex Corp. | 48,800 | 2,991 |
| RioCan REIT | 174,100 | 2,981 |
| Inter Pipeline Ltd. | 184,200 | 2,957 |
| ^ Power Financial Corp. | 128,200 | 2,947 |
| CCL Industries Inc. Class B | 18,100 | 2,935 |
| H&R REIT | 200,000 | 2,898 |
| CI Financial Corp. | 129,300 | 2,859 |
| Silver Wheaton Corp. | 222,500 | 2,766 |
| Keyera Corp. | 92,200 | 2,683 |
| Cameco Corp. | 216,000 | 2,665 |
| Restaurant Brands International Inc. (New York Shares) | 70,000 | 2,615 |
| Element Financial Corp. | 212,900 | 2,570 |
| SNC-Lavalin Group Inc. | 83,600 | 2,484 |
| * BlackBerry Ltd. | 265,000 | 2,459 |
| Canadian Utilities Ltd. Class A | 105,000 | 2,424 |
| Encana Corp. | 462,800 | 2,351 |
| ^ ARC Resources Ltd. | 189,000 | 2,281 |
| George Weston Ltd. | 27,800 | 2,149 |
| ShawCor Ltd. | 99,500 | 2,018 |
| RONA Inc. | 202,500 | 1,807 |
| AltaGas Ltd. | 80,600 | 1,800 |
| Industrial Alliance Insurance & Financial Services Inc. | 55,915 | 1,783 |
| * Tourmaline Oil Corp. | 106,700 | 1,723 |
| ^ Canadian Energy Services & Technology Corp. | 603,200 | 1,691 |
6
| | | |
| Vanguard® Developed Markets Index Fund | | |
| Schedule of Investments | | |
| December 31, 2015 | | |
| |
| | | | Market |
| | | | Value |
| | | Shares | ($000) |
| | CAE Inc. | 151,900 | 1,685 |
| | Husky Energy Inc. | 162,300 | 1,678 |
| ^ | WSP Global Inc. | 54,500 | 1,674 |
| | Methanex Corp. | 50,000 | 1,651 |
| | Canadian Oil Sands Ltd. | 266,100 | 1,590 |
| | Empire Co. Ltd. | 84,700 | 1,576 |
| ^ | Superior Plus Corp. | 200,000 | 1,555 |
| | Linamar Corp. | 27,900 | 1,507 |
| | Vermilion Energy Inc. | 54,400 | 1,479 |
| | First Quantum Minerals Ltd. | 379,600 | 1,421 |
| | Progressive Waste Solutions Ltd. | 59,816 | 1,409 |
| ^ | IGM Financial Inc. | 53,400 | 1,364 |
| ^ | Peyto Exploration & Development Corp. | 75,400 | 1,355 |
| ^ | PrairieSky Royalty Ltd. | 85,500 | 1,354 |
| | DH Corp. | 59,100 | 1,351 |
| | Canadian Apartment Properties REIT | 68,700 | 1,333 |
| | Finning International Inc. | 94,200 | 1,272 |
| | AutoCanada Inc. | 71,351 | 1,245 |
| | West Fraser Timber Co. Ltd. | 32,600 | 1,238 |
| | MacDonald Dettwiler & Associates Ltd. | 20,200 | 1,215 |
| | Canadian REIT | 39,200 | 1,192 |
| | Cineplex Inc. | 34,500 | 1,186 |
| | Ritchie Bros Auctioneers Inc. | 48,500 | 1,169 |
| | Eldorado Gold Corp. | 392,200 | 1,162 |
| ^ | Stantec Inc. | 46,700 | 1,158 |
| * | Kinross Gold Corp. | 630,800 | 1,144 |
| | Quebecor Inc. Class B | 46,400 | 1,136 |
| * | Turquoise Hill Resources Ltd. | 442,300 | 1,122 |
| | Atco Ltd. | 41,774 | 1,078 |
| | Tahoe Resources Inc. | 122,800 | 1,062 |
| ^ | Veresen Inc. | 162,000 | 1,037 |
| ^ | Whitecap Resources Inc. | 158,100 | 1,036 |
| * | Bombardier Inc. Class B | 1,065,600 | 1,032 |
| | Teck Resources Ltd. Class B | 259,800 | 1,003 |
| | Cominar REIT | 92,400 | 982 |
| * | Detour Gold Corp. | 93,600 | 975 |
| | Allied Properties REIT | 42,300 | 965 |
| | Yamana Gold Inc. | 516,700 | 960 |
| * | Lundin Mining Corp. | 344,800 | 947 |
| | TransForce Inc. | 53,600 | 915 |
| | Chartwell Retirement Residences | 96,400 | 885 |
| | Colliers International Group Inc. | 19,381 | 865 |
| * | Seven Generations Energy Ltd. Class A | 88,500 | 862 |
| | Toromont Industries Ltd. | 37,800 | 862 |
| ^ | Parkland Fuel Corp. | 49,900 | 840 |
| ^ | Hudson's Bay Co. | 64,200 | 840 |
| | Stella-Jones Inc. | 21,500 | 816 |
| | Algonquin Power & Utilities Corp. | 102,100 | 805 |
| ^ | Northland Power Inc. | 57,300 | 773 |
| * | Celestica Inc. | 68,200 | 754 |
| ^ | Home Capital Group Inc. Class B | 38,400 | 747 |
| | Canadian Western Bank | 44,200 | 747 |
| | Dream Office REIT | 59,400 | 746 |
| | FirstService Corp. | 18,165 | 734 |
| ^ | Boardwalk REIT | 21,300 | 730 |
| *,^ | Amaya Inc. | 57,800 | 728 |
| | Maple Leaf Foods Inc. | 42,300 | 726 |
| | Granite REIT | 25,335 | 695 |
| ^ | Gibson Energy Inc. | 69,300 | 692 |
| ^ | Capital Power Corp. | 53,600 | 688 |
| | Artis REIT | 73,800 | 683 |
| | First Capital Realty Inc. | 49,700 | 659 |
| * | New Gold Inc. | 280,600 | 653 |
| | Cott Corp. | 58,500 | 644 |
7
| | |
| Vanguard® Developed Markets Index Fund | | |
| Schedule of Investments | | |
| December 31, 2015 | | |
| |
| | | Market |
| | | Value |
| | Shares | ($000) |
| Precision Drilling Corp. | 162,400 | 642 |
| OceanaGold Corp. | 332,600 | 635 |
| Emera Inc. | 20,200 | 631 |
| * Raging River Exploration Inc. | 103,900 | 628 |
| * Canfor Corp. | 41,800 | 610 |
| Aimia Inc. | 88,600 | 603 |
| * Parex Resources Inc. | 79,100 | 581 |
| * Imperial Metals Corp. | 120,400 | 580 |
| Laurentian Bank of Canada | 16,100 | 562 |
| TMX Group Ltd. | 21,374 | 553 |
| * NovaGold Resources Inc. | 131,300 | 551 |
| TransAlta Corp. | 153,300 | 544 |
| Just Energy Group Inc. | 74,400 | 531 |
| Pason Systems Inc. | 37,700 | 528 |
| Jean Coutu Group PJC Inc. Class A | 40,800 | 528 |
| Manitoba Telecom Services Inc. | 24,100 | 519 |
| North West Co. Inc. | 24,900 | 516 |
| Pan American Silver Corp. | 79,100 | 515 |
| Osisko Gold Royalties Ltd. | 51,900 | 513 |
| * B2Gold Corp. | 505,900 | 512 |
| HudBay Minerals Inc. | 129,300 | 496 |
| * MEG Energy Corp. | 82,600 | 479 |
| Dominion Diamond Corp. | 46,800 | 478 |
| * Advantage Oil & Gas Ltd. | 94,100 | 478 |
| Alamos Gold Inc. | 140,900 | 463 |
| ^ Mullen Group Ltd. | 45,600 | 462 |
| Innergex Renewable Energy Inc. | 54,100 | 443 |
| ^ Secure Energy Services Inc. | 72,300 | 437 |
| Norbord Inc. | 22,400 | 436 |
| Transcontinental Inc. Class A | 34,100 | 425 |
| Centerra Gold Inc. | 88,100 | 420 |
| Enerflex Ltd. | 43,600 | 419 |
| * SEMAFO Inc. | 161,500 | 410 |
| ^ Genworth MI Canada Inc. | 21,200 | 408 |
| Russel Metals Inc. | 34,000 | 395 |
| * Torex Gold Resources Inc. | 432,700 | 394 |
| Enerplus Corp. | 114,100 | 392 |
| Ensign Energy Services Inc. | 71,300 | 380 |
| Baytex Energy Corp. | 115,000 | 372 |
| * ATS Automation Tooling Systems Inc. | 44,700 | 368 |
| Corus Entertainment Inc. Class B | 46,200 | 361 |
| Aecon Group Inc. | 31,900 | 355 |
| Cascades Inc. | 37,400 | 344 |
| Extendicare Inc. | 48,500 | 338 |
| Dorel Industries Inc. Class B | 14,500 | 328 |
| * Gran Tierra Energy Inc. | 147,900 | 322 |
| TORC Oil & Gas Ltd. | 85,300 | 317 |
| * IAMGOLD Corp. | 216,200 | 308 |
| Nevsun Resources Ltd. | 111,900 | 303 |
| Martinrea International Inc. | 39,100 | 297 |
| * Pretium Resources Inc. | 58,900 | 296 |
| * Great Canadian Gaming Corp. | 26,100 | 292 |
| Cogeco Cable Inc. | 6,300 | 281 |
| * First Majestic Silver Corp. | 85,900 | 280 |
| Westshore Terminals Investment Corp. | 32,900 | 277 |
| * Sierra Wireless Inc. | 17,300 | 272 |
| Northview Apartment REIT | 21,400 | 272 |
| * Kelt Exploration Ltd. | 78,700 | 241 |
| * NuVista Energy Ltd. | 81,000 | 238 |
| * Silver Standard Resources Inc. | 45,300 | 234 |
| Penn West Petroleum Ltd. | 274,000 | 232 |
| * Alacer Gold Corp. | 128,800 | 230 |
| * Crew Energy Inc. | 77,100 | 226 |
| * Athabasca Oil Corp. | 198,800 | 221 |
8
| | | |
| Vanguard® Developed Markets Index Fund | | |
| Schedule of Investments | | |
| December 31, 2015 | | |
| |
| | | | Market |
| | | | Value |
| | | Shares | ($000) |
| | Pengrowth Energy Corp. | 297,600 | 219 |
| *,^ | Pacific Exploration and Production Corp. | 173,800 | 215 |
| * | Primero Mining Corp. | 89,400 | 202 |
| * | China Gold International Resources Corp. Ltd. | 133,700 | 201 |
| | Canaccord Genuity Group Inc. | 53,800 | 199 |
| | Bonterra Energy Corp. | 15,800 | 196 |
| | InnVest REIT | 52,700 | 195 |
| * | Avigilon Corp. | 19,700 | 195 |
| ^ | Surge Energy Inc. | 122,400 | 187 |
| | Morguard REIT | 18,500 | 182 |
| | AGF Management Ltd. Class B | 47,300 | 178 |
| * | Birchcliff Energy Ltd. | 60,700 | 177 |
| | Trinidad Drilling Ltd. | 108,700 | 167 |
| * | Denison Mines Corp. | 310,000 | 157 |
| | Bonavista Energy Corp. | 117,300 | 154 |
| * | DREAM Unlimited Corp. Class A | 28,800 | 151 |
| | Major Drilling Group International Inc. | 44,200 | 140 |
| * | Paramount Resources Ltd. Class A | 29,300 | 130 |
| | First National Financial Corp. | 7,700 | 125 |
| ^ | Sprott Inc. | 71,501 | 123 |
| *,^ | Bellatrix Exploration Ltd. | 99,400 | 118 |
| * | Bankers Petroleum Ltd. | 145,100 | 107 |
| | Black Diamond Group Ltd. | 19,300 | 101 |
| *,^ | Trilogy Energy Corp. | 35,800 | 95 |
| | Sherritt International Corp. | 167,500 | 88 |
| * | Dundee Corp. Class A | 26,300 | 87 |
| | Calfrac Well Services Ltd. | 51,300 | 85 |
| * | Trican Well Service Ltd. | 151,500 | 70 |
| | | | 647,905 |
| Denmark (1.8%) | | |
| | Novo Nordisk A/S Class B | 7,208,503 | 417,359 |
| | Danske Bank A/S | 3,008,784 | 80,733 |
| | Vestas Wind Systems A/S | 865,120 | 60,419 |
| | Pandora A/S | 442,734 | 55,822 |
| | Novozymes A/S | 881,287 | 42,195 |
| | Carlsberg A/S Class B | 409,069 | 36,240 |
| | AP Moeller - Maersk A/S Class B | 25,768 | 33,609 |
| | Coloplast A/S Class B | 393,841 | 31,798 |
| * | Genmab A/S | 205,560 | 27,332 |
| | DSV A/S | 655,624 | 25,808 |
| | ISS A/S | 660,576 | 23,812 |
| | AP Moeller - Maersk A/S Class A | 17,303 | 22,281 |
| | Chr Hansen Holding A/S | 346,525 | 21,675 |
| | TDC A/S | 3,137,157 | 15,620 |
| * | Jyske Bank A/S | 274,779 | 12,429 |
| | Tryg A/S | 441,775 | 8,779 |
| * | William Demant Holding A/S | 91,212 | 8,688 |
| * | H Lundbeck A/S | 227,363 | 7,763 |
| | GN Store Nord A/S | 85,386 | 1,550 |
| | Sydbank A/S | 40,463 | 1,299 |
| * | Topdanmark A/S | 41,923 | 1,191 |
| | SimCorp A/S | 18,754 | 1,057 |
| ^ | FLSmidth & Co. A/S | 27,592 | 959 |
| * | Royal Unibrew A/S | 21,533 | 875 |
| | NKT Holding A/S | 13,337 | 688 |
| * | Dfds A/S | 16,878 | 655 |
| * | Bavarian Nordic A/S | 10,364 | 536 |
| | Rockwool International A/S Class B | 3,698 | 520 |
| | Spar Nord Bank A/S | 47,084 | 416 |
| | ALK-Abello A/S | 3,207 | 408 |
| | Matas A/S | 20,828 | 403 |
| | Schouw & Co. | 6,545 | 367 |
| | Ambu A/S Class B | 11,822 | 360 |
| | Alm Brand A/S | 41,886 | 294 |
9
| | | |
| Vanguard® Developed Markets Index Fund | | |
| Schedule of Investments | | |
| December 31, 2015 | | |
| |
| | | | Market |
| | | | Value |
| | | Shares | ($000) |
| | Solar A/S Class B | 3,579 | 227 |
| * | Bang & Olufsen A/S | 18,231 | 219 |
| * | D/S Norden A/S | 4,785 | 85 |
| | | | 944,471 |
| Finland (0.9%) | | |
| | Nokia Oyj | 14,531,051 | 102,801 |
| | Sampo Oyj Class A | 1,825,472 | 92,702 |
| | Kone Oyj Class B | 1,469,188 | 62,207 |
| | UPM-Kymmene Oyj | 2,025,659 | 37,607 |
| | Wartsila OYJ Abp | 606,281 | 27,682 |
| | Fortum Oyj | 1,735,144 | 26,143 |
| | Elisa Oyj | 612,505 | 23,046 |
| | Stora Enso Oyj | 2,224,922 | 20,118 |
| | Nokian Renkaat Oyj | 523,223 | 18,680 |
| | Neste Oyj | 502,457 | 14,996 |
| | Orion Oyj Class B | 388,797 | 13,452 |
| | Metso Oyj | 525,284 | 11,767 |
| | Kesko Oyj Class B | 267,386 | 9,372 |
| | Huhtamaki Oyj | 57,493 | 2,086 |
| | Amer Sports Oyj | 64,634 | 1,887 |
| | Tieto Oyj | 41,545 | 1,110 |
| | Metsa Board Oyj | 115,736 | 859 |
| | Cargotec Oyj Class B | 22,230 | 829 |
| | Konecranes Oyj | 31,886 | 789 |
| | Valmet Oyj | 71,741 | 691 |
| | Caverion Corp. | 66,001 | 646 |
| | Sponda Oyj | 128,448 | 546 |
| | Citycon Oyj | 206,420 | 536 |
| | Kemira Oyj | 40,745 | 480 |
| | Uponor Oyj | 29,933 | 442 |
| | YIT Oyj | 69,155 | 392 |
| ^ | Outotec Oyj | 99,276 | 364 |
| *,^ | Outokumpu Oyj | 111,626 | 327 |
| * | Oriola-KD Oyj | 66,371 | 311 |
| | Cramo Oyj | 13,617 | 281 |
| | Raisio Oyj | 58,800 | 270 |
| | Ramirent Oyj | 35,135 | 245 |
| * | Finnair Oyj | 34,468 | 203 |
| | Sanoma Oyj | 45,668 | 193 |
| * | Stockmann OYJ Abp Class B | 17,767 | 120 |
| | F-Secure Oyj | 33,538 | 94 |
| | | | 474,274 |
| France (8.4%) | | |
| | Sanofi | 4,404,647 | 375,374 |
| | TOTAL SA | 8,071,080 | 361,840 |
| | BNP Paribas SA | 3,789,155 | 214,381 |
| | AXA SA | 7,499,390 | 204,911 |
| | LVMH Moet Hennessy Louis Vuitton SE | 976,552 | 153,388 |
| | Danone SA | 2,212,538 | 149,510 |
| | Airbus Group SE | 2,157,753 | 145,406 |
| | Societe Generale SA | 2,849,788 | 131,325 |
| | Orange SA | 7,412,495 | 123,980 |
| | Schneider Electric SE | 2,146,662 | 121,940 |
| | Vinci SA | 1,812,396 | 116,166 |
| | Vivendi SA | 4,571,192 | 98,176 |
| | Engie SA | 5,525,962 | 97,883 |
| | Essilor International SA | 775,510 | 96,657 |
| | L'Oreal SA | 551,482 | 92,762 |
| | Air Liquide SA | 785,643 | 88,202 |
| | Pernod Ricard SA | 755,621 | 86,175 |
| | Cie de Saint-Gobain | 1,805,396 | 78,238 |
| | Safran SA | 1,084,966 | 74,541 |
| | Cie Generale des Etablissements Michelin | 722,766 | 68,795 |
| | Renault SA | 669,624 | 67,027 |
10
| | | |
| Vanguard® Developed Markets Index Fund | | |
| Schedule of Investments | | |
| December 31, 2015 | | |
| |
| | | | Market |
| | | | Value |
| | | Shares | ($000) |
| | L'Oreal SA Loyalty Line | 368,925 | 62,055 |
| | Air Liquide SA (Prime de fidelite) | 545,732 | 61,268 |
| | Carrefour SA | 2,115,443 | 61,051 |
| | Legrand SA | 1,027,825 | 58,140 |
| | Cap Gemini SA | 621,415 | 57,659 |
| | Kering | 289,236 | 49,452 |
| | Publicis Groupe SA | 738,432 | 49,103 |
| | Valeo SA | 301,880 | 46,542 |
| | Veolia Environnement SA | 1,815,128 | 43,066 |
| * | Alcatel-Lucent | 10,744,489 | 42,449 |
| | Dassault Systemes | 484,644 | 38,738 |
| | Credit Agricole SA | 3,073,944 | 36,224 |
| | Klepierre | 798,080 | 35,475 |
| | Sodexo SA | 355,203 | 34,702 |
| | Accor SA | 786,810 | 34,077 |
| | Christian Dior SE | 197,811 | 33,601 |
| | SES SA | 1,161,669 | 32,190 |
| | Hermes International | 90,546 | 30,607 |
| | Thales SA | 401,333 | 30,040 |
| | Bouygues SA | 729,934 | 28,943 |
| | Atos SE | 342,676 | 28,769 |
| * | Peugeot SA | 1,517,211 | 26,595 |
| | Ingenico Group SA | 209,887 | 26,492 |
| *,^ | Alstom SA | 825,027 | 25,200 |
| | Suez Environnement Co. | 1,256,730 | 23,505 |
| | Groupe Eurotunnel SE | 1,789,958 | 22,269 |
| | Iliad SA | 90,420 | 21,554 |
| | Technip SA | 433,179 | 21,542 |
| | SCOR SE | 551,596 | 20,640 |
| | Natixis SA | 3,643,733 | 20,613 |
| | Bureau Veritas SA | 990,397 | 19,740 |
| | Arkema SA | 273,556 | 19,149 |
| | Eutelsat Communications SA | 635,861 | 19,038 |
| | Bollore SA | 3,781,578 | 17,621 |
| | Zodiac Aerospace | 737,839 | 17,568 |
| | Gecina SA | 141,830 | 17,243 |
| | Societe BIC SA | 101,059 | 16,630 |
| | STMicroelectronics NV | 2,434,239 | 16,297 |
| | Rexel SA | 1,195,142 | 15,914 |
| | Edenred | 792,091 | 14,973 |
| | Wendel SA | 119,015 | 14,154 |
| | Lagardere SCA | 442,790 | 13,214 |
| | Numericable-SFR SAS | 353,500 | 12,842 |
| | Aeroports de Paris | 109,519 | 12,745 |
| | Fonciere Des Regions | 139,390 | 12,467 |
| | Electricite de France SA | 803,530 | 11,834 |
| | Credit Agricole SA Loyalty Line | 951,298 | 11,210 |
| | Eiffage SA | 172,118 | 11,124 |
| | JCDecaux SA | 290,075 | 11,120 |
| | Eurazeo SA | 159,034 | 10,968 |
| | SEB SA | 103,373 | 10,612 |
| ^ | Casino Guichard Perrachon SA | 223,525 | 10,269 |
| | Faurecia | 232,918 | 9,333 |
| | ICADE | 136,737 | 9,178 |
| | Imerys SA | 130,394 | 9,108 |
| | Ipsen SA | 132,578 | 8,784 |
| | CNP Assurances | 639,184 | 8,622 |
| | BioMerieux | 54,532 | 6,507 |
| | Remy Cointreau SA | 89,760 | 6,429 |
| | Euler Hermes Group | 50,681 | 4,883 |
| | Societe Television Francaise 1 | 403,926 | 4,485 |
| ^ | Vallourec SA | 450,638 | 4,195 |
| | Electricite de France SA Loyalty Line | 229,038 | 3,373 |
| | Teleperformance | 30,933 | 2,601 |
11
| | | |
| Vanguard® Developed Markets Index Fund | | |
| Schedule of Investments | | |
| December 31, 2015 | | |
| |
| | | | Market |
| | | | Value |
| | | Shares | ($000) |
| 2 | Euronext NV | 38,722 | 1,987 |
| | Orpea | 23,436 | 1,876 |
| | Eurofins Scientific SE | 4,666 | 1,628 |
| | Technicolor SA | 187,136 | 1,519 |
| | Rubis SCA | 19,730 | 1,497 |
| 2 | Elior | 70,971 | 1,487 |
| * | UBISOFT Entertainment | 51,006 | 1,476 |
| | Plastic Omnium SA | 31,444 | 1,000 |
| | Altran Technologies SA | 67,905 | 909 |
| | Nexity SA | 19,965 | 884 |
| | Sopra Steria Group | 7,100 | 835 |
| | Sartorius Stedim Biotech | 2,171 | 833 |
| * | DBV Technologies SA | 11,014 | 793 |
| | Alten SA | 13,348 | 772 |
| | Korian SA | 21,044 | 770 |
| | Havas SA | 88,699 | 746 |
| * | Air France-KLM | 89,164 | 679 |
| * | Nexans SA | 17,743 | 648 |
| | Elis SA | 36,086 | 597 |
| | Metropole Television SA | 34,685 | 596 |
| * | SPIE SA | 32,011 | 590 |
| | Virbac SA | 2,403 | 573 |
| *,2 | Europcar Groupe SA | 40,524 | 534 |
| | Vicat | 8,670 | 521 |
| | Mercialys SA | 22,618 | 458 |
| | Saft Groupe SA | 14,854 | 453 |
| | Coface SA | 44,177 | 448 |
| | Neopost SA | 17,935 | 438 |
| | IPSOS | 18,678 | 430 |
| | Gaztransport Et Technigaz SA | 10,106 | 427 |
| * | Genfit | 10,847 | 382 |
| | Faiveley Transport SA | 3,652 | 379 |
| * | Trigano SA | 5,396 | 329 |
| | Tarkett SA | 10,462 | 327 |
| * | Groupe Fnac SA | 5,375 | 317 |
| * | Parrot SA | 10,329 | 303 |
| *,^ | CGG SA | 95,298 | 278 |
| * | GameLoft SE | 40,882 | 269 |
| | LISI | 9,774 | 265 |
| | Vilmorin & Cie SA | 3,351 | 241 |
| ^ | Bourbon SA | 14,595 | 237 |
| | Boiron SA | 2,877 | 233 |
| *,^ | Etablissements Maurel et Prom | 70,828 | 229 |
| | FFP | 2,787 | 206 |
| | Guerbet | 2,616 | 184 |
| | Bonduelle SCA | 7,264 | 182 |
| ^ | Rallye SA | 11,637 | 181 |
| * | Eramet | 4,964 | 159 |
| * | Derichebourg SA | 41,088 | 147 |
| | Albioma SA | 8,069 | 131 |
| | Assystem | 5,003 | 131 |
| * | Euro Disney SCA | 91,734 | 129 |
| | Mersen | 6,217 | 115 |
| | Jacquet Metal Service | 6,893 | 107 |
| | Haulotte Group SA | 5,934 | 89 |
| | GL Events | 4,333 | 78 |
| * | Esso SA Francaise | 1,396 | 75 |
| | Solocal Group | 9,899 | 74 |
| | Union Financiere de France BQE SA | 2,787 | 74 |
| | Manitou BF SA | 3,628 | 56 |
| * | Stallergenes Greer plc | 1,556 | 54 |
| | | | 4,475,833 |
| Germany (8.2%) | | |
| | Bayer AG | 3,226,473 | 402,958 |
12
| | | |
| Vanguard® Developed Markets Index Fund | | |
| Schedule of Investments | | |
| December 31, 2015 | | |
| |
| | | | Market |
| | | | Value |
| | | Shares | ($000) |
| | Allianz SE | 1,766,775 | 311,445 |
| | Daimler AG | 3,711,917 | 310,147 |
| | Siemens AG | 3,066,875 | 296,709 |
| | SAP SE | 3,467,777 | 275,181 |
| | BASF SE | 3,583,885 | 273,015 |
| * | Deutsche Telekom AG | 12,289,306 | 220,725 |
| | Bayerische Motoren Werke AG | 1,266,010 | 133,377 |
| | Deutsche Bank AG | 5,370,029 | 130,410 |
| | Muenchener Rueckversicherungs-Gesellschaft AG in Muenchen | 570,725 | 113,710 |
| | Fresenius SE & Co. KGaA | 1,527,175 | 108,785 |
| | Volkswagen AG Preference Shares | 719,927 | 103,943 |
| | Linde AG | 717,653 | 103,672 |
| | Deutsche Post AG | 3,702,532 | 103,515 |
| | Continental AG | 418,849 | 101,324 |
| | Henkel AG & Co. KGaA Preference Shares | 680,350 | 75,929 |
| | adidas AG | 775,832 | 75,302 |
| | Fresenius Medical Care AG & Co. KGaA | 835,308 | 70,195 |
| | E.ON SE | 7,305,242 | 70,145 |
| | Infineon Technologies AG | 4,378,918 | 63,839 |
| | Deutsche Boerse AG | 717,104 | 63,035 |
| | Vonovia SE | 1,816,838 | 56,128 |
| | Merck KGaA | 504,430 | 48,840 |
| | HeidelbergCement AG | 549,983 | 44,823 |
| | Henkel AG & Co. KGaA | 450,316 | 43,074 |
| | ProSiebenSat.1 Media SE | 833,005 | 42,026 |
| * | Commerzbank AG | 4,053,864 | 41,830 |
| | Deutsche Wohnen AG | 1,306,034 | 36,114 |
| | Beiersdorf AG | 379,811 | 34,522 |
| | ThyssenKrupp AG | 1,656,885 | 32,845 |
| | Porsche Automobil Holding SE Preference Shares | 599,329 | 32,255 |
| | Symrise AG | 473,667 | 31,356 |
| | Brenntag AG | 599,023 | 31,214 |
| | GEA Group AG | 686,366 | 27,730 |
| | Hannover Rueck SE | 235,854 | 26,932 |
| | United Internet AG | 457,578 | 25,157 |
| * | QIAGEN NV | 884,115 | 23,963 |
| | RWE AG | 1,846,526 | 23,280 |
| ^ | Wirecard AG | 441,690 | 22,078 |
| | HUGO BOSS AG | 247,258 | 20,401 |
| | METRO AG | 635,850 | 20,257 |
| | MTU Aero Engines AG | 197,769 | 19,276 |
| | K&S AG | 749,717 | 19,111 |
| | Bayerische Motoren Werke AG Preference Shares | 212,990 | 17,820 |
| | Volkswagen AG | 108,898 | 16,734 |
| | Evonik Industries AG | 501,165 | 16,577 |
| | LANXESS AG | 357,865 | 16,468 |
| *,2 | Zalando SE | 403,147 | 15,922 |
| * | Deutsche Lufthansa AG | 902,733 | 14,219 |
| | OSRAM Licht AG | 330,389 | 13,803 |
| | Telefonica Deutschland Holding AG | 2,551,796 | 13,460 |
| | Fuchs Petrolub SE Preference Shares | 268,257 | 12,631 |
| | RTL Group SA | 147,035 | 12,245 |
| | MAN SE | 116,739 | 11,731 |
| | TUI AG-DI | 619,859 | 11,198 |
| | Kabel Deutschland Holding AG | 80,738 | 9,976 |
| | Fraport AG Frankfurt Airport Services Worldwide | 139,906 | 8,922 |
| | Axel Springer SE | 159,498 | 8,870 |
| | HOCHTIEF AG | 94,670 | 8,781 |
| | Fielmann AG | 96,351 | 7,104 |
| | Suedzucker AG | 305,081 | 6,047 |
| | FUCHS PETROLUB SE | 135,964 | 5,559 |
| | Hella KGaA Hueck & Co. | 120,007 | 4,984 |
| | Wacker Chemie AG | 57,517 | 4,809 |
| | Talanx AG | 145,309 | 4,469 |
13
| | | |
| Vanguard® Developed Markets Index Fund | | |
| Schedule of Investments | | |
| December 31, 2015 | | |
| |
| | | | Market |
| | | | Value |
| | | Shares | ($000) |
| | LEG Immobilien AG | 34,624 | 2,822 |
| | Freenet AG | 58,963 | 1,990 |
| | KION Group AG | 36,287 | 1,799 |
| | Rheinmetall AG | 23,088 | 1,535 |
| | STADA Arzneimittel AG | 34,030 | 1,372 |
| | Gerresheimer AG | 17,315 | 1,353 |
| | RWE AG Preference Shares | 139,719 | 1,347 |
| * | Dialog Semiconductor plc | 39,137 | 1,306 |
| ^ | KUKA AG | 14,153 | 1,267 |
| | Aurubis AG | 24,703 | 1,251 |
| | Sartorius AG Preference Shares | 4,673 | 1,219 |
| * | Nordex SE | 33,525 | 1,178 |
| | Deutsche EuroShop AG | 25,394 | 1,112 |
| | Aareal Bank AG | 32,367 | 1,019 |
| | Rational AG | 2,229 | 1,012 |
| | Norma Group SE | 17,455 | 965 |
| | Drillisch AG | 22,862 | 962 |
| | Krones AG | 7,812 | 930 |
| * | MorphoSys AG | 14,238 | 886 |
| | DMG Mori AG | 20,285 | 838 |
| | Bilfinger SE | 17,716 | 833 |
| * | GRENKELEASING AG | 4,139 | 826 |
| | TAG Immobilien AG | 65,682 | 818 |
| | Stroeer SE | 12,414 | 779 |
| | alstria office REIT-AG | 56,634 | 755 |
| | Software AG | 25,964 | 740 |
| | Jungheinrich AG Preference Shares | 8,723 | 719 |
| | CTS Eventim AG & Co. KGaA | 17,997 | 714 |
| | Wincor Nixdorf AG | 14,159 | 710 |
| | Leoni AG | 17,935 | 705 |
| | Bechtle AG | 7,371 | 701 |
| *,2 | Deutsche Pfandbriefbank AG | 54,817 | 664 |
| | RHOEN-KLINIKUM AG | 20,944 | 628 |
| * | PATRIZIA Immobilien AG | 21,079 | 616 |
| | Duerr AG | 7,577 | 601 |
| | Sixt SE Preference Shares | 14,283 | 586 |
| | Pfeiffer Vacuum Technology AG | 5,365 | 541 |
| | Salzgitter AG | 21,281 | 520 |
| | CompuGroup Medical AG | 13,616 | 498 |
| | Nemetschek AG | 10,020 | 497 |
| *,^ | SGL Carbon SE | 32,114 | 448 |
| | Indus Holding AG | 9,138 | 440 |
| ^ | Kloeckner & Co. SE | 50,722 | 439 |
| | ElringKlinger AG | 15,450 | 392 |
| | BRAAS Monier Building Group SA | 12,853 | 371 |
| | KWS Saat SE | 1,194 | 358 |
| | Puma SE | 1,618 | 348 |
| | Jenoptik AG | 22,028 | 342 |
| | Takkt AG | 16,639 | 333 |
| * | SMA Solar Technology AG | 5,752 | 318 |
| * | Vossloh AG | 4,926 | 318 |
| * | Heidelberger Druckmaschinen AG | 127,399 | 312 |
| | Draegerwerk AG & Co. KGaA | 4,741 | 311 |
| | Bertrandt AG | 2,499 | 300 |
| | Carl Zeiss Meditec AG | 8,323 | 258 |
| | BayWa AG | 7,681 | 237 |
| * | AIXTRON SE | 47,666 | 211 |
| | Wacker Neuson SE | 13,619 | 210 |
| | Gerry Weber International AG | 14,504 | 201 |
| | DIC Asset AG | 19,684 | 199 |
| | Deutz AG | 48,493 | 193 |
| | Sixt SE | 3,699 | 188 |
| | Deutsche Beteiligungs AG | 5,649 | 182 |
| | comdirect bank AG | 13,635 | 162 |
14
| | | |
| Vanguard® Developed Markets Index Fund | | |
| Schedule of Investments | | |
| December 31, 2015 | | |
| |
| | | | Market |
| | | | Value |
| | | Shares | ($000) |
| | Hamburger Hafen und Logistik AG | 9,858 | 150 |
| | Biotest AG | 6,630 | 135 |
| * | Hornbach Baumarkt AG | 4,064 | 125 |
| | Bauer AG | 5,790 | 109 |
| | Draegerwerk AG & Co. KGaA Preference Shares | 1,343 | 100 |
| * | H&R AG | 8,285 | 83 |
| | Biotest AG Preference Shares | 4,702 | 78 |
| * | CropEnergies AG | 12,064 | 70 |
| | | | 4,400,437 |
| Greece (0.0%) | | |
| | Hellenic Telecommunications Organization SA | 938,960 | 9,397 |
| | OPAP SA | 789,019 | 6,924 |
| | Alpha Bank AE | 1,166,642 | 3,126 |
| | National Bank of Greece SA | 943,044 | 349 |
| | National Bank of Greece SA ADR | 101,832 | 37 |
| | Piraeus Bank SA | 79,514 | 24 |
| | | | 19,857 |
| Hong Kong (3.3%) | | |
| | AIA Group Ltd. | 46,826,118 | 279,790 |
| | CK Hutchison Holdings Ltd. | 10,910,712 | 146,661 |
| | Hong Kong Exchanges and Clearing Ltd. | 4,664,050 | 118,816 |
| | Sun Hung Kai Properties Ltd. | 6,479,759 | 77,884 |
| | Cheung Kong Property Holdings Ltd. | 11,029,946 | 71,353 |
| | Hang Seng Bank Ltd. | 2,977,011 | 56,424 |
| | Link REIT | 8,849,411 | 52,759 |
| | Hong Kong & China Gas Co. Ltd. | 26,450,332 | 51,764 |
| | CLP Holdings Ltd. | 5,950,559 | 50,437 |
| | Power Assets Holdings Ltd. | 5,115,056 | 46,893 |
| | Jardine Matheson Holdings Ltd. | 948,969 | 45,956 |
| | BOC Hong Kong Holdings Ltd. | 14,008,849 | 42,629 |
| | Sands China Ltd. | 9,435,089 | 31,987 |
| | Hongkong Land Holdings Ltd. | 4,560,853 | 31,847 |
| | Wharf Holdings Ltd. | 5,341,652 | 29,451 |
| | MTR Corp. Ltd. | 5,408,863 | 26,708 |
| | Galaxy Entertainment Group Ltd. | 8,325,248 | 26,086 |
| | Swire Pacific Ltd. Class A | 2,274,465 | 25,406 |
| | Henderson Land Development Co. Ltd. | 3,999,433 | 24,397 |
| | Jardine Strategic Holdings Ltd. | 872,107 | 23,771 |
| | Cheung Kong Infrastructure Holdings Ltd. | 2,298,571 | 21,236 |
| | New World Development Co. Ltd. | 21,036,740 | 20,657 |
| | Techtronic Industries Co. Ltd. | 4,927,449 | 19,948 |
| | Hang Lung Properties Ltd. | 8,743,484 | 19,812 |
| | Want Want China Holdings Ltd. | 25,340,090 | 18,807 |
| | AAC Technologies Holdings Inc. | 2,742,403 | 17,840 |
| | China Mengniu Dairy Co. Ltd. | 10,617,464 | 17,236 |
| | Sino Land Co. Ltd. | 11,767,052 | 17,142 |
| | Bank of East Asia Ltd. | 4,569,243 | 16,950 |
| | Li & Fung Ltd. | 22,488,826 | 15,209 |
| | Samsonite International SA | 4,854,689 | 14,549 |
| | Wheelock & Co. Ltd. | 3,173,305 | 13,316 |
| | Swire Properties Ltd. | 4,616,807 | 13,275 |
| | Yue Yuen Industrial Holdings Ltd. | 3,213,364 | 10,885 |
| | Tingyi Cayman Islands Holding Corp. | 7,284,851 | 10,349 |
| * | Semiconductor Manufacturing International Corp. | 95,985,089 | 9,761 |
| | Hysan Development Co. Ltd. | 2,376,584 | 9,710 |
| | PCCW Ltd. | 15,690,278 | 9,172 |
| ^ | Esprit Holdings Ltd. | 7,311,503 | 8,048 |
| | NWS Holdings Ltd. | 5,370,324 | 8,017 |
| | New World China Land Ltd. | 9,959,519 | 7,945 |
| *,2 | WH Group Ltd. | 13,519,509 | 7,525 |
| | ASM Pacific Technology Ltd. | 922,164 | 7,200 |
| | Hopewell Holdings Ltd. | 1,954,187 | 7,001 |
| | Kerry Properties Ltd. | 2,502,924 | 6,811 |
| | Cathay Pacific Airways Ltd. | 3,934,101 | 6,769 |
15
| | | |
| Vanguard® Developed Markets Index Fund | | |
| Schedule of Investments | | |
| December 31, 2015 | | |
| |
| | | | Market |
| | | | Value |
| | | Shares | ($000) |
| ^ | Sun Art Retail Group Ltd. | 8,553,883 | 6,436 |
| * | Goldin Financial Holdings Ltd. | 3,271,135 | 6,404 |
| ^ | Prada SPA | 1,980,824 | 6,146 |
| | VTech Holdings Ltd. | 590,415 | 6,113 |
| | First Pacific Co. Ltd. | 8,929,738 | 5,915 |
| | SJM Holdings Ltd. | 7,292,211 | 5,168 |
| | Haitong International Securities Group Ltd. | 8,267,745 | 5,041 |
| ^ | Melco International Development Ltd. | 3,186,460 | 4,760 |
| ^ | Wynn Macau Ltd. | 4,047,641 | 4,703 |
| | Johnson Electric Holdings Ltd. | 1,344,364 | 4,595 |
| | Television Broadcasts Ltd. | 1,111,149 | 4,566 |
| | Champion REIT | 9,017,556 | 4,501 |
| | Xinyi Glass Holdings Ltd. | 7,543,077 | 4,408 |
| ^ | Brightoil Petroleum Holdings Ltd. | 13,189,536 | 4,398 |
| * | Global Brands Group Holding Ltd. | 22,168,428 | 4,198 |
| | China Travel International Investment Hong Kong Ltd. | 9,927,704 | 4,152 |
| | Shangri-La Asia Ltd. | 4,137,753 | 4,029 |
| ^ | Uni-President China Holdings Ltd. | 4,977,722 | 3,812 |
| ^ | Xinyi Solar Holdings Ltd. | 9,396,978 | 3,810 |
| | Cafe de Coral Holdings Ltd. | 1,276,690 | 3,741 |
| | MGM China Holdings Ltd. | 2,984,271 | 3,709 |
| | Orient Overseas International Ltd. | 773,805 | 3,704 |
| | Shui On Land Ltd. | 13,162,020 | 3,597 |
| | FIH Mobile Ltd. | 9,132,964 | 3,476 |
| | Great Eagle Holdings Ltd. | 1,027,688 | 3,344 |
| | L'Occitane International SA | 1,712,961 | 3,306 |
| ^ | Guotai Junan International Holdings Ltd. | 9,130,844 | 3,173 |
| | Kerry Logistics Network Ltd. | 2,171,862 | 3,159 |
| | Dah Sing Financial Holdings Ltd. | 583,420 | 2,904 |
| ^ | Chow Tai Fook Jewellery Group Ltd. | 4,499,617 | 2,900 |
| | Huabao International Holdings Ltd. | 7,395,015 | 2,682 |
| | Shun Tak Holdings Ltd. | 7,035,228 | 2,641 |
| | Texwinca Holdings Ltd. | 2,473,930 | 2,580 |
| | Dah Sing Banking Group Ltd. | 1,413,784 | 2,492 |
| | Kowloon Development Co. Ltd. | 2,474,260 | 2,443 |
| | Lifestyle International Holdings Ltd. | 1,706,530 | 2,276 |
| * | China Oceanwide Holdings Ltd. | 16,926,104 | 2,260 |
| * | Goldin Properties Holdings Ltd. | 1,658,878 | 1,904 |
| *,2 | China Jicheng Holdings Ltd. | 10,536,038 | 1,847 |
| *,^ | Good Resources Holdings Ltd. | 9,939,595 | 1,845 |
| ^ | United Co. RUSAL plc | 6,025,435 | 1,836 |
| ^ | Shougang Fushan Resources Group Ltd. | 13,861,711 | 1,780 |
| | Imperial Pacific International Holdings Ltd. | 80,676,480 | 1,754 |
| | Hutchison Telecommunications Hong Kong Holdings Ltd. | 4,936,435 | 1,709 |
| | Hopewell Highway Infrastructure Ltd. | 3,470,160 | 1,674 |
| | Towngas China Co. Ltd. | 2,660,066 | 1,541 |
| ^ | SA Sa International Holdings Ltd. | 3,730,227 | 1,261 |
| *,^ | China Huarong Energy Co. Ltd. | 27,105,460 | 847 |
| *,^ | Macau Legend Development Ltd. | 6,202,505 | 805 |
| | Fortune REIT | 707,000 | 727 |
| | Value Partners Group Ltd. | 504,000 | 586 |
| | Parkson Retail Group Ltd. | 4,444,494 | 577 |
| | Minth Group Ltd. | 290,000 | 576 |
| | Stella International Holdings Ltd. | 210,000 | 522 |
| | HKBN Ltd. | 397,000 | 511 |
| | Man Wah Holdings Ltd. | 417,600 | 490 |
| | NagaCorp Ltd. | 730,000 | 460 |
| | Town Health International Medical Group Ltd. | 2,162,000 | 445 |
| | Nexteer Automotive Group Ltd. | 386,000 | 427 |
| | Pacific Textiles Holdings Ltd. | 270,000 | 416 |
| | Luk Fook Holdings International Ltd. | 189,000 | 399 |
| *,^ | KuangChi Science Ltd. | 923,000 | 382 |
| * | FDG Electric Vehicles Ltd. | 5,920,000 | 365 |
| *,^ | China LNG Group Ltd. | 9,000,000 | 353 |
16
| | | |
| Vanguard® Developed Markets Index Fund | | |
| Schedule of Investments | | |
| December 31, 2015 | | |
| |
| | | | Market |
| | | | Value |
| | | Shares | ($000) |
| | SITC International Holdings Co. Ltd. | 626,000 | 331 |
| * | China Financial International Investments Ltd. | 2,490,000 | 319 |
| * | Freeman Financial Corp. Ltd. | 5,100,000 | 313 |
| | Yuexiu REIT | 576,000 | 309 |
| | Sunlight REIT | 623,000 | 307 |
| | SmarTone Telecommunications Holdings Ltd. | 194,500 | 294 |
| | Giordano International Ltd. | 630,000 | 294 |
| | G-Resources Group Ltd. | 12,312,000 | 292 |
| | CITIC Telecom International Holdings Ltd. | 754,000 | 287 |
| *,^ | China Harmony New Energy Auto Holding Ltd. | 410,000 | 287 |
| | Yingde Gases Group Co. Ltd. | 605,500 | 279 |
| | K Wah International Holdings Ltd. | 622,000 | 266 |
| * | Hang Fat Ginseng Holdings Co. Ltd. | 2,680,000 | 241 |
| | Beijing Enterprises Medical & Health Group Ltd. | 2,742,000 | 232 |
| | Ju Teng International Holdings Ltd. | 440,000 | 209 |
| | Prosperity REIT | 577,000 | 208 |
| | Chow Sang Sang Holdings International Ltd. | 126,000 | 207 |
| | Pacific Basin Shipping Ltd. | 934,000 | 204 |
| | Sun Hung Kai & Co. Ltd. | 311,000 | 204 |
| * | United Photovoltaics Group Ltd. | 2,034,000 | 195 |
| | NewOcean Energy Holdings Ltd. | 490,000 | 191 |
| | Chong Hing Bank Ltd. | 91,000 | 189 |
| * | HC International Inc. | 316,000 | 189 |
| * | Summit Ascent Holdings Ltd. | 438,000 | 188 |
| * | Gemdale Properties & Investment Corp. Ltd. | 2,820,000 | 188 |
| | Far East Consortium International Ltd. | 495,000 | 188 |
| ^ | Truly International Holdings Ltd. | 768,000 | 184 |
| * | CST Mining Group Ltd. | 15,712,000 | 183 |
| | China LotSynergy Holdings Ltd. | 3,880,000 | 181 |
| * | Goodbaby International Holdings Ltd. | 485,000 | 176 |
| | Lee's Pharmaceutical Holdings Ltd. | 138,000 | 172 |
| * | Mason Financial Holdings Ltd. | 3,480,000 | 171 |
| | APT Satellite Holdings Ltd. | 210,500 | 169 |
| ^ | Dynam Japan Holdings Co. Ltd. | 154,000 | 167 |
| * | Mei Ah Entertainment Group Ltd. | 1,640,000 | 166 |
| * | MMG Ltd. | 872,000 | 165 |
| * | Canvest Environmental Protection Group Co. Ltd. | 374,000 | 162 |
| * | China Ocean Shipbuilding Industry Group Ltd. | 5,345,000 | 162 |
| * | Peace Map Holding Ltd. | 3,340,000 | 160 |
| * | Kong Sun Holdings Ltd. | 1,925,000 | 158 |
| | HKR International Ltd. | 344,000 | 158 |
| * | Technovator International Ltd. | 244,000 | 155 |
| * | Sino Oil And Gas Holdings Ltd. | 5,600,000 | 151 |
| | Springland International Holdings Ltd. | 643,000 | 148 |
| | Regal Hotels International Holdings Ltd. | 242,000 | 145 |
| * | United Laboratories International Holdings Ltd. | 262,000 | 144 |
| | TCC International Holdings Ltd. | 780,000 | 143 |
| ^ | GCL New Energy Holdings Ltd. | 2,450,000 | 143 |
| ^ | China Aerospace International Holdings Ltd. | 1,038,000 | 140 |
| | New Sports Group Ltd. | 4,750,000 | 138 |
| * | Emperor Capital Group Ltd. | 1,662,000 | 136 |
| | Spring REIT | 341,000 | 133 |
| | China Silver Group Ltd. | 510,000 | 133 |
| | Road King Infrastructure Ltd. | 151,000 | 131 |
| *,2 | CGN New Energy Holdings Co. Ltd. | 602,000 | 131 |
| * | TOM Group Ltd. | 490,000 | 125 |
| | TCL Communication Technology Holdings Ltd. | 170,000 | 125 |
| * | Midland Holdings Ltd. | 280,000 | 115 |
| | Varitronix International Ltd. | 160,000 | 112 |
| | EVA Precision Industrial Holdings Ltd. | 608,000 | 108 |
| | Shenwan Hongyuan HK Ltd. | 215,000 | 106 |
| * | Microport Scientific Corp. | 223,000 | 106 |
| | AMVIG Holdings Ltd. | 252,000 | 104 |
| | Liu Chong Hing Investment Ltd. | 86,000 | 103 |
17
| | | |
| Vanguard® Developed Markets Index Fund | | |
| Schedule of Investments | | |
| December 31, 2015 | | |
| |
| | | | Market |
| | | | Value |
| | | Shares | ($000) |
| * | Suncorp Technologies Ltd. | 6,300,000 | 100 |
| | Singamas Container Holdings Ltd. | 978,000 | 99 |
| * | SOCAM Development Ltd. | 166,000 | 97 |
| * | Xinchen China Power Holdings Ltd. | 406,000 | 93 |
| *,^ | Sincere Watch Hong Kong Ltd. | 840,000 | 88 |
| | Lai Sun Development Co. Ltd. | 5,775,000 | 88 |
| * | Louis XIII Holdings Ltd. | 319,000 | 86 |
| * | Haier Healthwise Holdings Ltd. | 1,740,000 | 82 |
| | Polytec Asset Holdings Ltd. | 900,000 | 82 |
| | Trinity Ltd. | 536,000 | 79 |
| * | Winshine Entertainment & Media Holding Co. Ltd. | 1,056,000 | 79 |
| * | Sunshine Oilsands Ltd. | 968,500 | 78 |
| * | Hong Kong Television Network Ltd. | 405,000 | 75 |
| * | New Focus Auto Tech Holdings Ltd. | 856,000 | 75 |
| | New World Department Store China Ltd. | 484,000 | 73 |
| | Emperor Watch & Jewellery Ltd. | 2,910,000 | 72 |
| | IT Ltd. | 270,000 | 71 |
| * | Silver Base Group Holdings Ltd. | 465,000 | 69 |
| * | Honghua Group Ltd. | 1,118,000 | 69 |
| | Henderson Investment Ltd. | 862,000 | 69 |
| | GT Group Holdings Ltd. | 708,000 | 68 |
| *,^ | Auto Italia Holdings | 1,675,000 | 68 |
| | Yip's Chemical Holdings Ltd. | 198,000 | 67 |
| * | Anton Oilfield Services Group | 684,000 | 66 |
| * | China Household Holdings Ltd. | 3,360,000 | 65 |
| * | Yanchang Petroleum International Ltd. | 2,980,000 | 57 |
| * | Neo-Neon Holdings Ltd. | 386,000 | 52 |
| * | PetroAsian Energy Holdings Ltd. | 1,760,000 | 47 |
| | Inspur International Ltd. | 146,000 | 27 |
| * | SPT Energy Group Inc. | 136,000 | 12 |
| * | L'sea Resources International Holdings Ltd. | 53,784 | 2 |
| * | GCL New Energy Holdings Ltd. Rights Exp. 01/27/2016 | 918,750 | 1 |
| | | | 1,783,846 |
| Ireland (0.3%) | | |
| | Kerry Group plc Class A | 574,333 | 47,520 |
| * | Bank of Ireland | 107,507,196 | 39,365 |
| | Ryanair Holdings plc ADR | 304,066 | 26,290 |
| | Smurfit Kappa Group plc | 918,094 | 23,513 |
| | Glanbia plc | 677,557 | 12,473 |
| * | Ryanair Holdings plc | 246,897 | 4,024 |
| | Kingspan Group plc | 100,832 | 2,659 |
| | Paddy Power plc | 18,606 | 2,485 |
| | C&C Group plc | 198,158 | 798 |
| | Green REIT plc | 427,888 | 741 |
| | Permanent TSB Group Holdings plc | 66,775 | 335 |
| | FBD Holdings plc | 10,958 | 79 |
| * | Irish Bank Resolution Corp. Ltd. | 257,065 | — |
| | | | 160,282 |
| Israel (0.7%) | | |
| | Teva Pharmaceutical Industries Ltd. | 3,666,921 | 239,233 |
| | Bank Hapoalim BM | 3,818,821 | 19,713 |
| * | Bank Leumi Le-Israel BM | 4,885,213 | 16,939 |
| | Bezeq The Israeli Telecommunication Corp. Ltd. | 7,450,203 | 16,401 |
| | NICE-Systems Ltd. | 204,550 | 11,753 |
| | Elbit Systems Ltd. | 92,019 | 8,101 |
| | Frutarom Industries Ltd. | 138,862 | 7,456 |
| * | Israel Discount Bank Ltd. Class A | 4,046,883 | 7,339 |
| | Israel Chemicals Ltd. | 1,742,263 | 7,072 |
| | Teva Pharmaceutical Industries Ltd. ADR | 95,178 | 6,248 |
| | Mizrahi Tefahot Bank Ltd. | 442,368 | 5,283 |
| | Azrieli Group | 139,730 | 5,205 |
| * | Tower Semiconductor Ltd. | 264,021 | 3,764 |
| | Delek Group Ltd. | 18,012 | 3,607 |
| | Gazit-Globe Ltd. | 335,834 | 2,990 |
18
| | | |
| Vanguard® Developed Markets Index Fund | | |
| Schedule of Investments | | |
| December 31, 2015 | | |
| |
| | | | Market |
| | | | Value |
| | | Shares | ($000) |
| | Paz Oil Co. Ltd. | 18,298 | 2,875 |
| | Osem Investments Ltd. | 148,926 | 2,555 |
| | First International Bank Of Israel Ltd. | 165,444 | 1,953 |
| | Strauss Group Ltd. | 124,228 | 1,849 |
| | Melisron Ltd. | 53,032 | 1,697 |
| | Harel Insurance Investments & Financial Services Ltd. | 424,007 | 1,627 |
| * | Oil Refineries Ltd. | 4,099,991 | 1,621 |
| | Israel Corp. Ltd. | 8,892 | 1,612 |
| | Shikun & Binui Ltd. | 774,822 | 1,222 |
| | Delek Automotive Systems Ltd. | 108,079 | 962 |
| * | Clal Insurance Enterprises Holdings Ltd. | 74,543 | 910 |
| | Migdal Insurance & Financial Holding Ltd. | 843,302 | 614 |
| | Alony Hetz Properties & Investments Ltd. | 50,341 | 365 |
| * | EZchip Semiconductor Ltd. | 13,891 | 344 |
| * | Airport City Ltd. | 33,059 | 297 |
| * | Kenon Holdings Ltd. | 28,602 | 290 |
| * | Cellcom Israel Ltd. (Registered) | 45,328 | 282 |
| | Reit 1 Ltd. | 87,287 | 233 |
| * | Partner Communications Co. Ltd. | 51,869 | 229 |
| | Amot Investments Ltd. | 49,227 | 158 |
| * | Nova Measuring Instruments Ltd. | 15,431 | 154 |
| | Delta-Galil Industries Ltd. | 5,542 | 153 |
| * | Jerusalem Oil Exploration | 3,871 | 152 |
| * | Compugen Ltd. | 22,051 | 138 |
| | Rami Levy Chain Stores Hashikma Marketing 2006 Ltd. | 2,943 | 135 |
| * | IDI Insurance Co. Ltd. | 2,914 | 133 |
| | Electra Ltd. | 904 | 111 |
| | Ituran Location and Control Ltd. | 5,731 | 107 |
| * | Mazor Robotics Ltd. | 20,417 | 103 |
| * | Shufersal Ltd. | 33,255 | 103 |
| * | Phoenix Holdings Ltd. | 44,409 | 99 |
| * | Allot Communications Ltd. | 16,745 | 97 |
| * | Menorah Mivtachim Holdings Ltd. | 10,932 | 94 |
| * | Evogene Ltd. | 11,292 | 90 |
| | Norstar Holdings Inc. | 5,354 | 87 |
| * | Naphtha Israel Petroleum Corp. Ltd. | 16,532 | 81 |
| | Silicom Ltd. | 2,567 | 76 |
| | Africa Israel Properties Ltd. | 7,042 | 75 |
| * | Property & Building Corp. Ltd. | 1,038 | 73 |
| * | Jerusalem Economy Ltd. | 48,763 | 72 |
| * | Kamada Ltd. | 17,084 | 72 |
| * | Gilat Satellite Networks Ltd. | 19,683 | 69 |
| * | Africa Israel Investments Ltd. | 111,794 | 52 |
| * | AudioCodes Ltd. | 8,084 | 32 |
| * | Ceragon Networks Ltd. | 19,624 | 24 |
| | | | 385,181 |
| Italy (2.2%) | | |
| | Intesa Sanpaolo SPA (Registered) | 47,125,298 | 156,504 |
| | Eni SPA | 9,591,113 | 142,507 |
| | Enel SPA | 26,782,569 | 112,308 |
| | UniCredit SPA | 19,084,989 | 105,516 |
| | Assicurazioni Generali SPA | 4,925,462 | 89,972 |
| * | Telecom Italia SPA (Registered) | 43,077,821 | 54,593 |
| | Atlantia SPA | 1,859,375 | 49,196 |
| * | Fiat Chrysler Automobiles NV | 3,418,842 | 47,481 |
| | Luxottica Group SPA | 682,111 | 44,450 |
| | Snam SPA | 8,460,353 | 44,154 |
| | Terna Rete Elettrica Nazionale SPA | 5,586,027 | 28,729 |
| | CNH Industrial NV | 3,589,504 | 24,584 |
| | Telecom Italia SPA (Bearer) | 22,990,142 | 23,596 |
| | Unione di Banche Italiane SPA | 3,386,129 | 22,624 |
| | Tenaris SA | 1,826,601 | 21,630 |
| * | Finmeccanica SPA | 1,495,667 | 20,796 |
| | Mediobanca SPA | 2,145,015 | 20,562 |
19
| | | |
| Vanguard® Developed Markets Index Fund | | |
| Schedule of Investments | | |
| December 31, 2015 | | |
| |
| | | | Market |
| | | | Value |
| | | Shares | ($000) |
| * | Banco Popolare SC | 1,395,013 | 19,224 |
| | EXOR SPA | 390,396 | 17,719 |
| | Prysmian SPA | 810,665 | 17,712 |
| | Enel Green Power SPA | 6,118,229 | 12,436 |
| | Banca Monte dei Paschi di Siena SPA | 9,237,269 | 12,229 |
| | Mediaset SPA | 2,931,060 | 12,146 |
| | Intesa Sanpaolo SPA | 3,336,536 | 10,192 |
| | UnipolSai SPA | 3,986,915 | 10,143 |
| | Davide Campari-Milano SPA | 1,075,092 | 9,295 |
| *,^ | Saipem SPA | 981,405 | 7,933 |
| * | Banca Mediolanum SPA | 987,048 | 7,841 |
| ^ | Salvatore Ferragamo SPA | 180,183 | 4,223 |
| | Banca Popolare di Milano Scarl | 2,429,461 | 2,406 |
| | Banca Popolare dell'Emilia Romagna SC | 263,623 | 2,000 |
| | Parmalat SPA | 749,905 | 1,945 |
| | Recordati SPA | 56,340 | 1,470 |
| | Azimut Holding SPA | 57,771 | 1,436 |
| | Unipol Gruppo Finanziario SPA | 270,973 | 1,394 |
| * | Yoox Net-A-Porter Group SPA | 32,032 | 1,193 |
| | Italcementi SPA | 106,898 | 1,190 |
| | A2A SPA | 853,411 | 1,156 |
| | Banca Popolare di Sondrio SCARL | 250,062 | 1,118 |
| | Moncler SPA | 74,300 | 1,034 |
| 2 | Anima Holding SPA | 117,648 | 1,016 |
| | Banca Generali SPA | 31,481 | 990 |
| | FinecoBank Banca Fineco SPA | 118,300 | 973 |
| | Hera SPA | 365,427 | 968 |
| | De' Longhi SPA | 31,809 | 950 |
| | Brembo SPA | 16,507 | 798 |
| | Buzzi Unicem SPA-RSP | 69,547 | 768 |
| *,2 | Infrastrutture Wireless Italiane SPA | 136,836 | 746 |
| * | Credito Valtellinese SC | 619,884 | 730 |
| | Interpump Group SPA | 44,296 | 687 |
| | Ansaldo STS SPA | 63,451 | 680 |
| | Cerved Information Solutions SPA | 81,307 | 675 |
| * | Autogrill SPA | 70,188 | 669 |
| | DiaSorin SPA | 12,709 | 668 |
| | Societa Cattolica di Assicurazioni SCRL | 81,240 | 643 |
| | Tod's SPA | 7,638 | 603 |
| | Ei Towers SPA | 8,338 | 537 |
| | Banca Carige SPA | 377,361 | 514 |
| | Salini Impregilo SPA | 108,828 | 471 |
| | Beni Stabili SpA SIIQ | 586,873 | 442 |
| | Amplifon SPA | 49,576 | 429 |
| | Industria Macchine Automatiche SPA | 8,108 | 421 |
| | ACEA SPA | 27,033 | 416 |
| | Societa Iniziative Autostradali e Servizi SPA | 38,330 | 407 |
| *,2 | OVS SPA | 58,016 | 404 |
| | Iren SPA | 245,214 | 396 |
| | ERG SPA | 27,096 | 366 |
| * | Saras SPA | 189,751 | 366 |
| | MARR SPA | 17,508 | 362 |
| | Banca IFIS SPA | 11,511 | 359 |
| | Danieli & C Officine Meccaniche SPA-RSP | 22,523 | 321 |
| | Credito Emiliano SPA | 43,013 | 318 |
| | Italmobiliare SPA | 6,768 | 309 |
| | Brunello Cucinelli SPA | 16,798 | 297 |
| 2 | RAI Way SPA | 52,971 | 271 |
| | Piaggio & C SPA | 101,189 | 255 |
| | ASTM SPA | 19,067 | 239 |
| | Buzzi Unicem SPA | 12,905 | 231 |
| * | Safilo Group SPA | 18,503 | 214 |
| | Cementir Holding SPA | 32,069 | 204 |
| * | Geox SPA | 45,907 | 203 |
20
| | | |
| Vanguard® Developed Markets Index Fund | | |
| Schedule of Investments | | |
| December 31, 2015 | | |
| |
| | | | Market |
| | | | Value |
| | | Shares | ($000) |
| * | CIR-Compagnie Industriali Riunite SPA | 171,032 | 179 |
| | Zignago Vetro SPA | 27,145 | 179 |
| | Immobiliare Grande Distribuzione SIIQ SPA | 165,670 | 159 |
| ^ | Astaldi SPA | 25,241 | 154 |
| | Italmobiliare-RSP | 4,663 | 151 |
| | Esprinet SPA | 15,743 | 145 |
| *,^ | RCS MediaGroup SPA | 190,643 | 128 |
| | Danieli & C Officine Meccaniche SPA | 6,433 | 123 |
| | Trevi Finanziaria Industriale SPA | 60,115 | 119 |
| * | Fincantieri SPA | 265,809 | 115 |
| * | Gruppo Editoriale L'Espresso SPA | 85,092 | 93 |
| | DeA Capital SPA | 53,313 | 81 |
| * | Arnoldo Mondadori Editore SPA | 70,344 | 79 |
| * | Sogefi SPA | 33,811 | 79 |
| | Falck Renewables SPA | 62,775 | 75 |
| * | Juventus Football Club SPA | 253,426 | 71 |
| * | Cofide SPA | 90,350 | 41 |
| * | Unione di Banche Italiane SPA Rights Exp. 01/12/2016 | 3,302,491 | — |
| | | | 1,189,924 |
| Japan (23.1%) | | |
| | Toyota Motor Corp. | 10,452,674 | 643,665 |
| | Mitsubishi UFJ Financial Group Inc. | 54,036,917 | 334,718 |
| | Honda Motor Co. Ltd. | 6,958,493 | 222,404 |
| | Mizuho Financial Group Inc. | 96,168,257 | 192,337 |
| | KDDI Corp. | 7,351,422 | 190,918 |
| | Sumitomo Mitsui Financial Group Inc. | 5,047,994 | 190,517 |
| | SoftBank Group Corp. | 3,629,052 | 183,160 |
| | Takeda Pharmaceutical Co. Ltd. | 3,019,554 | 150,553 |
| | Japan Tobacco Inc. | 4,063,870 | 149,200 |
| | East Japan Railway Co. | 1,470,350 | 138,457 |
| | Seven & i Holdings Co. Ltd. | 3,013,788 | 137,985 |
| | FANUC Corp. | 759,543 | 130,862 |
| | Central Japan Railway Co. | 701,717 | 124,579 |
| | Canon Inc. | 4,029,118 | 121,881 |
| | Astellas Pharma Inc. | 8,497,296 | 120,966 |
| | Sony Corp. | 4,881,148 | 119,963 |
| | NTT DOCOMO Inc. | 5,262,553 | 107,943 |
| | Murata Manufacturing Co. Ltd. | 731,911 | 105,308 |
| | Tokio Marine Holdings Inc. | 2,726,043 | 105,292 |
| | Hitachi Ltd. | 18,056,638 | 102,316 |
| | Mitsubishi Estate Co. Ltd. | 4,913,850 | 102,175 |
| | Fuji Heavy Industries Ltd. | 2,427,536 | 100,005 |
| | Kao Corp. | 1,942,163 | 99,805 |
| | Keyence Corp. | 177,283 | 97,436 |
| | Nissan Motor Co. Ltd. | 9,103,089 | 95,316 |
| | Denso Corp. | 1,947,484 | 93,062 |
| | Mitsui Fudosan Co. Ltd. | 3,686,910 | 92,534 |
| | Mitsubishi Corp. | 5,371,712 | 89,348 |
| | Shin-Etsu Chemical Co. Ltd. | 1,600,130 | 86,992 |
| | Bridgestone Corp. | 2,511,093 | 86,134 |
| | Panasonic Corp. | 8,274,016 | 83,878 |
| | Mitsubishi Electric Corp. | 7,678,622 | 80,601 |
| | Mitsui & Co. Ltd. | 6,621,852 | 78,681 |
| | Nippon Telegraph & Telephone Corp. | 1,967,436 | 78,300 |
| | Daikin Industries Ltd. | 1,044,994 | 76,098 |
| | Nomura Holdings Inc. | 13,306,810 | 74,120 |
| | Dai-ichi Life Insurance Co. Ltd. | 4,389,830 | 73,037 |
| | Daiwa House Industry Co. Ltd. | 2,508,879 | 72,121 |
| | ORIX Corp. | 5,117,671 | 71,793 |
| | Fast Retailing Co. Ltd. | 197,692 | 69,155 |
| | Eisai Co. Ltd. | 1,038,241 | 68,680 |
| | Nidec Corp. | 940,288 | 68,186 |
| | Kubota Corp. | 4,378,301 | 67,639 |
| | FUJIFILM Holdings Corp. | 1,608,231 | 67,116 |
21
| | |
| Vanguard® Developed Markets Index Fund | | |
| Schedule of Investments | | |
| December 31, 2015 | | |
| |
| | | Market |
| | | Value |
| | Shares | ($000) |
| ITOCHU Corp. | 5,596,873 | 66,202 |
| Hoya Corp. | 1,613,864 | 65,995 |
| Ono Pharmaceutical Co. Ltd. | 354,423 | 63,198 |
| Nippon Steel & Sumitomo Metal Corp. | 3,172,107 | 62,752 |
| Komatsu Ltd. | 3,672,195 | 60,086 |
| SMC Corp. | 227,642 | 59,126 |
| MS&AD Insurance Group Holdings Inc. | 2,007,790 | 58,878 |
| Nintendo Co. Ltd. | 420,407 | 57,810 |
| Kyocera Corp. | 1,214,413 | 56,398 |
| Sumitomo Mitsui Trust Holdings Inc. | 14,796,194 | 56,038 |
| Toray Industries Inc. | 5,898,937 | 54,816 |
| Mitsubishi Heavy Industries Ltd. | 12,438,184 | 54,386 |
| Daiichi Sankyo Co. Ltd. | 2,622,952 | 54,137 |
| Shionogi & Co. Ltd. | 1,159,492 | 52,444 |
| Otsuka Holdings Co. Ltd. | 1,465,710 | 52,075 |
| Secom Co. Ltd. | 738,962 | 50,079 |
| Olympus Corp. | 1,253,323 | 49,342 |
| West Japan Railway Co. | 712,260 | 49,234 |
| Ajinomoto Co. Inc. | 2,042,193 | 48,350 |
| Sumitomo Realty & Development Co. Ltd. | 1,692,759 | 48,316 |
| Suzuki Motor Corp. | 1,582,519 | 48,083 |
| Sompo Japan Nipponkoa Holdings Inc. | 1,464,388 | 48,083 |
| Dentsu Inc. | 868,749 | 47,531 |
| Shimano Inc. | 306,980 | 47,139 |
| Asahi Group Holdings Ltd. | 1,468,941 | 45,984 |
| Mazda Motor Corp. | 2,218,318 | 45,774 |
| Oriental Land Co. Ltd. | 749,761 | 45,358 |
| Sumitomo Corp. | 4,396,282 | 44,822 |
| Nitto Denko Corp. | 612,251 | 44,698 |
| Kirin Holdings Co. Ltd. | 3,243,133 | 44,032 |
| MEIJI Holdings Co. Ltd. | 532,106 | 43,952 |
| Resona Holdings Inc. | 9,049,199 | 43,945 |
| Tokyo Gas Co. Ltd. | 9,038,768 | 42,471 |
| Sumitomo Electric Industries Ltd. | 2,982,899 | 42,121 |
| Aeon Co. Ltd. | 2,685,104 | 41,371 |
| Daiwa Securities Group Inc. | 6,652,804 | 40,673 |
| JX Holdings Inc. | 9,490,661 | 39,833 |
| Terumo Corp. | 1,276,320 | 39,558 |
| Recruit Holdings Co. Ltd. | 1,309,854 | 38,502 |
| Tokyo Electron Ltd. | 634,008 | 38,411 |
| Sekisui House Ltd. | 2,278,396 | 38,308 |
| Chubu Electric Power Co. Inc. | 2,759,984 | 37,794 |
| Rakuten Inc. | 3,275,725 | 37,729 |
| Sysmex Corp. | 560,281 | 35,939 |
| Asahi Kasei Corp. | 5,211,729 | 35,242 |
| Inpex Corp. | 3,599,996 | 35,096 |
| * Tokyo Electric Power Co. Inc. | 6,056,243 | 34,873 |
| Fujitsu Ltd. | 6,982,558 | 34,851 |
| Tokyu Corp. | 4,362,809 | 34,477 |
| * Kansai Electric Power Co. Inc. | 2,866,567 | 34,370 |
| Sumitomo Chemical Co. Ltd. | 5,962,055 | 34,241 |
| Toyota Industries Corp. | 635,576 | 33,986 |
| Marubeni Corp. | 6,536,122 | 33,603 |
| Japan Exchange Group Inc. | 2,146,480 | 33,553 |
| Daito Trust Construction Co. Ltd. | 288,101 | 33,279 |
| Mitsubishi Chemical Holdings Corp. | 5,151,801 | 32,687 |
| NEC Corp. | 10,174,604 | 32,238 |
| T&D Holdings Inc. | 2,436,467 | 32,146 |
| Aisin Seiki Co. Ltd. | 741,975 | 31,933 |
| Hankyu Hanshin Holdings Inc. | 4,897,290 | 31,832 |
| JFE Holdings Inc. | 2,017,950 | 31,687 |
| Shiseido Co. Ltd. | 1,521,426 | 31,568 |
| * Toshiba Corp. | 14,911,646 | 30,647 |
| Yamato Holdings Co. Ltd. | 1,439,803 | 30,507 |
22
| | |
| Vanguard® Developed Markets Index Fund | | |
| Schedule of Investments | | |
| December 31, 2015 | | |
| |
| | | Market |
| | | Value |
| | Shares | ($000) |
| TDK Corp. | 470,505 | 30,133 |
| Japan Post Holdings Co. Ltd. | 1,936,743 | 30,051 |
| Chugai Pharmaceutical Co. Ltd. | 858,327 | 29,918 |
| Kintetsu Group Holdings Co. Ltd. | 7,030,553 | 28,585 |
| Taisei Corp. | 4,232,662 | 27,880 |
| Osaka Gas Co. Ltd. | 7,690,273 | 27,777 |
| Unicharm Corp. | 1,345,021 | 27,468 |
| Makita Corp. | 475,091 | 27,378 |
| Bank of Yokohama Ltd. | 4,455,972 | 27,313 |
| Ricoh Co. Ltd. | 2,609,460 | 26,869 |
| Santen Pharmaceutical Co. Ltd. | 1,589,520 | 26,169 |
| Omron Corp. | 781,011 | 26,044 |
| Odakyu Electric Railway Co. Ltd. | 2,400,676 | 25,848 |
| Electric Power Development Co. Ltd. | 703,166 | 25,044 |
| Obayashi Corp. | 2,648,891 | 24,442 |
| Yamaha Motor Co. Ltd. | 1,087,350 | 24,373 |
| Isuzu Motors Ltd. | 2,225,339 | 23,973 |
| Nitori Holdings Co. Ltd. | 284,337 | 23,879 |
| NGK Insulators Ltd. | 1,058,598 | 23,861 |
| NTT Data Corp. | 493,130 | 23,841 |
| Dai Nippon Printing Co. Ltd. | 2,392,230 | 23,656 |
| Kikkoman Corp. | 682,340 | 23,641 |
| Tohoku Electric Power Co. Inc. | 1,872,784 | 23,412 |
| Japan Post Bank Co. Ltd. | 1,584,374 | 23,068 |
| LIXIL Group Corp. | 1,009,770 | 22,427 |
| Sumitomo Metal Mining Co. Ltd. | 1,823,199 | 22,132 |
| Asahi Glass Co. Ltd. | 3,756,457 | 21,520 |
| Suntory Beverage & Food Ltd. | 490,044 | 21,452 |
| ^ Casio Computer Co. Ltd. | 908,246 | 21,232 |
| Kawasaki Heavy Industries Ltd. | 5,661,877 | 20,948 |
| Toyota Tsusho Corp. | 887,997 | 20,773 |
| Lawson Inc. | 252,893 | 20,528 |
| Yahoo Japan Corp. | 5,033,954 | 20,463 |
| Shizuoka Bank Ltd. | 2,109,363 | 20,457 |
| Mitsubishi Motors Corp. | 2,412,057 | 20,407 |
| NSK Ltd. | 1,837,459 | 19,966 |
| * Kyushu Electric Power Co. Inc. | 1,816,417 | 19,797 |
| NGK Spark Plug Co. Ltd. | 751,737 | 19,792 |
| Koito Manufacturing Co. Ltd. | 481,505 | 19,745 |
| Kajima Corp. | 3,314,117 | 19,724 |
| TOTO Ltd. | 559,125 | 19,643 |
| Yakult Honsha Co. Ltd. | 397,733 | 19,467 |
| Keio Corp. | 2,231,677 | 19,272 |
| Tobu Railway Co. Ltd. | 3,874,988 | 19,113 |
| Sekisui Chemical Co. Ltd. | 1,459,017 | 19,049 |
| Chiba Bank Ltd. | 2,647,418 | 18,787 |
| Alps Electric Co. Ltd. | 690,398 | 18,722 |
| Toppan Printing Co. Ltd. | 2,005,927 | 18,481 |
| ^ Nikon Corp. | 1,368,715 | 18,332 |
| Isetan Mitsukoshi Holdings Ltd. | 1,401,212 | 18,273 |
| Shimizu Corp. | 2,231,999 | 18,200 |
| Rohm Co. Ltd. | 350,150 | 17,735 |
| Shimadzu Corp. | 1,055,139 | 17,663 |
| Daicel Corp. | 1,186,045 | 17,651 |
| Ryohin Keikaku Co. Ltd. | 86,577 | 17,533 |
| Konica Minolta Inc. | 1,696,140 | 16,987 |
| Seiko Epson Corp. | 1,089,656 | 16,780 |
| Nippon Paint Holdings Co. Ltd. | 689,901 | 16,697 |
| Fukuoka Financial Group Inc. | 3,362,867 | 16,675 |
| Seibu Holdings Inc. | 813,550 | 16,615 |
| Nisshin Seifun Group Inc. | 1,012,163 | 16,533 |
| Trend Micro Inc. | 401,564 | 16,294 |
| IHI Corp. | 5,888,533 | 16,255 |
| Bandai Namco Holdings Inc. | 764,410 | 16,150 |
23
| | |
| Vanguard® Developed Markets Index Fund | | |
| Schedule of Investments | | |
| December 31, 2015 | | |
| |
| | | Market |
| | | Value |
| | Shares | ($000) |
| Don Quijote Holdings Co. Ltd. | 456,818 | 16,043 |
| Yamaha Corp. | 662,936 | 16,013 |
| Kyowa Hakko Kirin Co. Ltd. | 1,007,055 | 15,846 |
| Aozora Bank Ltd. | 4,492,328 | 15,677 |
| Chugoku Electric Power Co. Inc. | 1,183,334 | 15,624 |
| Mitsui Chemicals Inc. | 3,499,760 | 15,521 |
| Hirose Electric Co. Ltd. | 127,800 | 15,473 |
| Mitsubishi Tanabe Pharma Corp. | 897,691 | 15,466 |
| Keikyu Corp. | 1,866,268 | 15,421 |
| Mitsubishi Materials Corp. | 4,892,736 | 15,410 |
| Nippon Yusen KK | 6,353,997 | 15,400 |
| Nomura Research Institute Ltd. | 396,111 | 15,212 |
| Nissin Foods Holdings Co. Ltd. | 286,338 | 15,194 |
| Kuraray Co. Ltd. | 1,241,829 | 15,042 |
| M3 Inc. | 716,209 | 14,850 |
| NH Foods Ltd. | 751,245 | 14,724 |
| Marui Group Co. Ltd. | 902,939 | 14,693 |
| Nagoya Railroad Co. Ltd. | 3,508,821 | 14,604 |
| JTEKT Corp. | 886,829 | 14,516 |
| Hamamatsu Photonics KK | 528,515 | 14,489 |
| MISUMI Group Inc. | 1,031,743 | 14,252 |
| Asics Corp. | 685,796 | 14,229 |
| Alfresa Holdings Corp. | 717,775 | 14,176 |
| Keisei Electric Railway Co. Ltd. | 1,103,023 | 14,073 |
| Suruga Bank Ltd. | 681,398 | 14,043 |
| Yaskawa Electric Corp. | 1,030,441 | 14,021 |
| J Front Retailing Co. Ltd. | 961,038 | 13,971 |
| Amada Holdings Co. Ltd. | 1,454,541 | 13,880 |
| Nippon Express Co. Ltd. | 2,945,760 | 13,843 |
| Obic Co. Ltd. | 260,613 | 13,795 |
| Taiheiyo Cement Corp. | 4,698,210 | 13,720 |
| Oji Holdings Corp. | 3,393,002 | 13,636 |
| Keihan Electric Railway Co. Ltd. | 1,967,734 | 13,178 |
| Bank of Kyoto Ltd. | 1,419,140 | 13,161 |
| Taisho Pharmaceutical Holdings Co. Ltd. | 184,392 | 13,023 |
| Stanley Electric Co. Ltd. | 590,852 | 12,962 |
| JGC Corp. | 846,796 | 12,961 |
| Rinnai Corp. | 145,804 | 12,919 |
| Kaneka Corp. | 1,242,336 | 12,913 |
| ANA Holdings Inc. | 4,472,353 | 12,903 |
| Toho Gas Co. Ltd. | 1,991,875 | 12,864 |
| Tosoh Corp. | 2,492,791 | 12,823 |
| Hiroshima Bank Ltd. | 2,247,451 | 12,774 |
| Kobe Steel Ltd. | 11,693,578 | 12,705 |
| USS Co. Ltd. | 845,090 | 12,698 |
| Teijin Ltd. | 3,709,876 | 12,643 |
| Credit Saison Co. Ltd. | 638,273 | 12,575 |
| Yamazaki Baking Co. Ltd. | 558,821 | 12,566 |
| Nissan Chemical Industries Ltd. | 549,773 | 12,480 |
| Joyo Bank Ltd. | 2,635,646 | 12,464 |
| Hisamitsu Pharmaceutical Co. Inc. | 294,841 | 12,378 |
| Suzuken Co. Ltd. | 325,606 | 12,374 |
| Nankai Electric Railway Co. Ltd. | 2,090,069 | 12,370 |
| Toho Co. Ltd. | 446,385 | 12,352 |
| Sohgo Security Services Co. Ltd. | 260,913 | 12,237 |
| Hulic Co. Ltd. | 1,389,237 | 12,198 |
| Toyo Suisan Kaisha Ltd. | 348,902 | 12,160 |
| Calbee Inc. | 286,846 | 12,113 |
| Shimamura Co. Ltd. | 102,965 | 12,058 |
| Japan Airlines Co. Ltd. | 336,517 | 12,045 |
| Hino Motors Ltd. | 1,040,043 | 12,020 |
| Sony Financial Holdings Inc. | 668,427 | 11,956 |
| Haseko Corp. | 1,075,072 | 11,886 |
| Kansai Paint Co. Ltd. | 783,300 | 11,873 |
24
| | |
| Vanguard® Developed Markets Index Fund | | |
| Schedule of Investments | | |
| December 31, 2015 | | |
| |
| | | Market |
| | | Value |
| | Shares | ($000) |
| Toyo Seikan Group Holdings Ltd. | 637,935 | 11,833 |
| Tsuruha Holdings Inc. | 135,925 | 11,777 |
| Tokyu Fudosan Holdings Corp. | 1,875,877 | 11,758 |
| Yokogawa Electric Corp. | 962,406 | 11,574 |
| JSR Corp. | 740,039 | 11,533 |
| Yamada Denki Co. Ltd. | 2,667,854 | 11,524 |
| Mitsui OSK Lines Ltd. | 4,481,892 | 11,305 |
| Iida Group Holdings Co. Ltd. | 609,750 | 11,301 |
| Shinsei Bank Ltd. | 6,046,114 | 11,127 |
| ^ Daihatsu Motor Co. Ltd. | 823,819 | 11,113 |
| Mabuchi Motor Co. Ltd. | 205,041 | 11,112 |
| Minebea Co. Ltd. | 1,293,318 | 11,073 |
| Seven Bank Ltd. | 2,510,502 | 11,010 |
| FamilyMart Co. Ltd. | 232,757 | 10,831 |
| Kewpie Corp. | 437,213 | 10,800 |
| Ezaki Glico Co. Ltd. | 198,869 | 10,744 |
| * Kyushu Financial Group Inc. | 1,518,720 | 10,702 |
| Hokuriku Electric Power Co. | 720,233 | 10,644 |
| Brother Industries Ltd. | 925,535 | 10,632 |
| Takashimaya Co. Ltd. | 1,178,349 | 10,612 |
| Kakaku.com Inc. | 533,562 | 10,495 |
| MediPal Holdings Corp. | 614,802 | 10,479 |
| Kose Corp. | 111,722 | 10,330 |
| Iyo Bank Ltd. | 1,061,941 | 10,318 |
| Yamaguchi Financial Group Inc. | 870,252 | 10,310 |
| Mitsubishi UFJ Lease & Finance Co. Ltd. | 1,989,019 | 10,236 |
| NOK Corp. | 437,203 | 10,213 |
| Hokuhoku Financial Group Inc. | 5,007,033 | 10,207 |
| Sojitz Corp. | 4,813,929 | 10,102 |
| Pigeon Corp. | 414,703 | 10,061 |
| Kobayashi Pharmaceutical Co. Ltd. | 121,771 | 10,001 |
| Hakuhodo DY Holdings Inc. | 915,204 | 9,902 |
| Sotetsu Holdings Inc. | 1,695,352 | 9,865 |
| Miraca Holdings Inc. | 222,590 | 9,794 |
| TonenGeneral Sekiyu KK | 1,155,362 | 9,754 |
| Sumitomo Heavy Industries Ltd. | 2,170,358 | 9,729 |
| Gunma Bank Ltd. | 1,671,693 | 9,720 |
| Otsuka Corp. | 197,356 | 9,695 |
| Park24 Co. Ltd. | 395,245 | 9,576 |
| Hachijuni Bank Ltd. | 1,562,734 | 9,564 |
| ^ Japan Airport Terminal Co. Ltd. | 215,220 | 9,528 |
| Air Water Inc. | 588,949 | 9,472 |
| Hoshizaki Electric Co. Ltd. | 152,127 | 9,457 |
| Lion Corp. | 1,002,270 | 9,431 |
| Fuji Electric Co. Ltd. | 2,234,435 | 9,371 |
| Kaken Pharmaceutical Co. Ltd. | 136,811 | 9,349 |
| Hitachi Metals Ltd. | 755,741 | 9,324 |
| AEON Financial Service Co. Ltd. | 417,197 | 9,320 |
| Shikoku Electric Power Co. Inc. | 594,147 | 9,281 |
| Nabtesco Corp. | 456,728 | 9,278 |
| Kurita Water Industries Ltd. | 438,802 | 9,189 |
| Disco Corp. | 97,443 | 9,176 |
| Chugoku Bank Ltd. | 681,222 | 9,090 |
| Sumitomo Rubber Industries Ltd. | 687,079 | 8,934 |
| Tokyo Tatemono Co. Ltd. | 820,476 | 8,930 |
| Konami Holdings Corp. | 372,928 | 8,877 |
| Nippon Shokubai Co. Ltd. | 124,791 | 8,684 |
| Asahi Intecc Co. Ltd. | 187,491 | 8,616 |
| DIC Corp. | 3,179,874 | 8,604 |
| Ube Industries Ltd. | 4,068,060 | 8,597 |
| Nishi-Nippon Railroad Co. Ltd. | 1,461,654 | 8,592 |
| Nomura Real Estate Holdings Inc. | 460,848 | 8,550 |
| Sundrug Co. Ltd. | 132,045 | 8,490 |
| Sawai Pharmaceutical Co. Ltd. | 124,007 | 8,490 |
25
| | | |
| Vanguard® Developed Markets Index Fund | | |
| Schedule of Investments | | |
| December 31, 2015 | | |
| |
| | | | Market |
| | | | Value |
| | | Shares | ($000) |
| | Temp Holdings Co. Ltd. | 540,769 | 8,382 |
| | Zenkoku Hosho Co. Ltd. | 253,429 | 8,372 |
| | Ebara Corp. | 1,761,636 | 8,372 |
| | Citizen Holdings Co. Ltd. | 1,162,325 | 8,354 |
| | Nexon Co. Ltd. | 511,637 | 8,323 |
| | NTN Corp. | 1,972,557 | 8,318 |
| | SBI Holdings Inc. | 769,989 | 8,309 |
| | THK Co. Ltd. | 445,384 | 8,255 |
| | Benesse Holdings Inc. | 281,916 | 8,119 |
| | Nippon Electric Glass Co. Ltd. | 1,586,400 | 7,996 |
| | Aeon Mall Co. Ltd. | 462,394 | 7,931 |
| | Mitsubishi Gas Chemical Co. Inc. | 1,547,560 | 7,913 |
| | Denka Co. Ltd. | 1,757,641 | 7,788 |
| | Toyo Tire & Rubber Co. Ltd. | 394,600 | 7,787 |
| | Matsumotokiyoshi Holdings Co. Ltd. | 152,333 | 7,773 |
| | Sugi Holdings Co. Ltd. | 138,311 | 7,631 |
| | CyberAgent Inc. | 184,549 | 7,604 |
| | Maruichi Steel Tube Ltd. | 256,391 | 7,569 |
| | Sankyo Co. Ltd. | 202,608 | 7,563 |
| | Kawasaki Kisen Kaisha Ltd. | 3,497,981 | 7,488 |
| | Mitsubishi Logistics Corp. | 567,330 | 7,475 |
| | Nifco Inc. | 160,830 | 7,449 |
| | 77 Bank Ltd. | 1,380,965 | 7,435 |
| | Rohto Pharmaceutical Co. Ltd. | 370,591 | 7,394 |
| | Square Enix Holdings Co. Ltd. | 304,766 | 7,368 |
| | Sumitomo Dainippon Pharma Co. Ltd. | 621,788 | 7,326 |
| | Aoyama Trading Co. Ltd. | 189,409 | 7,297 |
| | Nishi-Nippon City Bank Ltd. | 2,757,344 | 7,267 |
| | Nippon Shinyaku Co. Ltd. | 196,634 | 7,266 |
| | Tsumura & Co. | 260,875 | 7,244 |
| | Kamigumi Co. Ltd. | 832,285 | 7,166 |
| | Nippon Kayaku Co. Ltd. | 680,139 | 7,139 |
| | NHK Spring Co. Ltd. | 711,179 | 7,130 |
| * | Acom Co. Ltd. | 1,503,648 | 7,081 |
| | Nihon Kohden Corp. | 292,361 | 7,072 |
| | Azbil Corp. | 272,801 | 6,990 |
| * | Hokkaido Electric Power Co. Inc. | 680,092 | 6,987 |
| ^ | Topcon Corp. | 406,542 | 6,869 |
| | Sumitomo Forestry Co. Ltd. | 508,891 | 6,867 |
| | Sega Sammy Holdings Inc. | 722,765 | 6,760 |
| | Fujikura Ltd. | 1,245,859 | 6,729 |
| | Hitachi High-Technologies Corp. | 248,585 | 6,723 |
| | Glory Ltd. | 216,712 | 6,653 |
| | Resorttrust Inc. | 251,088 | 6,624 |
| | SCSK Corp. | 164,128 | 6,594 |
| ^ | Japan Post Insurance Co. Ltd. | 254,394 | 6,593 |
| | H2O Retailing Corp. | 332,987 | 6,507 |
| | Nichirei Corp. | 878,522 | 6,473 |
| | Toyoda Gosei Co. Ltd. | 284,197 | 6,456 |
| | Showa Denko KK | 5,495,080 | 6,436 |
| | Century Tokyo Leasing Corp. | 179,274 | 6,404 |
| | Kinden Corp. | 501,604 | 6,396 |
| | DeNA Co. Ltd. | 407,265 | 6,368 |
| *,^ | Sharp Corp. | 6,137,168 | 6,330 |
| | Hitachi Chemical Co. Ltd. | 398,324 | 6,319 |
| | Yokohama Rubber Co. Ltd. | 410,866 | 6,310 |
| | Dowa Holdings Co. Ltd. | 875,751 | 6,297 |
| | Ushio Inc. | 456,033 | 6,289 |
| | Sanwa Holdings Corp. | 791,533 | 6,260 |
| | Hitachi Construction Machinery Co. Ltd. | 400,048 | 6,222 |
| | Idemitsu Kosan Co. Ltd. | 387,277 | 6,184 |
| | MonotaRO Co. Ltd. | 222,417 | 6,154 |
| | Nisshinbo Holdings Inc. | 582,371 | 6,137 |
| | COMSYS Holdings Corp. | 435,860 | 6,129 |
26
| | |
| Vanguard® Developed Markets Index Fund | | |
| Schedule of Investments | | |
| December 31, 2015 | | |
| |
| | | Market |
| | | Value |
| | Shares | ($000) |
| Showa Shell Sekiyu KK | 737,886 | 6,021 |
| Start Today Co. Ltd. | 186,519 | 6,004 |
| Oracle Corp. Japan | 128,095 | 5,964 |
| Seino Holdings Co. Ltd. | 572,996 | 5,962 |
| Hikari Tsushin Inc. | 87,103 | 5,932 |
| Taiyo Yuden Co. Ltd. | 425,421 | 5,883 |
| ^ Ibiden Co. Ltd. | 408,657 | 5,859 |
| Izumi Co. Ltd. | 150,893 | 5,858 |
| Nippon Paper Industries Co. Ltd. | 361,993 | 5,856 |
| Wacoal Holdings Corp. | 477,229 | 5,707 |
| Sapporo Holdings Ltd. | 1,291,495 | 5,670 |
| SCREEN Holdings Co. Ltd. | 766,335 | 5,641 |
| House Foods Group Inc. | 284,777 | 5,623 |
| GS Yuasa Corp. | 1,490,873 | 5,541 |
| ^ Ito En Ltd. | 215,060 | 5,533 |
| Furukawa Electric Co. Ltd. | 2,596,504 | 5,496 |
| Daishi Bank Ltd. | 1,236,447 | 5,455 |
| Daido Steel Co. Ltd. | 1,363,801 | 5,451 |
| OSG Corp. | 287,678 | 5,439 |
| Nagase & Co. Ltd. | 430,131 | 5,422 |
| ^ Advantest Corp. | 652,183 | 5,410 |
| ^ Sanrio Co. Ltd. | 228,366 | 5,365 |
| Tokai Tokyo Financial Holdings Inc. | 882,635 | 5,361 |
| Welcia Holdings Co. Ltd. | 96,420 | 5,344 |
| Juroku Bank Ltd. | 1,350,158 | 5,342 |
| Sumco Corp. | 706,170 | 5,328 |
| Tadano Ltd. | 437,428 | 5,295 |
| Sumitomo Osaka Cement Co. Ltd. | 1,441,344 | 5,286 |
| ^ Cosmos Pharmaceutical Corp. | 33,407 | 5,266 |
| K's Holdings Corp. | 152,995 | 5,210 |
| Calsonic Kansei Corp. | 588,586 | 5,189 |
| UNY Group Holdings Co. Ltd. | 820,330 | 5,155 |
| Takara Holdings Inc. | 672,613 | 5,112 |
| Autobacs Seven Co. Ltd. | 280,354 | 5,110 |
| Chiyoda Corp. | 670,539 | 5,092 |
| ^ Kagome Co. Ltd. | 290,233 | 5,080 |
| TS Tech Co. Ltd. | 196,178 | 5,074 |
| Nipro Corp. | 462,409 | 5,056 |
| Awa Bank Ltd. | 856,045 | 4,988 |
| Taiyo Nippon Sanso Corp. | 549,507 | 4,970 |
| ABC-Mart Inc. | 90,672 | 4,963 |
| Bic Camera Inc. | 574,043 | 4,916 |
| Shiga Bank Ltd. | 974,393 | 4,870 |
| San-In Godo Bank Ltd. | 593,386 | 4,826 |
| Toyobo Co. Ltd. | 3,428,368 | 4,798 |
| Japan Steel Works Ltd. | 1,361,638 | 4,780 |
| Pola Orbis Holdings Inc. | 71,970 | 4,743 |
| Skylark Co. Ltd. | 366,300 | 4,733 |
| Coca-Cola West Co. Ltd. | 233,583 | 4,728 |
| Capcom Co. Ltd. | 195,984 | 4,726 |
| Toyota Boshoku Corp. | 234,788 | 4,726 |
| Toda Corp. | 885,647 | 4,722 |
| HIS Co. Ltd. | 140,671 | 4,699 |
| DMG Mori Co. Ltd. | 402,788 | 4,685 |
| OKUMA Corp. | 578,525 | 4,679 |
| Mitsui Engineering & Shipbuilding Co. Ltd. | 2,822,451 | 4,646 |
| Hyakugo Bank Ltd. | 953,585 | 4,635 |
| Tokai Rika Co. Ltd. | 188,292 | 4,634 |
| Zeon Corp. | 575,501 | 4,630 |
| Jafco Co. Ltd. | 117,570 | 4,583 |
| Musashino Bank Ltd. | 123,780 | 4,514 |
| Coca-Cola East Japan Co. Ltd. | 278,978 | 4,493 |
| Hitachi Capital Corp. | 165,796 | 4,455 |
| Keiyo Bank Ltd. | 911,367 | 4,316 |
27
| | | |
| Vanguard® Developed Markets Index Fund | | |
| Schedule of Investments | | |
| December 31, 2015 | | |
| |
| | | | Market |
| | | | Value |
| | | Shares | ($000) |
| | Senshu Ikeda Holdings Inc. | 1,037,990 | 4,279 |
| | Shimachu Co. Ltd. | 185,878 | 4,228 |
| | Shochiku Co. Ltd. | 437,502 | 4,174 |
| | Yamato Kogyo Co. Ltd. | 162,231 | 4,137 |
| | NTT Urban Development Corp. | 419,331 | 4,029 |
| | Okasan Securities Group Inc. | 707,284 | 4,027 |
| | Lintec Corp. | 191,347 | 4,025 |
| | Mitsui Mining & Smelting Co. Ltd. | 2,124,975 | 3,940 |
| *,^ | Japan Display Inc. | 1,364,097 | 3,930 |
| | Heiwa Corp. | 201,636 | 3,773 |
| | Hyakujushi Bank Ltd. | 1,007,958 | 3,747 |
| | Nisshin Steel Co. Ltd. | 354,991 | 3,743 |
| | Maeda Road Construction Co. Ltd. | 222,614 | 3,732 |
| | North Pacific Bank Ltd. | 1,075,517 | 3,712 |
| | Japan Aviation Electronics Industry Ltd. | 258,508 | 3,708 |
| | KYORIN Holdings Inc. | 176,089 | 3,669 |
| *,^ | Aiful Corp. | 1,111,261 | 3,638 |
| | Hokkoku Bank Ltd. | 1,088,399 | 3,613 |
| | Matsui Securities Co. Ltd. | 392,552 | 3,596 |
| | Mochida Pharmaceutical Co. Ltd. | 50,408 | 3,572 |
| | Itochu Techno-Solutions Corp. | 179,109 | 3,569 |
| ^ | COLOPL Inc. | 176,485 | 3,480 |
| | Rengo Co. Ltd. | 807,014 | 3,450 |
| * | Cosmo Energy Holdings Co. Ltd. | 250,734 | 3,367 |
| | FP Corp. | 89,762 | 3,247 |
| | Nippo Corp. | 197,884 | 3,218 |
| | Japan Petroleum Exploration Co. Ltd. | 118,581 | 3,185 |
| | Canon Marketing Japan Inc. | 199,642 | 3,122 |
| | Kissei Pharmaceutical Co. Ltd. | 123,589 | 3,100 |
| * | Orient Corp. | 1,453,430 | 3,049 |
| | Nissan Shatai Co. Ltd. | 279,865 | 3,012 |
| | SKY Perfect JSAT Holdings Inc. | 528,567 | 2,972 |
| | Onward Holdings Co. Ltd. | 480,049 | 2,952 |
| | Hitachi Transport System Ltd. | 169,136 | 2,949 |
| | NS Solutions Corp. | 123,304 | 2,810 |
| | Kandenko Co. Ltd. | 403,711 | 2,709 |
| | Exedy Corp. | 111,843 | 2,703 |
| ^ | Fukuyama Transporting Co. Ltd. | 537,928 | 2,670 |
| | Nippon Television Holdings Inc. | 124,571 | 2,266 |
| | Komeri Co. Ltd. | 107,648 | 2,219 |
| | PanaHome Corp. | 291,368 | 2,201 |
| | Tokyo Broadcasting System Holdings Inc. | 135,382 | 2,144 |
| *,^ | Laox Co. Ltd. | 994,000 | 1,896 |
| | Daikyo Inc. | 1,130,579 | 1,834 |
| | Gree Inc. | 359,453 | 1,707 |
| | Toshiba TEC Corp. | 456,252 | 1,629 |
| | Toppan Forms Co. Ltd. | 123,791 | 1,468 |
| | TV Asahi Holdings Corp. | 81,230 | 1,402 |
| | Fuji Media Holdings Inc. | 113,526 | 1,340 |
| | Sumitomo Real Estate Sales Co. Ltd. | 57,032 | 1,307 |
| | IT Holdings Corp. | 46,800 | 1,069 |
| | Mitsubishi Shokuhin Co. Ltd. | 42,800 | 1,051 |
| | Nanto Bank Ltd. | 330,356 | 1,035 |
| | Daifuku Co. Ltd. | 55,900 | 952 |
| | Horiba Ltd. | 21,200 | 819 |
| | Nihon M&A Center Inc. | 17,000 | 818 |
| | Pilot Corp. | 19,400 | 796 |
| | Toho Holdings Co. Ltd. | 32,300 | 785 |
| | ADEKA Corp. | 55,100 | 784 |
| | Ulvac Inc. | 26,700 | 756 |
| | Megmilk Snow Brand Co. Ltd. | 28,700 | 738 |
| * | Leopalace21 Corp. | 135,400 | 733 |
| | Ogaki Kyoritsu Bank Ltd. | 180,000 | 726 |
| | Nippon Suisan Kaisha Ltd. | 129,100 | 723 |
28
| | | |
| Vanguard® Developed Markets Index Fund | | |
| Schedule of Investments | | |
| December 31, 2015 | | |
| |
| | | | Market |
| | | | Value |
| | | Shares | ($000) |
| | Tsubakimoto Chain Co. | 90,000 | 693 |
| | Sangetsu Co. Ltd. | 37,900 | 692 |
| | Sankyu Inc. | 135,000 | 689 |
| | Tokyo Ohka Kogyo Co. Ltd. | 21,400 | 680 |
| | Penta-Ocean Construction Co. Ltd. | 159,900 | 668 |
| | Relo Holdings Inc. | 5,500 | 664 |
| | Nikkon Holdings Co. Ltd. | 32,800 | 654 |
| | Ain Holdings Inc. | 13,700 | 653 |
| | United Arrows Ltd. | 15,000 | 647 |
| | Zensho Holdings Co. Ltd. | 50,100 | 630 |
| | Miura Co. Ltd. | 43,300 | 613 |
| | NOF Corp. | 79,000 | 608 |
| | Fuyo General Lease Co. Ltd. | 12,900 | 608 |
| | Aica Kogyo Co. Ltd. | 30,300 | 595 |
| | Toagosei Co. Ltd. | 69,000 | 590 |
| | Morinaga & Co. Ltd. | 112,000 | 589 |
| | Okumura Corp. | 104,000 | 586 |
| | Oki Electric Industry Co. Ltd. | 465,000 | 582 |
| | Nichi-iko Pharmaceutical Co. Ltd. | 24,300 | 579 |
| | Iwatani Corp. | 112,000 | 578 |
| | Kumagai Gumi Co. Ltd. | 198,000 | 568 |
| | Takasago Thermal Engineering Co. Ltd. | 38,700 | 566 |
| | Ship Healthcare Holdings Inc. | 22,700 | 562 |
| | Kyoritsu Maintenance Co. Ltd. | 6,500 | 557 |
| | Nippon Seiki Co. Ltd. | 24,000 | 551 |
| | Mitsubishi Pencil Co. Ltd. | 11,900 | 550 |
| | Nishimatsu Construction Co. Ltd. | 145,000 | 550 |
| | Hazama Ando Corp. | 101,900 | 549 |
| | Nihon Parkerizing Co. Ltd. | 53,800 | 548 |
| | Ariake Japan Co. Ltd. | 9,800 | 542 |
| | TechnoPro Holdings Inc. | 18,500 | 540 |
| | Kyowa Exeo Corp. | 52,300 | 537 |
| | Kiyo Bank Ltd. | 37,000 | 534 |
| ^ | COOKPAD Inc. | 24,900 | 529 |
| | Tokyo Dome Corp. | 103,000 | 525 |
| | Central Glass Co. Ltd. | 114,000 | 523 |
| | Arcs Co. Ltd. | 23,600 | 520 |
| | Anritsu Corp. | 79,170 | 519 |
| | Kenedix Inc. | 144,000 | 517 |
| | Ai Holdings Corp. | 20,300 | 515 |
| | Amano Corp. | 38,000 | 514 |
| | Nippon Light Metal Holdings Co. Ltd. | 288,900 | 512 |
| | Morinaga Milk Industry Co. Ltd. | 110,000 | 501 |
| | Topre Corp. | 21,700 | 498 |
| | Valor Holdings Co. Ltd. | 21,000 | 495 |
| *,^ | euglena Co. Ltd. | 33,000 | 493 |
| | Kokuyo Co. Ltd. | 45,100 | 488 |
| | Fuji Machine Manufacturing Co. Ltd. | 46,000 | 484 |
| | Yaoko Co. Ltd. | 11,500 | 483 |
| | Hitachi Zosen Corp. | 87,700 | 481 |
| | Maeda Corp. | 71,000 | 480 |
| | Meitec Corp. | 14,000 | 479 |
| | Tokyo Seimitsu Co. Ltd. | 21,300 | 472 |
| | SHO-BOND Holdings Co. Ltd. | 12,900 | 471 |
| | Colowide Co. Ltd. | 30,900 | 470 |
| | Tokyo TY Financial Group Inc. | 13,800 | 462 |
| | Nippon Soda Co. Ltd. | 77,000 | 458 |
| | GMO internet Inc. | 34,800 | 458 |
| | Cocokara fine Inc. | 10,100 | 453 |
| | Nachi-Fujikoshi Corp. | 99,000 | 453 |
| | Hanwa Co. Ltd. | 104,000 | 449 |
| | Unipres Corp. | 19,800 | 447 |
| | ASKUL Corp. | 11,100 | 446 |
| | Toyo Ink SC Holdings Co. Ltd. | 109,000 | 445 |
29
| | |
| Vanguard® Developed Markets Index Fund | | |
| Schedule of Investments | | |
| December 31, 2015 | | |
| |
| | | Market |
| | | Value |
| | Shares | ($000) |
| Yoshinoya Holdings Co. Ltd. | 34,400 | 445 |
| Daikyonishikawa Corp. | 24,000 | 444 |
| Inaba Denki Sangyo Co. Ltd. | 13,900 | 444 |
| ^ Nippon Gas Co. Ltd. | 18,000 | 441 |
| Yamanashi Chuo Bank Ltd. | 86,000 | 440 |
| Toho Bank Ltd. | 123,000 | 439 |
| GMO Payment Gateway Inc. | 9,200 | 437 |
| Adastria Co. Ltd. | 7,800 | 436 |
| San-A Co. Ltd. | 9,700 | 435 |
| Duskin Co. Ltd. | 23,900 | 435 |
| Seiko Holdings Corp. | 77,000 | 435 |
| Fujitec Co. Ltd. | 42,400 | 434 |
| Nippon Densetsu Kogyo Co. Ltd. | 19,800 | 431 |
| Ryosan Co. Ltd. | 16,800 | 431 |
| Meidensha Corp. | 107,000 | 431 |
| Asatsu-DK Inc. | 17,540 | 424 |
| Okamura Corp. | 42,300 | 422 |
| Nichias Corp. | 64,000 | 421 |
| * Nippon Sheet Glass Co. Ltd. | 522,000 | 420 |
| Chiyoda Co. Ltd. | 13,500 | 420 |
| IBJ Leasing Co. Ltd. | 20,500 | 418 |
| Itoham Foods Inc. | 72,000 | 417 |
| Saibu Gas Co. Ltd. | 180,000 | 417 |
| TPR Co. Ltd. | 14,800 | 416 |
| * Tokuyama Corp. | 192,000 | 416 |
| * Pioneer Corp. | 150,900 | 415 |
| Sakata Seed Corp. | 17,500 | 414 |
| Shinmaywa Industries Ltd. | 46,000 | 412 |
| Takara Standard Co. Ltd. | 54,000 | 411 |
| Kusuri No Aoki Co. Ltd. | 8,400 | 410 |
| Trusco Nakayama Corp. | 10,500 | 409 |
| Keihin Corp. | 23,100 | 405 |
| Fuji Oil Holdings Inc. | 24,900 | 404 |
| Nippon Flour Mills Co. Ltd. | 56,000 | 402 |
| Totetsu Kogyo Co. Ltd. | 16,000 | 401 |
| FCC Co. Ltd. | 18,800 | 400 |
| Nihon Unisys Ltd. | 36,300 | 400 |
| Mandom Corp. | 9,900 | 399 |
| Koei Tecmo Holdings Co. Ltd. | 26,900 | 398 |
| Hokuetsu Kishu Paper Co. Ltd. | 67,100 | 395 |
| Fujitsu General Ltd. | 31,000 | 394 |
| Sumitomo Mitsui Construction Co. Ltd. | 419,900 | 394 |
| ^ TSI Holdings Co. Ltd. | 57,500 | 393 |
| Makino Milling Machine Co. Ltd. | 52,000 | 391 |
| Taikisha Ltd. | 16,300 | 390 |
| Takeuchi Manufacturing Co. Ltd. | 19,100 | 389 |
| Kanematsu Corp. | 229,000 | 385 |
| Transcosmos Inc. | 15,000 | 385 |
| HI-LEX Corp. | 13,200 | 381 |
| Bank of Okinawa Ltd. | 9,900 | 381 |
| Kuroda Electric Co. Ltd. | 20,600 | 381 |
| Sumitomo Bakelite Co. Ltd. | 91,000 | 379 |
| Next Co. Ltd. | 30,700 | 376 |
| Bank of Iwate Ltd. | 9,000 | 375 |
| Kanamoto Co. Ltd. | 14,800 | 374 |
| Furukawa Co. Ltd. | 182,000 | 374 |
| DCM Holdings Co. Ltd. | 51,500 | 374 |
| Nippon Signal Company Ltd. | 34,300 | 374 |
| Paramount Bed Holdings Co. Ltd. | 10,500 | 373 |
| Okamoto Industries Inc. | 41,000 | 372 |
| Toei Co. Ltd. | 38,000 | 372 |
| Accordia Golf Co. Ltd. | 38,700 | 371 |
| Kadokawa Dwango Corp. | 24,600 | 369 |
| Fuji Kyuko Co. Ltd. | 38,000 | 365 |
30
| | | |
| Vanguard® Developed Markets Index Fund | | |
| Schedule of Investments | | |
| December 31, 2015 | | |
| |
| | | | Market |
| | | | Value |
| | | Shares | ($000) |
| | Taiyo Holdings Co. Ltd. | 9,500 | 365 |
| | Fuji Seal International Inc. | 12,100 | 364 |
| | Senko Co. Ltd. | 54,000 | 364 |
| | Bank of Nagoya Ltd. | 99,000 | 362 |
| | Kyudenko Corp. | 20,000 | 358 |
| | Earth Chemical Co. Ltd. | 8,700 | 357 |
| | J Trust Co. Ltd. | 44,400 | 356 |
| | Nissha Printing Co. Ltd. | 18,300 | 355 |
| | Saizeriya Co. Ltd. | 14,000 | 351 |
| | Maruha Nichiro Corp. | 19,800 | 349 |
| | KYB Corp. | 115,218 | 349 |
| | Kintetsu World Express Inc. | 19,800 | 348 |
| | Alpine Electronics Inc. | 22,400 | 348 |
| | Heiwado Co. Ltd. | 15,700 | 345 |
| | Tokyo Steel Manufacturing Co. Ltd. | 55,400 | 344 |
| | Aomori Bank Ltd. | 107,000 | 343 |
| | Kureha Corp. | 89,000 | 343 |
| | Axial Retailing Inc. | 10,200 | 342 |
| | Tochigi Bank Ltd. | 60,000 | 342 |
| ^ | Zojirushi Corp. | 24,000 | 342 |
| | Hitachi Kokusai Electric Inc. | 25,000 | 340 |
| | Daiseki Co. Ltd. | 21,300 | 340 |
| | Tokyu Construction Co. Ltd. | 45,200 | 338 |
| | MOS Food Services Inc. | 12,500 | 337 |
| | Takuma Co. Ltd. | 41,000 | 336 |
| | Ashikaga Holdings Co. Ltd. | 86,000 | 335 |
| | Descente Ltd. | 26,300 | 334 |
| | Starts Corp. Inc. | 17,200 | 333 |
| | NET One Systems Co. Ltd. | 51,800 | 332 |
| | Chudenko Corp. | 15,000 | 331 |
| | Yamagata Bank Ltd. | 85,000 | 330 |
| ^ | Daio Paper Corp. | 38,500 | 330 |
| *,^ | Aplus Financial Co. Ltd. | 371,600 | 327 |
| | Okinawa Electric Power Co. Inc. | 12,500 | 324 |
| | Yamazen Corp. | 35,400 | 324 |
| | Sumitomo Warehouse Co. Ltd. | 61,000 | 323 |
| | EDION Corp. | 42,600 | 322 |
| | Akita Bank Ltd. | 93,000 | 320 |
| | Aida Engineering Ltd. | 31,000 | 320 |
| | Oita Bank Ltd. | 82,000 | 319 |
| | Foster Electric Co. Ltd. | 14,600 | 318 |
| | Token Corp. | 4,100 | 316 |
| | Internet Initiative Japan Inc. | 15,900 | 316 |
| | Marusan Securities Co. Ltd. | 30,000 | 314 |
| | Nomura Co. Ltd. | 20,400 | 313 |
| | NSD Co. Ltd. | 21,500 | 311 |
| | Yodogawa Steel Works Ltd. | 15,500 | 311 |
| | TOC Co. Ltd. | 35,400 | 310 |
| | ZERIA Pharmaceutical Co. Ltd. | 23,300 | 309 |
| | Aeon Delight Co. Ltd. | 9,600 | 308 |
| | Siix Corp. | 10,000 | 308 |
| | Komori Corp. | 26,300 | 308 |
| | Seikagaku Corp. | 20,500 | 305 |
| | Kameda Seika Co. Ltd. | 7,100 | 303 |
| | Tokai Carbon Co. Ltd. | 108,000 | 303 |
| | Jin Co. Ltd. | 8,200 | 302 |
| | Ryobi Ltd. | 71,000 | 300 |
| | Gurunavi Inc. | 14,400 | 299 |
| | UACJ Corp. | 128,000 | 299 |
| | PALTAC Corp. | 16,800 | 299 |
| | Aichi Bank Ltd. | 5,600 | 298 |
| | Noritz Corp. | 19,400 | 297 |
| * | Dexerials Corp. | 27,600 | 296 |
| | Asahi Diamond Industrial Co. Ltd. | 27,600 | 295 |
31
| | |
| Vanguard® Developed Markets Index Fund | | |
| Schedule of Investments | | |
| December 31, 2015 | | |
| |
| | | Market |
| | | Value |
| | Shares | ($000) |
| Aichi Steel Corp. | 63,000 | 295 |
| Nissin Kogyo Co. Ltd. | 20,300 | 294 |
| Japan Wool Textile Co. Ltd. | 40,000 | 294 |
| Towa Pharmaceutical Co. Ltd. | 4,700 | 292 |
| Mitsuba Corp. | 18,900 | 292 |
| Gulliver International Co. Ltd. | 29,300 | 292 |
| Hogy Medical Co. Ltd. | 5,800 | 292 |
| Sanyo Special Steel Co. Ltd. | 61,000 | 288 |
| Japan Securities Finance Co. Ltd. | 56,400 | 288 |
| Seiren Co. Ltd. | 26,500 | 286 |
| TOMONY Holdings Inc. | 75,100 | 286 |
| AOKI Holdings Inc. | 21,900 | 286 |
| Gunze Ltd. | 97,000 | 284 |
| Joyful Honda Co. Ltd. | 13,900 | 283 |
| Sanki Engineering Co. Ltd. | 32,800 | 282 |
| Monex Group Inc. | 108,600 | 282 |
| Financial Products Group Co. Ltd. | 36,000 | 281 |
| Takara Leben Co. Ltd. | 50,400 | 280 |
| Nikkiso Co. Ltd. | 35,200 | 278 |
| Milbon Co. Ltd. | 6,800 | 278 |
| Nichicon Corp. | 35,400 | 277 |
| Nippon Steel & Sumikin Bussan Corp. | 81,000 | 277 |
| Nitta Corp. | 10,100 | 276 |
| Ricoh Leasing Co. Ltd. | 8,900 | 276 |
| Geo Holdings Corp. | 17,500 | 275 |
| SMS Co. Ltd. | 13,000 | 273 |
| Oiles Corp. | 15,600 | 271 |
| Bank of the Ryukyus Ltd. | 19,200 | 270 |
| CKD Corp. | 27,100 | 269 |
| Unizo Holdings Co. Ltd. | 6,700 | 269 |
| Ihara Chemical Industry Co. Ltd. | 19,600 | 269 |
| DTS Corp. | 11,800 | 269 |
| As One Corp. | 7,000 | 268 |
| Shinko Electric Industries Co. Ltd. | 41,769 | 268 |
| Mirait Holdings Corp. | 32,500 | 268 |
| Daibiru Corp. | 32,400 | 267 |
| Jeol Ltd. | 41,000 | 266 |
| Star Micronics Co. Ltd. | 20,400 | 266 |
| Tomy Co. Ltd. | 40,600 | 266 |
| Fancl Corp. | 19,200 | 266 |
| Higashi-Nippon Bank Ltd. | 80,000 | 264 |
| Asahi Holdings Inc. | 16,900 | 264 |
| Bunka Shutter Co. Ltd. | 31,100 | 263 |
| Miyazaki Bank Ltd. | 82,000 | 263 |
| Kato Sangyo Co. Ltd. | 11,300 | 261 |
| Atom Corp. | 45,300 | 260 |
| NEC Networks & System Integration Corp. | 14,700 | 260 |
| Toa Corp. | 99,000 | 260 |
| Goldwin Inc. | 5,000 | 258 |
| Mizuno Corp. | 54,000 | 258 |
| Hokuetsu Bank Ltd. | 122,000 | 257 |
| Life Corp. | 10,400 | 257 |
| ^ Royal Holdings Co. Ltd. | 13,800 | 256 |
| Eagle Industry Co. Ltd. | 14,000 | 256 |
| Daihen Corp. | 54,000 | 254 |
| Nisshin Oillio Group Ltd. | 62,000 | 253 |
| Fuji Soft Inc. | 11,500 | 252 |
| Showa Sangyo Co. Ltd. | 66,000 | 252 |
| Shikoku Bank Ltd. | 111,000 | 251 |
| Chofu Seisakusho Co. Ltd. | 10,600 | 251 |
| Raito Kogyo Co. Ltd. | 25,800 | 251 |
| Futaba Corp. | 18,700 | 251 |
| Sakata INX Corp. | 23,800 | 250 |
| Hitachi Maxell Ltd. | 14,100 | 250 |
32
| | |
| Vanguard® Developed Markets Index Fund | | |
| Schedule of Investments | | |
| December 31, 2015 | | |
| |
| | | Market |
| | | Value |
| | Shares | ($000) |
| Nitto Boseki Co. Ltd. | 93,000 | 250 |
| kabu.com Securities Co. Ltd. | 80,000 | 250 |
| Inabata & Co. Ltd. | 24,700 | 249 |
| Kumiai Chemical Industry Co. Ltd. | 23,000 | 249 |
| Nichiha Corp. | 16,500 | 249 |
| Mitsumi Electric Co. Ltd. | 43,400 | 246 |
| Sanyo Chemical Industries Ltd. | 31,000 | 245 |
| United Super Markets Holdings Inc. | 28,700 | 245 |
| San-Ai Oil Co. Ltd. | 30,000 | 245 |
| Takasago International Corp. | 10,200 | 244 |
| Obara Group Inc. | 6,700 | 244 |
| Piolax Inc. | 4,300 | 243 |
| Pacific Industrial Co. Ltd. | 22,000 | 243 |
| Fukui Bank Ltd. | 124,000 | 241 |
| Zenrin Co. Ltd. | 11,800 | 240 |
| Nagaileben Co. Ltd. | 14,000 | 240 |
| Eighteenth Bank Ltd. | 82,000 | 240 |
| Shima Seiki Manufacturing Ltd. | 15,000 | 239 |
| Sato Holdings Corp. | 12,100 | 239 |
| Showa Corp. | 25,700 | 238 |
| Jaccs Co. Ltd. | 65,000 | 237 |
| Yorozu Corp. | 10,400 | 237 |
| Nitto Kogyo Corp. | 13,500 | 236 |
| Sekisui Jushi Corp. | 17,100 | 236 |
| OBIC Business Consultants Co. Ltd. | 4,200 | 235 |
| Namura Shipbuilding Co. Ltd. | 28,600 | 235 |
| Chugoku Marine Paints Ltd. | 32,000 | 235 |
| TKC Corp. | 8,800 | 234 |
| Tachi-S Co. Ltd. | 14,700 | 234 |
| * Macnica Fuji Electronics Holdings Inc. | 17,600 | 233 |
| Xebio Holdings Co. Ltd. | 12,300 | 232 |
| * Pacific Metals Co. Ltd. | 83,000 | 231 |
| Marudai Food Co. Ltd. | 60,000 | 231 |
| Noevir Holdings Co. Ltd. | 8,000 | 231 |
| Toshiba Plant Systems & Services Corp. | 20,800 | 230 |
| Doshisha Co. Ltd. | 11,400 | 230 |
| Create Restaurants Holdings Inc. | 8,300 | 230 |
| Morita Holdings Corp. | 21,100 | 229 |
| Musashi Seimitsu Industry Co. Ltd. | 11,200 | 228 |
| Shikoku Chemicals Corp. | 24,000 | 228 |
| Konoike Transport Co. Ltd. | 17,200 | 227 |
| Dip Corp. | 11,100 | 227 |
| Doutor Nichires Holdings Co. Ltd. | 14,600 | 226 |
| Nishio Rent All Co. Ltd. | 8,200 | 225 |
| Nishimatsuya Chain Co. Ltd. | 26,000 | 225 |
| Topy Industries Ltd. | 100,000 | 223 |
| TOKAI Holdings Corp. | 47,500 | 222 |
| Kitz Corp. | 49,300 | 221 |
| Yondoshi Holdings Inc. | 10,000 | 221 |
| Iino Kaiun Kaisha Ltd. | 53,100 | 220 |
| Daiho Corp. | 46,000 | 219 |
| Heiwa Real Estate Co. Ltd. | 20,000 | 219 |
| Matsuya Co. Ltd. | 21,300 | 218 |
| Sanken Electric Co. Ltd. | 62,000 | 217 |
| Kyoei Steel Ltd. | 12,100 | 217 |
| Fujimori Kogyo Co. Ltd. | 8,300 | 216 |
| Prima Meat Packers Ltd. | 80,000 | 215 |
| Dydo Drinco Inc. | 4,600 | 214 |
| Yuasa Trading Co. Ltd. | 8,600 | 212 |
| ^ OSAKA Titanium Technologies Co. Ltd. | 10,300 | 212 |
| Toridoll.corp | 11,600 | 212 |
| Kurabo Industries Ltd. | 124,000 | 211 |
| Ichibanya Co. Ltd. | 4,300 | 211 |
| Dainichiseika Color & Chemicals Manufacturing Co. Ltd. | 45,000 | 210 |
33
| | |
| Vanguard® Developed Markets Index Fund | | |
| Schedule of Investments | | |
| December 31, 2015 | | |
| |
| | | Market |
| | | Value |
| | Shares | ($000) |
| Hokuto Corp. | 10,900 | 210 |
| Clarion Co. Ltd. | 58,000 | 210 |
| Kohnan Shoji Co. Ltd. | 14,900 | 209 |
| Shizuoka Gas Co. Ltd. | 32,700 | 208 |
| Ringer Hut Co. Ltd. | 9,000 | 208 |
| Plenus Co. Ltd. | 12,400 | 207 |
| JVC Kenwood Corp. | 75,500 | 207 |
| Max Co. Ltd. | 20,000 | 206 |
| FIDEA Holdings Co. Ltd. | 91,600 | 206 |
| St. Marc Holdings Co. Ltd. | 7,400 | 206 |
| * Toyo Engineering Corp. | 80,000 | 206 |
| Kura Corp. | 5,100 | 205 |
| Sintokogio Ltd. | 25,300 | 205 |
| Sanden Holdings Corp. | 64,000 | 204 |
| Hiday Hidaka Corp. | 7,100 | 204 |
| Avex Group Holdings Inc. | 17,100 | 203 |
| Fujicco Co. Ltd. | 11,600 | 203 |
| Mani Inc. | 10,500 | 203 |
| Yokogawa Bridge Holdings Corp. | 17,500 | 202 |
| Enplas Corp. | 5,600 | 201 |
| Fujita Kanko Inc. | 40,000 | 201 |
| Press Kogyo Co. Ltd. | 46,200 | 201 |
| Hosiden Corp. | 35,600 | 200 |
| Sankyo Tateyama Inc. | 15,700 | 200 |
| Wakita & Co. Ltd. | 23,100 | 199 |
| Okabe Co. Ltd. | 25,800 | 198 |
| Daiwabo Holdings Co. Ltd. | 99,000 | 198 |
| Fuji Co. Ltd. | 9,700 | 197 |
| Pack Corp. | 7,800 | 196 |
| Nissin Electric Co. Ltd. | 23,800 | 193 |
| UKC Holdings Corp. | 8,600 | 193 |
| Kasai Kogyo Co. Ltd. | 13,300 | 192 |
| Kisoji Co. Ltd. | 10,700 | 192 |
| Mitsuboshi Belting Ltd. | 24,000 | 191 |
| Toyo Construction Co. Ltd. | 42,000 | 191 |
| Ohsho Food Service Corp. | 5,500 | 190 |
| Ci:z Holdings Co. Ltd. | 11,000 | 190 |
| Minato Bank Ltd. | 115,000 | 190 |
| Benefit One Inc. | 8,100 | 189 |
| Open House Co. Ltd. | 9,800 | 188 |
| Ikyu Corp. | 6,700 | 188 |
| Bando Chemical Industries Ltd. | 45,000 | 188 |
| Jamco Corp. | 5,600 | 188 |
| Osaka Soda Co. Ltd. | 49,000 | 187 |
| Itochu Enex Co. Ltd. | 24,500 | 187 |
| Yokohama Reito Co. Ltd. | 21,300 | 186 |
| Wacom Co. Ltd. | 46,800 | 186 |
| Takamatsu Construction Group Co. Ltd. | 8,700 | 186 |
| Relia Inc. | 21,600 | 185 |
| Eizo Corp. | 7,700 | 184 |
| Iseki & Co. Ltd. | 118,000 | 184 |
| Mitsui-Soko Holdings Co. Ltd. | 65,000 | 184 |
| Tekken Corp. | 74,000 | 183 |
| Ehime Bank Ltd. | 87,000 | 183 |
| Hibiya Engineering Ltd. | 13,300 | 182 |
| Optex Co. Ltd. | 7,300 | 181 |
| Tokai Corp. | 6,300 | 180 |
| Mitsui Sugar Co. Ltd. | 40,000 | 180 |
| Toshiba Machine Co. Ltd. | 53,000 | 180 |
| Nichii Gakkan Co. | 24,600 | 179 |
| Joshin Denki Co. Ltd. | 20,000 | 179 |
| Trancom Co. Ltd. | 3,200 | 178 |
| Sanyo Electric Railway Co. Ltd. | 45,000 | 176 |
| Taihei Dengyo Kaisha Ltd. | 17,000 | 176 |
34
| | |
| Vanguard® Developed Markets Index Fund | | |
| Schedule of Investments | | |
| December 31, 2015 | | |
| |
| | | Market |
| | | Value |
| | Shares | ($000) |
| Shinko Plantech Co. Ltd. | 21,400 | 176 |
| Belc Co. Ltd. | 4,800 | 175 |
| Ichiyoshi Securities Co. Ltd. | 19,100 | 175 |
| Toho Zinc Co. Ltd. | 76,000 | 175 |
| Shindengen Electric Manufacturing Co. Ltd. | 44,000 | 175 |
| Bank of Saga Ltd. | 78,000 | 174 |
| Tokyotokeiba Co. Ltd. | 78,000 | 174 |
| Kyokuto Kaihatsu Kogyo Co. Ltd. | 15,700 | 174 |
| Riso Kagaku Corp. | 10,700 | 174 |
| Hitachi Koki Co. Ltd. | 24,200 | 173 |
| Nippon Synthetic Chemical Industry Co. Ltd. | 24,000 | 172 |
| Daido Metal Co. Ltd. | 18,700 | 172 |
| Sodick Co. Ltd. | 23,300 | 172 |
| * Ishihara Sangyo Kaisha Ltd. | 202,000 | 171 |
| Kanto Denka Kogyo Co. Ltd. | 26,000 | 171 |
| Aisan Industry Co. Ltd. | 16,600 | 170 |
| Yurtec Corp. | 18,000 | 170 |
| Sogo Medical Co. Ltd. | 4,600 | 169 |
| Tv Tokyo Holdings Corp. | 8,900 | 168 |
| BML Inc. | 5,600 | 168 |
| Nippon Road Co. Ltd. | 34,000 | 168 |
| JCR Pharmaceuticals Co. Ltd. | 7,700 | 167 |
| Kansai Urban Banking Corp. | 14,900 | 167 |
| Towa Bank Ltd. | 187,000 | 167 |
| Ines Corp. | 17,800 | 165 |
| Kinugawa Rubber Industrial Co. Ltd. | 31,000 | 165 |
| Shibuya Corp. | 11,100 | 165 |
| Jimoto Holdings Inc. | 99,200 | 164 |
| Nihon Nohyaku Co. Ltd. | 26,200 | 164 |
| SMK Corp. | 33,000 | 163 |
| Tsurumi Manufacturing Co. Ltd. | 9,900 | 163 |
| Tamron Co. Ltd. | 8,800 | 162 |
| Arcland Sakamoto Co. Ltd. | 7,000 | 162 |
| T-Gaia Corp. | 14,200 | 162 |
| Goldcrest Co. Ltd. | 8,900 | 162 |
| Tsukishima Kikai Co. Ltd. | 17,800 | 161 |
| Konishi Co. Ltd. | 7,200 | 161 |
| Itoki Corp. | 22,700 | 161 |
| Sumitomo Riko Co. Ltd. | 19,300 | 161 |
| Yellow Hat Ltd. | 7,800 | 160 |
| Japan Pulp & Paper Co. Ltd. | 57,000 | 159 |
| Round One Corp. | 34,800 | 157 |
| Nippon Chemi-Con Corp. | 89,000 | 157 |
| Hamakyorex Co. Ltd. | 8,400 | 157 |
| Tenma Corp. | 8,000 | 156 |
| Nippon Thompson Co. Ltd. | 36,000 | 156 |
| G-Tekt Corp. | 11,100 | 156 |
| EPS Holdings Inc. | 14,100 | 155 |
| Sakai Chemical Industry Co. Ltd. | 46,000 | 155 |
| Sanyo Shokai Ltd. | 65,000 | 155 |
| Modec Inc. | 11,100 | 154 |
| Fujimi Inc. | 11,100 | 154 |
| Fukuda Corp. | 15,000 | 154 |
| Canon Electronics Inc. | 9,300 | 153 |
| Sumitomo Seika Chemicals Co. Ltd. | 25,000 | 152 |
| T Hasegawa Co. Ltd. | 11,700 | 151 |
| Riken Corp. | 43,000 | 151 |
| F@N Communications Inc. | 24,600 | 151 |
| Noritake Co. Ltd. | 66,000 | 151 |
| Neturen Co. Ltd. | 19,200 | 150 |
| Juki Corp. | 16,800 | 150 |
| Chiba Kogyo Bank Ltd. | 26,900 | 150 |
| * Unitika Ltd. | 319,000 | 150 |
| Nippon Koei Co. Ltd. | 41,000 | 150 |
35
| | | |
| Vanguard® Developed Markets Index Fund | | |
| Schedule of Investments | | |
| December 31, 2015 | | |
| |
| | | | Market |
| | | | Value |
| | | Shares | ($000) |
| | Justsystems Corp. | 19,300 | 149 |
| | Nohmi Bosai Ltd. | 11,900 | 149 |
| | Wowow Inc. | 5,900 | 149 |
| | Nittetsu Mining Co. Ltd. | 34,000 | 149 |
| | Kyokuto Securities Co. Ltd. | 11,800 | 149 |
| * | Toho Titanium Co. Ltd. | 18,100 | 148 |
| | Chiyoda Integre Co. Ltd. | 6,300 | 147 |
| | Kaga Electronics Co. Ltd. | 9,800 | 146 |
| | YAMABIKO Corp. | 17,400 | 146 |
| | Sac's Bar Holdings Inc. | 10,000 | 146 |
| | Union Tool Co. | 5,300 | 145 |
| | Tsukui Corp. | 13,200 | 145 |
| ^ | Alpen Co. Ltd. | 8,700 | 145 |
| | Sanshin Electronics Co. Ltd. | 13,900 | 145 |
| | METAWATER Co. Ltd. | 5,900 | 145 |
| | Torii Pharmaceutical Co. Ltd. | 6,300 | 144 |
| | Eiken Chemical Co. Ltd. | 7,800 | 144 |
| | JSP Corp. | 6,900 | 144 |
| | Tsukuba Bank Ltd. | 43,000 | 143 |
| | Sanyo Denki Co. Ltd. | 23,000 | 143 |
| | Tsugami Corp. | 33,000 | 143 |
| | Pressance Corp. | 4,300 | 143 |
| | Fukushima Industries Corp. | 6,000 | 142 |
| | Daisan Bank Ltd. | 96,000 | 141 |
| | Teikoku Sen-I Co. Ltd. | 11,000 | 141 |
| | Information Services International-Dentsu Ltd. | 7,300 | 141 |
| | Nippon Carbon Co. Ltd. | 56,000 | 141 |
| | Meiko Network Japan Co. Ltd. | 12,100 | 140 |
| | J-Oil Mills Inc. | 48,000 | 139 |
| | ASKA Pharmaceutical Co. Ltd. | 11,300 | 139 |
| | Tocalo Co. Ltd. | 6,700 | 138 |
| | Futaba Industrial Co. Ltd. | 28,900 | 138 |
| *,^ | Takata Corp. | 20,638 | 137 |
| | Key Coffee Inc. | 8,600 | 137 |
| | Pal Co. Ltd. | 5,700 | 137 |
| | Vital KSK Holdings Inc. | 16,600 | 135 |
| | Warabeya Nichiyo Co. Ltd. | 7,100 | 135 |
| | Tokushu Tokai Paper Co. Ltd. | 44,000 | 134 |
| | Mie Bank Ltd. | 60,000 | 133 |
| | Dai Nippon Toryo Co. Ltd. | 69,000 | 133 |
| | Toenec Corp. | 20,000 | 132 |
| | Toa Corp. | 12,600 | 132 |
| | Nippon Ceramic Co. Ltd. | 8,300 | 131 |
| | Sakai Moving Service Co. Ltd. | 4,800 | 130 |
| | Nippon Kanzai Co. Ltd. | 8,200 | 130 |
| | Kurimoto Ltd. | 68,000 | 128 |
| | Chukyo Bank Ltd. | 67,000 | 128 |
| | S Foods Inc. | 7,300 | 128 |
| | Tamura Corp. | 43,000 | 128 |
| | Belluna Co. Ltd. | 23,100 | 127 |
| | Kato Works Co. Ltd. | 29,000 | 127 |
| | Nissin Corp. | 44,000 | 126 |
| | Ryoyo Electro Corp. | 11,000 | 126 |
| | Nichiden Corp. | 5,100 | 126 |
| | Koa Corp. | 14,800 | 126 |
| | Yusen Logistics Co. Ltd. | 9,400 | 126 |
| | Kamei Corp. | 12,800 | 125 |
| | Qol Co. Ltd. | 8,900 | 125 |
| | OSJB Holdings Corp. | 62,400 | 125 |
| | Rock Field Co. Ltd. | 5,100 | 125 |
| | ESPEC Corp. | 10,200 | 125 |
| | Arata Corp. | 5,800 | 125 |
| | Katakura Industries Co. Ltd. | 11,500 | 124 |
| | Michinoku Bank Ltd. | 73,000 | 123 |
36
| | |
| Vanguard® Developed Markets Index Fund | | |
| Schedule of Investments | | |
| December 31, 2015 | | |
| |
| | | Market |
| | | Value |
| | Shares | ($000) |
| Kita-Nippon Bank Ltd. | 4,500 | 123 |
| Toyo Kanetsu KK | 57,000 | 123 |
| Keiyo Co. Ltd. | 29,200 | 123 |
| Sagami Chain Co. Ltd. | 11,500 | 123 |
| * Kintetsu Department Store Co. Ltd. | 45,000 | 123 |
| Fujibo Holdings Inc. | 66,000 | 122 |
| Mitsubishi Steel Manufacturing Co. Ltd. | 64,000 | 122 |
| Broadleaf Co. Ltd. | 12,400 | 122 |
| Studio Alice Co. Ltd. | 6,900 | 122 |
| Maruzen Showa Unyu Co. Ltd. | 34,000 | 121 |
| ^ Marvelous Inc. | 15,900 | 121 |
| Nippon Denko Co. Ltd. | 66,400 | 120 |
| Denyo Co. Ltd. | 7,700 | 120 |
| Okuwa Co. Ltd. | 13,000 | 120 |
| Meisei Industrial Co. Ltd. | 28,800 | 119 |
| Ministop Co. Ltd. | 6,100 | 118 |
| Hokkan Holdings Ltd. | 45,000 | 118 |
| Taisei Lamick Co. Ltd. | 4,500 | 118 |
| Koatsu Gas Kogyo Co. Ltd. | 21,000 | 118 |
| Toyo Securities Co. Ltd. | 38,000 | 117 |
| Kyokuyo Co. Ltd. | 51,000 | 117 |
| Cawachi Ltd. | 6,000 | 117 |
| * Kappa Create Co. Ltd. | 11,700 | 117 |
| Yahagi Construction Co. Ltd. | 17,100 | 117 |
| K&O Energy Group Inc. | 8,200 | 117 |
| Osaka Steel Co. Ltd. | 6,400 | 116 |
| Keihanshin Building Co. Ltd. | 20,700 | 116 |
| Daiichi Jitsugyo Co. Ltd. | 26,000 | 116 |
| Maeda Kosen Co. Ltd. | 12,700 | 116 |
| Nitto Kohki Co. Ltd. | 5,400 | 116 |
| Create SD Holdings Co. Ltd. | 4,700 | 115 |
| Mito Securities Co. Ltd. | 33,900 | 115 |
| * Tokyo Rope Manufacturing Co. Ltd. | 69,000 | 115 |
| KFC Holdings Japan Ltd. | 6,700 | 114 |
| * KNT-CT Holdings Co. Ltd. | 59,000 | 114 |
| France Bed Holdings Co. Ltd. | 13,700 | 114 |
| Osaki Electric Co. Ltd. | 20,000 | 113 |
| Shinko Shoji Co. Ltd. | 10,400 | 113 |
| ST Corp. | 11,900 | 112 |
| Tokyo Tekko Co. Ltd. | 25,000 | 112 |
| Mars Engineering Corp. | 6,600 | 112 |
| C Uyemura & Co. Ltd. | 2,600 | 111 |
| Shin-Etsu Polymer Co. Ltd. | 20,100 | 111 |
| Achilles Corp. | 86,000 | 111 |
| Shimizu Bank Ltd. | 4,500 | 110 |
| Tosho Co. Ltd. | 4,100 | 110 |
| Nippon Valqua Industries Ltd. | 42,000 | 109 |
| Godo Steel Ltd. | 55,000 | 109 |
| Misawa Homes Co. Ltd. | 14,700 | 108 |
| Nagatanien Holdings Co. Ltd. | 12,000 | 107 |
| Komatsu Seiren Co. Ltd. | 18,600 | 107 |
| Kanematsu Electronics Ltd. | 6,000 | 106 |
| Toyo Corp. | 11,700 | 106 |
| Corona Corp. Class A | 11,100 | 106 |
| * KLab Inc. | 16,100 | 106 |
| Sumitomo Densetsu Co. Ltd. | 8,200 | 106 |
| Tonami Holdings Co. Ltd. | 36,000 | 105 |
| Daiwa Industries Ltd. | 13,400 | 105 |
| Shibusawa Warehouse Co. Ltd. | 40,000 | 104 |
| Sinfonia Technology Co. Ltd. | 64,000 | 104 |
| CAC Holdings Corp. | 12,700 | 104 |
| Akebono Brake Industry Co. Ltd. | 41,500 | 103 |
| Yonekyu Corp. | 4,900 | 103 |
| Tosei Corp. | 16,200 | 102 |
37
| | |
| Vanguard® Developed Markets Index Fund | | |
| Schedule of Investments | | |
| December 31, 2015 | | |
| |
| | | Market |
| | | Value |
| | Shares | ($000) |
| Tomoku Co. Ltd. | 43,000 | 102 |
| Nihon Yamamura Glass Co. Ltd. | 67,000 | 101 |
| Maezawa Kasei Industries Co. Ltd. | 10,700 | 101 |
| Yushin Precision Equipment Co. Ltd. | 5,400 | 101 |
| Elematec Corp. | 4,200 | 101 |
| Sekisui Plastics Co. Ltd. | 29,000 | 101 |
| Oyo Corp. | 8,900 | 100 |
| Hokkaido Gas Co. Ltd. | 43,000 | 100 |
| Mitsubishi Research Institute Inc. | 3,500 | 100 |
| Kyodo Printing Co. Ltd. | 36,000 | 100 |
| Tokyo Energy & Systems Inc. | 11,000 | 100 |
| Takiron Co. Ltd. | 19,000 | 98 |
| Mitsui High-Tec Inc. | 15,700 | 98 |
| Denki Kogyo Co. Ltd. | 22,000 | 98 |
| Megachips Corp. | 11,200 | 98 |
| JP-Holdings Inc. | 34,200 | 98 |
| * Nippon Yakin Kogyo Co. Ltd. | 83,700 | 98 |
| Daiken Corp. | 33,000 | 97 |
| Arakawa Chemical Industries Ltd. | 9,600 | 96 |
| Cosel Co. Ltd. | 10,600 | 96 |
| Stella Chemifa Corp. | 5,800 | 95 |
| Kobe Bussan Co. Ltd. | 3,000 | 95 |
| Kitagawa Iron Works Co. Ltd. | 43,000 | 95 |
| Ryoden Trading Co. Ltd. | 14,000 | 94 |
| Starzen Co. Ltd. | 3,300 | 94 |
| U-Shin Ltd. | 15,300 | 94 |
| Maruwa Co. Ltd. | 4,200 | 93 |
| Matsuya Foods Co. Ltd. | 3,900 | 93 |
| Furuno Electric Co. Ltd. | 12,900 | 93 |
| CHIMNEY Co. Ltd. | 3,700 | 92 |
| Zuken Inc. | 9,600 | 92 |
| Fudo Tetra Corp. | 78,800 | 92 |
| Toyo Kohan Co. Ltd. | 26,200 | 92 |
| Toyo Tanso Co. Ltd. | 6,100 | 92 |
| MTI Ltd. | 16,200 | 91 |
| Tsutsumi Jewelry Co. Ltd. | 4,400 | 91 |
| Toli Corp. | 32,000 | 91 |
| Japan Transcity Corp. | 24,000 | 90 |
| Sun Frontier Fudousan Co. Ltd. | 12,200 | 90 |
| CONEXIO Corp. | 9,500 | 89 |
| Nippon Parking Development Co. Ltd. | 78,100 | 89 |
| Torishima Pump Manufacturing Co. Ltd. | 10,800 | 89 |
| Future Architect Inc. | 13,700 | 89 |
| NS United Kaiun Kaisha Ltd. | 50,000 | 89 |
| Tabuchi Electric Co. Ltd. | 14,300 | 89 |
| Advan Co. Ltd. | 9,700 | 88 |
| Nippon Beet Sugar Manufacturing Co. Ltd. | 52,000 | 88 |
| Okura Industrial Co. Ltd. | 30,000 | 87 |
| Nihon Trim Co. Ltd. | 2,500 | 87 |
| Mory Industries Inc. | 30,000 | 87 |
| Riken Technos Corp. | 25,100 | 87 |
| Taiho Kogyo Co. Ltd. | 7,200 | 87 |
| Asunaro Aoki Construction Co. Ltd. | 13,000 | 87 |
| Idec Corp. | 9,600 | 87 |
| * Fujiya Co. Ltd. | 54,000 | 86 |
| Teikoku Electric Manufacturing Co. Ltd. | 10,800 | 86 |
| Atsugi Co. Ltd. | 90,000 | 86 |
| Aichi Corp. | 12,900 | 86 |
| Artnature Inc. | 9,700 | 85 |
| CMK Corp. | 29,600 | 85 |
| * Nakayama Steel Works Ltd. | 132,000 | 85 |
| Maezawa Kyuso Industries Co. Ltd. | 6,600 | 85 |
| Toho Co. Ltd. | 4,100 | 84 |
| Onoken Co. Ltd. | 8,800 | 84 |
38
| | |
| Vanguard® Developed Markets Index Fund | | |
| Schedule of Investments | | |
| December 31, 2015 | | |
| |
| | | Market |
| | | Value |
| | Shares | ($000) |
| Showa Aircraft Industry Co. Ltd. | 8,200 | 84 |
| Giken Ltd. | 6,600 | 83 |
| Daikokutenbussan Co. Ltd. | 2,200 | 83 |
| Sumitomo Precision Products Co. Ltd. | 23,000 | 83 |
| Hisaka Works Ltd. | 10,400 | 83 |
| Pronexus Inc. | 10,100 | 83 |
| Mimasu Semiconductor Industry Co. Ltd. | 8,700 | 83 |
| Sinanen Holdings Co. Ltd. | 21,000 | 82 |
| Mitani Sekisan Co. Ltd. | 6,100 | 82 |
| Japan Cash Machine Co. Ltd. | 8,300 | 82 |
| Ateam Inc. | 5,600 | 82 |
| * Nippon Sharyo Ltd. | 34,000 | 81 |
| Krosaki Harima Corp. | 35,000 | 81 |
| NDS Co. Ltd. | 28,000 | 80 |
| * Mitsubishi Paper Mills Ltd. | 111,000 | 80 |
| Hioki EE Corp. | 4,400 | 80 |
| Chugai Ro Co. Ltd. | 41,000 | 80 |
| Itochu-Shokuhin Co. Ltd. | 2,300 | 79 |
| Takihyo Co. Ltd. | 19,000 | 79 |
| Alpha Systems Inc. | 4,900 | 79 |
| Funai Electric Co. Ltd. | 9,400 | 79 |
| Japan Drilling Co. Ltd. | 3,600 | 79 |
| Shiroki Corp. | 25,000 | 79 |
| Fuso Pharmaceutical Industries Ltd. | 34,000 | 79 |
| T RAD Co. Ltd. | 47,000 | 79 |
| Zuiko Corp. | 2,000 | 78 |
| Fujikura Kasei Co. Ltd. | 16,200 | 78 |
| Gakken Holdings Co. Ltd. | 35,000 | 78 |
| ^ Daikoku Denki Co. Ltd. | 6,000 | 78 |
| Aeon Fantasy Co. Ltd. | 4,400 | 78 |
| Cleanup Corp. | 12,500 | 77 |
| Kourakuen Holdings Corp. | 5,900 | 77 |
| Paris Miki Holdings Inc. | 19,800 | 77 |
| Honeys Co. Ltd. | 8,900 | 77 |
| Kanaden Corp. | 9,400 | 77 |
| Daisyo Corp. | 6,100 | 77 |
| Daidoh Ltd. | 18,400 | 77 |
| Asahi Co. Ltd. | 7,200 | 77 |
| Hosokawa Micron Corp. | 15,000 | 77 |
| Tokyo Electron Device Ltd. | 5,800 | 77 |
| Tokyo Rakutenchi Co. Ltd. | 18,000 | 76 |
| Asahi Organic Chemicals Industry Co. Ltd. | 41,000 | 76 |
| Endo Lighting Corp. | 7,400 | 76 |
| Chuo Spring Co. Ltd. | 31,000 | 76 |
| Uchida Yoko Co. Ltd. | 20,000 | 76 |
| * Kinki Sharyo Co. Ltd. | 23,000 | 76 |
| Kitano Construction Corp. | 29,000 | 75 |
| Mitsui Matsushima Co. Ltd. | 70,000 | 75 |
| Yushiro Chemical Industry Co. Ltd. | 6,300 | 75 |
| Weathernews Inc. | 2,200 | 75 |
| Senshukai Co. Ltd. | 11,300 | 75 |
| Tosho Printing Co. Ltd. | 17,000 | 75 |
| * Janome Sewing Machine Co. Ltd. | 11,500 | 75 |
| Icom Inc. | 3,600 | 75 |
| Sanoh Industrial Co. Ltd. | 12,100 | 75 |
| Organo Corp. | 19,000 | 75 |
| Takaoka Toko Co. Ltd. | 5,900 | 75 |
| NIFTY Corp. | 7,900 | 75 |
| Fuji Oil Co. Ltd. | 25,500 | 74 |
| NEC Capital Solutions Ltd. | 5,400 | 74 |
| Sankyo Seiko Co. Ltd. | 19,100 | 74 |
| GCA Savvian Corp. | 7,200 | 74 |
| Kobelco Eco-Solutions Co. Ltd. | 17,000 | 74 |
| Elecom Co. Ltd. | 5,700 | 74 |
39
| | |
| Vanguard® Developed Markets Index Fund | | |
| Schedule of Investments | | |
| December 31, 2015 | | |
| |
| | | Market |
| | | Value |
| | Shares | ($000) |
| Right On Co. Ltd. | 6,300 | 74 |
| Nippon Coke & Engineering Co. Ltd. | 88,200 | 74 |
| Hodogaya Chemical Co. Ltd. | 38,000 | 74 |
| Toyo Denki Seizo KK | 21,000 | 74 |
| Mitsui Home Co. Ltd. | 16,000 | 73 |
| Japan Radio Co. Ltd. | 24,000 | 73 |
| Srg Takamiya Co. Ltd. | 17,500 | 73 |
| Japan Pure Chemical Co. Ltd. | 3,900 | 73 |
| Yomiuri Land Co. Ltd. | 22,000 | 73 |
| Gecoss Corp. | 8,500 | 73 |
| Nihon Dempa Kogyo Co. Ltd. | 11,100 | 73 |
| Matsuda Sangyo Co. Ltd. | 6,100 | 73 |
| Seika Corp. | 30,000 | 73 |
| ^ Chuetsu Pulp & Paper Co. Ltd. | 43,000 | 73 |
| Parco Co. Ltd. | 7,900 | 72 |
| Toko Inc. | 23,000 | 72 |
| Airport Facilities Co. Ltd. | 15,200 | 72 |
| Ichikoh Industries Ltd. | 37,000 | 72 |
| Aiphone Co. Ltd. | 4,400 | 72 |
| Kyosan Electric Manufacturing Co. Ltd. | 24,000 | 72 |
| Toda Kogyo Corp. | 27,000 | 72 |
| Iwasaki Electric Co. Ltd. | 35,000 | 71 |
| CMIC Holdings Co. Ltd. | 5,600 | 71 |
| Happinet Corp. | 7,300 | 71 |
| Nippon Chemiphar Co. Ltd. | 14,000 | 71 |
| Shinwa Co. Ltd. | 5,100 | 71 |
| Chori Co. Ltd. | 5,100 | 71 |
| * WATAMI Co. Ltd. | 10,700 | 71 |
| * Yamada SxL Home Co. Ltd. | 106,000 | 71 |
| Toa Oil Co. Ltd. | 57,000 | 71 |
| Hakuto Co. Ltd. | 7,000 | 71 |
| Mitsubishi Nichiyu Forklift Co. Ltd. | 17,400 | 71 |
| Rhythm Watch Co. Ltd. | 54,000 | 70 |
| Tatsuta Electric Wire and Cable Co. Ltd. | 19,500 | 70 |
| Pasona Group Inc. | 9,800 | 70 |
| Dai-ichi Seiko Co. Ltd. | 5,300 | 70 |
| * FDK Corp. | 78,000 | 70 |
| * SWCC Showa Holdings Co. Ltd. | 119,000 | 70 |
| Aderans Co. Ltd. | 10,100 | 70 |
| Panasonic Industrial Devices SUNX Co. Ltd. | 12,900 | 69 |
| Nissei ASB Machine Co. Ltd. | 4,100 | 69 |
| AOI Electronics Co. Ltd. | 2,600 | 69 |
| Roland DG Corp. | 3,200 | 68 |
| ^ Dunlop Sports Co. Ltd. | 8,800 | 68 |
| Gun-Ei Chemical Industry Co. Ltd. | 27,000 | 68 |
| Mitsubishi Kakoki Kaisha Ltd. | 34,000 | 67 |
| Axell Corp. | 6,500 | 66 |
| * Shin Nippon Biomedical Laboratories Ltd. | 17,900 | 61 |
| | | 12,366,957 |
| Netherlands (2.7%) | | |
| Unilever NV | 6,073,506 | 264,553 |
| ING Groep NV | 15,008,021 | 203,060 |
| ASML Holding NV | 1,262,912 | 112,212 |
| Unibail-Rodamco SE | 382,619 | 97,159 |
| Koninklijke Philips NV | 3,577,046 | 91,302 |
| Koninklijke Ahold NV | 3,443,438 | 72,634 |
| Heineken NV | 845,548 | 72,055 |
| Akzo Nobel NV | 967,191 | 64,627 |
| RELX NV (Amsterdam Shares) | 3,645,830 | 61,404 |
| Koninklijke KPN NV | 12,157,399 | 45,984 |
| Aegon NV | 7,433,734 | 42,041 |
| Wolters Kluwer NV | 1,157,659 | 38,879 |
| NN Group NV | 1,035,801 | 36,546 |
| Koninklijke DSM NV | 683,431 | 34,271 |
40
| | | |
| Vanguard® Developed Markets Index Fund | | |
| Schedule of Investments | | |
| December 31, 2015 | | |
| |
| | | | Market |
| | | | Value |
| | | Shares | ($000) |
| | Heineken Holding NV | 382,557 | 29,452 |
| | Randstad Holding NV | 420,473 | 26,184 |
| * | Altice NV Class A | 1,483,783 | 21,318 |
| *,2 | ABN AMRO Group NV | 835,959 | 18,778 |
| | Gemalto NV | 312,750 | 18,766 |
| ^ | ArcelorMittal | 3,913,546 | 16,512 |
| | TNT Express NV | 1,798,369 | 15,212 |
| | Boskalis Westminster | 306,751 | 12,513 |
| | Koninklijke Vopak NV | 259,528 | 11,177 |
| * | OCI NV | 322,317 | 7,959 |
| * | Altice NV Class B | 457,700 | 6,671 |
| 2 | GrandVision NV | 196,848 | 5,907 |
| | Aalberts Industries NV | 52,722 | 1,817 |
| * | SBM Offshore NV | 102,019 | 1,289 |
| | Wereldhave NV | 21,757 | 1,220 |
| | Eurocommercial Properties NV | 25,033 | 1,081 |
| | ASM International NV | 26,985 | 1,058 |
| | IMCD Group NV | 27,105 | 1,002 |
| * | PostNL NV | 245,101 | 930 |
| * | APERAM SA | 25,821 | 918 |
| | TKH Group NV | 22,236 | 903 |
| * | TomTom NV | 65,761 | 827 |
| | Corbion NV | 32,674 | 791 |
| | Arcadis NV | 36,977 | 743 |
| | Delta Lloyd NV | 125,502 | 740 |
| * | Koninklijke BAM Groep NV | 121,546 | 676 |
| | USG People NV | 35,563 | 662 |
| * | Fugro NV | 33,516 | 550 |
| | Vastned Retail NV | 10,121 | 465 |
| *,2 | Refresco Gerber NV | 20,695 | 357 |
| | Accell Group | 15,032 | 344 |
| | Koninklijke Ten Cate NV | 12,654 | 329 |
| | NSI NV | 74,177 | 320 |
| | BinckBank NV | 34,027 | 293 |
| | Wessanen | 28,862 | 293 |
| | Brunel International NV | 9,575 | 174 |
| | | | 1,444,958 |
| New Zealand (0.2%) | | |
| | Spark New Zealand Ltd. | 7,029,716 | 15,829 |
| | Auckland International Airport Ltd. | 3,413,226 | 13,391 |
| | Fletcher Building Ltd. | 2,645,781 | 13,259 |
| | Fisher & Paykel Healthcare Corp. Ltd. | 2,142,990 | 13,028 |
| | Ryman Healthcare Ltd. | 1,616,365 | 9,381 |
| | Contact Energy Ltd. | 2,809,119 | 9,092 |
| | SKYCITY Entertainment Group Ltd. | 2,250,960 | 6,805 |
| | Mighty River Power Ltd. | 2,617,766 | 4,967 |
| *,^ | Xero Ltd. | 361,135 | 4,879 |
| | SKY Network Television Ltd. | 1,480,367 | 4,637 |
| | Kiwi Property Group Ltd. | 4,807,936 | 4,429 |
| | Air New Zealand Ltd. | 1,982,874 | 3,999 |
| | Vector Ltd. | 963,683 | 2,088 |
| | Warehouse Group Ltd. | 542,407 | 990 |
| | Z Energy Ltd. | 196,839 | 909 |
| * | Chorus Ltd. | 224,399 | 599 |
| | Trade Me Group Ltd. | 205,482 | 586 |
| | Infratil Ltd. | 222,741 | 498 |
| * | a2 Milk Co. Ltd. | 377,800 | 479 |
| | Goodman Property Trust | 535,125 | 454 |
| | EBOS Group Ltd. | 47,292 | 444 |
| | Precinct Properties New Zealand Ltd. | 439,309 | 375 |
| | Genesis Energy Ltd. | 271,502 | 358 |
| | Freightways Ltd. | 83,134 | 352 |
| | Nuplex Industries Ltd. | 103,479 | 336 |
| | Summerset Group Holdings Ltd. | 117,898 | 328 |
41
| | | |
| Vanguard® Developed Markets Index Fund | | |
| Schedule of Investments | | |
| December 31, 2015 | | |
| |
| | | | Market |
| | | | Value |
| | | Shares | ($000) |
| | Argosy Property Ltd. | 413,324 | 323 |
| | Metlifecare Ltd. | 66,146 | 209 |
| | Vital Healthcare Property Trust | 146,418 | 187 |
| * | Diligent Corp. | 43,363 | 181 |
| | Heartland Bank Ltd. | 200,799 | 181 |
| | TOWER Ltd. | 89,977 | 117 |
| | Kathmandu Holdings Ltd. | 87,358 | 93 |
| * | New Zealand Oil & Gas Ltd. | 251,061 | 73 |
| | | | 113,856 |
| Norway (0.5%) | | |
| ^ | Statoil ASA | 3,723,163 | 51,926 |
| | DNB ASA | 4,171,465 | 51,398 |
| | Telenor ASA | 2,680,340 | 44,677 |
| | Yara International ASA | 682,315 | 29,345 |
| | Orkla ASA | 2,890,625 | 22,804 |
| | Norsk Hydro ASA | 5,195,554 | 19,312 |
| | Marine Harvest ASA | 1,197,248 | 16,109 |
| | Gjensidige Forsikring ASA | 660,815 | 10,576 |
| | Schibsted ASA Class A | 316,662 | 10,411 |
| * | Schibsted ASA Class B | 318,567 | 10,139 |
| * | Subsea 7 SA | 1,050,259 | 7,434 |
| *,^ | Seadrill Ltd. | 1,362,752 | 4,706 |
| * | Storebrand ASA | 242,991 | 952 |
| ^ | TGS Nopec Geophysical Co. ASA | 56,189 | 894 |
| 2 | XXL ASA | 53,192 | 613 |
| | Bakkafrost P/F | 17,376 | 512 |
| | Petroleum Geo-Services ASA | 118,082 | 483 |
| | Salmar ASA | 27,448 | 479 |
| | Veidekke ASA | 38,551 | 472 |
| | Kongsberg Gruppen ASA | 28,134 | 460 |
| | Atea ASA | 53,579 | 443 |
| *,^ | Nordic Semiconductor ASA | 85,473 | 415 |
| | SpareBank 1 SMN | 68,008 | 387 |
| * | Det Norske Oljeselskap ASA | 60,496 | 375 |
| | Opera Software ASA | 56,272 | 319 |
| 2 | BW LPG Ltd. | 37,870 | 310 |
| | SpareBank 1 SR-Bank ASA | 68,478 | 303 |
| | Leroy Seafood Group ASA | 7,522 | 280 |
| 2 | Aker Solutions ASA | 80,791 | 275 |
| 2 | Entra ASA | 32,578 | 262 |
| | Aker ASA | 13,234 | 244 |
| | Hoegh LNG Holdings Ltd. | 22,882 | 243 |
| | Prosafe SE | 101,440 | 239 |
| | Austevoll Seafood ASA | 38,138 | 232 |
| * | REC Silicon ASA | 1,103,856 | 222 |
| *,^ | DNO ASA | 328,000 | 221 |
| * | Norwegian Air Shuttle ASA | 5,894 | 214 |
| | Ocean Yield ASA | 22,249 | 172 |
| * | Norwegian Property ASA | 159,731 | 164 |
| * | Akastor ASA | 101,770 | 138 |
| | Wilh Wilhelmsen ASA | 31,616 | 126 |
| | Stolt-Nielsen Ltd. | 8,659 | 103 |
| | BW Offshore Ltd. | 219,823 | 64 |
| * | Fred Olsen Energy ASA | 16,339 | 64 |
| | | | 289,517 |
| Portugal (0.2%) | | |
| | EDP - Energias de Portugal SA | 7,641,602 | 27,535 |
| | Galp Energia SGPS SA | 1,895,601 | 22,119 |
| | Jeronimo Martins SGPS SA | 956,746 | 12,450 |
| * | Banco Comercial Portugues SA | 156,589,771 | 8,298 |
| | EDP Renovaveis SA | 776,892 | 6,111 |
| | NOS SGPS SA | 135,167 | 1,063 |
| | CTT-Correios de Portugal SA | 87,695 | 843 |
| | Sonae SGPS SA | 566,822 | 644 |
42
| | | |
| Vanguard® Developed Markets Index Fund | | |
| Schedule of Investments | | |
| December 31, 2015 | | |
| |
| | | | Market |
| | | | Value |
| | | Shares | ($000) |
| | Portucel SA | 145,319 | 565 |
| | REN - Redes Energeticas Nacionais SGPS SA | 114,803 | 347 |
| * | Banco BPI SA | 204,159 | 242 |
| | Altri SGPS SA | 41,057 | 213 |
| | Semapa-Sociedade de Investimento e Gestao | 12,783 | 176 |
| | Sonaecom SGPS SA | 49,847 | 112 |
| ^ | Mota-Engil SGPS SA | 45,790 | 95 |
| * | Pharol SGPS SA | 317,297 | 93 |
| * | Banco Espirito Santo SA | 10,412,510 | 13 |
| | | | 80,919 |
| Singapore (1.2%) | | |
| | DBS Group Holdings Ltd. | 6,982,618 | 81,833 |
| | Oversea-Chinese Banking Corp. Ltd. | 12,439,532 | 76,907 |
| | Singapore Telecommunications Ltd. | 28,448,777 | 73,348 |
| | United Overseas Bank Ltd. | 4,677,945 | 64,494 |
| | Keppel Corp. Ltd. | 5,559,619 | 25,397 |
| | CapitaLand Ltd. | 9,893,780 | 23,255 |
| | Global Logistic Properties Ltd. | 11,946,131 | 18,041 |
| | Singapore Exchange Ltd. | 3,246,165 | 17,557 |
| | ComfortDelGro Corp. Ltd. | 8,044,050 | 17,225 |
| | Singapore Press Holdings Ltd. | 6,154,286 | 17,058 |
| | Wilmar International Ltd. | 8,208,853 | 16,938 |
| | Singapore Airlines Ltd. | 1,958,943 | 15,435 |
| | CapitaLand Mall Trust | 10,147,153 | 13,769 |
| | Singapore Technologies Engineering Ltd. | 6,114,889 | 12,926 |
| | Genting Singapore plc | 23,689,684 | 12,782 |
| | City Developments Ltd. | 2,319,638 | 12,479 |
| | Ascendas REIT | 7,775,776 | 12,462 |
| | Hutchison Port Holdings Trust | 19,867,389 | 10,498 |
| | Jardine Cycle & Carriage Ltd. | 424,473 | 10,377 |
| | Suntec REIT | 9,461,078 | 10,304 |
| | UOL Group Ltd. | 1,811,195 | 7,938 |
| | Sembcorp Industries Ltd. | 3,484,162 | 7,468 |
| | CapitaLand Commercial Trust Ltd. | 7,694,834 | 7,301 |
| | Singapore Post Ltd. | 5,523,612 | 6,377 |
| | Yangzijiang Shipbuilding Holdings Ltd. | 7,969,328 | 6,157 |
| | Golden Agri-Resources Ltd. | 25,092,456 | 5,994 |
| | StarHub Ltd. | 2,264,469 | 5,893 |
| | Venture Corp. Ltd. | 949,858 | 5,487 |
| ^ | Noble Group Ltd. | 17,336,963 | 4,846 |
| ^ | Sembcorp Marine Ltd. | 3,264,484 | 4,017 |
| *,^ | Neptune Orient Lines Ltd. | 3,519,199 | 3,039 |
| ^ | SMRT Corp. Ltd. | 2,658,571 | 2,815 |
| ^ | Olam International Ltd. | 2,160,527 | 2,769 |
| ^ | SIA Engineering Co. Ltd. | 865,577 | 2,255 |
| | M1 Ltd. | 1,007,540 | 1,929 |
| | Wing Tai Holdings Ltd. | 1,519,775 | 1,877 |
| | Yanlord Land Group Ltd. | 2,525,236 | 1,786 |
| | Frasers Centrepoint Ltd. | 1,468,239 | 1,736 |
| ^ | COSCO Corp. Singapore Ltd. | 3,804,469 | 1,232 |
| | SATS Ltd. | 345,000 | 933 |
| | Mapletree Industrial Trust | 683,800 | 732 |
| | Keppel REIT | 1,030,700 | 675 |
| | Mapletree Greater China Commercial Trust | 1,040,500 | 670 |
| | Mapletree Commercial Trust | 726,200 | 665 |
| ^ | Indofood Agri Resources Ltd. | 1,734,900 | 598 |
| | Mapletree Logistics Trust | 808,700 | 563 |
| | Raffles Medical Group Ltd. | 160,400 | 470 |
| | Starhill Global REIT | 769,900 | 410 |
| | Keppel Infrastructure Trust | 1,100,200 | 395 |
| | Frasers Centrepoint Trust | 302,300 | 393 |
| | United Engineers Ltd. | 265,100 | 371 |
| | Genting Hong Kong Ltd. | 1,138,700 | 364 |
| | Asian Pay Television Trust | 795,700 | 358 |
43
| | |
| Vanguard® Developed Markets Index Fund | | |
| Schedule of Investments | | |
| December 31, 2015 | | |
| |
| | | Market |
| | | Value |
| | Shares | ($000) |
| First Resources Ltd. | 264,800 | 358 |
| Ascott Residence Trust | 421,000 | 351 |
| * Biosensors International Group Ltd. | 585,600 | 334 |
| CDL Hospitality Trusts | 354,100 | 331 |
| ^ Ezion Holdings Ltd. | 766,900 | 328 |
| Cache Logistics Trust | 471,900 | 302 |
| CapitaLand Retail China Trust | 277,600 | 291 |
| Frasers Commercial Trust | 315,200 | 282 |
| Cambridge Industrial Trust | 700,800 | 279 |
| SIIC Environment Holdings Ltd. | 463,200 | 249 |
| Lippo Malls Indonesia Retail Trust | 1,102,600 | 248 |
| Ascendas India Trust | 390,700 | 240 |
| Ascendas Hospitality Trust | 456,100 | 238 |
| First REIT | 276,500 | 234 |
| Far East Hospitality Trust | 493,800 | 231 |
| 2 ARA Asset Management Ltd. | 276,200 | 229 |
| OUE Hospitality Trust | 416,700 | 226 |
| Religare Health Trust | 320,700 | 226 |
| SPH REIT | 317,300 | 213 |
| Soilbuild Business Space REIT | 391,600 | 212 |
| Keppel DC REIT | 291,800 | 209 |
| OUE Ltd. | 165,500 | 209 |
| Croesus Retail Trust | 364,700 | 208 |
| Silverlake Axis Ltd. | 442,100 | 205 |
| * Yoma Strategic Holdings Ltd. | 604,800 | 197 |
| Sabana Shari'ah Compliant Industrial REIT | 373,200 | 188 |
| * Tiger Airways Holdings Ltd. | 639,100 | 184 |
| * Perennial Real Estate Holdings Ltd. | 257,900 | 173 |
| Accordia Golf Trust | 450,400 | 170 |
| * GL Ltd. | 253,000 | 156 |
| Super Group Ltd. | 232,500 | 137 |
| Midas Holdings Ltd. | 567,500 | 116 |
| Sarine Technologies Ltd. | 102,800 | 111 |
| * China Everbright Water Ltd. | 238,100 | 103 |
| OSIM International Ltd. | 135,200 | 103 |
| Hyflux Ltd. | 244,900 | 97 |
| CSE Global Ltd. | 297,500 | 96 |
| Bumitama Agri Ltd. | 181,200 | 90 |
| Keppel Telecommunications & Transportation Ltd. | 84,800 | 87 |
| Boustead Singapore Ltd. | 141,500 | 83 |
| Raffles Education Corp. Ltd. | 446,900 | 80 |
| * Gallant Venture Ltd. | 522,100 | 79 |
| * Ezra Holdings Ltd. | 1,132,000 | 79 |
| * Ying Li International Real Estate Ltd. | 645,800 | 75 |
| GMG Global Ltd. | 294,200 | 65 |
| * Boustead Projects Ltd. | 120,380 | 63 |
| * Vard Holdings Ltd. | 365,200 | 61 |
| Hi-P International Ltd. | 52,000 | 18 |
| * Ascendas REIT Rights Exp. 01/13/2016 | 291,591 | 13 |
| | | 640,455 |
| South Korea (4.0%) | | |
| Samsung Electronics Co. Ltd. | 311,723 | 332,478 |
| Samsung Electronics Co. Ltd. GDR | 204,525 | 108,436 |
| Hyundai Motor Co. | 565,737 | 71,353 |
| Samsung Electronics Co. Ltd. Preference Shares | 76,580 | 70,790 |
| NAVER Corp. | 104,337 | 58,182 |
| SK Hynix Inc. | 2,113,866 | 54,607 |
| Hyundai Mobis Co. Ltd. | 255,635 | 53,486 |
| Shinhan Financial Group Co. Ltd. | 1,474,184 | 49,520 |
| LG Chem Ltd. | 170,018 | 46,939 |
| Kia Motors Corp. | 1,004,128 | 44,774 |
| Amorepacific Corp. | 123,277 | 43,261 |
| Korea Electric Power Corp. | 915,878 | 38,803 |
| KT&G Corp. | 429,665 | 38,182 |
44
| | | |
| Vanguard® Developed Markets Index Fund | | |
| Schedule of Investments | | |
| December 31, 2015 | | |
| |
| | | | Market |
| | | | Value |
| | | Shares | ($000) |
| | POSCO | 265,881 | 37,245 |
| | Samsung Fire & Marine Insurance Co. Ltd. | 133,143 | 34,804 |
| | KB Financial Group Inc. | 1,215,362 | 34,241 |
| * | Samsung C&T Corp. | 272,812 | 32,202 |
| | LG Household & Health Care Ltd. | 34,658 | 30,776 |
| | Samsung Life Insurance Co. Ltd. | 302,281 | 28,248 |
| | SK Holdings Co. Ltd. | 138,624 | 28,244 |
| * | SK Innovation Co. Ltd. | 239,218 | 26,235 |
| | Samsung SDS Co. Ltd. | 109,962 | 23,651 |
| | Hana Financial Group Inc. | 1,147,184 | 22,924 |
| | Samsung SDI Co. Ltd. | 215,256 | 20,694 |
| | LG Corp. | 344,099 | 20,685 |
| *,^ | Celltrion Inc. | 285,441 | 20,365 |
| | LG Electronics Inc. | 430,093 | 19,554 |
| | LG Display Co. Ltd. | 885,262 | 18,336 |
| | Orion Corp. | 15,528 | 15,338 |
| | SK Telecom Co. Ltd. ADR | 757,168 | 15,257 |
| | Korea Zinc Co. Ltd. | 38,161 | 15,200 |
| *,^ | Hanmi Pharm Co. Ltd. | 24,451 | 14,977 |
| | Coway Co. Ltd. | 209,337 | 14,905 |
| | Kangwon Land Inc. | 417,171 | 13,616 |
| | AMOREPACIFIC Group | 108,282 | 13,528 |
| | E-MART Inc. | 80,243 | 12,876 |
| *,^ | Hyundai Heavy Industries Co. Ltd. | 173,568 | 12,829 |
| ^ | Kakao Corp. | 130,874 | 12,822 |
| | Korea Aerospace Industries Ltd. | 191,029 | 12,610 |
| | NCSoft Corp. | 69,543 | 12,537 |
| | Hyundai Motor Co. 2nd Preference Shares | 137,883 | 12,273 |
| | Hyundai Steel Co. | 289,748 | 12,210 |
| | Hyundai Glovis Co. Ltd. | 71,295 | 11,616 |
| | Hankook Tire Co. Ltd. | 290,500 | 11,587 |
| | Lotte Chemical Corp. | 55,632 | 11,352 |
| | Samsung Electro-Mechanics Co. Ltd. | 213,260 | 11,331 |
| | S-Oil Corp. | 164,782 | 11,038 |
| | Industrial Bank of Korea | 1,020,923 | 10,675 |
| | CJ Corp. | 50,143 | 10,651 |
| | Dongbu Insurance Co. Ltd. | 172,624 | 10,328 |
| | Shinhan Financial Group Co. Ltd. ADR | 296,631 | 9,964 |
| | CJ CheilJedang Corp. | 27,715 | 8,865 |
| | Hyosung Corp. | 89,446 | 8,847 |
| ^ | BNK Financial Group Inc. | 1,225,830 | 8,733 |
| | Woori Bank | 1,141,413 | 8,537 |
| | GS Holdings Corp. | 196,107 | 8,403 |
| | Lotte Shopping Co. Ltd. | 41,358 | 8,136 |
| ^ | Hotel Shilla Co. Ltd. | 123,072 | 8,059 |
| | KB Financial Group Inc. ADR | 282,558 | 7,875 |
| | Amorepacific Corp. Preference Shares | 40,033 | 7,801 |
| | Samsung Securities Co. Ltd. | 218,810 | 7,679 |
| | Hyundai Development Co-Engineering & Construction | 234,607 | 7,667 |
| | KCC Corp. | 21,657 | 7,640 |
| ^ | Hanssem Co. Ltd. | 38,886 | 7,620 |
| | Hyundai Motor Co. Preference Shares | 87,044 | 7,611 |
| | LG Uplus Corp. | 821,948 | 7,258 |
| | Hyundai Marine & Fire Insurance Co. Ltd. | 233,837 | 7,165 |
| | Hanwha Chemical Corp. | 311,199 | 7,090 |
| | Hyundai Engineering & Construction Co. Ltd. | 288,598 | 6,928 |
| | S-1 Corp. | 80,938 | 6,867 |
| | Yuhan Corp. | 29,710 | 6,854 |
| | Hyundai Department Store Co. Ltd. | 58,885 | 6,311 |
| | Lotte Confectionery Co. Ltd. | 3,178 | 6,162 |
| | KEPCO Plant Service & Engineering Co. Ltd. | 81,196 | 6,142 |
| | Hanwha Corp. | 184,954 | 6,132 |
| | Korea Investment Holdings Co. Ltd. | 146,051 | 6,103 |
| | LG Chem Ltd. Preference Shares | 28,850 | 6,027 |
45
| | | |
| Vanguard® Developed Markets Index Fund | | |
| Schedule of Investments | | |
| December 31, 2015 | | |
| |
| | | | Market |
| | | | Value |
| | | Shares | ($000) |
| | Hyundai Wia Corp. | 62,440 | 5,904 |
| | Daelim Industrial Co. Ltd. | 104,457 | 5,898 |
| ^ | BGF retail Co. Ltd. | 38,934 | 5,637 |
| | Daewoo Securities Co. Ltd. | 707,998 | 5,604 |
| ^ | Hanon Systems | 127,161 | 5,584 |
| ^ | Samsung Heavy Industries Co. Ltd. | 581,907 | 5,301 |
| | Shinsegae Co. Ltd. | 26,456 | 5,147 |
| | KT Corp. | 213,814 | 5,124 |
| | DGB Financial Group Inc. | 589,432 | 5,021 |
| *,^ | Hanmi Science Co. ltd | 45,442 | 4,927 |
| | Hanwha Life Insurance Co. Ltd. | 782,426 | 4,916 |
| | NongShim Co. Ltd. | 12,277 | 4,585 |
| *,^ | Hanwha Techwin Co. Ltd. | 150,316 | 4,503 |
| ^ | OCI Co. Ltd. | 71,044 | 4,479 |
| * | CJ Korea Express Co. Ltd. | 27,460 | 4,449 |
| | Lotte Chilsung Beverage Co. Ltd. | 2,332 | 4,400 |
| * | Cheil Worldwide Inc. | 245,972 | 4,302 |
| ^ | Mirae Asset Securities Co. Ltd. | 232,385 | 4,228 |
| | Woori Investment & Securities Co. Ltd. | 498,708 | 4,220 |
| | LG Household & Health Care Ltd. Preference Shares | 7,785 | 3,596 |
| *,^ | Daewoo Engineering & Construction Co. Ltd. | 760,074 | 3,595 |
| | Mando Corp. | 25,292 | 3,544 |
| | Hyundai Securities Co. Ltd. | 624,743 | 3,407 |
| ^ | Doosan Corp. | 44,611 | 3,352 |
| * | Korea Electric Power Corp. ADR | 157,271 | 3,329 |
| * | Korean Air Lines Co. Ltd. | 141,236 | 3,315 |
| ^ | Doosan Heavy Industries & Construction Co. Ltd. | 186,325 | 3,242 |
| | Samsung Card Co. Ltd. | 122,508 | 3,207 |
| | Korea Gas Corp. | 102,254 | 3,191 |
| | Dongsuh Cos. Inc. | 116,963 | 3,090 |
| *,^ | NHN Entertainment Corp. | 61,914 | 2,979 |
| | Kumho Petrochemical Co. Ltd. | 67,382 | 2,954 |
| | SK Telecom Co. Ltd. | 15,771 | 2,886 |
| ^ | LG Hausys Ltd. | 23,111 | 2,854 |
| *,^ | GS Engineering & Construction Corp. | 169,200 | 2,803 |
| | SK Networks Co. Ltd. | 575,425 | 2,669 |
| ^ | Paradise Co. Ltd. | 172,274 | 2,563 |
| | KT Corp. ADR | 214,980 | 2,560 |
| | Daewoo International Corp. | 175,779 | 2,421 |
| | LS Corp. | 66,862 | 2,273 |
| | SKC Co. Ltd. | 73,888 | 2,105 |
| ^ | Samsung Fine Chemicals Co. Ltd. | 68,479 | 2,066 |
| *,^ | Doosan Infracore Co. Ltd. | 509,130 | 2,016 |
| ^ | Hite Jinro Co. Ltd. | 98,458 | 1,957 |
| * | Samsung Engineering Co. Ltd. Rights Exp. 02/12/2016 | 345,467 | 1,897 |
| *,^ | Hyundai Mipo Dockyard Co. Ltd. | 39,230 | 1,716 |
| *,^ | Hanjin Shipping Co. Ltd. | 532,651 | 1,639 |
| | Samsung Fire & Marine Insurance Co. Ltd. Preference Shares | 9,550 | 1,533 |
| ^ | Daewoo Shipbuilding & Marine Engineering Co. Ltd. | 358,631 | 1,529 |
| ^ | KEPCO Engineering & Construction Co. Inc. | 47,308 | 1,384 |
| | LG Electronics Inc. Preference Shares | 53,872 | 1,308 |
| *,^ | Samsung Engineering Co. Ltd. | 102,356 | 1,250 |
| *,^ | Hyundai Merchant Marine Co. Ltd. | 332,076 | 1,160 |
| | CJ CheilJedang Corp. Preference Shares | 5,617 | 1,042 |
| * | ViroMed Co. Ltd. | 6,611 | 1,022 |
| | Medy-Tox Inc. | 2,183 | 943 |
| ^ | CJ CGV Co. Ltd. | 6,960 | 740 |
| | Ottogi Corp. | 701 | 727 |
| * | CJ E&M Corp. | 10,410 | 711 |
| | LG Innotek Co. Ltd. | 7,747 | 644 |
| | SK Chemicals Co. Ltd. | 9,934 | 611 |
| | Korea Kolmar Co. Ltd. | 7,444 | 597 |
| | Korean Reinsurance Co. | 49,421 | 594 |
| | Youngone Corp. | 16,598 | 592 |
46
| | | |
| Vanguard® Developed Markets Index Fund | | |
| Schedule of Investments | | |
| December 31, 2015 | | |
| |
| | | | Market |
| | | | Value |
| | | Shares | ($000) |
| | Meritz Securities Co. Ltd. | 171,658 | 576 |
| | Hyundai Greenfood Co. Ltd. | 27,096 | 569 |
| * | Com2uSCorp | 5,463 | 548 |
| *,^ | Komipharm International Co. Ltd. | 16,573 | 540 |
| | Green Cross Holdings Corp. | 14,984 | 531 |
| | KB Insurance Co. Ltd. | 20,927 | 519 |
| ^ | Cosmax Inc. | 3,222 | 500 |
| | Kolon Industries Inc. | 9,313 | 495 |
| *,^ | Kumho Tire Co. Inc. | 84,573 | 483 |
| | Eo Technics Co. Ltd. | 4,494 | 473 |
| | Hana Tour Service Inc. | 4,679 | 455 |
| | Green Cross Corp. | 2,897 | 448 |
| | Samyang Holdings Corp. | 3,180 | 425 |
| ^ | Fila Korea Ltd. | 5,207 | 418 |
| | Hansae Co. Ltd. | 9,271 | 415 |
| * | Osstem Implant Co. Ltd. | 5,673 | 389 |
| | Kolon Life Science Inc. | 2,314 | 387 |
| ^ | Meritz Fire & Marine Insurance Co. Ltd. | 27,914 | 383 |
| | GS Retail Co. Ltd. | 8,313 | 379 |
| | LG International Corp. | 13,234 | 378 |
| * | Ssangyong Cement Industrial Co. Ltd. | 26,238 | 364 |
| * | Innocean Worldwide Inc. | 6,137 | 364 |
| | Lotte Food Co. Ltd. | 406 | 326 |
| * | LG Life Sciences Ltd. | 6,326 | 322 |
| | LS Industrial Systems Co. Ltd. | 8,134 | 317 |
| | Korea Electric Terminal Co. Ltd. | 3,789 | 317 |
| | LOTTE Himart Co. Ltd. | 6,340 | 317 |
| * | Medipost Co. Ltd. | 3,860 | 315 |
| | KIWOOM Securities Co. Ltd. | 6,022 | 314 |
| *,^ | HLB Inc. | 16,998 | 307 |
| * | SM Entertainment Co. | 8,432 | 307 |
| | Huons Co. Ltd. | 3,983 | 307 |
| * | Pan Ocean Co. Ltd. | 98,049 | 306 |
| | Samlip General Foods Co. Ltd. | 1,281 | 300 |
| | Ilyang Pharmaceutical Co. Ltd. | 7,139 | 294 |
| | S&T Motiv Co. Ltd. | 3,982 | 290 |
| * | iNtRON Biotechnology Inc. | 6,313 | 288 |
| | Dong-A ST Co. Ltd. | 2,304 | 285 |
| | Daesang Corp. | 10,357 | 285 |
| | InBody Co. Ltd. | 5,811 | 284 |
| | OCI Materials Co. Ltd. | 2,831 | 278 |
| | Hyundai Home Shopping Network Corp. | 2,776 | 272 |
| * | Seoul Semiconductor Co. Ltd. | 20,536 | 271 |
| * | Hyundai Elevator Co. Ltd. | 5,296 | 270 |
| * | Wonik IPS Co. Ltd. | 28,118 | 268 |
| * | GemVax & Kael Co. Ltd. | 14,021 | 265 |
| | Taekwang Industrial Co. Ltd. | 284 | 263 |
| | Chong Kun Dang Pharmaceutical Corp. | 3,251 | 263 |
| | JB Financial Group Co. Ltd. | 55,590 | 259 |
| | iMarketKorea Inc. | 12,064 | 259 |
| | Handsome Co. Ltd. | 7,444 | 256 |
| | Hanjin Transportation Co. Ltd. | 6,482 | 254 |
| | Daou Technology Inc. | 13,440 | 247 |
| * | Seegene Inc. | 7,698 | 245 |
| | Amicogen Inc. | 4,367 | 244 |
| | Young Poong Corp. | 260 | 243 |
| | Hanjin Kal Corp. | 14,441 | 238 |
| | Hansol Chemical Co. Ltd. | 4,466 | 235 |
| | Loen Entertainment Inc. | 3,291 | 235 |
| | CJ O Shopping Co. Ltd. | 1,434 | 232 |
| | Poongsan Corp. | 9,929 | 231 |
| | Bukwang Pharmaceutical Co. Ltd. | 10,651 | 229 |
| | LF Corp. | 9,904 | 227 |
| * | Hansol Technics Co. Ltd. | 9,317 | 225 |
47
| | |
| Vanguard® Developed Markets Index Fund | | |
| Schedule of Investments | | |
| December 31, 2015 | | |
| |
| | | Market |
| | | Value |
| | Shares | ($000) |
| Korea Petrochemical Ind Co. Ltd. | 1,555 | 224 |
| * Chabiotech Co. Ltd. | 18,672 | 223 |
| Ahnlab Inc. | 3,123 | 215 |
| Halla Holdings Corp. | 3,929 | 214 |
| * Muhak Co. Ltd. | 6,573 | 213 |
| Dong-A Socio Holdings Co. Ltd. | 1,470 | 211 |
| GS Home Shopping Inc. | 1,462 | 208 |
| Daishin Securities Co. Ltd. Preference Shares | 33,531 | 207 |
| Koh Young Technology Inc. | 6,299 | 206 |
| * Hanwha General Insurance Co. Ltd. | 30,978 | 206 |
| SFA Engineering Corp. | 4,887 | 205 |
| Korea Real Estate Investment & Trust Co. Ltd. | 85,426 | 205 |
| Grand Korea Leisure Co. Ltd. | 9,942 | 203 |
| * Dongbu HiTek Co. Ltd. | 16,735 | 202 |
| Dongwon F&B Co. Ltd. | 604 | 201 |
| YG Entertainment Inc. | 5,228 | 197 |
| Hankook Tire Worldwide Co. Ltd. | 13,165 | 196 |
| JW Pharmaceutical Corp. | 6,355 | 195 |
| * Asiana Airlines Inc. | 48,623 | 191 |
| LEENO Industrial Inc. | 4,806 | 191 |
| Meritz Financial Group Inc. | 17,272 | 191 |
| IS Dongseo Co. Ltd. | 5,002 | 188 |
| Nexen Tire Corp. | 17,947 | 188 |
| Dae Hwa Pharmaceutical Co. Ltd. | 5,999 | 187 |
| * Webzen Inc. | 9,399 | 187 |
| * Kumho Industrial Co. Ltd. | 14,856 | 187 |
| Interpark Holdings Corp. | 19,646 | 183 |
| Hanil Cement Co. Ltd. | 2,036 | 183 |
| Korea Kolmar Holdings Co. Ltd. | 3,308 | 182 |
| DuzonBizon Co. Ltd. | 10,250 | 178 |
| Partron Co. Ltd. | 21,294 | 177 |
| * Genexine Co. Ltd. | 2,205 | 174 |
| Cuckoo Electronics Co. Ltd. | 890 | 173 |
| Tongyang Life Insurance Co. Ltd. | 17,435 | 172 |
| * Binex Co. Ltd. | 12,489 | 170 |
| * Gamevil Inc. | 2,599 | 170 |
| Youngone Holdings Co. Ltd. | 2,920 | 169 |
| Hyundai Livart Furniture Co. Ltd. | 5,643 | 167 |
| Chongkundang Holdings Corp. | 1,759 | 165 |
| KONA I Co. Ltd. | 5,566 | 161 |
| Crown Confectionery Co. Ltd. | 351 | 161 |
| * Sansung Life & Science Co. Ltd. | 6,353 | 160 |
| Dongwon Industries Co. Ltd. | 701 | 158 |
| * Dongkuk Steel Mill Co. Ltd. | 32,301 | 157 |
| Hancom Inc. | 7,884 | 156 |
| * Ssangyong Motor Co. | 23,563 | 155 |
| * Mirae Asset Life Insurance Co. Ltd. | 36,092 | 155 |
| CJ Hellovision Co. Ltd. | 14,225 | 153 |
| Maeil Dairy Industry Co. Ltd. | 4,047 | 152 |
| Silicon Works Co. Ltd. | 4,651 | 152 |
| * COSON Co. Ltd. | 8,018 | 151 |
| Soulbrain Co. Ltd. | 4,373 | 150 |
| ^ AK Holdings Inc. | 2,774 | 149 |
| Kwang Dong Pharmaceutical Co. Ltd. | 15,748 | 148 |
| Lutronic Corp. | 3,893 | 148 |
| * WeMade Entertainment Co. Ltd. | 4,691 | 147 |
| * Humedix Co. Ltd. | 2,833 | 147 |
| Huchems Fine Chemical Corp. | 11,264 | 146 |
| Binggrae Co. Ltd. | 2,507 | 146 |
| Posco ICT Co. Ltd. | 33,685 | 145 |
| * China Ocean Resources Co. Ltd. | 41,933 | 143 |
| * Seobu T&D | 7,763 | 143 |
| Daewoong Pharmaceutical Co. Ltd. | 2,366 | 142 |
| Seah Besteel Corp. | 6,025 | 141 |
48
| | |
| Vanguard® Developed Markets Index Fund | | |
| Schedule of Investments | | |
| December 31, 2015 | | |
| |
| | | Market |
| | | Value |
| | Shares | ($000) |
| * Hyundai Rotem Co. Ltd. | 11,170 | 139 |
| Cell Biotech Co. Ltd. | 2,828 | 136 |
| Namyang Dairy Products Co. Ltd. | 217 | 136 |
| Sungwoo Hitech Co. Ltd. | 17,500 | 133 |
| KISWIRE Ltd. | 4,087 | 132 |
| Cosmax BTI Inc | 2,239 | 130 |
| * Yuanta Securities Korea Co. Ltd. | 41,903 | 129 |
| S&T Dynamics Co. Ltd. | 11,026 | 128 |
| Kolon Corp. | 1,982 | 128 |
| * i-SENS Inc. | 4,444 | 128 |
| * Naturalendo Tech Co. Ltd. | 7,280 | 128 |
| Daekyo Co. Ltd. | 16,798 | 127 |
| POSCO Chemtech Co. Ltd. | 10,911 | 127 |
| JW Holdings Corp. | 17,072 | 126 |
| * SK Securities Co. Ltd. | 131,033 | 126 |
| Kolao Holdings | 14,441 | 125 |
| * Foosung Co. Ltd. | 27,431 | 124 |
| * Jusung Engineering Co. Ltd. | 18,682 | 124 |
| GOLFZON Co. Ltd. | 1,604 | 120 |
| * Coreana Cosmetics Co. Ltd. | 13,052 | 119 |
| Hankook Shell Oil Co. Ltd. | 294 | 118 |
| NS Shopping Co. Ltd. | 747 | 118 |
| * Green Cross Cell Corp. | 3,064 | 117 |
| * Agabang&Company | 13,014 | 116 |
| Hansol Paper Co. Ltd. | 6,631 | 116 |
| KT Skylife Co. Ltd. | 7,723 | 113 |
| SK Gas Ltd. | 1,820 | 113 |
| SL Corp. | 7,606 | 111 |
| Able C&C Co. Ltd. | 5,599 | 111 |
| Samchully Co. Ltd. | 1,222 | 107 |
| KH Vatec Co. Ltd. | 7,394 | 106 |
| * Hanjin Heavy Industries & Construction Co. Ltd. | 31,443 | 103 |
| Lock&Lock Co. Ltd. | 9,523 | 99 |
| Hyundai Corp. | 4,054 | 98 |
| * Samsung Pharmaceutical Co. Ltd. | 12,566 | 97 |
| * Taeyoung Engineering & Construction Co. Ltd. | 21,570 | 95 |
| * Pharmicell Co. Ltd. | 25,588 | 91 |
| E1 Corp. | 1,720 | 90 |
| * Woongjin Thinkbig Co. Ltd. | 10,222 | 88 |
| Humax Co. Ltd. | 6,113 | 88 |
| * Neowiz Games Corp. | 6,433 | 88 |
| Namhae Chemical Corp. | 10,079 | 87 |
| Youlchon Chemical Co. Ltd. | 8,546 | 86 |
| * Duksan Hi-Metal Co. Ltd. | 9,534 | 85 |
| KISCO Corp. | 2,469 | 85 |
| SBS Media Holdings Co. Ltd. | 25,502 | 84 |
| Daeduck Electronics Co. | 12,872 | 83 |
| Hanil E-Hwa Co. Ltd. | 6,426 | 82 |
| * Korea Line Corp. | 5,109 | 82 |
| INTOPS Co. Ltd. | 4,411 | 80 |
| * Taewoong Co. Ltd. | 5,921 | 80 |
| * Insun ENT Co. Ltd. | 15,567 | 79 |
| Samyang Corp. | 901 | 79 |
| Sam Young Electronics Co. Ltd. | 7,278 | 79 |
| MegaStudy Co. Ltd. | 2,219 | 78 |
| * Hansol Holdings Co. Ltd. | 13,108 | 77 |
| Lumens Co. Ltd. | 21,018 | 76 |
| Dae Han Flour Mills Co. Ltd. | 486 | 76 |
| Sung Kwang Bend Co. Ltd. | 10,250 | 75 |
| DY Corp. | 12,529 | 74 |
| Seoyon Co. Ltd. | 6,931 | 74 |
| * Duk San Neolux Co. Ltd. | 3,085 | 74 |
| Hanjin Heavy Industries & Construction Holdings Co. Ltd. | 14,316 | 73 |
| * ICD Co. Ltd. | 12,602 | 73 |
49
| | | |
| Vanguard® Developed Markets Index Fund | | |
| Schedule of Investments | | |
| December 31, 2015 | | |
| |
| | | | Market |
| | | | Value |
| | | Shares | ($000) |
| * | Eusu Holdings Co. Ltd. | 10,999 | 73 |
| * | Hyundai C&F Inc. | 2,746 | 72 |
| * | STS Semiconductor & Telecommunications | 34,862 | 72 |
| | Daeduck GDS Co. Ltd. | 8,479 | 72 |
| * | KTB Investment & Securities Co. Ltd. | 37,805 | 72 |
| * | NEPES Corp. | 14,177 | 72 |
| * | Eugene Investment & Securities Co. Ltd. | 31,699 | 72 |
| | Kyobo Securities Co. Ltd. | 9,050 | 71 |
| | Hanwha Investment & Securities Co. Ltd. | 21,643 | 71 |
| | SeAH Steel Corp. | 1,546 | 71 |
| * | Kwangju Bank | 10,782 | 70 |
| | TK Corp. | 8,821 | 70 |
| * | 3S Korea Co. Ltd. | 34,655 | 69 |
| | Dongbu Securities Co. Ltd. | 20,993 | 68 |
| * | Interflex Co. Ltd. | 7,464 | 67 |
| | Iljin Display Co. Ltd. | 14,131 | 65 |
| * | CUROCOM Co. Ltd. | 54,411 | 64 |
| * | MegaStudyEdu Co. Ltd. | 432 | 23 |
| | | | 2,119,471 |
| Spain (2.8%) | | |
| | Banco Santander SA | 55,770,416 | 274,357 |
| | Telefonica SA | 16,533,086 | 183,418 |
| | Banco Bilbao Vizcaya Argentaria SA | 24,591,253 | 179,684 |
| | Iberdrola SA | 21,788,368 | 154,458 |
| | Industria de Diseno Textil SA | 4,111,167 | 141,236 |
| | Amadeus IT Holding SA | 1,639,278 | 72,251 |
| * | Repsol SA | 4,129,400 | 45,462 |
| * | Ferrovial SA | 1,575,848 | 35,635 |
| | Red Electrica Corp. SA | 416,078 | 34,755 |
| | CaixaBank SA | 9,883,826 | 34,402 |
| * | Banco de Sabadell SA | 17,939,138 | 31,794 |
| | Grifols SA | 649,179 | 30,006 |
| *,2 | Aena SA | 251,442 | 28,793 |
| | Abertis Infraestructuras SA | 1,643,993 | 25,711 |
| | Enagas SA | 886,770 | 25,014 |
| | Endesa SA | 1,218,487 | 24,479 |
| | Gas Natural SDG SA | 1,198,586 | 24,442 |
| | Bankia SA | 17,963,942 | 20,905 |
| * | ACS Actividades de Construccion y Servicios SA | 688,860 | 20,154 |
| | Banco Popular Espanol SA | 6,114,758 | 20,147 |
| | Bankinter SA | 2,673,906 | 18,962 |
| | Grifols SA Preference Shares | 508,943 | 16,493 |
| | Distribuidora Internacional de Alimentacion SA | 2,462,504 | 14,524 |
| | Mapfre SA | 3,917,407 | 9,806 |
| | Acciona SA | 99,261 | 8,500 |
| | Zardoya Otis SA | 694,516 | 8,123 |
| | Mediaset Espana Comunicacion SA | 685,401 | 7,457 |
| *,^ | Acerinox SA | 533,274 | 5,439 |
| | Corp Financiera Alba SA | 67,515 | 2,914 |
| | Merlin Properties Socimi SA | 177,738 | 2,227 |
| | Gamesa Corp. Tecnologica SA | 122,758 | 2,102 |
| | Viscofan SA | 25,540 | 1,541 |
| 2 | Cellnex Telecom SAU | 77,841 | 1,455 |
| ^ | Bolsas y Mercados Espanoles SHMSF SA | 42,827 | 1,443 |
| | Ebro Foods SA | 46,695 | 919 |
| | Grupo Catalana Occidente SA | 24,799 | 860 |
| * | Inmobiliaria Colonial SA | 1,159,196 | 808 |
| | Almirall SA | 33,226 | 672 |
| *,2 | Euskaltel SA | 53,293 | 670 |
| ^ | Tecnicas Reunidas SA | 17,256 | 652 |
| | Melia Hotels International SA | 47,973 | 634 |
| * | NH Hotel Group SA | 114,411 | 626 |
| *,^ | Indra Sistemas SA | 65,202 | 612 |
| *,^ | Fomento de Construcciones y Contratas SA | 75,600 | 573 |
50
| | | |
| Vanguard® Developed Markets Index Fund | | |
| Schedule of Investments | | |
| December 31, 2015 | | |
| |
| | | | Market |
| | | | Value |
| | | Shares | ($000) |
| * | Hispania Activos Inmobiliarios SA | 37,361 | 531 |
| | Prosegur Cia de Seguridad SA | 112,896 | 520 |
| | Applus Services SA | 54,484 | 493 |
| | Obrascon Huarte Lain SA | 82,973 | 473 |
| | Cia de Distribucion Integral Logista Holdings SA | 21,246 | 448 |
| | Faes Farma SA | 131,872 | 394 |
| | CIE Automotive SA | 22,380 | 375 |
| ^ | Sacyr SA | 167,391 | 329 |
| | Atresmedia Corp. de Medios de Comunicacion SA | 29,778 | 317 |
| | Liberbank SA | 460,847 | 291 |
| | Construcciones y Auxiliar de Ferrocarriles SA | 1,026 | 284 |
| | Ence Energia y Celulosa SA | 70,451 | 266 |
| * | Pharma Mar SA | 83,140 | 226 |
| | Papeles y Cartones de Europa SA | 31,966 | 180 |
| ^ | Promotora de Informaciones SA | 26,630 | 151 |
| | Abengoa SA Class B | 464,072 | 98 |
| | Tubacex SA | 37,334 | 71 |
| | Duro Felguera SA | 39,851 | 57 |
| * | Deoleo SA | 225,088 | 56 |
| | | | 1,520,675 |
| Sweden (2.7%) | | |
| | Nordea Bank AB | 12,301,686 | 134,971 |
| | Hennes & Mauritz AB Class B | 3,708,620 | 131,917 |
| | Telefonaktiebolaget LM Ericsson Class B | 11,642,310 | 112,247 |
| | Swedbank AB Class A | 4,050,416 | 89,205 |
| * | Assa Abloy AB Class B | 3,678,839 | 77,008 |
| * | Svenska Handelsbanken AB Class A | 5,654,984 | 75,107 |
| | Svenska Cellulosa AB SCA Class B | 2,262,997 | 65,582 |
| | Investor AB Class B | 1,760,412 | 64,695 |
| | Skandinaviska Enskilda Banken AB Class A | 5,663,602 | 59,561 |
| | Atlas Copco AB Class A | 2,364,146 | 57,980 |
| | Volvo AB Class B | 5,969,192 | 55,350 |
| | TeliaSonera AB | 10,006,660 | 49,692 |
| | Hexagon AB Class B | 1,003,194 | 37,111 |
| | Sandvik AB | 4,186,233 | 36,491 |
| | Atlas Copco AB Class B | 1,549,345 | 35,620 |
| | Skanska AB Class B | 1,401,974 | 27,189 |
| | SKF AB | 1,613,549 | 26,061 |
| | Swedish Match AB | 736,614 | 26,030 |
| | Investment AB Kinnevik | 786,955 | 24,239 |
| | Alfa Laval AB | 1,200,061 | 21,908 |
| | Electrolux AB Class B | 864,259 | 20,852 |
| | Getinge AB | 710,621 | 18,615 |
| | Securitas AB Class B | 1,194,926 | 18,272 |
| | Trelleborg AB Class B | 930,936 | 18,067 |
| | Boliden AB | 1,071,626 | 17,954 |
| | Industrivarden AB Class A | 770,562 | 14,421 |
| | Meda AB Class A | 1,052,204 | 13,265 |
| * | Lundin Petroleum AB | 828,941 | 11,961 |
| | Tele2 AB | 1,194,164 | 11,909 |
| | Industrivarden AB | 604,414 | 10,340 |
| | Husqvarna AB | 1,442,208 | 9,518 |
| | Melker Schorling AB | 40,693 | 2,581 |
| *,^ | Fingerprint Cards AB Class B | 28,338 | 1,967 |
| | Elekta AB Class B | 195,728 | 1,663 |
| | BillerudKorsnas AB | 86,424 | 1,599 |
| | ICA Gruppen AB | 41,049 | 1,491 |
| * | Hexpol AB | 135,259 | 1,450 |
| * | Swedish Orphan Biovitrum AB | 85,760 | 1,360 |
| | Castellum AB | 88,971 | 1,267 |
| * | Svenska Handelsbanken AB Class B | 92,084 | 1,266 |
| * | Fastighets AB Balder | 50,771 | 1,250 |
| | NCC AB Class B | 40,143 | 1,245 |
| * | Betsson AB | 66,625 | 1,221 |
51
| | | |
| Vanguard® Developed Markets Index Fund | | |
| Schedule of Investments | | |
| December 31, 2015 | | |
| |
| | | | Market |
| | | | Value |
| | | Shares | ($000) |
| | Fabege AB | 72,398 | 1,196 |
| | Nibe Industrier AB Class B | 32,140 | 1,080 |
| | AAK AB | 13,900 | 1,030 |
| | Loomis AB Class B | 32,813 | 1,024 |
| * | NetEnt AB | 17,104 | 997 |
| * | Axfood AB | 56,121 | 972 |
| | Indutrade AB | 16,809 | 953 |
| * | Wallenstam AB | 107,066 | 861 |
| | Hufvudstaden AB Class A | 59,158 | 836 |
| | JM AB | 27,289 | 812 |
| | L E Lundbergforetagen AB Class B | 14,241 | 785 |
| | Modern Times Group MTG AB Class B | 29,188 | 745 |
| | Saab AB Class B | 23,694 | 730 |
| | Wihlborgs Fastigheter AB | 36,042 | 727 |
| | Kungsleden AB | 99,560 | 711 |
| | Peab AB | 89,728 | 687 |
| | Com Hem Holding AB | 74,984 | 679 |
| | Ratos AB | 117,624 | 679 |
| | Intrum Justitia AB | 19,487 | 663 |
| | Avanza Bank Holding AB | 14,776 | 642 |
| * | Lifco AB Class B | 25,123 | 627 |
| 2 | Thule Group AB | 39,720 | 541 |
| * | Sweco AB Class B | 36,651 | 538 |
| * | Pandox AB | 27,901 | 512 |
| | Hemfosa Fastigheter AB | 43,765 | 486 |
| | Nobia AB | 38,856 | 486 |
| | Holmen AB | 14,682 | 454 |
| | AF AB | 23,773 | 404 |
| | Atrium Ljungberg AB | 23,022 | 363 |
| *,^ | SSAB AB Class A | 111,401 | 296 |
| | Klovern AB Preference Shares | 8,793 | 293 |
| | Concentric AB | 22,308 | 283 |
| | SAS AB Preference Shares | 4,239 | 265 |
| | Lindab International AB | 35,239 | 261 |
| *,^ | SSAB AB Class B | 114,351 | 256 |
| | Bure Equity AB | 27,904 | 227 |
| | Haldex AB | 23,317 | 218 |
| | Clas Ohlson AB | 11,496 | 208 |
| | Investment AB Oresund | 7,705 | 202 |
| * | Collector AB | 13,274 | 199 |
| | Klovern AB | 175,313 | 197 |
| | Rezidor Hotel Group AB | 51,777 | 191 |
| | Axis Communications AB | 4,595 | 187 |
| * | SAS AB | 64,567 | 186 |
| | Nordnet AB | 37,843 | 183 |
| | Mekonomen AB | 8,146 | 167 |
| | SkiStar AB | 10,874 | 160 |
| | NCC AB Class A | 5,106 | 159 |
| | Fastighets AB Balder Preference Shares | 3,402 | 126 |
| | Hemfosa Fastigheter AB Preference Shares | 4,899 | 88 |
| | Sagax AB Preference Shares | 23,353 | 87 |
| | | | 1,417,157 |
| Switzerland (8.4%) | | |
| | Nestle SA | 12,149,820 | 901,945 |
| | Roche Holding AG | 2,691,906 | 745,950 |
| | Novartis AG | 8,330,377 | 716,573 |
| | UBS Group AG | 13,690,057 | 265,580 |
| | Credit Suisse Group AG | 7,349,708 | 158,327 |
| | ABB Ltd. | 8,493,389 | 151,587 |
| | Zurich Insurance Group AG | 581,615 | 149,417 |
| | Cie Financiere Richemont SA | 1,982,169 | 141,870 |
| | Syngenta AG | 356,746 | 139,631 |
| | Swiss Re AG | 1,336,612 | 130,542 |
| | Givaudan SA | 36,180 | 65,665 |
52
| | | |
| Vanguard® Developed Markets Index Fund | | |
| Schedule of Investments | | |
| December 31, 2015 | | |
| |
| | | | Market |
| | | | Value |
| | | Shares | ($000) |
| | Actelion Ltd. | 385,881 | 53,616 |
| | Geberit AG | 146,569 | 49,643 |
| | LafargeHolcim Ltd. (Zurich Shares) | 952,219 | 47,682 |
| | Swisscom AG | 87,932 | 44,002 |
| | Adecco SA | 631,049 | 43,191 |
| ^ | Swatch Group AG (Bearer) | 118,501 | 41,151 |
| | Julius Baer Group Ltd. | 849,647 | 41,104 |
| | SGS SA | 20,006 | 38,021 |
| | Swiss Life Holding AG | 125,203 | 33,723 |
| | Lonza Group AG | 203,943 | 33,168 |
| * | LafargeHolcim Ltd. (Paris Shares) | 635,227 | 32,133 |
| | Galenica AG | 19,080 | 29,852 |
| | Chocoladefabriken Lindt & Sprungli AG Registered Shares | 399 | 29,758 |
| | Sika AG | 8,212 | 29,676 |
| | Schindler Holding AG | 172,155 | 28,801 |
| | Partners Group Holding AG | 76,383 | 27,470 |
| | Kuehne & Nagel International AG | 191,673 | 26,259 |
| | Sonova Holding AG | 199,050 | 25,290 |
| | Baloise Holding AG | 182,923 | 23,183 |
| | Chocoladefabriken Lindt & Sprungli AG Participation Certificates | 3,628 | 22,656 |
| * | Dufry AG | 183,835 | 21,873 |
| | Clariant AG | 1,056,195 | 20,026 |
| | Swiss Prime Site AG | 248,792 | 19,430 |
| ^ | Transocean Ltd. | 1,361,769 | 17,023 |
| | Aryzta AG (Switzerland Shares) | 301,992 | 15,277 |
| | Roche Holding AG (Bearer) | 55,148 | 15,246 |
| | PSP Swiss Property AG | 155,555 | 13,641 |
| | Schindler Holding AG (Registered) | 79,645 | 13,431 |
| | Helvetia Holding AG | 23,086 | 13,005 |
| | Swatch Group AG (Registered) | 185,808 | 12,548 |
| | EMS-Chemie Holding AG | 28,446 | 12,519 |
| | GAM Holding AG | 620,657 | 10,273 |
| | Barry Callebaut AG | 7,596 | 8,251 |
| ^ | Sulzer AG | 84,763 | 7,967 |
| | Pargesa Holding SA | 114,313 | 7,222 |
| | Banque Cantonale Vaudoise | 10,884 | 6,905 |
| | DKSH Holding AG | 102,048 | 6,418 |
| | BB Biotech AG | 6,055 | 1,759 |
| | Georg Fischer AG | 2,214 | 1,503 |
| | dorma&kaba Holding AG | 1,996 | 1,356 |
| | Aryzta AG (Ireland Shares) | 26,749 | 1,342 |
| | Straumann Holding AG | 4,124 | 1,252 |
| | Flughafen Zuerich AG | 1,640 | 1,231 |
| *,2 | Sunrise Communications Group AG | 18,713 | 1,103 |
| | Temenos Group AG | 20,695 | 1,069 |
| | Logitech International SA | 69,445 | 1,064 |
| | ams AG | 31,401 | 1,050 |
| | Valiant Holding AG | 8,704 | 1,022 |
| | Tecan Group AG | 6,276 | 1,017 |
| | Cembra Money Bank AG | 14,576 | 935 |
| | Panalpina Welttransport Holding AG | 7,609 | 850 |
| | OC Oerlikon Corp. AG | 94,216 | 839 |
| | Forbo Holding AG | 671 | 790 |
| | Bucher Industries AG | 3,414 | 769 |
| | Leonteq AG | 5,177 | 748 |
| | Mobimo Holding AG | 3,347 | 743 |
| | U-Blox AG | 3,213 | 684 |
| | Allreal Holding AG | 5,116 | 682 |
| | Belimo Holding AG | 261 | 640 |
| | Gategroup Holding AG | 14,048 | 616 |
| | SFS Group AG | 8,490 | 592 |
| | Emmi AG | 1,166 | 523 |
| | Burckhardt Compression Holding AG | 1,704 | 522 |
| | Autoneum Holding AG | 2,495 | 502 |
53
| | | |
| Vanguard® Developed Markets Index Fund | | |
| Schedule of Investments | | |
| December 31, 2015 | | |
| |
| | | | Market |
| | | | Value |
| | | Shares | ($000) |
| | Rieter Holding AG | 2,433 | 457 |
| | Schweiter Technologies AG | 533 | 451 |
| | St. Galler Kantonalbank AG | 1,213 | 437 |
| | VZ Holding AG | 1,467 | 431 |
| * | Cosmo Pharmaceuticals SA | 2,644 | 428 |
| | Kuoni Reisen Holding AG | 1,501 | 418 |
| | Implenia AG | 8,109 | 413 |
| | EFG International AG | 33,938 | 361 |
| | Huber & Suhner AG | 7,457 | 347 |
| | Daetwyler Holding AG | 2,310 | 330 |
| | Vontobel Holding AG | 6,930 | 328 |
| | Valora Holding AG | 1,453 | 302 |
| *,^ | Meyer Burger Technology AG | 49,226 | 293 |
| | Kudelski SA | 18,949 | 273 |
| | Conzzeta AG | 417 | 266 |
| | Siegfried Holding AG | 1,309 | 256 |
| * | AFG Arbonia-Forster Holding AG | 24,440 | 247 |
| | Ascom Holding AG | 15,514 | 246 |
| | Ypsomed Holding AG | 1,585 | 229 |
| * | Bell AG | 66 | 224 |
| | BKW AG | 5,785 | 219 |
| * | Zehnder Group AG | 5,480 | 210 |
| * | APG SGA SA | 544 | 210 |
| * | Basilea Pharmaceutica AG | 2,156 | 207 |
| | Vetropack Holding AG | 115 | 181 |
| | Alpiq Holding AG | 1,578 | 166 |
| * | Schmolz & Bickenbach AG | 278,396 | 138 |
| | Swissquote Group Holding SA | 5,188 | 131 |
| * | Plazza AG | 574 | 113 |
| | Bachem Holding AG | 979 | 51 |
| * | Orascom Development Holding AG | 4,752 | 48 |
| | | | 4,522,135 |
| United Kingdom (18.3%) | | |
| | HSBC Holdings plc | 75,627,962 | 597,027 |
| | British American Tobacco plc | 7,220,019 | 400,959 |
| | GlaxoSmithKline plc | 19,005,387 | 383,832 |
| | BP plc | 70,775,423 | 367,800 |
| | Royal Dutch Shell plc Class A | 15,074,802 | 341,434 |
| | Vodafone Group plc | 103,038,698 | 334,132 |
| | AstraZeneca plc | 4,930,679 | 333,056 |
| | Diageo plc | 9,711,063 | 265,189 |
| | Lloyds Banking Group plc | 239,104,787 | 257,277 |
| | Reckitt Benckiser Group plc | 2,485,263 | 229,954 |
| | BT Group plc | 32,427,055 | 225,161 |
| | Prudential plc | 9,922,553 | 223,551 |
| | SABMiller plc | 3,665,234 | 219,270 |
| | Royal Dutch Shell plc Class B | 9,490,159 | 216,291 |
| | Barclays plc | 65,106,154 | 209,563 |
| | National Grid plc | 14,589,762 | 201,217 |
| | Unilever plc | 4,675,723 | 200,553 |
| | Imperial Tobacco Group plc | 3,726,143 | 196,807 |
| | BG Group plc | 13,217,641 | 191,602 |
| | Shire plc | 2,297,084 | 157,598 |
| | Rio Tinto plc | 4,770,608 | 138,898 |
| | Aviva plc | 15,755,573 | 119,593 |
| | WPP plc | 5,052,934 | 116,227 |
| | Compass Group plc | 6,408,846 | 111,055 |
| | BHP Billiton plc | 8,212,373 | 91,583 |
| | Legal & General Group plc | 23,081,714 | 91,079 |
| | BAE Systems plc | 12,326,507 | 90,755 |
| | Standard Chartered plc | 10,453,042 | 86,731 |
| | SSE plc | 3,818,719 | 85,745 |
| | ARM Holdings plc | 5,480,168 | 83,529 |
| | RELX NV (London Shares) | 4,307,192 | 75,962 |
54
| | |
| Vanguard® Developed Markets Index Fund | | |
| Schedule of Investments | | |
| December 31, 2015 | | |
| |
| | | Market |
| | | Value |
| | Shares | ($000) |
| * Tesco plc | 31,587,694 | 69,407 |
| Sky plc | 4,079,678 | 66,878 |
| Experian plc | 3,778,993 | 66,792 |
| Associated British Foods plc | 1,345,213 | 66,194 |
| Centrica plc | 19,670,437 | 63,162 |
| Smith & Nephew plc | 3,496,442 | 62,314 |
| Rolls-Royce Holdings plc | 7,168,115 | 60,717 |
| Next plc | 563,414 | 60,495 |
| Glencore plc | 45,400,293 | 60,162 |
| ITV plc | 14,522,878 | 59,128 |
| * Royal Bank of Scotland Group plc | 12,559,638 | 55,829 |
| Wolseley plc | 1,015,050 | 55,131 |
| Land Securities Group plc | 3,036,689 | 52,641 |
| Old Mutual plc | 19,003,537 | 49,992 |
| London Stock Exchange Group plc | 1,219,971 | 49,358 |
| CRH plc (London Shares) | 1,592,280 | 46,099 |
| Whitbread plc | 711,023 | 46,086 |
| CRH plc (Dublin Shares) | 1,583,612 | 45,670 |
| British Land Co. plc | 3,945,052 | 45,648 |
| Capita plc | 2,531,889 | 45,049 |
| Standard Life plc | 7,616,046 | 43,614 |
| Kingfisher plc | 8,988,851 | 43,538 |
| Marks & Spencer Group plc | 6,361,145 | 42,354 |
| Carnival plc | 711,704 | 40,543 |
| Taylor Wimpey plc | 12,621,222 | 37,730 |
| Sage Group plc | 4,192,311 | 37,249 |
| InterContinental Hotels Group plc | 923,305 | 35,989 |
| Barratt Developments plc | 3,891,921 | 35,863 |
| International Consolidated Airlines Group SA (London Shares) | 3,967,447 | 35,672 |
| United Utilities Group plc | 2,590,043 | 35,663 |
| Persimmon plc | 1,194,450 | 35,635 |
| Bunzl plc | 1,268,681 | 35,199 |
| Pearson plc | 3,175,391 | 34,328 |
| Ashtead Group plc | 1,963,998 | 32,323 |
| Direct Line Insurance Group plc | 5,365,846 | 32,164 |
| Johnson Matthey plc | 799,597 | 31,279 |
| GKN plc | 6,681,216 | 30,319 |
| Burberry Group plc | 1,717,211 | 30,213 |
| St. James's Place plc | 2,020,753 | 29,951 |
| Inmarsat plc | 1,750,763 | 29,351 |
| DCC plc | 340,496 | 28,446 |
| Severn Trent plc | 887,228 | 28,362 |
| Dixons Carphone plc | 3,818,223 | 28,099 |
| Provident Financial plc | 565,456 | 28,037 |
| Travis Perkins plc | 956,769 | 27,756 |
| Mondi plc | 1,411,857 | 27,674 |
| Hammerson plc | 3,053,246 | 26,992 |
| Berkeley Group Holdings plc | 491,752 | 26,734 |
| 3i Group plc | 3,761,586 | 26,647 |
| Intertek Group plc | 625,820 | 25,600 |
| RSA Insurance Group plc | 3,936,563 | 24,707 |
| Rexam plc | 2,718,653 | 24,249 |
| Croda International plc | 526,404 | 23,586 |
| Royal Mail plc | 3,529,152 | 23,116 |
| Informa plc | 2,518,330 | 22,759 |
| Anglo American plc London Shares | 5,106,306 | 22,403 |
| Randgold Resources Ltd. | 362,607 | 22,339 |
| TUI AG | 1,219,100 | 21,767 |
| Rightmove plc | 354,917 | 21,568 |
| easyJet plc | 840,945 | 21,568 |
| DS Smith plc | 3,647,411 | 21,336 |
| Smiths Group plc | 1,530,913 | 21,171 |
| J Sainsbury plc | 5,508,616 | 20,978 |
| Pennon Group plc | 1,588,561 | 20,153 |
55
| | | |
| Vanguard® Developed Markets Index Fund | | |
| Schedule of Investments | | |
| December 31, 2015 | | |
| |
| | | | Market |
| | | | Value |
| | | Shares | ($000) |
| | G4S plc | 6,051,339 | 20,101 |
| | Derwent London plc | 371,626 | 20,100 |
| | William Hill plc | 3,418,367 | 19,950 |
| | Schroders plc | 441,616 | 19,342 |
| | Inchcape plc | 1,661,908 | 19,175 |
| | Hargreaves Lansdown plc | 854,615 | 18,973 |
| | Admiral Group plc | 769,751 | 18,809 |
| 2 | Merlin Entertainments plc | 2,773,690 | 18,598 |
| | Cobham plc | 4,453,411 | 18,597 |
| | Wm Morrison Supermarkets plc | 8,438,046 | 18,386 |
| | Howden Joinery Group plc | 2,367,722 | 18,345 |
| *,2 | Auto Trader Group plc | 2,763,089 | 18,015 |
| | Segro plc | 2,843,292 | 17,994 |
| | Capital & Counties Properties plc | 2,760,134 | 17,896 |
| | Hikma Pharmaceuticals plc | 523,494 | 17,746 |
| | Intu Properties plc | 3,598,421 | 16,812 |
| | Meggitt plc | 3,032,772 | 16,745 |
| | Aberdeen Asset Management plc | 3,864,807 | 16,469 |
| * | Melrose Industries plc | 3,789,585 | 16,233 |
| | Coca-Cola HBC AG | 754,308 | 16,064 |
| | Tate & Lyle plc | 1,795,820 | 15,818 |
| | ICAP plc | 2,081,286 | 15,622 |
| | Rentokil Initial plc | 6,591,863 | 15,466 |
| | Babcock International Group plc | 976,596 | 14,615 |
| | Investec plc | 1,980,503 | 13,965 |
| | IMI plc | 1,058,911 | 13,437 |
| | John Wood Group plc | 1,418,949 | 12,779 |
| | Aggreko plc | 932,629 | 12,555 |
| | Weir Group plc | 822,088 | 12,076 |
| | Petrofac Ltd. | 1,005,599 | 11,795 |
| | Daily Mail & General Trust plc | 1,024,114 | 10,540 |
| | Amec Foster Wheeler plc | 1,512,941 | 9,551 |
| | Antofagasta plc | 1,377,080 | 9,473 |
| * | Tullow Oil plc | 3,501,564 | 8,577 |
| ^ | Polymetal International plc | 962,864 | 8,239 |
| * | Sports Direct International plc | 957,828 | 8,140 |
| | Fresnillo plc | 654,675 | 6,807 |
| ^ | TalkTalk Telecom Group plc | 2,033,740 | 6,527 |
| ^ | Ashmore Group plc | 1,514,037 | 5,704 |
| | Bellway plc | 67,767 | 2,834 |
| | Amlin plc | 275,447 | 2,693 |
| | Halma plc | 207,427 | 2,641 |
| | Henderson Group plc | 580,706 | 2,639 |
| | Betfair Group plc | 45,135 | 2,595 |
| | Hiscox Ltd. | 157,504 | 2,442 |
| | Booker Group plc | 895,562 | 2,390 |
| | IG Group Holdings plc | 201,628 | 2,384 |
| | Greene King plc | 169,694 | 2,323 |
| | Great Portland Estates plc | 189,220 | 2,306 |
| | Man Group plc | 843,674 | 2,170 |
| * | BTG plc | 209,906 | 2,127 |
| | Telecity Group plc | 114,493 | 2,116 |
| | Micro Focus International plc | 89,025 | 2,091 |
| | Shaftesbury plc | 152,536 | 2,055 |
| | Spirax-Sarco Engineering plc | 39,937 | 1,931 |
| | UBM plc | 243,092 | 1,884 |
| * | Just Eat plc | 255,330 | 1,854 |
| | Essentra plc | 144,084 | 1,756 |
| | RPC Group plc | 141,637 | 1,736 |
| | Spectris plc | 65,398 | 1,736 |
| | Phoenix Group Holdings | 125,071 | 1,685 |
| | Cable & Wireless Communications plc | 1,533,794 | 1,678 |
| | Regus plc | 339,263 | 1,667 |
| | Intermediate Capital Group plc | 179,425 | 1,654 |
56
| | |
| Vanguard® Developed Markets Index Fund | | |
| Schedule of Investments | | |
| December 31, 2015 | | |
| |
| | | Market |
| | | Value |
| | Shares | ($000) |
| Beazley plc | 286,186 | 1,643 |
| Hays plc | 764,732 | 1,642 |
| Close Brothers Group plc | 82,479 | 1,626 |
| WH Smith plc | 61,519 | 1,599 |
| BBA Aviation plc | 569,554 | 1,589 |
| AA plc | 332,712 | 1,537 |
| * Balfour Beatty plc | 382,423 | 1,523 |
| Jupiter Fund Management plc | 228,999 | 1,522 |
| * Thomas Cook Group plc | 844,407 | 1,507 |
| Moneysupermarket.com Group plc | 276,035 | 1,493 |
| Berendsen plc | 92,005 | 1,459 |
| Playtech plc | 116,251 | 1,423 |
| QinetiQ Group plc | 336,811 | 1,342 |
| Grafton Group plc | 118,237 | 1,291 |
| WS Atkins plc | 53,546 | 1,279 |
| Rotork plc | 474,330 | 1,276 |
| Britvic plc | 117,361 | 1,257 |
| SSP Group plc | 259,465 | 1,241 |
| Saga plc | 418,493 | 1,235 |
| UNITE Group plc | 123,459 | 1,193 |
| UDG Healthcare plc | 134,964 | 1,190 |
| Victrex plc | 44,519 | 1,180 |
| Greencore Group plc | 225,753 | 1,178 |
| Domino's Pizza Group plc | 74,708 | 1,158 |
| Kennedy Wilson Europe Real Estate plc | 64,984 | 1,156 |
| Michael Page International plc | 161,415 | 1,153 |
| Ultra Electronics Holdings plc | 39,457 | 1,149 |
| National Express Group plc | 230,714 | 1,128 |
| Bovis Homes Group plc | 74,961 | 1,121 |
| Crest Nicholson Holdings plc | 136,030 | 1,115 |
| Restaurant Group plc | 109,415 | 1,107 |
| Carillion plc | 241,954 | 1,081 |
| Greggs plc | 55,202 | 1,070 |
| Kier Group plc | 51,802 | 1,061 |
| Dignity plc | 28,007 | 1,051 |
| * Firstgroup plc | 660,777 | 1,044 |
| Galliford Try plc | 46,315 | 1,041 |
| Stagecoach Group plc | 234,631 | 1,025 |
| Lancashire Holdings Ltd. | 110,169 | 1,016 |
| Ladbrokes plc | 557,776 | 984 |
| Indivior plc | 355,297 | 982 |
| * Ocado Group plc | 219,429 | 980 |
| Big Yellow Group plc | 78,003 | 925 |
| Savills plc | 70,693 | 924 |
| Jardine Lloyd Thompson Group plc | 67,882 | 919 |
| Go-Ahead Group plc | 23,203 | 909 |
| Workspace Group plc | 63,965 | 901 |
| Mitie Group plc | 196,502 | 900 |
| Cineworld Group plc | 108,138 | 897 |
| Bodycote plc | 104,585 | 873 |
| Drax Group plc | 237,424 | 855 |
| Elementis plc | 253,423 | 853 |
| Redrow plc | 123,048 | 853 |
| Paragon Group of Cos. plc | 163,817 | 852 |
| Electrocomponents plc | 241,468 | 846 |
| AVEVA Group plc | 35,361 | 840 |
| * Serco Group plc | 599,162 | 834 |
| HomeServe plc | 134,562 | 824 |
| Pets at Home Group plc | 202,499 | 823 |
| Senior plc | 234,634 | 795 |
| Grainger plc | 230,282 | 788 |
| LondonMetric Property plc | 323,205 | 781 |
| Marston's plc | 314,461 | 770 |
| Laird plc | 147,246 | 770 |
57
| | | |
| Vanguard® Developed Markets Index Fund | | |
| Schedule of Investments | | |
| December 31, 2015 | | |
| |
| | | | Market |
| | | | Value |
| | | Shares | ($000) |
| | Dairy Crest Group plc | 75,963 | 760 |
| | Dechra Pharmaceuticals plc | 47,191 | 759 |
| | Genus plc | 32,352 | 742 |
| * | Cairn Energy plc | 318,446 | 737 |
| | Vesuvius plc | 149,232 | 735 |
| | Bwin Party Digital Entertainment plc | 385,813 | 734 |
| | Debenhams plc | 676,637 | 730 |
| 2 | Spire Healthcare Group plc | 155,710 | 719 |
| | Virgin Money Holdings UK plc | 126,680 | 710 |
| | Tullett Prebon plc | 129,293 | 707 |
| | Synthomer plc | 150,585 | 703 |
| | Dunelm Group plc | 50,575 | 700 |
| | Tritax Big Box REIT plc | 364,995 | 698 |
| | Diploma plc | 62,301 | 696 |
| | Card Factory plc | 128,718 | 694 |
| | Al Noor Hospitals Group plc | 42,530 | 694 |
| * | SVG Capital plc | 93,116 | 675 |
| | Hansteen Holdings plc | 397,766 | 674 |
| | Brewin Dolphin Holdings plc | 146,286 | 665 |
| | SIG plc | 309,528 | 654 |
| | Mitchells & Butlers plc | 129,150 | 653 |
| 2 | John Laing Group plc | 209,653 | 649 |
| | Home Retail Group plc | 442,794 | 649 |
| | Ted Baker plc | 14,664 | 645 |
| *,2 | Wizz Air Holdings plc | 23,840 | 641 |
| | Interserve plc | 82,832 | 632 |
| | Fidessa Group plc | 21,199 | 629 |
| | St. Modwen Properties plc | 98,533 | 603 |
| | F&C Commercial Property Trust Ltd. | 297,832 | 590 |
| | Morgan Advanced Materials plc | 156,398 | 571 |
| * | Vectura Group plc | 219,316 | 567 |
| | Centamin plc | 598,579 | 567 |
| | Entertainment One Ltd. | 226,337 | 557 |
| | Renishaw plc | 20,078 | 553 |
| | Halfords Group plc | 110,902 | 546 |
| * | Ophir Energy plc | 376,118 | 543 |
| | Computacenter plc | 41,804 | 522 |
| | J D Wetherspoon plc | 46,961 | 518 |
| | Telecom Plus plc | 32,741 | 518 |
| | International Personal Finance plc | 121,524 | 516 |
| | BGEO Group plc | 18,263 | 512 |
| 2 | Sophos Group plc | 131,625 | 510 |
| | esure Group plc | 134,552 | 503 |
| | Countrywide plc | 85,188 | 501 |
| | Keller Group plc | 40,534 | 496 |
| | KCOM Group plc | 288,984 | 491 |
| * | Enterprise Inns plc | 282,559 | 462 |
| 2 | Zoopla Property Group plc | 124,104 | 437 |
| | NMC Health plc | 35,072 | 435 |
| | UK Commercial Property Trust Ltd. | 345,452 | 434 |
| * | SuperGroup plc | 17,831 | 432 |
| | Northgate plc | 73,122 | 423 |
| | RPS Group plc | 118,641 | 413 |
| | Redefine International PLC | 546,316 | 403 |
| | Foxtons Group plc | 144,362 | 399 |
| | Xchanging plc | 139,775 | 397 |
| | Helical Bar plc | 54,936 | 386 |
| * | Allied Minds plc | 62,162 | 367 |
| | Petra Diamonds Ltd. | 283,599 | 364 |
| | Just Retirement Group plc | 146,834 | 360 |
| | N Brown Group plc | 79,246 | 359 |
| | Devro plc | 81,852 | 350 |
| | De La Rue plc | 53,626 | 350 |
| | Hunting plc | 77,074 | 347 |
58
| | | | | |
| Vanguard® Developed Markets Index Fund | | | | |
| Schedule of Investments | | | | |
| December 31, 2015 | | | | |
| |
| | | | | | Market |
| | | | | | Value |
| | | | | Shares | ($000) |
| * | Aldermore Group plc | | | 101,327 | 346 |
| | Chesnara plc | | | 69,585 | 343 |
| *,2 | Shawbrook Group plc | | | 65,541 | 340 |
| | Oxford Instruments plc | | | 29,111 | 328 |
| | Spirent Communications plc | | | 312,019 | 328 |
| | Poundland Group plc | | | 106,681 | 326 |
| | ITE Group plc | | | 136,465 | 315 |
| | Chemring Group plc | | | 109,670 | 308 |
| | Picton Property Income Ltd. | | | 290,828 | 303 |
| | Premier Farnell plc | | | 204,117 | 295 |
| | Shanks Group plc | | | 202,284 | 288 |
| * | Evraz plc | | | 264,518 | 285 |
| | OneSavings Bank plc | | | 51,518 | 270 |
| * | Imagination Technologies Group plc | | | 136,834 | 269 |
| | Soco International plc | | | 121,747 | 263 |
| * | Mothercare plc | | | 79,601 | 258 |
| | Schroder REIT Ltd. | | | 285,010 | 250 |
| | Vedanta Resources plc | | | 58,495 | 236 |
| | U & I Group plc | | | 69,468 | 230 |
| | Fenner plc | | | 106,200 | 224 |
| | 888 Holdings plc | | | 82,607 | 222 |
| | Acacia Mining plc | | | 84,044 | 222 |
| * | Premier Foods plc | | | 378,072 | 218 |
| *,^ | KAZ Minerals plc | | | 143,494 | 215 |
| * | Genel Energy plc | | | 84,393 | 212 |
| *,^ | AO World plc | | | 92,003 | 211 |
| * | Lamprell plc | | | 145,323 | 211 |
| | Daejan Holdings plc | | | 2,204 | 206 |
| | Stobart Group Ltd. | | | 129,689 | 204 |
| * | Premier Oil plc | | | 284,688 | 204 |
| | Cape plc | | | 55,861 | 193 |
| | Xaar plc | | | 30,364 | 188 |
| | Partnership Assurance Group plc | | | 90,139 | 183 |
| * | EnQuest plc | | | 404,683 | 114 |
| | Speedy Hire plc | | | 181,857 | 111 |
| | Lonmin plc | | | 86,503 | 106 |
| * | Hochschild Mining plc | | | 129,399 | 92 |
| | Gem Diamonds Ltd. | | | 21,692 | 42 |
| |
| | | | | | 9,810,953 |
| |
| Total Common Stocks (Cost $52,830,528) | | | | 53,038,379 |
| |
| |
| Temporary Cash Investments (1.7%)1 | Coupon | | | |
| Money Market Fund (1.5%) | | | | |
| 3,4 | Vanguard Market Liquidity Fund | 0.363% | | 840,518,811 | 840,519 |
| |
| |
| | | | | Face | |
| | | | Maturity | Amount | |
| | | | Date | ($000) | |
| U.S. Government and Agency Obligations (0.2%) | | | | |
| 5,6 | Federal Home Loan Bank Discount Notes | 0.200% | 2/5/16 | 10,000 | 9,997 |
| 5 | Federal Home Loan Bank Discount Notes | 0.360% | 3/4/16 | 2,000 | 1,999 |
| 5 | Federal Home Loan Bank Discount Notes | 0.466% | 3/7/16 | 6,300 | 6,295 |
| 5 | Federal Home Loan Bank Discount Notes | 0.331% | 4/13/16 | 5,000 | 4,994 |
| 5,7 | Federal Home Loan Bank Discount Notes | 0.260% | 4/27/16 | 5,000 | 4,993 |
| 5,7 | Federal Home Loan Bank Discount Notes | 0.391% | 5/27/16 | 8,000 | 7,983 |
| 8 | Freddie Mac Discount Notes | 0.245% | 1/5/16 | 20,000 | 20,000 |
| 6,8 | Freddie Mac Discount Notes | 0.220% | 4/15/16 | 8,400 | 8,391 |
| 7 | United States Treasury Note/Bond | 0.375% | 5/31/16 | 15,000 | 14,995 |
59
Vanguard® Developed Markets Index Fund
Schedule of Investments
December 31, 2015
| | | | |
| | | | Face | Market |
| | | Maturity | Amount | Value |
| | Coupon | Date | ($000) | ($000) |
| 6,7 United States Treasury Note/Bond | 3.250% | 5/31/16 | 19,593 | 19,813 |
| | | | | 99,460 |
| Total Temporary Cash Investments (Cost $940,005) | | | | 939,979 |
| Total Investments (100.7%) (Cost $53,770,533) | | | | 53,978,358 |
| Other Assets and Liabilities—Net (-0.7%)4 | | | | (383,160) |
| Net Assets (100%) | | | | 53,595,198 |
* Non-income-producing security.
^ Includes partial security positions on loan to broker-dealers. The total value of securities on loan is $503,221,000.
1 The fund invests a portion of its cash reserves in equity markets through the use of index futures contracts. After giving effect to futures
investments, the fund's effective common stock and temporary cash investment positions represent 99.9% and 0.8%, respectively, of net
assets.
2 Security exempt from registration under Rule 144A of the Securities Act of 1933. Such securities may be sold in transactions exempt from
registration, normally to qualified institutional buyers. At December 31, 2015, the aggregate value of these securities was $132,047,000,
representing 0.2% of net assets.
3 Affiliated money market fund available only to Vanguard funds and certain trusts and accounts managed by Vanguard. Rate shown is the 7-day
yield.
4 Includes $537,516,000 of collateral received for securities on loan.
5 The issuer operates under a congressional charter; its securities are generally neither guaranteed by the U.S. Treasury nor backed by the full
faith and credit of the U.S. government.
6 Securities with a value of $8,005,000 have been segregated as collateral for open forward currency contracts.
7 Securities with a value of $30,965,000 have been segregated as initial margin for open futures contracts.
8 The issuer was placed under federal conservatorship in September 2008; since that time, its daily operations have been managed by the Federal
Housing Finance Agency and it receives capital from the U.S. Treasury, as needed to maintain a positive net worth, in exchange for senior
preferred stock.
ADR—American Depositary Receipt.
GDR—Global Depositary Receipt.
REIT—Real Estate Investment Trust.
60
This page intentionally left blank.
© 2016 The Vanguard Group, Inc.
All rights reserved.
Vanguard Marketing Corporation, Distributor.
SNA1270 022016

Report of Independent Registered Public Accounting Firm
To the Board of Trustees of Vanguard Tax-Managed Funds and the Shareholders of Vanguard Developed Markets Index Fund:
In our opinion, the accompanying statement of net assets – investments summary and the related statements of operations and of changes in net assets and the financial highlights (included in Item 1 of this Form N-CSR) and the schedule of investments (included in Item 6 of this Form N-CSR) present fairly, in all material respects, the financial position of Vanguard Developed Markets Index Fund (constituting a separate portfolio of Vanguard Tax-Managed Funds, hereafter referred to as the “Fund”) at December 31, 2015, the results of its operations for the year then ended, the changes in its net assets for each of the two years in the period then ended, and the financial highlights for each of the periods indicated, in conformity with accounting principles generally accepted in the United States of America. These financial statements, financial highlights, and schedule of investments (hereafter referred to as "financial statements") are the responsibility of the Fund's management. Our responsibility is to express an opinion on these financial statements based on our audits. We conducted our audits of these financial statements in accordance with the standards of the Public Company Accounting Oversight Board (United States). Those standards require that we plan and perform the audit to obtain reasonable assurance about whether the financial statements are free of material misstatement. An audit includes examining, on a test basis, evidence supporting the amounts and disclosures in the financial statements, assessing the accounting principles used and significant estimates made by management, and evaluating the overall financial statement presentation. We believe that our audits, which included confirmation of securities at December 31, 2015 by correspondence with the custodian and brokers, by agreement to the underlying ownership records of the transfer agent and the application of alternative auditing procedures where securities purchased had not been received, provide a reasonable basis for our opinion.

PricewaterhouseCoopers LLP
February 16, 2016
PricewaterhouseCoopers LLP, Two Commerce Square, 2001 Market Street, Suite 1800, Philadelphia, PA 19103-7042
T: (267) 330-3000, F: (267) 330-3300, www.pwc.com/us
Item 7: Disclosure of Proxy Voting Policies and Procedures for Closed-End Management
Investment Companies.
Not Applicable.
Item 8: Portfolio Managers of Closed-End Management Investment Companies.
Not Applicable.
Item 9: Purchase of Equity Securities by Closed-End Management Investment Company and
Affiliated Purchasers.
Not Applicable.
Item 10: Submission of Matters to a Vote of Security Holders.
Not Applicable.
Item 11: Controls and Procedures.
(a) Disclosure Controls and Procedures. The Principal Executive and Financial Officers concluded that the Registrant’s Disclosure Controls and Procedures are effective based on their evaluation of the Disclosure Controls and Procedures as of a date within 90 days of the filing date of this report.
(b) Internal Control Over Financial Reporting. There were no significant changes in Registrant’s Internal Control Over Financial Reporting or in other factors that could significantly affect this control subsequent to the date of the evaluation, including any corrective actions with regard to significant deficiencies and material weaknesses.
Item 12: Exhibits.
(a) Code of Ethics.
(b) Certifications.
Pursuant to the requirements of the Securities Exchange Act of 1934 and the Investment Company Act of 1940, the registrant has duly caused this report to be signed on its behalf by the undersigned, thereunto duly authorized.
| | VANGUARD TAX-MANAGED FUNDS |
| |
| |
| BY: | /s/ F. WILLIAM MCNABB III* |
| F. WILLIAM MCNABB III |
| CHIEF EXECUTIVE OFFICER |
| |
| Date: February 18, 2016 |
Pursuant to the requirements of the Securities Exchange Act of 1934 and the Investment Company Act of 1940, this report has been signed below by the following persons on behalf of the registrant and in the capacities and on the dates indicated.
| | VANGUARD TAX-MANAGED FUNDS |
| |
| BY: | /s/ F. WILLIAM MCNABB III* |
| F. WILLIAM MCNABB III |
| CHIEF EXECUTIVE OFFICER |
Date: February 18, 2016 |
| VANGUARD TAX-MANAGED FUNDS |
BY: | /s/ THOMAS J. HIGGINS* |
| | THOMAS J. HIGGINS |
| CHIEF FINANCIAL OFFICER |
Date: February 18, 2016 |
* By: /s/ Heidi Stam
Heidi Stam, pursuant to a Power of Attorney filed on April 22, 2014 see file Number 2-17620, Incorporated by Reference.