UNITED STATES
SECURITIES AND EXCHANGE COMMISSION
Washington, D.C. 20549
FORM N-CSR/A
CERTIFIED SHAREHOLDER REPORT OF REGISTERED
MANAGEMENT INVESTMENT COMPANIES
Investment Company Act file number | File No. 811-08520 |
TIAA SEPARATE ACCOUNT VA-1
| (Exact name of Registrant as specified in charter) |
| 730 Third Avenue, New York, New York | 10017-3206 | |
| (Address of principal executive offices) | (Zip code) |
Stewart P. Greene, Esq.
c/o TIAA-CREF
730 Third Avenue,
New York, New York 10017-3206
| (Name and address of agent for service) |
Registrant’s telephone number, including area code: 212-490-9000
Date of fiscal year end: December 31
Date of reporting period: December 31, 2007
| Item 1. | Reports to Stockholders. |

| PricewaterhouseCoopers LLP | ||||
PricewaterhouseCoopers Center 300 Madison Avenue New York NY 10017 Telephone (646) 471 3000 Facsimile (813) 286 6000 |
Report of Independent Registered Public Accounting Firm
To the Management Committee and Contractowners of TIAA Separate Account VA-1:
We have audited, in accordance with the standards of the Public Company Accounting Oversight Board (United States), the financial statements of the Stock Index Account of TIAA Separate Account VA-1 (hereafter referred to as “VA-1”) at December 31, 2007, and for the year then ended and have issued our unqualified report thereon dated February 25, 2008 (which report and financial statements are included in Item 1 of this Certified Shareholder Report on Form N-CSR). Our audit included an audit of the VA-1 schedule of investments in securities (the “Schedule”) as of December 31, 2007 appearing in Item 6 of this Form N-CSR. This Schedule is the responsibility of VA-1’s management. Our responsibility is to express an opinion on this Schedule based on our audit.
In our opinion, the Schedule referred to above, when read in conjunction with the financial statements of VA-1 referred to above, presents fairly, in all material respects, the information set forth therein.
 |
PricewaterhouseCoopers LLP February 25, 2008 |
PERFORMANCE OVERVIEW AS OF DECEMBER 31, 2007
| Inception date | Total return | Average annual total returns | ||||||||||||
| 1 year | 5 years | 10 years | since inception* | |||||||||||
EQUITIES | ||||||||||||||
Stock Index Account | 11/1/1994 | 4.54 | % | 12.91 | % | 5.70 | % | 10.51 | % | |||||
| * | The performance shown is computed from the inception date of the account (the date on which the account became publicly available). Previously, performance for this account was computed from the day prior to the inception date. |
The returns quoted represent past performance, which is no guarantee of future results. Returns and the principal value of your investment will fluctuate. Current performance may be higher or lower than that shown above, and you may have a gain or a loss when you redeem your accumulation units. For current performance information, including performance to the most recent month-end, please visit www.tiaa-cref.org, or call 800 223-1200.
UNDERSTANDING THIS REPORT
This report contains information about the TIAA Separate Account VA-1 and describes the account’s results for the year ended December 31, 2007. The report contains five main sections:
| • | The performance overview on the inside front cover shows the account’s returns over a variety of time periods. |
| • | The letter from Edward Grzybowski, the chief investment officer of Teachers Advisors, Inc., the account’s investment adviser, explains how economic conditions affected investment returns from U.S. stocks during the twelve-month period. |
| • | The account performance section compares the account’s return with the returns of its benchmark index and peer group. |
| • | The summary portfolio of investments lists the industries or types of securities in which the account had investments as of December 31, 2007, and the largest individual issues the account held on that date. |
| • | The financial statements contain detailed information about the operations and financial condition of the account. |
As always, you should carefully consider the investment objectives, risks, charges and expenses of any account before investing. Please visit our website at www.tiaa-cref.org, or call 800 223-1200, for a prospectus that contains this and other important information. We urge you to read it carefully before investing.
| 2 | ||
| 4 | ||
| 5 | ||
| 6 | ||
Stock Index Account | 8 | |
| 11 | ||
Financial statements | ||
| 16 | ||
| 17 | ||
| 18 | ||
| 19 | ||
| 20 | ||
| 25 | ||
| 26 | ||
| 27 | ||
| Inside back cover | ||
The U.S. stock market endured a bumpy ride in 2007. After a lackluster first quarter, U.S. stocks rebounded impressively in the second quarter, stalled in the third and turned negative in the fourth.
For the year, the Russell 3000® Index, a broad measure of the U.S. stock market, gained 5.1%—below its 6.2% average annual return over the ten years ended December 31, 2007, and its weakest performance since 2002.
U.S. economic growth tapers off
Preliminary estimates are that the nation’s gross domestic product (GDP) rose 2.2% in 2007—slower than the 2.9% growth recorded in 2006.
During the year, a worsening slump in the U.S. housing market and continued fallout from the subprime lending crisis weighed on the overall economy. Financial institutions, jolted by rising defaults and forced to take large write-downs on their mortgage investments, tightened loan underwriting standards. This credit crunch contributed to slower growth in consumer spending, an important component of GDP.
U.S. corporate earnings growth, a key driver of stock performance, suffered in this environment. After experiencing double-digit growth in 2006, corporate earnings plummeted in 2007. In the third quarter, they turned negative on a year-over-year basis for the first time since the fourth quarter of 2001.
With the health of the economy appearing more fragile, the Federal Reserve cut the federal funds rate three times between September and December. At year-end, the rate stood at 4.25%. The Fed also held two money auctions in December to increase liquidity in the short-term funding markets.
While stocks struggle, bonds rally
Amid this growing economic uncertainty, the Russell 3000 Index lost 1.8% in the second half of the year. During the same period, the Lehman Brothers U.S. Aggregate Index, which measures the broad investment-grade U.S. bond market, gained 5.9%.
Bonds, led by U.S. Treasuries, benefited from a “flight to quality” as investors sought safe havens from increasingly volatile equity markets. For the year as a whole, the Lehman index gained 7%—outperforming the Russell 3000 for the first time since 2002.
Another reversal of a longstanding trend occurred within the Russell 3000: growth stocks topped value stocks after seven consecutive years of underperformance. For the year, growth issues gained 11.4%, while value shares lost 1%. Among stocks of different capitalization sizes, large caps rose 5.8%, mid caps advanced 5.6% and small caps declined 1.6%.
2 2007 Annual Report ¡ TIAA Separate Account VA-1
Financial stocks, which represented more than one-fifth of the index’s market capitalization at year-end, plunged 16.3%—reflecting the negative impact of subprime woes on banks and other lenders. The Russell’s second-largest sector, consumer discretionary, fell 3.6%.
In contrast, the “other energy,” integrated oils, and materials and processing sectors scored outsized gains of 40.3%, 29.7% and 26.1%, respectively. The integrated oils sector is made up of companies involved in all aspects of oil exploration, production and refining, while the “other energy” sector includes gas distributors and pipelines, as well as companies engaged in mining, production, servicing and drilling. Stocks in both sectors were boosted by rising energy prices. The price of oil soared in 2007, approaching $100 per barrel in the fourth quarter.
Low-cost indexing helps keep the account ahead of its peers
The Stock Index Account, the underlying investment of the TIAA Separate Account VA-1, uses an indexing strategy, which has served the account well. For 2007, the account’s 4.5% return exceeded the 4.3% average return of its peer group, the Morningstar Large Blend (VA) category. For the ten years ended December 31, 2007, the account posted an average annual return of 5.7%, versus the 4.2% average annual return of its Morningstar category.

Edward J. Grzybowski
Chief Investment Officer
Teachers Advisors, Inc.
While past performance is no guarantee of future results, the broad diversification that indexing provided enabled this portfolio to capture the market’s gains when stocks moved up and to avoid concentrated losses in individual market sectors when stocks declined.
Generally, indexing helps keep an account’s expenses low, so investors receive a larger share of the portfolio’s earnings. Although lower expenses do not guarantee higher returns, the account’s annual expense charge of just 0.67% makes it an attractive choice for the cost-conscious investor.
|
Edward J. Grzybowski |
Chief Investment Officer |
Teachers Advisors, Inc. |

TIAA Separate Account VA-1 ¡ 2007 Annual Report 3
MORE INFORMATION FOR POLICYHOLDERS
Portfolio listings
Securities and Exchange Commission (SEC) rules intended to provide investors with more meaningful information about account performance allow investment companies to list the top holdings of each account in their annual and semiannual reports instead of providing complete portfolio listings. The account files complete portfolio listings with the SEC, which are available to policyholders.
You can obtain a complete list of TIAA Separate Account VA-1’s holdings (called “TIAA Separate Account VA-1 Statement of Investments”) as of the most recently completed fiscal quarter (currently for the period ended December 31, 2007) in the following ways:
| • | by visiting the TIAA-CREF website at www.tiaa-cref.org; or |
| • | by calling TIAA-CREF at 800 842-2776 to request a copy, which will be provided free of charge. |
You can also obtain a complete list of the Stock Index Account’s holdings as of the most recently completed fiscal quarter, and for prior quarter-ends, from the SEC. (Form N-CSR lists holdings as of December 31 or June 30; Form N-Q lists holdings as of March 31 or September 30.) Copies of these forms are available:
| • | through the Electronic Data Gathering and Retrieval System (EDGAR) on the SEC’s website at www.sec.gov; or |
| • | at the SEC’s Public Reference Room. (Call 800 SEC-0330 for more information.) |
Proxy voting
The Separate Account’s ownership of stock gives it the right to vote on proxy issues of companies in which it invests. A description of our proxy voting policies and procedures can be found at our website at www.tiaa-cref.org, or on the SEC website at www.sec.gov. You may also call us at 800 223-1200 to request a free copy. A report of how the account voted during the most recently completed twelve-month period ended June 30 can be found at our website or at www.sec.gov.
Contacting TIAA-CREF
There are three easy ways to contact us: by email, using the Contact Us link at the top of our homepage; by mail at TIAA-CREF, 730 Third Avenue, New York NY 10017–3206; or by phone at 800 223-1200.
Account management
TIAA Separate Account VA-1 is managed by a portfolio management team of Teachers Advisors, Inc. The members of this team are responsible for the day-to-day operations of the account.
4 2007 Annual Report ¡ TIAA Separate Account VA-1
Annuities are designed for retirement savings or for other long-term goals. They offer several payment options, including lifetime income. Payments from variable annuities are not guaranteed, and the payment amounts will rise or fall depending on investment returns.
Benchmarks (benchmark indexes) are groups of securities, such as the Russell 3000® Index or the MSCI EAFE® Index, whose performance can be used as a standard by which to judge the performance of a variable annuity.*
Expense ratio is the annual amount that investors pay for the management of a variable annuity account. The amount is expressed as a percentage of the account’s average net assets. Expense ratios do not include front-end or back-end sales charges, if any, or trading costs. See “Total return.”
Market capitalization is the total value of a company’s outstanding stock. It is calculated by multiplying the number of a company’s outstanding shares by the current market price per share.
Peer groups are groupings of variable annuities with similar objectives whose performance can be compared with that of an individual variable annuity with a similar objective.
Price/earnings ratio (P/E) is calculated by dividing the market value of a portfolio’s assets by its earnings per share over a twelve-month period.
Securities is a general name for stocks (also known as “equities”), bonds (also known as “fixed-income securities”) or other investments.
Separate account is an account established by a life insurance company, separate from its general account, for the investments in nonguaranteed insurance and annuity products. In contrast, a life insurer’s general account supports products with principal and interest guarantees. Separate accounts generally are registered with the SEC as investment companies.
Total return is the amount an investment provides to investors after expenses are deducted. Total return is expressed as a percentage. It includes any interest or dividends, as well as any change in the market value of the investment.
| * | Russell 3000 is a trademark and service mark of Russell Investment Group. TIAA-CREF products are not promoted or sponsored by, or affiliated with, Russell Investment Group. EAFE (which stands for Europe, Australasia, Far East) is a trademark of Morgan Stanley Capital International, Inc. |
TIAA Separate Account VA-1 ¡ 2007 Annual Report 5
IMPORTANT INFORMATION ABOUT EXPENSES
As a TIAA Separate Account VA-1 contract owner, you incur only one of two potential types of costs.
| • | You incur no transaction costs, including sales charges (loads) on contributions, on reinvested dividends or on other distributions. There are also no redemption fees or exchange fees. |
| • | However, you do incur ongoing costs, including investment advisory fees, administrative expenses, and mortality and expense risk charges. |
The example that appears on this page is intended to help you understand your ongoing costs (in dollars) of investing in the account. It is also designed to help you compare these costs with the ongoing costs of investing in other variable annuity accounts and mutual funds.
The example assumes $1,000 was invested on July 1, 2007, and held for six months until December 31, 2007.
Actual expenses
The first line in the table uses the account’s actual expenses and its actual rate of return. You may use the information in this line, together with the amount you invested at the beginning of the period, to estimate the expenses that you paid over the six-month period.
Simply divide your beginning accumulation by $1,000 (for example, an $8,600 accumulation divided by $1,000 = 8.6), then multiply the result by the number in the first line under the heading “Expenses paid” to estimate the expenses you paid during the six-month period.
EXPENSE EXAMPLE
Six months ended December 31, 2007
Stock Index Account | Starting account value (7/1/07) | Ending account value (12/31/07) | Expenses paid* (7/1/07– 12/31/07) | |||||||
Actual return | $ | 1,000.00 | $ | 978.90 | $ | 3.34 | ||||
5% annual hypothetical return | 1,000.00 | 1,021.83 | † | 3.41 | ||||||
| * | “Expenses paid” is based on the account’s annualized expense ratio for the most recent fiscal half year, multiplied by the average account value over the six-month period, multiplied by 184/365. There were 184 days in the six months ended December 31, 2007. The account’s annualized six-month expense ratio for that period is 0.67%. The total annual expense ratio reflects a voluntary agreement by the account’s investment adviser to waive a portion of its fee. Without this waiver, the account’s total annual expense ratio would be 0.90%. Although TIAA reserves the right to increase the account’s mortality and expense risk charge to a maximum of 1.00% per year, the total annual expense ratio should never exceed 1.50%. |
† | Ending account value for the hypothetical example would be $1,025.24 before expenses. The table shows the value after subtraction of expenses in order to be comparable with the ending account value shown for the account’s actual return. |
6 2007 Annual Report ¡ TIAA Separate Account VA-1
Hypothetical example for comparison purposes
The second line in the table shows hypothetical account values and hypothetical expenses based on the account’s actual expense ratio for the six-month period and an assumed annual rate of return of 5% before expenses—which is not the account’s actual return.
Do not use the hypothetical account values and hypothetical expenses to estimate the actual expenses you paid for the period. Instead, you can use this information to compare the ongoing costs of investing in an individual account with ongoing costs of other variable annuity accounts and mutual funds. To do so, compare this 5% hypothetical example with the 5% hypothetical examples that appear in the shareholder reports of the other accounts or funds.
TIAA Separate Account VA-1 ¡ 2007 Annual Report 7
STOCK INDEX ACCOUNT U.S. STOCKS
PERFORMANCE IN THE TWELVE MONTHS ENDED DECEMBER 31, 2007
The Stock Index Account returned 4.54% for the year, compared with the 5.14% gain of its benchmark, the Russell 3000® Index, and the 4.33% average return of the account’s peer group, the Morningstar Large Blend (VA) category, which tracked 4,899 variable annuities as of December 31, 2007.
Broad equity market slumps after strong first half
During the first six months of 2007, U.S. stocks produced an impressive 7.11% return, as measured by the Russell 3000 Index. In the year’s second half, however, the market struggled because of investor concerns about a slowing domestic economy and mounting default rates in the subprime credit markets. The Russell 3000 Index fell 1.84% during the last six months of the year.
For the year, growth stocks outperformed value issues by wide margins across all three capitalization sizes, as defined by the Russell indexes. Large-cap growth stocks were the top performers, posting an 11.81% gain, while small-cap value stocks posted a 9.78% loss.
U.S. stocks lagged foreign equities entirely because of the weakening dollar versus other currencies. The MSCI EAFE® Index, which measures stocks in developed foreign markets, climbed 11.17% in dollar terms.
For the ten-year period ended December 31, 2007, the average annual return of the Russell 3000 Index was 6.21%—more than two percentage points below the 8.66% average annual gain registered by the EAFE.
Integrated oils and technology lead the way
During the period, nine of the benchmark’s twelve industry sectors posted positive returns, with six generating double-digit gains. The strongest positive contributions to performance came from the integrated oils and technology sectors, which rose 29.7% and 15.8%, respectively.
These robust returns were partly offset by losses in the financials and consumer discretionary sectors, which fell 16.3% and 3.6%, respectively.
Largest stocks generally post strong results
In descending order according to capitalization size, the five largest stocks in the benchmark performed as follows: ExxonMobil, 24.3%; General Electric, 2.7%; Microsoft, 20.8%; AT&T, 20.6%; and Procter & Gamble, 16.6%.
For the period, the account’s return was comparable to that of the benchmark, minus the effects of expenses and of some cash holdings for liquidity. The account had a risk profile similar to that of the benchmark.
8 2007 Annual Report ¡ TIAA Separate Account VA-1
INVESTMENT OBJECTIVE
This account seeks a favorable long-term return from a diversified portfolio selected to track the overall market for common stocks publicly traded in the United States, as represented by a broad stock market index.
INVESTMENT RISKS
In addition to the risks of any equity investment—market risk and company risk—the account is subject to special risks, including index risk. For a detailed discussion of risk, please see the prospectus.
THE ACCOUNT’S BENCHMARK
The Russell 3000® Index measures the performance of the stocks of the 3,000 largest publicly traded U.S. companies, based on market capitalization. This index measures the performance of about 98% of the total market capitalization of the publicly traded U.S. equity market. You cannot invest directly in this index.
PERFORMANCE AS OF DECEMBER 31, 2007
| Total return | Average annual total returns | Cumulative total returns | |||||||||||||
| 1 year | 5 years | 10 years | 5 years | 10 years | |||||||||||
Stock Index Account | 4.54 | % | 12.91 | % | 5.70 | % | 83.57 | % | 74.17 | % | |||||
Russell 3000 Index | 5.14 | 13.62 | 6.21 | 89.42 | 82.77 | ||||||||||
Morningstar Large Blend (VA) | 4.33 | 11.36 | 4.23 | 69.72 | 51.17 | ||||||||||
The returns presented above and in the graphs show past performance, which is no guarantee of future results. Returns and the principal value of your investment will fluctuate. Current performance may be higher or lower than that shown, and you may have a gain or a loss when you redeem your accumulation units. For current performance information, including performance to the most recent month-end, please visit www.tiaa-cref.org.
Russell 3000 is a trademark and service mark of Russell Investment Group. TIAA-CREF products are not promoted or sponsored by, or affiliated with, Russell Investment Group.
ACCOUNT PROFILE
Inception date | 11/1/1994 | Weighted median market capitalization | $ | 37.8 billion | |||||||
Net assets | $ | 989.29 million | P/E ratio (weighted 12-month trailing average) | 17.7 | |||||||
Total annual expense ratio‡ | 0.67 | % |
‡ | The total annual expense ratio reflects a voluntary agreement by the account’s investment adviser to waive a portion of its fee. Without this waiver, the account’s total annual expense ratio would be 0.90%. Although TIAA reserves the right to increase the account’s mortality and expense risk charge to a maximum of 1.00% per year, the total annual expense ratio should never exceed 1.50%. |
TIAA Separate Account VA-1 ¡ 2007 Annual Report 9
STOCK INDEX ACCOUNT U.S. STOCKS
$10,000 OVER 10 YEARS
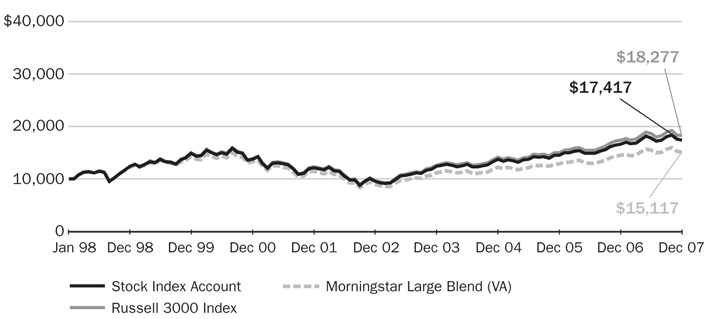
An investment of $10,000 in this account on January 1, 1998, would have grown to $17,417 over the next 10 years, including reinvestment of dividends and distributions. For the purpose of comparison, the graph also shows the change in the values of the account’s benchmark and peer group during the same period.
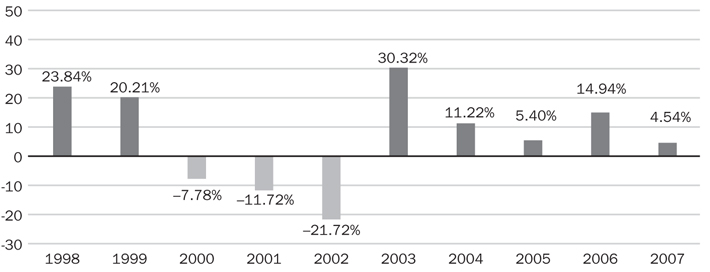
CALENDAR YEAR TOTAL RETURNS SINCE 1998
HOLDINGS BY COMPANY SIZE
| % of portfolio investments | ||
Over $15 billion | 68.6 | |
$4 billion–$15 billion | 17.6 | |
Under $4 billion | 13.8 | |
Total | 100.0 |
10 2007 Annual Report ¡ TIAA Separate Account VA-1
SUMMARY PORTFOLIO OF INVESTMENTS
STOCK INDEX ACCOUNT n DECEMBER 31, 2007
| Shares | Company | Value (000) | % of net assets | |||||||||
| COMMON STOCKS | ||||||||||||
| AGRICULTURAL PRODUCTION-CROPS e* | $ | 48 | 0.00 | %** | ||||||||
| AGRICULTURAL PRODUCTION-LIVESTOCK e | 124 | 0.01 | ||||||||||
| AGRICULTURAL SERVICES e* | 15 | 0.00 | ** | |||||||||
| AMUSEMENT AND RECREATION SERVICES | ||||||||||||
| 121,235 | Walt Disney Co | 3,913 | 0.40 | |||||||||
| e* | Other | 2,656 | 0.26 | |||||||||
| 6,569 | 0.66 | |||||||||||
| APPAREL AND ACCESSORY STORES e* | 5,172 | 0.52 | ||||||||||
| APPAREL AND OTHER TEXTILE PRODUCTS e* | 1,483 | 0.15 | ||||||||||
| AUTO REPAIR, SERVICES AND PARKING e* | 728 | 0.07 | ||||||||||
| AUTOMOTIVE DEALERS AND SERVICE STATIONS e* | 1,602 | 0.16 | ||||||||||
| BUILDING MATERIALS AND GARDEN SUPPLIES e* | 5,247 | 0.53 | ||||||||||
| BUSINESS SERVICES | ||||||||||||
| 14,027 | * | Google, Inc (Class A) | 9,699 | 0.98 | ||||||||
| 503,646 | Microsoft Corp | 17,930 | 1.81 | |||||||||
| 235,842 | * | Oracle Corp | 5,325 | 0.54 | ||||||||
| e* | Other | 39,783 | 4.02 | |||||||||
| 72,737 | 7.35 | |||||||||||
| CHEMICALS AND ALLIED PRODUCTS | ||||||||||||
| 94,229 | Abbott Laboratories | 5,291 | 0.53 | |||||||||
| 132,581 | Merck & Co, Inc | 7,704 | 0.78 | |||||||||
| 33,287 | Monsanto Co | 3,718 | 0.38 | |||||||||
| 429,329 | Pfizer, Inc | 9,759 | 0.99 | |||||||||
| 193,225 | Procter & Gamble Co | 14,187 | 1.43 | |||||||||
| 82,280 | Wyeth | 3,636 | 0.37 | |||||||||
| e* | Other | 48,983 | 4.95 | |||||||||
| 93,278 | 9.43 | |||||||||||
| COAL MINING e* | 2,542 | 0.26 | ||||||||||
| COMMUNICATIONS | ||||||||||||
| 378,276 | AT&T, Inc | 15,721 | 1.59 | |||||||||
| 180,666 | e* | Comcast Corp (Class A) | 3,299 | 0.33 | ||||||||
| 177,613 | Verizon Communications, Inc | 7,760 | 0.78 | |||||||||
| e* | Other | 16,563 | 1.68 | |||||||||
| 43,343 | 4.38 | |||||||||||
| DEPOSITORY INSTITUTIONS | ||||||||||||
| 271,468 | Bank of America Corp | 11,201 | 1.13 | |||||||||
| 69,259 | Bank of New York Mellon Corp/The | 3,377 | 0.34 | |||||||||
| 302,596 | Citigroup, Inc | 8,908 | 0.90 | |||||||||
| 208,983 | JPMorgan Chase & Co | 9,122 | 0.92 | |||||||||
| 106,357 | US Bancorp | 3,376 | 0.34 | |||||||||
| 121,651 | Wachovia Corp | 4,626 | 0.47 | |||||||||
| See notes to financial statements | TIAA Separate Account VA-1 n 2007 Annual Report | 11 |
| SUMMARY PORTFOLIO OF INVESTMENTS | continued |
STOCK INDEX ACCOUNT n DECEMBER 31, 2007
| Shares | Company | Value (000) | % of net assets | |||||||||
| DEPOSITORY INSTITUTIONS — continued | ||||||||||||
| 207,802 | Wells Fargo & Co | $ | 6,274 | 0.63 | % | |||||||
| e* | Other | 24,510 | 2.49 | |||||||||
| 71,394 | 7.22 | |||||||||||
| EATING AND DRINKING PLACES | ||||||||||||
| 73,043 | McDonald's Corp | 4,303 | 0.44 | |||||||||
| e* | Other | 4,421 | 0.44 | |||||||||
| 8,724 | 0.88 | |||||||||||
| EDUCATIONAL SERVICES e* | 1,443 | 0.15 | ||||||||||
| ELECTRIC, GAS, AND SANITARY SERVICES | ||||||||||||
| 41,142 | Exelon Corp | 3,359 | 0.34 | |||||||||
| e,m,v* | Other | 37,760 | 3.82 | |||||||||
| 41,119 | 4.16 | |||||||||||
| ELECTRONIC AND OTHER ELECTRIC EQUIPMENT | ||||||||||||
| 52,912 | * | Apple Computer, Inc | 10,481 | 1.06 | ||||||||
| 371,381 | * | Cisco Systems, Inc | 10,053 | 1.02 | ||||||||
| 355,437 | Intel Corp | 9,476 | 0.96 | |||||||||
| 101,967 | Qualcomm, Inc | 4,012 | 0.41 | |||||||||
| e,m,v* | Other | 32,616 | 3.29 | |||||||||
| 66,638 | 6.74 | |||||||||||
| ENGINEERING AND MANAGEMENT SERVICES e* | 9,201 | 0.93 | ||||||||||
| ENVIRONMENTAL QUALITY AND HOUSING e* | 2 | 0.00 | ** | |||||||||
| FABRICATED METAL PRODUCTS e* | 5,231 | 0.53 | ||||||||||
| FOOD AND KINDRED PRODUCTS | ||||||||||||
| 141,700 | Coca-Cola Co | 8,696 | 0.88 | |||||||||
| 99,711 | PepsiCo, Inc | 7,568 | 0.76 | |||||||||
| e* | Other | 18,402 | 1.86 | |||||||||
| 34,666 | 3.50 | |||||||||||
| FOOD STORES e* | 3,218 | 0.33 | ||||||||||
| FORESTRY | 1,195 | 0.12 | ||||||||||
| FURNITURE AND FIXTURES e* | 2,796 | 0.28 | ||||||||||
| FURNITURE AND HOME FURNISHINGS STORES e* | 1,709 | 0.17 | ||||||||||
| GENERAL BUILDING CONTRACTORS e* | 1,657 | 0.17 | ||||||||||
| GENERAL MERCHANDISE STORES | ||||||||||||
| 147,502 | Wal-Mart Stores, Inc | 7,011 | 0.71 | |||||||||
| e* | Other | 7,495 | 0.76 | |||||||||
| 14,506 | 1.47 | |||||||||||
| HEALTH SERVICES e* | 13,472 | 1.36 | ||||||||||
| HEAVY CONSTRUCTION, EXCEPT BUILDING e* | 808 | 0.08 | ||||||||||
| HOLDING AND OTHER INVESTMENT OFFICES e,v* | 21,762 | 2.20 | ||||||||||
| HOTELS AND OTHER LODGING PLACES e* | 3,826 | 0.39 | ||||||||||
| 12 | 2007 Annual Report n TIAA Separate Account VA-1 | See notes to financial statements |
| SUMMARY PORTFOLIO OF INVESTMENTS | continued |
STOCK INDEX ACCOUNT n DECEMBER 31, 2007
| Shares | Company | Value (000) | % of net assets | |||||||||
| INDUSTRIAL MACHINERY AND EQUIPMENT | ||||||||||||
| 138,962 | * | Dell, Inc | $ | 3,406 | 0.34 | % | ||||||
| 631,150 | d | General Electric Co | 23,397 | 2.36 | ||||||||
| 163,729 | Hewlett-Packard Co | 8,265 | 0.84 | |||||||||
| 83,833 | International Business Machines Corp | 9,062 | 0.92 | |||||||||
| 4,449 | e,m,v* | Other | 26,426 | 2.67 | ||||||||
| 70,556 | 7.13 | |||||||||||
| INSTRUMENTS AND RELATED PRODUCTS | ||||||||||||
| 177,190 | Johnson & Johnson | 11,819 | 1.19 | |||||||||
| 70,297 | Medtronic, Inc | 3,534 | 0.36 | |||||||||
| e* | Other | 31,144 | 3.15 | |||||||||
| 46,497 | 4.70 | |||||||||||
| INSURANCE AGENTS, BROKERS AND SERVICE e* | 4,219 | 0.43 | ||||||||||
| INSURANCE CARRIERS | ||||||||||||
| 137,111 | American International Group, Inc | 7,994 | 0.81 | |||||||||
| 81,978 | UnitedHealth Group, Inc | 4,771 | 0.48 | |||||||||
| e,v* | Other | 32,670 | 3.30 | |||||||||
| 45,435 | 4.59 | |||||||||||
| JUSTICE, PUBLIC ORDER AND SAFETY e* | 303 | 0.03 | ||||||||||
| LEATHER AND LEATHER PRODUCTS e* | 1,169 | 0.12 | ||||||||||
| LEGAL SERVICES e* | 211 | 0.02 | ||||||||||
| LOCAL AND INTERURBAN PASSENGER TRANSIT e* | 17 | 0.00 | ** | |||||||||
| LUMBER AND WOOD PRODUCTS e* | 225 | 0.02 | ||||||||||
| METAL MINING e* | 5,153 | 0.52 | ||||||||||
| MISCELLANEOUS MANUFACTURING INDUSTRIES e* | 2,925 | 0.30 | ||||||||||
| MISCELLANEOUS RETAIL | ||||||||||||
| 90,582 | CVS Corp | 3,601 | 0.36 | |||||||||
| e* | Other | 9,204 | 0.93 | |||||||||
| 12,805 | 1.29 | |||||||||||
| MOTION PICTURES | ||||||||||||
| 230,399 | Time Warner, Inc | 3,804 | 0.38 | |||||||||
| e* | Other | 6,646 | 0.68 | |||||||||
| 10,450 | 1.06 | |||||||||||
| MUSEUMS, BOTANICAL, ZOOLOGICAL GARDENS e* | 20 | 0.00 | ** | |||||||||
| NONCLASSIFIABLE ESTABLISHMENTS e* | 71 | 0.01 | ||||||||||
| NONDEPOSITORY INSTITUTIONS e* | 12,419 | 1.26 | ||||||||||
| NONMETALLIC MINERALS, EXCEPT FUELS e* | 659 | 0.07 | ||||||||||
| OIL AND GAS EXTRACTION | ||||||||||||
| 72,092 | Schlumberger Ltd | 7,092 | 0.72 | |||||||||
| e,m,v* | Other | 27,969 | 2.82 | |||||||||
| 35,061 | 3.54 | |||||||||||
| See notes to financial statements | TIAA Separate Account VA-1 n 2007 Annual Report | 13 |
| SUMMARY PORTFOLIO OF INVESTMENTS | continued |
STOCK INDEX ACCOUNT n DECEMBER 31, 2007
| Shares | Company | Value (000) | % of net assets | |||||||||
| PAPER AND ALLIED PRODUCTS e* | $ | 4,581 | 0.46 | % | ||||||||
| PERSONAL SERVICES e* | 1,373 | 0.14 | ||||||||||
| PETROLEUM AND COAL PRODUCTS | ||||||||||||
| 131,478 | Chevron Corp | 12,271 | 1.24 | |||||||||
| 99,977 | ConocoPhillips | 8,828 | 0.89 | |||||||||
| 345,505 | Exxon Mobil Corp | 32,370 | 3.27 | |||||||||
| 51,013 | Occidental Petroleum Corp | 3,927 | 0.40 | |||||||||
| e* | Other | 16,859 | 1.71 | |||||||||
| 74,255 | 7.51 | |||||||||||
| PIPELINES, EXCEPT NATURAL GAS | 998 | 0.10 | ||||||||||
| PRIMARY METAL INDUSTRIES e* | 10,759 | 1.09 | ||||||||||
| PRINTING AND PUBLISHING e* | 4,355 | 0.44 | ||||||||||
| RAILROAD TRANSPORTATION e* | 6,495 | 0.66 | ||||||||||
| REAL ESTATE e* | 1,019 | 0.10 | ||||||||||
| RUBBER AND MISCELLANEOUS PLASTIC PRODUCTS e* | 2,998 | 0.30 | ||||||||||
| SECURITY AND COMMODITY BROKERS | ||||||||||||
| 25,098 | Goldman Sachs Group, Inc | 5,397 | 0.55 | |||||||||
| 64,471 | Morgan Stanley | 3,424 | 0.35 | |||||||||
| e* | Other | 21,860 | 2.20 | |||||||||
| 30,681 | 3.10 | |||||||||||
| SOCIAL SERVICES e* | 124 | 0.01 | ||||||||||
| SPECIAL TRADE CONTRACTORS e* | 651 | 0.07 | ||||||||||
| STONE, CLAY, AND GLASS PRODUCTS | ||||||||||||
| 44,057 | 3M Co | 3,715 | 0.38 | |||||||||
| e* | Other | 1,191 | 0.12 | |||||||||
| 4,906 | 0.50 | |||||||||||
| TEXTILE MILL PRODUCTS e* | 30 | 0.00 | ** | |||||||||
| TOBACCO PRODUCTS | ||||||||||||
| 128,664 | Altria Group, Inc | 9,724 | 0.98 | |||||||||
| e | Other | 1,925 | 0.20 | |||||||||
| 11,649 | 1.18 | |||||||||||
| TRANSPORTATION BY AIR e* | 3,987 | 0.40 | ||||||||||
| TRANSPORTATION EQUIPMENT | ||||||||||||
| 48,169 | Boeing Co | 4,213 | 0.43 | |||||||||
| 60,826 | United Technologies Corp | 4,656 | 0.47 | |||||||||
| e* | Other | 16,451 | 1.66 | |||||||||
| 25,320 | 2.56 | |||||||||||
| TRANSPORTATION SERVICES e* | 1,747 | 0.18 | ||||||||||
| TRUCKING AND WAREHOUSING e* | 3,681 | 0.37 | ||||||||||
| WATER TRANSPORTATION e* | 2,834 | 0.29 | ||||||||||
| WHOLESALE TRADE-DURABLE GOODS e* | 3,433 | 0.35 | ||||||||||
| 14 | 2007 Annual Report n TIAA Separate Account VA-1 | See notes to financial statements |
| SUMMARY PORTFOLIO OF INVESTMENTS | concluded |
STOCK INDEX ACCOUNT n DECEMBER 31, 2007
| Shares | Company | Value (000) | % of net assets | ||||||||||
| WHOLESALE TRADE-NONDURABLE GOODS e* | $ | 5,551 | 0.56 | % | |||||||||
| TOTAL COMMON STOCKS | (Cost $653,518) | 985,877 | 99.66 | ||||||||||
| Issuer | |||||||||||||
| SHORT-TERM INVESTMENTS | |||||||||||||
| U.S. GOVERNMENT AND AGENCIES DISCOUNT NOTES d+ | 3,187 | 0.32 | |||||||||||
| Company | |||||||||||||
| INVESTMENT OF CASH COLLATERAL FOR SECURITIES LOANED | |||||||||||||
| 105,657,487 | State Street Navigator Securities Lending Prime Portfolio | 105,657 | 10.68 | ||||||||||
| 105,657 | 10.68 | ||||||||||||
| TOTAL SHORT-TERM INVESTMENTS | (Cost $108,844) | 108,844 | 11.00 | ||||||||||
| TOTAL PORTFOLIO | (Cost $762,362) | 1,094,721 | 110.66 | ||||||||||
| OTHER ASSETS & LIABILITIES, NET | (105,429 | ) | (10.66 | ) | |||||||||
| NET ASSETS | $ | 989,292 | 100.00 | % | |||||||||
| * | Non-income producing. |
| ** | Percentage represents less than 0.01%. |
| + | Notes mature 01/02/08 – 04/25/08. |
| d | All or a portion of these securities have been segregated by the custodian to cover margin or other requirements on open futures contracts. |
| e | All or a portion of these securities are out on loan. |
| m | Indicates a security that has been deemed illiquid. |
| v | Security valued at fair value. |
Cost amounts are in thousands.
For ease of presentation, we have grouped a number of industry classification categories together in the Summary portfolio of investments. Note that the Account uses more specific industry categories in following its investment limitations on industry concentration.
| See notes to financial statements | TIAA Separate Account VA-1 n 2007 Annual Report | 15 |
| STATEMENT OF ASSETS AND LIABILITIES |
TIAA SEPARATE ACCOUNT VA-1 n DECEMBER 31, 2007
| (amounts in thousands, except amounts per accumulation unit) | Stock Index Account | ||
ASSETS | |||
Investments, at cost | $ | 762,362 | |
Net unrealized appreciation of investments | 332,359 | ||
Investments, at value (including securities loaned of $102,221) | 1,094,721 | ||
Cash | 113 | ||
Dividends and interest receivable | 1,367 | ||
Receivable from securities sold | 994 | ||
Other | 66 | ||
Total assets | 1,097,261 | ||
LIABILITIES | |||
Payable for collateral for securities loaned | 105,657 | ||
Payable for securities purchased | 1,499 | ||
Payable for variation margin on open futures contracts | 13 | ||
Amount due to investment advisor | 800 | ||
Total liabilities | 107,969 | ||
NET ASSETS | |||
Accumulation Fund | $ | 989,292 | |
Accumulation units outstanding | 10,345 | ||
Net asset value per accumulation unit | $95.65 | ||
| 16 | 2007 Annual Report n TIAA Separate Account VA-1 | See notes to financial statements |
TIAA SEPARATE ACCOUNT VA-1 n DECEMBER 31, 2007 |
| (amounts in thousands) | Stock Index Account | |||
INVESTMENT INCOME | ||||
Income: | ||||
Dividends | $ | 18,424 | ||
Securities lending income, net | 582 | |||
Total investment income | 19,006 | |||
EXPENSES: | ||||
Investment advisory charges | 3,061 | |||
Administrative expenses | 2,040 | |||
Mortality and expense risk charges | 4,081 | |||
Total expenses before waiver | 9,182 | |||
Investment advisory charges waived | (2,347 | ) | ||
Net expenses | 6,835 | |||
Investment income – net | 12,171 | |||
REALIZED AND UNREALIZED GAIN (LOSS) ON TOTAL INVESTMENTS | ||||
Net realized gain (loss) on: | ||||
Portfolio investments | 33,602 | |||
Futures transactions | (212 | ) | ||
Net realized gain on total investments | 33,390 | |||
Net change in unrealized depreciation on: | ||||
Portfolio investments | (109 | ) | ||
Futures transactions | (28 | ) | ||
Net change in unrealized depreciation on total investments | (137 | ) | ||
Net realized and unrealized gain on total investments | 33,253 | |||
Net increase in net assets resulting from operations | $ | 45,424 | ||
| See notes to financial statements | TIAA Separate Account VA-1 n 2007 Annual Report | 17 |
| STATEMENT OF CHANGES IN NET ASSETS |
TIAA SEPARATE ACCOUNT VA-1 n DECEMBER 31, 2007
| Stock Index Account | ||||||||
| Years Ended December 31, | ||||||||
| (amounts in thousands) | 2007 | 2006 | ||||||
FROM OPERATIONS | ||||||||
Investment income – net | $ | 12,171 | $ | 10,683 | ||||
Net realized gain on investments | 33,390 | 18,361 | ||||||
Net change in unrealized appreciation (depreciation) on investments | (137 | ) | 103,029 | |||||
Net increase in net assets resulting from operations | 45,424 | 132,073 | ||||||
FROM CONTRACTOWNER TRANSACTIONS | ||||||||
Premiums | 19,369 | 19,322 | ||||||
Net contractowner transfers to fixed account | (13,882 | ) | (20,047 | ) | ||||
Withdrawals and death benefits | (57,663 | ) | (58,505 | ) | ||||
Net decrease in net assets resulting from contractowner transactions | (52,176 | ) | (59,230 | ) | ||||
Net increase (decrease) in net assets | (6,752 | ) | 72,843 | |||||
NET ASSETS | ||||||||
Beginning of year | 996,044 | 923,201 | ||||||
End of year | $ | 989,292 | $ | 996,044 | ||||
| 18 | 2007 Annual Report n TIAA Separate Account VA-1 | See notes to financial statements |
TIAA SEPARATE ACCOUNT VA-1
| Stock Index Account | ||||||||||||||||||||
| For the Years Ended December 31, | ||||||||||||||||||||
| 2007 | 2006 | 2005 | 2004 | 2003 | ||||||||||||||||
PER ACCUMULATION UNIT DATA: | ||||||||||||||||||||
Investment income | $ | 1.750 | $ | 1.568 | $ | 1.378 | $ | 1.359 | $ | 1.041 | ||||||||||
Expenses | 0.575 | 0.584 | 0.519 | 0.468 | 0.310 | |||||||||||||||
Investment income – net | 1.175 | 0.984 | 0.859 | 0.891 | 0.731 | |||||||||||||||
Net realized and unrealized gain on investments | 2.979 | 10.909 | 3.222 | 6.727 | 15.066 | |||||||||||||||
Net increase in Accumulation Unit Value | 4.154 | 11.893 | 4.081 | 7.618 | 15.797 | |||||||||||||||
Accumulation Unit Value: | ||||||||||||||||||||
Beginning of year | 91.492 | 79.599 | 75.518 | 67.900 | 52.103 | |||||||||||||||
End of year | $ | 95.646 | $ | 91.492 | $ | 79.599 | $ | 75.518 | $ | 67.900 | ||||||||||
TOTAL RETURN* | 4.54 | % | 14.94 | % | 5.40 | % | 11.22 | % | 30.32 | % | ||||||||||
Ratio of expense to average net assets before expense waiver | 0.90 | % | 0.90 | % | 0.90 | % | 0.90 | % | 0.76 | % | ||||||||||
Ratio of expense to average net assets after expense waiver | 0.67 | % | 0.67 | % | 0.67 | % | 0.67 | % | 0.53 | % | ||||||||||
Ratio of net investment income to average net assets | 1.19 | % | 1.13 | % | 1.12 | % | 1.28 | % | 1.26 | % | ||||||||||
Portfolio turnover rate | 6 | % | 7 | % | 6 | % | 5 | % | 4 | % | ||||||||||
Accumulation Units outstanding at end of year (in thousands) | 10,345 | 10,882 | 11,598 | 12,123 | 12,176 | |||||||||||||||
Net assets at end of year (in thousands) | $ | 989,292 | $ | 996,044 | $ | 923,201 | $ | 915,478 | $ | 826,747 | ||||||||||
| * | Based on per accumulation data. |
| See notes to financial statements | TIAA Separate Account VA-1 n 2007 Annual Report | 19 |
TIAA SEPARATE ACCOUNT VA-1
Note 1—significant accounting policies
TIAA Separate Account VA-1 (“VA-1”) is a segregated investment account of Teachers Insurance and Annuity Association of America (“TIAA”) and was organized on February 16, 1994, under the insurance laws of the State of New York for the purpose of issuing and funding individual variable annuity contracts. VA-1 is registered with the Securities and Exchange Commission as an open-end management investment company under the Investment Company Act of 1940. VA-1 consists of a single investment portfolio, the Stock Index Account (“Account”).
The accompanying financial statements were prepared in accordance with U.S. generally accepted accounting principles (GAAP), which may require the use of estimates made by management. Actual results may differ from those estimates. The following is a summary of the significant accounting policies consistently followed by the Account.
Valuation of investments: Equity securities listed or traded on a national market or exchange are valued based on their sale price on such market or exchange at the close of business on the date of valuation, or at the mean of the closing bid and asked prices if no sale is reported. Debt securities will generally be valued using prices provided by a pricing service, which may employ various indications of value including but not limited to broker-dealer quotations. Certain debt securities, other than money market instruments, are valued based on the most recent bid price or the equivalent quoted yield for such securities (or those of comparable maturity, quality and type). Money market instruments with maturities of one year or less, are valued in the same manner as debt securities or derived from a pricing matrix that has various types of money market instruments along one axis and various maturities along the other. Investments in registered investment companies are valued at net asset value on the valuation date.
Portfolio securities for which market quotations are not readily available are valued at fair value as determined in good faith under the direction of and in accordance with the responsibilities of the Management Committee.
Trading in securities on most foreign exchanges and over the counter markets is normally completed before the close of the domestic stock market and may also take place on days when the domestic market is closed. If events materially affecting the value of foreign securities occur between the time when the exchange on which they are traded closes and the time when the Account’s net assets are calculated, such securities may be valued at fair value in accordance with procedures adopted by the Management Committee.
Accounting for investments and investment income: Security transactions are accounted for as of the trade date. Interest income is recorded as earned and includes accretion of discounts and amortization of premiums using the effective yield method. Dividend income is recorded on the ex-dividend date or, for certain foreign securities, as soon thereafter as the Account is informed of the ex-dividend date. Realized gains and losses on security transactions are based on the identified cost basis.
| 20 | 2007 Annual Report n TIAA Separate Account VA-1 |
Distributions received from Real Estate Investment Trusts (“REIT”) are recorded on the ex-dividend date. Each REIT reports annually the tax character of its distributions. Dividend income, realized gains and unrealized appreciation (depreciation) reflect the amounts of taxable income, capital gain and return of capital reported by each REIT, and management’s estimates of such amounts for REIT distributions for which actual information has not been reported.
Securities lending: The Account may lend portfolio securities to qualified financial institutions and brokers. By lending investment securities, the Account attempts to increase its net investment income through the receipt of interest (after rebates and fees) on collateral. Such income is reflected separately on the Statement of Operations. The value of the loaned securities and the liability related to the cash collateral received are reflected on the Statement of Assets and Liabilities. The loans are secured by collateral at least equal to 102% of the market value of the securities loaned for United States securities and 105% of the market value of securities loaned for foreign securities. All cash collateral is invested in the State Street Navigator Securities Lending Prime Portfolio.
Futures contracts: The Account may use futures contracts to manage exposure to the equity markets or for cash management purposes to remain highly invested in the equity markets while minimizing transaction costs. Buying futures contracts tends to increase exposure to the underlying instrument/index, while selling futures contracts tends to decrease exposure to the underlying instrument/index or hedge other investments. Initial margin deposits are made upon entering into a futures contract and variation margin payments are made or received reflecting changes in the value of the futures contracts. Futures contracts are valued at the last sale price as of the close of the board of trade or exchange on which they are traded. Daily changes in the value of such contracts are reflected in net unrealized gains and losses. Gains or losses are realized upon the expiration or closing of the futures contracts, or if the counterparties do not perform in accordance with contractual provisions.
Risks of investments in futures contracts include the possible adverse movement of the securities or indices underlying the contracts, the possibility that there may not be a liquid secondary market for the contracts, that a change in the value of the contract may not correlate with a change in the value of the underlying securities, or that the counterparty to a contract may default on its obligation to perform.
Restricted securities: Restricted securities held by the Account, if any, may not be sold except in exempt transactions or in a public offering registered under the Securities Act of 1933. The risk in investing in such securities is generally greater than the risk of investing in securities which are widely held and publicly traded.
Cash: The Account may hold cash in its account with the custodian. The Account throughout the year, may have a cash overdraft balance. A fee is incurred on this overdraft.
| TIAA Separate Account VA-1 n 2007 Annual Report | 21 |
| NOTES TO FINANCIAL STATEMENTS |
Federal income taxes: VA-1 is taxed as a life insurance company under Subchapter L of the Internal Revenue Code. VA-1 should incur no material federal income tax liability.
Investment transactions with affiliates: The Account may purchase or sell investment securities in transactions with affiliated entities under procedures adopted by the Management Committee, pursuant to the Investment Company Act of 1940. These transactions are effected at market rates without incurring broker commissions.
Indemnification: In the normal course of business, the Account enters into contracts that contain a variety of representations and warranties and that provide general indemnities. The Account’s maximum exposure under these arrangements is unknown, as this would involve future claims against the Account that have not yet occurred. Also, under the Account’s organizational documents, the Managers and Officers of VA-1 are indemnified against certain liabilities that may arise out of their duties to VA-1. However, based on experience, the Account expects the risk of loss due to these warranties and indemnities to be remote.
Note 2—investment adviser and affiliates
Teachers Advisors, Inc. (“Advisors”), a wholly owned subsidiary of TIAA and a registered investment adviser, provides investment advisory services for VA-1 pursuant to an Investment Management Agreement among TIAA, Advisors and VA-1. TIAA provides all administrative services for VA-1 pursuant to an Administrative Services Agreement with VA-1. The contracts are distributed primarily by Teachers Personal Investors Services, Inc. (“TPIS”), also a wholly owned subsidiary of TIAA, which is a registered broker-dealer and a member of the Financial Industry Regulatory Authority (formerly, the National Association of Securities Dealers, Inc.). The Investment Management Agreement sets the investment advisory charge at an annual rate of 0.30% of the net assets of the Account. Advisors has agreed to waive a portion of such fee, so that the daily deduction is equivalent to an annual charge of 0.07% of the net assets of the Account. The Administrative Services Agreement sets the administrative expense charge at an annual rate of 0.20% of the net assets of the Account. TIAA also imposes a daily charge for bearing certain mortality and expense risks in connection with the contracts, equivalent to an annual rate of 0.40% of the net assets of the Account (prior to July 1, 2003, this daily charge was 0.10%). Although TIAA reserves the right to increase the account’s mortality and expense risk charge to a maximum of 1.00% per year, the total expense ratio should never exceed 1.50% per year.
The Managers of the Account, all of whom are independent, receive remuneration for their services, plus travel and other expenses incurred in attending Committee meetings. Managers may elect to participate in a deferred compensation plan and defer all or a portion of their compensation. TIAA oversees the administration and recordkeeping of these deferred compensation plans on behalf of the Account.
| 22 | 2007 Annual Report n TIAA Separate Account VA-1 |
| continued |
Note 3—investments
At December 31, 2007, the net unrealized appreciation on investments was $332,359,553, consisting of gross unrealized appreciation of $406,720,619 and gross unrealized depreciation of $74,361,066.
Purchases and sales of non-government securities, other than short-term instruments, for the year ended December 31, 2007, were $61,684,182 and $102,241,960, respectively.
At December 31, 2007, the Account held open futures contracts as follows:
| Number of Open Contracts | Market Value | Expiration Date | Unrealized Appreciation (Depreciation) | ||||||||
E-mini S&P 500 Index | 28 | $ | 2,068,080 | March 2008 | $ | (29,872 | ) | ||||
E-mini S&P 400 Index | 3 | 259,440 | March 2008 | (889 | ) | ||||||
E-mini Russell 2000 Index | 3 | 231,660 | March 2008 | 208 | |||||||
| $ | (30,553 | ) | |||||||||
In July 2006, the Financial Accounting Standards Board (“FASB”) issued Interpretation No. 48, “Accounting for Uncertainty in Income Taxes—an Interpretation of FASB Statement No. 109” (“FIN 48”). FIN 48 establishes for all entities, including pass-through entities such as VA-1, a minimum threshold for financial statement recognition of the benefit of positions taken in filing tax returns (including what jurisdiction the entity may be taxable in), and requires certain expanded tax disclosures. FIN 48 is effective for fiscal years beginning after December 15, 2006, and is to be applied to all open tax years as of the date of effectiveness. Management has evaluated the application of FIN 48 to the Account’s financial statements for the period ended December 31, 2007. There was no material impact to the financial statements or disclosures as a result of adopting this pronouncement.
Note 4—accumulation units
Changes in the number of Accumulation Units outstanding were as follows:
| Years Ended December 31, | ||||||
| 2007 | 2006 | |||||
Accumulation Units: | ||||||
Credited for premiums | 202,804 | 222,075 | ||||
Cancelled for transfers and disbursements | (740,021 | ) | (938,409 | ) | ||
Outstanding: | ||||||
Beginning of year | 10,881,773 | 11,598,107 | ||||
End of year | 10,344,556 | 10,881,773 | ||||
| TIAA Separate Account VA-1 n 2007 Annual Report | 23 |
| NOTES TO FINANCIAL STATEMENTS | concluded |
Note 5—line of credit
The Account participates in a $1.5 billion unsecured revolving credit facility to be used for temporary purposes, including the funding of contract owner withdrawals. Certain affiliated accounts and mutual funds, each of which is managed by Advisors or an affiliate of Advisors, also participate in this facility. An annual commitment fee for the credit facility is borne by Advisors. Interest associated with any borrowing under the facility by the Account is charged to the Account at rates that are based on the Federal Funds Rate in effect during the time of the borrowing. The Account is not liable for borrowings under the facility by affiliated accounts or mutual funds. During the year ended December 31, 2007, the Account did not borrow under this facility.
Note 6—new accounting pronouncements
In September 2006, FASB issued Statement of Accounting Standards No. 157, “Fair Value Measurement” (“SFAS 157”). This new standard applies to all entities that follow U.S. GAAP and their valuation techniques for assets and liabilities. SFAS 157 defines fair value, establishes a framework for measuring fair value under GAAP, and expands disclosures about fair value measurements. SFAS 157 is effective for financial statements issued for fiscal years beginning after November 15, 2007. Management is currently evaluating the impact the adoption of SFAS 157 will have on the Account’s financial statements.
| 24 | 2007 Annual Report n TIAA Separate Account VA-1 |
REPORT OF INDEPENDENT REGISTERED
PUBLIC ACCOUNTING FIRM
To the Management Committee and Contractowners of
TIAA Separate Account VA-1:
In our opinion, the accompanying statement of assets and liabilities, including the summary portfolio of investments, and the related statements of operations and of changes in net assets and the financial highlights present fairly, in all material respects, the financial position of the Stock Index Account of TIAA Separate Account VA-1 (hereafter referred to as “VA-1”) at December 31, 2007, the results of its operations for the year then ended, the changes in its net assets for each of the two years in the period then ended, and the financial highlights for each of the three years in the period then ended, in conformity with accounting principles generally accepted in the United States of America. These financial statements and financial highlights (hereafter referred to as “financial statements”) are the responsibility of VA-1’s management; our responsibility is to express an opinion on these financial statements based on our audits. We conducted our audits of these financial statements in accordance with the standards of the Public Company Accounting Oversight Board (United States). Those standards require that we plan and perform the audit to obtain reasonable assurance about whether the financial statements are free of material misstatement. An audit includes examining, on a test basis, evidence supporting the amounts and disclosures in the financial statements, assessing the accounting principles used and significant estimates made by management, and evaluating the overall financial statement presentation. We believe that our audits, which included confirmation of securities at December 31, 2007 by correspondence with the custodian and brokers, provide a reasonable basis for our opinion. The financial highlights for each of the periods in the two year period ended December 31, 2004 were audited by other auditors whose report dated February 25, 2005 expressed an unqualified opinion on those financial highlights.

PricewaterhouseCoopers LLP
New York, NY
February 25, 2008
| TIAA Separate Account VA-1 n 2007 Annual Report | 25 |
2007 SPECIAL MEETING (UNAUDITED)
TIAA SEPARATE ACCOUNT VA-1
Managers
The results below were certified by Broadridge Financial Solutions Inc., independent tabulator for the TIAA Separate Account VA-1.
On September 17, 2007, at a special meeting of contractowners, the following persons were elected to serve on the Management Committee:
| Nominee | Dollars for | Percent | Dollars against | Percent | Dollars abstain | Percent | ||||||||||||
| Forrest Berkley | $ | 2,903,839.75 | 97.730 | % | $ | 28,759.66 | 0.968 | % | $ | 38,699.68 | 1.302 | % | ||||||
| Nancy A. Eckl | $ | 2,895,993.90 | 97.466 | $ | 37,879.61 | 1.275 | $ | 37,425.58 | 1.260 | |||||||||
| Eugene Flood, Jr. | $ | 2,900,539.04 | 97.619 | $ | 29,127.79 | 0.980 | $ | 41,632.26 | 1.401 | |||||||||
| Howell E. Jackson | $ | 2,904,206.42 | 97.742 | $ | 33,723.60 | 1.135 | $ | 33,369.07 | 1.123 | |||||||||
| Nancy L. Jacob | $ | 2,902,133.84 | 97.672 | $ | 30,321.80 | 1.020 | $ | 38,843.45 | 1.307 | |||||||||
| Bridget A. Macaskill | $ | 2,900,199.48 | 97.607 | $ | 30,309.12 | 1.020 | $ | 40,790.49 | 1.373 | |||||||||
| James M. Poterba | $ | 2,913,036.40 | 98.039 | $ | 24,704.28 | 0.831 | $ | 33,558.41 | 1.129 | |||||||||
| Maceo K. Sloan | $ | 2,891,662.33 | 97.320 | $ | 38,090.24 | 1.282 | $ | 41,546.52 | 1.398 | |||||||||
| Laura T. Starks | $ | 2,898,176.80 | 97.539 | $ | 30,806.87 | 1.037 | $ | 42,315.42 | 1.424 | |||||||||
Nancy A. Eckl was elected to office. Forrest Berkley, Eugene Flood, Jr., Howell E. Jackson, Nancy L. Jacob, Bridget A. Macaskill, James M. Poterba, Maceo K. Sloan and Laura T. Starks continued in office.
| 26 | 2007 Annual Report n TIAA Separate Account VA-1 |
TIAA SEPARATE ACCOUNT VA-1 MANAGEMENT COMMITTEE MEMBERS AND OFFICERS
Disinterested members
Name, Address and Date of Birth (“DOB”) | Position(s) Held with | Term of Office and Length of Time Served | Principal Occupation(s) During Past 5 Years | Number of Portfolios in Fund Complex Overseen by Member | Other Directorships Held by Members | |||||
Forrest Berkley c/o Corporate Secretary 730 Third Avenue New York, NY 10017-3206 DOB: 4/25/1954 | Member | Indefinite term. Member since 2006. | Retired Partner (since 2006), Partner (1990-2005) and Head of Global Product Management (2003-2005), GMO (formerly, Grantham, Mayo, Van Otterloo & Co.) (investment management); and member of asset allocation portfolio management team, GMO (2003-2005). | 61 | Director and member of the Investment Committee, the Maine Coast Heritage Trust and the Boston Athaneum, and Director, Appalachian Mountain Club. | |||||
Nancy A. Eckl c/o Corporate Secretary 730 Third Avenue New York, NY 10017-3206 DOB: 10/6/1962 | Member | Indefinite term. Trustee since September 2007. | Former Vice President (1990-2006), American Beacon Advisors, Inc. and Vice President of certain funds advised by American Beacon Advisors, Inc. | 61 | Independent Director, the Lazard Funds, Inc., Lazard Retirement Series, Inc., Lazard Global Total Return and Income Fund, Inc. and Lazard World Dividend and Income Fund, Inc. and Member of the Board of Managers of Lazard Alternative Strategies Fund, LLC. | |||||
Eugene Flood, Jr. c/o Corporate Secretary 730 Third Avenue New York, NY 10017-3206 DOB: 10/31/1955 | Member | Indefinite term. Member since 2005. | President, and Chief Executive Officer (since 2000) and a Director (since 1994) of Smith Breeden Associates, Inc. (investment advisor). | 61 | None |
| TIAA Separate Account VA-1 n 2007 Annual Report | 27 |
| MANAGEMENT | continued |
TIAA SEPARATE ACCOUNT VA-1 MANAGEMENT COMMITTEE MEMBERS AND OFFICERS
Disinterested members—continued
Name, Address and Date of Birth (“DOB”) | Position(s) Held with | Term of Office and Length of Time Served | Principal Occupation(s) During Past 5 Years | Number of Portfolios in Fund Complex Overseen by Member | Other Directorships Held by Members | |||||
Michael A. Forrester c/o Corporate Secretary 730 Third Avenue New York, NY 10017-3206 DOB: 11/05/1967 | Member | Indefinite term. Trustee since 2007 | Chief Operating Officer, Copper Rock Capital Partners (since September 2007). Formerly Chief Operating Officer, DDJ Capital Management (2003-2006); and Executive Vice President (2000-2002), Senior Vice President (1995-2000) and Vice President (1992-1995), Fidelity Investments. | 61 | None | |||||
Howell E. Jackson c/o Corporate Secretary 730 Third Avenue New York, NY 10017-3206 DOB: 1/4/1954 | Member | Indefinite term. Member since 2005. | James S. Reid, Jr. Professor of Law (since 2004), Vice Dean for Budget (2003-2006) and on the faculty (since 1989) of Harvard Law School. | 61 | None | |||||
Nancy L. Jacob c/o Corporate Secretary 730 Third Avenue New York, NY 10017-3206 DOB: 1/15/1943 | Chairman of the Management Committee, Member | Indefinite term. Member since 2001. | President and Founder (since October 2006) of NLJ Advisors, Inc. (investment advisor). Formerly, President and Managing Principal, Windermere Investment Associates (1997-June 2006), Chairman and Chief Executive Officer, CTC Consulting, Inc. (1994-1997) and Executive Vice President, U.S. Trust Company of the Pacific Northwest (1993-1997). | 61 | Director and Chairman of the Investment Committee of the Okabena Company (financial services). |
| 28 | 2007 Annual Report n TIAA Separate Account VA-1 |
Bridget A. Macaskill c/o Corporate Secretary 730 Third Avenue New York, NY 10017-3206 DOB: 8/5/1948 | Member | Indefinite term. Member since 2003. | Principal, BAM Consulting LLC (since 2003), Independent Consultant for Merrill Lynch (since 2003). Formerly, Chairman, Oppenheimer Funds, Inc. (2000-2001). Chief Executive Officer (1995-2001); President (1991-2000); and Chief Operating Officer (1989-1995) of that firm. | 61 | Director, Prudential plc, Scottish & Newcastle plc (brewer), Federal National Mortgage Association (Fannie Mae), International Advisory Board, and British-American Business Council. | |||||
James M. Poterba c/o Corporate Secretary 730 Third Avenue New York, NY 10017-3206 DOB: 7/13/1958 | Member | Indefinite term. Member since 2006. | Head (since 2006) and Associate Head (1994-2000 and 2001–2006) Economics Department, Massachusetts Institute of Technology (MIT), Mitsui Professor of Economics, MIT (1996-present). Program Director, National Bureau of Economic Research (since 1990). | 61 | The Jeffrey Company and Jeflion Company (unregistered investment companies) | |||||
Maceo K. Sloan c/o Corporate Secretary 730 Third Avenue New York, NY 10017-3206 DOB: 10/18/1949 | Member | Indefinite term. Member since 2001. | Chairman, President and Chief Executive Officer, Sloan Financial Group, Inc. (since 1991); Chairman, CEO and CIO, NCM Capital Management Group, Inc. (since 1991); and Chairman and CEO, NCM Capital Advisers Inc. (since 2003). | 61 | Director, SCANA Corporation (energy holding company) and M&F Bancorp, Inc. |
| TIAA Separate Account VA-1 �� n 2007 Annual Report | 29 |
| MANAGEMENT | continued |
TIAA SEPARATE ACCOUNT VA-1 MANAGEMENT COMMITTEE MEMBERS AND OFFICERS
Disinterested members—concluded
Name, Address and Date of Birth (“DOB”) | Position(s) Held with | Term of Office and Length of Time Served | Principal Occupation(s) During Past 5 Years | Number of Portfolios in Fund Complex Overseen by Member | Other Directorships Held by Members | |||||
Laura T. Starks c/o Corporate Secretary 730 Third Avenue New York, NY 10017-3206 DOB: 2/17/1950 | Member | Indefinite term. Member since 2006. | Chairman, Department of Finance, the Charles E. and Sarah M. Seay Regents Chair in Finance (since 2002-present), and Director, AIM Investment Center, McCombs School of Business, University of Texas at Austin (2000-present); Professor, University of Texas at Austin (1987-present); Fellow, Financial Management Association (2002-present). Associate Dean for Research (2001-2002), Associate Director of Research, the Center for International Business Education and Research, University of Texas at Austin (2002-2003) and Director of the Bureau of Business Research, University of Texas at Austin (2001-2002). | 61 | None |
| 30 | 2007 Annual Report n TIAA Separate Account VA-1 |
Officers
| Name, Address and Date of Birth (“DOB”) | Position(s) Held with | Term of Office and Length of Time Served | Principal Occupation(s) During Past 5 Years | |||
Herbert M. Allison, Jr. TIAA-CREF 730 Third Avenue New York, NY 10017-3206 DOB: 8/2/1943 | President and Chief Executive Officer | One-year term. President and Chief Executive Officer since 2002. | Chairman, President and Chief Executive Officer of TIAA and President and Chief Executive Officer of CREF and TIAA Separate Account VA-1 (since 2002). Formerly, President and Chief Executive Officer of TIAA-CREF Institutional Mutual Funds and TIAA-CREF Life Funds (2002-2/2007). President and Chief Executive Officer of Alliance for Lifelong Learning, Inc. (2000-2002), President, Chief Operating Officer and Member of the Board of Directors of Merrill Lynch & Co., Inc. (1997-1999). | |||
Mary (Maliz) E. Beams TIAA-CREF 730 Third Avenue New York, NY 10017-3206 DOB: 3/29/1956 | Executive Vice President | One-year term. Executive Vice President since July 2007. | Executive Vice President of TIAA (since July 2007) and of TIAA-CREF Institutional Mutual Funds, CREF, TIAA-CREF Life Funds and TIAA Separate Account VA-1 (collectively, the “TIAA-CREF Fund Complex”) (since September 2007). Manager, President and Chief Executive Officer, TIAA-CREF Individual & Institutional Services, LLC (since July 2007); Senior Managing Director and Head of Wealth Management Group, TIAA (since 2004). Formerly Partner, Spyglass Investments (2002-2003); Partner and Managing Director, President of Global Business Development for the Mutual Fund Group and Head of International Mutual Fund and Offshore Business of Zurich Scudder Investments; and Head of U.S. Scudder Direct Retail Business and Chief Executive Officer of Scudder Brokerage (1997-2002). | |||
Richard S. Biegen TIAA-CREF 730 Third Avenue New York, NY 10017-3206 DOB: 5/8/1962 | Vice President and Chief Compliance Officer | One-year term. Vice President and Chief Compliance Officer since February 2008. | Chief Compliance Officer of the TIAA-CREF Fund Complex, Vice President and Advisor Chief Compliance Officer of TIAA, and Chief Compliance Officer of Advisors and Investment Management. Formerly, Managing Director/Director of Global Compliance, AIG Global Investment Group (2000-2008); Senior Vice President/Group Head, Regulatory Oversight Group, Scudder Kemper Investments, Inc. (1998-2000); Chief Compliance Officer/Vice President, Legal Department, Salomon Brothers Asset Management, Inc. (1997-1998); Assistant General Counsel/Director, Securities Law Compliance, the Prudential Insurance Company of America (1994-1997); and Enforcement Staff Attorney, U.S. Securities and Exchange Commission (1988-1994). |
| TIAA Separate Account VA-1 n 2007 Annual Report | 31 |
| MANAGEMENT | continued |
TIAA SEPARATE ACCOUNT VA-1 MANAGEMENT COMMITTEE MEMBERS AND OFFICERS
Officers—continued
| Name, Address and Date of Birth (“DOB”) | Position(s) Held with | Term of Office and Length of Time Served | Principal Occupation(s) During Past 5 Years | |||
Gary Chinery TIAA-CREF 730 Third Avenue New York, NY 10017-3206 DOB: 11/28/1949 | Vice President and Treasurer | One-year term. Vice President and Treasurer since 2004. | Vice President and Treasurer of TIAA, CREF and TIAA Separate Account VA-1 (since 2004), Vice President (since 2004) and Treasurer (2004-2007) of TIAA-CREF Institutional Mutual Funds and TIAA-CREF Life Funds. Vice President and Treasurer of Teachers Advisors, Inc. (“Advisors”), TIAA-CREF Investment Management, LLC (“Investment Management”), TIAA-CREF Individual Institutional Services, LLC (“Services”), Teachers Personal Investors Services, Inc. (“TPIS”), TIAA-CREF Tuition Financing, Inc. (“Tuition Financing”), TIAA-CREF Life Insurance Company (“TIAA-CREF Life”) and TCT Holdings, Inc. | |||
Scott C. Evans TIAA-CREF 730 Third Avenue New York, NY 10017-3206 DOB: 5/11/1959 | Executive Vice President | One-year term. Executive Vice President since 1997. | Principal Executive Officer and President of TIAA-CREF Institutional Mutual Funds and TIAA-CREF Life Funds (since 2007); Executive Vice President (since 1999) and Head of Asset Management (since 2006) of TIAA, CREF and TIAA Separate Account VA-1. Director of TPIS (since 2006) and Advisors (since 2004). President and Chief Executive Officer of Investment Management and Advisors, and Manager of Investment Management (since 2004). Executive Vice President and Head of Asset Management of the TIAA-CREF Mutual Funds (2006-2007). Formerly, Manager of TIAA Realty Capital Management, LLC (2004-2006), Chief Investment Officer of TIAA (2004-2006) and the TIAA-CREF Funds Complex (2003-2005). | |||
I. Steven Goldstein TIAA-CREF 730 Third Avenue New York, NY 10017-3206 DOB: 9/24/1952 | Executive Vice President | One-year term. Executive Vice President since 2003. | Executive Vice President of TIAA and the TIAA-CREF Funds Complex (since 2003). Formerly, Director of TIAA-CREF Life (2003-2006); Advisor for McKinsey & Company (2003); Vice President, Corporate Communications for Dow Jones & Co. and The Wall Street Journal (2001-2002); and Senior Vice and Chief Communications Officer for Insurance Information Institute (1993-2001). | |||
George W. Madison TIAA-CREF 730 Third Avenue New York, NY 10017-3206 DOB: 10/17/1953 | Executive Vice President and General Counsel | One-year term. Executive Vice President and General Counsel since 2003. | Executive Vice President and General Counsel of TIAA and the TIAA-CREF Funds Complex (since 2003). Formerly, Executive Vice President, Corporate Secretary, and General Counsel of Comerica Incorporated (1997-2003). |
| 32 | 2007 Annual Report n TIAA Separate Account VA-1 |
Erwin W. Martens TIAA-CREF 730 Third Avenue New York, NY 10017-3206 DOB: 3/18/1956 | Executive Vice President | One-year term. Executive Vice President since 2003. | Executive Vice President of TIAA and the TIAA-CREF Funds Complex (since 2003). Director of Advisors, TPIS, and Manager of Investment Management. Formerly, Managing Director and Chief Risk Officer, Putnam Investments (1999-2003); and Head and Deputy Head of Global Market Risk Management, Lehman Brothers (1997-1999). | |||
Dermot J. O’Brien TIAA-CREF 730 Third Avenue New York, NY 10017-3206 DOB: 3/13/1966 | Executive Vice President | One-year term. Executive Vice President since 2003. | Executive Vice President of TIAA and the TIAA-CREF Funds Complex (since 2003), and head of Corporate Services (since 2006). Formerly Director, TIAA-CREF Life (2003-2006); First Vice President and Head of Human Resources, International Private Client Division and Global Debt Markets, Merrill Lynch & Co. (1999-2003); and Vice President and Head of Human Resources, Japan Morgan Stanley (1998-1999 | |||
Marjorie Pierre-Merritt TIAA-CREF 730 Third Avenue New York, NY 10017-3206 DOB: 5/28/1966 | Vice President and Acting Corporate Secretary | One year term. Vice President and Acting Corporate Secretary since September 2007 | Vice President and Acting Corporate Secretary of TIAA and the TIAA-CREF Fund Complex (since September 2007); Assistant Corporate Secretary of TIAA (2006-2007); Assistant Corporate Secretary of The Dun & Bradstreet Corporation (2003-2006); and Counsel, The New York Times Company (2001-2003). | |||
Georganne C. Proctor TIAA-CREF 730 Third Avenue New York, NY 10017-3206 DOB: 10/25/1956 | Executive Vice President and Chief Financial Officer | One-year term. Executive Vice President and Chief Financial Officer since 2006. | Executive Vice President and Chief Financial Officer of TIAA, CREF and TIAA Separate Account VA-1 (since 2006). Manager and Executive Vice President of Investment Management, Director and Vice President of TPIS and Advisors (since 2006). Formerly Executive Vice President and Chief Financial Officer of Life Funds, TIAA-CREF Mutual Funds and TIAA-CREF Institutional Mutual Funds (2006–2/2007); Executive Vice President, Finance, Golden West Financial Corporation (2002-2006) and Senior Vice President, Chief Financial Officer and Director, Bechtel Group, Inc. (1999-2002). | |||
Cara L. Schnaper TIAA-CREF 730 Third Avenue New York, NY 10017-3206 DOB: 2/13/54 | Executive Vice President | One-Year Term. Executive Vice President since February 2008. | Executive Vice President, Technology and Operations of TIAA, and Executive Vice President of the TIAA-CREF Fund Complex (since February 2008). Formerly, Principal, Market Resolve, LLC (2006–February 2008); and Head, Middle Office, Investment Banking (2000-2002), Head, Technology and Operations, Equities (1999-2000) and Chief Operating Officer Technology and Operations, Emerging Markets, Foreign Exchange and Commodities (1997-1999), JP Morgan Chase & Co. |
| TIAA Separate Account VA-1 n 2007 Annual Report | 33 |
| MANAGEMENT | concluded |
TIAA SEPARATE ACCOUNT VA-1 MANAGEMENT COMMITTEE MEMBERS AND OFFICERS
Officers—concluded
| Name, Address and Date of Birth (“DOB”) | Position(s) Held with | Term of Office and Length of Time Served | Principal Occupation(s) During Past 5 Years | |||
Bertram L. Scott TIAA-CREF 730 Third Avenue New York, NY 10017-3206 DOB: 3/26/1951 | Executive Vice President | One-year term. Executive Vice President since 2001. | Executive Vice President of TIAA and the TIAA-CREF Funds Complex (since 2006). Director and President of TIAA-CREF Enterprises, Inc. (since 2000). Formerly, Executive Vice President, Product Management of TIAA and TIAA-CREF Funds Complex (2000-2005); President and Chief Executive Officer, Horizon Mercy (1996-2000). | |||
Edward D. Van Dolsen TIAA-CREF 730 Third Avenue New York, NY 10017-3206 DOB: 4/21/1958 | Executive Vice President | One-year term. Executive Vice President since January 2006. | Executive Vice President (since 2006). Director of Tuition Financing and Manager of Services. President and CEO, TIAA-CREF Redwood, LLC. Formerly Senior Vice President, Pension Products (2003-2006), Vice President, Support Services (1998-2003), of TIAA and the TIAA-CREF Funds Complex. | |||
| Please note that the Account’s Statement of Additional Information (SAI) includes additional information about the Account’s members and is available, without charge, through our website, www.tiaa-cref.org or by telephone at 800 223-1200. | ||||||
| 34 | 2007 Annual Report n TIAA Separate Account VA-1 |
TIAA-CREF WEBSITE
Account performance, personal account information and transactions, product descriptions, and information about investment choices and income options
www.tiaa-cref.org
24 hours a day, 7 days a week
AUTOMATED TELEPHONE SERVICE
Check account performance and accumulation balances, change allocations, transfer funds and verify credited premiums
800 842-2252
24 hours a day, 7 days a week
TELEPHONE COUNSELING CENTER
Retirement saving and planning, income options and payments, and tax reporting
800 842-2776
8 a.m. to 10 p.m. ET, Monday–Friday
9 a.m. to 6 p.m. ET, Saturday
PLANNING AND SERVICE CENTER
TIAA-CREF mutual funds
800 223-1200
8 a.m. to 10 p.m. ET, Monday–Friday
INSURANCE PLANNING CENTER
After-tax annuities and life insurance
877 825-0411
8 a.m. to 8 p.m. ET, Monday–Friday
FOR HEARING- OR SPEECH-IMPAIRED PARTICIPANTS
800 842-2755
8 a.m. to 10 p.m. ET, Monday–Friday
9 a.m. to 6 p.m. ET, Saturday
TIAA-CREF BROKERAGE SERVICES
Self-directed brokerage accounts for investing in stocks, bonds and mutual funds
800 927-3059
8 a.m. to 7 p.m. ET, Monday–Friday
TIAA-CREF TRUST COMPANY, FSB
Asset management, trust administration, estate planning, planned giving and endowment management
888 842-9001
9 a.m. to 6 p.m. ET, Monday–Friday
ADVISOR SERVICES
888 842-0318
8 a.m. to 7:30 p.m. ET, Monday–Friday
You should carefully consider the investment objectives, risks, charges and expenses before investing. Please call 800 223-1200 or visit www.tiaa-cref.org for a prospectus that contains this and other information. Please read the prospectus carefully before investing. Investment products are not FDIC insured, may lose value and are not bank guaranteed. TIAA-CREF Individual & Institutional Services, LLC, and Teachers Personal Investors Services, Inc., members FINRA/SIPC, distribute securities products. Teachers Insurance and Annuity Association (TIAA), New York, NY, and TIAA-CREF Life Insurance Co., New York, NY, issue insurance and annuities. TIAA-CREF Brokerage Services is a division of TIAA-CREF Individual & Institutional Services, LLC. TIAA-CREF Trust Company, FSB, provides trust services.
©2008 Teachers Insurance and Annuity Association—College Retirement Equities Fund (TIAA-CREF), New York, NY 10017-3206

| Item 2. | Code of Ethics. |
2(a) The Management Committee of TIAA Separate Account VA-1 (the “Registrant”) has adopted a code of ethics for senior financial officers, including the Registrant’s principal executive officer, principal financial officer, principal accounting officer, or controller, and persons performing similar functions, in conformity with rules promulgated under the Sarbanes-Oxley Act of 2002.
2(b) No response required.
2(c) During the reporting period, there were no amendments to the code of ethics.
2(d) During the reporting period, there were no implicit or explicit waivers granted by the Registrant from any provision of the code of ethics.
2(e) Not applicable.
2(f) A copy of the current code of ethics is filed as an exhibit to this Form N-CSR.
| Item 3. | Audit Committee Financial Expert. |
3(a)(1) The Registrant’s Management Committee has determined that the Registrant has at least one audit committee financial expert serving on its Audit Committee.
3(a)(2) Maceo K. Sloan is the Registrant’s audit committee financial expert and is “independent” for purposes of Item 3 of Form N-CSR.
| Item 4. | Principal Accountant Fees and Services. |
PricewaterhouseCoopers LLP (“PwC”) performs independent audits of the Registrant’s financial statements. To maintain auditor independence and avoid the appearance of conflicts of interest, the Registrant, as a policy, does not engage PwC for management advisory or consulting services.
4(a) Audit Fees.
For the fiscal years ended December 31, 2007 and December 31, 2006, PwC’s aggregate fees for the audit of the Registrant’s annual financial statements were $147,860 and $120,000, respectively.
4(b) Audit Related Fees.
For the fiscal years ended December 31, 2007 and December 31, 2006, PwC’s aggregate fees for services related to the performance of the audit of the Registrant’s annual financial statements were $0 and $0, respectively.
For the fiscal years ended December 31, 2007 and December 31, 2006, the Audit-Related Fees billed by PwC to Teachers Advisors, Inc. (“Advisors”) or to any entity controlling, controlled by or under common control with Advisors that provides ongoing services to the Registrant (collectively, “Fund Service Providers”) were $697,000 and $835,700, respectively.
4(c) Tax Fees.
For the fiscal years ended December 31, 2007 and December 31, 2006, PwC’s aggregate fees for tax services billed to the Registrant were $10,000 and $10,000, respectively.
For the fiscal years ended December 31, 2007 and December 31, 2006, PwC’s aggregate fees for tax services billed to the Fund Service Providers were $10,000 and $10,000, respectively.
4(d) All Other Fees.
For the fiscal years ended December 31, 2007 and December 31, 2006, PwC’s aggregate fees for all other services to the Registrant were $0 and $0, respectively.
For the fiscal years ended December 31, 2007 and December 31, 2006, PwC’s aggregate fees for all other services billed to the Fund Service Providers were $0 and $0, respectively.
4(e)(1) Preapproval Policy.
The Registrant’s audit committee (“Audit Committee”) has adopted a Preapproval Policy for External Audit Firm Services (the “Policy”). The Policy describes the types of services that may be provided by the independent auditor to the Registrant and certain of its affiliates without
impairing the auditor’s independence. Under the Policy, the Audit Committee is required to preapprove all services to be performed by the Registrant’s independent auditor in order to ensure that such services do not impair the auditor’s independence.
The Policy requires the Audit Committee to: (i) appoint the independent auditor to perform the financial statements audit for the Registrant and certain of its affiliates, including approving the terms of the engagement, and (ii) preapprove the audit, audit-related, tax and other services to be provided by the independent auditor to the Registrant and certain of its affiliates and the fees to be charged for provision of such services from year to year.
4(e)(2) Services provided pursuant to paragraph (c)(7)(i)(C) of Rule 2-01 of Regulation S-X (the “de minimis exception”):
Audit-Related Fees:
There were no amounts that were approved by the Audit Committee pursuant to the de minimis exception for the fiscal years ended December 31, 2007 and December 31, 2006 on behalf of the Registrant.
There were no amounts that were approved by the Audit Committee pursuant to the de minimis exception for the fiscal years ended December 31, 2007 and December 31, 2006 on behalf of the Fund Service Providers that relate directly to the operations and financial reporting of the Registrant.
Tax Fees:
There were no amounts that were approved by the Audit Committee pursuant to the de minimis exception for the fiscal years ended December 31, 2007 and December 31, 2006 on behalf of the Registrant.
There were no amounts that were approved by the Audit Committee pursuant to the de minimis exception for the fiscal years ended December 31, 2007 and December 31, 2006 on behalf of the Fund Service Providers that relate directly to the operations and financial reporting of the Registrant.
All Other Fees:
There were no amounts that were approved by the Audit Committee pursuant to the de minimis exception for the fiscal years ended December 31, 2007 and December 31, 2006 on behalf of the Registrant.
There were no amounts that were approved by the Audit Committee pursuant to the de minimis exception for the fiscal years ended December 31, 2007 and December 31, 2006 on behalf of the Fund Service Providers that relate directly to the operations and financial reporting of the Registrant.
4(f) The percentage of hours expended by PwC’s engagement to audit the Registrant’s financial statements for the most recent fiscal year attributable to work performed by persons other than PwC’s full-time, permanent employees was less than 50%.
4(g) Non-Audit Fees for Related Entities.
For the fiscal years ended December 31, 2007 and December 31, 2006, aggregate non-audit fees billed to the Registrant and to its Fund Service Providers by PwC were $1,119,000 and $823,200, respectively.
4(h) The Registrant’s Audit Committee has considered whether the non-audit services that were rendered by PwC to the Registrant’s Fund Service Providers that were not pre-approved pursuant to paragraph (c)(7)(ii) of Rule 2-01 of Regulation S-X are compatible with maintaining PwC’s independence.
| Item 5. | Audit Committee of Listed Registrants. |
Not Applicable.
| Item 6. | Schedule of Investments. |
TIAA SEPARATE ACCOUNT VA-1 - Stock Index Account
TIAA SEPARATE ACCOUNT VA-1
STOCK INDEX ACCOUNT
PORTFOLIO OF INVESTMENTS (unaudited)
December 31, 2007
SHARES | COMPANY | VALUE (000) | |||||
COMMON STOCKS - 99.66% | |||||||
AGRICULTURAL PRODUCTION-CROPS - 0.00%** | |||||||
2,584 | e* | Chiquita Brands International, Inc | $ | 48 | |||
TOTAL AGRICULTURAL PRODUCTION-CROPS | 48 | ||||||
AGRICULTURAL PRODUCTION-LIVESTOCK - 0.01% | |||||||
803 | e | Cal-Maine Foods, Inc | 21 | ||||
2,370 | e | Pilgrim’s Pride Corp | 69 | ||||
23 | e | Seaboard Corp | 34 | ||||
TOTAL AGRICULTURAL PRODUCTION-LIVESTOCK | 124 | ||||||
AGRICULTURAL SERVICES - 0.00%** | |||||||
727 | e* | Cadiz, Inc | 15 | ||||
TOTAL AGRICULTURAL SERVICES | 15 | ||||||
AMUSEMENT AND RECREATION SERVICES - 0.66% | |||||||
17,680 | * | Activision, Inc | 525 | ||||
3,321 | e* | Bally Technologies, Inc | 165 | ||||
433 | Churchill Downs, Inc | 23 | |||||
978 | e | Dover Downs Gaming & Entertainment, Inc | 11 | ||||
11,424 | Harrah’s Entertainment, Inc | 1,014 | |||||
2,272 | International Speedway Corp (Class A) | 94 | |||||
1,482 | * | Lakes Entertainment, Inc | 10 | ||||
1,909 | e* | Leapfrog Enterprises, Inc | 13 | ||||
1,967 | e* | Life Time Fitness, Inc | 98 | ||||
3,817 | e* | Live Nation, Inc | 55 | ||||
1,437 | e* | MTR Gaming Group, Inc | 10 | ||||
3,185 | * | Magna Entertainment Corp | 3 | ||||
3,301 | e* | Marvel Entertainment, Inc | 88 | ||||
1,472 | e* | Multimedia Games, Inc | 12 | ||||
4,563 | * | Penn National Gaming, Inc | 272 | ||||
3,407 | e* | Pinnacle Entertainment, Inc | 80 | ||||
4,554 | e* | Six Flags, Inc | 9 | ||||
1,000 | Speedway Motorsports, Inc | 31 | |||||
1,000 | e* | Town Sports International Holdings, Inc | 10 | ||||
2,343 | e* | WMS Industries, Inc | 86 | ||||
121,235 | Walt Disney Co | 3,913 | |||||
2,602 | e | Warner Music Group Corp | 16 | ||||
4,762 | e* | Westwood One, Inc | 9 | ||||
1,461 | e | World Wrestling Entertainment, Inc | 22 | ||||
TOTAL AMUSEMENT AND RECREATION SERVICES | 6,569 | ||||||
APPAREL AND ACCESSORY STORES - 0.52% | |||||||
5,367 | Abercrombie & Fitch Co (Class A) | 429 | |||||
4,747 | * | Aeropostale, Inc | 126 | ||||
11,052 | American Eagle Outfitters, Inc | 230 | |||||
1
TIAA SEPARATE ACCOUNT VA-1 - Stock Index Account
SHARES | COMPANY | VALUE (000) | |||||
4,458 | e* | AnnTaylor Stores Corp | $ | 114 | |||
1,533 | e | Bebe Stores, Inc | 20 | ||||
2,844 | Brown Shoe Co, Inc | 43 | |||||
749 | Buckle, Inc | 25 | |||||
664 | * | Cache, Inc | 6 | ||||
3,338 | e* | Carter’s, Inc | 65 | ||||
2,400 | e* | Casual Male Retail Group, Inc | 12 | ||||
2,074 | e | Cato Corp (Class A) | 32 | ||||
1,406 | e* | Charlotte Russe Holding, Inc | 23 | ||||
7,700 | e* | Charming Shoppes, Inc | 42 | ||||
10,787 | e* | Chico’s FAS, Inc | 97 | ||||
1,410 | e* | Children’s Place Retail Stores, Inc | 37 | ||||
2,493 | e | Christopher & Banks Corp | 29 | ||||
836 | e* | Citi Trends, Inc | 13 | ||||
3,907 | e* | Collective Brands, Inc | 68 | ||||
1,051 | e* | DSW, Inc (Class A) | 20 | ||||
3,000 | e* | Dress Barn, Inc | 38 | ||||
1,885 | e* | Eddie Bauer Holdings, Inc | 12 | ||||
2,704 | * | Finish Line, Inc (Class A) | 7 | ||||
9,500 | Foot Locker, Inc | 130 | |||||
33,409 | Gap, Inc | 711 | |||||
6,129 | * | Hanesbrands, Inc | 167 | ||||
2,222 | e* | HOT Topic, Inc | 13 | ||||
2,305 | e* | J Crew Group, Inc | 111 | ||||
1,141 | e* | JOS A Bank Clothiers, Inc | 32 | ||||
1,539 | e* | Jo-Ann Stores, Inc | 20 | ||||
19,641 | * | Kohl’s Corp | 900 | ||||
19,420 | e | Limited Brands, Inc | 368 | ||||
888 | * | New York & Co, Inc | 6 | ||||
15,499 | e | Nordstrom, Inc | 569 | ||||
4,283 | e* | Pacific Sunwear Of California, Inc | 60 | ||||
8,511 | Ross Stores, Inc | 218 | |||||
517 | e* | Shoe Carnival, Inc | 7 | ||||
2,847 | Stage Stores, Inc | 42 | |||||
1,200 | e | Talbots, Inc | 14 | ||||
1,880 | * | Tween Brands, Inc | 50 | ||||
1,345 | e* | Under Armour, Inc (Class A) | 59 | ||||
7,238 | e* | Urban Outfitters, Inc | 197 | ||||
4,270 | * | Wet Seal, Inc (Class A) | 10 | ||||
TOTAL APPAREL AND ACCESSORY STORES | 5,172 | ||||||
APPAREL AND OTHER TEXTILE PRODUCTS - 0.15% | |||||||
762 | e | Columbia Sportswear Co | 34 | ||||
811 | * | G-III Apparel Group Ltd | 12 | ||||
3,320 | Guess ?, Inc | 126 | |||||
2,122 | e* | Gymboree Corp | 65 | ||||
6,665 | e | Jones Apparel Group, Inc | 107 | ||||
1,658 | e | Kellwood Co | 28 | ||||
800 | e* | Lululemon Athletica, Inc | 38 | ||||
6,408 | Liz Claiborne, Inc | 130 | |||||
1,392 | e* | Maidenform Brands, Inc | 19 | ||||
3,569 | Phillips-Van Heusen Corp | 132 | |||||
3,780 | e | Polo Ralph Lauren Corp | 234 | ||||
7,612 | e* | Quiksilver, Inc | 65 | ||||
836 | e* | True Religion Apparel, Inc | 18 | ||||
2
TIAA SEPARATE ACCOUNT VA-1 - Stock Index Account
SHARES | COMPANY | VALUE (000) | |||||
5,469 | VF Corp | $ | 376 | ||||
2,859 | * | Warnaco Group, Inc | 99 | ||||
TOTAL APPAREL AND OTHER TEXTILE PRODUCTS | 1,483 | ||||||
AUTO REPAIR, SERVICES AND PARKING - 0.07% | |||||||
646 | e* | Amerco, Inc | 42 | ||||
1,436 | e* | Dollar Thrifty Automotive Group, Inc | 34 | ||||
4,569 | e* | Exide Technologies | 37 | ||||
18,502 | * | Hertz Global Holdings, Inc | 294 | ||||
1,073 | e* | Midas, Inc | 16 | ||||
873 | Monro Muffler, Inc | 17 | |||||
3,749 | Ryder System, Inc | 176 | |||||
336 | e* | Standard Parking Corp | 16 | ||||
2,709 | * | Wright Express Corp | 96 | ||||
TOTAL AUTO REPAIR, SERVICES AND PARKING | 728 | ||||||
AUTOMOTIVE DEALERS AND SERVICE STATIONS - 0.16% | |||||||
6,514 | Advance Auto Parts | 247 | |||||
1,053 | Asbury Automotive Group, Inc | 16 | |||||
9,707 | e* | Autonation, Inc | 152 | ||||
2,834 | * | Autozone, Inc | 340 | ||||
2,692 | e* | CSK Auto Corp | 13 | ||||
13,246 | e* | Carmax, Inc | 262 | ||||
4,176 | * | Copart, Inc | 178 | ||||
1,061 | e | Lithia Motors, Inc (Class A) | 15 | ||||
1,048 | e* | MarineMax, Inc | 16 | ||||
6,973 | * | O’Reilly Automotive, Inc | 226 | ||||
3,620 | e | Penske Auto Group, Inc | 63 | ||||
2,119 | e* | Rush Enterprises, Inc (Class A) | 39 | ||||
1,793 | e | Sonic Automotive, Inc (Class A) | 35 | ||||
TOTAL AUTOMOTIVE DEALERS AND SERVICE STATIONS | 1,602 | ||||||
BUILDING MATERIALS AND GARDEN SUPPLIES - 0.53% | |||||||
967 | e* | Builders FirstSource, Inc | 7 | ||||
3,882 | e* | Central Garden and Pet Co (Class A) | 21 | ||||
7,745 | e | Fastenal Co | 313 | ||||
104,778 | Home Depot, Inc | 2,823 | |||||
92,104 | Lowe’s Cos, Inc | 2,083 | |||||
TOTAL BUILDING MATERIALS AND GARDEN SUPPLIES | 5,247 | ||||||
BUSINESS SERVICES - 7.35% | |||||||
25,632 | * | 3Com Corp | 116 | ||||
813 | e* | 3D Systems Corp | 13 | ||||
2,600 | ABM Industries, Inc | 53 | |||||
2,473 | e* | ACI Worldwide, Inc | 47 | ||||
1,504 | e | Aircastle Ltd | 40 | ||||
2,116 | e* | AMN Healthcare Services, Inc | 36 | ||||
400 | e* | athenahealth, Inc | 14 | ||||
2,635 | e | Aaron Rents, Inc | 51 | ||||
1,806 | e* | Acacia Research (Acacia Technologies) | 16 | ||||
36,301 | Accenture Ltd (Class A) | 1,308 | |||||
3,677 | * | Actuate Corp | 29 | ||||
3,887 | Acxiom Corp | 46 | |||||
1,377 | Administaff, Inc | 39 | |||||
35,981 | * | Adobe Systems, Inc | 1,537 | ||||
3
TIAA SEPARATE ACCOUNT VA-1 - Stock Index Account
SHARES | COMPANY | VALUE (000) | |||||
1,328 | e* | Advent Software, Inc | $ | 72 | |||
5,663 | * | Affiliated Computer Services, Inc (Class A) | 255 | ||||
9,967 | * | Akamai Technologies, Inc | 345 | ||||
4,810 | e* | Alliance Data Systems Corp | 361 | ||||
11,673 | * | Amdocs Ltd | 402 | ||||
1,676 | e* | American Reprographics Co | 28 | ||||
872 | * | Ansoft Corp | 23 | ||||
4,724 | * | Ansys, Inc | 196 | ||||
2,100 | e | Arbitron, Inc | 87 | ||||
4,191 | e* | Ariba, Inc | 47 | ||||
7,187 | e* | Art Technology Group, Inc | 31 | ||||
5,411 | * | Aspen Technology, Inc | 88 | ||||
1,058 | e | Asset Acceptance Capital Corp | 11 | ||||
14,117 | * | Autodesk, Inc | 702 | ||||
34,355 | Automatic Data Processing, Inc | 1,530 | |||||
6,370 | * | Avis Budget Group, Inc | 83 | ||||
3,323 | e* | Avocent Corp | 77 | ||||
23,992 | * | BEA Systems, Inc | 379 | ||||
12,283 | * | BMC Software, Inc | 438 | ||||
4,821 | e* | BPZ Energy, Inc | 54 | ||||
631 | e* | Bankrate, Inc | 30 | ||||
436 | e | Barrett Business Services | 8 | ||||
12,324 | * | BearingPoint, Inc | 35 | ||||
2,836 | Blackbaud, Inc | 80 | |||||
1,799 | * | Blackboard, Inc | 72 | ||||
1,746 | * | Blue Coat Systems, Inc | 57 | ||||
5,613 | e* | Borland Software Corp | 17 | ||||
862 | * | Bottomline Technologies, Inc | 12 | ||||
3,069 | e | Brady Corp (Class A) | 108 | ||||
2,665 | Brink’s Co | 159 | |||||
25,194 | CA, Inc | 629 | |||||
2,042 | * | CACI International, Inc (Class A) | 91 | ||||
394 | * | Cavium Networks, Inc | 9 | ||||
3,710 | e* | CBIZ, Inc | 36 | ||||
3,243 | e* | CMGI, Inc | 42 | ||||
9,641 | e* | CNET Networks, Inc | 88 | ||||
2,159 | e* | Commvault Systems, Inc | 46 | ||||
839 | * | COMSYS IT Partners, Inc | 13 | ||||
3,076 | * | CSG Systems International, Inc | 45 | ||||
17,044 | e* | Cadence Design Systems, Inc | 290 | ||||
669 | * | Capella Education Co | 44 | ||||
4,020 | e* | Cerner Corp | 227 | ||||
5,043 | * | ChoicePoint, Inc | 184 | ||||
2,005 | * | Chordiant Software, Inc | 17 | ||||
3,700 | e* | Ciber, Inc | 23 | ||||
11,254 | * | Citrix Systems, Inc | 428 | ||||
759 | e* | Clayton Holdings, Inc | 4 | ||||
2,400 | e* | Clear Channel Outdoor Holdings, Inc (Class A) | 66 | ||||
1,115 | e* | CoStar Group, Inc | 53 | ||||
3,055 | * | Cogent Communications Group, Inc | 72 | ||||
2,800 | e* | Cogent, Inc | 31 | ||||
2,776 | Cognex Corp | 56 | |||||
17,758 | * | Cognizant Technology Solutions Corp (Class A) | 603 | ||||
840 | e | Compass Diversified Trust | 13 | ||||
602 | e | Computer Programs & Systems, Inc | 14 | ||||
4
TIAA SEPARATE ACCOUNT VA-1 - Stock Index Account
SHARES | COMPANY | VALUE (000) | |||||
10,591 | e* | Computer Sciences Corp | $ | 524 | |||
18,443 | * | Compuware Corp | 164 | ||||
2,071 | * | Concur Technologies, Inc | 75 | ||||
8,500 | * | Convergys Corp | 140 | ||||
3,935 | * | Cybersource Corp | 70 | ||||
3,299 | * | DST Systems, Inc | 272 | ||||
300 | * | Data Domain, Inc | 8 | ||||
2,053 | * | DealerTrack Holdings, Inc | 69 | ||||
3,468 | Deluxe Corp | 114 | |||||
2,557 | e* | Digital River, Inc | 85 | ||||
1,448 | * | DivX, Inc | 20 | ||||
1,500 | * | DynCorp International, Inc (Class A) | 40 | ||||
1,285 | * | EPIQ Systems, Inc | 22 | ||||
7,927 | e* | Earthlink, Inc | 56 | ||||
1,800 | e* | Echelon Corp | 37 | ||||
2,891 | e* | Eclipsys Corp | 73 | ||||
1,000 | Electro Rent Corp | 15 | |||||
19,050 | * | Electronic Arts, Inc | 1,113 | ||||
31,114 | Electronic Data Systems Corp | 645 | |||||
3,541 | e* | Epicor Software Corp | 42 | ||||
8,889 | Equifax, Inc | 323 | |||||
2,253 | e* | Equinix, Inc | 228 | ||||
4,575 | e* | Evergreen Energy, Inc | 10 | ||||
1,397 | e* | ExlService Holdings, Inc | 32 | ||||
12,382 | * | Expedia, Inc | 392 | ||||
5,244 | * | F5 Networks, Inc | 150 | ||||
923 | FTD Group, Inc | 12 | |||||
2,695 | e | Factset Research Systems, Inc | 150 | ||||
3,496 | Fair Isaac Corp | 112 | |||||
2,479 | e* | FalconStor Software, Inc | 28 | ||||
11,743 | Fidelity National Information Services, Inc | 488 | |||||
200 | * | First Advantage Corp (Class A) | 3 | ||||
10,296 | * | Fiserv, Inc | 571 | ||||
983 | * | Forrester Research, Inc | 28 | ||||
4,229 | * | Gartner, Inc | 74 | ||||
1,444 | * | Gerber Scientific, Inc | 16 | ||||
3,037 | e* | Getty Images, Inc | 88 | ||||
1,647 | e | Gevity HR, Inc | 13 | ||||
2,712 | e* | Global Cash Access, Inc | 16 | ||||
1,061 | e* | Global Sources Ltd | 30 | ||||
14,027 | * | Google, Inc (Class A) | 9,699 | ||||
1,107 | e* | H&E Equipment Services, Inc | 21 | ||||
10,329 | * | HLTH Corp | 138 | ||||
1,272 | * | HMS Holdings Corp | 42 | ||||
2,249 | e | Healthcare Services Group | 48 | ||||
912 | Heartland Payment Systems, Inc | 24 | |||||
1,329 | Heidrick & Struggles International, Inc | 49 | |||||
5,126 | Jack Henry & Associates, Inc | 125 | |||||
1,384 | * | Hudson Highland Group, Inc | 12 | ||||
3,542 | e* | Hypercom Corp | 18 | ||||
448 | e* | ICT Group, Inc | 5 | ||||
1,935 | * | IHS, Inc (Class A) | 117 | ||||
12,268 | IMS Health, Inc | 283 | |||||
771 | e | Imergent, Inc | 8 | ||||
5,959 | * | Informatica Corp | 107 | ||||
5
TIAA SEPARATE ACCOUNT VA-1 - Stock Index Account
SHARES | COMPANY | VALUE (000) | |||||
2,218 | e | Infospace, Inc | $ | 42 | |||
1,446 | * | Innerworkings, Inc | 25 | ||||
727 | e* | Innovative Solutions & Support, Inc | 7 | ||||
558 | e* | Integral Systems, Inc | 13 | ||||
2,217 | Interactive Data Corp | 73 | |||||
803 | e* | Interactive Intelligence, Inc | 21 | ||||
3,256 | e* | Internap Network Services Corp | 27 | ||||
2,646 | e* | Internet Capital Group, Inc | 31 | ||||
27,952 | e* | Interpublic Group of Cos, Inc | 227 | ||||
3,184 | * | Interwoven, Inc | 45 | ||||
20,603 | * | Intuit, Inc | 651 | ||||
3,071 | e* | Ipass, Inc | 12 | ||||
10,856 | e* | Iron Mountain, Inc | 402 | ||||
1,953 | * | JDA Software Group, Inc | 40 | ||||
32,025 | * | Juniper Networks, Inc | 1,063 | ||||
1,200 | e | Kelly Services, Inc (Class A) | 22 | ||||
1,544 | e* | Kenexa Corp | 30 | ||||
941 | e* | Keynote Systems, Inc | 13 | ||||
1,774 | * | Kforce, Inc | 17 | ||||
2,967 | e* | Kinetic Concepts, Inc | 159 | ||||
1,667 | e* | Knot, Inc | 27 | ||||
2,700 | * | Korn/Ferry International | 51 | ||||
5,167 | e | Lamar Advertising Co (Class A) | 248 | ||||
7,959 | * | Lawson Software, Inc | 82 | ||||
2,000 | e* | Limelight Networks, Inc | 14 | ||||
3,238 | e* | Lionbridge Technologies | 11 | ||||
511 | e* | Liquidity Services, Inc | 7 | ||||
2,245 | * | LivePerson, Inc | 12 | ||||
1,120 | e* | LoJack Corp | 19 | ||||
6,206 | * | MPS Group, Inc | 68 | ||||
2,666 | * | MSC.Software Corp | 35 | ||||
2,311 | e* | Magma Design Automation, Inc | 28 | ||||
2,098 | * | Manhattan Associates, Inc | 55 | ||||
5,174 | Manpower, Inc | 294 | |||||
1,171 | * | Mantech International Corp (Class A) | 51 | ||||
1,311 | e | Marchex, Inc (Class B) | 14 | ||||
4,846 | e | Mastercard, Inc (Class A) | 1,043 | ||||
9,755 | * | McAfee, Inc | 366 | ||||
4,700 | * | Mentor Graphics Corp | 51 | ||||
503,646 | Microsoft Corp | 17,930 | |||||
648 | * | MicroStrategy, Inc (Class A) | 62 | ||||
2,315 | e* | Midway Games, Inc | 6 | ||||
5,117 | e | MoneyGram International, Inc | 79 | ||||
7,821 | * | Monster Worldwide, Inc | 253 | ||||
4,760 | e* | Move, Inc | 12 | ||||
6,028 | * | NAVTEQ Corp | 456 | ||||
11,006 | * | NCR Corp | 276 | ||||
1,732 | e | NIC, Inc | 15 | ||||
2,111 | * | Ness Technologies, Inc | 19 | ||||
3,227 | e* | NetFlix, Inc | 86 | ||||
1,608 | * | Network Equipment Technologies, Inc | 14 | ||||
21,820 | * | Novell, Inc | 150 | ||||
8,269 | * | Nuance Communications, Inc | 154 | ||||
20,234 | Omnicom Group, Inc | 962 | |||||
2,647 | * | Omniture, Inc | 88 | ||||
6
TIAA SEPARATE ACCOUNT VA-1 - Stock Index Account
SHARES | COMPANY | VALUE (000) | |||||
1,673 | * | On Assignment, Inc | $ | 12 | |||
1,415 | e* | Online Resources Corp | 17 | ||||
5,712 | e* | OpenTV Corp (Class A) | 8 | ||||
235,842 | * | Oracle Corp | 5,325 | ||||
860 | e* | PDF Solutions, Inc | 8 | ||||
2,281 | e* | Packeteer, Inc | 14 | ||||
7,453 | * | Parametric Technology Corp | 133 | ||||
438 | e | Pegasystems, Inc | 5 | ||||
1,196 | * | PeopleSupport, Inc | 16 | ||||
1,789 | e* | Perficient, Inc | 28 | ||||
5,518 | * | Perot Systems Corp (Class A) | 74 | ||||
2,169 | * | Phase Forward, Inc | 47 | ||||
1,058 | e | Portfolio Recovery Associates, Inc | 42 | ||||
4,849 | * | Premiere Global Services, Inc | 72 | ||||
2,510 | * | Progress Software Corp | 85 | ||||
1,000 | QAD, Inc | 9 | |||||
1,284 | e | Quality Systems, Inc | 39 | ||||
4,302 | e* | Quest Software, Inc | 79 | ||||
1,287 | e* | RSC Holdings, Inc | 16 | ||||
1,505 | * | Radiant Systems, Inc | 26 | ||||
1,200 | e* | Radisys Corp | 16 | ||||
1,891 | * | Raser Technologies, Inc | 28 | ||||
6,912 | e* | RealNetworks, Inc | 42 | ||||
11,838 | e* | Red Hat, Inc | 247 | ||||
781 | e | Renaissance Learning, Inc | 11 | ||||
4,532 | e* | Rent-A-Center, Inc | 66 | ||||
712 | e* | RightNow Technologies, Inc | 11 | ||||
8,993 | Robert Half International, Inc | 243 | |||||
3,346 | Rollins, Inc | 64 | |||||
4,489 | * | S1 Corp | 33 | ||||
639 | * | SI International, Inc | 18 | ||||
1,239 | e* | SPSS, Inc | 44 | ||||
2,484 | e* | SRA International, Inc (Class A) | 73 | ||||
797 | * | SYNNEX Corp | 16 | ||||
5,800 | * | Salesforce.com, Inc | 364 | ||||
5,900 | * | Sapient Corp | 52 | ||||
3,543 | e* | Secure Computing Corp | 34 | ||||
1,301 | e* | Smith Micro Software, Inc | 11 | ||||
1,534 | * | Sohu.com, Inc | 84 | ||||
4,123 | * | SonicWALL, Inc | 44 | ||||
15,649 | e* | Sonus Networks, Inc | 91 | ||||
3,912 | e | Sotheby’s | 149 | ||||
4,207 | e* | Spherion Corp | 31 | ||||
1,404 | e* | Stratasys, Inc | 36 | ||||
54,608 | * | Sun Microsystems, Inc | 990 | ||||
5,794 | * | Sybase, Inc | 151 | ||||
1,700 | e* | SYKES Enterprises, Inc | 31 | ||||
55,112 | * | Symantec Corp | 890 | ||||
1,133 | e* | Synchronoss Technologies, Inc | 40 | ||||
8,758 | * | Synopsys, Inc | 227 | ||||
784 | e | Syntel, Inc | 30 | ||||
1,034 | e | TAL International Group, Inc | 24 | ||||
4,249 | e* | THQ, Inc | 120 | ||||
12,747 | * | TIBCO Software, Inc | 103 | ||||
1,534 | e | TNS, Inc | 27 | ||||
7
TIAA SEPARATE ACCOUNT VA-1 - Stock Index Account
SHARES | COMPANY | VALUE (000) | |||||
4,650 | e* | Take-Two Interactive Software, Inc | $ | 86 | |||
879 | * | Taleo Corp (Class A) | 26 | ||||
2,576 | * | TeleTech Holdings, Inc | 55 | ||||
1,161 | e | TheStreet.com, Inc | 18 | ||||
2,517 | e | Total System Services, Inc | 70 | ||||
1,168 | e* | TradeStation Group, Inc | 17 | ||||
300 | e* | Travelzoo, Inc | 4 | ||||
2,823 | e* | Trizetto Group, Inc | 49 | ||||
3,096 | * | TrueBlue, Inc | 45 | ||||
1,541 | e* | Ultimate Software Group, Inc | 48 | ||||
571 | e* | Unica Corp | 5 | ||||
22,840 | e* | Unisys Corp | 108 | ||||
3,701 | United Online, Inc | 44 | |||||
4,619 | * | United Rentals, Inc | 85 | ||||
2,400 | e* | VMware, Inc | 204 | ||||
6,076 | * | Valueclick, Inc | 133 | ||||
1,577 | e* | Vasco Data Security International | 44 | ||||
13,359 | e* | VeriSign, Inc | 502 | ||||
1,519 | Viad Corp | 48 | |||||
1,694 | * | Vignette Corp | 25 | ||||
1,107 | * | Visual Sciences, Inc | 20 | ||||
792 | * | Vocus, Inc | 27 | ||||
858 | e* | Volt Information Sciences, Inc | 16 | ||||
31,641 | Waste Management, Inc | 1,034 | |||||
449 | e* | WebMD Health Corp (Class A) | 18 | ||||
2,958 | * | Websense, Inc | 50 | ||||
4,910 | * | Wind River Systems, Inc | 44 | ||||
73,975 | * | Yahoo!, Inc | 1,721 | ||||
69,918 | * | eBay, Inc | 2,321 | ||||
1,565 | e* | eSpeed, Inc (Class A) | 18 | ||||
947 | e* | i2 Technologies, Inc | 12 | ||||
1,449 | e* | iGate Corp | 12 | ||||
1,814 | * | inVentiv Health, Inc | 56 | ||||
1,967 | infoUSA, Inc | 18 | |||||
TOTAL BUSINESS SERVICES | 72,737 | ||||||
CHEMICALS AND ALLIED PRODUCTS - 9.43% | |||||||
876 | e* | AMAG Pharmaceuticals, Inc | 53 | ||||
1,431 | * | APP Pharmaceuticals, Inc | 15 | ||||
94,229 | Abbott Laboratories | 5,291 | |||||
357 | * | Abraxis Bioscience Inc/New | 25 | ||||
1,887 | e* | Acadia Pharmaceuticals, Inc | 21 | ||||
2,399 | e* | Acorda Therapeutics, Inc | 53 | ||||
2,100 | * | Adams Respiratory Therapeutics, Inc | 125 | ||||
13,246 | Air Products & Chemicals, Inc | 1,306 | |||||
1,600 | e* | Albany Molecular Research, Inc | 23 | ||||
4,904 | Albemarle Corp | 202 | |||||
5,024 | Alberto-Culver Co | 123 | |||||
2,114 | * | Alexion Pharmaceuticals, Inc | 159 | ||||
1,212 | e* | Alexza Pharmaceuticals, Inc | 10 | ||||
5,676 | * | Alkermes, Inc | 88 | ||||
2,616 | e* | Allos Therapeutics, Inc | 16 | ||||
2,039 | e* | Alnylam Pharmaceuticals, Inc | 59 | ||||
2,624 | e* | Alpharma, Inc (Class A) | 53 | ||||
4,537 | * | American Oriental Bioengineering, Inc | 50 | ||||
8
TIAA SEPARATE ACCOUNT VA-1 - Stock Index Account
SHARES | COMPANY | VALUE (000) | |||||
928 | American Vanguard Corp | $ | 16 | ||||
66,638 | * | Amgen, Inc | 3,095 | ||||
749 | * | Animal Health International, Inc | 9 | ||||
1,500 | Arch Chemicals, Inc | 55 | |||||
3,078 | e* | Arena Pharmaceuticals, Inc | 24 | ||||
2,036 | e* | Arqule, Inc | 12 | ||||
3,660 | e* | Array Biopharma, Inc | 31 | ||||
2,120 | e* | Arrowhead Research Corp | 8 | ||||
1,439 | e* | Auxilium Pharmaceuticals, Inc | 43 | ||||
2,400 | e* | Aventine Renewable Energy Holdings, Inc | 31 | ||||
6,679 | Avery Dennison Corp | 355 | |||||
26,837 | Avon Products, Inc | 1,061 | |||||
1,170 | e | Balchem Corp | 26 | ||||
6,710 | * | Barr Pharmaceuticals, Inc | 356 | ||||
872 | * | Bentley Pharmaceuticals, Inc | 13 | ||||
5,486 | * | BioMarin Pharmaceuticals, Inc | 194 | ||||
657 | e* | BioMimetic Therapeutics, Inc | 11 | ||||
18,138 | * | Biogen Idec, Inc | 1,032 | ||||
2,716 | e* | Bionovo, Inc | 5 | ||||
900 | e* | Bradley Pharmaceuticals, Inc | 18 | ||||
120,385 | Bristol-Myers Squibb Co | 3,193 | |||||
1,015 | e* | Cadence Pharmaceuticals, Inc | 15 | ||||
3,523 | CF Industries Holdings, Inc | 388 | |||||
3,844 | Cabot Corp | 128 | |||||
2,400 | e* | Calgon Carbon Corp | 38 | ||||
1,815 | Cambrex Corp | 15 | |||||
631 | e* | Caraco Pharmaceutical Laboratories Ltd | 11 | ||||
7,366 | Celanese Corp (Series A) | 312 | |||||
3,105 | * | Cell Genesys, Inc | 7 | ||||
3,899 | e* | Cephalon, Inc | 280 | ||||
4,127 | * | Charles River Laboratories International, Inc | 272 | ||||
1,163 | * | Chattem, Inc | 88 | ||||
15,194 | Chemtura Corp | 119 | |||||
4,024 | Church & Dwight Co, Inc | 218 | |||||
8,777 | Clorox Co | 572 | |||||
31,293 | Colgate-Palmolive Co | 2,440 | |||||
3,622 | * | Cubist Pharmaceuticals, Inc | 74 | ||||
2,618 | * | Cypress Bioscience, Inc | 29 | ||||
5,402 | e* | CytRx Corp | 15 | ||||
2,578 | Cytec Industries, Inc | 159 | |||||
1,702 | * | Cytokinetics, Inc | 8 | ||||
4,015 | e* | Dendreon Corp | 25 | ||||
5,095 | e* | Discovery Laboratories, Inc | 11 | ||||
58,318 | Dow Chemical Co | 2,299 | |||||
56,496 | Du Pont (E.I.) de Nemours & Co | 2,491 | |||||
3,494 | e* | Durect Corp | 22 | ||||
5,082 | Eastman Chemical Co | 310 | |||||
10,688 | Ecolab, Inc | 547 | |||||
1,704 | * | Elizabeth Arden, Inc | 35 | ||||
4,500 | e* | Encysive Pharmaceuticals, Inc | 4 | ||||
3,094 | e* | Enzon Pharmaceuticals, Inc | 29 | ||||
6,679 | Estee Lauder Cos (Class A) | 291 | |||||
4,676 | FMC Corp | 255 | |||||
2,913 | Ferro Corp | 60 | |||||
19,584 | * | Forest Laboratories, Inc | 714 | ||||
9
TIAA SEPARATE ACCOUNT VA-1 - Stock Index Account
SHARES | COMPANY | VALUE (000) | |||||
818 | e* | GTx, Inc | $ | 12 | |||
4,118 | e* | GenVec, Inc | 6 | ||||
29,002 | * | Genentech, Inc | 1,945 | ||||
16,161 | * | Genzyme Corp | 1,203 | ||||
2,274 | e | Georgia Gulf Corp | 15 | ||||
4,250 | e* | Geron Corp | 24 | ||||
57,870 | * | Gilead Sciences, Inc | 2,663 | ||||
3,329 | H.B. Fuller Co | 75 | |||||
3,942 | e* | Halozyme Therapeutics, Inc | 28 | ||||
7,111 | Hercules, Inc | 138 | |||||
9,624 | * | Hospira, Inc | 410 | ||||
8,974 | * | Human Genome Sciences, Inc | 94 | ||||
5,464 | Huntsman Corp | 140 | |||||
861 | e* | Idenix Pharmaceuticals, Inc | 2 | ||||
3,844 | * | Idexx Laboratories, Inc | 225 | ||||
3,674 | * | ImClone Systems, Inc | 158 | ||||
4,347 | * | Immucor, Inc | 148 | ||||
3,006 | e* | Indevus Pharmaceuticals, Inc | 21 | ||||
1,281 | e | Innophos Holdings, Inc | 19 | ||||
1,460 | Innospec, Inc | 25 | |||||
236 | e | Inter Parfums, Inc | 4 | ||||
1,694 | e* | InterMune, Inc | 23 | ||||
5,470 | International Flavors & Fragrances, Inc | 263 | |||||
4,067 | * | Inverness Medical Innovations, Inc | 228 | ||||
2,859 | * | Invitrogen Corp | 267 | ||||
2,531 | e* | Javelin Pharmaceuticals, Inc | 9 | ||||
2,481 | e* | KV Pharmaceutical Co (Class A) | 71 | ||||
922 | e | Kaiser Aluminum Corp | 73 | ||||
1,504 | e* | Keryx Biopharmaceuticals, Inc | 13 | ||||
14,912 | * | King Pharmaceuticals, Inc | 153 | ||||
1,077 | e | Koppers Holdings, Inc | 47 | ||||
358 | e | Kronos Worldwide, Inc | 6 | ||||
1,289 | * | Landec Corp | 17 | ||||
5,552 | e | Ligand Pharmaceuticals, Inc (Class B) | 27 | ||||
60,767 | Eli Lilly & Co | 3,244 | |||||
4,300 | Lubrizol Corp | 233 | |||||
4,800 | * | MGI Pharma, Inc | 195 | ||||
2,536 | e* | MannKind Corp | 20 | ||||
987 | e | Mannatech, Inc | 6 | ||||
2,109 | e* | Martek Biosciences Corp | 62 | ||||
7,861 | e* | Medarex, Inc | 82 | ||||
3,315 | * | Medicines Co | 64 | ||||
3,427 | e | Medicis Pharmaceutical Corp (Class A) | 89 | ||||
1,298 | e* | Medivation, Inc | 19 | ||||
132,581 | Merck & Co, Inc | 7,704 | |||||
2,420 | e | Meridian Bioscience, Inc | 73 | ||||
20,319 | * | Millennium Pharmaceuticals, Inc | 304 | ||||
1,175 | e | Minerals Technologies, Inc | 79 | ||||
2,951 | e* | Minrad International, Inc | 10 | ||||
1,402 | e* | Momenta Pharmaceuticals, Inc | 10 | ||||
33,287 | Monsanto Co | 3,718 | |||||
9,506 | * | Mosaic Co | 897 | ||||
19,233 | e* | Mylan Laboratories, Inc | 270 | ||||
3,373 | * | NBTY, Inc | 92 | ||||
964 | e | NL Industries, Inc | 11 | ||||
10
TIAA SEPARATE ACCOUNT VA-1 - Stock Index Account
SHARES | COMPANY | VALUE (000) | ||||||
4,000 | e* | Nabi Biopharmaceuticals | $ | 14 | ||||
7,692 | Nalco Holding Co | 186 | ||||||
1,189 | e* | Nastech Pharmaceutical Co, Inc | 5 | |||||
2,526 | e* | Neurocrine Biosciences, Inc | 11 | |||||
1,115 | NewMarket Corp | 62 | ||||||
1,495 | e* | Noven Pharmaceuticals, Inc | 21 | |||||
1,900 | * | OM Group, Inc | 109 | |||||
3,527 | e* | OSI Pharmaceuticals, Inc | 171 | |||||
4,620 | Olin Corp | 89 | ||||||
843 | * | Omrix Biopharmaceuticals, Inc | 29 | |||||
3,536 | e* | Onyx Pharmaceuticals, Inc | 197 | |||||
2,901 | e* | OraSure Technologies, Inc | 26 | |||||
807 | e* | Osiris Therapeutics, Inc | 10 | |||||
7,345 | e* | PDL BioPharma, Inc | 129 | |||||
10,040 | PPG Industries, Inc | 705 | ||||||
2,164 | e* | Pacific Ethanol, Inc | 18 | |||||
1,792 | e* | Pain Therapeutics, Inc | 19 | |||||
2,340 | e* | Par Pharmaceutical Cos, Inc | 56 | |||||
1,703 | * | Parexel International Corp | 82 | |||||
1,492 | e* | Penwest Pharmaceuticals Co | 9 | |||||
4,725 | Perrigo Co | 165 | ||||||
1,182 | e* | PetMed Express, Inc | 14 | |||||
429,329 | Pfizer, Inc | 9,759 | ||||||
1,726 | e* | PharMerica Corp | 24 | |||||
1,639 | * | Pharmion Corp | 103 | |||||
6,365 | * | PolyOne Corp | 42 | |||||
1,354 | e* | Poniard Pharmaceuticals, Inc | 6 | |||||
1,425 | e* | Pozen, Inc | 17 | |||||
19,493 | Praxair, Inc | 1,729 | ||||||
1,891 | e* | Prestige Brands Holdings, Inc | 14 | |||||
193,225 | Procter & Gamble Co | 14,187 | ||||||
1,419 | e* | Progenics Pharmaceuticals, Inc | 26 | |||||
92 | * | Protalix BioTherapeutics, Inc | — | ^ | ||||
1,976 | e* | Quidel Corp | 38 | |||||
7,403 | RPM International, Inc | 150 | ||||||
13,803 | e* | Revlon, Inc (Class A) | 16 | |||||
1,957 | * | Rockwood Holdings, Inc | 65 | |||||
8,324 | e | Rohm & Haas Co | 442 | |||||
2,502 | e* | Salix Pharmaceuticals Ltd | 20 | |||||
2,916 | e* | Santarus, Inc | 8 | |||||
98,898 | Schering-Plough Corp | 2,635 | ||||||
1,824 | * | Sciele Pharma, Inc | 37 | |||||
2,676 | Scotts Miracle-Gro Co (Class A) | 100 | ||||||
3,076 | Sensient Technologies Corp | 87 | ||||||
6,507 | * | Sepracor, Inc | 171 | |||||
6,799 | Sherwin-Williams Co | 395 | ||||||
8,021 | Sigma-Aldrich Corp | 438 | ||||||
500 | Stepan Co | 16 | ||||||
3,078 | e* | SuperGen, Inc | 11 | |||||
900 | e* | SurModics, Inc | 49 | |||||
2,786 | Tronox, Inc (Class B) | 24 | ||||||
2,100 | e* | Tercica, Inc | 14 | |||||
555 | e* | Trubion Pharmaceuticals, Inc | 6 | |||||
3,302 | e | UAP Holding Corp | 127 | |||||
2,900 | * | US BioEnergy Corp | 34 | |||||
11
TIAA SEPARATE ACCOUNT VA-1 - Stock Index Account
SHARES | COMPANY | VALUE (000) | |||||
594 | e* | USANA Health Sciences, Inc | $ | 22 | |||
5,342 | e* | USEC, Inc | 48 | ||||
1,278 | e* | United Therapeutics Corp | 125 | ||||
5,212 | * | VCA Antech, Inc | 231 | ||||
5,951 | e* | Valeant Pharmaceuticals International | 71 | ||||
6,561 | Valspar Corp | 148 | |||||
1,618 | e* | Vanda Pharmaceuticals, Inc | 11 | ||||
1,992 | e* | Verasun Energy Corp | 30 | ||||
8,024 | e* | Vertex Pharmaceuticals, Inc | 186 | ||||
4,346 | e* | Viropharma, Inc | 35 | ||||
425 | * | Visicu, Inc | 5 | ||||
4,714 | e* | WR Grace & Co | 123 | ||||
5,559 | * | Warner Chilcott Ltd (Class A) | 99 | ||||
6,278 | * | Watson Pharmaceuticals, Inc | 170 | ||||
893 | e | Westlake Chemical Corp | 17 | ||||
82,280 | Wyeth | 3,636 | |||||
8,116 | e* | XOMA Ltd | 28 | ||||
1,312 | * | Xenoport, Inc | 73 | ||||
2,399 | e* | Zymogenetics, Inc | 28 | ||||
TOTAL CHEMICALS AND ALLIED PRODUCTS | 93,278 | ||||||
COAL MINING - 0.26% | |||||||
4,033 | e* | Alpha Natural Resources, Inc | 131 | ||||
8,714 | e | Arch Coal, Inc | 392 | ||||
11,129 | Consol Energy, Inc | 796 | |||||
7,316 | e* | International Coal Group, Inc | 39 | ||||
5,174 | Massey Energy Co | 185 | |||||
16,209 | e | Peabody Energy Corp | 999 | ||||
TOTAL COAL MINING | 2,542 | ||||||
COMMUNICATIONS - 4.38% | |||||||
378,276 | AT&T, Inc | 15,721 | |||||
2,743 | e | Alaska Communications Systems Group, Inc | 41 | ||||
25,561 | * | American Tower Corp (Class A) | 1,089 | ||||
1,895 | e* | Anixter International, Inc | 118 | ||||
507 | e* | Aruba Networks, Inc | 8 | ||||
356 | Atlantic Tele-Network, Inc | 12 | |||||
1,206 | * | Audiovox Corp (Class A) | 15 | ||||
2,522 | e* | Brightpoint, Inc | 39 | ||||
1,410 | e* | Clearwire Corp (Class A) | 19 | ||||
3,172 | e* | CTC Media, Inc | 96 | ||||
13,439 | Cablevision Systems Corp (Class A) | 329 | |||||
1,055 | e* | Cbeyond Communications, Inc | 41 | ||||
1,478 | e | Centennial Communications Corp | 14 | ||||
2,093 | * | Central European Media Enterprises Ltd (Class A) | 243 | ||||
6,705 | CenturyTel, Inc | 278 | |||||
25,044 | e* | Charter Communications, Inc (Class A) | 29 | ||||
16,520 | * | Cincinnati Bell, Inc | 78 | ||||
12,479 | e | Citadel Broadcasting Corp | 26 | ||||
20,942 | Citizens Communications Co | 267 | |||||
30,374 | Clear Channel Communications, Inc | 1,049 | |||||
180,666 | e* | Comcast Corp (Class A) | 3,299 | ||||
1,530 | Consolidated Communications Holdings, Inc | 30 | |||||
2,186 | e* | Cox Radio, Inc (Class A) | 27 | ||||
14,035 | * | Crown Castle International Corp | 584 | ||||
12
TIAA SEPARATE ACCOUNT VA-1 - Stock Index Account
SHARES | COMPANY | VALUE (000) | |||||
1,802 | e* | Crown Media Holdings, Inc (Class A) | $ | 12 | |||
2,624 | e* | Cumulus Media, Inc (Class A) | 21 | ||||
813 | * | DG FastChannel,Inc | 21 | ||||
44,225 | * | DIRECTV Group, Inc | 1,022 | ||||
12,727 | * | EchoStar Communications Corp (Class A) | 480 | ||||
9,238 | Embarq Corp | 458 | |||||
2,106 | e | Emmis Communications Corp (Class A) | 8 | ||||
2,180 | e | Entercom Communications Corp (Class A) | 30 | ||||
5,154 | * | Entravision Communications Corp (Class A) | 40 | ||||
1,820 | e | Fairpoint Communications, Inc | 24 | ||||
8,501 | e* | FiberTower Corp | 19 | ||||
354 | * | Fisher Communications, Inc | 13 | ||||
8,914 | * | Foundry Networks, Inc | 156 | ||||
3,022 | * | General Communication, Inc (Class A) | 26 | ||||
1,077 | * | GeoEye, Inc | 36 | ||||
2,793 | e* | Global Crossing Ltd | 62 | ||||
4,870 | Global Payments, Inc | 227 | |||||
1,202 | e* | Globalstar, Inc | 10 | ||||
964 | * | Golden Telecom, Inc | 97 | ||||
3,118 | e | Gray Television, Inc | 25 | ||||
1,540 | e* | Harris Stratex Networks, Inc (Class A) | 26 | ||||
396 | e* | Hughes Communications, Inc | 22 | ||||
1,520 | e | Hearst-Argyle Television, Inc | 34 | ||||
10,819 | * | IAC/InterActiveCorp | 291 | ||||
6,383 | e* | ICO Global Communications Holdings Ltd | 20 | ||||
3,749 | e | IDT Corp (Class B) | 32 | ||||
2,017 | e | Ibasis, Inc | 10 | ||||
1,874 | e | Iowa Telecommunications Services, Inc | 30 | ||||
1,587 | e* | Knology, Inc | 20 | ||||
3,101 | e* | Leap Wireless International, Inc | 145 | ||||
93,633 | e* | Level 3 Communications, Inc | 285 | ||||
23,497 | e* | Liberty Global, Inc (Class A) | 921 | ||||
36,850 | * | Liberty Media Holding Corp (Interactive A) | 703 | ||||
7,891 | * | Liberty Media Corp - Capital (Series A) | 919 | ||||
1,798 | * | Lin TV Corp (Class A) | 22 | ||||
1,367 | e* | Lodgenet Entertainment Corp | 24 | ||||
2,626 | * | Mastec, Inc | 27 | ||||
4,583 | e* | Mediacom Communications Corp (Class A) | 21 | ||||
3,528 | * | MetroPCS Communications, Inc | 69 | ||||
9,996 | * | NII Holdings, Inc | 483 | ||||
1,715 | NTELOS Holdings Corp | 51 | |||||
4,651 | e* | NeuStar, Inc (Class A) | 133 | ||||
661 | e* | Nexstar Broadcasting Group, Inc (Class A) | 6 | ||||
1,681 | e* | Nextwave Wireless, Inc | 9 | ||||
1,200 | e* | North Pittsburgh Systems, Inc | 27 | ||||
1,922 | e* | Novatel Wireless, Inc | 31 | ||||
1,632 | e* | Orbcomm, Inc | 10 | ||||
4,253 | e* | PAETEC Holding Corp | 41 | ||||
98,464 | e | Qwest Communications International, Inc | 690 | ||||
1,881 | e | RCN Corp | 29 | ||||
5,650 | e* | Radio One, Inc (Class D) | 13 | ||||
741 | * | Rural Cellular Corp (Class A) | 33 | ||||
1,756 | e* | SAVVIS, Inc | 49 | ||||
6,304 | * | SBA Communications Corp (Class A) | 213 | ||||
695 | e | Salem Communications Corp (Class A) | 5 | ||||
13
TIAA SEPARATE ACCOUNT VA-1 - Stock Index Account
SHARES | COMPANY | VALUE (000) | |||||
1,404 | Shenandoah Telecom Co | $ | 34 | ||||
3,111 | e | Sinclair Broadcast Group, Inc (Class A) | 26 | ||||
2,599 | e* | Spanish Broadcasting System, Inc (Class A) | 5 | ||||
172,069 | Sprint Nextel Corp | 2,259 | |||||
956 | e | SureWest Communications | 16 | ||||
766 | e* | Switch & Data Facilities Co, Inc | 12 | ||||
1,160 | * | Syniverse Holdings, Inc | 18 | ||||
6,282 | Telephone & Data Systems, Inc | 393 | |||||
1,962 | e* | Terremark Worldwide, Inc | 13 | ||||
9,585 | * | Time Warner Cable, Inc (Class A) | 265 | ||||
4,990 | e* | TiVo, Inc | 42 | ||||
1,032 | * | US Cellular Corp | 87 | ||||
1,642 | USA Mobility, Inc | 23 | |||||
177,613 | Verizon Communications, Inc | 7,760 | |||||
1,500 | * | Virgin Mobile USA, Inc | 13 | ||||
1,993 | e* | Vonage Holdings Corp | 5 | ||||
27,536 | Windstream Corp | 359 | |||||
18,370 | * | XM Satellite Radio Holdings, Inc (Class A) | 225 | ||||
1,069 | e | iPCS, Inc | 38 | ||||
3,186 | e* | j2 Global Communications, Inc | 67 | ||||
TOTAL COMMUNICATIONS | 43,343 | ||||||
DEPOSITORY INSTITUTIONS - 7.22% | |||||||
1,117 | 1st Source Corp | 19 | |||||
732 | Abington Bancorp, Inc | 7 | |||||
922 | Alabama National Bancorp | 72 | |||||
1,700 | e | Amcore Financial, Inc | 39 | ||||
678 | e | AmericanWest Bancorp | 12 | ||||
853 | e | Ameris Bancorp | 14 | ||||
1,536 | e | Anchor Bancorp Wisconsin, Inc | 36 | ||||
7,795 | e | Associated Banc-Corp | 211 | ||||
5,317 | Astoria Financial Corp | 124 | |||||
33,699 | e | BB&T Corp | 1,034 | ||||
1,341 | BOK Financial Corp | 69 | |||||
520 | e | Bancfirst Corp | 22 | ||||
1,517 | Banco Latinoamericano de Exportaciones S.A. | 25 | |||||
586 | * | Bancorp, Inc | 8 | ||||
5,040 | e | Bancorpsouth, Inc | 119 | ||||
4,488 | Bank Mutual Corp | 47 | |||||
271,468 | Bank of America Corp | 11,201 | |||||
3,393 | Bank of Hawaii Corp | 174 | |||||
638 | e | Bank of the Ozarks, Inc | 17 | ||||
69,259 | Bank of New York Mellon Corp/The | 3,377 | |||||
2,977 | e | BankAtlantic Bancorp, Inc (Class A) | 12 | ||||
1,599 | e | BankFinancial Corp | 25 | ||||
2,017 | e | BankUnited Financial Corp (Class A) | 14 | ||||
777 | e | Banner Corp | 22 | ||||
550 | Berkshire Hills Bancorp, Inc | 14 | |||||
2,260 | e | Boston Private Financial Holdings, Inc | 61 | ||||
3,927 | e | Brookline Bancorp, Inc | 40 | ||||
4,428 | e | CVB Financial Corp | 46 | ||||
831 | e | Capital City Bank Group, Inc | 23 | ||||
599 | e | Capital Corp of the West | 12 | ||||
828 | e | Capitol Bancorp Ltd | 17 | ||||
1,324 | e | Capitol Federal Financial | 41 | ||||
14
TIAA SEPARATE ACCOUNT VA-1 - Stock Index Account
SHARES | COMPANY | VALUE (000) | |||||
1,800 | e | Cascade Bancorp | $ | 25 | |||
399 | e | Cass Information Systems, Inc | 13 | ||||
3,316 | e | Cathay General Bancorp | 88 | ||||
3,800 | e* | Centennial Bank Holdings, Inc | 22 | ||||
622 | e | Center Financial Corp | 8 | ||||
1,887 | e | Central Pacific Financial Corp | 35 | ||||
1,722 | e | Chemical Financial Corp | 41 | ||||
3,197 | Chittenden Corp | 114 | |||||
302,596 | Citigroup, Inc | 8,908 | |||||
4,633 | e | Citizens Banking Corp | 67 | ||||
825 | e | City Bank | 18 | ||||
1,123 | e | City Holding Co | 38 | ||||
2,497 | e | City National Corp | 149 | ||||
875 | e | Clifton Savings Bancorp, Inc | 9 | ||||
675 | e | CoBiz, Inc | 10 | ||||
9,930 | e | Colonial Bancgroup, Inc | 134 | ||||
1,059 | e | Columbia Banking System, Inc | 31 | ||||
9,548 | Comerica, Inc | 416 | |||||
11,780 | Commerce Bancorp, Inc | 449 | |||||
4,414 | e | Commerce Bancshares, Inc | 198 | ||||
345 | e* | Community Bancorp | 6 | ||||
2,024 | e | Community Bank System, Inc | 40 | ||||
1,003 | Community Trust Bancorp, Inc | 28 | |||||
2,340 | e | Corus Bankshares, Inc | 25 | ||||
3,671 | e | Cullen/Frost Bankers, Inc | 186 | ||||
1,609 | e | Dime Community Bancshares | 21 | ||||
983 | e* | Dollar Financial Corp | 30 | ||||
1,361 | e | Downey Financial Corp | 42 | ||||
3,926 | East West Bancorp, Inc | 95 | |||||
512 | e | Enterprise Financial Services Corp | 12 | ||||
2,804 | e* | Euronet Worldwide, Inc | 84 | ||||
3,778 | e | FNB Corp | 56 | ||||
33,150 | Fifth Third Bancorp | 833 | |||||
720 | e | First Bancorp | 14 | ||||
4,676 | First Bancorp | 34 | |||||
900 | e | First Busey Corp | 18 | ||||
2,100 | e | First Charter Corp | 63 | ||||
367 | First Citizens Bancshares, Inc (Class A) | 54 | |||||
4,700 | e | First Commonwealth Financial Corp | 50 | ||||
1,486 | e | First Community Bancorp, Inc | 61 | ||||
680 | e | First Community Bancshares, Inc | 22 | ||||
2,359 | e | First Financial Bancorp | 27 | ||||
1,332 | e | First Financial Bankshares, Inc | 50 | ||||
903 | e | First Financial Corp | 26 | ||||
600 | e | First Financial Holdings, Inc | 16 | ||||
7,689 | e | First Horizon National Corp | 140 | ||||
915 | e | First Indiana Corp | 29 | ||||
1,238 | e | First Merchants Corp | 27 | ||||
3,362 | e | First Midwest Bancorp, Inc | 103 | ||||
7,184 | e | First Niagara Financial Group, Inc | 86 | ||||
987 | e | First Place Financial Corp | 14 | ||||
486 | e* | First Regional Bancorp | 9 | ||||
504 | e | First South Bancorp, Inc | 11 | ||||
998 | First State Bancorporation | 14 | |||||
1,077 | e* | FirstFed Financial Corp | 39 | ||||
15
TIAA SEPARATE ACCOUNT VA-1 - Stock Index Account
SHARES | COMPANY | VALUE (000) | ||||||
5,102 | e | FirstMerit Corp | $ | 102 | ||||
1,967 | e | Flagstar Bancorp, Inc | 14 | |||||
1,105 | e | Flushing Financial Corp | 18 | |||||
1,364 | e | * | Franklin Bank Corp | 6 | ||||
4,200 | e | * | Fremont General Corp | 15 | ||||
2,394 | e | Frontier Financial Corp | 44 | |||||
11,161 | Fulton Financial Corp | 125 | ||||||
3,468 | e | Glacier Bancorp, Inc | 65 | |||||
699 | e | Great Southern Bancorp, Inc | 15 | |||||
437 | e | Greene County Bancshares, Inc | 8 | |||||
1,711 | e | Hancock Holding Co | 65 | |||||
2,620 | Hanmi Financial Corp | 23 | ||||||
1,911 | e | Harleysville National Corp | 28 | |||||
928 | e | Heartland Financial USA, Inc | 17 | |||||
803 | Heritage Commerce Corp | 15 | ||||||
709 | e | Home Bancshares, Inc | 15 | |||||
883 | e | Horizon Financial Corp | 15 | |||||
33,320 | e | Hudson City Bancorp, Inc | 500 | |||||
22,354 | Huntington Bancshares, Inc | 330 | ||||||
632 | e | IBERIABANK Corp | 30 | |||||
323 | Imperial Capital Bancorp, Inc | 6 | ||||||
938 | Independent Bank Corp | 26 | ||||||
1,683 | e | Independent Bank Corp | 16 | |||||
4,091 | e | IndyMac Bancorp, Inc | 24 | |||||
1,040 | e | Integra Bank Corp | 15 | |||||
3,295 | e | International Bancshares Corp | 69 | |||||
3,434 | * | Investors Bancorp, Inc | 49 | |||||
1,234 | e | Irwin Financial Corp | 9 | |||||
208,983 | JPMorgan Chase & Co | 9,122 | ||||||
2,198 | e | KNBT Bancorp, Inc | 34 | |||||
1,441 | e | Kearny Financial Corp | 17 | |||||
23,996 | Keycorp | 563 | ||||||
1,025 | e | Lakeland Bancorp, Inc | 12 | |||||
734 | e | Lakeland Financial Corp | 15 | |||||
4,664 | e | M&T Bank Corp | 380 | |||||
2,236 | e | MB Financial, Inc | 69 | |||||
1,004 | e | Macatawa Bank Corp | 9 | |||||
731 | e | MainSource Financial Group, Inc | 11 | |||||
15,732 | Marshall & Ilsley Corp | 417 | ||||||
5,244 | * | Metavante Technologies, Inc | 122 | |||||
1,081 | e | Midwest Banc Holdings, Inc | 13 | |||||
206 | e | NASB Financial, Inc | 5 | |||||
2,152 | e | NBT Bancorp, Inc | 49 | |||||
1,144 | e | Nara Bancorp, Inc | 13 | |||||
35,619 | e | National City Corp | 586 | |||||
3,198 | e | National Penn Bancshares, Inc | 48 | |||||
3,099 | * | Net 1 UEPS Technologies, Inc | 91 | |||||
19,143 | e | New York Community Bancorp, Inc | 337 | |||||
6,972 | e | NewAlliance Bancshares, Inc | 80 | |||||
13,419 | Northern Trust Corp | 1,028 | ||||||
1,341 | e | Northwest Bancorp, Inc | 36 | |||||
3,801 | e | Old National Bancorp | 57 | |||||
799 | e | Old Second Bancorp, Inc | 21 | |||||
853 | e | Omega Financial Corp | 25 | |||||
1,295 | Oriental Financial Group, Inc | 17 | ||||||
16
TIAA SEPARATE ACCOUNT VA-1 - Stock Index Account
SHARES | COMPANY | VALUE (000) | ||||||
713 | e | * | Oritani Financial Corp | $ | 9 | |||
1,580 | e | PFF Bancorp, Inc | 19 | |||||
21,380 | e | PNC Financial Services Group, Inc | 1,404 | |||||
2,744 | e | Pacific Capital Bancorp | 55 | |||||
688 | e | Park National Corp | 44 | |||||
13,264 | People’s United Financial, Inc | 236 | ||||||
595 | e | Peoples Bancorp, Inc | 15 | |||||
986 | e | * | Pinnacle Financial Partners, Inc | 25 | ||||
17,620 | Popular, Inc | 187 | ||||||
424 | e | Preferred Bank | 11 | |||||
1,141 | e | PrivateBancorp, Inc | 37 | |||||
2,230 | e | Prosperity Bancshares, Inc | 66 | |||||
2,140 | e | Provident Bankshares Corp | 46 | |||||
4,058 | e | Provident Financial Services, Inc | 59 | |||||
2,753 | e | Provident New York Bancorp | 36 | |||||
43,112 | Regions Financial Corp | 1,020 | ||||||
769 | e | Renasant Corp | 17 | |||||
612 | e | Republic Bancorp, Inc (Class A) | 10 | |||||
598 | e | Rockville Financial, Inc | 7 | |||||
629 | Roma Financial Corp | 10 | ||||||
317 | e | Royal Bancshares of Pennsylvania (Class A) | 3 | |||||
1,811 | e | S&T Bancorp, Inc | 50 | |||||
846 | e | S.Y. Bancorp, Inc | 20 | |||||
605 | e | SCBT Financial Corp | 19 | |||||
2,091 | e | * | SVB Financial Group | 105 | ||||
1,000 | e | Sandy Spring Bancorp, Inc | 28 | |||||
357 | Santander BanCorp | 3 | ||||||
740 | e | Seacoast Banking Corp of Florida | 8 | |||||
938 | e | Security Bank Corp | 9 | |||||
370 | e | Sierra Bancorp | 9 | |||||
1,893 | * | Signature Bank | 64 | |||||
1,066 | e | Simmons First National Corp (Class A) | 28 | |||||
4,761 | e | South Financial Group, Inc | 74 | |||||
721 | e | Southside Bancshares, Inc | 15 | |||||
740 | Southwest Bancorp, Inc | 14 | ||||||
24,406 | e | Sovereign Bancorp, Inc | 278 | |||||
24,314 | State Street Corp | 1,974 | ||||||
1,199 | Sterling Bancorp | 16 | ||||||
3,900 | e | Sterling Bancshares, Inc | 44 | |||||
1,778 | e | * | Sterling Financial Corp | 29 | ||||
3,133 | e | Sterling Financial Corp | 53 | |||||
701 | Suffolk Bancorp | 22 | ||||||
585 | e | * | Sun Bancorp, Inc | 9 | ||||
21,817 | SunTrust Banks, Inc | 1,363 | ||||||
2,075 | e | * | Superior Bancorp | 11 | ||||
4,965 | e | Susquehanna Bancshares, Inc | 92 | |||||
17,015 | Synovus Financial Corp | 410 | ||||||
8,192 | TCF Financial Corp | 147 | ||||||
7,255 | e | * | TFS Financial Corp | 87 | ||||
300 | Taylor Capital Group, Inc | 6 | ||||||
1,482 | * | Texas Capital Bancshares, Inc | 27 | |||||
1,372 | e | TierOne Corp | 30 | |||||
709 | e | Tompkins Trustco, Inc | 28 | |||||
726 | e | Trico Bancshares | 14 | |||||
5,202 | e | Trustco Bank Corp NY | 52 | |||||
17
TIAA SEPARATE ACCOUNT VA-1 - Stock Index Account
SHARES | COMPANY | VALUE (000) | |||||
2,902 | e | Trustmark Corp | $ | 74 | |||
106,357 | US Bancorp | 3,376 | |||||
1,110 | e | USB Holding Co, Inc | 22 | ||||
6,278 | e | UCBH Holdings, Inc | 89 | ||||
2,088 | e | UMB Financial Corp | 80 | ||||
3,609 | e | Umpqua Holdings Corp | 55 | ||||
814 | e | Union Bankshares Corp | 17 | ||||
2,923 | UnionBanCal Corp | 143 | |||||
2,534 | e | United Bankshares, Inc | 71 | ||||
2,128 | e | United Community Banks, Inc | 34 | ||||
1,981 | e | United Community Financial Corp | 11 | ||||
460 | e | United Security Bancshares | 7 | ||||
792 | e | Univest Corp of Pennsylvania | 17 | ||||
7,462 | e | Valley National Bancorp | 142 | ||||
690 | ViewPoint Financial Group | 11 | |||||
827 | e* | Virginia Commerce Bancorp | 10 | ||||
7,937 | e | W Holding Co, Inc | 10 | ||||
320 | WSFS Financial Corp | 16 | |||||
121,651 | Wachovia Corp | 4,626 | |||||
5,275 | e | Washington Federal, Inc | 111 | ||||
53,979 | e | Washington Mutual, Inc | 735 | ||||
881 | e | Washington Trust Bancorp, Inc | 22 | ||||
681 | e* | Wauwatosa Holdings, Inc | 9 | ||||
3,232 | Webster Financial Corp | 103 | |||||
207,802 | Wells Fargo & Co | 6,274 | |||||
1,534 | e | WesBanco, Inc | 32 | ||||
977 | e | West Coast Bancorp | 18 | ||||
2,016 | e | Westamerica Bancorporation | 90 | ||||
850 | e* | Western Alliance Bancorp | 16 | ||||
47,279 | Western Union Co | 1,148 | |||||
1,174 | Westfield Financial, Inc | 11 | |||||
4,160 | e | Whitney Holding Corp | 109 | ||||
4,204 | e | Wilmington Trust Corp | 148 | ||||
980 | e | Wilshire Bancorp, Inc | 8 | ||||
1,580 | e | Wintrust Financial Corp | 52 | ||||
6,629 | e | Zions Bancorporation | 310 | ||||
TOTAL DEPOSITORY INSTITUTIONS | 71,394 | ||||||
EATING AND DRINKING PLACES - 0.88% | |||||||
3,081 | Burger King Holdings, Inc | 88 | |||||
1,322 | * | AFC Enterprises | 15 | ||||
758 | e* | BJ’s Restaurants, Inc | 12 | ||||
745 | e* | Benihana, Inc (Class A) | 9 | ||||
2,400 | Bob Evans Farms, Inc | 65 | |||||
6,950 | Brinker International, Inc | 136 | |||||
790 | e* | Buffalo Wild Wings, Inc | 18 | ||||
1,623 | e | CBRL Group, Inc | 53 | ||||
1,748 | e* | CEC Entertainment, Inc | 45 | ||||
3,658 | e | CKE Restaurants, Inc | 48 | ||||
1,971 | e* | California Pizza Kitchen, Inc | 31 | ||||
621 | e* | Carrols Restaurant Group, Inc | 6 | ||||
1,858 | e* | Chipotle Mexican Grill, Inc (Class B) | 229 | ||||
8,645 | Darden Restaurants, Inc | 240 | |||||
6,036 | e* | Denny’s Corp | 23 | ||||
2,437 | e | Domino’s Pizza, Inc | 32 | ||||
18
TIAA SEPARATE ACCOUNT VA-1 - Stock Index Account
SHARES | COMPANY | VALUE (000) | ||||||
1,061 | e | IHOP Corp | $ | 39 | ||||
3,822 | * | Jack in the Box, Inc | 98 | |||||
3,561 | e | * | Krispy Kreme Doughnuts, Inc | 11 | ||||
1,203 | e | Landry’s Restaurants, Inc | 24 | |||||
883 | e | * | McCormick & Schmick’s Seafood Restaurants, Inc | 11 | ||||
73,043 | McDonald’s Corp | 4,303 | ||||||
654 | * | Morton’s Restaurant Group, Inc | 6 | |||||
1,720 | e | O’Charleys, Inc | 26 | |||||
1,702 | e | * | PF Chang’s China Bistro, Inc | 39 | ||||
1,450 | e | * | Papa John’s International, Inc | 33 | ||||
957 | e | * | Red Robin Gourmet Burgers, Inc | 31 | ||||
3,600 | e | Ruby Tuesday, Inc | 35 | |||||
800 | e | * | Ruth’s Chris Steak House, Inc | 7 | ||||
4,411 | e | * | Sonic Corp | 97 | ||||
45,334 | * | Starbucks Corp | 928 | |||||
3,384 | e | * | Texas Roadhouse, Inc (Class A) | 37 | ||||
4,394 | e | * | Cheesecake Factory | 104 | ||||
1,689 | e | * | Steak N Shake Co | 18 | ||||
11,594 | e | Tim Hortons, Inc | 428 | |||||
3,982 | e | Triarc Cos (Class B) | 35 | |||||
5,339 | Wendy’s International, Inc | 138 | ||||||
32,048 | Yum! Brands, Inc | 1,226 | ||||||
| TOTAL EATING AND DRINKING PLACES | 8,724 | |||||||
EDUCATIONAL SERVICES - 0.15% | ||||||||
8,774 | * | Apollo Group, Inc (Class A) | 615 | |||||
5,862 | e | * | Career Education Corp | 147 | ||||
5,717 | e | * | Corinthian Colleges, Inc | 88 | ||||
3,674 | DeVry, Inc | 191 | ||||||
2,487 | * | ITT Educational Services, Inc | 212 | |||||
968 | Strayer Education, Inc | 165 | ||||||
1,448 | e | * | Universal Technical Institute, Inc | 25 | ||||
| TOTAL EDUCATIONAL SERVICES | 1,443 | |||||||
ELECTRIC, GAS, AND SANITARY SERVICES - 4.16% | ||||||||
40,839 | * | AES Corp | 874 | |||||
4,796 | AGL Resources, Inc | 181 | ||||||
10,136 | Allegheny Energy, Inc | 645 | ||||||
1,693 | e | Allete, Inc | 67 | |||||
6,962 | Alliant Energy Corp | 283 | ||||||
15,781 | * | Allied Waste Industries, Inc | 174 | |||||
12,827 | Ameren Corp | 695 | ||||||
822 | American Ecology Corp | 19 | ||||||
24,400 | American Electric Power Co, Inc | 1,136 | ||||||
1,100 | e | American States Water Co | 41 | |||||
8,118 | Aqua America, Inc | 172 | ||||||
24,847 | e | * | Aquila, Inc | 93 | ||||
5,341 | Atmos Energy Corp | 150 | ||||||
3,100 | e | Avista Corp | 67 | |||||
2,253 | e | Black Hills Corp | 99 | |||||
1,063 | e | CH Energy Group, Inc | 47 | |||||
13,685 | e | CMS Energy Corp | 238 | |||||
1,013 | California Water Service Group | 38 | ||||||
1,195 | * | Casella Waste Systems, Inc (Class A) | 16 | |||||
19,246 | Centerpoint Energy, Inc | 330 | ||||||
19
TIAA SEPARATE ACCOUNT VA-1 - Stock Index Account
SHARES | COMPANY | VALUE (000) | |||||
616 | Central Vermont Public Service Corp | $ | 19 | ||||
1,104 | * | Clean Harbors, Inc | 57 | ||||
3,305 | e | Cleco Corp | 92 | ||||
16,257 | e | Consolidated Edison, Inc | 794 | ||||
892 | e | Consolidated Water Co, Inc | 22 | ||||
11,030 | Constellation Energy Group, Inc | 1,131 | |||||
7,381 | * | Covanta Holding Corp | 204 | ||||
2,304 | e | Crosstex Energy, Inc | 86 | ||||
6,926 | e | DPL, Inc | 205 | ||||
9,870 | DTE Energy Co | 434 | |||||
36,254 | Dominion Resources, Inc | 1,720 | |||||
77,073 | Duke Energy Corp | 1,555 | |||||
20,616 | * | Dynegy, Inc (Class A) | 147 | ||||
19,930 | Edison International | 1,064 | |||||
42,504 | El Paso Corp | 733 | |||||
2,788 | * | El Paso Electric Co | 71 | ||||
1,913 | Empire District Electric Co | 44 | |||||
231 | e* | EnerNOC, Inc | 11 | ||||
4,384 | Energen Corp | 282 | |||||
9,504 | Energy East Corp | 259 | |||||
1,700 | * | EnergySolutions, Inc | 46 | ||||
453 | e | EnergySouth, Inc | 26 | ||||
12,066 | Entergy Corp | 1,442 | |||||
41,142 | Exelon Corp | 3,359 | |||||
24,861 | FPL Group, Inc | 1,685 | |||||
18,640 | FirstEnergy Corp | 1,348 | |||||
5,249 | e | Great Plains Energy, Inc | 154 | ||||
5,200 | e | Hawaiian Electric Industries, Inc | 118 | ||||
2,092 | e | ITC Holdings Corp | 118 | ||||
2,843 | e | Idacorp, Inc | 100 | ||||
4,710 | Integrys Energy Group, Inc | 243 | |||||
1,400 | Laclede Group, Inc | 48 | |||||
11,115 | MDU Resources Group, Inc | 307 | |||||
1,200 | e | MGE Energy, Inc | 43 | ||||
419 | Markwest Hydrocarbon, Inc | 26 | |||||
1,512 | Metal Management, Inc | 69 | |||||
15,651 | e* | Mirant Corp | 610 | ||||
14,823 | e* | NRG Energy, Inc | 642 | ||||
6,541 | NSTAR | 237 | |||||
5,101 | e | National Fuel Gas Co | 238 | ||||
1,850 | e | New Jersey Resources Corp | 93 | ||||
16,776 | NiSource, Inc | 317 | |||||
2,750 | e | Nicor, Inc | 116 | ||||
2,408 | NorthWestern Corp | 71 | |||||
9,442 | Northeast Utilities | 296 | |||||
1,750 | e | Northwest Natural Gas Co | 85 | ||||
5,851 | OGE Energy Corp | 212 | |||||
6,802 | Oneok, Inc | 305 | |||||
833 | e | Ormat Technologies, Inc | 46 | ||||
1,956 | e | Otter Tail Corp | 68 | ||||
21,494 | PG&E Corp | 926 | |||||
4,199 | PNM Resources, Inc | 90 | |||||
23,607 | PPL Corp | 1,230 | |||||
11,772 | Pepco Holdings, Inc | 345 | |||||
936 | e* | Pico Holdings, Inc | 31 | ||||
20
TIAA SEPARATE ACCOUNT VA-1 - Stock Index Account
SHARES | COMPANY | VALUE (000) | |||||
4,665 | Piedmont Natural Gas Co, Inc | $ | 122 | ||||
1,025 | e* | Pike Electric Corp | 17 | ||||
6,239 | Pinnacle West Capital Corp | 265 | |||||
1,726 | Portland General Electric Co | 48 | |||||
15,770 | Progress Energy, Inc | 764 | |||||
5,000 | m,v* | Progress Energy, Inc | 0 | ||||
15,518 | Public Service Enterprise Group, Inc | 1,524 | |||||
7,154 | Puget Energy, Inc | 196 | |||||
10,539 | Questar Corp | 570 | |||||
20,883 | * | Reliant Energy, Inc | 548 | ||||
10,176 | Republic Services, Inc | 319 | |||||
1,126 | e | Resource America, Inc (Class A) | 17 | ||||
7,275 | SCANA Corp | 307 | |||||
1,020 | e | SJW Corp | 35 | ||||
16,145 | Sempra Energy | 999 | |||||
13,561 | Sierra Pacific Resources | 230 | |||||
1,884 | e | South Jersey Industries, Inc | 68 | ||||
46,004 | Southern Co | 1,783 | |||||
6,440 | Southern Union Co | 189 | |||||
2,572 | Southwest Gas Corp | 77 | |||||
1,025 | e | Southwest Water Co | 13 | ||||
5,708 | * | Stericycle, Inc | 339 | ||||
12,829 | e | TECO Energy, Inc | 221 | ||||
6,491 | UGI Corp | 177 | |||||
1,633 | e | UIL Holdings Corp | 60 | ||||
2,373 | Unisource Energy Corp | 75 | |||||
4,904 | e | Vectren Corp | 142 | ||||
3,019 | WGL Holdings, Inc | 99 | |||||
3,949 | * | Waste Connections, Inc | 122 | ||||
499 | Waste Industries USA, Inc | 18 | |||||
1,458 | e* | Waste Services, Inc | 12 | ||||
5,625 | Westar Energy, Inc | 146 | |||||
36,647 | Williams Cos, Inc | 1,311 | |||||
7,164 | Wisconsin Energy Corp | 349 | |||||
25,349 | e | Xcel Energy, Inc | 572 | ||||
| TOTAL ELECTRIC, GAS, AND SANITARY SERVICES | 41,119 | ||||||
ELECTRONIC AND OTHER ELECTRIC EQUIPMENT - 6.74% | |||||||
7,316 | * | ADC Telecommunications, Inc | 114 | ||||
4,100 | * | AMIS Holdings, Inc | 41 | ||||
2,293 | * | ATMI, Inc | 74 | ||||
3,547 | e | AVX Corp | 48 | ||||
723 | e* | AZZ, Inc | 20 | ||||
1,500 | e* | Acme Packet, Inc | 19 | ||||
1,556 | * | Actel Corp | 21 | ||||
2,651 | Acuity Brands, Inc | 119 | |||||
7,209 | * | Adaptec, Inc | 24 | ||||
3,699 | e | Adtran, Inc | 79 | ||||
2,343 | e* | Advanced Analogic Technologies, Inc | 26 | ||||
2,251 | * | Advanced Energy Industries, Inc | 29 | ||||
34,301 | e* | Advanced Micro Devices, Inc | 257 | ||||
21,706 | Altera Corp | 419 | |||||
2,495 | e* | American Superconductor Corp | 68 | ||||
6,834 | Ametek, Inc | 320 | |||||
6,298 | e* | Amkor Technology, Inc | 54 | ||||
21
TIAA SEPARATE ACCOUNT VA-1 - Stock Index Account
SHARES | COMPANY | VALUE (000) | |||||
10,954 | Amphenol Corp (Class A) | $ | 508 | ||||
3,097 | e* | Anadigics, Inc | 36 | ||||
20,013 | Analog Devices, Inc | 634 | |||||
52,912 | * | Apple Computer, Inc | 10,481 | ||||
4,877 | e* | Applied Micro Circuits Corp | 43 | ||||
8,272 | * | Arris Group, Inc | 83 | ||||
3,325 | e* | Atheros Communications, Inc | 102 | ||||
28,949 | * | Atmel Corp | 125 | ||||
12,022 | * | Avanex Corp | 12 | ||||
8,620 | * | Avnet, Inc | 301 | ||||
2,797 | Baldor Electric Co | 94 | |||||
674 | e | Bel Fuse, Inc (Class B) | 20 | ||||
4,279 | * | Benchmark Electronics, Inc | 76 | ||||
782 | e* | BigBand Networks, Inc | 4 | ||||
28,853 | * | Broadcom Corp (Class A) | 754 | ||||
457 | e* | CPI International, Inc | 8 | ||||
2,100 | e | CTS Corp | 21 | ||||
1,663 | e* | Ceradyne, Inc | 78 | ||||
2,612 | * | Checkpoint Systems, Inc | 68 | ||||
5,374 | e* | Ciena Corp | 183 | ||||
371,381 | * | Cisco Systems, Inc | 10,053 | ||||
1,458 | e* | Comtech Telecommunications Corp | 79 | ||||
32,205 | e* | Conexant Systems, Inc | 27 | ||||
10,968 | Cooper Industries Ltd (Class A) | 580 | |||||
5,056 | e* | Cree, Inc | 139 | ||||
1,000 | Cubic Corp | 39 | |||||
9,243 | * | Cypress Semiconductor Corp | 333 | ||||
1,958 | * | DSP Group, Inc | 24 | ||||
1,168 | e* | DTS, Inc | 30 | ||||
1,921 | e* | Diodes, Inc | 58 | ||||
2,576 | e* | Ditech Networks, Inc | 9 | ||||
2,248 | * | Dolby Laboratories, Inc (Class A) | 112 | ||||
956 | * | EMS Technologies, Inc | 29 | ||||
8,961 | Eaton Corp | 869 | |||||
2,000 | * | Electro Scientific Industries, Inc | 40 | ||||
1,937 | * | EnerSys | 48 | ||||
3,562 | * | Energizer Holdings, Inc | 399 | ||||
2,523 | e* | Energy Conversion Devices, Inc | 85 | ||||
5,831 | e* | Evergreen Solar, Inc | 101 | ||||
2,444 | e* | Exar Corp | 19 | ||||
7,886 | * | Fairchild Semiconductor International, Inc | 114 | ||||
14,527 | e* | Finisar Corp | 21 | ||||
2,244 | * | First Solar, Inc | 599 | ||||
1,238 | e | Franklin Electric Co, Inc | 47 | ||||
2,934 | e* | FuelCell Energy, Inc | 29 | ||||
15,290 | * | Gemstar-TV Guide International, Inc | 73 | ||||
1,744 | * | Genlyte Group, Inc | 166 | ||||
6,150 | e* | GrafTech International Ltd | 109 | ||||
1,507 | e* | Greatbatch, Inc | 30 | ||||
3,985 | Harman International Industries, Inc | 294 | |||||
5,636 | e* | Harmonic, Inc | 59 | ||||
8,349 | Harris Corp | 523 | |||||
1,865 | e* | Helen of Troy Ltd | 32 | ||||
6,021 | e* | Hexcel Corp | 146 | ||||
829 | * | Hittite Microwave Corp | 40 | ||||
22
TIAA SEPARATE ACCOUNT VA-1 - Stock Index Account
SHARES | COMPANY | VALUE (000) | |||||
47,699 | Honeywell International, Inc | $ | 2,937 | ||||
1,800 | * | Hutchinson Technology, Inc | 47 | ||||
1,200 | e* | Infinera Corp | 18 | ||||
600 | * | IPG Photonics Corp | 12 | ||||
1,636 | e* | IXYS Corp | 13 | ||||
2,223 | e | Imation Corp | 47 | ||||
12,101 | * | Integrated Device Technology, Inc | 137 | ||||
355,437 | Intel Corp | 9,476 | |||||
2,862 | e* | InterDigital, Inc | 67 | ||||
2,296 | * | InterVoice, Inc | 18 | ||||
4,573 | e* | International Rectifier Corp | 155 | ||||
8,268 | Intersil Corp (Class A) | 202 | |||||
13,081 | e* | JDS Uniphase Corp | 174 | ||||
3,477 | e* | Jarden Corp | 82 | ||||
6,007 | * | Kemet Corp | 40 | ||||
7,656 | L-3 Communications Holdings, Inc | 811 | |||||
1,293 | e | LSI Industries, Inc | 24 | ||||
47,037 | * | LSI Logic Corp | 250 | ||||
7,863 | e* | Lattice Semiconductor Corp | 26 | ||||
2,740 | Lincoln Electric Holdings, Inc | 195 | |||||
14,118 | e | Linear Technology Corp | 449 | ||||
1,534 | e* | Littelfuse, Inc | 51 | ||||
732 | e* | Loral Space & Communications, Inc | 25 | ||||
13,650 | * | MEMC Electronic Materials, Inc | 1,208 | ||||
2,847 | e* | MIPS Technologies, Inc | 14 | ||||
7,339 | e* | MRV Communications, Inc | 17 | ||||
28,543 | * | Marvell Technology Group Ltd | 399 | ||||
3,108 | * | Mattson Technology, Inc | 27 | ||||
1,334 | e* | Medis Technologies Ltd | 21 | ||||
133 | e,m,v* | Medis Technologies Ltd | 0 | ||||
1,540 | * | Mercury Computer Systems, Inc | 25 | ||||
2,500 | Methode Electronics, Inc | 41 | |||||
4,755 | Micrel, Inc | 40 | |||||
13,347 | e | Microchip Technology, Inc | 419 | ||||
46,315 | e* | Micron Technology, Inc | 336 | ||||
4,543 | * | Microsemi Corp | 101 | ||||
4,100 | * | Microtune, Inc | 27 | ||||
8,407 | Molex, Inc | 230 | |||||
1,168 | * | Monolithic Power Systems, Inc | 25 | ||||
2,161 | * | Moog, Inc (Class A) | 99 | ||||
141,618 | Motorola, Inc | 2,272 | |||||
555 | e* | Multi-Fineline Electronix, Inc | 10 | ||||
300 | e | National Presto Industries, Inc | 16 | ||||
17,087 | National Semiconductor Corp | 387 | |||||
1,013 | e* | Netlogic Microsystems, Inc | 33 | ||||
22,712 | * | Network Appliance, Inc | 567 | ||||
7,718 | e* | Novellus Systems, Inc | 213 | ||||
33,105 | * | Nvidia Corp | 1,126 | ||||
13,834 | e* | ON Semiconductor Corp | 123 | ||||
1,144 | * | OpNext, Inc | 10 | ||||
869 | e* | OSI Systems, Inc | 23 | ||||
3,460 | e* | Omnivision Technologies, Inc | 54 | ||||
6,944 | e* | On2 Technologies, Inc | 7 | ||||
6,068 | Openwave Systems, Inc | 16 | |||||
1,210 | e* | Oplink Communications, Inc | 19 | ||||
23
TIAA SEPARATE ACCOUNT VA-1 - Stock Index Account
SHARES | COMPANY | VALUE (000) | ||||||
1,628 | e | * | PLX Technology, Inc | $ | 15 | |||
13,218 | e | * | PMC - Sierra, Inc | 86 | ||||
1,250 | e | Park Electrochemical Corp | 35 | |||||
1,447 | * | Pericom Semiconductor Corp | 27 | |||||
2,260 | * | Photronics, Inc | 28 | |||||
2,609 | Plantronics, Inc | 68 | ||||||
3,100 | * | Plexus Corp | 81 | |||||
5,444 | * | Polycom, Inc | 151 | |||||
1,400 | * | Polypore International, Inc | 25 | |||||
458 | * | Powell Industries, Inc | 20 | |||||
4,438 | e | * | Power-One, Inc | 18 | ||||
7,309 | e | * | Powerwave Technologies, Inc | 29 | ||||
9,396 | * | QLogic Corp | 133 | |||||
101,967 | Qualcomm, Inc | 4,012 | ||||||
14,875 | e | * | RF Micro Devices, Inc | 85 | ||||
8,217 | e | RadioShack Corp | 139 | |||||
5,680 | e | * | Rambus, Inc | 119 | ||||
1,083 | e | Raven Industries, Inc | 42 | |||||
1,983 | Regal-Beloit Corp | 89 | ||||||
1,100 | e | * | Rogers Corp | 48 | ||||
32,531 | * | Sanmina-SCI Corp | 59 | |||||
1,867 | * | Seachange International, Inc | 13 | |||||
4,166 | * | Semtech Corp | 65 | |||||
5,145 | e | * | Silicon Image, Inc | 23 | ||||
3,220 | * | Silicon Laboratories, Inc | 121 | |||||
5,900 | e | * | Silicon Storage Technology, Inc | 18 | ||||
90,524 | e | * | Sirius Satellite Radio, Inc | 274 | ||||
10,341 | * | Skyworks Solutions, Inc | 88 | |||||
3,071 | * | Smart Modular Technologies WWH, Inc | 31 | |||||
5,639 | e | * | Spansion, Inc (Class A) | 22 | ||||
2,490 | e | * | Spectrum Brands, Inc | 13 | ||||
1,279 | * | Standard Microsystems Corp | 50 | |||||
1,500 | e | * | Starent Networks Corp | 27 | ||||
898 | * | Stoneridge, Inc | 7 | |||||
1,668 | e | * | Sunpower Corp (Class A) | 217 | ||||
745 | e | * | Supertex, Inc | 23 | ||||
12,134 | e | * | Sycamore Networks, Inc | 47 | ||||
2,907 | e | * | Symmetricom, Inc | 14 | ||||
1,530 | e | * | Synaptics, Inc | 63 | ||||
3,593 | e | * | Syntax-Brillian Corp | 11 | ||||
2,833 | * | TTM Technologies, Inc | 33 | |||||
2,804 | e | Technitrol, Inc | 80 | |||||
913 | e | * | Techwell, Inc | 10 | ||||
3,400 | e | * | Tekelec | 43 | ||||
2,403 | Teleflex, Inc | 151 | ||||||
26,740 | * | Tellabs, Inc | 175 | |||||
2,944 | * | Tessera Technologies, Inc | 122 | |||||
87,696 | Texas Instruments, Inc | 2,929 | ||||||
3,556 | * | Thomas & Betts Corp | 174 | |||||
3,408 | e | * | Trident Microsystems, Inc | 22 | ||||
9,492 | * | Triquint Semiconductor, Inc | 63 | |||||
29,991 | Tyco Electronics Ltd | 1,114 | ||||||
1,167 | e | * | Ultra Clean Holdings | 14 | ||||
1,466 | e | * | Universal Display Corp | 30 | ||||
1,000 | e | * | Universal Electronics, Inc | 33 | ||||
24
TIAA SEPARATE ACCOUNT VA-1 - Stock Index Account
SHARES | COMPANY | VALUE (000) | |||||
7,742 | e* | Utstarcom, Inc | $ | 21 | |||
5,243 | * | Varian Semiconductor Equipment Associates, Inc | 194 | ||||
1,399 | * | Viasat, Inc | 48 | ||||
1,471 | e | Vicor Corp | 23 | ||||
10,877 | * | Vishay Intertechnology, Inc | 124 | ||||
1,011 | e* | Volterra Semiconductor Corp | 11 | ||||
4,543 | e | Whirlpool Corp | 371 | ||||
18,234 | Xilinx, Inc | 399 | |||||
1,286 | e* | Zoltek Cos, Inc | 55 | ||||
3,150 | * | Zoran Corp | 71 | ||||
724 | e* | iRobot Corp | 13 | ||||
| TOTAL ELECTRONIC AND OTHER ELECTRIC EQUIPMENT | 66,638 | ||||||
ENGINEERING AND MANAGEMENT SERVICES - 0.93% | |||||||
2,118 | e* | Aecom Technology Corp | 61 | ||||
1,230 | * | Advisory Board Co | 79 | ||||
8,040 | * | Amylin Pharmaceuticals, Inc | 297 | ||||
4,841 | * | Applera Corp (Celera Genomics Group) | 77 | ||||
4,682 | e* | Ariad Pharmaceuticals, Inc | 20 | ||||
445 | * | Michael Baker Corp | 18 | ||||
900 | CDI Corp | 22 | |||||
706 | e* | CRA International, Inc | 34 | ||||
3,622 | e* | CV Therapeutics, Inc | 33 | ||||
23,578 | * | Celgene Corp | 1,090 | ||||
758 | e* | Cornell Cos, Inc | 18 | ||||
2,517 | e | Corporate Executive Board Co | 151 | ||||
1,618 | e | Diamond Management & Technology Consultants, Inc | 12 | ||||
5,381 | e* | Exelixis, Inc | 46 | ||||
1,100 | * | Exponent, Inc | 30 | ||||
5,476 | e | Fluor Corp | 798 | ||||
3,419 | * | Gen-Probe, Inc | 215 | ||||
1,100 | * | Genpact Ltd | 17 | ||||
1,326 | * | Greenfield Online, Inc | 19 | ||||
3,404 | e* | Harris Interactive, Inc | 15 | ||||
5,800 | * | Hewitt Associates, Inc (Class A) | 222 | ||||
1,113 | * | Huron Consulting Group, Inc | 90 | ||||
4,807 | e* | Incyte Corp | 48 | ||||
4,737 | e* | Isis Pharmaceuticals, Inc | 75 | ||||
7,324 | * | Jacobs Engineering Group, Inc | 700 | ||||
10,330 | * | KBR, Inc | 401 | ||||
798 | * | Kendle International, Inc | 39 | ||||
2,541 | e* | Kosan Biosciences, Inc | 9 | ||||
1,549 | e* | LECG Corp | 23 | ||||
584 | Landauer, Inc | 30 | |||||
1,975 | e* | Lifecell Corp | 85 | ||||
1,864 | e* | Luminex Corp | 30 | ||||
1,221 | e | MAXIMUS, Inc | 47 | ||||
685 | e* | MTC Technologies, Inc | 16 | ||||
2,143 | * | Maxygen, Inc | 17 | ||||
13,624 | * | McDermott International, Inc | 804 | ||||
14,148 | e | Moody’s Corp | 505 | ||||
2,554 | e* | Myriad Genetics, Inc | 119 | ||||
3,394 | e* | Navigant Consulting, Inc | 46 | ||||
1,978 | e* | Neurogen Corp | 7 | ||||
1,729 | e* | Omnicell, Inc | 47 | ||||
25
TIAA SEPARATE ACCOUNT VA-1 - Stock Index Account
SHARES | COMPANY | VALUE (000) | ||||||
20,718 | Paychex, Inc | $ | 750 | |||||
1,234 | e | * | PharmaNet Development Group, Inc | 48 | ||||
9,556 | Quest Diagnostics, Inc | 506 | ||||||
1,812 | * | Regeneration Technologies, Inc | 16 | |||||
3,876 | e | * | Regeneron Pharmaceuticals, Inc | 94 | ||||
8,827 | e | * | Rentech, Inc | 16 | ||||
3,214 | Resources Connection, Inc | 58 | ||||||
2,518 | e | * | Rigel Pharmaceuticals, Inc | 64 | ||||
10,300 | e | * | SAIC, Inc | 207 | ||||
3,562 | e | * | Savient Pharmaceuticals, Inc | 82 | ||||
2,563 | e | * | Seattle Genetics, Inc | 29 | ||||
1,940 | e | * | Senomyx, Inc | 15 | ||||
4,929 | * | Shaw Group, Inc | 298 | |||||
507 | * | Stanley, Inc | 16 | |||||
1,956 | e | * | Symyx Technologies, Inc | 15 | ||||
692 | e | * | Tejon Ranch Co | 28 | ||||
3,521 | e | * | Telik, Inc | 12 | ||||
3,591 | * | Tetra Tech, Inc | 77 | |||||
4,873 | * | URS Corp | 265 | |||||
1,742 | e | * | Verenium Corp | 9 | ||||
2,733 | Watson Wyatt & Co Holdings (Class A) | 127 | ||||||
600 | e | * | comScore, Inc | 20 | ||||
3,090 | * | eResearch Technology, Inc | 37 | |||||
| TOTAL ENGINEERING AND MANAGEMENT SERVICES | 9,201 | |||||||
ENVIRONMENTAL QUALITY AND HOUSING - 0.00%** | ||||||||
2,403 | e | * | Home Solutions of America, Inc | 2 | ||||
| TOTAL ENVIRONMENTAL QUALITY AND HOUSING | 2 | |||||||
FABRICATED METAL PRODUCTS - 0.53% | ||||||||
2,088 | e | * | Alliant Techsystems, Inc | 238 | ||||
532 | e | Ameron International Corp | 49 | |||||
4,374 | Aptargroup, Inc | 179 | ||||||
6,862 | Ball Corp | 309 | ||||||
1,064 | e | CIRCOR International, Inc | 49 | |||||
766 | * | Chart Industries, Inc | 24 | |||||
7,354 | Commercial Metals Co | 217 | ||||||
1,343 | e | * | Commercial Vehicle Group, Inc | 19 | ||||
3,158 | Crane Co | 135 | ||||||
10,461 | * | Crown Holdings, Inc | 268 | |||||
757 | e | Dynamic Materials Corp | 45 | |||||
1,746 | e | * | Griffon Corp | 22 | ||||
546 | Gulf Island Fabrication, Inc | 17 | ||||||
916 | e | Insteel Industries, Inc | 11 | |||||
30,351 | Illinois Tool Works, Inc | 1,625 | ||||||
904 | e | * | Ladish Co, Inc | 39 | ||||
496 | e | Lifetime Brands, Inc | 6 | |||||
2,280 | e | * | Mobile Mini, Inc | 42 | ||||
6,723 | e | Mueller Water Products, Inc (Class A) | 64 | |||||
1,321 | e | * | NCI Building Systems, Inc | 38 | ||||
509 | * | Park-Ohio Holdings Corp | 13 | |||||
10,630 | Parker Hannifin Corp | 801 | ||||||
6,093 | Pentair, Inc | 212 | ||||||
1,422 | Silgan Holdings, Inc | 74 | ||||||
2,152 | e | Simpson Manufacturing Co, Inc | 57 | |||||
26
TIAA SEPARATE ACCOUNT VA-1 - Stock Index Account
SHARES | COMPANY | VALUE (000) | |||||
1,859 | e* | Smith & Wesson Holding Corp | $ | 11 | |||
3,654 | Snap-On, Inc | 176 | |||||
4,979 | e | Stanley Works | 241 | ||||
1,389 | e* | Sturm Ruger & Co, Inc | 12 | ||||
685 | e | Sun Hydraulics Corp | 17 | ||||
3,948 | e* | Taser International, Inc | 57 | ||||
809 | * | Trimas Corp | 9 | ||||
1,173 | e | Valmont Industries, Inc | 105 | ||||
1,666 | e | Watts Water Technologies, Inc (Class A) | 50 | ||||
| TOTAL FABRICATED METAL PRODUCTS | 5,231 | ||||||
FOOD AND KINDRED PRODUCTS - 3.50% | |||||||
1,269 | e* | Altus Pharmaceuticals, Inc | 7 | ||||
46,478 | Anheuser-Busch Cos, Inc | 2,433 | |||||
39,914 | Archer Daniels Midland Co | 1,853 | |||||
700 | * | Boston Beer Co, Inc (Class A) | 26 | ||||
7,450 | e | Bunge Ltd | 867 | ||||
14,117 | Campbell Soup Co | 504 | |||||
263 | Coca-Cola Bottling Co Consolidated | 15 | |||||
141,700 | Coca-Cola Co | 8,696 | |||||
19,411 | Coca-Cola Enterprises, Inc | 505 | |||||
30,473 | ConAgra Foods, Inc | 725 | |||||
11,746 | e* | Constellation Brands, Inc (Class A) | 278 | ||||
4,559 | Corn Products International, Inc | 168 | |||||
4,436 | * | Darling International, Inc | 51 | ||||
12,900 | Del Monte Foods Co | 122 | |||||
629 | e | Farmer Bros Co | 14 | ||||
5,007 | e | Flowers Foods, Inc | 117 | ||||
20,338 | General Mills, Inc | 1,159 | |||||
19,869 | H.J. Heinz Co | 927 | |||||
4,024 | e* | Hansen Natural Corp | 178 | ||||
10,758 | e | Hershey Co | 424 | ||||
4,677 | Hormel Foods Corp | 189 | |||||
740 | e | Imperial Sugar Co | 14 | ||||
800 | e | J&J Snack Foods Corp | 25 | ||||
3,519 | J.M. Smucker Co | 181 | |||||
1,401 | e* | Jones Soda Co | 10 | ||||
15,055 | Kellogg Co | 789 | |||||
98,121 | Kraft Foods, Inc (Class A) | 3,202 | |||||
1,575 | e | Lancaster Colony Corp | 63 | ||||
1,746 | e | Lance, Inc | 36 | ||||
686 | e* | M&F Worldwide Corp | 37 | ||||
597 | e | MGP Ingredients, Inc | 6 | ||||
8,308 | McCormick & Co, Inc | 315 | |||||
6,110 | Molson Coors Brewing Co (Class B) | 315 | |||||
621 | National Beverage Corp | 5 | |||||
919 | e* | Peet’s Coffee & Tea, Inc | 27 | ||||
8,468 | Pepsi Bottling Group, Inc | 334 | |||||
3,834 | PepsiAmericas, Inc | 128 | |||||
99,711 | PepsiCo, Inc | 7,568 | |||||
2,153 | * | Performance Food Group Co | 58 | ||||
1,622 | * | Ralcorp Holdings, Inc | 99 | ||||
1,066 | e | Reddy Ice Holdings, Inc | 27 | ||||
1,203 | e | Sanderson Farms, Inc | 41 | ||||
44,957 | Sara Lee Corp | 722 | |||||
27
TIAA SEPARATE ACCOUNT VA-1 - Stock Index Account
SHARES | COMPANY | VALUE (000) | |||||
6,686 | e* | Smithfield Foods, Inc | $ | 193 | |||
2,372 | e | Tootsie Roll Industries, Inc | 65 | ||||
2,025 | * | TreeHouse Foods, Inc | 47 | ||||
15,114 | Tyson Foods, Inc (Class A) | 232 | |||||
14,836 | Wrigley (Wm.) Jr Co | 869 | |||||
| TOTAL FOOD AND KINDRED PRODUCTS | 34,666 | ||||||
FOOD STORES - 0.33% | |||||||
97 | Arden Group, Inc (Class A) | 15 | |||||
1,515 | e | Great Atlantic & Pacific Tea Co, Inc | 47 | ||||
700 | Ingles Markets, Inc (Class A) | 18 | |||||
41,630 | Kroger Co | 1,112 | |||||
1,886 | e* | Panera Bread Co (Class A) | 68 | ||||
1,414 | e* | Pantry, Inc | 37 | ||||
2,557 | Ruddick Corp | 89 | |||||
27,020 | Safeway, Inc | 924 | |||||
12,857 | Supervalu, Inc | 482 | |||||
212 | Village Super Market (Class A) | 11 | |||||
611 | e | Weis Markets, Inc | 24 | ||||
8,728 | e | Whole Foods Market, Inc | 356 | ||||
2,103 | * | Winn-Dixie Stores, Inc | 35 | ||||
| TOTAL FOOD STORES | 3,218 | ||||||
FORESTRY - 0.12% | |||||||
4,673 | Rayonier, Inc | 221 | |||||
13,213 | Weyerhaeuser Co | 974 | |||||
| TOTAL FORESTRY | 1,195 | ||||||
FURNITURE AND FIXTURES - 0.28% | |||||||
1,625 | e | Ethan Allen Interiors, Inc | 46 | ||||
2,907 | e | Furniture Brands International, Inc | 29 | ||||
2,905 | e | HNI Corp | 102 | ||||
3,977 | Herman Miller, Inc | 129 | |||||
3,882 | Hillenbrand Industries, Inc | 216 | |||||
680 | e | Hooker Furniture Corp | 14 | ||||
3,257 | Interface, Inc (Class A) | 53 | |||||
36,219 | Johnson Controls, Inc | 1,305 | |||||
1,737 | e | Kimball International, Inc (Class B) | 24 | ||||
3,352 | e | La-Z-Boy, Inc | 27 | ||||
10,815 | e | Leggett & Platt, Inc | 189 | ||||
23,113 | Masco Corp | 499 | |||||
2,732 | e | Sealy Corp | 31 | ||||
3,095 | e* | Select Comfort Corp | 22 | ||||
4,232 | e | Tempur-Pedic International, Inc | 110 | ||||
| TOTAL FURNITURE AND FIXTURES | 2,796 | ||||||
FURNITURE AND HOME FURNISHINGS STORES - 0.17% | |||||||
16,945 | e* | Bed Bath & Beyond, Inc | 498 | ||||
10,474 | e | Circuit City Stores, Inc | 44 | ||||
9,625 | * | GameStop Corp (Class A) | 598 | ||||
1,232 | e | Haverty Furniture Cos, Inc | 11 | ||||
2,965 | Knoll, Inc | 49 | |||||
3,326 | e* | Mohawk Industries, Inc | 247 | ||||
6,020 | e* | Pier 1 Imports, Inc | 31 | ||||
4,902 | Steelcase, Inc (Class A) | 78 | |||||
28
TIAA SEPARATE ACCOUNT VA-1 - Stock Index Account
SHARES | COMPANY | VALUE (000) | |||||
1,789 | e | Tuesday Morning Corp | $ | 9 | |||
5,558 | e | Williams-Sonoma, Inc | 144 | ||||
| TOTAL FURNITURE AND HOME FURNISHINGS STORES | 1,709 | ||||||
GENERAL BUILDING CONTRACTORS - 0.17% | |||||||
115 | e | Amrep Corp | 4 | ||||
310 | e* | Avatar Holdings, Inc | 13 | ||||
2,556 | e* | Beazer Homes USA, Inc | 19 | ||||
485 | e | Brookfield Homes Corp | 8 | ||||
7,355 | Centex Corp | 186 | |||||
19,198 | DR Horton, Inc | 253 | |||||
2,297 | e* | Hovnanian Enterprises, Inc (Class A) | 16 | ||||
4,706 | e | KB Home | 102 | ||||
8,304 | e | Lennar Corp (Class A) | 149 | ||||
862 | e | M/I Homes, Inc | 9 | ||||
2,061 | e | MDC Holdings, Inc | 77 | ||||
1,316 | McGrath RentCorp | 34 | |||||
1,472 | e* | Meritage Homes Corp | 21 | ||||
279 | e* | NVR, Inc | 146 | ||||
1,250 | e* | Palm Harbor Homes, Inc | 13 | ||||
1,625 | * | Perini Corp | 67 | ||||
13,220 | e | Pulte Homes, Inc | 139 | ||||
2,630 | e | Ryland Group, Inc | 72 | ||||
4,272 | e* | Standard-Pacific Corp | 14 | ||||
794 | e* | Team, Inc | 29 | ||||
7,726 | e* | Toll Brothers, Inc | 155 | ||||
1,883 | e* | WCI Communities, Inc | 7 | ||||
3,445 | Walter Industries, Inc | 124 | |||||
| TOTAL GENERAL BUILDING CONTRACTORS | 1,657 | ||||||
GENERAL MERCHANDISE STORES - 1.47% | |||||||
2,874 | e* | 99 Cents Only Stores | 23 | ||||
4,214 | * | BJ’s Wholesale Club, Inc | 143 | ||||
6,733 | e* | Big Lots, Inc | 108 | ||||
632 | e | Bon-Ton Stores, Inc | 6 | ||||
2,068 | e* | Cabela’s, Inc | 31 | ||||
3,355 | Casey’s General Stores, Inc | 99 | |||||
481 | e* | Conn’s, Inc | 8 | ||||
27,321 | Costco Wholesale Corp | 1,906 | |||||
3,877 | e | Dillard’s, Inc (Class A) | 73 | ||||
9,228 | e | Family Dollar Stores, Inc | 177 | ||||
2,720 | e | Fred’s, Inc | 26 | ||||
13,817 | JC Penney Co, Inc | 608 | |||||
26,388 | Macy’s, Inc | 683 | |||||
1,292 | e* | Retail Ventures, Inc | 7 | ||||
8,388 | e | Saks, Inc | 174 | ||||
1,757 | e | Stein Mart, Inc | 8 | ||||
27,811 | TJX Cos, Inc | 799 | |||||
52,323 | Target Corp | 2,616 | |||||
147,502 | Wal-Mart Stores, Inc | 7,011 | |||||
| TOTAL GENERAL MERCHANDISE STORES | 14,506 | ||||||
HEALTH SERVICES - 1.36% | |||||||
839 | e* | Alliance Imaging, Inc | 8 | ||||
1,533 | e* | Amedisys, Inc | 74 | ||||
29
TIAA SEPARATE ACCOUNT VA-1 - Stock Index Account
SHARES | COMPANY | VALUE (000) | ||||||
748 | e | * | American Dental Partners, Inc | $ | 8 | |||
10,498 | AmerisourceBergen Corp | 471 | ||||||
1,984 | * | Amsurg Corp | 54 | |||||
2,667 | * | Apria Healthcare Group, Inc | 58 | |||||
3,714 | e | * | Assisted Living Concepts, Inc (A Shares) | 28 | ||||
535 | e | * | Bio-Reference Labs, Inc | 17 | ||||
2,607 | e | Brookdale Senior Living, Inc | 74 | |||||
17,615 | Cigna Corp | 946 | ||||||
5,854 | e | * | Community Health Systems, Inc | 216 | ||||
750 | * | Corvel Corp | 17 | |||||
3,963 | * | Covance, Inc | 343 | |||||
9,571 | * | Coventry Health Care, Inc | 567 | |||||
2,321 | e | * | Cross Country Healthcare, Inc | 33 | ||||
1,413 | e | * | CryoLife, Inc | 11 | ||||
6,435 | * | DaVita, Inc | 363 | |||||
3,516 | e | * | Edwards Lifesciences Corp | 162 | ||||
300 | e | * | Emeritus Corp | 8 | ||||
1,864 | e | * | Enzo Biochem, Inc | 24 | ||||
13,424 | * | Express Scripts, Inc | 980 | |||||
810 | e | * | Genomic Health, Inc | 18 | ||||
1,497 | e | * | Gentiva Health Services, Inc | 29 | ||||
14,969 | e | Health Management Associates, Inc (Class A) | 90 | |||||
4,400 | * | Healthsouth Corp | 92 | |||||
2,237 | e | * | Healthways, Inc | 131 | ||||
1,722 | e | * | Hythiam, Inc | 5 | ||||
3,543 | e | * | Immunomedics, Inc | 8 | ||||
2,054 | e | * | Kindred Healthcare, Inc | 51 | ||||
1,383 | e | LCA-Vision, Inc | 28 | |||||
735 | e | * | LHC Group, Inc | 18 | ||||
7,195 | * | Laboratory Corp of America Holdings | 543 | |||||
3,672 | * | LifePoint Hospitals, Inc | 109 | |||||
5,141 | * | Lincare Holdings, Inc | 181 | |||||
2,394 | * | Magellan Health Services, Inc | 112 | |||||
1,371 | e | * | Matria Healthcare, Inc | 33 | ||||
18,173 | McKesson Corp | 1,191 | ||||||
419 | * | Medcath Corp | 10 | |||||
17,135 | * | Medco Health Solutions, Inc | 1,737 | |||||
300 | e | National Healthcare Corp | 16 | |||||
5,807 | e | * | Nektar Therapeutics | 39 | ||||
1,311 | e | * | Nighthawk Radiology Holdings, Inc | 28 | ||||
2,544 | * | Odyssey HealthCare, Inc | 28 | |||||
7,429 | e | Omnicare, Inc | 169 | |||||
3,052 | * | Pediatrix Medical Group, Inc | 208 | |||||
6,515 | Pharmaceutical Product Development, Inc | 263 | ||||||
3,409 | e | * | Psychiatric Solutions, Inc | 111 | ||||
745 | e | * | Radiation Therapy Services, Inc | 23 | ||||
1,200 | * | RehabCare Group, Inc | 27 | |||||
3,479 | * | Sierra Health Services, Inc | 146 | |||||
1,374 | e | * | Skilled Healthcare Group, Inc (Class A) | 20 | ||||
939 | e | * | Stereotaxis, Inc | 11 | ||||
2,651 | * | Sun Healthcare Group, Inc | 46 | |||||
2,773 | e | * | Sunrise Senior Living, Inc | 85 | ||||
30,068 | e | * | Tenet Healthcare Corp | 153 | ||||
2,659 | Universal Health Services, Inc (Class B) | 136 | ||||||
35,237 | * | WellPoint, Inc | 3,091 | |||||
30
TIAA SEPARATE ACCOUNT VA-1 - Stock Index Account
SHARES | COMPANY | VALUE (000) | |||||
744 | * | eHealth, Inc | $ | 24 | |||
| TOTAL HEALTH SERVICES | 13,472 | ||||||
HEAVY CONSTRUCTION, EXCEPT BUILDING - 0.08% | |||||||
321 | e* | Comverge, Inc | 10 | ||||
4,311 | * | Foster Wheeler Ltd | 668 | ||||
2,325 | Granite Construction, Inc | 84 | |||||
2,122 | * | Matrix Service Co | 46 | ||||
| TOTAL HEAVY CONSTRUCTION, EXCEPT BUILDING | 808 | ||||||
HOLDING AND OTHER INVESTMENT OFFICES - 2.20% | |||||||
5,664 | AMB Property Corp | 326 | |||||
2,039 | e | Acadia Realty Trust | 52 | ||||
1,925 | e* | Affiliated Managers Group, Inc | 226 | ||||
505 | e | Agree Realty Corp | 15 | ||||
3,433 | e | Alesco Financial, Inc | 11 | ||||
123 | e* | Alexander’s, Inc | 43 | ||||
1,828 | e | Alexandria Real Estate Equities, Inc | 186 | ||||
8,795 | e | Allied Capital Corp | 189 | ||||
1,413 | American Campus Communities, Inc | 38 | |||||
8,501 | American Financial Realty Trust | 68 | |||||
23,991 | Annaly Mortgage Management, Inc | 436 | |||||
3,218 | e | Anthracite Capital, Inc | 23 | ||||
3,102 | Anworth Mortgage Asset Corp | 26 | |||||
5,937 | e | Apartment Investment & Management Co (Class A) | 206 | ||||
7,815 | e | Apollo Investment Corp | 133 | ||||
850 | Arbor Realty Trust, Inc | 14 | |||||
6,591 | Ashford Hospitality Trust, Inc | 47 | |||||
936 | Associated Estates Realty Corp | 9 | |||||
4,819 | AvalonBay Communities, Inc | 454 | |||||
3,142 | BRE Properties, Inc (Class A) | 127 | |||||
433 | e | BRT Realty Trust | 7 | ||||
4,502 | BioMed Realty Trust, Inc | 104 | |||||
6,268 | Boston Properties, Inc | 575 | |||||
5,335 | e | Brandywine Realty Trust | 96 | ||||
3,981 | CBL & Associates Properties, Inc | 95 | |||||
1,814 | CBRE Realty Finance, Inc | 10 | |||||
3,482 | Camden Property Trust | 168 | |||||
2,642 | e | Capital Lease Funding, Inc | 22 | ||||
190 | Capital Southwest Corp | 22 | |||||
800 | e | Capital Trust, Inc (Class A) | 25 | ||||
2,712 | e | Cedar Shopping Centers, Inc | 28 | ||||
442 | e | Cherokee, Inc | 14 | ||||
2,945 | Colonial Properties Trust | 67 | |||||
2,299 | Corporate Office Properties Trust | 72 | |||||
2,443 | Cousins Properties, Inc | 54 | |||||
1,504 | e | Crystal River Capital, Inc | 22 | ||||
10,500 | e | DCT Industrial Trust, Inc | 98 | ||||
3,319 | e | Deerfield Capital Corp | 27 | ||||
7,395 | Developers Diversified Realty Corp | 283 | |||||
5,943 | DiamondRock Hospitality Co | 89 | |||||
3,247 | Digital Realty Trust, Inc | 125 | |||||
5,829 | Douglas Emmett, Inc | 132 | |||||
8,769 | Duke Realty Corp | 229 | |||||
1,377 | e | EastGroup Properties, Inc | 58 | ||||
31
TIAA SEPARATE ACCOUNT VA-1 - Stock Index Account
SHARES | COMPANY | VALUE (000) | |||||
1,200 | Education Realty Trust, Inc | $ | 13 | ||||
1,723 | e | Entertainment Properties Trust | 81 | ||||
1,227 | Equity Lifestyle Properties, Inc | 56 | |||||
2,470 | �� | e | Equity One, Inc | 57 | |||
16,363 | Equity Residential | 597 | |||||
1,493 | Essex Property Trust, Inc | 146 | |||||
3,926 | e | Extra Space Storage, Inc | 56 | ||||
3,328 | Federal Realty Investment Trust | 273 | |||||
3,926 | FelCor Lodging Trust, Inc | 61 | |||||
2,899 | e | First Industrial Realty Trust, Inc | 100 | ||||
1,470 | First Potomac Realty Trust | 25 | |||||
3,189 | e | Franklin Street Properties Corp | 47 | ||||
9,089 | e* | Friedman Billings Ramsey Group, Inc (Class A) | 29 | ||||
3,200 | e | GMH Communities Trust | 18 | ||||
13,247 | General Growth Properties, Inc | 546 | |||||
1,193 | e | Getty Realty Corp | 32 | ||||
638 | e | Gladstone Capital Corp | 11 | ||||
2,171 | e | Glimcher Realty Trust | 31 | ||||
1,100 | e | Gramercy Capital Corp | 27 | ||||
12,321 | HCP, Inc | 429 | |||||
998 | e* | HFF, Inc (Class A) | 8 | ||||
13,475 | HRPT Properties Trust | 104 | |||||
4,880 | Health Care REIT, Inc | 218 | |||||
3,212 | e | Healthcare Realty Trust, Inc | 82 | ||||
2,467 | Hersha Hospitality Trust | 23 | |||||
3,247 | e | Highwoods Properties, Inc | 95 | ||||
2,378 | e* | Hilltop Holdings, Inc | 26 | ||||
2,389 | Home Properties, Inc | 107 | |||||
5,735 | Hospitality Properties Trust | 185 | |||||
31,929 | Host Marriott Corp | 544 | |||||
5,056 | e,v | IMPAC Mortgage Holdings, Inc | 3 | ||||
4,513 | e | Inland Real Estate Corp | 64 | ||||
3,315 | Investors Real Estate Trust | 30 | |||||
1,655 | e | JER Investors Trust, Inc | 18 | ||||
3,168 | e* | Jamba, Inc | 12 | ||||
2,062 | Kilroy Realty Corp | 113 | |||||
13,130 | Kimco Realty Corp | 478 | |||||
1,900 | Kite Realty Group Trust | 29 | |||||
1,314 | e | LTC Properties, Inc | 33 | ||||
2,579 | e | LaSalle Hotel Properties | 82 | ||||
4,101 | e | Lexington Corporate Properties Trust | 60 | ||||
5,546 | e | Liberty Property Trust | 160 | ||||
2,561 | e,v | Luminent Mortgage Capital, Inc | 2 | ||||
5,284 | MFA Mortgage Investments, Inc | 49 | |||||
1,507 | MVC Capital, Inc | 24 | |||||
4,379 | Macerich Co | 311 | |||||
3,822 | Mack-Cali Realty Corp | 130 | |||||
2,313 | e | Maguire Properties, Inc | 68 | ||||
2,550 | e | Medical Properties Trust, Inc | 26 | ||||
2,802 | * | Meruelo Maddux Properties, Inc | 11 | ||||
1,526 | Mid-America Apartment Communities, Inc | 65 | |||||
1,230 | e | Mission West Properties, Inc | 12 | ||||
1,400 | e | National Health Investors, Inc | 39 | ||||
3,765 | National Retail Properties, Inc | 88 | |||||
4,957 | Nationwide Health Properties, Inc | 156 | |||||
32
TIAA SEPARATE ACCOUNT VA-1 - Stock Index Account
SHARES | COMPANY | VALUE (000) | |||||
2,523 | e | Newcastle Investment Corp | $ | 33 | |||
2,538 | e* | NexCen Brands, Inc | 12 | ||||
3,513 | e | NorthStar Realty Finance Corp | 31 | ||||
433 | e* | Novastar Financial, Inc | 1 | ||||
4,121 | e | Omega Healthcare Investors, Inc | 66 | ||||
1,073 | PS Business Parks, Inc | 56 | |||||
946 | e | Parkway Properties, Inc | 35 | ||||
1,209 | e | PennantPark Investment Corp | 12 | ||||
1,975 | Pennsylvania Real Estate Investment Trust | 59 | |||||
10,805 | e | Plum Creek Timber Co, Inc | 497 | ||||
2,677 | e | Post Properties, Inc | 94 | ||||
2,494 | Potlatch Corp | 111 | |||||
15,511 | Prologis | 983 | |||||
1,216 | e | Prospect Capital Corp | 16 | ||||
7,739 | Public Storage, Inc | 568 | |||||
979 | e | Quadra Realty Trust, Inc | 8 | ||||
3,865 | e | RAIT Investment Trust | 33 | ||||
992 | Ramco-Gershenson Properties | 21 | |||||
6,195 | e | Realty Income Corp | 167 | ||||
1,529 | e | Redwood Trust, Inc | 52 | ||||
4,304 | Regency Centers Corp | 278 | |||||
1,355 | e | Resource Capital Corp | 13 | ||||
3,638 | SL Green Realty Corp | 340 | |||||
700 | Saul Centers, Inc | 37 | |||||
4,718 | Senior Housing Properties Trust | 107 | |||||
13,486 | Simon Property Group, Inc | 1,171 | |||||
1,302 | Sovran Self Storage, Inc | 52 | |||||
4,727 | Strategic Hotels & Resorts, Inc | 79 | |||||
1,069 | Sun Communities, Inc | 23 | |||||
3,736 | Sunstone Hotel Investors, Inc | 68 | |||||
1,844 | e | Tanger Factory Outlet Centers, Inc | 70 | ||||
687 | e | Tarragon Corp | 1 | ||||
3,403 | Taubman Centers, Inc | 167 | |||||
8,031 | e | Thornburg Mortgage, Inc | 74 | ||||
3,042 | e | U-Store-It Trust | 28 | ||||
8,850 | UDR, Inc | 176 | |||||
1,095 | e | Universal Health Realty Income Trust | 39 | ||||
1,407 | e | Urstadt Biddle Properties, Inc (Class A) | 22 | ||||
8,304 | Ventas, Inc | 376 | |||||
17,912 | e | Virgin Media, Inc | 307 | ||||
8,192 | Vornado Realty Trust | 720 | |||||
3,681 | WABCO Holdings, Inc | 184 | |||||
2,850 | e | Washington Real Estate Investment Trust | 90 | ||||
4,713 | Weingarten Realty Investors | 148 | |||||
3,164 | Winthrop Realty Trust | 17 | |||||
35,252 | e | iShares Russell 3000 Index Fund | 2,975 | ||||
7,812 | iStar Financial, Inc | 204 | |||||
| TOTAL HOLDING AND OTHER INVESTMENT OFFICES | 21,762 | ||||||
HOTELS AND OTHER LODGING PLACES - 0.39% | |||||||
1,418 | e | Ameristar Casinos, Inc | 39 | ||||
1,131 | e* | Bluegreen Corp | 8 | ||||
2,948 | Boyd Gaming Corp | 100 | |||||
2,172 | e | Choice Hotels International, Inc | 72 | ||||
2,696 | e* | Gaylord Entertainment Co | 109 | ||||
33
TIAA SEPARATE ACCOUNT VA-1 - Stock Index Account
SHARES | COMPANY | VALUE (000) | |||||
1,718 | e* | Great Wolf Resorts, Inc | $ | 17 | |||
1,142 | e* | Isle of Capri Casinos, Inc | 16 | ||||
6,384 | * | Las Vegas Sands Corp | 658 | ||||
920 | e* | Lodgian, Inc | 10 | ||||
7,236 | * | MGM Mirage | 608 | ||||
1,242 | e | Marcus Corp | 19 | ||||
20,149 | Marriott International, Inc (Class A) | 689 | |||||
604 | e* | Monarch Casino & Resort, Inc | 15 | ||||
1,158 | * | Morgans Hotel Group Co | 22 | ||||
2,588 | e | Orient-Express Hotels Ltd (Class A) | 149 | ||||
566 | e* | Riviera Holdings Corp | 17 | ||||
12,155 | Starwood Hotels & Resorts Worldwide, Inc | 535 | |||||
1,798 | e* | Trump Entertainment Resorts, Inc | 8 | ||||
1,755 | e* | Vail Resorts, Inc | 94 | ||||
11,158 | Wyndham Worldwide Corp | 263 | |||||
3,369 | Wynn Resorts Ltd | 378 | |||||
| TOTAL HOTELS AND OTHER LODGING PLACES | 3,826 | ||||||
INDUSTRIAL MACHINERY AND EQUIPMENT - 7.13% | |||||||
5,607 | * | AGCO Corp | 381 | ||||
627 | * | Altra Holdings, Inc | 10 | ||||
1,361 | e* | ASV, Inc | 19 | ||||
1,014 | e | Aaon, Inc | 20 | ||||
3,594 | Actuant Corp (Class A) | 122 | |||||
1,703 | Albany International Corp (Class A) | 63 | |||||
1,534 | e* | Allis-Chalmers Energy, Inc | 23 | ||||
475 | Ampco-Pittsburgh Corp | 18 | |||||
84,560 | Applied Materials, Inc | 1,502 | |||||
1,200 | e* | Astec Industries, Inc | 45 | ||||
3,264 | * | Asyst Technologies, Inc | 11 | ||||
7,081 | e* | Axcelis Technologies, Inc | 33 | ||||
4,039 | Black & Decker Corp | 281 | |||||
981 | Black Box Corp | 35 | |||||
2,004 | * | Blount International, Inc | 25 | ||||
3,023 | Briggs & Stratton Corp | 69 | |||||
23,785 | * | Brocade Communications Systems, Inc | 175 | ||||
4,785 | * | Brooks Automation, Inc | 63 | ||||
2,294 | Bucyrus International, Inc (Class A) | 228 | |||||
3,800 | Carlisle Cos, Inc | 141 | |||||
674 | e | Cascade Corp | 31 | ||||
39,176 | Caterpillar, Inc | 2,843 | |||||
5,864 | * | Cirrus Logic, Inc | 31 | ||||
1,162 | * | Columbus McKinnon Corp | 38 | ||||
1,943 | * | Cray, Inc | 12 | ||||
6,374 | Cummins, Inc | 812 | |||||
2,836 | Curtiss-Wright Corp | 142 | |||||
2,201 | e* | Cymer, Inc | 86 | ||||
27,762 | Deere & Co | 2,585 | |||||
138,962 | * | Dell, Inc | 3,406 | ||||
4,020 | Diebold, Inc | 116 | |||||
4,851 | Donaldson Co, Inc | 225 | |||||
12,501 | Dover Corp | 576 | |||||
5,247 | * | Dresser-Rand Group, Inc | 205 | ||||
1,630 | * | Dril-Quip, Inc | 91 | ||||
128,351 | * | EMC Corp | 2,378 | ||||
34
TIAA SEPARATE ACCOUNT VA-1 - Stock Index Account
SHARES | COMPANY | VALUE (000) | |||||
981 | * | ENGlobal Corp | $ | 11 | |||
3,700 | * | Electronics for Imaging, Inc | 83 | ||||
5,455 | * | Emulex Corp | 89 | ||||
1,375 | * | EnPro Industries, Inc | 42 | ||||
8,875 | e* | Entegris, Inc | 77 | ||||
7,347 | * | Extreme Networks, Inc | 26 | ||||
7,832 | * | FMC Technologies, Inc | 444 | ||||
1,124 | e* | Flotek Industries, Inc | 41 | ||||
2,307 | * | Flow International Corp | 22 | ||||
3,680 | Flowserve Corp | 354 | |||||
1,063 | e* | Fuel Tech, Inc | 24 | ||||
3,376 | * | Gardner Denver, Inc | 111 | ||||
673 | e* | Gehl Co | 11 | ||||
631,150 | General Electric Co | 23,397 | |||||
2,288 | e* | Goodman Global, Inc | 56 | ||||
1,051 | e | Gorman-Rupp Co | 33 | ||||
4,528 | Graco, Inc | 169 | |||||
8,123 | * | Grant Prideco, Inc | 451 | ||||
673 | Hardinge, Inc | 11 | |||||
163,729 | Hewlett-Packard Co | 8,265 | |||||
334 | e* | Hurco Cos, Inc | 15 | ||||
5,144 | IDEX Corp | 186 | |||||
1,615 | * | Immersion Corp | 21 | ||||
16,514 | Ingersoll-Rand Co Ltd (Class A) | 767 | |||||
3,395 | e* | Intermec, Inc | 69 | ||||
83,833 | International Business Machines Corp | 9,062 | |||||
19,147 | International Game Technology | 841 | |||||
1,163 | * | Intevac, Inc | 17 | ||||
11,645 | Jabil Circuit, Inc | 178 | |||||
6,891 | Joy Global, Inc | 454 | |||||
993 | * | Kadant, Inc | 29 | ||||
1,979 | e | Kaydon Corp | 108 | ||||
4,786 | Kennametal, Inc | 181 | |||||
3,600 | * | Kulicke & Soffa Industries, Inc | 25 | ||||
7,466 | * | Lam Research Corp | 323 | ||||
3,798 | Lennox International, Inc | 157 | |||||
5,795 | * | Lexmark International, Inc (Class A) | 202 | ||||
700 | e | Lindsay Manufacturing Co | 49 | ||||
949 | Lufkin Industries, Inc | 54 | |||||
7,460 | Manitowoc Co, Inc | 364 | |||||
2,549 | * | Micros Systems, Inc | 179 | ||||
860 | e* | Middleby Corp | 66 | ||||
2,342 | e | Modine Manufacturing Co | 39 | ||||
937 | * | NATCO Group, Inc (Class A) | 51 | ||||
381 | Nacco Industries, Inc (Class A) | 38 | |||||
2,164 | * | Netgear, Inc | 77 | ||||
1,891 | e | Nordson Corp | 110 | ||||
3,203 | * | Oil States International, Inc | 109 | ||||
7,666 | Pall Corp | 309 | |||||
6,172 | e | Palm, Inc | 39 | ||||
12,525 | e* | Quantum Corp | 34 | ||||
1,335 | * | RBC Bearings, Inc | 58 | ||||
1,201 | e* | Riverbed Technology, Inc | 32 | ||||
1,782 | e* | Rackable Systems, Inc | 18 | ||||
630 | * | Rimage Corp | 16 | ||||
35
TIAA SEPARATE ACCOUNT VA-1 - Stock Index Account
SHARES | COMPANY | VALUE (000) | |||||
1,100 | Robbins & Myers, Inc | $ | 83 | ||||
9,049 | Rockwell Automation, Inc | 624 | |||||
409 | e* | Silicon Graphics, Inc | 7 | ||||
3,483 | SPX Corp | 358 | |||||
1,945 | e* | STEC, Inc | 17 | ||||
7,798 | * | Safeguard Scientifics, Inc | 14 | ||||
13,961 | * | SanDisk Corp | 463 | ||||
744 | e | Sauer-Danfoss, Inc | 19 | ||||
1,742 | e* | Scansource, Inc | 56 | ||||
3,970 | e* | Scientific Games Corp (Class A) | 132 | ||||
33,426 | Seagate Technology, Inc | 852 | |||||
16,448 | m,v* | Seagate Technology, Inc | 0 | ||||
1,100 | e* | Semitool, Inc | 10 | ||||
2,025 | e* | Sigma Designs, Inc | 112 | ||||
4,015 | e* | SourceForge, Inc | 10 | ||||
800 | Standex International Corp | 14 | |||||
341 | * | T-3 Energy Services, Inc | 16 | ||||
1,000 | e* | Tecumseh Products Co (Class A) | 23 | ||||
1,200 | Tennant Co | 53 | |||||
11,006 | * | Teradata Corp | 302 | ||||
6,400 | * | Terex Corp | 420 | ||||
5,313 | Timken Co | 175 | |||||
2,458 | Toro Co | 134 | |||||
11,044 | Trane, Inc | 516 | |||||
881 | e* | TurboChef Technologies, Inc | 15 | ||||
281 | Twin Disc, Inc | 20 | |||||
1,608 | e* | Ultratech, Inc | 18 | ||||
7,805 | * | Varian Medical Systems, Inc | 407 | ||||
3,790 | e* | VeriFone Holdings, Inc | 88 | ||||
1,482 | e | Watsco, Inc | 54 | ||||
13,792 | * | Western Digital Corp | 417 | ||||
2,025 | Woodward Governor Co | 138 | |||||
4,449 | * | Zebra Technologies Corp (Class A) | 154 | ||||
TOTAL INDUSTRIAL MACHINERY AND EQUIPMENT | 70,556 | ||||||
INSTRUMENTS AND RELATED PRODUCTS - 4.70% | |||||||
7,072 | e | Garmin Ltd | 686 | ||||
1,214 | * | Abaxis, Inc | 44 | ||||
1,059 | e* | Abiomed, Inc | 16 | ||||
1,020 | e* | Accuray, Inc | 16 | ||||
3,672 | e* | Advanced Medical Optics, Inc | 90 | ||||
4,200 | e* | Affymetrix, Inc | 97 | ||||
23,000 | * | Agilent Technologies, Inc | 845 | ||||
3,618 | e* | Align Technology, Inc | 60 | ||||
18,654 | Allergan, Inc | 1,198 | |||||
4,631 | e* | American Medical Systems Holdings, Inc | 67 | ||||
543 | e | American Science & Engineering, Inc | 31 | ||||
928 | Analogic Corp | 63 | |||||
1,600 | e* | Anaren, Inc | 26 | ||||
1,310 | e* | Angiodynamics, Inc | 25 | ||||
11,326 | Applera Corp (Applied Biosystems Group) | 384 | |||||
600 | e* | Argon ST, Inc | 11 | ||||
1,690 | e* | Arthrocare Corp | 81 | ||||
1,087 | e* | Aspect Medical Systems, Inc | 15 | ||||
742 | e | Badger Meter, Inc | 33 | ||||
36
TIAA SEPARATE ACCOUNT VA-1 - Stock Index Account
SHARES | COMPANY | VALUE (000) | |||||
6,333 | Bard (C.R.), Inc | $ | 600 | ||||
39,857 | Baxter International, Inc | 2,314 | |||||
3,852 | Beckman Coulter, Inc | 280 | |||||
14,982 | Becton Dickinson & Co | 1,252 | |||||
1,200 | e* | Bio-Rad Laboratories, Inc (Class A) | 124 | ||||
80,839 | * | Boston Scientific Corp | 940 | ||||
3,985 | * | Bruker BioSciences Corp | 53 | ||||
711 | e* | Cantel Medical Corp | 10 | ||||
2,899 | e* | Cepheid, Inc | 76 | ||||
2,300 | * | Coherent, Inc | 58 | ||||
1,500 | e | Cohu, Inc | 23 | ||||
1,940 | * | Conmed Corp | 45 | ||||
2,727 | e | Cooper Cos, Inc | 104 | ||||
29,991 | Covidien Ltd | 1,328 | |||||
5,665 | e* | Credence Systems Corp | 14 | ||||
829 | * | Cutera, Inc | 13 | ||||
1,543 | e* | Cyberonics, Inc | 20 | ||||
475 | e* | Cynosure, Inc (Class A) | 13 | ||||
2,562 | DRS Technologies, Inc | 139 | |||||
14,975 | Danaher Corp | 1,314 | |||||
800 | Datascope Corp | 29 | |||||
9,684 | Dentsply International, Inc | 436 | |||||
1,255 | e* | Dionex Corp | 104 | ||||
1,718 | * | ESCO Technologies, Inc | 69 | ||||
462 | * | Eagle Test Systems, Inc | 6 | ||||
17,610 | e | Eastman Kodak Co | 385 | ||||
48,646 | Emerson Electric Co | 2,756 | |||||
1,694 | * | Esterline Technologies Corp | 88 | ||||
833 | * | Excel Technology, Inc | 23 | ||||
910 | e* | FARO Technologies, Inc | 25 | ||||
2,156 | e* | FEI Co | 54 | ||||
8,364 | e* | Flir Systems, Inc | 262 | ||||
2,946 | e* | Formfactor, Inc | 98 | ||||
2,463 | * | Fossil, Inc | 103 | ||||
1,733 | * | Haemonetics Corp | 109 | ||||
6,971 | e* | Hologic, Inc | 478 | ||||
1,260 | e* | I-Flow Corp | 20 | ||||
919 | e* | ICU Medical, Inc | 33 | ||||
4,300 | e* | ION Geophysical Corp | 68 | ||||
1,400 | e* | II-VI, Inc | 43 | ||||
3,212 | e* | Illumina, Inc | 190 | ||||
1,332 | e* | Integra LifeSciences Holdings Corp | 56 | ||||
2,329 | * | Intuitive Surgical, Inc | 756 | ||||
2,044 | e | Invacare Corp | 52 | ||||
1,673 | e* | Ionatron, Inc | 5 | ||||
1,741 | e* | Itron, Inc | 167 | ||||
2,194 | e* | Ixia | 21 | ||||
177,190 | Johnson & Johnson | 11,819 | |||||
11,724 | e | Kla-Tencor Corp | 565 | ||||
520 | e* | Kensey Nash Corp | 16 | ||||
3,660 | e* | L-1 Identity Solutions, Inc | 66 | ||||
4,233 | e* | LTX Corp | 13 | ||||
3,076 | * | MKS Instruments, Inc | 59 | ||||
1,408 | MTS Systems Corp | 60 | |||||
800 | * | Masimo Corp | 32 | ||||
37
TIAA SEPARATE ACCOUNT VA-1 - Stock Index Account
SHARES | COMPANY | VALUE (000) | |||||
742 | e* | Measurement Specialties, Inc | $ | 16 | |||
873 | e* | Medical Action Industries, Inc | 18 | ||||
70,297 | Medtronic, Inc | 3,534 | |||||
2,502 | e | Mentor Corp | 98 | ||||
1,469 | e* | Merit Medical Systems, Inc | 20 | ||||
2,475 | * | Mettler-Toledo International, Inc | 282 | ||||
935 | e* | Micrus Endovascular Corp | 18 | ||||
3,307 | e* | Millipore Corp | 242 | ||||
1,789 | e | Mine Safety Appliances Co | 93 | ||||
1,178 | Movado Group, Inc | 30 | |||||
2,200 | * | Wright Medical Group, Inc | 64 | ||||
3,725 | National Instruments Corp | 124 | |||||
1,185 | e* | Natus Medical, Inc | 23 | ||||
2,159 | e* | Newport Corp | 28 | ||||
710 | e* | Northstar Neuroscience, Inc | 7 | ||||
2,136 | * | NuVasive, Inc | 84 | ||||
794 | e* | NxStage Medical, Inc | 12 | ||||
246 | e* | OYO Geospace Corp | 19 | ||||
1,010 | * | Orthofix International NV | 59 | ||||
1,140 | e* | Palomar Medical Technologies, Inc | 17 | ||||
7,339 | PerkinElmer, Inc | 191 | |||||
13,441 | Pitney Bowes, Inc | 511 | |||||
4,869 | e* | Resmed, Inc | 256 | ||||
4,842 | * | Respironics, Inc | 317 | ||||
10,243 | Rockwell Collins, Inc | 737 | |||||
2,074 | * | Rofin-Sinar Technologies, Inc | 100 | ||||
5,330 | Roper Industries, Inc | 333 | |||||
1,464 | * | Rudolph Technologies, Inc | 17 | ||||
3,325 | e* | Sirf Technology Holdings, Inc | 84 | ||||
1,080 | e | Sirona Dental Systems, Inc | 36 | ||||
1,640 | * | Sonic Innovations, Inc | 13 | ||||
1,305 | e* | Sonic Solutions, Inc | 14 | ||||
957 | * | SonoSite, Inc | 32 | ||||
1,958 | * | Spectranetics Corp | 30 | ||||
20,694 | * | St. Jude Medical, Inc | 841 | ||||
3,970 | STERIS Corp | 114 | |||||
18,895 | Stryker Corp | 1,412 | |||||
2,227 | * | Symmetry Medical, Inc | 39 | ||||
2,400 | * | Techne Corp | 159 | ||||
2,183 | * | Teledyne Technologies, Inc | 116 | ||||
11,602 | * | Teradyne, Inc | 120 | ||||
25,928 | * | Thermo Electron Corp | 1,496 | ||||
3,422 | e* | Thoratec Corp | 62 | ||||
7,398 | * | Trimble Navigation Ltd | 224 | ||||
1,810 | * | Varian, Inc | 118 | ||||
1,820 | e* | Veeco Instruments, Inc | 30 | ||||
2,000 | * | Ventana Medical Systems, Inc | 174 | ||||
828 | e* | Vital Images, Inc | 15 | ||||
666 | Vital Signs, Inc | 34 | |||||
3,486 | * | Vivus, Inc | 18 | ||||
1,469 | * | Volcano Corp | 18 | ||||
6,179 | * | Waters Corp | 489 | ||||
1,200 | e* | X-Rite, Inc | 14 | ||||
57,344 | Xerox Corp | 928 | |||||
14,538 | * | Zimmer Holdings, Inc | 962 | ||||
38
TIAA SEPARATE ACCOUNT VA-1 - Stock Index Account
SHARES | COMPANY | VALUE (000) | |||||
1,200 | * | Zoll Medical Corp | $ | 32 | |||
1,176 | e* | Zygo Corp | 15 | ||||
2,690 | e* | ev3, Inc | 34 | ||||
TOTAL INSTRUMENTS AND RELATED PRODUCTS | 46,497 | ||||||
INSURANCE AGENTS, BROKERS AND SERVICE - 0.43% | |||||||
17,963 | AON Corp | 857 | |||||
6,834 | Brown & Brown, Inc | 161 | |||||
2,076 | e | Crawford & Co (Class B) | 9 | ||||
6,200 | e | Gallagher (Arthur J.) & Co | 150 | ||||
19,373 | Hartford Financial Services Group, Inc | 1,689 | |||||
2,336 | Hilb Rogal & Hobbs Co | 95 | |||||
31,591 | Marsh & McLennan Cos, Inc | 836 | |||||
2,320 | e | National Financial Partners Corp | 106 | ||||
1,515 | * | United America Indemnity Ltd (Class A) | 30 | ||||
557 | White Mountains Insurance Group Ltd | 286 | |||||
TOTAL INSURANCE AGENTS, BROKERS AND SERVICE | 4,219 | ||||||
INSURANCE CARRIERS - 4.59% | |||||||
19,293 | ACE Ltd | 1,192 | |||||
3,440 | * | AMERIGROUP Corp | 125 | ||||
31,344 | Aetna, Inc | 1,809 | |||||
29,917 | Aflac, Inc | 1,874 | |||||
2,273 | Alfa Corp | 49 | |||||
340 | e* | Alleghany Corp | 137 | ||||
3,614 | Allied World Assurance Holdings Ltd | 181 | |||||
34,858 | Allstate Corp | 1,821 | |||||
6,238 | e | Ambac Financial Group, Inc | 161 | ||||
3,620 | e | American Equity Investment Life Holding Co | 30 | ||||
5,031 | American Financial Group, Inc | 145 | |||||
137,111 | American International Group, Inc | 7,994 | |||||
615 | American National Insurance Co | 75 | |||||
978 | American Physicians Capital, Inc | 41 | |||||
1,131 | * | Amerisafe, Inc | 18 | ||||
1,541 | e | Amtrust Financial Services, Inc | 21 | ||||
3,110 | * | Arch Capital Group Ltd | 219 | ||||
1,571 | * | Argo Group International Holdings Ltd | 66 | ||||
5,006 | Aspen Insurance Holdings Ltd | 144 | |||||
7,407 | Assurant, Inc | 496 | |||||
4,150 | Assured Guaranty Ltd | 110 | |||||
9,401 | Axis Capital Holdings Ltd | 366 | |||||
625 | Baldwin & Lyons, Inc (Class B) | 17 | |||||
10,431 | W.R. Berkley Corp | 311 | |||||
1,743 | e | CNA Financial Corp | 59 | ||||
1,100 | * | CNA Surety Corp | 22 | ||||
2,823 | * | Centene Corp | 77 | ||||
24,561 | Chubb Corp | 1,341 | |||||
9,813 | Cincinnati Financial Corp | 388 | |||||
2,162 | * | Citizens, Inc | 12 | ||||
3,273 | e | Commerce Group, Inc | 118 | ||||
10,017 | e* | Conseco, Inc | 126 | ||||
454 | * | Darwin Professional Underwriters, Inc | 11 | ||||
2,592 | Delphi Financial Group, Inc (Class A) | 91 | |||||
850 | Donegal Group, Inc (Class A) | 15 | |||||
168 | EMC Insurance Group, Inc | 4 | |||||
39
TIAA SEPARATE ACCOUNT VA-1 - Stock Index Account
SHARES | COMPANY | VALUE (000) | |||||
3,600 | Employers Holdings, Inc | $ | 60 | ||||
3,475 | e | Endurance Specialty Holdings Ltd | 145 | ||||
426 | e* | Enstar Group Ltd | 52 | ||||
3,457 | e | Erie Indemnity Co (Class A) | 179 | ||||
3,668 | Everest Re Group Ltd | 368 | |||||
881 | FBL Financial Group, Inc (Class A) | 30 | |||||
558 | e* | Fpic Insurance Group, Inc | 24 | ||||
13,156 | e | Fidelity National Title Group, Inc (Class A) | 192 | ||||
1,175 | e* | First Acceptance Corp | 5 | ||||
5,326 | e | First American Corp | 182 | ||||
763 | * | First Mercury Financial Corp | 19 | ||||
869 | Flagstone Reinsurance Holdings Ltd | 12 | |||||
26,613 | Genworth Financial, Inc (Class A) | 677 | |||||
540 | e* | Greenlight Capital Re Ltd (Class A) | 11 | ||||
7,008 | HCC Insurance Holdings, Inc | 201 | |||||
3,274 | Hanover Insurance Group, Inc | 150 | |||||
839 | Harleysville Group, Inc | 30 | |||||
6,861 | * | Health Net, Inc | 331 | ||||
1,750 | * | HealthExtras, Inc | 46 | ||||
2,916 | * | Healthspring, Inc | 56 | ||||
2,970 | Horace Mann Educators Corp | 56 | |||||
10,277 | * | Humana, Inc | 774 | ||||
2,835 | IPC Holdings Ltd | 82 | |||||
423 | e | Independence Holding Co | 5 | ||||
1,436 | e | Infinity Property & Casualty Corp | 52 | ||||
314 | Kansas City Life Insurance Co | 14 | |||||
1,114 | e | LandAmerica Financial Group, Inc | 37 | ||||
10,028 | e | Leucadia National Corp | 472 | ||||
16,569 | Lincoln National Corp | 965 | |||||
26,651 | Loews Corp | 1,342 | |||||
8,009 | e | MBIA, Inc | 149 | ||||
5,088 | e | MGIC Investment Corp | 114 | ||||
608 | * | Markel Corp | 299 | ||||
3,703 | e | Max Re Capital Ltd | 104 | ||||
1,665 | * | Meadowbrook Insurance Group, Inc | 16 | ||||
1,767 | Mercury General Corp | 88 | |||||
28,848 | Metlife, Inc | 1,778 | |||||
742 | e | Midland Co | 48 | ||||
720 | e* | Molina Healthcare, Inc | 28 | ||||
6,148 | Montpelier Re Holdings Ltd | 105 | |||||
376 | e | NYMAGIC, Inc | 9 | ||||
1,024 | e | National Interstate Corp | 34 | ||||
154 | National Western Life Insurance Co (Class A) | 32 | |||||
3,152 | Nationwide Financial Services, Inc (Class A) | 142 | |||||
838 | * | Navigators Group, Inc | 54 | ||||
1,658 | e | Odyssey Re Holdings Corp | 61 | ||||
14,152 | Old Republic International Corp | 218 | |||||
1,314 | OneBeacon Insurance Group Ltd | 28 | |||||
1,846 | e* | PMA Capital Corp (Class A) | 15 | ||||
5,465 | e | PMI Group, Inc | 73 | ||||
3,527 | PartnerRe Ltd | 291 | |||||
3,636 | * | Philadelphia Consolidated Holding Co | 143 | ||||
7,094 | Phoenix Cos, Inc | 84 | |||||
3,659 | Platinum Underwriters Holdings Ltd | 130 | |||||
1,393 | e | Presidential Life Corp | 24 | ||||
40
TIAA SEPARATE ACCOUNT VA-1 - Stock Index Account
SHARES | COMPANY | VALUE (000) | |||||
2,793 | e* | Primus Guaranty Ltd | $ | 20 | |||
16,376 | Principal Financial Group | 1,127 | |||||
2,003 | * | ProAssurance Corp | 110 | ||||
44,236 | * | Progressive Corp | 848 | ||||
4,294 | Protective Life Corp | 176 | |||||
28,332 | Prudential Financial, Inc | 2,636 | |||||
1,105 | e* | RAM Holdings Ltd | 5 | ||||
1,557 | e | RLI Corp | 88 | ||||
5,032 | e | Radian Group, Inc | 59 | ||||
1,878 | Reinsurance Group Of America, Inc | 99 | |||||
4,289 | RenaissanceRe Holdings Ltd | 258 | |||||
5,694 | Safeco Corp | 317 | |||||
784 | Safety Insurance Group, Inc | 29 | |||||
4,085 | e,v* | Scottish Re Group Ltd | 3 | ||||
999 | * | SeaBright Insurance Holdings, Inc | 15 | ||||
1,469 | e | Security Capital Assurance Ltd | 6 | ||||
3,600 | e | Selective Insurance Group, Inc | 83 | ||||
2,873 | Stancorp Financial Group, Inc | 145 | |||||
913 | e | State Auto Financial Corp | 24 | ||||
1,214 | e | Stewart Information Services Corp | 32 | ||||
5,839 | Torchmark Corp | 353 | |||||
1,074 | e | Tower Group, Inc | 36 | ||||
1,735 | Transatlantic Holdings, Inc | 126 | |||||
40,618 | Travelers Cos, Inc/The | 2,185 | |||||
648 | e* | Triad Guaranty, Inc | 6 | ||||
1,337 | e | United Fire & Casualty Co | 39 | ||||
81,978 | UnitedHealth Group, Inc | 4,771 | |||||
2,795 | e | Unitrin, Inc | 134 | ||||
2,474 | e* | Universal American Financial Corp | 63 | ||||
21,288 | UnumProvident Corp | 506 | |||||
1,000 | * | Validus Holdings Ltd | 26 | ||||
2,485 | * | WellCare Health Plans, Inc | 105 | ||||
91 | Wesco Financial Corp | 37 | |||||
11,131 | XL Capital Ltd (Class A) | 560 | |||||
2,375 | Zenith National Insurance Corp | 106 | |||||
TOTAL INSURANCE CARRIERS | 45,435 | ||||||
JUSTICE, PUBLIC ORDER AND SAFETY - 0.03% | |||||||
7,308 | * | Corrections Corp of America | 216 | ||||
3,103 | e* | Geo Group, Inc | 87 | ||||
TOTAL JUSTICE, PUBLIC ORDER AND SAFETY | 303 | ||||||
LEATHER AND LEATHER PRODUCTS - 0.12% | |||||||
4,890 | e* | CROCS, Inc | 180 | ||||
22,707 | * | Coach, Inc | 694 | ||||
1,554 | e* | Genesco, Inc | 59 | ||||
3,106 | * | Iconix Brand Group, Inc | 61 | ||||
1,333 | Steven Madden Ltd | 27 | |||||
2,878 | e* | Timberland Co (Class A) | 52 | ||||
378 | e | Weyco Group, Inc | 10 | ||||
3,523 | Wolverine World Wide, Inc | 86 | |||||
TOTAL LEATHER AND LEATHER PRODUCTS | 1,169 | ||||||
LEGAL SERVICES - 0.02% | |||||||
2,772 | * | FTI Consulting, Inc | 171 | ||||
41
TIAA SEPARATE ACCOUNT VA-1 - Stock Index Account
SHARES | COMPANY | VALUE (000) | |||||
714 | e* | Pre-Paid Legal Services, Inc | $ | 40 | |||
TOTAL LEGAL SERVICES | 211 | ||||||
LOCAL AND INTERURBAN PASSENGER TRANSIT - 0.00%** | |||||||
564 | e* | Emergency Medical Services Corp (Class A) | 17 | ||||
TOTAL LOCAL AND INTERURBAN PASSENGER TRANSIT | 17 | ||||||
LUMBER AND WOOD PRODUCTS - 0.02% | |||||||
660 | e | American Woodmark Corp | 12 | ||||
4,900 | e* | Champion Enterprises, Inc | 46 | ||||
742 | e | Deltic Timber Corp | 38 | ||||
6,361 | Louisiana-Pacific Corp | 87 | |||||
442 | e | Skyline Corp | 13 | ||||
979 | e | Universal Forest Products, Inc | 29 | ||||
TOTAL LUMBER AND WOOD PRODUCTS | 225 | ||||||
METAL MINING - 0.52% | |||||||
5,583 | * | Apex Silver Mines Ltd | 85 | ||||
2,557 | e | Cleveland-Cliffs, Inc | 258 | ||||
28,976 | e* | Coeur d’Alene Mines Corp | 143 | ||||
2,939 | Foundation Coal Holdings, Inc | 154 | |||||
23,322 | Freeport-McMoRan Copper & Gold, Inc (Class B) | 2,389 | |||||
7,406 | e* | Hecla Mining Co | 69 | ||||
26,155 | Newmont Mining Corp | 1,277 | |||||
1,620 | * | Patriot Coal Corp | 68 | ||||
3,261 | e* | Rosetta Resources, Inc | 65 | ||||
2,140 | e | Royal Gold, Inc | 65 | ||||
1,718 | e* | ShengdaTech, Inc | 25 | ||||
4,398 | e | Southern Copper Corp | 462 | ||||
1,968 | e* | Stillwater Mining Co | 19 | ||||
2,885 | * | US Gold Corp | 9 | ||||
5,188 | e* | Uranium Resources, Inc | 65 | ||||
TOTAL METAL MINING | 5,153 | ||||||
MISCELLANEOUS MANUFACTURING INDUSTRIES - 0.30% | |||||||
988 | * | Armstrong World Industries, Inc | 40 | ||||
1,544 | Blyth, Inc | 34 | |||||
4,691 | Callaway Golf Co | 82 | |||||
2,087 | e | Daktronics, Inc | 47 | ||||
9,381 | e | Fortune Brands, Inc | 679 | ||||
9,750 | Hasbro, Inc | 249 | |||||
1,657 | e* | Jakks Pacific, Inc | 39 | ||||
1,066 | e | Marine Products Corp | 7 | ||||
24,326 | Mattel, Inc | 463 | |||||
2,137 | e | Nautilus, Inc | 10 | ||||
1,217 | * | RC2 Corp | 34 | ||||
700 | e* | Russ Berrie & Co, Inc | 11 | ||||
2,343 | e* | Shuffle Master, Inc | 28 | ||||
467 | e | Steinway Musical Instruments, Inc | 13 | ||||
29,991 | Tyco International Ltd | 1,189 | |||||
TOTAL MISCELLANEOUS MANUFACTURING INDUSTRIES | 2,925 | ||||||
MISCELLANEOUS RETAIL - 1.29% | |||||||
1,264 | e* | 1-800-FLOWERS.COM, Inc (Class A) | 11 | ||||
872 | e* | AC Moore Arts & Crafts, Inc | 12 | ||||
42
TIAA SEPARATE ACCOUNT VA-1 - Stock Index Account
SHARES | COMPANY | VALUE (000) | |||||
18,672 | * | Amazon.com, Inc | $ | 1,730 | |||
3,240 | Barnes & Noble, Inc | 112 | |||||
21,215 | e | Best Buy Co, Inc | 1,117 | ||||
1,412 | e | Big 5 Sporting Goods Corp | 20 | ||||
1,004 | e* | Blue Nile, Inc | 68 | ||||
921 | e | Books-A-Million, Inc | 11 | ||||
3,769 | e | Borders Group, Inc | 40 | ||||
968 | e* | Build-A-Bear Workshop, Inc | 14 | ||||
3,306 | e* | CKX, Inc | 40 | ||||
90,582 | CVS Corp | 3,601 | |||||
2,000 | Cash America International, Inc | 65 | |||||
3,853 | e* | Coldwater Creek, Inc | 26 | ||||
4,676 | * | Dick’s Sporting Goods, Inc | 130 | ||||
5,966 | * | Dollar Tree Stores, Inc | 155 | ||||
2,322 | * | Ezcorp, Inc (Class A) | 26 | ||||
1,606 | * | GSI Commerce, Inc | 31 | ||||
2,439 | e* | Hibbett Sports, Inc | 49 | ||||
2,107 | Longs Drug Stores Corp | 99 | |||||
2,547 | MSC Industrial Direct Co (Class A) | 103 | |||||
2,071 | e* | Nutri/System, Inc | 56 | ||||
16,820 | * | Office Depot, Inc | 234 | ||||
4,584 | OfficeMax, Inc | 95 | |||||
840 | e* | Overstock.com, Inc | 13 | ||||
8,307 | Petsmart, Inc | 195 | |||||
811 | Pricesmart, Inc | 24 | |||||
37,701 | e* | Rite Aid Corp | 105 | ||||
4,539 | e* | Sears Holdings Corp | 463 | ||||
895 | * | Shutterfly, Inc | 23 | ||||
1,250 | e* | Stamps.com, Inc | 15 | ||||
43,747 | Staples, Inc | 1,009 | |||||
461 | e | Systemax, Inc | 9 | ||||
8,340 | Tiffany & Co | 384 | |||||
1,504 | e* | Valuevision International, Inc (Class A) | 9 | ||||
61,006 | Walgreen Co | 2,323 | |||||
1,783 | e | World Fuel Services Corp | 52 | ||||
3,026 | e* | Zale Corp | 49 | ||||
933 | e* | Zumiez, Inc | 23 | ||||
2,296 | e* | Priceline.com, Inc | 264 | ||||
TOTAL MISCELLANEOUS RETAIL | 12,805 | ||||||
MOTION PICTURES - 1.06% | |||||||
2,781 | e* | Avid Technology, Inc | 79 | ||||
12,560 | e* | Blockbuster, Inc (Class A) | 49 | ||||
37,287 | CBS Corp (Class B) | 1,016 | |||||
840 | e | Carmike Cinemas, Inc | 6 | ||||
1,605 | e | Cinemark Holdings Inc | 27 | ||||
17,200 | * | Discovery Holding Co (Class A) | 432 | ||||
4,014 | * | DreamWorks Animation SKG, Inc (Class A) | 102 | ||||
1,016 | e* | Gaiam, Inc (Class A) | 30 | ||||
3,427 | e* | Macrovision Corp | 63 | ||||
2,600 | e | National CineMedia, Inc | 66 | ||||
139,403 | News Corp (Class A) | 2,856 | |||||
3,910 | e | Regal Entertainment Group (Class A) | 71 | ||||
230,399 | Time Warner, Inc | 3,804 | |||||
8,960 | e* | Time Warner Telecom, Inc (Class A) | 182 | ||||
43
TIAA SEPARATE ACCOUNT VA-1 - Stock Index Account
SHARES | COMPANY | VALUE (000) | |||||
37,954 | * | Viacom, Inc (Class B) | $ | 1,667 | |||
TOTAL MOTION PICTURES | 10,450 | ||||||
MUSEUMS, BOTANICAL, ZOOLOGICAL GARDENS - 0.00%** | |||||||
1,793 | e* | Premier Exhibitions, Inc | 20 | ||||
TOTAL MUSEUMS, BOTANICAL, ZOOLOGICAL GARDENS | 20 | ||||||
NONCLASSIFIABLE ESTABLISHMENTS - 0.01% | |||||||
1,398 | e* | Energy Infrastructure Acquisition Corp | 14 | ||||
3,300 | e* | Hicks Acquisition Co I, Inc | 30 | ||||
2,900 | e* | Triplecrown Acquisition Corp | 27 | ||||
TOTAL NONCLASSIFIABLE ESTABLISHMENTS | 71 | ||||||
NONDEPOSITORY INSTITUTIONS - 1.26% | |||||||
2,159 | * | Guaranty Financial Financial Group, Inc | 35 | ||||
2,000 | e* | Aldabra 2 Acquisition Corp | 19 | ||||
2,400 | * | Alternative Asset Management Acquisition Corp | 22 | ||||
4,592 | Advance America Cash Advance Centers, Inc | 47 | |||||
2,254 | e | Advanta Corp (Class B) | 18 | ||||
6,944 | e* | AmeriCredit Corp | 89 | ||||
11,423 | e | American Capital Strategies Ltd | 377 | ||||
63,350 | American Express Co | 3,295 | |||||
3,510 | Ares Capital Corp | 51 | |||||
645 | e | Asta Funding, Inc | 17 | ||||
2,000 | Chimera Investment Corp | 36 | |||||
11,733 | CIT Group, Inc | 282 | |||||
24,323 | Capital One Financial Corp | 1,150 | |||||
9,101 | e | CapitalSource, Inc | 160 | ||||
3,111 | e | Centerline Holding Co | 24 | ||||
1,233 | e* | CompuCredit Corp | 12 | ||||
37,128 | Countrywide Financial Corp | 332 | |||||
611 | e* | Credit Acceptance Corp | 13 | ||||
30,035 | Discover Financial Services | 453 | |||||
966 | e* | Encore Capital Group, Inc | 9 | ||||
59,521 | Fannie Mae | 2,380 | |||||
591 | e | Federal Agricultural Mortgage Corp (Class C) | 16 | ||||
1,621 | e | Financial Federal Corp | 36 | ||||
1,630 | * | First Cash Financial Services, Inc | 24 | ||||
3,742 | e | First Marblehead Corp | 57 | ||||
40,467 | Freddie Mac | 1,379 | |||||
3,300 | * | GLG Partners, Inc | 45 | ||||
1,426 | e | Hercules Technology Growth Capital, Inc | 18 | ||||
2,956 | e* | INVESTools, Inc | 52 | ||||
1,938 | e* | Information Services Group, Inc | 13 | ||||
893 | Kohlberg Capital Corp | 11 | |||||
2,305 | e* | Marathon Acquisition Corp | 18 | ||||
3,210 | e | MCG Capital Corp | 37 | ||||
1,200 | * | Mercadolibre, Inc | 89 | ||||
812 | e* | NewStar Financial, Inc | 7 | ||||
1,181 | e | NGP Capital Resources Co | 18 | ||||
1,557 | e* | NTR Acquisition Co | 15 | ||||
1,165 | e | Nelnet, Inc (Class A) | 15 | ||||
2,600 | e* | Ocwen Financial Corp | 14 | ||||
3,083 | * | PHH Corp | 54 | ||||
1,115 | e | Patriot Capital Funding, Inc | 11 | ||||
44
TIAA SEPARATE ACCOUNT VA-1 - Stock Index Account
SHARES | COMPANY | VALUE (000) | |||||
25,169 | * | SLM Corp | $ | 507 | |||
258 | e | Student Loan Corp | 28 | ||||
1,200 | e | TICC Capital Corp | 11 | ||||
15,252 | Textron, Inc | 1,087 | |||||
1,332 | e* | World Acceptance Corp | 36 | ||||
TOTAL NONDEPOSITORY INSTITUTIONS | 12,419 | ||||||
NONMETALLIC MINERALS, EXCEPT FUELS - 0.07% | |||||||
1,482 | e | AMCOL International Corp | 53 | ||||
2,075 | e | Compass Minerals International, Inc | 85 | ||||
2,908 | e* | General Moly, Inc | 34 | ||||
6,159 | e | Vulcan Materials Co | 487 | ||||
TOTAL NONMETALLIC MINERALS, EXCEPT FUELS | 659 | ||||||
OIL AND GAS EXTRACTION - 3.54% | |||||||
568 | e | APCO Argentina, Inc | 16 | ||||
1,212 | * | ATP Oil & Gas Corp | 61 | ||||
28,385 | Anadarko Petroleum Corp | 1,865 | |||||
2,190 | e* | Arena Resources, Inc | 91 | ||||
1,428 | Atlas America, Inc | 85 | |||||
1,792 | * | Atwood Oceanics, Inc | 180 | ||||
17,947 | BJ Services Co | 435 | |||||
19,711 | Baker Hughes, Inc | 1,599 | |||||
2,507 | e* | Basic Energy Services, Inc | 55 | ||||
2,505 | Berry Petroleum Co (Class A) | 111 | |||||
1,840 | e* | Bill Barrett Corp | 77 | ||||
905 | e* | Bois d’Arc Energy, Inc | 18 | ||||
2,914 | * | Brigham Exploration Co | 22 | ||||
1,573 | e* | Bronco Drilling Co, Inc | 23 | ||||
1,794 | e* | CNX Gas Corp | 57 | ||||
2,632 | e* | Cal Dive International, Inc | 35 | ||||
1,319 | e* | Callon Petroleum Co | 22 | ||||
13,856 | * | Cameron International Corp | 667 | ||||
1,285 | * | Carrizo Oil & Gas, Inc | 70 | ||||
3,135 | e* | Cheniere Energy, Inc | 102 | ||||
28,492 | e | Chesapeake Energy Corp | 1,117 | ||||
5,089 | e | Cimarex Energy Co | 216 | ||||
632 | * | Clayton Williams Energy, Inc | 20 | ||||
2,526 | e* | Complete Production Services, Inc | 45 | ||||
2,751 | * | Comstock Resources, Inc | 94 | ||||
1,300 | * | Concho Resources, Inc | 27 | ||||
811 | e* | Contango Oil & Gas Co | 41 | ||||
1,798 | * | Continental Resources, Inc | 47 | ||||
474 | e* | Dawson Geophysical Co | 34 | ||||
4,024 | e* | Delta Petroleum Corp | 76 | ||||
15,200 | * | Denbury Resources, Inc | 452 | ||||
4,143 | e | Diamond Offshore Drilling, Inc | 588 | ||||
9,113 | ENSCO International, Inc | 543 | |||||
3,362 | e* | EXCO Resources, Inc | 52 | ||||
1,723 | e* | Edge Petroleum Corp | 10 | ||||
3,307 | * | Encore Acquisition Co | 110 | ||||
2,129 | * | Energy Partners Ltd | 25 | ||||
7,432 | Equitable Resources, Inc | 396 | |||||
3,794 | e* | Exterran Holdings, Inc | 310 | ||||
2,157 | e* | FX Energy, Inc | 12 | ||||
45
TIAA SEPARATE ACCOUNT VA-1 - Stock Index Account
SHARES | COMPANY | VALUE (000) | |||||
4,016 | * | Forest Oil Corp | $ | 204 | |||
515 | e* | GMX Resources, Inc | 17 | ||||
1,949 | e* | GeoGlobal Resources, Inc | 10 | ||||
424 | e* | Geokinetics, Inc | 8 | ||||
5,603 | * | Global Industries Ltd | 120 | ||||
939 | e* | Goodrich Petroleum Corp | 21 | ||||
11,559 | * | Grey Wolf, Inc | 62 | ||||
853 | e* | Gulfport Energy Corp | 16 | ||||
55,913 | Halliburton Co | 2,120 | |||||
2,496 | e* | Harvest Natural Resources, Inc | 31 | ||||
5,725 | * | Helix Energy Solutions Group, Inc | 238 | ||||
6,324 | Helmerich & Payne, Inc | 253 | |||||
6,794 | * | Hercules Offshore, Inc | 162 | ||||
597 | Kayne Anderson Energy Development Co | 14 | |||||
5,069 | * | Mariner Energy, Inc | 116 | ||||
1,692 | e* | McMoRan Exploration Co | 22 | ||||
6,041 | e* | Meridian Resource Corp | 11 | ||||
16,719 | * | Nabors Industries Ltd | 458 | ||||
21,880 | * | National Oilwell Varco, Inc | 1,607 | ||||
5,171 | * | Newpark Resources, Inc | 28 | ||||
16,276 | Noble Corp | 920 | |||||
3,462 | * | Oceaneering International, Inc | 233 | ||||
6,456 | e* | Oilsands Quest, Inc | 26 | ||||
2,048 | * | Parallel Petroleum Corp | 36 | ||||
6,555 | e* | Parker Drilling Co | 49 | ||||
9,595 | e | Patterson-UTI Energy, Inc | 187 | ||||
2,296 | Penn Virginia Corp | 100 | |||||
10,359 | e* | PetroHawk Energy Corp | 179 | ||||
1,000 | e* | Petroleum Development Corp | 59 | ||||
2,768 | e* | Petroquest Energy, Inc | 40 | ||||
2,681 | * | Pioneer Drilling Co | 32 | ||||
7,624 | Pioneer Natural Resources Co | 372 | |||||
7,752 | * | Plains Exploration & Production Co | 419 | ||||
10,147 | * | Pride International, Inc | 344 | ||||
3,296 | * | Quicksilver Resources, Inc | 196 | ||||
1,462 | e | RPC, Inc | 17 | ||||
9,058 | Range Resources Corp | 465 | |||||
6,954 | Rowan Cos, Inc | 274 | |||||
72,092 | Schlumberger Ltd | 7,092 | |||||
1,453 | e* | SEACOR Holdings, Inc | 135 | ||||
12,286 | Smith International, Inc | 907 | |||||
10,405 | * | Southwestern Energy Co | 580 | ||||
3,800 | St. Mary Land & Exploration Co | 147 | |||||
1,752 | * | Stone Energy Corp | 82 | ||||
5,008 | e* | Sulphco, Inc | 26 | ||||
5,049 | * | Superior Energy Services | 174 | ||||
615 | e* | Superior Offshore International, Inc | 3 | ||||
720 | e* | Superior Well Services, Inc | 15 | ||||
1,701 | * | Swift Energy Co | 75 | ||||
1,841 | e* | TXCO Resources, Inc | 22 | ||||
4,457 | e* | Tetra Technologies, Inc | 69 | ||||
3,448 | e | Tidewater, Inc | 189 | ||||
942 | e* | Toreador Resources Corp | 7 | ||||
18,859 | Transocean, Inc | 2,700 | |||||
755 | e* | Trico Marine Services, Inc | 28 | ||||
46
TIAA SEPARATE ACCOUNT VA-1 - Stock Index Account
SHARES | COMPANY | VALUE (000) | |||||
500 | * | Union Drilling, Inc | $ | 8 | |||
361 | m,v* | PetroCorp | 0 | ||||
2,793 | * | Unit Corp | 129 | ||||
3,680 | e* | Vaalco Energy, Inc | 17 | ||||
764 | * | Venoco, Inc | 15 | ||||
1,693 | e | W&T Offshore, Inc | 51 | ||||
1,989 | * | W-H Energy Services, Inc | 112 | ||||
3,436 | e* | Warren Resources, Inc | 49 | ||||
20,642 | * | Weatherford International Ltd | 1,416 | ||||
2,386 | * | Whiting Petroleum Corp | 138 | ||||
2,395 | * | Willbros Group, Inc | 92 | ||||
29,426 | XTO Energy, Inc | 1,511 | |||||
TOTAL OIL AND GAS EXTRACTION | 35,061 | ||||||
PAPER AND ALLIED PRODUCTS - 0.46% | |||||||
2,993 | e* | AbitibiBowater, Inc | 62 | ||||
6,403 | Bemis Co | 175 | |||||
2,317 | * | Buckeye Technologies, Inc | 29 | ||||
3,345 | e* | Cenveo, Inc | 58 | ||||
1,356 | e* | Chesapeake Corp | 7 | ||||
26,945 | * | Domtar Corporation | 207 | ||||
2,970 | Glatfelter | 45 | |||||
4,634 | e* | Graphic Packaging Corp | 17 | ||||
2,066 | Greif, Inc (Class A) | 135 | |||||
26,643 | International Paper Co | 863 | |||||
26,607 | Kimberly-Clark Corp | 1,845 | |||||
11,293 | e | MeadWestvaco Corp | 353 | ||||
1,971 | e* | Mercer International, Inc | 15 | ||||
1,075 | Neenah Paper, Inc | 31 | |||||
4,643 | Packaging Corp of America | 131 | |||||
1,984 | Rock-Tenn Co (Class A) | 50 | |||||
1,040 | Schweitzer-Mauduit International, Inc | 27 | |||||
15,753 | * | Smurfit-Stone Container Corp | 166 | ||||
6,153 | Sonoco Products Co | 201 | |||||
6,477 | Temple-Inland, Inc | 135 | |||||
3,174 | Wausau Paper Corp | 29 | |||||
TOTAL PAPER AND ALLIED PRODUCTS | 4,581 | ||||||
PERSONAL SERVICES - 0.14% | |||||||
316 | e | CPI Corp | 7 | ||||
8,286 | Cintas Corp | 279 | |||||
2,067 | e* | Coinstar, Inc | 58 | ||||
1,405 | e | G & K Services, Inc (Class A) | 53 | ||||
19,744 | e | H&R Block, Inc | 367 | ||||
2,055 | e | Jackson Hewitt Tax Service, Inc | 65 | ||||
2,615 | Regis Corp | 73 | |||||
5,024 | e* | Sally Beauty Holdings, Inc | 45 | ||||
17,997 | Service Corp International | 253 | |||||
1,036 | e* | Steiner Leisure Ltd | 46 | ||||
864 | Unifirst Corp | 33 | |||||
2,092 | e | Weight Watchers International, Inc | 94 | ||||
TOTAL PERSONAL SERVICES | 1,373 | ||||||
PETROLEUM AND COAL PRODUCTS - 7.51% | |||||||
783 | e | Alon USA Energy, Inc | 21 | ||||
47
TIAA SEPARATE ACCOUNT VA-1 - Stock Index Account
SHARES | COMPANY | VALUE (000) | ||||||
20,252 | Apache Corp | $ | 2,178 | |||||
3,437 | Ashland, Inc | 163 | ||||||
1,100 | * | CVR Energy, Inc | 27 | |||||
5,926 | Cabot Oil & Gas Corp | 239 | ||||||
131,478 | Chevron Corp | 12,271 | ||||||
99,977 | ConocoPhillips | 8,828 | ||||||
683 | Delek US Holdings, Inc | 14 | ||||||
27,223 | Devon Energy Corp | 2,420 | ||||||
14,962 | EOG Resources, Inc | 1,335 | ||||||
345,505 | Exxon Mobil Corp | 32,370 | ||||||
6,733 | Frontier Oil Corp | 273 | ||||||
2,769 | e* | Headwaters, Inc | 33 | |||||
17,001 | Hess Corp | 1,715 | ||||||
2,772 | Holly Corp | 141 | ||||||
43,454 | Marathon Oil Corp | 2,645 | ||||||
11,508 | Murphy Oil Corp | 976 | ||||||
7,953 | * | Newfield Exploration Co | 419 | |||||
10,456 | Noble Energy, Inc | 831 | ||||||
51,013 | Occidental Petroleum Corp | 3,927 | ||||||
1,700 | * | SandRidge Energy, Inc | 61 | |||||
7,430 | Sunoco, Inc | 538 | ||||||
8,359 | Tesoro Corp | 399 | ||||||
33,585 | Valero Energy Corp | 2,352 | ||||||
1,100 | e | WD-40 Co | 42 | |||||
1,509 | e | Western Refining, Inc | 37 | |||||
TOTAL PETROLEUM AND COAL PRODUCTS | 74,255 | |||||||
PIPELINES, EXCEPT NATURAL GAS - 0.10% | ||||||||
38,633 | Spectra Energy Corp | 998 | ||||||
TOTAL PIPELINES, EXCEPT NATURAL GAS | 998 | |||||||
PRIMARY METAL INDUSTRIES - 1.09% | ||||||||
7,055 | * | AK Steel Holding Corp | 326 | |||||
53,179 | Alcoa, Inc | 1,944 | ||||||
6,314 | Allegheny Technologies, Inc | 546 | ||||||
2,599 | e | Belden CDT, Inc | 116 | |||||
1,200 | * | Brush Engineered Materials, Inc | 44 | |||||
3,312 | Carpenter Technology Corp | 249 | ||||||
1,483 | e* | Century Aluminum Co | 80 | |||||
526 | * | Claymont Steel, Inc | 12 | |||||
528 | e* | Coleman Cable, Inc | 5 | |||||
4,100 | e* | CommScope, Inc | 202 | |||||
96,206 | Corning, Inc | 2,308 | ||||||
1,511 | e | Encore Wire Corp | 24 | |||||
12 | e* | Esmark, Inc | — | ^ | ||||
659 | e* | LB Foster Co (Class A) | 34 | |||||
3,250 | e* | General Cable Corp | 238 | |||||
1,633 | e | Gibraltar Industries, Inc | 25 | |||||
718 | e* | Haynes International, Inc | 50 | |||||
3,639 | Hubbell, Inc (Class B) | 188 | ||||||
1,977 | Matthews International Corp (Class A) | 93 | ||||||
2,431 | Mueller Industries, Inc | 70 | ||||||
538 | e* | Northwest Pipe Co | 21 | |||||
18,455 | Nucor Corp | 1,093 | ||||||
529 | Olympic Steel, Inc | 17 | ||||||
48
TIAA SEPARATE ACCOUNT VA-1 - Stock Index Account
SHARES | COMPANY | VALUE (000) | |||||
8,421 | Precision Castparts Corp | $ | 1,168 | ||||
2,169 | e | Quanex Corp | 113 | ||||
1,496 | * | RTI International Metals, Inc | 103 | ||||
1,362 | e | Schnitzer Steel Industries, Inc (Class A) | 94 | ||||
5,792 | Steel Dynamics, Inc | 345 | |||||
1,141 | e* | Superior Essex, Inc | 27 | ||||
1,597 | e | Texas Industries, Inc | 112 | ||||
4,472 | e | Titanium Metals Corp | 118 | ||||
1,864 | e | Tredegar Corp | 30 | ||||
7,234 | United States Steel Corp | 875 | |||||
400 | * | Universal Stainless & Alloy | 14 | ||||
4,206 | e | Worthington Industries, Inc | 75 | ||||
TOTAL PRIMARY METAL INDUSTRIES | 10,759 | ||||||
PRINTING AND PUBLISHING - 0.44% | |||||||
2,726 | e* | ACCO Brands Corp | 44 | ||||
3,442 | e | American Greetings Corp (Class A) | 70 | ||||
5,182 | e | Belo (A.H.) Corp (Class A) | 90 | ||||
2,400 | e | Bowne & Co, Inc | 42 | ||||
269 | CSS Industries, Inc | 10 | |||||
734 | * | Consolidated Graphics, Inc | 35 | ||||
594 | e | Courier Corp | 20 | ||||
600 | * | Dolan Media Co | 17 | ||||
3,752 | Dun & Bradstreet Corp | 333 | |||||
1,693 | e | Ennis, Inc | 30 | ||||
14,354 | Gannett Co, Inc | 560 | |||||
821 | e | GateHouse Media, Inc | 7 | ||||
3,041 | e | Harte-Hanks, Inc | 53 | ||||
2,807 | Journal Communications, Inc (Class A) | 25 | |||||
2,965 | e | Lee Enterprises, Inc | 43 | ||||
800 | * | MSCI, Inc | 31 | ||||
1,522 | e | Martha Stewart Living Omnimedia, Inc (Class A) | 14 | ||||
2,758 | e | McClatchy Co (Class A) | 34 | ||||
20,992 | McGraw-Hill Cos, Inc | 920 | |||||
1,488 | Media General, Inc (Class A) | 32 | |||||
3,078 | Meredith Corp | 169 | |||||
514 | Multi-Color Corp | 14 | |||||
8,530 | e | New York Times Co (Class A) | 150 | ||||
945 | e* | Playboy Enterprises, Inc (Class B) | 9 | ||||
2,715 | e | Primedia, Inc | 23 | ||||
4,232 | e | R.H. Donnelley Corp | 154 | ||||
13,466 | R.R. Donnelley & Sons Co | 508 | |||||
977 | e | Schawk, Inc | 15 | ||||
2,073 | e* | Scholastic Corp | 72 | ||||
5,407 | e | EW Scripps Co (Class A) | 243 | ||||
1,179 | e | Standard Register Co | 14 | ||||
4,875 | e* | Sun-Times Media Group, Inc (Class A) | 11 | ||||
3,018 | e* | Valassis Communications, Inc | 35 | ||||
2,630 | e* | VistaPrint Ltd | 113 | ||||
356 | Washington Post Co (Class B) | 282 | |||||
3,097 | John Wiley & Sons, Inc (Class A) | 133 | |||||
TOTAL PRINTING AND PUBLISHING | 4,355 | ||||||
RAILROAD TRANSPORTATION - 0.66% | |||||||
21,787 | Burlington Northern Santa Fe Corp | 1,813 | |||||
49
TIAA SEPARATE ACCOUNT VA-1 - Stock Index Account
SHARES | COMPANY | VALUE (000) | |||||
26,748 | CSX Corp | $ | 1,176 | ||||
2,350 | e* | Genesee & Wyoming, Inc (Class A) | 57 | ||||
4,812 | e* | Kansas City Southern Industries, Inc | 165 | ||||
24,054 | Norfolk Southern Corp | 1,213 | |||||
16,485 | Union Pacific Corp | 2,071 | |||||
TOTAL RAILROAD TRANSPORTATION | 6,495 | ||||||
REAL ESTATE - 0.10% | |||||||
2,159 | * | Forestar Real Estate Group, Inc | 51 | ||||
11,914 | e* | CB Richard Ellis Group, Inc (Class A) | 257 | ||||
378 | e | Consolidated-Tomoka Land Co | 24 | ||||
2,100 | DuPont Fabros Technology, Inc | 41 | |||||
4,444 | Forest City Enterprises, Inc (Class A) | 197 | |||||
982 | Grubb & Ellis Co | 6 | |||||
2,306 | Jones Lang LaSalle, Inc | 164 | |||||
1,663 | e* | LoopNet, Inc | 23 | ||||
297 | e* | Stratus Properties, Inc | 10 | ||||
4,678 | e* | St. Joe Co | 166 | ||||
7,137 | e | Stewart Enterprises, Inc (Class A) | 64 | ||||
1,468 | Thomas Properties Group, Inc | 16 | |||||
TOTAL REAL ESTATE | 1,019 | ||||||
RUBBER AND MISCELLANEOUS PLASTIC PRODUCTS - 0.30% | |||||||
464 | e* | AEP Industries, Inc | 15 | ||||
3,774 | Cooper Tire & Rubber Co | 63 | |||||
781 | * | Deckers Outdoor Corp | 121 | ||||
12,989 | * | Goodyear Tire & Rubber Co | 367 | ||||
881 | e* | Metabolix, Inc | 21 | ||||
17,073 | Newell Rubbermaid, Inc | 442 | |||||
21,792 | Nike, Inc (Class B) | 1,400 | |||||
1,704 | e | Schulman (A.), Inc | 37 | ||||
9,876 | Sealed Air Corp | 228 | |||||
809 | * | Skechers U.S.A., Inc (Class A) | 16 | ||||
2,188 | e | Spartech Corp | 31 | ||||
1,479 | e | Titan International, Inc | 46 | ||||
714 | e* | Trex Co, Inc | 6 | ||||
3,650 | Tupperware Corp | 121 | |||||
2,075 | e | West Pharmaceutical Services, Inc | 84 | ||||
TOTAL RUBBER AND MISCELLANEOUS PLASTIC PRODUCTS | 2,998 | ||||||
SECURITY AND COMMODITY BROKERS - 3.10% | |||||||
879 | e* | Penson Worldwide, Inc | 13 | ||||
14,393 | Ameriprise Financial, Inc | 793 | |||||
8,541 | Broadridge Financial Solutions, Inc | 192 | |||||
7,281 | e | Bear Stearns Cos, Inc | 643 | ||||
3,906 | e | BlackRock, Inc | 847 | ||||
3,372 | CME Group, Inc | 2,313 | |||||
1,547 | Calamos Asset Management, Inc (Class A) | 46 | |||||
57,867 | Charles Schwab Corp | 1,479 | |||||
1,086 | e | Cohen & Steers, Inc | 33 | ||||
994 | * | Cowen Group, Inc | 9 | ||||
1,600 | * | Duff & Phelps Corp | 31 | ||||
26,134 | e* | E*Trade Financial Corp | 93 | ||||
7,400 | e | Eaton Vance Corp | 336 | ||||
528 | e | Evercore Partners, Inc (Class A) | 11 | ||||
50
TIAA SEPARATE ACCOUNT VA-1 - Stock Index Account
SHARES | COMPANY | VALUE (000) | |||||
2,300 | * | FBR Capital Markets Corp | $ | 22 | |||
526 | e* | FCStone Group, Inc | 24 | ||||
5,905 | Federated Investors, Inc (Class B) | 243 | |||||
10,088 | Franklin Resources, Inc | 1,154 | |||||
448 | GAMCO Investors, Inc (Class A) | 31 | |||||
982 | e* | GFI Group, Inc | 94 | ||||
25,098 | Goldman Sachs Group, Inc | 5,397 | |||||
1,134 | e | Greenhill & Co, Inc | 75 | ||||
2,464 | e* | Interactive Brokers Group, Inc (Class A) | 80 | ||||
4,300 | * | IntercontinentalExchange, Inc | 828 | ||||
26,000 | Invesco Ltd | 816 | |||||
2,790 | e* | Investment Technology Group, Inc | 133 | ||||
11,335 | e | Janus Capital Group, Inc | 372 | ||||
7,640 | Jefferies Group, Inc | 176 | |||||
1,786 | e* | KBW, Inc | 46 | ||||
6,754 | * | Knight Capital Group, Inc (Class A) | 97 | ||||
3,465 | e* | LaBranche & Co, Inc | 17 | ||||
6,023 | e* | Ladenburg Thalmann Financial Services, Inc | 13 | ||||
3,156 | e | Lazard Ltd (Class A) | 128 | ||||
8,021 | Legg Mason, Inc | 587 | |||||
32,581 | Lehman Brothers Holdings, Inc | 2,132 | |||||
6,300 | * | MF Global Ltd | 198 | ||||
1,518 | e* | MarketAxess Holdings, Inc | 19 | ||||
54,106 | Merrill Lynch & Co, Inc | 2,904 | |||||
64,471 | Morgan Stanley | 3,424 | |||||
913 | e* | Morningstar, Inc | 71 | ||||
16,419 | NYSE Euronext | 1,441 | |||||
6,885 | e* | Nasdaq Stock Market, Inc | 341 | ||||
5,636 | e | Nymex Holdings, Inc | 753 | ||||
1,153 | e* | Piper Jaffray Cos | 53 | ||||
6,123 | Raymond James Financial, Inc | 200 | |||||
8,370 | SEI Investments Co | 269 | |||||
1,726 | SWS Group, Inc | 22 | |||||
870 | e | Sanders Morris Harris Group, Inc | 9 | ||||
766 | e* | Stifel Financial Corp | 40 | ||||
16,220 | T Rowe Price Group, Inc | 987 | |||||
15,926 | TD Ameritrade Holding Corp | 319 | |||||
1,322 | e* | Thomas Weisel Partners Group, Inc | 18 | ||||
702 | e | US Global Investors, Inc (Class A) | 12 | ||||
98 | Value Line, Inc | 4 | |||||
1,311 | * | WP Stewart & Co Ltd | 7 | ||||
5,415 | Waddell & Reed Financial, Inc (Class A) | 195 | |||||
2,681 | e | optionsXpress Holdings, Inc | 91 | ||||
TOTAL SECURITY AND COMMODITY BROKERS | 30,681 | ||||||
SOCIAL SERVICES - 0.01% | |||||||
1,834 | * | Bright Horizons Family Solutions, Inc | 63 | ||||
1,396 | * | Capital Senior Living Corp | 14 | ||||
617 | e* | Providence Service Corp | 17 | ||||
1,211 | * | Res-Care, Inc | 30 | ||||
TOTAL SOCIAL SERVICES | 124 | ||||||
SPECIAL TRADE CONTRACTORS - 0.07% | |||||||
246 | e | Alico, Inc | 9 | ||||
1,884 | e* | AsiaInfo Holdings, Inc | 21 | ||||
51
TIAA SEPARATE ACCOUNT VA-1 - Stock Index Account
SHARES | COMPANY | VALUE (000) | |||||
1,567 | e | Chemed Corp | $ | 88 | |||
2,673 | Comfort Systems USA, Inc | 34 | |||||
2,650 | * | Dycom Industries, Inc | 71 | ||||
3,912 | * | EMCOR Group, Inc | 92 | ||||
1,632 | e* | Insituform Technologies, Inc (Class A) | 24 | ||||
987 | e* | Integrated Electrical Services, Inc | 18 | ||||
685 | * | Layne Christensen Co | 34 | ||||
9,892 | e* | Quanta Services, Inc | 260 | ||||
TOTAL SPECIAL TRADE CONTRACTORS | 651 | ||||||
STONE, CLAY, AND GLASS PRODUCTS - 0.50% | |||||||
44,057 | 3M Co | 3,715 | |||||
2,068 | e | Apogee Enterprises, Inc | 35 | ||||
1,443 | e | CARBO Ceramics, Inc | 54 | ||||
1,565 | * | Cabot Microelectronics Corp | 56 | ||||
2,941 | e | Eagle Materials, Inc | 104 | ||||
8,722 | Gentex Corp | 155 | |||||
862 | Libbey, Inc | 14 | |||||
5,902 | e* | Owens Corning, Inc | 119 | ||||
9,456 | * | Owens-Illinois, Inc | 468 | ||||
2,151 | e* | US Concrete, Inc | 7 | ||||
5,000 | e* | USG Corp | 179 | ||||
TOTAL STONE, CLAY, AND GLASS PRODUCTS | 4,906 | ||||||
TEXTILE MILL PRODUCTS - 0.00%** | |||||||
404 | e* | Heelys, Inc | 3 | ||||
874 | e | Oxford Industries, Inc | 22 | ||||
905 | e | Xerium Technologies, Inc | 5 | ||||
TOTAL TEXTILE MILL PRODUCTS | 30 | ||||||
TOBACCO PRODUCTS - 1.18% | |||||||
128,664 | Altria Group, Inc | 9,724 | |||||
6,549 | Loews Corp (Carolina Group) | 559 | |||||
10,479 | e | Reynolds American, Inc | 691 | ||||
9,797 | e | UST, Inc | 537 | ||||
1,760 | e | Universal Corp | 90 | ||||
2,405 | e | Vector Group Ltd | 48 | ||||
TOTAL TOBACCO PRODUCTS | 11,649 | ||||||
TRANSPORTATION BY AIR - 0.40% | |||||||
3,864 | e* | ABX Air, Inc | 16 | ||||
14,725 | e* | AMR Corp | 207 | ||||
677 | e* | Air Methods Corp | 34 | ||||
5,873 | e* | Airtran Holdings, Inc | 42 | ||||
2,436 | e* | Alaska Air Group, Inc | 61 | ||||
326 | * | Allegiant Travel Co | 10 | ||||
809 | e* | Atlas Air Worldwide Holdings, Inc | 44 | ||||
1,471 | e* | Bristow Group, Inc | 83 | ||||
5,828 | e* | Continental Airlines, Inc (Class B) | 130 | ||||
1,058 | e | Copa Holdings S.A. (Class A) | 40 | ||||
14,662 | * | Delta Air Lines, Inc | 218 | ||||
2,603 | e* | ExpressJet Holdings, Inc | 6 | ||||
18,827 | FedEx Corp | 1,679 | |||||
11,166 | e* | JetBlue Airways Corp | 66 | ||||
1,480 | e* | Midwest Air Group, Inc | 22 | ||||
52
TIAA SEPARATE ACCOUNT VA-1 - Stock Index Account
SHARES | COMPANY | VALUE (000) | |||||
16,113 | * | Northwest Airlines Corp | $ | 234 | |||
882 | e* | PHI, Inc | 27 | ||||
1,228 | e* | Pinnacle Airlines Corp | 19 | ||||
2,007 | * | Republic Airways Holdings, Inc | 39 | ||||
4,035 | Skywest, Inc | 108 | |||||
47,731 | Southwest Airlines Co | 582 | |||||
6,915 | e | UAL Corp | 247 | ||||
4,982 | e* | US Airways Group, Inc | 73 | ||||
TOTAL TRANSPORTATION BY AIR | 3,987 | ||||||
TRANSPORTATION EQUIPMENT - 2.56% | |||||||
2,061 | e* | AAR Corp | 78 | ||||
1,493 | e* | Accuride Corp | 12 | ||||
418 | e* | Aerovironment, Inc | 10 | ||||
1,438 | * | Aftermarket Technology Corp | 39 | ||||
2,719 | e | American Axle & Manufacturing Holdings, Inc | 51 | ||||
569 | e | American Railcar Industries, Inc | 11 | ||||
1,306 | * | Amerigon, Inc | 28 | ||||
1,100 | e | Arctic Cat, Inc | 13 | ||||
4,699 | e | ArvinMeritor, Inc | 55 | ||||
4,871 | Autoliv, Inc | 257 | |||||
5,637 | * | BE Aerospace, Inc | 298 | ||||
48,169 | Boeing Co | 4,213 | |||||
5,519 | e | Brunswick Corp | 94 | ||||
3,374 | e | Clarcor, Inc | 128 | ||||
940 | * | Comtech Group, Inc | 15 | ||||
4,014 | e* | Force Protection, Inc | 19 | ||||
3,359 | Federal Signal Corp | 38 | |||||
3,728 | e* | Fleetwood Enterprises, Inc | 22 | ||||
122,889 | e* | Ford Motor Co | 827 | ||||
809 | e | Freightcar America, Inc | 28 | ||||
3,656 | e* | GenCorp, Inc | 43 | ||||
516 | e* | GenTek, Inc | 15 | ||||
24,767 | General Dynamics Corp | 2,204 | |||||
29,499 | e | General Motors Corp | 734 | ||||
10,412 | Genuine Parts Co | 482 | |||||
7,651 | Goodrich Corp | 540 | |||||
869 | e | Greenbrier Cos, Inc | 19 | ||||
1,580 | e | Group 1 Automotive, Inc | 37 | ||||
15,753 | Harley-Davidson, Inc | 736 | |||||
5,143 | Harsco Corp | 329 | |||||
5,897 | e* | Hayes Lemmerz International, Inc | 27 | ||||
1,585 | e | Heico Corp | 86 | ||||
11,115 | ITT Industries, Inc | 734 | |||||
1,612 | Kaman Corp | 59 | |||||
21,539 | Lockheed Martin Corp | 2,267 | |||||
598 | * | Miller Industries, Inc | 8 | ||||
1,720 | e | Monaco Coach Corp | 15 | ||||
661 | e | Noble International Ltd | 11 | ||||
21,110 | Northrop Grumman Corp | 1,660 | |||||
3,572 | e* | Orbital Sciences Corp | 88 | ||||
4,528 | Oshkosh Truck Corp | 214 | |||||
22,794 | e | Paccar, Inc | 1,242 | ||||
7,965 | * | Pactiv Corp | 212 | ||||
2,188 | e | Polaris Industries, Inc | 105 | ||||
53
TIAA SEPARATE ACCOUNT VA-1 - Stock Index Account
SHARES | COMPANY | VALUE (000) | |||||
27,152 | Raytheon Co | $ | 1,648 | ||||
1,197 | e | A.O. Smith Corp | 42 | ||||
1,983 | e | Spartan Motors, Inc | 15 | ||||
4,145 | * | Spirit Aerosystems Holdings, Inc (Class A) | 143 | ||||
990 | Standard Motor Products, Inc | 8 | |||||
1,631 | e | Superior Industries International, Inc | 30 | ||||
2,648 | * | TRW Automotive Holdings Corp | 55 | ||||
2,719 | * | Tenneco, Inc | 71 | ||||
2,119 | e | Thor Industries, Inc | 81 | ||||
723 | * | TransDigm Group, Inc | 33 | ||||
5,080 | e | Trinity Industries, Inc | 141 | ||||
1,126 | e | Triumph Group, Inc | 93 | ||||
60,826 | United Technologies Corp | 4,656 | |||||
7,954 | e* | Visteon Corp | 35 | ||||
2,193 | e | Wabash National Corp | 17 | ||||
3,132 | Westinghouse Air Brake Technologies Corp | 108 | |||||
1,944 | e | Winnebago Industries, Inc | 41 | ||||
TOTAL TRANSPORTATION EQUIPMENT | 25,320 | ||||||
TRANSPORTATION SERVICES - 0.18% | |||||||
1,330 | e | Ambassadors Group, Inc | 24 | ||||
446 | e* | Ambassadors International, Inc | 7 | ||||
10,400 | CH Robinson Worldwide, Inc | 563 | |||||
783 | e* | Dynamex, Inc | 21 | ||||
13,398 | e | Expeditors International Washington, Inc | 599 | ||||
2,972 | e | GATX Corp | 109 | ||||
2,568 | * | HUB Group, Inc (Class A) | 68 | ||||
4,899 | * | Lear Corp | 136 | ||||
2,500 | * | Orbitz Worldwide, Inc | 21 | ||||
2,493 | e | Pacer International, Inc | 36 | ||||
1,588 | e | Ship Finance International Ltd | 44 | ||||
6,068 | UTI Worldwide, Inc | 119 | |||||
TOTAL TRANSPORTATION SERVICES | 1,747 | ||||||
TRUCKING AND WAREHOUSING - 0.37% | |||||||
1,500 | e | Arkansas Best Corp | 33 | ||||
1,483 | e* | Celadon Group, Inc | 14 | ||||
2,934 | e | Con-way, Inc | 122 | ||||
1,949 | e | Forward Air Corp | 61 | ||||
3,489 | e | Heartland Express, Inc | 49 | ||||
5,941 | e | J.B. Hunt Transport Services, Inc | 164 | ||||
3,656 | Landstar System, Inc | 154 | |||||
952 | e* | Marten Transport Ltd | 13 | ||||
1,717 | e* | Old Dominion Freight Line | 40 | ||||
103 | e* | Patriot Transportation Holding, Inc | 9 | ||||
900 | e* | Saia, Inc | 12 | ||||
40,944 | United Parcel Service, Inc (Class B) | 2,895 | |||||
200 | e* | Universal Truckload Services, Inc | 4 | ||||
2,855 | e | Werner Enterprises, Inc | 49 | ||||
3,617 | e* | YRC Worldwide, Inc | 62 | ||||
TOTAL TRUCKING AND WAREHOUSING | 3,681 | ||||||
WATER TRANSPORTATION - 0.29% | |||||||
2,650 | Alexander & Baldwin, Inc | 137 | |||||
3,978 | e* | American Commercial Lines, Inc | 65 | ||||
54
TIAA SEPARATE ACCOUNT VA-1 - Stock Index Account
SHARES | COMPANY | VALUE (000) | |||||
829 | e | Arlington Tankers Ltd | $ | 18 | |||
27,017 | Carnival Corp | 1,202 | |||||
1,332 | e | Double Hull Tankers, Inc | 16 | ||||
2,567 | e | Eagle Bulk Shipping, Inc | 68 | ||||
2,983 | e | Frontline Ltd | 143 | ||||
1,084 | e | Genco Shipping & Trading Ltd | 59 | ||||
680 | e | General Maritime Corp | 17 | ||||
2,142 | e | Golar LNG Ltd | 47 | ||||
1,244 | * | Gulfmark Offshore, Inc | 58 | ||||
2,063 | e | Horizon Lines, Inc (Class A) | 38 | ||||
1,586 | e* | Hornbeck Offshore Services, Inc | 71 | ||||
3,407 | * | Kirby Corp | 158 | ||||
1,036 | Knightsbridge Tankers Ltd | 25 | |||||
1,459 | e | Nordic American Tanker Shipping | 48 | ||||
2,450 | e* | Odyssey Marine Exploration, Inc | 15 | ||||
1,898 | e | Overseas Shipholding Group, Inc | 141 | ||||
8,396 | e | Royal Caribbean Cruises Ltd | 356 | ||||
400 | e* | TBS International Ltd (Class A) | 13 | ||||
2,303 | e | Teekay Corp | 123 | ||||
931 | e* | Ultrapetrol Bahamas Ltd | 16 | ||||
TOTAL WATER TRANSPORTATION | 2,834 | ||||||
WHOLESALE TRADE-DURABLE GOODS - 0.35% | |||||||
2,158 | e | Agilysys, Inc | 33 | ||||
3,106 | Applied Industrial Technologies, Inc | 90 | |||||
7,511 | * | Arrow Electronics, Inc | 295 | ||||
2,819 | Barnes Group, Inc | 94 | |||||
2,807 | e* | Beacon Roofing Supply, Inc | 24 | ||||
691 | e* | BlueLinx Holdings, Inc | 3 | ||||
6,944 | BorgWarner, Inc | 336 | |||||
1,739 | e | Building Material Holding Corp | 10 | ||||
702 | Castle (A.M.) & Co | 19 | |||||
1,444 | e* | Conceptus, Inc | 28 | ||||
1,490 | * | Digi International, Inc | 21 | ||||
1,195 | e* | Drew Industries, Inc | 33 | ||||
2,198 | * | Genesis Microchip, Inc | 19 | ||||
573 | e* | Hansen Medical, Inc | 17 | ||||
800 | e | Houston Wire & Cable Co | 11 | ||||
6,606 | IKON Office Solutions, Inc | 86 | |||||
8,393 | * | Ingram Micro, Inc (Class A) | 151 | ||||
3,362 | * | Insight Enterprises, Inc | 61 | ||||
1,758 | * | Interline Brands, Inc | 38 | ||||
3,799 | e | Knight Transportation, Inc | 56 | ||||
5,792 | * | LKQ Corp | 122 | ||||
300 | e | Lawson Products, Inc | 11 | ||||
300 | e* | MWI Veterinary Supply, Inc | 12 | ||||
2,610 | e | Martin Marietta Materials, Inc | 346 | ||||
2,729 | Owens & Minor, Inc | 116 | |||||
4,604 | e* | PSS World Medical, Inc | 90 | ||||
8,816 | * | Patterson Cos, Inc | 299 | ||||
2,583 | e | PEP Boys-Manny Moe & Jack | 30 | ||||
3,009 | e | Pool Corp | 60 | ||||
4,138 | Reliance Steel & Aluminum Co | 224 | |||||
1,634 | * | Solera Holdings, Inc | 40 | ||||
3,376 | * | Tech Data Corp | 127 | ||||
55
TIAA SEPARATE ACCOUNT VA-1 - Stock Index Account
SHARES | COMPANY | VALUE (000) | |||||
696 | e* | TomoTherapy, Inc | $ | 14 | |||
2,317 | * | Tyler Technologies, Inc | 30 | ||||
4,214 | e | W.W. Grainger, Inc | 369 | ||||
2,793 | e* | WESCO International, Inc | 111 | ||||
744 | e* | West Marine, Inc | 7 | ||||
TOTAL WHOLESALE TRADE-DURABLE GOODS | 3,433 | ||||||
WHOLESALE TRADE-NONDURABLE GOODS - 0.56% | |||||||
4,181 | Airgas, Inc | 218 | |||||
2,860 | e* | Akorn, Inc | 21 | ||||
5,454 | * | Alliance One International, Inc | 22 | ||||
3,382 | e* | Allscripts Healthcare Solutions, Inc | 66 | ||||
896 | e | Andersons, Inc | 40 | ||||
1,953 | e* | Bare Escentuals, Inc | 47 | ||||
1,671 | e* | Beijing Med-Pharm Corp | 18 | ||||
4,745 | Brown-Forman Corp (Class B) | 352 | |||||
22,334 | Cardinal Health, Inc | 1,290 | |||||
2,137 | e* | Central European Distribution Corp | 124 | ||||
638 | e* | Core-Mark Holding Co, Inc | 18 | ||||
7,952 | e | Dean Foods Co | 206 | ||||
8,175 | * | Endo Pharmaceuticals Holdings, Inc | 218 | ||||
1,588 | e* | Fresh Del Monte Produce, Inc | 53 | ||||
852 | e* | Green Mountain Coffee Roasters, Inc | 35 | ||||
2,432 | e* | Hain Celestial Group, Inc | 78 | ||||
5,563 | * | Henry Schein, Inc | 341 | ||||
2,657 | Herbalife Ltd | 107 | |||||
9,318 | e | Idearc, Inc | 164 | ||||
1,430 | K-Swiss, Inc (Class A) | 26 | |||||
500 | e | Kenneth Cole Productions, Inc (Class A) | 9 | ||||
901 | e* | LSB Industries, Inc | 25 | ||||
231 | e* | Maui Land & Pineapple Co, Inc | 7 | ||||
3,315 | Men’s Wearhouse, Inc | 89 | |||||
1,570 | Myers Industries, Inc | 23 | |||||
785 | e | Nash Finch Co | 28 | ||||
3,094 | Nu Skin Enterprises, Inc (Class A) | 51 | |||||
1,009 | e* | Nuco2, Inc | 25 | ||||
804 | * | Perry Ellis International, Inc | 12 | ||||
1,539 | e* | School Specialty, Inc | 53 | ||||
2,212 | e* | Source Interlink Cos, Inc | 6 | ||||
1,382 | e | Spartan Stores, Inc | 32 | ||||
38,300 | Sysco Corp | 1,195 | |||||
5,668 | * | Terra Industries, Inc | 271 | ||||
2,117 | e* | Tractor Supply Co | 76 | ||||
2,582 | e* | United Natural Foods, Inc | 82 | ||||
1,702 | e* | United Stationers, Inc | 79 | ||||
423 | e | Valhi, Inc | 7 | ||||
849 | e* | Volcom, Inc | 19 | ||||
1,325 | * | Zep, Inc | 18 | ||||
TOTAL WHOLESALE TRADE-NONDURABLE GOODS | 5,551 | ||||||
| TOTAL COMMON STOCKS (Cost $653,518) | 985,877 | ||||||
56
TIAA SEPARATE ACCOUNT VA-1 - Stock Index Account
PRINCIPAL | ISSUER | VALUE (000) | ||||||
SHORT-TERM INVESTMENTS - 11.00% | ||||||||
U.S. GOVERNMENT AND AGENCIES DISCOUNT NOTES - 0.32% | ||||||||
$ 2,200,000 | d | Federal Home Loan Bank (FHLB), 01/02/08 | $ | 2,200 | ||||
1,000,000 | d | Federal Home Loan Mortgage Corp (FHLMC), 04/25/08 | 987 | |||||
TOTAL U.S. GOVERNMENT AND AGENCIES DISCOUNT NOTES | 3,187 | |||||||
SHARES | COMPANY | |||||||
INVESTMENT OF CASH COLLATERAL FOR SECURITIES LOANED - 10.68% | ||||||||
105,657,487 | State Street Navigator Securities Lending Prime Portfolio | 105,657 | ||||||
TOTAL INVESTMENT OF CASH COLLATERAL FOR SECURITIES LOANED | 105,657 | |||||||
| TOTAL SHORT-TERM INVESTMENTS (Cost $108,844) | 108,844 | |||||||
| TOTAL PORTFOLIO - 110.66% (Cost $762,362) | 1,094,721 | |||||||
OTHER ASSETS & LIABILITIES, NET - (10.66)% | (105,429 | ) | ||||||
| NET ASSETS - 100.00% | $ | 989,292 | ||||||
| * | Non-income producing. |
| ** | Percentage represents less than 0.01%. |
| ^ | Amount represents less than $1,000. |
| d | All or a portion of these securities have been segregated by the custodian to cover margin or other requirements on open futures contracts |
| e | All or a portion of these securities are out on loan. |
| m | Indicates a security that has been deemed illiquid. |
| v | Security valued at fair value. |
Cost amounts are in thousands.
57
| Item 7. | Disclosure of Proxy Voting Policies and Procedures for Closed-End Management Investment Companies. |
Not Applicable.
| Item 8. | Portfolio Managers of Closed-End Management Investment Companies. |
Not Applicable.
| Item 9. | Purchases of Equity Securities by Closed-End Management Investment Company and Affiliated Purchasers. |
Not Applicable.
| Item 10. | Submission of Matters to a Vote of Security Holders. |
There were no material changes to the procedures by which shareholders may recommend nominees to the Registrant’s Board of Trustees.
| Item 11. | Controls and Procedures. |
(a) An evaluation was performed within 90 days of the date hereof under the supervision of the Registrant’s management, including the principal executive officer and principal financial officer, of the effectiveness of the design and operation of the Registrant’s disclosure controls and procedures. Based on that evaluation, the Registrant’s management, including the principal executive officer and principal financial officer, concluded that the Registrant’s disclosure controls and procedures were effective for this annual reporting period.
(b) There were no changes in the Registrant’s internal control over financial reporting that occurred during the Registrant’s fiscal year-end that materially affected, or are reasonably likely to materially affect, the Registrant’s internal control over financial reporting.
| Item 12. | Exhibits. |
12(a)(1) Copy of current code of ethics
12(a)(2)(i) Section 302 certification of the principal executive officer
12(a)(2)(ii) Section 302 certification of the principal financial officer
12(b) Section 906 certification of principal executive officer and principal financial officer
SIGNATURES
Pursuant to the requirements of the Securities Exchange Act of 1934 and the Investment Company Act of 1940, the Registrant has duly caused this report to be signed on its behalf by the undersigned, thereunto duly authorized.
| TIAA SEPARATE ACCOUNT VA-1 | ||||
| Date: May 28, 2008 | By: | /s/ Roger W. Ferguson, Jr. | ||
| Roger W. Ferguson, Jr. | ||||
| President and Chief Executive Officer | ||||
Pursuant to the requirements of the Securities Exchange Act of 1934 and the Investment Company Act of 1940, this report has been signed below by the following persons on behalf of the registrant and in the capacities and on the dates indicated.
| Date: May 28, 2008 | By: | /s/ Roger W. Ferguson, Jr. | ||
| Roger W. Ferguson, Jr. | ||||
| President and Chief Executive Officer | ||||
| (principal executive officer) | ||||
| Date: May 28, 2008 | By: | /s/ Georganne C. Proctor | ||
| Georganne C. Proctor | ||||
| Executive Vice President and Chief Financial Officer | ||||
| (principal financial officer) | ||||
EXHIBIT INDEX
| Item 12. | Exhibits. |
12(a)(1) Copy of current code of ethics
12(a)(2)(i) Section 302 certification of the principal executive officer
12(a)(2)(ii) Section 302 certification of the principal financial officer
12(b) Section 906 certification of principal executive officer and principal financial officer